District Census Handbook, Kolaba - Linguistic Survey Of India
Upload
khangminh22Category
view
1download
0
• CENSUS 1961 KERALA STATE
DISTRICT CENSUS HANDBOO I( 2
KOZHIKODE
M. K. DEV ASSY B. A., B. L.
OF THE INDIAN ADMINISTRATIVE SERVICE SUPERINTENDENT OF CENSUS OPERATIONS, KERALA
AND THE UNION TERRITORY OF LACCADIVE, MINICOY AND AMINDIVI ISLANDS
1965

PRINTED BY THE S.G.P. AT THE GOVERNMENT PRESS,
ERNAKULAM, 1965

PREFACE
The District Census Handbooks were started for the first time in the history of the decennial censuses in India in 1951. The Handbooks of the TravancoreCochin and Madras States in the 1951 Census contained, besides a short account of the district and the people, important Census ,tables for the district and a village directory consisting of the area, houses, population, number of literates, the distribution of population by livelihood classes, the number of institutions and general information on amenities etc., in respect of every village. In the 1961 Census it was decided with the concurrence of the State Government to continue the publication of the District Census Handbooks. The contents of the District Census Handbooks of the 1961 Census are, however, a little more ambitious than those of the 1951 Census Handbooks in that besides the items of information mentioned above a large number of tables giving general information about the districts have been added. The number of such tables comes to 43 besides 59 inset tables excluding those given in respect of Census data. As far as possible, an attempt has been made through these tables to give an epitome of the progress made by the district in various fields during the inter-censal period 1951-61. The book is divided into three parts. Part A gives a general description of the district, the progress made during the last decade, a review of the population, literacy, employment and unemployment, household. economic data etc., of the district based on Census data and a gazetteer. The appendices to this part contain the various tables of general information on which the review of progress has been based. Part B ,contains' the Census data of 1961 comprising the general population tables, economic tables including household economic tables, social and cultural tables, and special tables for Scheduled Castes and Scheduled Tribes. Part C ~s the Village Directory. It is hoped that this han·dbook will serve as a useful reference book on the Kozhikode district.
A book of this kind could not have been compiled but for the hearty co-operation and goodwill extended by the various departments of the State. and Central Governments to whose kindness I am deeply indebted. The District Census Handbook Section of my office consisting of a Statistical Assistant and a couple of Compilers has been in charge of the entire work of collection and compilation of the data for this handbook. At the time of addressing the various departments for collection of information for the District Census Handbook Shri H. Padm<l:nabha Iyer of the Bureau of Economics and Statistics
I06/1-ia

was the Statistical· Assistant in charge of the Section. After a short period of work in this section he was transferred to the Tabulation Office, Kozhikode, as the Tabulation Officer. He was succeeded by Shri S. Jayashanker of the Bureau of Economics and Statistics as Statistical Assistant in charge of this handbook. While Shri Padmanabha Iyer has rendered excellent service in piloting the work of the collection of data for the handbooks, Shri J ayashanker who succeeded him has borne the brunt of the work in the preparation of this handbook which involved a good deal of careful analysis and laborious compilation. I feel happy in acknowledging the valuable contribution made by them and particularly Shri Jayashanker in the compilation of this important book. I should also acknowledge the good work of the Compilers of the District Census Handbook Section, Sarvashri K. N. Raman and E. V. Unnikrishnan Nair and of Draftsm~n Shri S. Krishna Pillai who has prepared the entire set of maps given in the book. '
. I should express my deep sense of gratitude to Shri P. K. Abdulla 1. A. S., Secretary to Government and Shri K. Swaminathan, Superintendent of Government Presses for the warm Co-operation extended by them for the timely printing of this handbook.
Above all I am grateful to Shri Asok Mitra, I.C.S., Registrar General, for the valuable guidance and help extended to me in this work.
Trivandrum, 15th September 1965. M. K. DEVASSY
.. 11

PREFACE
PART A GENERAL
History of the district Situation Administrative units
CONTENTS
Area, physical features and natural divisions River systems Mountains Backwaters Soils Geology Climate Forests Land tenures Agriculture Live-stock Education Public health Vital statist~cs Electric power Communications Industries Trade Fisheries Community development Revenue Local self government Co-operativy societies Criminal justice Registration Small savingtl scheme . Printing preSses and periodicals Entertaiftments Employment Exchange· activities Important events Occupied houses and households Growth of population Population by taluks Rural.urban distribution of population Population by natural regions Population density Sex-ratio Age Marital status Religion Literacy and education Languages Birth place Workers and non-workers Household economic data Gazetteer
PAGE
3 3 3 3 4 5 5 5 5 6 7 8
18 25 25 27 29 29 30 33 37 37 38 38 39 40 41 43 43 43 43 43 43 43 46 47 47 48 48 50 52 53 53 53 58 58 59 67 70
APPENDICES
Appendix
Appendix 2
Appendix 3 Appendix 4
Appendix 5
Appendix 6 Appendix 7 Appendix 8 Appendix 9
Appendix 10 Appendix 11 Appendix 12
Appendix 13
Appendix 14 Appendix 15
Appendix 16 Appendix 17 Appendix 18 A~pendix 19
Appendix 20 Appendix 21
Appendix 22
Appendix 23
Appendix 24.Appendix 25
Appendix 26
Appendix 27
Appendix 28
Appendix 29 Appendix 30
Appendix 31
Appendix 32
Normals of rainfall and rainy days (based on available data for the period 1901 to 1950) for Badagara, Kozhikode, Kuttiyadi, Manjeri, Nilambur, Quilandy, Tirurangadi and Vythiri stations
Rainfall data for Badagara, Kozhikode, Kuttiyadi, Manjeri, Nilambur, Quilandy, Tirurangadi and Vythiri stations
Temperature data for Kozhikode station Major and minor forest products Production of important crops for the last six years Retail prices of certain commodities for Kozhikode centre Consumer Price Index numbers for Kozhikode centre Live-stock and poultry (Live .. stock Census 1961) Agricultural machinery and implements (Live-stock Census
1961 ) Colleges for the academic year 1960-61 Technical Institutions Number of institutions and number of persons treated for
the period 1950-51 to 1960-61 Patients treated in various hospitals and dispensaries by
diseases for 1960-61 . Rural sanitation for the period 1950-51 to 1960-61 Anti-adulteration activities for the period 1956-57 to
1960-61 Polymetric table of distances Facilities at various railway stations List of post offices Connections provided from telephone exchanges during the
period 1950-51 to 1960-61 Handicrafts Average earnings of workmen per day in a category of work
for the period 1950-51 to 1960-61 Number of industrial disputes resulting in work-stoppages
for the period 1957 to 1960 Number of industrial disputes by causes for the period
1957 to 1960 Number and tonnage of vessels Imports into the ports of Badagara and C a1icut for the
period 1951-52 to 1959-60 Exports from the ports of Badagara and Calicut for the
period 1951-52 to 1959-60 Physical achievements and people's contribution for the
period 1957-58 to 1960-61 Receipts under excise revenue for the period 1950-51 to
1960-61 Sales tax revenue for the period 1950-51 to 1960-61 Agricultural income tax and agricultural super tax classi
fied by grade of income for the period 1957-58 to 1960-61
Incidence of land revenue assessment for the period 1950-51 to 1959-60
Receipts under entertainment tax for the period 1950-51 to 1959-60
IV
PAGE
81
81 84 85 85 85 91 92
98 98 99
99
100 102
102 103 106 107
109 109
110
112
112 112
113
117
127
129 129
130
132
132

Appendix 33 Appendix 34
Income of municipalities for the period 1955-56 to 1960-61 Expenditure of municipalities for the period 1955-56 to
1960-61
Appendix 35 Appendix 36
Income ofpanchayats for the period 1955-56 to 1960-61
Expenditure of panchayats for the period 1955-56 to 1960-61
Nature and len~h of sentence of convicts in jails for the period 1950-51 to 1960-61 .
Appendix 37
Appendix 38 Number of polite stations, strength of police personnel, etc., for the period 1950-51 to 1960-61
Appendix 39 Number of registered documents and values of property transferred for the period 1950-51 to 1960-61
Appendix 40 Number of printing presses and periodicals for the period 1950-51 to 1960-61
Appendix 41 Cinemas conducted in Badagara and Calicut municipalities for the period 1959-60 and 1960-61
Appendix 42 Employment exchange activities for the period 1955-56 to 1960-61
Appendi.'{ 43 Important events during the last decade
PART B CENSUS DATA
(i) STATE TABLES I AREA, HOUSES AND POPULATION
II VARIATION IN POPULATION DURING SIXTY YEARS III WORKERS AND NON-WORKERS CLASSIFIED BY SEX
(ii) KOZHIKODE DISTRICT TABLES A-General Population Tables
A-I AREA, HOUSES AND POPULATION Fly-leaf
A-II
A-III
. Table A-I Appendix I Statement showing 1951 territorial units constituting the
present set-up of Kozhikode District Appendix II Number of villages with a population of 5,000 and over
and towns with a population under 5,000 Appendix III Houseless and Institutional Population
\VARIATION IN POPULATION DURING FORTY YEARS Fly-leaf Table A-II
. Appepdix Statement showing 1951 population according to the territorial jurisdiction in 1951, changes in area and the population involved in those changes
VILLAGES CLASSIFIED BY POPULATION Fly-leaf
SPECIAL TABLE A-III DES0MS CLASSIFIED BY POPULATION Fly-leaf Table A-III Special Table A-III
A-IV TOWNS (AND TOWN-GROUPS) CLASSIFIED BY POPULATION IN 1961 WITH VARIATION SINCE 1901 Fly-leaf Table A-IV Appendix I
Appendix II
New towns added in 1961 and towns in 1951 declassified in 1961 .
Details of constitution of towns with their area and jurisdiction
v
PAGE
133
134 135
135
136
136
137
137
137
138 ~8
3 4 6
11 14
16
17 17
18 1.9
20
21
21 22 22
24 25
27
28

B-Economic Tables
NOTE
B-1 WORKERS AND NON-WORKERS CLASSIFIED BY SEX AND BROAD AGE-GROUPS . Fly-leaf Table n:-I
B-III INDUSTRIAL CLASSIFICATION OF WORKERS AND NONWORKERS BY EDUCATIONAL LEVELS
PAGE
29
31 32
Fly-leaf 34 Table B-III Part-A 35 Table B-III Part-B
E-IV: INDUSTRIAL CLASSIFICATION BY SEX AND CLASS OF WORKER OF PERSONS AT WORK OTHER THAN AT CULTIVATION Fly-leaf Table B-IV Part-A Table B-IV Part-B
36
38 49 51
Table B-IV Part-C 55 Appendix to B-IV Part-C 58 Table B-IV Part-C (i) 61
B-V OCCUPATIONAL CLASSIFICATION BY SEX OF PERSONS AT WORK OTHER THAN CULTIVATION Fly-leaf TableB-V Appendix
B-VI OCCUPATIONAL DIVISIONS OF PERSONS AT WORK OTHER THAN CULTIVATION CLASSIFIED BY SEX, BROAD AGEGROUPS AND EDUCATIONAL LEVELS IN URBAN AREAS ONLY
63 65 90
Fly-leaf 95 Table B-VI 96
B-VII PART-A PERSONS WORKING PRINCIPALLY (i) AS CULTI. VATORS (ii) AS AGRICULTURAL LABOURERS OR (iii) AT HOUSEHOLD INDUSTRY CLASSIFIED BY SEX AND BY SECONDARY WORK (i) AT HOUSEHOLD INDUSTRY (ii) AS CULTIVATOR OR (iii) AS AGRICULTURAL LABOURER
PART-B INDUSTRIAL CLASSIFICATION BY SEX OF FER. SONS WORKING IN NON-HOUSEHOLD INDUSTRY, TRADE, BUSINESS, PROFESSION OR SERVICE WHO ARE ALSO ENGAGED IN HOUSEHOLD INDUSTRY Fly-leaf 100 Table B-VII Part-A 101 Appendix 102 Table B-VII Part-B 103
B-VIII PERSONS UNEMPLOYED AGED 15" AND ABOVE BY SEX, BROAD AGE-GROUPS AND EDUCATIONAL LEVELS Fly-leaf Table B-VIII Part-A Table B-VIII Part-B
VI
113 114 116

B-IX PERSONS NOT AT WORK CLASSIFIED BY SEX, BROAD AGEGROUPS AND TYPE OF ACTIVITY
PAGB
Fly-leaf 117 Table B-IX 118
B-X SAMPLE HOUSEHOLDS (i) ENGAGED NEITHER IN CULTIVATION NOR HOUSEHOLD INDUSTRY (ii) ENGAGED EITHER IN CULTIVATION OR HOUSEHOLD INDUSTRY BUT NOT IN BOTH 'AND (iii) ENGAGED BOTH IN CULTIVATION AND HOUSEHOLD INDUSTRY FOR ALL AREAS Fly-leaf 122 Table B-X 123-
B-XI SAMPLE HOUSEHOLDS ENGAGED IN CULTIVATION CLASSIFIED BY INTEREST IN LAND AND SIZE OF LAND CULTIVATED IN RURAL AND URBAN AREAS SEPARATELY Fly-leaf 124-Table B-XI 125-
B-XII SA:MPLE HOUSEHOLDS ENGAGED IN CULTIVATION ONLY CLASSIFIED BY SIZE OF LAND CULTIVATED AND NUMBER OF FAMILY WORKERS AND HIRED WORKERS, IN RURAL AND URBAN AREAS SEPARATELY Fly-leaf 127 Table B-XII 128
B-XIII SAMPLE HOUSEHOLDS ENGAGED BOTH IN CULTIVATION AND HOUSEHOLD INDUSTRY SHOWING SIZE OF LAND CULTIVATED CLASSIFIED BY PRINCIPAL HOUSEHOLD INDUSTRY IN RURAL AND URBAN AREAS SEPARATELY Fly-leaf Table B-XIII
132 133.
'Appendix 133
B-XIV SAMPLE HOUSEHOLDS ENGAGED ONLY IN HOUSEHOLD INDUSTRY CLASSIFIED BY PRINCIPAL HOUSEHOLD INDUSTRY IN ALL AREAS Fly-leaf Table B-XIV Part-A Appendix Table B-XIV Part-B i
B-XV SAMPLE HOUSEHOLDS ENGAGED BOTH IN 'CULTIVATION AND HOUSEHOLD INDUSTRY CLASSIFIED BY SIzE OF LAND IN RURAL AND URBAN AREAS SEPARATELY
B-XVI
Fly-leaf, Table B-XV
SAMPLE PRINCIPAL HOUSEHOLD INDUSTRY CLASSIFIED BY. PERIOD OF WORKING AND TOTAL NUMBER OF WORKERS ENGAGED iN HOUSEHOLD INDUSTRY IN ALL AREAS Fly-leaf Table B-XVI
134-135 136-13i
139-14(}
145,
14& Appendix 150·
B-XVII SAMPLE HOUSEHOLDS CLASSIFIED BY SIZE AND PARTICIPATIONIINaHOUSEHOLD CULTIVATION OR INDUSTRY Fly-leaf 151 Tablt; B-XVII 152: .
.. Vll
l06/l-ii

PAGE
C-Social and Cultural Tables NOTE 154
C-I COMPOSITION OF SAMPLE HOUSEHOLDS BY RELATIONSHIP TO HEAD OF FAMILY CLASSIFIED BY SIZE OF LAND CULTIVATED Fly-leaf Table C-1
'C-Il AGE AND MARITAL STATUS Fly-leaf TableC-II
e-III AGE, SEX AND EDUCATION Fly-leaf Table C-III Part-A Table C-III Part-B Table C-III Part-C
e.v MOTHER TONGUE
155 156
158 159
162 163 164 167
Fly-leaf 168 Table C-V 170
C-VII RELIGION Fly-leaf 172 Table C-VII 173 Table C-VII Supplement 173
C-VIII SCHEDULED CASTES AND SCHEDULED TRIBES Fly-leaf 175 Table C-VIlI Part-A 176 Table C. VIII Part-B 176
D-Migration Tables NOTE 178
E-Housiag and Establishment Tables NOTE 178
SeT, so & ST-Special Tables for Scheduled C«stes and Scheduled Tribes OOTI . l~
SCT-I INDUSTRIAL CLASSIFICATION OF PERSONS AT WORK AND NON-WORKERS BY SEX FOR SCHEDULED CASTES AND SCHEDULED TRIBES Fly-leaf 181 Table SCT·I Part-A 182 Table SCT·l Part·B 186
SCT.II AGE AND MARITAL STATUS FOR SCHEDULED CASTES AND SCHEDULED TRIBES . Fly-leaf 189 Table SCT-II Part-A 190 Table SOT-II Part-B 194
SCT.III SCHEDULED CASTES AND SCHEDULED TRIBES CLASSI. FlED BY EDUCATIONAL LEVELS Fly.leaf 196 Table SCT-III Part-A (i) 197 Table SCT-III Part-A (ii) 198 Table SCT·III Part.B (i) 199 Table SCT.III Part·B (ii) 200
VJl1

SCT-IV RELIGION FOR SCHEDULED CASTES AND SCHEDULED TRIBES
PAGE
Fly-leaf 201 Table SCT-IV Part-B 202
SCT-V SAMPLE HOUSEHOLDS ENGAGED IN CULTIVATION CLASSIFIED BY INTEREST IN LAND AND SIZE OF LAND CULTIVATED IN RURAL; AREAS ONLY FOR MEMBERS OF SCHE. DULED CASTES AND SCHEDULED TRIBES Fly-leaf Table SOT-V Part-A
204 203
Table SOT. V Part.B 204-
Sa.I PERSONS NOT AT WORK CLASSIFIED BY SEX, TYPE OF ACTIVITY AND EDUCATIONAL LEVELS FOR SCHEDULED CASTES Fly.leaf 205 Table SO-I 206
ST.I MOTHER TONGUE AND BILINGUALISM FOR SCHEDULED TRIBES Fly-leaf 208 Table ST-I 209
ST-II PERSONS NOT AT WORK CLASSIFIED BY SEX AND TYPE OF ACTIVITY FOR SCHEDULED TRIBES Fly-leaf Table ST-II
PART C VILLAGE DIRECTORY
(i) PRIMARY CENSUS ABSTRACT Kozhikode District Badagara Taluk Quilandy " Kozhikode " Tirur " Ernad " South Wynad "
(ii) AMENITIES I Educational and reading facilities 2 Medical facilities 3 Drinking water facilities 4 Communication and Transport facilities 5 Electrification facilities 6 Miscellaneous
(iii) INDUSTRIAL ESTABLISHMENTS
(iv) INDEX OF VILLAGES ANI) DESOMS
USTOFMAPS 1 Kozhikode District 2 Badagara Taluk 3 Quilandy " 4 Kozhikode
" 5 Tirur " 6 Ernad " 7 South Wynad " IX
211 212 .. _.. ......
()
6 20 3~ 56 62 72
79 83 86 90 94 95
103
113

o ,
UJ IX o ~ z z t1
KOZHIKODE DISTRICT _._._._ STATE BOUNDARY ._.-.-._ DISTRICT BOUNDAR.Y ............ ; .... -... TALUK &OUNDAR.Y
Milet 10 8 • 4 1 0
! .pnj'. fO 8 e 4 2 0
10 !
i 20
. 20
i !
30 Kilometres
CANNANORf DISTRIC.T
KERAlA
~ STATE HIGHWAY
LOCAL ROAD
\ ~ RAilWAY
i R:- RIVER
'" 1> * TALUK HEADQUARTERS
\ e PISTRICT HEADQUARTERS
" 71 7 ao'E
PrlrMdltC.S.O.Trlvandrvm •. D.'"5o
0 ,
N

PART A
GENERAL

PART A-GENERAL
History of the District
1. With the enactment of the States Reprganisation Act, 1956 (Central Act 37 of 1956) on 1s't November 1956 the former Malabar district (except Laccadive and Minicoy Islands) and the old Kasaragod taluk of South Kanara district of the Madras State formed part of the Kerala State. These areas constituted the Malabar district of Kerala. But this district continued as such only till 1st January 1957 when it was trifur· cated into the three new revenue districts of Cannanore, Kozhikode and Palghat, The Kozhikode district thus formed on 1st January 1957 consisted of Badagara and Quilandy taluks formed out of the old Kurumbranad taluk on this date, . the Kozhikode taluk, the Ernad taluk (i.e., the resicluary portion of the old Ernad taluk left after taking a portion to the Tirur taluk) and the Tirur taluk newly formed on this date taking in a por. tion of the old Ernad taluk and the old Ponnani taluk. On 15th March 1957 the South Wynad taluk was transferred from the Cannanore district to this district. Situation
2. Bounded on the north by Cannanore district, on the east by the natural barrier of Western Ghats, by the Mysore district of the Mysore State and the Nilgiris district of the Madras State, on the south by Palghat district and on the west by the Arabian sea, the Kozhikode district lies between north latitudes 10 0
47' and 11 0 52' and east longitudes 75° 32' and 760 33'. Administrative UiUts
3. Koihikode district is divided into six taluks Badagara, Ernaq, Kozhikode, Quilandy, South Wynad and Tirur, with 332 amsoms or revenue villages. The distribution of these villages among the various taluks
"UltemeDt 1 DISTRIBUTION OF VILLAGES
f No. of villages lying Total nb- in towns
Area in ber of reve-Taluk sq. miles nue villages
Badagara 212'26 47 Eroad .873'33 64 Kozhikode 379'13 71 Quilandy 294-49 57 South Wynad 532'61 20
Wholly 3 1
12 1
Tirur 278'44 73 5
Partly
4
4. Badagara and Calicut are the two municipal towns of this District. There are 85t panchayats and 16t community development blocks. Out of sixteen blocks 12 are Stage I and the rest are Pre-extension.
Area, Physical Features and Natural Divisions
5. With an area of 2,570'26 sq. miles (*) the Kozhi. kode district stands foremost among the districts of Kerala in point of area. The district, like all other districts, shows the division of the State into the three natural regions, the lowland, the midland and the highland. "The western coast of India has been historically the most active, partly for reasons inherent in its own nature-a coast with numerous havens, creek or roadstead, a narrow immediate hinterland with a few well-defined routes into the interior-and partly by virtue of its location facing the interconti. nental nodes of South-West Asia. Maritime activity goes back to the beginnings of history, and this was the first part of Ind ia to receive the atten tion of Renaig. sance Europe; indeed some fragments of the Portu. guese empire here have survived the British "(**). This deltaic or western littoral region, the land of lagoons, marshes and canals fed by innumerable streams and rivers that scour the country down the table land and bring rich alluvial deposits to fertilise and enrich the lowlands is conspicuous for its extensive cultivation of cocoanut palm and paddy. For purposes of demar. cation this narrow strip of region having a coastal line of seventy miles and lying below 25 feet above mean sea level constitutes the lowland. All the taluks except Ernad and South Wynad have coastal areas. The industrial development of the district is mainly can. fined to this region of high cultivation and old civiliza. tion. The midland lying between 25 feet a~d 250 feet above the mean sea level has fertile soil with luxuriant vegetation the main culivation being rice, pepper, cocoanut, arecanut, tapioca and rubber. To the east of the midland, 250 feet above the mean sea level, lies the highland region overrun by mountains, hills and woods and undulating ridges in all directions intersected by extensive valleys of wet cultivation. Some of the mountains in this region rise above 5,000 feet in height. Tea, coffee, cardamom and rubber are the main cash crops here. The maximum breadth of the district is 55 miles while the minimum is 13 miles.
6. Badagara, the northernmost taluk of the district has low laterite hills and extensive cultivation of cocoa· nuts and rice. The terrain and type of land of Q.uilandy
t During the period 1960·61 t As in October 1961 (*) 6,656'95 sq. km. (**) India and Pakistan by O.H.K. Spate, Page 596

RIVER SYSTEM
taIuk is similar to that of Badagara taluk except for its north-eastem portion of 87'05 sq. miles of unsurveyed hills. Cocoanut, rice, arecanut, pepper, tapioca and rubber are tne important crops of Quilandy taluk. The physical features of Kozhikode taluk have striking resemblances with the other taluks mentioned above. Rice and cocoanuts are the principal crops of this taluk. Rubber, being an important cash crop, is cultivated in the eastern and north-eastern villages of the taluk. Besides, this taluk has 75'97 sq. miles of unsurveyed hilly areas .. ,' Mountain peaks like Camel's Hump, Velleri mala and Elambileri are situated in this taluk. The deltaic region of Kallayi, river is an important industrial centre. Tirur taluk 'lies in the lowland and midland regions, its chief crop being cocoanuts. A major portion of Ernad taluk is covered by mountains, wood and unsurveyed hills. The unsurveyed region comes to 327'84 sq. miles in 1961. The forests of this taluk have valuable teak plantations. South Wynad taluk is situated entirely in the highland region and consists of several detached hills of considerable elevations. An important feature of South Wynad is the extensive cultivation of tea, coffee and cardamom.
7. The subjoined statement gives the area of the district by natural divisions :-
Statement 2 NATURAL DIVISIONS
Total Rural Natural division sq. miles sq. miles
Urban sq. miles
60'7 Total 2,570'2 2,509'5 Highland 1,137'3 1,137'3 Midland 1,260'9 1,217-8 43'l Lowland 172'0 154'4 17'6
8. The following further classification gives the number of villages and towns lying in the natural divisions of each taluk with their areas.
Statement 3 TALUKS BY NATURAL DIVISIONS
Area in sq. miles and number of
Villages lying in Towns lying in ~
Numberl High- Mid- Low- High- Mid- Low-Taluk Area land land land land land land
Badagara Number 1 5 38 1 Area 43-1 60'3 100'7 8'24
Brnad Number 2 61 I Area 372'5* 495'7 5'12
Kozhikode Number I 58 9 Area 102'1* 247'6 .. 29-41
Quilandy Number 45 11 1 Area· 87'0* 172-8 32'1 2'59
South Number 20 Wynad Area 532'6
Tirur Number 61 7 2 3 Area 241-4 21'6 8'56 6'82
• Inclusive of unsurveyed area
4
The entire area given against Quilandy taluk for highland pertains to unsurveyed hills. Ernad and Kozhikode taluks also have unsurveyed hills. '
The River System
9. Out of the 44 rivers in Kerala there are eight west-flowing and one east-flowing rivers in this district. Chaliyar or Beypore river is not a big river by Indian standards, even though it has a length of 105 miles and ranks fourth in the State. It has a drainage area of 1,085 sq. miles of which 145 sq. miles lie in the Madras State and an annual run-off of 185,000 million cubic feet. The Beypore river rises from the Elambileri hills and draining the Wynad Ghats and Nilagiri Plateau flows through Cholamala estate, Kanthapara, Kurumbanmala, Mannathiamblam, Mambad, Edavanna, Ariyakod, Vazhakkad and Feroke and discharges itself into the sea at Beypore six miles south of Calicut. Karimpuzha, Chaliyar, Punnapllzha, Cherupuzha, Iringapuzha, Kurumbapuzha, Kanhirapuzha and Vadapurampuzha are its important tributaries. The river is navigable for country boats aU the year round up to a length of 44 miles from Beypore. Motor-boats can only ply upto a distance of 13'5 miles at all seasons even though the river can be used for motor-boat traffic to a distance of 33'5 miles during monsoon periods. Next to Beypore river in length comes Kadalundi river with a length of 81 miles. This river is known by different names in different parts. At Malappuram it is known as "Anakkayam river" while at Tirurangadi it bears the name as" Tirurangadi river". This river has a catchment area of 430 sq. miles and a total run-off of 77,300 million cubic feet. It has its origin in the southern slopes of Kunda mountain at an elevation 4,000 feet abovt mean sea level. This river traverses through Karuvarankundu, Melathur, Pandikad, Malappuram and Tirurangadi and empties itself_into the sea at Kadalundi. It allows motor-boat traffic to a distance of 14 miles while the country boats can get upstream upto 27 :niles. Another importa~t riv~r of this dis.trict is Murat otherwise known as Kuthyadl or Kotta flver. It originates from the Wynad H¥ls and traverses through Tiruvallur, Muyipott, M~niyur and K~ravancheri before it drains its water mto the ArabIan sea at Kottakkal port two miles south ofBadagara. It has
length of 46 miles with a catchment area of 166 sq. ~iles and an annual run-off of 46,980 m~llion cubic feet. Country boats. usually ply to a dIstance of 6 miles. The follow~, statement gives the names. places of origin and length of rivers :-

SOILS
Statement 4
RIVERS * Length in miles
~ River Place of origin Total Navigable
Chaliyar Elambileri mala 105 44 (Beypore)
Kabani Wynad forests N.A. N.A. Kadalundi Forests of the Silent 81 27
Valley Kallayi Cherukulathur village 14 6 Korapuzha Arikkankunnu and Kodi-
yanadumala 'r _::) 15'5
Mahe Narippatta and Kavilum- 34 15 para
Murat (Kutti- Wynad hills 46 6 yadi)
Pooraparamba Pooraparamba 5 3 Tirur Atavanad 30 6
* Source :-" Water Resources of Kerala .. N.A. Not availabl~
Kabani, the east-.flowing inter-state river rises in the Wynad forests and flows through South Wynad and North Wynad taluks and joins as a tributary of Cauvery. The important tributaries of Kabani are Panamaram and Mananthody rivers. Kabani enters the Mysore State at Kalvalli. The rivers originating as they do from the copious mountainous catchments help in no small measure the fields and gardens to produce excellent harvests besides providing excellent inland navigational facilities. Mountains
10. The eastern region of this district is covered by thick forests, low ridges and innumerable valleys. The important nine hills with their heights are .given below:- .
Hill or Peak Height Vavul or Wayutmala 7,673 feet VeIIaramala 7,362 " Elembilerimala 6,032 " Kurichipandimala 5,271 " Nattavaram hill 4,553 " Mottumala or Manikunnu 4,509 " Pandalur hill 2,002 " Chekkumalai hill 1,970 " Urot mala 1,567 "
In addition to the above there are small outlying hills.
Backwaters 11. Kuttiyadi Thura of Badagara taluk and Pook
kot lake of South Wynad taluk are the two important lakes of this district. Soils
12. The soils of this district can be classified into three viz, sandy, laterite and hilly and forest. The sandy soil occurs all along the western side of Badagara,
5
Quilandy, Kozhikode and Tirur taluks. The soil in the midland region of the district is laterite and in the eastern part hilly and forest. The sandy soil varies in texture from sandy loams to pure sand and is highly porous having very little retentive capacity. Paddy and cocoanut are mostly grown in this soil. This soil is extremely deficient in all the major plant foods and lime. . Its primary requirement is organic matter. It is highly acidic in reaction. The laterite soil is formed by weathering mainly of acidic rocks under alternate wet and dry tropical conditions. The typical laterite soil is characterised by a versicular structure and the accumulation of hydrated oxides of iron and aluminium. Most of the bases and silica have been removed by drastic leaching. At or near water table the ,soil material is soft and can be cut into blocks which harden on exposure. This material makes excellent ·bricks· for building purposes. This soil is porous and well drained and has poor retentive capacity and fertility. Where the rainfall is only 70" to 80" the soil has not developed into true laterites. There is accumulation of iron and aluminium in such type of soil and it shows many of the properties of laterites. I t does not have the versicular structure peculiar to true laterites and cannot be used as building stones. This soil is more fertile than pure laterite soils. All garden-land crops like cocoanut, arecanut and fruit palms etc. are grown in this soil. The hilly and forest soil is characterised by a surface layer of organic matter d<rived from forest growth. This soil is rich in nitrogcln but extremely poor in bases due to heavy leaching. The phosphate content is also very low. Wh.en the forests are cieared this soil gradually undergoes laterisation. The sbil is particularly suited for plantation crops such as tea, coffee, cardamom and rubber. It is strongly acidic in reaction. Geology
13. The geological formations met with in the district are four in number viz, (i) a belt of crystalline rocks of the Archean group, (ii) a belt of residual laterite, (iii) a belt of warkalli beds of Tertiary group and (iv) a western-most coastal belt of recent deposits. The most extensive rocks are the gneisses. Mica Schists probably of the Dharwar age are exposed at a few places. The Dharwars are represented by garnetiferrous ferruginous quartzite, mica and talc schists and are found exposed in the south-eastern Wynad and north-west of Gudallur. The gneisses of the district probably belong to the peninsular suite. Large exposures of Charnockite of the intermediate type are found near Meppadi and neighbourhood and south and south-east of Kalpatta of South Wynad Taluk. The

CLIMATE
biotite granite intrusions at Kalpatta and Sultan's Battery deposits cannot be economically exploited. Crystalline are considered by Dr. H. H. Hayden to be equivalents rocks as Vlell as laterites are extensively used for build-of the dospet granite. Residual laterite belt is situated ing purposes. The former is also widely used as road to the west of the Archean crystallines. It has been metal. formed as a result of the in situ alteration of Crystalline Climate rocks. Warkalli beds (Tertiary formation) consist of a 15. The climate of this district more or less succession of coarse sandstones and variegated clays at represents the equatorial conditions. Like other parts times carrying lignitic material. They range in age of the State this district has also four seasons, the dry from upper Miocene to Pliocene. Coastal belt of recent weather from December to February, hot weather from deposits include all marine, lacustrine and alluvial March to May, south-west monsoon from June to
. deposits of recent origin. September and the retreating or north-east monsoon &onomic Minuals from October to November.
14. Five kinds of economic minerals are seen in this (a) Temperature district, viz, clays, limeshell, magnetic iron ores, gold 16. The average monthly temperature of this district and building stones. Tile clays are worked extensh'ely varies approximately between 18°C (64'4Q F) and 360C at Feroke for the manufacture of tile and bricks for (96IaOF). The highest temperature recorded during which there are several factories functioning on this area. the decade 1951-61 at the Kozhikode Observatory was Fairly good varieties of China clay are reported to 36' 1°C in the month of May 1952, while the lowest occur in the South Wynad taluk at Tavinhal, Vythiri, was 18·3°C in the months of December 1953 and and Chundale. Limeshell is exploited from the December 1956. Three factors contribute to the Kadalundi river and Korapuzha for lime burning. prevalence of a uniform temperature, viz, (i) the super-Magnetic iron ores occur at a number of places such as heated condition of the surface soil, (ii) the cool sea-Nanminda, Cheekilode and Kanniparamba of Kozhi- breezes and the abundance of rain throughout more kode taluk. Some of these occurrences appear to be than half of the year and (iii) the process of evapora-commercially workable on a moderate scale. Gold tion. occurs sporadically in a number of places in the Wynad (b) Humidity taluk, where some active mining for gold was carried 17. The statement showing the percentage of mean on for a couple of decades in the latter part of the 19th relative humidity for Kozhikode centre is furnished century,and early part of the present century. These below:-
Statement 5 HUMIDITY *
1951 1952 1953 1954 1955 1956 1957 1958 1959 1960 1961 Month ,.--.J'----, ,...--..A-_-., ,....-.A-_--., ,..-"----., r--...A._-., ,...--~---., r--..A---., ,---.-"--..., r----"----., ,-__ .A----, r--.A----,
8.30 17.308.30 17.108.3017.308.3017.308.3017.308.30 17.308.3017.308.30 17.308.30 17.308.3017.308.30 17.30 1ST 1ST 1ST 1ST 1ST 1ST 1ST 1ST iST 1ST 1ST 1ST 1ST 1ST 1ST 1ST 1ST 1ST 1ST 1ST 1ST 1ST
January 72 65 71 63 72 63 75 63 February 71 63 74 65 75 63 76 63 March 71 69 73 67 73 70 74 67 April 79 78 73 72 77 72 76 71 May 80 76@80 75 77 74 . 79 7'2: June 89 84 89 81 88 85 93 86 july 92 88 92 87 92 87 94 87 August 94- 89 93 86 89 82 93 86 September 85 79 83 80 83 77 87 78 October 81 73 83 78 86 78 87 76 November 80 77 77 68 81 81 73 64-December 74- 63 77 66 72 60 76 66
• Source: Meteorological Department, Madras. 1ST-Indian Standard Time @ Mean for 29 days
73 62 76 68 72 71 75 71 85 80 91 86 90 84-00 85 88 82 85 78 83 76 71 65
The highest percentage of mean relative humidity at 8.30 hours was 95 in the month of August 1958 while that for 17.30 hours was 90 in the months of July and August 1961. The lowest percentage of mean relative humidity at 8.30 houri was recorded as 70 in the
6
77 69 73 61 71 60 70 63 78 64 74 63 73 67 79 69 71 65 74 66 76 65 77 69 76 71 70 65 73 67 70 68 76 69 73 69 76 71 70 67 71 69 71 69 77 72 73 71 82 76 80 75 85 78 82 78 85 80 82 76 92 85 91 84 87 83 89. 83 90 81 91 86 91 87 94 87 93 86 92' 89 91 87 94- 90 94 85 92 83 95 87 91 . 85 91 85 94 90 90 82 86 77 88 82 91 84 90 85 90 83 90 81 84- 78 86 82 87 82 87 81 83 77 82 71 80 70 81 73 83 72 86 78 78 67 71 64- 74 64- 72 63 77 66 76 64 71 62
months of March and April of 1957 and January and March of 1959. At 17.30 hours the lowest percentage of humidity was 60Zduring the months of December 1953 and January :1958.

RAIN FALL
(c) Rainfall 18. As stated above the year may be broadly
divided into four seasons. The following statement shows the rainfall in ' millimetres during the above seasons :-
Year Normal··
1951 1952 1953 1954-1955 1956 1957 1958 1959 1960
Average for the decade
Statement 6 RAINFALL BY SEASONS
South-west Dry weather Hotwea- Monsoon December· therMarch June to to February to May September
mm. mm. mm. 4-9.2 335.9 2,629.5
7.4- 287.1 2,264.0 36.8 242.4 1,954.1
127.0 118.2 2,#0.9 16.0 289.1 2,919.8 26.3 846.0 2,411.3 9.7 621.4 2,141.8 1.6 357.7 2,860.9
13.7 380.9 2,443.3 5.7 509.5 3,762.1
35.1 725.9 2,202.6
27.9 437.8 2,540.1
* Data for December relates to the previous year
North-east Monsoon October
to Novemj ber mm. #6.7 402.6 406.2 417.6 301.9 654.3 510.6 #8.7 293.0 263.8 445.0
414.4
** Based on available figures relating to the period 1901 to 1950
19. The dry weather season commences by the later half of December and prevails upto February. On an average the rainfall recorded is for 1.9 days in December, 0.7 day in January and 0.4 day in February. The Kozhikode coast receives· 33.4 mm, 9.0 mm. and 6.8. mm. of rainfall during the months of December, January and February respectively. During the decade the driest dry weather season was in 1957.
20. The hot weat~er season begins by the first week of March anq lasts up to the second or third week of May. During this season temperature rises rapidly and pressure decreases. The rainfall condition is slightly better during this period when compared to dry weather season. The driest hot weather season was in 1953 during the decade 1951-61.
21. Hot weather season is succeeded by the southwest monSoon period. Monsoon begins by the end of Mayor by the early days of June and it lasts upto September. " In view of the steady march of temperature and pressure in the earlier months of the y,ear, the sudden 'burst' and its delay until June call for explanation; pressure in June is much the same as in May, and the lower June temperature is itself due to cooling by the rains. The explanation lies, apparently, in pressure conditions over the Indian Ocean as a whole. The SW monsoon when fully deployed is of course fed by the moist SE trades, and their normal goal is the equatorial low; in April, and even into May, a tract of
relatively high pressure, or at least of slight gradients, persists over the Arabian Sea. This is shown, inter alia by the 29'70 May isobar, which runs from Oman to
Cutch and then bends Sand SE over the Peninsula to the Cauvery Delta. The Arabian Sea in fact lies between two great lows, one over the Punjab and the other over the En Sudan, and winds round the Indian low trend mostly from the NW. Air currents do indeed cross the west coast in May but their relative humidity is much less than that of similar currents in July". * Clouded skies and about 25 days rainfall in a month are the peculiarities of south-west monsoon. During the decade the wettest south-west monsoon was in 1959 and the mildest in 1952:
22. This season is taken over by the north-east 'or retreating monsoon. Temperature will slightly go high during this season followed by afternoon thunder, showers and storms. This monsoon is locally known as Thula Varsham. During the interq::nsal period Thula Varsham was heaviest in 1955 and mildest in 1959.
23. Normal rainfall and rainfall data for the period 1951-61 for Badagara, Kozhikode, Kuttiyadi, Manjeri, Nilambut, Quilandy, Tirurangadi and Vythiri centres are furnished in Appendices I and 2. Temperature data recorded at the Kozhikode Observatory is furnished in Appendix 3. Forests
24. The eastern side of Kozhikode district i~
covered by thick forests. For administrative purposes they are divided into divisions and ranges. Parts of Kozhikode, Nilambur and Palghat forest divisions fall under the revenue jurisdiction of this district. This is distributed (fully or partly) among nine forest ranges viz, Sultan's Battery, Chethalath, Kuttiyadi, Tamarasseri, Chaliyam, Nilambur North, Nilambur South, Karuvali and Mannarghat East. The forests of this district can be classified into plains deciduous, plateau deciduous, tropical ever-green and semi ever-green. Of these, plains deciduous are confined to the foot of the hills to the west of the Western Ghats, occurring at elevations between 150 and 1,000 feet above the mean sea level. The plateau deciduous is found on the Wynad plateau at elevations between 2,300 feef and 3,500 feet above the mean Sea level. The tropical ever-green forests are found at elevations above 1,000 feet and semi ever-green in areas between the evergreen and deciduous forests both in the plains and plateau. During the financial year 1960-61 Kozhikode and Nilambur divisions have produced major and minor products to the tune of Rs. 169'08 lakhs. The table showing the production and value of major and -'India and Pakistan by O.H.K. Spate, Pa'"ies 48-49

LAND TENURES
minor forest produces for the decade 1950-51 to 196~61 for these divisions are given in Appendix 4. Land Tenures
25. The Kerala Agrarian Relations Act, 1960, dealing with the tenancie~ in Kerala as a whole came into force in part on 15th February 1961. But consequent on the decisions of courts on certain questions arising out of ~his Act, the operation of the Act was suspended by a Proclamation dated 18th December 1962 and the Act was repealed when the Kerala Land Reforms Act, 1963 was enacted. Thus the position with regard to lani tenures as on 1st March 1961, the reference date for 1961 Census, ill as if the Kerala Agrarian Relations Act, 1960 had not 'been in force. Subsequently, the Kerala Land Reforms Act, 1963 was passed
. which vitally affects the tenancies in Kerala. It is, therefore, necessary to give an account of the land tenures as they stood on 1st March 1961 without taking into account the Kerala Agrarian Relations Act, 1960 and as after the enactment of the Kerala Land Reforms Act, 1963. As on 1st March 1961
Jenmom 26. There are various theories about the origin of
jenmom right. The traditional account that Sree Parasurama made an entire gift of the land in Kerala to Brahmans has not found acceptance with most of the authorities on the subject. It is, however, evident from the trend of authorities that a considerable portion of the land in Kerala was owned by certain individuals or families among whom were a large number of Namboothiries and Nairs. The Jenmies recognised by the early British administrators of the former Malabar include
. Brahmans, Nairs, Thiyas and Mukkuvans. The right possessed by the Jenmi over the jenmom land is one of ownership in the soil as complete as ever was enjoyed by a free-holder in England. The title of the Jenmi is inherent and the Jenmi is a little territorial sovereign over his land by virtue of this ownership. Barring a few cases, the J enrnies used to let out the jenmom land for cultivation to others enjoying only the benefit of rent derived therefrom, the manner of so letting the land varying according to the tenure created.
Inams· 27. There are two kinds of inams, viz, personal and
service inams. The former are granted for the support of individuals or families either as reward for the service rendered or as a mark of favour as distinguished from service inams granted for future performance or services. The latter are conditional on the performance of future services and as such do not carry witp them absolute proprietorship. In respect of most of the personal
8
inams the grant carries absolute proprietorship with the right of alienation while in the case of the rest conditions like prohibition of alienation or resumption after the lifetime of the inam holder are seen incorporated in the grant. Wherever such conditions are incorporated the inam does not confer absolute proprietorship. An inam may be granted either by Sirkar or by private individuals. In either case there is no difference in the features of the tenure. The following are some of the personal inams ;-
(a) Anubhogam: This means land given as a kudiyiruppu or otherwise to persons belonging to the same caste as that of the grantor bearing a small rent or tax for their maintenance for no service of any description like, for instance, gifts made by a goodwill of the sovereign .
(b) Adima: Adima is a grant of land by Rajas or petty chieftains generally made to their domestics for cultivation for personal services, past or future. The adima grant for past services is not resumable and the grantee enjoys absolute powers of disposal of the same. There are several kinds of inams each distinguished from the other according to the terms of the inam. Gurudakshina, rakshqbhogam, danapramanam, etc., are some of them.
Kanom 28. Kanom means a transfer for consideration in
money or in kind or in both by landlord of an interest in specific immovable property to another (called kanomdar) for the latter's enjoyment, the incidents of which traIl.sfer include
(a) a right in the transferee to hold the said property liable for a consideration paid by him or due to him which consideration is called kanartham,
(b) the liability of the transferor to pay the transferee interest on the kanartham and
(c) the payment of michal'aram by the transferee.
The ka110m tenant enjoys fixity of tenure unless the kanom relates to commercial sites or the kanom is one, the consideration for which exceeded 40.per cent of the value of the Jenmi's right·in the holdings. But, in the case of l:anoms pertaining to commercial sites the tenant enjo),s fixity of tenure if immediately before the commencement of the Malabar Tenancy Act, 1929, the tenant had fixity of tenure in such sites or a right to . obtain renewal of his tenancy in respect of it. The landlord enjoys the right of resumption on the termina_ tion of the term of the kanom for self cultivation and irrespective of the r.xpiry of such term on grounds like denial of the landlord's title, intentional and wilful act of waste and collusively permitting a stranger to encroach upon the land. On the termination of the

LAND TENURES
1erm of the kanom the landlord can evict the tenant for self cultivation by the landlord's tarwad, thavazhi, etc., for bona fide purpose of constructing a building for landlord's tarwad, thava::;hi, etc., and for the extension of a Temple, Mosque, Church or other· places certified by the Collector of the :district where the landlord is the trustee thereof. The eviction in these cases shall not apply to the holding or that portion of a holding which consists of kudiyiruppu or protected ulkudi. The tenant has a right to sue for restoration of the holding if the land is not used for the purpose for which the eviction was sought within a specified period. Kanom~Kuzhikanom
29. This means and includes a transfer by a landlord to another (called kanom-ku::;hikanomlar) of garden lands or other lands or of both with fruit-bearing trees, if any, standing thereon at the time of transfer for the enjoyment of those trees and for the purpose of pl~nting such . fruit-bearing trees thereon. The incidents of such transfer include
(a) a right in the transferee to hold t;le said land liable for the consideration paid by him or due to him which ·consideration is called kanartham and
(b) the liability of the transferor to pay the transferee interest on the kanartham unless otherwise agreed to by the parties. The incidents of this tenure are the same as in the case of kanom.
Kuzhikanom 30. Ku::;hikanom means and includes a transfer by
the landlord to another called ku~hikanomdar of garden lands or other lands or both with the fruit-bearing trees, if any, standing thereon at the time of transfer for the enjoyment of those trees and for the purpose of planting such fruit-bearing trees thereon. The incidents of this tenure are the same as in the case of kanomku::;hikanom. ,
Customary Verumpattom 31. Customary verumpattomdar means any verllm
pattomdar, who, before the commencement of the Malabar Tenancy (Amendment) Act, 1951 (Madras Act XXXIII of 1951), was entitled by the custom of the locality in which the land was situated to possession of the land for definite period of years and for whose continuance thereon, after termination of that period, for a further period a renewal fee had to be paid to the landlord as an incident of the tenure ·and <;ustomary verumpattom is the holding of the customary verumpattomdar. The incidents of this tenure are the same as in the case of kanom.
Kudiyiruppu 32. Kudiyiruppu means and includes the site of any
residential building, the site or sites of other buildings
106/1-2 9
appurtenant thereto, such other lands as are necessary for the convenient enjoyment of such residential building and the easements attached thereto, but does not include an ulkudi. The tenant enjoys fixity of tenure. The tenancy right is heritable and transferable if the tenant is actually cultivating the land. The tenant is evictable on the grounds mentioned for kanom and in addition, on the non-payment of rent within 3· months of the due date. He enjoys <it right of purchase from the landlord if the kudiyiruppu has been occupied for not less than 10 consecutive years.
Separate Kudiyiruppu 33. A separate kudiyiruppu means a kudiyiruppu
which is the sole property comprised in a holding. The rights of the tenant are the same as in the case of a tenant in kudiyiruppu.
Separable Kudiyiruppu 34. This means a Kudiyiruppu which is included with
other property in a holding and which is not necessary for the convenient enjoyment as usual of any other part of the holding. The rights of the tenant are the same as that of a tenant in the case of a separate kudi.Jiruppu.
Cultivating Verumpattom 35. Verumpattomdar means a tenant other than a
kanomdar, kanom-ku::;hikanomdar or kuzhikanomdar of a holding for agricultural purposes. Cultivating verumpattomdar in respect of a holding means any verumpattomdar who not being a Jenmi, intermediary or customary verumpattomdar of that holding has, expressly or impliedly, contracted to cultivate the lands in that holding and is actually cultivating the same. Cultivating verumpattom means a holding of a cultivating i verumpattomdar. The tenant enjoys the same rights as the holder of a kudiyiruppu except the right of purchase.
Ulkudi 36. This means a hut in any portion of a land in
the occupation of a person who has been permitted by the person entitled to possession of such land to occupy the hut and who otherwise has no interest in such land. He has no fixity of tenure.
Protected· Ulkudi 37. This is an ulkudi which has been in the conti
nuous occupation of the holder or any member of his tarwad, thavazhi, illom, kudumbakavaru or family for not less than one year. The tenant enjoys fixity of tenure. After the enactment of the Kerala Land Reforms
Act, 1963 38. The Kerala Land Reforms Act, 1963, repealed
the Kera1a Agrarian Relations Act, 1960, the Malabar

LAND TENURES
Tenancy Act, 1929, the Cochin VerumpattomdarsAct, VIII of 1118, the Madras Cultivating Tenants (Payment of Fair Rent) Act, 1956 and the TravancoreCochin Prevention of Eviction of kudikidappukars Act, 1955 and enacted a single statute governing the relationship between landlord and tenant throughout the State.
Exemt'tions from the provisions regarding tenancies.
39. Subject to certain provisos, the prOViSions regarding tenancies in this Act are not applicable to (i) leases of lands or buildings br both belonging to or vested in the Government of Kerala or the Government of any other State in India or the Government of India or a local authority or a Corporation owned or controlled by any of the above Governments, (ii) leases only of buildings and the site thereof with the land, if any, appurtenant thereto, (iii) leases of land or of buildings or of both specifically granted for industrial or commercial purposes, (iv) tenancies of land or buildings or of both created by the Administrator-General or the Official Trustee or an Official Receiver or officer appointed by a Court of Wards, or by any person holding under or deriving titles from any of the officers or the court, (v) tenancies in respect of land or buildings or of both created by mortgagees in possession or by persons deriving title from such mortgagees except a cultivating tenant holding land in the taluks of Hosdrug or Kasaragod to which the Malabar Tenancy Act, 1929, did not extend under a lease granted before 15th February 1961 by a usufructuary mortgage as defined in the Transfer of Property Act, 1882, (vi) tenancies in respect of land or of buildings or of both created by persons having only life interest or other limited interest in it, (vii) leases of private forests except where a person was entitled to fixity of tenure immediately before 21st January 1961 under any law then in force, (viii) tenancies in respect of plantations exceeding thirty acres in extent, (ix) tenancies in respect of kayal patasekharams of Kuttanad area specified in Schedule IV of the Act so long as such patasekharams are used for the cultivation of paddy or such other crops as may be notified by Government, (x)tenancies in respect of sites, tanks and premises of any temple, mosque or church including sites on which religious ceremonies are conducted and sites of office buildings and other buildings attached to such temple, mosque· or church created by the owner, trustee or manager of such temple, mosque or church, (xi) lands transferred for felling trees and (xii) any transaction relating only to the usufruct of trees or to the tapping of «>coanut or other
10
palm-trees or to the tapping of rubber trees. The exemption mentioned above in respect of Government leases is subject to the proviso that in the case of kandukrishi lands sub-leased by a tenant holding such lands under Government, the provisions of sections 13· to 26 of the Act shall, so long as the lease granted by the Government subsists, apply to the tenants holding under the sub-lease as they apply to tenants holding lands other than Government lands. In respect of the exemption relating to tenancies created by the Administrator-General etc. mentioned above, the exemption shall cease to apply to any tenancy created by the Court of Wards, where the landlord on whos e behalf the tenancy was created does not terminate the tenancy by a registered notice within a period of six months from the date on which the property was released from the superintendence of the Court of Wards. Provisions of sections 13 to 26 of the Act, relating to fixity of tenure will apply to exemptions granted to tenancies created c' by mortgagees in possession or by persons deriving title from such mortgagees or by persons having only life interest or other limited interest in the land or buildings or both so long as the mortgage or the life interest or other limited interest subsists. Where a tenancy is created by a nissanthathikavaru as defined in the Madras aliyasanthana Act, 1949, in respect of lands or buildings or both over which the nissanthathikalJaru has only a life interest the exemption will apply only regarding Sections 53 to 72 and not others governing tenancies. In the case of tenancies in respect of agricultural lands which are treated as plantations under sub-clause (c) of Section 44 of Section 2 of the Act the exemption referred to supra shall apply only to Sections 53 to 72 of the Act. Provisions of Sections 4 to 52, 73 and 74 of the Act will apply to tenancies in respect of. kayal patasekharams of the Kuttanad area in spite of the exemption mentioned about them supra. The Government are also given limited powers of exemption under the Act.
The Scope and Objects of the Act 40. The main objects of the Rerala Land Reforms
Act, 1963 are :-
(1) To confer fixity of tenure on tenants; (2) To fix the fair rent in respect of a holding; (3) To confer the right of purchase of the land
lords' rights, title and interest on the cultivating tenants ;
(4) To define the rights and liabilities of kudikidappukars; and
(5) To place a ceiling on the ownership and possession of land and provide for the disposal of excess land

LAND TENURES
There are also some provisions of secondary importance in addition to the above.
Fixity of Tenore-Tenants and tenancies 41. For a proper appreciation of the provisions
relating to tenancies as a whole the definitions of tenants and tenancies are of supreme importance. A tenant means any person who has paid or has agreed to pay rent or other consideration, for his being allowed by another to possess and enjoy the land of the latter, and includes an intermediary, a kanrnndar, a kanomkuzhikanomdar, a kuzhikanomdar, Ii mulgenidar, a verumpattomdar of any description (including a customary verumpattomdar) , the holder of a chalgeni lease, the holder of a kudiyiruppu, the holder of a vaidageni lease, an odacharthudar or a person claiming under an odacharthudar who was actually cultivating on the 11th day of April 1957 and was continuing to cultivate at the commencement of this Act the land or any portion of the land to which the odacharthu relates, a mortgagee with possession of immovable property situate in Cochin if the property comprised in the mortgage consists of agricultural land other than planted with rubber, coffee, tea or cashew and the interest on the mortgage amount is less than forty per cent of the total rent fixed in the mortgage document, a mortgagee with possession of immovable property situate in Cochin if the property comprised in the mortgage consists of agricultural land, he was by himself or through any mewber of his family or .tarwad holding the property comprised in the mortgage as a verumpattomdar on or after 1st Chingom 1111 and the verumpattom was terminated after 1st Chingom 1111 and before the commencement of this Act but he .continued in possession of the property without interruption by himself or through any member of his family or tarwad, as a mortgagee with ,possession from the date of such termination till the commencement of this Act, .any person who, on 11th April 1957 was continuously in occupation of the land of another situate in Malabar for not less than two years; honestly believing himself to be tenant and continued to be in occupation of such land at the commencement of this Act, any person who, by virtue of the provisions of Section 6 of the Kerala Stay of Eviction Proceedings Act, 1957, was {lntitled to cultivate any nilam after lith April 1957 and was cultivating the nilam at the commencement of this Act, a tenant who, on or after 11 th April 1957, was holding land less in extent than the ceiling area and had executed a deed surrendering his leasehold right to the landlord but had not actually transferred possession of the land to the landlord before the commencement of this Act, a pUllam or kumri cultivator, .
106/1-2a II
a licensee in Kuttanad area, a varamdar, a vechupakuthidar and a person holding land situate in any part of the Hosdrug or Kasaragod taluks to which the Malabar Tenancy Act, 1929, did not extend under a transaction described in the document evidencing it as bhogya, otti, nattotti, arwar, illidarwar or krithasartha illidarwar but not being a usufructuary mortgage as defined in the Transfer of Property Act, 1882. Where, in a document, a person is described as a sambalapattomdar, ';ambalachittudar or coolipattomdar in respect of any nilam situate in the Palghat district, he shall be presumed to be a tenant unless it is proved that he has not undertaken any risk of cultivation. A' Cultivating tenant' means a tenant who is in actual possession of, and is entitled to cultivate, the land comprised in the holding. Kanom means the transfer for' consideration, in money or in kind or both, by a landlord of an interest in specific immovable property to another person for the latter's enjoyment, whether described in the document evidencing the transaction as kanom or kanapattom the incidents of which transfer include :-
(a) a right in the transferee to hold the said property liable for the consideration paid by him or due to him;
(b) the liability of the transferor to pay to the transferee interest on such consideration unless otherwise agreed to by the parties ; and
(c) payment of michavaram or customary dues or renewal on the expiry of any specified period, and in areas other than Malabar, includes such transfer of interest in specific immovable property which is described in the document evidencing the transaction as otti, karipanayam, panayam, nerpanayam or by any other name and which has the incidents specified in sub-clauses (a) and (b) above and also the following incidents :-
(i) renewal on the expiry of any specified period and
(ii) payment of customary dues. Kanapattom or any other demise governed by the Travancore Jenmi and Kudiyan Act of 1071 or the Kanom Tenancy Act, 1955, is not a kanom for the purposes of this Act. Where there has been no stipulation in the document evidencing the transaction for renewal on the expiry of any specified period, but there has been a renewal or payment of renewal fees, it shall be deemed that there had been a provision for such renewal in the document. Kanom kuzhikanom means and includes a transfer by a landlord to another person of garden lands or of other lands or of both, with the fruit-bearing trees, if any, standing thereon at the time of the transfer, for the enjoyment of

LAND TENURES
those trees and for the purpose of planting such fruitbearing trees thereon, the incidents of which transfer include:-
(a) a right in the transferee to hold the said lands liable for the consideration paid by him or due to him, which consideration is called kanartham, and
(b) the liability of the transferor to pay to the transferee interest on the kanartham unless otherwise agreed to by the parties. A usufructuary mortgage as defined in the Transfer of Property Act, 1882 (Central Act 4 of 1882) is not a kanom ku;;,mkanom. Kudiyiruppu means a holding or part of a holding consisting of the ~ite of any residential building, the site or sites of other buildings appurtenant thereto, such other lands as are necessary for the convenient enjoyment of such residential building and easements attached thereto but does not include a kudikidappu. Kuzhikanom means and includes a transfer by a landlord to another person of garden lands or other lands or of both with the fruit-bearing trees, if any, standing thereon, at the time of the transfer, for the enjoyment of those trees and for the purpose of planting such fruit-bearing trees thereon but shall not include a usufructuary mortgage as defined in the Transfer of Property Act, 1882. "Punam or kumri cultivation" means fugitive or intermittent cultivation of paddy on dry lands in Malabar and "punam or kumri cultivator" means a person who has raised crops by punam or kumri cultivation in any year between 1953 and 1959 and where there are successive cultivators in respect of the same land the cultivator who raised crops last by such cultivation during the said period. "Holder of a chalgeni lease" means a lessee or sub-lessee of specific immovable property situate in the taluk of Hosdrug or Kasaragod in the district of Cannanore who has contracted either expressly or impliedly to hold the same under a lease, whether for a specified period or not. "Mulgeni" means a tenancy in perpetuity at a fixed invariable rent created in favour of a person called mulgenidar. Vaidageni means a lease for a term of years. Varam means an agreement for the cultivation of nilam with paddy and sharing the produce made between the owner and the person who undertakes cultivation under such arrangement and includes the arrangements known as pathivaram, pankuvaram and lJankupattom; and varamdar means the person who undertakes cultivation under a varam agreemeI).t. Vechvpakuthy means a transaction whereunder , a landowner permits another person to be in joint possession with him of any land with the following stipu-
lations';-
12
(i) Vechupakuthidar shaH improve the land wi thin a specified period ;
(ii) at the end of the period so specified (a) the land shall be partitioned between the
land owner and the vechupakuthidar; (b) upon such partition all the rights of either
party over the portion of the land set apart for the other shall stand transferred to and vest in the other ; and
(iii) during the period between the date of the transaction aforesaid and the partition of the land the vechupakuthidar shall pay to the land owner such rent as may be specified. Verumpattomdar means a lessee or sub-lessee of immovable property, whether called verumpattomdar or venpattomdar who has expressly or impliedly contracted to hold the same under a lease with or without security for rent and includes a tharikuthukaran in. the Palghat district but does not include a kanomdar, a kanom-kuzhikanomdar or kuzhikanomdar. "Customary verumpattomdar" means any verumpattomdar of immovable property situate in any area to which the Malabar Tenancy Act, 1929, extended, who before the commencement of the Malabar Tenancy (Amendment )Act, 1951, was entitled by the customs of the locality in which the land was situated to possession of the said land for a definite perio d of years, and for whose continuance thereon, after the termination of that period, for a further period, a renewal fee had to be paid to the landlord as incident of the tenure.
Fixity of Tenure 42. The Act confers fixity of tenure on every ten
ant in respect of his holding except where the tenant holds under a landlord who is a member of the armed forcel! or is a seaman if the tenancy was created by such landlord within a period of three months before he became a member of the armed forces or seaman or where the tenant holds under the legal representative of the landlord. Resumption is allowed in the following cases :-
(a) For the purpose of extending a place of public religious worship provided the Collector of the district certifies that the same is so needed;
( b) For the bona fide purpose of constructing a building for the r(!Sidence of a landlord (other than a sthani or the trustee or owner of a place of public religious worship) or any member of his family;
(c) For the bona fide purpose of cultivation by the landlord (other than a sthani or the trustee or the owner of a place of public religious worship) or any member of his family;

LAND TENURES
(d) In respect of agricultural lands interspersed within the boundaries of the area cultivated with plantation crops, where such holding or part thereof is necessary for the purposes of plantation ; and
(e) If the tenant of the agricultural lands mentioned under (d) above wilfully commits any act of material waste in the plantation.
In the case of (b) above resumption is allowed only up to 20 cents where resumption is sought on behalf of one person and up to 50 cents where it is sought on behalf of two or more persons. The total extent of land in the possession of the landlord shall not be raised above five standard acres and the total extent of land in the possession of the tenant shall not be reduced below :20 cents in the case of such resumptions. Any land held by a member of a Scheduled Caste or Scheduled Tribe as tenant is exempted from such resumption. In the case of resumption under (c) above the total .extent of land in the possession of the landlord shall not be raised above the ceiling area and the total extent of land in the possession of the cultivating tenant shall not be reduced below the ceiling area by such resumption. The resumption is allowed only from a tenant who is in possession of land above the ceiling area. A small holder (other than a sthani or the trustee or owner of a place of public religious worship) is however, allowed to resume from his tenant a portion of the holding not exceeding one half provided that by such resumption the total extent of land in the possession of the small holder shall not be raised above four standard acres or four acres in extent whichever is greater and that except as provided in sub-sections (2) and (3) of section 53 of the Act no land shall be resumed from a tenant wholwas entitled to fixity of tenure in respect of his holding immediately before 21st January 1961 under any law there in force. A" Small holder" means a landlord who does not have interest in' land exceeding eight standard acr~s or 24 acres in extent, whichever is less, as owner, intermediary or cultivating tenant or in two or more of the above capacities so however that the extent of non-resumable land in his possession as owner or as cultivating tenant, or partly as owner and partly as cultivating tenant does not exceed four standard acres or four acres in extent whichever is greater. A person who was in possession of, or had interest in land exceeding the limits mentioned above before 1st December 1957 but such extent of land was reduced to the said limit5 or below by partition or transfer effected after the above date shall not be deemed to be a small holder nor shall such partition or transfer entitle the allottee Of transferee to exercise the rights of a
13
small holder in respect of the land allotted or transferred to him. No resumption of a i,udiyiruppu is allowed whether it is sought by smallholder or not. ~ubject to certain exemptions a time limit of one year from the commencement of the Act has been fixed for preferring applications for resumption. The Act also contains provisions for the grant of compensation for improvements and solatium to the tenant from whom any land is resumed.
43. An application for restoration by a cultivating tenant from whom land was resumed for construction of a residential building or for personal cultivation or on the ground of the land being necessary for purposes of plantation will lie if within three years of such resumption the person who resumed the land fails without reasonable excuse to use the land for the purpose for which it was resumed. The restoration is allowed only subject to certain limitations enjoined by the Act.
Fair Rent 44. The fair rent in respect of a holding is the rent
payable by the cultivating tenant to his landlord and it shall be the rent calculated at the rates specified in Schedule III applicable to the class of lands comprised in the holding, or the contract rent, whichever is less. When the fair rent in respect of a holding has been determined under any law in force Immediately before 21st January 1961, the fair rent so determined shall be deemed to be the contract rent. Where a cultivating tenant or an intermediary is holding under a small holder, the fair rent shall, at the :option of the small holder, be the rent calculated at the rates specified in Schedule III applicable to the class of lands comprised in the holding; or where the fair rent in respect of the holding has been determined under any law in force immediately before 2lstJanuary 1961 such fair rent, or, where the fair rent has not been so determined 75 per cent of the contract rent. The fair rent payable by a cultivating kanomdar or a cultivating customary verumpattomdar shall not exceed the michavaram payable by such kanomdar or the rent payable by such customary verumpattomdar as the case may be. 'Where any land included in a holding is set apart for communal purposes and is used for such purposes, the extent of the land so set apart shall not be taken into account in fixing the fair rent of such holding. The cultivating tenant or any landlord may apply in the prescribed form to the Land Tribunal for determining the fair rent in respect of a holding. Where in respect of a holding there is an intermediary at the commencement of this Act and as a result of the determination of the fair rent there has been a reduction or increase in

LAND TENURES
the rent payable by the cultivating tenant, the rent payable by the intermediary to his landlord shall be reduced or increased in the same proportion as the rent to which he was entitled was reduced or increased. The landlord and the tenant are competent to agree as to what shall be the fair rent payable and where such an agreement is filed with the Land Tribunal, the latter shall pass orders determining such agreed rent as the fair rent. Where the rent payable has not been determined by the Land Tribunal, the landlord shall be entitled to receive and the tenant shall be bound to pay the rent that was payable immediately before the commencement of this Act. In the case of a varomdar such rent shall mean the average of the share of the landlord in the produce for the three years immediately preceding such commencement, or, where the varomdar was not cultivating the land continuously for the said period of three years,' the share of the landlord for the year in which the varomdar cultivated the said land immediately before such commencement. Where there has been a damage to, or failure of crops, owing to causes beyond the control of the tenant in any holding, the tenant shall be entitled to a remission of the rent payable by him in proportion to the extent of such damage ()r failure. The remission is to be ordered by the District; Collector or any other officer authorised by Government by notification in the Gazette.
Purchase of Landlords' rights by cultivatiag tenants.
45. The Act enables the cultivating tenants entitled to fixity of tenure to purchase the landlords' rights in the holding. The provisions in this respect have, however, not yet been enforced. A summary of the 'salient provisions in this respect is given below.
A cultivating tenant (including the tenant of a kudiyirippu) who is entitled to fixity of tenure under section 13 is also entitled to purchase the right, title and interest of the land owner and the intermediaries, if any, in respect of the land comprised in the holding provided he or the family of which the cultivating tenant is a member does not own an extent of land not less than the ceiling area. Where he or the family of which he is a member owns land Jess than the ceiling area the right of purchase is allowed only to the extent ,of land as will, together with the land already owned, make up the ceiling area. If the landlord is entitled to resume any portion of the holding and he applies for such resumption the right of purchase will extend only to the remaining area. Where the land owner or an intermediary is a small holder and the cultivating tenant was entitled to fixity of tenure immediately lJefore 21st January 1961 under any law then in force
14
the cultivating tenant shall not be entitled to purchase the right, title and interest of the land owner and the intermediaries unless the cultivating tenant agrees in writing that the small holder may exercise the right of resumption in respect of the holding under section 17. In the event of such agreemeat the small holder shall, notwithstanding any thing contained in the second proviso to section 17 and notwithstanding the expiry of the period fixed under clause (I) of section 18 for making application for resumption, be entitled to exercise the right of resumption and the cultivating tenant shall be entitled to purchase the right, title and interest of the landowner and the intermediaries in respect of the remaining part of the holding left after resumption. An application for the purchase of landlord's right shall be made by the cultivating tenant to the Land Tribunal. The purchase price payable by the cultivating tenant shall be the aggregate of;-
(i) sixteen times the fair rent in respect of the holding or part thereof to which the purchase relates;
(ii) the value of structures, wells and embankments of a permanent nature belonging to the land owner or the intermediaries if any, and
(iii) one half of the value of the timber trees belonging to the land owner or intermediaries, if any. The Act provides for the apportionment of such price between the landlord and intermediaries, if any. The Land Tribunal shall pass orders, where the purchase is to be allowed, allowing the application for purchase and specify details relating to the purchase price, the value of encumbrances etc., and the amount payable to the land owner and each of the intermediaries after deducting the value of the encumbrances or the claim for maintenance or alimony. The purchase price shall be payable in sixteen equal instalments. But where the purchase price is less than Rs. 160 the number of instalments shall be so fixed by the Land Tribunal that the amount payable in each instalment shall not be less than Rs. 10. It shall be open to the cultivating tenant to pay the entire price in a lump in which case the amount payable shall be only 75 per cent of the purchase price. The purch~e price payable will bear interest at 4! per cent per annum from the date on which the right, title and interest from the land owner and intermediaries vested in the cultivating tenants. Where the purchase price is paid in instalments the second and subsequent instalments shall be deposited together with interest on the amount outstanding on the date of deposit. A cultivating tenant shall be liable to pay rent to his landlord until he makes the deposit.
46. Where in respect of a holding the land owner

LAND TENURES
or the intermediary is a religious, charitable or educa-, tional institution of a public nature such institution is given the option to choose as to whether the right, title and interest of the institution in respect of the holding may be permitted to be purchased from the institution by the cultivating ten ant on payment of the purchase price or such right, title and interest should be vested in the Government in consideration of the payment of an annuity in perpetuity by the Government. The annuity payable to the institution in the latter case shall be a sum equal to the annual rent which the institution was entitled to receive immediately before 21st January 1961 after deducting 21 per cent thereof by way of collection charges. Where in respect of a holding held by a tenant referred to in sections 4, 5, 6, 7, 8, 9, 10 or 11 there was no stipulation for payment of any rent immediately before 21st January 1961 the annuity shall be an amount equal to 4! per cent of 16 times the fair rent in respect ofthe holding. The Government shall pay the annuity payable to the institution every year in perpetuity. Where, however, the right, title and interest of the institution are subject to any encumbrance the value of the encumbrance shall be paid to the holder of the encumbrance and 5 per cent of the value of the encumbrance shall be reduced from the annuity and the balance, if any, alone shall be paid to the institution.
47. Where the value of the encumbrance is more than 20 times the annuity if there is only one encumbrance 20 times the annuity shall be paid to the holder of the encumbrance and if there are more than one encumbrance 20 times the value of encumbrances shall be paid to the holders thereof in their order of priority and no amouqt by way of annuity shall be payable to the institution. The filing of an application by a religious, charitable or educational institution of a public nature under sub-section (i) of section 66 or the vesting of the right, title and i~terest of the institution
, in the Government under sub-section (5) of section 66 of the Act, shall not affect the right of the cultivating tenant to purchase such right, title and interest in accordance with the provisions 53-64 of the Act already referred to. Where a cultivating tenant does not apply for a purchase of the right, title and interest vested in the Government under section 66 the tenant holding directly under the religious, charitable or educational institution of a public nature shall continue as tenaRt under the Government. The Act contains provisions for scaling down the arrears of rent in accordance with the schedule given under Section 73. After the commencement of this Act no tenancy shall be created in
15
respect of any land. But where any land owner is a minvr or a widow or an unmarried woman or a divorced woman or a person incapable of cultivating the land by reason of any physical or mental disability or a serving member of the armed forces or seaman such person may create a tenancy, but the tenant shall not be entitled to a right to purchase. Any tenancy created in contravention of the above provision shall be invalid.
Rights and liabilities of Kudikidappnkars 48. A kudikidappukaran means a' person who has
neither a homestead nor any land as owner or as tenant in possession, on which he could erect a homestead and-
(i) who has been permitted with or without an obligation to pay rent by a person in lawful posses~ion
of any land to have the use and occupation of a portion of such land for the purpose of erecting a homestead; or
(ii) who has been permitted by a person in lawful possession of any land to occupy, with or without the obligation to pay rent, a hut belonging to such person and situate in the said land but otherwise has no interest in the land; and
kudikidappu means the land or the homestead or hut so permitted to be erected or occupied together with the easements attached thereto. A person shall not be deemed to be a kudikidappukaran if the aforesaid. permission was granted after the II th of April 195 7 by a mortgagee in possession or by a tenant from whom the land in which the kudikidappu is situate is liable to be resumed. A person shall not also be deemed to be a kudikidappukaran if the permission was granted in respect of any hut not belonging to him and situate in a plantation or in any area of land which is appurtenant to a mill, factory or workshop and in connection with the employment of such person in the plantation, mill, factory or workshop unless he was, immediately before the commencement of the Act, entitled to the rights of a kudikidappukaran or the holder of a protected ulkudi or kudikidappu under any law then in force. A hut means any dwelling house which wasconstructed at a cost not exceeding Rs. 400 or could have at the time of construction yielded a monthly rent not exceeding Rs. 4. Any person who was in occupation of a kudikidappu on the lith day of April 1957 and who continues to be in such occupation at the commencement of the Act shall be deemed to be in occupation of such kudikidappu with permission as required above. Also, where any kudikidappukaran secures any mortgage with permission over the land in which the kudikidappu is situated his kudikidafJPu

LAND TENURES
right shall revive on the redemption of the mortgage, provided that he has at the time of the redemption neither a homestead nor any land, either as owner or as tenant in possession, on which he couLl erect a homestead. No kudikidappukaran shall be evicted from his kudikidappu except on the ground that he has alienated his right of kudikidappu to another person or he has rented or leased out his kudikidappu to another person or he has ceased to reside in the kudikidappu continuously for a period of two years or he has another kudikidappu or has obtained ownership and possession of land for erecting a homestead. A kudikidappukaran shall not be deemed to have ceased to reside in a kudikidappu notwithstanding the fact that he was not actually residing therein if any of his near relatives viz, husband or wife, children, grantchildren, father, mother, brother or sister who was residing with him in the kudikidappu for a continuous period of not less than one year continues to reside in the kudikidappu. A person in possession of the land on which there is a homestead or hut in the occupation of a kudikidappukaran may, if he bona fide requires the land for building purpose for himself or any member of his family including major sons and daughters or for purposes in connection with a town planning scheme approved by the competent authority or for any industrial purpose require the kudikidappukaran to shift to a new site belonging to him subject to the following conditions:-
(i) The land owner shall pay to the kudikidappukaran the price of the homestead if any erected by the
kudikidappukaran; (ii) the new site shall be fit for erecting a home
stead and shall be within a distance of one mile from the existing kudikidappu;
(iii) the extent of the new site shall be the extent of the kudikidappu subject to a minimum of 3 cents and a maximum of 10 cents; and
(iv) the land holder shall transfer ownership and possession of the new site to the kudikidappuk,aran and shall pay him the reasonable cost of shifting the kudi. kidappu to the new site.
Where the above conditions are complied with the kudikidappukaran shall be bound to shift to the new site.
49. Where a person does not hold more than 25 cents of land and there is a hut in the occupation of a kudikidappukaran on such land, he may, if he requires the land occupied by such hut for constructtng a building for his own residence apply to the Government for acquisition of land to which the kudikidappu may be :shifted whereupon Government after collecting the cost
16
of acquisition from the applicant may acquire the land and give possession of the land to the kudikidappukaran and require him to shift to the said land. The kudikidappukaran shall then be bound to shift to the new site. But he will be entitled to the expenses as determined by an officer authorised by Government to be reasonably required to shift to the new site. The site acquired for the purpose shall be subject to a minimum of 3 cents and a maximum of 10 cents. Again, where the owner of the land in which there is a kudi. kidappu considers that the kudikidappu is so located as to cause inconvenience to him he may require the kudikidappukaran to shift to another part of his land provided that the site to which the kudikidappu is required to be shifted is fit for the location of the kudikidappu and the owner of the land transfers to the kudikidappukaran ownership and possession of land equal to the extent of the existing kudikidappu subject to a minimum of 3 cents and a maximum of 10 cents and pay the price of the homestead if any erected by the kudikidappukaran and the cost of shifting the kudikidappu. The Act scales down the arrears of rent payable by a kudikidappukaran to one year's rent or the actual amount in arrears whichever is less and lixes the maximum of the future rent.
Restriction on ownership and possession of land in excess of ceiling area and disposal of excess lands.
50. The next salient provisions of the Act relate to the ceiling of ownership and possession of land and the disposal of excess lands. These provisions have not been enforced so far. Subject to the exemptions given under section 81 of the Act the ceiling area of land has been fixed to be 12 standard acres in the case of an adult unmarried person or a family consisting of not more than 5 members; and 12 standard acres increased by one standard acre for each member in excess of five, so, however that the total extent of ceiling area shall not exceed 20 standard acres in the case of a family consisting of more than five members. The ceiling area shall in no case be less than 1'5 acres in extent or more than 36 acres in extent. All the lands owned or held individually by the members of a family or jointly by some or all of the members of such family shall be deemed to be owned or held by the family. In calculating the extent of land owned or held by a family or an adult unmarried person the shares of the members of the family or the adult unmarried person, as the case may be, in the lands owned or held by a co-operative society or by an institution or by a joint family shall be taken into account. Where a person has two or more legally wedded wives living, the husband, one of the

LAND TENURES
wives named by him for the purpose and their unmarried minor children shall be deemed to be one family; and the other wife or each of the other wives and their unmarried minor children shall be deemed to be a separate family. An adult unmarried person shall include a divorced husband or divorced wife who has not remarried, provided that if such divorced husb:md or divorced wife is the guardian of any unmarried minor child, he or she together with such unmarried minor child shall be deemed to be a family. It shall be lawful for any adult member in a family to own or hold land in excess of the ceiling area to the extent necessary to make up the ceiling area of his lineal descendants other than his minor unmarried children who are alive on the date notified under sub-section (i) of section 83 and who would inherit his lands on his death provided that the aforesaid adult member shall take into account all acquisitions of lands or interests· in land made by such lineal descendants or the members of their families for fixing the total extent that such adult member shall be entitled to own or hold from time to time and shall be bound to surrender the excess. In the case of lineal descendants who are members of other familiES the ceiling area shall be that applicable to their families. Where a family or an adult unmarried person owns or holds land in excess of the ceiling area on the notified date mch excess land shall be surrendered by the person who is competent to do so within such time and to such authority as may be prescribed. Where, however, any person who bona fide believes that the ownership or possession of any land owned or held by him or by the members of his family is liable to be purchased by the cultivating tenant or to I be resumed by the land owner or the intermediary under provisions of this Act, the extent of the land so liable to be purchased or to be resumed shall not be taken into account in calculating the extent of land to be surrendered. The Land Board is to finally determine the extent of land liable to be surrendered. Where ownership or possession or both of any land is surrendered by or assumed from a person or is vested in the Government under section 86 or 87 such person shall be entitled to compensation. Where the rights of an intermediary are extinguished, such intermediary shall also be entitled to compensation. The compensation payable to an owner for the surrender or assumption of ownership and possession of land shall be 55 per cent of the market value of the land and improvements, if any, thereon. The compensation payable to the land owner, the intermediary or cultivating tenant for the surrender, assumption, vesting in the Government
106/1-3
17
or extinguishment of their rights shall be the portion of 55 per cent of the market value of the land and improvements, if any, thereon that will fall to his share if such values are apportioned among the land owner, cultivating tenant and inter~
mediary, if any, in respect of the land according to the following provisions :-
(1) the portion of the compensation for any building or other improvements shall be set apart to the person to whom such building or other improvemen t belongs ;
(2) ninety per cent of the portion of the compensation for the site of any homestead or hut in the occupation of a kudikidappukaran shall be deducted from the total amount of compensation;
(3) the balance remaining after deducting the amounts referred to in clauses (i) and (ii) shall be apportioned among the land owner, the intermediaries and the cultivating tenant in proportion to the profits derivable by them from the land immediately before the surrender, assumption or vesting in the Government, as the case may be. "Profits derivable from the land" shall be deemed to be equal to (i) in the case of a land owner, the rent which he was entitled to get from the tenant holding immediately under him; (ii) in the case of an intermediary, the difference between the rent which he was entitled to get from his tenant and the rent for which he was liable to his landlord; and (iii) in the case of a cultivating tenant, the difference between the net income and the rent payable by him. The rent payable by the cultivating tenant and the intermediary for this purpose shall be as calculated under the provisions of this Act.
(4) Where a mortgagee in possession surrenders possession of the land mortgaged to him,-
(i) where the ownership of the land mortgaged has been surrendered by the owner of the land, the mortgagee shall be treated as a holder of an encumbrance in respect of the land, and the encumbrance shall be discharged as provided in sections 91 and 92 ;
(ii) in other cases, the Government shall pay to the mortgagee the amount to which he would have been entitled under clause (i) if the ownership of the land mortgaged had been surrendered to the Government, and hold the land as mortgagee with possession with all the rights and liabilities of the mortgagee.
51 The compensation or the amount of encumbran~e, as the case may be, shall be paid either in cash or negotiable bond redeemable in 16 years and carrying interest at the rate of 4! per cent per annum with effect from the date on which the ownersh:p or possession or both of the land has or have vested in the

LAND TENURES
Government under section 86 or section 87 or partly in cash and partly in such bonds in such manner as may be prescribed. The Act also makes provision for payment of advance towards compensation. Where the land owner whose ownership of land is vested in the Government or the intermediary whose rights are extinguished under sub-section 4 of section 86 was a small holder and the cultivating tenant of the holding was entitled to fixity of tenure immediately before 21st January 1961 under any law then in force the ownership or possession or both of such land vested in the Government shall be assigned to such small holder. Where there are more than one such small holder in respect of such land th,e small holder nearest to the cultivating tenant shall have pllority for such assignment. The purchase price payable by the small holder for assignment of the ownership or possession or both of the land shall be 55 per cent of the market value of such rights. The purchase price shall be payable eitha- in a lump or 16 equal annual instalments. Any person who does not possess any land or possesses only less than 5 acres of land in extent may apply to the Land Board for assignment on registry of lands to him.
. The Land Board shall, after reserving in each village the lands necessary for public purposes, assign on registry the remaining lands vested in the Government as specified below :-
( I) The holdings in which there are kudikidappukars shall, as far as possible, be assigned to such kudikida}pukars ;
(2) Out of the remaining area available for assignment,
(a) fifty per cent shall be assigned to the landless agricultural labourers of which one-half shall be assigned to the landless agricultural labourers belonging to Scheduled Castes or Scheduled Tribes residing in the same village or adjacent villages;
(b) twenty-five per cen\ shall be assigned to small holders and other landlords who are not entitled to resume any land;
(c) the remaining twenty-five per cent shall be assigned to the cultivators who do not possess more than 5 acres of land in extent. In assigning lands under this sub-section to the persons specified in sub-
clauses (a), (b) and (c) above, first preference shall be given to ex-servicemen belonging to the respective classes, and, subject as above, preference shall be given to co-operative societies formed by persons specified in the respective sub-clauses. Where the excess land that is available for assignment is either kayal or kole nilam, such land shall be assigned only to co-operative societies formed by landless agricultural labourers. For the above purpose a kudikidappukaran or a tenant of a kudiyiruppu shall be deemed to be a landless agriculturallabourer if he does not possess any other land.
(3) The Land Board shall not assign to any person more than 5 acres in extent of land. Where a person possesses any land, only so much land as will make the extent of land in his possession five acres shall be assigned to him.
52. The purchase price of land assigned on registry shall be an amount equal to 55 per cent of the market value of the land and improvements if any thereof and shall be payable either in lump or in 16 equal annual instalments. The assignment shall be made on payment of the purchase price either in lump or in the firSt instalment thereof. Where the purchase price is pay. able in instalments, the amount outstanding after payment of each instalment shall bear interest at the rate of 4! per cent per annum. The Land Board shall, subject to such rules as may be made by Government in this behalf manage the lands vested in them until they are assigned under sections 94 and 96 by making arrangement for their cultivation and protection. The Act has invalidated certain voluntary transfers effected after the date of publication of the Kerala Land Reforms Bill, 1963 in the Gazette.
53. From the nature of the provisions of the Kerala Land Reforms Act, 1963, it would be seen that this statute does not affect land tenures not specifically mentioned in it. Such tenures are not, therefore, affected by the Kerala Land Reforms Act, 1963.
Agriculture 54. Kozhikode district has 15·22 per cent of the
cropped area of Kerala State. The following statement gives the classification of land in the Kozhikode district from 1955-56 to 1960-61.
Statement 7 LAND UTILISATION *
Classification of land Total area according to village papers Forests .Barren and unculturable land
1955-56 1,634,814
379,250 105,724
• Source :-Department of Statistics, Kerala
1956-57 1,634,814
391,361 105,724
18
Area in acres
1957-58 1,634,814
392,172 125,482
1958-59 1,634,814
468,613 49,041
1959-60 1,634,814
479,514 47,687
-. 1960-61
1,634,814 479,514 47,564
-(cont.)

LAND UTILISATION
Statement 7-( contcld.)
LAND UTILISATION
Area in acres ,.. .A.
Classification of land 1955-56 1956-57 1957-58 1938-59
Land put to non-agricultural uses 62,225 62,225 64,883 64,883 Culturable waste 86,733 111,240 109,728 109,316 Permanent pastures and other grazing
lands 8,144 8,598 8,570 8,554 Land under miscellaneous tree crops )18,518 129,408 117,868 121,927 Current fallows 33,487 42,738 42,458 39,658 Other fallows 58,962 30,659 31,248 27,605 Net area sown 781,771 752,861 742,405 745,217 Area sown more than once 99,532 115,446 94,043 78,892 Total cropped area 881,303 868,307 836,448 824,109
The above figures reduced to percentages give the following results :-
Statement 8
LAND UTILISATION .BY PERCENTAGES TO THE TOTAL
Classification of land 1955-56 Total area according to village papers 100-00 Forests 23'20 Barren and unculturable land 6'47 Land put to non-agricultural uses 3'80 Culturable waste 5' 30 ,Permanent pastures and other grazing lands 0' 50 Land under miscellaneous tree crops 7'25 Current fallows 2'05 Other fallows 3,61 Net area sown 47'82 Area sown more than once 6'09 Total cropped area 53'91
1956-57 1957-58 100'00 100-00 23'94 23-99 6·47 7-68 3'80 3'97 6'80 6'71 0'53 0'52 7'92 7'2! 2'61 2'60 1·88 1'91
46'05 45·41 7-06 5·75
53'U 51'16
1958-59 100'00 28'66 3'00 3'97 6'69 0'52 7-46 2-43 1'69
45'58 4-83
50'41 55. The cropped area for the period 1955-56 to
1958-59 showed a declining trend and thereafter it increased steadily. The cropped area for the last six
years may be groups.
classified in to
Statement 9
DISTRIBUTION OF CROPPED AREA BY MAJOR GROUPS * (Area in acres)
r-
Major Group 1955-56 1956-57 1957-58 1958-59 1959-60
Total cropped area 881,303 868,307 836,448 824,109 873,443
1 FOOD CROPS 565,000 539,580 497,93;) 500,778 529,623 (i) Food grains 340,032 336,180 296,747 297,938 296,690 (ii) Sugar crops 1,589 1,619 1,953 1,755 2,033
(iii) Condiments and spices 103,862 94,038 85,141 82,344 94,679 (iv) Fruits and vegetables 119,517 107,743 114,094 118,741 136,221
2 NON-FOOD CROPS 316,303 328,727 338,513 323,331 343,820 (i) Oil seeds 254,097 254,547 234,738 237,994 243,932 (ii) Fibres 60 350 360
(iii) Narcotics and plantation crops 45,857 5B,536 69,101 74,834 76,496 (iv) Other non-food crops 16,349 15,644 14,614 10,153 23,032
* Source-Department of Statistics, Kerala.
------~
1959-60 1960-61
64,883 75,546
8,372 104,517 38,114 27,605
788,576 84,867
873,443
1959-50 100'00 29'33 2'92 3'97 4'62
64,914 74,403
8,358 )04,517 38,116 25,841
791,587 91,790
883,377
1960·61 100'00 29'33 2'9t 3'97 4'55
0'51 O-:il 6-39 6'40 2'33 2'33 1'69 1'58
48'24 43'42 5'19 ':;'61
53-43 54'03
the following major
..., 1960-61
Actual Percentage
883,377 100'00
534,457 60'50 288,1l4 32'61
1,995 0'23 104,956 1l'8a 139,392 15"78 348,920 39'50 247,005 27'96
600 0'07 77,691 8'80 23,624 2'67
56. The area cultivated in this district under different crops for the period 1955-56 to 1960-61 is given below:
19 106/1-3a

PADDY CULTIVATION
Statement 10
AREA UNDER DIFFERENT CROPS FOR THE PERIOD 1955-56 TO 1960-61 * (Area in acres)
Crop 1955-56 1956-57 Rice Total 323,000 317 ,600
Autumn 191,300 187,400 Winter 115,800 114,500 Summer 15,900 15,700
Ragi 2,740 3,072 Other cereals and millets 3,028 3,145 Pulses Il,264 12,363 Sugarcane 49 55 Other sugar crops 1,540 1,564 Pepper 33,444 33,473 Chillies 2,245 1,677 Ginger 8,041 8,132 Turmeric 2,054 1,887 Cardamom 1,092 1,565 Betelnuts 51,347 38,675 Other condiments and spices 5,639 8,629 Mangoes 24,459 22,923 Bananas including plantains 17,227 19,054 Other fresh fruits 17,100 13,354 Cashewnut 10,621 10,483 Other dried fruits 1,232 576 Tapioca 36,878 30,450 Sweet potatoes 5,225 3,832 Other vegetables 6,775 7,071 Sesamum 3,234 3,158 Cocoanuts 250,813 251,339 Other oil seeds 50 50 Fibres Tobacco 66 Tea 8,854 9,531 Coffee 20,101 23,309 Rubber 16,836 21,911 Other plantation crops 3,785 Other non-food crops 16,349 15,644
* .source :-Department of Statistics, Kera1a 57. The percentages of the area of the district
under food crops and non-food crops for the period 1955-56 to 1960-61 are furnished below:
Statement II
PERCENTAGES OF AREA UNDER FOOD CROPS AND NON.FOOD CROPS FOR THE PE!UOD 1955-56 TO 1960-6 1
1955-56 1956-57 1957-58 1958-59 1959-60 1960-61 Total crop-
ped area 100'00 100'00 100'00 100'00 100'00 100·00 .F oorl crop s 64'11 62'14 59'53 60'77 60'64 60'50 Non-food crops 35'89 37'86 40'47 39'23 39'36 39'50 Percentage of
cropped area of the dis-trict to crop-ped area of the State, 16'37 16'13 15'31 14'88 15'33 15'22
20
1957-58 1958-59 1959-60 1960-61 276,573 277,923 276,086 267,152 175,900 178,633 176,320 164,278 95,806 94,490 96,766 99,874 4,867 4,800 3,000 3,000 2,922 3,083 3,804 3,880 3,161 3,106 3,161 3,189
14,091 13,826 13,639 13,893 72 72 70 70
1,881 1,683 1,963 1,925 31,353 31,585 32,370 39,695
1,686 1,892 1,971 1,670 6,360 6,388 8,380 10,875 2,550 2,393 2,973 3,015 1,781 2,600 2,600 2,633
39,0l() 35,236 43,970 44,553 2,401 2,250 2,415 2,515
21,406 19,702 18,566 18,918 19,904 18,710 22,560 22,301 15,784 17,020 16,134 16,681 11,674 12,375 24,032 25,702
935 30 30 30 30,703 40,134 45,333 46,933 3,832 3,875 3,927 3,321 9,856 6,895 5,639 5,506 3,823 1,699 1,659 1,533
250,884 236,295 242,273 245,472 31 l.
60 350 360 600 67 90 90
9,351 9,801 9,801 9,801 26,440 26,787 28,449 28,449 30,462 35,600 3,1,600 36,885 2,781 2,556 2,556 2,556
14,614 10,153 23,032 23,624
Rice, cocoanuts and arec-anuts are the more important crops of this district deserving detailed study.
(a) Rice
58. Paddy is cultivated in three seasons of the year. The one associated with the autumn season is known as 'Kanni crop', with the winter is called the , Mundakan crop' and with the summer the 'Puncha crop'. The crop.cutting surveys conducted by the State Statistics Department gave the following results in respect of area and yield per acre of paddy and production of rice in tons for the agricultural year ending with June 1961.~

PADDY CULTIVATION
Statement 12 AREA UNDER PADDY CULTIVATION, YIELD PER ACRE AND PRODUCTION FOR 196(1.61'
l\Iean yield of dry paddy Production of rice in District/Taluk Area in acres in lb./acre tons
Autumn Winter Kozhikode District 164,278 . 99,874 Badagara TaJuk 16,138 1,987 Ernad~" 54,340 29,368 Kozhikode " 17,375 10,887 Quilandy .. 28,075 3,861 S<>uth Wynad ,I 35,020
Tiru~r:__~:----!.!.,"-::--__ 48,350 18,751 '" Source:-Department of Statistics, Kerala
Summer 3,000
3,000
Autumn 1,291
988 1,252
890 544
2,012
Winter 1,734 1,180 1,932
960 1,356 1,807 1,876
Summer 2,076
2,076
Autumn 62,226
4,724 19,954 4,536 4,480
28,532
Winter 50,808
688 16,642 3,065 1,536
18,560 10,317
Summer 1,827
1,827
Kozhikode district accounts for 13'88 per cent of of paddy in the State. The percentage distribution of area under paddy and 10·93 per cent of the production area and production of paddy is furnished below:-
Statement 13 PERCENTAGE DISTRIBUTION OF AREA UNDER PRODUCTION OF PADDY BY TALUKS FOR 196(1.61
District/Taluk r-Total
Kozhikode District 100'00 Badagara Taluk 6'79 Ernad 31'33 Kozhikode .. 10'58 Quilandy 1 1'95 South Wynad " 13'11
Autumn 100'00
9'82 33'08 10'58 17'09
Tirur.. 26'24 29'43
Area
The above figures show that the summer Puncha) crop is cultivated only in Tirur taluk.
Winter 100'00
1'99 29'41 10'90 3'87
35'06 18'77
(or
59. The agricultural Research Station at Ambalavayal (South Wynad taluk) started functioning from 1945. Here they are doing agronomic research on paddy, sugarcane, tapioca, ginger, yam, banana, mandarin, oranges, pineapple, lemon, pepper, cardamom, coffee, cocoa, kolanut, camphor, vannitta, eucaliytus and cinnamon. The Agricultural.Research Station at Koothali also conducts experiments on paddy, pepper, pulses and vegetables. The results of the agronomic research on paddy conducted during the period 1956-57 to 1960"::61 at the Ambalavayal Research Station are furnished below:-
(i) Experimental trials of~Jeerakasala' variety of paddy
60. Trial for evolving high yielding strain of Jeerakasala by selection was started during 1952-53. Three promising high yielding Jeerakasala cultures 179,190 and 534 were selected for trial for the period 1956-57 to 1958-59. The following are the results of the experiments:-
Year of trial
1956-57 1957-58 1958-59
Percentage of increase in yield
179 7·6
10'4 20'8
Jeerakasala culture
190 5'5 2'4
14'8
534 3'7 1'7
13'0
........-., Summer UMNIO
Production
Total Autumn Winter 100'00 100'00 l()()Ooo
4-71 7'59 j'35 31'86 32'07 32·76 6'62 7'29 6'03 5'24 7'20 3'02
16'16 36'53
Summer 100'00
100'00 35'41 45'85 20'31 100'00
The above results confirm that Jeera~asala culture 179 has the maximum yield.
(ii) Ratooning trial of paddy 61. Ratooning trial of paddy was conducted in
1956-57 for the third year in succession. The varieties were K othandan, Maranellur, Chennallu Ceylon and Ninidhan. The treatments consisted of leaving stubbles (9") to ratoon after the main crop harvest giving a weeding and an application of ammonium sulphate as top dressing at 50 pounds per acre and irrigating when necessary. Ninidhan has recorded the maximum yield and appears to be more promising as a ratoon.
(iii) Trial of first crop season paddy seeds during second season
. 62. An observational trial of growing high yielding first crop season paddy varieties during the second season was carried out to study their performance in respect of duration and yield during the second crop season. The varieties used were TKM 5, TKM 6, WND 2, Kothandan, Maranellu, Ninidhan, MTU 19, Maranellur Ceylon, Chennellu Ceylon and Jeerakasala. The result indicated that it is not advisable to grow first crop varieties in general during second crop season as their performance in respect of yield gets considerably affected probably due to the influence of the season.
(iv) Yield trials of different second season paddy varieties
63. Comparative yield trials of different second sea~ son paddy varieties were conducted during 1959-60.
21
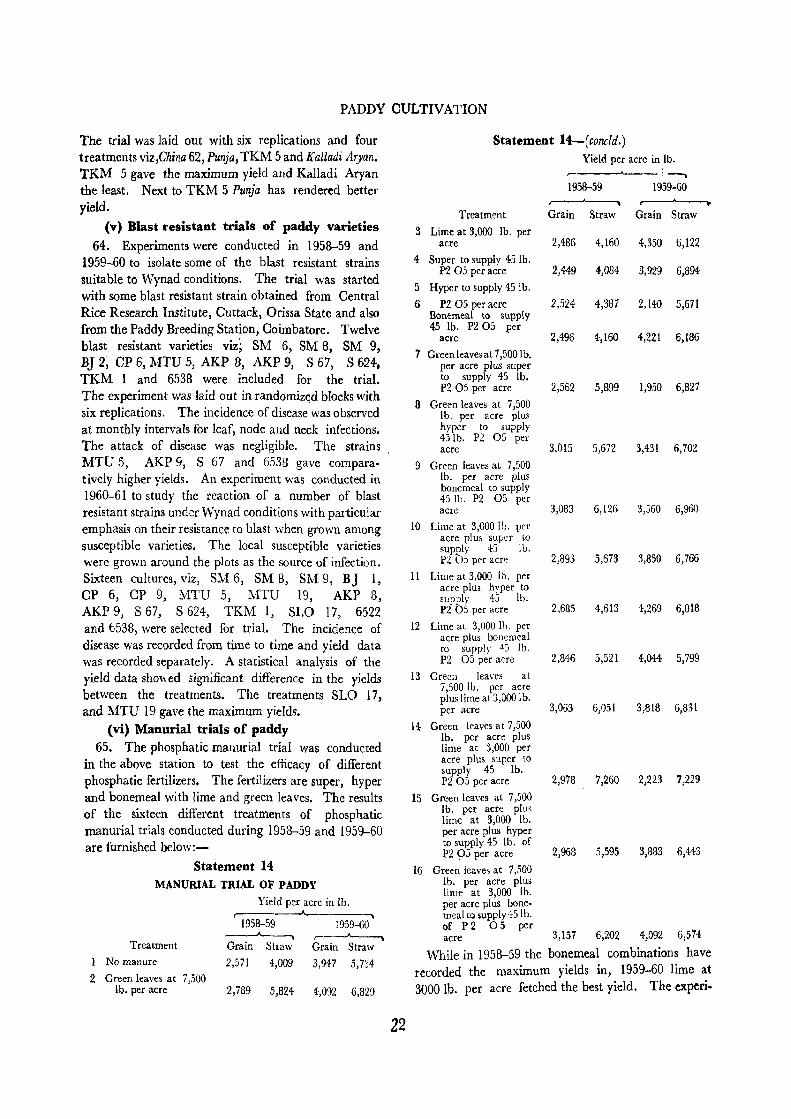
PADDY CULTIVATION
The trial was laid out with six replications and four treatments viz,China 62, Punja, TKM 5 and Kalladi Aryan. TKM 5 gave the maximum yield and Kalladi Aryan the least. Next to TKM 5 Punja has rendered better yield.
(v) Blast resistant trials of paddy varieties
64. Experiments were conducted in 1958-59 and 1959-60 to isolate some of the blast resistant strains suitable to Wynad conditions. The trial was started with some blast resistant strain obtained from Central Rice Research Institute, Cuttack, Orissa State and also from the Paddy Breeding Station, Coimbatore. Twelve blast resistant varieties viz; SM 6, SM 8, SM 9, BJ 2, CP 6, MTU 5, AKP 8, AKP 9, S 67, S 624. TKM 1 and 6538 were included for the trial. The experiment was laid out in randomiz~d blocks with six replications. The incidence of disease was observed at monthly intervals for leaf, node and neck infections. The attack of disease was negligible. The strains MTU 5, AKP 9, S 67 and 6538 gave comparatively higher yields. An experiment was conducted in 1960-61 to study the reaction of a number of blast resistant strains under Wynad conditions with particular emphasis on their resistance to blast when grown among susceptible varieties. The local susceptible varieties were grown around the plots as the source of infection. Sixteen cultures, viz, SM 6, SM 8, SM 9, BJ 1, CP 6, CP 9, MTU 5, MTU 19, AKP 3, AKP 9, S 67, S 624, TKM 1, SLO 17, 6522 and 6533, were selected for trial. The incidence of disease was recorded from time to time and yield data was recorded separately. A statistical analysis of the yield data showed significant difference in the yields between the treatments. The treatments SLO 17, and MTU 19 gave the maximum yields.
(vi) Manurial trials of paddy 65. The phosphatic manurial trial was conducted
in the above station to test the efficacy of different phosphatic fertilizers. The fertilizers are super, hyper and bonemeal with lime and green leaves. The results of the sixteen different treatments of phosphatic manurial trials conducted during 1953-59 and 1959-60 are furnished below:-
Statement 14 MANURIAL TRIAL OF PADDY
Treatment
Yield per acre in lb. r--------A--
1958-59 1959-60 ~ r---A.~ Grain Straw Grain Straw
1 No manure 2,571 4,009 3,947 5,734
2 Green leaves at 7,500 lb. per acre 2,789 5,824 4,092 6,829
22
Statement 14-(concld.) Yield per acre in lb.
1--. 1958-59 1959-60
Treatment Grain Straw Grain Straw
3 Lime at 3,000 lb. per acre 2,486 4,160 4,350 6,122
4 Super to supply 45 lb. P2 05 per acre 2,449 4,084 3,929 6,894
5 Hyper to supply 45 lb.
6 P2 05 per acre 2,524 4,387 2,140 5,671 Bonemeal to supply 45 lb. P2 05 per
acre 2,496 4,160 4,221 6,186
7 Gl'een leaves at 7,500 lb. per acre plus super to supply 45 lb. P2 05 per acre
8 Green leaves at 7,500 lb. per acre plus hyper to supply 43 lb. P2 05 per acre
9 Green leaves at 7,500 lb. per acre plus bonemeal to supply 45 lb. P2 05 per acre
10 Lime at 3,000 lb. per acre pi us super to supply 45 lb. P2 05 per acr~
11 Lime at 3,000 lb. per acre plus hyper to supply 45 lb. P2 05 per acre
2,562 5,899 1,950 6,827
3.015 5,672 3,431 6,702
3,083 6,126 3,560 6,960
2,893 5,673 3,850 6,766
2,685 4,613 4,269 6,018
12 Lime at 3,000 lb. per acre plus bone meal to supply +5 lb. P2 05 per acre 2,846 5,521 4,044 5,799
13 Green leaves at 7,500 lb. per acre plus lime at 3,000 lb. per acre 3,063 6,051 3,818 6,831
14 Green leaves at 7,500 lb. per acre plus lime at 3,000 per acre plus super to supply 45 lb. P2 05 per acre 2,978 7,260 2,223 7,229
15 Green leaves at 7,500 lb. per acre plus lime at 3,000 lb. per acre plus hyper to supply 45 lb. of P2 05 per acre 2,968 5,595 3,883 6,443
16 Green ieaves at 7,500 lb. per acre plus lime at 3,000 lb. per acre plus bonemeal IO supply 45 lb. of P2 05 per acre 3,157 6,202 4,092 6,574
While in 1953-59 the bonemeal combinations have recorded the maximum yields in, 1959-60 lime at 3000 lb. per acre fetched the best yield. The experi.

COCOANUT CULTIVATION
ments conducted in 1960-61 did not yield any' remark. able results even when the treatments of lime and bonemeal combination gave good yield.
(vii) Duration of crop and yield per acre
66. The duration of paddy crop and yield per acre of different varieties of paddy seeds for 1960-61 are furnished below:-
Statement 15 YIELD PER ACRE OF DIFFERENT PADDY VARIETIES
Variety First cropo
Chennellu Ceylon Chettu Val iyan CP6 CP9 Jeerakasala 179 Jeerakasala 190 Jeerakasala 534 Jeerakasala (Bulk) Jeerakasala (trial) Kotharldan }.1aranellu Maranellu 881 Maranellu 881 Maranellu Ceylon MTU 19 8LO 17 Velumbala WND 1 WND2 WND 2 (Line) WND 2 (NPK trial)
Second Crop-China 62 Kalladi Aryan Punja Bulk , Punja cultures TKM5
(b) Cocoanut~
Duration in days
160 195 185 187 194-194-194-194-194-170 200 203 201 202 211 211 206 180 200 175 200
160 155 160 160 160
Yield per acre inlb.
1,882 2,033
980 300
3,070 3,230 3,692 1,000 1,055 2,087 2,550 1,310 2,660 1,600 1,400 2,090 1,724-2,300 2,117 2,000 1,966
871 1,200 1,426 1,500 1,840
67. Kozhikode district has an area of 245,472 ~cres under cocoanut cultivation which is 19'84 per cent of State area under cocoanuts. The following statement gives the estimated tal uk-wise area under -cocoanuts for the year 1960-61:-
Statement 16 AREA AND PRODUCTION OF COCOANUTS, 1960-61
District/Taluk Kozhikode District Badagara Taluk Ernad
" Kozhikode " Quilandy " South Wynad " Tirur
"
Area in Production in acres million nuts
(Estimates) (Estimates) 245,472 639'0 67,386 175"4-30,500 79-4 34,877 90'8 68,030 177'1
72 0'2 44,607 116'1
23
68. A sample survey (2nd round) sponsored by the Indian Central Cocoanut Committee was conducted by the State Statistics Department during 1960-61. According to the preliminary report of this survey Kozhikode district has an area of 298,425 acres under COcoanut cultiv;::.tion. This acreage differs from the figures furnished in the above statement. This district stands foremost in regard to area and production in the State, the percentages being 22'79 and 30'85 respectively. Kozhikode district has only 15 barren nuts, per 1,000 bearing palms.
69. The Survey gave the following results on the average annual yield and income from an acre of pure cocoanut plot in the Kozhikode district:-
Average No. of bearing palms per acre Average yield from a bearing palm Total yield from an acre
68 40
2,720 Rs.18·25 Price of ] 00 cocoanuts
Total income from an acre of pure cocoanut plot " 496'40
70. The month· wise production of cocoanuts reduced to percentages for Kozhikode district for 1960-61 are as follows:-
Statement 17 MONTH·WISE PERCENTAGE OF PRODUCTION
t>lonth Total July 1960 August " September " October
"
Percentage of production 100'00
4°72 5°82 5°05 6°27
November " 5'78 December " 6°67 January 1961 8°28 February " ]]004-
March " 11' 79 April " 10'44 May " 15'10 June " 9.04-
The survey indicates that Kozhikode district is free from the attack of cocoanut diseases.
71. Of the total cocoanut palms 71,21 per cent are of bearing status, while the rest belong to non-bearing. The subjoined statement gives the distribution of cocoanut palms with respect to age and bearing status reduced to percentages. The number of palms under study was 14,000.
Statement 18 PERCENTAGE DISTRIBUTION OF COCOANUT
PALMS BY BEARING STATUS
Below 5 years
5 "
6 "
i Percentage distribution
Total 20'40 1'27 1·25
Bearing Non-bearing 20'40
1'27 ]'25

TAPIOCA CULTIVATION
Statement 18-(concld.) Percentage distribution
Total Bearing Non-bearing
7 years 1'7B 8 " 2'06 9 " 1"42 0'65
10-14 " 4'75 3-66 15-19 " 13'43 13'29
20 years and above 53'64 53'61
1'78 2'06 0·77
The above statement reveals that the bearing palms in this district is from 9 years.
1·09 0'14 0'03 age of
72. The survey also gives information on the vari. ous methods of disposal of cocoanuts in Kozhikode district. About 89 per cent of nuts are sold.
Statement 19 PERCENTAGE OF HARVESTED PRODUCE USED
FOR VARIOUS PURPOSES
Type of disposal Total
(i) Home consumption (ii) Religious purpose
(iii) Sold as cocoanuts (iv) Converted into copra (v) Other purposes
Percentage to total harvested
produce 100-00
7·35 0'37
88'70 1'23 2'35
Majority of nuts in the last item viz, other purposes, are used as seeds.
(c) Tapioca 73. Tapioca is the subsidiary food of the majority
of people of this district. Both area and production of tapioca in this district come to 8 per cent of the State area and production. The mbjoined statement gives estimated taluk-wise area and production of tapioca for 1960-61:-
Statement 20 AREA AND PRODUCTION OF TAPIOCA, 1960-61
District/Taluk Kozhikode District Badagara Taluk
" Ernad Kozhikode Quilandy " South Wynad " Tirur
(d) Areca-nut
Area in acres
(Estimates) 46,933 4,068 9,981 6,501 8,50B 7,368
10,507
Production in tons
(Es tima tes) 1,29,901
11,259 27,625 17,994 23,549 20,393 29,OBI
74. Kozhikode district has the largest area under areca-nuts in the State coming to 44,553 acres which is 33 per cent of the total area of areca-nuts in the State. The areca palms of this district had produced 2,571 million nuts in 1960-61, against the State figure of 7,737 million nuts. The statement given hereunder shows the tal uk-wise area and production of areca-nuts.
24
Statement 21 AREA AND PRODUCTION OF ARECA-NUTS, 1960-61
Area in Production in acres million nuts
District/Taluk (Estimates) (Estimates) Kozhikode District 44,553 2,571'0 Badagara Taluk 4,077 235'3 Ernad 15,320 884'1 Kozhikode 9,174 529·4 Quilandy
" 6,644 3BN South Wynad" 138 7'9 Tirur 9,200 530'9
75. A sample survey was conducted by the State Statistics Department under the technical guidance of the Indian Council of Agricultural Research. The preliminary results obtained from the second round of this survey are dealt with in detail here. According to the survey this district has an area of 29,065 acres. These figures are not comparable with the official figures furnished in the above statement. Thi~ district has an estimated number of 26'7 million palms. It is estimated that in a bearing palm there are on an average 105 ripe and 59 tender nuts.
76. The survey gave the following results on the average annual yield and income from an acre of areca-nut plot in this district:-
Average number of areca-nut palms per acre Total number of areca-nuts per acre Number of ripe nuts per acre Number of tender nuts per acre Price for 100 ripe nuts Price for 100 tender nuts Total value of areca-nuts produced in an acre
563 92,332 59,115 33,217
Rs.2·25 Rs. 1'75
Rs. 1,911'39
The average yield of areca-nuts under different agegroups is furnished below. 964 palms in this district were taken into consideration for this detailed stU'::I.y.
Statement 22 YIELD OF ARECA-NUT PALMS BY AGE-GROUPS
Average yield per palm per
Age of palm year
Total 169'24 Below 10 years 74-41 10-19
" 157'92
20-29 " 168'73
30-39 " 195'60
40 years and above 160'65
77. 83'15 per cent of areca-nut palms are raised on loamy Soil, 16'40 per cent on sandy basins and the rest on clayey plots in this district. 32 per cent of the total palms receive irrigation of one way or other.
78. The following statement furnishes the percentage of annual produce harvested in each month for the period 1960-61:-

EDUCATION
Statement 23 PERCENTAGE OF ANNUAL PRODUCE
HARVESTED, 1960-61 Percentage of annual harvested produce
A-----l Month Ripe nuts Tender nuts
1960-61. . 100-00 100'00 July 1960 0'77 9'90 August" 5'28 18'92 September " 3'87 16'89 October" 1H4 22'27 November " 14'62 12'83 December " 11'89 6'05 January 1961 17-63 2'64 February " 17'42 1'45 March,. 3'62 0'02 April" 1'08 0'77 May" 10'38 3'47 June " 4'79
79. Pepper, cashewnut, bananas including plan-tains, tea, coffee and rubber are the other important crops. The production of important crops for the period 1955-56 to 1960-61 is furnished in Appendix 5. The prices of important commodities for Kozhikode centre are also given in Appendix 6. The cost of living index numben are furnished in Appendix 7. Live-stock
80. The fo~lowing statem_elif~~£ n;~stoc~ and poultry accordmg to ~!ie:' \~6i ._~eus~s_( !dr.;~~llkode district :- .
Statement 24 LIVE-STOCK AND POU{TIty; 1961 *
1961 Live-stock J
Category Census > Perc~ltage
/it)O·OO A Total Live-stock I CATTLE Total
(a) Males over 3 years Total (i) Breeding
(ii) '~reeding and working' and 'working only'
(iii) Others (b) Females over. 3 years Total
(i) Breeding Total (a) In milk (b) Dry and not calved
(ii) Working (iii) Others
(c) Young-stock II BUFFALOES
(a) Males over 3 years (i) Breeding
Total
(ii) 'Breeding and working' and' working only'
(iii) Others (b) Females over 3 years
(i) Breeding Total (a) In milk (b) Dry and not calved
(ii) Working
106/1-4
701t,~!f8. . 1t6;060' 58'73 ---n3,807 16'07
1,27+ 0'18
107,589 15'19 4,944 0'70
172,244 24'31 167,309 23-62 59,566 8'41
107,743 15'21 3,200 0'45 1,735 0'24
130,009 18'35 68,179 9-62 34,017 4'80
368 0'05
32,562 4'60 1,087 0'15
24,369 3044 21,945 3' 10 9,245 1'31
12,700 1'79 2,012 0'28
25
Statement 24-concld.
Category (iii) Others
(c) Young-stock III SHEEP IV GOATS V HORSES AND PONIES
VI OTHER LIVE-STOCK B Total Poultry
1961 Livestock census
412 9,793 2,1.17
220,890 42
1,070 1,395,511
Percentage 0'06 1'38 0'31
31-18 0'01 0-15
• Source :-Department of Animal Husbandry, Kerala.
A detailed taluk-wise classification of the live-stock and poultry as per the 1961 Live-stock Census is given in Appendix 8. Another table giving the taluk-wise figures of agricultural implements is furnished as Appendix 9. Education
(a) General education 81. The Madras Local Boards Act of 1834 was
mainly responsible for the rapid expansion of educational institutions in the district. The momentum for establishing new elementary schools was accelerated by the promulgation of the Elementary Education Act. The educational system has undergone remarkable changes during the last decade especially after the formation of Kerala State. The duration of school course was raised from II to 12 years in 1956-57. Thus the primary grade covered the first eight standards, the initial five being lower primary while the rest upper primary. Standards IX to XII constituted the secondary grade. The admission to schools was restricted to pupils who attained the age of 5~ or over in 1958-59. During this year the number of years of primary education was once again reduced from 8 to 7 thus re-introducing the II years duration of course again. In 1959-60 ten year course of study was introduced by admitting pupils who had passed the new IV and V standards of primary schools to the VI standard. The upper primary sections of High Schools were permitted to conduct standard V even though standard V was allowed to continue in certain primary schools. At present standards I to IV constitute the lower primary section while standards V to VII the upper primary section. The secondary school has standards VI II to X. During the academic year 1957-58 the schools in Malabar were brought under the control of a Deputy Director whose office is situated at Kozhikode. For effective and proper control over the development of primary education an Assistant Educational officer was appointed in each educational sub-district. The Government Fishery schools in the Malabar region which were under the administrative control of the Fisheries Department were transferred to the Department of Public

EDUCATION
Instruction during the same year. All educational institutions managed by the Malabar District Board and Municipal Councils were handed over to the Department of Public Instruction with effect from 1st October 1957.
82. Out of 2·6 million persons who constitute the 1961 population of the district more than 1'05 million persons are' literates and educated persons '. Of these 665,386 are males and 397,909 are females. This gives a literacy percentage of 40'6 for the total population, 51·1 for males and 30·2 for females. In respect of total literacy this district has the eighth rank among the nine districts of the State.
83. The following stateJTlent gives the number of· school-going children by age-groups for Kozhikode district during the academic years 1950-51, 1955-56 and 1960-61 ;-
Statement 25 SCHOOL-GOING CIULDREN *
Age-group 1950-51 1955-56 Less than 5 years
5--9 " 10--14 " 15-19 " 20 and above
112,953 80,311 17,974
757
148,382 101,009 22,548 6,426
• Source :-Department of Education, Kerala
1960--61 118
201,412 155,012 32,017
930
The above statement shows a remarkable increase in the number of school-going children from 1950-51 to 1960-61, the percentage of increase being 83' 73.
84. A classified statement showing the number of schools in each category is given below:-
Statement 26 NUMBER OF SCHOOLS, 1950-51 TO 196().61 *
Year
1950-51 1951-52 1952-53 1953-54 1954-55 1955-56 1956-57 1957-58 1958-59 1959-60 1960-61
Nursery schools ,---"--,
G P
Lower Upper primary primary High schools schools schools Others Total ~ ,..-----A---, ~ ,-"--., ~
GP GPGPGP GP 23 1,500 :2 256 2 30 4 50 31 I,S.1b 23 1,501 2 264 2 30 4 56 31 I,S} I 23 1,520 3 265 2 31 4- 78 32 1,894 23 1,520 4 272 3 32 4 84 34 I,W8 23 1,543 4- 276 4- 32 4 81 S5 1,9~2
23 1,581 4 284 4 34 4 82 35 1,981 27 1,581 4 310 8 44 4- 82 43 2,017
527 1,390 87 260 36 44 21 67 671 1;761 523 921 99 262 37 49 20 18 679 1,250 522 921 100 262 37 48 19 ,7 t;78 1,238
.. 3 514 923 101 269 38 48 16 ;·3 669 1,246
G - Government P - Private *SouTce :-Department of Education, Kerala
85. Another statement showing the number of pupils, strength of staff, etc., is furnished hereunder:-
Statement 27 STRENGTH OF PUPILS AND STAFF t
Institutions District Total
Number of Schools Strength
1950--51 1951-52 1952-53 1953-54 1954-55 1955-56 1956-57 1957-58 1958--59 1959-60 1960-61
Teachers
Lower Primary J
Junior Basic Schools Number of Schools Strength
Teachers
Upper Primary/ Senior Basic Schools
Number of Schools Strength
Teachers
High Sc/lOOIS/ Post Basic Schools
Number of Schools Strength
Boys Girls Men Women
Boys Girls Men Women
Boys Girls Men Women
Boys Girls
1,867 126,337
85,658 6,121 2,196
1,523 85,039 61,341 4,209 1,316
258 27,327 17,766 1,323
588
32 13,049
5,674
1,882 130,899 84,519 6,468 2,126
1,524 88,006 60,054-4,451 1,192
266 27,494 18,664
1,366 625
32 14,453 4,891
t SOUT,e :-Department of Education, Kerala
1,926 138,478 94,891 6,663 2,358
1,543 90,217 67,776 4,527 1,360
268 32,206 19,961 1,456
680
33 15,041 6,213
1,942 143,534 100,590
6,881 2,455
1,543 94,435 71,881 4,621 1,399
276 32,797 21,205
1,552 719
35 15,331
6,548
1,967 154,300 106,212
7,215 2,58t
1,566 100,274 75,591 4,832 1,445
280 37,852 22,730
1,670 790
36 15,167
6,852
2,016 162,684 115,681
7,479 '2,830
1,604 105,953 82,532 5,076 1,525
288 38,738 24,393
1,652 936
38 16,775
7,721
2,060 176,495 124,116
7,324 2,725
1,608 120,404 94,360 4,866 1,610
314 37,369 21,426
1,613 737
52 14,592 6,496
2,432 189,714 136,696
8,199 3,127
1,917 117,709 93,973 5,277 1,875
3~7 44,602 29,083
1,757 774
80 24,185 11,197
1,929 214,381 151,537
8,696 3,385
1,444 135,778 107,577
4,859 I, 03
361 48,739 28,420 2,402
982
86 27,657 13,683
1,916 223,853 157,377
9,878 4,184
1,443 120,666 95,303 5,326 2,080
362 68,198 43,886 3,177 1,401
85 33,595 16,873
1,915* 227,396* 162,053· 11,146 4,118*
1,437 121,366 97,611 6,056 1,804
370 69,305 42,840
3,561 1,561
86 34,979 20,295
• Inclusive of figureS pertaining to nursery schools. There are 3 nursery schools in the district in 1960-61 with a strength of 78 Boys and 4() Girls and 3 Women teachers.
26

EDUCATION
Statement 27-concld. Institutions
Teachers 1950-51 1951-52 1952-53 1953-54 1954-55 1955-56 1956-57 1957-58 1958-59 1959-60 1960-61
1fen 544 606 633 661 665 700 694 991 1,323 1,291 1,460 Women 255 272 280 300 309 329 328 419 420 666 714
85 86 86 88 38 26 19 Other Schools
Number of Schools Strength Boys 1,007 1,218 4,130 -3,218 2,207 1,394 1,668
Girls 1,039 1,035 1,83'1 2,443 1,857 1,315 1,307 Teachers Men 48 51 151 174 112 84 69
Women 40 40 50 59 80 37 36 (b) Higher education Providence Women's College in 1952, St. Joseph's 86. Under the University of Kerala there are six College, Devagiri in 1956 and Government College at
Arts and Science Colleges in this district besides one Madappally in 1958. Besides the above Arts and Science Training College, one Medical College and three Orien· Colleges there are one Government Training College tal Title colleges. The present Guruvayurappan College started in 1950 and a Medical College establish~d in was first started as a school in 1877. In 1878 this was 1957. Rouzathul Uloom Arabic College was first esta-named Kerala Vidyasala and was affiliated to the Uni· blished at Anakkayam in 1942 and was shifted to Man· versity of Madras as a Second Grade College. In 1900 jery in 1944 and two years later it was again shifted to it was named Zamorin's College, and again in July 1952 Feroke. The Madeenathul Uloom Arabic College, Guruvayurappan College. The Malabar Christian Pulikkal was started in July 1947. The Sulla Mussalam College was founded in 1848 as a primary school by the Arabic Collage, Ariyakkode was founded as an Arabic Basel Evangelical Mission. It was converted into a Madraua in 1944 and was upgraded into a college in Second Grade College in 1907. The Faroke College, 1955. The subjoined statement gives the number of Feroke, was established on 12th August 1948. During colleges, students and teachers for the period 1950-51 the decade 1951-61 three colleges were founded viz., to 1960-61:-
Statement 28 COLLEGIATE EDUCATION *
Arts & Science Medical Training Oriental study ,-----.A.-------v-----"----"-'Ir- ~ __ . __ __..,-_-_-____,J...,_--- ___ Num- Num- Num- Num-
ber Strength Teachers her Strength Teachers ber Strength Teachers ber Strength Teachers M F M r M F M
1950-51 3 739 111 48 7 1951-52 3 1,037 L08 65 5 1952-53 4 1,244 181 77 10 1953-54 4 1,363 217 78 16 1954-55 4 1,377 288 79 19 1955-56 4 1,524 332 79 20 1956-57 5 t,713 387 112 29 1957-58 5 1,244 391 83 23 1 33 15 12 1958-59 6 2,130 515 126 27 1 85 41 24 1959-60 6 2,331 536 149 32 1 163 61 33 1960-61 6 2,609 679 173 34 1 262 110 39
* Source :-University of Kerala
87. On 30th January 1961 a University centre was opened to give adequate facilities for post.graduate training and research in science and humanities. This is a landmark in the history of development of university education in the district. The details of colleges for the academic year 1960-61 are furnished in Appendix 10.
(c) Professional and technical schools 88, Kerala Polytechnic, Calicut; Government Indus
trial School, Calicut; Junior Technical School, Manjeri; Coir School, Beypore; Fisheries Technical High School, Madappally and the Fishermen Training Centre, Beypore are the important professional and technical
11)6/1-4.
F ~f F 11 F M F ~,f F 60 24 12 3 2 89 14
1 59 27 12 3 2 89 H 1 62 25 12 3 2 90 15 1 63 38 13 2 2 107 3 15 1 69 31 12 4 2 102 5 17 1 63 37 12 4 3 160 30 20 1 69 31 12 4 3 184 25 20
1 1 88 30 4, 6 3 185 18 21
27
4 I 106 13 4 6 3 171 18 13 2 1 134 16 6 6 3 180 16 19 3 5 1 115 35 5 5 3 125 10 18 2
schools of this district. The table showing the number of polytechnics with their strength and pupils is furnished in Appendix 11. Public Healih
89. The first Government hospital was opened at Calicut in October 1845. This was taken over by the Municipality when it was created in 1865 and it continued under the control of the Municipality till 1920. In 1920 Government again took over the management of this hospital for providing better medical facilities and it was treated as the Headquarters Hospital. This hospital was upgraded into a Medical College Hospital

PUBLIC HEALTH
in August 1955. Three clinics, viz, for dental, tuberculosis, and venereal diseases were attached to this hospital in 1957, 1958 and 1959 respectively. The Women's and Children's Hospital at Calicut was started in October 1901. Hospitals at Badagara, Vythiri, Manjery, Nilambur and Malappuram were also old
institutions. The Lunatic Asylum at Kuthiravattam about two and half miles east of Calicut was established on 20th May 1872 at a cost of Rs. 39,250. As on 1st April 1961 this district has the following Government Allopathic institutions :-
Statement 29
GOVERNMENT ALLOPATIDC INSTITUTIONS AS ON 1ST APRIL 1961*
Doctors Nurses ,---A----, ~
Year of Gra- Licen- Wo- Midwi- Com- No. of Name of institution starting duates tiates Men men ves pounders Others beds
Hospitals: Medical College Hospital, Ca!icut (previously
H.Q. Hospital) 1845 27 8 40 11 139 481 W. & C. Hospital, Calieut 1901 8 22 2 7 97 286 Government Hospital, Manjeri 1868 4 7 2 20 61
Do. Nilambur NA 1 10 29 Do. Vythiry 1886 13 24
Police Hospital, Malappuram 1896 2 2 15 36 Mental Hospital, Calieu! 1872 1 7 10 1 132 364 Secondary Health Centre, Badagara NA 2 3 2 15 37
Dispensaries : Government Dispensary, Ambalavayal 1947 11 16
Do. Areacode 1929 4 4 Do. Chaliam 1956 4 Do. Kalikavu 1927 3 6 Do. Kalpatta 1957 5 5 Do. Kunnamangalam 1956 4 Do. Naripetta 1961 4 Do. Quilandy 1921 9 16 Do. Sultan's Battery 1891 -4- 6 Do. Tamarassery 1927 5 14 Do. Tanur 1959 4 Do. Tirur 1918 8 15 Do. Tiruraqgadi 1961 .. 4 Do. Thiruvellur 1959 5 Do. Valancherry 1956 4
Police Dispensary, Areacode ~ Do. Klary Do. Pandikad' J
Attached to Police Hospital, Malappuram
Mobile Medical Unit, Kalpatta Primary Health Units;
Primary Health Unit, Balussery Do. Kondotti Do. Kuttiadi Do. Nadapuram Do. Perambra Do. Valayam Do. Wandur
,.. Source :-District Medical Officer, Kozhikode NA- Not available.
1959
1959 1959 1957 1924 1958 1958 1959
Apart from the above mentioned medical institutions there are 30 Maternity and Child Welfare centres including one maternity home. The Maternity and Child Health centres are situated at Kavilampara, Vadayam, Naripetta, Kadameri, Villiapally, Memunda and Iringal of Badagara taluk; Atholi, Chembra,
28
3
3 6 6 3 9 6 3 8 6 3 9 21
1 2 JO 6 1 1 10 6 I 3 10 6
Avala, Changaroth, Keezhariyur, PayyoH and Tikkody of Quilandy taluk; Kakkodi, Mukkom, Puduppadi and Kuruvattur of Kozhikode taluk; Pookkattur, Kotinhi, Kanmanam, Purattur and Keraladeswarapuram of Tirur taluk; Karumarakkad, Nilambur, Edakkara and Chungathara of Ernad taluk

PUBLIC HEALTH
and Koliyudi and K')ttathara of South Wynad taluk. The only Maternity Home is located at Kakkur.
90. In addition to the above Government allopathic institutions the,e are two Government ayurvedic hospitals, fourteen Government ayurvedic dispensaries and one Government Homeopathic dispensary. The following statement gives the ayurvedic and homeopathic institutions, number of doctors, nurses, beds and patients treated bath outdoor and indoor during 1960-61 :-
Statement 30 GOVERNMENT AYURVEDIC INSTITUTIONS IN 1960-61 *
, Name of Institution Govt. Ayurvedic Hospital, Badagara Do. Payyoli
Govt. Ayurvedic Dispensary, Athiyotti Do. Atholi Do. Chaliyappuram Do. Chemmaruthur Do. Edacheri Do. Edavanna Do. Manthrathur Do. Meenangadi Do. Olavanthur Do. Padinjerathara Do. Velluvambram Do. Vettam Do. Vylathur Do. Vythiri
Govt. Homeopathic Dispensary, Calicut
Number of No. of pati-Num- nursing ents treated ber of personnel Num-r-~ doc-~ber of Out- Intors M F beds door door
2 2
1 I 1
10 10
95,938 73 20,731 94
5,721 4,872
29,467 28,13:) 9,448 1,096
11,291 NA
5,680 9,203
38,418 13,494
NA 5,237
57,058
* SouTce:-Director of Indigenous Medicines, Kerala
NA-Not available.
The number of medical institutions, patients treated etc., for the period 1951-61 are furnished as appendices 12 and 13. Details of rural sanitation and antiadulteration activities are furnished in appendices 14 and 15.
Vital Statistics
91. The statute making the registration of births and deaths compulsory had not been extended to the entire taluk of South Wynad and 45 desoms of Kozhikode and Ernad taluks. Births and Deaths Act of 1899 (Madras Act III of 1899) was extended to these regions only in 1961.
92. The following statement gives the number of births and deaths and their rates for Kozhikode district for the period 1958 to 1960 :-
29
Statement 31 BmTH AND DEATH RATES
* Estimated Number mid year of live- Birth ::\lumber Death
Year population births rate of deaths rate
195B 2,458,e H 62,515 25'42 21,650 8'80
1959 2,517,357 62,645 24'89 23,269 9'24-1960 2,576,964 56,861 22'07 20,707 8'04
* Population figures are furnished by Registrar G~n~ral,
India
93. The following statement gives the distribution of deaths according to age-groups :-
Statement 32 DEATH BY AGE-GROUP t
Age-group 1958 1959 1960
Total 21,659 23,269 20,707
Below 1 year 3,780 4,240 2,694
1...J: years} 5,741 4,832 2,774
5-9 " 949 1,049
10-14 " 564 407 523
15-19 " 394 349 402
20-29 " 1,343 1,183 834
30-39 " 1,428 1,424 1,174
40-49 " 1,344 1,289 1,335
50-59 " 1,542 1,575 1,836
60 years and above 5,514- 7,021 8,086
t SouTce:-Department of Statistics, Kerala 94. The following statement furnishes the deaths
and death rates by causes :-Statement 33
DEATH AND DEATH RATE BY CAUSES *
Causes Total
Small pox Typhoid } Other fevers Dysentery and Diarrhoea
Respiratory diseases
Maternal diseases
Accidents Other causes
1958 1959 1960 ,_--.A.----, ,--'---. ,-~ Number Rate Number Rate Number Rate 21,650 8·80 23,269 9'24 20,707 8'04
91 0'04 350 0'14 282 0'11 3,253 1·32 3,134 1'24 127 0'05
2,100 0'82
1,581 0'64 1,658 0'66 1,373 0'53
1,671 0·68 1,879 0·75 1,935 0'75
220 0'09 245 0'10 184 0'07
472 0·19 488 0'19 500 0'20
14,362 5'84 15,515 6'16 14,206 5'51
* Source:-Department of Statistics, Kerala
Electric Power ' 95. The power for distribuhon in this district
is at present purchased from the Pykara Hydro Electric system of the Madras State. Kuthumunda, the main receiving sub-station of Pykara systems in Kerala is connected with Upatti sub-station by 66 KV double circuit line. From Kuthumunda the transmission line branches into two 66 KV single circuit lines, one serving the sub-stations at Mananthody and Cannanore and the other energising the sub-station at Kozhikode. The sub-stations at Kozhikode and Tirur are linked with 11/33 KV single circuit line.

COMMUNICATIONS
The construction work of Chalakudy-ShoranurKozhikode 110 KV double circuit line is in progress. The civil works of 110 KV transforming stations at Kozhikode and Malappuram are progressing rapidly. There is also provision to construct an additional 110 KV single circuit line connecting Kozhikode and Cannanore during the Third Five Year Plan. Communications
(a) Roads 96. Ibn Batuta who visited Malabar during
1342-47 wrote about the miserable condition of roads as "No one travels in these parts, upon beasts of burden; nor is their any horse found except wi th the King. When, however, any merchant has to buy or sell goods, they are carried upon backs of men who are always ready to do so (for hire)." Even in the later periods of the eighteenth century there were practically no roads except certain paths set apart for the use of bullock-carts. A change came by the Mysorean invasions of Haidar Ali and Tippu Sultan during the period 1766 to 1793. Colonel Alexander Dow in his minutes on the state of roads in 1796 clearly describes that "Tippu projected and in a great part finished the extensive chain of roads that connected all principal places of Malabar and pervaded the wildest parts of the country .............. His routes are in general well chosen and lead through almost every part of the province". Shamnauth, Zamorin's minister, has left the following account of Tippu's Gun-roads: -
"I. From Calicut to the present cantonment Polwye by Purrinalettu, Cheakur, Tamra. cheri.
2. From Ma1apuram to Tamracheri, 3. From Malapuram to Pudupani and from
thence to the ghat.
4. From Calicut to Ferokia, Carate Hobli, Elamaruthoo, Chatamungul, Purrinalettu, Tamracheri.
5. From Ferokia through Shernad taluk by Chalapoora Hobli, Pooloor, Tirurangadi, Venkatakotta, Poolanalettu, Erakerlu, Kemaro, Waleakoomuttu, Tirucheraparamba, Cowlpara, Mungarey river, Pattambi, Walayar river, Coimbatore.
6. From Palghat to Dindigul, Tallamangala, Wundelarrullatiel, Nellimootiel, Wellikumbil, Margienaympalim, Peelachi, Worunmalakatu, Kannenerukuvaturu, Palni, Virupakshu, Dindigul.
7. f'rom Venkatakotta, Purumbil, WaUunata. kuny (Velateru), Palaketeri, Angadipuram, Muleakurchi, Karialutu, Vellatur, Rapelallawuloora, Peynat, Koondepulla river, Mannar, Attaparu, Tengraumttooroo, Wellimamut1 1, Coimbatore,"
97. During the next thirty years great strides have been made towards the development of roads. The later half of the nineteenth century was conspicuous for the development of roads. The establishment of Malabar District Board had largely contributed to the development of village and District Board roads. The Town Improvement Act of 1865 authorised the Muni. cipalities to spend a portion of their expenditure on the construction of drains and roads. The Road Cess Act of 1866 enabled the District Board to spend more on the construction and maintenance of roads. There was rapid increase in road mileages during the first half of the twentieth century. The following statement gives the classification and length of roads by taluks in 1960-61.
Statement 34
ROADS Total State Highway Major District Roads Village roads ** Others
,.--.-.-A.-. _____ ~~,...---"--~,--J'----_v___-.A.-.-
Len. Len- Len· Len- Len-gth Length gth Len- gth Len· gth Len· gth Len-per per per gth per per gth per per gth per per gth per 100 llakh 100 11akh 100 11akh 100 Ilakh Len· 100 1 lakh
District/Taluk Length sq. popula- Length sq. popu- Length sq, popu· Length sq, popu· gth in sq. popu-inkm. km. tion in km. km. lation in km. km. lation inkm. km. lation km. km. lation
Kozhikode District 1,961'63 29'47 74'95 331'73 4'98 12'68 796'82 11'97 30'45 746'98 11'22 28'54 86'10 1'29 3'29 Badagara Taluk 215-06 39'11 67-22 21'52 3'91 6'73 85'50 15'55 26'73 102'19 18'58 31'94 5'85 1'06 1'83 Ernad
" 369'65 16'34 70'50 88'52 3-91 16'88 150-47 6'65 28'70 130'66 5'78 24-92 Kozhikode
" 560'84 57' 12 84'93 88'52 9'02 13-40 159'52 16-25 24'16 232-55 23'68 35'22 80'25 8'17 12'15 Quilandy .. 265-44 34'80 72'46 29'37 3'85 8'02 97'37 12'77 26'58 138'70 18'19 37'86 South Wynad " 237'37 17'21 128-27 103'80 7·53 56'09 83'08 6'02 44'89 50'49 3'66 27'28 Tirur
" 313-27 43044 55'82 220'88 30'63 39'36 92'39 12'81 16'46
··Inclusive of Panchayat roads of' more than local importance'
30

COMMUNICATIONS
98. An account of road surface for Kozhikode district is furnished below:-
Statement 35 ROADS SURFACE
Road surface Total Bituminous Concrete Water Bound
Total km.
1961'63 382'93
Maccadum 7~'89
Unmetalled 694·71
State Highway
km. 331'73 331'73
District roads km.
796'82 50'09
578'56 168'17
Village roads km.
746'98 I'll
219'33 526'54
Others km.
86'10
Others 86·10.... 86'10 Polymetric table of distances is furnished in Appen-
dix 16. (b) Railways " . . 99. The construction work ,-2f railway lme III thiS
district was undertaken by the Madras Railway Company and to their credit they opened for traffic t~e railway line connecting Chaliam (present Kadalundl) .and Tirur on 12th March 1861. On 1st May 1861 it was extended up to Kuttipuram and on 23rd September 1361 it reached Pattambi railway station situated in the present Palghat District. The railway line con~ecting Chaliam with Calicut was available for traffic on 2nd January 1833. It was further extended to Badagara .on 1st October 1901 and the line reached MaRgalore in 1907. The Nilambur-Shoranur broadgauge railway line was opened for traffic in October 1927. The $outhern-most railway station of this line falling within the revenue jurisdiction of this district is Tuvur. No addition of railway line was made thereafter. Thus the present Kozhikode district has 73 miles of broadgauge line. The railway line traverses t~rough
four taluks of the district, viz, B~ara, QUllandy, Kozhikode and Tirur. Mahe and Pallipuram are the two extreme stations of this district. From Mahe to Tirur it runs parallel to the sea-shore and from there it turns on a south-eastern direction upto Shoranur railway junction. Facilities provided at the various railway stations of thi& district are furnished in Appendix 17.
100. This district has a continuous inland water route connecting Badagara and Ponnani. Details of this route are given below:-
Statement 36
Description Badagara to Eringal Eringal to Payyoli Payyoli to Panthalayani Panthalayani to Agalapuzha
CANALS·
* SOIIrce:-Water Resources, Kerala
Length of Length in artificial
miles canal in miles 0'50 3'25 5'25 3'00 3'00
31
Statement 36-concld.
Length of
Description Length in artificial
miles canal in miles
Agalapuzha to Elathur 9'50 Elathur to Kallayi (Canoly canal) NXl 7'00 Kallayi to Olavanna 2'00 OIavallna to Beypore 4'75 4'75 Beypore to Kadalundi 10'00 Kadalundi to Tirur 29'00 29'00
The above water route is part of the west-coast canal connecting Trivandrum and Badagara. Most of the rivers of this district are used for inland water transport.
(c) Ports
101. Badagara and Calicut are the two important ports of this district.
(i) Port of Badagara
102. The Port of Badagara is open to foreign vessels • The port limits take in a backwater portion also. Coasting steamers and sailing vessels call at the port regularly. Cargo is transported by lighters from the anchorage to the beach. The construction of a pier at an estimated cost of Rs. 6 lakhs was included in the Second Five Year Plan. Cocoanuts and pepper are the main exports from this port.
(ii) Port of Calicut
103. Calicut has been an important port from very ancient time. It probably rose to importance about the eleventh or twelfth century A. D. In the first half of the fourteenth century, when Shaik Ibn Batuta visited it, it was certainly a place of great trade, and so it continued till the arrival of the Portuguese in the end of the fifteenth century. After that its decline was rapid due to the interference of the Portuguese with the Muhammaden trade, and it has never since recovered its position and Cochin, its rival, under Portuguese and Dutch influence, has, with its greater natural facilities always hitherto had an advantage. Both Calicut and Beypore are open to foreign trade. Calicut is not completely close to the steamer traffic during the south-west monsoon period but whenever there is heavy rain steamers do not call on the port as it is an open roadstead. Hence, no sailing vessel traffic takes place during the south-west monsoon period. Beypore wharf is also closed during the south-west monsoon period as the Bar is dangerous to cross due to monsoon swell and sea which breaks heavily and enter the river. The following development works are in progress at the port.
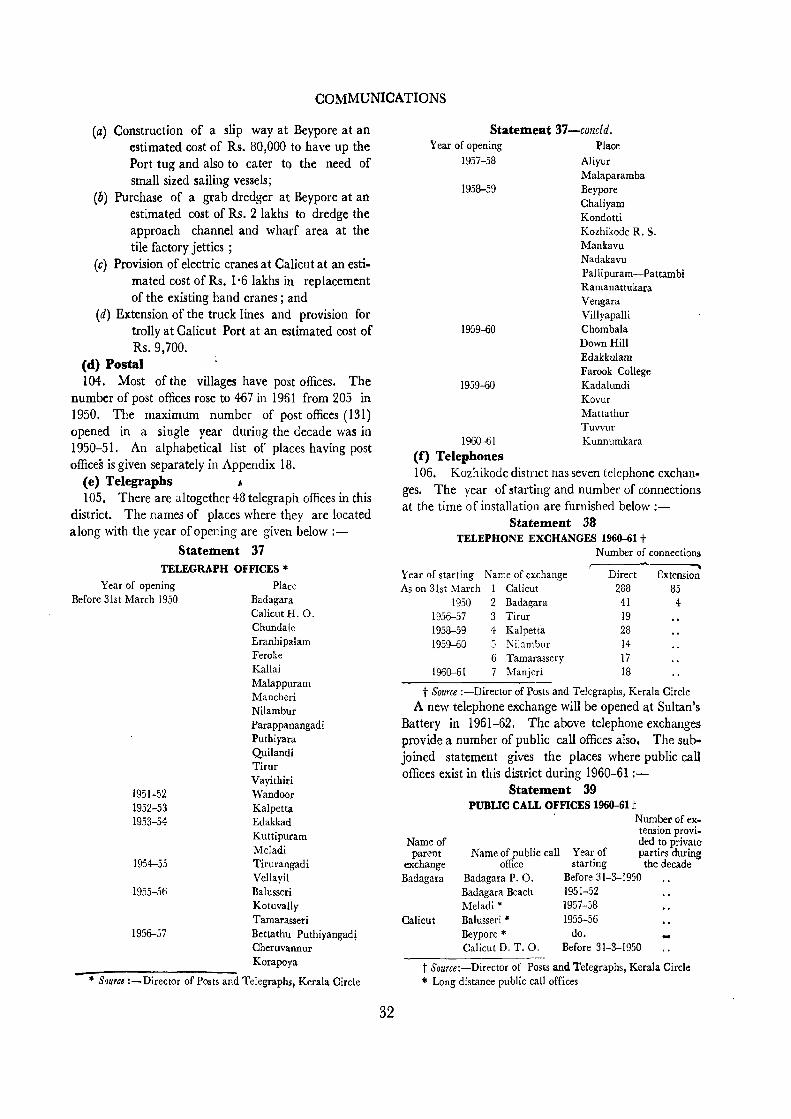
COMMUNICATIONS
(a) Construction of a slip way at Beypore at an estimated cost of Rs. 80,000 to have up the Port tug and also to cater to the need of small sized sailing vessels;
(b) Purchase of a grab dredger at Beypore at an estimated cost of Rs. 2 lakhs to dredge the approach channel and wharf area at the tile factory jetties ;
(c) Provision of electric cranes at Calicut at an estimated cost of Rs. 1'6 lakhs in replacement of the existing hand cranes; and
(d) Extension of the truck lines and provision for trolly at Calicut Port at an estimated cost of Rs.9,700.
(d) Postal 104. Most of the villages have post offices. The
number of post offices rose to 467 in 1961 from 205 in 1950. The maximum number of post offices (131) opened in a single year during the decade was in 1950-51. An alphabetical list of places having post offices is given separately in Appendix 18.
(e) Telegraphs /J
105. There are altogether 48 telegraph offices in this district. The names of places where they are located along with the year of opening are given below :
Statement 37 TELEGRAPH OFFICES *
Year of opening Before 31st March 1950
1951-52 1952-53 1953-54
1954-55
1955-56
1956-57
Place Badagara Calicut H. O. Chundale Eranhipalam Feroke Kallai Malappuram Mancheri Nilambur Parappanangadi Puthiyara Quilandi Tirur Vayithiti Wandoor Kalpetta Edakkad Kuttipuram Meladi Tirurangadi Vellayil Balusseri Kotuvally Tamarasseri Bettathu Puthiyangadi Cheruvannur Korapoya
• Source :-Director of Posts and Telegraphs, Kerala Circle
32
StatemeBt 37-concld. Year of opening
1957-58 Place
Aliyur
1958-59
1959-60
1959-60
1960-61
Malaparamba Beypore Chaliyam Kondotti Kozhikode R. S. Mankavu Nadakavu Pallipuram-Pattambi Ramanattukara Vengara VillyapaUi Chombala Down Hill Edakkulam Farook College Kadalundi Kovur Mattathur Tuvvur Kunnumkara
(f) Telephones 106. Kozhikode distnct has seven telephone exchan
ges. The year of starting and number of connections at the time of installation are furnished below :
Statement 38 TELEPHONE EXCHANGES 1960-61 t
Number of connections
Year of starting Narr,e of exchange As on 31st March 1 Calicut
Direct 288
41 19 28
Extension 85
1950 2 Badagara 4 1956-57 3 Tiruf 1958-59 4 Kalpetia 1959-60 :i Nibmbur 14
6 Tamarassery 17 1960-61 7 Manjeri 18
t Source :-Director of Posts and Telegraphs, Kerala Circle
A new telephone exchange will be opened at Sultan's Battery in 1961-62. The above telephone exchanges provide a number of public call offices also. The sub· joined statement gives the places where public call offices exist in this district during 1960-61 :-
Name of parent
exchange Badagara
Calicut
Statement 39 PUBUC CALL OFFICES 1960-61 t
Number of extension provided to private
Name of public call Year of parties during office starting the decade
Badagara P. O. Before 31-3-1950 Badagara Beach 1951-52 Meladi * 1957-58 Balusseri * 1955-56 Beypore * do. Calicut D. T. O. Before 31-3-1950
t SQurce:-Director of Posts and Telegraphs, Kerala Circle >It Long distance public call offices

INDUSTRIES
Statement 39-concld.
Name of parent
exchange
Number of extension provided to private
Name of public call Year of parties during office starting the decade
Calicut H. P. O. b('fore 3\-3-\950 Calicut New Bus-
stand Calicut R. S.
Chalapuram
Eranhipalam
Feroke
Kadalundi * Kallayi
Kondotti * Kuthira vattam
Nadakavu
Parappanangadi * Puthiyara
Quilandy * West HIli
Kalpetta Chundale
Manjeri
Kalpetta
Meenangadi * Meppadi * Sultan's Battery * Vythiri
Malappuram * Manjeri
19j8~59
Before 31-3-1950 1952-53 1960-61 1954-55 1958-59 1952-53
1958-59 do.
1959-60 1958-59 1960-61 Before 3\-3-1950 1960-61 1959-60 1958-59 1959-60
do.
1958-59 do.
1955-56 do.
Nilambur Nilambur Tamarasseri Tamarasseri
Before 31-3-19jO 1959-60 1958-59 1954-55
Tirur Edakkulam * Tanur * Tirur Before 31-3-1950
4
3
5
12
The Kuttipuram long distance public call office
situated with'in the revenue jurisdiction of this district
is attached to the Ponnani Telephone Exchange. A
table showing Jhe number of direct and extension
connections provided during the period 1950-5 I to 1960-61 is given separately in Appendix 19.
Industries
107. According to the Housing and Establishment
Tables based on the house lists prepared in 1960
in connection with the 1961 Census there are 6,946
factories and workshops together in Kozhikode district
out of 58,365 industrial establishments of Kerala
State. The above factories and workshops of Kozhi
kode district engage 45,067 employees which come
to 11'4 per cent of the total workers of Kerala State.
The following statement gives the taluk-wise industrial establishments of Kozhikode district:-
106/1-5 33
Statement 40 DISTRIBUTION OF INDUSTRIAL ESTABUSHMENTS
Number of industrial
District! Taluk
establishments Percentage distribution -... ( .A.~_~
Total Rural Urban Total Rural Urban KO:i!:hikode
District 6,946 4,371 2,575 100'00 100'00 100'00 Badagara Taluk 1,058 720 338 15'23 16'47 13'13 Ernad 1,001 920 81 14'41 21'05 3'14 Kozhikode " 2.595 907 1,688 37'36 20'75 65'55 Quilandy " 543 417 131 7'89 9'54 5'09 South Wynad " 277 277 3'99 6'34 Tirur ,,1,4-67 1,130 337 21'12 25'85 13'09 Kozhikode taluk has the maximum number of industrial establishments closely followed by Tirur, Badagara and Ernad Taluks. Ten important industries of this district in the order of the volume of employment are furnished below:-
Manufacture of tiles and bricks Manufacture of coir and coir products Manufacture of beedi Handloom weaving Sawing of wood Manufacture of jewellery Manufacture of rubber goods like smoke
7,432 workers 4,098 " 3,636 " 2,810 " 2,466 " 2,081 "
rubber, rubber sheets, etc. 1,831" Tailoring 1,825 " Processing of cashewnut 1,294 " Cotton-weaving in powerloom 1,180"
Considering the number of establishments, textiles, foodstuffs and beverages and tobacco products are the most important industries in this district.
(i) Textiles 108. Under this broad classification there are five
major groups (Major groups 23-27) according to the Standard Industrial Classification. The number of establishments with the volume of employment under the above five major groups as per the Housing and Establishment Tables are given below:-
Statement 41 CLASSIFICATION OF TEXTILE INDUSTRY BY TYPE
OF WORK AND VOLUME OF EMPLOYMENT No. of indus- Volume trial estab- of
De~cription lishment employment Cotton spinning by Ambar charka 12 132 Cotton dyeing and bleaching 9 51 Cotton weaving in powerlooms 2 1,180 Handloom weaving 293 2,810 Manufacture of cotton rope and twine 4-Manufacture of jute products 1 1 Manufacture of hosiery 3 122 Tailoring 946 1,825 Manufacture of coir and coir products 335 4,098 Manufacture and repairing of umbrellas 74 ~06
The more important industries according to the volume of employment are manufacture of coir and coir products and hand loom weaving. The taluk-wise

INDUSTRIES
distribution of llidustrial establishments under these two industries are furnished below:
Statement 42 TALUK-WISE DISTRIBUTION OF com AND COIR
PRODUCTS AND HANDLOOM WEAVING INDUSTRillS
Coir and Coir products Handloom weaving
Taluk Total Rural Urban Total Rural Urban Badagara 3 3 206 140 66 Ernad 16 16 4 4- .;
Kozhikode 87 16 71 54 9 45 Quilandy 6 6 24 7 17 South Wynad 2 2 Tirur 223 197 26 3 3
109. The average attendance of a textile factory worker is 200 days in a year while the average earnings come to Rs. l' 75 per day. A detailed statement for the period 1950-51 to 1960-61 is given below:-
Statement 43 AVERAGE DAILY EARNINGS OF TEXTILE WORKERS *
Weavers Winders (skilled) (unskilled)
Year Ivfen Men Rs. Rs.
1950-51 2-00 I-is 1951-52 2-00 1-25 1952-53 2-15 1-25 1953-54- 2-15 1'30 1954-55 2-15 I-3D 1955-56 2-25 I-3D 1956--57 2'40 1-40 1937-58 2'50 1.45 1958--59 2'65 1'50 1959-60 2'75 1'75 196Q--{) I 3'00 2'00
* Source :-Labour Commissioner, Kerala
(ii) Foodstuffs and beverages .
Pin (double) Women
Rs. 1-10 I-IS 1'20 ]'25 1-25 1'25 1'30 1'35 1'4,0 1'60 1.75
110. Major groups 20 and 21 represent the industries based on foodstuff's and beverages. The number of industrial establishments with the volume of employment as per the Housing and Establishment Tables for Kozhikode district is given in the subjoined statement. In the order of the number of est ,blishments manufacture of avil or appalam, etc. stands first closely followed by preservation of fish. In respect of vo1um:! of employment processing of cashewnut tops the list.
Statement 44 DISTRIBUTION OF FOODSTUFFS AND BEVERAGE INDUSTRIES BY TYPE OF WORK AND VOLUME
OF EMPLOYMENT
Description Production of copra Processing of areca-nut Rice and flour mill
Number of Volume of industrial es- employ-tablishments ment
82 15 40
181 73
230 Production of rice, flour, etc., by hand
pounding 22 143
Description
Statement 44-condd. Number of Volmne of industrial es- employtablishments ment
Processing of cashewn ut 5 1,294
Slaughtering of cattle 19 36
34
Preservation of fish Bakery Dairy products Oil mills including one shark liver oil
factory Extraction of oil by country chuck Manufacture of hydrogenated oil Manufacture of' Avil' , 'Appalam', etc. Production of sodawater, lemonade etc. Production of ice Manufacture of ice cream Processing, packing and distribution
of tea Grinding, processing, packing and dis
tribution of coffee
247 872 211 784-
3 32
43 298 148 420
I 74-259 890
99 316 6 56 2 7
20 573
11 526
(iii) Tobacco products Ill. Tobacco products is represented in the standard
Industrial Classification by major group 22. The Housing and Establishment tables give the number of industrial establishments under diff'erent categories with the volume of employment. Here are the
figures:-Statement 45
DISTRIBUTION OF TOBACCO PRODUCT INDUSTRIES BY TYPE OF WORK AND VOLUME
OF EMPLOYMENT
Description Manufacture of beedi Manufacture of cigars Manufacture of chewing tobacco
No. of indus- Volume of trial establish- employ-
ment ment 811 3,636
93 510 1 4
Size of Employment 112. The number of industrial establishments distri
buted among various taluks by size of employment are
as follows :-Statement 46
INDUSTRIES CLASSIFIED BY SIZE OF EMPLOYMENT Size of Employment
r-----------~----------~ 100
per I per- 2-5 6-9 10-19 20-49 50-99 sons
son per- per- per- per- per- and
District/Taluk Total sons sons sons sons sons above
Kozhikode 2,4133,557 468 289 123 53 43 District .. 6,!J46
Badagara 1,058 34-7 571 98 34- 5 3 taluk
Ernad taluk .. 1,001 387 486 68 39 16 3 2
Kozhikode 393 1,307 134- 116 71 39 35 taluk ., 2,595
Quilandy 548 202 235 40 14 6 taluk .,
South Wynad 277 141 112 5 4, 11 3 1 taluk
Tirur taluk .• 1,467 443 796 123 82 14 5 4

INDUSTRIES
There are only 43 industrial establishments with workers of the order of 100 persons and above. The following statement gives the actual number of persons employed in these 43 industries cla~sified by type of fuel used;-
Statement 47 INDUSTRIES WITH 100 PERSONS AND ABOVE
CLASSIFIED BY TYPE OF FUEL
Description
Processing of cashewnut
Processing of coffee
Cotton weaving in powerlooms
Handloom weaving
Manufacture of coir and coir products
Sawing of wood Printing and
publishing of newspapers and periodicals
Manufacture of rubber goods including rubber sheets
Manufacture of . Ayurvedic
medicines
No. of persons employed by kind of fuel or power used
Coal wood
No. of and factor- Elect- Liquid bag- Olh- No
ies Total ricity fuel asse ers power
2 1,191 1,191
2 425 325 100
2 1,1801,180
4 648 648
7 1,088 502 586 3 531 531
2 388 388
4 1,250 .. 1,100 150
L7Z172
Description Manufacture
of tiles and bricks
Manufacture of aluminium utensils
Manufacture and repair of motor vehicles, cycle parts and
Statement 47-concld. No. of persons employed by kind of
fuel or power used ,_ ________ ..A-______ ~
Coal wood
No. of and factor- Elect- Liquid bag- Oth- No.
ies Total ricity fuel asse ers power
14 7,001 3,930 543 •• 2,528
150 .. 150
accessories 294 294
The particulars of the number of factories and workshops classified by industry, power and no-power and size of employment are given in the E III table. The number of: industrial establishments in each village of the district is given in the Village Directory. A table showing the important r.entres of handicrafts with the materials used and particulars of products is furnished in Appendix 20. A separate table showing the daily average earnings of workers in timber, tile, and printing press industries are furnished in Appendix 21. Registered Factories
113. Kozhikode district had 273 registered factories during the year ending 30th June 1961. The following statement gives the classification of these factories by size of employment :-
Statement 48 REGISTERED FACTORIES SHOWING THE CAPACITY OF EMPLOYMENT*
Capacity of employment
, '.Description
Rice mills I Rice and oil mills
Oil mills Hydrogenation factory Shark liver oil factory Canning of fruits and preservation of fish
including cold storages Tea Coffee curing Coffee and cashew Cashew and manure making Beedi and cigar
Dyeing and printing Handloorn weaving and dyeing
* Source :-Inspector of Factories, Kerala
106/1-5a
Total No. of Less register- than ed f~ct- 20 per- 20 per·
I orles sons sons 3 2 1
10 8 1 1
4-13 6 3 I 1 8 2
2 2 5 4
35
50 per· 100 per- 250 per- 350 per. 500 per- 750 per- 1500 per-sons sons sons sons sons sons sons
3
1 1
5 1 2
5 -

INDUSTRIES
Statement 48-concld.
Total Capacity of employment
No. of Less register- than ed fact- 20 per- 20 per- 50 per- 100 per- 250 per- 350 per- 500 per- 750 per- 1500 per-
Description
Manufacture of handlooms Manufacture of cotton yarn and cloth Manufacture of hosiery Manufacture of coir yarn rehanking Manufacture of umbrella, umbrella sticks,
handles and other metal fittings Sawing of timber Manufacture of splints and venens Manufacture of furniture ami other accessories 2\Ianufacture of slate, foot-rule, butto ns, etc. Printing and binding Rubber pr(Jducts Receiving and ammoniating rubber latex Tyre retreading Hand mixing of manures Dipping match sticks, packing, etc. Manufacture of Ayurvedic medicines Manufacture of soaps Manufacture of tiles Manufacture of porcelain articles Smithy and carpentry Foundry Manufacturing of machine tools Repairing of radio and armature rewinding Repairing and servicing of motor vehicles Wood covered slate pencils, match splints
veneer, etc. Grinding, powdering, milling and cutting
of nuts
ories sons
15 1 3
13
13 58 7 15 4
21 5 7
6 5
1 3
20 2 1 3
26 10
114. Kozhikode taluk stands foremost in the district in regard to number of registered factories in 1960-61 with 200 factories. The following statement gives the taluk-wise distribution of the registered factories in the district :-
Statement 49 TALUK-WISE DISTRIBUTION OF REGISTERED
FACTORIES*
Number of registered Percentage
District/Taluk factories distribution Kozhikode District 273 100'00 Badagara Taluk 13 4'76 Ernad "
9 3'30 Kozhikode "
200 73'26 Quilandy "
9 3'30 South Wynad "
8 2'93 Tirur "
34 12'45
-TS~u;~e-:~lnspecto;:Of Factories, Kerala
Hydrogenation Factory, Shark Liver Oil Factory and Soap Institute are three important commercial concerns of the Government of Kerala in this district.
sons sons sons sons sons sons sons sons 6 4 4
2 4 5 2 2
7 5 14 21 13 3
6 7 2
6 6 3 1 3 3
2 2 2 7 3 4
36
7 8
Government Hydrogenation Factory
115. The Madras Government approved a scheme for installing a State owned Hydrogenation Factory in Ca1icut in October 1945. Even though the construction of the factory was completed in 1953 it went into commercial production only in 1958-59. This factory produces the following articles :-
Production in tons Name of product (Average for 3 years ending
31-3-1961) Vanaspati 458 Refined oil 763 Vegetable tallon 13 Soap stock 126
During 1960-61 this factory employed 66 persons. The total value of the output is estimated to Rs. 35'50 Iakhs during 1960·-61 showing an increase of about Rs. 24'51 lakhs since 1958-59. Shark Liver Oil Factory, Calicut
116, With the outbreak of the Second World War the supply of cod liver oil to India was cut off and it became difficult to treat the Vitamin A and D

INDUSTRIES
deficiency in India. In order to tide over th1s difficulty, the Director General, :Medical Services, New Delhi visited Madras and stressed the necessity for the commercial manufacture of shark liver oil Vitamin A and D products, especially to meet the requirements of defence forces in India. With this object in view, the shark liver oil manufacture was commenced in Calicut in 1940 under the guidance of jthe Superintendent, Kerala Soap Institute, Calicut. The present factory was commenced in 1942 and commercia Ii sed in 1943. After the cessation of war the production of shark liver oil was switched over to meet the needs of the civilian population. Originally the factory was manufacturing only one brand of shark liver oil namely MGB Shark Liver Oil. When the importance of the factory increased high potency sha>:k liver oil under the name of" Adamin" was introduced to the market in 1944-45. In 1948-49 stay-fit brand shark liver oil and veterinary brand shark liver oil were introduced. During 1950-51 Adamin oil was marketed in the capsule form. In 1956-57 stay-fit capsules to meet the requirements of all classes of people were made available at a cheaper rate. At present the factory is marketing the following products throughout India:-
Name of product Vitamin contents A D
Stay-fit brand shark liver oil 1,000 100 i.u.g. Sea gold brand shark liver oil 1,500 100
" tl,OOO Potency High Potency oil 6,000 20,000 Potency High Potency all 20,000
" Stay-fit capsule 3,000 500 i.u.g. per
capsule Adamin capsule 6,000 1,000
" " Veterinary brand Univrut 1,500 150 Dz i.u.g. Trivax 6,000 600 D2
" Kerala Soap Institute
\
117. The Kerala Soap Institute formerly known as Government Soap Factory was started in 1914 as an experimental unit at Tanur and it was later shifted to Calicut. It was converted as a commercial concern in 1917. It is now under the control of the Department of Industries and Commerce. The capital invested in the concern is now about Rs. II lakhs including the cost of land, building, machinery, raw materials, stock in trade, etc. It yields a net return of 12 to 15% to Government by way of interest and profit. The chief raw materials used in the manufacture are v~getable oils like cocoanut oil, mowhora oil, vep oil, etc., and rosin tallow, caustic soda, perfumery articles and chemicals. Nearly 85 to 90% of
37
these are indigenous and the rest are imported. The institute is making all kinds of soaps viz, washing, toilet, medicated, shaving, soft and insecticidal, by the usual processes of cold, semi-boiled, boiled and milled. The labour strength of this factory is abJut 75 workers. Strikes and lock-outs
118. Two tables, one showing the number of industrial disputes resulting in work stoppages for the period 1957 to 1960 and another showing the number of industrial disputes by causes for the period 1957 to 1960 are given in Appendices 22 and 23 respectively. Trade
119. The total value of exports and imports in relation to the two important ports of Calicut and Badagara for 1951-52 to 1959-60 is given below:-
Statement 50 TOTAL VALUE OF IMPORTS AND EXPORTS*
Imports Exports ,-
Value in rupees Value in rupees r--_A---..., ,---";"'__--...,
Year calicut Badagara Cali cut Badagara 1951-52 NA 210,068 58,728,964 17,936,622 1952-53 NA 204,255 62,828,250 21,066,183 1953-54 NA 305,537 65,994,196 17,454,796 1954-55 36,889,840 202,598 55,909,390 12,486,089 1955-56 37,358,387 162,361 66,057,986 14,2.50,171 1956-57 41,746,589 NA 45,318,646 18,638,823 1957-58 33,050,960 23,836 52,150,778 18,566,861 1958-59 24,013,012 221,146 85,820,69,* 19,137,838 1959-60 24,210,407 118,542 63,495,640 18,888,369
NA-Not available *Source:-Principal Port Officer, Cali cut
Detailed tables showing tonnage of vessels for the period 1951-52 to 1960-61 and imports and exports for the period 1951-52 to 1959-60 are furnished in Appendices 24, 25 and 26. Fisheries
120. The important marine fishes obtained in the coastline of Kozhikode District are Mackerel seer, Oil sardines, Clupea fimbriatus, Engraulis mystex, Salmon, Ribbon fish, Silver bellies, Pomfret, Prawns and Sharks. There are seventeen fish curing yards in this district viz, the yards at Madakkara, Madappally, Melady, Badagara, Quilandy, Elathur, Pudiappa, Calicut, Naduvattom, Beypore (North), Beypore (South), Kadalundi, Parappanangadi, Tanur, Puthikadapuram, Paravanna and Kottayi. The important fishing centres are Tanur, Parappanangadi, Kozhikode, Paravanna, Kottayi, Pudiappa, Quilandy and Badagara. Development of marine fisheries is aimed at by the supply of mechanised boats to fishermen at subsidised rates. Inland fishing is also developed by bringing exotic varieties of fish from other places and

COMMUNITY DEVELOPMENT
stocking them in the inland waters. The Government I ce and Cold Storage Factory at Calkut is the largest of the existing ice-making, freezing and storage plants in Kerala. The two main activities of this plant are ice making and freezing of fish, prawns, lobsters and frog legs. The ice manufactured here is used for icing the fish for storage at the plant and for sale to fishermen.
121. A survey conducted by the Fisheries Department on fishermen's assets and liabilities in 1957-58 reveals the following :-
Statement 51 ASSETS AND LIABILITIES OF FISHERMEN
Kozhikode District
Kerala State
6'40 1,943
Statement 51-concld. Details
(c) Average per household
Catamaran Nets (a) Shore seine
(b) Boat seine (c) Drift net (d) Average per household
Line and Hooks (a) Sets (h) Numbers
Kozhikode DIstrict
0'27 15
24B 6,094 6,731
2'58 305
86,225 Income Rs. 3,777,841 Average income per household Rs. 744 Debt Rs. 2,131,766 Asset Rs. 301,582 Average debt per household-
(a) for debtors only Rs. (b) for all Rs.
Community Development
473 420
Kera1a State
0·13 8,280 4,501
21,281 35,778
1'46 16,312
168,078 22,772,297
542 13,508,837 2,949,643
401 322
Details
Average household size Big boats (a) Plank
(b) Dugouts (c) Average for
household Small boats (a) Plank
9 374 987 4,455
122. The particulars of the deVelopment blocks,
(b) Dugouts
0'27 202
1,186
0'15 the stage of each block, the year of starting, area and 1,230 the number of villages or panchayats included in each 4,319 block in this district are given below :_
Statement 52 DEVELOPMENT BLOCKS*
Taluk Name of block Present status Badagara Kunnummal Stage I
" Thoonery
" "
Thoclannur "
" • Badagara P. Extn. Quilandy Perambra Stage I
" Balusseri
" . Kozhikode Kunnamangalam "
Kozhikode Koduvally Stage I
Tirur Tirurangadi "
" Tanur
"
" Tirur P. Extn. Ernad Wandoor Stage I
" Kondotty " .. Malappuram "
" Manjeri P. Extn. S. Wynad Sultan Battery
" • SouTce :-Deve1opment Commissioner, Kerala. The achievements under all the blocks together for the period 1956-57 to 1960-61 are given in Appendix 27.
Revenue
123. Statements of the followin! items of revenue have been given in Appendices 28 to 32.
1 Receipts under excise revenue for the period 1950-51 to 1960-61.
38
Year of starting 2-10-1956
1-4-1957 1-4-1959
1-4-1961 2-10-1957
1-4-1958 1-4-1958
2-10-1959
2-10-1958
2-10-1959
1-4-1961 1-4-1957
2-10-1957 1-4-1959
1-4-1960 1-4-1960
Area in sq. miles
100'07 51'07 42'85
22'91 64-36 70'37
119'30
104-90
45'96
47'97
46'14 459-55 112'25
BO'07
110'34 371'18
No. of villages or panchayats
II 12 14
10 17 19 19
20
13
14
15 14 17 16
17 11
Remarks N.R.S.
" Converted into stage r on 1-4-1960
N.E.S.
" Pre-Extension block con-verted into stage r on 1-4-1959
Converted into stage I block on 2-10-1960
Converted into stage I on 2-10-1959
Converted into stage I block on 2-10-1960
N.E.S.
" Converted into stage I on 1-4-1960
2 Sales tax revenue for the period 1950-51 to 1960-61.
3 Agricultural income tax and supertax for the period 1957-58 to 1960-61.
4 Incidence of land revenue assessment for the period 1950-51 to 1959-60 ..
5 Receipts under entertainment tax for the period 1950-51 to 1959-60.

LOCAL SELF GOVERNMENT
The excise revenue collected from the Ko:, hikode District has decreased from Rs. 24,372 in 1950-51 to Rs. 16,467 in 1960-61. While sales tax revenue has increased from Rs. 4,956'45 to Rs. 9,592'55, the agricultural income tax and supertax has increased considerably from Rs. 1,043,787'77 in 1957-58 to Rs. 1,550,119'98 in 1959-60. The land revenue assessed on fully assessed area has slightly reduced from Rs. 2,415,299 in 1950-51 to Rs. 2,284,153"1.n 1959-60. Land revenue assessed on cultivated area has fallen from Rs. 2,382,726 in 1950-51 to Rs. 1,659,602 in 1959-60. Land Revenue assessed per head by population has risen from 0'91 in 1950-51 to 1'12 in 1959-60. The entertainment tax has increased from Rs. 18 lakhs in 1950-51 to Rs. 172 lakhs in 1959-60.
Local self Government
124. Local Self Government consists of three important institutions viz, Municipalities, District Board and Panchayats.
(a) Municipalities
125. The Town Improvement Act X of 1865 enacted by the Madras Government was the first statute establishing municipalities. Prior to the enactment of this statute the municipalities were nothing but voluntary organisations. Calicut Municipality was formed on 3rd July 1866 by extending the above A~t. This Act was in force till 1871 and it was repealed by Act III of 1871. This was again amended by the Act IV of 1884. For a long time the District Collector was the President of the Calicut Municipality. In 1884 the District Municipalities Act was passed by the Madras Government which provided for an elected VicePresident aIJ-d the election of 75 per cent of the members of the council by tax payers. "In 1886-87 the full complement of elected councillors viz, 18 out of 24, was secured and the privilege of electing its chairman was conferred upon the council. The experiment, however, was not a success and the administration of the Municipality, never good, went from bad to worse till in 1890, in view of the discreditable and unsatisfactory administration of the previous year, both privileges were withdrawn. A paid chairman held office for two years, and subsequently the Revenue Divisional Officer was the ex-officio Chairman till 1901. The privilege of electing one half of the councillors was restored in 1896--97, and since 1901 the council has once more been permitted to elect its own chairman. Subsequently, the council became entitled to elect threefourth of its members, the remaining one-fourth being
39
appointed by ~vemment. The official element in the strength .C){:.~:le council was gradually withdrawn and with the coming into force of Act V of 1920, the nomination of Government officials was completely stopped and the strength of the council rose from 24 to 32, composed entirely of non-officials. The council continues to elect its own chairman and vice-chairman. "1 The Amendment Act of 1930 abolished the system of nominations and provision was made for the reservation of seats for minority communities by a system of election by all the voters in each ward. Amendment Act XV of 1933 made it obligatory on the part of Government to appoint Municipal Commissioners. In pursuance of of this Act the Madras Government appointed Commissioners to all Municipalities in 1934. The Adult Franchise which was introduced in 1938 made the Municipalities full-fledged democratic institutions. The Badagara Municipality waS constituted with effect from 1st October 1953. The Kerala Municipalities Act 1960 which was brought into force on 1st September 1961 now governs the Municipalities of this district also. The income and expenditure of Badagara and Calicut Municipalities are given separately in Apperldices 33 and 34 respectively.
(b) District Board
126. The Malabar District Board was established in 1859 with the main object of promoting primary education in the rural areas. In 1863 it was empowered to collect an Education Cess. By the Road Cess Act of 1866 it was entrusted with the maintenance of bad roads etc. In 1871 the constitution of the board was placed on a par with that of the municipalities with the Collector as the president and three nominated members, the Collector being the supreme authority. Various legislations were passed gradually improving the status of the District Boards and clothing them with more powers. The Acts of 1884, 1920 and 1930 deserve mention in this connection. The second of these series provided for the election of two-thirds of the members by adult franchise who have attained the age of 25 and also by those who are assessed to land revenue or annual rental value or profession tax of Rs. 10. The franchise was further extended in 1930 and the reservation of seats was provided for minority communities. In 1937 all the educational institutions, hospitals, and dispensaries as also major roads under the District Board were taken over by Government. The District Board was abolished by the Kerala Panchayats Act 1960.
1. Malabar DistrictGazetteer by C. A. Innes, 1951, P tOO-tOl

PANCHAYATS
(c) Panchayats 127. The Madras Local Boards Act 1884 was res
ponsible for the creation of District Boards and Union Boards. The Union Boards had the jurisdiction of semi-urban areas. The idea of creation of Village Panchayats for the administration of certain local affairs was stressed by Charles Hobhouse, Chairman of the Royal Commission appointed in December 1907, The Government ofIndia re&olutions of 1915 and 1918 authorised the Local Government to implement the scheme of development of Panchayats based on some general principles. By the resolution of 1915 Village Panchayats were formed in revenue villages. The Madras Village Panchayats ,Act of 1920 enabled any village however small to Rave its own Panchayat. The District Gazetteer for Kozhikode district published in 1962 gives the following information on the further development of Panchayats. "Even after the' enactment of this measure (Panchayats Acts 1920) the Panchayats and Unions continued to function in the rural areas discharging more or less similar functions under different Acts. Consequently the Madras Village T'anchayats Act 1920 was repealed and all the Panchayats were brought under the scope of the Madras Local Boards Act 1920 which governed the constitution and working of the Village Unions. The difference between the Panchayats and Unions, however, continued till 1937 when Panchayats were brought under the same system of administration for all purposes and simply cI~ssified as "major" and "minor" for audit purposes. With a view to improving further the efficiency of Panchayat administration the Madras Local Boards Act 1920 was amended by the Government in 1943 to provide for the appointment of Executive Officers for such Panchayats as were notified by the
Government. It may also be noted in this connection that under the Madras Local Boards Act 1920 the Panchayats in the District were under the control of the Malabar District Board on the one hand, and the Inspector of Municipal Councils and Local Boards on the other. The budgets of the Panchayats were passed by the District Board and whatever taxes they levied were done only with the approval of the District Board. Even for the supersession of Panchayats the remarks of the District Board were duly considered by the Government. This dual control militated against the effective functioning of the Panchayats. The Madras Village Panchayats Act of 1916 was, therefore, enacted during the Adviser's regime releasing Village Panchayats from this dual control and placing ttem in charge of the District Collectors and a Registrar~ General of Panchayats. This Act was allowed to lapse in April 1948 and in its place was enacted the Madras Village Panchayats Act 1]50 which confer~ed very large powers on Panchayats and limited the control of the District Collectors to certain emergency powers. This Act was brought into force on I st April 1951 and it governed the constitution of Panchayats in the District till the passing of the Kerala Panchayats Act (1960) and the progressive enforcement of its provisions with effect from June 20, 1960." The income and expenditure of Panchayats of this district are furnished in Appendices 35 and 36.
Co-operative Societies 128. The number of co-operative societies in this
district along with the number of members, share capital, expenditure, reserve, working capital and loan issued for the year ending 30th June 1961 is given below:-
Statement 53 TYPES OF CO-OPERATIVE SOCIETIES FOR THE PERIOD 1960-61 *
Loans issued Paid up share Deposits and Reserve and Total working by co-0I,Jer.ative)
Total Total No. of capital borrowings other funds capital societies Type of society No. members (Rs. in lakhs) (Rs. in lakhs) (Rs. in lakhs) (Rs. in lakhs) (Rs. in lakhs)
Central Co-operative Bank I 1,140 31'64 215-48 13'01 260'13 178'32 Primary Land Mortgage Bank 1,784 0'35 3'74 0'01 4'10 0'46 Agricultural credit societies:
2-62 17-47 31'10 (i) Large sized 9 19,331 4'19 10'66 (ii) Small 228 88,973 19'42 59'75 21'29 100'46 53-45
Non-agricultural credit societies 34 78,980 9-63 62'44 3'09 75'16 77'27 Apex Marketing society 228 2'65 0'73 2'83 6'21 Central Marketing Society I 8,532 2'88 14'35 1·33 18'56 18'12 Primary Marketing Societies 6 1,114 1'54 1'30 0'96 3'80 1'46
Milk supplies unions 2 1,816 0'46 0'76 1'18 2'40 1'71
Milk supplies societies 17 2,058 0'21 0'19 0-40 0'19
Farming societies 4 146 0'04 0'03 0.07 0'03 Primary consumers co.operative stores: 13 3,528 0'38 2'00 1-42 3'80
Housing societies 9 1,329 1'83 3'10 2'93 7'86 0'69 --~* Source ;-The Registrar of Co-operative Societeis, Kerala.
40

CO·OPERATIVE SOCIETIES
Statement 53-concld. Loans issued
Type of society Total Total No. of No. members
Paid up share capital
(Rs. in lakhs)
Deposits and borrowings
(Rso in lakhs)
Reserve and Total working by co-operative other funds capital societies (Rs. in lakhs) (Rs. in lakhs) (B.so in lakhs)
Other industrial society Fisheries societies Other non-credit societies
I 26
99 3,772
(i) Agricultural 8 4,623 (ii) Non·agricultural 85 5,499
Supervising unions 6 319 Co-operative institutes 19
129. The sub-joined statement gives the classification of loans issued by the agricultural and non. agricultural credit societies by purpose for the year ending 30th June 1961.
Statement 54 LOANS ISSUEJ) BY AGRICULTURAL AND NON·AGRICUL
TURAL CREDIT SOCIETIES IN 1960-61 *'
Items Grand Total
Agricultural credit
societies Rs.
3,455,374 4,568,277 SHORT TERM LOAl'lS TOTAL
Seasonal agricultural operations
Purchase of agricultural implements
Mar,keting of crops Industrial purposes Consumption loans (domestic,
2,980,079
658,877 100,138
ceremonial, etc.) 220,411 Others 608,772 MEDIUM TERM LOANS TOTAL 3,887,097 Sinking or repairs to wells 22,120 Purchase of machinery 18,129 Purchase of cattle 115,375
- Minor improvement to lands 704,846 Other purposes 3,026,627
Non-agricultural credit
societies Rs.
7,727,145 5,758,386
1,835,635
263,805 283,500 554,468
650,483 2,170,495 1,968,759
50,457 48,504 50,560
644,286 1,174,952
.. Source :-The Registrar of Co-operative Societies, Kerala
0'01 1'02
0'74 1'62
0'77
2'02 HI
Criminal Justice
0'57
8 0 02 6°03
0°01 2°36 0'90
10'78 0'01 12°06
130. The number of judges and magistrates both for civil and criminal courts for Kozhikode District are furnished below:-
Statement 55 NUMBER OF JUDGES AND M,\GISTR,\TES 1950.61 *'
Details
I CIVIL
(i) District Judge
(ii) Other Judges:
(a) Stipendiary
(b) Honorary
II CRIMINAL
(i) Session Judge
(ii) Other Judges
(iii) District Magistrate
(iv) Other Magistrates:
(a) Stipendiary
(b) Honorary
• Source :-The High Court of Kerala r
Number
15
3
1
9 4
131. The following statement gives the position regarding the principal offences under the Indian Penal Code in the Kozhikode district for the period 1950-51 to 1960-61.
Statement 56 PRINCIPAL OFFENCES UNDER I.P.C. IN THE DISTRICT FOR THE PERIOD 1950-51 TO 1960-61*
House tres-pass and
house break· Offence aga- Offences ingwith in· inst the State under sec· tention to and public tions against . Ordinary commit
Year tranquillity Murder the person Dacoity Cattle theft theft offence Robbery Other crimes ,--..A-_-, ,-_---'--........ ----'-----, ,...--..A-.-, ,.---A.-....",.....---A--.,-----A----,. ~ ~
Con- Con- Con- Con- Con- Con- Con- Con- Con-vic· vic- vic· vic- vic- vic- vic- vic- vic-
Re- tion Re· tion- Re- tion Re- tion Re- tion Re- tion Re- tion Re· tion Re- tion por- obta. por- ob~a- por· obta- por- obta- por· obta· por- obta- por· obta· por· obta- por- obta-ted ined ted ined ted ined ted ined ted ined ted ined ted ined ted ined ted ined
1950-51 55 6 19 12 213 66 1 32 21 588 240 309 130 2 554 261
1951-52 74 9 20 8 285 87 2 17 11 413 209 266 98 444 198
1952-53 62 13 25 II 255 84 30 19 400 157 274 103 5 406 122
1953-54 79 19 29 IB 290 93 52 36 651 368 370 155 5 1 451 152
1954-55 125 42 26 11 286 98 36 19 525 233 280 98 4- 2 322 140
1955-56 114- 27 22 9 376 120 36 16 409 183 232 95 4 547 255
* Source.-Inspector-General of Police, Kerala
41 106/1-6

CRIMINAL JUSTICE
Statement 56-concld. House tres
pass and house break-
Offence aga- Offences ing with in-inst the State under sec- tention to and public tions against. Ordinary commit .
Year tranquillity Murder the person DacOIty Cattle theft theft offence Robbery Other crirnC$ ~~-------',.---A----.~~r--"'--""",,----"--~~'----\.
~~ ~~ ~~ ~ ~~ ~~ ~~ .~~ ~~ viction obtained
vic vic vic viction obta-· ined 259 335 420 239 392
vic- vic. vic-Re- tion Re- tion Re- tion Repor- obta- par- obta- por- obta- por-ted ined ted ined ted ined ted
1956-57 74 11 31 16 409 148 2 1957-58 135 19 37 13 507 190 1 1958-59 161 22 38 18 624 241 2 1959-60 118 9 32 15 636 201 2 1960-61 149 4 42 13 684 181 2
vic-tion Reobta- porined ted
1 33 24 38 28 26
21 15 27 16 12
Reported 455 547 567 549 545
tion Reobta- porined ted 239 22B 246 268 198 293 229 343 172 312
tion Reobta- porined ted 106 3 95 7 84 10
108 8 77 7
tion Roobta- porined ted
1 3 2
685 707 829 803 535
132. The following state~ent presents the number of convicts received and released in different jails of the district ;-
Statement 57-concld.
Number of convicts at the
beginning ,..---'--- ......
Number of convicts receiv"!d
d'lring the year
Number of convicts released
during the year
Total remaining at the end of
year Statement 57 NUMBER OF CONVICTS IN DIFFERENT JAD..S
FOR THE PERIOD 1950-51 TO 1960-61
Vear
Number of convicts
at the beginning ~
M F 94
Number of convicts
received during the
year
M F 1,029 29
Number of convicts released
during the year ~
M F
Total remaining at the end of
year ,...-----'--.,
M F 104 2 37 2
Year
1957-58 1958-59 1959-60 1960-61
M F 69
130 110 115
7 12 14
~~------
,..--_"______
M F 1,881 51 2,4B9 B7 2,512 120 2,297 72
M F 1,820 44 2,509 82 2,507 lI8 2,347 81
* Source:-Inspector-General of Prisons, Kerala
~. M F 130 7 110 12 ll5 14-65 5
The increase of both men and women convicts reo-· ceived during 1958-59 and 1959-60 are conspicuous. The largest number of releases during the decade were' in 1958-59.
1950-51 1951-52 1952-53 1953-54 1954-55 1955-56 1956-57
104 37 90
148
2 2 1
986 20 17 34 39 56 30
2,097 1,623 1,887 1,805 1,602
1,019 27 1,053 20 2,044 18 1,565 35 1,924 39 1,810 54 1,639 32
90 148 1 II 133. The following statement gives the,classification.
111 106 2 of convicts by age and literacy for the period 1950-51 106 2 69 to 1960-6 t.
Statemellt 58 CONVICTIONS CLASSIFIED BY AGE AND LITERACY *
Age and lite-racy 1950-51 1951-52 1952-53 1953-54 1954-55 1955-56 1956-57 1957-58 1958-59 1959-60 1960-61
Under 16 years M 4 32 49 57 130 101 33 3 3 F 1
16-20 years M 183 286 372 321 580 319 453 435 499 460 93 F 9 8 7 8 13 16 3 7 6 8 3
21-29 years M 437 388 1,314 597 575 781 555 744 !170 1,090 1,174 F 9 8 2 14- 16 21 19 18 32 38 31
30-39 years M 194 119 262 404 292 301 296 368 584 542 768 F 7 2 4- 6 4- 14 4 12 31 44 27
40-59 years M 170 139 80 204 240 248 231 281 340 336 245 F 4, 2 3 6 5 5 4 10 15 23 10
60 years and above
M 41 22 20 40 70 55 ·40 50 96 84 9 F 1 I 3 3 7
* Sduru:-Inspector-General of Prisons, Kera1a.
42
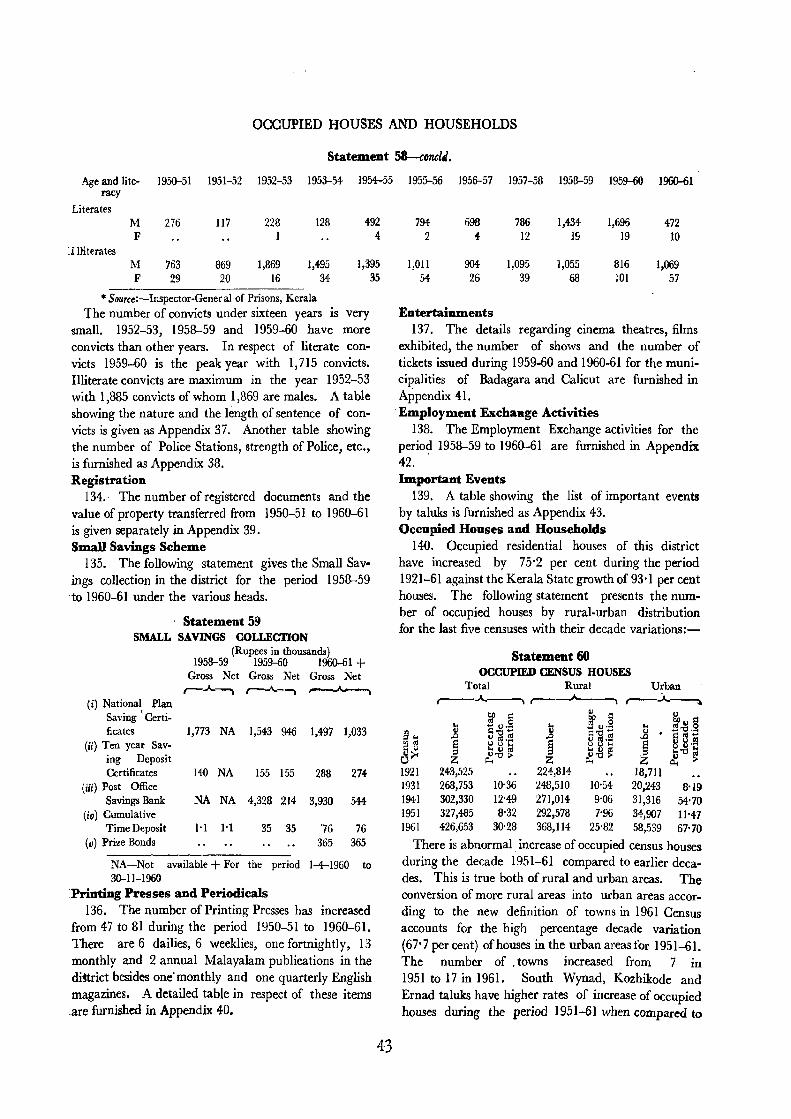
OCCUPIED HOUSES AND HOUSEHOLDS
Statement 58-cDncli.
Age and lite- I 95()-51 1951-52 1952-53 1953-54 1954-55 racy
Literates M 276 117 228 128 492 F 1 4
:1 !literates M 763 869 1,869 ),495 1,395 F 29 20 16 34 35
• SQurce:-Inspector-General of Prisons, Kerala The number of convicts under sixteen years is very
small. 1952-53, 1958-59 and 1959-60 have more convicts than other years. In respect of literate convicts 1959-60 is the peak year with 1,715 convicts. Illiterate convicts are maximum in the year 1952-53 with 1,885 convicts of whom 1,869 are males. A table showing the nature and the length of sentence of convicts is given as Appendix 37. Another table showing the number of Police Stations, strength of Police, etc., is furnished as Appendix 38. Registration
134.- The number of registered documents and the value of property transferred from 1950-51 to 1960-61 is given separately in Appendix 39. . Small Savings Scheme
135. The following statement gives the Small Savings collection in the district for the period 1958-59 to 1960-61 under the various heads.
Statement 59 SMALL SAVINGS COLLECTION
(Rupees in thousands) 1958-59 1959-60 196()-61 +
(i) National Plan Saving \ Certi-ficates
(ji) Ten year Sav-ing Deposit Certificates
(iii) Post Office Savings Bank
(ill) Cumulative Time Deposit
(II) Prize Bonds
Gross Net Gross Net Gross Net ,--A----a r-..A..---., ~
1,773 NA 1,543 946 1,497 1,033
140 NA 155 155 288 274
NA NA 4,328 214 3,930 544
1'1 1-1 35 35 '76 76 365 365
NA-Not available + For the period 1-4-1960 to 30-11-1960
Printing Presses and Periodicals 136. The number of Printing Presses has increased
from 47 to 81 during the period 1950-51 to 1960-61. There are 6 dailies, 6 weeklies, one fortnightly, 13 monthly and 2 annual Malayalam publications in the diStrict besides one' month~y and one quarterly English magazines. A detailed table in respect of these items are furnished in Appendix 40.
43
1955-56 1956-57 1957-58 1958-59 1959-60 1960-61
794 698 786 1,434 1,696 472 2 4- 12 19 19 10
1,01l 904 1,095 1,055 816 1,069 54 26 39 68 101 57
Entertainments 137. The details regarding cinema theatres, films
exhibited, the number of shows and the number of tickets issued during 1959-60 and 1960-61 for the municipalities of Badagara and Calicut are furnished in Appendix 41.
-Employment Exchaage Activities 138. The Employment Exchange activities for the
perio~ 1958-59 to 1960-61 are furnished in Appendix 42. Important Events
139. A table showing the list of important events by taluks is furnished as Appendix 43. Occupied Houses and Households
140. Occupied residential houses of this district have increased by 75'2 per cent during the period 1921-61 against the Kerala State growth of 93'1 per cent houses. The following statement presents the number of occupied houses by rural-urban distribution for the last five censuses with their decade variations:-
rIl ;:S .. '" oj
E~ o 1921 1931 1941 1951 1961
Statement 60 OCCUPIED CENSUS HOUSES
Total Rural Urban r---...A.. .... - ......... , r----"----, ,..---~
.. .8
~ 243,525 268,753 302,330 327,485 426,653
10'36 12"49 8'32
30'28
.. "
I 224,814 248,510 271,014 292,578 368,114
10'54 9'06 7'96
25'82
.. ~ . i
18,711 20,243 31,316 34,907 58,539
8'19 54'70 lI-47 67-70
There is abnormal increase of occupied census houses during the decade 1951-61 compared to earlier decades. This is true both of rural and urban areas. The conversion of more rural areas into urban areas according to the new definition of towns in 1961 Census accounts for the high percentage decade variation (67'7 per cent) of houses in the urban areas for 1951-61. The number of. towns increased from 7 in 1951 to 17 in 1961. South Wynad, Kozhikode and Ernad taluks have higher rates of increase of occupied houses during the period 1951-61 when compared to

PERSONS PER OCCUPIED CENSUS HOUSE
other taluks of the district. South Wynad ta1uk tops the list with 75·57 percentage of deca~e variation.
141. The density of occupied census houses in the rural areas showed an increase from 11,547 in 1951 to 14 669 in 1961 per 100 sq. miles. In the urban areas , ,
the density of houses per sq. mile has risen from 955 in 1951 to 964 in 1961.
142. The following statement gives the number of persons per 1,000 occupied census houses in the district by rural-urban distribution for the five censuses:
Statement 61 PERSONS PER 1,000 OCCUPIED CENSUS HOUSES
FROM 1921 to 1961
Census Year
1921 1931 1941 1951 1961
Persons per 1,000 occupied houses ,..-.--:.....,--..A..------,
Total 5,279 5,547 5,530 6,306 6,134
RlXal Urban, 5,272 5,362 5,517 5,916 5,477 5,992 6,142 7,684 5,935 7,388
The persons per occupied census house for each taluk of the district for 1961 are given below:-
Statement 62 PERSONS PER OCCUPIED CENSUS HOUSE BY
TALUKS,I961 Persons per occupied census house
Taluk .A.,-----~
Total Rural Urban Badagara 6'15 6'03 7'03 Eroad 5'83 5'83 Kozhikode 6'60 6'08 Quilandy 5'94 5'90 South Wynad 5'26 5'26
5'88 7-49 7'10
Tirur 6'18 6'10 6'71
South Wynad taluk has the lowest number of persons per occupied census house, while the largest number pertains to Kozhikode taluk.
143. For every 100 occupied residential houses in the district there are 103 households. The following statement gives the proportion of households to occupied houses for both rural areas and for towns:-
Statement 63 PROPORTION OF HOUSEHOLDS TO OCCupmD
CENSUS HOUSES Rural areas Urban areas
~
Proportion Proportion of house- of house-holds to holds to occupied occupied
Taluk houses Town houses Badagara 1'00 Badagara 1'04
(Municipal) Beypore 1'02
Ernad 1'02 Calicut 1'18 (Municipal)
Edakkad 1'02 Kozhikode 1'02 Elathur 1'02
44
Statement 63--concld. Rural areas
Taluk Quilandy South Wynad
l'irur
Proportion of households to occupied
houses l'Ol 1'05
1'02
Urban areas
Proportion of households to occupied
Town houses Feroke 1'01 Kadalundi 1'02 Kommeri 1'00 Manjeri 1'02 Nellikode 1'00 Olavanna 1'00 Panthalayini 1'07 Parappanangadi 1'06 Parayancherry , 1'01 Puthiyangadi 1'03 Tanur 1'04 Trikkandiyur 1'03
1 H. During the houselisting operations connected with the 196 I census a wealth of details like the purpose for which the census l:ouse is used, tenure status, material of wall and roof, the number of persons and rooms per household, etc., were collected. The following statement gives the distribu tion of 1,000 census houses classified by uses in the district :-
Statement 64
DISTRIBUTION OF CENSUS HOUSES BY DIFFERENT CATEGORIES AND BY RURAL-URBAN AREAS
Distribution of 1,000 census!
Distribution of houses between
Category of census house
Total nuxnber of census houses
1 Vacant census houses 2 Occupied census
house used as-
(i) Dwellings (ii) Shop-cum-dwel
lings (iii) Workshop-cum
dwellings (iv) Hotels, sarais,
dharmasalas, tourist's houses and inspection houses
(v) Shops excluding eating houses
(vi) Business houses and offices
(vii) Factories workshops andlworksheds
(viii) Schools and other educational institution including training classes, coaching and shop classes
1,000 census houses rural and urban
~---~---~ ~~ Total Rural Urban Rural Urban
1,000 1,000 1,000
85 84 88
806 822· 713
N
il
5
13
6
2
N N
N 2
10
6
89
14
32
5
849
842
866
923
816
534
735
589
625
875
151 158
134
77
184
466
265
411
375
125

DISTRIBUTION OF CENSUS HOUSES BYTENURE STATUS
Statement 64-concld. The following statement gives the taluk.wise distribution of households by owned and rented tenure status of dwellings :-
Category of census house
(ix) Restaurants, sweetmeat
shops and eating places
( x) Places of entertainment and community gathering (Panchayat Ghar)
Distribution of 1,000 census houses
Total Rural Urban
22 22 22
N N 3
Distribution of 1,000 census
houses between rural and urban ~ Rural Urban
846 154
336 664
Statement 65 DISTRIBUTION OF 1,000 HOUSEHOLDS BETWEEN
OWNED AND RENTED TENURE STATUS OF TIIEIR DWELLINGS BY TALUKS
DistrictfTaluk Kozhikode
District Badagara taluk Ernad Kozhikode " Quilandy " South Wynad
Total Rural Urban r-A_, ,_A-, ,_A-,
Owned Rented Owned Rented Owned Rented
859 854 92:1 808 934
141 146
77 192 66
888 868 925 925 935
112 132
75 75 65
685 758 846 618 912
315 242 154 382 88
(xi) Public health and medical institutions, hospitals, health centres, Doctor's clinics, 718 282 718 282 dispensaries etc. I 1 3 715 285 Tirur" 860 140 870 130 790 210
(xii) Others 9 5 28 505 495 146. The highest percentage of census households of N-Negligible this district use stone as wall material. The following
145. An analysis of 20 per cent sample households statement gives the taluk·wise distribution of 1,000 by tenure status, wall and roof material and number of households living in census houses used wholly or partly persons and rooms per household gives very useful data. as dwellings by predominant material of wall :-
Statement 66 TALUK.WISE DISTRIBUTION OF 1,000 HOUSEHOLDS BY PREDOMINANT MATERIAL OF
WALL OF THEIR DWELLINGS
Kozhikode Badagara Emad Material of wall district taluk taluk
,---" '------, ,.....--''--........ ,.....--,'_____'
Rural Urban Rural Urban Rural Urban Grass leaves, reeds or
bamboo 150 164 106 171 91 Timber 1 20 2 1
Mud 293 39 6 9 603 318
Unburnt bricks 177 89 312 130 1
Burnt bricks 15 N N C.1. Sheets or other
metal sheets \ N N
Stone 364 687 574 688 304 682
Cement concrete N N N
All other material N 1 n ~
Kozhikode Quilandy taluk taluk
,----....J~ ~ Rural Urban Rural Urban
145 171 213 215 I 31 1
37 4 69 388 56 226 60
10 1 N
419 736 489 725 N
N 1 2
South Wynad . taluk
Rural
476 6
48 269 135
N 63 2 1
Tirur taluk
r--"---, Rural
54 N
583 57 N
306
Drban
154 3
127 199
517
N
N-Negligible 147. The same sample households were analysed to households by predominant material of roof of their
study the predominant material of roof. The following dwellings:-statement gives the taluk·wise distribution of 1,000
Statement 67 TALUK.WISE DISTRIBUTION OF 1,000 HOUSEHOLDS BY PREDOMINANT MATERIAL OF
ROOF OF THEIR DWELLINGS South
, Kozhikode Badagara Emad Kozhikooe Quilandy Wynad Material or roof district taluk taluk taluk taluk taluk
~ ~ ~ ,...---A---. ~ Rural Urban Rural Urban Rural Urban Rural Urban Rural Urban Rural
Grass leaves, reeds, thatchwood and bamboo 812 508 921 783 757 323 818 433 908 637 736
Tiles, slate, shingle 187 492 79 217 242 677 182 567 92 363 259
Corrugated iron, zinc or other metal sheets N N N N 4:
45
Tirur taluk
Rural Urban
768 611 232 388
..

GROWTH OF POPULATION
Statement 67-coneld.
Material of roof Kozhikode
district r---A----, Rural Urban
Badagara taluk
,---A-------, Rural Urban
Ernad taluk
r---A----, Rural Urban
Kozhikode taluk
r----"-----. Rural Urban
Quilandy taluk
~ Rural Urban
South Wynad taluk
Rural
Triur taluk
,-----A---., Rural Urban
Asbestos cements sheets
Concrete and stone slabs
All other material
N-Negligihle
N
N N
N
N N N
N
. 148. The sample households selected for the study of the predominant material of wall and roof were taken to assess the number of rooms per household and number of persons per room. The subjoined statement gives the distribution of 1 ;000 census households according'to number of rooms occupied :-
Statement 68 DISTRIBUTION OF 1,000 HOUSEHOLDS BY
NUMBER OF ROOMS OCCUPIED No Five regu- rooms lar One Two Three Four and
District/Taluk room room rooms rooms rooms more
Kozhikode District 15 217 318 237 109 104
Badagara taluk 105 14-2 241 294 218
Ernad " 21 234- 34-2 266 64 73
Kozhikode " 9 226 298 263 92 112 Quilandy
" 26 234 269 213 139 119
South Wy-12 nad
" 510 333 85 32 28
Tirur "
17 129 444 254 75 81
149. The persons per room and per household in the district are 2'19 and 5'80 respectively. The number of persons per room and per household in the district for rural and urban areas is furnished below :-
Statement 69 NUMBER OF PERSONS PER ROOM AND
PERSONS PER HOUSEHOLD Number of persons Number of persons
Number of rooms per room per household
Total Rural Urban Total Rural Urban Total 2'19 2"19 2'17 5'80 5'69 6-45
One room 4-,71 4-69 4'88 4-'71 4-69 4,88
Two rooms 2'78 2'74- 3'08 5'56 5'47 6'15 Three rooms 2'05 2'05 2'06 6'16 6'15 6'19 Four rooms 1-68 1,64 1'91 6'73 6'57 7-63 Five rooms and
more 1'20 1'18 1'24 7'01 6'58 8·93
Growth or Population 150. According to the census of 1961 this district
has a population of 2,617,189. The population of the district has increased by 127'19 per cent during the past sixty years against the State increase of 164'27 per cent. The following statement gives the population and percentage decade variation for seven censuses :-
46
N
N
N N N
Statement 70 VARIATION IN POPULATION
N
Percentage decade Census Year Population variation
1901 1,151,981 1911 1,251,737 + 8'66 1921 1,285,622 + 2'71 1931 1,490,770 + 15'96 1941 1,671,990 + 12'16 1951 2,065,284 + 23-52 1961 2,617,189 + 26'72
The district's growth rates have been lower than the State rates till the 1941 Census. This position had changed in the censuses of 1951 and 1961, This district ranks first among the districts of Kerala in respect of area and population, while it stands fifth in regard to rate of growth of population for the decade 1951-61. The following statement shows the rate of population growth compared to the adjacent districts:-
Statement 71 RATE OF POPULATION GROWTH COMPARED
wrrn ADJACENT DISTRICTS Rate or growth Average annual
District growth rate 1901-61 1951-61 1901-61
Cannanore 126'11 29'47 2'1 Coorg 78·75 4-0'72 1'3 Kozhikode 127'19 26'72 2'1 Mysore 8(}-76 17'32 1'3 Nilgiris 262-60 31'30 4'4 Palghat 81'80 13'51 1-4
151. All the taluks of the district except Badagara and Tirur have higher population growth rates than that of the State increase of 24-76 per cent during the last decade. The 1951-61 decade variation and percentage increalie of population since 1921 census for each of the taluks are as follows :-
Statement 72 TALUK.WlSE GROWTH RATE OF POPULATION
Taluk Badagara Ernad Kozhikode Quilandy South Wynad Tirur
Decennial growth Percentage increase rate 1951-61 1921-61
22'01 89'4-1 29'59 98-47 27'89 127-14 25'51 94'85 68'69 236'86 16'79 76'00

DISTRIBUTION OF POPULATION
South Wynad taluk has significant population growth rate during the decade 1951-61 with 68'69 as against 59'17 in 1941-51 and 15'89 in 1931-41. This rapid increase of population since 1941 Census was due to the immigration of a large number of agriculturists from North Travancore to this taluk for the cultivation of extensive areas of private forests.
152. The following statement gives the rural-urban population and their decade growth rates during 1901-61 in this district:-
Statement 73 GROWTH OF POPULATION BY RURAL-URBAN
CLASSIFICATION Rural Urban
r-------A-------, r-----~------~ Percentage
decade Census year Number variation Number
Percentage decade
variation 1901 1,063,681 88,300 -1911 1,153,762 + 8'47 97,975 + 10'96 1921 1,185,293 + 2'73 100,329 + NO
"1931 1,371,021 + 15'67 119,749 + 19-36 1941 1,484,346 + 8'27 187,644 + 56'70 1951 1,797,062 + 21'07 268,222 + 42'94 1961 2,184,682 + 21'57 432,507 + 61'25
The increase in population in urban areas during the decades 1931-41 and 1951-61 were due to the addition offour towns in 1941 and ten towns in 1961. Population by Taluks
153. The 2'6 million population of the district is distributed among six taluks. The following statement gives the taluk-wise distribution of population as ·per the 1961 Census,- .
District/ Taluk
Kozhikode District
Badagara taluk
Ernad taluk
Statement 74 POPULATION BY TALUKS, 1961
;persons
Population Percentage
distribution ~
Males Females Persons Males Females
2,617,189 1,300,974 1,316,215 100'00 100.00 100'00
319,913 156,646 163,267 12'23 12'04 1NO
524,294 260,458 263,836 20'03 20'02 20'05
District! Taluk
Quilandy taluk
South Wynad taluk
Tirur
Statement 74-concld. Percentage
Population distribution ~ __ A_ ___ , r--A--,
Persons Males Females Persons Males Femal~s
366,343
185,055
181,108
97,906
185,235 14'00 13'92 14'07
87;149 7'07 6'62
taluk 561,212 271,435 289,777 2J-44 20'86 22'02
Among the taluks of this district Kozhikpde taluk stands foremost in regard to size of population closely followed by Tirur and Ernad taluks. Even though South Wynad taluk ranks second in respect of area, it is the least populous one, I The irregular terrain, large areas of thick forests and plantations contribute to the low population of this taluk,
Rural-urban distribntion of Population
154. As per the' 1961 Census 83 per cent of the total population of the district live in the rural areas. The following statement sets out the distribution of the number of persons per 10,000 population of the district and of the State for the last seven censuses for rural and urban areas separately:- -t
Statement 75 DISTRIBUTION OF 10,000 POPULATION BY
RURAL AND URBAN CLASSIFICATION
Rural Urban ,--- ,_--A ___ , Kumber of Number of Number of Number of persons to persons to persons to persons to
10,000 total 10,000 rural 10,000 total 10,000 urban population population population population
of the of the of the of the Census year district State district State
1901 9,233 1,790 767 1,943 1911 9,217 1,742 783 1,867 1921 9,220 1,664 780 1,474 1931 9,197 1,596 803 1,307 1941 8,878 1,509 1,122 1,569 1951 8,701 1,533 1,299 1,469 1961 8,347 1,523 1,653 1,693
155. The following statement shows the rural-urban distribution of population by taluks as per the 1961
Kozhiltode taluk 660,372 333,421. 326,951 25'23 25-63 24'84 Census :-
District/Taiuk Kozhikode District Badagara taluk Ernad
Statement 76 RURAL-URBAN DISTRIBUTION OF POPULATION BY TALUKS, 1961
Number of r-Rural villages Towns
310 17 44 63
Rural Urban -----~ r--~ ~
Percentage Percentage Percentage Percentage of rural of rural of urban of urban
population population to population to population to to total rural total rural total urban total urban
population of population population population Population the district of the State Population of the district of the State 2,184,682 100'00 15'23 432,507 100'00 16-93
276,005 12'63 1'92 43,908 10'15 1'72 512,0113 23'44 3'57 12,276 2'84 0'48
47

DENSITY OF POPULATION
Statement 76-concld.
Rural Urban
Percentage Percentage Percentage Percentage of rural of rural of urban of urban
population population population to population to to total rural to total rural total urban total urban
Number of
Rural population of population population of population District/Taluk villages Towns Population the district of the State Population the district of the State
Kozhikode taluk 59 9 378,528 17'33 2'64 281,844 65'17 11-03 Quilandy " 56 1 348,987 15'97 2-43 17,356 4'01 0'68 South Wynad" 20 185,055 8'47 1'29 Tirur" 68 5 484,089 22'16 3'38 77,123 17'83 3'02 Kozhikode district ranks second in respect of the population in urban areas of the State in 1961, the first place being taken by Trivandrum district with 17'56 per cent. _ Population by Natural R~ons
156. 74 per cent of the total population of the district livejin the midland region while 17 per cent live III the lowland and the rest in the highland. The following statement gives the actual population and their percentages in the different regions of the district by taluks.
Statement 77 POPULATION BY NATURAL'REGIONS
Highland Midland Lowland ~ r----A---. ~
Per- Per- Per-:)istrict/Taluk Actual centage Actual centage Actual centage
Kozhikode District 232,746 100'00 1,930,757 100'00 453,686 100'00
Badagara taluk 12,789 5-50 41,583 2' 15 265,541 58'53
Ernad taluk 23,789 10-22 500,505 25'92 Kozhikode
taluk 11,089 4-76 649,283 33-63 Quilandy
taluk 24 0-01 265,632 13'76 100,687 22'19 South Wynad
taluk 185,055 79-51 Tirur taJuk 473,754 24'54 87,458 19'28
Ernad and South Wynad taluks do not have sea-coasts. Even though Kozhikode taluk has sea-coast the villages of this taluk fall either in the midland or highland regions as the major portion of these villages are above 25 feet above the mean sea level.
157. There is no town in the highland region. The South Wynad taluk has no urban area. The ruralurban distribution of the remaining five taluks by natural regions is furnished below :-
Statement 78 DISTRIBUTION OF POPULATION BY NATURAL
REGIONS AND RURAL-URBAN CLASSIFICATION Midland
District/Taluk r-~ Rural Urban
Kozhikode District 100'00 100'00 Badagara taluk 2'60
Lowland r-~,
Rural Urban· 100'00 100'00
62'82 43'53
48
Statement 78-concld.
District/Taluk
Ernad taluk Kozhikode " Quilandy " Tirur
"
Midland ., ~ Rural Urban
30'53 2z.g8 16'61 27-28
3-70 84'99
!l'31
Population Density
Lowland ~ Rural Urban
23-62 [3-56
17'21 39'26
158. The number of persons per square mile in the district has increased from 448 in 1901 to 1,018 i. 1961. The subjoined statement gives the tal uk-wise population density for the last five Censuses, The density of population has shown substantial increase in the case of South Wynad taluk.
Statement 79 POPULATION DENSITY PER SQ. MILE BY TALUKS
District/Taluk 1921 1931 1941 1951 1961 Kozhikode district 500 580 651 804 1,018 Badagara taluk 796 922 994 1,235 1,507 Ernad ,,302 344 389 463 600 Kozhikode " 767 9[7 1,073 1,362 1,742 Quilandy " 638 740 798 991 1,244 South Wynad" 103 112 129 206 347 Tirur ,,1,145 1,327 1,474 1,726 2,016
159. The population density is further classified below by natural regions and rural-urban areas.
Statement 80 POPULATION DENSITY BY NATURAL REGIONS
Highland * Midland Lowland
District/Taluk r----....._-~'""\ t"" ____ .A-.... __ ...
Rural Total Rural Urban I Total Rural Urba; Kozhikode District 205 1,5311,313 7,696 2,638 2,285 5,715 Badagara taluk 297 690 690 2,438 2,201 5,328 Ernad " 64 999 985 2,398 Kozhiltode" 109 2,344 1,484 9,583 Quilandy" N 1,537 1,537 2902 2,596 6,701 South Wynad" 347 .. Tirur "
.. 1,895 1,807 4,383 3,080 2,216 5,807
* No Urban area N-denotes negligible figure which is less than one. The
actual value is 0'3

POPULATION DENSITY BY NATURAL REGIONS
The above statement shows the degree of congestion in the respective regions. The highland region of Quilandy taluk consists of unsU! veyed areas of forests which lie outside the village boundaries ar.d hence have very low density. South Wynad is an entirely rural taluk. Lowland regions have higher population density compared to midland and highland regions. Lowland region of Tirur taluk tops the list with 3,080 persons per square mile. The following'paragraphs point out the classification of villages by natural regions under different population density ranges. A. Rural Areas
(i) Highland region 160. The highland region of this district consists of
24 revenue villages. None of these villages has a population density of above 1,000. The following statement sets out the number of revenue villages coming under different density ranges:-
Statement 81 CLASSIFICATION OF RURAL IfiGHLAND VILLAGES BY
DENSITY RANGES Population density
per sq. mile
Less than 250 250-499 500-749 750-999
1,000 and above
Number of rural revenue villages
4 to 7 3
Four villages have a population density of less than 250. They are Kidanganad, Noolpuzha, Pulpalli and Thaviyode villages of South Wynael taluk. Of these Kidanganad is the least densely populated village in the whole district with 51 persons per 5q. mile. It is followed by Noolpuzha with 123 persons per sq. mile, PulpaIIi with 198 and Thaviyode with 232. Major portions of the first three villages are covered with thick
\
inaccessible forests, while Thaviyode Village has low hills and plantations. These factors account for the low density of population. The most densely populated village of the highland. region in the whole district is Karuvarakundu village of Ernad taluk with a population densit} of 958 persons per sq. mile. Even though the northern and eastern portions of this village are bounded by the unmn-eyed areas it has compara
tively more communicational and educational facilities. Karuvarakundu is connected with Manjeri and Nilambur by good rnotorable roads. This village having an area of 15'30 sq. miles has tea estates and rubber plantations.
(ii) Midland region
161. The midland villages have comparatively higler population densities. The following statement
106/1-7 49
gives the distribution of 230 midland villages classified by different density ranges .~
Statement 82 CLASSIFICATION OF RURAL MIDLAND VILLAGES
BY DENSITY RANGES Population density
per sq. mile
Less than 500 500-999
1,000-1,499 1,500-1,999 2,000-2,499 2,500-2,999 3,000--3,499
Number of rural revenue villages
4 40 67 68 32 9 4
3,500-3,999 3 4,000 and above 3
Nallalam, Kottuli and Nedungottur are the more densely populated villages in the midland region. They exceed the population density limit of 4,000 persons per sq. mile and they form part of Kozhikode taluk. Nallalam village with 5,739 persons per sq. mile is circumscribed by the Calicut (Municipal), Olavanna and Beypore towns. The western boundaries of the Kottuli village (4,898 persons per sq. mile) and the Nedungottur village (4,137 persons per sq. mile) touch the Calicut municipal limits and these two villages lie on either side of the Calicut-Mysore road.
(iii) Lowland region 162. All the 56 lowland villages in this district
have population densities of above 1,000. Nine villages exceed the density of 3,000. Villages classified by different density ranges are given hereunder :-
Statement 83 CLASSIFICATION OF RURAL LOWLAND VILLAGES
BY DENSITY RANGES Population density
per sq. mile
Less than 1,000 1,000-1,999 2,000-2,999 3,000 and above
Number of rural revenue villages
22 25 9
Of the nine villages coming under the population density range of 3,000 and above persons per sq. mile, six, viz, Uralangal with 4,832, Chorode with 4,272, Muttingal with 3,999, Azhiyur with 3,695, Onchiyur wit~ 3,600 and Kunnamkara with 3,152 persons per sq. mIle are in the Badagara taluk, two, viz, Viyyur with 3,163 and Edakkulam with 3,017 persons per sq. mile are in the Quilandy taluk and one village Mangalam with 4,090 persons per sq. mile is in Tirur taluk. All the above villages in the Badagara tal uk lie north to Badagara Municipal Town. These villages are situated within three miles from the West COdst Road. The Calicut-Mangalore Railway line traverses through almost all these villages and runs parallel to the West

SEX-RATIO
Coast road. Proximity to Badagara municipal town and potentiality of cpmmunication facilities are contributory factors for the population density of these villages. The Viyyur and Edakkulam villages are north and south ofPantalayini town respectively. The southernmost tip of Mangalam village of Tirur taluk touches the mouth of the Ponnani river. The navigational facilities and nearness to Ponnani Port are the main causes for the high density of population of this village. B. Urban Areas
163. There is no town in the highland re,gion of the district. Out of 17 towns 5 are located in the lowland region. All the lowland towns have a density of population exceeding 5,000 persons per sq. mile while the majority of midland town~ have less than 5,000 persons per sq. mile. Calicut, Parayancherry and Puthiyangadi towns exceed the population density limit of 10,000. The following statement gives the population density of each town of the district in the ascending order of densities:
Statement 84 POPULATION DENSITY OF TOWNS BY NATURAL
REGIONS Population Population
Midland density per Lowland density per Town sq. mile Town sq. mile
Manjeri 2,398 Tanur 5,286 Olavanna 2,862 Badagara 5,329 Trikkandiyur 4,011 ' (Municipal) Edakkad 4,121 Kadalundi 6,023 Elathur 4,345 Pantalayini 6,701 Nellikode 4,462 Parappanangadi 6,838 Feroke 4,621 Beypore 5,099 Kommeri 5,194 Puthiyangadi 10,569 Parayancheri 13,574 Calicut 16,288
(Municipal)
Sex-ratio 164. The sex-ratios (number of females per 1,000
males) of this district shows fluctuations between 1901 and 1961. The 1901 Census had showed a sex-ratio of 1,001 which was very near equality. But during the Censuses of 1911 to 1941 the sex-ratios of this district were not only much higher but even greater than the State sex-ratios. Mter reaching 1,038 in 1941 it declined steadily thereafter.
the following statement gives the sex-ratios for the last seven censuses for the total, rural and urban areas.
Census year 1901 1911
Statement 85 SEX-RATIO 1901-1961
Total 1,001 1,009
Rural 1,008 1,016
Urban 925 937
50
Statement 35-concld. Census year Total Rural Urban
1921 1,023 1,029 946 1931 1,030 1,037 957 1941 1,038 1,043 995 1951 1,016 1,019 1,001 1961 1,012 1,016 989
165. The following statement compares the talukwise sex-ratios for both rural and urban areas:
Statement 86 TALUK-WISE SEX-RATIO FOR 1951 AND 1961 BY
RURAL-URBAN CLASSIFICATION I~I 1%1
'I'aluk ,--~ Tatal Rural Urban Total Rural Urban
Badagara 1,054 1,059 998 1,042 1,049 998 Ernad 1,029 1,029 1,054 1,013 1,012 1,041 Kozhikode 1,000 1,008 982 981 988 970 Quilandy 1,019 1,014 1,069 1,023 1,021 1,063 South Wynad 807 807 890 890 Tirur 1,055 1,059 1,015 1,068 1,074 1,031
During the decade sex-ratio had decreased in Badagara, Ernad and Kozhikode taluks while the other taluks of the district showed an increase.
166. Sex-ratio can be further analysed by natural regions. The highland regions have exceptionally low sex-ratios when compared to other natural regions except for Ernad taluk. The following. statement establishes this:-
Statement 87 SEX-RATIO BY NATURAL REGIONS
Highland· Midland Lowland District/Taiuk ,..-'-, ~ ,--_--J,--_""""
Rural Total Rural Urban Total Rural Urban Kozhikode
District 907 1,013 1,021 976 1,065 1,074 1,033 Badagara
taluk 919 1,003 1,003 .. 1,055 1,067 998 Ernad taluk .. 1,023 1,012 1,012 1,041 Kozhikode
taluk 943 981 990 970 Quilandy
taluk 846 1,002 1,002 .. 1,081 1,084 1,063 South Wynad
taluk 890 Tirurtaluk .. f,066 1,071 1,001 1,078 1,093 1,060
* No urban area
A further analysis of the rural areas at the village level and the urban areas at the town level is given below:-
(a) Rural Areas
(i) Highland region 167. 22 villages out of 24 have recorded preponder
ance of males over females. Oorangattiri and Karuvarakundu villages however, show a departure from this and their sex-ratios work out to 1,040 and 1,014 respectively.

SEX-RATIO
(il) Midland region
168. Only 74 villages out of 230 midland villages follow the general phenomenon of highland villages in regard to sex-ratio. They are Kayakody (968) Velliyode (978) and Naripatta (986) villages of
Badagara taluk; Perambra (922), Kalpattur (946), Velam (954), Paleri (955), Kayana (955), Cherapuram (961), Kavumthara (964), Balusseri (968),
Menhaniam (970), Unnikulam (971), Changroth (980~, Kottur (981), Muyipoth (984), Avitanallur (984),'
Cheruvannur (987), Iyyad (987), Nochad (988), Trikuttisseri (989), Kozhikallur (990), Chenoli (991), Naduvannur (991), Meppayur (994), Sivapuram (996) and Muthuvannacha (998) of Quilandy tal uk ; . Kovoor (894), Thiruvambadi (918), Thazhakode (929), Chevayur (932), Vellayicode (936), Mayanad (946), Poolacode (946), Iringallur (955), Patinhattumuri (956), Nediyanad (959), Kottuli (967), Peruvayal
(967), Kodal (968), Mavoor (970), Kodiyattur (973), Elettif (974) Chelavoor (975), Punnasseri (976), Nallalam (979), Karoth (930), Kedavoor (981), Kumaranellur (981), Koodathayi (982), Perurnana (984), Makkada (988), Kizhakkoth (990), Cberuppa ( 997) and Puthoor (999) villages c.f Kozhikode taluk; Veliprom (946) and Cheriarrundam (975) villages of
Tirur taluk; and Kondotty (964), Azhinhalam (970), Kizhuparamba (970), Pandikkad (970), Nilambur (972), Puliacode (980), Vazhayur (982), Olavathur (984), Cheacode (986), Payyanad (991), Vaniambalam (992), Kurumarakkad (995), K avanur (995), Andiyurkunnu (995), Che1embra (996), Inclianur (996), and Muthuvattur· (998), villages of Ernad taluk. Twenty.
three villages exc~ed the sex-ratio limit of 1,100. The highest number of females per 1,000 males in the mid· land region of the district is in the Thalakkad village of Tirur taluk with 1,225. This village has the unique distinction of having the maximum number offemales per I,OGO males among the villages of the district.
(iii) Lowland region
,169. Only in 5 out of 56 villages in this region men out-number women. All these five villages are located in the Badagara taluk. They are Aroor (970), Ayen. cheri (976), Thiruvallor (990), Kuttiyadi (992), and Mokeri (993). Thuneri village has the maximum
number of females per 1,000 males, the ratio being
1,197.
106/1-71 51
(b) Urban Areas
170. Only seven towns have greater number of males than females. They are Beypore, Calicut,
Olavanna, Puthiyangadi, Feroke, Parayancherri and Badagara. Majority of the towns in the lowland have a preponderance of females over males. The following statement gives the number of females per 1,000 males
for each town of the district classified by natural regions in the descending order of sex-ratios :-
Statement 88 SEX-RATIO OF TOWNS BY NATURAL RECIONS
Midland Lowland ,-
Town Sex-ratio Town Sex-ratio
Manjeri 1,041 Kadalundi 1,086 Edakkad 1,033 Tanur 1,069 Nellikode 1'(),22 Pantalayini 1,063 Elathur 1,015 Parappanangadi 1,007 Trikandiyur 1,01l lloadagara 998 Kommeri 1,003 (Municipal)
Parayancheri 998 Feroke 996 Puthiyangadi 992 Olavanna 983 Calicut 966
(Municipal)
Beypore 939
17l. The single year sex-ratio upto 10 years shows that the number of boys are higher than girls of all ages except for the age 3. The sex-ratios show a steady increase from the age-group 15-19 to 25-29 and then slowly comes down to 940 at the age-group 45-49. The sex-ratios of elderly persons (60+) show a favourable trend to females. The following statement gives the. sex-ratios under different age-groups :-
Statement 89 SEX-RATIO BY AGE-GROUPS
Agel Age-group Sex-ratio Age-group
Under 1 year 987 20--24 I 980 25-29 2 963 30--34 3 1,011 35-39 4 952 40-44 5 971 45-49 6 929 50--54 7 981 55-59
8 925 60--64 9 981 65--69
10--14 952 70 -I-15-19 1,054
Sex-ratio
1,099 1,162 1,078
999 945 940 984 971
1,113 1,058 1,167
172. Sex-ratio is further analysed by industrial
classification of workers and non-workers :-

SEX-RATIO Statement 90
SEX-RAno BY INDUSTRIAL CATEGORIES Workers
In Mining, Quarrying, Live, stock, In F()restry, manu-Fishing, facturing In
Hunting and other Trans-Plantations, At than port, Sto-
As Agri- Orchards House- House- In Trade rage and AsCulti- cultural [and allied hold hold In Con- and Com- Commu- In Other Non-Total District!
Taluk Workers vator labourer activities Industry Industry struction merce nication services workers
Ko:dlikode 310 District
Badagara 33'1 taluk
Ernad· 351 taluk
Kozhikode 216 taluk
Quilandy 348 taluk
South Wynad 457 taluk
I 240
443
256
141
244
333
II 794
I,m
880
447
726
697
III 182
85
130
81
130
617
Tirur 279 161 927 48 taluk
Quilandy taluk has an abnormal figure of 2,386 females per 1,000 males in the category of Household Industry _ Workers engaged in manufacturing other than household industry, in construction and in trade .and commerce have lesser number of females than .males in all the taluks_ Sex-ratio of non-workers is highest in Tirur taluk_
173_ Sex-ratios by major religions are furnished ':below:-
Statement 91 SEX-RATIO BY RELIGION
.Age
Religion Christians Hindus Muslims
Sex-ratio 924
1,000 1,036
174. A study of the age-structure is always helpful to assess the future trends of population. The popula-
.. tion of the district may be broadly divided into five ,categories, viz,' infants and _ young children', 'boys and girls', 'young men and women', 'middle aged men and women' and 'elderly persons' - The following statement gives the percentage under each category ,to the total population of the district:-
Statement 92 PERCENTAGE DISTRIBUTION OF POPUL!T10N BY
BROAD CATEGORIES
Category Infants and young children Boys and girls Young men and women Middle aged men and women Elderly persons
Age-group 0-4-5--14
15--34 35-54 55 and
above
Percentage 15-1 27-8 30-9 18-2 8'0
IV 1,363
617
715
1,702
2,386
431
1,710
52
V VI VII VIII IX X 215 14 18 47 275 1,636
144 10 9 371 382 1,612
179 3 28 13 301 1,657
2ll 24 II 16 236 1,624
514 10 28 JO 211 1,589
57 4 6 2 317 1,432
196 9 24 8 266 1,737
Among the elderly persons there are 186 centenarians of whom 81 are males. There are two men and one woman at the age of 120.
175. The following statement gives the percentage of males to total males and percentage of females to total females for total, rural and urban areas :-
Statement 93 PERCENTAGE OF MALES AND FEMALES TO TOTAL
MALES AND FEMALES IN THE DISTRICT Total Rural Urban
~~ Percen- Percen- Percen- Percen- Percen- Percen-tage of tage of tage of tage of tage of tage of males females males females males females
Age/Age- to total to total to total to total to total to total group males females males females males females
Under 1 year 2-99 2'92 3-(14 2'97 2-72 2'63 1 2-97 2-88 3'04 2-94 2-65 2-57 2 3'55 3-38 3-63 3-43 3-18 3'12 3 2'73 2'73 2-76 2-77 2-54 2'49 4 3-09 2'90 3-14 2-95 2'83 2-68 5--9 14-61 13-79 14-79 13-97 13-73 12'89
10-14 14'03 13-21 14-08 13-23 13'81 13-08 15--19 8-15 8-49 8'01 8-39 8'86 9-05 20-24 8'03 8-72 7-90 8-70 8'67 8-86 25--29 7-12 8-18 7,06 8'20 7-39 8'06 30-34 6-34 6-75 6-27 6,70 6'70 7,04 35-39· 5'88 5'80 5'83 5'73 6'12 6-15 40-44 5'03 4-70 4-98 4-64 5-27 4-98 45--49 4'16 3-87 4'14 3'82 4'30 4-12 50-54 3-49 3'39 1'44 3'34 3-73 3-65 55--59 2-35 2-26 2-35 2,22 2'38 2-47 60-64 z;J7 2-38 2'18 2-34 2-12 2-58 65-69 1-34 1,40 1'36 1-40 1-24 1-42 70 + 1-93 2-22 1-96 2-23 1-75 2-15
Age not O'M 0,03 0'04 0-03 0-01 stated 0'01

RELIGION
Marital Status each sex. The proportion of men who have lost their partners in life to total males is comparatively less than the proportion of widows to total females in the district.
176. The distribution of population by marital ·status is given hereunder :-
Statement 94 DISTRIBUTION OF 1,000 PERSONS OF EACH SEX BY
MARITAL STATUS Marital status Total Rural Urban
Religion
1. Males 1,000 1,000 1,000
177. Till the census of 1941 all important tabulations were based on religion. This was changed by adopting economic classification for all purposes iv 1951 and subsequently shifting economic classification in favour of i-!}dustrial classification in 1961. The numerically important religions of this district are Hinduism, Isla", ~ - i Christianity. This district has a larger ..... 'llOer of Hindus and Muslims than any other district in the State, the percentages to the total population of these religions of the State being 13'48 and 36'95 respectively. The following statement gives the distribution of population in the district by religions as per the 1961 Census:-
(i) Never married 612 608 631 (ii) Married 364 367 351
(iii) Widowed 14 14 13 (iv) Divorced or separated 9 10 5 (v) Unspecified N
..2. Females 1,000 1,000 1,000 (i) Never married 478 477 487
(ii) Married 382 385 363 (iii) Widowed III 108 128 (iv) Divorced or separated 28 29 22 (v) Unspecified N
, N '-Negligible.
The above statement reveals that there are only 364-married men and 382 married women per thousand of
Statement 95 DISTRIBUTION OF POPULATION BY RELIGION
Number Percentage distribution ,-- -'--
Religion Total Rural Urban Total Rural Urban All religions 2,617,189 2,184,682 432,507 lCJOoOO 100'00 100'00 Buddhists 17 4 13 N N N Christians 110,874 95,417 15,457 4'24 4-37 3-57 Hindus 1,386,112 1,125,067 261,045 52'96 51-50 60'36 Jains 1,275 777 498 0'05 0-03 O·~ Muslims 1,118,851 963,411 155,440 42'75 44'10 35'9'. Sikhs 11 3 8 N N N Others 40 1 39 N N 0'01 Religion not stated 9 2 7 N N N
'N'-Negligible.
178. Taluk-wise distribution of rural population given in the following statement:-:by religions'with 1 per cent or more of population is
Statement 96 RELIGION~ BY POPULATION IN RURAL AREAS BY TALUKS (REUGIONS WITH LESS THAN 1 PER CENT
OF THE POPULATION ARE OMITTBD)
Christians Hindus Muslims ,-___ .A.. ___ ----. ,---.A..-____" ,-__ _......_______.
DistrictJTaluk (Rural only)
Percentage to Percentage to Percentage to rural rural rural
Number 95,417
population Number population Number population Kozhikode District Badagara taluk
Ernad " Kozhikode " Quilandy "
4'37 2-02 2'80 6'34 4'05
South Wynad " Tirur "
5,571 14,310 23,985 14,151 36,073
1,327 19-49 0'28
1.iteracy and Education 179. The general literacy rate of the district has
increased from 29'14 per cent in 1951 to 40'63 per ~nt in 1961. The present literacy rate of this district
53
1,125,067 51'50 963,411 44'l0 191,924 69'54 78,5071 28'44 189,500 37'01 308,206 60' 19 231,586 61'18 122,948 32'48 245,924 70'47 88,911 25-48 103,662 56'02 44,549 24'07 162,471 33'56 320,290 66'16
is lower than that of the State percentage of 46'85. The following statement gives the growth of literacy in the district and taluks during the decade 1951-51:-

LITERACY AND EDUCATION
Statement 97 GROWTH OF UTERACY, 1951-61
Percentage o( literates to
Proportion of Ii tera tes to
total literate! in the district District/Taluk
Total literates the total
population Difference
1951
Kozhikode District 601,837 Badagara ta1uk 79,157 Ernad" 99,44<l Kozhikode 192,081 Quilandy " 92,866 South Wynad " 25,877 Tirur" 112,416
More than half of the people of Kozhikode taluk in 1961 are returned as literat~ and educated persons. South Wynad taluk has only about 6 per cent of the total literates of the district.
1961 1951 1961 1951-61 1961
1,063,295 29'14 40'63 + 11-49 135,050 30-19 42-21 + 12-02 12-70 187,802 24'58 35-82 + 11'24 17-66 332,807 37-20 50'40 + 13'20 31 '30 159,086 31-82 43-43 + 11-61 14'96 62,688 23'59 33-88 + 10-29 5-90
185,862 23-39 33'12 + 9'73 17048
literacy rate has risen by 12'92 per cent. In all the taluks of the district the difference in female literacy growth rates between 1951 and 1961 is higher than that of male literacy rates. The male and female literacy rates for 1951 and 1961 are given below:-180. During the decade 1951-61 the male literacy
rate has increased by 9'99 per cent while the female -. Statement 98
GROWTH OF LITERACY BY SEX, 1951-61 Proportion of
literates to total literates in the
Difference district under Percentage of Percentage of 1951-61 each sex, 1961
District/Taluk Male literates Female literates male literacy female literacy ~, r-_____,.___"._.._....~----,...------"-----,Male Female Male Female
1951 1961 1951 1961 1951 1961 1951 1961 literates literates literates literates Kozhikode District 421,647 665,386 180,190 397,909 41-16 51-15 17'31 30'23 + 9'99 +12'92 Bad~ara taluk 56,686 87,216 22,471 47,834 44-41 55-68 16-70 29-30 + 11-27 + 12-60 13-11 12'02 Emad.. 67,676 116,091 31,764 71,711 33·95 44-57 15'48 27-18 +10'62 +11-70 17045 18-02 Kozhikode II 132,958 202,229' 59,123 130,578 51'50 60-65 22-90 39-94 + 9'15 +17-04 30·39 32-82 Quilandy .. 67,438 102,441 25,428 56,645 46'65 56-56 17'26 30'53 + 9'91 + 13'32 15'40 14·24 South Wynad .. 19,914 41,814 5,963 20,874 Tirur 76,975 115,595 35,441 70,267
The prog;~ss in the rate of male literacy during 1951-61 has been highest in Badagara taluk and lowest in Kozhikode taluk. In the case of female literacy the progress has been highest in the Kozhikode taluk and lowest in Tirur Taluk.
181. The rural percentage literacy for Kozhikode District for 1961 is 38'65 against the urban literacy rate of 50'62. The following statement gives the ruralurban literacy rates by taluks for 1961:-
Statement 99 RURAL-URBAN LITERACY BY SEX, 1961
Percentage Percentage Percentage of male lite- of female lite-of literates rates to the rates to the to the total total male total female
District/Taluk population population population ,-.A.-, ,-.A.~ ,-..A..~
Rural Urban Rural Urban Rural Urban
Kozhikode Distrit;:t 38065 50-62 49'26 60'53 28'20 40-61
Baciagara taluk 41'24 48'36 54'97 60;03 28'15 36'67 Eroad taluk 35-41 52'72 44'20 60'14 26'73 45'59
54
32-81 42-71 12-17 23-95 + 9'90 + II' 78 6'28 5'24 32-91 42-59 14-37 24'25 + 9'68 + 9-88 17'37 17-66
Statement 99-concld.
Percentage Percentage Percentage of male lite- of female lite-of literates rates to the rates' to the
of the total total male total female Districtrraluk population pcpulatiQn population
,....----A----- r-----"-----, Rural Urban Rural Urban Rural Urban
Kozhikode taluk 47024 54'63 58'34 63'73 36'01 45'26
Qui1andy taluk 43'26 46'80 56'49 57-99 30'29 36'28 South Wynad
taluk 33'88 42-71 23-95
Tirur taluk 32'37 37-78 4I-48 49'41 23-90 26-50
The literacy ratios in urban areas of this district are' higher than that of rural areas. In regard to female literacy the Tirur taluk has low ratios for both rural and urban areas, The following paragraphs give a. more detailed analysis of general literacy by rural and urban areas.

LITERACY AND EDUCATION
_A. Rural Areas 182. The general literacy of the rural areaS of this
district has increased at an average rate of 6-9 per cent per year during the decade 1951-61. The 310 revenue villages which constitute the rural areas of the district fall under the three natural regions. The subjoined statement gives the number of villages classified under six literacy ra~ges and by natural regions in each taluk:-
Statement 100 RURAL VILLAGES CLASSIFIED BY
LITERACY PERCENTAGES Number of villages under percentage
ranges of literacy ..A.. """"I
District/Taluk = c by natural regions ~ e
":1iJ ~o,
Kozhikode District 1 Badagara taluk
2 Ernad " 3 Kozhikode " 4 Quilandy " 5 South Wynad "
6 Tirur " (i) Highland Kozhikode District
1 Badagara taluk
2 Ernad " 3 Kozhikode " 4 ' South Wynad "
(ii) Midland Kozhikode District
1 Bad:\gara taluk
2 Ernad " 3 Kozhikode " 4 Quilandy 5 Tirur
(iii) Lowland \
" "
j~
~ ~ g) 8 ~ 8 d ~ d" '" 0. ""' & 47 125
14> 15 34
14 2 12 5 13
25 36
7 14
2
5
39
13
2 24
1 13
93 5
34 13 10 31
Kozhikode District 1 18 1 Badagara taluk 11 2 Quilandy" 2 3 Tirur 5
., =
~e I" ~& 113 27 13 26 38 2 7
3
2
76
13 26 31 6
34 26 7
- -Note:-Taluks with nil entries are omitted_
13 4
16
1 13 2
3 1 2
6
6
6
All these villages of this district irrespective of natural divisions have literacy rates of above 20 per cent. Six villages cross the general literacy rate of 60 per cent and over. Proximity to towns and availability of -educational facilities have largely contributed to the high literacy rates in these following villages:-
Statement 101 IDGH LITERACY VILLAGES
Village 1 Nedungottur (Kozhikode taluk)
2 Vengeri ( " ,,) 3 Kottuli ( " ) -4 E1athur (" ,,)
Percentage of literacy 64'81 63-01 62'17 61'29
55
Statement 101-coneld. Village Percentage of literacy
5 Kodal (Kozhikode taluk) 60'87 6 Karuvisseri ( " ,,) 60'43
47 villages register literacy rates between 20 a~1d 29 per cent_ .More than half of these villages lie in Tirur taluk. Seven out of 47 villages lie in the highland region, while one village lies in the lowland region. The following statement prese~s the villages having literacy percentages of below 30 per cent:-
Statement 102 • LOW LITERACY VILLAGES
Village I Omachapuzha (Tirur taluk) 2 Kidanganad (South Wynad " ) 3 Vilayil (Ernad " ) 4 Melmuri (Tirur " ) 5 Olakkara ( " " ) 6 Mooniyur ( " " ) 7 Karumbathur (" " ) 8 Peruvallur ( " " ) 9 Thuvur (Emad " )
JO Pulliacode ( " " ) 11 Athavanad (Tirur " )
12 Thennala ( " " ) 13 Vadakkumbram ( " " ) 14 Cherur' ( " " ) 15 Oorangathiri (Ernad " ) 16 Nannambra (Tirur " ) 17 Ananthavoor (" " ) 18 Noolpuzha (South Wynad " ) 19 Kotinhi (Tirur " ) 20 Trippanachi (Ernad " ) 21 Ullanam (Tirur " ) 22 Olavattur (Ernad " )
23 Kavanur ( " " ) 24 Velam (Quilandy" ) 25 Cheriamundam (Tirur " )
26 Tanalur ( " " ) 27 Koduvayur (" " ) 28 Pariapuram (" " ) 29 Vengara ( " " ) 30 Kuppadithara (South Wynad " ) 31 Kuzhimanna (Ernad " ) 32 Kannamangalam (Tirur " ) 33 Mangalam (" " ) 34 Padinharethara (South Wynad" ) 35 Urakam Kizhmuri (Ernad " ) 36 Trikkulam (Tirur " ) 37 Ponmundam (" " ) 38 Valakkulam (" " ) 39 Cherap'llfam (Quilandy ,,) 40 Ponginichikkallur (South Wynad" ) 41 Vellaynr (Ernad ,,)
42 Valluvambram (" " ) 43 Wandur ( " " ) 44 Karuvarakundu ( " " ) 45 Kalikavu ( " " ) 46 Puduppalli (Tirur " ) 47 Karippur (Ernad " )
Percentage of literacy 20-21 20-43 2l'<J9 21-11 2JoJ5 21-78 21-92 22-45 23-22 23-26 23-31 24-09 24-47 24-54 24-85 24-85 25-07 25-18 24-45 25-93 25-99 26-24 26-35 26-80 26-86 27-12 27-26 27-58 27-58 27-68 27-98 28-15 28-46 28-47 28-69 28-76 28-77 28-79 29-19 29'23 29-28 29-28 29'34 29-39 29-84-29-90 29-94

LITERACY AND EDUCATION
183. Out of 10'8 lakhs of males in the rural areas of the district about 5·5 lakhs are illiterates. All the villages of this district except eight villages have male literacy rates of above 30 per cent. 48 villages cross the literacy mark of 60 per cent out of which one village even goes to the limit of 72'30 per ceut. The following statement sets out the number of rural villages classified by male literacy percentages :-
Statement 103 RURAL VILLAGES CLASSIFIED BY MALE
LITERACY PERCENTAGES No. of villages under percentage
ranges of male literacy
District/Taluk by natural regions
Kozhikode District 1 Badagara taluk
2 Eroad " 3 Kozhikode " 4 Quilandy " 5 South W ynad " 6 Tirur " (i) Highland
Kozhikode District 1 Badagara taluk 2 Eroad " 3 Kozhikode " 4 South Wynad "
(ii) Midland Kozhikode Distl'ict
1 Badagara taluk
2 Eroad " 3 Kozhikode 4 Quilandy 5 Tirur
" " " (iii) Lowland
Kozhikode District 1 Badagara taluk
2 Quilandy "
Less than ~0-29 30-39 4Q-49 50-59 20 • per per per per per cent cent cent cent
cent 8
2
1 5
1
7
2
5
53
16 1
6 30
8
2
6
43
14 I
28
2
92 6
33 8 5
13 27
1 13
69 2
33 7 4
23
109 32 11 25 36
5
1 1
76 3
II 25 33 4
3 Tirur " 2
9 4 1 4
32 28 3 1
Note :-Taluks with nil entries are omitted
60 per cent and
above 48 6 1
25 15
35
1 25 8 1
13 6 7
The villages which exceed the general literacy percentage of 60 per cent are given hereunder:
Statement 104 HIGH MALE LITERACY VILLAGES
Village 1 Elathur 2 Karuvisseri 3 Vengeri 4 Kcdal 5 Nedungottur 6 Kottuli 7 Karannoor 8 Patinhattumud 9 Chevayur
10 Makkada 11 Ayanikkad
Percentage of literacy (Kozhikode taluk) 72'30
" " " "
" " " " (Quilandy
.. 'J
" " " " r" .. " "
71-45 71'09 70'90 70'73 70'21 69'32 68'17 67'94 67'85 66'45
56
Statement 104-concld.
Village 12 Tarrtarasseri (Kozhikode taluk) 13 Karuvattur ( " ) 14 Mayanad (" ,,) 15 Pannikottur (" ,,) 16 Kovur (" ,,) 17 Purameri (Badagaca),,) 18 Vilayattur (Quilandy ,,) 19 Annasseri (Kozhikodtt,,) 20 Iringal (Quilandy" ) 21 Onchiyam (Badagara ,,) 22 Purakad (Quilandy,,) 23 Chemancherry (" ,,) 24 Punnasseri (Kozhikode,,) 25 Nanminda (" ,,) 26 Melur (Quilandy" ) 27 Nallalam (Kozhikode,,) 28 lringallur ( " ) 29 Cheruvannur (Quilandy ,,) 30 Madavoor (Kozhikode ,,) 31 Malappuram (Ernad ,,) 32 Ponmeri (Badagara ,,) 33 Kalpathur (Quilandy ,,)
34 Balusseri (" " ) 35 Memunda (Badagara ,,) 36 Naduvalloor (Kozhikode " ) 37 Moodadi (Quilandy,,) 38 Kannankara (Kozhikode ,,) 39 Muyipoth (Quilandy ,,) 4Q Edakkulam (" ,,) 41 Karayad (" ,,) 42 Katcheri (Badagara ,,) 43 Thalakolathur (Kozhikode ,,) 44 Kunnamangalam(" ,,) 45 Neduva (Tirur " ) 46 Kottur (Quilandy,,) 47 Thuneri (Badagara ,,) 48 Viyyur (Quilandy ,,)
Percentage of literacy 66'33 65'90 65'90 65'45 65'39 65-22 64'73 64'56 64'26 63'39 63'23 63'22 63·16 62'85 62'80 62-74 62-63 61'44 62'31 62-10 62'09 62'06 61"88 61'74 61-58 61'39 61'30 61-17 61'02 61'02 60'53 60'53 60'44 60'44 60'36 60'11 60'10
The following eight villages have low male literacy rates of less than 3p per cent :-
Statement 105 LOW MALE LITERACY VILLAGES
Percentage of Village li teracy ~
1 Melmuri (Tirur taluk) 25'92 2 Karumbattur ( " 26'99 3 Athavanad ( ,,) 28'50 4 Kidanganad (South Wynad tal uk) 28'67 5 Vilayil (Ernad taluk) 28'71 6 Vadakkumbram (Tirur taluk) 28'96 7 Orrtachapuzha ( ,,) 29'05 8 Thuvur (Ernad taluk) 29'36
184. Out of 11'0 lakh females In the rural areas of the district about 7'9 lakh are illiterates. Considering the lower percentage of literacy the female literacy rates are grouped under eight percentage ranges. The following statement sets out the number of rural villages classified under these ranges :-

LITERACY AND EDUCATION
Statement 106
RURAL VILLAGES CLASSIFIED BY FEMALE LITERACY PERCENTAGES
No. of villages under percentage ranges of female literacy
Less 10-14 15-19 20-29 30-39 40-49 50-59 60 per DistrictJ Talukby natural regions
than cent 10 per per per per per per cmt
r cent cent cent cent cent cent abo~~
Kozhikode District 1 Bacla
gara taluk
2 Eroad taluk
3 Kozhikode taluk
4- Quilandy taluk
5 South Wynad taluk
6 Tirur taluk
(i) Highland
Kozhikode District 1 Bada
gara taluk
2 Ernad taluk
3 Kozhikode taluk
4 South Wyn'}d taluk
(ii) Midland \
K.ozhikode District 1 Bada-
gara taluk
2 Ernad taluk
3 Kozhikode taluk
4 Quilandytaluk
5 Tirur taluk
(iii) Lowland
Kozhikode _ District
I Badagara taluk
8 40 139 98 19 6 ...
5 21 16 2
2 8 34 18
2 20 18 13 6
2 24 27 2
5 12 2
4 18 28 17
1 , 14 3
12 2
7 30 102 68 17 6
4-
2 7 33 18
2 19 18 13 6
2 21 19 2
4 18 25 13
f 23 27 2
4 17 IS 2
106/1-8 57
Statement lO6-cor.cld.
No. of villages under percentage ranges of female literacy
r---------"-----------. Districtl Taluk by natural regions
Less than 10 per cent
60 per 10-14 15-19 20-29 30-39 40-49 50-59 cent per per per per per per and cent cent cent cent cent cent above
2 Quilandy taluk
3 Tiror taluk
3 8
3 4
Note :-Taluks with nil entries are omitted
As seen from the above statement there are only six villages with a literacy rate of 50 per cent and above. All these villages are located in the Kozhikode taluk. Theyare:-
Statement 107
IfiGH FEMALE LITERACY VILLAGES
Village
1 Nedungottur
2 Vengeri
3 Kottldli
4 Kodal
5 Elathur
6 Karuvisseri
Percentage of female literacy
59-17 55'63
53'85 50'50
50'39 50'30
There is no village in this district with a literacy rate of less than 10 per cent. In the next higher range of 10-14 there are eight villages. They are arranged below in the ascending order otliteracy :-
Statement 108
LOW FEMALE LITERACY VILLAGES Percentage
Village
1 Kidanganad (South Wynad taluk) 2 Omachapuzha (Tirur taluk)
3 Olakara (Tirur taluk)
4 Peruvallur (Tirur taluk)
5 Velam (Quilandy taluk)
6 Moorriyur (Tirur taluk)
7 Vilayil (Ernad taluk)
8 Puliacode (Eroad taluk)
B. Urban Areas
of female literacy
11'56
11'64
l!'66 12'28
12'58
13'06 13-66
14060
185. There are altogether 1 7 towns in this district.
They are distributed among midland and lowland regions. Edakkad Town ranks first in respect of total. male and female literacy percentages while Tanur comes last. The following statement illustrates this:-

LANGUAGES Statement 109
PERCENTAGE OF UTERACY BY TOWNS Midland Town Percentage of literacy
Total I Edakkad 65' 78 2 Parayancherry 62'93 3 Kommeri 58' 55 4 Nellikode 57'00
Male 74'90 71'37 67'34 66'40 63'07
Female 56'96 54-48 49'78 47'79
5 Beypore 54'67 6 Calicut (Municipal) 54'63 63'71 7 l\1anjeri 52'72 60'14 8 Trikkandiyur 52'21 59·88 9 Olavanna 51'19 62'35
10 Elathur 46'89 59'63 11 Puthiyangadi 46'86 54·35
45'71 45'23 45'59 44-62 39'84 34'33 39·30
12 Feroke 41'78 54'63 28'87
Literacy by Age, Sex and Education (a) Illiterates 186, There are 1,553,Sll illiterates in this District
of whom 633,588 are males, The number of illiterates in age-group 0·4 is 394,332 and this comprises the total population in the same age-group,
(b) Liter.ates 187, The population in the age-gi'ouP 0-4 has to
be excluded from the total population for calculating the' rffective rate of literacy', The effective literacy percentage of this district comes to 47'83 in 1961, The following statement furnishes the number of literates by educational levels and effective rates of literacy.
Statement 110 LITERATES BY EDUCATIONAL LEVEL AND EFFECTIVE
RATE OF LITERACY Percentage Effective
Educational level
Total literates
Literates (without educational level)
Persons
1,063,295
739,815
of total literates
100'011
69-58
rate of literacy
(Percmtage) 47'83
33-28 Primary or Junior
Basic 280,271 26'36 12'61 Matriculation and above 43,209 4'06 1'94
Only 4 per cent of the totalliter.1tes have passed the Matriculation and above. The following statement furnishes the effective rates of literacy for males and females:-
Statement III EFFECTIVE RATE OF UTERACY BY SEX
Educational level
Total literates Literates (without educational
level) Primary or Junior Basic Matriculation and above
Effective rate of
male literacy (Percentage)
60'41
41'66 15'74 3'01
Effective rate of female literacy
(Percentage) 35-49 .
25'06 9'53 0'90
58
Lowland Town Percentage of literacy
Total Male Female 1. Badagara (Municipal) 48'36 60'03 36'67 2. Pantalayini 46'80 57'99 36-28 3. Kadalundy 40'58 53'99 28'23 4. Parappanangadi 30'91 44'24 17'67 5. Tanur 23047 33-98 13-63
It is significant to note that only 9 out of every 1,000 females have passed the Matriculation Examination or above,
Languages 18~l. More than 98 per cent of the total inhabitants
of this district have their mother tongue as Malayalam. This is followed by Tamil, another language ot the Dravidian Family. Here are the figures for the first ten languages in the district:-
Statement 112
PRINCIPAL LANGUAGES ~Iother tongue
Malayalam Tamil Kannada Telugu Gujarathi Tulu Konkani Urdu English Hindi
Birth Place
Total speakers 2,581,955
15,296 6,093 4,033 2,446 1,833 1,717 1,440
694 598
189. 99 per cent of the total population of the district were born within the State of enumeration. Persons belonging to all the States of India except Dadra and Nager Haveli, Himachal Pradesh, Manipur, Nagaland, North-East Frontier Agency and Tripura and territory of Sikhim numbering more than sixteen thousand have been present in this district at the time of enumeration. The foreign nationals who have been enumerated in this district were born in Aden, Burma, Canada, Ceylon, France, Germany, Indonesia, Iran, Italy, Nepal, Netherlands, Pakistan, Portugal, Saudi Arabia, Singapore, Malaya and British Borneo, Union of South Africa, Spain, Switzerland, Thailand, United Arab Republic, United Kingdom and United States of Ameri~a. The following statement gives the

WORKERS AND NON-WORKERS
number of persons born within and outside the Kozhikode distl'ict.-
Place of birth
Statement 113
PLACE OF amm Total Rural Urban
Within the State of enumeration 2,595,652 2,170,630 425,022
Ca) Born within Kozhikode district 2,439,795 %,040,260 399,533
Cb) Born mother districts of the State
II States in India beyond the State of enumeration
III Born in countries in Asia beyond India (including U.S.S.R.)
IV Countries in Europe (excluding U.S.S.R.)
V Countries in Africa
VI Countries in North America and South America
VII Countries in Oceania VIII Born at sea
IX Unclassifiable
Workers and Non-workers
155,857 130,370 25,487
16,212
701
67 17
9
4,531
9,201 7,011
342 359
41 26 2 15
8
4,458 73
190. In the earlier Indian Censuses, or atleast, at the last few Censuses, income or economic independence was recognised as the criterion for measuring the economy of the country. Account was made of all persons who were economically independent and of all those who were economically dependent. An intermediate category of economic semi-dependents was also introduced from the 1931 Census onwards. This category wa~ called 'working dependent' in the 1931 Census, 'partly dependent' in 1941 and 'earning dependent' in 1951 and even here an element of income was introduced;, It was felt that the strict application of the criterion of income or . economic independence suppressed those who worked in family economic activities but did not actually earn an income like men other than the head of the household and women of the family or children working at cultivation or cottage industries of the household. In the 1961 Census, therefore, stress has been laid on work so that all people who work including family workers who are not in receipt of any income or working children who cannot earn enough for their maintenance are also reckoned as workers. Work includes not only actual work bu(also effective supervision and direction of work. In the 1951 Census population was divided into eight livelihood classes. In this Census instead of the eight
l06/1-8a 59
livelihood classes of 1 S51 workers are grouped under nine industrial categories as follows:-
I Working as Cultivator;
II Working as Agricultural Labourer;
III Working in Mining, Quarrying, Live-stock, Forestry, Fishing, Hunting and Plantations, Orchards and allied activities;
IV Working at Household Industry;
V Working in Manufacturing other than House
hold Industry;
VI Working in Construction;
VII Working in Trade and Commerce;
VIII Working in Transport, Storage and Communi
cations; and
IX Working in Other Services.
191. 30'63 per cent of the total population of the district constitute workers. Of these 4'88 per cent of the total population of the district are engaged in cultivation, 4·32 per cent in agricultural labour, 3'49 per cent in mining, quarrying, live"stock, forestry, fishing, hunting and plantations, orchards and allied activities, 1'99 per cent in household industry, 2'56 per cent in manufacturing other than household industry, O' 28 per cent in ·construction, 2'03 per cent in trade and commerce, 1·06 pe~ cent in transport, storage and communications and 10'02 per cent in other services. The percentage of workers of this district is higher than that of the State in regard to mining, quarrying etc., in trade and commerce, in transport, storage and communications and in other services. The following statement gives the distribution of every thousand persons in a taluk into workers and non-workers by sex:-
Statement 114 DISTRIBUTION OF 1,000 PERSONS IN EACH1 TALUK
INTO WORKERS AND NON-WORKERS BY SEX
District/Taluk Workers Non-workers ,------'---~ .------"-----,
Per- Fe- Per- Fe-sons Males males sons Males males
Kozhikode district 306 471 144 694 529 856
Badagara taluk 290 445 141 710 555 859
Ernad 331 493 171 669 507 829 " Kozhikode 281 457 101 719 543 899
Quilandy 304 456 155 696 544 845
South Wynad 429 556 285 571 444 715 "
Tirur 284 459 120 716 541 880 "
Workers 192. 81akhs of the total population of the district
are classified as workers. The following statement gives the distribution of workers by industrial categories
and sex:-

DISTRIBUTION OF WORKERS
Statement 115 DISTRlBUTION OF WORKERS BY INDUSTRIAL
CATEGORIES AND SEX Industrial category of workers
Total workers I AI; Culti
vators II As Agricul.
tural la-bourers
III In Mining, Quarrying, Live-stock, Forestry, Fishing, Hunting, and Plantations, Orchards and allied activities
IV At Household
Persons Males Females ,...---'----, ,----'----.,
Per- Per- Per-Number cent- Number cent- Number cent-
age age age 801,706 100'00 612,214 100'00 189,492 UMNJO
127,814 15-95 103,098 16-84 24,746 13-06
113,024 14-10 63,013 10'29 50,01l 26_39
91,433 11-41 77,357 12'64 14,076 7'43
Industry 51,992 6-49 22,002 3-59 29,990 15-83
Statement 115-concld. Industrial Persons Males Females category of ,......--A---, ,.....-'----, r--"-----. workers Per- Per- Per-
Number cent- Number cent- Number cent-age age age
VI In Construc-tion 7,331 0-91 7,231 1-18 100 0-05
VII In Trade and Commerce 53,173 6-63 52,256 8'54 917 0'48
VIII In Trans-port, Storage and Commu-nications 27,685 3'45 26,452 4-32 1,233 0'65
IX In other ser-vices 262,274 32'71 205,689 33'60 56,585 29'86
193. The industrial category of workers may be broadly classified into three sectors. They are--
(i) Primary sector-Industrial categories I, II and III
(ii) Secondary sector-Industrial categories IV, V and VI
(iii) Tertiary sector-Industrial categories VII, VIII and IX
The distribution of 1,000 workers by sex in primary, secondary and tertiary sectors for the district
V In manu· facturing other than Household Industry 66,950 8'35 55,116 9'00 11,834 6'25 and for taluks are as follows :-
Statement 116 DISTRIBUTION OF 1,000 WORKERS IN EACH TALUK BY SECTORS OF INDUSTRY AND SEX
Primary ,------"- \
DistrictjTaluk Persons Males Females
Kozhikode District 414 398 469 Badagara taluk 326 314 363
Ernad taluk 507 476 596
Kozhikode taluk 243 248 219
Qui1andy ta1uk 395 409 355
South Wynad taluk 756 714 847 Tirur taluk 40B 401 435
The high percentage of workers in the primary sector of South Wynad taluk deserves special notice. Kozhikode taluk leads in the secondary and tertiary sectors with 21'9 and 53'8 per cent of workers respectively. In regard to female workers in these sectors South Wynad leads in the primary sector, while Quilandy in the secondary and Badagara in the tertiary sectors.
194. About half of the workers are in the age-group 15-34. Workers in this age-group are comparatively higher in all industrial categories except in the industria1!category of cultivators in which the proportion of workers is highest in the age-group 35-59. The number of workers in the age-group 0-14 are less than those coming under the age-group 60 and over in all the industrial categories. The following statement gives the distribution of workers in each industrial category by.broad age-groups.
Secondary Tertiary
Persons Males Females Persons Males Females
6Q
158 138 221 428 464 310 154 154 153 .120 532 484 108 110 103 385 414 301
219 187 372 538 565 409 194 114 423 411 477 222 43 54 20 201 232 133
173 150 255 419 449 310
Statement 117 DISTRIBUTION OF 1,000 WORKERS IN EACH
INDUSTRIAL CATEGORY BY BROAD AG&'GROUPS
Industrial category of workers
Total workers As cultivators As Agricultural labour
ers In Mining, Quarrying,
Live-stock, Forestry, Fishing, Hunting and Plantations, Orchards and other allied activities
At Household Industry In manufacturing other
than Household Industry
Total 0--14
1,000 28 1,000 16
1,000 34
1,000 34 1,000 52
1,000 23
Age-group
15--34 35--59 60 +
498 408 422 432
537 382
466 4ll 499 376
542 393
66 130
46
89 73
41
Age not
stated N N
N N

DISTRIBUTION OF WORKERS BY AGE.GROUPS
Statement 117-concld.
Age-group
Industrial category Total 0-14 15-34 35-59 60+ Age of workers not
In Construction In Trade and Commerce In Transport, Storage
and Communications In Other SerVIces
1,000 8 1,000 11
1,000 11 1,0{)0 30
, N ' denotes negligible figures
499 &428 498 436
530 431 515 409
65 54
28 46
stated
N
N .. N
195. The following statement furnishes the distribution of 1,000 workers in each age-group by industrial categories :-
Statement 118
DISTRIBUTION OF 1,000 WORKERS IN EACH AGE-GROUP BY INDUSTRIAL CATEGORIES
Age-group
Industrial category of workers
Total workers As Cultivators As Agricultural
Labourers In Mining, Quarry
ing, Live-stock, Forestry, Fishing, Hunting and Plantations, Orchards and other allied activities
At Household Industry
ln Manufacturing other than Household Industry'
In Construction In Trade and Com-
merce In Transport,
Storage and Communications
In Other Services
~----------~--------~ 0-14
1,000 95
174
143
123
71 3
26
14 351
15-34
1,000 135
152
107
65
91 9
66
37 338
35-59
1,000 169
132
ll5
60
80 9
71
36 328
60+
1,000 315
98
154
72
52 9
5S
15 230
Age not
stated
1,000 122
152
75
36
84 3
119
24 385
The workers are mostly engaged in the industrial category of other services under each age-group except in the age-group 60 and over. Cultivators account for 31'5 per cent of the total workers under the age-group 60 and over;
196. The position of male workers is almost similar to total workers mentioned in the foregoing paragraph. The following statement sets out the distribution of 1,000 male workers in each age-group by industrial categories :-
61
Statement 119 DISTRIBUTION OF 1,000 MALE WORKERS IN EACH
AGE-GROUP BY INDUSTRIAL CATEGORIES Age-group
Industrial category of workers
Total workers As Cultivators As Agricultural Labour
ers In Mining, Quarrying,
Live-stock, Forestry, Fishing, Hunting, and Plantations, Orchards and other allied activities
At Household Industry In Manufacturing other
than Household Industry
In Construction In Trade and Commerce In Transport, Storage
Age 0--14 15--34 35-59 60 + not
stated 1,000 1,000 1,000 1,000 1,000
114 143 173 333 139
t54 109 97 81 120
202 116 67 35
81 102 4 12
41 87
127 168 34 45
80 22
33 51 99 12 11 4 90 64 146
and Communications 20 i-6 46 17 29 In Other Services 317 350 338 230 361
197. In all the age-groups the proportion of female workers is highest in the category of 'Other Services'. Female workers engaged as agricultural labourers come second in all age-groups except in the age-groups 0-14 and 60 and over. The following statement presents the distribution of 1,000 female workers in each age-group by industrial categories :-
Statement 120 DISTRIBUTION OF 1,000 FE\lALE WORKERS IN EACH
AGE-GROUP BY INDUSTRIAL CATEGORIES
Industrial category of workers
Total wOl'kers As Cultivators As Agricultural Labourers .•
In Mining, Quarrying, Live-stock, Forestry, Fishing, Hunting and Plantations, Orchards and other allied activities
At Household Industry
In Manufacturing other than Household IndU8-try
In Construction
In Trade and Commerce
In Transport, Storage and Communications
In Other Services
Age-group
Age 0--14 15-34 35-59 60+ not
stated
1,000 1,000 1,000 1,000 1,000 65 109 154 228 49
207 286 253 179 295
50 77 72 90 49
211 158 147 204 98
55 57 71 58 17 1 N N N 3 4 6 10
385 405 ,01 292 230 +92

DISTRIBUTION OF WORKERS BY INDUSTRIAL CLASSIFICATION
198. 84'78 per cent of workers live in the rural areas of the district and each taluk by industrial areas of the district. The following statement categories ;-gives the distribution of 1,000 workers in the rural
Statement 121 DISTRIBUTION OF 1,000 WORKERS IN THE RURAL AREAS OF THE DISTRICT AND EACH TALUK BY
INDUSTRIAL CATEGORY OF WORKERS Industrial category r-----------____ .__________ ~
In Mining, Quarrying, Live-stock, Fares try, In Fishing, Manu-Hunting facturing In Tran-and Plan- other In sport,
tations, At than Trade Storage As As Agri- Orchards House- House- In and and In
DistrictJTaluk Culti- cultural, and allied hold hold Cons- Com- Commu- Other (Rural areas only) Total valors labourers activities industry industry truction merce nications Services
Kozhikode District 1,000 184 163 U8 67 60 8 53 25 322 Badagara taluk 1,000 122 94 137 76 44 11 76 31 409 Ernad" 1,000 247 215 51 44 54 9 32 '17 331 Kozhikode " 1,001) 167 114 86 82 78 9 66 36 362 Quilandy " 1,000 134 121 145 129 54 9 61 28 319 South Wynad " 1,000 229 252 275 16 22 5 22 6 173 Tirur" 1,000 170 158 105 57 91 7 63 30 314
In this district) 8'4 per [cent of total rural workers proportion of workers in Parappanangadi, Puthiyangadi are engaged as cultivators. Among the taluks the per- and Tanur towns is engaged in fishing and other allied centage of cultivators is highest in the Ernad taluk. activities. More than 35 per cent workers in Beypore, Highest proportion of workers in South Wynad taluk is Feroke and Olavanna towns are engaged in manu-engaged in mining, quarrying, live-stock, forestry, facturing other than household industry. Maximum fishing, hunting and plantations, orchards and allied workers in all other towns fall in the industrial category activities, while in all ~other taluks workers under of ' other services'. The following statement gives the , other services' claim the highest proportion, distribution of 1,000 workers in towns under each
199. In the urban areas of the district the highest industrial category ;-
Statement 122 DISTRIBUTION OF 1,000 WORKERS IN TOWNS UNDER EACH INDUSTRIAL CATEGORY
Industrial category
--"------------------~ In Mining, Quarrying, Live-stock,
Forestry, Fish-ing, Hunting In Manu-and Planta- At facturing In Transport,
As Agri- tions, Orchards House- other than In Trade Storage and Tot"i As Culti- cultural and other allied hold Household luCon- and Communica- In Other
Town workers vators labourers activities Industry. _Industry struction Commerce tions Servicell Badaga!a
(Municipal) 1,000 27 32 101 96 185 18 151 75 315 Beypore 1,000 18 18 63 66 351 7 78 157 242 Calicut
(Municipal) 1,000 4 1 49 36 203 14 168 111 414 Edakkad 1,000 55 10 13 8 281 14 115 55 449 Elathur 1,000 8 7 149 27 282 13 101 59 354 Feroke 1,000 38 57 20 55 350 21 87 64 308 Kadalundi 1,000 28 32 166 134 199 25 82 47 287 Kornrneri ~ 1,000 24 9 16 19 316 21 121 47 427 Manjeri 1,000 112 89 12 25 149 17 85 56 455 Nellikode 1,000 33 11 14 44 262 20 180 72 364 Olavanna 1,000 57 59 23 128 364 10 71 20 !68 Pantalayini 1,000 28 22 260 94 123 11 157 30 275
62

DISTRIBUTION OF WORKERS BY EDUCATIONAL LEVELS
Statement 122-concld.
Industrial category r'-----
In Mining, Quanying, Live-stock,
Forestry, Fish-ing, Hunting In Manu-and Planta- At facturing
As AgriAs Culti- cultural
vatoIs labourers
tions, Orchards House- other than In Transport
In Trade Storage and Total
workers and other allied hold Household In Con- and Communi- In Other
Town activities Industry Industry struction Commerce cations Services
Parappanangadi
Parayancheri
Puthiyangadi
Tanur
Trikkandiyur
1,000
1,000
1,000
1,000
1,000
23 4
4
43 70
6
26
95
424
6 401 350 20
200. The distribution of workers by educational levels are worth analysing. The male and female workers in different industrial categories classified by
57 109 5 119 25 232 22 281 25 125 75 462 37 113 8 135 53 249
136 55 4 112 32 240
37 94 17 149 65 453
educational levels per 1,000 male and female workers in the rural areas are furnished in the following statement :-
Statement 123
DISTRIBUTION OF 1,000 MALE AND 1,000 FEMALE WORKERS IN EACH INDUSTRIAL CATEGORY
IN RURAL AREAS BY EDUCATIONAL LEVELS
Industrial category Total Illiterate
,.----~
Males Females r---"------,
Males Females
'Total workers
As Culti va tors
As Agriculturallabourer~
In Mining, Quarrying, Live-stock, Forestry, Fishing, Hunting and Plantations, Orchards and other allieq activities
At Household Industry
In Manufacturing other than Household Industry
In Construction
In Trade and Commerce
.In Transport, Storage and Communications
In Other Services
1,000
1,000 I,ll;)\)
1,000
1,000
1,000
1,000
1,000
1,000
1,000
1,000
1,000 1,000
1,000 1,000
1,000
1,000
1,000
1,000 1,000
406
309 668
456
337
216
237 231
403
437
More than half of the male cultivators are literates
without any educational qualification. The pro
portion of literate male workers without educational
level to total male workers is highest in all industrial
,categories except those engaged as agricultural
labourers, in mining and quarrying etc., and in other
813
642
919
822 790
800 782 783
857 802
63
Educational levels
Literate (without educational level) r---"'_______' Males Females
451 528 281
439
531
603 627 585
444
399
140 295
67
147
169
161
218 169
130 114
t ------., Primary or Junior Matriculation and
Basic above ,---A---.
Males Females
120
lSI
50
94
130
171
121
164
130 117
37 62 14
31 41
38
39
10 51
~ Males Females
23 12
11
2
10 15 20
23 47
10
I
N
N N
9
3
33
services, where the illiterate male workers claim the
highest proportion. In regard to female workers
majority of them are illiterates.
201. The following statement sets out the distribu
tion of 1,000 male and 1,000 female workers by
educational levels in the urban areas of the district:-

WORKERS BY OCCUPATIOt'iAL DIVISIONS
Statement 124' DIS'IRIBUTION OF 1,000 MALE AND 1,000 FEMALE WORKERS IN EACH INDUSTRIAL CATEGORY
IN URBAN AREA BY EDUCATIONAL LEVELS In Mining, Quarrying, Live-stock, Forestry, Fishing,
Hunting, In manu-Plantations, facturing In Trans-
Orchards other port, As Agri- and other At House- than In Trade Storage
Total As Culti- cultural allied acti- hold Household In Con- and and Com- In other Educational level workers vators labourers vities Industry Industry struction Commerce munication services
I-IX I II III IV V VI VII VIII IX ~ ,.....-A---. ,..---..A---,. r~ r-""-----'\ r.....A.....-,. ~ ,...-.A--., ,-----A---., ~
M F M F M F M F M F M F M F M F M F M F Total workers ~~~~~~~~~~~~~~~~~~~~
1 Illiterate 275 648 236 548 636 904 625 828 285 706 161 693 173 578 158 800 353 513 265 563 2 Literates without
educational levels 471 194 524 315 290 79 320 126 583 227 582 243 493 89 510 132 428 142 434 171
3 Primary or Junior Basic 159 73 169 116 7l 17 48 34 124 66 206 56 152 44 220 31 131 38 150 93
4 Matriculation or Higher Secondary 78 71 65 21 3 6 8 7 46 7 140 267 99 37 79 247 115 140
5 Technical diploma not equal to degree N N 14 N 2
6 Non-technical diploma not equal to degree N N N N
7 University degree or post-graduate degree other than technical degree 10 4 4 3 6 22 11 5 38 21 7
8 Technical degree or diploma equal to degree or post-graduate degree Total 5 10 2 N 4 N 2 N 22 2 3 22 12 2(}
(i) Engineering N N I 19 N N 1 N (ii) Medicine 1 N 2 2-
(iii) Agriculture N N N (iv) Veterinary or
dairying N N (v) Technology N N (vi) Teaching 1 7 1 4 N N N 4 15
(vii) Others 3 2 N N 1 N 3 2 3 22 5 3
N-Negligible 202. 54 per cent of the total workers excluding
cultivators and agricultural labourers are returned as craftsmen, production process_wcrkers and labourers not elsewhere classified. A detailed classification of workers
excluding cultivators and agricultural labourers intO. occupational divisions aloJ;lg with their total number and sex-wise distribution is given below :-
Statement 125 WORKERS (EXCLUDING CULTIVA'IORS AtloiD AGRICUL'IURAL
Workers Occupational divisions
Males Persons All divisions 560,838 ~,lO3
1 Professional, technical and related workers 30,324 24,496
2 Administrative, executive and mana-gerial workers 15,139 14,932
3 Clerical and related workers 13,244 12,869 4 Sales workers 50,701 49,937 5 Farmers, fishermen, hunters, loggers
and related workers 87,679 73,322 6 Miners, quarrymen and related
workers 3,715 3;631
64
LABOURERS) BY OCCUPATIONAL DMSIONS Percentage distribution
Females Persons Males Females 114,735 100'00 100'00 100'00
5,828 5-41 5-49 5'08
207 2'70 3'35 0'18 375 2'36 2'89 0'33 764 9'04 ll'19 0'67
14,357 15-64 16-44 12'51
84 0'66 0'81 0'07

NON-WORKERS Statement 125-concld.
Workers Percentage distribution Occupational divisions
Persons
7 Workers in transport and communica-tion occupations 15,765
8 Craftsmen, production process workers and labourers not else-where classified 304,364
9 Service, sport and recreation workers 38,379
10 Worker'! not classifiable by occupa-tion 1,528
Non-workers 203. The non-working population of this district
comes to 16'1 per cent of the total non-workers of the State. Of the 181akhs non-workers of this district 11 lakhs are females. The following statement shows the distribution of non-workers by age-group :-
Statement 126 DISTRIBUTION OF NON-WORKERS BY AGE-GROUP
AND SEX Non-workers Distribution
Age-group > ~ Persons Males Females Per- Males Fe-
sons males
All ages 1,815,483 688,760 1,126,723 1,000 1,000 1,000
0-14 1,100,381 558,705 541,676 606 811 481
15-34 409,423 83,173 326,250 226 121 ~90
35-59 208,131 19,424 188,707 115 28 167
60+ 97,027 27,234 69,793 53 40 62
Age not stated 521 224 297 N N N
N-Negligible
""'\
Males Females Persons Males Females
15,647 118 2'81 3'51 0'10
228,045 76,319 54'27 51'12 66'52
21,739 16,640 6·84 4'87 14'50
1,485 43 0'27 0'33 0'04 204. Among the non-working population 44 per
cent are dependants, infants and disabled persons.
Their proportion is much higher in rural areas when
compared to urban areas. Better educational facilities
in towns contribute to the higher percentage of full
time students in these regions. Among women, th?se
engaged in household duties, claim the highest propor
tion while dependent infant, and disabled females
come second. It is significant to note that 24 out of
every 1,0CO persons in urban areas are either seeking
employment for the first time or employed before but
now out of employment and seeking work. The fol
lowing statement shows the distribution of 1,000 non
workers by type of activity in rural and urban areas:-
Statement 127 DISTRIBUTION OF 1,000 TOTAL MALE AND FEMALE NON.WORKERS IN THE DISTRICT BY TYPE OF
ACTIVITY AND BY RURAL AND URBAN AREAS Total
Type of activity P M F
Total Don-workers 1,000 1,000 1,000
(i) Full-tim!'! students 237 363 (ii) Household duties 295 (iii) Dependents, infants and
disabled 441 581 (iv 1 Retired, reritier' or inde-.
pendent means 8 14 (vl Beggars, vagrants, tc. 5 8
(vi) Inmates of penal, mental and charitable institutions N
(vii) Persons seeking employ-ment for the first time II 26
(viii) Persons employed before, but now out of employment and seeking work 3 7
N-Negligible
205. In the rural areas of the district there are 16,974 \lnemployed persons. Of these 28 per cent are confined to Kozhikode taluk closely followed by Quilandy and Tirur taluks. More than 80 per cent of the unemployed persons in the rural areas belong to
106/1-9
160 476
356
4 3
N
N
65
Rural Urban ---. r----A - __ -,
P M F P M F 1,000 1,000 1,000 1,000 1,000 1,000
231 354 156 266 407 182 291 470 314 501
454 597 366 379 502 306
7 13 4 II 23 3 5 8 3 5 8 3
N
9 22 17 42 3
2 5 N 7 17
the age group 15-34. The following statement presents the tal uk-wise
figures of unemployed persons by age-groups for rural areas :-

UNEMPLOYED PERSONS BY'EDUCATIONAL LEVELS
Statement 128 UNEMPLOYED PERSONS IN RURAL AREAS OF EACH TALUK BY AGE-GROUP
Persons seeking employment for the first time Persons employed before but now out of employment and seeking work
District I Talllk (Rural areas) r---------------~------------~ ~------------~-------------~ Total 0-14 15-34 35-59 60+ Age not Total 0-14 15-34 35-59
stated 60+ Agenot
stated Kozhikode District 13,875 1,350 11,918 591 9 7 3,099 37 1,805 1,133 119 Badagara taluk 2,301 258 1,915 125 2 1 523 8 274 201 40 Ernad " 1,679 204 1,422 51 1 1 404 8 218 153 23 Kozhikode" 3,959 260 3,498 194 2 5 865 8 510 325 21 Quilandy 3,034 174 2,729 129 2 502 3 321 166 11 South Wynad " 380 38 332 10 171 2 101 63 5
5
2 I 1
Tirur " 2,522 416 2,022 , 82 2 634 8 381 225 19 1 206. Only about 15 per cent of the unemployed Matriculation and above. The following statement gives
males under the age-group ,15 years and above are the unemployed persons in the rural areas of the district
illiterate. Educated unemployment is largest among under the age-group 15 years and above seeking females. More than 469 out of 1,000 unemployed employment (whether for the first time or not) and
females have passed the educational mark of their distribution by sex and educational levels :-State ment 129
PERSONS UNEMPLOYED AGED 15 AND ABOVE IN RURAL AREAS BY SEX AND BY EDUCATIONAL LEVELS Unemployed persons aged 15 and above Percentage distribution
Educational levels Persons Males
Total unemployed 15,587 14,540 Illiterate 2,356 2,135 Literate (without educational 6,315 6,207
level) Primary or Junior Basic 4,153 3,926 Matriculation and above 2,763 2,272
207. Out of 6,988 total unemployed persons in the urban areas, 4,929 persons are seeking employment for the first time. The following statement furnishes the number of unemployed persons of 15 years and above
Females 1,047
221 108
227 491
,_________ _.IL_ _____ --,.
r-Persons 100'00 15'12 40.51
26'64 17'73
Males Females 100'00 100'00 14'68 21'11 42'69 10'31
27'00 15'63
21'68 46'90
in the urban areas of the district seeking employment (whether for the first time or not) by sex and educa. tionallevels :-
Statement 130 PERSONS UNEMPLOYED AGED 15 AND ABOVE BY SEX AND EDUCATIONAL LEVELS IN URBAN AREAS
Educational levels
Total 1 Illi tera te 2 Literate (without educa
tionallevel) 3 Primary or Junior Basic 4 Matriculation or Higher
Secondary 5 Technical diploma not equal
to degree 6 Non-technical diploma not
equal to degree 7 University degree or post
graduate degree other than technical degree
3 T echmcal degree or diploma equal to degree or postgraduate degree Total
(i) Engineering (ii) MediciRe
Total unemployed
P 6,988
665
2,624 2,031
1,545
9
74
39 2
M 6,327
627
2,583 1,939
1,095
9
50
24 2
F 661 38
41 92
450
24
15
66
Seeking employment for the
P 4,929
358
1,686 1,497
1,299
6
52
31 1
first time
M 4,380
341
1,650 1,421
908
6
34
20 I
F 549
17
36 76
391
18
11
Persons employed before but now out of employment and
P 2,059
307
938 534
246
3
22
8 I
seeking work
M 1,947
236
933 518
187
3
16
4 I
F 112 21
5 16
59
6
4

HOUSEHOLD ECONOMIC DATA
Statement 130-concld.
Educational level
(iii) Agriculture (iv) Veterinary or Dairying (II) Technology
Total unemployed
p M F
(vi) Teaching 4 I 3 (vii) Others 33 21 12
Household Economic Data 208. Upto and inclusive of the Census in
1951 the economic tables were confined to the population as such and did not extend to household units. But in the 1961 Census certain items of economic data relating to the households as such were collected in addition to the economic data pertaining to each individual of the household. The data ' thus collected in respect of households related to ho~Se'hold cultivation and household industry. The household cultivation for this purpose was defined to cover plots or parcels of land which are cultivated by the household itself, i.e., lands which lie within the village or in an adjacent village or within such a distance as to enable the household to work on the land or actively supervise its cultivation. If, however, the head of the household insisted that he was cultivating the land situated at a distance from his household, his statement was accepted and such land also was treated as coming within the scope of household cultivation. Cultivation for purposes of the above definition was taken to involve plbughing, sowing and harvesting and consists of the production of cereal crops (including Bengal gram) such as rice, wheat, jower, bajra, maize; roots and tubers iike potato, yam, beet, sugarcane, etc., production of puhes, such as arhar, moong, mazur, urd, khesari, other grams, production of raw jute, raw cotton and kindred fibre crops. It does not include the following :-
A. Other Field Produ.ces :-
Production of other crops including vegetables not covered by the above items.
2 Production of fruits and nuts in plantations, vines and orchards (like cocoanut, areca-nut,
cashewnut, etc.) 3 Production of wood, bamboo, cane, reeds,
thatching grass, etc. 4 Production of juice by tapping palms. 5 Production of other agricultural produces
(including fruits and nuts not covered by Sl. No. 2 andfl~wers) not covered above.
B. Plantation crops :-I Production of tea in plantation. 2 Production of coffee in plantation.
106/1-9a 67
Seeking employment for the first time
Persons employed before but
now out of employment and seeking work
~------~------~ r-______ A-_____ ~
p
2 26
M
19
F
2 9
p
2 5
M
1 2
3 Production of rubber in plantation.
F
1 3
4 Production of tobacco in plantation (does not include tobacco which is cultivated in rota_ tion with other cereal crops, in which case it would go under cultivation).
5 Production ofganja, cinchona, opium, poppy, saffron, etc.
6 Production of other plantation crops not covered above (under this category cardamom has been included as a plantation crop).
209. Household industry was defined as an industry not on the scale of registered factory conducted by the head of the household himself and or mainly by the members of the household at home or within the village in rural areas and only at home in urban areas. The particulars given in' the following paragraphs are based on the data tabulated from a 20 per cent sample of household schedules.
210. Households engaged neither in household cultivation nor in household industry come to 73 per cent of the total sample households taken for detailed study. The proportion of households engaged exclusively in household cultivation is higher in rural areas when compared to urban areas. The percentage of " households engaged in household industry only" is more or less the same in rural as well as in urban areas. The following statement illustrates the above analysis:-
Statement 131 DISTRIBUTION OF 1,000 SAMPLE HOUSEHOLDS AMONG
(i) ENGAGED NEITHER IN HOUSEHOLD CULTIVATION NOR IN HOUSEHOLD INDUSTRY; (ii) EN.
GAGED EITHER IN HOUSEHOLD CUL TI· VATION OR IN HOUSEHOLD INDUSTRY
BUT NOT IN BOTH; AND (iii) EN. GAGED BOTH IN HOUSEHOLD
CULTIVATION AND HOUSE-HOLD INDUSTRY IN
THE DISTRICT
Total Rural
All households 1,000 1,000 I Households engaged neither
In household cultivation nor in household industry 729 698
2 Households engaged m household cultivation only 215 245
Urban 1,000
914
.19

HOUSEHOLD CULTIVATION
StatemeDt 131-concld. Total Rural Urban
3 Households engaged in household industry only 49 49 45
4 Households engaged both in cultivation and household industry 7 8 2
211. The proportion of households engaged neither in cultivation nOr in household industry is minimum in South Wynad taluk w hen compared to other taluks of the district. South Wynad taluk is still conspicuous in regard to number of households engaged in household cultivation only. This proportion of households is far above the district rural percentage. The following statement shqws the distribution of sample houses in each tal uk by their broad classification :-
StatemeDt 132 DISTRIBUTION OF 1,000 SAMPLE HOUSEHOLDS IN THE
RURAL AREAS OF THE DISTRICT (i) ENGAGED NEITHER IN HOUSEHOLD CULTIVATION NOR
IN HOUSEHOLD INDUSTRY (ii) ENGAGED EITHER IN HOUSEHOLD CULTIVATION
OR HOUSEHOLD INDUSTRY BUT NOT IN BOTH; AND (iii) ENGA.
GED BOrn IN HOUSEHOLD CULTIVATION & HOUSE
HOLD INDUSTRY
Bada- Kozhi- Qui- South gara Eroad kode landy Wynad Tirur
Taluk Taluk Taluk Taluk Taluk Taluk Total households 1,000 1,000 1,000 1,000 1,000 1,000 1 Households
engaged nei-ther in house-hold cultiva-tion nor in household industry 778 664 708 670 654 726
2 Households engaged in household cultivation only 172 297 230 213 323 227
3 Household engaged in household industry only 44 34 56 103 13 41
4 Households engaged both in household cultivation and house-hold industry 6 5 6 14 10 6
212. An analysis of the distribution of households by the type of interest in the land cultivated shows that in the district the largest percentage of households engaged in household cultivation are only tenants of private persons or institutions. The next largest
68
percentage of households are those cultivating land either owned or held from Government only. The posi. tion is true in respect of rural and urban areas. The following statement gives the percentage distribution of sample households engaged in household cultivation in the district by interest in land cultivated by them.-
StatemeDt 133 PERCENTAGE DISTRIBUTION OF SAMPLE HOUSE
HOLDS ENGAGED IN HOUSEHOLD CULTI. VATION IN THE DISTRICT CLASSlFmD
BY THE INTEREST IN LAND
Interest in land cultivated Total households
Total 100'00
Rural 100'00
Urban 100-00
I Owned or held from Govern-ment 15'78 15'11 39'77
2 Held from private persons or institutions for payment in money, kind or share 74'66 75'30 51'74
3 Partly held from Government and partly from private persons for payment in money, kind or share 9-56 9' 59 8'49
213. Among the households in the district cultivating land owned or held from Government 33'15 per cent cultivate less thln one acre of land only. The percentage of households shows a declining trend with the increasing slabs of size of land cultivated except in slabs 1·0 to 2'4 acres, 15'0 to 29'9 acres and 30'0 to 49'9 acres. In regard to households held from private per. sons or institutions for payment in money, kind or share the percentage of households progressively declines with the increasing slabs of size of land with the exceptions of the slabs 1·0 to 2'4 acres and 15'0 to 29'9 acres. Given below is a statement showing the percentage of sample households cultivating land under each type of interest by size of land cultivated in the district.
Statement 134 PERCENTAGE OF SAMPLE HOUSEHOLDS CULTIVAT.
ING LAND UNDER EACH TYPE OF INTEREST BY SIZE OF LAND CULTIVATtD IN THE DISTRICT
Size of land in acres All households Less than I acre 1'0- 2'4 acres
2'5- 4'9 "
Percentage of household cultivated
Owned or )le1d from Government
100'00 33'15 39'59 16'03
Partly held from Gov-
Held from ernment private and partly
persons or from private institutions persons or
for payment institutions in money, for payment kind or in money,
share kind or share 100'00 100'00 38'78 9'00 39-47 34'16 14'18 32'76

HOUSEHOLD INDUSTRIES
Statement 134-(concld.)
Percentage ef household cultivated
Partly held from Gov-
Held from ernment private and partly
persons or from private institutions persons or for payment institutions
Owned or in money, for payment held from kind or in money,
Size of land in acres Government share kind or share
5'0- 7'4 acres 6'41 4-57 12-74 7-5- 9-9
" I-51 1-28 4-56
10-0-12-4 "
1-31 0'90 3'04 12'5-14'9 "
0'36 0'19 1-14 15-0-29-9
" 0-79 0-53 2-12
30-0-49'9 " 0-43 0-04 0-43
50-0+ 0-16 0-01 0-05 Unspecified 0-26 0_05
214. Among the total workers engaged in households with household cultivation only 62·84 per cent are family workers against the remaining 37-16 per cent of hired workers. 97'64 per cent of the total family
workers and 93'08 per cent of hired workers in the above households live in rural areas. Taking the workers engaged in both households cultivation and household industry 73'99 per cent workers are returned as family workers while the rest are hired workers. In the rural areas of the district the percentages of family workers and hired workers in the category of households both engaged in household cultivation and household industry are 96- 50 and 87'43 respectively.
215. The percentage of hired workers to total workers employed by the households engaged in household cultivation only shows an increasing trend with the increase in size of land cultivated except in respect of the slab 10'0 to 12'4 acres and 12'5 to 14'9 acres. The average number of workers in households engaged in household cultivation only is 2'66 persons against 3'49 in the households engaged in both household cultivation and household industry. The following statement presents the average number of family workers and hired workers engaged in .the types of households mentioned above :-
Statement 135 THE AVERAGE NUMBER OF FAMILY AND WREn WORKERS AND THE PERCENTAGE OF lURED WORKERS OUT OF
THE TOTAL WORKERS ENGAGED BY THE SAMPLE HOUSEHOLDS IN HOUSEHOLD CULTIVATION ONLY AND HOUSEHOLDS ENGAGED BOTH IN HOUSEHOLD CULTIVATION AND HOUSEHOLD INDUSTRY
Households engaged in both household cultivation and household industry Households engaged in household cultivation only
,.---------~----------------, ,------"-----------. Average number of
Size of land acres
Total workers
Family workers
Hired workers
All sizes 2'66 1'67 0'99 Less than 1 i 1-76 1-41 0-35
1.0 - 2.4 2-48 1-68 0'80 2.5 - 4-9 3-43 1-94 1-49 5-0 -7-4 4-12 2-08 2-04 7-5-9-9 7-37 2-20 5-17
JO'O-I2-4 5-30 2-19 3-11 12-5 - 14-9 6-07 2-34 3-73 15-0-29-9 7-21 2'08 5'13
,30-0 - 49-9 7-96 I-50 6-46 50'0 + 24-63 1-88 22-75 Unspecified I-57 I-57
216. The number of households engaged in household industry classified by the principal household industry in the district has been given in Table B XIV Part B of this volume. The following statement shows the first ten ranks of household industries on the basis of this table :-
Statement 136 THE FIRST TEN RANKS OF HOUSEHOLD INDUSTRms
IN THE DISTRICT BASED ON 20 PER CENT SAMPLE HOUSEHOLDS
Rank Household Industry 1 Manufacture of coir and coir products
69
Percentage of hired
workers to total workers
Total workers
Average number of
Family Hired workers workers
Percentage of hired
workers to total worker.
37-16 20-04 32'33 43-47 49'48 70-19 58'67 6H5 71'15 81-16 92-39
3-49 2'58 0'91 3-04 2-55 0-49 3-73 2-54 1'19 4-22 2-71 1·51 5-05 2'70 2-35 4-50 3-00 1.50 3-00 3-00 1-00 1-00 6-33 3-67 2-66
3-00 3-00
Statement 136-(conld.)
26'01 15-98 31-98 35-69 46-53 33-33
42'1l
Rank II
Household Industry Manufacture of materials from cork, bamboo, cane,
leaves and other allied products III Cotton weaving in handlooms IV Manufacture of jewellery, silverware and wares
using gold and other precious metals V Manufacture of sundry hardwares such as G_I. pipe,
wi,re net, bolt, screw, bucket, cutlery VI Manufacture of earthenware and earthen pottery
Manufacture of bidi VII VIII Production of rice, atta, flour, etc_ by milling,
dehusking and processing of crops and food grains

GAZETTEER-BADAGARA TALUK
Rank
Statem.ent 136-concld) Household Industry
IX Making of textile garments including rain coats and, headgar
{
Production of indigenous sugar, gur from sugarcane or palm juice and production of candy.
X Production of other food products such as sweetmeat and condiments, muri, murki, chira, khoi, cocoa,chocolate, toffee, lozenge
217. The largest per cent of households in all the three categories of households given in the following statement have 4 to 6 members, while the lowest per cent are confined to single member households. The following statement sets out the percentage of sample households,classified ~y size and participation in household cultivation or household industry in rural areas :-
Statement 137 PERCENTAGE OF SAMPLE HOUSEHOLDS CLASSIFIED
BY SIZE AND PARTICIPATION IN HOUSEHOLD CULTIVATION OR IN HOUSEHOLD INDUSTRY
IN RURAL AREAS OF THE DISTRICT Percentage of
----, Households Households Households
engaged nei- engaged in engaged in
Size of sample ther in household household
household industry cui ti va tion households cultivation only nor in house-hold industry
TOTAL lOll-OIl 100.00 100000 Single'member house-
hold 4'30 2'01 1'53 2.:.._ 3 members 18-43 14'51 10'45 4-6
" 46'52 45'37 39'03
6-9 " 24'17 27'93 32'70
10 members and over 6'58 10'18 16'29 Gazetteer
Badagara Taluk (Area: 212'3 sq. miles; Population: 319,913)
218. Badagara taluk is bounded on the north by the Tellicherry taluk, on the east by the North Wynad and South Wynad taluks, on the south by the Quilandy taluk and on the west by the Arabian Sea. This new taluk was formed on 1st January 1957. Consisting of 47 revenue villages this taluk is divided into two fukas, viz, Badagara and Nadapuram. The chief crops of this taluk are rice, cocoanut and pepper.
Badagara 219. Badagara, the northern-most town of this dis
trict lies just north of Kotta or Kuttiyadi river. This municipal town, formed on 1 st October 1958 with an area of 8.24 sq. miles and comprising three revenue villages viz, Badagara, Nadukkuthazha and PuthU_ ppanam, is situated on the sea-coast at the northern extremity of the Elathur-Badagara back-water. The
70
town is linked with Calicut by west-coast road and by a broadgauge railway line, the distances being 29 miles and 28 miles respectively. The railway line runs parallel to the west-coast road and the Arabian sea. The historical ruined fort situated here originally belonged to the Kolattiri Rajas. In 1564 it was acquired by theKadattanad Raja but was taken over by the Mysoreans at a later period. In 1790 it was taken from Tippu Sultan by the British who handed over the fort to the Kadattanad Raja. He converted this historical monument into a Brahman feeding house, which wasafterwards transferred to the Paravantala temple in Badagara village which is dedicated to Subramanyan. This historical temple was reconstructed by the Kadattanad Raja probably in the year 1864. Near this temple there is an important well. "The well is a fine masonry-built structure, still in excellent preservation and at the spot where Tacholi Othenan is said to have cleared it, it is twenty feet six inches between perpendiculars. There is a massive conical-shaped block of laterite some three feet in height planted erect in the ground about fifteen paces from the well, and one mythical tradition says he jumped the well with this and a jack tree in his arms .............. " Tacholi Othenan, the hero of the Ballads of North Malabar was born at Tacholi Manikkoth near Meppayil, a mile from Badagara town. The Lokanar kavu, the historical temple, which is mentioned very frequently in the Vatakkan Pattukal is situated in Memunda village, 3 miles south-east of Badagara town. The Jamayath Mosque situated on the beach is 114 by 42 feet. There is also a Catholic church here. Badagara Port is open to foreign trade and usually coasting steamers and sailing vessels call at the port. The Government Arts and Science College is located at Madappally about 3 miles from Badagara. There is a Secondary Health Centre and an Ayurvedic Hospital besides many public insti
tutions. Chombala
220. Chombala, situated five miles north of Badagara, is a Basel Evangelical station. The mission was started there in 1849. Chombala Mission has its branches at Mahe, Badagara, Mavarattu, Perambra and Karakkad.
Kuttipuram 221. In Kuttipuram village, 10 miles north-east of
Badagara is situated the ancient palace of Kadattanad Valiya Raja. The general orders issued by Tippu Sultan to all the different detachments of his troops are available from the records found in the Palghat Fort after its capture in 1790. In pursuance of this direction

GAZETTEER-ERNAD TALUK
2,000 Nairs and their families living in this old fort at Kadattanad were attacked by the Mysorean detachments in March 1789 and they were subjected to submission to Tippu's terms which were "a voluntary profession of the Muhammadan faith, or a forcible conversion with deportation from their native land. The unhappy captives gave a forced assent, and on the next day the rite of circumcision was performed on all the males, every individual of both sexes being com. pelled to elose the ceremony by eating be~f". There is a Siva temple at Kuttipuram.
Kuttiyadi 222. Kuttiyadi is situated about eighteen miles from
Badagara. There is an old redoubt which belonged to the Kottayam Raja and on a later date was seized by the Mysoreans. This fort mounting 4 guns was taken over by the Kottayam Raja in May 1790. Kuttiyadi Pass was strategically important at the time of Pazhassi's freedom struggle. 'In the course of excava· tions conducted in 1957 the shafts of the two golden swords supposed to have been used by the Paz hassi Raja were unearthed'. There is an old Jamllyath mosque here. •
Nadapuram 223. About eleven miles north-east of Badagara is
situated Nadapuram. There is an old Jamayath Mosqu~ at Nadapuram. Two miles from Nadapuram is located the Orakatari Ganapathi temple. The Thalapoli festival conducted here in January-February attracts thousands of devotees. Ernad Taluk (Area: 873'3 sq. miles; Population
524,294). 224. Ernad is the largest taluk in the State. It is
bounded on the north by Kozhikode and South Wynad taluks on th~ east, by the Nilgiri district of Madras State, on the south by Perintalmanna and Tirur taluks. and on the west by Tirur. taluk. The eastern portions (If this district 'Qave unsurveyed areas to the extent of 327'84 sq. miles. Portions of this taluk were transferred to the newly formed Tirur taluk on 1st January 1957. The present Emad taluk consists of four firkhas viz kondotti, Malappuram, Manjeri and Wandur. Ther~ are 64 villages in the taluk including one town. The . i:hief crops are pepper, arecanuts, cocoanuts and rice. This taluk has the world's oldest teak plantation. Areacode .
225. Nine miles of Kondotti, Areacode is situated on the south bank of Beypore river. Areacode and the
.. neighbourhood were the scenes of many murders and forcible conversions during the Malabar Rebellion which broke out during 15th October 1921. Small boats
71
can ply at all seasons of the year as far up the Beypore river as Areacode. Areacode has a consider. able timber trade from very early times. Pottery is the main industry here. 'There are several undeciphered Vattezhuthu pillar inscriptions here. In the course of the construction of a local school some caves were excavated. The caves six feet deep lead to two rooms and a kitchen underground where shreds of pottery and household utensils were found". The Sullamuslam Arabic College is situated here besides one Government Dispensary and an Oriental Secondary School. Kalikavu
2~6. Kalikavu is situated about twenty-one miles north-east of Manjeri. There are a number of rubber plantations here. Kalikavu was also a centre of 1921 Muslim out-breaks. Kalikavu is linked with Edavanna and Nilambur by motorable roads. Karuvarakundu
227. Karuvarakundu is about 27 miles away from Nilambur. At Karuvarakundu there are some good tea estates and rubber plantations, besides thick forests. The waterfall, a few caves, temples, churches and mosques are some of the items of importance. Kondotti
228. About 16! miles from Calicut, Kondotti is an important place on the Calicut-Madras Road. Kondotti, which was the stronghold of the Muslims, was ablaze with rebellion iIi 1921. Some fanatics even raided the Sub-Registrar's Offi~e on 23th October 1921 and burnt the records. Here is a famous mosque called Kondotti thakkiya which is believed to have been built in 948 M.E. (A.D. 1773) by the then Tangal named Muhammed Shaha and in which lie his mortal remains. The Valia Nercha is celebrated here for five days annually from 13 to 17 Arabic month (Kumbhom -Meenom). The Pazhayangadi mosque is about five centuries old. There are many public institutions here. Kottakkal
229. A place well known for the Ayurvedic system of treatment Kottakkal is situated seven miles from Malappuram. Kottakkal has a fortified palace of the Kizakke Kovilakam Rajas, one of the three branches of • the Zamorin's family. The Ayurvedic College (Patasala) is attached to the Kottakka1 Arya Vaidyasala established as early as 1902. Malappuram
230. Malappuram is an important place on the Calicut.Madras Road, the distance from Calicut being only la~uf 32 miles. Seven miles south of Manjeri, Malappuram is one of the Revenue Divisional

GAZETTEER-KOZHIKODE TALUK
Headquarters of KQzhikode District. The ruined fort of Tippu Sultan stands here as a historical monument. Malappuram was the centre of Muslim risings of 1841, 1843, 1849, 1851 and 1921. The Malabar Special Police which was formed to suppress the Muslim fanatical outbreaks of 1921 still has their headquarters here. There are two churches at Malappuram one of which is an old Roman Catholic Church. The Malappuram Jamayath Mosque is of some importance. The annual N ereho is held here usually for four days in the month of April. The sacred places of Muslims in addition to the above mosque are Hajyar Palli and Sayyid's Jarum. Besides the above religious institutions there are three temples dedicated to Siva viz, Tripuranthakan temple, Mannar' temple and Channath temple. There are a number of public institutions here.
Manjeri 231. Manjeri, the headquarters of Ernad Taluk, is
situated 27 miles from Calicut. There are a number of pre-historic sites here. For a short period in 1766 Manjeri was Hyder Ali's headquarters. With Manjeri as headquarters Hyder Ali's troops spread over the face of the country and they set fire to houses, cut down fruit trees and destroyed cattle and many unhappy inhabitants were brought as prisoners. According to Wilk's Historical Sketches these prisoners were at first either beheaded or hanged 'but as their numbers increased, Hyder conceived the plan of sparing them for the use of his former territories. This cure for rebellion in one province and for defective population in another, of which such numerous examples occur in the jewish history, was not successfully practised by Hyder. The captives were uncared for, and owing to privations and a violent change of climate, of 15,000 wh~ were removed, it is supposed that 200 did not survive the experiment'. The historically important Manjeri Political Conference was held here on 28th April 1920 to discuss the Montague-Chelmsford Reforms of 1919. This Conference rejected the Chelmsford Reforms against the strong opposition of Dr. Annie Beasant who was present at the Conference. Manjeri was also a centre of the Malabar Rebellion of 1921. There is a pagoda known as Srimuttra Kunnu or Kunnath temple dedicated to Durga. The inscription in the east wall of the temple shows that it was built by Manavikrama in 827 M.E. or (1651 A.D.). Another inscription on the north wall states that it was built by the same gentleman on 333 M.E. (1657 A.D.). This temple was attacked by the Muslim fanatics under the leadership of Attan Kurikkal in 1849. The annual Pooram festival is held during the month of March-ApriI.
72
There are three mosques and two churches, Protestant and Catholic at Manjeri. Besides the above there are many public institutions including taluk office, munsiff's court, etc. Manjeri continued as a census town in 1961.
Nilambnr 232. Situated 45 miles from Calicut on the Calicut.
Gudalur Road, Nilambur is an important centre for timber trade. Nilambur is connected with Shoranur junction with a broadgauge railway line. Nilambur is conspicuous for its large Teak plantations. The Nilambur Teak Plantations were first suggested by Mr. Conolly, Collector of Malabar in 1840. The bamboos obtained from the forests of Nilambur are largely used by the Birla's Paper Pulp Factory at Calicut. There are two temples here one dedicated to Siva and the other to Vettakkorumakan. The latter temple belongs to the Nilambur Kovilakom. There are large dolmens, menhirs and rock-cut caves here. Kozhikode Taluk (Area: 379'1 sq. miles; Population:
660,372). 233. Kozhikode taluk is bounded, on the north by
the Quilandy taluk, on the east by South Wynad and Ernad taluks, on the south by Ernad and Tirur taluks and on the west by the Arabian Sea. Consisting of 71 villages this tal uk is divided into four firkas viz, Chevayur, Koduvalli Kozhikode town and Kunna. mangalam. Rice, cocoanuts, pepper and betelnuts are the important crops. Beypore
234. Beypore lies at the mouth of Beypore river six miles south of Calicut. In 1961 Beypore is treated as a Census town. It consists of the area falling within Beypore and Cheruvannur villages and portion of N aduvattom village. Vaypura or Vada Parappanad are the former names of Beypore. Tippu Sultan visited Beypore twice during April 1788. The Calicut Resident in his letter dated 14th April 1788 says that' the Nabob has been twice to Beypore, where on the 12th he began the construction of a strong fort, and it is supposed he intends to transfer the trade of Calicut thither', and next day . he reported that' the NabQb was to proceed that day to Beypore to select a site to. build his new city' . Even now Beypore flourishes as a~ important trade centre. Beypore Port is now part of' Calicut Port. The Siva temple at Beypore is conspicuous for its beautiful carvings. The boat-building yard here is under construction. Cheruvannur village is famous for its tile works and other by-products of clay. The tiles produced here are transported to Burma, Ceylon ~and Singapore. Calicut
235. The early history of Malabar centred round Calicut. This important town is believed to have been founded by the Zamorin. The Zamorins were

GAZEITEER-KOZHIKODE TALUK
origiruilly Eradis of Nediyirippu in Ernad taluk, The Zamorin in his attempts to establish his supremacy in Malabar had to fight Porlattiri for almost 48 years. After that he had to adopt strategical methods and he attacked Porlattiri's fort and compelled the latter to take refuge in the Kolathiri Kingdom. Ibn Batuta who visited Calicut during the period 1342-47 records that Calicut is 'one of the great "'Orts of the District of Malabar and in which merchants from all 'parts are found', The Chinese Muslim Ma Huan who came to Calicut in the earlier periods of the 15th ct:ntury also gives interesting accounts of the people, their customs and manners. Abdur Razzak, the Persian ambassador;. visited Calicut as early as 1442. He described Calicut as Ca perfectly secured harbour, which, like that of Ormuz, brings together merchants from every city and every country'. Two years later Nicolo Conti the first Christian traveller described Calicut as a maritime city of 8 miles in circumference, a notable emporium for all Il,ldia abounding in pepper, lac, ginger, a larger kind of cinnamon, myrobalans and Zedari'. Other important foreign travellers are Athanaseus Niketen (Russian traveller) Hie roinimo Di Santa Stefana (Genovese traveller) and Pero De Covilham (a Portuguese diplomat). On 27th May 1498 Vasco Da Garna landed at Kappad a few miles north of Calicut for trade contacts with the Malabar coast. His visit to Calicut is an epoch making event in the history of Kerala, Portuguese established a fort in Calicut in 1513. The English, thq French and the Danes were allowed by Zamorin to construct forts at Calicut. The old palace of Zamorin is situated at
I Kottaparambu very near Mananchira. Calicut Muni, cipality was established on July 3rd 1866. Measures
are being_ take:t;l to convert this Municipality into a Corporation. The major Government factories situa~ ted here are the Kerala Soap Factory, the Government Hydrogenatil;>n . Factory and the Government Oil Factory. The timber yard at Kallai is the second largest in the world. Calicut is still an important port on the west-coast. The lighthouse at Calicut was constructed in February 1847. The important temples are Sreekanteshwar temple, the Tali temple, Tiruvannur temple, Varakkal temple, Bilathikulam temple, Arikkodi Kavu temple and Kokkolikottu temple. The important mosques are the Kuttichira mosque, the Pazhaya Palli and Sheik kinde Patti. The construction of the ancient Roman Catholic Church dedicated to , Mater de Deos ' was completed in 1725. "Though from the architectural point of view, it is lacking in merit, the building is picturesque still. The great bell is dated 1750; the smaller and older bell cracked and
106/1-10
was recast in 1853. The images of the virgin Mary and the crucifixion and a painting of the Madonna and Child were brought out by the Portuguese for their Chapel at Tanur, and thence moved to Calicut. They are reputed to be the work of the best artists of the age and are still in a state of good preservation". The then Zamorin granted a garden in perpetuity for the support of the church. In December 1878 the Malabar and Canara Portuguese Missions were, by the Bull of Pope Pius IX, placed under the jurisdiction of Jesuits under whom it remains. The Anglican and Basel Mission churches at Calicut were built during the middle of the nineteenth century. There are a good number of schools and colleges both within and in the neighbourhood of Calicut. In 1950 the All India Radio Station was started here. Besides the above institutions there are a number of hospitals, dispensaries, public offices, etc., including one Medical College. Mavoor
236. Mavoor village with its pulp factory is growing as an industrial centre. The factory will be commissioned shortly.
Tamarasseri 237. Tamarasseri is an important place on the
Calicut-Wynad route. This is one of Tippu Sultan's Gun-roads. Tamarasseri Ghat is used for the export of coffee and other articles from Wynad. Qui1andy Taluk (Area: 294' 5 sq. miles; Popula
tio : 366,343) 238. The present Quilandy taluk was part of former
Kurumbranad taluk of Malabar District. The new taluk was formed on 1st January 195 -. The Kotta or Kuttiyadi river separates Quilandy taluk from Badagara. This taluk is bounded on the north by the Badagara taluk, on the east by South Wynad taluk, on the south by Kozhikode taluk and on the west by the Arabian Sea. It consists of three firkas, viz , Balussery, Perambra and Quilandy. There are 57 revenue villages in the taluk. One of them is a census town, Pantalayini. The chief crops of this district are rice, cocoanut and pepper.
73
Balusseri 239. Balusseri is an important place of this taluk.
Here is a famous temple dedicated to Vettakorumakan which is now in ruins. There is a Government High School and a National Extension Block here.
Kappad 240. Vasco Da Gama dropped his first anchor here
in the year 1498. Gaspar Correa describes his first landing as follows:-"The ships," after sighting Mount Deli and passing Cannanore, "continued running
GAZETTEER-SOUTH WYNAD TALUK
along the coast close to land, for the coast was clear, without banks against which to take precautions; and the pilots gave orders to cast' anchor in a place which made a sort of bay, because there commenced the city of Calicut. This town is named Capocate" (Kappad) • It is about a mile west of the Tiruvangoor Bazaar which is at the 10th mile of Llalicut-Cannanore road. A monument has been erected here.
Kottakkal 241. Kottakkal is situated on the mouth of Kuttiyadi
river, three miles s:mth of B:l.dagara and one mile west of Moorad 'mridge. Here one can see the remnants of the historic fort of Kunhali Marakkar who fought heroically against the Portqguese. This place is in Payyoli village. In olden days there were 40 mosques for each of the 40 muslim families here. They belonged to the Royal family of Kunhali Marakkar. ,In 1600 Kottakkal was captured by the Portuguese with the help of Zamorin. At present there is an important mosque, known as Kottakkal Palli. A big sword said to have been used by the famous warrier Kunhali Marakkar is kept in this mosque. The Sacrifice Rock is located opposite to the Kottakkal Port. Hamilton observes that the Sacrifice Rock lying off Kottakkal about 8 miles in the sea is so called because 'when the Portugues e first settled at Calicut, the Cottica (Kottakkal) cruizers surprised a Portuguese ve3Sel and sacrificed all thei r prisoners on that Rock'.
Pantalayini-Kollam 242. Pantalayini-Kollam, the historical place, !s
the' Patale' of Pliny, the' Pandarani' of the Portuguese chronicles, the 'Flandarina' of Friar Odoric, the , Fundreeah of T ahafat-ul-Mujahidin and :the 'Fanda_ raina' of Ibn Batuta. Malik Ibn. Dinar founded the ~osque at PantalayUii-KoUam in the seventh century and he appointed one of his ten sons as its Kazi. Logan in his 'Malabar' observes that "an
inscription on the Muhammadan gra:1ite tombstone still standing at Pantalayini-KoUam, recites, after th e usual prayer, that Ali-Ibn-Udthorman was obliged to leave this world, for ever to the one which is everlasting, and which receives the spirits of all in the year 166 of Hejira, so called after Muhammed the Prophet left Mecca for Medina". This ancient mosque resembles the mosque at Mecca. The dome is covered with sheets of copper. The Visharikavu temple dedicated to Bhagavathi is situated two miles from Quilandy town. The annual festival is conducted for a period of 8 days in March-April while the festival on the finaL day is known as Kaliyattam. Besides the above mentioned religious institutions there are a good number of
74
mosques and temples. Pantalayini is treated as a census town in 196 I. Q.uilandy
243. Quilandy is the headquarters of the Quilandy taluk. It is about 24 miles away from Calicut. Sayed Abdulla Bin Sayed Abdulla Hajee founded an old mosque here in 1779. There is an old temple at Saktankulangara amsom. The inscription on a slab in front of this temple depicts that Kalasam (purification) ceremony of the temple was performed in 1730 A.D. "According to this inscription the temple was built during the reign of Udayavarma, the scion of Khatolkacha, the son of, Bhima". There are many public offices here including Government dispensary, taluk office, schools, etc.
Urakuzhi Waterfall 244. This is situated in the hilly tract of Kayanna
village of this taluk. The site is a picturesque one surrounded by lofty hills and virgin forests. The nearest approach to the site by road is from Tamarasseri or Balusseri. The Urakuzhi Scheme is the only Hydro Electric Project under investigation in this district. This scheme envisages the construction of a reservoir above the Urakuzhi waterfalls in the head reaches of the Kuttiadi (Murat) river. South Wynad Taluk (Area: 532'6 sq. miles; Popula
tion 185,055) 245. South Wynad, the least populous taluk in
the district was part of old Wynad taluk. This taluk is bounded on the north by the North Wynad taluk and the Mysore district, on the east by Mysore and Nilagiri districts, on the south by Ernad and Kozhikode taluks and on the west by Kozhikode and Badagara taluks. The whole taluk lies in the rural areas. Consistin~ of 20 villages this taluk is divided into 3 firkas Kalpetta, Kaniyanbetta, and Sultan's Battery. The chief crops are hill produces like coffee, ,tea, etc.
Ambalavayal 246. Situated 23 miles from Vythiri, Ambalavay:d
is an important centre of Wynad colonisation. The Chingeri colony near Ambalav'Olyal was started in 1957-58 to settle 100 families of Scheduled Tribes. Megalithic burial sites have been discovered from Chingeri in Ambalavayal amsom.
Kalpetta 247. Kalpetta is six miles north ofVythiri ottlhe
way to Mysore. This place is stated to be one of the abodes of Kuruchiyas, Kurumbars, Paniyars, the aborginal tribes of Wynad. The munsiff court is situated here. It contains in addition to public office, a hospital, a high school, a middle school and some primary
GAZETTEER-TIRUR TALUK
schools. It is the most important centre of trade in the taluk and is thickly populated.
Lakkidi 248. Lakkidi with a panoramic background is situa
ted 36' miles from Calicut on the Calicut-Mysore frontier road. This place rose to importance from the time of the Mysorean invasion. The old Mysorean stockade (Lakkidikotta) stood here. Lakkidilcotta means literally stick or timber fort, and this is how the place at the head of Tamarasseri Ghat obtained its name. The deep valleys of the green hills can be seen from here. It is also a tourist centre.
Pukkot lake 249. This lies about two miles north of Lakkidi.
It is a natural sheet of water among hills, the only thing of the kind of which the district can boast. On the picturesque bank elf the lake the European planters had built houses and a club. These establishments are now in a dilapidated condition. There is an old European cemetery close to the lake, where there are some graves and tombs.
Sultan's Battery 250. Sultan's Battery, otherwise known as Ganapa~
tivattam (literally the circle or range of the God . Ganapathi), is situated twenty-one miles from Vythiri and sixty miles from Calicut on the Calicut-Mysore frontier road. It is called Sultan's Battery from the fact that Tippu Sultan had a fort here. There was a British regiment stationed here in the early part of the 19th century to suppress the freedom struggle of Pazhassi Raja. To the south-west of Sultan's Battery lies the E dakkal Mala, one of the principal hills of the taluk. " On its western slope, near the crest, is to be found the Edakkal cave which has excited the ~uriosity of many an archaeologist and anthropologist. The
\ cave contains inter~sting carvings on its walls. In addition there a{'e some i~scriptions and a few small figures and symobls. The Edakkal carvings clearly represent human and animal figures and objects .for human use and symbols. The most interesting features of the sculptures are the frequent human figures with a peculiar head-dress. The figures of animals are indistinct. The symbols that are of frequent occurrence in the engravings are the Swasthika in various forms and specimens of the familiar circular "Sun-sy mbols ". There is evidence also of some magic squares ". The Ganapathi temple which belongs to the Kottayam Raja is the most important one. Tippu Sultan attacked' and destroyed the temple leaving behind the idol and a few monolitic stones. There is an inscription on the Dipastambha of this temple~ In the north court of the
I06/l-IOa
Mariamman temple there is an old stone inscription. The Vasti temple which belongs to Jains is preserved as an ancient monument by the Archaeological Department of the Government of India. The deciduous forests of the neighbouring village produce valuable timber trees and articles like wax, honey and resin.
Vythiri 251. Vythiri, the headquarters of the South Wynad
taluk, is situated 39 miles away from Calicut on the Calicut Mysore Frontier Road. All the important public offices are situated here. There is a Roman Catholic Chapel here. The Kunnath temple is now in ruins.
75
Tirur Taluk (Area: 278'4 sq. miles; Population 561,212).
252. This taluk was carved out by taking 30 villages of old Ernad taluk and 43 villages of old Ponnani taluk, on 1st January 1957. It is bounded on the north by the Kozhikode taluk, on the east by Ernad and Perintalmanna and Ottapalam taluks, on'the south by the Ponnani taluk and on the west by the Arabian Sea. Consisting of 73 villages and 5 towns this taluk is divided into five firkas, viz, Kuttipuram, Tanur, Tirur, Tirurangadi, and Vengara. Rice and cocoanut are the important crops .
Feroke 253. Feroke of Ferokabad, the place proposed by
Tippu Sultan for his capital of Malabar, is situated seven miles south of Calicut on the Calicut-Madras Road. The remnants of the fortress built by the Tippu Sultan in 1788 are seen half a mile south-west of the present town. Tiles and ceramic industries are concentrated here. The Farook College and the Rouzathul Vloom Arabic College are the important institutions.
Kadalundi 254. Kadalundi is situated nine miles south of
Calicut. This is an island formed by the Kadalundj and Beypore rivers on three sides and by the Arabian Sea on the west. This small island is connected with Calicut by rail. Tundi was one of the glamorous sea ports of ancient Kerala. Periplus Maris Erythraeai describes it as five hundred stadia from the mouth of the Mouziris river which has been pretty satisfactorily identified with Muyiri-Kodu or Crangannore. William Logan identifies Tundi with Kadalundi and rejects the other versions' pertaining to Ponnani. For that he argues that the mouth of the river Ponnani is a long way short of 500 ltadia from the mouth of Cranganore river. This account relates to the first century A.D. Nirum Kayicha Kotta temple is dedicated to Lord Ayyappan.

· GAZETTEER-TIRUR TALUK
Mambram 255. Mambram is situated on the north bank of
Tirur Angadi river. Logan's Manual gives the follow· ing account of Mambram. " In the early part of the 18th century a Yangal named Sayyid Hussain Ibn Alabi Jiffiri Tangal, who is supposed to have come from Arabia, settled at the place called Mambram or Mam. puram which was then an extensive waste. I twas reclaimed and planted with cocoanut trees for the growth of which the soil appears to be admirably adapted. He lived in a house called Taramal, and died in the month of Shahan in the Hijira 1169 .••••• .•. , ........ ' The Mukham or Shrine intended and used primarily as a rec~ptacle for the dead bodies of the principal Tangals is a rectangular ~uilding constructed on very solid foundations, and divided into large hall like rooms. The building has upper storeys; in one portion there are three and in the other two storeys. The second floor of one of the rooms stands on a higher elevation than that of the other; and over it an upper floor stands, the circular wall of which is capped by the dome. On the foundation floor of the domed hall are laid 9 coffins, including in them those of Sayyid Alabi who died in 1019 M.E. (Hejira 1260), and his uncle and those of their nearest deceased relatives. The other hall is the place where verses from the Koran are read for the salvation of the soles of the deceased". The Mambram mosque is now situated in th~ place of a Hindu temple which was converted into a mosque in 1921. During the Malabar Rebellion of 1921 the false report of the destruction of this mosque led to large scale atrocities by some fanatics.
Mangalam 256. Situated about six miles south~west of the
Tirur railway station and on the bank of Bharathapuzha, Mangalam is the birth place of Poet Laureate Val1athol Narayana Menon. Parappanangadi
257. Parappanangadi railway station is situated 16 miles south of Calicut railway station. It is an important business centre. The Palace of the Kshatriya family of Parappanad Rajas is located at a short distance from the railway station. It was from this family that the consorts of the Rani's Travancore family were usually selected. Parappanangadi is treated as a census town in 1961. Tanu
258. Situated, south of Calicut, Tanur is tre~ted as a cen$US town in -1961. The origin of the ,",ord Tanur is from 'Tanniyur', meaning the village of Yanni trees. St. Francis Xavier visited this place in 1546, and converted the local chieftain. The Jamat
76
mosque is the most important mosque here. Kerala. dhiswaram temple is one of the ancient temples of Kerala. The Trikkoyikad temple believed to have been founded by Parasurama is famous for the mural paintings of Brahma, Vishnu, Siva and Narasimhamurthi. Tanur has a fisheries demonstration factory and a fish curing yard.
TirUDavayi 259. The Tirunavayi railway station is situated on
the banks of Bharathapuzha 31 miles south of Calicut. Tirunavayi Siva temple is so c .. l1ed on account of its having been, it is believed, founded by the famous Iline saints. This historical place witnessed several feasts and coronations. These festivals and coronations were known as the great Magha or Mahamagha which was afterwards speIt as Mamangom. This historical and colourful ceremony was described by William Logan in his Malabar Manual as follows :-
" The tradition is that this festival was instituted in the days of the emperors (Perumals), that is, prior to the Kollam Era, and that when the last emperor set out for Mecca and left the country without a head, the duty of celebrating it devolved on the Raja of the locality where the festival used to take place that is, on the Valluvanad alias Vellatri alias Arangott Raja. And this arrangement seems to have been continued up to the twelfth or thirteenth century A.D., when the power of the Zamorins (chiefly through Muhammadan influence and arms and trade) became supreme in all Keralam. From that time down to the last celebration of the festival in 1743 the Zamorins were present at this festival as Suzerains of all Ker. alam, including Travancore, which as a Malayali State only attained to the first rank shortly after the date of the last Mahamakkam festival in 1743. Those who acknowledged the Zamorin's suzerainty sent Hags in token offealty, and the places where these flags used. to be hoisted at festival time are still pointed out. The Vallu.vanad Raja w\lo is still represented in the management of the Tirunavayi temple by one out of the four Brahman Karalar~, instead of sending a flag used to send men called Chavers (men who have elected to die) whose office it was to endeavour to cut their way through the Zamorin's guards to his throne •••• Tile festival used to continue for twenty-eight days every twelfth year when the planet Jupiter was in retrograde motion in the sign of Karkadagam or Cancer or the Crab, and at the time of the eighth Lunar asterism in the month of Makaram the festival used to culminate". Another memorable event that had happened here in the recent period was the immersing of the ashes of Mahatma Gandhi, the Father of our Nation,

GAZETEER-TIRUR TALUR
in the Bharathapuzha. In memory of tNs a statue of Gandhiji was constructed here. The SaTvodaya Mela is conducted here annually in the month of January or February. Tirur
260. Situated 26 miles south of Calicut is the headquarters of Tirur taluk. It is connected with Calicut by road and railway. Tirur is an important trading centre in fish and betel leaves. Fresh and dried :fish are exported everyday through the Tirur railway station to all neighbouring and distant places. There are many public institutions here. Trikandiyv
261. This place is associated with the Tunchath Ramanujan EhK:,uthachan, who played a significant role in the cultural revival of the Malayalam language. He made valuable contributions to the Malayalam literature through his Kilipattus based on the cardinal principle of Bhakti. Thunchan Parambu is situated about one mile west of Tirur railway station. Logan observes that "It was no less than a revolution when in the . seventeenth century one Tunchath Ezhuth<ichan, a man of the Sudra (Nayar) caste, boldly made an alphabet-the existing Malayalam one-derived chiefly from the Grantha-the sanskrit alphabet of the Tamils, which permitted of the free use of the Sanskrit in writing-and boldly set to work to render the chief Sanskrit poems into Malayalam. Regarding the obstacles which he had to meet and the opposition which was offered to him Mr. F. W. Ellis has the following remarks in a dissertation on the Malayalam language: C The difficulties with which he had in consequence to struggle gave him an energy of character wh'ich it is probable he would not have possessed had his caste. been without blemish. The Brahmans envied h~ genius and learning, and are said to have seduced him by the arts of sorcary into the habit of ebrietyt, wishing to overshadow the mental powers which they feared. The poet, however, triumphed -on his habits, though he could not abandon them, and, in revenge against those whom he considered the cause of his debasement, he opposed himself openly to the prejudices and the intolerance ·{)f the Brahmans. The mode of vengeance he chose
77
was the exaltation of the Malayalam tongue, declaring it his intention to raise this inferior dialect of the Tamil to an equality of the sacred language of the go:ls and rishis. In the prosecution of this purpose he enriched the Malayalam with the translations all of which, it is said, he composed while under the immediate influence of intoxication. No original compositions are attributed to him'. Tunchath Ezhuthachan's success even in his own lifetime seems to have been great, and it was in consequence of his influence and success that Malayalam as a written language, obtained its most recent development .•••.• Tunchath Ezhuthachan's memory, however, is not likely to die down, for relics thus lost are easily replaced and the sacred honours paid to them are easily shifted to the substitutes". Even today the sacred sand at T unchan Parambu, is taken away by the people from far and near to be used on the occasion of the Vidyarambham. It is believed that this sand possesses extraord1nary powers of inspiration in the field of education. Steps are being taken to con .. struet a memorial to Tunchat Acharyan. Thuchan's birthday is celebrated here annually as Tunjan Dinam. The Trikandiyur Siva temple situated here is associated with Thunchath Ezhuthachan. Trikandiyur is treated as a census town since 1941.
Vettathpathiyangadi
262. Situated at a distance of 3 miles from Tirur railway station this place was formerly the seat of the Raja of Vettathnad. The Triprangod temple dedicated to Siva lies about two miles south of Vettathputhiyangadi. The ceremony of Sanghabhishekam (pouring of water on the head of the idol by means of a conch, shell), is supposed to be the most acceptable offering to Siva and this is performed largely by the people under the honest belief that their life will be prolonged. The Garudankavu temple is dedicated to the Vishnu's bird, Garuda. Such dedications being rare the temple is regarded with considerable reverence and is also largely resorted to by the Hindu population for protection from any' Sarpa pida '. There is an important and old mosque here.
+Another version is that his parents used to administer a little toddy to him to get over stammering.


APPENDICES


APPENDIX I NORMALS OF RAINFALL AND RAINY DAYS· (Based on available data for the period 1901 to 1950)
Geo: Co-ordinates
,----"-----, North East No, of
:!Itation Latitude Longitude years Jan, Kozhikode I 9'0
District n 0'7 Badagara lIo 36' 75° 35' 50 I 7-6
II 0'6 Kozhikode II 0 lSI 75° 47' 50 I 11'7
(Observatory) II 0'7 Kuttiyadi no 401 75° 451 50 113,7
II I'D Manjeri 11Q 071 76Q 081 50 I 8'1
II 0'5 Nilambur 11° 17' 76° 141 50 6'6
II 0'5 Qui1andy 11° 27' 75° 421 50 I 8'9
II 0'6 Tirurangadi lIo 03 1 75Q 55' 50 I 5'3
II 0'5 Vythiri 11 Q 331 76°, 02 1 50 I 9'9
II 0'8
I Rainfall figures in millimetres II Number of rainy days * Source:-Indian Meteorological Department
CENTRE: BADAGARA \. 1951 1952 1953
Feb, 6'8 0'4 6'3 0'3 8'4 0'3 9'9 0'5 4-3 0'3 5'8 0'4 4'1 0'3 6'1 0'4 9'4 0'7
1954
Mar, April May 18'4 84'0 233'5 1'2 5'0 9'3
15'0 77'7 261'6 1'0 4'5 9'6
18'5 86'9 261-6 0'8 4'0 9'0
25'9 122,7 295'1 1-6 6,8 11-4
20'1 75'9 197'9 I-l 4'5 8'2
13'2 62'0 157'5 I-l 4'3 7-6
16'0 69'3 257'3 0'9 3'9 9'3
14'2 72'1 242'1 1'1 4'0 9'0
24'6 105'4 195'1 2'3 8'2 10'3
APPENDIX 2 RAINFALL *
1955 1956
June 853'9 23'9
955'0 24'6
824'2 24'2
1027-4 25'0
711'2 22'9
636'5 21'8
892'3 24'7
760'7 24'2
1023-6 24'1
1957
July Aug, Sept, Oct, Nov, Dec, 1005,9 530'5 239'2 286'6 160'1 33'4
26'7 21'1 13'3 12'6 N 1'9 1002'3 523'7 231'4 258'6 143'0 23'9
27'1 20'8 13'0 lI'2 6'6 1'7 857,3 439'7 220'0 262'6 156'7 30'S
26'6 19'7 12'3 lI'O 6'8 I-6 1278'1 741'7 313'9 374'9 242'6 58-4
28'0 24'5 15-4 15'5 9'3 2'8 832'9 424-9 201'7 308'1 170'2 30'5 25'8 19'4 11'7 13'3 7'4 1'6
861'6 433'1 191'3 280'9 133'1 28'5 26'1 19'8 12'6 12'9 7'4 1'8
949'7 512'6 224'0 256'8 138'7 27'2 26'4 21'0 12'4 10'9 6'6 1'7
765'6 390'1 208'5 253'2 159'0 37'3 25'6 19'4 12'6 11'8 7'4 1'8
1499'4 778'5 322'6 297'9 137'7 31'0 27'9 24'0 16'8 14'4 8'0 2'3
Latitude : 11 0 36' N Longitude: 750 35' E
1958 1959 1960
Annual :H61'3
123'5 3506' 1
121'0 3178'1
117'0 4504'3
141'8 2985'8
ll6'7 2810'1
116'3 3356'9 118'7
2914'2 117·8
4435'1 139'8
1961 ,..---"---y-_.A.--.--.A._-.,--.A._-.r_-"---y--.A._-.,--.A._-..-.A.---.,,---'-_-y---A---y-_'''''"'___,
Month A B A B A B A B A B A B A B A B A B A B A B
January .. 6'1 ,. February 58'4 " 8'1 " March 1 18'3 2 1l'7 " 13'5 " 2 50'8 '. April 5 103-6 8 82'S 4 26'7 4 85'6 7 59'9 7 148'1 4 78'0 4 36'4 7 201'1 9 84'0 2 17'2 May 6 69'9 14 273'6 3 34'5 13 166'1 20 733'3 16 567'7 14 350'0 14 192'4 16 387'4 20 606'4 15 481'6 June 27 1113'0 29 1022'1 21 479'3 26 1435'6 29 1246'1 27 802-4 30 1329'4 19 977'1 23 1120'7 26 611'026 1214'4 July 24 730'026 483'9 30 1631'2 29 1023-4 22 576'3 26 560'6 26 1134'6 28 816'7 30 1519'6 22 933'0 30 1227'8 August 15 187'522 334'3 21 278'622 602'5 21 355'3 19 380'723 420'924 446'026 664'7 18 362'423 946'~ September 13 333'3 3 14'0 5 42'9 18 218'9 21 637'8 15 230-4 5 37'1 10 66'0 21 504'8 14 257'3 23 573'0 October 8 125'2 11 262'6 19 318'5 7 166'6 17 664'7 14 334'0 14 259'6 5 58'1 10 77'711 181'2 11 332'5 November 7 71'9 .. 2 47'0 2 10'4 1 67'8 10 109'7 " 6 142'0 5 93'2 14 200'6 3 100'0 December 1 32'3 2 83'8 ._ 3 9'1 .. ,. 1 4'3
A Number of rainy days B Monthly rainfall in millimetres • Source:-Department of Statistics, Kerala,
81 106/1-11

APPENDIX 2
RAlNFALL-contd. Latitude 11° 15' N Longitude 75° 47! E
CENTRE . KOZHIKODE . 1951 1952 1953 1954 1955 1956 1957 1958 1959 1950 1961
Month ,.-A--.. ,.-A--.. r-"---\ ~ ,...-A-., ~ ~ ~ ~ r-A.'"'I ,A.""""\
A B A B A B A B A B A B A B A 13 A B A B A 13 January 1 5'3 4'1 .. February 9'4 2'8 20'3 .. 6'6 ,- 3'0 .. }'2 -, 4'8 March 6'9 1 5-6 24-1 1 12'7 I 45-0 .. 0'8 73'8 -. 3 69'6 1 9-8
April 6 92'2 4 73-1 7 100-1 6 166'6 6 176-3 6 179'8 10'2 4 29'6 5 32-6 10 160'2 2 64'0 May 9 152'7 11 172-5 2 26-9 10 319'0 21 725'7 17 491-0 11 380-6 17 292-2 17 513'6 22 503_2 14 690'6
June 26 940'1 26 797'1 20 460-0 291384-5 27 998'2 24 974'3 271114'5 20 937-9 211052-8 23 76$'2 251279-7
July 20 692'4 28 448'1 281194'6 26 770-6 20 440'7 22 509'5 28 984-5 25 763'8 301617-4 21 865-6 291235-6
August 19 189'0 24 358:1 16 254-8 20 537-2 18 246'4 15 324'9 18 334-5 25 338-1 21 401-7 15 281-6 27 812-2
September 10 186-7 3 19'1 6 58'2 15 183-9 17 637'8 16 168'1 I 11'9 8 54-2 19 411'5 15 419'8 22 580'6 October 10 142-0 14 401'3 17 336-3 13 226'3 19 657-6 15 426'2 14 350-0 9 40'5 9 119-0 6 227'2 11 206-8 November 11 168-7 .. 1'5 2 31-5 2 64-3 6 79-8 10 196-6 6 Ill'O 6 134-2 5 96'6 14 301-1 4- 68-2 December 94-7 5 66'3 ., 1'3 " 2'3 .- I 29'0 :3 62'0 3 49'6 "
Latitude llo 40' N Longitude 75° 45' E
CENTRE: KUITIADI 1951 1952 1953 1954 1955 1956 1957 1958 1959 1960 1961
Month ~ ,.--...A---., ~ r----"---, ,---.A-.., r---"--; r----"---, ,....-....A---- ,..-.....A-......, ,....-....A---o ,--."--,
A B A B A B A B A B A B A 13 A 13 A 13 A B A B January 2 56'4- -, 0·3 ,- .- NA NA February -' 5 43-7 11'4 1 2-5 --March 3-6 4 55'9 .. 2'5 .. -, 2 55'8 .- .. 2 126'7 NA NA April 8 83-6 8 174'7 6 69'6 5 64'3 6 62-7 6 201'9 2 44'7 9 259'9 9 143'9 8 274-7 2 4S'0 May 3 llS'1 16 241-1 5 54-9 9 170'2 20 917-2 13 466'1 18 490'0 15 275'4 19 369'8 20 396'4 12 636.3 June 29 1191'8 30 953'0 22 526'3 30 1685'8 26 1101'3 26 1358'7 29 2042'7 21 916'5 261331'5 21 638'8 27 984'S July 24 1056'9 27 744-5 29 1663·7 29 1228'6 16 576'8 25 1037'1 28 1752-3 30 1209-5 30 1873'0 12 643'5 29 1861'0 August 21 427'5 26 574'5 22 504'9 23 825'7 22 553'0 20 355'3 24 693'7 28 835'1 8 165'7 4 176'8 NA NA September 14 364'7 1 10'7 12 110'2 16 340'1 17 469'7 20 286'0 5 34-8 13 249-0 4 123'3 6 208'0 23 582'2 October 17 225'0 13 546'9 23 587'0 16 312'4 11 322'8 12 364'0 23 230'1 9 243'0 6 186'2 2 104'1 NA NA November 17 307'1 .. 6 53-3 9 44'7 9 513'1 9 373'9 12 361'9 12 114'5 10 289-5 9 421-8 9 95-3 December ,. 4 154'9 .. 6 57'1 1 3-1 .. 2'0 .. - 1 9'6
Latitude 11° 07' N Longitude 76° 08' E
CENTRE : MANJERI 1951 1952 1953 1954 1955 1956 1957 1958 1959 1960 1961
Month ~ .....-"---. r--A---. ,.--A--. ,...-....A---. r--A-. ,..--...A--., r--A-. r--A-. r--A-. ,..._.A-.,
A B A 13 A B A B A B A B A B A B A B A B A B January 2 15-7 .. February 0'8 2 30-0 IS'8 .. March 1'5 11'4- .- 3 48'8 . ' 25-7 1 5-1 10-7 .. April 10 209'5 3 28-2 7 81-0 6 84'6 5 130-6 6 150'1 3 64'5 4 77'9 6 178-6 7 96'7 6 65'4 May 8 126'5 8 104'1 7 36-8 8 143'8 12 530'6 14 322'3 11 248'7 16 279-6 14 219_7 22 606-7 14 558-7 June 27 811'8 25 559'1 23 320-0 26 1063-0 25 740'2 23 738'1 28 1021'1 16 791-5 22 9B9'9 25 620'5 24 1302-S July IS 478'S 22 438'7 30 1170-2 25 557'8 19 335-0 25 591'8 27 911-9 30 835'2 29 1497'1 23 769'0 30 1145'7 August 21 212'9 25 408'9 22 370-3 18 408-4 19 262-9 18 S1S'3 20 287'8 27 412-2 22 41N 11 239'2 25 603-7 September 11 385'6 1 7.9 10 52-I 16 209'3 18 478-3 14 184'9 3 19-6 4 32-1 18 397'5 19 310'2 20 404-4-October 15 277e6 10 262'4 21 355-1 11 352-0 12 246'4 11 310'6 12 323-1 13 166'8 10 169'0 13 255'2 NA NA November 12 278'6 3'3 I 2-5 2 28-5 '" 52'8 12 239'S 12 202-9 10 225'5 7 75-0 15 468'1 3 137-2 December 1 14-2 4- 65-Q .. 2 20-1 1 7'6 .. e" .. 2-0 S'6 l'S 2 11'5
A Number of rainy days B Monthly rainfall in millimetres NA Not available
82

APPENDIX 2
RAINF ALL-contd. Latitude 11° 17' N
76° 14' E CENTRE : NILAMBUR
Longitude
1951 1952 1953 1954 Month A B A B A B A B
r--A--, ~ ~ r--''--., January 2 17'5 February 1'5 .. March 1 10-7 April 6 123'2 3 34'8 5 61'0 8 84'1 May 9 207"8 4 60'5 7 32'5 • 8 114-3
June 25 551'2 24 439'7 20 452'9 23 712'0 July 21 557'0 29 537'5 281231'1 24 621'3 August 15 155'2 26 370'8 23 438'9 23 469-4 September 10 264'9 5 60'5 9 61'7 14 113'3 October 10 236-7 12 295'9 20 374-4 11 272"5 November 6 136'9 .. 5'6 1 4-3 2 50-0 December 6'6 5 57'1 .. 2 27'9
1955 1956 1957 1958 A B A B A B A B ~ ,.._A.-.-., ~ ,--.A---..
1 8'1 1 3'8 "
.. 1 4'6 .. 24-6 5 123'9 6 100'8 " 4 124-0
16 510'3 14 268-5 1 111-3 14 248-6 26 788'7 28 671'4 27 1042'7 17 525'3 17 332'0 20 545_6 27 1157-0 25 95H 19 311'4 17 445-8 23 435-6 21 487-6 19 524'5 11 85'9 3 21'6 9 61-8 20 601'2 14 216-4 15 253-2 12 181'9 5 102.6 10 180'1 8 m'7 11 149-3 1 5'1 •• 10'2 .,
1959 1960 1961 A B A B A B
r---A--. ,.-....A---, ,--A---,
.. NA NA .. 2'6 NA NA
4 36-9 9 119-1 5 81'8 13 386'2 23 362-2 14 414'6 20 937'2 25 442-823 824-0 291505-3 24 676-1 28 1602-7 22 432-3 12 185-6 NA NA 18 348'0 13 21H 18 358'1
7 123-0 10 309-4 NA NA 4 74'3 NA NA .. 2 24'9 NA NA ••
Latitude : 11 () 27' N Longitude: 75" 42' E
CENTRE: QUILANDY 1951 1952 1953 1954 1955 1956 1957 1958 1959 1960 1961
Month ~ ~ r-'--.~,..-A---.,~,..-A---.,r-'---,~,..-A---.,,..---A---, A B A B A B A B A B A BA B A B A B A B A B
January February .. 2 147-8 •• March .. 1 15-2 ., .. 3 38-9 1 15-5 .. .. 1 43-2 .. .. 2 50'8 NA NA April 7 217-2 6 43'4 1 23'4 3 43'4 7 233'7 6 132-3 •. 2'3 2 16-8 5 156-3 ~ 255'3 .. May 8 128-8 9 146-8 3 14-0 6 105-9 18 919'2 14 515-4 10 277-413 223'4 18 400-022 515'7 14 4228-1
June 26 ·876-3 29 1103'6 13 546-6 24 1357-1 25 1610-4 21 848-929 1319'0 17 781-6 23 1246'8 24 963'3 25 3156'7
July 20 722-9 26 978-1 27 1618'2 20 570'7 21 810'8 26 566'9 26 1081'3 23 802'0 31 U47"7 18 949'9 31 1875'0 August 17 230-424 630'4 21 439'7 16 756'4 18 294'6 18 392-2 20 407'7 23 456'324 593-1 15 386'] 28 1501'9 September 11 340-9 3 31-0 7 76'2 14 251'2 17 437'9 6 79-0 2 22'9 9 75'620 961-9 17 501'8 24 1983-4· October 10 252-2 12 486-724 426-7 11· 277'6 16 515'4 12 294-6 13 285'2 7 42'2 7 171'9NA NA 11 101'2 November 12 318-3 _ 3 89'7 •• 0-8 2 25.4- 5 ll8'1 4- 41'1 5 127-6 5 149'8 13 573-6 5 330-0 December 1 6-3 1 89-7 •• - 1 30'7 .• .- 1 2'5 .• .. 1 5'0
Latitude llo 03'N
CENTRE: TIRURANGADI Longitude: 75° 55' E
1951 1952 1953 1954 1955 1956 1957 1958 1959 1960 1961 Month ~ r---A--.. ,.---'--, ...-'---. r--A-, "...--A--, r-A--. ,..-A---., ...-'---. r--A--, r--"--,
A B A B A B A B A B A B A B A B A B A B A B January 1 16-5 •• 0'5 •• ...... .. 1 34'3 .. February 50'0 1 3-3 1 7-9 .. l·g .. 9'7 "
March 1 4-l 1 5'6 3 41'1 1 3'1 2 14'2 2 69'3 1 11'7 .. .. 2 34'5NA NA April 7 220'2 1 21'6 4 77-5 3 127'5 7 127-8 7 178'3 ., 7 162'0 5 lBO-3 7 243'7 2 22'9 May 5 86'1 11 185-9 2 24'1 11 191-8 17 626'9 17 532'4 11 35704 17 266'5 20 418.7 22 483'2 16 717'9 June 27 974-3 27 799'1 24 370'1 281017'0 28 859'824 615'2 28 1136') 18 925'0 251060') 24 569'525 1145'0 July 22 592'3 26 424·4 29 1270'0 24 556'023 315'2 21 454'729 769'4 24 716'6 301492-022 942'2 30 1140'5 August 16 129'0 26 377'9 21 288-3 17 449'8 18 230'4 13 314'7 21 238'3 20 356'7 23 411·3 16 332'7 26 720'0 September 10 460'0 3 17'0 11 71'6 13 139-7 18 575'8 19 172'7 6 36'3 6 44'5 15 361'5 17 349'223 625'2 October 12 188'7 12 323'6 20 311'7 15 306·8 12 610'1 15 326'9 14 205'5 7 78'8 6 134'9NA NA 16 362'2 November 13 229'6 .. 1'3 2 35'3 2 9-1 6 171'5 13 134'1 10 150'9 II 223'9 6 63'8 19 316'5 ._.
December 34'3 4 79'3 .. 2 9'9 1 27-2 .. .. I 12'2 3 59.9 2 33'0 ••
A Number of rainy days B Monthly rainfall in millimetres NA Not available
83 1 06J 1-11 a

APPENDIX 2
RAINF ALL-concld. Latitude: n° 33' N Longitude: 76° 02' E
CENTRE : VYTHIRI 1951 1952 1953 1954 1955 1956 1957 1958 1959 1960 1961
Month ~~-y----A---..,~ ~ A B A B A B A B A B A B A B A B A B A B A B
January .. 3 17'5 •• 2'5 1 2'5 .. 0·3 .. February .. 5 43'7 2 49'8 1 7'1 .. .. 2 25'1 .. .. 2 50'5 1 6'1 .. March !-8 2 39-4 .• 0'3 3 71'6 3 32'3 .. .. 3 35'0 .. 3 46·4 NA NA April 8 146'1 12 106'7 17 199'4 6 77'2 10 151'4 10 143-3. 6 69'9 8 136'3 7 89"4- 15 181'4 13 108·8 May Il 207-8 12 112'5 7 49'5 6 65'3 18 674'1 15 481'1 16 301'5 14 157'6 20 361'6 18 537'1 IS 603'4 June 29 989'l 28 890'3 24 745'7 28 1377-7 27 1126'7 27 1175·8 26 1133-6 18 936'1 21 1245-4 29 675'0 26 1729'0
July 24 1192'8 30 1012'4 28 1603'8 26 1288'0 26 429'5 26 1167'4 25 1334·3 29 1755'2 30 2633'5 261528'5 31 3556'9 August 20 355'6 31 724'9 25 1119'9 22 899'2 25 470'7 19 632·721 542'5 27 791'8 24 738'8 18 436'9 26 1125'2 September 16 368'5 7 61'2 8 75'2 20 304'024 516'1 10 133·7 1 27'2 9 189'7 22 498'1 19 307'1 18 548'4 October 13 189'5 10 653'3 22 360'2 15 272'521 545'1 14- 348'7 14- 404'6 II 171'2 12 121'4 7 106'8 16 462'5 November 9 72'4 2 5'3 3 6'9 2 20'3 4 58'4 10 110'7 10 238'8 11 244'3 7 165'1 9 94'0 5 44'9 December 10'4 5 76'5 1 4'1 3 24-4 I 3'8 .. 7-6 1 7-6 4 9H ..
A Number of rainy days B Monthly rainfall in millimetres NA Not available
APPENDIX 3 TEMPERATURE
Latitude: 1 JO 15' N Longitude: 75° 47.1 E
CENTRE KOZHIKODE
Month
January February March April May June July August September October November December
1951 1952 1953 1954 1955 r---~------.
ABC DA B C DABCDABCDABCD 31'5 32'2 22'5 19'4 34'l 35'6 22'3 18'9 31'7 32'3 22'3 20'0 32'6 34-4 23'1 20'6 32'1 32'S 22'2 19'4 31'5 32'2 23'0 20'6 33'4 35'6 24'1 22'2 31'9 33-322'320'0 32'7 33'3 22'8 20'0 32'7 33'9 24'0 22'8 32'8 33'9 24'7 22'2 33'2 34-4 24-6 22'8 33-6 34-4 25'5 22'8 33'2 35'0 24'9 22'2 32' I 32'8 24-8 22'2 33'0 33'9 25'4 22'8 34'4 35'6 26'5 23'3 33'5 34-425'6 22'2 33'3 34'4 26'1 22'8 32'9 35'025'623'3 33'2 33'9 25'9 23-9 33'3 36'1 25'8 22'333'634-426'022'2 32'935'025'722'2 31'3 32'8 24'6 21'7 29'5 31·7 23'5 22'2 30'3 32'8 23-6 22'231'1 33'324'922'829'1 31'723-321'728'231'1 23-522'2 23'6 31'1 23'3 22'2 29'1 31-1 23'5 22'223'031'1 22'721'1 47'930'622'821'728-430'623-421-7 28'9 30'0 23'8 23-3 28'9 30'6 23-6 22'2 29'9 32'2 24'022'2 28'6 30'623'421'7 28'5 30'0 23'8 22'2 30'8 33'3 24-4 22'8 30'7 33'9 23'5 22'2 30'9 33·3 24'0 22'8 29'6 31'7 23'5 21'1 29-6 32'2 23'8 22'2 31'8 33'9 24'6 23'3 30'1 32'8 23'7 21'731'1 32'224'222'830'031'723'421'1 30'332'823'9 22'S 31'9 33'9 24-3 23'3 31'4 32'8 22'8 20'631'7 33'323'220'031-632'822'7 19'430'832'223-320"0 32'0 33'3 2H 18.9 31'3 32'8 22'5 20'6 32'3 33'921'8 18'3 3I-8 33'322'5 19'4 31'433'3 21'3 18-9
1956 1957 1958 1959 1960 1961 ,--~ .----A------.
ABC DA BCD ABC DAB C DAB C DAB CD 31'4 32'2 21'5 19-4 30'9 31'9 21'8 19-4 32'1 33'7 22'5 20'7 32'4 34-6 22'9 21'2 31'7 32'9 22'5 19'9 31'5 33'0 22'8 19'9 31'9 33'9 22'6 20'6 31'7 33'7 23'5 22'2 32'3 33'4 23'7 21'1 32"4 33'4 23'8 22'2 32'1 33'0 22'7 19'4 31'3 32'5 23'320'9 32'8 33'3 25-0 23'3 32-1 33'9 24'1 22'7 32'7 33'7 25' 1 23'2 33-3 34'8 25'3 23'8 32'6 33'7 24-6 21'8 32'9 33'8 25'6 23'S 33'2 34'4 25'8 23'3 33-2 34'9 26'3 24'5 33'6 34'8 26'0 22'6 33'9 35'3 26'2 23'7 32'7 33-6 24'5 ,22'2 33'4 34'0 26'5 22'9 30'8 33'3 24·3 21'1 32'0 35'0 25'9 23'2 31'7 33'9 25'1 21'2 32'7 35'0 25'4 20'5 31'4 34'0 24'0 21'9 31'3 34'7 25'121'9 28-4 31'1 23'1 20'6 28'5 31'9 23'8 22'7 30'1 33'7 24-3 21'8 29'4 32'6 24'2 21'7 29'8 31'4 23'3 21-4 28'5 31-4 23-621-4, 28'1 30'6 23·1 21'1 27'6 30'3 23'6 22-1 28'7 30'7 23'9 22'1 27'4 30'3 22-9 21'7 28'8 31'0 23'1 21'5 27'4 29'2 23'021'8 28'3 29'4 23"3 22'2 28'1 29'8 23'6 22'4 28'4 30'3 23'9 22·7 28'5 30'5 24-0 22'5 28'9 30'4 23'0 21'8 28'1 30'4 23-422'1 28'4 30'0 23-3 22'2 29'3 30'6 23'5 22'4 29'6 30'9 24'2 23'0 28'9 30'7 N'1 22'9 28'6 31'3 23'0 2l'2 28'9 30'6 23'22H 29'6;31'1 23·6 22'2 30'0 31·7 24'1 22'7 30'0 31'4 24'3 22'7 30'0 3l'4 24'3 23'4 30'0 32'4 23'0 21'2 30'2 32'8 23·7 22'~ 31'1 32'2 23·7 22'2 31'2 34·1 24'1 22'4 31'0 32'6 24'2 21·3 31'1 32'4 23-4 21'3 30'1 31'9 22'5 19'3 31'6 32'9 23'621'1 3l'6 32'2 21'7 18'3 32'3 34'8 23-5 20'4 32'0 33'4 22'8 20'8 31 '2 32'4 21'8 18-4 31-0 32'3 21-6 19'4 31'9 32·9 22-7 19-4
A Mean maximum B Highest temperature in centigrade C Mean minimum D Lowest temperature in centigrade
84

APPENDIX 4
MAJOR AND MINOR FOREST PRODUCTS· Major Products Minor Products ~ ___________ ______.A..._
Timber Pulp and Charcoal other than Rose- match- and Fire- Total Bamboo Total Rose-wood wood Teak Pole wood wood Value Cocoanut Others
(Cubic (Cubic (Cubic (Cubic and Cane Value Year metres) metres) (Nos.) metres) metres) (Rs.) (Nos.) (Nos.) (lb.) (Rs.)
]950-51 22,381 363 11 1,246 5,27,875 150,111 99,850 112,673 21,696 1951-52 25,306 141 10 196 7,65,201 265,815 121,601 63,913 26,291 1952-53 22,792 122 72 4,126 8,40,507 284,947 61,653 38,500 11,102 1953-54 28,325 150 36 5,169 6,93,800 97,788 125,325 56,110 10,925 1954-55 22,096 140 3,134 231 2,651 8,94,915 54,826 1I4,700 102,237 13,223 1955-56 30,679 122 135 5,346 12,62,652 299,006 90,593 87,703 18,896 1956-57 30,574 238 77,431 67 6,919 11,43,485 348,643 74,724 97,313 14,347 1957-58 36,879 85 205,946 61 6,318 20,89,898 165,571 58,306 30,674 15,717 1958-59 60,374 283 115,765 268 9,652 36,29,377 328,572 47,457 61,540 13,360 1959-60 45,515 427 66,769 183 7,350 36,73,1l8 251,287 65,184 22,910 15,754 1960-61 51,078 206 1,717 94 17,172 12,00,266 169,295 53,029 26,004 25,841
*Source:-Forest Department, Kerala APPENDIX 5
PRODUCTION OF IMPORTANT CROPS FOR THE LAST SIX YEARS • Crop Unit 1955-56 1956-57 1957-58 1958-59 1959-60 1960-61 Rice Tons 132,372 130,200 103,900 105,119 125,067 114,861 Jowar do. 44 48 30 20 20 20 Ragi do. 1,695 1,951 2,020 2,136 2,620 2,645 Pulses do. 1,760 2,088 2,214 2,393 2,400 2,448 Sugarcane do. 882 1,060 1,390 1,390 130 130 Pepper do. 2,927 2,846 2,520 2,496 2,520 3,190 Ginger do. 3,406 3,480 2,270 2,293 3,060 4,150 Turmeric do, 917 674 911 855 1,061 1,075 Cardamom do, 20 28 32 46 47 47 Bananas do. 46,182 55,740 58,353 55,192 7,362 7,664 Cashewnut do, 6,638 6,550 7,300 7,738 14,930 15,951 Sesamum do, 414 337 410 183 180 168 Areca-nut Million nuts 2,311 2,108 2,126 1,920 2,413 2,571 Cocoanut do, 702 704 702 661 670 639 Tobacco Tons N.A, N.A. 34 50 50 Tea do, 2,688 7,378 7,378 4,842 4,842 4,842 Coffee do, 4,105 4,623 4,986 4,445 4,540 4,540 Rubber do. NA. 1,938 2,124 2,403 2,403 2,499 Tapioca do, 106,000 84,300 86,400 84,279 125,473 129,901 Lemongras~ Oil In bottles of 22 oz. each N.A, N.A, 92,437 432,718 702,039 702,039 * Source:-Department of Statistics, Kerala
APPENDIX 6 RETAIL PRICES OF CERTAIN COMMODITmS, 1957 *
CENTRE: KOZHIKODE Rice 2nd Elephant- Ladies Fish (Mis-
Sort Dha) Banana Potatoes Onions Bririjal yam Finger Pumpkin ceJIaneous ) Month (seer) (seer) (doz,) (lb.) (Ib,) (Ib,) (lb.) (Ib,) (lb.) (maund)
(I) (2) (3) (4) (5) (6) (7) (8) (9) (10) ( II) January 0'39 0'40 0'86 0'20 0'09 0'15 0'12 0'34 0'50 7'75 February 0'42 0'36 0'88 0'20 0'09 0'15 0'08 0'34 0'50 7'12 March 0'48 0'34 0'89 0'22 0'09 0'15 0'08 0'34 0'50 7'75 April 0'49 0'34 0'94 0'22 0'09 0'17 0'09 0'36 0'53 6'50 May 0'49 0'35 1'07 0'22 0'10 0'17 0'11 0-36 0'53 7'10 June 0'48 0'36 1'12 0'22 0'12 0'13 O'll 0'34 0'53 12'50 July 0'47 0'36 1-08 0'21 0'12 0'17 0'11 0'36 0'53 11'75 August 0-45 0'36 O'8~ 0'19 0'22 0'15 0'09 0'35 0'53 9'80 September 0'43 0'37 0'89 0'20 0'20 0'16 0'09 0'33 0'52 7'50 October 0'44 0'37 0'87 0'19 0·20 0'16 0'08 0'34 0'50 7'00 November 0'46 0'37 1'04 0'20 0'22 0'16 0'09 0'30 0'50 7'50 December 0'45 0'37 0'99 0'21 0'21 0'18 0'08 0'26 0'50 7'38 • Source!-Department of Statistics, Kerala
85

Month
January
February
March
April
May
June
July
August
September
October
November
December
Month
January February
March
April
May
June
July
August
September
October
November
December
Month
January February
March
April
May
June
July August
September
October
November
December
APPENDIX 6
RETAIL PRICES OF CERTAIN COMMODITIES, 1957-contd.
Meat Cocoanut (lb,). (each)
(12) (13)
1'25 1'25
1'25
1'25
1'25 1'25
1'25 1'25 1'25 1'25 ['25
1'25
Cocoanut Oil
(bot,)
(22) 1'16
1'20 1'26
1'37 1'16 1'19 1'27 1,31
1'33 1'33
1'45
1'50
0'21 0'20
0'19
0'22 0'21 0'20 0'20
0'20 0'22 0'22 0'22
0'22
Gingelly Oil (bot,)
(23) 1'69
1'69
1'78 1·94 1,73
l'65 1'69
1'70 1'75 1'75
1'72 1'75
Shirting
Milk (bot,)
(14)
0'62
0'62
0'62
0'62 0'62
0'62 0'62
0'62
0'62
0'62
0'62 0'62
Ghee (lb.)
(24)
2'62 2'65 2-64 2'75 2'75 2'75
2'75
2'75 2'75
2'75 2'75
N5
Upper cloth Dhoties
(4 cubits)
(32)
2·12
2'12 2,12
(yard)
(33)
(4 cubits)
(34)
2'12
2'12 2'12 2'l2 2'12
2'12 2'12
2'l2 2'12
1'09 HI H2 1'12 1'12 1'12 1-12 1'12
1'12
1'12 1'12
HZ
l'62 1,62
1'62 1'62
1'62 1'62 1-62 1-62 1-62 1'62 )'62
)'62
Salt (seer)
(15)
0'06 0'06 0'06 0'06
0'06 0'06 0'06
0'06
0'06
0'06 0'06
0'06
Sugar (lb.) (25)
0'45 0'45 0'47 0'47 0'49
0'52 0'55
0'53 0'50 0'50 0'50
0'52
Sarees (6 yards)
(35)
6'00
6'09 6'37
6'37 6'37
6'37 6-37 6-37
6'37
6'37 6'37 6'37
86
Chillies Tamarind Turmeric Corriander Mustard
Cummin. seeds (seer) (21)
)'04
)'00 )-01
1'06 )'10
1'02 1'()(} )-05
)'12
1'12 )'13 )'47
(lb,) (lb.) (lb.) (seer) (seer)
(16) (17) (18) (19) (20)
)'06 )'02 },(~3
1'12 1'16
1'03
1'00 0'94 0'92 0'87 1'00 1'00
Jaggery (lb,) (26)
0'33 0'31 0.31 0'31
0'32
0'29 0'28 0'24 0'22 0'23 0'31 0'27
Petticoats (1 yard)
(36)
1 1'08 H2 1,12
1'12 1'12 1'12 H2 1'12 1'12 1'12 1,12
0'27 0'23
0'19
0'22 0'24
0'25 0'24
0'22
0'22 0'23
0'24 0'25
Coffee (lb,)
(27)
2'25 2'25 2'25 2'25 2'25
2'25 2'25
2'25 2'25 2'25 2'30 2'37
0'50 0.42
0'50 0'52
0'52
0'46 0'42 0'37
0'37
0'37
0'37 0'37
Tea (lb.) (28) 2'74 2'45 2'25 2'25 2-25 2'25 2'25 2'25 2'25 2'25 2'33
2-44
0'27 0'26 0'27
0'27
0'28 0'25 0'24
0'25 0'20
0'22 0'22
0'22
Fire-wood (thulam)
(29)
0'62
0'62 0'63 0'69 0'69
0'69 0'69 0'53
0'50 0'50 0'52
0'56
0'75 0'75 0'75
0'77
0'77 0'71 0'69 0'73
0'75 0'75
0'75 0'75
Kerosine Matches Oil (box of •
(bot.) 60 sticks),
(30) (31~ 0'25 0'05 0'25 0'05 0'25 0'05 0'25 0'05 0'26 0-05
0'27 0'06
0'27 0'06
0'27 0'06 0'27 0'06 0'27 0'06
0'26 0'06 0'25 0'()6
Betel nuts Tobacco
Betel leaves (Chewing) Beedie,. (25) (40)
0'12
0'12 0'12
O'IZ 0'12
0'12 0'12-0'12. 0'12-0'12
O'IZ 0'12.
(12 packets)
(37)
0'25 0'25
0'25 0'28 0'28
0'28 0-28
0'28 0'28 0'28 0'28
0'28
([00) (palam)
(38) (39)
0'37
0'37 0'37 0,44
0-43 0'31 0'28 0'24 0'26 0'33 0'26 0'34
0'56 0-56 0'56 0'62 0'62
0'62 0'62 0-49
0'45 0'49 0'50
0'50

Month (1)
January
February
March
April
May
June
July
Augast
.September
October
November
December
Month
January
February
March
April
May
June July
August
September October
November
December
Month
January
February
March April
May
June July August
.September
October
November December
APPENDIX 6
RETAIL PRICES OF CERTAIN COMMODITIES, 1958
Rice 2nd Sort (seer) (2)
0'44
0'43
0'42
0'42
0'42
0'44
0'46
0'45
0'47
0'51
0'52
0'51
Meat (lb,) (12)
1-25
1'25
1'25
1'25
1-25
1'25
1'25
1'25
1'25 1-25
1-25
1'25
Cocoanut Oil
(bot.) (22)
1'50
1-46
1'44
1'47
1"46 1-47
1'52
1'51
1'56
1'50
1'57
1'55
Dhal (seer) (3)
0'37
0·37
0'37
0'37
0'37
0-37
0'39
0'41
0'43
0'52
0'56
0'56
Cocoanut (each) (13)
0-22 0-22
0'22
0'23 0-25
0'25
0'25
0-25
0'25 0'25
0'25
0'25
Gingelly Oil
(bot.) (23)
1'75
1'75
1'62
1'65
1'62
1'62
l'64
1'62
1'62
1'62
1'62
1'62
Banana (doz,)
(4)
0'99
0'91
1'07
1'22
1'17
H2
1'09
1'05
(l'90
0'87
0'85
0'81
Milk (boL) (14)
0'62
0'62
0'62
0'62
0'62
0'62
0'62
0'62
0'62 0'62
0'62
0'62
Ghee (lb.) (24)
2'75
2'75
2'75
2'75
2'75
2'75
2'75
2'75
2'75
2'75 2'75
2'75
Potatoes (Ib,) (5)
0'20
0'21
0'22
0'22
0'23
0'22
0'25
0'23
0'22
0'22
0'28
0'28
Salt (seer) (IS)
0'06
0'06
0'06
0'06
0'06
0'06
0'06
0'06
0'06 0'06
0'06
0'06
Sugar (Ib,) (25)
0'53
0'53
0'53
0'53
0'53
0'53
0'53
0'54
0'53
0'53
0'53
0'54
87
Onions (Ib,) (6)
0'18
0'16
0'16
0'13
0'12
0'15
0'16
0'14
0'16
0'16
0'16
0'16
Brinjal (lb.) (7)
0'24
0'22
0'16
0'18
0'17
0'15
0'16
0'13
0'16
0'16
0'17
O'I!!
Elephant- Ladies yam Finger (Ib,) (Ib,) (8) (9)
0'08
0'09
0'09
0'09
0'10
0'12
0'11
0'09
O'OB
0'08
O'OB
0'08
0'31
0'32
0'26
0'30
0'35
0'28
0-34
0'33
0'31
0'31
0'34
0'37
Pumpkin (lb.)
(10)
0'50
0'50
0'48
0'47
0'47 0',1]
0'47
0'47
0'47
0'47
0'47
0'47
Fish (Miscellaneous) (maund)
(11)
6'88
5'00
3'60
5'38
7'00
7'88
10'17
INO
8'38
8'50
9'10
6'75
Corri- Cummin Chillies Tam'lrind Turmeric ander
(seer) (19)
(lb.) (lb.) (lb.) (16) (17) (18)
1'00
1'00
1'06
0'89
0'77
0'75
0'77
0'81
0'77 1'06
1'06
1'06
Jaggery (Ib,) (26)
0'24
0'22
0'22
0'23
0'26
0'26
0'27
0'27
0'26
0'27
0'28
0'28
0'30
0'27
0'28
0'26
0'25
0'25
0'26
0'26
0'31 0'31
0'31
0'31
Coffee (lb.) (27)
2'37 2'37
2'37
2'37
2'37
2'37
2'37
2'37
2'37
2'37
2'37
2'37
0'36 0'22
0'37 0'24
0'37 0'25
0'42 0'25
0'44 0'25
0'44 0'25
0'45 0'26
0'44 0'25
0'44 0'25 0'44 0'25
0'44 0'25
0'44 0'25
Tea Fire-wood (lb.) (thulam) (28) (29)
2'44 0'56
2'44 0'56
2'44 0'56
2'44 0'56
l'44 0'56
2'44 0'56
2'44 0'66
2'44 0'69
2'44 0'69
2'44 0'69
2'44 0'69
2'44 0'69
Mustard (seer) (20)
0'75
0'72
0'69
0'71
0'75
0'71
0'76
0·75
0'75 0'75
0'75
0'75
Kerosene Oil (bot.) (30)
g'25
0'25
0'25
0'25
0'25
0'25
0'25
0'25
0'25
0'25
0'25
0'25
seeds (seer) (21)
1'50
1'50
1'55
1'69
1'60
1'69
2'27
2'11
2'00 2-13
2-25
2'25
Matches (box of
60 sticks) (31)
0'06
0'06
0'06
0'06
0'06
0'06
0'06
0'06
0'06
0'06
0'06
0'06

Month
January
February
March
April
May
June
July
August
September
Octo\)el'
November
December
Month . (1)
January
February
March
April
May
June
July August
September
October
November
Deceinber
Month
January
February
March
April
May
June
July
August
September
October November
December
APPENDIX 6
RETAH.. PRICES OF CERTAIN COMMODITmS, 1958-concld.
Dhoties (4 cubits)
(32)
2-12
2-12
2-12
2-12
2'12
2'12
2'12
2'13
2'12 2-12 :
2-12 2-12
Shirting (yard)
(33)
1-12
1-12
H2 1-12
H2 1-12
H2
I-l3
1'12
1'12
1'12 1-12
Upper cloth
(4 cubits) (34)
1-62
1-62
1'62
1-62
I-62 1-62
1-62
1-62
1'62
1'62
1'62 1-62
Sarees (6 yards)
(35)
6-37
6-37
6'37
6-37
6'37
6'37 6-37
6-40 6'50 6-50
6'50 6-50
Petticoats (yards)
(36)
H2 1-12
1-12
1-12
1-12
1-12
H2
1'13
H2
1-12
1'12 1-12
Betelnuts Betelleaves (12 packets) (100)
(37) (38)
0-28
0-28
0'28
0-25
0-28
0-28
0-28
0-28
0-28
0-28
0-28 0-28
0-31 0-31
0-25
0-28 0-25
0-19
0-16
0-25
0-26
0-4:1
0-42
0-28
Tobacco (Chewing)
(palam) (39)
0-50
0-56 0-50
0-50 0-50
0-55
0-54
0-56
0-53 0-56
0'57
0-62
RETAIL pRICES OF CERTAIN COMMODITmS, 1959
Rice 2nd Sort (seer)
(2)
0-45
0-44
0'44
0-47
0'51 0-55
0-57
0'51
0-52
0-52
0-52
0'47
Dbal (seer) (3)
0-56
0-59
0-72
0-69
0-69
0-66
0-62 0-58
0-56
0'56 0-52
0'44
Banana (doz,) (4)
0-87
0-91
1-17
1-25 1-25
1-25 1-20
1'00 1'03
0'95 1-00
0-99
Potatoes (lb.) (5)
0-28
0-28
0-28
0-25 0-27
0-28
0-27
0-25
0-24
0'20 0-24
0-23
Onions Brinjal (lb.) (Ib,) (6) (7)
0-16 0-16
0-16
0-16
0-16
0'16 0-16
0'16 0-17
0'17
0'18 0-19
0-19
0-22
0-23 0-22
0-18
0'16 0-16
0'16 0-17
0-17
0-18 0-19
Elephant. . Ladies yam finger Pumpkin
(lb.) (10)
(lb.) (lb,) (8) (9)
0-08
0-09
0-09 0-09 0-17
0-14 0-12
0'12 0-11
0'09 0-09
0-09
0-37 . 0-47
0-37 0-47
0-37 0-47
0-37 0-47
0-37 0-47
0-37 0-46
0'37 0-44
0'37 0'44 0-37 0-40
0'37 0'34 0-37 0-28
0'37 0-27
Beedie~
(25) (40)
0'12
0-12
0-12
0-12 0-12
0-12
0-12
0-12
0-12
0-12
0'12 0-12
Fish (Miscellaneous) (maund)
(11)
5-70
6-38
8-50
8-75
8-88
13'88 11-70
8'25 10-63
ll'OO
11'50
ll'88
Corri- 9ummin Meat (lb_)
(12)
1-25
1-25
1-25
1-25
1-25
1-25
1-25 1-25
1'25 1-25
1'25
1'25
Cocoanut (each) (13)
0-25
0-25
0'25
0'25
0-25
0'25 0-25
0'22
0'22
0'22
0'22 0-22
Milk Salt (bot_)· (seer) (14) (15)
0-62
0-62
0-62
0-62
0-62 0-62
0-62
0'62 0-62
0-62
0'62 0-62
0-06
0-06
0-05
0-06
0-06
0-06
0'06 0-06
0-06
0-06
0'06
0-06
88
Chillies Tamarind Turmeric (lb_) (Ib_) (lb_) (16) (17) (18)
1-14
1-25 1-16
1'12
H2
1'12
1'12 1-20
1'28 1-45
1'56
1'64
0'31
0-25 0-31
0-34
0'36
0'56
0'56 0-50
0'62 0-65
0'94
1'00
0'44-
0-50
0'55
0'56
0'56 0'56
0'56
0'56
0'62
0'70
0'75 0-72
ander (seer) (19)
0-29
0-4:1
0'41 0-46
0'50 0-50
0'45 0'49
0'52 0'51
0'59
0'59
Mustard (seer) (20)
0'63 0-62
0-62
0'62
0'67 0-69
0'69 (j'7l
0-75
0-75
0'75
0'71
seeds (seer) (21)
2-30
2-25
2-25
2-25
2-25
2-06
2'00
2'00
2'00 1-85
1-75
1'75

Month
January
February
March
April
May
June
July
August
September
October
November
December
Month
January
February
March
April
May
June
July
August
September
October
November
December
Month (1 )
January
February
March
April
May
June
July
August
September
October
November
December
APPENDIX 6
RETAIL PRICES OF CERTAIN C9MMODITIES, 1959 -(coneld.)
Cocoanut Oil (bot.) (22)
Gingelly Oil (bot.) (23)
1'58
1'58
]'56
1'56
1'56
1'58
1'56
1'56
1'56
1'56 1·56
1'56
Ghee (lb.) (24)
Dhoties (4 cubits)
(32)
2·12
2'12
2'12
2'12
2'12
2'12 2·12
2'12
2'12
2'12
2'12 2'12
1'50
1'49
Jo44 1'44
1"46 1-46
1'4-5
1'44
1'52
1'55
1'56
]'53
Shirting (yard)
(33)
1'12
1'12
1'12
1'12
1'12
1'12
1'12
1'12
H2
1'12
H2
1'12
2'75
2'75
2'75
2'75
2'75
2'75
2'75
2'75
2'75
2'75
2'75
2'75
Upper cloth
(4 cubits) (34)
I-62
1'62
I-62
i'62
1'62
1-62 1'62
1'62
I-62
I-62 , 1-62
1'62
Sugar (lb.) (25)
0'56
0'56
0'56
0'61
0'60
0·59
0'59
0'66
0'84
0'93
1'09
0'95
Saries (6 yards)
(35)
6·50
6'50
6'50
6'50
6'50
6'50
6'50
6'50
6'50
6'SO
6-50
6'50
Jaggery (lb.) (26)
0'27
0'27
0'28
0'28
0'34
0'41
0'44-
0'41
0'33
0'42
0'50
0'46
Coffee (lb.) (27)
2'37
2'37
2'37
2'37
2'37
2'37
2'37
2'37
2'37
2·37
2'47
2.50
Tea (lb.) (28)
2'44-
2'44-
2'44 2'44
2'44
2'44
2'44
2-44
2'44
2'44
2'48
2'62
Fire-wood (thulam)
(29)
0'63
0'62
'()'62
0'62
0'62
0·62
0'62
0'62
0'62
0'62
0'62
0'62
Kerosene oil
(bot.) (30)
0'27
0'28
0-28
0'28
0·28
0'25
0'25
0'25
0'25
0-25
0'25
0·25
Petticoats Betelnuts (yard) (12 packets)
Betel leaves Tobacco (chewing)
(36) (37)
1'12
H2
1'12
1'12
1'12
1'12
1'12
1'12
H2
1.12
1'12
1'12
0'28
0'28
0'28
0'28
0'28
0'28
0'28
0'28
0'28
0'28
0'28
0'28
(100) (33)
0'35
0'30
0'28
0'27
0'19
0'16
0'17
0'24
0'25
0'27
0·33
0'31
(palam) (39)
0-62
0'56
0-62
0'62
0·72
0'62
0'62
0'62
0'62
0'62
0'62
0'62
RETAIL PRICES OF CERTAIN COMMODITIES, 1960
Rice 2nd Sort (seer)
(2)
0'44
0'46
0'45
0'47
O'SI
0'51
0'S2
0'51
0'S2
0·52
0'52
0'51
Dhal (seer)
(3)
Bananas (doz.)
(4)
0'43 1'06
0-42 1'00
0'41 1'03
D-41 1'12
0-41 1'25
0·41 1·15
0'41 1-02
0',41 1.09
0'41 1'06
0'39 0'85
0'37 0'92
0·34 - 0'84
Potatoes (lb.)
(S)
0'24
0'22 0'22
0'22
0'23
0'23
0'22
0'19
0'21
0·19
0·22
0'22
89
Onions Brinjal (lb.) (lb.) (6) (7)
0'19
0'18
0'16
0'16
0'16
0'16
0'16
0'16
0'15
0'12
0'17
0'20
0'19
0'19
0'19
0'18
0.17
0·14
0·15
0'14
0·18
0'16
.0'20
0'24
Elephant- Ladies yam finger (lb.) (lb.) (8) (9)
0'09
0'09
0'09
0'12
0'16
0'16
0'12
0'10
0'09
0.09
0'09
0'09
0'37
0'37
0'37
0'37
0'37
0'33
0'37
0·31
0'34
0·41
0·41
0'45
Pumpkin (lb.) (10)
0'27
0'27
0'27
0'27
0'27
0'14
0'12
0'12
0'12
0'12
0'12
0'14
Matches (box of 60 sticks)
(31)
0.06
0'06
0'06
0'06
0'06
0'06
0'06
0'06
0'06
0'06
0'06
0'06
Beedies (25) (40)
0'12
0'12
0-12
0'12
0-12
0'12
0'12
0'12
0'12
0'12
0'12
0'12
Fish (Miscel. laneous) (maund)
(ll) 12'00
1l'38
13.13
13-00
15'88
13'75
12'00
8'75
10'50 6'75
9.25
6'45

APPENDIX 6
RETAIL PRICES OF CERTAIN COMMODlTmS, 1960-(concld,)
Corri- Cummin Meat Cocoanut Milk Salt Chillies Tamarind Turmeric ander Mustard seeds
-Month (lb. (each) (bot,) (seer) (Ib,) (Ib,) (lb.) (seer) (seer) (seer) (12) (13) (14) (15) (16) (17) (18) (19) (20) (21)
january 1'25 0'22 0'62 0'06 1'77 '0'70 0'69 0-51 0'63 1-75 February 1'25 0-22 0'62 0-06 1'53 0'62 0'69 0-47 0'69 1'75 March 1-25 0-22 0'62 0-06 1·38 0'62 0'69 0'47 0'69 1'75 April 1'25 0'22 0-62 0-06 1'29 0-66 0'69 0-47 0-69 1'75 May 1-25 0-22 0'62 0'06 1-25 0'66 0'69 0'47 0-68 1'75 june 1-25 0'22 0'62 0'06 1'25 0-62 0'69 0-48 0'69 1'74 july 1-25 0'22 0'62 0'06 1'35 0'72 0'69 0-52 0'69 1'55 August 1-25 0'22 0'62 0'06 1-37 0'62 0'69 0-55 0'72 1'50 September 1-25 0'24 0-62 0'06 1'44 0-66 0'69 0-53 0-69 1'50 October 1'25 0-22 0'62 0'06 1'34 0'62 0'69 0'50 0-69 1'50 November 1'2.5 0-22 0-62 0-06 1'31 0'56 0-69 0'50 0-69 1-50 December 1'40 0-22 0-62 0'06 1-31 0'50 0-66 0'48 0-69 1'65
Cocoanut Gingelly Kerosene Matches Oil Oil Ghee Sugar Jaggery Tea Coffee Fire-wood Oil (box of
Month (bot,) (bot,) (Ib,) (lb,) (lb_) (lb,) (Ib,) (thulam) (bot_) 60 sticks) (22) (23) (24) (25) (26) (27) (28) (29) (30) (31)
January I-54 I-58 2'75 0'86 0-41 2-62 2-50 0-62 0-25 0'06 February )'53 )'56 2'75 0'89 0'38 2'62 2-50 0-62 0'25 0-06
March 1-49 I-58 2'75 0-87 0-38 2'62 2'50 0'62 0-25 0'06 April i'46 1-65 2-75 0-82 0'40 2'62 2'50 0-62 0-25 0-06
May I-50 1·75 2-75 0-90 0-41 2-62 2'50 0-62 0'25 0'06
June I-52 1-75 2'75 0-92 0'42 2-62 2-50 0-62 0'25 0'06
July I-56 1-75 2'75 0'92 0'40 2-62 2-50 0-62 0-25 0-06
August l'62 1'91 2-83 0'75 0-37 2-62 2-50 0'62 0'25 0'06 September l-64- 1'97 3'00 0-75 0-36 2'62 2'50 0-62 0-25 0'06 October 1'69 2-12 3'00 0-75 0-35 2-62 2-;>0 0-62 0-25 0'06 November 1-72 2-12 3-00 0-75 0'37 2'62 2-50 0-62 0-25 0-06
December 1'73 2-12 3'00 0'67 0-36 2-62 2'50 0'62 0-25 0'06
Upper Tobacco Dhoties Shirting cloth Saries Petticoats Betelnuts Betell~ves (chewing) Beedies
Month (4!cubits) (yard) (4 cubits) (6 yards) (yard) (12 packets) (100) (palam) (25) (32) (33) (34) (35) (36) (37) (38) . (39) (40)
January 2-12 1'12 H2 6-50 1-12 0'28 0'36 0-72 0'12 February 2-12 1-12 H2 6'50 l'l2 0'28 0'25 0'67 0-12
March 2'12 1'12 ['62 6'50 1-12 0-28 0,25 0-69 0'12 April 2'12 1'12 1'62 6'50 1'12 0'28 0-25 0-63 0-12
May 2-12 1'12 l'62 6'50 H2 0'28 0'20 0'62 0'12
june 2'12 J-12 H2 6'50 I'J2 0'28 0'15 0'62 0'12
july 2'12 1-12 1-62 6-50 1-12 0-28 0'14 0-62 0-12
August 2'12 1-12 1'62 6'50 1'12 0'28 0'21 0'70 0'12 September 2'12 1-12 1-62 6-50 1-12 0'28 0'28 0'72 0'12 October 2'12 1-12 1-62 6'50 1'12 0'28 0-28 0'66 0'12 November 2-12 1-12 1'62 6'50 1'12 0'28 0'31 0'69 0-12
December 2'12 1'12 1'62 6'50 1-12 0'28 0'31 0-65 O'i2
90

APPENDIX 7
CONSUMER PRICE INDEX NUMBERS FOR THE PERIOD 1957 TO 1961 *
Year January February March . April May June July August September October November December
1957 425 428 434 442. 449 448 444 434 423 418 421 429
1958 429 423 417 418 421 426 432 435 442 451 460 468
1959 456 451 446 460 480 505 509 476 487 488 489 467
1960 452 455 452 461 476 479 483 477 481 480 481 474
1961 471 476 485 493 500 512 523 519 512 505 500 51C
}lott.-Base: Average prices from July 1935 to June 1936= 100 • SOIIfce:-Departrnent of Statistics, Kerala
91 106/1-12a

APPENDIX
LIVE-STOCK AND POULTRY-
Total Kozhikode District Badagara Taluk Ernad Taluk Items Males
Females T R U T R U T R U ( I) (2) (3) (4) (5) (6) (7) (8) (9) (10) (II)
TOTAL LIVE-STOCK 708,398 660,4{)8 47,990 81,224 75,304 5,920 184,022 181,178 2,844
416,060 396,913 19,147 48,661 46,426 2,235 111,660 109,824 1,836 (I) CATTLE 170,204 165,155 5,049 13,000 12,565 435 56,890 56,195 695
245,856 231,758 14,098 35,661 33,861 1,800 54,770 53,629 1,141
(a) Males over three years Total 113,807 111,173 2,634 6,757 6,532 225 42,042 41,642 400
(i) Used for bree-ding only 1,274 1,206 68 146 138 8 200 199
(ii) Used for bree-ding and work both 5,424 5,306 118 162 155 7 2,245 2,212 33
(iii) Used for work only Total 102,165 99,850 2,315 6,106 5,909 197 37,791 37,438 353
(a) Castrated 85,529 83,566 1,963 5,528 5,350 178 31,364- 31,138 226 (b) Uncastra-
ted 16,636 16,284 352 578 559 19 6,427 6,300 12.7 (iv) Bulls and Bullo-
cks over three years not in use f Of bree-ding or work 4,944 4,811 133 343 330 13 1,806 1,793 13
(b) Females over three years Total 172,244 162,505 9,739 25,420 24,141 1,279 38,256 37,482 774 {i} Breeding cows Total 167,309 157,770 9,539 25,065 23,788 1,277 36,540 35,773 767
(a) In Milk 59,~66 55,362 4,204 7,971 7,485 486 12,136 11,823 313 (b) Dry 72,496 68,950 3,546 10,492 10,010 482 17,507 17,183 324 (e) Not calved
even once 3:i,247 33,458 1,789 6,602 6,29~ 309 6,897 6,767 130 (ii) Cows over
three years used for work only 3,200 3,123 77 263 262 1,283 1,277 6
(iii) Cows over three years not in lISe for work: or bree-ding purposes 1,735 1,612 123 92 91 I 433 432 I
(c) Young stock Total 130,009 123,235 6,i74 16,484 15,753 731 31,362 30,700 662 Males 56,397 53,982 2,415 6,243 6,033 210 14,848 14,553 295 Females 73,612 69,253 4,359 10,241 9,720 521 16,514 16,147 367
(i) Underoneyear Total 70,532 65,966 4,566 9;098 8,605 493 15,946 15,574 372 Males 33,050 31,183 1,867 4,216 4,028 188 7,683 7,506 177 Females 37,482 34,783 2,699 4,882 4,577 305 8,263 8,068 195
(ii) One to three years Total 59,477 57,269 2,208 7,386 7,148 238 15,416 15,126 290
Males 23,347 22,799 548 2,027 2,005 22 7,165 7,047 118 Females 36,130 34-,470 1,660 5,359 5,143 216 8,251 8,079 172
II BUFFALOES Total 68,179 66,231 1,948 641 • 616 25 19,884 19,694 190 lIlales 38,938 38,598 340 152 148 4 11,033 10,969 64 Female~ 29,241 ~.27,633 1,608 489 468 21 8,851 8,725 126
fa) Males over three years Total 34,017 33,786 231 % 94 2 9,707 9,662 45
* Source :-Department of Animal Husbandry, Kerala.
92

8
UVE-STOCK CENSUS, 1961 *
South Wynad Forest Kozhikode lTaluk Quilandy Taluk Taluk Tirur Taluk areas ., _____ -A-____ ---y------__ -"--_____ .,r-___ ..A. __ --y-_______ ..A. _____ ---,
T R U T R U T T R U T (12) (13) (14) (I.")) (16) (17) (18) (19) (20) (21) (22)
12~754 97,993 26,761 101,037 98,854 2,183 82,283 133,878 123,596 10,282 1,200
70,790 60,699 10,091 64,457 63,463 994 55,012 64,682 60,691 3,991 798 24,811 22,477 2,334 20,557 20,347 210 25,964 28,608 27,233 2,375 374 45,979 38,222 7,737 43,900 43,116 784 29,048 36,074 33,458 2,616 414
141989 13,998 991 11,327 11,263 64 18,231 20,185 19,231 954 276
242 199 43 156 155 265 264 249 15
731 664 67 484 479 5 1,245 523 517 6 34
13,205 12,397 808 10,209 10,153 56 15,962 18,657 17,75.€) 901 235
11,298 10,628 670 8,434 8,378 56 14,061 14,639 13,806 833 205
1,907 1,769 138 1,775 1,775 1,901 4,018 3,950 tl8 30
811 738 73 478 476 2 759 741 709 32 6
:32,797 27,397 5,400 29,923 29,429 494 20,703 24,818 23,026 1,792 327 :31,960 26,718 5,242 29,245 28,755 490 20,062 24,118 22,355 1,763 319 12,236 9,684 2,552 10,655 10,406 249 8,455 8,029 7,425 604 84 12,926 11,091 1,835 11,863 11,693 170 8,247 11,247 10,512 735 214
6,798 5,943 855 6,727 6,656 71 3,360 4,842 4,418 424 21
401 346 55 397 395 2 354 496 483 13 6
436 333 , 103 281 279 2 287 204 188 16 2 :23,004 19,304 3,700 23,207 22,771 436 16,078 19,679 18,434 1,245 195
9,822 8,479 1,343 9,230 9,084 146 7,733 3,423 8,002 421 98 l3,182 10,825 2,357 13,977 13,687 290 8,345 11,256 10,432 824 97 J3,781 11,202 2,579 12,579 12,304 275 8,751 10,278 9,431 847 99 6,355 5,289 1,066 5,837 5,715 122 4,420 4,491 4,177 314 48 7,426 5,913 1,513 6,742 6,589 153 4,331 5,787 5,254 533 51
9,223 8,102 1,121 10,628 10,467 161 7,32.7 9,401 9,003 398 96 3,467 3,190 277 3,393 3,369 24 3,313 3,932 3,825 107 50 5,756 4,912 844- 7,235 7,098 137 4,014 5,469 5,178 291 46 3,608 2,398 1,210 2,547 2,513 34 20,502 20,596 20,107 489 401 1,053 950 103 815 811 4 12,400 13,290 13,125 165 195 2,555 1,443 1,107 1,732 1,702 30 8,102 7,306 6,982 324 2()1)
831 789 42 540 538 2 10,649 12,037 11,897 140 157
93

APPENDIX-
LlVE-STOOK AND POULTRY-
Total Kozhikode District Badagara Taluk Ernad Taluk Males Items Femals
T R U T R U T R U (I) (2) (3) (4) (5) (6) (7) (8) (9) (10) (II)
(i) Used for bree· ding only 368 35<\- 14 12 10 2 SO 79
(ii) Used for bree· ding and work botb 1,650 1,594 56 7 7 513 511 2
(iii) Used for work-only Total 30,912 30,757 155 69 69 8,846 8,805 41
(a) Castrated 25,413 25,282 131 51 51 7,208 7,178 30 (b) Uncastra-
ted 5,499 5,475 24 18 18 1,638 1,627 II (iv) Bulls and Bullo-
cks over three years not in use for bree-ding or work 1,087 1,081 6 8 8 268 267
( 6) Females over three years Total 24,369 22,965 1,404 393 374 19 7,574- 7,475 99 (i) Breeding cows Total 21,945 20,592 1,353 364 345 19 6,492 6,393 99 (a) In Milk 9,245 8,295 950 171 164 7 2,648 2,589 59
(b) Dry 9,125 8,806 319 149 141 8 2,768 2,730 38 (c) Not calved
even onCe 3,575 3,491 1M 44- 40 4 1,076 1,0H 2 (ii) Cows over three years used for work only 2,012 1,980 32 16 16 970 970
(iii) Cows over three years not in use for work or bree-ding purpo$es 412 393 19 13 13 ll2 112
(c) Young stock Total 9,793 9,480 313 152 148 4 2,603 2,557 46 Males 4,921 4,812 109 56 54 2 1,326 1,307 19 Females 4,872 4,668 204 96 94 2 1,277 1,250 27
(i) Under one year Total 5,157 4,903 254 113 110 3 1,387 1,345 42 Males 2,499 2,402 97 39 38 1 691 674 17 Females 2,658 2,501 157 74 72 2 696 671 25
(ii) One to three years Total 4,636 4,577 59 39 38 1,216 1,212 4-
Males 2,422 2,410 12 17 16 635 633 2 Females 2,214- 2,167 47 22 22 581 579 2
III SHEEP Total 2,157 2,133 24 1,923 1,923 (i) Up to one year 399 397 2 353 353
(ii) Over one year Total 1,758 1,736 22 1,570 1,570 Males 473 468 5 416 416 Females 1,285 1,268 17 1,154 1,154
IV GOATS Total Z20,890 194,082 26,808 31,870 28,212 3,658 50,553 49,735 818 (i) Upto one year 73,889 64,146 9,743 10,697 9,138 1,559 16,855 16,546 309
(ii) Over one year Total 147,001 129,936 17,065 21,173 19,074 2,099 33,698 33,189 509 Males 24,982 22,059 2,923 3,585 3,400 185 5,834 5,74-2 92 Females 122,019 107,877 14,142 17,588 15,674 1,914- 27,864- 27,447 417
94

8
LIVE~STOCK CENSUS,1961-(contd.)
Kozhikode Taluk Quilandy Taluk South Wynad
Taluk Tirur Taluk ~ _______ A-____ -.r _______ A-__ ___,,-_~~ ______ A ______ ~
Fore~t areas
T R U T R U T T R U T
(12) (13) (14) (15) (16) (17) (18) (19) (20) (21) (22)
36 28 8 38 37 120 81 79 2
68 62 b GO 60 54() 431 383 48 31
703 676 27 422 421 9,655 11,103 lJ,017 86 114 ;)94- 576 18 307 306 8,634 8,527 8,445 82 92
109 100 9 1I5 115 1,021 2,576 2,572 4 22
24 23 20 20 334 422 418 4 II
2,234 1,259 975 1,375 1,347 28 6,546 6,066 5,783 283 181 2,066 1,121 945 1,156 1,128 28 6,201 5,488 5,226 262 178 1,287 559 728 612 587 25 2,375 2,122 1,991 131 30
601 432 169 391 389 2 2,823 2,255 2,153 102 138
178 130 48 153 152 1,003 1,111 1,082 29 10
134- 112 22 176 176 265 449 439 10 2
34 26 8 43 43 80 129 1I8 11 1 543 \ 350 193 632 628 4 3,307 2,493 2,427 66 63 222 161 61 275 273 2 1,751 1,253 1,228 25 38 321 189 132 357 355 2 1,556 1,240 1,199 41 25 393 2M. 159 330 328 2 1,672 1,231 1,183 48 31 162 105 57 161 159 2 865 562 542 20 19 231 129 102 169 169 807 669 641 28 12
150 116 34 302 300 2 1,635 1,262 1,244 18 32 60 56 4 114 114 886 691 686 5 19 90 60 30 18B 186 2 749 571 558 13 13
83 61 22 87 87 47 17 15 2 8 7 1 18 18 10 10 9
75 54 21 69 69 37 7 6 1 18 14 4 24 24 13 2 1 I 57 40 17 45 45 24 5 5
lO,064 34,684 15,380 33,696 32,543 1,153 6,194 4B,512 42,713 5,799 17,110 11,713 5,397 11,202 10,777 425 1,764 16,260 14,207 2,053
12,954 22,971 9,983 22,494 21,766 728 4,430 32,252 28,506 3,746 5,579 3,817 1,762 4,034 3,931 103 1,169 4,781 4,000 781
27,375 19,154 8,221 18,460 17,835 625 3,261 27,471 • 24,.'i06 2,965
95

APPENDIX
LIVE-STOCK AND POULTRY
Total Ko~hikode District Badagara Taluk Ernad Taluk Items Males
,-___ • __ .A. ______ --. ,-____ --A-,.---- .."
Females T R U T R U T R U (1) (2) (3) (4) (5) (6) (7) (8) (9) (10) ell )
V HORSES AND PONIES Total 42 8 34 3 2
Males 26 6 20 2 2 Females 16 2 14 I
(a) Over three years Total 32 6 26 3 2 Males 20 5 15 2 2 Females 12 II
(b) Young stock Total 10 2 8 ¥ales 6 5 Females 4 3
W U pto one year Total Males Females
(ii) One to three years Total 10 2 3 Males 6 I 5 Females 4 1 3
VI MULES Total 16 16 (a) Upto three years 5 5 (b) Over three years 11 11
VII DONKEYS Total II II Males 9 9 Females 2 2
VIII PIGS Total 1,043 1,014 29 49 49 [2 2 POULTRY Total 1,395,511 1,281,725 107,786 89,635 84,276 5,359 442,311 436,511 5,-
I ROWLS Total 1,388,764 1,281,952 106,812 89,530 84,176 5,354 440,997 435,215 5,782 Des! 1,353,462 1,251,789 101,673 86,765 81,669 5,096 433,703 428,249 5,454 Improved 35,302 30,163 5,139 2,765 2,507 258 7,294 6,966 328
(a) Hens Desi 569,561 516,652 52,909 43,704 4{),546 3,158 162,239 160,023 2,216 Improved 14,621 12,099 2,522 1,476 1,344 132 2,723 2,603 120
(b) Cocl.s Desi 205,789 192,375 13,414 10,435 10,013 422 71,685 70,848 837 Improved 9,666 8,439 1,227 635 592 43 2,396 2,267 129
(cl Chicken Desi 578,1l2 542,762 35,350 32,626 31,110 1,516 199,779 197,378 2,401 Improved 11,015 9,625 1,390 654- 571 83 2,175 2,096 79
II DUCKS Total 6,186 5,239 947 49 44- 5 1,244 1,227 17 (a) Duck 4,665 4-,1I6 549 29 26 3 887 879 8 (6) Drakes 922 666 256 10 9 I 233 224- 9 (c) Ducklings 599 457 142 10 9 I 124- 124-
III OTHERS 561 534- 27 56 56 70 69
96

LlVE:"STOCK CENSUS, 1961-(concld.}
South Wynad Forest Kozhikode Taluk Quilandy Taluk Taluk Tirur Taluk areas r------__..",A..-----v-----A------l ,--__ ,J..._ __ -""'\ ,..---___ A _____ ,
T (12)
R (13)
31 2 16 1 15 . 1
22 11 11 9 2 5 1 4 1
9 2 5 1 4 1
178 149
341,433 269,4416
340,259 269,016 330,084 262,679
10,175 6,337 141,543 106,180
4,501 2,615 45,574 36,936 2,352 1,484
142,9&7 119,563 3,322 2,238
1,120 360 611 ' 161 300 97 209 102
54 30
106/1-13
U T R (14) (15) (16)
29 3 15 3 14
22 3 11 3 11
1 4-3
1 4 3
2 2
2 2
29 245 245
72,027 144,579 141,616
71,243 143,84B 140,889 67,to5 136,976 134,086
3,838 6,872 6,803 35,363 50,690 49,089 1,886 2,551 2,508 8,638 17,932 17,587
868 1,860 1,838 23,404 68,354 67,410
1,084 2,461 2,457
760 708 704 450 546 543 203 61 60 107 101 101 24- 23 23
U T T (17) (18) (19)
2 4 2 4
2 4 2 4
14 5 9
11 9 2
524 45
2,963 130,473 244,675
2,959 130,005 241,727 2,890 125,839 237,710
69 4,166 4,017 1,601 42,570 128,011
43 1,548 1,811 345 19,343 to,504-22 1,220 1,201 944 63,926 69,195
4 1,398 1,005
4- 430 2,628 3 257 2,330 .
11l 205 62 93 38 320
97
R (20)
14 5
9
11 9 2
45
223,038
220,253 216,882
3,371 117,44D
1,470 37,332 1,036
62,110 865
2,467 2,245
163 59
318
U (21)
21,637
21,4-74 20,828
646 10,571
341 3,172
165 7,085
140
161 85 42 34 2
T (22)
2,405
2,398 2,385
13 804
11 316
2 1,265
7 5 2

APPENDIX 9
AGRICULTURAL MACHINERY AND IMPLEMENTS * Oil En-gines
Ghanis Sugarcane crushers with Electric ~ pumps pumps Persian Tractors Worked Worked for irri- for irri- wheels r---"-
, _ _..A-__ "",
""I 5 seers Less Ploughs ~ and than
DistrictlTaIuk
(I)
Kozhikode District
Wooden Iron Carts by by gation gation or Govern-
power bullocks purposes purposes Rhats ment Private more 5 seers
Badagara
Total Rural Urban
(2)
79,108 77,907
1,201 3,543 3,470
(3)
242 237
(5)
4 S
(6)
39 36 3 1 I
(7)
378 372
6 taluk Total
Rural Urban Total
73 29,2'37
5 15 13 2
91
(4)
1,162 1,098
64 144 136
8 .. .. Ernad
" Rural Urban
Kozhikode Total
Quilandy
" Rural
"
Urban Total Rural Urban
South Wynad I" Rural
Tirur
-p ores t area
" Total Rural Urban Total
29,010 227
8,389 8,033
356 5,631 5,612
19 14,701
17,424 16,898
526 183
91
20 18 2
20 20
46
50 49 I
324 324
153 124 29 99 95 4
191
251 228 23
• Source:-Department of Animal Husbandry, Kerala I No urban area
1
2
2 2
2 3
11 II
6
14 J4
50 50
10 10
12 12
6
300 294
6
APPENDIX 10
(8)
58 46 12 1 I
12 II I 4 1 3 4 4
37 30 7
(9)
9 9
3 3
3
2 2
(10)
2 2
2 2
COLLEGES FOR THE ACADEMIC YEAR 1960-61 ...
51. No. (1 )
Name of Institution
(2) Arts and Science Colleges
Government Government College, Bada
gara
Private 2 Guruvayurappan College,
Calicut
3 Malabar Christian College, Calicut
4, Farook College, Feroke
5 Providence ,Women's College, Calicut
• SQurce :-University of Kerala
Strength of Students No. of Teachers r------J~------~.~,
Established in
Courses of study Total Men Women
(3) (4) (5) (6) (7)
Pre. Uty.,
B.A., B.Sc. 313
1879 Pre. Uty., B.A., M.A. (Eeon.), B.Se., B.Com. 599
1848 Pre. Uty., B.A., B.Sc. 701
1948 Pre. Uty., B.A" B.Sc., M.Sc. (Math.), B. Com. ' 679
1952 Pre. Uty., B.A., B.Sc.
98
33B
264 49
479 120
558 143
650 29
338
Full Part time time
(8) (9)
17
42
36
48
19
(II)
24 21 3 2 2
3 I 2
16
2
(12)
397 335 62 53 44 9
50 50
159 127 32 61 58 3
74 56 18
(13)
277 254 23 47 46
1 76 76
43 33 10 30 28 2
75 65 10
No. of Students living in college hostels
Total Men
(10) (11)
196 196
65 65
354 354
Women (12)
234

APPENDIX 10 COLLEGES FOR THE ACADEMIC YEAR 1960-61 (concld.)
S1. No. (1 )
Name of Institution (2)
6 St. Joseph's College, Devagiri
Professional Colleges Government
7 Government Training College, Calicut
8 Medical College, Calicut Private
9 Rousethul U100m Arabic Col-lege, F eroke
10 Madeenathul Uloom Arabic College, Feroke
11 Sullamussalam Arabic College, Areacode
Courses 81. Name of of No. Institution study
1 Kerala Go- C.E., Students Boys vernment Polytechnic, Calicut-5
Ch.E., Girls E.E. Teachers Men M.E., Women F.T.,
t2 Junior Tech-One year Students Boys nical School, course Girls Manjeri Teachers Men (COVI.) Women
Established in
(3)
Courses of study (4) .
1956 Pre. Vty., B.A., B.Sc., M.A. (Eng.),
Strength of Students ,..------A----.,
Total Men Women (5) (6) (7)
M.Sc. (Math.) 658 658
1950 B.Ed. 150 115 35 ., M.B.B.S, 372 262 110
1944- Afzal-Ill-Ulama 52 52
1946 do. 54 54
19jj do. 29 19 10
APPENDIX 11 TECHNICAL INSTITUTIONS *
No. of Teachers ,..---"-----..,
Full Part time time (8) (9)
45
10 44
7
6
7
Strength of Students/Teachers
No. of Students living in College hostels
Total Men Women (10) (1 I) (12)
402 402
50 33 17 322 237 85
52 52
1950-51 1951-52 1952-53 1953-54 1954-55 1955-56 1956-57 1957-58 1958-59 1959-60 1960-61
53 156 129 99 134 126 103 222 217 193 229
33 29 33 38 28 33 30 45 33 39
-43
58 2 6 2
'" Source ;-Department of Technical Institutions, Ke t This institution has started functioning from 1960- v •
APPENDIX 12 NUMBER OF INSTITUTIONS AND NUMBER OF PERSONS TREATED FOR THE
PERIOD 1950-51 TO 1960-61 * Type of Institution
Hospital
Mental Hospital
, Details
}N:;:t:~e:f{ Out door persons treated In door
1 Number
JNumber of {out door
persons treated In door
1 Number Number of r Out door
Dispensaries r persons ~ J treated L In door
Primary Health Centres
}N~~:~~f rOut door persons { treated L In door
Mobile }N!b.:~~f rOut door Dispensary persons {
treated L In door
1950-51 1951-52 1952-53 1953-54 1954-55 1955-56 1956-57 1957-58 1958-59 1959-60 1960-61 6 6 6 6 6 6 6 6 6 6 6
172,~6 181,073 165,427 200,702 214,495 344,233 338,796 313,962 353,842 514,903 412,652
17,378 17,730 21,679 25,888 27,402 29,280 35,125 37,277 39,679 42,007 43,946 1 1 1 1 1 1 I 1 1 1 I
1,321 982
755 758 846 1,046 931 979 1,070 1~087 1,083 1,136 1,229 6 6 6 6 6 6 10 II 11 18 18
107,026 110,224 99,408 107,234 96,839 117,932 237,740 297,850 305,617 330,122 336,395
1,304 1,381 1,340 1,699 1,956 2,478 3,402 9,131 9,544 5,295 5,570 2 3 9 9
4,572 19,990 189,387 173,353
2,381 2,906 1 1
3,879 22,558
• S9urce :- Department of Health Services, Kerala
99 106/1-13.
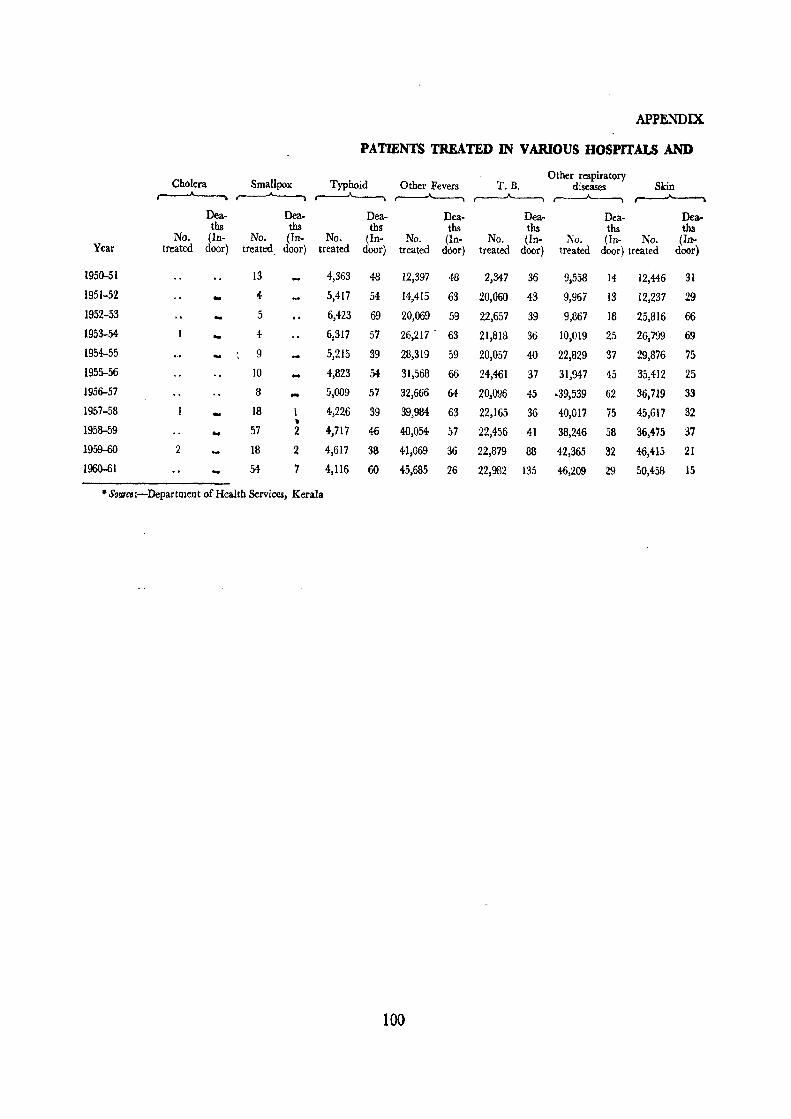
APPENDIX
PATIENTS TREATED IN VARIOUS HOSPITALS AND
Cholera Smallpox Typhoid Other Fevers T.B. Other respiratory
diseases Skin ~ ~ ~ r----'------, ,..-----'-----, ~ ~
Dea- Dea- Dea- Dea- Dea- Dea- Dea-ths ths ths' ths ths ths ths
No. (In- No. (In- No. (In- No. (In- No. (In- Xo. (In- No. (In-Year treated door) treated door) treated door) treated door) treated door) treated door) treated door)
1950-51 13 4,363 48 12,397 48 2,347 36 9,558 14 12,446 31
1951-52 ... 4- 5,417 54 14,415 63 20,060 43 9,967 13 12,237 29
1952-53 ... 5 6,423 69 20,069 59 22,657 39 9,867 18 25,816 66
1953-54 ... 4 6,317 57 26,217 . 63 21,818 36 10,019 25 26,799 69
1954-55 9 5,215 39 28,319 59 20,057 40 22,829 37 29,876 75
1955-56 10 4,823 54 31,568 66 24,461 37 31,947 45 35,412 25
1956-57 8 - 5,009 57 32,666 64 20,096 45 ·39,539 62 36,719 33
1957-58 ... 18 4,226 39 39,984 63 22,165 36 40,017 75 45,617 32 • 1958-59 ... 57 2 4,717 46 40,054 57 22,456 41 38,246 58 36,475 37
1959-60 2 18 2 4,617 38 41,069 36 22,879 88 42,365 32 46,415 21
1960-61 54 7 4,116 60 45,685 26 22,982 135 46,209 29 50,458 15
.. Solltce:-Department of Health Services, Kerala
100

13
DISPENSARIES BY DISEASES FOR THE PERIOD 1950-51 TO 1960-61 * Ear, Nose and Injuries and
Throat Labour Venereal Cancer accidents Others Total r----"----I ,.-------A... __ ~ ~~ ~ ~ ,..----'------, .
Dea- Dea- Dea- Dea- Dea- Dea- Dea-ths tbs ths tbs tbs ths ths
No. (In- No. (In- No. (In- No. (In- No. (In- No. JIn- No. (In-treated door) treated door) treated door) treated door) treated door) treated oor) treated door)
6,652 2,002 28 3,316 16 150 12 5,696 77 102,475 107 161,715 417
8,547 2,018 26 ,3,285 18 167 13 6,467 79 21,875 105 104,459 #3
9,545 3,115 28 4,579 26 188 21 7,415 68 22,218 99 J31,897 494
10,165 4,218 21 6,987 35 299 41 8,325 45 26,875 97 148,044- 489
10,275 3 5,145 19 6,867 27 645 31 9,412 54 29,568 69 168,217 453
11,715 4,919 23 6,745 26 599 -; 41 10,053 69 30,025 57 192,277 444-
10,928 4,785 21 6,833 29 798 62 11,543 55 31,545 43 200,469 47I
11,655 2 4,619 18 8;745 37 876 72 12,347 60 32,817 92 223,087 527
16,579 4,762 28 8,899 21 947 69 12,675 53 30,085 98 215,953 511
19,518 6 5,945 33 8,947 25 988 89 18,873 62 31,015 97 242,651 529
21,146 8 6,782 42 10,928 29 1,004 95 19,143 66 322,613 139 551,120 651
101

APPENDIX 14-
RURAL SANITATION FOR THE PERIOD 1950-51 TO 1960-61 '"
Items ·1950-51 1951-52 1952-53 1953-54 1954-55 1955-56 1956-57 1957-58 1958-59 1959-60 1960-6l
1 No. of wells 'constructed 7 7 5 7 2 6 14- 13 27 24 26 2 No. of wells cleaned and re-
paired 25 22 20 35 21 24 43 37 51 61 3 No. of bore-hole latrines cons-
tructed 2 56 12 3 7 59 31 19 41 4 No. of other type latrines put
up 20 48 31 5 42 [5 58 90 103 122 196 5 No. of markets inspected 15 15 15 . 15 17 17 16 24- 38 63 63 6 No. of fairs and festivals for
which sanitary arrangements were made 14 lil 14 14 14 14 14 14 17 17 17
7 No. of offences detected ~nder Public Health 23 21 48 30 30 50 120 79 96 271 185
8 No. of offenders convicted 22 16 41 22 25 29 28 57 43 136 21
'" Source :-Department of Health Services, Kerala
APPENDIX 15
ANTI.ADULTERATION ACTIVITIES FOR THE PERIOD 1956.57 TO 1960-61 '"
Total No. of Number of cases Fines realised Total No. of reported samples used adulterated Prosecutions Disposed Convicted Total Average amount
Year Rs. Rs. 1956-57 60 28 12 9 9 1,070 119 1957-58 450 94 103 91 83 11,182 135 1958-5~ 874 87 48 54 51 8,675 170 1959-60 746 153 119 96 92 8,630 94 1960-61 901 320 266 205 168 17,935 107
--·-Source:-Director of Health Services, Kerala
102

APPENDIX 16
POLYMETRIC TABLE OF DISTANCES * I WEST COAST ROAD
Note.-The road overlaps the Calicut-Madras Road between Calicut and Ramanattukara. (Distance in miles)
Rama-Muttun- Bada- Qui- nattu- Edari- Valan- Kutti-
Mahe gal gara Payyoli landy Calicut Feroke kara Kakkad kode cherry puram
Mahe 7-2 9-5 16·1 23·5 38·5 45·5 484 6()'6 6504- 80·3 84-5 Tellicherry (2-4) Cannanore (16-4)
Muttun· 2-3 8-7 16-3 31-3 38-3 41-2 53-4 58-2 73-1 77·3 Nadapuram (7-2) gal Kanakamala via Nadapuram
(5·5) Kuttiyadi via Nadapuram
(15-0) Thottipalam via Kuttiyadi
(19-0) Pakramthalam via Thotti-
palam (25-0) Bada- 6-4 14-0 29-0 36-0 38-7 51-1 55-7 7()'6 75-0 Badagara R.S. (0-2) gara Tiruvallur (6-0)
Valiapally (3-4) PayyoJi 7-4 22-4- 29-4- 32-3 44-5 49-3 64-2 68-4 Peram bra (11-0)
Kuttiadi via Perambra (18-5) Qui- 15-0 22-0 24-7 37-1 4-1-7 56-6 61·0 Quilandy R.S. (0-2)
landy Ulleri (5-4) Balussery via. Ulleri (10-0) Tamarasseri via Balusseri
(17.7) Perambra via Ulleri and Naduvannur (8-3)
Calicut 7-0 9-7 22·1 26-7 41-6 46-0 Calieut R.S. (0-4) Chevayoor (4-4) Mavoor (13-0) Beypore (6-4)
Feroke 2-7 15-1 19-7 34-6 39-0 VeIipuram (3-2) Rama- 12-2 17-0 31-7 36-1 Kondotti (6-4) nattu- Parakkadavu (8-7) kara Parappanangadi R.S. via.
Parakkadavu (10-0) Kakkad 4-6 19-5 23-7 Tirurangadi (1-0)
Kondotti via Tirurangadi (22-0)
Parappanangadi (5-6) Tirur via Parappanangadi
(12·0) Edari- 14-7 19·1 Kottakkal (I-I) kode 1\1alappuram (8-2)
Talakadathur (5-0) Tirur R.S. via Talakadathul'
(8-1) Valan- 4-2 Angadipuram ( 12-0) -:herry Perintalmanna (13-0)
Tanalur (J 7-0) Puthanatani (6-0)
Kutti- Malappuram (224) puram Bettath Pudiyangadi (8-0)
Tirur (10-0) Tanur via Tirur (23-0) Tritala (B-O) Trichur via Shoranur (40-4)
• Sour,,:-The Executive Engineer, Buildings and Roads, Calicut
103

Calicut Kallayi Ferok.e Calicut 1-3 7·0
Kallayi 5·5 Feroke
APPENDIX 16
POLYMETRIC TABLE OF DISTANCES-(ccmtd.}
Ramana-ttuk.ara
9·7
8·4 2·7
Ramana· ttukara
II Calicut-Madras Road
Kondotti 16-3
15-0 9-3 6·4
Kondotti
Mongam 21-5
20·2 14-5 11-6
5·2
Malappuram 32·3
31-0 25-3 22·4-
16-0
Kuttilangadi (District Boundary) (33-5) Madras (445-2) KaUayi R.S. (0-0) Feroke R.S. (0-0) Tirurangadi (B-6)
Vazhakkad (7·2) Tirurangadi (9.5) Areacode (9·2) Manjeri via Areacode (18-7)
Mongam 10-6 Manjeri (5-5) Nilambur (21-2)
Malappuram Kuttilangadi (District Boundary) (1-2) Angadipuram R.S. (10-4) Perintalmanna (1l-5) Palghat (58.3) Kottakkal (8-4) Tirur (17-0) Parappanangadi (20-1) Pattambi via Perintalmanna (25-5)
m Calicllt-Nilambur-Gudalar Road
Hote.-The road overlaps Calicut-Madras Road for the first 23 miles 6 furlongs.
Calicu~ Mongam Manjeri Trikkalangode Edavanna \Vadapuram Calicut 21·5 29-3 33-1 36-6 42-6
Mongam 7·6 Manjeri
11-4 3-6
15-1 7-3
21-1 13-3
Tdkkalimgocie 3-5 9-5 Edavanna 6-0
Vadapuram
104
Nilambur 45-0
23·3 15·5
11-7 .8·2
2·2
Nilambur
State Boundary (64-3) Gudalur (77.1) Malappuram (10-6) Anakkayam (2-0) Malappuram (7-4) Pandikkad (8-0) Tiruvali (4-4) Wandur (7-4) Kalika vu (14·4) Wandur (5-4) Pandikkad (14-0) Kalikavu (14"() Karuvaramkundu (26-7) Melattur via Karuvaramkundu
(29·7) State Boundary (19-3) Gudalur (32-1)

'Calicut Eranhi- Kunna-palam mangalam
. Calicut 2-3 9-3
Eranhi- 7·0 palam
Kunna-manga-lam
APPENDIX 16
POLYMETRIC TABLE OF DISTANCES-(concld.)
Tamara· sseri 17·6
15-3
8-3
Tamara-sseri
IV Calicut-Vythiri--Gudalur Road
Pudup- Lakkidi Vythiri padi 26-0 36·0 39-4
23-5 33·5 37·1
16·5 26-5 30-1
8-2 18-2 21·6
Puduppadi 10-0 13-4 Lakkidi 3-4
Vythiri
Chundale Meppadi~ Vaduvan-
41·6 48-4
39-3 46-1
32·3 39-1
24·0 30-6
15·6 22-4 5-6 12-4 2-2 9-0
Chundale 6·6 Meppadi
chai 57-2
54-7
47-7
39·4
31-2 21-2 17-6
15-4 8-6
Vaduvanchal
State Boundary (60-3) Gudalur (83-5) Balusseri . (9-5)
Nanminda (18-2) Chathamangalam (3-0) Manasseri (8-1) Mukkom (9-1) Balusseri (7-7) Quilandy; (17-7)
Pozhuthana (4-0) Kuthirapandy (17-2) Tharavana via Tariode
(21-0) Kalpetta (4-0) Churalmala (8-0) Ambalavayal (5-2) Sultan's Battery (11.6) State Boundary (3-1) Choladi (5-6) Gudalur (26.3)
V Calicut-Vythiri-Mysore Road
NDk.-The road overlaps the Calicut-Vythiri-Gudalur road for the first 41 miles 6 furlongs.
Calicut Vythiri Chundale Kalpetta Meenangadi S, Battery Calicut 39-4 41-6 45-6 53-4 60-1
Vythiri 2-2 6-2 14-0 20-4 Chundale 4-0 11-6 18-2
Kalpetta 7-6 14-2
Meenangadi 6-4-S. Battery
105
State; Boundary (73-1) Mysore City (133-3) Taruvana (21.0) Gudalur (41.7) Edapatty (1.5) Panamaram via Edapatty (9.2) Kaniambetta (8-2) Vaduvanchal (11-6) Cherambadi (6-7) Nulpuzha (9-5) Gudalur via Nulpuzha (26-7) State Boundary (13-1)

APPENDIX 17
FACILITIES AT VARIOUS RAILWAY STATIONS (BROAD GAUGE) *
Distance from Calicut Railway
Station Waiting Parcel Tele- Free Refresh-,---~ room and cloak Plat- Advance Stret· grams! clean- ment
Sf. Name of railwa)' In In retiring foom foom form booking chers Tellt- mgser- Book Medical stalls, No. station km. miles facilities facilities tickets facilities phones vices stalls facilities etc.
(1 ) (2) (3) (4) (5) (6) • (7) (8) (9) (10) (11) (12) (13) (14)
Manplore-Shoranur Railway line
1 Mahe 60 37 U, III PL P FAE
2 Mukkali H. 3 Nadapuram Road 52 32 III PL 4 Badagara 46 28 U, III and PL p S TP FAE V
U (L) 5 Iringal 41 28 III PL TL 6 Paryoli 36 22 III .PL 7 Tikkoti 34 21 III PL TL 8 Vellarakkad H. 9 Quilandy 25 15 U,III PL TL FAE
10 Chemancheri 20 12 III PL 11 Elathur 12 7 III PL 12 West Hill 5 3 U, III PL 13 Vellayil H. 14 Calicut U, U (L), PL, C, P Dl,OP I, S TL,TP FCS B FAE, V,N
III, R TBO AMRV 15 Kallayi 2 I U,III PL P 16 Feroke 10 6 U, III PL P TL 17 Kadalundi 15 9 III PL 18 VaUikkunnu 20 13 III PL 19 Parappanangadi 25 16 U, III PL 20 Tanur 33 21 III, III (L) PL 21 Tirur 41 26 U, HI PL, C, P Dl TP B FAE V
OA 22 Tiruna-vaya 50 31 III PL 23 Kuttippuram 56 35 U, III PL TL FAE 24- Pallippuram 66 41 III PL
Nilambur-Shoranur RaU~y line
1 Nilambur foad III PL,OA TL FAE 2 Vaniambalam lOt 7t III PL 3 Tuvvur 19t, 13t III PL
.. Source:-Divisional Superintendent (Commercial), Olavakkot
t Distance from Nilambur Road Railway Station PL Parcel facilities S Stretchers
U Upper Class Waiting Room TBO Town Booking Office FCS Free Cleaning Service U (L) Upper Class Waiting Room for OA Out Agency B Bookstalls
ladies C Cloak Room facilities FAE First Aid Equipment III Third Class Waiting Room P Platform tickets V Vegetarian Refreshment Room
III (L) Third Class Waiting Room for DI Advance Booking N Non-Vegetarian do. ladies I Invalid chairs AMRV Accidental Medical Relief Van
R Retiring Rooms
1/"

APPENDIX 18
LIST OF POST OFFICES * Post offices as 00 31st March 1950 117 ~ludadi 162 Quilandi
118 ~Iuthungal 163 Randathani
1 Alathiyur 59 Iruvetty 119 .Muttil 164 St. Vincent Colony
2 Aliyur 60 Kadalundi 120 Nadakavu 163 Sultan's Battery
3 Amarambalam 61 Kadameri 121 Nadapuram 166 Tamaracheri
4 Anakkara 62 Kakkattil 122 Naduvannur 167 Tanalur
5 Arakkinar 63 Kakkoti 123 Naduvattam 168 Tanur
6 Areacode 64 Kalikavu 124 Nanmunda 169 Tavanur
7 Arikkulam 65 Kallachi 125 Nilambur 170 Tayyalingal
8 AriyaJlur 66 Kallai-~br 126 Niramaruthur I7l Tenhipalam
9 Atavanad 67 Kalpakancheri 127 01akara I7Z Tennala
10 Atholi 68 Kalpetta 128 Olavanna 173 Thali
11 Ayancheri 69 Karakkad 129 Omacbapuzha 174- Thekkankuttur
12 Badagara 70 Karakunnu 130 Omasseri 175 Thovarimala
13 Badagara Beach 71 Karuvarakundu 131 Oorgammelmuri 176 Tikkoti
14 Balusseri 72 Katalur 132 Orkattiri 177 Tirur
15 Betath Puthiyangadi 73 Kavmnannam 133 Othukkungal 178 Tirurangadi
16 Beypore 74 Kayanna 134 Ozhur 179 Tiruvachira
17 Bhumivathukal 75 Keezhil 135 Panayi 180 Tiruvali
18 Bilathikulam 76 Keezhuparamba 136 Pandalur 181 Tiruvannur
19 Calieut Beach 77 Kerala Estate 137 Pandikad 182 Tripanacbi
20 Calicut H. O. 78 Kolagapara 138 Panthe~rankavu 183 Tuneri
21 Calieut R. S. 79 Kolaparamba 139 Para~'l'.&! 184 Tuvoor
22 CaIicut South Beach 80 Kondotti 140 IParappanangadi 185 Ullanam
23 Chalapuram 81 Korapoya 141 Payyoli 186 Unnikulam
24 Chaliyam 82 Kotinhi 142 Perambra 187 Vadu'lianchal
25 Chamravattam 83 Kottakkal 143 Peravanna 188 Valancheri
26 Chandakunnu 84 Kotuvalli 144 Peringadi 189 Valayam
27 Chathamangalam 85 Kudalur 145 Peruvayal 190 Valiyora
28 Chelanur 86 Kundungal 146 Ponmala 191 Vallikunnu
29 Chemancheri 87 Kunnamangalam-Mbr 147 Ponmeri 192 Vaniyambalam
30 Chembra Peak Estate 88 Kunnathara 148 Pozhuthana 193 Vayittiri
:31 Chembrasseri 89 Kurimbattur 149 Pudupadi 194 Vazhakkad
32 Chengoroth 90 Kuthiravattam 150 Pudllpanam 195 Vazhayur
33 Chengottur 91 Kuttayi 151 Pukkottur 196 Velam
34 Cherapuram 92 Kuttiadi 152 PuJiyacode 197 Velimukku
35 Cherode 93 Kuttikattur 153 Pullangode 198 Vellakatpadi
26 Cheruvannur 94 Kuttipala 154 Pulikkal-Ramanattukara 199 Vellarmala
37 Chettipadi 95 Kuttipuram 155 Pulpatta 200 Vellayil
38 Chevayur 96 Ku~himanna 156 Punnol 201 Vengapalli
39 Chikkod 97 Mahe 157 Plirameri 202 Vengara
40 Chombala 98 Malaparamba 158 Purathur 203 Villiapalli
41 Chundale 99 Malappuram 159 Puthiyangadi 204 Wandoor
42 Codacal 100 Mampad 160 PlIthiyara 205 West Hill
-43 Down Hill 101 Mandarathur 161 Pllthumala
44 Edacheri 102 Mangaiam Opeoed during 1950-51 45 Edakulam 103 Maniyur 1 Achooranam 15 Cheriyamundam -46 Edarikkode 104 Manjeri 2 Anantavur 16 Cheruppa 47 Edavanna 105 Mankavu 3 Andiyurkunnu 17 Cheruvannur-Meladi -48 Edayur 106 Mannur 4 Annasseri 18 Cheruvayur 49 Elankur 107 Marakkara 5 Arur 19 Chikkilode 50 Eranhipalam 108 Marikunnu 6 Avitanallur 20 Chulur .51 Farook College 109 Mavoor 7 Ayinikkad 21 Chllndampatta 52 Feroke 110 Meladi 8 Azhinhilam 22 Edakkara .53 Indiannur HI Melmuri-Mbr 9 Chathangottupuram 23 Edakkat-West Hill 54 Irimbiliyam 112 Meppadi 10 Chelavur 24 Edakkulam 55 lringal 113 !\feppayur II Chelembra 25 Elettil 56 Iringannur 114 Mokkam 12 CheJiya 26 Eranhikkal 57 Iringavur 115 Mooniyur 13 Chennamangalur 27 Iringallur-Kottakkal .58 lrumbuzhi H6 :Morayur 14 Chennara 28 Iringathur
,.. Source :-Director of Posts and Telegraphs, Kerala Circle
107

APPENDIX 18
LIST OF POST OFFICES-(contd.) Opeaed during 1950-51-(comld.) 11 Kolakkad 22 Parannur
12 Konganore 23 Punnasseri 29 Irivallur 81 Neeleswaram 13 Kootaranhi 24 Punnur-Cherupalam 30 Kachcheri 82 Nellikode 14- Koothali 25 Purakkad-Meladi 31 Kakkur 83 Nenmeni I,) Kllrm-attur 26 Purakkadi-Wyna:l 32 Kalpathur 84 Nochat 16 Maikavu 27 Puthoor-Eranhipalam 33 Kamblakad 85 Nulpuzha 17 Naripetta 28 Puthur-Badagara 34 Kannamangalam 86 Olavattur 18 Natakkuthazha 29 Thinur 35 Karippur 87 Oorakam-Kizhumuri 19 Natuvathur 30· Vattoli 36 Karthikapalli 88 Padinharathara 20 Palath 31 Vettam-Pallipuram 37 Karumala 89 Paleri 21 Pallikkara-Meladi 38 Karuvambram 90 Pallikkal
Opened during 1952-53 39 Karuvannul' 91 Panangad 4{J Karuvasseri 92 Parambathkavu Edakkara-Nilambur
41 Kavanur 93 Parappur Opened during 1953-54 42 Kavil 94 Paruthur Iyyad 2 Kuningad 43 Kavilampara : 95 Pathiyarakara
Opened duriAg 1954-55 44 Kayakkodi 96 Payimbra
1 Ambalavayal 6 Mulankavu 45 Kayappanichi 97 Pal'yanad 2 Attiyodi 7 Nut Street
% Keraladiswarapuram 98 Perakamanna 3 Cheeral S Paipathur 47 Kilakoth 99 Perumanna
48 Kilur-Meladi 100 Peruvalllir 4 Chullirode 9 Pattarkadavu
49 Kinalur 101 Ponmundam 5 Kythapoyil 10 Pullurampara
50 Kodiyura 102 Poothadi Opened during 1955-56 51 KokkaUur 103 Porur 1 Chempanoda 9 :Munduparamba 52 Kollam 104 Puduppalli 2 Chokkad 10 Muthuvanacha 53 Kommeri 105 Pukkode 3 Chungathara 11 Naluthara 54 Koodathayi 106 Punnapala 4 Eranhimangad 12 Neelancheri 55 Kotancheri 107 Puthur-Kottakkal 5 Kattippara 13 Pokkunnu 56 Kottathara lOB Thalakolathur 6 Kayanna Bazaar 14 Ripon-Wynad 57 Kottuii 109 Thariote 7 Kelakam 15 Venniyur 58 Kottur 110 Thuvakkad 8 Modakkallur 59 Kurichiagam 111 Tiruvangoor
Opened duriag 1956-57 60 Kuruvangad 112 Tolavanur 61 Kuruvattur 113 Trikkalangad 1 Chekkiyad 10 Nilambur-R. s. 62 Madakkima!a 114 Triprangode 2 Kadalundi-Nagaram 11 Pallara
63 Madavur 115 Ulliyeri 3 Karekkad 12 Pallikunnu-Wynad
64 Makkada U6 Urangattiri 4 Kayani 13 Perassanur
65 Marudonkara' 117 Vadakumpram 5 Kovur 14 Pookayil Bazaar
66 Mattathur 118 Vadavanur 6 Kuttipuram-Kottakal 15 Puthanpalli
67 Mayanad 119 Vakayad 7 Mambram 16 Tanur Nagaram
68 Melur-Quilandi 120 Valakulam 8 Mayyanur 17 Ulikkal
69 Mennanyam 121 . Valiyakunnu 9 Nadavayal 18 Vellirod
70 Mokeri-Nadapuram 122 Valluvambram ~pened during 1957-58 71 Muchukunlllt 123 Vatayam I Kunnambetta 3 Ponmeri-Parambil 72 Muttil 124 Va yikkalasseri 2 Pnmbra 4 Puthur-Pallikal 73 I_\IutuvaUur 125 Vellaiyicode
Opened duri.ng 1958-59 74 1_\1uyippotu 126 Vellayur 75 Nallalam 127 Velliparamba 1 Chemmarathur 6 Perumugham 76 Narukar::; 128 Vengalam 2 Karulayi 7 Sree Ramakrishna Mission 77 Ned:va:ud 129 Vengeri 3 Manimooly 8 Talayad 78 Nt'diyiruppu 130 Vettam 4 Nateri 9 Thekkumuri
79 Nedumgottur 131 Vilayil 5 Pazhamallur 10 Tiruthiyad 80 Neduva Operaed during 1959-60
Opened during 1951-52 1 Chekkitapara 8 Kulath vayal
2 EzhamDesom 9 Naduvath 1 Avilora 6 Kannoth-Eranhipalam 3 Hajiarpalli 10 Neervaram 2 Chekkunnummal 7 Karanthur 4 Kariyambadi 11 PaHoor. 3 Cheruvadi 8 Keezhariyoor 5 Katampuzha 12 Pandakkal 4 Eravattur 9 Kodancheri-Eranhipalam 6 Kavumannam 13 Pannikottur 5 Kannankara 10 Kodiyathur 7 Kaleri 14 Pantarangadi
108

APPENDIX 18
LIST OF POST OFFICES-(concld.)
Opened during 1959-60-(concld.) 5 Kallanode 13 Nellarachal 15 Pudukode 18 Thekkumthara 6 Karad 14 Pappinippara 16 Puthuparamba 19 Vdancode 7 Koroth Road 15 PayinKanniyul' 17 Thariote-North 20 Venapara 8 Melangadi 16 Pudiyanirathu
9 Mongam 17 Thalakadathur Opened dlll"ing 1961)..61 10 Mundakutti 18 Uppada
1 Anchanchavadi 3 Chenoli II Muyilothara 19 Vadapuram 2 Chathangottunada 4 Kainatti 1:2 Nayarkuzhi 20 Vazhavetta
APPENDIX 19
CONNECTIONS PROVIDED FROM TELEPHONE EXCHANGES DURING THE PERIOD 1950-51 TO 1960-61 *
Name of 1950-51 1951-52 1952-53 1953-54 1954-55 1955-56 1956-57 1957-58 1958-59 1959--60 1960-61 Exchange~'
,.-l'----, c--"---, r---'--, ,.--..A.....-.... r-"-----. ,..-A....-..., r--"---, r--"---, r--"---, ,......J\.--.., ~ D E D E D E D E D E D E D
Badagara 3 II 2 2 2 Calicut t 44 9 7 173 28 140 109 64 42 48 129 Kalpetta Nilambur
* Source :-Director of Posts and Telegraphs, Keraia Circle
D Direct connection from Exchange
E Extension from direct connection
t The Exchange is at present" auto "
Name of centre
Tirur
Wandoor
Calicut
Quilandy
Vythiri
Name of craft
Screwpine weaving an~ bamboo work
Bamboo work
Bamboo work, wooden toys manufacture, laminated wood work, embroidery, granite carving
Brass work on cocoanut shell
Bamboo work
APPENDIX 20
HANDICRAFTS * Materials used
Screwpine leaves, bamboo and reed
Bamboo and reed Bamboo and reed, soft wood, paints, pieces of different woods, cloth and thread, granite
Brass, cocoanut shell, wood and lac
Bamboo and reed
* Source :-Department of Industries and Commerce, Kerala
109
E D E D E D E D E 7 6 10 I
79 9 60 6 77 49 487 23 :2 7
7
Particulars of products
Screwpine mats, mats and baskets of bamboo
Mats and baskets
Mats and baskets of bamboo, wooden toys, trays made by pasting pieces of wood of different colour, embroidered articles and carved granite figures for religious' and other purposes
Brass broidered articles like hookahs, electric lampstands, flower vases, ash-trays, etc.
Mats and baskets

APPENDIX
AVERAGE EARNINGS OF WORKMEN PER DAY IN A CATEGORY OF WORK
SI. Name of Whether skilled 1950--51 1951-52 1952-53 1953-54-No_ Employment Nomenclature of work or unskilled ~ ~ ~ r-~ M F M F M F M F <I) (2) (3) (4) (5) (6) (7) (8) (9) (10) (11) (12) I Timbt:r (sawmill) Band saw Operator Skilled 2-33 2-33 2-33 2-33
Engine Driver do_ 3-75 3-75 3'75 g-75 Head fitter do_ 3-35 3-35 3-35 NO Carpenter do_ 3-00 3-00 3-00 3-00 Circular saw Coolies do_ 1-75 1-75 1-75 1-75 Blacksmith do_ 2-20 2-20 2-20 2-20 Broker Semi skilled 1-75 1-75 1-75 1-80 Oiler do. 1-70 1-70 1-70 1-75 Fireman do_ 2-00 2-00 2-00 2-12 Measuring clerk do_ 2-30 2'30 2-30 2-33 Time ~eeper Unskilled 1-80 1-80 1-80 1-80
II Tile General work in Pug Mill do_ l-50 I-50 1'62 1-62 l'62 1-62 H2 1-62 Press Semiskilled 1-87 1-87 2-00 2'()() 2-00 2-00 2-00 2-00 Kiln do_ 1-81 1-94 1-94 )-94 Fitter and Carpenter Skilled 2-00 2-00 2-00 2-00
III Textile Weavers, Jackad fitter, } do_ 2-00 2-00 2-15 2-15 Carpet fitter
Winders Pin (Double) Unskilled 1'15 1'10 1'25 l'l5 1'25 1'20 1'30 1'25 IV Printing press Compositor, Binder, Printer, Skilled 1'00 1'00 "00 1'10
Foreman V Matches Turner, Fitter, Crosscut, I do. 1-00 1·10 1'20 1'25
Saw operator, Drier J operator
Inner Box operator, Helper Unskilled 0'75 0'75 0'75 0'75 -0-75 0'75 "00 0'90 VI Oil Mills Engine Driver, Blacksmith, Skilled 1'15 1'20 1'25 1-30
Electrician, Turner Yard worker, Yard Moopens, Unskilled 1'00 )'00 1'10 1'15
Oiler, Head load workers Chuck worker, Cutterman Semi skilled 1'00 1'00 1'00 1'15
• SeUT" :-Labour Commissioner, Kerala
110

21
FOR THE PERIOD 1950-51 TO 1960-61 *
1954-55 1955-56 1956-57 1957-58 1958-59 1959-60 1960-61 ~ ,..----'----; ,.----"----, ,..---A---, r----'----. ~ ~
M F M F M F M F M F M F 1\1 F (13) (14) (15) (16) ( 17) ( 18) (19) (20) (21) (22) (23) (24-) (25) (26)
2-33 2'50 2'50 2'50 2'50 2,56 2'56 3'75 3'90 3'90 3'90 3'90 3'95 3'95 3-42 3-42 3042 3-42 3-45 3-45 3-45 3'10 3~1O 3'10 ., 3'15 3'15 3'25 3'25 2'00 2'00 2'00 2'00 2'10 2'10 2'10 2'25 2'25 2'25 2'35 . 2'35 2'40 2'4{) 1'80 1'80 1'85 1'85 1'85 1'90 1'90 1'75 1'75 1'80 i'80 i'80 1'80 1'80 2'12 2'12 2'15 2'15 2'l5 2'15 2'15 2'33 2'33 2'35 2'35 2'35 2'35 2'35 1'85 1'85 I'B5 1'85 1'95 1'95 1'95 1-62 1'62 1-62 1'62 1'62 1'62 1'78 \'78 2'30 2-05 2'40 2'15 HO 2'34-2'00 2'00 2'00 2'()() 2'12 2'12 2'25 2'25 2'55 2'4{) 2'65 2'59 2'65 2'59 1'94 1'94 2'06 2'19 2'80 2'90 2'90 2'00 2'00 2'19 3'05 3'15 3-25 3'25 2'15 2'25 2'4{) 2'50 2'65 2-75 g'OO
1'30 1'25 1'30 1'25 1'4{) 1'30 l'45 1.35 1'50 l'40 1'75 1'60 2'00 1-75 1'15 1'15 1'20 1-25 1'30 1'35 1'40
1'30 1'35 H{) 1.50 1'80 1'80 2'50
1'00 1'00 1'00 1'00 HO 1'10 1'25 1'20 1'30 1-20 1'50 1'30 1'75 1-60 1'50 1'75 2'00 2'25 2'31 2'50 2'50
1'15 1'15 1'50 1'60 1'75 1'75 2'00
1-25 ... 1'50 1'60 }'75 2-00 2'15 2'15
111

APPENDIX 22
NUMBER OF INDUSTRIAL DISPUTES RESULTING IN WORK STOPPAGES FOR THE PERIOD 1957 TO 1960 '"
Plantations Saw mills Textiles Tiles Others Total ~ A-
I I J.
No. of No. of No. of No. of No. of No. of work- work- work- work- work- work-
No. of erS Man- No. of ers Man- No. of ers Man- No. of erS Man- No. of ers Man- No.of ers Man-dis- affe- days dis- affec- days dis- affec- days dis- affec- days dis- affec- days dis- affec- days
Year putes cted lost putes ted ,lost putes ted lost putes ted lost putes ted lost putes ted lost
(1) (2) (3) (4) (5) (6) (7) (8) (9) (10) (11) (12) (13) (14) (15) (16) (17) (18) (19)
1957 10 3,889 6,697 3 170 927 . 12 125 l,375 26 2,666 1,283 2 90 90 53 6,940 10,318 1958 22 3,470 32,519 3 231 3,062 5 534 10,340 2 686 1,846 .. 32 4,921 47,767 1959 3 462 5,320 2 41 357 33 231 5 1,667 2,748 150 1,6SO 12 2,353 10,306 1960 2 943 6,231 29 464 64 1,216 3 701 87 7 1,237 7,998
* Source:-Labour Commissi(/ner, Kerala
APPENDIX 23
NUMBER OF INDUSTRIAL DISPUTES BY CAUSES FOR THE PERIOD 1957 TO 1960 '"
By causes Details of work stoppage Result Method of settlement r-
Na. of No. of Par-Total workers work- No. of tially Direct
No. of Retr- Hours Ilormal- ers Man- Sue- Un- sue- Con- nego- Adju-dis- Per- ench- of ly em- affec- days cess- success- cess- lnde- cili- tia- dica- Oth-
Year putes Bonus wages sonal ment Leave work Others played ted lost ful ful ful finite ation tions tion ers
(I) (2) (3) (4) (5) (6) (7) (8) (9) (10) (11) (12) (13) (14) (15) (16) (17) (18) (19) (20)
1957 526 41 144 103 21 79 14 124 7,900 6,940 10,172 410 38 78 456 19 35 16 1958 819 24 201 215 118 35 226 5,500 4,921 47,767 625 " 194 557 33 21 208 1959 834 13 185 142 96 124 274 2,413 2,353 10,306 780 54 660 49 . 42 83 1960 839 14- 98 137 15 102 162 311 2,010 1,924- 15,939695 .. 144 596 52 31 160
'" SO!4rCe :-Labour CommiSSlon~r, Kerala
APPENDIX 24
i NUMBER AND TONNAGE OF VESSELS WHIOH ENTERED OR CLEARED AT CALlOUT PORT FOR THE PERIOD 1951 .. 52 TO 1959-60. *
Entered Cleared ,-
Steamers Sailing craft Steamers Sailing craft
Year No. Tons )fo. Tons No. Tons No. Tons (I) (2) (3) (4) (5) (6) (7) (8) (9)
1951-52 264 364,372 1,299 108,229 259 358,344 1,327 108,122 1952-53 385 509,210 1,398 120,073 385 509,210 1,374 115,053 1953-54 461 655,960 1,324 119,644 461 655,960 1,289 117,990 1954-55 349 512,330 1,465 122,490 350 59,706 1,494 121,504 1955-56 269 518,654 1,653 147,761 269 518,654- 1,624- 137,878
. 1956-57 J18 568,454 1,628 142,597 318 568,768 1,596 137,537 1957-56 248 514,508 1,905 161,396 248 511,508 1,852 157,899 1958-59 307 594,853 1,558 162,415 312 595,657 1,856 162,29(} 1959-60 372 625,087 1,894- 176,179 364 619,181 1,817 167,868
'" Source :-Principal Port Officer, Calieut
112

APPENDIX 24
ii NUMBER AND TONNAGE OF VESSELS WillCR ENTERED OR CLEARED WITH CARGOES AT BADAGARA PORT IN COASTING TRADE FOR THE PERIOD 1951·52 TO 1960-61 *
Entered Cleared
Steamers Sailing vessels Steamers Sailing vessels .J
Year No. Tons No. Tons No. Tons No. Tons (1) (2) (3) (4) (5) (6) (7) (8) (9)
1951-52 81 57,698 42 2,926 81 57,698 43 2,977 1952-53 137 88,965 35' 2,913 ]37 88,965 34 2,887 ]953-54 148 95,497 59 5,309 148 95,497 58 5,176 ]954-55 83 63,062 41 3,810 83 63,062 43 3,~ ]955-56 69 52,877 30 2,773 69 52,877 3] 2,775 1956-57 108 88,897 20 1,682 108 88,897 20 1,682 1957-58 96 75,927 39 3,819 96 75,927 39 3,819 ]958-59 96 72,368 26 2,741 96 72,368 26 2,741 1959-60 124 83,333 31 3,353 124 83,333 3] 3,303 1960-61 53 29,909 19 2,098 53 29,909 19 2,098
• Source:-Principal Port Officer, Calicut
APPENDIX 25
i IMPORT INTO THE PORT OF BADAGARA FOR THE PERIOD 1951-52 TO 1959-60 *
Year (1)
1951-52 1952-53 1953-54 1954-55 1955-56 1956-57 1957-58 1958-59 1959-60
Year
1951-52 1952-53 1953-54 1954-55 1955-56 1956-57 1957-58 1958-59 J959-6O
Coir manufactured
Quan. tity Value
(ewt.) Rs.
(2) (3)
2 10
"\
Drugs and medicines
,..------A----Quantity
(14)
Value Rs. (15) 5,320
(1ST JULY TO 30TH JUNE)
Salt Sundries ~
Quan. tity Value Quan- Vallie
(tons) Rs. tity Rs. (4) (5) (6) (7)
2,893 1,64,380 30,596 2,430 1,57,086 47,159 3,495 2,22,636 53,304 1,867 1,29,477 18,750 2,037 1,06,811 21,025
3,907 23,836· 2,904 1,93,117 1,291 72,742
Dates ~
Quan-tity Value
(tons) Rs. (16) (17)
1 600
Grains (other than rice and paddy)
Quan-tity Value
(tons) Rs. (18) (19)
2 1,800
Paddy ,.------A---. Quan-
tity Value (tons) Rs.
(8) (9)
84 19,500
Gums and resins ~
Quan-tity Value
(cwt.) Rs.
(20) (21) 2 260
• Souree:-Department of Statistics, Kerala
113 106/1-15
Oil cakes Chemicals ~
Quan-tity Value Quan- Value
(ewt.) Rs. tity Rs. (10) (11) (12) (13)
300
125 24,657 1,600 241 34,871 215 34,525
3,560 45,800
Hardware and cutlery Jute-gunny bags
,---.-A-----, ,..-----A------Quan- Quan-
tity Value tity Value Rs. (Nos.) Rs.
(22) (23) (24) (25) 200 300 300

APPENDIX 25
i IMPORT INTO THE PORT OF BADAGARA FOR THE PERIOD 1951-52 TO 1959-60-(eoncld.)
Year
1951-52 1952-53 1953-54 1954-55 1955-56 1956-57 1957-58 1958-59 1959-60
Rope and twine r-----'----. Quan-
tity Value (cwt.) Rs.
(26) (27) 28 4,000
Mats and mattings Paints and colours ,.-------A----. ~--..
Quan- Quan-tity Value tity Value
(5. yds.) Rs. Rs.
(28) (29) (30) (31) 360 200 812
Seeds Sugar Tobacco ..------'-----; r----~ r-"--"
Quan- Quan- Quan-titv Value tity Value tity Value
(cwt~.) Rs. Rs. (tons) Rs. (32) (33) (34) (35) (36) (37) 6 800
2 1,000 3 2,340
148 28,029
ii IMPORT INTO THE PORT OF CALICUT FOR THE PERIOD 1951.52 TO 1959.60 •
Chemicals and che-Beedi leaves mical preparations Chillies Coir mats Coir yarn & fibre Coif rope ~ ~ r---'-----; r---~ ~
Quan- Quan- Quan- Quan- Quan-titv Value tity Value tity Value lity Value Quantity Value lity Value
Year (cwi) Rs. (cwt.) Rs. (ewt) Rs. (ewt) Rs. (cwt) Rs. (cwt) Rs.
(1) (2) (3) (4) (5) (6) (7) (8) (9) (10) (11) (12) (13) 1951-52 N.A. N.A.
1952-53 N.A. N.A.
1953-54 N.A. N.A.
1954-55 960 56,560 2,85,477 66 5,305 1955-56 235 12,270 2,85,625 23 950 1956-57 3,25,234-1957-58 3,1l4 1,96,346 12,35,911 4 282
1958-59 16 1,450 2,46,896 7 1,000 1959-60:
Coastal 367 33,060 7,564- 1,71,469 18 714 400 14,994 89 3,130
Foreign 855 13,028
Coit manufactures Cocoanut Copra Cotton piece goods Cottoll raw Twists & yarn ~ ~ ~ ~ ~
Quan- Quan- Quart- Quan-Quantity Value Quantity Value tity Value tity Value tity Value tity Value
Year (cwt) Rs. (Nos.) Rs. (tons) Rs. (Yds.) Rs. (tons) Rs. (lb.) Rs.
(14) (15) (16) (17) (18) (19) (20) (21) (22) (23) (24) (25)
1951-52 1952-53 1953-54 1954-55 1,420 23,085 886,134 40,829 3,246 33,85,231 4,194,530 44-,88,84{) 1,098 27,25,227 55,725 47,700
1955-56 1,500 15,000 742,044 24,016 2,341 21,30,122 7,332,696 81,81,743 740 13,21,845 1I,691 25,295
1956-57 688,571 39,147 730 8,30,512 3,661,651 4,48,960 563 13,50,200 42,440 1957-58 25 1,240 847 1I,62,41O 266,381 3,08,830 1,997 42,32,577 18,259
1958-59 51 981 200,038 15,744- 5,146 2,43,897 41,825 43,688 3,144 75,79,068 8,400 47,780
1959-60: Coastal 2,632 471,129 48,491 7,411 4,29,654 41 5,345 11,584 9,86,756
Foreign - 17,062 11,81,968 14,800 6,34,067
Source:-Departtnent of Statistics, Kerala
114

APPENDIX 25 .. IMPORT INTO THE PORT OF CALlCUT FOR THE PERIOD 1951-52 TO 1959-60-(concld.) u
Cashewnuts Drugs & medicines Dyeing & tanning
Molasses & jaggery substances Mats & mattings metals & ores ~ r------"'-----, r----"-----, ~ Quan- Quan
tity Value Quantity Value Quantity Value tit y- Value Quantity Value Quant ty Value Year (tons) Rs. (cwt) Rs. (cwt) Rs. (s. yds.) Rs. (ewt) Rs. (ewt) Rs (26) (27) (28) (29) (30) (31) (32) (33) (34) (35) (36) (37)
1951-52 1952-53 1953-54 1954-55 1,504 7,20,649 2,00,300 434,952 26,256 922 1,39,264 110 2,494 1955-56 1,218 9,05,979 2,12,998 40,490 112,840 12,657 3,106 3,67,443 134 3,719 1956-57 1,09,lO2 27,970 6,723 3,09,692 1957-58 377 58,797 63,309 27,905 45 50 4,980 3,13,427 lSI 2,901 1958-59 6,435 4,99,874 73,835 519 19,810 1,810 3,620 4,611 3,12,235 1959-60:
Coastal 29 630 10 1,800
Foreign 10,210 3,91,375
Machinery and Mill work Groundnuts Hides and skins Vegetable oil Oil cakes Paints & colours ~ ~ ~ ...... ~ ~ Quan- Quan- Quan- Quan
tity Value tity Value tity Value Quantity Value tity- Value Quantity Value Year Rs. (ewt) Rs. (cwt) Rs. (Gals) Rs. (tons) Rs. (cwt) Rs. (38) (39) (40) (41) (42) (43) (44) (45) (46) (47) (48) (49)
1951-52 1952-53 1953-54 1~54--55 10,529 281 1,963 10,636 ]4,60,280 1,42,274 1955-56 768 42,326 5,451 12,11,726 1,88,942 1956-57 12,500 232 2,235 10,976 25,13,868 1,00,870 1957-58 180 6,941 45,035 9,212 22,30,416 82,829 1958-59 606 2,392 8,468 25,79,943 1,45,798 1959-00:
Coastal 44 1,975 89 ],761 102,382 15,83,471 140 33,640
Foreign (cwt.)
Salts Shells & Corrie Tobacco Sandal wood Other wood Sundries Sugar ~~ ,......--'----, ~ ~ ~ Quan- Quim- Quan- Quan- Quan- Quan-
Value tity Value tity Value Q~tity Value tity Value tity Value tity Value tity Year (tons) Rs. (cwt) Rs. (Ibs) Rs. (cwt) Rs. Rs. Rs. (tons) Rs.
(50) (51) (52) (53) (54) (55) (56) (57) (58) (59) (60) (61) (62) (63) 1951-52 1952-53 1953-54 J954-55 15,133 9,88,883 505 7,693 742,359 15,15,386 7 1,500 44,833 42,77,479 2,285 21,03,332 1955-56 ]3,258 9,18,163 ISO 3,063 1,163,172 19,36,042 300 2,24,352 71,17,521 783 7,20,086 1956-57 11,140 4,88,164 845,488 17,26,490 1,68,693 40,08,223 5,077 49,25,677 J957-58 17,458 9,76,383 95,720 1,32,785 1,078 2,34,2]3 9,21,266 4,321 41,96,893 1958-59 15,726 7,01,964 91,374 1,63,900 1,92,077 4,96,657 5,046 55,09,345 J959-60:
Coastal 15,717 5,62,530 5,000 5,500 2,82,065 Foreign ... 9,431
115 106/1-15a

APPENDIX 25
jj IMPORT INTO THE PORT OF CALICUT FOR THE PERIOD 1951-52 TO 1959-60-(concld.)
Year
1951-52 1952-53 1953-54 1954-55 1955-56 1956-57 1957-58 1958-59 1959-60:
Books and Bricks and Seeds publications tiles ~~~ Quan- Value tity (tons) Rs.
(64) (65)
4,506 28,04,733 4,487 29,75,340 2,423 21,12,181 3,501 19,33,296 3,659 27,53,123
Quan-tity
(cwt)
(66)
Value Rs.
(67)
1,202 18,800 23,025
Quan-tity
(Nos.)
(68)
250 250
Value Rs.
(69)
38 30
Spirits and Wood manu- Wood and wines Glass-ware factures timber ~ ,-----A.---, r-----A----, ~ Quan- Quan- Quan- Quan-
tity Value tity Value tity Value tity Value (Gals.) Rs. (cwt) Rs. Rs. (C.T.) Rs.
(70) (71) (72) (73) (74) (75) (76) (77)
Coastal 65,197 23,03524 4.750 2.73,221 (cwt.)
2,420 1,857 980 42,310 7,002 1,792 2,02,515
Foreign •.• 385
Sugar and Fruits Turmerlc jaggery Tamarind Soap Rope and twine Fish and meat
~ ~ ,-----A.---, ~ ,-----"----, ,------A-----; ,------'---,. Quan- Quan- Quan- Quan- Quan- Quan- Quan-
tity Valu,' tity Value tity Value tity Value tity . Value tity Value tity Value Year (cwt) Rs. (cwt) Rs. Rs. (cwt) Rs. (cwt) Rs. (tons) Rs. (cwt) Rs.
(78) (79) (80) (81) (82) (83) (84) (85) (86) (87) (88) (89) (90) (91) 1951-52 1952-53 1953-54 1954-5S 455 26,620 1,295 9,758 1,832 38,828 1955-56 114 24,350 1,010 2,89,738 5,325 70,689 1956-57 55.625 8,35,695 1957-58 6,570 8,402 93,601 1958-59 2,345 16,93,930 2;937 36,1l() 1959-60:
Coastal 5 215 161 3,964 53 1,400 720 86,000 1,742 88,467 52 1,631 Foreign _ 35,192 7,59,176
'-
Fish oil Mineral oil Other oils Dates Ginger Gum and resins ,--___ .A. __ , ,--_A ___ , ,--___ .A. ___ ,
,-----......_~ r------'-~ Quantity Value Value Quantity Value Quantity Value Quantity . Value Quantity Value
Year (cwt) Rs. Quantity Rs. (cwt) Rs. (tons) Rs. (cwt) . Rs. (cwt) Rs.
(92) (93) (94) (95) (96) (97) (98) (99) (100) (LOl) (102) (103) 1951-52 1952-53 ... 1953-54 1954-55 64 III 2,322 5,25,379 146 8,400 1955-56 56 17,399 3,042 6,95,503 18S 22,050 1956-57 3,17B 27,109 137 8,500 1957-58 3,912 11,027 17,078 4,48,451 637 16,500 15 1,350 1958-59 22,350 36,232 3,564 97,652 552 16,000 41 3,81(). 195~:
Coastal 293 6,750 72 7,070 192 7,380 Foreign 42,590 ...
116

APPENDIX 25
ii IMPORT INTO THE PORT OF CALICUT FOR THE PERIOD 1951.52 TO 1959·60-(concld.)
GUIUly cloth Jute-gunny bags Paddy Rice Wheat Other grains ,..--__ .A._----, ,..--__ .A. __ ----,
~-----. ,-----"---, ,..-----"--------, ,..--_ __A._~
Quantity Value Quantity Value Quantity Value Quantity Value Quantity Value Quantity Value Year (Yds.) Rs. (Nos.) Rs.
(104) (105) (106) (107) 1951-52 1952-53 1953-54 1954--55 16503 12,300 83,151 80,736 1955--56 4,000 2,600 61,900 54,210 1956-57 1957-58 11,850 14,350 1958-59 3,700 3,100 1,750 195!kJO:
Coastal
Foreign
Hardware and cutlery Pulses and grams , __ __..A. __ -, ,--__ ..A
I
Year Quantity
1951-52 1952-53 1953-54 1954--55 1955-56 1956-57 1957-58 1958-59 1959-60:
Coastal Foreign
(116)
Value Rs.
(117)
1,35,621 2,94,668
91,277 30,705 32,155
Quantity Value (cwt) Rs. (118) (119)
40,279 10,52,024
(tons) Rs. (tons) Rs. (cwt) Rs. (tons) Rs.
(108) (109) (110) (111 ) (112) (113) (114) (115)
2,947 6,86,625 16,126 72,14,856 5,289 25,22,237 312 1,26,954 8,958 42,28,901 5,105 26,39,542
35,083 1,87,18,243 5,114 23,60,715 21,697 1,15,58,815 3,664 24,49,635
6 2,420 325 1,91,656 2,418 2,39,465
.. 1,197 15,606 24,647 847,373 (cwt.)
484,493 1,18,56,177 (cwt.)
Manioc meal Metal products Maida Manures .---_.A. ___ , , ___ .Jo.....__, ~-,
Quantity Value Quantity Value Quantity Value Quantity Value (cwt) Rs. (cwt) Rs. (cwt) Rs. (tons) Rs.
(120) (121) (122) (123) (124) (125) (126) (127)
418 1,22,267 51 13,770
353 1,06,065 90 24,500
200 3,125 3,659 1,89,159 386 12,000
APPENDIX 26
i EXPORT FROM TIlE PORT OF BADAGARA FOR THE PERIOD 1951·52 TO 1959-60 *
Coboanut Coir and coir products
Building materials Copra Fish Coastal Coastal Foreign Coastal Coastal Coastal
,.------.A.-----, ~ Quantity Value Quantity Value Quantity Value Quantity Value Value Quantity Value
Year (Nos.) Rs. (ewt) Rs. (cwt) Rs. (tons) Rs. Quantity Rs. (cwt) Rs.
(1) (2) (3) (4) (5) (6) (7) (8) (9) (10) (11) (12) (13) 1951-52 16,569,710 35,60,436 40 2,885 5,575 1,01,25,180 440 6,600 1952-53 21,685,755 37,59,151 9,525 1,40,55,510 1953-54 23,016;128 41,67,855 5,790 83,60,540 175 1954-55 14,593,871 27,92,166 3,054 53,74,979 1955--56 21,653,625 34,58,826 340 3,000 6,833 87,91,855 1956-57 39,573,226 62,38.104 1,102 56,175 6,104 91,77,174 1 1,344 69,958 124,937 1,13,04,958 1957-58 1958-59 31,223,060 63,11,343 1,520 92,013 5,719 1,03,60,581 195!kJO 34,509,051 73,74,278 - 101,988 1,04,02,828 ... -
'" Source:-Department of Statistics, Kerala
117

APPENDIX 26
i EXPORT FROM TIlE PORT OF BADAGARA FOR THE PERIOD 1951-52 TO 1959-60-(concld.)
Mats and Hardware and Wood and Ginger Jute-gunny bags mattings Pepper Salt cutlery timber
Coastal Coastal Coastal Coastal Coastal Coastal Coastal ~~~ ,----A.----, ~~
Quantity Value Quantity Value Quantity Value Quantity Value Quan- Value Quan- Value Quan- Value tity tity tity
Year (cwt) Rs. (Nos.) Rs. (s. yds.) Rs. (cwt) Rs. (ton) Rs. Rs. Rs. (14) (15) (16) (17) (18) (19) (20) (21) (22) (23) (24) (25) (26) (27)
1951-52 2,715 436,750 6,225 5,812 20 50 6,022 3,775,130 75 2,568 40 1952-53 1,475 140,290 4,841 2,542,655 6,490 1953-54 160 18,710 13,526 4,781,996 65 1954-55 598 77,660 8,584 1,818,914 66 1,800 1955-56 901 108,955 9,331 1,609,161 21 1,235 1956-57 5,770 386,930 20,720 2,696,515 1957-58 3,189 143,727 .. 7,480 632,031 .1.1958-59 2,300 58,820 8,780 1,032,855 794 4{J,956 959-60 888 56,660 3,795 777,230 1,55,937
Cordage and rope Fruits and Jute Sundries Betel nuts Cashew kernels of vegetable fibre vegetables manufactures Coastal Coastal Coastal Coastal Coastal, Coastal r-~ ,---.A
Quan- Value Quantity Value Quantity Value Quantity Value Quantity Value Quantity Value tity
Year Rs. (cwt) Rs. (lb.) Rs. (cwt) Rs. (lb.) Rs. Rs. (28) (29) (30) (31) (32) (33) (34) (35) (36) (37) (38) (39)
1951-52 21,171 1952-53 448,427 596 94,855 27 60 80 6,000 45 3,300 1953-54 106,907 9 1,400 100 1954-55 2,416,650 1955-56 243,395 40 1,500 1956-57 1957-58 240
, 36,600
1958-59 32,601 4,720 1,066,772 10 11,950 (tons)
1959-60 51,356 292 65,525 279 155
Provision and Ma~ure oilman stores Cocoanut oil Rubber-raw Bricks and tiles Sandalwood
Coastal Coastal Coastal Coastal Coastal Coastal ~ Quan- Value Quantity Value Quantity Value Quantity Value Quantity Value Quantity Value
tity Year (cwt) Rs. (ton) Rs. (gat) Rs. (lb.) Rs. (Nos.) Rs. (ton) Rs.
(40) (41) (42) (43) (44) (45) (46) (47) (48) (49) (50) (51) 1951-52 1952-53 467 9,400. 1953-54 81 1,268 105 15,675 18 105 ,. 1954-55 230 1,920 1,120 2,000 1955-56 ... ~ 203,300 25,494 2 6,000 1956-57 ... 19577~8 ", 33,993,220 6,369,226 ... 1,326 1958-59 1959-60 -,. -
118

APPENDIX 26
EXPORT FROM 1HE PORT OF BADAGARA FOR THE PERIOD 1951-52 'IO 1959-6C-(concld.)
Wood manufactures Cane Coffee Lemongrass oil Manioc meal Oils
Coastal Coastal Coastal Coastal Coastal Coastal ,.------"----.. r-~
Quantity Value Quantity Value Quantity Value Quantity Value Quantity Value Quantity Value Year Rs. (cwt) Rs. (cwt) Rs. (gal.) Rs. (cwt) Rs. (gal.) Rs.
(52) (53) (54) (55) (56) (57) (58) (59) (60) (61) (62) (63)
1951-52 1952-53 1953-54 1954-55 1955-56 750 1956-57 7,115 761 39,BOO 183 32,410 82 4,600 1957-58 7,400 15 33 375 12 45 1958-59 55,330 10 1959-60
Turpentine Tubers Cardamom Tobacco Rice Coir yarn and fi bre Coastal Coastal Coastal Coastal Coastal Coastal
---., Year Quantity Value Quantity Value Quantity Value Quantity Value Quantity Value Quantity Value
(gal.) Rs. (ton) Rs. (ewt) Rs. (lb.) Rs. (cwt) Rs. (ewt) Rs.
(64) (65) (66) (67) (68) (69) (70) (71) (72) (73) (74) (75) 1951-52 1952-53 1953-54 1954-55 1955-56 1956-57 1957-58 1,200 1958-59 320 38,200 8 8,378 24,462 28,029 1959-60 6 200 100 4,200
ii EXPORT FROM THE PORT OF CALICUT FOR THE PERIOD 1951-52 TO 1959-60*
Books and printed Bricks and tiles Apparel Beedi leaves Betel nuts matter ---., Coastal Coastal Coastal Coastal Coastal Foreign
r---"-----, r~ r---"---, r---"---, r--__J,.,---.. ..----""---.. Quantity Value Quantity Value Quantity Value Quantity Value Quantity Value Quantity Value
Year Rs. (ewt) Rs. (cwt) Rs. Rs. (Nos.) Rs. (Nos.) Rs.
(I) (2) (3) (4) (5) (6) (7) (8) (9) (10) (11) (12) (13) 1951·52
, 10 2,048 148 3,765 5,898,469 885,518 28,346,527 4,859,207
1952-53 9 1,021 130 17,368 3,874,940 537,604 22,639,676 3,733,336 1953-54 1,272 49,713 190 41,785 7,333,904 910,656 25,550,124 3,991,043 1954-55 250 9 758 107 13,755 100 6,670,434 787,528 31,416,656 4,284,313 1955-56 4 259 17 2,310 7,697,874 924,607 22,543,317 2,924,481 1956-57 6 ISO 11 1,805 5,486,933 743,486 4,758,750 676,572 1957-58 21 1,251 118 24,336 11,179,782 1,763,895 21,367,946 3,418,871 1958-59 5 310 407 88,019 431,876 66,751 16,784,688 2,688,740 1959-60 593 118,724 12,643,356 1,812,074 20,469,648 3,007,638
*Source:-Department of Statistics, Kerala
119

APPENDIX 26
ii EXPORT FROM THE PORT OF CALICUT FOR THE PERIOD 1951.52 TO 1959-60-(contd.)
Building materials
Coastal r----'----.
Quan- Value thy
Bamboos
Coastal Foreign ,....----A----- r----"------. Quan- Value Quan- Value
tity tity
Books and printing materials Aloe jute and other fibre
Coastal Foreign ~ ,...--A----.,
Quan- Value Quan- Value thy tity
Coastal Foreign
Year Rs. (ewt) Rs. (cwt) Rs. Rs. Rs.
r---"-----, ~ Quan- Value Quantity Value
tity
(cwt) Rs. (cwt) Rs.
1951-52 1952-53 1953-54 1954-55 1955-56 1956-57 1957-58 1958-59 1959-60
Year
1951-52 1952-53 1953-54-1954--55 1955-56 1956-57 1957-58 1958-59 1959-6(1
Year
1951-52 1952-53 195:i-S4 1954-55 1955-56 1956-57 1957-58 1958-59 1959-60
(14) (15) (16) (17)
436
1,281 1,942
840 8,085
744
241,863
(18 (19) (2O) (21)
10,269 50
2,438 N.A. 421
(22) (23) (24) (25) (26) (27)
1,599 77,470
Cardamom Caslu;w kernels Cashew nuts
Coastal Foreign Coastal Foreign Coastal r--"-----. ~ .----"-----, ~ ~ Quantity Value Quantity Value Quantity Value Quantity Value Quantity Value (cwt) Rs. (cwt) Rs. (ton) Rs. (ton) Rs. (cwt) Rs.
(28) (29) (30) (31) (32) (33) (34) (35) (36) (37) 21 18,992 424 585,419 .3 11,242 423 1,980,959 52 30,720 383 343,141 135 582 2,331,304-18 15,760 248 185,105 2,000 3,953 3,689,236 5 900 82 69,719 187 178,912 282 807 2,541,282 5 900 55 60,436 457 476,302 16,914 2,851,901 oW 39,307 142 165,540 12,021 2,774,572 5 7,020 375 405,000 13,672 2,734,400 1~ 15,599 91 101,393 8,999 2,040,855 78 75,724 8() 70,820 13,547 2,717,932
Cashewnut shell liquids Chemical and ehemi-Cement cal preparations Chillies Cocoanuts
Coastal Foreign Coastal Coastal Coastal Coastal ~ ~ ,---.A..--.. ,......_A.-..-. ,........_A--., ,.-----A---..,
Quan- Value Quantity Value Quan- Value Quantity Value Quantity Value Quantity Value tity tity (gals.) Rs. Rs. Rs. (ewt) Rs. (ewt) Rs. (Nos.) Rs.
(38) (39) (40) (41) (42) (43) (44) (45) (46) (47) (48) (49) 21,221 90,059 3,962 68 8,652 27,295,573 4,679,657
210 i 474 40,327,750 5,913,196 41,260 161,836 40,428 114 10,316 9,353,406 6,427,360
58,278 17 1,854- 32,449,869 4,813,950 .. 78,360 82 10,760 34,210,655 4,856,567 141,358 12 ],400 32,321,742 4,958,143 152,329 43 4,244 17,200,083 3,378,939 69,145 24,729,137 5,003,721
4,213 590 38,200 33,228,256 6,846,099
120

APPENDIX 26
.. EXPORT FROM THE PORT OF CALICUT FOR THE PERIOD 1951-52 TO 1959-60-(contd.) u
Coffee Coir and coir products Cocoanuts
Foreign Coastal Foreign Coastal Foreign
~ ...-----'----, ~ ~ ~ Quantity Value Quantity Value Quantity Value Quantity Value Quantity Value
Year (Nos.) Rs. (ewt) Rs. (ewt) Rs. (ewt) Rs. (ewt) Rs. (SO) (51) (52) (53) (54) (55) (56) (57) (58) (59)
1951-52 2,950 1,012,759 18,291 1,008,429 113,015 5,847,054 1952-53 2,762 499,801 2,097 562,792 16,602 696,380 84,458 3,029,833 1953-54 2,340 371,288 13,700 5,934,292 16,040 483,541 169,764 4,700,918 1954-55 1,988 315,853 9,870 3,075,030 15,480 408,633 172,290 6,072,87:J
1955-56 1,004 163,529- 2,644 998,127 26,330 917,138 153,708 6,053,038 1956-57 1,089 183,239 16,276 3,229,924 18,250 752,398 149,138 5,481,557 1957-58 16,587,419 3,351,472 14,660 3,745,630 15,220 412,028 137,260 3,789,271 1958-59 23,200 5,452 21,317 4,723,837 25,365 941,587 175,177 5,785,501 1959-60 30,500 7,331 2,518 445,323
Coir yarn and fibre Coir mats and mattings Coir rope Other coir ,----..A----, products
Coastal Foreign Coastal Foreign Coastal Foreign Coastal
~--. ,-------"----- ~ ,---'-----, ~ r----"-----. r---'---.. Quantity Value Quantity Value Quan- Value Quan- Value Quan- Value Quan- Value Quan- Value
tity tity tity tity tily
Year (ewt) Rs. (cwt) Rs. Rs. Rs. (ewt) Rs. (ewt) Rs. (cwt) Rs.
(60) (61) (62) (63) (64) (65) (66) (67) (68) (69) (70) (71) (72) (73) 1951-52 1952-53 1953-54 1954-55 1955-56 1956-57 1957-58 1958-59 1959-60 18,006 703,215 122,744 6,486,891 184 16,654 10,997 401,470 63 3,151
Other coir Cordage and rope of vegetable fibre Copra Confectionary and Cotton piece products ,.....---J.----, food products goods Foreign Coastal Foreign Coastal Foreign Coastal Coastal
,---A----"-I ,----"'----. r---"'----. ,---A-----, ..-----J----. ,.---~ ~ Quan- Value Quantity Value Quantity Value Quantity Value Quantity Value Quan- Value Quan- Value
tity tity tity
Year (cwt) Rs. (cwt) Rs. (ewt) Rs. (ton) Rs. (ton) Rs. (lb.) Rs. (yds.) Rs.
(74) (75) (76) (77) (78) (79) (80) (81) (82) (83) (84) (85) (86) (87) 1951-52 11,578 1,014,495 18,482 1,016,539 67 1,915,278 4,030 6,920 1952-53 12,770 638,066 8,709 334,746 3,975 5,308,337 49,184 134,263 1953-54- 16,154- 697,335 13,530 450,244 3,451 1,623,317 7,783 14,494-1954-55 11,763 552,168 10,134 338,964 1,254 1,747,220 46,548 50,279 1955-56 .. 26,184 1,347,621 12,205 512,484 1,908 2,352,499 114,838 66,53$ 1956-57 .. 25,726 1,190,072 4,459 193,093 1,147 1,304;322 9,139 10,095
·1957-58 16,778 672,047 4,059 292,248 293 513,554 478 2,263,282 750 1,107 1958-59 1,756 131,700 475 854,365 32,448 56,539 1959-60 378 49,283 .. 47,403 4,078,318 .. 87,196 61,253 32,932 47,239
121 106/1-16

APPENDIX 26
ii EXPORT FROM THE PORT OF CALlOUT FOR THE PERIOD 1951-52 TO 1959-60-(contd.)
Cotton piece Cotton raw Cotton twist and Cotton waste Other manufactures goods r- yarn -, Foreign Coastal Foreign Coastal Coastal Foreign Coastal
r---"----. ,---'------, ,-.---A------, ~ ~ r--~ ~-, Quan- Value Quan- Value Quan- Value Quan- Value Quantity Value Quantity Value Quantity Value
tity tily tity tity Year (yds.) Rs. (cwt) Rs. (ewt) Rs. (lb.) Rs. (ewt) Rs. (cwt) Rs. (ewt) Rs.
(88) (89) (90) (91) (92) (93) (94) (95) (96) (97) (98) (99) (100) (101) 1951-52 794 3,120 510 1952-53 244 6,623 47 750 2,800 1953-54 580 590 463 15,583 913 60,290 3,957 1954-55 8,400 6,565 140 11,000 4 235 318 449 3,358 138,800 7,640 434,134 1,346 1955-56 18 55,000 1,122 69,353 8,099 414,767 43,672 1956--57 895 71,855 510 1957-58 .. 10 275 12,234 1958--59 1959-60
Cotton raw and Drugs and Dyeing and tan- Fibre for brush and brooms Fish-dry, salted and unsalted waste medicines ning substances
-, Coastal Coastal Coastal Coastal Foreign Coastal Foreign
r----A---, ,------~ ~ ,...----~ ,--- ~ Quan- Value Quan- Value Quan- Value Quan Value Quan- Value Qu~n- Value Quan- Value
tity tity tity tity tity t1ty tity Year (cwt) Rs. (cwt) Rs. (ewt) Rs. (ton) Rs. : (ton) Rs. (cwt) Rs. (cwt) Rs.
(102) (103) (104) «105) (106) ((107) (108) (109) (110) (lll) (112) (113) (114) (115) 1951-52 1,995 460 531,869 2,483 36,055 1952-53 12,605 78 52,569 115 7,591 1953-54 79,013 74 31,878 1954-55 94,303 226 II,ll5 16 685 1955-56 103,458 1,084 114,416 4 160 458 82,987 1956-57 15,290 136 127,116 1957-58 ll,604 128 2,082 1958--59 30,863 1959-60 2,371 90,085 591 32,215
Furniture and cabinet ware Ghee Ginger
Coastal Foreign Coastal Foreign Coastal Foreign
,.-----"------ r---~ ~ Value Quan- Value Quan- Value Quan- Value Quan- Value Quantity Valu~ Quantity
tity tity tity tity
Year Rs. Rs. (cwt) Rs. (cwt) Rs. (cwt) Rs. (cwt) Rs.
(116) (117) (118) (1l9) (120) (121) (122) (123) (124) (125) (126) (127)
1951-52 118,376 20,944 2,690,078 4,756 461,488
1952-53 85,229 19,561 1,439,470 10,347 755,535
1953-54 365,260 19,415 1,547,633 12,681 1,283,084
1954--55 175,979 37 6,854 12,712 1,461,492 9.072 1.144,126 1,955-56 158,086 396 23,582 3,167,862 12,938 1,575,358 1956--57 41,949 3,493,035 1,734 144,012 1957-58 160 21,825 1,110,537 19,124 973,403 1958-59 9,194 480,780 22,052 1,153,161 1959-60 39,502 1,706,153 17,082 1,361,203
122

ii
Year
1951-52 1952-53 1953-54 1954-55 1955-56 1956-57 1957-58 1958-59 195!kiO
Year
1951-52 1952-53 1953-54 1954-55 1955-56 1956-57 1957-58 1958-59 1959-60
, Year
1951-52 1952-53 1953-54 1954-55 1955-56 1956-57 1957-58 1958-59 1959-60
APPENDIX 26
EXPORT FROM THE PORT OF CALICUT FOR THE PERIOD 1951-52 TO 1959-60-(contd.)
Fruits and vegetables new Tamarind Other sorts ,-----"-----,
Coastal Foreign Coastal Foreign Coastal Foreign --y----A-----, "-----, ,
Quan- Value Quan- Value Quan- Value Quantity Value Quantity Value Quan- Value tit}' tity tity tity
Rs. Rs. (ton) Rs. (ton) Rs. (ton) Rs. (ton) Rs.
(128) (129) (130) ( 131) (132) (133) (134) (135) (136) (137) (138) (139)
,-
320 112,592 130 72,388 78 31,094 270 45,546 711 246,849
162,571 212,090 86,482
34,133 367 (cwt.) 5,962 2,121 56,446 1,127 10,974 174,529 20,980
" 174,846 11,260 63,969
735 4,903 98,060 934 22,956 7,206 11,182 380,494 50
" 41,197
1.063 40,189
Grains, pulse and Hardware and Instruments and flour rice Wheat Others Groundnuts cutlery apparatus, etc.
Coastal Coastal Coastal Coastal Coastal Coastal ,--- ~ ~ ~
Quantity, Value Quantity Value Quantity Value Quan- Value Quan- Value Quan- Value tity tity tity
(ton) Rs. (ton) Rs. (ton) Rs. (cwt) Rs. Rs. Rs.
(140) (141) (142) (143) (144) (145) (146) (147) (148) (149) (150) (151 )
280 181,169 7 5.029 54 29,374 14,540 626,759 293,906 236 133,993 120 196 6,410 360 323 163,406 173 103,727 ill 90,455 50,302 822 346,461 140 16 5,589 81 1,090 50,629 4,120 • 540 229,806 2 (cwt) 105 4 1,583 17 287 12,575 367 188,085 30 24 8,374 5,540 517 222,598 20 (cwt) 350 1 8,972 4 1,122 702 44 21,689 2,823 43 839
14,832 (cwt) 326,219 241 (cwt) 5,632
Other manu- Manioc meal Jute-gunny bags Rope and twine factures Manure
Coastal
Quantity Value
(Nos.) Rs.
(152) (153)
16,114 18,402 45,625 48,435 37,828 21,072 8,905 6,775 1,605 1,376 2,600 2,319
900 699 4,350 4,274
Coastal Coastal Coastal Foreign Coastal ~ r---"----, ,...-----A----- r-------"-------. ,------"---, Quan- Value Quan- Value Quan- Value Quan- Value Quantity Value
tity tity tity tity
(cwt) (Rs.) Rs. Rs.
(154) (155) (156) (157) (158) (159) (160)
9,520 3 275 10,530
7,622 23,390 7,170 2,500 38,975 2,823
22,535 328,606 44,372
123
Rs.
(161)
448,214
659,702
(cwt)
(162)
100 55
140
67 (ton) 139
" 9 "
Rs. (163)
125 2,650 1,750
11,044 254,200
3,513
106/1-16a

APPENDIX 26
ii EXPORT FROM THE PORT OF CALICUr FOR THE PERIOD 1951-52 TO 1959-60-(contd.)
Matches Mats and mattings Metals and ores Molasses and jaggery r--- -..
Coastal Coastal Foreign Coastal Coastal Foreign ,-------A---.. ~
Quan- Value Quantity Value Quantity Value Quantity Value Quan- Value Quan- Value tity tity tity
Year (Gross) Rs. (s.yds.) Rs. (s. yds.) Rs. (cwt) Rs. (cwt) Rs. Rs.
(164) (165) (166) (167) (16B) (169) (170) (171) (172) (173) (174) (175)
1951-52 5,192 29,874 54,003 10,891 32 1,334 1952-53 1,765 10,144 8,057 2,408 18 1,930 1953-54 5,634 1,583 96 2,683 56 2,412 1954-55 4 22 768 167 30 720 18,261 740 12,629 1955-56 8,015 1,425 913 5,800 741 15,036 1956-57 1,396 1,595 80 2,067 1957-58 41 268 1,0:1-7 1,127 7,100 6,100 4- 658 740 19,267 1958-59 9 819 240 7,065 1959-60 }62 (cwt) 13,215
Cocoanut oil Groundnut oil Kerosene oil Lemongrass oil Fish oil
Coastal Coastal Coastal Coastal Foreign Coastal Foreign ,.----'-------, ,.........---'-~ ~~ ,----'----; ..-~ Quantity Value Quantity Value Quantity Value Q~- Value Quan. Value Quan- Value Quantity Value
tlty tity tity
Year (ga!.) Rs. (gal.) Rs. (ga!.) Rs. (gal.) Rs. (ga!.) Rs. (cwt) ~. (gal.) Rs.
(176) (177) (17B) (179) (180) (181) (182) (183) (184) (185) (186) (187) (188) (189)
1951-52 14,730 105,028 17,346 125,516 1,400 1,916 1952-53 50,500 388,317 7 47 917 1,303 722 23,081 1953-54 23,104 187,645 13,019 94,316
• 1954-55 2,007 14,34B 3,488 5,722 1955-56 2,503 14,223 2,870 4,057 250 17,414 1956-57 1,254- 7,515 1,288 1,899 1957-58 4,755 44,244 3,782 5,888 5,077 122,253 1958-59 316 2,875 1959-60 4,925 46,372 2,234 3,629 405 30,632 4,022 (cwt) 42,414
Other oils Oil cakes Paddy Paint and colours
Coastal Foreign Coastal Foreign . Cqastal Coastal ~ ~ ~
Quantity Value Quan- Value Quantity Value Quantity Value Quantitr Value Quan- Value tity tity
Year (gal.) Rs. !-(gals.) Rs. (ton) Rs. (cwt) Rs. (ton) Rs. Rs. ( 190) (191) (192) (193) (194) (195) (196) (197) (198) (199) (200) (201)
1951-52 370 1,863 22 9,078 1952-53 351 1,073 9 3,026 1953-54 1,225 3,984- 10 2,175 1954-55 l,o-ro 11,340 1,440 ]955-56 117 3,110 1956-57 108 664 1957-58 5,204- 33,259 258 1,08,328 ]958-59 29,928 85,066 1959-60 308 1,125 2,170 (cwt) 59,098. 2,000 32,000
124

APPENDIX 26
00 EXPORT FROM THE PORT OF CALICUT FOR THE PERIOD 1951-52 TO 1959-60-(contd.) n
Palmyra fibre Pepper Provision and oilman store ,-____ ..-J..
) ,- __.A.
Coastal Foreign Coastal Foreign Coastal Foreign ,---A---, r-----'----. ,-------A...---, ..."
,-___ .A. ~
Quan- Value Quan- Value Quantity Value Quantity Value Quantity Value Quan- Value Year tity tity tity
(cwt) Rs. (cwt) Rs. (cwt) Rs. (cwt) Rs. (cwt) Rs. (cwt) Rs.
(202) (203) (204) (205) (206) (207) (208) (209) (210) (211) (212) (213)
1951-52 14,596 7,664,628 2,330 1,504,553 43,679 610,199 1952-53 12,937 5,926,800 2,835 1,608,988 107,846 2,170,630 1953-54 560 20,751 19,709 5,017,540 5,193 1,741,731 70,886 1,400,349 1954--55 1,180 52,029 14,229 2,511,342 1,197 234,893 81'882 731,252 1955-56 35,671 5,606,492 4,523 677,199 85,820 839,564 ' .. 1956-57 30,980 3,414,690 12,821 800,914 55,761 1,014,624 1957-58 24,392 2,432,713 4,571 455,765 80,662 919,653 1958-59 7,922 1,047,029 1,826 241,337 11,646 137,110 1959-60 12,995 2,689,290 5,492 1,256,357
Rubber-Raw Rubber Manufac- Salt Seeds Soap tured ,-----'---------1
Coastal Foreign Coastal Coastal Coastal Coastal Foreign ,-----A----, ~ ~
,-__ ..A..--, ,-~~
Quan- Value Quan- Value Quantity Value Quan- Value Quan- Value Quan- Valu~ Quan- Value tity tity tity tity tity tity
Year (lb.) Rs. (lb.) Rs. (cwt) Rs. (ton) Rs. (ton) Rs. (cwt) Rs. (cwt) Rs.
(214) (215) (216) (217) (218) (219) (220) (221) (222) (223) (224) (225) (226) (227) 1951-52 270 725 174 6,125 5 5,836 2,175 228,013 1952-53 188,869 249,335 15 483 201 4,155 3,505 334,630 1953-54 7,168 8,019 3 31,775 4,328 464,447 1954--55 171,706 151,975 12 933 10 2,401 2,763 287,831 133 1955-56 508,483 489,626 82 5,732 7 2,113 4,391 412,608 1956-57 182,090 158;809 3 233 2 1,438 3,454 354,019 1957-58 164,295 224,316 474,441 481,966, 100 4,591 20 6,089 1,425 177,283 1958-59 463,843 532,693 1 90 43 10,397 1,259 179,774 J959-60 6,724 967,435 13,384 2,159,321 1,726 258,308
(cwt).
Textiles Tobacco Sugar Tea unenumerated manufactured
,- ---" • Coastal Foreign Coastal Foreign Coastal Coastal r----"-----... ,-~ .------'------..." r--""-----, - - - ......___,
Quantity Value Quan- Value ~~ Quantity Value Quantity Value Quan- Value Quan- Value tity tity tity
Year (ton) Rs. (ton) Rs. (lb.) Rs. (lb.) Rs. Rs. (lb.) Rs.
(228) (229) (23O) (231) (232) (233) (234) (235) (236) (237) (238) (239) 1951-52 20 23,425 46,753 80,518 3,631,762 7,038,660 1952-53 19 11,860 31,530 49,330 3,434,607 6,086,651 1953-54- 82 65,046 85,000 144,693 5,127,448 10,694,003 4,221 1954-55 18 14,771 16 5,500 128,775 281,360 3,760,370 1l,044,201 500 1,035 1,793 ~19S5-56 15 11,345 127,478 213,802 3,203,584 9,206,219 797 3,051 1955-57 6 5,584 62,267 107,834 2,361,979 5,286,984 74 170
:1957-58 23 20,607 32,166 47,496 21,367,946 3,418,871 7,059 6,732 :1953-59 4- 4,366 22,584 32,960 5,181,018 7,561,386 J959-60 709 28,476 6 170 108;143 197,079 2,416,679 4,344,713 460 1,044
(cwt) (cwt)
125

APPENDIX 26
ii EXPORT FROM THE PORT OF CALICUT FOR THE PERIOD 1951-52 TO 1959-60-(eontd.)
To bacco unmanufactured Turmeric Tapioca ---"---------.
Coastal Foreign Coastal Foreign Coastal Foreign "------. ~ ,.-----A---------. ,.--_,A___.___---. ,.---A------. ~
Quantity Value Quan-tity
Value Quantity Value Quantity Value Quan-tity
Value Quantity Value
Year (lb.) Rs. (lb.) Rs. (cwt) . Rs. (cwt) Rs. (cwt) Rs. (cwt) Rs.
(240) (241) (242) (243) (244) (245) (246) (247) (248) (249) (250) (251)
1951-52 ,2,816 23,808 120 I 40 1952-53 4,648 16,033 I 78 38 1,125 1953-54 4,543 10,929 47 4,175 1954-55 5,104 11,573 298 12,680 248 23,325 1955-56 • 6,119 14,404 2,109 143,825 214 12,192 1956-57 3,056 6,723 624 31,006 31 776 1957-58 3,317 6,700 21 1,995 24,491 798,244 1958-59 1,110 2,464 1959-60 15,218 11,574 1,840 920 56 2,820
Rosewood Teakwood ,---------A-- Sandal wood
Coastal Foreign GJastal Coastal Foreign ~--.. .A.
Quantity Value Quantity Value Quantity Value Quantity Value Quantity Value
Year (ton) (ton) Rs. (ton) (Rs.) (ton) (Rs.) (ton) (Rs.)
(252) (253) (254) (255) (256) (257) (258) (259) (260) (261) 1951-52 849,923 1,743 174 40,125 629 479,003, 1952-53 1,239,693 488 103,407 1,710 1,060,682 1953-54 4,417 1,950 481,717 2,029 1,405,900' 1954-55 4,760 526,473 1,649 1,148,824 1955-56 3,203 3,438 834,864 1,412 1,157,947 1956-57 2,658 829,097 386 209,048, 1957-58 1,713 4,402,410 2,227 546,223 1958-59 1,801 368,737 131 26,821 79 16,180 1959-60
Other kinds Wood manufactures Sundries r--~
Coastal Foreign Coastal Foreign Coastal Foreign
~ Quantity Value Quantity Value Quantity Value Quantity Value Quan- Value Quan- Value
tity tity Year Rs. Rs. Rs. Rs. Rs. Rs.
(262) (263) (264) (265) (266) (267) (268) (269) (270) (271) (272) (273)
1951-52 1,960,501 4,444,402 24,963 10,785 3,279,775 1952-53 2,526,310 3,986,049 9,698 616,856 9,263,502 1953-54 2,310,939 4,549,326 7,628 85,064 3,615,010 1954-55 2,652,489 4,611,735 9,424 80,917 1,913,401 1955-56 4,471,354 6,615,384 7,230 73,997 4,436,958 1956-57 3,177,459 1,641,990 60 73,607 1,845,992 1957-58 4,944,088 1,906,355 217,649 672,689 1958-59 544,838 49,460,800 3,037 398,293 446,993; 1959-60 77,253 148,143 890,380 303,672
126

APPENDIX 26
if EXPORT FROM THE PORT OF CALICUT FOR THE PERIOD 1951-52 TO 1959-60-(concld.)
Year
1951-52 1952-53 1953-54 1954-55 1955-56 1956-57 1957-53 1958-59 1959-60
1 2 3 4 5 6 7 8 9
10 11 ]2 13
14 15 16 17 18 19 20 21 22 23 24 25 26
Vegetables
Coastal ~ Quantity Value
(cwt) Rs. (27+) (275)
Wood and Timber
Coastal ~ Quan- Value
tity Rs.
Foreign ~ Quan- Value
tity
(276) (277) (278) Rs.
(279)
Leather manufactur.;. Fish manure ',._-~
Coastal ,----A-----, Quan- Value
tity
(28()) (281)
Foreign Coastal Foreign ..-------'---, ~ ~ Quan- Value Quan- Value Quan- Value
tity tity thy Rs.
(282) (283) (234) (285) (286)
2J14
Rs. (237)
i 19,091
33,180 466,553 6,816,186 7,556,680 6,311
APPENDIX 27 PHYSICAL ACIDEVEMENTS AND PEOPLE'S CONTRIBUTION FOR THE PERIOD
1957-58 TO 1960-61 " Items
Compost pits (Nos.) Chemical fertilizers (Mds.) Insecticides (ewt) Plants sprayed (Nos.) Improved seeds (Mds.) Green manure seeds distributed (lb.) Green manure cuttings (Nos.) Implements distributed (Nos.) Cocoanut seedlings (Nos.) Fertilizer and cultural demonstration (Nos.) Agricultural demonstration plots Holdings taken up Area under Japaneese Method of Paddy Cultivation
(Acres) Quantity of vegetable seeds (lb.) Improved implements (Nos.) Area brought under fruit trees (Acres) Young farmers clubs (Nos.) Crop competition (Nos.) Persons participated (Nos.) Breeding centres-natural (Nos.) Breeding centres-artificial (Nos.) Pedigree b~~ls supi'lied (Nos.) Inseminatiqn-natural (Nos.) Insemination-artificial (Nos.) Veterinary dispensaries (Nos.) Animals innoculated an 1 Vaccinated (Nos.) Bulls castrated (Nos.) Poultry centres opended (Nos.) Pedigree birds supplied (Nos.) Hatching eggs distributed (Nos.) Poultry treated and vaccinated (Nos.) Cattle show conducted (Nos.) Quantity of mineral mixture (:'!ds.) Area under fodder cultivation (Acres) Milk societies Regd. (Nos.) Pumpsets supplied (Nos.) Area under vegetables (Acres)
1957-58 990 25 ton 10 ton
278 paras 19 cwt
30 2,635
7
332
55 14
10
754 306
2 539
3,721 552
I
103
1958-59 3,031 7,119
19 ton
16 cwt
147 12,455
3,272
20 9
3 2Z 94
:l 6,153 1,231
619 4,409 3,456
6
2
1959-60 4,897
13,697 903
424 5,145
298 20,518
606
3,731
;:9 62
6 ~
10 225 43
4 12,430 1,962
20 263
1,358 3,984
5
15
1960-61 3,570
120,828 4,928
77,070 647
3,ll4 280,515
24,403 1,424
1,349
1,407 226 218
41 325 483
4
2 443 323
2 21,199 2,584
7 745
1,189 6,980
5 76 59 2
63
2' 28 29 30 31 32 33 34-35 36 37 38 Tanks improved (Nos.)
----"',,-S-=o-urce":=bevelopment Commissioner, Kerala
19
127

APPENDIX 27 PHYSICAL ACHIEVEMENTS AND PEOPLE'S CONTRIBUTION FOR THE PERIOD
1957-58 TO 1960-61-(contd.) Items 1957-58 1958-59 1959-60 1960-61.
39 Canals and channels constructed (Nos.) il 4{) Net area irrigated (a) Wells 51 41 (b) Tanks 138 42 (e) Canals 20 249 43 (d) Others 337 44 Area reclaimed (Acres) 18 70 132 402 45 Demonstration plots for soil conservation (Nos.) 17 19 46 Surface wells constructed (Nos.) 19 "II 33 47 Surface wells renovated (Nos,) 5 3 13 48 Fisheries and Fingerlings (Nos,) 9,582 5,878 14,510 17,800 49 Soakage pits (Nos.) 68 20 21 63 50 Rural latrines (Nos,) 83 163 137 185 51 Drains constructed (Y cis,) 4 32 II 390 52 Village lanes paved (Sq, yds.) 108 53 Secondary/Primary h~lth centres (Nos.) 4 H 9 1 54 Matetnity and child welfare centres 1 55 Family Planning Advising clinics (Nos,) 1 56 Village Houses constructed (Nos.) 36 45 18 57 Village leaders organisations (Nos,) 20 7 58 Village leaders and young farmers' clubs (Nos.) 38 59 Village Houses reconditioned (Nos.) 2 23 60 Aid given to existing schools (Nos.) 47 61 Community Centres (Nos.) 16 15 1 8 62 Children's Parks (Nos,) 12 I 6 10 63 Sports clubs (Nos.) 16 57 31 47 64 Adults Literacy Centres (Nos.) 48 8 65 63 65 Adults benefited (Nos.) 833 433 1,139 1,044 66 New libraries and reading rooms (Nos.) 9 86 44 42 67 Books supplied (Nos.) 2,126 2,414 1,101 1,975 68 Entertainments (Nos.) 166 427 268 520 69 Cultural clubs (Nos.) 11 114 34 102 70 Members (Nos.) 980 7I 'Women's dubs (Nos.) 13 30 18 31 72 Members 4,271 73 Village leaders camps 8 39 23 74 Village, leaders trained (Nos.) 1,447 75 N.C.C., A.C.C. and B.S.S. Catnps 2 5 76 Cinema shows 134 77 Pucca roads (Miles) 6 84 9 78 Katcha roads (Miles) 48 % 21 83 79 Existing roads improved (Miles) 20 80 Culverts 10 16 15 81 Quality seeds (Mds.) 608 82 Foot bridge 6 83 Production centres 10 8 5 15 84 Crafts adopted B S5 Students trained 418 86 Bee-hives supplied (Nos.) II 346 93 177 87 Credit/Multipurpose co-operative societies (Nos.) 23 29 88 Membership 7,356 15,905 89 Industrial co-operative societies (Nos.) 4 16 27 18 90 Membership 1,323 91 Farming co-operative societies (Nos.) 2 2 2 92 Membership 35 78 1,894 93 Other societies 13 21 9 13 94 Membership 1,336 95 Labour value (Rs. '000) 74'00 93-()() 275'25 llN3()' 96 Land (Acres) 40 73 8 41 97 Land value (Rs. '0(0) 37'00 106'00 32'00 98 Cash and other contributions (Rs. '000) 34'00 28'00 52'00 m·()()
128

APPENDIX 28
RECEIPTS UNDER EXCISE REVENUE FOR mE PERIOD 1950-51 TO 1960.61 lit
Total Foreign Liquor Opium and Ganja Spirituous preparations Others ,---------A------, r-~ ,--------A------, r-----"----~ Demand CoUee- Balance Demand Collee- !Balance Demand Collee- Balance Demand Collec- Balance Demand Collec- Balance
tion tion tion tion tion
Year ·Rs. Rs. Rs. Rs. Rs. Rs. Rs. Rs_ Rs_ Rs_ Rs. Rs_ Rs_ Rs_ Rs_ 1950-51 24,371 24,371 9,920 9,920 6,285 6,285 6,600 6,600 1,566 1,566 1951-52 31,132 31,132 10,980 10,980 8,925 8,925 10,220 10,220 1,007 1,007 1952-53 31,131 31,131 11,671 11,671 7,527 7,527 10,016 10,016 1,917 1,917 1953-54 25,748 25,748 10,760 10,760 3,865 3,865 10,901 10,901 222 222 1954-55 23,296 23,296 9,539 9,539 4,626 4,626 9,122 9,122 9 9 1955-56 . 21,662 21,662 9,620 9,620 3,557 3,557 8,477 8,477 8 8 1956-57 24,475 24,475 10,910 10,910 4,149 4,149 9,171 9,171 245 245 1957-58 11,991 11,991 1,155 1,155 3,608 3,608 7,021 7,021 207 207 1958-59 14,406 14,406 1,319 1,319 3,470 3,470 9,299 9,299 318 318 .. 1959-60 17,433 17,433 2,923 2,923 6,460 6,460 7,B06 7,806 244 244 196()...61 16,472 16,468 4 3,380 3,380 4,895 4,895 7,543 7,539 4 654 654
• S"ulce:-Board of Revenue, Kerala
APPENDIX 29
SALES TAX REVENUE FOR THE PERIOD 1950-51 TO 1960-61 * (Rs. in '000)
Sales lax Sales tax Sales tax on Registration Year Total ordinary additional motor spirit fee Licence fee Miscellaneous
1950-51 4,956-45 4,782-21 89-95 17'61 44-12 22-56 1951-52 4,759-19 4,581-47 90-51 17-99 51-03 18-19 1952-53 3,530-94 3,368-03 85-38 24·76 39'04 13'73 1953-54 4,829'01 4,655'73 85·35 43'79 29'96 14'18 1954-55 4,201-16 4,031-01 82·99 43-73 27'72 15-71 1955-56 3,26(NlO 3,086-90 81-13 47-15 35-46 15'36 1956-57 5,224'85 5,000-04 1 )4.-50 56'68 41'12 12-51 1957-58 8,121-85 7,717-58 265'34 33-96 101-80 3-17 1958-59 7,346-29 7,162-56 0'90 32'10 148-61 2'12 1959-60 8,446'15 8,182-53 3-75 31'42 151'51 70'94 1960-61 9,59'2'55 9,283'53 4'08 36-89 153-09 1I4'96
, Source:-Board of Revenue, Kerala
129 106/1-17

APPENDIX
GRADE OF INCOME, AGRICULTURAL INCOME TAX AND AGRICULTURAL SUPER
Total Individual
Year Grade of Income Total AIT Super tax AIT Super tax Rs_ Rs. Rs. Rs. Rs.
1957-58 Up to Rs_ 5,000 2,51,027'13 2,51,027'13 2,50,187'13 5,001
" 10,000 35,051'54 35,051'54 25,611'28
10,001 "
25,000 1,14,97.'d6 1,12,078'84 2,896'32 55,198'35 25,001
" 50,000 90,341'35 83,054-71 7,286-64 21,303'01 3,376'56
50,001 100,000 4,28,637-23 2,66,056'54 1,62,580'69 ]9,873'87 1,00,001
" 200,000 8,659-92 8,659'92 8,659-92
2,00,001 and over 1 ,20, 105'44 72,219-00 47,886'44
1958-59 Up to Rs. 5,000 4,39,350-21 4,34,610-57 4,739'64 3,71,096'43 5,001 10,000 5,29,866-12 5,29,866-12 4,47,557'92
10,001 "
25,000 3,73,651-56 3,73,651-56 2,96,245-07 . 25,001
" 50,000: 3,72,840-18 3,14,174'77 58,665-41 2,21,636-59 29,367'96
50001 "
100,000 2,52,476-58 2,18,735-52 33,741'06 1,37,008'83 12,368'16 1,00,001
" 200,000 3,45,921-62 2,20,806'76 1,25,1l4'86 1,77,172'01 98,952'45
2,00,001 and over 7,96,655-45 5,46,373-27 2,50,282-18
1959-60 Up to Rs_ 5,000 43,541'49 43,541'49 41,544-19 5,001 ." 10,000 9,94,157'98 9,94,157-98 9,86,758-24
10,001 25,000 2,96,829'45 2,90,849-37 5,980'08 2,31,101'15 25,001
" 50,000 5,14,791-31 4,97,723'57 17,067-74 4,29,911'97 10,413-30
50,001 "
100,000 2,38,558'74 1,73,040-68 65,518-06 98,351-42 40,105'88 1,00,001
" 200,000 ],18,226-29 81,109-91 37,116-38 42,266-50 28,602-06
2,00,001 and over 12,99,733-58 9,03,427'46 3,96,306-12
1960-61 Up to Rs_ 5,000 2,13,708'88 2,13,708-88 2,12,540-62 5,001
" 10,000 2,48,871'86 2,48,871'86 2,34,217'13
10,001 "
25,000 1,32,186-90 1,28,372'73 3,814'17 75,814'21 25,001 50,000 1,50,309'87 1,32,073'49 18,236-38 75,618'24 9,818-15 SO,OOI
" 100,000 86,831-32 64,006'11 22,825-21 7,791-98 2,415-12
1.,00,001 "
200,000 1,02,814'62 57,lll'99 45,702'63 36,793'84 38,488'36 2,00,001 and over 6,20,396'53 2,97,987'62 3,22,4{)8'91
• Sorwce:-Board of Revenue, Kerala
130

30
TAX CLASSIFmD BY GRADE OF INCOME FOR THE PERIOD 1957-58 TO 1960-61 * ~arunlakkathayall1 Unregistered Finn
Undivided Hindu Family Tharavad etc, Tenants-in·common etc. Companies ~ "---....... ,.----~-....... r----~--,
AIT Super tax AIT Super tax AIT Super tax AIT Super tax ArT Super tax
Rs. Rs, Rs_ Rs, Rs, Rs_ Rs, Rs, Rs, Rs,
840'00 9,062'59 377'67
33,799'62 17,886'87 5,194'00 2,896'32 26,751'25 317-76 2,4Q3'81 32,536'64 3,592'32 67,421'16 25,739'54 6,107'50 2,378'65 1,70,275'36 1,36,841'15
72,219'00 47,886,44-
61,381'83 2,132'31 4,739'64 64,818'07 13,830'83 3,659'30 20,206'78 29,454'99 2,509'25 16,413'17 8,822'30 1I,064'Q4 2,240'15 5,493'Q4 352'20 20,725'65 2,915'75 54,903'25 24,141'55 13,091'24 11,826'4Q 2,978'87 22,634'98 7,838'35 34,174'01 10,555'68
43,634'75 26,162'41 5,46,373'27 2,50,282'18
537'58 729'86 729'86 3,299'64 132'35 264'32 907'43 2,796'00
23,005'27 1,393-58 2,857-78 3,328'48 29,163' 11 5,980'08 12,308'67 701'40 7,712'93 4,666'75 260'04 43,123'25 5,693'00 5,895'36 27,579'60 41,214'30 25,412'18
24,375'06 14,468'35 8,514032 9,03,427'46 3,96,306'12
240'02 310'12 618'12 2,818'15 8,514'20 808'15 2,514'23
14,523'17 7,312'10 2,410'11 2,500'00 25,813'14 3,814'17 6,412-08 50,043'17 8,418'23
56,214'13 20,410'09 20,318'15 7,214'27
2,97,987'62 3,22,408'91
I 131
106/1-17a

APPENDIX 31
INCIDENCE OF LAND REVENUE ASSESSMENT FOR THE PERIOD 1950-51 TO 1959-60
Incidence of Land revenue on fully
Area fully assessed Land revenue Land revenue Land revenue assessed area assessed on fully assessed per assessed on ~~
Nature of Area of the Total Cultivated assessed area head by cultivated area Per total Per culti. Year tenure District (acres) (acres) (acres) Rs. population Rs. area vated area
1950-51 Ryotwari I ,644 ,964-04- 1,046,605 828,761 24,15,299 0'91 23,82,726 2'30 2'87
1951-52 " " 1,048,731 832,150 24,20,651 0'91 23,95,785 2'30 2'88
1952-53 " " 1,052,680 833,965 24,24,563 0'92 23,91,407 2'30 2'87
1953-54 " " 1,057,681 843,952 24,29,359 0'92 23,97,235 2'29 2'84-
1954-55 " " 1,061;875 849,574- 24,32,908 0'92 24,02,356 2'29 2'83
1955-56 " 926,954- 728,880 19,64,821 0'92 19,42,844 2'12 2-66
1956-57 " " 823,428 698,069 18,74,844 0'92 18,52,942 2'28 2-65
1957-58 " " 863,544 630,301 18,76,249 0'92 14,37,382 2'16 2'28
1958-59 " " 1,103,897 661,747 23,43,747 1'15 12,49,745 2'12 2'16
1959-60 " " 1,104,192 769,512 22,84,153 1'12 16,59.602 2'07 2'16
APPENDIX 32
RECEIPTS UNDER ENTERTAINMENT TAX FOR THE PERIOD 1950-51 TO 1959-60 *
Year
1950-51 1951-52 1952-53 1953-54 195-}-'55 1955-56 1956-57 1957-58 1958-59 1959-60
--------------------* -Source:-Department of Local Bodies, Kerala
132
Rs. in lakhs 18 22
145 99 93
109 116 153 180 172

APPENDIX 33
i INCOME OF BADAGARA MUNICIPALITY DURING THE PERIOD 1958-59 TO 1960-61 *
Income from 1958-59 1959-60 1960-61 Income from 1958-59 1959-60 1960-61 L:"ld cess 105'86 353-48 4,719·47 Sale of rubbish 82·00 110·00 205·00 House tax 21,785·83 2,087-23 67,457·90 Grant from Government 16,188·11 14,286·00 18,668·01 Profession tax (including Cart stand, bus stand
surcharge) 4,335-40 6,386·10 11,460·43 slaughter house collec-Vehicle tax 4,179·06 1,246·30 tion 1,598·01 3,591·79 3,617·12 Entertainment tax 5,306·11 11,672·52 5,888·03 Deposits 7,127·82 10,254·89 Licence fees 5,463·12 10,475·29 21,484·55 Other miscellaneous items 3,243·39 4,490·50 11,458·28 Public market Total 59,274·17 81,974·32 1,68,941·47 Private market 400·00 825-45 811·31
Miscellaneous * Source:-Municipal Commissioner, Badagara Property tax 16,046·84 1l,460·43 .\I.B.-This Municipality was constituted with effect from 1st Scavenging tax 766·34 342·24 209·75 October 1958
.. INCOME OF CALICUT MUNICIPALITY DURING THE PERIOD 1955/.56 T-O 1960.61 * u
Income from 1955-56 19'»-57 1957-58 1958-59 1959-60 1960--61
Land tax 55,493 29,599 30,938 28,405 33,390 36390 House tax 3,76,342 3,70,770 3,75,412 4,04,954 5,07,029 5,34 579 Profession tax (including surc:lalge) 30,865 70,725 94,165 1,02,855 1,02,935 1,13,621 Vehicle tax 24,312 7,614 24121 7,517 7,003 7,309 Entertainment tax 1,06,439 1,07,355 1,47,086 1,67,715 1,61,315 34,000 Licence fees 1,13,560 1,18,577 1,26,052 1,36,227 1,17,807 1,23,377 Public market 62,247 65,349 76,534 90,341 86,067 1,48,904 Private market Miscellaneous scavenging tax 14,317 1,26,431 1,28,307 1,36,850 I 66,263 1,81,745 Library cess 23,745 23,427 23,739 27,854 33,969 36,916 Lorry stand, cart stand, bus stand 12,150 11,402 15,426 22,795 26,101 24,486 Slaughter house 1,305 2,405 3,167 3,585 5,710 6,065 Bunk 6,329 7,567 11,838 28,432 30,813 23,097 Pound 120 108 377 519 113 183 'Groundnut 963 2,085 4,775 4,256 3,527 4,337
, Tree planting 1,481 692 2,346 2,468 7,000 1,143 Extracts from B & D %8 548 512 648 836 986
, I Total 8,30,136 9,44,654- 10,64,795 11,65,421 12,89,878 12,77,138
.• Source:-MunicitJl\1 Commissioner, Calicut
133

APPENDIX 34
i EXPENDITURE OF BADAGARA MUNICIPALITY FOR THE PERIOD 1958-59 TO 1960-61*
Items 1958-59 195~ 1960-61 Items 1958-59 195~ 196(H)1
Administrative and collec-tion cbarges 5,9840 74 17,857064, 19,7170 93 (g) Agriculture
public garden and
2 Public safety: (h) Veterinary charges
(a) Lighting 4,914'55 13,9150 77 12,9020 31 4 Public works:
(0) Police (e) Fire (a) Roads 1,1240 70 3,167'51 11,231 052 (d) Miscellaneous (b) Buildings 118000
3 Public health and con- (e)" Establishment venience: (d) Stores
(a) Water supply ... (e) Miscellaneous
(b) Drainage 2000 00 3,4330 70 (c) Conservancr 13,834'16 23,949'34- 29,591-80 5 Public Instruction
(d) Hospital, dispensary 6 Contributioll for general and vaccination
(e) Plague charges purposes
(f) Market and slaughter houses
7 Miscellaneous
• SOlIfce-Municipal Commissioner, Badagara Total 25,85B-15 59,090026 76,995-26
ii EXPENDITURE OF CALlOUT MUNICIPALITY FOR THE PERIOD 1955-56 TO 1960 .. 61 * Item~ 1955-56 1956-57 1957-58 1958-59 195~ 1960-61
Public safety: (a) Lighting B6,659 3,24,289 1,05,097 1,12,970 1,18,475 16,992
(h) Fire 1,271
2 Public health and convenience: (a) Water supply 86,619 76,664 1,47,069 1,37,137 4,32,313 1,66,763
(6) Drainage 12,9B9 1O,35B 13,170 12,133 42,397 13,268
Cc) Conservancy 2,32,996 2,13,710 3,16,051 3,14,344- 3,34,136 3,54,531 (d) HoSpital, dispensary and vaccina-
tion 55,652 58,076 64,899 80,043 1,25,313 79,086
(e) Plague charges 21B 816
(f) Market and slaughter houses 9,390 8,387 10,497 16,655 25,825 81,174
(g) Agriculture and public gardens 3,198 1,918 6,955 20,278 39,931 20,3M
3 Public works: (a) Roads 2,13,876 2,17,384 2,99,416 3,63,539 2,78,445 3,69,250
(b) Buildings 247 1,331 909 57 2,865 951
(c) Establishments 93,406 87,429 1,13,235 2,31.497 1,23,814 1,12,653
(d) Store 13,287 12,249 8,196 12;462 7,971 10,228 \
(e) Rest house 875 1,720 6,467 4,749 4,261 4,131
(J) Miscellaneous choultries and W. sheds 180 54-6 902 1,()77 80B 1,162
Total B,09,374 10,14,279 10,92,863 13,OM97 1537,825 12,30,553
.. Source:-Municipal Commissioner, Calioot
134

APPENDIX 35
i INCOME OF PANCHAYATS FOR THE PERIOD 1955-56 TO 1960-61 * Items 1955-56 1956-57 1957-58 1958--59 195~0 1960--61
I Number of Panchayats 86 36 35 85 85 85 2 Land Cess 4, 764'()0 8,140-15 13,801-21 18,001-03 37,008-03 2,634'304· 3 House Tax #,200-15 67,100-00 84,604'84- 1,13,111'02 1,78,036'64- 3,29,980'72 4 Profession Tax 14,555-14 19,238-65 35,011-03 69,160'82 43,910'01 98,539-59 5 Vehicle Tax 3,425-56 5,427-15 10,939'83 16,144'00 17,999'41 JO,888-09 6 Entertainment Tax 17,926-00 32,701-31 60,111'11 70, III 'os 50,667'32 1,21,779'09 7 Licence fees 19,347'89 30,880'94- 80,107'02 72,221'02 56,604'31 1,17,993'89 8 Public Markets 13,642'19 13,473'21 13,001'19 18,004'04 19,059'17 20,002'14 9 Private Markets 9,428-11 10,085-68 9,202'03 14,001'15 4,830'00 7,820'00
IO Miscellaneous 60,000'02 97,654'!lO 2,11,008'02 3,43,279'14 4,09,510-83 5,28,473'19 11 Total 1,87,289-06 2,14,601'09 5,17,786'28 7,34,033'25 8,22,625'72 12,38,lll'05
-. SQurce :-Director of Panchayats, Kerala \
APPENDIX 36
EXPENDITURE OF PANCHAYATS FOR THE PERIOD 1955-56 TO 1_-61 * Items 1955-56 1956-57 1957-58 1958-59 1959-60 1960-61
Administration and Collection 52,300'00 54,000'00 58,000'00 86,OOO'()() 89,000'00 1,29,000'00 Charges
2 Public Safety-(a) Lighting 12,000'00 14,000'00 28,000'00 43,000'00 46,000'00 66,000'00 (b) Police 1,000'00 2,000'00 3,000'00 j,OOO'OO 8,000'00 (e) Fire (d) Miscellaneous 13,900'00 10,000'00 15,000'00 23,000'00 27,000'00 37,000'00
3 Public Health and Convenience-(a) Water Supply 12,000 00 14,000'00 20,000'00 31,000'00 36,000'00 46,000'00 (b) Drainage 5,000'00 4,000'00 7,000'00 9,000'00 11,000'00 16,000'00 (c) Conservancy 3,000'00 4,000'00 8,000'00 12,000'00 15,000'00 21,000'00 (d) Hospital, Dispensary and Vaccina- 12,000'00 12,000'00 26,000'00 38,000'00 39,000'00 51,000'00
tion (e) Plague Charges (1) Market and Slaughter Houses 12,000'00 13,000-00 25,000'00 38,000'00 41,000'00 66,000'00 (g) Agriculture and Public Gardens 1,000'00 3,000'00 4,000'00 5,000'00 8,000'00 ; (h)· Veterinary Charges 6,000'00 9,000'00 9,000'00 12,000'00
4 Public Works-(a) Roads 20,000'00 22,000-00 +5,000'00 68,000'00 72,000'00 ],02,000-00 (b) Buildings 12,000'00 11,000'00 20,000'00 31,000'00 36,000'00 45,000'00 (c) Establishments 8,000'00 9,000'00 11,000'00 17,000'00 19,000-00 29,000'00 (d) Stores 4,000'00 4,000'00 9,000'00 13,000'00 13,000'00 23,000'00 (e) Miscellaneous 3,000'00 4,000'00 10,000'00 15,000-00 15,000'00 21,000'00
5 Public Institution 2,100'00 1,000'00 13,000'00 19,000'00 21,000'00 30,000'00 6 Contribution for General Purpo!!es 4,100'00 20,000'00 9,000'00 13,000'00 16,000'00 22,000'00 7 Miscellaneous 7,IJOO'00 2,000'00 7,000'00 10,000'00 13,000'00 18,000'00
.. Source :-Director of Panchayats, Kerala
135

APPENDIX 37
NATURE AND LENGTH OF SENTENCE OF CONVICTS IN JAILS FOR THE PERIOD 1950-51 TO 1960-61 *
:Nature of Imprison-ment Transpor- Death
r---"-------, Less than 1 to 5 5 to lO Exceeding tation for sentence Simple Rigorous I year years years 10 years life
~-----. ,---A-., ,.......--"--. ,----A----, ,.------"---. ,----A------, r--'------, ,----A----, Year 11 F M F M F M F M F M F 1\1 F M F 1950-51 90 94-9 29 943 18 86 9 5 1 5 2 1951-52 154 2 832 18 954- 10 27 9 2 3 1952-53 420 8 1,677 9 2,065 13 28 2 2 3 1953-54 386 20 1,237 14- 1,512 30 94- 4- 5 12 1954-55 986 25 991 14- 1,807 35 66 3 4 1 1 1955-56 427 23 1,378 33 1,746 32 46 20 5 8 3 1956-57 304- 10 1,298 20 1,530 21 61 9 lO 1957-58 618 18 1,263 33 1,804 40 68 II I 8 1958-59 831 32 1,658 55 2,370 77 1I2 lO 3 3 1959--00 1,280 58 1,232 62 2,441 116 53 I 10 8 j
1960-61 408 21 1,133 46 1,473 52 57 14 3 8
* Source :-Inspector-General of Prisons, Kerala
APPENDIX 38
NUMBER OF POLICE STATIONS, STRENGTH OF POLICE PERSONNEL ETC. FOR THE PERIOD 1950-51 TO 1960-61 *
Number of Police Personnel
~----------~ Number of outposts Superintend- Circle In-ents and De- spectors Sergeants
Number of With Without puty Supe- and Sub- and Head- Police Year stations Lock up Lock up rintendents Inspectors constables constables
1950-51 30 9 Not Available 1951-52 33 7 1952-53 33 7
" 1953-54 33 7 195-1-55 33 7
" 1955-56 35 7 " 1956-57 36 8 " 1957-58 36 8 3 62 127 933
1958-59 37 lO 3 62 126 947 1959-60 37 10 3 64- 129 954 1~1 37 10 3 64 125 927.
·Source :-Inspector-General of Police, Kerala
136

APPENDlX 39
NUMBER OF REGISTERED DOCUMENTS AND VALUES OF PROPERTY TRANSFERRED FOR THE PERIOD 1950-51 TO 1960-61*
_\ggregale value of property transferred by Regd. documents
~umber of Registered documents -. r--- Affecting Affecting
Immovable property Movable property Total immov- mov-Number ,---__ ~I...-----y- -, Regd. able pro- able pro- TotaJ
of Com- Com- Jocu- perly pefty (Rs. Total in receipts Year Offices pulsory Optional Total pulsory Optional Total ments (Rs. in '000) in '000) '000 Rs. Rs:
1950 26 55,589 8,998 64,587 265 6,060 6,325 70,912 24,U35 2,208 26,243 273,101 1951 26 53,280 9,703 67,933 292 7,006 7,293 75,21t 30416 2,829 ;3,245 306,502
1952 26 46,9:)0 7,818 54,768 763 6,668 7,431 62,199 24,955 2,455 27,410 276,807 19.53 26 57,182 9,3.54 66,.536 229 7,.5H 7,743 74,279 27,435 2,139 29,574 289,476 1954 26 48,195 8,479 56,674 217 4,944 5,161 61,835 26,695 966 27,661 259,763 1955 26 42,530 7,643 50,178 167 4,630 4,797 54,975 25,329 967 26,296 246,034
1956 26 51,410 9,139 60,549 202 5,132 5,384 65,933 63,941 1,507 65,448 325,019 1957 26 50,484 9,315 59,799 179 5,350 5529 65,328 32,373 1,767 34,140 316,198 1958 26 4:9572 6,933 56,j05 176 4,227 4,403 60,9OB 36,503 1,696 38,199 327,757 1959 26 50,04:2 6,HO 56,482 188 3,757 3,945 60,427 36,248 1,608 37,856 341,310 1960 26 5-,,642 6,858 62)00 191 3,771 3,962 66,462 39,408 1,551 40,959 393,594 lIpto 15th December
·Source:-Inspector-General of Regi5tration, Kerala
APPENDIX 40
Refunds and Total
draw l"xpen-backs dilure Rs. Rs.
47 167,121 132 209,257 152 220,356 104 93,903 130 115,203 156 ; 12,3J2 180 219,095 56 246,629 84 ]311,394
589 246,467 247,433
NUMBER OF PRINTING PRESSES AND PERIODICALS FOR THE PERIOD 1939.')1 TO 1953-51 ;e
y' ~umber of Periodicals ~umberof Number of
,-_____ ..i,L _________ ---"'-
Printing Daily :Monthly Quarterly Presses Newspapers Weekly Fortnightly r---~
Year Private ).1alayalam ~Ialayalam Others :Malay_alam Englisb Malayalam 1950-51 47 3 4 3 1 1951-52 50 3 4 \,. 3 1 1952-53 54 3 4 ,.
u
1953-54 59 3 5 3 1954-55 63 3 5 3 1955-56 64 3 5 8 1956-57 I 67 3 5 9 1957-58 70 -!: S 11 1958-59 72 6 I) 13 1959-60 77 6 6 13 1960-61 81 6 6 13
* Source :-District Collector, Kozhikode
APPENDIX 41
CINEMAS FOR THE YEARS 1959-60 AND 1960-61*
Name of Munici-
Year pality
1959-60 { Bada~ara Kozhlkode
1960-61 {Badagara Kozhikode
Number of Cinema Theatres
Perma- Tempo-nent rary
NA NA Not available
NA NA Not available
Seasonal
NA
NA
• Soutce :-Municipal Commissioner, Badagara
NA-Nol available
106/1-18
Number of Films exhibited during the year r- "'" i>.Ialayalam English Hindi Tamil Others
1 5 11
13 31 22 38
English
Total ::-':0. of shows
during (:,e year 161
673
Annual Malayalam
1
2 2
No. of tickets issued during
the year under all classes 53,001
218,643

APPENDIX 42
EMPLOYMENT EXCHANGE ACTIVITIES FOR THE PERIOD 1955-56 TO 1960-61*
1955-56 1956-57 1957-58 1958-59 1959--60 1960-61
Registrations 7,284 10,996 14,820 10,366 11,492 9,992 Placings 1,921 1.881 2,952 1,595 1,643 1,352 Live Register 7,778 9,478 12,866 8,186 9,665 12,025
{"""'"too C"", 148 172 178 187 409 504
Special types of appli- Scheduled Tribes I 50 28 58 35 cants that were Ex-Service Personnel available on the and Ex-Service Dis-Live Register abled Personnel 833 544 532 390 457 410
Employed- Persons 2 123 418 568 505
* Source :-Director of Employment, Kerala
APPENDIX 43
IMPORTANT EVENTS DURING THE LAST DECADE '"
Name of taluk
Quilandy
Kozhikode talul.:
Tirur taluk
Tirur taluk
Ernad taluk
Name of the event
Communal trouble in Payyoli
Muthukad agitation
Formation of Qui-landy taluk
Naduvattam Firing Out-break of Flue Inauguration of Medi-
cal College Abolition of food con
trol and rationing Separation of Judiciary
from executive Formation of new TiJ:ur
taluk Abolition of food con
trol and rationing Revival of Shoranur
Nilambur Railway Transfer of 30 villagei
to Tirur taluk Opening of Arabic
College Floods
Place of occurrence
Melady
Date or year of occurrence
1953
Pillaperuvanna desom of First wee~ of Decem-Perambra amsom ber 1954 to second
week of January, 1955
Naduvattom Whole taluk Chevayur
Whole taluk
Whole taluk:
do.
do.
Areacode
Nilambuf, Mambad and Malappuram
1957
1953 1957 1958
1952
1-7-1954
1-10-1955
1952
1953
1955
1958
19::'9
* SQurce ;-TahsiidafS of the respective taluks
138
Details regarding the importance of the events, if any
There was a quarrel between two communities over the performance of some religious rites which led to violence and death of one person.
This agitation was organised by the Praja Socialist Party against the eviction of trespasses of the Forest area of Koothali Estates by the Government.

TALUKMAPS

VILLAGES AND TOWNS IN BADAGARA TALUK
Serial Serial number Serial Serial number number in the Pri- number in the Pri-
in the mary Census in the mary Census map Name Abstract map Name Abstract
(1) (2) (3) (I) (2) (3)
Highland Village 22 Kuttipram 22 Kavilumpara 23 Kummancode 23
24 Vellur 24 Midland Villages 25 Purameri 25
2 Chekkiyad 2 26 Vulathapuram 26 3 Valayam 3 27 Karthikapally 27 4 Velliyode 4 28 Ponmeri 28 5 Naripatta 5 29 Vullilappally 29 6 Kayakody 6 30 Memunda 30
Lowland Villages 31 Chemmarathur 31 32 Kottappally 32 7 Azhiyoor 7 33 Kadameri 33 8 Kunnummakara 8 34 Aroor 34 9 Onchiyam 9 35 Kunnummal 3S 10 Uralangal 10 36 Mokeri 36 II Muttungal II 37 Kuttiyadi 37 12 Chorode 12 38 Vatayam 38 13 Vykilasseri 13 39 Ayencheri 39 14 Eramala 14 40 Thiruvalloor 40 15 Edacheri 15
Mantharathur 41 41 16 Katcheri 16
42 Maniyur 42 17 Iringannur 17 43 Palayad 43 18 Thunneri 18
19 Parakkadavu 19 44 Karuvancheri 41
20 Vanimel 20 Lo~land Town
21 Iyyencode 21 Badagara I

Mllee
BADAGARA TALUK
4 2 '-I. !
--,. i 1> 4
o 4 S
i'-1~~~-iiiiiiiiiiif; :::11 2 0 6. 12 KilOD\et!reB·
_ TALUX BOUNDARY --_ VILLACE BOUNDARY
TELLICHERRY TALUK
106/1- ia
'1'AttJKS
1: Badaga.ra 2 QUilandy
,3 Kozhlkode 4 Tiror 5. Ernad 6 South Wynad
NORTH WYNAD'· TALUK
QUILANDY TALUK
LEGEND /,.
=:=::::;. STATE HIGHWAY
___ ·LOCAL ROAD
-+-to+-t-t r,AIL ,\V A Y
~ RIVER
® REST HOUSE
® POLICE STATJOIN
it POST AND TELE~RAPH OFFICE
• VILLAGE 2,00,0 - 5,UOO :P~PU1M'WN
• ,'IILLAGE p BOVE 5,000 POPULATION
_ MUNICIPAL TOWN
® TALUX 'HEADQUARTERS

VILLAGES AND TOWNS IN Q_UILANDY TALUK
Serial Serial number Serial Serial number number in the Pri- number in the Pri-in the mary Census in the mary Census map Name Abstract map Name Abstract
(1) (2) (3) (1) (2) (3)
Midland Villages 31 Naduvannur 15
1 Pallikkara 45 32 Ulliyeri 71)
2 Thurayur 46 33 Kunnathara 77
3 Mliyipoth 47 34 Velur 78
4 Cheruvannur 48 35 Edakara 79
5 Avala 49 36 Modakkallur 80
6 Cherapuram 50 37 Kokkallur 81
7 Velam 51 38 Balusseri 82
3 F aleri 52 39 Trikuttisseri 83
9 Changaroth 53 40 Avitanallllr 34
10 Muthuvannacha 54 41 Panangad 85
II Kallode 55 42 Sivapuram 86
12 Eravattur 56 43 Iyyad 87
13 Kalpathur '57 44 Unnikulam 88
14 Meppayur 58 45 Kinalur 89
15 Vilayattur 59 16 Iringath 60 Lowland Villages
17 Kozhukkallur 61 46 Iringal 90
18 Keezhariyur 62 47 Ayanikkac! 91
19 Purakad 63 48 Trikottllr 92
20 Kuruvangad 64 49 11eladi 93
21 Naderi 65 50 Moodad.i 94
22 Arikulam 66 51 , Vanmugham 95
23 Karayad 67 52 Viyyur 96
24 Kavumthara 63 53 Melur 97 25 Kochad 69 54 Edakkulam 93 26 Chenoli 70 55 Thiruvangoor 99
27 Menhaniam 71 56 Chemancherry 100 28 Perambra 72 29 Kayanna 73 Lowland Town
30 Kottur 74 Patttalayini II

BADAGARA T~LUf(
ARABIAN <5EA
- rrAl"'~.JO~ - - - ~~ IOVND~ •
"!J.UK8 It Badapra ~ iQuilandy
J~ .!f~lkod,? 14 !'l'1ru1 fJ Ernad
J) ~utb W~
.~.,
KOZHttcODE T ALl).1<
LEGENl)
==.. IS1 A lE. R Hill\\' ~ ')'
___ tt.G;CAL RuAD
~ = iC~~
=::&:- IJlIYD
® e8ll1C~ ~!t
TALUt<
._
• 'vn~ 2.QQv - 0.000 (f~'gI.IA11U.l l'<
• ~~ ~ ,~)~09 IPQl'W.IA1"iJ1~
£.

VILLAGES AND TOWNS IN KOZHIKODE TALUK
Serial Serial number Serial Serial number number in the Pri- number in the Pri-
in the mary Census in the mary Census map Name Abstract map Name Abstract
(I) (2) (3) (I) (2 ) (3)
.Highland Village 35 Kunnamangalam 135
Puduppadi 101 36 Chelavoor 136
37 Chevayur 137 Midland Villages 3f! Nedungottur 138
2 Elathur 102 39 Kottuli 139
3 Thalakolathur 103 40 Kovoor 140
4 Annasseri 104 41 Mayanad 141
5 Kannankara lOS 42 Cherukulathur 142
6 Naduvall )or 106 43 Chathamangalam 143
7 Cheekilode 107 44 Chooloor 144
8 Nanminda lOS 45 Manasseri 145
9 Pannikkottur 109 46 Thazekode 146
10 Nediyanad 110 .f7 K umaranelloor 147
11 Punnasseri III 48 Ponlacode 14S
12 Parannoor 112 4lJ Kanniparamba 149
13 Eravannur 113 50 Irringallur 150
14 Palath 114 51 Nalialam 151
1.5 Thamarasseri liS .52 Kodal 152
16 Makkada 116 53 Vellayicode 153
17 Karannoor 117 54 Penimanna 154
18 Karuvisseri 11 S 55 Peruvayal 155
19 Vengeri 119 56 Cheruppa 156
20 Patinhattumuri 120 57 Mavoof 157
21 KUfuvattoof 121 58 Kodiyattur l58
22 Paimbalasseri 122 59 Pannicode 159
23 Madavoor 123
24 Kizhekoth 124 Midland Towns
25 Elettil 125 Elathur III
26 Parambathukavu 126 II Edakkad IV
27 Vavad 127 V III Pu thi yangadi
28 Karoth 128
~9 Kedavoor 129 IV Calicut VI
30 Koodathayi 130 V Parayancheri VII
31 Thiruvambadi 131 VI Nellikode VIII
32 Neeieswaram 132 VII Kommeri IX
33 Puthoor 133 VIII Beypore X
34 Koduvally 134 IX Olavanna XI

. ,KOZHIKODE TALUK Mil... Z 0
,. ,W; I i 64.2 0
" ! S !
l2
18 Kilome-tTe."
_ TALUK BOUNDARY --- VILLAGE BOUNDARY
SOUTH WYNAD TALUK
QUILANDV TALUK
ERNAD 'T-Al,;UK
LEGEND,
== STAT~_ HIGHWAY'--
- -- WCAL ROADS ~/' -+-+0+-+- RAILWAY
TIRUR "TALUK « RIVER '
® REST HOUSE
® POLICE STATION
. KOZHIKODE DISTRICT T POST AND TELEGRAPH OF,rlel:
• VILLACt 'BELOW 2POO POpUlATION
TALUKS • 'VILLAGE ~OQ() -5'000 E'O'ULA110H ,
30
1 Badagara, 2 Quilandy ' 3 Kozhikbd," 4 Tirur
o • VILLAGE ABOVE ~ooo fOPULATION ll.
1~r:::r:::J:1 rc'C'NSIJS TOWN ' '-'~.: ... ~
,
5 Ernad ~ MUNICIPAL TOWN
6 South Wynad @ TALUKHEADQUARtERs
r
--

VILLAGES AND TOWNS IN TIRUR TALUK
Serial Serial number Serial Serial number number in the Pri- number in the Pri-in the mary C~nsus in the mary Census map Name Abstract map Name Abstract
(I) (2) (3) (I) (2) (3)
Midland Villages 39 Iringavoor 198
I Veliprom 160 40 Kurumb'lthur 199
2 Mannur 161 41 Marakkara 200
3 Vallikunnu 162 42 Melmuri 201
4 Thenhipalam 163 43 Vadakkumbram 202
5 Velimukku 164 44 Thozhuvannur 203
6 Olakkara 165 45 Athavanad 204
7 Peruvallur 166 46 Ananthavoor 205
8 Kannaman galam 167 47 Thekkankuttur 206
9 Koduvayur 168 48 Thalakkad 207
10 Mooniyur 169 49 Ahthiyur 208
11 Ullanam 170 50 Pudupalli 209
12 Neduva 171 51 Vettompalliprom 210
13 Pariapuram 172 52 Thriparangode 211
14 Kotinhi 173 53 Thirunavaya 212
15 Thrikblam 174 54 Naduvattom 213
16 Tirurangadi 175 55 Kattipparuthi 214
17 Vengara 176 56 Edayur 215
18 Cherur 177 57 Valliakunnu 216
19 Valiyora 178 58 Irimbli yam 217
20 Iringallur 179 59 Kuttippuram 218
21 Mattathur )80 60 Paruthur 219
22 Parappur 181 61 Cherukudangad 220
23 Valakkulam 182 Lowland Villages 24 Thennala 183 62 Arianallur 221 25 Nannambra 184 63 Niramaruthur 222 26 Keraladeeswarapuram 185 64 Pachattiri 223 27 Ozhur 186 65 Vettom 224 28 Omachapuzha 187 66 Mangalam 225 29 Perumana 188 67 Chennora 226 30 Puthur J89 68 Purathur 227 31 Klari 190
Midland Towns 32 Kal pakancherry 191 33 Valavannur 192 II Feroke XII
34 Ponmundam 193 V Trikkandiyur XIII
35 Tanalur 194 Lowland Towns
36 Tirur 195 I Kadalundi XIV
37 Cheriamundam 196 III Parappanangadi XV
38 Kanmanam 197 IV Tanur XVI

/
ARABIAN SEA
LEGEND
STATE mGRV\T A Y""
--- LOCAl; ROAl);
aIVElJ
'RES'!' HOUSE
" 'OLICE STATJO'!'If
r POST AND TELEGRAPH OFFICE
• VILLACF 2000 -'.5 o{lIO POPULATrOiN . ,
• VILLAGE
"",':"f'f',~ t3:;;; ..... ~ U T WN ........ . CENS S 0 .......
• mlJK' HEADQUARTERS
106/1-ii
2 ~ ! !
i. i 4 2
TIRUR" TALUK. o.
r I)
i 4· !
6
TALUK BOUNDAKY
VILt;AGE BOUNDARY
.. -;,t~ t{
i :8 I
12 E;ilomet res
ERNAO TALUK
1'ALU.JCS
.1 Badag&ra :<l Quilandy 3 Kozhik<>de 4 Tirur .5 'Ernad 6 South Wynad

VILLAGES AND TOWNS IN ERNAD T ALUK
Serial Serial number Serial Serial number number in the Pri- number in the Pri-in the mary Census in the mary Census. map Name Abstract map Name Abstract
(I) (2) (3) (I) (2) (3)
Highland Villages 32 Porur 259 33 C ha thangottu puram 260
I Oorangattiri 228 Elankur 261 34
2 Karuvarankundu 229 Trikkalangode 262 35
Midland Villages 36 Pulpatta 263 37 Trippanachi 264
3 Azhinhilam 230 38 Kuzhimanna 265 4 Vazhayur 231 39 Kondotty 266 5 Karumarakkad 232 40 Karippur 267 6 Cheruvayur 233 41 Nediyiruppu 268 7 Kizhuparamba 234 42 Morayur 269 8 Mambad 235 43 Arimbra 270 9 Nilambur 236 44 Pookottur 271
10 Amarambalam 237 45 Valluvambram 272 J 1 Wandur 238 46 Narukara 273 12 Punnappala 239 47 Karuvambram 274 13 Tiruveli 240 48 Irumbuzhi 275 14 Edavanna 241 49 Melmuri 276 15 Perakamanna 242 50 Orakammelmuri 277 16 Kavanur 243 51 Utakamkizhumuri 278 17 Areacode 244 52 Ponmala 279 18 Vilayil 245 53 Kottakkal 280 19 Cheacode 246 54 Indianur 281 20 Olavattur 247 55 Chengottur 282 21 Cherukavu 248 56 Malappuram 283 22 Chelembra 249
57 Anakkayam 284 23 Pallikkal 250
58 Payyanad 285 24 Andiyurkunnu 251
59 Pandallur 286 25 Muthuvallur 252
60 Vettikka ttiri 287 26 Puliacode 253
61 Chembrasseri 238 27 Irivetty 254
62 Pandikkad 289 28 Karakunnu 255
63 Tuvur 290, 29 Vaniambalam 256
30 Kalikavu 257 Midland Town
31 Vellayur 258 Manjeri XVII

..,. 0 30 E ~;~ ____________ ~~ ______________________ 7~6~15~ ______________________ ~ __ i~
o 11
~. ERNAD TALUK , ~~'" -/
$ :
12 . :
MII~sq 20
~~ i"
4
6 1 2 0 6 12 18 Kilometres
_ l'ALUK BOUNDARY - - - VILLAGE BOUNOAR¥
SOUTH WYNAD TALU~
KOZHtKODE TALUK
!I'ALmm 1 Badaga r3
"2 Ou:la nay :> hOl",kod. 4 T,rul
" E.rnad
.(
t) S" clr> Wynad
MADRAS STATE NILGIRIS DISTRICl)
LEGEND :(
= S'T'ATE HIGHWAY
- - - LOCAL ROAD
-0-- RA.!LWAY
~ RMR
,. • •
RBST HOUSE
POL ICE S1' A TlON
POST AND TELEGRAPH OFFICE
VTLLAGE 21>JXJ - 5,000 POPU!. A '!'Tn.",
VD..,LAGE~ABOYE ~ f-.OPI.rt.ATIO~
N~~====~~:;~~---------o~--------------~~~ i
I
30
I]
11 , 15

VILLAGES AND TOWNS IN SOUTH WYNAD TALUK
Serial Serial number Serial Serial number number in the Pri- number in the Pri-in the mary Census in the mary Census map Name Abstract map Name Abstract
(1) (2) (3) (I) (2) (3)
Highland Villages 12 Sultan's Battery 302 I Padinharethara 291 13 Purakkadi 303 2 Kuppadithara 292 14 Vengappally 304 3 Kottathara 293 15 Kunnathidavaka 305 4 Thaviyode 294 16 Kottappadi 306 5 Achooranum 295 17 Muppainad 307 6 Kalpatta 296 18 Ambalavayal 308 7 Muttil 297 19 Nenmani 309 I.l Ponginichickallur 298 20 Noolpuzha 310 9 Puthadi 299
10 Pulpalli 300 Towns
11 Kidanganad 301 Nil

~rE~~ ______ ~7,f'_ ____ ~ ________________ _27~R~1~5 __________________ _!'~ C· ...
SOUTH WYNA·D TALUK \liles ~ 2 0 8 t2
" i _, I .= 'S - i.e 1
Iii 6 -! '2 .) 6 I 2 ! 8 KiloDlt.'tres
...- TALUlt BOUNDARY - - - VILLAGE BOUNDAR\"
MYSORE STATE (MY50RE DIST ~IC T)
lit-4:' NORTH WV~AD TALUK
MADRAS. STATE (NILGIRIS DISTRICT)
0 u
I
30 ERNAD TAL-tJK
KOZHIKODE TALUK LEGEND' -
STATE HIGHWAY
--- LC1CAL ROAD
KOZHIKODE DISTR£CT ~ RIVER
® ~ST H01;~P.
TALllKS' ® POLICE STi\TlON
1 Badagara . . T POST AND TELEGRAPH 1)1 I h.'I-. . 0
,2 Qullandy 3 K07hil~ode • VTLLAGE: 2,000 ... ~O()O rorULATTON
4 Tirlll ABOv£: 51100 POPVLA1fQN 5 El'Ilaf! • VILL".GE
6 SOlll h Wynad ® TALUK HEADQUARTEl~~ N . i> I
70 )5
106fl-iii
I
o lL
0
t1
0
-. Ii E

Page
3
4 5
11 14 20 25
26 28 37 49
53 55 57
UBATA
Item Column Line
State Table I 11 4
" 11 5
" 9 21
" 11 23
" 11 27
" 11 3()
" Note I 3
State Table II 3
" Heading Fly-leaf to Table A-I 1 8 Table A-I Foot Note 2 Table A-II Appendix-Heading I Table A-IV 5 10
" 2 I
" 3 39 Table A-IV Appendix II Note 3 Table B-III Part-B 12 16 Table B-IV Part-A 8 49
" 2 51 Table B-IV Part-B 12 J4. Table B-IV Part-C 15 18
" 1 13
" lruert the following at the appropriate places Col. Col. Col. Col. Col. Col. Col. Col. Col. Col.
2 3 4 5 6 7 8 9 10
Minor group 804 2,099 2,080 19 651 641 10 . • -
" 805 1,091 1,036 55 573 528 45
" 831 2,514 2,466 48 132 12& Ii " 840 1,073 1,063 10 536 530 6
65 Table B-V Put asterisk (*) mark on the left side of all Divisions except Division X 74 'Table B-V Division 5 6 6
77 "Group 72 2 34-79 "Group 82 7 37
80 83 85
" " 7 42 " Family 859 7 41 " Group 94 2 23
Table B-V Badagara talukDivision 6 3 13
86 'Table B-V Kozhikode talukDivision I 2
For
905,625 754,8527 165'469 761,57 70,32
222,53 Substracting KQzhikod VARIATIDON territoriess Thesq.km. their +83,824-Non-Municipal 1964-1961 3,651 19
Division 8
OJI. II
Col.
12 2,080 1,036 2,466 1,063
321
2
.,799
39
XI
Col.
13
19 55 48 10,
Read
905,627 754;852 165,469 761,573 70,325
222,530 Subtracting Ka;;hikode VARIATION terri tories t The sq.km.
the +89,824
1961 1951
5,651 16 U 2
16 * Division 8
Col. Col.
14 15
641 10 528 45 126 6 530 6
6 324-2 26 3
'4,790
639
IX 87 Table B-V Kozhikode taluk Description of Division 7-8 CRAFTSMEN, fRODUCTION
PROCESS WORKERS NOT
ELSEWHERE CLASSIFIED
CRAFTSMEN, PRODUCTION PRO
CESS WORKERS AND LABOURERS
NOT ELSEWHERE CLASslFlEll-
Ip.T.o.

Page
90
92 98
100 105
150
170 171
179
181
Item
Table B-V Appendix Family 039
" " Table B-VI
" 139 " 780
Fly-leaf to Table B-VII Para 4 Table B-Vn Part-B District Rural
P.W. Division 0, Major group 39 Table B-XVI-Appendix District Rural
Major group 31 B-XVI-Appendix District Urban '
Major group 20 Table C-V
" " SCT, SO & ST-Note
Throughout the State except Malabar district
Fly-leaf to Table SCT-I
186 Table SCT-I Part-B urban
" 192 Table SCT-I1 Part-A
" " " " 194 Table SCT -II Part-B
199 Table SCT -III part-B (i)
" 201 Fly-leaf to Table SCT-IV 202 Table SOT-IV Part-B 206 Table SO-I District Total
" " 213 Table ST-II
ERRATA-concld.
Column
I 2 I 1 2
3
2
2 I
11 17
12 12 42 42 34 39 40 I Heading I 2 1 2 10 11
Line
4 3
50
16
22
38
S1. No. 13
4
18 19 12 13 24 31 31 SI. No. II
S1. No. 27 2 S1. No.5
5 1
2, 3 and4 Heading
For
XI IX (15) IX (M2,112, FI) 10'
10
B-2
P-14 Arabic/Arabi 1 (Column No.)
Pulayan or (Oheramar)
for rural and urban areas of the district and for rural areas down to taluk level the sex-wise
4514 72
Muthuan BDUCATION Toti house Kuttunayakan
190
422,003 population Total
non-working
Read
IX IX (M 15) IX (M 212, Fl) X 5
D-2
F-14 ArabicJArbi 11 18
Pulayan or Cheramar
for rural and urban areas of the district the sex-wise
6 6 8 17 31 451 472 Muthuwan EDUCATION Thoti hence Kattunayakan 180 4 22,003 Total non-working
population ,

106/1-18a
PARTB
CENSUS DATA .

(i) STATE TABLES

I AREA, HOUSES AND POPULATION **
Number of villages Number of
Total Area in Popula- ,--.....____, Num- occupied Population Rural ,---"-----, tion per Inha- Uninha- ber of residential
State/District Urban Sq. mile Sq. km. Sq. mile bited bited towns houses Persons Males Females (1) (2) (3)(a) (3)(h) (4) (5) (6) (7) (8) (9) (!Oi (11)
KERALA T 15,002 (aJ 38,855 (a) 15,002'6 (b) 38,856'7 (b) 1,127 1,573 2 t 92 2,803,533 16,903,715 8,361,927 8,541,788
R 14,571-1 37,739'0 985 1,573 2t 2,422,217 14,349,574 7,079,168 7,270,406 U 431'5 1,117'7 5,919 92 381,316 2,554,141 1,282,759 1,271,382
Cannanore T 2,744 (a) 7,107 (a) 2,191'3 (b) 5,675'5 (b) 812 235 18 278,556 1,780,294 874,667 905,625
R 2,116'2 5,48H 699 235 237,691 1,480,177 725,325 754,8527 (; 75'1 19404 3,998 18 40,865 300,117 149,342 150,775
Kozhikode T 2,042 (a) 5,289 (a) 2,570'2 (b) 6,656'8 (b) 1,018 310 17 426,653 2,617,189 1,300,974 1,316,215
R 2,509'5 6,499'5 871 310 368,114 2,184,682 1,083,556 1,101,126 U 15M 157'3 7,121 17 58,539 432,507 217,418 215,089
Palghat T 1,982 (a) 5,133 (a) 1,979-6 (b) 5,127'2 (ll) 397 298 7 305,594 1,776,566 851,746 924,820
R 1,943'0 5,032-5 326 298 277,547 1,604,716 767,251 337,465 U 36'6 94-7 4,700 7 28,047 171,850 84,495 87,355
Trich\1r T 1,149 (a) 2,976 (al 1,137'0 (b) 2,944'8 (b) 1,442 238 7 265,621 1,639,862 784,736 855,126
R 1,104'6 2,860'8 1,317 238 236,911 1,454,210 694,821 759,389 U 32'4 84'0 5,726 7 28,710 185,652 89,915 95,737
Ernakulam T 1,270 (a) 3,289 (a) 1,289'5 (b) 3,339'8 (5) 1,442 107 12 299,908 1,859,913 931,248 928,665
R 1,236'0 3,201'1 1,185 107 240,914 1,464,603 727,922 736,681 U 53'S 138'7 7,379 12 58,994 395,310 203,326 191,984
Kottayam T 2,326 (a) 6,024 (al 2,455'6 (b) 6,360'0 (b) 706 101 7 296,483 1,732,880 882,580 850,300
R • 2,418'3 6,263"4- 648 101 271,929 1,567,411 798,454 768,957 U 37'3 96'6 4,436 7 24,554- 165,469 84,126 81,343
Alleppey T 698 (a) 1,808 (a) 708'1 (b) 1,834'0 (b) 2,558 99 8 312,991 1,811,252 893,435 917,817
R 654'9 1,696'1 2,292 99 262,733 1,500,821 739,248 761,57 U 53'2 137'9 5,831 8 50,258 310,431 154,187 156,244
Quilon T 1,944 (a) 5,035 (a) 1,827'3 (b) 4,732'7 (b) 1,062 98 3 328,673 1,941,228 972,657 968,571
R 1,812'3 4,694'0 992 98 307,101 1,796,992 898,746 898,246 U 15'0 38'7 9,648 3 21,572 144,236 .73,911 70,32
Trivandrum T 847 (a) 2,194 (a) 844'0 (b) 2,185'9 (b) 2,067 87 13 289,054 1,744,531 869,884 874,647
R 776'3 2,010'5 1,669 87 219,277 1,295,962 643,843 652,117 U 67'7 175-4 6,626 13 69,777 448,569 226,039 222,53
** This table includes area, houses and population of unsurveyed forest areas also. Note,-1 Under columns 3 (a) and 3 (b), (a) represents the area figures furnished by Surveyor General of India, and (b) repre-
sents the area figures furnished by the State Survey Department. The urban areas are based on the area of individual towns furnished by the local authorities. The rural area for a district is obtained by sub,tracting the urban area
2 from the State survey area. t
The sq. km. and density figures of urban areas of District/State are worked out using the area figures corrected up to two places of decimals obtained by adding the areas of towns in the respective units and not using the area figures given in the table. In addition to this the figures relating to sq. km. are further adjusted to make the District/State totals agree.
3 Population per sq. mile has been calculated on area figures supplied by State Survey Office, t These two are only portions of two villages consisting of paddy field and uncultivated land lying m the rural areas.
The urban portions of these villages lying in two municipal towns are inhabited.
3
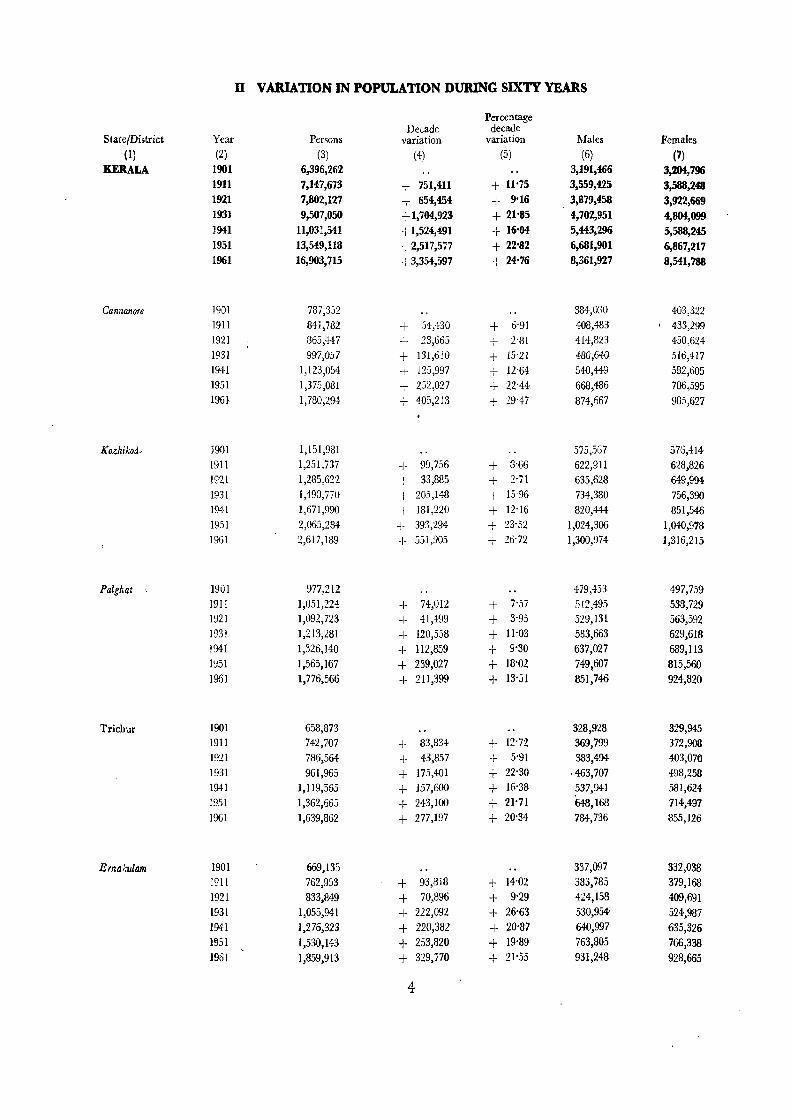
n VARIATION IN POPULATION DURING SIXTY YEARS
Percentage Decade decade
State/District Year Persons variation variation Males Females
(1) (2) (3) (4) (5) (6) (7) KERALA 1901 6,396,262 3,191,466 3,204,796
1911 7,147,673 + 751,411 + 11'75 3,559,425 3,588,248 1921 7,802,127 + 654,454 + 9'16 3,879,458 3,922,669 1931 9,507,050 +1,704,923 + 21'85 4,702,951 4,804,099 1941 11,031,541 +1,524,491 + 16'04 5,443,296 5,588,245 1951 13,549,113 +2,517,577 + 22'82 6,681,901 6,867,217 1961 16,903,715 +3,354,597 + 24'76 8,361,927 8,541,788
Cannanore 1901 787,352 384,030 403,322 1911 841,782 + 54,430 + 6-91 408,483 , 433,299 1921 365,447 .J_ 23,665 + 2-81 414,823 450,624 I
1931 997,057 + 131,610 + 15-21 480,640 516,417 1941 1,123,054 + 125,997 + 12-64- 540,449 582,605 1951 1,375,081 + 252,027 + 22'44- 668,486 706,595 196~ 1,780,294 + 405,213 + 29'47 874,667 9Qj,627
KozhikQa. 1901 1,151,981 575,567 576,414 1911 1,251,737 + 99,756 + 3-66 622,911 628,826 1921 1,285,622 + 33,885 + 2'71 635,628 649,994 1931 1,490,770 + 205,148 + 15-96 734,380 756,390 1941 1,671,990 + 181,220 + 12-16 820,444- 851,546 1951 2,065,284 + 393,294 + 23'52 1,024,306 1,040,978 1961 2,617,189 + 551,905 + 16-72 1,300,974 1,316,215
Palghat 1901 977,212 479,453 497,759 1911 1,051,224 + 74,012 + 7'57 512,49-) 538,729 1921 1,092,723 + 41,499 + 3'95 529,131 563,592 1931 1,213,281 + 120,558 + JI'03 583,663 629,618 1941 1,326,140 + 112,859 + 9'30 637,027 689,113 1951 1,565,167 + 239,027 + 18'02 749,607 815,560 1961 1,776,566 + 211,399 + 13'51 851,746 924,820
Trichur 1901 658,873 328,928 329,945 1911 742,707 + 83,834 -+. 12'72 369,799 372,908 1921 786,564- + 43,857 + 5'91 383,494 403,070 1931 961,965 ...L 175,401 + 22'30 \ 463,707 498,258 I
1941 1,119,565 + 157,600 + 16'38 ~37,941 581,624 1951 1,362,665 + 243,100 + 21'71 648,168 714,497 1961 1,639,862 + 277,197 + 20'34 784,736 855,126
Ernakulam 1901 669,135 337,097 332,038 ;,]Il 762,953 + 93,818 + 14'02 383,785 379,168 1921 833,849 + 70,896 + 9'29 424,158 409,691 1931 1,055,941 + 222,092 + 26'63 530,954 524,987 1941 1,276,323 + 220,382 + 20-87 640,997 635,326 Hl51 1,530,143 + 253,820 + 19'89 763,805 766,338 1961 1,859,913 + 329,770 + 21'55 931,248 928,665
4

D VAlUATIDON IN POPULATION DURING SIXTY YEARS-(concld.)
Percentage Decade decade
State/District Year Persons variation variation Males Females (1) (2) (3) (4) (5) (6) (7)
Kottay. 1901 475,427 243,730 231,697 1911 559,989 + 84,562 + 17'79 287,513 272,476 1921 649,768 + 89,779 + 16'03 336,122 313,646 1931 889,664- + 239,896 + 36'92 458,466 431,198 1941 1,083,329 + 193,665 + 21'77 556,584 526,745 1951 I,Sf7,668 + 244,339 + 22'55 674,061 653,607 1961 1,732,880 + 405,212 + 30'52 882,580 850,300
Alleppey 1901 668,388 336,520 331,868 1911 767,239 + 98,851 + 14'79 386,107 381,132 1921 909,555 + 142,316 + 18'55 459,690 449,865 1931 1,130,715 + 221,160 + 24'32 567,484 563,231 1941 1,274,029 + 143,314 + 12'67 636,901 637,128 1951 1,521,303 + 247,274 + 19'41 753,552 767,751 1961 1,811,252 + 289,949 + 19'06 893,435 917,817
Quilon 1901 523,401 263,449 259,952 1911 600,570 + 77,169 + 14'74 302,136 298,434 1921 712,206 + 111,636 + 18'59 360,034 352,172 1931 910,806 + 198,600 + 27'89 455,898 454,908 1941 1,142,054 + 231,248 + 25'39 569,622 572,432 1951 1,473,995 + 331,941 + 29'07 739,252 734,743 1961 1,941,228 + 467,233 + 31'70 972,657 968,571
Trivandrum 1901 484.493 242,692 241,801 1911 569,472 + 84,979 + 17'54 286,196 283,276 1921 666,393 + 96,921 + 17'02 336,378 330,015 1931 856,851 + 190,458 + 28'58 427,759 429,092 1941 1,015,057 + 158,206 + 18'46 503,331 511,726 1951 1,327,812 + 312,755 + 30'81 660,664 667,148 1961 1,744,531 + 416,719 + 31'38 869,884 874,647
jl,(ote:-Districts formed after the Cen$us of 1951 are given in italics.
5 106/1-19

m WORKERs AND NON·WORKERS
In Mining, Quarrying, Live-stock, Forestry, FishiC, Hunt-ing and Planta-
As tions, Orchards As Agricultural and Allied
Total Total Workers Cultivator labourer activities Statel Rural Total Population (I-IX) I II III District Urban , -.--, ,------A--.. ,.-----y----..
Persons Males Females Males Females Males Females Males Females Males Females (I) (2) (3) (4) (5) (6) (7) (8) (9) (10) (11) (12) (13)
KERALA T 16,983,715 8,361,927 8,541,788 3,94:7,038 1,683,295 904,502 273,601 516,914 461,482 398,622 88,737 R 14,34:9,574: 7,079,168 7,270,406 3,357,206 1,517,995 877,346 264,045 501,978 446,000 357,149 87,186 U 2,554,14:1 1,2112,759 1,271,382 589,832 165,300 27,156 9,556 14,936 15,482 41,473 1,551
Cannanore T 1,780,294 874,667 905,627 420,723 203,991 92,047 60,924 47,275 62,776 34,046 5,318 R 1,480,177 725,325 754,852 347,784 188,138 88,734 58,254 46,052 59,844 29,001 5,692 U 300,117 149,342 150,775 72,944 20,853 3,313 2,670 1,223 2,932 5,045 126
Ko;;hikode T 2,617,189 1,300,974 1,316,215 612,214 189,492 103,093 24,746 63,013 50,011 77,357 14,07~ R 2,184,682 1,083,556 1,101,126 510,876 168,771 101,169 24,142 61,991 48,740 66,477 13,837 U 432,507 217,413 215,089 101,338 20,721 1,929 604 1,022 1,271 10,880 239
Palghat T 1,776,565 851,746 924,820 438,385 251,021 98,079 42,{26 95,035 122,532 28,072 4,653 R 1,604,716 767,251 837,465 397,687 236,033 95,823 41,350 92,745 118,552 26,106 4,621 U 171,850 B4,495 87,355 40,698 14,988 2,256 1,076 2,290 3,980 1,966 32
Trichur T 1,633,831 78~, 736 83:j,126 m,232 187,207 6{-,938 25,338 34,982 48,049 35,919 4,799 R 1,414,210 634,821 759,339 317,473 m,m 62,280 24,323 33,888 46,415 33,612 4,464 U 18j,G.'i2 8'),91.1 95,737 39,759 1+,756 :l,6.i3 1,015 1,094 1,634 2,307 335
Emakulam T 1,859,913 931,248 928,665 437,902 179,381 89,910 36,87Y 39,932 46,841 35,586 3,739 R 1,464,603 727,922 736,631 342,775 159,600 87,446 35,999 38,635 45,800 32,634 3,477 U 393,310 203,326 191,984 95,127 19,781 2,464 380 1,297 1,041 2,952 262
Kottayam T 1,732,880 882,580 850,300 427,057 138,058 99,479 13,918 54,692 30,478 95,819 46,829 R 1,567,411 798,454 768,957 389,042 129,102 96,385 13,402 52,887 29,523 93,732 46,676 U 165,469 34,126 81,343 38,015 8,956 3,094 516 1,805 955 2,087 153
Alleppey T 1,811,2.52 893,435 917,817 407,737 202,687 92,182 17,384 60,866 55,968 33,127 1,981 R 1,500,821 739,248 761,573 340,660 178,154 87,333 16,254 58,103 53,150 29,672 1,826 U 310,431 154,187 156,244 67,077 24,533 4,849 1,130 2,763 2,818 3,455 155
Quilon T 1,941,228 972,657 968,571 445,188 186,162 169,413 30,990 60,272 26,422 33,286 5,2'14 R 1,796,992 898,746 898,246 412,203 174,451 167,510 30,790 59,533 26,345 30,449 5,152 U 144,236 73,911 70,325 32,985 II,71l 1,903 200 739 77 2,837 62
Trivandrum T 1,744,531 869,884 874,647 400,595 140,296 95,356 20,996 60,847 18,405 25,410 1,623 R 1,295,962 643,845 652,117 298,706 111,295 90,666 19,531 58,144 17,631 15,466 1,441
U 448,569 226,039 222,530 101,889 29,001 4,690 1,465 2,703 774- 9,944 187
- No" :-Districts formed after the 1951 Census are printed in italics.
6

CLASSIFIED BY SEX
Workers
In Manufacturing
At other than In Transport, Household Household In In Trade and Storage and In Other Industry Industry Construction Commerce Communications Services Non-workers
IV V VI VII VIII IX X r-----"---... ,....-----A----, ~ r--~ r-----"----., r---"-----, ,---~ Males Females Males Females Males Females Males Females Males Females Males Females Males Females (14) (IS) (16) (17) (18) (19) (20) (21) (22) (23) U24) (25) (26) (27)
188,654 299,9C8 392,950 136,522 67,664 3,038 298,218 23,'il5 144,913 7,6CO 1,()S4,6Cl 388,692 4,414,889 6,858,493 168,672 272,331 280,911 113,004 54,451 2,407 205,039 16,101 89,397 5,574 822,263 311,347 3,721,962 5,752,411 19,982 27,577 112,039 23,518 13,213 631 93,179 7,614 55,516 2,026 212,338 77,345 692,927 1,106,082
23,349 17,508 58,045 7,306 6,191 265 34,919 2,951 11 ,251 1,194 113,605 50,249 453,939 696,636 20,427 14,742 34,088 4,588 4,702 176 24,187 1,805 6,467 1,003 94,126 42,034 377,541 566,714 2,922 2,766 23,957 2,718 1,489 89 10,732 1,146 4,784 191 19,479 8,215 76,398 129,922
22,002 29,990 5\116 11,834 7,231 100 52,256 917 26,452 1,233 205,689 56,535 633,760 1,126,723 19,193 25,967 33,576 7,409 5,539 5S 35,603 567 15,933 917 171,395 47,137 572,680 932,355 2,309 4,023 21,540 4,425 1,692 45 16,653 350 10,519 316 34,294 9,448 116,080 194,368
27,333 20,078 33,515 5,163 9,921 1,237 26,672 1,771 13,138 173 106,565 52,988 413,361 673,799 25,504 13,320 27,262 3,69!} 3,834 1,101 19,782 1,498 8,710 123 92,921 46,769 369,564 601,432 1,884 1,758 6,253 1,464 1,087 136 6,890 273 4,428 50 13,644 6,219 43,797 72,367
21,199 31,393 39,184 1l,349 6,862 358 31,368 2,009 14,286 1,379 108,494 62,533 427,504 667,919 19,674 30,226 32,800 10,093 5,895 278 23,961 1,G09 11,231 1,174 94,132 53,869 377,348 566,933 1,525 1,167 6,384 1,256 967 80 7,407 400 3,055 205 14,362 8,664 50,156 80,981
20,539 27,886 56,213 12,618 10,584 466 36,699 2,784 27,563 1,188 120,876 46,980 493,346 749,284-18,989 26,439 39,463 10,322 8,243 366 21,189 1,830 12,228 731 ~83,948 34,636 385,147 577,081 1,550 1,447 16,750 2,296 2,341 100 15,510 ~954 15,335 457 36,928 12,344 108,199 172,203
\ 11,815 14,092 31,645 2,300 8,637 233 27,162 1,623 10,683 323 87,125 28,262 455,523 712,242 10,688 12,959 26,909 2,041 7,661 210 20,062 1,134 7,753 249 72,965 22,903 409,412 639,855 1,127 1,133 4,736 259 976 23 7,100 489 2,930 74 14,160 5,354 46,111 72,387
21,703 82,650 44,077 12,037 5,788 125 34,535 1,899 17,181 588 98,278 30,055 485,693 715,130 19,454 73,234 30,923 9,569 4,266 59 22,945 1,307 11,244 364 76,720 22,391 398,588 583,419 2,249 9,416 )3,154 2,468 1,522 66 1l,590 592 5,937 224 21,558 7,664 87,110 131,711
16,645 38,934- 46,342 60,978 5,639 93 27,133 1,751 13,395 212 73,013 21,518 527,469 732,409 16,017 37,760 38,260 54,281 4,998 35 22,323 1,549 10,500 181 62,613 18,308 436,543 723,795
628 1,224 8,032 6,697 641 8 4,860 202 :2,895 31 10,400 3,210 40,926 58,614-
24,014 37,327 28,813 12,937 6,811 161 27,424 8,010 10,964 1,310 120,956 39,522 469,289 734,351 18,726 32,684 17,630 11,002 4,313 77 14,987 4,802 5,331 332 73,443 23,295 345,139 540,822 5,288 4,643 11,183 1,935 2,498 84 12,437 3,208 l5,633 478 47,513 16,22.7 124,150 193,529
7 l06jl-19a


(ii) KOZHIKODE DISTRICT TABLES
A-General PopulatioD Tables


A-I AREA, HOUSES AND POPULATION
Fly-leaf
Effect or States Reorganisation in 1956
1. Sub-section 1 (b) of section 5 of the States Reorganisation Act, 1956 (Central Act 37 of 1956) gives the constitution of the Malabar district. The whole of section 5 is reproduced below :-
" 5. (1) As from the appointed day, there shall be formed a new Part A State to be known as the State of Kerala comprising the following territoriess, namely:-
(a) the territories of the existing State of Travancore-Cochin, excluding the terrtories transferred to the State of Madras by section 4; and
(b) the territories comprised in-
(i) Malabar district, excluding the island of Laccadive and Minicoy, and
(iii Kasargod taluk of South Kanara district ;
and thereupon the said territories shall cease to form part of the States of Travancore-Cochin and Madras respectively.
(2) The territories specified in clause (b) of sub. section (1) shall form a separate district to be known as Malabar district in the State of Kerala ".
Territorial Redistributions since 1956
2. In exercise of the powers conferred by the Madras District Limits Act 1865 the Government of Kerala with effect from 1st January 1957 altered the jurisdiction of Malabar district and trifurcated the same into the new districts of Cannanore, Kozhikode and Palghat as per Notification No. SRN3-29174[56, dated 19th December 1956. The district of Kozhikode thus formed comprised the following :.,.-
Names of divisions
comprised in the district
I Kozhikode
Names of taluks Names of firkas comprised in the division
Badagara
2 Quilandy
3 Kozhikode
comprised in the taluk
I Badagara 2 Nadapuram
I Perambra 2 Quilandy 3 Balussery
Kozhikode Town
2 Chevayur 3 Kunnaman
galam 4 Koduvalli
11
Names of divisions
comprised in the district
2 Malappuram
Names of taluks comprised in the division Ernad
2 Tirur
Names of firkas comprised in
the taluk 1 Manjeri 2 Wandur 3 Malappuram 4 Kondotty 1 Tirurangady 2 Tirur 3 Vengara 4 Tanur 5 Kuttipuram
With effect from 15th March 1957 the following change of jurisdictio.'l. was made as per Notifi:atian dated lIth March 1957 given below:-
"In modification of Notification No. SRN3-29174/56, dated 19-12-1956 it is hereby notified tha:t South Wynad taluk, which from 15-3-1957 shall cease to form part of Cannanore district, shall with effect from the said date, be added to the Kozhikode district and included in the Kozhikode division ". The other reported changes in the jurisdiction of villages between 1951-61 are filrnished below:-
(i) formation of seven new villages in South Wynad taluk, viz., Padinharethara, Kuppadithara, Thaviyode, VengappaUy, Kottathara, Kunnathidavaga, Achoornum by re-grouping desoms comprised in the villages Kumbla, Thaviyode, Vythiri and Kottathara villages.
(ii) formation of two revenue villages, viz, Sultan's Battery and Ambalavayal by adding portions of Kidanganad, Noolpuzha, Muppainad, Nenmeni and Chingeri desoms. Area Figures
3. The area -of the district given by the Surveyor General, India, is 2,042 sq. miles. The figure does not tally with the area given by the Director of Survey and Land Records, Kerala which is 2,570'26 sq. miles. , The area figures given in this hand book are those furnished by the State Director of Survey and Land Records. In regard to Municipal towns the figures for area have been furnished by the respective Municipal Commissioners in consultation with Director of Survey, District Collector and Tahsildars. The area figures of non-municipal towns are supplied by the concerned Tahsildars. Definition of urban area-A historical slU'vey
4. It has not been possible to adopt a uniform definition of urban area throughout the world. It differs-

from country to country, even in the highly industrialised West. According to the census report of 1881 of the Madras State which applies to this district' size, compactness and certain architectural and commercial or other industrial features were of the consideration which went to make up the definition of a town'. In the Census of 1901 of Madras a census town was taken to comprise a municipality of whatever population and every other continuous collection of houses permanently inhabited by not less than 5,000 persons which, the Superintendent of Census Operations, having regard to the character and relative density of its population, its importance as a centre of trade and its historical associations, might decide to treat as a town· Calicut and Badagara were the only towns in this district in the Census of 1901. A town as defined for the purpose of the Census of 1911 in Madras, included all municipalities and Can tonments and every other continuous collection of houses inhabited by not less than 5,000 persons which the Superintendent of Census Operations considered fit to treat as a town. Tanur was thus added to the list of town s in this district in the Census of 1911. From this period up to 1941 there has been no change in the number of towns. In the Census of 1941 Pantalayani, Feroke, Trikandiyur and Manjeri were also treated as towns. No addition of towns was made in 1951. Thus, on the eve of the Census of 1961 there were only seven towns in this district. Owing to the growing importance of urbanisation the 1961 Census laid down a three-fold criterion for classification of area as a town besides corporations I municipalities, civil lines and Cantonn:ents which were automatically recognised as towns. According to this criterion only places with a minimum population of 5,000 persons and a density of not less than 1,000 persons per sq. mile with at least 75 per cent of the male population engaged in non-agricultural pursuits that could be recognised as a town. The population, density and extent of male population engaged in nonagricultural pursuits were to be determined with l'eference tol the Census figures of 1951. Exception were however, allowed where an area may have a population of less· than 5,000 but has definite urban characteristics and amenities. Similarly, where a place was treated as a town in 1951 but is not eligible to be treated as a town in 1961 if the State Govern_ ment desired that it should be treated as a town in 1961, it was considered as an exceptional case. On an application of the above principles the list of towns in this district has been considerably extended brihging the number of towns to 17. Of these Pantalayani and Manjeri are the towns of 1951 which do not satisfy
12
the criterion laid down in 1961 but were treated as towns in 1961 based on the recommendations of the State Government. Edakkad and Kommeri towns do not satisfy the criterion except for their minimum population according to the 1951 Census figures. They have been recognised as towns in the Census of 1961 in view of the fact that as per the 1961 Census their population are above 5,000 and they fulfil the criteria of density and employment in non-agricultural pursuits and further have definite urban characteristics and amenities. The State Government when consulted was also in favour of treating them as towns.
5. The following statement gives the number of towns in the various Censuses :-
Progress of census towns since 1901 1901 1911 1921 1931 1941 1951 1961
2 3 3 3 7 7 17 Census Vmage
6. For the purposes of 1961 Census a village means a revenue village. These villages have 'desoms' as the constituent units in most cases. Some, however, have no subdivisions as 'desoms'. Unlike in the previous Censuses the' desoms' have not been'treated as census villages in 1961. Tables A-I and A-III are given on the basis of revenue villages. However, in view of the different definitions of a Census village adopted in the previous censuses a Special Table (A-III) is given furnishing the number of census villages according to the definition of Census village in 1951 Census also i.e. according to the number of desoms. The Kozhikode district has 332 revenue villages out of which 22 lie wholly in towns and 4 partly in towns. The particulars of this are given in Statement No. 1 of Part A supra. Census House
7. A Census house is a structure or part of a structure inhabited or vacant, giving on the road or a ~ommoh staircase or a common courtyard leading to a main gate or enjoying a separate entrance. It may be a dwelling, a shop, a shop-cum-dwelling, a workshopcum-dwelling, or a place of business, workshop, school, etc. Occupied Residential House
8. An occupied residential house is a census house occupied by one or more census households and includes a shop-cum-dwelling, workshop-cum-dwelling and a dwelling with other uses. Even where more than one household occupy one census house, it is considered as only one occupied residential house. Natural Divisions
9. Since 1901 the territories comprising Malabar district and Kasaragod taluk of the South Kanara

district came under the sixth natural division of Madras designated as West Coast Division. There was nO further subdivision on the basis of meteorological or geographical features. In the present Census, natural divisions are formed on the basis of contour lines, whole State being divided into three natural divisions based on the following criterion:--
(i) Highland consisting of areas lying 250 feet and over above the mean ~ea level.
(ii) Midland comprising areas lying between 25 feet and 250 feet above the mean sea level.
(iii) Lowland consisting of the areas falling below 25 feet above the mean sea level.
Since the contour maps of the Survey of India for Kerala shows the contours only upto 50 feet above the mean sea level, it was inevitable that the determination of the areas falling in the classification oflowland had to be done with reference to the reports of the Municipal Commissioners and Tahsildars who had necessarily to depend upon a certain amount of approximation for the purpose .. There are, indeed, some revenue villages lying partly in one classification and partly in another. In all such cases the village was classified according to the category in which its major portion fell. In the case of towns also the same principle was followed. It could be said with some amount of gratification, but not without some reservation due to the non-availability of contour maps below 50 feet above the mean sea level, that for the first time in Kerala, the classifi-
106/1-20 13
cation by natural divisions has been done on the basis of contour lines. Appendices
Appendix I
10. This Appendix gives the 1951 territorial units constituting the present set up of Kozhikode District down to taluk 1eve1. All notified changes that have taken place since 1951 Census are incorporated in this Appendix.
I
11. The revised area figures, based on the latest village-wise figures furnished by the Director of Survey and Land Records, were adopted for preparing this Appendix.
12. The symbol numbers viz, 1,2,3 and 4 for the above changes of jurisdiction are given in column 3 of the Appendix I. The annexure to Appendix I gi,:es the details involved in these transfers with reference to the 1951 District Census Handbooks.
13. The sub-appendix to Table A-I shows the area of the only municipal town in the district which bad undergone change in area since 1951.
Appendix II
I 14. Appendix II to Table A-I shows the number of villages with a population of 5,000 and over and towns with a population under 5,000 for each taluk.
Appendix m 15. Appendix III to Table A-I .. furnishes figures of
the houseless and institutional population. An institution is a place where unrelated persons are living together.

A-I AREA, HOUSES AND POPULATION **
Number of Districtl villages Number of Taluk/ Total Area in tPopulation ~ occupied Population
Town-Group Rural ,.--------J--------.. per Inhab- Un-in- Number residential ,--/Town Urban Sq. mile Sq. km. Sq. mile ited habited of towns houses Persons Males Females
1 2 3(a) 3(b) 4 5 6 7 8 9 10 II
xozm· T 2,570'2 6,656'8 1,018 310 17 426,653 2,617,189 1,300,974 1,316,215 KODE R 2,509'5 6,499'5 871 310 368,114 2,184,682 1,083,556 1,101,126 DISTRICT U 60'7 157-3 7,121 17 58,539 432,507 217,418 215,089
HIGHLAND R 1,137'3 2,945'4 205 24 43,235 232,746 m,OH 110,699
MIDLAND T 1,260'9 3,265'8 1,531 230 12 311,498 1,930,757 959,221 971,536 R 1,217'8 3,154'1 1,313 230 267,172 1,599,116 791,414 807,702 U 43'1 111'7 7,696 12 44,326 331,641 167,807 163,834
LOWLAND T 172'0 445'6 2,638 56 5 71,920 453,686 219,706 233,980 R 154'4 4OQ'0 2,285 56 57,707 352,820 170,095 182,725 U 17'6 45'6 5,715 5 14,213 100,866 49,611 51,255
.Badagara T 212-3 549'9 1,507 44 1 51,908 319,913 156,646 163,267 tabak R 204'1 528'6 1,352 44 45,727 276,005 134;675 141,330
U 8'2 21'3 5,329 1 6,181 43,908 21,971 21,937 HIGHLAND
R 43'1 111'6 297 2,178 12,789 6,665 , 6,124
MIDLAND R 60'3 156'2 690 5 6,767 41,583 20,760 20,823
LOWLAND T 108'9 282'1 2,438 38 42,963 265,541 129,221 136,320 R 100'7 260'8 2,201 38 36,782 221,633 107,250 114,383 U 8'2 21·3 5,329 6,181 43,908 21,971 21,937
Badagara (M) U 8'24 21'34 5,329 6,181 43,908 21,971 21,937
Q.oi1andy T 294'5 762'7 1,244 56 1 61,496 366,343 181,108 185,235 talak R 291'9 756'0 1,196 56 59,080 348,987 172,696 176,291
U 2·ti 6·7 6,701 1 2,416 17,356 8,412 8,944 HIGHLAND
R 87'0 225'3 N 4 24- 13 II MIDLAND
R 172'3 447·5 1,537 45 45,336 265,632 132,700 132,932 LOWLAND
T 34'7 89'9 2,902 11 16,156 100,687 48,395 52,292 R 32'1 83'2 2,596 11 13,740 83,331 39,983 43,348 U 2'6 6'7 6,701 2,416 17,356 8,412 8,944
Pantalayini U 2'59 6·71 (NM)
6,701 2,416 17,356 8,412 8,944
Kozhikode T 3'19'1 981'9 1,742 59 9 98,343 660,372 333,421 326,951 talak R :Mg'7 905-7 1,082 59 61,883 378,528 190,377 188,151
U 29'4 76'2 9,583 9 36,460 281.844 143,044 138,800
HIGHLAND R 102'1 264'4 109 2,014 1l,089 5,706 5,383
MIDLAND T 277'0 717'5 2,344 58 9 96,329 649,283 327,715 321,568 R 247'6 641'3 1,484 58 59,869 367,439 184,671 182,768 U 29'4 76'2 9,583 9 36,460 281,844 143,044- 138,800
** This table includes area, houses and population of unsurveyed forest areas also. The sq. Km. and density figures of urban areas of taluk/district are worked out using the area figures corrected upto two places
of decimals obtained by adding the areas of the towns in the respective units and not using the area figures given in the table. In addition to this the figures relating to sq. km. are further adjusted to make the taluk/districtJState totals agree. The sum of areas given separately for Highland, Midland and Lowland areas for each taluk in eac~ ?f tbe two cat~gories-:rotal and Rural-Will differ slightly from the consolida~d figure given for the taluk as a whole. ThIS IS due to the dlfferem:es In computation at the level of decimal for tbe natural divisions of each taluk.
New towns in 1961 are printed in italics. M.-Municipal N.M.-Non-Municipal N.-Denotes negligible figure which is less than one. The actual value is 0.3
14

A·I AREA, HOUSES AND POPULATION-(concld.)
Number of Districtf villages Number of Talukf Total Area in tPopulation ~ occupied Population
Town-Group Rural ,.----~ per Inhab- Un-in- Number residential ,~~ ___ __A.
fTown Urban Sq_ mile Sq_ km_ Sq_ mile ited habited of towns houses Persons :Males Females I 2 3 (a) 3 (b) 4 5 6 7 8 9 10 II
Calicut U 23-09 59-80 10,764 5 31.371 248,548 126,502 122,046 (town group)
3d-61 (a) Calicut U 11-82 16,238 23,256 192,521 97,911 94,61(} (M)
(b) Parayan-che"y
U 0-54 1-40 13,574 1,170 7,330 3,668 3,662
(NM) (c) Kommeri
(NM) U 1-24 3-21 5,194 1,006 6,4+1 3,215 3,226
(d) Beypore U 6-75 17048 (NM)
5,099 5,161 34,415 17,753 16,662
(e) Olavanna (NM)
U 2-74 • 7-10 2,862 1,278 7,841 3,955 3,886
ElathuT L 1-93 5-13 (NM)
4,345 1,229 8,604 4,270 4,334
Edakkad U 1-39 3-60 (NM)
4,121 865 5,728 2,817 2,911
Puthiyangadi U 0-95 2-46 10,569 1,166 10,041 5,041 5,000 (NM)
Nelli~; .. ode U 2-00 5-18 (NM)
4,462 1,329 8,923 4,414 4,5W
Tirur laluk T 278'4 721-1 2,016 68 5 90,469 561,212 271,435 289,777 R 263-0 681-3 I,Ml 68 79,048 484,089 233,460 250,629 U 15-4 39'8 5,014 5 11,421 77,123 37,975 39,148-
MIDLAND T 250-0 647-5 1,895 61 2 77,668 473,754 229,345 244,409 R 241-4 625-3 1,807 61 71,863 436,233 210,598 225,635 U 8'6 22-2 4,383 2 5,805 37,521 18,747 18,774
Feroke (NM) U 5-22 13-52 4,621 1 3,754 24,124 12,085 12,039 Trikkandiyur U 3-34 8-65 4,011
(NM) 1 2,051 13,397 6,662 6,735
LOWLAND
T 28-4 73-6 3,080 7 3 12,801 87,458 42,090 45,368 R 21-6 56-0 2,216 7 7,185 47,856 22,862 24,994 U 6-8 17-6 5,807 3 5,616 39,602 19,228 20,374
Kadalundi U 2-04- 5'28 6,023 (NM)
1 1,809 12,287 5,890 6,397
Parappanan- U 1-32 3-42 6,838 1,234 9,026 4,498 4,528 gadi (NM)
Tanur (NM) U, 3-46 8'96 5,286 2,573 18,239 8,840 9,449
Ernadtaluk T 873-3 2,261-8 600 63 1 89,538 524,294 260,458 263,836 R 868'2 2,248'5 590 63 87,471 512,018 254,442 257,576 U 5'1 13'3 2,398 1 2,061 12,276 6,016 6,~
HIGHLAND R 372-5 964-7 64 2 4,140 23,789 11,757 12,032:
MIDLAND T 500'8 1,297-1 999 61 85,398 500,505 248,701 251,804-R 495'7 1,283-8 985 61 83,337 488,229 242,685 245,544 U 5-1 13-3 2,398 2,061 12,276 6,016 6,26(}
Manjeri U 5-12 13-26 (NM)
2,398 2,061 12,276 6,016 6,26(}
HIGHLAND South R
Wynad 532·6 1,379'4 347 20 34,899 185,055 97,906 87,149
taluk
15 lO6/1-20a

A.I ABEA, HOUSES AND POPULATION
APPENDIX I
Statement showing 1951 territorial units constituting the present set up of Kozhikode district
Only those territorial units which have undergone changes since 1951 have been shown in this Appendix. The area figures or several taluksgiven in the A-I table of 1951 Census do not taUy with the total area of the ultimate units given in the rural and urban statistics of 1951 District Census Handbooks. These discrepancies are not also seen explained anywhere. Hence these area figures have notibeen accepted for purposes of this Appendix. Instead, the area figures arrived at in consultation with the Director of Survey and Land Records, Kerala, District Collector, Municipal Commissioners and Tahsildars have been adopted.
1951 District/Truuk Territorial
units
2
Kozhikode District
Badagara taluk
Quilandy taluk
Tirur taluk
Ernad taluk Ernad taluk
Details of gain in territories Details of loss in territories r--------~_,.__--------_v__ '-------.... ~et area
Brief description
3
Newly constituted with following
I
the
Area in "-
Sq. miles Sq. km.
4 5
2,570'2 6,656.8
(i) Kurumbranad taluk (506'8 1,873-2 4,851'6 sq. miles), Kozhikode taluk (379'1 sq. miles) and Ernad taluk (987'3 sq. miles) transferred from Malabar district of Madras State
(ii) Tanur, Tirur and Kuttip- 164-4 4-Z;,-l)
(iii)
puram firkas trans-ferred from Ponnani taluk of Malabar district of l\Iadras S tate and
Kalpetta, Sultan's Battery and Kaniyambatta firkas transferred from former Wynad taluk of Malabar district of Madras State
Newly constituted with Badagara and Nadapuram firkas of Kurumbranad taluk of Malabar district of Madras State
2 Newly constituted with Perambra and Quilandy firkas-of Kururnbranad taluk of Malabar district of Madras State
3 Newly constituted with the following
(i) Tirurangadi and Vengara firkas transferred from Ernad taluk and
(ii) Tanur, Tirur and Kuttipuram firkas transferred from Ponnani taluk of Malabar district of Madras State
532-6 1,379-4
212-3 549-9
762'7
278-4 721'1
114-0 295-3
164-4 425'8
Area in (Gain '+', Loss '_') ,Ilrief descri ,-------"------l
tion Sq. miles Sq. km. Sq. miles Sq. kms.
6 7 8 9 10
(+) 2, 570'2 (+ )6,656-8
\+) :212-3 (+) 549-9
(+) 294-5 (+) 762-7
(+) 278-4 (+) 721-1
Tirurangadi 114'0 295'3 (-) 114'O (-) 295-3 and Ven-gara firkas transferred to the new-ly formed Tirur taluk
South Wynad taluk 4- Newly constituted, with 532-6 1,379-4 (+ ) 532-6 (+) 1,379'4 Kalpetta, Sultan's Battery and Kaniyam-batta lirkas transferred from Wynad taluk of Malabar district of Madras State
16
, \

A·I AREA, HOUSES 4ND POPULATION
Symbol number
I
2
3
4
Name of 1961 tal uk
Badagara
Quilandy
Tirur
South Wynad
ANNEXURE TO APPENDIX I
Location code numbers with reference to the 1951 District Census Handbook
Villages with location Code numbers I to 53, 55, 56, 60 to 83 and 96 to 110 of Rural Tract ]';0. 206 and 38 of non-city Urban Tract number 73
Villages with location Code numbers 54, 57 to 59,84 to 95 and III to 252 of Rural Tract No. 206 and 155 of non-city Urban Tract number 73
Villages with location Code numbers 23,32,44 to 48,50 to 53,59 to 65,77 to 79, 81, 83 to 89 and 91 of Rural Tract No. 208, I, to 39, 42, 43,48 and 49 of Rural Tract No.2 10 and 32 of non-city Urban Tract No. 73 and 18 and 2 of non-city Urban Tract No. 74
Villages with location code numbers 4, 5, ]5 to 17 and 25 to 34 of Rural Tract No. 205
SUB-APPENDIX TO APPENDIX I
Statement showing area fat 1951 and 1961 fat those municipal towns which have undergone changes in area since 1951 Census
Name of Municipal Town
Calicut
Area in sq. miles ,-
·1951 ll·18
APPENDIX D
1961 11·82
Remarks
Revised computation
Number of villages with a population of 5,000 and over and towns with a population under 5,000 Villages with a population of 5,000 and over Towns with a population under 5,000 ,-- ",
Percentage of Percentage of total rural popu- total urban
lation of the population of DistrictJTaluk Number Population district Number Population the district
(I) (2) (3) (4) (5) (6) (7)
X.OZHlKODE DISTRICT 235 1,883,417 86'21
Badagara taluk 28 209,980 9·61
Quilandy " 38 279,371 12·79
Kozhikode " 41 311,789 14·27
Tirur " 58 439,601 20·12
Brnad " 52 464,671 21·27
South Wynad " IS 178,005 8-15
APPENDIXm Houseless and Institutional Population
Total Houseless population Institutional population Rural ,- -. -"------,
DistrictJTaluk Urban Persons Males Females Persons Males Females
(I) (2) (3) (4) (5) (6) (7) (8)
KOZHlKODE DISTRICT T 4,457 3,814 643 14,104: 11,007 3,097 R 1,0f0 736 301 7,589 6,225 1,364 U 3,417 3,078 339 6,515 4,782 1,733
Badagara taluk T 260 189 71 543 417 126 R 133 96 37 219 186 33 U 127 93 34 324 231 93
Quilandy taluk T 143 108 35 710 583 ]27 R 10l 80 21 544 460 84-U 42 28 14 166 123 43
Kozhikode taluk T 3,182 2,939 24-3 7,975 5,736 2,239 R 127 104 23 2,432 1,755 677 U 3,055 2,835 220 5,543 3,981 1,562
Tirur taluk T 242 165 77 1,918 1,652 266 R 89 65 24 1,557 1,319 238 U 153 100 53 361 333 28
Brnad taluk T 276 178 98 1,902 1,808 94 R 236 156 80 1,781 1,694 87 U 40 22 18 121 114' 7
:South Wynad taluk T 354 235 119 1,056 811 245 R 354- 235 119 1,056 811 245
17

A.U VARIATION IN POPULATION DURING FORTY YEARS
Fly-leaf
Adjustments of Population 1. 'Fable A-II furnishes the variation in population
for the last five Censuses from 1921 to 1961 adjusted according to the present jurisdiction of the district. A full account of the territorial changes between 1951 and 1961 affecting the jurisdiction of the district and taluks are given in the fly-leaf to Table A-I supra. The districts were brought up-to-date as in 1961 on the basis of these changes. Where the territorial changes affected the units within the district the population figures were available in the District Census Handbooks for 1951 Census if such changes related to the entire tracts or units adopted for that Census. Except in the case of urban areas such units went down to the level of villages and desoms. Where, however, the changes affected either an entire urban tract or the ultimate rural unit which may be a village or desom, as the case may be, the population of the affected portion had to be estimated. For purposes of this estimation in the ca~e of the 1951 population it was assumed that the proportion of the population of the affected portion to the total population of that particular unit is the same as the proportion of the area of that affected portion bore to the total unit. Hence, the formula adopted for estimating the 1951 population in the case of areas affected by changes was, Area of the affected portion Population of the entire The area of the entire unit- X unit.
In estimating the male and female population of such affected portions the same sex-ratio which existed in
the case of the entire unit was applied to the affected portions also.
2. In estimating the population of this di~trict for 1941 wherever the population figures were not available as such for any portion of a unit affected by the territorial cha~ges it was assumed that the proportion of the populatIOn of that affected portion to the popu-lation of the whole unit as per the 1951 Census was. applicable to the previous census also. Thus the formula applied was, The population of the entire
unit in the 1941 Census The population of The Population o{the entire X the affected portion
unit in the 1951 Census in the 1951 Census. The same formula was applicable to the previous censuses mutatis mutandis, i.e. for the year 1951 the Census year prior to the one for which the population had to be fixed was substituted and for the year 1941 the year of the particular Census for which the population had to be estimated was given. For purposes of sex distribution the proportion applicable for the entire unit in the previous census was made applicable for the affected portion in the concerned census also.
Appendlx
3. The Appendix to Table A-II furnishes the area and population affected by each territorial change of jurisdiction since 1951. The foot-notes of this Appendix give the dates of transfers.
I v 1-'

A.D VARIATION IN POPULATION DURING FORTY YEARS
Percentage Decade vari- decade
DistrictJTaluk Year Persons ation variation Males Females
KOZHIKODE DISTRICT 1921 1,285,622 635,628 649,994
1931 1,490,770. +205,148 +15'96 734,380 756,390
1941 1,671,990 +181,220 +12'l6 820,444 851,546
1951 2,065,284 + 393,2M +23'52 1,024,306 1,040,978
1961 2,617,189 +551,905 +26'72 1,300,974 1,316,215
Badal\ara taluk 1921 168,896 82,056 86,840
1931 195,799 +26,003 +15'93 95,398 100,401
1941 211,061 +15,262 +7'79 102,089 108,972
1951 262,208 +51,147 +24'23 127,634 134,574
1961 319,913 +57,705 +22'0l 156,646 163,267
Quilandy taluk 1921 188,01l 91,342 96,669
1931 217,959 +29,948 +15'93 106,195 1ll,764
1941 234,947 + 16,988 +7'79 lJ3,642 121,305
1951 291,883 +56,936 +24'23 144,571 147,312
1961 366,343 +74,460 +25'51 181,108 185,235
Kozhikodc taluk 1921 290,739 144,409 146,330
1931 347,817 +57,078 +19-63 173,396 174,421
1941 406,839 +.,.'i9,022 +16'97 201,830 205,009
1951 516,372 +109,533 +26'92 258,168 258,204
1961 660,372 +144,000 +27.89 333.121 326,951
"Tiror taluk 1921 318,873 15ti,570 162,303
1931 369,413 +50,540 +15'85 179,211 190,202
1941 410,481 +41,068 +11'12 198,197 212,284
1951 480,550 +70,Q69 +17'07 233,879 246,671
1961 561,212 +80,662 +16'79 271,435 289,777
.Emad taluk 1921 264,168 130,487 133,681
1931 300,312 +36,144 +]3-68 147,210 153,102
1941 339,743 +39,431 +13'13 ]67,131 172,612
1951 4<l4,571 +64,828 +19'03 19?,360 205,211
1961 524,294 +1l9,723 +29'59 260,458 263,836
.South Wynad taluk 1921 54,935 30,764 24,171
1931 59,470 +4,535 +8'26 32,970 26,500
1941 68,919 +9,449 +15'89 37,555 31,364
1951 109,700 +40,781 +59'17 60,694 49,006
1961 185,055 + 75,35.) +68'69 97,906 87,149
19

A·D VARIATION IN POPULATION DURING FORTY YEARS
APPENDIX
Statement showing 1951 population according to their territorial jurisdiction in 1951, bhanges in area and the population involved ill those changes
(The State of Kerala was created on 1st day of November 1956 by Central Act No. 37 of 1956 out of the former State of Travancore-Cochin and parts of Malabar and South Kanara districts of Madras State).
1951 popula-tion accord- Population Net increase
Area in 1961· Area in 19.51* ing to juris- in 1951 or decrease ,..--_______lo..__ __ , diction adjusted to between
1961 prevailing jurtsdiction columns District/Taluk Sq. miles Sq. km. population Sq. miles Sq. km. in 1951 of 1961 7 and 8
(1) (2) (3) (4) (5) (6) (7) (8) (9)
*. KOZHlKODE 2,570'2 6,656'8 26,17,189 2,065,284 + 2,065,2M DISTRICT (+ 2,570'2) (+ 6,656'8) (+2,065,284)
Badagara taluk 212'3 549'9 319,913 262,208 + 262,2oa.
(+ 212'3) (+ 549'9) (+ 262,208)
Quilandy "
294'5 762'7 366,343 291,883 + 291,883
(+ 294'5) (+ 762'7) (+ 291,883)
Kozhikode "
379'1 981'9 66[),372 379'1 931'9 516,372 516,372
Tirur "
278:4 721" 561,212 480,550 + 4BO,550
(+ 278'4) (+ 721'1) (+ 480,550)
Ernad "
873'3 2,261'3 524,294 987'3 2,557'1 614,283 404,571 209,712 (- 114'0) (- 295'3) (- 209,712)
South Wynad taluk 532'6 1,379'4 135,055 109,700 + 109,70(}
(+ 532'6) (+ 1,379-4) (+ 109,700) --~.-~---
* Area figures under columns 2, 3, 5 and 6 relate to the area figures supplied by the State Survey Department.
*"'In 1951 there was no Kozhikode district. The taluks or portion of taluks which now form part of Kozhikode district were part of Madras State. At the time of reorganisation of States a new Malabar district was formed consisting of Malabar district excluding Laccadive and Minicoy Islands and Kasaragod taluk of South Kanara district. In exercise of the powers conferred by the ,Madras District Limits Act, 1365 the Government of Kerala with effect from 1st January 1937 had altered the jurisdiction of Malabar district and formed three new districts, viz., Cannanore, Kozhikode and Palghat, comprising the Malabar district of States Reorganisation Act 1956 excluding Cochin and newly formed Chowghat taluks and inclusive of Chittur taluk of Trichur district. On 1st January 1957 South Wynad taluk was part of Cannanore district. With effect from 15th March 1957 South Wynad taluk was transferred to Kozhikode district.
20

A-m VILLAGES CLASSIFIED BY POPULATION
Fly-leaf
1. The definition of village has been given in the flyleaf to table A-I. Besides table A-III which gives the revenue villages by population sizes another table
, furnishing the distribution of desoms according to the
pop~lation sizes has also been given as a special table A-III.
2. The statement given below shows the percentages of population of each taluk living in villages of various population sizes :-
Percentage of population living in revenue villages of various population sizes with reference to tlie total rural population in each talU];; in 1961
DistrictfTaluk Less than 200 200--499 500-999 1,000-1,999 2,Q00-4,999 5,000-9,999 10,000 and above
KOZHIKODE DISTRICT N* 0.04 13-75 59'05 27'16 Badagara taluk 23'92 61'69 14'39 Quilandy
" 0'01* 19'94 61'19 18'86
Kozhikode " 0'20 IN3 55'27 27'10
T.irur " 9'19 70'15 20'66
Ernad "
N* 9'25 55-47 35'28 South Wynad " 3'81 39-66 56'53
* Denotes population of unsurveyed forest areas lying outside village boundaries.
3. The subjoined statement gives the percentage of villages by class of village according to population sizes in 1961 :-
Percentage of revenue villages by population class ojvillage, 1961 District/Taluk Less than 200 200-499 500-999 1,000-1,999 2,000-4,999
KOZHIKODE DISTRICT 0'32 23'87 lIadagara taluk 36'36 Quilandy " 32'14 Kozhikode " 1'70 28'81 Tirur " 14'71
. Ernad " 17'46 South Wynad " 10'0 )
5,000-9,999
61'61 56'82 57'1-1 55'93 72'06 66'67 50'00
10,000 and above
14'20 6'82
10'72 13'56 13'23 15'87 40'00
SPECIAL TABLE A-llI DESOMS CLASSlFmD BY POPULATION
Fly.leaf
The 1961 Gensus village (i.e. revenue village) has desoms as its constituent units. These constituent units have been treated as census villages in the previous censuses. This necessitated the preparation of a Special Table A-III. This table gives the figures for the number and population of desoms in the following population groups:
1061)-21 21
1 Population of less than
2 " 3 4
5 6 7
" .. " "
206 200- 499 500- 999
1,000- 1,999 2,000- 4,999 5,000- 9,999
persons.
" " " " "
1,000 and above "

DistrictfTaluk
(1 )
KOZHIKODE DISTRICT
1 Badagara taluk
2 Quilandy " 3 Kozhikode " 4 Tirur " 5 Ernad " 6 South Wynad "
A-III VILLAGES CLASSIFIED
I Villages with less than 2,000
~
Less than 200 200--499 500-999 Total
,-----__'______, A.--__
No. of Total rural population inhabited '-, -----...___-~ 1\0. of villages Persons Males Females villages
(2) (3) (4) (5) (6)
310 2,184,682 1,0I3,55i 1,101,126
44 276,005 134,675 141,330 56 348,987 172,696 176,291 59 378,528 190,377 188,151 68 484,089 233,460 250,629 63 512,018 254,442 257,576 20 185,055 97,906 87,149
Population Population Population ,.-----A----, No. of ~ No. of,------A------Males Females villages Males Females villages Males Females
(7) (8) (9) (10) (II) (12) (13) (14)
21 11 1 379 333
13 11 379 383
8
Note .-This table includes population of unsurveyed forest areas also. Entries against males and females with nil entry against number of villages indicate population of unsurveyed forest area only.
1 2 3 4 5 6
SPECIAL TABLE A-III DESOMS CLASSIFIED
I Desoms \I-jth less than 2,001}
r--------____..A._----------Less than 200 200-499 500-999
Total Total rural population ,-____ _A...____---, r--~ ,--~
~o. of in- -. Population Population Population habited No. of ,--~ Xo. of ,..---"--, ::\o.ofJ~
District/Talui: desom, Persons Males Females de,oms Males Females de50ms Males Females desoms Males Females
(1) (2) (3) (4) (5) (6) (7) (B) (9) (10) ( 11) ( 12) (13) (14)
KOZHIKODE DISTRICT 756 21,84,682 1,083,556 1,101,126 8 633 577 52 10,156 10,455 140 53,338 54,700
Badagara ta1ul.: 136 276,005 134,675 141,330 4 6 11 1,949 2,020 24 9,210 9,596 Quilandy 196 348,987 172,696 176,291 4 212 213 21 4,001 4,064 54 20,366 21,044 Kozhikode
" 170 378,523 190,377 188,151 2 188 143 16 3,099 3,223 35 13,439 13,665
Tirur "
63 484,089 233,460 250,629 .. Ernad
" 16i 512,018 254,442 257,576 95 83 4 725 798 27 10,323 10,395
South Wynad " 29 185,055 97,906 87,149 134 132 382 350
Note.-This table includes population of forest areas also. Entries agaimt male> and females with nil entry against number of deiOlI15 indicate population of forest area only.
22

BY POPULATION
population II Villages with a population of 2,000-9,999 III Villages with a population of 10,000 and above
--~-
,--____________ -A. ,--____ --A-..
1,000-1,999 2,000-4,999 5,000--9,999 10,000 and above ~-------~---,
__A._ __ -, '---
,---_____ .A_ ______ ~
Population Population PopUlation Population No. of ,-------.A.._---" No. of ,------~, No. of r- ____ ...A.._----.. No. of ,-- --'-------., villages Males Females vIllages Males Females villages \[ales Females villages Males Females
(15) (16) (17) (18) (19) (20) (21) (22) (23) (24) (25) ::26)
74 1{7,105 153,366 191 636,513 653,459 44 299,538 293,907
16 31,788 34,237 25 83,151 87,118 3 19,736 19,975 18 34,281 35,311 32 105,611 107,924- 6 32,791 33,045 17 32,810 33,167 33 104,719 104,480 " 8 52,469 SO,121 10 21,276 23,212 49 163,373 176,203 9 48,811 51,214 11 23,320 24,019 42 1+0,695 143,313 10 90,419 90,244 2 3,630 3,420 10 38,964- 34,421 II 55,312 {9,308
-BY POPULATION
population II Dcsoms with a population of 2,000--9,999 HI Desoms with a population of 10,000 and above
---- ----------------""\ ,------- -----------, r------~.--"""'--" - -.-~
1,000--1,999 2,000--4,999 5,000---9,999 10,000 and abow r -------.,,-- r------------.A.._----, ,--~---~--.-------.,
Population Population Population Population No. of ,-__ ...A.. __ ~ No. of ,--___ ..A.----, No. of ,---- _.A..__ __ , ;'1]0. of r----- ...... ~ --,
desoms Males Females desoms Mal", Females desoms ;'\Iales Females desoms ;\Iah Females
(J:i ) (16) (17) (18) (19) (20) (21) (22) (23) (24-) (2:"') ::?6)
199 145,776 IfS,539 253 397,436 403,348 83 277,785 2&9,653 31 198,432 193,854
45 31,988 34,209 51 78,227 81,314 4 1:),297 14,185 50 35,645 36,239 61 93,031 94,827 6 19,441 19,904 46 33,416 33,659 62 96,868 95,309 .} 15,973 15,873 4- 27,394 ~6,279
10 21,276 23,212 49 163,373 176,203 9 +8,811 '01,214 54 4{),709 41,113 61 93,436 95,554 10 33,220 34,280 II 75,934- :'),353
-1: 4,018 3,319 8 H,.j9S 13,132 9 32,481 29,208 7 'Hi,~93 .ci,008
23 106/1-212

A-IV TOWNS (AND TOWN-GROUPS) CLASSIFIED BY POPULATION IN 1961 WITH VARIATION SINCE 1901
Fly-leaf Definition of Town .
1. This has been given in fly-leaf to table A-I supra. Classification of Cities and Towns
2. The cities and towns are classified according to their population as given below :- .
Class I lowns with a population of 100,000 and above
Class II Towns with a population of 50,000-99,999
Class III Towns with a population of 20,000-49,999
Class IV Towns with a population of 10,000-19,999
Clas; V Towns with a population of 5,000-9,999
Class VI Towns with a population of less than 5,000
Town-Group 3. Calicut town-group is the only town-group in
this district. It consists of Calieut municipal town, Parayancheri, Kommeri, Beypore and Olavanna towns. In Table A-IV the constituent parts of a town-group, though they come under different classes, are shown under the class of the town-group itself. The same method was adopted in striking the class totals in the previous censuses also.
Changes in Classification of Towns and their Status
4. The following statement gives the class and status of each town for the last seven censuses :-
Changes in classification of towns, 190 1 to 1961 Census year
Town·group/Town (I)
Calieut Town Group (a) Calieut (b) Parayaneheri (e) Kommeri (d) Beypore (e) Olavanna
2 Badagara 3 Pantalayini 4 Elathur 5 Edakkad 6 Puthiy~nga!ii 7 Nellikode 8 Kadalundi 9 Feroke
10 Parappanangadi 11 Tanur 12 Trikkandiyur 13 Manjeri
M-Municipal Town
1961 (2) I
III (M) IV (T) VeT) V (T)
IV (T) V (T)
IV (T) III (T) V (T)
IV (T) IV (T) IV (T)
T-Town
1951 (3) I
III (T) III (T)
IV (T)
IV (T) IV (T) IV (T)
1941 (4) I
IV (T) IV (T)
V(T)
V (T) V (T) V (T)
__A_ ____________ ---,
1931 1921 1911 1901 (5) (6) (7) (8) II II II II
IV (T) V(T) IV (T) IV,(T)
V (T) V (T) VeT)
The class and status of towns which form part of the Calieut town-group are furnished below :-Town 1961 1951 1941 1931 1921 1911 1901
(8) (I) (2) (3) (4) (5) (6) (7) Calieut I (M) I (M) I (M) II (M) II (M) II (MC) II (MC) Parayaneheri V (T) Kommeri V (T) Beypore III (T) rnuan~ Vm MG-Municipal Cantonment
Appendices Appendix I
5. Appendix I to Table A-IV gives the area and population of the new towns added in 1961 and the 1951 towns which have been declassified in 1961. In this district 10 towns were added in 1961 while all the 7 towns of the last census continued as such. Note A to
24
this appendix furnished the names, areas and population of the 1951 villages which constitute the newly added towns of 1961.
Appendix n 6. Appendix II to Table A-IV furnishes the Juris
diction of all the 17 towns based on the 1961 set up.

A-IV TOWNS (AND TOWN-GROuPS) CLASSIFmD BY POPULATION IN 1961 , WITH VARIATION SINCE 1901
Percentage Status of Decade decade
Name of Town/Town-group town Year Persons variation variation Males Females (I) (2) (3) (4) (5) (6) (7) (8)
All classes
1901 88,300 45,872 42,428 1911 97,975 + 9,675 + 10'96 50,585 47,390 1921 100,329 + 2,354 + 2-40 51,544 48,785
60'74 sq. miles 1931 119,749 + 19,420 + 19'36 61,205 58,54t 157'31 sq. km. 1941 187,644 + 67,895 + 56.70 94,042 93,602
1951 268,222 + 80,578 + 42'94 134,023 134,199 1961 432,507 + 164,285 + 61'25 217,418 215,08!}
Class I (100,000 aad above)
23'09 sq. miles 1941 126,352 63,998 62,354 59'80 sq. Ian. 1951 158,724 + 32,372 + 25'62 80,069 78,655
1961 248,548 + 83,824 + 56'59 126,502 122,046 Calicut town-group Non-Municipal 1901 76,981 39,986 36,995
23'09 sq. miles 1911 78,417 + 1,436 + 1'87 40,680 37,737 59'80 sq. km. 1921 82,334 + 3,917 + 5'00 42,527 39,807
1931 99,273 + 16,939 + 20'57 51,030 48,243 1941 126,352 + 27,079 + 27'28 63,998 62,354 1951 158,724 + 32,372 + 25'62 80,069 78,655 1961 248,548 + 89,824 + 56'59 126,502 122,046
Calicut 1901 76,981 39,986 36,995 11'82 sq. miles Municipal 1911 78,417 + 1,436 + JoB7 40,680 37,737 30'61 sq. km. 1921 82,334 + 3,917 + 5'00 42,527 39,807
1931 99,273 + 16,939 + 20'57 51,030 48,243 1941 126,352 + 27,079 + 27'28 63,998 62,354 1951 158,724 + 32,372 + 25'62 80,069 78,655 1961 192,521 + 33,797 + 21'29 97,911 94,610
Btypore 6·75 sq. miles Non-Municipal 1961 34;415 17,753 16,662 17'48 sq. km.
Olavanna 2'74 sq. miles Non-Municipal 1961 7,841 3,955 3,886 7'10 sq. kn'l.
Parayanchefi 0'54 sq. miles Non-Municipal 1961 7,330 ,668 3,662 H{) sq. km.
KOIIlIIt4ri 1.24sq. miles Non.Municipal 1961 6,441 3,215 3,226 3'21 sq. Ian.
(Class n (50,000-99,999)
1901 76,981 39,986 36,995 1911 78,417 + 1,436 + 1'87 40,680 37,737 1921 82,334 + 3,917 + !HlO 42,527 39,807 1931 99,273 + 16,939 + 20'57 51,030 48,243
Class m (20,000-49,999)
13'46 sq. mUes 1951 49,965 24,507 25,458 34'36 sq. Jun. 1961 68,032 + 18,067 + 36'16 34,056 33,976
25 106/1-

A-IV TOWNS (AND TOWN .. GROUPS) CLASSIFmn BY POPULATION IN 1961 WITH VARIATION SINCE 191H-(concld.}
Status of Percentage
Decade decade !'fame of Town/Town-group town Year Persons variation variation Males Females
(1) (2) (3) (4) (5) (6) (7) (8) Badagara Municipal 1901 11,319 5,886 5,433
8.24 sq. miles 1911 11,3';9 170 - 1'50 5,707 5,442 21'34 sq. km. 1921 9,804 1,345 - 12.06 4,975 4,829
1931 11,259 + 1,455 + 14'84 5,756 5,503 1911 17,924 + 6,665 + 59'20 8,944 8,980 1951 20,964 + 3,040 + 16'96 10,491 10,473 1961 43,908 + 22,944 +109'44 21,971 21,937
Feroke Non-Municipal 1941 6,249 3,070 3,179 5'22 sq. miles 1951 19,463 + 13,214 +211"46 9,761 9,702 13'52 sq. km. 1961 24,124 + 4,661 + 23'95 12,085 12,039
(Class IV (10,000-19,999)
1901 11,319 5,886 5,433 1911 11,149 170 1'50 5,707 5,442 1931 .11,259 5,756 5,503
17'50 sq. miles 1941 30,637 + 19,378 +172'11 15,069 15,568 4j '32 sq. km. 1951 59,533 + 28,896 + 94-32 29,447 30,086
1961 83,646 + 24,113 + 40'50 40,861 42,785 Tanur Non-Municipal 1911 8,409 4,198 4,211
5.46 sq. miles 1921 8,191 218 - 2'59 4,042 4,149 8'96 sq. km. 1931 9,217 + 1,026 + 12'53 4,419 4,798
1941 9,37(} + 153 + 1'66 4,503 4,867 1951 17,883 + 8,513 + go'85 8,752 9,131 1961 18,289 + 406 + 2'27 8,840 9,449
Pantalayini Non-Municipal 1941 12,713 .. .. 6,125 6,588 2'59 sq. miles 1951 29,001 + 16,288 + 128'12 14,016 14,985 6'71 sq. km. 1961 17,356 - 11,64-5 - 40'15 8,412 8,944
Trikkandiyur Non-Municipal 1941 9,489 .. 4,667 4,822 3·34 sq. miles~ 1951 11,830 + 2,341 + 24-67 5,892 5,938 8'65 sq. km. 1961 13,397 + 1,567 + 13'25 6,662 6,735
Kadalundi , 2'04 sq. miles Non-Municipa 1961 12,287 5,890 6,397 5'28 sq. km.
Manjeri 1941 5,547 2,735 2,812 5'12 sq. miles Non-Municip 1951 10,357 + 4,810 + 85'71 5,042 5,315 13'26 sq. km. 1961 12,276 + 1,919 + 18'53 6,016 6,260
Puthiyangadi 0'95 sq. miles Non-Municipal 1961 10,041 5,041 5,000 2'46 sq. km.
Class V (5,000-9,999)
1911 8,409 4,198 4,211 1921 17,995 + 9,586 + 114'00 9,017 8,978
6'60 sq. miles 1931 9,217 - 8,778 48'78 4,419 4,798 17'3 3sq. km. 1941 30,655 + 21,438 + 232'59 14,975 15,680
1961 32,281 15,999 16,282 Parappanangadi
1'32 sq. miles Non-Municipal 1964 9,026 4,498 4,528 3'42 sq. km.
}{ellikode 2'00 sq. miles Non-Municipal 1961 8,923 4,414 4,509 5'18 sq. km.
Elathur 1'98 sq. miles Non-Municipal 1961 8,604 4,270 4,334 5'13 sq. km.
Edakkad 1'39 sq. miles Non-Municipal 1961 5,728 2,817 2,911 3'60 sq. km.
26

,--
Name of town
(1 )
Elathur
Edakkad
Puth(vangadi
ParaJancheri
Nellikode
Kammeri
Beypore
Olavanna
Kadlilundi
Parappanangadi
A-IV TOWNS (AND TOWN-GROUPS) CLASSIFIED BY POPULATION IN 1961 WITH VARIATION SINCE 1901
APPENDIX I
JI/ew towns added in 1961 and towns in 1951 declassified in 1961
(Names of towns tr~ated as such for the first time in 1961 (vide column I) are printed in it,liGf)
New towns added in 1961 Towns in 1951 which have been declassifit'd as rllral in 1961 -'- ,- -,
Area Population Area Population r---- _ _A.__-----, ,..--~
,-----'--_, ,..--___ A-__ -,
Sq. miles Sq.km. 1961 1951 Name of town Sq. miles Sq.km. 1961 1951
(2) (3) (4) (5) (6) (7) (8) (9) (10)
1'98 5'13 8,604 6,813
1'39 3-60 5,728 4,404
0'95 2'46 10,041 N.A.
0'54 1'40 7,330 6,061
2'00 5'18 3,923 6,956
1'24 3'21 6,441 4,772
6'75 IN8 34,415 N.A.
2'74 7'10 7,841 5,682
2'04 5'28 12,287 10,580
1'32 H2 9,026 7,780
Note-A-Statement showing the names of towns which have been newly added in 1961 with the name and population as in 1951 of each village constituting the town
Name of new town
(I)
ElathuT
Edakkad
Pllthiyangadi
ParaJancheri
Nellikode
Kommeri
Beypore
Olavanna
Kadalundi
Parappanangadi
No A. denotes not availabk R. denotes rural tract number
Name
(2)
Elathur
Edakkad
Puthiyangadi (Partly)
Parayancheri
Nellikode
Kommeri
Beypore (Panchayat) (Partly)
Oiavanna
Kadalundi
Parappanangadi
*These area figures have been subsequently revised in 1961 Census
27
Constituent villages
1951 ,--______ -A-___ -----,
Location Code Area in number Sq. miles Population
(3) (4) (5)
R. ~07-38 1'96* 6,813
R.207-38 1'39* 4,404
R.207-87 N.A. N.A.
R.207-1:23 0'54 6,061
R.207-127 1'9B* 6,956
R.207-126 1'22* 4,772
R.207-144 N.A. N.A.
R.207-146 2'73* 5,632
R.208--44 2'05* 10,580
R.208-59 1'31 7,7B{}

2
3
4
5
6
7
8
9
10
II
12
13
14
15
1·6
17
A-IV TOWNS (AND TOWN-GROUPS) CLASSIFIED BY POPULATION IN 1961 WITH VARIATION SINCE 1901
APPENDIX II
Details of constitution of towns with their area and Jurisdiction
Note :-In this appendix the jurisdiction of towns based on the 1961 set up is taken into account. The jurisdiction of certain towns given in this appendix is different from that given in note A to Appendix I,to table A·IV as the latter is based on the 1961 set up.
Town with area in acres
(1)
Badagara (Municipal)
Pantalayini
Elathur
Edakkad
Puthiyangadi
Calicut (Municipal)
Parayancheri
Nellikode
Kommeri
Beypore
Olavanna
Kadalundi
Feroke
Parappanangadi
Tanur
Trikkandiyur
Manjeri
(5,271 '97)
(1,657'60)
(1,264'68)
(890'02)
(610'84)
(7,567'45)
(346'87)
(1,279'13)
(790'34)
(4,323'00)
(1,754'73)
(1,306'24)
(3,343'64)
(843'60)
(2,217'02)
(2,136'26)
(3,275'37)
Jurisdiction with area in acres of each unit
(2)
Badagara (2,100'89), Puthuppanam (1,561'18) and Nadakkuthazha (1,609'90) villages
Pantalayini village (1,657'60)
Elathur_desom (1,264'68) in Elathur village
Portion of Edakkad desom (8900 02) in Edakkad village which lies outside Calicut Municipal town.
Portion of Puthiyangadi desom (610'84) in Edakkad village which lies outside C21licut Municipal town.
Katcheri (1,525'67), Kalathinkunnu (796'01), Kasba (656'47), Panniankara (1,812'15) and Nagaram (850-21) villages and portions of Edakkad (295'30), Nedungottur (509'82), Chevayur (27'01) and Naduvattom (81'70) villages and Valayanad desom (1,013'11) of Va lay an ad village
Parayancheri desom (346'87) in Kottuli village
Nellikode village (1,279'13)
Kommeri desom (790'34) in Va1ayanad village
Cheruvannur (1,754'15) and Beypore (890'72) villages and portion of Naduvattom village (1,678'13) which lies outside Ca1icut Municipal town.
Olavanna village (1,754'73)
Kadalundi village (1,306'24)
Feroke village (3,343'64)
Parappariangadi village (843'60)
Rayirimanga1am village (2,217'02)
Trikkandiyur village (2,136'26)
Manjeri village (3,275'37)
28

B-ECONOMIC TABLES
NOTE
The 17 Economic Tables of 1961 Census are divided into two parts, viz, (i) General Economic Tables (B-1 to B-1 X) prepared from individual slips and (ii) Household Economic Tables (B-X to B-XVII) prepared from 20 per cent sample Household Schedules. All the above tables pertaining to this district are presented in this volume except Table B-I1 which deals
29
with' workers and non-workers in cities, town-groups and towns arranged territorially classified by sex and broad age-groups'. This table is furnished as Table B-II in 'Volume VII-Kerala State-Part-II-BGeneral Economic Tables'. The concepts and definitions of workers, non-workers, etc. are also explained in that volume.


B-1 WORKERS AND NON.WORKERS CLASSIFIED BY SEX AND BROAD AGE-GROUPS
Fly-leaf
1. Table B-1 given for the total, rural and urban areas for the district is the basic economic table showing the total population, the total number of workers, the classification of workers into nine industrial categories and non-workers by sex and broad age-groups. The age-groups adopted for the tables are 0-14, 15-34, 35-59, 60+ and 'age not stated '. The age-groups correspond to the different stages of
. life which have special significance with reference to capacity to work, viz, children, young persons, middle-aged persons and elderly persons. The corresponding table in the 1951 Census gives the distribution ()f population by eight livelihood classes and their further sub divisions into self-supporting persons, earning dependants and non-earning dependants. There was no classification by age-groups in that table. The livelihood classes under which the population was grouped in 1951 were the following :-
I Cultivators of land wholly or mainly owned and their dependants
II Cultivators of land wholly or mainly unowned and their dependants
III Cultivating labourers and their dependants
IV Non-cultivating owners of land ; agricultural rent receivers and their dependants
V Persons engaged in production other than cultivation and their dependants
VI Persons engaged III commerce and their dependants
VII Persons engaged in transport and their dependants
VIII Persons engaged in other services and miscellaneous sources and their dependants
2. As it was felt that the strict application of the criterion of income or economic independence suppressed those who worked in family economic activity but did not actually earn an income like men other than the head of the household and women of the family or children working in cultivation or cottage industries of the household, the classification of the population into self-supporting persons and earning and non-earning dependants has been given up in the table for 1961. All persons who work including family workers who are not in receipt of any income or working children who cannot earn enough for their maintenance are
l06/1-22a 31
treated as workers and grouped under the following industrial categories instead of the eight livelihood classes in 1951 referred to above:-
I Working as Cultivator
II Working as Agricultural Labourer
III Working in Mining, Quarrying, Live-stock, Forestry, Fishing, Hunting and Plantations, Orchards and allied activities
IV Working at Household Industry
V Working in manufacturing other than Household Industry
VI Working in Construction
VII Working in Trade and Commerce
VIII Working in Transport, . Storage, and Communications
IX Working in Other Services
The non-workers have been classified under the following categories and dealt with in Table B-IX :-
1 Full-time students or children attending school who do no other work
2 Persons engaged in unpaid home duties who do no other work such as make articles at home for sale, or wages, nor help regularly even part-time in family cultivation, industry, trade or business
3 Dependants including infants and children not attending schools and persons permanently disabled from work because of illness or old age
4 Retired persons not employed again, rentiers, persons living on agricultural or non-agricultural royalty, rent or dividend or any other person of independent means for securing which he does not have to work and who does no other work
5 Beggars, vagrants, independent women without indication of source of income or others of unspecified sources of existence
6 Convicts in jails and inmates of penal, mental and charitable institutions
7 Persons seeking employment for the first time
8 Persons employed before, but were out of employment and were seeking work during the reference period

B-1 WORKERS AND NON.WORKERS CLASSIFIED
Workers
In Mining, Quar-rying, Live-stock, Forestry, Fishing, Hunting and Plantations, Or-
Total As Agricultural chards and Rural Total Workers As Cultivator Labourer allied activities Urban Age-group Total population (I-IX) I II III
,.--- ~ ~ ,-------'-------.. ,-----"-------P M F M F M F M F M F
(I) (2) (3) (4) (5) (6) (7) (8) (9) (10) (11) (12) (13)
KOZHIKODE
Total Total 2,617,189 1,300,974 1,316,215 612,214 189,492 103,098 24,746 63,013 50,011 77,357 14,076
0-14 1,122,364 572,139 550,225 13,434 8,549 1,541 554 2,066 1,769 2,715 429
15-34 808,740 385,615 423,125 302,442 96,875 43,353 10,574 33,051 27,683 35,151 7,439
35-59 535,455 '272,014- 263,441 252,590 74-,734 43,690 11,502 24,337 18,880 32,157 5,373
60+ 149,774 70,708 79,066 43,474 9,273 14,476 2,113 3,526 1,661 7,312 832 Age not
stated 856 498 358 274 61 38 3 33 18 22 3
Rural Total 2,184,682 1,083,556 1,101,126 510,876 168,771 101,169 24,142 61,991 48,740 66,477 13,837
0-14 947,333 481,999 465,334 11,330 7,333 1,532 548 2,050 1,744 2,274 425 15-34 669,0{}4 316,864 352,140 252,138 87,244 42,789 10,402 32,591 26,986 29,624 7,356 35-59 442,083 224,603 217,480 209,328 65,930 42,816 1I,157 23,870 18,384 28,009 5,250
60+ 125,432 59,605 65,827 37,813 8,205 13,994 2,032 3,447 1,608 6,548 803 Age not
stated 830 485 345 267 59 38 3 33 18 22 3
Urban Total 432,507 217,418 215,089 101,338 20,721 1,929 604 1,022 1,271 10,880 239
,0-14 175,031 90,140 84,891 2,104 1,216 9 6 16 25 441 4 15-34 139,736 68,751 70,985 50,304 9,631 564 172 460 697 5,527 83
35-59 93,372 47,411 45,961 43,262 8,804 874 345 467 496 4,148 123
60+ 24,342 11,103 13,239 5,661 1,068 482 81 79 53 764 29
Age not stated 26 13 13 7 2
32

BY SEX AND BROAD AGE-GROUPS
Workers
In Manufacturing In Transport, At Household other than House- In Trade and Storage Jnr1
Industry hold Industry In Constl11ction Commerce Comruunicatio;lS In Other Services Non-workers IV V VI VII VIII IX X
,.:~ ,......_.....__ ~ ~ ~ M F l\l F M F M F M F M F M F
(14) (15) (16) (17) (18) (19) (20) (21) (22) (23) (24) (25) (26) (27)
DISTRICT
22,002 29,990 55,116 11,834 7,231 100 52,256 917 26,452 1,233 205,689 56,585 688,760 1,126,723 Total
897 1,802 1,086 475 50 5 547 24 272 29 4,260 3,462 558,705 541,676 0-14
10,658 15,268 30,747 5,512 3,603 56 26,126 370 13,867 810 105,886 29,163 83,173 326,250 15-34
8,507 11,027 21,028 5,309 3,104 36 22,759 431 11,549 383 85,459 21,793 19,424 188,707 35-59
1,934 1,887 2,228 537 473 3 2,784 92 756 11 9,985 2,137 27,234 69,793 60+
6 6 27 40 8 99 30 224 297 A.N.S.
19,193 25,967 33,576 7,409 5,539 55 35,603 567 15,933 917 171,395 47,137 572,680 932,355 Rural 801 1,644 738 347 47 4 356 18 202 27 3,330 2,576 470,669 458,001 0-14-
9,387 13,369 19,083 3,625 2,752 27 18,115 247 8,628 599 89,169 24,633 64,726 264,896 15-34 7,339 9,327 12,297 3,101 2,382 23 15,305 255 6,678 283 70,632 18,150 15,275 151,550 35-59 1,660 1,621 1,433 335 357 1,787 47 418 3 8,169 1,750 21,792 57,622 60+
6 6 25 40 7 95 28 213 286 A.N.S.
2,809 4,023 21,540 4,425 1,692 45 16,653 350 10,519 316 34,294 9,448 116,080 194,368 Urban 96 158 348 128 3 1 191 6 70 2 930 886 88,036 83,675 0-14
1,271 1,399 11,664- 1,387 851 29 8,011 123 5,239 211 16,717 4,530 18,447 61,354 15-34 1,168 1,700 8,731 2,208 722 13 7,454 176 4,871 100 14,827 3,643 4,149 37,157 35-59
274 266 795 202 116 2 997 45 338 3 1,816 387 5,442 12,171 60+
2 4 2 6 II A.N.S.
33

:s-m INDUSTRIAL CLASSIFICATION OF WORKERS AND NON.WORKERS BY EDUCATIONAL LEVELS
Fly-leaf
1. This table presents the data relating to literacy and educational levels of the working population under the nine industrial categories and of the non-working population. It enables to assess the literacy and educationallevels of the workers as well as the non-workers. The table is divided into two parts, Part A dealing with urban areas and Part B dealing with rural areas of the district.
2. Besides giving the number of illiterates and literates (without educational level) in both urban and rural areas, the remaining literates of these areas are classified as follows ;-
Urban
1 Primary or Junior Basic 2 Matriculation or Higher Secondary 3 Technical diploma not equal to degree 4 Non-technical diploma not equal to degree 5 University degree or Post-graduate degree other
than technical degree 6 Technical degree or diploma equal to degree
or Post-graduate degree (i) Engineering
(ii) Medicine (iii) Agriculture ( iv) Veterinary and Dairying (V) Technology
(vi) Teaching and (vii) Others
34
Rural
I Primary or Junior Basic
2 Matriculation and above
3. All persons who have ability to read and write with understanding, i.e., to read any simple letter with felicity and write any simple letter with understanding are considered literates. Those who have passed Lower Primary or Junior Basic but have not passed Matriculation, Higher Secondary, S.S.L.C. or E.S.L.C. come under the category of Primary or Junior Basic and aU those who have passed Matriculation, Higher Secondary, S.S.L.C. or E.S.L.C. come under the category of Matriculation or Higher Secondary.
4. In connection with the enumeration of technical personnel, degrees in science subjects like Physics,Mathe. matics, Chemistry, Geology, Geo-Physics, Geography, etc., have been recognised as technical degrees. These do not come under the specific items (i.e. i to vi) covered by 'technical degree or diploma equal to degree or post-graduate degree'. Hence wherever the subject of graduation or post-graduation has been given these have been included under' Others' (i.e,. vii) in the urban areas. This accounts for the high percentage of 'others' coming under 'technical degree or diploma equal to degree or post-graduate degree'.

B-m PART.A INDUSTRIAL CLASSIFICATION OF WORKERS AND NON·WORKERS BY EDUCATIONAL LEVELS IN URBAN AREAS ONLY
Educationallevel3
(1)
Total 1 Illiterate 2 Literate (without educational levels) 3 Primary or Junior Basic 4 Matriculation or Higher Secondary 5 Technical diploma not equl to degree 6 Non-technical diploma not equal to
degree 7 University degree or post-graduate
degree other than technical degree 8 Technical degree or diploma.equal to
degree or post-graduate degree (i) Engineering
(ii) Medicine (iii) Agriculture (iv) Veterinary and Dairying (v) Technology (vi) Teaching
(vii) Others
In Manufacturing other than House-
hold Industry In Construction V VI
r--M F M F
(13) (H) (15) (16)
DISTRICT
21,540 4,425 1,692 45 3,461 3,066 292 26
12,545 1,075 835 4 4,431 249 257 2
983 31 237 12 12 U
6
62 2 10
40 2 37 8 32
2
1 29 2 5
Total population of workers and non-workers As Cultivator
I
Workers
In Mining, Quarrving _Live-stock }'(Jrc,~ry, Fishing; Hunting and Plantations, Or-
As Agricultural chards and allied Labourer activities
II III ~----.. ,---~ ,---J'--..., ,. __ .A..----,
P M F M F M F (2) (3) (4) (5) (6) (7) (8)
432,507 217,418 213,561 85,813 139,601 82,713 58,976 34,192 17,524 12,441
147 140
71 64
1,570 1,297
1,057 758 70 69 92 72 13 13 6 6 3 3
317 148 556 447
In Trade and
215,089 1,929 127,748 456 56,888 1,011 24,784
5,083 7
7
273
299 I
20
169 109
Workers
325 126
8
3
604 331 190 70 13
In Transport, Storage and
1,022 1,271 650 1,149 296 100 73 22 3
1\1 F (9) (10)
10,880 239 6,798 198 3,487 30
524 8 60 2
8
3
3
At Household Industry
IY ,.~
M F (11) (12)
KOZHlKODE 2,809 4,023
800 2,842 1,638 912
349 265 20 4-
Commerce Communications In Other Services Non-workers VII VIII IX X
r- r- r- ""' M F M F M F M F (17) (18) (19) (20) (21) (22) (23) (24)
16,653 350 10,519 316 34,294 9,448 116,080 194,368 Total 2,633 280 3,712 162 9,089 5,370 57,922 114,324 I 8,494 46 4,498 45 14,883 1,616 35,026 52,870 2 3,661 II 1,379 12 5,148 879 18,045 23,266 3 1,648 13 833 78 3,958 1,321 4,573 3,609 4
5 9 62 7 28 5
2 48 5 8 2 6
175 55 12 705 65 273 193 7
35 33 7 401 185 205 104 8 2 1 20 1 5 (i) 1 69 20 2 (ii)
9 <) (iii) 4 2 (iv) 3 (v)
121 143 23 25 (vi) 32 31 7 175 21 171 79 (vii)
35

B-ID-PART.B INDUSTRIAL CLASSIFICATION OF WORKERS AND NON.WORKERS
In Mining, Quarrying, Live-stock, Forestry, Fishing, Hunting and Plantations, Orchards and
Total population of workers and As Agricultural allied acti \'1-
Educational levels nOn- workers As Cultivator Labourer ties I II III
-, ,--_.A._----, , __ .A_...._-.,
P M F M F M F M F (I) (2) (3) (4) (5) (6) (7) (8) (9) (10)
KOZHIKODE Total 2,184,682 1,083,556 1,101,126 101,169 24,142 61,991 48,740 66,477 13,837
Illiterate 1,340,333 549,775 790,558 31,218 15,511 41,451 44,775 30,310 11,376 Literate (without educational 600,214 376,151 224,063 53,468 7,112 17,413 3,281 29,149 2,033
levels) Primary or Junior Basic 221,295 139,219 82,076 15,229 1,486 3,084 683 6,281 424 Matriculation and above 22,840 18,411 4,429 1,254 33 43 737 4
BADAGARA Total 276,005 134,675 141,330 6,800 2,939 3,511 4,058 10,M7 938
Illiterate 162,189 60,648 101,541 1,645 1,952 1,724 3,625 3,374- 666 Literate (without educational
levels) 93,341 59,349 33,492 4,454 855 1,673 404 5,541 227
Primary or Junior Basic 17,364 11,603 5,761 567 128 113 29 534- 45 Matriculation and above 3,111 2,575 536 134- 4 68
QUILANDY Total 348,987 172,696 176,291 11,475 2,751 7,493 5,406 13,527 1,884
llliterate 198,024 75,133 122,891 2,213 1,745 4,014 4,816 4,549 1,414 Literate (without educational 119,575 75,836 43,739 7,354 888 3,034 516 7,835 407
levels) Primary or Jumor Basic 27,941 18,879 9,062 l,nO 114 3S8 73 1,070 63 Matriculation and above 3,447 2,848 599 138 4 7 1 73
KOZHIKODE Total 378,528 190,377 188,151 15,600 2,135 8,413 3,686 8,118 997
Illiterate 199,698 79,303 120,395 2,836 1,018 4,233 3,306 2,725 321 Literate (without educational 133,187 30,346 52,341 9,993 973 3,670 329 4,703 159
levels) Primary or Junior Basic 39,750 25,553 14,197 2,561 140 502 51 584 15 Matriculation and above 5,893 4,675 1,218 205 4 8 WI 2
TIRUR Total 484,089 233,460 250,629 20,214 3,209 11,329 10,329 13,666 713
llliterate 327,367 136,630 190,737 8,407 2,197 3,642 9,649 8,362 578 Literate (without educational 74,373 47,818 26,555 7,821 7J2 1,890 4-03 3,463 96
levels) Primary or Junior Basic 78,582 46,035 32,497 3,740 293 793 277 1,805 39 Matriculation and above 3,767 2,927 340 246 7 4 36
ERNAD
Total 512,018 254,442 257,576 33,473 8,573 19,454 17,043 7,681 991 Illiterate 330,688 141,969 188,719 11,990 5,696 14,249 15,826 3,961 812 Literate (without educational 132,706 80,944 51,762 16,293 2,298 4,362 1,040 2,919 157
levels) Primary or Junior Basic 44,035 27,815 16,220 4,818 569 833 177 662 22 Matriculation and above 4,589 3,714 875 372 10 JO 139
SOUTH WYNAD
Total 185,055 97,906 87,149 13,607 4,535 11,791 8,218 13,468 8,314 Illiterate 122,367 56,092 66,275 4,127 2,903 8,589 7,553 6,839 7,085 Literate (without educational 47,032 30,858 16,174 7,548 1,386 2,734 589 4,683 987
levels) Primary or Junior Basic 13,623 9,284 4,339 1,773 242 455 7G 1,626 240 vIatriculation and above 2,033 1,672 361 159 4 13 320 2
36

BY EDUCATIONAL LEVELS IN RURAL AREAS ONLr
Workers
At Household Industry
IV
In Manufacturing other than House
hold Industry V
,.------A---.., M F M F
(11) (12) (13) (14)
DISTRICT 19,193 25,967 33,576
7,259 20,246
6,474 20,513 10,179 4,384
2,496 44
TALUK 3,782 1,035 2,431
310 6
TALUK 4,003 1,158 2,397
441 7
TALUK 3,022
906 1,743
362 11
TALUK 3,133 1,294 1,158
673 8
TALUK 4,388 1,733 2,049
595 11
TALUK 865 348 401
115 1
1,062 5,743 8 328
2,280 1,639
569
69 3
9,777 7,959 1,530
287
3,651 4,171 1,178
I
3,180 504-
2,326
332 18
3,737 576
2,721
390 50
6,719 811
4,505
302 1,309
4,743 3,900
576
94
10,557 3,356 5,271
265 1,879 2 51
3,143 2,518
493
7,696 1,601 4,563
132 1,459 73
373 1,687 326 411 38 860
7 2
374 42
lOUjl- 23
7,409 5,925 1,193
283 8
374 299
65
10
1,985 1,565
373
46
1,535 1,168
303
60 4
2,003 1,697
197
109
1,416 1,123
233
55 3
96 73 20
3
In Trade In Construe- and
tion Commerce VI VII
,--.A.._-y----.-A-, M F M F (15) (16) (17) (18)
5,539 1,314 3,474
66B 83
880 170 650
57 3
944 167 703
67 7
894
229 548
111 6
963 256 514
169 24
1,453 402 858
130 13
55 35,603 567 43 8,224 444 12 20,850 96
5,830 22 699 5
8 6,063 59 53
6 4 1,148 4 4,305
528 82
10 6,364 170 7 1,245 133 3 4,295 34
7 7
9 4 5
5 5
727 97
3
6,980 39 983 28
4,495 6
1,330 172
2 3
9,191 137 3,486 108 3,961 18
1,639 10 IOj 1
5,266 152 1,041 114 2,880 30
1,187 158
7 1
405 16 1,739 10 90 16 321 8
201 914 2
84 30
419 85
37
In Transport, Storage and Communi-
---.....
In Other Services
IX Non-workers
X cations
VIII ,.....---A----- r--__ .A. ___ ""\ ,... __ .A.----"""\
M F M F (19) (20) (21) (22)
15,933 6,417 7,076
2,074 366
917 736 119
9 3
1,732 777 717 668 874 102
9S 46
7
171,395 74-,907 68,363
20,076 8,049
23,571 9,128
10,909
2,308 1,226
2,979 1,267 1,501
32 28,158
183 23
24 10,089 6 14,233
2,397 1,439
3,788 31 31,942 10,719 15,490
908 24 2,075 5
712 93
4,102 2,350 1,111
550 91
2,874 1,019 1,325
448 82
458 156 190
86 26
1 1
35 34
41 35 5
4,029 1,704
33,975 19,610 8,653
4,533 1,179
43,323 20,907 15,295
5,422 1,699
1 10,426 1 4,454
3,783
1,387 802
47,137 37,795 5,393
2,378 1,57 I
9,244 7,627 1,093
325 199
5,873 4,539
750
316 268
6,448 4,871
813
411 353
9,261 7,68.5
628
640 308
13,003 10,574-
1,634-
510 285
3,303 2,499
4-75
176 158
M F (23) (24)
572,680 34-2,201 145,933
77,738 6,808
75,139 40,703 26,686
6,759 991
94,016 49,355 31,713
11,446 1,002
104,901 54,953 33,614
14,053 2,281
126,330 80,867 13,976
30,304-1,183
128,834 85,066 30,400
12,211 1,157
43,460 30,757 9,544
2,965 194
932,355 653,390 200,440
75,729 2,796
120,653 85,008 30,167
5,148 330
148,403 100,689 39,232
8,159 323
167,622 104,981 48,575
13,215 851
220,190 164,885 23,919
30,864-522
213,209 152,016 45,870
14,743 575
62,278 45,811 12,677
3,595 195

B-IV INDUSTRIAL CLASSIFICATION BY SEX AND CLASS OF WORKER OF PERSONS . AT WORK OTHER THAN AT CULTIVATION
Fly-leaf
1. This table contains the sex-wise distribution of non-agricultural workers according to their principal work by divisions, major groups and minor groups of Indian Standard Industrial Classification (1. S. I. C.) issued by the Ministry of Labour and Employment, Government of India, following the International Standard Industrial Classification recommended by the D.N.O. The minor groups 000 to 004 and 999 of the 1.S.l.C. do not appear in this table because of the exclusion of cultivators, agricultural labourers and non-workers in this table. Industrial minor groups 000 to 004 relate to agriculture and the minor group 999 to fresh entrants to the labour market who are treated as non-workers. The table is prepared in three parts, Parts A and B containing figures up to divisions and major groups only and Part C giving figures for minor groups also.
2. In table B-IV Part-A which is prepared for the total, rural and urban areas of the district, the workers principally engaged in household industry are djvided into' Employees' and' Others' for each of the divisions 0, 1 and 2 and 3 and their major groups. For the rural areas the figures by divisions are furnished down to taluk level. The study of household industry is a special feature of the 1961 Census.
3. Table B-IV Part-B is prepared for total and urba'n areas of the district. For the rural areas the figures by divisions are furnished down to taluk level. Here the non-agricultural workers engaged in nonhousehold industries are classified into' Employer', , Employee', 'Single worker' and 'Family worker' according to their participation in work. This distribution is available for each of the divisions and major groups of the 1.8.1.C.
4. Table B-IV Part-C presents the combined as we!l as separate sex-wise figures of persons working ill household industry and non-household industry by
. divisions, major groups and minor groups of I.S.I.C. for the total and urban areas of the district. For the rural areas the figures by divisions are furnished down to taluk level. In this table those minor groups the figures of which are less than I per cent of the respective divisions (less than O' 5 per cent in the case of divisions 2 and 3) have been omitted. The figures of such minor groups are shown in the appendix at the end of the table.
5. The corresponding table of 1951 Census viz, table B-III, gives the number of self-supporting
38
persons in non-agricultural livelihood classes by 10 divisions and 88 sub divisions according to the Indian Census Economic Classification (l.e.E.C.) classified into 'Employers', 'Employees' and 'Independent workers' according to the economic status. Under the I.C.E.C. scheme the unit of classification was in every case the individual. This scheme bears more resemblance to the occupational classification given in the table B-V of 1961 than to the 1. 8. I. C. scheme followed in table B-IV of 1961. Under the 1.8.I.C. scheme the unit of classification is the organised establishment, the classification of every" member of the establishment being according to the classification of the establishment based on the commodity produced or the service performed as a result of the work of the establishment.
6. It may be seen from the table that the figures under Minor group 900--' Activities unspecified and not adequately described including activities of such individuals who fail to provide sufficient information about their industrial affiliation to enable them to be classified' -are considerably large in both rural and urban areas of all districts. Most of these entries relate to these returning their nature of work as 'general coolies' or' general labourers' and the nature of industry as 'no fi-x.ed place of work'.
7. The list of Indian Standard Industrial Classification by divisions, major groups and minor groups is reproduced below: -
Indian Standard Industrial Classification
This classification groups the industries into-
9 Divisions, 45 Major Groups and 343 Minor Groups.
The divisions and major groups with their Code numbers are listed below :-
DIVISIONS
o Agriculture, Live-stock, Forestry, Fishing and Hunting
Mining and Quarrying 2 & 3 Manufacturing 4 Construction 5 Electricity, Gas, Water and Sanitary services 6 Trade and Commerce 7 Transport, Storage and Communication 8 Services 9 Activities not adequately described

MAJOR GROUPS Division 0 Agriculture, Live-stock, Forestry,
Fishing and Hunting 00 Field produce and Plantation crops 01 Plantation crops 02 Forestry and Logging 03 Fishing 04 Live-stock and Hunting
Division 1 Mining and Quarrying 10 Mining and Quarrying
Division 2 & 3 Manufacturing 20 Foodstuffs 21 Beverages 22 Tobacco products 23 Textile-cotton 24 Textile-jute 25 Textile-wool 26 Textile-silk 27 Textile-miscellaneous 28 Manufacture of wood and wooden products 29 Paper and paper products 30 Printing and publishing 31 Leather and leather products 32 Rubber, petroleum and coal products 33 Chemicals and chemical products 34-35 Non-metallic mineral products oth~r than
petroleum and coal 36 Basic metals and their products except
machinery and transport equipment 37 Machinery (all kinds other than transport)
and electrical equipment 38 Transport equipment 39 Miscellaneous manufacturing industries
Division 4 Construction 40 Construction
Division 5 Electricity, Gas, Water and Sanitary Services
50 'Electricity and Gas 51 Water supply and sanitary services
Division 6, Trade and Commerce 60-63 Wholesale Trade 64-68 Retail Trade 69 Trade and Commerce Miscellaneous
Division 7 Transport, Storage and Communica-tion
70-71 Transport 72 Storage and Warehousing 73 Communications
Division 8 Serv~ces 80 Public Services 81 Educational and Scientific Services 82 Medical and Health Services 83 Religious and Welfare Services 84 Legal Services
106/1-23a
39
85 Business Services 86 Community Services and Trade and Labour
associa tions 87 Recreation Services 88 Personal Services 89 Services (not elsewhere classified)
Division 9 Activities not ade~uately described 90 Activitie5 unspecified and not adequately
described. (This includes new entrants to the labour market) (Classification and Code numbers at the 3 digit level in respect of minor groups are shown in the subsequent pages)
Division 0 Agriculture, Live-stock, Forestry, Fishing and Hunting
Major Minor Groufl Group (Code) Description (Code)
00 FIELD PRODUCES AND PLANTATION CROPS
Production of cereal crops (including Bengal gram) such as rice, wheat, jowar, bajra, maize 000 Production of pulses, such as arhar, moong, masur, urd, khesari, other gram 001 Production of raw jute and kindred fibre crops 002 Production of raw cotton and kindr-ed fibre crops 003 Production of oilseeds, sugarcane and other cash crops 004 Production of other crops (including vegetables) not covered above 005 Production of fruits and nuts in plantation, vines and orchards 005 Production of wood, bamboo, cane reeds, thatching grass, etc. 007 Production of juice by tapping palms 008 Production of other agricultllral produce (including fruits and nuts not covered by code number 006 and flowers) not covered above 009
01 PLANTATION CROPS-
Production of tea in plantation 010 Production of coffee in plantation Oil Production of rubber in plantation 012 Production of tobacco in plantation 013 Production of ganja, cinchona,
opium Production of other plantation crops not covered above
02 FORESTRY AND LOGGING-
Planting, replanting and conservation of forests
014
015
02(}

Major Group (Code) Description
02 FORESTRY AND LOGGING-coneld. Felling and cutting of trees and transportation of logs Preparation of timber Production of fuel including charcoal by exploitation of forest Production of fodder by exploitation of forests Production of gums, resins, lac, barks, herbs, wild fruits and leaves by the exploitation of forests Production and gathering of other. forest products not covered above
03 FISHING-
Production of fish by fishing in sea Production of fish by fishing in inland waters including the operation of fish farms and fish hatcheries Production of pearls, conch, shells, sponges by gathering or lifting from sea, river, pond
04 LIVE-STOCK AND HUNTING-
Production and rearing of live-stock (large heads only) mainly for milk and animal power such as cow, buffalo, goat Rearing of sheep and production of wool Rearing and production of other animals (mainly for slaughter) such as pig Production of ducks, hens and other small birds, eggs by rearing and poultry farming Rearing of bees for the production of honey, wax and collection of honey Rearing of silk worms and production of cocoons and raw silk Rearing of other small animals and insects Trapping of animals or games propagation Production of other animal husbandry products such as skin, bone, ivory and teeth
Division I Mining and Quarrying 19 MINING AND QUARRYING
Mining of coal Mining of iron ores Mining of gold and silver ores Mining of manganese
Mindr Group (Code)
021 022
023
024
025
026
030
031
032
040
041
042
043
044
045
046
047
048
100 101 102 103
40
Major Group (Code) Description
Mining of mica Mining of other non-ferrous metallic
ores Mining of crude petroleum and natural gas Quarrying of stone (including slate), clay, sand, gravel, limestone Mining of chemical earth such as soda ash Mining and quarrying of non-metallic products not classified above such as precious and semi-precious stones, asbestos, gypsum, sulphur, asphalt
Division 2 and 3 Manufacturing 20 F OODSTUFFS-
Production of rice, atta, flour, etc., by milling, dehusking and processing of crops and foodgrains Production of sugar and syrup from sugarcane in mills Production of indigenous sugar, gur from sugarcane or palm juice and production of candy Production of fruit products such as jam, jelly, sauce and canning and preservation of fruits Slaughtering, preservation of meat and fish and canning of fish Production of bread, biscuits, cake and other bakery products Production of butter, ghee, cheese and other dairy products Production of edible fats and oils (other than hydrogenated oil) Production of hydrogenated oils (vanaspati) Production of other food products such as sweetmeat and condiments, muri, murki, chira l khoi, cocoa, chocolate, toffee, lozeI?-ge
21 BEVERAGES-
Production of distilled spirits, wines, liquor from alcoholic malt, fruits and malts in distillery and brewery Production of country liquor Production of indigenous liquor such as toddy, liquor from mahua, palm JUlce Production of other liquors not covered above
Minor Group (Code)
104
105
106
107
108
109
200
201
202
203
204
205
206
207
208
209
210 211
212
213

Major Group (Code) Description
21 BEVERAGES-Concld.
Production of aerated and mineral water Production of ice Production of ice cream Processing of tea in factories Processing of coffee in curing works Production of other beverages
22 TOBACCO PRODUCTS
Manufacture of bidi Manufacture of cigars and cheroots Manufacture of cigarette and cigarette tobacco Manufacture of hookah tobacco Manufacture of snuff Manufacture of jerda and other chewing tobacco Manufacture of other tobacco products
23 TEXTILE-COTTON-
Cotton ginning, cleaning, pressing and baling Cotton spinning (other than in mills) Cotton spinning and weaving in mills Cotton dyeing, bleaching Cotton weaving in power looms Cotton weaving in handlooms Manufacturing of khadi textile in handlooms Printing of cotton textile Manufacturing of cotton nets Manufacturing of cotton, cordage, rope and twine
24 TEXTILE-J UTE-\
Jute pressing and baling Jute spinning and weaving Dyeing and bleaching of jute Printing of jute textile Manufacture of other products like rope, cordage from jute and simi. lar fibre such as hemp, mesta
25 TEXTILE-WOOL-
Wool baling and pressing Wool cleaning and processing (scouring) Wool spinning and weaving in mill Wool spinning other than in mills Wool weaving in power loom Wool weaving in handloom Embroidery and art work in woollen
textile
Minor Group (Code)
214 215 216 217 218 219
220 221
222 223 224
225
226
230 231 232 233 234 235
236 237 238
239
240 241 242 243
244
250
251 252 253 254 255
256
41
Major Group (Code) Description
26 TEXTILE-SILK-
Spinning and weaving of silk textile in mill Dyeing and bleaching of silk Spinning of silk other than in mills Weaving of silk textile by power loom Weaving of silk textile by handloom Printing uf silk textile Manufacture of silk cordage, rope and twine
27 TEXTILE-MISCELLANEOUS
Manufacture of carpet and all other similar type of textile products Manufact.llre of hosiery and other knitted fabrics and garments Embroidery and making of crepe, lace and fringes Making of textile garments including raincouts and headgear Manufacture of made up textile goods except wearing apparel such as curtains, pillow cases, bedding materials, mattress, textile bags ::\fanufacture of waterproof textile products such as oil cloth, tarpaulin Manufactme and recovery of all types of fibres for purposes of padding, wadding and upholstery filling Manufacture of coir and coir products Manufacture of umbrellas Processing and manufacture of textile products not covered above
28 MANUFACTURE OF WOOD AND WOODEN
PRODUCTS-
Sawing and planing of wood Manufacture of wooden furniture and fixtures :Manufacture of structural goods (including treated such as beams, posts, windows
wooden timber)
doors,
Manufacture of wooden industrial goods other than transport equipment such as bobbin and similar equipment and fixtures Manufacture of other wooden products such as utensils, toys, artwares Manufacture of veneer and plywood
Minor Group (Code)
260 261 262 263 264 265
266
270
271
272
273
274
275
276
277 278
279
280
281
232
233
284 285

Major Group (Code) Description
28 MANUFACTURE OF WOOD AND WOODEN
PRODucTS-concld.
Manufacture of plywood products such as tea chest Manufacture of boxes and packing cases other than plywood Manufacture of materials from cork, bamboo, cane, leaves and other allied products Manufacture of other wood and allied products not covered above
29 PAPER AND PAPER PRODUCTS
Manufacture of pulp from wood, rags, waste paper and other fibres and the conversion of such pulp into any kind of paper and paper board in mill Manufacture of pulp from wood, rags, waste paper and other fibres and the conversion of such pulp into any kind of paper and paper board handmade Manufacture of products, such as paper bags, boxes, cards, envelopes and moulded pulp goods from paper, paper board and pulp
30 PRINTI~G AND PUBLISHING-
Printing and publishing of newspapers and periodicals Printing and publishing of books All other types of printing including lithography, engraving, etching, block making and other work con· nected with printing industry All types of binding, stitching, sizing and other allied work connected with binding industry
31 LEATHER AND LEATHER PRODUCTS
Curing, tanning and finishing of hides and skins and preparation of finished leather Manufacture of shoes and other leather footwear Manufacture of clothing and wearing apparel (except footwear) made of leather and fur Manufacture of leather products (except those covered by Code Nos.3ll, 312), such as leather
Minor Group (Code)
286
287
288
289
290
291
292
300 301
302
303
310
311
312
42
Major Group (Code) Description
upholstery, suit cases, pocket books, cigarette and key cases, purses, saddlery, whip and other articles Repair of shoes and other leather footwear Repair of all other leather products except footwear
32 RUBBER, PETROLEUM AND COAL PRO-
DUCTS-
Manufacture of tyres and tubes Manufacture of rubber footwear Manufacture of rubber goods used for industrial purpose Manufacture of all kinds of other rubber products from natural or synthetic rubber including rubber raincoat Production of petroleum, kerosene and other petroleum products in petroleum refineries Production of coaltar and coke in coke oven Manufacture of other coal and coal. tar products not covered elsewhere
33 CHEMICALS AND CHEMICAL PRODUCTS
Manufacture of basic industrial chemicals such as acids, alkalis and their salts not elsewhere specified Manufacture of dyes, paints, colours and varnishes Manufacture of fertilizers Manufacture of ammunition, explosives and fireworks Manufacture of matches Manufacture of medicines, phar. maceutical preparations, perfumes, cosmetics and other toilet prepara. tions except soap Manufacture of soap and other washing and cleaning compounds Manufacture of turpentine, synthetic resin, and plastic products and materials (including synthetic rub. ber) Manufacture of common salt Manufacture of other chemicals and chemical products not covered above (including inedible oils and fats)
Minor Group (Code)
313
314
315
320 321
322
323
324
325
326
330
331 332
333 334
335
336
337 338
339

Major Group (Code) Description
34-35 NON-METALLIC MINERAL PRODUCTS
OTHER THAN PETROLEUM AND
COAL-
Manufacture of structural clay products such as bricks, tiles Manufacture of cement and cement products Manufacture oflime Manufacture of structural stone goods, stone dressing and stone crushing Manufacture of stonewares, other than images Manufacture of stone images Manufacture of plaster of Paris and its products Manufacture of asbestos products Manufacture of mica products Manufacture of earthen ware and earthen pottery Manufacture of chinaware and crockery Manufacture of porcelain and its products Manufacture of glass bangles and beads . Manufacture of glass apparatus Manufacture of earthen image, busts and statues Manufacture of earthen toys and artwares except those covered by code No. 355 Manufacture of glass and glass products except optical and photographir lenses and glass products covered above Manufacture· of other non-metallic mineral '. products not elsewhere specified
36 BAsra METALS AND THEIR PRODUCTS
EXCEPT MACHINERY AND TRANS
PORT EQUIPMENT-
Manufacture of iron and steel including, smelting, refining, rolling, conversion into basic forms such as billets, blooms, tubes, rods Manufacture including smelting, refining of non-ferrous metals and alloys illl basic forms Manufacture of armaments Manufacture of structural steel products such as joist, rail, sheet, plate
Minor Group (Code)
340
341 342
343
344 345
346 347 348
350
351
352
353 354
355
356
357
359
360
361 362
363
43
Major Group (Code) Description
Manufacture of iron and steel furniture Manufacture of brass and bell-metal products Manufacture of aluminium products Manufacture of metal products (other than of iron, brass, bell-metal and aluminium) such as tin can Enamelling, galvanising, plating (in cluding electroplating), polishing and welding of metal products Manufacture of sundry hardwares such as G.I. pipe, wire net, bolt, screw, bucket, cutlery (This will also include the manufacture of sundry ferrous engineering products done by jobbing engineering concerns which cannot be classified in major groups 36, 37, 38 and 39)
37 MACHINERY (ALL KINDS OTHER THAN
TRANSPORT) AND ELECTRICAL
EQUIPMENT-
Manufacture and assembling of machinery (other than electrical) except textile machinery Manufacture and assembling of prime mover and boilers, other than electrical equipment, such as diesel engines, road rollers, tractors Manufacture of machine tools Manufacture of textile machinery and accessories Manufacture of heavy electrical machinery and equipment such as motors, generators, transformers Manufacture of electric lamps & fans Manufacture of insulated wires and cables Manufacture of all kinds of battery Manufacture of electronic equipment such as radio, microphone 11anufacture of electric machinery and apparatus, appliances not specified above
38 TRANSPORT EQUIPMENT
Manufacture, assembling and repairing of locomotives Manufacture of wagons, coaches, tramways and other rail road equipment other than that covered by code No. 363
Minor Group (Code)
364
365 366
367
368
369
370
371 372
373
374-375
376 377
378
379
380
381

Major Group (Code) Description
I
38 TRANSPORT EQ,UIPMENT-concld.
Manufacture and assembling of motor vehicles of all types (excepting motor engines) Manufacture of motor vehicles, engine parts and accessories Repairing and servicing of motor vehicles Manufacture of bicycles and tricycles and accessories such as saddle, seat frame, gear Building and repairing of water transport equipment such as ships, boats and manufacture of marine engines Manufacture and repair of air trans.. port equipment including aeroplanes, aeroengines Repairing of bicycles and tricycles Manufacture of other transport equipment not covered above such as animal-drawn and hand-drawn vehicles
39 MISCELLANEOUS MANUFACTURING INDUS-
TRIES-
Manufacture of optical instruments and lenses, ophthalmic goods and photographic equipment and supplies
Manufacture of scientific, medical and surgical instruments and equipment and supplies Assembling and repairing of watches and clocks Manufacture of jewellery, silverware and wares t:sing gold and other precious metals Manufacture and tuning of musical instru rr:ents Manufacture of stationery articles not covered elsewhere such as pencil, penholder, fountain pen Manufacture of sports goods Manufacture and repair work of goods not assignable to any other group
Division 4 Construction 40 CONSTRUCTION-
Construction and maintenance of buildings including erection, floor_ ing, decorative constructions, electrical and sanitary installations
Minor GroUV (Code)
382
383
384
385
386
387 388
389
390
391
392
393
394
395 396
399
400
44
Major Group (Code) Description
Construction and maintenance of
Minor Group (Code)
roads, railways, bridges, tunnels 401 Construction and maintenance of telegraph and telephone lines 402 Construction and maintenance of water ways and water reservoirs, such as bund, embankments, dam, canal, tank, tubewells, wells 403
Division 5 Electricity, Gas, Water and Sanitary Services
50 ELECTRICITY AND GAS-
Generation and transmission of elec-tric energy 500 Distribution of electric energy 501 Manufacture of gas in gas works and distribution to domestic and indus-trial consumers 502
51 WATER SUPPLY AND SANITARY SERVICES
Collection, purification and distribution of water to domestic and industrial consumers 510 Garbage and sewage disposal, opera-tion of drainage system and all other types of work connected with public health and sanitation 511
Division 6 Trade and Commerce 60-63 WHOLESALE TRADE-
Wholesale trading in cereals and pulses 600 Wholesale trading in vegetables, fruits, sugar, spices, oil, fish, dairy products, eggs, poultry and other foodstuff (not covered elsewhere) 601 Wholesale trading in all kinds of fabrics, and textile products such as garments, hessian, gunny bag, silk and woollen yarn, shirtings, suit-ings, hosiery products 602 Wholesale trading in beverages, such as tea (leaf), coffee (seed and powder), aerated water 603 Wholesale trading in intoxicants such as wines, liquors 604 Wholesale trading 111 other intoxi-cants such as opium, ganja, etc. 605 Wholesale trading in tobacco, bidi, cigarettes and other tobacco pro-
·ducts 606 Wholesale trading in animals 607 Wholesale trading in straw and fod-
der 608

Major Group (Code) Description
60-63 WHOLESALE TRADE-COfIeld.
Wholesale trading in medicines and chemicals Wholesale trading in fuel and lighting products such as coke, coal, kerosene, candle Wholesale trading in toilets, perfumery and cosmetics Wholesale trading in metal, porcelain and glass utensils, crockery, chinaware Wholesale trading in wooden, steel and other metallic furniture and fittings
Wholesale trading in footwear Wholesale trading in tyres, tubes and allied rubber products Wholesale trading in petrol, mobiloil and all ied products Wholesale trading in other house .. hold equipment not covered above Wholesale trading in bricks, tiles and other building materials Wholesale trading in wood, bam. boo, cane, thatches and similar products
Wholesale trading in paper and other stationery goods Wholesale trading in agricultural and Industrial machinery, equipment and tools and appliances other than electrical
Wholesale trading in electrical machinery and equipment like motor, battery, electric fan, bulb Wholesale 1rading in all kinds of transport and storage equipment Wholesale trading in skins, leather and fur Wholesale trading in clocks, eye glasses, frames Wholesale trading in hardware and sanitary equipment Wholesale trading in scientific, medical and surgical instruments
Wholesale trading in precious metals and stones, gold and silverwares and jewellery Wholesale trading in all goods not covered above
10611-24
Minor Group (Code)
610
611
612
613
614 615
616
617
618
628
621
63()
631
632
633
634
63~
636
637
638
639
45
Major Group (Code) Description
64-68 RETAIL TRADE-
Retail trading in cereJlls, pulses, vegetables, fruits, sugar, spices, oil, fish, dairy products, eggs, poultry Retail trading in beverages such as tea (leaf) , coffee (seed and powder) , aerated water Retail trading in intoxicants such as wines, liquors Retail trading in other intoxicants such as opium, ganja, etc. Retail trading in tobacco, bidi, cigarettes and other tobacco products Retail trading in fuel such as coke, coal, firewood and kerosene Retail trading in foodstuffs like sweetmeat, condiments, cakes, biscuits, etc.
Retail trading in animals
Retail trading in straw and fodder
Retail trading in fibres, yarns, dhoti, saree, ready-made garments of cotton, wool, silk and other textiles and hosiery products; (this includes retail trading in piece goods of cotton, wool, silk and other textiles) Retail trading in toilet goods, perfumes and cosmetics Retail trading in medicines and chemicals Retail trading in footwear, headgear such as hat, umbrella, shoes aud chappals Retail trading in tyres, tubes and allied rubber products Retail trading in petrol, mobiloil and allied products
Retail trading in wooden, steel and other metallic furniture and fittings Retail trading in stationery goods and paper Retail trading in metal, porcelain and glass utensils Retail trading in earthenware and earthen toys Retail trading in other household equipments not covered above
Minor Group (Code)
64-()
641
642
643-
644
645-
646-647 643.
65()
651
652:
653
654
655-
66()
661
662
663
664
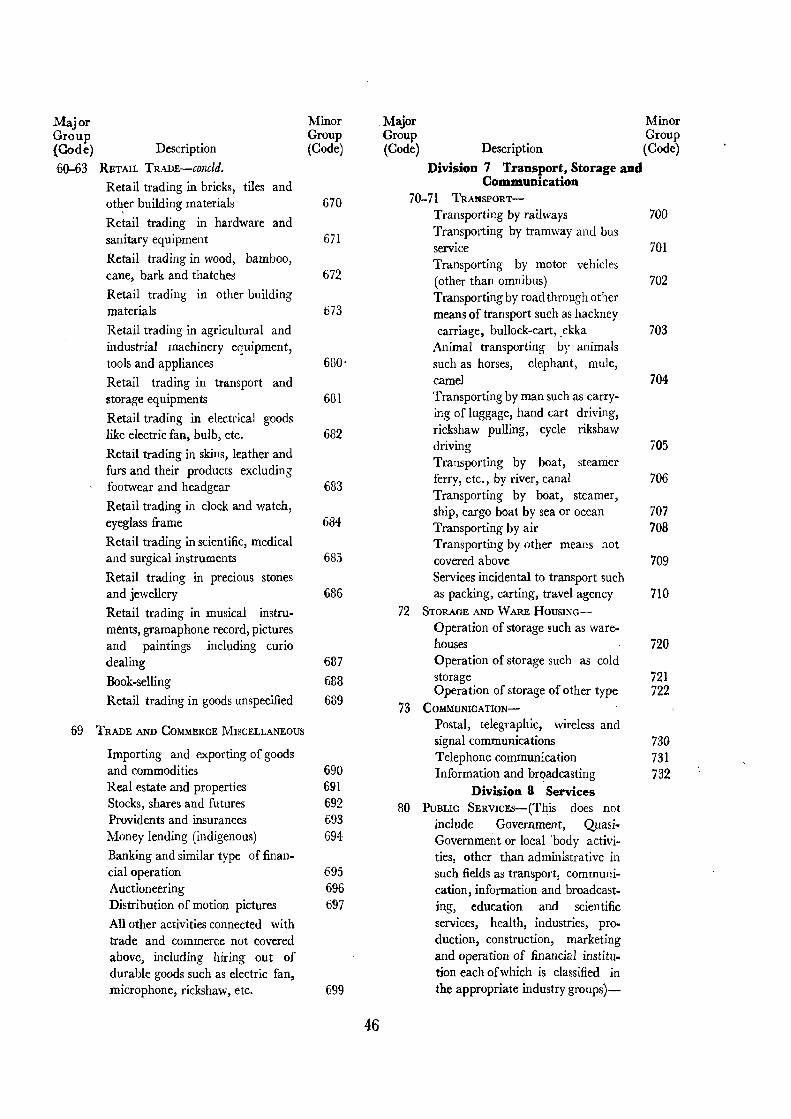
Major Group (Code)
60-63
Description
RETAIL TRADE-concld. Retail trading in bricks, tiles and ot~er building materials
Retail trading in hardware and sanitary equipment
Retail trading in wood, bamboo, cane, bark and thatches
Retail trading in other building materials
Retail trading in agricultural and industrial machinery equipment, tools and appliances
Retail trading in transport and
Minor Group (Code)
670
671
672
673
680·
storage equipments 681
Retail trading in electrical goods like electric fan, bulb, etc. 682
Retail trading in skins, leather and furs and their products excluding footwear and headgear 683
Retail trading in clock and watch, eyeglass frame 684
Retail trading in scientific, medical and surgical instruments 685
Retail trading in precious stones and jewellery 686
Retail trading in musical instru-ments, gramaphone record, pictures and paintings including curio dealing 687
Book-selling 688
Retail trading in goods unspecified 689
69 TRADE AND COMMERCE MISCELLANEOUS
Importing and exporting of goods and commodities 690 Real estate and properties 691 Stocks, shares and futures 692 Providents and insurances 693 Money lending (indigenous) 694
Banking and similar type of finan-cial operation 695 Auctioneering 696 Distribution of motion pictures 697
All other activities connected with trade and commerce not covered above, including hiring out of durable goods such as electric fan, microphone, rickshaw, etc. 699
46
Major Group (Code) Description
Division 7 Transport, Storage and Communication
70-71 TRANSPORT-
Transporting by railways Transporting by tramway and bus serVlce Transporting by motor vehicles (other than omnibus) Transporting by road through other means of transport such as hackney carriage, bullock-cart, ekka
Animal transporting b)' animals such as horses, elephant, mule, came] Transporting by man such as carrying of luggage, hand cart driving, rickshaw pulling, cycle rikshaw driving Transporting by boat, steamer ferry, etc., by river, canal Transporting by boat, steamer, ship, cargo boat by sea or ocean Transporting by air Transporting by other means not covered above Services incidental to transport such as packing, carting, travel agency
72 STORAGE AND WARE HOUSING
Operation of storage such as warehouses Operation of storage such as cold storage Operation of storage of other type
73 COMMUNICATION-
Postal, telegraphic, wireless and signal communications Telephone communication Information and brQadcasting
Division 8 .Services 80 PUBLIC SERVICES-(This does not
include Government, QuasiGovernment or local 'body activities, other than administrative in such fields as transport, communication, information and broadcasting, education and scientific services, health, industries, production, construction, marketing and operation of financial institution each of which is classified in the appropriate industry groups)-
Minor Group (Code)
700
701
702
703
704
705
706
707 708
709
710
720
721 722
730 731 732

Major Group (Code) Description
80 PUBLIC SERVIcEs-concld. Public services in Union and State army including territorial corps and volunteer corps Public service in Navy Public service in Air Force Public service in Police Public service in administrative departments and offices of Central Government Public service m administrative departments and offices of QuasiGovernment organisation, municipalities, local boards, etc. Public services m administrative departments and offices of State governments
81 EDUCATIONAL AND SCIENTIFIC SERVICE$-
Educational services such as those rendered by technical colleges, technical schools and similar technical and vocational institutions Educational services such as those rendered by colleges, schools and similar other institutions of nontechnical type Scientific services and research institutions not capable of classification under any individual group
82 MEDICAL AND HEALTH SERVICES
Public health and medical services renclered by organisations and individuals such as by hospitals, sanatoria, nursing homes, maternity and child welfare" clinic as also by hakimi, unani, ayurvedic, allopathic and homoeopathic practitioners Veterinary services rendered by organisations and individuals
83 RELIGIOUS AND WELFARE SERVICES
Religious services rendered by religious organisations and their establishments maintained for worship or promotion of religious activities, this includes missions, ashrams and other allied organisations
106/1-24a
Minor Group (Code)
800 801 802 803
804
805
809
810
811
812
820
821
830
47
Major Group (Code) Description
Religious and allied services rendered by pandit, priest, preceptor, fakir, monk
Welfare services rendered by organisations operating on a non-profit basis for the promotion of welfare of the community such as relief societies, red-cross organisation for the collection and allocation of contributions for charity
84 LEGAL SERVICES-
Legal services rendered by barrister, advocate, solicitor, mukteer, pleader, mukurie, munshi Matrimonial services rendered by organisations and individuals
85 BUSINESS SERVICES-
Engineering services rendered by professional organisations or individuals Business services rendered by organisations of accountants, auditors, book-keepers or like individuals Business services rendered by professional organisations or individuals such as those of advertising and publicity agencies Business services rendered by professional organisations or individuals such as of those rendered by news· agency, newspaper correspondent, columnist, journalists, editors, authors
86 COMMUNITY SERVICES AND TRADE
AND LABOUR ASSOGIATIONS
Services rendered by trade associations,chambers of commerce, trade uni!ms and similar other organi. sations Services rendered by civic, social, cultural, political and fraternal organisations such as rate payers association, club, library Community services such as those rendered by public libraries, museums, botanical and zoological gardens, etc.
87 RECREATION SERVICES-
Production of motion picture and allied services such as processing, editing~ etc.
Minor Group (Code)
831
832
840
841
850
851
852
853
860
861
862
870

I
Major Group (Code) Description
87 RECREATION SERVICEs-conc{d.
Recreation serVIces rendered by cinema homes by exhibition of motion pictures Recree;; tion services rendered by organisations and individuals such as those of theatres, opera companies, ballet and dancing parties, musicians, exhibitions, circus, carnivals Recreation services rendered by indoor and outdoor sports by organisations and individuals in_ cluding horse, motor,. etc., racing
:S8 PERSONAL SERVICES-
Services rendered to households such as those by domestic servants cooks Services rendered to households such as those by governess, tutor, private secretary Services rendered by hotels, boarding houses, eating houses, cafes, restaurants and similar other organisations to provide lodging and boarding facilities
Minor Group (Code)
871
872
873
830
!l81
882
48
Major Group (Code) Description
Laundry services rendered by organisations and individuals. This includes all types of cleaning, dyeing, bleaching, dry cleaning
Minor Group (Code)
services 883 Hair dressing, other services rendered by organisations and indi-viduals such as those by barber, hairdessing saloon and beauty shops 884 Services rendered by portrait and commercial photographic studios 885
89 SERVICES (NOT ELSEWHERE CLASSIFIED)
Services rendered by organisations or individuals not elsewhere classified 890
Division 9 Activities not adequately described
90 Activities unspecified and not adequately described including activities of such individuals who fail to provide sufficient information about their industrial affiliation to enable them to be classified 900
Fresh entrants to the Labour Market 999

B-IV PART-A INDUSTRIAL CLASSIFICATION BY SEX AND 6LASS OF WORKER OF PERSONS AT WORK AT HOUSEHOLD INDUSTRY
Branch of Industry Total Employee Others Division and Major group Total
of I.S.I.C. Rural r-------_____A-~-------_v__-------..A--------r----.A.---~
Urban ~fales Females lI.lalcs Females -'lales Females
i)) (2) (3) (+) (5) (6) (7) (8)
KOZIDKODE DISTRICT
All Divisions T 22,002 29,990 4,511 5,970 17,491 24,020
R 19,193 25,967 3,965 :>,322 15,228 20,645
U 2,809 4,()23 546 048 2,263 3,375
Division ° T 340 IH 79 13 261 131
R 181 31 47 G J3-t 25
U 159 J 13 32 7 127 106
~ [ajor group 00 T 75 27 48 4-
R 31 2 3 28 1
U 44 3 2-t 20 3
" 02 T 20 2 1:3
R 19 2 17
U J
" 03 T 6 57 6 :; 61
R + 1 I 3
U 2 66 5 2 61
" 0+ T 239 71 49 6 EO 65
R 127 27 41 4 -26 23 U ll2 H 3 2 JIJ4 42
Divi,ion 1 T R
Major group 10 T R
Division 2&3 T 21,661 29,846 4,431 5,9)7 17,130 23,889
R 19,01l 25,936 3,917 5,316 15,(l~+4 20,620
U 2,650 3,910 514 6-:-1 2,136 3,269
Major group 20 T 3,048 2,113 6-J-l 192 2,407 1,921
R 2,464- 1,764- 543 170 1,921 1,594
U 534 349 98 22 486 327
!\lajor group 21 T J03 36 14 89 35
R 100 34 13 37 34
U 3 2 2 1
" 22 T 1,934- 91 1,053 18 376 73
R 1,366 89 1,034 17 832 72 U 68 2 24- I 44 1
" 23 T 5,081 4,659 1,062 :,1)2 4,019 4,157
R 3,996 3,684- 838 4-11 3,158 3,273
U 1,085 975 224- 91 361 884
" 27 T 1,621 17,235 569 4,952 1,052 12,283
R 1,407 14,961 512 4-,438 895 10,523
U 214 2,274- 57 514 157 1,760
" 28 T 2,956 3,592 327 94- 2,629 3,498
R 2,820 3,384- 313 33 2,507 3,301
U 136 208 14- 11 122 197
" 29 T 5 2 3
R .) 2 3
" 30 T 19 15 7 12 15
R 14 14 7 7 14
U 5 1 5 1
•• 31 T 127 17 20 107 19 R III 15 16 95 14
16 2 4 12 2
49

B-IV PART-A INDUSTRIAL CLASSIFICATION BY SEX AND CLASS OF WORKER OF PERSONS AT WORK AT HOUSEHOLD INDUSTRY-coneld.
Branch of Industry Total Total Employee Others Division and Major group Rural -v-----"------..
of I.S.1.e. Urban Males Females Males Females Males Female,
(I) (2) (3) (4) (5) (6) (7) (8)
Major group 32 T 7 2 :, R 2 U 5 1 4
" 33 T 232 69 48 8 134 fit
R 195 5Y 40 8 155 51 U 37 10 S 29 lO
" 34-35 T 1,901 1,205 77 43 1,824- 1,162
R 1,791 1,140 76 43 1,715 1,097 U 110 65 1 109 65
" 36 T 2,435 479 221 30 2,214- 449
R 2,270 458 197 29 2,073 429 U 163 21 24 141 20
" 37 T 4 4
R 4 4
" 38 T 32 12 20
R 30 11 19 U 2 I I
" 39 T 2,165 326 373 1I4 1,792 212
R 1,945 325 316 114 1,629 21t U 220 I 57 163 1
BADAGARA TALUK-RURAL
All Divisions 3,782 2,280 882 221 2,900 2,O~
Division 2&3 3,782 2,280 882 221 2,900 2,059
QUILANDY TAL UK-RURAL
All Divisions 4,003 9,777 739 2,413 3,264 7,364 Division 0 53 6 6 2 47 4
" I 1
" 2&3 3,949 9,771 732 2,411 3,217 7,S6U
KOZHIKODE TALUK-RURAL
All Divisions 3,022 5,651 698 1,543 2,324 4,108 Division 0 27 15 6 1 21 14
" 2&3 2,995 5,636 692 1,542 2,303 4,094
TIRUR TALUK-RURAL
All Divisions 3,133 4,743 719 878 2,414 3,865-DivisIOn 0 13 5 3 3 10 2
" 2&3 3,120 4,733 716 875 2,404- 3,863
ERNAD TALUK-RURAL
All Divisions 4,388 3,143 785 254 3,603 2,~
Division 0 31 I 1 30 1
" 2&3 4,357 3,142 784 254 3,;;73 2,888
soum WYNAD TALUK-RURAL
AU Divisions 865 373 142 13 723 360 Division 0 57 4 31 26 4
OJ 2&3 808 369 111 13 697 356
50

B-IV PART-B INDUSTRIAL CLASSIFICATION BY SEX AND CLASS OF WORKER OF PERSONS AT WORK IN NON-HOUSEHOLD INDUSTRY, TRADE,
BUSINESS, PROFESSION OR SERVICE
Branch of Industry Division and Major ~roup of LS.I.C.
Tolal lJI·ban
Total Employer Employee Single Worker Family Worker r------"------y--------A-----v-----'----~___v___--"--~
M F :\1 F J\I F M F 1\1 F
1.1) (3) (1) (5) (6) (7) (8) (9) (10) (11) (12)
.All Divisions Total 424,101
U~ban 95,578
Division I) Total 73,755 Urban 10,682
:\la jur broup 00 Tolal 35,7:28 Crban 9')1
" 01 Total
Urban
" 02 TUial
l:rban
" 03 Total
Urban
" 04 Total
Urban
Division Total Urban
Major group 10 Total
Division:2 & 3
eTban
Total Urban
}'lajor group 20 Total Urban
"
"
"
"
"
"
"
"
"
..
21
22
23
24
Total Urban
Total Urban
·Total Urban
, Total Urban·
Total Urban
26 Total Urban
27 Total Urban
28 Total Urban
29 Total Urban
30 Total Urban
31 Total Urban
32 Total Urban
JI),836 79
2,375 172
16,157 9,:295
2,6.'>9 185
3,602 19B
3,602 198
55,116 21,540
3,441 1,481
3,444 217
7,105 1,751
2,944 1,651
111 96
~
2
23 20
5,996 2,966
15,323 4,771
61 IB
1,389 968
340 179
333 155
84,745
14,823
13,992 239
4,230 63
9,368 3
104 7
169 ISO
121 16
84
8-1:
11,834 4,425
2,694 657
406 281
38
718 388
2 :2
6,438 2,532
531 72
3 3
12 11
2
47 9
KOZHIKODE DISTRICT
15,250
5,967
3,306 333
1,609 43
1,130 9
15 3
543 320
9 3
5
5
1,451 709
216 105
349 19
84 28
41 28
2 2
221 134
129 10-1:
2
5) 36
II 8
31 24
555
67
458 31
341 29
113
3
21 10
8 2
5 4
3 2
5)
149,012
53,132
2),{31 3,771
2,901 302
13,661 67
1,148 71
5,978 3,265
1,743 66
1,003 32
1,003 32
32,1:22 15,807
2,270 1,047
1,429 165
5,125 1,293
2,580 1,542
53 46
3 2
22 19
2,837 1,733
5,733 2,945
55 15
1,251 875
116 67
265 114
37,216
10,809
9,092 50
226 13
8,72.7 3
73 1
37 29
29 4
49
49
6,308 3,038
1,510 520
352 277
26
491 348
2,979 1,381
107 30
3 3
12 11
44 8
242,234
34,673
32,119 5,830
20,706 575
1,106 3
1,206 98
8,.)21 5,063
580 III
2,584 166
2,584 166
20,870 4,891
868 308
1,460 29
1,865 425
301 81
.')6
48
2,871 1,075
9,412 1,716
4 :2
76 53
190 93
33 15
44,765
3,862
2,937 156
2,467 20
261
28 6
127 119
54 11
35
35
5,210 1,343
1,121 ll2
36 4
12
161 36
3,345 1,140
407 4.0
3
17,605
1,806
12,899 678
10,512 31
939
6
1,115 647
327
10
10
673 133
87 21
206 4-
31 5
22
67 24
49 6
7 4
23 II
4 2
2,209
85
1,505 2
1,196 1
267
3
2 1
37
295 34-
55 23
17
65 3
109 7
14

B-IV PART-B INDUSTRIAL CLASSIFICATION BY SEX AND CLASS OF WORKER OF PERSONS AT WORK IN NON-HOUSEHOLD INDUSTRY, TRADE,
BUSINESS, PROFESSION OR SERVICE-contd.
Branch of Industry Total Total Employer Employee Single Worker Family Worker Division and Major ,.----..A---. A "-----v------"---'-. .A.
Urban " T-group of I.S.I.C. M F M F M F M F M F
(I) (2) (3) (4) (5) (6) (7) (8) (9) (10) (ll) (12)
Major group 33 Total 1,238 .ro3 39 1,089 3BO 88 14 22 9 Urban 520 242 21 473 240 20 I 6 f:
" 34-35 Total 6,838 328 83 6,220 309 529 13 6 5
Urban 4,272 215 63 3,919 211 290 4
" 36 Total 1,931 42 52 752 18 1,061 14 66 10
Urban 667 2 35 348 I 272 1 12
" 37 Total 148 5 120 23
Urban 94 5 69 20
" 38 Total 1,251 57 991 194 9
Urban -930 50 769 108 3
" 39 Total 3,197 167 73 1,211 74 1,839 81 74 11
Urban 782 9 45 366 6 336 3 35
Division 4 Total 7,231 100 137 2,851 71 4,243 29 Urban 1,692 45 77 857 35 758 10
Major group 40 Total 7,231 100 137 2,851 71 4,243 29 Urban 1,692 45 77 857 35 758 10
Division 5 Total 1,315 252 5 1,303 252 7 Urban 833 213 3 830 213
Major group 50 Total 519 5 3 516 5 Urban 229 3 I 228 3
" 51 Total 796 247 2 787 247 7
Urban 6(}4 210 2 602 210
Division 6 Total 52,256 917 7,510 22 10,972 247 31,052 583 2,722 65 Urban 16,653 350 3,651 14 5,848 196 6,393 130 761 10'
Major group Total 2,227 70 538 891 54 713 15 85 1 ~3 Urban 1,642 63 401 655 54 517 9 69
.. ~ Total 47,202 815 6,692 20 8,266 172 29,666 560 2,578 63 Urban 13,555 266 3,079 13 4,137 126 5,668 ll7 671 II}
" 69 Total 2,827 32 280 2 1,815 21 673 B 59 1
Urban 1,456 21 l7l 1 1,056 16 20B 4 21
Division 7 Total 26,452 1,233 203 14,963 350 11,286 8113 Ufban 10,519 ~16 110 7,341 139 3,068 177
Major group Total 24.263 1,095 187 12,854 218 11,222 877 70-71 Urban 9,133 IB2 94- 6,035 11 3,()().l, 171
" 72 Total 668 29 16 588 23 64 6
Urban 665 29 16 585 23 64 6 .. "
73 Total 1,521 109 1,521 109 Urban 721 105 721 105
Division 8 Total 63,762 22,490 2,542 54 43,969 18,150 15,969 3,944- 1,2B2 342-Urban 16,726 7,801 943 12 12,192 6,946 3,376 806 215 37
Major group 80 Total 1l,146 327 " 1l,146 327 Urban 3,849 234 3,849 234-
" 81 Total 13,277 4,595 45 6- 13,142 4,577 90 12 Urban 2,058 1,730 16 I 2,019 1,728 23 1
" 82 Total 4,051 959 200 2 1,909 708 1,942 249 .",
Urban 1,264 464- 93 2 701 414 470 48
" 83 Total 5,230 333 17 3 3,962 249 1,251 81
Urban 705 62 5 I 518 42 IB2 19
52

B-IV PART-B INDUSTRIAL CLASSIFICATION BY SEX AND CLASS OF WORKER OF PERSONS AT WORK IN NON-HOUSEHOLD INDUSTRY, TRADE,
BUSINESS, PROFESSION OR SERVlCE~ contd.
Branch of Industry Division and Major Total group of l.S.l.C. Urban
(I) (2)
Major group 8+
" 85
86
" 87
" 88
" 89
Total Urban
Total Urban
Total Urban
Total Urban
Total Urban
Total Urban
Total ~ M F
(3) (4)
1,077 531
931 216
376 112
767 338
25,699 7,421
1,208 232
10 6
4
45 24
30 14
16,025 5,231
162 35
Division 9 Total 140,612 33,843 1,434 Urban 16,735
Major group 90 Total 140,612
All Divisions
Division 0
" " " " " " " "
2&3 4 5 6 7 8 9
All Divisions
Division
" "
"
" " "
o I \
2&3 4 5 6 7 8 9
All Divisions
Division
" " " " " " " "
o 1
2&3 4 5 6 7 8 9
Urban 16,735
45,443
9,566 451
3,180 880
75 6,063 1,732 7,355
16,141
55,709
12,898 629
3,737 944
79 6,364· 2,979 7,576
20,503
58,441
7,280 838
6,719 894 177
6,980 3,788 9,565
22,200
33,843 1,434
11,400
935 3
374 8
13 59
777 2,123 7,108
9,954
1,847 37
1,985 10 6
170 32
2,218 3,649
9,057
964 33
1,535 7
15 39 31
1,979 4,454
Employer ~ M F
Employee ~
Single Worker ~
M F M F
(5) (6) (7) (8) (9) (10)
6 5
17 6
4
32 18
2,157 800
64
91 91
91 91
42 8
405 144
674 178
174 60
380 220
II,902 4,466
275 37
16,398 6,454
16,398 6,454
BADAGARA TALUK-RURAL
1,450
607
44
524 11
263
75
73
2
10,806
1,671 99
1,525 214
75 710 753
4,706 1,053
6 3
3 1
34 17
H 5
12,177 4,489
55 13
666 382
240 32
198 52
355 100
10,358 1,940
869 195
2,697 124,104 192 10,171
2,697 124,104 192 10,171
2,978
79 1
131 7
13 6
177 1,835
729
31,371
5,647 352
1,573 665
4,829 968
2,249 15,088
QUILANDY TALUK-RURAL
1,559
683
69 2 1
550 14
240
179
171
5
2
10,799
1,546 196
1,298 268 78
749 863
4,884 917
KOZHIKODE TALUK-RURAL
1,725
181 2
98 II 1
904 36
492
37 21,107
26 2,245 346
4 4,215 385 172
1,453 2,561
7 6,512 3,218
53
2,707
154 35
573 4 6
II 12
1,700 212
39,301
7,423 425
2,261 674
4,578 2,102 2,252
19,586
3,950 33,261 568 3,103
11 490 913 2,365
3 498 15 4 7 4,252
12 1,191 1,883 2,376
538 18,982
4 3
II 7
16 9
3,464 697
107 22
31,144 1,24-0
31,144 1,240
8,126
642 2
229 I
53 600 220
6,379
6,444
1,058 2
1,289 6
145 20
487 3,437
4,879
237 22
567 4
30 19 84
3,916
Family 'Worker ,----'---. M F
(II) (12)
1,282 215
19 19
19 19
1,816
1,641
38
137
4,050
3,246 8
109
487
200
2,348
1,751
41
371
185
342 37
2'
2' 2'
221 141
66
624 464
liS
12
191
133
51
2

B-IVPART-B INDUSTRIAL CLASSIFICATION BY SEX AND CLASS OF WPRKER OF PERSONS AT WORK IN NON.HOUSEHOLD INDUSTRY, TRADE,
BUSINESS, PROFESSION OR SERVICE-concld.
Branch of Industry Total Employer Employee Single Worker Family Worker Major Division and Total ~ r----'--, ,----A-----. ~ . r--A ---,
group of LS.I.C. Urban M F M F M F M F M F
(1 ) (2) (3) (4) (5) (6) (7) (8) (9) (10) (11 ) (12)
TIRUR TALUK-RURAL
All Divisions 72,454 12,158 1,616 36 18,444 4,094 47,881 7,661 4,513 367
Division 0 12,934 710 298 28 2,683 52 6,434 413 3,519 217
" 1 732 3 I 190 1 539 2 2
" 2&3 10,557 2,003 421 2 4,665 957 5,195 1,003 276 41
" 4 963 9 12 343 6 608 3
" 5 13 13 .. 6 9,191 137 823 2 1,067 13 6,763 94 538 28
" 7 4,102 35 11 1,629 7 2,462 28
" 8 7,925 3,558 50 4 5,629 2,545 2,068 928 178 81
" 9 26,037 5,703 2,225 513 23,812 5,190
ERNAD TALUK-RURAL
All Divisions 68,293 15,608 1,242 43 19,509 4,196 46,004 11,176 1,538 193
Division 0 7,006 991 104 15 3,694 758 2,388 154 820 64
675 2 115 558 ~ ..
" 2&3 7,696 1,416 64 3,660 626 3,921 758 51 32
" 4 1,453 5 14 504 3 935 2
" 5 119 4 118 4 I
" 6 5,266 152 693 4 738 14 3,455 122 380 12
" 7 2,874 41 16 1,449 2 1,409 39
" 8 11,493 3,981 349 24 7,803 2,509 3,054 1,363 287 85
" 9 31,711 9,018 1,428 280 30,283 8,738
SOUTH WYNAD TALUK-RURAL
All Divisions 28,183 11,745 1,691 118 15,215 8,482 9,743 2,617 1,534 528
Division 0 13,389 8,306 1,050 114 9,821 7,431 1,274 277 1,244 484
" 79 8 25 I 54 7
" 2&3 1,687 96 46 9-'] J~ 70 664 21 25 5
" 4 405 16 20 280 13 105 3
" 5 19 I 17 2
" 6 1,739 10 365 407 782 9 185
" 7 458 1 5 367 1 86
" 8 3,122 830 205 4 2,243 732 594 56 80 38
" 9 7,285 2,477 1,103 233 6,182 2,244
I
54

B-IV PART-C INDUSTRIAL CLASSIFICATION BY SEX AND DIVISIONS, MAJOR GROUPS AND MINOR GROUPS OF PERSONS AT WORK OTHER THAN CULTIVATION
Nete ;-Minor groups having less than 1 per cent of workers of the respective Division (less than Q. 5 per eent in case of minor groups of Division 2 & 3), have not been shown in this table. Divisions thus affected are marked with an asterisk (*).
Workers at Household Workers in Non-Household Branch of Industry Total Workers Industry Industry
Division, Major group ,------'---, r----___,A__~
and Minor group of Total Urban Total Urban Total Urban I.S.I.C. ----, r-----~ ,-'----, ,..-~ ,..--'--, r---'----.,
P M F P M F M F M F 1\1 F M F (I) (2) (3) (4) (5) (6) (7) (8) (9) 10 (11) (12) (13) (14) (15)
KOZHlKODE DISTRICT All Divisions 560,838 446,103 114,735 117,233 98,387 18,846 22,002 29,990 2,809 4,023 424,101 84,745 95,578 14,82:J *Division ° 88,231 74,095 14,136 11,193 10,841 352 340 144 159 113 73,755 13,992 10,682 239
Major group 00 40,038 35,803 4,235 1,061 995 66 75 5 44 3 35,728 4,230 951 63 Minor group 005 1,427 1,092 335 18 18 1,092 335 18
" 006 33,299 29,940 3,359 596 551 45 29,940 3,359 551 45
" 009 5,137 4,603 534 320 302 18 4,603 534 302 18
Major group 01 26,204 16,836 9,368 82 79 3 16,836 9,368 79 3 Minor group 010 9,499 4,158 5,341 15 15 4,158 5,341 15
" 011 9,285 6,844 2,441 10 9 6,844 2,441 9
" 012 5,638 4,456 1,182 14 13 4,456 1,182 13
" 015 1,782 1,378 404 43 42 I 1,378 404 42 1
Major group 02 2,500 2,395 105 180 173 7 20 2,375 104 172 7 Minor group 021 1,820 1,795 25 100 100 1,795 25 100 Major group 03 16,399 16,163 236 9,513 9,297 216 6 67 2 66 16,157 169 9,295 150 Minor group 030 14,526 14,393 133 8,106 7,988 118 2 27 2 26 14,391 106 7,986 92
03l 1,766 1,664 102 1,392 1,294 98 1 40 40 1,663 62 1,294 58 Major group 04 3,090 2,898 192 357 297 60 239 71 112 44 2,659 121 185 16 Minor group 040 3,005 2,828 177 351 291 60 223 61 112 44 2,605 116 179
·Division 1 3,687 3,603 84 198 198 3,602 84 198 Major group 10 3,687 3,603 84 198 198 3,602 84 198 Minor group 107 3.679 3,596 83 197 197 3,595 83 197
*Division 2 & 3 118,457 76,777 41,680 32,525 24,190 8,335 21,661 29,846 2,650 3,910 55,116 11,834 21,540 4,425 Major group 20 11,296 6,489 4,807 3,071 2,065 1,006 3,048 2,113 584 349 3,441 2,694 1,481 657 Minor group 200 3,541 967 2,574 555 264 291 585 888 28 45 382 1,686 236 246
" 202 1,170 754 416 201 125 76 616 415 92 75 138 1 33 1
" 203 723 108 615 219 25 194 6 I 102 614 25 194
" 204 851 642 209 492 346 146 164 33 60 478 n6 286 146
" 205 1,159 1,120 39 260 259 1 173 31 11 947 8 248
" 207 1,702 1,568 134 528 508 20 722 105 135 15 846 29 373 5 209 2,018 1,218 800 745 470 275 755 625 257 213 463 175 213 62
Major group 21 3,989 3,547 442 503 220 283 103 36 3 2 3,444 406 217 281 Minor group 219 2,691 2,618 73 2,618 73 Major group 22 9,168 9,039 129 1,821 1,819 2 1,934 91 68 2 7,105 38 1,751 Minor group 220 8,502 8,373 129 1,386 1,384 2 1,896 91 67 2 6,477 38 1,317
" 221 647 647 435 435 22 625 434
Major group 23 13,402 8,025 5,377 4,099 2,736 1,363 5,081 4,659 1,085 975 2,944 718 1,651 383 Minor group 231 1,266 136 1,130 128 30 98 82 993 .. 50 54 137 30 48
" 232 1,129 961 168 778 630 148 961 168 630 143
" 235 9,479 6,117 3,362 3,023 1,970 1,053 4,594 3,078 1,079 894 1,523 284 891 159
" 236 951 447 504 28 4 24 324 436 12 123 68 4 12
Major group 24 III 111 96 96 111 96 ., 25 4 3 1 3 2 1 3 1 2 1
" 26 25 23 2 22 20 2 23 2 20 2
" 27 31,290 7,617 23,673 7,986 3,180 4,806 1,621 17,235 214 2,274 5,996 6,438 2,966 2,532
Minor group 273 4,324 4,102 222 1,446 1,390 56 578 108 26 19 3,524 114 1,364 37
" 277 25,171 2,333 22,838 5,369 985 4,384 967 16,964 178 2,252 1,366 5,874 807 2,132
" 278 911 862 49 640 639 1 30 37 2 832 12 637 1
Major group 28 22,402 18,279 4,123 5,187 4,907 280 2,956 3,592 136 208 15,323 531 4,771 72 Minor group 280 7,228 7,212 16 3,050 3,042 8 33 6 2 .. 7,179 10 3,040 8
" 281 4,299 4,287 12 519 518 1 493 5 16 .. 3,794 7 502
" 282 2,903 2,888 15 729 728 1 476 12 14 .. 2,412 3 714
55 lO6Jl-25a

B-IV PART-C INDUSTRIAL CLASSIFICAnON BY SEX AND DIVISIONS, MAJOR GROUPS AND MINOR GROUPS OF PERSONS AT WORK OTHER THAN CULTIVATION-contd. .
Workers at Household Workers in Non-Household Branch of Industry Total Workers Industry Industry
Division, Major grOU) -, ~ ----, and Minor group of Total Urban Total Urban Total Urban
I.S.I.C. r----------A..-.----, r-~-' ,....-----A--, p M F P M F M F M F M F .M F
(I) (2) (3) (4) (5) (6) (7) (8) (9) (10) (11) (12) (13) (14) (15)
KOZIUKODE DISTRICT
Minor group 288 5,932 1,972 3,960 478 220 258 1,681 3,565 95 208 291 395 125 50
" 289 1,736 1,731 5 262 262 271 4 8 1,460 1 254
Major group 29 69 61 8 21 18 3 5 61 3 18 3
" 30 1,435 1,408 27 985 973 12 19 15 5 1,389 12 968 11
Minor group 300 722 717 5 474 470 4 7\7 5 470 4-Major group 31 486 467 19 197 195 2 127 17 16 2 340 2 179
" 32 387 34-0 47 169 160 9 7 5 333 47 155 9
" 33 1,942 1,470 472 809 557 252 232 69 37 10 1,238 403 520 242
Minor group 334 657 ' 307 350 382 159 223 1 306 349 159 223
" 335 652 604 48 103 87 16 138 27 21 9 466 21 66 7
Major group 34--35 10,272 8,739 1,533 4,662 4,382 280 1,901 1,205 110 65 6,838 328 4,272 215 Minor group 340 6,355 6,016 339 3,889 3,678 211 81 52 13 4 5,935 287 3,665 207
" 350 2,788 1,694 1,094 1I3 60 53 1,629 1,082 58 52 65 12 2 I
Major group 36 4,887 4,366 521 855 332 23 2,435 479 165 21 1,931 42 667 2
Minor group 369 2,935 2,604 331 413 399 14 1,789 316 69 13 815 15 330 I
Major group 37 153 148 5 95 94 1 4 148 I 94 1
" 38 1,284 1,283 932 932 32 2 1,251 930
Minor group 384 348 843 694- 694 8 840 693
Major group 39 5,855 5,362 493 1,012 1,002 10 2,165 326 220 3,197 167 782 9
Minor group 393 4,458 4-,364 94 753 751 2 2,030 79 210 2,334 15 541 1
" 399 1,070 679 391 48 46 2 107 247 4 5n 144 42 2
-*Division 4 7,331 7,231 100 1,737 1,692 45 7,231 100 1,692 45
Major group 40 7,331 7,231 100 1,737 1,692 4S 7,231 100 1,692 45
Minor group 400 5,352 5,309 43 1,260 1,244- 16 5,309 43 1,244 16
" 401 1,638 1,586 52 378 352 26 1,586 52 352 26
" 403 320 315 5 92 89 3 315 5 89 :3
" Division '- 1,567 1,315 252 1,046 833 213 1,315 252 833 213 ;)
Major group 50 524 519 5 232 229 3 519 5 229 3
Minor group 500 77 77 4 4 77 4-
" 501 437 432 5 223 220 3 432 5 220 3
Major group 51 1,043 796 247 814 604 210 796 247 604 210
Minor group 510 40 37 3 18 16 2 37 3 16 2
" 511 1,003 759 244 796 588 208 759 244 588 208
-Division 6 53,173 52,256 917 17,003 16,653 350 .. 52,256 917 16,653 350
Major group 60-63 2,297 2,227 70 1,705 1,642 63 2,227 70 1,642 63
~Iinor group 601 547 524- 23 483 460 23 524 23 460 23
" 621 549 549 476 476 549 476
Major group 64-68 48,017 47,202 815 13,821 13,555 266 .. 47,202 815 13,555 266
Minor group 640 15,614- 15,373 241 5,910 5,765 ' 145 .. 15,373 241 5,765 145
" 641 587 , 581 6 145 142 3 581 6 142 3
" 644 836 834 2 456 455 834 2 455
" 646 704- 678 26 286 270 16 678 26 270 16
650 2,169 2,151 18 956 938 18 2,151 18 938 18 " "
652 2,041 2,025 16 540 533 7 2,025 16 533 7
" 661 3,857 3,838 19 1,601 1,596 5 3,838 19 1,596 S
662 561 557 4 85 83 2 557 4 83 2 " "
672 1,721 1,708 13 1,184 1,182 2 1,708 13 1,182 2
" 689 16,740 16,472 268 1,063 1,048 15 .. 16,472 268 1,048 15
Major group 69 2,359 2,827 32 1,477 1,456 21 2,827 32 1,456 21
Minor group 695 1,558 1,544- 14 870 ~57 13 1,544 14 857 13
" 699 320 812 8 303 301 2 812 8 301 2
• Division 7 27,685 26,452 1,233 10,835 10,519 316 .. 26,452 1,233 10,519 316
Major group 70-71 25,358 24,263 1,095 9,315 9,133 182 .. 24,263 1,095 9,133 182
56

B-IV PART-C INDUSTRIAL CLASSmCATION BY SEX AND DIVISIONS, MAJOR GROUPS AND MINOR GROUPS OF PERSONS AT WORK OTHER THAN CULTIV ATION-concld.
tBranch of Industry Total Workers Worliers at Household Workers in Non-Houshold Division, Major Industry Industry
and Minor group r- r----~ group of Total Urban Total Urban Total Urban LS.I.C. ,--------'-------. r- ,---....._____, ,---....._____, ~--..~
P :\1 F P .M F 11 F l\I F M F M F
(I) (2) (3) (4) (5) (6) (7) (8) (9) (10) (II) (12) (13) (14) (15)
Minor group 700 1,7+3 1,743 1,057 1,057 1,743 1,057 701 1,661 1,658 3 612 609 3 " 1,658 3 609 3 702 3,451 3,+50 1,318 1,318 3,450 1,318 703 1,492 1,492 233 233 1,492 233 70+ 423 +22 4 4 422 4 705 1~,117 11,032 1,085 3,250 3,075 175 .. 11,032 1,085 3,075 175
" 706 1,633 1,632 1 446 446 1,632 1 446
" 707 2,675 2,671 4- 2,330 2,326 4 ,. 2,671 4 2,326 4-
Major group 72 697 668 29 694 665 29 668 29 665 29 Minor group 720 655 63() 25 635 630 ?-_J 630 25 63() 25 Major group 73 1,630 1,521 109 826 721 105 .. 1,521 109 721 105 Minor group 730 1,37+ 1,322 52 597 549 48 .. 1,322 52 549 48
Division 8 36,2.,)2 63,762 22,490 24,527 16,726 7,801 63,762 22,490 16,726 7,8QJ Major group 80 11,473 11,146 327 4,033 3,849 234 .. 11,146 327 3,849 234 l"linor group 803 2,624: 2,611 13 747 738 9 2,611 13 738 9
" 809 5,659 5,419 240 2,112 1,942 170 5,419 240 1,942 170
Major group 81 17,872 13,277 4,595 3,788 2,058 1,730 .. 13,277 4,595 2,058 1,730 Minor group 811 17,423 12,877 4,546 3,473 1,786 1,687 .. 12,877 4,546 1,786 1,687 Major group 82 5,010 4,051 959 1,728 1,264 464 .. 4,051 959 1,264 464 Minor group 320 4,939 3,981 958 1,702 1,239 463 3,981 958 1,239 463 Major group 83 5,563 5,230 333 767 705 62 .. 5,230 333 705 62 Minor group 830 2,935 2,690 245 586 549 37 .. 2,690 245 549 37 Major group 84 1,087 1,077 10 537 531 6 .. 1,077 IO 531 6
85 935 931 4- 217 216 1 " 931 4 216
" 86 421 376 45 136 ll2 24 .. 376 45 112 24
" 87 797 767 30 352 338 14 767 30 333 14-
" 88 41,724 25,699 16,025 12,652 7,421 5,231 .. 25,699 16,025 7,421 5,231
Minor group 800 17,683 5,741 11,942 6,603 2,021 4,582 .. 5,741 ll,942 2,021 4,582
" 882 14,139 13,393 746 4,219 3,908 311 13,393 746 3,908 311
" 883 4,227 1,359 2,868 724 445 279 1,359 2,868 445 279
" 884 4,760 4,376 384 833 814 19 .. 4,376 384 814 19
Major group 89 1,370 1,208 162 267 232 35 ,. 1,208 162 232 35
Minor group 890 1,370 1,208 162 267 232 35 1,208 162 232 35
Division 9 174,455 140,612 33,843 18,169 16,735 1,434 140,612 33,843 16,735 1,434 Major group \ 90 174,455 140,612 33,843 18,169 16,735 1,434- 140,612 33,843 16,735 1,434
Minor group 900 174,455 140,612 33,843 18,169 16,735 1,434 140,612 33,843 16,735 1,434
57

B-lV PART-C INDUSTRIAL CLASSIFICATION BY SEX AND DIVISIONS, MAJOR GROUPS AND MINOR GROUPS OF PERSONS AT WORK OTHER THAN CULTIVATION
APPENDIX
Minor groups having less than 1 per cent of workers of the respective Division, (less than 0'5 per cent in case of minor groups of Division 2 and 3), have been shown in this Appendix. The follo-wing abbreviations have been used:-
HI = Household Industry M =l\lales
NHI = Non-homehold Industry F = Females
KOZHIKODE DISTRICT
007 Total NHI (~Il3, FI), Urban NIH (MI); 271 Total HI (M6, F3), NHI (MI09, FlO) Urban HI 008 Total HI (M75,F5), NHI (M30, FI), Urban HI (Ml), NHI (M47, F9); 272 Total HI (FI), NHI (M44,F3), NHI (1\f79); 020 Total NHI (M261, F51), (MS, FI6), Urban NHI (M2, F5); 274 Total HI
. Urban NHI (MIl); 022 Total NHI (M61), Urban (F16), NHI (lViI6, F353), Urban NHI (M7, F343); NHI (M5); 023 Total HI (MI4, FI), NHI (MI42, 275 Total NHI (M5), Urban NHI (Ml); 276 Total F6), Urban NHI (M50); 024 Total HI (MI), Urban NHI (M5), Urban NHI,(M3); 279 Total HI (M36, HI (MI); 025 Total HI (M5), NHI (M1O, FlO), flOl), NHI (MI21, F58), Urban HI (M7, F3), NHI UrbanNHI (FI); 026 TotalNHI (Ml06,F12),Urban (M98); 283 Total NHI (M9, F103) , UrhanNHI NHI (M6, F6); 032 Total HI (M3), NHI (MI03, (M5); 284 Total HI (Ml), NHI (M30), Urban NHI FI), Urban NHI (MI5); 041 Total NHI (MI8); (MI5); 285 Total HI (Ml), NHI (Ml06, FIl), 042 Total NHI (M5), Urban NHI (Ml); 043 Total Urban HI (MI),~NHI (M83, Fil); 286 Total NHI HI (M8, F7), NHI (M13, F5), Urban NHI (M3); (M4, Fl), Urban NHI (1.11, Fl); 287 Total NHI 044 Total HI (M7, F2), NHI (M8), Urban NHI (M2); (M38), Urban NHI (M32); 290 Total NHI (M50, 045 Total HI (MI), NHI (Ml); 047 Total NI-II FI), Urban NHI (MIO, Fl); 291 Total HI (FS), (M6); 048 Total HI (Fl), NHI (M3); 100 Total NHI (M2); 292 Total NHI (M9, F2), Urban NHI NHI (M5); 109 Total NHI (M2, Fl), Urban NHI (M8, F2); 301 Total HI (Fll), NHI (M75), Urban (M 1); 201 Total NHI (F2); 206 Total HI (M27, NHI (M27); 302 Total HI (MI), NHI (~H53, F7), FI5),NHI (M9), UrbanH! (MI), NHI (M5); 208 UrbanHI(MI),NHI(M397,F7);303TotaIHI(MI8,F4). Total NHI (M76, F3), Urban NHI (M62, F3); 210 NHI (MI44), Urban HI (M4, FI), NHI (M74); 310 rotal NHI (Ml), Urban NHI (MI); 211 Total HI Total HI CMI6, F4) NHI (M5), Urban NHl (Ml); (M7, F5), NHI (M35); 212 Total HI (M84,F29), 311 Total HI (M92,F7),NHI (M235,F2), Urban HI NHI (M65), Urban HI (M2), NHI (MI3); 213 Total (MI4, F2), NIII (MIlO); 312, Total NHI (M2); 313 NHI (M47, F3), Urban NHI (MI); 214 Total HI Total HI (M2, F2), NHI (M28) , Urban HI (M2), (MI2), NHI (MI20), Urban HI (Ml), NHI (M83) ; NHI (MI7); 314 Total HI (MI7, FJ), NHI (1\166), 215 Total NHI (M56, F14), Urban NHI (M5l, F14); Urban NHI (M50); 315 Total HI (FI), NHI (M4), 216 Total NHl (M3), UrbanNHI (M2); 217 Total Urban NHI (MI); 320 Total NHI (M175), Urban NHI (M418, F33), Urban NHI (I\'19); 218 Total HI NHI (M124); 321 Total NHI (MI); 322 Total HI (F2), NHI (M81, F283), Urban HI (F2), NHI (M57, (M7), NHI (M96, F36), Urban:HI (M5), NHI (MI); F267); 223 Total HI (MI6); 225 Total NHI (MI) ; 323 Total NHI (M45,F9), Urban NHI (M30, F9); 226 Total NHI (M2); 230 Total HI (F5), NHI (M4, 324 Total NHI (MIl, F2); 3Z5 Total !\lHI (M3); FI), Urban HI (FI), NHI (M2); 233 Total HI 326 Total NHI (M2); 330 Total NHI (M20) , (M69, FI9), NHI (M140, Fl), Urban HI (M4, Fl), Urban NHI (MI7); 331 Tot;tl HI (MIl), NHI NHI (M84); 234 Total NHI (MlOI, F3), Urban (MlO, F2), Urban HI (MI), NHI (M8); 332 NHI (M7, F2); 237 Total HI (Fl), NHI (M2), Total HI (Fl), NHI (M44, FlO), Urban NHI (M23); Urban NHI (Ml); 238 Total HI (MIO, FI22), NHI 333 Total HI (M3), NIH (M29), Urban hi (MI), (M3, F55), Urban HI (M2, FI7), NHI (M2, FI8); N,HI (M3); 336 Total HI (M 19, FI), NHI (M332, 239 Total HI (M2, F5), NHI (M28, Fl), Urban NHI FI3), Urban HI (M13, FI), NHI (M236, FI2); 337 (Fl); 240 Total NHI (M2); 241 Total NHI (M104), Total HI (Fl), NHI (M2), urban NtH (MI); 338 Urban NHI (M95); 244 Total NHI (M5), Urban Total NHI (MIl); 339 Total .HI (M60, F33), NHI NHI (MI); 255 >otal NHI ~M2, FI), Urban NhII (M18, F3), Urban HI (Ml), NHI (M?); 341 Total (M2, FI); 256 Total NHI (MI); 260 Total NtH HI (M27, F2), NHl (M58), Urb:m HI (M26, F2), (M2I, F2), Urban NHI (M20, F2); 266 Total NHI NHI (M43); 342 Total HI (MI57, FG9), NHI (M94, (M2); 270 Total HI (M4, F5), NHI (1'.110, Fl); F6), Urban HI (1\119, F7)' NHI (M30, FI); ~43 Total

B-IV PART-C INDUSTRIAL CLASSIFICATION BY SEX AND DIVISIONS, MAJOR GROUPS AND MINOR GROUPS OF PERSONS AT WOR : OTHER THAN CULTIVATION-contd.
HI (M3), ~HI (M414, F20), Urban HI (MI), NHI (M324, F3); 344 Total HI (MI), NHI (1\14), Urban NHI (MI); 345 Total NHI (M2), Urban NHI (1\12); 346 TotalNHI (M3), Urban NHI (1\13); 347 Total NHI (MI), Urban NHI (MI); 348 T,tal NHI (MI); 351 Total HI (1',11), NHI (MIS3, F3), Urban HI (Ml), NHI (Ml77, F3); 352 Total NHI (1\:156), Urban NHI (MI9); 353 Total NHI (1\13), Urban NHI (MI); 354 Total HI (MI), NHI (M6), Urban HI (MI); 356 Total HI (MI), NHI (M2), Urban HI (MI), NHI (M2); 357 Total NIH (M2), Urban NHI (MI); 359 Total NHI (M4), Urban NHI (Ml); 360 Total HI (M53, F48), NHI (M93, F6), Urban NHI (M29); 361 Total HI (I\19, F2), NHI (M23), Urban NHI (M6); 362 Total HI (M-t, FI2), NHI (M89, F5), Urban in (MI), NHI (MI); 363 Total NHI (M7), Urban NHI (M2); 364 Total HI (MI32, Fl1), NHI (M86, F4), Urban NHI (M7); 365 Total HI (M343, F68), NHI (M83, FI), Urban HI (M78, F8), NHI (M33); 366 Total NHI (M6), Urhan NHI (M5); 367 Total HI (M93, F22), NHI (M370, FlO), Urban HI (MIS), NHI (MISS, Fl); 368 Total HI (iv112), NHI (M359, FI), Urban HI (M2), NHI (M99); 370 Total NHI (M9) , Urban NHI (MI); 371 Total NHI (MS) Urban NHI (M2) ; 372 Total NHI (M8) ; Urban NHI (M2) ; 374 Total NHI (MI5), Urban NHI (M6); 375 TO'tal NHI (M5), Urban NHI (M3); 377 Total HI (F4), NHI (M5), Urban NHI (M5); 378 Total NHI (M58, FI), Urban 1'\HI (M50, Fl); 379 Total NHI (M43) , Urban NHI (M25); 380 Total NHI (M34), Urban NHI (M20); 381 Total NHI (M9), Urban NHI (M2) ; 382 Total NHI (M20); 383 Total NHI (M9), Urban NHI (M4-); 385 Total NHI (M7), Urban NHI (M5); 386 Tota,l HI (MIS), NHI (M73), Urban NHI (M4S); 387 Total NHI (~n); 388 Total HI (MS) NHI (M2I2, FI), Urban HI (MI), NHI (MI46); 389 Total HI (MI), NHI (M46), Urban NHI (MI5); 390 Total NHI (M4), Urban NHI (M2); 391 Total NHI (M3); 392 Total HI (M22), NHI (M229), Urban NHI (MISS); 394 Total HI (M3), NHI (M8), Urban HI (M3), NHI (M6); 395 Total HI(M3), NHI (M46, F8), Urban HI (M3), NHI (M35, F6); 396 Total NHI (MI), Urban NHI (MI); 402 Total NHI (M21), Urban NHI (M7); 502 Total NHI (MlO), Urban NHI (M5); 600 Total NHI (M288, F2), Urban NHI (MI97, F2); 602 Total NHI (M139, F34), Urban NHI (MI24, F34); 603 Total NHI (M87, Fl), Urban NHI (M68, FI); 606 Total NHI (M55) , Urban NHI (M40) ; (i07 Total NHI (M40), Urban NHI (M9); 608 Total NHI (MIO); 610 TotalNHI (M14), Urban NHI (M8); (:ill Total NHI (M7), Urban NHI (M6); 612 Total
59
NHI (M4), Urban NHI CM4); 613 Total NHI (M2), Urban NHI (M2); 614 Total NHI (M8) Urban NHI (MI); 615 Total NHI eMS), Urban NHI (Ml); 616 Total NHI (1\16), Urban NHI (M6); 617 Total NIh (M62), Urban NHI (M56); 618 Total NHI (M7), Urban NHI (M5) ; 620 Total NHI (MIS), Urban NHI (MI3); 630 Total NHI (MSI), Urban NHI (MS7); 631 Total NHI (~14), Urban NHI (M3); 632 Total NHI (M5), Urban NHI (M4), 633 Total NHI (M48), Urban NIH (I\1I2); 634 Total NHI (MI), Urban NHI (M!); 636 Total NHI (M8), Urban NHI (M8); 638 Total NHI p.r2); 639 Total NHI (M286, FlO), Urban NHI (MIOI, F3); 642 Total NHI (M7, FI), Urban NHI (~f3); 643 Total NHI (M2); 645 total NHI (M439, F56), Urban NHI (M257, FI); 647 Total NHI (~I518), Urban NHI (M66); 648 Total NHI ()'Il32, F93), Urban NHI (M35, F48); 651 Total NHI (MI79, F2), Urban NHI (M7I); 653 Total NHI (MI89), Urban NHI (MI73); 654 Total NHI (M3I, FI), Urban NHI (M23, FI); 65S Total NHI (MI13), Urban NHI (M84); 660 Total NHI (M130) Urban NHI (M40); 663 Total NHI (MI68, F33), Urban NHI (M36); 664 Total NHI (M70, FS), Urban NHI (1\127); q70 Total NHI (M54, F3), Urban NHI (MI7, FI); 671 Total NHI (MI92), Urban NHI (MI75); 673 Total NHI (1\129, FI), Urban NHI (M8); 680 Total NHI (1'Il4), Urban NHI (M9); 681 Total NHI CM123), Urban NHI (M100); 682 Total NHI (1197, FI), Urban NHI (M87); 683 Total NHI (MS6, Fl), Urban NHI (M35, Fl); 684 Total NHI (~f56), Urban NHI (M3I); 685 Total NHI (M3), Urban NHI (M3) ; 636 Total NHI (M280) Urban NHI (M202); 687 Total NHI (MI8), Urban NHI (MI5); 688 Total NHI (M85), Urban NHI (M46); 690 Total NHI (M125), Urban NHI (MIl7); 691 Total NHI (M53, Fl), Urban NHI (M21); 692 Total NHI (MlS), UrbanNHI (M2); 693 Total NHI (M204, F9), Urban NHI (MI35, F6); 694 Total NHI (M54), Urban NHI (M5); 696 Total NHI (MI), Urban NHI (Ml); 697 Total NHI (MI9), Urban NHI (MI7); 708 Total NHI (MI7), Urban NHI (M7); 709 Total NHI (M89), Urban NHI (M9); 710 Total NHI (M57), Urban NHI (M49); 721 Total NHI (M9, F3), Urban NHI (M9, F3) ; 722 Total NHI (M29, F1), Urban NHI (M26, FI); 731 Total NHI (MII6, F47), Urban NHI (M93, F47); 732 Total NHI (M83, FlO), Urban NHI (M79, FlO); 810 Total NHI (M341 , F45), Urban NHI (M2H, F40); 812 Total NHI (M59, F4), Urban NHI (M28, F3); 821 Total NHI (M70, Fl), Urban NHI (M25, FI); 832 Total NHI (M74, F40), Urban NHI (M30, FI9); 841 Total

B-IV PART-C INDUSTRIAL CLASSIFICATION BY SEX AN~ DIVISIONS, MAJOR GROuPS AND MINOR GROUPS OF PERSONS AT WORK OTHER THAN CULTIV ATION-concld.
NHI (MI4), Urban NHI (MI); 850 Total NHI (MI97, FI), Urban NHI (MI37, Fl); 851 Total NHI (M574, F2), Urban NHI (M35); 852 Total NHI (M22), Urban NHI (M2); 853 Total NHI (MI38, Fl), Urban NHI (M42); 860 Total NHI (M86, F3), Urban NHI (M3l, Fl) ; 861 Total NHI (M275, F40), Urban NHI (M74, F23); 862 Total NHI (MI5, F2),
60
Urban NHI (M7); 870 Total NHI (M61, FI), Urban NHI (M30); 871 Total NHI (.MlSO), Urban NHI (Ml14); 872 Total NHI (M500, F27), Urban NHI (MIS3, F14); 873 Total NHI (M26, F2), Urban NHI (MIl); 881 Total NHI (M695, FBi), UrbanNHI (MI51, F39); 885 Total NHt (MI35, FI), Urban NHI (1'.182, Fl).

B·IV.PART.C (i) INDUSTRIAL CLASSIFICATION BY SEX AND DIVISION OF PERSONS AT WORK OTHER THAN CULTIVATION
Workers in Non-Bra'lch of Industry Total Workers Workers at Household Household
Division of Industry Industry I.S.I.C. .A. r- ----, -.. r- ..,
p 1\1 F l\I F ~l F
(I) (2) (3) (4) (5) (6) (7) (8)
BAD:\GARA TAL UK-RURAL
All Divisions 62,905 49,225 13,680 3,782 2,280 45,443 11,400
Division 0 10,.;01 9,566 935 9,:566 935
" I 454 451 3 451 3
" 2&3 9,616 6,962 2,65.J. 3,782 2,280 3,180 374
" 4 388 880 S 830 8
" 5 88 75 13 75 13
" 6 6,122 6,063 59 6,063 59
" 7 2,509 1,732 777 1,732 777
" 8 9,478 7,355 2,123 7,355 2,123
" 9 23,249 16,141 7,108 16,141 7,108
QUILANDY TAL UK-RURAL
All Divisions 79,443 59,712 19,731 4,003 9,777 55,709 9,954
Division 0 14,804 12,951 1,853 53 6 12,898 1,847
" 1 667 630 37 I 629 37
" 2&3 19,442 7,686 11,756 3,949 9,771 3,737 1,985
" 4 954 944 10 944 10
" 5 85 79 6 79 6
" 6 6,534 6,364 170 6,364- 170
" 7 3,011 2,979 32 2,979 32
" 8 9,794 7,576 2,218 7,576 2,218
" 9 24,152 20,503 3,649 20,503 3,G49
KOZHIKODE TALUK-RURAL
All Di.visions 76,171 61,463 14,708 3,022 5,651 58,441 9,057
Division 0 8,286 7,307 979 27 1-.J 7,280 964
" 1 871 838 33 338 33
" 2&3 16,885 9,714 7,171 2,%j 5,636 6,719 1,535
" 4 901 894 7 894 7
" 5 192 li7 13 177 15
" 6 7,019 6,930 39 6,980 39
" 7 3,819 3,738 31 3,738 31
" 8 11,544 9,563 1,979 9,565 1,979
" 9 26,654 22,200 4,454 22,200 4,454
TIRUR TALUK-RURAL
All Divisions 92,4a8 75,587 16,9Gl 3,133 4,743 72,454 12,158
Division 0 13,C62 12,947 715 13 5 12,934 710
" 1 735 732 3 732 3
" 2&3 20,+13 i3,677 6,741 3,120 4,738 10,557 2,003 .. 4 9il 963 9 963 9
" 5 13 13 .. 13
" 6 9,328 9,191 137 9,191 137 .. 7 4,137 4,J02 35 4,102 35 .. 8 11,483 7,925 3,558 7,925 3,358 .. 9 31,740 26,037 5,703 26,037 5,703
61 105/1-26

B-IV PART-C (i) INDUSTRIAL CLASSIFICATION BY SEX AND DIVISIONS OF PERSONS AT WORK OTHER THAN CULTIVATION-(contd.)
Workers in Non-Branch of Industry Total Viorkers Workers at Household Household
Division of Industry Industry r.S.I.C r-----~-----_, ,-____ ___A.. ______ _, ,- -.
P M F M F 1\1 F
(1 ) (2) (3) (4) (5) (6) (7) (8)
ERNAD TAL UK-RURAL
All Divisions 91,432 72,681 18,751 4,388 3,143 68,293 15,608
Division 0 ..
8,029 7,037 992 31 I 7,006 991
" I 675 675 675
" 2&3 16,611 12,053 4,558 4,357 3,142 7,696 1,416
" 4 1,458 1,453 5 1,453 5
" 5 123 119 4 1\9 4
" 6 5,418 5,266 152 5,266 152 .. 7 2m5 2,874 41 2,874 41
" 8 15,474 11,493 3,981 11,493 3,981
" 9 40,729 31,711 9,018 31,711 9,018
SOUTH WYNAD TALUK-RURAL
All Divisions 41,166 29,048 12,118 865 373 28,183 11,745
Division 0 21,756 13,446 8,310 57 4: 13,389 8,306
" 1 87 79 8 79 8
" 2&3 2,960 2,495 465 808 369 1,687 96
" 4 421 405 16 405 16
" 5 20 19 1 19 I
" 6 1,749 1,739 10 1,739 10
" 7 459 458 I 458 1
" 8 3,952 3,122 830 3,122 830
" 9 9,762 7,285 2,477 7,285 2,477
62

B.V OCCUPATIONAL CLASSIFICATION BY SEX OF PERSONS AT WORK OTHER THAN CULTIVATION
Fly-leaf
1. This table gives the distribution of non-agricultural workers by sex according to the 'National Classification of Occupations' issued by the Ministry of Labour and Employment, Government of India, which classifies occupations into 331 families, 75 groups and 11 divisions. A few modifications as mentioned below have heen made in the National Classification of Occupations, while classifying the economic data in this table.
(i) The family OX4 relating to Geographers has been deleted and code 073 assigned to them. Actuaries coming under the family 073 according to the National Classification of Occupations have been brought under 072 Statisticians.
(ii) The families 400-0wner cultivators, 401-Cultivating tenants, 4I4-Agricultural labourers and the major group XO-Workers without occupations of the National Classification of Occupations have been omitted because of the exclusion of cultivators, agricultural labourers and non-workers for the purpose of classification in this table.
(iii) The code number 063 given to Jurists and Legal Technicians n. e. c. (including petition writers) in the National Classification of Occupations has been changed to 069.
(iv) The family 673-Teleprinter operators has been newly added.
Under this scheme each individual is classified on the basis of the nature of his (or her) work irrespective of the nature of establishment where he (or she) works. Each of these divisions, groups and families is cross-classified with the 7 non-agricultural industrial categories (categories III to IX)
2. The cross-classification of occupation with industry is a peculiarity of the 1961 Census and this being the first time that such an attempt is made there are some occupational families which appear incongrous vis-a-vis the industrial category in which they have placed. Such instances are given below suggesting the more appropriate categories to which they should be'long:-
APPROPRIATE INDUSTRIAL CATEGORIES OF OCCUPATIONAL FAMILIES
Industrial category Total Urban as given ,----...A-~---... ,-___ ..A. ____ , Appropriate industria I
Code No. Description of the family in the Fe- Fe- category table Males males Males males
2 3 4 5 6 7
300 Working proprietors, V 2 2 J VII Wholesale trade IX JO 10
301 Working proprietors, Retail trade IX 694 14 105 2 VII 310 Agents and Salesmen, Insurance IX 10 1 3 VII 312 Brokers and agents, Securities and Shares IX 10 5 III,VSII or VIII 319 Insurance and real estate salesmen, Sales-
men of Securities and services and Auc-tioneers n. e. c. IX 4 2 "OIl
320 Commercial Travellers JX 15 11 VII 340 Money lenders (including Indigenous BaIl-
kers) IX 2 2 VII 341 Pawn brokers IX I VII 411 Farm worken, .'\nimals, Birds and Insects
Rearing VII 5 3 3 3 III,IV or V 439 Fishermen and Related workers n. e. c. V 233 134 143 133 'I
VII 9 58 9 58 J III or IV VIII 12 12
501 Quarrymen V :)
J III,IV orVI IX 12 6 502 Drillers, :Mines and Quarries IX I III 511 Well Drillers other than Petroleum and Gas IX III 590 Miners, Quarrymen and related workers
n. e. c. IX III 672 Radio ComT:1unications and Wireless
Operators V 13 II VIII or IX 679 Telephone, Telegraph and related Tele-
communication Operators n. e. c. V 3 3 VIII or IX
63 106jl-26a

APPROPRIATE INDUSTRIAL CATEGORIES OF OCCUPATIONAL FAMILffiS-(contd.)
Code No. Descripfion of the family
700
702 709
730 734 741 757 791 806
811 813 814
815
839
855
859
874
2
Fibre preparers, Ginners, Cleaners, Seaurers, etc.
Spinners, Piecers and Winders Spinners, Weavers, Knitters Dyers and Related workers n. e. c.
Furnacemen :Metal Moulders and Core makers Jewellers, Goldsmiths and Silversmiths Metal plate and structural metal workers Bricklayers, Plasterers, Masons Engravers, Etchers and Block makers (prin-ting)
Potters and related clay farmers Moulders and Pressers, Glass Grinders, Cutters, Decorators and finishers
Pulverisors and mixers cement, clay and other ceramics
Chemical and Related Process workers, n. e. c.
Makers of musical instruments and related workers
Craftsmen and production process workers n. e. c.
Operators of earth-moving and other construction machinery n. e. c.
n. e. c.-not elsewhere classified.
Industrial category as given in the table
3
VII VII
VII VII IX IX
VII V
IX VII IX
IX
IX
VII IX
IX VII IX
VIII IX
3. In spite of the limitations pointed out above, this table will be of much use in giving an idea about the variety of occupations and the employment opportunities under different industries.
64
Total Urban ~----.. r----"----........ Appropriate industrial
category Fe" Fe-Males m~les Males males
4
2 4
2
to 3
52
1 3 2
3
1 3
1 9 1 4
5
47
18
6
4
10
39
1 3 2
3
1 2
4
7
47
8
IV or V IV or V
IVor V III,IV,V, IJr VIII IV,V or VIII IV,V or VII III,IV,V or Vln VI
IV or V IVorV IV or V
IV or V
IVorV
] IV or V
IVorV
) IV or V
] V or VI
4. In this table those occupational families the figures of which are less than 1 per cent of the respective Divisions (less than 0·5 per cent in the case of Division 7-8) have been omitted giving the figures of those families in the appendix at the end of the table.

B-V OCCUPATIONAL CLASSIFICATION BY SEX OF PERSONS AT WORK OTHER THAN CULTIVATION
Total Workers
r--A__ _______________________ ~
D ivision/GrouplFamily Total Urban ------- r--------"-------, r-
..Jo..._ __________ ~
Category Persons Males Females Pe;'sons .Males Females
1 2 3 4 5 6 7
IWZHlKODE DISTRICT All Divisions
Total 560,838 446,103 114,735 117,233 98,387 18,846
1lI 91,433 7J,357 14,076 11,119 10,880 239 IV 51,992 22,002 29,990 6,832 2,809 4,023 V 66,950 55,116 11,834 25,965 21,540 4,425
VI 7,331 7,231 100 1,737 1,692 45 vn 53,173 52,256 917 17,003 16,653 350 VDI 27,685 26,452 1,233 10,835 10,519 316
IX 262,274 205,689 56,585 43,742 34,294 9,448
Division 0 PROFESSIONAL, TECHNICAL AND RELATED WORKERS
Total 30,324 24,496 5,828 7,095 4,929 2,166 III 10 9 1 6 5 1 IV 106 37 ]9 17 12 5 V 362 333 29 175 160 15
VI 259 257 2 213 216 2 VII 132 131 1 89 89
VIII 51 47 4 46 42 4-IX 29,404 23,632 5,772 6,544 4,405 2,139
Group 00 ARCHITECTS, ENGINEERS AND SURVEYORS
Total 535 534 1 352 351 1 III 3 3 1 1 V 36 36 26 26
VI 200 200 164- 164 VIII 14 14 13 13
IX 282 281 143 147
Group 01 CHDIISTS, PHYSICISTS, GEOLOGISTS AND OTClER PHYSICAL SCIE~(TISTS
Total 34 31 3 28 26 2 IV 2 2 2 2 V 19 16 3 17 15 2
\'I[ 1 1 1 IX 12 12 8 3
Group 02 BIOLOGISTS, VETERINARIA0fS, AGRONOMISTS AND RELATED SCIENTISTS
Total 116 III 5 63 58 5 III 3 3 3 3
V 4 3 4 3 IX 109 IOJ 4- 56 52 4
Group 03 PHYSICIANS, SURGEONS AND DENTISTS
Total 2,692 2,575 117 739 685 54 \' 21 20 9 3 I
VII 52 51 25 25 VIII 1 1
IX 2,618 2,503 115 704 651 53
Family 031 PHYSICIANS, AYURVEDIC
Total 1,388 1,356 32 217 213 4 V 16 16 4 4
YII 33 38 12 12 IX 1,334- 1,302 32 201 197 4-
Family 033 PHYSICIANS, OTHERS
Total 454 443 11 169 165 4 V 5 4 1 5 4- 1
VII 5 5 5 5 IX 444- 434 10 159 156 3
65

B-V OCCUPATIONAL CLASSIFICATION BY SEX OF PERSONS AT WORK OTHER THAN CULTIVATION-:-(contd.)
Total Workers r- -"-----------------------.
Division/Group/Family Tolal Urban ..A._
~~--------- r- ,-------..- ----, Category Persons Males Females Persons l\Iales females
1 2 3 4 5 ti 7
Group 04 NURSES, PHARMACISTS A:-!D OTHeR m;mCAL A:-ID HEALTH TE:CH:-IICIANS
Total 2,200 1,420 730 9-10 579 361 tIl 4 3 2 tV W4 85 19 15 10 ;)
V 186 169 17 39 3S 4 \'II 67 67 53 33
\'iU + + , 4 .,.
IX 1,833 • 1,0e'2 743 8:22 471 3SI Family 040 NURSES
Total 343 44 299 238 22 21<; V 1
Vii I p-
""- 341 42 299 235 20 216 Family 041 l\lIDWIVES AND HEALTH VISITORS
TOtal 329 329 67 67 III I 1 IX 323 328 66 66
Family 042 NURSING ATTENDANTS A:-.ID RELATED WORKERS
TOtal 345 294 51 107 84 23 1lI I 1
VII 8 8 6 6 IX 336 285 51 101 73 23
Family 043 PHARMACISTS A:-.ID PH.\RMACEUTICAL TECHNICIANS
. Total 684 634 50 277 254 ~3 III 2 2 1 1 IV 104 85 19 15 10 5 V 184 167 17 37 33 4
VII 58 58 51 51 VIII 3 3 3 3
IX 333 :t19 14 170 156 14-Family 046 SANITATION TECHNICIA.c'lS
Total 335 331 4 162 158 4 VIII I 1 1
IX 334 330 4 161 157 4-Group 05 TEACHERS
Total 18,266 13,737 4,529 3,450 1,781 ],669 V 14 10 4 8 4- 4-IX 18,2:)2 13,727 4,525 3,H2 1,777 ' 1,665
family 051 TEACHERS, SECOC'lOARY SCHOOLS
Total 1,753 1,187 566 757 395 362 IX 1,753 1,187 566 757 395 362
Family 052 TEACBERS, MIDDLE AND PRIMARY SCHOOLS
Total 13,476 9,339 3,637' 1,947 852 1,095 IX 13,476 9,839 3,637 1,9+7 8'i2 1,09.')
Family 059 TEACBERS, N.E,C.
Total 2,742 2,476 266 601 421 180 V 14 10 4 3 4- 4-
IX 2,728 2,466 262 593 417 176 Group 06 JURISTS
Total 912 906 6 311 308 3 V 1 1
VII 2 2 2 :2 IX 909 903 6 308 305 J
66

B-V OCCUPATIONAL CLASSIFICATION BY SEX OF PERSONS AT WORK OTHER THAN CULTIVATION-(contd.)
Total Workers r- --- .....
Division/Group /Family Total Urban r----- -'-----------, ,----- .,
Category Persons Males Females Persons Males Females
I 2 3 4 :J 6 7
Family 069 JURISTS AND LEGAL TECHINICIA1'IS, N.E.C. (mCLUDING PETITION WRITERS)
Total 557 556 1 45 ~5
VII 2 2 2 2 IX 555 554 43 43
Group 07 SOCIAL SCIENTISTS AND RELATED WORKERS Total 328 283 45 159 H7 12
V 10 9 I 10 9
VI 1 1 1 I VII 10 10 3 3
VIII 4 4 4 4 IX 303 259 44: HI 130 II
Group 08 ARTISTS, WRITERS AND RELA TED WORKERS Total 720 675 45 310 290 20
V 65 63 2 57 55 2 VIII 22 18 4 22 18 4
IX 633 594- 39 231 217 14
Family 086 MUSICIANS AND RELATED WORKERS Total 453 423 30 148 IS9 ,~
VIII 11 10 1 11 10 IX 442 413 29 137 129 0
Group 09 DRAUGHTSMEN, AND_SCIENCE AND ENGINEERING TECHNICIANS, N.E.C. Total 156 148 8 109 1M 5
" V 3 3 3 3 VI 58 56 2 53 51 2
VIII 3 3 IX 92 86 6 53 50 :>
Group OX OTHER PROFESSIONAL, TECHNICAL AND RELATED WORKERS Total 4,365 4,076 289 634 600 .:'1
V 3 3 1 I VIII 3 3 2 :2
IX 4,359 4,070 289 631 597 34 Family OXO ORDAINED RELIGIOUS WORKERS
Total 1,710 1,636 74 132 128 -:I IX 1,710 1,636 74 13~ U3 4
Family OXI NON-ORDAINED RELIGIOUS WORKERS Total 1,932 1,780 152 310 293 17
IX 1,932 1,780 1.52 310 293 17 Family OX2 ASTROLOGERS, PAL~!ISTS AND RELATED WORKERS
Total 589 534 55 136 126 11) IX 589 534 53 136 126 10
Division 1 AmuNlsTRATIVE, EXECUTIVE AND MANAGERIAL WORKERS
Total 15,139 14,932 207 3,748 3,703 43 III 233 228 5 5 5 IV 18 17 1 10 9 V 1,536 1,499 37 453 447 6
n 304 303 1 161 160 1 VII 1,423 1,417 6 528 524 4 VIII 243 240 3 128 127 IX 11,382 11,228 154 2,463 2,431 32
Group 10 Amu:mTRAToRS:AND EXECUTIV(OFFICIALS, GOVERNMENT Total 3,464 3,419 45 603 594 H
IX 3,464 3,419 45 608 594 1-1
67

B-V OCCUPATIONAL CLASSIFICATION BY SEX OF PERSONS AT WORK OTHER THAN CULTIVATION-(contd.)
Total Workers r- ____________________ .A.
Division/Group/Family Total Urban ------------ r- -. r- -"---
Category Persolls Males Females Persons :Hales
2 3 4 5 6
Family 100 Am!I~ISTRATORS A~D EXI:m;TIVE OFfiCIALS, CE~TRAL GOVER~\!ENT Total 1,197 1,192 5 219 219
IX 1,197 1,192 5 219 219 :Family 101 ADMI~ISTRATORS A~D EXECUTIVE OFFICIAL', STATE GOVERN~IENT
Total 744 720 24 295 2B3 IX 7H 720 24 295 2,S3
Family 104 VILLAGE OFFICIALS Total 1,379 1,365 14 52 51
rx 1,379 1,365 I4 52 51 Croup II DIRECTORS AND)IAlilAGERS, WHOLESALE AND RETAIL 'IRADI.
Total 1,009 1,006 3 260 258 V II 10 1 7 6
nI 998 996 2 253 252 Family III DIRECTORS AND \lANAGERS, R!;:TAIL TR.'.DE
Total 941 938 3 226 224 V 11 10 1 7 6
VII 930 928 2 219 218 Group 12 DIRECTORS, MA~AGERS A~D WORKING PROPRIETORS-FINANCL'.L INSTITUTIONS
Total 379 377 2 243 2!1l VII 379 377 2 243 241
Family 120 DIRECTORS, ~!ANAGERS AND WORKING PROPRIETORS, BASKS
Total 202 201 1 142 141 VII 202 201 I HZ 141
Group 13 DIRECTORS, MANAGERS AND WORKING PROPRIETORS, OTHER SERVICES Total 10,287 10,130 157 2,637 2,610
III 233 228 5 5 5 IV 18 17 1 10 9 V 1,125 1,489 36 446 441 VI 304 303 161 160
VII 46 44 2 32 31 VIII 243 240 3 128 127
IX 7,918 7,809 109 1,855 1,837 Family I30;DIRECTORS, MANAGERS AND WORKING PROPRIETORS-mNING, Q.UARRYING AND WELL-DRU.LING
Total 221 221 1 1 III 221 221 I 1
Family 13I'DIRECTORS, MANAGeRS AND WORKING PROPRIETORS, CONSTRUCTION ~ Total 302 301 1 ..
,~ W2 WI Family 133 DIRECTORS, ~!ANAGERS A:'ID WORKI:'IG PROPRIETORS, MANUFACTt;RING
Total 1,462 1,455 7 IV 18 17 I V 1,444 1,438 6
159 159
446 10
436
Family 134 DIRECTORS, MANAGERS AND WORKI:-:G PROPRIETORS, TR"\N~PORT .\~D COMMUNICATIONS Total 243 240 3 128 VIII 243 240 3 128
158 158
441 9
432
127 127
Family 135 DIRECTORS M'\~AGERS AND WORKI:-:G PROPRIETORS, RECREATION I;."TERTAINMENT AND CATERING SERVICES
Females
7
12 12
I 1
2 1 I
2 J J
2 2
1 1
27
1 5 1 1 1
18
1
5 1 4
1 ]
Total 7,749 7,622 127 1,749 1,731 18 V 77 47 30 9 8 1
VII 38 37 I 29 28 1 IX 7,634 7,.333 96 1,711 1,695 16
F'amily 136 DIRECTORS, MANAGERS AND \\"ORKING PROPRIETORS, OTHER SERnCES Total 192 186 \ 6
IX ]92 186 6
68
111 111
109 109
2 2
~
~

B-V OCCUPATIONAL CLASSIFICATION BY SEX OF PERSONS AT WORK OTHER THAN CULTIVATION-(contd.)
Total Workers Division/Group/Family ----.
Total Urban Category
,--_____ .A--r-- ""'"I
Persons Males Females Persons Males Females
1 2 3 4 5 6 7
Division 2 CLERIC!,L AND RELATED WORKERS
Total 13,244 12,869 375 7,911 7,605 306 III 580 579 I 63 63 V 1,265 1,246 19 993 978 15 vr J09 98 11 78 67 II
VII 2,740 2,726 14 1,802 1,790 12 VIII 1,109 1,083 26 871 846 25
IX 7,441 7,137 304 4,104 3,861 243
Group 20 BOOK-KEEPERS AND CASHIERS
Total 1,648 1,640 8 1,319 1,312 7
III 19 19 10 10 V 177 177 155 155
VI 2 2 2 2 VII 672 671 569 569
VIII 132 132 120 120 IX 646 639 1 463 456 7
Family 200 BooK-KEEPERS, BOOK-KEEPING AND ACCOUNn CLEBKS
Total 1,351 1,344 7 1,087 1,081 6
III 14 14- 7 7 V 151 151 135 135
VI 2 2 2 2 VII 572 571 485 485
VIII 104 1M 100 100 IX 508 502 6 358 352 G
Family 201 CASHIERS
Total 249 249 190 190
III 5 5 3 3 V 26 26 20 20
VII 100 100 84 34 VIII 20 20 13 13
IX 98 98 70 70
Group 21 STENOGRAPHERS AND TYPISTS
Total 469 368 101 320 233 87 III 5 5
V 46 39 7 41 34 7 VI 12 8 4 10 6 4
VII 31 25 6 31 25 6 VIJI 10 7 3 10 7 3
IX 365 284 81 223 161 67
Family 211 TYPISTS
Total 349 260 89 261 185 76 III 5 5 V 33 23 5 29 24 5
VI 12 8 4 10 6 4 VII 25 22 3 25 22 3
VIII 9 6 3 9 6 3 IX 265 191 74 188 127 61
Group 22 OFFICE MACHINE OPERATORS
Total 2 2 1 1
IX 2 2 1
69 IJ>6/1-27

B-V OCCUPATIONAL CLASSIFICATION BY SEX OF PERSONS AT WORK. OTHER THAN CULTIVATION-(contd.)
Total Workers
Division/Group/Family --. Total Urban
Category -------"- , ,---_________ .A. _____ ---.,
Persons Males Females Persons Males Females
2 3 4 5 6 7
Group 28 CLERICAL WORKERS, MISCELLANEOUS
Total 7,861 7,630 231 4,779 4,589 190 III 450 449 1 38 38 V 828 817 II 641 633 8
VI 68 62 6 51 45 6 VII 1,751 1,745 6 1,020 1,014 6
VIII 804 786 18 622 604 18 IX 3,960 3,771, 189 2,4{)7 2,255 152
Family 280 GENERAL AND OTHER MINISTERIAL ASSISTANTS AND CLERKS
Total ' 6,279 6,058, 221 4,356 4,168 188 III 397 397 37 37 V 716 705 II 598 590 8
VI 64 58 6 48 42 6 VII 1,098 1,092 6 893 887 6
VIII 696 678 18 566 548 13 IX 3,308 3,128 180 2,214- 2,064 150
Family 289 MISCELLANEOUS OFFICE WORKERS INCLUDING RECORD KEEPERS, .YUHARRERS, DESPATCHERS, PACKERS AND BINDERS OF
OFFICE PAPERS
Total 1,582 1,572 10 423 421 2 III 53 52 1 I I V 112 112 43 43
VI 4 4 3 3 VII 653 653 , 127 127
VIII 108 108 56 56 IX 652 643 9 193 191 2
Group 29 UNSKILLED OFFICE WORKERS
Total :;,264 3,229 35 1,492 1,470 22 III 106 106 15 15 V 214 213 1 156 156
VI 27 26 1 15 14 VII 286 285 1 182 182
VIII 163 158 5 119 ll5 4 IX 2,468 2,441 27 1,005 988 17
Family 290 OFfICE ATTENDANTS INCLUDING PEONS, MESSENGERS, USHERS, HALL PORTERS, DURWANS, ETC. N.E.C.
Total 3,264 3,229 35 1,492 1,470 22 III 106 106 15 15 .. V 214 213 I 156 156
VI 27 26 1 15 14 VlI 286 28:) I 182 18:! ..
VIII 163 158 5 119 115 4-fIX 2,468 2,441 27 1,005 988 17
!;>ivision 3 SALE WORKERS
Total 50,701 49,937 764 13,672 1~,516 156 III 72 70 2 69 68 I IV 31 14 17 30 , 1-4- 16 V 707 699 8 452 444 8
VII 46,473 45,817 656 12,461 12,336 125 VIII 191 191 .. 154 154
IX 3,227 3,146 81 506 500 6
Group 30 WORKING PROPIHETORS, WHOLESALE"'AND RETAIL TRADE
Total 36,102 35,667 435 8,592 8,524 68 III 49 48 1 48 48 IV 17 14 3 17 14 3 V 327 321 6 185 179 6
VII 34,940 34,529 411 8,197 8)140 57 VIII 51 51 32 32
IX 718 704- 14 113 III 2
70

B-V OCCUPATIONAL CLASSIFICATION BY SEX OF PERSONS AT WORK OTHER THAN CULTIVATION-(contd.)
Total Workers
r- ----"" Division/Group/Family Total Urban
r----------A -------___ , r-__A.. ________ ""\
Category Persons Males Females Persons Males Females
1 2 3 4 5 6 7
Family 300 WORKIxG PROPRIETORS, WHOLESALE TRADE
Total 660 660 432 432 V 2 2 2 2
VII 643 643 424 424-IX 10 10 6 6
Family 301 WORKING PROPRIETORS, RETAIL TRADE
Total 35,442 35,007 435 8,160 8,092 68 III 49 43 1 48 43 IV 17 14- 3 17 14- 3 V 325 319 6 183 177 6
VII 34,292 33,881 411 7,773 7,716 57 VIII 51 51 32 32
IX 703 694- 14 107 105 2 Group 31 INSURANOE AND REAL ESTATE SALESMEN, SALESMEN OF SECURITIES AND_ SERVICES AND AUCTIONEERS
Total. 350 343 7 125 122 3 V I 1
VII . 232 276 6 82 79 3 VIII 33 33 27 27
IX 34 33 16 16
Group 32 COMMERCIAL TltAVELLERS AND MANUFACTURERS' AGENTS
Total 876 876 812 812 V 99 99 90 90
VII 605 605 553 558 ," VIII 72 72 72 7'1.
IX 100 100 92 92
Family 321 MANUFACTURER'S AGENTS
Total 796 796 747 747 V 95 95 36 36
VII 554- 554 516 516 VIII 65 65 65 65
IX 82 32 80 80
Group 33 SALESMEN, SHOP ASSISTA:-lTS A.1IID RELATED WORKERS
Total 13,349 13,027 322 4,135 4,050 85 III 23 22 1 21 20 1 IV 14 14 13 13 V 280 278 2 177 175 2
VII 10,625 10,386 239 3,618 3,.553 65
'XIII 35 35 23 23 IX 2,372 2,306 66 283 279 4
Family 330 SALESMEN AND SHOP ASSISTANTS WHOLESALE AND RETAIL TRADE
Total 8,461 8,359 102 2,867 2,843 24 III 2 2 1 I 'V 189 188 102 101
VII 5,946 5,906 40 2,493 2,472 21 VIII 34 34 23 23
IX 2,290 2,229 61 243 246 2
Family 331 HAWKERS, PEDLARS A:\ID STREET VENDORS
Total 3,981 3,780 201 1,255 1,194 61 III 21 20 1 20 19 I
IV 13 13 13 13 V 79 78 1 75 74 1
VII 3,826 3,642 184- 1,123 1,079 44 IX 42 40 2 24- 22 2
71. 106/1-27a

B-V OCCUPATIONAL CLASSIFICATION BY SEX OF PERSONS AT WORK OTHER TIlAN CULTIVATION-(contd.)
Total Workers ~
Division/Group/Family Total Urban .--__ ..A.
Category Persons Males Females Persons Males Females' 1 2 3 4- 5 6 7
Family 339 SALESMEN, SHOP ASSISTANTS AND RELATED WORKERS, N. E. c.
Total 907 888 19 13 13 ~V 1 ~ ,. 1 V 12 12
VII 853 838 15 :: 2 VIII 1 1
IX 40 37 3 11 11
Group 34- MONEY LENDERS AND PAWN BROKERS
Total 24 24 ... 8 8 VII 21 21 6 6 IX 3 3 2 2
Division 4 FARMERS, FISHERMEN, HUNTERS, LOGGERS AND RELATED WORKERS
Total 87,679 73,322 14,357 11,530 10,944 SSG III 85,953 72,025 13,928 10,361 10,139 222 IV 550 395 155 308 184 124 V 624 486 138 458 325 133
VI 3 3 VII 257 156 101 245 148 97
VIII 28 28 19 19 IX 264 229 35 139 129 1(}
Group 40 FARMERS AND FARM MANAGERS
Total 30,123 26,196 3,927 162 139 2'> III 29,986 26,077 3,909 137 116 21 IV 85 73 12 IX 52 46 6 25 23 2
Family 403 PLANTERS AND PLANTATION MANAGERS
TotiU 28,274 24,703 3,571 10:;; 86 16 III 28,259 24,692 3,567 91 75 16 IX 15 11 4 11 11
Family 409 FARMERS AND FARM MANAGERS, N.E.C.
Total 1,356 1051 305 45 42 3 III 1,343 1,045 298 41 38 3 IV 7 7 IX 6 6 4 4
Group 41 FARM WORKERS
Total 37,983 28,134 9,849 1,053 954 99 III 37,329 27,604 9,725 660 641 19 IV 350 292 58 220 179 41 V 114 III 3 47 47
VII 50 11 39 43 8 35 VIII 6 6 6 6 ~IX 134 110 24 77 73 4-
Family 411 FARM WORKERS, ANIMALS, BIRDS AND INSECTS REARING
Total 2,878 2,579 299 203 147 56· III 2,617 2,379 238 36 25 11 IV 232 176 56 144 104 40
VII 8 ? 3 6 3 S-IX 21 l!i 2 17 15 2
72

B-V OCCUPATIONAL CLASSIFICATION BY SEX OF PERSONS AT WORK OTHER THAN~CULTIVATION-(contd.) .
Total Workers ,--
Division/Group/Family Total Urban ,__ ---. Category Persons Males Females Persons Males Females
1 2 3 4 5 6 7
Family 413 TAPPERS (PALM, RUBBER TREES, ETC.)
Total 3,217 2,820 397 214 208 6 III 2,981 2,594 387 84 83 1 IV 117 116 1 76 75 1 V 106 103 3 43 43
VII 9 4 5 7 4 3 IX 4- 3 1 4- 3 1
Family 415 PLANTATION LABOURERS
Total 30,607 21,587 9,020 538 534 4 III 30,563 21,543 9,020 514 510 4-IX 44- 44- 24 24
Family 419 FARM WORKERS, N.E.C.
Total 1,121 998 123 S5 5 30 III 1,061 990 71 ~ 4,
IV 1 1 V 2 2 1
VII 32 1 31 29 29 IX 25 5 20
Group 42 HUNTERS AND RELATED WORKERS
Total 9 6 3 III 9 6 3
Group 43 FISHERMEN AND RELATED WORKERS
Total 16,962 16,485 477 10,003 9,545 458 III 16,292 16,099 193 9,433 9,257 176 IV 100 16 84: 88 5 83 V 369 235 134- '281 148 133
VII 174- 112 62 174 112 62 VIII 12 12 12 12
IX 15 11 4 15 11 4-Family 430 F~HERME~DEEP~EA
Total 11,161 11,161 4,771 4,771 III 11,156 11,156 4,766 4,766 IX 5 5 5 5
Family 4-31 FISHERMEN, INLAND AND COASTAL WATERS
Total 4,973 , 4,906 67 4,593 4,542 51 III 4,863 4,800 63 4,483 4,436 47
VII 107 103 4 107 103 4 IX 3 3 3 3
Group 44- LOGGERS AND OTHER FORESTRY WORKERS
Total 2,602 2,501 101 312 306 6 III 2,337 2,239 98 131 125 6 IV 15 14 1 V 141 140 1 130 130
VI 3 3 VII 33 33 28 28
VIII 10 10 I 1 IX 63 62 22 22
Family 442 LOG FELLERS AND WOOD CUTTERS
Total 1,973 1,946 27 285 285 III 1,780 1,754 26 116 116 V 136 136 130 130
VI 3 3 VII 33 33 28 28 IX 21 20 11 11
73

B-V OCCUPATIONAL CLASSIFICATION BY SEX OF PERSONS AT WORK OTHER THAN CULTIVATJON-(contd.)
Total Workers
r- ... Division/Group/Family Total Urban
--------- r- ----------'--- --"- ., Category Persons Males Females Persons Males Females
1 2 3 4: 5 6 7
Division IlI.fINERS. QUARRYMES A:-ID RELATED WORKERS
Total 3,715 3,631 84 210 210
III 3,680 3,597 83 201 201 IV 1 1 V 6 5 1 VI 13 13 3 3 IX 15 15 6
Grou:.> 50 1vIINERS AND QUARRYMl:N
Total 3,707 3,623 84 209 209 III 3,676 3,593 83 201 201 IV 1 1 V 6 5
VI 11 11 2 2 IX 13 13 6 6
Family 501 QUARRYMEN
Total 3,683 3,599 84 209 209
III 3,656 3,573 83 201 201 IV 1 1 V 6 5 1 .
VI 8 8 2 2 IX 12 12 6 6
Group 51 'VELL DRILLERS AND RELATED WORKERS
Total 4 4 III 3 3 IX
Group 59 }.lINERs, QUARRYMEN AND RELATED WORKERS, N.E.C.
Total 4 4 1 1
III I 1 VI 2 2 IX I 1
Division 6 iVORKEKS IN TRANSPORT ASD COM~dU"ICATIO~ O:::CUPATlO",
Total 15,765 15,647 118 6,520 6,442 78
III 22 22 5 5 V 118 113 75 75
VI 12 12 8 8 VII 35 35 32 32
YIII 15,262 15.145 117 6,252 6,174 78 IX 316 315 1 148 148
Group 60 DECK OFFICERS, ENGINEER OFFICERS AND PILOTS, SHIP
Total 2 2 1 1
VIII I 1 1 IX 1 1
Group 61 DECK AND ENGINE ROOM RATINGS (SHIP), BARGE CREWS AND BOATMEN
Total 4,021 4,017 4 2,577 2,573 4 III 1 1 1 1
V 35 35 6 6 VII 2 2 1 1
VIII 3,974 3,970 4 2,560 2,556 4-IX 9 9 9 9
74

B-V OCCUPATIONAL CLASSIFICATION BY SEX OF PERSONS AT WORK OTHER THAN CULTIVATION-(contd.)
Total Workers r-
Division/Group/Family Total ---------Category Persons Males Females Persons
1 2 3 4 5
Family 610 DECK RATINGS (SHIP), BARGE CREWS A:-iD BOATMEN
Total 4,011 4,007 .. 2,569 III 1 1 I V 35 35 6
VII 2 2 1 VIII 3,966 3,962 4 2,554
IX 7 7 7
Group 62 AIRCRAFT PILOTS, NAVIGATORS AND FLIGHT ENGINEERS
Total 7 7 VIII 2 2
IX 5 5
Group 63 DRIVERS AND FISHERME:-f, RAILWAY ENGINE
Total ISO ISO 93 VIII 150 150 93
Group 64 DRIVERS ROAD TRANSPORT
Total 6,516 6,516 2,975 III 15 15 4 V 59 59 54
VI 10 10 7 VII 3:? 32 31
VIII 6,219 6,2!9 2,764 IX 181 181 115
Family 641 MOTOR VEHICLE AND MOTOR CYCLE DRIVERS
Total 2,714 2,714 1,236 III 11 11 3 V 46 46 43
VI 10 10 7 VII 28 28 27
VIII 2,455 2,455 1,056 IX 164 164- 100
Family 642 CYCLE RICKSHAW DRIVERS AND RICKSHAW PULLERS
Total 336 386 334 'V 1
VIII 385 385 333
Family 643 ANIMAL DRAWN VEHICLE DRIVERS
Total 1,859 1,859 228 V 4 4 3
VIII 1,854 1,854 224 IX 1 1 I
Family 649 DRIVERS,
Total
III V
VII VIII
IX
ROAD TR,\NSPORT,
1,445 N.E.C. (INCLUDING PALKI AND DOLI BEARERS)
4 8 4
1,413 16
1,445 1,177 4 1 8 7 4
1,413 16
4 1,151
14
Group 65 CONDUCTORS, GUARDS AND BRAKESMEN (RAILWAY)
Total 40 40 VIII 40 4D
36 36
Group 66 INSPECTORS, SUPERV1S0RS, TRAFFIC CONTROLLERS AND DESPATCHERS, TRANSPORT
Total 244 244 146 VIII 244 244 146
75
Urban _
Males
6
2,565 I 6 I
2,550
93 93
2,975 4
54 7
31 2,764
115
1,236 3
43 7
27 1,056
100
334
33:1
228 3
224 1
1,177 1 7 4
1,151 14
36 36
146 146
7
Females
7
4
4

B-V OCCUPATIONAL CLASSIFICATION BY SEX OF PERSONS AT WORK OTHER THAN CULTIVATlON-(contd.)
Total Workers
r- ---------'""\ Division/ Group/Family Total Urban _,______,
r- '""\ Category Persons Males Females Persons Males Females
1 2 3 4 5 6 7 Group 67 TELEPHONE, TELEGRAPH AND RELATED TELECOMMUNICATION OPERATORS
Total 279 203 76 196 122 74 V 20 20 15 15
VI 2 2 1 VIII 198 122 76 161 87 74
IX 59 59 19 19 Group 68 POSTMEN AND MESSENGERS
Total 682 681 1 136 136 III 6 6 V 4 4
VII 1 VIII 639 638 135 135
IX 32 32 1 1 Family 680 POSTMEN
Total 423 423 105 105 .. VIII 423 423 105 105
Family 681 MESSENGERS (INCLUDING DAKPEONS)
Total 259 258 1 31 31 4· III 6 6 V 4 4
VII 1 1 VIII 216 215 30 30
IX 32 32 1 Group 69 WORKERS IN TRANSPORT AND COMMUNICATIONS OCCUPATIONS, N.E.C.
Total 3,824 3,787 37 360 360 VIII 3,795 3,759 36 356 356
IX 29 28 1 4 4 Family 691 CoNDUCTORS, ROAD TRANSPORT
Total 463 463 152 152 VIII 463 463 152 152
Family 692 WORKERS IN TRANSPORT OCCUPATIONS, N.E.C.
Total 3,045 3,010 35 71 71 VIII 3,045 3,010 35 71 71
Division 7-8 CRAFTSMEN, PRODUCTION PROCESS WORKERS, AND LABOURERS NOT EI.SEWHERE CLASSIFIED
Total 304,364 228,045 76,319 52,650 42,787 9,863 III 553 537 16 392 377 15 IV 51,274 21,482 29,792 6,465 2,589 3,876 V 61,442 49,895 11,547 22,978 18,783 4,195
VI 6,600 6,515 85 1,246 '1,215 31 VII 1,904- 1,779 125 1,658 ~,559 99
VIII 9,796 8,727 1,069 3,120 ~,925 195 IX 172,795 139,110 33,685 16,791 15\339 1,452
Group 70 SPINNERS, WEAVERS, KNITTERS, DYERS AND RELATED WORKERS
Total 39,030 10,026 29,004 9,376 3,321 6,055 IV 28,076 6,111 21,965 4,455 1,246 3,209 V 10,857 3,875 6,982 4,833 2,040 2,793
VII 55 8 47 53 6 47 IX 42 32 10 35 29 ti
Family 700 FIBRE PREPARERS, GINNERS, CLEANERS, SCOURERS, ETC.
Total 4,060 804 3,256 865 120 745 IV 1,426 278 1,148 286 40 246 V 2,629 523 2,106 577 78 499
VII 2 2 1 1 IX 3 1 2 1 1
76
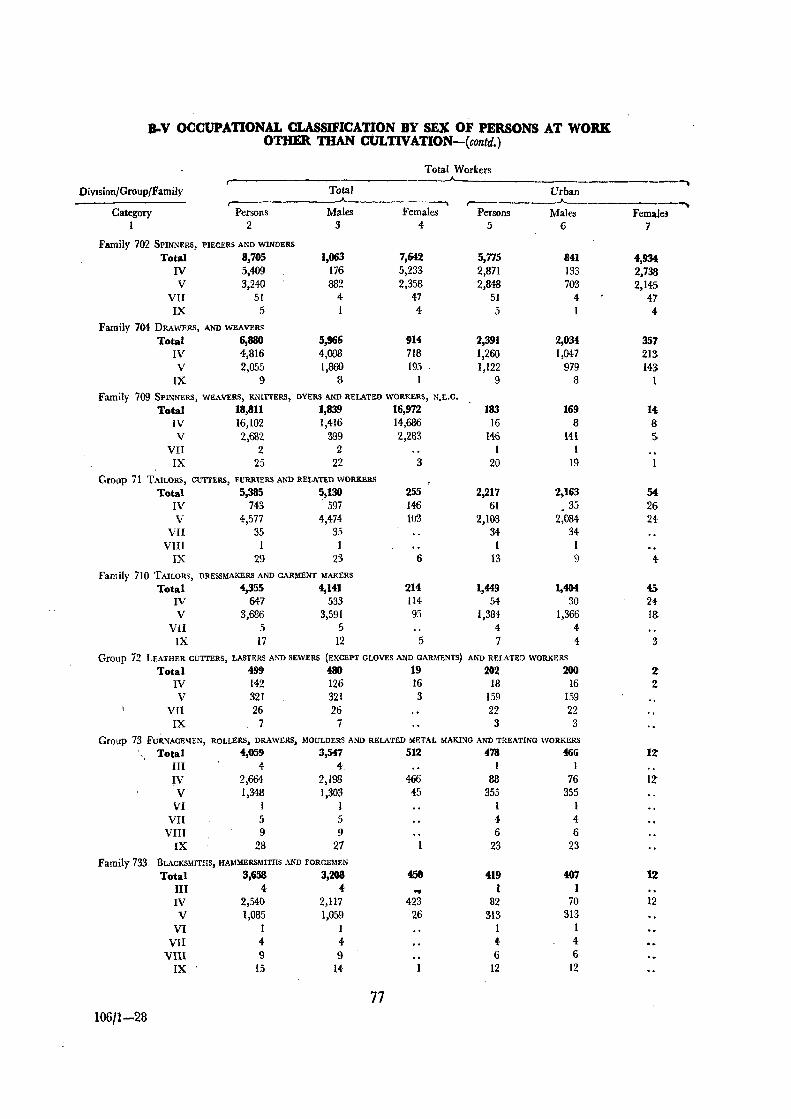
B-V OCCUPATIONAL CLASSJFICATION BY SEX OF PERSONS AT WORK OTHER THAN ct1LTlVATION-{contd.)
Total Workers
Total Urban Division/Group/Family
Category Males 3
------Females
r--,----~-------"""' Persons
2 Persons Males Females
I 4- 5 6 7
Family 702 SPINNERS, PIECERS AND WlNDERS
Total 8,705 IV 5,409 V 3,240
VII 51 IX 5
1,063 176 882
4-I
7,642 5,233 2,358
47 4
5,775 841 2,871 133 2,848 703
51 4-5 1
Family 704 DRAWERS, AND WEAVERS
Total 6,880 IV 4,816 V 2,055
IX 9
5,966 4,098 1,860
8
914 718 195
1
2,391 2,034 1,260 1,047 1,122 979
9 8
Family 709 SPINNERS, WEAVERS, KNITTERS, DYERS AND RELATED WORKERS, N.E.C.
Total 18,811 1,839 16,972 183 169 IV 16,102 1,416 14,686 16 8 V 2,682 399 2,283 146 141
VII 2 2 1 I IX 25 22 3 20 19
Group 71 TAILORS, CUTTERS, FURRIERS AND RELATED WORKERS
Total 5,385 5,130 IV 743 597 V 4,577 4,474-
VII 35 95 VIII 1 1
IX 29 23
255 146 103
6
2,217 2,163 61 . 35
2,108 2,084 34 34
1 1 13 9
Family 710 TAILORS, DRESSMAKERS AND GARMENT MAKERS
Total 4,355 4,141 IV 647 533 V 3,686 3,591
VII 5 5 IX 17 12
214 114 95
5
1,449 1,404 54 30
1,384 1,366 4 4 7 4
Group 72 LEATHER CUTTERS, LASTERS AND SEWERS (EXCEPT GLOVES AND GARMENTS) AND RELATED WORKERS
Total 499 480 19 202 200 IV 142 126 16 18 16 V 321 321 3 159 159
VII 26 26 22 22 IX 7 7 3 3
Group 73 FURNACEMEN, ROLLERS, DRAWERS, MOULDERS AND RELATED METAL MAKING AND TREATING WORKERS
Total 4,059 3,547 512 478 466 III 4 4 I 1 IV 2,664 2,198 466 88 76 V 1,348 1,303 45 355 355 VIII 1 1
VII 5 5 4 4 VIII 9 9 6 6
IX 28 27 23 23
Family 733 BLACKSMITHS, HAMMERSMITHS AND FORGEMEN
Total 3,658 3,208 450 419 407 III 4 4 .. 1 1 IV 2,540 2,117 423 82 70 V 1,085 1,059 26 313 313
VI 1 1 1 1 VII 4 4- 4 4
Vlll 9 9 6 6
IX 15 14 12 12
77 106/1-28
4,934 2,738 2,145
47 4
357 213 143
1
14 8 5-
54 26 24
6 24 18
3
2 2
lZ
12
12
12

B·V OCCUPATIONAL CLASSIFICATION BY SEX OF PERSONS AT WORK. OTHER THAN CULTIVATION-(contd.)
Total Workers ,- -"-------,----------,
Division/Group/Family Total Urban ,--- ----,
Category Persons Males Females Persons Males Females
1 2 3 4 5 6 7
Group 74':'PREClSlO)O Il;STRUMENT MAKERS, WATCH MAKERS, JEWELLERS AND RELATED WORKERS
Total 4,856 4,761 95 996 994 2 IV 2,174 2,094 80 215 214 V 2,594 2,579 15 705 704
VII 84 84 75 75 IX 4 4- I 1
Family 741 JEWELLERS, GOLDSMll'HS A~D SILVERSMITHS
Total 4,581 4,486 95 825 823 2 IV 2,152 2,072 80 215 214 V 2,346 2,331 IS 539 538
VII 80 80 71 71 IX 3 3
Group 75 TOOL-MAKERS, MACHINISTS, PLUMBERS, WELDERS, PLATERS AND RELATED WORKERS
Total 2,926 2.910 16 1,819 1,814 5 III 6 6 I }
IV 228 212 16 91 36 5 V 2,005 2,005 1,357 1,357
VI 15 • 15 II II VII 23 23 9 9
VIII 386 386 128 128 IX 263 263 222 222
Croup 76 ELECTRIClAXS AND RELATED ELECTRICAL A,'ro ELECTRONICS WORKERS
Total 893 890 3 512 511 1 V Il3 Jl3 73 73
VI 132 132 II6 116 VII 45 46 42 42
VIII 88 88 77 77 IX 514 511 3 204 203
Group 77 CARPE~TERS, JOINERS, C!\'BI!<ET MAKERS, COOPERS AND RELATED WORKERS
Total 16,5M 16.458 .f6 4,530 4,519 11 III 8 8 3 3 IV 1,310 1,289 21 4{) 40 V 14,635 14,610 25 4,242 4,231 11
VI 208 208 108 108 VII 58 58 57, 57
VIII 20 20 18 18 IX 265 265 62 62
Family 770 CARPE"'TERS, JOINERS, PATTERN MAKERS (WOOD)
Total 9,465 9,432 33 1,692 1.689 3 III 5 5 1 I
IV / 1,264- 1,244 20 39 39 V 7,708 7,695 13 1,465 1,462 3
VI 206 206 .. 107 107 VII 23 23 22 22
VIII II 11 9 9 IX 248 248 49 49
Family 772 SAWYERS A~D WOOD WORKING MACHINISTS
Total 6,768 6,761 7 2,661 2,658 3
III 2 :?' I 1 IV 24 24
V 6,702 6,695 7 2,624 2,621 3 VI 1 1
VII 28 28 28 28 VIII 3 3 3 3
IX 8 8 5 5
78

B-V OCCUPATIONAL CLASSIFICATION BY SEX OF PERSONS AT WORK OTHER THAN CULTIVATION-(contd.)
Total Workers ,.--
Division/Group/Family Total Urban r---------"--
Category Persons Males Females
I 2 3 4
Group 78 PAINTERS AND PAPER HANGERS
Total 387 3116 1 III 5 5 IV V 79 i9
VI 62 62 VII 4 4
VIII 23 23 IX 213 212
Group 79 BRIGKLAYERS, PLASTERERS AND CONSTRUCTION WORKERS, N.E.C.
Total 6,216 6,134 82 IV 30 26 4 V 358 338 20
VI 5,715 5,653 57 VII 4 4
VIII 15 15 IX 94 93
Family 791 BRICKLAYERS, PLASTERERS, MASONS
Total 4,007 3,999 8 V 52 52
VI 3,932 3,924 8 VIII 13 13
IX 10 10
r---------'----Persons 1Iales
5
316 3
63 46 2
11 188
986 4
243 697
I 10 31
563 39
513 10
316 J
63 40
'2 11
W'3
978 .!
240 692
I 10 31
559 39
509 10
I
Group 80 90MPOSITORS, PRINTERS, ENGRAVERS, BOOK-BINDERS AND RELATED WORKERS
Total 1,413 1,405 8 630 IV 20 13 2 4 V 1,348 1,343 5 615
VII 4 3 1 2 IX 41 41 9
Group 81 POTTERS, KILNMEN, GLASS AND CLAY FORMERS AND RELATED WORKERS
Total 7,179 5,744 1,435 3,139 IV 3,063 1,874 1,189 153 V 4,081 3,837 244 2,964
VII 4 4 4 IX 31 29 2 18
'Family 811 POTTERS AND RELATED CLAYFORMERS
Total 5,722 4,372 1,350 2,673 IV 2,820 1,703 1,117 115 V 2,877 2,646 231 2,546
VII 3 3 3 IX 22 20 2 9
Group 82 MILLERS, BAKERS, BREWMASTERS AND RELATED FOOD AND BEVERAGE WORKERS
Total 12,913 7,594 5,319 2,842 III 170 168 2 167 IV 5,242 3,095 2,147 905 V 6,847 4,041 2,806 1,560
VII 28:i 262 23 163 VIII 3 3 3
IX 366 25 341 44
79 lO6fl-28a
623 3
610 I 9
2,933 100
2,813 +
16
2,432 7].
2,400 3 7
1,795 165 555 907 147
3 18
Females
7
8
3 5
4
i I 5 I
206 53
151
191 43
146
z
1,047
35(} 653
16
2

B-V OCCUPATIONAL CLASSIFICATION BY SIX OF PERSONS AT WORK . OTHER THAN CULTIVATION-(contd.)
Total Workers
Division/Group/Family Total Urban ,---_--------A-- -. ~
Category Persons Males Females Persons Males Females
I 2 3 4 5 6 7
Family 820 MILLERS, POUNDERS, HUSKERS AND PARCHERS, GRAINS AND RELATED FOOD WORKERS
Total 4,!H2 1,516 3,~6 1,686 854: 132 III 162 160 2 162 160 2 IV 1,932 353 1,079 533 293 240
V 2,422 424 1,998 882 323 539 VII 82 70 12 79 69 IO
VlII 3 3 3 3 IX 341 6 335 27 6 21
Family 829 MILLERS, BAKERS, BREWMASTERS AND RELATED FOOD AND BEVERAGE WORKERS, N.E.C.
Total 1,558 1,015 543 49 32 17 III 3 3 3 3 IV 913 504 409 4 3 1 V 633 505 133 41 25 16
VII I 1 IX 3 :2
Group 83 CHEMICAL AND RELATED PROCESS WORKERS
Total 590 418 172 172 157 15 IV 167 125 42 24 20 4 V 416 286 130 143 132 11
VII 2 2 2 2 IX .5 5 3 3
Group 84 TOBACCO PREPARERS AND PRODUCTS MAKERS
Total 8,975 8,850 125 1,644 1,642 2 IV 2,022 1,932 90 71 69 2 V 6,835 6,800 35 1,461 1,461
VII 112 112 107 107 IX 6 6 5 5
Family 842 CHEROOT, CIGAR AND BEEDI MAKERS
Total B,948 8,823 125 1,642 1,640 2 IV 2,006 1,916 90 70 68 2 V 6,825 6,790 35 1,461 1,461
VII III III 106 106 IX 6 6 5 5
Group 85 CRAFTSMEN AND PRODUCTION PROCESS WORKERS, N.E.C.
Total 8,524 4,045 4,479 981 509 472 IV 5,380 1,776 3,604 324 lJ6 208 V 3,076 2,236 840 628 368 260
VII 8 8 7 7 VIII 3 3 3 3
IX 57 22 35 19 15 4
Family 850 BASKETRY WEAVERS AND RELATED WORKERS
Total 6,098 1,999 4,099 465 212 253 IV 5,331 1,742 3,589 302 97 205 V 741 248 493 151 106 45
VII I 1 I 1 IX 25 8 1'7 11 8 3
Family 859 CRAFTSMEN AND PRODUCTION PROCESS WORKERS, N.E.C.
Total 2,133 1,798 335 369 160 209 IV 38 23 , 15 12 9 V 2,067 1,765 302 353 148 205
VII 1 1 I 1 IX 27 9 18 3 2
80

B-V OCCUPATIONAL ~SlFICATlON BY SEX OF PSltSONS AT WORK OTHER THAN CULTIVATlON-(contd.)
Total Workers
Division/Group/Family Total Urban ...... ,-- ---Category Persons 1Iales Females Persons Males Females
1 2 3 4 5 6 7
Group 86 TESTERS, PACKERS, SORTERS AND RELATED WORKERS
Total 802 679 123 770 641 122 III n 71 1 63 63 IV 5 3 2 :; 3 2 V 427 331 96 423 327 96
VII 143 131 12 143 131 12 VIII 118 III 7 100 93 7
IX 37 32 5 36 31 5
Group 87 STATIONARY ENGINE AND EXCAVATING AND UFTING EQUIPMENT OPERATORS AND !\ELATED WORKERS
Total 662 662 689 fi09 III 8 8 V 207 207 178 178
VI 22 22 20 20 VII II 11 10 10
VIII 344 344 342 342 IX 70 70 59 59
Group 89 LABOURERS, N.E.C.
Total 182,551 147,926 34,625 20,431 11,589 1,842 III 280 267 13 154 141 13 IV 7 5 2 6 5 1 V 1,315 1,117 198 866 679 187
VI 445 417 28 247 221 26 VII 995 953 42 921 898 23
VIII 8,786 7,724 1,062 2,421 2,233 188 IX 170,723 137,443 33,2BO 15,816 14,412 1,404
Family 890 LOADERS AND UNLOADERS
Total 3,882 3,802 80 682 i36 46 III 28 28 16 16 V 209 203 6 51 45 6
VI 2 2 VII 35 35 35 35
VIII 3,552 3,485 67 550 513 37 IX 56 49 7 30 27 3
Family 899 L.\SOURERS, N.E.C.
Total 178,669 144,124 34,545 19,749 17,953 1,796 III 252 239 13 198 125 13 IV 7 5 2 6 5 1 V 1,106 914 192 815 694 181
VI 443 415 28 247 221 26 VII 960 918 42 886 863 23
VIII 5,234 4,239 995 1,871 1,720 151 IX 170,667 137,394 33,273 15,736 14,385 1,401
Division 9 SERVICE, SPORT AND RECREATION WORKERS
Total 38,379 21,739 16,6tO 12,8i5 7,244 5,621 III 313 273 40 7 7 V 788 735 53 306 255 51
VI 13 12 1 6 6 VII 83 69 14 64 51 13
VllI 939 926 13 185 173 12 IX 36,243 19,724 16,519 12,297 6,752 5,545
81

:o..V OCCUPATIONAL CLASSIFICATION BY SEX OF PERSONS AT WORK . OTHER THAN CULTIVATION (contd.)
Total Workers _____.A._ ____________________ -,
Division{Group/Family
Category
Total r----.-----~--------.
Persons Males Females 1 234
Group 90 FIRE FIGHTERS,
Total POLICEMEN, GUARDS
3,668 Al\"D RELATED WORKERS
3,658 10 III 236 V 299
VI 9 VII 51
VIII 138 IX 2,935
235 299
9 51
138 2,926 9
Family 901 POLICE CONSTABLES, INVESTIGATORS AND RELATED WORKERS
Total 2,333 2,331 2 VIII 12 12
IX 2,321 2,319 2
Family 903 WATCHMEN AKD CHOWKIDARS
Group 91
Family 910
Total 1,187 III 236 V 299
VI S VII 51
VIII 125 IX 468
HOUSE-KEEPERS, COOKS, MAIDS AND
Total 22,068 If[ 44 V 105
VI[ 13 VIII 6
IX 21,900
1,179 235 299
8 51
125 461
RELATED WORKERS
9,468 22 90 12 6
9,338
8
7
12,600 22 15 1
12,562
ROUSE-KEEPERS, MATRONS, STEWARDS (DOMESTIC AND INSTITUTIONAL)
Total 722 646 76 III 5 5 V 2 2
IX 715 639 76
Family 911 COO]'(S, COOK-BEARERS (DOMESTIC AND INSTITUTIONAL)
Total 5,102 3,339 III 15 14 V 98 88
VII 13 12 VIII 6 6
IX 4,970 3,219
1,763 I
10 1
1,751
Family 912 BUTLERS, BEARERS, WAITERS, MAIDS A:'i"D OTHER SERVANTS (DO~!ESTIC)
Family 919
Total 15,291 5,092 10,199 IX 15,291 5,092 10,199
ROUSE-KEEPERS,
Total III
V IX
COOKS, MAIDS AND RELATED WORKERS, N.E.C.
768 391 377 5 3 2
762 388 374
Group 92 WAITERtl, BARTENOERS AND RELATED WORKERS
835 30~
3. 527
Total 845 V 306
VII 3 IX 536
82
10 1
9
Urban r-----------..A.-----------,.
Persons Ma'es Females
::i
1,359 4
212 6
37 96
1,004-
659 10
649
610 4-
212 5
37 86
266
8,192
34-II 6
8,141
75
75
2,520
30 II 6
2,473
5,466 5,466
57
57
523 4 3
516
6
1,355 4
21~
6 37 9ti
1,0GO
659
10 649
606 4
212 5
37 86
262
3,325
20 10 6
3,289
49
49
1,618
20 10 6
'1,532
1,608 1,608
50
50
513 3 3
507
7
4
4
4
4,867
14
4,852
26
26
902
10 I
891
3,8!:& 3,858
7
1
10 1

B-V OCCUPATIONAL CLAssmCATION BY SEX OF PERSONS AT woRK. OTHER mAN CULTIVATlON-(contd.}
Total Workers
Division/Group/Family Total Urban r- --., r------
Category Pel'sons Males Females Persons :Males Females I 2 3 4- 5 6 7
Family 920 \VAITERS, B.'\RTENDERS, AND llELATED WORKERS (IN51TrUll0NAL)
Total 845 835 10 523 513 Ie V 306 305 i 3 1
VII 3 3 3 :} IX 536 527 9 516 507 9
Group 93 BUlI.DI:>iG ·C.~RE'TAKERS, CLEANERS AND RELATED WORKERS
Total 2,502 1,730 752 1,016 m .33 III 33 16 17 3 3
V 55 19 36 H 8 35 VI 4- 3 I
VII 16 3 13 13 I 12 VIII 794- 781 13 83 71 12
IX 1,600 928 672 ~ 570 374-
'Family 931 CLEA"<ERS, SWEEPERS AND W .... TERIdEN
Total 2,496 1,746 7.;0 1,011 i50 fal III 31 14 17 I 1
V 55 19 36 43 8 3:; VI 4- 3 1
VII 16 3 13 13 I 12 VIII 793 780 13 82 70 12
IX 1,597 927 670 942 570 372
Group 94 B.4JUlERS, HAllt DRESSERS, : BEAUTICIANS AND RELATED WORKERS
Total 4,799 4,400 390 M5 82. 21 IX 4,790 4,4{)() 390 845 824- 21
Family 94D BARBERS, HAIR :DRESSERS, BEAUTIClk""S' AND .. , RELATED WORKERS
Total 4,790 4,400 390 M5 '24 21 IX 4,790 4,400 390 845 824- 21
-Gro\\p 95 LAUNDERERS, DRY CLEA;\IERS' AND PRESSERS
Total 4,277 1,4M 2.873 ,« ~ 284 V 16 15 I 7 6 1
VIII 1 IX 4,260 1,388 2,872 737 4-54- 283
.Family 950 LAUNDRYlIEN, WASll:ERMEN AliiD DHOBIES
Total 4,219 1,347 2.872. i!lO oflY1 283 V 16 15 1 7 6
VIII 1 IX 4,202 1,331 2,871 683 401 282
'Group 96 ATHLETES, SPORTSMEN AND RELATED WORKERS
Total 15 14 1 11 10 IX 15 14 1 11 10
-Group 97 PHOTOGRAPHERS AND RE~~TED CAMERA OPE~~TORS
Total 122 122 69 69 V 7 7 6 6
IX 115 115 63 63
83

B-VOOCUPATIONAL CLSSIFICATION BY SEX OF PERSONS AT WORK OTHER THAN CULTIVATION-(cllltd.)
Total Workers A_ _____________________ ~
DivisionfGroupfFamily Total Urban
---- -. Category Persons Males Females Persons Males Females
I 2 3 4 5 6 7
Group 99 SERVICE, SPORT AND RECREATION WORKERS, N.E.C.
Total 92 88 4 36 35 1 IX 92 88 4: 36 35 I
Division X WORKERS NOT CLASSIFIABLE BY OCCUPATION
Total 1,528 1,485 43 1,032 1,007 2~
III 17 17 10 10 IV 12 6 6 2 I 1 V 102 100 2 75 73 2
VI 18 18 17 17 VII 126 126 124 124
VIII 66 65 I 60 59 1 IX 1,187 1,153 34 744 723 21
Gl'oupXB WORKERS REPORTING OCCUPATIONS UNIDENTIFIABLE OR UNCLASSIFlABLE
Total 1,463 1,425 38 970 949 21 III 16 16 9 9 IV 12 6 6 2 I I V 77 75 2 50 4fI 2
VI 17 17 17 17 VII llB liB 1I6 116
VIII 65 64 1 59 58 1 IX 1,158 1,129 29 717 700 17
Family X80 WORKERS REPORTING OCCUPATIONS UNIDENTlFIABLE OR UNCLASSIFIABLE
Total 1,463 1,425 38 970 949 21 III 16 16 9 9 IV 12 6 6 2 I 1 V, 77.; 75 2 50 4fI 2
VI 17 17 17 17 VII 118 UB 116 116
VIII 65 64 I 59 58 1 IX 1,158 1,129 29 717 700 17
Group X9 WORKERS NOT REPORTING OCCUPATIOXS
Total 65 60 5 62 58 4
III I I 1 V 25 25 25 25
VI 1 1 VII 8 8 8 8
VIII I 1 1 1 IX 29 24 5 27 23 4:
Family X90 WORKERS NOT REPORTING OCCUPATIONS
Total i5 60 5 62 58 4
III 1 I I V 25 25 25 25
VI I ' I
VII B 8 8 8 VIII I I I 1
IX 29 24 5 27 . 23 4-
84

Division
Category
I
All Division!!
Division °
Division
Division 2
Division 3
All Divisions
B.V OCCUPATIONAL CLASSIFICATION BY SEX OF PERSONS AT WORK OTHER THAN CULTIV ATION-contd.
Total Workers Division Total Workers
Persons Males Females Category Persons Males Females
2 3 4 2 3 4
BADAGARA TALUK-RURAL
Division 4 FARMERS, FISHERMEN, HUNTERS, LOGGERS AND
Total 62,905 49,225 13,680 RELATED WORKERS
m 10,955 10,017 938 Total 10,583 9,650 938
IV 6,062 3,782 2,280 III 10,493 9,557 936
V 3,554 3,180 374 IV 43 43
VI 888 880 8 V 40 38 2-
VB 6,122 6,063 59 VIII 9 9
vm 2,509 1,732 777 IX 3 3
IX 32,815 23,571 9,244 Division 5 MINERS, RUARRYMEN AND RELATED WORKERS
PROFESSIONAL, TECHNICAL AND RELATED
WORKERS Total 453 451 2
Total 3,742 3,203 539 III 453 451 2
V 4- 4-IX 3,733 3,199 539 Division 6 WORKERS IN TRANSPORT AND COMMUNICATIONS
OCCUPATlOJ;8
ADMINISTRATIVE, EXECUTIVE AND MANAGE- Total 659 657 2 RIAL WORKERS VIII 641 39 2
Total 1,748 1,732 ffi IX 18 18 IV 2 2 V 22 22 Division 7-8 CRAFTSMEN,
VI 7 7 PRODI:CTION PROCESS WORKERS
AND LABOURERS NOT ELSEWHERE CLASSIFIED
VII 21 21 Total 35,512 24,914 VIII IS 15
lO,59a
IX 1,681 1,665 16 IV 6,017 3,737 2,280 V 3,457 3,085 372
CLERICAL AND RELATED WOilKERS VI 830 872 8
Total 686 672 14- VIII 1,733 1,009 774-
III 8 8 IX 23,375 16,211 7,164-
V 14 14 VI 1 I Division 9 SERVICE, SPORT AND RECREATION WORKERS
VII 159 159 Total 3,018 1,526 1,492
VIII 21 21 III 1 1
IX 483 469 14- V 1
SALES WORKERS VIII 39 38
Total 6,434 6,356 78 IX 2,977 1,436 1,491
V 16 16 VII 5,942 5,883 59 Division X ~'ORKERS NOT CLASSIFIABLE BY OCCUPATION'
VIII I 1 Total 65 64-
IX 475 456 19 IX 65 64
QUILANDY TALVK-RURAL
Division 0 PROFESSIONAL, TECHNICAL AND RELATED
WORKERS
Total 79,443 59,712 19,731 m 15,411 13,527 1,884 Total 3,763 3,134 629
IV 13,780 4,003 9,777 IV 7 7
V 5,722 3,737 1,985 V 8 7 VI 954 944 10 VI 4 4 vn 6,534 6,364 170
vm 3,011 2,979 32 VII 5 5
IX 34,031 28,158 5,,873 IX 3,739 3,111 623
85
106/1-29

B-V OCCUPATIONAL CLASSIFICATION BY SEX OF PERSONS AT WORK OTHER THAN CULTIVAlION-(contd.)
Division Total Workers Division Total Workers ,.---------'-------------., ,. -'-
Category Persons ~Iales Females Category Persons Males Females
I 2 3 4 2 3 4
Division ADm:-lISTRATIVE, EXECUTIVE A:-ID ~gNAGE- Division 6 WORKERS IN TRA"SPORT AND CO~MUMCA-
RUL WORKERS TrONS OCCUPATIO"S
Total 2,324 2,311 13 Total 919 918 III 29 29 V IV I VIII 90ti 905 V 71 71 IX 12 12
\1 15 15 VII 560 559
VIII II 10 I Division 7-8 CRAFTSMEN, PRODUCTIO>i PROCESS WORKERs
IX 1,637 1,626 II AND LABOURERS NOT ELSEWHERE CLASSIFIED
Division 2 CLERIC_\L AND RELATED WORKERS Total 46,65.} 31,210 15,445
III - l' I Total 616 608 8 IV 13,702 3,936 9,766
III 6 6 V 5,590 3,606 1,984 V 13 13 VI 934 924 10
VII 92 92 VII 37 37 VIII 17 16 I VIII 2,036 2,007 29
IX 488 481 7 IX 24,355 20,699 3,ti56 Division 3 SALLS WORKERS
Total 6,334 6,149 135 V 3 3 Division 9 SERVICE, SPORT AND RECREATION WORKERS
VII 5,832 5,663 169 Total 3,197 1,649 1,548
VIII 5 5 III 5 5
IX 494 478 16 V 6 6
4 FAR~IERS, FISHERMEN, HUNTERS, LOGGERS AND VI 1 I
Division VII 6 6 RELATED WORKERS
Total 14,770 12,917 1,853 VIII 30 30
III 14,705 12,858 1,847 IX 3,149 1,601 1,548
IV 59 53 6 V 2 2 Division X WORKERS NOT CLASSIFIABLE BY OCCUPATION
I'" ."- 4 4 Total 198 186 12
Division 5 MINERS, QUARRYMEN AND RELATED WORKERS IV 10 5 5
Total 667 630 37 V 27 27
III 665 628 37 VII 2 2
IV 1 I VIII 6 6
V 1 IX 153 146 7
KOZHlKODE TALUK-RURAL
All Divisicms Division AmnNISTRA TIVE, EXECUTIVE AND MANAGIl-
76,171 61,463 14,708 RIAL WORKERS
Total 2,163 2,149 14 III 9,115 8,118 997 Total
IV 8,673 3,022 5,651 III 127 122 5
V 8,254 6,719 1,535 V 71 69 2
VI 901 894 7 VI 37 37
Vll 7,019 6,980 39 VII 69 68
VllI 3,819 3,788 31 VIII 34 34
IX 38,390 31,942 6,448 XI 1,825 1,819 6
Division 0 PROFESSIONAL, TECHNICAL AND RELATED Division 2 CLERICAL AND REUTED WORKERS
WORKERS Total 1,629 1,609 20
Total 4,250 3,539 711 III 69 68 I
III 3 3 V 132 129 3
IV 42 42 VI 5 5
V 46 44 2 VII 428 427
VII 21 20 1 VIII 97 97
IX 4,138 3,430 708 IX 898 883 15
86

Division
Category
1
Division 3
Division 4:
Division 5
All Divisions
Division 0
Division '1
B-V OCCUPATIONAL CLASSIFICATIO N BY SEX OF PERSONS AT WORK OTHER THAN CULTIVATION-(contd.)
Total Workers r- ,--------~------------'~
Persons
2
SALES WORKERS
Total III IV V
VII VIII
IX
7,762 2 1
17 6,488
23 1,231
Males
3
7,701 I
17 6,453
23 1,207
Females
4
61 I
35
24
FARMERS, FISHERMEN, HUNTERS, LOGGERS AND RELATED WORKERS
Total III IV V
IX
MINERS,
Total III
V VI IX
8,038 7,972
42 6
18
7,068 7,018
26 6
18
QUARRYMEN AND RELATED
869 836 864 831
1 1 I 1 3 3
970 954
16
WORKERS
33 33
Division
Category
I
Division 6
Division 7-8
Division 9
Division X
TIRUR TALUE-RURAL
Total III IV V VI
VII VIII
IX
92,488 14,379 7,376
12,560 972
9,323 4,137
43,236
75,537 13,666 3,133
10,557 963
9,191 4,102
33,975
1,6901 713
4,743 2,003
9 137 35
9,261
PROFESSIONAL, TECHNICAL AND RELATED WORKERS
Total 5,139 4,335 804 IV 5 5 V 21 21
VI 7 7 VIII 4 4
IX 5,102 4,303 799
AD~!INISTRATIVE, EXECUTIVE AND MANAGERIAL WORKERS
Total '1,364 1,320 44-V 869 840 29
VI 37 37 VIi
VIII IX
13 4
441
13 4
426 15
Division 2
Division 3
Di\'ision 4
Division 5
87
Total Workers A-___ __________ ~
Persons Males Females
2 3 4
\VORKERS IN TRANSPORT AND COMMUNICATION OCCUPATIONS
Total 1,764 1,764 III 2 2
V I I VI 2 2
VIII 1,718 1,718 IX 41 41
CRAFTSMEN, PRODUCTION PROCESS WORKERS NOT ELSEWHERE CLASSIFIED
Total 45,338 34,068 III 8 8 IV 8,588 2,954 V 7,935 6,407
'vI 856 849 VII 5 4
VIII 1,495 1,464 IX 26,451 22,382
11,270
5,634 1,528
7 I
31 4,069
SERVICE, SPORT AND RECREATION WORKERS
Total 4,286 2,657 1,629 III 68 65 3
V VII
VIII IX
45 8
452 3,713
45 8
452 2,087 1,626
WORKERS NOT CLASSIFIABLE BY OCCUPATION
Total 72 72 IX 72 72
CLERICAL AND RELATED WORKERS
Total 677 670 7 V 30 30
VI 8 8 VII
VIII IX
73 40
526
SALES WORKERS
Total 9,458 V 202
VII IX
9,225 31
72 40
520
9,325 202
9,094 29
FARI.IERS, FISHER}!EN, HUNTERS, RELATED WORKERS
Total 13,812 III 13,644 IV 17 V
VII IX
89 4
58
13,068 12,934
13 88
33
6
133
131 2
LOGGERS AND
744 710
4 1 4
25
MINERS, QUARRYMEN AND RELATED WORKERS
Total 743 739 4 III 735 732 3
V 2 1 1 IX 6 6
106/1-29a

B-V OCCUPATIONAL CLASSIFICATION BY SEX OF PERSONS AT WORK OTHER THAN CULTIVATION-(contd.)
Division Total Workers Division Total Workers r--- ..... r----.A.--._----,
Category Persons Males Females Category Persons Males Females
I :.! 3 4 I 2 3 4
Division 6 'WORKERS IN TRANSPORT AND COMMUNI CAnONS Division 9 SERVICE, SPORT AND RECREATION WORKERS OCCUPf;TIONS
Total 5,759 3,048 2,711 Total 4,031 3,995 36
V 8 8 V 390 389 1 VII I 1 VII I VIII 3,986 3,951 35 IX 36 35 1 VIII 35 35
Division 7-8 CRf;FTS)lEN, PRODUCTION PROCESS WORKERS AND IX 5,333 2,624- 2,709 LABOURERS NOT ELSEW}lERE CLASSIFIED
Total 51,419 39,003 12,416 IV 7,&54 3,120 4,734 V 10,949 8,978 1,971
VI 920 911 9 Division X WORKERS NOT CLASSIFIABLE BY OCCUPATION
VII II 11 Total 86 84 2 VIII 68 68
IX 31,617 25,91.5 5,702 IX 86 84- 2
ERNAD TALUK.-RURAL
All DivisioDS Division 3 SALES WORKERS
Total 91,432 72,681 18,751 Total 5,056 4,929 127 m 8,672 7,681 991 III I I
IV 7,531 4,388 3,143 V 5 5 V 9,112 7,696 1,416 VII 5,042 4,915 127
VI 1,458 1,453 5 VIII 8 8
vn 5,418 5,266 152 Division 4 FARMERS, FISHERMEN, HUNTERS, LOGGERS AND vm 2,915 2,874 41 RELATED WORKERS
IX 5~,326 43,323 13,003 Total 7,576 6,603 973 III 7,504 6,533 971
Divisioll 0 PROFESSIONAL, TECHNICAL AND RELATED IV 20 19 WORKERS
V 22 707
21 Total 4,975 4,268 VI 3 3 IV 30 23 7 VII 8 8 V 108 97 II IX 19 19 VI 4 4 VII 16 16 Division 5 MINERS, QUARRYMEN AND' RELATED WORKERS
VIII 1 Total 684 684-IX 4.816 4,127 689 III 675 675
VI 9 9 Division ADMINISTRATIVE, EXECUTIVE AND MANAGi:RJAL
Division WORKERS 6 WORKERS IN TRANSPORT AND OOMMUNlCAT~ON OCCUPJ"TIONS
Total 2,935 2,866 69 Total 1,557 1,556
III II 11 III 10 10 IV 5 5 V 31 31
V 38 38 VII 2 2 VI 20 20 VIII 1,458 1,457 , VII 38 38 IX 56 56
, VIII 38 37 1
IX 2,785 2,717 68 Division 7-8 CRAFTSMEN, PRODUCTION PROCESS WORKERS AND Lf;BOURERS NOT ELSEWHERE CLASSIFIED
Division 2 CLERICAL AND RELATED WORKERS Total 60,200 46,531 13,669 Total 1,035 1,019 16 III 131 130 1 III 186 186 IV 7,476 4,341 3,135 V 71 70 V 8,822 7,420 1,402
VI 8 8 VI 1,413 1,408 5 VII 121 121 VII 187 162 25
VIII 53 53 VIII 1,181 1,142 39 IX 596 581 15 IX 40,990 31,928 9,062
88

B-V OCCUPATIONAL CLASSIFICATION BY SEX OF PERSONS AT WORK OTHER THAN CULTIVATION-(contd.)
Division
Category
I
Division 9
Total Workers r------------A----------""\ Persons
2 Males
3 Females
4
SERVICE, SPORT AND RECREATION WORKERS
Total 7,374 4,185 3,189 III 147 128 19
V 15 14 1 VII 4 4
VIII 176 176 IX 7,032 3,863 3,169
Division
Category
1
Division X
Persons
2
Total Workers
l\IaJes 3
Females
4 WORKERS NOT CLASSIFIABLE BY OCCUPATION
Total 40 40 III 7 7 VI I I IX 32 32
SOUTH WYNAD TALUK-RURAL
.All Divisions Division 4 FARMERS, FISHER.IiEN, HUNTERS, LOGGERS AND
Total 41,166 29,048 12,118 RELATED WORKERS
m 21,782 13,468 8,314 Total 21,365 13,072 8,293 IV 1,238 865 373 III 21,274 12,986 8,288 V 1,783 1,687 96 IV 61 57 4
VI 421 405 16 V 7 6 I vn 1,749 1,739 10 IX 23 23
vm 459 458 1 IX 13,734 10,426 3,308 Division 5 MINERS, Q.UAR1lYMEN AND RELATED WORKERS
Total 89 81 8 PROFE~IONAL, TECHNICAL AND RELATED WORKERS III 87 79 8 Division 0
V 2 2 Total 1,360 1,088 272
III 1 I Division 6 WORKERS IN TR.I\NSPORT AND COMMUNICATION IV 5' 3 2 OCCUPATION
VI 26 26 Total 315 315 VII 1 III 5 5 IX 1,327 1,057 270 V 2 2
VI 2 2 Division 1 ADMINISTRATIVE, EXECUTIVE AND MANAGERIAL VIII 301 301
WORKERS IX 5 5 Total 857 851 6
III 61 61 Division 7-8 CRAFTSMEN, PRODUCTION PROCESS WORKERS ANI> V 12 12 LABOURERS NOT ELSEWHERE CLASSIFIED
VI 27 27 Total 12,590 9,532 3,058 VII 194 194 III 21 21
, VIII 13 13 IV 1,172 805 367 IX 550 544 6 V 1,711 1,616 95
VI 351 336 15 Division 2 CLERICAL AND RELATED WORKERS VII 6 6
VIII 113 112 Total 690 686 4
IX 9,216 6,636 2,580 HI 248 248 V 12 12
Division 9 SERVICE, SpORT AND RECREATION WORKERS VI 9 9 Total 1,880 1,430 450 VII 65 65
III 85 67 18 VIII 10 10 V 25 25 IX 346 342 4 VI 6 5
VIII 22 22 Division 3 SALES WORKERS IX 1,742 1,311 431
Total 1,985 1,961 24 V 12 12 Division X WORKERS NOT CLASSIFIABLE BY OCCUPATION
VII 1,483 1,473 10 Total 35 32 3 IX 490 476 14 IX 35 32 3
89

B-V OCCUPATIONAL CLASSIFICATION BY SEX OF PERSONS AT WORK. OTHER THAN CULTIVATION-(contd.)
APPENDIX
Families having less than t per cent of the workers of the respective Divisions and less than 0'5 per cent in case of families of Division 7-8 only have been
III In Mining, Quarrying, Live-stock, Forestry, Fishing, Hunting and Plantations, Orchards and allied activities
IV At Household Industry
V In Manufacturing other than Household Industry
VI In Construction
shown in this Appendix. The following abbreviations have been used :-
VII In Trade and Commerce
VIII In Transport, Storage and Communications
IX In other Services
M Males
F Females
KOZHlK.ODE DISTRICT
000 Total IX (Ml), Urban IX (MI,. 001 Total V (M5), VI (MI30), VIII (Ml), IX (MI09), Urban V (M2), VI (M98), VIII (MI), IX (M55), 002 Total V (M9), VI (MI), VIII (M4), IX (MI5), Urban V (M9), VI (MI), VIII (M3), IX (M9), 003 Total V (M4) , VI (M2), VIII (M9) , IX (M37), Urban V (M4), VI (M2), VIII (M9), IX (M26), 004 Total V (M3), IX (MI), Urban V (M3), 006 Total III (MI), V (MI), IX. (MI), Urban III (MI), V (MI), 007 Total III (M2), V (M4), VI (M6), IX (M78), Urban VI (M4), IX (M3I), 009 Total V (MIO), VI (M6I), IX (M39, Fl), Urban V eM7), VI (MS9), IX (M25, FI), 010 Total V (MI5, F2), VlI (Ml), IX (M5) , Urban V (MI4, F2), VII (MI), IX (M3), 011 Total IV (M2), Urban IV (M2), 013 Total IX (M3), Urban IX (M2), 015 Total IX (M2), Urban IX (M2), 019 Total V (Mi, FI), IX (M2), Urban V (MIl IX (Ml), 020 Total III (Ml), V (M2, Fl,) IX (MI8, F3), Urban III (Ml), V (M2, FI), IX (MIS, F3,) 021 Total IX (M54), Urban IX (MIl), 023 Total III (M2), V (Ml), IX (M12, Fl), Urban III (M~), V (Ml), IX (M7,Fl), 029 Total IX (M21) Urban IX (MI6), 030 Total VII (M3), VIII (MI), IX (M202, F34), Urban VII (M3), VIII (MI), IX (M104, F26), 032 Total VII (M2, FI), IX (M22S, F30), Urban VII (M2), IX (M7S, FI4), 035 Total IX (M93, F6), Urban IX (M85, F5), 039 Total VII (M3), XI (M244, F3), Urban VII (M3), IX (M3I, FI), 044 Total IX (M4, F4), Urban IX (MI, F3), 045 Total IX (MI2, FI4), Urban IX (M7, FI3), 047 Total V (Ml), IX (M3, F2), Urban V (MI), IX (Ml) 049 Total IX (M97, F27), Urban IX (M5I, FI2); 050 Total IX (M231, F43), Urban IX (MII2, F23), 053 Total IX (M4, FI7), Urban IX (Mi, F9), 060 Total IX (M45) , Urban IX (M42); 061 Total V (MI), IX (M294, F3), Urban V (MI),JX (M220, F3), 062 Total IX (MIO, F2), 070 Total IX
90
(MI4), Urban IX (MI3), 071 Total V (M3), VI (Ml), VII (MlO), VIII (M4), IX (MSO, FI), Urban V (M3), VI (MI), VII (M3), VIII (M4), IX (M49, Fl), 072 Total IX (MIl), Urban IX (M9), 075 Total IX (MI), Urban IX (Ml); 076 Total V (M6, Fl), IX (MI07, F42), Urban V (M6, FI), IX (M29, FlO), 077 Total IX (Ml), 078 Total IX (MIS), Urban IX (M3), 079 Total IX (M30, Fl), Urban IX (M26), OSO Total IX (M3), Urban IX (MI), OSI Total V eM5I, FI), IX (M52), Urban V (M49, FI), IX (M36) , 083 Total V (MS, FI), VIII (MS, FI), IX (M54, F2), Urban V (MS, FI), VIII (MS, FI), IX (M27, F2), OS4 Total V (M4), IX (MI), Urban V (MI), 085 Total IX (MI8, F4), Urban IX (M5, FI), OS7 Total IX (M39, F3), Urban IX (MI4, F2), OS9 Total VIII (M3, F2), IX (MI4, FI), Urban VIII (M3, F2), IX (M5, Fl), 090 Total V (M2), VI (MS3, F2), IX (M44, FI), Urban V (M2), VI (M49, F2), IX (M29), 091 Total V (MI), IX (M33, F2), Urban V (MI), IX (MI4, Fl), 099 Total VI (M3), VIII (M3), IX (M9, F3), Urban VI (M2), IX (M7, F2). OX3 Total V (MI), VIII (M2), IX (M38, F4)~
Urban V (Ml), VIII (M2), IX (M26, F2), OX9 Total V (M2), VIII (Ml), IX (MS2, F4), Uban IX (M24, Fl), 102 Total IX (M61, F2), Urban IX (M25, Fl), 103 Total IX (M50), Urban IX (MIO), 109 Total IX (M3l), Urban IX (M6), 110 Total VII (M6S), Urban VII (M34), 121 Total VII (M40, Fl), Urban VII (M39, FI), 129 Total VII (MI36), Urban VII (M61), 132 Total IX (M4S), Urban IX (MI8), 139 Total III (M7, F5), V (M4), VI (M2), VII (M7, FI), IX (M40, F7), Urban III (M4),_ V (MI), VI (M2), VII (M3), IX (IS); 202 Total VIn (MS), IX (M39, FI), Urban VIII (M7l, IX (M34, FI), 210 Total V (MIl, F2), VII (M3, F3), VIn (Ml), IX (M93, F7), Urban V (MlO, F2), VII (M3, F3), VIn

B-V OCCUPATIONAL CLASSIFlCATION BY SEX OF PERSONS AT WORK OTHER THAN CUL TIVATION-(contd.)
\1\,11), IX (M 34, F6); 220 Total IX (~f2), Urban IX {MI), 310 Total VII (M87, F6), IX (MIO, FI), Urban VII (M30, F3), IX (M3), 311 Total V (MI), VII (M77) , VIII (116), IX (M9) , Urban VII (M27), VIII (MI), IX (:'16), 312 Total VII (M37), VIII (M27), IX (MID), Urban VII (~1l0), VIII CM26), IX (MS); 313 Total VII (MI), Urban VII (MI), 314 Total VII (~f2), 319 Total VII (M72), IX (M4), Urban VII (Mil), IX (:'v12), 320 Total V (M4), VII (M24), IX (MIS), Urban V (.:v14), VII (M21), IX (Mil), 329 Total VII (M27), VIII (M7), IX (M3), Urban VII (M2I), VIII (M7), IX (~1l), 340 Total VII (M2I), IX (M2), Urban VII (M6), IX (M2), 341 Total IX (MI), 402 Total III (MI30), IX (M27, F2), Urban III (M3), IX (?I,I8, F2), 404 Total III (M21O, F44,) IV (M73, F5), IX (M2), Urban III (F2), 410 Total III (M45) , IX (MI), Urban IX (MI), 412 Total III (M53, F9), V (M6) , VII (MI), VIII (M6), IX (M38, FI), Urban III (MI9, F2), V (M3), VII (MI), VIII (M6), IX (M30, FI), 420 Total III (M4), 421 Total III (M2, F3), 432 Total III (M1l2, FI), IV (M4, FI), V (M2), Urban III (,\126), 439 Total III (MSI, FI29), IV (MI2, F83), V (1\1233, FI34), VII (M9, F58), VIII (MI2), IX (M3, F4) Urban III (M29, FI29), IV (M5, F83), V (MI48, FI33), VII (M9, F58), VIII (MI2), IX (M3, F4), 440 Tota,1 III (MI3I), IX (M32), Urban III (M2), IX (M2), 441 Total III (MI49, F9), Urban III (M6, F6), 443 Total III (M83, F3), IV (MI4, FI), V (M4, FIl, 449 Total III (MI22, F60), VIII (MlO) , IX (MIO), Urban III (MI), VIII (MI), IX (M9), 500 Total III (M3), 502 Total IX (MI), 503 Total III (MI6); VI (M3), 509 Total III (MI), 510 Total III (Ml), 511 Total III (M2), IX (M I), 590 Total III (M 1 ), VI (M2), IX (MI), Urban VI (MI), 600 Total VIII (MI), Urban VIII (MI), 601 Total IX (MI), 611 Total VIII (M8) , IX (M2), Urban VIII (M6), IX (M2), 620 Total VIII (MI), IX (MI), 621 Total VIII (MI), IX (M2), -622 Total IX (M2), 630 Total VIII (M67), Urban VIII (M47), 631 Total VIII (M83), Urban VIII (M46), 640 Total VIII (MII2), 650 Total VIn (M I), Urban VIII (MI), 651 Total VIII (MS7), Urban VIII (M35), 652 Total VIII (M2), 660 Total VIII (M94), Urban VIII (M62), 661 Total VIII (MI), Urban VIII (MI), 662 Total VIII (MI49), Urban VIII (M83), 670 Total V (M4), VIII (M36, F63) , IX (M28), Urban V (MI), VIII (M28, F6I), IX (M9), 671 Total VIII (M42, FI3), IX (M5), Urban VIII (M39, FI3). IX (M3), -672 Total V (MIS), VIII (MI9). IX (M23), Urban V (MIl), VIn (M8), IX (M5), 679 Total V (M3), VI (M2) VIII (M25), IX (M3), Urban V (M3), VI(MI)
91
VIII (MI2), IX (M2), 690 Total VIII (MlOO), Urban VIII (M48), 693 Total VIII (MII4), IX (M28, FI), Urban VIII (M33), IX (M4), 694 Total VIII (M72, FI), Urban VIII CM2), 701 Total V (M6), Urban V (M3), 703 Total IV (FI), V (MI, F2), Urban V (MI), 705 Total V (MI), Urban V (MI), 706 Total IV (MI37, F52), V (MI79), Urban IV (MI5, FI), V (MIlS), 707 Total IV (M2, FI08), V (M9, F37), Urban V (M6, FI), 708 Total IV (M4, FIg), V (MIS, FI), Urban IV (M3, F3), V (MI3), 71 i Total VII (MI), Urban VII (MI), 713 Total V (M9), VIII(Ml) Urban V (M9), VIII (MI), 714 Total IV (F2), 715 Total IV (MIO, F30), V (M293, F5), VII (M7), IX (M6, FI), Urban IV (M3, F2), V (MI54, F5), VII (M7), IX (M2, FI), 719 Total IV (M.54), V (M58I, F3), VII (M22), IX (M5), Urban IV (M2), V(M555, FI), VII (M22), IX (M3), 720 Total IV (M106, FlO), V (M274, F2), VII (M25), IX (M7), Urban IV(::vt:I4, F2), V (MI43), VII (M21), IX (MS), 721 Total IV (M4), V (M22). VII (MI), Urban IV (MI), V (M5), VII (MI), 729 Total IV (MI6, F6), V (M25, FI), Urban IV (MI), V (MIl), 730 Total V (MI), VII (MI), Urban V (MI), 731 Total V (MI), 734 Total IV (M62, FI3), V (M59); IX (MlO), Urban IV (M6), V (M34), IX (MIO), 735 Total V (MI), 739 Total IV (MI9, F30), V (MI82, FI9), IX (M3), Urban V(M7), IX (MI), 740 Total IV (M22), V (M248), VII (M4), IX (MI), Urban V (MI66), VII (M4), IX (MI), 750 Total III (M5), IV (M4), V (MI9l), VII (MI), VIII (M207), IX (M33), Urban V (M49), VII (MI), VIII (M12), IX (MI2), 751 Total V (M41), VI (MI), VIII (M3), IX (M34), Urban V (M37), VIII (M3,) IX (M34), 752 Total V (M47) , VIII (M65) , IX (M21), Urban V (M33), VIII (MI7), IX (MI8), 753 TotallV (MI4), V (M1078), VI (MIl), VII (M14) , VIII (M98), IX (MI47), Urban V (M919), VI (MlO), VIII (M87), IX (MI41), 754 Total IV (MI74, FI5), V (M214), VII (M7), IX (M5), Urban IV (M84, F5), V (MI95), VII (M7), IX (M3) , 755 Total V (M3), VI (MI), VIII (MI), IX (M9), Urban V (M3), IX (M4) , 756 Total V (M44), VIII (M6), IX (MIO), Urban V (M40), VIII (M6); IX (M9), 757 Total V M22), VI (MI), VII (MI), VIII (M5), Urban V (M2) , VI (MI), VII (MI), VIII (MS), 758 Total IV (M2) , V (M341), Urban IV (M2), V (M70) , 759 Total III (MI), IV (MI8, FI), V (M24), VI (MI) VIII (MI), IX (M4), Urban III (MI), V (M9), IX (MI), 760 Total V (M43), VI (M50), VII (1'424), VIII MIS) IX (Min, F3), Urban V (M26), VI (M42). VII (M23), VIII (MIl), IX (M80, FI), 761 Total V (M8), VI (MIO), VII (M3), VIII (MS) , IX (M24) ,

B-V OCCUPATIONAL CLASSIFICATION BY SEX OF PERSONS AT WORK OTHER THAN CULTIVATlON-(contd.)
Urban V (M5), VI (MIO) , VII (M3), VIII (M7), IX (MIO), 762 Total V (M36), VII (M2), VIII (M3), IX (MI2), Urban V (M25), vn (M2), VIII (M3), IX (M4) , 763 Total VI (MI), VIn (MIO), Urban VIII (M6), 764 Total V (MI4), VI (M70), VII (MI2), VIII (M52) , IX (MISI), Urban V (M9), VI (M64) , VII (MI2), VIII (M4S) , IX (M77), 769 Total V (MI2), VI (MI), VII (M5), VIII (M2), IX (M117), Urban V (MS), VII (M2), VIII (M2), IX (M32) , 771 Total IV (MIS), V (M62) , VIn (M2), Urban V (M35) , VIII (M2), 773 Total V (MIL), VIII (M2), Urban VIII (M2), 774 Total IV (M2), V (MIS), VIII (M2), Urban V (MIO), VIII (M2), 775 Total V (M3), IX (M4) , Urban V (M3), IX (M3), 779 Total' III (MI), IV (M4, FI) V (MI29, F5), VI (MI), VII (M7), IX (M5), Urban III (MI), IV (MI), V (MlOO, FS), VI (MI), VII (M7), IX (MS), 7S0 Total III (MS), IV (MI), V (M79), VI (M62) , VII (M4), VIII (M23), IX (M2112,Fl), Urban III (M3) , IV (MI), V (M65), VI (M46), VII (M2), VIII (MIl), IX (MISS), 790 Total IV (M4) , V (M250, F20), VI (M594), VII (M4) , IX (M32), Urban IV (MI), V (MI93, F3), VI (M41), VII (Ml), IX (MI3), 792 Total V (MI), VI (M2), Urban V (MI), 793 Total IV (M22, F4), V (M7), VI (M2), Urban IV (M3) , V (MS), VI (M2), 794 Total VI (M3I), IX (MIS, FI), Urban VI (M24) , IX (M3), 795 Total VI (M8S, F2), Urban VI (M33, FI), 799 Total V (M2S) , VI (MI020, F47), VIII (M2), IX (M33), Urban V (M2), VI (MS3), IX (MI4), 800 Total V (M3S0), IX (M2) , Urban V (MS), IX (M2), 801 Total V (M4IS, F2), IX (M22), Urban V (M279, F2), S02 Total V (MI2), IX (MI), Urban V (MS), IX (Ml), S03 Total V (MI68), IX (MS), Urban V (M103), IX (Ml), S04 Total V (M9) , Urban V (M4) , S05 Total V (MI), Urban V (MI), 806 Total IV (MI), V (M23), IX (MI), Urban IV (MI), V (MI4), IX (MI), 808 Total IV (MI6, F2), V (M21O, F3), VII (MI, FI), IX (M3), Urban IV (M2, FI), V (MI34, F3), VII (Ml, FI), IX (M2), 809 Total IV (MI), V tM122) VII (M2), IX (M7), Urban V (MS9), IX (M2), 810 Total IV (MI46, F56), V (MI82, F6), VII (Ml), IX (M3), Urban IV (M8, F7), V (MIlS, F2) VII (Ml), IX (M3), 813 Total V (M74, Fl), IX (M2), Urban V (M71, FI), IX (M2), 814 Total V (M90, FI), IX (MI), Urban V (MSI, FI), IX (MI), 815 Total IV (M21, FI2), V (M180, FI), IX (M3), Urban IV (M20, F3), V (MI29, FI), IX (M3), 819 Total IV (M4, F4), V (M66S, F4), Urban V (MI7), S21 Total IV (M721, F104), V (M635, F31), VII (MI4), Urban
92
IV (MI32, FI3), V (MI88, F2), VII (MI4), 822 Total III (M4), IV (M37, F14), V (M5), VII (MI9, FS), IX (M3), Urban III (MI), IV (Fl), 823 Total IV (M600, F443), V (MI09, FI), Urban IV (M32, F73), V (MI, FI), 824 Total IV,(MI99, FS8), V (M894, FI7). VII (M22, FI), IX (M6, F4), Urban IV (M37, FI9), V (M220, FlO), VII (M22, FI), IX (M5, F4), 825 Total IV (M14, FI), V (M140), VII (M3), IX (M3), Urban IV (MI, FI), V (M62), VII (MI), IX (M3) , 826 Total IV (MI67, F39), V (MIS7, F507), VII (M6, F3), IX (MI), Urban IV (M57, F2), V (M64, F20), VII (M6, F3), IX (MI), 827 Total V (M96, F2), VII (MI26,) IX (M2), Urban V (MI5), VII (M34), IX (M2), 828 Total III (MI), V (MI076, F1l7), VII (MI, F2), IX (M2, FI), Urban III (MI), V (M9, F4S), VII (MI, F2), IX (FI), 831 Total IV (MI4, FI), V: (MIlO, F9), VII (MI), IX (M2), Urban IV (MI4, FI), V (MIll', F9), VII (MI), IX (M2), 832 Total V (MI), Urban V (MI), 833 Total V (MIO), Urban V (MIO), 834 Total V (MI), 839 Total IV (MIll, F4I), V (MI64, FI2I), VII (MI), IX (M3), Urban IV (M6, F3), V (Mil, F2), VII (Ml), IX;,(MI) 840 Total V (M2), 849 Total IV (MI6), V (M8), VII (MI), Urban IV (Ml), VII (MI), 851 Total IV (M4), V (M203, F39), VII (M2), VIII (M3) , IX (Ml), Urban IV (M4) , V (M99, FS), VII (M2), VIII (M3), IX (Ml), 8S2 Total V (M3, FI) Urban V (M3), 853 Total IV (MI), V (M3, Fl), VII (M2), Urban V (MI, FI), VII (M2), 854 Total IX (M3), Urban IX (M3), 855 Total IV (MS), V (M6), VII (MI), IX (MI), Urban IV (MS), V (M6), IX (MI), 856 Total IV (MI), V (M8, F4), VII (MI), Urban IV (MI), V (M5, F4), VII (MI), 860 TotalIII (M61), IV (FI), V (MI05, FS3), VII (MSO, FIl), VIII (M76, F4), IX (MI2, F5), Urban III (M61), IV (FI), V (MI02, F83), VII (M50, FII), VIII (M75, F4). IX (MI2, F5), 861 Total III (MIO, FI), IV (M3, FI)" V (M226, FI3), VII (M81, FI), VIII (M35, F3), IX (M20) , Urban III (M2), IV (M3, FI), V (M225, FI3), VII (M81, FI), VIII (MI8, F3), IX (MI9), 870 Total III (M7), V (MI21), VI (M3), VIII (M5), IX (M31), Urban V (M11I), VI (M3), VIII (M5), IX (M22), 871 Total V (M27) , VIII (MI2), IX (M9), Urban V (M26), VIII (M11), IX (M8), 872 Total V (MI), VIII (M3), IX (M2), Urban V (MI), VIII (M3), IX (M2), 874 Total V (M2). VI (M9), VIII (MI), IX (M4), Urban V (Ml), VI (MS), IX (M4), 876 Total V (M50) , VI (MI0), VII (M1O), VIII (M323), IX (M23), Urban V (M38), VI (M9), VII (MI0), VIII (M323), IX (M22), 879 Total III (MI), V (M6), VII (MI), IX (MI), Urban

B-V OCCUPATIONAL CLASSIFICATION BY SEX OF PERSONS AT WORK OTHER THAN CULTIVATION-concld.
V (MI), IX (MI), 900 Total VI (MI), IX (M36), Urban VI (MI), IX (M25), 902 Total IX (M66), Urban IX (M61), 909 Total VIII (Ml), IX (M44), Urban IX (M3), 913 Total III (FI9), V (F4), IX (FI62), Urban V (F4), IX (F70), 930 Total III (M2), VIII (MI), IX (MI, F2), Urban III (M2), VIII (MI),
106/1-30 93
IX (F2), 951 Total IX (M57, FI), Urban IX (M53, Fl), 960 Total IX (MI4, FI), Urban IX (MIO, FI), 970 Total IX (M25), Urban IX (MI2), 979 Total V (M7), IX (M90), Urban V (M6), IX (~I51), 990 Total IX (Mll), Urban IX (MS), 999 Total IX (M77, F4), Urban IX (M27, FI).


B-V1 OCCUPATIONAL DIVISIONS OF PERSONS AT WORK OTHER THAN CULTIVATION CLASSIFIED BY SEX, BROAD AGE-GROUPS AND EDUCATIONAl.
LEVELS IN URBAN AREAS ONLY
Fly-leaf
This table is prepared only for the urban areas of the district. This gives the distribution of nonagricultural workers in the 11 occupational divisions of National Classification of Occupations by educational levels and broad age-groups. The changes made in the N .C.O. for the purpose of B-V table are applicable in the case of this table also. The educational levels given in the table are the same as those given in table B-III Part-A and the age-groups are those followed in table B-I. The age-groups correspond to different
l06/1--30a
stages of life which have special significance with reference to the capacity to work, viz., children, young persons, middle-aged persons and elderly persons. This table gives very valuable data in asses~ing the underemployment among educated persons and also provides useful information about those· occupations which attract educated personnel. In this table the figures for age-groups of total workers under each occupational division have not been given.
95

B-VI OCCUPATIONAL DIVISIONS OF PERSONS AT WORK OTHER .THAN CULTIVATION
".
Occu-pati- Non.tech-onal nical diplo-Divi- Literate (with- Matriculation Technical rna not sion Age- Total literate out educational Primary or or Higher diploma not equal to No. group Total workers workers levels) Junior Basic secondary equal to degree degree
r----'-------"\ ,.----~ ,---~ ,----"-----, ,----"-----, ,.----A------, ,----"-----, P M F M F M F ~f F !VI F M F M F
2 3 4 5 6 7 8 9 10 11 12 13 14 15 16 17
KOZIDKODE
All Total 117,233 98,387 18,846 71,602 6,902 46,380 3,728 15,749 1,426 7,739 1,461 112 7 56 5 Divi. 0-14 3,264 2,079 1,185 1,178 421 946 350 232 70 1 sions 15-34 58,042 49,280 8,762 38,027 4,458 22,938 2,224 9,532 887 4,562 1,143 72 1 24 5
35-59 49,884 41,921 7,963 29,734 1,935 20,297 1,078 5,725 466 3,053 313 32 6 29 60+ 6,034 5,100 934 2,657 86 2,195 75 260 3 123 3 8 3
Age not 9 '1 2 6 2 4 1 1 1 stated
0 Total 1,095 4,929 2,166 4,806 2,119 1,442 170 902 614 1,542 1,101 83 1 48 5 0-14 5 1 3 I 2
15-34 2,118 1,405 406 84 345 332 880 836 52 20 5 35-59 2,337 697 820 75 515 281 634 267 25 6 27 60+ 346 15 213 10 40 1 28 3 6 1
Age not 1 stated
1 Total 3,748 3,703 45 3,509 34 1,635 6 721 6 865 10 8 2 0-14 16 12 4
15-34 1,456 18 579 2 332 2 423 7 3 35-59 1,856 15 921 4 363 4 412 3 4 2 60+ 181 1 123 22 30
Age not stated
2 Total 7,911 7,605 306 7,566 304 2,057 14 1,875 12 3,321 248 2 2 0-14 7 5 2
15-34 4,291 271 868 7 989 8 2,170 226 2 2 35-59 3,072 33 1,066 7 841 4 1,118 22 60+ 195 118 43 32
Age not 1 I stated
3 Total 13,672 13,516 156 11,127 34 7,332 25 2,863 7 840 2 1 I 0-14 125 97 28
15-34 5,296 12 3,184 10 l,ffi2 2 405 35-59 5,136 21 3,560 14 1,118 5 419 2 60+ 570 1 491 60 16 Age not stated
4 Total 11,530 10,944 586 4,136 115 3,527 100 554 12 46 2 0-14 145 3 126 3 19
15-34 2,405 61 2,000 54 373 5 25 2 35-59 1,444 45 1,272 33 lSI 7 20 60+ 142 6 129 5 11 I Age not
stated
5 Total 210 210 57 49 8 0-14
15-34 20 18 2 35-59 27 23 4 60+ 8 6 2 Age not 2 2 stated
96

CLASSIFIED BY SEX, BROAD AGE-GROUPS AND EDUCATIONAL LEVELS IN URBAN AREAS ONLr
Educational levels ----,
Technical degree or diploma equal to degree or post-graduate degree ,...... A--_______________________ ,
University degree or post-
graduate degree Veterinary and other than tech-
O~hers nical degree Engineering Medicine Agriculture dairyil~g Technology Teaching ~ r--~ ,-~, ,-_.A._, ,---...A.-_-""l ,-_A.--------, ,.-____ ..A__----"\ r---"....~~
M F M F 1\[ F 1\1 F M F M F M F I\1 F 18 19 20 21 22 23 24- 25 26 27 28 29 30 31 32 33
DISTRICT
1,016 80 63 1 70 20 11 4 3 124 144 275 30
552 69 34 1 32 11 7 4 62 89 203 28 403 11 28 36 9 -1 61 50 66 2 61 1 2 3 1 5
1
421 45 50 65 20 4 4 2 116 134 127 17
185 34 27 30 11 4 4 59 87 100 15 182 11 23 33 9 57 46 21 2 54 2 2 1
209 3 6 3 7 1 4 7 48 2
83 3 3 I 3 1 2 28 2 123 2 2 4 3 4- 20
3
25) 24- 2 57 6
212 24- 47 6 36 10 2
66 2 1 16
35 9 30 7 1
5 1 3
4 3 1
97

B-VI OCCUPATIONAL DIVISIONS OF PERSONS AT WORK OTHER THAN CULTIVATION
Occu-pati- ]'I;on-tech-onal llical diplo-Divi- Literate (with- Matriculation Technical rna not sian Age- Total literate out educational Primary or or Higher diploma not equal to No. group Tolal workers workers levels) Junior Basic ~econdary epual to degree degree
,.-----------'-----.. ,.---------"----"-. ,..-----'--.........., r-~ r---~~--' ,.--A------, ,...-----'---,
P M F :M F M F .M F M F M F .M F
2 3 4 5 6 7 8 9 10 1I 12 13 14 15 16 17
6 Total 6,520 6,442 78 3,894 73 2,809 I 730 2 330 59 3
0-14 21 18 3 15-34 1,813 64 1,282 375 2 142 51 2 35-59 1,970 9 1,437 338 184 8 I 60+ 90 72 14 4 Age not stated
7-3 Total 52,650 42,787 9,863 30,347 2,726 23,264 2,165 6,581 544 473 16 11 3
0-14 458 156 354 1I9 104 36 1 15-34 17,458 1,831 12,479 1,424 4,602 392 357 14 9 2 35-59 1I,515 713 9,569 598 1,824 1I4 114 2 60+ 914 26 860 24 51 2 2 Age not 2 2 staled
9 Total 12,865 7,244 5,621 5,274 1,478 3,792 1,237 1,296 225 160 14
0-14 396 261 327 227 69 34 15-34 2,823 790 1,970 640 753 142· 86 6 35-59 1,907 392 1,360 335 462 49 73 8 60+ 148 34 135 34 12 Age not stated
10 Total 1,032 1,007 25 886 19 473 10 214 4 162 3 4
0-14 5 4 1 15-34 347 6 152 3 99 2 74 4 35-59 470 10 269 6 109 2 79 2 60+ 63 3 48 1 5 9 Age not stated
98

CLASSIFIED BY SEX, BROAD AGE-GROUPS AND EDUCATIONAL LEVELS IN URBAN AREAS ONL'r-(coneld.) •
Educational levels
Technical degree or diploma equal to degree or post-graduate degree ,-____________________ . _________ A
-------------"""\ University
degree or postgraduate degree other than tech-
nical degree Engineering ~,---~
M F M F
13 19 20 21
15
7 3
7
4 3
II 9
23
11 II I
7
7
2 1
1
2
2
Medicine Agriculture ,--~ ~
M F M F
22 23 24 25
1
99
Veterinary and dairying Technology
,------'---, M F M F
26 '27 23 29
Teaching r----"---,
M F
30 31
1
2
Others ~ M F
32 33
7
5 '2
6
4 2
2 2
7
4 2
4
1

u..VHPART.A PERSONS WORKING PRINCIPALLY (i) AS CULTIVATORS (ii) AS AGRICULTURAL LABOURERS OR (iii) AT HOUSEHOLD INDUSTRY CLASSIFmD BY SEX AND BY
SECONDARY WORK (i) AT HOUSEHOLD INDUSTRY (ii) AS CULTIVATOR OR (iii) AS AGRICULTURAL LABOURER. PART·B INDUSTRIAL CLASSIFICATION
BY SEX OF PERSONS WORKING IN NON-HOUSEHOLD INDUSTRY, TRADE, BUSINESS, PROFESSION OR SERVICE WHO ARE
ALSO ENGAGED IN HOUSEHOLD INDUSTRY
Fly-leaf
1. This table which is prepared in two parts, viz., Part-A and Part-B, gives information on secondary work. Tables B-VII Part-A and Part-B are tabulated for total, rural and urban areas of the district. For rural areas it is presented by divisions down to taluk level. Workers who have no secondary work are excluded from this tdbJe.
2. Part-A of the table is prepared in the case of workers who are principally engaged.
(i) as cui ti va tor (ii) as agricultural labcurer or
(iii) at household inriustry and who are also additionally engaged in anyone of the above three categories of work. Workers who are principally engaged at household industry are also given by divisions and major groups of 1.S I.e. This table is important as it shows the extent to which cultivation is supplemented by household industry or vice versa.
100
3. P.art-B of the table presents data on the basis of cross-tabulation of principal and secondary work in the case of persons who are principally engaged in nonhousehold industry, trade, business, profession or service and also additionally working at household industry. The household industries and non-household industries are further classified according to divisions and major groups of I.S.1.C. From this table the extent of influence of principal work on the nature of secondary work can be studied.
4. In table B VII Part-A the major groups of those industries where the persons engaged in auxiliary work are less than 10 per cent of the persons having that particular major group as principal work in Table B-IV Part- A have been omitted on the basis of the figures of total area. These major groups are shown in the appendix.

u-vn PART-A PERSONS WORKING PRINCIPALLY (i) AS CULTIVATORS (ii)AS AGRICULTURAL LABOURERS (iii) AT HOUSEHOLD INDUSTRY CLASSIFIED BY SEX AND BY
SECONDARY WORK (i) AT HOUSEHOLD INDUSTRY(ii) AS CULTIVATOR OR (iii) AS AGRICULTURAL LABOURERS
Note.-Major groups of household industry, where persons having secondary work as cultivation or agricultural labour, are less than 5 per cent of the persons having the major group as principal work, have not been shown in this table, but are given in the appendix to this table. Divisions thus affected are marked with an asterisk (*)
Principal work
Cultivator, Agricultural Total Secondary wo~k
-.' labourer (lr Household Industry Rural (i) At Household (iii) As Agricultural
(Division and Major Group) Urban Industry (ii) As Cultivator Labourer -, ---M F M F M F
(I) (2) (3) (4) (5) (6) (7) (8)
KOZHlKODE DISTRICT
Cultivator T 741 207 6,649 1,670 R 735 204 6,518 1,637 U Ii 3 131 33
Agricultural Labourer T 104 393 4,632 1,522 R 104 382 4,549 1,489 U 11 83 33
Household Illdustry-All Divisions T 882 337 163 671
R 848 322 159 654 U 34 15 4 17
Division 0 T 23 3 2 R 23 2 2 U 5
Major Group 00 T 5 R 5
" 04 T 23 3 2
R 18 2 2 U 5 1
*Division 2-3 T 854 334 161 671 R 825 320 157 654 U 29 14 4 17
Major Group 20 T 298 103 39 45 R 283 101 38 45 U 10 2 1
" 21 T 25 13 4- 5
R 25 13 4 S.
" 28 T 74 32 75 340
R 72 29 75 334 U 2 3 6,
" 32 T 2
R 2 .. 33 T 37 17 5 1 R 37 16 5 1 U 1
BADAGARA TAL UK-RURAL
Cultivator 4 83 66,
Agri~ultural Labourer Ii 4 279 157 Household Industry-
All Divisions 143 41 59 60
Division 2.and 3 143 41 59 6(} QUILANDY TALUK-RURAL
Cultivator 1M 62 468 120 Apicultural Labourer I' 151 398 105 Household Industry-
All Divisions 160 114 31 319-Division 0 5
2 and 3 155 114 31 319, .. 101
106/1-31

B-vn PART·A PERSONS WORKING PRINCIPALLY (i) AS CULTIVATORS (ii) AS AGRICULTURAL LABOURERS (iii) AT HOUSEHOLD INDUSTRY CLASSlFmD BY SEX AND BY
SECONDARY WORK (i) AT HOUSEHOLD INDUSTRY (ii) AS CULTIVATOR OR (iii) AS AGRICULTURAL LABOURERS-(concld.)
Principal work Secondary work ""'I
Cultivator, Agricultural Total (i) At Household (iii) As Agricultural Labourer or Household Industry Rural Industry (ii) As Cultivator Labourer
(Division and :Major Group) Urban ~~ r----------"-----.M F M F M F
(1) (2) (3) (4-) (5) (6) '(7) (8)
KOZHIKODE TALUK-RURAL
Cultivator 89 12 708 60 Agricultural Labourer 14 60 388 37 Household Industry-
All Divisions 114 20 11 61 Division 0 6 1
" :land 3 108 19 10 61
TIRUR TALUK-RURAL
Cultivator 59 14 1,509 273 Agricultural Labourer 16 74 967 247 Household lndustry-
All Divisions 60 26 3 140 Division 0 2
" 2 and 3 58 26 3 140
ERNAD TALUK-RURAL
Cultivator 217 51 2,880 763 Agricultural Labourer 17 75 1,871 677 Household Industry-
All Divisions 289 101 34 58 Division 0 4-
" 2 and 3 285 101 34- 58
SOUTH WYNAD TALUK-RURAL
Cultivator 266 61 870 355 Apicultural Labourer 32 18 646 266 Household Industry-
All Divisions 82 20 21 16 Division 0 6 I 1
" 2 and 3 7ij 19 20 16
APPENDIX
Major groups of household industry where persons having secondary work as cultivation or agricultural labour, are less than 5 per cent of the persons having the major group as prinicpal work, have been shown in this appendix. The following abbreivations havelbeen used:-
ii-Cultivator M - Males iii-Agricultural Labourer F - Females
22 Total ii (M57) iii (M5, FI) Rural ii (M57), iii (M5, Fl) 23 Total ii (M78, F26), iii (MIO, FII) Rural ii (M72, F23)
iii (MIO, FII) Urban ii (M6, F3) 27 Total ii· (M78, FI23), iii (MI2, F255) Rural ii (M69, F1l9)
iii (Mil, F244) Urban ii (M9, F4) iii (Ml, Fll) 31 Total ii (M7) Rural ii (M7)
34-35 Total ii (M30, F9) iii (M4, F12) Rural ii (M30, F8) iii (M4-, F12) Urban ii (Fl) 36 Total ii (M90, F9), iii (M3) Rural ii (MOO, F9)
iii (}<13) 39 Total ii (M78, F2) iii (1\14, FI) Rural ii (M76,F2)
iii (M2, FI) Urban ii (M2) iii (M2)
102

8-VB PART·B INDUSTRIAL CLASSmCATION BY SEX OF PERSONS WORKING IN NON.HOUSEHOLD INDUSTRY, TRADE, BUSINESS, PROFESSION OR
SERVICE WHO ARE ALSO ENGAGED IN HOUSEHOLD INDUSTRY
Principal work Principal work
Additional work Additional work at Household Industry at Household Industry
(DivislOn and Major group) Males Females (Division and Major group) Males Females ( I) (2) (3) (I) (2) (3)
KOZIUKODE DISTRICT-TOT.u,
P.W. All DivisioDs 424,101 84,745 Major group 20 3 A.W. Division 0 25 " 22 I
Major group 00 9 " 27 3
" 01 2 " 28 4 2 .. 03 I " 33 31 10 .. 04 13 " 34-35 2
Division 2&3 491 323 .. 36 2 1 Major group 20 136 22 " 39 1 .. 21 5 1 P.W. Major group 03 16,157 16~
" 22 38 A.W. Division 0 2
" 23 49 7 Major group 04 2
" 27 78 129 Division 2&3 39 .. 28 B4 135 Major group 20 33 .. 33 71 24 " 23 6
" 34-35 II 3 P.W. Division 1 3,602 M
36 10 1 A.W. Division 0 I
" 39 9 1 Major group 04 I
Division 2&3 9 1l P.W. Division 0 73,755 13,992 Major group 20 2 A.W. Division 0 10 28 7 II
Major group 00 6 P.W. Major grOIlP 10 3,602 M "
01 1 A.W. Division 0 I
" 04 3 Major group 04- 1
Division 2&3 204 57 Division 2&3 9 11 Major group 20 64- I Major group 20 2
" 21 28 7 11 "
" 22 12 P.W. DivisioD 2 & 3 55,116 1l,83-l .. 23 12 A.W. Division 0 1
" 27 31 18 Major group 04 1
" 22 9 9 Division 2&3 28 29
" 33 63 24 Major group 20 4
" 34-35 5 3 21 1 36 4 I " " 22 :3
" 39 3 1 23 I 3 i " P.W. Major group 00 35,728 4,238 "
27 3 23 A.W. Division 0 7 " 28 11 3
Major group 00 6 " 34-35 2 01 I .. 36 2
" Division 2&3 120 41 JJ 39 1 Major group 20 28 P.W. Major group 20 3,441 2,694
21 1 A.W. Division 2&3 4 Z .. 22 11 Major group 20 3
" 23 6 21 .. 27 28 18 " 23 1 J.
28 5 7 " 27 1 .. "
33 32 14 P. W. Major group 23 2,944 71S
" 34-35 5 1 A.W. Division 2&3 2 3
" 36 2 :Major group 23 1 2
" 39 2 JJ 28 1 1
P.W. Major group 27 5,996 6,433 P.W. Major group 01 16,836 9,368 A.W. Division 2 & 3 9 21 A.W. Division 0 1 Major group 20 I
Major group 04 1 27 2 21 Division 2 & 3 45 16 .. 28 6
103 lO6Jl-31a
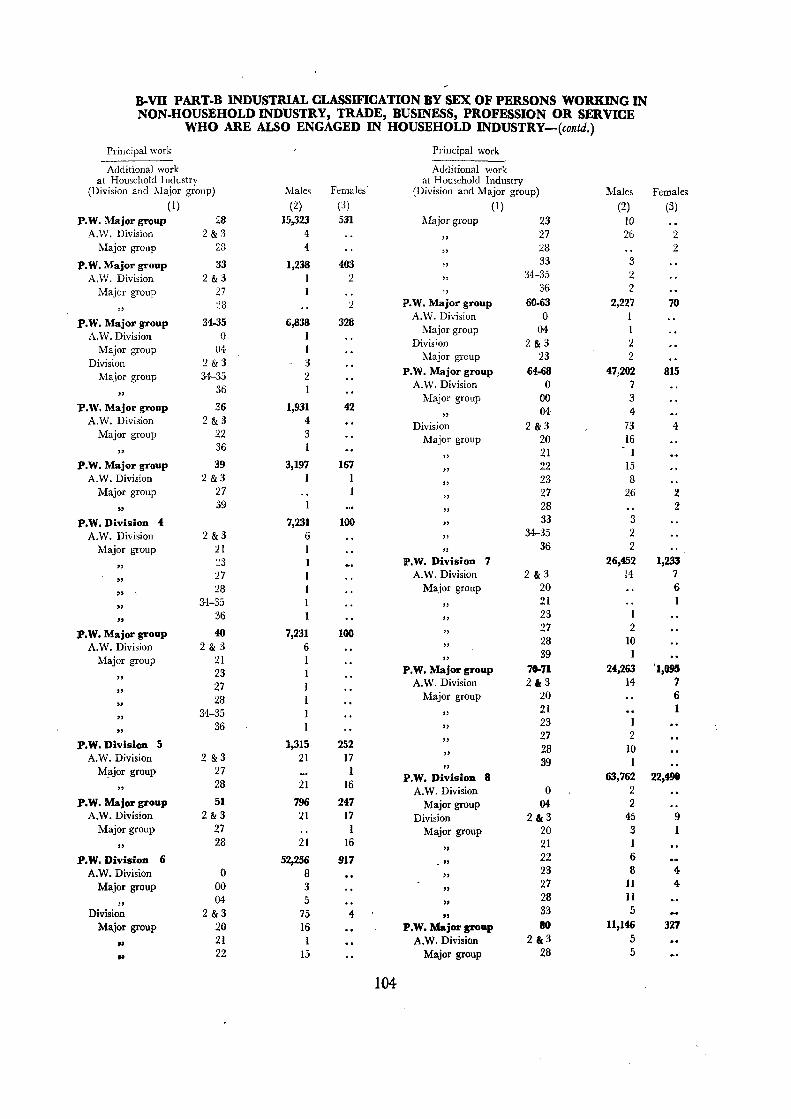
B.vn PART.B INDUSTRIAL CLASSIFICATION BY SEX OF PERSONS WORKING IN NON.HOUSEHOLD INDUSTRY, TRADE, BUSINESS, PROFESSION OR SERVICE
WHO ARE ALSO ENGAGED IN HOUSEHOLD INDUSTRY-(contd.)
Principal work Principal work
Additional work Additional work at Household Industry at Household Industry
(Division and :'-Iajor group) Males Females (Division and Major group) Males Females (I) (2) (3) (I) (2) (3)
P. W. Major group 28 15,323 531 Major group 23 10 A.W. Division 2&1 4
" '27 26 2 Major group 23 4
" 28 2
P.W. Major group 33 1,238 403 " 33 3
A.W. Division 2&3 1 2 " 34-35 2
Major group 27 36 2 28 2 P.W. Major group 60-63 2,227 70
" P.W. Major group 34-35 (i,838 328 A.W. Division 0 1
A.W. Division 0 1 Major group 04
Major group 04- 1 Division 2&3 2
Division 2&3 3 Major group 23 2
Major group 34-35 '2 P.W. Major group 64.-68 47,202 815
36 A.W. Division 0 7 " Major group 00 3
P.W. Major group 36 1,931 42 04- 4 A.W. Division 2&3 4 " Division 2 &3 73 4
Major group 22 3 l\bjor group 20 16 "
36 21 1 " P.W. Major group 39 3,197 167 " 22 15
A.W. Division 2 &3 1 "
23 8 Major group 27
" 27 26 2
" 39
" 28 2
P.W. Division 4 7,23i 100 " 33 3
A.W. Division 2 &3 6 " 34-35 2
Major group 21 " 36 2
" ~3 P.W. Division 7 26,452 1,233
" 27 A. W. Division 2&3 14 7
" 28 Major group 20 6
" 34-35 "
21 1
" 36 "
23 1
P.W. Major group 40 7,231 100 " 27 2
A.W. Division 2&3 6 " 28 10
Major group 21 " 39 1
23 P.W. Major group 70.71 24,263 '1,095 " A.W. Division 2,3 14 7 27 " Major group 20 6 28 " 21 1 34-35 " " 23 1 36 " " 27 2
" P.W. Division 5 1,315 252 28 10 A.W. Division 2 &3 21 17 " 39 1
Major group 27 1 " P.W. Division 8 63,762 22,498 "
28 21 16 A.W. Division 0 2
P.W. Major group 51 796 247 Major group 04 2 A.W. Division 2&3 21 17 Division 2&3 45 9
Major group 27 1 Major group 20 3 1
" 28 21 16
" 21 1
P.W. Division 6 52,256 917 -" 22 6
A.W. Division 0 8 " 23 8 4
Major group 00 3 " 27 11 4-
04 5 " 28 11
" Division 2 &3 75 4- " 33 5
Major group 20 16 P.W. Major group 80 111146 3'1:1 ,. 21 1 A.W. Division 2 &3 5
" 22 15 Major group 28 5
104

B-vn PART-B INDUSTRIAL CLASSIFICATION BY SEX OF PERSONS WORKING IN NON.HOUSEHOLD INDUSTRY, TRADE, BUSINESS, PROftSSION OR SERVICE
WHO ARE ALSO ENGAGED IN HOUSEHOLD INDUSTRY-(contd.)
Principal work Principal work
Additional work Additional work at Household Industry
Females at Household Industry
(Division and Major group) Males (Division and Major group) Males Females (I) (2) (3) (I) (2) (3)
P.W. Major group 81 13,277 4,595 P.W. Major group 88 25,699 16,025 A.W. Division 0 I A.W. Division 2&3 8 6
1\1a jor group 04 I Major group 20 2 Division 2&3 7 3
" 22 4-Major group 21 23 1 2
" 23 4- 2 " 27 I 3
" 27 1 P.W. Division 9 140,612 33,843 33- P.W. Division ° 3
P.W. Major group 32 4,051 959 Major group 01 A. W. Division 2&3 8 "
03 Major group 28 4- "
04-
" 33 4- Division 2 & 3 89 189
83 5,230 333 Major group 20 47 14-P.W. Major group 22 2 A. W. Division 0 1 " 04- I "
23 16 Major group
" 27 4- 81
Division 2&3 3 28 14- 94-20 " Major group I 34-35 23 2 " " "
36 P.W. Major group Sf 1,077 10 "
39 4: A.W. Division 2 & 3 I P.W. Major group 90 140,til2 33,843
Major group 27 A.W. Division 0 3
P.W. Major group 85 931 4 Major group 01 1 A.W. Division 2&3 "
(3
Major group 27 I " 04-
Division 2&3 89 189 P.W. Major group 86 376 45 Major group 20 47 14-
A.W. Division 2&3 3 22 2 " Major group 22 2 23 16 "
" 23 I 27 4 81
" P.W. Major group 87 767 30 " 28 14- 94
A.W. Division 2&3 9 " 34:-35
Major group 27 7 "
36 I 28 2 "
39 4 "
KOZHlKODE DISTRICT-RURAL
P.W. All Divisions 328,523 69,922 P.W. Division 0 63,073 13,753 A.W. Divisioo 0 I4 A.W. Division 0 6
Major group 00 4- Major group 00 2 01 2 "
01 1 " 04- 3 03 I " " Division 2&3 203 56
" 04- 7
Major group 20 63 1 Division 2&3 411 296 "
21 1
Major group 20 125 22 " 22 12
21 3 I " 23 12
" '27 31 18 22 38 " 0' 28 9 8 '23 39 3 " " 33 63 24 27 69 127 " .. 34-35 !:i 3 28 43 114 " .. 36 of I 33 69 24 •• " 39 3 34-35 JO 3 .. 36 6 1 P.W. Major VO., 00 34,m 4,167 39 9 A.W. Division 0 3
105
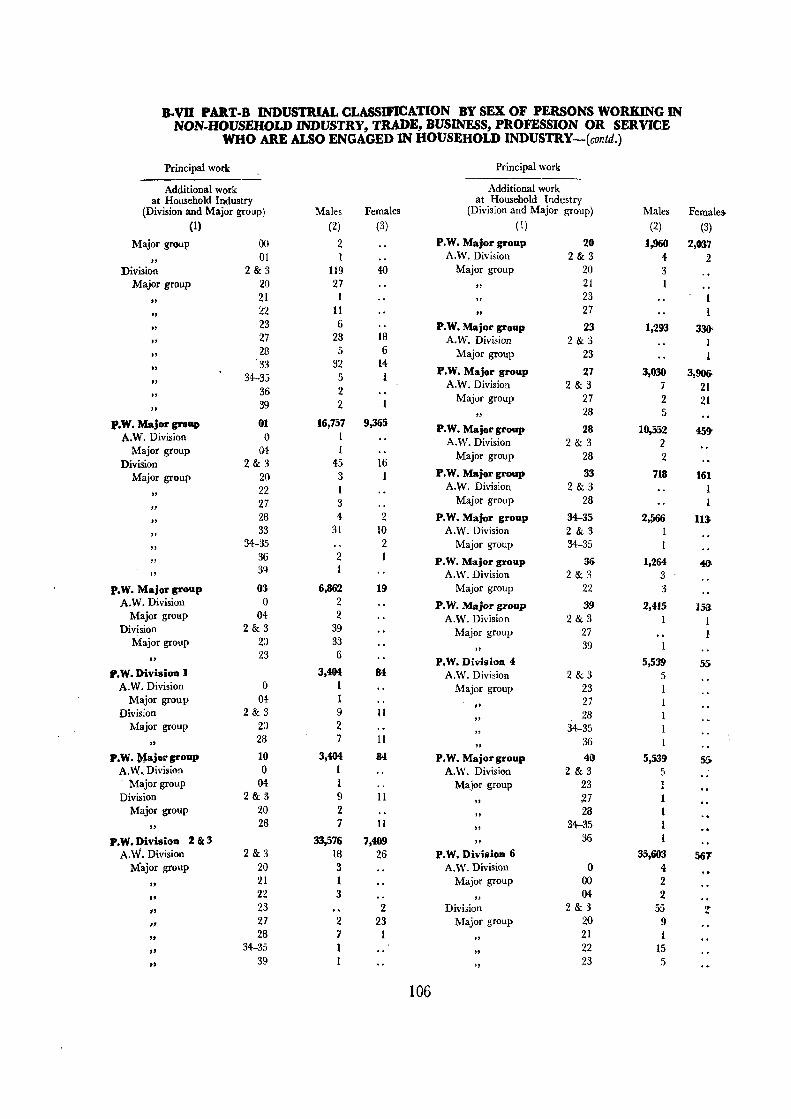
B-VU PART.B INDUSTRIAL CLASSmCATION BY SEX OF PERSONS WORKING IN NON.HOUSEHOLD INDUSTRY, TRADE, BUSINESS, PROFESSION OR SERVICE
WHO ARE ALSO ENGAGED IN HOUSEHOLD INDUSTRY--(contd.)
Principal work Principal work
Additional work Additional work at Household Industry at Household Industry
(Division and Major group) Males Females (Division and Major group) Males Femaleilo (1) (2) (3) (1) (2) (3)
Major group 00 2 P.W. Major group 20 1,960 2,037
" 01 1 A.W. Division 2&3 4 2
Division 2&3 119 40 Major group 20 3 Major group 20 27 " 21
" 21 I 23
" 22 11 " 27
" 23 6 P.W. Major group 23 1,293 330-
" 27 28 18 A.W. Division 2&3
" 28 5 6 Major group 23
" '33 32 14
P.W. Major group 34--35 5 1 27 3,030 3,90& " A.W. Division
36 2 2 & 3 7 21 " Major group 27
39 2 1 2 21 " 28 5
P.W. Major greap 01 16,757 9,365 P.W. Major group 28 10,552
A.W. Division 0 1 459'
Major group 04 I A.W. Division 2 & 3 2
Division 2&3 45 16 Major group 28 2
Major group 20 3 1 P.W. Major group 33 718 161 22 1 A.W. Division 2&3 I
" 27 3 Major group 28 " "
28 4 2 P.W. Major group 34-35 2,S6f) 113
" 33 31 10 A.W. Division 2 & 3 I
" 34--35 2 Major group 34-35
36 2 1 P.W. Major group 36 1,264 46-
" 39 1 A.W. Division 2&3 3
P.W. Major group 03 6,862 19 Major group 22 3 A.W. Division 0 2 P. W. Major group 39 2,415 15&
Major group 04 2 A.W. Division 2&3 1 Division 2&3 39 Major group 27
Major group 20 33 39 23 6 "
" P. W. Division 4 5,539 55-P.W. Division 1 3,404 84 A.W. Division 2&3 5
A.W. Division 0 I Major group 23 Major group 04 I 27
" Division 2&3 9 11 28 " Major group 20 2 34-35 "
" 28 7 11 36
" P.W. Major group 10 3,404 84 P.W. Major group 40 5,539 5S
A.W., Division 0 ( A.W. Division 2&3 5 - Major group 04 1 Major group 23 Division 2&3 9 11
" 27 Major group 20 2
" 28
" 28 7 11
" 34-35
P. W. Division 2&3 33,576 7,409 " 36
A.W. Division 2&3 16 26 P.W. Division 6 35,603 561 Major group 20 3 A.W. Division 0 4
" 21 1 Major group 00 2 .. 22 3
" 04 2
" 23 2 Divi::;ion 2&3 55 Z
" 27 2 23 Major group 20 9
" 28 7 1
" 21 I
" 34-35 1
" 22 15
" 39 1
" 23 5
106

B-vn PART-B INDUSTllIAL CLASSMCATION BY SEX OF PERSONS WORKING IN NON-HOUSEHOLD INDUSTRY, TRADE, BUSINESS, PROFESSION OR SERVICE
WHO ARE ALSO ENGAGED IN HOUSEHOLD INDUSTRY-(contd.)
Principal work Principal work
Additional work Additional work at Household Industry
Females at Household Industry
(Division and Major group) Males (Division and Major group) Males Females (I) (2) (3) (J) (2) (3)
Major group 27 20 2 P. W. Major group 82 2,787 495
" 33 2 A.W. Division 2 & 3 4
" 34--35 2 Major group 28 1 36 1
" 33 3 'p.W~Major group 60-63 585 7 "
A.W. Division 0 P.W. Majorgroup 83 4525 271 Major group 04 A. W. Division 2 & 3 3
Division 2 & 3 Major group 20 1 Major group 23 " 23 2
P.W. Major group 64-68 33,647 549 P.W. Major group 84 546 4 A. W. Division 0 3 A. W. Division 2 & 3
Major group 00 2 Major group 27
" 04 I
P.W. Majorgroup 85 715 3 Division 2 & 3 54 2 A.W. Division 2 & 3 1
Major group 20 9 Major group 27 1 21 I
" P.W. Majorgroup 86 264 21 22 15 " A. W. Division 2 & 3 3 23 4 " Major group 22 2 27 20 2 " 23 I 33 2 " " "
34--35 2 P.W. Major group 87 429 16
" 36 A. W. Division 2 & 3 9
"P.W. Division 7 15,933 917 Major group 27 7 A.W. Division 2 & 3 7 7
" 28 2,
Major group 20 6 P.W. Major group 88 18,278 10,794
21 1 " A.W. Division 2 & 3 6 4
23 I " Major group 20 2 1
2.7 2 22 4 " " 28 3 23 1 " ,. 39 1 27 2 " " P.W. Major group 78-71 15,130 913
123,877 32,409 . A.W. Division 2&3 7 7 P.W. Division 9
20 6 A.W. Division 0 2 Major group
Major group 01 1 21 1
" 03 1 23 1 " " Division 2 & 3 82 189 27 2
" 3 Major group 20 45 14 28 " 22 2 39 " " 23 13
P.W. Division 8 47,036 14,689 " 27 4- 81 A.W. Division 0 1 " 28 13 94
Major group 04 1 " 34-35 1 Division 2&3 3:2 5 " 39 4
Major group 20 3 1 ,. 22 6 P.W. Major group 90 123,877 32,409
" 23 7 1 A.W. Division 0 2 " 9 3 Major group 01 1 27
28 3 " 03 1
" 4 Division 2 & 3 82 189 33 " Major group 20 45 14 P.W. Major group 81 11,219 2,865
A.W. Division 0 I " 22 2
Major group 04 1 23 13 " 27 4 81
Division 2 & 3 5 " Major group 23 4 28 13 94
" 34-35 1 ,. 27 " 4 33 .. 39 00
107

B-VU PART·B INDUSTRIAL CLASSIFICATION BY' SEX OF PERSONS WORKING IN NON·HOUSEHOLD INDUSTRY, TRADE, BUSINESS, PROFESSION OR SERVICE
WHO ARE ALSO ENGAGED IN HOUSEHOLD INDUSTRY-(contd.)
Principal work Principal work
Additional work Additional work at Household Industry at Household Industry
(Division and Major group) Males Females (Division and Major group) Males Female:> (I) (2) (3) (1) (2) (3)
KOZHIKOOE DISTRICT-URBAN
P.W. All DivisioDs 95,578 14,823 Major group 04 I A.W. Division 0 11 Division 2&3 2
Major group 01) 5 Major group 34-35 1
" 04 6 36 1 Division 2 & 3 80 27 P.W. Major group 36 667 2 Major group 2~ 11 A.W. Division 2&3 I
" 21 2 Major group 36 1 " '23 10 4
" 27 9 2. P.W. Division'! 1,692 45-
" 28 41 21 A.W. Division 2&3 1
" 33 2 Major group 21 1
" 34-35 1 P.W. Major group 4{)' 1,692 45-" 36 4 A.W. Division 2&3 I
P.W. Division Q 10,682 239 Major group 21 1 A.W. Division 0 4 P.W. Division 5 833 213 Major group 00 4 A.W. Division 2&3 21 17 Division 2&:.; Major group 27 I Major group 20
" 28 21 1& " 28
P.W. Major group 51 P.W. Major greup 00 951 63 604 210 A.W. Division 0 4
A.W. Division 2&3 21 17 Major group 00 4 Major group 27 1
Division 2 &3 1 " 28 21 16,
Major group 20 1 P.W. Division 6 16,653 350 " 28 A.W. Division 0 4
P.W. Division 2&3 21,540 4,425 Major group 00 1 A.W. Division 0 1
" 04 3 Major group 04 1 Division 2&3 20 Z
Division 2&3 10 3 Major group 20 7 Major group 20 1
" 23 5
" 23 1 " 27 6
27 1 " 28 2
" 28 4 2 33
" 34-35 1 " 36
" 36 2 P.W. Major group 60-03 1,642 P.W. Majo\'gr"p 23 1,651 388 63
A.W. Division 2&3 1 A.W. Division 2 & 3 2 2 Major group 23 l Major group 23 1 1
" 28 1 1 P.W. Major group &H8 13,555 266; P.W. Major group 27 2,966 2,532 A.W. Division 0 4
A.W. Division 2&3 2 Major group 00 1 Major group 20 1 " 04 3
" 23 1 Division 2&3 19 2 P.W. Major group 28 4,771 72 Major group 20 7
A.W. Division 2 & 3 2 " 23 4 Major group 28 2 " 27 Ii
P.W. Major group 33 520 242 " 28 2 A.W. Division 2&3 1 I .. 33 1
Major group 27 1 " 36 1
" 28 P.W. Division 7 10,519 316 P.W. Major grGUp 3i-35 4,272 215 A.W. Division 2&3 7
A.W. Division 0 1 Major group 28 7
108

B-VII PAR1.B INDUSTRIAL CLASSIFICATION BY SEX. OF PERSONS WORKING IN , NON·HOUSEHOLD INDUSTRY, TRADE, BUSINESS, PROFESSION OR SERVICE
WHO ARE ALSO ENGAGED IN HOUSEHOLD INDUSTRY-contd.
Principal Work Principal Work ---
Additional work Additional work at Household Industry at Household Industry
(Division and Major group) Males Females (Division and Major group) Males Females (1) (2) (3) (1) (2) (3)
P.W. Major group 7~71 9,133 182 P.W. Major group 83 705 62 A.W. Division 2&3 7 A.W. Division 0 1
Major. group 28 7 Major group 04 1
P.W. Divisioa 8 16,726 7,801 P.W. Major group 88 7,421 5,231 A.W. Division 0 I A. W. Division 2&3 2 2
Major group M 1 Major group 23 1 1 Division 2&3 13 4 27 1 1
" Major group 21 ., 23 I 3 P.W. Division 9 16,735 1,434
" 27 2 I A.W. Division 0 1 ,. 2B 8 Major group 04 1
" 33 Division 2&3 7
P.W. Major group 80 3,M9 234 Major group 20 2 A. W. Divisioo. 2 &3 5 "
23 3 Major group 28 5 "
28 1
P.W. Major group 81 2,0S8 1,730 " 36 1
A.W. Division 2&3 2 2 P.W. Major group 90 16,735 1,434 Major group 21 1 A.W. Division 0 1
" 23 2 Major group 04 I
JJ 27 Division 2&3 1
P.W. Major Sl'oup 82 1,264 464 Major group 20 2 A.W. Division 2&3 4 "
23 3 Major group 28 3 .. 28 1
" 33 1 "
36 1
BADAGARA TALUK-RURAL
P.W. All DivisioDs 45,443 11,400 P.W. DivisiOD 2 & 3 3,110 374
A.W. Division 0 7 A.W. Division 2&3 I
Major group 00 2 Major group 28 I
" 01 I P.W. Divisioa 6 6,06:J 59
,. 04 4 A.W. Division 0 l. Division 2 &3 82 14 Major group 04 1
Major group 20 64 12 Division 2&3 4
" 21 1 Major group 20 4
" 23 12 P.W. Divisioa 7 1,732 777
" 27 1 A.W. Division 2& :;I 1 7
" 28 3 Major group 20 6
., 34-35 2 21 "
P.W. Divisioa 0 9,566 935 .. 23 1
A.W. Division 0 4 P.W. Divisioa8 7,355 2,123
Major group 00 2 A.W. Division 0 1
04 2 Major group 04 1 "
Division 2&3 34 Division 2&3 4
Major group 20 28 Major group 20 1
27 t ,.1 23 3 " .. 28 3 P.W. Division 9 16,141 7,1.
" 34-35 2 A. W. Division 0 1
Major group 01 I P.W. Division 1 45l 3 Division 2 & 3 37 6
A. W. Division '2 & 3 2 Major group 20 29 6 Major group 20 2
" 23 8
109 ' lO6Jl-32

B-VII PART-B INDUSTRIAL CLASSIFICATION BY SEX OF PERSONS WORKING IN NON-HOUSEHOLD INDUSTRY, TRADE, BUSINESS, PROFESSION OR SERVICE
WHO ARE ALSO ENGAGED IN HOUSEHOLD INDUSTRY -contd.
Principal Work Principal Work
Additional work Additional work at Household Industry
(Division and Major group) Males Females at Household Industry
(Division and 1Iajor group) Males Females (1) (2) (3) (1) (2) (3)
QUILANDY TALUK-RURAL
P. W. All Divisions 55,709 9,95i P.W. Division 2 & 3 3,737 1,985 A.W. Division 0 2 A. W. Division 2&3 7 24-
Major group 01 1 Major group 22 3
" 04 1 23 2
Division 2&3 128 91 " 27 I 22
Major group 20 26 " 28 2
" 22 ·8
" 34-35 I
" 23 15 2 P.W. Division 4 944 10
" 27 51 48 A. W. Division 2&3 3
" 28 8 39 Major group 27 1
,. 33 13 34-35 1 34-35 3 "
36 1 " "
36 2 P.W. Di vision 6 6,364 170
" 39 2 A. W. Division 2&3 22
Major group 20 2 P.W. Division 0 12,898 1,847 .. \ 22 3
A. W. Division 0 1 " 23 2
Major group 01 1 .. 27 14-Division 2&3 73 25
" 34-35
Major group 20 24 P.W. Division 7 2,979 32
" 22 2 A. W. Division 2&3 5
" 23 11 Major group 27 2
" 27 24 17 "
28 2 28 6 "
39 1 " "
33 10 P. W. Division 8 7,576 2,218
34-35 A. W. Division" 2&3 16 " 36 1 Major group 23 2 " 39 1 " 27 9 "
" 28 2
P.W. Division 1 629 37 " 33 3
A. W. Division 0 1 P.W. Division 9 20,503 3,649 Major group 04 1 A. W. Division 2&3 31
Division 2&3 2 11 Major group 27 9 Major group 28 2 11
" 28 22
KOZHIKODE TALUK-RURAL
P. W. All Divisions 58,441 ',057 P.W. Division 4 894 7 A. W. Division 0 3 A. W. Division 2&3 1
Major group 00 2 Major group 23 1
" 04- 1 P.W.Division 6 6,980 39
Division 2&3 17 3 A. W. Division 0 3 Major group 20 Major group 00 2
" 21 1 " 04 1
" 22 2 Division 2&3 7
" 23 3 Major group 20 1
" 27 6 .. 22 2 .. 28 3
" 23 1
" 33 3 "
27 3
" 39 1 P.W. DivisionS 9,565 1,979
P.W. Division 0 7,280 964 A. W. Division 2&3 1
A. W. Division 2&3 7 Major group 33 1
Major group 21 1 P.W. Division 9 22,200 4,45i
" 27 3 A. W. Division 2&3 1 3 .. 33 2 Major group 23
39 1 " 28 3
110

B-VU PART-B INDUSTRIAL CLASSIFICATION BY SEX OF PERSONS WORKING IN NON·HOUSEHOLD INDUSTRY, TRADE, BUSINESS, PROFESSION OR SERVICE
WHO ARE ALSO ENGAGED IN HOUSEHOLD INDUSTRY-contd.
Principal Work Principal Work
Additional work Additional work at Household Industry at Household Industry
(Division and Major group) Males Females (Divi,ion and Major group) Males Females
(1) (2) (3) (1) (2) (3)
TIRUR TALUK-RURAL
p.W. All Divisions 721454 12,158 Major group 20 3 A. W. Division 2 & 3 52 129 "
21 Major group 20 14 "
27
" 21 1 "
39
" 22 1I P.W. Division 4 963 9
" 23 3 1 A. W. Division 2&3
" 27 3 76 Major group 28
" 28 10 52 P.W. Division 6 9,191 137
" 34-35 4 A. W. Division 2&3 6 2
" 36 2 Major group 20 1
" 39 4 22
" P.W. Division 0 12,934 710 "
23 A. W. Division 2&3 23 "
27 2 2 Major group 20 8 "
36
" 22 9 P.W. Division 8 7,925 3,553
" 23 A. W. Division 2&3 1 3
" 27 Major group 22 1
" 20
" 23 1
" 34-35 3
" 27 2
" 36 1 P. W. Division 9 26,037 5,703
P.W. Division 1 732 3 A. W. Division 2&3 10 123 A. W. Division 2 & 3 5
Major group 20 2 23 1
Major group 28 . 5 "
27 71
P.W. Division 2 & 3 10,557 2,003 " 28 3 52
34-35 1 A. W. Division 2&3 6 "
" 39 3
ERNAD TALUK-RURAL P. W. All Divisions 68,293 15,608 Major group 22 9
A. W. Division 0 2 23 1 Major group 03 1 .. '~ "
27 1
" 04 1
" 33
Division 2&3 57 23 "
34-35 Major \ group 2.0 14 6
P.W. Divisi.n 7 2,874 41
" 22 16
A. W. Division 2&3 1
" 23 6
Major group 28 I
" 27 5 3
" 28 14 14 P.W. Division 8 11,493 3,981
" 33 1 Division 2&3 9 2
" 34-35 1 Major group 20 I
P.W. Division 0 7,006 991 " 22 5
A. W. Division 0 1 " 23 2
Major group 04 1 " 27
Division 2&3 " 28
Major group 20 P.W. Division 9 31,711 9,013
P.W. Division 2 & 3 7,696 1,416 A. W. Division 0 1
A. W. Division 2&3 5 1 Major group 03 1
Major group 27 Division 2&3 :!/) 19 Major group 20 12 4
" 28 5 22 2
" P.W. Division 6 5,266 152 "
23 3 A. W. Division 2&3 14
" 27 4
Major group 20 1 "
28 7 14
IIi lOo,1-32a

:u.Vll PART-B INDUSTRIAL CLASSIFICATION BY SEX OF PERSONS WORKING IN NON-HOUSEHOLD INDUSTRY, TRADE, BUSINESS, PROFESSION OR SERVICE
WHO ARE ALSO ENGAGED IN HOUSEHOLD INDUSTRY-concld.
Principal Work Principal Work ------
Additional work Additional work at Household Industry
(Division and Major group) Males Females at Household Industry
(Division and ~Iajor group) Males Female
( I) (2) (3) ( 1) (2) (3)
SOUTH WYNAD TALUK-RURAL
P. W. All Divisions 28,183 11,745 Major group 33 51 24 A. W. Division 2&3 75 36 "
34-35 2 Major group 20 6 4 "
36 2 1
" 21 I "
39
" 22 1 P.W. Division 6 1,739 10
" 27 3 A. W. Division 2&3 2
" 28 8 5 Major group 21 1 33 . 52 24 -
" 33 1 34-35 2 "
" "
36 2 1 P.W. Division 8 3,122 830
" 39 2 A. W. Division 2&3 1
P.W. Division 0 13,389 8,306 Major group 20 i
A. W. Division 2&3 66 29 P.W. Division 9 7,285 2,477
Major group 20 3 A. W. Division 2&3 6 7
,. 22 I· Major group 28 2 4
" 27 3 "
28 3 3
" 28 5 2
" 39
112

B-VDI PERSONS UNEMPLOYED AGED 15 AND ~OVE BY SEX, BROAD AGE-GROUPS AND EDUCATIONAL LEVELS
Fly.leaf
1. This is a very important table which provides information on persons :..tged 15 and above who are unemployed by sex and educational levels in rural and urban areas of the district. The table will be useful for purposes of planning for employment and also for assessing the available man-power. It is divided into two parts. Part-A relates to urban areas and is presented for the district. Part-B relates to rural areas and is presented down to taluk level.
2; Part.A of the table gives the distribution of
persons seeking employment for the first time in the age-groups 15-19, 20-24, 25-29, 30-34 and 35+ and also the distribution of persons who were employed before but now out of employment and seeking work in the age-groups 15-19,20-24, 25-34, 35-44, 45-59 and 60+ by educational levels, as given in Table B-III Part-A.
3. Part.B of the table presents the distribution of unemployed persons aged 15 and above by the same educational levels as given in Table B-III Part.B.
'113

:o.VUI PART.A PERSONS UMEMPLOYED AGED 15 AND ABOVE BY SEX,.
Seeking employment for the first time A_ _______________ ~
Age group r- .A.
""' Educational levels Total unemployed Total 15-19 20-24 25-29 30-34 35+ ..-----"-----, ,--_A---,. ,.---_-"--, ,..----..A...~ r--..A..--~ ~_---, ~----.
P M F M F M F M F ~r F M F M F (1) (2) (3) (4) (5) (6) (7) (8) (9) (10) (11) (12) (13) (14) (15) (16)
KOZIUKOPE.
Total 6,988 6,327 661 4,380 549 1,683 204 1,504 268 448 60 528 12 217 5
I Illiterate 665 627 38 341 17 186 5 63 4 26 3 37 2 29 3
2 Literate (without educational 2,624 2,583 41 1,650 36 728 15 %4 11 143 7 196 2 119 level)
3 Primary or Junior Basic 2,031 1,939 92 1,421 76 548 33 474- 35 171 8 181 47
4 Matriculation or Higher 1,545 1,095 450 908 391 220 151 468 195 93 38 105 6 22 Secondary
5 Technical diploma not equal 9 9 6 2 3 to degree
6 Non-technical diploma not equal to degree
7 University degree or post- 74 50 24 34 18 22 14 7 2 5 2 graduate degree other than technical degree
8 Technical degree or diploma 39 24 15 20 II 11 9 5 2 4 ,equal to degree or post-graduate degree \
(i) Engineering 2 2 I (ii) Medicine
(iii) Agriculture
(iv) Veterinary or Dairying
(v) Technology
(vi) Teaching 4 1 3 2 1 1
(vii) Others 33 21 12 19 9 II B 5 . I 3
114

'BROAD AGE-GROUPS AND EDUCATIONAL LEVELS IN URBAN AREAS ONLY
Persons emplo~d before but now out of employment and seeking work r-______________ ~ ______________ A______________________________~
Age group r- ~------------------------------~
Total 15-19 20--2+ 25-34 35--44 45-59 ~--... r-~ r---.A....--., r--..A---., r---~-_.,..-----A------ ,--____ .A... ____ -,
.M F M F M F M F M F M F M (17) (18) (19) (20) (21) (22) (23) (24) (25) (26) (27) (28) (29)
DISTRICT
1,947 112 145 17 326 49 607 22 427 10 34:2 12 100
286 21 27 28 I 46 5 61 3 79 II 45
933 5 69 lSI 2 287 213 2 189 H
518 16 36 2 104- 7 200 -1 123 3 48 7
187 59 13 15 56 31 62 10 29 2 24 3
3 2
16 6 4, .5 9 2
4 4 3 2
1 1
2 3 3
115
F (30)
2
~I
2
3 .J,
5
6
7
8
Educational levels
Total
Illiterate
Literate (without educational level)
Primary or Junior Basic
Matriculation or Higher Secondary
Teclmical diploma not equal to degree
Non-technical diploma not equal to degree
University degree or post-graduate dergree other than
. technical degree
Technical degree or diploma equal to degree or post-graduate degree
(i) Engineering
(ii) Medicine
(iii) Agriculture
(iv) Veterinary or Dairying
(v) Technology
(vi) Teaching
(vii) Others

a-VDI PART-B PERSONS UNEMPLOYED AGED 15 AND ABOVE BY SEX AND EDUCATIONAL LEVELS IN RURAL AREAS ONLr
Rural unemployeds by educational levels --I--- ---'\
Literate (without Primary or Junior Matriculation District/Taluk Total unemplored Illiterate educational level) Basic and above
-. ,-----"------, ~-. ,..-----"-----1 ~ p M F P M F ' P M F P M F P M F
(1) (2) (3) (4) (5) (6) W) (8) (9) (!O) (11) (12) (13) (14) (15) (16)
KOZfDKODE., DISTRICT 15,587 14,54t) 1,047 2,356 2,135 221 6,315 6,207 108 4,153 3,926 227 2,763 2,272 491
Badagara taluk 2,558 2,435 123 358 313 45 1,248 1,239 9 505 498 7 447 385 62
Quilandy "
3,359 3,166 193 312 290 22 1,586 1,562 24 853 817 36 608 497 111
Ko:z:hikode "
4,556 4,370 186 478 452 26 1,905 1,885 20 1,463 1,419 44 710 614 96
Tirur " 2,732 2,486 246 683 637 46 939 914 25 676 601. 75 434 334 100
Emad "
1,871 1,619 252 387 320 67 498 470 28 545 485 60 441 344 97
South Wynad " 511 464 47 138 123 15 139 137 2 111 106 5 123 98 ,25
116

B.IX PERSONS NOT AT WORK CLASSlFmD BY SEX, BROAD AGE.GROUPS AND TYPE OF ACTIVITY
Fly.leaf
I. This table gives the type of activities of non_ workers. Non-workers are classified into 8 categories which are given in fly-leaf to table B-I. It is the first time in the history of Indian Census that information on the activities of non-workers are collected and tabulated. Any study of workers and non-workers is likely to be incomplete without getting detailed data on the type of activities of non-workers, especially
106/1-33
when the figures of non-workers are more than 50 per cent of the total population.
2. The excess of student population in the agegroup 0-14 of this table over the literates in the age-group 5-14 of Table C-III of this volume is due to the student population in the lower standards of the primary schools, nursery schools and kintergarten schools who do not know how to read and write with understanding.
117

B-IX PERSONS NOT AT WORK CLASSIFIED BY SEX
Age-group Total non-working population Full time students Household duties Dependents, infants
and disabled ,-----A----, ,..-------'------.. ~ ,.-__ A __ --..,
P M F .M F M F M F (I) (2) (3) (4) (5) (6) (7) (8) (9) (10)
KOZHII{ODE
Total 1,815,1.113 688,760 1,126,723 250,146 180,506 535,516 400,440 400,920 0-14 1,100,381 558,705 511,676 218,451 170,262 32,620 337,813 338,139
15-34 409,423 83,173 326,250 31,617 10,203 298,269 30,271 14,446 35-59 208,131 19,424 188,707 25 13 173,911 10,812 11,523 60+ 97,lYl.7 27,234 69,793 30,576 21,391 36,686 Age not stated 521 224 297 53 28 140 153 126
KOZHIKODE
Total J,505,035 572,680 932,355 202,892 145,137 438,067 342,104 341,420 0-14 928,670 470,669 458,001 179,840 139,073 28,980 288,954 289,370
15-34 329,622 64,726 264,896 22,987 6,026 245,121 26,178 11,364 35-59 166,825 15,275 151,550 12 10 139,445 9,005 9,+57 60+ 79,414 21,792 ,57,622 24,382 17,819 31,113 Age not stated 304 218 286 53 28 139 148 116
KOZHIKODE
'Total 310,448 116,080 194,368 47,254 35,369 97,449 58,336 59,500 0-14 171,711 88,036 83,675 38,611 31,189 3,640 48,859 48,769
15-34 79,801 18,447 61,354 8,630 4,177 53,148 4,093 3,082 35-59 41,306 4,149 37,157 13 3 3+,466 1,807 2,066 60+ 17,613 5,442 12,171 6,194 3,572 5,573 Age not stated 17 6 11 1 5 10
BADAGARA
Total 195,792 75,139 120,653 30,024 19,441 58,718 39,152 40,929 0-14 114,660 58,254 56,406 26,760 18,669 3,585 31,140 34,043
15-34 44,403 10,209 34,194 3,261 771 31,206 4,233 1,808 35-59 24,899 3,151 21,748 19,877 1,414 1,264 60+ 11,755 3,503 8,252 4,028 2,347 3,785 Age not stated 75 22 53 3 22 18 29
QUILANDY
'Total 242,419 94,016 148,403 36,284 24,958 69,110 52,678 53,288 0-14 145,461 74,182 71,279 32,047 23,926 3,657 41,937 43,603
15-34 54,913 13,080 41,833 4,223 1,015 38,320 5,535 2,116 35-59 27,314 2,649 24,665 2 22,785 1,720 1,556 -60+ 14,609 4,061 10,548 4,309 3,460 5,989 Age not stated 122 44 78 14 15 39 26 24
KOZHIKODE
Total 272,523 104,901 167,622 41,438 34,807 83,138 56,754 48,609 0-14 159,640 81,538 78,102 35,284 32,738 6,376 45,875 38,939
15-34 64,597 15,470 49,127 6,137 2,060 44,675 4,955 2,021 35-59 32,569 3,303 29,266 3 27,326 2,006 1,583 -60+ 15,599 4,514 11,085 4,741 3,867 6,050 Age not stated 118 76 42 17 6 20 51 16
TIRUR
Total 346,520 126,330 220,190 40,887 28,389 107,440 80,126 82,328 0--14 210,120 105,781 104,339 '36,831 27,429 7,007 68,423 69,760
15-34 78,205 12,279 65,926 4,042 951 61,454 5,465 2,846 35--59 40,167 3,167 37,000 2 4- 33,864 1,962 2,435 -60+ 17,923 5,061 12,862 5,075 4,247 7,270 Age not stated 105 42 63 12 5 40 29 17
118

... BROAD AGE-GROUPS AND TYPE OF ACTIVITY
Inmates of penal, men- Persons seeking employ- Persons employed before, Retired, rentier or inde- Beggars, vargants, etc. tal and charitable ment for the first but now out of employ-
pendent means institutions time ment and seeking work Age-group-,....-~ ,.------"------, ----..
M F M F M F M F M F (II) (12) (13) (14) (15) (16) (17) (18) (19) (20)
DISTRICT-TOTAL
9,864 3,977 5,283 3,726 421 242 17,677 1,587 4,929 249 Total 10 22 659 480 33 25 1,682 128 57 0-14:
1,357 956 1,802 667 155 84 15,198 1,427 2,773 198 15--34 4,158 1,847 1,595 1,251 181 88 773 30 1,880 44 35--59 4,338 1,151 1,223 1,326 51 45 17 2 214 7 60+
1 I 4 2 1 7 5 .• Age not stated:
DISTRICT-RURAL
7,210 3,347 4,382 3,101 278 123 l12,852 1,023 2,962 137 Total 10 19 576 433 15 13 1,237 113 37 0-14
1,149 859 1,568 497 114 36 11,035 883 1,695 110 15-34 3,203 1,531 1,261 1,003 117 57 566 25 1,111 22 35-59 2,847 937 974 1,166 31 17 7 2 114 5 60+
1 3 2 1 7 5 •• Age not stated
DISTRICT-URBAN
2,654 630 901 625 143 119 4,825 564 1,967 112 Total 3 83 47 18 12 445 15 20 0-14
208 97 234 170 41 48 4,163 544 1,078 88 15-34 955 316 334 248 64 31 207 5 769 22 35--59
1,491 214 249 160 20 28 10 100 2 60+ 1 •• Age not stated
TALUK-RURAL
2,475 906 797 526 2,181 120 510 13 Total 1 98 98 248 10 8 0-14-
366 206 275 88 1,811 104 263 11 15-34 1,167 439 249 163 121 4 200 1 35-59
942 259 175 177 2 39 60+ 1 •• Age not stated
TALUK-RURAL
1,029 374 689 465 7 1 2,844 190 485 17 Total 2 35 77 160 14 3 0--14
165 92 292 101 3 2,558 171 304 17 15-34 439 m 193 145 2 124 5 166 35-59 424 108 162 142 2 2 11 60+
1 2 1 •. Age, not stated
TALUK-RURAL
1,081 390 750 388 250 94 3,803 156 825 40 Total 2 4 104 24 15 II 250 10 8 0-14
120 97 332 73 97 22 3,355 143 474 36 15-34 486 172 190 131 109 44 191 3 321 4 35-59 473 117 123 160 28 17 2 21 60+
1 1 5 1 •. Age not stated
TALUK-RURAL
1,350 985 1,093 753 4 9 2,259 263 611 23 Total 8 7 135 94 2 376 40 8 0-14
235 315 373 115 3 3 1,802 220 359 22 15-34 567 433 332 256 1 4 79 3 224 1 35-59 540 230 253 287 2 19 60+ ... ... 1 1 •• Age not stated
119 106/1-33a

B-IX PERSONS NOt AT WORK CLASSIFIED BY SEX,
Total non-working population Household duties Dependents, infants
Age-group Full time students and disabled r----~-~ ...... -----., ,--_.A...-._-,. ,--------"------- ,.--__ -A._---.,
P M F \1 F M F M F ( 1) (2) (3) (4) (5) (6) (7) (8) (9) (10)
ERNAD
Total 342,On 128,834 213,209 41,622 28,886 97,729 83,392 84,790 0-14 220,3BI 111,3B3 108,998 37,301 28,003 6,608 73,714 74,239
15-34 71,419 11,286 60,133 4,304 883 56,731 5,066 2,047 35-59 34,168 2,404 31,764 10 29,114 1,517 2,049 60+ 15,999 3,728 12,271 5,260 3,072 6,429 Age not stated 76 33 43 7 16 23 26
SOUTH WYNAD
Total 105,738 43,460 62,278 12,637 8,656 21,932 30,002 ~31,476 0-14 78,408 39,531 38,877 11,617 8,308 1,747 27,865 28,786
15-34 16,085 2,402 13,683 1,020 346 12,735 924 526 35-59 7,708 601 7,107 1 6,479 386 579 60+ 3,529 925 2,604 969 826 1,590 Age not stated 8 7 2 1 4
120

BROAD AGE-GROUPS AND TYPE OF ACTIVITY-concld.
Inmates of penal, Persons seeking em- Persons employed before, Retired, rentier or Beggars, vagrants, mental and chal'i- ployment for the but now out of empIoy-independent means etc. table institutions first time ment and seeking work ;---"-------, ,------"-------, .---"--, ,..---'----., --, M F ~I F M F M F M F
(II) (12) (13) (14) (15) (16) (17) (18) (19) (20)
TAL UK-RURAL
1,146 657 1170 859 6 3 1,429 2541 369 35 Total 5 189 110 171 33 8 0-14
254 148 246 93 5 2 1,214 208 197 21 15-34 474 291 219 288 42 9 141 ]2 35-59 418 213 216 367 1 21 2 60+
1 2 Age not stated
TALUK-RURAL
129 3S 183 110 11 16 336 oM 162 ! Total 15 30 32 6 2 0-14
9 1 50 27 6 8 295 37 98 3 15-34 70 24 73 20 4 8 9 59 4 35-59 50 IO 45 33 1 3 2 60 +
Age not stated
121

B.X SAMPLE HOUSEHOLDS (i) ENGAGED NEITHER. IN CULTIVATION NOR HOUSEHOLD INDUSTRY, (ii) ENGAGED EITHER IN CULTIVATION OR HOUSEHOLD INDUSTRY
BUT NOT IN BOTH AND (iii) ENGAGED BOTH IN CULTIVATION AND HOUSEHOLD INDUSTRY FOR ALL AREAS
Fly-leaf
All the household economic tables presented in this part are prepared from 20% sample of household schedules. This table shows the number of households in the 4 categories, viz. (i) Households engaged neither in cultivation nOr in household industry ,( ii) Households
122
engaged in cultivation only, (iii) Households engaged in household industry only and (iv) Households engaged in both cultivation and household industry, for I. the total, rural and. urban areas of the district and for the rural areas of taluks.

B·X SAMPLE HOUSEHOLDS (i) ENGAGED NEITHER IN CULTIVATION NOR HOUSEHOLD INDUSTRY, (ii) ENGAGED EITHER IN CULTIVATION OR HOUSEHOLD INDUSTRY
BUT NOT IN BOTH AND (iii) ENGAGED BOTH IN CULTIVATION AND HOUSEHOLD INDUSTRY FOR ALL AREAS
(BASED ON 20% SAMPLE)
Households en- Households Households en-Total gaged neither Households engaged in gaged both in
Total number in cultivation engaged in household cultivation and Rural of house- nor in house- cultivation industry household
DistrictJTaluk Urban holds hold industry only only industry
(I) (2) (3) (4) (5) (6) (7)
KOZHIKODE DISTRICT T 87,052 63,519 18,707 4,239 587
R 74,441 51,991 18,209 3,674 567
U 12,611 11,528 498 565 20
Badagara taluk R 9,113 7,086 1,567 405 55
Quilandy R 11,B25 7,920 2,52U 1,213 172
Kozhikode "
R 12,545 8,877 2,884 702 82
Tirur "
R 15,900 11,545 3,615 649 91
Ernad "
R 17,865 11,859 5,299 612 95
South Wynad " R 7,193 4,704 2,324 93 72
123

B-XI SAMPLE HOUSEHOLDS ENGAGED IN CULTIVATION CLASSIFIED BY INTEREST IN LAND AND SIZE OF LAND CULTIVATED IN RURAL AND
URBAN AREAS SEPARATELY
Fly.leaf
This table gives a cross classification of the cultivating households consisting of households engaged in cultivation only and households engaged in both cultivatign and household industry by the interest in land and the size of land cultivated. The interest in land is c1assified into (a) owned or held from Government (b) held from private persons or institutions for payment in money, kind or share or (c) partly held from
124
Government and partly from private persons for payment in money, kind or share. The size of holdings is grouped under less than 1 acre, 1'0-2'4 acres, 2'5-4·9 acres, 5,0-7,4 acres, 7'5-9'9 acres, 10'0-12'4 acres, 12'5-14'9 acres, 15'0-29'9 acres, 30'0-49'9 acres, 50 + acres and size unspecified. The table is prepared for the rural and urban areas of the district and for the rural areas of taluks,

B-XI SAMPLE HOUSEHOLDS ENGAGED IN CULTIVATION CLASSIFIED BY INTEREST IN LAND AND SIZE OF LANDCULTIVAT.ED IN RURAL
AND URBAN AREAS SEPARATELY
(BASED ON 20 % SMIPLE)
No_ of Households engaged in cultivation by size of land in acres culti- ,
vating Interest in land house- Less 1-0- 2-:;- 5-0- 7-5- 10-0- 12-5- 15-0- 30-0- 50+ Unspeci-
cultivated holds than 1 2_i: 4-9 H 9-9 12'4 14-9 29-9 49-9 fied
(1) (2) (3) (4) (S) (6) (7) (8) (9) (10) ( 11) (12) (13)
KOZmKODE DISTRICT-RURAL
Total 18,776 6,578 7,294 3,061 1,066 311 224 60 136 25 7 If
a 2,838 945 1,124 450 181 44 38 11 22 12 4 7 b 14,138 5,472 5,561 2,022 652 183 130 28 76 5 2 7 c 1,800 161 609 589 233 84 56 21 38 8 1
KOZIDKODE DISTRICT-URBAN
Total 518 184 227 74 22 3 2 3 1 1 a 206 64 81 38 14 2 2 2 1 1 1 b 268 115 125 21 6 1 c 44 5 21 15 2 1
BADAGARA TALUK-RURAL
Total 1,622 817 608 157 27 4 4 2 3 a 127 58 54 11 2 2 b 1,370 739 500 III l4 3 2 c 125 20 51 35 11 2 2
QUILANDY TALUK-RURAL
Total 2,692 1,250 1,025 303 79 19 6 3 3 1 3 a 260 113 92 39 9 3 2 b 2,247 1,118 879 192 45 6 2 3 2 c 185 19 54 7'l. 25 10 2 3
KOZHIKODE TALUK-RURAL
Total 2,966 1,100 1,179 432 147 43 33 6 21 4 1 a 388 187 145 40 10 4 1 b 2,336 891 932 328 103 32 29 4 15 1 c 242 22 102 64 34 7 3 2 5 3
TIRUR TALUK-RURAL
Total 3,706 1,481 1,449 542 143 42 24 7 11 3 2 2 a 646 325 233 62 14 2 4 2 2 b 2,415 1,095 989 261 59 6 3 1 c 645 61 227 219 70 34 17 5 8 3
ERNAD TALUK-RURAL
Total 5,394 1,709 2,065 1,018 364 100 76 14 39 5 1 3 a 399 184 127 61 15 3 5 I 2 1 b 4,557 1,486 1,775 811 293 83 61 9 32 3 3 c 438 39 163 146 56 14 10 4 5
SOUTH WYNAD TALUK-RURAL
Total 2,396 221 968 609 306 103 81 30 60 12 4 2 a 1,018 78 473 237 131 32 26 9 17 10 3 2 b 1,213 143 486 319 138 53 33 11 28 c 165 9 53 37 18 2~ 10 15
Note:-a-Owned or held from Government b-Held from private persons or institutions for payment in money, kind or share c-Partly held from Government and partly from private persons for payment in money, kind or share
125 106/1-34


B-Xll SAMPLE HOUSEHOLDS ENGAGED IN CULTIVATION ONLY CLASSlFIED BY SIZE OF LAND CULTIVATED AND NUMBER OF FAMILY WORKERS AND HIRED
WORKERS IN RURAL AND URBAN AREAS SEPARATELY
Fly.leaf
This table shows the classification of households engaged in cultivation only according to the number of persons engaged in cultivation by the size of holding groups in acres. The number of persons engaged in cultivation are grouped under 1 person, 2 persons, 3-5 persons, 6-10 persons, more than 10 persons and
l06JI-Ma
127
unspecified. In the case of households where more than 1 person is working, the number of family workers and hired workers have been shown separately. The table is prepared for the rural and urban areas of the district and for the rural areas of taluks.

8-XU SAMPLE HOUSEHOtDS ENGAGED IN CULTIVATION ONLY CLASSIFIED HIRED WORKERS IN RURAL
(BASED ON
Cultivating households
Total of cultivating households 1 person 2 persons -, ,-____ ..A.. ___ -----... r-------.A.___-----......
Size of land House- Family worker Hired Home- Family worker House- Family worker Hired (class ranges in holds ,.----...'----.. worker holds ,....-~ holds worker
acres) M F M F M F
(1) (2) (3) (4) (5) (6) OJ (8) (9) (10) (11) (12)
KOZIDKODE
All sizes 18,209 24,688 5,809 17,190 8,900 8,109 791 4,007 5,881 1,652 481
Less than 1 6,284 7,105 1,731 2,115 4,127 3,665 462 1,249 1,763 588 147 1'0 - 2'4 7,130 9,725 2,277 5,238 3,435 3,183 252 1,755 2,599 718 193 2'5- 4'9 2,9M 4,682 1,137 4,353 951 892 59 684 1,034 246 88 5'0- N 1,046 1,798 392 2,030 241 227 14 214 314 79 35 7-5- 9'9 305 552 122 1,570 55 55 49 77 11 10
10-0-IN 222 410 74 691 42 41 1 35 58 7 5 12-5-14'9 59 107 31 220 11 9 2 4: 7 1 15·0-29'9 134 243 38 698 24 24 13 22 2 2 30-0-49'9 25 34 4 168 6 5 1 2 4: 50 + 7 12 2 107
Unspecified 13 20 1 8 Il 2 3 I
BADAGARA
All sizes 1,567 1,843 737 1,419 S18 715 103 304 382 204 22
Lessthan! 780 824 361 351 472 404- 68 163 194- 124- 8 1-0 - 2'4 594 734 286 494 288 258 30 113 149 66 11 2_5- 4-9 _ 153 221 71 436 44 40 4 27 37 14- 3 5-0- H 27 45 16 87 10 9 1
.. 7'5- 9-9 4 5 21 1 1 2 10-0-12'4 4 5 3 15 1 1 15-0 -29-9 2 4- 15 Unspecified 3 5 2 2
QUILANDY
All sizes 2,520 3,005 641 3,_ 1,322 1,188 134 476 649 191 116 Less than 1 1,136 1,180 281 849 732 645 87 208 266 95 55 l'O - 2'4 985 1,230 249 1,884- 485 447 38 194 267 75 46 2'5 - 4-9 290 420 82 773 90 82 8 52 80 16 8 5-0- N 78 115 17 281 10 9 20 30 4 6 7'5 - 9-9 17 38 8 58 2 3 1
10-0-1N 6 9 2 19 2 2 1 12'5 -14-9 3 4- 1 2 2 2 15-0 - 29-9 2 5 1 11 .. 30-().-49-9 1 1 3 Unspecified 2 3 2
KOZHIKODE
All sizes 2,8M 3,733 541 2,335 1,809 1,679 130 563 907 154 65 Less than 1 1,054 1,158 159 195 821 748 73 149 231 48 19 1-0 - 2"4- 1,158 1,519 196 620 705 661 44- 258 423 65 28
i 2-5 - 4-9 418 619 102 512 206 197 9 98 158 26 12 5-0- N 146 234 39 112 53 50 3 35 58 10 2 7-5- 9-9 43 84 17 835 9 9 10 17 I 2
10-0 -IN 33 58 11 17 10 9 8 13 2 1 12-5 -14-9 6 13 5 20 15-0 -29-9 21 42 10 16 4 4 4 6 30-0 -49'9 4 5 1 8 1 Unspecified 1
128

BY SIZE OF LAND CULTIVATED AND NUMBER OF FAMU...Y WORK.i.RS AND AND URBAN AREAS SEPARATELY
20 % SAMPLE)
according to number of persons engaged in cultivation
3-5 persons 6-10 persons More than 10 persons Unspecified ....___-----, ,------'"----- ..A. ___ ~
House- Family worker Hired House- Family worker Hired House- Family worker Hired House- Family worker Hired holds ~ worker holds r----"-----> worker hoids ,...---~ worker holds ~--. worker
M F M F M F M F
(13) (14) (15) (16) (17) (18) (19) (20) (21) (22) (23) (24) (25) (26) (27) (28)
DISTRICT-RURAL
4,056 8,246 2,462 3,898 833 1,784 698 3,456 391 668 206 9,318 22 37 779 1,477 577 650 66 128 79 258 55 72 25 1,052 8 8
1,621 3,323 1,028 1,374 203 457 219 712 106 163 60 2,938 It 21 1,039 2,129 592 1,114 233 518 195 930 73 109 45 2,213 4 8
388 822 177 457 158 340 97 696 45 95 25 842 It7 228 47 136 74 146 57 338 20 46 7 1,086 66 143 25 95 49 103 23 254 30 65 18 337 18 41 5 22 14 22 12 73 12 28 12 124 27 56 9 39 34 61 16 184 36 74 11 473
6 12 1 11 1 2 6 10 11 2 151 2 6 1 1 5 4 5 1 102 3 9
TALUK-RURAL
329 566 324 314 77 133 80 328 34 47 26 741 5 14 121 190 144 105 15 26 22 62 8 10 3 175 1 1 148 259 141 147 34 58 39 131 9 10 IO 195 2 10 52 1M 35 48 17 22 12 85 11 18 6 297 2 3 4 6 3 8 10 25 7 45 3 5 5 34 1 1 3 1 18 2 3 3 1 2 12
2 5 2 10 3
TALUK-RURAL
485 828 206 725 109 189 60 521 116 ~1 50 2,506 10 12 143 211 77 ,236 21 26 7 Il7 27 32 15 438 5 3 219 ~88 93 304 35 68 25 160 48 60 18 1,367 4 7 88 161 28 133 33 . 59 18 149 26 38 12 481 1 2 24 42 5 40 15 25 4 73 9 9 3 162 8 21 2 5 3 6 5 11 4 8 42 1 2 2 2 4 2 16 1 2 2
2 5 11 :3
TALUK-RURAL
425 964 195 315 56 138 47 198 30 45 15 1,755 1 2 ~ 73 159 32 47 3 9 2 8 7 11 4 119 2
164 369 71 112 16 46 It 45 15 20 5 435 93 217 44 70 15 39 19 49 6 8 4 381 48 108 21 49 9 15 3 41 3 2 20 19 45 !4 13 4 10 2 20 3 800 13 32 6 9 2 4 2 7 2 7 1 4 6 5 19
10 23 6 6 3 9 3 '9 :3 4 8
·f
129

B-XII SAMPLE HOUSEHOLDS ENGAGED IN CULTIVATION ONLY CLASSIFIED HIRED WORKERS IN RURAL
(BASED ON
Cultivating households r--------------------------------Total of cultivating households 1 person 2 persons r---~--~ .,
Size of land House- Family worker Hired douse- Family worke~ House- Family worker Hired (class ranges in holds .------'----. worker holds r------'---------, holds r-~ worker
acres) M F M F M F (1) (2) (3) (4) (5) (6) l7) (8) (9) (10) (11 ) (12)
TIRUR All sizes 3,615 5,134 892 3,382 1,865 1,656 209 756 1,228 20G 78 Less than I 1,430 1,662 352 498 953 830 123 269 422 90 26 1'0- z.4 1,421 2,114 357 1,242 666 600 66 342 562 92 30 2'5- 4'9 534 934 139 1,026 184 170 14 113 194 18 14 5'0- N 139 263 35 380 34 30 4 25 39 6 5 7'5 - 9'9 42 80 3 67 10 10 5 3 2
10'0-12'4 24 44 3 67 8 8 2 12'5 -14'9 7 12 2 20 2 2 1 15'0 - 29'9 II 14 52 5 5 30'0-49'9 3 7 10 50+ 2 2 20 Unspecified 2 2 2 2
ERNAD All sizes 5,299 7,857 1,964 3,~36 2,223 2,056 167 1,260 1,897 499 124 Less than 1 1,670 2,045 509 207 1,009 907 102 408 588 191 37 1'0- 2'4 2,030 2,999 769 778 849 800 49 532 802 214 48 2'5 - 4'9 999 1,685 446 1,171 257 244 13 222 347 72 25 5'0- N 362 684 148 814- 63 60 3 62 99 16 9 7'5- 9'9 100 187 45 362 19 19 14 23 3 2
10'0-12'4 76 149 30 285 12 12 14 24 2 2 12'5 -14'9 14 24 5 75 2 2 1 2 15'0 -29'9 39 69 11 229 8 8 5 8 30'0-49'9 5 7 15 2 2 2 4 50+ 1 3 Umpecified 3 5 2 2
SOUTHWYNAD All sizes 2,324 3,116 1,034 2,238 863 815 48 646 818 398 76 Less than 1 214 236 69 15 140 131 9 52 62 40 2 1'0- 2'4 942 1,129 420 220 442 417 25 316 396 206 30 2'5- 4'9 590 803 297 435 170 159 11 172 218 100 26 5'0- H 294 457 137 356 71 69 2 72 88 43 13 7.5- 9'9 99 158 49 227 16 16 17 24 6 4
10'0 - 12'4 79 145 25 288 9 9 11 18 3 1 12'5 -14'9 29 54 18 103 5 5 2 4 15'0-29'9 59 109 16 375 7 7 4 8 30'0-49'9 12 14 3 132 2 50+ 4 7 87 Unspecified 2 4
KOZHlKODE All sizes 498 587 151 1,277 223 200 23 94 119 43 26 Less than 1 173 182 50 157 96 M 12 34 39 18 11
1-0 - 2"4 219 268 76 660 . 85 78 7 45 58 22 10 2-5- 4-9 74 99 17 210 31 29 2 12 17 3 4 5-0;- 7-4 22 26 5 145 7 5 2 3 5 1 7"5- 9-9 3 3 24
1000-12-4 2 4 3 6 15-0-29-9 2 2 2 2 30-0-49-9 1 1 1 1 50+ 1 1 75 Unspecified 1 1 1 1
130
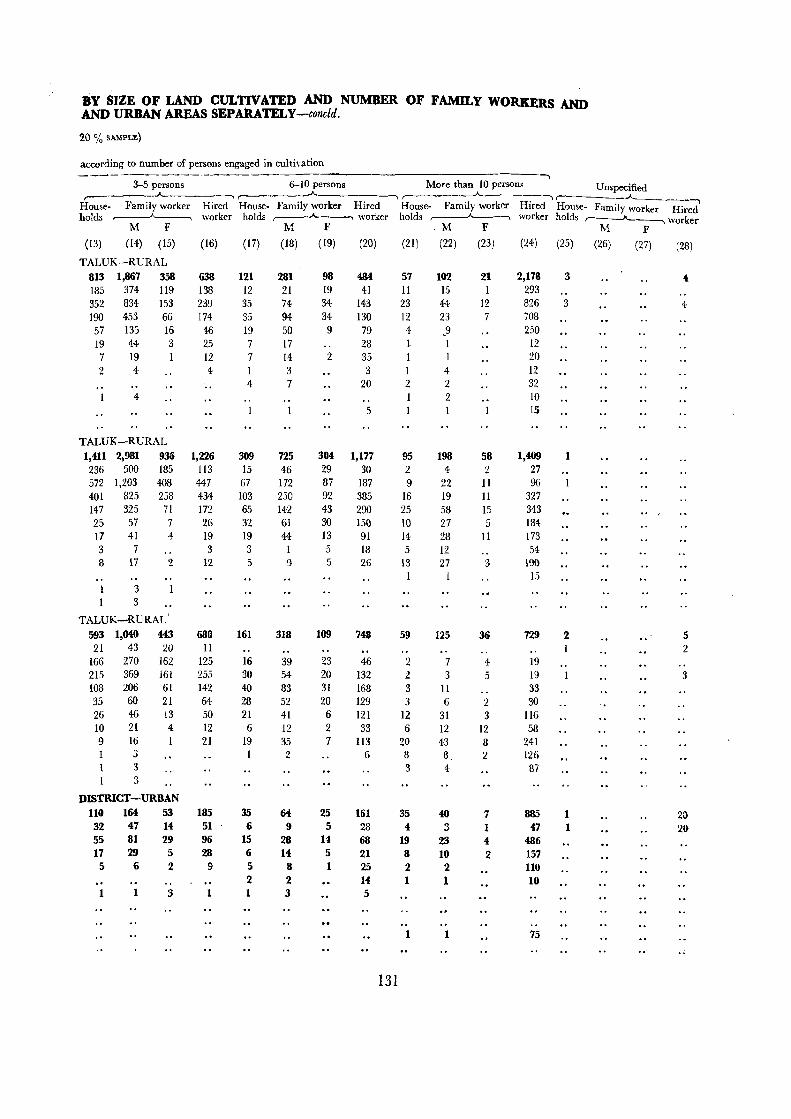
BY SIZE OF LAND CULTIVATED AND NUMBER OF FAMILY WORKERS AND AND URBAN AREAS SEPAkATELY -concld.
20 % SAMPLE)
according to number of persons engaged in cultivation , 3-5 persons 6-10 persons More than 10 persons Unspecified
,--- -, ~---.--'r----_-"---___ -, House- Family worker Hired House- Family worker Hired House- FamIly worker HIred House- Family worker Hired holds ~ worker holds ,..------A----- worker holds ~-, worker holds ...--....A------, worker
M F M F .M F M F
(13) (14) (IS) (16) (17) (18) (19) (20) (21) (22) (23) (24) (25) (26) (27) (28) TALUK-RURAL
813 1,867 358 638 121 281 98 484 57 102 21 2,178 3 4 185 374 119 138 12 21 19 41 II 15 I 293 352 834 153 239 35 74 34 143 23 44 12 826 3 4 190 453 66 174 35 94 34 130 12 23 7 708 57 135 16 46 19 50 9 79 4 "9 250 19 44 3 25 7 17 28 12 7 19 I 12 7 14 2 35 20 2 4 4 1 3 3 I 4 12
4 7 20 2 2 32 4 2 10
5 15
TALUK-RURAL 1,411 2,981 936 1,226 309 725 304 1,177 95 198 58 1,409 1 236 500 185 113 15 46 29 30 2 4 2 27 572 1,203 408 447 67 172 87 187 9 22 11 96 401 825 258 434 103 250 92 385 16 19 11 327 147 325 71 172 65 142 43 290 25 58 15 343 25 57 7 26 32 61 30 IS(} 10 27 5 184 17 41 4 19 19 44 13 91 14 28 II 173 3 7 3 3 5 18 5 12 54 8 17 2 12 5 9 5 26 13 27 3 190
1 1 15 1 3 1 3
TALUK-RURAL'
593 1,040 443 680 161 318 109 748 59 125 36 729 2 5 21 43 20 11 2
166 270 162 125 16 39 23 46 2 7 4 19 215 369 161 255 30 54 20 132 2 3 5 19 3 108 206 61 142 40 83 31 168 3 11 33 35 60 21 64 28 52 20 129 3 6 2 30 26 46 13 50 21 41 6 121 12 31 3 116 10 21 4: 12 6 12 2 33 6 12 12 58 9 16 21 19 35 7 113 20 43 8 241
3 2 6 8 8 2 126 3 3 4 87
I 3
DISTRICT-URBAN 110 164 53 185 35 64 25 161 35 40 7 885 1 23 32 47 14 51 6 9 5 28 4 3 1 47 1 2Q 55 81 29 96 15 28 14 68 19 23 4 486 17 29 5 28 6 14 5 21 8 10 2 157 5 6 2 9 5 8 1 25 2 2 110
2 2 14 1 1 10 1 1 3 1 1 3 5
1 1 75
131

B-XID SAMPLE HOUSEHOLDS ENGAGED BOTH IN CULTIVATION AND HOUSEHOLD INDUSTRY SHOWING SIZE OF LAND CULTIVATED CLASSlFmD BY PRINCIPAL
HOUSEHOLD INDUSTRY IN RURAL AND URBAN AREAS SEPARATELY
Fly-leaf
1. This table shows the distribution of households engaged in both cultivation and household industry by the size of land cultivated. The household industries are classified according to divisions and major groups
,ofIndian Standard Industrial Classification (LS.LC.). The table is prepared for rural and urban areas of the district.
132
2. The major groups of household industry having less than 10 per cent of the figures of the respective divisions are not given in this table. A mark of asterisk (*) is given on such divisions and the figures of those major groups are shown in the appendix to this table.

B-xm SAMPLE HOUSEHOLDS ENGAGED BOTH IN CULTIVATION AND HOUSEHOLD INDUSTRY SHOWING SIZE OF LAND CULTIVATED CLASSIFIED BY PRINCIPAL
HOUSEHOLD INDUSTRY IN RURAL AND URBAN AREAS SEPARATELY
(BASED ON 20% SAMPLE)
Household Industry Total Number of households by size in acres of land cultivated Code (Division .and No. of __.., No. of Major Group house- Less 1'0- 2'5- 5'0- 7'5- 10'0- 12'5- 15'0- 30'0- Unspeci-
I.S.I.C. only of I.S.I.C.) holds than I 2'4 4'9 N 9'9 IN 14'9 29'9 49'9 50 + fied 1 2 3 4 5 6 7 8 9 10 II 12 13 14
KOZlUKODE DISTRICT-RURAL
All Divisions All Industries 567 294 164 77 20 6 2 1 2 1 Division 0 Agriculture, Live-stock, Forestry,
Fishing and Hunting 13 3 2 5 3 Major group 00 Field produce and plantation
crops 2
" 02 Forestry and Logging 2 1
" 04 Live-stock and Hunting 9 2 1 4 2
·Division 2-3 Manufacturing 554- 291 162 72 17 6 2 2 Major group 20 Foodstuffs 99 49 34 13 2
" 27 Textile-miscellaneous 229 150 48 26 3
" 33 Chemicals and chemical pro- 65 5 22 18 11 5 2
ducts
KOZlUKODE DISTRICT-URBAN
All Divisions AU Industries 20 11 8 1
Division 0 Agriculture, Live-stock, Forestry, 2 Fishing and Hunting
Major group 00 Field produce and plantation 2 crops
*Division 2-3 Manufacturing 18 10 7 Major group 20 Food st~ffs 5 2 2
" 27 Textile-miscellaneous 10 5 5
APPENDIX
Major groups of Household Industry which are less than 10 per cent of the respective division have not been shown in the main table which shows such divisions by an asterisk. Major groups thus dropped from the main table are given run on in this Appendix. The figure preceding the bracket represents the code number of the major group dropped from the table. Alph'abets given in brackets are abbreviations meant for different ranges of holdings in acres as explained below. The numerical figures given after the alphabet denotes the number of households in that particular range indicated by that alphabet.
Abbreviation Class ranges of land in acres Abbreviation
A means Less than I acre G B i "
1-0 - 2-4 acres H C "
2'5 - 4'9 "
I D "
5'0-704 " J
E "
7'5 - 9'9 "
K F
" 10-0 -IN
" The list of major groups dropped from the main table is given below :
,RURAL
Class ranges of land in acres means 12'5 - 14'9 acres
" 15'0 - 29'9 "
" 30'0 - 49'9 "
" 50'0 +
" Unspecified
21 (A-I, C-2); 22 (A-I2, B-8, C-3); 23 (A-26, B-15, C-6) ; 28 (A-I5, B-17, C-2); 31 (A-I, B-1); 32 (B-1); 34 & 35 (A-ll, C-I) ; 36 (A-12, B-5, Col, D-I); 39 (A-9, B-ll).
URBAN 23 (A-I); 28 (A-I): 39 (A-I).
133 106{;,-35

B-XlV SAMPLE HOUSEHOLDS ENGAGED ONLY IN HOUSEHOLD lNDUSTRY CLASSlFmD BY PRINCIPAL HOUSEHOLD INDUSTRY IN ALL AREAS
1. This table prepared in two parts gives the classification of households engaged only in household industry by divisions, major groups and minor groups of I.S.I.O. for total, rural and urban areas ~f the district. Part A of the table shows for each division and major group of I.S.I.O. the number of households according to the number of persons engaged in household industry. The number of persons engaged in household industry are grouped under I person, 2 persons, 3-5 persons, 6-10 persons and more than 10 persons.
Fly-leaf
134
2. In Table B.XIV, Part A major groups of household industry having less than 10 per cent of the figures of the respective divisions are not given in the table; A mark of asterisk (*) is given on such divisions and the figures of those major groups are shown in the appendix to this table.
3. Part B of the table gives the number of households engaged only in household industry by each minor gr,oup ofI.S.LO.

B-XIV SAMPLE HOUSEHOLDS ENGAGED ONLY IN HOUSEHOLD INDUSTRY CLASSIFIED BY PRINCIPAL HOUSEHOLD INDUSTRY IN ALL AREAS
Part A-Households classified by major groups of Priucipal Household Industry and number of persons engaged
(BASED ON 20% SAMPLE)
Household Industry Total Households engaged in household industry according to the
number of persons engaged
(Division and Major Total No. of r--------------A..-- -. Code No. of Group only of Rural House- 1 2 3-5 6-10 More than Unspeci.
LS.LC. I.S.I.C.) Urban holds person I persons persons persons 10 persons fied
(I) (2) 3 (4) (5) (6) (7) (8) (9) (10)
KOZIUKODE DISTRICT
All Divisions All Industries T 4,239 1,812 1,367 941 102 15 2
R 3,674 1,610 1,173 801 74 14 2
U 565 202 194 140 28 1
* Division 0 Agriculture, Live- T 41 23 11 7
stock, Forestry, R 19 11 5 3
Fishing and Hunt- U 22 12 6 4
ing
Major group 04 Live-stock and Hunt- T 37 22 10 5
ing R 16 10 4 2
U 21 12 6 3
* Division 2 & 3 Manufacturing T 4,198 1,789 1,356 934 102 15 2
R 3,655 1,599 1,168 798 74 14 2
U 543 190 188 136 28
Major group 23 Textile-Cotton T 605 139 198 216 45 7
R 472 122 147 168 29 6
U 133 17 51 48 16 I
Major group 27 Textile- T 1,698 925 532 228 10 3
Miscellaneous R 1,470 808 460 192 7 3
U 228 117 72 36 3
Major group 28 Manufacture of T 658 249 214 176 17 1
wood and wooden R 618 235 200 166 15 1
products U 40 14 14 10 2
135 lOi/1-35a

B-XIV SAMPLE HOUSEHOWS ENGA-GED ONLY IN HOUSEHOLD INDUSTRY CLASSIFIED BY PRINCIPAL HOUSEHOLD INDUSTRY IN ALL AREAS
APPENDIX
Major groups of Household Industry which are less than 10 per cent of the respective division have not been shown in the main table, which shows such divisions by an asterisk. Major groups thus dropped from the main table are given run on in this appendix. The figure preceding the bracket represents code number of the major group dropped from the table. Alphabets given in brackets are abbreviations meant for class ranges of persons engaged in the household industry as explained below. The numerical figure given after alphabet denotes the number of households in that particular range indicated by that alphabet.
Abbreviation Class range of persons A means 1 person B
" 2 persons C 3-5 persons D
" 6-10 persons E
" More than 10 persons F ., Unspecified
136
The list of major groups dropped from the main table is given helow:-
TOTAL-00 (A-I, B-1, C-2); 20 (A-I06, 8-125, 0-100, D-H, E-I, F-I); 21 (A-2, B-5, C-I); 22 (A-I 16, B-3 I , C-20, D-2, E-2) ; 25 (A-I) ; 30 (A-2, C-I) ; 31 (A-6, B-6, C-3); 32 (A-I, C-I); 33 (A-5, B-8, C-6, D-I) ; 34 & 35 (A-55, B-81, C-73, D-8); 36 (A.79, B-8S, 0-68, D-5, E.!) ; 39 (A.103, 13=71, C-4I).
RURAL-OO (A.I, B.I, C·I) ; 20 (A-91, B·96, C.75, D·IO, E-I, FoI); 21 (A-2, B-5) ; 22 (A-lll, B-30, C-20, D-2, E·2) ; 30 (A-I, 0-1) ; 31 (A-6, B-5, C-2) ; 32 (A-I) ; 33 (A-5, B-7, C-6); 34 & 35 (A.52 , B-73, 0-67, D-7); 36 (A-70, B-77, C-63, D-4, E-I) ; 39 (A-95, B-68, C-38).
URBAN-OO (0-1) ; 20 (A-IS, 8-29, C-25, D-4); 21 (C-I) ; 22 (A-5, B-1) ; 25 (A-I); 30 (A-I); 31 (B-1, C.1) ; 32 (0-1) ; 33 (8-1, D-I) ; 34 & 35 (A-3, B-8, C-6, D-l) ;36 (A-9, 8-8, 0-5, D-l); 39 (A-a, 8-3, C-3) •

B.XIV SAMPLE HOUSEHOLDS ENGAGED ONLY IN HOUSEHOLD INDUSTRY CLASSIFIED BY PRINCIPAL HOUS~OLD INDUSTRY IN ALL AREAS
Part B-Households classified by minor groups of Principal Household Industry
(BASED ON 20% SAMPLE)
Code No. of I.S.I.C.
Household Industry Minor Group (Description)
Number of households
.-------"'--, Total Rural Urban
(I) (2)
All Industries
006* Production of fruits and nuts in planta. tion, vines and orchards
{)40 Production and rearing of live-stock (large heads only) mainly for milk and animal power such as cow, buffalo, goat
043 Production of ducks, hens and other small birds, eggs by rearing and poultry f\lrming
044 Rearing of bees for the production of honey, wax and collection of honey
200 Production of rice, atta, flour, etc., by milling, dehusking and processing of crops and foodgrains
202 Production of indigenous sugar, gur from sugarcane or palm juice and production of candy
204 Slaughtering, preservation of meat and fish and canning of fish
205 Production of bread, biscuits, cake and other bakery products
207 Production of edible fats and oils (other than hydrogenated oil) .
209 Production of other food products such ali sweet meat and condiments, muri, murki, chira, khoi, cocoa, chocolate, toffee, lozenge
2 I I Production ~r country liquor
212 Production of indigenous liquor, such as toddy, liquor from mahua, palm juice
214 Production of aerated and mineral water
2!~ Processing of coffee in curing works
220 Manufacture of bidi
221 Manufacture of cigars and cheroots
223 Manufacture of hookah tobacco
231 Cotton spinning (other than in mills)
235 Cotton weaving in handlooms
236 Manufacture of Khadi textile in handloollls
238 Manufacturing of cotton nets
253 Wool spinning other than in mills
(3) (4) (5)
4,239 3,674 565
4 3
34 14 20
2
98 86 12
84 63 21
23 17 6
6 6
52 44 8
84 58 26
5 5
1
168 163 5
1
2 81 70 11
504 390 114
2 2 18 10 8
137
Code No. of
LS.I.C. Household Industry Minor Group
(Description)
Number of households
,....-----J'--~ Total Rural Urban
(1) (2)
272 Embroidery and making of crepe, lace and fringes
273 Traditional garments
276 Manufacture and recovery of all types of fibres for purposes of padding, wadding and upholstery filling
277 Manufacture of coir and coir products
278 Manufacture of umbrellas
280 Sawing and planing of wood
281 Manufacture of wooden furniture and fixtures
282 Manufacture of structural wooden goods (including treated timber) such as beams, posts, doors, windows
284 Manufacture of other wooden products such as utensils, toys, artwares
288 Manufacture of materials from cork, bamboo, cane, leaveS and other allied products
303 All types of binding, stitching, sizing and other allied work connected with binding industry
310 Currying, tanning and finishing of hides and skins and preparation of finished leather
311 Manufacture of shoes and other leather footwear
313 Manufacture of leather products (except those covered by code Nos. 311, 312), such as leather upholstery, suit-cases, pocket-books, cigarette and key cases, purses, saddlery, whip and other articles
320 Manufacture of tyres and tubes
322 Manufacture of rubber goods used for industrial purpose
335 Manufacture of medicines, pharmaceutical preparations, perfumes, cosmetics and other toilet preparations except
soap
339 Manufacture of other chemicals and chemical products not covered above (including inedible oils and fats)
341 Manufacture of cement and cement products
(3) (4) (5)
4 3
93 74 19
22 21
1,573 1,366 207
6 6 2 2
47 43 4
17 17
55 54
537 502 35
3 2
2 2
12 11
7 5 2
13 13
5 5

B-XIV SAMPLE HOUSEHOLDS ENGAGED ONLY IN HOUSEHOLD INDUSTRY CLASSIFIED BY PRINCIPAL HOUSEHOLD INDUSTRY IN ALL AREAS
Part B-Households classified by minor groups of Principal Household Industry-concld.
Code No. of
I.S.I.C.
(1)
Household Industry Minor Group (Description)
(2)
342 Manufacture of lime
343 Manufacture of structural stone goods, stone dressing and stone crushing
350 Manufacture of earthenware and
Number of households
Total Rural Urban
(3) (4) (5)
27 27
earthen pottery 183 171 12 355 Manufacture of earthen image, busts
and statues
364 Manufacture of iron and steel furniture 1 365 Manufacture of brass and bell-metal
products 31 23 8
367 Manufacture of metal products (other than of iron, brass, bell metal and aluminium) such as tin can 6 6._
368 Enamelling, galvanising, plating (inclu-ding electroplating), polishing and welding of metal products 1 ••
Code No. of
LS.l.C.
(I)
Household Industry !\linor Group (Description)
(2)
369 Manufacture of sundry hardwares such as G. I. pipe, wire net, bolt, screw, bucket, cutlery (this will also include the manufacture of sundry ferrous engineering products done by jobbing engineering concerns which cannot be classified in major groups 36, 37,"38
Number of households
Total Rural Urban
(3) (4) (5)
and 39) 199 185 14
392 Assembling and repairing of watches and clocks 2 2 •.•
393 Manufacture of jewellery, silverware and wares using gold and other precious metals 212 199 13
395 Manufacture of stationery articles not covered elsewhere sech as pencil, pen-holder, fountain pen
... The figures furnished against this code relate to households engage:!. in the production of 'copra'. In the Generai Economic Table B-IV and Housing Table E-III the production of copra has been included in code number 200.
138

B-XV SAMPLE HOUSEHOLDS ENGAGED BOTH IN CULTIVATION AND HOUSEHOLD INDUSTRY CLASSIFIED BY SIZE OF LAND IN RURAL AND URBAN AREAS SEPARATELY
Fly-leaf
1. This table shows the classification of households engaged in both cultivation and household industry by the size of land cultivated and the number of persons engaged in household industry. In the case of households where more than 1 person is engaged in household industry the number of family workers and hired
139
workers have been given separately. The table is prepared for the rural areas of the district and taluks and the urban areas of the district.
2. This table shows the relationship between the scale of household industry and the scale of cultivation.

:o..xv SAMPLE HOUSEHOLDS ENGAGED BOTH IN CULTIVATION AND HOUSEHOLD
(BASED ON
Total of cultivating households which are Cultivating households
engaged in Household Industry 1 person 2 persons ----. --"----y---------"--
Size of land Family workers Family workers Family workers (class ranges House- ,--------'---.. Hired House- House- Hired
in acres) holds Males Females workers holds Males Females holds Males Females workers
(I) (2) (3) (4) (5) (6) (7) (8) (9) (10) (II) (12)
KOZHIKODE
All sizes 567 836 627 466 75 62 13 177 211 137 6
Less than 1 294 386 359 127 36 25 11 109 129 89 1·0-2'4 164 250 170 164 24 23 1 48 53 38 5 2'5-{'9 77 139 70 116 11 10 1 18 26 9 1 5'0-7'4 20 '38 16 47 2 2 1 2 7-5-9'9 6 12 6 9 1 1
10'0-12'4 2 5 1 1 1 1 1~'5-14'9 1 1 1 1 15'0-29'9 2 5 2 3 Unspecified 1 3
BADAGARA
All sizes 55 88 61 67 6 5 1 16 20 12
Less than I 37 55 44 22 4 3 14 18 10 1.0-2.4 14 23 14 39 1 2 2 2 2.5-4.9 4 Iv 3 6 I
QUILANDY
All sizes 172 208 230 230 14 9 5 54 55 52 1
Less than 1 114- 124- 160 77 10 5 5 41 43 39 1.0-2.4- 40 55 47 79 2 2 11 9 12 2.5-4.9 13 19 16 67 2 2 2 3 1 5.0-7.4- I 2 2 7.5-9.9 2 4- 2 4-
15.0-29.9 1 4- 3 Unspecified 1 3
KOZHIKODE
All sizes 82 126 81 25 15 11 4 26 34 17 1
Less than 1 46 61 49 2 10 7 3 17 23 11 1.0-2.4- 21 27 18 14- 4- 3 1 8 9 6
2.5-4.9 14- 36 13 10 1 1 2
5.0-7.4- 1 2 ' 1
TIRUR
All sizes 91 145 122 29 9 7 2 30 33 26 1
Less than 1 51 71 64 14 6 5 18 18 18 1.0-2.4- 28 46 4{l 11 2 2 10 11 8
2.5-4.9 8 16 13 1 1 2
5.0-7.4- 4- 12 5 4- 1 2
140

INDUSTRY CLASSIFIED BY SIZE OF LAND IN RURAL AND URBAN AREAS SEltARATELY
20 ~ SAMPLE)
engaged in Household Industry
3-5 persons 6-10 persons More than 10 persons r--
Family workers Family workers Family workers House- Hired House- Hired House- r----A._--, Hired holds Males Females workers holds Males Females workers holds Males Females workers
(13) (14) (15) (16) (17) (18) (19) (20) (21) (22) (23) (24)
DISTRICT-RURAL
247 429 383 78 50 101 76 176 18 33 18 206
130 203 232 27 15 25 24 55 4 4 3 45 70 129 103 18 12 26 21 38 10 ' 19 7 103 30 64 29 19 16 36 26 51 2 3 5 45 11 19 11 13 4 8 2 21 2 7 3 13 3 9 3 1 2 2 3 8 1 4
1 1 2 4 3 1 3
TALUK-RURAL
24 42 37 13 6 15 8 18 3 6 3 36
16 29 29 5 2 3 3 7 1 2 1 10 7 11 7 8 2 5 3 5 2 4 2 26 1 2 1 2 7 2 6
TALUK-RURAL
76 106 142 13 18 23 21 86 10 15 10 130
52 64 103 10 9 11 II 42 2 1 2 25 18 30 29 3 3 3 3 15 6 11 3 60 3 7 5 4 4 5 22 2 3 5 45 1 2 2 1 3 1 2 4
\ .. 4- 3 3
TALUK-RURAL
36 65 54 11 4 14 6 4 1 2 10
19 31 35 2 a 13 11 3 2 II)
8 19 7 6 4 14 6 4 1 2 1
TALUK-RURAL
45 86 78 4 5 13 14 10 2 6 2 14
26 47 45 4.- 10 12 24- 22 4 9 10 10 5 10 8 1 4 4-2 5 3 5 2 4
141 lC6/1-36

B-XV SAMPLE HOUSEHOLDS ENGAGED BOTH IN CULTIVATION AND HOUSEHOLD
(BASED ON
Total of cultivating households which are Cultivating households
engaged in Household Industry I person 2 persons -v--
Size of land Family workers Family workers Family workers (class ranges House- Hired House_ ,------~ House- Hired
in acres) holds Males Females workers holds Males Females holds Males Females workers
(I) (2) (3) (~) (5) (6) (7) (8) (9) (10) (11) (12)
ERNAD
.All sizes 95 159 91 57 13 12 1 30 43 17
Less than 1 39 65 37 12 4 3 16 24 8 1.0-2.4 35 59 39 16 5 5 10 13 7 2.5-4.9 19 30 14 16 4 4 4 6 2 5.0-7.4 '2 5 13
SOUmWYNAD
.All si_ 72 110 42 57 18 18 21 26 13 3 Less than 1 7 10 5 2 2 3 3 3
1.0-- 2.4 26 40 12 5 10 10 7 9 3 2 2.5- 4.9 ]9 28 11 17 2 2 10 13 6 I 5.0-- 7.4 12 17 7 30 2 2 7.5- 9.9 4- 8 4 5 1 I
10.0--]2,4 2 5 12.5-14.9 1 1 15.0--29.9 I I 2
KOZIDKODE
AlIsiz'e. 20 29 24 67 2 2 3 5 1
Less than 1 11 17 16 21 1 1 2 4 1.0-204 8 10 6 41 I I I 1 1 15.0-29.9 1 2 2 5
142

INDUSTRY CLASSIFIED BY SIZE OF LAND IN RURAL AND URBAN AREAS SEPARATELY-concld.
20 % SAMPLE)
.:ngaged in Household Industry A ________________
3-5 persons 6-10 persons More than 10 persons .A.._ _____ ----"
,---- Family workers Family workers Family workers
Mouse- Hired House- Hired House- Hired
holds Males Females workers holds Males Females workers holds Males Females workers
(13) (14) (15) (16) (17) (18) (19) (20) (21) (22) (23) (24)
TALUK-RURAL
39 72 46 18 11 28 24 23 2 .. 3 16
15 27 18 6 4 11 10 6
16 30 25 1 3 9 5 8 2 2 7
8 15 3 11 3 5 9 5 1 3 4: 2 9
TALUK-RURAL
27 58 26 19 6 8 3 35
2 5 2 9 21 9 3
~ 11 5 2 2 2 14-
7 10 5 13 3 5 2 17
2 6 3 1 1 I 1 4
4
2
DISTRICT-URBAN
7 10 11 8 6 10 6 35 2 2 6 24
5 6 9 Ii 2 5 .. 6 1 1 3 9
2 4 2 2 3 3 24 1 1 3 15
1 2 2 5
143
106/1- 36a

B-XVI SAMPLE PRINCIPAL HOUSEHOlJ) INDUSTRY CLASSIFIED BY PERIOD OF WORKING AND TOTAL NUMBER OF WORKERS ENGAGED IN HOUSEHOLD
INDUSTRY IN ALL AREAS
Fly-leaf
1. This table shows the classification of households engaged in household industry by the period of working grouped under 1-3 months, 4-6 months, 7-9 months and 10 months to I year. Under each of these groups the number of households, the number of family workers by sex and the number of hired workers are given. The information is available for each of the divisions and major groups of principal household industry. Households engaged in household industry have been divided into those "with cultivation" and
145
" without cultivation". The table is prepared for total, rural and urban areas of the district.
2. Major groups of household industry having less than I 0% of the figures of the respective divisions have been omitted in this table. Such divisions are marked with an asterisk (*) and the figures of those major groups are shown in the appendix to this table.
3. This table furnishes valuable data on the seasonality of various household industries.

B-XVI SAMPLE PRINCIPAL HOUSEHOLD INDUSTRY CLASSIFIED BY PERIOD OF WORKINC
(BASED eN
Total 1 to 3 months r-- ...... ,--------"------
Family Family Household Industry Total workers :Workers (Division and major Rural House- ,__.A-----, Hired House- ~ Hired
Code No. group only) Urban holds M F worker, holds M F worker.
(1) (2) (3) (4) (5) (6) (7) (8) (9) (10) (11)
KOZHlKODE
All Industries Total 4,826 4,373 5,385 1,075 280 161 291 64 (a) 587 865 651 533 69 92 54 47 (b) 4,239 3,508 4,734 542 211 69 237 17
Rural 4,241 3,843 4,698 861 266 152 282 60 (a) 567 836 627 466 69 92 54 47 (b) 3,674 3,007 4,071 395 197 60 228 13
Urban 585 530 687 214 14 9 9 4 (a) 20 29 24 67 (b) 565 SOl 663 147 14 9 9 4
*Division 0 Agriculture, live-stock, forestry, fishing and
Total 56 35 3 hunting 63 22 4 (a) IS 23 5 23 3 4 (b) 41 40 17 12
Rural 32 39 14 15 3 4 (a) 13 21 5 11 3 4 (b) 19 18 9 4
Urban 24 24 8 20 (a) 2 2 12 (b) 22 22 8 £l
Major Group 00 Field produce and plan-tation crops Total 8 10 4- 15
(a) 4 6 12 (b) 4 4 4 3
Rural 5 7 2 1 (a) 2 4 (b) 3 3 2
Urban 3 3 2 14 (a) 2 2 12 (b) I I 2 2
Major Group 04 Live-stock and hunting Total 46 49 17 16 (a) 9 13 4 7 (b) 37 36 13 9
Rural 25 28 11 10 (a) 9 13 4 7 (b) It' 15 7 3 ..
Urban 21 21 6 6 (b) 21 21 6 6
.~
*Division 2 and 3 Manufacturing Total 4,770 4,310 5,363 1,040 279 158 291 60 (a) 572 842 646 510 68 89 54 43 (b) 4,198 3,468 4,717 530 211 69 237 17
Rural 4,209 3,804 4,684 846 265 149 282 56 (a) 554 815 622 455 68 89 54 43 (b) 3,655 2,989 4,062 391 197 60 228 13
Urban 561 506 679 194 14- 9' 9 4 (a) 18 27 24 55 (b) 543 479 65i 139 14 9 9 4
(a) With cultivation (b) Without cultivation
146

AND TOTAL NUMBER OF WORKERS ENGAGED IN HOUSEHOLD L'lDUSTRY IN ALL AREAS
20 % SAMPLE)
4 to 6 months 7 to 9 months 10 months to I year Months not stated .---~ ---,
~ Family Family Family Family workers workers workers workers
House- ~ Hired House- r--.A--, Hired House- r-~'---.. Hired House- ,..---A--, Hired holds M F workers holds M F workers holds 'M F workers holds M F workers (12) (13) (14) (15) (16) (17) (18) (19) (20) (21) (22) (23) (24) (25) (26) (27)
DISTRICr
853 526 985 189 653 444 828 222 2,924 3,112 3,176 593 116 130 105 7 142 209 142 104 89 129 105 141 272 405 338 237 15 30 12 4 711 317 843 85 564 315 723 81 2,652 2,707 2,838 356 101 100 93 3 767 479 875 142 577 377 732 168 2,515 2,705 2,704 484 116 130 105 7 138 204 135 87 83 120 99 127 262 390 327 201 15 30 12 4 629 275 740 55 494 257 633 41 2,253 2,315 2,377 283 101 100 93 3
86 47 110 4.7 76 67 96 54. 4.09 4Jl7 4.72 109 4 5 7 17 6 9 6 14 10 15 11 36
82 42 183 30 70 58 90 40 399 392 461 73
-4 6 3 3 3 5 46 47 17 26 2 4-3 5 2 2 I 3 8 10 3 16 1 3 .. 1 I 1 1 2 2 38 37 14 10 1 1 1 3 5 2 2 1 3 24 25 11 8 2 4 1 3 5 2 2 3 6 8 3 4 1 3
-- 18 17 8 4 1 2 2 22 22 6 18
2 2 12 2 2 20 20 6 6
2 2 6 6 2 13 3 3 3 .. 12 3
2 2 3 3 2 1 4 4 2 1 3 1 1 3 3 3 2 1
2 2 2 2 12 2 2 12
2 2 .-4- 6 3 40 41 15 13 3 5 3 5 7 3 4 I 1 , 35 34- 12 9 3 5 3 20 21 9 7 3 5 3 5 7 3 4
15 14 6 3 20 20 6 6 20 20 6 6
849 520 984 1~ 650 441 825 217 2,878 3,065 3,159 567 114 126 1M 7 139 2M 141 1M 87 127 1M 138 264- 395 335 221 14 27 12 4 710 316 843 85 563 314 721 79 2,614 2,670 2,824 346 100 99 92 3 764 474 874 142 575 375 731 165 2,491 2,680 2,693 476 114 126 1M 7 135 199 134 87 81 lJ8 98 124 256 382 324 197 14 27 12 4 629 275 740 55 494- 257 633 41 2,235 2,298 2,369 279 100 99 92 3
85 46 110 47 75 66 94- 52 387 385 466 91 4- 5 7 17 6 9 6 14 8 13 II 24- ..
8) 41 103 30 69 57 88 38 379 372 455 67
147

R-XVI SAMPLE PRINCIPAL HOUSEHOLD INDUSTRY CLASSIFIED BY PERIOD OF WORKING
(SASED ON
Total 1 to 3 months -A ___ ---, ,---____ ..A.__ ___ ~
Household Industry Total Family Family workers workers
(Division and major Rural House· .,---"--, Hired [House. r---"---, Hired Code No. group only) Urban holds M F workers holds M F workers
(1) (2) (3) (4) (5) (6) (7) (8) (9) (10) (11)
Major Group 23 'Iextile-Cotton Total 653 907 811 239 14 9 14 (a) 48 66 64 81 4 5 5 (b) 605 841 74:7 158 10 4 9
Rural 519 725 625 188 12 8 13 (a) 47 65 61 72 4 5 5 (b) 472 660 564 116 8 3 8
Urban 134 182 186 51 2 (a) 1 1 3 9 (b) 133 181 183 4:2 2
Major Group 27 Textile-Miscellaneous Total 1,937 559 2,855 324 135 39 157 32 (a) 239 301 367 191 25 29 26 18 (b) 1,698 258 2,488 133 110 10 131 14
Rural 1,699 500 2,511 235 127 34 151 28 (a) 229 287 352 154 25 29 26 18 (b) 1,470 213 2,159 81 102 5 125 10
urban 238 59 344 89 8 5 6 4 (a) 10 14 15 37 (b) 228 45 329 52 8 5 6 4
Major Group 26 Manufacture of wood and wooden products Total 693 634 860 15 71 35 86
(a) 35 43 45 6 5 6 (b) 658 591 815 15 65 30 80
Rural 652 586 808 14 67 32 84 Ca) 34 41 42 6 5 6 (b) 618 545 766 14 61 27 78
Urban 41 48 52 4 3 2 (a) I 2 3 (b) 40 4:6 49 4 3 2
(a) With cultivation (b) Without cultivation
148

AND TOTAL NUMBER OF WORKERS ENGAGED IN HOUSEHOLD INDUSTRY IN ALL AREAS-concld.
20 % SAMPLE)
4 to 6 months 7 to 9 months 10 months to I year Months not stated -, ---.
Family Family Family Family workers workers workers workers
House· ,---..-A---, Hired House- r----"---I Hired House- ~ Hired House- ~ Hired holds M F workers holds M F workers holds M F workers holds M F workers (12) (13) (14) (15) (16) (17) (18) (19) (20) (21) (22) (23) (24) (25) (26) (27)
58 46 57 13 76 115 89 47 483 703 633 179 22 34- 18 10 8 10 11 7 10 7 25 25 41 40 45 2 2 2 48 38 47 2 69 105 82 22 458 662 593 134- 20 32 16 53 44 52 11 55 78 59 28 377 561 483 149 22 34- 18 10 8 10 11 7 10 7 25 24 40 37 36 2 2 2 43 36 42 48 68 52 3 353 521 446 113 20 32 16 5 2 5 2 21 37 30 19 106 142 150 30
1 1 3 9 5 2 5 2 21 37 30 19 105 141 147 21
436 102 618 91 355 90 531 88 966 310 1,492 110 45 18 57 3 52 67 70 58 49 58 76 53 108 138 190 59 5 9 5 3
384 35 548 33 306 32 455 35 858 172 1,302 51 40 9 52 383 90 534 54 311 76 474 57 833 282 1,295 93 45 18 57 3 49 63 64- 43 45 51 70 39 105 135 187 51 5 9 5 3
334 27 470 11 266 25 404 18 728 147 1,108 42 40 9 52 53 12 84 37 44- 14 57 31 133 28 197 17 3 4- 6 15 4 7 6 14 3 3 3 8
50 8 78 22 40 7 51. 17 130 ,25 194- 9
153 92 181 5 90 44- 126 374 458 463 10 5 5 4 10 11 16 2 3 4 16 22 19 1 2
" 143 81 165 5 88 41 122 358 436 444- 10 4- 3 4
148 90 177 5 go 44- 126 342 415 417 9 5 5 4 10 11 16 2 3 4- 15 20 16 1 2
138 79 161 5 88 41 122 327 395 401 9 4 3 i 5 2 4 32 43 46
1 2 3 5 2 4- 31 41 43
14~
106/1-37

B-XVI SAMPLE PRINCIPAL HOUSEHOLD INDUSTRY CLASSIFIED BY PERIOD OF WORKING AND TOTAL NUMBER OF WORKERS ENGAGED IN HOUSEHOLD INDUSTRY IN ALL AREAS
APPENDIX
Major groups of Household Industry which are Jess than 10 per cent of the respective divisions have not been shown in the main table which shows such division by an asterisk (*). Major groups thus dropped from the main table are given run on in the Appendix. The figure preceding the bracket represents the Code number of the major group dropped from the table. Alphabets given in brackets are abbreviations meant for different ranges of period of working in the House. hold Industries "with" or "with-out" Cultivation as explained below. Thy numerical figure given after alphabet denotes the number of households in that particular range indicated by that alphabet.
Abbreviation Class range of period of working
A means With cultivation 1 to 3 months
B" "4t06,,
C " ,,7t09 " D " ,,10 months to 1 year X " "Unspecified E means Without cultivation 1 to 3 months
F " ,,4t06 " G '" ,,7 t09 ,,1 H " ,,10 months to 1 year
Y " "Unspecified
150
The list of major groups dropped from the main table is given below:-
Kczhikode District
Total :--02 (A-I, C-1); 20 (A-8, B·2I, C-I3, D-59, X.3, £-10, F-56, G.29 , H-242, Y-lO); 21 (D-2, X.I, F-I, H-7); 22 (B-3, C-I, D-17, X-2, E-1, F-I4, G-18, H.I34, Y-4); 25 (H-I); 30 (F-1, H.2); 31 (D-2, F.l,
G-3, H-ll); 32 (B-1, H-1, Y.I); 33 (A-22, B-32, C-8, D-3, E.9, F-2, G-2, H-7); 34-35 (A-I, B-6, C-3, D-2, E-2, F-45, G-32, H-I33, Y-5); 36 (A-I, B-2, C-I, D-15, E-I, F-7, G.3, H-212, Y-lO); 39 (A-I, B-2, C-3, D-15, E-3, F-8, G.8, H-I90, Y,:,6).
Rural :-02 (A-I, C-1); 20 (A-8, B.20, C-12, D-56, X-3, E-IO, F-42, G-25, H.187, Y.IO); 21 (D-2, X.I, F-I, H-6); 22 (B.3, C-I, D-17, X.2, E.I, F-13, G.18, H.I29, Y-4); 30 (F-I, H.I); 31 (E-2, F-I, G.2, H-IO); 32 (B-1, Y.l); 33 (A.22, B-32, C.8, D-3, E.9, F-2, G-2, H.5); 34-35 (A. 1 , B-6, C-3, D-2, B-2, F-41, G·30, H-12l, Y.5); 36 (A.I, B-2, C-l, D.15, E-l, F-7, G-8, H.189, Y-lO); 39 (A.I, B-2, C-2, D.I5, E.3, F-6, G.7, H.179, Y-6).
Urban :-20 (B.I, C.I, D-3, p.14, G-4, H-55); 21 (H.l)i 22 (F-I, H.5); 25 (H.I); 30 (H.I); 31 (G.I, H-l); 32 (H-I); 33 (H.2); 34·35 (F-4, G·2, H.12); 36 (H.23); 39 (C.l, F.2, G.l, H.l1);

~XVD SAMPLE HOUSEHOLDS CLASSIFIED BY SIZE AND PARTICIPATION IN HOUSEHOLD CULTIVATION OR INDUSTRY
Fly-leaf
1. This table shows the classification of households 2. The total number of households and the total in the 3 groups viz. (i) Households engaged neither household population ~ the total, rural and urban in cultivation nor in household industry (ii) House- areas of the district are given below. The total number holds engaged in household industry only and (iii) of households is the same as that given in the Primary Households engaged in cultivation, by the size of Census Abstract and the total household population is households such as households having single memb,!r the total population as per P. C. A. excluding house-2-3 members, 4-6 members, 7-9 members and 10 or less and institutional population! more members. The number of male and female members of the households in each of these groups also are given. The households engaged in cultivation are further classified by the size of land cultivated. The table is prepared for the total, rural and urban areas of the district.
106/1-37a
Total Rural Urban
Total
Rural
Urban
151
Number of households
440,027
376,278
63,749
Household population
. Persons Males Females
2,598,628 1,286,153 1,312,475 2,176,053 1,076,595 1,099,458
422,575 209,558 213,017

B-XVII SAMPLE HOUSEHOLDS CLASSIFIED BY SIZE AND PARTICIPATION
(BASED ON
Total number
of Total sample house- Single member Total sample hold population household 2-3 members Rural house- ., ,....~
Urban holds P M F House M F House- M F holds holds
(1) (2) (3) (4) (5) (6) (7) (8) (9) (10) (11)
KOZlUKODE
Total 87,052 5111,281 256,509 261,772 2,966 1,572 1,394 13,884 16,719 19,461
All Rural 74,Hl 434,501 215,011 219,490 2,597 1,367 1,230 12,078 14,538 16,922
(i) Households engaged neither in cultiva-tion nor in house-hold industry 51,991 284,451 139,336 145,115 2,236 1,139 1,097 9,583 11,358 13,509
(ii) Households engaged in household in-dustryonly 3,674 22,386 10,777 11,609 74 21 53 533 602 812
(jii) Households engaged in cultivation 18,776 127,664 64,898 62,766 287 207 80 1,962 2,578 2,601
Size of holding group Less than 1 acre 6,578 41,251 20,621 20,630 114 65 49 837 1,025 1,203
1.0- 2.4 acres 7,294 49,016 24,900 24,116 112 89 23 754 1,008 975 2.5- 4.9
" 3,061 22,499 11,445 1l,054 42 34 8 241 343 289
5.0- 7.4 "
1,066 8,285 4,388 3,897 10 10 73 111 75 7.5- 9.9
" 311 2,559 1,364 1,195 4 4 23 36 27
10.0-12.4 "
224 1,948 1,037 9Il 18 30 16 12.5-14.9
" 60 529 284 245 2 2 4- 4- 6
15.0-2~.9 "
136 1,182 641 541 3 3 8 14 6 30.0-49.9
" 25 240 138 102 2 5 1
50.0+ 7 51 26 25 1 1 I Unspecified 14 104- 54- 50 1 1 2
.All Urbaa 12,611 83,780 41,498 42,282 3&9 205 164 1,8116 2,181 2,539
152

IN HOUSEHOLD CULTIVATION OR INDUSTRY
20% SAMPLE)
Size of sample households
4-6 members 7-9 members 10 members and over Total
"" Rural House- M F House- M F House- M F Urban holds holds holds
(12) (13) (14) (IS) (16) (17) (18) (19) (20)
DISTRICT
38,071 93,854 97,997 23,176 89,962 89,687 8,955 54,402 53,233 Total
33,184 81,785 85,472 19,7~2 76,622 76,170 6,850 40,699 39,696 All Rural
(i) Households engaged neither in cultiva-
24,188 58,806 62,411 12,566 43,223 48,528 tion nor in house-
3,418 19,810 19,570 hold industry
(ii) Households engaged III household in-
1,667 3,999 4,455 1,026 3,955 4,052 374 2,200 2,237 dustryonly
7,329 18,980 18,606 6,140 24,444- 23,590 3,058 18,689 17,889 (iii) Households engaged
in cultivation
Size of holding group 2,857 7,326 7,308 2,039 7,938 7,854 731 4,267 4,216 Less than 1 acre 2,885 7,434 7,363 2,441 9,766 9,427 1,102 6,603 6,328 1.0- 2.4 acres 1,048 2,736 2,654 1,065 4,284 4,112 665 4,048 3,991 2.5- 4.9
" 348 941 834 341 1,402 1,257 294 1,924 1,731 5.0- 7.4 " 74 207 179 106 431 394 104 686 595 7.5- 9.9 " 53 149 125 76 315 284 77 543 486 10.0-12.4 "
16 42 43 15 62 54 23 174 142 12.5-14.9 " 36 104- 78 42 186 146 47 334- 311 15.0-29'9
" 6 21 9 6 26 23 11 86 69 30.0-49.9 " 1 4 2 5 21 22 50.0+ 5 16 11 4 13 17 4- 24 20 Unspecified
4,887 12,069 12,525 3,444 13,34.0 13,517 2,105 13,703 13,537 AU Urban
153

C-SOCIAL AND CULTURAL TABLES
NOTE
1. Eight tables constitute the Social and Cultural Tables of 1961 Census. Of these tables, Table C-I has been prepared from 20 per cent sample Household Schedules. All the other tables are based on full count. The eight tables are
C-I Composition of sample households~
C-II Age and Marital Status
C-III
C-IV
C.V
C-VI
C-VU
Age, Sex and Education
Single Year Age Returns
Mother-tongue
Bilin~alism
Religion
C-VIn Classification of literacy and Industrial ~ category of workers and non-workers of Scheduled Castes/Scheduled Tribes
All the tables of this senes are presented in this volume except C.IV and C-VI. These tables are published in "Volume VII Kerala State-Part II CCultural and Migration Tables".
2. In addition to the above eight tables there are eight tables relating to technical personnel. They are furnished as appendices to Table C-III in 'Volume VII-Kerala State-Part n C-Cultural and Migration Tables '.
154

C-I COMPOSmON OF SAMPLE HOUSEHOLDS BY RELATIONSHIP TO' HEAD OF FAMll..Y CLASSIFIED BY SIZE OF LAND CULTIVATED
1, This table gives the family composition of households which has been prepared on a 20 per cent sample basis from the household schedules separately for' the total, rural and urban areas of the district. The members in the household have been divided into two groups viz. family members and non-family members. Among the family members, heads of households and their spouses have been given by sex. Married relations have been classified into married sons, other married males and other married females. Never married, widowed and divorced or separated relations also have been given by sex. Similarly sex-wise figures of non-family members or unrelated members are
Fly-leaf
155
given. This table will be of sociological interest indicating the strength of the joint family system.
2. Though the above table gives only the composi. tion of households, the corresponding table C-I of 1951 Census gives both the size and composition of households which was based on a 0·1 per cent sample households prepared from the National Register of Citizens. But in the case of Travancore-Cochin State, this table was prepared from a 4 per cent sample households.
3. In this Census the size of the households (based on 20 per cent sample) has been given separately as Table B-XVII.

C-I COMPOSmON OF SAMPLE HOUSEHOLDS BY RELATIONSHIP TO HEAD OF
(BASED ON
r-----------
Total Total No. of Rural sample
Urban households Total sample household population Heads of households ~ r-----A-----"
Persons Males Females Males Females
(1) (2) (3) (4) (5) (6) (7)
KOZHlKODE
Total 87,052 518,281 256,5O!t 261,772 73,200 13,743
All Rural 74,441 434,501 215,011 219,490 62,694 11,658
(i) Households englfged neither 51,991 284,451 139,336 145,115 42,503 9,43 [ in cultivation nor in household industry
(ii) Households engaged in 3,674 22,386 10,777 11,609 3,137 533 household industry only
(iii) Households engaged in 18,776 127,664 64,898 62,766 17,054 1,694 cultivation
Size of holding group Less than 1 acre 6,578 4[,251 20,621 20,630 5,847 722
1.0- 2.4 acres 7,294- 49,016 24,900 24,116 6,662 621
2.5- 4.9 "
3,061 22,499 11,445 1l,054 2,824 234
5.0- 7.4 "
1,066 8,285 4,388 3,897 989 76
7.3- 9.9 "
311 2,559 1,364 1,195 288 2[
10.0-12.4 "
224 1,948 1,037 9[1 212 11
12.5-14.9 60 529 284 245 58 2
15.0-29.9 "
136 1,182 641 541 130 5
SO.0-49.9 "
25 240 138 102 24
50'0+ 7 51 26 25 7 Unspecified 14 104- 54 50 13
AU Urban 12,611 83,780 41,498 42,282 10,586 2,085
156

FAMILY CLASSIFIED BY SIZE OF LAND CULTIVATED
20% SAMPLE)
Composition of households ~ --""'\
Never married,
widowed and Spouses of divorced or
heads of separated households Married relations relations Unrelated persons ~~ .......A I r-------"------, r--A-----,
Males Females Sons Other Other Males Females Males Females males females
(8) (9) (10) (II) (12) (13) (14) (15) (16)
DISTRICT
1,246 61,983 14,982 n,061 39,060 152,306 144,198 3,714 2,788 Total
999 53,356 13,009 7,948 28,345 127,422 124,312 2,939 1,819 All Rural
747 35,879 7,304 4,956 17,115 82,529 81,865 1,297 8?C ~J (i) Households engaged neither in cultivatiou nor in household industry
25 2,735 738 480 1,590 6,337 6,720 60 31 (ii) Households engaged in house-hold industry only
227 14,742 4,967 2,512 9,640 38,536 35,727 1,582 963 (iii) Households engaged in culti-vation
Size of holding group
66 5,056 1,423 740 2,994 12,434 11,735 111 123 Less than 1 acre
85 5,747 1,925 953 3,663 • 14,903 13,818 372 267 1.0- 2.4 acres
49 2,462 948 435 1,782 6,745 6,294 444 282 2.5~ 4.9 " 22 850 392 182 675 2,543 2,152 260 144 5,('- 7.4 "
4- 251 126 70 211 746 661 130 51 7.5- 9.9 " 178 82 67 160 577 524 98 38 10.0-12.4 " 49 17 IS 39 154- 141 37 14- 12.5-14.9 " 109 44 4() 86 332 310 95 3! 15.0--29.9 " 22 4- 5 15 75 54 30 10 30.()-49.9 " 6 3 13 13 5 3 50.0+
12 6 12 34- 25 Unspecified
247 8,627 1,973 3,113 10,715 24,884 19,1186 775 969 AU Urbaa
157 106/1-38

C-D AGE AND MARITAL STATUS
Fly-leaf
I. This table gives the sex-wise distribution of population by age-groups and marital status for the total, rural and urban areas of the district. For rural areas, it is presented down to taluk level. The agegroups followed in this table are 0-9, 10-14, 15-19, 20-24, 25-29, 30-34, 35-39, 40-{4, 45-49, 50-54, 55-59, 60-64, 65-69, 70+ and' age not stated' which conform to international standards.
2. The corresponding table at the 1951 Census (Table C III-Age and Civil Condition) was prepared on a 10 per cent sample unlike the present one done on full count.
158
3. The marital status groupings in 1961 Census and the civil condition groupings in the 1951 Census are given below:-
Marital Status (1961) Civil Condition (1951)
~ever married 1 Unmarried
2 ~Iarried 2 ~farried
3 Widowed 3 Widowed or Divorced
4 Divorced or Separated
5 Unspecified Status

Agegroup
(I)
All ages
0--9
10--14
15-19
20--24
25-29
30-34
35-39
45-49
50-54
55-59
65-69
70-;-
Age not stated
Total Rural Urban
(2)
T R U
T R U
T R U
T R U
T R U
T R U
T R U
T R U
T R U
T R U T R U
T R U
T R U T R U
T R U
T R U
l06/1-38a
c-u AGE AND MARITAL STATUS
Marital Status r--------------.A.-----________ ~
Total population
P M F
(3j (4) (5)
Never married r-----"---,
M F
(6) (7)
Married r---..,A..--~
M F
(8) (9)
KozmKODE DISTRICT
\\'idowed ,-----'-----.
~1 F
(IO~ (l I)
Di\~orced or
Separated r----__.._--~
111 F
(1~) (n
2,617,189 1,300,974 1,316,215 795,727 629,862 473,661 502,253 18,703 146,767 1l,851 36,467 2,184,682 1,083,556 1,101,126 658,654 525,182 397,392 424,056 15,847 119,283 10,671 31,783
432,507 217,-HS 215,089 137,073 104,680 76,269 78,197 2,856 27,434 1,130 4,{)79
765,9i2 649,108 116,864
3j6,392 298,225 53,167
217,861 179,147 38,714
219,318 181,404 37,91+
200,203 166,818 33,390
17l,353 Hl,633 29,il8
152,831 126,308 26,543
127,219 105,041 22,178
105,091 86,876 18,215
90,016 74,049 1.'),967
60,278 49,809 10,469
59,528 49,368 lO,160
35,924 30,171 5,753
::;4,322 45,893 8,429
356 830
26
389,533 329,4+2 60,li6
132,581 151,557 30,O~~
106,065 86,8l1 19,254
lO-J.,49-l: 85,6-!-2 18,852
92,S83
76,5\7 16,066
82,473 67,394 14,579
76,465 63,1:)9
13,306
65,41:2 53,945 11,467
54,i33 44,324 9,359
45,374 37,261
8,1l3
30,530 25,414
5,166
28,176 23,5!t9 4,607
17,459 1+,760 2,699
25.073 21,276 3,797
498 435
13
376,414 389,558 376,414 319,666 329,442 319,666 56,H3 60,116 56,748
173,811 145,668 28,143
111,796 9~,336
19,460
114,824 95,762 19,062
107,625 90,301 17,324
38,880 73,Hl 15,139
76,386 63,149 13,237
61,807 51,096 1O,7lI
50,908 42,052
8,856
44,642 36,788
7,854
29,698 24,393 5,303
31,352 25,799
5,553
13,465 15,41l 3,054
29,249 24,6l7 4,632
358 345
13
l82,051 152,046 30,005
102,169 83,172 18,997
72,659 57,318 15,341
39,726 23,264
7,462
9,390 7,154 2,736
3,571 2,524 1,047
1,642 1,134
508
1,093 776 317
730 522 208
568 419 149
336 249 87
209 1@6 43
271 223
48
254 245
9
167,620 140,220 27,400
261 5,623 24+ 4,913
17 112
54,733 3,490 52,601 43,138 3,24+ 45,202 11,595 246 7,399
14,388 29,922 92,114 10,677 26,515 78,281 4,211 3,407 13,833
5,953 59,000 92,182 4,194 50,621 77,974 1,759 8,379 14,208
3,285 69,931 74,59 [ 2,321 58,405 62,329
964 11 ,526 12,262
2,218 70,546 61,183 1,5;;2 ~8,588 51,070
666 lJ,958 10,113
1,643 61,535. 43,623 1,171 50,922 36,455
472 10,613 7,168
1,004 50,832 32,066 711 42,103 26,937 293 8,729 5,129
721 42,115 21,916 498 34,625 13,507 223 7,490 3,409
421 27,780 12,084 289 23,095 ]0,166 132 4,685 1,918
314 24,703 8,278 227 20,648 7,052 87 4,055 ] ,226
17l 14,842 3,550 118 12,506 3,047 53 2,336 503
308 18,485 2,320 242 15.661 2,005 66 2,824 315
169 219 120 158 215 liB II 4 2
159
5
36 436 34 399
,) 37
2Li 1,627 198 1,313
17 314
HI 3,323 33-1: 2,m 57 610
65 7 5~6i:3
56+ 4,505 93 1,168
869 8,499 i3~1 6.699 134 1.800
1,056 12,937 870 10,381 186 2,556
1,370 15,267 1,175 12,205
195 3,062
1,774 20,134 1,455 16,166
319 3,968
1,737 16,216 1,461 13,094
276 3,122
2,671 21,942 2,251 17,320
420 4,122
2,091 14,31)8 1,803 11,912
288 2.456
5,776 26,21~1
4,907 2VJ05 869 +.2!?
9 4'; 9 46
4: 4
2~8 22.1,
1,574 1,489
85
2,299 2,t36
163
1,921 1,704 ~17
1,41+ 1,249
163
1,116 96~
154-
348 734 114
iv9 617
92 473 41i 36
445 401 44
3.2
303 23+ ~l
3,84+ 3,4;+
370
6,08U 5,332
698 6,064
5,320 7-t4
5,274 4,534
740
4,447 B,791
656
3,555 3,042
513
2,34U 2,172
368
1,837 1,533
249
961 831 130
81)6 6(1)
116
364 3"'-' 42
IS 15
Unspecified status ~
:vI F
(14) (15)
1,032 866 992 817 40 49
264 262
:2
H2 137
124 122
2
117 liZ
,)
74 67 7
63 63
')
63 57 6
40 36 4
46 42
4
21 20
~o
20
26 24 2
8 8
231 226
132 123
9
115 109
6
103 100
3
57 52 5
39 37 2
49 47 2
31 27 4
34 2!! 5
15 15
12 10 :!
12 12
27 22 5
8 3

c.u AGE AND MARITAL STATUS-coutd.
Marital Status ,------
_____ ..A. ____________ ~
Agegroup
(I)
Total Rural
Urban
(2)
All ages R 0- 9
10-14 15-19 20-24 25-29 30-34 35-39 40-44 45--49 50-54 55-59 60-64 65-69 70-1-
Age l~ot stated
All ages R 0- 9
10-14 15-19 20-24 25-29 30-34 35-39 40--44 45-49 50-54 55--59 60-64 65-69 70+
Age not stated
Total population ,-----'------I
P M F
(3) (4) (5)
276,005 78,429 37,879 21,615 22,';99 20,869 17,866 i6,169 13,019 11,990 10,064 7,356 7,(J7{J +,5S2 6,403
125
348,987 99,483 48,137 27,396 27,7,:'5 2G,2S1 22,962 :21,183 16,242 14,6~9
12,013 8,917 8,432 5,902 9,398
167
134,675 39,875 19,227 10,137 10,197 9,170 8,336 7,862 6,377 5,995 4,907 3,806 3,425 2,309 2,989
63
172,696 50,617 2~,.550
13,196 12,956 ll,987 10,981 1O,:i59 8,172 7,462 6,132 4,674 4,086 2,877 4,349
98
141,330 38,554 18,652 11,478 12,402 11,699 9,530 8,307 6,642 5,995 5,157 3,550 3,645 2,243 3,414
62
176,291 48,866 23,587 14,200 14,799 1+,294 11,981 10,624 8,070 7,237 5,881 4,243 4,346 3,025 5,049
89
Never married ~
M F
(6) (7)
:0.Iarried ,---~
M F
(8) (9)
BADAGARA TALUK-RURAL
80,473 39,875 19,122 9,863 7,175 2,821
824 293 133 III
70 50 39 29 4-5 23
63,838 38,554 17,530 5,141 1,219
390 261 199 133 114 87 50 4-5 28 55 32
50,529 56,556
38 1,035 238 5,861
2,853 10,397 6,022 10,239 7,227 8,083 7,328 6,675 6,006 4,785 5,621 3,818 4,531 2,539 3,495 1,392 2,996 1,176 1,971 355
2,166 183 37 17
QUlLANDY TALUK-RURAL
104,182 50,617 24,449 12,912 9,672 4,278 1,236
407 175 122 87 47 37 30 61 52
82,221 64,153 68,519 48,866 22,627 42 854 6,950 1,626
681 410 309 261 160 J09 62 39 20 59 42
241 3,074 7,312 9,360 9,802 7,751 7,090 5,743 4,301 3,663 2,474 3,262
38
6,809 12,270 12,358 10,089 8,613 5,744 4,727 3,067 1,769 1,196
632 360
31
KOZHIKODE TAL UK-RURAL
All ages 0- 9
- 10-14 15-19 20-24 25-29 30-34 35-39 40--44 45--49
R 378,528 110,013 51,4~8
30,910 31,428 28,594 25,6lD 22,261 18,331 14,957
50-54 12,690 55-59 8,891 60-64 8,844 65-69 5,')55
70+ 8,824 Age not stated 182
190,377 56,086 26,426 15,422 ]5,467 13,470 12,682 11,390 9,543 7,815 6,551 4,453 4,170 2,733 4,030
J39
188,151 53,937 25,002 15,488 15,%1 15,124 12,928 iO,871 3,788 7,142 6,139 4,438 4,674 2,822 4,794
43
119,128 56,086 26,390 13,152 12,136 5,754 2,081
673 274 171 137 64 5Q 40 37 83
93,824 53,937 24,322 9,124-2,860 1,290
772 496 396 215 143 77 70 33 66 23
67,150 69;244
657 237 5,944
3,147 12,227 7,378 12,673
10,217 10,642 10,388 8,617 8,966 6,248 7,351 4,626 6,120 3,304 4,127 1,954 3,715 1,284 2,353 611 3,100 443
51 14
160
Widowed ,---~
~I F
(10) ('1)
2,091 16,369
1 2
33 73 77 90
134 198 205 311 263 690
1
7 46
158 321 555 868
1,285 i,685 2,270 1,959 2,309 1,71)9 3,112
5
2,393 20,061
4-2 39
25 151 36 432 64 674 92 987 85 1,478
134 1,894 178 2,378 236 2,228 312 2,9»1 304 2,299 924 4,534
1 12
2,432 20,471
5 63
24 182' 61 386 84 737
116 1,1~3
145 1,664 165 1,951 201 2,453 ,95 2,282 337 3,208 292 2,125 811 4-,237
5
Divorced or
Separated
M F
(12) (13)
1,365
6 130 257 203 149 136 120 104 54 73 45 86 2
1,729
7 157 334 301 244 147 108 114 84 71 64 95 3
1,511
13 146 266 285 203 146 120 83 64 65 43 77
4,461
36 418 616 745 624 564 43+ 375 255 147 ill 67 63 6
5,271
39 373 725 795 796 707 572 448 319 180 158 72 86
4,603
17 354 690 775 727 635 480 350 239 123 ll2 53 47
Unspecified status ~
M F
(14) (15)
217
66 28 26 37 9
15 12 9 4 2 6 1 2
239
59 34 28 27 20 14 14 8
10 6 3 5 7 4
156
36 20 14 11 15 ]0 12 8
10 3 3 5 5 4
106
44 12 12 4 7
5 3 6 2 4 3
2
219
63 29 27 28 12 8
15 8 8 4 2 2
10 3
9
1 3 2
2

C-D AGE AND MARITAL STATUS-con,ld.
Total Age- Rural group Urban Total population
(I) (2)
All ages R
0-9 10-1+ 15-19 ~O-2+
25-29 30-34 35-39 40-44 45-49 50-54 55-59 60-64 65-69 70+
Age not stated
All ages R
0- 9 10-14 15-19 20-24 25-29 30-34 35-39 40-44 45-49 50-54 55-59 60-64 65-69 70+
Age not stated
All ages R
0- 9 10-14 15-19 20-24 25-29 30-34 35-39 40-44 45-49 50-54 55-59 60-64 65-69 70+
Age not stated
r------.A.-___ --, p }'I F
(3) (4) (5)
484,089
146,097 68,522 40,795 39,436 35,461 30,802 27,058 23,263 18,139 16,643 10,438 11,150 6,454 9,639
19:2
512,018
156,982 69,077 44,401 43,617 39,528 31,618 27,446 25,333 19,452 17,266 10,568 10,993 6,140 9,476
121
185,055
58,094 23,182 14,030 16,569 16,085 12,777 12,191 3,853 7,639 5,373 3,639 2,879 1,568 2,153
23
233,460
74,083 34,703 i9,221 17,500 15,140 13,773 12,741 11,533 8,872 7,919 5,020 5,097 3,079 4,668
III
250,629
72,014 33,819 21,574 21,936 20,321 17,029 14,317 11,730 9,267 8,724 5,418 6,053 3,375 4,971
81
254,442 257,576
79,524 35,658 21,763 20,94+ 18,302 15,327 13,717 13,052 9,981 8,539 5,296 5,1"32 2,934 4,208
65
97,906
29,257 11,993 7,072 8,578 8,448 6,795 6,890 5,268 4,699 3,213 2,165
1,659 828
1,032 9
77,458 33,419 22,638 22,673 21,226 16,291 13,729 12,281 9,471 8,727 5,272 5,861 3,206 5,268
56
87,149
28,837 11,189 6,958 7,991 7,637 5,982 5,301 3,585 2,940 2,160 1,474 1,220
740 1,121
14
Marital Status
r-----------------~--------~----------~ , Divorced
Never married ~
M F (6) (7)
~Iarried r-~
M F
(3) (9)
TIRUR TALUK-RURAL
144,656 119,845
74,083 72,014 34,606 32,978 18,213 10,102
82,835 95,087
50 933
10,914- 2,551 6,271 10,478 12,080 11,880
4,213 912 1,288 446
473 301 2-U 163 96
173 60 39 47 46
172 10,894 123 8,318 85 57 33
7,311 4,406 4,359
17 2,542 28 '3,254 26 59
750 10,642 17,690 17,407 14,264 11,4{)5 8;212 5,680 4,227 2,178 1,5:;1
643 434
34
LRNAD TALUK-RURAL
a53,078 121,298 94,604 99,018
79,52+ 35,513 20,205 11,922 3,724 1, III
411 223 151 96 61 46 23 19 39
77,458 31,825 8,429 1,844
754 351 197 167 83 60 31 34 15 22 28
90 1,370 8,275
13,765 13,641 12,845 12,349 9,336 7,963 4,807 4,509 2,481 3,149
24
1,404-12,637 18,661 18,258 13,73-1-11,CJ77 8,592 5,89) 4,093 2,124-1,479
622 402
18
Widowed ,---~-,
\,1 F
(10) (11)
3,924 28,3;8
3 10 ]03 46 373 77 732
119 1,208 153 1,708 216 2,665 241 3,026 379 4,073 355 3,004 599 4,369 447 2,660
1,278 4,440 4 14
5 19 120 52 355
101 657 119 1,01}0 ]56 1,619 212 2,732 319 3,016 323 4,198 321 2,956 498 4,193 373 2.502 923 4,768
1 7
SOUTH WY~AD TALUK-RURAL
57,137
29,257 11,966 6,827 5,499 2,474
614-267 87
30 2+ 17 5 4 2
44,156
28,837 10,938 3,392
38,121 35,632
577 167
81 50 42 16 14 12 6 5
12 7
161
1+ 213 225 3,309
2,895 7,036 5,666 7,039 5,880 3,497 6,345 4,683 4,956 1,87.)-4,387 2;191 2,957 1,':7') 1,959 i.J:9 1,406 396
685 183 730 J83
6 -l-
1,595
38 76
105 HI 122 '0')
171 149 204 J24
5,816
28 94-
135 221 394 ';;57 633 794-,,65 790 537 914
3
or Unspecified separated status ~ ..------'----. ]\1 F!vI F
(12) (13) (14) (IS)
1,861 7,064
37 38 693
242 1,291 362 1,238 273 1,095 219 880 170 661 146 427 126 328 81 175 73 126 4-5 49 83 59 2 5
3,207
3 147 678 695 450 305 204 172 143 104 87 55
103
998
13 136 222 1~2
129 99 68 47 30 32 B 17
8,894
137 1,416 1,783 1,528 1,115
831 784 472 370 159 155 66 76 2
1,495
18 220 277 239 177 174 III 100 77 47 28 15 12
184
46 27 27 10 13 16 11 4 7 5
6 6 6
141
-" :J~
22 17 17
13
4 3 9 3 2 2 4
55
3 6
10 10
4-8 4 4-2 3
255
51 34 31 32 16 23 20 11 11 4 4 6
10 2
178
48 36 30 29 11 5 6 5 4-2
50
19 9 7 7 6

COm AGE, SEX AND EDUCATION
Fly-leaf
1. This table gives the sex-wise distribution of population by age-groups and educational levels for the district. It is divided iato three parts, Part A dealing with all areas, Part B dealing with urban areas and Part C dealing with rural areas. The age-groups followed in all the three parts are 0-4, 5-9, 10-14 15-19, 20-24, 25-29, 30-H, 35-44, 45-59,60+ and , age not stated'.
2. The classification of eciuCl.tional levels are different for rural and urban areas. Besides giving the number of illiterates and literates (without educational level), the remaining literates are classified as fellows :
Urba71 I Primary or Junior Basic 2 Matriculation or Higher Secondary 3 Technical diploma not equal to degree 4 Non-technical diploma not equal to degre~ 5 University degree or post-graduate degree
other than technical degree 6 Technical degree or diploma equal to degree
or post-graduate degree (i) Engineering (ii) Medicine
(iii) Agriculture (iv) Veterinary and Dairying (I')) Technology
(vi) Teaching (vii) Others
162
Rural
Primary or Junior Basic
2 !vlatriculation or Higher Secondary
3. All per~ons who have ability to read and write with understanding, i.e., to read any simple letter with felicity and write a simple letter with understanding, are considered literates. Those who have passed Lower Primar>" or Junior Basic but have not passed Matriculation, . Higher Secondary, S.S,L.C. or E.S.L.C., come under the category of Primary or Junior Basic and all who have passed Matriculation, Higher Secondary, S.S.L.C. or E.S.L.C., come under the category of Matriculation or Higher Secondary.
4. In connection with the enumeration of technical personnel, degrees in science subjects like Physics, Mathematics, Chemistry, Geology, Geo~Physics,
Geography, etc., have been recognised as technical degrees. These do not come under the specific items covered by 'technical degree or diploma equal to degree or post-graduate degree'. Hence wherever the subject of graduation has been given these have been included under 'others' in the urban areas. This accounts for the higher percentage of ' others' coming under' technical degree or diploma equal to degree or ~ost~graduate degree'.

em PART-A AGE, SEX AND EDUCATION IN A.U AREAS
Educational levels ,-- ~
Literate (without Primary or Junior Matriculation and Total population llliterate educational levels) :!3asic above
r- -, ,----..A..__""'"\ ~ ~ ,---'------;
Age-group P :\1 F :M F 11 F M F .M F
(I) (2) (3) (4) (5) (6) (7) (8) (9) (10) (II) (12)
KOZHIKODE DISTRICT
All ages 2,617,189 1,300,974 1,316,215 635,588 918,306 458,864 2.80,951 ~73,4U 106,860 33,111 10,098
0---1- 394,332 199,445 194,887 199,445 194,887
5- 9 371,640 190,113 181,527 125,102 126,742 54,696 46,3134 10,315 8,401
10--14 356,392 182,581 173,811 45,221 68,725 82,118 65,864 55,176 39,171 66 51
15-19 217,861 106,065 111,796 28,029 53,321 40,603 35,370 31,837 20,338 5,5% 2,767
20--24 219,318 lM,494 114,824 29,186 65,291 45,768 32,978 20,360 13,232 9,180 3,323
25-29 200,208 92,583 107,625 29,747 .68,944 42,686 27,615 14,186 9,249 5,964 1,817
30-34 171,353 82,173 88,880 26,675 59,506 40,088 21,833 12,0(l2 ~,619 3,708 922
35-44 280,070 141,877 138,193 52,250 103,289 67,987 27,164 17,339 6,936 4,301 304 ..
57,389 16,638 9,824 2,411 3,350 45-59 255,385 130,137 125,248 59,574 105,865 334
60+ 149,774 70,708 79,06'; 40,127 71,459 27,325 7,054 2,323 478 933 75
Age not stated 856 498 358 232 277 204 51 49 25 13 5
163

c·m PART·B AGE, SEXAND
Educational ,-.
Literate (without Primary or Junior Matriculation ror Total populatloa Illiterate educational levels) Basic Higher Secondary ~ r---~-' r------"---~
Age-group P M F M F M F M F M F
(I) (2) (3) (4) (5) (6) (7) (8) (9) (10) (II) (12)
KOZHIKODE
. All age. 437,507 217,4111 215,089 85,813 127,748 82,713 56,888 34,192 24,784 12,441 5,083
0- 4 59,287 30,262 29,025 30,262 29,025 .. 5- 9 57,577 29,854 27,723 17,708 17,139 11,848 10,296 298 288
10-14 58,167 30,024 28,143 5,487 7,970 14,331 11,936 10,180 8,219 26 18
15-19 38,714 19,254- 19,460 3,347 6,374 7,067 6,672 6,661 5,052 2,098 1,327
20-24 37,914 18,852 19,05~ 3,374 7,732 7,840 6,294 4,097 3,253 3,129 1,565
25-29 :3,390 16,066 17,324- 3,472 8,502 7,099 5,320 3,047 2,482 1,946 894
30-34 29,718 14,579 15,139 3,10'.) 8,023 6,923 4,583 2,795 1,952 1,369 502
35-44 48,721 24,773 23,948 6,239 15,19.) 12,128 5,943 4,123 2,230 1,919 497
45-59 44,651 22,638 2:!.OI3 7,6tii: 11),673 10,756 4,044 2,361 1,036 1,487 225
60+ 24,342 II,IOS U.!39 5,124 11,104- 4,717 1,799 630 272 466 54
Age not stated 26 l} 13 7 II 4- I
164

EDUCATION IN URBAN AREAS ONLr
levels
Non-Technical technical University degree Technical degree or diploma equal to degree or post-graduate degree diploma diploma not or post-graduate ,-
not equal to equal to degree other than Veterinary and degree degree technical degree Engineering Medicine Agriculture dairying Technology Teaching Others ~ r----"-----, M F M F M F M
(13) (14) (15) (16) (11) (18) (19)
DISTRICT
140 7 64 7 1,297 273 fi9
9 1 16 13 1 37 3 ... 195 125 6 29 16 296 62 20 19 1 9 226 35 11
J2 5 15 224 30 H· 21 14 225 8 15
13 6 2 115 2
l00J1-39
F M F M F M F M
(20) (21) (22) (23) (24) (25) (26) (2.7)
1 72 20 13 ,
6 2
14 ... 5 ... 14- 6
13 6 2
23 3 4-
2 3
165
F
(28)
M
(29)
F
(30)
M F
(31) (32)
148 169 447 1.
53 22 3 29 160 5&
22 44- 96 15 4() 28 64- 9 28 37 56 5 34- 23 14 21 8 3


c..m PART.C AGE, SEX AND EDUCATION IN BURAL AREAS ONLT
Educational levels Literate (without
educational Primary or Junior Matriculation Total population Illiterate levels) Basic and above
Age-group P M F M F M F M F ,..---'----'\
M F
(I) (2) (3) (4) (5) (6) (7) (8) (9) (10) ( II) (12)
KOZlUKODE DISTRICT
All a~es 2,184,682 ~1,083,556 1,101,126 549,775 790,558 376,151 224,063 139,219 82,076 18,411 4,429
0-4 335,045 169,183 165,862 169,183 165,862
5-9 314,063 160,259 153,804 107,394 109,603 42,848 36,088 10,017 8,113 ... 10-14 298,225 152,557 145,668 39,734 60,755 67,787 53,928 44,996 30,952 40 33
15-19 179,147 86,811 92,336 24,682 46,947 33,536 28,698 25,176 15,286 3,417 1,405
20-24 181,404 85,642 95,762 25,812 57,559 37,928 26,684 16,263 9,979 5,639 1,540
25-29 166,818 76,517 90,301 26,275 60,442 35,587 22,295 11,139 6,767 3,516 797
30-34 141,635 67,894 73,741 23,566 51,483 33,165 17,250 9,207 4,667 1,956 341
35-44 231,349 117,104- 114,245 46,011 88,094 55,859 21,221 13,216 4,706 2,018 224
45-59 210,734 107,499 103,235 51,890 89,192 46,633 12,594 7,463 1,375 1,513 74
60 + 125,432 59,605 65,827 35,003 60,355 22,608 5,255 1:693 206 301 II
Age not stated 330 485 345 225 266 200 50 49 25 1 ) 4-
167 106Jl-39a

C.V. MOTHER TONGUE
This table which corresponds to Table D-I Language (i) Mother tongue of 1951 Census gives the sex-wise distribution of the population under different mother tongues for the total, rural and urban areas of the
district and up to taluk level for rural areas. This is finalised in consultation with the Linguist of Registrar General's Office. The following notes have also been prepared by the Linguist :-
NOTE I
1. The following mother tongues arranged in alphabetical order in column I of the statement given below as pel' Table C-V have been classified in the Linguistic Survey of India. The Linguistic Survey of India classification number is mentioned against each mother tongue in column 3.
2. If in column 3 no classification number is given against any mother tongue of column I, then it would mean that the name refers to either old or middle Indo-Aryan language or a language group or branch or family name from the Linguistic Survey of India.
3. Wherever a tongue is mentioned in column 3 it is to be understood that the mother tongue is either a dialect or another name or form of the tongue mentioned against it in column I which in its turn has been classified by the Linguistic Survey of India in the appropriate place for that tongue.
4. If in column I, there is a tongue which bears no classification number in the Linguistic Survey of India then in colvmn 2 the name of the classified language or group will be given of which the mother tongue of column 1 is either a dialect or another name or form. In such a case the number of classified language of column 2 has been given in column 3.
5. In column 2 standardized spellings according to Linguistic Survey of India has been given against each mother tongue of column I.
Alphabetical order of mother tongues classified by the Linguistic Survey of
India
I Bengali 2 Coorgi/Kodagu 3 Gujarati 4 Hindi 5 Hindustani 6 Kachchhi 7 Kannada 8 Kashmiri 9 Konkani
10 Malayalam II Marathi 12 Nawait 13 Nepali 14 Oriya 15 Punjabi 16 Sindhi 17 Tamil 18 Telugu 19 Tulu 20 Urdu
Classified name in the Linguistic Survey of India
2
Bengali KOdagu/Coorgi Gujarati Hindi Hindostani Kachchhi Kanarese Kashmiri Konkani
Malayalam Marathi Daldi Naipali Oriya Punjabi Sindhi Tamil Te1ugu Tulu Urdu
NOTE 2
Classification number in the Linguistic Survey of
India
3
529 301 652 586 582 451 296 Karandi 399 494 cf., Note 2
Goanese cf., Note 2
293 Pania 455 497 cf., Note 2 781 Gorkhali 502 632 Sikhi 445 285 319 302 585
The following mother tongues arranged in alphabetical order as per Table C-V and are indicated Iby asterisk and dagger or a dagger alone in that Table have been tentatively classified or reclassified by the Linguist in the manner stated below:-
(T) against the mother tongue in column 1 indicates that it has been tentatively classified, (TR) means that it has been tentatively reclassified by the Linguist.
168
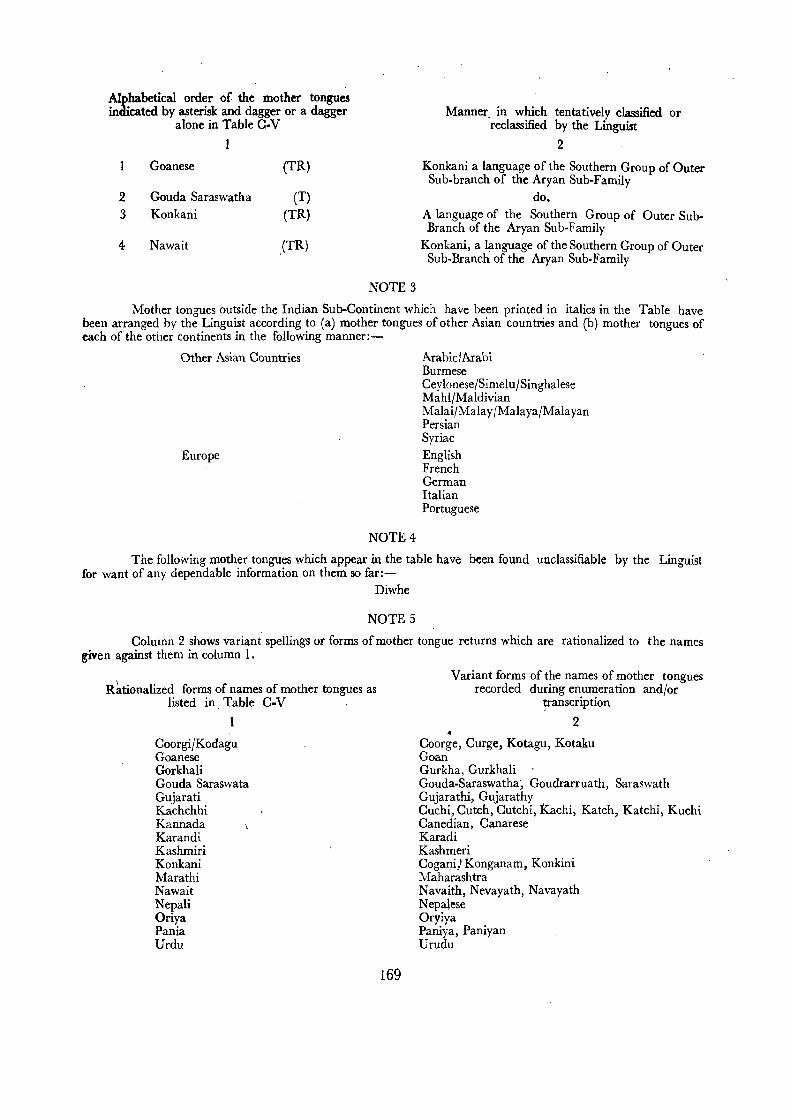
Alphabetical order of the mother tongues indicated by asterisk and dagger or a dagger
alone in Table C·V
2 3
4-
Goanese
Gouda Saraswatha Konkani
Nawait
(TR)
(T) (TR)
(TR)
NOTE 3
Manner in which tentatively classified or 'reclassified by the Linguist
2
Konkani a language of the Southern Group of Outer Sub-branch of the Aryan Sub-Family
do. A language of the Southern Group of Outer SubBranch of the Aryan Sub-Family
Konkani, a lilnguage of the Southern Group of Outer Sub-Branch of the Aryan Sub-Family
Mother tongues outside the Indian Sub-Continent which have been printed in italics in the Table have been arranged by the Linguist according to (a) mother tongues of other Asian countries and (b) mother tongues of each of the other continents in the following manner:-
Other Asian Countries
Europe
NOTE 4
Arabic/Arabi Burmese Ceylonese/Simelu/Singhalese Mahl/Maldivian Malai/Malay/Malaya/Malayan Persian Syriac English French German Italian Portuguese
The following mother tongues which appear in the table have been found unclassifiable by the Linguist for want of any dependable information on them so far:-
Diwhe
NOTES
Column 2 shows variant spellings or forms of mother tongue returns which are rationalized to the names given against them in column 1.
R~tionalized forms of names of mother tongues as listed in Table C-V
I
Coorgi/Kodagu Goanese Gorkhali Gouda Saraswata Gujarati Kachchhi Kannada Karandi Kashmiri Konkani Marathi Nawait Nepali Oriya Pania Urdu
169
Variant forms of the names of mother tongues recorded during enumeration and/or
?,anscription
2 •
Coorge, Curge, Kotagu, Kotaku Goan Gurkha, Gurkhali Gouda-Saraswatha~ Goudrarruath, Saraswath Gujarathi, Gujarathy Cuchi, Cutch, Cutchi, l<.achi, Katch, Katchi, Kuchi Canedian, Canarese Karadi Kashmeri Cogani} Konganam, Konkini Maharashtra Navaith, Nevayath, Navayath Nepalese Oryiya Paniya, Paniyan Urudu

Mother tongue (1)
1 Arabic/Arabi '2 Bengali 3 Burmese 4 Ceylonese/Simelu/Singhalese 5 CoorgijKodagu 6* Diwhe 7 English 8 French 9 Gentwn
lOt Goanese II Gorkhali 12*tGouda Saraswata 13 Gujarati 14 Hindi IS Hindustani
. 16 Ltaliml 17 Kachchhi 18 Kannada 19 Karandi 20 Kashmiri 21t Konkani 22 ,lfahl! Maldivian 23 .lIalaifJfalay/MalayaJ
klalayan 24 yIalayalam 25 Marathi 26t Nawait 27 Nepaii 28 Oriya 29 Pania 30 Persian 31 Portuguese 32 Punjabi 33 Sindhi 34 Syriac 35 Tamil 36 Telugu 37 TuIu 38 Urdu
Persons
(2) 10 15
6 II 5 7
694 3 5
21 7 I
2,446 598
5 13
126 6,093
37
1,717 8
24
Total
Males
(3) 8 9 2 5 3 5
330 2
9 7
1,780 327
2 6
88 3,103
18
844 8
6
Females (4) 2 6 4 6 2 2
364
4 12
I 666 271
3 7
38 2,990
19
873
18
Kozhikode District
Rural
Persons Males (5) (6) 5 5 9 5 2 9 3 5 3 7 5
129 71
2 2
15 5 178 86
5 2 5 2
C-V MOnIER TONGUE
---~ Urban
r--.------~--------~ Females Persons
(7) (8)
5 4 6 2 4 6 2 2 2
58 565 3
4 I 21 5
10 2,431 92 420 3 3 8
126
Males (9) 3 4 2 2
259 2 1 9 5
1,775 241
Females (10)
2 2 2
306
12
656 179
5,603 2,840 2,763 490
4 88
263
1: 38
21.7 37 18
413 187
20
19
226
IS
1 1,304
8 OJ7
8 647
2,531,955 1,281,829 1,300,126 2,165,617 1,073,735 1,091,832 4
416,333 511
35 3 3
1 208,044
383 33 3 3
3 208,294
128 2
561 412 149 40 37 3 16 16 3 3 1 3
22 32 96
5 15,296 4,033 1,833 1,440
1 13 22 42 I
8,220 2,088
865 861
2 9
10 54 4
7,076 1,945
968 579
50 29 21 5 4 I
13 13
14 8 1 1 4 4 5
8,189 2,481 1,733
121
4,284 1,300
815 73
6
4 3,905 1,181
918 48
3 8
31 92
7,107 1,552
100 , 1~319
5 21 38
3,936 788 50
788
2 3
10 54
3,171 764-50
531
Note:- (i) Mother tongues printed in italics belong to countries outside the Indian Continent (ii) Asterisk (*) means that the mother tongue is unclassified in the Linguistic Survey of India
(iii) Dagger (t) denotes that the mother tongue though classified in Linguistic Survey of India is either tentatively reclassified or considered unclassifiable by the Linguist.
(iv) Asterisk and dagger (Ot) denotes that tbe mother tongue is unclassified by Grierson but is tentatively classified by the Linguist.
170

(ALPHABETICAL ORDER) Taluks (Rural areas only)
Badagara Quilandy Kozhikode Tirur Ernad South Wynad r-~ ,---~ r---"'--~ ,..-----A-----'I ~ Males Femalca Males Femalca Males Females Males Females Males Females Males Females ( I) (12) (13) (14) (15) (16) (17) (18) (19) (20) (21) (22)
1 1 1 1 1 2 ! 3 2
3 2 6 4, 3 2 5
5 2 6 3 3 4 3 1 7 2 56 50 7
8 3 9
10 11 12
3 8 1 1 13 2 2 5 6 6 7 73 75 14-
2 3 15 2 2 16
17 13 12 18 31 8 19 48 51 2,753 2,650 18
18 19 19 20
2 5 3 12 30 4, 7 8 5 156 ISO 21 22
5 13 23 134,613 141,293 172,556 176,164 190,034- 187,815 233,061 250,277 253,388 256,681 90,133 79,602 24-
3 1 2 19 16 6 3 25 4, I 26
4- 9 27 28 29 30
5 3 3 2 31 1 32 4- 33
4- 34-43 21 92 86 116 83 98 79 548 430 3,387 3,206 35 lSI 11 27 21 168 175 236 206 366 338 488 430 36
4 4 4 5 S07 909 37 9 3 5 ]5 11 31 29 38
171

C-VB RElJGION
Fly-leaf
The distri bution of population 9Y' sex under different religions is given in this table. In the table the figures of only six major religions in India have been shown. The remaining beliefs have been clubbed into 'other
172
religions and persuasions' the details of which are presented in the supplement to the table. This table corresponds to Table D-JI Religion of 1951 Census.

e-VD RELIGION
Name of Religions , Total Total Buddhists Christians Rural r---
District/Taluk Urban P M F M F M F
(1) (2) (3) (4) (5) (6) (7) (8) (9)
KOZHlKODE DISTRICT
Kozhikode District Total 2,617,189 1,300,974 1,316,215 12 5 57,638 53,236 Rural 2,184,682 1,083,556 1,101,126 3 I 49,658 45,759 Urban 432,507 217,418 215,089 9 4 7,980 7,477
Badagara taluk Rural 276,005 134,675 141,330 2,897 2,674 Qui1andy
" " 348,987 172,696 176,291 7,327 6,824
K~zhikode " "
378,528 190,377 188,151 12,520 Il,465 Tirur
" " 484;089 233,460 250,629 666 661
Eroad " " 512,018 254,442 257,576 2 7,466 6,844
South Wynad " " 185,055 97,906 87,149 ]8,782 17,291
arranged in alphabetical order Other Religions and .....,
Hindus Jains Muslims Sikhs persuasions Religion not stated
M F M F M F M F M F M F
(10) (II) (12) (13) (14) (15) (16) (17) (18) (19) (20) (21)
693,021 693,091 610 665 549,650 569,201 10 1 25 15 • 1 558,844 566,223 378 399 474,667 488,744 3 I 2 134,177 126,868 232 266 74,983 80,457 7 1 24 15 6 1 93,958 97,966 2 37,819 40,688
121,398 124,526 43,970 44,941 1
116,000 115,586 3 61,851 61,097 2 2 78,279 84,192 154,515 165,775
93,910 95,590 153,064 155,142
55,299 48,363 376 394 23,448 21,101
c. VD RELIGION SUPPLEMENT
Details of combined entries included under "other rdigums and persuasions"
Total Rural
Sect Urban Persons Males Females
Zorastrians (Parsis) T 14 9 5 R 1 1 U 13 8 5
Kollach U 14 8 6 Lewona U 11 7 4 Agnostic U 1 ]
173 106/1-40


U-VW SUHEDULtiU VAS1'ES AND SCHEDULED TRIBES
Fly-leal
1. This ta hIe is prepared in two parts, Part A dealing with Scheduled Caste population and Part B dealing with Scheduled Tribe population. These give the sexwise distribution of Scheduled Castes and Scheduled Tribes into literates and illiterates and also into workers in the nine industrial categories and non-workers for
106/1-4Oa 175
total, rural and urban areas of the district and for rural areas by taluks.
2. The corresponding Table of 1951 (Table D-III Scheduled Castes and Scheduled Tribes) shows onlY the population of Scheduled Castes and Scheduled Tribes without their livelihood pattern.

c-vm SCHEDULED CASTES
PART.A CLASSIFICATION BY LITERACY AND INDUSTRIAL CATEGORY
Workers r---________ -A ____________ ~
As Literate As Agricultural
and educated Total Workers Cultivator Labourer Total Total Illiterate Persons I-IX I II Rural ,-----A..----. ~ ~ ~ r-----"----.
DistrictfTaluk Urban P M F M F M F M F M F M F (1) (2) (3) (4) (5) (6) (7) (8) (9) (10) (11) (12) (13) (14) (15)
KOZHlKODE
Kozhikode District T 1«,212 71,419 72,793 53,092 63,857 18,327 8,936 38,250 29,556 1,153 606 14,474 16,4«
R 131,192 64,896 66,296 49,486 59,101 15,410 7,195 34,932 27,484 1,105 577 14,070 15,699 U 13,020 6,523 6,497 3,606 4,756 2,917 1,741 3,318 2,072 43 29 404 745
Badagara taluk R 651 324 327 97 121 227 206 163 20 5
Quilandy " R 11,611 5,716 5,895 3,734 4,923 1,982 972 2,728 1,959 34 6 755 690
Kozhikode "
R 34,486 17,159 17,327 11,570 14,628 5,589 2,699 8,687 5,834 145 73 2,720 2,514
Tirur " R 28,692 14,064- 14,628 11,102 13,123 2,962 1,505 7,438 6,102 193 83 3,106 3,862
Broad " R 50,524 24,512 26,012 20,636 24,391 3,876 1,621 13,755 12,544- 680 396 7,175 8,45Q
South Wynad It R 5,228 3,121 2,107 2,347 1,915 774 192 2,161 1,025 48 19 314 183
PABT-B CLASSIFICATION BY LITERACY AND INDUSTRIAL CATEGORY
Workers
As Literate As Agricultural
and educated Total Workers Cultivator Labourer Total Total Illiterate Persons I-IX I II Rural ~ ~ ~ ~ ,.--A---,
District/Taluk Urban P M F M F M F M F M F M F
(1) (2) (3) (4) (5) (6) (7) (8) (9) (10) (U) (12) (IS) (14) (15)
KOZIDKODE
Kozhikode District T 69,958 35,173 34,785 28,4« 32,169 6,729 2,616 19,266 14,802 2,5771,379 9,141 8,626
R 68,838 34,619 34,219 28,152 31,753 6,467 2,466 19,013 14,625 2,566 1,375 9,099 8,561
U !1,120 554: 566 292 416 262 150 253 177 11 4 42 65
Badagara ta1uk R 3,165 1,580 1,585 .1,162 1,394- 418 191 824 574 68 1 95 54
Quilandy "
R 20,578 10,094- 10,484 6,680 8,926 3,414 1,5?8 4,981 4,013 96 55 1,855 1,775
Kozhikode "
R 1,748 879 869 718 791 ll61 78 457 272 9 85 72
Tirur " R 253 134 119 112 108 22 11 76 54 4- 3 SO 31
Broad " R 5,488 2,670 2,818 2,483 2,744- 187 74- 1,588 1,484 58 52 855 1,029
South Wynad " R 37,606 19,262 18,344- 16,997 17,790 2,265 554 11,087 8,228 2,331 1,264- 6,179 5,600
176

AND SCHEDULED TRIBES
OF WORKERS AND NON.WORKERS AMONG SCHEDULED CASTES
Workers
In Mining, Quarry-ing, Live-stock,
Forestry, Fishing, Hunting and In Manufactur-Plantations, ing, other In Transport,
Orchards and At Household than House- In Trade and Storage and In Other aillied activities Industry hold Industry In Construction Commerce Communications Services Non-workers
III IV V VI VII VIII IX X ~ r-----"------. ,.------A-----, ,--"--...... ,--"----, r---"----, ,---"----.. , __ .A._---.
M F M F M F M F M F M F M F M F (16) (17) (18) (19) (20) (21) (22) (23) (24) (25) (26) (27) (28) (29) (30) (31)
DISTRICT
3,680 1,084 1,340 2,589 980 601 351 30 185 93 462 61 15,625 8,048 33,169 43,237
3,640 1,080 1,227 2,374 441 398 288 14 109 44 318 43 13,734 7,255 29,964 38,812
40 4 113 215 539 203 63 16 76 49 144 18 1,891 793 3,205 4,425
5 2 I 8 3 7 133 18 161 307
261 77 191 662 44 41 45 5 23 I 34 5 1,341 472 2,988 3,936
678 193 225 571 93 96 150 7 45 12 71 25 4,560 2,343 8,472 11,493
646 70 210 'HI3 143 172 39 1 24 21 142 12 2,935 1,398 6,626 8,526
716 27 576 636 82 87 49 1 8 10 61 I 4,408 2,936 10,757 13,468
1,334- 713 23 21 71 5 6 3 357 88 960 1,082
OF WORKERS AND NON.WORKERS AMONG SCHEDULED 'I1UBES
Workers
In Mining, Quarry-ing, Live-stoc~,
Forestry, fishing, Hunting and In Manufactur-Plantations, ing, others In Transport,
Orchards and At Household than House- In Trade and Storage and In Other allied activities Industry hold Industry In Construction Commerce Communications Services Non-workers
III IV V VI VII VIII IX X ~ ...----"------~ r---"----.. ~ ~ ~--. ~ M F M F M F M F M F M F M F M F
(16) (17) (18) (19) (20) (21) (22) (23) (24) (25) (26) (27) (28) (29) (30) (31)
DISTRICT
2,039 777 460 1,617 64 137 53 2 30 9 245 15 4,657 2,240 15,907 19,983
2,032 771 451 1,592 51 122 45 1 26 9 215 13 4,528 2,181 15,606 19,594
7 , 9 25 13 15 8 1 4 30 2 129 59 301 339 60 11 247 353 14 32 2 5 2 16 9 317 112 756 1,011
367 75 138 1,166 21 70 24- 14 7 34 3 2,432 862 5,113 6,471
88 26 5 16 2 6 7 19 242 152 422 597
14- 2 1 I I 25 18 58 65 136 11 3 62 472 391 1,082 1,334-,
1,367 646 60 57 13 14 10 4 ' 83 1,040 646 8,175 10,116
177

D-MIGRATION TABLE
NOTE
Seven tables in this series present the migration trends analysed on the reports of the 1961 Census. They are-
D-I D-ll D-III D-III A
D-IV
D-V
Non-Indian Nationals Place of birth Migrants classified by place of birth and duration of residence in place of enumeration Migrants from other States and outside India (less than 5 years of duration) classified by age
groups Migrants in cities classified by sex, broad age-groups, educational levels and in case of workers also
by occupational divisions and groups Cities showing population born locally, migrants from rural areas and migrants from other towns
and cities D-VI Distribution of industrial categories of workers and non-workers by place of birth
All the above tables are published in "Volume VII-Kerala State-Part II C-Cultural and Migration Tables".
E-HOUSING AND ESTABLISHMENT TABLES
NOTE
The data for these tables have been compiled from the Houselists prepared for the 1961 Census. The Housing and Establishment Tables are presented in the following five tables:-
E-I Census houses and the uses to which they are put E-Il Tenure status of sample census households living in census houses used wholly or partly as dwelling
(based on 20 per cent sample) E-III Census houses used as factories and workshops classified by industry, power and no power used
and size of employment E-IV Distribution of sample households living in census houses used wholly or partly as dwelling by
pre-dominant material of wall and pre-dominant material of roof (based on 20 per cent sample)
E-V Sample households classified by number of members and number of rooms occupied (based on 20 per cent sample)
All the above tables are published in "Volume VII-Kerala State-Part IV A and B-Rep)rt on Housing and Establishment Tables".
178

SCT, SC & ST-SPECIAL TABLES FOR SCHEDULED CASTES AND SCHEDULED TRIBES
NOTE
The tabulation of Scheduled Castes and Scheduled Tribes in 1961 was based on the' Scheduled Castes and Scheduled Tribes Lists (Modification) Order, 1956' Issued by the President of the Indian Union. According to this list the following are the names of Scheduled Castes and Scheduled Tribes:-
Scheduled Castes
Throughout the Kerala State 1 Chakkiliyan 2 Kuravan, Sidhanar 3 Nayadi 4 Pallan 5 Paraiyan, Parayan (Sambavar) 6 Valluvan
1 2 3
Scheduled Tribes
Irular or lrulan Kadar Muthuwan, Mudugar, or Muduvan
Throughout the ~ State except Kasaragod Tabak of Malabar District
1 Kanakkan or Padanna 2 Panan
Throughout the State except Malabar~District (excluding Kasaragod Talak)
I Paravan
Throughout the State except Malabar District 1 Ayyanavar 1 Eravallan
2 Bharatar 2 Hill Pulaya
3 Boyan 3 Kanikaran or Kanikkar
4 Domban 4 Kochu Velan
5 Kakkalan 5 Malai Arayan
6 Kavara 6 Malai Pandaram
7 Kootan (Koodan) 7 Malai Vedan
8 Mannan ( mlffiooO) 8 Malakkuravan
9 Padannan 9 Malayan
10' Palluvan 10 Malayarayar
11 Pathiyan 11 Mannan (m<Olocm)
12 Perumannan 12 Palleyan
13 Pulayan or (Cheramar) 13 Palliyar
14- Thandan 14 Ulladan (Hill dwellers)
IS Ulladan 15 Uraly
16 Uraly 16 Vishavan
17 Vallon 18 Vannan 19 Velan 20 Vetan 21 Vettuvan
III Malabar District 1 AdiAndhra 1 Adiyan 2 Adi Dravida 2 Arandan 3 Adi Karnataka 3 Kammara 4 Ajila 4; Kattunayakan 5 Arunthathiyar 5 Konda Kapus 6 Baira 6 Kondareddis 7 Bakuda 7 Koraga 8 Bandi 8 Kota 9 Bellara 9 Kudiya or Melakudi
10 Charnar or Muchi 10 Kurichchan
179

Scheduled Castes Scheduled Tribes
In Malabar District-concld. II Chandala II Kurumans
12 Cheruman 12 Maha Malasar
13 Godagali 13 Malasar
14 Godda 14 Mala yekandi
15 Gosangi 15 . PalliYlm
16 Holeya 17 Kadaiyan
16 Paniyan 17 Pulayan
18 Kalladi 19 Karimpalan 20 Koosa 21 Kudumban 22 Maila 23 Mavilan 24 Moger 25 Mundala 26 Nalakeyava 27 Pambada 28 Panchama 29 Puthirai Vannan 30 Raneyar ~l Samagara 32 Samban 33 Semman 34 Thoti
[n Malabar District (excluding Kasaragod taluk) 1 Gavara Kurumbas 2 Malayan 3 Pula ya Vettuvan
In Kasaragod taluk of Malabar District 1 Bathada Marati 2 RasIa 3 Nalkadaya.
180

SC'll.I INDUSTRIAL CLASSmCATION OF PERSONS AT WORK AND NON.WORKERS BY SEX FOR SCHEDULED CASTES AND SCHEDULED TRIBES
Fly.leaf
I. This table prepared in two parts, Part A dealing with Scheduled Castes and Part B dealing with Sche. duled Tribes, gives for each caste and tl'ibe separately for rural and urban areas of the district and for rural areas down to taluk level the sex-wise distribution of population into workers in the nine industrial categories and non-workers.
2. Part A also gives the sex-wise number of workers in each Scheduled Caste engaged in special occupations like 'Tanning and currying of hides and skinB' and , Scavenging'.
3. The following statement presents the tal uk-wise distribution of Scheduled Castes and Scheduled Tribes by rural-urban distribution and by sex.
Total population oj Scheduled Castes and Scheduled Tribes, 1961
Total Scheduled Castes Scheduled Tribes Rural
District(faluk Urban Persons Males Females Persons Males Females
Kozhikode District T 144,212 71,419 72,793 69,!58 35,173 34,785 R 131,192 64,896 66,296 68,838 34,619 34,219
U 13,020 6,523 6,497 1,120 554 566
Badagara< taluk T 882 434 44-8 3,274- 1,642 1,632 R 651 324 327 3,165 1,580 1,585 U 231 110 121 109 62 47
Quilandy .. T 11,905 5,857 6,043 20,881 10,238 10,643 R 11,611 5,716 5,895 20,578 10,094 10,484-U 294 141 153 303 144- 159
Kozhikodc "
T 41,186 20,507 20,679 2,094 1,052 1,042 R 34,486 17,159 17,327 1,748 879 869 U 6,700 3,348 3,352 346< 173 173
Tirur ., T 33,607 16,582 17,025 476 244- 232 R 28,692 14,064- 14,628 253 134 119 U 4,915 2,518 2,397 223 110 113
Emad .. T 51,404 24,918 26,486 5,627 2,735 2,892 R 50,524 24,512 26,012 5,488 2,671) 2,818 U 800 406 474- 139 65 74-
SeIlth Wynad .; R 5,228 3,121 2,107 37,606 19,262 18,m
181 106/1-41

SC'I'-I PART-A INDUSTRIAL CLASSIFICATION OF PERSONS AT
Workers
In Mining, Quarrying, Live-stock, Forestry,
As Fishing, Hunting and Plantations,
As Agricultural Orchards and Total Total Workers Cultivator Labourer allied activities
I-IX I II III ~ ,----'-----" ~ r---~
Name of Scheduled Caste P M F M F M F M F M F (I) (2) (3 (4) (5) (6) (7) (8) (9) (10) (I I) (12)
KOZIDKODE
Total 1,31,192 64,896 66,296 34,932 27,484 1,IOS 577 14,070 15,699 3,640 1,_ 1 AdiAndhra 130 61 69 44 42 2 Adi Dravida +58 233 225 119 124 45 59 19 11 3 Adi Karnataka 371 198 173 122 87 5 8 10 83 70 -4 Arunthathiyar 168 92 76 73 55 4 8 68 47 5 Bakuda 404 210 194 106 102 63 98 6 Chakkiliyan 346 177 169 87 40 1 SO 36 7 Cheruman 67,277 33,321 33,956 18,336 15,028 394 221 8,406 9,455 1,997 482 8 Gavara 33 17 16 9 5 I 9 Godda 7 4- 3 3
10 Kadaiyan
II Kalladi B,045 5;444- 5,601 2,918 2,308 49 26 1,264 1,348 284- 29 12 Kanakkan or Padanna 32,659 15,955 16,704 8,458 7,000 528 298 3,564 4,243 641 102 13 KarimpaJan 2,018 1,026 992 480 161 21 3 103 44 73 12 14 Kudumban 10 5 5 3 2 1 15 Kuravan, Sidhanar 314 148 166 80 66 3 2 3 I 15 17 16 Malayan 2,379 1,203 1,176 602 216 37 16 84 44- 37 11 17 Mog~ 307 154 153 81 55 5 14- 9 39 oW 18 Mundala 82 36 46 21 21 15 21 19 Nayadi 45 22 23 12 6 3 6 4
20 Pallan 26 16 10 10 6 9 6 21 Panan 2,316 1,153 1,163 536 268 4 32 42 27 15 22 Panchama 19 12 7 6 5 3 23 Paraiyan, Parayan (Sambavar) 3,591 1,821 1,770 1,055 915 6 2 38 ]9 64 27 24 PuJaya Vettuvan 316 148 168 76 36 3 2 4- 4 13 2 25 Puthirai Vannan 680 34:1 339 157 50 4 4- 2 6 2 26 Samban 6 6 1
27 Thoti 14 7 7 4- 4-
28 Valluvan 6,162 3,077 3,085 1,525 882 40 5 490 .w4 154 52 -Uhc1assified 8 8 8
182

WORK AND NON-WORKERS BY SEX FOR SCHEDULED CASTES
Workers Workers in special occupations
~----'\
In In Manufacturing Transport, Tanning and
At other than In Trade Storage and currying of Household Household In and Communi- In Other hides and Industry Industry Construction Commerce cations Services Non-workers skins Scavenging
IV V VI VII VIII IX X ~~ ~~ ~,----A--""" .---""-----. ,-....._____, r--..J....--..,
M F M F M F M F M F M F M F M F M F (13) (14) (15) (16) (17) , (18) (19) (20) (21) (22) (23) (24:) (25) (26) (27) (28) (29) (30)
DISTRICT-RURAL ... 1,227 2,374 441 398 288 14 109 44 318 43 13,734 7,255 29,964 38,812 20 !)
42 42 17 27
1 45 4: 52 5 114 101
1 3 9 10 4: 76 86 1 19 21
19 23 4 104 92
21 2 17 4 7 2 90 129 91 1,048 180 236 148 10 29 22 157 28 6,934 3,526 14,985 18,928
7 5 8 11
2 I 3
11 21 4 22 12 3 4 4 28 7 1,273 848 2,526 3,293
30 169 44 50 64 22 17 72 2 3,493 2,119 7,497 9,704 5 40 1 3 3 277 61 546 a31
2 1 2 3
22 6 22 4 2 12 36 68 100
16 II 7 2 2 2 417 131 601 960 5 4- 7 4 6 73 98
4 2 15 25
2 10 17
6 4 220 , 168 22 4: 9 8 214- 39 617 895
5 2 6 2 736 789 58 47 2 15 136 31 766 855 14 3
6 1 21 24 1 16 13 I 72 132 18 2 43 4- 25 1 52 44- 184 289
.. ., ~ .. 5 4- 2 1 3 3
9 4 5 30 12 6 794 400 1,552 2,203
8
183 106/1-41 a

SCT-I PART-A INDUSTRIAL CLASSIFICATION OF PERSONS
Workers __ ._J'--___
In Mining, Quarrying, Live-stock, Forestry,
Fishing, Hunting As and Plantations
As Agricultural Orchards and Total Total Workers Cultivator Labourer allied activities
I-IX I II III ~ ,------A---., ,-__ .A. __ -.,
~ Name of Scheduled Caste P M F M F M F M F M F
( 1) (2) (3) (4) (5) (6) (7) (8) (9) (10) (11) (12)
KOZHIKODE
Total 13,020 6,523 6,497 3,318 2,072 48 29 4M 745 40 4 1 AdiAndhra 16 10 6 5 2 2 AdiDravida 155 62 93 27 9 3 ArjlDtha thiyar 105 52 53 32 4 ChaickiIiyan 380 210 170 128 25 1 5 Cheruman 7,404 3,668 3,736 1,873 1,390 34 24 355 WI 25 6 Gavara 7 7 7 7 Kalladi 194 103 91 51 27 2 3 1
8 ICanakkan or Padanna 1,372 699 673 335 188 14 5 45 92 5 2 9 Karimpalan 39 20 19 10 2 8
10 Kudumban 99 50 49 28 }6
Il Kuravan, Sidhanar 431 230 201 115 64 12 Maila 10 7 3 3 1 13 Malayan 82 45 37 19 5
14 Mavilan 3 3 3 15 Moger 35 22 13 II 4
16 Nayadi 33 18 15 10 1
17 Panan 274 141 133 61- 9 18 Paraiyan, Parayan (Sambavar) 1,305 657 648 358 260 19 Pulaya Vettuvan 479 228 251 104 26 20 Puthirai Vannan~ 568 287 281 134 30 2 21 Valluvan 28 10 18 7 6
Unclassified 1 1
184
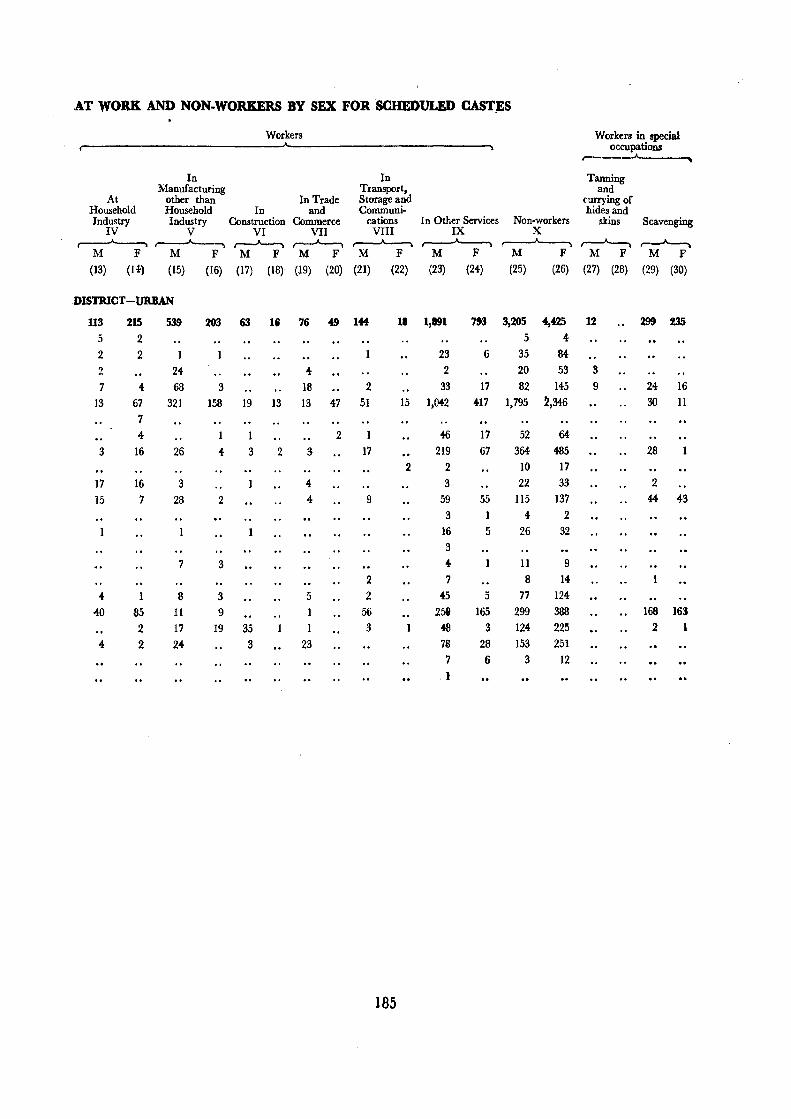
AT WORK AND NON·WORKERS BY SEX FOR 'SCHEDULED CAST,ES
Workers Workers in special occupations
r-----A .. In In Tanning
Manufacturing Transport, and At other than In Trade Storage and currying of
Household Household In and Communi- hides and Industry Industry Construction Commerce cations In Other Services Non-workers skins Scavenging
IV V VI VII VIII IX X ,-------'---.. ,.....--.-A--, r----J'---. ~ ~ ~ ,-----A-----.., r---"----. r-~
M F M F M F M F M F M F M F M F M F (13) (14) (15) (16) (17) (18) (J9) (20) (21) (22) (23) (24) (25) (26) (27) (28) (29) (30)
,DISTRICT -URBAN
113 215 539 203 63 Ui 76 49 144 18 1,891 7t3 3,205 4,425 12 299 !35
5 2 5 4-2 2 23 6 35 84-2 24 4- 2 20 53 3
7 4 6B 3 18 2 33 17 82 145 9 24 16 13 67 321 158 19 13 13 47 51 15 I,M2 417 1,795 ~,346 30 11
7 4 1 2 46 17 52 64-
3 16 26 4- 3 2 3 17 219 67 364- 485 28 2 2 10 17
17 16 3 4- 3 22 33 2 15 7 28 2 4- 9 59 55 115 137 44 43
3 4 2 16 5 26 32 3
7 3 4 11 9 2 7 8 14
4- 1 8 3 5 2 45 5 77 124 40 85 . 11 9 1 56 25& 165 299 388 168 163
2 17 19 35 1 3 4B 3 124 225 2 4 2 24- 3 23 7$ 28 153 251
7 6 3 12 . I
185

SCT-I PART.B INDUSTRIAL aASSmCATION OF PERSONS
In Mining, Quarry-ing Live-stock, Fore-
As stry Fishing, Hunting
and Plantations, As Agricultural Orchards& allied
Total Total Workers Cultivator Labourers activities (I-IX) I II III
Name of r----"----. ,...--"----. ~ Scheduled Tribe P M F M F M F M F M F
(1) (2) (3) (4) (5) (6) (7) (8) (9) (10) (11) (12)
KOZIDKODE
Total ",1131 34,'19 34,219 19.013 14,fi25 2,5&6 1,375 9,099 8,561 2,032 771
1 Adiyan 289 146 143 79 69 1 75 66 3 2 2 Arandan ID 20 20 9 7 2 4: 1 3 Kadar 261 134 127 76 29 11 2 7 3 25 3 4: Kammara 15 10 5 7 2 5 Kattunayakan 3,688 1,869 1,819 1,090 854 43 22 703 639 163 9()
6 Kota 8 5 3 2 1 7 Kurichchan 3,037 1,570 1.467 858 418 462 226 175 91 148 54 8 Kurumans 11,025 5,699 5,326 3,212 1,834 1,649 884 938 671 316 124-9 Kurumbas 211 97 114 50 44 19 14 25 27 5 1
10 Malasar 47 26 19 26 15 26 14-11 Muthuwan. Mudugar or
Muduvan 42 14 28 10 7 4 2 12 Palliyan to 4 6 2 2 2 2 13 Paniyan 22,695 1l,445 11,250 6,655 5,824 189 129 4,602 4,597 774 349 14 Pulayan 27,470 13,576 13,892 6,937 5,519 186 97 2,572 2,463 567 132
KOZIDKODE
Total 1,121 554 5fi6 253 177 11 4 42 65 7 I Kadar 15 7 B 6 6 6 2 K.ammara 15 9 6 3 I 3 Kattunayakan 13 5 8 3 3 4- Kurichchan I 1 5 Kurumans 43 24 19 13 6 Kurumbas I 1 1 1 7 Paniyan II 6 2 2 II Pulayan 1,924 502. 522 225 166 10 4 42 65
186

AT WORK AND NON·WORKERS BY SEX FOR SCHEDULED TRIBES
Workers _--"'-
In Manufacturing In Transport In Other At Household other than In Trade and Storage and
Industry Household Industry In Construction Commerce Communications Services Non-workers IV V VI VII VIII IX X ~ ,...----1'----, ~ ~,......--.-A--- ~,.-.--J'----,
M F M F M F M F M F M F M F
(13) (14) (15) (16) (17) (18) (19) (20) (21) (22) (23) (24) (25) (26)
DISTRICT-RURAL
451 1,592 51 122 45 1 26 9 215 13 4,52' 2,111 15;606 19,594 Tetal 67 74 1
3 3 3 11 13 2 1 5 26 21 58 98 3 5 2 2 3 3 4 2 2 24 152 102 779 965 5
2 1 3 2 6 2 5 66 45 712 1,049 7
~2 48 3 3 42 218 106 2,487 3,492 8 1 2 47 70 9
1 2 4 10
~ 7 4 21 11 2 4 12
13 6 4- 3 I 4 1 92 2 976 737 4-,790 5,426 13 386 1,536 35 114 39 16 7 51 10 3,083 1,159 6,64-1 8,373 I~
DISTRICT-URBAN
!) 25 13 15 • 1 4 at 2 129 59 301 389 Tot.1 I 2 1
3 1 6 5 2 3 3 2 5 3
1 ~
3 10 11 18 5 6
1 1 4- 2 7 9 25 9 12 8 26 2 119 57 277 356 8
187


SCT·n AGE AND MARITAL STATUS FOR SCHEDULED CASTES AND SCHEDULED TRIBES Fly·leaf
This table prepared in two Parts, Part A dealing with Scheduled Castes and Part B dealing with Sche_ duled Tribes, gives sex-wise distribution of each Scheduled Caste and Scheduled Tribe by broad
106/1- 42
Age-groups (i) 0-14
(ii) 15-44 (iii) 45 and above (iv) Age not stated
189
age-groups and marital status for the district. The age-groups and marital status followed in the table are given below:-
Marital status (i) Never married
(ii) Married (iii) Widowed (iv) Divorced or separated (v) Unspecified status

SCT.n PART·A AGE AND MARITAL
Total population
Divorced! Total Never married Married Widowed Separated
Name of Scheduled ,..-___ A ___ --... r--"---. ,~ ~ ,.--"----, Caste P M F M F M F M F M F
(1) (2) (3) (4) (5) (6) (7) (8) (9) (10) (11) (12)
Total 144,212 71,419 72,793 39,669 32,579 29,177 29,735 1,457 8,138 1,111 2,335 1 Adi Andhra 146 71 75 38 31 29 31 4 7 6 2 Adi Dravida 613 295 318 182 157 105 107 5 43 3 11 3 Adi Karnataka 371 198 173 96 69 97 91 4 12 4 Arun thathiyar 273 144 129 74 54 67 68 3 6 5 Bakuda 404 210 194 109 77 90 94 8 18 3 5 6 Chakkiliyan 726 387 339 224 156 151 142 8 32 4 9 7 Cheruman 74,681 36,989 37,692 20,652 16,915 15,022 15,313 745 4,205 568 1,254 8 Gavara 40 17 23 13 12 4 9 2 9 Godda 7 4 3 2 2
]0 Kadaiyan I II Kalladi 11,239 5,547 5,692 3,082 2,626 2,247 2,318 127 563 90 185 ]2 Kanakkan or Padanna 34,031 16,654 17,377 8,937 7,474 7,068 7,215 337 2,081 311 606 ]3 Karimpalan 2,057 1,046 1,011 648 515 353 364 34 108 11 24 14 Kudumban 109 55 54 31 27 20 22 4 5 15 Karavan, Sidhanar 745 378 367 202 153 162 171 10 40 4 3 16 Maila 10 7 3 4 3 2 17 Malayan 2,461 1,248 1,213 730 575 484 490 22 123 12 25 18 Mavilan 3 3 3 19 Moger 342 176 166 107 79 64 69 2 15 3 3 20 Mundala 82 36 46 19 29 16 15 1 1 21 Nayadi 78 40 38 21 17 19 16 2 3 22 Pallan 26 16 10 9 4 6 6 23 Panan 2,590 1,294 1,296 767 624 496 496 21 137 10 39 24 Pancharna 19 12 7 7 2 5 5 25 Paraiyan, Parayan 4,896
(Sambavar) 2,478 2,418 1,272 970 1,119 1,139 56 256 3] 53
26 Pulayavettuvan 795 376 419 236 223 135 133 4 52 11 27 PuthiJai Vannan 1,248 628 620' 389 325 226 216 9 67 4 12 28 Samban 6 6 6 29 Thoti 14 7 7 3 4 3 3 30 Valluvan 6,190 3,087 3,103 1,805 1,458 1,176 1,199 52 363 53 83
Unclassified 9 9 3 6
190

STATUS FOR SCHEDULED CASTES
Age 0-14
-----~ Divorcedl Unspecified
Unspecified status T()tal Never married Married Widowed Separated status ,------A------, ,.---......_____, ~ ,----"----.. r--~ ~
M F M F M F M F M F M F M F
(13) (14) (15) (16) (17) (18) (19) (20) (21) (22) (23) (24) (25) (26)
5 6 30,364 29,289 30,325 28,910 35 332 1 5 3 39 3 T()tal
24 30 24 30 1 126 117 126 115 2 2
71 64 71 64 3 32 42 32 42 4-89 70 89 70 5
161 141 161 139 2 6
2 5 15,677 15,210 15,661 15,063 14 129 2 13 3 7 9 13 9 12 8
2 2 9 I J()
2,364 2,319 2,358 2,301 6 14 4 11 7,278 6,988 7,265 6,833 II 132 3 2 2J 12
460 448 459 447 1 13 21 24 21 24 14
158 150 158 147 3 15 3 3 1 16
541 481 541 476 5 17
18 77 69 77 69 19 13 25 13 25 20 14 16 H 16 21 7 4 7 4 22
543 507 543 505 2 23 6 I 6 I 24
948 876 946 851 2 24- 25 152 180 152 178 2 26 245 250 244 249 27
4 4 28 3 2 3 2 29
1,336 1,259 1,336 1,244- 14 30 .. Un-classified
191 106/1-42a

SCT.ll PART-A AGE AND MARITAL Age 15-44
r----------------'---Never Divorcedl Unspecified Never
Total married Married Widowed Separated status Total married Name of Scheduled r---~ ,.---A-, ,..--.A----, ,..---A----,,-.A--""",\ ,--A_-, ,.--_'_--.. ~-..
Caste M F M F M F M F M F M F M F M F
Total Adi Andhra
2 Adi Dravida 3 Adi Karnataka 4 Arunthathiyar 5 Bakuda 6 Chakkiliyan 7 Cheruman 8 Gavara 9 Godda
10 Kadaiyan II Kalladi 12 Kanakkan or Padanna 13 Karimpalan 14 Kudumban 15 Kuravan, Sidhanar 16 Maila 17 Malayan 18 Mavilan 19 Moger 20 Mundala 21 Nayadi 22 Pallan 23 Panan 24 Panchama 25 Paraiyan, Parayan
(Sambavar) 26 Pulayavettuvan 27 Puthirai Vannan 28 Samban 29 Thoti 30 Valluvan
Unclassified
(27) (28) (29) (30) (31) (32) (33) (34) (35) (36) (37) (38) (39) (40) (41) (42)
29,952 32,294 9,265 3,562 19,382 24,884 362 4195 939 1,951 4 2 11,086 31 36 14 I 17 28 2 5 .... 16
134 152 56 41 74 95 7 3 9.... 35
101 94 24 5 76 84 4 26
95 78 42 12 52 62 3 17
82 100 20 7 60 82 6 2 5 39
175 159 62 16 106 124 4 II 3 8 51
15,616 16,1ii42 4,953 1,794 10,000 12,842 185 962 477 1,043 5,689 794 38 •..... I
2
2,287 6,875
436
22 165
3 441
2,590 715 7,597 1,661
414 186
• 25 10 158 44
2 536 187
316 623
65
3 5
96
1,460 4,857
235
12 117
2 241
1,967 31 5,994 86
308 7
19
145
2 390 6
67 76 30 10 33 59
16 20 6 4 10 14
19 16 7 12 12
86266
520 583 221 116 287 404 5 5 6 1 4 5
1,100 1,194 321 117 734 956 19
163 164
273 260 2 2 5
1,299 1,371
6
83 44 143 74
2 2
466 209 3
80 102 124 167 5
1 3 776 1,005 11
3
192
148 80 471 270
20 8 3 5 4
30 7
4 3
7
80 26
9
12
85 45
159 1 ..
508 21
3
20 .. •.
3 1
3
32
41
9 7
72 1 •.
892
2,499
150 12
55 1
266 3
32
7 7
230 1
428
61
110
2 4514
3
11,197 71 104 9 .•
49 ..
15
9 .• 24 ..
39 1 1
5,835 35 57
1
781 7 2,788 10
148 3 5 ..
59 ..
196 2
21 ..
1 .. 6 ..
1
3
3
206 3 3
348 3 2
75 1
110 2
72 3
1
2
5

STATUS FOR SCHEDULED CASTES-coneld. Age 45+ Age not stated
.A. ---.. r- ~
Divorced! Unspecified Never Divorced! Unspecified Married Widowed Separated status Total married Married Widowed Separated status ~ r---'--""\ ~ ;--"--., ,.---"----, ~ r-"---, ,...--"---... ~ ,..---A---, M F M F M F M F M F M F M F M F M F M F
(43) (44) (45) (46) (47) (48) (49) (50) (51) (52) (53) (54) (55) (56) (57) (58) (59) (60) (61) (62)
9,752 4,512 1,094 6,236 168 344 1 1 17 13 8 3 a 7 2 1 1 .. Total
12 3 4 5 1 1
31 10 4 36 2 2 21 7 4 8 3 15 6 2 3 4
30 12 8 12 5 45 16 4 21 1 I 6
5,005 2,399 559 3,241 89 197 7 5 3 3 3 7
1 I 8 9
10
779 336 96 415 10 22 4 2 2 2 Il
2,199 1,088 251 1,605 39 78 2 4 2 12
117 54 27 88 3 3 13
8 3 4 2 14 45 23 10 35 15
I 16
243 95 16 93 5 5 17
3 18
31 10 II 19
6 I 20
7 4- 2 21 22
208 90 16 106 3 7 23 24
383 159 31 176 5 11 2 2 25
55 29 4 43 I 2 26
101 48 4- 55 3 5 21 28
2 29
399 179 41 278 8 10 30 3 Un-
~lassified
193

1 2 3 4
5 6 7 8 9
Name~or Scheduled ~ Tribe
(I)
Total Adiyan Arandan Kadar Kammara Kattunayakan Kota Kurichchan Kurumans
Kurumbas 10 Ma[asar II Muthuan, Mudugar, or Muduvan 12 Palliyan 13 14
1
2 -3 4 5 6 7 8 9
10 II
12 13 14
Paniyan Pulayan
Name of Scheduled Tribe
(I)
Total
Adiyan Arandan
Kadar Kammara Kattunayakan Kota Kurichchan Kurumans Kurumbas
Malasar Muthuwan, Mudugar
or Muduvan Palliyan
Paniyan Pulayan
r----Total ~ M F
(27) (28)
14,056 15,251
52 66 6 7
64 62 9 4
741 782 2 2
642 614 2,174 2,206
33 45 16 12
5 2
4,586 5,724
10 2
5,140 6,293
P
(2)
69,958 289 40
276 30
3,7()1 8
3,038 11,068
2[2 47 42 10
22,703 28,494
Total
M
(3)
35,173 146
20 141 19
1,874 5
1,570 5,723
98 28 14
4-
F
(4)
34,785 [43
20 135 II
1,327 3
1,468 5,345
114 [9
28 6
11,451 11,252 [4,080 14,414
SCT-n PART-B AGE AND MARITAL
Total Population ._---A---. ____________________ __
Never married ,...----A---, M F
(5) (6)
19,5Ol 78 [2 33 11
993 4
878 3,[80
53 10 4
2 6,274 7,!H4
16,105 65 10 63
7 377
2 725
2,779 57 B
16 4
5,180 6,312
Married ,...----A---.
M F
. (7) (3)
14,525 65 7
54 8
815 1
669
2,324 37 13 10 2
4,740 5,780
14,800 63 8
53 4
803 I
650 2,259
47 8
12 2
4,861 6,029
Widowed ~
M F
(9) (10)
Divorcedl Separated ~ M F
(11) (12)
KOZHIK.ODE
710 2 1 2
46
14 154
2 5
279 205
3,111 9 2
15
122
83 272
9 3
437 763 6
20 25
9 10 65 35
I
972 158 238 1,624 181 44!)
Age 15-44 ---. ,.....---.J--
DivorcedJ Unspecified Ne .. -er Never married Married Widowed Separated status
..---A----, ,__.___, ,-.....__, Total married
,----A---, ,.A..--,\
M F M F ~~ M F M F
(29) (30) (31) (32)
4,321
12 2
23 3
191 2
179 672
13 6
1,299 1,918
1,767
6
7
71 2
49 347
7 5
615 657
9,134 12,180
38 55 4 6
33 47 6 3
516 660
450 546 1,407 1,773
19 35 8 7
5
3,040 3,602
194
10 2
4,039 4,997
M F M F M F
(33) (34) (35) (36) (37) (38)
232
17
7 42
2
116 46
690
4
32
11 53 2
279 308
369 612 " 1
5
2 4 ..
17 19
6 8 .. .. 53 33 .. ..
'I , , , ,
131 206 " ISS 336 .. ..
(39) (W) (41) (42}
5,~ 5,114 28. 2l
27 17 .... 4 3",.
17 17 ..
2 I" 331 233
1 231 176 2
1,042 702 4 20 19 ... , B 4- ..
5 1 ..
1,901 1,521 14-2,356 2,419 7 17

STATUS FOR SCHEDULED TRIBES
Age 0-14-r- ---"-
Unspecified Divorced! Unspecified status Total Never married Married Widowed Separated status
,....----A----- ~ ~ ~ ,.----.A---, ,.-----..-A---- r----"--------M F M F M F M F M F M F M F
(13) (14) (15) (16) (17) (18) (19) (20) (21) (22) (23) (24) (25) (26)
DISTRICT
1 15,162 14,416 15,148 14,315 14 95 1 5 .. Total 67 60 66 59 I I 10 10 10 10 2 60 56 60 56 3 8 6 8 6 4-
802 812 801 805 7 5 2 2 6
697 678 697 675 3 7
2,507 2,436 2,504 2,431 3 5 8 45 50 45 50 9
4 3 4 3 10
4 17 4- 16 11
4- 4 12
4,964 4,590 4,961 4,564 3 24 2 13
5,991 5,694- 5,985 5,636 6 54 3 14
Age 45 + Age not stated A ------ -----, r----. -'- .......,
Divorced! Unspecified Never Divorced! Unspecified
Married Widowed Separated status Total married Married Widowed Separated status
r---"----. r---"----. r---"----. ~ ,.........A.., .~ ,...........__, ,--...J'--.. r--"---, ,.-....A---.,
M F M F M F M F M F M F M F M F M F M F
{43) (44) (45) (46) (47) (48) (49) (50) (51) (52) (53) (54) (55) (56) (57) (58) (59) (60) (61) (62)
5,372 2,523 478 2,419 68- 151 9 5 • 4 2 5 2 I •. Total
26 7 9 1 3 2 1 I 2
16 6 1 11 3 2 1 4:
296 136 29 90 3 6 5 1 1 6
219 10) 7 72 3 2 7 914: 4:80 112 219 12 2 8
18 12 2 7 9 5 3 3 10
5 Jl 12
1,697 .:me 163 692 27 30 13 2,167 977 159 1,315 23 110 9 3 .. 2 5 14
195

SCT-m SCHEDULED CASTES AND SCHEDULED TRIBES CLASSlFmD BY EDUCATIONAL LEVELS
Fly-leaf
1. This table prepared separately for UI ban and rural areas of the district gives the sex-wise distribution of literacy and educational levels of each Scheduled Caste and Scheduled Tribes.
2. The data relating to urban areas are given in Part A (~1 and Part A (ii), the former dealing with Scheduled Castes and the latter dealing with Scheduled Tribes. The classification of literacy levels is furnished below:-
I Illiterate 2 Literate (without educational level)
3 Primary or Junior Basic 4 Matriculation or Higher Secondary 5 Technical diploma not equal to degree
6 Non-technical diploma not equal to degree
7 University degree or post-graduate degree and'
8 Technical degree or diploma equal to degree or post-graduate degree
3. The data relating to rural areas are given in Part B (i) dealing with Scheduled Castes and Part B (ii) dealing with Scheduled Tribes. The population of each Caste and Tribe is classified into
196
1 Illiterate 2 Literate (without educational level)
3 Primary or Junior Basic and
4 Matriculation and above.

SCT-m PART-A (i) EDUCATION IN URBAN AREAS ONLY FOR SCHEDULED CASTES
Educational levels
Tech-Non- University Technical
Tech- degree or degree or Matri- nical nical post diploma culation di~loma diploma graduate equal to
Literate or not not degree degree or (without Primary or Higher . equal equal other than post
Illite- educational Junior Second- to to technical graduate Total rate level) Basic ary degree degree degree degree
Name of Scheduled r--"---. r---"--. r---"----, ,---A---, r-"-. ,.--A--, ~ ,...-A--" ~ Caste M F M F M F M F M F M F M F M F M F (1) (2) (3) (4) (5) (6) (7) (8) (9) (10) (11) (12) (13) (14) (15) (16) (17) (18) (19)
KOZHIKODE DISTRICT-URBAN
Total 6,523 6,497 3,606 4,756 2,181 1,162 640 533 93 45 1 .. 1 2
1 AdiAndhra HI 1) 5 3 5 2 \ 2 AdiDravida 62 93 18 51 30 6 12 32 2 4 3 Arunthathiyar 52 53 20 29 19 14 13 7 3 4 Chakkiliyan 210 170 131 ll8 67 38 12 12 2 5 Cheruman 3,668 3,736 2,217 2,961 1,215 577 208 190 28 8 6 Gavara 7 7 7 KaJladi 103 91 53 69 38 14 12 8 8 Kanakkan or Padanna 699 673 375 455 186 118 120 95 17 5 I .. 9 Karimpalan 20 19 16 16 3 I I 2
10 Kudumban 50 49 12 35 25 12 10 2 3 .. 11 Kuravan, Sidhanar 230 201 137 162 66 27 24 11 3 12 Maila 7 3 6 2 1 1 13 Malayan 45 37 9 11 27 16 8 7 3
'14, Mavilan 3 2 ]5 Moger 22 13 8 6 12 4 2 2 .. .. 16 Nayadi 18 15 16 13 2 2 17 Panan 141 133 44 49 65 61 28 22 4 18 Paraiyan, Parayan
(Sambavar) 657 648 359 . 461 203 117 84 67 11 3 19 Pulaya Vettuvan 228 251 91 169 101 61 30 18 6 3 20 Puthirai Vannan 287 281 86 130 III 88 71 52 18 10 1 .. 21 Valluvan 10 18 3 9 3 3 4 5 1
Unclassified 1 1
197 ]06/1-~3

SCT-m PART·A (ii) EDUCATION DC URBAN AREAS ONLr FOR SCHEDULED TRIBES
Educational levels
University Technical Non- degree or degree or
Matri- Techni. techni- post- diploma culation cal cal graduate equal to
Literate or diploma diploma degree degree or (without Primary Higher not not other than post-
educa- or Junior Second- equal to equaito technical graduate Total Illiterate tional level) Basic ary degree degree degree degree
Name of ~ ,....-'----, ~ r---"---. ,.--A--, r-"---. ,.--A--, ~ r-"---. Scheduled Tribe M F M F M F M F M F M F M F M F M F
(I) (2) (3) (4) (5) (6) (7) (8) (9) (10) (11) (12) (13) (14) (15) (16) (17) (18) (l9)
KOZHIKODE DISTRICT-URBAN
Total 554 566 292 fl' 172 72 77 70 13 7 .. 1
I Kadar 7 8 7 8
2 Kammara 9 6 4: 4- 2 I 2
3 Kattunayakan 5 8 5 3 of. .., Kurichchan I
5 Kurumans 24 19 20 1& 4-
6 Kurumbas 1
7 Paniyan 6 2 5 1 I I
8 Pulayan 502 522 250 382 166 66 74: 67 12 6 .. 1
198

SCT-ID PART-B (i) BDUCATION IN RURAL AREAS ONLY FOR SCHEDULED CASTES
Educational levels
Literate (without Primary or Matriculation Total Illiterate educational level) Junior Basic and above
Name of .---A--~ ,..----"----.. ~ ~ ~ Scheduled Caste M F M F M F M F M F (I) (2) (3) (4) (5) (6) (7) (8) (9) (10) (11)
KOZIDKODE DISTRICT-RURAL
Total 64,896 66,296 49,486 59,101 12,221 6,833 3,827 1,136 162 26
I AdiAndhra 61 69 55 65 5 4- I 2 Adi Dravida 233 225 154 211 57 12 20 2 2 3 Adi Karnataka 198 173 157 167 29 5 12 I 4- Arunthathiyar 92 76 80 76 6 6 5 lIakuda -- 210 194 145 177 44 15 21 2 6 Chakkiliyan 177 169 113 142 52 26 12 1 7 Cheruman 33,321 33,956 25,949 30,717 5,971 2,781 1,335 449 66 9 8 Gavara 17 16 11 16 3 3 9 Godda 4 3 3 3 1
10 [{adaiyan 11 Kalladi 5,444- 5,601 4,548 5,154 744 404- 151 43 1 12 Kanakkan or Padanna 15,955 16,704 12,445 15,199 2,713 1,232 767 265 30 8 13 Karimpalan 1,026 992 659 828 283 134 83 30 1 14 Kudumban 5 5 3 4- 2 . 1 15 Kuravan, Sidbanar 148 166 78 128 54 31 14 7 2 16 Malayan 1,203 1,176 830 846 312 282 57 48 4-17 Moger 154 153 97 113 40 ,27 14 12 3 18 Mundala 36 46 30 43 3 3 3 19 Nayadi 22 23 19 22 1 1 2 20 PaUan 16 10 14- 10 2 21 Panan 1,153 1,163 460 603 510 434- 163 123 20 3 22 Pancbama 12 7 7 6 4 1 1 23, Paraiyan, Parayan
(Sambavar) 1,821 1,770 1,278 1,569 416 161 117 ,40 10 24- Pulaya Vottuvan 148 168 58 til 69 28 20 19 1 ... 25 Puthirai Vannan 341 339 84- 185 189 115 56 36 12 S 26 Samban 6 2 4 27 Toti 7 7 7 6 1 ... 28 Valluvan 3,077 3,085 2,199 2,690 709 335 160 58 9 2
U ncJassified B 2 5 1 \
199 106Jl~3a

SCT .. m PAJlT.;.B (ii) EDUOATION IN RURAL AREAS ONLY fOR SCHEDULED TlUBES
Educational level ----'"" Literate (without Primary or Junior Matriculation and
Total Illiterate educational level) Basic above Name of r-----"-----"\ ~ ~
Scheduled Tribe M F M F M F M F M F (1 ) (2) (3) (4) (5) (6) (7) (8) (9) (to) (11)
KOZHIKODE DISTRICT-RURAL
Total 34,619 34,219 28,152 31.753 5,152 2,078 1,2f5 385 7. .1
1 Adiyan 146 143 140 143 2 4-2 Arandan 20 20 15 15 4- 5 3 Kadar 134 127 110 1lS 20 « 4-4- Kammara 10 5 6 5 4- - -5 Kattunayakan 1,869 1,819 1,851 1,614- 17 4: 6 Kota 5 3 2 1 2 2 7 Kurichchan 1,570 1,4{J7 1,235 1,34:6 249 95 86 26 8 Kurumans 5,699 5,326 ",329 5,054- 1,152 230 218 42 -9 Kurumbas 97 114- 85 110 11 4-
10 Malasar 28 19 23 18 4- 1 -11 Muthuwan. Mudupr or Muduvan 14 ~I 12 28 %
12 Palliyan 4: 6 4- 6 13 Paniyan 11,445 1l,25t 11,044 11,1# 294- B9 104 17 3 14 Pulayan 13,578 13,892 9.296 11,952 3,392 1,641 823 296 67 3
200

SCT.IV RELIGION FOR SCHEDULED CASTES AND SCHEDULED TRIBES
Fly.leaf
This table prepared in two parts, Part A dealing with Scheduled Castes and Part B dealing with Scheduled Tribes gives the classification of each Scheduled Caste and Scheduled Tribe according to their religion for the rural and urban areas of the district. In this district
201
the Scheduled Castes belong to Hindu religion only and house Table SCT -IV Part-A is not presented as the required information is available in Table SOT-I Part-A.

seT.IV PART·B RELIGION FOR SCHEDULED TRIBES
Name of Religion _..A-- --------Indefinite Religion not
Name of Total Christian Hindu Muslim beliefs stated Scheduled Rural ,------"- r---"'----. ~ ,---"------, ~ ,..---"----,
Tribe Urban P M F M F M F M F M F M F (I) (2) (3) (4) (5) (6) (7) (8) (9) (10) (11) (12) (13) (14) (15)
KOZIDKODE DISTRICT
Total R 68,838 34,619 34,219 153 145 34,463 34,071 3 3 U 1,120 554 566 1 554 565
1 Adiyan R 289 146 143 146 143 2 Arandan R 40 20 20 20 20 3 Kadar R 261 134 127 134 127
U 15 7 8 7 8 -4 Kammara R 15. 10 5 10 5
U 15 9 6 9 6
5 Kuttuna-yakan R 3,688 1,869 1,819 1,869 1,819
U 13 5 8 5 8 6 Kota R 8 5 3 5 3 .. 7 Kurich-
chan R 3,037 1,570 1,467 3 1,570 1,464 U 1 1
8 Kurumans R 11,025 5,699 5,326 5699 5,326 U 43 24 19 24 19
9 Kurumbas R 211 97 114 97 114 U 1 1
lO Ma1asar R 47 28 19 28 19 11 Muthuwan,
Mudugar or Muduvan R 42 14 28 14 28
12 PalJiyan R 10 4 6 4 6 ,'.
13 Paniy'an R 22,695 11,445 11,250 2 6 11,442 11,244 U 8 6 2 6 2
14 Pulayan R 27,470 13,578 13,892 151 136 13,425 13,753 2 3 U '1,024 502 522 502 522
202

SCT-V SAMPLE HOUSEHOLDS ENGAGED IN CULTIVATION CLASSIFIED BY INTEREST IN LAND AND SIZE OF LAND CULTIVATED FOR SCHEDULED CASTES AND
SCHEDULED TRIBES
Fly-leaf
This table gives data in respect of households of members of Scheduled Castes and Scheduled Tribes in a 20 per cent sample of all households in rural areas of the district. It is prepared in two partll, Part A dealing with Scheduled Castes and Part B dealing with Scheduled Tribes. This table gives the number of cultivating households and their distribution according to the interest in land cultivated such as:-
203
Owned or held from Government
2 Held from private persons or institutions for payment in money, kind or share
3 Partly held from Government and partly from private persons for payment in money, kind or share

SCT .. V PART.A SAMPLE HOUS~OLDS ENGAGED lIN CULTIVATION CLASSIFIED BY INTEREST IN LAND AND SIZE OF LAND CULTIVATED IN RURAL
AREAS ONLr FOR MEMBERS OF SCHEDULED CASTES
(Households of members of Scheduled Castes in a 20 per cent sample of all households)
Interest in No_of Households engaged in cultivation by size of land in acres ..
land cultivating L th Unspeci-cultivated households ess 1 an 1-0-2-4 2-5-4-9 5'O-H 7-5-9-9 10-0-12-4 12-5-14-9 15-0-29-9 30'0-49'9 50 + fied
(1) (2) (3) (4) (5) (6) (7) (8) (9) (10) (11) (12) (13)
KOZHIKODE DISTRICT-RURAL
Total 271 . 139 97 30 4 1
(a) 31 6 9 16 (b) 234 132 85 13 3 (c) 6 3
Note_-(a) Owned or held from Government
(b) Held from private persons or instltutions for payment in money, kind or share
(c) Partly held from Government and partly from private persons for payment in money, kind of share
sct ~ ART·B SAMPLE HOUSEHOLDS ENGAGED IN CULTIVATION CLASSIFmD
Interest in land
cultivated
(1)
Total
(a) (6) (c)
! INTEREST IN LAND AND SIZE OF LAND CULTIVATED IN RURAL AREAS ONLr FOR MEMBERS OF SCHEDULED TRmES
(Households of members of Scheduled Trihes in a 20 per cent sample of all households)
1'01,): of Households engaged in cultivation by size of land in acres
cultivating Less than households 1 l'O-N 2'5-4-9 5'0-7'4 7-5-9-9 10,0.12-4 lZ'5-14'9 15'0-29'9 30-0-49-9
(2) (3) (4) (5) (6) (7) (8) (9) (10) (Il)
KOZHIKODE DISTRICT-RURAL
44t 49 190 116 47 17 11 5 5 '
186 10 91 50 23 6 2 .(.
Z35 39 97 58 22 8 7 3 19 2 8 2 3 2 2
Note,-(a) Owned or held from Government
(b) Held from private persons or institutions for payment in money, kind or share
(c) Partly held from Government and partly from private persons for payment in money, kind or share
204
..." Unspeci-
50 + fied
(IZ) (13)
.. .. .. .. .. .. ..

SC·I PERSONS NOT AT WORK CLASSIFIED BY SEX, TYPE OF ACTIVITY AND EDUCATIONAL LEVELS FOR SCHEDULED CASTES
Fly-leaf
This table prepared for total, rural and urban areas of the district gives the sex-wise classification of nonworkers among Scheduled Castes according to their literacy and educational levels and according to the type of activity such being as full time students, persons
1~/1--44 205
seeking employment for the first time, persons employed before but now out of employment and seeking work and others. The educational levels are the same as that followed in Table SCT-III Part-B.

SC.I PERSONS NOT AT WORK CLASSIFIED BY SEX, TYPE OF ACTIVITY AND EDUCATIONAL LEVELS FOR SCHEDULED CASTES
Persons seek-ing employ- Unemploy-
Total non-working ment for the ed but seek-population Full time students first time ing work Others ~ ,~ ,-----'----. ~
Educational levels P M F M F M F M F M F
KOZHIKODE DISTRICT-TOTAL
Total 76,406 33,169 43,237 10,738 7,064 373 55 55 422,003 36,114 Illiterate 58,660 23,037 35,623 2,005 1,618 151 36 21 4 20,860 33,965 Literate (without educational level) 13,825 7,688 6,137 6,610 4,379 118 9 20 940 1,749 Primary or Junior Basic 3,732 2,308 1,424 2,023 1,030 77 2 13 195 39l Matriculation or Higher Secondary 190 128 52 92 36 27 8 I 8 8 Above Matriculation or Higher Secondary 9 8 I 8 1
KOZHIKODE DISTRICT-RURAL •
Total 68,776 29,964 38,812 9,367 5,886 292 39 41 3 20,264 32,884 Illiterate 53,946 21,262 32,684 1,852 1,442 136 29 19 3 19,255 31,210 Literate (without educational level) 11,878 6,704 5,174 5,768 3,767 84 4 11 84] 1,403 Primary or Junior Basic 2,834- 1,901 933 1,674 664 52 1 10 165 268 Matriculation or Higher Secondary 110 89 21 65 13 20 5 I 3 3 Above Matriculation or Higher Secondary 8 8 8
KOZHIKODE DISTRICT-URBAN
Total 7,630 3,205 4,425 1,371 1,178 81 16 14 1 1,739 3,230 llliterate 4,714- 1,775 2,939 153 176 15 7 2 1,605 2,755 Literate (without educational level) 1,947 984 963 842 612 34- 5 9 99 346 Primary or Junior Basic 898 407 491 349 366 25 I 3 30 124 Matriculation or Higher Secondary 70 39 31 27 23 7 3 5 5 Above Matriculation or Higher Secondary 1 I
BADAGARA TALUK-RURAL
Total 468 161 307 76 70 3 1 1 81 23i Illiterate 187 78 109 15 13 63 96 Literate (without educational level) 231 65 166 47 41 17 124-
Primary or Junior Basic 47 16 31 13 15 16 Matriculation or Higher Secondary 3 2 I 1 Above Matriculation or Higher Secondary
QUILANDY TALUK-RUR.AL
Total 6,924 2,988 3,936 1,206 809 36 , 1,740 3,127 Illiterate 4,9B7 1,910 3,077 317 261 5 2 1,586 2,816 Literate (without educational level) 1,618 868 750 706 467 20 2 140 283 Primary or Junior Basic 307 198 109 175 81 ... 8 1 14 28 Matriculation or Higher Secondary 12 12 8 3 Above Matriculation or Higher Secondary
KOZHIKODE TALUK-RURAL
Total 19,965 8,472 11,493 3,066 1,968 110 7 19 1 5,277 9,511 Illiterate 14,659 5,437 9,222 525 384 40 4 8 4,864- 8,833 Literate (without educational level) 4,155 2,275 1,880 1,887 1,307 36 I 6 346 572 Primary or Junior Basic 1,098 720 37B 626 267 24 5 65 III Matriculation or Higher Secondary 4B 35 13 23 10 10 2 2 Above Matriculation or Higher Secondary 5 5 5
206

SC-I PERSONS. NOT AT WORK CLASSIFffin BY SEX, TYPE OF ACTIVITY AND EDUCATIONAL LEVELS FOR SCHEDULED CASTES---concld.
Persons seek-
Total non-working ing employ- Unemploy_
,ment for the ed but seek-population Fulltime students first time ing work Others
,...--.---A------, ..---'-----, ..----'----, r----"------, Educational levels P M F M F M F M F M F
T1RUR TALUK-RURAL Total 15,152 6,626 8,526 2,044 1;366 74 12 3 1 4,505 7,147
Illiterate 11,982 4,751 7,231 372 313 4B 9 2 4,329 6,908 Literate (without educational level) 2,646 1,540 1,106 1,379 913 16 2 I 144 191 Primary or Junior Basic 507 321 186 283 138 7 1 31 47 Matriculation or Higher Secondary 14 II 3 7 2 3 I Above Matriculation or Higher Secondary 3 3 3
ERNAD TALUK-RURAL
Total 24,225 10,757 13,468 2,734 1,553 '50 17 2 7,971 11,898
Illiterate 20,484 8,372 12,ll2 595 461 33 14 7,744 11,637 Literate (without educational level) 2,919 1,766 1,153 1,580 947 8 177 206 Primary or Junior Basic 790 591 199 53:} 145 6 50 54 Matriculation or Higher Secondary 32 28 4- 25 3 3 A hove Matriculation or Higher Secondary
SOUTH WYNAD TALUK-RURAL
Total 2,042 960 1,082 241 120 19 2 1. I 690 959
Illiterate 1,647 714 933 28 10 10 2 7 669 920 Literate (without educational level) 309 190 119 169 92 3 I 17 27 Primary or Junior Basic 85 55 30 43 18 6 2 4 12 Matriculation or Higher Secondary 1 Above Matriculation or Higher Secondary ..
207 l06/1-44a

ST-I MOmER TONGUE AND BILINGUALISM FOR SCHEDULED TRIBES
Fly-leaf
This table prepared for the district' gives in respect of each Scheduled Tribe the sex-wise distribution of speakers of diffefent mother tongues and persons
208
speaking various subsidiary languages in addition to their mother tongues.

ST-I MOTHER TONGUE AND Bll.JNGUALISM FOR SCHEDULED TRIBES
Mother tongue and total number of persons returned
as speaking a language rubsidiary to the mother
Total speakers tongue , .A. __ --,
~
Name of Scheduled Tribe Males Females Males Females Subsidiary language
(I) ( 1) (3) (4) (5) (6)
KOZIDKODE DISTRICT-TOTAL
COORGI/KODAGU
Kurumans 3 2 3 Malayalam (M3)
KANNADA
I Adiyan 74 96
2 Kattunayakan 517 539 Malayalam (M1)
3 Kmumans 228 231 2 Malayalam (F2)
4 Paniyan 59 64
MALAYALAM
1 Adiyan n 47
2 Arandan 20 21)
3 Kadar 141 135 English (MI)
... Kammara 15 6 Tamil (FI)
5 Kattunayakan 1,352 1,280
6 Kota 5 3
7 Kurichchan 1,570 1,468 5 English (M5)
8 Kurumans 5,492 5,111 9 2 English (M6, F2) Hindi (MI) Kannada (MI) Tamil (Ml)
9 Kurumbas 98 114
10 Malasar 5 I
11 Muthuwan, Mudugar or Muduvan 1+ 28
12 Paniyan 11,392 11,!87 5 2 English (M4, F2) Tamil (MI)
13 Pulayan 1+,080 14,+12 91 13 English (M90, FI3 Hindi (MI)
PANIA
Paniyan
TAMIL I
1 Kattunayakan 5 8
'2 Kurumans
3 Mala~ 23 18
-4 Palliylih ... 6
5 Pulayan 2
TELUGU
1 Kammara ... 5
KOZIDKODEDmTRICT-.~
COORGI/KODAGU ] Kuruman! 3 2 3 Malayalam (M3)
KANNADA
I Adiyan 74- 96
'2 Kattunayakan 517 539 ,Malayalam (MI)
3 KurumaDll 228 231 2 MalayaJam (F2)
~ Paniyan 59 64
M-Males F-Females
-209

ST·I MOTIlER TONGUE AND BILINGUALISM FOR SCHEDULED TR.IBES-conc{d~ •
Mother tongue and total number of persons returned
as speaking a language subsidiary to the mother
Total speakers tongue -A--__ , ~----.
Nam.e of Scheduled Trfue Males Females Males Females Subsidiary language
(I) (2) (3) (4) (5) (6)
MALAYALAM
Adiyan 72 47
2 Arandan 20 20 3 Kadar 134 127 English (MI)
4 Kammara 6 5 Kattunayakan 1,352 1,280 6 Kota 5 3 7 Kurichchan 1,570 1,467 5 English (M5)
8 Kurumans 5,463 5,092 9 2 English ~M6. F2) Hindi ( I) Kannada (MI) Tamil (MI)
9 Kurumbas 97 114 10 Malasar 5 1
11 Muthuwan, Mudugar or Muduvaa 14- 28 12 Paniyan 11,386 11,185 5 2 English (M4. F2)
Tamil (MI)
13 Pulayan 13,578 13,890 80 12 English (M79, F12) Hindi (MI)
PANIA
Paniyan
TAMIL
Kurumans
2 Malasar 23 18 3 Palliyan .{- 6 4 Pulayan 2
TELUGU
Kammara .. 5 " M-:-Malet F-Fell1&les
210

ST·n PERSONS NOT AT WORK CLASSIFIED BY SEX AND TYPE OF ACTIVITY FOR SCHEDULED TRIBES
Fly-leaf
This table prepared for the district gives the type of activity of the non-working pop\llation' of Scheduled Tribes such as being fulltime students, persons seeking
211
employment for the first time, persons employed before but now out of employment and seeking work and others in respect of Scheduled Tribe by sex.

ST-D PERSONS NOT AT WORK CLASSIFIED BY SEX AND TYPE OF ACTIVITY , FOR SCHEDULED TRIBES
Persons seeking Unemployed Total non-working Full-time employment for but seeking
population students the first time work Others --. r---"-----. ~ ,..--.-"----.
. Name of Scheduled Tribe P M F M F M F M F M F
(I) (2) (2) (3) (4) (5) (6) (7) (8) (9) (10) (II)
KOZHIKODE DISTRICT-TOTAL
Total 35,890 15,907 19,983 4,020 2,293 66 24 Ii 1 11,815 17,665 1 Adiyan 141 61 74 5 62 74-2 Arandan 24- II 13 5 5 6 8 3 Kadar 159 59 100 6 5 53 95 4- Kammara 11 9 8 3 6 8 5 Kattunayakan 1,751 781 970 16 6 765 964-6 Kota 5 3 2 3 2 1 Kurichchan 1,762 712 1,050 218 lOG 494- 944-8 Kurumans 6,003 2,498 3,510 602 210 1,896 3,299 9 Kurumbas 117 4-7 70 6 4 41 66
10 Malasar 6 2 4 2 4 II Muthuwan. Mudugar or
Muduvan 25 4- 21 2 3 I!} 12 Palliyan 6 2 4 I 4-13 Paniyan 10,222 4,7M 5,428 290 64 4, 4,500 5,363 14 Pulayan 15,647 6,918 8,729 2,864 1,889 62 23 5 3,987 6,817
KOZHIKODE DISTRICT-RURAL
Total 35,200 15,6Oi 19,594 3,859 2,166 61 , Ii I 11,680 11,41& 1 Adiyan 141 67 74- 5 62 74-2 Arandan 24 11 13 5 5 6 8 3 Kadar 156 58 98 6 5 52 93 4, Kammara 6 3 3 3 3 5 Kattunayakan 1,744- 779 965 16 5 763 960 6 Kota 5 3 2 3 2 7 Kurichchan 1,761 712 1,04:9 218 105 494 944-8 Kurumans 5,979 2,431 3,492 600 209 1,887 3,282 9 Kurumbas 1I7 47 70 6 4 41 66
10 Malasar 6 2 4 2 4 11 Muthuwan, Mudugar or
Muduvan 25 4- 21 2 3 19 12 Palliyan 6 2 4 1 4, 13 Paniyan 10,216 4,791» 5,426 290 63 2 4,498 5,362 14 Pulayan 15,014 6,641 8,373 2,708 1,766 59 8 5 3,859 6,5~
KOZlUKODE DISTRICT-URBAN
Total li90 301 389 161 127 5 15 135 247 ~
I Kadar 3 I 2 1 2 2 Kammara 11 6 5 3 3 5 3 Kattunayakan 7 2 5 2 4 4 Kurichchan I 5 Kurumans 29 II IS 2 9 17 6 Paniyan 6 4 2 1 2 2 1 7 Pulayan 633 277 356 156 123 3 15 llS 218
BADAGARA TALUK-RURAL
1 Kattunayakan 12 12 12 2 Kurichchan 330 ISO 200 31 II 99 189 3 Paniyan 153 65 B8 2 2 63 86 4 Pulayan 1,272 561 7ll 283 213 5 273 497
212

ST.D PERSONS NOT AT WORK CLASSIFIED BY SEX AND TYPE OF ACTIVITY fOR SCHEDULED TRIBES-- concld.
population Full·time Persons seeking Unemployed employment for but seeking
Total non-working students the first time work' Others
Name of Scheduled Tribe ~ ~ ,----"-----, ~
P M F M F M F M F M F
(I) (2) (3) (4) (5) (6) (7) (8) (9) (10) (11 )' (12)
QUILANDY TALUK-RURAL
1 Arandan 22 10 12 5 5 5 7
2 Kurumans 18 7 11 1 6 11
3 Paniyan 41 17 24 2 15 24-
4- Pulayan 11,503 5,079 6,424- 2,170 1,393 49 7 2,859 5,024
KOZHIKODE TALUK-RURAL
J Kadar 42 14 28 2 13 26
2 Kammara 6 3 3 3 3 3 Kurumans 11 5 6 5 (;
4- Paniyan 371 148 223 2 6 1% 217
5 Pulayan 589 252 337 87 6B 3 3 159 269
TIRUR TALUK-RURAL
1 Kattunayakan 5 3 2 3 2
2 Kurumbas 3 3 3
3 Pulayan 115 52 63 14 9 38 54
ERNAD TALUK-RURAL
I Adiyan 10 4 6 4: 6
2 Arandan 2 1 1 1 1
3 Kadar 8 3 5 3 5
4- Kattunayakan 62 21 41 2 1 19 40
5 Kota 5 3 2 3 2 6 Kurumans 63 33 30 1 1 32 29
7 Kurumbas 27 13 14 13 14
8 Paniyan 1,519 669 850 41 7 628 843
9 Pulayan 720 335 385 73 41 261 344-
SOUTH WYNAD TAL UK-RURAL
1 Adiyan 131 63 6B 5 58 68
2 Kadar 106 41 65 5 3 36 62
3 Kattunayak~ 1,665 755 910 14 4 741 906
4- Kurichchan 1,431 582 849 187 94 395 755
5 Kurumans 5,887 2,44-2 3,445 598 208 1,844 2,23&
6 Kurumbas 87 31 56 6 4 25 52
7 Malasar 6 2 4 2 4
8 Muthuwan, Mudugar or Muduvan 25 4 21 1 2 3 19
9 Palliyan 6 2 4 1 4
10 Paniyan 8,132 3,891 4,241 243 48 2 3,646 4,192
11 Pulayan 815 362 453 81 42 1 279 411
213 106/1 -45

ERRATA
Page Column Line For Read
12 2 14 Kutiyura Kotiyura 16 44 81 31
18 4&5 Heading Occupie Occuf,ied 2 I Lowland villages-(contd.) Lowland viUages-concld. 2 37 Karuvancheri 5 Karuvancheri
20 1 Sl. No. of Panta- 1. II layini town
21 Last coL 4 I II
29 35 14- 48 484-
32 9 14- 2 8 16 36 41 49
" 37 69 68
" 38 78 7I
" 39 31 36
" 41 36 34
" 42 64- 60
" 43 20 21
33 29 33 3,986 8,986 4() -4: 42 7 77 41 23 31 44 5 2 1,001 1,011 45 Last col. 42 1 47 34 33 11 101 48 16 10 170 176
" 11 256 255
" 12 5.025 502
" 33 18 180
56 6,7 & 8 Major Heading Total number of porsons Total number of persons 1, I X XII I 2 XI XIII
57 Last col. 4- X XII 31 XI XIII
63 20 1 114 4 51. No. 137 2-3-41 2-3-44 U8 2 "
673 Payyathur Payyatthur 119 2 " 719 PUDUPPALLI PUDUPALLI

I06/1-45a
PARTe VILLAGE DIRECTORY

PRIMARY CENSUS ABSTRACT Fly-leal
1. The Primary Census Abstract is presented down to block level for urban areas and desom level for rurcl areas.
Occupied Census House 2. A census house is a structure or part of a struc
ture, inhabited or vacant, giving on the road or a (;ommon staircase or a common courtyard leading to a main gate or enjoying a separate entrance. It may be a dwelling, a shop, a shop-cum-dwelling, a workshopcum-dwelling, or a place of business, workshop, school etc. A census house that i~ inhabited is an occupied census house.
DweUing 3. A dwelling is a census house used exclusively for
residential purposes.
Shop-cam-dwelling 4. A shop-cum-dwelling is a census house used both
as a shop and as a residence.
Workshop-cum-dwelling 5. A census house used both as a workshop and as
a residence is a workshop-cum-dwelling.
Household ,6. A household is a group of persons who commonly
live together in the same census house and take their meals from a common mess unless the exigencies of work prevent them from doing so.
Literacy and Education 7. For purposes of enumeration the ability to read
and write was recognised as the test of literacy. The test applied for reading was the ability to read any simple letter either in print or in manuscript and that for writing was ability to write a simple letter. Persons who could both, read and write and have also passed a written examination or examinations as a proof of the educational standard attained were taken as educated persons.
Workers and non-workers 8. A worker was defined for the purposes of this
census as a person working as a cultivator, or an agricultural labourer, or working at household industry, or doing any other productive work, or working in any possible combination of the above four categories of work. The basis of work was deemed to be satisfied in the case of seasonal work like cultivation, live-stock, dairying, household industry etc., if the person has had some regular work of more than one hour a day
throughout the greater part of the working season. In the case of regular employment in any trade, profession, service, business or comIllerce, the basis of work was deemed to be satisfied if the person was employed during any of the fifteen days preceding the day of enumeration. A person who was working but absent from his work during the fifteen days preceding the day on which enumerated, or even exceeding the period of fifteen days due to illness or other causes was treated as worker. Work includes not only actual work but also effective supervision and direction of work. Persons under training as apprentices with or without stipend or wages were also regarded as workers. An adult woman who was engaged in household duties but was doing no other productive work to augment the family's resources was not considered as a worker. If, however, in addition to her household work she engaged herself in work such as rice pounding for sale or wages or in domestic services for wages for others or minding cattle or selling firewood etc., or ar-y such work, she was treated as a worker. Persons like beggars, pensioners, agricultural or non-agricultural royalty, rent or dividend receivers, who might have been earning an income but were not participating in any productive work, were not treated as workers unless they also worked in cultivation, industry, trade, profession, business or commerce. A public or social service worker who was actively engaged in public service activity or a political worker who was also actually engaged in furthering the political activity of his party was regarded as a worker. A person was considered to be working as cultivator, if, he or she, was engaged either as employer, single worker or family worker in cultivation of land or supervision or direction of cultivation of land owned or held from Government, institutions or private persons. A person was considered agricultural labourer if he was working in another person's land only as labourer without exercising any supervision or direction in cuI. tivation for wages in cash, kind or share such as a share of produce. He should have no right or lease or contract on land on which he works, nor should he be responsible for taking decisions as to which crop to sow and when, or taking the risks of cultivation. A person was considered as working in household industry if the industry comes' within the definitIOn of the household industry. A worker may be an employer, i.e., a person who hires one or more persons in his work, or an employee, i.e., who does

his work under others for wages or salary in cash or kind, or a single worker, i.e., who is doing his work without employing others except casually and without the help of other members of the family except casually, or a family worker, i.e., a member who works without receiving wages in ca~h or kind, in an industry, business or trade, conducted mainly by members of the family and ordinarily does at leas~ one hour of work every day during the working season. The following explanations of these categories of workers were accepted for census enumeration:-
(i) An employer is not only responsible for his own personal work but also for giving work to others in the business rUR by him. But a person who employs domestic servants for household duties or has subordinates under him in an office where he is employed by others, is not an employer, even if he has the power to employ another person in his office on behalf of his own employer or employers.
(ii) There may be persons who are employed as managers, superintendents, agents, etc. and in that capacity employ or control other workers on behalf cf their own employers. Such persons are only employees as explained above, and should not be regarded as employers.
(iii) A single worker is not employed by any one else and in his turn, does not employ anybody else, not even members of his household except casually. The definition of a single worker will include a person who works _in joint partnership with one or several persons hiring no employees, and also a member of a producers co-operative. Each one of the partners or members of such producers' co-operatives is a ' single worker '.
(iv) An industry in which a family worker is engaged should be on a scale larger than what is earned in household industry in Question 10, whether run at home or away from home, in town or village and even away from village in rural areas, and should ordinarily be in the nature of a recognised partnership, joint stock (;ompany or registered factory. For the purpose of this definition members of a family may be drawn from beyond the limits of the household by ties of blood or marriage. The family worker may not be entitled to a share of the profits in the work of the business carried on either by the person or ,head of the household or other relatives. For purposes of enumeration, non-workers were persons who were not engaged in any productive work. Thus a person who had been offered work but had not actually joined, or an adult woman who was engaged in household duties but was doing no other productive work to augment the family's resources, or persons like beggars, pensioners, agricultural o~ non-agricultural
2
royalty, rent or dividend receivers, who were earning an income but were non participating in any productive work were all treated as non-workers. The nonworkers are sub-grouped into eight categories according to the nature of their activity as given below.- .
I Full-time students or children attending school who do no other work.
2 Persons engaged in unpaid home duties who do no other work such as make articles at home for sale, or wages, nor help regularly even part-time in family cultivation, industry, trade or business.
3 Dependents including infants and children not attending schools and persons permanently disabled from work because of illness or old age.
4 Retired persons not employed again, rentiers, persons living on agricultural or non-agricultural royalty, rent or dividend or any other person of independent means for securing which he does not have to work and who does riO other work.
5 Beggars, vagrants, independent women without indication of source of income or others of unspecified sources of existence.
6 Convicts in jails, inmates of penal, mental and charitable institutions.
7 Persons seeking employment for the first time.
8 Persons employed before, but were out of employment and were seeking work during the rderence period.
The following industrial classification has been adopted for the primary economic classification of population.-
I Working as Cultivator II Working as Agricultural Labourer
III Working in Mining, Quarrying, Live-stock, Forestry, Fishing, Hunting and Plantatio~s, Orchards and allied activities
IV Working at Household Industry V Working in Manufacturing other than
Household Industry VI Working in Construction
VII Working in Trade and Commerce VIn Working in Transport, Storage and Com
munications IX Working in Other Services X Non-workers
Household Industry 9 . For purposes of enumeration an industry was consi
dered to be a homehold industry if it was below the scale of a registered factory conducted by the head of the

household himself and/or mainly by members of the household at home or within a village in rural areas and only at home iFl urban areas. The industry should have embraced production, processing, servicing or repairing and included making and selling of goods. The following three tests were laid down to determine whether an industry is a household industry or not:-
(a) Household industry should embrace, manufacturing, processing, servicing or repairing and may include sale but should not be confined simply to buying and selling. At least part of the goods offered for sale from the household should be manufactured or processed by members of the household.
(b) Household industry should be on a household scale where the workers mainly will be the head of the household himself and members of the household, the role of hired workers from outside being of secondary importance. Thus l in any household industry, members of the household should be in a position to lend a hand in the industry whenever they find time in the course of their daily chores. Household industry cannot, therefore,
3
be on the scale of a registered factory but can use machinery and employ power like steam engine or oi1 engine or electricity to drive the machinery.
(c) Location is also important, for proximity decides participation by members of the household. In a village this participation is possible if the household industry is located at home or within the village, because village organisation is such as makes it possible for members of the household to move about freely in the village to look after their wor k. In urban areas such a free movement is not possible and, therefore, in urban areas, only those industries which are located at home can be considered for purposes of household industry. Where, however, part of the work is done outside the house e.g., preparing and dyeing the yarn for weaving or winding into warp and woof or cleaning metal surfaces. before electroplating in baths, it should still be considered a household industry, even in urban areas, as the main operation of weaving or of electroplating is conducted within the house and only one or two operations are conducted outside.


106/1-46
(i) PRIMARY CENSUS ABSTRACT
Kozhikode District Badagara Taluk
Quilandy " Kozhikode " Tirur " Ernad " South Wynad"

PRIMARY CENSUS
KOZHIKODE DISTRICT
Occupied Literate and Total residential Total number of Scheduled Scheduled educated Workers
houses persons enumerated Castes Tribes persons I-IX District/Taluk/ ~...____., ,-------A------~ ,------A----. ,..-----J'_____., r---'~ Town/Ward/Block Area No. No.of
81. Village/Desom/ in of house-No. Forest Range acres houses holds Persons Males Females M F M F M F M F (1) (2) (3) (4) (5) (6) (7) (8) (9) (10) (11) (12) (13) (14) (15) (16)
KOZHIKODE T 1644964.04 426653 440027 2617189 1300974 1316215 71419 72793 35173 34785 665386 397909 612214 189492
DISTRICT R 1606085.28 368114 376278 2184682 1083556 1101126 64896 66296 34619 34219 533781 310568 510876 168771
U 38878.76 58539 63749 432507 217418 215089 6523 6497 554 566 131605 87341 101338 20721
BADA.GARA
iJADAGARA T 135849'03 51908 52318 319913 156646 163267 434 448 1642 1632 87216 47834 69641 23026
TALUK R 130577'06 45727 45870 276005 134675 141330 324 327 1580 1585 74027 39789 59536 20677
U 5271'97 6181 6448 43908 21971 21937 110 121 62 47 13189 8045 10105 2349
Lowland Town
I Badagara (Municipal) 5,271'97 6,181 6,448 43,908 21,971 21,937 110 121 62 47 13,189 8,045 10,105 2,349
Ward I Kuriyadi 97'84 169 188 1,443 720 723 322 252 374 45
Block I 118 137 1,057 537 520 201 162 297 20
" 2 51 51 386 183 203 121 90 77 25
Ward 2 Mukachery 96'74 191 223 1,645 848 797 310 141 440 15
Block 3 , 79 93 634 325 309 81 44 174 .. "
4 112 130 1,01l 523 488 229 97 266 15
W~d 3 Nalupura-bhagam 86'00 125 185 1,237 597 640 360 132 266 36
Block 5 10 20 166 90 76 53 12 36 13
" 6 98 136 927 441 486 275 100 203 19
" 7 17 29 144 66 78 32 20 27 4-
Ward 4 Pandikasala-va1appu 105'00 261 326 1,972 983 989 372 191 506 21
Block 8 73 99 637 312 325 127 70 154 4-
" 9 103 130 720 361 359 106 34 196 17
" 10 85 97 615 310 305 139 87 156
Ward 5 Purankara 179'87 303 314 2,374 1,216 1,158 4 589 292 595 89
Block 11 34 36 295 156 139 71 30 79 .. " _ 12 132 141 970 494 476 262 1I8 248 51
" 13 137 137 1,109 566 543 I 4 256 144 268 38
Ward 6 Pakkayil-bhagam 175'34 268 271 1,816 907 909 4 539 352 456 107
Block 14 166 169 978 500 478 4 331 223 251 78
" 15 102 102 838 407 431 208 129 205 29
Ward 7 Sarampally Mukkola-bhagam lll'48 150 180 1,518 751 767 2 457 f163 393 19
Block 16 36 39 361 184- 177 2 106 21 99 7
" 17 114 141 1,157 567 590 351 142 294- 12
Ward 8 Cholamvayal 130'22 227 230 1,468 726 742 3 3 467 304 359 55 Block 18 145 148 1,009 502 507 3 3 319 187 254 25
" 19 82 82 459 224 235 148 117 105 30
6

ABSTRACT
As Cultivator
I
Workers ____ __..Jo__
In Mining, Quarrying, Livestock, Forestry, Fishing, Hunting and In Manu-Plantations, facturing
As Agri- Orchards At House- other than cultural and allied hold Household
Labourer activities Industry Industry II III IV V
~--A--..., ,.----'~ ~ ,...---"-----,
M F M F
(17) (18) (19) (20)
M F M F (21) (22) (23) (24)
M (25)
F
(26)
In Transport, In Trade Storage and
In Con- and Communi-struction Commerce cations
VI VlI VIII ~ ...---'-----. ~
M F M F M F
(27) (28) (29) (30) (31) (32)
KERALA STATE
------.
In Other Non-Services Workers
IX X ,.--.-J~ ,.----_,__~
M F
(33) (34) M
(35) F
(36)
103098 24746 63013 50011 77357 14076 22002 29990 55116 11834 7231 100 52256 917 26452 1233 205689 56585 688760 1126723 T
101169 24142 61991 48740 66477 13837 19193 25967 33576 7409 5539 55 35603 567 15933 917 I7I395 47137572680 932355 R
1929 604 1022 1271 10880 239 2809 4023 21540 4425 1692 45 16653 350 10519 316 34294 9448 116D80 194368 U
TALUK
6980 3090 3658 4307 11253
6BOO 2939 3511 4058 10017
957 4490 2769 5122 738 1104 93B 3782 2280 3180 374 880
IBO 151 147 249 1236 19 70B 489 1942 364 224
180
9
9
I
1
151 147 249 1,236
210
208 2
192
117 75
2
199 52
108 39
265
38 81
146
19
3
3
3
3
2 2
3'
3
8 7 2 6 2 8
1
1
7
106/1-46a
2 ',. 6 2
12 7 5
1
1
2
2
708
1
4
29
10 19
55
24 31
1
4
4
489 1,942 364 224
14
14
4
4
53 3 3
32 3 2 21 I
40
7 33
52 3
46 3
19
6
2 2
6 L 7
70 66
5 45 36 20 30
9
1 8
25 128 22 33
19 81 22 32 6 47 I
4
4
5
5
92 23 69
77
49 28
2 .. 12
.. I
7
5
5
11 7933 75 2510 931 26591 10148 87005 140241 T
8 6063 59 1732 777 23571 9244 75139 120653 R
3 1870 16 778 154 3020 904 11866 19588 U
3 1,870 16
47 3
26 2 21 1
78 15 63 1
97 18 63 16
99 40 36 23
72
16 34 22
60 32 28 1
167 50
117 82
66 16
1
1
778 154
8 9 4 3 4 6
69
17 52
52 2 3
47 1 2 1
59 19 20 20 27
5 15 7
4
I 3
67 20
19 13 48 7
62 13 49
42
32 10
3,020
52
25 27
57
18 39
54
10 39 5
129 36 26 67
132 15 63 54
91
54 37
59 6
53
147
96 51
904: 11,866
26 346
8 240 18 106
11
11
408
151 257
30 331
9 54 18 238 3 39
6 477
4 158 2 165
154
19,588 1 678 500 1 173 2
782 309 3 473 4
604
63 5 467 6 74 7
968 321 8 342 9 305 10
12 621 1,069
77 139 11 10 2
246 425 12 298 505 13
26 451 13 249 13 202
11 358 7 85 4 273
47 367
18 248 29 119
802
400 14 402 15
748 170 16 578 17
687 482 18 205 19

PRIMARY CENSUS
KOZlDKODE DISTRICT
Occupied Li terate and Total residential Total number of Scheduled Scheduled educated Workers
houses persons enumerated iCastes Tribes persons I-IX District/Tal uk/ ~ r--7'_____'" r--->'----' ~~ Town/Ward/Block/ Area No. No. of
SI. Village/Desom/ in of house-No. Forest Range acres houses holds Persons Males Females M F M F M F M F
(1) (2) (3) (4) (5) (6) (7) (8) (9) (1O) (11) (12) (13) (14) (15) (16)
Lowland Town-(contd.)
Ward 9 Peruvattum-thazha bha. gam 131'67 209 227 1,636 837 799 572 315 376 72
Block 20 54 59 481 232 249 155 106 99 22
" 21 129 142 957 506 451 341 168 226 42
" 22 26 26 198 99 99 76 41 51 8
Ward 1O Payanghavu-bhagom 138-95 226 226 1,572 792 780 522 331 345 94
Block 23 118 118 850 422 428 283 182 206 61
" 24 108 103 722 370 352 239 149 139 33
Ward II Chaliyatheru-bhagam 140' 10 289 290 2,060 1,067 993 5 2 718 445 486 207
Block 25 40 40 306 165 141 .. 116 89 61 23 26 141 141 890 4-62 428 1 5 2 335 199 212 86
" 27 . 108 109 864 440 424 267 157 213 98
Ward 12 Arakkilad-bh~gam 136'08 312 315 2,077 1,021 1,056 3 2 574 322 465 125
Block 28 34 34 234 HI 123 62 37 52 6
" 29 135 138 968 474 494 3 2 258 130 215 48
" 30 143 143 875 . 436 439 254 155 198 71
Ward 13 Puthur-hhagam 306'77 292 292 2,019 1,001 1,018 5 3 13 643 360 438 108
Block 31 142 142 1,052 529 523 4 13 352 190 220 39
" 32 150 15O 967 472 495 1 3 291 170 218 69
Ward 14 Nadakkutha. zhabhagam 622'17 345 346 2,180 1,081 1,099 5 6 618 330 492 232
Block 33 119 120 855 406 449 192 91 205 143
" 34 146 146 838 433 405 5 6 270 133 192 73
" 35 80 80 487 242 245 156 106 95 16
Ward 15 Meppayil North 272'44 323 323 2,083 1,032 1,051 27 31 4 4 652 406 509 183
Block 36 61 61 390 184 206 2 4 131 98 84 13
" 37 148 148 951 477 474 25 27 293 167 225 41 38 Il4 114 742 371 371 4 4' 228 141 200 129
Ward 16 Meppayil South 272'44 248 248 1,641 803 838 19 18 5 8 522 390 346 92
Block 39 30 30 204 108 96 4 4 ,. 71 43 46 8
" 40 143 143 949 451 498 5 8 301 231 194 64
" 41 75 75 488 244 244 15 14 150 116 106 20
Ward 17 Kannam-kuzhi Chee·· ramveedu bhagam 185'18 273 273 1,905 942 963 6 7 7ll 566 395 69
Block 42 63 63 405 192 213 3 1 137 114 89 13
" 43 142 142 1,021 492 529 3 6 385 330 202 41
" 44 68 68 479 258 221 189 122 '104 15
8

ABSTRACT
DRALA STATE
Workers
------------------------------~----------------------------------------~ In Mining, Quarrying, Livestock, Forestry, Fishing, Hunting and Plantations, Orchards and allied activities
As Agri-As cultural
Cultivator Labourer I II
~r--~ III
,---~
M F M F M F
(17) (18) (19) (20) (21) (22)
16 10 6
3
2 1
3 3
13 Jl 2
2
28 20 5 1 9 3
14 16
5 6
5 6
10 29 5 13 5 11
3
3
9
1 1 7
5
5
22 .. 1
21
6
6
20 7
11 2
18 13 5
10
1 9
19
3 3
]3"
16
3 13
34 24 3~ 153 48 13 4 23 114 24 16 16 9 39 19 5 4 1 5
16
3 11 2
16
2 12 2
15
1 14
17 15 24 1 10 8 5 11 893
5
3
2
.5 4 1
16 .. 1
15
9
4 5
25 1
24
7
1 2 4
22 5
17
In Manufacturing
At House- other than hold Household In Con-
Industry Industry struction IV V VI
...---''----, r---' '---, ,..--'------,
In Transport, In Trade Storage and
and Communi-Commerce cations
VII VIII ~~
In Other Non-Services Workers
IX X ,..----J.......__, ,....~
M F M F MF MFM F M 11 M F
(35) 1(36) (23) (24) (25) (26) (27) (28) (29) (30) (31) (32) (33) (34)
2
2
6 3 3
3 .. 3
.. 1
236 165
18 16 127 65 91 84
56
22 34
28
17 11
97 26 56 15
100
66 34
49 15 15 19
94
to 65 19
4
4
5
5
23 6 9 8
13 12 I
10
5 5
17
3 14
16 109 4
3 1
24 20 4
143
2 HI
25
1 20
4
1 55 15 54
8
6 2
94
1 93
24 2
21 1
83
31 33 19
103 30 62 11
4 9 1 I 6 2 3
11
I 8 2
10
8 2
84 3 3
11 62 3 2 11 1
102 3
32 44 :3 26
9
9 2 2 5
90 27 56 7
50
36 14
68 :3 11 19 3 38
71
10 34 27
94
48 46
91
29 48 14
62 8
49 5
46 4
20 22
84 20 37 27
45 8
32 5
10
5 5
20 2 4
14
28 2
20 6
7 I 4 2
14
12 2
4
.. 4
27 13 15 5 12 8
21 16
6 5 10 II 5
21
5 11 5
13 1
10 2
8
8
13 20
3 1 10 12
7
99 25 60 14
122
56 66
97 15 41 41
150 21 56 73
161
93 68
149
59 47 43
114
37 57 20
127
!7 59 51
58 461 17 133 35 280 6 48
36 4J.7
19 216 17 231
29 58! 3 104
17 250 9 227
49 556 4 59
22 259 23 238
65 563 32 309 33 254
27 589
13 201 4 241
10 147
38 10 11 17
523
100 252 171
41 457
I 62 30 257 10 138
160 41 547 24 8 103 92 25 290 44~ 8 154
727 227 20 409 21
91 22
686 367 23 319 24
786 118 25 342 26 326 27
931 t17 28 446 29 368 30
910
484 31 426 32
867
306 33 332 34 229 35
868
193 36 433 37 242 38
746 88 39
434 40 224 41
894
200 42 488 -+3 206 ...

PRIMARY CENSUS
KOZHlKODE DISTRICT
Occupied Literate and Total residential Total number of Scheduled Scheduled educated Workers
houses persons enumerated' Castes Tribes persons I-IX District/Taluk/ ,-----A------, ,....---A---, r---"---t ~ r---"--> Town/Ward/Block/ Area No. No. of
81. Village/Desom/ in of house· No. Forest Range acres houses holds Persons Malei Females M F M F M F M F (1) (2) (3) (4) (5) (6) (7) (8) (9) (10) ( 11) (12) ( 13) (14) (15) (16)
Lowland Town (coneld.) Ward 18 Badagara·
vayal Kotta· paramba 2~'94 265 266 1,855 959 896 7 4- 2 650 4-54 430 126
Block 45 76 76 522 273 249 2 3 190 138 122 40 " 46 145 146 1138 569 569 5 1 1 381 274 252 75 "
47 44 44 195 117 78 79 42 56 11 Ward 19 Karimpana.
palamNara· yananagaram 231'56 289 290 1,918 959 959 10 12 1 677 495 439 87
Block 48 107 107 745 379 366 6 7 1 261 189 169 41 " 49 143 143 949 478 471 4 5 339 244 219 30 " 50 39 40 224 102 122 77 62 51 16
Ward 20 Cheenam· veedubha· gam 270'00 267 269 1,864- 982 882 2 3 19 13 639 387 431 liS
Block 51 103 105 805 428 377 2 3 6 284 173 204- 38
" 52 141 14l 905 475 430 .. .. 304- 176 206 62
" 53 23 23 154 79 75 13- 12 51 38 21 18 Ward 21 'KayyiIbha·
gom 290'32 277 288 1,946 973 973 605 412 453 140 Block 54 117 123 799 407 392 283 185 190 61
.. 55 140 145 1,027 511 516 288 195 233 65 II 56 20 20 120 55 65 34 32 30 14-
Ward 22 Kakkattil 405'86 300 302 2,099 1,011 1,088 11 22 540 325 437 142 Block 57 133 135 945 468 477 2 5 266 182 218 100
.. 58 131 131 848 394 454- 9 17 194 118 168 40 " 59 36 36 306 149 157 80 25 51 2
Ward 23 Kanthilatt· paUy Moo-
281-00 338 342 11 5 698 442 104-radbhagom 2,185 1,088 1,097 12 6 445 Block 60 114- 114 692 356 336 6 9 233 113 142 26
" 61 139 143 947 464- 483 6 2 6 5 299 203 191 48 _" 62 85 85 5-W 268 278 166 129 109 30
Ward 24 Panikkotti· bhagom 314'00 234 234 1,395 675 720 3 3 432 235 232 63
Block 63 55 55 321 169 152 110 58 61 25 " 64 144 144 877 416 461 3 3 272 ISO 135 3() " 65 35 35 197 90 107 50 27 36 8
Highland Village
Kavilumpara 27,604'58 2,178 2,190 12,789 6,665 6,124 23 20 171 181 3,725 1,966 3,195 670 1 Kallat 203 203 1,175 588 587 7 5 331 108 279 76 2 Adukkath 161 161 1,031 520 511 25 19 258 79 224 31 3 Maunur SO 50 316 161 155 6 12 83 20 70 14-4 Maruthonkara 515 519 3,160 1,672 1,488 60 65 902 548 827 166 5 Moyilothara 417 417 2,337 1,220 1,117 13 11 704- 343 558 149 6 Kavilurnpara 832 840 4,770 2,504 2,266 22 20 60 69 1,447 868 1,237 234
10

ABSTRACT
KERALA STATE
Workers
In Mining, Quarrying, Livestock, Forestry, Fishing, Hunting and In Manu-Plantations, facturing In Transport,
As Agri- Orchards At House- other than In Trade Storage and As cultural and allied hold Household In Con- and Communi- In Other Non-
Cultivator Labourer activities Industry Industry struction Commerce cations Services Workers I II III IV V VI VII VIII IX X ~ ~ r----"----; r--'----"'\ r--.A......-" ,---A----, ~ ~...-----'---\ ~
M F M F M F M F M F M F M F M F M F M F
(17) (18) (19) (20) (21) (22) (23) (24) (25) (26) (27) (28) (29) (30) (31) (32) (33) (34) ~35) (36)
6 6 2 6 91 2 14 75 3 J4 216 118 529 770
1 2 .. 26 7 20 3 2 64 35 151 209 45 5 I 6 2 2 I 54 7 46 10 120 72 317 494 46
2 II 9 2 32 II 61 67 47
3 4 7 3 101 16 84 46 8 178 74 520 872
1 1 1 .. 27 4 34 28 73 41 210 325 48 2 1 1 4 2 67 9 47 14 7 75 20 259 441 49
2 2 I 7 3 3 1 4 1 30 13 51 106 50
12 14- 5 5 15 28 25 94 10 21 80 23 9 153 55 551 764
2 2 2 8 17 12 47 15 43 10 7 60 17 224- 339 51 10 7 3 5 6 7 7 44 9 6 31 13 2 86 32 269 368 52
5 1 4 6 3 I 6 7 6 58 57 53
32 2 22 11 100 71 4 97 37 11 160 44 520 833
16 2 7 4- 51 35 3 44- 7 1 61 19 217 331 54 16 II 7 42 28 I 50 I 28 10 85 19 278 451 55
4 7 8 3 2 14 6 25 51 56
98 2 17 19 80 97 9 76 31 125 23 574 946
50 2 10 19 41 60 3 38 14- " 61 19 250 377 57 45 7 36 36 3 28 5 I 44 3 226 414 58 3 3 1 3 10 12 20 I 98 155 59
15 12 26 5 9 12 21 113 47 22 71 30 .. 5 144- 14- 646 993
3 1 7 9 43 13 3 33 13 4 39 .. 214 310 60 6 6 24 2 8 .. 48 32 12 23 2 68 8 273 435 61 6 6 2 3 5 12 22 :2 7 15 15 1 37 6 159 248 62
9 10 3 2 4 13 18 11 9 6 29 13 144- 23 443 6j7
5 8 2 1 2 I 5 8 (1 8 6 27 6 108 127 63 3 1 10 17 5 16 1 99 13 281 431 64 J 2 2 2 1 I 1 5 6 1 18 4 54 99 65
225 45 71 23 1,118 50 48 7 89 11 12 149 6 98 45 1,385 483 3,470 5,454 1
+ 51 3 2 4 11 5 24- 6 176 68 309 511 1
+ ... 32 6 25 32 19 124 Jl 296 480 2
i- 1 15 1 4 12 11 11 23 2 91 141 3 148 28 45 21 261 6 30 2 15 3 2 24- 17 285 106 845 1,322 4
58 16 25 2 178 22 6 1 4 14 2 271 108 662 %8 5 7 581 18 9 49 7 5 50 6 30 15 506 188 1,267 2,032 6
11
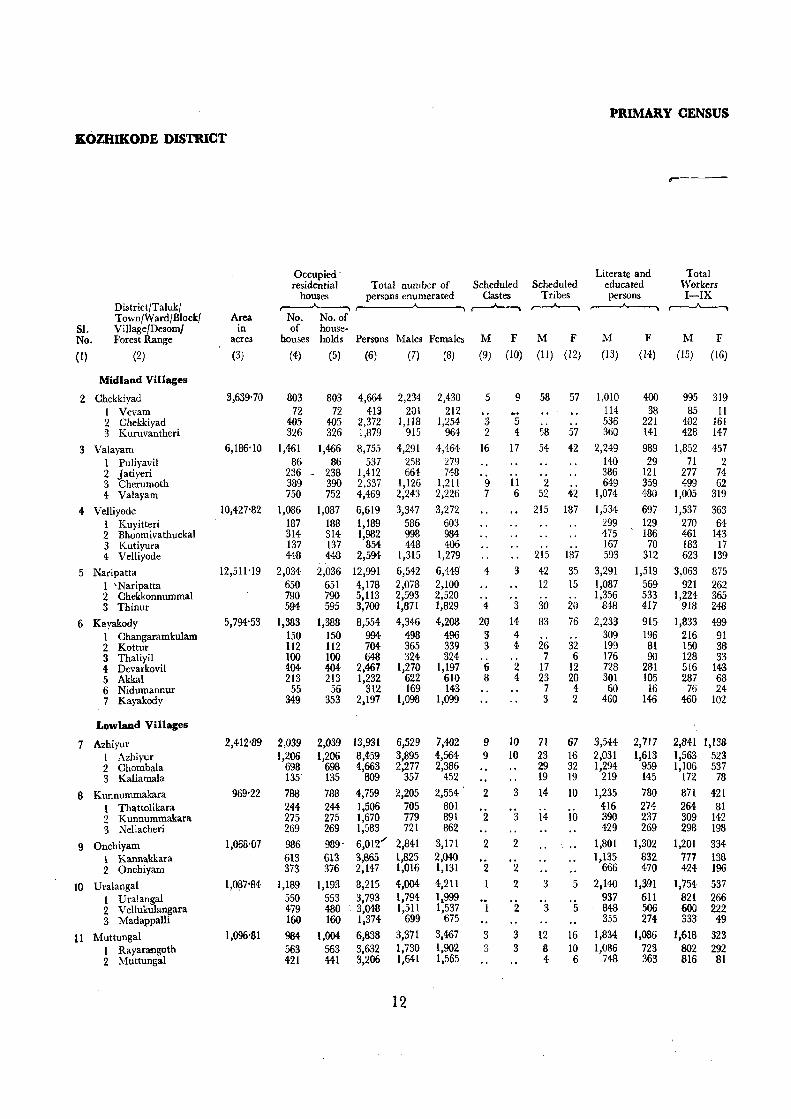
P1UMAB.Y CENSUS
ltOZHIKODE DISTRICT
,-----
Occupied- Literate and Total residential Total number of Scheduled Scheduled educated Workers
houses persons enumerated Castes Tribes persons I-IX District/Taluk/ ~ r------"------. ~ ,.....-A-----, ~ ~ Town/Ward/Block/ Area No, No,of
51, Village/Desom/ in of house-No, Forest Range acres houses holds Persons Males Females M F M F M F M F
(1) (2) (3) (4) (5) (6) (7) (8) (9) (10) (11) (12) (13) (14) (15) (16)
Midland Villages
2 Chekkiyad 3,639'70 803 803 4,664 2,234 2,430 5 9 58 57 1,010 400 995 319 1 Vevam 72 72 413 201 212 .. 114 38 85 11 2 Chekkiyad W5 W5 2,372 1,118 1,254 <1 5 536 221 482 161 3 Kuruvantheri 326 326 1,879 915 964 2 4 58 57 360 141 428 147
3 Valayam 6,186'10 1,461 1,466 8,755 4,291 4,464 16 17 54 42 2,249 989 1,852 457 1 Puliyavil 86 86 537 258 279 140 29 71 2 2 Jatiyeri 236 - 238 1,412 664 748 386 121 277 74 3 Cherumoth 389 390 2.337 1,126 1,211 9 II 2 649 359 499 62 4 Valayam 750 752 4,469 2,243 2,226 7 6 52 42 1,074 480 1,005 319
4- Velliyode 10,4-27'82 1,086 1,087 6,619 3,347 3,272 215 187 1,534 697 1,537 363 1 Kuyitteri 187 188 1,189 586 603 299 129 270 64 2 Bhoomivathuckal 314 314- 1,982 998 984 475 186 461 143 3 Kutiyura 137 137 854 448 406 " 167 70 183 17 4 Velliyode 448 448 2,594- 1,315 1,279 215 187 593 312 623 139
5 Naripatta 12,511'19 2,034 2,036 12,991 6,542 6,449 4 3 42 35 3,291 1,519 3,063 875 1 'Naripatta 650 651 4,178 2,078 2,100 12 15 1,087 569 921 262 2 Chekkonnurnmal 790 790 5,113 2,593 2,520 .. 1,356 533 1,224 365 3 Thinur 594 595 3,700 1,871 1,829 4- 3 30 20 848 417 918 248
6 Kayakody 5,794'53 1,383 1,388 8,554 4,346 4,208 20 14 83 76 2,233 915 1,833 499 I Changaramkulam 150 ISO 994 498 496 3 4 " 309 196 216 91 2 Kottur 112 112 704 365 339 3 4 26 32 199 81 150 38 3 Thaliyil 100 100 648 324 324 7 6 176 90 128 33 4 Devarkovil W4 W4 2,467 1,270 1,197 6 2 17 12 728 281 516 143 5 Akkal 213 213 1,232 622 610 8 4 23 20 301 105 287 68 6 Nidumannur 55 56 312 169 143 7 4 60 16 76 24 7 Kayakody 349 353 2,197 1.098 1,099 3 2 460 146 460 102
Lowland Villages
7 Azhiyur 2,412'89 2,039 2,039 13,931 6,529 7,W2 9 10 71 67 3,544 2,717 2,841 1,138 1 Azhiyur 1,206 1,206 8,459 3,895 4,564- 9 10 23 16 2,031 1,613 1,563 523 2 Chombala 698 698 4,663 2,277 2,386 29 32 1,294 959 1,106 537 3 Kallamala 135- 135 809 357 452 19 19 219 145 172 78
6 Kunnummakara 969'22 788 788 4,759 2,205 2,554- 2 3 14 10 1,235 780 871 421
1 Thattolikara 244 244 1,506 705 801 416 274 264 81 2 Kunnummakara 275 275 1,670 779 891 2 3 14 10 390 237 309 142 3 Ne11acheri 269 269 1,583 721 862 429 269 298 198
9 Onchiyam 1,068'07 986 989- 6,012 .... 2.841 3,171 2 2 1,801 1,302 1,201 334 1 Kannakkara 613 613 3,865 1,825 2,040 1,135 832 777 138 2 Onchiyam 373 376 2,147 1,016 1,131 2 2 666 470 424 196
10 Uralangal 1,087'84 1,189 1.193 8,215 4.004- 4.211 2 3 5 2,140 1,391 1,754 537
1 Uralangal 550 553 3,793 1,794 1,999 '2 -3 937 611 821 266 2 Vellukulangara 479 480 3,048 1,511 1,537 1 5 848 506 600 222 3 MadappaUi 160 160 1,374 699 675 355 274 333 49
11 Muttunga1 1,096'81 984 1.004- 6,838 3,371 3,%7 3 3 12 16 1,834 1,086 1,618 323
I Rayaraogoth 563 563 3.632 1,730 1,902 3 3 8 10 1,086 723 802 292 2 Muttungal 421 441 3,206 1,641 1,565 4 6 748 363 816 81
12

ABSTRACT
KERALA STATE
Workers __ --------------.A.---.---_____ ..;.... _______ _
As Cultivator
I -r--'--'-'
As Agricultural
Labourer II
,---""'___'
In Mining, Quarrying, Live-stock, Forestry, Fishing, Hunting and Plantations, Orchards and allied activities
1II
At Household
Industry IV
r--"----
In Manufacturing other than Household Industry
V
In Construction
VI r----"----,
M F
(17) (18)
M F M F M
(19) (20) (21) (22) (23)
F M
(24) (25)
F M F
(26) (27) (28)
146 3
60 83
156
17 35
104
209 26 14-
169 138 32 40 66
_218 47 26 11 29 45 9
51
142 85 36 21
85 15 44-26
118 44-74-91 39 51 I
,67 57 10
16
1l 5
23
. , 5
18
36 6 5
25 64 39 9
16 71 18 8
15 14 9 6 1
106
9 97
55 38 6 3 B
24 13 I
10
27 13 10
4-69
.. 1
l. 68
15
8 7
5 ..
91 ..
49 42
385 5
1 82 .. 73 4- 225
15 1 3
11
1 o. I
434 64
128 22
220 902 190 385 327
10 639 52 35 22
159 .. I
.. 1 8
161 21
189
75 134 '0180 766 24 66 96 386 47 60 70 352 4 8 14 28
31 114 188 27 7 9
II
2 27 13 20 2 101 168
82 30 52
153 72 68 13
70 66 4
39
39 14 12 2
33 33
56 272 4 249
52 23 11 595 9 295 2 56
244
22 464 22 129
335
"16/1-47
32
17 15 25 .. 8 3
14
25 2 3 1
19 70 6
27 37 54 15 I
.. 5 8
25
24
19 5
29 7 4
10 8
25 1
14
10 53 20 22 11
21 2 3 4 1 5 6
4
.. 4
2 .. 2
30 15 14 I
28 3 3
.. 6
12 3 I
33 3
26 4
20 .. 2 9 9
21 5 8 3 5
53 23 28 2
69 3 2
14 25 12 .. 13
21. 371 280 217 I 83 86 156
19 259 163 44-1 29 31 17
' ..
10 8 2
98 20 17 61
121 64 57
181 108 58 15
64 61
3
38 119 8 . 63 9 31
21 25 45 III 15 71 30 40
138 152 85 59 43 93 10 33 242 32 138
I 104
4-
I 3
10
7
3
9 6 2 1
60
2 50
5 I I
45 17 21
7
15
8 i I
8 7 I
4 3 I
14-I
10 3
28 .. 9
14 5
3 2
1
14 6 5 3
10
.. 1 3 2 .. 4
.-67 46 20
1
27 16 3 8
39 29 10
74 26 46 2
39 20 19
13
In Trade and
Commerce VII
r--"'-----.,
M F
(29) (30)
147 30 82 35
185 13 54 55 63 61
8 31 13 9
227 100 105 22
152 15 8
30 61 12 .. 26
337 184 144
9
94 24 40 30
129 87 42
169 58 94 17
177 68
109
2
.. 2
2
2
12
.. 2 5 3 2
4 1 1 2
2 2
In Transport, Storage and Communi- In Other Non-
cations Services Workers VIII IX X
,.............. ~ r---A------.,
M F M
(31) (32) (33)
6 .. 1 5
39 . . 12 9
18
17 2 9 3 3
42 19 17 6
116 4 7
20 67 10
8
116 80 30 6
14 8 3 3
17 16 1
37 I4 22
1
109 39 70
38
.. 38
9 .. 2
7
22
3 12 7
428 48
226 154
955 8
91 291 565 743 149 256 142 196
24 1,607 20 518 3 612 1 477
III 539 16 93 3 69
II 26 21 171 24 39 1 40,
35 101
140 691 52 477 76 161 12 53
293 III 149 33
5 355 5 217
138
31 441 3 210
20 178 8 53
67 423 63 257 4 166
F
(34)
214 11
124 79
379 2
56 52
269 260
55 126
4 75
677 176 309 192 153 38 23
3 41
7 10 31
393 246 140
7
M
(35)
1,239 Jl6 636 487
2,439 187 387 627
1,238
1,810 316 537 265 692
3,479 1,157 1,369
953 2,513
282 215 196 754 335 93
638
3,688 2,332 1,171
185
F (36)
2,111 201
1,093 817
4,007 277 674
1,149 1,907 2,909
539 841 389
1,140 5,574 1,838 2,155 1,581
3,709 405 301 291
1,054-542 119 997
6,264 4,041 1,849
374 148 1,334 2,133 70 44-1 720 71 470 749 7 423 664
136 75 61
194-90 86 18
117 98 19
1,640 1,048
592 2,250
973 911 366
1,753 928 825
2,837 1,902
935 3,674 1,733 1,315
626 3,144-1,610 1,534
2 1 2 3
3 1 2 3 4
4-1 2 3 4-
5 I 2 3
6 I 2 3 4 5 6 7
7 1 2 3
a 1 2 3
9 1 2
10 1 2 3
11 1 2

PRIMARY CENSUS
KOZIDKODE DISTRICT
Occupied Literate and Total residential Total number of Scheduled Scheduled educated Workers
houses persons enumerated Caste, Tribes persons I-IX DistrictfTalukf ~ ,---A----, ,---A----; ,__,.;....____" ,.---'--, Town/Ward/Block/ Area No. No. of
Sl. VillagefDesom/ in of house-No. Forest Range acres houses holds Persons Males Females M F M F M F M F
(1 ) (2) Lowland Villages-Ccaned.)
(3) (4) (5) (6) (7) (8) (9) (10) (I I) (12) (13) (14) (15) (16)
12 Chorode 1,071'50 1,036 1,036 7,135 3,523 3,612 10 7 8 8 2,089 1,445 1,713 607 1 Erapuram 466 466 3,708 1,865 1,843 10 7 (I 8 1,053 697 942 157 2 N elluyankara 122 122 795 384 411 215 223 203 135 3 Chennamangalam 145 145 936 456 480 306 235 205 115 4 Chorode 303 303 1,696 818 878 453 290 363 20G
13 Vykilasseri 1,145'20 869 869 4,834 2,222 2,612 6 10 1,254 901 942 412 1 KurukkiJad 351 351 2,012 939 1,073 534 427 406 187 2 Vykilasseri 429 429 2.328 1,065 1,263 3- 7 552 395 441 192 3 Varssyekuni 39 89 494 Z18 276 3 3 113 79 95 33
14 Eramala 2,314'43 1,400 1,400 8,226 3,843 <!,333 39 36 15 14 2,186 1,350 1,797 1,110 1 Orkatteri 688 688 4,034 1,897 2,137 26 20 14 14 1,113 678 883 442 2 Adiyur 345 345 2,170 1,052 1,1I8 7 IO 1 567 322 533 363 3 Eramala 298 298 1,639 718 921 422 294 307 255 4 Payyatthur 69 69 383 176 207 6 6 84 56 74 50
15 Edacheri 2,094'53 1,315 1.315 7,873 3,761 4,112 9 8 13 16 2,050 996 1,623 780 1 Edacheri 1,217 1,217 7,262 3,471 3,791 9 8 13 15 1,896 909 1,501 683 2 Vengo1y 36 36 219 103 ll6 1 50 39 43 23 3 Thuruthi 62 62 392 187 205 104 48 79 69
16 Katcheri 725'33 383 388 2,380 1,092 1,283 6 4 661 397 484 307 1 Katcheri 290 290 1,304 821 983 6 4 491 313 357 191 2 Kottembrom 98 98 576 271 305 170 34 127 116
17 Iringannur 1,174'26 573 578 3,355 1,567 1,788 20 25 917 576 650 343 I Iringannur 478 478 2,740 1,283 1,457 744 455 549 312 2 Kayapanachi 100 100 615 284 331 20 25 173 121 101 31
18 Thuneri 1,881'09 1,060 1,062 5,744 2,615 3,129 16 21 1,572 332 1,008 521 I Thuneri 446 448 2,410 1,135 1,275 13 17 687 381 503 277 2 Mudavantheri 614 614 3,334 1,480 1,854 3 4- 885 451 505 244
19 Parakkadavu 1,680'28 599 599 3,476 1,631 1,845 4 2 942 311 637 157 1 Ummathur 261 261 1,463 652 811 4 2 401 139 232 41 2 Parakkadavu 139 139 846 408 438 I 230 77 176 26 3 Thanakkottur 197 197 1,157 567 590 303 94 228 88 4 Vilakkottur 2 2 10 4 6 3 I I 2
2(J Vanimal 821'80 563 563 3,498 1,733 1,765 860 401 708 206 I Verkadavu 161 161 1,020 490 530 274 159 200 36 2 Mambilakkool 209 209 1,252 638 614 272 110 262 98 3 Vanimal 193 193 1,226 605 621 314 132 246 72
21 Iyyencode 1,473-78 881 881 5,280 2,578 2,702 10 7 2 5 1,296 500 1,007 320 I Kakkattil 231 231 1,473 685 793 2 5 352 100 266 81 2 Vishnumangalam 205 205 1,209 588 621 I I 288 124 224 67 3 Chiyyur 163 163 974 492 482 9 6 199 74 193 35 4 Peruvankara 41 41 246 124 122 59 45 34 3 5 Iyyencode 241 241 1,373 689 684 398 157 290 134-
22 Kuttipram 1,847'64 1,084 1,084 6,445 3,154 3,291 11 7 1,859 1,015 1,305 378 I Varikkoli 211 211 1,275 590 685 .. 1 1 341 210 279 139 2 Narikkatteri 299 299 1,742 872 870 1 439 229 373 106 3 Chelakkad 170 170 988 478 510 4 3 296 155 142 24 4 Kuttipram 4{)4 404 2,440 1,214 1,226 6 3 783 421 511 109
14

.ABSTRACT
KERALA &TATE
Workers __________ ~_. ____ .A. ________________ _
--,
As Cultivator
I ~
In Mining, Quarrying, Live-stock, Forestry, Fishing, Hunting and Plantations,
As Agri- Orchards cultural and allied
Labourer activities II III
r--"----, r--~
At Household
Industry IV ,..--......__.,
M F l\I F M F M F
(22) (23) (24) (17) (18) (19) (20) (21)
l!4 9 7
34 64
129 43 64 22
326 123 120 73 10
247 215
6 26
101 M 17
187 154 33
207 109 98 76 20 13 42
1
18 17 .. I
100 21 25 27
27 160 66 61 6
27
132 II 7
46 68 95 29 54 12
224 106 57 61
127 116
1 10
48 28 20
77 59 18
104 70 34
3 2
.. 1
2 2
15 3 4 3 .. 5
59 36 18 2 3
106/1-47a
56 116 9 16 5 18
17 20 25 62 30 78 15 '13 9 .'i5 6 IO
266 499 90 164
112 225 57 lIO 7
72 232 57 182
1 2 14 48
95 144 79 126 16 18
52 170 51 167 1 3
81 48 33
2
.. 1
48 2
35 I
., 10
12 4 4-1 3
196 159 37 10 1
, . 7 2
19 2
17
33 20 II .. 2
379 330
4 6
39 26 13 7 6
47 23
5 18 1
34 34
16 15 I
10 6 4
18 14 4
9 2 2 5
228 78
J08 42 48 25 11 4
8
55 19 21 3
12
23
3 20
172 41 94
6 31
10 209 10 133
70 6
8 214 1 132 1 59 6 22
8 3 4 I
1
195 189
6
53 3
50
44 43 I
48 41 7
21 6 9 6
"
5 1
4
43 14 5 3
21 19 8 7
' . 4
100 13 80 4 3
99 70 27 2
178 102 51 25
139 132
7
54
54 15 15
17 13 4
9 3 5 I
3
3
21 12
I
8
13 9 2
2
In Manufacturing other than
In Transport, In Trade Storage and
Household In Con- and Communi- In Other Kon-Industry struction Commerce cations Services Workers
V VI VII VIII IX X r--""'-----..~ ~,-----"----,,---A----, ,.--.--A----.,
M F M
(25) (26) (27)
299 177 25 48 49
47 30 12 5
160 87 49 20 4
152 143
4 5
36 29 7
22 18 4
52 28 24
8 5 1 2
13 I 4 8
35 13 5 7
.. 10
124 46 30 17 31
10 8
2
2 2
j
5
37 37
2
2
"
6
5
4-4
I
17 9 2 3 3
21 IO 9 2
34 15 12 7
38 38
15 15
8 8
18 9 9
15 7 5 3
4 .. 3 I
16 6 6
.. 4
12 3 3
.,
6
15
F M F M F M
(28) (29). (30) (31) (32) (33)
223 133 18 25 47
4 88 4 42
32 14
228 153 30 36 9
198 194
2 2
16 10 6
63 63
87 34 53
143 50 44 49
91 II 40 40
192 75 41 42 7
27 136 23 48 11 54
3 3
37 27 2 3 5
:!6 12 9 5
22 16 5 1
35 32
I 2
7 7
13 8 5
9 8 I
2 ., I I
34 8
14 12
25 9 I
12
3
27 6 3 3
15
39 32 4 3
416 207 46 63
100 9 366 8 lOB
.. I
7 6
.. I
3 3
229 29
500 244 1+1 73 42
652 599 23 30
145 115 30
251 198 53
488 212 276 361 141 101 119
55 315 13 84 42 93
138
4 500 4 101
95 97 27
180 760 104 196 101 359
F
(34)
184 74 26 39 45
115 51 56 8
189 58 29 52 50
240 216
13 11
59 37 22
80 70 10
203 34
169 135 35 21 79
132 17 47 68
257 56 46 31 3
121
271 73 75 21
102
M
(3;:')
1,810 923 181 251 455
1,280 533 624 123
2,016 1,014
519 411 102
2,138 1,970
60 108
608 464 1H
917 734 183
1,607 632 975 994 420 232 339
3
1,025 290 376 359
1,571 419 364 299
90 Z99
1,849 311 499 336 703
F
(36)
3,005 1,686
276 365 678
2,200 886
J,071 243
3,27.'1 1,695
75.~ 666 157
3,332 3,103
93 136
981 792 189
1,445 1,145
300 2,608
998 1,610
1,688 770 412 502
4
1,559 494 516 549
2,382 712 554 447 119 550
2,913 546 764 486
1,117
12 I 2 3 4
13 I 2 3
I4 1 2 3 4
15 I 2 3
16 1 2
17 I 2
13 I 2
19 I 2 3 4-
20 1 2 3
21 1 2 3 4-5
22 1 2 S 4
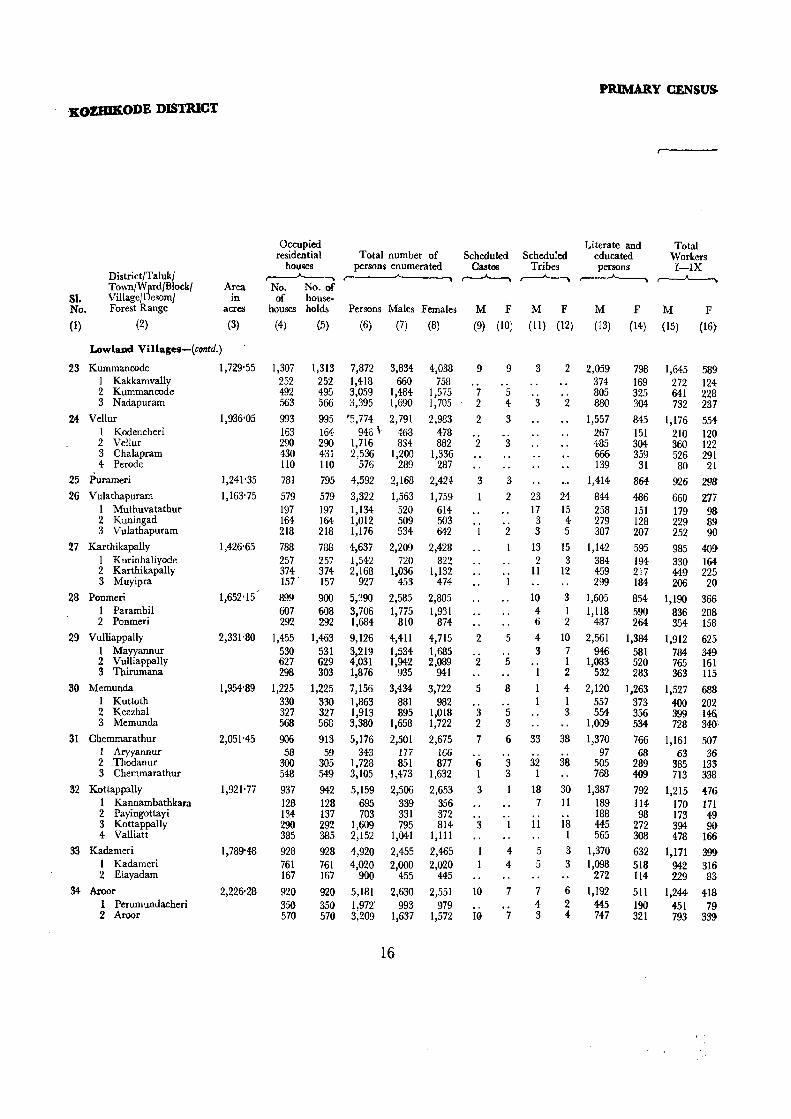
PRIMARY CENSUS
xozamODE DISTRICT
Occupied Literate and Total residential Total number of Scheduled Scheduled educated Workers
houJOes persons enumerated Castl16 Tribes persons I-IX DistrictjTalukj ,------A----.. r---A-----. ,...---A.--. ~ ~ TownjWJ.rdjBlock/ Area No. No. of
SI. Villagel esom/ in of house-No. Forest Range acres houses holds Persons Males Females M F M F M F M F
(1) (2) (3) (4) (5) (6) (7) (8) (9) (10) (11) (12) (13) (14) (15) (16)
Lowland Villages-(contd.)
23 Kummancode 1,729'55 1,307 1,313 7,872 3,834 4,038 9 9 3 2 2,059 798 1,645 589 1 Kakkamvally 252 252 1,418 660 758 .. 374 169 272 124 2 Kummancode 492 495 3,059 1,484 1,575 7 5 805 325 641 228 3 Nadapuram 563 566 3,395 1,690 1,705 2 4 3 2 880 304 732 237
24- Vellur 1,936'05 993 995 r5,774 2,791 2,983 2 3 1,557 845 1,176 554 I Kodencheri 163 164- 946 \ 468 478 267 151 210 120 2 Vellur 290 290 1,716 834- 882 2 3 485 304 360 122 3 Chalapram 430 431 2,536 1,200 1,336 666 359 526 291 4 Perode 110 110 576 289 287 139 31 80 21
25 Purameri 1,241'35 781 795 4,592 2,168 2,424- 3 3 1,414 864- 926 298 26 Vulathapuram 1,163'75 579 579 3,322 1,563 1,759 2 23 24 844 486 660 277
I Muthuvatathur 197 197 1,134 520 614 17 15 258 151 179 98 2 Kuningad 164- 164 1,012 509 503 .- 3 4 279 128 229 89 3 Vulathapuram 218 218 1,176 534- 642 1 2 3 5 307 207 252 90
27 Karthikapally 1,426-65 788 788 4,637 2,209 2,428 13 15 1,142 595 985 409 I Kurinhaliyode 257 257 1,542 720 822 2 3 384 194 330 164 2 Karthikapally 374 374 2,168 1,036 1,132 .- II 12 459 217 449 225 3 Muyipra 157 - 157 927 453 474 1 299 184 206 20
28 Ponmeri 1,652-15 899 900 5,390 2,585 2,805 10 3 1,605 854 1,190 366 1 Parambil 607 608 3,706 1,77.5 1,931 4 1 1,118 590 836 208 2 Ponmeri 292 292 1,684 810 874 6 2 487 264- 354 158
29 Vulliappally 2,331-80 1,455 1,463 9,126 4,411 4,715 2 5 4 10 2,561 1,384 1,912 625 1 Mayyannur 530 531 3,219 1,534 1,685 3 7 946 581 784 349 2 Vulliappally 627 629 4,031 1,942 2,089 2 5 .. 1 1,083 520 765 161 3 Thirumana 298 303 1,876 935 941 1 2 532 283 363 115
30 Memunda 1,954'89 1,225 1,225 7,156 3,434 3,722 5 8 1 4 2,120 1,263 1,527 688 1 Kuttoth 330 330 1,863 881 982 .. 1 1 557 373 400 202 2 Keezhal 327 327 1,913 895 1,018 3 5 3 554 356 399 116 3 Memunda 568 568 3,380 1,658 1,722 2 3 1,009 534 728 340
31 Chemmarathur 2,051-45 906 913 5,176 2,501 2,675 7 6 33 38 1,370 766 1,161 507 I Aryyannur 58 59 343 177 166 .. .- 97 68 63 36 2 _Thodanur 300 305 1,728 851 877 6 3 32 38 505 289 385 133 3 Chemmarathur 548 549 3,105 1,473 1,632 1 3 1 768 409 713 338
32 Kottappally 1,921'77 937 942 5,159 2,506 2,653 3 18 30' 1,387 792 1,215 476 1 Kannambathkara 128 128 695 339 356 7 11 189 114 170 171 2 Payingottayi 134 137 703 331 372 .- 188 98 173 49 3 Kottappally 290 292 1,609 795 814 3 1 l! 18 445 272 394 90 4 Valliatt 385 385 2,152 1,041 I,ll! I 565 308 478 166
33 Kadameri 1,789'48 928 928 4,920 2,455 2,%5 4 5 3 1,370 632 1,171 399 1 Kadameri 761 761 4,020 2,000 2,020 4 5 3 1,098 518 942 316 2 Elayadam 167 167 900 455 445 272 114 229 83
34 Aroor 2,226'28 920 920 5,181 2,630 2,551 10 7 7 6 1,192 511 1,244 418 1 Perumundacheri 350 350 1,972' 993 979 4 2 445 190 451 79 2 Aroor 570 570 3,209 1,637 1,572 10 7 3 4 747 321 793 339
16

ABSTRACT
Workers
As Cultivator
I ~
M F
(17) (18)
195 41
114 40
241 48 59
107 27
145 126 40 49 37
128 38 55 35
145 98 47
149 44 81 24 91 30 16 45 89 .. 20 69
135 31 6
24 74
203 164-
39
199 90
109
53 26 13 14
135 53 32 46 4
66 74 24 24 26 75 47 21 7
52 29 23 76 48 23
5
55 15 8
32 38 .. 6
32 40
5 .. 15 20 33 29
4
47 6
41
In Mining, Quarrying, Live-stock, Forestry, Fishing, Hunting and Plantations,
As Agri- Orchards At House-cultural and allied hold Labourer activities Industry
II III IV ~ ,-----A----; ~
M F
(19) (20)
M. F
(21) (22)
14 I
II 2
120 46 39 9
26 117 65 5
21 39 95 17 63 15
154 106 48
169 37
13! Ii
29 .. 29
158 61 31 58 8
84 90
3 45 42
131 57 64 10
104 25 79
181 106 75
120 169 8 21
43 ,49 69 '99
104 126
12 92
13 28 85
83 15 59 9
43 12 24 7
43
32 1 3
23
72 48 24
179 151 28
136 65 53 18
316 59 96
161 250 31 81
138
129 130 428 25 55 35 22 32 39 55 37 169 27 6 185
113 78 180 77 45 133 36 33 47
137 108 199 78 54 47 59 54 152
2 .. 2
3
3
2
2 2
25 16 9
58 37 21 47 34 9 4
100 24 28 48
82 19 14 49 99 26 2
18 53 21 13 8
9 5 4
M F
(23) (24)
43 4 8
31 101 28 38 35
69 49
9 22 18 47 13 30 4
94 73 21
204 152
19 33
65 32 13 20
93 .. 46 47 61 10 12 22 17
72 62 10 30 10 20
5
.. S
49 2 8
38 1
48
23 9
10 4
45 19 25 1
42 37 5
54 33 6
15
40 18 3
19
62 .. 33 29 25 11 1 9 4
43 42
1
6 .. 6
In Manufacturing other than Household Industry
V ~
M F
(25) (26)
136 19 27 90 48
3 7
34 4
31 27 8 6
13
71 39 22 10
42 21 21
150 51 45 54
112 43 8
61
34 1
11 22
16 5 7 .. 4
30 20 10
32 II 21
12 .. 6 6
7
.. 6
2 3 2
.. 1
2 2
4 1 1 2
2
.. 1 1
10 9 1
4 1 3
In Construction
VI ,.----'----,
M F
(27) (28)
20 1
10 9
23 9 4
10
15 6 4-1 1
11 6 2 3
17 12 5
46 11 30 5
30 12 11 7
31 . . 8
23 9
3 6
22 18
4
14 7 7
17
In Transport, In Trade Storage and
and Communi- In Other Commerce cations Services
VII VIII IX ~ ,.---...A----., ,......._A-.""'\
M F
(29) (30)
279 42
110 127 143
19 29 84 11
125 69 14 23 32 91 37 37 17
105 57 48
380 170 144 66
177 46 48 83
91 6
34 51 54 17 9
13 15
157 132 25 82 24 58
3
.. 3
2 .. 1 I
3 I 2 3 2 I
3
.. 2
2
.. 2
M F M F
(33) (34) (31) (32)
35 4
21 10 13 2 8 3
32 17
1 6
10
11 3 6 2
HI 12 6
104 40 49 15
38 11 7
20
17 o •
5 12 58 6 .. 8
44 75 63 12 47 29 18
9 .. 9
2
840 145 281 414 444
43 152 237
12
349 269
97 93 79
4 459 4 129
210 120
13 12 I
93 56 13 24 12 3 1 8
4
4
5 .. 5
436 306 130 574 214 213 147 578 159 157 262
452 25
168 259 325 41 78
100 106
319 273
46
504 155 349
476 98
169 209 199
3 50
138 8
94
84 57 10 17
129 21
106 2
94 67 27
169 68 34 67
305 119 56
130 194
3 48
143
178 74 I4: 10 80
212 176 36
238 13
225
KERALA:' STATE
NonWorkers
X r----A..~
M
(35)
2,189 388 843 958
1,615 258 474 674 209
1,242 903 341 280 282
1,224 390 587 247
1,395 939 456
2,499 750
1,177 572
1,907 481 496 930
1,340 114 466 760
1,291 169 158 401 563
1,284 1,058
226 1,386
542 844
F
(36)
3,449 634
1,347 1,468 2,429
358 760
1,045 266
2,126 1,482
516 4[4 552
2,019 658 907 454
2,439 1,723
716
4,090 1,336 1,928
826
3,034 780 872
1,382 2,168
130 744
1,294
2,177 185 323 724 945
2,066 1,704
362 2,133
900 1,233
23 1 2 3
24 1 2 3 4
25 26 1 2 3
27 1 2 3
28 1 2
29 I 2 3
30 1 2 3
31 1 2 3
32 1 2 3 4
33 I ~
34 1 2

KOZHlKODE DISTRICT
SJ. No,
(I)
DistrictfTalukf Town/Ward/Block/ Village/Desom{ Forest Range
(2)
Area III
acres
(3)
Lowland V iIlage .. - (coni d.)
35 Kunnummal
KunnummaJ 2 Vatloli 3 Pathiripatta
36 Mokeri
Kovukunnu 2 Mokeri 3 Karandot
37 Kuttiyadi
1 Vrath :2 Valayannur 3 Thondipoyil
33 Vatayam
1 Nittur 2 Vataya~
39 Ayencheri
40 Thiruvalloor
I Vellookkara 2 Thiruvalloor
41 Mantharathur
11'fotapilavil • 2 Kurumthodi
3 Mantharathur
42 Maniyur
Maniyur 2 Cherandathur 3 Elambilad
43 Palayad
1 Palayad 2 Pathiyarakkara
H Karuvancheri
1 Chellattapoyil 2 Meenathkara 3 Kunnathkara 4 Muthuvana
Karuvancheri
1,922'66
1,850'28
1,352'08
2,410'09
2,078'24
2,841'23
2,212'92
2,498'02
1,370'15
1,587-63
uccupie residential
houses Total number of
persons enumerated ~~ r------~~----~
No, No. of of house-
houses holds
(4) (5)
1,352
434 591 327
800
183 388 229
65:':
3l.J. 95
243
951
383 568
775
1,335
128 1,207
918
256 282 380
1,172
604 259 309
736 160 576
614
llZ 67 74-
152 209
1,352
434 591 327
800 183 388 229
652
314 95
243
955
387 568
780
1,339
128 1,211
919
256 283 380
1,202
605 288 309
738
160 578
614 112 67 74
152 209
Persons Males Females
(6)
8,764
2,754-3,643 2,367
5,169
1,098 2,592 1,479
4,222
2,102 618
1,502
'i,817
2,250 3,567
4,461
7,295
647 6,648
4-,930
1,547 1,338 2,045
6,694-
3,628 1,444-1,622
4,445
996 3,449
3,530
668 380 471 851
1,157
(7)
4,342
1,325 1,830 1,187
2,593
543 1,306
744-
2,119
1,022 315 782
2,882
1,149 1,733
2,258
3,665
327 3,338
2,401
754 631
1,016
3,303
1,812 720 77I
2,194
482 1,712
1,737
315 185 248 413 576
18
(8)
4,422
1,429 1,813 1,180
2,576
555 1,286
735
2,103
1,080 303 720
2,935 1,101 1,834
2,203
3,630
320 3,310
2,529
793 707
1,029
3,391
1,816 724 851
2,251
514 1,737
1,793
353 195 223 441 581
PRIMARY CENSUS
r-----
Literate and Total Scheduled Scheduled educated Workers
Castes Tribes persons I-IX r-'---, ,--.A__, ,.----"-----, ~
M F M F M F M F
(9) (10) (11) (12) (13) (1+) (15) (16)
8 3 5
3
3
19
8 11
14
14
13 lO
3
9
2
7
5
5
4
4
5
3 2
3
3
26
8 18
10
10
9
6 2 1
13
5
8
7
16
15
6
6
14-
14
14
10 4
49
144
30 114
80
20 17 43
248
123 84 41
63
40 23
55
14 27 6
8
19 2,489
19 786 1,055
648
6 1,480
6 277 814-389
16 1,138
16 512 lS5 471
20 J ,515
7 513 13 1,002
+3 1,308
155 1,822
35 144 120 1,678
81 1,309
16 393 II 346 54 570
249 1,958 125 1,099 77 377 47 482
64' 1,27G
44 212 20 1,064
70 829
21 160 36 65 9 127
154 4 323
1,228
447 488 293
7 "~ ,-145 457 170
494
203 70
221
768
274 494
720
716
55 661
710 210 205 295
1,034-
561 203 270
682
91 591
389
75 31 23 75
185
1,858
595 m 492
1,031
176 473 382
884
420 117 347
1,199
389 810
1,090
1,624
144 1,480
1,032
351 241 440
1,642
914 344 384
931
215 716
799 132 96
105 190 276
575 109 277 189
449
55 254 140
397 257 43 97
583
187 396
156
467 30
437
202 51 29
122
571
401 108 62
240
90 150
354 114 69 8
72 91

ABSTRACT
KERALA STATE
As Cultivator
I r--"---,
As Agricultural Labourer
II ~
Workers ~ ____ ._~.A.
In Mining, Quarrying, Live-stock, Forestry, Fishing, Hunting and Plantations, Orchards and allied activities
III ,------A----,
At House. hold
Industry IV ~
In Manufacturing other than Household Industry
V r-~
In Transport, In Trade Storage and
In Con- and Communi- In Other Non-struction Commerce cations Services ,rorkers
VI VII VIII IX X r--"---, r-~ r---"----. ~ ~
M F M
(17) (18) (19)
F 1\1
(20) ,(21)
F M
(22) (23)
F M
(24) (25)
F M
(26) (27)
F M
(28) (29)
F M
(30) (31)
F M
(32) (33)
F
(34)
M
(35)
F
(36)
192 36 70
66 14 3 60 17 28 66 5 39
118 45 22
4 3 17 51 II 5 63 31
123 64-
76 39 24 13 23 12
249 128 167
53 20 30 196 108 137
190 16 46
195 89 69
26 1 4 169 88 65
163 64 134-
39 2 59 35 13 7 89 49 68
248' 105 104
135 55 69 69 31 14-44 19 21
92 17 32
34 8 2 58 9 30
124 79 129
24 20 46 20 13 30 16 7 20 25 14 12 39 25 21
53 327
63 13 157 {o 102
5 156
24 61
5 71
57
47 6 4
77 104
29 76 75
38 81
83 294-
17 83 277
26 36
3 12 9
23 15
125 164-
96 63 24 29 5 72
17 152
3 17 149
203 122
85 19 50 3
8 35 37 32 55
15 51
2 26 11 24-2
II 26
3 4- 14 4 11
18 67
17 27 9
31
2 16
4 2 12
3 60
29 49
2 7 27 42
55 19 10 26
18 337
8 268 45
10 24
24 102
49 24 53
31 33 5 3 5
8 18 13 II
25
8 16 I
7
7
49
39 4 6
Ii
6 11
24
44
44
24
2 2
20
294 227
47 20
72
45 27
29
2
12 14
67
43 15
9
37
6 23 8
28
7 4
17
3:?
16 23
12
36
35
42
15 9
18
21 16 4
62
8 54
33
I
6 3
23
6
6
5
2 3
1
10
I 9
16 16
4
3 1
41
41
15
6 9
3
3
8
3 4
3
3
12
14 2
12
21
8 5 8
6
4
2
10
1 9
19
6
4 8
19
\) ...
164 60 84 20
86
7 3.5 44
124
37 14 73
43 II 37
69
95
12 83
114
49 30 35
168
74 31 63
101
17 84
49
2 3
17
II 16
3
2
2
2
3
3
64
26 36
2
29 1
22 6
45
8 I
36
27
2 25
101
68 13 55
26 9 4
13
30
21 9
26
26
3
2
2 908 2 297
358 253
554
liS 262 179
5 431
216 . 56
5 159
10 546 8 244 2 302
519
804
62 742
441 141
132 168
564
264 143 157
354 101 253
287 29 40 35 80
103
435 2,484
75 730 219 1,059 141 695
375 1,562
49 367 236 833
90 362
258 1,23;)
162 602 24 198 72 435
339 1,683
151 760 188 923
54 1,168
205 2,041
11 183 194 1,858
82 1,369
41 403 11 390 30 576
29 1,661
15 898 6 376 8 387
66 1,263
37 267 29 996
10 933
2 183 89
143 3 223 5 300
3,8i:7
1,320 1,536
991
2,127
500 1,032
595
1,706
823 260 623
2,352
9-14 1,438
2,0'1,7
3,163
290 2,873
2,327
742 678 907
2,820 1,415
616 789
2,011
424 1,587
1,439
239 126 215 369 490
35
2 3
36
1 2 :3
37
I 2 3
38
I 2
39
40
1 2
41
1 2 3
42
1 2 3
43
2
44
I 2 3 4 5

PRIMARY CENSUS
KOZHIKODE DISTRICT
Occupied Literate and Total resid entia! Total number of Scheduled Scheduled educated Workers
houses persons enumerated Castes Tribes persons I-IX District/Taluk/ ,..---'----. ..... r--"------. ~ r- ,----'-----., Town/Ward/Block! Area No. No. of
SI. Village/Desom/ in of house-No. Forest Range acrell houses holds PerSOJ18 Males Females Iv! F M F M F M F
(1) (2) .. (3) (4) (5) (6) (7) (8) (9) (10) (11) (12) (13) (14) (15) (16)
QUILANDY
QUlLANDY TALUK T 188,470'9761,496 62,508 366,343 181,108 185,235 5,857 6,04810,23810,643 102,441 56,645 82,667 28,793
R 186,813'37 59,080 59,923 348,987 172,696 176,291 5,716 5,895 10,094 10,484 97,563 53,400 78,680 27,888
U 1,657'60 2,416 2,585 17,356 8,412 8,944 141 153 144 159 4,878 3,245 3,987 905
LowlaadToWll
I. Pantalayini 1,657'60 2,416 2,585 ~17,356 8,412 8,944 141 153 144 159 4,878 3,245 3,987 905
Ward 1 Panta1ayini 983'30 1,175 1,226 8,276 4,003 4,273 88 81 84 103 2,533 1,702 1,761 470 Block I 135 136 1,140 615 525 33 394 221 272 29
" 2 144 150 1,108 505 603 ., 17li 52 229 23
" 3 138 155 1,029 475 554 5 5 238 69 218 16
, ~ 4 133 151 964 4S1 483 32 26 342 211 209 22
" ;) 140 142 951 436 515 3 36 .. 322 320 192 73
" 6 142 145 1,006 467 539 1 1 I 4 358 346 174 69 7 139 139 831 408 423 1 I 21 13 286 201 192 115
" 8 148 149 890 440 450 9 5 44- 57 295 192 194 97
" 9 56 59 357 176 181 4 7 18 29 122 90 81 26
Ward 2 Kovilkandy 229'67 674 781 l5,426 2,638 2,788 6 6 1,241 796 1,395 164
Block 10 77 96 656 306 350 173 82 114 11
" II 116 137 956 480 476 6 6 216 83 240 18
" 12 125 155 993 468 525 225 170 266 59
" 13 127 155 1,107 540 567 291 177 321 34-
" 14 162 164- 1,158 569 5S9 259 225 324 42
" 15 67 74 556 275 281 77 59 130
Ward 3 Kothamangalam 444'63 567 578 3,654 1,771 1,885 47 66 60 56 1,IM 747 831 271 Block 16 70 76 491 240 251 7 6 4 7 147 90 123 69
" 17 146 148 973 486 487 12 12 .. 299 186 218 108
" 18 ,143 144 890 436 454 .. 56 49 267 205 195 48
" 19 141 142 857 407 450 10 22 259 159 190 39'
" 20 67 68 443 202 241 IS 26 132 107 lOS 7
Highland Village
Unsurveyed Forest area outside village boundary
55,710'17 9 24 13 II 12 11 Kuttiyadi Range 4 .. 9 2
Midland Villages
45 Pallikkara 1,145-60 494 494 2,647 1,267 1,380 2 3 96 100 737 500 526 289
46 Thurayur 1,356'80 708 709 4,011 1,976 2,035 270 319 1,13? 547 942 395
1 Thurayur 645 646 3,650 1,790 1,860 244 286 1,039 506 847 364 2 Toleri 63 63 361 186 175 26 33 98 41 95 31
47 Muyipotb 1,606'40 680 680 3,740 1,885 1,855 7 6 199 195 1,153 603 915 154
1 Muyipotb 575 575 3,164 J,593 1,571 7 6 153 148 990 519 764 138 2 Vennarode 105 105 576 292 284 46 47 163 84- 151 16
48 Cheruvannur 1,913'60 934- 934 5,183 2,609 2,574 17 13 182 211 1,629 776 1,281 462
1 Cheruvannur 520 520 2,931 1,467 1,464 8 7 166 190 919 428 681 74 2 Pampjrikunnu 414 414 2,252 1,142 1,110 9 6 16 21 710 348 600 388
20

ABSTRACT
KERALA STATE
Workers __A --,
In Mining, Quarrying, Live-stock, Forestry, Fishing, Hunting and In Manu-Plantations, facturing In Transport,
As Agri- Orchards other than In Trade Storage and As cultural and allied At H'ousehold Household In Con- and Communi- In Other Non-
Cultivator Labourer activities Industry Industry struction Commerce cations Services Workers I II III IV V VI VII VIII IX X ~ r---"---, r----"--, ~ ,..--.....A-..-., ~ ,---A----. ~ ~ .----"-----,
M F M F M F M' F M F M F M F M F M F M F
(17) (18) (19) (20) (21) (22) (23) (24) (25) (26) (27) (28) (29) (30) (31) (32) (33) (34) (35) (36)
TALUK
11,551 2,813 7,535 5,471 14,761 1,923 4,20510,035 4,177 2,147 998 10 7,105 198 3,126 32 29,209 6,164 98,441 156,442 T
11,475 2,751 7,493 5,406 13,527 1,884 4,003 9,777 3,737 1,985 944 10 6,364 170 2,979 32 28,158 5,873 94,016 148,403 R
76 62 42 65 1,234 39 202 258 440 162 54 741 28 147 .. 1,051 291 4,425 8,039 U
76 62 42 65 1,234 39 202 258 440 162 54 .. 741 28 147 .. 1,051 291 4,425 8,039
49 54 40 57 336 37 88 112 223 46 33 .. 344 2 92 .. 556 162 2,242 3,803 149 10 8 .. 33 5 .. 67 29 343 496 1 86 1 25 44 3 .. 71 22 276 580 2 52 33 .. 89 .. 6 .. 38 16 257 538 3 I .. 44 3 4 .. 69 1 21 .. 70 18 272 461 4 1 66 50 13 1 3 .. 23 -- il .. 75 22 244 442 5
.. 4 18 18 29 14 6 .. 23 1 18 . . 76 36 293 470 6 31 41 19 34 23 25 2 4 36 7 2 . , 19 8 .. 52 4 216 308 7 16 11 18 20 16 11 .. 34 27 20 6 .. 26 13 ., 72 11 \ 246 353 8 2 2 3 3 4 2 6 6 1 4 ., 18 7 .. 35 95 155 9
866 5 5 95 84 I .. 246 25 17 .. 164 50 1,243 2,624 37 13 I 42 3 ., 18 9 192 339 II)
102 5 5 22 3 74 9 ., 28 10 240 458 11 186 - 16 . 47 .. ., 44 4 .. 16 12 202 466 12 144 36 6 1 .. 70 11 -- ., 70 17 219 533 13 283 6 27 14 13 1 .. 20 2 245 547 14 114 2 2 12 145 281 15
26 8 2 8 32 2 109 141 122 32 20 .. 151 38 .. 331 79 940 1,612 .. 5 29 28 18 29 1 ., 33 1 -- 36 12 117 182 16 .. I 11 32 88 41 1 8 .. 52 21 ., 52 19 268 379 17
9 1 I 7 9 .. 18 8 14 I 6 . - 19 .. 6 .. 113 31 241 406 18 12 3 1 2 2 23 16 32 1 3 24 1 5 ., 89 15 217 411 19 5 4 5 7 1 17 2 .. 23 5 .. 41 2 97 234 2()
6 2 2 .. 4 9
42 20 24 49 58 54 13 94 17 I .. 59 16 9 .. 303 55 741 1,091 45
178 34 148 268 71 23 25 29 30 34 -- 72 52 .. 332 40 1,034 1,640 46 165 30 134 243 68 23 25 29 29 5 ., 65 50 .. 306 38 943 1,496 I 13 4 14 25 3 1 29 -- 7 2 .. 26 2 91 144 2
83 8 66 17 202 21 7 53 27 6 58 27 .. 439 54 970 1,701 47 68 7 56 14 156 19 7 49 23 6 -- 51 22 .. 375 48 829 1,433 1 15 1 10 3 46 2 4 4 7 5 .. 64 6 141 268 2
.135 82 35 51 157 24 254- 234 19 3 12 .. 93 1 .. 575 E8 1,328 2,112 48 49 2 5 1 124 21 9 11 5 2 56 1 .. 432 37 786 1,390 1 86 80 30 50 33 3 245 223 14 1 12 .. 37 143 31 542 722 'l.
21 106/1--48

PRlMAlty CENSUS
KOZHIKODE DISTRICT
Occupied Literate and Total residential Total number of Scheduled Scheduled educated Workers
houses persons enumerated Castes Tribes persons I-IX District/Taluk/ ~ ~~ ~ r---A----., Town/Ward/Block/ Area No. No.of
51. ViUageJDesom/ in of house-No. Forest Range acres houses holds Persons Males Females M F M F M F M F
(1) (2) (3) , (4:) (5) (6) (7) (8) (9) (10) (11) (12) (13) (14) (15) (16)
MidIaad V ilIages-contd.
49 Avala 1,811'20 681 683 3,826 1,904 1,922 13 10 328 342 1,114: 536 913 268 1 Avala 341 342 1,886 926 960 4 1 220 233 517 245 453 165 2 Kuttoth 340 341 1,940 978 962 9 9 108 109 597 291 460 103
50 Cherapuram 3,161'60 1,304 1,306 7,269 3,707 3,562 3 8 103 93 1,565 557 1,786 374-
51 Velam 3,212'80 1,069 1,070 6,027 3,085 2,942 7 4 147 149 1,245 370 1,518 628 I Cherukunnu 248 249 1,402 700 702 11 7 276 76 294 33 2 Kurichagam 189 189 1,052 525 527 7 3 30 32 147 59 233 68 3 Velam 632 632 3,573 1,860 1,713 I 106 110 822 235 991 527
52 Paleri 1,766'40 672 673 3,939 2,015 1,924 116 126 1,120 466 864- 185 1 Paleri 286 287 1,620 837 783 54 46 492 239 380 127 2 Cheriyakumbalam 129 129 850 446 4{)4 15 18 215 108 176 22 3 Valiyakumbalam 78 78 458 236 222 25 24 154- 46 102, 14 4: Vadakkumpad 179 179 1,011 496 515 22 38 259 73 206 22
53 Changaroth 4,288'00 1,149 1 {I 54 6,426 3,246 3,180 36 30 310 303 1,733 1,013 1,608 397 I Kunnasseri 105 105 592 321 271 .. .. 5 8 165 58 162 22 2 Kannatti 230 230 1,214 603 611 1 I 37 35 328 169 300 61 3 Kadiyangad . 163 165 907 463 444 12 7 25 26 219 98 227 70 4 Changaroth 327 328 1,845 899 946 23 22 124 122 431 290 465 151 5 Kokkad 13 13 58 28 30 22 13 15 4 6 Avatukka 311 313 1,810 932 878 119' 112 568 385 439 89
.54 M uthuvannacha 1,5)0'40 486 487 2,803 1,403 1,400 103 113 837 366 676 241 1 Kuniyode 85 85 486 244 242 I 2 155 88 105 25 2 Paravur 77 77 437 204 233 1 26 34 109 31 92 33 3 Muthuvannacha 167 167 986 510 476 26 32 348 162 248 104 4 Kallur 157 158 894 445 449 50 45 225 85 231 79
55 Kallode 2,828'80 1,073 1,075 6,029 2,980 3,049 14 13 319 3291 1,725 955 1,373 546 1 Kallode 301 301 1,675 795 880 9 9 79 77 435 293 371 194 2 Koothali 493 494- 2,877 1,454 1,423 5 4 144 147 827 390 678 174 3 Paithoth 210 210 1,130 566 564 77 89 357 192 250 142 4 Panakkad 69 70 347 165 182 19 16 106 80 74 36
56 Eravattur 2,278'40 819 824 4,530 2,250 2,280 17 13 376 387 1,286 636 1,109 368 1 Edavarad 271 274 1.484 738 746 4 2 127 135 397 150 359 90 2 Kaipram 70 72 382 197 185 7 8 67 61 105 44- 97 2+ 3 Eravattur 478 478 2,664- 1,315 1,349 6 3 182 191 784 442 653 254
.57 Kalpathur 2,62HJO 1,107 1,109 6,541 3,361 3,180 36 22 245 216 2,086 1,104 1,545 532 1 Kalpathur 438 440 2,587 1,284 1,303 6 5 33 46 830 470 596 196 2 Ramallur lJO 110 579 301 278 23 28 191 84 137 28 3 Valiakkode 273 273 1,526 790 736 .. 54 46 468 247 348 140 4 Kizhinhaniam 286 286 1,849 986 863 30 17 135 96 597 303 464- 168
58 Meppayur 2,598'40 1,243 1,245 7,036 3,528 3,508 23 27 194 173 2:021 981 1,555 448 I Kizhpayur 446 448 2,514 1,270 1,244 92 80 799 356 553 102 2 Meppayur 466 466 2,658 1,309 1,349 B 9 51 57 689 375 528 241 3 Kayalad 175 175 1,027 538 489 2 2 37 26 312 131 274 55 4' Changaramvalli 156 156 837 411 426 13 16 14 10 221 II9 200 50
59 Vilayattur 1,446'40 578 579 3,348 1,633 1,715 JO 9 88 87 1,057 567 773 292 1 Vilayattur 392 393 2,205 1,078 1,127 B 7 73 73 701 4{)4 500 203 2 Elampilad IB6 186 1,143 555 588 2 2 15 14 356 163 273 89
22
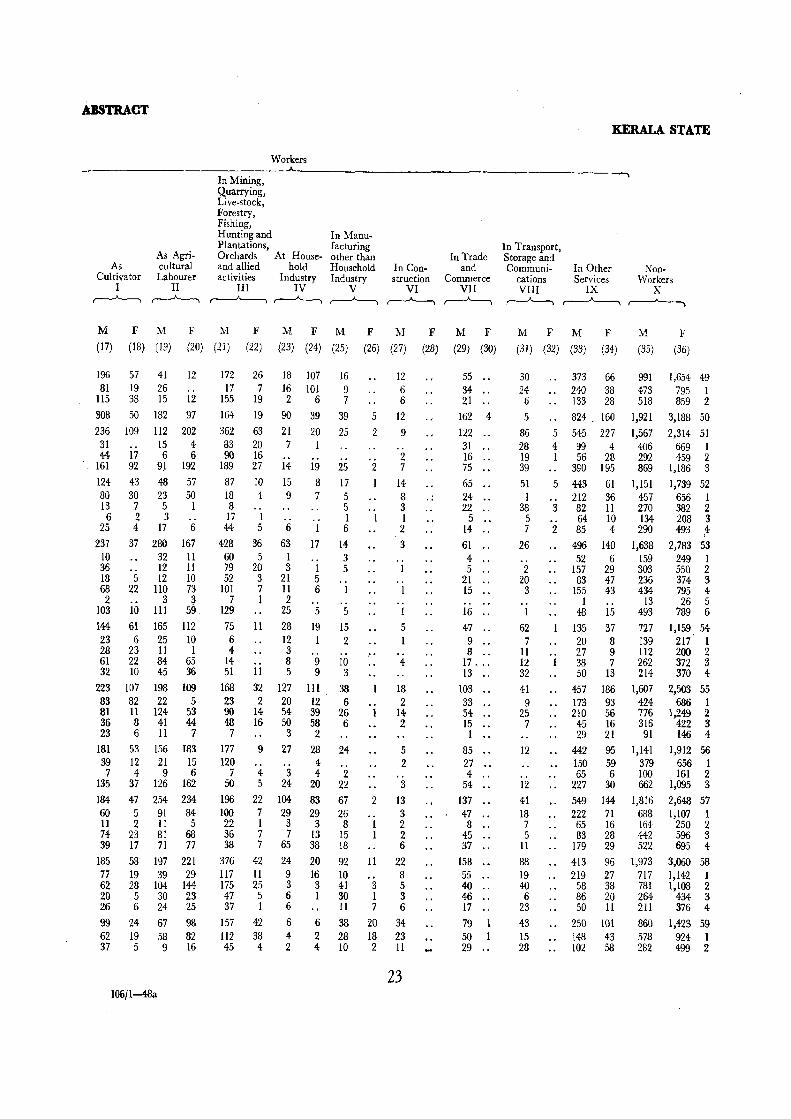
ABSTRACT KERALA STATE
Workers .A.
In Mining, Quarrying, Live-stock, Forestry, Fishing, Hunting and In Manu-Plantations, facturing In Transport,
As Agri- Orchards At House- other than In Trade Storage and As cultural and allied hold Household In Con- and Communi- In Other Non-
Cultivator Labourer activities Industry Industry struction Commerce cations Services Workers I II III IV V VI VII VIII IX X
r--"-----, ,..-----A----., r-----'---. ,-----A---., ~ ,-----A---., ~ ~ .---"-----., r-----"-------
M F M F M F M F M F M F M F M F M F M F (17) (18) (19) (20) (21) (22) (23) (24) (25) (26) (27) (28) (29) (30) (3i) (32) (33) (34) (35) (36)
196 57 41 12 172 26 18 107 16 12 55 _. 30 373 66 991 1,654- 49 81 19 26 .. 17 7 16 101 9 6 34 .. 24 240 38 473 795 1
115 38 15 12 155 19 2 6 7 6 21 .. 6 133 28 518 859 2 30B 50 182 97 164 19 90 39 39 5 12 162 4 5 824. 160 1,921 3,188 50 236 109 112 202 362 63 21 20 25 2 9 122 .. 86 5 545 227 1,567 2,314 51
31 15 4 83 20 7 1 .. 31 .. 28 4 99 4 406 669 1 44 17 6 6 90 16 .. 2 16 .. 19 I 56 28 292 459 2
161 92 9.1 192 189 27 14 19 25 2 7 75 .. 39 390 195 869 1,185 3 124 43 48 57 87 10 15 8 17 14 65 .. 51 5 443 51 1,151 1,739 52 80 30 23 50 18 4 9 7 5 8 .. 24 1 .. 212 36 457 655 I 13 7 5 1 8 .. 5 .. 3 22 . . 38 3 82 11 270 382 2 6 2 3 .. 17 I .. .. I I I 5 .. 5 _. 64 10 134 208 3
25 4 17 5 44 5 6 I 5 2 14 .. 7 2 85 4 290 493 ,4 237 37 280 157 428 36 63 17 14 3 61 .. 26 496 140 1,638 2,783 53
10 32 11 60 5 I .. 3 .. 4 .. .. 52 6 159 249 I 36 .. 12 11 79 20 3 1 5 1 5 .. 2 157 29 303 550 2 18 5 12 10 52 3 21 5 .. .. 21 .. 20 83 47 235 374 3 68 22 110 73 101 7 11 6 1 1 15 .. 3 155 43 434 795 4 2 .. 3 3 7 1 2 .. .. .. .. .. 1 .. 13 25 5
103 10 III 59 129 25 5 5 1 16 .. I 48 15 493 789 6 144 61 165 112 75 11 28 19 15 5 47 .. 62 135 37 727 1,159 54 23 6 25 10 6 12 1 2 9 .. 7 20 8 139 217 1 28 23 11 1 4 3 .. .. .. 8 .. 11 .. 27 9 112 200 2 61 22 84 65 14 .. 8 9 10 4 17 ... 12 1 38 7 262 372 3 32 10 45 36 51 11 5 9 3 13 .. 32 50 13 214 370 4
223 107 198 109 158 32 127 III 38 18 103 .. 41 457 186 1,607 2,503 55 83 82 22 5 23 2 20 12 6 .. 2 33 .. 9 173 93 424 686 1 81 11 124 53 90 14 54 39 26 1 14 54 .. 25 210 56 776 1,249 2 36 8 41 44 48 16 50 58 6 2 15 .. 7 45 16 315 422 3 23 6. 11 7 7 3 2 1 .. 29 21 91 146 4
181 53 156 183 177 9 27 28 24 5 85 .. 12 442 95 1,141 1,912 56 39 12 21 15 120 .. 4 2 27 .. 150 59 379 656 1 7 4 9 6 7 4 3 4 2 .. 4 .. . . 65 6 100 161 2
135 37 126 162 50 5 24 20 22 3 54 .. 12 227 3D 662 1,095 3 184- 47 254 234 196 22 104 83 67 2 13 137 .. 41 549 144 1,816 2,648 57 60 5 91 84 100 7 29 29 25 .. 3 47 .. 18 222 71 688 1,107 1 11 2 11 5 22 1 3 3 8 1 2 8 .. 7 65 16 164 250 2 74 23 81 68 36 7 7 13 15 1 2 45 .. 5 83 28 442 595 3 39 17 71 77 38 7 65 38 18 6 37 .. 11 179 29 522 695 4
185 58 197 221 376 42 24 20 92 11 22 158 .. 88 413 95 1,973 3,060 58 77 19 39 29 117 11 9 16 10 8 55 .. 19 219 27 717 1,142 1 62 28 104 144 175 25 3 3 41 3 5 40 .. 40 58 38 781 1,108 2 20 5 30 23 47 5 6 1 30 1 3 46 .. 6 86 20 264- 434 3 26 6 24 25 37 1 6 11 7 6 17 .. 23 50 11 211 375 4
99 24 67 98 157 42 6 6 38 20 34 79 43 250 101 860 1,423 59 62 19 58 82 112 38 4 2 28 18 23 50 15 148 43 573 924 I 37 5 9 16 45 4 2 4 10 2 11 29 .. 28 102 58 282 499 2
23 106/1-48a

PRIMARY CENSUS
KOZHIKODE DISTRICT
Occupied Literate and Total residential Total number of Scheduled Scheduled educated Workers
houses persons enumerated Castes Tribes persons I-IX District/Taluk/ ~ ,-----"- ~ r----"-"""I ~--. r----'-----.
Town/Ward/Block/ Area No. No. of Sl. V iltage/Desom/ in of house-No, Forest Range acres houses holds Persons Males Females M F M F M F M F ( 1) (2) (3) (4) (5) (6) (7) (8) (9) (10) (11) (12) (13) (14) (15) (16)
Midland Villages-contd. ,
60 Iringath 1,235'20 517 517 3,071 1,503 1,568 5 5 190 194- 705 273 682 262 I Mukappur 89 89 512 257 255 2 " 64- 43 137 55 117 53 2 Iringath 310 310 1,823 885 938 3 5 76 87 450 194 417 155 3 Kuluppa 118 118 736 361 375 50 64- 118 24 148 54
61 Kozhukkallur 1,715-20 745 745 4,244- 2,133 2,111 23 24 66 58 1,234- 592 966 308 I Narakkode 216 216 1,403 722 681 I 14 8 467 185 307 81 2 Kozhukkallur 278 278 1,245 611 634 17 16 10 8 345 186 276 57 3 Nitumpoil 131 131 828 422 406 2 3 17 13 286 170 208 97 4 Chavatta 120 120 768 378 390 4 4 25 29 136 51 175 73
62 Keezhariyur 3,377'20 1,434 1,435 8,162 3,958 4,204 154 161 180 217 2,262 1,157 1,946 970 I Keezhariyur 611 611 3,439 1,689 1,750 91 99 31 37 844- 263 815 260 2 Naduvathur 524 525 2,986 1,412 1,574 26 26 83 112 883 612 721 469 3 Nambrath 299 299 1,737 857 880 37 36 66 68 535 282 410 241
63 "Purakad 1,094'40 633 633 3,422 1,686 1,736 II 10 72 83 1,066 605 749 284-.... 1 Kozhipuram 169 169 873 427 446 .. " II 12 309 191 143 64-
2 Purakad 464- 464 2,549 1,259 1,290 II 10 61 71 757 414 606 220 64 Kuruvangad 1,491'20 918 924 5,712 2,692 3,020 193 191 103 129 1,538 1,020 1,089 64-6
1 Peruvathur 247 247 1,589 760 829 42 40 38 41 471 375 326 127 2 Kuruvangad 671 677 4,123 1,932 2,191 151 151 65 88 1,067 64-5 763 519
65 Naderi ' 1,849'00 805 853 4,544- 2,170 2,374 9 6 200 228 1,156 588 1,007 526 1 Naderi 138 138 800 380 420 " 22 26 206 100 181 103 2 Kurichikkara 121 121 623 294 329 2 9 12 172 87 163 83 3 Moozhikumethal 101 102 594- 279 315 I .. 48 59 125 59 133 50 4 Kavumvattom 157 162 910 429 481 5 5 74 78 212 143 172 80 5 Kuttirakuda 153 172 863 439 424 t " 36 44- 266 120 197 110 6 Maruthur 135 158 754 349 405 I 11 9, 175 79 161 100
06 Arikulam 2,150'40 1,028 1,126 5,429 2,619 2,810 84- 78 180 213 1,433 860 1,312 603 1 Mavatta 126 144- 678 332 346 16 18 11 10 184 119 162 109 2 Arikulam 280 349 1,502 738 764- 60 55 16 9 483 314 351 159 3 Kannanibath 131 138 699 322 377 1 " 21 38 137 68 158 67 4 Vakoli 142 142 697 332 365 1 47 62 185 115 164 59 5 Utteri 121 122 644- 325 319 3 29 28 160 72 158 '44-6 Urallur 228 231 1,209 570 639 4 4 56 66 284 172 319 165
67 Karayad 1,715-20 725 797 3,884 1,932 1,952 7 12 125 127 1,179 617 953 163 1 Tiruvangara 418 462 2,291 1,135 1,156 3 6 54 ~i 693 376 578 " 108
"1 Karayad 233 261 1,219 616 603 4 6 32 388 215 285 37 3 Ekkattur 74 74 374 181 193 39 37 98 26 90 18
68 Kavumthara 3,232'00 1,208 1,230 6,965 3,547 3,418 31 23 376 390 1,905 77I 1,590 352 1 Elankamel 80 84- 437 202 235 2 2 13 14- 101 47 100 21 2 Kavil 771 784- 4,320 2,217 2,103 28 19 266 265 1,197 457 1,046 283 3 Karuvannur 357 362 2,208 1,128 1,080 1 2 97 III 607 267 444- 48
69 Nochad 1,612'80 672 672 3,781 1,902 1,879 16 15 160 16.6 1,032 440 759 204-1 Nochad 418 418 2,289 1,138 1,151 6 7 78 78 602 229 435 128 2 Velliyur 254 254 1,492 764- 728 10 8 82 88 430 211 324 76
70 Chenoli 2,259'20 988 991 5,672 2,849 2,823 18 15 214 222 1,431 645 1,251 242 1 Chenoli 365 366 2,083 1,024 1,059 10 9 58 60 572 303 44-1 47 2 Puttat 110 110 602 313 289 1 6 3 167 60 122 15 3 Cheruvalloor 174 175 937 454 483 '7 ,. 29 40 215 85 199 46 4 Valoor 339 340 2,0,SQ 1,058 992 6 121 119 477 197 489 134-
24

.ABSTRACT
KERALA STATE
Workers .A-
In Mining, Quarrying, Live-stock, Forestry, Fishing, Hunting and In Manu-Plantations, facturing In Transport,
As Agri- Orchards At other than In Trade Storage and As cultural and allied Household Household In and Communi- In Other Non-
Cultivator Labourer activities Industry Industry Construction Commerce cations Services Workers I II III IV V VI VII VIII IX X
~ ~ ~ ,..---A--, ~~ ~ ,...---A--. r----A---I r----"------,
M F M F M F M F M F M F M F M F M F M F
(17) (18) (19). (20) (21) (22) (23) (24) (25) (26) (27) (28) (29) (30) (31) (32) (33) (34) (35) (36)
103 24 50 87 72 12 45 101 21 6 73 13 299 38 821 1,306 60 23 9 15 16 9 I' 1 21 ., 26- 6 37 6 140 202 1 54 11 17 26 37 9 44- 80 14 6 44- 7 194 29 468 783 2 26 4 18 45 26 2 7 3 68 3 213 321 3
183 84- 158 84 174 26 18 29 40 6 14 90 28 261 79 1,167 1,803 61 57 19 90 48 64 9 2 10 .. .. 42 3 39 , 5 415 600 1 39 14 56 20 65 12 9 " 13 1 2 30 5 57 10 335 577 2 39 33 2 22 2 3 4 11 5 10 3 120 51 214 309 3 48 18 12 14 23 3 4 25 6 12 8 17 45 13 203 317 4
.252 79 164 112 309 21 184 611 36 2 20 118 48 815 145 2,012 3,234 62 101 30 25 14 182 10 24 159 12 .. 8 47 30 386 47 874 1,490 1 90 27 110 44- 84 II 100 327 10 2 9 45 15 258 58 691 1,105 2 61 22 29 54 43 60 125 14 3 26 3 171 40 447 639 3
32 12 185 70 18 I7l 25 4 61 14 410 31 937 1,452 63 26 10 25 11 7 36 7 2 7 3 66 7 284 382 1
6 2 160 59 11 135 18 2 54 11 344 24 653 1,070 2
165 78 73 103 57 12 39 341 133 30 24 106 61 431 81 1,603 2,374 64
56 24 5 10 13 6 4 61 35 .. 40 .. 12 161 26 434 702 1 109 54 68 93 44- 6 35 280 98 30 24 66 1 49 270 55 1,169 1,672 2
227 53 121 54 49 2 43 245 41 133 31 62 17 416 39 1,163 1,848 65 44- 23 37 14 7 2 14 53 3 1 2 9 2 63 10 199 317 I
33 14 30 8 3 58 2 2 2 6 I 78 9 131 246 ~ 55 2 18 8 ,. 32 I 7 9 10 .. 40 I 146 265 25 2 18 16 4 3 20 19 39 3 14 I 85 3 257 401 4 35 5 II 5 14 20 73 7 16 6 9 6 89 II 242 314 5 35 7 7 11 16 3 9 9 68 9 14 7 61 5 188 305 6
247 77 190 201 117 12 89 148 39 35 11 85 56 478 130 1,307 2,207 66 37 9 III 28 13 I 10 62 " " 18 4 69 9 170 237 I
50 II 38 50 41 9 9 12 17 19 2 19 22 153 58 387 605 2 31 12 74 50 6 3 3 1 3 6 3 29 4 164 310 3
48 12 17 15 11 5 3 5 9 2 7 2 67 20 168 306 4-19 4 18 8 9 " 32 13 1 4 2 8 9 60 15 167 275 5 62 29 32 50 37 2 30 58 13 2 2 27 16 100 24 251 474 6
127 19 28 7 135 16 11 12 50 4 8 106 4 43 44-5 101 979 1,789 67 70 16 " 2 90 IS II 3 16 4 4 55 I 23 309 67 557 1,048 I
45 I IS 3 9 I 2 31 4 49 3 4 128 27 331 566 2 12 2 13 2 36 7 3 2 16 8 7 91 175 3
257 36 235 235 160 15 46 15 163 13 32 97 88 512 37 1,%7 3,066 68
14- 2 8 7 22 I 6 9 12 2 2 5 21 10 .. 102 214 1
191 20 216 219 84 14 35 3 103 11 11 58 .. 32 316 16 1,171 1,820 2 52 14 II 9 54 5 3 48 19 304- I 35 186 21 684 1,032 3
177 13 84 88 47 3 18 19 28 3 16 52 30 307 78 1,143 1,675 69 104 8 64 70 10 .. 16 18 5 9 37 17 173 32 703 1,023 1
73 5 20 18 37 3 2 I 23 3 7 15 13 134 46 440 652 2
202 40 71 73 168 13 57 14 46 13 91 26 577 102 1,598 2,581 70
76 9 9 II 77 4 28 10 16 43 5 187 13 583 1,012 I
25 2 7 6 18 5 9 6 1 5 7 44- 2 191 274 2
19 6 8 20 13 ,. 8 3 14 21 4 112 17 255 437 3
82 23 47 36 60 4 12 I 10 12 22 10 234 70 569 858 4
~
25

PRIMARY CENSUS KOZHIKODE DISTRICT
Occupied Literate and Total residential Total number of Scheduled Scheduled educated Workers
houses persons enumerated Castes Tribes persons I-IX District/Taluk/ ~ ~., r---"---"""'\ ~ ~ r----"----. Town/Ward/B1ock{ Area No. No. of
81' Village/Desoml in of house-No. Forest Range acres houses holds Persons Males Females M F 1\1 F M F M F
(1) (2) (3) 4 (5) (6) (7) (8) (9) (10) (11) (12) (13) (14) (15) (16) Midland Villages-contd.
71 Menhaniam 2,713'60 1,286 l,287 7,346 3,729 3,617 25 2S 375 359 2,OSO 973 1,728 SOL 1 Menhamam 787 787 4,472 2,276 2,196 21 24 176 145 1,29:; 669 1,091 332 2 Pandicode 171 172 97] 465 506 1 73 86 257 119 205 45 ::I Vengapatta 153 153 883 455 428 4 3 75 82 252 94 224 85 4 Marutheri 175 175 1,020 533 487 51 46 286 91 208 39
72 Perambra 3,577'60 1,715 1,775 10,038 5,222 4,816 32 31 381 382 3,063 . 2,150 2,532 473 1 Kiliyampilayi 81 87 426 228 198 I 17 16 104 47 95 9 2 Pillaperuvanna 797 849 4,806 2,564 2,242 8 4 200 174 1,609 1,202 1,272 174 3 Perambra 760 762 4,374 2,210 2,164 24 26 153 182 1,253 871 1,060 261 4 Koratti 77 77 432 220 212 11 10 97 30 lOS 29
73 Kayanna 5,254'40 2,164 2,270 13,287 6,798 6,489 78 69 465 437 3,785 2,696 3,241 835 I Kayanna 631 678 3,496 1,730 1,766 5 10 170 185 699 303 805 288 2 Mattanode 100 100 587 294 293 25 26 155 120 134 12 3 Kotakkallur 34 3.4- 229 121 108 9 \I 00 75 .54 2 4 Onhal 78 78 477 263 214 7 3 184 133 122 11 5 Atbiodi 1,068 1,1IB 7,OBI 3,664 3,417 47 32 183 ISS 2,297 1,823 1,801 440 6 Cherukad 253 262 1,417 726 691 26 27 71 57 370 242 325 82
74 Kottur 2,912'00 1,073 1,075 6,388 3,224 3,IM 136 139 214 209 1,946 1,004 1,485 314 1 Kunnaramvally 69 69 387 189 198 9 8 18 19 93 50 86 12 2 Peravanchery 25 25 140 63 72 6 10 34 18 35 9 3 Mulat 262 263 1,596 796 800 6 12 76 68 449 232 327 89 4 Naremknlam 127 128 685 338 347 65 69 10 10 200 115 161 49 5 Kottur 214 214 1,266 639 627 34 31 39 50 404 215 297 56 6 Thiruvot 209 209 1,279 652 627 16 13 30 25 440 225 318 59 7 Paloli 167 167 1,035 542 493 6 6 35 27 326 149 261 40
3,033'60 V
3,765 13 453 455 2,010 75 Naduvannur 1,211 1,229 7,563 3,798 18 956 1,790 462 1 Mannankavu 191 192 1,197 577 620 63 66 301 118 283 47 2 Ayanikkad 6 6 31 16 15 I 9 13 7 4 5 6 3 Kakkanchery 159 159 907 440 467 4 3 81 78 253 139 203 43 4 Koyakkad 102 102 674 359 315 .. 62 54 220 120 161 19 5 Naduvannur 753 770 4,754 2,406 2,348 14 9 238 244- 1,229 575 1,138 347
76 Ulliyeri 3,078'40 1,208 1,208 7,291 y' 3,550 3,741 321 354 77 00 2,039 1,024- 1,619 567 1 Manat 101 101 581 257 324 33 35 3 132 55 113 61 2 Mundoth 65 65 427 202 225 4 7 28 26 129 57 94- 51 3 Narath 207 207 1,244 599 645 30 32 49 51 318 166 271 164 4- Ulliyeri 685 685 4,185 2,062 2,123 229 261 1,243 643 958 207 5 Oravil 150 150 854 430 424 25 19 217 103 183 84
77 Kunnathara 2,470'40 1,085 1,085 6,588 3,201 3,387 45 46 284 303 1,777 829 1,451 1,014 1 Kannur 314 314 2,009 1,003 1,006 22 19 59 51 569 241 465 383 2 Ollur 366 366 2,175 1,067 1,108 3 3 104 113 571 245 475 329 3 Puthurvattam 90 90 488 236 252 8 3 16 24 144 57 109 76 4 Puthenchery 184- 184 1,124 538 586 .. 60 56 273 152 238 155 5 Kunnathara 131 131 792 357 435 12 21 45 59 220 134 164 71
78 Velur 1,862'40 1,076 1,097 6,746 3,238 3,508 476 536 3 2 1,852 1,064 1,489 916 1 Velur 640 649 3,968 1,932 2,036 346 376 .. .. 1,082 593 879 501 2 Kongannur 436 448 2,778 1,306 1,472 130 160 3 2 770 471 610 415
79 Edakkara 2,342'40 777 780 4,854 ' 2,360 2,494 384 502 1,269 763 1,119 604 1 Kolakkad 440 442 2,6B4 1,312 1,372 221 286 723 430 608 382 2 Edakkara 337 33B 2,170 1,048 1,122 163 216 546 333 511 222
26

.ABSTRACT
KERALASTATE
Workers ~
In Mining, Quarrying, Live-stock, Forestry, Fishing, Hunting and In l\fanu-Plantations, facturing In Transport,
As Agri- Orchards At House- other than In Trade Storage and As cultural and allied hold Household In Con- and Communi- In Other Non-
Cultivator Labourer activities Industry IndUstry structiOR Commerce cations Services Workers I II III IV V VI VII VIII IX X
,,---"----. ,-----"-----, ,_ ...... _, ,_-"--, ,---"----., ~ ~ ~ ~ ,----"-------.
M F M F M F M F M F M F M F M F M F M F
(17) (18) (19) (20) (21) (22) (23) (24) (25) (26) (27) (28) (29) (30) (31) (32) (33) (34) (35) (36)
224 66 113 154 231 12 68 48 98 4 15 192 2 56 731 215 2,001 3,116 71 113 36 56 94 143 8 61 42 89 4 12 154 2 27 436 146 1,185 1,864- 1 28 II I 7 13 '3 6 6 I .. 20 11 125 21 260 461 2 43 10 40 37 51 1 3 2 3 6 75 35 231 343 3 40 9 16 16 24 1 5 I 15 12 95 13 325 448 4
683 71 361 196 774- 39 32 23 92 3 8 75 29 478 141 2,690 4,343 72 25 3 26 1 20 2 .. .. 1 .. .. 4 19 3 133 189 1
436 51 188 73 380 4 12 8 50 1 4 18 5 179 37 1,292 2,068 2 200 17 91 94 374 33 20 15 34 2 4 53 16 268 100 1,150 1,903 3
22 56 28 7 4 4 12 I 115 183 4
1,353 172 923 495 282 21 44- 17 93 22 93 3 45 386 124 3,557 5,654- 73 164- 18 312 229 98 11 12 9 21 3 51 3 37 107 17 925 1,478 1 87 3 40 8 I 2 2 2 I 160 281 2 43 .. 10 I .. .. .. 2 67 106 3 63 2 41 7 6 1 6 .. .. .. 6 1 141 203 4
909 130 399 206 139 8 24 5 63 I 16 1 32 8 211 89 1,863 2,977 5 87 19 121 45 37 1 8 3 1 3 8 60 14 401 609 6
155 62 III 92 439 15 11 9 71 4 6 88 84- 520 132 1,739 2,850 74 5 2 9 4, 23 3 14 1 3 5 .. 27 2 103 186 1 5 5 4 4 13 .. 5 I 1 I 5 .. 33 63 2
44- 32 28 31 112 3 5 3 12 I 18 1 106 20 469 7ll 3 24 15 16 13 43 1 1 3 4 .. .. 9 .. 64- 17 177 298 4 21 5 20 6 89 5 2 12 1 1 12 4 136 39 342 571 5 21 2 22 20 106 .. 15 2 27 11 116 35 334 568 6 35 I 12 J4 53 3 3 3 9 16 67 66 19 281 453 7
191 19 20 27 330 22 91 92 125 87 23 114 107 2 789 213 2,008 3,303 75 32 7 I' 39 2 5 8 12 10 184 30 294 573 1 1 I .. .. .. 4 5 11 9 2
46 2 11 3 .. 13 14 1 I 13 2 117 24 237 424 3 .. 46 4 9 5 2 .. 11 .. 1 3 4 89 6 198 296 4 66 6 19 17 27~ 17 89 92 96 65 21 86 91 2 395 148 1,268 2,001 5
192 37 107 92 53 4 93 253 69 46 26 170 59 750 134- 1,931 3,174 76 29 2 I 2 2 50 3 2 4 .. 70 9 144 263 I 24 .. I 2 1 , . 8 35 1 I 10 5 43 14 108 174 2 75 18 21 22 22 2 8 63 12 31 4 31 6 .. 92 28 328 481 3
155 IS 76 57 24 2 37 49 34 13 18 104 42 I 468 70 1,104 1,916 4 9 2 8 II 4 38 56 19 2 1 21 6 77 13 247 340 5
269 57 127 50 160 7 104 779 76 3 19 118 39 539 117 1,750 2,373 77 84- 46 46 15 35 .. 30 297 22 7 45 17 179 24 538 623 1
105 3 II 7 63 4 25 253 33 I 37 4 196 62 592 779 2 18 2 28 4 1 15 69 1 .. 6 12 28 1 127 176 3 31 I 29 17 24 22 126 20 I 5 15 10 82 10 300 431 4 31 5 13 7 37 3 12 34- 2 9 8 54 20 193 364- 5
J II 31 75 28 267 45 175 746 88 20 189 82 482 65 1,749 2,592 78 76 7 56 6 178 22 86 423 66 16 95 50 256 42 1,053 1,535 1 35 24 19 22 89 23 89 323 22 4 94 32 226 23 696 1,057 2
:260 16 255 269 122 23 54 224 62 8 35 82 28 221 64 1,241 1,890 19 79 7 103 164 92 22 32 143 47 6 29 59 18 149 40 704- 990 1
181 9 152 105 30 I 22 81 15 2 6 23 10 72 24 537 900 2
27

PRIMARY CENSUS
KOZHlKODE DISTRICT
Occupied Literate and Total residential Total number of Scheduled Scheduled educated Workers
houses persons enumerated Castes Tribes persons I-IX Dlstrict/Taluk/ ,...----A----.. r--- -, ,------'----, ~-, ,---"---.. ,--....__-, Town/Ward/Block/ Area No. No. of
SI. Village/Desom/ in of house-No. Forest Range acres houses holds Persons Males Females 1\1 F M F M F M F
(1) (2) , (3) (4) (5) (6) (7) (8) (9) (10) (11) (12) (13) (14) (15) (16,
Midland Villages-contd.
80 Modakkallur 2,515-20 766 766 4,657 2,249 2,408 265 338 30 35 1.193 627 984 587 1 Thorayi 149 149 957 455 502 54 64 214 106 199 172 2 Kotasseri 90 90 506 245 261 26 40 2 123 62 110 82 3 Atuvat 83 83 485 235 250 32 55 141 64 90 78 4 Koruvalur 47 47 314 156 158 21 20 ., 101 57 71 48 5 Koommulli 112 112 659 329 330 22 28 26 28 209 115 153 53 6 Modakkallur 125 125 725 352 373 58 66 .. .. 190 96 154 61 7 Kothangal 113 113 709 329 380 45 57 4 5 143 88 142 64 8 Kolathur 47 47 302 148 154 7 8 72 39 65 27
81 Kokkallur 2,96%0 1,115 1,1l5 6,617 3,290 3,327 193 203 154 161 1,890 1,070 1,409 269 I Koonancherry 130 130 775 375 400 34 37 11 20 171 84 160 48 2 Kokkallur 166 166 954 498 456 1 I 29 21 270 107 174 12 3 Kannamkode 119 119 650 320 330 4 3 32 32 154 95 148 21 4 Eramangalam 294 294 1,704 854 850 66 66 48 49 445 216 370 79 5 Panayi 241 241 1,465 710 755 9 16 33 39 475 300 313 70 6 Mannampoil 165 165 1,069 533 536 79 80 1 375 268 244 39
82 Balusseri 2,617'60 1,375 1,385 8,654 4,39~ 4,257 184 140 324 323 2,721 1,690 1,931 375 I Kannikavu 149 149 928 482 446 .. .. 27 28 325 196 226 9 2 Thuruthiyad 241 241 1,386 690 696 6 6 42 55 422 276 276 32 3 Puthurvattam 433 434 2,685 1,364 1,321 45 30 167 173 808 460 576 102 4 Balusseri 552 561 3,655 1,861 1,794 133 104 88 67 1,166 758 853 232
83 Trikuttisseri 1,318'40 691 696 4,235 2,129 2,106 64 7i 155 151 1,249 623 992 192 I Vakayad 496 498 3,061 1,550 1,511 47 52 90 73 903 437 737 130 2 Trikuttisseri 195 198 1,174 579 595 17 19 65 73 341 186 255 62
84 Avitanallur 2,566'40 926 926 5,209 2,625 2,584 382 366 175 209 1,315 721 1,235 301 1 Avitanallur 509 509 2,900 1,464 1,436 258 233 8$ III 834 505 701 185 2 Nelliyeri 44 44 238 115 123 24 36 2 6 53 19 54 17 3 Punath 373 373 2,071 1,046 1,025 100 97 B8 92 428 197 480 99
85 Panangad 2,734'00 1,145 1,152 7,272 3,630 3,642 455 448 110 120 2,011 1,213 1,694 1,460 I Nirmallur 293 297 1,802 885 917 165 164 407 236 419 146-2 Panangad 852 855 5,470 ~ 2,745 2,725 290 284 110 120 1,604 977 1,275 314
86 Sivapuram 2,598'40 1,105 1,109 6,978 3,496 3,482 239 258 50· 59 2,027 1,230 1,329 168 I Sivapuram 408 411 2,553/ 1,248 1,305 121 125 .. 4- 751 444 479 61 2 Kaipram 26 26 172 87 85 23 24 1 4 48 18 35 8 3 Karumala 67l 672 4,253 2,161 2,092 95 109 49 51 1,228 768 815 99
87 Iyyad 2,132'20 890 923 5,449 2,742 2,707 303 309 32 35 1,525 946 1,062 106 , I Veeryampram 138 138 821 406 415 7 4 29 34 236 140 156 17
2 Iyyad 430 433 2,637 I,:m 1,313 195 195 3 I 789 538 517 57 3 Mangat 322 352 1,991 1,012 ' 979 101 110 500 268 389 32
88 Unnikulam 4,614040 1,889 1,943 11,351 5,759 5,592 571 532 61 60 2,740 1,396 2,240 314 1 Vallioth 192 229 1,111 567 544 16 11 2 298 167 228 21 2 Unnikulam 746 762 . 4,360 2,182 2,178 259 234 33 29 922 338 884 149 3 Poonoor 526 527 3,326 1,702 1,624 194 197 20 21 887 599 685 102 4 Kimthapuram 425 425 2,554 1,308 1,246 102 90 8 8 633 292 443 42
19 Kinalur 3,936'80 1,169 1,230 6,863 3,423 3,445 275 271 190 195 1,754- 1,010 1,549 400 1 Mundakkara 321 339 2,020 991 1,029 86 88 79 81 658 440 436 76 2 Poovampoyil Il7 118 735 394 391 65 62 18 18 227 147 161 29 3 Kinalur 731 773 4,063 2,038 2,025 124 121 93 96 869 423 952 295
28

AlSTRACT
KERALA STATE
Workers
In Mining, Quarrying,
......
Live-stock, Forestry, Fishing, Hunting and In Manu-Plantations, facturing In Transport,
As Agri- Orchards At House- other than In Trade Storage and As cultural and allied hold Household In Con- and Communi- In Other Non-
Cultivator Labourer activities Industry Industry struction Commerce cation Services Work.ers I II III IV V VI VII VIII IX X ~ ,---A-~ ~ r---"-----. ~ ~ r---~ ~ ~ ~
M F M F M F M F M 'F M F M F M F M F M F (17) (18) (19) (20) (21) (22) (23) (24) (25) (26) (27) (28) (29) (30) (31) (32) (33) (34) (35) (36)
150 25 178 47 148 19 47 431 39 10 4 91 3a 3 289 52 1,265 1,821 SO II .. 16 6 38 3 17 141 1 2 36 I 77 22 256 330 t 8 3 6 1 23 2 14 68 6 2 1 II 2 39 6 135 179 2
28 1 17 9 4 II 2 57 2 1 2 12 3 23 3 145 175 3 14 2 15 3 5 3 37 7 2 6 1 20 4 85 110 4 34 5 43 6 5 3 36 12 5 13 13 30 6 176 272 5 30 9 52 10 20 4 3 34 3 1 6 9 30 4 198 312 6 17 3 19 12 41 6 38 8 II 46 5 187 316 7 8 2 10 12 3 5 20 6 24 2 83 127 8
176 4 ~9 117 175 13 84 40 30 11 10 126 63 396 84 1,881 3,058 81 15 20 16 19 3 14 19 3 .. 20 3 66 9 215 352 I 24 64 6 8 3 7 7 1 2 21 20 21 2 324 444 2 36 2 42 11 12 5 3 .. .. 1 13 19 20 5 172 309 3 41 40 32 85 4 17 1 6 2 3 25 7 146 40 48 77l 4 44 1 31 32 48 3 40 17 3 6 2 33 13 99 11 397 685 5 16 152 20 3 1 11 2 2 14 1 44 17 289 497 6
154 22 87 13 189 21 185 164 170 12 18 207 2 84 837 141 2,466 3,88% 82 14 10 14 1 .. 7 .. 27 1 2 151 8 256 437 1 47 3 42 2 42 3 3 15 13 1 5 23 14 87 8 414 664 2 48 11 20 7 86 9 21 24 77 10 12 65 1 33 214 40 788 1,219 3 45 8 15 4 47 9 160 125 73 1 1 92 35 385 85 1,00B 1,562 4
167 10 24 27 156 24 44 17 46 9 17 93 23 422 105 1,137 1,914 83 122 6 21 20 123 11 37 17 34- 8 14 72 20 .. 294- 68 813 1,381 1 45 4 3 7 33 13 7 12 1 3 21 3 128 37 324- 533 2
130 47 61 52 318 32 34 18 14 5 56 9 608 152 1,390 2,283 B4 86 36 33 25 177 19 21 6 8 23 2 351 99 763 1,251 1 6 2 , 1 1 7 2 2 g .. 4 34 9 61 106 2
3S 9 27 26 134 11 11 9 6 5 29 7 223 44 566 926 3
219 62 219 91 247 18 80 71 102 11 27 95 3 54 651 204 1,936 3,182 Bi 47 27 29 17 93 5 35 22 27 6 12 22 24 .. 130 69 466 771 1
172 35 190 74 154 13 45 49 75 5 15 73 3 30 521 135 1,470 2,411 2
173 21 40 2 279 19 33 22 85 15 16 116 68 519 88 2,167 3,314 86 80 7 18 1 29 3 7 10 56 1 11 57 22 199 38 769 1,244 1 8 .. 15 .. . . 4 1 3 4 8 52 77 2
85 14 22 1 235 16 26 12 25 14 4 56 46 316 42 1,346 1,993 3
221 12 56 3 239 14 8 16 42 9 17 61 3 37 3B1 49 1,680 2,601 87 17 5 57 4 .. 10 1 3 17 10 42 7 250 398 1
155 5 37 3 81 10 2 8 21 5 14 36 3 12 159 23 807 1,256 2 49 2 19 101 6 8 11 3 .. • 8 15 180 19 623 947. 3
270 23 243 42 460 53 20 5 126 13 23 2 123 54 911 176 3,519 5,278 88 63 2 33 5 21 1 2 1 12 .. 24 2 71 12 339 523 1 50 4 15 2 311 37 1 3 44 6 8 37 31 3B7 97 1,298 2,029 2 75 14 157 34 107 15 16 1 52 6 8 2 33 27 210 30 1,017 1,522 3 82 3 38 I 21 1 18 I 7 29 4 243 37 865 1,204 4
285 30 347 174 289 52 33 29 66 I 13 74 38 404 113 1,874 3,045 89 60 8 46 10 36 6 16 18 40 12 26 15 185 33 555 953 1 15 2 33 13 32 2 1 I 8 .. 8 1 63 11 233 362 2
210 20 268 151 221 44 16 10 18 I 1 40 22 156 69 1,086 1,730 3
29 106/1-49

PRIMARY CENSUS
KOZIDKODE DISTRICT
Occupied Literate and Total residential Total number of Scheduled Scheduled educated Workers
houses persons enumerated Castes Tribes persons I-IX District/Taluk ~ ---~ r---"----. ,.--J---.., ,...----A----, Town/Ward/Block/ Area No. No. of
SI. V illage/Desom/ in of house-No. Forest range acres houses holds Persons Males Females M F M F M F M F
(I) (~) (3) (4) (5) (6) (7) (8) (9) (10) (11 ) (12) (13) (14) (15) (16)
Lowland Villages
90 Iringal 1,304-80 1,190 1,193 7,630 3,632 3,948 11 124 130 2,366 1,317 1,657 573
91 Ayanikkad 1,318'40 697 700 4,056 1,884 2,172 15 II 96 116 1,252 780 911 458
92 Trikkottur 1,254'40 326 835 5,086 2,465 2,621 3 63 54 1,320 603 1,169 625 1 Trikkottur 465 472 2,877 1,410 1,467 3 49 42 773 290 693 404 2 Palur 361 363 2,209 1,055 1,154 14 12 547 313 476 221
93 Meladi 2,400'00 1,689 1,724 10,090 4,883 5,207 41 27 288 342 2,834 1,606 2,287 996 1 Kannamku1am 392 392 2,408 1,138 1,270 2 1 43 53 646 399 557 182 2 Meladi 607 607 3,583 1,775 1,808 29 20 65 66 1,029 547 861 381 3 Kizhur 690 725 4,099 1,970 2,129 10 6 180 223 1,159 660 869 433
94- Moodadi 2,438'40 1,342 1,342 7,663 3,737 3,926 6 8 332 347 2,294 1,216 1,729 915 1 Parakkad 55 55 320 144 176 15 9 83 50 64 45 2 Moodadi 250 250 1,473 723 750 45 46 477 238 346 224 3 Purakkal 106 106 258 129 129 8 9 98 46 71 38 4 Velakode 64 64 651 326 325 .. ,. 202 129 127 81 5 Vellarakode 255 255 1,637 801 836 ., " 58 63 492 279 366 131 6 Muchukunnu 612 612 3,324 1,614 1,710 6 8 206 220 942 474 755 396
95 Vanmugh<;m 1,612'80 1,167 1,207 6,992 3,368 3,624 16 10 78 85 1,660 745 1,501 862 1 Vanrougharo 296 296 1,753 837 916 " .. 9 15 284 101 386 249 2 Elampilad I7! 171 955 440 515 5 3 1 I 246 149 191 150 3 Veeravancheri 174 194 979 491 488 10 6 19 26 305 150 230 144 4 Chingapuram 141 157 699 352 347 27 23 227 151 145 68 5 Katalur 150 151 990 476 514 .. .. .. . . 211 41 221 103 6 Veemanga1am 235 238 1,616 772 844 I 1 22 20 387 153 328 148
96 Viyyur 2,195'20 1,751 1,754 10,849 5,228 5,621 28 24 292 299 3,142 1,974 2,390 1,203 1 Mannamangalam 204 2M 1,362 654 708 4 2 430 293 306 167 2 Maralur 118 118 668 302 366 12 20 196 129 128 16 3 Puliyancheri 353 353 2,026 973 1,053 .. 78 81 652 404 429 252 4 Kolakkad 141 141 743 363 380 1 .. .. 176 93 189 112 5 Kollam 590 593 4,036 1,950 2,086 20 15 71 60 1,089 736 896 355 6 ViyYur 345 345 2,014 986 1,028 7 9 127 136 599 319 442 301
97 Melur 2,041-60 1,382 1,389 8,145 3,847 4,298 73 79 124 135 2,416 1,706 1,660 ' 997 1 Melur 566 570 3,458 '1,610 1,848 54 57 61 73 1,005 825 652 328 2 - Elatheri 278 278 1,669 770 899 4 8 " " 516 345 362 268 3 Chelia 538 541 3,018 1,467 1,551 15 14 63 62 895 536 646 401
98 Edakkulam 1,324-80 1,028 1,074 6,246 2,981 3,265 88 102 9 11 1,819 1,216 1,326 567 1 Edakkulam 877 916 5,324 2,528 2.796 72 82 9 11 1,552 1,054 1,109 442 2 Mangat 151 I:i8 922 453 469 16 20 267 162 217 125
99 Thiruvangoor 2,361'60 1,595 1,623 10,221 4,901 5,320 220 235 110 106 2,916 1,432 2,142 1,111 1 Thiruvangoor 1,012 1,028 6,571 3,115 3,456 140 161 80 77 1,898 951 1,315 704 2 Vengalam 583 595 3,650 1,786 1,864 80 74 30 29 1,018 481 827 407
100 Chemancherry 1,772'80 1,073 1,077 6,353 3,007 3,346 33 39 91 103 1,901 1,275 1,332 582 I Kada1ur 104- 104 661 301 360 3 7 .. .. 114 18 140 22 2 Cheroancherry 512 515 3,031 1,437 1,594 20 24 47 48 988 751 616 200 3 Thuvvakocle 223 223 1,345 659 686 1 ., 21 30 410 215 305 219 4 Kolakkad 234 235 1,316 610 706 9 8 23 25 389 231 271 141
30

ABSTRACT
KERALA STATE
Workers -- ____,.__
In Mining, Quarrying, Live-stock, Forestry, Fishing, Hunting and In Manu-Plantations, facturing In Transport,
As Agri- Orchards At House- other than In Trade Storage and As cultural and allied hold Household In Con. and Communi- In Other
Cultivator Labourer activities Industry Industry struction Commerce catioDS Services Non-Workers I 11 III IV V VI VII VIII IX X ~ ~ ,..--"----, ~ ,-----A--, ~ ~ ~ ~
M F M F M F M F M F M F M F M F M F M F
(17) (18) (19) (20) (21) (22) (23) (24) (25) (26) (27) (28) (29) (30) (31) (32) (33) (34) (35) (36)
58 37 20 33 224 29 188 185 174 169 17 185 82 7 709 112 2,025 3,375 .go
108 85 52 55 185 17 70 218 30 15 11 72 38 2 345 66 973 1,714- 91
81 64- 59 35 245 52 155 387 23 2 9 116 9 92 389 76 1,296 1,996 92 46 43 32 12 107 35 130 264- 13 2 3 59 1 44- 259 47 717 1,063 1 35 21 27 23 138 17 25 123 10 6 57 8 48 130 29 579 933 2
176 102 95 116 631 146 214 408 100 19 22 248 20 70 731 185 2,596 4,211 93 36 38 7 24 241 17 30 34 28 9 10 55 4 18 132 56 581 1,088 1 34 49 11 19 267 70 50 163 52 3 4 126 3 33 284 74 914 1,427 2
106 15 77 73 123 59 134 211 20 7 8 67 13 19 315 55 1,101 1,696 3
220 37 92 28 434 110 146 628 88 19 12 121 63 548 92 2,008 3,011 94 18 2 I .. ro 1 .. 32 4 8 1 30 2 80 131 I 59 8 15 2 74 13 55 191 6 1 25 19 92 10 377 526 2 14 6 13 3 2 34 3 4 6 23 1 58 91 3 14 3 .. 26 10 5 60 10 .. I 18 II 42 8 199 244 4 31 8 12 .. 58 26 47 80 55 4 6 45 17 1 95 12 435 705 5 84 16 58 26 253 57 37 231 10 7 4 28 15 266 59 859 1,314 6
125 58 47 19 522 37 40 684 75 15 47 2 155 3 123 367 43 1,367 2,762 95 25 II 13 5 201 10 .. 205 19 5 26 2 28 I 31 43 10 451 667 I 27 16 19 33 7 16 113 13 1 6 24 12 41 8 249 365 2 28 19 9 8 43 5 4 108 18 1 3 17 26 1 82 2 261 344 3 16 5 4 6 22 5 3 41 7 11 10 72 11 207 279 4 9 2 112 4 5 87 4 5 26 17 47 6 255 4ll 5
20 5 2 111 6 12 125 18 4 7 49 2 27 82 6 444 696 6
198 48 69 77 321 96 250 608 260 142 20 301 74 III 860 158 2,838 4,418 96 4
\ 69 3 33 148 69 1 31 14 85 16 348 541 1 .. 20 3 1 1 12 1 26 7 23 3 9 2 32 4 174 350 2 66 13 48 55 17 .. 34 152 20 1 I 42 15 186 31 544 801 3 32 6 4 12 29 10 55 74 5 I 2 8 1 53 9 174 268 4 9 6 3 152 70 57 113 120 78 11 185 17 52 307 71 1,054 1,731 5
67 20 13 9 42 12 45 114 23 62 .2 26 57 27 197 27 544 727 6
103 65 36 16 310 132 110 284 138 382 37 158 I 110 658 117 2,187 3,301 97
35 24 8 9 96 37 56 214 33 2 11 66 38 309 41 958 1,520 I 31 8 6 4 67 54 19 29 59 150 7 31 20 122 23 408 631 2 37 33 22 3 147 41 35 41 46 230 19 61 52 227 53 821 1,150 3
121 49 10 12 332 23 14 106 89 290 24 129 14 91 516 72 1,655 2,698 98
106 48 4 3 271 13 12 97 73 207 17 1I3 13 76 437 60 1,419 2,354 I 15 I 6 9 61 10 2 9 16 83 7 16 I 15 79 12 236 344 2
156 62 114 92 504 66 III 480 103 289 34 4 315 6 157 648 III 2,759 4,209 99
101 32 76 66 298 46 73 411 65 77 13 226 6 96 367 66 1,800 2,752 I 55 30 38 26 206 20 38 69 38 212 21 4 89 61 1 281 45 959 1,457 2
119 52 50 29 338 87 75 211 63 122 8 104 30 545 81 1,675 2,764- 100
9 4 2 5 78 5 .. .. 2 7 13 2 34 1 161 338 1 63 26 19 14 143 53 52 51 29 38 8 52 16 234 18 821 1,394 2 21 13 8 3 66 10 12 113 16 45 16 9 157 35 354 467 3 26 9 21 7 51 19 11 47 16 32 23 3 120 27 339 565 4
31
106/1-49a

PRIMARY CENSUS
KOZHIKODE DISTRICT
Occupied Literate and Total residential Total number of Scheduled Scheduled educated Workers
houses persons enumerated Castes Tribes persons I-IX District/Taluk/ ~ ,...--A--, ~ ~~ Town/Ward/BlocK/ Area No. No. of
81. ViUage/Desom/ in of house-No. Forest range acres houses holds Persons Males Femal~~ M F M F M F M F
(1) (2) (3) (4) (5) (6) (7) (8) (9) (10) (II) (12) (13) (14) (15) (16) KOZHIKODE
KOZIDKODE T 242,639-86 98,343 104,286 660,372 333,421 326,95120,507 20,679 1,052 1,042 202,229 130,578 152,344 32919
TALUK R 223,812-80 61,883 63,414 378,528 190,377 188,15117,15917,327 879 869 111,074 67,756 85,476 20529
U 18,827'06 36,460 40,872 281,844 141,044 133,800 3,348 3,352 173 173 91,155 62,822 66,868 12390
Midland Towns
Ul Elathur 1,264,68 1,229 1,251 8,604 4,270 4,334 140 149 2,546 1,488 1,748 699 Ward 1 Elathur 1,264-68 1,229 1,251 8,604 4,270 4,334 140 149 2,546 1,488 1,748 699
Block I 144 148 958 483 475 19 24 209 127 226 77
" '2 149 157 1,288 668 620 12 13 240 83' 321 90
" 3 138 140 888 429 459 17 16 282 144 183 63
" 4 142 144 873 424 449 13 14 279 182 I7l 115 5 123 124 963 460 503 16 19 328 239 195 117
" 6 146 146 966 505 461 16 13 .. 366 212 161 81
" 7 148 14B 905 449 456 35 38 295 151 180 68
" 8 14O 145 1,021 492 529 4 6 331 203 179 49
" 9 99 99 742 360 382 2 6 216 147 132 39
lV Edakkad 890-02 865 881 5,728 2,817 2,911 169 157 5 7 2,110 1,658 1,143 229 Ward I Edakkad 890'02 865 881 5,728 2,817 2,911 169 157 5 7 2,110 1,658 1,143 229
Block 10 163 164 1,087 520 567 24 22 5 7 395 337 180 28
" II 141 141 938 445 493 7 13 350 309 186 27
" 12 159 159 945 484 461 63 66 351 249 202 47
" 13 120 121 941 455 486 14 II 336 250 195 39
" 14 146 ISO 907 451 456 21 17 329 257 182 24
" 15 136 146 910 462 448 40 28 349 256 198 64
V Puthiyangadi 610'81 1,166 1,199 10,0'U 5,041 5,000 100 104 2,740 1,965 2,395 229 Ward I Puthiyangadi 610'84 1,166 1,199 10,041 5,041 5,000 100 104 2,740 1,965 2,395 229
Block 16 144 148 1,218 611 607 20 20 274 178 305 21
" 17 142 144 1,546 808 738 9 10 424 335 418 51
" 18 147 148 1,246 601 645 13 20 343 297 290 19
" 19 147 156 1,118 550 568 21 18 385 291 234 49
" 20 138 144 1102 531 571 15 16 243 152 248 16 " 21 148 148 1~311 655 656 I 2 216 84 342 11 " 22 157 160 1,356 695 661 12 8 421 300 303 . 24 " 23 143 151 1,144 590 554 9 10 434 328 255 38
VI Calbt (M!lnicipal) 7,:;61'45 23,255 27,488 192,521 97,911 94,610 2,063 2,027 84 99 62,382 42,790 45,929 8,237 Ward 1 953-61 2,136 2,332 15,967 8,081 7,886 220 230 8 I) 5,555 4,261 3,493 833
BlOCK 1 134 135 947 479 468 26 23 353 265 207 41
" 2 141 165 997 519 478 7 11 419 313 204 69
" 3 140 150 1,142 528 614 2 I 311 308 231 78
" 4 150 168 1,191 602 589 1 377 295 280 31
" 5 138 142 862 ' 435 d-27 .. I 322 261 195 56
" 6 139 139 975 524 451 5 7 404 281 238 36
" 7 136 167 1,027 505 522 3 5 285 224 226 64
" 8 133 152 1,143 590 553 .. .. 186 102 289 20
" 9 120 136 goJ 445 455 6 5 351 282 191 60
" 10 123 145 1,04~ 583 462 6 482 293 215 23
" II 145 156 1,008 501 507 53 57 8 6 358 289 20B 75
" 12 138 147 1,024 521 503 6 6 410 329 210 62
32

.ABSTRACT
KERALA STATE
Workers _A__
In Mining, Quarrying, Live-stock, Forestry, Fishing, Hunting and In Manu-Plantations, facturing In Transport,
As Agri- Orchards At House- other than In Trade Storage and As cultural and allied hold Househo[d In Con- and Communi- In Other
Cultivator Labourer activities Industry Industry struction Commerce cations Services Non-Workers I II III IV V VI VII VIII IX X
,.----..A.---. ,....-A-----, ~ ~ r--'-----, ,.--.-A----, r--'-----, ~ r----A------, r-----"-------
M F M F 11 F M F M F M F M F M F M F M F (17) (18) (19) (20) (21) (22) (23) (24) (25) (26) (27) (28) (29) (30) (31) (32) (33) (34) (35) (36)
TALUK
16,200 2,290 8,682 3,88312,905 1,846 4,4097,502 22,109 4,676 1,920 47 18,518 20812,110 18955,491 13,078 181,077 294,032 T 15,600 2,135 8,413 3,686 8,118 997 3,022 5,651 6,719 1,535 894 7 6,980 39 3;788 3131,942 6,448 104,901 167,622 R
600 155 269 197 4,787 49 1,3871,851 15,390 3,141 1,026 40 11,538 169 8,322 15823,549 6,630 76,176126,410 U
19 7 11 364 1 28 39 173 517 32 246 1 134 10 745 120 2,522 3,635 III 19 7 11 364 28 39 173 517 32 246 134 10 745 120 2,522 3,635 5 84 .. 2 2 18 55 .. 36 .. [3 68 20 257 398 1
196 I 2 4 8 63 I 40 I 13 4 61 17 347 530 2 .. 8 1 ]0 53 5 33 10 4 117 5 246 396 3 2 46 7 I 12 106 5 30 27 2 42 6 253 334 4 5 17 2 4 23 103 7 27 13 101 10 265 386 5 3 3 7 2 1 .. 46 59 7 14 9 76 15 344 380 6 .. 4 7 2 15 41 2 17 16 119 25 269 388 7 1 .. .. 7 6 25 21 8 1 33 15 95 16 313 480 8 3 4 4 I 20 29 4 16 18 66 6 228 343 9
58 17 10 3 17 1 8 3 273 113 19 155 3 76 527 89 1,674 2,682 IV 58 17 10 3 17 1 8 3 273 113 19 155 3 76 527 89 1,674 2,682 19 6 7 9 .. 34 17 4 20 16 71 5 340 539 10 14 1 1 2 42 12 22 13 92 14 259 466 11 10 5 1 3 .. 41 13 2 31 .. 13 101 29 282 414 12 12 5 2 3 2 1 53 15 8 27 2 12 78 14 260 447 13 2 .. 5 3 46 15 2 21 11 95 6 269 432 14 1 2 1 57 41 3 34 1 11 90 21 264 384 15 7 4 .. 1,052 84 13 191 104 18 4 338 17 136 4 569 83 2,646 4,771 V 7 4 .. 1,052 84 13 191 104 IB 4 338 17 136 4 569 83 2,646 4,771 2 3 200 2 4 II 7 .. 29 10 51 7 306 586 16 4 1 305 2 9 40 2 I 24 2 18 54 7 390 687 17
125 .. .. 20 3 8 3 23 10 .. 104 13 311 626 18 3 14 I 36 30 2· 71 27 1 81 17 316 519 19
76 2 21 6 2 33 .. 10 104 10 283 555 20 262 .. .. 5 4 .. 22 2 2 51 5 313 645 21
I 38 62 1 44 9 2 49 I 39 2 68 II 392 637 22 43 2 7 45 5 2 87 12 20 1 56 13 335 516 23
141 73 42 36 2,597 29 869 1,051 9,528 1,464 731 31 3,986 116 5,896 13817,139 5,299 51,982 86,373 VI 8 9 2 413 2 61 30 70B 291 75 2 504 20 294 9 1,428 470 4,58B 7,053
3 4 6 60 13 4 1 34 5 15 87 24 272 419 I .. 6 .. 58 35 8 23 5 29 .. 80 28 315 410 2 1 1 50 8 2 59 43 4 18 I 8 1 83 23 297 543 3
121 .. .. 34 23 20 19 86 13 322 553 4 .. 7 2 30 10 52 26 4 31 13 58 18 240 371 5 1 10 1 93 18 6 43 3 19 .. 65 13 2B6 417 6
35 8 2 48 39 8 42 29 1 56 18 279 462 7 159 .. 21 II 2 42 .. 23 .. 42 10 301 532 8
3 I 3B 10 7 47 2 13 1 82 47 254 395 9 3 2 25 3 4 25 23 133 20 368 439 10
6 3 5 3 10 47 20 .. 32 2 16 99 40 293 432 11 1 1 2 3 39 19 12 41 1 16 3 95 39 311 441 12
33

PRIMARY CENSUS
KOZHIK.ODB DISTRICT
Occupied Literate and Total residential Total number of Scheduled Scheduled . educated Workers
houses persons enumerated Castes Tribes persons I-IX District/Taluk ~ ..... ~ ~ ~~ Town/Ward/Block/ Area No. No. of
51. Village/Desom/ in of house-No. Forest range acres houses holds Persons Males Females M F M F M F M F (1) (2) (3) (4) (5) (6) (7) (8) (9) (10) (11) (12) (13) (14) (IS) (16~
Mqfland TOWfll""""ontd.
Block 13 138 150 958 479 479 3 2 357 269 198 52' "
14 14{J 144 1,012 499 513 4 7 398 373 234 70 "
IS 14{J lSI 1,136 553 583 80 86 317 210 ' 209 65 " 16 81 85 600 318 282 18 19 225 167 158 31
Ward 2 859'14 1,4{lO 1,%1 10,223 5,110 5,113 152 161 5 8 3,555 2,712 2,186 502' Block 17 64 69 486 251 235 197 135 110 31
JJ 18 134 135 985 513 472 ,. 381 284 225 26 "
19 144 145 980 485 495 29 29 3% 291 187 48 JJ 20 131 143 1,001 516 485 23 25 339 209 216 6o. "
21 118 122 860 426 434 14 14 239 181 184 28 " 22 123 131 790 417 373 25 20 247 151 200 32
" 23 143 152 992 464 528 16 22 315 261 205 41
" 24 144 147 1,088 557 531 16 11 435 319 235 52
" 25 133 139 994 454 540 24 35 267 272 184 53
" 26 148 151 1,087 538 549 1 2 .. 425 330 214 31
" 27 118 127 960 489 471 4 3 5 8 364 279 226 100
Ward 3 319'00 1,768 2,057 14,292 7,109 7,183 176 142 7 8 4,084 2,997 3,364 670 Block 28 13 19 124 59 65 2 4 7 8 42 38 27 1
" 29 142 145 1,013 487 526 387 333 213 73
" ..sO 137 143 835 409 426 327 285 193 40'
" 31 149 171 1,266 696 570 50 7 458 223 328 84 " 32 149 152 1,036 533 503 438 343 257 89 "
33 128 147 1,058 508 550 3 3 223 179 253 70 , 34 137 148 1,033 532 501 11 6 382 270 251 44 "
35 133 1% 995 503 492 11 11 341 275 211 35
" 36 137 142 632 404 428 57 71 254- 196 177 54
" 37 118 119 842 342 500 12 16 172 252 141 59 38 132 147 1,194 580 614 30 24 186 101 298 38
JJ 39 159 222 1,571 774 797 294 153 389 18
" 4{J 139 175 1,499 761 738 335 199 383 24-
" 41 95 181 994 521 473 245 150 243 41,
Ward 4- 180'00 1,097 1,379 10,136 5,194 4,942 139 118 3,178 2,262 2,5% 530 Block 42 50 52 353 180 173 ISS 129 97 39
" 43 138 140 998 477 '521 5 3 375 333 214 57
" 44 138 167 1,066 510 556 38) 343 244 68
" 45 121 184 1,198 594 604- 3% 232 282 21
JJ 46 136 181 1,394 711 683 .. 409 312 309 57
" 47 141 180 1,376 701 675 16 12 329 220 368 35
" 48 134 203 1,443 734 709 5 6 355 172 335 23 " 49 139 168 1,148 590 558 8 8 380 229 307 63
" 50 100 104- 1,160 697 %3 105 89 448 292 390 167
Ward 5 733'00 1,808 1,930 13,880 6,709 7,171 274 341 33 39 4,897 4,397 2,903 664 Block 51 25 26 171 82 89 4- 7 53 43 35 9
" 52 149 164 1,064 517 547 41 47 372 324 224 48
" 53 150 153 1,IW 557 571 6 8 423 338 237 37
" 54 13l 152 1,28 647 581 418 248 297 49
" 55 144 153 1,031 504- 527 14 15 359 290 215 53
" 56 144 149 1,088 480 608 3 8 366 392 204- 61
" 57 144 153 1,119 557 562 71 88 434 362 257 69
" 58 145 147 1,267 513 754 24 32 382 525 202 68
34

i-,,_
.ABSTRACT KERALA STATE
Workers
In Mining, Quarrying, Live-stock, Forestry Fishing, Hunting and In Manu-Plantations, facturing In Transport,
As Agri- Orchards At House- other than In Trade Storage and As cultural and allied hold Household In Con- and Communi- In Other
Cultivator Labourer activities Industry Industry struction Commerce cations Services Non-Workers I II III IV V VI VII VIII IX X
.,.--A--. ~ ,.....-"----, ~ ~ r------"-----, ,---"-----, ,---"-----, ~ ~
M F M F M F M F M F M F M F M F M F ~I F
(17) (18) (19) (20) (21) (22) (23) (24) (25) (26) (27) (28) (29) (30) (31) (32) (33) (34) (35) (36)
.. 4 38 5 2 25 .. 20 109 46 281 427 13 5 2 37 3 8 .. 41 1 23 123 55 265 443 14
.- 14 3 5 I 28 17 145 60 344 518 15 3 1 45 15 I 12 I I 85 16 160 251 16
25 33 4 4 32 30 39 488 242 67 3 397 8 269 5 374 163 2,924 4,611 4 .. .. . . 27 21 3 19 12 44 10 141 204 17 2 I I 1 47 ]0 7 .. - 47 28 93 14 288 446 18 1 2 5 2 39 20 7 2 42 .. 14 77 24 298 447 19 1 1 8 3 47 39 13 33 1 22 86 12 300 425 20 2 I 2 39 10 7 53 2 33 47 16 242 406 21 1 1 3 46 24 2 50 4 15 82 4 217 341 22
.. .. 31 34 I " 30 19 124 7 259 487 23 7 1 3 10 8 3 44 18 7 I 18 .. 34 .. 107 21 322 479 24 I 9 5 2 42 25 5 28 1 30 5 64 20 270 487 25 .. .. 1 .. 63 16 3 26 42 79 15 324 518 26 6 36 2 1 6 18 63 25 12 46 20 71 20 263 371 27
739 10 17 14 607 182 94 635 9 289 8 982 446 3,745 6,513 I 3 2 8 4 .. 9 I 32 64 28
.. 5 60 20 10 29 .. 20 2 89 51 274 453 29 2 40 7 5 .. 48 1 12 86 32 216 386 30 I 3 3 56 9 46 I 77 18 .. 127 71 368 486 31
.. 3 2 47 4 9 46 28 2 124 81 276 414 32 1 61 1 .. 46 10 2 41 3 20 I 82 55 255 480 33
44 I 57 9 4 32 16 97 35 281 457 34 1 6 .. 64 19 2 32 22 84 16 292 457 35 2 .. 2 64 33 1 22 9 .. 79 19 227 374 36
27 .. I 40 24 .. 9 20 1 44 34 201 441 37 5 I .. 31 II I 141 .. 31 39 26 282 576 38
204 2 I 47 10 5 69 I 46 18 4 385 779 39 245 3 5 27 11 4 47 2 30 I 25 7 378 714 40 138 1 I 3 25 15 3 34 2 13 1 29 14 278 432 41
32 18 3 338 3 9 6 493 77 47 2 356 5 332 7 921 426 2,648 4,412 3 8 ., 4 9 7 65 36 83 134 42 2 57 1 4 29 17 105 56 263 464 43 4 .. 72 19 9 35 .. 26 .. 98 49 266 488 44 2 1 72 3 11 42 1 89 2 65 15 312 583 45
1 59 .. 68 13 5 30 1 28 2 118 41 402 626 46 182 I 3 34 15 61 .. 58 32 17 333 640 47 49 I I 66 II .. .. 69 1 37 113 10 399 686 48
.. .. 20 .. .. .. 64 9 4 2 40 I 41 . . 138 51 283 495 49 30 18 3 17 1 6 3 52 6 10 41 I 29 2 187 lSI 307 296 50 12 4 I 2 45 16 8 728 143 89 12 522 7 335 18 1,155 469 3,806 6,507 .. I 1 11 8 2 .. 7 14 .. 47 80 51 4 1 3 4 2 44 20 7 44 I 22 2 96 22 293 499 52 3 I 1 52 3 4 " 59 31 2 87 31 320 534 53
.. 4 64 8 19 1 67 .. 4B 95 40 350 532 54 I 6 86 30 19 2 22 2 27 55 18 289 474 55
2 3 1 .. 24- 2 3 .. 39 .. 21 3 lIS 52 276 547 56 6 4- 50 5 7 1 45 2 21 3 124- 58 300 493 57
2 1 58 2 10 4 39 21 1 71 61 311 686 58
35

PRIMARY CENSUS
KOZHIKODE DISTRICT
Occupied Literate and Total residential Total number of Scheduled Scheduled educated Workers
houses persons enumerated Castes Tribes persons I-IX District/Taluk/ ..----"----- ...... r---A--t ~ ,--..-'----""'\ ~ Town/Ward/Block! Area No. No. of
Sl. Village/Desom/ in of house-No. Forest range acres houses holds Persons Males Females M F M F M F M F
(I) (2) (3) (4) (5) (6) (7) (8) (9) (to) (11) (IZ) (13) (14) (15) (16}
MidllUld TOWD.-contJ.
Block 59 142 154 1,073 550 523 34 29 18 17 389 333 231 4(}
" 60 144 152 1,112 550 562 23 15 375 344- 233 32
" 61 135 147 1,022 487 535 54 6B 356 315 204- 28
" 62 142 161 1,043 519 524 24 .. .. 399 344- 228 65
" 63 142 148 998 486 512 15 22 391 365 24<l 80
" 64 71 71 536 260 276 180 174 96 25
Ward 6 113'00 521 539 3,698 1,904 1,794- 42 30 1,534 1,250 984 351 Block 65 63 63 414 202 212 149 143 97 38
" 66 146 151 1,19B 638 560 4 3 516 397 331 166 .. 67 144 144 1,013 529 484 439 332 275 54
" 68 135 147 845 423 422 38 27 344 299 219 75 .. 69 33 34 228 li2 116 86 79 62 18
Ward 7 76'00 396 447 3,340 1,850 1,490 54 44 1,399 769 925 146 Block 70 33 34 732 396 336 6 2 301 194 213 47
" 71 III 120 828 452 376 45 42 331 201 241 47
" 72 129 133 958 509 449 3 355 156 245 22
" 73 123 160 822 493 329 412 218 226 30
Watd 8 57'00 164 166 1,400 664 736 513 516 275 13Q , Block 74 S S 56 31 25 21 15 14 2
" 75 137 137 1,212 563 649 I 1 440 461 230 llS
" 76 19 21 132 70 62 52 40 31 10
Ward 9 58'00 236 356 2,907 1,541 1,366 1,023 510 7li 70 Block 77 104: 145 1,107 600 507 418 234 290 31
" 78 104: 161 1,351 704- 647 459 196 321 29
" 79 28 50 449 237 212 146 80 106 10
Ward 10 30'00 167 193 1,629 889 74{) 25 17 642 318 554 67
Block 80 74 90 702 431 271 5 1 327 133 275 22
" 81 93 103 927 458 469 20 16 315 185 279 45
Ward 11 46'00 234- 251 1,908 954 954 726 629 430 ' 131
Block 82 58 62 441 231 210 189 155 118 4:l
" 83 145 149 1,208 594 614 447 421 246 87
" 84 31 40 259 129 130 90 53 66 3
Ward 12 59'00 338 539 4,099 %,072 2,027 1,320 499 979 106
Block i85 85 109 693 362 331 259 123 187 10
" 86 86 174 1,231 643 594 417 112 297 27
" 87 83 157 1,317 655 662 376 149 317 53
" 88 84 99 852 412 440 268 115 178 16
Ward 13 92'00 609 681 5,105 2,699 2,406 36 31 1,957 1,062 1,308 132
Block 89 70 70 374 221 153 195 113 143 14
" 90 157 161 1,089 573 516 8 7 430 264 274 14
" 91 124 163 1,412 745 667 2 1 51B 258 366 25
" 92 157 IB5 1,742 903 839 613 282 404- 67
" 93 101 102 488 257 231 26 23 201 145 121 12
Ward 114 95'00 555 896 ~,133 3,118 3,065 16 19 1,797 833 1,448 126
Block 94 35 46 273 141 132 4 9 124 72 73 15
" 95 98 133 990 509 481 5 2 317 142 235 9
36

ABSTRACT
KERALA STATE Workers
_.A.
In Mining, ....... Quarrying, Live-stock, Forestry Fishing, Huntingand In Manu-Plantations. facturing In Transport,
As Agri- Orchards At House- other than In Trade Storage and As cultural and allied hold Household In Con- and Communi- In Other
Cultivator Labourer activities Industry Industry struction Commerce cations Services Non-Workers I II III IV V VI VII VIII IX X ,.-----A.___, ~ r-----'----; ,.----"------, ,----"----I ~ ~ ,.----"------, r----'----.. r---A.----..
M F M F M F M F M F M F M F M F M F M F (17) (18) (19) (20) (21) (22) (23) (24) (25) (26) (27) (28) (29) (30) (31) (32) (33) (34) (35) (36)
.. 4 62 18 2 \43 16 2 104 20 319 483 59 I 2 .. 90 14 2 ~ 26 86 18 317 530 60
6 3 .. 63 12 4 27 64 15 283 507 61 .. 5 .. 3 55 9 5 3 4:1- .. 25 4 94 46 291 459 62 1 7 1 3 I 41 9 7 I 49 1 38 1 94 66 246 432 63
1 2f1 3 6 5 56 22 164 251 64 3 7 4 207 19 25 5 125 2 91 25 522 300 Q2J 1,443 .. I 1 19 .. 1 2 . . 6 I 67 37 105 174 65 2 .. 67 5 14 5 50 1 30 22 168 133 307 394 66 I 6 3 71 7 4 40 .. 25 2 125 45 254 430 67
45 7 5 23 1 20 126 67 204 347 68 5 1 10 10 36 18 50 98 69
7 47 20 147 5 5 244 3 96 2 379 116 925 1,344 3 7 2 44 2 3 47 2 13 1 96 40 183 289 70 4 17 18 24 1 2 77 1 18 99 27 211 329 71
19 32 .. "69 42 83 22 264 427 72 4 47 2 51 23 1 101 27 267 299 73
3 20 2 2 67 21 2 162 126 389 606 .. .. .. 5 9 2 17 23 74
3 13 1 2 55 17 1 140 116 333 531 75 7 1 7 4 1 13 8 39 52 76
14 2 33 14 111 6 4 258 2 67 230 45 824 1,296 5 18 3 36 .. 2 99 .. 35 95 28 310 476 77 8 2 7 6 54 3 .. 137 2 28 1 87 15 383 618 78 1 8 5 21 3 2 22 4 48 2 131 202 79
3 5 24 5 77 3 4 155 24 266 52 335 673 ~ .. .. " .. 40 1 63 .. 9 161 21 156 249 80 1 5 1 1 24 5 37 2 4 92 1 15 105 31 179 424 81
14 12 5 77 3 5 113 3 46 12 163 108 524 823 12 2 8 1 32 2 12 4 52 34 113 169 82 2 8 4 52 2 4 60 1 22 B 98 7Z 348 527 83
2 1 17 1 21 12 13 2 63 127 84 12 I 145 4 8 416 135 262 101 1,093 1,921 3 32 .. 1 99 8 44 10 175 321 85 5 .. .. 46 3 1 115 48 82 24 346 567 86 3 1 1 34 1 6 119 62 92 51 338 609 87 1 33 83 17 44 16 234 424 88
7 9 8 162 12 454 255 409 122 1,391 2,274 1 7 5 20 4 35 15 61 9 78 139 89 1 28 .. 2 78 16 149 14 299 502 90 3 .. 49 I I 190 42 81 24 379 642 91 2 .. 1 60 2 150 101 1 89 65 499 772 92
2 2 5 3 1 81 29 10 136 219 93
32 10 3 327 5 30 450 2 217 382 116 1,670 2,939 4 2 36 3 8 1 19 13 68 II7 94
10 ..
8 274 472 95 49 5 68 1 24 79
37 106/I-SO
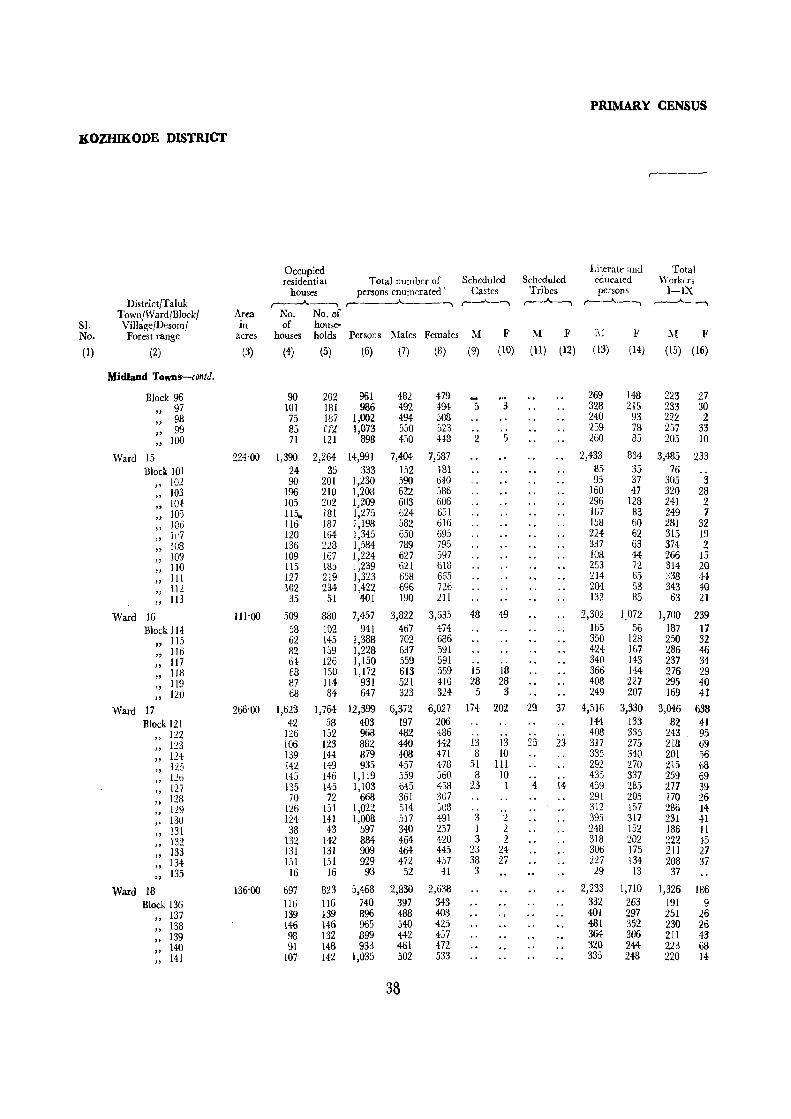
PRIMARY CENSUS
KOZHIKODE DISTRICT
Occupied titerate and Total residential Total number of Scheduled Scheduled educated Workers
houses persons enumerated' Castes Tribes persons I-IX District/Taluk ,---A_____" ......, r--_;"_~ ,-----.A....--., r---...... _______, ,-......___..A.__--,
Town/Ward/Block/ Area No. No. of SJ. ViJlage{Desom{ In of house-No. F ores t range acres houses holds Persons Males Females ~I F M F ,11 F ~f F
(1) (2) (3) (4) (5) (6) (7) (8) (9) (10) (11) (12) (13) (14) (15) (16)
Midland Towns-contJ.
Block 96 90 202 961 4-82 4-79 , .. 269 148 223 27
" 97 101 181 986 492 494 5 3 328 215 233 30
" 98 75 187 1,002 4-94 508 240 93 222 2
" 99 85 U/. 1,073 550 523 .. 259 78 237 33
" 100 7I 121 898 4-50 443 2 5 260 85 205 10
Ward 15 224'00 1,390 2,264- 14,991 7,404 7,5S7 2,4-33 834 3,485 233 Block JOI 24 35 333 152 IBI B5 35 76
" 10:2 90 201 1,230 590 640 95 37 305 3
" 103 196 210 1,208 622 586 160 47 320 28
" 104 105 202 1,209 603 606 296 128 241 2
" 105 115,. 181 1,275 624 651 167 83 249 7
" 106 116 187 1,198 582 016 158 60 281 32
" le7 120 164 1,345 650 095 224 62 315 19
" 108 136 228 1,584 789 795 337 63 374 2
" 109 109 167 1,224 627 597 108 44 266 15
" 110 115 185 1,239 621 618 253 72 314 20
" III 127 219 1,323 658 665 214 65 :,38 +4-
" 112 102 234 1,422 696 726 204- 53 343 40
" 113 35 51 .wI 190 211 132 85 63 21
Ward 16 Ill'OO 509 880 7,457 3,822 3,535 48 49 2,302 1;072 1,700 239 Block IH 58 102 941 467 474 165 56 187 17
" 115 62 145 1,388 702 686 350 128 250 32
" ]]6 82 159 1,228 637 591 424 167 286 4-6
" 1I7 64 126 1,150 559 591 .. 340 143 237 34
" lIS 88 150 1,172 613 559 15 18 366 144 276 29
., 119 87 114 931 521 410 28 28 408 227 295 40
" 120 68 84 647 323 324 5 3 249 207 169 4-1
Ward 17 266'00 1,623 1,764 12,399 6,372 6,027 174 202 29 37 4,516 3,330 3,046 638 Block 121 42 58 403 197 206 144 133 82 4-1
" 122 126 152 968 482 486 .. .. 408 335 243 95 123 106 123 882 440 442 13 13 0- 23 317 275 218 69
" _J
" 124 139 144 879 408 471 8 10 335 340 201 56
" 125 142 149 935 457 478 51 111 292 270 215 68
" 126 145 146 1,119 559 560 8 10 .. ., 435 337 259 69
" 127 135 145 1,103 045 4:38 23 I 4 14 459 2B5 277 39
" 128 70 72 668 361 307 291 205 170 26
" 129 126 151 1,022 514- 50B " 312 m 286 14
,. 130 124 141 1,008 517 491 3 2 3% 317 231 H
" 131 38 43 597 34-0 257 I 2 248 152 186 11
" 132 132 142 884 464 420 3 2 318 202 222 45
" 133 131 131 909 464 445 23 24 3U6 175 211 27
" 134 lSI 151 929 472 457 38 27 227 134 208 37
" 135 16 16 93 52 41 3 29 13 37
Ward 18 136'00 697 823 5,468 2,830 2,638 2,233 1,710 1,326 186 Block 136 116 116 740 397 343 332 263 191 9
" 137 139 139 896 488 4-08 4-01 297 251 26
" 138 14-6 14-6 965 540 425 481 352 230 20
" 139 98 132 899 442 4j7 364- 306 211 43
" 14-0 91 148 933 4-61 472 320 24-4- 223 68
" 141 !O7 l4-2 1,035 502 533 335 248 220 H
38

ABSTRACT
KERALA STA.TI Workers
------~--.~- -~--..A-
In Mining, ~
Quarrying, Live-stock, Forestry, Fisning, Hunting and In Manu-Plantations, facturing
In Trade In Transport,
As Agri- Orchards At House- other than Storage and As cultural and allied hold Household In Con- and Communi- In Other
Cultivator Labourer activities Industry Industry struction Commerce cations Services Non-Workers I II III IV \" VI VII VIII IX X
,--.10...--, ~ ~ ,-----'--, ,--~ ~ ,--~ ,..-----"--, r---'-------I
M F M F M F M F M F M F M F M F M F M F
(17) (18) (19) (20) (21) (22) (23) (24) (25) (26) (27) (28) (29) (30) (31) (32) (33) (34) (35) (36)
5 1 57 3 6 62 34 58 23 259 452 96 3 6 42 5 62 43 ~?
I~ 29 259 464 97 4 " 58 5 71 45 39 2 272 506 98 6 1 60 1 6 85 1 46 53 3l 293 490 99
25 94- 24 62 10 245 438 100 ,
399 2 5 20 624 45 8 612 9 632 9 1,205 148 3,919 7,354 ., .. .. 12 33 16 15 . . 76 181 101 96 1 4 .. 18 50 .. 137 2 285 637 102 62 67 9 31 I 69 2 91 16 302 558 103 15 57 .. 50 48 " 71 2 362 604 104 9 " .. 79 4 .. 49 28 I 84 2 375 644 105
64 1 1 60 15 3 25 8 49 79 8 301 584 106 36 67 9 43 34 13:) 10 335 676 107 8 70 1 119 65 112 1 415 793 108 6 50 .. .. 62 13 135 15 361 582 109
15 .. 55 4 2 60 56 126 16 307 598 110 52 .. 4 19 44- 1 2 57 91 1 8d 23 320 62l 111 35 1 5+ 2 .. 38 10+ 5 III 32 353 686 112
:) I 27 9 21 21 127 190 113
9 21 10 300 Lj 19 548 177 623 213 2,122 3,396 1 .. 37 1 49 23 76 17 280 457 114 I 2 22 .. 2 .. , 109 15 99 32 452 654 115 6 I 60 1 .. 118 25 76 45 351 545 116
1 .. 1 .. 29 .. 2 105 12 87 3+ 322 557 117 1 8 5 56 1 5 100 36 70 23 337 530 118
4 2 61 3 7 S3 55 135 35 226 370 119 5 3 35 10 2 "3'4 1 11 82 27 15+ 283 120
15 2 30 61 14 582 89 46 603 9 280 13 1,427 512 3,326 5,389 1 9 {) 3 II 13 46 34 115 165 121
.. .. 52 13 5 62 23 3 101 78 239 391 122 2 2 3 54 13 1 22 ., 27 2 110 51 222 373 123 I 67 3 2 37 2 21 3 73 43 207 415 124 2 .. 37 5 I 43 16 1 116 62 242 410 125
.. 6 2 86 26 13 55 28 69 43 300 491 126-13 2 4! 3 39 4 9 80 27 100 35 368 419 127
.. 16 1 2 33 LO 1 109 24 191 281 128 2 .. 61 2 4 80 2 35 104 10 228 494 129
1 6 1 .. 52 6 2 45 2 31 1 94 31 286 450 130 1 .. 17 .. 1 19 9 1 139 10 154 246 131
7 28 1 31 4 I 47 14 94- 40 242 375 132 1 8 5 22 " 22 15 1 143 21 253 418 133
17 4 3+ 1 2 33 2 LO 112 30 264 420 134 5 14 1 17 15 41 135
16 37 8 206 14 24 261 83 5 698 157 1,504 2,452 1 .. 32 1 1 46 14 2 97 6 206 334 136 2 20 2 46 3 11 45 10 117 2l 237 382 137 1 .. 23 4 .. 59 9 . . 134 26 310 399 138
. , 3 7 2 • 30 .. 1 1 34 1 21 1 115 38 231 414 139 1 7 5 4 42 B 6 40 14 2 108 54 238 404 14()
2 5 33 2 I 37 15 127 12 282 519 141
39 106/1-50a

PRIMARY CENSUS
KOZHIKODE DISTRICT
Occupied Literate and Total residential Total number of Scheduled Scheduled educated Workers
houses persons enumerated Castes Tribes persons I-IX District/Taluk/ ~ r--~ .---"----, ,-~ r-~ ,----"---, Town/Ward/Block/ Area No. No. of
SI. Village/Desom/ in of house-No. Forest range acres houses holds Persons Males Females M F .M F M F 11 F (I) (2) (3) (4) (5) (6) (7) (8) (9) (10) (11) (12) (13) (14) ( 15) (16)
Midland Towns--contd.
Ward 19 254'00 818 1,076 7,611 3,884 3,727 8 8 2,952 2,192 1,908 374 Block 142 II 17 112 53 59 3 6 26 21 25 4
" 143 108 149 1,029 515 514 395 300 231 45
" 144 95 134 896 425 471 275 217 208 65
" 145 84 140 867 443 424 364 273 210 66
" 146 95 140 938 473 465 360 268 231 26
" 147 113 127 1,136 574 562 .. .. 350 237 276 36
" 148 132 159 1.173 608 563 5 2 512 396 290 58
" 149 114 139 1;017 545 472 450 318 309 45
" 130 66 71 443 248 195 220 162 128 29
Ward 20 265'00 866 997 6,671 3,378 3,293 39 43 2,219 1,519 1,472 194 Block lSI 104 125 747 381 366 2 2 222 138 158 17
" 152 140 184 1,281 651 630 ,5 10 420 261 281 33
" 153 168 168 1,146 577 569 I .. 405 314 247 46
" 154 146 203 1,387 724 663 18 16 392 177 343 27
" 155 152 161 1,065 529 536 .. .. 423 359 219 52
" 156 156 156 1,045 516 i529 13 15 357 270 224 19
Ward 21 961'70 2,213 2,478 15,564 7,785 7,779 147 144 4,388 2,764 3,721 538 Block 157 127 154 1,024 512 512 15 IS 371 269 240 40
" 158 148 158 994 514 480 20 14 328 223 253 17
" 159 159 159 988 517 471 .. .. 290 183 246 13
" 160 132 173 1,067 544 523 2 2 283 156 257 II
" 161 128 154 962 466 496 224 124 237 40
" 162 124 155 950 460 490 232 125 230 38
" 163 134 156 906 464 442 .. 178 117 197 22
" 164 138 148 938 443 495 II 7 263 187 227 113
" 165 139 143 923 439 484 .. .. 188 120 223 40
" 166 139 145 917 456 461 11 14 302 180 204 33
" 167 142 151 913 450 463 14 18 294 193 234 11
" 168 131 149 1,020 520 500 24 26 291 174 216 22
" 169 146 146 963 497 466 23 22 262 159 234 14
" 170 142 142 874 416 458 16 19 264 202 199 37
" 171 143 149 967 488 479 II 7 247 149 231 33
" 172 lOS 154 912 468 444 301 174 228 49
" 173 36 42 246 131 115 70 29 65 5 Ward 22 :293'00 701 759 4,660 2,306 2,354 21 18 1,567 1,300 980 187
Block 174 109 114 674 336 338 16 12 235 209 149 26
" 175 134 141 884 415 469 3 3 306 308 197 28
" 176 132 142 875 429 446 1 .. 274 219 132 38
" 177 122 136 834 420 414 I 3 .. 331 284 ISS 27
" 179 127 139 820 420 400 253 157 180 39
" 178 7 87 573 286 287 168 123 117 29
Ward 23 375'00 1,183 1,303 8,201 4,137 4,064 173 157 2,656 1,846 1,907 625 Block 180 54 77 511 258 253 .. .. 115 67 116 10
" 181 127 146 1,141 629 512 38 26 343 136 283 59
" 182 138 142 857 449 408 II 9 275 206 217 125 183 137 158 899 439 460 9 13 274 196 209 109
" 184 139 150 871 414 457 23 25 251 175 205 96
" 185 132 152 969 482 487 8 6 351 279 222 45
" 186 147 154 ,986 475 511 4 2 363 281 211 58
" 187 146 148 917 459 458 44 44 331 240 204 45
" 188 135 147 828 419 409 8 7 281 221 187 74
" 189 28 29 222 113 109 28 25 72 45 53 4
40

ABSTRACT
KERALA STATE Workers
.A. ~
In ~lining, Quarrying, Live-stock, Forestry, Fishing, Hunting and In xlanu-Plantations, facturing In Transport,
As Agri- Orchards At House- other than In Trade Storage and As cultural and allied hold Household In Con· and Communi- In Other
Cultivator Labourer activities Industry Industry struction Commerce cations Services Non·Workers I II III IV V VI VII VIII IX X ,-___.,_____, ,-------"------, ,-~-, ,..----"--, r-~ ,...---JI------,.------'-----; r----A--- r----"--------. ,.-_-A---.
M F M F l\I F M F ~f F M F M F M F M F M F (17) (18) (19) (20) (21) (22) (23) (24) (25) (26; (27) (28) (29) (30) (31) (32) (33) (34) (35) (36)
38 9 5 402 12 37 368 6 ISO 9 903 342 1,976 3,353 .. .. .. 5 .. ) .. .. 19 4 28 55 142 5 1 1 50 ., 2 45 I 17 2 111 41 284 469 143 4 .. 63 5 5 21 .. 18 .. 97 60 217 406 144-2 ) 28 2 6 48 4 17 ) 109 58 233 358 145 1 I 31 2 1 40 14 1 143 23 242 439 146
.. 18 7 1 74 1 4 63 .. 26 2 84- 32 298 526 141 I 5 .. 57 2 6 39 1 33 2 149 53 318 507 148
3 2 85 12 85 18 1 106 42 236 427 149 9 I 26 7 85 29 120 166 150
26 12 11 332 14 11 276 3 245 569 164 1,906 3,099 2 .. 55 3 3 35 3 16 .. 47 11 223 349 151 8 10 66 .. 2 47 .. 68 1 80 32 370 597 152
I .. .. 45 2 2 51 .. 23 126 43 330 523 153 5 1 ,J 42 3 .. 54 92 139 23 381 636 154
1 3 I 10 87 5 3 39 13 72 37 310 484 155 8 37 1 1 40 .. 33 105 18 292 510 156
15 4 3 306 3 26 232 1,004 119 37 604 5 511 4 1,214 172 4,064 7,241 4 14 118 IO 7 50 17 44 15 272 472 157 ) 74 1 3 49 7I .. 55 16 261 463 158 IO .. .. 90 3 3 40 30 2 73 8 271 458 159 7 10 3 62 1 46 56 76 7 287 512 160
36 3 24 73 13 .. 19 .. 46 60 3 229 456 161 11 35 66 I 26 I 45 81 2 230 452 162
.. 6 19 39 1 15 23 1 113 2 267 420 163 3 1 24 2 100 53 6 2 23 22 97 7 216 382 164
141 25 12 6 6 10 7 47 9 216 444 165 4 14 I .. 71 27 2 17 1 16 79 5 252 428 166
.. \ . I 2 2 76 6 5 21 20 109 3 216 452 167 1 9 1 .. 1 41 8 57 42 66 12 304 478 168
.. .. 9 I 45 2 56 42 82 12 263 452 169 2 3 3 3 .. .. 71 21 3 49 16 52 13 217 421 170 4 10 I 4 4 68 II 1 32 .. 31 I 81 16 257 446 17I 1 20 I .. 33 4: 2 71 3 18 82 42 240 395 !72
3 5 12 I 23 9 17 66 110 173 28 21 35 356 60 6 144 2 44 I 379 89 1,326 2,167 12 5 2 54 3 3 15 .. 11 1 49 20 187 312 174 4 3 3 67 I .. 36 2 13 74 22 218 441 175
.. .. 2 2 12 50 14 2 30 4 92 12 247 408 176 I 1 3 2 3 55 4 26 5 62 20 265 387 177
2 6 14 90 21 .. 18 6 58 4 240 361 178 5 3 I 40 17 1 19 5 44 II 169 258 179
5 4 42 4 366 378 524 55 12 2 306 3 ·109 543 179 2,230 3,439 1 1 22 4 l 14 7 71 5 142 243 180
3 38 39 62 6 5 64 20 91 14 346 453 181 2 108 106 53 10 I 17 9 27 9 232 283 182
80 79 52 5 I 29 3 44 25 230 351 183 2 3 I 60 51 59 8 .. 22 .. 9 50 36 209 361 184-1 8 I 8 23 78 5 I 38 I 18 70 15 260 442 185 2 4- II 15 15 59 4: .. 51 12 61 35 264 453 186
8 I 14 12 60 4- 1 .. 38 IO 73 28 255 413 187 5 1 42 52 61 9 1 2 26 16 36 10 232 335 188 2 18 I 7 2 5 20 2 60 105 189
41

PRIMARY CENSUS
KOZHIKODE DISTRICT
Occupied Literate and Total residential Total number of Scheduled Scheduled educated Workers
houses persons enumerated Castes Tribes persons I-IX DistrictJTalukJ r----"------. ~--. ~ ,..--A----, ,-......A.----, ,----J'---.. TownJWardJBlock! Area No. No. of
SI. ViJlage/Desom/ in of house-No. Forest range acres houses holds Persons Males Females M F M F 1\1 F 1\1 F
(1) (2) . (3) (4) (5) (6) (7) (8) (9) (10) ,(II) (12) (13) (14) (15) (16)
Midland Towns-conld.
Ward 24 417'00 1,031 1,101 7,338 3,677 3,661 90 37 2,689 2,097 1,638 210 Block 190 121 129 903 458 445 12 8 32,'j 257 217 22
" 191 153 155 1,112 562 550 13 10 408 330 231 26
" 192 186 191 1,032 544 488 3 3 384 2'14 257 45
" 193 137 148 1,085 553 532 23 20 403 293 260 35 194 143 152 976 475 501 35 43 327 240 232 27
" 195 122 154 1,054 513 541 4 3 402 347 208 23
" 19(:; 144 147 962 458 504 365 331 193 26
" 197 25 25 214 114 100 75 55 40 6
Ward 25 594'00 796 816 5,556 2,795 2,761 119 141 1,733 1,103 1,196 329 Block 193 118 121 832 421 411 28 34 276 191 186 19
" 199 152 152 977 489 488 22 30 306 225 204 85 200 143 146 941 461 480 54 57 325 218 213 53
:: 201 150 159 1,110 572 538 5 3 408 235 249 86 " 202 142 144 1,039 523 516 10 17 253 132 204 55 " 203 91 94 657 329 328 165 102 1+0 31
Houseless Population (Port) 956 952 4 324 950 4 Houseless Population 882 675 207 108 43 2 190 8 488 22
VB Parayancheri 346-87 1,170 1,179 7,330 3,668 3,662 82 83 54 40 2,618 1,995 1,683 368 Ward I Parayancheri 346'87 1,170 1,179 7,330 3,668 3,662 82 83 54 40 2,618 1,995 1,683 368
Block 24 129 129 761 397 364- 7 12 288 206 198 4S
" 2S 150 150 1,006 501 50S .. .. 405 345 242 76
" 26 152 152 976 484 492 9 6 31.3 249 213 46
" 27 142 146 916 452 464 33 33 .. 338 283 200 63
" 28 161 161 980 492 488 .. .. 23 15 388 293 226 37
" 29 147 147 935 470 465 4 2 .. 349 262 199 44-30 156 157 920 459 461 .. 31 25 300 197 224 31
" 31 133 137 836 413 423 29 30 235 160 181 26
VDI Nellikode 1,279'13 1,329 1,332 8,923 4,414 4,:09 167 170 2,931 2,155 1,957 . 337 Ward I Nellikode 1,279'13 1,329 1,332 8,923 4,414 4,509 167 170 2,931 2,155 1,957 337
Block 32 143 143 1,031 509 5'J') 22 26 359 280 228 39 33 151 152 1,012 523 489 I :2 393 302 226 20 34 114- 114 960 488 472 4 12 3j8 2'ii: 21B 33 35 126 126 847 413 434 20 17 217 142 194 27
" 36 164 164 952 473 479 21 21 300 195 211 10 37 154 154 1,042 504 538 29 28 339 282 216 41 38 161 163 1,077 515 562 45 44 321 232 225 63
" 39 158 158 979 486 493 .. .. 337 261 211 89 40 158 158 1,023 503 520 25 20 307 207 228 15
IX Kommeri 790-34 1,006 1,008 6,441 3,215 3,226 104 102 2,165 1,606 1,471 173 Ward 1 Kommeri 790'34 1,006 1,008 6,441 3,215 3,226 104 102 2,165 1,606 1,471 173
Block 41 136 136 951 471 480 .. '4
362 317 214 29
" 42 140 140 934 448 486 2 313 249 210 29
" 43 145 147 903 455 448 319 233 188 33
" 44 145 145 827 411 416 • 19 18 309 241 198 II
" 45 ISO 150 913 463 450 19 12 282 168 219 12 46 142 142 882 426 456 49 45 302 250 201 24
" 47 148 148 1,031 541 490 15 23 278 148 241 35
42

ABSTRACT
KERALASTATE
Workers ...A.. -.
In ~Iining, Quarrying, Live-stock, Forestry, Fishing,
In :\lanu-Hunting and Plantations, facturing In Transport
As Agri- Orchards At House- other than In Trade Storage and As cultural and allied hold Household In Con- and Communi- In Other
Cultivator Labourer activities Industry Industry struction Commerce cations Services Non-Workers I II III IV V VI VII VIII IX X
,----"--, r---"----. ,---A---. .---"------, ,-----A--, ,------A...---., ,----''----. r---"---. ,---.----'--, ,_.A.__-..
:M F 1\1 F M F M F :\1 F M F M F M F M F l\1 F
(17) (18) (19) (20) (21) (22) (23) (24) ( 25) (26) (27) (28) (29) (30) (31) (32) (33) (34) (35) (36)
6 16 6 {53 19 36 3 330 5 105 685 180 2,039 3,451 .. 1 64 6 2 50 17 .. 83 16 24! 423 190 I 3 50 2 4 59 2 17 I 97 21 331 524 191 1 .. 4 2 70 7 4 42 2 20 114 36 287 443 192
I -1 75 2 17 42 1 26 95 32 293 497 193 .. 1 81 1 2 3 37 9 102 23 243 474 194
3 I 1 1 -? 1 3 34 4 110 21 305 518 195 J_
2 .. 54 4 53 8 72 26 265 478 196 1 3 1 7 13 4 12 5 74 94 197
12 15 8 19 23 32 184 388 39 21 212 9 88 412 63 1,599 2,432 1 .. .. II I 10 5 70 .. I 29 . . 13 61 3 235 392 198 4 2 5 5 I 9 49 81 3 1 27 5 9 67 21 ~85 403 199 5 13 3 2 I .. 85 10 9 28 4 8 74 24 248 427 200
1 13 9 76 68 2 6 44 24- 85 7 323 452 201 2 2 I 53 39 ., 4 67 14 75 2 319 461 202
5 3 1 45 24 17 20 50 I) 189 297 20)
950 4 2 60 7 26 I 51 344- 20 187 185
7 1 11 1 17 27 497 79 SO 2 254 3 ISO .. 697 251 1,985 3,294 VII 7 11 17 27 497 79 50 2 254 3 150 4 697 251 1,985 3,294
5 13 71 12 2 31 .. 26 .. 62 19 199 319 24 1 .. .. I 64 7 4 45 I 18 2 109 64 259 429 25 2 I I .. 68 8 2 40 17 83 37 271 446 26 4 1 4 6 59 6 4 18 .. 17 93 51 252 401 27
1 .. 4 49 4 1 46 2 15 110 31 266 451 28 2 1 65 23 15 39 24 .. 54 20 271 421 29 .. 6 4 64 12 9 12 19 1 114 14 235 430 30 I 1 3 57 7 13 23 14 ] 72 15 232 397 31
59 17 10 15 31 1 30 71 535 66 45 1 401 12 164 1 681 153 2,457 4,172 VUI 59 17 10'- 15 31 I 30 71 536 66 45 1 401 12 164 I 681 153 2,457 4,172 8 2 3 11 41 2 4- 1 46 18 97 33 281 48:3 32 7 1 68 3 4- 58 22 66 17 297 469 33 2 I 3 .. 87 15 8 36 15 66 18 270 439 34 3 2 1 I 60 9 4 56 13 55 n 219 4{)7 35 .. .. 4 57 2 6 45 16 83 8 262 469 36 7 7 .. .. 1 4 .. 31 3 4 35 . . 20 114 31 288 497 37
13 3 .5 2 II .. .. 5 54 2:3 8 46 12 21 67 18 290 499 38 9 3 2 3 6 1 2 65 64 7 4 39 29 56 10 275 404 39
10 2 ;3 10 6 5 74 2 3 40 10 77 I 275 505 40
35 .. 12 2 26 14 18 49:1 30 35 197 2 77 585 117 1,744 3,053 IX 35 4 12 2 26 14 18 490 30 35 197 2 77 585 117 1,744 3,053 2 1 2 66 .. H 47 17 66 26 257 451 4!
73 6 6 23 8 100 23 238 457 42 .. 2 5 71 10 1 23 .. 22 69 18 267 +15 43
2 I 7 .. 75 4 5 29 2 7 72 5 213 405 44 4 .. 1 11 2 82 9 .. 20 8 91 3 244 438 45 6 ] 3 5 9 .. 65 .. 1 23 10 79 23 225 +32 46
21 2 7 2 13 58 1 8 32 5 108 19 ~OO 455 47
43

PRIMARY CENSUS
KOZlUKODE DISTRICT
r----
Occupied Literate and Total residential Total number of Scheduled Scheduled educated Workers
houses persons enumerated Castes Tribes persons I-IX DistrictJTalukJ ,...------A-----., , ,---l'-, ,------'--, r-~ '-.......)---l Town/Ward/Block/ Area No. No. of
SI. Village/Desom/ m of house-No. Forest range acres houses holds Persons Males Females M F M F M F l\I F (1) (2) (3) (4) ( 5) (6) (7) (8) (9) (10) (11) (12) (13) (14) (15) (16)
Midland Towlls-concld. X Beypore 4,323'00 5,161 5,252 34,415 17,753 16,662 363 420 30 2.7 11,197 7,617 8,744 1,717
Ward I Beypore 890'72 992 1,001 7,468 4,310 3,158 50 54 2,517 1,463 2,641 343 Block 48 148 149 921 462 459 6 5 346 255 197 51
" 49 150 150 769 364 405 4 8 223 179 155 90
" 50 139 140 887 413 474 1 1 282 239 193 55
" 51 145 145 1,001 514 487 271 193 263 21
" 52 144 159 1,025 519 506 .. .. 272 202 228 12
" 53 142 143 858 439 419 5 1 292 188 216 89
" 54 124 125 805 397 408 34 39 268 212 187 30 Houseless Population (Port) 1,202 1,202 561 1,202
Ward 2 Naduvattom 1,678'13 2,022 2,044 12,572 . 6,218 6,354 157 135 6 8 3,803 2,703 2,900 637 Block 55 10 10 69 38 31 .. .. .. 25 15 15 2
56 138 139 830 410 420 17 21 6 8 292 213 175 31
" 57 141 141 914 448 466 19 19 285 221 205 73
" 58 156 159 894 414 480 16 16 248 208 179 133
" 59 144 146 852 410 442 28 12 227 175 192 73 "
60 144 145 854 440 414 11 12 309 191 189 22 "
61 144 153 1,186 627 559 I 3 267 173 326 61
" 62 140 144 853 426 427 13 8 268 181 218 111
" 63 155 155 988 502 486 18 13 302 185 223 16
" 64 150 150 880 412 468 9 10 318 272 199 12
" 65 173 173 1,052 531 521 .. 290 171 258 10
" 66 141 143 853 408 445 3 3 276 231 169 14
" 67 164 164 976 473 503 14 14 257 157 232 24
" 68 152 152 905 444 461 4 2 282 193 210 31
" 69 70 70 466 235 231 4 2 157 117 110 24
Ward 3 Cheruvannur 1,754-15 2,147 2,197 14,375 7,225 7,150 156 231 24 19 4,877 3,446 3,203 732 Block 70 65 68 409 204 205 5 2 .. 142 82 108 21
" 71 142 144 791 384 407 25 29 8 4 235 137 176 48
" 72 135 140 979 475 504 13 10 314 233 208 67
" 73 138 143 987 460 527 343 285 203 41
" 74 146 149 1,006 501 50S 5 7 315 238 209 18 75 146 151 911 450 461 18 21 284 205 193 4(}
" 76 137 140 926 455 471 28 30 331 273 227 39 77 143 146 1,058 530 528 .. .. 400 270 234 54
" 7i> 135 138 887 476 411 2 2 .. .. 349 210 22~ 27 79 128 133 883 434 449 13 19 2 7 305 230 216 49
" 80 138 141 979 537 442 6 7 408 252 169 61
" 81 139 140 873 440 433 6 31 9 5 255 173 189 51
" 82 142 147 861 433 428 15 39 5 '3 234 168 208 48 83 144 144 923 462 461 7 23 264 189 204 56
" 84 139 141 1,026 517 509 7 9 373 270 223 71
" 85 130 132 876 467 409 6 2 320 226 211 41
XI Olavanna 1,754-73 1,278 1,282 7,841 3,955 3,886 160 140 2,466 1,548 1,798 401 Ward 1 Olavanna 1,754'73 1,278 1,282 7,841 3,955 3,886 160 140 2,466 1,548 1,798 401
Block 86 151 151 966 480 485 1 .. 247 164 210 85 "
87 145 145 905 447 458 15 12 245 158 195 18 "
b8 Wi 145 900 461 439 30 28 290 166 207 63 "
&9 145 145 866 443 423 15 13 274- 171 204 44 " 90 147 150 864 444 420 25 19- 257 156 198 59 91 140 141 877 436 441 16 12 288 186 205 52 " 92 163 163 971 496 475 58 56 345 196 227 65 "
93 122 122 739 376 363 254 157 168 8 94 12O 120 753 372 381 266 194 184 7
44

ABSTRACT
KERALA STATE
Workers .A.
In Mining, "'" Quarrying, Live-stock, Forestry. Fishing,
In Manu-Hunting and Plantations, facturing In Transport,
As Agri- Orchards At House- other than In Trade Storage and As cultural and allied hold Household In Con- and Communi- In Other
Cultivator Labourer activities Industry Industry struction Commerce cations Services Non-Workers I II III IV V VI VII VIII IX X
~r---'------.~~~~..---"-r---A---.. r----'----..
M F M F M F M F M F M F M F M F M F M F
(17) (18) (19) (20) (21) (22) (23) (24) (25) (26) (27) (28) (29) (30) (31) (32) (33) (34) (35) (36)
156 31 113 75 639 16 203 482 3,044 626 73 2 805 15 1,645 1 2,066 469 9,009 14,94:' X 12 2 20 21 230 1 45 160 416 84 8 158 1 1,273 1 479 77 1,669 2,8m 7 3 2 11 15 13 69 18 5 9 4 1 74 17 265 408 48 1 2 6 1 2 75 78 8 5 4 62 I 209 315 49
5 2 57 45 25 3 101 10 220 419 50 119 9 12 21 2 37 22 55 7 251 466 51
" .. .. 75 .. 1 11 . . .. 39 21 81 12 291 494 52 1 1 2 1 ' 12 1 14 59 90 6 2 1 28 1 11 56 19 223 330 53 3 1 13 12 7 2 I 90 5 1 15 6 50 11 210 378 54
" 1,202 66 23 61 35 369 14 119 220 974 222 42 312 9 256 701 114 3,318 5,717 4 2 .. 1 .. 5 J .. 2 .. J 1 23 29 55
21 8 12 3 3 6 4 76 12 6 5 8 38 4 235 389 56 13 7 5 ., 1 18 26 59 12 3 31 12 63 28 243 393 57 4 10 11 3 26 101 56 8 4 16 4 56 13 235 347 58 6 22 II 43 61 3 4 17 " 8 63 27 218 369 59 4 4 4 11 .. 5 3 73 12 1 30 2 20 41 1 251 392 60
" 3 275 14 1 9 15 27 2 10 5 2 21 3 301 498 61 2 13 9 19 7 7 72 90 1 18 26 60 5 208 316 62
" 4 1 13 10 5 75 4 3 27 46 45 6 279 470 63 4 I 1 11 5 65 1 5 44 .. 15 53 6 213 456 64 1 6 3 90 5 6 55 2 50 47 3 273 51] 65
" 4 I 3 77 7 1 20 23 41 6 239 431 66 3 1 6 11 8 107 12 2 17 33 52 4 241 479 67 1 6 4 .. 4 7 9 83 15 4 7 8 92 1 234 430 68 3 2 1 3 1 3 60 13 13 I 28 6 125 207 69
78 6 32 19 40 39 102 1,654 320 23 335 5 116 886 278 4,022 6,418 3 ~ 2 1 1 59 16 1 13 9 16 3 96 184 70 6 1 .. 2 4 23 53 2 .. 15 9 86 23 208 359 71
16 6 6 5 5 46 83 5 5 37 5 46 10 267 437 72 1 1 1 1 4 12 97 11 3 28 1 67 17 257 486 73 9 2 .. 1 95 8 20 2 80 10 292 487 74 7 1 3 2 6 1 114 32 .. 23 .. 9 31 4 257 421 75
3 168 11 1 14 3 6 35 25 228 432 76 .. .. 10 126 32 31 1 9 58 21 296 474 77 4 1 .. 1 127 16 18 8 66 11 251 384 78 5 1 7 1 5 .. 2 86 . 26 4 .. 23 18 68 19 218 400 79 4 1 .. 3 2 84 27 2 1 25 6 45 30 368 381 80 8 I 7 .. 12 115 22 18 3 44 10 251 382 81 6 3 3 3 .. 1 3 121 33 13 3 58 9 225 380 82 5 4 2 1 4 110 37 3 21 .. 8 47 18 258 405 83 4 .. 5 105 29 1 29 1 9 70 41 294 438 84
5 5 1 111 13 3 7 11 69 27 256 368 85
118 8 75 55 50 134 147 658 142 23 156 44 540 49 2,157 3,485 XI 118 8 75 55 50 134 147 658 142 23 156 44 540 49 2,157 3,485 1
3 2 60 79 59 4 3 19 4 60 2 270 401 86 3 2 7 32 14 50 1 8 18 6 69 3 252 440 87 7 12 10 23 10 26 65 20 1 20 13 56 7 254 376 88
28 1 6 5 14 1 S 68 27 14 1 72 3 239 379 89 13 13 9 6 28 18 75 25 4 21 5 33 7 246 361 90 27 4 14 8 87 27 4 11 5 57 13 231 389 91 10 2 25 21 2 96 30 1 33 2 60 10 269 410 92 7 1 2 .. 98 5 .. 8 ' 5 49 1 208 355 93
20 1 3 60 3 2 12 3 84 3 188 374 94
45
106/1-51

PRIMARY CENsus KOZHIKODE DISTRICT
Occupied Literate and Total residential Total number of Scheduled Scheduled educated Workers
houses persons enumerated Castes Tribes persons I-IX DistrictJTalukJ ....--'-----, ,---.~ ,---A--, ,---A--, ~ ~
Town/Ward/Block! Area No. No. of SI, VillagefDesomJ in of house-
No, Forest range acres houses holds Persons Males Females l\f F M F M F M F
(1) (2) (3) (4) (5) (6) (7) (8) (9) (10) (11) (12) (13) (14) (15) (16)
Highland Village
101 Puduppadi 16,746'54 2,014 2,040 1l,089 5,706 5,383 772 737 151 172 2,574 1,414 2,908 718 1 Vezhapoor 426 432 2,227 1,112 1,1l5 107 126 I 629 375 534 125 2 Malapuram 370 373 1,946 963 983 216 237 7 12 247 72 486 140 3 Padoor 439 439 2,712 1,424 1,288 116 82 25 23" 828 603 701 127 4 Puduppadi 779 796 4,204 2.207 1,997 333 292 118 137 870 364 1,IB7 326
Unsurveyed forest 48,622'39 area outside village boundary
Midland Villages
102 EJathur 543'95 113 113 762 379 383 48 49 271- 193 155 50 1 Perinthiruthi 113 113 762 379 383 4B 49 274 193 155 50
103 Thalako1athur 1,812'80 1,131 1,158 7,251 3,~89 3,762 179 219 9 10 2,112 1,309 1,422 1,067
104 Annasseri 1,237-65 547 549 3,474 1,690 1,784 99 119 2 2 1,091 790 785 463
105 Kannankara 2,432-61 936 959 5,991 2,961 3,030 299 358 1,815 1,157 1,403 580 1 Tehanur 218 227 1,331 656 675 113 150 386 257 310 122 2 Kannankara 361 368 2,411 1,174 1,237 79 89 720 496 561 212 3 Kandanoor 250 255 1,566 801 765 70 80 510 263 386 207 4 Indad 107 J09 683 330 353 37 39 199 141 146 39
106 Naduvalloor 2,818-74 795 796 4,556 2,267 2,289 379 373 7 7 1,396 863 1,053 406 1 Pavandur 154 154 902 449 453 71 71 232 126 201 71
.2 Ramallur 249 249 1,403 681 722 84- 103 426 307 313 98 3 Naduvalloor 392 393 2,251 1,137 1,114 224- 199 7 7 738 430 539 237
107 Cheekilodc 1,939'42 714 715 4,376 2,156 2,220 328 373 43 61 1,219 645 923 260 1 Cheekilode 4-50 451 2,783 1,367 1,416 199 241 5 21 805 456 560 173 2 Kolathur 264 264 1,593 789 804 129 132 38 40 414 189 363 87
108 Nanminda 3,762-78 1,828 1,839 11,212 5,566 5,646 625 658 42 61 3,498 2,319 2,319 642
109 Pannikkottur 1,334-03 596 596 3,434 1,693 1,741 236 256 2 3 J,108 772 681 .58 1 Palangode 169 169 994 487 507 81 98 340 243 187 7 2 Kodoli 116 116 621 311 310 56 60 207 152 144 5 3 - Pannikkottur 233 233 1,334 649 685 77 88 394 255 255 36 4 Kumdayi 78 78 485 246 239 22 10 2 3 167 I17 95 10
110 Nediyanad 2,067-67 1,005 1,187 5,908 3,016 2,892 462 411 1,670 865 1,278 172
111 Punnasseri 1,398'11 699 700 4,109 2,079 2,090 238 239 1,313 823 855 263 I Punnasseri 436 436 2,547 1,291 1,256 168 163 813 507 486 175 2 Kuttamboor 263 264 1,562 788 774- 70 76 500 316 369 88
112 Parannoor 2,139-84 859 865 5,013 2,505 2,508 344- 396 1,459 939 1,058 197 1 Punnoor Chern- 417 423 2,403 1,191 1,212 195 225 748 485 482 lIB
palam 442 442 2,610 1,314- 1,296 149 I7l 711 454 576 79 2 Parannoor
113 Eravannur 1,557'72 650 650 3,862 1,893 1,969 196 201 1,069 667 877 337 1 Pullaloor 28B 288 1,704 841 863 61 72 472 309 402 107 2 Eravannur 362 362 2,158 1,052 1,106 135 129 597 358 475 230
114 Palath 1,991-50 317 823 4,958 2,454- 2,504 253 272 44 30 1,453 922 1,122 341 I Iruvallur 286 286 1,610 788 822 77 80 44 30 430 292 323 116 2 Palath 531 537 3,348 1,666 1,682 176 192 1,023 630 799 225
46

ABSTRACT KERALA STATE
Workers __________ .A. ____ _ -------------- ----------,
As Cultivato,
I ,-----'--,
M F
(17) (18)
As Agricultural
Labourer II ~
In Mining, Quarrying, Live-stock, Forestry, Fishing, Hunting and Plantations, Orchards and allied activities
III ,-----'---"'\
M F
(19) (20)
M F
(21) (22)
674 50 89
352 183
62 355 97 531 206
i5 15
6 32 5 5
43 27 8 291
3 3
9 133 33 77 37
1 63 16 87 258 120
3 3
1 1
At Household
Industry IV ~
In Manufacturing other than Household Industry
V ,-----'--,
M F M F
(23) (24) (25) (26)
44 11 3 7
23
1 1
6
3
65 22 10 12 21
9
8
20 16 20 16
104
121
391 129 126
17
14
50 49
71
83
29
15 154 831 94 82
87 49
186 55 62 59
159 100 5~
230
92 22 19 42 9
238
134 72 62
229 102 127
41
33 119 7 31 2 29
22 38 2 21
24 203 4 10 7 44
13 154
18 122 12 70 6 52
21 229
.. 1
27
12 9 3
12 10 2
25 4 6 7 8
116
30 6
24
40 17 23
131 70 56 13 24 36 31 7 20 14
158 124 14 33 53 55 91 36 34 123 12 52 22 71
73 207
8 .. 1 4 3
104 24 34 33 13
59 272
13 .. 13 2(}
20
125 51 74
138 30
108
227 37 43 24 66 24 42
124 10 9 1 103 27 34 23
289 65 90 55 49 24 47 11
240 41 43 44
106Jl-51a
29 II 18
5 1 2 I 1
10 2 8
12
7 7 4 3
.. 1
3 3
83 198
31 .. 13 12 6
40 5 3
32 26 17 9
161
22 6 5
10 1
25 69 54 15
23 16 7
320 50
118 141 II
140 46 19 75
87 57 30
313
20 4 1
12 3
21
155 117 38 63 36 27
24 227 13 76 II 151
45 104 9 35
36 69
59 130
85 6
27 27 25 51 +
15 34 21 15 6
159 21 14 1 3 3
51 47 33 14
31 20 11
29 18 11
48 13 35
6 .. 3 2 1
19
3 16
20 1
.. 1
14
4 4
18
18
In Transport, In Trade Storage and
In Con- and Communi- In Other struction Commerce cations Services Non-Workers
X ,---'----,
VI VII VIII IX ,.----'----, ~ ~ r----"--"
M F M F
(27) (28) (29) (30)
21 6
1:1
12 8
24 5 ~
13 2
3 .. 2 1
7 2 5
47
7 5 .. . 1 1
17
5 5
10 5 5
7 6 1
4
4
47
114 36 17 18 43
22 22
210
88
90 21 3U 34 5
70 10 21 39
67 41 26
240 41 14 5 8
14:
98 51 33 18
59 26 ~3
73 34 39 64 14 50
.. I
I 1
2 1 1
M F M
(31) (32) (33)
88 21 9 6
52
8 8
37 39 32 12 II 9
51 15 17 19
15 8 7
65
20 14 1 2 3
80 37 19 18
74 12 62
65 32 33
31 6
25
•• 1,016 223 276 216 301
85 85
678 317 561
93 237 157 24
320 69 94
157
383 255 128
931
349 84 73
149 43
381
357 213 14~
454 254 200
343 142 201
522 174 348
F
(34)
!II
(35)
338 2,798 76 578 97 477 65 723
100 1,020
28 224 28 224
72 2,067
50 905 85 8
63 10 4
63 6
15 42
110 89 21
202 28 3 3
18 4:
44 71 40 31
1 1 72 29
1,558 346 613 415 184
1,214 2+8 368 598
1,233 807 i-25
3,247
1,012 300 167 394 151
1,733
1,224 805 419
1,447 709 738
F
(36)
4,665 101 990 1 843 2
1,161 3 1,671 4
333 102 333 1
2,695 103 1,321 10i-
2,450 553
1,025 558 314
1,883 38:! 624 877
1,960 1243 '717
5,00-1:
1,683 500 30:) 649 229
2,720
1,767 1,081
686
2,311 1,094 1,217
!O5 I 2 3 4
lOG I 2 3
107 I 2
103
109
2 3 4
ll()
111 I 2
ll~ I 2
45 1,016 1,632 113 16 439 756 1 29 577 876 2 97 1,332 2,163 114 45 465 706 I 52 867 1,457 2

PRIMARY CENSUS
KOZHIKODE DISTRICT
Occupied Literate and Total residential Total number of Scheduled Scheduled educated Workers
houses persons enumerated Castes Tribes persons I-IX District/Talukl r-~r-~ ,--~ r--"---. ~ ~
Town/Ward/Block! Area No. No. of 51. Village/Desorn/ in of house-No. Forest range acres houses hol:!s Persons Males Females M F M F M F M F
(I) (2) (3)' (4) (5) (6) (7) (8) (9) (10) (11) (12) (13) (14) (15) (16)
Midland Villages-conta.
lIS Thamarasseri 1,778'53 773 780 4,942 2,468 2,474 301 326 1,637 1,131 1,159 149 I Maruthad 223 225 1,347 661 686 105 127 448 305 330 53 2 Muthuvad 35 35 214 106 108 25 21 74 58 47 5 3 Thamarasseri 515 520 3,381 1,701 1,680 171 178 l,ll5 768 782 91
116 Makkada 2,778'08 1,252 1,361 8,490 4,271 4,219 385 382 7 5 2,898 1,994 1,80B 282 1 Badirur 290 326 2,030 1,033 997 140 130 686 439 457 45 2 Makkada 742 815 4,968 2,493 2,475 222 232 1,689 1,179 1,062 144 3 Morikkara 220 220 1,492 745 747 23 20 7 5 523 376 289 93
117 Karannoor 953-86 812 818 5,513 2,676 2,837 138 132 2 1,855 1,324 1,063 431
1 Karannoor 316 319 2,126 1,031 1,095 67 65 " 701 495 405 170 2 Puthur 496 499 3,387 1,645 1,742 71 67 2 1,154 829 658 256
118 Karuvisseri 1,147'98 931 936 6,298 3,016 3,282 124 146 23 26 2,155 1,651 1,326 5,025
1 Karuvisseri 639 644 4,294 2,06B 2,226 75 84 23 26 1,479 1,094 908 323 2 Mokavoor 292 292 2,004 948 1,056 49 62 676 557 418 179
119 Vengeri 1,319.37 816 845 5,953 2,843 3,110 137 130 2,021 1,730 1,207 245
I Varadoor 255 259 1,942 833 1,109 45 36 584 679 357 55 2 Vengeri 561 586 4,011 2,010 2,001 92 94 1,437 1,051 850 190
120 Patinhattumuri I,B27'38 954 958 6,207 3,173 3,034- 186 171 2,163 1,373 1,390 220
1 Morikkara 191 191 1,245 635 610 31 28 448 332 260 35 2 Moothool 103 103 702 346 356 19 18 265 189 152 12 3 KiraJlur 78 78 545 268 277 5 4 197 137 llO 19 4 Patinhattumuri 203 206 1,283 664 619 31 29 433 211 325 51 5 Kizhakkumuri 379 380 2,432 1,260 1,172 100 92 820 504 543 103
121 Kuruvattoor 4,939'78 1,292 1,306 8,222 4,070 4,152 335 339 2,682 1,698 1,856 407
1 Kuruvatloor 413 417 2,631 1,308 1,323 106 108 874 539 659 267 2 Pullalur 150 150 933 469 464 16 19 284 141 182 11 3 Pymbra 497 499 3,120 1,533 1,587 126 115 1,003 653 648 97 4 Po1ur 232 240 1,538 760 778 87 97 521 365 967 32
122 Paimbalasseri 1,345'57 687 687 4,000 1,996 2,004 174 161 1,127 478 772 80
I Pullicoth 113 113 723 362 361 45 45 221 103 147 16 2- Paimbalasseri 375 375 2,182 1,0?6 1,086 96 87 638 317 401 34 3 Arambra 199 199 1,095 538 557 33 29 268 58 224 30
123 Madavoor 1,878'82 854 872 4,991 2,481 2,510 285 311 5 .6 1,546 872 1,133 18
1 Madavoor 596 612 3,400 1,692 1,708 213 219 5 6 1,017 576 755 100 2 Mattancherri 258 260 1,591 789 802 72 92 529 296 378 80
124- Kizhakkoth 2,115'16 1,080 1,080 6,118 3,074 3,044 210 196 1,615 751 1,356 195
1 Kizhakkotb 656 656 3,729 1,363 1,866 109 96 979 464 327 100 2 Panoor 424 424 2,389 1,211 1,178 101 100 636 287 529 95
125 Elettil 2,805'03 1,387 1,388 7,860 3,981 3,879 262 235 6 8 1,884 727 1,788 224
I Avilora 447 #7 2,452 1,223 1,229 24 18 1 3 612 210 569 79 2 Elettil 750 751 4,274 2,163 2,111 204 187 5 5 961 379 961 117 3 Valiyaparamba 190 190 1,1.34 595 539 34 30 311 138 258 28
126 Parambathukavu 1,932'29 1,026 1,028 5,831 2,867 2,964 185 184 16 7 1,449 722 1,322 152
1 Manipuram 146 147 899 422 477 24 35 1 194 98 199 47 2 Parambathukavu 679 679 3,861 1,902 1,959 129 126 15 7 961 474 891 88 3 Karivampoyil 201 202 1,071 543 528 32 23 294 150 232 17
48

ABSTRACT
As Cultivator
I ,_...A.---'\
As Agricultural
Labourer II ~
In Mining, Quarrying, Live-stock, Forestry, Fishing, Hunting and Plantations, Orchards At House-and allied hold activities Industry
III IV ~~
Workers
In Manufacturing
other than I;Iousehold Industry
V r---"-----...
In Construction
VI r---"-----...
MF MF MF MF MF M F
(17) (18) (19) (20) (21) (22) (23) (24) (25) (26) (27) (28)
301 87 10
204 272 86
162 24
62 44 18
£8 23 45
93 37 56
228 18 17 13 47
]33
421 138 64
140 79
124 19 74 31
145 ]03 42
91 46 45
244 44
l7l 29
139 18 91 30
33 2
31 13 4 9
24 13 11
36 4
32 15 3
12 32 2 .. 12 15 3
55 21 6
22 6
14 10 4
96 84
12
62 9
49 4
13 3
10 8 4 4
12 8 4
98 14 8 1
28 47
106 63
1 30 12
98 8
70 20
119 93 26
3 127 1 119 2 8
21 3
11 7
3
3
14 4
10
55 5
31 19
14 12
2 16 .. 10 6 8 1 7 3 3
.. 1
,8
2
6
42 14
25 3
15 7
8
51 12 31 8
10 7 3
25 19 6
53 19 34 17 3
.. 10 4
156 34 13 88 21
18 71 2 8 9 27 7 36
48 298 39 176 9 122
2 414 2 203
13 6 2 5
211
559 220 231 108 151 19 96 36
4 4
.. 1
4 4
16
6 10
19
4 14 1
3
3
25 15 10
32 10 22 33 16 9 8
25 .. 21
4
6 1 .. 5
18 6
12
113 46
67 54 118 189 17 11 17 33 58 114 4 49 58
55 329 159 19 128 42 36 201 117
9 3 2 4
60 5
41 14
9 3 6
54 226 314 148 25 29
111 247 130 lI5 67 18
16 3
13
32 175 108
16 3
2 5 6
9 23 45 7 1 4 4
29 68 212 51 197 .. .. 10 8 7 7
42 11 24 7
16 8 8
37 33 4
40 9
27 4
42 20 20
2
16 4 8 4
55 18 37 47 44 3
12 1 9 2
19 8 9 2
30 145 97 44 7 I
27 18
144 42 20 41 41 18 .. 8
10 38 36 2
119 72 47
61 8
45 8
154 IS
135 :t
12 96
29 8 1
6 14 7 1
3 3
.. 1
4 4
16 4
12 8 5 3
2 .. 2
20 9
11 31 7
20 4
24 7
17
22 16 6
27 3
24 6
3
2 1
10 2
4 4
16 5
11
16 6
10 20 3
15 2
20 1
12 7
49
.. 1
In Trade and
Commerce VII ~
In Transport, Storage and Communi-
cations VIII ~
DRALA STATE
-'"'\
In Other Services Non-Workers
IX X ~ r----A---.
M F M
(29) (SO) (31)
F (32)
M
(33)
F
(34)
M
(35)
F
(36)
74 11 2
61
207 36
124 47
181 58
123
193 158 35
152 36
116
112 42 14 10 17 29
126 31 17 39 39
122 34 56 32 93 62 31
128 95 33
117 51 53 13
163 29
1I6 18
.. 1
3
1 2
1 I
30 9
21
174 25
112 37
66 21 45
109 77 32 97 28 69 84 26 13 7
13 25
138 58 9
52 19
55 8
35 12
61 42 19
45 35 10
18 7 6 5
69 8
53 8
504 76 35
393 2 768
248 2 417
J03
493 204 289
533 339 194
582 193 389 732 110 90 76
176 280 687 240
58 244 145
242 59
107 76
347 230 II7 379 218 161
715 223
.• 403 89
529 84
1 337 108
71 26 3
42
72 25 23 24 59 30 29 85 71 14
87 31 56
90 16 10 3
14 47 71 34 1
25 11
38 10 15 13 34 14 20
95 39 56
148 53 85 10
89 33 53 3
1,309 331 59
919
2,463 576
1,431 456
1,613 626 987
1,690 1,160
530 1,636
476 1,160
1,783 375 194 158 339 717
2,214 649 287 885 393
1,224 215 695 314
1,348 937 411
1,718 1,036
682 2,193
654 1,202
337
1,545 223
1,011 311
2,325 115 633 1 103 2
1,589 3 3,937 116
952 I 2,331 2
654 3 2,406 117
919 1 1,487 2 2,780 118 1,903 I
877 2
2,865 119 1,054 1 1,811 2 2,814 120
575 1 344 2 258 3 568 4
1,069 5
3,745 1,056
453 1,490
746
121 1 2 3 4
1,924 122 345
1,052 527
1 2 3
2,330 123 1,608
722 I 2
2,849 124-1,766 1 1,083 2
3,655 125 1,150 1 1,994 2
511 3
2,812 126 430 I
1,871 2· 511 3

PRIMARY CENSUS
KOZHIKODE DISTRICT
Occupied Literate and Total residential Total number of Scheduled Scheduled educated Workers
houses persons enumerated Castes Tribes persons I-IX District/Talukl ~ .,~~~.,~
Town/Ward/Block/ Area No. No. of SI. Village/Desom/ in of house-NQ. Forest range acres houses bolds Persons Males Females M F M F M F M F
(I) (2) (31 (4) (5) (6) (7) (8) (9) (10) (11) (12) (13) (14) (15) (16)
Midland ViUages-contd.
127 Vavad 1,927-66 972 973 5,439 2,675 2,764 182 202 1,402 628 1,167 123 1 Panakkod 104 104 573 293 280 14 23 176 87 118 12 2 Eranchora 27 27 157 87 70 41 17 31 I 3 Vavad 404 405 2,328 1,103 1,22.5 96 98 569 243 497 30 4 Pongottur 153 153 856 419 437 51 49 266 169 193 34 5 Kolaranthiri 284 284 1,525 773 752 21 32 1 350 112 328 46
128 Raroth 2,210'38 1,092 1,207 6,335 3,199 3,136 356 335 1,782 847 1,421 257 1 Andona 101 101 611 305 305 44 43 181 94 147 22 2 Raroth 440 440 2,586 i,315 1,271 180 176 822 428 545 95 3 Chembra 168 168 997 494 503 62 55 .. 229 67 246 30 4 Karingamanna 114 114 673 338 335 31 21 1 144 86 153 25 5 VaEmanna 269 384 1,468 747 721 39 40 406 172 330 85
129 Kedavoor 9,106'51 2,108 2,203 12,070 6,094 5,976 321 793 148 118 3,008 1,736 2,732 628 I lrpona 155 156 935 472 463 30 31 7 5 270 171 219 21 2 Palliprom 216 225 1,271 631 640 60 52 50 43 361 205 285 40 3 Punnoor 814 853 4,684 2,370 2,314 273 255 22 13 1,039 581 1,050 151 4 Chamal 370 393 2,035 1,021 1,014 293 304 36 35 4Q7 211 51l 232 5 Kedavoor 553 576 3,145 1,600 1,545 160 151 3:1 22 931 568 717 134
130 Koodathayi 6,023'79 1,163 1,187 6,753 3,409 3,349 242 213 52 50 1,809 1,131 1,560 545 1 Omasseri 134 147 673 333 345 14 13 120 51 141 33 2 Koranthiri 72 72 393 187 206 17 16 11 6 93 79 38 23 3 Perilli 53 53 314 144 170 25 18 1 7 34 81 71 43 4 Cherumaruthayi 53 53 334 170 164 24 25 .. 80 49 76 20 5 Palora 559 564 3,378 1,743 1,635 55 50 40 37 972 645 366 359 6 Koodathayi 287 293 1,661 832 829 107 91 460 276 318 67
131 Thiruvambadi 12,263'53 3,543 3,686 22,677 11,324 10,353 500 459 166 150 6,439 4,345 5,953 1,505 1 Thiruvarnbadi 2,708 2,834 17,389 9,130 8,259 242 221 159 143 4,959 3,580 4,664 1,286 2 Koodancheri 657 661 4,226 2,167 2,059 152 133 7 7 1,234 1,099 1,049 125 3 Manakkattupuram III 1I8 596 305 291 56 48 132 107 139 45 4 Cheruppa 67 73 466 222 244 50 57 114 59 101 49
132 Neeleswaram 5,405'26 11,028 1,059 5,764 2,830 2,884 386 358 11 13 1,306 786 1,408 284 1 Vennacode 197 197 1,033 506 527 37 37 6 . 9 235 105 284. 45 2 ~ Neeleswaram 494 520 2,372 1,458 1,414 247 210 606 373 704 158 3 Thechiyad 74 74 390 186 204 15 27 33 42 97 27 4 Palannoor 23 25 174 101 73 15 22 58 38 41 14 5 Kulikipara 35 35 445 223 217 16 9 141 124 89 8 6 Nadukil 63 66 374 190 184 32 24 .. 100 60 88 19 7 Poolapoyil 92 92 476 211 265 24 29 5 4 33 44 105 13
133 puthoor 2,747'34 1,219 1,220 6,772 3,333 3,334 415 402 7 5 1,701 627 1,483 267
1 Chokkoor; 32 82 457 221 236 12 7 .. 95 50 101 9 2 Kodiyathoor 479 479 2,602 1,237 1,315 85 76 7 5 630 195 584 90 3 Puthoor 513 514 2,918 1,466 1,452 255 258 778 334 644 138 4 Vennacode 145 145 795 414 331 63 61 198 48 154 30
134 Koduvally 1,689'23 892 392 5,169 2,546 2,623 154 162 1,326 550 1,220 149 1 Koduvally 649 649 3,781 1,877 1,904 89 83 951 335 884- 97 2 Kuduvanmuzhi 99 99 574 232 292 35 41 145 78 139 13 3 Thalaperumanna 144 144 814 387 427 30 38 230 137 197 39
135 Kunnarnangalam 4,981'27 2,020 2,024 12,546 6,214 6,332 633 633 6 3,756 2,237 2,659 528
50

ABSTRACT KERALA STATE
Workers ~
In Mining, Quarrying, Live-stock, Forestry, Fishing,
In Manu-Hunting and Plantations, facturing In Transport,
As Agri- Orchards At House- other than In Trade Storage and
As cultural and allied hold Household In Con- and Communi- In Other
Cultivator Labourer activities Industry Industry struction Commerce cations Services Non-Workers
I II III IV V VI VII VIII IX X ~ ~ ~ ~..--"------>,------A---, ~r--"------. ~~
M F M F 11 F M F M F M F M F M F M F M F
(17) (18) (19) (20) (21) (22) (23) (24) (25) (26) (27) (28) (29) (30) (31) (32) (33) (34) (35) (36)
172 8 120 23 209 8 69 28 48 8 96 29 416 55 1,508 2,641 127
25 28 7 19 1 3 7 .. 12 26 175 268 I
7 4 .. 4 .. .. .. 1 6 10 . . 56 69 2
39 47 2 94 1 32 6 18 ., 57 8 202 21 606 1,195 3
36 4 36 4 23 2 8 6 3 2 79 24 226 403 4
65 8 41 10 56 2 13 17 15 2 18 19 99 9 445 706 5
249 14 209 43 84 2 69 38 67 3 4 97 60 582 157 1,778 2,879 128
26 1 42 14 8 7 3 7 .. 15 14 28 4 158 284 1
78 2 57 22 32 23 13 45 2 2 41 25 242 56 770 1,176 2
55 72 1 7 18 8 9 15 6 64 21 248 473 3
37 3 3 7 .. 2 I 3 .. 8 7 86 21 185 310 4
53 8 35 6 30 2 19 13 3 1 2 18 8 162 55 417 636 5
457 55 176 30 555 174 24 15 85 16 152 59 .. 1,258 353 3,312 5,348 129
16 I 6 .- 47 2 ., 17 19 9 105 18 253 442 1
45 3 3 2 29 3 5 .- 6 4 47 3 1+3 32 346 600 2
207 10 87 5 206 39 6 1 29 9 31 8 467 96 1,320 2,163 3
109 35 68 18 139 96 4 9 13 I 9 1 1 167 73 510 782 4
80 6 12 < 5 134 34 9 5 20 2 46 38 376 134 883 1,361 5
,685 172 487 259 43 8 19 17 6 38 8 3 257 100 1,849 2,804 130
63 7 25 16 1 9 7 1 35 10 192 312 1
49 8 34 15 2 .. .. .. .. 3 .. 99 183 2
37 17 16 15 2 .. 1 1 1 3 13 8 73 127 3
40 1 33 19 1 .. 2 .. .. 94 144 4
409 136 318 169 30 8 8 I 6 I 3 21 3 68 43 877 1,276 5
87 3 61 25 7 9 2 2 9 3 138 39 514 762 6
2,805 583 940 352 547 77 120 10 128 9 289 58 1,057 481 5,871 9,348 131
2.,277 569 632 245 363 55 106 9 93 3 266 51 873 406 4,466 6,973
499 12 224 54 145 8 5 .. 22 4 23 5 122 51 1,118 1,934 2
26 2 34 16 13 8 9 1 4 .. 1 47 18 166 246 3
3 50 37 21 6 9 2 1 15 6 121 195 4
655 41 369 117 82 28 34 7 25 35 5 202 90 1,472 2,600 132
168 17 30 12 6 .. 7 2 5 .. 10 1 57 14 222 482 1
325 18 172 54 67 18 22 4 11 1 13 3 91 63 754 1,256 2
42 4 38 15 1 7 5 1 2 8 1 89 177 3
11 8 5 3 .. 19 9 60 59 4
53 2 20 2 3 3 .. 1 .. 1 .. 11 1 139 209 5
26 42 16 1 1 4 1 2 1 11 2 102 165 6
30 59 13 1 3 7 5 106 252 7
307 36 156 126 212 6 66 14 65 4 21 69 53 534 79 1,905 3,117 133
14 .. 9 5 18 10 5 . , 1 7 .. 2 35 2 120 227 1
103 5 81 61 88 5 20 2 32 1 9 28 1 21 202 15 703 1,225 2
160 25 52 46 74 35 7 15 3 6 27 28 247 57 822 1,314 3
30 6 14 14 32 1 5 13 5 7 2 50 5 260 351 4
86 10 32 5 248 20 36 15 61 2 9 227 88 433 95 1,326 2,474 134
25 3 2 162 16 6 7 52 1 5 191 77 364 70 993 1,807 1
27 3 11 .. 39 .. 11 I 3 .. 2 .. 12 .. 6 28 9 143 279 2
34 4 19 5 47 4 19 7 6 1 2 1 24 1 5 41 16 190 388 3
301 50 128 46 :09 40 100 120 206 10 21 1 253 176 .. 1,165 261 3,555 5,804 135
51

PRIMARY CENSUS J(OZHIKODE DISTRICT
Occupied Literate and Total residential Total number of Scheduled Scheduled educated Workers
houses persons enumerated Castes Tribes persons I-IX District/Talukl r---"----. ,--.A.....-..,. .. --A--..., ,----"--........ ,...----A---. Town/Ward/Blockl Area No, No, of
81. VillageJDesomJ in of house-No, Forest range acres houses holds Persons Males Females M F M F M F M F (1) (2) (3) (4) (5) (6) (7) (8) (9) (10) (11) (12) (13) (14) (15) (16}
Midland Villages---contd,
136 Chelavoor 3,065'26 1,642 1,686 10,453 5,293 5,160 375 343 3,166 1,945 2,361 480 1 Cheruvatta 204 208 1,257 613 644 87 70 376 251 280 60 2 Parambil 354 361 2,382 1,222 1,160 69 66 817 521 543 135 3 Chelavoor 897 930 5,652 2,863 2,789 171 164 1,590 965 1,271 191 4 Konot 187 187 1,162 595 567 48 43 383 208 267 94
137 Chevayur 2,347'03 1,639 1,685 12,526 6,484 6,042 365 330 50 39 4,405 3,020 2,500 587 138 Nedungottur 331'81 313 325 2,151 1,049 1,102 51 55 742 652 478 127 139 Kottuli; 781'82 880 934 5,976 3,038 2,938 126 143 2,133 1,582 1,325 233 140 K{)voor 3,088'55 1,547 1,560 10,017 5,288 4,729 258 278 3,458 1,993 2,269 272
1 Kovoor 502 507 4,528 2,501 2,027 148 148 1,820 1,001 1,055 106 2 Valliparamba 77I 779 3,843 1,939 1,904 79 91 1,172 743 851 III 3 Kuttikkattoor 274 274 1,646 848 798 31 39 466 249 363 55
141 Mayanad 4,175'68 1,348 1,361 8,932 4,589 4,343 225 226 3,024 1,861 2,048 430 1 Karanthur 583 586 3,806 1,910 1,896 131 128 1,239 766 909 164 2 Mayanad' 498 504 3,422 1,795 1,627 49 48 1,272 797 733 188 3 Fayingottupuram 267 271 1,704 884 820 45 50 513 298 406 78
142 Cherukulathur 2,405'55 956 957 5,607 2,765 2,841 250 241 1,599 999 1,288 519 1 Cherukulathur 266 266 1,553 770 783 67 60 519 355 378 126 2 Poovattparamba 278 278 1,616 823 793 91 78 342 123 392 180 3 Penungolam 239 240 1,420 709 711 60 65 423 255 319 114 4 Mundakkal 173 173 1,018 464 554 32 38 315 266 199 99
143 Chathamangalam 5,068'49 963 1,021 5,510 2,714 2,796 416 407 2 3 1,504 798 1,272 350 1 Pullanoor 156 156 812 385 427 8 10 168 68 200 24 2 Malayamma 17l 172 870 420 450 37 38 225 109 197 31 3 Muttayatt 117 122 671 327 344 58 46 .. " 152 73 135 13 4 Vennacode 110 130 616 310 306 66 72 2 3 176 69 153 38 5 Pullaloor 84 85 472 234 238 .. .. 123 50 105 27 6 Chenoth III 123 728 360 368 95 88 230 145 157 102 7 Chathamangalam 214 233 1,341 678 663 151 153 430 284 325 '125
144 Chooloor 3,661'95 1,073 1,153 6,262 3,046 3,216 456 518 1,796 1,120 1,408 417 1 Chooloor 604 674 3,596 1,755 1,841 305 358 , 1,062 640 838 27~ 2 Sanketham 47 47 253 124 129 25 30 64 24 71 35 3 Koozhakode 83 92 439 214 225 25 27 127 102 95 23 4 Vellanoor 222 222 1,248 605 643 59 51 358 247 244 53 5 Kuyimanna !17 118 726 348 378 42 52 185 107 160 27
145 Manasseri 2,236'95 651 652 3,665 1,817 1,848 275 275 972 571 827 368 1 Manasseri 362 362 2,015 990 1,025 188 195 484 276 491 290 2 Chennamangalam 289 290 1,650 827 823 87 80 488 295 336 78
146 Thazhekode 2,236'95 890 919 5,63.9 2,924 2,715 459 480 2 2 1,685 923 1,292 401 1 Thazhekode 693 719 4,424 , 2,330 2,094 335 337 2 2 1,356 698 1,044 334 2 Kacheri 197 200 1,215 594 621 124 143 32~ 225 248 67
147 Kumaranelloor 4,552'29 1,014 1,144 6,139 ,3,099 3,040 322 349 6 3 1,234 640 1,433 494 1 Alli 312 411 2,165 1,130 1,035 166 168 .. 410 223 540 199 2 Anayankunnu 289 290 1,619 806 813 91 103 1 360 200 362 137 3 Kumaranelloor ·413 443 2,355 1,163 1,192 65 78 5 3 464 217 531 158
52

ABSTRACT
KERALA STATE
Workers ----- ------------- ___ A _______________ _
As Cultivator
I ~
In Mining, Quarrying, Live-stock, Forestry, Fishing, Hunting and Plantations,
As Agri- Orchards cultural and allied
Labourer activities II III
,..-----A---. ~
At Household
Industry IV
,...---A---..
In Manufacturing other than Household Industry
V ,----'----.
In Construction
VI ,..-----A---.
In Trade and
Commerce VII
,..-A----.
In Transport, Storage and Communi- In Other Non-
cations Services Workers VIII IX X
,.----"---. ,.-------A--" ,--~
M F (17) (18)
M FM F M F M F M F M F M F M F M
(35)
F
(36) (19) (20) (21) (22) (23) (24) (25) (26) (27) (28) (29) (30) (31) (32) (33) (34)
229 25 66
125 13
114
.14
49
309 109 108 92
217 81 61 75
335 100 82 87 66
175 16 11 36 30 18 23 41
250 156
10 12 47 25
151 III 40
126 98 28
:217 106 54 57
30 208 5 28 9 52
12 98 4 30
18 63
6
16 3
16 373 4 156 9 175 3 42
11 5 6
117 61 8
48
48 230 12 7
16 13
103 65 37 25
44 210 .. 1 20 2 46
59 13 3 24 33 4 49
17 285 15 244
25 2 8
8
89 1':;3 10 22 22 17 50 87 7 27
26 101
26 1
18 7
37 13 4
20
64
34
32
90 22 47 21
132 71 42 19
35 2':; 11 3 20
19 3 17 1
121 233 .. I 8
31 4
38 39
178 174
4
72 56 19 11 25 25 25
61 49 .. 6 6
108 154 130 55 106 14-7 118 24
2 7 12 31
13 119 158 206 9 101 HI 158 4 18 17 48
16 174 108 369 9 48 41 194 1 95 55 26 6 31 12 149
106/1-52
11 1
.. 9 1
2
4
11 6 5
13 10 3
9 1 8
15 5 3
.. 1 1 4 1
4 4
3 1 2
18 14
4-
97 49 7
41
100 243 183 16 3 26 18
44 79 51 12 4968964 4 70 18
19 120 400 90
4 21 116 59
34 47 389 83
67 83 216 59 20 30 89 7 38 15 77 52 9 38 50
132 264 159 8 92 80 74 7 38 138 53 1 2 46 32
44 126 103 216 21 44 26 16 3 14 27 135 4 18 37 51
16 50 13 14
61 64 62 5 1 13 2 I 19 333 2 5 684 2 17
41 34 18 1
67 61 49 4 33 17 39 2 19 27 2
I 3 IJ 13 3 3 1 5 2
17 16 36 9 6 15 8 10 21
53 29 73 3 42 23 63 3 11 6 10
23 15 27 7 2 6 678
10 6 I>
34 4 4
23 3
28
9
23
29 11 16 2
38 22 6
10
8 3
.. 5
16 2 3 1
.. 1
.. 9
8 5
3
5 3 2
26 19 7
12 ]
1 ]0
53
.. 1
284 30 65
150 39
293
71
179
226 104 96 26
216 102 66 48
65 21 19 20 5
82 13 12 2 7 9
10 29
72 41
2 14 15
77 30 47
96 83 13
35 3 8
24
228 12 37
160 19
4 333
4
-4
48
95
89 33 38 18
87 56 23 8
49 24-15 8 2
30 3 1
.. 2 4 6
14
19 8 .. 1 5 5
23 4
19
46 37 9
38 1
11 26
3 942 138 207
2 483 1 114
5 1,149
182
521
870 511 256 103
950 350 436 164
419 69
161 118 71
9 403
.. 9
76 73 25 37 35 • 58 99
597 263
15 65
150 104-
309 148 161
547 443 104-
538 174 153
•• 211
87 18 13 45 11·
322
41
82
76 57 12 7
96 48 36 12
56 28 13 10 5
106 18 25 .. 6 1
19 37
152 66 4
18 40
, 24
III 59 52
176 1# 32
258 98 67 93
2,932 333 679
1,592 328
3,984
571
1,713
3,019 1,446 1,088
485
2,541 1,001 1,062
478
1,478 392 431 390 265
1,442 185 223 192 157 129 203 353
1,638 917
53 119 361 188
990 499 491
1,632 1,286
346
],666 590 444 632
4,680 136 584 1
1,025 2 2,598 3
473 4 5,455 137
975 138
2,705 139
4,457 140 1,921 1 1,793 2
743 3
3,913 141 1,732 1 1,439 2
742 3
2,322 142 657 1 613 2 597 3 455 4-
2,436 143 403 1 419 2 331 3 268 4 211 5 266 6 538 7
2,799 144-1,562 ]
94 2 202 3 590 -4 351 5
1,480 145 735 I 745 2
2,314 146 1,760 1
554 2
2,546 147 836 1 676 2
1,034 3

PRIMARY CENSUS
KOZHIKODE DISTRICT
Occupied Literate and Total residential Total number of Scheduled Scheduled educated Workers
houses persons enumerated Castes Tribes persons I-IX District/TaMI ,-----"---. A.-_----., ,---"---, ,....-.---A--, ~
Town/Ward/Blockl Area No. No. of 51. V illagejDesom/ IQ of house·
No. Forest Range acres houses holds Persons Males Females M F M F M F M F (I) (2) (3) (4) (5) (6) (7) (8) (9) (10) (11) (12) (13) (14) (15) (16}
Midland Villageli-concld.
148 Poolacode 3,375'96 996 1,019 5,746 2,953 2,793 334 335 1,448 736 1,327 213 1 Munnur 46 46 313 161 152 97 57 65 I 2 Puzhur 210 210 1,199 631 568 20 21 316 121 296 24 3 Aryancode 144 144 792 .412 380 12 10 151 67 189 15 4 Narayinkuzhi 208 208 1,132 569 563 81 78 284 163 256 42 5 Etimala 116 124 662 345 317 59 59 192 112 142 32 6 Poolacode 272 287 1,648 835 813 162 167 408 216 379 99
149 Kanniparamba 1,632'74 496 506 2,770 1,348 1,422 274 307 601 404 642 171 1 Kanniparamba 334 337 1,781 854 927 214 230 329 256 401 136-2 Palangad 162 169 989 494 495 60 77 272 148 241 35
150 IringaUur 1,512'35 1,005 1,007 6,372 3,259 3,113 163 143 18 33 2,041 1,114 1,453 287 1 Iringallur 706 707 4,493 2,308 2,185 116 106 18 33 1,475 785 999 241 2 Palazhi 299 300 1,879 951 928 47 37 566 329 454 46
151 Nallalam ' 787'28 1,126 1,158 7,059 3,567 3,492 89 82 2,238 1,350 1,639 362
152 Kodal 2,027-76 1,014 1,020 6,473 3,289 3,184 182 176 3 2,332 1,608 1,492 222 1 Kodal 710 716 4,575 2,317 2,258 113 121 3 1,636 1,188 1,069 134 2 Kailamadam '304 304 1,898 972 926 69 55 696 420 423 88
153 Vellayicode 2,102-79 1,115 1,121 6,970 3,601 3,369 211 203 2,110 1,151 1,679 262 1 Puthur 682 686 4,253 2,170 2,083 112 111 1,277 718 1,011 169 2 Ve1layicode 433 435 2,717 1,431 1,286 99 92 833 433 668 93
154- Perumanna 1,973'94 690 705 4,256 2,145 2,111 250 258 1,249 752 1,042 145
155 Peruvayal 1,490'07 501 508 2,936 1,493 1,443 146 134 838 428 694 211 1 Peruvayal 335 339 1,961 1,000 961 94 91 610 310 461 157 2 Koyalam 166 169 975 493 482 52 43 228 118 233 54-
156 Cheruppa 1,679'81 613 618 3,549 1,777 1,772 175 206 5 5 1,030 501 867 232 I Cheruppa 138 138 883 442 441 68 74 4 5 233 121 210 64 2 Mankkad 151 151 823 417 406 30 44 1 241 136 216 6B 3 Valayannoor 234- 236 1,346 663 683 56 7I 408 177 311 58 4 Malapram 90 93 497 255 242 21 17 148 67 130 42
157 Mavoot 1,787'99 681 716 3,948 2,004- 1,944 255 282 992 490 985 224 I Kalpatta 157 162 925 4-55 470 71 85 174 83 224- 31 2 Mavoor 388 415 2,257 1,183 1,074- 99 104 626 281 580 113 3 Aduvad 136 139 766 366 400 85 93 192 126 181 8()
158 Kodiyathur 1,866'16 1,068 1,070 5,869 2,974 2,895 186 155 16 II 1,559 827 1,105 148 1 Cheruvadi 588 589 3,259 1,659 1,600 131 111 16 11 770 300 623 111 2 Kodiyathur 400 481 2,610 1,315 1,295 55 44 789 527 482 37
159 Pannicode 8,041'05 1,057 1,069 5,753 2,861 2,892 447 465 28 34- 1,256 725 1,378 457 1 Kakkad 187 189 1,037 517 520 100 89 325 226 256 20 2 Kavasseri 355 363 2,009 994 1,015 118 133 379 154 464 183 3 Pannicode 515 517 2,707 1,350 1,357 229 243 28 34- 552 345 658 254
54

,ABSTRACT
KERALA STATE
Workers
---------------------------------~,------------------------------------~
As Cultivator
I .,.-'---,
In Mining, Quarrying, Live-stock, Forestry, Fishing, Hunting and Plantations,
As Agri- Orchards cultural and allied Labourer activities
II III ~ ,...........__,
At Household Industry
IV ~
In Manufacturing
other than Household
Industry V
,----A--,
In Construction
VI r---'----.
In Transport, In Trade Storage and
and Communi-Commerce cations
VII VIII ,----'----. .----"---""\
In Other Non-Services Workers
IX X ,---..J'-.. r--~
M FM FM F MFM F M FM F MFM F M F
(17) (18) (19) (20) (21) (22) (23) (24) (25) (26) (27) (28) (29) (30) (31) (32) (33)
.287 26 291 97 54 6 94 11 42 29 I 1 45 2 40 8 5 33 17 42, 73 3 4 1 55 57 22 I
2 3
22 7 9 17 3 24 7 23 3 1 5 99 21 96 57 22 36 3 9
132 5 168 128 11 48 9 22 80 3 154 12() 3 38 8 52 2 14 8 8 10 1 22
98 7 46 28 118 2 2
90 190 307 65 5 38 22 71 57 168 233 33 2 8 6 47 33 22 74
39 8 34 23 37 63 138 592
205 12 70 53 114 2 2
65 96 255 155 12 29 30 91 42 55 161 50 41 23 23 23 41 94
209 17 224 131 9 176 78 8 48
159 17 16?
185 56 47 121 35 33 64 21 14
170 5 89 35 2 22 39 4 62 1 13 34 2 50
191 26 lIO 'Wl 9 18
106 12 53 37 5 39
306 15 209 155 6 98 151 9 III
439 35 130 109 1 92 78 12 18
252 22 20
lCJ6/1-52a
55 89 174 41 59 127 14 30 47
55 9 24
31 10 28 19 7 19 12 3 9
72 44 7 16 46 31 I 2 6 9 6 6 833
12 1 5
97 40 19 8 3 I
41 23 14 4B 14 4
83 18 26 67 18 25 16 I
56 62 23 18 6 21 43 8 17 13,.. 15
62 274 48 140 14 134
33 127
59 23 51 14 8 9
26 52 2 24 8 8 5 14
II 6
43 88 3 12
28 62 12 14
16 27 14 15 2 12
16 33 6
6 12 10 15
4
2 1
18 16 2
103
11 7 4
78 40 38
7 6 I
19
15
4
11
6 5
4
I I 2
29 24 5
24 16 13 3
28 23 5
8 6 2 9 4 3
2 4:2 23 15 4
6 6
12
5 7
55
2 2
67 7
16 10 14-8
12
18 12 6
182 120 62
173
127 75 52
189 110 79
49
50 37 13
77 20 10 39 8
52 9
33 10
4:3 37 6
46 9
28 9
3
3 I 2
2
2
2
16
6
8
15 14 I
88 69 19
174-
54 49 5
91 57 34
8
15 9 6
34 3
22 3 6
47 15 31 I
15 15
22
18 4
472 27
134 59 97 60 95
•• 227 99
128
495 322 173
503
586 454 132
401 188 213
503
328 215 113 376 69
115 174
18
2 396 95
2 243 58
4:55 •. 254 " 201
611 34
•. 254 323
(34) (35) (36)
68 1,626 2,580 148 I 96 151 1
12 335 544 2 11 223 365 3 12 313 521 4-18 203 285 5 l4 456 714 6
29 706 1,251 149 5 453 791 I
24 253 460 2
40 1,806 2,826 150 26 1,309 1,944 I 14 497 882 2 87 1,928 3,130 151
47 1,797 2,962 152 27 1,248 2,124 1 20 549 838 2
47 1,922 3,107 153 30 1,159 1,914 I 17 763 1,193 2 40 1,103 1,966 154
57 799 1,232 155 45 539 804 1 12 260 428 2
101 910 1,540 156 12 232 377 I 33 201 338 2 43 352 625 3 13 125 200 4
54 1,019 1,720 157 10 231 439 1 29 603 961 2 15 185 320 3
34: 1,869 2,747 158 24 1,036 1,489 I 10 833 1,258 2
337 1,483 2,435 159 1 261 500 1
136 530 832 2 200 692 1,103 3

PRIMARY CENSUS
KOZIDKODE DISTRICT
Occupied Literate and Total residential Total number of Scheduled Scheduled educated Workers
hOUSes parsons enumerated Castes Tribes persons I-IX District/Taluk( ~ , r--"""'_, ,.--A-"",\ ,....._...A---. ~
Town/Ward/Blockl Area No. 'No. of 81. Village/Desom( in of house-No. Forest Range acres houses holds Persons Males Females M F M F M F M F (1) (2) (3) (4) (5) (6) (7) (8) (9) (10) (II) (12) (13) (14) (15) (16)
TlRUR
TlRVR TALUK T 178,203.49 90,469 92,58~ 561,212 271,435' 289,77716,58217,02~ 244 232 11~,595 70,267 124,642 34,770 R 168,356.73 79,048 80,852 484,089 233,460 250,629 14,064 14,628 134 119 96,830 59,892 107,13030,439 U 9,846.76 11,421 11,733 77,123 37,975 39,148 2,518 2,397 110 113 18,765 10,375 17,512 4,331
Midland ToWlls~
'X Feroke 3,343-64 3,754 3,799 24,124 12,085 12,039 1,2~7 1,197 6,602 3,476 5,422 1,421 Ward I Feroke 931'11 1,330 1,335 8,493 4,296 4,197 444- 419 2,173 1,022 1,92'2 553
Block 14 158 158 960 486 474 92 87 196 122 226 114
" 15 145 146 893 455 438 71 53 187 74 178 47
" 16 142 142 990 498 492 2 2 191 73 226 31
" 17 143 143 957 483 474 42 38 258 72 216 40
" 18 149 149 866 437 429 54 59 202 93 202 67
" 19 152 155 1,036 539 497 37 37 353 201 228 94-
" 20 148 148 928 448 480 67 59 257 157 210 69
" 21 150 ISO 935 468 467 41 52 ' 264 106 215 34-
". 22 143 144 928 482 446 38 32 265 124 221 57 Ward 2 Feroke 2,412'53 2,424 2,464 15,631 7,789 7,842 813 778 4,429 2,454 3,500 874
Block 21 144 144 944 518 426 143 127 339 169 258 83
" 24 140 143 1,028 537 491 17 8 270 127 217 28
" 25 14{) 145 904 466 438 55 54 299 178 218 44-
" 26 137 139 836 400 436 1 1 223 126 188 46
" 27 135 137 989 480 509 4 3 302 143 224 28
" 28 158 169 1,134- 560 574 82 75 321 176 263 83
" 29 141 141 938 478 460 46 44 258 161 210 29
" 30 143 145 900 425 475 39 44 241 152 206 52
" 31 14{) 143 835 400 435 23 15 157 80 169 23 .. 32 138 139 932 453 479 28 37 251 206 192 40
" 33 146 148 878 447 431 49 48 303 168 212 89
" 34 142 147 835 409 426 33 24 248 132 180 77
" 35 145 147 935 464 471 86 75 303 180 230 68,
" 36 145 147 867 459 408 12 13 288 147 191 28
" 37 143 143 934 463 471 61 58 239 121 183 26
" 38 141 141 868 409 459 35 45 212 90 188 .85
" 39 146 146 874 421 453 99 107 175 98 17I 45
XI Trikkandiyur 2,136'26 2,051 2,112 13,397 6,662 6,735 605 618 1 3,989 3,005 3,063 721 Ward 1 Trikkandiyur 2,136'26 2,051 2,112 13,397 6,662 6,735 605 618 I .• '3,989 3,005 3,063 721
Block 68 ISO ISO 996 485 511 55 59 265 203 211 77
" 69 143 143 891 414 477 88 98 225 192 200 91
" 70 146 146 903 419 484 53 56 230 225 174- 22
" 71 144 146 906 429 477 68 63 277 222 202 75
" 72 126 128 706 424 282 17 13 307 144 238 16
" 73 138 144 989 496 493 45 51 283 209 236 67
" 74 114 147 969 482 487 17 25 269 167 226 45
" 75 120 128 878 448 430 15 17 284 190 204 34-
" 76 I-W 140 886 455 431 79 47 1 3# 271 188 59
" 77 141 147 897 412 485 49 59 256 275 161 69
OJ 78 144 144 941 471 470 12 II 345 280 223 52
" 79 157 161 995 528 467 26 24 334 181 267 32
" 80 150 150 964 453 511 17 28 271 252 193 22
" 81 142 142 821 413 408 28 21 159 84 188 17 .. 82 96 96 655 333 322 36 46 140 110 152 31
56

ABSTRACT
KERALASTATE
Workers -"-
In Mining, Quarrying, Live-stock, Forestry, Fishing, Hunting and In Manu-Plantations, facturing In Transport,
As Agri- Orchards At House- other than In Trade Storage and As cultural and allied hold Household In Con- and Com(lluni- In Other Non-
Cultivator Labourer activities Industry Industry struction Commerce cations Services Workers I II III IV V VI VII VlII IX X
r---"---> ~ ,...-"----, ,----A---, ,...-"----, ,...-"----, ,...---A---. r---"--o ~ r----A---...
M F M F M F M F M F M F M F M F M F M F
(17) (18) (19) (20) (21) (22) (23) (24) (25) (26, (27) (28) (29) (30) (31) (32) (33) (34) (35) (36)
TALUK
20,950 3,37711,76010,90317,255 836 3,588 6,13413,837 2,712 1,289 11 11,390 271 5,171 39 39,402 10,437 146,793 255,007 T 20,214 3,20911,329 10,32913,666 713 3,133 4,74310,557 2,003 963 9 9,191 137 4,102 35 33,975 9,261 126,330 220,190 R
736 168 431 574 3,589 123 455 1,391 3,280 709 326 2 2,199 134 1,069 4 5,427 1,226 20,463 34,817 U
231 30 148 240 130 5 112 263 1,915 485 142 2 550 46 437 1 1,757 355 6,663 10,612 X
68 ' 5 53 114 72 37 26 556 242 68 144- 44- 289 635 121 2,374 3,644
4 5 9 14- 6 78 77 3 12 33 77 20 260 360 14 5 4 23 1 4 5 52 I4 2 10 53 47 5 277 391 15 8 1 .. 45 11 8 11 .. 16 105 43 9 272 461 16
12 1 4 2 6 9 3 20 3 1 18 . ., 40 106 31 267 434 17 8 13 18 5 6 65 26 1 25 21 .. 58 23 235 362 18
10 3 9 17 110 13 29 32 43 5 1 33 17 311 403 19 12 1 7 14 .. 72 59 23 17 t8 63 3 238 411 20 5 6 21 '.' 4 1 61 8 4 4 19 112 4 253 433 21 4 10 17 1 90 31 5 10 5 96 9 261 389 ' 22
163 25 95 126 58 5 75 237 1,359 243 74 2 406 2 148 .. 1,122 234 4,289 6,968
3 2 7 26 2 6 8 95 21 1 26 21 97 26 260 343 23 1 8 .. 86 15 2 38 9 73 13 320 463 24-5 2 12 9 6 99 20 5 27 10 61 6 248 394 25
1 1 1 2 2 51 23 1 54 29 49 20 212 390 26 5 1 7 3 11 3 46 4 45 .. 20 87 20 256 481 27
14· 1 8 7 9 1 54 17 1 50 1 13 U3 57 297 491 28 11 2 8 .. 1 106 19 1 14 3 66 8 268 431 29 7 9 11 3 6 22 87 12 5 25 7 57 7 219 423 30
11 4 3 .. .. 12 12 74 1 7 11 1 50 6 231 412 31 13 13 9 11 5 2 2 88 13 8 15 11 31 11 261 439 32 8 1 4- 14 1 7 56 112 13 9 20 6 45 5 235 342 33
22 2 6 60 82 9 2 14 2 50 8 229 349 34 9 1 1 22 13 2 2 104 21 3 20 6 72 22 234 403 35
14 1 6 1 3 3 78 14 9 14 2 64 10 268 380 36 11 .. 9 4 3 4 58 15 16 1 85 3 280 445 37 24 10 8 10 1 2 51 77 9 13 10 1 4 49 4 221 374 38 5 1 9 11 5 6 62 17 7 2 7 3 73 8 250 408 39
203 62 162 196 77 88 53 339 16 64 .. 553 9 246 1 1,331 384 3,599 6,014 Xl 203 62 162 196 77 88 53 339 16 64 553 9 246 1 1,331 384- 3,599 6,014
14 5 24 39 21 2 7 34 1 4 18 16 78 25 274 434 68 26 7 52 75 7 1 4 21 2 3 12 .. 4 74 9 214 380 69 16 6 3 " 6 14 3 9 26 2 29 71 II 245 462 70 18 7 15 25 10 2 4- 18 1 4 19 13 103 38 227 402 71 8 .. 4 8 12 4 19 I 4 39 , . 30 114 11 186 266 72 9 1 12 21 5 1 8 21 3 1 54 1 54 79 33 260 426 73
14 2 1 .. 2 It 5 34- 3 .. 75 2 17 72 33 256 442 74 10 2 .. 1 7 7 18 4 53 22 90 24 244 396 75 5 4 2 1 1 6 2 8 1 5 36 12 113 51 267 372 76
12 12 27 30 2 .. 20 30 4 1 66 26 251 416 77 8 2 3 3 3 20 5 36 1 6 44 2 10 93 39 248 418 78 5 2 1 1 23 5 32 5 66 2 16 118 23 261 435 79 3 6 3 6 1 2 23 2 43 8 104 14 260 489 80
35 5 11 6 7 1 24- 7 97 12 225 391 81 20 1 4 1 1 34 16 14 4 59 35 181 285 82
57

PRIMARY CENSUS
KozHIKODE DISTRICT
Occupied Literate and Total residential Total number of Scheduled Scheduled educated Workers
houses persons enumerated Castes Tribes persons I-IX District/Talukl r-----"----, ,--'----., ,..---A----, .----"----. ~ Town/Ward/BlockJ Area No. No. of
81. Village/Desom! in of house-No. Forest Range acres houses holds Persons Males Females M F M F M F M F
(1) (2) (3) (4) (5) (6) (7) (8) Lowland TOWDS
(9) (10) (II) (12) (13) (14) (15) (16)
XIV KadaJaDdi 1,306'24 1,1109 1,845 12,287 5,890 6,397 439 409 3,180 1,806 2,535 783 Ward I Kadalundi 1,306-24 1,809 J,845 12,287 5,890 6,397 439 4()9 3,180 1,806 2,535 783
Block 1 134 143 986 -ws 518 158 53 243 39
" 2 137 145 1,161 566 595 192 103 278 46
" 3 138 141 1,105 495 610 .. 188 122 181 26
" 4 142 145 1,065 490 575 5 3 229 98 187 71
" 5 140 143 929 453 476 18 13 201 82 168 41
" 6 142 144- 922 440 482 56 50 286 180 196 47 7 141 141 859 397 462 86 81 244- 152 169 85
" 8 147 149 881 41J 470 J3 12 285 190 180 47
" 9 141 141 830 403 427 127 119 238 126 191 71
10 143 147 852 423 429 54- 49 247 150 174 77
" 11 143 144- 975 478 497 I .. 327 218 215 54-
" 12 141 141 909 437 472 31 36 287 176 171 146
" 13 116 117 795 416 379 48 46 288 J54- 177 32
Chaliyam Forest Depot 4 4 18 13 5 10 2 5
:xv p .... ppamlllgBdi 843.60 1,234 1,307 9,IJ26 4,498 4,528 65 27 1,990 800 2,291 337 Ward 1 Parappanangadi 843-60 1,234 1,307 9,026 4,498 4,528 65 27 1,990 800 2,201 337
Block 40 134- 152 1,023 514 509 .. .. 183 57 226 26
" 41 137 142 945 485 460 10 4 274 136 234 32
" 42 140 148 1,099 564 535 .. .. 168 58 320 11
" 43 134- 139 870 439 431 15 10 240 107 201 14
" 44- 140 144- 913 462 451 40 13 288 117 207 71
" 45 126 141 1,021 497 524 196 53 246 97
" 46 143 144 940 436 504 282 166 187 43
" 47 143 153 1,055 514 541 216 78 270 36
" 48 137 144- 1,160 587 573 143 28 310 7
XVI Tanur 2,217'02 2,573 2,670 18,289 8,840 9,449 152 146 109 113 3,004 1,288 4,291 1,063 Ward I Rayirimangalam 982'77 1,470 1,561 11,321 5,476 5,845 34- 34- 53 50 1,203 239 2,694 299
Block 49 131 140 1,033 522 511 40 33 96 32 251 17
" 50 145 148 1,006 473 533 37 20 233
" 51 133 141 1,035 523 512 13 17 38 17 290 51
" 52 137 140 933 462 471 36 I 242 65
" 53 136 144 1,044 515 529 .. 31 2 292 14
" 54 138 143 1,050 490 560 I 3 164 24 217 26
" 55 129 137 1,066 479 587 201 32 195 38
" 56 137 156 1,087 523 564 133 15 246 6
" 57 133 151 971 432 539 216 32 2O} 17
" 58 137 144- 1,175 583 592 20 19 144- 32 282 45
" 59 114 117 921 474 447 13 12 107 32 245 20
Ward 2 Rayirimangalam 1,234'25 1,103 1,109 6,968 3,364 3,604- 118 112 56 63 1,801 1,049 1,597 764-Block 60 100 100 721 352 369 3 3 206 123 181 134 . ' 61 146 147 947 454- 493 16 17 .. 253 124 200 68
" 62 143 144 1,006 470 536 13 II 51 60 175 65 207 75
" 63 149 151 864 439 425 32 32 5 3 273 161 240 80
" 64 137 137 886 '415 471 14 9 241 153 194 94
" 65 146 148 846 415 431 20 18 225 169 189 89 .. 66 144- 144- 905 444 461 20 22 260 158 204- 95 .. 67 138 138 793 375 418 168 96 182 129
58

ABSTRACT
KERALA STATE
Workers .A.... __ -----, In Mining, Quarrying, Live-stock, Forestry, Fishing, Hunting and In Manu-Plantations, facturing In Transport,
As Agri- Orchards At House- other than In Trade Storage and
As cultural and allied hold Household In Con- and Communi- In Other Non-
Cultivator Labourer activities Industry Industry struction Commerce cations Services Workers
I II III IV V VI VII VIII IX X
,~~r--"---->r--"---->~~~r---A-----.~ ~
M F M F M F M F M F M F M F M F M F· M F
(17) (18) (19) (20) (21) (22) (23) (24) (25) (26) (27) (28) (29) (30) (31) (32) (33) (34) (35) (36)
66 26 28 78 540 10 57 388 528 134 1M 268 3 156 808 144 3,355 5,614 XIV
66 26 28 78 540 10 57 388 528 134 84 268 3 156 808 144 3,355 5,614
I 171 ,. 2 16 18 17 I 16 20 13 6 225 479 1 I 198 4 I 33 14 3 1 20 3 40 6 288 549 2 2 .. ,. 56 10 12 . . 12 30 I 69 15 314 584 3 6 I I 15 32 31 15 13 41 5 75 23 303 504 4 .. .. 38 21 44 9 3 25 I 8 50 10 285 435 5 2 4 16 7 7 16 67 10 9 13 12 75 5 244 435 6 9 5 8 32 13 10 71 35 11 12 1 44 3 228 377 7 7 4 1 10 4 18 73 24 19 7 7 52 1 231 423 8
11 5 4 18 1 13 Hi 63 5 4 16 8 71 27 212 356 9 12 4- 6 12 11 4- 13 45 35 .. I 21 1 17 58 II 249 352 10
9 3 2 8 5 24 23 8 8 34 14 112 19 263 443 II
5 2 8 2 5 136 33 3 23 25 72 3 266 326 12 1 2 1 7 11 44 5 2 9 36 77 14 239 347 13
4 8 4
53 5 15 1 1,071 6 18 126 226 50 12 229 74 63 514 75 2,297 4,191 XV
53 5 15 1 1,071 6 18 126 226 50 12 229 74 63 514 75 2,297 4,191 3 2 2 126 .. 6 11 15 22 62 3 288 483 40 8 2 75 2 4 47 19 27 9 66 7 251 428 41 2 282 2 1 6 ., 17 1 17 3 244 524 4-2
12 4 1 31 20 1 1 25 .. lOS 12 238 417 43 16 2 19 6 47 32 2 42 5 83 24 255 380 44 1 .. 2 135 " 18 39 3 2 30 74 11 26 2 251 427 45 5 I 3 15 2 8 25 50 I 4 30 15 57 14 249 461 46 3 1 108 .. 2 24 22 3 3 29 13 89 9 244 505 47 3 1 280 2 2 4 2 7 9 6 1 277 566 48
183 45 78 59 1,771 102 180 561 272 24 24 599 2 167 2 1,017 268 4,549 8,386 XVI
30 5 2 1,731 100 13 112 23 9 364 2 78 2 364 156 2,782 5,546 153 7 29 1 3 30 16 20 9 271 494 49
.. 214 ., .. . . 11 6 2 240 533 50 2 4 221 12 1 10 2 24 15 14 36 233 461 51
230 56 2 1 7 3 8 220 406 52 240 9 10 14 29 4 223 515 53
2 74 9 20 3 2 52 12 55 14 273 534 54
2 15 13 1 8+ 4 77 37 284 549 55 I .. 154 5 47 39 6 277 558 56 7 .. 29 .' .. ,. 14 2 70 . . 79 17 231 522 57
II .. 2 201 21 1 1 3 3 2 15 .. 22 2 27 16 301 547 58 5 1 1 200 4 2 7 2 10 2 3 19 9 229 427 59
153 44 73 57 40 2 179 548 160 15 235 89 653 112 1,767 2,840
44 11 17 8 2 7 112 16 3 19 2 71 3 171 235 60
30 10 2 .. 4 7 24 24 36 2 95 34 254 425 61 8 5 34 7 4 13 21 1 6 44 15 97 27 263 461 62 2 4 3 69 36 I 35 29 130 11 199 345 63
13 3 1 15 2 3 73 21 18 17 107 15 221 377 64 32 11 44 12 7 3 58 13 3 8 I 78 6 226 342 65
12 8 .. 2 1 43 77 20 1 56 22 49 6 240 366 66
12 I 5 109 122 9 1 19 I 26 6 193 289 67
59

PRIMARY CENSUS
KOZIDKODE DISTRICT
Occupied Literate and Total residential Total number of Scheduled Scheduled educated Workers
houses persons enumerated Castes Tribes persons I-IX District/Taluk/ ,...----"-----, ,...-_____,.,______,
r-~ ,..--A-~ ,---__;...,___" ~ Town/Ward/Block! Area No. No. of
Sl. VillageJDesomJ in of house-, No. Forest Range acres houses holds Persons Males Females M F M F M F M F (I) (2) (3) , (4) (5) (6) (7) (8) (9) (10) (11) (12) (13) (14) (15) (16)
Midland Villages
,160 Veliprom 2,892'58 1,893 1,904 12,498 6,422 6,076 684 639 4 3,274 1,612 2,617 471 161 Mannur 1,616'55 1,248 1,254 7,876 3,816 4,060 330 371 2,038 1,277 1,658 690 162 Vallikunnu 3,023'14 1,619 1,635 11,048 5,379 5,669 386 418 .. 2,553 1,527 2,292 559 163 Thenhipalam 4,279'16 1,575 1,587 9,723 4,704 5,019 387 394 2 2,126 1,297 2,157 629 164 Velimukku 4,222'71 1,656 1,661 10,175 4,940 5,235 377 370 2,077 984 2,240 802 165 Olakkara 2,175'77 853 86'1 5,181 2,506 2,675 236 234 784 312 1,168 330 166 Peruvallur 2,497'74 932 945 5,706 2,767 2,939 247 247 1 920 361 1,345 591 167 Kannamangalam 3,171'05 897 904 5,378 2,577 2,801 375 412 973 541 1,293 512 168 Koduvayur 3,663'50 1,972 1,990 12,058 5,812 6,246 340 341 2,268 1,019 2,741 476 169 Mooniyur 2,417'80 1,383 1,394- 8,638 4,113 4,525 213 226 1,290 591 1,838 285 170 Ullanam 2,052'58 869 913 5,051 2,477 2,574 264 288 903 410 1,177 303 171 Neduva 2,602'47 1,600 1,732 9,604 4,553 5,051 360 338 1 .. 2,752 1,982 2,049 602 172 Pariapuram 2,599-49 1,025 1,044 6,287 3,068 3,219 195 194 1,083 651 1,502 722 173 Kotinhi 2,216'91 933 943 5,284 2,468 2,816 40 52 893 452 1,181 309 174 Trikkulam 2,374'07 1,465 1,482 8,582 3,927 4,655 187 222 1,561 907 1,669 418 175 Tirurangadi 2,007'42 1,576 1,595 10,067 4,665 5,402 70 74 2,418 913 1,682 386 176 Vengara 2,744'17 1,466 1,529 8,764 4,149 ' 4,615 347 331 .. 1,623 794 1,756 628 177 Cherur 3,806'77 946 954 5,655 2,710 2,945 170 151 5 4 926 462 1,293 390 178 Valiyora 1.867'35 1,237 1,336 7,699 3,622 4,077 107 124 1,683 852 1,563 336 179 Iringallur 1,641'29 843 848 4,860 2,405 2,455 36 28 1,158 744 1,124 ' ,199 180 Mattathur 2,289'02 1,228 1,235 7,024 3,431 3,593 68 86 1,430 809 1,633 393 181 Parappur 2,087'73 1,079 1,086 6,379 3,085 3,294 51 43 1,472 1,013 1,446 270 182 Valakkulam 2,188'16 1,013 1,017 5,780 2,B15 2,965 117 117 1,069 595 1,340 254-183 Thennala 1,597'71 1,056 1,064 6,044 2,844 3,200 63 66 915 541 1,288 227 184 Nannambra 2,316'30 1,269 1,300 7,300 3,379 3,921 159 155 1,115 699 1,528 283 185 Keraladeeswarapuram 1,521'38 .671 675 4,275 2,083 2,192 172 IBO 961 714 1,035 278 186 Ozhur 2,124'59 1,056 1,120 6,235 2,953 3,282 139 138 .. 1,188 881 1,428 248 187 Omachapuzha 1,799'68 1,015 1,054 5,972 2,940 3,032 119 119 8 12 854 353 1,209 200 188 Perumanna 2,935'42 1,581 1,582 9,384 4,663 4,721 114 100 2,035 1,153 2,210 228 189 Puthur 2,164'79 1,021 1,084 6,044 2,957 3,087 181 178 1,402 973 1,34B 118 190 Klari 1,764'82 930 944- 5,792 2,B90 2,902 80 74 1,431 909 1,350 280 191 Kalpakancherry 4,016'46 2,190 2,232 13,060 6,512 6,548 41 25 3,027 1,584- 3,042 382 192 Valavannur 1,827'97 1,173 1,IBI 7,160 3,556 3,604 19 21 1,365 836 1,648 1q7 193 Ponmundam 2,262'58 1,638 1,656 9,797 4,826 4,971 56 54 3 2 1,915 904 2,094 105 194 Tanalur 2,222'69 1,387 1,402 8,321 4,095 4,226 87 100 3 I 1,542 715 1,755 196 195 Tirur 1,962'14 1,652 1,681 10,647 5,211 5.436 137 135 2,455 1,739 2,392 399 196 Cheriamundam 1,443'57 1,302 1.306 7,930 4,016 3,914 38 40 1,463 667 1,869 238 197 Kanmanam 1,947'59 1,061 1,071 6,347 3,150 3,197 80 81 1,154 770 1,507 366 198 Iringavoor 1,338'75 858 861 4,966 2,418 2,548 43 48 2 2 950 541 1,157 183 199 Kurumbathur 3,292'74 1,105 1,128 6,696 3,172 3,524 98 97 856 612 1,482 287 200 Marakkara 2,718'90 1,130 1,140 6,558 3,214 3,344 90 83 .. 1,182 796 1,542 285 201 Melmuri 4,140'78 1,008 1,012 5,769 2,797 2,972 127 135 II 14 725 493 1,359 267 202 Vadakkumbram 4,126'09 748 759 4,729 2,227 2,502 269 289 645 512 1,105 651 203 Thozhuvannur 2,815'79 679 690 4,263 2,056 2,207 188 170 805 544 1,024 520 204 Athavanad 3,32J049 1,009 1,042 6,260 3,018 3,242 163 191 860 599 1,381 278 205 Ananthavoor 2,118'65 1,358 1,480 8,218 4,041 4,177 98 109 1,372 688 1,877 373 206 Thekkankuttur 2,065'91 912 952 5,532 2,600 2,932 201 213 1,03ll 726 1,288 585 207 Thalakkad 1,896'67 1,050 1,062 6,793 3,053 3,740 176 211 1 1,468 1,502 1,411 530 206 Alathiyur 1,197'69 605 606 3,647 , 1,712 1,935 100 120 847 620 761 381 209 Pudupalli 1,780'53 628 659 3,829 1821 2,008 195 241 5 12 662 483 805 439 210 VettompaJliprom 2,330'59 867 908 5,209 2,546 2,663 180 188 988 614 1,134 524-211 Thriparangode 1,580'59 905 914 5,419 2,571 2,848 145 159 6 2 1.193 891 1,246 651 212 Thirunavaya 2,720'02 1,670 1,760 10,207 4,857 5,350 320 336 42 45 2,023 1,300 2,183 668
60

·ABSTRACT
KERALA STATE
Workers
In Mining, Quarrying, Live-stock, Forestry, Fishing,
Hunting and In Manu-Plantations, facturing In Transport,
As Agri- Orchards At House- other than In Trade Storage and As cultural and Allied hold Household In Con- and Communi- In Other Non-
Cultivator Labourer activities Industry Industry struction Commerce cations Services Workers I II III IV V VI VII VIII IX X
,~ ~~ ~ ,.--.A----, ~ .....---"----, ~ ,...---"---, ~
M F M F M F M F M F M F M F M F M F M F
(17) (18) (19) (20) (21) (22) (23) (24) (25) (26) (27) (28) (29) (30) (31) (32) (33) (34) (35) (36)
301 34 162 111 62 5 79 92 744 53 63 204 3 96 906 173 3,305 5,605 160 127 19 40 74 ~3 16 206 768 308 39 104 52 469 83 2,158 3,370 161 257 52 64 32 544 8 41 347 242 33 28 164 90 862 87 3,087 5,110 162 512 70 284 77 60 3 80 303 260 68 5 112 35 809 108 2,547 4,390 163 603 34 III 66 103 5 39 500 261 70 33 185 87 1 818 126 2,700 4,433 164 260 10 184 139 !45 15 15 37 93 35 7 145 1 58 261 93 1,338 2,345 165 399 91 164 118 77 1 42 229 79 1 3 77 3 13 491 148 1,422 2,348 166 314 82 72 108 30 5 57 36 61 2 10 116 1 8 625 278 1,284 2,289 167 711 55 210 67 60 2 94 59 513 10 15 202 6 64 1 872 276 3,071 5,770 168 423 17 193 118 70 2 56 53 183 15 26 1 269 1 109 1 509 77 2,275 4,240 169 242 22 63 31 41 8 31 97 96 4 19 77 49 559 141 1,300 2,211 170 154 43 99 77 41 1 164 268 319 63 56 213 .. 149 854 150 2,504 4;449 171 299 68 163 97 162 33 54 298 124 15 15 74 1 27 584 210 1,566 2,497 172 382 45 422 173 26 21 2 3 97 13 75 38 126 67 1,287 2,507 173 239 32 131 113 76 5 8 22 216 44 21 203 78 697 202 2,258 4,237 174 263 20 55 65 65 91 43 291 96 18 328 2 40 531 160 2,983 5,016 175 314 60 191 204 137 27 51 14 302 24 20 131 7 75 535 292 2,393 3,987 176 384 42 178 108 118 27 29 6 61 1 I 80 54 388 206 1,417 2,555 177 356 61 131 114 III 28 8 238 32 9 205 2 78 407 1I9 2,059 3,741 178 .234 26 195 49 r3l 2 5 60 7 6 93 21 379 115 1,281 2,256 179 245 II 15 24 599 46 39 22 88 4 12 189 3 73 2 373 281 1,798 3,200 180 350 17 99 32 140 I 96 38 68 18 15 161 1 15 502 163 1,639 3,024 131 311 49 69 20 146 28 22 85 26 11 91 27 578 131 1,475 2,711 182 256 39 89 53 266 22 17 2 92 17 13 210 3 33 312 91 1,556 2,973 183 444 23 133 98 90 12 47 39 III 6 12 114 .. 26 546 100 1,851 3,638 184 237 38 135 104 8 123 76 76 2 10 87 2 21 338 56 1,048 1,914 185 340 55 30 69 55 4 119 57 74 2 20 67 16 18 655 45 1,525 3,034 186 345 23 167 44 80 26 7 49 5 72 .. 14 451 121 1,731 2,832 187 266 5 83 21 480 25 7 5 138 25 22 157 4 72 985 143 2,453 4,493 188 187 23 19 17 304 5 14 :3 127 7 16 111 3 66 1 504 59 1,609 2,969 189 136 63 39 17 319 32 .. 51 1 II 1 50 .. 4 740 166 1,540 2,622 190 224 35 87 45 1,206 58 56 29 158 18 9 4 275 4 97 930 189 3,470 6,166 191 135 4 16 13 . 719 40 61 11 100 21 15:; 11 122 1 340 66 1,908 3,437 192 186 3 33 6 606 10 7 I 159 6 24 190 3 104 785 76 2,732 4,866 193 330 55 72 51 179 3 34 11 158 1 5 215 .. 68 694 75 2,340 4,030 194 .235 32 239 164 223 6 35 17 243 14 19 389 1 189 820 165 2,819 5,037 195 158 9 81 54 453 28 13 10 99 27 28 307 80 650 110 2,147 3,676 196 365 42 218 201 281 19 44 15 71 23 15 108 48 .. 357 66 1,643 2,831 197 231 13 115 42 307 27 15 4 55 1 16 .. 67 3 120 5 231 88 1,261 2,365 198 306 41 118 86 371 22 24 15 65 10 8 1 88 1 32 1 470 110 1,690 3,237 199 249 10 226 63 317 15 28 19 102 55 2 66 4 21 531 119 1,672 3,059 200 379 32 120 62 112 10 9 .. 82 6 7 19 34 597 157 1,438 2,705 201 353 73 552 534 27 2 15 8 45 2 2 14 .. 9 88 32 1,122 1,851 202 239 28 298 334 41 2 34 13 69 12 13 57 I 15 258 80 1,032 1,687 203 397 30 167 137 B5 :') 36 9 4B 2 :) 59 .. 31 555 95 1,637 2,964 204 227 13 121 156 600 9 27 17 Bl 57 15 193 5 41 572 115 2,154 3,804 205 353 121 357 394 136 4 25 9 102 6 10 66 2 35 204 49 1,312 2,347 206 208 63 189 219 47 6 84 15 186 6 9 165 2 35 488 219 1,642 3,210 207 169 51 186 285 43 14 5 105 2 54 7 181 40 951 1,554 208 171 31 298 331 3 .. 34 18 56 .. 4 33 .. 10 196 59 1,016 1,569 209 283 86 186 254 44 1 20 II 99 7 7 94 1 62 .. 339 164 1,412 2,139 210 353 100 330 435 69 12 12 2 121 7 2 63 .. 41 1 255 94 1,325 2,197 211
. ,507 33 228 297 211 12 28 15 334 107 10 140 I 124 601 203 2,674 4,682 212
61 106/1-53

PRIMARY CENSUS
KOZHIKODE DISTRICT
Occupied Literate and Total residential Total number of Scheduled Scheduled educated Workers
houses persons enumerated Castes Tribes persons I-IX District/Taluk/ ~ r---'''''__''_' r---''---.. ~~ Town/Ward/Block! Area No, No,of
81. VillageJDesom! in of house-No. Forest Range acres houses holds Persons Males Females M F M F M F M F
(1). (2) (3) , (4) (5) (6) (7) (8) (9) (10) (11) (12) (13) (14) (15) (16)
Midland Villages-concld,
213 Naduvattom 3,578'65 1,345 1,375 8,257 3,878 4,379 469 440 1,465 1,219 1,757 756 214 Kattipparuthi 2,595'84 1,410 1,414 8,692 4,216 4,476 351 348 2,239 1,519 1,870 670 215 Edayur 3,441'73 840 854 4,967 2,394 2,573 267 279 966 629 1,128 514 216 Valiakunnu 2,989'36 994 1,022 5,893 2,873 3,020 350 409 1,277 1,013 1,445 791 217 Irimbliyam 2,955'10 916 928 5,648 2,722 2,926 416 437 1 1,173 847 1,277 581 218 Kuttippuram 4,058'35 1,517 1,549 9,233 4,395 4,838 395 474 1 1,959 1,300 2,215 668 219 Paruthur 2,469'87 817 852 4,908 2,268 2,640 605 635 895 803 964 585 220 Cherukudangad 2,646'95 1,182 1,185 6,915 3,263 3,652 424 443 1,333 1,034 1,555 467
Lowland Villages
221 Ariallur 1,782'14 835 848 5,075 2,420 2,655 217 222 1,421 942 1,0BO 854 222 Niramaruthur 2,355'33 1,093 1,142 7,108 3,466 3,642 256 254 29 20 1,306 1,107 1,647 461 223 Pachattiri 2,039'07 1,173 1,257 8,443 3,981 4,462 168 170 2 1,768 1,562 1,839 696 224 Vettom 1,687'92 795 80B 5,194 2,437 2,757 109 107 1,015 668 I,OB2 556 225 Mangalam 1,605'25 1,401 1,489 10,265 5,013 5,252 130 150 3 1,824 1,097 2,485 483 226 Cbennora 1,395'38 . &i-3 654 4,044 1,892 2,152 175 199 " 894 662 826 527 227 Purathur 2,965'48 ],245 1,301 7,727 3,653 4,074 267 300 4 5 1,585 1,026 1,738 938
ERNAD
ERNADTALUK T 558,929'55 89,538 91,597 524,294 260,458 263,836 24,918 26,436 2,735 2,892 116,091 71,711 l28,474 45,113' R 555,654'18 87,477 89,486 512,018254,442 257,57624,512 26,012 2,670 2,818 112,473 68,857 125,608 44,367 U 3,275'37 2,061 2,111 12,276 6,016 6,260 406 474 65 74 3,618 2,854 2,866 746
Midland Town
XVD Manjeri 3,275'37 2,061 2,111 12,'ll6 6,016 6,260 406 474 65 74 3,618 2,854 2,866 746 Ward 1 Manjeri 3,275'37 2,061 2,111 12,276 6,016 6,260 406 474 65 74 3,618 2,854 2,866 746
Block I 137 144 968 487 481 10 3 370 311 236 56
" 2 138 142 839 428 4Il 31 25 232 Il4 182 32
" 3 141 H2 845 432 414 257 183 156 13
" 4 142 147 875 433 442 28 28 .. 170 120 200 32
" 5 142 146 968 489 479 37 34 I I 329 235 267 75
" 6 136 139 924 453 471 10 15 202 142 217 45
" 7 140 142 814 394 420 57 61 226 180 185 59
" 8 147 149 886 403 483 77 87 268 244 177 52
" 9 136 139 809 372 437 5 5 .. 269 263 188 61
" 10 139 143 726 316 410 14 16 6 8 218 241 134 37
" II 140 143 716 339 377 I 229 240 164 47
" ]2 149 149 772 409 363 1 286 173 228 29
" 13 122 133 754 362 392 17 47 34 39 247 216 183 54
" 14 138 138 687 347 340 110 145 216 131 174 89
" 15 114 Il5 692 352 340 9 7 24 26 99 61 175 65
Highland Villages
228 Oorangattiri 18,797'01 1,660 1,682 9,124 4,472 4,652 600 662 4 2 1,505 762 2,119 664 1 Arikkod 715 717 3,835 1,896 1,939 293 312 I 722 357 876 198 2 Oorangattiri 945 965 5,289 2,576 2,713 307 350 3 2 783 405 1,243 466
229 Karuvarakundu 9,794'05 2,478 2,807 14,657 7,277 7,380 554 604- 19 16 2,822 1,486 3,669 1,651 1 Cheramba 2,478 2,807 14,657 7~277 7,380 554 604 19 16 2,822 1,486 3,669 1,651 Reserve Forest Outside
Village Boundary Mannarghat East 209,820'24 2 2 8 8 8 6
62

.ABSTRACT
KERALA STATE
Workers
In Mining, Quarrying, Live-stock, Forestry, Fishing, Hunting and In Manu-Plantations, facturing In Transport,
As Agri- Orchards At House- other than In Trade Storage and As cultural and allied hold Household In Con- and Communi- In Other Non-
Cultivator Labourer activities Industry Industry struction Commerce cations Services Workers I II III IV V VI VII VIII IX X
r--~ ~ ~ ~ ,----.A-----, ~ ~ r---"-----.~ r------"-~
M F M F M F M F M F M F M F M F M F M F
(17) (18) (19) (20) (21) (22) (23) (24) (25) (26) (27) (28) (29) (30) (31) (32) (33) (34) (35) (36)
359 91 131 132 143 5 63 59 91 28 38 82 1 45 6 805 434 2,121 3,623 213 253 32 199 210 81 5 23 14 251 40 14 328 17 67 4 654 348 2,346 3,806 214 306 35 268 268 32 32 11 34 .. 6 68 4 6 376 196 1,266 2,059 215 466 247 234 315 80 2 36 37 133 32 21 .. 61 2 37 7 377 149 1,428 2,229 216 324 58 342 343 76 6 77 45 74 16 14 1 62 I 31 277 111 1,445 2,345 217 425 75 439 352 99 7 (Ii 44 180 22 39 1 276 3 110 587 164 2,180 4,170 218 176 104 329 317 32 I 74 21 64 8 3 34 1 15 237 133 1,304 2,055 219 483 57 188 191 59 5 68 32 99 14 8 135 2 56 1 459 165 1,708 3,185 220
131 30 100 62 42 8 28 706 153 13 127 115 371 48 1,340 1,801 221 235 46 189 257 497 7 24 7 96 4 143 2 42 417 142 1,819 3,181 222 269 47 216 493 578 3 54 49 160 23 27 138 1 153 244 80 2,142 3,766 223 245 91 93 236 39 . , 48 68 98 73 4 81 .. 19 I 455 87 1,355 2,201 224 143 21 42 78 1,037 27 54 32 266 J16 344 4 142 I 457 204 2,528 ,4,769 225 247 112 113 230 35 50 36 65 42 50 .. 57 209 107 1,066 1,625 226 203 19 164 192 167 1 295 458 288 212 8 79 1 292 I 242 54 1,915 3,136 227
TALUK
33,810 81641 19,58717,2297,715 1,000 4,445 3,177 8,184 1,465 1,515 5 5,571 1553,077 41 44,570 13,400 131,984 218,723 T 33,473 8,57319,45417,043 7,681 991 4,388 3,143 7,696 1,416 1,453 5 5,266 1522,874 41 43,323 13,003 128,834 213,209 R
337 68 133 186 34 9 57 34 488 49 62 305 3 203 .. 1,247 397 3,150 5,514 U
337 64 133 186 34 9 57 34 488 49 62 305 3 203 .• 1,247 397 3,150 5,514 xvn 337 68 133 186 34 9 57 34 488 49 62 305 3 203 ., 1,247 397 3,150 5,514 I
21 13 3 37 .. 4 46 1 31 93 42 251 425 I 5 2 2 62 10 I 26 26 62 18 246 379 2 6 .. .. .. 54 I I 31 20 44 12 276 401 3 7 3 4 2 2 70 4 1 16 21 79 23 233 410 4-
12 6 26 24 I 6 40 11 3 44 25 110 34 222 404 5 53 3 .. 21 4 21 9 113 38 236 426 6 33 4 35 35 I 13 5 13 2 8 13 5 64 13 209 361 7 3 1 .. II 4 32 6 1 16 15 94 41 226 431 8
42 7 2 7 3 1 4 10 37 2 10 13 4 73 34 184 376 9 16 6 II 11 1 .. .. 11 1 6 5 .. 4 80 19 182 373 10 21 I 3 5 .. 5 5 14 3 13 13 I 1.0 85 32 175 330 11 6 .. 1 4 4 46 I 5 41 I 17 108 23 181 334 12 8 17 22 :3 3 .. 20 4 7 15 15 95 28 179 338 13
27 7 24 43 8 8 2 24 2 5 .. 76 37 173 251 14 72 15 15 39 9 8 7 I 71 3 177 275 15
-636 IIO 96 91 97 7 46 17 19 3 :3 51 7 35 9 1,136 420 2,353 3,988 228 253 33 48 30 83 7 22 9 14 3 2 29 7 34 9 391 100 1,020 1,741 I 383 77 48 61 14 24 8 5 1 22 1 745 320 1,333 2,247 2 BOO 232 469 485 828 355 63 53 214 21 21 114 29 ., 1,123 505 3,608 5,729 229 :l00 232 469 485 828 355 63 53 214 21 21 114 29 .. 1,123 505 3,608 5,729 I
8
63 H16JI-53a

PRIMARY CENSUS
KOZHlKODE DISTRICT
Occupied Literate and Total residential Total number of Scheduled Scheduled educated Workers
houses persons enumerated Castes Tribea persons I-IX District/Taluk/ ~ r---"---. r--"-"""\ r- ~ Town/Ward/Block! Area No. No, of
51. Village/Desom/ in of house-No, Forest Range acres houses holds Persons Males Females M F M F M F M F
(I) (2) (3) (4) (5) (6) (7) (8) (9) (10) (11) (12) (13) (14) (15) (16)
Midland Villages
230' Azhinhilam 2,299'27 1,095 1,120 7,069 3,589 3,480 464 428 2 1,958 1,136 1,733 296 I Azhinhilam 467 476 3,092 1,569 1,523 173 165 2 892 SIS 751 113 2 l'uthukode 342 350 2,105 1,079 1,026 163 157 490 260 500 128 3 Karad 286 294 1,872 941 931 128 106 576 361 482 55
231 Vazhayur 3,576'54 1,130 1,195 6,992 3,527 3,465 366 348 1,780 1,085 1,686 379 1 Vazhayur 633 690 3,918 1,974 1,944 244 230 972 590 921 235 2 Kakkove 314 320 2,050 1,040 1,010 66 65 571 389 510 69 3 l'eringavu 183 IB5 1,024 513 511 56 53 237 106 255 75
232 Karurnarakkad 2,808'32 1,052 1,090 6,251 3,133 3,118 282 313 1,597 836 1,470 268 I Karumarakkad 362 369 2,226 1,119 1,107 93 113 512 191 504 144 2 Vazhakkad 595 620 3,466 1,738 1,728 140 151 933 556 835 96 3 Ananthavur 95 101 559 276 283 49 49 152 89 131 28
233 Cheruvayur 3,096'01 1,191 1,213 6,825 3,404 3,421 459 469 1,556 746 1,713 347 1 Cheruvayur 534 541 3,066 1,516 1,550 230 256 716 346 744 165 2 Maprom 259 266 1,470 740 730 103 96 312 132 382 73 3 Chaliyapram 398 406 2,289 1,148 1,141 126 117 528 268 587 109
234 Kizhuparamba 3,705'37 1,179 1,191 6,723 3,413 3,310 303 327 1,370 710 1,593 311 1 Kizhuparamba 338 348 2,044 1,039 1,005 106 107. 523 274 508 103 2 Trikkalayur 134- 134 701 346 355 29 40 207 139 163 38 3 KunniyU 378 379 2,062 1,046 1,016 60 70 382 155 475 99 4 Pathanapuram 329 330 1,916 982 934 108 110 258 142 447 71
235 MaIllbad 21,108'57 1,526 1,566 8,976 4,367 4,609 524 558 118 1I3 1,913 1,042 2,157 844 1 Mambad 1,523 1,563 8,968 4,362 4,606 524 558 118 113 1,910 1,040 2,154 843
Nilambur South 3 3 8 5 3 3 2 3 1 Range
236 Nilambur 50,433-55 10,621 11,073 61,387 31,128 30,259 1,728 1,681 1,543 1,600 14,521 9,708 16,056 6,597 1 Nilambur t 2,469 2,632 13,620 6,979 6,641 465 506 605 609 2,750 1,680 3,752 1,823 2 Ni1ambur t 2,812 2,869 16,197 8,283 7,914 590 537 416 482 3,193 2,193 4,351 1,955 3 Nilambur t 3,166 3,365 18,937 9,427 9,510 388 353 194 178 5,462 3,7!l 4,690 1,433 4 Nilambur t 2,168 2,201 12,603 6,425 6,178 285 285 316 315 3,114 2,124- 3,255 1,383
Nilambur North 6 6 30 14 16 12 16 2 8 3 Range
237 Amarambalam 15,249'38 2,974 3,024 16,672 8,312 8,360 1,146 1,200 395 444 3,165 1,931 4,313 2,392 1 Amarambalam 2,946 2,990 16,540 8,244 8,296 1,146 1,200 332 380 3,158 1,931 4,280 2,391
Karulai Range 28 34 132 68 64 63 64 7 33 I
238 Wandur 7,349'70 1,495 1,512 8,667 4,253 4,414 832 863 72 72 1,565 978 2,163 1,439 1 Kappil 698 704 3,935 1,928 2,007 373 330 72 72' 801 543 971 648 2 Wandur 797 808 4,732 2,325 2,407 459 483 764 435 1,192 791
239 Punnappala 4,571'68 828 838 4,880 2,361 2,519 491 533 4- 8 1,134 785 1,247 753 1 Chadagankulam 392 400 2,366 1,136 1,230 193 214 4 8 552 368 586 378 2 Punnappala 436 438 2,514 1,225 1,289 298 319 582 417 661 375
240 Tiruvali 3,794'74 722 724 4,264 2,041 2,223 389 445 108 131 886 684- 1,067 656
241 Edavanna 6,805'10 1,300 1,325 7,817 3,852 3,965 506 509 36 37 1,980 1,396 1,853 592 1 Pathapiriyam 507 519 2,951 1,446 1,505 247 231 33 35 698 514 705 240 2 Edavanna 572 583 3,533 1,739 1,794 164 199 1 " 962 628 804- 211 3 Eranhikkode 221 223 1,333 667 666 95 79 2 2 320 254 344 141
242 Perakamanna 5,835'68 920 928 5,358 ' 2,558 2,BOO 356 383 1,024 634 1,273 519 1 Vadasseri 64 64 380 168 212 25 21 67 26 80 33 2 Chathallur 128 130 679 329 350 44 53 146 115 156 85 3 Perakamanna ns 734 4,299 2,061 2,238 287 309 all 493 1,037 401
t Census deso;ns-
64

ABSTRACT
KERALA STATE
Workers --A--
In Mining, Quarrying, Live-stock, Forestry, Fishing, Hunting and In Manu-Plantations, facturing In Transport,
As Agri- Orchards At House- other than In Trade Storage and As cultural and allied hold Household In Con- and Communi- In Other Non-
Cultivator Labourer activities Industry Industry struction Commerce cations Services Workers I II III IV V VI VII VIII IX X
r---'~ ~,..----J,----, ~ ~ ".----'----, ~~
M F M F M F M F M F M F M F M F M F M F
(17) (18) (19) (20) (21) (22) (23) (24) (25) (26) (27) (28) (29) (30) (31) (32) (33) (34) (35) (36)
343 15 114 68 85 30 55 308 70 52 73 44 684 88 1,856 3,184 230 126 3' 43 40 39 15 15 148 31 20 38 17 305 24 818 1,410 1 115 11 64 28 27 9 37 85 16 22 22 26 130 36 579 898 2 102 I 7 19 6 3 75 23 10 13 1 249 28 459 876 3 354 38 176 80 44 44 92 177 56 25 117 190 2 559 109 1,841 3,086 231 198 23 123 41 26 23 24 82 50 19 48 81 2 321 95 1,053 1,709 1 97 7 32 20 10 1 18 32 75 4 1 55 102 120 5 530 941 2 59 8 21 19 8 .. 3 36 20 2 5 14 1 7 118 9 258 436 3
317 26 138 98 52 51 12 41 7 3 70 73 725 125 1,663 2,850 232 113 15 85 64 40 14 10 13 4 1 26 49 163 51 615 963 1 168 11 9 13 12 36 2 14 3 40 24 532 67 903 1,632 2 36 44 21 1 14 2 4 30 7 145 255 3
385 28 372 153 54 3 80 10 82 18 15 48 49 628 134 1;691 3,074 233 194 9 102 62 19 2 33 8 48 14 11 22 15 300 69 772 1,385 1 73 3 66 29 2 24 " 7 1 9 2 198 41 358 657 2
118 16 204 62 33 1 23 2 27 4 3 17 32 130 24 561 1,032 3 328 7 40 20 28 50 9 18 7 4 48 41 ., 1,036 267 1,820 2,999 234 139 3 6 16 5 35 5 7 4 37 35 244 75 531 902 1
11 24 4 16 1 7 3 5 3 4 7 1 88 27 183 317 2 100 2 2 4 4 1 2 1 3 359 96 '571 917 3 78 2 8 3 4 4 3 2 345 69 535 863 4
457 81 359 331 114 3 50 27 140 18 27 81 4 36 893 380 2,210 3,765 235 457 81 359 331 111 3 50 27 140 18 27 81 4 36 893 379 2,208 3,763 1
3 I 2 2
5,066 1,531 3,501 2,771 934 162 587 241 593 25 136 2 641 29 357 10 4,241 1,826 15,072 23,662 236 1,182 471 905 803 567 153 89 53 . 78 1 13 .. 51 1 33 834 341 3,227 4,818 1 1,807 487 1,702 1,306 86 93 31 33 6 16 1 80 1 32 5 452 118 3,932 5,959 2
579 160 145 135 205 7 358 137 363 17 90 1 462 27 267 5 2,221 944 4,737 8,077 3 1,498 413 749 527 73 2 47 20 69 1 17 48 25 729 420 3,170 4,795 4
3 5 3 6 13
1,267 394 1,228 1,440 343 24 122 31 148 10 17 91 3 82 2 1,015 438 3,999 5,968 237 1,267 394 1,228 1,440 332 23 122 81 148 10 17 91 3 60 2 1,015 438 3,964 5,905 1
11 1 22 35 63 557 242 676 870 153 153 116 105 25 46 - ., 69 5 12 392 181 2,090 2,975 238 276 114 311 404 88 53 49 31 6 15 20 1 2 175 74 957 1,359 I 231 12B 365 466 65 100 67 74 19 31 49 4 10 217 107 1,133 1,616 2 387 202 217 251 57 71 54 58 II 11 42 5 399 235 1,114 1,766 239 167 93 116 140 26 26 23 47 10 4 30 3 167 107 550 852 1 220 109 101 111 31 45 26 11 1 7 12 2 232 128 564 914 2
369 167 135 183 33 41 26 35 2 20 19 6 409 278 ~74 1,567 240 442 96 281 258 70 5 136 32 116 22 18 105 3 74 611 176 1,999 3,373 241 211 32 165 151 33 4 53 11 34 6 13 17 2 10 169 34 741 1,265 I 114 22 72 62 35 1 50 7 82 16 2 87 1 60 302 102 935 1,583 2 Il7 42 44- 45 2 33 14 3 1 4 140 40 323 525 3 373 48 458 364 61 9 24 12 19 3 7 23 10 ..• 29B 82 1,285 2,281 242 22 1 26 21 2 3 4 .. 1 4 .. 7 16 6 8B 179 1 48 5 73 69 10 10 4 2 2 11 7 173 265 2
303 42 359 274 49 9 11 4 17 2 3 1 21 3 - 271 69 1,024 1,837 3
65

PIUMARY CENSUS
KOZHlKODE DISTRICT
Occupied Literate and Total residential Total number of Scheduled Scheduled educated Workers
houses persons enUIIlerated Castes Tribes persons I-IX District/Taluk/ r---"------o ~ ~ ~ ,-----A---, Town/Ward/Block/ Area No. No. of
81. ViJIage/Desom/ in of house-No. ~rest Range acres houses holds Persons Males Females M F M F M F M F
(1) (2) (3) (4) (5) (6) (7) (8) (9) (10) (11) (12) (13) (14) (15) (16)
Midland VilIagelil-Contd. 243 Kavanur 3,512-25 1,032 1,057 6,189 3,102 3,087 3i2 427 1,123 508 1,548 453
1 Kavanur 833 849 4,916 2,453 2,463 305 357 847 372 1,202 371 2 Vakkalur 199 208 1,273 649 624 67 70 276 136 346 82
244 Areacode 3,016-99 1,456 1,508 8,980 4,464- 4,516 416 486 7 2 2,200 1,354 2,030 505 1 Ugrapuram 327 330 1,890 942 948 45 53 7 2 39B 243 417 115 2 Chembrakkattur 270 274 1,569 789 780 153 180 216 J06 337 140 3 Kozhakkottur 325 328 1,873 928 945 179 198 423 255 416 123 4 Areacode 232 246 1,742 853 889 . - .. 570 382 381 31 5 Puthalam 302 330 1,906 952 954 39 55 593 368 479 96
245 Vilayil 3,961-75 1,256 1,264 7,346 3,626 3,720 450 495 1,041 508 1,812 508 1 Mundakkal 160 161 922 465 457 35 22 68 31 227 27 2 Parappur 491 495 2,741 1,358 1,383 198 217 580 287 689 235 3 Vilayil 329 331 2,053 984 1,069 70 86 284 157 489 129 4- Mundambra 276 277 1,630 819 811 147 170 109 33 4Q7 117
246 Cbeacode 4,012-04 1,192 1,196 6,765 3,407 3,358 303 320 1,427 650 1,636 364 1 Omanur 468 468 2,618 1,334 1,284 128 140 484 165 610 175 2 Cheacode 565 567 3,257 1,616 1,641 117 125 722 380 809 136 3 Vavur 159 161 890 457 433 58 55 221 105 217 53
247 01avattur 3,640-93 774 803 4,513 2,275 2,238 256 260 816 368 1,143 393 I Aroor, 100 107 609 306 303 32 42 157 94 171 69 2 Olavattur 674 696 3,904 1,969 1,935 224 218 659 274- 972 324
248 Cherukavu 3,358-34 1,202 1,222 7,366 3,673 3,693 374 368 1,844 1,136 1,704 480 1 Cherukavu 180 181 1,109 545 564 54 58 269 146 270 113 2 Pengad 211 212 1,310 653 657 100 83 325 193 317 184 3 Puttupadam 183 186 1,119 581 53B 53 44 290 155 284 61 4 Paravur 220 224 1,303 618 685 44 51 323 242 290 15 5 Chevayur 408 419 2,525 1,276 1,249 123 132 637 400 543 107
249 CheJembra 3,904'18 1,782 1,804 10,851 5,437 5,414 475 485 2,278 1,267 2,544 716 250 Pallikkal 3,411'59 1,218 1,230 7,240 3,568 3,672 478 459 1,507 791 1,554 557
I Pallikkal 974 979 5,779 2,1343 2,936 365 358 1,158 587 1,216 515 2 Puthur 244 251 1,461 725 736 J13 101 349 204 338 42
251 Andiyurkunnu 3,312'28 1,324 1,358 8,150 4,085 4,065 392 413 1,816 1,009 1,901 652 1 Andiyurkunnu 211 214 1,347 668 679 35 34 360 294 268 63 2 Muttayur 330 350 2,127 1,073 1,054- 115 121 524 269 474 142 3 Mozhangallur 211 2Jl 1,256 641 609 60 69 143 40 292 88 4 Vellara 166 173 1,049 509 540 75 84 291 177 257 108 :> Valiyaparamba 334 338 1,970 991 979 87 87 .. 459 224 520 215 6 Nunhallur 72 72 401 191 204 20 18 39 5 90 35
252 Muthuvallur 3,575-09 1,066 1,080 6,346 3,176 3,170 528 503 1,438 695 1,569 339 I Parathakkad 142 143 286 152 134 54 51 38 6 66 9 2 Mundakulam 246 251 1,999 986 1,013 86 81 403 197 507 96 3 Thavanur 369 377 2,236 1,134 1,102 177 162 565 242 535 116 4 Muthuvallur 309 .309 1,825 904 921 211 209 432 250 461 118
253 Puliacode 2,690-95 786 787 4,566 2,306 2,260 214 232 732 330 1,132 231 1 Puliacode 537 538 3,129 1,586 1,543 160 175 501 231 779 186 2 Vellari 128 128 730 362 .368 24 20 102 55 185 9 3 Kadungallur 121 121 707 358 349 30 37 129 44 168 36
254 Itivetty 4,228'42 904 921 5,372 2,665 2,707 356 424 5 4 1,132 648 1,337 473 I Elayur 258 260 1,471' 721 750 128 149 403 249 360 87 2 Irivetty 348 ' 358 2,165 1,076 1,089 150 188 5 4 413 226 534 222 3 Chengara 298 303 1,736 868 868 78 87 316 173 443 164
66

ABSTRACT
KERALA STATE
Workers ~
In .Mining, Quarrying, Live-stock, Forestry, Fishing, Hunting and In Manu-Plantations, facturing In Transport,
As Agri- Orchards At House- other than In Trade Storage and As cultural and allied hold Household In Con- and Communi- In Other Non-
Cultivator Labourer activities Industry Industry struction Commerce cations Services Workers I II III IV V VI Vll Vlll IX X ~ ~ ,----A----, ...-----"--. ,.--"____' ,.---.A----, ,--A--,~~ ~
M F M F M F M F M F M F M F M F M F M F
(17) (18) (19) (20) (21) (22) (23) (24) (25) (26) (27) (28) (29) (30) (31) (32) (33) (34) (35) (36)
459 61 154 203 121 2 37 20 72 5 25 61 40 579 161 1,554 2,634 243 359 58 149 l7l 80 2 34 20 58 4 21 46 " 17 438 116 1,251 2,092 1 100 3 5 32 41 3 14 I 4 IS 1 23 141 45 303 542 2 252 22 65 126 89 4 66 37 232 23 28 176 4 133 17 989 272 2,434 4,011 244 69 3 25 8 17 40 29 17 2 4 22 .. 12 .. 211 73 525 833 1 67 8 26 80 13 II 2 9 1 8 7 I 3 193 48 452 640 2 59 7 6 IS 33 6 5 28 4 7 18 21 238 92 512 822 3 II .. .. 3 8 3 1 .. 114 3 2 68 2 68 6 109 14 472 358 4 46 4 8 20 18 I 8 I 64 13 7 61 I 29 11 238 45 473 858 5
591 95 149 127 170 35 16 8 56 4 11 27 10 782 239 1,814 3,212 245 96 9 26 6 25 I .. .. 4 I 1 5 70 JO 238 430 1
232 58 36 47 51 12 16 5 21 1 6 13 10 304 112 669 1,148 2 133 13 51 35 87 21 3 30 .. 4 7 177 57 495 940 3 130 15 36 39 7 I 1 2 2 231 60 412 694 4 472 64 389 183 109 2 34 4 58 7 18 53 2 61 442 102 1,771 2,994 246 104 32 106 95 91 2 3 2 24 5 6 38 .. 32 206 39 724 1,109 1 285 19 212 51 13 25 2 25 2 1I 12 2 27 199 60 807 1,505 2 83 13 71 37 5 6 9 I 3 2 37 3 240 380 3
188 145 284 155 217 10 7 15 33 6 42 9 357 68 1,132 1,845 247 26 3 100 53 7 .. 12 2 6 .. 18 13 135 234 1
162 142 184 102 210 10 7 15 21 4- 36 9 339 55 997 1,611 2 460 154- 170 65 71 3 31 103 120 77 44 78 30 700 78 1,969 3,213 248
72 35 36 II 20 3 5 19 26 .. 6 I 116 33 275 451 1 122 105 30 31 16 31 43 I 9 15 93 5 336 473 2 93 6 14 II '11 10 27 16 7 .. 20 6 114 10 297 477 3 71 3 3 I 5 I 8 15 1 12 7 2 174 2 328 670 4
102 5 87 11 19 20 63 39 31 36 6 ," 203 28 733 1,142 5 SOl 81 272 J22 127 135 226 384 199 61 170 248 646 88 2,893 4,698 249 320 34 256 109 28 140 336 108 28 22 100 2 22 558 48 2,014 3,115 250 229 28 133 80 27 124 332 95 28 10 79 2 20 499 45 1,627 2,421 1
91 6 123 29 1 16 4 13 12 21 2 59 3 387 694 2 398 68 170 144 126 7 60 326 104 10 56 112 95 780 97 2,184 3,413 251
58 26 29 20 11 5 3 16 5 2 33 6 108 9 400 616 I 72 24 56 70 11 21 17 53 2 43 30 14 174 29 599 912 2 98 8 45 40 3 4 39 2 I 18 15 101 1 355 521 :3 45 8 9 7 18 4 12 51 18 2 .. 17 16 122 36 252 432 4
104 .. 21 3 68 3 15 194 11 1 10 7 41 243 15 471 763 5 21 2 10 4 10 3 22 4 7 3 32 7 107 169 6
326 21 384 197 225 13 28 20 138 19 14 58 39 357 68 1,607 2,831 252 21 4 2 3 7 7 .. 2 .. I 26 2 86 125 I
141 6 121 68 61 1 8 6 32 2 8 27 10 99 13 479 917 2 72 7 131 56 109 12 5 6 55 10 I 21 I 25 116 24 599 986 3 92 4 130 70 48 8 8 49 7 5 9 4 116 29 443 803 4
324 31 112 86 130 9 40 13 6 5 11 29 7 473 87 1,174 2,029 253 232 25 87 65 90 4 40 13 3 5 11 14 5 .. 297 74 807 1,357 ·1 65 4 10 3 107 5 177 359 2 27 2 15 21 40 5 3 12 2
, 69 8 190 313 3 431 73 166 192 102 5 25 10 33 12 17 37 14 512 180 1,328 2,234 254-120 6 48 16 31 6 1 6 1 2 14 3 130 63 361 663 I 171 45 83 88 40 2 10 8 17 7 4 10 1 5 194 71 542 867 2 140 22 35 88 31 3 9 1 10 4 11 13 6 188 46 425 704- i
67

PRIMARY CENSUS
KOZHlKODE DISTRICT
Occupied Literate and Total residen tial Total number of Schedule:! Scheduled educated Workers
houses persons enumerated Castes Tribes persons I-IX DistrictJTaluk/ ~ r--~ ~~ ~ ~
TownJWardJBlockJ Area No. No. of S1. Village/Desom/ in of house-No. Forest Range acres houses hOlds Persons Males Females M F M F M F M F (1) (2) (3) (4) (5) (6) (7) (8) (9) (10) (II) (12) (13) (14) (15) (16)
Midland Villages-contd.
255 Karakunnu 3,735'90 793 806 4,738 2,340 2,398 271 295 9 5 1,025 530 1,149 359 1 Karakunnu 677 689 4,083 2,023 2,060 217 240 9 5 911 473 996 288 2 Amayur 116 117 655 317 338 54 55 114 57 153 71
256 Vaniambalam 4,342'37 1,528 1,543 9,464 4,750 4,714 485 486 2 2,189 1,116 2,325 1,026 1 Pazhetam 264 264 1,593 822 771 68 68 314 146 389 215 2 Mudappillasseri 311 313 1,933 948 985 115 116 440 279 471 196 3 Vaniambalam 953 966 5,938 2,980 2,958 302 302 2 1,435 691 1,465 617
257 Kalikavu 10,742'39 2,724 2,800 14,864 7,405 7,459 680 712 117 125 2,934 1,502 3,734 1,837 1 Trikunnasseri 2,724 2,800 14,864 7,405 7,459 680 712 117 125 2,934 1,502 3,734 1,837
258 Vellayur 6,002'41 1,479 1,502 8,255 4,067 4,188 388 422 1 1,518 899 2,154 1,079 1 Pariyangad 820 833 4,538 2,258 2,280 196 224 702 311 1,114 587 2 Poongod 205 212 1,191 576 615 85 89 .. 280 207 335 121 3 Vellayur 454 457 2,526 1,233 1,293 107 109 1 536 381 705 371
259 Porur 4,015'81 887 908 5,194 2,580 2,614 439 463 1 2 1,156 787 1,394 859 1 Putrakovil 339 344 1,958 958 1,000 140 179 413 276 505 325 2 Ayanikkod 158 159 931 462 469 51 60 ., " 194 134 237 138 3 Porur 390 405 2,305 1,160 1,145 248 224 I 2 549 377 652 396
26) Chathangottupuram 4,605'34 879 883 5,134 2,553 2,581 471 499 ],202 835 1,422 988 1 Palakod 139 140 740 364 376 64 72 181 140 207 143 2 Eramanga1am 185 186 1,164 570 594 171 175 310 247 322 273 3 Edappalam 157 158 926 441 485 48 59 148 .98 252 159 4 Chathangottupuram 239 239 1,394 701 693 158 159 323 223 383 234-5 Vi thanasseri 159 160 910 477 433 30 34 240 127 258 179
261 Elankur 7,456'99 1,129 1,136 6,669 3,325 3,344 322 317 125 151 1,271 898 1,792 1,074 262 Trikka1angode 3,663'71 801 826 4,521 2,256 2,265 194 232 18 21 1,022 661 1,054 543
1 Trikka1angode 462 480 2,673 1,319 1,354 126 159 8 7 528 325 607 348 2 Karrikkad 339 346 1,848 937 911 68 73 10 14 494 336 447 195
263 Pulpatta 4,646'39 1,216 1,229 7,154 3,510 3,644 479 547 1,515 1,021 1,730 482 1 Cheruputhur 107 108 630 306 324 45 66 188 133 146 35 2 Olamathil 127 129 761 377 384 65 70 .. 194 123 182 41 3 Pukadathur 189 194 1,147 569 578 85 102 1 214 125 270 96 4 Valamangalam 157 157 926 465 461 63 64 179 100 237 50 5 TQttekkad 195 195 1,200 576 624 33 40 203 163 302 62 6 -Pulpatta 441 446 2,490 1,217 1,273 188 205 537 377 593 198
264 Trippanachi 2,817'33 994 1,018 5,785 2,851 2,934 342 381 .. 980 520 1,261 356 1 Palakkat 463 478 2,672 1,340 1,332 187 211 371 188 593 173 2 Muthannur 268 272 1,579 770 809 64 68 243 107 324 52 3 Trippanachi 263 268 1,534 741 793 91 102 366 225 344 131
265 Kuzhimanna 3,154'73 1,134 1,159 6,794 3,324 3,470 318 371 1,284 617 1,641 320 1 Kizhusseri 575 597 3,486 1,718 1,768 199 216 646 283 866 161 2 Kuzhimanna 559 562 3,308 1,606 1,702 119 155 638 334 775 159
266 Kondotty 2,684'52 1,794 1,860 11,195 5,701 5,494 551 570 2,904 1,440 2,705 428 1 Kolathur 1,647 1,713 10,329 5,272 5,057 478 498 2,670 1,314 2,486 377 2 Neerad 147 147 866 429 437 73 72 234 126 219 51
267 Karippur 3,173'45 1,064 1,064 6,085 2,932 3,153 302 296 1,211 611 1,461 355 1 Karippur 694 694 4,027 1,940 2,087 175 172 768 353 980 281 2 Cherayil 370 370 2,058 992 1,066 127 124 443 258 481 74
268 Nediyiruppu 4,99l'OO 1,785 1,823 10,533 5,208 5,325 608 634 5 3 2,580 1,691 2,431 664 I Nediyiruppu 1,486 1,523 8,912 4,435 4,477 355 356 5 3 2,322 1,516 2,066 503 2 Chcrayi1 299 300 1,621 773 848 253 278 258 175 365 161
68

ABSTRACT
kERALA. STATE Workers
.A. . ....., In Mining, Quarrying, Live-stock, Forestry, Fishing, Hunting and In Manu-Plantations, facturing In Transport,
As Agri- Orchards At House- other than In Trade Storage and As cultural and allied hold Household In Con- and Communi- In Other Non-
Cultivator Labourer activities Industry Industry struction Commerce cations Services Workers I II III IV V VI VII VIII IX X
r----A---, ~ ~ ~ ~~ ,....-........___, ~ ,----A--..... ~
M F M F M F M F M F M F M F M F M F M F (17) (18) (19) (20) (21) (22) (23) (24) (25) (26) (27) (28) (29) (30) (31) (32) (33) (34) (35) (36)
414 39 219 218 28 37 6 45 16 20 25 17 344 79 1,191 2,039 255 374 30 175 181 20 35 5 41 14 20 24 17 290 57 1,027 1,772 1 40 9 44 37 8 2 1 4 2 1 54 22 164 267 2 446 199 298 433 85 231 81 277 82 32 196 10 103 657 223 2,425 3,686 256 129 64 71 131 22 .. 29 3 .. 7 5 126 17 433 556 1 114 39 42 54 23 5 3 57 21 3 33 I 28 166 78 477 789 2 203 96 185 248 40 226 78 191 58 29 156 9 70 365 128 1,515 2,341 3 978 308 775 963 563 155 148 87 144 38 45 143 7 27 911 279 3,671 5,622 257 978 308 77S 963 563 155 148 87 144 38 45 143 7 27 911 279 3,671 5,622 1 736 359 333 255 174 51 71 41 76 23 10 54 9 691 349 1,913 3,109 258 334 ISO 98 138 143 49 45 30 39 20 7 48 5 395 199 1,144 1,693 1 125 47 38 26 20 I " .. 25 2 3 .. 4 120 45 241 494 2 277 162 197 91 11 1 26 11 12 1 6 176 105 528 922 3 485 263 310 369 63 71 50 59 16 10 38 23 335 161 1,186 1,755 259 158 88 148 169 16 29 17 33 14 12 17 92 37 453 675 I 86 53 46 66 19 3 4 3 2 11 6 61 15 225 331 2 241 122 116 134 28 39 29 23 2 8 15 182 109 508 749 3 529 260 354 396 22 180 119 32 4 18 21 265 208 1,131 1,593 260 82 42 58 81 .. 16 5 11 4 I 35 15 157 233 I 85 45 53 48 3 39 26 2 11 5 I 124 153 248 321 2 106 44 61 77 4 20 31 9 .. 8 44 7 189 326 3 157 59 142 153 12 22 6 10 2 2 5 1 32 14 318 459 4-99 70 40 37 3 83 51 2 1 2 30 19 219 254 5 828 379 398 422 26 7 65 41 52 22 11 9 8 395 203 1,533 2,270 261 354 165 183 207 15 30 27 64 13 19 20 12 357 131 1,202 1,722 262 206 117 91 131 11 24 21 32 1 15 6 222 78 712 1,006 1 148 48 92 76 4 6 6 32 12 19 5 6 135 53 490 716 2 477 39 333 283 77 4 23 12 86 5 24 31 5 674 ISB 1,780 3,162 263 24 2 25 27 6 4 3 84 6 160 289 1
36 .. 32 39 4 .. .. 14 10 2 2 82 2 195 343 2 99 5 91 86 13 1 4 1 1 2 5 55 3 299 482 3 75 1 93 47 8 3 6 3 1 48 2 228 411 4
101 18 53 34 17 7 3 19 3 1 3 .. 101 4 274 562 5 142 13 39 50 29 3 9 8 42 2 8 17 3 1 304 121 624 1,075 6 416 52 175 170 79 30 32 62 16 9 40 17 433 85 1,590 2,578 264 169 10 82 82 33 13 14 19 6 1 25 7 244 60 747 1,159 1 128 19 34 21 41 5 4 16 2 I 6 .. 93 6 446 757 2 119 23 59 67 5 12 14 27 8 7 9 10 96 19 397 662 3 377 25 276 104 82 6 54 33 106 11 18 BO 2 36 612 139 1,683 3,150 265 178 12 164 68 41 1 36 27 71 9 7 4{) 2 29 294 42 852 1,607 1 199 13 112 36 41 5 18 6 35 2 11 34 7 318 97 831 1,543 2 286 73 467 178 71 67 48 702 9 35 208 76 793 118 2,996 5,066 266 243 70 428 151 68 65 43 696 7 32 202 75 677 104 2,786 4,680 1
43 3 39 27 3 2 5 6 2 3 6 1 116 14 210 386 2 453 82 386 197 34 3 5 4 77 6 3 49 32 422 63 1,471 2,798 267 337 74 194 147 28 3. 2 55 6 3 32 27 302 51 960 1,806 1 116 8 192 50 6 3 4 22 17 5 120 12 511 992 2 531 99 217 193 35 4 74 70 120 30 23 129 97 •. 1,205 267 2,777 4,661 268 373 35 158 131 31 3 73 68 113 28 21 115 95 •• I,OB7 237 2,369 3,974 I 158 64 59 62 4- 1 I 2 7 2 2 14 2 118 30 40B 687 2
69 106/1-54

PRIMARY CENSUS
KOZHlKODE DISTRICT
r----
Occupied Literate and Total residential Total number of Scheduled Scheduled educated Workers houses persons enumerated Castes Tribes persons I-IX
District/Taluk/ r-~ r--"----, ,.-----A----, ~ ~ Town/Ward/Block/ Area No. No. of
Sl. Village/Desom/ in of house-No. Forest Range acres houses holds Persons Males Females M F M F M F M F
(1) (2) (3) (4) (5) (6) (7) (8) (9) (10) (11) (12) (13) (14) (15) (16)
Midland'ViIlages-contd. 269 Morayur 3,168'45 1,327 1,376, 7,937 3,948 3,989 392 454 2,044 1,256 1,960 664
I Ozhukur 472 485 2,882 1,430 1,452 78 99 601 349 709 206 2 Morayur 552 572 3,241 1,630 1,611 253 288 .. 911 563 821 344 3 Mongam 303 319 1,814 888 926 61 67 532 344 430 114
270 Arimbra 2,893'02 434 454 2,236 1,086 1,150 85 93 439 277 561 204-271 Pookottur 2,471'19 1,007 1,027 5,535 2,673 2,862 165 226 1,100 668 1,279 256
I Vellur 368 374 2,034 979 1,055 44 74 466 327 466 109 2 Aravankara 250 255 1,341 650 691 63 66 214 109 321 52 3 Pookottur 389 398 2,160 1,044 1,116 58 86 420 232 492 95
272 ,Valluvambram 2,523'34 1,103 1,105 6,222 3,054 3,168 228 251 1,186 636 1,562 403 1 Valluvambram 533 534 2,979 1,456 1,523 147 167 607 339 686 176 2 Pullanur 317 318 1,803 895 908 48 53 384 204 483 155 3 Muthiraparamba 253 253 1,440 703 737 33 31 195 93 393 72
273 Narukara 2,207-44 867 868 5,098 2,519 2,579 285 314 1,395 960 1,227 318 I Vimbur 240 240 1,353 659 694 39 42 320 191 327 49 2 Narukara 222 223 1,281 631 650 128 127 337 258 298 127 3 Kottupatta 405 405 2,464 1,229 1,235 118 145 738 511 602 142
274 Karuvambram 12,524'71 1,128 1,155 6,962 3,423 3,539 316 411 1,856 1,327 1,658 543 1 Kidangazhi 191 194 1,071 522 549 12 12 189 129 291 53 2 Karuvambram 325 327 1,955 966 989 91 115 576 416 483 183 3 Melakkam 612 634 3,936 1,935 2,001 213 234 1,091 782 884 307
275 Irumbuzhi 2,734'82 972 985 5,616 2,772 2,844 201 231 1,351 973 1,292 288 1 Pappinippra 236 238 1,380 . 702 678 52 51 399 276 361 122 2 Irumbuzhi 736 747 4,236 2,070 2,166 149 180 952 697 931 166
276 Melmuri 3,355'54 1,203 1,218 6,779 3,300 3,479 202 256 1,464 986 1,593 264-277 Urakammelmuri 3,430'46 591 593 3,355 1,658 1,697 113 ll5 637 418 780 225 278 Urakamkizhmuri 1,729-63 864 874 4,898 2,373 2,525 121 156 890 515 1,041 273 279 Ponmala 2,313'08 924 932 5,728 2,857 2,871 85 9B 1.214 732 1,410 226
1 Ponmala 790 797 4,883 2,436 2,447 85 97 981 647 1,232 216 2 Chappanangadi 134 135 845 421 424 1 233 85 178 10
280 Kottakkal 2,667'90 2,032 2,069 12,095 5,969 6,126 131 134 3,008 2,134 2,758 536 1 Kottakka1 1,334 1,368 7,979 3,927 4,052 81 79 2,197 1,627 1,807 371-2 Kuttipuram 698 701 4,116 2,042 2,074 50 55 811 507 951 162
281 Indianur 2,385-01 745 752 4,390 2,199, 2,191 31 26 1,059 787 1,157 210 1 Villur 302 302 1,784 899 885 .. 433 288 475 54-2 Kottur 200 204- 1,146 584 562 16 14 291 223 304- 94 3 Indianur 243 246 1,460 716 744 15 12 335 276 378 62
282 Chengottur 3,033'77 862 866 5,185 2,567 2,618 136 134 1,057 751 1,279 459 1 Kuriyad 134 134 792 390 402 6 8 228 177 186 49 2 Talakappu 123 123 706 345 361 5 5 135 68 151 54 3 Chunur 113 113 756 376 380 9 8 148 lOS 185 51 4 Mannazhi 174 178 966 494 472 86 88 221 156 234 94 5 Chengottur 188 188 1,225 590 635 28 21 193 169 304- 121 6 Kolka1am 130 130 740 372 368 2 4 132 76 219 9()
283 Ma1appuram 4,970'18 2,874 2,898 18,021 8,884 9,137 307 306 3 5,517 4,125 3,844 68% 1 Malappuram 945 969 5,720 2,797 2,923 20 18 1,430 977 1,248 238
2 (Valiyangadi)
12,301 6,087 287 288 3 4,087 3,148 2,596 444 Malappuram 1,929 1,929 6,214 (Kunnummal)
70
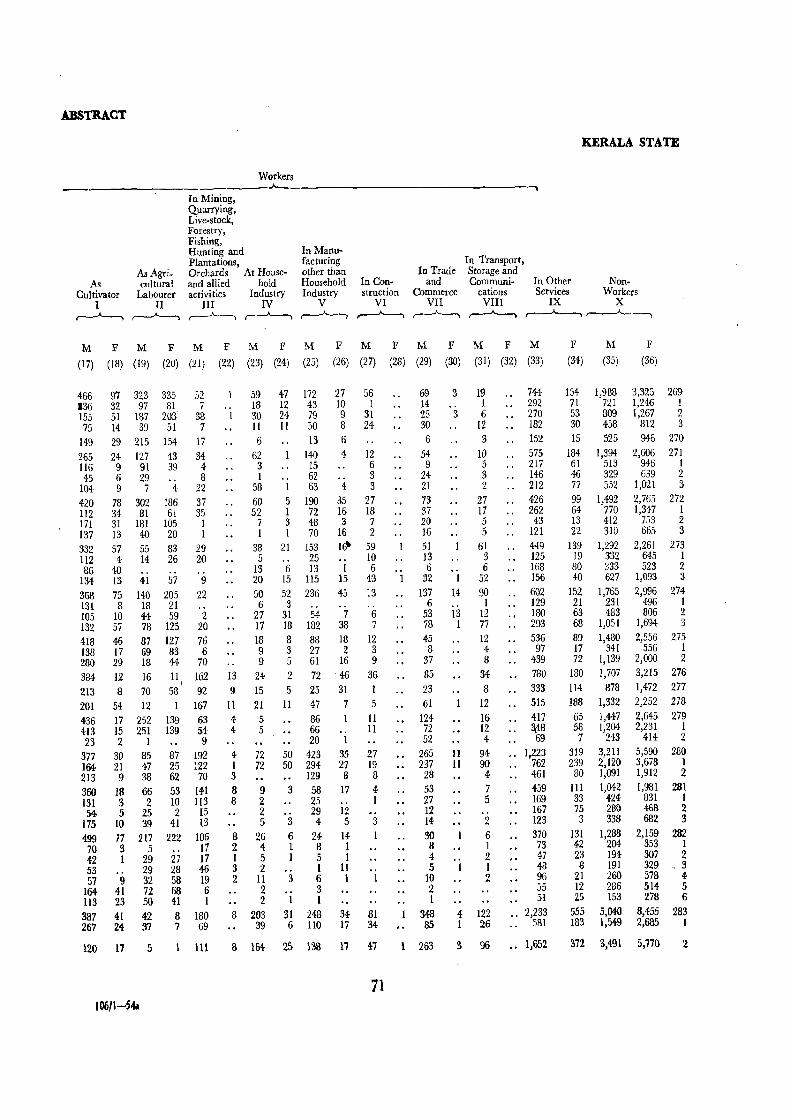
ABSTRACT
KERALA STATE
Workers . _______________________ A---. ____________________________ --
As Cultivator
I r--"----...
As Agricultural
Labourer II
,--A---,
In Mining, Quarrying, Live-stock, FQrestry, Fishing, Hunting and Plantations, Orchards At House-and allied hold activities Industry
III IV ,.----A---. ~
In Manu-facturing other than Household In Con-Industry struction
V VI ,~ ".......-'----
In Trade and
Commerce VII ~
In Transport, Storage and Communi- In Other Non-
cations Services Workers VIII IX X
,----A--, ~ r-----'-----,
M FM FM FM FM FM FM FM FM F M F
(36) (17) (18) (19) (20) (21) (22) (23) (24) (25) (26) (27) (28) (29) (30) (31) (32) (33)
466 136 155 75
149 265 116 45
104
420 112 171 137
332 112 86
134 368 131 105 132 418 138 280 384-213 201 436 413 23
377 164 213 360 131 54
175 499
70 42 53 57
164 Il3 387 267
97 323 32 97 51 187 14 39
29 215 24 127 9 91 6 29 9 7
78 302 34 81 31 181 13 40
335 81
203 51
154
43 39 .. 4
186 61
105 20
57 55 83 4 14 26
40 .. 13 41 57 75 140 205 8 18 21
10 44 59 57 78 125 46 87 127 17 69 83 29 18 44 12 16 11 8 70 58
54 12
\
52 7
38 7
17
34 4 8
22 37 35
1 1
29 20
9
22 .. 2
20 76 6
70
162 92
167 17 252 139 63 15 251 139 54 2 I 9
30 85 87 192 21 47 25 122 9386270
18 66 53 141 3 2 10 113 5 25 2 15
10 39 41 13 17 217 222 3 5 I 29
9 41 23 41 24
29 32 72 50
42 37
.. 27 28 58 68 41 8 7
106 17 17 46 19 6 1
180 69
120 17 5 111
106/1-;4.1
.. 1
59 18 30 11 6
62 3 I
58 60 52
7 1
38 5
13 20 50 6
27 17 18 9 9
13 24 9 15
11 21 4 5 4 5
4 72 I 72 3 8 9 8 2
2 5
8 26 2 4 I 5 3 2 2 11
2 2
8 203 39
47 12 24 II
.. I
172 43 79 50 13
140 15 62 63
27 10 9 8
6 4
4 5 190 35 1 72 16 3 48 3 1 70 16
21 153 10' .. 25 6 13 I
15 115 15
52 236 45 3 ..
31 54 7 IB 182 38 8 88 18 3 27 2 5 61 16
2 72 46 5 25 31
II 47 7 86 66 20 I
50 423 35 50 294 27
3
3
129 8 58 25 29 4
17
12 5
6 24 14 1 8 I 1 5 I
I II 3 6 1
3 1 1
31 248 34-6 110 17
56 1
31 24
12 6 3 3
27 18 7 2
59 10 6
43
13 .. 6 7
12 3 9
36
5
II 11
27 19 8 4 1 .. 3
81 34
B 164 25 138 17 47
71
69 14 25 30 6
54 9
24 21 73 37 20 16 51 13 6
32 137
6 53 78 45 8
37 85 23 61
124 72 S2
•• 265 237
28 53 27 12 14 30 8 4 5
10 2 1
348 85
263
3
3
14
13 I
19 1 6
12 :3
10 5 :3 2
27 17 5 5
61 3 6
52
90 I
12 77 12 4 8
34 8
12 16 12 4
II 94 11 90
4 7 5
2 6 1 2 1 2
4 122 1 26
744 292 270 182 152
575 217 146 212 426 262 43
121 449 125 168 156
602 129 180 293 536 97
439 780 333 515 417 ~48 69
.. 1,223 762
.. 461 459 169 167 123 370 73 47 48 96 55 51
•. 2,233 581
3 96 ., 1,652
(34) (35)
154 71 53 30 15
184 61 46 77 99 64 13 22
139 19 80 40
152 21 63 68 89 17 72
180
114 188 65 58 7
319 239 80
111 33 75 3
131 42 23 8
21 12 2.5
555 183
1,988 721 B09 458 525
1,394 513 329 552
1,492 770 412 310
1,292 332 333 627
1,765 231 483
1,051 1,480
341 1,139 1,707
878 1,332 1,447 1,204
243 3,211 2,120 1,091 1,042
424 280 338
1,288 204 194 191 260 286 153
5,040 1,549
3,325 269 1,246 1 1,267 2
812 3 946 27()
2,606 271 946 I 639 2
1,021 3 2,765 272 1,347 1
753 2 665 3
2,261 273 645 I 523 2
1,093 3
2,996 274 496 I 806 2
1,694 3
2,556 275 556 I
2,000 2 3,215 276
1,472 277 2,252 278 2,645 279 2,231 I
414 2 5,590 280 3,678 1 1,912 2 1,981 281
831 1 468 2. 682 3
2,159 282 353 1 307 2 329 .. 3 378 4 514 5 278 6
8,455 283 2,685 I
372 3,491 5,770 '2

pRIMARY CENSUS
KOZHIKODE DISTRICT
Occupied Literate and Total residential Total number of Scheduled Scheduled educated Workers
houses persons enumerated Castes Tribes persons I-IX District/TalukJ ~ ~~ r~ ,.---.-"--, ,---~ TownJWardJBlockJ Area No. No. of
Sl. Village/Desoml in of house-No. ForEst Range acres houses holds Persons Males Females M F M F M F M F
(I) (2) (3) (4) (5) (6) (7) (8) (9) (10) (Il) (12) (13) (14) (15) (16)
Midland Villages-coneid.
284 Annakkayam 3,343'00 874 895 5,012 2,444 2,568 1J4 101 1,191 881 1,170 261 1 Vengailur 193 195 1,140 548 592 19 24 277 189 251 t80 2 PelUmbalam 271 274 1,565 787 778 19 13 406 306 379 60 3 Annakkayam 410 426 2,307 1,109 1,198 76 64 508 386 540 121
285 Payyanad 5,lll'79 1,08B 1,088 6,193 3,lll 3,082 239 267 1,236 707 1,676 835 1 Payyanad 710 710 4,031 2,025 2,006 190 204 712 329 1,090 506 2 Nillikkuth 37B 378 2,162 1,086 1,076 49 63 524 378 586 329
286 Pandallur 5,138'21 1,005 1,007 5,467 ,2,675 2,792 178 209 13 II 1,141 835 1,391 470
287 Vettikkattiri 5,685'76 1,186 1,197 6,805 3,380 3,425 299 312 21 18 1,370 853 1,688 691 I Vettikkattiri 259 265 1,507 758 749 72 84 1 265 193 364 178 2 Valluvangad 695 700 3,917 1,941 1,976 170 166 795 504 967 424 3 Karaya 132 132 774 383 391 32 29 .. .. 170 75 210 34 4 Va1arad 100 100 607 298 309 25 33 20 18 140 81 147 55
(I
288 Chembrasseri 4,172-66 901 90S 4,978 2,425 2,553 375 412 36 41 994 692 1,338 792 1 Theyyampadikuth 107 108 553 274 279 35 39 32 39 116 J03 152 96 2 Kodasseri, 378 380 2,157 1,030 1,127 194 222 4 2 425 315 536 367 3 Chembrasseri 416 417 2,268 1,121 1,147 146 151 453 274 650 329
289 Pandikkad 4,292'05 1,287 1,299 7,379 3,746 3,633 331 396 1,898 1,118 2,015 684 1 Pandikkad 714 725 4,144 2,026 2,118 159 186 962 631 997 343 2 Perukkad 84 84 456 208 248 35 57 III 93 95 73 3 Pukkuth 342 342 1,942 1,079 863 79 98 656 295 684 m 4 Poolamanna 147 148 837 433 404 53 55 169 99 239 91
290 Thu~ur 7,799'81 1,831 1,846 10,388 5,098 5,290 714 690 7 10 1,497 915 2.646 1,332
SOUTH WYNAD
SOUTH WYNAD TALUK 340,871'l4 34,899 36,733 185,055 97,906 87,149 3,121 2,10719,26218,344 41,814 20,374 54,446 24,871
Highland Villages 291 Padinharethara 9,796'95 924 924- 5,205 2,754 [2,451 10 1 609 656 1,058 424- 1,516 605
292 Kuppadithara 3,852'19 626 626 3,569 1,827 1,742 3 4 423 373 661 327 921 293
293 Kottathara 7,814'14 1,109 1,128 7,092 3,693 3,399 41 20 1,077 1,084 .1,738 882 2,037 664
294 Thariyode 17,540'16 1,073 1,107 6,354 3,443 2,911 54 25 684 640 1,721 1,019 1,910 496
295 Achooranam 17,578'89 1,370 1,679 8,071 4,284 3,787 201 49 349 349 1,696 742 2,421 1,480 1 Achooranam 1,137 1,321 6,092 3,132 2,960 33 20 174 168 1,268 560 1,672 1,168 2 Pinangode 233 358 1,979 1,152 827 168 29 175 181 428 182 749 312
296 Kalpatta 8,408'91 1,842 2,132 10,364 5,876 4,488 331 161 913 740 2,854 1,062 3,556 1,417
297 Muttil 11,713'57 2,257 2,390 12.445 6,498 5,947 181 136 1,180 1,105 2,730 1,447 3,582 1,667
298 Ponginichickallur' 9,371'88 1,841 1,937 9,934 5,223 4,711 112 74 1,219 1,173 1,958 946 2,827 1,225 . 1 Ponginichickallur 618 662 3,323 1,776 1,547 22 16 429 WI 764 424 914 314
2 Pu1padi 1,223 1,275 6,611 3,447 3,164 90 58 790 772 1,194 522 1,913 911
299 Puthadi 26,225'56 2,638 2,702 14,093 7,291 6,802 135 79 1,715 1,726 3,225 1,930 3,970 1,791 1 VeJicumbam 541 542 2,867 I,454 1,413 4 2 301 344 632 420 738 335 2 Puthadi 2,097 2,160 1I,226 5,837 5,389 131 77 1,414 1,382 2,593 1,510 3,232 1,456
300 Pulpal1i 31,191'73 1,784 1,821 9,640 5,041 4,599 52 46 1,358 1,358 1,903 1,049 2,791 1,134 1 Pakkom 491 507 2,509 1,307 1,202 7 5 561 575 382 176 724 399 2 Pulpalli 1,231 1,242 6,829 3,579 3,250 45 41 718 702 1,501 871 1,966 659
Chethalath Range 62 72 302 155 14-1 19 8] 20 2 WI 76
72

.ABSTRACT
Workers _______________________________ A-__ _
In Mining, Quarrying Live-stock, Forestry, Fishing, Hunting and In Manu-Plantations, facturing In Transport,
As Agri- Orchards At House- other tBan In Trade Storage and As cultural and allied hold Household In Con- and Communi- In Other
Cultivator Labourer activities Industry Industry struction Commerce cations Services I II III IV V VI VII VIII IX ~ ,.....---'---. ,----"-----..~---..~~--v----"----,r-----"----.,
M F
(17) (18)
M F M
(19) (20) (21)
334 68 74 55 94 76 31 42 39 22 98 10 12 7 53
1W 27 20 9 ~
699 361 142 131 27 447 180 135 120 24 252 181 7 11 3
534 94 227 163 31
694 226 296 233 37 169 51 38 59 12 363 157 182 129 7 101 13 37 13 11 61 5 39 32 7
482 257 265 256 46 60 26 65 54 1
157 100 139 157 26 265 131 61 45 19
477 164 213 269 46 249 68 91 106 19 25 10 25 32 3
116 65 76 97 11 87 21 21 34 13
857 332 673 664 208
F M
(22) (23)
10
7 3
.. 1
2
2
18
32 6
13 13
103 67 36
38
56 14 35 .. 7
51 13 29 9
81 56 6 5
14
106
F M F.
(24) (25) (26)
8 1
7
99 66 33
21
37 14 20 .. 3
58 13 39 6
29 15 5 4 5
43
20 17
3
121 77 44
26
37 9
21 6 1
33 2
13 18
71 41 .. 14 16
94
6
2 4
26 9
17
16
21 6
12 .. 3
4 .. 4
23 22
1
6
M F M
(27) (28) (29)
7 4 3
16 12 4
10
22 .. 15 2 5
6 1 4 1
35 14 1 6
14
17
39 11 10 18
10 8 2
20
40 2
34 4
24 I
13 10
80 61
5 5 9
51
F M F M
(30) (31) (32) (33)
10 10
.. 1
.. 1
16 15
.. I
2
15 4 .. 11
4 3 1
7
15 4
11
14 1
11 2
35 34
49
555 69
190 296
554 317 237
498
491 116 299 49 27
417 8
144 265
977 432
30 451
64
591
F
(34)
114 !I
34 71
208 121 87
175
173 48
105 8
12
215 3
66 146
181 117 26 11 27
267
KERALA STATE
NonWorkers
X ~
M
(35)
F
(36)
1,274 2,307 284 297 512 1 408 718 2 569 1,077 3
1,435 2,247 285 935 1,500 I 500 747 2
1,284 2,322 286
1,692 2,734 287 394 571 1 974 1,552 2 173 357 3 151 254 4
1,087 1,761 288 122 183 1 494 760 2 471 818 3
1,731 2,949 289 1,029 1,775 1
113 175 2 395 686 3 194 313 4
2,452 3,958 290
TALUK 13,607 4,53511,791 8,21813,468 8,314 865 373 1,687 96 405 16 1,739 10 458 1 10,426 3,308 43,460 62,278 R
481 143 437
485 89 303
572 136 372
670 106 391
122 31 283 73 17 112 49 14 171
110 30 304
654 240 803
721 192 915 324 52 291 397 140 624
1,436 591 1,097 158 24 416
1,278 567 681
1,347 320 1,184 281 86 394
.1,064 229 730 2 5 60
310'. 267 47
175 30 4
305 638 145
148 294 44
143 1,278 1,157 23 837 1,004
120 441 153
215 1,392 717
595 1,037 426
737 528 179 202 104 24 535 424 155
825 544 155 275 13 .. 550 531 155
768 24 309 9 .. 392 5 1 67 10
27
7
26
46
13 13
45
35
51 12 39
46 2
44
58 6
52
14
2
8
5
2 2
18
26
24 1
23
32 1
31
21 .. 21
27
2
25
35
126 120
6
182
98
66 21 45
67 10 57
6 1 5
2
13
1
3 3
3
14
5
5
1
12
4
8 8
71
18
5 2 3
7 .. 7
.. 1
73
24
9
37
58
• 82 74 8
5 271
2 78
67 19 48
53 7
46
36 12 24
4
4 .. 4
5
12
14
8 6 2
79
19
22 9
13
30 3
27
3
3
247
83
343
398
501 429
72
... 1,102
840
452 132 320
690 129 561
132 21 82 29
89
23
56
192
144 119 25
425
363
92 34 58
179 35
144
23 4
15 4
1,238
906
1,656
1,533
1,863 1,460
403
2,320
2,916
2,396 862
1,534
3,321 716
2,605
2,250 583
1,613 54
1,846 291
1,449 292
2,735 293
2,415 294
2,307 295 1,792 1
515 2
3,071 296
4,280 297
3,486 298 1,233 1 2,253 2
5,011 299 1,078 1 3,933 2
3,465 300 803 1
2,591 2 71

PRIMARY CENSUS
XOZHlKODE DISTRICT
Occupied Literate and Total residential Total number of Scheduled Scheduled educated Workers
houses persons enumerated . Castes Tribes persons I-IX District/Taluk{ ~ ~ ~ ~ ,...._.....A---Town/Ward/Block/ Area No. No.of
SI. ViUage/DesomJ in of house-No. Forest Range acres houses holds Persons Males Females M F M F M F M F (1) (2) (3) (4) (5) (6) (7) (8) (9) (10) (1I) (12) (13) (14) (15) (16)
Highland V illages--concld.
301 Kidanganad 43,292'59 681 721 3,481 1,803 1,678 .5 2 694 699 517 194 968 438 1 Chenad 211 232 1,230 648 582 .5 2 191 189 202 83 311 12~ 2 Kidanganad 34 34 159 74 85 33 39 17 10 42 25 3 Vadakkanad 303 304 1,555 794 761 288 276 221 86 434 217
Sultan's Battery 28 30 107 60 47 5 8 32 II 44 16 Range
Chethalath Range 105 121 430 227 203 177 187 45 4 137 51
302 Sultan's Battery 11,231'78 2,600 2,726 13,687 7,333 6,354 1I0 90 1,239 1,092 3,484 1,693 3,901 1,411
303 Purakkadi 13,223'30 2,301 2,320 11,157 5,857 5,300 100 50 1,735 1,618 2,623 1,420 3,350 1,666 1 Purakkadi 1,557 1,575 7,616 4,003 3,613 33 20 1,348 1,226 1,741 955 2,257 1,156 2 Chingeri 744 745 3,541 1,854 1,687 67 30 387 392 882 465 1,093 510
304 VengappaUy 5,216'37 828 910 5,251 2,981 2,270 183 51 640 630 1,335 566 1,851 723 1 Thekkumthara 223 250 1,538 888 650 65 12 224 210 389 182 524 170 2 Vengappally 605 660 3,713 2,093 1,620 113 39 416 420 946 384 1,327 553
305 Kunnathidavaga 11,736'55 1,349 1,462 6,891 3,735 3,156 428 338 154 120 1,864 987 2,132 1,008
306 Kottappadi ' 21,397'38 3,180 3,378 15,881 8,382 7.,499 363 262 699 636 3,589 1,791 4,647 2,716 1 Thrikkaipatta 645 667 3,295 1,708 1,587 53 39 321 276 740 412 1,009 622 2 Kottappadi 2,535 2,7ll 12,586 6,674 5,912 310 223 378 360 2,849 1,379 3,638 2,094
307 Muppainad 28,144-52 2,615 2,832 11,806 6,200 5,606 472 431 46B 418 2,510 1,097 3,494 2,202
308 Ambalavayal 14,984-73 1,787 1,789 8,999 4,695 4,304 81 59 - 797 792 2,118 1,174 2,556 827
309 Nenmani 17,139-05 2,959 2,977 15,187 7,875 7,312 247 221 2,019 1,919 3,165 1,691 4,341 2,403
310 Noolpuzha 31,010'89 1,135 1,172 5,948 3,115 2,833 12 8 1,290 1,216 1,065 433 1,675 705 1 Noo1puzha 931 946 4,913 2,579 2,334 12 8 999 923 952 405 1,374 545
Sultan's Battery 204 226 1,035 536 499 291 293 113 28 301 160, Range
74

ABSTRACT
KERALA STATE Workers
In Mining, ""' Quarrying, Live-s tock, Forestry, Fishing, Hunting and In Manu-Plantations, facturing In Transport,
As Agri- Orchards At House- other than In Trade Storage and As cultural and allied hold. Household In' Con- and Communi- In Other Non-
Cultivator Labourer activities Industry Industry struction Commerce cations Services Workers I II III IV V VI VII VIII IX X
. .-----'-----, ,.--A..---., ,.---...____, r---'-----, r---'''_____' r---'---, ~ ,----"----. ,..--J,--__ ~
M F M F M F M F M F M F M F M F M F M. F (17) (18) (19) (20) (21) (22) (23) (24) (25) (26) (27) (28) (29) (30) (31) (32) (33) (34) (35) (36)
201 46 218 227 182 75 4 II 52 299 89 835 1,240 301 52 7 84 97 67 4 3 6 19 80 21 337 453 1 20 7 16 16 4 1 I .. I I 32 60 2
102 27 89 89 99 60 1 I 5 138 40 360 544 3 6 4 11 10 27 2 16 31
21 29 25 33 53 25 90 152
1,168 403 895 606 368 130 90 34 154 14 57 4 236 67 866 219 3,432 4,943 302
962 437 1,028 754 516 249 104 36 50 2 16 103 19 552 188 2,507 3,634 303 761 371 746 543 276 127 59 7 20 .. 1 55 II 328 108 1,746 2,457 1 201 66 282 211 240 122 45 29 30 2 15 48 8 224 80 761 1,177 2 139 78 184 243 1,088 269 25 16 29 5 21 3 357 117 1,130 1,547 304 57 16 86 95 271 38 8 8 8 I I .. 92 13 364 480 I 82 62 98 148 817 231 17 8 21 4 20 3 265 104 766 1,067 2 81 24 31 17 866 736 56 11 145 2 48 143 39 723 217 1,603 2,148 305
507 217 413 255 1,814 1,752 95 45 302 30 56 220 37 .. 1,203 416 3,735 4,783 306 305 168 298 191 235 215 20 10 8 2 2 15 1 125 36 699 965 1 202 49 115 64 1,579 1,537 75 35 294 28 54 205 1 36 .. 1,078 380 3,036 3,818 2
326 44 309 175 1,666 1,774 13 6 247 2 28 129 21 755 201 2,706 3,404 307
911 193 6J1 266 503 209 53 33 38 15 42 7 376 126 2,139 3,477 308
1,962 973 1,367 1,055 344 207 63 36 69 3 33 82 18 403 128 3,534 4,909 309
752 242 646 399 89 38 II 3 15 19 2 37 2 104 21 1,440 2,128 310 673 204 537 325 42 7 II 3 7 4 37 2 61 6 1,205 1,789 1
79 38 109 74 47 31 8 15 2 43 15 235 339
75


160/I-SS
(ii) AMENITIES
1 Educational and reading facilities
2 Medical facilities
3 Drinking water facilities
4 Communication and transport facilities
5 Electrification facilities
6 Miscellaneous


AMENITIES 1 EDUCATIONAL AND READING FACILITIES
P for Primary School M for Middle School H for High School C for Higher Institution including Colleges
T for Technical Institutions L for ;Library
RR for Reading Room CRS for Community Radio Set
Badagara Taluk Rural :-
Azhiyur village :-Azhiyur desom P4, M2, HI, Ll RRI' Chombala desom P2, M2, TI, Ll, RR2; K~lIamaI~ desom PI, Ml. Kunnummakara Village:Thattolikara desom P'2; Kunnummakara deiOm PI; Nellacheri desom P2. Onchiyam village :-Kannakkara desom P5, L2, RRI, CRSI; Onchiyam desom PI, Ml, RRI. Uraiangal village :-Uralangal desoII1; P2, Ll; Vellukulangara desom P2, Ll; Madappallt desom PI, HI, CI, TI, Ll, RRl. Muttungal village :-Rayarangoth desom P2, RRI; Muttungal desom PI, Ml. Chorode village :-Erapuram desom P4, MI, RRI; Nelluyankara desom PI; Chennamangalam desom PI; Chorode desom PI, L L Vykilasseri village: -Kurukkilad ?esom PI; Vykilasseri desom P2, Ml; Varssyekum desom PI, M\. Eramala village :-Orkatteri desom P3, RR 1, CRS I; Adiyur desom PI; Eramala desom P2, M I , H 1. Edacheri village :-Edacheri desom P4, M2, Ll, CR~ II· Thuruthi desom Pl. Katcheri village :-Katchen de~om PI, Ml; Kottembram desom PI, CRSl. Iringannur village :-Iri~gannur desom P2,. ~I, L2I, CRS6; Kayapanachl desom PI. Thunen vIllage:-:Thuneri desom P2 MI, Ll, RRI, CRSl; Mudavantheri desom P3. 'Parakkadavu village :-Ummathur desom Pl' Parakkadavu desom PI, RRI, CRS4; Thanakk~ttur desom PI, Ml. Chekkiyad village :Vevam desom'PI; Chekkiyad desomP3; Kuruvantheri desom MI. Valayam village :-PuIiyavil desom PI; Jatiyeri desom PI; Cherumoth desom. P2; Valayam deso~'~, MI, HI, LI, RR2. _Yelhyode village :-KuYItten desom PI; BhoomlVathuckai desom P2, RRI, CRSI; Kotiyura desom PI; Velliyode desom P4. Vanimal village :-Verkada~u desom PI; Vanimal desom PI, RRl. Iyyencode vtllage:Kakkattil desom P2; Vishnumangalam desom PI; Chiyyur desom PI; Peruvankara desom PI; I yyancode desom Pl. Kuttipram village :-Varikkoli desom Pl' Narikkatteri desom PI; Chelakkad desom P2; K~ttipram desom P2, HI; Kummancode village:Kakkamvally desom PI; Kummancode desom P3; Nadapuram desom P2, MI; Vellur village :-Kodencheri desom P2; Vellur desom P2, L 1, RR 1 ; Chalapram desom PI, MI, RRI; Perode desom PI. Purameri village :-Purameri desom P4, MI, eRSl. Vulathapuram village :-Muthuvatathur desom P2; Kuningad desom P2, CRSl; Vulathapuram desom P2~
160/1-5Sa
79
Karthikapally village :-KurinhaIiyode desom P2, Ml RRI' Karthikapally desom P3, Ll, RR1; Mu'yipra 'desom PI. Ponmeri village :-Parambil desom P4. Vulliappally village :-Mayyannur de~om P3, LI, RRI; Vulliappally desom P3, MI;. Thrru· mana desom P2, Ll, RRI. Memunda village:Kuttoth desom PI, RR1; Keezhal desom PI, M2, RR3' Memunda desom P2, Hi. Chemmarathur village :-Thodanur desom P3~ Ml ; Chemmarathur desom P2, MI.' Kottappally VIllage :-Kannamba~hkara desom Pl' Kott2ppally desom P2; Valbat desom P2 MI' Kadameri village:-Kadamerd (som P3, MI ;' 'Elayadam desom P3. Aroor village:Perumundacheri desom P3; Aroor desom PI, MI, CRS!. Kunnummal village :-Kunnummal desom P3' Vattoli desom PI MI, RRI; Pathiripatta desom PI: MI, RRI, CRSI. ' Naripatta village :-Naripatta desom P3 MI RRI' Chekkonnummal desom P2;
, ". 11 Thinur desom P4, MI. Kavilumpara village :-Ka at desom P2' Adukkath desom PI, MI; Mannur desom PI; Maruthonkara desom Pl,Hl, LI,RR2;Moyilothara desom PI, RRl; Kavilumpara desom P3. Kayakody village :-Changaramkulam desom PI, M~; Kottur desom PI; Thaliyil desom PI; DevarkovIl.d~som P2; Akkal desom PI; Kayakody desomPl. Moken village:Kovukunnu desom PI; Mokeri desom PI, RRl, CRS 1; Karandot desom PI. Kuttiyadi village :-Urath desom PI, L1. Vatayam village :-Nittur desom P2, 11; Vatayam desom P2, Ml. 'Ayencheri village :-Ayencheri desom P7, M 1. Thiruvalloor village :-Vellookkara des om PI; Thiruvalloordesom P4, M2,HI, RRI. Mantharathur village:-Motapilavil desom P2; Kurumthodi desom PI, M2; Mantharathur desom P2, Ml CRSI. Maniyur village :-Maniyur desom P2, M2: CRSI; Cherandathur desom PI; . Elampilad desom P2. Palayad village :-Palayad desom PI ~ Pathiyarakkara desom P3, M2, LI. Karuvanchen village :-Chellattapoil desom PI; Meenathkara desom P'l; Kunnathkara desom PI; Muthuvana desom PI; Karuvancheri desom PI. Urban :-
Badagara municipal :-Kuriyadi ward Ml; l.V1ukachery ward P2, MI, HI, CI; Pandikasala Valappu ward PI, CI, CRSl; Purankara ward P2; Pakkayilbagom ward P2; Sarampalli-Mukkolabhagom ward PI; Cholamvayal ward P2, TI, RRI; Payangha. vubhagom ward MI, Tl, CRSl; ChaIiyatherublla. gom ward P2; Arakkiladbhagom ward P2, RRl;

AMENITIES
Puthurbhagom P2; Nadakkuthazhabhagom ward CRSI; -Meppayil North ward HI, CRSI; Meppayil South ward PI, MI; Kannamkuzhicheeramveedubhagom ward P2, RRI; Badagaravayal~Kottaparamba ward P2, H2, MI, TI, L2, RR2,CRSI; Karimpanapalam Narayananagaram ward P2; Cheenamveedubhagom ward PI, MI; Kayyilbhagom ward PI, MI, RRI; Kakkattil ward PI, MI; Kanthilattpally-Mooradbhagom ward PI; Panikkottibhagom ward PI, Ml.
Q.uilandy Talak Rural:-
Iringal village :-Iringal desom P7, M2, LI, RR 1. Ayanikkad village :-Ayanikkad desom P2, MI. Trikkottur village :-Trikkottur desom PS, MI, HI; Palur desom Pl. Pallikkara village :-Pallikkara desom P2. Meladi village :-Kannamkulam desom PI, RRI; Meladi desom P.6, M2, RR4; Kizhur desom PI, MI, RRl. Thurayur village:-Thurayur desom PS; Toleri desom PI. Muyipoth village:Muyipoth desom P2-; Vennarode desom P2. Cheruvannur village:-Cheruvannur desom P3, RR2; Pampirikunnu desom P2. Avala village:-Avala desom P2, RRI; Kuttoth desom PI. Cherapuram village:-Cherapuram desom P6. Velam village:Cherukunnu desom PI; Kurichagam desom PI; Velam desom P2. Paleri village:-Paleri desom P2, HI, RRI; Cheriyakumbalam desom PI; Valiyakumbalam desom PI; Vadakkumpad desom PI, RRI. Changaroth village:-Kunnasseri desom PI; Kannatti desom PI; Kadiyangad desom PI; Changaroth desom PI, RRl, Kokkad desom PI; Avatukka desom PI. Muthuvannacha village.:-Kuniyode desom PI; Muthuvannacha desom Pl. Kallode village :-Kallode desom P3, RRI ; CRSl; Koothali desom PI, MI; Paithoth desom P2; Panakkad'desom P2. Eravattur village:-Edavanad desom PI; KC1-ipuram desom PI, RRI; Eravattur desom P2. Kalpathur village:-Kalpathur desom P2, HI, CRSI, RR2; Ramallur desom PI, RRI; Valiakkode desom P3, RR2; Kizhinhaniam desom P2, RRI. Meppayur village:-Kizhpayur desom PI, RRI; Meppayur desom P3, HI, CRSI, RR2; Kayalad desom PI, RRI; Changaramvalli desom P2, RRl. Vilayattur village:-Vi!ayattur desom P2, RR2; Elampilad desom PI, RRl. Iringath village:Mu1.appur desom PI; Iringath desom P3, MI; Kuluppa desom PI. Kozhukkallur village:-Narakkode desom PI; Kozhukkallur desom P6, RRI, CRSI; Nitumpoil desom PI; Chavatta desum Pl. Keezhariyur village:Kee£hariyur desom P5, M3, RRI; Naduvathur desom Pl; Nambrath desom PI, MI. Moodadi village:Parakkad desom PI; Moodadi desom P4, M3, L2, RR2; PuI'akkaI desom PI; Vellarakode desom PI, Ll, RRI; Muchukunnu desom Pl. Purakad village:Kozhipram desom PI; Purakad d~som P3, RRI. Vanmugham village:-Vanmugham desom P4, MI; Veeravancheri desom PI; Katalur desom PI; Veemangalam desOfP PI. Viyyur village:-Mannamangalam desom PI; Maralur desom PI; PuIiyancheri desom PI; Kolakkad desom PI; Kollam desom PI, MI; Viyyur desom P6, M2, RRI, CRSI. Kuruvangad village:Peruvathur desom PI; Kuruvangad desom P4, M2, RRI. Naderi village:-Naderi desom P4, MIj
80
Kurichikkara desom PI; Kavumvattom desom PI; Maruthur desom PI. Arikulam viIlage:-Mavatta desom PI; Arikulam desom PS, M2; Kannarnbath desom PI; Vakoli desom PI; Urallur desom PI, Ml. Karayad vilIage:-TiruvangaI'a desom P2; Karayad desom PI; Ekkattur desom PI. Kavumthara village:Elankamel desom P2; Kavil desom P3; Karuvannur desom PI. Nochad village:-Nochad desom PI, RRI; VelIiyur desom PI. Chenoli village :-Chenoli desom P3,L7, RRI; Puttat desom PI; Cheruvalloor desom PI; Valoor desom PI. Menhaniam viIJage:-Menhaniam desom P3, Ll, CRSI; Pandicode desom PI; Vengapatta desom PI; Marutheri desom P2. Perambra viIlage:KiIiyampilayi desom P2; Pillaperuvanna desom P2, Perambra desom P4, HI; Koratti desom P2. Kayanna village:-Kayanna desom Ml; Mattanode desom PI; Kotakkallur desom PI; OnhaI desom PI; Athiodi desom PI, M2; Cherukad desom PI. Kottur village: - Pera vanchery desom PI; M ulat desom P2; Naremkulam desom MI; Kottur desom MI, 11; Thiruvot desom PI; Paloli desom PI. Naduvannur vilIage:-Mannankavu desom PI; Ayanikkad desom P2, M I; Kakkanchery desom PI; Koyakkad desom P l; Naduvannur desom P2, MI. Ulliyeri vilIage:-Manat desom P2, MI; Narath desom PI; Ulliyeri desom P2, MI, RRl; Oravildesom PI. Kunnathara viIlage:Kannur desom MI, LI, RRI; Ollur desom P2; Puthenchery desom PI; Kunnathara desom PI. Melur village:-Melur desom PS, M2, RR2; Elatheri desom PI, Ml; Chelia desom PI, LI. Edakkulam village:Edakkulam desom P4, M2, HI; Mangat desom PI, MI, LI. Thiruvangoor village:-Thiruvangoor desom P3, M4, RR3; Vengalam desom PI, MI. Chemancherry village:-Kadalur desom MI; Chemancherry desom PI, M3; Kolakkad desom MI. Velur village:Velur desom PI, Hl;,Kongannur desom PI, MI, RRI. Edakkara village :-Kolakkad desom PI; Edakkara desom PI. ModakkaIIur vilIage:-Thorayi desom PI; Kotasseri desom PI; Koommulli desom MI; Modakkallur desom PI, LI; Kolathur desom PI. Kokkallur vilIage:-Koonancherry desom PI; Kokkallur desom M 1, CRS I; Kannamkode desom P2; Eramangalam desom PI; Panayi desom PI; Mannampoil desom PI. BaIusseI'i village:-Kannikavu desom PI; Thuruthiyad desom P2; Puthurvattam desom P2, CRSI, RRI; Balusseri desom P2, MI, CRSI, Ll, RRI. Trik\Jttisseri viIlage:-Vakayad desomPl, MI, HI; Trikuttisseri desom Ml, L1. Avttanallur village:-Avitanallur desom PI, MI; Nelliyeri desom MJ; Punath desom P2, Ml. Panangad village:-Nirmallur desom PI, RRI; Panangad desom P21 Ll, RRI. Sivapuram village:-Sivapuram desom PI, Ml; Karumala desom PI. Iyyad village:-Veeryampram desom PI; Iyyad desom PI, M2; Mangat desom P2, RRl. Unnikulam villag(':-Vallioth desom P2; Unnikulam desom Pl. MI, eRSl, 11, RRI; Poonoor desom P2, MI, CRSI; Kanthapuram desom P3. Kinalur village:-Mundakkara desom P2; Poovampoyil desom PI; Kinalur desom Pl. Urban:-
Pantalayini town:-Pantalayini ward PI, M3, HI, eRSl, Ll, RR4; Kovilkandy ward PI, RRl; Kothamangalam ward PI, RRI.

EDUCATIONAL AND READING FACILITIES
Kozhikode Taluk
Rural:-Elathur vilIage:-Perinthiruthi desom PI. Thalako
Iathur village:-Thaiakolathur desom P4, MI, LI. Annasseri village:-Annasseri desom P3, MI. Kannankara village:-Tehanur desom MI, RRI; Kannankara desom P2, LI, RRI; Kandanoor desom PI; Indad desom PI. Naduvalloor village:-Pavandur desom PI; Ramallur desom PI; Naduvalloor desom PI, MI, Ll, RRI, CRS!. Cheekilode village:-Cheekilode desom P2; Kolathur desom PI. Nanminda village:-Nanminda desom P4, MI, LI, RRI. Pannikkottur village:-Palangode desom PI, MI; Kodoli desom PI; Pannikkottur desom PI. Nediyanad village:-Nediyanad desom P3, M2, LZ. Punnasseri village:-Punnasseridesom P3; Kuttamboor desom Pl. Parannoor village:-Punnoor Cherupalam desom P2, RRI; Parannoor desom P2. Eravannur village:-Pullaloor desom P2; Eravannur desom PI, MI, RRI. Palath village:-Iruvallur desom PI, RRI; Palath desom P3, MI, RRI. Thamarasseri village:-Maruthad desom PI, MI; Muthuvad desom PI; Thamarasseri desom PI, HI, Ll. Makkada village:-Makkada desom P4, 11; Morikkara desom Pl. Karannoor village:-Karannoor desom P2, MI, Ll ; Puthur desom PI, M 1. Karuvisseri village:Karuvisseri desom PI; Mokavoor desom PI. Vengeri, village:-Varadoor desom PI, CI, LI; Vengeri desom PI, MI, Ll. Patinhattumuri village:-Morikkara desom PI, MI, 11; Moothool desom PI; Kirallur desom PI ; Kizhakkumuri desom PZ, M2. Kuruvattoor village:- Kuruvattoor desom PI, RRl; Pullalur desom PI; Pymbra desom P3, RR I; Polur desom P3. Paimbalasseri village:- Pulliooth desom PI; Paimbalasseri, desom P2, RRI; Arambradesom Pl. Madavoor village:- Madavoor desom P2, MI; Mattancherri desom P2. Kizhakkoth village:Kizhakkoth desom P3, CRSI; Panoor desom PI, MI, RRI. Elettil village:- Avilora desom P2, CRSI; Elettildesom PI, MI; VaIiyaparamba desom MI. Parambathkavu village:- Manipuram desom PI, RRI; Parambathkavu desom PI, HI; Karivampoyil desom PI, RRI. Vavad village :-Vavad desom PI; Kolaranthiridesom Pl. Raroth village:Andona desomPl, RRI; Raroth desom RRI; Chembra desomPI; Valimanna desom PI. Kedavoor village:IrponadesomPI; Palliprom desom PI, MI, CRSI; Punnoor desorn P2; Chamal desom PI; Kedavoor desom PI, MI, HI; Puduppadi village:- Vezhapoor desom LI, RR2, CRSI; Padoor desom MI; Puduppadi desom PI, MI, CRSI. Koodathayi village :;-Omasseri desom PI; Cherumaruthayi desom PI; Palora desom P2; Koodathayi desom MI. Thiruvambadi village :-Thiruvambadi desom P5, L2, RR5; Koodancheri desom PI, LI, RRI; Cheruppa desom MI. Neeleswaram village:-Vennacode desom RRI; Neeleswaram desom PI; Palannoor desom PI; Kulikipara desom PI. Puthoor village:Chokkoor desom PI; Kodiyathoor desom PI; Puthoor desom MI. Koduvally village:-Koduvally desom PI, LI, RRI, CRSI; Thalaperumanna desom PI.
81
Kunnamangalam village:- Kunnamangalam desom P6, HI, LI, RR4. Chelavoor village:- Cheruvatta desom PI; Parambil desom PI, MI LI RRI' Chelavoor desom P2, L2, RR2; Konot' de~m PI: Chevayur village :-Chevayurdesom P6, HI, M3, L2, RRI. Nedungottur village:- Nedungottur desom P2, RR2. Kottuli village:- Kottuli desom PI, Ml. Ll, RRI. Kovoor village: -Kovoor desom P3, MI',HI, Tl, 11, RRI; Valliparamba desom P2; Kuttlkkattoor desom P2, LI, RRI. Mayanad village :-Karanthur desom P3, LI; Mayanad desom PI, MI, Cl, 11, RRI; Payingottupuram desom Pl. Cherukulathur village:- Cherukulathur desom P4, MI, RR3; ·Poovattparamba desom PI; Penungolam desom PI, MI; Mundakkal desom PI, MI. Chathamangalam village:- Malayamma desom PI; Vennacode desom PI; Pullaloor desom PI; Chenoth desom PI; Chathamangalam desom P3, LI, RRI. Chooloor village:- Chooloor desom P4, M2, RRI. Manasseri village:- Manasseri desom PI, RRI; Chennamangalam desom PI, MI, RRI. Thazhekode village:-Thazhekode desom P2, 11; Kacheri desom Pl. Kumaranelloor village:-Anayankunnu desom PI; Kumaranelloor desom PI, RRI. Poolacode village:-Puzhur desopl Ml; Aryancode desom PI; Narayinkuzhi desom MI, RRI; Erimala desom PI; Poolacode desom PI, RRI; Kanniparamba village:-Kanniparamba desom PI; PaianO'ad desom Pl. Iringallur village:-Iringallur desom 1>2, L4; Palazhi desom MI, L2. Nallalam village:Nallalam desom P2, MI, L2, RR2, CRSI. Kodal village:-Kodal desom P4, L2; Kailamadam desom PI, MI, HI, L2. Vellayicode village:-Puthur desom PI, CRSI; Vellayicode' desom Pl. Perumanna village:-Perumanna desom P2, CRS!. Peruvayal village:-Peruvayal desom MI; Koyalam desom Pl. Cheruppa village:-Cheruppa desom PI; Mankkad desom PI; Valayannoor desom PI. Mavoor village:-Mavoor desom PI, MI, RRI; Aduvad desom PI. Kodiyathur vilJage:-Cheruvadi desom P3, MI, RR2; Kodiyathur desom P2, RRl. Pannicode village: - Kakkad desom PI; Ka vasseri desom PI; Pannicode desom P2, RRI.
Urban:-
Elathur town:-Elathur ward P2, MI, HI, L3, RR3. Edakkad town:-Edakkad ward PI, MI, L3. Puthiyangadi town:-Puthiyangadi ward P4, M2, RR4. Calicut Municipal:-Ward I PI, M5, T2; ward 2 P6, M2, 11, RRl; ward 3 PI, M2, H2; ward 4 PI, eRSI; ward 5 PI, M2, HI, L2, RR2; ward 6 HI, CI; ward 7 PI, HI, CI, LI, RRI, CRSI; ward 8 PI, MI, H2; ward 9 HI; ward 11 TI; ward 12 MI, LI, RRI, CRS!; ward 14 PI, MI; ward 15 P4, MI; ward 16 P2, LI; ward I7P4, M2,H2, LI, RRI; ward 18MI, HI; ward 19 P3, H2, RRI,CRSl; ward20P5,MI,Hl,LI, RR1; ward 21 P3; ward 22 P2, 11, RRI; ward 23 P3; ward 24 P3, RR2, CRSI; ward 25 MI, Cl, RRI. Parayancheri town :-Parayancheri ward M2, LI, RR3. NelJikode town:-Nellikode ward P4, MI, L3. Kommeri town:-Kommeri ward P2, L2. Beypore town-

AMENITIES
Eeypore ward P3, HI, T2, RR3, CRS2; Naduvattom ward P3, MI, RR2, CRS2; Cheruvannur ward P6, M2, TI, L4, RR3, CRS2: Olavanna town:-Olavanna ward P3, M2, RR2.
TirorTalok
Rural:-Veliprom village:-P4, M5, HI, TI, 01, RR2.
Mannur village:-P4, Ml. Vallikunnu village:-P6, M2, LI, RR2. Ariallur village:-P7, RR1. Thenhipalam village:-P3, M2, HI, RR2. Velimukku village:-P4, MI, RRI. Olakkara village:-P3. Peruvallur village:-P2. Kannamangalam village:-P4, Ml. Koduvayur village:-P6. Mooniyur village:P3, M2, RR2. Ullanam village:-P2. Neduva viIlage:-P3, M3, HI, L3, RR4. Pariapuram village:P3, RR3. Kotinhi village:-P3, RRI. Trikkulam village:-P3, M2. Tirurangadi village:-P7, M2, H3, TI, Ll, RR3, CRS2. Vengara village:-P3, Ml. Cherur village:-P4. VaIiyora village:-P4, CRSl. Iringallur village:-P5. Mattathur village:·-P5, MI, CRSl, LI, RR3. Parappur village:-P6, RR2, CRS}' Vaiakkulam village:-P4. Thennaia village:P4. Nannambra village:-P4, MI. Keraladeeswarapuram village:-P4, MI, HI, TI, RRI, L1. Ozhur village:-P5, L1. Omachapuzha viUage:P3, L2. Perurnanna village:-P7. Puthur village:P5, RR2. Klari village:-P4. Kaipakancherry village:-P8, MI, HI, RR2. Valavannur vil· lage:-P6, L1. Ponrnundarn village:-P5, Ml. Tanalur village:-P3, MI, RR2. Niramaruthur viIlage:-P3, MI, Ll, RRl. Pachattiri viIlage:-P3, .M2, L2, RR2. Tirur village:-P8, Ml. Cheriamundam viVage:-P5, RRI. Kanmanam viIlage:-P8, RR2. Iringavoor village:-P2, MI, L1. Kurumbathur village :-P2, M2. Marakkara vilIage:-P3, MI, RRl. Melrnuri village:-P2. Vadakkumbram village:-P2, Ml. Thozhuvannur village:-P3. Athavanad village:-P2. Ananthavoor village:-P3. Thek-
. kankuttur village:-P4, MI, RR1. Thalakkad viIIage:-P3, MI, HI, Ll, RRI. Vettom village:PI, MI, RRl. Alathiyur vilIage:-P4, LI, RRI. Mangalam village:-P4, MI, TI, LI, RR4. Chennora village:-P2, Ml. Purathur village:-P4, M2, RRl. Pudupalli village:-Pl. Vettompalliprom village:-P4, MI, RR1. Thriparangode village:P4, MI. Thirunavaya village:-P6, MI, HI. Naduvattom village:-P5, MI, Ll, RRI. Kattipparuthi village:-P4, M2, HI, L2, RR2. Edayur village:P4, MI. Valiakunnu village:-P4. Irimbliyam viIlage:-P4, MI, LI, RRI. Kuttippuram village:P6, MI. Paruthur village:-P2, MI, RR!. Cherukudangad viUage:-P5.
Urhan:-Kadalundi town:-PII, M2, HI, CRS2, L5, RRS.
Feroke town:-P8, M3, HI, L2, RR5. Parappanangadi town:-P5, MI, RR2. Tanur town:-P8, M3, LI, RR4, CRS!. Trikkandiyur town:-Pll, M3, HI, LI, RR2, CRS3.
82
Broad Talok Rural:-Azhinhilarn village:-Azhinhilam desom PI, MI, HI,
LI, RRI; Puthukode desom PI, MI, HI; Karad desom PI. Vazhayur village :-Vazhayur desom P2, MI, RR2; Kakkove desom P2, RR2; Peringavu desom P2, RRI; Karumarakkad village:-Karumarakkad desom P2; Vazhakkad desom P3, MI, HI, RRl; Ananthavur desom Pl. Cheruvayur village:-Cheruvayur desom P2, MI, RRI; Maprom desom PI; Chaliyapram desom P2. Kizhuparamba village:~ Kizhupararnba desom P2, RRI; Trikkalayur desom P2; Kunniyil desom PI; Pathanapuram desom P2. Oorangattiri village:-Arikkod desom P3; Oorangattiri desom P3, L1. Marnbad village:-Mambad desom P6, M2, 11, RRl. Nilambur viliage:-P20, M5, H2, L6, RR6, CRS3; Amarambalam village:-Amarambalam desom P9, MI, L2, RR3. Wandur village:Kappil desom P2, MI, L2, RR2, CRSl; Wandur desom PI, MI, Hl, L2, RR2. Punnappala village:Chadagankularn desorn PI, RRI; Punnappala desom P2, RId. Tiruvali viIlage:-Tiruvali desom P2, MI, HI, RRl. Edavanna viIlage:-Pathapiriyam desom P2, MI, RRI; Edavanna desom P2, MI, HI, RRI; Eranhikkode desom P2. Perakarnanna village:Vadasseri desom PI; Chathallur desom P2; Perakamanna desom PI, Ml. Kavanur village:-Kavanur desom P2, MI; Vakkalur desom P2. Areacode vilIage:Ugrapurarn desom P2, MI, HI, RRI; Chembrakkattur desorn PI, RRI; Kozhakkottur desom PI; Areacode desorn PI, MI, HI, RRI; Puthalam desomPI. Vilayil village:-Mundakkal desom PI; Parappur desom PI; Vilayil desom PI, MI, RRl; Mundambra desom PI. Cheacode viUage:-Omanur desorn PI. MI; Cheacode desom PI, MI; Vavur desorn PI. Olavattur viIlage:-Aroor desom PI; Olavattur desom P2, MI, Ll, RRI, CRSl; Cherukavu village:-dheruka vu desom PI, M I ; Pen gad desom PI; Puttu padam desom PI; Paravur desom PI; Chevayur desom Pl. Chelernbra vilIage:-Chelernbra desom P6, Ll, RRI. PaIlikkai village:-Pallikkal desorn P2, MI, Ll, RRI, CRSl; Puthur desom PI, L1. RRI. Andiyurkunnu village: - Andiyurkunnu desom PI, MI, L2, RR2, .CRSI; Muttayur desom PI, L2, RR2; Mozhangallur desom PI, Ll, RRI; Vellara, desom PI, LI, RRI; Munhallur desom PI. Muthuvallur village :-Parathakk;ld desom PI; Mundakulam desom PI; Thavanur desom PI, MI; Muthuvallur desom PI, RRI. Puliacode village:-Puliacode desom PI; Vellari desom PI; Kadupgallur desom PI. Irivetty village:-Elayur desom PI, LI, RRI; Irivetty desom P2, LI, RRI; Chengara desom PI. Karakunnu village:-Karakunnu desom P2, MI, RRI; Arnayur desom Pl. Vaniambalam village:-pazhetam desom PI; Mudappillasseri desom PI, MI, RRI; Vaniamba. lam desom P2, MI, 11, RRI. Kalikavu vilhge:Trikunnasseri desom PB, M3, L2, RR3. Vellayur village:-Pariyangad desom PI; Poongod desom PI; Vellayur desom PI, Ml. Porur village:-Putrakovil desom PI; Ayanikkod desom PI; Porur desom PI, MI, Ll, RRl, CRS!. Chathangottupuram village:-Pala. kod desom PI; Eramangalam desom PI; Edappalam

MEDICAL FACILITIES
desom P2; Chathangottupuram desom PI, RRI; Vithanasseri desom P2. Elankur village:--Elankur desom P7 RRI. Trikkalangode village:--Trikkalangode des~m PI, MI, RRI; Karikkad desom Pl. Pulpatta village.--Cheruputhur desom PI, RRl; Olamathil desom PI, MI, Ll RRl; Valamangalam desom PI; Tottekkad desom PI; Pulpatta desom PI, LI, RRI, CRSI. Trippanachi village:-Palakkat desom PI, RRl; Muthannur desom PI; Trippanachi desom PI, LI, RRI. Kuzhimanna viIlage:-Kizhusgeri desom P2, MI LI, RRI; Kuzhimanna desom P2. Kondotty vill~ge:-Kolathur desom P4, Ml, HI, L2, RR2, eRSI; Neerad desom P4, RRl. Karippur vilIage:Karippur desom P2; Cherayil desom P2. Nediyiruppu viIIage:-Nediyiruppu desomP5, MI, Ll, RRI,CRSI; Cherayil desom P3, RRI. Morayur viIlage:-Ozhu. kur desom P2, LI, RRI; Morayur desom P2, MI, HI, LI, RRI, CRSI; Mongam desom PI. Arimbra viIlage:-Arimbra desom PI, RRI. Pookottur village:-Vellur desom PI; Aravankara desom PI; Pookottur desom PI, MI, HI, RRI, CRSl Valluvambram village:-Valluvambram desom PI, RRl, CRSI; Pullanur desom PI. Narukara village:Vimbur desom PI ; Narukara desom P2; Kottupatta desom P2. Karuvambram village: - Kidangazhi desom P2; Karuvambram desom P2, TI; Melakkam desom P2. Irumbuzhi village:-Pappinippra desom Pl ; Irumbuzhi desom P2, MI, RRI, CRS!. Melmuri village:-Melmuri desom P5, MI, RRI. Urakam Melmuri village :-Urakam MeImuri desom P2. Urak 1m kizhmuri village:-Urakam kizhmuri desom P5 MI, HI, RRI. Ponmala vilhge:-Ponmala desom P3: RRI; Chappanangadi desom P3. Kottakkal viIIage:-Kottakkal desom F5, MI, HI, LI, RRI, CRSI ; Kuttipur~m desom P3, MI. Indianur village:Villur desom PI ; Kottur desom PI ; Indianur desom PI, RRI. Chengottur vilIage:-Kuriyad desom PI, MI' Tahkappu desom PI ; Mannazhi desom PI; Che~gottur desom PI, MI. MaIappuram viIlage:Malappuram (Valiyangadi) desom P5, M2, HI, TI, Ll RR2; Malappuram (Kunnummal) desom P4, M2, HI', LI, RRI, CRSI. Annakkayam village:-Vengallur desom P2; Perumbalam desom P2; Annakkayam
desom P3, L~,. RRI. Payyanad village:-P~yyanad desom P2 ; Ndlikkuth desom P3. Pandallur vlllage:Pandallur desom P6. Vettikkattiri viJlage:-Vettikka_ ttiri desom P2 ; Valluvangad desomPI ; Karaya desom PI; Valarad desom P2. Chembrasseri village:Theyyampadikuth desom PI; Kodasseri desom P2 MI, Ll, RRI; Chembrasseri desom P2. Pandikkad village:-Pandikkad desom P2, MI, HI, Ll, RRI, eRSI; Perukkad desom PI; Pukkuth desom PI; Poolamanna desom Pl. Thuvur village:-Thuvur desom P7, MI, L2, :RR2, CRS2. Karuvarakundu village:Cheramba desom P8, MI, HI, Ll, RR4, CRS2. Urban:-
Manjeri town:-Manjeri ward P9, M2, HI, T2, L2, RR2, CRS!. South Wynad Taluk Rural:-
Padinharethara village:-Padinharethara desom P2, Ll, RRI, CRS!. Kuppadithara viIIage:-Kuppadithara desom P4, LI, RRI. Kottathara village:Kottathara desom P5. Thariyode village:-Thariyode desom P3, HI, RR3. Achooranam viIlage:Achooranam desom P2, TI ; Pinangode desom Pl, T3, RRI. Kalpatta village:-Kalpatta desom P4, MI, RRl. Muttil village:-Muttil desom P9. Ponginichickallur vilIage:-Ponginichickallur desom P2, HI; Pulpadi desom P2. Puthadi village:-Velicumbam desom P2; Puthadi desom P3. Pulpalli village:Pakkom desom P2 ; Pulpalli desom P2. Kidanganad vilIage:-Chenad desom PI, RRI. Sultan's Battery viUage:-Sultan's Battery desom P9, MI, HI, L4, CRSI. Purakkadi village:-Purakkadi desom P2, HI; Chingeri desom P3. VengappaUy village:-Thekkumthara desom P2, RRI ; Vengappally desom P2, RRl. Kunnathidavaga viIlage:-Kunnathidavaga desom P2, M2, L2, RR2, CRSI. Kottappadi vilIage:-Thrikkaipatta desom PI; Kottappadi desom P5, RR2. Muppainad viIlage:-Muppainad desom PI, L3. CRSI. Ambalavayal village:-Ambalavayal desom P5, M2, L2, CRS 2. Nenmanivillage:-Nenmani desom P9, M I, L6, CRS2. Noolpuzha village:-Noolpuzha desom PI, RRI.
AD RHC AHOS MPR MCW AYD AYH VETD VETH HM
2 MEDICAL FACILITIES
for Allopathic Dispensary
Badagara Taluk
Rural:-
for Rural Health Centre for Allopathic Hospital for Medical Practitioner for Maternity and Child Welfare Centre for Ayurvedic Dispensary for Ayurvedic Hospital for Veterinary Dispensary for Veterinary Hospital for Homoeopathic Dispensary or Hospital
Kunnummakara desom MPRI. Onchiyam village:Kannakkara desom MCWl. Eramala village:-Or
Azhiyur village :-Azhiyur desom AYD I; ChombaIa desom ADI, MPRI. Kunnummakara village:-
katteri desom A YD L Edacheri village :-Edacheri desom AYHI, HMI. Thuneri village:-Thuneri desom, ADJ, AYDl, VETHI. Parakkadavu village:-
83

AMENITIES
earakkadavu desom ADI, VETHI, HMI; Thanakkot. tur desom RHC!. Valayam village:-Cherumoth descm AYD4; Valayam desom RHCl, MPRI, AYD2. Velliyode village :-Bhoomivathuckal desom AYD2, VETDJ; Velliyode desom AYD 1. I yyencode vii. lage:-Iyyencode desom RHC]. Kuttipram village:Kuttipram desom AYD2. Kummancode village:Kakkamvally desom AD 1, AYD 1 ; Kummancode desom AYDI; Nadapuram desom ADJ, RHCl, MPR3, AYD8. Vellur village:-Vellur desom ADJ ; Chalapram desom AD I, A YD I. Purameri vii. Jage:-Purameri desom ADl, HMI. Vulathapuram village:-Vulathapuram desom VETDI. Ponmeri village:-Parambil desom MCWI. Vulliappally village:-Mayyannur desom RHCI, MPRI; Thi. rumana desom MPRI. Memunda viIlage:Kuttoth desom RHCI;, Keezhal desom MPRl. Chemmarathur village:-Aryyannur desom AYDI. Kadameri village:-Kadameri desom RHCI. Kunnummal village:-Kunnummal desom ADI, MCWl, AYDl, HMl; Vattoli desom AYDI, HMI; Pathiripatta desom HMI. Naripatta viUage:-Naripatta desom ADJ, RHCl, MPRl, AYD2; Chekkonnummal desom AYD3; Thinur desom AYDI. Kavilumpara village:-Maruthonkara desom MCWl, VETHIj KavIIumpara desom VETDI, VETHI, HMI. Kayakody village:-ThaliyiJ desom HM 1; Devarkovil desom HMI. Mokeri village:-Mokeri desom ADl, MPRI, AYD2, AYH2, VETHI, HMI. Kuttiyadi village:-Urath desom HMI; Thondipoyil desom AD2, RHCI, MPR2, HMI. Ayencheri village:Ayencheri desom MPRI. Thiruvalloor village:Thiruvalloor desom RHCI, MPRJ, MCWl. Mantharathur village:-Mantharathur desom MCWl, AYDI. Maniyur village:-Maniyur desom MPRl, MCWI, AYDI. Urban:-
Badagara Muncipal town:-Nalupurabhagom ward MCWl; Pandikasala valappu ward AYDI; Purankara ward MCWI; Sarampally Mukkolabhagom ward AYD4, AYHI, HM2; CholamvayalwardADI, MPRl, AYD7, HM3; Peruvattumthazhabhagom ward AYD3; Payanghavubhagom ward A YD I; Chaliyatherubhagom ward AYDlj Puthurbhagom ward AYDl; Nadakkuthazhabhagom ward AYD2j Meppayil South ward A YD I j Badagaravayalkottaparamba ward AD 10, AHOSl, MPR6, VETHlj Karimpanapalam Narayananagaram ward AD2, MPR2, VETHlj Cheenamveedubhagom ward A YD6; Kayyilbhagom ward A YD2; Kakkattil ward A YD 1 ; KanthiIattpaUy Mooradbhagom ward AYD3j Panikkottibhagom ward AYDl.
Q,uilandy Taluk Rural:-
Iringal village:-Iringal desom MCWl. Trikkottur village: --Trikkottur desom MCWI, AYD2, HMI. Meladi village:-Kannamkulam desom AYDl; Meladi desom ADl, MPR2, MeWI, AYD3, AYHI. Muyipoth village: - Muyipoth desom RHCl, AYD2, VETDI. Cheruvannur .village:-Cheruvannur desom AYDl. Avala village:-Avala
84
desom RHCl, AYD2. Cherapuram village:Cherapuram desom AYDI. Changaroth village:Kunnasseri desom AYD I j Changaroth desom RHC 1, AYD2. Eravattur village:-Kaipram desom AYDI. Kalpathur village:-Kalpathur desom ADl, AYDI; Valiakkode desom A YD I; Kizhinhaniam desom A YD 1 ; Meppayur village:-Kizhpayur desom AYDJ; Meppayur desom AYDl, HMl. Vilayattur village:-Vilayattur desom MPRI, AYDI; Elampilad desom AYDI. Iringath village:-Iringath desom AYDJ. Kozhuk~al~ lur village:-Kozhukkallur desom HM!. Keezhanyur village:-Keezhariyur desom MCWI, AYD4, HMI; Naduvathur desom AYDI; Nambrath desom AYDI. Moodadi village:-Moodadi desom AYD2. ViYYl!r village:-Viyyur desom VETDI. Kuruv~n~ad vdlage:-Kuruvangad desom MCW!. Naden vllIage:Naderi desom AYDI. Arikulam village:-Arikulam desom AYDt, HMI. Chenoli village:-Chenoli desom A YDI HM I ; Cheruvalloor desom A YDl; Valoor desom' AYDl. Menhaniam village:-Menhaniam desom AD2, MPR2, MCWl, AYD2, VETDI, HMI; Vengapatta desom AYD I. Perambra village :-Peram· bra desom ADl, MPRI. Kottur vilIage:-Kottur desom AYD2. Naduvannur village:-Naduvannur desom AYD3, VETDI, HMl. Ulliyeri village:Ulliyeri desom ADI, AYDJ; Oravil desom AYD2. Kunnathara village:-Kannur desom ADI, AYD5j OUur desom AYDl; Puthenchery desom AYDl; Melur village:-Melur desom HMI. Edakkulam village:Edakkulam desom AYD3. Thiruvangoor village:Thiruvangoor desom AYD6. Chemancherry village:Chemancherry desom AD2, AYDI, HM2. Velur viUage:-Velur desom AYD3; Kongannur desom AYD2. Kokkallur village:-Kokkallur desom AYD2. Balusseri village:-Balusseri desom AD4, MPR5, MCWl, AYDIO. Tl'ikuttisseri viIlage:-Vakayad desom AYDI; Trikuttisseri desom AYDI. Avitanallur village:-Avitanallur desom AYD2. Panangad viI. lage:-Nirmallur desom AYDI; Panangad desom ADI, RHCI, AYD6. Sivapuram viIlage:-Karumala desom AD2. Iyyad village:-Iyyad desom ADJ, AYDI. Unnikulam village:-Unnikulam desom ADI, AYD3, VETDl; Poonoor desom ADl, AYDI. Kinalur village·-Mundakkara desom AYD2; Poovampoyil desom AYD 1; Kinalur desom AYD3.
Urban:-Pantalayini town:-PaIitalayini ward AD4, AHOSI,
MPR4, AYD15, VETHl, HM5; Kovilkandy ward AYDI; Kothamangalam ward ADI, MPRl, AYD2.
Kozhikode Taluk Rural:-
Thalakolathur village:-Thalakolathur desom ADS, MPRl, MCWl, AYD2, HM3. Annasseri village:Annasseri desom AYDI. Kannankara village:-Tehanur desom AYD3; Kannankara desom AYD2, HMI. Cheekilode village:-Cheekilode desom AYD2, HMI. Nanminda village:-Nanminda desom MCWI, AYDI, HMI. Parannoor village:-Punnoor Cherupalam desom MeWI, AYDl. Eravannur village:-Eravan. nur desom AYD2. Palath village:-Iruvallur desom AYD2, HM2, Palath desom AYD3. Thamarasseri
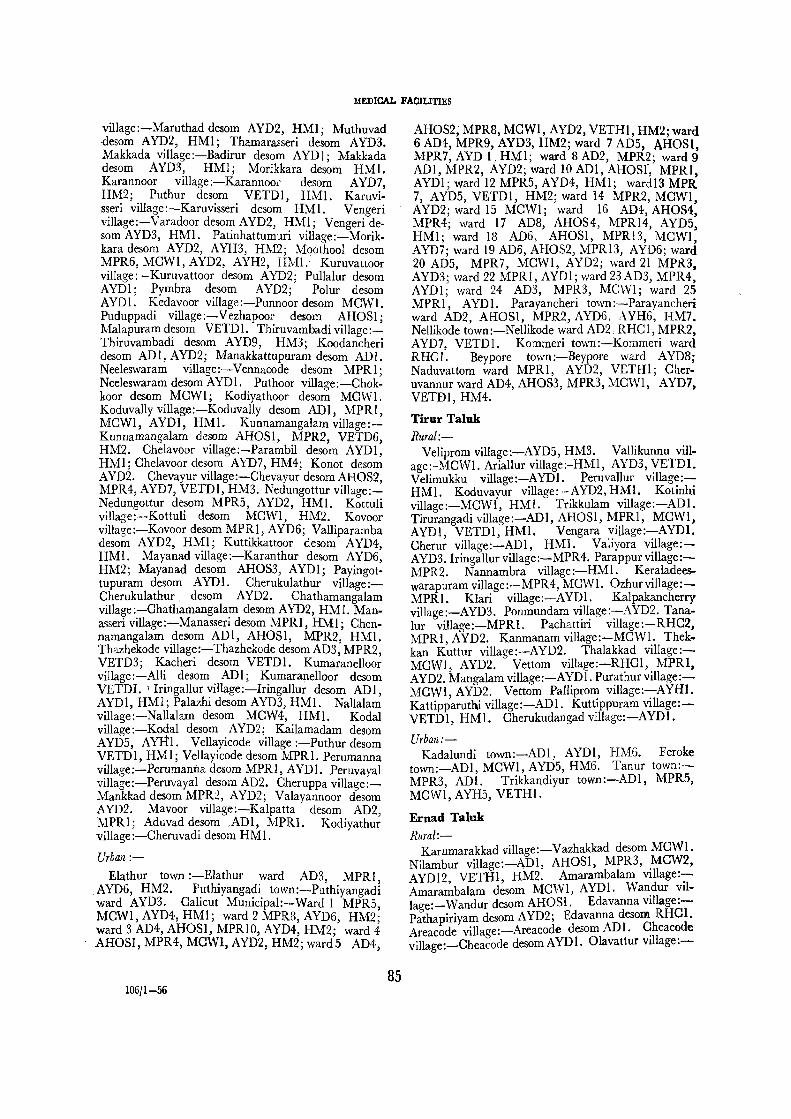
MEDICAL FACILITIES
village:-Maruthad desom AYD2, HMI; Muthuvad desom A YD2, HMI; Thamarasseri desom A YD3. Makkada village:-Badirur desom AYD1; Makkada desom AYD3, HMI; Morikkara desom HMI. Karannoor village:-Karannoot desom AYD7, HM2; Puthur desom VETDI, HMI. Karuvisseri village:-Karuvisseri desom HMI. Vengeri village:-Varadoor desom AYD2, HMl; Vengeri desom AYD3, HMI. Patinhattumuri village:-Morikkara desom AYD2, AYH3, HM2; Moothool desom MPR6, MOWl, AYD2, AYH2, HMl. Kuruvattoor village: -Kuruvattoor desom AYD2; Pullalur desom A YDl ; Pymbra desom AYD2; Polur desom AYDI. Kedavoor village:-Punnoor desom MOWI. Puduppadi village:-Vezhapoor desom AHOSI; Malapuram desom VETDI. Thiruvambadi village:Thiruvambadi desom AYD9, HM3; Koodancheri desom ADI, AYD2; Manakkattupuram desom ADI. Neeleswaram village:-Vennacode desom MPRI; Neeleswaram desom AYDI. Puthoor village:-Ohokkoor desom MOWl; Kodiyathoor desom MOWl. Koduvally village:-Koduvally desom ADI, MPRl, MOWI, AYDl, HMl. Kunnamangalam village:Kunnamangalam desom AHOSl, MPR2, VETD6, HM2. Ohelavoor village:-Parambil desom AYDI, HMI; Ohelavoor desom AYD7, HM4; Konot desom AYD2. Ohevayur village:-Ohevayur desomAHOS2, MPR4, AYD7, VETDI, HM3. Nedungottur village:Nedungottur desom MPR5, AYD2, HMl. Kottuli village:-Kottuli desom MOWl, HM2. Kovoor village:-Kovoor desom MPRl, AYD6; Valliparamba desom AYD2, HMl; Kuttikkattoor desom AYD4, HMl. Mayanad village:-Karanthur desom AYD6, HM2; Mayanad desom AHOS3, A YD l; Payingottupuram desom A YD 1. Oherukulathur village:Oherukulathur, desom AYD2. Ohathamangalam village:-Ohathamangalam desom AYD2, HMI. Manasseri village:-Manasseri desom MPRI, HMl; Ohennamangalam desom ADl, AHOSI, MPR2, HMl. Thazhekode village:-Thazhekode desomAD3, MPR2, VETD3; Kacheri desom VETDI. Kumaranelloor village:-Alli desom ADl; Kumaranelloor desom VETDI. \ Iringallurvillage:-IringaJlur desom ADl, AYDI, HMI; Palazhi desom AYD3, HMI. Nallalam village:-Nallalam desom MOW4, HMI. Kodal village:-Kodal desom AYD2; Kailamadam desom AYD5, AYHl. Vellayicode village :-Puthur desom VETDI, HMl; Vellayicode desom MPRI. Perumanna village:-Perumanila desom MPRI, AYDl. Peruvayal village:-Peruvayal desom AD2. Oheruppa village:Mankkad desom MPR2, AYD2; Valayannoor desom AYD2. Mavoor village:-Kalpatta desom AD2, MPRI; Aduvad desom ,ADI, MPRI. Kodiyathur village :-Oheruvadi desom HMI.
Urban :-
Elathur town :-Elathur ward AD3, MPRI, AYD6, HM2. Puthiyangadi town:-Puthiyangadi ward AYD3. Oalicut Municipal:-Ward 1 MPR5, MOWl, AYD4, HMl; ward 2 MPRS, AYD6, HM2; ward 3 AD4, AHOSl, MPRIO, AYD4, HM2; ward 4
~ AHOSI, MPR4, MOWl, AYD2, HM2; ward 5 AD4,
106/1-56 85
AHOS2;MPR8, MeWl, AYD2, VETHl, HM2;ward 6 AD4, MPR9, AYD3, HM2; ward 7 AD5, AHOSl, MPR7, AYD I, HM1; ward 8 AD2, MPR2; ward 9 ADl, MPR2, AYD2; ward 10 ADl, AHOSr, MPRI, AYDI; ward 12 MPR5, AYD4, HMI; wardl3 MPR 7, AYD5, VETDl, HM2; ward 14 MPR2, MOWI, AYD2; ward 15 MOW1; ward 16 AD4, AHOS4, MPR4; ward 17 ADS, AHOS4, MPRI4, AYD5, HMI; ward 18 AD6, AHOSI, MPR13, MOW1, AYD7; ward 19 AD6, AHOS2, MPRI3, AYD6; ward 20 ADS, MPR7, MOWI, AYD2; ward 21 MPR3, AYD3; ward 22 MPRI, AYDI; ward 23AD3, MPR4, AYDl; ward 24 AD3, MPR3, MeWI; ward 25 MPRI, AYDI. Parayancheri town:-Parayancheri ward AD2, AHOSl, MPR2, AYD6, AYH6, HM7. Nellikode town:-Nellikode ward AD2; RHOI, MPR2, AYD7, VETDI. Kommeri town:-Kommeri ward RHC!. Beypore town:-Beypore ward AYD8; Naduvattom ward MPR1, AYD2, VETHl; Oheruvannur ward AD4, AHOS3, MPR3, MOWI, AYD7, VETDI, HM4.
Tirur Taluk Rural:-
Veliprom village:-AYD5, HM3. Vallikunnu village:-MOWl. Ariallur village:-HMI, AYD3, yETDl. Velimukku village:-AYDI. Peruvallur vJllage:HMI. Koduvayur village: -AYD2, HM!. Kotinhi village:-MOWl, HMI. Trikkulam village:-ADl. Tirurangadi village:-ADl, AHOS1, MPRI, MOWl, AYDl VETDl, HMi. Vengara village:-AYDl. Cheru; village:-ADl, HMI. Valiyora village:AYD3. Iringallur village :-MPR 4. Parappur village:MPR2. Nannambra village:-HMI. Keraladeeswarapuram village:-MPR4, MOWl. Ozhurvillage:MPRI. Klari village:-AYDi. Kalpakancherry village:-AYD3. Ponmundam v~1l:age:-:-AYD2. Tanalur village:-MPRl. Pachattm vlllage:-RH02, MPRI AYD2. Kanmanam village:-MOWI. Thekkan Kuttur village:-AYD2. Thalakkad village:MOWI AYD2. Vettom village:-RHOl, MPRI, AYD2. Mangalam village:-AYDI. Purathurvillage:MOWI AYD2. Vettom Palliprom village:-AYHI. Kattip~aruthi village:-ADI. Kuttippuram vilIage:VETDl, HMi. Oherukudangad village:-AYDI.
Urban:-Kadalundi town:-ADI, AYD1, HM6. Feroke
town:-ADl, MOWI, AYD5, HM6. Tanur town:MPR3, ADi. Trikkandiyur town:-ADl, MPR5, MOW1, AYH5, VETHi.
Ernad Taluk Rural:-
Karumarakkad village:-Vazhakkad desom MOWl. Nilambur village:-i\Dl, AHOSl, MPR3, .MOW2, AYD12, VETHI, HM2. Amarambalam village::Amarambalam desom MOWI, AYDI. Wan.dur vIIlage:-Wandur desom AHOSI. Edavanna village:Pathapiriyam desom AYD2; Edavanna desom RHOl. Areacode viIlage:-Areacode desom ADI. ~heacode village:-Oheacode desom A YD I. 01avattur vlllage:-

AMENITIES
AHOSI. AYD3.
Urban:-
l'huvur village:-Thuvur desom AD 1,.
Manjeri town:-AD3, AHOS1, MPR5, AYDI2, VETHl, HM3.
South Wynad Taluk Rural:-
Olavattur desom MPRl, AYDl. Chelembra village:Chelembra desom HMI. Pallikkal village:-Pallikkal desoJIl HMI. Vaniambalam village:-Mudappillasseri desom AYD2; Vaniambalam desom RHCl, AYD3, VETHI. Kalikavu village:-Trikunnasseri desom AD I. Elankur village:-Elankur desom AYDI. Trikkalangode village:-Trikkalangode desom A YD 1. Kondotty village:-Kolathur desom RHC1, MPR2, AYD2, VETDI, HMI. Nediyiruppu village:-Nedi-yiruppu desom AYD2. Morayur village:-Mongam Padinharethara village:-Padinharethara desom desom AYDl. Pookottur village:-Pookottur desom AYDI. Kalpatta village:-Kalpatta desom AHOSI. MCWr. Valluvambram village:-Valluvambram Kidanganad village:-Chenad desom HMl. Sultan's desom AYDI, HMI. Urakam Kizhmuri village:- Battery village:-Sultan's Battery desomADl, AHOS1, Urakam Kizhmuri desom AYDl. Kottakkal village:- MPRl, MCW2, AYDl6, VETDI, HMI. Kmmathi. Kottakkal desom MPRI, AYHl, HMI. Malappuram davaga village:-Kunnathidavaga desom AHOSI. village:-Malappuram (Valiyangadi) desom ADI, Kottappadi village:-Kottappadi desom RHCl. Mup-MPR2, AYD3; MalappuraJ;n (Kunnummal) desom pain ad village:-Muppainad desom AYD2. Ambala-AHOSI, MPR2, MCWI, AY"b3, VETDI, HMI. vayal village:-Ambalavayal desom AD], MPRI. Payyanad village:-Payyanad desom HMl. Pandik- Nenmani viIlage:-~enmani desom MCW2, AYD6. kad village:-Pandikkad desom AYD3; Pukkuth desom HM2. Noolpuzha village:-Noolpuzha desom HMI.
3 DRINKING WATER FACILITIES
S for safe or protected water supply including pipes, tube-wells, etc.
Badagara Taluk Rural:-
PW for Pucca well PF for public fountain KW for Kuccha well TK for Tank RIV for River
Azhiyur village:-Azhiyur desom PW875, KW51; Chombala desom PW425 , KW18; Kallamala desom PWIOO, KWlO. Kunnummakara village:-Thattolikara desom PW113, KWI8; Kunnummakara desom PW1l5, KWI3; Nellacheri desom PW97, KWI2. Onchiyam village:-Kannakkara desom PW121, KW5; Onchiyam desom PW8I, KW8. UralangaI village:Uralangal desom PW212, KWI3; Vellukulangara desom PWl19, KWI5; Madappalli desomPW63, KW 13. Muttungal village:-Rayarangoth desom PW58, KWI7; Muttungal desom PW63, KWI9. Chorode village:-Erapuram desom PW82, KW5; Nelluyankara desom PW73, KW7; Chennamangalam desom PW75, KW6; Chorade desom PW82, KW6. Vykilasseri village:-Kurukkilad desom PW69, KW5; Vykilasseri desom PW112, KWI5; Varssyekuni desom PW93, KW7. Eramala village:-Orkatteri desom PW315, KW8; Adiyur desom PWIIO, KW24; Eramala desom SI, PW218, KWI5; Payyatthur desom PW184, KWI3. Edacheri village:-Edacheri desom PW3, KW25; Vengoly desom PW25, KW45; Thuruthi desom PW41, KW47. Katcheri village:-Katcheri desom PWll, KW3~; Kottem.brom desom PW41, KW27. Iringannur vIlI~ge:-Irmgannur desom PW41, KW23; Kayapanachl. desom PW23, KW7. Thuneri village:Thunen desom PWI2, KW33; Mudavantheri desom PWI4, KW27. Parakkadavu village:-Ummathur desom PW37, KW29; Parakkadavu desom PW31, KW29; Thanakkottur desom PW31, KW24; Vilakkottur desom PW39, KW27. Chekkiyad village:-Vevam
86
desom PW49, KW27; Chekkiyad desom PW21, KW39; Kuruvantheri desom PW45 , KW39. Valayam village:-Puliyavil desom PW27, KW4; Jatiyeri desom PW28, KW31; Cherumoth desom PW17, KW50; Valayam desom PW19. KW38. Velliyode village:Kuyitteri desom PW69, KW27; Bhoomivathuckal desom PW29, KW49; Kotiyura desom PW35, KW63; Velliyode desom PW45, KW39. Vanimal village:Verkadavu deosm PW71, KW23; Mambilakkool desom PW64, KW33; Vanimal desom PW37, KW24. Iyyencode village:-Kakkattil desom PW260, KW31; Vishnumangalam desom PW275, KW30; Chiyyur desom PW201, KW9; Peruvankara desom PW52, KW4; Iyyencode desom Sl, PW298, KWI4. Kuttipram village :-Varikkoli desom PW301, KW40; Narikkatteri desom PW275, KW75; Chelakkad desom PW250, KW50; Kuttipram desom PW390, KW30. Kummancode village:-Kakkamvally desam PW210, KW2; Kummancode desom, PW475, KW35; Nada. puram desom PW425 , KW50. Vellur village:Kodencheri desom PW21, KW24; Vellur desom PW51, KWll; Chalapram desom PW49, CW27; Perode desom PW3I, KW42. Purameri viIIage:-PW37, KW23. Vulathapuram village:-Muthuvatathur desom PW62, KW23; Kuningad desom PW47, KW21; Vulathapuram desom PW31, KW23. Karthikapally village:-Kurinhaliyode desom PW97, KWI2; Karthikapally desom PWI21, KWI8; Muyipra desom PW157, KWI3. Ponmeri village:-Parambil desom PW315. KW18; Ponmeri desom PW78, KW13. Vulliappally village:-Mayyannur desom PW275, KWI2; Vulliappally desom PW217, KW13; Thirumana desom PW368"

DRINKING WATER FACILITIES
KW13. Memunda village:-Kuttoth desom PW116, KW13; Keezhal desom PW1l8, KW15; Memunda <1esom PW1l5, KWi2. Chemmarathur village:Aryyannur desom PW24, KW3; Thodanur desom PW1l5, KW6; Chemmarathur desom PW218, KW2. Kottappally village:-Kannambathkara desom PW67, KW2; Payingottayi desom PW75, KW3; Kottappally desom PW215, KW4; Valliatt desom PW313, KW8. Kadameri village:-Kadameri desom PW217, KW15; Elayadam desom PW27, KW4. Aroot' lillage:-Perumundacheri desom PW34, KW19; Aroor desom PW29, KW21. Kunnummal village:-Kunnummal desom PW49, KW23; Vattoli desom PW64, KW39; Pathiripatta desom PW104, KW41. Naripatta village:Naripatta desom PW61, KW32; Chekkonnummal desom PWlOl, KW27; Thinur desom PW55, KW41. Kavilumpara village:-Kallat desom PW77, KW,12; Adukkath desom PW45, KW63; Mannur desom PW79, KW84; Maruthonkara desom PWJ09, K W24; Moyilothara desom PW65, KW37; Kavilumpara desom PW24, KW29. Kayakody village:-Changaramkulam desom PW61, KW29; Kottur desom PW29, KW43; Thaliyil desom PW61, KW27; Devarkovil desom PW47, KW13; Akkal desom PW89, KW19; Nidumannur desom PWlOO, KWI8; Kayakody desom PW91, KW24. Mokeri village:-Kovukunnu desom PW84, KW35; Mokeri desom PW61, KW45; Karandot desom PW97, KW31. Kuttiyadi village :-Urath desom PW34, KW43; Valayannur desom PW35, KW43; Thondipoyil desom PWI04, KW13. Vatayam village:Nittur desom PW44, KW31; Vatayam desom PW21, KWI5. Ayencheri village:-PW465, KW17. Thiruvalloor village:-Vellookkara desom PW65, KW17, RIV; Thiruvalloor desom PW412, KW13, RIV. Mantharathur village:-Motapilavil desom PW162, KWI3, RIV; Kurumthodi desom PW153, KWI5; Mantharathur desom PW162, KWI5. Maniyur village:-Maniyur desom PW318, KWI3, RIV; Cherandathur desom PW182, KWI3; Elambilad desom Sl, PW155, KWI3, RIV. Palayad village:-Palayad desom PW175, KW2; Pathiyarakkara desom S4, PW81O, KW25. Karuvancheri village:-Cpellattapoyil desom PW150, KW4; Meenathkara desom PW30, KW5; Kunnathkara desom PW20, KW2; Muthuvana desom PW125, KW21; Karuvancheri desom PW180, KW7.
Urban :-
Badagara Municipal Town:-Kuriyadi ward PW25, KWIO, TKI; Mukachery ward PW40, KW15, TK2; Nalupurabhagam ward Sl, PW45 , KW20, TK2; Pandikasala valappu ward PW20, KWIO, TK4; Purankara ward PWI5, KW25, TKl; Pakkayilbhagam ward PW5, KW6, RIV; Sarampally Mukkolabhagam ward PW80, KW30, TK4; Cholamvayal ward PW225, KW125, TK3; Peruvattumthazhabhagam ward PW125, KW35, TK2; Payanghavubhagom ward PW62, KW15, TK3; Chaliyatherubhagam ward PW150, KW20, TK2; Arakkiladbhagam ward PW90, KW40, TK2; Puthurbhagam ward PW130, KW28, TK4; Nadakkuthazhabhagam ward PW113, KW120, TK2; Meppayil North wardPWl20, KW30; Meppayil
JD6I1-56a 87
South ward PWI09, KWll, TK2; KannamkuzhiCheeramveedubhagam ward PW60, KW20; Badagara vayal Kottaparamba ward PWI04, KW19, TK3; Karimpanapalam Narayananagaram ward PW160, KW15; Cheenamveedubhagam ward PW45, KW2, TK2; Kayyilbhagom ward PW').7, KW3, TKI, RIV; Kakkattil ward PW29, KWI, TKI, RIV; Kanthilattpally Mooradbhagom ward PW22, KW4, TK4; Panikkottibhagom ward PWI8, KW3, TKI.
Q.uilandy Taluk Rural :-
Ayarikkad village :-PW 1. Trikkottur village :Trikkottur desom PW2. Pallikkara village:-PWI. Meladi village:-Kannamkulam desom PWl; Meladi desom PW7; Kizhur desom PWl. Thurayur viUage:Thurayur desom PW2; Toleri desom PWI. Muyipoth village:-Muyipoth desom, RIV. Cheruvannur viIlage:-Cheruvannur desom PWI; Pampirikunnu desom PWI. Avala village:-Avala desom PWl, RIV. Cherapuram village.-PW2. Paleri village:Paleri desom PWI, RIV. Changaroth village:Changaroth desom PWI, RIV. Muthuvannacha vilIage:- Kuniyode deso~ PWI; Muthuvan. nacha desom PWI, RIV. Kallode village:-Kallode desom PWI, RIV. Paithoth desom PWl. Kalpathur village:-Kalpathur desom PW2; Ramallur desom PW2; Valiakkode desom PW2; Kizhinhaniam desom PWl. Meppayur village:-Meppayur desom PWI; Changaram valli des');}} PWl. Vilayattur village:-Vilayattur desom PWI. Iringath village:Iringath desom PW3; Kuluppa desom PWI. Moodadi village:~M30dadi desom PW2. Kuruvangad village:-Kuruvangad desom PW5. Nochad village:Nochad desom PWI. Chenoli village;-Chenoli desom PW1. Menhaniam village:-Menhaniam desom PW2. Perambra village:-Perambra desom PWI. Naduvannur village:-Ayanikkad desom PWI. Kunnathara village:-Kannur desom PW3; OHur desom PWl; Kunnathara desom PWl. Melur village:-Melur desom PW2, RIV. Edakkulam village:-Edakkulam desom PWl. Thiruvangoor village:-Thiruvangoor desom PW4. Chemancherry village:-Chemancherry desom PWI. Velur village:-Velurdesom PW4; Kongannur desom PWI. Edakkara village:-Kolakkad desom TK 2, RIV. Kokkallur village:-Kokkallur desom TK2. Balusseri vlllage:-Kannikavu desom PWI; Puthurvattam desom PW2; Balusseri desom Sl. Avitanallur village:-Avitanallur desom PWI. Panimgad village:-Panangad desom PW2. Iyyad village:-Iyyad desom PW1. Unnikulam village:-Unnikulam desom TKl; Poonoor desom TKI.
Urban:-Pantalayini town:-Pantalayini ward Sl, PW2.
Kozhikode Taluk Rural:-
Elathur village:-Perinthiruthi desom Sl, KW75, RIV. Thalakolathur village:-PW2, KW975, TKIO, RIV. Annasseri village:-TK6, RIV. Kannankara village:-Tehanur desom KW240, TK5; Kannankara desom KW350, TK6; Kandanoor desom KW288, TK2.

AMENlTlES
Indad desom KW75, TKI. Naduvalloor village:Pavandur desom PWl; Naduvalloor . desom PWI. Nanminda village:-PW4. Pannikkottur village:Pannikkottur desom Sl. Nediyanad village:-PWl. Palath village:-lruvallur desom KW21O, TK4; Palath desom KW472, TKII. Thamarasseri \,!llage:-Maruthad desom TK220, RIV; Muthuvad desom TK23; Thamarasseri desom TK580, RIV. Makkada village:-Badirur desom KW300, TK5, RIV; Makkada desom KW800, TK9, RIV; Morikkara desom KW225, TK3, RIV. Karannoor village:-Karannoor desom KW360, TK6, RIV; Puthur desom KW360, TK6, RIV. Karuvisseri village:-Karuvisseri desom TKIO, KW 450, RIV. Mokavoor desom KW200, TK5, RIV. Vengeri village:-Varadoor desom KWIOO, TK6; Vengeri desom KW250, TK8, RIV. Patinhattumuri village:-Morikkara desom KW180; Moothool desom KW90, TKI; Kirallur desom KW60; Patinhattumuri desom KW260, TK5; Kizhakkumuri desom KW350, TK5. Kuruvattoor village:-Kuruvattoor desom TK4; Pullalur desom TK2; Pymbra desom TK3, RIV; PoIur desom TKl. Paimbalasseri village:-Paimbalasseri desom Sl. Madavoor village:-Madavoor desom KWI. Elettil village:-Avilora desom PWl; Elettil desom PWI. Vavad viIlage:-Panakkod desom PWl. Raroth village :-Andona desom PW I; Raroth desom PW 1; Karingamanna desom RIV; Valimanna desom RIV. Kedavo0f village:-Palliprom desom PWl; Kedavoor desom PWI. Puduppadi village:-Vezhapoor desom PW2; Puduppadi desom TKl. Thiruvambadi village:-Thiruvambadi desom PWI, RIV; Koodancheri desom RIV; Manakkattupuram desom RIV; Cheruppa desom RIV. Neeleswaram village:Vennacode desom RIV. Koduvally village:Koduvally desom PWI. Kunnamangalam village:KW3, RIV. Chelavoor village:-Cheruvatta desom TK2, RIV; Parambil desom KW270, TK3, RIV; Chelavoor desom TK8, RIV, KW860; Konot desom KW90, TK2. Chevayur village:-Sl, TK4, RIV. Nedungottur village :-KW375, RIV. Kottuli village :-KWIOO,TK75, RIV. Kovoor village :-Kovoor desom KW756; Valliparamba desom KW670, TKI6, RIV; Kuttikkattoor desom KW305, TKI2. Mayanad village :-Karanthur desom KW592, TK7; Mayanad desom PWI, KW498, TK8; Payingottupuram desom KW269 , RIV. Chathamangalam village :-Pullanoor desom RIV; Chathamangalam desom KW2. Chooloor village :-Chooloor desom RIV. Manasseri village :-Chennamangalam desom KWl, RIV. Thazhekode village :-Thazhekode desom KWl, TKl, RIV. Kumaranelloor village :-Anayankunnu desom RIV. Poolacode village :-Munnur desom RIV; Puzhur desom RIV. Kanniparamba village :-Kanniparamba desom TK4; Palangad desom KW2, TKI, RIV. Iringallur village :-Iringallur desom KW650, TKIO, RIV; Palazhi desom KW280, TK15. Nallalam village :-KW550, TK3. Kodal village: -Kodal desom KW650, TK25, RIV ; Kailamadam desom KW290, TK4, RIV. Vellayicode village :-Puthur desom RIV; Vellayicode desom RIV. Perumanna village :-KWI, RIV. Peruvayal village :-Peruvayal desom KWl; Koyalam desom
88
RIV. Ch$:ruppa village :-Cheruppa desom TKI. RIV; Mankkad desom PW2, TK2, RIV; Valayannoor desom PWI, RIV; Malapram desom TK2. Mavoor village :-Kalpatta desom KWI, TKI, RIV . Mavoor desom KW2, TK3; Aduvad desom RIV: Kodiyathur village :-Cheruvadi desom PWI ; Kodiyathur desom PWI, TK1, RIV. Pannicode village :_ Kakkad desom RIV; Kavasseri desom KWl, RIV.
Urban :-Elathur town :-RIV, PWI, KW3, TK860.
Edakkad town :-KW810, TK5. Puthiyangadi town:KWI030, TK4. Calicut Municipal town :-ward 1 PW1049, PF24, KW31, TK26; ward 2 PF27, PW777, KW19, TKI9; ward 3 PF22, PW637, KW15, TK4; ward 4 PFI6, PW409, KW21, TKl; ward 5 PF16, PW901, KW32, TK36; ward 6 PFIO, PW229, KWI3, TK8; ward 7 PF5, PWl29, KW2, TKS; ward 8 PF5, PW125, KW2 TKI; ward 9 PF4, PW137, KW6; ward 10 PF3, PW59, KWl; ward 11 PF7, PW99, KW3, TK3; ward 12 PF12, PWl77, KW3, TK3; ward 13 PF6, PW226,KW6, TK6; ward 14 PFI0, PW243, KW2, TK4; ward 15 PFI3, PW256, KW4, TK7; ward 16 PF9, PW298 KW3, TK3 ; ward 17 PF23, PW569, KW12, TKlO; ward 18 PF21, PW272, KW5, TK16; ward 19 PF22, PW389, KW6, TK23; ward 20 PF14, PW240, KWIO, TK8; ward 21 PF20, PW396, KWl3 TKI8; ward 22 PF6, PW298, KWll, TK29; ward 23 PFI3, PW380, KWI4, TK29; ward 24 PF17, PW339, KW12, TK3; ward 25 PF6, PW315, KW8, TK33. Parayancheri town :-SI, KW300, TK25, RIV. Nellikode town:PWI, KW1000, TK75. Kommeri town :-KW420, TKI8. Beypore town :-Beypore ward S2, KW300, TK6, RIV; Naduvattom ward Sl, TK6, PWI~ KW500; Cheruvannur ward KW200, TKI2, RIV. Olavanna town :-KWIIOO TK, RIV.
Tirur Taluk Rural:-
Veliprom village :-KW3. Mannur village :-KW2. Vallikunnu village :-KW3. Ariallur village :-KW3. Thenhipalam village :-KW3. Velimukku village:KW3. Peruvallur village :-,-PWI. Kannamangalam village :-PW3. Koduvayur village :-TK6, PW2, RIV. Mo6niyur village :-KW2. Ullanam village:KWI. Neduva village :-KW4. Pariapuram village:SI, PW2, TK2. Kotinhi village :-KWI. Trikkulam village :-PW2, KW4. Tirurangadi village :-KW6. Vengara village :-PW2, RIV. Cherur village:PWl, TK4, RIV. Valiyora village :-PWI, RIV. Iringallur village :-PWI, TKl, RIV. Mattathur village :-PWl, TK2, RIV. Parappur village :-PWl, TK3, RIV. Valakkulam village :-PW2, TK4. Thennala village :-PWl, TK2. Nannambra village:KW2. Keraladeeswarapuram village :-PW2, KWI. Ozhur village :-PWl. Perumanna village :-PW13, KW3, TK7; Puthur village :-PW2, TK3, RIV. Klari village :-PW2, TK4. Kalpakancherry village:TK5. Valavannur village :-PW6, TK8. Ponmundam village :-PWIO. Niramaruthur village :-PW3, KW2. Pachattiri village :-PWIO. Tirur village :-RIV.

DRINKING WATER FACILITIES
K anrnanam village :--TK6. t Iringavoor village : __ TK5. Kurumbath\tr village :--PW3. Vadakkumbrarn village :-PWI. Th'Qzhuvannur village :-PW3. Athavanad village :-PWl. Thekkankuttur village :-PWI, RIV. Thalakkad village :-PWI, RIV. Vettom village :-PW7. Mangalam village :-PW9. Purathur village :-PW3, RIV. Pudupalli village :-PWl. Vettom Palliprorn village:-PW7, RIV. Thriparangode village:-PWll. Thirunavaya village:-PW5, RIV. Naduvattom village:-PWI. Kattipparuthi village:-PW2. EC'ayur village:-PWl. Irirnbliyarn village:-PWI. Kuttippurarn village:-PW2. Paruthur vilIage:-RIV, PWI. Cherukudangad vil1age:PWI, RIV.
Urhan:-Kadalundi town:-KWI7. Feroke town :-KW6.
Parappanangadi town :-KW3. Tanur town :-S4, PWll, KW2, TK2. Trikkandiyur town :-PW3, RIV.
Ernad Taluk Rural:-
Azhinhilarn village :-Azhinhilarn desom PW120, KW60, TK2, RIV; Puthukode desom PWlOO, KW40, TK2, RIV; Karad desom PW80, KW30, TK2, RIV. Vazhayur village:-Vazhayur desom PW120, KW20, TK20, RIV; Kakkove desom PW80, KWB, TK 1, RIV; Peringavu desom PWIOO, KWlO, TK2, RIV. Karurnarakkad village :-Karurnarakkad desorn PW80, KW20, TK5, RIV; Vazhakkad desom PW90, KWIO, TK4, RIV; Ananthavur desom PW60, RW4, TK2, RIV. Cheruvayur village:-Cheruvayur desom PWIIO, KW30, TK6, RIV; Maprom desom PW120, KW20, TK4, RIV; Chaliyaprarn desorn PW150, KW30, TK3, RIV. Kizhuparamba village:-Kizhupararnba desorn
, PWBO, KWIO, TK4; Trikkalayur desom PW90, KW4, TK2; Kunniyil desom PW80, KW6, TK3; Pathanapuram desom PW40, KW4, TK2. Oorangattiri village:-Arikkod desorn PW180, KW20, TK6, RIV ; Oorangattiri desom PW195, KW30, TK8, RIV. Marnbad village:-PWIOOO, KW500, TKIO, RIV. Nilambur village:-PW4500, KW800, TK200, RIV.·· Amarambalarn village:-PW1200, KW600, TK20, RIV. Wandur village:-Kappil desom PW400, KW120, TKI6, RIV; Wandur desom PW600, KWIIO, TK12. Punnappala village:-Chadagankularn desom PW300, KW20, TKI2; Punnappala desom PW400, KW40, TK20. Tiruvali village:-PW450, KW60, TK20. Edavanna village:-Pathapiriyam desom PW200, KW50, TKIO; Edavanna desom PW270, KW60, TK20, RIV; Eranhikkode desom PW280, KW70, TK20. Perakamanna village:-Vadasseri desom PW80, KW20, TK6, RIV; Chathallur desom PW120, KW30, TK8, RIV; Perakamanna desom PW220, KW60, TKI2, RIV. Kavanur village:Kavanur desom PW160, KW20, TKI2; Vakkalur desom PW160, KW20, TKI6. Areacode village:Ugrapurarn desom PW80, KW20, TK4, RIV; Chembrakkattur desom PW90, KW30, TK8, RIV; Kozhak. kottur desom PWIIO, KW40, TK12, RIV; Areacode desom PW120, KW30, TKIO, RIV; Puthalam desom PW80, KW20, TK4. Vilayil village:-Mundakkal desom PW90, KWIO, TK4; Parappur desom PW80,
89
KW20, TK8; Vilayil desom PWllO, KW60, TK4; Mundambra desom PW80, KW20, TK8. Cheacode village:-Omanur desom PW80, KW20, TK6, RIV; Cheacode desom PW65, KWI6, TK4; Vavur desom PW80, KW40, TK6. Olavattur village:-Aroor desom PW80, KW20, TK4; Olavattur desom PW120, KW40, TK20. Cherukavu village:- Cherukavu desom PW70, KW20, TKB; Pengad desom PW80, KW30, TK4; Puttupadam desom PW80, KW40, TK6; Paravur desom PW60, KW20, TK4; Chevayur desom PW70, KW30, TK6. Chelembra viJIage:-PW500, KW120, TK20, RIV. Pallikkal village:-Pallikkal desom PW180, KW60, TK20; Puthur desom PW220, KW80, TKI6. Andiyurkunnu village:-Andiyurkunnu desom PW60, KW20, TK4; Muttayur desom PW70, KW30,' TK6; Mozhangallur desom PW40, KW20, TK4; Vellora desom PW60, KWI5, TK6; Valiyaparamba desom PW50, KWI2, TK4; Nunhallur desom PW40, KW12, TK2. Muthuvallur village:-Parathakkad desom PW60, KW20, TK6; Mundakulam desom PW70, KW16, TK4; Thavanur desom PW80, KW20, TK8; Muthuvallur desoiTI PW60, KWI5, TK6. Puliacode village:-Puliacode desom PW90, KW20, TK8; Vellari desom PW80, KW16, TK4; Kadungallur desom PW130, KW20, TK6. Irivetty village:-Elayur desom PW80, KWI6, TK4; Irivetty desom PW90, KW20, TK6; Chengara desom PW70, KWI6, TK3. Karakunnu village:-Karakunnu desom PW120, KW20, TK8; Amayur desom PWI05, KW26, TK4. Vaniambalam village:-Pazhetam desom PW120, KW40, TKI2, RIV; Mudappillasseri desom PW140, KW35, TKI6, RIV; Vaniambalam desom PW180, KW40, TK8. Kalikavu village:-Trikunnasseri desom PW1200, KW400, TK60, RIV. Vellayur village:-Pariyangad desom PW400, KW120, TK40, RIV; Poongod desom PW600, KW120, TK30; Vellayur desom PW650, KW160, TK60. Porur village:-Putrakovil desoID PW250, KW120, TK20; Ayanikkod desom PW300, KW160, TKIO ; Porur desom PW420, KW170, TKI2. Chathangottupuram village:-Palakod desom PW320, KWllO, TKI6; Eramangalam desomPW360,KW120, TKI8; Edappalam desom PW380, KWIIO, TKI4; Chathangottupuram desom PW31O, KW90, TK8; Vithanasseri desom PW290, KW80, TK7. Elankur village:-PW800, KW250, TK80. Trikkalangode village:- Trikkalangode desom PW180, KW60, TK20; Karikkad desom PW120, KW30, TK8. Pulpatta village:-Cheruputhur desom PW80, KW20, TK6; Olamathil desom PWIIO, KW40, TK8; Pukadathur desom PW90, KW35, TK6; Valamangalam desom PW80, KW20, TK4; Tottekkad desom PW120, KW30, TK6; Puipatta desom PW130, KW40, TK7. Trippanachi village:-Palakkat desom PW90, KW30, TK8; Muthannur desom PW80, KW40, TK12; Trippanachi desom PWllO, KW30, TK8. Kuzhimanna village:Kizhusseri desom PW150, KW70, TKl6j Kuzhimanna desom PW160, KW60, TK16. Kondotty village:Kolathur desom PW700, KW80, TK20; Neerad desom PW600, KW75, TK16. Karippur village:-Karippur desom PW160, KW40, TKI2; Cherayil desom PW1l5, KW35, TK9. Nediyiruppu viIlage:-Nediyiruppu desom PW220, KW60, TK8; Cherayil desom PW270, KW80, TKI2. Morayur village:-Ozhukur desom

AMENlTIBS
PW320, KWllO, TK16; Morayur desom PW360, KW80, TK12; Mongam desom PW310, KW70, TK8. Arimbra village:-PW20, KW280, TK5. Pookottur. village:-Vellur desom PW20, KW370, TK8; Aravankara desom PW15, KW31O, TK6; Pookotturdesom PW12, KW280, TK8. Valluvambram viJlage:Valluvambram desom PW120, KW20, TK6; Pullanur desom PW90, KW16, TK4; Muthiraparamba desom PWllO, KW15, TK4. Narukara village:-Vimbur desom PW60, KW20, TK8; Narukara desom PW80, KW30, TKI2; Kottupatta desom PW70, KW25 , TK9. Karuvambram village:-Kidangazhi desom PW60, KWI8, TK12; Karuvambram desom PW80, KW20, TK8; Melakkam desom PW70, KW16, TKo. Irumbuzhi village:-Pappinippra desom PW180, KW30, TK8; lrumbuzhi desom PWIZO, KW20, TK7, RIV. Melmuri village:-PW250, KW140, TKIO. Urakam Melmuri village:-PW516, KWI7, TK5. Urakam kizhmuri vi!lage:-PW783, KW23, TKIl. Ponmala village:Ponmala desom PW120, KW60, TK8; Chappanangadi desom PWIIO, KW90, TK6. Kottakkal village:Kottakkal desom PW180, KW62, TKI2; Kuttipuram desom PW152, KW66, TK8. Indianur village:Villur desom PW90, KWI2, TK4; Kottur desom llWllO, KWI3, TK4; Indianur desom PW60, KW8, TK2. Chengottur village:-Kuriyad desom PW40, KW20, TK4; Talal-:appu desom PW50, KWI6, TKS; Chunur desom PW60, KWI2, TK4; Mannazhi desom PW70, KW20, TK6; Chengottur desom PW80, KW27, TK8; Kolkalam desom PW40, KW16, TKS. Malappuram village:-M~lappuram (Valiyatigadi) desom PW2l6, KW50, TK12, RIV; Malappuram (Kunnummal) desom PW218, KW68, TKI3, RIV. Annakkayam village:-Vengallur desom PW90, KW30, TKS, RIV; Perumbalam desom PW80, KW40, TK8, RIV; Annakkayam desom PW120, KW30, TK12 RIV. Payyanad village:-Payyanad desom PW300; KW40, TK20; Nillikkuth desom PW220, KW30, TK8. Pandallur village:-PW200, KW30, TK6. Vettikka-
.._ ttlfl village:-Vettikkattiri desom PW80, KW40, TKI2; Valluvangad desom PW90, KW20, TK8; Karaya desom PW60, KW30, TK6; Valarad desom PW90, KW25, TKl6. Chembrasseri village:-Theyyampadikuth desom PW210, KW40, TK4; Kodasseri desom PW160, KW40, TK6; Chembrasseri desom PW120, KW30, TK8. Pandikkad villa~e:-Pandikkad desom PW250, KW80, TK20, RIV; Perukkad desom PW21O, KW60, TK18; Pukkuth desom PW260, KW76, TK16; Poolamanna desom PW220, KW40, TK12. Thuvur village:-PW1200, KW500, TKSO, RIV. Karuvarakundu village:-Cheramba desom PW200J, KW600, TK120, RIV. Urban:-
Mmjeri town-Manjeri ward: PW756, KWIOO, TK25.
South Wynad Taluk Rural:-
Padinharethara village:-RIV, KW250. Kuppadithara village:-RIV, KW250. Kottathara village:PW52, RIV. Thariyode village:-RIV, KW125. Achooranam village:-Achooranam desom RJV; Pinangode desom RIV. Kalpatta village:-KW220, PW6. Muttil village:-PW2. Ponginichickallur village:-Pulpadi desom PW2. Puthadi village:Puthadi desom PW2. Kidanganad village:-Chenad desom PWll; Kidanganad desom PW4; Vadakkanad des')m PW5 TKl. Sultan's Battery village:-PW50, TK5. Pur;kkadi village:-Purakkadi desom PWI; Chingeri desom PWl. Vengappally village:-Thekkumthara desom KWIOO; Vengappally desom RIV, KW142. Kunnathidavaga village:-PW5, S2, KW425, TKI, RIV. Kottappadi village:-Thrikkaipatta desom KW32; Kottappadi desom PW4, KW92, RIV. Muppainad village:-PWIO, RIV. Ambalavayal village:-PWI3. Nenmani village:-PW6. Noolpuzha village:-PWI5, RIV.
4 COMMUNICATION AND TRANSPORT FACILITIES
Badagara Taluk
Rural:-
PO TO PH RH CH R W Rly
for Post Offices for Telegraphs
for Phones for Rest House for Choultries for Connected by Road for Connected by Water for Connected by Railway
Azhiyur village:-Azhiyur desom POZ, TOI, CHI, R; Chombala desom PO I, R; Kallamala desom R. Onchiyam village:-Kannakkara desom POI, R. Uralangal village:-Uralangal desom POI, R; Vellukulangara desom R; Madappalli desom PO I, R. Muttungal village:Rayarangoth desom POI, R; Muttungal desom. POl,R.
Chorode village:-Erapuram desom POI, PHl5, R; Chennamangalam desom R. Vykilasseri village:Vykilasseri desom POL Eramala village:-Orkatteri desom POI, R. Edacheri village:-Edacheri desom POI, R; Vengoly desom CHI; Thuruthi desom R. Katcheri village:-Katcheri desom RHI. Iringannur village:-Iringanriur desom PHI, R; Kayapanachi desom RHI. Thuneri village:-Thuneri desom POI, R, W; Mudavantheri desom R, W. Parakkadavu
90

COMMUNICATION AND TRANSPORT FACILITIES
, village:-Parakkadavu desom POI, R, W. Chekkiyad village:-Kuruvantheri desom POI. Valayam village:-Jatiyeri desom CHI; Valayam desom POI, CHI. Velliyode village:-Bhoomivathuckal desom POI, CHI, R; Kotiyura desom POL Vanimal village:-Verkadavu desom POI; Vanimal desom CHI, R. Iyyencode village:-Kakkattil desom R, W. Vishnumangalam desom R, W; Chiyyur desom R; Peruvankara desom R, W; Iyyencode desom R, W. Kuttipram village:-Varikkoli desom R; Narikkatteri desom R; Chelakkad desom R; Kuttipram desom R. Kummancode village:-Kakkamvally desom PO I, R; Kummancode desom R; Nadapuram desom POI, R. Vellur village:-Kodencheri desom POI, R; Vellur desom R; Chalapram desom R, W; Perode desom R, W. Purameri village:-Purameri desom POI, R, W. Vulathapuram village:-Kuningad desom POI, R; Vulathapuram desom R. Karthikapally village:Karthikapally desom POI. Punmeri vil1age:-Parambil desom R; Ponmeri desom R. Vulliappally village:Mayyannur desom T02, R; Thirumana desom TOI, R. Chemmarathur village:-Thodanur desom POI; Chemmarathur desom POI. Kottappally village:Valliatt desom POI. Kadameri village:-Kadameri desom R. Aroor village:-Perumundacheri desom TOI. Kunnummal village:-Kunnummal dseom R; Vattoli desom POI, R; Pathiripatta desom POI, R. Naripatta village:-Naripatta desom POI, CH3; Chekkonnummal desom POI, CH3; Thinur desom POI, CH3, R. Kavilumpara village:-Adukkath desom R, W; Mannur desom W; Maruthonkara desom POI, R, W; Moyilothara desom POI; Kavilumpara desom P03, R, W. Kayakody village:-Changaramkulam desom R; Kottur desom R; Thaliyil desom POI, R, W; Devarkovil desom R, W. Mokeri village:Mokeri desom POI, R. Kuttiyadi village:-Urath desom W; Valayannur desom PO I; Thondipoyil desom PO I, W. Thiruvalloor village:-Thiruvalloor desom POI. Palayad viIlage:-Pathiyarakkara desom TOI, CHI,R. Urban:-
Badagara Municipal town:-Kuriyadi ward PHI, R; Mukachery wa:r;d PHS, R; Nalupurabhagam ward PH2, R; Pandikasalavalappu desom PH6, R; Pakkayilbhagam ward R, Rly; Sarampally Mukkolabhagam ward PH6, R, Rly; Cholamvayal ward POI, PHIl, R'; Peruvattumthazhabhagam ward PH2, R, Rly; Payanghavubhagam ward CHI, R; Chaliyatherubhagam ward PHI, R; Arakkiladbhagam ward POI, R; Puthurbhagam ward R; Nadakkuthazhabhagam ward POI, R; Meppayil North ward R; Meppayil South ward R; Kannamkuzhi Cheeramveedubhagam ward R; Badagara vayal Kottaparamba ward PO I, PH II,
,RHI, R; Karimpanapalam Narayananagaram ward POI, PHIl, RHI, R; Cheenamveedubhagam ward POI, R, PHI; Kanthilattpally Mooradbhagam ward R. Q.uilandy Taluk Rural-
Iringal village:-Iringal desom POI, PHI, R, W, Rly. Ayanikkad village:-Ayanikkad desom POI, R,
91
Rly. Trikkottur village:-Trikkottur desom POI, R, Rly. Pallikkara village:-Pallikkara desom POI, R. Meladi village:-Kannamkulam desom POI; Meladi desom P02, TOI, PB2, R, Rly; Kizhur desom POI, R, W. Thurayur village:-Thurayur desom POI, R, W; Toleri desom POI, R. Muyipoth village:Muyipoth desom POI. Cheruvannur village:-Cheruvannur desom POI, R. Avala village:-Avala desom POI, R. Cherapuram village:-Cherapuram desom POI. Velam village:-Cherukunnu desom POI; Velam desom POI, W. Paleri vilIage:-Paleri desom POI, R. Changaroth village:-Changaroth desom POI, R, W; Kokkad desom W; Avatukka deso!"!} W. Muthuvannacha village:-Muthuvannacha desom POI, R. Kallode village:-Kallode desom POI, R; Koothali desom R. Eravattur village:~Eravattur desom POI. Kalpathurvillage:-Kalpathur desom POI, R; Valiakkode desom POI, R. Meppayur village:-Meppayur desom POI, R. Vilayattur village:-Vilayattur desom POI, R. Iringath village:-Iringath desom R. Keezhariyur village:-Keezhariyur desom PO 1. Moodadi village:-Moodadi desom POI, R, Rly; Vellarakode .desom Rly. Purakad village:-Purakad desom POI. Vanmugham village:-Vanmugham desom POI. Viyyur village:-Puliyancheri desom W; Kolakkad desom W; Kollam desom W; Viyyur desom POI, R. Naderi village:-Naderi desom POI. Arikulam village:-Arikulam desom POI, R. Nochad village:-Nochad desom POI, R; Velliyur desom R. Chenoli village:-Chenoli desom POI, R; Puttat desom R. Menhaniam village:-Menhaniam desom POI, RHI, R; Pandicode desom R; Vengapatta desom R; Marutheri desom R. Perambra village:Kiliampilai desom POI; Pillaperuvanna desom POI, R; Perambra desom POI, R. Kottur village:Kottur desom POI. Naduvannur vilIage:-Ayanikkad desom POI, W; Naduvannur desom POI. Ulliyeri village:-Manat desom R; Mundoth desom R; UBiyeri desom POI, R; Oravil desom R. Kunnathara village:-Kannur desom R. Melur viIlage:-Melur desom P02, R, Rly; Chelia desom POI, W. Edak. kulam village:-Edakkulam desom POI, R, W, Rly. Thiruvangoor vilIage:-Thiruvangoor desom P02, R; Vengalam desom POI. Chemancherry village:Kadalur desom PO I; Chemancherry desom P02, R, W, Rly. Velur vilIage:-Velur desom POI, R, W; Kongannur desom POI. Edakkara village:-Kolakkad desom PO 1; Edakkara desom PO 1. Kokkallur village:-Kokkallur desom POI, R. Balusseri village:Thuruthiyad desom POI; Puthurvattam desom R; Balusseri desorn POI, TOI, R. Trikuttisseri village:Vakayad desom POI; Trikuttisseri desom W. Avitanallur village:-Avitanallur des.om POl,R. Sivapuram viIIage:-Sivapuram desom POI, R; Karumala desom POI, R. Iyyad village:-Iyyad desom POI, R. Unnikulam viUage:-Unnikulam desom POl,R.
Urban:-
Pantalayini town :-Pantalayini ward PO I, TO I, PH4, RHI, CHI, R, Rly; Kovilkandy ward R; Kothamangalam ward PHI, R.

AMENITIES
ltozhikode Taluk
RlI1al:-
Elathur village:- Perinthiruthi desom W. Thalakolathur village:-Thalakolathur desom POI, R, W. Annasseri village :-Annasseri desom POI, R, W. Kannankara village :-Tehanur desom POI, R, Wj Kannankara desom R, W; Kandanoor desom R.W. Naduvalloor village :-Naduvalloor desom POI. CheekiIode village :-Cheekilode desom PO I. Nanminda village:-Nanminda desom pal. Pannikkottur viIlage:-Pannikkottur desom POI. Nediyanad village:Nediyanad desom POI. Punnasseri viIlage:-Punnasseri desom PO 1. Parannoor village :-Punnoor Cherupalam desorn POI; Parannoor desorn pal. Palath village:Iruvallur desom POI, R; Palath desorn pal, R. Thamarasseri village :-Maruthad desom R; Tharnarasseri desorn POI, R. Makkada village:-Badir IT
desom R, W; Makkada desorn POI, R j Morikkara desorn POI, R, W. Karannoor village:Karannoor desom POI, R; Puthur desom R. Karuvisseri village:-Karuvisseri desom POI, R; Mokavoor desom R. Vengeri village:-Varadoor desom R; Vengeri desom POI, R. Patinhattumuri village:-Morikkara desorn R; Moothool desorn R. Kuruvattoor village :-Kuruvattoor desom PO I; Pymbra desom POI. Madavoor village:-Madav\lor desom POI. Kizhakkoth village:-Kizhakkoth desom pal; Panoor desom POI. Elettil village :-Avilora desom POI; Elettil desorn POI. Pararnbathkavu village :-Manipuram desom POI. Raroth village :Raroth desorn R; Chern bra desom R. Puduppadi village :-Vezhapoor desom pal, RHI, Tal, PHI; Puduppadi desorn P02, RHI. Koodathayi village :Omasseri desom POI; Perilli desom POI; Palora desom P02.· Thiruvarnbadi village :-Thiruvambadi desom P05 ; Koodancheri desom PO I. Neeleswaram village :-Vennacode desom POI; Thechiyad desom PO 1 ; Palannoor desorn PO I. Puthoor village :Puthoor desorn POI. Koduvally villa~e :-Koduvally desom PO I, TO I. Kunnamangalam village :-Kunnamangalarn desom pal. Chelavoor village :-Parambil desom R ; Chelavoor desom PO 1, PHI, R. Chevayur village :-Chevayur desom P02, PHI4, R. Nedungottur village :-Nedungottur desom POI, R. Kottuli village :-Kottuli desom POI, R, W. Kovoor village :-Kovoor desom PHI, R; Valliparamba cesam POI, R; Kuttikkattoor desom POI, R. Mayanad village :-Karanthur desom POI, PHI, R, W; Mayanad desom pal, R. Chatharnangalam village :-Chathamangalam desom pal. Chooloor village :-Chooloor desom pal. Manasseri village:Chennamangalam desom PO I. Thazhekode village :_ Thazhekode desom pal. Iringallur village :-IringallurdesomPOI, R, W. Palazhi desom POI, R. Nallalam village :-Nallalam desom·PHI, R, W. Kodal village :-Kodal desom R, W; Kailamadam desom pal, R, W. Perumanna village :-Perumanna des()m pal. Peruvayal village :-Peruvayal deso:n pal. Cheruppa village :-Mankkad desom POI. Mavoor village :-Aduvad desom pal. Kodiyathur village:Cheruvadi desom PO I ; Kodiyathur desom PO 1.
92
Urban :-
Elathur town :-Elathur ward P02, Tal, PHI, R, W, Rly. Edakkad town :-Edakkad ward pal, R,W. Puthiyangadi town :-Puthiyangadi ward POI, R, Rly. Cali cut Municipal town :-ward 1 POI, Tal, RHI ; ward 3 P02, T02, PHI; ward 5 P02, Tal, PHI; ward 7 pal, Tal, PHI, CH2; ward 8 POI, Tal, PHI; ward II RHI; ward 12; pal; ward 13 POI, PHI; ward 17 P02; ward 18, POI; ward 19 POI, PHI; ward 20 POI, Tal, PHI; ward 23 POI; ward 2-1- pal; ward 25 pal. Parayancheri town :-Parayancheri ward pal, PH6 R, W. Nellikode town :-Nellikode ward P02, PH5: R. Kommeri town :-Kommeri ward POI, R. Beypore Town :-Beypore ward POI, Tal, PH3, W, R; Naduvattom ward pal, R, Rly; Cheruvannur ward POI, TOI, R, Rly. Olavanna town :-Olavanna ward POI, R, W.
Tirur Taluk Rural :-
Veliprom village :-P02, Tal, R. Mannur village :-POI. Vallikunnu village :-P02, W, Rly. Ariallur village :-POI, Rly. Thenhipalam village :_ POI, R. Velimukku village :-POI. Olakkara village :-POI. Peruvallur village :-POI. Kannamangalam village :-POI, CHI. Koduvayur village :_ PO 1. Mooniyur village :-PO I. Ullanam village :_ POI. Neduva village :-P02, Rly. Pariapuram village :-POI, R, W, Rly. Kotinhi village :-POI. Trikkulam village :-POI, TOI, RHI. Tirurangadi village :-P03, Tal, RHI, R, W, Rly. Vengara village :-CHl, R. Cherur village :-POI, CHI. Valiyora village :-POl, CHI, R. Iringallur village:POI, CHI. Mattathur village :-POI, Tal. Parappur village :-POl, CHI. Valakkulam village:P02. Thennala village :-POI. Nannambra village:P02. Keraladeeswarapuram village :-POL Ozhur village :-POL Omachapuzha village :-POI. Perumanna village :-POI, R. Puthur village :-P02. Klari village :-P01. Kalpakancherry village:P02, R. Valavannur village :-POl, R. Ponmundam village :-R. Tanalur village :-POI. Niramaruthur village :-POL Pachattiri village :-POI Tal, W. Tirur village :-POI, R, W. Cheriamun= dam village :-P02, R. Kanmanam village :-POl, R. Iringavoor village :-POl. Kurumbathur village :_ POI, R. Marakkara village :-P02. Melmuri village :-P02. Vadakkul)lbram village: :-POI. Thozhuvannur village :-POI, R. Athavanad village :-POI, R. Ananthavoor village :-POI. Thekkankuttur village :-PO~. Thalakkad village .-POl, Tal, R, W. Vet tom VIllage :-POI, W. Alathiyur village :-POI, R. Mangalam village :-P02, R, W. Chennora village :-POL Purathur village :-POl,R. Pudupalli village:-POL Vet tom Palliprom village:P02, R. Thriparangode village:-POl, R. Thirunavaya village:-P03, Tal. Naduvattom village:P02, R, W, Rly .. Kattipparuthi village:-P02, RHI, R. Edayur Village: -POI, R. Valiakunnu village:-POI, R, W. Irimbliyam village:-POI Ryl, W. Kuttippuram village:-P02, Tal, RHI, R;

COMMUNICATION AND TRANSPORT FACILITIES
W, Rly. Paruthur village:-POI. Cherukudangad village:-P02, TOI, Rly'
Urban:-Kadalundi town:-P02, Tal, Rly. Feroke town:
P02, Tal, R, W, Rly. Parappanangadi town:POI, TOL Tanur town:-P02, Tal, RHI, R, Rly, W. Trikkandiyur town:-P02, TOI, PHI, RHI. CHI, R, W, Rly.
Ernad Taluk Rural:-
Azhinhilam village:- Azhinhilam desom POI, R; Puthukode desom R. Vazhayur village:Vazhayur desom POI, R. Karumarakkad village:Karumarakkad desom W; Vazhakkad desom POI, W; Ananthavur desom W. Cheruvayur village:-Cheruvayur desom POI, W; Maprom desom W; Chaliyapram desom W. Kizhuparamba village:Kizhuparamba desom PO 1. Ooran.f5attiri village;Arikkod desom W; Oorangattiri desom PO 1, W. Mambad village:-Mambad desom POI, W. Nilambur viIIage:- POB, TOI, PH2I, RH3, R, Rly. Amarambalam village:-Amarambalam desom P04, RHI, R. Wandur village:- Kappil desom POI, Rly; Wandur desom R. Punnappala viUage:Chadagankulam desom POI, R; Punnappala desom POI, R. Tiruvali village:-Tiruvali desom POI, R. Edavanna village:- Pathapiriyam desom POI, R; Edavanna desom POI, R; Eranhikkode desom R. Perakamanna viIla~e:-Chathailur lesom R; Perakamanna desom POL Kavanur village:- Kavanur desom POI, R; Vakkalur desom R. Areacode village:Ugrapuram desom R; Chembrakkattur desom R; Kozhakkottur desom R; Areacode desom PO I, RHI, R; Puthalam desom R. Vilayil village:Vilayil desom POI, R; Mundambra desom R. Cheacode village:- Omanur desom R; Cheacode desom POI, R; Vavur desom R. Olavattur viUage:Aroor desom R; Olavattur desom POI, R. Ghefllkavu viUage:-Cherukavu desom POI, R. Chelembra village;- Chelembra desom POI, R. Pallikkal village:- Pallikkal desom POI, R; Pllthur desom POI, R. Andiyurkunnu village:- Andiyurkunnu desom POI, R. Muthuvallur village:-Parathakkad desom R; Mundakulam desom R; Thavanur desom R; Muthuvallur desom POI, R. Puliacode village:Puliacode desom POI, R; Kadungallur desom R. Irivetty village:-Elayur desom R; Irivetty desom POI, R; Chengara desom R. Karakunnu village:Karakunnu desom POI, R; Amayur desom POI. Vaniambalam village:-Pazhetam desom R; Mudappillasseri desom POI, R, Rly; Vaniambalam desom POI, Tal, RHI, R. Kalikavu village:-Trikunnasseri desom P03, RHI, R. Vellayur village:Pariyangad desom POI, R. Rly; Poongod desom POI. Porur village:- Ayanikkod desom R; Porur desom pal. Chathangottupuram village:-Chathangottupurarn desom PO 1. Elankur village:-Elankur desom POI. Trikkalangode village;-Trikkalangode desom POI, R; Karikkad desom R. Pulpatta village:-Pulpatta desom PO 1. Trippanachi village:Trippanachi desom POI. Kuzhimanna village:-
106/1-57 93
Kizhusseri desom R; Kuzhimanna desom POI, R. Kondotty village:- Kolathur desom POI, RHI, R; Neerad desom R. Karippur village:- Karippur desom POI, R; Cherayil desom R. Nediyiruppu village:-Nediyiruppu desom PO 1, Tal, R; Cherayil desom R. Morayur village:-Ozhukur desom R; Morayur desom PO 1, R; Mongam desom R; Pookottur village:- Vellur desom R; Aravankara desom R; Pookottur desom POI, R. Valluvambram village:-Valluvambram desom POI, R; Pullanur desom R; Muthiraparamba desom R. Narukara village:- Vimbur desom R; Narukara desom POI, R; Kottupatta desom R. Karuvambram village:-Kidangazhi desom R; Karuvambram desom POI, R; Melakkam desom R. lrumbuzhi village:-Irumbuzhi desom POI, R. Melmuri village:-Melmuri desom POI, R. Urakam Melmuri village:-Urakam Melmuri desom POI, R. Urakam kizhmuri village:- Urakam kizhmuri desom P02, Tal, R. Ponmala village:-Ponmala despm POI, R; Chappanangadi desom R. Kottakkal vilfage:Kottakkal desom POI, TOI, R; Kuttipuram desom R. Indianur village:-Indianur desom POI. Chengottur village :-Chengottur desom PO 1. Malappuram village:-Malappuram (Valiyangadi) desom P02, Tal R; Malappuram (Kunnummal) desom P02, Tal, PH5, RHl, CHI, R. Annakkayam village:Vengallur desom R; Annakkayam desom POI, R. Payyanad village :-Payyanad desom PO I, R; Nillikkuth desom R. Pandallur viIlage:-Pandallur desom POI, R. Vettikkattiri village:-Vettikkattiri desom POI, R; Valluvangad desom R; Valarad desom R. Chembrasseri village:-Theyyampadikuth desom Rly; Kodasseri desom PO I, R. Pandikkad village:Pandikkad desom POI, RHI, R; Perukkad desom R; Pukkuth desom POI, R; Poolamanna desom POI, R. Thuvur village:-Thuvur desom POI, Tal, R, Rly. Karuvarakundu village:-Cheramba desom P04, CHI, R. Urban:-
Manjeri town:-Manjeri ward POI, Tal, PH35, RH2, CHI, R. South Wynad Taluk Rural :-
Padinharethara village: - Padinharethara desom POL Kuppadithara village:-Kuppadithara desom POI. Kottathara village:-Kottathara desom POI. Thariyode village:-Thariyode desom P03. AchoDranam village :-Achooranam desom PO 1; Pinangode desom POI. Kalpatta village:-Kalpatta desom P02, Tal, PHI. Muttil village:-Muttil desom R. Ponginichickallur viHage:-PonginichikaUur desom R; Pulpadi desom R. Sultan's Battery village:-Sultan's Battery desom P04, TOI, PHI, RHI. Purakkadi vilIage:-Purakkadi desom R; Chingeri desom R. Vengappally village:-Thekkumthara desom PO I; Vengappally desom POI. Kunnathidavaga village:Kunnathidavaga desom P02, T02, PH2, CH2, RH2, R. Kottappadi vi Uage:-Thrikkaipatta desom PO 1, R; Kottappadi desom POI, Tal, PHI, t{HI, R. Ambalavayal village:-Ambalavayal desom POI, RHI.

AMENITIES
5 ELECTRIFICATION FACILITmS
E for Electricity
E (I) for Industrial use
E (A) for Agricultural use
E (D) for Domestic use
Badagara Taluk
Rural :-
Eramala village:-Orkatteri desom E1. Edacheri village:-Edacheri desom E(A)I, E3, E(D)3; Vengo1y desom E(D) 1. Katcheri village:-Kottembrom desom E(D) I. Iringannur village:-Iringannur desom El, E(A)2, E(D)2. Thuneri village:Thuneri desom E1, E(D)35. Parakkadavu village:Parakkadavu desomE1, E(D)27. Iyyencodevillage:Kakkattil desom EI, E(D)17; Chiyyur desom El, E(D)IO; Iyyencode desom EI, E(D)13. Kuttipram village:-Varikkoli desom El, E(D)2; Narikkatteri desom El, E(D)4; Chelakkad desom EI, E(D) 11; Kuttipram desom EI, E(D)47. Kummancode village:-Kakkamvally desom E(D)21; Kummancode desom E(D)43; Nadapuram desom EI, E(D)69, E(I) 1. Vellur village:-Kodencheri desom EI, E(D) I; Vellur desom EI, E(A)3; Chalapram desom E1, E(D)4. Purameri village:-Purameri desom EI, E(D)33. Vulliappally village:-Mayyannur desom El; Thirumana desom El. Memunda village:-Memunda desom El. Kadarneri village:Elayadam desom E(D) 1. Aroor village:-Aroor desom ~(D) 1. Kunnummal village:-Kunnummal desom E23; Vattoli desom E(D) 1, E 21; Pathiripatta desom £1, E(D)l. Naripatta village:-Naripatta desom El, E(D)15; Chekkonnummal desom EI, E(D)25; Thinur desom El, E(D)37. Kavilumpara village:-Moyilothara desom E(D)2; Kavilumpara desom E(A)3. Kayakody village:-ThaIiyiI desom E(D)15; Devarkovil desom E3, E(D)3; Akkal desom E (D) 2. Mokeri village:-Mokeri desom E15. Kuttiyadi village:-Urath desom E(D) 13; Thondipoyil desom E(D)47.
Urban:-
B(ldagara Municipal town :-Kuriyadi ward E(D) 8; Mukachery ward E(I) I, E(D)30; Nalupurabhagam ward E(I)l, E(D)45; Pandikasala Valappu ward E(D)50; Pakkayilbhagam ward E(I)2, E(D)2; Sarampally Mukkolabhagam ward E(I)3, E(D)65; Cholamvayal ward - E(I)5, E(D)408; Peruvattumthazhabhagam ward E (I) 5, E(D) 50; Payanghavubhagam ward E(D)23; Chaliya-therubhagam ward E(D)30; Puthurbhagam ward E(D)3; Nadakkuthazhabhagam ward E(D)20; Meppayil South ward E(D)9; Kannamkuzhi Cheeram Veedubhagam ward E(D)40; Badagara Vayalkottaparamba ward E (1) 2, E(D)648; Karimpanapalam Narayananagaram ward E(D)38j Cheenam Veedu bhagam ward E (1) 1, E(D)32.
94
Q.ailandy Taluk Rural:-
Meladi village :-Meladi desom E (I) 1. Thurayur village:- Thurayur desom E (D) 18. Changaroth village:- Changaroth desom E (D) 2. Kallode village:Kallode desom E (D) 7. Kalpathur village:-Kalpathur desom E(D) 7. Meppayur village:-Meppayur desom E (D) II. Iringath village:-lringath desom E (D) 60. Moodadi village:-Moodadi desom E (D) 30. Viyyur village:-Kollam desom E(D) 25; Viyyur desom E (1)1, E (D) 110. Menhaniam village:-Menhaniam desom E (D) 26. Ulliyeri village:-Ulliyeri desom E (D). Kokkallur village :-Kokkallur desom E (D). Urban:-
Pantalayini town:-Pantalayini ward E; E (I) 1, E(D); Kovilkandy ward E (D); Kothamangalam_ward E (D).
Kozhikode Taluk Rural:-Nanminda village:-Nanminda ciesorri E, E(D). Makkada village:- Makkada desom E, Morikkara desom E. Karuvisseri village:-Karuvisseri desom E. Patinhattumuri village:-Morikkara desom E. Kizhakkoth village:-Kizhakkoth desom E; Panoor desom E. Kedavoor village:-Irpona desom E, E(D); Palliprom desom E, E(D); Punnoor desom E, E,(D); Kedavoor desom E, E(D). Puduppadi village:Vezhapoor desom E, E(D); Puduppadi desom E, E(D). Koduvally village:-Koduvally desom E, E(D). Chevayur village:-Chevayur desom E. Nedungottur village:-Nedungottur desom E(D). Kottuli village:-Kottuli desom E. Kovoor village:-Kovoor desom E. Mavoor village:-Mavoor desom E. Urban:-
Puthiyangadi town:-Puthiyangadi ward:-E(I) 3, E(D). Parayancheri town:~Parayancheri ward E, E(l). Nellikode town:-Nellikode ward E. Kommeri Town:-Kommeri ward B(D): Beypore town.:Beypore ward E (I), E(D); Naduvattom ward E(A), E (D); Cheruvannur ward ... E(l), E(D).
Tirur Taluk Rural:-
Veliprom village:-E. Koduvayur village:-E (A), E(D}. ~Mooniyur village:-E (I), E(A), ECD). Neduva village:-E(D). Pariapuram village:- E(D). Trikkulam viIlage:-E, E(l), E(A), E(D). Tirurangadi village:-E (I), E (A) E (D).Vengara village:E(I), E(A). Valiyora village:-E(I), E(A).

MISCELLANEOUS
Mattathur village:-E (I). Puthur viJlage:-E (D)~ Pachattiri village:-E (D). Tirur village:-E (I), E (D). Cheriamundam village:- E (D). Thalakkad village:- E (D). Vettom village E (D). Mangalam village:- E (D). Chennora village:- E (D). Pudu. palli village:- E (A). Vettom Palliprom village:E (D): Urban:-
Feroke town:-E (I), E(D). Parappanangadi town:-E (D). Tanur town:-E (1), E (D). Trikkandiyur town:-E (I), E (A), E (D).
Ernad Taluk Rural:-
Mambad village:-Mambad desom E, E (I), E (D). Nilambur village:-E, E (I), E (A), E (D). Wandur village:-Wandur desom E, E (D). Edavanna village:-Edavanna desom E, E (I), E (D). Cherukavu village:-Cherukavu desom E, E (D). Vaniambalam village:-Vaniambalam desom E, E (D). Kondotty village:-Kolathur desom E, E (D); Neerad desom E, E (D). Nediyiruppu village:-Nediyiruppu desom E,
E (D) ; Cherayil desom E, E (D). Morayur village:Ozhukur desom E, E (D); Morayur rdesom E, E (D); Mongam desom E, E (D). Karuvambram village:Melakkam:desom:E, E (D) :-Melmuri village-Melmuri desom E, E (D). Kottakkal village:-Kottakkal desom E, E (D). Malappuram village:-Malappuram (Valiyangadi) desom E, E (D); Malappuram (Kun. nummal) desom E, E (D).
Urban:-Manjeri town:-Manjeri ward E, E (I), E (D).
South Wynad Taluk
Rural:-Achooranam village:-Achooranam desom E (D).
Kalpatta village:- Kalpatta desom E (D). Muttil village:-Muttil desom E (D). Sultan's Battery vlU~ age:-Sultan's Battery desom E (1), E (D). Kunnathidavaga village:-Kunnathidavaga desom E (D). Kottappadi village:-Kottappadi desom E(D). Ambalavayal village:-Ambalavayal desom E (D). Nenmani village:-Nenmani des am E (I), E (D).
6 MISCELLANEOUS
T for Temple C for Church M for Mosque 0 for Others CT for Cinema Theatre DH for Dramatic Hall PH for Public Hall P for Park Mt for Market B for Bank S for Stadium
Badagara Taluk
Rural :-
Azhiyur village :-Azhiyur desom T5, M4; Chombala desom T2, Cl, M3; Kallamala desom MI. Kunnummakara village :-Thattolikara desom MI ; Kunnumakara desom TI ; Nellacheri desom TI, MI; Onchiyam village :-Kannakkara desom T3, M2; Onchiyam desom MI, Bl. Uralangal village:Uralangal desom TI, M2, Bl ; Vellukulangara desom 'fl, M2; Madappalli desom' TI, MI, S2 ; Muttungal village :-Rayarangoth desom TI, MI; Muttungal desom T2, Ml. Chorode village :-Erapuram desom T3, MI ; Chennamangalam desom TI, MI; Chorode desom Tl, MI. Vykilasseri village :-Kurukkilad desom TI ; Vykilasseri desom T4, MI; Varssyekuni <lesom TI. Eramala village :-Orkatteri desom T3, M2; Adiyur desom TI ; Eramala desom T3, Ml ; Payyatthur desom Tl. Thuneri village :-Thuneri aesom T2, MI, Mtl. Parakkadavu vilIage:-Parakkadavu desom M2. Chekkiyad village :-Chekkiyad
106/1-57a
95
desom MI; Kuruvantheri desom MI. Valayam village :-Puliayavil desom MI; Jatiyeri desom MI ; Cherumoth desom CI ; Valayam desom Tl. Velliyode village:-Kotiyura desom MI; Velliyode desom CI, Ml. Iyyencode village :-Peruvankara desom Tl. Kuttipram village:-Varikkoli desom TI; Narikkatteri desom T3 ; Chelakkad desom T2; Kuttipram desom T3. Kummancode village :-Nadapuram desom M4, CTl, BI. Vellur village :-Vellur desom Tl; Chalapram desom T2; Perode desom MI. Purameri village :-TI, Mtl. Vulathapuram village:Muthuvatathur dewm TI, MI ; Vulathapuram desom TI. Karthikapally village: -Kurinhaliyode desom Tl, MI; Karthikapally desom Tl, M2; Muyipra desom Ml. Ponmeri village :-Parambil desom TI, Ml; Ponmeri desom TI. Vulliappally village :-Mayyannur desom T2, Bl . Thirumanadesom T2, M2, PI, Bl. Memunda village:_: Kuttoth desom T2, BI; Keezhal desom T2, MI; Memunda desom T2, MI, BI. Chemmarathur village:-Aryyannur desom MI ; Thodanur desom TI,

AMENITIES
MI ; Chemmarathur desom T4. Kottappally village:Kannambathkara desom MI ; Payingottayi desom TI; Kottappally desom TI, MI ; Valliatt desom TI, Ml. Kadameri village:-Kadameri desom T2, Ml, Bl. Aroor village:-Aroor desom C1. Kunnummal vilIage:-Kunnummai desom CI, 01; VattoIi desom Cl, 01, PI, Mtl. Naripatta village:-Naripatta desom TI, MI, Cl; Chekkonnummal desom MI. Kavilumpara vilIage:-Adukkath desom 01; Maruthonkara desom TI; Kavilumpara desom C4, Bl. Kayakody village:-Changaramkulam desom C2; Devarkavil desom Cl ; Kayakody desom C1. Mokeri village:-Mokeri desom CI, PI ; Karandot desom Mtl. Kuttiyadi village:-Thondipoyil desom CI, :Mtl. Vatayam village:-Nittur desom T2, C1; Vatayam desom C1. Ayencheri village:-T4, M3. Thiruvalloor village:-Thiruvalloor desom T2, Ml. Mantharathur village:-Motapilavil desom Tl ; Kurumthodi desom Ml; Mantharathur desom Mti. Maniyur village:Maniyur desom T2 ; Cherandathur desom TI ; Elambilad desom TI, Ml. Palayad village:-Pathiyarak. kara desom T2, Cl, M2. Urban:-
Badagara Municipal town:-Kuriyadi ward TI, MI; Mukachery ward M2; Nalupurabhagam ward M2; Pandikasalavalappu ward M2; Purankara ward MI; Pakkayilbhagam ward TI; Sarampally Mukkolabhagam ward Mtl; Cholamvayal ward M3, aT], Mtl, B2; Peruvattumthazhabhagam ward T3, BI ; Payamghavubhagom ward T2 ; Chaliyatherubhagam ward. T2; Arakkiladbhagam ward TI, M2 ; Puthurbhagatn ward TI, Ml; Nadakkuthazhabhagam ward TI, M3; Meppayil North ward T1 ; Meppayil ~!:lUth ward T2 ; Kannamkuzhi Cheeramveedubhagam ward T3 ; Badagara vayalkottaparamba ward T3, C2, CTI, Mt1, B6; Karimpanapalam Narayananagaram ward T3; Cheenamveedubhagam ward T2, MI ; Kakkattil ward MI; Kanthilattpally Mooradbhagom ward TI, CI, MI ; Panikkottibhagom ward T2. Q.uilandy Taluk Rural:-
Iringal village:-TI, M5, 02. Ayanikkad village:TI,01. Trikkottur vilIage:-Trikkottur desom T3, M4; Palur desom Ti, Ml. Pallikkara village:T2, MI. Meladi village:-Kannamkulam desom T2; M_eladi desom T6, MI, 07, MtI, B3; Kizhur desom T2, Mtl. Thurayur village:-Thurayur desom T2, MI, 03, Mt2; Toleri desom Tl. Muyipoth village:-Muyipoth des£?m TI, Mlj Vennarode desom TI. Cheruvannur village:-Cheruvannur desom. T2, M2j Pampirikunnu desom T2, M2. Avala village:-Avala desom Ti, MI; Kuttoth desom Tl, Ml. Cherapuram village:-T2. Velam village:Cherukunnu desom Tl; Kurichagam desom TI; Velam desom T2. Paleri village: - Paleri desGm TI, M 1 ; Cheriyakumbalam desom MI. Changaroth village:Kunnasseridesom Tl; Kannatti desom Tl; Kadiyangad . desom TI; Changaroth desom TI, MI, Cl; Kokkad desom MI; Avatukka desom Ml. Muthuvannacha village:-Kuniyode desom Tl; Muthuvarutacha desom
96
TI, Ml. Kallode village:-Kallode desom T1, Ml; Koothali desom T I; Paithoth desom TI; Panakkad desom Tl. Eravattur village:-Kaipram desom Tl; Eravattur desom TI, Ml. Kalpathur village:Kalpathur desom T2, MI; Ramallur desom T2; Valiakkode desom T2; Kizhinhaniam desom TI, Ml. Meppayur village:-Kizhpayur desom Tl; Meppayur desom TI, MI, Mtl,BI; Kayaladdesom ~I; Changaramvalli desom Tl. Vilayattur village:-Vilayattur desom Tl, Ml; Elampilad desom TI, Ml. Iringath village:-Iringath desom T2, MI, 01; Kuluppa desom Tl. Kozhukkallur vilIage:-Narak. kode desom TI; Kozhukkallur desom T4, 01; Chavatta desom Tl. Keezhariyur village:-Keezhariyur desom T5, M2; Naduvathurdesom TI; Nambrath desom Ml. Moodadi village:-Parakkad desom TI; Moodadi desom TIO, MI, 05; Purakkal desom T 1 ; Velakode desom TI; Vellarakode desom T I ; Muchukunnu desom TI. Purakad village:-Kozhipram desom TI, Ml; Purakad desom TI, MI, 01. Vanmugham village:-Vanmugham desom T3, M4; Eiampilad desom TI; Katalur desom TI, Ml; Veemangalam desom TI, Ml. Viyyur village:-Mannamangalam desom TI, Ml; Maralur desom TI, MI; Puliyancheri desom TI; Kolakkad desom Tl; Kollam desom TI; Viyyur desom T5, M6, 02. Kuruvangad village:Peruvathur desom Tl; Kuruvangad desom T5, Ml. Naderi village:-Naderi desom T3, MI, 03; Kuttirakuda desom TI; Maruthur desom Tl. Arikulam village :-Mavatta desom TI; Arikulam desom T6, 04; Kannambath desom TI; Utteri desom TI; Urallur desom Tl. Karayad village:-Tiruvangara desoIll TI, Ml. Kavumthara village:-Kavii desom T3, M3; Karuvannur desom T4, Ml. Nochad viIlage:Nochad desom TI, MI; Velliyur desom Tl. Chenoli village :-Chenoli desom T2, Ml; Puttat desom Tl; Cheruvalloor desom T2; Valoor desom T2. Menhaniam village:-Menhaniam desom TI, MI, PI, Mtl, B 1; Pandicode desom T 1; V enga patta desom T 1 ; Marutheri desom T1. Perambra village:-Perambra desom T 1, MI; Koratti desom T I. Kottur village:Kunnaramvally desom Tl; Peravanchery desom Tl; Kottur desom Tl. Naduvannur village:-Ayanikkad desom TI; Kakkanchery desom MI; Koyakkad desom Cl; Naduvannur desom Ml, C2, Bl. Ulliyeri village:-Mundoth desom Cl; Ulliyeri desom T3, Ml. Kunnathara vilIage:-Kannur desom Tl; Ollur desom TI; Puthurvattam desom TI; Puthenchery desom Ti; Kunnathara desom TI, Ml. Melur village:-Melur desom T5, Ml, 01; Elatheri desom TI; Chelia desom Tl. Edakkulam village:-Edakkulam desom T6, M3, 02; Mangatdesom TI. Thiruvangoor village:-Thiruvangoor desom T6, M9,01O; Vengaiam desom T2, M3. Chemancherry village:-Kadalur desom TI; Chemancherry desom T5, MI, 02; Thuvvakode desom TI; Kolakkad desom TI, 01. Velur village:-Velur desom TI; Kongannur desom Tl. Edakkara village:Koiakkad desom T2, M2; Edakkara desom T2, Ml. . Modakkallur village:-Thorayi desomTl, M2; Atuvat desom Tl; Koruvalur desom Tlj Modakkallur desom TI; Kolathur desom Tl. Kokkallur village:-Kan. namkode desom Ml; Eramangalam desom TI, Ml;

MISCELLANEOUS
Balusseri village:-Kannikavu desom TI; Thuruthiyad desom T4; Puthurvattam desom T2; Balusseri desom T3, PI, Mtl,B3. Trikuttisseri village:-Vakayaddesom Tl; Trikuttisseri desom Tl. Avitanallur village:-Avitanallur desom TI; Punath desom TI, MI, CI, 02. Panangad village:-Nirmallur desom TI; Panangad desom T3, MI. Sivapuram village:-Karumala desom M2, 01. Iyyad village:-Veeryampram desom Tl; Iyyad desom TI; Mangat desom Tl.Unnikulam village:- Unnikulam desom TI, Ml. Kanthapuram desom Tl, Ml. Kinalur village :-Mundakkara desom TI; Kinalur desom TI, Ml.
Urban:-
Pantalayini town:-Pantalayini ward T5, M9, CI, 02, PI, B3; Kovilkandy ward T2, Ml; Kothamangalam ward T3, Ml.
Kozhikode Taluk Rural:-
Thalakolathur village:-T2, M4, Mtl, Bl. Annasseri village:-T5, CI, M2, Mtl. Kanmmkara village:-Tehanur desom TI, MI; Kannankara des om T3, BI; Kandanoor desom T2. Naduvalloor village:-Pavandur desom MI; Ramallur desom TI; Naduvalloor desom Tl, Ml. Cheekilode village:Cheekilode desom T2, MI; Kolathur desom TI, Ml. Nanminda village:-T4, MI, B1. Pannikkottur village:-Palangod desom TI, MI, Mtl; Kodoli desom TI; Pannikkottur desom Tl, MI. Nediyanad village:~T3, MI, Mtl. Punnasseri village:-Punnasseri desom T2, MI ; Kuttamboor desom TI. Parannoor village :-Punnoor Cherupalam desom TI, MI; Parannoor desom TI, MI. Eravannur village :-Pullaloor desom TI ; Eravannoor desom T2. Palath village:lruvallur desom T2; PaIath desom T7, MI; Thamarasseri village :-Maruthad desom T4, 01 ; Muthuvad desom T4; Tharr.arasseri desom T4, MI, 01. Makkada village :-Badirur desom T4 ; Makkada desom T8, M2, BI; Morikkara desom T3. Karannoor viIlage:-Karannoor desom T2, Mtl, B2 ; Puthur desom T5, MI, Bl. Karuvisseri village :-Karuvisseri desom T7; Mokavoor desom T3. Vengeri village :-Varadoor desom TI, 02; Vengeri desom T3, 06. Patinhattumuri village :-Morikkara desom MI; Moothool desom T2, B2 ; Kirallur desom TI, Patinhattumuri desom TI ; Kizhakkumuri desom TI. Kuruvattoor village :Kuruvattoor desom T4; Pullalur desom TI, M I ; Pymbra desom T2; Polur desom TI, Paimbalasseri village :-Paimbalasseri desom C2; Arambra desom C2. Madavoor village :-Madavoor desom TI; Mat. tancherri desom MI. Kizhakkoth village:-Kizhakkoth desom M2; Panoor desom MI. Elettil village :Avilora desom M3; Elettil desom M2, Mtl; Valiaparamba de~om M2. Parambathkavu village:Manipuram desom TI; Parambathkavu desom TI, Ml ; Karivampoyil desom Ml. Vavad village :Vavad de:om Mtl; Pongottur desom TI; Kolaranthiri desom C I. Raroth village : -Andona desom M 1 ; Raroth desom TI, M3, SI ; Chembra desom M2, Bl; Karingamanna desom M I; Valimanna desom M2. Kedavoor village :-Irpona desom MI; Palliprom
97
desom M2; Punnoor desom Cl, M2; Kedavoor desom T3, MI. Puduppadi village :-Vezhapoor desonr TI, CI, Mtl ; Malapuram desom MI ; Padoor desom MI; Puduppadi desom 01, M2. Koodathayi village :-Omasseri desom MI, Mtl; Palora desom C4; Kpodathayi desom TI, 01, MI. Thiruvambadi, village :-Thiruvambadi desom T5, C8, M5; Koodancheri desom TI, CI, MI; Manakkattupuram desom T2 ; Cheruppa desom TI. Neeleswaram village :-Vennacode desom TI; Neeleswaram
,desom T4; Thechiyad desom MI; Palannoor desom TI, C 1; Kulikipara desom. TI; Nadukil desom T2; Poolapoyil desom M2. Puthoor village :-Chokkoor desom M2; Kodiyathoor desom MI ; Vennacode desom M1. Koduvally village:Koduvally desom M3, Mti ; BI; Thalaperumanna desom TI,MI. Kunnajllangalam village :-T9, M3. Chelavoor village :-~heruvatta desom T2, Ml ; Parambil desom T2; Chelavoor desom TlO, Ml2 ; Konot desom T2. Chevayur village:-T6, CI, M2. Nedungottur village :-T2, Ml. Kottuli village :T30. Kovoor village :-Kovoor desom T7, MTI ; Valliparamba desom T6, M2; Kuttikkattoor desom T5, Ml. Mayanad village :-Karanthur desom T4, MI ; Mayanad desom T3, MI, 01. Cherukulathur village :-Cherukulathur desom T4, C2. Chathamangalam village : -Pullanoor desom Ml ; Malayamma desom MI ; Pullaloor desom MI; Chathamangalam desom Mtl. Chooloor village :-Chooloor desom T8, M2. Manasseri village: - Manasseri desom T3 ; Chennamangalam desom TI, Ml. Thazhekode village :-Thazhekode desom Tl, Ml. Kumaranelloor village :-Alli desom Tl, CI ; Anayankunnu desom TI, MI ; Kumaranelloor desom Tl, M3. Poolacode village :-Munnur desom MI ; Aryancode desom Ml; Narayinkuzhi desom TI ; Poolacode desom Tl. Kanniparamba village :-Kanniparamba desom T3; Palangad desom TI. Iringallur village :-Iringallur desom T6, MI ; Palazhi desom Tl, MI. Nallalam village :-T4, M8, CTI, Mtl, B1. Kodal village: -Kodal desom T2, M2 ; Kailamadam desom Tl. Vellayicode Village :--Puthur desom Tl, MI ; Vellayicode desom TI, Ml. Perumanna village :-T2, 01. Peruvayal village :-Peruvayal desom TI, BI; Koyalam ~esom Tl. Cheruppa village :-Cheruppa desom Tl ; Mankkad desom Tl, Bl ; Valayannoor desom T2, Ml. Mavoor village :-Kalpatta desom TI ; Mavoor desom T5, MI, Mtl; Aduvad desom Tl. Kodiyathur viHage :-Cheruvadi desom M4; Kodiyathur desom TI, M2, Mtl. Pannicode village :-Kakkad desom MI ; Kavasseri desom T2 ; Pannicode desom T2, Ml.
Urban :-
Elathur town :-T2, M3, CTI, BI, Mtl· Edakkad town :-T2. Puthiyangadi town :-T2, MIl. Calicut Municipal town :-ward I T3, C 14, M20, Mtl, BI ; ward 2, T2, M2, 05; ward 3 TI, 01, MI, 03, Mtl, BI ; ward 4 TI, 01, M3, 02, PI ; ward 5 T4, MI, 011; ward 6 TI, C4, MI, 03, BI ; ward 7 T4, 01, CTI,PHI, PI, B2 ; ward 8 Tl, Cl, M2, B3; ward 9 TI, M4, Mtl, B5; ward 10 M3, 01, cn, PI, Mtl, B2; ward 11 TI, 02, B2;

AMENITIES
ward 12 Tl, M8; ward 13 T3, 01, B2; ward 14 C1, M4 ; ward 15 M13; ward 16 MIO; ward 17 T3, C I, M2, 07, OTl, Mtl, SI ; ward 18 T6, MI, CTI, BI ; ward 19 T2, MI, 03, Bl; ward 20 T2, OT1, Mtl; ward 21 T2, M3, 08; ward 22 T3, MI;OI ; ward 23 T4, MI, 03; ward 24 T8, M3 07, OT1; ward 25 T3, MI, 01. Par~yancheri town :-T20, 01, Mt2. Nellikode town:T18, MI, OTI, BI. Kommeri town:-T5, 02. Beypore town:-Beypore ward T13, M2; Naduvattom ward 1'6, M2 ; Oheruvannur ward Tl, 02, Mtl, B3; Olavanna town:-TI, MI, 05. Tirur Taluk Rural:-
Veliprom village:-TlO, M5, Mtl, B3. Mannur village:-TI, M4, CI. Vallikunnu village:-T2, MS, PI, MtI. Ariallur village:-T4, M2, Mtl. Thenhipalam village:-TS, MS. Velimukku viIlage:-T3, MIO. OJakkara village:-T4, M14. PeruvaIJur village:-T8, M9. Kannamangalam viHage:-T3, M2, 08. Koduvayur village:-T2, M12, Mtl. Moolliyur viIIage.-TI, M12. Ullanam village:-TIO, M2. Neduva village:- 1'6, M8, OTI, Mtl, B3. PariaptJram viHage:-T7, M7. Kotinhi village:-M8. Trikkulam village:-TI, M2. Tirurangadi village:-T3, lvf16, Mt5, BI. Vengara viIIage:-T2, M20, Mtl, B2. Cherur viIlage:-T4, M4, 06. Valiyora village:-Tl, M20. Iringallur viIlage:-TI, M5, OS. Matt&thur viIlage:-TI, M12. Parappur viIIage:-T3, M3, 06. Valakkulam village:-Tl, M2. Thennala village:TI, M3. Nannambra village: -T4, M15. Keraladeeswarapuram village:-T9, M2, Mtl. Ozhur village:-T6, M3. Omachapuzha viIlage:-T4, M7. Perurnanna viIlage:-T5, M6, Mtl, M.S.P. Oamp-I. Puthur village:~Tl, M5. Klari vilIage:-T3, M3. Kalpakancherry village:-Mll, MtI. Valavannur viIlage:-T4, M6. Ponmundam village:-T2, M3, Mt1. Tanalur village:- T2, M12. Niramarllthur viIlage:-T6, MIO. Pachattiri viIIage:-M8. Tirur village:-T3, M:2. Oheriamundam village:-TI, M5, PHI, Mtl. Kanmanam viIlage:-T5, M14, Mtl. Iringavoor viIIage:-T5, MS. Kurumbathur villa~e:T2, M4. Marakkara village:-T8, M2, Mt2. Melmuri village:-T4, M7. Vadakkumbram viUage:-T7, M4. Thozhuvannur village: - T4, M6. Athavanad viIla~e:T2, M2. Ananthavoor village:-MtI. Thalakkad village:-T3, M6. Vettom village:-TI, M9. Alathiyur village: - T2, M3. MangaJam village: -lvfl 2. Chennora -village:-M4. Purathur viIIage:~M3. Pudupalli vilIage:-M3. Vettom Palliprom village:Tl, M4. Thirunavaya viIIage:-M5, 01, T2. Naduv~tom village:-TI S, M7. Kattipparuthi village:lv, M5, Mt2, B2. Edayur village:-T6, M7. Valiakunnu village:-TlI, M4, BI. Irimbliyam viIIa~e:T8, M6, BI. Kuttippuram vilIage:-T6, M12, Otl, Mtl, Bl. Paruthur village:--T4, Ml. Oheruklldangad village:-T9, M5, Mtl. Urban:-
Kadalundi town:-T2, MIO, 02, Mt3, B3. Feroke town:-T2, M30, OTl, PI, Mt4, BI. Parappanangadi town:-M12. Tanur town:-T8, M 13, OTI, Mt2. Trikkandiyur town:-T4, M5, OTI, PI, Mt2, BS.
98
Ernad Taluk Rural:-
Azhinhilam village:-Azhinhilam desom Tl, MI; Puthukode desom Tl, MI; Karad desom Tl, MI. Vazhayur village:-Vazhayur desom TI, MI; Kakkove desom Tl, M2; Peringavu desom TI, MI. Karumarakkad village: -Karumarakkad desom TI, MI; Vazhakkad desom M2; Ananthavur desom TI, M!. Oheruvayur village:-Oheruvayur desom T2, MI ; Maprom desom 1'1, MI ; Ohaliyapram desom T2, MI. Kizhuparamba village:-Kizhuparamba desom TI. M2; Trikkalayur desom TI, M2; Kunniyil desom TI, MI; Pathanapuram desomMl. Oorangattiri village:Arikkod desom T2, M3; Oorangattiri desom T3, M4. Mambad viIlage:-02, M4, Mtl. Nilambur village:TIl, C12, M9, OT2, Mt2. B3. Amarambalam vilJage:-T3, 03, M3. Wandur village:-Kappil desom T3, 01, MI ; Wandur desom T3, 01, Ml. Punnappala village:-Ohadagankulam desom TI, M3; Punnappala desom T2, M3. Tiruvali viIlage:-T8, M3. Edavanna village:-Pathapiriyam desom TI, M3; Edavanna desom M2, Mtl; Eranhikkode desom MI. Perakamanna village:-Vadasseri desom TI, MI; Ohathallur desom TI, M2; Perakamanna desom Tl, M2. Kavanur village:-Kavanur desom T3, M2; Vakkalur desom T2, Ml. Areacode village:-Ugrapuram desom Tl, M2; Ohembrakkattur desom TI, M2; Kozhakkottur desom M2; Areacode desom Tl, M3; Puthalam desom TI, MI. Vilayil village:Mundakkal desom T2, MI ; Parappur desom T2, MI ; Vilayil desom T2, MI ; Mundambra desom Tl, MI. Oheacode village :-Omanur desom Tl, M2 ; Oheacode desom TI, M2; Vavur desom TI, M2. Olavattur village:-Aroor desom M2; 01avattur desom M2. Oherukavu village:-Oherukavu desom TI, MI; Pengad desom TI, MI ; Puttupadam desom TI, MI; Paravur desom Tl, MI; Ohevayur desom TI. Ml. Ohelembra village:-T6, M3. Pallikkal village:_;,_. Pallikkal desom M2; Puthur desom M3. Andiyurkunnu village:-Andiyurkunnu desom MI ; Muttayur desom MI ; Mozhangallur desom MI ; Vellara desom Ml ; VaIiyaparamba desom Tl, MI ; Nunhallurdesom T1. Muthuvallur viIlage:-Parathakkad desom TI, MI ; Mundakulam desom TI, Ml; Thavanur desom Tl Ml; Muthuvallur desom M2. Puliacode village:Puliacode desom Tl, Ml; Vellari desom TI, Ml; Kadungallur desom TI, M1. Irivetty village:-Elayur desom T I, M 1; Irivetty desom T I, MJ; Ohengara desom TI Ml. Karakunnu village:-Karakunnu desom TI. M3' Amayur desom TI,M4. Vaniambalamvillage:Pazhetam desom TI, MI; Mudappillasseri desom TI, M2; Vaniambalam desom Tl, M2, Mtl, B1. Kalikavu viIlage:-Trikunnasseri desom T2, M6, MtI. Vellayur village:-Pariyangad desom Tl, Ml; Poongod desom TI, M2; Vellayur desom TI, Ml. Porur village:-Putrakovil desom T2, MI; Ayanikkod desom Ml; Porur desom TI, M2. Ohathangottupuram viI. lage:-Palakod des om T2, MI; Eramangalam desom T2, MI; Edappalam desom Tl, M~; Chathangottupuram desom TI, Ml; Vithanassen desom TI, MI. Elankur village:-T9, M12. Trikkalangode village:Trikkalangode desom T3, Ml; Karikkad desom T3.
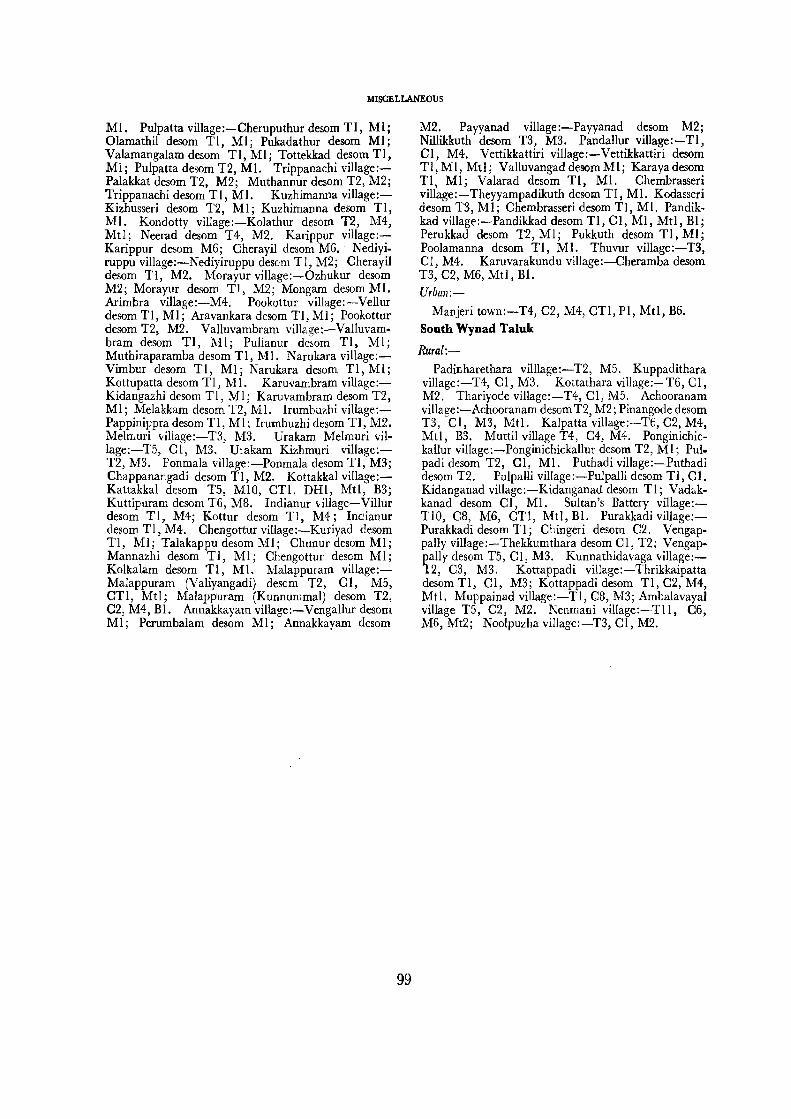
MISCELLANEOUS
M1. Pulpatta village:-Cheruputhur desom TI, Mli Olamathil desom TI, MI; Pukadathur desom MI; Valamangalam desom TI, MI; Tottekkad desom TI, Ml; Pulpatta desom T2, Ml. Trippanachi village:Palakkat desom T2, M2; Muthannur desom T2, M2; Trippanachi desom TI, M1. Kuzhimanna village:Kizhusseri desom T2, M I; Kuzhimanna desom TI, MI. Kondotty village:-Kolathur desom T2, M4, MtI; Neerad desom T4, M2. Karippur vilIage:Karippur desom M6; Cherayil desom M6. Nediyiruppu village:-Nediyiruppu desom TI, M2; Cherayil desom TI, M2. Morayur viJlage:-Ozhukur desom M2; Morayur desom TJ, M2; Mongam desom Ml. Arimbra village:-M4. Pookottur village:-Vellur desom TI, MI; Aravankara desom TI, MI; Pookottur desom T2, M2. Valluvambram viIJage:-ValIuvambram desom TI, MI; Pullanur dewm TI, MI; Muthiraparamba desom TI, Ml. Narukara village:Vimbur desom TI, Ml; Narukara desom TI, Ml; Kottupatta desom TI, MI. Karuvambram village:Kidangazhi desom TI, MI; Karuvambram desom T2, MI; Melakkam desom T2, M1. lrumbuzhi village:Pappinippra desom TI, MJ; lrumbuzhi desom TI, M2. Melrr,uri village:-T3, M3. Urakam Melmuri viIlage:-T5, CI, M3. Urakam Kizhmuri village:T2, M3. Ponmala viIlage:-Ponmala desom TI, MS; Chappanangadi desom Tl, M2. Kottakkal village:Kattakkal desom T5, MIO, CTI, DHl, Mtl, B3; Kuttipuram desom T6, MS. Indianur village-Villur desom TI, M4; Kottur desom TI, M4; Indianur desom TI, M4. Chengottur village:-Kuriyad desom TI, MI; Talakappu desom MI; Chunur desom MI; Mannazhi desom TI, MI; Chengottur desom MI; Kolkalam ciesom TI, Ml. Malappuram village:Malappuram (Valiyangadi) desom T2, CI, MS, CTI, Mtl; Malappuram (KunnummaI) desom T2, C2, M4, BI. Annakkayam village:-Vengallur desom MI; Perumbalam desom MI; Annakkayam desom
99
M2. Payyanad village:-Payyanad desom M2; Nillikkuth desom T3, MS. Pandallur village:-TI, CI, M4. Vettikkattiri village:-Vettikkattiri desom TI,MI, Mtl; ValluvangaddesomMI; Karayadesom TI, MI; Valarad desom TI, Ml. Chembrasseri village:-Theyyampadikuth desom TI, MI. Kodasseri desom T3, Ml; Chembrasseri desom TI, Ml. Pandikkad village:-Pandikkad desom TI, CI, MI, Mtl, BI; Perukkad desom T2, MI; Pukkuth desom TI, Ml; Poolamanna desom TI, Ml. Thuvur village:-T3, CI, M4. Karuvarakundu village:-Cheramba desom T3, C2, M6, MtI, BI. Urban:-
Manjeri town:-T4, C2, M4, CTI, PI, MtI, B6. South Wynad Taluk
Rural:-
Padinharethara villlage:-T2, M5. Kuppadithara village:-T4, CI, M3. Kottathara village:-T6, Cl, M2. Thariyoce village:-T4, CI, M5. Achooranam village:-Achooranam desom T2, M2; Pinangode desom T3, CI, M3, Mtl. Kalpatta village:-T6, C2, M4, Mtl, B3. Muttil village T4, C4, M4. Ponginichickallur village:-Ponginichickallur desom T2, Ml; Pul. padi desom T2, CI, MI. Puthadi village:-Puthadi desom T2. PulpaYi village:-Pulpalli desom TI, Cl. Kidanganad village:-Kidanganad desom Tl; Vadakkanad desom CI, Ml. Sultan's Battery village:TlO, CS, M6, CTI, Mtl, Bl. Purakkadi village:Purakkadi desom Tl; Chingeri desom C2. Vengappally village:-Thekkumthara desom CI, T2; Vengappally desom T5, CI, M3. Kunnathidavaga village:-12, C3, M3. Kottappadi village:-Thrikkaipatta desom TI, CI, M3; Kottappadi desom TI, C2, M4, Mtl. Muppainad village:-TI, C8, M3; Ambalavayal village T5, C2, M2. l'~enmani village:-Tll, C6, M6, Mt2; Noolpuzha village:-T3, CI, M2.


(iii) INDUSTRIAL ESTABLISHMENTS
106/1-58


Code
048 200.1 200.2 200.3 200.4
200'5
201 202
203.1
203.2 204.1 204.2 205 206 207.1 207.2 208 209
210 214 215 216 217 218
219 220 221 224 225 230 231 232 233 234 235 236 237 239
241
INDUSTRIAL ESTABLISHMENTS
The description of the codes used in the succeeding pages is furnished below :-
Description
Manufacture of gut from intestines of cattles
. Production of copra Processing of areca nut Rice and flour mill Production of rice, flour, etc. by' handpound
ing Processing of cardamom, ginger, pepper,
etc. Production of sugar from sugarcane in mills Production of indigenous sugar, gur from
sugarcane and production of sugar candy Canning and preservation of fruits and pro-
duction of jam, jelly, etc. Processing and preservation of cashewnuts Slaughtering of cattle Preservation of fish, frog's legs, etc. Bakery Production of dairy products Oil mill including sharkliver oil factories Extraction of oil by ghani Manufacture of hydrogenated oil Manufacture of 'avil' (beaten rice).
, appalam ' etc. Production of brandy, vinegar, etc. Manufac;ture of sodawater, lemonade, etc. Manufacture of ice Manufacture of icecream Processing, packing and distribution of tea Processing, grinding, packing and distribution
of coffee MAnufacture of syrup (beverages) Manufacture of bidi Man~acture of cigar Manufacture of tobacco snuff Man~fa(;ture of chewing tobacco Cotton ginning, cleaning, pressing,· etc. Cotton spinning other than in mills Cotton spinning and weaving in mills Dyeing and bleaching of cotton Cotton weaving in powerlooms Handloom-weaving Khadi weaving in hand loom Printing of cotton textiles
Manufacture of cotton thread, rope, twine, etc.
Jute spinning
103
Code
244
264 271 272 273 274 277 278.1
278.2 280 281 282
283
284
285
286
287
288 289
290
291
292 300
301 302
303 310
3Il 313
314 320.1 320'2
Description
Manufacture of jute products including re-pairing of gunny bags
Weaving of silk by handloom Manufacture of hosiery 'goods
Making of embroidery products Tailoring
Manufacture of quilts and matress Manufacture of coir and coir products Manufacture and assembling of umbrella and
production of spare-parts of umbrellas Repairing of umbrellas Sawing of wood
Manufacture of wooden furuiture and fixtures Manufacture of structural wooden goods such
as doors, beams, etc. Manufacture of wooden industrial goods such
as parts of handlooms, ambarcharka, bobbins, etc.
Manufacture of wooden utensils, photoframes, photoframing, toys, etc,.
Manufacture of veneer, p.lywood and match splinters
Manufacture of plywood products such as tea-chest, etc.
Manufacture of wooden boxes and packing cases
Cane industry including basket-weaving, etc. Manufacture of miscellaneous wooden articles
such as sticks, sandals, rulers, etc. Manufacture of paper and paper-board in
mills Manufacture of paper-board and paper by
hand Making of pape: boxes, bags, envelopes, etc. Printing and publishing of newspapers and
periodicals Printing and publishing of books Miscellaneous printing works including type
cutting Book-binding Currying, tanning and finishing of leather,
hides, and skins Manufacture of leather shoes and chappals Manufacture of leather products such as suit-
case, bags, etc. Repairing of leather shoes and chappals Manufacture of tyres and tubes
Retreading of tyres
106/1-58a
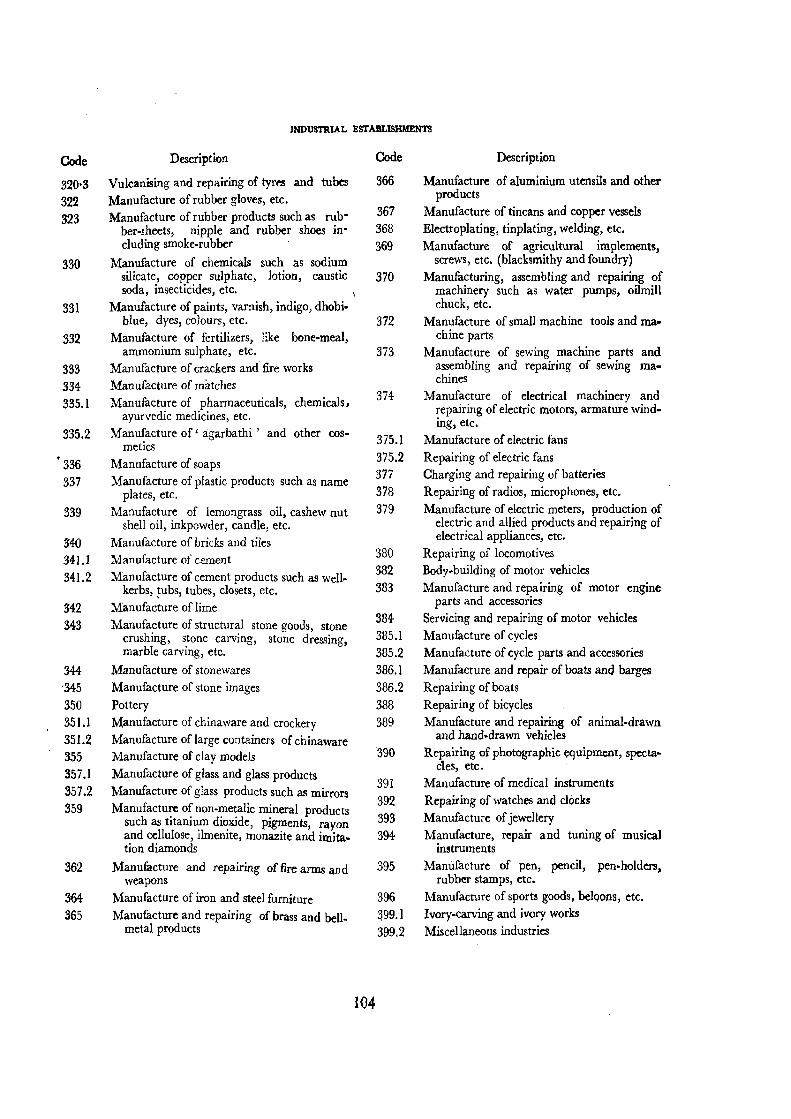
Code
320·3 322 323
330
331
332
333 $34 335.1
335.2
• 336 337
339
340 341.1 341.2
342 343
344 -345 350 351.1 351.2 355 357.1 357.2 359
362
3M 365
JNDUSTRIAL ESTABLISHMENTS
Descriptmn
Vulcanising and repairing of tyres and tubes Manufacture of rubber gloves, etc. Manufacture of rubber products such as rub·
ber-sheets, nipple and rubber shoes including smoke-rubber
Manufacture of chemicals such as sodium silicate, copper sulphate, lotion, caustic soda, insecticides, etc.
Manufacture of paints, varnish, indigo, dhobi· blue, dyes, colours, etc.
Manufacture of fertilizers, like bone-meal, ammonium sulphate, etc.
Manufacture of crackers and' fire works Manufacture of matches Manufacture of pharmaceuticals, chemicals,
ayurvedic medicines, etc. Manufacture of' agarbathi' and other cos·
metics Manufacture of soaps Manufacture of plastic products such as name
plates, etc. Manufacture of lemongrass oil, cashew nut
shell oil, inkpowder, candle, etc. Manufacture of bricks and tiles Manufacture of cement Manufacture of cement products such as well
kerbs, ~ubs, tubes, closets, etc. Manufacture of lime Manufacture of structural stone goods, stone
crushing, stone carving, stone dressing marble carving, etc. '
Manufacture of stonewares Manufacture of stone images Pottery M;anufacture of chinaware and crockery Manufacture of large containers of chinaware Manufacture of clay models Manufacture of glass and glass products Manufacture of glass products such as mirrors Manufacture of non-metalic mineral products
such as titanit1;m di~xide, pigments, rayon and cellulose, Ilmelllte, monazite and imitation diamonds
Manufacture and repairing of fire arms and weapons
Manufacture of iron and steel furniture Manufacture and repairing of brass and bell.
metal products
104
Code
366
367 368 369
370
372
373
374
375.1 375.2 377 378 379
380 382 383
384 385.1 385.2 386.1 386.2 388 389
390
391 392 393 394
395
396 ~99.l
3~9.2
Description
Manufacture of aluminium utensils and other products
Manufacture of tincans and copper vessels Electroplating, tinplating, welding, etc. Manufacture of agricultural implements,
screws, etc. (blacksmithy and foundry) Manufacturing, assembling and repairing of
machinery such as water pumps, oilmill chuck, etc.
Manufacture of small machine tools and machine parts
Manufacture of sewing machine parts and assembling and repairing of sewing machines
Manufacture of electrical machinery and repairing of electric motors, armature winding, etc.
Manufacture of elp-ctric fans Repairing of electric fans Charging and repairing of batteries Repairing of radios, microphones, etc. Manufacture of electric meters, production of
electric and allied products and repairing of electrical appliances, etc.
Repairing of locomotives Body-building of motor vehicles Manufacture and repairing of motor engine
parts and accessories Servicing and repairing of motor vehicles Manufacture of cycles Manufacture of cycle parts and accessories Manufacture and repair of boats and barges Repairing of boats Repairing of bicycles Manufacture and repairing of animal-drawn
and hand-drawn vehicles Repairing of photographic equipment, specta-
cles, etc. Manufacture of medical instruments Repairing of watches and clocks Manufacture of jewellery Manufacture, repair and tuning of musical
instruments Manufacture of pen, pencil, pen-holders,
rubber stamps, etc. Manufacture of sports goods, beloons, etc. Ivory-carving and ivory works Miscellaneous industries

INDUSTRIAL ESTABUSHMENTS
I [This table gives the total number of industrial establishments arranged in asce'lding order of minor groups.~ The first figure is the number of minor groups and the figure within brackets is the number of establishments.]
KozlUkode District
TOTAL:-048(1), 200.1(82), 200.2(15), 200.3(40), 200.4(22),203.2(5), 204.1(19), 204.2(247), 205(211), 206(3), 207.1(43), 207.2(148), 208(1), 209(259), 214(99),215(6),216(2),217(20), 218(11), 220(811), 221(93),225(1), 231(12), 233(9), 234(2), 235(293), 239(1), 244(1),271(3),273(946),277(335),278.1(1]), 278.2(63),280(77),281(150),283(1),284(12), 286(3), 287(11), 288(10), 289(6), 300(5). 301(6), 302(73), 303(12),310(3),311(109),313(2), 314(28), 320.2(1), 320.3(27),323(58), 330(1), 331(5), 332(1), 333(14), 334(19), 335.1(219), 336(35), 339(73), 340(25), 341.2(2),342(67),343(1),350(91), 351.1(1), 365(47), 366(1),367(93),368(19),369(475), 370(6), 375.2(3), 377(4),378(17), 379(6), 383(3), 384(12]), 386.2(1), 388(339), 389(]3) 392(104), 393(703), 394(5), 395(8), 399.2(15).
Rural:-048(1),200.1(73), 200.2(15), 200.3(21), 200.4(12),
203.2(4), 204.1(14), 204.2(184), 205(117), 206(3), 207.1(7), 207.2(140), 209(166), 214(59), 217(19), 218(2), 220(687), 221(19), 225(1), 231(9), 233(1), 235(165), 271(1), 273(499), 277(238), 278.2(32), 280(6), 281(49), 283(1), 284(4), 287(2), 288(7), 289(3), 300(1), 301(4), 302(18), 303(4), 311(57), 314(24),320.2(1),320.3(1), 323(57),331(1), 333(14), 334(8),335.1(196),336(11),339(73), 340(7), 342(55), 350(91),365(38),367(34), 368(5), 369(380), 370(2), 377(2), 378(1), 379(1), 384(2]), 388(144), 392(38), 393(514),395(1), 399.2(6).
Urban:-200.1(9),200.3(19), 200.4(10), 203.2(1), 204.l(5),
204.2(63), 205(94), 207.l(36), 207.2(8), 208(1), 209(93), 214(40), 215(6), 216(2), 217(1), 2Id(9), 220(124), 221 (74) ,\ 231 (3), 233(8), 234(2); 235(128), 239(1),244(1),271(2),273(447), 277(97), 278.1 (II), 278.2(31),280(71),281 (lOl), 284(8), 286(3), 287 (9), 288(3),289(3), 300(4}, 301(2),302(55),303(8),310(3), 311(52), 313(2), 314(4), 320.3(26), 323(1), 330(1), 331(4),332(1),334(ll),335.l(23), 336(24), 340(18), 341.2(2), 342(12), 343(1),.351(1), 365(9), 366(1), 367(59), 368(14), 369(95), 370(4), 375.2(3), 377(2), 378(16),379(5),383(3),384(100),386.2(1), 388(195), 389(13),392(66),393(189),394(5),395(7),399.2(9).
:Badagara Taluk
TOTAL:-200.1(29), 200.3(2), 204.2(74), 205(40), 207.1(8),207'2(32),209(41),214(13),215(1),220(49), 221(70), 233(3), 235(206),273(74), 277(3), 278.1(1), 278.2(7), 280(4), 281(4), 284(3), 288(4), 289(1), 301(2), 302(8), 303(1), 311(15), 314(2), 320.3(1), 333(3), 334(1), 335.1(49), 336(2), 342(11), 350(4), 365(6), 367(14), 369(87); 377(1), 378(2), 384(8); 388(20}; 392(11), 393(139); 399.2(2).
105
Rural:-200.1(29).204.2(71), 205(29), 207.1(5), 207.2(32),
209(28), 214(10), 220(31), 221(12), 235(140), 273(41), 277(3), 278.2(3), 281(4), 284(1), 288(3), 289(1), 301(2), 302(1), 303(1), 311(10), 3H(1), 333(3), 334(1), 335.1(40), 342(8), 350(4), 365(4), 367(3), 369(72), 377(1), 384(2), 388(14), 392(6), 393(104).
Urban:-
200.3(2), 204.2(3), 205(11), 214(3), 215(1), 220(18), 235(66), 273(33), 278.1(1), 284(2), 288(1), 302(7), 320.3(1), 335.](9), 336(2), 367(11), 369(15), 378(2), 392(5), 393(35), 399.2(2).
Villages:-
207.1(3), 221 (58), 278.2(4), 311(5),
342(3) , 384(6),
209(13). 233(3). 280(4), 314(1), 365(2), 388(6),
Azhiyur 204.2(56), 205(3),207.2(2),209(2), 214(1) 220(3), 235(35), 273(7), 277(2), 334(1), 335.1 (12), 342(2), 369(5) l 393(9). Kunnummakara 235(2), 393(1). Onchiyam l04.3(15), 207.2(1), 220(2), 221 (3), 273(3), 335.l (5), 392(1), 393(1). Uralanga1 205(1), 207.2(5), 214(1), 220(2), 235(12), 281(1), 333(1), 335.1(1), 369(2), 393(5). Muttunga1 200.1(2), 207.2(1), 209(1), 220(6), 221(1), 273(1), 335.1(5), 342(2), 350(1), 369(3),393(5). Chorode 207.1(3), 207.2(2), 214(1), 221(5), 235(9), 369(1), 388(1), 393(2). Vykilasseri 235(9). Eramala 205(2), 209(7), 235(7), 277(1), 288(1),302(1),34'2(2), 367(1),369(3),393(8). Edacheri 235(30), 369(2), 393(5). Katcheri 235(8). Iringannur 220(2), 369(2), 393(3). Thuneri 209(2), 273(1), 335.1 (1). Parakkadavu 200.l (1), 205( 1), 209(1), 214(1), 369(1), 393(4). Chekkiyad 369(1), Valayam 369(1), 388(1), 393(2). Velliyode 273(1), 369(3),388(1). VanimaI393(1). Iyyencode 209(1), 350(1), 369(2), 388(2), 393(2). Kuttipram 205(1}. 278.2(1), 284(1),369(2), 393(4). Kummancode 205(9), 209(3), 214(3), 220(6), 273(15), 281(1), 301(2), 311(7), 314(1), 365(2), 367(1), 369(5), 388(2), 392(3), 393(18). Vellur 335.1(1). Purameri 209(1),235(1),369(3),393(1). Karthikapally 200.1(2), 235(1). Ponmeri 207.2(7), 335.1(3). Vulliappally 200.1(24), 205(5), 207'1(2), 207.2(14), 209(1), 214(1), 220(5), 221(), 235(6), 273(2), 278.2(2), 288(1), 289(1), 303 (1), 333(2), 335'1(4), 342(1), 350(1) 365(1), 369(7), 377(1), 384(1), 388(2), 393(9). Memunda 205(2), 209(4), 221(1), 235(3), 273(1), 342(1),369(6), 393(2). Chemmarathur 209(2), 235(1), 335.1(2), 350(1), 369(3), 393(2). Kottappally 288(1), 335.1(1), 369(6), 388(1), J93(J). Kadameri 369(1). Kunnummal 205(1), 21(42), 220(2), 273(2), 281(1), 311(1), 384(1), 388(3), 393(5). Naripatta 365 (1), 369(1), 393(3).. Kavilumpara 209(1), 220(1), 273(1), 335.1(1), 369(2), 393(1). Kayakody 273(1), 369(1). Mokeri 205(1), 209(1), 220(1), 273(1), 281(1),

INDUSTRIAL ESTABLISHMENTS
367(1), 369(1), 393(2). Kuttiyadi 205(3), 209(1), 220(1), 273(2), 311(2), 335.1(1), 369(2), 392(2), 393(3). Vatayam 273(1). Ayencheri 335.1(3). Thiruvalloor 3v9(1), 388(1), 393(4). Maniyur 235(14), 273(2), 369(1). Palayad 235(1), 369(4), 393(1).
Towns:-Badagara Municipal 200.3(2), 204 2(3), 205(1l),
207.1(3), 209(13),214(3),215(1), 220(18), 221(58), 233(3), 235(66), 273(33), 278.1(1), 278.2(4), 280(4), 284(2), 288(1), 302(7), 311(5), 314(1), 320.3(1),335.1(9), 336(2), 342(3), 365(2), 367(11), 369(15), 378(2), 384(6), 388(6),392{5), 393(35), 399.2(2). Q.uilandy Taluk
TOTAL:-200.1(4), 200.2(6), 200.4(1), 203.2(1), 204.1(2), 204.2(16), 205(21), 207.1(1), 207.2(18), 209(20), 214(12), 215(2),220(72),221(21), 231(2), 233(3), 235(24), 273(52),277(6), 278.2(13),280(2), 281(1l),283(1), 287(2), 300(1), 302(7), 311(5), 314(1), 323( 1 0),331 (1), 333(4),334(2), 335.1 (4) ,336(2), 339(2), 342(14), 350(1), 365(3), 367(4), 368(5), 369(45),378(1),384(1), 388(30), 392(9),393(83).
Rural:-200.1(4), 200.2(6), 200.4(1), 203.2(1), 204.1(1),
204.2(16), 205(16), 207.1(1) 207.2(17), 209(15), 214(7), 220(57), 221(7), 231(1), 233(1), 235(7), 273(37), 277(6), 278.2(10), 280(1), 281(10), 283(1), 287(2), 300(1), 302(5), 311(3), 314(1), 323(10), 331(1), 333(4), 334(2), 335.1(4) 336(2), 339(2), .342(14), 350(1), 365(3), 367(1), 369(39), 388(26),392 (5), 393(68). Urban:-
204.1(1), 205(5), 207.2(1), 209.(5), 214(5), 215(2), 220(15),221(14), 231 (1), 233(2), 235(17), 273(15), 278.2(3), 280(1), 281(1), 302(2), 311(2) 367(3), 368(5), 369(6), 373(1), 384(1), 388(4), 392(4), 393(15). Villages:-
Iringal 205(2), 207.1(1), 280(1), 281(1), 342(1), 369(2),393(5). Trikkottur 200.4(1), 207.2(2),221(1), 235(1), 273(4), 283(1), 336(1), 393(1). Pallikkara 334(1). Meladi 205(1), 209(1), 214(1), 220(5), 221(1), 235(2), 273(1), 278.2(1), 281(1), 302(2), 369-(3), 383(4), 392(1), 393(5). Thurayur 281(1), 369(3) 393(2). Cheruvannur 200.1(1), 235(1), 393(1): Avala 393(1). Paleri 273(1). Changaroth 273(1), 393(1). Kallode 205(1), 220(1). Kalpathur 200.2(1), 204.1(1), 281(1), 333(4), 369(1). Meppayur 200.1(1), 205(2), 207.2(1), 209(1), 273(1), 278.2(1) 281(1), 369(1), 388(2), 393(3). Vilayattur 200.1(2)' 207.2(6), 220(2), 369(1). Iringath 273(1), 369(1), 393(2). Keezhariyur 220(1),369(1). Moodadi 273(1), 334(1), 388(1), 393(1}. Vanmugham 287(2), 302(1), 331(1), 339(2), 388(3), 393(1). Viyyur 204.2(5), ·205(4), 207.2(1), 209(1), 214(1), 220(18), 221(3), 273(8), 278'2(3), 335.1(1), 342(1), ~65(1}, 369( 1), 383(3), 393(4). Kuruvangad 221 (1). Ankulam 220(1). Karayad 220(1), 235(1). Kavumathara
106
220(2), 373(1), 393(1). Chenoli 207.2(1), 209(1), 273(1). Menhaniam 205(1), 214(2), 220(1), 273(1), 278.2(2), 300(1), 314(1), 367(1), 369(5), 388(3), 392(2), 393(12). Perambra 207.2(1), 281(1), 323(2). Kayanna 273(1), 369(2). Naduvannur 220(1), 233(1), 350(1): Kunnathara 342(1), 393(2). Melur 220(1), 277(4), 393(1). Edakkulam 207.2(4), 221(1), 369(1), 393(1). Thiruvangoor 203.2(1) 204.2(11), 214(1), 220(2), 273(4), 281(1), 342(6), 393(1). Chemancherry 205(1), 220(3), 302(1), 342(2), 369(1). Velur 205(1), 209(1), 220(3), 273(3), 277(2), 278.2(1), 281(1), 369(3) 388(2), 393(5). Edakkara 200.2( 1), 220( 1). Modakkallur 323(1), 393(1). Kokkallur 273(1), 369(1). Balusseri 200.2(4), 209(6), 214(1), 220(4), 235(2), 273(3}, 278.2(1), 281(1), 302(1), 311(1), 335.1(1),. 342(1), 365(1), 369(3), 388(3), 392(1), 393(8). AVltanallur 220(1), 369(1), 393(1). Panangad 205(1), 207.2(1), 214(1), 220(2), 335.1(1), 336(1), 369(4), 388(1), 393(3). Sivapuram 273.2(1), 393(1). Iyyad 231(1). Unnikulam 205(2), 209(4), 220(7), 273(4), 311(2), 323(1), 335.1(1), 34:.!(t), 365(1), 369(4), 388(4), 392(1), 393(4). Kinalur 281(1), 323(6).
Towns:-Pantalayini 204'1(1), 205(5), 207'2(1),
214(5), 215(2), 220(15), 221(14), 233(2), 235(17), 273(15), 278'2(3), 281(1), 302(2), 311(2), 367(3), 369(6), 378(1), 334(1), 388(4), 392(4),
Kozhikode Taluk
209(5), 231(1), 280(1), 368(5),
393(15).
TOTAL:-200.1(33), 200.2(4),200.3(17), 200.4(12), 203.2(1), 204.1(3), 204.2(17), 205(83), 207.1(33), 207.2(19), 208(1), 209(115), 214(41), 215(2) 216(2), 217(1), 218(6), 220(196), 231(8),233(3), 234(2), 235(54), 239(1), 244(1), 271(2), 273(492), 277(37), 278.1(9), 278.2(26), 280(60), 281(104), 284(7), 286(3), 287(9), 288(4), 289(3), 300(4), 301(1), 302(35), 303(8), 310(1) 311(36), 313(2), 314(8), 320.2(1), 320.3(21), 323(29), 330(1), 331(2), 332(1), 333(1), 334(8), 335.1(69), 336(18), 339(50), 340(21), 341.2(1), 342(15), 343(1), 350(23), 351.1(1), 365(2), 367(43), 368(6), 369(149), 370(5), 375.2(3), 377(2), 378(13),379(5), 383(3), 384(88), 386.2(1), 388(194), 389(13), 392(44), 393(191), 394(5), 395(5), 399.2(4).
Rural:- , 200.1(29), 200.2(4),200.3(1), 200.4(3), 204.1(1),
205(23), 207.2(12), 209(55), 214(18), 220(158), 231(6), 235(9), 271(1), 273(141), 277(16) 278.2(5), 280(1), 281(15), 284(1),288(3), 311(3), 314(5), 320.2(1), 323(28), 333(1), 334(1), 335.1(62), 336(4), 339(50), 340(4), 342(9), 350(23), 365(1), 367(3), 369(83), 370(1), 384(2), 388(25), 392(2), 393(97) .
Urban:-200.1(4), 200.3(16), 200.4(9), 203.2(1), 204.1(2),
204.2(17), 205(60), 207.1(33), 207.2(7), 208(1). 209(60), 214(23), 215(2), 216(2), 217(1), 218(6).

INDUSTRIAL ESTABLISHMENTS
220(38), 231(2), 233(3), 234(2), 23:>(45), 239(1), 244:(1), 271(1), 273(351), 277(71), 278.1(9),
. 278'2(21), 280(59), 281(89), 284:(6), 286(3), 287(9), ;(88(1), 289(3), 300(4:), 301(1), 302(35), 303(8),310(1), 311(33), 313(2), 314(3), 320'3(21), 323(1), 330(1), 331(2), 332(1), 334(7),335'1(7), 336(14:), 340(17), 34:1.2(1), 34:2(6), 343(1), 351.1(1), 365(1), 367(40), 368(6), 369(66), 370(4), 375.2(3), 377(2), 378(13), 379(5), 383(3), 384(86), 386.2(1), 388(169), 389(13)~ 392(42) 393(94), 394(5), 395(5), 399.2(4). Villages :-
Elathur200' 1 (2), 220( 1). Thalakolathur 200'1(2). 205(1), 207'2(1), 214(1), 220(1); 273 (7), 393(3). Annasseri 200'3(1), 220(2), 273(1), 393(1). Kannankara 200'1(1), 220(1), 273(1), 335'1(4), 393(2). Naduvalloor 209(2); 220(7);- 231(1), 273(3), 335'1 (2), 393(3). Cheekilode 273(2), Nanminda 205(1), 207'2(1), 209(2)" 220(14), 235(1), 273(8), 314(1), 335'](1), 369(2). 388(1), 393(3). Nediyanad 209(2), 220(2), 273(4), 278'2(1), 369(2), 393 (1) . Punnas~ed 209 ( 1 ) ; 231 (1) . Parannoor 231(2), 335.1(1) .. Palath :209(1), 220(4), 235(1), 273(3), 277(1), 369(1), 393(1). Thamarasseri 205(1), 209(1), 220(3), 273(3), 323(1), 369(2), 388(1), 393(2). Makkada 209(1), 335.1(1), 369(1). Karannur 2001(1), 205.1, 209(3), 214:(1), 220(2), 273(4:), 281(2), 335.1(3), 369(1), 383(4), 393(2). Karuvisseri 200.1(5) 207'2(1), 277(1), 342(4). Vengeri 209(1), 231(1), 273(1), 284(1), 336(1), 393(2). Patinhattumuri 205(3), 207.2(3), 209(3), 214(2), 220(12), 231(1), 235(3), 273(10),281(1), 333(1), 336(1), 350(4), 365(1), 367(1), 369(1), 388(6), 393(3). Kuruvattoor 200.4(1), 207.2(1), 209(3), 220(9), '273(1). Paimbalasseri 273(2), 369(1). Madavoor 200.1(2) 207.2(3), 220(1), 273(1), 335.1(1), 369(1)' Kizhakkoth 369(1),393(1), Elettil 209(1), 273(2), 393(2). Parambathkavu 209(2), 220(1), 369(3), 393(1). Vavad 200.1(3), 220(3), 273(1), 335.1(4), 369(3), 393(3). Raroth 200.1(4), 20Q.2(1), 209(1), 220(2), 273(5), 323(1), 335.1(3), 342(1), 367(1), 369(6), 393(1). Kedavoor 200.1(2), 200.2(2), 205(2), 214(1), 273(1), 323(5), 393(2)._Puduppadi 209 (1), 220(3), 273(2), 323(5), 335.1(2);, 369(1), 370(1), 384(l), 388(1), 393(2). Koodathayi 200.4(1), 205(1), 273(1), 339(42), 369(4), 393(2). Thiruvambadi 200.4(1), 204.1(1), 207.2(2), 220(3), 235(2), 278.2(2), 323(7), 367(1), 369(11). 388(2), 392(1), 393(5). Neeleswaram 220(1), 323(2), 339(4), 369(5). Puthoor 220(7), 273(2), 3p9(2), 393(3). Koduvally 205(1), 209(5), 214(2), 220(9), 273(5), 281(1), 311(2), 3]4(4), 335.1(10), 369(2), 388(]), 392.(1), 393(9). Kunnamangalam 2Q().1(2), 214(2) 220(7), 273(10), 281(2), 336(1), 342(3), 369(4), 393(6). Chelavoor 205(2), 209(2), 214(1), 220(5), 273(6), 278.2(1), 28i(3), 335.1(1), 350(10), 369(1), 393(3). Chevayur 205(3), 209(2), 214(1), 220(2), 273(7), 281(7), 335.1(12), 34:0(1), 350(2), 369(4), 388(1), 393(3). Nedungottur 273(2). Kottuli 273(2), 34:0(2). Kovoor 205(3), 209(5), -214(3), 220(7),
107
273(6), 278.2(1), 281(1), 311(1), 369(2), 384(1), 393(4). Mayanad 209(4), 214(1), 273(2), 288(3), 335.1(1), 336(1), 369(2), 388(1), 393(4). Cherukulathur 220(1l), 235(2), 273(1), 369(1). Chathamangalam 273(3), 369(1). Manasseri 220(1), 273(2), 369(2), 393(3). Thazhekode 205(1), 209(2), 214(1), 273(3), 281(2), 335.1(5), 369(4), 388(1), 393(4). Kumaranelloor 200.2(1), 273(1), 323(7), 350(4), 369(2), 393(1). Poolacode 369(1). Iringallur 209(1), 273(2), 277(7), 281(1), 335.1(2), 388(1). Nallalam 200.1(5), 205(1), 209(3), 220(7), 271(1), 273(6), 277(4), 280(1), 320.2(1), 334(1), 340(1), 369(1), 388(4), 393(4). Kodal 205(2), 209(2), 214(1), 273(4), 277(2), 281(1), 388(1), 393(3). Vellayicode 209(2), 220(13), 273(1), 277(1), 369(1}. Perumanna 273(3). Peruvayal 209(1), 220(9), 273(1), 335.1(2), 369(2). Cheruppa 220(3), 273(3), 350(3), 369(1), 393(2). ~voor 214(1), 273(3), 335.1(6), 393(2). Kodiyathur 209(1), 220(5), 273(3), 369(4), 393(4). Pannicode 335.1(]), 339(4), 342(1). Towns :-
Elathur 200.](4), 204.2(17), 205(1), 207.1(1), 209(3), 214(2), 273(9), 277(3), 342(4), 369(1), 386.2(1), 383(4), 392(1), 393(1). Edakkad 273(6), 388(2). Puthiyangadi 205(1), 207.2(1), 209(2), 220(1), 235(2), 273(5), 281(1), 330(1),388(5), 392(1),393(2). Calicut Municipal 200.3(16), 200.4(8), 203.2(1), 204.1(2), 205(52), 207.1(32), 207.2(5), 208(1), 209(45), 214:(18), 215(2), 216(2), 217(1), 218(5), 220(17), 231(2), 233(3), 234(2),235(33), 239(1),244(1),271(1), 273(280), 277(48), 278.1(9}~ 278.2(18), 280(56), 281(74), 284(6), 286(3), 287(9), 288(1), 289(3), 300(4), 301(1) 302(34), 303(8), 310(1), 311(31), 313(2), 314(3), 320.3(19), 323(1), 331(2), 332(1), 335.1(5), 336(13),340(3), 34l.2(1), 342(1), 365(1), 367(39), 368(6), 369(53), 370(3), 375.2(3), 377(2), 378(13), 379(5), 383(3), 384(86), 388(152), 389(13), 392(37), 393(79), 394:(5), 395(4), 399.2(4). Parayancheri 200.4(1), 207.2(1), 320.3(1), 340(3). Nellikode 205(1), 209(3), 220(7), 273(11), 369(2), 388(3) 393(3). Kommeri 214(1), 220(1), 277(1). Beypore 205(5), 209(7), 214(2), 218(1), 220(9), 235(10), 273(34), 277(3), 278'2(3), 230(3), 281(14), 302(1), 311(2), 320'3(1), 334(7), 335'1(2), 336(1), 340(11), 342(1), 343(1), 35H(1) 367(1), 369(9), 370(1), 388(3), 392(3), 393(8), 395(1). 01avanna 220(3), 273(6), 277(16), 369(1), 393(1).
TirW'Taluk
TOTAL-~OO'I(15), 200'2(5), 200'3(2), 200'4(1), 204'1(1l), 204'2(140), 205(26), 207'1(1), 207'2(46), 20::1(49), 214:(12), 215(1), 218(3), 220(224), 221(2), 225(1), 231(1), 235(3), 271(1), 273(186), 277(223), 278'2(6), 280(8), 281(14), 288(1), 301(3), 302(13), 303(3), 310(2), 311(18), 314(15), 333(5), 334(5), 335'1(61), 336 (9). 340(4), 341'2(1), 342(21), 350(24), 365(28), 366(1), 367(12) 368(2), 369(45), 370(1), 377(1). 384(6), 388(28), 392(19), 393(151), 395(3), 399'2(4).
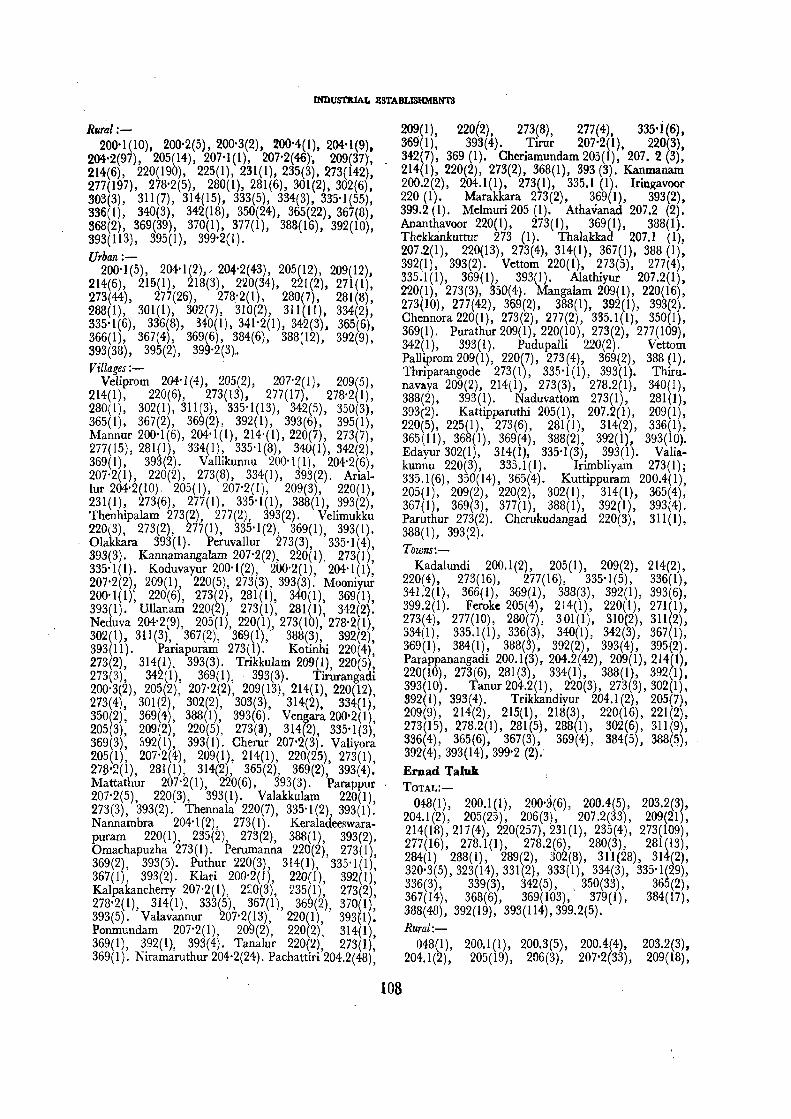
INDUSTRIAL ESTABLISHMENTS
Rural :-200'1(10), 200'2(5), 200'3(2), 200'4(1), 204'1(9),
204'2(97), 205(14), 207-l(1), 207'2(46}, 209(37), 214(6}, 220(190), 225(1), 231(1), 235(3), 273(142), 277(197), 278'2(5), 280(1), 281(6), 301(2), 302(6), 303(3), 311 (7), 314(15), 333(5), 334(3}, 335'1 (55), 336(1), 340(3), 342(18), 350(24}, 365(22), 367(8), 368(2), 369(39), 370(1), 377(1), 388(16), 392(10) 393(113), 395(1), 399'2(1). '
Urban:-200'1(5), 204'1(2)" 204'2(43), 205(12), 209(12),
214(6), 215(1), 218(3), 220(34), 221(2), 271(1), 273(44), 277(26), 278'2(1), 280(7), 281(8), 288(1), 301(1), 302(7), 310(2), 311(1l), 334(2), 335'1(6), 336(8), 340(1), 341'2(1), 342(3)1 365(6), 366(1), 367(4), 369(6), 384(6), 388(12), 392(9) 393( 38), 395(2), 399'2 (3).. ' Villages:-
Veliprom 204'1(4), 205(2), 207'2(1), 209(5), 214(1), 220(6), 273(13), 277(17), 278'2(1), 280(1), 302(1), 311(3), 335'1(13), 342(5), 350(3), 365(1), 367(2), 369(2), 392(1), 393(6), 395(1), Mannur 200'1(6), 204'1(1), 214'(1}, 220(7}, 273(7), 277(15), 281(1), 334(1)~ 335'1(8), 340(1), 342(2), 369(1), 393(2). Valhkunnu 200'1(1), 204'2(6), 207'2(1), 220(2), 273(8), 334(1), 393(2). Arial. lur 204'2(10) 205(1), 207'2(1), 209(3), 220(1), 231(1), 273(6), 277(1), 335'1(1), 388(1) 393(2) Thenhipalam 273(2), 277(2), 393(2). V~limukk~ 220\3), 273(2), 277(1), 335'1(2), 369(1), 393(1). Olakkara 393(1). Peruvallur 273(3), 335'1(4), 393(3). Kannamangalam 207'2(2), 220(1), 273(l), 335'1(1). Koduvayur 200'1(2), 200'2(1), 204'1(1), 207'2(2), 209(1), 220(5), 273(3), 393(3). Mooniyur 200'1(1): 220(6), 273(2), 281(1), 340(1}, 369(1), 393(1). Ullanam 220(2), 273(1), 281(1}, 342(2). Neduva 204'2(9), 205(1), 220(1), 273(10), 278'2(1} 302(1), 311(3),. 367(2), 369(1), 38S(3), 392(2): 393(11). Panapuram 273(1). Kotinhi 220(4) 273(2), 314(1), 393(3). Trikkulam 209(9, 220(5): 273(3), 342(1), 369(1), 393(3}. Tlfurangadi 200'3(2), 205(2), 207'2(2), 209(13}, 214(1) 220(12) 273(4), 301(2), 302(2), 303(3), 314(2),' 334(1): 350(2), 369(4), 388(1), 393(6). Ven~ara 200'2(1) 205(3), ~09(2), 220(5), 273(11), 314(2), 335'1 (3); 369(3), 692(1), 393(1). Cherur 207'2(3). Valiyora 205(1), 207'2(4), 209(1), 214(1), 220(25), 273(1) 27B'2(1), 281(1), 314(2), 365(2), 369(2), 393(4): Mattathur 207'2(1), 220(6), 393(3). Parappur 207'2(5}, 220(3}, 393(1). Valakkulam 220(1) 273(3), 393(2). Thennala 220(7), 335'1(2), 393(1}: Nannambra 204'1 (2), 273( I). Keraladeeswara. puram 220(1), 235(2), 273(2), 388(1), 393(2). Omachapuzha 273(1). Perumanna 220(2) 273(1} 369(2), 393(5). Puth~r 220(3), 314(1), '335'1(1}: 367(1), 393(2). Klan 200'2(1), 220(1}, 392(1), Kalpakancherry 207'2(1), 2~0(3), 235(1), 273(2) 278'2( 1), 314(1), 333(5), 367(1), 369(2), 370(1): 393(5). Valavannur 207'2(13), 220(1), 393(1). Ponmundam 207'2(1}, 209(2), 220(2), 314(1), 369(1), 392(1), 393(4). Tanalur 220(2) 273(1) 369(1). Niramaruthur 204'2(24). Pachattiri'204.2(48):
209(1), 220(2), 273(8), 277(4), 335' 1 (6). 369(1), 393(4). Tirur 207'2(1) 220(3) 342(7), 369 (I). Cheriamundam 205(1),' 207. 2 (3): 214(1), 220(2), 273(2), 368(1), 393 (3). Kanmanam 200.2(2), 204.1(1), 273(1), 335.1 (1). Iringavoor 220 (I). Marakkara 273(2), 369(1), 393(2) 399.2 (1). Melmuri 205 (1). Athavanad 207.2 (2): Anant~avoor 220(1), 273(1}, 369(1}, 388(1). Thekkankuttur 273 (1). Thalakkad 207.1 (I). 207.2(1), 220(13), 273(4), 314(1), 367(1), 388 (1)~ 392(1), 393(2). Vettom 220(1), 273(5}, 277(4), 335.1(1), 369(1), 393(1). Alathiyur 207.2(1), 220(1), 273(3), 350(4). Mangalam 209(1), 220(16), 273(10), 277(42), 369(2), 388(1), 392(1), 393(2). Chennora 220(1), 273(2), 277(2), 335.1(1), 350(1}, 369(1}. Purathur 209(1), 220(1O}, 273(2), 277(109), 342(1), 393(l). Pudupalli 220(2). Vet tom Palliprom 209(1), 220(7), 273(4), 369(2), 388 (1). Thriparangode 273(1), 335'1(1}, 393(1). Thirunavaya 209(2), 214(1), 273(3), 278.2(1}, 340(1}, 388(2), 393(1). Naduvattom 273(1), 281(1), 393(2). Kattipparuthi 205(1), 207.2(1), 209(1), 220(5), 225(1), 273(6), 281(1), 314(2), 336(l}, 365(11), 368(1), 369(4), 388(2), 392(1), 393(10). Edayut 302(1), 314(1), 335-1(3), 393(1). Valia· kunnu 220(3), 335.1(1). Irimbliyam 273(1); 335.1(6), 350(14), 365(4). Kuttippuram 200.4(1), 205(1), 209(2), 220(2), 302(1), 314(1), 365(4), 367( 1), 369(3), 377 (1), 388(1}, 392( 1), 393(4). Paruthur 273(2). Cherukudangad 220(3), 311(1), 388(1), 393(2). Towns:-
Kadalundi 200.1(2), 205(1), 209(2), 214(2), 220(4), 273(16}, 277(16), 335'1(5), 336(1), 341.2(1), 366(1), 369(1), 388(3), 392(1), 393(6), 399.2(1). Feroke 205(4), 214(1), 220(1), 271(1), 273(4), 277(10}, 280(7), 301(1), 310(2), 311(2), 334(1), 335.1(1), 336(3), 340(1), 342(3), 367(1), 369(1), 384(1), 388(3), 392(2), 393(4), 395(2). Parappanangadi 200.1(3), 204.2(42), 209(1),214(1), 220(10), 273(6), 281(3), 334(1), 388(1), 392(1), 393(10). Tanur 204.2(1}, 220(3), 273(3),302(1). 392(1), 393(4). Trikkandiyur 204.1 (2), 205(7), 209(9), 214(2}, 215(1), 218(3), 220(16), 221(2), 273(15), 278.2(J), 281(5), 288(1), 302(6), 311(9),. 336(4), 365(6), 367(3), 369(4), 384(5), 388(5), 392(4),393(14),399'2 (2).
108
Ernad Taluk TOTAL:-
048(1), 200.1(1), 200'3(6), 200.4(5), 203.2(3), 204.1(2), 205(25), 206(3}, 207.2(33), 209(21), 214(18),217(4), 220(257),231(1), 235(4), 273(109}, 277(16), 278.1(1), 278.2(6), 280(3), 281(13}, 284(1) 288(1), 289(2), 302(8), 311(28), 314(2), 320'3(5),323(14),331(2), 333(1), 334(3), 335'1(29), 336(3), 339(3), 342(5), ,350(33), 365(2), 367(14), 368(6), 369(103), 379(1), 384(17), 388(48), 392(19), 393(114),399.2(5). Rural:-
048(1), 200.1(1), 200.3(5), 200.4(4), 203.2(3), 204.1(2), 205(19), 206(3), 207'2(33), 209(18),

INDUSTRIAL ESTABLISHMENTS
214 (15), 217(4), 220(238), 231(1), 235(4), 273 (105), 277(16), 278.2(4), 280(3), 281 (10), 284(1), 288(1), 289(2), 302(4), 311(27), 314(2), 320.3(1), 323(14), 333(1), 334(1), 335.1(28), 336(3),339(3), 342(5), 350(33), 365(2), 367(13), 368(3), 369(101), 379(1), 284(16), 388(44), 392(13), 393(107), 399.2 (5). Urban:-
200.3(1), 200.4(1), 205(6), 209(3), 214(3), 220(19), 273(4), 278.1(1), 278.2(2), 281(3), 302(4), 311(1), 320.3(4), 331(2), 334(2), 335.1(1), 367(1), 368(3), 369(2), 384(1), 388(4), 392(6), 393 (7). Villages:-
Azhillhilam 235(2), 273( I), 288( 1), 366(1), 393(1). Vazhayur 273(2). Karumarakkad 209(2), 220(1), 273(2), 278.2(1), 392(1), 393(2). Cheruvayur 273(1), 393(1). Kizhuparamba 220(4), 273(1), 323(1), 339(1), 369(2),393(1). Oorangattiri 207.2(1), 273(1), 350(4), 369(1). Mambad 200.3(1), 220(10), 273(2), 281(1), 323(2), 342(1), 350(3), 369(2), 388(1). Nilambur 200.3(1), 200.4(4), 205(3), 214(3), 220(11), 273(12), 280(2), 281(1), 289(2), 302(1), 314(1), 320.3(1), 323(3), 335.1(1), 336(1), 339(1), 350(13), 365(2), 367(1), 368(2), 369(35), 379(1), 384(5), 388(10), 392(1), 393(12), 399.2(1). Amaramba1am 200.3(1), 206(2), 273(1),311(1), 369(2),388(2). Punnappala 207'2(1), 209(3) 335.1(4), 367(1), 369(2), 393(1). Tiruvali 207.2(1), 220(1), 335.1(2), 342(1). Edavanna 204.1(1), 207.2(5), 214(1), 220(15), 273(4), 311(1), 323(1), 388(2), 393(4). Perakamanna 207.2(2), 220(3). Kavanur 200.1(1), 273(2), 342(1), 393(1). Areacode 205(3), 209(2), 214(1) 220(2), 350(1), 369(2), 392(1). Vilayil 273(1). Cheacode 220 (2), 273(1). 01avattur 273(1), 335.1(3). Cherukavu !:!20(1), 273(1), 369(2), :192(2). Chelembra 209(1), 220(2}, 273(2), 277(15), 393(1). Pallikkal 220(1), 273l3), 277(1), 335.1(1). 393(1). Andiyurkunnu 048(1), 207.2(4), 220(7), 231(1), 273(2), 311(1), 335.HI), 350(1), 369(2), 388(3), 393(2). Muthuvallur 220(1). Puliacode 220(1), 235(2), 273(1), 369(1), 393(1). Irivetty 207.2(5), 220(3), 335.1(1). Karakullnu 209(3), 220(3), 273(1),393(1). Vaniambalam 200.3(1), 203.2(1), 204. 11(1), 205(2), 214(2), 220(31), 273(4), 280(1), 281(2), 302(1), 3ll(2), 334(1), 384(2), 388(8), 392(1), 393(6). Ka1ikavu 214(1), 220(1), 311(1), 323(1), 335'1(1), 350(3), 369(1!,,;,~ Vellayur 311(1), 323(1), 388(1), 393(2). Elaidoi 220(4), 339(1). Pulpatta 273 (1). Trippanachi 220(2), 273( 1). Kuzhimanna 205(1), 207.2(1), 209(3), 220(1), 273(3), 281(1), 311(2), 335'1(5), 369(1), 393(2). Kondotty 207.2(3), 209(3), 214(2), 220(32), 273(10), 281(1), 284(1), 302(1), 311(3), 336 (1), 367(2), 369(5), 388(2), 393(6). Karippur 220(1). Nediyiruppu 205(2), 220(3), 273(4), 369(4), 388(1), 392(1), 393(4). Morayur 220(3), 273(3), 311(1), 350(4), 367(1), 369(5), 388(1). 393(6). Arimbra 323(1). Pookottur 220(10), 273(1), 335.1(1), 393(1). Valluvambram 220(17),· 273(1), 350(1), 369(1).
l06jl-59 109
Nerukara 220(3), 369(1). Karuvambram 203 2 (1) 220(5). Irumbuzhi 205(1). 369(1) 393(3)" Me1muri 220(1), 273(1), 388(2),' 393(4): Urakammelmun 220 (4); 393 (2). Urakamkizhmuri 220(1),388(1), 393(1). Ponma1a 207.2(1) 220(10) 369(2), 393(2). Kottakkal 205(2),' 206(1)' 209(1), 214(2), 220(17), 273(5), 278.2(1), 281(4)' 302(1), 311(6), 333(1), 335.1(7), 367(4), 369(1)' 384(3), 388(1), 392(2), 393(14), 399.2(4). Chen: gottur 207.2(2), 220(1), 323(1), 369(4), 393(1). Malappuram 200.3(1), 205(4), 207.2(1), 214(3), 220(15), 273(23), 278.2(2), 311(8), 314(1), 342(2), 367(4), 368(1), 369(4), 384(6), 388(5), 392(4), 393(21). Annakkayam 207.2(]), 273(]), 350(3), 369(2). Payyanad 203.2(1», 220(5). Pandallur 207.2(4), 369(6). V~ttikkattiri 207.2(1), 220(2), 369(1). Chembrassen 220(1). Pandikkad 205(1), 273(3), 369(4), 388(2). 393(1). Thuvur 323(1), 335.1(1), 393(2). Karuvarakundu 217(4), 273(2), 323(2), 369(7), 388(2). Towns :-
Manjeri 200.3(1), 200.4(1), 205(6),209(3), 214(3), 220(19), 273(4), 278.1(1), 278.2(2), 281(3), 302(4), 311(1), 320.3(4), 331(2), 334(2), 335.1(1), 367(1), 368(3), 369(2), 384(1), 388(4), 392(6j, 393 (7).
South Wynad Taluk Rural ;-
200.3(13), 200.4(3), 204.](1), 205(]6), 209(13), ~14(3), 217(15), 2]8(2), 220(13), 235(2), 273(33), fl8.2(5), 281(4), 284(1), 302(2), 311(7), 323(5), 335.1(7), 336(1), 339(18), 342(1), 350(6), 365(6), 367(6), 369(46), 378(1), 384(1), 388(19), 392(2), 393 (25). Villages :-
Padinharethara369(1). Thaviyode200.3(2), 273(2), 335.1(2), 369(1). Achooranam 205(1), 2]7(3), 367(1),369(1), 388(1). Kalpatta 200.3(1), 205(4), 209(3), 214(1), 218(1), 220(1), 273(9), 278.2(2), 281(1), 302(2), 311(3), 335.1(4), 342(1), 350(2), 365( 1), 367(2), 369(5), 378( I), 384( 1), 388(4), 392(1), 393(5). Muttil 205(1), 273(1), 365(1), 369(5), 388(]), 393(2). Ponginichickallur 200.3(1), 350(3), 367(1), 369(2), 388(2). Puthadi 200'3(1), 220(1), 273(1), 369(1), 393(1). Pulpalli 369(5). Sultan's Battery 200.3(1), 200.4(3), 205(3), 209(2), 214(]), 235(1), 273(7), 278.2(2), 281(2), 311(1), 336(1), 365(1), 367(2), 369.1(2), 388(4), 393(6). Purakkadi 205(1), 209(1), 311(1); 365(1 \, 369(6), 388(1). Vengappally 205(1), 209(2), 273(1), 365(1), 369(4). Kunnathidavaga 205(2), 214(1), 217(3), 278.2(1), 388(1), 392(1), 393(3). Kottappadi 200.3(2), 204.1 (1), 205(3), 209(4), 217(5), 218(1), 220(9), 273(4), 284(1), 311(2), 323(1), 350(1), 369(5), 388(3), 393(5). Muppainad 217(3), 220(2), 273(4), 323(1), 369(3),393(1). Ambalavayal 209(1),273(1), 281(1), 323(2), 335.l(1), 339(18), 369(4), 388(1), 393(2). Nenmani 200.3(5), 217(1), 273(3), 323(1), 365 (1), 388 (I). Noolpuzha 235 (1),369 (1).


(iv) INDEX OF VILLAGES AND DESOMS
J06/1-59a '


INDEX OF vn.LAGES AND DESOMS
The names of the Census villages viz., revenue villages and of the Census desoms are given in full capitals and in lower case. respectively. Wherever a Census village has only one desom and that bears the same name of the village the desom has been omitted.
81. No. No. Sl. No. No. in the according in the according
Primary to Census Primary to Census 81. Alphabetical1ist of Census Location 81. Alphabetical list of Census Location No. village/desom Abstract Code No. village/desom Abstract Code
1 ACHOORANAM 295 , 2-6-5 54 Balusseri 82'4 2 2-49-4 2 Achooranam 295'1 2-6-5-1 55 Bhoomivathucka1 4·2 2-1-16-2 3 Adiyur 14'2 2-1-8-2 56 Chadagankulam 239'1 2-5-11-1 4 Adukkath 1.2 2-1-34-2 57 Chalapram . 24'3 2-1-21-3 5 Aduvad 157'3 2-3-57-3 58 Ghaliyapram 233'3 2-5-4-3 6 Akkal 6·5 2-1-35-5 59 Chamal 129'4 2-3-28-4 7 ALATHIYUR 208 2-4-53 60 Changaramkulam 6'1 2-1-35-1 8 Ani 1471 2-3-47-1 61 Changaramvalli 58·4 2-2-18-4 9 AMARAMBALAM 237 2-5-9 62 CHANGAROTH 53 2-2-13
10 Amayur 255'2 2-5-27-2 63 Changaroth 53'4 2-2-13-4 11 AMBALAVAYAL 308 2-6-18 64 Chappanangadi 279·2 2-5-51-2 12 ANANTHAVOOR 205 2-4-49 65 Chathallur 242'2 2-5-14-2 13 Ananthavur 232'3 2-5-3-3 66 CHATHAMANGALAM 143 2-3-43 14 Anayankunnu 147'2 2-3-47-2 67 Chathamangalam 143·7 2-3-43-7 15 ANDIYURKUNNU 251 2-5-23 68 CHATHANGOTTUPURAM 260 2-5-32 16 Andiyurkunnu 251'1 2-5-23-1 69 Chathangottupuram 260'4 2-5-32-4 17 Andona 128'1 2-3-27-1 70 Chavatta 61-4 2-2-21-4 18 ANNAKKAYAM 284 2-5-56 71 CHEACODE 246 2-5-18 19 Annakkayam 284'3 2-5-56-3 72 Cheacode 246'2 2-5-18-2 20 ANNASSERI 104 2-3-3 73 CHEEKILODE 107 2-3-6 21 Arambra 122'3 2-3-21-3 74 Cheekilode 107'1 2-3-6-1 22 Aravankara 271.2 2-5-43-2 75 CHEKKIYAD 2 2-1-14 23 AREACODE 244 2-5-16 76 Chekkiyad 2·2 2-1-14-2 24 Areacode 244'4 2-5-16-4 77 Chekkonnummal 5,2 2-1-~3-2 25 ARIALLUR 221 2-4-4 78 Chelakkad 22'3 2-1-19-3 26 Arikkod 228'1 2-5-6-1 79 CHELAVOOR 136 2-:1-36 27 ARIKULAM 66 2-2-29 80 Che1avoor 136·3 2-3-36-3 28 Arikulam 66,2 2-2-29-2 81 GHELEMBRA 249 2-5-21 29 ARIMBRA 270 2-5-42 82 Chelia 97'3 2-2-41-3 30 AROOR 34 2-1:"'31 83 Chellattapoyil 44'1 2-1-44-1 31 Aroor 34'2 2-1-31-2 84 CHEMANCHERRY 100 2-2-44. 32 Aroor 247'1 2-5-19-1 85 Chemancherry 100'2 2-2-44-2' 33 Aryancode 148'3 2-3-48-3 86 Chembra 128'3 2-3-27-~ 34 Aryyannur 31'1 2-1-28-1 87 Chembrakkattur 244'2 2-5-16-2 35 ATHAVANAD 204 2-4-48 88 CHEMBRAS8ERI 288 2-5-60 36 Athiodi 73'5 2-2-36-5 89 Chembrasseri 288·3 2-5-60-3 37 Atuvat 80'3 2-2-47-3 90 CHEMMARATHUR 31 2-1-28 38 AVALA 49 2-2-9 91 Chemmarathur 31·3 2-1-28-3 39 Avala 49.1 2-2-9-1 92 Chenad 301·1 2-6-11-1 40 Avatukka 53'6 2-2-13-6 93 Chengara 254,3 2-5-26-3 41 Avilora 125'1 2-3-24-1 94 CHENGOTTUR 282 2-5-54 42 AVITANALLUR 84 2-2-51 95 Chengottur 2B2.5 2-5-54-5 43 Avitanallur 84'1 2-2-51-1 96 Chennamangalam 12'3 2-1-6-3 44- AYANIKKAD 91 2-2-2 97 Chennamangalam 145'2 2-3-45-2 45 Ayanikkad 75'2 2-2-38-2 98 CHENNORA 226 2-4-55 46 Ayanikkod 259,2 2-5-31-2 99 CHENOLI 70 2-2-33 47 AYENCHERI 39 2-1-39 100 Chenoli 70·1 2-2-33-1 48 AZHINHILAM 230 2-5-1 101 Chenoth 143·6 2-3-43-6 49 Azhinhilam 230'1 2-5-1-1 102 Cheramba 229·1 2-5-63-1 50 AZHIYUR 7 2-1-1 103 Cherandathur 42.2 2-1-42-2 51 Azhiyur 7'1 2-1-1-1 104 CHERAPURAM 50 2-2-10 52 Badirur 116' I 2-3-15-1 105 Cherayil 267·2 2-5-39-2 53 BALUSSERI 82 2-2-49 106 Cherayil 268'2 2-5-40-2
113

INDEX OP VILLAGES AND DESOMS
SI. No. No. SI. No. No. in the according in the according
Primary to Census j>rimary to Census SI. Alphabetical list of Census Location 51. Alphabetical list of Census Location No. villageJdesom Abstract Code No. . villageJdesom Abstract Code
107 CHERIAMUNDAM 196 2-4-40 164 ELETTIL 125 2-3-24 108 Cheriyakumbalam 52-2 2-2-12-2 165 Elettil 125-2 2-3-24-2 109 Cherukad 73'6 2-2-36-6 166 ERAMALA 14 2-1-8 110 CHERUKAVU 248 2-5-20 167 Eramala 14-3 2-1-8--3 111 Cherukavu 248'1 2-5-20-1 168 Eramangalam 8T~4 2-2-48-4 112 CHERUKUDANGAD 220 2-4-68 169 Eramangalam 260'2 2-5-32-2 113 CHERUKULATHUR 142 2-3-42 170 Eranchora 127'2 2-3-26-2 114 Cherukulathur 14-2'1 2-3-42-1 171 Eranhikkocle 241'3 2-5-13-3 115 Cherukunnu 51-1 2-2-11-1 172 Erapuram 12'. 2-1-6-1 116 Cherumaruthayi 130-4 2-3-30-4 173 ERAVANNUR 113 2-3-12 117 Cherumoth 3-3 2-1-15-3 174 Eravannur 113'2 2-3-12-2 118 Cheruppa 131-4 2-3-31-4 175 ERAVATTUR 56 2-2-16 119 CHERUPPA 156 2-3-56 176 Eravattur 56'3 2-2-16-3 120 Cheruppa 156-1 2-3-56-1 177 Erimala 148'5 2-3-1-8-5 121 Cheruputhur 263'1 2-5-35-1 178 Indad 105'4 2-3-4-4 122 CHERUR 177 2-4-19 179 INDIANUR 281 2-5-53 123 Cheruvadi 158'1 2-3-58-1 180 Indianur 281'3 2-5-53-3 124 Cheruvalloor 70'3 2-2-33-3 181 IRIMBLIYAM 217 2-4-65 125 CHERUVANNUR 48 2-2-8 182 IRINGAL .90 2-2-1 126 Cheruvannur 48'1 2-2-8-1 183 IRINGALLUR 150 2-3-50 127 Cheruvatta 136'1 2-3-36-1 184 Iringallur .150-1 2-3-50-1 128 CHERUVAYUR 233 2-5-4 185 IRINGALLUR 179 2-4-21 129 Cheru.vayur 233'1 2-5-4-1 186 IRINGANNUR 17 2-1-11 130 CHEVAYUR 137 2-3-37 187 Iringannur 17-1 2-1-11-1 131 Chevayur 248'5 2-5-20-5 188 IRINGATH 60 2-2-20 132 Chingapuram 95-4 2-2-25-4 189 Iringath 60-2 2-2-20-2 133 Chingeri 303'2 2-6-13-2 190 IRINGAVOOR 198 2-4-42 134 Chiyyur 21-3 2-1-18-3 191 IRIVETTY 254 2-5-26 135 Chok~oor 133'1 2-3-33-1 192 lrivetty 254-2 2-5-26-2 136 Chombala 7'2 2-1-1-2 193 Jrpona 129-1 2-3-28-1 137 CHOOLOOR 144 2-3-41 194 IRUMBUZHI 275 2-5-47 138 Chooloor 144-1 2-3-44-1 195 Irumbuzhi 275'2 2-5-47-2 139 CHORODE 12 2-1-6 196 Iruvallur 114'1 2-3-13-1 140 Chorode 12'4 2-1-6-4 197 IYYAD 87 2-2-54-141 Chunur 282-3 2-5-54-3 198 Iyyad 87-2 2-2-54-2 142 Devarkovil 6'4 2-1-35.,..4 19-9 IYYENCODE 21 2-1-18' 143 EDACHERI 15 2-1-9 200 Iyyencode 21'5 2-1-18-5 144 Edacheri 15-1 2-1-9-1 201 Jatiyeri 3-2 2-1-15-2 145 EDAKKARA 79 2-2-46 202 Kacheri 146'2 2-3-46-2 146 Edakkara 79'2 2-2-46-2 203 Kadalur 100-1 2-2-44-1 147 EDAKKULAM 98 2-2-42 204 KADAMERI 33 2-1-30 148 Edakkulam 98-1 2-2-42-1 205 Kadameri 33'1 2-1-30 .. :1 149 Edappalam 260-3 2-5-32-3 206 Kadiyangad 53'3 2-2-13-3 150 EDAVANNA 241 2-5-13 207 Kadungallur 253'3 2-5-25-3 151 Edavanna 241-2 2-5-13-2 208 Kailamadam 152'2 2-3-52-2 152 Edavarad 56'1 2-2-16-1 209 Kaipram 56'2 2-2-16-2 153 EDAYUR 215 2-4-63 210 Kaipram 86-2 2-2-53-2 154 Ekkattur 67'3 2-2-30-3 211 Kakkad 159'1 2-3-59-1 155 Elambilad 42-3 2-1-42-3 212 ~kkamvally 23'1 2-1-20-1 156 Elampilad 59-2 2-2-19-2 213 Kakkanchery 75-3 2-2-38-3 157 Elampilad 95-2 2-2-25-2 214- Kakkattil 21-1 2-1-18-1 158 Elankamel 68-1 2-2-31-1 215 Kakkove 231-2 2-5-2-2 159 ELANKUR 261 2-5-33 216 KALIKAVU 257 2-5-29 160 Elatheri 97'2 2-2-41-2 217 Kallamala 7-3 2-1-1-3 161 ELATHUR 102 2-3-1 218 KaHat 1'1 2-1-34-1 162 Elayadam 33-2 2-1-30-2 219 KALLODE 55 2-2-15 163 Elayur 254'1 2-5-26-1 220 Kallode 55-1 2-2-15-1
114

INDEX OF VILLAGES AND DESOMS
SI. No. No. S1. No. No. in the according in the according
Primary to Census Primary to Census SI. Alph<\betical list of Census Location 81. Alphabetical list of Census Location No. village/desom Abstract Code No. village/desom Abstract Code
221 Kallur 54'4 2-2-14-4 278 Kavasseri 159'2 2-3-59-2 222 KALPAKANCHERRY 191 2-4-33 279 Kavil 68'2 2-2-31-2 223 KALPATHUR 57 2-2-17 280 KAVILUMPARA 1 2-1-34 224 Kalpathur 57'l 2-2-17-1 281 Kavilumpara 1'6 2-1-34-6 225 Kalpatta 157'1 2-3-57-1 282 KAVUMTHARA 68 2-2-31 226 KALPATTA 296 2-6-6 283 Kavumvattom 65-4 2-2-28-4 227 Kandanoor 105-3 2-3-4-3 284 KAYAKODY 6 2-1-35 228 KA='l"MANAM 197 2-4--41 285 Kayakody 6'7 2-1-35-7 229 Kannakkara 9-1 2-1-3-1 286 Kayalad 58-3 2-2-18-3 230 KANNAMANGALAM 167 2-4-9 287 KAY ANNA 73 2-2-36 231 Kannambath 66-3 2-2-29-3 288 Kayanna 73'1 2-2-36-1 232 Kannambathkara 32'1 2-1-29-1 289 Kayapanachi 17'2 2-1-11-2 233 Kannamkode 81-3 2-2--48-3 290 KEDAVOOR 129 2-3-28 234- Kannamkulam 93-1 2-2-5-1 291 Kedavoor 129'5 2-3-23-5 235 KANNANKARA 105 2-3-4 292 Keezhal 30'2 2-1-27-2 236 Kannankara 105'2 2-3-4-2 293 KEEZHARIYUR 62 2-2-22 237 Kannatti 53'2 2-2-13-2 294 Keezhariyur 62'1 2-2-22-1 238 Kannikavu 82'1 2-2--49-1 295 KERALADEESW ARAPU· 239 KANNIPARAMBA 149 2-3-49 RAM ]85 2-4-27 240 Kanniparamba 149'1 2-3-49-1 296 KIDANGANAD 301 2-6-11 241 Kannur 77'1 2-2-40-1. 297 Kidanganad 301'2 2-6-]]-2 242 Kanthapuram 88-4 2-2-55--4 298 Kidangazhi 274'1 2-5-46-1 243 Kappil 238'1 2-5-10-1 299 Kiliyampilayi 72'1 2-2-35-1 244 Karad 230'3 2-5-1-3 300 KINALUR 89 2-2-56 245 KARAKUNNU 255 2-5-27 301 Kinalur 89'3 2-2-56-3 246 Karakunnu 255'1 2-5-27-1 302 Kirallur 120'3 2-3-19-3 247 Karandot 36-3 2-1-36-3 303 KIZHAKKOTH 124 2-3-23 248 KARANNOOR 117 2-3-16 304 Kizhakkoth 124'1 2-3-23-1 249 Karannoor 117'1 2-3-16-1 305 Kizhakkumuri 120'5 2-3-19-5 250 Karanthur 141-1 2-3-41-1 306 Kizhinhaniam 57'4 2-2-17-4 251 Karaya 287'3 2-5-59-3 307 Kizhpayur 58'1 2-2-13-1 252 KARAYAD 67 2-2-30 308 KIZHUPARAMBA 234 2-5-5 253 Karayad 67'2 2-2-30-2 309 Kizhupararnba 234'1 2-5-5-1 254 Karikkad 262'2 2-5-34-2 310 Kizhur 93'3 2-2-5":3 255 Karingamanna 128'4 2-3-27-4 311 Kizhusseri 265'1 2-5-37-1 256 KARIPPUR 267 2-5-39 312 KLARI 190 2-4-32 257 Karippur 267·1 2-5-39-1 313 KODAL 152 2-3-52 258 Karivampoyil 126-3 2-3-25-3 314 Kodal 152'1 2-3-52-1 259 KARTHlKAPALLY 27 2-1-24 315 Kodasseri 288'2 2-5-60-2 260 Karthikapally 27-2 2-1-24-2 316 Kodencheri ~4'1 2-1-21-1 261 Karurnala 86·3 2-2-53-3 317 Kodiyathoor 133'2 2-3-33-2 262 KARUMARAKKAD 232 2-5-3 318 KODIYATHUR 158 2-3-58 263 Karumarakkad 232'1 2-5-3-1 319 Kodiyathur 158-2 2-3-5S-2 264 KARUVAMBRAM 274- 2-5-46 320 Kodoli 109'2 2-3-8-2 265 Karuvambrarn 274'2 2-5--46-2 321 KODUVALLY 134 2-3-34 266 KARUVANCHERI 44- 2-1-44 322 Koduvally 134-1 2-3-34-1 267 Karuvancheri 44'5 2-1-44-5 323 KODUVAYUR 168 2-4-10 268 Karuvannur 68·3 2-2-31-3 324 Kokkad 53'5 2-2-13-5 269 KARUVARAKUNDU 229 2-5-63 325 KOKKALLUR 81 2-2-48 270 KARUVISSERI 118 2-3-17 326 Kokkallur 81-2 2-2-43-2 271 Karuvisseri 118·1 2-3-17-1 327 Kolakkad 96'4 2-2-26-4 272 Katalur 95'5 2-2-25-5 328 Kolakkad 100'4- 2-2-44-4 273 KATCHERI 16 2-1-10 329 Kolakkad 79'1 2-2-46-1 274 Katcheri- 16-1 2-1-10-1 330 Kolaranthiri 127'5 2-3-26-5 275 KA TTIPPARUTHI 214 2-4-62 331 Kolathur 80'8 2-2-47-8 276 KAVANUR 243 2-5-15 332 Kolathur 107'2 2-3-6-2 277 Kavanur 243'1 2-5-15-1
115

INDEX OF VILLAGES AND DESOMS
Sl. No. No. SI. No. No. in the according in the according
Primary to Census Primary to Census SI. Alphabetical list of Census Location Sl. Alphabetical list of Census Location No. village/desom Abstract Code No. village/desom Abstract Code
333 Kolathur 266'1 2-5-38-1 390 KUNNATHARA 77 2-2-40 334 Kolkalam 282'6 2-5-54-6 391 Kunnathara 77'5 2-2-40-5 335 Kollam 96'5 2-2-26-5 392 KUNNATHIDAVAGA 305 2-6-15 336 KONDO TTY 266 2-5-38 393 Kunnathkara 44'3 2-1-44-3 337 Kongannur 78'2 2-2-45-2 394 Kunniyil 234'3 2-5-5-3 338 Konot 136'4 2-3-36-4 395 KUNNUMMAKARA 8 2-1-2 339 Koodancheri 131'2 2-3-31-2 396 Kunnummakara 8·2 2-1-2-2 340 KOODATHAYI 130 2-3-30 397 KUNNUMMAL 35 2-1-32 341 Koodathayi 130'6 2-3-30-6 398 Kunnu¥l:mal 35'} 2-1-32-1 ,342 Koommulli 80'5 2-2-47-5 399 KUPl1ADITHARA 292 2-6-2 343 Koonancherry 81'1 2-2-48-1 400 Kurichagam 51'2 2-2-11-2 344 Koothali 55'2 2-2-15-2 401 Kurichikkara 65'2 2-2-28-2 345 Koozhakode 144'3 2-3-44-3 402 Kurinhaliyode 27'1 2-1-24-1 346 Koranthiri 130'2 2-3-30-2 403 Kuriyad 282'1 2-5-54-1 347 Koratti 72'4 2-2-35-4 404 Kurukkilad 13'1 2-1-7-1 348 Koruvalur 80'4 2-2-47-4 405 KURUMBATHUR 199 2-4-43 349 Kotakkallur 73'3 2-2-36-3 406 Kurumthodi 41'2 2-1-41-2 350 Kotasseri 80'2 2-2-47-2 407 KURUVANGAD 64 2-2-27 351 Kothangal 80'7 2-2-47-7 408 Kuruvangad 64'2 2-2-27-2 352 KOTINHI 173 2-4-15 409 Kuruvantheri 2'3 2-1-14-3 353 Kotivura 4'3 2-1-16-3 410 KURUVATTOOR 121 2-3-20 354 'KOITAKKAL 280 2-5-52 411 Kuruvattoor 121'1 2-3-20-1 355 Kottakkal 280'1 2-5-52-1 412 Kuttamboor Ill':.! 2-3-10-2 356 KOTTAPPADI 306 2-6-16 413 Kuttikkattoor 140'3 2-3-40-3 357 Kottappadi 306'2 2-6-16-2 414 KUTTIPPURAM 218 2-4-66 358 KOTTAPPALLY 32 2-1-29 415 KUTTIPRAM 22 2-1-19 359 Kottappally 32'3 2-1-29-3 416 Kuttipram 22'4 2-1-19-4 360 KOTrATHARA 293 2-6-3 417 Kuttipuram 280'2 2-5-52-2 361 Kottembrom 16'2 2-1-10-2 418 Kuttirakuda 65'5 2-2-28-5 362 KOTTULI 139 2-3-39 419 KUTTIYADI 37 2-1-37 363 Kottupatta 273'3 2-5-45-3 420 Kuttoth 30'1 2-1-27-1 364 Kottur . 6'2 2-1-35-2 421 Kuttoth 49'2 2-2-9-2 365 KOTTUR 74 2-2-37 422 Kuyimanna 144'5 2-3-44-5 366 Kottur 74'5 2 -2-37-5 423 Kuyitteri 4'1 2':"1-16-1 367 Kottur 281'2 2-5-53-2 424 KUZHIMANNA 265 2-5-37 368 KOVOOR· 140 2-3-40 425 Kuzhimanna 265·2 2-5-37-2 369 Kovoor 140'1 2-3-40-1 426 Madappalli 10'3 2-1-4-3 370 Kovukunnu 36'1 2-1-36-1 427 MADAVOOR 123 2-3-22 371 Koyakkad 75'4 2-2-38-4 428 Madavoor 123'1 2-3-22-1 372 Koya1am 155'2 2-3-55-2 429 MAKKADA 1'16 2-3-t5 373 Kozhakkottur 244-'3 2-5-16-3 430 Makkada 116'2 2-3-15-2 374 Kozhipram 63'1 2-2-24-1 431 MALAPPURAM 283 2-5-55 375 KOZHUKKALLUR 61 2-2-21 432 Malappuram (Kunnummal) 283'2 2-5-55-2 376 Koihukkallur 61'2 2-2-21-2 433 Malappuram (Valiyangadi) 283'1 2-5-55-1 377 Kuduvanmuzhi 134'2 2-3-34-2 434 Malapram 156'4 2-3-56-4 378 Kulikipara 132'5 2-3-32-5 435 Malapuram 101'2 2-3-29-2 379 Kuluppa 60'3 2-2-20-3 436 Malayamma 143'2 2-3-43-2 380 KUMARANELLOOR 147 2-3-47 437 MAMBAD 235 2-5-7 381 Kumaranelloor 147'3 2-3-47-3 438 Mambilakkool 20'2 2-1-17-2 382 Kumdayi 109'4 2-3-8-4 439 Manakkattupuram 131-3 2-3-31-3 383 KUMMANCODE 23 2-1-20 440 MANASSERI 145 2-3-45 38t Kummancode 23'2 2-1-20-2 441 Manasseri 145'1 2-3-45-1 385 Kuningad 26'2 2-1-23-2 442 Manat 76'1 2-2-39-1 386 Kuniyode 54'1 2-2-14-1 443 MANGALAM 225 2-4-54 387 KUNNAMANGALAM 135 2-3-35 444 Mangat 98·2 2-2-42-2 388 Kunnaramvally 74'1 2-2-37-1 445 Mangat 87'3 2-2-54-3 389 Kunnasseri 53'1 2-2-13-1 446 Manipuram 126'1 2-3-25-1
116

INDEX OF VILLAGES AND DESOMS
SI. No. No. SI. No. No. in the according in the according
Primary to Census Primary to Census 81. Alphabetical list of Census Location 81. Alphabetical list of Census Location
No. village/desom Abstract Code No. village/desom Abstract Code
447 MANIYUR 42 2-1-42 504 Moyilothara 1'5 2-1-34-5 448 Maniyur 42'1 2-1-42-1 505 Mozhangallur 251'3 2-5-23-3 449 Mankkad 156'2 2-3-56-2 506 Muchukunnu 94'6 2-2-23-6 450 Mannamangalam 96'1 , 2-2-26-1 507 Mudappillasseri 256'2 2-5-28-2 451 Mannampoil 81'6 2-2-48-6 508 Mudavantheri 18-2 2-1-12-2 452 Mannankavu 75'1 2-2-38-1 509 Mukapur 60-1 2-2-20-1 453 Mannazhi 282'4- 2-5-54-4 510 Mulat 74'3 2-2-37-3 454- Mannur 1'3 2-1-34-3 511 Mundakkal 142'4 2-3-42-4 455 MANNUR 161 2-4-2 512 Mundakkal 245'1 2-5-17-1 456 MANTHARATHUR 41 2-1-41 513 Mundakkara 89-1 2-2-56-1 457 Mantharathur 41-3 2-1-41-3 514 Mundakulam 252'2 2-5-24-2 458 Maprom 233'2 2-5-4-2 515 Mundambra 245'4 2-5-17-4-459 MARAKKARA 200 2-4-44 516 Mundoth 76,2 2-2-39-2 460 Maralur 96'2 2-2-26-2 517 Munnur 148-1 2-3-48-1 461 Maruthad 115'1 2-3-14-1 518 MUPPAINAD 307 2-6-17 462 Marutheri 71'4 2-2-34-4 519 Muthannur 264'2 2-5-36-2 463 Maruthonkara 1'4 2-1-34-4 520 Muthiraparamba 272-3 2-5-44-3 464 Maruthur 65·6 2-2-28-6 521 Muthuvad 115'2 2-3-14-2 465 Mattancherri 123'2 2-3-22-2 522 MUTHUVALLUR 252 2-5-24 466 Mattanode 73'2 2-2-36-2 523 Muthuvallur 252'4 2-5-24-4 467 MATTATHUR 180 2-4-22 524 Muthuvana <14'4 2-1-44-4 468 Mavatta 66'1 2-2-29-1 525 MUTHUVANNACHA 54 2-2-14 469 MAVOOR 157 2-3-57 526 Muthuvannacha 54'3 2-2-14-3 470 Mavoor 157-2 2-3-57-2 527 Muthuvatathur 26'1 2-1-23-1 471 MAYAN AD 141 2-3-41 528 Muttayatt 143'3 2-3-43-3 472 Mayanad 141'2 2-3-41-2 529 Muttayur 251'2 2-5-23-2 473 Mayyannur 29'1 2-1-26-1 530 MUTTIL 297 2-6-7 474 Meenathkara 44'2 2-1-44-2 531 MUTTUNGAL 11 2-1-5 475 MELADI 93 2-2-5 532 Muttungal 1l'2 2-1-5-2 476 Meladi 93'2 2-2-5-2 533 . MUYIPOTH 47 2-2-7 477 Melakkam 274'3 2-5-46-3 534 Muyipoth 47-1 2-2-7-1 478 MELMURI 201 2-4-45 535 Muyipra 27'3 2-1-24-3 479 MELMURI 276 2-5 .... 43 536 Nadapuram 23-3 2-1-20-3 480 MELUR 97 2-2-41 537 NADERI 65 2-2-28 481 Melur 97·1 2-2-41-1 538 Naderi 65'1 2-2-28-1 482 MEMUNDA 30 2-1-27 539 Nadukil 132'6 2-3-32-6 483 Memunda 30'3 2-1-27-3 540 NADUV ALLOOR 106 2-3-5 484 MENHANIAM 71 2-2-34 541 Naduvalloor 105'3 2-3-5-3 485 Menhaniam 71-1 2-2-34-1 542 NADUVANNUR 75 2-2-38 486 MEPPAYUR 53 2-2-18 543 Naduvannur 75'S 2-2-38-5 487 Meppayur 582 2-2-18-2 544 Naduvathur 62'2 2-2-22-2 488 MODAKKALLUR 80 2-2-47 545 NADUVATTOM 213 2-4-61 489 Modakkallur 80-6 2-2-47-6 546 NALLALAM 151 2-3-51 490 Mokavoor 118-2 2-3-17-2 547 Nambrath 62·3 2-2-22-3 491 MOKERI 36 2-1-36 548 NANMINDA 108 2-3-7 492 Mokeri 36-2 2-1-36-2 549 NANNAMBRA 184 2-4-26 493 Mongam 269-3 2-5-41-3 550 Narakkode 61·1 2-2-21-1 494 MOODADI 94 2-2-23 551 Narath 76-3 2-2-39-3 495 Moodadi 94-2 2-2-23-2 552 N ara yinkuzhi 148-4 2-3-48-4 496 MOONIYUR 169 2-4-11 553 Naremkulam 74-4 2-2-37-4 497 Moothool 120'2 2-3-19-2 554 N arikka tteri 22-2 2-1-19-2 498 Moozhikumethal 65-3 2-2-28-3 555 NARIPATTA 5 2-1-33 499 MORAYUR 269 2-5-41 556 Naripatta 5' 1 2-1-33-1 500 Morayur 269'2 2-5-41-2 557 NARUKARA 273 2-5-45 501 Morikkara 116'3 2-3-15-3 558 Narukara 273'2 2-5-45-2 502 Morikkara 120'1 2-3-19-1 559 NEDIYANAD 110 2-3-9 503 Motapilavil 41'1 2-1-41-1 560 NEDIYIR UPPU 268 2-5-40
117 1/106-60

INDEX OF VILLAGES AND DESOMS
SI. No. No. SI. No. No_ in the according in the according
Primary to Census Primary to Census SI. Alphabeticallist of Census Location SI. Alphabetical list of Census Location No. village I desom Abstract Code No. villageJdesom Abstract Code
561 Nediyiruppu 268.1 2-5-40-1 618 Palayad 43'1 2-1-43-1 562 NEDUNGOTTUR 138 2-3-38 619 Palazhi 150-2 2-3-50-2 563 NEDUVA 171 2-4-13 620 PALERI 52 2-2-12 564 NEELESWARAM 132 2-3-32 621 Paleri 52-1 2-2-12-1 565 Neeleswaram 132'2 2-3-32-2 622 PALLIKKAL 250 2-5-22 566 Neerad 266'2 2-5-38-2 623 Pallikkal 250-1 2-5-22-1 567 Nellacheri 8'3 2-1-2-3 624 PALLIKKARA 45 2-2-4 568 Nelliyeri 84-2 2-2-51-2 625 Palliprom 129-2 2-3-28-2 569 Nelluyankara 12-2 2-1-6-2 626 Paloli 74-7 2-2-37-7 570 NENMANI 309 2-6-19 627 Palora 130-5 2-3-30-5 571 Nidumannur 6'6 2-1-35-6 628 Palur 92-2 2-2-3-2 572 NILAMBUR 236 2-5-8 629 Pampirikunnu 48'2 2-2-8-2 573 Nilambur 236'1 2-5-8-1 630 Panakkad 55'4 2-2-15-4 574 Nilambur 236-2 2-5-8-2 631 Panakkod 127-1 2-3-26-1 575 Nilambur ~'36-3 2-5-8-3 632 PANANGAD 85 2-2-52 576 Nilambur 236-4 2 5-8-4 633 Panangad 85-2 2-2-52-2 577 Nillikkuth 285-2 2-5-57-2 634 Panayi 81-5 2-2-48-5 578 NIRAMARUTHUR 222 2-4-37 635 PANDALLUR 286 2-5-58 579 Nirmallur 85-1 2-2-52-1 636 Pandicode 71'2 2-2-34-2 580 Nittur 38-1 2-1-38-1 637 PANDIKKAD 289 2-5-61 581 Nitumpoil 61-3 2-2-21-3 638 Pandikkad 289-1 2-5-61-1 582 NOCHAD 69 2-2-32 639 PANNICODE 159 2-3-59 583 Nochad 69-1 2-2-32-1 640 Pannicode 159-3 2-3-59-3 584 NOOLPUZHA 310 z-6-20 64. PANNIKKOTTUR 109 2-3-8 585 Nunhallur 251-6 2-5-23-6 642 Pannikkottur 109-3 2-3-8-3 586 OLAK!KARA 165 ~-4-7 643 Panoor 124-2 2-3-23-2 587 01amathil 263'2 2-5-35-2 644 Pappinippra 275-1 2-5-47-1 588 OLAVATTUR 247 2-5-19 645 Parakkad 94-1 2-2-23-1 589 01avattur 247'2 2-5-19-2 646 PARAKKADAVU 19 2-1-13 590 Ollur 77-2 2-2-40-2 647 Parakkadav"" 19-2 2-1-13-2 591 OMACHAPUZHA 187 2-4-29 648 PARAMBATHKAVU 126 2-3-25 592 Omanur 246'1 2-5-18-1 649 Parambathkavu 126-2 2-3-25-2 593 Omasseri 130'1 2-3-30-1 650 Parambil 28-1 2-1-25-1 594 ONCHIYAM 9 2-1-3 651 Parambil ·136-2 2-3-36-2 595 Onchiyam 9'2 _ 2-1-3-2 652 PARANNOOR 112 2-3-11 596 Onhal 73'4 2-2-36-4 653 Parannoor 112'2 2-3-11-2 597 OORANGATTIRI 228 2-5-6 654 PARAPPUR 181 2-4-23 598 Oorangattiri 228'2 2-5-6-2 655 Parappur 245-2 2-5-17-2 599 Oravil 76-5 2-2-39-5 656 Parathakkad 252'}' 2-5-24-1 600 Orkatteri 14-1 2-1-8-1 657 Paravur 54'2 2-2-14-2 601 Ozhukur 269-1 2-5-41-1 658 Paravur 248-4 2-5-20-4 602 OZHUR 186 2-4-28 659 PARIAPURAM 172 2-4-14 603 PAC HATTI RI 223 2-4-38 660 Pariyangad 258-1 2-5-30--1 604 PADINHARETHARA 291 2-6-1 661 PARUTHUR 219 2-4-67 605 Padoor 101'3 2-3-29-3 662 Pathanapuram 234-4 2-5-5-4 606 PAIMBALASSERI 122 2-3-21 663 Pathapiriyam 241'1 2-5-13-1 607 Paimb11asseri 122'2 2-3-21-2 664 Pathiripatta 35'3 2-1-32-3 608 Paithoth 553 2-2-15-3 665 Pa thi yarakkara 43-2 2-1-43-2 609 Pakkom 300-1 2-6-10--1 666 PA TINHATTUMURI 120 2-3-19 610 Palakkat 264-1 2-5-36-1 667 Patinhattumuri J20'4 2-3-19-4 -611 Palakod 260-1 2-5-32-1 668 Pavandur 106-1 2-3-5-1 612 Palangad 149'2 2-3-49-2 669 Payingottayi 32-2 2-1-29-2 613 Palangode 109'1 2-3...:8-1 670 Payingottu puram 141-3 2-3-41-3 614 Palannoor 132-4 2-3-32-4 671 PAYYANAD 285 2-5-57 615 PALATH 114 2-3-"13 672 Payyanad 285-1 2-5-57-1 616 Palath 114-2 2-3-13-2 673 Payyathur 14-4 2-1-8-4 617 PALAYAD 43 2-1-43 674 Pazhetam 256-1 2-5-28-1
118

INDEX OF VILLAGES AND DESOMS
81. No. No. SI. No. No. in the according in the according
Primary to Census Primary to Census 81. Alphabeticallist of Census Location 81. Alphabetical list of Census Location No. village/desom Abstract Code No. village/desom Abstract Code
675 Pengad 248'2 2-5-20-2 732 Pullanur 272'2 2-5-44-2 676 Penungolam 142'3 2-3-42-3 733 Pullicoth 122'1 2-3-21-1 £77 PERAKAMANNA 242 2-5-14 734 Pulpadi 298'2 2-6-8-2 678 Perakamanna 242'3 2-5-14-3 735 PULPALLI 300 2-6-10 679 PERAMBRA 72 2-2-35 736 Pulpalli 300'2 2-6-10-2 680 Perambra 72'3 2-2-35-3 737 PULPATTA 263 2-5-35 681 Peravanchery 74'2 2-2-37-2 738 Pulpatta 263'6 2-5-35-6 682 Perilli 130'3 2-3-30-3 739 Punath 84'3 2-2-51-3 633 Peringavu 231'3 2-5-2-3 740 PUNNAPPALA 239 2-5-11 684 Perinthiruthi 102'1 2-3-1-1 741 Punnappala 239'2 2-5-11-2 €85 Perode 24'4 2-1-21-4 742 PUNNASSERI III 2-3-10 686 Perukkad 289'2 2-5-61-2 743 Punnasseri lll'l 2-3-10-1 687 PERUMANNA 154 2-3-54 744 Punnoor 129'3 2-3-28-3 fj88 PERUMANNA 188 2-4 30 745 Punnoorcherupalam 112-1 2-3-11-1 689 Peru mba lam 284'2 2-5-56-2 746 PURAKAD 63 2-2-24 -690 Perumundacheri 34'1 2-1-31-1 747 Purakad 63'2 2-2-24-2 fj91 PERUVALLUR 166 2-4-8 748 PURAKKADI 303 2-6-13 692 Peruvarikara 21-4 2-1-18-4 749 Purakkadi 303'1 2-6-13-1 693 Peruvathur 64'1 2-2-27-1 750 Purakkal 94.3 2-2-23-3 694 PERUVAYAL 155 2-3-55 751 PURAMERI 25 2-1-22 €95 Peruvayal 155'1 2-3-55-1 752 PURATHUR 227 2-4-56 696 Pillaperuvanna 72-2 2-2-35-2 753 PUTHADI 299 2-6-9 697 Pinangode 295'2 2-6-5-2 754 Puthadi 299.2 2-6-9-2 698 Polur 121'4 2-3-20-4 755 Puthalam 244'5 2-5-16-5 699 PONGINICHICKALLUR 298 2-6-8 756 Puthenchf'ry 77'4 2-2-40-4 700 Ponginichickallur 298'1 2-6-8-1 757 PUTHOOR 133 2-3-33 701 Pongottur 127-4- 2-3-26-4 758 Puthoor 133'3 2-3-33-3 702 PONMALA 279 2-5-51 759 Puthukode 230'2 2-5-1-2 703 Ponmala 279'1 2-5-51-1 760 Puthur 117'2 2-3-16-2 704 PONMERI 28 2 .... 1-25 761 Puthur 153'1 2-3-53'-1 705 Ponmeri 28'2 2-1-25-2 762 PUTHUR 189 2-4-31 706 PONMUNDAM 193 2-4-35 763 Puthur 250'2 2-5-22-2 707 POOKOTTUR 271 2-5-43 764 Puthurvattam 77'3 2-2-40-3 708 Pookottur 271'3 2-5-4-3-3 765 Puthurvattam 82'3 2-2-49-3 709 POOLACODE 148 2-3-48 766 Putrakovil 259'1 2-5-31-1 710 Poolacode 148'6 2-3-48-6 767 Puttat 70'2 2-2-33-2 711 Poolamanna 289'4 2-5-61-4 768 Puttupadam 248'3 2-5-20-3 712 Poolapoyil 132'7 2-3-32-7 769 Puzhur 148'2 2-3-48-2 713 Poongod 258'2 2-5-30-2 770 Pymbra 121-3 2-3-20-3 714 Poonoor 88'3 2-2-55-3 771 Ramallur 57'2 2-2-17-2 715 Poovampoyil 89'2 2-2-56-2 772 Ramallur 106'2 2-3-5-2 716 Poovattparamba 142'2 2-3-42-2 773 RAROTH 128 2-3-27 717 PORUR 259 2-5-31 774 Raroth 128.2 2-3-27-2 718 Porur 259'3 2-5-31-3 775 Rayarangoth n'l 2-1-5-1 719 PUDUPPALLI 209 2-4-57 776 Sanketham 144.2 2-3-44-2 720 PUDUPPADI 101 2-3-29 777 SIVAPURAM 86 2-2-53 721 Puduppadi 101'4 2-3-29-4 778 Sivapuram 86'1 2-2-53-1 722 Pukadathur 263'3 2-5-35-3 779 SULTAN'S BA'ITERY 302 2-6-12 723 pukkuth 289-3 2-5-61-3 780 Talakappu 282.2 2-5-54-2 724 PULIACODE 253 2-5-25 781 TANALUR 194 2-4-36 725 Puliacode 253'1 2-5-25-1 782 Tehanur 105.1 2-3-4-1 726 Puliyancheri 96'3 2-2-26-3 783 THALAKKAD 207 2-1-51 1'I:l Puliyavil 3-1 2-1-15-1 784 THALAKOLATHUR 103 2-3-2 728 Pullaloor 113-1 2-3-12-1 785 Tha1aperumanna 134'3 2-3-34-3 729 Pullaloor 143'5 2-3-43-5 786 Thaliyil 6'3 2-1-35-3 730 Pullalur 121'2 2-3-20-'2 787 THAMARASSERI 115 2-3-14 73J Pullanoor 143'1 2-3-43-1 788 Thamarasseri 115-3 2-3-14-3
119

llIDEX OF VILLAGES AND DBSOMS
S1. No. No. SI. No. No. in the according in the according
Pri~~ry to Census Primary to Census Sl. Alphabetical list of Census Location SI, Alphabetical list of Census Location
No. villagejdesom Abstract Code No, viUage{desom Abstract Code
789 Thanakkottur 19'3 2-1-13-3 846 Ummathur 19'1 2-1-13-1 790 THARIYODE 294 2-6-4 847 UNNIKULAM 88 2-2--,55 791 Thattolikara 8'1 2-1-2-1 848 Unnikulam 88,2 2-2-55..:.2 792 Thavanur 252'3 2-5-24-3 849 URAKAMKIZHMURI 278 2-5-50 793 THAZHEKODE 146 2-3-46 850 URAKAMMELMURI 277 2-5-49 794 Thazhekode 146'1 2-3-46-1 851 URALANGAL 10 2-1-4 795 Thechiyad 132'3 2-3-32-3 852 Uralangal 10'1 2-1-4-1 796 THEKKANKUTTUR 206 2-4-50 853 Urallur 66'6 2-2-29-6 797 Thekkumthara 304'1 2-6-14-1 854 Urath 37-1 2-1-37-1 798 THENHIPALAM 163 2-4-5 855 Utteri 66'5 2-2-29.,..5 799 THENNALA 183 2-4-25 856 Vadakkanad 301'3 2-6-11-3 800 Theyyampadikuth 288·1 2-5-60-1 857 VADAKKUMBRAM 202 2-4-46 801 Thinur 5'3 2-1-33-3 858 Vadakkumpad 52'4 2-2-12-4 802 Thirumana 29'3 2-1-26-3 859 Vadasseri 242'1 2-5-14-1 803 THIRUNAVAYA 212 2-4-60 860 Vakayad t:l3·1 2-2-50-1 804 THIRUVALLOOR 40 2-1-40 861 Vakkalur 243'2 2-5-15-2 805 Thiruvalloor 40'2 2-1-40-2 862 Vakoli 66'4 2-2-29-4 806 THIRUV AMBADI 131 2-3-31 863 VALAKKULAM 182 2-4-24 807 Thiruvambadi 13H 2-3-31-1 864 Valamangalam 263'4 2-5-35-4 808 THIRUVANGOOR 99 2-2-43 865 Valarad 287·4 2-5-59-4 809 Thiruvangoor 99'1 2-2-43-1 866 VALAVANNUR 192 2-4-34 810 Thiruvot 74'6 2-2-37-6 867 VALAYAM 3 2-1-15 811 Thodanur 31'2 2-1-28-2 868 Valayam 3'4 2-1-15--4 812 Thondipoyil 37'3 2-1-37-3 869 Valayannoor 156'3 2-3-56-3 813 Thorayi 80'1 2-2-47-1 870 Valayannur 37'2 2-1-37-2 814 THOZHUVANNUR 203 2-4-47 871 Valiakkode 57'3 2-2-17-3 815 Thrikkaipatta 306'1 2-6-16-1 872 VALIAKUNNU 216 2-4-64 816 THRIPARANGODE 211 2-4-59 873 Valimanna 128·5 2-3-27-5 817 THU:NERI 18 2-1-12 874 Valiyakumbalam 52'3 2-2-12-3 818 Thuneri 18'1 2-1-12-1 875 Valiyaparamba 125'3 2-3-24-3 819 THURAYUR 46 2-2-6 876 Valiyaparamba 251'5 2-5--23-5 820 Thurayur 46'1 2-2-6-1 877 VALlYORA 178 2-4-20 821 Thuruthi 15·3 2-1-9-3 878 Valliatt 32'4 2-1-29-4 822 Thuruthiyad 82'2 2-2-49-2 879 VALLI KUNNU 162 2-4-3 823 THUVUR 290 2-5-62 880 Vallioth 88-1 2-2-55-1 824 Thuvvakode 100'3 2-2-44-3 881 Valliparamba 140'2 2-3-40-2 825 TIRUR 195 2-4-39 882 VALLUV AMBRAM 272 2-5-44 826 TIRURANGADI 175 2-4-17 883 Valluvambram 272'1 2-5-44-~ 827 TIRUVALI 240 2-5-12 884 Valluvangad 287'2 2-5-59-2 828 Tiruvangara 67'1 2-2-30-1 885 Valoor 70'4- 2-2-33-4 829 ToIeri 46-2 2-2-6-2 886 VANIAMBALAM 256 2-5-28 830 Tottekkad 263'5 2-5-35-5 887 Vaniambalam 256'3 2-5-28-3 831 TRIKKALANGODE 262 2-5-:t4 888 VANIMAL 20 2-1-17 832 Trikkalangode 262'1 2-5-34-1 889 Vanima1 20'3 2-1-17-3 833 Trikkalayur 234'2 2-5-5-2 890 VANMUGHAM 95 2-2-25 834 TRIKKOITUR 92 2-2-3 891 Vamnugham 95'1 2-2-25-1 835 Trikkottar 92'1 2-2-3-1 892 Varadoor 119'1 2-3-18-1 836 TRIKKULAM 174- 2-4-16 893 Varssyekuni 13'3 2-1-7-3 837 Trikunnasseri 257'1 2-5-29-1 894 VATAYAM 38 2-1-38 838 TRIKUTTISSERI 83 2-2-50 895 Vatayam 38'2 2-1-38-2 839 Triku ttisseri 83'2 2-2-50-2 896 Vattoli 35'2 2-1-32-2 840 TRIPPANACHI 264- 2-§-36 897 VAVAD 127 2-3-2& 841 Trippanachi 264'3 2-5-36-3 898 Vavad 127'3 2-3-26-3 842 Ugrapuram 244'1 2-5-16-1 899 Vavikkoli 22-} 2-1-19-1 843 ULLANAM 170 2-4-12 900 Vavur 246'3 2-5-18-3 844 ULLIYERI 76 2-2-39 901 Vazhakkad 232'2 2-5-3-2 845 Ulliyeri 76'4 2-2-39-4 902 VAZHAYUR 231 2-5-2
120

INDEX OF VILLAGES AND DESOMS
S1. No. No. SI. No. No. in the according in the according
Primary to Census Primary to Census 81. Alphabetical list of Census Location S1. Alphabetical list of Census Location No, village/-desom Abstract Code No. village/desom Abstract Code
903 Vazhayur 23H 2-5-2-1 937 VENGERI 119 2-3-18 904 Veemangalam 95'6 2-2-25-6 938 Vengeri 119'2 2-3-18-2 905 V eera vancheri 95'3 2-2-25-3 939 Vengoly 15'2 2-1-9-2 906 Veeryampram 87'1 2:-2-54-1 940 Vennacode 132' I 2-3-32-1 907 Velakode 94'4 2-2-23-4 941 Vennacode 133-4 2-3-33-4 908 VELAM 51 2-2-11 942 Vennacode 143'4 2-3-43-4 909 Velam 51'3 2-2-11-3 943 Vennarode 47'2 2-2-7-2 910 Velicumbam 299'1 2-6-9-1 944 Verkadavu 20'1 2-1-17-1 911 VELIMUKKU 164 2-4-6 945 VETTIKKATTIRI 287 2-5-59 912 VELIPROM 160 2-4-1 946 Vettikkattir 1 287'1 2-5-59-1 913 Vellanoor 144'4 2-3-44-4 947 VETTOM 224 2-4-52 914 Vellara 251-4 2-5-23-4 948 VETTOM PALLIPROM 210 2-4-58 915 Vellarakode 94-5 2-2-23-5 949 Vevam 2'1 2-1-14-1 916 Vellari 253,2 2-5-25-2 950 Vezhapoor 101'1 2-3-29-1 917 VELLAYICODE 153 2-3-53 951 Vilakkottur 19'4 2-1-13-4 918 Vella yicode 153'2 2-3-53-2 952 VILAYATTUR 59 2-2-19 919 VELLAYOR 258 2-5-30 953 Vilayattur 59' I 2-2-19-1 920 Vellayur 258'3 2-5-30-3 954 VILAYIL 245 2-5-17 921 VELLIYODE 4 2-1-16 955 Vilayil 245-3 2-5-17-3 922 Velliyode 4'4 2-1-16-4 956 Villur 281 '1 2-5-53-1 923 VelIiyur 69-2 2-2-32-2 957' Vimbur 273'1 2-5-45-1 924 Vellookkara 40-1 2-1-40-1 958 Vishnumangalam 21'2 2-1-18-2 925. Vellukulangara 10,2 2-1-4-2 959 Vithanasseri 260'5 2-5-32-5 926 VELLUR 24 2-1-21 960 VIYYUR 96 2-2-26 927 Vellur 24'2 2-1-21-2 961 Viyyur 96'6 2-2-26-1) 928 Vellur 271-1 2-5-43-1 962 VULATHAPURAM 26 2-1-23 929 VELUR 78 2-2-45 9b3 Vulathapuram 26-3 2-1-23-3 930 Velur 78'1 2-2-45-1 964 VULLIAPPALL Y 29 2-1-26 931 Vengalam 99'2 2-2-43-2 96:> Vulliappally 29'2 2-1-26-2 932 Vengallur 284'1 2-5-56-1 966 VYKILASSERI 13 2-1-7 933 Vengapatta 71'3 2-2-34-3 967 Vykilasseri 13-2 2-1-7-2 934 VENGAPPALLY 304 2-6-14 968 WANDUR 238 2-5-10 935 Vengappally 3042 2-6-14-2 969 Wandur 238'2 2-5-10-2 936 VENGARA 176 2-4-18
121 11106-61
Copyright © 2022 FDOKUMEN