KOZHIKODE, KERALA 673 632 SYLLABUS B. Sc. STATISTICS
93
1 FAROOK COLLEGE (AUTONOMOUS) KOZHIKODE, KERALA 673 632 SYLLABUS B. Sc. STATISTICS (CORE AND COMPLEMENTARY COURSES) CHOICE BASED CREDIT SEMESTER SYSTEM UG 2019 (FCCBCSS- UG 2019) 2019 ADMISSION ONWARDS
-
Upload
khangminh22 -
Category
Documents
-
view
9 -
download
0
Transcript of KOZHIKODE, KERALA 673 632 SYLLABUS B. Sc. STATISTICS

1
FAROOK COLLEGE (AUTONOMOUS) KOZHIKODE, KERALA 673 632
SYLLABUS
B. Sc. STATISTICS (CORE AND COMPLEMENTARY COURSES)
CHOICE BASED CREDIT SEMESTER SYSTEM UG 2019 (FCCBCSS- UG 2019)
2019 ADMISSION ONWARDS

2
CERTIFICATE
I hereby certify that the documents attached are the bona fide copies of the syllabus of B.Sc. Statistics Programme to be effective from the academic year 2019-20 onwards.
Date: PRINCIPAL
Place: Farook College

3
CONTENTS
TITLE PAGE NUMBERS
PROGRAM STRUCTURE OF B.Sc. STATISTICS PROGRAMME 4
CREDIT AND MARK DISTRIBUTION OF B. Sc. STATISTICS PROGRAMME
5-6
CORE COURSE STRUCTURE (B. Sc. STATISTICS PROGRAMME)
7
EVALUATION AND GRADING 8-11
SYLLABI OF CORE COURSES 12-24
SYLLABI OF ELECTIVE COURSES 25-27
SYLLABI OF OPEN COURSES 28-30
MODEL QUESTION PAPERS OF CORE, ELECTIVE AND OPEN COURSES (FOR B. Sc. STATISTICS PROGRAMME)
31-51
STATISTICS: SYLLABI OF COMPLEMENTARY COURSES (FOR B.Sc. MATHEMATICS)
52-62
STATISTICS: MODEL QUESTION PAPERS OF COMPLEMENTARY COURSES (FOR B.Sc. MATHEMATICS)
63-66
STATISTICS: SYLLABI OF COMPLEMENTARY COURSES (FOR B.Sc. PSYCHOLOGY)
67-75
STATISTICS: MODEL QUESTION PAPERS OF COMPLEMENTARY COURSES (FOR B.Sc. PSYCHOLOGY)
76-82
ACTUARIAL SCIENCE: SYLLABI OF COMPLEMENTARY COURSES (FOR B.Sc. STATISTICS
83-87
ACTUARIAL SCIENCE: MODELQUESTION PAPERS OF COMPLEMENTARY COURSES (FOR B.Sc. STATISTICS)
88-93

4

5
Sem
este
r
Pap
er C
ode
Course C
redi
t
Inst
ruct
iona
l H
ours
per
W
eek
Dur
atio
n of
E
xam
Tot
al M
arks
: (I
nte
rnal
and
E
xter
nal i
n th
e ra
tio
1:4)
I
--- A01 Common Course: English 3 4 2 75
--- A02 Common Course: English 3 5 2 75
--- A07 Common Course: Additional Language 4 4 2.5 100
BST1B01 Core Course: Official Statistics and Probability 4 4 2.5 100
BMT1C01 Complementary Course: (Mathematics) Mathematics-1 3 4 2 75
BAS1C01 Complementary Course: (Actuarial Science) : Financial Mathematics
3 4 2 75
AUD1E01 Audit Course: Environmental Studies 4 credits course ( Not included in CGPA/SGPA)
Total 20 500
II
--- A03 Common Course: English 4 4 2.5 100
--- A04 Common Course: English 4 5 2.5 100
--- A08 Common Course: Additional Language 4 4 2.5 100
BST2B02 Core Course: Bivariate Random Variables and Probability Distributions 4 4 2.5 100
BMT2C02 Complementary Course: (Mathematics) Mathematics-2
3 4 2 75
BAS2C02 Complementary Course: (Actuarial Science) : Life Contingencies
3 4 2 75
AUD2E02 Audit Course: Disaster Management 4 credits course ( Not included in
CGPA/SGPA)
Total 22 550
III
--- A05 Common Course: English 4 5 2.5 100
--- A09 Common Course: Additional Language 4 5 2.5 100
BST3B03 Core Course: Statistical Estimation 4 5 2.5 100
BMT3C03 Complementary Course: (Mathematics) Mathematics-3
3 5 2 75
BAS3C03 Complementary Course: (Actuarial Science) Life Contingencies and Principles of Insurance
3 5 2 75
AUD3E03 Audit Course: Human Rights/Intellectual Property Rights/ Consumer Protection
4 credits course ( Not included in CGPA/SGPA)
Total 18 450

6
IV
--- A06 Common Course: English 4 5 2.5 100
--- A10 Common Course: Additional Language 4 5 2.5 100
BST4B04 Core Course: Testing of Hypothesis 4 5 2.5 100
BMT4C04 Complementary Course: (Mathematics) Mathematics-4
3 5 2 75
BAS4C04 Complementary Course: (Actuarial Science) Probability Models and Risk Theory
3 5 2 75
AUD4E04 Audit Course: Gender Studies/Gerontology
4 credits course ( Not included in CGPA/SGPA)
Total 18 450
V
BST5B05 Mathematical Methods in Statistics 4 5 2.5 100
BST5B06 Sample Surveys 5 5 2.5 100
BST5B07 Linear Regression Analysis 4 5 2.5 100
BST5B08 Statistical Computing 5 5 2.5 100
BST5D 01 BST5D 02 BST5D 03
Open Course: Economic Statistics Quality Control Basic Statistics
3 3 2 75
Project Work --- 2 -
Total 21 475
VI
BST6B09 Time Series and Index Numbers 4 5 2.5 100
BST6B10 Design of Experiments 5 5 2.5 100
BST6B11 Population Studies, Actuarial Science and Vital Statistics
4 5 2.5 100
BST6B12 Operations Research and Statistical Quality Control
4 5 2.5 100
BST6B13 Project Work 2 2 -- 100
BST6B14(E) BST6B15(E) BST6B16(E)
Probability Models and Risk Theory Stochastic Processes Reliability Theory
2 3 2 75
Total 21 575
English 22 550 Additional Language 16 400 Mathematics(Complementary course-1) 12 300 Actuarial Science(Complementary course-1I) 12 300 Open Course 3 75 Statistics(Core Courses) 55 1375
Total 120 3000

7
Core and Elective Courses
Sem
este
r
Pap
er C
ode
Pap
er t
itle
Cre
dit
Inst
ruct
ion
al
Hou
rs p
er
Wee
k
Du
rati
on o
f E
xam
I BST1B01 OFFICIAL STATISTICS AND PROBABILITY
4 4 2.5
II
BST2B02
BIVARIATE RANDOM VARIABLES AND PROBABILITY DISTRIBUTIONS
4
4
2.5
III BST3B03 STATISTICAL ESTIMATION 4 5 2.5
IV BST4B04 TESTING OF HYPOTHESIS 4 5 2.5
V
BST5B05
MATHEMATICAL METHODS IN STATISTICS
4
5
2.5
BST5B06 SAMPLE SURVEYS 5 5 2.5
BST5B07 LINEAR REGRESSION ANALYSIS
4 5 2.5
BST5B08 STATISTICAL COMPUTING 5 5 3
BST5D 01
BST5D 02
BST5D 03
ECONOMIC STATISTICS
QUALITY CONTROL
BASIC STATISTICS
3
3
2
PROJECT WORK --- 2 ---
VI BST6B09
TIME SERIES AND INDEX NUMBERS 4 5 2.5
BST6B10 DESIGN OF EXPERIMENTS
5 5 2.5
BST6B11
POPULATION STUDIES, ACTUARIAL SCIENCE AND VITAL STATISTICS
4
5
2.5
BST6B12
OPERATIONS RESEARCH AND STATISTICAL QUALITY CONTROL
4
5
2.5
BST6B13 PROJECT WORK 2 2 --
BST6B14(E) BST6B15(E) BST6B16(E)
PROBABILITY MODELS AND RISK THEORY STOCHASTIC PROCESSES RELIABILITY THEORY
2
3
2

8
Ability Enhancement courses/Audit courses: These are courses which are mandatory for a
programme but not counted for the calculation of SGPA or CGPA. There shall be one Audit course each
in the first four semesters. These courses are not meant for class room study. The students can attain
only pass (Grade P) for these courses. At the end of each semester there shall be examination conducted
by the college from a pool of questions (Question Bank) set by the College. The students can also attain
these credits through online courses like SWAYAM, MOOC etc. (optional). The list of passed students
must be finalized at least before the fifth semester examination. The list of courses in each semester with
credits are given below.
COMPLEMENTARY COURSES OF B.Sc. STATISTICS
Complementary 1: Mathematics Complementary 2: Actuarial Science
EVALUATION AND GRADING
Evaluation: The evaluation scheme for each course shall contain two parts:
1) Internal assessment 2) External Evaluation
20% weight shall be given to the internal assessment. The remaining 80%
weight shall be for the external evaluation.
(A) THEORY AND PRACTICAL:
Internal Evaluation of Theory Courses
The internal assessment shall be based on a predetermined transparent system involving written
tests, Class room participation based on attendance in respect of theory courses and lab
involvement/records attendance in respect of Practical Courses.
Semester
Course Code Course Name Credit Remarks
I AUD1E01
Audit Course: Environmental Studies
4
Not included in CGPA/SGPA
II AUD2E02 Disaster Management 4
III
AUD3E03 Human Rights/Intellectual Property Rights/ Consumer Protection
4
IV AUD4E04 Gender Studies/Gerontology 4

9
Theory: Components with percentage of marks of Internal Evaluation of Theory Courses are- Test
paper 40%, Assignment 20%, Seminar 20% and Class room participation based on attendance 20%.
For the test paper marks, at least one test paper should be conducted. If more test papers are conducted,
the mark of the best one should be taken.
Split up of of marks for Test paper (40% of total)
Range of Marks in test paper
Out of 8 (Maximum internal
marks is 20)
Out of 6 (Maximum internal
marks is 15)
Less than 35% 1 1
35% - 45% 2 2
45% - 55% 3 3
55% - 65% 4 4
65% -85% 6 5
85% -100% 8 6
Split up of of marks for Class Room Participation (20% of total)
Range of CRP Out of 4 (Maximum internal marks is 20)
Out of 3 (Maximum internal marks is 15)
50% CRP < 75% 1 1
75% CRP < 85% 2 2
85 % and above 4 3
Internal Evaluation of Practical Courses: For practical courses - Record 60% and lab
involvement 40% as far as internal is concerned. (If a fraction appears in internal marks, nearest
whole number is to be taken)
External Evaluation of Theory Courses
External evaluation carries 80% of marks. All question papers shall be set by the College. The
external question papers may be of uniform pattern with 80/60 marks. The courses with 2/3
credits will have an external examination of 2 hours duration with 60 marks and courses with
4/5 credits will have an external examination of 2.5 hours duration with 80 marks.

10
Pattern of Question Papers
Question paper type 1 (for 80 marks) Scheme of Examinations: The external QP with 80 marks and internal examination is of 20 marks. Duration of each external examination is 2.5 hours. The pattern of External Examination is as given below. The students can answer all the questions in Sections A & B. But there shall be Ceiling in each section. Section A Short answer type carries 2 marks each - 15 questions Ceiling - 25 Section B Paragraph/ Problem type carries 5 marks each - 8 questions Ceiling - 35 Section C Essay type carries 10 marks (2 out of 4) 2×10=20
Question paper type 2 (for 60 marks) Scheme of Examinations: The external QP with 60 marks and internal examination is of 15 marks. Duration of each external examination is 2 Hrs. The pattern of External Examination is as given below. The students can answer all the questions in Sections A & B. But there shall be Ceiling in each section. Section A Short answer type carries 2 marks each - 12 questions Ceiling - 20 Section B Paragraph/ Problem type carries 5 marks each - 7 questions Ceiling - 30 Section C Essay type carries 10 marks (1 out of 2) 1×10 =10
Questions in each part should be equally distributed among the various modules of the syllabus.
External Evaluation of Practical Courses
External evaluation carries 80% of marks. The external examination in practical courses shall be conducted by two examiners one internal and an external. The Board of examiners (BoE) shall decide the pattern of question paper. The duration of the external examination is 3 hours. The external examination at each center shall be conducted and evaluated on the same day jointly by two examiners one external and one internal. Evaluation shall be done by assessing each candidate on the scientific and experimental skills, the efficiency of the algorithm/program implemented, the presentation and interpretation of the results.
(B) PROJECT EVALUATION: (Internal and External)
Evaluation of the Project Report shall be done under Mark System. The evaluation of the project will be done at two stages: Internal Assessment (supervising teachers will assess the project and award internal Marks) and External evaluation (external examiner appointed by the College.). Grade for the project will be awarded to candidates, combining the internal and external marks. The internal to external components is to be taken in the ratio 1:4. Assessment of different components may be taken as below.

11
Internal (20% of total)
External (80% of Total)
Components Percentage of internal marks Components
Originality 20 % Relevance of the Topic, Statement of Objectives
Methodology 20 % Reference/ Bibliography, Presentation, quality of Analysis/ Use of Statistical
Tools. Scheme/Organization of Report
30 % Findings and recommendations
Viva Voce 30 % Viva Voce
GRADING:
Indirect grading System based on a 10-point scale is used to evaluate the performance of students.
Each course is evaluated by assigning marks with a letter grade (O, A+, A, B+, B, C, P, F, I or Ab) to that course by the method of indirect grading. An aggregate of P grade (after external and internal put together) is required in each course for a pass and also for awarding a degree (A minimum of 20% marks in external evaluation is needed for a pass in a course. But no separate pass minimum is needed for internal evaluation).
Indirect Grading System in 10 -point scale is as below:
Ten Point Indirect Grading System
Percentage of Marks (Both
Internal &External put
together)
Grade Interpretation Grade point
Average ( G)
Range of grade points
Class
95 and above O Outstanding 10 9.5 -10 First Class with
Distinction 85 to below 95 A+ Excellent 9 8.5 -9.49
75 to below 85 A Very good 8 7.5 -8.49
65 to below 75 B+ Good 7 6.5 -7.49 First Class
55 to below 65 B Satisfactory 6 5.5 -6.49
45 to below 55 C Average 5 4.5 -5.49 Second Class
35 to below 45 P Pass 4 3.5 -4.49 Third Class
Below 35 F Failure 0 0 Fail
Incomplete I Incomplete 0 0 Fail
Absent Ab Absent 0 0 Fail

12
DETAILED SYLLABI OF CORE COURSES
BST1B01: OFFICIAL STATISTICS AND PROBABILITY Contact Hours per week: 4 Number of credits: 4 Number of Contact Hours: 72 Course Evaluation: External 80 Marks+ Internal 20 Marks Duration of Exam: 2.5 Hours
Objectives:
1. To summarize the data in a diagrammatic and graphical way, obtain descriptive
statistics and make possible & appropriate interpretations 2. To understand various approaches to probability & compute probabilities.
Module 1: Statistical organizations in India-MOSPI; CSO, NSSO, DES; Roles functions and activities of CSO, NSSO and DES; Measures of central tendency Arithmetic Mean, Geometric Mean, Harmonic Mean, Median, Mode, Percentiles, Quartiles; Measures of dispersion- Variance, Standard deviation, Mean deviation, Quartile deviation, Coefficient of variation; moments, skewness, Kurtosis. 20 hours
Module 2: Fitting of straight line, parabola, exponential, polynomial, (least square method), correlation- Correlation coefficient, Rank Correlation-correlation co-efficient, Partial Correlation, Multiple Correlation, Scatter diagram, regression, two regression lines, regression coefficients. 17 hours.
Module 3: Experiment, Non- random and Random experiments, Sample space, event, classical definition of probability, statistical regularity, field, sigma field, axiomatic definition of probability and simple properties, addition theorem (two and three events), conditional probability of two events, multiplication theorem, independence of events-pair wise and mutual, Bayes theorem. 25 hours
Module 4: Random variable-discrete and continuous, probability mass function (pmf) and probability density function (pdf)-properties and examples, Cumulative Distribution function and its properties, change of variable (univariate case). 10 hours
References 1. V. K. Rohatgi, An Introduction to Probability Theory and Mathematical Statistics, Wiley Eastern. 2. S.C.Gupta and V. K. Kapoor, Fundamentals of Mathematical Statistics, Sultan Chand and Sons 3. A.M. Mood, F.A. Graybill and D C Bose, Introduction to Theory of Statistics, McGraw Hill 4. John E Freund, Mathematical Statistics (6th edn), Pearson Edn, NewDelhi 5. Statistical system in India (CSO), 1995.

13
BST2B02: BIVARIATE RANDOM VARIABLE AND PROBABILITY DISTRIBUTIONS
Contact Hours per week: 4 Number of credits: 4 Number of Contact Hours: 72 Course Evaluation: External 80 Marks+ Internal 20 Marks
Duration of Exam: 2.5 Hours
Objectives: 1. To derive various descriptive statistics; verify the existence of reproductive property
of distributions using generating functions-their limitations and advantages.
2. To understand the applications of theoretical discrete distributions
Module 1: Mathematical expectations-definition, raw and central moments (definition and relationships), moment generating function and properties, characteristic function (definition and basic properties). 20 hours
Module 2: Bivariate random variable, joint pmf and joint pdf, marginal and conditional probability, independence of random variables. 15 hours
Module 3: Skewness and kurtosis using moments, bivariate case-conditional mean and variance, covariance, Karl Pearson Correlation coefficient, independence of random variables based on expectation. 12 hours
Module 4: Degenerate distribution, Standard discrete distributions-Bernoulli, Binomial, Poisson, Geometric, negative binomial, Hyper geometric (definition, properties and applications), Uniform. Limit Theorems: inequality, Convergence in probability, Convergence in distribution (definition and example only), weak law of large numbers (iid
25 hours
References 1. V. K. Rohatgi, An Introduction to Probability Theory and Mathematical Statistics, Wiley Eastern. 2. S.C.Gupta and V. K. kapoor Fundamentals of Mathematical Statistics, Sultan Chand and Sons 3. A.M. Mood, F.A. Graybill and D C Bose, Introduction to Theory of Statistics, McGraw Hill 4. John E Freund, Mathematical Statistics (6th edn), Pearson Edn, NewDelhi

14
BST3B03: STATISTICAL ESTIMATION Contact Hours per week: 5 Number of credits: 4
Number of Contact Hours: 90 Course Evaluation: External 80 Marks+ Internal 20 Marks
Duration of Exam: 2.5 Hours
Objectives: 1. To understand the applications of theoretical discrete distributions 2. To equip the students with the theory essential for estimation of unknown
parameters. 3. Understand various sampling distributions and the related concepts, criteria of good
estimators and interval estimation
Module 1: Continuous type-Uniform, exponential, gamma, Beta, Normal (definition, properties and applications), Lognormal, Pareto and Cauchy (Definition only). Central limit theorem (Llindberg- Levy-iid case). 20 hours
Module 2: Sampling distributions: Parameter, Statistic, standard error, Sampling from normal distribution: distribution of sample mean, sample variance, chi-square, students t distribution, and F distribution (definition, derivation, property and relationships). 15 hours
Module 3: Estimation of Parameter: Point Estimation. Desirable properties of a good estimator, unbiasedness, consistency, sufficiency, Fisher - Neyman factorization theorem (Statement and application only), efficiency, Cramer - Rao inequality; Methods of Estimation - method of maximum likelihood, method of moments, Bayesian estimation method. 40 hours.
Module 4; Interval Estimation: Large sample confidence interval for mean, equality of means, equality of proportions. Derivation of exact confidence intervals for means , variance and ratio of variances based on Normal, t, chi square distribution and F distribution. 15 hours
References 1. V. K. Rohatgi, An Introduction to Probability Theory and Mathematical Statistics, Wiley Eastern. 2. S.C.Gupta and V. K. Kapoor. Fundamentals of Mathematical Statistics, Sultan Chand and Sons 3. A.M. Mood, F.A. Graybill and D C Bose, Introduction to Theory of Statistics, McGraw Hill 4. John E Freund, Mathematical Statistics (6th edn), Pearson Edn, NewDelhi

15
BST4B04: TESTING OF HYPOTHESIS Contact Hours per week: 5 Number of credits: 4
Number of Contact Hours: 90 Course Evaluation: External 80 Marks+ Internal 20 Marks
Duration of Exam: 2.5 Hours
Objectives: 1. To introduce the concepts of hypothesis testing 2. Identify a suitable test of significance to test a given hypothesis -large sample
test/small sample test for testing different parameters
Module 1: Testing of Hypotheses; concept of testing hypotheses, simple and composite hypotheses, null and alternative hypotheses, type I and type II errors, critical region, level of significance, power of test. Most powerful tests Uniformly most powerful test, Neyman Pearson Lemma (statement only). Sequential sampling and SPRT (Basic concepts only).
20 hours Module 2: Large sample tests concerning mean, equality of means, proportions, equality of proportions. Small sample tests based on t distribution for mean, equality of means and paired t test, one-way ANOVA. (Include real life applications and practical problems): 30 hours
Module 3: Tests based on F distribution. Tests based on chi square distribution Test for the significance of population variance, goodness of fit and for independence of attributes. Test for correlation coefficients. (Include real life applications and practical problems). 20 hours.
Module 4: Non parametric tests - advantages, disadvantages; Kolmogorov - Smirnov test; one sample and two sample sign tests; Wilcoxon signed rank test; Median test; Mann Whitney test; Kruskal Wallis test and test for randomness (run test). (Include real life applications and practical problems). 20 hours
References 1. V. K. Rohatgi, An Introduction to Probability Theory and Mathematical Statistics, Wiley Eastern. 2. S.C.Gupta and V. K. Kapoor, Fundamentals of Mathematical Statistics, Sultan Chand and Sons 3. A.M. Mood, F.A. Graybill and D C Bose, Introduction to Theory of Statistics, McGraw Hill 4. John E Freund, Mathematical Statistics (6th edn), Pearson Edn, NewDelhi

16
BST5B05: MATHEMATICAL METHODS IN STATISTICS Contact Hours per week: 5 Number of credits: 4
Number of Contact Hours: 90 Course Evaluation: External 80 Marks+ Internal 20 Marks
Duration of Exam: 2.5 Hours
Objectives:
1. To get a good exposure to the basic concepts of Mathematics. 2. To introduce the mathematical concepts required to learn theoretical statistics.
Module 1: Real Number system: Mathematical induction, order properties of real number, Bernoulli, Cauchy, triangle inequality, absolute value, Completeness property-suprema & infima, Archimedean property, Density theorem, nested interval property. 20 hours
Module 2: Sequences: Limit, limit theorems, Squeeze theorem, convergence of sequence, root test and ratio test, monotone convergence theorem, subsequence and Bolzano- Weierstrass theorem, Cauchy criterion, limits of functions, limit theorems of functions. Infinite series and its convergence, Ratio test and Root test. 25 hours
Module 3: Continuous functions: Definition, Boundedness theorem, Maximum minimum theorem, Location of roots theorem, Intermediate value theorem, uniform continuity, Differentiation, Interior extremum theorem, theorem, Mean value theorem, theorem. 25 hours
Module 4: Riemann Integration: Definition, Integrability criteria, integrability of continuous and monotone functions, properties of integrals, first and second fundamental theorems on integral calculus. 20 hours
References 1. Malik S.C. and Savitha Arora, Real Analysis, New Age International 2. Robert G Bartle, Real Analysis, Wiley 3. Shanti Narayanan, Elements of Real Analysis

17
BST5B06: SAMPLE SURVEYS Contact Hours per week: 5 Number of credits: 5
Number of Contact Hours: 90 Course Evaluation: External 80 Marks+ Internal 20 Marks
Duration of Exam: 2.5 Hours
Objectives: 1. To equip students with Sampling Techniques used in conducting sample surveys.
2. To compare the efficiency of various estimation strategies resulting from different sampling techniques.
Module 1: Census and Sampling, principal steps in sample survey-probability sampling, judgment sampling, organization and execution of large sample surveys, sampling and non- sampling errors, preparation of questionnaire. 20 hours
Module 2: Simple random sampling with and without replacement- methods of collecting simple random samples, unbiased estimate of the population mean and population total-their variances and estimate of these variances-simple random sampling for proportions. 20 hours
Module 3: Stratified random sampling: estimation of population mean and total, proportional and Neymann allocation of sample sizes-cost function-optimum allocation considering cost- comparison with simple random sampling. Systematic Sampling: Linear and circular systematic sampling, comparison with simple random sampling. 30 hours
Module 4: Cluster sampling: Clusters with equal sizes-estimation of the population mean and total, comparison with simple random sampling, two stage cluster sampling-estimate of variance of population mean. 20 hours
References 1. Murthy M N, Sampling theory and methods, Statistical Publishing society, Calcutta 2. Daroja Singh and F S Chaudhary, Theory and Analysis of Sample Survey Designs, Wiely Estrn Limitted 3. Cochran W.G, Sampling Techniques, Wiely Estern

18
BST5B07: LINEAR REGRESSION ANALYSIS Contact Hours per week: 5 Number of credits: 4
Number of Contact Hours: 90 Course Evaluation: External 80 Marks+ Internal 20 Marks
Duration of Exam: 2.5 Hours
Objectives: 1. To identify an appropriate relationship between two variables using scatter plot and
fitting the same by the method of least squares- straight line, second degree polynomial, power & exponential curves
2. Describe the concepts of correlation & regression and perform regression analysis for the given data
Module 1: Regression and Model building: Scatter diagram, regressor, response, error, uses of regression. Simple linear regression: Simple liner regression model, assumptions, Least square estimation of parameters, Properties of the Least-square estimators and the fitted Regression
2, Hypothesis testing of slope and intercept. Interval estimation of 2). Coefficient of determination. Estimation of
regression parameters by the method of Maximum likelihood. 25 hours
Module 2: Multiple Linear Regression: Multiple linear regression model, assumptions, least square estimation of parameters, Properties of the Least-square estimators Hypothesis testing in Multiple linear regression (ANOVA), Test on individual regression coefficients, Interval estimation of coefficients, slope and intercept, co-efficient of determination. 20 hours
Module 3: Model adequacy checking: Residual analysis, Methods of scaling residuals standardized residuals, studentized residuals, PRESS residuals, R- Student. Residual plots Normal probability plots, plot of residuals against fitted values, plot of residuals against the
regressor, plot of residuals in time sequence. PRESS Statistic, R2 for prediction based on PRESS. 25 hours
Module 4: Polynomial and logistic regression: Polynomial models in one variable and two variables, Piece wise polynomial fitting (Basic concept only). Logistic regression- model with binary response variable, Estimation and Interpretation of the Parameters in logistic regression model. 20hours
Book for Study 1. D C. Montegomerry, E A Peak and G G Vining, Introduction to Linear regression analysis, Wiley 2003.
References 1. Seber, Linear Regression Analysis, Wiley 1977. 2. D. D Joshi, Linear Estimation and Design of Experiments, Wiley 1987. 3. D N Gujarathi, D C Porter and G Sangeetha, Basic Econometrics, Mc Graw Hill, 2003

19
BST5B08: STATISTICAL COMPUTING Contact Hours per week: 5 Number of credits: 5
Number of Contact Hours: 90 Course Evaluation: External 80 Marks+ Internal 20 Marks
Duration of Exam: 3 Hours
Objectives: Statistical computing is a practical course. Its objectives are to develop scientific and experimental skills of the students and to correlate the theoretical principles with application based studies.
An introductory section is included in the course to familiarise the students with the basics of R package. Introduction to R: R as a calculator, statistical software and a programming language, R preliminaries, getting help, data inputting methods(direct and importing from other spread sheet applications like Excel), data accessing, and indexing, Graphics in R, built in functions, saving, storing and retrieving work. Looping and Decision making for loop, while loop, if command, if else command. The practical is based on the following modules:
Module 1. Diagrammatic representation of univariate and bivariate data - box plots, stem and
leaf diagrams, bar plots, pie diagram, scatter plots. Module 2. Descriptive statistics - measures of central tendency (mean, median and mode),
partition values, measures of dispersion (range, standard deviation, mean deviation and inter quartile range), summaries of a numerical data, skewness and kurtosis, random sampling with and without replacement.
Module 3. Probability Distributions: Random number generation. Module 4. Statistical Inference: One- and two-sample tests, z test, t-test, F-test, chi-square test
of independence and goodness of fit, interval estimation for mean, difference of mean and variance, tests for normality (Shapiro- -q plot), ANOVA (one- way)
Module 5. Correlation and regression analysis (bivariate and multivariate data), polynomial regression, logistic regression.
Practical is to be done using R package. At least five statistical data oriented/supported problems should be done from each course. Practical record shall be maintained by each student and the same shall be submitted for verification at the time of external examination. The Board of examiners (BoE) shall decide the pattern of question paper. The duration of the external examination is 3 hours. The external examination at each centre shall be conducted and evaluated on the same day jointly by two examiners one external and one internal, appointed at the centre of the examination by the college on the recommendation of the Chairman, BoE. The question paper for the external examination at the centre will be set by the external examiner in consultation with the Chairman, BoE and HoD of the centre. The questions are to be evenly distributed over the entire syllabus. Evaluation shall be done by assessing each candidate on the scientific and experimental skills, the efficiency of the algorithm/program implemented, the presentation and interpretation of the results. References:
1. Michale J. Crawley, THE R BOOK, John Wiley & Sons, England (2009) 2. Sudha G. Purohit et.al., Statistics Using R, Narosa Publishing House, , India(2008) 3. John Verzani, simple R-Using R for Introductory Statistics, (http://
www.math.csi.cuny.edu/Statistics/R/SimpleR/Simple. ) 4. W. N. Venables, D. M. Smith and the R Core Team, An Introduction to R , Notes on R: A
Programming Environment for Data Analysis and Graphics, Version 2.15.2 (2012-10-26) (http://www.r-project.org)

20
BST6B09: TIME SERIES AND INDEX NUMBERS Contact Hours per week: 5 Number of credits: 4
Number of Contact Hours: 90 Course Evaluation: External 80 Marks+ Internal 20 Marks
Duration of Exam: 2.5 Hours
Objectives: 1. To expose statistics students to the areas of time series and index numbers. 2. To bring out its significant role in various areas of study
Module 1: Time series analysis: Economic time series, different components, illustrations, additive and multiplicative models, determination of trends, growth curves, analysis of seasonal fluctuations, construction of seasonal indices. 25 hours
Module 2: Analysis of Income and allied distributions-Pareto distribution, graphical test,
coefficient . 20 hours
Module 3: Index numbers: Meaning and definition-uses and types-problems in the construction of index numbers-simple aggregate and weighted aggregate index numbers. Test for consistency of index numbers-factor reversal, time reversal and unit test, Chain base index numbers-Base shifting-splicing and deflating of index numbers. Consumer price index numbers-family budget enquiry-limitations of index numbers. 30 hours
Module 4: Attitude Measurements and Scales: issues in attitude measurements scaling of attitude-Guttman scale, Semantic differential scale, Likert scale; selection of appropriate scale-limitations of scales. 15 hours
Books for references 1. SC Gupta and V K Kapoor, Fundamentals of applied statistics, Sulthan chand and sons 2. Goon A M, Gupta M K and Das Gupta, Fundamentals of Statistics Vol II, The World press, Calcutta 3. Box G E P and Jenkins G M, Time series analysis, Holden Day 4. Meister David, Behavioral Analysis and Measurement methods, John Wiley New York 5. Luck et al. Marketing Research, Prentice Hall of India, New Delhi

21
BST6B10. DESIGN OF EXPERIMENTS Contact Hours per week: 5 Number of credits: 5
Number of Contact Hours: 90 Course Evaluation: External 80 Marks+ Internal 20 Marks
Duration of Exam: 2.5 Hours
Objectives: 1. To provide basic principles of experimentation 2. To discuss the analysis of data relating to agriculture, biological sciences and
industry.
Module 1: Linear estimation, estimability of parametric functions and BLUE Gauss- Markov theorem-Linear Hypothesis. 15 hours
Module 2: Analysis of variance, one way and two way classification (with single observation per cell), Post Hoc Tests - test. Analysis of covariance with a single observation per cell (Concept and model only).
15 hours
Module 3: Principles of design-randomization-replication-local control, completely randomized design; Randomized block design; Latin square design. Missing plot technique; comparison of efficiency; Greco-Latin square design (Concept only). 35 hours
Module 4: Basic concepts of factorial experiments, 22 and 23 factorial experiments, Basic concepts of Incomplete block design, Balanced incomplete block design and Partially Balanced incomplete block design. 25 hours
Books for references 1. S.C. Gupta and V K Kapoor, Fundamentals of applied Statistics, Sulthan Chand and Sons 2. M N Das and N Giri, Design of Experiments, New Age international, 4. D.D Joshy, linear Estimation and Design of Experiments, Wiley Eastern 5. Montgomery, D C, Design and Analysis of Experiments, John Wiley

22
BST6B11: POPULATION STUDIES, ACTUARIAL SCIENCE AND VITAL STATISTICS
Contact Hours per week: 5 Number of credits: 4
Number of Contact Hours: 90 Course Evaluation: External 80 Marks+ Internal 20 Marks
Duration of Exam: 2.5 Hours
Objectives: 1. To impart basic concepts in population studies, actuarial science and vital statistics 2. To prepare students to take up a career in Actuarial Practice
Module 1: Sources of vital statistics in India-functions of vital statistics, Rates and ratios- mortality rates-crude, age specific and standard death rates-fertility and reproduction rates- crude birth rates-general and specific fertility rates-gross and net reproduction rates.
30 hours
Module 2: Life Tables-complete life tables and its characteristics-Abridged life tables and its characteristics, principle methods of construction of abridged life tables-
30 hours
Module 3: Fundamentals of insurance: Insurance defined meaning of loss, peril, hazard and proximate cause in insurance, Costs and benefits of insurance to society-branches of insurance. Insurable loss exposures-feature of loss that is deal of insurance, Construction of Mortality table-computation of premium of life insurance for fixed duration and for the whole life.
30 hours
Books for reference 1. S.C. Gupta and V K Kapoor, Fundamentals of applied Statistics, Sulthan Chand and Sons 2. Benjamin B, Health and Vital Statistics, Allen and Unwin 3. Mark S Dorfman, Introduction to Risk Management and Insurance, Prentice Hall 4. C.D.Daykin, T. Pentikainen et al, Practical Risk Theory of Acturies, Chapman and Hill

23
BST6B12: OPERATIONS RESEARCH AND STATISTICAL QUALITY CONTROL Contact Hours per week: 5 Number of credits: 4
Number of Contact Hours: 90 Course Evaluation: External 80 Marks+ Internal 20 Marks
Duration of Exam: 2.5 Hours
Objectives:
1. To impart an insight of the applications of Operations Research in Management 2. To provide an insight into quality assessment techniques.
Module 1: Linear programming: Mathematical formulation of LPP, Graphical and Simplex methods of solving LPP-duality in linear programming. 20 hours
Module 2: Transportation and assignment problems, North-west corner rules, row column and least cost method- approximation method, Assignment problem, Hungarian algorithm of solution. 20 hours
Module 3: General theory of control charts, causes of variations in quality, control limits, sub-grouping, summary of out-of-control criteria, charts of attributes, np chart, p chart, c chart, Charts of variables: X bar chart, R Chart and sigma chart, Revised control charts, applications and advantages. 25 hours
Module 4: Principles of acceptance sampling-problems and lot acceptance, stipulation of good and bad lots-functions, concepts of AQL, LTPD,AOQL, Average amount of inspection and ASN function.
25 hours
References 1. Gupta and Manmohan, Linear programming, Sulthan Chand and sons 2. Hardley G, Linear programming, Addison-Wesley 3. Taha, Operations Research, Macmillan, 4. V.K.Kapoor, Operations Research, Sultan Chand and Sons 5. S.C.Gupta and V.K.Kapoor Fundamentals of Applied Statistics, Sultan Chand and Sons

24
BST6B13: PROJECT WORK Contact Hours per week: 4 (V semester-2 and VI semester-2) Number of credits: 2
Number of Contact Hours: 72 Course Evaluation: External 80 Marks+ Internal 20 Marks
Objectives: 1. The project work will helps the students to enhance their Research attitude.
2. It also helps in applying the theory of research in real life situations. Students get an exposure to study the working atmosphere of an enterprise or they can undertake research on any socially relevant area based on their various courses.
The following guidelines may be followed for project work. 1. The project is offered in the fifth and sixth semester of the degree course and the duration of the project may spread over the complete year. 2. A project may be undertaken by a group of students, the maximum number in a group shall not exceed 5. However the project report shall be submitted by each student. 3. There shall be a teacher from the department to supervise the project and the synopsis of the project should be approved by that teacher. The head of the department shall arrange teachers for supervision of the project work. 4. As far as possible, topics for the project may be selected from the applied branches of statistics, so that there is enough scope for applying and demonstrating statistical skills learnt in the degree course. 5. Field/Industrial/Organization visit is mandatory for the data collection.

25
ELECTIVE COURSES
1. BST6B14 (E): PROBABILITY MODELS AND RISK THEORY
Contact Hours per week: 3 Number of credits: 2 Number of Contact Hours: 54 Course Evaluation: External 60 Marks+ Internal 15 Marks Duration of Exam: 2 Hours Objectives:
1) To understand the different types of risk models. 2) To apply the risk theory in insurance.
Module 1: Individual risk model for a short time: Model for individual claim random variables-sums of independent random variables-Approximation for the distribution of sum- Application to insurance. 10 hours Module 2: Collective risk models for a single period: The distribution of aggregate claims- selection of basic distributions-properties of compound Poisson distribution-approximation to the distributions of aggregate claims. 15 hours Module 3: Collective risk models over an extended period: Claims process-The adjustment coefficients-Discrete time model-the first surplus below the initial level-The maximal aggregate loss. 15 hours Module 4: Application of risk theory: Claim amount distributions approximating the individual model-stop-loss re-insurance-the effect of reinsurance on the probability of ruin. 14 hours
Books for reference 1. Institute of Actuaries, Act Ed. Study Materials 2. McCutcheon, JJ, Scott William (1986): An introduction to Mathematics of Finance 3. Butcher M V, book 4. Neil, Alistair, Heinemann (1977) Life contingencies 5. Bowers, Newton Let et al (1997) Actuarial mathematics, society of Actuaries, 2nd

26
2. BST6B15 (E): STOCHASTIC PROCESSES Contact Hours per week: 3 Number of credits: 2 Number of Contact Hours: 54 Course Evaluation: External 60 Marks+ Internal 15 Marks Duration of Exam: 2 Hours
Objectives:
1) To learn modeling of uncertainty through random variables.
2) To understand the concept of stochastic processes and their properties.
Module 1generating functions. 6 hours Module 2: Definition of stochastic process, Four classifications of Stochastic Processes, Markov Property, Markov process, Markov Chain, Graphical representations. Initial distributions (problems), Transition probabilities, Chapmann and Kolmogrov equations, Transition probability matrices (examples and computation). Higher order transition
probabilities (Pn). 30 hours Module 3: Accessibility and communication of states. First passage probabilities, classification of states (recurrent, transient), mean recurrence. Periodicity, Ergodic theorem (Statement only), irreducible, class property. Stationary distribution. Limiting distribution (Definition and problems only). 18 hours
Books for reference
1. Medhi, J(1996). Stochastic Processes, Wiley Eastern Limited.
2. Karlin, S and Taylor, H.M.(1978). An Introduction to Stochastic Modeling (3rd edition), Academic Press
3. Karlin, S and Taylor, H.M.(1978). A first course in Stochastic Processes. Academic Press, New York.
4. Ross, S.M.(1983). Stochastic Processes, John Wiley and Sons.

27
3. BST6B16(E): RELIABILITY THEORY
Contact Hours per week: 3 Number of credits: 2 Number of Contact Hours: 54 Course Evaluation: External 60 Marks+ Internal 15 Marks Duration of Exam: 2 Hours
Objectives:
1) To understand the structural properties of coherent systems.
2) To equip the students to determine the reliability of a system.
3) To understand the different parametric distributions in reliability
Module 1: Structural properties of coherent Systems: System of components series and parallel structure with example-dual structure function-coherent structure-preservation of coherent system in terms of paths and cuts representation of bridge structure-times to failure- relative importance of components-modules of coherent systems. 20 hours
Module 2: Reliability of Coherent systems: Reliability of a system of independent components-some basic properties of system reliability-computing exact system reliability- inclusion exclusion method-reliability importance of components. 20 hours
Module 3: Parametric distributions in reliability: A notion of ageing (IFR and DFR only) with examples-exponential distribution-Poisson distribution. 14 hours
Books for references 1. R E Barlow and F Proschan (1975) Statistical Theory of Reliability and life testing, Holt Rinhert, Winston 2. N Ravi Chandran, Reliability Theory, Wiley Eastern

28
OPEN COURSES
1. BST5D 01: ECONOMIC STATISTICS Contact Hours per week: 3 Number of credits: 3 Number of Contact Hours: 54 Course Evaluation: External 60 Marks+ Internal 15 Marks Duration of Exam: 2 Hours
Objectives:
1) To expose the students to the areas of time series and index numbers.
Module 1: Time series analysis: Economic time series, different components, illustrations, additive and multiplicative models, determination of trends, growth curves, analysis of seasonal fluctuations, construction of seasonal indices. 24 hours
Module 2: Index numbers: Meaning and definition-uses and types-problems in the construction of index numbers-simple aggregate and weighted aggregate index numbers. Test for consistency of index numbers-factor reversal , time reversal and unit test, Chain base index numbers-Base shifting-splicing and deflating of index numbers. Consumer price index numbers-family budget enquiry-limitations of index numbers. 30 hours
Books for references 1. S C Gupta and V K Kapoor, Fundamentals of Applied Statistics, Sulthan Chands and sons 2. Goon A M, Gupta M K and Das Gupta, Fundamentals of Statistics Vol II, The World Press, Calcutta.

29
2. BST5D 02: QUALITY CONTROL Contact Hours per week: 3 Number of credits: 3 Number of Contact Hours: 54 Course Evaluation: External 60 Marks+ Internal 15 Marks Duration of Exam: 2 Hours
Objectives:
1) To understand the basics of quality control. 2) To provide an insight into quality assessment techniques.
Module 1: General theory of control charts, causes of variations in quality, control limits, sub-grouping, summary of out-of-control criteria, charts of attributes, np chart, p chart, c chart, Charts of variables: X bar chart, R Chart and sigma chart, Revised control charts, applications and advantages. 30 hours
Module 2: Principles of acceptance sampling-problems of lot acceptance, stipulation of good and bad lots- simple and double sampling plans, their OC functions, concepts of AQL, LTPD,AOQL, Average amount of inspection and ASN function.
24 hours
References 1. Grant E L, Statistical quality control, McGraw Hill 2. Duncan A J, Quality Control and Industrial Statistics, Taraporewala and sons 3. Montegomery D C, Introduction to Statistical Quality Control, John Wiley and son

30
3. BST5D 03: BASIC STATISTICS
Contact Hours per week: 3 Number of credits: 3 Number of Contact Hours: 54 Course Evaluation: External 60 Marks+ Internal 15 Marks Duration of Exam: 2 Hours
Objectives:
1) To equip students with Sampling Techniques used in conducting sample surveys. 2) To understand the basic concepts in probability. 3) To learn the random variables in two-dimension and their properties.
Module 1: Elements of Sample Survey: Census and Sampling, advantages, principal step in sample survey-sampling and non-sampling errors. Probability sampling, judgment sampling and simple random sampling. 10 hours
Module 2: Measures of Central tendency: Mean, median and mode and their empirical relationships ; Measures of Dispersion: absolute and relative measures, standard deviation and coefficient of variation. 12 hours
Module 3: Fundamental characteristics of bivariate data: univariate and bivariate data, scatter
principle of least squares, fitting of straight line. 15 hours
Module 4: Basic probability: Random experiment, sample space, event, algebra of events, Statistical regularity, frequency definition, classical definition and axiomatic definition of probability-addition theorem, conditional probability, multiplication theorem and independence of events (limited to three events). 17 hours
References 1. V. K. Rohatgi, An Introduction to Probability Theory and Mathematical Statistics, Wiley Eastern. 2. S.C.Gupta and V. K. Kapoor, Fundamentals of Mathematical Statistics, Sultan Chand and Sons 3. A.M. Mood, F.A. Graybill and D C Bose, Introduction to Theory of Statistics, McGraw Hill 4. John E Freund, Mathematical Statistics (6th edn), Pearson Edn, New Delhi

31
STATISTICS: MODEL QUESTION PAPERS OF CORE COURSES
BST1B01: OFFICIAL STATISTICS AND PROBABILITY Time: 2 ½ Hours Max.: 80 Marks
PART A Each question carries 2 marks.
1. List out the important activities of Central Statistics Organization. 2. What are the main roles of state level statistical organizations? 3. The mean salary of 80 male employees in a firm is Rs. 5200 and that of 20 females
in the same firm is Rs. 4200. What is the mean salary of all the employees in that firm?
4. Obtain the median for the following frequency distribution
X 1 2 3 4 5 6
Frequenc y
8 10 11 16 20 25
5. Compare range and quartile deviation. 6. The mean, median and standard deviation of a moderately asymmetrical
skewness.
7. Write down the normal equation for fitting an exponential curve y = abx 8. Describe negative and positive correlation. Give example. 9. Define random experiment. Write an example. 10. State addition theorem of probability for three events. 11. Define independence of events. 12. Write the axiomatic definition of probability. 13. Distinguish between discrete and continuous random variables. 14. Define distribution function. Write any two properties of distribution function. 15. Let f(x) = 2x+3, 0 < x < 1; 0 otherwise. Verify whether f(x) is a probability density
function or not. Maximum Mark = 25
PART B Each question carries 5 marks
16. For a group of 150 candidates, the mean and standard deviation of scores were found to be 38 and 16 respectively. Latter on it was found that the scores 45 ad 53 were misread as 54 and 35 respectively. Find the standard deviation of corrected figures.
17. Explain skewness and kurtosis. 18. Explain the least square method of fitting a parabola. 19. Consider the following set of rankings for a sample of 10 elements. Compute
Spearm data.
Element 1 2 3 4 5 6 7 8 9 10 x 10 6 7 3 4 2 8 5 1 9
y 8 4 10 2 5 7 6 3 1 9

32
20. State and prove theorem. 21. A problem in Statistics is given to 3 students A, B and C whose chances of
solving it are ½, ¾ and ¼ respectively. What is the probability that the problem will be solved?
22. Let f(x) = 1, 0 < x < 1; 0 otherwise. Find the distribution of Y= -2log X 23. For a discrete r.v. X with probability distribution
x -2 -1 0 1 2 P(X=x) 0.1 0.2 0.3 k 0.2
find the value of (i) k (ii) p(-1 1).
PART C
Maximum Mark = 35
Each question carries 10 marks (Answer any TWO Questions) 24. Police records show the following numbers of daily crime reports for a sample of
days during the winter months and a sample of days during the summer months. Compare the variability of the two periods.
Winter 18 20 15 16 21 20 12 16 19 20
Summer 28 18 24 32 18 29 23 38 28 18
25. A box contains 3 blue and 2 red balls while another box contains 2 blue and 5 red balls. A ball drawn at random from one of the boxes turns out to be blue. What is the probability that it came from the first box
26. A committee of 4 people is appointed from 3 officers of the production department, 4 officers of the purchase department, 2 officers of the sales department and 1 charted accountant. Find the probability of forming the committee in the following manner. (1) There must be one from each category (2) It should have at least one from the purchase department (3) The charted accountant must be in the committee.
27. For n events A1 , A2 , , An show that
1.
2. 2 X 10 = 20

33
BST2B02: BIVARIATE RANDOM VARIABLE AND PROBABILITY DISTRIBUTIONS Time: 2 ½ Hours Max.: 80 Marks
PART A Each question carries 2 marks
1. Define expectation of a random variable. Write any two properties of expectation.
2. Show that V(aX + b) = a2V(X). 3. Let X1 and X2 be two independent random variables. Prove that M X1+X2(t) =
MX1(t) MX2(t). 4. Define characteristic function and write any two properties. 5. Define distribution function of a bivariate random variable and write any two
properties. 6. When do you say that two random variables are independent? 7. State and prove the multiplication theorem of expectation 8. Define conditional expectation and conditional variance of a bivariate random
variable. 9. For a discrete bivariate random variable (X, Y), prove that E{E(X|Y)} = E(X) 10. If X and Y are two independent random variables then show that Cov(X, Y) = 0. 11. Write the moment coefficients of skewness and kurtosis. 12. Describe degenerate probability distribution. 13. Define Binomial random variable. 14. Derive the mean of a Poisson random variable. 15. Define convergence in probability. Maximum Mark = 25
PART B Each question carries 5 marks
16. Let X be a random variable with the following probability distribution x -3 6 9
P(X = x) 1/6 1/2 1/3
Compute (i) V(X) and (ii) E(2X+1)2 17. A random variable X has m.g.f.
of X and hence fid its mean and variance. 18. The joint pdf of a bivariate random variable ifs f(x y) = 2; 0 < x < 1; 0 < y < x. Check
for independence f X ad Y
19. If X and Y have joint pdf f ( x , y )= x+ y ,0< x , y <1. Find
20. Sow that V(X) = E[V(X|Y)] + V[E(X|Y)]
21. Let X and Y are two independent and identically distributed geometric random variables. Then show that the conditional distribution of X|X+Y = n is uniform
22. Establish the memory less property of geometric distribution.
23. variables. Maximum Mark = 35

34
PART C Each question carries 10 marks (Answer any TWO Questions)
24. (i) State and prove the addition theorem of expectation (ii) Derive the relationship between raw moments and central moments
25. If (X, Y) is a bivariate discrete random variable with joint probability mass function
X
Y
1 2 3
1 2
21 3
21 4
21
2 3
21 4
21 5
21
(i) Find the marginal distributions of X and Y (ii) Compute P(X|Y=1) and (ii) Compute P(Y|X=2)
26. If X and Y are two r.v.s having the joint pdf f(x y) = 2 x y ; 0 < x, y < 1. Find xy. 27. Show that Poisson distribution is a limiting case of Binomial distribution under
certain conditions. 2 × 10 = 20

35
BST3B03: STATISTICAL ESTIMATION Time: 2 ½ Hours Max.: 80 Marks
PART A
Each question carries 2 marks.
1. If X is a random variable with a continuous distribution function F. Then show that F ~ Uniform[0, 1]
2. Write the relationship between normal and log normal distributions.
3. Define Pareto distribution.
4. Derive the moment generating function of Gamma distribution.
5. State Lindberg-Levy central limit theorem.
6. Distinguish between parameter and statistic.
7. State the additive property of Chi square distribution.
8. Establish the relationship between t and F distributions.
9. Define Cramer-Rao inequality
10. State Neyman Pearson Factorisation theorem
11. Define unbiasedness and efficiency of an estimator.
12. What is the significance of Bayesian estimation method?
13. Describe interval estimation.
14. Define confidence interval and confidence coefficient.
15. Write the confidence for the mean of normal distribution when population standard deviation is unknown.
Maximum Mark = 25 PART B
Each question carries 5 marks
16. State and prove memory less property of exponential distribution.
17. If X follows Beta distribution of second kind then (1 + X)-1 follows Beta distribution of first kind with same parameter.
18. If two independent random samples of sizes 15 and 20 are taken from N(2, 42). What is
the probability of (S1 2/ S2 2) < 2.
19. Derive the moment generating function of X2 distribution
20. Prove that in a Normal distribution sample mean is a consistent estimator of population mean.
21. distribution.
22. Establish confidence interval for the difference of proportions of two binomial populations.

36
23. Derive exact confidence interval for the difference of population means based on t distribution.
Maximum Mark = 35 PART C
Each question carries 10 marks (Answer any TWO Questions)
24. X is a normal variate with mean 42 and standard deviation 4. Find the probability that a value taken by X is (i) less than 50, (ii) greater than 50, (iii) greater than 40, (iv) in between 40 and 50 and (v) equal to 45.
25. applications.
26. (i) If T is a consistent estimator of , then prove that T2 is a consistent estimator of 2. (ii) For a rectangular distribution over (a, b), a<b , find the maximum
likelihood estimates of a and b.
27. Derive the confidence interval for the mean of a Normal population N(µ, 2), when (a) is known (b) is unknown and the sample size is small.
2 × 10 = 20

37
BST4B04- TESTING OF HYPOTHESIS Time: 2 ½ Hours Max.: 80 Marks
PART A Each question carries 2 marks.
1. Define simple and composite hypotheses. 2. Distinguish between Type I error and Type II error. 3. Discuss sequential sampling. 4. What is the significance of SPRT? 5. Distinguish between small sample tests and large sample tests. 6. Write the critical regions of large sample test. 7. Compare parametric and non-parametric tests 8. Write a suitable situation where ANOVA test is applicable. 9. List the assumptions of one sample t test. 10. When do you use correction? 11. Identify a suitable test and its test statistic for testing the significance of a correlation
coefficient. 12. What is meant by goodness of fit? 13. Write short note on Median Test 14. Write the test statistic of Wilcoxon-signed rank and identify its asymptotic
distribution. 15. Briefly discuss run test.
Maximum Mark = 25 PART B
Each question carries 5 marks 16. The continuous random variable X has the frequency function
, 0 x ,0 oth erwise
It is desired to test the hypothesis H 0 : =1 against H 1 : =2 using a single observation
X. X 0.95 is used as the critical region. Evaluate Type I error and Type II error. 17. Explain pared t test. Give a practical situation where this test is suitable. 18. A sample of 25 boys who passed SSLC examination are found to have mean marks 50
with standard deviation 5 for English. The mean marks of 18 girls are found to be 48 with standard deviation 4 for the same subject. Does this indicate any significance difference between the marks of boys and girls assuming the population standard deviation are equal?
19. In a sample of 600 men from a certain city 400 are fund to be smokers In 900 from another city 450 are smokers Do the data indicate that the cities are significantly different as far as smoking habits of people are concerned.
20. Tests were carried out to assess the strength of single fibre yarn spun on two different machines A and B and the results are given below:
Machine A 4 4.4 3.9 3 4.2 4.4 5 Machine B 5.3 4.3 4.1 4.4 5.3 4.2 3.8

38
Assuming the samples have been taken from normal population, test the hypothesis that variability is same for both the machines.
21. Explain Chi square test for independence of attributes. 22. A sample of 10 men was used in a study to test the effects of a relaxant on the time
required to fall asleep for male adults. Data for 10 subjects showing the number of minutes required to fall asleep with and without the relaxant follow. Use a 0.05 level of significance to determine whether the relaxant reduces the time required to fall asleep. Perform sign test and draw your conclusion.
Subject 1 2 3 4 5 6 7 8 9 10 Without Relaxant 15 12 22 8 10 7 8 10 14 9 With Relaxant 10 10 12 10 8 5 9 7 11 6
23. Explain Kolmogorov-Smirnov test. Suggest a situation where this test is useful.
Maximum Mark = 35 PART C
Each question carries 10 marks (Answer any TWO Questions)
24. State Neyman Pearson Lemma. Use the lemma to obtain the best critical region
for testing H 0 : = 0 against H 1 : = 1 , in the case of a normal
population with mean and variance 2 . Find the power of the test.
25. List basic assumptions of ANOVA and explain the procedure or performing an ANOVA test.
26. Fit a Poisson distribution for the following data and test the goodness of fit.
X 0 1 2 3 4 5 6 frequency 275 72 30 7 5 2 1
27. Explain (i) Wilcoxon signed rank test and (ii) Mann Whitney test 2 × 10 = 20
39
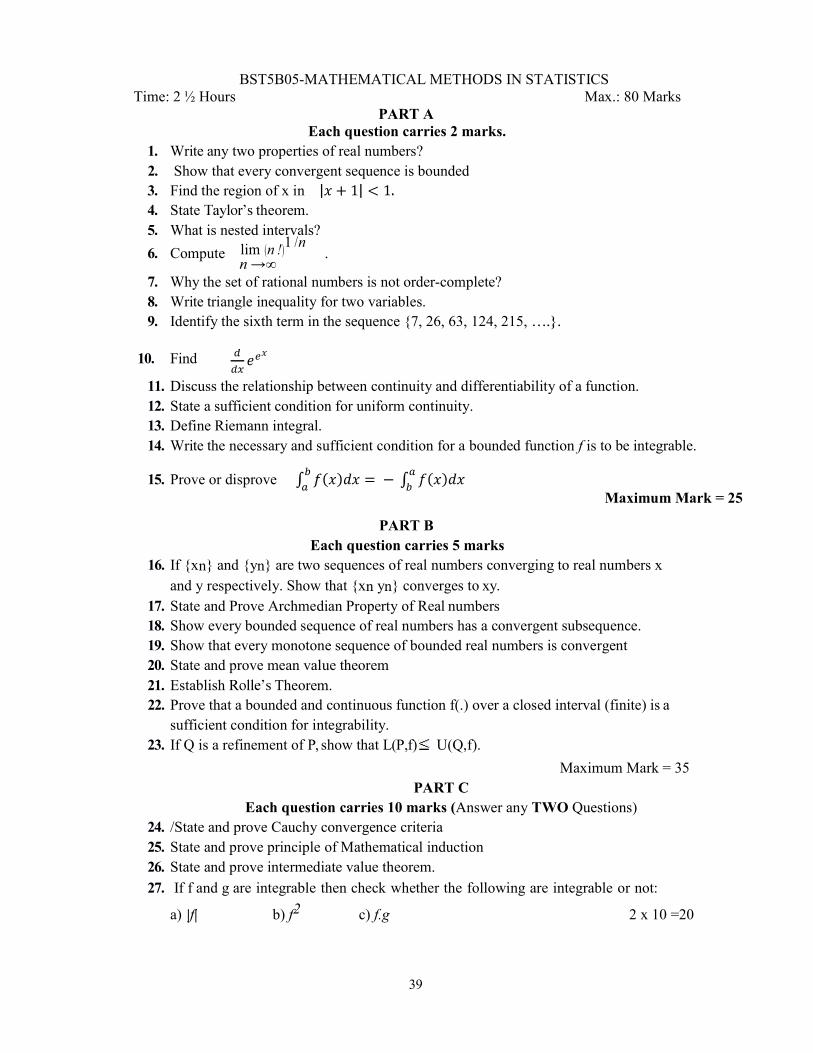
BST5B05-MATHEMATICAL METHODS IN STATISTICS Time: 2 ½ Hours Max.: 80 Marks
PART A Each question carries 2 marks.
1. Write any two properties of real numbers? 2. Show that every convergent sequence is bounded 3. Find the region of x in 4. State theorem. 5. What is nested intervals?
6. Compute lim (n !)1 /n .
7. Why the set of rational numbers is not order-complete? 8. Write triangle inequality for two variables. 9. Identify the sixth term in the sequence {7, 26, 63, 124, 215,
10. Find
11. Discuss the relationship between continuity and differentiability of a function. 12. State a sufficient condition for uniform continuity. 13. Define Riemann integral. 14. Write the necessary and sufficient condition for a bounded function f is to be integrable.
15. Prove or disprove
PART B
Maximum Mark = 25
Each question carries 5 marks 16. If {xn} and {yn} are two sequences of real numbers converging to real numbers x
and y respectively. Show that {xn yn} converges to xy. 17. State and Prove Archmedian Property of Real numbers 18. Show every bounded sequence of real numbers has a convergent subsequence. 19. Show that every monotone sequence of bounded real numbers is convergent 20. State and prove mean value theorem 21. Establish Theorem. 22. Prove that a bounded and continuous function f(.) over a closed interval (finite) is a
sufficient condition for integrability. 23. If Q is a refinement of P, show that L(P,f) U(Q,f).
Maximum Mark = 35 PART C
Each question carries 10 marks (Answer any TWO Questions) 24. /State and prove Cauchy convergence criteria 25. State and prove principle of Mathematical induction 26. State and prove intermediate value theorem.
27. If f and g are integrable then check whether the following are integrable or not:
a) |f| b) f2 c) f.g 2 x 10 =20

40
BST5B06: SAMPLE SURVEYS
Time: 2 ½ Hours Max.: 80 Marks PART A
Each question carries 2 marks. 1. Distinguish between census and sampling. 2. What is meant by judgement sampling? 3. Define secondary data. State its major sources. 4. Compare sampling and non-sampling errors. 5. Write any four properties of a good questionnaire. 6. Discuss simple random sampling. 7. Compute the total number of samples of size n = 2 from a population of N = 6. 8. Write the unbiased estimate of population total and its variance. 9. formula for proportional allocation. 10. In a systematic sampling N =40 and n = 4, find the value of k. 11. If is the intraclass correlation coefficient between the units of the same
systematic sample, then when do you say that systematic sampling would be more efficient as compared with srswor?
12. Briefly explain cluster sampling. 13. Write a situation where two stage sampling is applicable. 14. Distinguish between a stratum and a cluster. 15. Discuss Neyman allocation of sample sizes.
Maximum Mark = 25 PART B
Each question carries 5 marks 16. What are the advantages of sampling over census? 17. Explain the probability sampling and non-probability sampling with the help of
examples. 18. Explain the concept of stratified sampling. 19. Obtain an unbiased estimate of population mean in simple random sampling with
replacement. Find the variance of the estimate. 20. Show that sample proportion, p is an unbiased estimate of population proportion,
P. Also obtain the confidence interval for the population proportion 21. Show that sample mean is an unbiased estimate of population mean in stratified
random sampling. Also find its variance. 22. What you mean by precision of an estimate? Show that mean of a systematic sample
is more precise than mean of simple random sample. 23. Obtain an unbiased estimator of population mean in cluster sampling. Also find its
variance. Maximum Mark = 35

41
PART C Each question carries 10 marks (Answer any TWO Questions)
24. Explain in detail the principal steps in a sample survey.
25. Show that where is the interclass correlation between
the units of the same systematic sample.
26. If the population consists of a linear trend, then prove that
27. Compare the efficiencies of the Neyman and proportional allocations with that of an unstratified random sample of the same size.
2 × 10 = 20
42
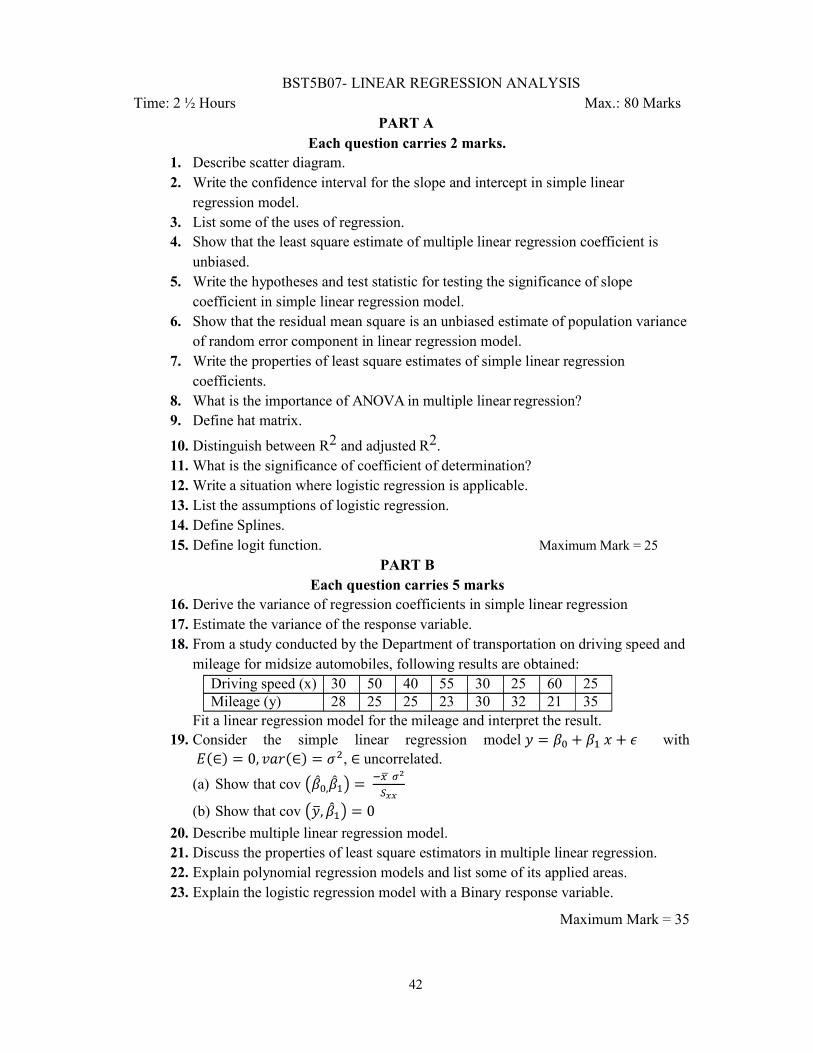
BST5B07- LINEAR REGRESSION ANALYSIS Time: 2 ½ Hours Max.: 80 Marks
PART A Each question carries 2 marks.
1. Describe scatter diagram. 2. Write the confidence interval for the slope and intercept in simple linear
regression model. 3. List some of the uses of regression. 4. Show that the least square estimate of multiple linear regression coefficient is
unbiased. 5. Write the hypotheses and test statistic for testing the significance of slope
coefficient in simple linear regression model. 6. Show that the residual mean square is an unbiased estimate of population variance
of random error component in linear regression model. 7. Write the properties of least square estimates of simple linear regression
coefficients. 8. What is the importance of ANOVA in multiple linear regression? 9. Define hat matrix.
10. Distinguish between R2 and adjusted R2. 11. What is the significance of coefficient of determination? 12. Write a situation where logistic regression is applicable. 13. List the assumptions of logistic regression. 14. Define Splines. 15. Define logit function. Maximum Mark = 25
PART B Each question carries 5 marks
16. Derive the variance of regression coefficients in simple linear regression 17. Estimate the variance of the response variable. 18. From a study conducted by the Department of transportation on driving speed and
mileage for midsize automobiles, following results are obtained: Driving speed (x) 30 50 40 55 30 25 60 25 Mileage (y) 28 25 25 23 30 32 21 35
Fit a linear regression model for the mileage and interpret the result. 19. Consider the simple linear regression model with
, uncorrelated.
(a) Show that cov
(b) Show that cov
20. Describe multiple linear regression model. 21. Discuss the properties of least square estimators in multiple linear regression. 22. Explain polynomial regression models and list some of its applied areas. 23. Explain the logistic regression model with a Binary response variable.
Maximum Mark = 35

43
PART C Each question carries 10 marks (Answer any TWO Questions)
24. Derive the least square estimates of simple linear regression coefficients and show that they are unbiased.
25. Explain the role of residual in model adequacy checking. 26. Explain test for significance of regression coefficients in multiple linear regression 27. Describe the estimation of regression coefficients in logistic regression model.
2 × 10 = 20

44
BST6B09: TIME SERIES AND INDEX NUMBERS Time: 2 ½ Hours Max.: 80 Marks
PART A Each question carries 2 marks.
1. Give example for seasonal and cyclic variations in time series. 2. Define Time series 3. What is meant by de-seasonalisation of data? 4. Write the steps for calculating the seasonal index using the method of simple
averages. 5. Define moving averages. 6. What is family budget method? 7. Write the importance of lognormal distribution in income analysis. 8. law. 9. Describe additive models in time series. 10. What is coefficient? 11. Define index numbers. 12. Mention any three uses of index numbers. 13. Write Marshal-Edgeworth index number and Dorbish and index number. 14. What are the scales of measurements? 15. Define Guttman scale.
Maximum Mark = 25 PART B
Each question carries 5 marks 16. How trend is measured using Moving Averages. 17. Explain periodic variations in Time series with suitable examples 18. Describe the Link Relative Method of measuring seasonal variation. 19. Explain Lorentz curve 20. Explain classification of index numbers 21. Give major limitations of index numbers 22. Explain the method of leastsquares. 23. How is a Likert scale measured? Is a Likert scale quantitative or qualitative?
Maximum Mark = 35 PART C
Each question carries 10 marks (Answer any TWO Questions) 24. What are the components of time series explain with example 25. Explain the use of Pareto distribution and its applications. 26. Briefly explain Link relative methods also explain its merits and demerits 27. What is attitude scale? Explain the advantages and limitations of scales in attitude
measurements? 2 × 10 = 20

45
BST6B10: DESIGN OF EXPERIMENTS Time: 2 ½ Hours Max.: 80 Marks
PART A Each question carries 2 marks.
1. Explain Gauss Markov set up of linear model. 2. Define estimable parametric function. 3. What is meant by best linear unbiased estimator? 4. Discuss the concept of ANCOVA. 5. In a LSD with 4 treatments and error sum of squares is 16, find the Mean error sum of
squares. 6. Write any situation where Graeco-Latin square design is suitable. 7. Distinguish between CRD and RBD. 8. Define treatment. 9. How to compare various designs of experiments?
10. In a 22 factorial design two factors A and B are given each at two levels, Write down the main effects and interaction effects of A and B.
11. Distinguish between 22 and 23 factorial designs. 12. Define incidence matrix 13. Discuss orthogonal design. 14. Describe BIBD. 15. What is the significance of PBIBD?
Maximum Mark = 25 PART B
Each question carries 5 marks 16. Consider three independent random variables y1 , y2 and y3 having common
variance 2 and E (Y 1 ) = 1 2 , E (Y 2)= 1 + 2 , E (Y 3 )=2 1 2 . Show that 3 1 2 2 is an estimable parametric function.
17. Find the least square estimate of the parameter vector in Gauss - Markov model and also find an unbiased estimator of 2 .
18. What is meant by analysis of variance of experimental data? What are the assumptions used in it?
19. Give the analysis for completely randomized design 20. Derive the expression for estimating one missing observation in RBD 21. Explain the efficiency of LSD compared to RBD 22. How can estimate the effects and calculate the sum of squares in factorial experiment? 23. test
Maximum Mark = 35 PART C
Each question carries 10 marks (Answer any TWO Questions)
24. State and prove Gauss-Markov theorem.

46
25. What is meant by missing plot technique and what are procedures used to obtain the missing observation. Write the expression for estimating two missing values in LSD and explain the ANOVA table in this case.
26. Explain the principles of design of experiments.
27. Define the main effects and interaction effects in a 23 factorial experiment. Also give its ANOVA table.
2 × 10 = 20

47
BST6B11: POPULATION STUDIES, ACTUARIAL SCIENCE AND VITAL STATISTICS
Time: 2 ½ Hours Max.: 80 Marks PART A
Each question carries 2 marks. 1. Define vital statistics. Give examples. 2. What is Crude birth rate? 3. Write the relation between N. R. R. And G. R. R. 4. Define mortality rate. 5. Write merits and demerits of general fertility rate. 6. Write any two characteristics of complete life tables. 7. What do you understand by an abridged life table? 8. What are the various uses of vital statistics? 9.
life. 10. Discuss the costs and benefits of insurance to society. 11. Explain different kinds of policies. 12. Explain life insurance and fire insurance. 13. Define peril and hazard. 14. What is proximate cause in insurance? 15. List different branches of insurance. Maximum Mark =25
PART B
Each question carries 5 marks 16. Explain different methods of obtaining vital statistics. 17. Explain direct method of standardisation. 18. What are the assumptions in a life table? 19. State the merits and demerits of Crude Birth Rate. 20. Differentiate between Life insurance and General insurance. 21. Describe reinsurance and double insurance. Also explain the difference between them. 22. Explain the principles of insurance. 23. Discuss the costs and benefits of insurance to society.
Maximum Mark =35 PART C
Each question carries 10 marks (Answer any TWO Questions) 24. Determine the standardised death rates for region A and B from the following.
Age Group
0-10
10-25
25-40
40-60 Above 60
Death per 1000, A ( m A ) 2 8 15 32 41
Death per 1000, B( mB )) 4 10 18 28 38
Standard Population (in thousands) 3
12
12
30
50
25. Give brief account on sample registration system.
26. Explain the chief characteristics of an ideally insurable loss exposure. 27. Explain the method of calculating the premium of life insurance. (2 x 10 =20)

48
BST6B12: OPERATIONS RESEARCH AND STATISTICAL QUALITY CONTROL
Time: 2 ½ Hours Max.: 80 Marks PART A
Each question carries 2 marks. 1. Define slack and surplus variables. 2. Distinguish between feasible solution and optimal feasible solution 3. Define artificial variable? When do we use it? 4. Define degeneracy in transportation problem. 5. What is meant by North West corner rule in lpp? 6. What are the disadvantages of BIG-M method over two phase method? 7. What are the causes of variation in quality control? 8. Explain the need for quality control techniques in production. 9. Describe C chart. 10. How to read a control chart? 11. What are the difference between defects & defectives? 12. What is the significance of OC curve? 13. risk. 14. Define LTPD. 15. What are ASN and ATI for the single sampling plan?
Maximum Mark = 25 PART B
Each question carries 5 marks 16. Describe linear programming problem. Write some of its applications. 17. Explain the graphical method for solving linear programming problem. 18. Find a geometrical interpretation and solution as well for the following linear
programming problem. Maximize Z = 3x1+5x2
Subject to x1 +2x2 2000 x1 +x2 1500 x2
x1 x2
19. Explain assignment problem. Describe any method to solve it. 20. What is meant by a control charts? Explain the applications of these charts. 21. Describe procedure or drawing X bar and R charts. 22. Explain AQL and ASN. 23. Explain the main control charts for attributes and obtain their control limits.
Maximum Mark = 35

49
PART C Each question carries 10 marks (Answer any TWO Questions)
24. Find the initial basic feasible solution of the following transportation problem. There are four origins three destinations. The availabilities are 9, 10, 8, 7 and the requirements are 17,10,7 respectively.
A B C
D 2 3 2 E 1 3 4 F 2 3 1 G 2 4 3
25. What are the computational procedures of dual simplex method, explain with an example?
26. Distinguish between double and single sampling plans. 27. Draw the OC curve of the single sampling plan showing the consumers and producers
risks. 2 × 10 = 20

50
ELECTIVE PAPER
BST6B16(E) : RELIABILITY THEORY Time : 2 hours Maximum Marks : 60
Section A (Each question carries 2 marks)
1. Define state of a system. 2. Represent a 3-out-of-3 structure. 3. Define a coherent structure. 4. What do you mean by structural importance of components? 5. Give examples of a series system and a parallel system. 6. Describe the representation of a structure using minimal path sets. 7. Define critical path vector and critical path set.
8. Define Coherent modules. 9. Define lack of memory property. Show that exponential distribution possesses that property.
10. Define Poisson distribution. 11. Distinguish between DFR and IFR distributions. 12. Show that the mean of the exponential distribution is the reciprocal of its failure rate. Maximum Marks = 20
Section B (Each question carries 5 marks)
13. Define Bridge structure. Represent a bridge structure as parallel-series/series-parallel structure. 14. Explain any one method of computing exact system reliability. 15. Let )( ph be a system reliability of a coherent system, then show that )(ph is strictly
increasing in each ip for 10 ip for all i .
16. Let )(x be the structure function of a coherent system of order n . Then show that
n
ii
n
ii xxx
11
)( .
17. Derive the reliability of a k-out-of-n structure. 18. Show that the hazard function uniquely determines the reliability function. 19. Show that constant hazard function is a characteristic property of exponential distribution . Maximum Marks = 30
Section C (Answer any one question; each question carries 10 marks)
20. Let be a coherent structure. Then show that
)()()()( yxyxi (ii) )(.)().( yxyx
21. Explain inclusion exclusion principle for finding system reliability. (10x1=10)
***************

51
OPEN COURSE BST5D03: BASIC STATISTICS
Time : 2 hours Maximum Marks : 60
Section-A
Each question carries two marks
1. Distinguish between population and sample. 2. what is meant by sampling and non sampling errors. 3. Distinguish between census and sampling. 4. Distinguish between simple and weighted arithmetic mean. 5. Give four desirable properties of a good average. 6. Distinguish between quartile deviation and mean deviation. 7. What is a scatter diagram? 8. Define the term correlation. 9. What is the principle of least squares. 10. State multiplication theorem of probability. 11. Define random experiment. 12. What do you mean by independence of two events.
Maximum Marks = 20
Section-B Each question carries five marks
13. State the advantages of sample survey over census. 14. If all observations are not equal. Show that Geometric mean lies between Arithmetic mean and
Harmonic mean. 15. Given AM=24.6, Mode=26.1, find the value of the median for a moderately asymmetrical distribution. 16. Write any four properties of correlation coefficient. 17. Prove that coefficient of correlation lies between -1 and +1. 18. State and prove addition theorem of probability of two events. 19. Define frequency definition, classical definition and axiomatic definition of probability.
Maximum Marks = 30
Section-C Answer any one question. Each question carries ten marks
The runs scored by two batsman in 5 innings are given below. Find who is the more consistant batsman?A : 25 50 45 30 70 B : 10 70 50 20 95
Turn Over
21. Fit a straight line to the following data. X : 1 2 3 4 5
Y : 14 13 9 5 2 (1 x 10 = 10 marks)

52
STATISTICS: SYLLABI OF
COMPLEMENTARY COURSES
FOR B.Sc. MATHEMATICS PROGRAMME
CBCSSUG 2019 (2019 admission onwards)
Sem No
Course Code
Course Title Instructional Hours/week
Cred it
Exam Hours
Ratio Ext: Int
1 BST1C01 INTRODUCTORY STATISTICS
4 3 2 4:1
2 BST2C02 PROBABILITY THEORY
4 3 2 4:1
3 BST3C03 PROBABILITY DISTRIBUTIONS AND SAMPLING
THEORY
5 3 2 4:1
4 BST4C04 STATISTICAL INFERENCE AND
QUALITY CONTROL
5 3 2 4:1
Question Paper Pattern
Question number To
Type of Questions and Marks
01 to 12 Short answer type carries 2 marks each - 12 questions (Maximum Marks 20)
13 to 19 Paragraph/ Problem type carries 5 marks each 7 questions (Maximum Marks 30)
20 to 21 Essay type carries 10 marks (1 out of 2) (Maximum Mark 10)
01 to 21 Total Marks: 60

53
SEMESTER I
BST1C01- INTRODUCTORY STATISTICS
Contact Hours per week: 4 Number of credits: 3 Number of Contact Hours: 72 Course Evaluation: External 60 Marks+ Internal 15 Marks Duration of Exam: 2 Hours
Blue Print for Question Paper Setting / Scrutiny
Max. Marks: 60 Question Paper Syllabus
Section s or
Parts
Mark
Question Number
s
MODULE 1 MODULE 2 MODULE 3 MODULE 4 7 Hrs 30 Hrs 15 Hrs 20 Hrs
7 Marks 30 Marks 19Marks 21 Marks
A
2
1 2 2 2 3 2 4 2 5 2 6 2 7 2 8 2 9 2
10 2 11 2 12 2
B
5
13 5 14 5 15 5 16 5 17 5 18 5 19 5
C 10 20 10
21 10 7 32 19 21
Question Paper setter has to give equal importance to both theory and problems in section B and C.

54
I. INTRODUCTORY STATISTICS (CODE: BST1C01)
Objectives:
1. To understand the statistical system in India. 2. To learn the basics of data collection and techniques of exploratory data analysis. 3. To get familiarizes with the basic visualization techniques of data analysis and
interpretations. 4. To identify an appropriate relationship between two variables using scatter plot and
fitting the same by the method of least squares- straight line, second degree polynomial, power & exponential curves.
5. To expose students to the areas of time series and index numbers.
Module 1: Official statistics: The Statistical system in India: The Central and State Government organizations, functions of the Central Statistical Office (CSO), National Sample Survey Organization (NSSO) and the Department of Economics and Statistics.
7 hours Module 2: Introduction to Statistics: Nature of Statistics, Uses of Statistics, Statistics in relation to other disciplines, Abuses of Statistics. Concept of primary and secondary data. Designing a questionnaire and a schedule. Concepts of statistical population and sample from a population, quantitative and qualitative data, Nominal, ordinal and time series data, discrete and continuous data. Presentation of data by table and by diagrams, frequency distributions by histogram and frequency polygon, cumulative frequency distributions (inclusive and exclusive methods) and ogives. Measures of central tendency (mean, median, mode, geometric mean and harmonic mean) with simple applications. Absolute and relative measures of dispersion (range, quartile deviation, mean deviation and standard deviation) with simple applications. Co-efficient of variation, Box Plot. Importance of moments, central and non-central moments, and their interrelationships. Measures of skewness based on quartiles and moments; kurtosis based on moments.
30 hours Module 3: Correlation and Regression: Scatter Plot, Simple correlation, Simple regression, two regression lines, regression coefficients. Fitting of straight line, parabola, exponential, polynomial (least square method).
15 hours Module 4:Time series: Introduction and examples of time series from various fields, Components of times series, Additive and Multiplicative models. Trend: Estimation of trend by free hand curve method, method of semi averages, method of moving averages and fitting various mathematical curves. Seasonal Component: Estimation of seasonal component by Method of simple averages, Ratio to Trend.
Index numbers: Definition, construction of index numbers and problems thereof for weighted and unweighted index numbers including -Marshall and
20 hours
References:
1. S.C. Gupta and V.K. Kapoor. Fundamentals of Mathematical Statistics, Sultan Chand
& Sons, New Delhi

55
2. Goon A.M., Gupta M.K. and Dasgupta B. (2002): Fundamentals of Statistics, Vol. I & II, 8th Edn. The World Press, Kolkata.
3. Mukhopadhyay P. (2011): Applied Statistics, 2nded. Revised reprint, Books and Allied 4. Hoel P.G. Introduction to mathematical statistics, Asia Publishing house. 5. Chatfield.C. The Analysis of Time Series: An Introduction, Chapman & Hall 6. Guide to current Indian Official Statistics, Central Statistical Office, GOI, New Delhi. 7. www.mospi.gov.in 8. www.ecostat.kerala.gov.in

56
SEMESTER II
BST2C02- PROBABILITY THEORY
Contact Hours per week: 4 Number of credits: 3 Number of Contact Hours: 72 Course Evaluation: External 60 Marks+ Internal 15 Marks Duration of Exam: 2 Hours
Blue Print for Question Paper Setting / Scrutiny
Max. Marks: 60 Question Paper Syllabus
Section s or
Parts
Mark
Question Number
s
MODULE 1 MODULE 2 MODULE 3 MODULE 4 25Hrs 12Hrs 15 Hrs 20 Hrs
28 Marks 16 Marks 16 Marks 19 Marks
A
2
1 2 2 2 3 2 4 2 5 2 6 2 7 2 8 2 9 2
10 2 11 2 12 2
B
5
13 5 14 5 15 5 16 5 17 5 18 5 19 5
C 10 20 10
21 10 28 16 16 19
Question Paper setter has to give equal importance to both theory and problems in section B and C.

57
II. PROBABILITY THEORY (CODE: BST2C02)
Objectives: 1. To understand the concept of probability 2. To understand the basic concepts about random variables and properties 3. To learn the random variables in two-dimension and their properties.
Module 1: Introduction to Probability: Random experiment, Sample space, events, classical definition of probability, statistical regularity, field, sigma field, axiomatic definition of probability and simple properties, addition theorem (two and three events), conditional probability of two events, multiplication theorem, independence of events-pair wise and mutual, Bayes theorem and its applications.
25 hour Module 2: Random variables: Discrete and continuous, probability mass function (pmf) and probability density function (pdf)-properties and examples, Cumulative distribution function and its properties, change of variables (univariate case only)
12 hours Module 3: Mathematical expectations (univaraite): Definition, raw and central moments(definition and relationships), moment generation function and properties, characteristic function (definition and use only), Skewness and kurtosis using moments
15 hours Module 4: Bivariate random variables: Joint pmf and joint pdf, marginal and conditional probability, independence of random variables, function of random variable. Bivariate Expectations, conditional mean and variance, covariance, Correlation coefficient, independence of random variables based on expectation.
20 hours
References :
1. Rohatgi V. K. and Saleh, A.K. Md. E. (2009): An Introduction to Probability and
Statistics. 2ndEdn. (Reprint) John Wiley and Sons. 2. S.C.Gupta and V. K. Kapoor, Fundamentals of Mathematical Statistics, Sultan Chand and Sons. 3. Mood, A.M. Graybill, F.A. and Boes, D.C. (2007): Introduction to the Theory of Statistics, 3rd Edn., (Reprint), Tata McGraw-Hill Pub. Co. Ltd. 4. John E Freund, Mathematical Statistics, Pearson Edn, New Delhi 5. Hoel P.G. Introduction to mathematical statistics, Asia Publishing house.

58
SEMESTER III
BST3C03- PROBABILITY DISTRIBUTIONS AND SAMPLING THEORY
Contact Hours per week: 5 Number of credits: 3 Number of Contact Hours: 90 Course Evaluation: External 60 Marks+ Internal 15 Marks Duration of Exam: 2 Hours
Blue Print for Question Paper Setting / Scrutiny
Max. Marks: 80 Question Paper Syllabus
Section s or
Parts
Mark
Question Number
s
MODULE 1
MODULE 2
MODULE 3
MODULE 4
30Hrs 25Hrs 10Hrs 25 Hrs 28 Marks 21 Marks 9 Marks 21 Marks
A
2
1 2 2 2 3 2 4 2 5 2 6 2 7 2 8 2 9 2 10 2 11 2 12 2
B
5
13 5 14 5 15 5 16 5 17 5 18 5 19 5
C 10 20 10
21 10 28 21 9 21
Question Paper setter has to give equal importance to both theory and problems in section B and C.

59
III. PROBABILITY DISTRIBUTIONS AND SAMPLING THEORY. (CODE:BST3C03)
Objectives:
1. To understand the applications of theoretical discrete distributions 2. To understand the concept of convergence of sequence of random variables, law of large
numbers and central limit theorem. 3. To understand various sampling methods and sampling distributions.
Module 1: Standard distributions: Discrete type-Bernoulli, Binomial, Poisson, Geometric, Negative Binomial (definition only), Uniform (mean, variance and mgf). Continuous type-Uniform, exponential and Normal (definition, properties and applications); Gamma (mean, variance, mgf); Lognormal, Beta, Pareto and Cauchy (Definition only)
30 hours Module 2: Limit theorems: inequality, Sequence of random variables, parameter and Statistic, Sample mean and variance, Convergence in probability (definition and example only), weak law of large numbers (iid case), Bernoulli law of large numbers, Convergence in distribution (definition and examples only), Central limit theorem (Lindberg levy-iid case)
25 hours Module 3: Sampling methods: Simple random sampling with and without replacement, systematic sampling (Concept only), stratified sampling (Concept only), Cluster sampling(Concept only)
10 hours Module 4: Sampling distributions: Statistic, Standard error, Sampling from normal distribution, distribution of sample mean, sample variance, chi-square distribution, t- distribution, and F distribution (definition, derivations and relationships only).
25 hours
References:
1. Rohatgi V. K. and Saleh, A.K. Md. E. (2009): An Introduction to Probability and
Statistics. 2ndEdn. (Reprint) John Wiley and Sons. 2. S.C.Gupta and V. K. Kapoor, Fundamentals of Mathematical Statistics, Sultan Chand
and Sons. 3. Mood, A.M. Graybill, F.A. and Boes, D.C. (2007): Introduction to the Theory of Statistics, 3rd Edn., (Reprint), Tata McGraw-Hill Pub. Co. Ltd. 4. John E Freund, Mathematical Statistics, Pearson Edn, NewDelhi
5. Cochran W.G. (1984):Sampling Techniques( 3rdEd.), Wiley Eastern.

60
SEMESTER IV
BST4C04 - STATISTICAL INFERENCE AND QUALITY CONTROL
Contact Hours per week: 5 Number of credits: 3 Number of Contact Hours: 90 Course Evaluation: External 60 Marks+ Internal 15 Marks Duration of Exam: 2 Hours
Blue Print for Question Paper Setting / Scrutiny
Max. Marks: 60 Question Paper Syllabus
Section s or
Parts
Mark
Question Number
s
MODULE 1
MODULE 2
MODULE 3
MODULE 4
30 Hrs 35 Hrs 10 Hrs 15Hrs 26 Marks 30Marks 9 Marks 14 Marks
A
2
1 2 2 2 3 2 4 2 5 2 6 2 7 2 8 2 9 2 10 2 11 2 12 2
B
5
13 5 14 5 15 5 16 5 17 5 18 5 19 5
C 10 20 10
21 10 26 30 9 14
Question Paper setter has to give equal importance to both theory and problems in section B and C.

61
IV: STATISTICAL INFERENCE AND QUALITY CONTROL. (CODE: BST4C04)
Objectives:
1. To equip the students with the theory essential for estimation of unknown
parameters. 2. To understand the criteria of good estimators and interval estimation 3. To understand the concepts of testing of hypotheses and application of the
sampling distributions in the testing problems. 4. To equip the students with preliminary ideas and techniques of control charts.
Module 1: Estimation theory: Parametric space, sample space, point estimation. Neyman Factorization criteria, Requirements of good estimator: Unbiasedness, Consistency, Efficiency, Sufficiency and completeness. Minimum variance unbiased (MVU) estimators. Cramer-Rao inequality (definition only). Minimum Variance Bound (MVB) estimators. Methods of estimation: Maximum likelihood estimation and Moment estimation methods (Detailed discussion with problems); Properties of maximum likelihood estimators (without proof); Least squares and minimum variance (concepts only). Interval estimation: Confidence interval (CI);CI for mean and variance of Normal distribution; Confidence interval for binomial proportion and population correlation coefficient when population is normal.
30 hours Module 2: Testing of Hypothesis: Level of significance, Null and Alternative hypotheses, simple and composite hypothesis ,Types of Errors, Critical Region, Level of Significance, Power and p-values. Most powerful tests, Neyman-Pearson Lemma (without proof), Uniformly Most powerful tests. Large sample tests: Test for single mean, equality of two means, Test for single proportion, equality of two proportions. Small sample tests: t-test for single mean, unpaired and paired t-test. F test for equality of variances, Chi-square test for goodness of fit, test of independence and association of attributes. Testing means of several populations: One Way ANOVA, Two Way ANOVA (assumptions, hypothesis, ANOVA table and problems)
35 hours Module 3: Non-parametric methods: Advantages and drawbacks; Test for randomness, Median test, Sign test, Mann-Whiteny U test and Wilcoxon test; Kruskal Wallis test (Concept only)
10 hours Module 4: Quality Control: General theory of control charts, causes of variations in quality, control limits, sub-grouping, summary of out-of-control criteria. Charts of variables - X bar chart, R Chart and sigma chart. Charts of attributes c-charts, p-chart and np-chart.(Concepts and problems).
15 hours
References: 1. Rohatgi V. K. and Saleh, A.K. Md. E. (2009): An Introduction to Probability and
Statistics. 2ndEdn. (Reprint) John Wiley and Sons. 2. Gupta, S.P. Statistical Methods. Sultan Chand and Sons: New Delhi. 3. S.C.Gupta and V. K. Kapoor, Fundamentals of Mathematical Statistics, Sultan Chand and
Sons 4. Mood, A.M. Graybill, F.A. and Boes, D.C. (2007): Introduction to the Theory of
Statistics, 3rdEdn., (Reprint), Tata McGraw-Hill Pub. Co. Ltd.

62
5. John E Freund, Mathematical Statistics, Pearson Edn, NewDelhi 6. Grant E L, Statistical quality control, McGraw Hill 7. Montogomery, D. C. (2009): Introduction to Statistical Quality Control, 6th Edition, Wiley India Pvt. Ltd.

63
Statistics: Model Question Papers of Complementary Courses (For B.Sc, Mathematics Programme)
First Semester B.Sc. (Mathematics) Degree Examination
Model Question paper Statistics- Complementary
BST1C01- INTRODUCTORY STATISTICS Time: 2 Hours Maximum Marks: 60
Part A Each question carries 2 Marks.
Maximum Marks that can be scored in this Part is 20 1. What are the main roles of State level statistical organizations? 2. What are the main functions of Statistics? 3. What are ogives? What are its uses? 4. Show that GM of a set of positive observation lies between AM and HM. 5. What do you mean by partition values?. 6. Calculate median for the following data Class: 0-5 5-10 10-15 15-20 20-25 f : 5 10 15 12 8 7. Compare range and quartile deviation. 8. Define correlation and regression. 9. Write down the normal equations to fit a straight line y = a + bx. 10.What are the components of time series? 11. Write down an additive and a multiplicative model of a time series with the components T, S, C and I. 12. Give the formula for Fisher's ideal index.
Part B
Each question carries 5 Marks. Maximum Marks that can be scored in this Part is 30
13. Explain the important activities of Central Statistics Organization. 14. Distinguish between primary data and secondary data. 15. Draw less than ogive and more than ogive and obtain median. Class: 0-10 10-20 20-30 30-40 40-50 50-60 60-70 f : 5 12 28 40 21 10 4 16. Define rth central moment and express it in terms of the raw moments of order r or less. 17. Explain the principle of least squares method of fitting of a second degree curve of the form
y = a + bx + cx2 for n pairs of values. 18. Show that coefficient of correlation lies in between -1 and +1. 19. Fit an exponential trend to the following time series Year : 1990 1991 1992 1993 1994 1995 Values : 2 3 4 6 9 13
Part C
Answer any one question and carries 10 Marks. 20. (a) Show that mean deviation is a minimum when calculated from the median. (b) The runs scored by batsman in 5 innings are given. Find the score consistent batsman. A: 25 50 45 30 70 B: 10 70 50 20 95 21. What are index numbers? Briefly discuss the problems in construction of index numbers.

64
Second Semester B.Sc. (Mathematics) Degree Examination Model Question Paper
Statistics- Complementary BST2C02- PROBABILITY THEORY
Time: 2 Hours Maximum Marks: 60 Part A
Each question carries 2 Marks. Maximum Marks that can be scored in this Part is 20
1. Define the terms random experiment and sample space. 2. What are the axioms of probability theory? 3. State and prove the addition theorem of probability. 4. Define Conditional probability. 5. What is relationship between distribution function and density function? 6. Define discrete and continuous random variables. 7. Let X be a continuous random variable pdf f(x) then find the pdf of Y = . 8. If X and Y are two random variables, show that E(X +Y ) = E(X)+E(Y ). 9. Find the characteristic function of f(x) = a exp (-ax), a > 0, x > 0. 10. Define joint distribution and marginal distribution of a random variables. 11. Define conditional mean and conditional variance in discrete case. 12. Prove that -
Part B Each question carries 5 Marks.
Maximum Marks that can be scored in this Part is 30 13. State and prove Baye's theorem and indicate its importance. 14. If A, B, C are pair wise independent and A is independent of BUC then show that A, B, C are mutually independent. 15. A continuous random variable X has the following density function,
{- { 0, elsewhere (a) Find the constant a (b) Determine the distribution function. (c) Sketch the graphs of f(x) and F(x). (d) If three independent observations are made what is the probability that exactly one of them is larger than 1.5.
16. If X has the pdf then f(x) = - <X< . Find the density
function of Y = . 17. Define a probability density function and state its properties. 18. If the probability density of X is defined by f(x) = C exp(- , a>0. Find the value of C. Also find the first three moments. 19. Find the mean and standard deviation of a random variable X with pdf f(x) = 6x(1 - x); 0 < x < 1.
Part C Answer any one question and carries 10 Marks.
20. For events A1, A2, .....An show that
21. If X and Y have the joint pdf given by f(x; y) = ; x= 1,2,3; y=1,2. Obtain
(a) (b) E(X/Y=2) and (c) V(X/Y=2).

65
III Semester B.Sc. (Mathematics) Degree Examination Model Question Paper
Statistics (Complementary) BST3C03-PROBABILITY DISTRIBUTIONS AND SAMPLING THEORY
Time: 2 hours Max. Marks: 60 SECTION-A
Each question carries 2 Marks. Maximum Marks that can be scored in this section is 20.
1. Describe Poisson distribution. 2. Define Binomial random variable. 3. Derive the mean of a discrete uniform random variable. 4. Find the mgf of Geometric distribution. 5. Define convergence in probability. 6. Define convergence in distribution. 7. State Lindberg-Levy central limit theorem. 8. Define simple random sampling with replacement. 9. What do you mean by cluster sampling? 10. Define F statistic. What is its probability density function? 11. What is meant by sampling distribution? 12. Write down the probability density function of distribution.
SECTION-B
Each question carries 5 Marks. Maximum Marks that can be scored in this section is 30.
13. State and prove memory less property of exponential distribution. 14. Find the mean and variance of Gamma distribution.
State the weak law of large numbers. Examine if WLLN is satisfied by the following sequence
of random variables where n = 1, 2, ... and with probability .
16. State and prove Chebychev's inequality.
17. A random variable takes the values -1, 1, 3, 5 with probabilities
respectively. Find an upper bound for 18. Distinguish between systematic sampling and stratified sampling. 19. Establish the relationship between t, F and 2 distribution.
SECTION-C (Answer any one Question and carries 10 marks)
20. (a) Derive the moment generating function of Normal random variable.
(b) Show that the even order central moments of the Normal distribution with 2 is
21. Derive the distribution of sample mean X and sample variance S2 2).
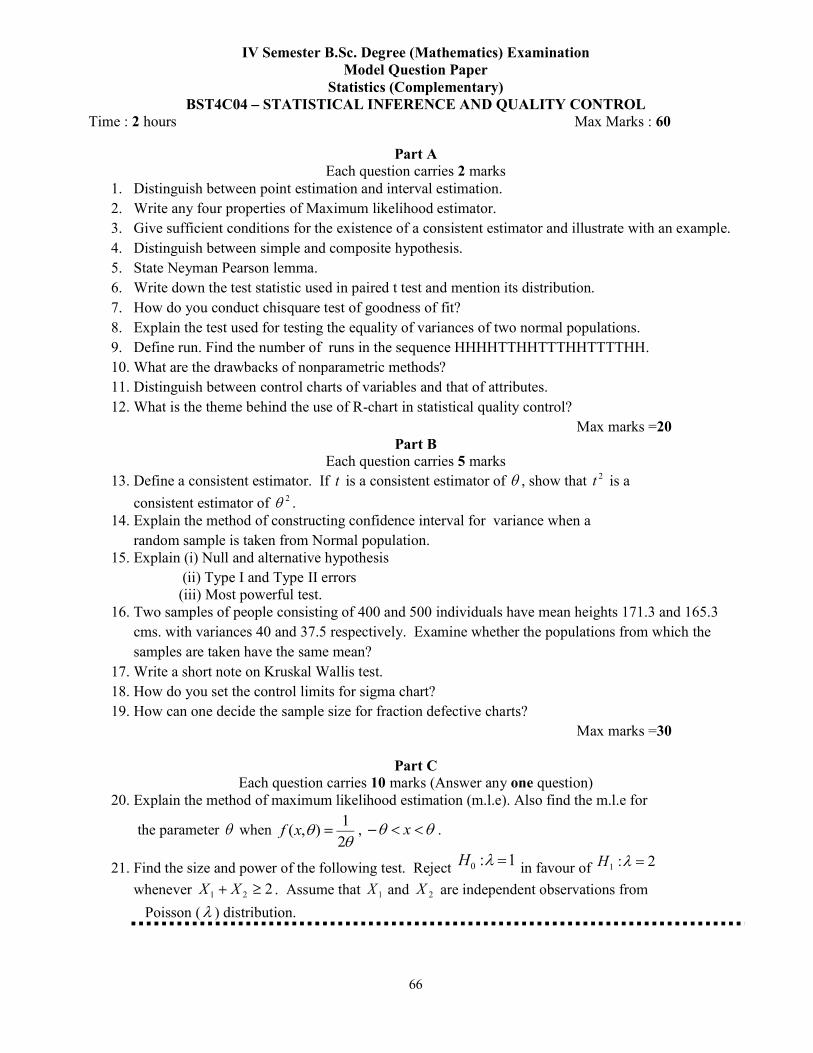
66
IV Semester B.Sc. Degree (Mathematics) Examination
Model Question Paper Statistics (Complementary)
BST4C04 STATISTICAL INFERENCE AND QUALITY CONTROL Time : 2 hours Max Marks : 60
Part A Each question carries 2 marks
1. Distinguish between point estimation and interval estimation. 2. Write any four properties of Maximum likelihood estimator. 3. Give sufficient conditions for the existence of a consistent estimator and illustrate with an example. 4. Distinguish between simple and composite hypothesis. 5. State Neyman Pearson lemma. 6. Write down the test statistic used in paired t test and mention its distribution. 7. How do you conduct chisquare test of goodness of fit? 8. Explain the test used for testing the equality of variances of two normal populations. 9. Define run. Find the number of runs in the sequence HHHHTTHHTTTHHTTTTHH. 10. What are the drawbacks of nonparametric methods? 11. Distinguish between control charts of variables and that of attributes. 12. What is the theme behind the use of R-chart in statistical quality control?
Max marks =20 Part B
Each question carries 5 marks 13. Define a consistent estimator. If t is a consistent estimator of , show that 2t is a
consistent estimator of 2 . 14. Explain the method of constructing confidence interval for variance when a
random sample is taken from Normal population. 15. Explain (i) Null and alternative hypothesis
(ii) Type I and Type II errors (iii) Most powerful test.
16. Two samples of people consisting of 400 and 500 individuals have mean heights 171.3 and 165.3 cms. with variances 40 and 37.5 respectively. Examine whether the populations from which the samples are taken have the same mean?
17. Write a short note on Kruskal Wallis test. 18. How do you set the control limits for sigma chart? 19. How can one decide the sample size for fraction defective charts?
Max marks =30
Part C Each question carries 10 marks (Answer any one question)
20. Explain the method of maximum likelihood estimation (m.l.e). Also find the m.l.e for
the parameter when 21
),(xf , x .
21. Find the size and power of the following test. Reject 1:0H in favour of 2:1H
whenever 221 XX . Assume that 1X and 2X are independent observations from
Poisson ( ) distribution.

67
STATISTICS: SYLLABI OF COMPLEMENTARY COURSES
FOR B.Sc. PSYCHOLOGY PROGRAMME
CBCSSUG 2019 (2019 admission onwards)
Sem No
Course Code
Course Title Instructio nal hours/ week
Credit Exam Hours
Ratio Ext: Int
1 BST1C05 DESCRIPTIVE STATISTICS
4 3 2 4:1
2 BST2C06 REGRESSION ANALYSIS AND PROBABILITY
THEORY
4 3 2 4:1
3 BST3C07 PROBABILITY DISTRIBUTIONS
AND PARAMETRIC
TESTS
5 3 2 4:1
4 BST4C08 STATISTICAL TECHNIQUES FOR
PSYCHOLOGY
5 3 2 4:1

68
SEMESTER I
BST1C 05- DESCRIPTIVE STATISTICS Contact Hours per week: 4 Number of credits: 3 Number of Contact Hours: 72 Course Evaluation: External 60 Marks+ Internal 15 Marks Duration of Exam: 2 Hours
Question Paper Pattern
Type of
Questions Question number
To
Marks
Short Answer
01 to 12
Short answer type carries 2 marks each - 12 questions
(Maximum Marks 20)
Paragraph/ Problems
13 to 19 Paragraph/ Problem type carries 5 marks each 7 questions
(Maximum Marks 30)
Essay 20 to 21 Essay type carries 10 marks (1 out of 2)
(Maximum Marks 10) Total 01 to 21 60
Question Paper setter has to give equal importance to both theory and problems in sections B and C.
Objectives 1. To generate interest in Statistics 2. To equip the students with the concepts of basic Statistics 3. To provide basic knowledge about Statistical methods
Module 1: A basic idea about data- collection of data, primary and secondary data, organization, planning of survey and diagrammatic representation of data. 10 Hours Module 2: Classification and tabulation- Classification of data, frequency distribution, formation of a frequency distribution, Graphic representation viz. Histogram, Frequency Curve, Polygon, Ogives, Bar diagram and Pie diagram 10 Hours Module 3: Measure of central tendency- Arithmetic Mean, Median, Mode, Geometric Mean, Harmonic Mean, Combined Mean, Advantages and disadvantages of each average.
20 Hours
Module 4: Measures of dispersion- Range, Quartile Deviation, Mean Deviation, Standard Deviation, Combined Standard Deviation, Percentiles, Deciles, Relative Measures of Dispersion, Coefficient of variation. 16 Hours
Module 5: Skewness and Kurtosis- Measure of Kurtosis. 16 Hours

69
References 1. Gupta, S.P. Statistical Methods. Sultan Chand and Sons: New Delhi. 2. Gupta, S.C., & Kapoor, V.K. Fundamentals of Applied Statistics. New Delhi: Sultan Chand and Sons. 3. Garret, H.E., &Woodworth, R.S. Statistics in Psychology and Education. Bombay: Vakila,
Feffex and Simens Ltd. 4. Mood, A.M., Graybill, F.A and Boes, D.C. Introduction to Theory of Statistics. 3rd Edition Paperback International Edition. 5. Mukhopadhyay,P. Mathematical Statistics. New central Book Agency (P) Ltd: Calcutta.
Assignments/ Seminar
Assignments/Seminar are to be given to students. The purpose of the assignments/seminar is to provide practical exposure to the students.

70
SEMESTER II
BST2C06- REGRESSION ANALYSIS AND PROBABILITY THEORY Contact Hours per week: 4 Number of credits: 3 Number of Contact Hours: 72 Course Evaluation: External 60 Marks+ Internal 15 Marks Duration of Exam: 2 Hours Question Paper Pattern
Type of
Questions Question number
To
Marks
Short Answer
01 to 12 Short answer type carries 2 marks each - 12 questions (Maximum Marks 20)
Paragraph/ Problems
13 to 19 Paragraph/ Problem type carries 5 marks each 7 questions (Maximum Marks 30)
Essay
20 to 21 Essay type carries 10 marks (1 out of 2) (Maximum Marks 10)
Total 01 to 21 60
Question Paper setter has to give equal importance to both theory and problems in sections B and C.
Objectives
1. To make the students aware of various Statistical tools 2. To create awareness about probability
Module 1: Bivariate data- relationship of variables, correlation analysis, methods of studying
s Coefficient of Correlation, Calculation of Correlation from a 2-way table, Interpretation of Correlation Coefficient, Rank Correlation
11 Hours Module 2: Regression analysis- linear regression, Regression Equation, Identifying the Regression Lines properties of regression coefficients, numerical problems
9 Hours Module 3: Partial and Multiple Correlation Coefficients- Multiple Regression Equation, Interpretation of Multiple Regression Coefficients (three variable cases only)
16 Hours Module 4: Basic probability- Sets, Union, Intersection, Complement of Sets, Sample Space, Events, Classical, Frequency and Axiomatic Approaches to Probability, Addition and Multiplication Theorems, Independence of Events (Up-to three events)
20 Hours Module 5: Random Variables and their probability distributions- Discrete and Continuous Random Variables, Probability Mass Function, Distribution Function of a Discrete Random Variable
16 Hours
References

71
1. Gupta, S.P. Statistical Methods. Sultan Chand and Sons: New Delhi. 2. Gupta, S.C., &Kapoor, V.K. Fundamentals of Applied Statistics. New Delhi: Sultan Chand and Sons. 3. Garret, H.E., &Woodworth, R.S. Statistics in Psychology and Education. Bombay: Vakila,
Feffex and Simens Ltd. 4. Mood, A.M., Graybill, F.A and Boes, D.C. Introduction to Theory of Statistics. 3rd Edition Paperback International Edition. 5. Mukhopadhyay, P. Mathematical Statistics. New central Book Agency (P) Ltd: Calcutta.
Assignments/ Seminar
Assignments/Seminar are to be given to students. The purpose of the assignments/seminar is to provide practical exposure to the students.

72
SEMESTER III
BST3C07- PROBABILITY DISTRIBUTIONS AND PARAMETRIC TESTS Contact Hours per week: 5 Number of credits: 3 Number of Contact Hours: 90 Course Evaluation: External 60 Marks+ Internal 15 Marks Duration of Exam: 2 Hours
Question Paper Pattern
Type of Questions
Question number
To
Marks
Short Answer
01 to 12 Short answer type carries 2 marks each - 12 questions (Maximum Marks 20)
Paragraph/ Problems
13 to 19 Paragraph/ Problem type carries 5 marks each 7 questions (Maximum Marks 30)
Essay
20 to 21 Essay type carries 10 marks (1 out of 2) (Maximum Marks 10)
Total 01 to 21 60
Question Paper setter has to give equal importance to both theory and problems in sections B and C.
Objectives
1. To get a general understanding on various probability distributions 2. To familiarize the uses of Statistical test.
Module 1: Distribution Theory- Binomial, Poisson and Normal Distributions, Mean and Variance (without derivations), Numerical Problems, Fitting, Importance of Normal Distribution, standard normal distribution, simple problems using standard normal tables, Central Limit Theorem (Concepts only). 25 Hours Module2: Methods of Sampling- Random Sampling, Simple Random Sampling, Stratified, Systematic and Cluster Sampling, Non Random sampling, Subjective sampling, Judgment sampling and convenience sampling.
20 Hours
Module 3: Fundamentals of Testing- Type-I & Type-II Errors, Critical Region, Level of Significance, Power, p value, Tests of Significance
15 Hours Module 4: Large Sample Tests Test of a Single, Mean Equality of Two Means, Test of a Single Proportion, and Equality of Two Proportions. 10 Hours

73
Module 5: Small Sample tests-Test of a Single Mean, Paired and Unpaired t-Test, Chi-Square Test of Variance, F-Test for the Equality of Variance, Tests of Correlation
20 Hours References 1. Gupta, S.P. Statistical Methods. Sultan Chand and Sons: New Delhi. 2. Gupta, S.C., &Kapoor, V.K. Fundamentals of Applied Statistics. New Delhi: Sultan Chand and Sons. 3. Garret, H.E., &Woodworth, R.S. Statistics in Psychology and Education. Bombay: Vakila,
Feffex and Simens Ltd. 4. Mood, A.M., Graybill, F.A and Boes, D.C. Introduction to Theory of Statistics. 3rd Edition Paperback International Edition. 5. Mukhopadhyay, P. Mathematical Statistics. New central Book Agency (P) Ltd: Calcutta. Assignments/ Seminar Assignments/Seminar are to be given to students. The purpose of the assignments/seminar is to provide practical exposure to the students.

74
SEMESTER IV
BST4C08- STATISTICAL TECHNIQUES FOR PSYCHOLOGY
Contact Hours per week: 5 Number of credits: 3 Number of Contact Hours: 90 Course Evaluation: External 60 Marks+ Internal 15 Marks Duration of Exam: 2 Hours
Question Paper Pattern
Type of
Questions Question number
To ...)
Marks
Short Answer
01 to 12 Short answer type carries 2 marks each - 12 questions (Maximum Marks 20)
Paragraph/ Problems
13 to 19 Paragraph/ Problem type carries 5 marks each 7 questions (Maximum Marks 30)
Essay
20 to 21 Essay type carries 10 marks (1 out of 2) (Maximum Marks 10)
Total 01 to 21 60
Question Paper setter has to give equal importance to both theory and problems in sections B and C.
Objectives
1. To make the students aware of various Statistical test in different areas of Psychology 2. To give knowledge about applications of Statistics in different areas of Psychological studies.
Module 1: Analysis of Variance- assumptions, One-way and Two-way Classification with Single Observation per Cell, Critical Difference.
20 Hours
Module 2: Non Parametric tests- Chi-square Test of Goodness of Fit, Test of Independence of Attributes, Test of Homogeneity of Proportions. 20 Hours Module 3: Sign Test- Signed Rank Test, Rank Sum Test, Run Test and Krushkal-Wallis Test.
20 Hours
Module 4: Factorial Design- Basics of factorial Design, Factorial experiments and their uses
in Psychological studies, Concepts of 22, 23 factorial experiments (without derivation), simple problems.
15 Hours
Module 5: Preparation of Questionnaire- Scores and Scales of Measurement, Reliability and Validity of Test Scores. 15 Hours

75
References
1. Gupta, S.P. Statistical Methods. Sultan Chand and Sons: New Delhi. 2. Gupta, S.C., &Kapoor, V.K. Fundamentals of Applied Statistics. New Delhi: Sultan Chand and Sons. 3. Garret, H.E., &Woodworth, R.S. Statistics in Psychology and Education. Bombay: Vakila,
Feffex and Simens Ltd. 4. Mood, A.M., Graybill, F.A and Boes, D.C. Introduction to Theory of Statistics. 3rd Edition Paperback International Edition.
5. Douglas C. Montgomery. Design and Analysis of Experiments. 9th Edition.
Assignments/ Seminar
Assignments/Seminar are to be given to students. The purpose of the assignments/seminar is to provide practical exposure to the students.

76
STATISTICS- MODEL QUESTION PAPERS FOR B.Sc. PSYCHOLOGY PROGRAMME
FIRST SEMESTER B.Sc DEGREE(Psychology) EXAMINATION Statistics- Complementary
BST1C05 DESCRIPTIVE STATISTICS Time: 2 Hours Max Marks: 60
SECTION-A
Each question carries 2 Marks. Maximum Marks that can be scored in this section is 20.
1. Compare less than and greater than Ogives. 2. What do you mean by percentiles? 3. Define geometric mean 4. What is the variance of the observations 8, 10, 12? 5. How will you find range of a grouped frequency distribution? 6. What is meant by relative measure of dispersion? 7. Define quartile deviation 8. Distinguish between discrete and continuous data. Give examples 9. The average pulse rate of 40 males was found to be 78 and that of a group of 60 females was 69. Find the combined mean pulse rate of the 100 patients.
10. What is combined standard deviation? 11. What are the advantages of median? 12. Draw a bar diagram depicting the following data
Year 1992 1993 1994 1995 Export (in crore)
55 63 60 70
SECTION-B
Each question carries 5 Marks. Maximum Marks that can be scored in this section is 30.
13. Explain Kurtosis. What are the different types of Kurtosis? 14. Discuss the graphical methods used for representing a frequency
distribution 15. The blood serum cholesterol levels of 10 patients are given below. Calculate
the S.D. and C.V. 220, 230, 240, 250, 260, 270, 280, 255, 265, 290
16. Write the importance of diagrams and graphs for data analysis 17. Define classification. What are the different types of classification? 18. Explain Quartile deviation. What are the advantages and disadvantages of quartile
deviation? 19. Calculate AM and SD for the following data
Class 10-14 14-18 18-22 22-26 26-30
frequen cy
20 30 11 3 5

77
SECTION-C (Answer any one Question and carries 10 marks)
20. Calculate the mean deviation about the mean for the given data.
21. (a) Define Skewness. What are the different types of Skewness?
(b) the following frequency distribution
Class 65- 69
70- 74
75- 79
80- 84
85- 89
90- 94
95- 99
100- 104
frequen cy
8 15 18 25 14 9 6 5
Class 0-10 10-20 20-30 30-40 40-50 50-60 60-70 Frequenc y
4 8 12 15 12 6 3

78
SECOND SEMESTER B.Sc DEGREE (Psychology) EXAMINATION Statistics- Complementary
BST2C06 REGRESSION ANALYSIS AND PROBABILITY THEORY Time: 2 Hours Max Marks: 60
SECTION-A
Each question carries 2 Marks. Maximum Marks that can be scored in this section is 20.
1. coefficient 2. Distinguish between discrete and continuous variables 3. What is meant by a scatter diagram? 4. State the Multiplication theorem of probability for two events 5. Define probability mass function 6. Define sample space. Give one example 7. Define the following
(a) Disjoint set (b) Universal set (c)Null set
8. If P( A )=0 .2, P( B)=0 .6, P( A B )=0 . 3 , then P( AUB )= ----------
9. If f ( x )=k x , x=1,2,3 and zero elsewhere is a p.m.f. Find P( X 5) .
10. If r12=0 . 93 , r13=0 . 99 and r23=0 . 92 . Calculate r12. 3 11. Consider the following p.m.f
x 1 0 2
f (x ) k 2 k 3 k
Find the value of k . 12. Distinguish between mutually exclusive events and mutually exhaustive events
SECTION-B Each question carries 5 Marks.
Maximum Marks that can be scored in this section is 30. 13. Distinguish between partial correlation and multiple correlations 14. What is meant by linear regression? What are two regression lines? Give their
equations 15. Explain the different approaches to the theory of probability. 16. State addition theorem in probability. A problem in mathematics is given two students
A and B. Whose chances of solving it are 1/3 and 2/3 respectively. What is the probability that the problem will be solved?
17. If x =6 , y=10 and cov ( x, y ) = -30, find the correlation between
X and Y . Comment on the same. Also find the regression coefficients. 18. In a box there are 8 white, six blue and 10 pink balls. If 3 balls are drawn at random
from the box, what is the probability that

79
(a) Two balls are white (b) None of 3 is pink (c) 3 balls are blue
19. Define the distribution function of a discrete random variable. Also write its properties
SECTION-C (Answer any one Question and carries 10 marks)
20. A random variable X has the following probability function
x -1 0 2
f (x ) k 2 k 3 k
(a) Determine the value of k (b) Find P( X <2 ) and P( X
(c) Write down the distribution function of X 21. (i) State the important properties of Karl correlation.
(ii) Calculate the correlation coefficient for the following data X 7 15 13 3 10 12 Y 27 45 51 9 33 51

80
THIRD SEMESTER B.Sc DEGREE (Psychology) EXAMINATION Statistics- Complementary
BST3C07 PROBABILITY DISTRIBUTIONS AND PARAMETRIC TESTS Time: 2 Hours Max Marks: 60
SECTION-A Each question carries 2 Marks.
Maximum Marks that can be scored in this section is 20. 1. What is meant by a Statistical test? Give an example 2. Write down the test Statistic for testing the equality of means of two normal population
whose variance are equal and when the sample sizes are small 3. Distinguish between Null and Alternative hypothesis 4. Give two instances where binomial distribution can be applied 5. What is sampling frame? 6. What is convience sampling? 7. Define sampling distribution 8. A binomial distribution has n=500 and p=0.1. Find the mean and variance of this distribution 9. State central limit theorem 10. Define power of a test 11. What is standard error 12. Write down the p.d.f of standard normal distribution
SECTION-B Each question carries 5 Marks.
Maximum Marks that can be scored in this section is 30. 13. What are the main features of Normal distribution
14. If 3% electric bulbs manufactured by a company are defective. Find the probability that in a sample of 100 bulbs, exactly five bulbs are defective ( Given e 3=0 . 0492)
15. Describe Paired sample t test 16. Distinguish between systematic sampling and stratified sampling. 17. A sample of 25 items were taken from a population with SD 10 and the sample mean is found
to be 65. Can it be regarded as a sample from a normal population with mean . (use 18. The customer accounts at a certain departmental store have an average balance of Rs. 120 and
SD of Rs. 40. Assume that the account balance are normally distributed (a) What proportion of the accounts as over Rs. 150 (b) What proportion of accounts in between Rs. 100 and Rs. 150
19. Sample sizes 10 and 18 taken from two normal population gave standard deviation
14 and 20 respectively. Test the hypothesis that the samples have come from
population with the same standard deviation at 5% level of significance SECTION-C
(Answer any one Question and carries 10 marks) 20. Explain the test procedure for test the equality of variance of two normal
populations with known mean 21. The screws produced by certain machine were checked by examining samples. The
following table shows the distribution of 128 sample according to the number of defective items they contained
No. of defective
0 1 2 3 4 5 6 7 Total
No of samples
7 6 19 35 30 23 7 1 128
Fit a binomial distribution to the data

81
FOURTH SEMESTER B.Sc DEGREE (Psychology) EXAMINATION Statistics- Complementary
BST4C08 STATISTICAL TECHNIQUES FOR PSYCHOLOGY
Time: 2 Hours Max Marks: 60
SECTION-A Each question carries 2 Marks.
Maximum Marks that can be scored in this section is 20. 1. What is meant by validity 2. What are contingency tables 3. Write down the test statistic of chi- square test for testing homogeneity 4. What are the advantages of non- parametric test 5. What is meant by Ratio scale 6. State three assumptions of ANOVA technique 7. State the null hypothesis of one way ANOVA 8. Define the term reliability 9. Write down the test statistic of chi- square test for testing goodness of fit 10. What is meant by interval scale 11. Write any three assumptions associated with non parametric test 12. What do you mean by pilot survey
SECTION-B
Each question carries 5 Marks. Maximum Marks that can be scored in this section is 30.
13. What are the steps in preparing a questionnaire? 14. Write a short note on Krushkal- Wallis test 15. Describe the importance of factorial experiments in psychological studies 16. Briefly explain Rank sum test 17. The following are the marks obtained by 10 students in a certain examination
Marks: 43 48 65 57 31 60 37 48 78 59 Test the hypothesis that population variance is 100 (Test at 5% level of significance)
18. The following data give the number of lesions on halves of eight tobacco leaves
Pair number
1 2 3 4 5 6 7 8
Proportion
1, X1
31 20 18 17 9 8 10 7
Proportion
2, X2
18 17 14 11 10 7 5 6
different 19. Explain the chi- square test for independence of attribute

82
SECTION-C (Answer any one question and carries 10 marks)
20. A trucking company wishes to test the average life of each of the three brands of tyres.
The company uses all branches on randomly selected trucks. The records showing the lives (thousands of miles) of tyres are as given. Using ANOVA, test the hypothesis
that the average life for each brand is the same
Brand I Brand II Brand III
6 6 2
1 3 5
5 4 6
2 3 7
21. (i) Define the term validity (ii) Explain various types of validity
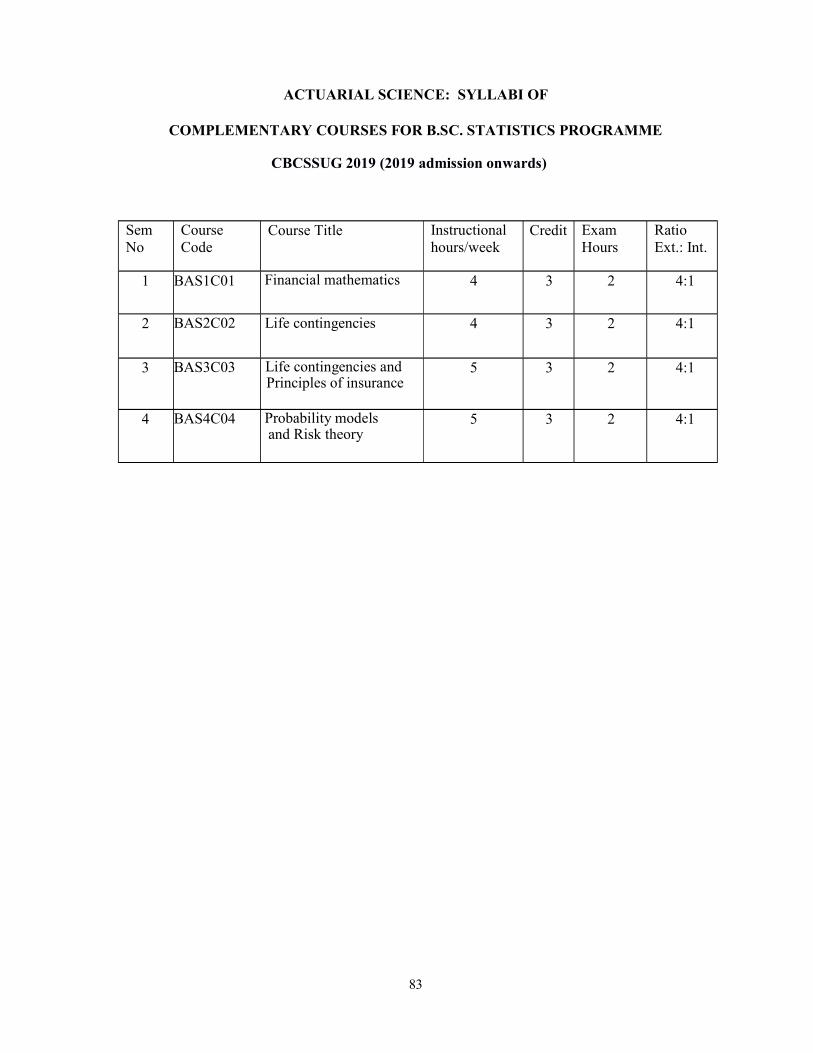
83
ACTUARIAL SCIENCE: SYLLABI OF
COMPLEMENTARY COURSES FOR B.SC. STATISTICS PROGRAMME
CBCSSUG 2019 (2019 admission onwards)
Sem No
Course Code
Course Title Instructional hours/week
Credit Exam Hours
Ratio Ext.: Int.
1 BAS1C01 Financial mathematics 4 3 2 4:1
2 BAS2C02
Life contingencies
4 3 2 4:1
3 BAS3C03 Life contingencies and Principles of insurance
5 3 2 4:1
4 BAS4C04
Probability models and Risk theory
5 3 2 4:1

84
SEMESTER I Course I
BAS1C01-FINANCIAL MATHEMATICS Contact Hours per week: 4 Number of credits: 3 Number of Contact Hours: 72 Course Evaluation: External 60 Marks+ Internal 15 Marks Duration of Exam: 2 Hours
Objectives:
1) To describe how to use a generalized cash flow model in financial transaction 2) To understand how interest rates or discount rates may be expressed in terms of different
time periods 3) To understand and use the more important compound interest functions, including annuities certain 4) To describe how a loan may be repaid by regular instalments of interest and capital
Module I: Cash flow models, Cash flow process, A zero-coupon bond, A fixed interest security, An index--
5 Hours Module II : Rates of interest-Simple and Compound interest rates- Accumulation and Present value of a single payment, Effective and Nominal rate of interest-Constant force of interest-Relationship between these rate of interest, Effective and nominal rate of discount, Accumulation and Present value of a single payment using thes 1,t2),A(t),v(t1,t2) and v(t).Expressing accumulation and present values of a single payment using these symbols-when the force of interest is a
20 Hours Module III: Level annuities, Present values, Payments made in arrear, Payments made in advance, Accumulations, Continuously payable annuities, Annuities payable pthly, Annuities payable pthly, Accumulations, Perpetuities, Perpetuities payable pthly
20 Hours Module IV: Deferred and increasing annuities, Deferred annuities, Continuously payable annuities, Continuously payable annuities, Varying annuities, Annual payments, Continuously payable annuities, Decreasing payments, Compound increasing annuities 12 Hours Module V:Equations of value, Solving for an unknown quantity, Loan schedules-Calculating the capital, Calculating the interest and capital elements, Consumer credit transactions: flat rates and APRs
15 Hours Books for study and reference: Institute of Actuaries Act Ed. Study materials CT1 McCutcheon, J.J., Scott William (1986): An introduction to Mathematics of Finance Butcher,M.V., Neill, Alistair, Heinemann, (1977): Life contingencies. Newton LBowers, et al (1997):Actuarial Mathematics, The Societies of Actuaries, 2nd Ed

85
SEMESTER II Course II
BAS2C02-LIFE CONTINGENCIES Contact Hours per week: 4 Number of credits: 3 Number of Contact Hours: 72 Course Evaluation: External 60 Marks+ Internal 15 Marks Duration of Exam: 2 Hours
Objectives:
1) To understand the simple assurance and annuity contracts, and develop formulae for the means and variances of the present values of payments under these contracts
2) To construct life tables 3) To learn straightforward functions involving two lives.
Module I: Survival distribution and Life tables: Probability for the age at death-The force of mortality, Other life table functions, Life table functions at non-integer ages, uniform distribution of deaths (UDD),constant force of mortality (CFM),Select mortality, Some analytical laws of mortality 20 Hours Module II: Insurance payable at the moment of death and insurance payable at the end of year of death(whole, n-year term, n year pure endowment, n-year endowment, deferred),commutation functions, Critical illness assurance contracts, relationship between Insurance payable at the moment of death and insurance payable at the end of year of death.
17 Hours Module III: Life annuity contracts, annuities payable annually in advance (whole life, temporary, deferred), Continuous annuities, annuities payable annually in arrears, commutation functions, Evaluation of assurances and annuities 17 Hours Module IV: Simple annuities and assurances involving two lives, Random variables to describe joint life functions, Joint lifetime random variables and joint life table functions, Last survivor lifetime random variables, Determining simple probabilities involving two lives, Present values of joint life and last survivor assurances,Present values of joint life and last survivor annuities, Contingent and reversionary benefits, Contingent probabilities of death.
18 Hours Books for study and reference: Institute of Actuaries Act Ed. Study materials CT5 McCutcheon, J.J., Scott William (1986): An introduction to Mathematics of Finance Butcher,M.V., Nesbit, Cecil. (1971)Mathematics of compound interest, Neill, Alistair, Heinemann, (1977): Life contingencies. Bowers, Newton Let al (1997): Actuarial mathematics, society of Actuaries, 2nd Ed

86
SEMESTER III Course III
BAS3C03-LIFE CONTINGENCIES AND PRINCIPLES OF INSURANCE Contact Hours per week: 5 Number of credits: 3 Number of Contact Hours: 90 Course Evaluation: External 60 Marks+ Internal 15 Marks Duration of Exam: 2 Hours
Objectives:
1) To describe various benefit premiums and benefit reserves contracts 2) To describe the principles of insurance 3) To describe life and general insurance contacts 4) To understand and apply the utility theory to economic and financial problems
Module I: Net premiums: Premiums, Frequency of payment Fully continuous premiums-fully discrete premiums-(whole life, n-year term, pure endowment, endowment, deferred) True mthly payment premiums-Apportionable premiums-Commutation functions-Accumulation type benefits 20 Hours Module II: Reserves-Prospective reserve, Fully continuous net premium reserves-other formulas for fully discrete net premium results- Reserves based on semi continuous basis-Reserves based on apportion able or discounted continuous basis-Recursive formulae for fully discrete basis-Reserves at fractional duration- Differential equation for fully continuous reserves,
25 Hours Module III: Concept of Risk-Peril-Hazard, the concept of Insurance- Insurance Act, Classification of Insurance-Types of Life Insurance, Types of General insurance- fire ,marine, miscellaneous, motor, engineering, Aviation and agricultural-Alternative classification-Insurance of property-pecuniary interest, liability &person, Distribution between Life & General Insurance-History of General Insurance in India.
25 Hours Module IV: Utility theory, Utility functions, The expected utility theorem, The expression of economic characteristics in terms of utility functions- Non-satiation, Risk aversion, Risk-averse investor, Risk-seeking investor, Risk-seeking investor, Some commonly used utility functions- The quadratic utility function, The log utility function, The power utility function, Limitations of utility theory, optimal insurance. 20 Hours Books for study and reference: Institute of Actuaries Act Ed. Study materials CT5 and CT7 McCutcheon, J.J., Scott William (1986): An introduction to Mathematics of Finance Butcher,M.V., Nesbit, Cecil. (1971)Mathematics of compound interest, Neill, Alistair, Heinemann, (1977): Life contingencies. Bowers, Newton Let al (1997): Actuarial mathematics, society of Actuaries, 2nd Ed

87
SEMESTER IV Course IV
BAS4C04-PROBABILITY MODELS AND RISK THEORY Contact Hours per week: 5 Number of credits: 3 Number of Contact Hours: 90 Course Evaluation: External 60 Marks+ Internal 15 Marks Duration of Exam: 2 Hours
Objectives:
1) To determine optimum strategies under the theory of games 2) To describe the operation of simple forms of proportional and excess of loss reinsurance 3) To learn the basic short term contracts 4) To describe the aggregate claim process and the cashflow process for a risk. 5) To understand the basic concepts of ruin theory
Module I: Decision theory, Zero-sum two-player games, Domination, The Minimax criterion, Randomized Strategies, Statistical games, Decision criteria, Reinsurance, Proportional reinsurance, Non-proportional reinsurance, Reinsurance arrangements 25 Hours Module II: Individual risk model for a short time: Model for individual claim random variables-Sums of independent random variable- Approximation for the distribution of the sum Application to insurance
20 Hours Module III: The collective risk model, The collective risk model, The basic model, Notation and assumptions, Distribution functions and convolutions, Moments of compound distributions, The compound Poisson distribution, The compound binomial distribution, The compound negative binomial distribution, The adjustment coefficient, The maximal aggregate loss.
25 Hours Module IV: Ruin theory, Basic concepts, The surplus process, The probability of ruin in continuous time, The probability of ruin in discrete time, Premium security loadings.
20 Hours Books for study and reference: Institute of Actuaries Act Ed. Study materials McCutcheon, J.J., Scott William (1986): An introduction to Mathematics of Finance Butcher,M.V., Nesbit, Cecil. (1971)Mathematics of compound interest, Neill, Alistair, Heinemann, (1977): Life contingencies. Bowers, Newton Let al (1997): Actuarial mathematics, society of Actuaries, 2nd Ed

88
ACTUARIAL SCIENCE: MODEL QUESTION PAPERS OF COMPLEMENTARY COURSES FOR B.Sc. STATISTICS PROGRAMME
First Semester B.Sc. Statistics Degree Examination
Model Question Paper (2019 onwards)
Complementary Course for Statistics
BAS1C01-FINANCIAL MATHEMATICS
Time: Two Hours Maximum: 60 Marks PART-A (Short Answer)
Each question carries two marks. Maximum 20 Marks
1. Define effective rate of interest. 2. Find the accumulated value, if principal of Rs.850 invested for 18 years at compound interest of
7.5% per annum. 3. Calculate at 4.8% per annum convertible quarterly.
4. Calculate at 6% p.a. convertible monthly.
5. Calculate at i=6%. 6.
effective. 7. Calculate the flat rate of interest paid on a loan of Rs.48000 that is repaid over 25 years. Payments
are made monthly. Each payment is 278 8. Define a Zero-Coupon bond. 9. Calculate at 7.5% p.a. 10. Calculate P, if I=10, R=125, i=8% and n=10. 11. Define commercial rate of discount 12. What do you mean a fixed interest security?
Maximum Marks=20 PART-B (Paragraph)
Each question carries five marks. Maximum 30 marks 13. The force of interest is:
Find the present value at time 0 of the payment stream , which is received between 0&5. 14. Derive the expression for the present value of an annuity immediate annuity. 15. A credit company offers a loan of Rs.5000. the loan is to be repaid over a 4 year term by level
monthly installments of Rs.130 payable in arrears. What is the APR for the transaction? 16. A loan of Rs.250000 is being repaid by an annuity payable quarterly in arrear for 25 years. The
annual amount of annuity is calculated at an effective rate of interest of 10% per annum. a) Calculate the quarterly payment under the annuity. b) Calculate the capital and interest in the 25th payment.
17. Calculate the present value at time 0 of payments of Rs.50 at time 0, Rs.60 at time 1, Rs. 70 at time 2 and so on. The last payment is at time 10. Assuming that the annual effective rate of interest is 4.2%.

89
18. Find the present value of an immediate annuity of Rs.500 per annum payable quarterly for 12 years at the following rate of interest. a) 10% per annum b) 9% per annum convertible half yearly. c) 7.5% per annum convertible quarterly. d) 11% per annum convertible every two years.
19. Derive an expression for . a) Algebraically b) By general reasoning.
Maximum Marks=30 PART-C (Essay)
Each question carries ten marks. Maximum 10 marks 20. A loan of Rs.4000 is repayable over 5 years by level quarterly installments calculated using a rate
of interest of 5% per annum effective. a) Calculate the amount of each quarterly installment. b) What is the capital content of the sixth repayment? c) How much interest is paid in the second year? d) Determine when the amount of loan outstanding falls below Rs.1000.
21. The force of interest is given by
a) Find the expression for the accumulation factor from time 0 to t. b) Calculate the accumulation of Rs.150 from time t=0 to t=12
Maximum Marks=10

90
Second Semester B.Sc. Statistics Degree Examination
Model Question Paper (2019 onwards)
Complementary Course for Statistics
BAS2C02-LIFE CONTINGENCIES Time: Two Hours Maximum: 60 Marks
PART-A (Short Answer) Each question carries two marks. Maximum 20 Marks
22. What does tPxy mean? 23. Define curtate future life time. 24. Calculate the probability that a 50 year old dying between ages 68 and 70. 25. Define select mortality. 26. Prove the identity . 27. Define joint life status. 28. Define Survival function. 29. Calculate 4P30 and 2 from AM92 ultimate mortality at 4% interest.
30. If Calculate
31. Define n-year term insurance. 32. What is meant by critical illness assurance contract? 33. Define contingent events. Maximum Marks=20
PART-B Each question carries five marks. Maximum 30 marks
34. Derive the commutation function for the n-year term and n- year pure endowment assurance contract.
35. Write a note on Analytical Laws of Mortality. 36. Prove that
i. n ii. tpx
37. Explain continuous Whole life Assurance contract. Find its mean and variance. 38. Calculate the following using AM92 ultimate mortality
i. 3P45:41
ii.
iii. .
39. Prove that n = n
40. Explain n-year temporary life annuity. Maximum Marks=30
PART-C (Essay) Each question carries ten marks. Maximum 10 marks
41. Derive the relationship between Insurance payable at the moment of death and the end of the year of death.
42. Calculate 3P62.5 based on the PFA92C20 table in the table using i. The UDD assumption.
ii. The CFM assumption. Maximum Marks=10

91
Third Semester B.Sc. Statistics Degree Examination
Model Question Paper (2019 onwards)
Complementary Course for Statistics
BAS3C03-LIFE CONTINGENCIES AND PRINCIPLES OF INSURANCE
Time: Two Hours Maximum: 60 Marks PART-A (Short Answer)
Each question carries two marks. Maximum 20 Marks 1. Define pecuniary loss. 2. Define Apportionable premiums. 3. Define exponential utility function. 4. What you meant by a risk neutral investor? 5. Define Prospective reserve. 6. Define Aviation insurance. 7. What is valuation of the policy? 8. Define Hull insurance. 9. Define risk. 10. Define net premium. 11. What do you mean by non-satiation? 12. Define utility.
Maximum Marks=20 PART-B (Paragraph)
Each question carries five marks. Maximum 30 marks 13. Distinguish between Life Insurance and General Insurance. 14. Briefly explain Fire Insurance and Marine Insurance. 15. Explain benefit reserve under fully continuous Whole life Insurance. 16. Calculate the annual premium for a term assurance with a term of 10 years to a male aged 30, with a
sum assured of Rs.500000, assuming AM92 ultimate mortality and interest of 4% p.a. Assume that the death benefit is payable at the end of the year of death.
17. 18. A 10-year term assurance with a sum assured of £500,000 payable at the end of the year of death, is
issued to a male aged 30 for a level annual premium of £330.05. Calculate the prospective reserve at the end of the fifth year, ie just before the sixth premium has been paid, assuming AM92 Ultimate mortality and 4% pa interest.
19. Explain fully continuous whole life premium. Maximum Marks=30
PART-C (Essay)
Each question carries ten marks. Maximum 10 marks 20. Explain benefit reserve under n-year endowment Insurance (discrete) and derive its variance. 21. State and explain Thieles differential equation.
Maximum Marks=10

92
Fourth Semester B.Sc. Statistics Degree Examination
Model Question Paper (2019 onwards)
Complementary Course for Statistics
BAS4C04-PROBABILITY MODELS AND RISK THEORY Time: Two Hours Maximum: 60 Marks
PART-A (Short Answer) Each question carries two marks. Maximum 20 Marks
1. What is meant by a zero-sum two-person game? 2. Define saddle point. 3. Suppose and . Find . 4. Define compound Poisson distribution. 5. Obtain the mean and variance of the claim random variable X, where q=0.06 and the claim amount is
fixed at B. 6. Define adjustment coefficient. 7. What you meant by maximal aggregate loss? 8. What is time of ruin? 9. Define Convolution. 10. Define reinsurance. 11. n that R=log3. 12. Define inverse Gaussian distribution.
Maximum Marks=20 PART-B
Each question carries five marks. Maximum 30 marks 13. The following table gives the strategies available to two players A and B in a game and the payoff.
Player A I II III IV Player B 1 2 3
Determine the optimum strategies of A and B in this game and find the value of the game.
14. a) Explain minimax criterion. b) Briefly explain the concept of Proportional Reinsurance arrangement
15. The distribution of the number of claims from a motor portfolio is negative binomial with parameter
Calculate the mean variance of aggregate claim distribution. 16. Does the compound binomial distribution have an additive property? If so, state the property carefully. 17. A compound distribution S is such that P(N=0)=0.6, P(N=1) =0.3 and P(N=2)=0.1. Claim amounts are
either 1 unit or 2 units, each with probability 0.5. Derive the distribution function of S.
18. If S has a compound Poisson distribution, then show that the distribution of converges to
19. Explain Translated Gamma Distribution.
Maximum Marks=30
3 4 5 16 10 12 9 146 14 7 5

93
PART-C (Essay) Each question carries ten marks. Maximum 10 marks
20. a) Show that sums of independent compound Poisson random variables is itself a Compound Poisson random variable.
.
21. a) Explain the surplus process. b) Explain probability of ruin in continuous time
Maximum Marks=10
*****************************************************************