District Census Handbook, Mahbubnagar, 1961 - Linguistic ...
Upload
khangminh22Category
view
0download
0
CENSUS 1961
GUJARAT
DISTRICT CENSUS HAND,BOOK
1
JAMNAGAR DISTRICT
R. K. TRIVEDI
Superintendent of Census Operations, Gujarat
PRICE Rs. 9.15 nP.
DISTRICT: JAMNAGAR
tO -a:: tn -o
~ J.Olij.L S 10 :: "

CENSUS OP INDIA 1961
LIST OF PUBLICATIONS
CENTRAL GOVERNMENT PUBLICATIONS
Census of India, 1961 Volume V-Gujarat is being published in the following parts:
I-A
I-B
l-C
II-A
II-B(l)
II-B(2)
U-C III
IV-A IV-B
V-A V-B
VI
VII-A
VII-B
VIlI-A
VIII-B
IX
X
General Report
Report on Vital Statistics and Fertility Survey
Subsidiary Tables
General Population Tables
General Economic Tables (Tables B-1 to B-IV-C)
General Economic Tables (Tables B-V to B-IX)
Cultural and Migration Tables
Household Economic Tables (Tables B-X to B-XVII)
Report on Housing and Establishments
Housing and Establishment Tables
Tables on Scheduled Castes and Scheduled Tribes
Ethnographic Notes on Scheduled Castes and Scheduled Tribes (including reprints)
Village Survey Monographs (25 Monographs)
Selected Crafts of Gujarat
Fairs and Festivals
Administration Report-Enumeration I Not for Sale
Administration Report-Tabulation
A tlas Volume
Special Report on Cities
STATE GOVERNMENT PUBLICATIONS
17 District Census Handbooks in English
17 District Census Handbooks in Gujarati
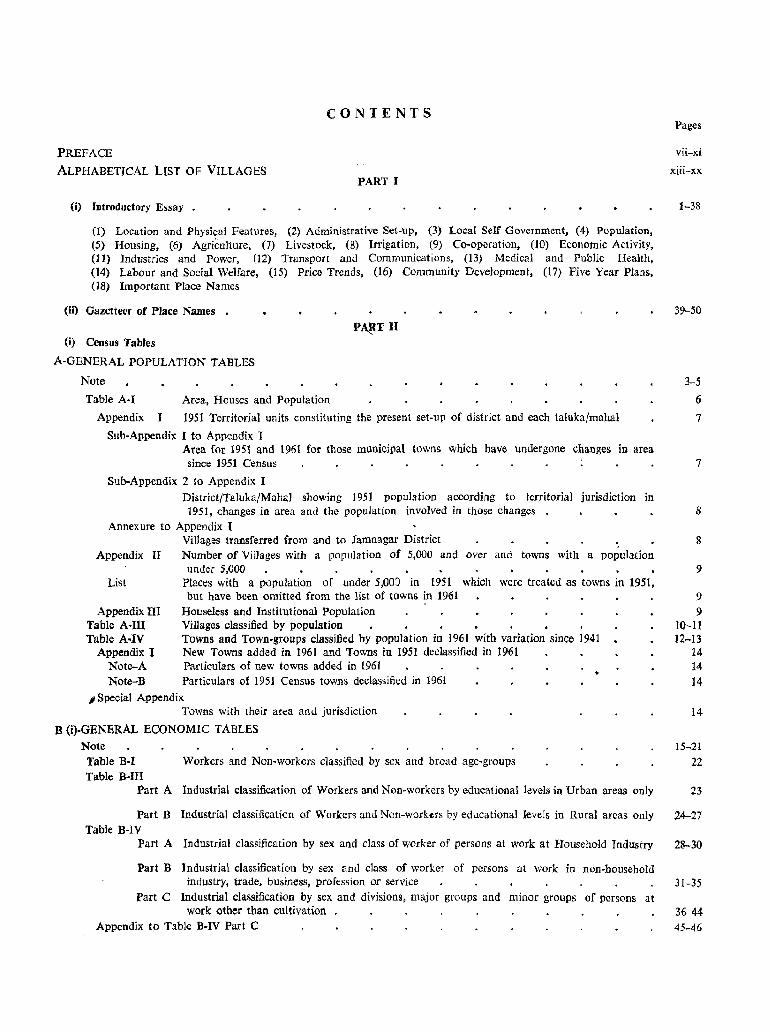
CONTENTS
PREFACE
ALPHABETICAL LIST OF VILLAGES PART I
(i) Introductory Essay •
(1) Location and Physi~al Features, (2) Administrative Set-up, (3) Local Self Government, (4) Population, (5) Housing, (6) Agriculture, (7) Livestock, (8) Irrigation, (9) Co-operation, (10) Economic Activity, (11) Industries and Power, (12) Transport and Communications, (13) Medical and Public Health, (14) Labour and Social Welfare, (15) Price Trends, (16) Community Development, (17) Five Year Plans, (18) Important Place Names
(ii) Gazetteer of Place Names
(i) Census Tables
A-GENERAL POPULATION TABLES
Pages
vii-xi
xiii-xx.
1-38
39-50
Note 3-5
Table A·I Area, Houses and Population 6
Appendix. I 1951 Territorial units constituting the present set-up of district and each taluka/mahal 7
Sub-Appendix I to Appendix I Area for. 1951 and 1961 for those municipal towns which have undergone changes in area since 1951 Census 7
Sub-Appendix 2 to Appendix I District/Taluka/Mahal showing 1951 population according to territorial jurisdiction in 1951, changes in area and the population involved in those changes 8
Annexure to Appendix I Villages transferred from and to Jamnagar District 8
Appendix II Number of Villages with a population of 5,000 and over and towns with a population under 5,000 9
List Places with a population of under 5,003 in 1951 which were treated as towns in 1951, but have been omitted from the list of towns in 1961 9
Appendix III Table A-Ill Table A·IV
Appendix I Note-A Note-B
House1ess and Institutional Population Villages classified by population Towns and Town-groups classified by population in 1961 with variation since 1941 New Towns added in 1961 and Towns in 1951 declassified in 1961 Particulars of new towns added in 1961 Particulars of 1951 Census towns declassified in 1961
, Special Appendix. Towns with their area and jurisdiction
B (i)-GENERAL ECONOMIC TABLES
Note Table B·I Workers and Non-workers classified by sex and broad age-groups Table B·III
Part A Industrial classification of Workers and Non-workers by educational levels in Urban areas only
Part B Industrial classification of Workers and Non-workus by educational levels in Rural areas only Table B-lY
Part A Industrial classification by sex and class of worker of persons at work at Household Industry
Part B Industrial classification by sex and class of worker of persons at work in non·household industry, trade. business, profession or service
Part C Industrial classification by sex and divisions, major groups and minor groups of persons at work other than cultivation
Appendix to Table B·IV Part C
9 10-11 12-13
14 14 14
14
15-21
22
23
24-27
28-30
31-35
3644 45-46
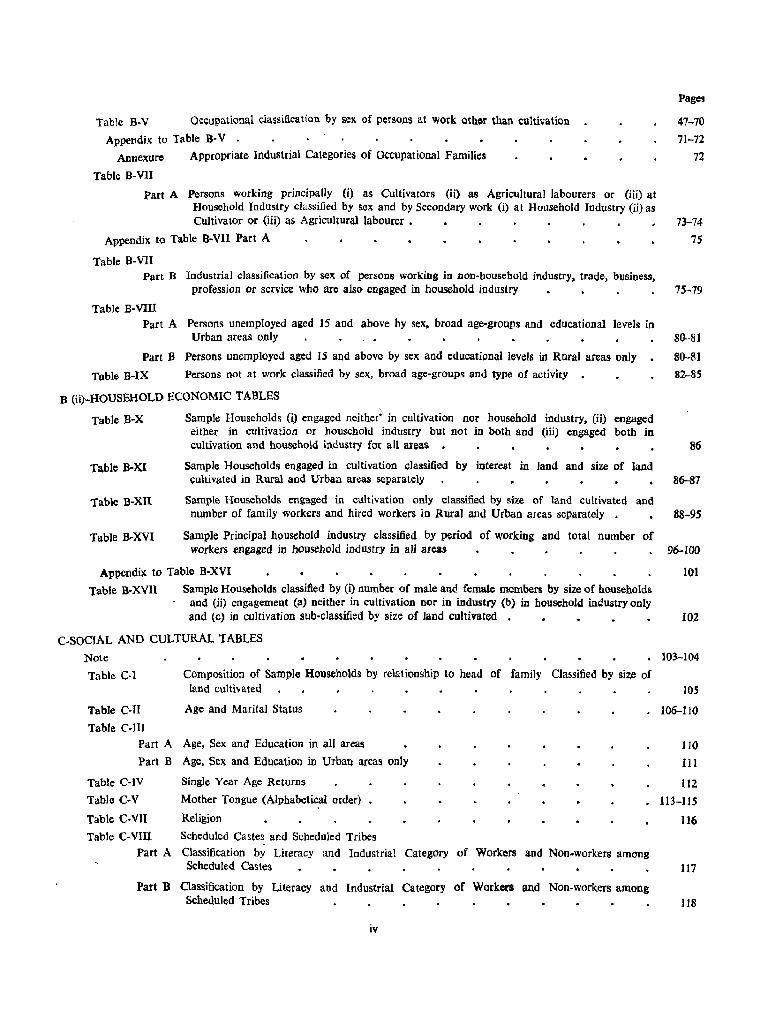
Table B-V O~cup .. tional ciassification by se)l. of persons at work oth~r than cultivation
Appendix to Table B-V . Annexure Appropriate Industrial Categories of Occupational Families
Table B-VII
Part A Persons working principally (i) as Cultivators (ii) as Agricultural labourers or (iii) at HousehOld Industry classified by sex and by Secondary work (i) at Household Industry (ii) as
Pages
47-70
71-72
72
CUltivator or (iii) as Agricultural labourer. 73-74
Appendix to Table B-VIl Part A 75
Table B-YII Part B Industrial classification by sex of persons working in non-household industry, trade, business,
profession or service who are also engaged in household industry 75-79
Table B-VIlI Part A Persons unemployed aged 15 and above by sex. broad age-groups and educational levels in
Urban areas only 80-81
Part B Persons unemployed aged IS and above by sex and educational levels in Rural areas only 80-81
Table B-IX Persons not at work classified by sex, broad age-groups and type of activity 82-85
B {H)-HOUSEHOLD ECONOMIC TABLES
Table B-X
Table B-XI
Table B-XlI
Table B-XVI
Sample Households (i) engaged neither" in cultivation nor household industry. (ii) engaged either in cultivation or household industry but not in both and (iii) engaged both in cultivation and household industry for all areas • 86
Sample Households engaged in cultivation classified by interest in land and size of land cultivated in Rural and Urban areas separately 86-87
Sample Households engaged in cultivation only classified by size of land cultivated and number of family workers and hired workers in Rural and Urban areas separately • 88-95
Sample Principal household industry classified by period of working and total number of workers engaged in bousebold industry in aU areas 96-100
Appendil{ to Table B-XYI 101
Table B-XVlI Sample Households classified by (i) number of male an<! female members by size of households and (ii) engagement (a) neither in cultivation nor in industry (b) in household industry only and (c) in cultivation sub-classified by size of land cultivated • 102
C-SOCIAL AND CULTURAL TABLES
Note 103-104
Table C-l
Table ColI
Table C-lII
Composition of Sample Households by relationship to head of family Classified by size of land cultivated lOS
Age and Marital Status 106--110
Part A Age, Sex and Education in all areas 110
III
lIZ
Part B Age, Sex and Education in Urban areas only
Table Catv Table C-V
Table C·VII
Table C-VIII
Single Year Age Returns
Mother Tongue (AlphabetLcal order)
Religion
Scheduled Castes and Scheduled Tribes
• 113-115
116
Part A Classification by Literacy and Industrial Category of Workers and Non-workers amoDg Scheduled Castes 117
Part B Classification by Literacy and Industrial Category of Workers and Non-workers among Scheduled Tribes 118
iv
E.HOUSING TABLES Note
Pages
119-121 Table E-l Census Houses and the uses to which they are put 122-123 Table E-Il Tenure Status of Sample Census households living in census houses used wholly or partly as
dwelling 124-125
Table E-IV Distribution of Sample households living in census houses used wholly or partly as dwelling by predominant material of wall and predominant material of roof 126-127
Table E-V Sample households classified by number of members and by number of rooms occupied • 128-129
SCT-SPECIAL TABLES FOR SCHEDULED CASTES AND SCHEDULED 'TRIBES
Note Table SCT-I
Part A Industrial classification of persons at work and non-workers by sex for Scheduled Castes Part B Industrial classification of persons at work and non-workers by sex for Scheduled Tribes
STATEMENT A-POPULATION OF SCHEDULED CASTES
STATEMENT B-POPULATION OF SCHEDULED TRIBES VILLAGE-WISE LIST OF INDUSTRIAL ESTABLISHMENTS
I ANNEXURE-STANDARD INDUSTRIAL CLASSIFICATION
LIST OF RURAL CRAFTS AND NUMBER OF PERSONS EMPLOYED IN PRODUCTION
(ii) Official Statistics (A detailed list of tables on Official Statistics is given at page 168)
0, PART m VilJage Directory
Note
.Jamnagar Taluka
Dhrol Taluka
]odiya. Mahal
Kalavad Taluka
LaJpur Mahal
Jamjodhpllr Taluka
Okhamandal Taluka
Kalyanpur Mahal
Khambhalia Talllka.
Bhanvad Mahal
MAPS
District Map
131
132-133 134
135
135
137-141 142-144 145-166
167-197
3
5-23
25-29 31-35
37-43
45-50
51-57
59-66
67-71
73-81
83-88
Frontispiece
rairs Facing Page 195 Taluka Jamnagar
" 5 Taluka Dhrol
" 25 Mahal Jodiya 31 Taluka Kalavad 37 Mahal Lalpur .. 45 Taluka Jamjodhpur .. " 51 Taluka Okhamandal
" .. 59 Mahal Kalyanpur .. .. 67 Taluka Khambhalia
oJ " 73 Mahal Bhanvad .. 83
v

PREFACE
Before 1951, only the figures of population of revenue villages were given in what were then called 'Village Handbooks'. But the decision to bring out the District Census Handbooks giving extracts from all the important census tables for every district of the State was taken for the first time in 1951. In addition to the census tables, the minimum information given in the Primary Census Abstract related to the area of the village, number of houses and households, total population, houseless and institutional population, literates, and agricultural and non-agricultural classes distributed under 8 main livelihood classes. Census statistics given in the Primary Census Abstract were further supplemented by the addition of useful administrative information on such items as post offices, railway stations, distance of bazzar from village, primary schools, village panchayats, co-operative society, etc. This was a unique achievement of the Indian Census giving as it did the basic demographic and economic information for the smallest administrative unit, namely, the village, and in some States, even for each hamlet and also for wards in towns and cities. The 1951 series of District Census Handbooks, however, varied in content and size from State to State depending upon the resources offered by the State Government. The Registrar General, there
fore, desired that the Handbooks brought out during the Census of 1961 should contain certain minimum statistical data, maps and other useful information which should be uniformly adopted throughout the country. The matter was discussed at the conferences and seminars of the Superintendents of Census Operations before the contents of the various sections of the District Census Handbook were decided upon.
The Government of Gujarat at first proposed to include a very limited number of census tables in the District Census Handbook as against a very extensive and comprehensive coverage accepted for common adoption by the States. But on reviewing tbe matter on receipt of the recommendations of the third conference of Superintendents of Census Operations, the Government thought
advisable to incorporate as many of the census tables as possible to enhance its usefulness. The result has been that the District Census Handbook of 1961 differs widely in the matter of content and coverage from that published after the Census of 1951 and contains a number of new features. examined below.
The District Census Handbook has been sub-divided into three parts. viz., :-
PART I-THE DISTRICT
(i) Introductory Essay
(ii) Brief Gazetteer of Place Names
PART II-STATISTICS
(i) Census Tables
(ii) Villagewise List of Industrial Establishments
(iii) Handicrafts Tables
(iv) Departmental or Official Statistics
PART Ill-VILLAGE DIRECTORY
(i) Explanatory Note
(ii) Village Directory
(iii) Taluka Maps
Part I is entirely new. While all the items under Part II except that relating to the main Census Tables are added for the first time, the Village Directory Section has been enlarged by the inclusion of certain useful information and maps. Various items included in each of these three parts are listed below.
PART I-THE DISTRICf
(i) Introductory Essay
This is a new feature added for the first time. The district bas been introduced by giving at the outset certain essential information about its geographical location, physical features, historical background. administrative divisions, territorial changes, topography. soil, climate,
i.emp<irature, rainfall, etc, Growth of population, its distribution between rural and urban areas, density, literacy, sex ratio, marital status, econofuic activities, etc., have been discussed with reference to census tables. Agriculture, livestock, social services, co-operation, transport and communications, facilities of education, medical relief, housing, labour, Community Development Programme, progress of Plan schemes, etc., have also been reviewed in the light of available official statistics. In fine, all the essential details relating to the demographic, economic, social and cultural aspects as revealed by the census and departmental statistics have been examined to give a succinct account of the
district as it stood in 1961.
(ii) Brief Gazetteer of Place Names
The gazetteer gives in brief information about all the places of historical or religious importance and interest in the district. While the historical
background and other relevant details have been taken from the old District Gazetteers, inf orma· tion in respect of major irrigation projects, townships, crafts, fairs and festivals, etc., have been separately collected and brought up-to-date in consultation with the Collectors.
PART II--STATISTICS
Part II contains (a) all the important Census Tables including those compiled from House-lists and (b) Official Statistics, furnished by the various State departments.
Census Statistics
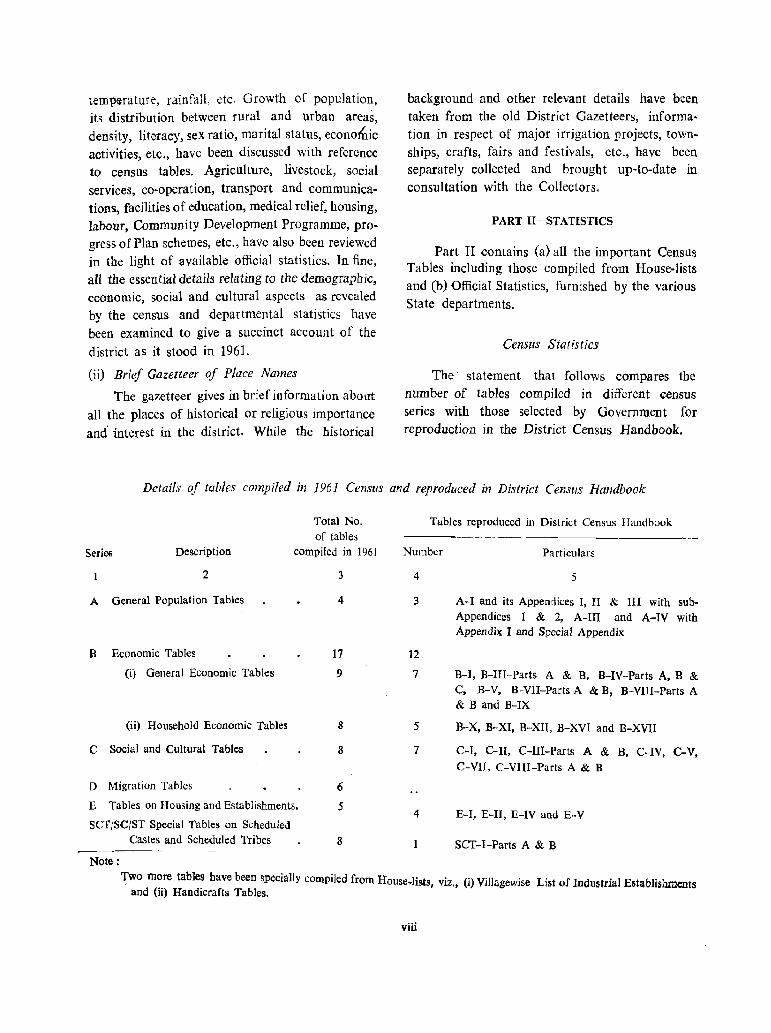
The' statement that follows compares tbe number of tables compiled in different census series with those selected by Government for reproduction in the District Census Handbook.
Details of tables compiled in 1961 Census and reproduced in District Census Handbook
Series Description
2
A General Population Tables
B Economic Tables
(i) General Economic Tables
(ii) Household Economic Tables
C Social and Cultural Tables
o Migration Tables
Total No. of tables
compiled in 1961
3
4
17
9
8
8
E Tables on Housing and Establishments.
SCT/SC/ST Special Tables on Scheduled
6
5
Castes and Scheduled Tribes 8
Note:
Tables reproduced ill District Census Handbook
Number
4
3
12
7
5
7
4
Particulars
5
A-I and its Appendices I, II & III with sub·
Appendices 1 & 2, A-III and A-IV with Appendix 1 and Special Appendix
B-1, B-III-Parts A & B. B-IV-Parts A, B & C, B-V, B-VII-Parts A & B, B-VIII-Parts A & Band B-IX
B-X, B-XI, B-Xn, B-XVI and B-XVII
C-I, C-1I, C-III-Parts A & B, C-IV, C-V,
C-VII, C-VIII-Parts A & B
E-I, E-II, E-IV and E-V
SCT-I-Parts A & B
1wo more tables have been specially compiled from House-lists viz. (i) Villagewise List of Industrial Establishments and (ii) Handicrafts Tables. ' •
viii

Official Statistics
The picture the census statistics present will be incomplete without the official or departmental statistics reviewing the progress made by the various administrative departments during the past decennium. An attempt has, therefore, been made to compile important official statistics for publication in the District Census Handbook. These statistics which relate to the past ten years must be adjusted to the existing set-up of administration, if they are to be really useful and
comparable. This, however, was not possible in spite of efforts to that effect. For, extensive changes in the territorial jurisdiction of districts and
talukas have taken place during the last ten years, first as a result of integration in 1956 and then due to bifurcation on May 1, 1960 when Gujarat came into being as a separate political unit for the first time. Non-availability of the
required data in case of most of the Princely States and Estates was another handicap. The
task of compilation of official statistics was thus beset with innumerable difficulties. The proformae for the various statements numbering 49 as approved by Government and the Registrar General were circulated to all the concerned Heads of Departments as early as July 1961. In view of the importance of these statistics, the Government by circular letter No. CNS-1461-A2 dated the 27th July 1961 addressed to all Heads of Departments had also directed that official statistics called for by the Superintendent of Census Operations should be furnished within two months through the Director, Bureau of Economics and Statistics, after thorough scrutiny by some
responsible officer of the department along with a cerdficate to the effect that the data furnished are up-ta-date, complete and authentic in all particulars. The delay, however, caused in furnishing correct and complete information by the
departments delayed final compilations and resulted in protracted correspondence to rectify the
discrepancies and incompleteness noticed during the course of verification at the Bureau. Non
availability of the required information for the various administrative units as at present constituted was another obstacle. The progress had, therefore, to be reviewed from time to time in a
ix
series of meetings with the. Director, BLlrcau of
Economics and Statistics and representatives of the departments concerned. The offices from which information was not received had to be frequently reminded by the Director, the Census Department and at times even by the Chief Secretary. Some of the tables proposed to be included could not be inserted or had to be revised either for want of receipt of timely information or owing to the non-availability or incompleteness of the data furnished. Where data for individual years are not available, tbey have been collected for the years 1950-51, 1955-56, 1960-61 which mark the commencement of the First , Second and Third Five Year Plans. Where statistics for these periods are not available, they are gIven only for the year 1960-61; and where the
figures compiled are not available for the units as at present constituted, the clarification as to the unit to which they refer has been made in the footnote to the statements which also disclose the source of compilation.
PART Ill-VILLAGE DIRIKTORY
The Village Directory or the Primary Census Abstract includes information regarding popu
lation, area, occupied houses, households, workers classified into nine industrial categories of workers and non-workers, Scheduled Castes and Scheduled Tribes; literates and edacated, etc., for each village as well as for every ward and block of about 120 houses in each town. In addition, it gives information on certain essential amenities existing in the village such as educational facilities, public health and medical facilities, supply of drinking water, electricity and its uses, etc., by means of
abbreviations placed against the name of each village. This additional information has been compiled from the special 'village notes' devised for the purpose and collected thl'OLlgh the Block Development Officers. They relate to the position as it existed about March 1961
The figures of population of Scheduled Castes
and Scheduled Tribes were given in 1951 for certain arbitrary tracts formed by the grouping
of talukas. The result was that the administration was seriously handicapped in the absence of relevant particulars for the various administrative
units of a district whkh were required oft and
on for planning and other purposes. This lacuna has been removed on the present occasion .irj
giving ngures of Scheduled Castes and Scheduled Tribes for each village in the Primary Census Abstract. The talukas and villages given in the Village Directory are arranged in the order of
their location code numbers.
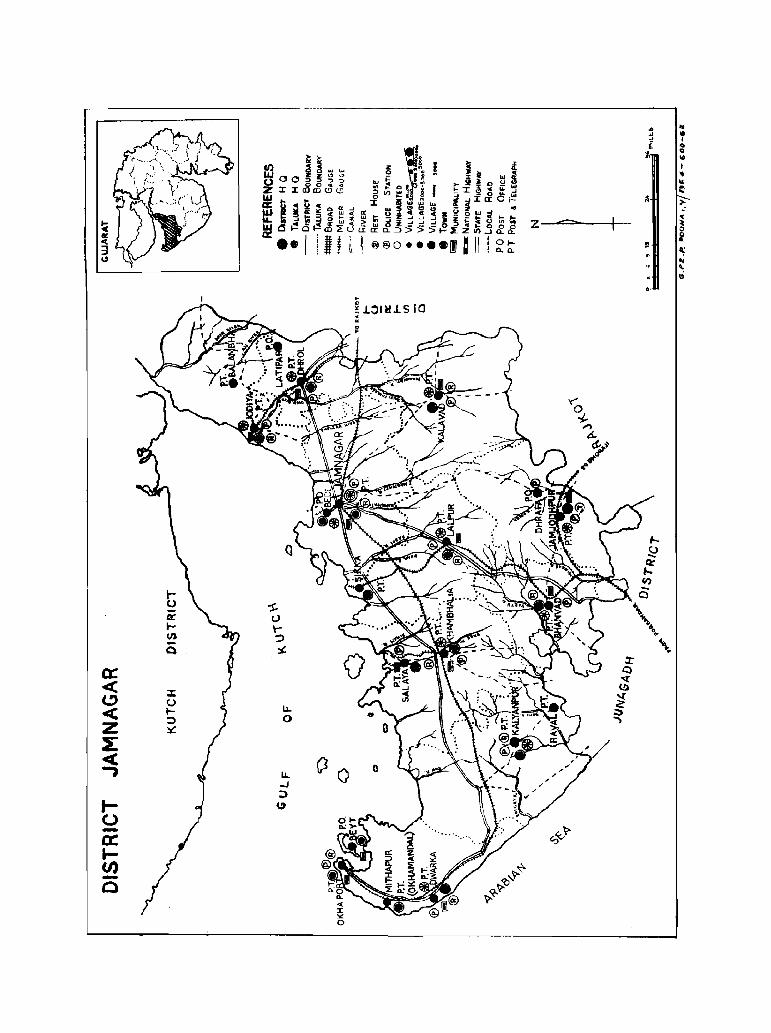
MAPS
The Village Directory is preceded by taluka maps showing villages by their location code numbers and dots varying according to the size of the village. Other items such as district or
taluka headquarters, railway, national highway, State highway, local roads, post office, post and telegraph, canal, river, rest house, police station, etc., have been shown on the map with appropriate symbols. Two key maps, one for the State showing the district boundary and the position of the district in the State in hatching and the
position of the taluka in the district in black and another key map for the district showing
taluka boundary and the position of taluka in the district in hatching have also been included in the taluka map. In addition to taluka maps, a map of the district has also been given at the commencement of the Handbook showing the various items listed above for the taluka map and villages having population over 5,000. The key map given in the district map shows district boundary and the position of the district in the State in hatcbing.
The preparation of district and taluka maps and finalisation of area figures proved to be
another handicap. The District Inspectors of Land Records bad furnished tracings which had
to be brought up-to-date in the light of cbanges in boundaries owing to integration on the one hand and bifurcation on the other. Frequent references and back references entered into at various levels, the Settlement Commissioner, Superintendents and District Inspectors of Land Records to remove the discrepancies and reconcile the inconsistencies noticed did not yield much result. The matter was,
therefore, finally set at rest by calling a conference of Superintendents and District Inspectors of
Land Records Who did on-the-spot checking and verification and certified the correctness of
x
the ultimate delimitation of boundaries and location of villages appearing in the taluka and district maps and accuracy of area figures entered
in the Primary Census Abstract.
PAGING
Each of the three parts of the District Census Handbook will have a separate series of
page numbers starting with 1.
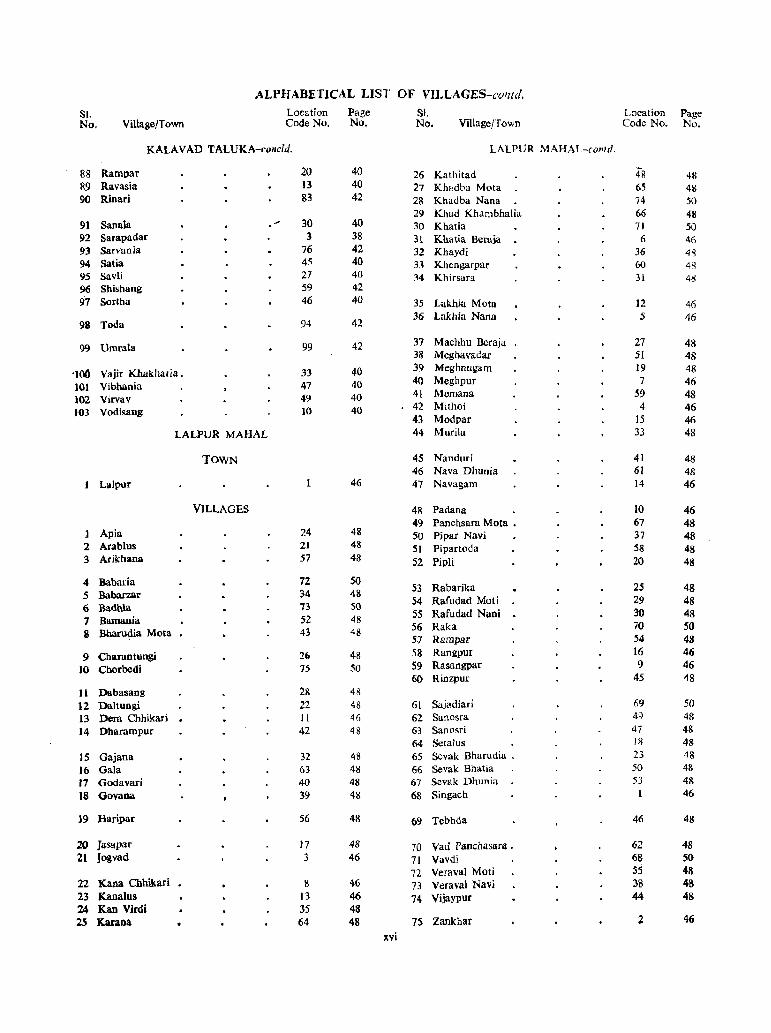
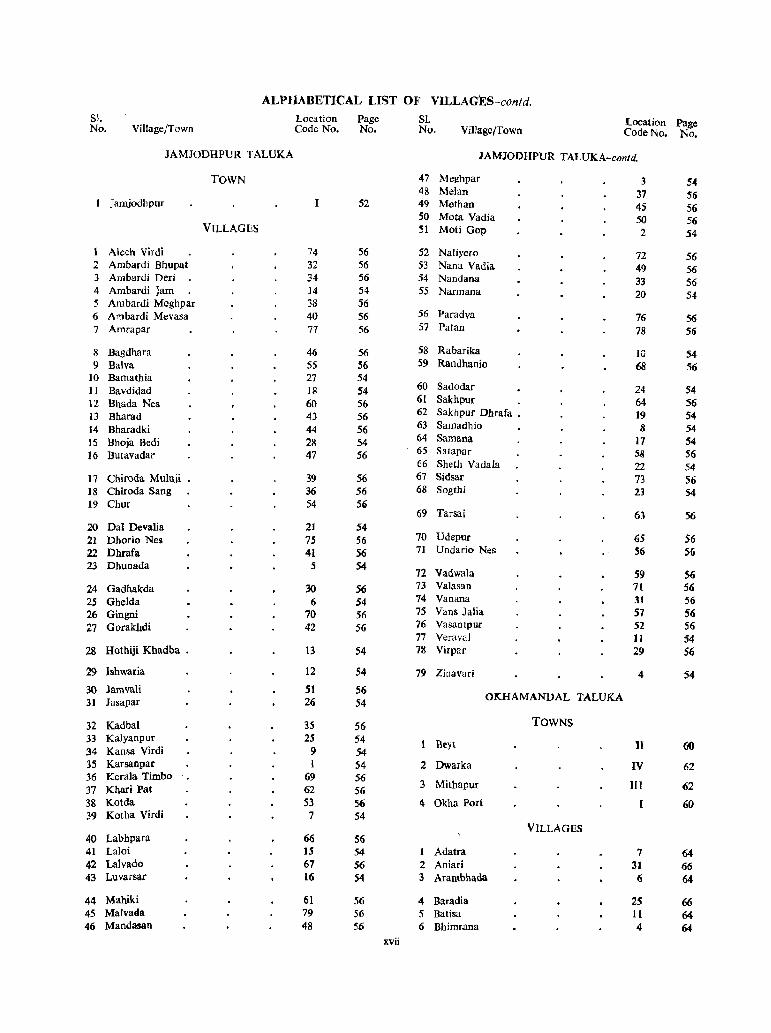
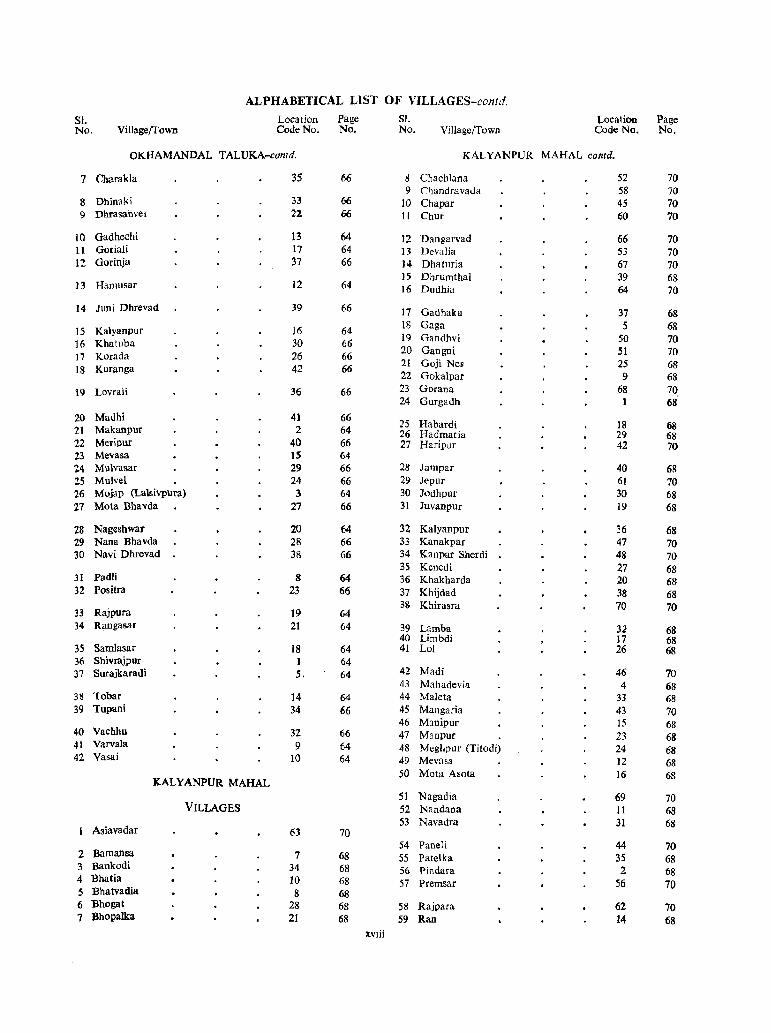
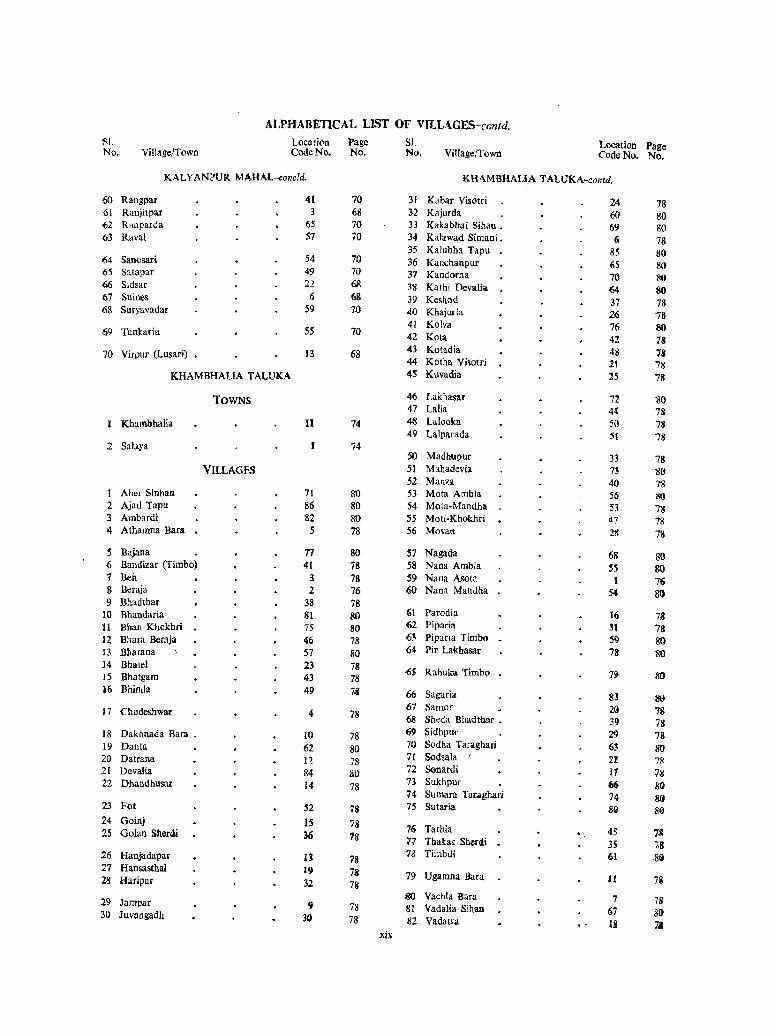
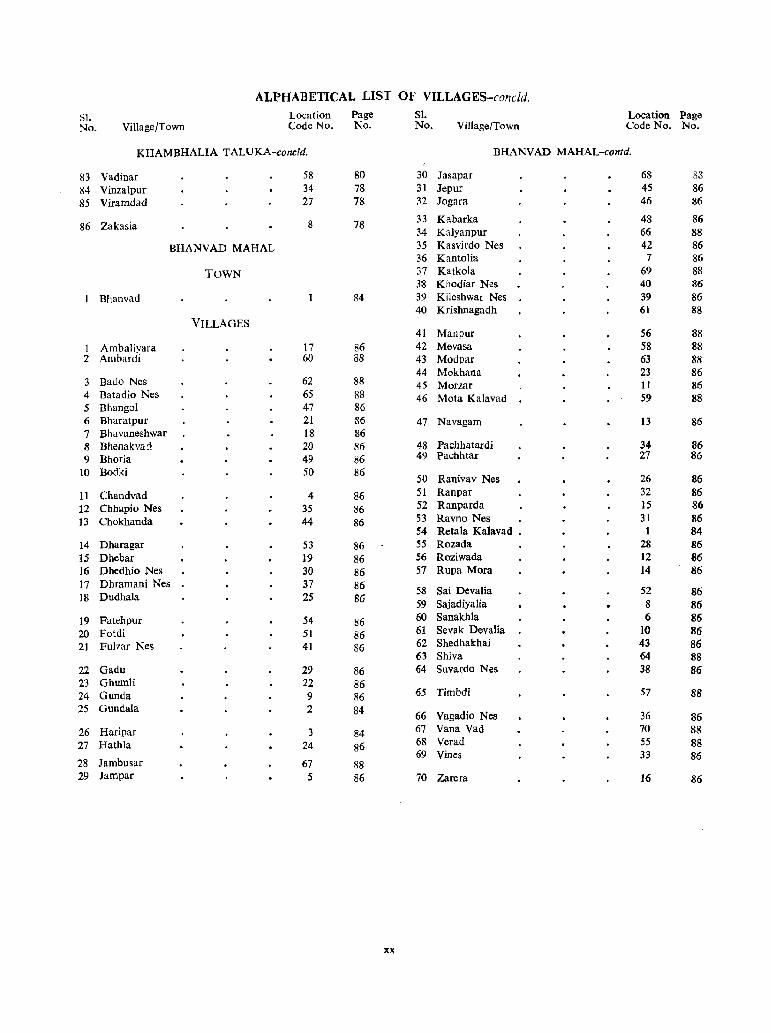
ALPHABETICAL LIST OF VILLAGES
With a view to enable the reader to trace
a village from the Village Directory, an alpha· beticallist of villages giving the names of villages and indicating their location code numbers, page number and serial number on the page at which they are printed has been given separately for
each Taluka/Mahal at the commencement of the Handbook.
THE HANDBOOK.
The contents of the District Census Handbook explained above have been finalised after
frequent deliberations at various census confer
ences and seminars, and meticulous care as to their form, size and presentation. But these by themselves would not have been sufficient had the Government not readily responded to the various suggestions made in this behalf. If I may
say so, the Government had placed implicit faith in me, and accepted all the proposals made by me from time to time to add to the utility of this important compilation. It is hoped that the District Census Handbook in its present form will satisfy a growing demand for basic census data by ultimate territorial units and other background information about the district and also prove to be a useful book of reference to the administrative departments and the public.
The Government of Gujarat has taken a further deCision, namely, to print the District Census Handbook also in the regional language of the State, viz., Gujarati. This will very much add to the utility of this publication. The Handbook in Gujarati will contain (i) Note introducing
the district, (ii) Alphabetical list of villages, (iii) Census Tables A-I, A-III and SCT-I, (iv) Village Directory with explanatory note and
(v) District and Taluka maps.
ACKNOWLEDGEMENTS
Help in the compilation of the District Census Handbooks has been forthcoming from various quarters, to all of whom I am deeply
indebted. I, however, wish to express my thanks to Shri V. Isvaran and Shri V. L. Gidwani, Chief Secretaries to Government, and Sbri M. G. Shah, Deputy Secretary, General Administration Department for all the facilities they have given in their preparation and publication of these Handbooks. I am also obliged to the Bureau of Economics and Statistics for the services rendered in the compilation of Official Statistics furnished by the Heads of Departments and the checking of the statistical data in the draft-notes for the Introductory Essays prepared by the District Statistical Officers. My thanks are also due to Shri H. V. Desai, Settlement Commissioner, SUI crintendents of Land Records and District Inspectors of Land Records for their assistance
in the finalisation of area figures and veriiicatjon of district and taluka maps. Lastly I should place on record my gratitude to Shri Balwantray G. Mehta, Chief Minister of Gujarat, whose keen interest has to no small extent ensured the expeditious printing and publication of the District Census Handbooks.
Programme for the printing of District Census Handbooks has this time been very heavy indeed, more so as they are published both in Gujarati and English. The arrangements made by Shri B. A. Koreishi, Director, Government Printing and Stationery, and Shri G. J. Gonsalves, Deputy
AHMEDABAD.
9th March. 1964.
xi
Director, for the printing of the voluminous work pertaining to the District Census Handbooks at the various Government and local presses, are thankfully acknowledged. The excellent work turned out by the Government Photo-zincographic
Press, Poona in printing district and taluka maps deserves special mention.
I would like to place on record the valuable contribution made by the members of the Census Organisation at various levels in bringing out the Handbook in its present form. Mention in particular should be made of Shri K. F. Patel,
Deputy Superintendent of Census Operations, Shri J. D. Shah, Statistical Assistant, Shri H. S. Bhatt,
in charge proof reading section and Shri K. D. Vaishnav and Shri L. S. Shrimali of draftsman section. Before I conclude I must pay tribute to the
conscientious discharge of duties by the late Shri J. K. Patel, Special Mamlatdar whose services
were placed by Government at the disposal of the Census Organisation, for supervising the
printing of District Census Handbooks. It is a matter of great regret that his services were lost to us, as he was removed from our midst in the
prime of bis life owing to sudden heart failure.
Finally, tbe Registrar General bas given such anxious thought and care since the inception of the Census Organization to ensure that the District Census Handbook which the Census of 1961 brings out is an up-to-date book of reference for the District by including all available usefUl data both census as well as official. I am grateful to him for tbe valuable suggestions made and guidance given by him in this important publication.
R. K. TRIVEDI,
Superintendent of Census Operations,
Gujarat.

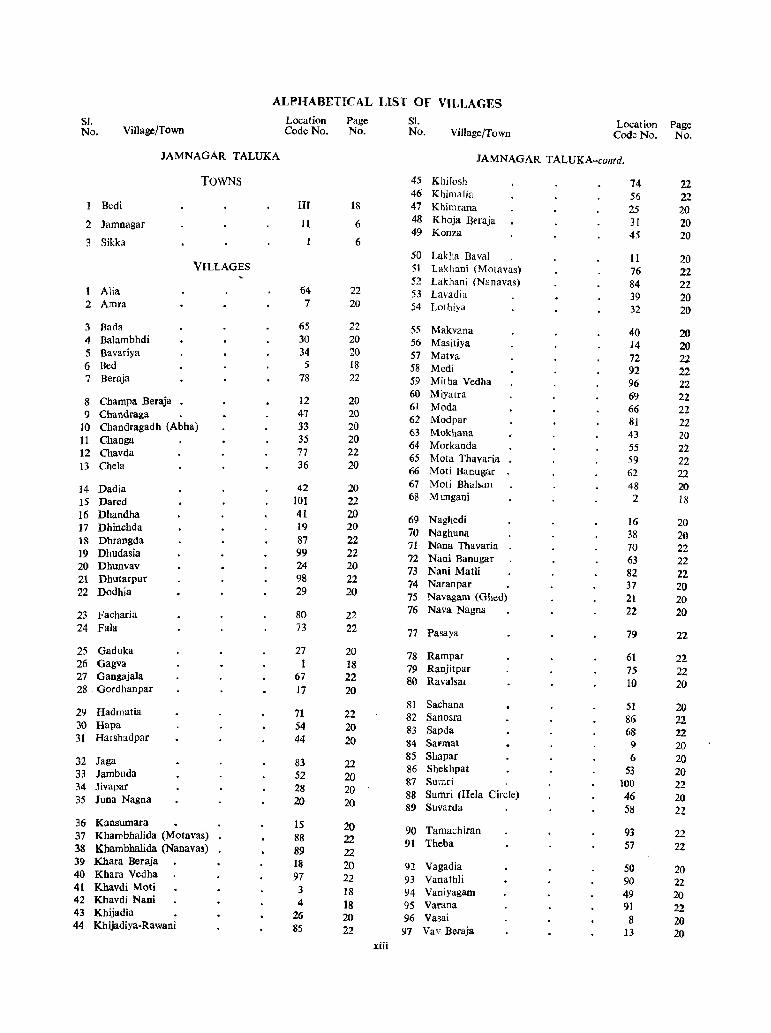
ALPHABETICAL UST OF VILLAGES
SI. Location Page SI. Location Page No. Village/Town Code No. No. No. Village/Town Cod~ No. No.
JAMNAGAR TALUKA JAMNAGAR TALUKA-contd.
TOWNS 45 Khilosh 74 22 46 Khimalja 56 22
Bedi III 18 47 Khimrana 25 20 II 6 48 Khoja Beraja 31 20 2 Jamnagar
49 Konza 45 20 3 Sikka 6
50 Lakha Baval II 20 VILLAGES 51 Lakhani (Motavas) 76 22
52 Lakhani (Nanavas) 84 22 Alia 64 22 53 Lavadia 39 20
2 Amra 7 2(J 54 Lalhiya 32 20
3 Rada 65 22 55 Makvana 40 20 4 Balambhdi 30 20 56 Masitiya 14 20 5 Bavariya 34 20 57 Matva 72 22 6 Bed 5 18 58 Medi 92 22 7 Beraja 78 22 59 Mitha Vedha 96 22
60 Miyatra 69 22 8 Champa Beraja 12 20 61 Moda 66 22 9 Chandraga 47 20 62 Modpar 81 22 10 Chandragadh (Abha) 33 20 63 Mokhana 43 20 11 Changa 35 20 64 Morkanda 55 22 12 Chavda 77 22 65 Mota Thavaria 59 22 13 Chela 36 20 66 Moti Banugar 62 22
42 20 67 Moti Bhalsan 48 20 14 Dadia 68 Mungani 2 18 15 Dared 101 22
16 Dhandha 41 20 69 Naghedi 16 20 17 Dhinchda 19 20 70 Naghuna 38 20 18 Dhrangda 87 22 71 Nana Thavaria 70 22 19 Dhudasia 99 22 72 Nani Banugar 63 22 20 Dhunvav 24 20 73 Nani MatH 82 22 21 Dhutarpur 98 22 74 Naranpar 37 20 22 Dodhia 29 20 75 Navagam (Ghed) 21 20
23 Facharia 80 22 76 Nava Nagna 22 20 24 Fala 73 22 77 Pasaya 79 22 25 Gaduka 27 20 78 Rampar 61 22 26 Gagva I 18 79 Ranjitpar 75 22 27 Gangajala 67 22 80 Ravalsar 10 20 28 Gordhanpar 17 20
81 Sachana 51 20 29 Hadmatia 71 22 82 Sanosra 86 22 30 Hapa S4 20 83 Sapda 68 22 31 Harshadpar 44 20 84 Sarmat 9 20 85 Shapar 6 20 32 Jaga 83 22 86 Shekhpat 53 20 33 Jambuda 52 20 &7 Sumri 100 22 34 Jivapar 28 20 88 Sumri CHela Circle) 46 20 35 Juna Nagna 20 20 89 Suvarda 58 22
36 Kansumara 15 20 90 Tamachiran 93 22 37 Khambhalida (Motavas) 88 22 91 Theba 57 22 38 Khambhalida (Nanavas) 89 22 39 Khara Beraja 18 20 92 Vagadia 50 20 40 Khara Vedha 97 22 93 Vanathli 90 22 41 Khavdi Moti 3 18 94 Vaniyagam 49 20 42 Khavdi Nani 4 18 95 Varana 91 22 43 Khijadia 26 20 96 Vasai 8 20 44 Khijadiya·Rawani 85 22 97 Vav Beraja 13 20
xiii
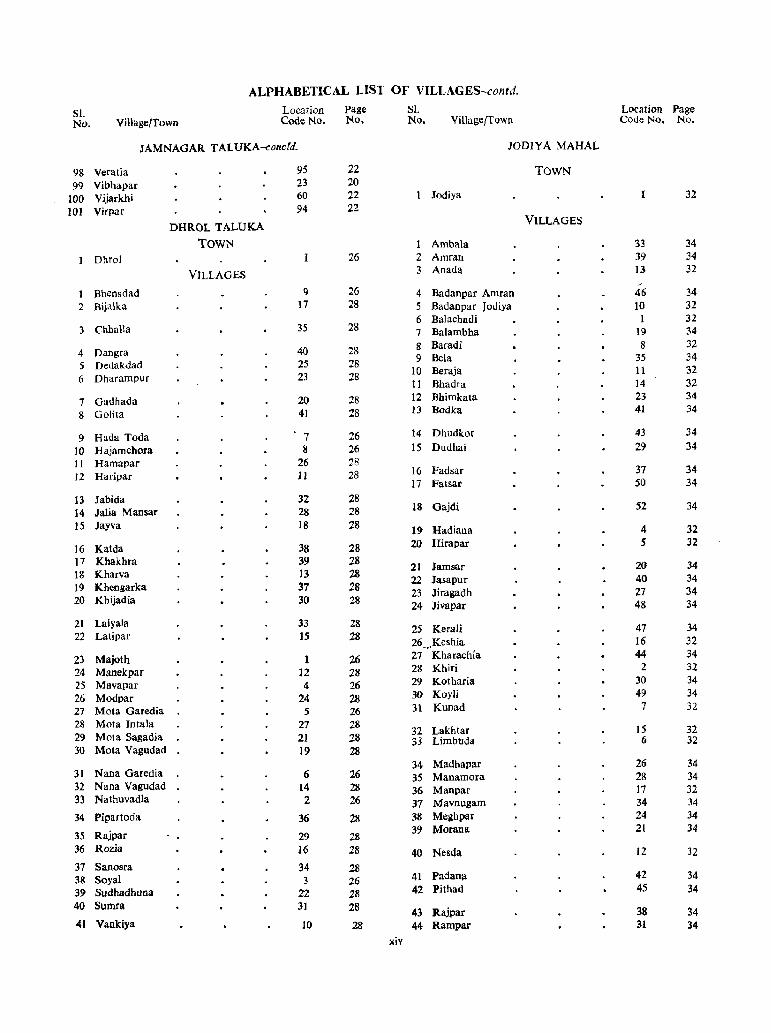
ALPHABETICAL LIST OF VILLAGES-contd.
SI. Location page SI. Location Page
No. ViUage!TowD Code No. No. No, Village/Town Code NQ. No.
JAMNAGAR TALUKA--conc!d. JODIY A MAHAL
98 Veratia 95 22 TOWN 99 Vibhapar 23 20
100 Vijarkhi 60 22 1 Jodiya 1 32
101 Virpar 94 22
DHROL TALUKA VILLAGES
TOWN 1 Ambala 33 34
Ohrol I 26 2 Amrao 39 34
VIllAGES 3 Anada 13 32 ,
) Bhensdad 9 26 4 Badanpar Anuan 46 34
2 Bijalka 17 28 5 Badanpar Jodiya 10 32
Chballa 35 28 6 Ba1achadi 32
3 7 Balambha 19 34
4 Oangra 40 28 8 Baradi 8 32
5 Dedakdad 25 28 9 Bela 35 34
6 Dharampur 23 28 10 Beraja 11 32 11 Bhadra 14 32
7 Gadhada 20 28 12 Bhimkata 23 34
8 Galita 41 28 13 Bodka 41 34
9 Hada Toda . 7 26 14 Dhudkot 43 34
10 Hajamchora 8 26 15 Dudhai 29 34
II Hamapar 26 28 12 Haripar 11 28 16 Fadsar 37 34
17 Fatsar 50 34
13 Jabida 32 28
14 Jalia Mansar 28 28 18 Gajdi 52 34
IS Jayva 18 28 19 Hadiana 4 32
16 Katda 38 28 20 Ricapar 5 32
17 Khakhra 39 28 Jamsar 18 Kharva 13 28
21 20 34
19 Khengarka 37 28 22 Jasapur 40 34
20 Khijadia 30 28 23 Jiragadh 27 34
24 Jivapar 48 34
21 Laiyala 33 28 22 Latipar 15 28
25 Kerali 47 34
26_ •. Keshia 16 32
23 Majoth 1 26 27 Kharachia 44 34
24 Manekpar 12 28 28 Khiri 2 32
25 Mavapar 4 26 29 Kotharia 30 34
26 Modpar 24 28 30 Koyli 49 34
27 Mota Garedia 5 26 31 Kunad 7 32
28 Mota Intala 27 28 29 Mota Sagadia 21 28
32 Lakhtar 15 32 33 Limbuda 6 32
30 Mota Vagudad 19 28
31 Nana Garedia 34 Madhapar 26 34
6 26 35 Manamora 28 34 32 Nana Vagudad 14 28 36 Manpar 17 32 33 Nathuvadla 2 26 37 Mavnugam 34 34
34 Pipartoda 36 28 38 Meghpar 24 34
35 Rajpar 29 28 39 Moran a 21 34
36 Rozia 16 28 40 Nesda 12 32
37 Sanosra 34 28 38 Soyal 3 26 41 Padana 42 34
39 Sudhadhuna 22 28 42 Pithad 45 34
40 Sumra 31 28 43 Rajpar 38 34 41 Vankiya 10 28 44 Rampar 31 34
xiv
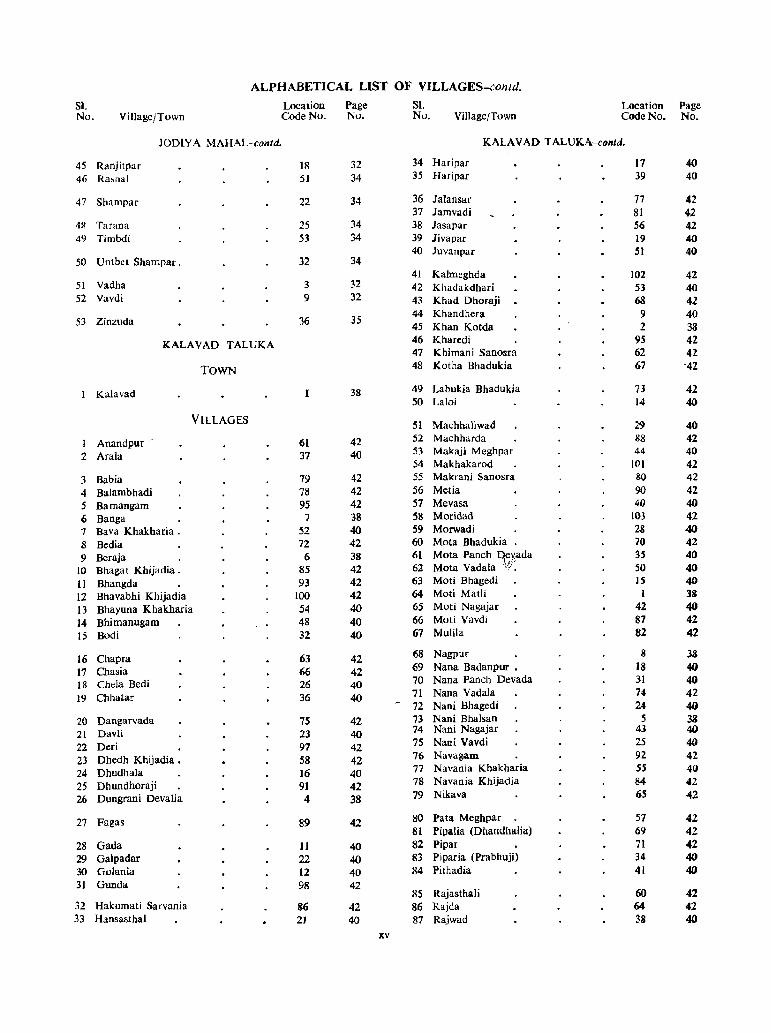
ALPHABETICAL LIST OF VILLAGES-colild.
SI. Location Page SI. Location Page No. Village/Town Code No. No. No. VillagefTown Code No. No.
JODIY A MAHAL-contd. KALAVAD TALUKA-contd.
45 Ranjitpar 18 32 34 Haripar 17 40 46 Rasnal 51 34 35 Haripar 39 40
47 Shampar 22 34 36 lalansar 77 42 37 Jamvadi 81 42
4~ Tarana 25 34 38 Jasapar 56 42 49 Timbdi 53 34 39 Jivapar 19 40
40 Juvanpar 51 40 50 Unthet Shampar. 32 34
41 Kalmeghda 102 42 51 Vadha 3 32 42 Khadakdhari 53 40 52 Vavdi 9 32 43 Khad Dhoraji 68 4l
53 Zinzuda 36 35 44 Khandhera 9 40 45 Khan Kotda 2 38
KALAVAD TALUKA 46 Kharedi 95 42 47 Khimani Sanosra 62 42
TOWN 48 Kotha Bhadukia 67 42
1 Kalavad I 38 49 Labukia Bhadukia 73 42 50 Laloi 14 40
VILLAGES 51 Machhaliwad 29 40
I Anandpur / 61 42 52 Machharda 88 42
2 Arala 37 40 53 Makaji Meghpar 44 40 54 Makhakarod WI 42
3 Babia 79 42 55 Makrani Sanosra 80 42 4 Balambhadi 78 42 56 Metia 90 42 5 Bamangam 95 42 57 Mevasa 40 40
6 Banga 7 38 58 Moridad 103 42 7 Ba va Khakharia . 52 40 59 Morwadi 28 40 8 Bedia 72 42 60 Mota Bhadukia 70 42 9 Beraja 6 38 61 Mota Panch ~xada 35 40
10 Bhagat Khijadia. 85 42 62 Mota Vadala ,? 50 40 11 Bhangda 93 42 63 Moti Bhagedi 15 40
12 Bhavabhi Khijadia 100 42 64 Moti Matli 1 38
13 Bhayuna Khakharia 54 40 65 Moti Nagajar 42 40
14 Bhimanugam 48 40 66 Moti Vavdi 87 42 15 Bodi 32 40 67 Mulila 82 42
16 Chapra 63 42 68 Nagpur 8 3S
17 Chasia 66 42 ()9 Nana Badanpur • 18 40
18 Chela Bedi 26 40 70 Nana Panch Devada 31 40
19 Chhata:r 36 40 71 Nana Vadala 74 42 - 72 Nani Bhagedi 24 40 20 Dangarvada 75 42 73 Nani Bhalsan 5 3&
21 Davli 23 40 74 Nani Nagajar 43 40
22 Deri 97 42 75 Nani Vavdi 25 40
23 Dhedh Khijadia. 58 42 76 Navagam 92 42
24 Dhudhala 16 40 77 Navania Khakharia 55 40
25 Dhundhoraji 91 42 78 Navania Khijadia 84 42
26 Dungrani Devalia 4 38 79 Nikava 6S 42
27 Fagas 89 42 80 Pata Meghpar 57 42 81 Pipaiia (Dhandhalia) 69 42
28 Gada II 40 82 Pipar 71 42 29 Galpadar 22 40 83 Piparia (Prabhuji) 34 40 30 Golania 12 40 84 Pithadia 41 40 31 Gunda 98 42
85 Rajasthali 60 42 32 Hakumati Sarvania 86 42 86 Rajda 64 42 33 Hansasthal 21 40 87 Raj wad 38 40
xv
ALPIIABETICAL LIST OF VILLAGES-comd.
SI. Location Page SI. Location Page No. Village/Town Code No. No. No. ViUage/Town Code No. No.
KALAVAD TALUKA-conclJ. LALPUR MAHAL-conld.
88 Ramoar 20 40 26 Kathitad 48 48 89 Ravasia B 40 27 Khadba Mota 65 48 90 Rinari 83 42 28 Khadba Nana 74 50
29 Khad Khambhalia 66 48 91 Sanala 30 40 30 Khatia 71 50 92 Sarapadar 3 38 3l Kha tia Beraja 6 46 93 Sarvania 76 42 32 Khaydi 36 48 94 Satia 45 40 33 Khengarpar 60 4H 95 Savli 27 40 ;\4 Khirsara 31 48 96 Shishang 59 42
97 Sortha 46 40 35 Lakhia Mota 12 46
Toda 94 42 36 Lakhia Nana 5 46
98
99 Urnrala 99 42 37 Machhu Bcraja 27 48 38 Meghavadar 51 48
'lOll Vajir Khakharia. 33 40 39 Meghnugam 19 48
101 Vibhania 47 40 40 Meghpur 7 46
102 Virvav 49 40 41 Memana 59 48
103 Vodisang 10 40 42 Mithoi 4 46 43 Modpar 15 46
LALPUR MAHAL 44 Murila 33 48
TOWN 4S Nanduri 41 48 46 Nava Dhunia 61 48
I Lalpur 1 46 47 Navagam 14 46
VILLAGES 48 Padana 10 46 49 Panchsara Mota • 67 48
Apia 24 48 50 Pipar Navi 37 48 2 Arablus 21 48 5) Pipartoda 58 48 3 Arikhana 57 48 52 Pipli 20 48
4 Babaria 72 SO 53 Rabarika 25 48
5 Babarzar 34 48
6 Badbla 73 50 54 Rafudad Mott 29 48
7 Bamania 52 48 55 Rafudad Nani 30 48
i! Bharudia Mota 43 48 56 Raka 70 50 57 Rampar 54 48
9 Charantnngi 2~ 48 58 Rangpur 16 46
10 Choroodi 75 50 59 Rasangpar 9 46 60 Rinzpur 45 48
H Dabasang 2& 48
12 Daltungi 22 48 61 Saj~diari 69 50
13 Dera Chhikari . 11 46 62 Sanosra 49 48 14 Dbararnpur 42 48 63 Sanosri 47 48
64 Setalus 18 48
IS Gajana 32 48 65 Sevak Bharudia . 23 ~8
16 Gala 63 48 66 Sevak Bhatia 50 48
17 Godavari 40 48 67 Sevak Dhunia 53 48 Ii! Govana 39 48 68 Singach 1 46
19 Haripar 56 48 69 Tebhda 46 48
20 ]asapar 17 48 70 Vad Panchasara . 62 48 21 Jogvad 3 46 71 Vavdi 68 50
72 Veraval Moti 55 48 22 Kana Cbhikari 8 46 73 Veraval Navi 38 48 23 Kanalus 13 46 74 Vijaypur 44 48 24 Kan Virdi 35 48 2S Karana 64 48 7'5 Zankhar ;Z 46
xvi
ALPHABETICAL UST OF VILLAGES-contd. Sl. Location Page SI. Location Page No. Village/Town Code No. No. No. Village/Town Code No. No.
JAMJODHPUR TALUKA JAMJODHPUR TALUKA-conld.
TOWN 47 Meghpar 3 54 48 Melan 37 56
I Jamjodhpur 52 49 Methan 45 56 50 Mota Vadia 50 56
VILLAGES 51 Moti Gop 2 S4
Alech Virdi 74 56 52 Naliyero 72 56 2 Ambardi Bhupat 32 56 53 Nana Vadia 49 56 3 Ambardi Deri 34 56 54 Nandana 33 56 4 Ambardi Jam 14 54 55 Narmana 20 54 5 Ambardi Meghpar 38 56 6 Ambardi Mevasa 40 56 56 Paradva 76 56 7 Amrapar 77 56 57 Patan 78 56
1I Bagdhara 46 56 58 Rabarika IV 54 9 Balva 55 56 59 Randhanio 68 56
10 Bamathia 27 54 II Bavdidad 18 54 60 Sadodar 24 54 12 Bh&da Nes 60 56 61 Sakhpur 64 56 13 Bharad 43 56 62 Sakhpur Dhrafa . 19 S4 14 Bharadki 44 56 63 Samadhio 8 54 15 Bhoja Bedi 28 54 64 Samana 17 54
16 Butavadar 47 56 65 Satapar 58 56 66 Sheth Vadala 22 54
17 Chiroda Muluji 39 56 67 Sidsar 73 56 18 Chiroda Sang 36 56 68 Sogthi 21 54 19 Chur 54 5v
69 Tarsai 63 56 20 Dal Devalia 21 54 21 Dhorio Nes 75 56 70 Udepur 65 56 22 Dhrafa 41 56 71 Undario Nes 56 56 23 Dhunada 5 54
72 Vadwala 59 56 24 Gadhakda 30 56 73 Valasan 71 56 25 Ghelda 6 54 74 Vanana 31 56 26 Gingni 70 56 75 Vans Jalia 57 56
27 Gorakhdi 42 S6 76 Vasantpur 52 56 77 Veraval 11 54
28 Hothiji Khadba • 13 54 78 Virpar 29 56
29 Ishwaria 12 S4 79 Zinavari 4 54
30 Jamvali 51 56 OKHAMANDAL TALUKA
31 Jasapar 26 54
32 Kadbal 35 56 TOWNS
33 Kalyanpur 25 54 Beyt II 60 34 Kansa Virdi 9 54 3S Karsanpar 1 54 2 Dwarka IV 62 36 Kerala Timbo 69 56
3 Mithapur 37 Khari Pat 62 56 III 62
38 Kotda 53 S6 ~ Okha Port 60 39 Kotha Virdi 7 54
VILLAGES 40 Labhpara 66 56 41 Laloi 15 54 I Adatra 7 64 42 Lalvado 67 56 2 Aniari 31 66 43 Luvarsar 16 54 3 Arambhada 6 64
44 Mahiki 61 56 4 Baradia 25 66 45 Ma1vada 79 56 5 Batisa 11 64 46 Mandasan 48 56 6 Bhimr.ana 4 64
xvii
ALPHABETICAL LIST OF VILLAGES-contd.
SI. Location Page Sl. Location Page No. Village(Town CadeNo. No. No. Village/Town Code No. No.
OKHAMANDAL TALUKA-contd. KALYANPUR MAHAL comd.
7 CharakJa 3S 66 8 Chachlana 52 70 9 Chandravada 58 70
8 Dhinaki 33 66 10 Chapar 4S 70 9 Dhrasanvel 22 66 11 Chur 60 70
10 Gadhechi 13 64 12 Dangarvad 66 70 II Goriali 17 64 13 Devalia 53 70 12 Gorinja 37 66 14 Dhaturia 67 70
15 Dhrumthal 39 68 13 Hamusar 12 64 16 Dudhia 64 70
14 Juni Dhrevad 39 66 17 Gadhaka 37 68
15 Kalyanpur 16 64 18 Gaga 5 68
16 Khatuba 30 66 19 Gandhvi 50 70
17 Korada 26 66 20 Gangni 51 70 21 Goji Nes 25 68 18 Kuranga 42 66 22 Gokalpar 9 68
19 Lovrali 36 66 23 Gorana 68 70 24 Gurgadh 68'
20 Madhi 41 66 25 Habardi 18 68 21 Makanpur 2 64 26 Hadmatia 29 68
22 Meripur 40 66 27 Haripur 42 70 23 Mevasa IS 64 24 Mulvasar 29 66 28 Jampar 40 6R 25 Mulvel 24 66 29 Jepur 61 70 26 Mojap (Lalsivpura) 3 64 30 Jodhpur 30 68 27 Mota Bhavda 27 66 31 Juvanpur 19 68
28 Nageshwar 20 64 32 Kalyanpur 36 68 29 Nana Bhavda 28 66 33 Kanakpar 47 70 30 Navi Dhrevad 38 66 34 Kanpar Sherdi 48 70
35 Kenedi 27 68 31 Padli 8 64 36 Khakharda 20 68 32 Positra 23 66 37 Khijdad 38 68
33 Rajpura 19 64 38 Khirasra 70 70
34 Rangasar 21 64 39 Lamba 32 68 40 Limbdi 17 68
35 Samlasar 18 64 41 Lol 26 68 36 Shivrajpur 64 37 Surajkaradi 5, 64 42 Madi 46 70
43 Mahadevia 4 68 38 Tobar 14 64 44 Maleta 33 68 39 Tupani 34 66 45 Mangaria 43 70
46 Manipur 15 68 40 Vachhu 32 66 47 Manpur 23 68 41 VarvaJa 9 64 48 Meghpur (Titodi) 24 68 42 Vasai 10 64 49 Mevasa 12 68
KALYANPUR MAHAL SO Mota Asata 16 68
51 Nagadia 69 70 VILLAGES 52 Nandana 11 68
53 Navadra 31 68 Asiavadar 63 70
54 Paneli 44 70 2 Bamansa 7 68 SS Patelka 35 68 3 Bankadi 34 68 56 Pindara 2 68 4 Bhatia 10 68 57 Premsar 56 70 5 Bhatvadia 8 68 6 Bhogat 28 68 58 Rajpara 62 70 7 Bhopalka 21 68 59 Ran 14 68
xviii
ALPHABETICAL LIST OF VILLAGES-contd. SI. Location Page Sl. Location Page No. Village/Town Code No. No. No. Village/Town Code No. No.
KALYANPUR MAHAL--'Conc/d. KHI\MBHAUA TALUKA-contd.
60 Rangpar 41 70 31 Kabar Visotri 24 78 61 Ranjitpar 3 68 32 Kajurda 60 80 (;2 Ranparda 65 70 33 Kakabhai Sihan . 6'l 80 63 Raval 57 70 34 Kalawad Simani. 6 78
35 Kalubha Tapu 85 80 64 San()sari 54 70 36 Kanchanpur 65 80 65 Satapar 49 70 37 Kandorna 70 l<O 66 Sidsar 2Z 68 38 Kathi Devalia 64 SO 67 Suines 6 68 39 Keshod 37 73 68 Suryavadar 59 70 40 Khajucia 26 78
55 41 Kolva 76 80 69 Tankaria 70 42 Kota 42 78
70 Virpur (Lusari) 13 68 43 Kotadia 48 78 44 Kotha Visotri 21 78
KHAMBHALIA TALUKA 45 Kuvadia 25 ill
TOWNS 46 Lakhasar n '80 47 Lalia 44 78
Khambhalia II 74 48 Lalooka 50 78 49 Lalparada 51 78
2 Salaya 74 50 Madhupur 33 78
VILLAGES 51 Mahadevia 73 gO 52 Manza 40 18
1 AheT Sinhan 71 80 53 Mota AmbIa 56 80 2 Ajad Tapu 86 80 54 Mota·Mandha 53 1'8 3 Ambardi 112 80 55 Motl-Khokhri 47 78 <4 Athamna Bara 5 7'8 56 Movatt 2l! 78
5 Bajana 77 80 57 Nagada 68 SO 6 Bandizar (Timbo) 41 78 58 Nana AmbIa 55 80 7 Beh 3 78 59 Nana Asola t 76 8 Beraja 2 76 60 Nana Mandb.a 54 80 9 Bhadthar 38 78
10 Bhandaria 81 80 61 Parodia 16 73 11 Bhan Khokhri 75 80 <62 Piparia 31 78 12 Bhara Beraja 46 78 063 Piparia Timbo - 59 80 13 Bharana 57 80 64 Pir Lakhasar 73 '80 14 Bhatel 23 78 .(is Rahuka Timbo 15 Bhatgam 43 78 7'J 8l)
16 Bhinda 49 78 66 Sagaria 81 89 17 Chudeshwac 4
67 Samor 2G 78 78 6S Sheda Bhadtbar • 39 78 18 Dakhna.da Ba ra . 10 78 69 Sidhpu'f 29 78 19 Dania 62 80 7Q Sodha Taraghari 6~ 80 20 Datrana 12 78 7I Sodsala I 2l 78 21 Devalia 84 80 72 Souardi Ii' n 22 Dhandhusal 14 78 73 SukhpUf
" 80 74 Sumara Tacaghari 74 8(1
23 Fot 52 78 75 Sutacia 89 S0 24 Goinj 15 7S 76 Tathia 25 Golan Sherdi 36 78 . 45 78
717 Thakar Sherdi 3S 7,8 26 Hanjadapar U 78 78 Timbdi 61 ,89 27 Hansasthal 19 78 79 Ugamna Bara 28 Haripar 32 7g 11 7i
29 80 Vachla Bara 7 78 Jampar I} 78 81 Vadalia Sihan 67 80 30 Juvangadh 30 78 82 Vadatra IS 71 xix
ALPHABETICAL LIST OF VILLAGES-concld.
Sl. Location Page 51. Location Page No. Village/Town Code No. No. No. Village/Town Code No. No.
KHAMBHALIA TALUKA-concld. BHANVAD MAHAL-contd.
83 Vadinar 58 80 30 Jasapar 68 8S
84 Vinzalpur 34 78 31 Jepur 45 86 85 Viramdad 27 78 31 Jogara 46 86
86 Zakasia 8 78 33 Kabarka 48 86 34 Kalyanpur 66 88
BHANVAD MAHAL 35 Kasvirdo Nes 42 86 36 Kantolia 7 86
TOWN 37 Katkola 69 88 38 Khodiar Nes 40 86
1 Bhanvad 84 39 Kileshwar Nes 39 86 40 Krishnagadh 61 88
VILLAGES 41 Manpur 56 88
1 Ambalivara 17 86 42 Mevasa 58 88 2 Ambardi 60 88 43 Modpar 63 88
44 Mokhana 23 86 3 Bado Nes 62 88 45 Morzar 11 86 4 Batadio Nes 65 88 46 Mota Ka!avad 59 88 5 Bhango! 47 86 6 Bharatpur 21 86 47 Navagam 13 86 7 Bhavaneshwar 18 86 8 Bhenakvad 20 86 43 Pachhatardi 34 86 9 Bhoria 49 86 49 Pachhtar 27 86
10 Bodki 50 86 50 Ranivav Nes 26 86
11 Chandvad 4 86 51 Ranpar 32 86
12 Chhllpio Nes 35 86 52 Ranparda 15 86
13 Chokhanda 44 86 53 Ravno Nes 31 86 S4 Retala Kalavad • 1 84
14 Dharagar 53 86 55 Rozada 28 86 15 Dhebar 19 86 56 Roziwada 12 86 16 Dhedhio Nes 30 86 57 Rupa Mora 14 86 17 Dhramani Nes 37 86 Sai Devalia 18 Dudhala 25 86
58 52 86 59 Sajadiyalia 8 86
19 Fatehpur 54 86 60 Sanakhla 6 86 20 Fotdi 51 86 61 Sevak Devalia 10 86 21 Fulzar Nes 41 86 62 Shedhakhai 43 86
63 Shiva 64 88 22 Gadu 29 86 64 Suvardo Nes 38 86 23 Ghumli 22 86 24 Gunda 9 86 65 Timbdi 57 88 25 Gundala 2 84 66 Vagadio Nes 36 86 26 Haripar 3 84 67 Vana Vad 70 88 27 Hathla 24 86 68 Verad 55 88
28 Jambusar 69 Vines 33 86
67 88 29 Jampar 5 86 70 Zarera Uj 86
PART I
1 INTRODUCTORY ESSAY
~ GAZETTEER OF PLACE NAMES

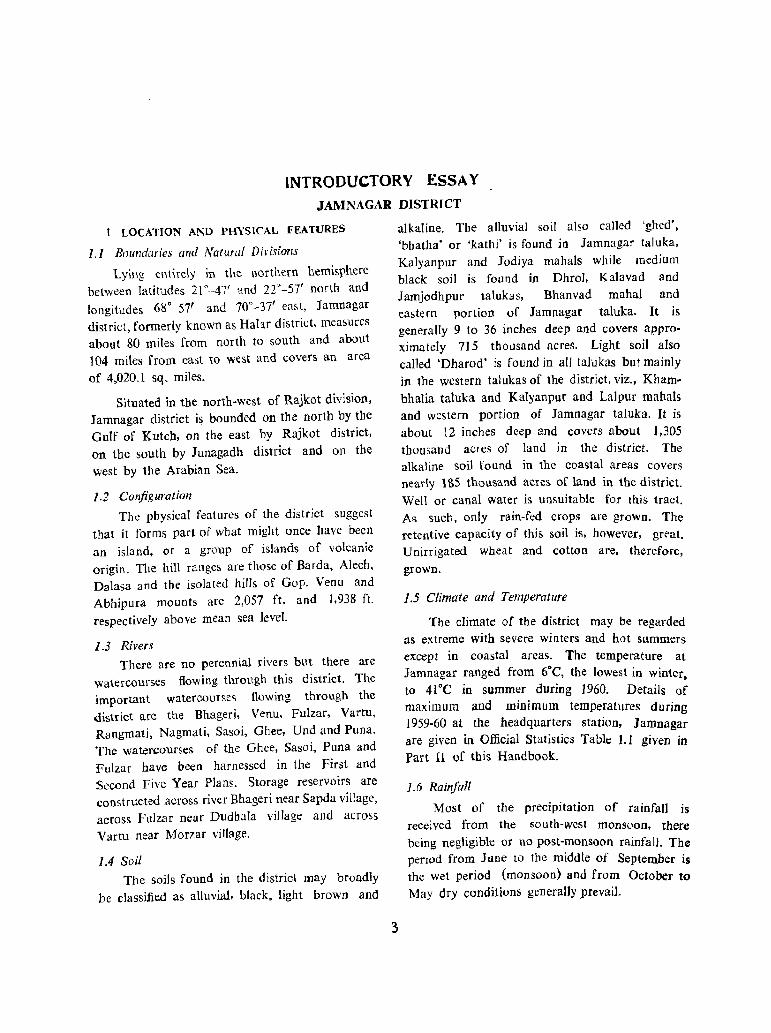
lNTRODUCTORY ESSAY JAMNAGAR DISTRICT
1 LOCATION AND PHYSICAL FEATURES
1.1 Boundaries and Natured Dirisiorzs
Lying ent\rdy in the northern hemisphere between latitudes 21°-47' and 22'-57' north and
longitudes 68°-57' and 70°-37' east, Jamnagar district, formerly known as Halar district, measures about 80 miles from north to south and about 104 miles from east to west and covers an area
of 4,020.1 sq. miles.
Situated in the north-west of Rajkot division, Jamnagar district is bounded on the north by the Gulf of Kutch, on the east by Rajkot district,
on the south by J unagadh district and on the
west by the Arabian Sea.
1.2 Configuration
The physical features of the district suggest
that it forms part of what might once have been an island, or a group of islands of volcanic
origin. The hill ranges are those of Barda, Alech, Dalasa and the isolated hills of Gop. Venu and Abhipura mounts are 2,057 ft. and ),938 ft.
respectively above mean sea level.
1.3 Rivers There are no perennial rivers but there are
watercourses flowing through this district. The important watercOUEes flowing through the district are the Bhageri, Venu, Fulzar, Vartu, Rangmati, Nagmati, Sasoi, Ghee, Und and Puna. The watercourses of the Ghee, Sasoi, Puna and
Fulzar have been harnessed in the First and Second Five Year Plans. Storage reservoirs are constructed across river Bhageri near Sapda village, across Fulzar near DUdhala village and across
Vartu near Morzar village.
1.4 Soil The soils found in the district may broadly
be .classifie.d as alluvial, black, light brown and
alkaline. The alluvial soil also called 'ghed'. 'bhatha' or 'kathi' is found in Jamnagar taluka, Kalyanpllr and Jodiya mahals while medium black soil is found in Dhrol, Kalavad and Jamjodhpur talukas, Bhanvad mahal and eastern portion of Jamnagar taluka. It is generally 9 to 36 inches deep and covers approximately 715 thoLlsand acres. Light soil also called 'Dharod' is found in all ta]ukas but mainly in the western talukas of the district, viz., Khambhalia taluka and Kalyanpur and Lalpur mahals and western portion of Jamnagar taluka. It is about 12 inches deep and covers about },305 thousand acres of land in the district. The alkaline soil found in the coastal areas covers nearly 1&5 thousand acres of land in the district.
Well or canal water is unsuitable for this tract. As such, only rain-fed crops are grown. The retentive capacity of this soil is, however, great. Unirrigated wheat and cotton are, therefore,
grown.
1.5 Climate and Temperature
The climate of the district may be regarded as extreme with severe winters and hot summers except in coastal areas. The temperature at Jamnagar ranged from 6°C, the lowest in winter to 41°C in summer during 1960. Details of maximum and minimum temperatures during 1959·60 at the headquarters station, Jamnagar are given in Official Statistics Table 1.1 given in Part II Qf this Handbook.
3
1.6 Rainfall
Most of the precipitation of rainfall is received from the south-west monsoon, there being negligible or no post-monsoon rainfall. The perIod from June to the middle of September is the wet period (monsoon) and from October to May dry conditions generally prevail.
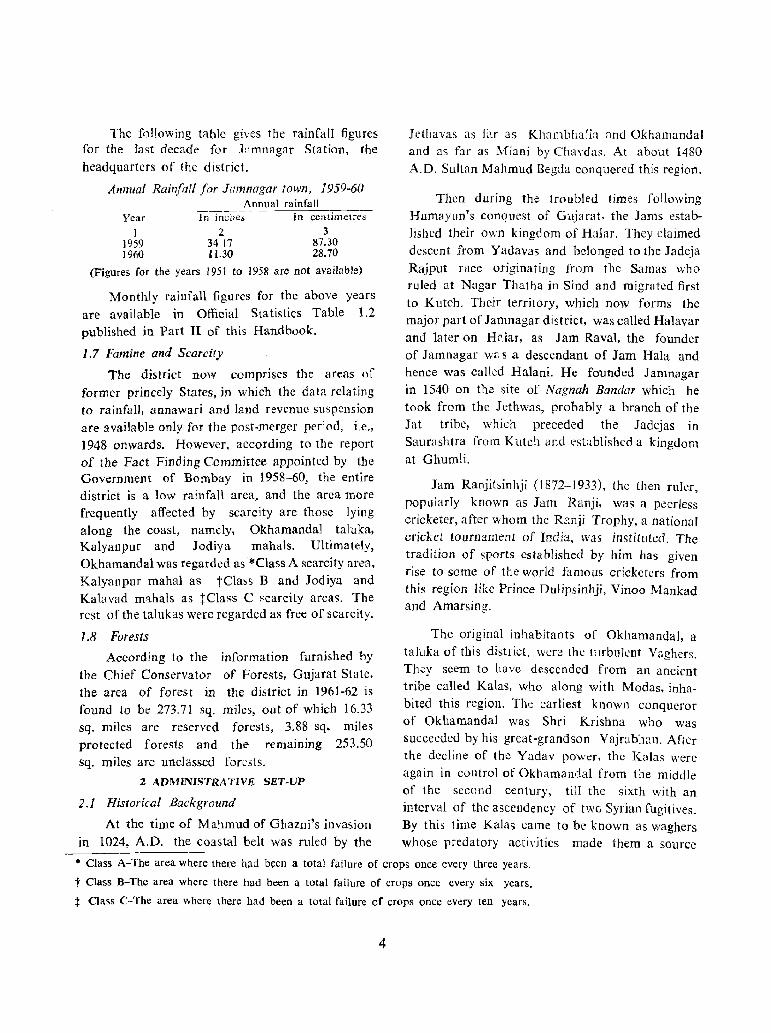
The fnllowing table gives the rainfall figures for the last decade for Jamnagar Station, the headquarters of the district.
Annual Rainfall for Jamnagar town, 1959-60 Annual rainfall
Year 1 n in..:hes In centimetres
I 1959 19110
2 3417 11.30
3 87.30 28.70
(Figures for the years 1951 to 1958 are not available)
Monthly rainfa1l figures for the above years are available in Official Statistics Table 1.2 published in Part II of this Handbook.
1.7 Famine and Scarcity
The district now comprises the areas of former princely States, in which the data relating to rainfall, annawari and land revenue suspension are available only for the post-merger period, i.c., 1948 onwards. However, according to the report of the Fact Finding Committee appointed by the Government of Bombay in 1958-60, the entire district is a low rainfall area, and the area more frequently affected by scarcity are those lying along the coast, namely, Okhamandal taluka, Kalyanpur and Jodiya mahals. Ultimately, Okhamandal was regarded as *Class A scarcity area, Kalyanpur mahal as tClass Band Jodiya and Kalavad mahals as tClass C scarcity area". The rest of the talukas were regarded as free of scarcity.
1.8 Forests
According to the information furnished by the Chief Conservator of Forests, Gujarat State, the area of forest in the district in ]961-62 is found to be 273.71 sq. miles, out of which 16.33 sq. miles are reserved forests, 3.88 sq. miles protected forests and the remamlllg 253.50 sq. miles are unclassed forests.
2 ADMINISTRATIVE SET-VP
2.1 Historical Background
At the time of Mahmud of Ghazni's invasion in 1024, A.D. the coastal belt was ruled by the
Icthavas as far as Khmnbha:ia [lnd OkhamandaI and as far as Miani by Ch3ydas. At about 1480 A.D. Sultan Mahmud Begda conquered this region.
Then during the troubled times following Humayun's conquest of Gujarat, the Jams established their own kingdom of Halar. They claimed descent from Yadavas and belonged to the Jadeja Rajput race originating from the Samas who ruled at Nagar Thatha in Sind and migrated first to Kutch. Their territory, which now forms the major part of Jamnagar district, was called Halavar and later on Hr.lar, as Jam Raval, the founder of Jamnagar WiJ s a descendant of Jam Hala and hence was called Balani. Be founded Jamnagar in 1540 on the site of Nagnah Bandar which he took from the Jethwas, probably a branch of the Jat tribe, which preceded the Jadejas in Saurashtra from Kutch and established a kingdom at Ghumli.
Jam Ranjitsinhji (t872-1933), the then ruler, popularly known as Jam Ranji, was a peerless cricketer, after whom the Ranji Trophy, a national cricket tournament of India, was instituted. The tradition of sports established by him has given rise to some of the world famous cricketers from this region like Prince Dulipsinhji, Vinoo Mankad and Amarsing.
The original inhabitants of Okhamandal, a taluka of tbis district, were the Llrbuknt Vaghers. They seem to have descended from an ancient tribe called Kalas, who along with Modas, inhabited this region. The earliest known conqueror of Okhamandal was Shri Krishna who was succeeded by his great-grandson Vajrabhan. After the decline of the Yadav power, the Kalas were again in control of Okhamandal from the middle of the second century, till the sixth with an interval of the ascendency of tWG Syrian fugitives. By this time Kalas came to be known as waghers whose predatory activities made them a sourCe
* Class A-The area w here there had been a total failure of crops once every three years.
t Class B-The area where there had been a total failure of crops once every six years.
~ Class C-The area where there had been a total failure of crops once every ten years.
4
of constant trouble and threat to the peace of the Knthiawar peninsula. Between the middle of the 13th and beginning of the 19th century, Okhamandal passed into the hands of Hindu and Muslim rukrs and was finally captured by the British, when the Vagher pirates captured a British vessel and threw an English couple over board in 1804. ,\s Dwarka and Beyt wcre regarded as holy places by Hindus, Okhamandal was handed over to the Gaekwad in 1817 in whose possession it continued till the merger of the Baroda State in 1949 and was finally included in Jamnagar district in 1959.
2.2 Territorial Changes
The north-west corner of the district, conical in shape, known as Okhamandal taluka was formerly a part of Amreli district. The district was formed in 1949 out of the territories of the
former State of Nawanagar, Dhrol, Dhrafa, Tldna and part of Jalia Dcwani at the time of their merger with the Indian Union. H bec,lme part of Bombay State and formed part of Gujarat State on its formation into a separate State on 18t May, 1960, The territorial changes which took place betwt:t:n the period 1951-61 are given in sub-Appendix 2 to Appendix I to table A-II published in Part II of this Handbook.
2.3 Administrative Divisions
Jamnagar is one of the districts of Rajkot division of Gujarat State. For the purposes of revenue administration the district is divided into 3 sub-divisions with 6 talukas and 4 mahaIs,
The details about the area and population in respect of these sub-divisions are given in the following table.
Administrative Divisions, 1961
Sl. No. 1
2 3 4 5 6
7 8 9
10
Sub-Division! Taluka/Mahal
2
District Total
Total for Jamnagar
Sub·division Jamnagar
Total for Eastem
Sub·division Dhrol Jodiya Kalavad Lalpur Jam jodhpur
Total for Khambhalia Sub-division
Okhamandal Kalyanpur Kbambhalia Bhanvad
Area No. of (in sq. miles) towns
3 4
4,020.1 15
476.5 3 476.5 3
1,948.1 5 218.4 343.1 495.2 436.3 455.1
1,595.5 7 271.7 4 552.9 .. 483.3 2 2876 I
Details of inhabited and uninhabited villages, density and occupied houses are available in Census Table, A-I published in Part II of this Handbook.
2.4 Revenue
The Collector is in charge of the general administration, law and order and civil supplies. He is assist· '<{ by a Personal Assistant in his office
5
No. of Population
villages Total Rural Urban 5 6 7 8
720 328,419 534,761 293,658
101 255,970 87,975 167,995 101 255,970 87,975 167,995
351 302,315 256,386 45,929 41 35,310 25,527 9,783 53 61,445 53,624 7,821
103 74,929 65,837 9,092 75 53,045 47,610 5,435 79 77,586 63,788 13,798
268 270,134 190,400 79,734 42 60.595 21,512 39,083 70 68,933 68,933 86 81,972 53,140 28,832 70 58,634 46,815 II ,819
and Deputy Collectors in charge of 3 sub-divisions having their headquarters at Jamnagar, Jamjodhpur and Khambhalia. There are 6 Mamlatdars in charge of 6 taluka offices at Jamnagar, Dhrol, Kalavad, Jamjodhpur, Khambhalia and Okharnandal and 4 mahalkaris in charge of the mahal offices at Jodiya, Lalpur, Kalyanpur and Bhanvad.
2.5 Land Tenures
Owing to the feudal character of the economy at the time of States' integration, there was in the former Saurashtra State villages included in this district, a variety of tenures which could
be broadly classified as under:-
(i) Khalsa lands comprised of the areas of covenanting States where cash assessment was levied;
(ii) Khalsa lands comprised of the areas of the covenanting States where crop-share or Bhagbatai system prevailed; and
(iii) Non-khalsa lands held on Girasdari and Barkhali teRures, where rent was levied JIlostly in crop-share. All the non-khalsa categories such as Mulgiras, Bhayat, Talukadari, etc .• were broadly classified under Girasdari tenure and the rest as Barkhali land held as Mulgiras was not alienated as it was held by the Girasdar even before the State came into being. Barkhali lands included grants to Devasthans, village servants, etc., and other grants such as Inam, Jivai, Dharmada or Kherati, when the State's revenue was partly or wholly alienated. Girasdari tenure involved proprietary rights with or without the right of transfer with the permission of the Darhar or the State, which the Barkhali did not.
In some of the above areas various obnoxious
'veras' or levies prevailed which were abolished immediately after integration and the formation of the new State of Saurashtra. Occupancy rights were granted to holders of Khalsa lands, and where crop-share system prevailed it was converted into cash assessment in respect of both khalsa and non-kQalsa lands. Pending regular survey and settlement, the lands were broadly classified into good, medium and
inferior and on the basis of avera$e yield of 15 years, udhad, i.e., lump cash assessment was fixed for every khata or holding in those khalsa village where crop-share system was ill vo~ue. .
2.6 Revenue
The method of survey used during the princely regime except in the case of the former Baroda State areas was to have a traverse laid down on the village boundaries with the help of theodolite, then to have an adhar line and one or two supplementary adhar lines and· then to do detailed survey of each field by chain and cross-staff method. The areas of each survey number and its sub-divisions and for each class of land comprised therein were separately entered in the land records under an indicative number, i.e., survey number, the numbering of sub-divisions being subordinate to the number of parent survey number. In the case of the former Baroda State areas, the method of survey adopted was that of 'Chok Mapani' system, according to which. the whole area to be surveyed was laid down in choks of 32 chains which were further sub-divided into smaller blocks of 4 by 10 chains, each chain being equal to 80 ft. The rest of the method was the same as above. All the unsurveyed areas have since been surveyed, and no area in this district now remains unsurveyed.
2.7 Revenue Settlement
Soils of villages of the former Nawanagar (Jamnagar) and Baroda States which are included in tbis district were classified during the former States, regime. The soil classification system followed in the former Baroda State area was the same as the Gujarat classification system. The main classes of land as recognised for classification in the former Nawanagar State villages were (1) Jarayat (Dry crop) and (2) Peet (irrigated), which corresponds to the Gujarat soil classification system (except in respect of subsoil f~ctor).
Instead of adding sub-soil classification value and assessment, Kos-ratc was applied to the lands under well irrigation.
For the villages of the various former States which were not classified, the Land Records Department of the former Saurashtra Government evolved, in the year 1956, a system of classification which. though mostly analogous to the
Gujarat classification system differs slightly from it in respect of soil classes and details of subsoil classification and average classification values. Instead of working out average classification value for each survey number or its sub-division, the areas with different c1assification values in the same survey number or sub-division are reduced into area of 16 annas classification value. Unlike Gujarat classification system, well irrigated lands according to Saurashtra classification system are treated as bagayat lands. The sub-soil classification system is more or less similar to that of Gujarat classification system. It, however, differs from the latter insofar . as the sub-soil classification scale is not related to soil classification values of all the lands in the zone or 'Vaga' adjudged to have this facility but to 3 or 4 acres of land, as the case may be, which are considered as irrigable from each kos or water-bag on the existing wells.
The above system of classification is continued after the reorganisation of States for villages where soils are not classified before, or ,for villages where the soils, though classified before, are required to be re-classified. However, where soils of a part of a village are classified before and those of the remaining part are to be classified, • the system followed in the classified part of the village is adopted for the rest of the village to maintain uniformity. The classification work is in progress and will be completed as a Plan scheme before the end of the Third Five Year Plan.
The villages of the former Nawanagar and Baroda States were settled villages and they were declared as deemed settled villages by Govern· ment. The rest of the villages were unsettled. For deemed settled villages, remission of excess of then existing rates of assessment over the rates of assessment obtaining in the *Comparable Union Areas, was sanctioned with effect from 1959-60 under Land Revenue Rule 18 framed under Section 52 of Land Revenue Code, allowing rates of assessment where they were lower to continue as they were· For other villages and areas not so deemed settled, Land Revenue Rule 17 is framed
under Section ~2 of Bombay Land Revenue Code. According to this rule, the villages were placed into homogeneous groups on consideration of the factors of physical configuration, climate and rainfall, prices and yields of principal crops and then for each of these groups, the Comparable Union Areas were determined on the basis of homogeneityof soil and crop pattern. The rates prevailing in the former State villages were then compared with the rates of the Comparable Union Areas. In respect of classified villages, if the assessment worked out by application of the formula of Comparable Union Areas to the classification value was more than that prevailing, i.e., the existing assessment, the latter was continued and where the former was lower than the latter, the latter was brought down to the level of the former. [n respect of unclassified villages the existing rates were respected if they were lower than those obtaining in the Comparable Union Areas and they were brought to the level of the latter, where they were higher. Where the lands were not scientifically classified, they were classified as good, medium and inferior and 2/3rd of the rate for good lands was applied to the medium lands and 1(3rd to the inferior lands. Well irrigated lands were considered as Bagayat and double the rate of Dry Crop land in the group was fixed for such lands. Assessment was worked out on this basis for all the survey numbers and sub-divisions in the district and recorded accordingly.
2.8 Agrarian Structure and Land Reforms
The Saurashtra Land Reforms Act and the Saurashtra Barkhali Abolition Act passed in 1951, did away with Girasdari tenure and all kinds of Barkhali tenures with effect from 1-9-1951 (vide Saurashtra Government Notification Revenue Department No. RD./N/1758, dated 18-5-51). The land reforms legislation, besides abolishing inams and special tenures, provided for determination of cash assessment on the basis of arithmetic average of assessment leviable in the surrounding adjoining assessed khalsa or non-khalsa lands or villages, until the villages in which such lands were situated were surveyed and settled.
*Union Areas-Areas forming part of the pre-Independence districts of the Bombay Province
7
Non-agricultural lands such as waste lands, grass la~ds. gauchars, roads and rivers, etc., which forme-d part of the estates but did not vest in Government were acquired under the Saurashtra Estate Acquisition Act, 1952. All these steps of agrarian reforms have resulted in introducing Ryotwari system, cash assessment on a systematic basis and fixity of tenure on a permanent basis for the whole of Saurashtra region.
The Bombay Preventation of Fragmentation and Consolidation of Holdings Act was applied to the district, but action initiated for consolidation of holdings had soon to be withdrawn on account of agitation of the agriculturists on the ground of restriction over their rights on land. 'The implementation of the Act is under the consideration of the State Government. The Gujarat Agricultural Lands Ceiling Act, 1960, has also been made applicable to thi& ~istrict.
2.9 Size of Land Holding
The size of land holding and number of landholders obtaining provide useful data for the study of agrarian problems of the district. Details as to the number of holders and the area of land held in various groups are given in the following table.
Size of land holdings, 1961 Size of land Percentage PerCeI).t;lge to
holdings No. of to total Area held total area (in acres) holders holders (in acres) beld
I 234 5 Total 62,312 100.00 1,272,705-25 100.00 0-5 6,922 10.9 30,703· 04 2.4 5-i5 17,082 27 . .0 142,436-13 11·2
15-25 18,863 29.8 376,475-37 29.6 25-100 20,317 32.1 'fD2,074-17 55.2
100 and above 123 0.2 21,015-34 1.6
In the size group 0-5, 6,922 of landholders or 10.9 per cent hold 2.4 per cent of the total area, while in the acre-group 5-15, 27 per cent of holders are found having 11.2 per cent of land. The interesting feature disclosed is that about 32.1 per ceot of holders in the size group 25-100 acres hold about 55.2 per cent of the total area of land. The economic hoiding determined for the different areas comprising this district is in the range of 32 to 40 acres. In view of this 32.1 per cent of Q,olders have 55.2 per cent of the total area whi_ch can be said to be
8
comprised in economic holding, the I proportion of those which are uneconomic, being comparatively small.
2.10 Parliamentary and Assembly Constituencies
Under the Delimitation of Parliamentary and Assembly Constituencies Order, 1961, 1 seat is allotted to this district for the purpose of election to the House of the People and 6 seats for the State Assembly. The details comprising the territorial extent of the Parliamentary and Assembly Constituencies are shown below.
Delimitation of Parliamentary and Assembly Constituencies
A
Parliamentary Constituencies
SI. Name of No. Constituency
1 2
1 Jamnagar
Extent in terms of Assembly Constituencies
3
Jodiya, Jamnagar, Kalavad, Jamjodhpur, Khambhalia, Dwarka and Porbandar
B
Assembly Constituencies
SI. Name of No. Constituency 1 2 1 Jodiya
2 Jamnagar 3 Kalavad
4 Jamjodhpur 5 Khambhalia 6 Dwarka
2.11 Judiciary
Extent of Constituency 3
Jodiya mahal, Dhrol taluka and 28 villages of Vantbali circle of Jamnagar taluka
Jamnagar city Jamnagar Taluka (excluding Jamnagar city and 28 villages of Vanthali Circle of Jamnagar Taluka) and Kalawad taluka
Jamjodhpur taluka and Lalpur mahal Khambhalia taluka and Bhanvad mahal Okhamandal taluka and Kalyanpur mahal
The judicial set-up of the district comprises of one District and Sessions Judge, one Assistant District Judge, one Civil Judge (Sr. Division) and nine Civil Judges (Jr. Division). As Sessions Judge, he is empowered to impose any sentence authorised by law, but any sentence of death subject to confirmation by the High Court. The Assistant Sessions Judge is empow~red to impose any sentence authorised by law, except a sentence of death or i,m.prisionment for life or of imprisonment
for a term exceeding 10 years. The District Judge
has unlimited jurisdiction in civil suits while the
Assistant Judge has jurisdiction up to Rs. 15,000 in such suits. Civil Judge (Sr. Division) and
judicial Magistrate lS empowered to impose a
sentence of imprisonment for a term not exceeding
2 years and fine not exceeding two thousand
rupees. He has got unlimited jurisdiction in civil
suits. Civil Judges (Jr. Division) have jurisdiction
up to Rs. 10,000 in civil suits.
2.12 Police
The total strength of civil police in 1960-61
amounted to 674 persons. There were 16 police
stations and 14 police outposts in the district. The
total number of cognisable offences investigated
was 1,370. Thus there was 1 police per 5.96 sq.
miles of area. The number of persons per police
was 1,229 and the number of cognisable offences
investigated per police was 2.03.
The number of crimes by major class of
offences in the district is extracted from table
11.3 given in Part II of this Handbook wherein
further details regarding number of persons
acquitted or discharged and number of persons
convicted will be found.
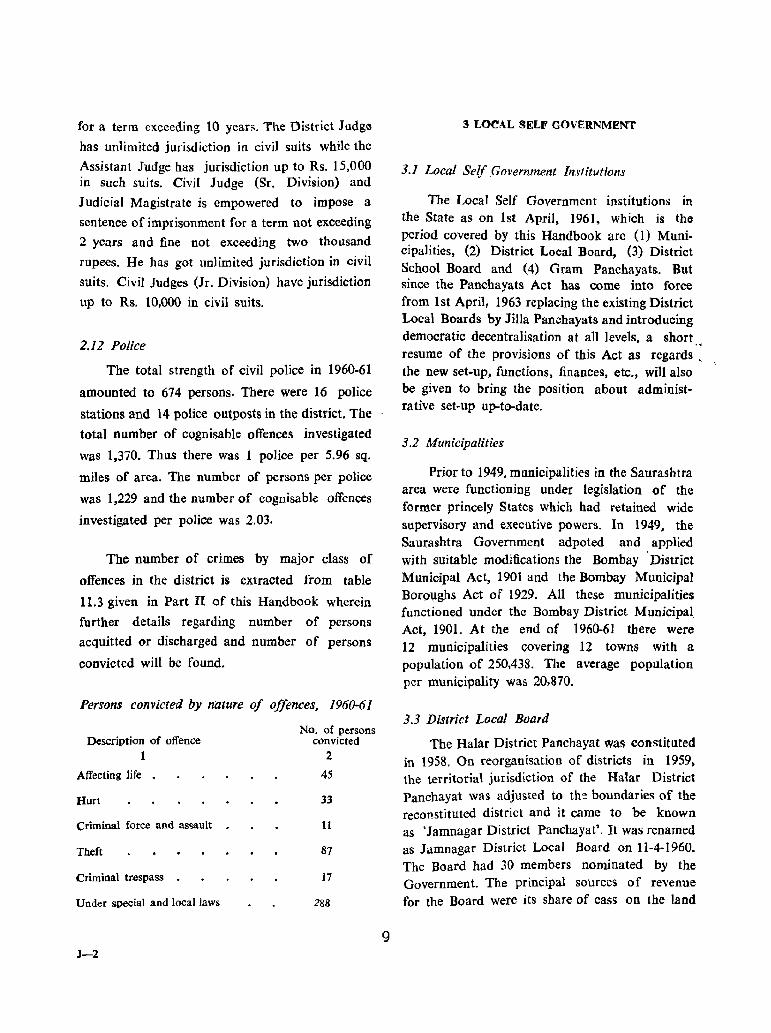
Persons convicted by nature of offences, 1960-61
No. of persons Description of offence convicted
1 2
Affecting life 45
Hurt 33
Criminal force and assault 11
Theft 87
Criminal trespass 17
Under special and local laws 288
J-2 9
3 LOCAL SELF GOVERNMENT
3.1 Local Self .Government Institutions
The Local Self Government institutions in the State as on 1st April, 1961, which is the period covered by this Handbook are (I) Municipalities, (2) District Local Board, (3) District School Board and (4) Gram Panchayats. But since the Panchayats Act has come into force from 1st April, 1963 replacing the existing District Local Boards by Jilla Panchayats and introducing democratic decentralisation at all levels, a short
"
resume of the provisions of this Act as regards. the new set-up, functions, finances, etc., will also be given to bring the position about administrative set-up up-ta-date.
3.2 MuniCipalities
Prior to 1949, municipalities in the Saurashtra area were functioning under legislation of the former princely States which had retained wide supervisory and executive powers. In 1949, the Saurashtra Government adpoted and applied with suitable modifications the Bombay . District Municipal Act, 1901 and the Bombay Municipal Boroughs Act of 1929. All these municipalities functioned under the Bombay District Municipal, Act, 1901. At the end of 1960-61 there were 12 municipalities covering 12 towns with a population of 250,438. The average popUlation per municipality was 20,870.
3.3 District Local Board
The Halar District Panchayat was constituted in 1958. On reorganisation of districts in 1959, the territorial jurisdiction of the Halar District Panchayat was adjusted to th~ boundaries of the reconstituted district and it came to be known as 'Jamnagar District Panchayat'. It was renamed as Jamnagar District Local Board on 11-4-1960. The Board had 30 members nominated by the Government. The principal sources of J"evenue for the Board were its share of cass on the land
revenue statutorily payable to the District School
Board and other development grants sanct\oned
by the Government. Total income and expenditure
of the Board during 1960-61 were Rs. 1,167,713
and Rs. 992,830 respectively. The main sources
of income are civil works and local rates and
the major heads of expenditure are civil public
works and medical. The following table shows
income and expenditure of the J amnagar District
Local Board during 1960-61 under different
heads.
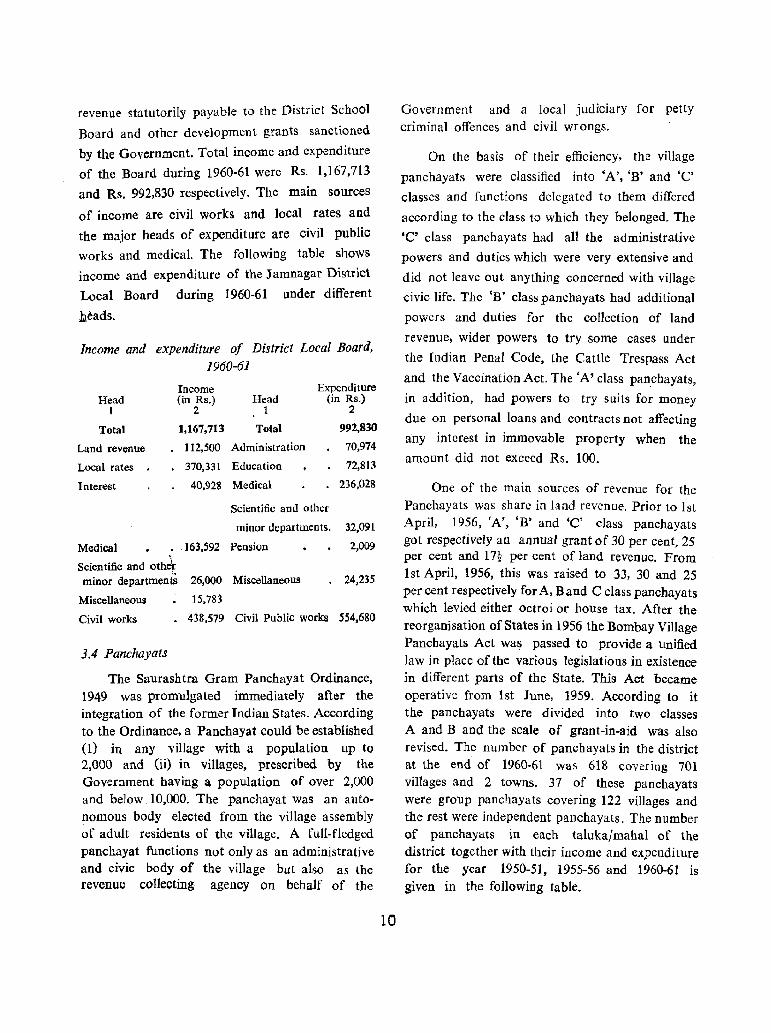
Income and expenditure of District Local Board, 1960-61
Head 1
Total
Land revenue
Local rates
Interest
Medical . Scientific and oth~
Income (in Rs.)
2
1,167,713
112,500
370,331
40,928
163,592
Expenditure Head (in Rs.)
1 2
Total 992,830
Administration 70,974
Education 72,813
Medical 236,028
Scientific and other
minor departments. 32,091
Pension 2,009
minor departments 26,000 Miscellaneous 24,235
Miscellaneous
Civil works
3.4 Panchayats
15,783
• 438,579 Civil Public works 554,680
The Saurashtra Gram Panchayat Ordinance, 1949 was promulgated immediately after the integration of the former Indian States. According to the Ordinance, a Panchayat could be established (1) in any village with a population up to 2,000 and (ii) in villages, prescribed by the Government baving a popUlation of over 2,000 and below 10,000. The panchayat Was an autonomous body elected from the vjUage assembly of adult residents of the village. A full-fledged panchayat functions not only as an administrative and civic body of the village but also as the revenue collecting agency on behalf of the
10
Government and a local judiciary for petty criminal offences and civil wrongs.
On the basis of their efficiency, the village
panchayats were classified into 'A', 'B' and 'C'
classes and functions delegated to them differed
according to the class to which they belonged. The
'C' class panchayats had all the administrative
powers and duties which were very extensive and
did not leave out anything concerned with village
civic life. The 'B' class panchayats had additional
powers and duties for the collection of land
revenue, wider powers to try some cases under
the Indian Penal Code, the Cattle Trespass Act
and the Vaccination Act. The 'N class panchayats,
in addition, had powers to try suits for money
due on personal loans and contracts not affecting
any interest in immovable property when the
amount did not exceed Rs. 100.
One of the main sources of revenue for the Panchayats was share in land revenue. Prior to 1st April, 1956, 'A', 'B' and 'C' class panchayats got respectively an annual grant of 30 per cent, 25 per cent and 1 n per cent of land revenue. From 1st April, 1956, tbis was raised to 33, 30 and 25 per cent respectively for A, Band C class pancbayats which levied either octroi or bouse tax. After the reorganisation of States in 1956 the Bombay Village Panchayats Act was passed to provide a unified law in place of the various legislations in existence in different parts of the State. This Act became operative from 1st June, 1959. According to it the panchayats were divided into two classes A and B and the scale of grant-in-aid was also revised. The number of panchayats in the district at the end of 1960-61 was 618 covering 701 villages and 2 towns. 37 of these panchayats were group panchayats covering 122 villages and the rest were independent panchayats. The number of panchayats in each talukafmahal of the district together with their income and expenditure for the year 1950-51, 1955-56 and 196().61 is given in the following table.
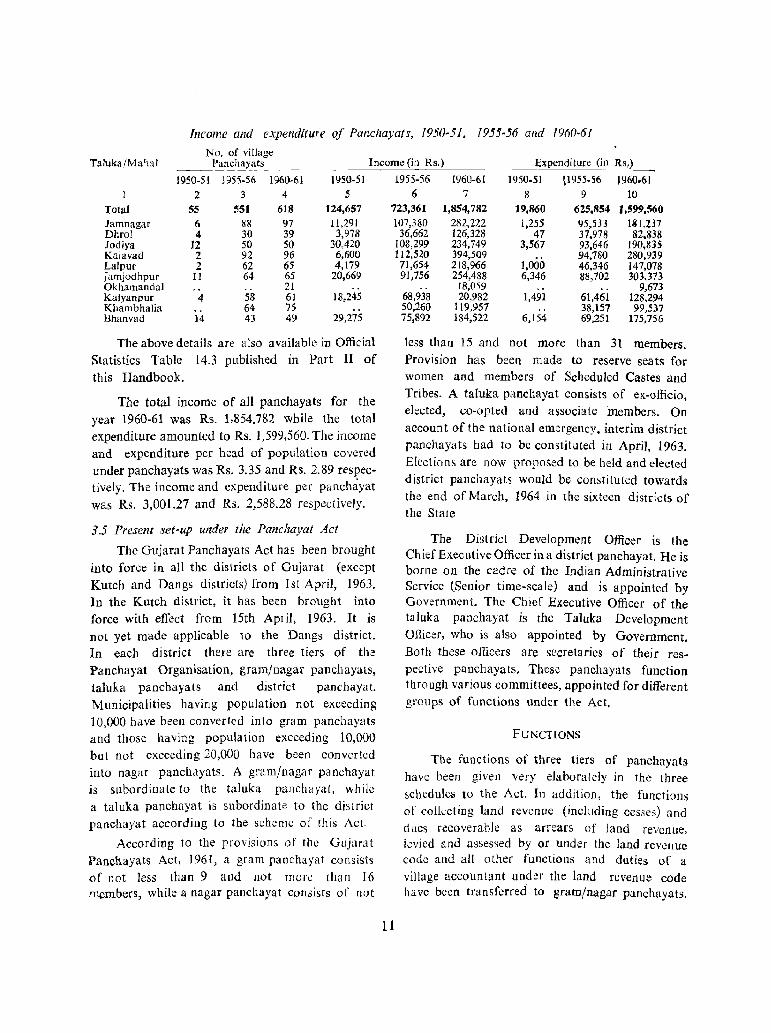
Income and expenditure of Panchayats, 1950-51, 1955-56 and 1960-61
No. of village Taluka/Ma'1al Panchayats Income (in Rs.) E:xpenditul'e (in Its,)
1950·51 1955-56 1960·61 1950-51
2 3 4 5 Total 5S 551 618 124,657
Jamnagar 6 88 97 11,291 Dtrol 4 30 39 3,978 Jodiya 12 50 50 30,420 Kalavad 2 92 96 6,600 LaJpur 2 62 65 4,179 Jamjodhpur 11 64 65 20,669 Okhamandal . , 21 .. Kalyanpur 4 58 61 18,245 Khambhalia .. 64 75 Bhanvad 14 43 49 29,275
The above details are also available in Official Statistics Table 14.3 published in Part II of this Handbook.
The total income of all panchayats for the year 1960-61 was Rs. 1.854,782 while the total expenditure amounted to Rs. 1,599.560. The income and expenditure per head of population covered under panchayats was Rs. 3.35 and Rs. 2.89 respec· tively. The income and expenditure per panch~yat was Rs. 3,001.27 and Rs. 2,588.28 respectively.
3.5 Present set-up under tlte Panchayat Act
The Gujarat Panchayats Act has been brought into force in an the districts of Gujarat (except Kutch and Dangs districts) from 1st April, 1963. In the Kutch district, it has been brought into force wilh effect from 15th April, 1963. It is not yet made applicable to the Dangs district. In each district there are three tiers of the Panchayat Organisation, gram/nagar panchayats, 1aluka panchayats and district panchayat. Municipalities having popUlation not exceeding 10,000 have been converted into gram panchayats and those having popUlation exceeding 10,000 but not exceeding 20,000 have been converted into nagar panchayats. A gram/nagar panchayat is subordinate to the taluka panchayat, wh jle a taluka panchayat is subordinate to the district panchayat according to the scheme of this Act.
According to the prOVisions of the Gujarat Panchayats Act, 1961, a gram panchayat consists (If not less than 9 and not more than 16 members, while a nagar panchayat consists of not
1955-56 1960·61 1950.51 (1955.56 1960.61 6 7 8 9 10
723,361 1,854,782 J9,860 625.854 1,599,560
11
107,380 282,222 1,255 95,533 181,Z37 36,662 126,328 47 37,978 82.838
108,299 234,749 3,567 93,646 190,835 112,520 394,509 94,780 280,939 71,654 218,966 1,000 46.346 147,078 91,756 254,488 6,346 88,702 303,373
.. 18,059 9,673 68,938 20,982 1,491 61,461 128,294 50,260 119,957 .. 38,157 99,537 75,892 184,522 6,154 69,251 175,756
less than 15 and not more than 31 members. Provision has been made to reserve sea ts for women and members of Scheduled Castes and Tribes. A taluka panchayat consists of ex-officio, elected, co-opted and associate members. On aecoun t of the national emergency. interim district panchayats had to be constituted in April, 1963. Elections are nOw proposed to be held and elected district panchayats would be constituted towards the end of March, 1964 in the sixteen districts of the Stale
The District Development Officer is the Ch ief Executive Officer in a district panchayat. He is borne on the cadre of the Indian Administrative Service (Senior time-scale) and is appointed by Government. The Chief Executive Officer of the taluka panchayat is the Taluka Development Officer, who is also appointed by Government. Both tbese officers are secretaries of their respective panchayats. These panchayats function through various committees, appointed for different groups of functions under the Act.
FUNCTIONS
The functions of three tiers of pancbayats have been given very elaborately in the three schedules to the Act. In addition, the functions of collecting land revenue (including cesses) and dues recoverable as arrears of land revenue, levied and asses<;ed by or under the land revenue code and all other functions and duties of a village accountant under the land revenue code have been transferred to gram/nagar panchayats.
The powers ex.ercised and the functions and duties performed by the District School Board have been similarly transferred to the taluka and district panchayats and all primary schools have been placed under the control of taluka and district panchayats. A large number of functions such as registration of co-operative societies, approval of amendment to the bye~Jaws of co-operative societies, calling of or extending the period for tbe calling of annual general meeting of co-operative societies and such other functions wbich under the Co-operative Societies Act were exercised by the Registrar, CQ-operative Societies, have been transferred to district panchayats. Moreover, functions relating to agriculture, animal husbandry, public health and medical relief, social welfare, cottage industries and small scale industries and District Statistical Office, have been transferred on an agency basis to tbe district pancbayats.
STAFF
To enable the panchayats to carry out numerous activities entrusted to them, Government has transferred/deputed a number of its employees alongwith the functions transferred. The staff of the District School Boards and District Local Boards has also been transferred to taluka/district panchayats. It has been envisaged in the Act to constitute a Pancbayat Service in connection with the affairs of panchayats and to maintain a uniform standard in the recruitment for panchayat service. A Panchayat Service Selection Board has been constituted for this purpose.
FUNDS
The panchayats have been given necessary funds to execute all schemes transferred to them. In addition, provision has been made in tbe Act, for various tiers of panchayat to levy taxes and fees. A gram or nagar panchayat, subject to certain conditions can levy a tax on buildings, a pilgrim tax, a tax On fairs, festivals ~nd other entertainments, a taK on bicycles or vehicles drawn by animals, a sanitary tax, etc. It can also levy fee on markets, cart stands, tonga stands, for the supply of water from wells and tanks for purposes other than domestic use and for cattle. The taluka pancbayat and district panchayat can
12
request Government for increase in stamp duty. Moreover, provision has been made in the Act for making grants to the panchayats for its activi ties.
At present, the implementation of the Act is being done mostly. through the Commissioner. They have been delegated with most of the powers of the State and exercise supervision over panchayats.
Provision has also been made in the Act under which the State Government will give grants to the panchayats on the basis of the average of the land revenue collected during the last three preceding Years, after deducting therefrom the expenditure on the salaries and training of the secretaries of gram panchayats and village accountants and crediting 5 per cent of the amount to the State Equalisation Fund. Fifty percent of the balance will be distributed among gram panchayats and nagar panchayats, 25 per c~ among taluka pailchayats and 10 per cent among the district panehayats. Out of the remaining 15 per cent of the land revenue, n per cent will be carried to tbe District Equalisation Fund and n percent to the Gram Encouragement Fund.
4 POPULATION
4.1 Growth of Population
In 1951. the popUlation of the district as constituted in 1961. was 616,896. According to the 1961 Census the same has gone up to 828,419 and increased by 211,523 or 34.29 per cent, the highest during the last sixty years and higher than that observed in the case of Gujarat State which is 26.88 per cent. The following table compares the growth rate in the district during the last sixty years.
Variation in population during 1901 to 1961
Decade Percentage Year Population variation decade vanation
1 2 3 4 1901 352,150 1911 359,604 + 7,454 + 2.12 1921 359,631 + 27 + 0.01 1931 425,463 + 65,832 + 18.31 1941 517,833 + 92,370 + 21.71 1951 616,896 + 99,063 + 19.13 1961 828,419 +211,523 + 34.29 1901 to 1961 +476,269 +135.25
Sexwise details are available in Census Table A-II published in Census of India, 1961, Vol ume V -Gujarat-Part II-A.
The unprecedented growth of numbers between 1951-61 can, however, be attributed to the decline in death rate, accompanied by steady improvements in medical and public health services available to the people since Independence.
OCCUPIED RESIDENTIAL HOUSES AND
HOUSEHOLDS
The total number of occupied residential houses in the district is 141.027 or 3.78 per cent in the State. The average number of persons per occupied census house for total, rural and urban areas of the State and district is given below.
A verage number of persons per occupied census house, 1961
Total/Rural/Urban State District 1 2 3
Total S.53 587
Rural 554 6.04
Urban 5.52 5.60
It will be seen. that the average number of persons per occupied census house in the district is higher than that of the State for its total, rural and urban areas.
The number of households in the district was, total 144,396, rural 90,059 and urban 54,337 and that of houses, total 141,027, rural 88,581 and urban 52.446. The number of households per <cent of houses, therefore, comes to 102.39, 101.67 and 103.61 for the total, rural and urban areas respectively. The average number of persons per household for total, rural and urban areas of the district comes to 5.74, 5.94 and 5.40 respectively.
4.2 Rural/Urban Distribution
The criteria for determining whether a place was rural or urban varied from census to census and rendered such data incomparable. A uniform definition for urban areas was, therefore, adopted during the Census of 1961, by laying down that
13
a place should be classified as urban if it was (I) a municipality, cantonment or civil lines or, (2) had-(a) a population of 5,000 or over and (b) 75 per cent or more of the total male population was dependent on non-agricultural pursuits.
'Village' is a revenue village which is an administrative rather than a demographic unit. The definition of the term 'Village' has practically remained the same during the entire census period. In short, it is a revenUe or cadastral survey village which has got a separate entity and a distinct number assigned to it in the revenue records of the State.]t may consist of a single village with a cluster of houses or a number of hamlets with separate clusters of houses. In forest areas it may even consist of scattered houses situated on the field within the boundaries of the village. It may be inhabited or uninhabited.
4.2 (i) Rural Population
The total number of villages in the district is 720 of which 19 are uninhabited. The total rural population of the district is 534,761 gIVing an average of 763 persons per inhabited village. The proportion of rural popUlation (64.55 per cent) to {he total populat:on in the district is lower than similar proportion in the State which is 74.23 per cent. Percentage distribution of rural population by size group of villages is given below.
Percentage distribution of rural population by size group of villages, 1961
Percentage to Percentage to No. of total No. Rural total rural
Size group villages of villages population population
1 2 3 4 5
Less than 200 76 10.84 8,385 1.57
200-499 216 30.81 75,090 14.04
500-999 250 3566 179,262 33.52
1,000-1,999 122 17.41 165,136 30.88
2,000-4,999 33 4.71 8S,533 1600
5,000-9,999 4 0.57 21,355 3.99
10,000 and above ..
Details of sexwise population for talukas/ mahals are available in Census Table A -III published in Part II of this Handbook.
292 or 41.65 per cent of villages in th~ dhtrict fall in the class range less than 500, while 58.35
per cent of the total have population above 500. Thirty-seven of them are large size villages
(2,000 and above) covering 19.99 per cent of rural
population. It is significant to note that the major
part of rural population (80.01 per cent) is
Number of towns classified by
concentrated in villages having ropuJation Lss than 2,000 and there is concentration 0f major proportion
of rural population in medium size villages.
4.2 (ii) Urban Population
Statement showing the number of tOWll~
classified by popUlation is furnished be!ow.
size groups during 1901 to 196! I
I II III IV V VI 100,000 and above 50,000 to 99,999 20,000 to 49,999 10,000 to 19,999 5,000 to 9,999 Below 5,000 -~--~~-------- -~~----
No. of Popula- No. of Popula- No. of Popula- No. of Popula- No. of Papula- No. of Popula-Year i:owns tion towns tion towns tion towns tion towns tion towns tion
1 Z 3 4 5 6 7 8 9 10 11 12 13
1961 148.572 20,064 5 62,329 7 59,307 1 3,386 1951 104,4~9 I 15,194 9 74,155 5 21,347 1941 71,588 2 23,066 6 46,391 2 8,700 1931 55,056 10,913 5 34,303 1 3,860
1921 42,495 4 28,929 1 3,968 1911 44,887 4 28,979 1 3,658 1901 53,844 4 29,698 1 4.615
Sexwise details of each town are available in Census Table A-IV published in Part If of this Handbook.
Nearly 35.45 per cent of the total population of the district lives in urban areas, as against 25.77 per cent in the State. The number of towns in 1951 was 16 which has come down to 15 in 1961 owing to declassification of a number of them as a result of change in the definition of urban areas. According to this definition, Dhrafa, Balamhha and Raval which were treated as urb:m in 1951 were cleclassified and treated as rural in 1961, and Sikka and Bedi have been treated as urban in 1961.
The urban populi}tion of the district,
numbering 293,658 persons is spread over
15 towns of different sizes of which only
J amnagar comes under class I and has popUlation over 100,000. Of the rest, one is in class III, i.e., size group 20,000 to 49,999, 5 fall under class IV and have population above
10,000 and below 20,000 and 7 have population below lO,()OO and only one town is having
population below I 5,000. No town appears in
class II. The average pvpulation of a town in
this district is 19,577 persons as compared to
30,380 for the State. Although the extent of
urbanisation is found to be ~omparativel~ more
14
than that obtaining in the State as a whole the average population per town is lower than that of the State.
4.3 Density
The area of the district in 1951 was 3,411.0
square miles or 4.80 per cent of the total area of Gujarat. In 1961 it h~d increased to 4,020.1 square
miles or 5.66 per cent of the total area of the State due to changes in the territorial jUrisdiction
of the district. The corresponding percentages
of population for the district as constituted
in 1961 are, however, found to be 3.79 pa cent in 1951 and 4.01 per cent in 1961. The
average density of population is 206 persons
per square mile as against 290 for the State.
The urban density (4,041) is naturally higher than the rural (135) whcre the pressure of population
is comparatively less and the average density is worked out on the basis of the entire area within the revenue limits of the village and not
of the village site. These densities differ for different parts of the district a5 also for its rural
and urban areas as will be Seen from the table that follows.
Population per square mile, 1961
S ta te /District/ Population per square mile TalukajMahal Total Rural Urban
I 2 3 4 State 290 218 7,194 District 206 /35 4,041 Jamnagar 537 189 14,491 Dhrol 162 118 7,525 Jodiya 179 171 261 Kalavad 151 133 12,123 Lalpur 122 10iJ 3,623 Jamjodhpur 170 141 1l,038 Okhamandal 223 82 4,558 Kalyanpur 125 125 Khambhalia ]70 ]11 5,982 Bhanvad 204 169 1,051
While working out the density of urban areas, the "Urban units for which. area figures are not available have been ignored. Rural density is worked out on the basis of rural population only,
though the area figures include the area of those urban units for which separate area figures are not available. The highest average density (537) is found in Jamnagar taluka and the lowest (122) in Lalpur mahal. In rural areas also Jam nagar taluka bas the highest (189) and Okhamandal taluka the lowest (82) density. But among urban arcas Jamnagar taluka tops the list with 14,491 persons per sq. mile, the lowest being 261 for lodiya mabaL
4.4 Migration
The number of persons born (i) at the place of enumeration, (ij) elsewhere in the district,
(iii) outside the district of enumeration but within Gujarat State and those (iv) born outside Gujarat
State as per 1961 Census is given beJow.
Population by place of birth, 1961
Born in ------ Outside
Persons/ Total Place of Elsewhere the district Malesl popula- enumera· in the but in Outside Females tion tion district the State the State
1 2 3 4 5 6 Persons 828,419 562,388 172,014 70,103 23,914 Males 424,300 332,100 52,056 25.880 14,264
Females 40~,J]9 230,288 119,958 44,223 9,650
Percentages
Persons 100.00 67.89 20.76 8.46 2.89 Males 100.00 78.27 12.27 6.10 3.36 Females 100.00 56.99 29.68 10.94 2.39
In case of67.89 per cent of the population of the district, the place of enumeration is the same as the place of birth. This proportion for males is 78.27 per cent, as against 56.99 per cent for females owing to the migration of females after marriage, which appears to be mostly within the district. The proportion of females b:JTn outside the place of enumeration but within the district is as high as 29.68 per cent as compared to those born outside the district but within the State who account for 10.94 per cent and those ourside the State who account for 2.39 per cent only.
The percentage distribution of population born at the place of enumeration, bom elsewhere within the district and outside the district by nine categories of economic activity and of non-workers is !.hown below.
Distribution of population by categories of workers and non-workers classified by place of birth, 1961
Categories of workers
I II III IV V VI VII VIII IX X In Manu-
At facturing In In Transport, As In Mining. House- other than Trade Storage and In
Place of As Agricultural Quarrying. hold Household Tn and Communi- Other Non. birth Cultivator labourer etc. Industry Industry Con~truction Commerce cations Services workers
1 2 3 4 5 6 7 8 9 10 11
District Total 19.95 2.31 0.85 2.80 2.82 0.45 2.ll 1.14 4.67 62.90
Born at the place 20.99 1.95 0.66 2.63 1.73 0.25 1.95 0.76 3.24 65.84 of enumeration
Elsewhere in the 23.07 3.58 1.42 3.68 3.68 0.76 1.98 1.32 5.77 54.74 district
Outside the district 7.99 2.12 0.95 2.22 7Jj1 1.13 3.24 3.13 ]1.14 60.21
15
4.5 Sex Ratio
In 1961 the number of females per 1,000 males in the district was 952 which was higher than the similar ratio of 940 for the State. The corresponding rural and urban sex ratios for the district which were 967 and 927 respectively show that the proportion of females was comparatively Jess in towns than in v.illages.
The following statement compares sex ratios in towns in 1951 and 1961.
Females per thousand males in urban areas, 1951 and 1961
State! Sex Ratio DistrictJ Town 1951 1961
1 2 3 State !ItS 896 District 982 927 Sikka 868 Jamnagar 942 914
Bedi 813 Dhr()} 1,108 984 Jodiya 1,131 1,120 Kalavad 1,066 957 Lalpur 1,083 946 jamjodhpur 1,050 951 Okha port 834 808 Beyt 962 970 Mithapur 958 932 Dwarka 964 917 Salaya 1.045 1.099 Khambhalia ],035 938 Bhanvad 1.053 993
The urban areas with a sex ratio lower than that for the district average are Sikka, Jamnagar, Bedi, Okha Port and Dwarka.
The ratios in respect of these towns appear to be significantly lower due to concentration of male population brought about by the fact that all these towns are port areas where male population from other areas move out for employment and livelihood. Besides, the existence of different industries like woollen mill and pottery works at Jamnagar, Cement factory at Dwarka and Sikka and the intense monsoon shipping and marine activities at Bedi and Okha port contribute in bringing down the sex ratio at these places.
16
The higher female ratios in Jodiya and Salaya are mainly due to the absence of male members who have migrated to towns and big cities for service or business.
4.6 Age Distribution
Table C-JI given in Part II shows the distribution of the population by quinquennial age-groups. Table C-IV gives single year age returns. Broad age-groups are also given in Tables B-1 and C-II printed in Part II. Proportionate population figures by broad age-groups in 1961 are compared separately for males and females with the corresponding proportions for 1951 for the district as constituted then.
Percentage distribution of population by sex and age-groups, 1951 and 1961
Percentage of population by age-groups
1951 1961
Age-groups Males Females Males Females 1 2 3 4 5
Total A to D 100.00 100.00 100.00 100.00
0-4 14.22 14.21 ]6.97 17.06
5-14 26.78 26.61 28.45 27.33 A 0-14 41·00 40.82 45.42 44.39
15-34 3553 34.03 31.81 31.49 35-59 ]8.88 18.86 18.20 18.02
B 15-59 54.41 52.89 50.01 49.51 C 60+ 4:55 6.26 4.53 6.08 D Age not stated 0.04 0.03 0.04 0,02
The proportion of both males and females in the age-group 0-14 has increased during the decade owing to high birth rate which is responsible for an increase of 4.42 per cent in males and 3.57 per cent in females. But there is a slight decline in tbe proportion of males and females in the agegroups 15-34 and 35-59. This may perhaps be due to the migration of adult workers to other areas.
4.7 Marital Status
According to the CenSllS of 1961, 335,784 persons are returned as married, 167,418 males and 168,366 females. Never married persons account for 53.37 per cent of the total population. males being 57.83 per cent and females, 48.69 per cent of their respective population. The widowed
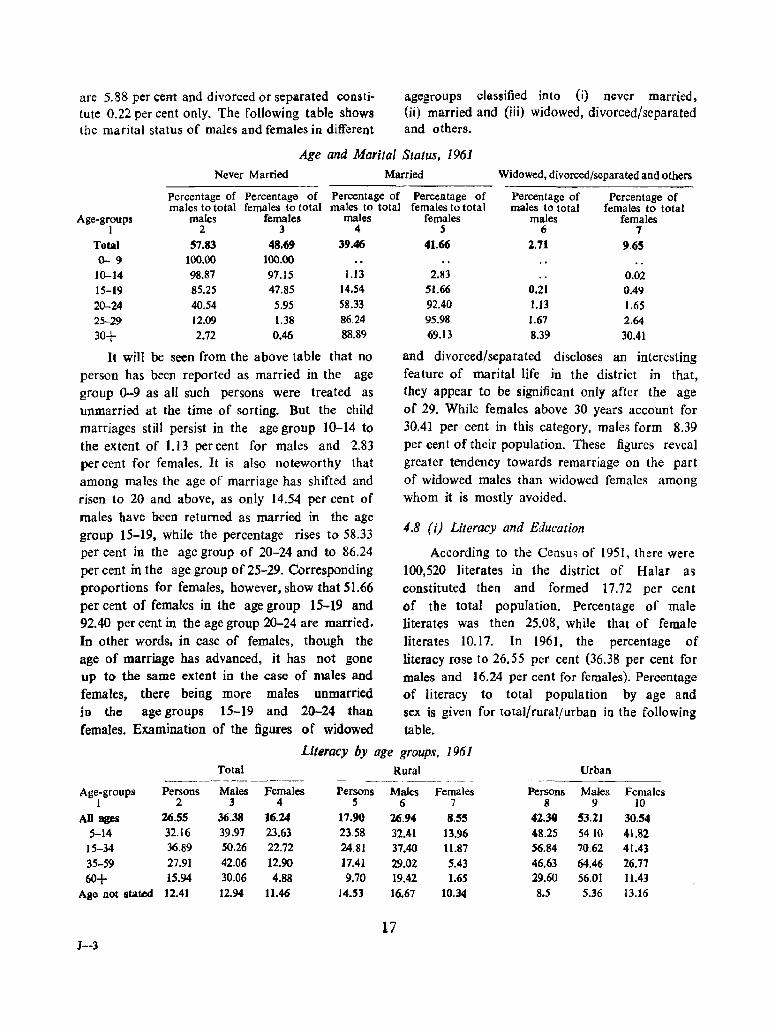
are 5.~8 per cent and divorced orseparated constitute 0.22 per cent only, The following tab1e shows the marital status of males and females in different
agegroups classified into (i) never married. (ii) married and (iii) widowed, divorced/separated and others.
Never Married
Age and Marital Status, 1961
Married Widowed, divorced/separated and others ----------------------
Percentage of Percentage of Percentage of PerceJltage of Percentage of Percentage of males to total females to total males to total females to total males to total females to total
Age-groups males females males 1 2 3 4
Total 57.83 48.69 39.46 0--9 100.00 100.00
10-14 98.87 97.15 1.13 15-19 85.25 47.85 14.54
20-24 40.54 5.95 58.33 25-29 12.09 1.38 86.24
30+ 2.72 0.46 88.89
It wiH be seen from the above table that no person has been reported as married in the age group 0-9 as all such persons were treated as unmarried at the time of sorting. But the child marriages still persist in the age group 10-14 to the extent of 1.13 per cent for males and 2.83 per cent for females. It is also noteworthy that among males the age of marriage has shifted and risen to 20 and above, as on1y 14.54 per cent of males have heen returned as married in the age group 15-19. while the percentage rises to 58.33 per cent in the age group of 20-24 and to 86.24
per cent in the age group of 25-29. Corresponding proportions for females. however, show that 51.66 per cent of females in the age group 15-19 and 92.40 per cent in the age group 20-24 are married. In other words. in case of females, though the age of marriage has advanced, it has not gone up to the same extent in the case of males and females, there being more males unmarried in the age groups 15-19 and 20-24 than females. Examination of the figures of widowed
females males females 5 6 7
41.66 2.71 9.65
2.83 0.02 51.66 0.21 0.49 92.40 1.13 1.65 95.98 1.67 2.64 69.13 8.39 30.41
and divorced/separated discloses an interesting feature of marital life in the district in that, they appear to be significant only after the age of 29. While females above 30 years account for 30.41 per cent in this category, males form 8.39 per cent of their population. These figures reveal greater tendency towards remarriage on the part of widowed males than widowed females among whom it is mostly avoided.
4.8 (;) Literacy and Education
According to the Censu, of 1951, there were 100,520 literates in the district of Halar as constituted then and formed 17.72 per cent of the total population. Percentage of male literates was then 25.08, while that of female literates 10.17. In 1961, the percentage of literacy rose to 26.55 per cent (36.38 per cent for males and 16.24 per cent for females). Percentage of literacy to total population by age and sex is given for total/rural/urban in the following table.
Literacy by age groups, 1961 Total Rural Urban --------- --~--~------ _- -_ -
Age-groups Persons Males Females Persons Males Females Persons Males Females 1 2 3 4 5 6 7 8 9 10
AU ages 26.55 36.33 16.24 17.90 26.94 8.55 42.30 53.21 30.54 5-14 32.16 39.97 23.63 23_58 32.41 13.96 48.2S 541{} 41.82
15-34 36.89 50.26 22.72 24.81 37.40 11.87 56.84 70.62 41.43 35-59 27.91 42.06 12.90 17.41 29.02 5.43 46.63 64.46 26.77
60+ 15.94 30.06 4.88 9.70 19.42 1.65 29.60 56.01 11.43 Age not stated 12.41 12.94 11.46 14.53 16.67 10.34 .8.5 5.36 13.16
17 J--3
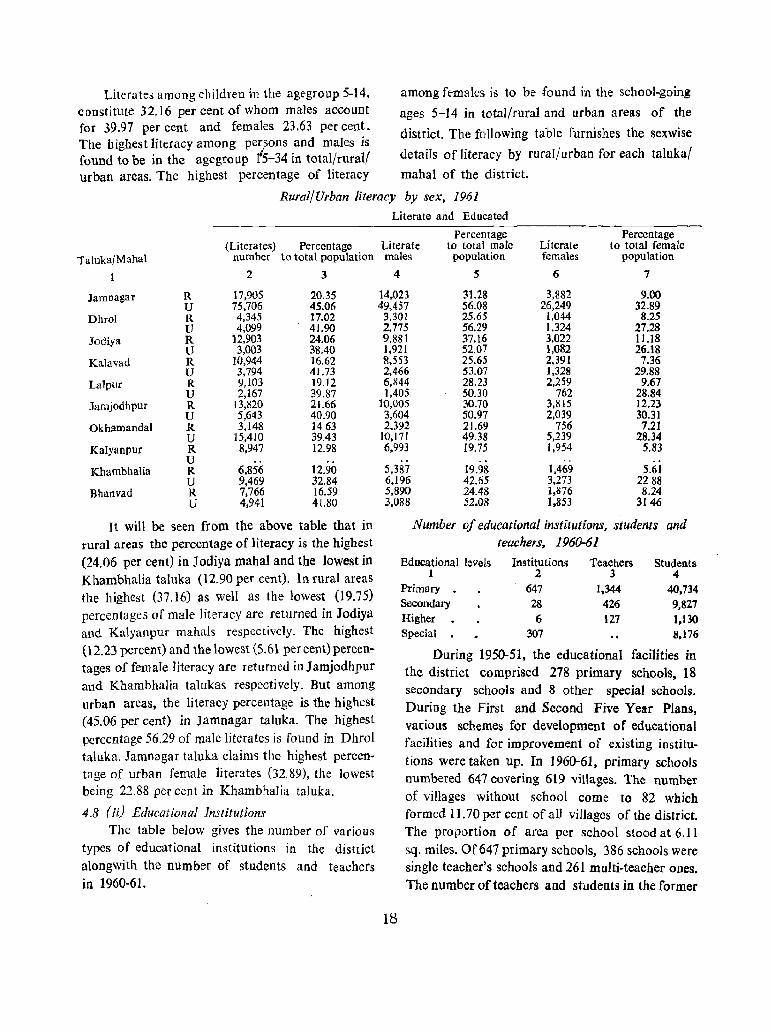
Literates among children in the agegroup 5-14, among females is to be found in the school-going
c()nstitute 32.16 per cent of whom males account ages 5-14 in total/rural and urban areas of the
for 39.97 per cent and females 23.63 per cent. district. The foll()wing table furnishes the sexwise The highest literacy among persons and males is
..i / 1/ details of literacy by rural/urban for each taluka/ found to be in the agegrottp r5-34 in total rura urban areas. The highest percentage of literacy mahal of the district.
Rural/Urban literacy by sex, 1961
Literate and Educated
Taluka/Mahal (Literates) Percentage
number to total population
1 2 3
Jamnagar R 17,905 20.35 U 75,706 45.06
Dhrol R 4,345 17.02 U 4,099 41.90
Jodiya R ]2,903 24.06 U 3,003 38.40
Kalavad R 10,944 16.62 U 3,794 41.73
Lalpllr R 9,103 19.12 U 2,167 39.87
Jamjodbpur R 13,820 2[,66 U 5,643 40.90
Okhamandal R 3,148 ]463 U 15,410 39.43
Kalyanpur R U
8,947 12.98
Khambhalia R 6,856 12.90 U 9,469 32.84
Bhanvad R 7,766 16.59 U 4,941 41.80
It will be seen from the above table that in rural areas the percentage of literacy is the highest (24.06 per cent) in J odiya mahal and the lowest in Khambhalia taluka (12.90 per cent). In rural areas the highest (37.16) as well as the lowest (19.75) percentages of male literacy are returned in Jodiya and Kalyaopur mahals respectively. The highest
(12.23 percent) and the lowest \5.61 per cent)percentages of female literacy are returned in J amjodhpur
and Khambhalia talukas respectively. But among urban areas, the literacy percentage is the highest (45.06 per cent) in Jamnagar taluka. The highest
percentage 56.29 of male literates is found in Dhrol taluka. Jamnagar taluka claims the highest percentage of urban female literates (32.89), the lowest being 22.88 per cent in Khambhalia taluka.
4.8 (if) Educational Institutions The table below gives the number of various
types of educational institutions in the district alongwith the number of students and teachers in 1960-61.
Percentage Percentage Literate to total male Literate to total female males population females population
4 5 6 7
14,023 31.28 3,882 9.00 49,457 56.08 26,249 32.89
3,301 25.65 1,044 8.25 2,775 56.29 1,324 27.28 9,881 37.16 3,022 11.18 1,921 52.07 1,082 26.18 8,553 25.65 2,391 7.36 2,466 53.07 1,328 29.88 6,844 28.23 2,259 9.67 1,405 50.30 762 28.84
10,005 30.70 3,815 12.23 3,604 50.97 2,039 30.31 2,392 21.69 756 7.21
10,171 49.38 5,239 28.34 6,993 19.75 1,954 5,83
.. 5,387 19.98 1,469 5.61 6,196 42.65 3,273 2288 5,890 24.48 1,lS76 8.24 3,088 52.08 1,853 3146
Number of educational institutions, students and teachers, 1960-61
18
Educational levels Institutions Teachers Students 1 2 3 4
Primary . 647 1.344 40,734 Secondary Z8 426 9,827 Higher 6 127 1,130 Special . 307 8.176
During 1950-51, the educational facilities in the district comprised 278 primary schools, 18 secondary schools and 8 other special schools. During the First and Second Five Year Plans, various schemes for development of educational facilities and for improvement of existing institu
tions were taken up. In 1960-61, primary schools numbered 647 covering 619 villages. The number
of villages without school come to 82 which formed 11.70 per cent of alJ villages of the district. The proportion of area per school stood at 6.11
s.q. miles. Of647 primary schools, 386 schools were single teacher's schools and 261 multi-teacher ones.
The number of teachers and students in the former
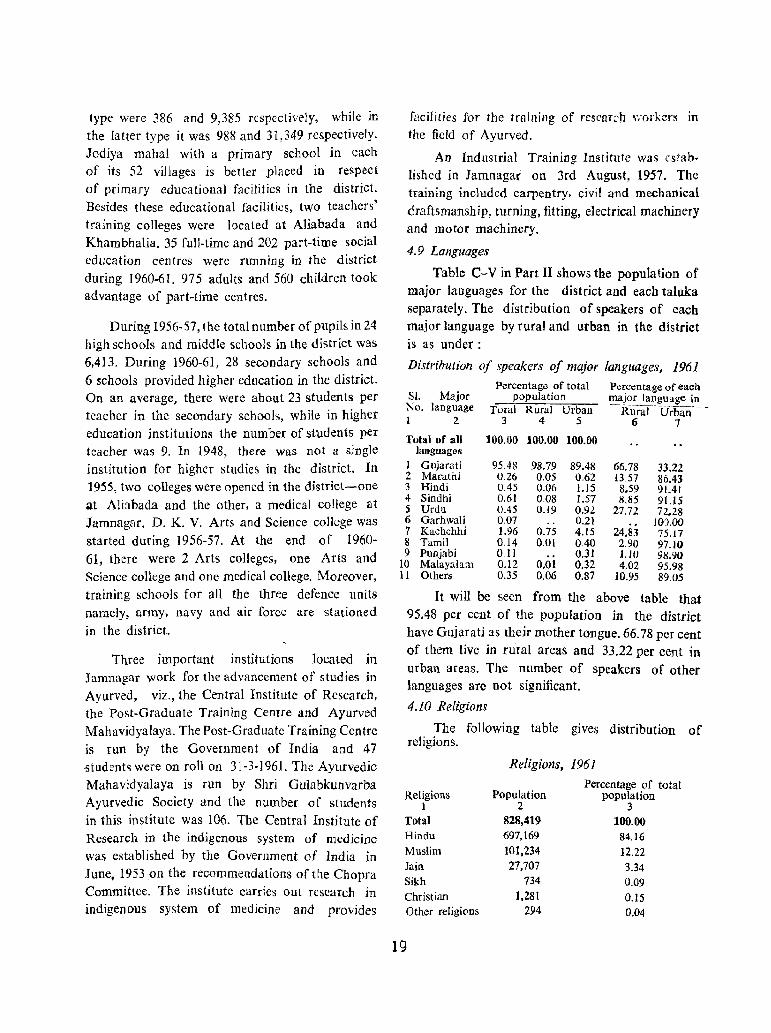
type were 386 and 9,385 respectively, while in the latter type it was 988 and 31,349 respectively.
Jodiya mahal with a primary school in each of its 52 villages is better placed in respect
of primary educational facilities in the district.
Besides these educational facilities, two teachers'
training colleges were located at Aliabada and
Khambhalia. 35 full-time and 202 part-time social education centres were running in the district
during 1960-61. 975 adults ano 560 children took
advantage of part-time centres.
During 1956-57, the total number of pupils in 24
high schools and middle schools in the district was
6,413. During 1960-61, 28 secondary schools and
6 schools provided higher education in the district. On an average, there were about23 students per
teacher in the secondary schools, while in higher
education institutions the number of students per teacher was 9. In 1948, there was not a single
institution for higher studies in the district. In
1955, two colleges were opened in the district-one
at Aliabada and the other, a medical college at Jamnagar. D. K. V. Arts and Science college was
started during 1956-57. At the end of 1960-
61, there were 2 Arts colleges, one Arts and
Science college and one medical college. Moreover.
training schools for all the thrf:e defence units namely, army, navy and air force are stationed
m the district.
Three important institutions located in lamnagar work for the advancement of studies in
Ayurved, viz., the Central Institute of Research, the Post-Graduate Training Centre and Ayurved
Mahavidyalaya. The Post-Graduate Training Centre
is run by the Government of India and 47 ,<;tudent~ were on roll on 31-3-1961. The Ayurvedic
Mahavidyalaya is run by Shri Gulabkunvarba Ayurvedic Society and the number of students
in this institute was 106. The Central Institute of
Research in the indigenous system of medicine was established by the Government of lndia in
June, 1953 on the recommendations of the Chopra
Committee. The institute carries out research in indigenous system of medicine and provides
facilities for the training of research workers in
the field of Ayurved.
An Industrial Training Institute was estab
lished in Jamnagar on 3rd August, 1957. The training included carpentry. civil and mechanical
draftsmanship, turning, fitting, electrical machinery and motor machinery.
4.9 Languages
Table C-V in Part II shows the population of
major languages for the district and each taluka separately. The distribution of speakers of each
major language by rural and urban in the district
is as under:
Distribution of speakers of major languages, 1961
Sl. Major Percentage of total
population Percentage of each major language in
Rural Urban No. language 1 2
Total Rural Urban 3 4 5 6 7
Total of all 100.00 100.60 160.00 languages
1 Gujarati 95.48 2 Marathi 0.26 3 Hindi 0.45 4 Sindhi 0.61 5 Urdu 0.45 6 Garhwali 0.07 7 Kachchhi 1.96
98.79 89.48 66.78 33.22 0.05 0.62 13.57 86.43 0.06 1.15 8.59 91.41 008 1.57 !I.BS 91.15 0.19 0.92 27.72 72.28
.. 0.21 JO:).OO 0.75 4.15 24.83 75.17
8 Tamil 0.14 9 Punjabi 0.11
10 Malayalam 0.12.
0.01 040 2.90 97.10 0.31 1.10 98.90
0.01 0.32 4.02 95.98 11 Others 0.35 0.06 0.87 10.95 89.05
It will be seen from the above table that 95.48 per cent of the popUlation in the district have Gujarati as their mother tongue. 66.78 per cent of them live in rural areas and 33.22 per cent in urban areas. The number of speakers of other languages are not significant.
4.10 Religions
The following table gives distribution of religions.
Religions, 1961
Religions Population Percentage of total
population I 2 3
Total 828,419 100.00 Hindu 697,169 84.16 Muslim IOl,234 12.22 Jain 27,707 3.34 Sikh 734 0.09 Christian 1,281 0.15 Other religions 294 0.04
19
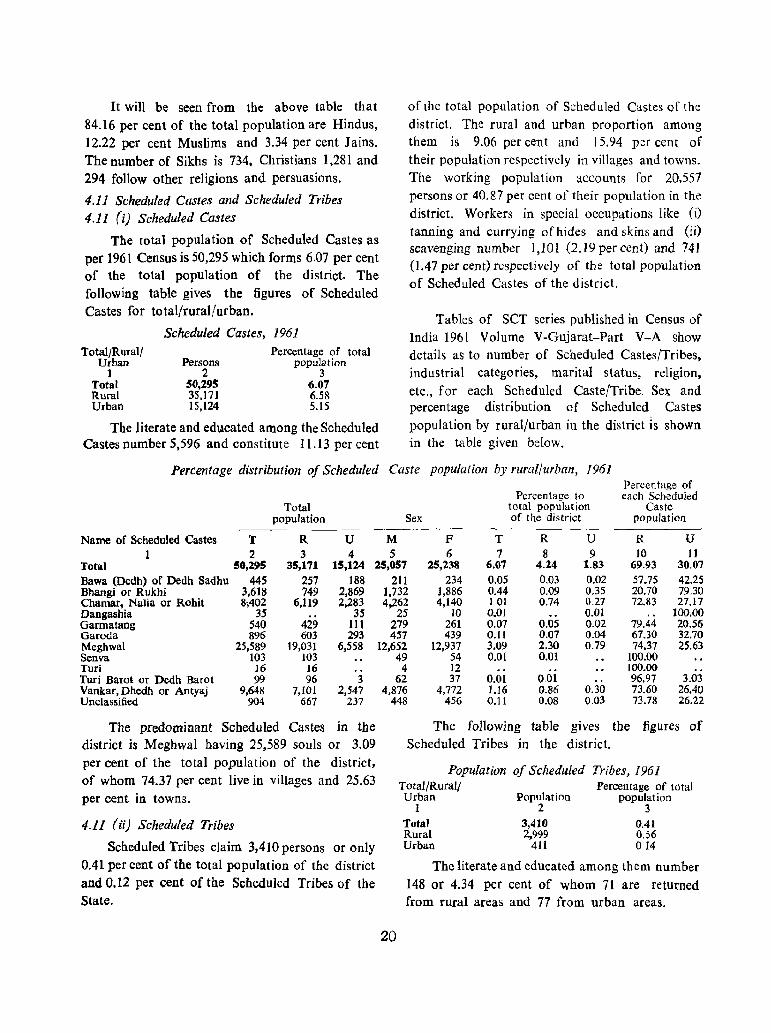
It will be seen from the above table that 84.16 per cent of the total population are Hindus, 12.22 per cent Muslims and 3.34 per cent Jains. The number of Sikhs is 734, Christians 1,281 and 294 follow other religions and persuasions.
4.11 Scheduled Castes and Scheduled Tribes 4.11 (i) Scheduled Castes
The total popUlation of Scheduled Castes as per 1961 Census is 50,295 which forms 6,07 per cent of the total population of the district. The following table gives the figures of Scheduled Castes for total/rural/urban.
Scheduled Castes, 1961 Total/Rural! Percentage of total
Urban Persons population 1 2 3
Total 50,295 6.07 Rural 35,]71 6,58 Urban ]5,124 S.15
The literate and educated among the Scheduled Castes number 5,596 and constitute 11.13 per cent
of the total population of Scheduled Castes of the district. The rural and urban proportion among them is 9.06 per cent and 15.94 per cent of their population respectively in villages and towns. The working population accounts for 20,557 persons or 40, g7 per cent of their popUlation in the district. Workers in special occupations like (i) tanning and currying of hides and skins and (ii) scavenging number 1,101 (2.19 percent) and 741 (1.47 per cent) respectively of the total population of Scheduled Castes of the district.
Tables of SeT series published in Census of India 1961 Volume V-Gujarat-Part V-A show details as to number of Scheduled Castes/Tribes, industrial categories, marital status, religion, etc" for each Scheduled Caste/Tribe, Sex and percentage distribution of Scheduled Castes population by rural/urban in the district IS shown in the table given below.
Percentage distribution of Scheduled Caste population by rural/urban, 1961 Percentage of
Percentage to each Scheduled Total total population Caste
population Sex of the district population --~----
Name of Scheduled Castes T R U M F T R U R U 1 2 3 4 5 6 7 8 9 ]0 II
Total 50,295 35,171 15,124 25,057 25,238 6.07 4.24 1.83 69,93 30,07
Bawa (Dedh) or Dedh Sadhu 445 257 188 Bhangi or Rukhi 3,618 749 2,869 Chamar, NaJia or Rohit 8;402 6,119 2,283 Dangashia 35 35 Garmatang 540 429 111 Garoda 896 603 293 Meghwal 25,589 19,031 6,558 Senva 103 103 Turi 16 16 Turi Barot or Dedh Barot 99 96 3 Vankar, Dhedh or Antyaj 9,648 7,101 2,547 Unclassified 904 667 237
The predominant Scheduled Castes in the district is Meghwal baving 25,589 souls or 3.09 per cent of the total population of the district, of whom 74.37 per cent live in villages and 25.63 per cent in towns.
4.11 (ii) Scheduled Tribes
Scheduled Tribes claim 3,410 persons or only 0.41 per cent of the total population of the district and 0.12 per cent of the Scheduled Tribes of the State.
211 234 0.05 0.03 0.02 57.75 42,25 1,732 1,886 0.44 0,09 0.35 20.70 79.30 4,262 4,140 101 0,74 0.27 72.83 27.17
25 10 0.01 0.01 .. 100.00 279 261 0.07 0.05 0.02 79.44 20.56 457 439 0.11 0.07 0.04 67.30 32.70
12,652 12,937 3.09 2.30 0,79 74.37 25.63 49 54 0.01 0.01 100.00
4 12 .. 100.00 62 37 0.01 00] .. 96.97 3.03
4,876 4,772 1.16 0.86 0.30 73.60 26.40 448 456 0.11 0.08 0.03 73.78 26.22
The following table gives the figures of Scheduled Tribes in the district.
20
Population Total/Rurall Urban
1 Total Rural Urban
of Scheduled Tribes, 1961
Population 2
3,410 2,999
411
Percentage of total population
3 0,41 0,56 0.14
The literate and educated among them number 148 or 4.34 per cent of whom 71 are returned from rural areas and 77 from urban areas.
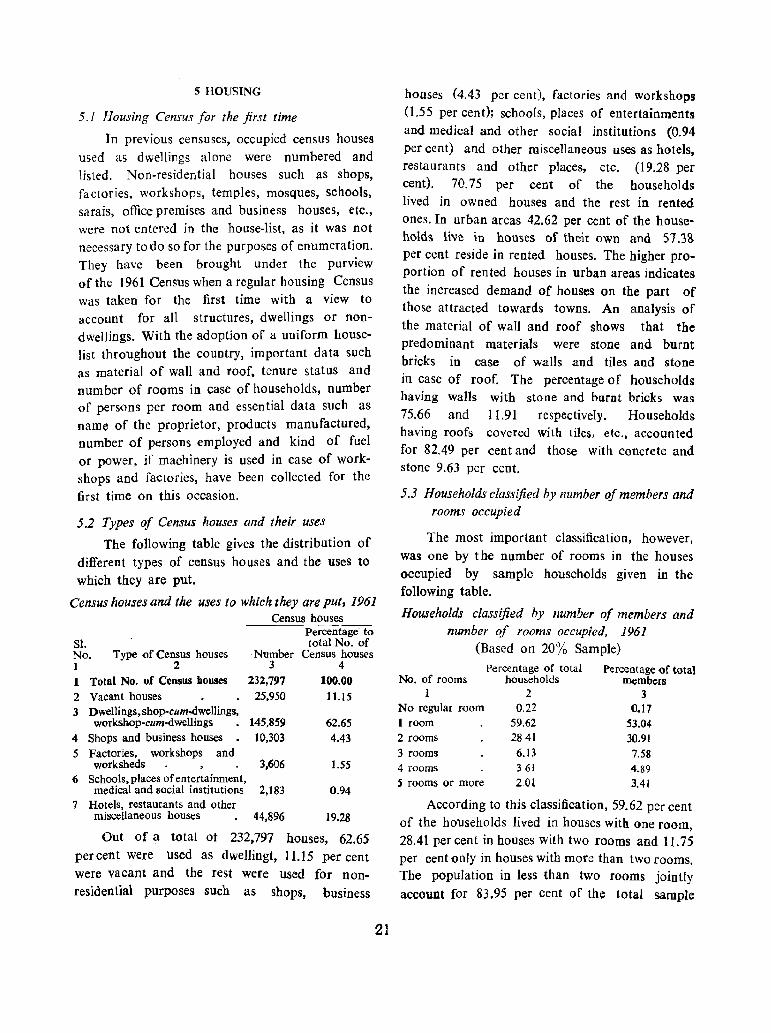
5 HOUSING
5.1 Housing Census for the first time
In previous censuses, occupied census houses used as dwellings alone were numbered and listed. Non-residential houses such as shops, factories, workshops, temples, mosques, schools, sarais, office premises and business houses, etc., were not entered in the house-list, as it was not necessary to do so for the purposes of enumeration. They have been brought under the purview of the 1961 Census when a regular housing Census was taken for the first time with a view to account for all structures, dwellings or nondwellings. With the adoption of a uniform houselist throughout the country, important data such as material of wall and roof, tenure status and Dumber of rooms in case of households, number of persons per room and essential data such as name of the proprietor, products manufactured, number of persons employed and kind of fuel or power, if machinery is used in case of workshops and factories, have been collected for the first time on this occasion.
5.2 Types (}f Census houses and their uses
The following table gives the distribution of different types of census houses and the uses to whicb tbey are put.
Census houses and the uses to which they are put, 1961 Census hou~ __
Percentage to SI. total No. of No, Type of Census houses Number Census houses 1 2 3 4
1 Total No. of Census houses 232,797 100.00
2 Vacant houses 25,950 11.15 3 Dwellings,shop-cum~wellings,
145,859 62.65 workshop-cum-dweUmgs •
4 Shops and business houses 10,303 4.43 5 Factories, workshops and
worksheds 3,606 1.55 6 Schools, places of entertainment,
medical and social institutions 2,183 0.94 7 Hotels, restaurants and other
miscellaneous houses . 44,896 19.28
Out of a total ot 232.797 houses, 62.65 percent were used as dwellingt, 11.15 per cent were vacant and the rest were used for nonresidential purposes such as shops, business
21
houses (4.43 per cent), factories and workshops 0.55 per cent); schools, places of entertainments and medical and other social institutions (0.94
per cent) and other miscellaneous uses as hotels, restaurants and other places, etc. (19.28 per cent). 70.75 per cent of the households lived in owned houses and the rest in rented ones. In urban areas 42.62 per cent of the households live in houses of their own and 57.3& per cent reside in rented houses. The higher proportion of rented houses in urban areas indicates the increased demand of houses on the part of those attracted towards towns. An analysis of the material of wall and roof shows that the predominant materials were stone and burnt bricks in case of walls and tiles and stone in case of roof. The percentage of households having walls with stone and burnt bricks was 75.66 and 11.91 respectively. Households having roofs covered with tiles, etc., accounted for 82.49 per cent and those with concrete and stone 9.63 per cent.
5.3 Households classified by number of members and rooms occupied
The most important classification, however, was one by t he number of rooms in the houses occupied by sample households given in the following table.
Households classified by number of members and number of rooms occupied, 1961
(Based on 20% Sample) Percentage of total Percentage Qf total
No. of rooms households members I 2 3
No regular room 0.22 0_17 I room 59.62 53.04 2 rooms 2841 30.91 3 rooms 6.13 7.58 4 rooms 361 4.89 5 rooms or more 2.01 3.41
According to this classification, 59.62 per cent of the households lived in houses with one room, 28.41 per cent in houses with two rooms and 11.75 per cent 0 nly in houses with more than two rooms. The popUlation in less than two rooms jointly account for 83.95 per cent of the total sample
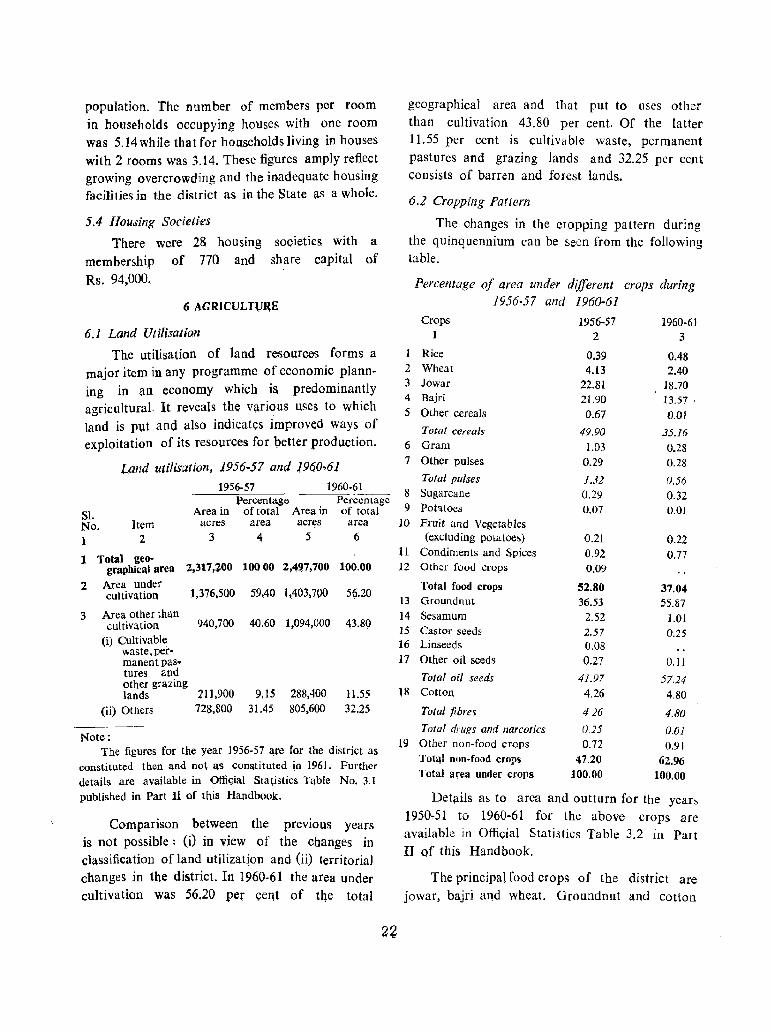
population. The number of members per room
in households occupying houses with one room was 5.14 while that for ho-aseholds living in houses with 2 rooms was 3.14. These figures amply reflect growing overcrowding and the inadequate housing faci1i ties in the district as in the State as a whole.
5.4 Housing Societies
There were 28 housing membership of 770 and
Rs. 94,000.
societies with a
share capital of
6 AGRrCVLT{J~E
6.1 Land Utilisation
The utilisation of land resources forms a major item in any programme of economic plann
ing in an economy wbich is predominantly agricultural. It reveals the various uses to which land is put and also indicates improved ways of exploitation of its resources for better production.
Land utilisation, 1956-57 a(ld 1960-61
1956-57 1960-61
Sl. Area in No. Item acres
1 2 3
1 Total geo-2,317,ZOO graphical area
2
3
Area under cultivation
Area other than cultiva.tion
(i) Cultivable waste, per. manentpas. tures and other grazing lands
(ii) Others
Note;
1,376,500
940,700
211,900 728.800
Percen tage of total Area in
area acr~s
4 5
10000 2,4~7,700
59,40 1,403.7()0
40.60 1,094,000
9.15 288,400 31.45 805,600
Percentage of total
area 6
100.00
5~.20
43.80
11.55 32.25
The figures for the year 1956-57 !Ire for the district as constituted then and not as constituted in 1961. Further details are available in Offi<;ial Statistic& Table No. 3.1 published in Part II of this Handbook.
Comparison between the previous years is not possible: (i) in view of the changes in classification of land utilization and (ji) territorial changes in the district. In 1960-61 the area under
cultivation was 56.20 pef cent of tqe total
geographical area and that put to uses other than cultivation 43.80 per cent. Of the latter 11.55 per cent is cultivable waste, permanent pastures and grazing lands and 32.25 per cent consists of barren and forest lands.
6.2 Cropping Pattern
The changes in the cropping pattern during the quinq uennium can be seen from the following table.
2 3 4
5
6
7
8 9
10
11 12
13 14 15 16
17
18
19
Percentage of area under different crops during 1956·57 and 1960-61
Crops 1956-57 1960-61 1 2 3
Rice 0.39 0.48 Wheat 4.13 2.40 Jowar 22.81 18.70 Bajri 21.90 13.57 . Other cereals 0.67 0.01
Total cet"eals 49.90 35.16 Gram I.D3 0.28 Other pulses 0.29 0.28
Total pulses 1.32 0.56 Sugarcane 0.29 0.32 Potatoes 0.07 0.01 Fruit and Vegetables (excluding potatoes) 0.21 0.22
Condiments and Spices 0.92 0.77 Other food crops 0.09
Total food crops 52.80 37.04 Groundnut 36.53 55.87 Sesamum 2.52 1.01 Castor seeds 2.57 0.25 Linseeds 0.08 Other oil seeds 0.27 D.ll
Total oil seeds 41.97 57.24 Cotton 4.26 4.80
Total fibres 426 4.80
Total drugs and narcotics 0.25 0,0] Other non-food crops 0.72 0.91 Tot~1 non·food crops 47.20 62.96 Total area under crops 100.00 100.00
Details as to area and outturn for the years
1950-51 to 1960-61 for the above crops are available in Official Statistics Table 3.2 ill Part
II of this Handbook.
The principal food crops of the district are
jowar, bajri aQd wheat. Groundnut and cotton
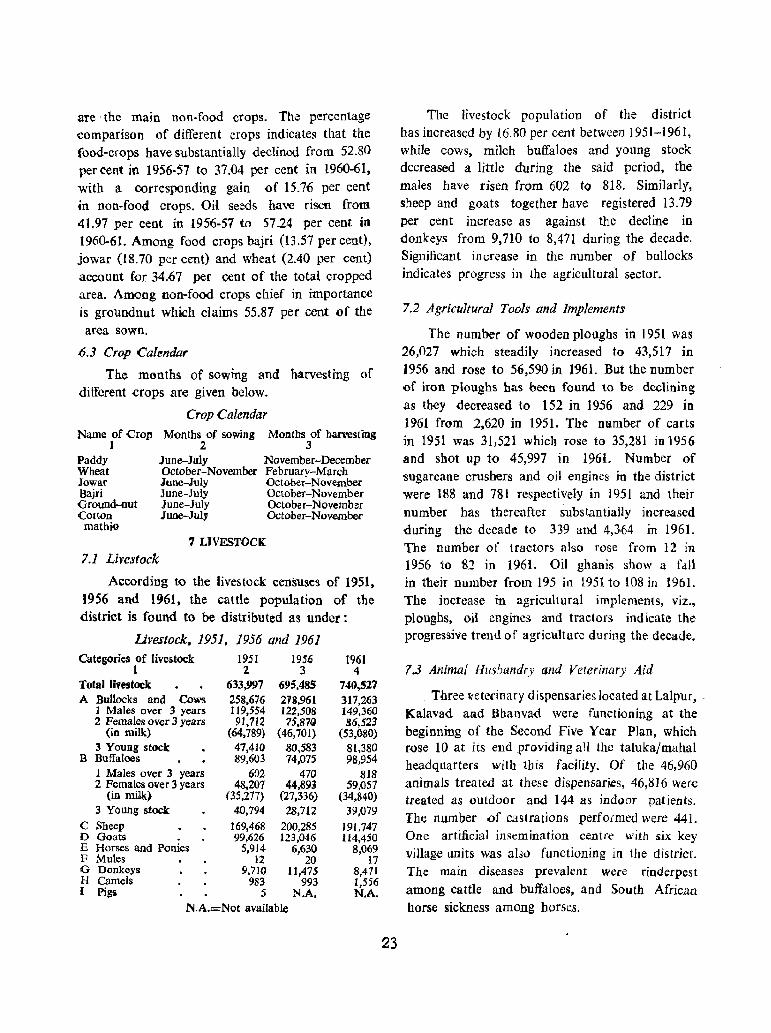
are . the main non-food crops. Th.e percentage comparison of different crops indicates that the food-crops have substantially declined from 52.80 percent in 1956-57 to 37.04 per cent in 1960-61. with a corresponding gain of 15.7<5 per cent in non-food crops. Oil seeds have risen from 41.97 per cent in 1956-57 to 57.24 per cent in 1960-61. Among food crops bajri (13.57 per cent), jowar (18.70 per cent) and wheat (2.40 per cent) account for 34.67 per cent of the total. cropped area. Among non-food crops chief in importance
is groundnut which claims 55.87 per cent of the area sown.
6.3 Crop Calendar
The months of sowing and harvesting of different .crops are given below.
Crop Calendar
Name of Crop MQnths of sowing Months of harvesting 123
Paddy Wheat Jowar
June-July November-December October-November February-March June-July Oct.ober-November
Bajri Ground-nut Cotton
June-July October-November June-July October-November June-July October-November
mathiO 7 LIVESTOCK
7.1 Livestock
According to the livestock censuses of 1951.
1956 and 1961. the cattle population of the district is found to be distributed as under:
livestock. 1951. 1956 and 1961 Categories of livestock 1951 1956 1961
1 2 3 4 Total livestock 633,997 695,485 740,527 A Bullocks and Cows 258,676 218,961 317,263
1 Males over 3 years 119,554 122,508 149,360 2 Females over 3 years 91,712 75,87(1 86,523
(in milk) (64,789) (46,701) (53,080) 3 Young stock 47,410 SO,583 81,380
B Buffaloes 89,603 74,075 98,954 1 Males over 3 years 602 470 818 2 Females over 3 years 48,207 44,893 59,057
(in milk) (35,277) (27.336) (34.840) 3 Young stock: 40,794 28,712 39,079
C Sheep 169,468 200,285 J91,747 D Goats 99ij26 123,046 114,450 E Horses and Ponies 5.914 6,630 8,069 F Mules 12 20 17 G Donkeys 9,7l() 11,475 8,471 H Camels 983 993 1,556 [ Pigs 5 N.A. N.A.
N.A.=Not available
23
The livestock population of the district has increased by 16.80 per cent between 1951-1961,
while cows, milch buffaloes and young stock decreased a little during the said period, the males have risen from 602 to 818. Similarly, sheep and goats together have registered 13.79 per cent increase as against the decline in donkeys from 9,710 to 8,471 during the decade. Significant increase in the number of bullocks indicates progress in the agricultural sector.
7.2 Agricultural Tools and Implements
The number of wooden ploughs in 1951 was 26,027 which steadily increased to 43,517 jn
195<l and rose to 56,590 in 1961. But the number of iron ploughs has been found to be declining as they decreased to 152 in 1956 and 229 in 1961 from 2,620 in 1951. The Damber of carts in 1951 was 31,521 which rose to 35,281 in 1956 and shot up to 45,997 in 1961. Number of sugarcane crushers and oil engines in the district were 188 and 781 respectively in 1951 and their number has thereafter substantially increased during the decade to 339 and 4,364 in 1961. The number of tractors also rose from 12 in 1956 to S2 in 1961. Oil ghanis show a fdll in their number from 195 in 1951 to 108 in 1961. The increase in agricultural implements, viz., ploughs, oil engines and tractors ind icate the progressive trend of agriculture during the decade.
7..3 Animal Husbandry and Veterinary Aid
Three veterinary dispensaries located at Lalpur, ~
Kalavad aRd Bhanvad were functioning at the beginning of the Second Five Year Plan, which rose 10 at its end providing all the taluka/mahal headquarters with this facility. Of the 46,960 animals treatell at these dispensaries, 46,8 I 6 were treated as outdoor and 144 as indoor patients. The number .of castrations perfo[med were 441. One artificial insemination centre with six key
village units was also functioning in the district. The main diseases prevalent were rinderpest
among cattle and buffaloes, and South African horse sickness among horses.
7.4 Fisheriej
Jodiya, Sachana, Bedi, Sarmat, Salaya, Sikka
and Okha ale important fishing centres in the district, advantageously situated in respect of fisheries and other marine products. All these fishing centres are in the Gulf of Kutch at a maximum depth of 29 fathoms, where fishermen usually get good catch at such low depth. There are forty-two coral reefs on the northern coast of Saurashtra from Navlakhi to Okha, providing excellent bed for pearl oysters. The sea around Saurashtra is found to support larger fisheries baving prime delicacies like pomfrets, prawns, jew fish, Indian salmons, etc. Mullets along with lady fish and cat fish account for 60 per cent of catch landed ill this area. Mullets are landed along the coast, and fishing is in full swing during winter in Okhamandal area. The total landing of Ghol and Dara in 1960-61 amounted to 740,000 Kgms. and that of pomfret to 15,000 Kgms. Prawns are also available in substantial quantity. Apart from fish, the coastal waters of the district are rich in Chanks useful in making bangles and pearl oysters producing pearls of good value. Another shell fishery is window-pane fishery. The shells of pearls are useful in some of the Ayurvedic preparations. The shel1~ themselves being calcium carbonate, are extensively used as one of the ingredients in manufacture of bleaching powder. Fisheries Department undertakes pearl fishing every three years.
8 IRRIGATION
During the year 1960-61 out of the total area of 1,403,700 acres under cultivation, 69,900 acres, i.e., 4.98 per cent were irrigated. Irrigation is mainly through wells. About 95.28 per cent of acres were irrigated by means of wells and the rest by means of Government canals and tanks. There are about two wells per 100 acres under plougb.
Rice and sugarcane are completely irrigated crops. A large percentage of wheat crop (64.84 per cent) is also irrigated. Important watercourses flowing throughQut the district are Bhageri, Sasoi, Ghee, Puna, Und, Venu, Nagmati and Rangmati. Of these Sasoi, Ghee, and Puna were undertaken
24
during the First Five Year Plan. Fulzar, Vartu and Sapda irrigation schemes were undertaken during the Second Five Year Plan. These works will bring larger areas under canal irrigation. The details of various medium irrigation schemes are given in the brief gazetteer of place names published in Part- I of this Handbook.
9 CO-OPERA nON
There were 545 various types of co-operative societies with a membership of 55,061 persons and share capital of Rs. 5,194,000 at the end of 1960-61. On an average there were lOt members per society with an average share capital of Rs. 9,530.00 and working capital of Rs. 40,716.00.
One District Central Co-operative Bank was working as a Central Financing Agency with a membership of 393 societies, share capital of Rs. 11.57 lakhs and working capital of Rs. 89.40 lakhs. The number of agricultural credit societies was 308 as against 40 non-agricultural credit societies. Of the remaining types, l4 were marketing societies. 11 forest labourers and labour contract societies, 54 consumer's co-operative societies, 28 housing societies and 63 industrial societies.
Agricultural credit SOCIetIes had advanced loans to the tune of Rs. 50.96 lakhs during 1960-61. The amount of loan advanced per society averaged to Rs. 18,483.77 as against Rs. 177.13 per member.
10 ECONOMIC ACTiVITY
10.1 Definitions
The criterion of income or economic independence was adopted for measuring the economy of the country during the past censuses. On the present occasion emphasis is on the work done or the economic activity pursued by an individual
so that all people such as family workers and children who work but do not earn enough for their maintenance are also accounted for as workers. Another important change relates to the presentation of the economic data according to
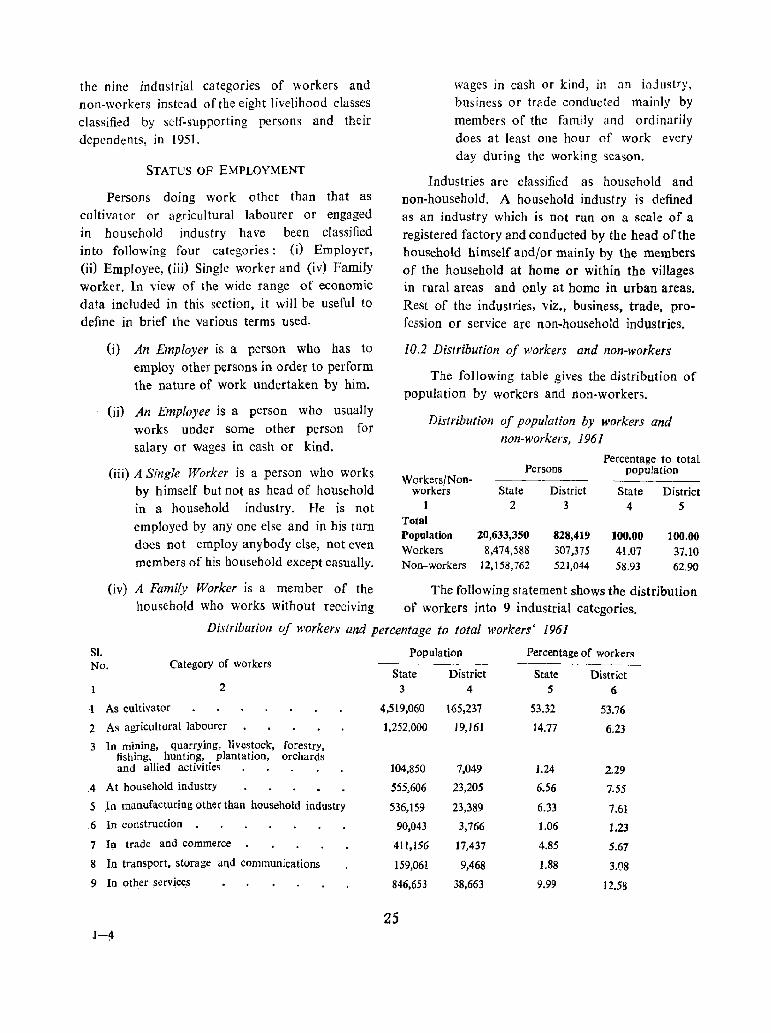
the nine industrial categories of workers and non-workers instead of the eight livelihood classes classified by self-supporting persons and their
dependents, in 1951.
STATUS OF EMPLOYMENT
Persons doing work other than that as cultivator or agricultural labourer or engaged in household industry have been classified into following four categories: (i) Employer, (ii) Employee, (iii) Single worker and (iv) Family worker. In view of the wide range of economic data included in this section, it will be useful to define in brief the various terms used.
(i) An Employer is a person who has to employ other persons in order to perform the nature of work undertaken by him.
(ii) An Employee is a person who usually works under some other person for salary or wages in cash or kind.
(iii) A Single Worker is a person who works by himself but not as head of household in a household industry. He is not employed by anyone else and in his turn does not employ anybody else, not even members of his household except casually.
wages in cash or kind, in an inJustry, business or trade conducted mainly by members of the family and ordinarily does at least one hour of work every day during the working season.
Industries are classified as household and non-household. A household industry is defined as an industry which is not run on a scale of a registered factory and conducted by the head of the household himself and/or mainly by the members of the household at home or within the villages in rural areas and only at home in urban areas. Rest of the industries, viz., business, trade, profession or service are non-household industries.
IO.2 Distribution of workers and non-workers
The following table gives the distribution of population by workers and non-workers.
Distribution of population by workers and non-workers, 1961
Persons Workers/Non-
Percentage to total population
workers State District State District 1 2 3 4 5
Total Population 20,633,350 828,419 100.00 100.00 Workers 8,474,588 307,375 41.07 37.10 Non-workers 12,158,762 521,044 58.93 62.90
(iv) A Family Worker is a member of the The following statement shows the distribution household who works without receiving of workers into 9 industrial categories.
Distribution of workers and percentage to total workers' 1961
SI. Population Percentage of workers No. Category of workers
State District State District 2 3 4 5 6
1 As cultivator 4,519,060 165,237 53.32 53.76
2 As agricultural labourer 1,252,000 19,161 14.77 6.23
3 In mining, quarrying, livestock, forestry, fishing, hunting, plantation, orchards and allied activities 104,850 7,049 1.24 2.29
4 At household industry 555,606 23,205 6.56 7.55
5 III manufacturing other than household indUstry 536,159 23,389 6.33 7.61
.6 In construction 90,043 3,766 1.06 1.23
7 In trade and commerce 411,156 J7,437 4.85 5.67
8 In transport, storage and communications 159,061 9,468 1.88 3.1)8
9 10 9ther service.s 846,653 38,663 9.99 12.58
25 j-~
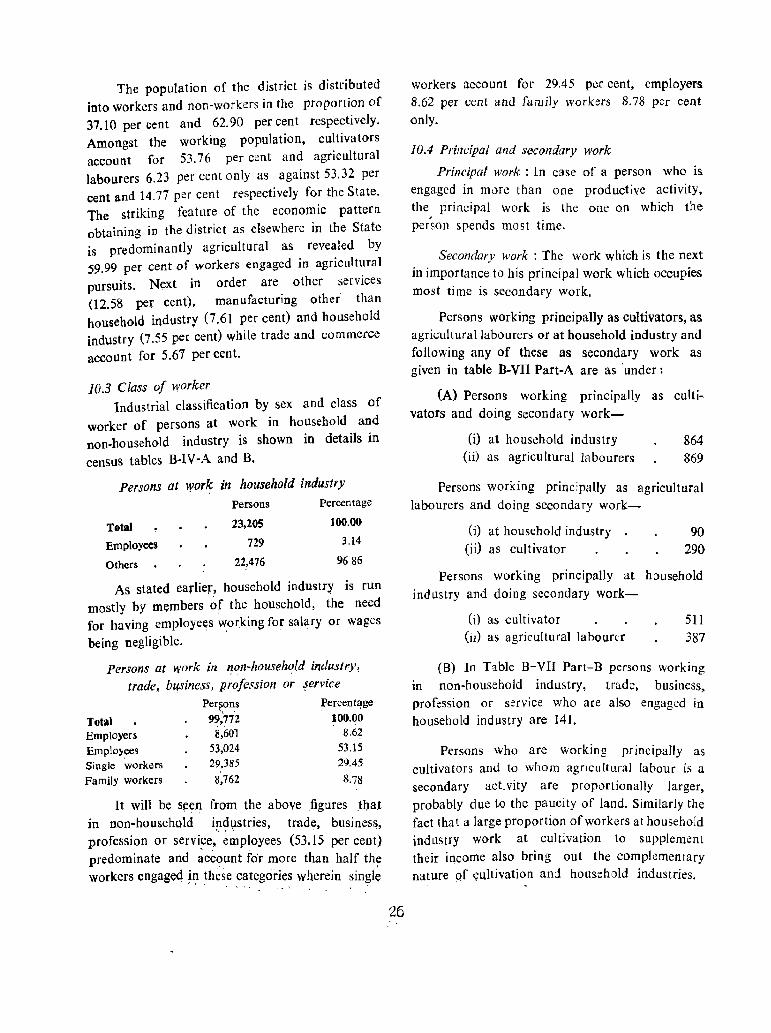
The population of the district is distributed
into workers and non-workers in the proportion of 37.10 per cent and 62.90 percent respectively. Amongst the working population, cultivators account for 53.76 per cent and agricultural
labourers 6.23 per cent only as against 53.32 per cent and 14.77 per cent respectively for the State.
The striking feature of the economic pattern. obtaining in the district as elsewhere in the State
is predominantly agricultural as revealed by 59.99 per cent of workers engaged in agricultural
pursuits. Next in order are other services 02.58 per cent), man ufacturing other than
household industry (7.61 per cent) and household industry (7.55 per cent) while trade and commerce
account for 5.67 per cent.
10.3 Class of worker
Industrial classification by sex and class of
worker of persons at work in household and non-household industry is shown in details in
census tables B-IV-A and B.
Persons at work in household industry Persons Percentage
Total 23,205 100.00
Employees 729 3.14
Others 22,476 9686
As stated earlier, household indu8try is run mostly by m~mbers of the household, the need for having employe~s working for salary or wages
being negligible.
Persons at "t',!ork in ~on-househC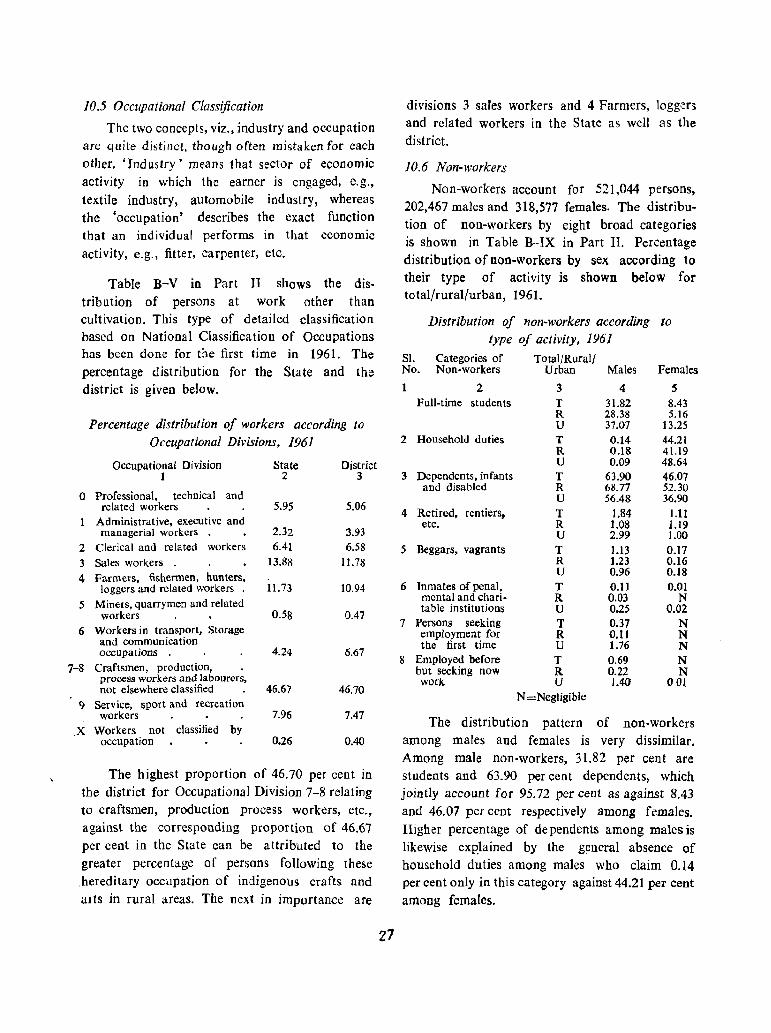
10.5 Occupational Classification
The two concepts, viz., industry and occupation are quite distinct, though often mistaken for each other. 'Industry' means that sector of economic activity in which the earner is engaged, e.g., textile industry, automobile industry, whereas the 'occupation' describes the exact function that an individual performs in that economic activity, e.g., fitter, carpenter, etc.
Table B-V in Part II shows the distribution of persons at work other than cultivation. This type of detailed classification based on National Classification of Occupations has been done for the first time in 1961. The percentage distribution for the State and the district is given below.
Percentage distribution of workers according to Occupational Divisions, 1961
Occupational Division State 1 2
o Professional, technical and related workers 5.95
Administrative, executive and managerial workers 2.32
2 Clerical and related workers 6.41
3 Sales workers 13.88
4 Farmers, fishermen, hunters, loggers and related workers 11. 73
5 Miners, quarrymen and related workers 0.58
6 Workers in transport, Storage and communication occupations 4.24
7-8 Craftsmen, production, . process workers and labourers, not elsewhere classified . 46.67
9 Service, sport and recreation workers
X Workers not classified by occupation
7.96
0.26
District 3
5.06
3.93
6.58 11.78
10.94
0.47
6.67
46.70
7.47
0.40
The highest proportion of 46.70 per cent in the district for Occupational Division 7-8 relating to craftsmen, production process workers, etc., against the corresponding proportion of 46.67 per cent in the State can be attributed to the greater percentage of persons following these hereditary occupation of indigenous crafts and aIls in rural areas. The next in importance are
27
divisions 3 sales workers and 4 Farmers, loggers and related workers in the State as well as the district.
10.6 Non-workers
Non-workers account for 521,044 persons, 202,467 males and 318,577 females. The distribution of non-workers by eight broad categories is shown in Table B-IX in Part II. Percentage distribution of non-workers by sex according to their type of activity is shown below for total/rural/urban, 1961.
SI.
Distribution of non-workers according to type of activity, 1961
Categories of Total/Rurall No. Non-workers Urban Males Females
2 3 4 5 Full-time students T 31.82 8.43
R 28.38 5.16 U 37.07 13.25
2 Household duties T 0.14 44.21 R 0.18 41.19 U 0.09 48.64
3 Dependents. infants T 63.90 46.07 and disabled R 68.77 52.30
U 56.48 36.90 4 Retired. rentiers, T 1.84 1.11
etc. R 1.08 1.19 U 2.99 1.00
5 Beggars, vagrants T 1.13 0.17 R 1.23 0.16 U 0.96 0.18
6 Inmates of penal, T 0.11 0.01 mental and chari- R 0.03 N table institutions U 0.25 0.02
7 Persons seeking T 0.37 N employment for R 0.11 N the first time U 1.76 N
8 Employed before T 0.69 N but seeking now R 0.22 N work U 1.40 o OJ
N =Negligible
The distribution pattern of non·workers among males and females is very dissimilar. Among male non-workers. 31.82 per cent are students and 63.90 per cent dependents, which jointly account for 95.72 per cent as against 8.43 and 46.07 per cent respectively among females. Higher percentage of dependents among males is likewise eXp'lained by the general absence of household duties among males who claim 0.14 per cent only in this category against 44.21 per cent among females.

The higher percentage of full-time students in the urban sector as compared to rural is,
however, explained by the greater consciousness
and opportunity townspeople have in the matter of education. The percentage of females engaged
in household duties is found to be higher in urban
areas than that in rural areas, since womenfolk in
villages in addition to their attending to household
chores also participate in agriculture and house
hold industry. While the percentage of unemployed
persons seeking work is insignificant for males,
that for females is negligible.
11 INDUSTRIES AND POWER
11.1 Registered Factories There were 161 registered factories in the
district at the end of the year 1961, employing
on an average 11,136 persons daily: From the point of view of employment offered, food, drinks
and tobacco are the most important industries
in the district. There were 70 such factories
in the district employing on an average
3,723 persons or 33.43 per cent of th~ total
factory employment per day~ Next in importance
to food, drinks and tQb~cco is metal and
minerals industry with 16 units which employed
2,274 persons and constituted 20.42 per cent of
the total employment in factories. Important amongst the rest ar~ cement factories at Sikka
and Dwarka and a chemical factory at Mitbapur.
11 Govern1\lent and local fund factories provided
employment to 883 persons.
11.2 Joint Stock Companies There were 26 joint stock companies
functioning on the 31st March, 1961 with
authorised capital of Rs. 100.55 lakhs and
subscribed capital of Rs. 46.59 lakhs. The authorised and subscribed capital per· joint stock
company comes to abo~t Rs. 38.67 lakhs and
about Rs. 17.92 lakhs respectively. The joint stock
companies classified as processing and manufactures
not elsewhere classified domina.t~ the joi~t stock
field with a total authorised capital of Rs. 570.00
lakhs and subscribed capital of Rs. 238.44 lakhs.
While such companies constitute 11.54 per cent
of the total number of joiqt §~CJck companies, their . • I ,; ~~ ~ .' ;
28
authorised and subscribed capital accounts for 56.69 per cent of authorised and 51.18 per cent of subscribed capital of all the joint stock companies floated in the district.
11.3 Banking
A steady increase in the banking facilities
available in the district has been noticed since
1950-51. In 1960-61, 20 scheduled banks and 20
co-operative banks were functioning in the district.
It is interesting to note that co-operative banks which formed 34.48 per cent of total banking
institutions at the end of the First Plan have
doubled in number in 1960-61.
11.4 Small Scale Industries
The important sman scale industries of the district are tie and dye (Bandhani), Atlas weaving,
jari embroidery, bleaching, dyeing and printing
of textiles, manufacture of soaps and cosmetics
such as perfumes, 'Kanku' etc., button manu
facture and manufacture of electrical spare parts.
There were 63 industrial co-operative societies,
of which 12 were Weavers' Co-operative Societies
with membership of 2,644 persons and share
capital worth Rs. 306 Iakhs.
U.5 Electricity and Power
Gujarat Electricity Board is the chief source of electric power in addition to 10 power
houses operating in the district. The total number
of towns and villages electrified was 28 in 1961.
The utilisation of electricity has increased
substantially daring the Second Five Year Plan. From 14,076,000 K.W.H. in 1950-51 it has gone up to 26,926,000 K.W.H. at the beginning of the
Second Five Year Plan and shot up to 57,740,0)0 K.W.H. in 1960-61. The utilisation of electricity
under industrial power has shown considerable rise
from 24,740,000 K.W.H. in 1955-56 to 48,970,000
KW.H. in 1960-61 revealing the greater dema'1d
)llade by industries for the use of electricity
in recent times. Table given below gives the
pattern of utili sa tion of electricity in the district
)p. tne years 1950-51, 1955·56 and 1960-61..
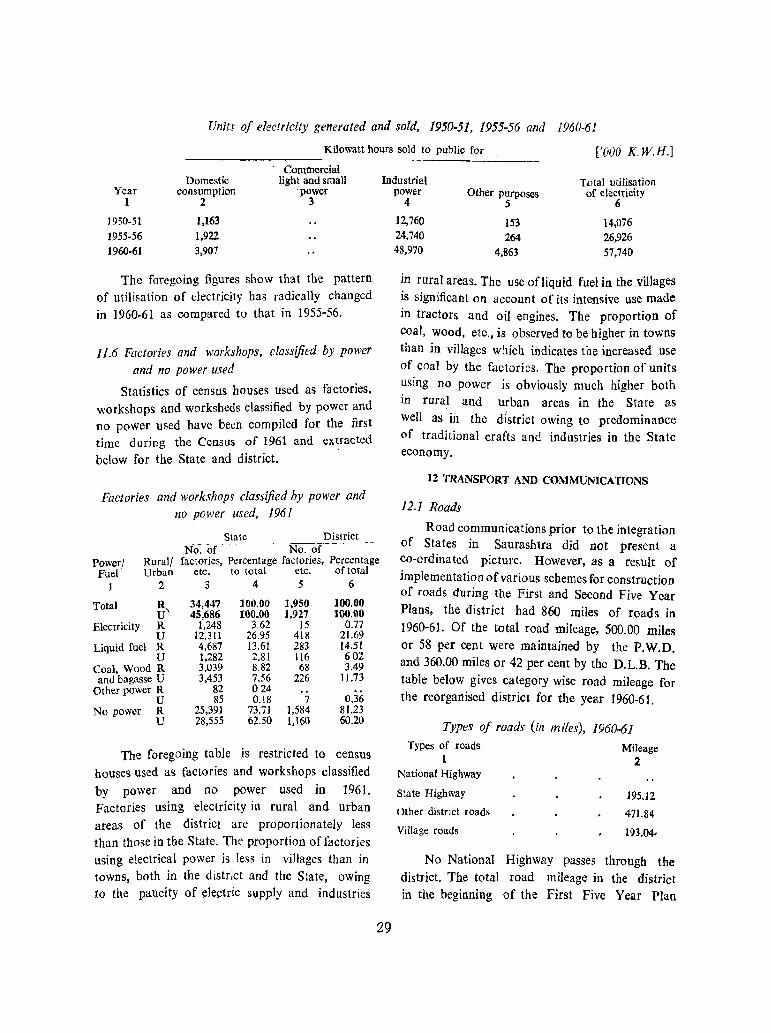
Units of electricity generated and sold, 1950-51, 1955-56 and 1960-61
Kilowatt hours sold to public for ['000 K W.H.]
Year 1
1950-51 1955-56 1960-61
Domestic consumption
2
1,163 1,922 3,907
Commercial light and small
power 3
The foregoing figures show that the pattern of utilisation of electricity has radically changed in 1960-61 as compared to that in 1955-56.
11.6 Factories and workshops, classified by power
aild no power used
Statistics of census houses used as factories, workshops and worksbeds classified by power and no power used have been compiled for the first time during the Census of 1961 and extracted
below for the State and district.
Factories and workshops classified by power and no power used, 1961
State District No. of No. of
Industrial power
4
12,760 24,740 48,970
Other purposes 5
153 264
4,863
Total utilisation of electricity
(j
14,076 26,926 57,740
in rural areas. The use ofliquid fuel in the villages is significant on account of its intensive use made in tractors and oil engines. The proportion of coal, wood, etc., is observed to be higher in towns than in viUages which indicates the increased use of coal by the factories. The proportion of units using no power is obviously much higher both in rural and urban areas in the State as well as in the district owing to predominance of traditional crafts and industries in the State economy.
12 TRANSPORT AND COMMUNICATIONS
12.1 Roads
Power} Fuel
Rural/ factories, Percentage factories. Percentage Urban etc. to total etc. of total
Road communications prior to the integration of States in Saurashtra did not present a co-ordinated picture. However, as a result of implementation of various schemes for construction of roads during the First and Second Five Year Plans, the district had 860 miles of roads in 1960-61. Of the total road mileage, 500.00 miles or 58 per cent were maintained by the P.W.D. and 360.00 miles or 42 per cent by the D.L.B. The table below gives category wise road mileage for the reorganised district for the year 1960-61.
1 2 3 4 5 6
Total R, 34,447 100.00 1,950 100.00 U 45,686 100.00 1,927 lOO.OO
Electricity R 1,248 3.62 15 0.77 U 12,311 26.95 418 21.69
Liquid fuel R 4,687 13.61 283 14.51 U 1,282 2.81 116 602
Coal, Wood R 3,039 8.82 68 3.49 and bagasse U 3,453 7.56 226 11.73
Other power R 82 0.24 U 85 0.18 7 0.36
No power R 25,391 73.71 1,584 81.23 U 28,555 62.50 1,160 60.20
The foregoing table is restricted to census houses used as factories and workshops classified by power and no power used in 1961. Factories using electricity in rural and urban areas of the district are proportionately less than those in the State. The proportion of factories using electrical power is Jess in villages than in towns, both in the district and the State, owing to the paucity of electric supply and industries
:29
Types of roads (in miles), 1960-61 Types of roads
1 National Highway
State Highway
Other district roads
Village roads
Mileage 2
195.12
471.84
193.04.
No National Highway passes through the district. The total road mileage in the district in the beginning of the First Five Year Plan
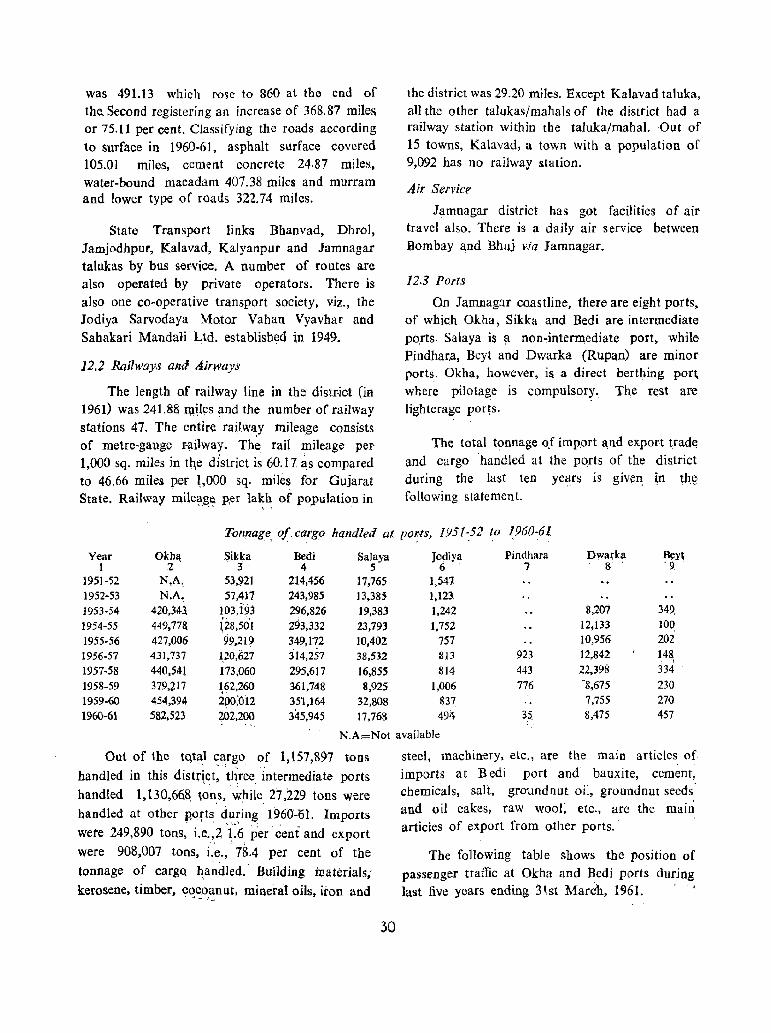
was 491.13 which rose to 860 at the end of the.. Second registering an increase of 368.87 miles or 75.11 per cent. Classifying the roads according
to surface in 1960-61, asphalt surface covered
105.01 miles, cement concrete 24·87 miles, water-bound macadam 407.38 miles and murram and lower type of roads 322.74 miles.
State Transport links Bbanvad, DhroJ,
Jamjodhpur, Kalavad, Kalyanpur and Jamnagar
talukas by bus service. A number of routes are also operated by private operators. There is
also one co-operative transport society, viz., the Jodiya Sarvodaya Motor Vahan Vyavhar and
Sahakari Mandali Ltd. established in 1949.
12.2 Railways and Airways
The length of railway line in the distr-ict (in 1961) was 241.88 ql~ll!s and the number of railway
stations 47. The entiJ:e railway mileage consists
of metre-gauge r-ailway.. The rail mileage per 1,000 sq. miles in tqe district is 60.17. as compared
to 46.66 miles per ~,OOO sq. miles for Gujarat State. Railway mi1e~ge Rer lakb. of pO'pulation in
, ~." " ; .
the district was 29.20 miles. Except Kalavad taluka,
all the other talukas/mahals of the district had a railway station within tbe taluka/mahal. Out of
15 towns, Kalavad, a town with a population of 9,092 has no railway station.
Air Service
Jamnagar district has got facilities of air travel also. There is a daily air service between
Bombay and Bhuj via Jamnagar.
12.3 Ports
On Jamnaglf coastline, there are eight ports, of whic,h Okha, Sikka and Bedi are intermediate
pO,rts. Salaya is a non~interTl\ediate port, while Pindhar,a, Beyt and Dwarka (Rupan) are minor ports. Okha, however, is a direct bertlling port
where pilotage is compulsory. The r~st are
lighterage por~s.
The total tonnage oJ import ~nd ex.port trad~
and cargo handled at the ports of the district
during the last tcn ye~rs is given ~n tb.~
following statement.
T-on,nage, of c~rgo handled at po~ts, 1951~52 to ~960-61
Year Okhl\: Sikka Bedi 1 2 3' 4
1951-52 N,A, 53,921 214,456 1952-53 N.A, 51,417 243,985 1953-54 4Z0,34l ~~3j9j 296,826 1954-55 449,77& \28,501 293,332 1955-56 427,006 99,219 349,172 1956-57 431,737 l.20,627 314,257 1957-58 440,541 173,060 295,617 1958-59 379,;1.17 '~2,260 361,748 1959-60 454,394 200;012 351,164 1960-61 582.523 202,200 345,945
SaJaya Jodiya 5 6 .
17,765 1,541 13,385 1,123 19,383 ],242 23,793 1,752 10,402 757 38.532 813
16,855 814 8,925 1,006
32,808 Sn 17,768 494
Pindhara 7
923 443 776
Dwatka 8
8,207 12,133 10,956 12,842 22,398 -8,675 7,755 8,475
Bey\ '9. '
349, 100 202 148 . , 334 230 270 457
N.A=Not available
Out of the tQ'::t1 ~argo of 1,157,897 tons
handled in this distr~ct, t~ree intermediate ports
handled 1,130,66~ to~s, while 27;n9 tons were bandIed at other Ilorts during 1960'-'61. Imports were 249,890 tons,' Le.,Z '1:6 per 'ceni and export
were 908,007 toos1 i.~.,' 78.4 per cent of the
tonnage of cargq ha~dled.· Building materials;
kerosene. timber, cocoanut, mineral oils, iron and "' ... 1_,_
30
steel, machinery, etc., aJ;e the main articles of imports at B edi port and bauxite, cement, chemicals, saIt, groundnut oil, groundnut seeds'
and oil cakes, raw wooI; etc., are the main
articles of export from other ports.
The following table shows the position of
passenger traffic at Okha and Bedi ports during last five years ending 31.st March, 1961.
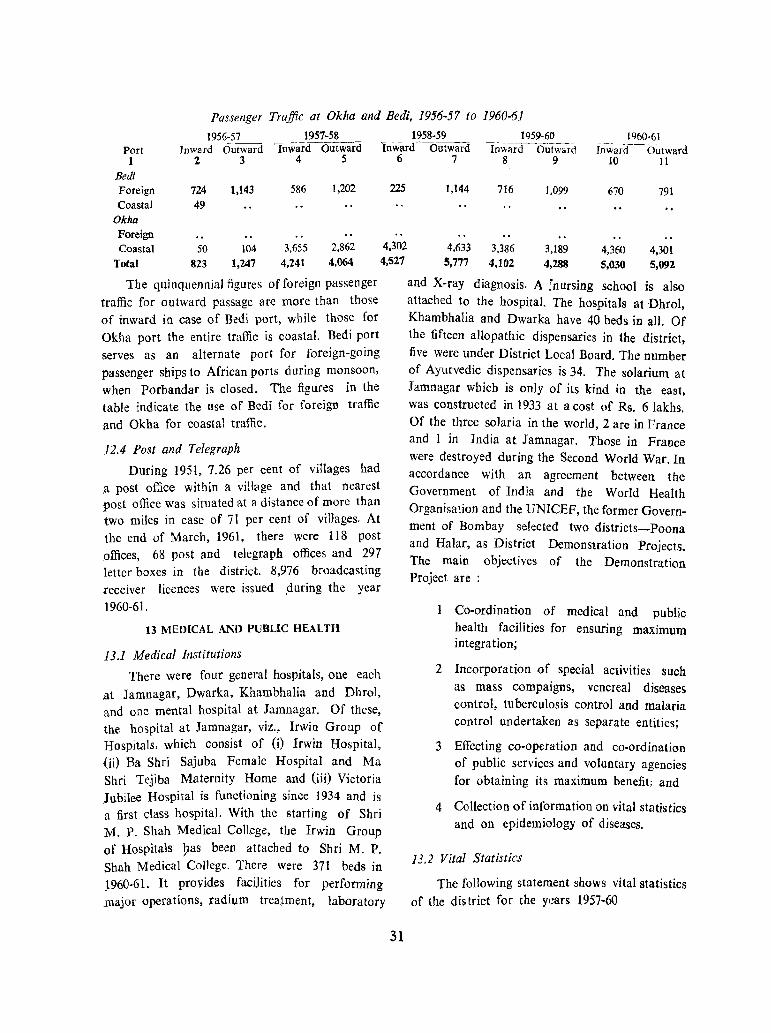
Passenger Traffic at Okha and Bedi, 1956-57 to 1960-61
1956-57 1957-58 Port ~I-nw-a-rd'---;Outward Inward Outward
1958-59 Inward Outward
1959-60 1960-61 Inw3fd--Outward
1 2 3 4 5 6 7 10 11 Bedi Foreign Coastal
724 49
1,143 586 1,202 225
Okha Foreign Coastal
Total 50
823 104
1,247
3,655 2,862
4,241 4,064
4,302 4,527
The quinquenniaJ figures of foreign passenger traffic for outward passage are more than those of inward in case of Bedi port, while those for Okha port the entire traffic is coastal. Bedi port serves as an alternate port for foreign-going passenger sbips to African ports during monsoon, when Porbandar is closed. The figures in the table indicate the use of Bedi for foreign traffic and Okha for coastal traffic.
12.4 Post and Telegraph
During 1951, 7.26 per cent of villages had ,a post office within a village and that nearest post office was situated at a distance of more than two miles in case of 71 per cent of villages. At the end of March, 1961, there were 118 post offices, 68 post and telegraph offices and 297 letter boxes in the district. 8,976 broadcasting receiver licences were issued ,during the ycar
1960-61.
13 MEDlCAL AND PUBLIC HEALTH
13.1 Medical Institutions
There were four general hospitals, one each
at Jamnagar, Dwarka, Khambhalia and Dhrol, and one mental hospital at Jamnagar. Of these, the hospital at Jamnagar, viz., Irwin Group of Hospitals, which consist of (i) Irwin Hospital, (ii) Ba Shri Sajuba Female Hospital and Ma Shri Tejiba Maternity Home and (iii) Victoria Jubilee Hospital is functioning since 1934 and is a first class hospital. With the starting of Shri M. P. Shah Medical College, the Irwin Group of Hospitals 9as been attached to Shri M. P. Shah Medical College. There were 371 beds in J960-61. It provides facilities for performing major operations, radium treatment. laboratory
31
1,144 716
4,633 3,386 5,777 4,102
1,099
3,189 4,288
670
4,360
5,030
791
4,301 5,092
and X-ray diagnosis. A :nursing school is also attached to the hospital. The hospitals at Dhrol, Khambhalia and Dwarka have 40 beds in all. Of the fifteen allopathic dispensaries in the district, five were under District Local Board. The number of Ayurvedic dispensaries is 34. The solarium at Jamnagar which is only of its kind in the east, was constructed in 1933 at a cost (If Rs. 6lakhs. Of the three solaria in the world, 2 are in France and 1 in India at Jamnagar. Those in France were destroyed during the Second World War. In accordance with an agreement between the Government of India and the World Health Organisation and the UNICEF, the former Government of Bombay selected two districts-Poona and Halar, as District Demonstration Projects. The main objectives of the Demonstration Project are :
Co-ordination of medical and public health facilities for ensuring maximum integration;
2 Incorporation of special activities such as mass compaigns, venereal diseases control, tuberculosis control and malaria control undertaken as separate entities;
3 Effecting co-operation and co-ordination of public services and voluntary agencies for obtaining its maximum benefit; and
4 Collection of information on vital statistics and on epidemiology of disease,s.
13.2 Vital Statistics
The following statement shows vital statistics of the dis trict for the years 1957-60
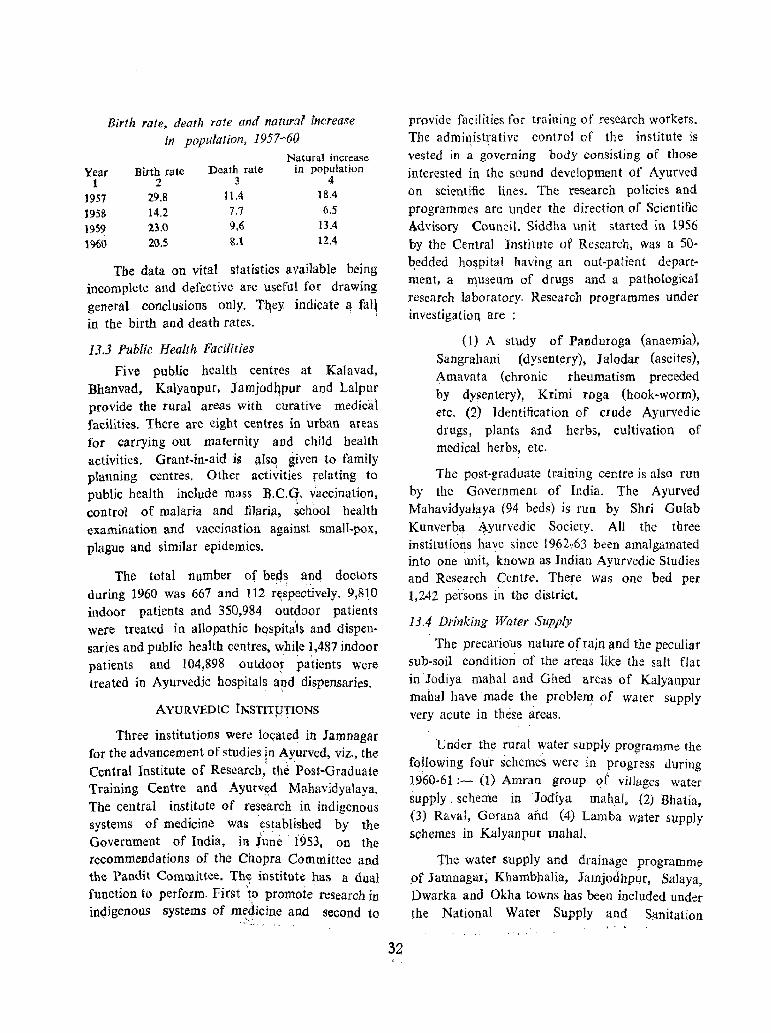
Birth rate, death rate and natural increase in population, 1957-60
Natural increase Year Birth rate Death rate in population
1 2 3 4
1957 29.8 1104 18.4
1958 14.2 7.7 6.5
1959 2?O.O 9,6 13.4
1%0 20.5 &.t 12.4
The data on vital statistics available being incomplete and defective are useful for drawing
general conclusions only. Tiley, indicate a fall in the birth and death rates.
13.3 Public Health Facilities
Five public health. centres at KaJavad, Bhanvad, Kalyanpur, J amjod~pur and Lalpur provide the rural areas with curative medical facilities. There are eight centres in urban areas for carrying out maternity and child health activities. Grant.in-aid is also given to family planning centres. Other activities relating to
public health include mass :a.C.q. vaccination, control of malaria and filari;l, school health examina.tion and vaccination against small.pox, plague and similar epidemics.
The total number of beds and doctors " . t
during 1960 was 667 and 112 r((spectively. 9,810 indoor patients and 350,984 outdoor patients were treated in allopathic hQspita'ls and dispen.
saries and public health centres, while 1,487 indoor patients and 104,898 outdoo~ :patients were treated in Ayurvedic hospitals and dispensaries .
. " :
AYURVEDIC INSTITUTIONS " .
Three institutions were lopated in Jamnagar for the advancement of studies !n Ayurved, viz., the
Central Institute of Research?' the Post-Graduate Training Centre and Ayutv~d Mahavidyalaya.
The central institute of research in indigenous systems of medicine was ~stablisbed by the Government of India, ill iune . 1953, on the recommendations of the Cllopra Committee and the Pandit Committee. The institute has a dual function to perform. First to promote research in in4igenolls systems of medicine and second to
~, .. - .+ '-~, -
32
provide facilities for training of research workers. The admil1istrative control of the institute is vested in a governing body consisting of those
interested in the sound development of Ayurved on scientific lines. The research policies and programmes are under the direction of Scientific Advisory Council. Siddha unit started in 1956 by the Central Institute of Research, was a 50-bedded ho~pital having an out-patient department, a muse 11m of drugs and a pathological research laboratory. Research programmes under investigation are :
(1) A study of Panduroga (anaemia),
Sangrahani (dysentery), Jalodar (ascites), Amavata (chronic rheumatism preceded
by dysentery), Krimi Toga (hook-worm), etc. (2) Identification of crude Ayurvedic drugs, plants and herbs, cultivation of p1edical herbs, etc.
The post·graduate training centre is also run by the Government of India. The Ayurved Mahavidyalaya (94 beds) is run by Shri Gulab
Kunverba ~yurvedic Society. All the three institutions have since 1962~63 been amalgamated into one unit, known as Indian Ayurvedic Studies and Research Centre. There was one bed per 1,242 persons in the district.
13.4 Drinking Water Supply
The precarious nature ofrajn and the peculiar sub·soil condition of the areas like the salt flat
in Jodiya mahal and Ghed areas of Kalyanpur mahal have made the probJell} of water supply very acute in these areas.
Under the rural water supply programme the following four schemes were in progress during 1960-61 :- (1) Arriran group of villages water
supply. scheme in JOdiya mahal. (2) Bhatia, (3) RavaI, Gorana and (4) Lamba wJlter supply schemes in Kalyanpur mabal.
The water supply and drainage programme .of Jamnagur; Khambhalia, Jamjodhpur, Salaya,
Dwarka and Okha towns has been included under the National Water Supply and SC).nitation
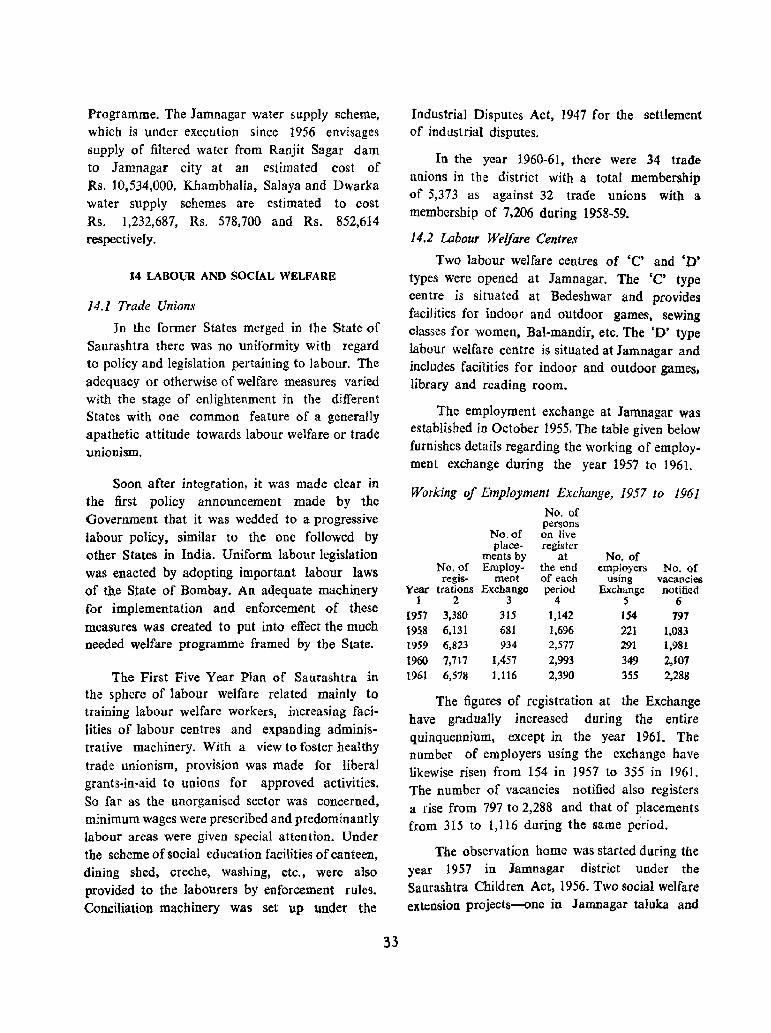
Programme. The Jamnagar water supply scheme, which is under execution since 1956 envisages supply of filtered water from Ranjit Sagar dam to Jamnagar city at an estimated cost of Rs. 10,534,000. Khambhalia, SaJaya and Dwarka water supply schemes are estimated to cost Rs. 1,232,687, Rs. 578,700 and Rs. 852,614 respectively.
14 LABOUR AND SOCIAL WELFARE
14.1 Trade Unions
In the former States merged in the State of Saurashtra there was no uniformity with regard to policy and legislation pertaining to labour. The adequacy or otherwise of welfare measures varied with the stage of enlightenment in the different States with one common feature of a generally apathetic attitude towards labour welfare or trade unionism.
Soon after integration, it was made clear in the first policy announcement made by the Government that it was wedded to a progressive labour policy, similar to the one followed by other States in India. Uniform labour legislation was enacted by adopting important labour laws of the State of Bombay, An aqequate maohinery for implementation and enforcement of these
measures was created to put into effect the much needed welfare programme framed by the State.
The First Five Year Plan of Saurashtra in the sphere of labour welfare related mainly to training labour welfare workers, increasing facilities of labour centres and expanding administrative machinery. With a view to foster healthy trade unionism, provision was made for liberal grants-in-aid to unions for approved activities. So far as the unorganised sector was concerned, minimum wages were prescribed and predominantly labour areas were given special attention. Under the scheme of social education facilities of canteen, dining shed, creche, washing, etc., were also provided to the labourers by enforcement rules. Conciliation machinery was set up under the
33
Industrial Disputes Act, 1947 for the settlement of industrial disputes.
In the year 1960-61, there were 34 trade unions in the district with a total membership of 5,373 as against 32 trade unions with a membership of 7,206 during 1958-59.
14.2 Labour Welfare Centres
Two labour welfare centres of 'C' and 'D' types were opened at Jamnagar. The 'C' type centre is situated at Bedeshwar and provides facilities for indoor and outdoor games, sewing classes for women, Bal-mandir, etc. The 'D' type labour welfare centre is situated at Jamnagar and includes facilities for indoor and outdoor games, library and reading room.
The employment exchange at Jamnagar was established in October 1955. The table given below furnishes details regarding the working of employment exchange during the year 1957 to 1961.
Working of Employment Exchange, 1957 to 1961
No. of
No. of persons on live
place- register ments by at No. of
No. of Employ- the end employers No. of regis- ment of each using vacancies
Year trations Exchange period Exchange notified 1 2 3 4 5 6
1957 3,380 315 1,142 154 197 195.8 6,131 681 1,696 221 1,083 1959 6,823 934 2,577 291 1,981 1960 7,717 1,457 2,993 349 2,101 1951 6,578 ],116 2,390 355 2.288
The figures of registration at the Exchange have gradually increased during the entire quinquennium, except in the year 1961. The number of employers using the exchange have likewise risen from 154 in 1957 to 355 in 1961. The number of vacancies notified also registers a rise from 797 to 2,288 and that of placements from 315 to l,116 during the same period.
The observation home was started during tbe year 1957 in Jamnagar district under the Saurashtra Children Act. 1956. Two social welfare extension projects-one in Jamnagar taluka and
the other in Jodiya mahal-for promoting t11,e welfare activities for women and children were started during the First Five Year Plan and were also continued during the Second Five Year
Plan period.
SOCIAL WELFARE
In 1954, the Government of Saurashtra constituted "The Saurashtra Social Welfare Advisory Board" to advise on the organisation and implementation of the social welfare programme
in the State.
Under the social welfare extension programme, activities were undertaken for organisation of bal-vadis and bal-kridangaos, maternity and health services, social education and arts and
crafts centres for women.
15 PRICE TRENDS
The average retail prices of important staple foodstuff during each calendar month of 1961
collected for Jamnagar, the headquarters of district are given in Table 16.1 in Part II of
this Handbook.
The prices of inferior -cereals, viz., jowar was
the highest in the month of July; in pulses Arhar (dal) recorded the highest prices in the month of August during the year 1961, while
those of Udid, in September during the same
period.
16 COMMUNITY DEVELOPMENT
/6.} Community Development Programme
The Community Development Programme, a unique and bold effort to mobilise public enthusiasm and co-operation in rebuildin~ the rural economy of India was inaugurated in the country on 2nd October, 1952. Kalyanpur and Kalavad projects were first Community Development Projects taken up in the district on 2-10-1953. The programme since then has undergone various organisational changes as a result of the recommendations of
the Balwantray Mehta Committee, appointed by the Planning Commission in 1957 to examine the
34
working of the C.D. programme and related matters and to recommend measures for improving the quality. tone and content of the programme. In pursuance of the recommendations of this committee the existing distinction between N.E.S. stage, intensive development stage and the postintensive stage was abolished with effect from
1-4-1958. All the Blocks under the All India Programme except blocks in the C.D. stage which
bad not completed their three years' period on 1-4-1958 were classified into stage I and stage II blocks with revised financial patterns and periods of operations. The Community Development Blocks,
on completing their period, will enter stage II. A stage I block has a five year period of operation with a ceiling of expenditure of Rs. 12 lakhs for this period. It is "The Intensive Development phase in which people's participation would be promoted as the method of Community Development and panchayats will be intimately connected
with the formulation of the Plans for their respective areas. The degree of success attained in the First Stage will be the evidence of the growth and functioning of self-reliant rural communities, which is the basic objective of the programme." Stage II of the programme with a provision of Rs. 5 1akhs for 5 years will seek to intensify the operation of the method of Community Development in its fuller amplitude
and will have greater emphasis on Community Development rather than on Development Programmes as such. Out of the 4 N.E.S. blocks allotted to Saurashtra by the Government of India, one block, viz., Kalyanpur was allotted to Jamnagar district. In addition to the C.D./N.E.S. programme, the erstwhile Government of Saurashtra initiated the Taluka Development and
pre-Extension Service Blocks. Under this scheme Jamjodhjmr block was started from 1st May, 1954. These blocks were, however, discontinued from
April 1957.
At the end of the First Five Year Plan all the
taluka!mahal except Jamnagar, Khambhalia and Dhrol talukas and Jodiya mahal were covered \lnder this programme.
J6.2 Coverage of Programme
At the end of the Second Five Year Plan on 31st March, 1961, there were 9 development
blocks in the district as under :
Coverage under Community Development Programme
by type of Block
Type of block at the time Type of Area No. of
Name of of initial block as in sq. villages Popula-he block allotment on 31-3-1961 miles covered tion 1961
1 2 3 4 5 6
Kalavad C.D. October, Stage II. 1953 from 1st
2-10-[953 October, 1956 495.2 102 74,929
Jamjodb- T.D. block Stage I pur from from
l-lO-1954 1-4-1957 455.1 76 77,586
Kalyan- N.E.S.2nd Stage II pur October, 1953 from 1-4-1958
(1-4-1955 CD. block) 552.9 69 68.933
Bhanvad P.E.S. block Stage I from 1-4-1955 1-4-1958 287.6 70 58,634
Lalpur Pre-exten- Stage I sion block from 1-4-1955 1-4-1960 436.3 74 53,045
Okha- C. D. 26th Stage II manda1 January, 1954 from 1-1-1960
(l block) (1st Novem- (t block) ber, 1956 C.D.
60,595 block) 271.7 45
Jamnagar P .E.S. block P.R.S. June, 1956 476.5 102 255,970
Kham- P.E.S. block P.E.S. bhalia 1-4-1956 483.3 83 81,972
Dhrol- P.E.S. P.RS. Jodiya 1-4-1956 561.5 95 96,755
At the end of March 1961, 26.26 per cent of
the area, 31.11 per cent of the villages and 29.6 per cent of the rural population were covered
by stage I block. The stage II blocks covered 34.46 per cent of the area, 29.86 per cent of villages and 29.2 per cent of the rural population,
while the three P.E.S. blocks covered 39,28 per cent of area, 39.03 per cent of the villages and
40.2 per cent of the rural population.
Expenditure incurred during the Second Five Year Plan by all types of blocks, namely, C.D., Stage I, Stage II and P.E.S. blocks in JamnagaI district was Rs. 3,327,648, of which Rs. 828,831
were incurred by community development blocks, Rs, 1,012,166 by Stage I and Stage II blocks
and Rs. 1,086,651 by pre-extension service blocks. The physical and financial progress achieved
under the first and second stage of blocks up 10 the year ending 31s' March, 1961 have been given in Official Statistics Table 15.1 published in
Part II of this Handbook.
17 FIVE YEAR PLANS
17.1 Achievements
A review of the progress of the Second Plan schemes implemented in the district is made in the following paragraphs. The statement given below shows the headwise expenditure incurred during the Plan period.
Headwise expenditure. during the Second Five Year Plan, 1956-61
Expenditure Percentage to
the total Head 1956-61 expenditure
1 2 1 Agricultural production • 1,271,850 1.45 Animal Husbandry 282,402 0.32 Community Development 5,071,512 5.77 Fisheries 261,307 0.30 Co-operation 31,525,890 35.87 Irrigation and Power 16.954,570 19.29 Industries and Mining . 463,015 0.53 Transport and Commu-nications . 7,220,303 8.21
Social Services Education 3,318,269 3.78 Health 13,891,934 15.81 Housing 1,558,610 1.77 Welfare of Backward Class 6,067,996 6.90 Total 87,887,658 100.00
Out of the total expenditure of Rs. 87,887,658, 35.87 per cent were spent on schemes relating
to co-operation which include grant of loans, etc., to Co-operative Societies. These were
followed by schemes relating to Social Services (28.26 per cent), Irrigation and Power (19.29 per
cent), Health (15.81 per cent) and Transport and
Communications (8.21 per cent). Thus 66.13 per
cent of the total expenditure incurred towards the schemes pertaining to Co-operation and Social Services indicate greater emphasis laid on
these schemes during the Plan period. The achievements under different heads are given
below.
17.2 Agriculture
For agricultural development during the First Plan 3,508 B. mds. of improved seed of wheat and 346 B. mds. of groundnut seed were distributed. Total manure distributed during the period was 20,263 tons of natural manure and 6,380 tons of mixed manure. Chemical fertilisers distributed were, 188 tons of superphosphate mixture, 29 tons superphosphate and 1,889 tons of other fertilisers. Under tbe crop protection Scheme 226,900 acres of land were brought under the purview of the scbeme during the First Plan and 535,000 acres during the Second. During the First Plan, 4,644 new wells were constructed and 997 were repaired, the respective figures for the Second Plan being 4,000 and 125.
Livestock
Security against diseases and improvement of breed of livestock is one of the main objectives of the Plan schemes. Various schemes under this bead were implemented during the First and tbe Second Plans, which proved to be a boon to agriculturists and cattle breeders. During the First Plan period, 3 veterinary dispensaries started at Lalpur, Kalavad and Bhanvad were staffed with trained stockmen. In the Second Plan provision was made for supplying good breed of Gir cows to institutions interested in cattle breeding work. Loans were also advanced for the establishment of cattle breeding centres, yeterinary hospitals and mobile veterinary dispensaries. 38.292 animals were treated and 13,671 were vaccinated against small-pox and other infectious diseases in tbe First Plan, while the corresponding figures were 44,039 and 12,617 respectively ill the Second. For the first time in 1959 key village scheme was implemented in the district with main centre at Jamnagar and sub-centres at Dhuvav, Hadiana, Bed, Chela and AHabada. In these centres 3,695 cows were artificiaJIy inseminated. With a view to popularise Gir breed of cattle, individual
36
cattle breeders and instltutions rearing pedigree bulls of that breed were given an allowance of Rs. 10 p.m. per bull. Preservation of green fodder by silagepit scheme was encouraged by giving a sum of Rs. 100 for a new pit and Rs. 50 for an old one. So far, 166 pits were prepared and financial assistance for 69 pits was provided.
17.3 Co-operation
Co-operative movement covered only 5 per cent of population till the end of the first co-operative year in 1951. At the end of the First Plan, co-operative field embraced 10 per cent of the total population and 49 per cent of villages of the district, while at the end of the Second Plan the proportion of population and villages covered was 65 per cent and 99 per cent respectively. There were 20 various types of co-operative societies in 1955-56 which rose to 545 in 1960-61. Agricultural credit co-operative societieil numbered 308 and non-agricultural credit societies 45 during 1960-61.
17.4 Medical and Public Health
The schemes undertaken during the First Plan included tbe extension of education and training to hospital and medical personnel, and construction of hospital and dispensary premises. The number of Primary Health Centres has risen from I in the First Plan to 4 with 13 sub-centres at the end of the Second Plan. During this period, the number of Primary Health Centres run by private institutions and local bodies was 8. The expenditure incurred after them amounted to Rs. 114,892. As much stress has been laid in the Five Year Plans on family planning, 10 family planning centres were started in the district.
17.5 Education
At the beginning of the First Plan, there were 298 primary schools, which rose to 574 at the end of the First Plan and 988 at the end of the Second Plan. The number of students for the corresponding period was 25,274, 49,492 and 64,970. The expenditure incurred on various schemes relating to primary education was Rs. 2,582,626.
In case of secondary schools, their number rose from 17 at the end of the First Plan to 48 at the end of the Second.
17.6 Irrigation
With an average annual rainfall of 15.62 inches
and absence of big watercourses, only medium
and minor irrigation schemes could be implemented
in the district. During the First Plan, Sasoi, Ghee
and Puna medium irrigation projects were under
taken. Minor irrigation projects of Sapda, Vartu,
Fulzar, Venu, Dhandhavada and Balpadi were
started in the Second Plan. The expenditure on
these projects was Rs. 13,158,262.
17.7 Fisheries
This industry is prospering on account of the location of the district on sea coast. In the then Jamnagar State, the industry was a State enterprise, but after merger of the State, fishermen's co-operative societies were formed with a view to give the fullest benefit to the fishermen for his toil. Instead of the licence system of the past, more fishermen's co-operatives were formed. Government is giving various types of assistance to 8 such societies for the development of this industry. The industry is carried on in 20 towns by 2.000 persons. During the Second Plan, the loans advanced amount to Rs. 3 lakhs, of which Rs. 175,000 have already been repaid. The total investment in this industry amounts to Rs. 600,000 and the annual catches netted are valued at Rs. 350,000. The collection of pearls numbered 11,519 and 1,200 tolas of pearl dust was obtained.
17.8 Electrification
With a view to facilitate development of small scale and cottage industries and to provide rural areas with other amenities, electricity has been brought to small villages away from urban areas. At the beginning of the First Plan, only Jamnagar and Dhrol were electrified, while at the end of the Second Plan 24 villages have this facility.
17.9 Housing
To alleviate the shortage of accommodation felt by industrial labourers and persons of low income group, the former Saurashtra Government formulated a scheme, as a result of which in 1955 the Saurashtra Housing Board was established. Under this scheme, of the 300 tenements proposed to be constructed, 100 tenements were built at Sikka.
37
17.10 Small Savings Scheme
The following figures show the progress under the scheme since 1957.
Collection under Small Savings. 1957-58 and 1960-61
Year Target Net deposits-
1957-58 26 lakhs 2,062,967 1958-59 28
" 1,199,574
1959-60 32.50 .. 4,140,790 1960-61 40 .. 7,119,000
It is heartening to nQte that since 1959-60 the net deposits have exceeded the targets by 127.40 per cent and 177.97 per cent respectively in 1959-60 and 1960-61.
18 IMPORTANT PLACE NAMES
18.1 Important Places
Important places in the district are:
Aliabada Famous for Gangajala Vidyapeeth, a group of educational institutions for rural reconstruction and Darbar Gopaldas Mahavidyalaya, the first non-government Arts and Science College in Saurashtra leading to degree courses
Balachadi A summer resort on seashore and a fishing centre having a Sainik School
Beyt An island known as Shankhoddhar Beyt for its shape resembling conch shell. Well-known place of pilgrimage where pilgrims to Dwarka invariably pay a visit
Dwarka Famous for the shrine of lord Shri Krishna called Jagatmandir or the Universal Shrine built 1400 years ago. In the precincts of the shrine, there is a seat of Shankara~ charya called Shardapeeth which is running an art college and Sanskrit academy carrying research in Sanskrit and Indology
Ghumli Once a flourish ing town and a capital of Jethwas. The old remains of the town are excellent specimen
of architecture and carving resembling those at Modhera in Mehsana district
Jamnagar Capital of the former Navanagar State ruled over by the Jams. Solarium built in 1933 is the only one of its kind in the world. Kotha and Lakhota are places worth
seeing. The crematorium having a good garden and a library is another place of interest
Mitl lpur A modern township grown up owing to Tata Chemicals Ltd., manufacturing salts, soda ash and other
chemicals
38
Nageshwar The seat of one of the twelve Jyotirlings in India-referred to as Nagesh in Darukavan
Okha Port A flourishing natural port on the Arabian Sea '
Sikka Port It has a cement factory and a pisci
culture centre
Details of these and other places will be found in the Brief Gazetteer of place names given in tbis Handbook.
18.2 Ancient Monuments
As stated earlier, the district is rich in ancient monuments. Official Statistics Table 18,3 gives details of each ancient monument together with the name of the village, place of location, the period of architecture, brief description, etc.
18.3 Fairs and Festivals
About 51 important fairs and festivals are celebrated at different places in rural and urban areas of the district. The details regarding the place where it is held, name of the fair/festival, the date on which it is held/observed and the estimated congregation are shown in the Official
Statistics Table 18.2 of this Handbook.
GAZETTEER OF PLACE NAMES
DISTRICT lAMNAGAR
V. P.=Village Panchayat; P. = Popula tion;
G. P.=Group Panchayat; N.=North Latitude;
M.=Municipality; E.=East Longitude.
1 Aliya-Bada (Taluka Jamnagar)
The two villages AUya V. P., P. 3,579 and Bada V. P., P. 1,815, situated on the opposite banks of the river Ruparel, are generally grouped together as Aliabada which is the name of the railway station on the Viramgam-Okha metregauge section about 10 miles east of Jamnagar. The pJace has gained importance since 1953 with the establishment in Aliya of a group of educational institutions called Gangajala Yidyapeeth. Decentralisation of educational institutions by establishing such centres in rural areas, reconstruction of vi11ages through them, making the youth village-minded and providing him with a proper philosophy of life are the ideals of the Yidyamandai, which manages these institutions. Darbar Gopaldas Mahavidyalay, the first non-Government College in Saurashtra, established in 1953. conducts arts courses and prepares students for the Ph.D. degree. Besides a Primary Teachers' Training College, there are institutions imparting training in agriculture, handicrafts and carrying out research in agriculture. The institution started a subsidised agricultural farm during the Second Five Year Plan and now manages in addition such centres as subsidised cattle-breeding, seed multiplication and Sarvoday centres. A cattle show is organised on Gopashtami (November) every year. The place is equipped with electricity.
2 Balachadi, V. P. (Mahal Jodiya), P. 427
It is 14 miles east to Jamnagar, on the shore of the Gulf of Kutch. According to one opinion its name is indicative of the bigh shores on the sea, which are a landmark in this part of the gulf. Another opinion is that it was the ancient burial ground of the children of Yadavas and, therefore. called Balakhadi, later corrupted into Balachadi. There is a legend that there was an
39
ashram of Durvasa Rishi to the north of the town, beyond which the land extended for some distance, but all that land with the a~hram are now covered by sea. Balachadi is a fishing centre and pearl oysters are found in the sea nearby. It used to be a summer resort of the Europeans stationed at Rajkot, 44 miles away, and the former Jamnagar State has built a nice bungalow on the high seashore. A Sainik School has been recently opened in this bungalow. On the seashore near Balachadi there is the temple of Baleshwer Mahadev, specially worshipped by Rabaris and Bharvads. A fair is held near the temple on Shravan Yad 13, 14 and Amavasya (August), which is attended by 15,000 to 20,000 persons from surrounding areas.
3 Balambha, V. P. (Mahal Jodiya), P. 5,691
It has a strong citadel built, according to Tarikh-e·Sorath, by Rao Desalji of Kutch in 1714, and enlarged by Meraman Khavas in 1784 after wresting it from the Rao. The mouth of the river Aji is about six miles from Balambha. The fresh water spring called Naoghan Kui in the hillock called Bina is associated with Ra Naoghan of Junagadh. According to legend, while going through Balambha on an expedition, he halted here, and, in order to quench the thirst of his army, thrust his spear into the ground at this place according to the bidding of his family goddess, whereupon sweet water sprang forth.
4 Bedi, V. P. CTaluka Jamnagar), P. 10,645
It is about five miles from Jamnagar in the north-west, linked by a metre-gauge roilway line and an asphalt road. [t is a flourishing intermediate port and handled, besides 1,568 passengers, 419,606 tons of cargo in 1961-62, improving upon its previous trade of 214,456 tons in 1951-52 and
349,172 tons in 1955-56. Exports accounted for 86 per cent of the total trade in 1961-62, and consisted mainly of oilcake, salt and bauxite. The main item of import was coal. About 91 per cent of the total traffic was carried by 181 steamers and 64.7 per cent of the trade was with foreign countries. The harbour, a mile and a half from the village has docks in good condition, a wharf and various facilities for the transport of goods by rail and roads. The steamers can reach the wharf during tide. There is also a jetty used at low tides. Bedi is one 0 f the ports where shipping is more intensive during monsoon due to closure of other fair-weather ports. As fishing is the predominant industry of the place, there is an ice factory and a cold storage plant with a capacity of 20 tons of fish. Oil mills and a salt works whose average annual produce is about 9,000 tons of salt are the principal industries of Bedi. It also has a workshop and a rest-house for the port staff. A lighthouse at Rozi is about four miles north of the
village.
5 Beyt, M. (Taluka Okhamandal), P. 3,386
Beyt or the island, is the short name by which Sbankhoddhar Beyt is popularly known. It is a narrow crooked strip of sand and rock situated in the Gulf of Kutch about 3 miles to the north of the mainland of Okhamandal and to the east ofOkha port. It is said to be named Sbankhoddhar as its shape resembles the conch shell which is found extensively on its shores, but more probably after the victory of Lord Visbnu over the demon Shankhasur in the Matsyavatar. Raman-dwip is its another name. Early Europtans called it Sanjana from a notorious pirate of that name. It is a well-known place of pilgrimage invariably visited by pilgrims to Dwarka. In order to preserve a permanent sign of pilgrimage it was customary in tbe past for the pilgrims to get themselves branded bere with red hot irons. for which a fee was charged. The principal shrines are the old and new temples of Shankh-narayan, dedicated to Matsya Avatar, an incarnation of Vishnu, and six others consecrated to Dwarkanath,
40
Radha, his wives-Lakshmi, Satyabhama and Jambuvanti, and his mother Devki. The old temple of Shankh-narayan was, according to a legend, built in the Satya Yug, in celebration of the defeat of Shankhasur. The new temple of Shankh-narayan, near the Shankh Talav was built about 180 years ago by the Rao of Kutch. Its
architecture is similar to that of the old one. which in turn resembles the temple of Dwarka though it is much smaller. The other six temples were built inside the fort wall shortly after the Muslim invasion in 1460, but they were destroyed during the assault by the British forces under Col. Donovan in 1858-59. Khanderao Gaekwad renovated them in the same year. The architecture of the new temples is very plain and withollt adornments. Beyet is a minor coastal port with little traffic of about 500 tons. 1n the past conch
shells used to be exported to Orissa, where they were used in the manufacture of bangles. A fair is held on Janmashtami (August) attended by about 1,500 to 2,000 persons from surrounding
villages.
6 Bhanvad, M., P. 1I,819
The headquarters of a mahaI. is situated in a hilly area about 52 miles from Jamnagar with which it is connected by road. The small river Bhanvadi flows near the town and joins tbe river Vartu about a mile further on, near tbe shrine of the Indreshwar Mahadev.
Bhanvad was founded by Bhan lethwa of Ghumli and was later fortified after its conquest by the Jam. To the south of the town there is an old bani an tree called Bhutwad or the banian tree where the ghost resides. Much folk-lore bas grown around a well-known legend about this tree. According to it, Bhan Jethwa had a flower garden at the place called Bhanwadi, whence it later on came to be named l3hanvad. Mangdo, a reputed Kathi warrior, to whose charge this garden was entrusted, had promised to marry Padmavati, a Bania maiden of Pal an. in the Alech hill, but was slain by robbers. His ghost haunted this tree
as well as the tree near which be had first met
Padmavati. Later on, she being. betrothed to another man, the bridal party camped under the haunted tree on their way for the marriage ceremony. With the consent of Mangda's uncle, who was in the bridal party, the ghost joined the procession and married Padmavati substituting himself for the deformed bridegroom. On return from the marriage, however, he restored the bride to her real husband and stayed back at the tree, where memorial stones were erected in his honour for the peace of his: soul. Even now, whenever marriages are performed in neighbouring villages, the newly weds are brought to the tree where they offer cocoanut to Mangdo, whereupon the marriage ceremony is deemed complete.
Besides the mahal offices, there are a powerhouse constructed in 1954, a taluka seed godown, a primary health centre, a veterinary dispensary and a co-operative sale-purchase union. Bhanwad is well-known for its ghee. Bhannath Mahadev is an ancient temple. Two annual fairs held at Indreshwer Mahadev on Shravan Vad 8 (J anmashtami) and amavasya (August) attract 2,000 and 10,000 persons respectively.
7 Dandawada Irrigation Scheme (Taluka Khambhalia)
Completed during the Second Five Year Plan, at an estimated cost of Rs. 888.634, has a reservoir, with the main earthen dam 4,500 feet long and 41.6 feet high. With a catchment area of 16 square miles, it irrigates about 1,200
acres of land.
8 Dhrol, M., P. 9,785, 24° 34' N., 70° 27' E.
A taluka headquarters, is a station on the Hadmatia Jodia metregauge railway line branching off the Rajkot-Jamnagar main line, about 34 miles north-west of Rajkot and 24 miles northeast of Jamnagar, with both of which it is connected by a State Highway, on which State Transport buses ply. It is situated on the bank of a small stream, a tributary of the river Undo Before the integration of States, Dhrol was a separate State, founded by Jam Hardholji, the brother of Jam Raval, who hailed from the
J-6
41
ruling Jadeja Rajput family Qf Kutch. Hardholji accompanied Jam Raval and helped him conquer Halar and tbus found the Jamanagar State. On his own part, Hardholji conq uered the territory compnsing the Dhrol State in about V.S. 1595. The field of Bhuchar Mori, two miles north-west of the town and connected with it by a road, is famous in history as the venue of an important battle between the Mogul forces and the Jam in 1591 A.D. As Jam Sataji had refused to surrender the fugitive Muzafar, the last Sultan of Gujarat, the Mogul viceroy of Ahmedabad had marched against the Jam and his allies. While the Jam himself returned to his capital after some preliminary skirmishes, the heir apparent Ajoji was slain in the battle after a valiant fight. The Moguls were ultimately victorious, and the Jam and Muzafar had to flee from Jamnagar. In 1592 Muzafar committed suicide at Dhrol while being taken to Ahmedabad in captivity. A major event of the time, this story has been a subject of much folklore and historical fiction and the palias (memorial stones) and a temple belonging to that period at the site are protected monuments.
The town is equipped with electricity and has a travellers' bungalow and a good high schQql building. There are three oil mills. Shoe-making is a well-known industry of this place. The fair held at Bhucbar Mori on Shravan Vad amavasya
(August) is attended by 8,000 persons. Other minor fairs are Janmashtami, Jesal Pir, Gebansha Pir and Nazar Mohammed Pic fairs.
9 Dwarka, M., P. 14,314
The headquarters of Okhamandal taluka, is in the extreme west of the Saurashtra peninsula on the Arabian Sea. It is a station on the Viramgam-Okha metre gauge railway line, 85 miles from Jamnagar, 135 miles from Rajkot and 235 miles from Ahmedabad. It is· also connected by a State Highway with Jamnagar and Okha on which bus services ply.
Dwarka is derived from Dwar, a door, and in ancient times its flourishing port was considered
to be the gateway to the mainland. It is also called Dwaramati Of Dwaravati, i.e., city of gates. Being the adopted home and capital of Lord Shri Krishna after he gave up Mathura, it is held in such a high esteem as a place of Hindu pilgrimage that it is one of the four principal holy places or Char dham and one of tbe seven ancient towns or Sapta puris in India. It is, therefore, visited by thousands of pilgrims and many scholars on historical study, tours from all over India.
The original inhabitants of Okhamandal were the turbulent Vaghers, said to have descended from an ancient tribe, called Kalas, who, along with Kabas and Modas, inhabited this region. The earliest known conqueror of Okhamandal was Shri Krishna who was succeeded by his great grandson, Vajranabh. After the decay of the Yadav power, the Kalas were again in control from the middle of the second century, till tbe sixth with an interval of the ascendancy of two Syrian fugitives. By this time Kalas came to be known as Vaghers whose predatory activities made them a source of constant trouble and threat to the peace of the· Kathiawar peninsula. Between the middle of the 13th and beginning of the 19th century Okhamandal passed into the hands of Hindu and Muslim rulers and was finally captured by the British when the Vagher pirates captured a British vessel and threw an English couple overboard in 1804. As Dwarka and Beyt
_were regarded holy places by Hindus, Okbamandal was handed oVer to the Gaekwar in 1817 in whose possession it continued till the merger of the Baroda State in 1949 and was finally inclUded in Jamnagar district in 1959.
The original Dwarka, believed to be of gold, bas been described in the Mahabharata and Puranas like Bhagvat, Vishn u Purana, Skaod Purana, Harivansh, etc. It is said that Revat, the great grandson of Vaivasvat Manu settled the town Kushasthali at this place. In order to prevent the Yadavas from being enfeebled by the attacks of Jarasandh whom he had defeated seventeen times, and of Kalyavat1, Shri Krishn~
42
abandoned MathuI'a, when Garuda found out and suggested Kushasthah 's a suitable site for the new capital. Here Shri Krishna settled Dwarka on an area twelve yojans round, about 5,127 years ago-according to some Indian scholars-and ruled there for a hundred years. Dwarka, surrounded by the sea-waters on all sides, traded with ports of many countries. But, following his demise and internecine feuds and ultimate destruction of the Yadavas, it was submerged in the sea, according to God's will. The exact location of Mul or original Dwarka is still a matter of doubt. According to some it was located at a place of that name in Kodinar taluka, while a scholar has claimed that he detected from the air the submerged Dwarka in the sea near the present site. According to another belief ancient Dwarka lies buried under the present town. Various theories are propounded to show that the original Dwarka was at the existing place~ e.g., the extensive formation of sand dunes on the banks, closing up of the sea-water channels on three sides of the town, narrowing of the Gomti because of the sea-silt, and visit of Dwarka by acharyas, like Shanker, Ramanuj, etc., devotees like Narsinh and Mira, saints like Kabir and Nanak, all of whom subscribed to the tradition that the original Dwarka existed at its present site. In any case, excavations recently undertaken up to the depth 40 feet below the level of the present town have revealed various layers of structural remains intercepted with layers of sand, silt, etc. Limestone blocks were found used in house floors and walls. Fragments of pottery were also discovered indicating that Dwarka had come in contact with the Roman world. These excavations show that Dwarka was inhabited before the Christian era, probably on an island formed by the waters of the Gomti creek: surrounding the present site of Dwarka. Still another Dwarka seems to have arisen and prospered about the second or third century. It is believed to be the island of Barake in the Gulf of Kutch mentioned in the Periplus. an ancient Greek work. Finds of amphora sherds indicate commerce with the Mediterranean region.
This Dwarka seems to have been buried under the sea in the fourth century, to be rebuilt in the sixth or seventh century during tbe reign of Chavdas.
The main temple of Dwarka, situated on the Gomti creek, is known as Jagat Mandir or the
Universal Shrine of Trilok-Sundar, the most beautiful in all the three worlds. The presiding deity of Dwarka, Shri Krishna, is also known as Dwarkanath or Dwarkadhish. It is an imposing edifice originally built by Vajranabh. According to some historians the present shrine was built 1,400 years ago by Guptaraja, a ruler on the Ganges who had conquered Okhamandal. It seems to have been extensively repaired or renovated after the Muslim invasion. This great temple having a plinth area of 1,800 square feet, consists of a shrine, an audience hall, the roof of which is supported by 60 pil)ars of granite and sandstone and a conical spire about 170 feet high, visible from twenty miles out at sea. The temple bas seven floors. There is a shrine of Shakti Mata on the fourth storey, while the fifth, reaching up to 100 feet, has the Ladwa Mandir. The chief material used is sandstone of inferior quality from local quarries which is being gradually affected by weather. There is elaborate carving on the outside and on the spire, while tbe inside is plain.
There is a legend that the original idol of Shri Krishna is now at Dakor, Kaira district. It is said that, taking pity on his old devotee Bodano Who came for darshan from such a great distance on every full moon day, the God in tbe form of tbe idol went with him to Dakor in V. S. 1212. The Gugli Pujaris at Dwarka chased Bodano to recover the idol and killed him in Dakor. The widow of Bodano offered to give the equivalent of the idol's weight in gold whereupon the Gllglis agreed to witbdraw. By a miracle the idol became as light as a golden nose-ring which was all the widow bad. The Guglis were disappointed, but the Lord merdfully directed that they would find an exact replica of the idol in a particular well at Dwarka on a
43
particlllar day. The impatient Gugtis looked for the idol earlier than they were told to, and, as a result, found an idol which, though similar to the original one, was smaller. It is said that, this is the idol, which is now enshrined at Dwarka.
The Sharda Peeth, an important institution of Dwarka, on the bank of the Gomti, has the temples of Shardamba and Chandramauleeshwer Mahadev nearby. It was established in recognition of Dwarka's importance as one of his four Maths in the four corners of India by Adya Sbankeracharya to carry out religious activities in the Pashchimamnaya, i.e., the Western region. The first head of the Sharda Peeth was Mandanmishra, the famed pundit wbom Shanker bad defeated in philosopb ical debate, and who had adopted sanyas under the name Sureshweracharya. The present Shankeracharya is the 77th in line at Sharda Peetb. The Sharda Peeth Vidya Sabba, an educational society sponsored by the Peeth, runs an arts college and a Sanskrit academy which carries out research and prepares scholars for the degree of Ph.D. in Sanskrit and Indology.
Other temples besides Jagat Mandir are the ancient temple of Rukmini, the wife of Lord Krishna. Ranmukteshwer Mahadev, Mahalaxmi, Damodadi. Goverdhannatbji, the shrines of Mirabai and Narsinh Mehta, the weII-known saint and poet. The Pancha Tirth on the opposite bank of the Gomti has five sweet water springs just near the creek of salt water. The Dwarkadhish and Rukmini temples are protected monuments believed to date back to the thirteenth century. While visiting Dwarka, the pilgrims also visit the island of Beyt, another Vaishnava place of pilgrimage 20 miles away.
The climate of Dwarka is salubrious b'ut there is scarcity of sweet water. The town is equipped with electricity and has a number of dharmashalas for the visiting pilgrims. There are a high school, a hospital established about 80 years ago by the munificence of a wealthy merchant of Bombay and a veterinary dispensary. There is also a cement factory. Yellow earth known as magmati is found in large quantities
in Okhamandal. There is a light house at Dwarka which has a minor port called Rupen about a mile to the north, which handled 5,921 tons of cargo in 1961-62, mainly consisting of export of cement. Wood and timber were the main items of imports.
A fair is held on Janmashtami, Shravan Vad 8, when about 17,000 people, both local and outsiders, attend. Dolotsav and other Vaishnava festivals are also celemonially observed at the temple of Dwarkadhish.
10 Fulzar Irrigation Scheme (Taluka Kaluvad)
A reservoir has been constructed across the river Fulzar near the village Dudhala. The main earthen dam, completed in 1957, is 5,300 feet long and 68.7 feet high. With a catchment area of 55 square miles, its irrigation potential will be 4,500 acres of land. The scheme is expected to be completed during the Third Plan period at an estimated cost of Rs. 35.30 lakhs.
11 Gandhvi, V. P. (Malzal Kalyanpur), P. 508
It is situated fourteen miles away from Kalyanpur on the north bank of Vartu river ncar its confluence with the sea opposite to Miyani. It was once a well-known port, about 20 miles north-west of Porbandar in Junagadh district. A road built recently connects it with the railway station of Bhatia between Khambhalia and Dwarka. State Transport buses ply on this road in fair weather. Gandhvi is probably the same as Gandaba mentioned by Farishta. It has the wellMknown temple of Harshad Mata, a form of Goddess Mahakali. The original temple on the top of the hill on the creek is deserted and the Mata is now installed in the temple at the foot of the hill. It is said that ships which sighted the old temple on the hill were wrecked. A shipwrecked rich merchant of Kutch named Jagadusha, performed penance before the Mata who agreed to come down to the foot of the hill on condition that an animal should be s.acrificed to her for each of the steps. When the number of animals thus sacrificed was found inadequate Jagadusha offered his family and finally himself for sacrifice.
44
Pleased at this, the Mata restored their lives and granted him a boon. Ship-wrecks are. said to have ceased since then.
12 Ghumli, V. P. (Mahal Bhanvad), P. 355.
About two miles from Bhanvad and connected with it by State Transport buses in the fair season, was once a large flourishing city and the ancient capital of Jethwas when they were at the zenith of their power. As it is situated in the Barda hills close to the forest, wild animals like leopards sometimes stray to the village. Though it is now in a deserted and ruinous condition, its remains are excellent specimens of architecture, preserved as protected monu~ents. The most famous of these, the Navlakha Shi~ temple, consists of a shrine with a pradakshina marg and a mandap hall with three entrances, one on each side. The one-storeyed structure built of lime stone on a plinth 153 feet by 102 feet has excellent carvings resembling those of Modhera. It was built by Bhan Jethwa, the grandfather of Halaman Jethwa, the story of whose love with Sone is well-known in folk-lore.
Other remains include Ganesh Dehra, the Ramapol, the Jetha Vav, the temples near Sone Kansari tank and the ruins, probably of palaces, on the Abapura hill. These monuments belong to the pre~Solanki period, i.e., 9th to 11th or 12th century, though Jethwas might have reigned there earlier. Ghumli is said to have been destroyed in the 14th century by Jam Bamanioji.
13 Jamjodhpur, M., P. 13,798
The headquarters of a taluka, is about fiftysix miles south of Jamnagar, close to the Alecll. hills. It is a station on the Dhola-JetalsarPorbandar metre-gauge section of the Western Railway, about 35 miles from Porbandar and connected with Jamnagar and Junagadh by State Transport bus services. Cotton and groundnut are produced in a fairly large quantity in this area. There are six oil mills and two ginning factories. Ghee, an important item of its trade, is expurted to various parts of India. Besides the power-house constructed in 1954, there are a primary health centre and a taluka seed godown.
14 Jamnagar, M., P. 148,572, 22° 28' N, 700 7' E.
Also called Nawanagar, is a district headquarters situated on the confluence of the rivers Nagmati and Rangmati and a junction station on the Viramgam-Okha metre-gauge railway section, 51 miles from Rajkot. It is on the Rajkot-Okha State Highway and State Transport buses connect it with Rajkot and other important towns around. There are regular air ~ervices to Rajkot, Bhuj and Bombay.
Jamnagar was, till its merger in Saurashtra in 194&, the capital of a prosperous State called Nawanagar ruled over by the Jams. Claiming to be the descendants of Yadavas, the Jams belong to the Jadeja Rajput race which originated from the Samas who ruled at Nagar Thatha in Sind and then migrated first to Kutch. Jam Raval founded Jamnagar in 1540 on the site of Nagnah Banda, which he took from the Jethwas, probably a branch of the J at tribe, who preceded the Jadejas in Saurashtra from Kutch. During the troubled times following Humayun's conquest of Gujarat, the Jams consolidated their own kingdoms. Their territory, which now forms the major part of Jamnagar district, was called Ralavar and later on Halar, as Jam Raval was a descendant of Jam Rala, and hence was called Ralani. In
1951, Jam Sataji gave asylum to Muzafar, the last Sultan of Gujarat, a fugitive from the Moguls. In the resultant battle between the armies of the Moguls and the allies of the Jam at Bhuchar Mori about two miles from Dhrol, Jam Sataji returned to Jamnagar after some preliminary skirmishes, but his son Ajoji was slain after a heroic fight. This event has become the subject of much folk-lore and historical fiction and Bhuchar Mori is since looked upon as synonymous with a massacre. Mogul tloops pillaged and occupied Jamnagar and restored it to the Jam after a year of exile on condition to pay tribute and help the Mogul troops.
Later on, Kutb-ud-din, Foujdar of Sorath, took Jamnagar and named it Islamnagar. Tamachi, the minor son of the Jam who fell in battle escaped to Kutch and thence to Okha MandaI
45
and ravaged the }amnagar dom:nions. In 1673 he was restored to the throne at the intervention of Maharaja Jasvantsiagji of Jodhpur, the viceroy of Gujarat. Meraman'or Meru Khavas, an equerry of Jam Lakha's wife, acquired much influence over the Jam and virtually kept him as a figurehead. He dominated the history of Jamnagar for the better part of the eighteenth century, till he died in 1 SOO. Repeated attempts to remove him not only by dissatisfied elements of Jamnagar, but also by neighbouring States and by Fateh Mamad of Kutch, failed. In 1788 he built a fort around Jamnagar and othei"wise strengthened it. He humbled the Kathis in 1792. Pressed by a British and Gaekwad army in 1&12 the Jam was forced to sign a treaty with these powers. On the merger of Jamnagar State in the Part B State of Saurashtra in 1948, the Jam Saheb was made the Raj Pramukh.
Jamnagar was made famous the world over by Jam Ranjitsinhji (1872-1933) popularly known as Jam Ranji, a peerless cricketer, after whom the Ranji Trophy, the national cricket tournament
of India was instituted. The tradition of sports established by him has given ri'le to world famous cricketers from this town like Prince Dulipsinhji, Vinoo Mankad and Amarsing.
Jamnagar is a walled city with several gateways. Its charm lies in the combination of old and new. Being a well laid out city with its stone buildings and wide streets and well-known for its flowers and perfumeries, it is styled the Paris of Saurashtra. It has also been called Chhoti Kashi (the smaller Kashi) on account of the large number of temples, the notable of which are Bhidbhanjan Mahadev, Nagnath Mahadev, Ashapuri Mata, Daoojini Haveli, Anada Bava Math and Dwarkadhish temple. There are also some fine mosques and Jain temples.
After Independence, the population of Jamnagar grew considerably owing to migration from Pakistan and establishment of naval and military stations. Jamnagar has since developed fast as an industrial town with a woollen mill, chemical works, 22 oil mills and four salt works. There are numerous handicrafts and small scale
industries, the main of which are the manufacture of nut-crackers, pen-knives, trunks, locks, soap, beads, metalware, musical instruments, buttons and stone carving, silk weaving, embroidery and lextiledyeing and printing. The kumkum, kaja/ and surma of Jarnnagar are also famous. The pride of the place is, however, the Bandhani (tie and dye) of which Jamnagar is the principal and most popular centre. The craftsmen of Jamnagar are well-known for weaving of pallao, sari-ends and jari brocade. Fishery is an important industry of the region and pearl oysters are an important marine product. Gandhi Udyog Mandir. established in 1955, provides training for agriculture, tailoring, printing, etc., and also produces hand-made paper. About two hundred tenements have been built in Jamnagar for industrial workers during the First Five Year Plan period. Jamnagar is a large business centre of groundllut, grains and garlic. Situated five miles inland from the seacoast, it has a good port Bedi on the gulf of Kutch, through which it carries on a large traffic with foreign countries.
Jamnagar has training establishments of an the three defence services. It has colleges of arts, science, commerce, law and medicine. Wellknown as a centre of Ayurveda for a long time, it has an Ayurvedic medical college with a museum and a post-graduate research centre in Ayurved. Besides the large Irvin Hospital, there is a solarium built in 1933, where various diseases are treated with sun rays by light therapy and heliotherapy. Its upper storey is so constructed that it can be rotated to face the sun during any part of the day. After the destruction of two similar solaria in France during World War II, the Jamnagar solarium is the only one of its kind in the world. The Government Girls' High School building, a specimen of fine architecture, is known as the gem of Jamnagar. The Jam Saheb's palace has an excellent picture gallery of Victorian paintings. The Lakhota palace, in the middle of a tank and approached by a stone bridge and the Kotha (bastion) on its bank are specimens of old architecture ,
46
constructed, along with excavations of the tank, during famine years between 1834 to 1846. The Lakhota now houses a museum which contains a collection of sculptures from Ghumli, Pachhtar, Pindhara, Gandhvi, Chotila, etc.. dating from 9th to 18th century as well as picture and numismatic galleries, pottery belonging to the early Christian era, paleolithic and microlithic finds from the Narmada valley and a manuscript and epigraphic gallery with copper plates and ancient inscriptions. Lakhota has a curious ancient weH, water from which is obtained by sucking air from a small hole in the floor of the building. There is an equestrian statue of Jam Raval, the founder of the city, in the Lakhota while a golden coloured statue of Jam Ranjitsinhji stands on the bank of the tank. There are several protected monuments in Jamnagar including the Lakhota, the Kotha, the sixteenth century temple of Nagnath Mahadev, the Kalika Mata temple, the Khambhalia gate belonging to the ninteenth century, a post-Chalukyan step-well and the Ra Kumbha Darbar of the medieval times. The Lal Baug, formerly a palace of the lam Saheb is now converted into a Government guest house. A townhall has been recently constructed and the city is equipped with electricity, piped water supply and city bus services. The water supply is drawn from Ranjit Sagar dam six miles away. The municipality maintains the crematorium which has not only a good garden with statues of saints, etc., but also a small library and is considered a place worth-seeing. A fair held on J anmashtami, Shravan Vad 8, (August) at the temple of Nagnath Mabadev is attended by about 100,000 persons.
15 Jodiya, M., P. 7,821, 22° 42' N, 700 21' E.
It is a mabal headquarters and a minor port 24 miles north-east of Jamnagar and 40 miles north-west of Rajkot. Situated on the river Und, it is the terminus of the Hadmatia-Jodiya metre gauge section, a branch off the Viramgam-Okha line of the Western Railway. It is connected by bus with Dhrol, Jamnagar and Morvi. It was originally a small fishing village, till Meraman Khavas started to develop its trade. Furtber
developed by Sundarji Khatri, a native agenr of the British Government 10 whom the mahal was farmed. it became an important port of Jamnagar State. However, it has now lost its trade. The harbour, open for coastal and foreign traffic, is about a mile and a half from the town and has
very little traffic, having handled only about 255 tons in 1961-62. The town has a power-house constructed in 1954, a subsidised agricultural farm opened during the First Five Year Plan, a veterinary dispensary and a handicrafts training institution
for women. A kotho (bastion) belonging to the nineteenth century is a protected monument. A scheme was executed near Jodia during the First Five Year Plan for reclamation of saline lands
at a cost of Rs. 1.99 lakhs. The Gulabasha Pir Drs, held in the month of Muharram, attracts
about 5,000 persons, mostly Muslims.
16 Kalavad, M •• P. 9,092
The headquarters of a taluka, isa walled town about 28 miles south-east of Jamnagar and
connected by a road and State Transport bus services with Rajkot. It is famous in local legend
as being the place where a Val a Rajput of Dhank family married the daughter of a Kathi and thus founded the present tribe of Vala Kathis. It was famous as far back as the eighteenth century
for very fine dangari, a type of cotton cloth used by royal families, before the introduction of the English calico. However, this industry
bas now entirely disappeared. Besides tbe taluka offices, there are a hospital and a veterinary dispensary, six oil mills and a co-operative salepurchase union. There is an ancient well-known
temple of Shitla Mata, the goddess of small-pox. A fair is held on Shravan Vad 15 (August) at Dhingeshwer Mahadev temple attended by about 10,000 persons. Another smaller fair, held on Janmashtami, Shravan Vad 8 (August) attracts
about 2,000 people.
The Balamdi Irrigation project envisages
construction of an earthen dam, 8,300 feet long and 52.S feet high, near Kalavad. With a catchment area of 26 sq uare miles it will be able to irrigate 3,420 acres. It is expected to be
47
completed during the Third Plan period at an
estimated cost of Rs. 1,844,262.
17 Ka/yanpur, V. P., P. 2,217
It is the headquarters of a mahaJ, connected by a road with the railway station of Bhatia on the Jamnagar-Okha metre gauge line, about 3 miles away. It has a primary health centre.
18 Khambhalia, M., P. 20,064, 22° ]21 N., 69° 44' E.
A taluka headquarters, is a railway junction on the Viramgam-Okha metre gauge section, 33 miles from Jamnagar, with a branch line up
to Salaya port, 9 miles away. It is connected by bus services with Jamnagar, Jamjodhpur, Bhanvad and Porbandar. It is a walled town situated at the confluence of two small rivers , the Ghee and Teli flowing into the Salaya creek about 10 miles east of Salaya port. It is an ancient town and was formerly a possession of the Vadhels from whom it was conquered by Jam Raval. It was the residence of the Jam
when Jamnagar was taken by Moguls and
even till the death of Emperor Aurangzeb. The rajtilak ceremony of the Jam on ascending
the throne was performed in the old Darbargadh at Khambhalia, which contains the shrine of Ashapuri Mata, the family goddess of the Jams, There are several old temples like Khamnath, Ramnath and ladeshwer Mahadev, Kalyanraiji and Maha Prabhuji's bethak and Ajmer Pir Dargah.
The ironsmiths of the town are renowned for
their skill and till the latter part of the 19th century gunsmiths of Khambbalia were capable
of making breech-loading fire-arms. There were ten oil mills and two ginning factories. Handloom cotton textiles and ivory bangles are its chief
handicrafts. Ghee, cotton-seeds and groundnut are the main items of its trade. There are also a teachers' training college, a public hospital, a veterinary dispensary, a seed multiplication centre,
a rest-house and three dharmashalas. The municipality runs a girls' high school, a public library
and a library for women. Besides a power-house constructed in 1954, it has piped water supply. There is also a small reservoir made by the Khamnath bund on the river Gbee.
A fair held at Khamnath Mahadev on tbe river Ghee on lanmashtami (August) attracts 12,000 to 15,000 people. A smaller fair, held on Bbadrapad Sud 5 (September) is attended by about 8,000 persons.
19 Lalpur, M., P. 5,435
Tbe headquarters of a mabal, is situated on the Kanalus-Katkola metre-gauge section of the Western Railway. It is about 24 miles soutb of Jamnagar, with which it is connected by an asphalt road. Bus services link it with Jamnagar, Porbandar, Bhanvad, Jamjodhpur, Kutiyana, etc. Besides the mahal offices, there is a hospital, a primary health centre, a secondary school, a veterinary dispensary, and a rest-house. There is an oil mill. A fair held on Janmashtami (August) is attended by about 4,500 persons.
20 Mithapur (Taluka Okhamandal), P. 1l,753
So called because of the large salt chemical industry that has been located here, is situated twelve miles north of Dwarka and is a station on the metre-gauge railway line between Dwarka and Okha, with which it is also connected by State Transport bus services. The Tata Chemicals Ltd. is a large and important industrial concern manufacturing salts, soda-ash and other chemicals. With the factory a modern township has grown up, equipped with electricity and water supply; and tbe company maintains an excellent hospital for the workers and the public. There is also a high school.
21 Nageshwer, G. p. (Taluka Okhamandal), P. 332
It is situated on Dwarka-Gopitalao bus route about ten miles north-east of Dwarka. The temple of Nageshwer Mahadev is considered to be very holy as it is believed to be one of the twelve Jyotirlingas in India, referred to as Nagesh in Darukavan. Vaghers, the main inhabitants of Okhamandal, attend the fair on Shravan Vad 15 (August) in large numbers. A similar fair locally known as Rakh Pancham fair, is held on Bhadrapad Sud 5 (September).
48
22 Okha Port, M. (Thluka Okhamandal), P. 9,630
The principal port of Okhamandal taluka, is situated on the north-western tip of Saurashtra peninsula. It is the terminus of Jamnagar-Okha metre gauge railway line, 103 miles from Jamnagar, and connected with it by a State Highway via Dwarka. It is also served by State Transport buses. The name Okhamandal is believed by some to be derived from Okha (bad) and mandai (territory), as it is an utterly barren land inhabited by predatory tribes known for their violent and turbulent nature and backwardness. According to another opinion, tbe area was called Okhamandal after Usha or Okha, the daughter of Banasur, who married Aniruddh, the grandson of Shri Krishna, and came to live there.
Okha is a flourishing port on the mouth of the Gulf of Kutch. It is a natural harbour without much silting. The steamers can berth straight on the wharf upto which the railway line has been extended. There is a workshop with modern machinery. The total traffic handled at this port during tbe year 1961-62 was 676,591 tons, of which 426,481 tons or 63 per cent were accounted for by exports. About 95 per cent of cargo was handled by steamers and foreign trade constituted 45 per cent of the total traffic. Apart from being the first in the imports of mineral oils (imported in bulk), and gunnies, and in exports of bauxite, cement and chemicals, this port has the maximum traffic, in both imports and exports among the ports managed by Gujarat State. It also ranks first in the whole country in the export of bauxite. A lighthouse constructed recently at a cost of Rs. 7 Lakhs is 80 feet high and its light is visible from a distance of about twelve miles. There is a factory of the Burmah Shell Oil Storage and Distributing Company for the manufacture of tin containers and filling and packing of kerosene.
Okha, a well laid out town which has grown up during the last thirty yearst is equipped with electricity and piped water supply, Potable water being scarce in the town, water is supplied from Gadhechi, twelve miles away. Shankhoddhar Beyet,
popularly known as Beyt, a well-known Vaishnava place of pilgrimage, is two miles to the n?rth of Okha Port, and approached by ferry serVIces.
23 Pachhtar, V. r. (Mahal Bhanvad), P. 1,057
It is situated in the west of Barda hills on the foot of the hills. It is believed to be a very ancient place, probably a flourishing town of the past, called Mungi Patan. There is an ancient temple of Amba Mata. A Panchayatan temple of the eighth century and a step-well called Vikia Vav are protected monuments.
24 Pindara, (Maha/ Kalyanpur), P. 1,261
It is a minor port 24 miles west of Khambhalia and sixteen miles from Kalyanpur and connected by State Transport bus services with Bhatia railway station. It derives its name from a kund (pond) called Pindatarak, i.e., one which causes an offering of a rice ball to fioat in it. It is said that it was a city called Devpuri existing even before Dwarka, and that Durvasa, Agastya and other rishis resided there. Old Pindara is situated about 2 miles to the north, but on account of the encroachment by sea, it was abandoned about 300 years ago for the present site. It is said that the Pandavas, on a pilgrimage for expiation of the sin of killing their own bretheren, halted here and, according to the directions of Durvasa Rishi. bathed in the kund and offered 108 iron balls, which floated on water. The rishi thereupon gave a blessing that rice pindas offered will henceforth float in this kund. This, it is. said, happens only if the priest has been satisfied previously. Pindara has since been a place of pilgrimage for performance of the shraddha ceremony. There are temples of Kapalmochan Mabadev, Moteshwer Mahadev and Durvasa Rishi's Agni-kund or sacrificial altar. It is said th~t remains of old temples covered by the sea can be seen at extremely low tides. The total volume of trade at the port during 1961-62 was 30B tons and consisted mainly of export of miscellaneous commodities.
25 Puna Irrigation Scheme (Mahol La/pur) It was completed during the First Five Year
Plan at the cost of Rs. 1,983,000. The dam on
49
the river Poona near village Kanalus in Lalpur mahal, about 22 miles from J amnagar, is 4,850 feet long and 40 feet high and the storage capacity of the reservoir is 494 M.C.ft. The project has an irrigation potential of 1,500 acres of land of six villages.
26 Rozi (Taluka Jamnagar)
Situated on the Gulf of Kutch about 8 miles to the north of Jamnagar, it has a cool and healthy climate which made it a favourite summer resort of the rulers of Jamnagar. There is a lighthouse at Rozi about 4 miles from Bedi. The well-known temple of Rozi Mata is named after a Charan woman. It is said that Jiyoji, son of Jam Raval of Jamnagar, had killed here a roz (or nilgai) while hunting. Since the roz had taken shelter at the nes of a Charan, the woman cursed the prince who died shortly afterwards. The woman committed traga or suicide and has since been worshipped, specially by the ruling family of Jamnagar and by the goldsmiths of that town.
27 Salaya, M. (Taluka Khambhalia), P. 8,768
A minor port on the Gulf of Kutch, is the terminus of the Khambhalia-Salaya metre gaage section of the Western Railway, nine miles from Khambhalia and connected with it by bus services. It was considered an important port during the Mogul period, and appears in the Mirat-i-Ahmedi as a port of the Jamnagar State. The total traffic handled at this port during 1961-62 was 4,508 tons of which 3,934 tons were imports consisting mainly of wood and timber. Cement was the main item of export. Since its trade was largely with Karachi, the traffic has suffered a set-back on account of the partition of India in 1947. Ships can sail up the creek right up to the town. There is a lighthouse on the island Kalubhar about ten miles in the north-east of Salaya. The town is equipped with electricity. Water supply is at present drawn from a distance of three miles. A scheme for piped water supply has been sanctioned in the Third Five Year Plan. Besides fishing, the other industries are an oil mill and salt works. There are port and customs offices, a municipal bigh school and
a dharmashala. A scheme was executed here during the First Five Year Plan for reclamation of saline lands at a cost of Rs. 1.42 lakhs.
28 Sapda Irrigation Scheme (Taluka Jamnagar)
It envisages the construction of a reservoir across the river Bhagedi near village Sapda. The main earthen dam will be 4,920 feet long and 65.7 feet high. With a catchment area of 20 square miles, it will be able to irrigate 2,500 acres of land. It is expected to be completed dunng the Third Plan period at an estimated cost of Rs. 20.90 lakhs.
29 Sasoi Irrigation Scheme (Mahal Lalpur)
It was completed during the First Five Year Plan at the cost of Rs. 8,383,457. The dam on the river Sasoi, near the villages Pipli and Meghraj, about twelve miles from Jamnagar, is 1,000 feet long and 49 feet high and the reservoir four miles long and three miles broad. The project has an irrigation potential of 9,300 acres of land of twelve villages.
30 Sikka, V. P. (Taluka Jamnagar), P. 8,778
It is an open intermediate port and a terminal station on Kanalus-Sikka metre gauge railway
50
line, 25 miles from Jamnagar by road. It handled 169,367 tons of cargo in 1961-62, of which the exports, mainly of cement, accounted for 134,828 tons or about 80 per cent. Coal and coke were the main items of import. About 96 per cent of the total cargo was handled by steamers while foreign trade constituted about 11 per cent of the total traffic. Sikka is an important centre of fishing where two pisciculture centres have been established since 1952, besides which there is also a fishermen's co-operative society. It also has a cement factory. There is a thermal powerstation with its capacity increased from 8,000
K. W. to 16,000 K. W. during the Second Five Year Plan. It supplies electricity to Jamnagar also. One hundred tenements have been built recently by the Housing Board for industrial workers.
31 Vartu Irrigation Project (Mahal Bhan¥ad)
It envisages the construction of an earthen dam across the river Vartu near village Morzar. The catchment area at the dam site is 66 square miles. It will irrigate about 7,830 acres of land. Expected to be completed during the Third Plan period, it is estimated to cost Rs. 61.75 lakhs.

PART 11
I CENSUS TABLES
2 OFFICIAL STATISTICS

A-GENERAL POPULATION TABLES
Out of 4 tables of A Series compiled at this Census, Tables A-I, A-III and A-IV giving area, bouses and population, classification of villages and towns have been reproduced in the District Handbook. They are the same as those given in 1951. The most distinguishing featllres, however, are the various appendices and sub-appendices giving details of (a) 1951 territorial units constituting the present set-up of the district showing changes which have taken place during the decade, (b) villages with a population of 5,000 and over and towns with a popUlation under 5,000, (c) houseless and institutional population, (d) 1951 population adjusted to 1961 administrative units, (e) new towns added in 1961, CO towns in 1951 declassified in 1961 and (g) towns with their area and jurisdiction.
A-I-AREA, HOUSES AND POPULATION
This table is more elaborate than that of 1951 as it gives in addition to area, houses and population, population per sq. mile, number of inhabited and uninhabited villages and number of towns. The data is given down to taluka/mahal with break-up for Total/Rural/Urban.
Brief Account of Changes in Area of the District from 1901 to 1961
Numerous changes have taken place since Independence in the areas of the districts, though the boundaries of various units comprised therein practically remained unchanged between 1901 and 1941. Three principal stages in which these changes have come about during the Post-Independence period are: (i) those that came in the wake of Independence after 1947; (ij) those that took place on the Reorganisa~ tion of States- in 1956 and (iii) those that resulted from the bifurcation of the bilingual Bombay State in 1960.
Even after reorganisation in 1956, several territorial changes were effected in 1959, the details of which have been given in sub-appendix 2 to Appendix 1 to Table A-I alongwith the relevant notifications. Broad changes that have taken place in the territorial limits of the district between 1951 and 1961 are, however, listed below:-
Jamnagar :- This district comprises the former Halar district and Okhamandal taluka of Amreli district.
Rural and Urban Population
During the past censuses there was no uniformity in the criteria prescribed for distinguishing urban areas from the rural. The definition of 'town', therefore, varied from State to State and the places were treated as towns if, in the opinion of the State Government or the Superjntendent of Census Operations, they were found to possess urban characteristics. It included all municipalities, cantonments, civil lines and aU places with more than 5,000 population which, it was decided, to treat as towns on the ground that they possessed urban characteristics. This definition of 'town' has remained substantially unchanged since 1891. To the characteristics aforementioned, Baroda State, which has merged into Bombay State in 1949 and now forms part of the newly formed Gujarat State added one more according to which all the headquarters of talukas were treated as towns. In view, however, of the increasing impe>rtance of studying urbanisation in all its varied aspects, the Registrar General, at the very outset of 1961 Census, emphasised the need for a uniform treatment by strictly defining the conc~pt of 'town'.
Town:
'Town' has been defined as a place having a municipality or a cantonment or a place with a population of 5,000 and over jf 75 per cent of its male population is dependent on non-agricultural pursuits. These tests were applied by the Collectors who furnished lists of places to be treated as towns in 1961, which were also got approved by the State Government and the Registrar General.
3
As against 16 places treated as towns in 1951, 15 qualify to be treated as urban according to the test prescribed by the Census of 1961. The loss of 1 is accounted for by declassification of 3 towns as villages as shown in statement A and promotion of 2 villages as towns as shown in statement B.
Class
VI
Class IV V
Village:
STATEMENT A
Urban areas of clas.J VI of 1951 eJjminated in 1961 with population of 1951 and 1961 Name and number of towns
3 ) Raval 2 Balambha 3 Dhrafa
STATEMENT B
1951 13,956
4,794 4,742 4,420
Population
1961 16,216 5,465 5,691 5,060
New urban areas of classes IV and V listed in 1961 with their names and population in 1961 Name and number of towns
1 Bedi 2 Sikka
1961 Population 10,645 8,778
'Village' is a revenue village which is an administrative rather than a demographic unit. The definition of the term 'village' has practically remained the same during the entire census period. In short, it is a revenue or cadastral survey village which has got a separate entity and a distinct number assigned to it in the revenue records of the State. It may consist of a single village with a cluster of houses or a number of hamlet!il with separate clusters of houses. In forest areas it may even consist of scattered houses situa ted on the field within the boundaries of the village. It may be inhabited or uninhabited.
Census House:
Owing to the diversity of local conditions it was not possible in the past to lay down a uniform definition of a 'Census House' common to an parts of the country. The definition adopted till the Census of 1941 had two-fold connotation which emphasised either (i) the structural aspect, i.e., building or house or (ii) the social aspect, i.e., family or household. The former was defined as the residence of one or more families having a separate and independent entrance from the common way. But the social aspect was
. emphasised by defining a "Household' as the home of the composite family with its resident dependents and servants. From 1881-1941, the Census Superintendents adopted the one or the other definition according to their convenience. A clear distinction was, however, drawn between a 'Census House' and a 'Census Household' in 1951 which gave a uniform meaning to the term 'Census House' or the 'Census Household' or the 'Family Unit'. The 'Census House' was defined as, 'a dwelling with a separate main entrance' and the 'Census Household' as 'all persons who live together in the same house and have a common mess'.
Though the definition of a 'Census House' introduced in 1951 was continued during the Census of 1961, it differs from that adopted by the Census of 1961 in that the latter is broad-based to include non-dwellings also. The house-list is thus an inventory of all stmctllres or part of structures with a separate entrance.
The following definitions of the term 'Census House' given in the instructions for filling the hOllse-list , WJ11 clarify the position still further.
"A 'Census House' is a structure or a part of a structure inhabited or vacant, or a dwelling, a shop, a shop-cum-dwelling, or a place of business, workshop, schoo], etc., with a separate entrance."
A-Ill-VILLAGES CLASSIFIED BY POPULATION
This table classifies inhabited villages only by size of population. After giving the total number of inhabited villages and rural population for every taluka/mahal, it shows tbe number of villages and pol'ulatioD for the following seven categories, namely:--
4
(I) less than 200, (2) 200·499, (3) 500·999, (4) 1;000-1,999, (5) 2,000-4,999, (6) 5,000-9,999 and (7) 10,000 and above.
Table A-Ill of 1951 gives .com14ined figures of inhabited towns and villages classified by population, while A-III of 1961 gives figures of villages only classified by population.
A-lV-ToWNS AND TOWN-GROUPS CLASSIFIED BY POPULATION IN 1961 WITH VARIATION SINCE 1941
This table gives statistic,; relating to the figures of population since 1941 showing the growth of each town from census to census. Percentage variation is given from decade to decade, not only for the towns, but also for town-groups, where one or more urban units form a compact urban area. The tota~ population of the town-group along with that of its constituent urban units is given under the class into which the town-group has been classified. Separate figures have, likewise, been given for municipal and non-municipal areas such as port area, suburban area, military area, railway colony, cantonment, etc., where a town is a combination of two or more such units. The following are the six classes into which the towns are grouped in Table A-IV according to the size of population:
CJass
11 III
Population
100,000 and above 50,000 to 99,999 20,000 to 49,999
Class
IV V
VI
Population
10,000 to 19,999 5,000 to 9,999 Less than· 5,000
The areas of towns in sq. miles and sq. kilometres are also given in the table for 1961.
The term 'town' as defined at the Census of 1961 and its uniform adoption all over the country on the basis of certain specified tests have been explained under' Urban and Rural Population' in the note to Table A-I.
'Town-group'-This is a new variant of the url:lan population which has been introduced for the first time on the present occasion. Large cities or expanding towns bring within their orbits new satellite towns. industrial areas or settlements interspersed by small bits of rural areas. Such urban areas, not necessarily municipal, are taken to form town-groups with the main city or town as one of the constituents .
• City'-Places having population of 100,000 and over either individually or as a town-group have been classified as cities.
5

A-J-.4.REA, HOUSES AND POPULATIO.~
Number of Villages Number of Total Area in Pupulation Number Occupied Population Rural .'--'-'--~ -~ .. ,-~ per Sq. In- Unin- of Residential ---~-~---"'
DistrictfTaluka/Mahal Urban Sq. Miles Sq.Km. Mile habited habited Towns Houses Persons Males Females
2 3(a) 3(b) 4 5 6 7 8 9 10 II
JAMNAGAR DISTRICT T 4,020.1 10,412.1 206 701 19 15 141,027 828,419 424,300 404,119 R 3,950.4 10,231.<i 135 701 19 88,581 534,761 271,923 262,838 U 69.7 180.5 4,041 15 52,446 293,658 152,377 141,281
Jamnagar .T 476.5 1,234.1 537 99 1 3 44,735 255,970 133,026 122,944 R 465.5 1,205.7 189 99 2 14,755 87,975 44,833 43,142 U 1l.0 28.4 14,49. 3 29,980 167,995 88.193 79,802
Dhrol .T 218.4 565.7 162 41 6,034 35,310 17,801 17,509 R 217.1 562.3 118 41 4,231 25,527 12,871 12,656 U 1.3 3.4 7,525 ],803 9,783 4,930 4,853
Jodiya .T 343.1 888.6 179 52 9,777 61,445 30,278 31,167 R 313.2 SIl.O 171 52 8,22] 53,624 26,589 27,035 U 29.9 776 261 1,556 7,821 3,689 4,132
Kalavad .T 495.2 1,282.6 151 101 2 12,402 74,929 37,988 36,941 R 494.5 1,280.7 133 101 2 .. 10,749 65,837 33,341 32;496 LJ 0.7 1.9 12,123 I 1,653 9,092 4,647 4,445
Lalpur .T 436.3 1,130.0 122 73 2 8,914 53,045 27,033 26,012 R 434.8 1,]26.1 109 73 2 8,139 47,610 24,240 23,370 U 1.5 3.9 3,623 775 5,435 2,793 2,642
Jamjodhpu r .T 455.1 1,178.7 ]70 75 4 13,300 77,586 39,665 37,921 R 453.8 1,175 . .5 141 75 4 10,834 63.788 32.594 31,194 U 1.3 3.2 11,038 2,466 13,798 7,071 6.727
Okbamandal .T 271.7 703.7 223 41 4 11,305 60,595 31,625 28,970 R 263,8 683.3 82 41 3,957 21,512 11,028 10,484 LJ 7.9 20.4 4,558 4 7,348 39,083 20,597 18,486
Kalyanpur .R 552.9 1,432.0 125 69 11,035 68,933 35,407 33,526
Khumbhalia .T 483.3 1,351.8 170 III 5 1 13,181 81,972 41,490 40,482 R 478.5 1,239.3 III 81 5 8,693 53,140 26,962 26,178 U 4.8 12.5 5,982 2 4,588 28,832 14,528 14,304
Bhanvad .T 287.6 744.9 204 69 1 10,244 58,634 29.987 28.647 R 276.3 715.7 169 69 I 7,967 46,815 24,058 22,757 U 11.3 29.2 1,051 2,277 11,819 5,929 5,890
NOTE:-1 Population per sq. mile under Column 4 ha. ,been wotked out 00. the area tlgures e:iven by the State Survey Department
given in Column 3(a). 2 Under Column 4, population of those urban unit!>, for which area figures are not available, is ignored for working
out urban' density. Rural density is worked out on the basis of rural population only though the area figures include areas of those urban units for which separate area figures are not available.
3 The sq. kilometres under Column 3(b) and density figures of urban areas of Taluka/Mahal and District under Column 4 are worked out using the area figures corrected upto 2 places of decimals obtained by adding the areas o( the towns in the respective units. In addition to this, the figures relating to sq. kms. are (urther adjusted to make the Taluka/Mahal and District totals. agree.
6
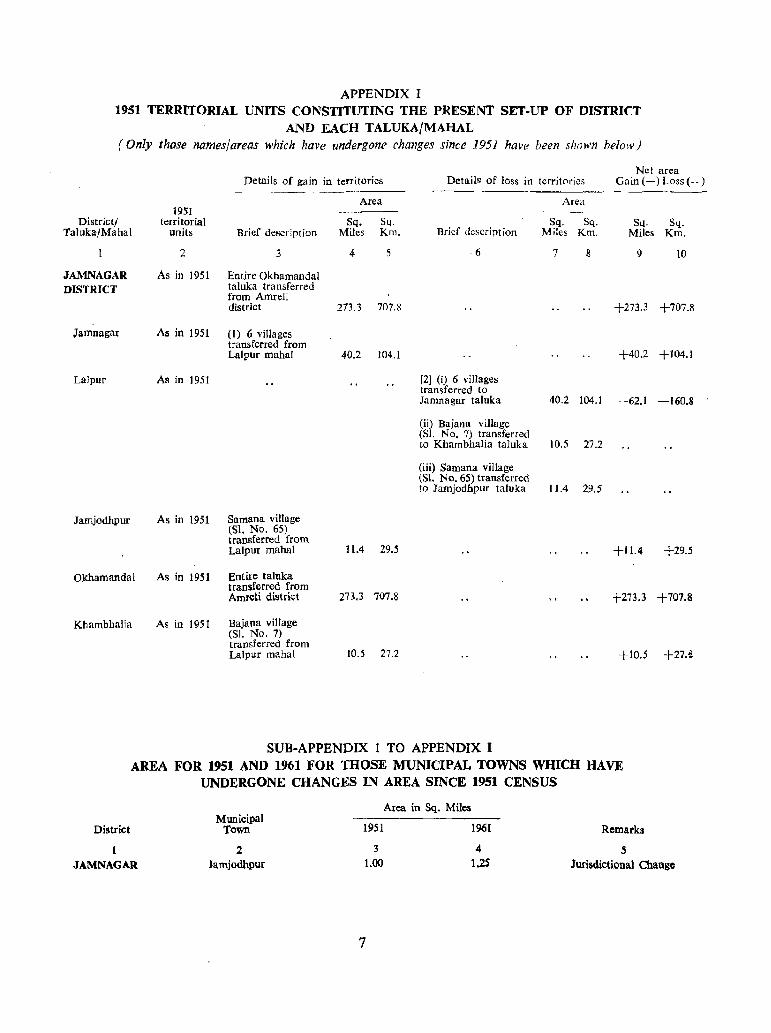
APPENDIX I 1951 TERRITORIAL UNITS CONSTITUTING THE PRESENT SET·UP OF DISTRICT
AND EACH TALUKA/MAHAL (Only those names/areas which have undergone changes since 1951 have been shown helow)
1951 District/ territorial
TaJuka-/Mahal units
2
JAMNAGAR As in 1951 DISTRICT
,Tamnagar As in 1951
Lalpur As in 1951
Jamjodhpur As in 1951
Okhamandal As in 1951
Khambhalia As in 1951
Details of gain in territories
Area
Sq. Sq. Brief description Miles Km.
3 4
Entire Okhamandal taluka transferred from Amreli district 213.3 707.8
(I) 6 villages transferred from Lalpur mahal 40.2 104.1
Samana village (SI. No. 65) transferred from Lalpur mahal 11.4 29.5
Entire taluka transferred from Amreli district 273.3 707.8
Bajaoa village (SI. No.7) transferred from Lalpur mahal 10.5 27.2
Net area Details of loss in territories Gain (+) Loss (-)
Area
Brief description Sq. Sq.
Miles Km. Sq. Sq.
Miles Km.
6 7 8 9 10
+273.3 +707.8
+40.2 + 104.1
[2] (i) 6 villages transferred to Jamnagar taluka 40.2 104.1 -62.1 -160.8 .
(ii) Bajana village (SI. No.7) transferred to Khambhalia taluka 10.5 27.2
(iii) Samana village (Sl. No, 65) transferred (0 Jamjodhpur taluka 11.4 29.5
+11.4 +29.5
+273.3 + 707.8
+10.5 +27.£
SUB-APPENDIX 1 TO APPENDIX I AREA FOR 1951 AND 1961 FOR THOSE MUNICIPAL TOWNS WIDeH HAVE
UNDERGONE CHANGES IN AREA SINCE 1951 CENSUS
Area in Sq. Miles Municipal
1951 1961 District Town Remarks
1 2 3 4 5 JAMNAGAR Jamjodhpur 1.00 1.25 Jurisdictional Change
7

SUB-APPENDIX 2 TO APPENDIX 1 DISTRICT/TALUI(A/MAHAL SHOWING 1951 POPULATION ACCORDING TO TERRITORIAL
JURISDICTION IN 1951, CHANGES IN AREA AND THE POPULATION INVOLVED IN THOSE CHANGES
(This relates to Appendix to Table A-II which exhibits data upto district level in Census of India 1961. Volume V Part lI-A. Gujarat)
Area in 1961 Area in 1951 District/Talukal ]961
Mahal Sq. Miles Sq.Km. Population Sq. Miles Sq.Km.
2 3 4 5 6
Jarnnagar District x 4,OZO.1 10,412.1 828,419 :3,411.0 8,834.5 (-t-609.1) (+1,577.6)
Jamnagar * 476.5 ],234.1 255,970 446.0 1,155.1 (+30.5) (+79.0)
Dhrol 218.4 565.7 35,310 157.0 406.6 (+61.4) <+159.1)
Jodiya 343.1 888.6 61,445 328.0 849.5 (+15.1) (+39.1)
Kalavad 495.2 1,282.6 74,929 441.0 1,142.2 (+54.2) (+140.4)
Lalpur + 436.3 1,130.0 53,045 444.0 1,150.0 (-7.7) (-20.0)
Jarnjodhpur xx. 455.1 1,178.7 77.586 333.0 862.5 C+122.1) (+~16.2)
Okhamandal H 271.7 703.7 60,595 273.0 707.1 (-1.3) (-3.4)
Kalyanpur 552.9 1.432.0 68,933 546.0 1,414.1 (+6.9) (+17.9)
Khambhalia ++ 483.3 1,251.8 81,972 457.0 1,183.6 (+26.3) (+68.2)
Bhanvad 287.6 744.9 58,634 259.0 670.8 (+28.6) (+74.1)
NOTE:-
1951 popu-lation accord-ing to juris-diction pre-vailing in
1951
7
574,472 (+42,424)
180,742 (+5,455)
28,351
52,146
55,424
46,860 (-7,038)
54.356 (+1,062)
42,424
49,986
64,750 (+521) 41,857
Population in 1951 ad-justed to jurisdiction of 1961
8
616,896
186,197
28,351
52,146
55,424
39.822
55,418
42,424
49,986
65,271
41,857
Net increase in or decrease
between col. 7 and
col. 8
9
+42,424
+5,455
-7,038
+1,062
x Okhamandal taluka (273.3) of Amreli district was transferred to Jamnagar district under Bombay Government Resolution, R.D., No. T. L. C.-38S8-C dated 19-6-1959.
* Under Saurashtra Government, Revenue Department Notification No. REV 5-4-28, dated 19-7-1951. the following 6 villages were transferred from Lalpur mahal to Jamnagar taluka, Gagava (5.0), Mungani (5.4), Khavdi Moti (17.5), Sikka (5.8), Khavdi Nani (4.2) and Sapar (2.3).
+ Under Saurashtra Government. Revenue Department Notification No. REV 5-4-28, dated 19-7-1951, (i) The following 6 villages were transferred to Jamnagar taluka from Lalpur mahal, Gagava (5.0), Mungani (5.4), Khavdi Moti (17.5), Sikka (5.8), Khavdi Nani (4.2) and Sapar (2.3). (ii) Bajana village (10.5) was transferred to Khambhalia taluka from Lalpur mabaI. (iii) Samana village (11.4) was transferred to Jamjodhpur taluka from Lalpur mahal.
xx Under Saurashtra Government, Revenue Department Notification No. REV 5-4-28, dated 19-7-1951, Samana village (11.4) was transferred from Lalpur mahal to Jamjodhpur taluka.
tt Entire taluka (273.3) was transferred from Amreli district to Jamnagar district under Bombay Government Resolution, R.D .• No. T.L.C.-3858 -C dated 19-6-1959.
++ Under Saurashtra Government, Revenue Department Notification No. REV 5-4-28, dated 19-7-1951, Bajana village (10.5) was transferred from Lalpur mahal to Khambhalia talllka.
Symbol No. given in Appendix
1 (1]
[2]
ANNEXURE TO APPENDIX I Villages transferred from and to Jamnagar District
Name of village
2 1 Gagava 2 Mungani . 3 Khavdi Mod. 4 Sikka . 5 Khavdi Nani . 6 Sapar
As agaiJJst [I]
.'
8
Sl. No. in 1951 Census Handbook
3
17 48 3S 73 36 68
Area (wherever available)
4 5.0 5.4
17.5 5.8 4.2 2.3

APPENDIX II NUMBER OF VILLAGES WITH A POPULATION OF 5,000 AND OVER AND l'OWNS
WITH A POPULATION UNDER 5,000 Note: Units of territory which have nothing to show for this statement have been excluded.
Villages with a population of 5,000 & over
Percentage to total rural District/TalukajMahal Number Population population of the district
Towns with a population of under 5,000
2 3
JAMNAGAR DISTRICT 4 21,355 Dllrol I 5,139 Jodiya I 5,691 Jamjodhpur . 1 5,060 Okhamandal Kalyanpur 5,465
4
3.99 0.96 1.06 0.95
1.02
LIST
Percentage to total urban Number Population population of the district
5 6 7
J 3,386 1.15
"
3,386 1.15
Places with a population of under 5,000 in 1951 which were treated as towns in 1951 but have been omitted from the list of towns in 1961
District Town Area in Sq. miles
2 3 JAM NAGAR Raval 16.1
Balambha 29.3 Dhrafa 17.0
APPENDIX III HOUSELESS AND INSTITUTIONAL POPULATION
Total Houseless Population Rural
Districr/Taluka/MahaJ Urban Persons Males Females
2 3 4 5
JAMNAGAR DISTRICT TOlal 5,554 3,631 1,923 Rural 3,884 2.235 1.649 Urban l,(i70 1,396 274
Jamnagar Total 2,SS4 2,005 579 Rural 1,094 716 378 Urban 1,490 1,289 201
Dltro/ Toral 146 8] 65 Rural ]46 81 65 Urban
Jodiya Total 362 190 172 Rural 338 179 159 Urban 24 II 13
Kalavad Total 541 320 221 Rural 531 314 217 Urban 10 6 4
LalpllT Total 537 289 248 Rural 510 272 238 Urban 27 17 10
Jamjodhpur . Total 322 165 157 Rural 307 158 149 Urban ]5 7 11
Okhamandal • Total 11 11 Rural Urban 1l 11
Kalyanpur Rural 224 136 83
Khambhalia Total 323 165 158 Rural 286 144 142 Urban 37 21 16
BhaDvad Total 504 269 235 Rural 448 235 213 Urban S6 34 22
9
Population in 1951
4
4.794 4,742 4,420
Institutional PopUlation
Persons Males Females
6 7 8
3,384 2,730 654 393 263 130
2.991 2,467 ~24
2,023 1,638 385 41 23 18
1,982 1,615 367
250 2J6 14 3 2 I
247 234 13 266 143 123 197 107 90 69 36 33
64 47 17 28 17 !l 36 30 6
8 7 1 7 7 1
26 26 26 26
291 200 97
297 200 91
74 74
344 336 8 10 .4. 6
31" 332 2
32 23 9 7 J 4
25 20 5

A-IIl-VILLAG.ES CLASSIFIED
I--VilJages wilh less
Less than 200 200-499 -"-----------""
Total number Total Rural Population No. Population No. Population of inhabited -------
District/Taluka/Mahai villages Persons Males Females Males Females Males Females
2 3 4 5 6 7 8 9 10 11
JAMNAGAR DISTRICT 701 534,761 271,923 262,838 76 4,308 4,077 216 38,474 36,616
1 Jamnagar 99 S7,975 44,833 43,142 7 491 458 24 4,163 4,043
2 Dhrol 41 25,527 12,871 12,656 5 345 335 17 2,946 2,874
3 Jodiya 52 53,624 26,589 27,(J35 3 184 174 lJ 2,191 2.ln
4 Kalavad 101 65,837 33,341 32,4'16 12 763. 739 36 6.219 $,903
5 Lalpur 73 47,610 24,240 23,370 3 22] 207 27 4,605 4,323
6 Jamjodhpur 75 63,788 32,594 31,194 13 676 667 22 4,055 3,787
7 Okhamandal 41 21,512 11,028 10,484 8 537 520 15 2,559 2.466.
8 Kalyanpur . 69 68,933 35,407 33,526 7 364 322 15 2,904 2,70'
9 Khambhalia 81 53,140 26,962 26,178 3 ]89 168 32 5,914 5,641
10 Bhanvad 69 46,815 24,058 22.757 15 538 487 17 2.918 2,746
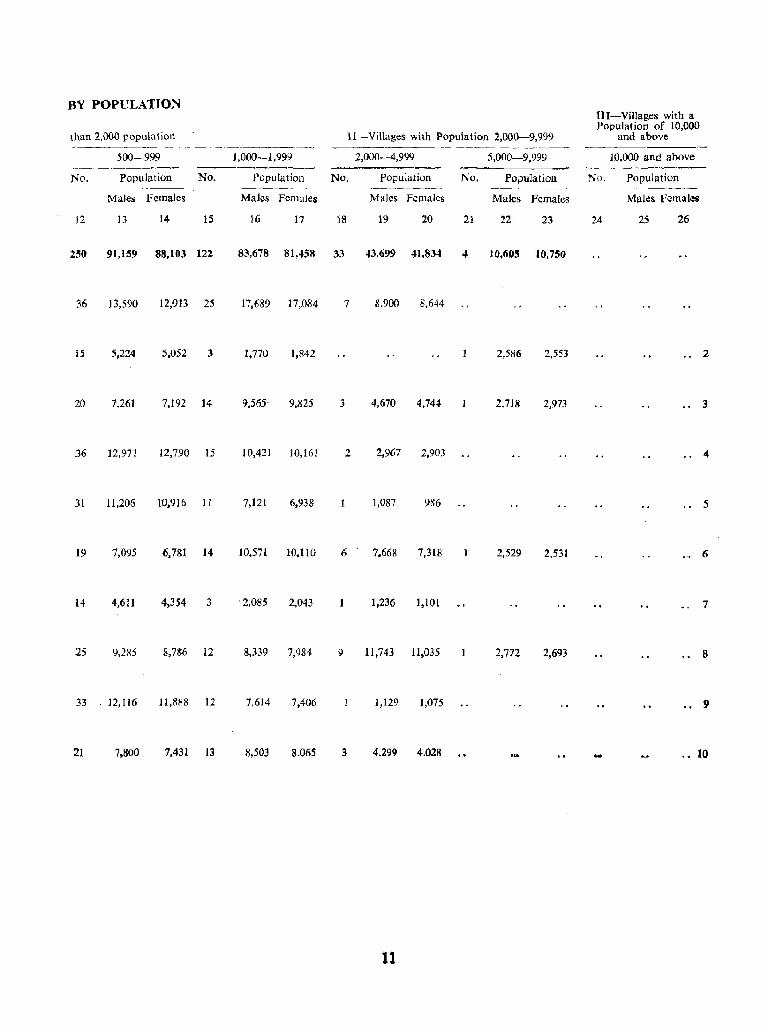
BY POPULATION III-Villages with a Population of 10,000
than 2,000 population it -Villages with Population 2,0.0.0-9,999 and above -------------_---_._---
50.0-999 ],.000-1,999 2,.00.0-4,999 5,.0.0.0-9,999 10,.000 and above _._-...!..__..__------No. Population No. Population No. Population No. Population No. Population
- _ --- ---- -----__ --------Males Females Males Females Males Females Males Females Males Females
12 13 14 15 16 17 18 19 2.0 21 22 23 24 25 26
250 91,159 88,103 122 83,678 81,458 33 43,699 41,834 4 10.605 10,750
36 13,590 12,913 25 17,689 17,.084 7 8,900 8,644
IS 5,224 5,.052 3 1,77.0 1,842 2,586 2,553 ., 2
2.0 7,261 7,192 14 9,565' 9,825 3 4,670 4,744 2,718 2,973 ., 3
36 12,971 12,790 15 1.0,421 10,161 2 2,967 2,903 .. 4
31 11,205 10,916 Ii 7,121 6,938 1,.087 9t;6 .. 5
19 7,095 6,781 14 ]0,571 10,110 6 7.668 7,318 2,529 2,531 ." 6
14 4,611 4,354 3 '2,085 2,.043 ],236 1,1.01 .. 7
25 9,285 8,786 12 8,339 7,984 9 11,743 11,035 2,772 2,693 .. S
33 12,116 11,8R8 12 7,614 7,4.06 1,129 1,075 .. 9
21 7.B.oO 7.431 13 8,5.03 8.065 3 4.299 4.028 .. 10
11
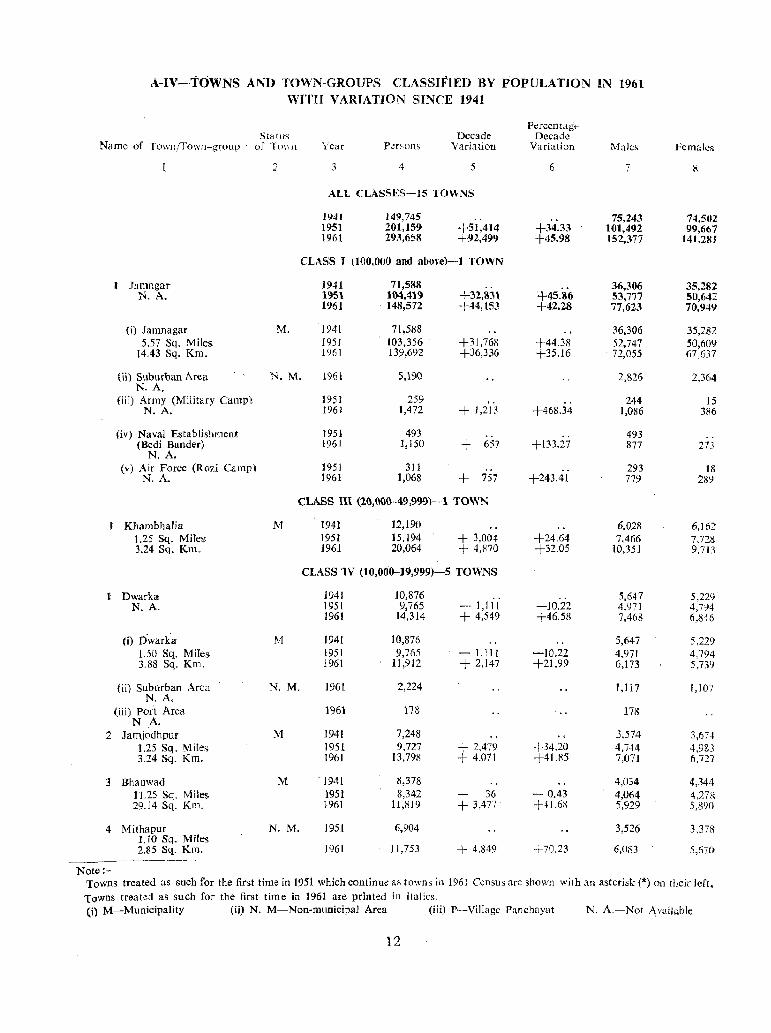
A~IV-TOWNS AND TOWN-GROUPS CI~ASSIFIED BY POPULATION IN 1961 WITH VARIATION SINCE 1941
Percent Ci ge Status Decade Decade
N<lme of Town/Towll-group . of 1'0\\)1 YeClr Person;; Variation Variation Males Females
2 3 4 5 6 7 ::I
ALL CLASSES--15 TOWNS
1941 149,745 .. 75,243 74,502 ] <J51 201,159 +51,414 +34.33 101,492 99,661 1961 293,658 +92,499 +45.98 152,377 141,28!
CLASS I (100,000 and abuve)-l TOWN
1 Jamngar 1941 71,588 36,306 35,282 N. A. 1951 11)4,419 +32,831 +45.86 53,777 50,642
1961 148,572 +44,153 +42.28 77,623 70,949
(i) Jamnagar ~,IJ. 1941 71,51)8 36,306 35,282 5.57 Sq. Miles 1951 103,356 +31,76R +44.38 52,747 50,609
14.43 Sq. Km. 1961 139,692 +36,336 +35.16 72,055 67,637
(ii) Suburban An:a N. M. 1961 5,190 2,826 2,36-1 N.A.
(iii) Army (Militi:lry Camp) 1951 259 244 15 N. A. 1961 1,472 + 1,213 +468.34 1,086 386
(iv) Naval Establishment 1951 493 .. 493 (Bcdi Bander) 1961 1,150 + 657 +133.27 877 27.1
N. A. (v) Air Force (Rozi Camp) 195] 311 .. 293 18
N.A. 1961 1,068 + 757 +243.41 779 289
CLA.SS m {20,OOO-49,9(1))-1 TOWN
KhambbaJia M 1941 12,190 6.028 6,162 1.25 Sq. Miles 1951 15,194 + 3,004- +24.64 7,466 7,728 3.24 Sq. Km. 1961 20,064 + 4,870 +32.05 1O,35J 9,713
CLASS 'IV (10,000-19,999)-5 TOWNS
1 Dwarka 1941 10,876 5,647 5,229 N. A. 1951 9,765 -1,111 -10.22 4,971 4,794
1961 14,314 + 4,549 +46.58 7,468 6,846
(I) D\varka M 1941 10,876 5,647 5,229 1.50 Sq. Miles 1951 9,765 - 1,111 -10.22 4,971 4,794 3.88 Sq. Km. 1961 11,912 + 2,147 +21.99 6,173 5,739
(ii) Suburban Area N. M. 1961 2,224 1,117 1,107 N. A.
(iii) Port Area 1961 178 178 N A.
2 Jamjodhpur 1\1 194! 7,248 3,574 3,67.f 1.25 Sq. Miles 1951 9,727 + 2,479 '+34.20 4,744 4,983 3.24 Sq. Km. 1961 13,798 + 4,071 +41.85 7,071 6,727
3 Bhanwad M 1941 8,378 4,034 4,344 J 1.25 Sq. Miles 1951 8,342 36 - 0.43 4,064 4,278 29.14 Sq. Km. 1961 11,819 + 3,477 +41.6X 5,929 5,890
4 Mithapur N. M, 1951 6,904 3,526 3.378 1.10 Sq. Miles 2.85 Sq. Km. 1961 11,753 + 4,849 -;-70.23 6,083 5,670
---~--~.
Note :-Towns treated as such for the first time in 1951 which continue as towns in 196] Census are shown with an asterisk (ok) on their lefl, Towns treate.:! as such for the first time in 1961 are printed in italics. (i) M-Municipality (ii) N. M-Non·municipal Area (iii) P-Village Panchayat N. A.-Not Available
12
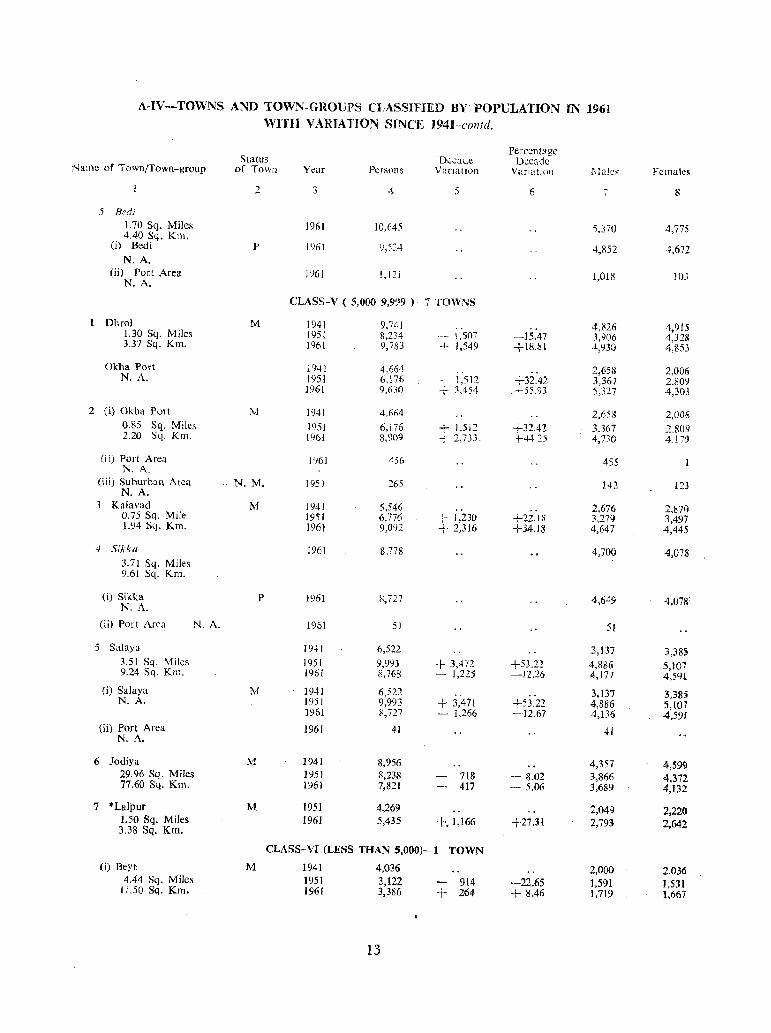
A-IV--TOWNS AND TOWN-GROUPS CLASSIFIED BY POPULATION IN 1961 WITH VARIATION SINCE J941-col1!d.
Name of Town/Town-group
5 Bed; 1.70 Sq. Miles 4.40 Sq. Km.
en Bedi N. A.
(ii) Port Area N. A.
1 Dhrol 1.30 Sq. Miles 3.37 Sq. Km.
Okha Port N. A.
2 (i) Okha Port 0.85 Sq. Miles 2.20 Sq. Km.
(i i) Port Area N. A.
(iii) Suburban Area N. A.
3 Kalavad 0.75 Sq. Mile 1.94 Slj. Km.
4 Sikku 3.71 Sq. Miles 9.61 Sq. Km.
(i) Sikka N. A.
(ii) Port Area
5 Salaya 3.51 Sq. Miles 9.24 Sq. Km.
(i) Salaya N. A.
eii) Port A rea N. A.
6 Jodiya
N. A.
29.96 Sq. Miles 77.60 Sq. Km.
7 *Lalpur 1.50 Sq. Miles 3,38 Sq. Krn.
(i) Heyt 4.44 Sq. Miles
11.50 Sq. Km.
Status of Town
2
p
M
Nt
N. M.
M
P
M
M
M
Year
3
1961
1961
1961
Persons
4
10,645
9,5:'4
1,121
Dc.;aue Variation
5
CLASS-V ( 5,000-9,999 )--7 TOWNS
1941 195[ 1961
1941 1951 1961
1941
1951 1961
1961
1951
1941 1951 1961
1961
1961
1961
1941
1951 1961
1941 1951 1961
1961
1941 1951 1961
1951 1961
9.741 8,234 9,783
4,664 6,176 9,630
4.664
6,i76 8,909
456
265
5.546 6,776 9,092
g,778
'6,727
51
6,522
9,993 8,768
6,522 9,993 8,727
41
8,956 8,238 7,821
4,269 5,435
-- 1,507 + 1,549
, 1,512 + 3.454
+ 1,512 + 2,733
+ 1,230 + 2,316
+ 3,472 - 1,22j
+ 3,471 - 1,266
718 - 417
+.1,166
CLASS-VI (LESS THAN 5,000)-1 TOWN
M 1941 1951 1961
4,036 3,122 3,386
13
914 + 264
Percentage Dccalk
Variatio!)
6
-15.47 +IiI.81
+32.42 +55.93
+32.42 +4425
+22.18 +:)4.18
+53.22 -12.26
+53,22 -·12.67
- 8.02 - 5.06
+27,31
-22.65 + g.46
5,37(J
4,852
1,018
4,826 3,906 4,930
2,658 3,367 5,327
2,653
3.367 4,730
455
142
2,676 3,279 4,647
4,700
4,649
5!
3,137
4,886 4,177
3,137 4,886 4,136
41
4,357 3,866 3,689
2,049 2,793
2,000 1,591 1,719
Females
4,775
4,672
!OJ
4,915 4,328 4,853
2,006 2,80'1 4,303
2,006
2,S09 4,.179
123
2,87() 3,497 4,445
4,078
4,073
3,38) 5,107 4,591
3,385 5,107 4,591
4,599 4,372 4,132
2,220 2,642
2,036 1,531 1,667
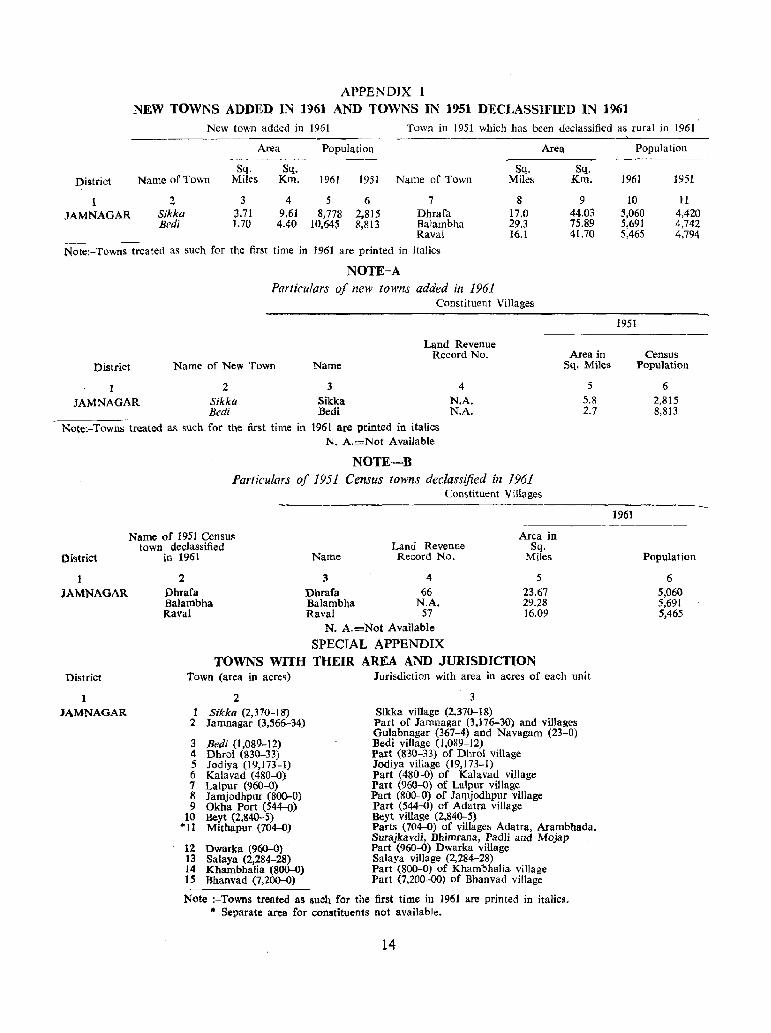
APPENDJX I NEW TOWNS ADDED IN 1961 AND TOWNS IN 1951 DECLASSIFIED IN 1961
New town added in 1961 Town in 1951 which has been declassified as rural in 1961
Area Population Area __ r ___ ~ ____
-----~----
Sq. Sq. Sq. District Name of Town Miles Km. 1961 1951 Name of Town Miles
1 2 3 4 5 6 7 8
JAMNAGAR Sikka 3.71 9.61 8,778 2.815 Dhrafa 17.0 Bedi 1.70 4.40 10,645 8,813 Balambha 29.3
Raval 16.1
Note:-Towns treatect as such for the first time in 1961 are printed in italics
Distriet
1 JAMNAGAR
NOTE-A Particulars of new towns added in 1961
Constituent Villages
Land Revenue Record No.
Name of New Town Name
2 3 4
Sikka Sikka N.A. Bedi Bedi N.A.
NQte:-Towns treated as ~uch for the first time in 1961 are printed in italics N. A.=Not Available
NOTE-B Particulars of 1951 Census towns declassified in 1961
Constituent Villages
Sq. Km.
9 44.03 75.89 41.70
Area in Sq. Miles
5 5.8 2.7
Population
1961 1951
10 11 5,060 4,420 5,691 4,742 5,465 4,794
1951
Census Population
6 2,815 8,813
--------------------
District
1 JAMNAGAR
District
1 JAMNAGAR
Name of 1951 Census town declassified
in 1961 Name
3
Land Revenue Record No.
4
Area in Sq.
Miles
2 Dhrafa Balambha Raval
Dhrafa 66 5
23.67 29.28 16.09
Balambha N.A. Raval 57
N. A.=Not Available
SPECIAL APPENDIX TOWNS WITH THEIR AREA AND JURISDICTION
Town (area in acre~) Jurisdiction with area in acres of each unit
2 3 I Sikka (2,370-18) Sikka village (2,370-18)
2 Jamnagar (3,566-34) Part of Jamnagar (3,176-30) and villages Gulabnagar (367-4) and Navagam (23-0)
3 Bedi (1,089-12) Dedi village (1,089-12) 4 Dhrol (830-33) Part (830-33) of Dhro! village 5 Jodiya (19,173-1) Jodiya village (19,173-1) 6 Kalavad (480"'()) Part (480 -0) of Kalavad village 7 Lalpur (960-0) Part (960-0) of LaJpur village 8 Jamjodhpur (SOO-O) Part (800-0) of Jamjodhpur village 9 Okha Port (544-0) Part (544-0) of Adatra village
10 Beyt (2,840-5) Beyt village (2,840-5) *U Mithapur (704-0) Parts (704-0) of villages Adatra, Arambhada,
Surajkavdi, Bhimrana, Padli and Mojap 12 Dwarka (960-0) Part (960-0) Dwarka village 13 Salaya (2,284-28) Salaya village (2,284-28) 14 Khambhalia (800-0) Part (800-0) of Kharnbhalia village 15 Bhanvad (7,20O-0) Part (7,200-00) of Bhanvad village
Note :-Towns treated as lIuch for the first time in 196J are printed in italics. • Separate area for constituents not available.
14
]961
Population
6 5,060 5,691 5,465
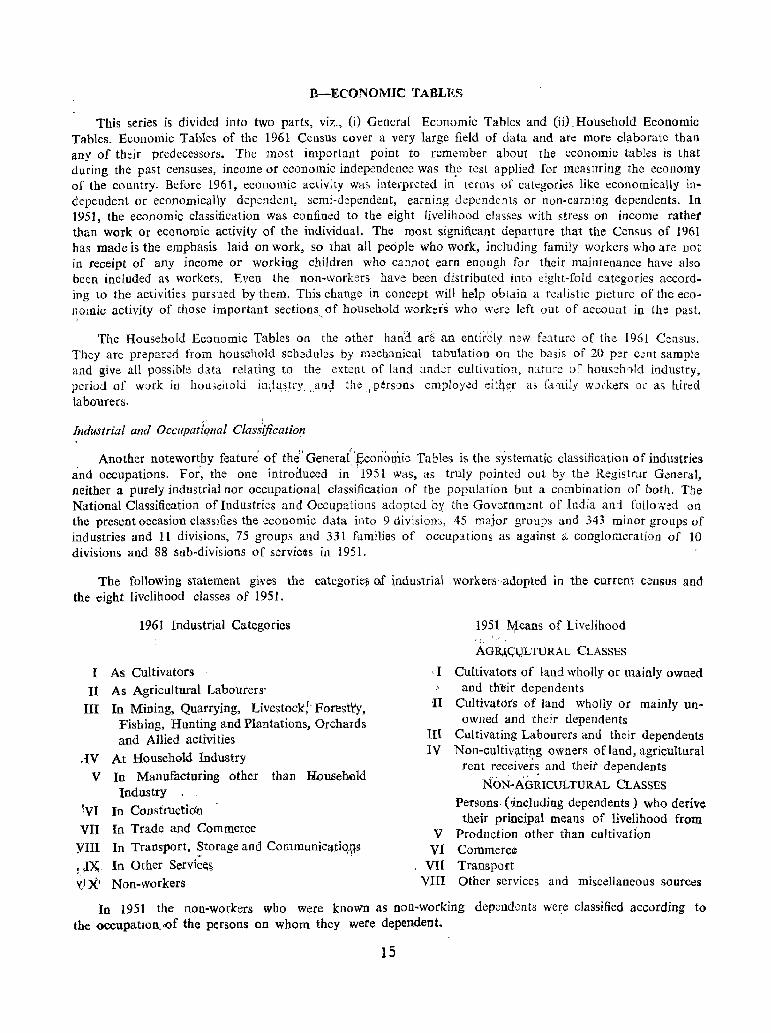
B-ECONOMIC TABLES
This series is divided into two parts, viz., (i) General Economic Tables and (ii). Household Economic Tables. Economic Tables of the 1961 Census cover a very large field of data and are more elllborate than any of their predecessors. The most important point to remember about the economic tables is that during the past censuses, income or economic independence was t~e test applied for measuring the economy of the country. Before 1961, economic activity was interpreted in terms of categories like economically independent or economically dependcnt, semi-dependent, earning dependents or non-earning dependents. In 1951, the economic classification was confined to the eight livelihood classes with stress on income rather than work Or economic activity of the individual. The most significant departure that the Cens.us of 1961 has made is the emphasis laid on work, so that all people who work, including family workers who are not in receipt of any income or working children who cannot earn enough for their maintenance have also been included as workers. Even the non-workers have been distributed into eight-fold categories according to the activities pursued by them. This change in concept will help obtain a realistic picture of the ecol~omic activity of those important sections, of household workers who were left out of account in the past.
The Household Economic Tables Oll the other han'd ar~ an entir'ely mw feature of tlle 1961 Census. They are prepared from household schedules by mechanical tabulation on the basis of 20 per c~nt sample and give all possible data relating to the extent of land under cultivation, nltUl-e of househ'lld industry, period of work in hou;eilOld ini!u,~try. ,aad the ,persDns employed eit11pr as f4.nily wuckers or as hired labourers.
Industrial and Occupatfqnal Class(;;cation
, I Ji {, .• '. .-
Another noteworthy feature of the General. economic Tables is the systematic classification of industries and occupations. For, the one' introduced in '1951 was, as truly pointed out by the Registrur General, neither a purely industrial nor occupational classification of the popUlation but a combination of both. The National Classification of Industri0s and Occupations adopted by the Government of India and folio Ned Oil the present occasion classifies the economic data into 9 divisions, 45 major groups and 343 minor groups of industries and II divisions, 75 groups and 331 families of occupations as against a conglomeration of 10 divisions and 88 sub-divisions of servic~s in 1951.
The fonowing statement gi:ves the categorie!, 00 industrial. workers 'adopted in the current census and the eight livelihood classes of 1951.
1961 Industrial Categories
I As Cultivators
II As Agricultural Labourers'
III In Milling, Quarrying, Livestock:' Forest1'y, Fisbing, Hunting and Plantations, Orchards and Allied activities
,IV At Household Industry
V In Manufacturing other than Hnusehllid Industry
!VI In Coustruc'tii1Jj
VII In Trade and Commerce
YIn In Transport, ~torage and Communic~tiqt\-s
! ~X;. In Other Servic~s
'(J X' Non-workers
1951 ~eans of Livelihood "I
'.,
AGRI,C1,JLTURAL CLASSES
,I Cultivators of land wholly or mainly owned . , and th~ir dependents n Cultivatots' 'of land wholly or mainly un
owned and their dependents III Cultivating Labourers and their dependents IV Non-cultiv\lting owners ofland, agricultural
rent receiver~ and theit dependents
NON-AORICULTURAL CLASSES
Persons· ('.including dependents) who derive their prin~ipal means of livelihood from
V Production other than cultivation VI Commerce
VII Transport VIn Other services and miscellaneous sources
In 1951 the non-workers who were known as non-working dependents wc~e classified according to the occupation. <of the persons on whom they were dependent.
15
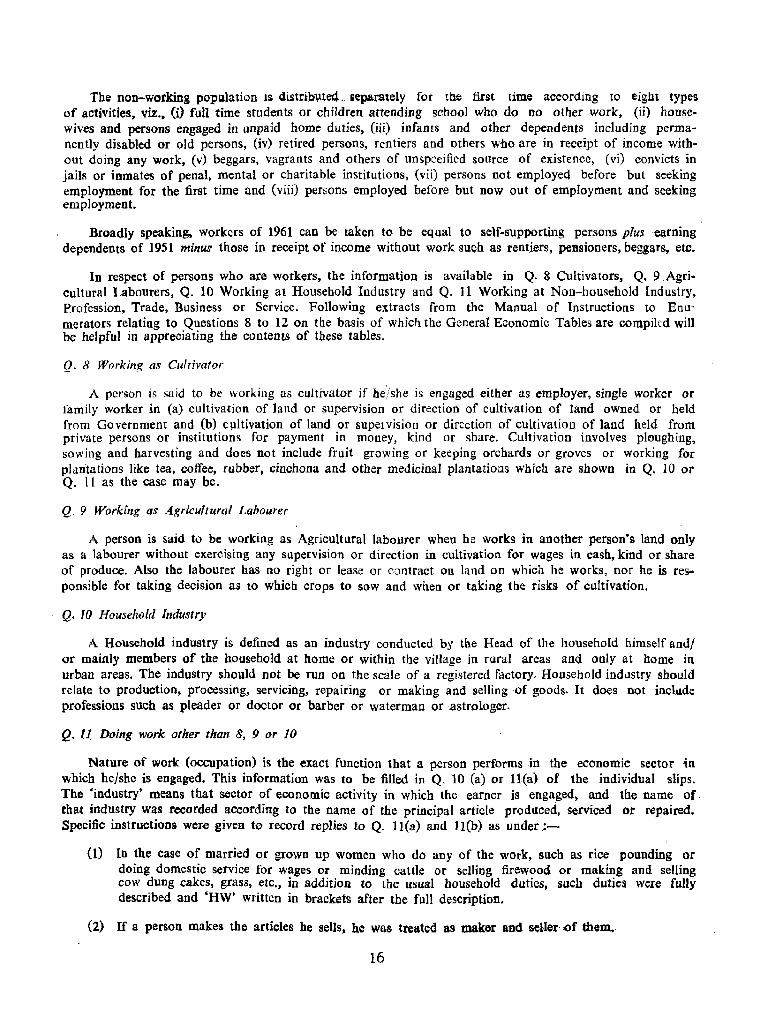
The non-working population is distribllte4 .. separately for the first time accordmg to eight types of activities, viz .• (i) full time students or children attending school who do no other work, (ii) housewives and persons engaged in unpaid home duties, (iii) infants and other dependents including permanently disabled or old persons, (iv) retired persons, rentiers and others who are in receipt of income without doing any work, (v) beggars, vagrants and others of unspecified sOUrce of existence, (vi) convicts in jails or inmates of penal. mental or charitable institutions, (vii) persons not employed before but seeking employment for the first time and (viii) persons employed before but now out of employment and seeking employment.
Broadly speaking, workers of 1961 can be taken to be equal to self-supporting persons plu$ earning dependents of 1951 minus those in receipt of income without work such as rentiers, pensioners, beggars, etc.
In respect of persons who are workers, the information is available in Q. 8 Cultivators, Q. 9.Agricultural Labourers, Q. 10 Working at Household Industry and Q. 11 Working at Non-household Industry. Profession, Trade, Business or Service. Following extracts from the Manual of Instructions to Enumerators relating to Questions 8 to 12 On the basis of which the General Economic Tables are compiled will be helpful in appreciating the contents of these tables.
Q. 8 WOI"king as Cultivator
A person is said to be working as cultivator if he/she is engaged either as employer, single worker or family worker in (a) cultivation of land or supervision or direction of cultivation of land owned or held from Government and (b) c!lltivation of land or supervision or direction of cultivation of land held from private persons or institutions for payment in money, kind or share. Cultivation involves ploughing, sowing and harvesting and does not include fruit growing or keeping orchards or groves or working for plantations like tea, coffee, rubber, cinchona and other medicinal plantations Which are shown in Q. 10 or Q. 11 as the case may be.
Q. 9 Working as Agricultural Labourer
A person is said to be working as Agricultural labourer when he works in another person's land only as a labourer without exercising any supervision or direction in cultivation for wages in cash, kind or share· of produce. Also the labourer has no right or lease or contract on land on which he works, nor he is res .. ponsible for taking decision as to which crops to sow and when or taking the risks of cultivation.
Q. 10 Household Industry
A Household industry is defined as an industry conducted by the Head of the household himself andl or mainly members of the household at home or within the village in rural areas and only at home in urban areas. The industry should not be run on the scale of a registered factory. Household indllstry should relate to production, processing, servicing, repairing or making and selling of goods. It does not inclllde professions such as pleader or doctor or barber or waterman or astrologer.
Q. lJ Doing work other than 8, 9 or 10
Nature of work (occupation) is the exact function that a person performs in the economic sector 'in which he/she is engaged. This information was to be filled in Q. 10 (a) or 11:(a) of the individual slips. The 'industry' means that sector of economic activity in which the earner is engaged~ and the name of· that industry was recorded according to the name of the principal article produced, serviced or repaired. Specific instructions were given to record replies to Q. 11(a) and ll(b) as under:-
(1) In the case of married or grown up women who do any of the work, such as rice pounding or doing domestic service for wages or minding cattle or selling firewood or making and selling cow dung cakes, grass, etc., in addition to the usual household duties, such duties were fully described and 'HW' written in brackets after the full description.
(2) If a person makes the articles he sells. he was treated as maker and seUet' ,of tbem.
16
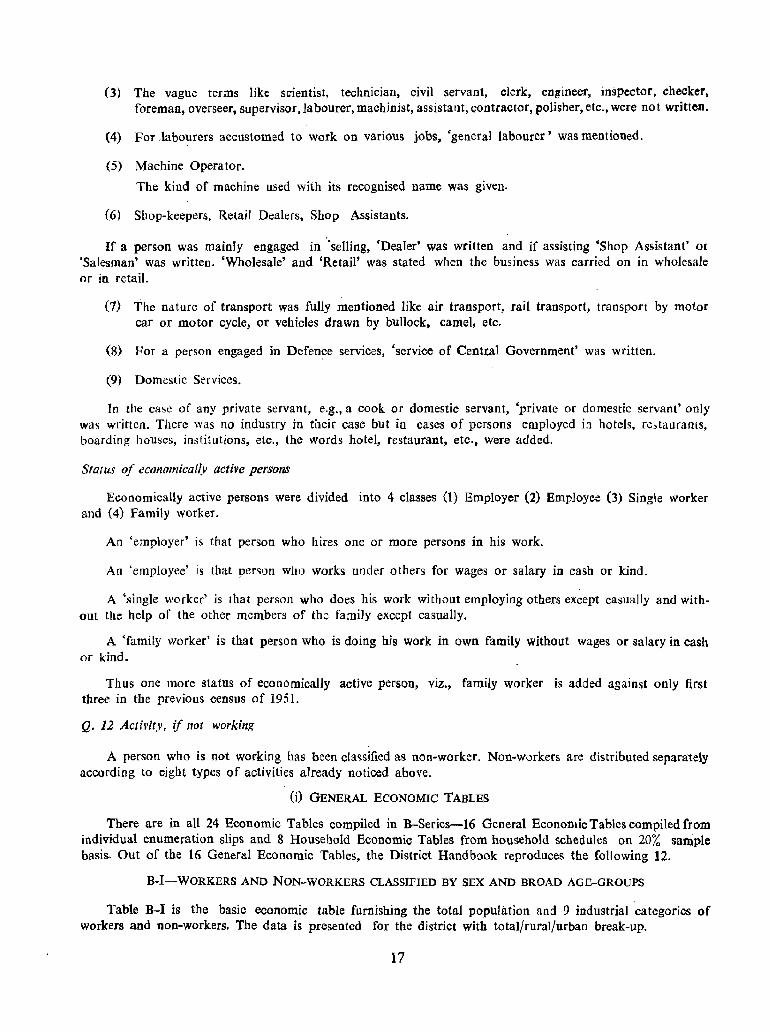
(3) The vague terms like s!:ientist, technician, civil servant, clerk, en~ineer, inspector, checker, foreman, overseer, supervisor, la bourer, machinist, assistant, contractor, polisher, etc., were not written.
(4) For .labourers accustomed to work on various jobs, 'general labourer' was mentioned.
(5) Machine Operator.
The kind of machine used with its recognised name was given.
(6) Shop-keepers, Retail Dealers, Shop Assistants.
If a person was mainly engaged in "selling, 'Dealer' was written and if assisting 'Shop Assistant' Of
'Salesman' was written. 'Wholesale' and 'Retail' was stated when the business was carried on in wholesale or in retail.
(7) The nature of transport was fully mentioned like air transport, rail transport, transport by motor car or motor cycle, or vehicles drawn by bullock, camel, etc.
(8) For a person engaged in Defence services, 'service of Centtal Government' was written.
(9) Domestic Services.
In the case of any private servant, e.g., a cook or domestic servant, 'private or domestic servant' only was written. There was no industry in their case but in cases of persons employed in hotels, re"taurallts, boarding houses, institutions, etc., the words hotel, restaurant, etc., were added.
Star us of economically actire persons
Economically active persons were divided into 4 classes (1) Employer (2) Employee (3) Single worker and (4) Family worker.
An 'employer' is that person who hires one or more persons in his work.
An 'employee' is that person who works under others for wages or salary in cash or kind.
A 'single worker' is that person who does his work without employing others except casually and without the help of the other members of the family except casually,
A 'family worker' is that person who is doing his work in own family without wages or salary in cash or kind.
Thus one more status of economically active person, viz., family worker is added against only first three in the previous census of 1951.
Q. 12 Activity, if not working
A person who is not working has been clac;sified as non-worker. Non-workers are distributed separately according Lo eight types of activities already noticed above.
(i) GENERAL ECONOMIC TABLES
There are in all 24 Economic Tables compiled in B-Series-16 General BconomicTables compiled from individual enumeration slips and 8 Household Economic Tables from household schedules on 20% sample basis. Out of the 16 General Economic Tables, the District Handb!)ok reproduces the following 12.
B-1-WORKERS AND NON-WORKERS CLASSIFIED BY SEX AND BROAD AGE-GROUPS
Table B-1 is the basic economic table furnishing the total population and 9 industrial 'categories of workers and non-workers. The data is presented for the district with total/rural/urban break-up.
17
The classification of workers and non-workers by broad age-groups, viz., 0-14, 15-34, 35-59 and 60 and above. is the special feature of 1961 census as these age-groups correspond to the different stages of life which have a special significance as regards capacity to work, viz., children, young persons, middle aged persons and old persons.
TABLE B-III-A AND B-INDUSTRIAL CLASSIFICATION OF WORKERS AND NON-WORKERS BY EDUCATIONAL LEVELS
This table which corresponds to the Table D-VII of 1951 is given in two parts-A & B. Part-A relates to the urban areas and Part-B relates to rural areas. The data in Part-A are presented for the district and that in Part-B down to taluka/mahal for rural areas.
In 1951, only literate and educated persons were classified into eight educational standards by 8 livelihood classes. No classification of illiterate persons into 8 livelihood classes was given in 1951; whereas in this Table, nine categories of workers and also non-workers are given for illiterate as well as for literates.
Non-technical diplomas and degrees have this time been distinguished froIlJ. technical diplomas and degrees and separate information given a]so for each technical degree.
TABLE B-IV-INDUSTRIAL CLASSIFICATION BY SEX AND CLASS OF WORKER OF PERSONS AT WORK OTHER THAN CUL TlVA TlON
This table corresponds to table B-III of 1951. It has been presented in three parts on the basis of the principal work of the persons. Part-A relates to persons at work in Household Industry, classified by branch of industry and class of workers (employee and others). Figures for the district are given for Divisions and Major groups for total/rural/urban and those for taluka/mahal for Divisions and rural areas only. Part-B pertains to persons at work in non-household industry, trade, business, profession or service. classified by branch of industry and class of workers (Employer, Employee, Single worker and Family worker). Figures for the district are given for Divisions and Major groups for total/urban and those for taluka/mahal figures for Divisions and rural areas only. The descriptions of divisions and major groups will be found in the Annexure to the VilIagewise List of Industrial Establishments. Part-C relates to persons at work at house~ hold as well as in non-household industry classified by branch of indUstry. Figures for the district arc given for Divisions, Major groups and Minor grmlps with descriptions for total/urban and those for taluka/mahal for Divisions only and rural areas only.
Table B-In of 1951 furnished figures of self-supporting persons only whereas in this table all the persons who work inclUding family workers who are not in receipt of any income or working children who . cannot earn enough for their maintenance are included as workers. In 1951, there were three classes of workers, viz., Employer. Employee and Independent workers whereas in this table, workers are classified in four categories, viz., Employer, Employee, Single worker and Family worker. the definitions of which are already given before.
Appendix to Part-C shows in run on lines Minor Groups with the number of male and female workers separately for household industry and non-household industry in brackets having less than 1% of workers of the respective Division (0.5% for Divisions 2 & 3 combined) which are omitted from the table.
TABLE B-V-OCCUPATIONAL CLASSIFICATION BY SEX OF PERSONS AT WORK OTHER THAN CULTIVATION
This is a new table in which cross-tabulation of industry and occupation has been made for the first time. Figures for the district are given by Divisions, Groups and Families for total/urban and for taluka/ mahal by Divisious only for rural areas.
Separate data are furnished for the persons working in household industry and other industrial categories as adopted in the Primary Census Abstract alongwith the Divisions, Groups and Families giving code numbers and actual description. The National Classification of occupation followed in this table is in conformity with international usuage.
Appendix to this table shows in run on lines, families with the number of male and female workers followed by industrial categories having less than 1% of workers of the respective Division (0.5% for Divisions 7 ~ 8 combined) which are omitted from the main table.
lR
While applying quality checks, some occupations appeared to have been classified under inappropriate industrial categories vis-a-vis the occupations or the nature of work done by persons in economic sector of their activity. Such cases are listed in the annexure to the table, indicating. the appropciate industrial category in which they deserve to be classified.
TABLE B-VII PART-A-PERSONS WORKING PRINCIPALLY (i) As CULTIVATORS, (ii) As AGRICULTURAL LABOURERS OR (iii) AT HOUSEHOLD INDUSTRY CLASSIFIED BY SEX AND BY SECONDARY WORK (i)·AT
HOUSEHOLD INDUSTRY, (ii) AS CULTIVATOR OR (iji) AS AGRICULTURAL LABOURER
TABLE B-VII PART-B-INDUSTRIALCLASSIFICATION BY SEX OF PERSONS WORKING IN NON-HOUSEHOLD INDUSTRY, TRADE, BUSINESS. PROFESSION OR SERVICE WHO ARE ALSO ENGAGED IN HOUSEHOLD INDUSTRY
In this table figures are presented for the district for Divisions and Major groups with total/rural/ urban break-up and those for taluka/mahal for Divisions and rural areas only. The descriptions of divisions and major groups will be found in the Annexure to the Villagewise List of Industrial Establishments;
In a similar table B-ll of 1951, there was cross-tabulation of self-supporting persons and earning dependents with reference to the secondary means of livelihood which was confined to 8 livelihood classes, while this table affords cross-tabulation between principal work in cultivation and houseliold industry or vice versa.
Appendix to Table B-VU-A shows in run on line'> Major Groups of household industry having secondary work, which are omitted from the table being less than 5% of major groups as prinCipal work followed in each case by the number of industrial categories and number of males and females having secondary work sepa· rately for total/rural and urban population in brackets.
TABLE B-VIII PART-A-PERSONS UNEMPLOYED AGED 15 AND ABOVE BY SEX, BROAD AGE~GROUPS AND EDUCATIONAL LEVELS IN URBAN AREAS ONLY
lABLE B-VIII PART-B-PERSONS UNEMPLOYED AGED IS AND ABOVE BY SEX, BROAD AGE-GROUPS. AND EDUCATIONAL LEVELS IN RURAL AREAS ONLY
This is a new table prepared for the first time in 1961. It is in two parts. Part-A relates to urban· areas and is presented for district. Part-B relates to rural areas and is presented down to taluka/mahal.
The classification of unemployed persons is shQwn separately for (i) those who are seeking employment for the first time and (ii) for those who were employed before but are now out of employment and seeking work. The age-groups given in the first case are quinquennial. viz.. 15-19. 20-24. 25-29. 30-34 and 35 + modified in the second case as 15-19. 20-24, 25-34, 35-44, 45-59 and 60 +.
In Part-A relating to urban areas information for unemployed persons is furnished ror all educational' levels, and ill Part-B for educational levels upto matriculation and above.
TABLE B-1 X-PERSONS NOT AT WORK CLASSIFIED BY SEX, BROAD AGE-GROUPS AND TYPE OF ACTIVITY
This is a new table introduced for the first time. The table is prese~ted for district with total/rurall urban break-up and for taluka!mahal for rural areas ooly. It classifies oon·working population into 8 types of activities based on the recommendation of the United Nations Organisation. They! are :-
Full time students 2 Persons performing household dllties without wages 3 Dependents, infants and disabled persons 4 Retired persons, rentiers or persons of independent means 5 Beggars, vagrants, etc.
6 Inmates of penal, mental and charitable institutions 7 Persons seeking employment for the first time
8 Persons employed before, but now out of employment and seeking work
19
(ii) HoUSEHOLD ECONOMIC TABLES
Out of the 8 Household Economic Tables compiled at this census, 4 tables which are reproduc,=,d in the District Handbook are :-
TABLE B-X-SAMPLE HOUSEHOLDS (i) ENGAGED NEITHER IN CULTIVATION NOR HOUSEHOLD INDUSTRY. (ii) ENGAGED EITHER IN CULTIVATION OR HOUSEHOLD INDUSTRY BUT NOT IN BOTH AND (iii) ENGAGED
BOTH IN CULTIVATION AND HOUSEHOLD INDUSTRY
( Based on 20% Sample)
This table is prepared for total. rural and urban for the district and for rural areas only for taluka/ mahal.
Cl}1tivation includes ownership, tenancy cultivation and agricultural labour. Household industry has been defined in the general note above.
TABLE B-XI-SAMPLE HOUSEHOLDS ENGAGED IN CULTIVATION CLASSIFIED BY INTEREST IN LAND AND SIZE OF LAND CULTIVATED IN RURAL AND URBAN AREAS SEPARATELY
(Based on 20% Sample)
For rural areas the data has been given down to taluka/mahal while that for urban areas has been giv~n . only for the district as a whole.
This table gives very useful data 011 the size of holdings and affords a cross-tabulation of names of local rights over land (interest), viz., (a) owned or held from Government, (b) held from private persons 0;· institutions, (c) partly held from Government and partly from private persons, and size of holding, viz., Jess than 1; 1.0-2.4; 2.5-4.9; 5.0-7.4; 7.5-9.9; 10.0-12.4; 12.5-14.9; 15.0-29.9; 30.0-49.9; SO + and unspecified.
TABLE B-XII-SAMPLE HOUSEHOLDS ENGAGED IN CULTIVATION ONLY CLASSIFIED BY SIZE OF LAND ;CUL;TIVATEP ~NP NUMBER OF FAMILY WORKERS AND HIRED WORKERS IN RURAL AND URBAN
. AREAS SEPARATELY
(Based on 20% Sample)
For rural areas the data has been given down to taluka/mahal and that for urban area for the district as a whole. The information for households that are engaged only in cultivation has been cross-tabulated by number of persons engaged in cultivation and each prescribed size class of holding. Working strength in cultivation is further separated into family workers and hired workers when more than 1 person is engaged in cultivation.
,TABLE.B-XVI""7SAMPLE PRINCIPAL HOUSEHOLD INDUSTRY CLASSIFIED BY PERIOD OF WORKING AND . . . TOTAL NUMBER OF WORKERS ENGAGED IN HOUSEHOLD INDUSTRY IN ALL AREAS
( Based on 20% Sample)
This table is presented for the district with total/rural/urban break-up. TIle data in respect of house holds engaged in household industry oilly or both in household industry and cultivation has been given separately with the Divisions and Major groups of household industry. The household industry has been classified according to the period of working viz.,
1-3 months, 4-6 months, 7-9 months, 10 months to one year. Under each duration period number of households, number of family workers and number of hired workers have also been given.
Appendix to this table shows in run on manner Major groups of household industry which . are omitted from the table being less than 10% of tbe respective Division, giving the number of major groups, with or without cultivation, with period of working in abbreviation and the number of households ill brackets separately for total, rural and urban.
20
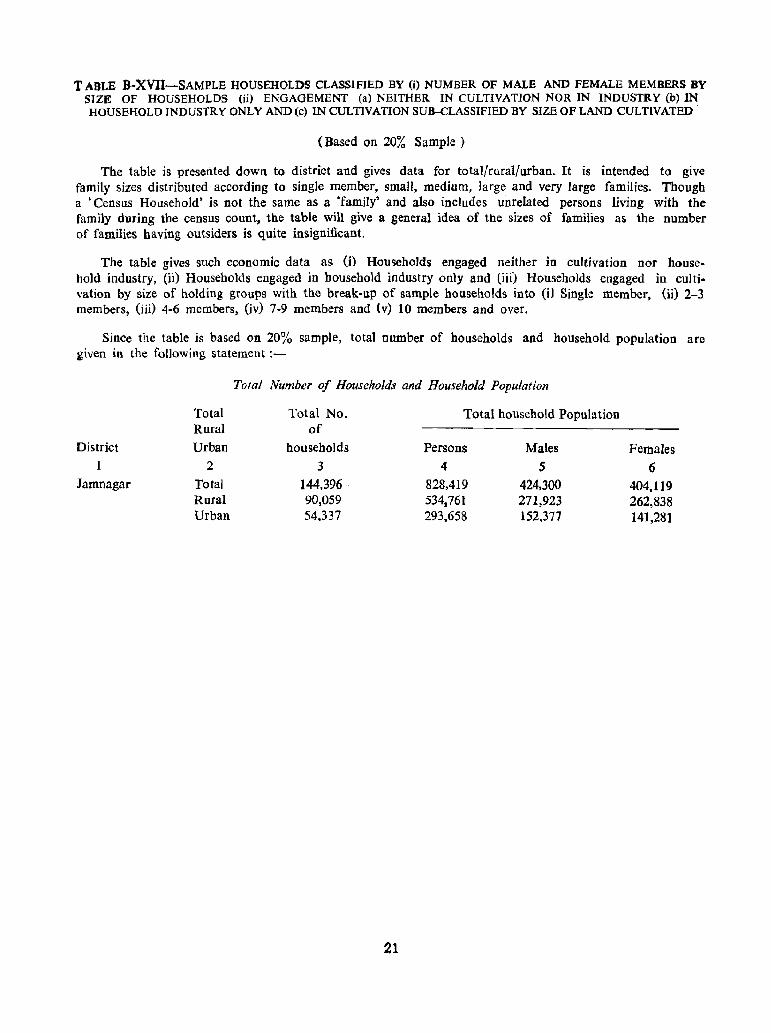
TABLE B-XVlI-SAMPLE HOUSEHOLDS CLASSIFIED BY (i) NUMBER OF MALE AND FEMALE MEMBERS BY SIZE OF HOUSEHOLDS (ii) ENGAGEMENT (a) NEITHER IN CULTIVATION NOR IN INDUSTRY (b) IN HOUSEHOLD INDUSTRY ONLY AND (c) IN CULTIVATION SUB-CLASSIFIED BY SIZE OF LAND CULTIVATED
(Based on 20% Sample)
The table is presented down to district and gives data for total/rural/urban. It is intended to give family sizes distributed according to single member, small, medium, large and very large families. Though a 'Census Household' is not the same as a 'family' and also includes unrelated persons living with the family during the census count, the table will give a general idea of the sizes of families as the number of families having outsiders is quite insignificant.
The table gives such economic data as (j) Households engaged neither in cultivation nor household industry, (ii) Households engaged in household industry only and (iii) Households engaged in cultivation by size of holding groups witll the break-up of sample households into (iJ Single member, (ii) 2-3 members, (iii) 4-6 members, (iv) 7-9 members and (v) 10 members and over.
Since the table is based on 20% sample, total number of households and household population are ~iven in the following statement :-
Total Number of Households and Household Population
Total Total No. Total household Popula tion Rural of
District Urban households Persons Males Females 2 3 4 5 6
Jamnagar Total 144,396 828,419 424,300 404,119 Rural 90,059 534,761 271,923 262,838 Urban 54.337 293,658 152.371 141,281
21
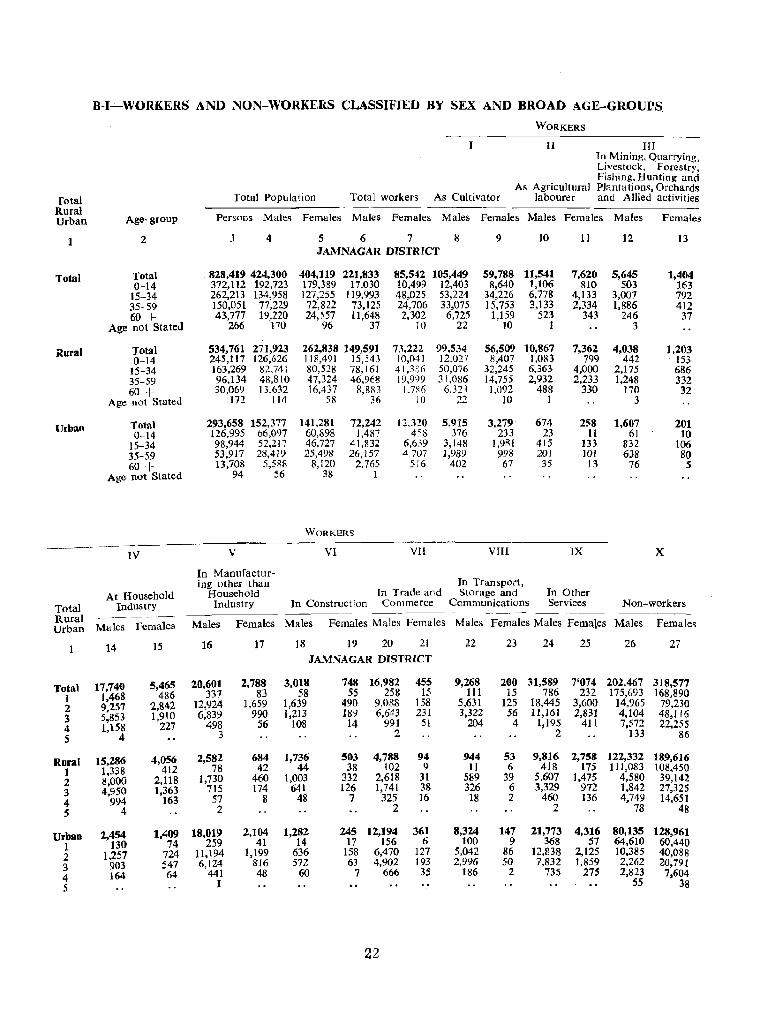
B-I-'-WORKERS AND NON-WORKERS CLASSIFIED BY SEX· AND BROAD AGE-GROUPS
WORKERS
II III T~ Mining, Quarrying, Llvestock, Forestry, Fishing, Hunting and
As Agricultuml Plantations, Orchards Total Total Population Total workers As Cultivator labourer and Allied activities Rural
Persons Males Females Males Females Males Urban Age-group Females Males Females Males Females
2 3 4 5 6 7 8 9 10 11 12 13 JAMNAGAR DISTRICT
Total Total 828,419 424,300 404,119 221,833 85,542 105,449 59,788 11,541 7,620 5,645 1,404 0-14 372,112 192,723 179,389 ]7,030 10,499 12,403 8,640 ],106 810 503 163
15-34 262,213 134,958 127,255 119,993 48,025 53,224 34,226 6,778 4,133 3,007 792 35-59 150,051 77,229 72,822 73,125 24,706 33,075 15,753 3,133 2,334 1,886 412 60 + 43,777 19,220 24,557 11,648 2,302 6,725 1,159 523 343 246 37
Age not Stated 266 170 96 37 10 22 10 1 3
Rural Total 534,761 271,923 262,838 149,591 73.222- 99.534 56,509 10,867 7,362 4,038 1,203 0-14 245,117 126,626 118,491 15,:43 10,041 12,027 8,407 1,083 799 442 153
15-34 ]63,269 82,741 80,528 78,161 41,3SG 50,076 32,245 6,363 4,000 2,175 686 35-59 96,134 48,810 47,324 46,968 19,999 31,086 14,755 2,932 2,233 1,248 332 60 + 30,069 13,632 16,437 8,883 I.7SIi 6,321 1.092 488 330 170 32
Age not Stated 172 114 58 36 10 22 10 1 3
Urban Total 293,658 152,377 141,281 72,242 12.320 5,915 3,279 674 258 1,607 201 0-14 126,995 66,097 60,898 1,487 458 376 233 23 11 61 10
15-34 98,944 52,217 46.727 41,832 6,639 3,148 1,9RI 415 133 832 106 35-59 53,917 28,419 25;498 26,157 4,707 ],989 998 201 101 638 80 60 + 13,708 5,588 8,120 2,765 516 402 67 35 13 76 5
Age not Stated 94 56 38 1
WORKERS
---~--
IV V VI VII VIII ]X X
In Manufactur-ing other than In Transport,
At Household Household In Trade and Storage and In Other
Total Industry Industry In Construction Commerce Communications Services Non-workers
Rural __ - ----_ .. - ---~~- -- ---_------ -~ _----__
Urban Males Females Males Females Males Females Males Females Males Females Males Females Males Females
14 15 16 17 18 19 20 21 22 23 24 25 26 27
JAMNAGAR DISTRICT
Total 17,740 5,465 20,601 2,788 3,018 748 16,982 455 9,268 200 31,589 7'074 202,467 318,577
I 1,468 486 337 83 58 55 258 15 111 15 786 232 175,693 168.890
2 9,257 2,842 12,924 1,659 1,639 490 9,088 158 5,631 125 18,445 3,600 14,965 79,230
3 5,853 1,910 6,839 990 1,213 ]89 6,643 231 3,322 56 11,161 2,831 4,104 48,116
4 1,158 227 498 56 108 14 991 51 204 4 ],195 411 7,572 22,255
5 4 3 2 2 ]33 86
Rural 15,286 4,056 2,582 684 1,736 503 4,788 94 944 53 9,816 2,758 122,332 189,616
1 1,338 412 78 42 44 38 102 9 11 6 418 175 111,083 108,450
2 8,000 2,118 1,730 460 1,003 332 2,618 31 589 39 5,607 1,475 4,580 39,142
3 4,950 1,363 715 174 641 126 1,741 38 326 6 3,329 972 1,842 27,325
4 994 163 57 8 48 7 325 16 18 2 460 136 4,749 14,651
5 4 2 2 2 78 48
Urban 2,454 1,409 18,019 2,104 1,282 245 12,194 361 8,324 147 21,773 4,316 80,135 128,961
1 130 74 259 41 14 17 156 6 100 9 368 57 64,610 60,440
2 ]'257 724 11,194 1,199 636 158 6,470 127 5,042 86 12,838 2,125 10,385 40,088
3 903 547 6,124 816 572 63 4,902 193 2,996 50 7,832 1,859 2,262 20,791
4 164 64 441 48 60 7 666 35 186 2 735 275 2,823 7,604
5 1 55 38
22
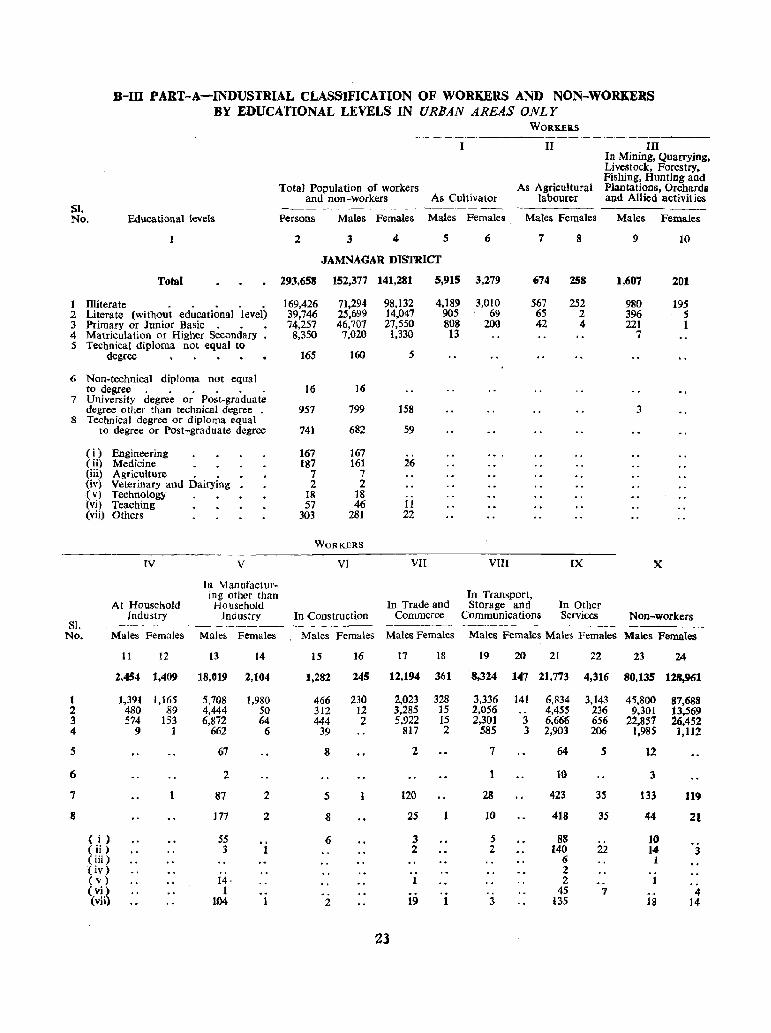
B-ill PART-A-INDUSTRIAL CLASSIFICATION OF WORKERS AND NON-WORKERS BY EDUCATIONAL LEVELS IN URBAN AREAS ONLY
51. No. Educational levels
Total
I Illiterate ..•.. 2 Literate (without educational level) 3 Primary or Junior Basic. . • 4 Matriculation or Higher Secondary • S Technical diploma not equal to
degree
6 Non-technical diploma not equal to degree. . • . . .
7 University degree or Post-graduate degree other than technical degree .
8 Technical degree or diploma equal to degree or Post-graduate degree
( i) Engineering (ii) Medicine (iii) Agriculture . • (iv) Veterinary and Dairying (v) Technology (vi) Teaching (vii) Others
IV
At Housefiold Industry
V
In. Manufacturing other than Household
Industry
Total Population of workers and non-workers As Cultivator
WORKER.S
II
As Agricultural labourer
III In Mining, Quarrying, Livestock, Forestry, Fishing, Hunting and Plantations, Orchards and Allied activit ies
Persons Males Females Males Females Males Females Males Females
2 3 4 5 6 7 8
JAMNAGAR DISTRICT
2'3,658 152,377 141,281 5,915 3,279 674 258
169,426 39,746 74,257 8,350
165
16
957
741
167 187
7 2
18 57
303
71,294 25,699 46,707 7.020
160
16
799
682
167 161
7 2
18 46
28J
WORKERS
VI
98.132 14,047 27,550
1,330
5
158
59
26
II 22
VII
4,189 905 808 13
In Trade and In Construction Commerce
3.010 69
ZOO
VUl
567 6S 42
Tn Transport,
252 2 4
IX
Storage and In Other Communications Services
9
1,607
980 396 221
7
3
x
10
201
195 5 1
Non-workers SI.
No. ---_---.-~ -----_
1 2 3 4
5
6
7
8
( i ) (ii) ( iii) (iv) (v) ( vi) (vii)
Males Females Males Females
11 12 13 14
2.454 1,409 18,01' 2,104
1,39t 1,165 480 89 574 153
9 1
5,708 4,444 6,872
662
67
2
87
177
55 3
14· J
104
1,980 50 64
6
2
2
Males Females Males Females Males Females Males Females Males Females
16 17 18 19 20 21 22 23 24 15
1,282 245 12,194 361 8,324 147 21,773 4,316 80,135 128,961
466 312 444
39
8
5
8
6
2
230 12 2
23
2,023 3,285 5,922
817
2
120
25
3 2
19
328 15 15 2
1
3,336 2,056 2,301
585
7
28
10
5 2
141 6,834 4,455
3 6,666 3 2,903
64
It)
423
418
88 140
6 2 2
45 135
3,143 236 656 206
5
35
35
22
7
45,800 9,301
22,857 1,985
12
3
133
44
10 14 1
18
87,688 13,569 26,452 1,112
119
21
3
4 14
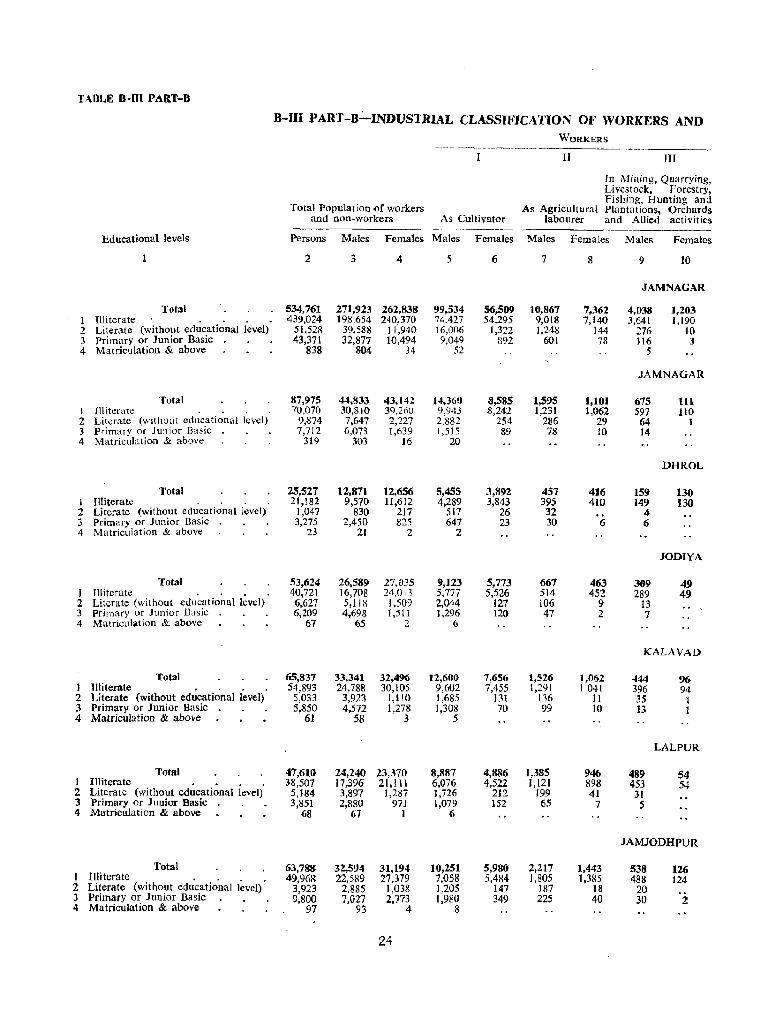
TABLE 8-0l PART-B
Educational levels
Total 1 Illiterate '" 2 Literate (without educational level) 3 Primary or Junior Basic 4 Matriculation & above
Total I Illiterate 2 Literate (without educational level) 3 Primary or Junior Basic 4 Matriculation & above
Total I Illiterate . . 2 Literate (without educational level) 3 Primary or Junior Basic 4 Matriculation & above
Total 1 Illiterate '" 2 Literate (without educationnl level) 3 Primary or Junior Basic 4 Matriculation & above
Total J III iterate '" 2 Literate (without educational level) 3 Primary or Junior Basic 4 Matriculation & above
Total 1 Illiterate .... 2 Literate (without educational 1evd) 3 Primary or Junior Basic. . 4 Matriculation & above
Total I lUi terate '" 2 Literate (without educational level) 3 Primary or Junior Basic . . 4 Matriculation & above
B-III PART-B"':'_INDVSTRIAL CLASSIFICATION OF WORKERS AND
Total Population of workers and non-workers As Cultivator
WORKERS
II
As AgricUltural labourer
JII
In Milling, Quarrying, Livestock, Forestry, Fishing, Hunting and Plantations, Orchards and Allied activities
Persons Males Females Males Females Males Females Males Females
2
534,761 439,024
51,528 43,371
838
87,975 70,070
9,874 7,712
319
25,527 21,182
1,047 3,275
23
53,624 40,721 6,627 6,209
67
65,837 54,893
5,033 5,850
61
47,610 38,507
5,184 3,851
68
63,788 49,968
3,923 9,800
97
3
271,923 198,654
39,588 32,877
804
44,833 30,810 7,647 6,073
303
12,871 9,570
830 2,450
21
26,589 16,708 5,IIR 4,698
65
33,341 24,788
3,923 4,572
58
24,240 17,396 3,897 2,880
67
32,59-1 22,589
2,885 7,027
93
4
262,838 240,370
11,940 10.494
34
43.142 39,260 2,227 1,639
16
12,656 11,612
217 825
2
27.035 24,013 1.509 1,511
2
32,496 30,105
1,110 1,278
3
23,370 21,111
1,287 971
1
31,194 27,379
1,038 2,773
4
24
5
99,534 74.427 16,006 9,049
52
14.360 9,943 2,882 1,515
20
5,455 4,289
517 647
2
9,123 5,777 2,044 1,296
6
12,600 9,602 1,685 1,308
5
8,887 6,076 1,726 1,079
6
10,251 7,058 1,205 1,980
8
6
56,509 54,295
1,322 892
8,585 8,242
254 89
3,81)2 3,843
26 23
5,773 5,526
127 120
7,656 7,455
131 70
4,886 4,522
212 152
5,980 5,484
147 349
7
10,867 9,018 1,248
601
1,595 1,231
286 78
457 395 32 30
667 514 106 47
1,526 1,291
136 99
1,385 1,121
]99 65
2,217 ],805
187 225
8
7,362 7,140
144 78
1,101 1,062
29 10
416 410
6
463 452
9 2
1,062 1,041
11 10
946 898 41
7
1,443 1,385
18 40
9 10
JAMNAGAR
4,038 3,641
276 116
5
1,203 1.190
10 3
JAMNAGAR
675 597
64 14
159 149
4 6
309 289
13 7
til 110
1
DHROL
130 130
JODIYA
49 49
KALAVAD
444 396 35 I3
489 453
31 5
96 94
1 1
LALPUR
54 54
JAMJODHPUR
538 488
20 30
126 124
2
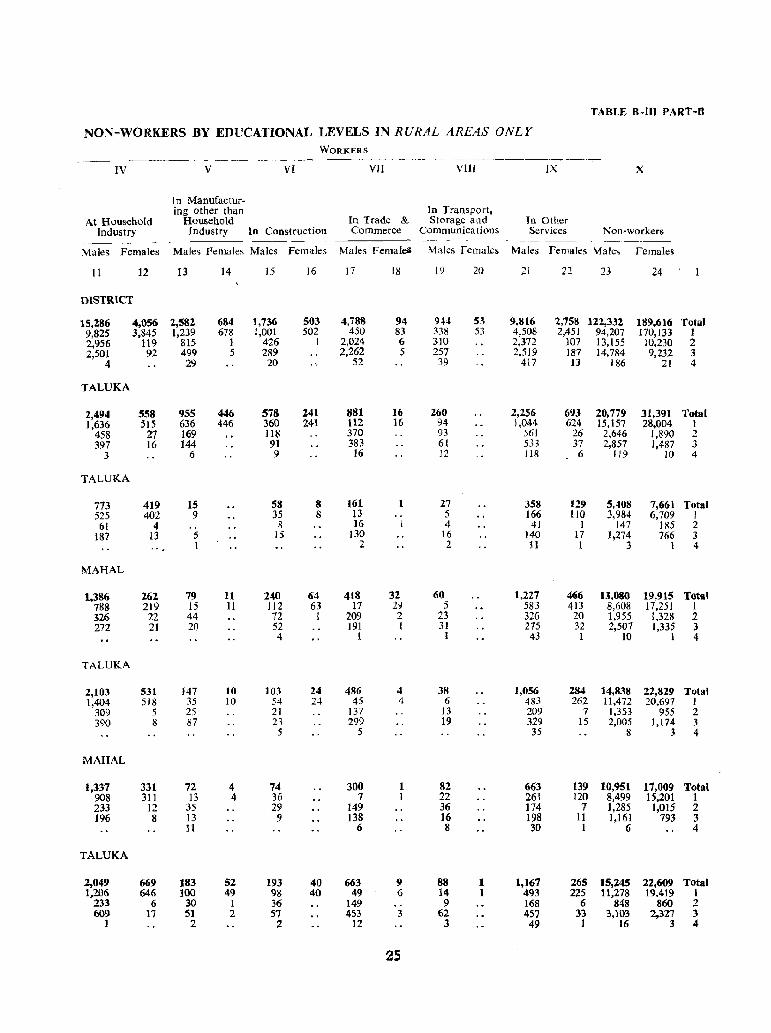
TABLE B-IH PART-8
NON-WORKERS BY EDUCATIONAl, LEVELS IN RURAL AREAS ONLY WORKERS
IV V VI VII VIII IX
In Manufactur-ing other than In Transport,
At Household Household In Trade & Storage and In Other Industry Industry [n Construction Commerce Communications Services Non-workers
----- -~-----.-- ---------
Males Females Males Females Males Females Males Female» Males Females Males Females Males Females
11 12 13 14 15 16 17 18 19 20 21 22 23 24
DISTRICT
15,286 4.,656 2,582 684 1,736 50) 4,788 94 9H 5~ 9,816 2,758 122,332 189,616 Total 9,825 3,845 1,239 678 1,001 502 450 83 338 53 4,508 2,451 94,207 170,133 I 2,956 119 815 1 426 1 2,024 6 310 2,372 107 13,155 10,230 2 2,501 92 499 5 289 2,262 5 257 2,519 187 14,784 9,232 3
4 29 20 52 39 417 13 186 21 4
TALUKA
2,494 558 955 446 578 241 881 16 260 2.256 693 20,779 31,391 Total 1,636 515 636 446 360 241 112 16 94 ),044 624 15,157 28,004 1
458 27 169 118 370 93 561 26 2,646 1,890 2 397 16 144 91 383 61 533 37 2,857 1,487 3
3 6 9 16 12 118 6 119 10 4
TALUKA
773 419 15 58 8 161 1 27 358 129 5.408 7,661 Total 525 402 9 35 8 13 .. 5 166 IIO 3.984 6.709 I
61 4 8 16 I 4 41 I 147 185 2 IS7 13 5 15 130 16 140 17 1,274 766 3
1 2 2 11 I :; 1 4
MAHAL
1,386 262 79 11 240 64 418 32 60 1,227 466 13,080 19,915 Total 788 219 15 II 112 63 17 2;1 5 583 413 8,608 17,251 1 326 22 44 72 1 209 2 23 326 20 1,955 1,328 2 272 21 20 52 191 I 31 275 32 2,507 1,335 3
4 1 I 43 1 10 1 4
,ALUKA
2,103 531 147 10 103 24 486 4 38 1,056 284 14,838 22,829 Total 1,404 518 35 10 54 24 45 4 6 483 262 11,472 20,697 1
309 5 25 21 137 13 209 7 1,353 955 2 390 8 87 23 299 19 329 15 2,005 1,174 3
5 5 35 8 3 4
MAHAL
1,337 331 72 4 74 300 1 82 663 139 10,951 17,009 Total 908 311 13 4 36 7 1 22 261 120 8,499 15,201 I 233 12 35 29 149 36 174 7 1,285 1,015 2 196 8 13 9 138 16 198 11 1,161 793 3
11 6 8 30 1 6 4
TALUKA
2,049 669 183 52 193 40 663 9 88 I 1,167 265 15,245 22,609 Total 1,206 646 100 49 98 40 49 6 14 1 493 225 11,278 19.419 1
233 6 30 1 36 149 9 168 6 848 860 2 609 17 51 2 57 453 3 62 457 33 3,103 2,327 :;
1 2 2 12 3 49 1 16 3 4
2S
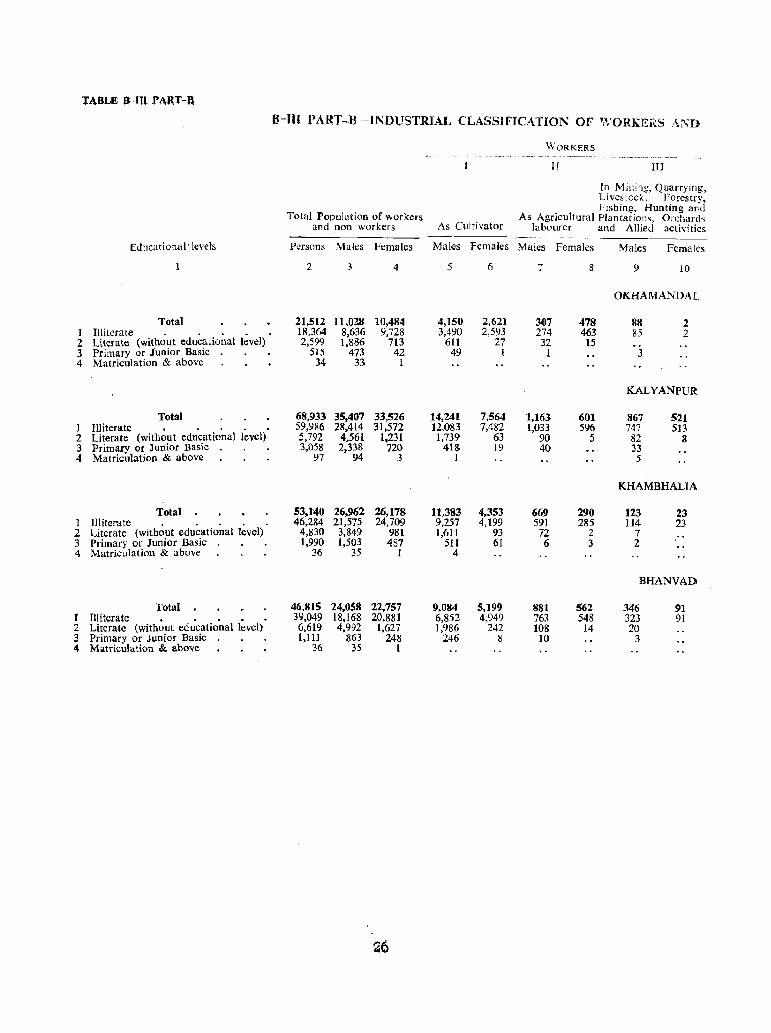
TABLE a-Ill PART-ll
Educational'levels
Total ] Illiterate . . . . 2 Literate (without educational level) 3 Primary or Junior Basic. . 4 Matriculation & above
Total I Illiterate • • . . 2 Literate (without educational level) 3 Primary or Junior Basic. . • 4 Matriculation & above
Total 1 IlIitera te . .. . 2 Literate (without educational level) 3 Primary or Junior Basic. • . 4 Matriculation & above
Total I llliterate • • • • 2 Literate (without educational level) 3 Primary or Junior Basic. • . 4 Matriculation & above
.6-JIl PART-B-l]\;DVSTRIAL CLASSIFICATiON OF WORKERS A~D
Total Population of workers and non-workers As Cultivator
WORKERS
II III
In Mining, Quarrying, Livestock, Forestry, Fishing, Hunting and
As Agricultural Plantations, Orchard~ labourer and Allied activities
Persons Males Females Males Females Males Females Males Females
2
21,512 18.364 2,599
515 34
68,933 59,986 5,792 3,058
97
53,1'40 46.284
4,830 1,990
36
46,815 39,049 6,619 1,111
36
3
11,028 8,636 1,886
473 33
35,407 28,414
4,561 2,338
94
26,962 21,575
3,849 1,503
35
24,058 18,168 4,992
863 35
4
10,484 9,728
713 42
1
33,526 31,572
1,231 720
3
26,178 24.709
981 487
]
22,757 20,881
1,627 248
1
5
4,150 3,490
6Il 49
14,241 12,083 1,739
41S 1
11,383 9,257 1,611
511 4
9,084 6,852 1,986
246
6
2,621 2,593
27 1
7,564 7,482
63 19
4,353 4,199
, 93 61
5,199 4;949
242 8
7
307 274 32
1
1,163 1,033
90 40
669 591
72 6
881 763 108
10
8
478 463 15
601 596
5
290 285
2 3
562 548
14
\) 10
OKHAMANDAL
88 85
3
2 2
KALYANPUR
867 747 82 33 5
521 513
8
KHAMBHALIA
123 114
7 2
23 23
BHANVAD
346 323 20
3
9] 91
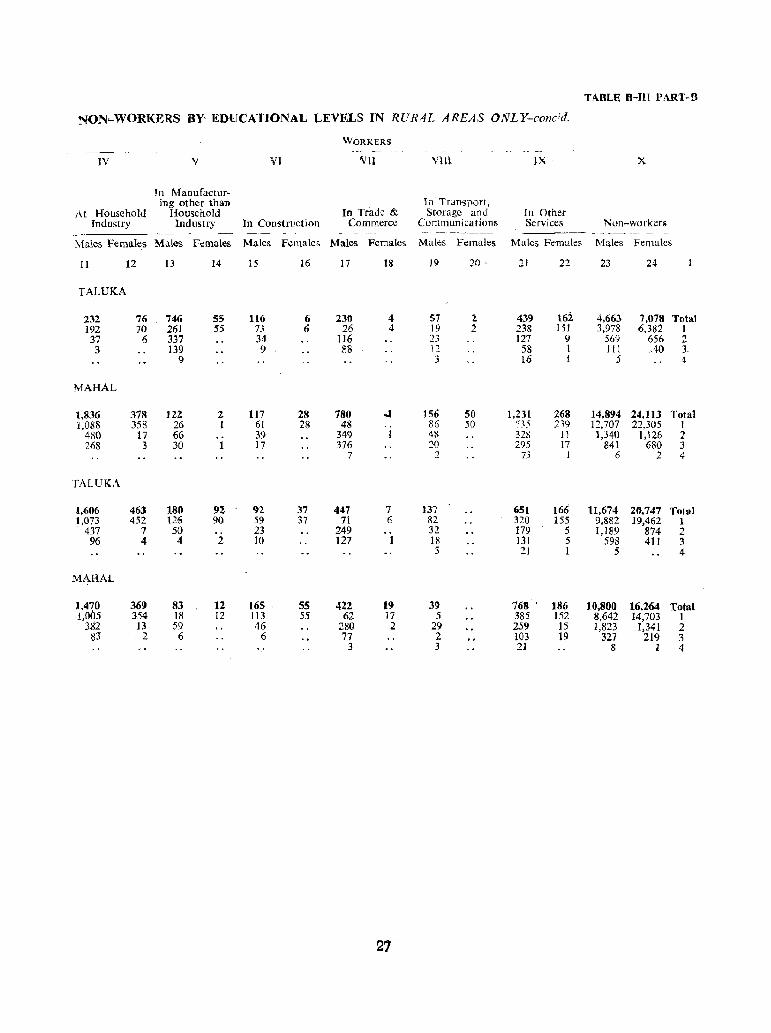
TABLE 8-IH PART-D
NON~WORKERS BY EDUCATIONAL LEVELS IN RURAL AREAS ONLY-cone'd.
WORKERS
IV V VI Vll vm IX, X
In Manufactur-ing other than In Transport,
At Household Household In Trade & Storage and In Other Industry Industry In Construction Commerce Communications Services Non-workers
-- - -----"--~.- ------ _--_ "--_------------
Males Females Males Females Males Females Males Females Males Females Males Ffrmales Males Females
I I 12 13 14 15 16 17 18 19 20 ' 21 22 23 24
TALUKA
232 76 746 55 116 6 230 4 57 1 439 162 4.663 7,078 Total 192 70 261 55 73 6 26 4 19 2 238 151 3,978 6,382 1 37 6 337 34 116 23 127 9 56<) 656 2 3 139 9 R8 J 2 58 I III AO 3-
9 3 16 I 5 4
MAHAL
1,836 378 122 2 117 28 780 ..t 156 50 1,231 268 14,894 24,113 Total 1,088 358 26 1 61 28 48 ., 86 50 ,'BS 239 12,707 22,305 1
480 17 66 39 349 I 48 3211 11 1,340 1,126 2 268 3 30 17 376 2{) 295 17 841 680 3
7 2 73 1 6 2 4
TALUKA
!,606 463 ISO 9Z 92 37 447 7 137 651 166 11,674 2D,747 Total 1,073 452 126 90 59 37 71 6 82 320 155 9,882 19,462 1
437 7 50 23 249 32 179 5 1,189 874 2 96 4 4 2 10 127 18 131 5 598 4tl 3
5 11 1 5 4
MAHAL
1,470 369 8J 12 165 55 422 19 3' 76S' , 186 10,800 16,264 Total 1,005 354 18 12 113 55 62 17 5 385 152 8,642 14,703 1
3E2 13 59 46 280 :2 29 259 15 1,823 1,341 2 83 2 6 6 77 2 103 19 327 219 3
3 3 21 8 2 4
27
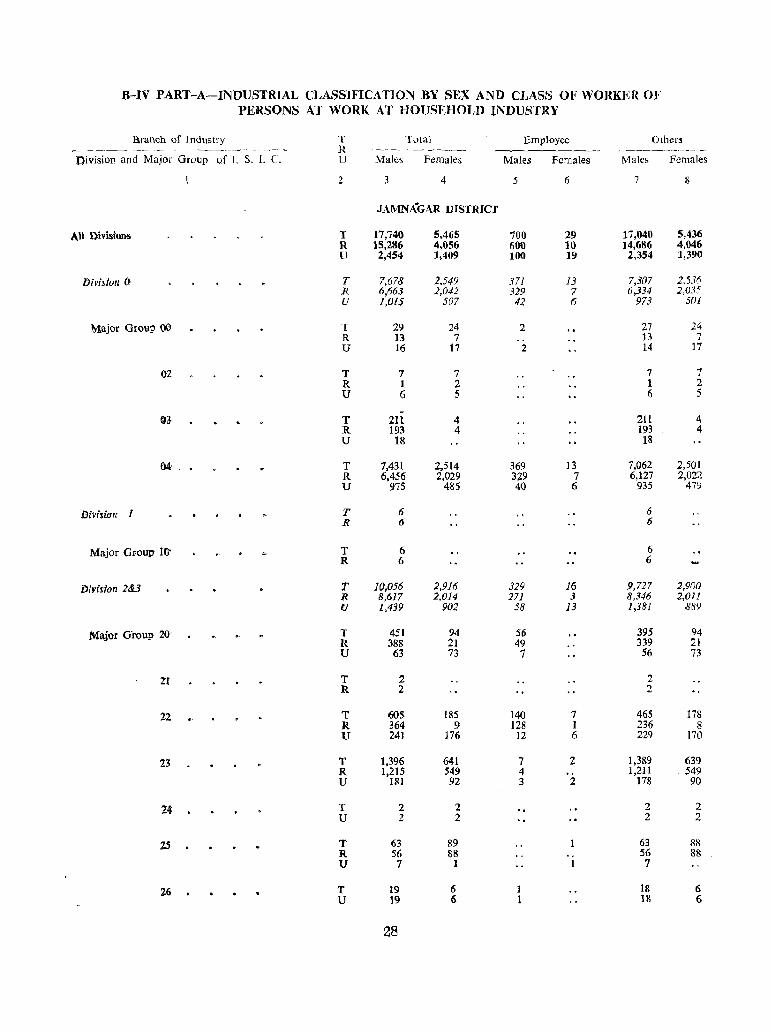
B-IV PART-A-INDUSTRIAL CLASSIFICATION BY SEX AND CLASS OF WORKER OF PERSONS AT WORK AT HOUSEHOLD INDUSTRY
Branch of Industry T Total Employee Others ~----- --.~ -_.- .- ~---,--~ R ~~------ .. - ~---.--.--~ Division a,nd Major Group of 1. S. L C. U Maks Females Males Females Males Females
2 3 4 5 6 7 8
JAMNAGAR DISTRICT
AU Divisions T 17,740 5,465 700 29 17,040 5,436 R 15,286 4,056 600 10 14,686 4,046 II 2,454 1,409 100 19 2,354 1,390
Division a T 7,678 2,549 371 13 7,30? 2,536 R 6,663 ),042 329 7 6,334 ),035 U 1,015 507 42 6 973 501
Major Group 00 T 29 24 2 27 24 R 13 7 " 13 7 U 16 17 2 14 17
02 T 7 7 7 7 R 1 2 1 2 U 6 5 6 5
IH T 211 4 211 4 R 193 4 193 4 U 18 18
04, T 7,431 2,514 369 13 7,062 2,501 R 6,456 2,029 329 7 6,127 2,022 U 975 485 40 6 935 479
Division I T 6 6 R 6 6
Major Group 10' T 6 6 R 6 6
Division 2&3 T 10,056 2,916 329 ]6 9,727 2,900 R 8,617 2,014 271 3 8,346 2,011 U 1,439 902 58 13 1,381 889
Major Group 20 T 451 94 56 395 94 R 388 21 49 339 21 U 63 73 7 56 73
21 T 2 2 R 2 2
22 T 60S 185 140 7 465 178 R 364 9 128 I 236 8 U 241 176 12 6 229 170
23 T 1,396 641 7 2 1,389 639 R 1,215 549 4 1,211 . 549 U 181 92 3 2 178 90
24 T 2 2 2 2 U 2 2 2 2
25 T 63 89 63 88 R 56 88 56 88 U 7 1 7
26 T 19 6 1 18 6 U 19 6 1 18 6
28
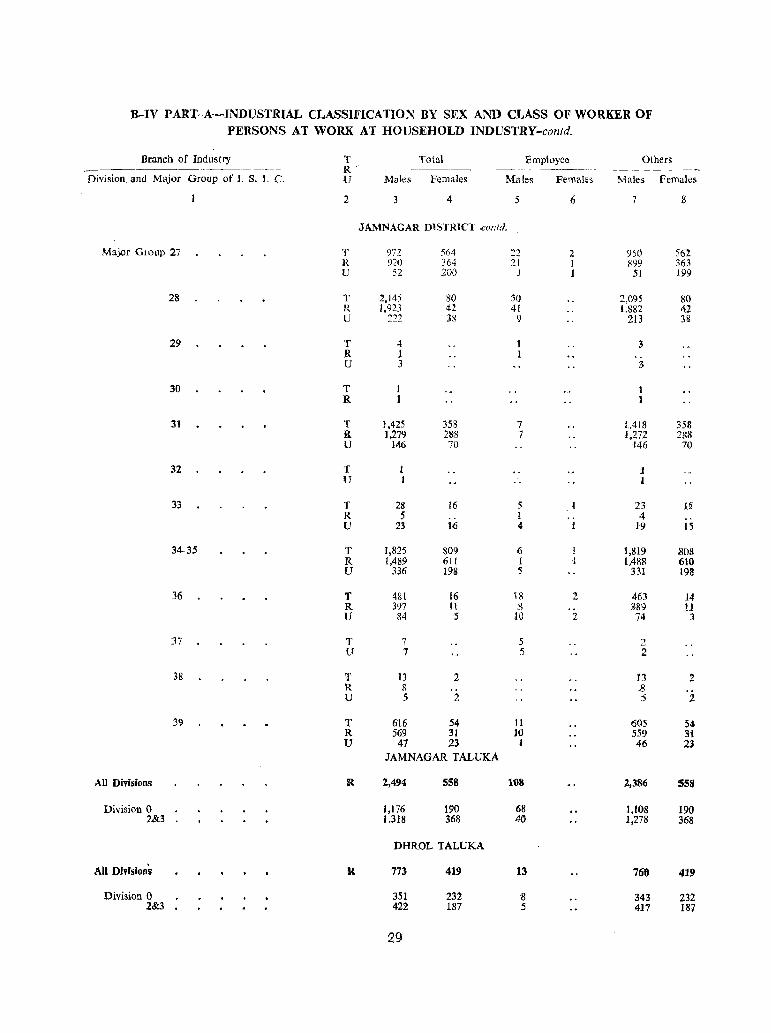
B-IV PART-A-INDVSTRIAL CLASSIFICATION BY SEX AND CLASS OF WORKER OF PEUSONS AT WORK AT HOUSEHOLD INDUSTRY-confd.
Branch of Industry T Total Employee Others R
Division. and Major Group of I. S. I. C. U Males Females Males Females l\'lales Females
2 4 5 6 7 8
JAMNAGAR DlSTRICT-coJi/d.
Major Group 27 T 972 564 22 2 950 56! R 920 364 21 I 899 363 l.J 52 200 1 1 51 199
28 T 2,145 80 50 2,095 80 R 1,923 42 41 1,882 42 U 222 3X 9 213 18
29 T 4 :; R J U 3 3
30 T R
31 T 1,425 358 7 t,418 353 R 1,279 2&8 7 1,272 288 U 146 70 J46 70
32 T l I U 1 1
33 T 28 16 5 1 23 15 R 5 .. J 4 .. U 23 16 4 J 19 IS
34-35 T 1,825 809 .6 1 1,819 .808 R 1,489 61! 1 1 I,4S8 610 U 336 198 5 331 198
36 T 481 16 18 2 463 14 R 397 11 ,3 389 .11 U 84 5 10 2 74 3
37 T 7 5 2 11 7 5 .2
38 T 13 2 13 2 R 8 )l U 5 2 5 1
39 T 616 54 11 (lOS 54 R 569 31 J() 559 31 U 47 23 I 46 23
JAMNAGAR TALDKA
All Divisions R 2,494 558 11)3 2,386 558
Division 0 1,176 190 68 1,108 190 2&3 1,3]8 368 40 1,278 368
DHROL TALUKA
All Division~ R 773 419 13 760 419
Division 0 351 232 8 343 232 2&3 422 187 5 417 187
29
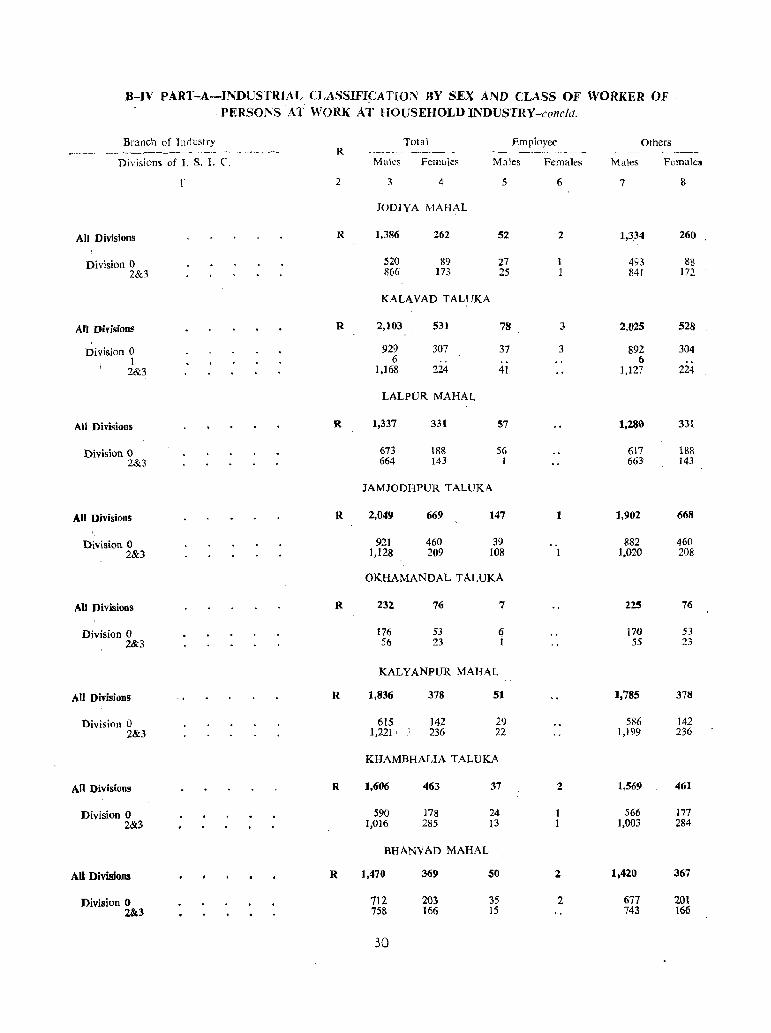
.B-JV PART-A-INDUSTRIAL CLASSIFICATION BY SEX AND CLASS OF WORKER OF . PERSONS AT WORK AT HOUSEHOLD INDUSTRY-condit.
Branch of Industry Total Employee Others ,,..----------~
•• _r __ J_ R -~--~- ----.-.-_ --'-~- -- -_---Divisions of I. s.. 1. C. Mules Females Males Females Males Females
1 2 3 4 5 6 7 8
JODIYA MAHAL
All Divisions R 1.386 262 52 2 1,3,34 260
Division 0 520 89 27 I 493 88 2&3 866 173 25 1 1141 172
KALAVAD TALUKA
All Divisions R 2,103 531 78 3 2,025 528
Division 0 929 307 37 3 892 304 1 6 6
2&3 1,168 224 41 1,127 224
LALPUR MAHAL
All Divisions R 1,337 331 57 1,230 331
Division 0 673 188 56 617 188 2&3 664 143 1 663 143
JAM JODHPUR TALUKA
All Divisions R 2,049 669 147 1 1,902 668
Division 0 921 460 39 882 460 2&3 1,128 209 108 1 1,020 208
OKHAMANDALTALUKA
,\II Divisions R 232 76 7 225 76
Division 0 176 53 6 170 53 2&3 56 23 i 55 23
KALYANPUR MAHAL
All Divisions R 1,836 378 51 1,785 378
Division 0 615 142 29 586 142 2&3 1,221 ' 236 22 1,199 236
KHAMBHALIA TALUKA
All Divisions R 1,606 463 37 2 1,569 461
Division 0 590 178 24 566 177 2&3 1,016 285 13 1,003 284
BHANVAD MAHAL
All Divisions R 1,470 369 50 Z 1,420 367
Division 0 712 20~ 35 2 677 201 2&3 758 166 15 743 166
30
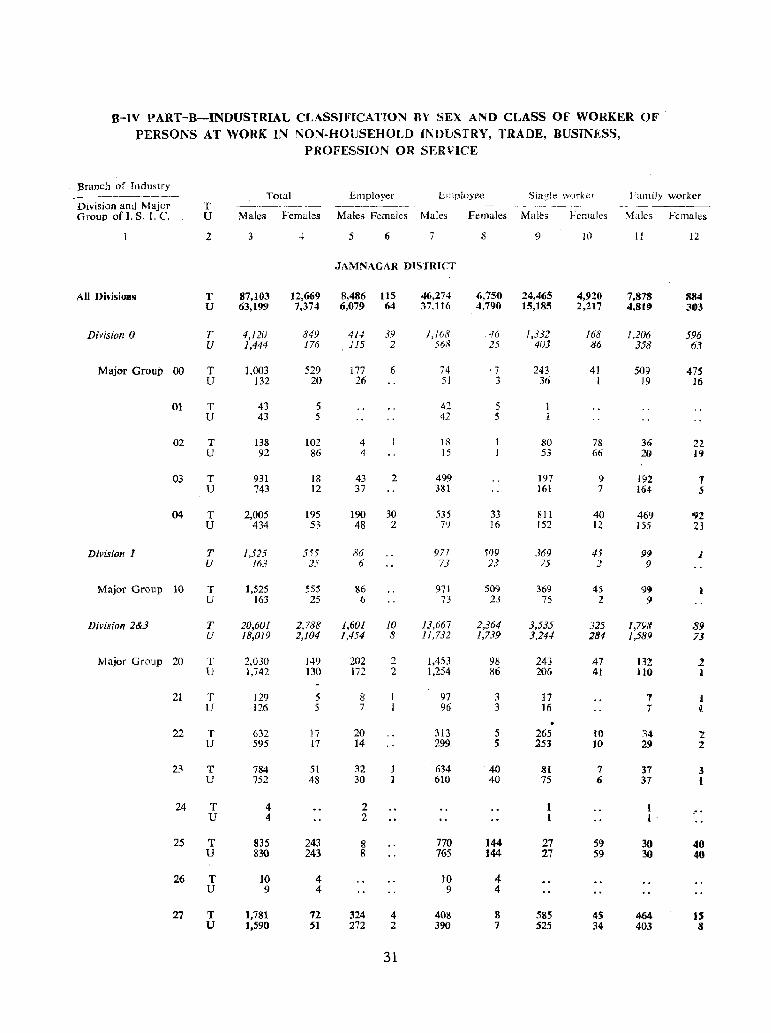
B-IV PART-B-INDUSTRIAL CLASSIFICATION BY SEX AND CLASS OF WORKER OF PERSONS AT WORK IN NON-HOUSEHOLD INDUSTRY, TRADE, BUSINESS,
PROFESSION OR SERVICE
llranch of Industry -~~~----~-- , Total Employer Employee Single worker Family worker Division and Major T ~"-"---"--.- ----_--_ ---------Group of 1. S. I. C. U Males Females Males Females Males Females Males Females Males Females
2 3 4 5 6 7 S 9 JO II 12
JAMNAGAR DlSTRTCT
All Divisions T 87,103 12,669 8,486 115 46,274 (;,750 24,465 4,920 7,878 884 U 63,199 7,374 6,079 64 37,116 4,790 15,185 2,217 4,819 303
Division 0 T 4,120 849 414 39 1,168 46 1,332 168 1,206 596 U 1,444 176 115 2 568 25 403 86 358 63
Major Group 00 T } ,003 529 177 6 74 ·7 243 41 509 475 U 132 20 26 51 3 36 1 19 16
01 T 43 5 42 5 U 43 5 42 5
02 T 138 102 4 18 80 78 36 22 U 92 86 4 15 53 66 2U 19
03 T 931 18 43 2 499 197 9 192 7 U 743 12 37 381 161 7 1M 5
04 T 2,005 195 190 30 535 3J 811 40 469 92 U 434 53 48 2 79 16 152 12. 155 23
Division 1 T 1,525 555 86 971 509 369 45 99 J U 163 25 6 73 23 75 ;] 9
Major Group 10 T 1,525 555 86 Sl7l 509 369 45 9<) U 163 25 6 73 23 75 2 9
Division 2&3 T 20,601 2.788 1,601 10 13,667 2,364 3,535 325 1,79<1 .89 U 18,019 2;104 1,454 8 11,732 1,739 3,244 284 I,589 .7J
Major Group 20 T 2,030 HI) 202 2 1,453 98 243 47 132 1 U 1,742 130 172 2 1,254 86 205 41 AlO 1
21 T 129 5 8 97 3 17 7 i U 126 5 7 96 3 16 7 iI.
22 T 632 17 20 313 5 265 I() 34 '2 U 595 17 14 299 5 153 10 2~ 2
23 T 784 51 32 634 40 81 7 37 3 U 752 48 30 610 40 75 6 37 1
24 T 4 2 1 U 4 2 I
25 T 835 243 8 770 144 27 5<) 30 40 U 830 243 g 765 144- 27 59 30 40
26 T 10 4 10 4-U 9 4 9 4
27 T 1,781 72 324 4 408 8 585 45 464 IS U 1,590 51 272 2 390 7 525 34 403 8
31

.8-IV PART-R....,.JNDUSTRIAL CLASSIFICATION BY SEX AND CLASS OF \VORKER OF PERSONS AT WORK IN NON-HOUSEHOLD INDUSTRY, TRADE, BUSINESS,
PROFESSION Ol~ SERVICE-contd.
Branch of Industry Total Employer Employee Single worker Family worker
Division and Major T --- -~------- ------~ ---------~
Group of I. S. I. C. U Maks Females Males Females Males Females Males Females Males Females
2 3 4 5 6 7 8 9 10 II 12
JAMNAGAR DlSTRICT-comd.
Major Group 28 T 1,299 25 133 370 25 630 166 U 1.215 25 124 352 25 591 148
29 T 12 12 U 8 8
30 T 173 14 136 15 8 U 160 13 125 14 8
31 T 658 4 103 1 127 274 154 U 579 2 98 1 127 231 123
32 T Z2 2 15 3 2 U 22 2 15 3 2
33 T 5,178 1,618 101 4,883 1,595 138 22 50 U 3,801 1,051 98 3,525 1,031 131 19 47
34-35 T 3,561 554 74 2,782 419 605 112 100 23 U 3,249 488 68 2,531 371 574 97 76 20
36 T 1,535 26 203 886 15 253 11 193 U 1,498 26 193 878 15 240 11 187
37 T 202 I 21 147 25 9 U ]86 I 21 140 16 9
3:8 T 35() 77 163 66 44 U 338 76 156 63 43
39 T 1,406 17 271 461 5 307 10 367 2 U 1,315 11 256 452 5 278 6 329
Division 4 T 3,018 748 80 1 1,139 334 ],799 413 U 1.282 245 51 J 337 91 894 153
Major Group 4(). T 3,018 748 80 1 1,139 334 1,799 413 U 1,282 245 51 1 337 91 894 153
DiviIlion 5 T 701 22 1 689 22 11 V 678 22 1 666 22 11
Major Group 50 T 648 21 648 21 U 634 21 634 21
51 T 53 1 1 41 11 U 44 1 I 32 II
Division 6 T 16.981 455 4,556 56 3,365 61 5.074 213 3.987 125 V 12,194 361 3,093 47 3,009 60 3,625 158 2,467 96
Major Group 60-63 T 1.494 18 388 591 17 223 292 U 1,277 18 313 570 17 183 211
32
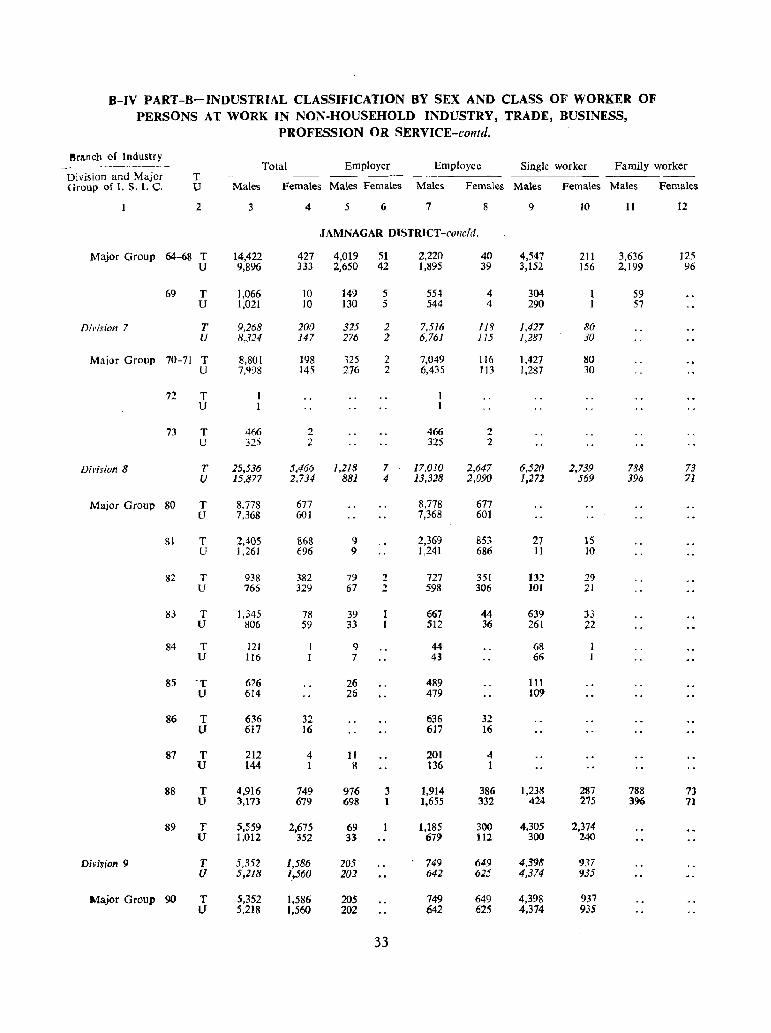
8-IV PART-8-INDUSTRIAL CLASSIFICATION BY SEX AND CLASS OF WORKER OF PERSONS AT WORK IN NON-HOUSEHOLD INDUSTRY, TRADE, BUSINESS,
PROFESSION OR SERVICE-contd.
8rllnch of Industry --"_ ... _-----_-- -- Total Employer Employee Single worker Family worker
Division and Major T Group of L S. I. C. U Males Females Males Females Males Females Males Females Males Females
2 3 4 5 6 7 8 9 10 11 12
JAMNAGAR DISTRICT-concfd,
Major Group 64-68 T 14,422 427 4,019 51 2,220 40 4,547 211 3,636 125 U 9,896 333 2,650 42 1,895 39 3,152 156 2,199 96
69 T 1,066 10 149 5 55~ 4 304 59 U 1,021 10 130 5 544 4 290 57
Dh'jsioll 7 T 9.268 200 325 2 7.516 lI8 1,427 80 U 8,324 147 276 2 6,761 115 1,287 30
Major Group 70-71 T 8.801 198 325 2 7,049 116 1.427 80 U 7.998 145 276 2 6,435 113 1,287 30
72 T U
73 T 466 2 466 2 U 325 2 325 2
DiI'isioll 8 T 25,536 5,466 1,21B 7 17,010 2.647 6,520 2,739 788 73 U 15,877 2,734 881 4 13,328 2,090 J,271 569 396 71
Major Group 80 T 8.778 677 8,778 677 U 7,368 601 7,368 601
3\ T 2.405 868 9 2,369 853 27 15 U 1,261 696 9 1,241 686 11 10
82 T 938 382 79 2 727 351 132 29 U 766 329 67 2 598 306 101 21
83 T 1,345 78 39 667 44 639 33 U 806 59 33 512 36 261 22
84 T 121 1 9 44 68 U 116 I 7 43 66
85 -T 626 26 489 III U 614 26 479 109
86 T 636 32 636 32 U 617 16 617 16
87 T 212 4 II 201 4 U 144 1 8 136 1
88 T 4,916 749 976 3 1,914 386 1,238 287 788 73 U 3,173 679 698 1 1,655 332 424 275 396 71
89 T 5,559 2,675 69 1,185 300 4,305 2,374 U 1,012 352 33 679 112 300 240
Division 9 T 5,352 1,586 205 749 649 4.398 937 (J 5,218 1.,560 202 642 625 4,374 935
Major Group 90 T 5,352 1,586 205 749 649 4,398 937 U 5,218 1,560 202 642 625 4.374 935
33
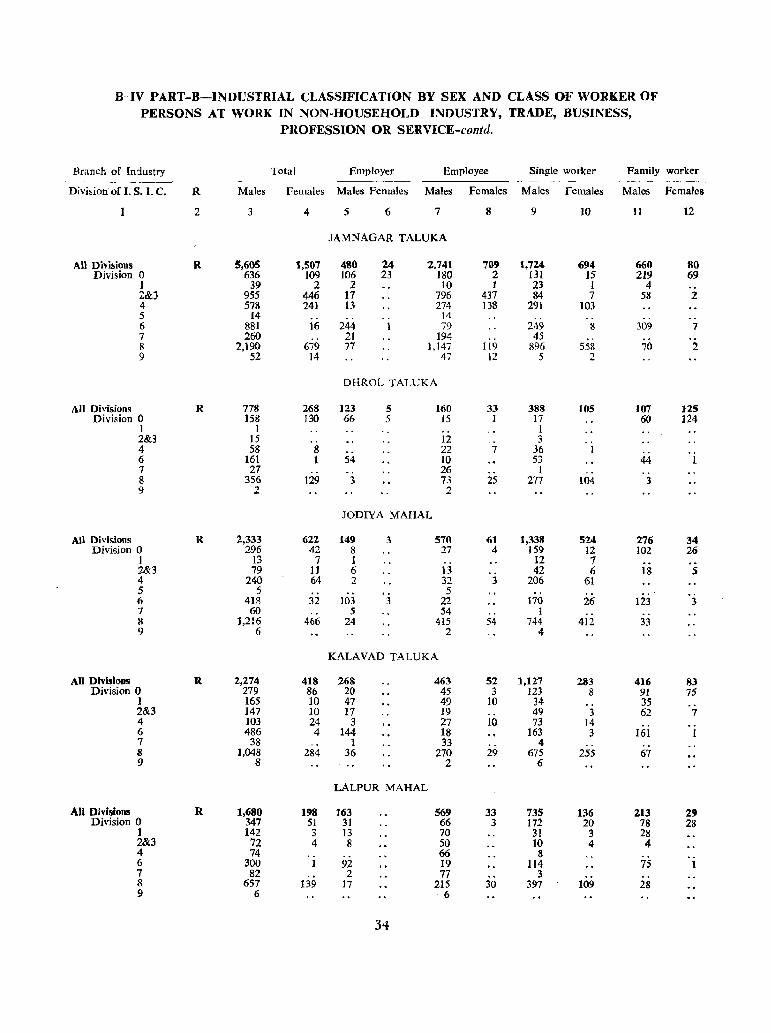
B IV PART-B-INDUSTRIAL CLASSIFICATION BY SEX AND CLASS OF WORKER OF PERSONS AT WORK IN NON-HOUSEHOLD INDUSTRY, TRADE, BUSINESS,
PROFESSION OR SERVICE-contd.
Branch of In:lustry Total Employer Employee Single worker Family worker - - - _--- _._._- ~- ~-.-
Division of I. S. I. c. R Males Females Males Females Males Females Males Females Males Females
2 3 4 5 6 7 8 9 10 II 12
JAMNAGAR TALUKA
All Divisions R 5,605 1,507 480 24 2.741 709 1,724 694 660 80 Division 0 636 109 106 23 180 2 131 J5 2J9 69
1 39 2 2 10 1 23 I 4 2&3 955 446 17 796 437 84 7 58 2 4 57& 241 13 274 138 291 103 5 14 .. " 14 .. ., 6 881 16 244 1 79 249 8 309 7 7 260 21 194 45 8 2,190 679 77 1,147 119 896 558 70 2 9 52 14 47 12 5 2
DHROL TALUKA
All Divisions R 778 268 123 5 160 33 388 105 107 125 Division 0 158 130 66 5 15 I 17 60 124
I 1 1 2&3 15 12 3 .. 4 58 8 22 7 36 1 6 161 1 54 10 S3 44 1 7 27 .. .. 26 1 .. 8 356 129 3 73 2S 277 104 3 9 2 2
JODlYA MAHAL
All Divisions R 2,333 622 149 3 570 61 1,338 524 276 34 Division 0 296 42 8 27 4 1S9 12 102 26
1 13 7 1 12 7 2&3 79 11 6 13 42 6 18 5 4 240 64 2 32 3 206 61 5 5 S 6 418 32 103 3 22 170 26 123 3 7 60 .. 5 54 .. 1 .. 8 1,216 466 24 415 54 744 412 33 9 6 2 4
KALAVAD TALUKA
AD Divisions R 2,274 418 268 463 52 1,127 283 416 83 Division 0 279 86 20 45 3 123 8 91 75
1 165 10 47 49 10 34 35 2&3 147 10 17 19 .. 49 3 62 7 4 103 24 3 27 JO 73 14 6 486 4 144 18 163 3 161 7 38 .. 1 33 " 4 .. S 1,048 284 36 270 29 675 255 67 9 8 2 6
LALPUR MAHAL
All Divisions R 1,680 198 163 569 33 735 136 213 29 Division 0 347 51 31 66 3 172 20 78 28
1 142 3 13 70 31 3 28 2&3 72 4 8 50 IO 4 4 4 74 66 8 6 300 1 92 19 114 75 1 7 82 2 77 3 8 657 139 17 215 30 397 109 28 9 6 ·6
34
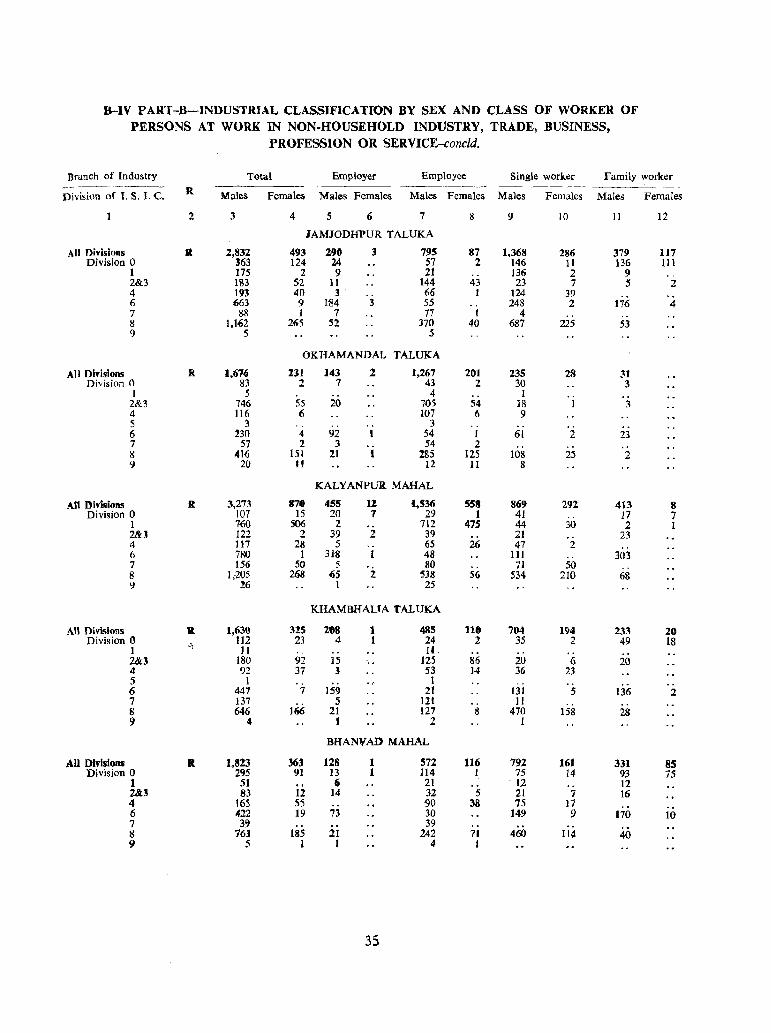
B-IV PART-B-INDUSTRIAL CLASSIFICATION BY SEX AND CLASS OF WORKER OF PERSONS AT WORK IN NON-HOUSEHOLD INDUSTRY, TRADE, BUSINESS,
PROFESSION OR SERVICE-concld.
Branch of Industry Total Employer Employee Single worker Family worker _-_._---- .-.-~--
R -------Division of I. S. I. C. Males females Males Females Males Females Males Females Males Females
1 2 3 4 5 6 7 8 9 10 11 12
JAMJODHPUR TALUKA
All Divisions R 2,832 493 290 3 795 87 1,368 286 379 117 Division 0 363 124 24 57 2 146 11 136 111
1 175 2 9 21 136 2 9 .-2&3 183 52 11 144 43 23 7 5 2 4 193 40 3 . 66 I 124 39 6 663 9 1~4 3 55 248 2 176 4 7 88 1 7 77 I 4 8 1,162 265 52 370 40 687 225 53 9 5 5
OKHAMANDAL TALUKA
All Divisions It 1,'% III 143 2 1,267 201 235 28 31 Division 0 83 2 7 43 2 30 3
I 5 . , .. 4 I 2&3 746 55 20 705 54 18 1 3 4 116 6 107 6 9 5 3 .. .. .. 3 . . .. 6 230 4 92 t 54 I 61 2 23 7 57 2 3 54 2 8 416 lSI 21 t 285 125 108 25 2 9 20 I! 12 11 8
KALYANPU.a. MAHAL
AU Divisions R 3,273 87e 455 U ',536 558 869 292 413 8 Division 0 107 15 20 7 29 1 41 .' 17 7
I 7<i0 506 2 712 475 44 30 2 I 2&J 122 2 39 2 39 21 23 4 117 28 5 .. 65 26 47 2 6 780 1 318 1 48 III .. 303 7 156 50 5 80 .. 71 50 .. 8 1;205 268 65 2 538 56 534 210 68 9 26 I 25
KHAMBHALIA TALUKA
All Di visiolls It 1,639 315 2118 1 435 118 704 194 233 20 Division 0
'i 112 23 4 t 24 2 35 2 49 18
1 11 .. .. 11 .. 2&3 180 92 15 " 125 86 20 6 20 4 92 37 J 53 14 36 23 5 1 1 .. 6 447 7 159 2.1 131 5 136 2 7 137 5 111 11 8 646 166 21 127 8 470 158 28 9 4 I 2 I
BHANVAD MAHAL
All Divisions R 1,8%3 J6J 128 1 572 116 792 161 331 8S Division 0 295 91 13 1 114 I 75 14 93 75
1 51 6 21 '12 12 2&3 83 12. 14 32 5 21 7 16 4 165 S5 90 38 75 17 6 422 19 73 30 149 9 170 10 7 39 39 8 763 185 21 242 71 460 114 40 9 5 1 I 4 I
3S
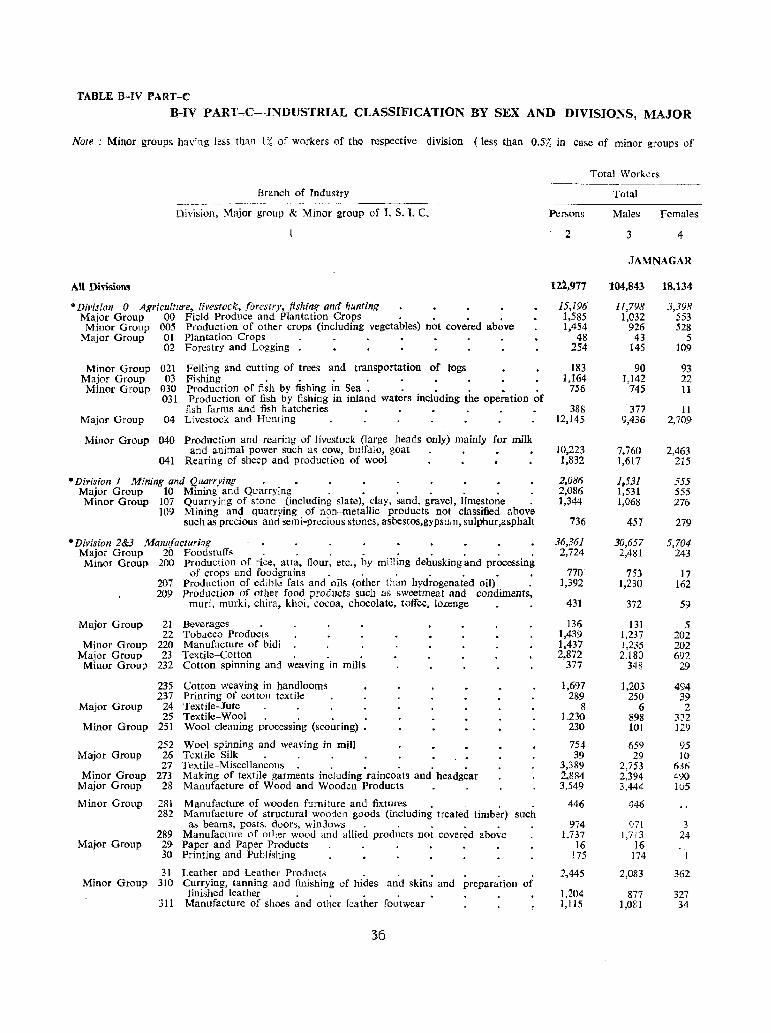
TABLE B-IV PART-C
B-IV PART~C~-1NDUSTRIAL CLASSIFICATION BY SEX AND DIVISIONS, MAJOR
Nate: Minor groups having less than 1% of workers of the respective division (less than 0.5% in case of minor groups of
Branch of Industry -------~
Division, Major group & Minor group of L S. 1. C.
All Dhi-sions
.. Division 0 Agriculture. lfvestock. forestry, fishinl5 and hunting Major Group 00 Field Produce and Plantation Crops . . • •
Minor Group 005 Production of other crops (including vegetables) not covered above Major Group 01 Plantation Crops .
02 Forestry and Logging .
Minor Group Major Group Minor Group
Major Group
021 Felling and cutting of trees and transportation of logs 03 Fishing . . . .
030 Production of fish by fishing in Sea . . • . • . 031 Production of fish by fishing in inland waters including the operation of
fish farms and fish hatcheries 04 Livestock and Hunting
Minor Group 040 Production and rearing of livestock (large heads only) mainly for milk and animal power such as cow, buffalo, goat
041 Rearing of shcep and production of wool
• Division J Mining and Quarrying Major Group 10 Mining and Quarrying . • . . . • Minor Group 107 Quarrying of stone (including slate), clay, sand, gravel, limestone .
109 Mining and quarrying of non-metallic products not classified above such as precious and semi-precious stones, asbestos,gypsum, sulphur,asphalt
* Division 2&3 Manufacturing Major Group 20 Foodstuffs .. ..... Millor Groul) 200 Production of rice, atta, flour, etc., by milling dehusking and processing
Major Group
Minor Group Major Group
Minor Group
Major Group
Minor Group
Major Group
Minor Group Major Group
Minor Group
Major Group
of crops and foodgrains . . . . . • 207 Production of edible fats and oils (other than hydrogenated oil) 209 Production of other food products such as sweetmeat and condiments,
muri, murki, chira. khoi, cocoa, chocolate, toffee, lozenge
21 Beverages 22 Tobacco Products
220 Manufacture of bidi 23 Textile-Cotton . . .
232 Cotton spinning an:! weaving in mills
235 237
24 25
251
252 26 27
273 28
281 282
289 29 30
Cotton weaving in hand looms Printing of cotton textile Textile-Jute Textile-Wool. . . • Wool cleaning processing (scouring) •
Wool spinning and weaving in mill Textile-Silk . Textile-Miscellaneous. . . . • • Making of textile garments including raincoats and headgear Manufacture of Wood and Wooden Products
Manufacture of wooden furniture and fixtures. . Manufacture of structural wooden goods (including treated timber) such as beams, posts, doors, windows. . . . .
Manufacture of other wood and allied products not covered above Paper and Paper Products Printing and Publishing
Persons
2
122,977
15,196 1,585 1,454
48 254
183 1,164
756
388 12,145
10,223 1.832
2,086 2,086 1,344
736
36,361 2,724
770 1,392
431
136 1,439 1,437 2,872
377
1,697 289
8 1.230
230
754 39
3,389 2.884 3,549
446
974 1,737
16 175
31 Leather and Leather Products . 2,445 Minor Group 310 Currying, tanning and finishing of hides and skins and preparation of
finished lea ther • . 1,204 311 Manufacture of shoes and other leather footwear 1,115
36
Total Workers
Total
Males Females
3 4
JAMNAGAR
104,843 18,134
11,798 3,398 1,032 553
926 528 43 5
145 109
90 93 1,142 22
745 11
377 11 9,436 2,709
7.760 2,463 1,617 215
1,531 555 1,531 555 1,068 276
457 279
30,657 5,704 2,481 243
753 17 1,230 162
372 59
131 5 1,237 202 1,235 202 2,180 692
348 29
1,203 494 250 39
6 2 898 332 101 129
659 95 29 10
2,753 636 2,394 490 3,444 li.J5
446
971 3 1,713 24
16 174
2,083 362
877 327 1,08 I 34
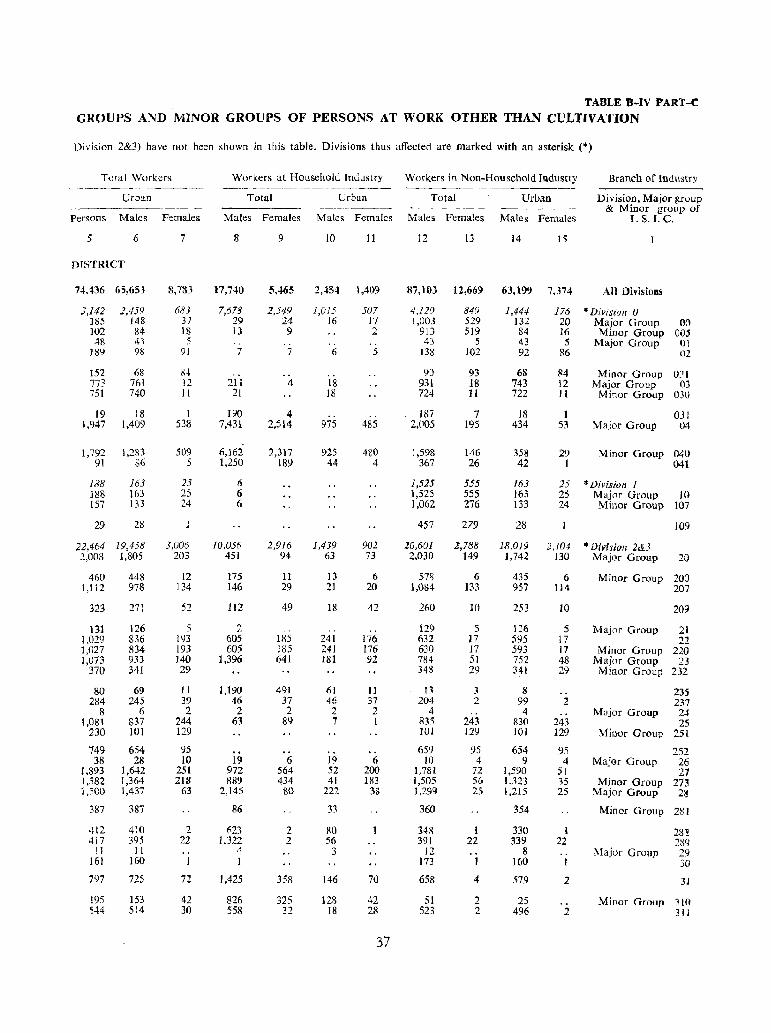
TABLE B~IV PART-C
GROUPS AND MINOR GROUPS OF PERSONS AT WORK OTHER THAN CULTIVATION
Division 2&3) have not been shown in this table. Divisions thus affected are marked with an asterisk (*)
Total Workers Workers at Household Industry Workers in Non-Household Illdustry Branch of Industry -- --------~--.-. ---~---~ --- ----.--_-------_---
Urban Total Urban Total Urban Division, Major group --~------------- -------- & Minor group of Persons Males Females Males Females Males Females Males Females Males Females I. S.l. C.
5 6 7 8 9 10 11 12 13 14 15
nfSTRlCT
74,436 65,653 8,783 17,740 5,465 2,45;1 1,409 87,103 lZ,669 63,199 7.374 All Divisions
J,142 2,459 683 7,678 2,549 1,015 507 4.120 849 1,444 176 "Division 0 ]85 148 37 29 24 16 17 1,003 529 132 20 Major Group 00 102 84 18 13 9 2 913 519 84 16 Minor Group 005 48 43 5 .. " .. 43 5 43 5 Major Group 01
18<') 98 91 7 7 6 5 138 102 92 86 02
152 68 8--1 .. .. 90 93 68 ~4 Minor Group 011 773 761 12 2li 4 18 931 18 743 12 Major Group 03 751 740 Il 21 18 724 11 722 11 Minor Group 03U
19 18 1 190 4 .. 187 7 18 I 031 1.947 1,409 538 7,431 2,514 975 485 2,005 195 434 53 Major Group 04
1,792 1,283 509 6,162 2,317 925 480 1,598 146 358 29 Minor Group 040 91 S6 5 1,250 189 44 4 367 26 42 I 041
188 163 25 I) 1,525 555 163 25 * Division 1 HiS 163 25 6 1,525 555 163 25 Major Group 10 157 133 24 6 1,062 276 133 24 Minor Group 107
29 28 457 279 28 109
22,464 19,458 3,006 10,056 2,916 1,439 902 20,601 1,788 18,019 2,104 • Division 2&3 2,008 1,805 203 451 94 63 73 2.030 149 1,742 130 Major Group 20
460 448 12 175 11 13 6 578 6 435 6 Minor Group 200 1,112 978 134 146 29 21 20 1,084 133 957 114 207
323 271 52 112 49 18 42 260 10 253 10 209
131 126 5 2 _. ., 129 5 126 5 Major Group 21 1,029 836 193 605 185 241 176 632 17 595 17 22 1,027 834 193 605 J85 241 176 630 17 593 J7 Minor Group 220 1,073 933 140 1,396 641 181 92 784 51 752 48 Major Group 23
370 341 29 348 29 341 29 Minor Group 232
80 69 II 1,190 491 61 11 13 J 8 235 284 245 39 46 37 46 37 204 2 99 .2 237
8 6 2 2 2 2 2 4 .. 4 Major Group 24 1,081 837 244 63 89 7 I 835 243 830 243 2S
230 101 129 101 129 101 129 Minor Group 251
749 654 95 659 95 654 95 252 38 28 10 19 6 19 6 10 4 9 4 Major Group 26
1,893 1,642 251 972 564 52 200 1,781 72 1,590 51 27 1,582 1,364 218 889 434 41 183 1,505 56 1.323 ,5 Minor Group 273 1,500 1,437 63 2,145 80 222 33 1,299 2S 1,215 25 Major Gwup 2$
387 387 86 33 360 354 Minor Group 281
<\12 410 2 62} 2 80 348 1 330 1 28~ 4i7 395 22 1,322 2 56 391 22 339 22 289
! 1 II .. 4 3 12 8 .. Major Group 29 161 160 J 1 173 J60 I :;0
797 725 72 1,425 3:58 146 70 658 4 579 2 3J
195 153 42 826 325 128 42 51 2 25 Minor Group 310 544 514 30 558 32 18 28 523 2 496 2 31l
37
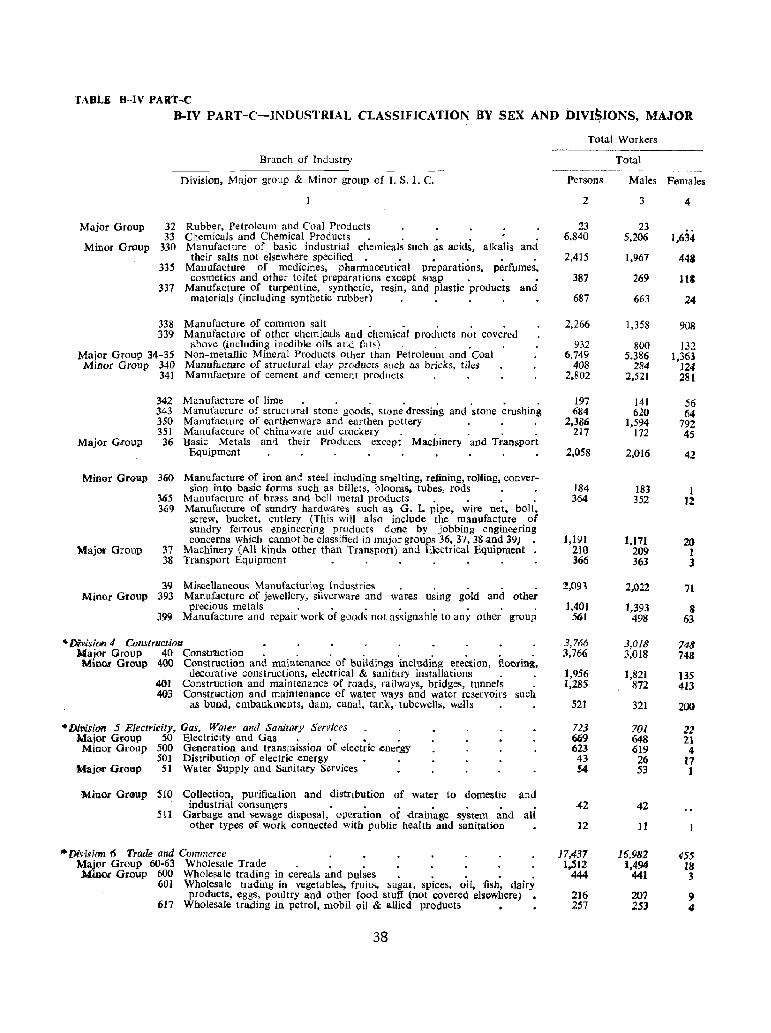
'fABLE "-IV PART-C
B-IV PART-C-INDUSTRIAl, CLASSIFICATION BY SEX AND DIVISIONS, MAJOR
Major Group 32 33
Minor Group 330
335
337
338 339
Major Group 34-35 Minor Group 340
341
342 343 350 351
Major <Poup 36
Minor Gr(}lIp 360
)65 369
Major Group 37 38
39 Minor Group 393
399
Branch of Industry
Division, Major group & Minor grOUP of I. S. I. C.
Rubber, Petroleum and Coal Products Chemicals and Chemical Products. . . . Manufacture of basic industrial chemicals such as acids, alkalis and their salts not elsewhere specified. . • . • .
Manufacture of mediCines, pharmaceutical preparations, perfumes, cosmetics and other toilet preparations except soap • .
Manufacture of turpentine, synthetic, resin, and plastic products and materials (including synthetic rubber)
Manufacture of common salt . . . . . Manufacture of other chemicals and chcmical products not covered
above (including inedible oils an(j fats) .. Non-metallic Mineral Products other than Petroleum and Coal Manufacture of structural clay prooucts such as bricks. tiles Manufacture of cement and cement products
Manufacture of lime. . . . . . . . Manufacture of structural stone goods, stone dreSSing and stone crushing Manufacture of earthenware and earthen pottery Manufacture of china ware and crockery Basic Metals and their Products except Machinery and Transport
Equipment
Manufacture of iron and steel including smelting, refining, rolling, conversion into basic forms such as billets, blooms. tubes, rods
Manufacture of brass and bell metal prooucts . . • . Manufacture of sundry hardwares such as G. L pipe, wire net, bolt, screw, bucket, cutlery (This will also include the manufacture of sundry ferrous engineering products done by jobbing engineering concerns which cannot be classified in major groups 36, 37, 3& and 39)
Machinery (All kinds other than Transport) and Electrical Equipment Transport Equipment . . . . . .
Miooel1aneous Manufacturing Indus,tries Manufacture of jewellery, silverware and wares using gok[ and other precious metals . . . . . .
Manufacture and repair work of goods not assignable to any other group
• [)ivisicm 4 Construction Major Group 40 Constttlction. . . . . . . Minor Group 400 Constructicm and maintenance of buiidings including erection, flooring,
401 403
decorative constructions, electrical & sanitary installations . Construction and maintenance of roads, railways, bridges, tunnels Construction and maintenance of water ways and water reservoirs such
as buu.d, embankments, dam, canal, tank, tube wells, wells
• OhiisiOft 5 Electricity, Gas, Water and Sanitl'l1'Y Services Major Group 50 ElectriCity and Gas. . • • Minor Group 500 Generation and transmission of electric ener:gy
501 Distribution of electric energy Uajoc Group 51 Water Supply and Sanitary Services
Mino.r GrGup S10 Collection, purification and distribution of water to .domestic and industrial consumers . . . . . •
511 Garbage and sewage disposal, operation of drainage system and all other types (;If work connected with" public health and sanitation
... D'iv,'sian 6 Trade and Commerce ' Major Group 60-63 Wholesale Trade . . . MinOr Group 600 Wholesale trading in cereals and pulses •••.
601 Wholesale trading in vegetables, fruits, sugar, spices, oil, fish, dairy products, eggs, poultry and other food stuff (not covered elsewhere)
617 Wholesale trading in petrol, mobil oil & allied products •
38
Total Workers
Total ----~~--~-------
Persons Males Females
2 3 4
23 23 6,840 5,206 1,634
2,415 1,967 443
387 269 113
687 663 24
2,266 1,358 908
932 800 132 6,749 5.386 1,363
408 284 124 2,802 2,521 28(
197 141 56 684 620 64
2,386 1,594 792 217 172 45
2,058 2,016 42
184 183 1 364 352 12
1,191 1,171 2() 210 209 1 366 363 3
2,093 2,022 71
1.401 1,393 8 561 498 63
3,766 3,018 748 3,766 3,018 748
1,956 1,821 135 1,285 872 413
521 32] 200
723 701 21 669 648 21 623 619 4
43 26 17 54 53 1
42 42
12 11
17,437 16,982 455 1.,512 1,494 18
444 441 3
216 207 9 257 253 4
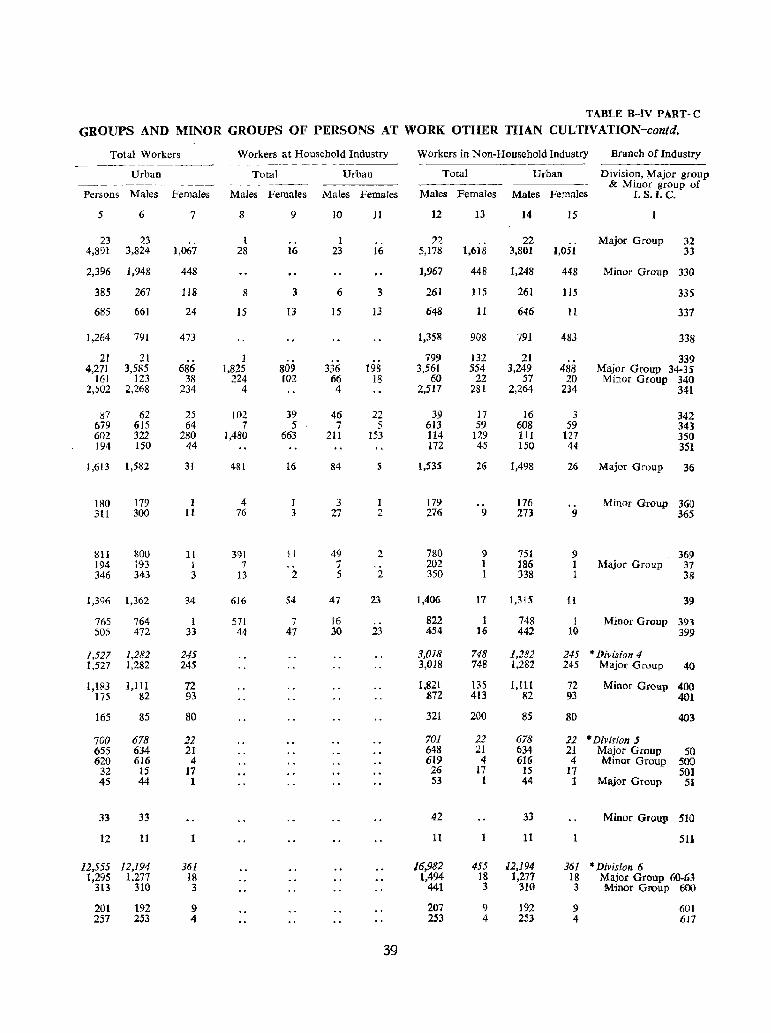
TABLE B-IV PART-C
GROUPS AND MINOR GROUPS OF PERSONS AT WORK OTHER THAN CULTIVATION-contd.
Total Workers Workers at Household Industry Workers in Non-Household Industry Branch of Industry - -~- - -
Urban Total Urban Total Urban Division, Major group ---~~--- & Minor group of
Persons Males Females Males Females Males Females Males Females Males Females I. S.I. C.
5 6 7 8 9 10 11 12 13 14 15
23 23 I .. I .. 22 22 Major Group 32 4,891 3,824 1,067 28 J6 23 16 5,178 1,618 3,801 1,051 33
2,396 1,948 448 1,967 448 1,248 448 Minor Group 330
385 267 118 8 3 6 3 261 115 261 115 335
685 661 24 15 13 15 13 648 11 646 11 337
1,264 791 473 1,358 908 791 483 338
21 21 1 799 132 21 339 4,271 3,585 686 1,825 809 336 198 3,561 554 3,249 488 Major Group 34-35
161 123 38 224 WZ 66 18 60 22 57 20 Minor Group 340 2,502 2,268 234 4 4 2,517 281 2,264 234 341
il7 62 25 102 39 46 22 39 17 16 3 342 679 615 64 7 5 7 5 613 59 608 59 343 602 322 280 1,480 663 211 153 114 129 111 127 350 194 150 44 172 45 150 44 351
1,613 1,582 31 481 16 84 S 1,535 26 1,498 26 Major Group 36
180 179 I 4 I 3 I 179 176 Minor Group 360 3ll 300 It 76 3 27 2 276 9 273 9 365
8Il 800 11 391 II 49 2 780 9 751 9 369 194 193 I 7 7 202 1 186 1 Major Group 37 346 343 3 13 2 5 2 350 1 338 1 38
1,396 1,362 34 616 54 47 23 1,406 17 1,315 H 39
765 764 1 571 7 16 822 1 748 I Minor Group 393 505 472 33 44 47 30 23 454 16 442 l() 399
],527 1,282 245 3,018 748 1,282 245 * Diri.sion 4 1,527 1,282 245 3,018 748 1,282 245 Major Group 40
1,183 ],111 72 1,821 135 1,111 72 Minor Group 400 175 82 93 872 413 82 93 401
165 85 80 321 200 85 80 403
700 678 22 701 21 678 22 * Divirion 5 655 634 21 648 21 634 2] Major Group 50 620 616 4 619 4 616 4 Minor Group 500
32 15 17 26 17 15 17 501 45 44 1 53 1 44 1 Major Group 51
33 33 42 33 Minor Group 510
12 II 11 11 511
/2,555 12,194 361 J6,982 455 12,194 361 *DMsion 6 1,295 1.277 18 1,494 1& 1,277 18 Major Group 6O-6J
313 310 3 441 3 310 3 Minor Group 600
201 192 9 207 9 192 9 601 257 253 4 253 4 253 4 617
39
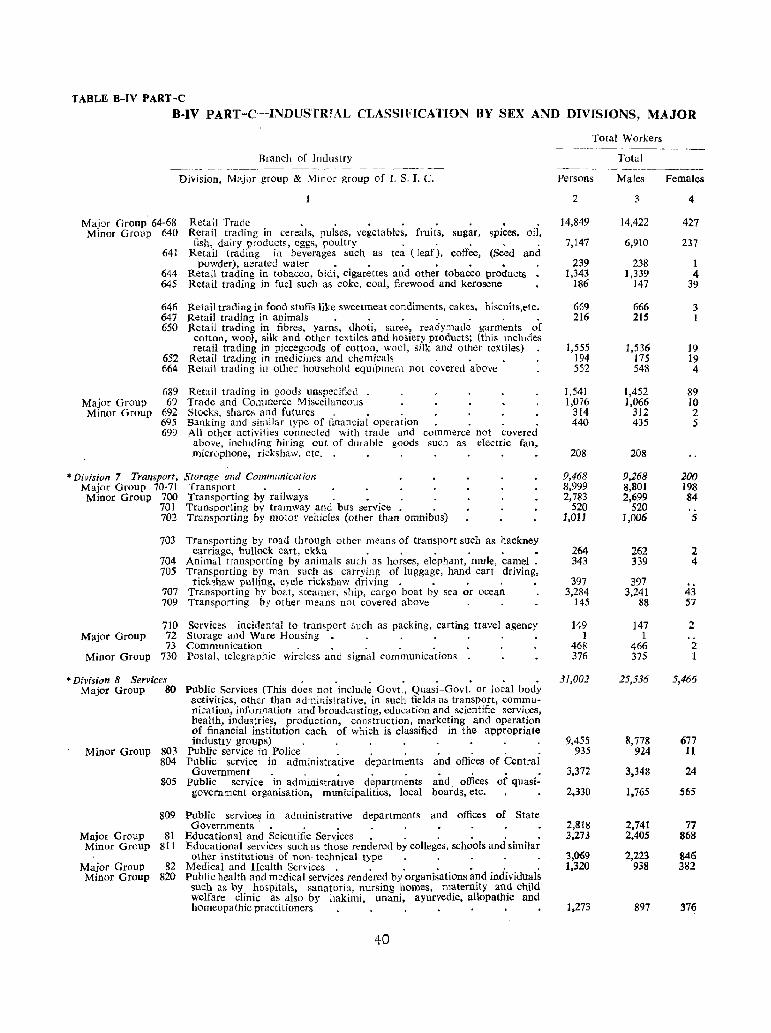
TABLE B-IV PART-C
B-IV PART-C--INDUSTRfAL CI,ASSIFlCATION BY SEX AND DIVISIONS, MAJOR
Branel, of Industry
Division, Major group & Minor group of 1. S. I. C.
Major Group 64-63 Retail Trade .... Retail trading in cereals, pulses, vegetables, flUits, sugar, spices, oil, Minor Group 640 fish, dairy products, eggs, poultry .
641
644 645
646 647 650
652 664
Retail trading in beverages such as tea (leaf), coffee, (Seed and powder), aerated water • . . • • •
Retail trading in tobacco, bidi, cigarettes and other tobacco products Retail trading in fuel such as coke, coal, firewood and kerosene
Retail trading in food stuffs like sweetmeat condiments, cakes, biscuits,etc. Retail trading in animals . . . . . . . Rctail trading in fibres, yarns, dhoti, saree, readymade garments of
cotton, wool, silk and other textiles and hosiery products; (this includes retail trading in piecegoods of cotton, wool, silk and other textiles)
Retail trading in medicines and chemicals . . Relail trading in other household equi'prnenl not covered above
689 Retail trading in goods unspecified . Major Group 69 Trade and Commerce Miscellaneous Minor Group 692 Stocks, shares and futures. . .
695 Banking and similar type of financial operation. . 699 All other activities connected with trade and commerce not covered
above, including hiring out of durable goods such as electric fan, microphone, rickshaw, etc.
* Div;si()n 7 Transport, Storage and Communication Major Group 70-71 Transport • . Minor Group 700 Transporting by railways .
Major Group
Minor Group
701 Transporting by tramway and bus service • . 702 Transporting by motor vehicles (other than omnibus)
703 Transporting by road through other means of transport such as hackney carriage, bullock can, ekka . . . . . •
704 Animal transporting by animals such as horses, elephant, mule, camel. 705 Transporting by man such as carrying of luggage, hand cart driving,
rick~haw pulling, cycle rickshaw driving. • • . 707 Transporting by boat, steamer, ship, cargo boat by sea or ocean 709 Transporting by other means not covered above
710 Services incirlental to transport such as packing, carting travel agency 72 Storage and Ware Housing 73 Communication .,.
730 Postal. telegraphic wireless and signal communications .
"Division 8 Services ~ . . .. . . .. . Major Group 80
Minor Group 803 804
805
809
Major Group 31 Minor GwuP 811
Major Group 32 Minor Group 820
Public Services (This does not include Govt., Quasi-Gov!. or local body activities, other than administrative, in such fields as transport, communication, information and broadcasting, education and scientific services, health, industries, production, construction, marketing and operation of financial institution each of which is classified in the appropriate industry groups)
Public service in Police . . . . . . . Public service in administrative departments and offices of Central Government. . • . .
public service in administratIve departments and offices of quasigovernment organisation, municipalities, local boards, etc.
Public service~ in administrative departments and offices of State Governments. . •
Educational and Scientific Services. . . . . . Educational services such as those rendered by colleges, schools and similar
other institutions of non-technical type Medical and Health Services. . • . • . . Public health ami medical services rendered by organisations and individuals such as by hospitals, sanatoria, nursing homes, maternity and child welfare clinic as also by hakimi, unani, ayurvedic, allopathic and homeopathic practitioners
40
Total Workers --- .. ~~-------
Total ---------------_--Persons Males Females
2 3 4
14,849 14,422 427
7,147 6,910 237
239 238 1 1,343 1,339 4
186 147 39
669 666 3 216 215 1
1,555 1,536 19 194 175 19 552 548 4
1,541 1,452 89 1,076 1,066 10
314 312 2 440 435 S
208 208
9,468 9,268 200 8,999 8,801 198 2,783 2,699 84
520 520 1,01 J 1,006 5
264 262 2 343 339 4
397 397 .. 3,284 3,241 43
145 88 57
149 147 2 1 1
468 466 2 376 375 1
31,002 25,536 5,466
9,455 8,778 677 935 924 II
3,372 3,348 24
2,330 1,765 565
2,818 2,741 77 3,273 2,WS 868
3,069 2,223 846 1,320 938 382
1,273 897 376
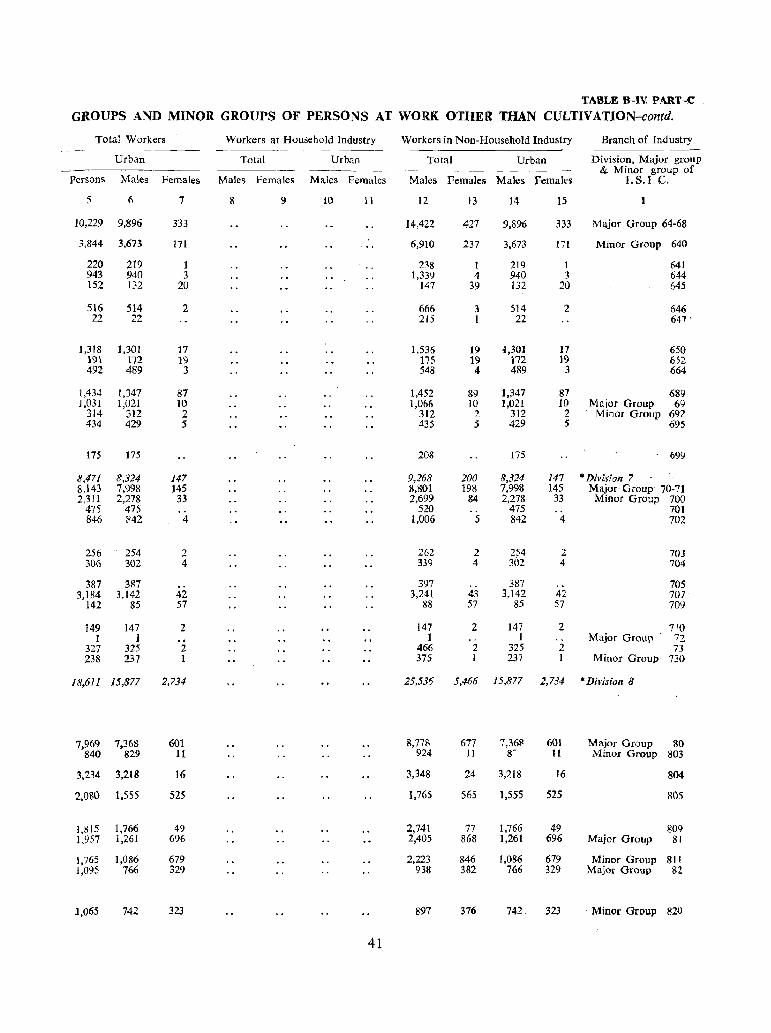
TABLE S--:IV PART-C
GROUPS AND MINOR GROUPS OF PERSONS AT WORK OTHER THAN CULTIV ATION-contd.
Total Workers Workers at Household Industry Workers in Non-Household Industry Branch of Industry
Urban Total Urban Total Urban Division, Major group ------ ---_---- & Minor group of
Persons Males Females Males Females Males Females Males Females Males Females 1. S. I. C.
5 6 7 8 9 10 11 12 13 14 15
10,229 9,896 333 14,422 427 9,896 333 Major Group 64-68
3,844 3,673 171 6,910 237 3,673 171 Minor Group 640
220 219 1 238 I 219 1 641 943 940 3 ],339 4 940 3 644 152 132 20 147 39 132 20 645
516 514 2 666 3 514 2 646 22 22 215 I 22 647 '
1,318 1,301 17 1,536 19 1,301 17 650 19\ 172 19 175 19 172 19 652 492 489 3 548 4 489 3 664
1,434 1,347 87 1,452 89 1,347 87 689 1,031 1,021 IO 1,066 10 1,021 10 Major Group 69
314 312 2 312 2 312 2 Minor Group 692 434 429 5 435 5 429 5 695
175 175 208 175 699
8,471 8,324 147 9,268 200 8,324 147 * Division 7 8,143 7,998 145 8,SO} 198 7,998 145 Major Group 70-71 2,311 2,278 33 2,699 84 2,278 33 Minor Group 700
475 475 520 475 701 846 842 4 1,006 5 842 4 702
256 254 2 262 2 254 2 703 306 302- 4 339 4 302 4 704
387 3117 397 387 .. 705 3,184 3,142 42 3,241 43 3,142 42 707
142 85 57 88 57 85 57 70Y
149 147 2 147 2 147 2 710 1 1 1 1 Major Group 72
327 325 2 466 2 325 2 73 238 237 1 375 1 237 1 Minor Group 730
18,61 I 15,877 2,734 25,536 5,466 15,877 2,734 *Division 8
7,969 7,368 601 8,778 677 7,36~ 601 Major Group 80 840 829 11 924 II 8- 11 Minor Group 803
3,234 3,218 16 3,348 24 3,218 16 804
2,080 1,555 525 1,765 565 1,555 525 80S
1,815 1,766 49 2,741 77 1,766 49 809 1,957 1,261 696 2,405 868 1,261 696 Major Group 81
1,765 1,086 679 2,223 846 1,086 679 Minor Group 811 1,095 766 329 938 382 766 329 Major Group 82
J,065 742 323 897 376 742 323 Minor Group 820
41
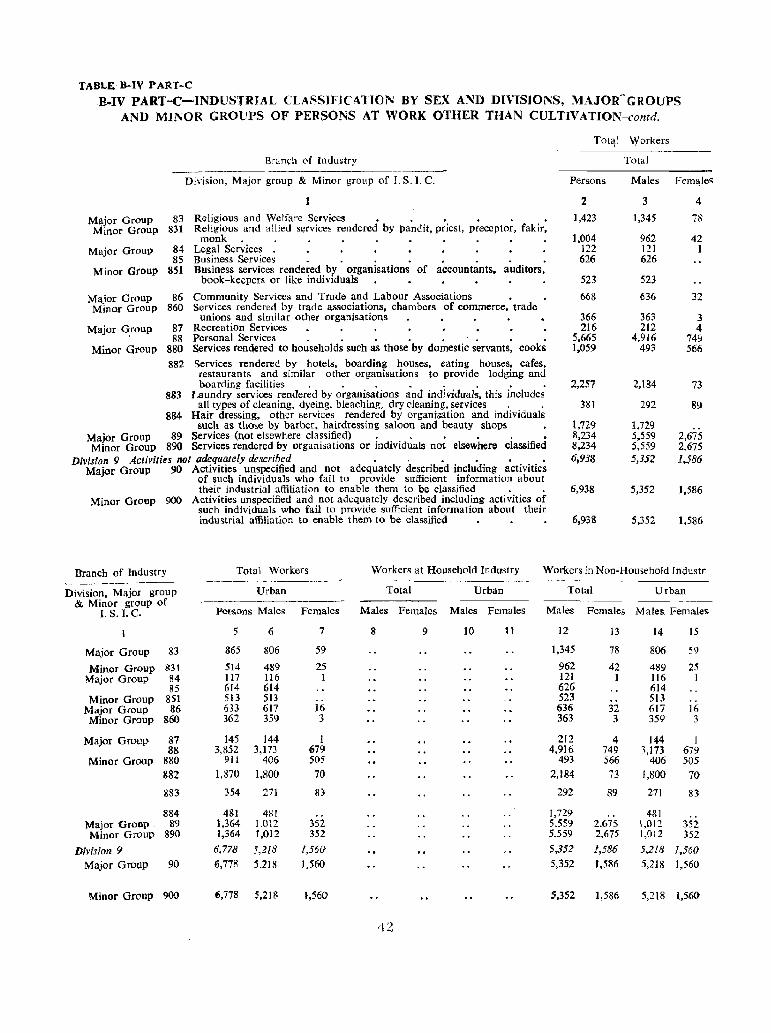
TABLE B-IV PART-C
B-IV-PART-C-INDUSTRIAL CLASSIF1CATION BY SEX AND DIVISIONS, MAJOR-GROUPS AND MINOR GROUPS OF PERSONS AT WORK OTHER THAN CULTIVATION-contd.
Major Group Minor Group
Major Group
Minor Group
Major Group Minor Group
Major Group
Minor Group
83 831
84 85
851
86 860
87 88
880
Br[lnch of Industry
Division, Major group & Minor group of 1. S. I. C.
Religious and Welfare Services • . • • . • Religious alld allied services rendered by pandit, priest, preceptor, fakir, monk. .
Legal Services . Business Services . . . • Business services rendered by organisations of accountants, auditors,
book-keepers or like individuals
Community Services and Trade and Labour Associations • Services rendered by trade associations, chambers of commerce, trade
unions and similar other organisations Recreation Services Personal Services . . . . • . . Services rendered to households such as those by domestic servants, cooks
882 Services rendered by hotels, boarding houses, eating houses, cafes, restaurants and similar other organisations to provide lodging and boarding facilities . . . • . . . .
883 Laundry services rendered by organisations and individuals. this includes all types of cleaning, dyeing, bleaching, dry cleaning, services. .
884 Hair dreSSing, other services rendered by organisation and individuals such as those by barber, hairdressing saloon and beauty shops
Major Group 89 Services (not elsewhere classified) . . . • . • Minor Group 890 Services rendered by organisations or individuals not elsewhere classified
Division 9 Actiyities not adequately described ..•••• Major Group 90 Activities unspecified and not adequately described including activities
of such individuals who fail to provide sufficient information about their industrial affilia ti on to enable them to be classified . .
Minor Group 900 Activities unspecified and not adequately described including activities of such individuals who fail to provide sufficient information about their industrial affiliation to enable them to be classified
Tot,!1 \yorkers
Total
Persons Males Fem[\Jes
2 3 4 1,423 1,345 7R
1.004 962 42 122 121 I 626 626
523 523
668 636 32
366 363 3 216 212 4
5,665 4,916 749 1,059 493 566
2,257 2,184 73
381 292 89
1,729 1,729 8,234 5,559 2,675 8,234 5,559 2.675 6,938 5,352 1..586
6,938 5,352 1,586
6,938 5,352 1,586
Branch of Industry Total Workers Workers at Household Industry Workers in Non-Household Industr ~.---~ - --------~
~ ~~- ..
Division, Major group Urban Total Urban Total Urban & Minor group of ---~--- ---~------
I. S. I.C. Pel's,ons Males Females Males Females Males Females Males Females Males Females
5 6 7 8 9 10 11 ]2 13 14 15
Major Group 83 865 806 59 1,345 78 806 59
Minor Group 831 514 489 25 962 42 489 25 Major Group 84 117 116 I 121 ] 116 I
85 614 614 626 614 Minor Group 851 513 513 523 513
Major Group 86 633 617 16 636 32 617 16 Minor Group 860 362 359 3 363 3 359 3
Major Group 87 145 ]44 I 212 4 144 I 88 3,852 3,173 679 4,916 749 3,173 679
Minor Group 880 911 406 505 493 566 406 505
882 1,870 1,800 70 2.184 73 1,800 70
883 354 271 83 292 89 271 83
884 481 481 1,72:9 481 Major Gronp 89 t,364 1.012 352 S.5S? 2.675 1,012 3.52 Minor Group 890 1,364 1,012 352 5,559 2,675 1,012 352
Division 9 6,778 5,218 J,560 5,352 1,586 5,218 1,560
Major Group 90 6,778 5.218 1,560 5,352 1,586 5,218 1,560
Minor Group 900 6,778 5.21& .,56() 5,352 1,586 5,218 {,560
42
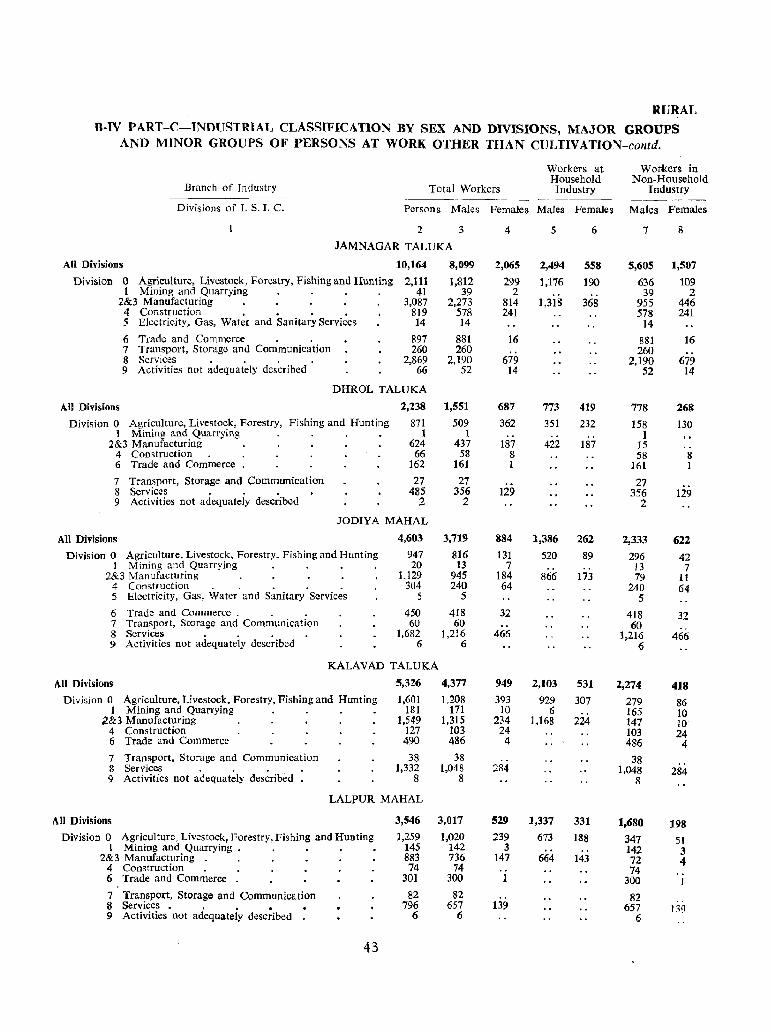
RURAL B-IV PART-C-INDUSTRIAL CLASSIFICATION BY SEX AND DIVISIONS, MAJOR GROUPS
AND MINOR GROUPS OF PERSONS AT WORK OTHER THAN CULTIVATION-contd.
Branch of Industry Total Workers
Workers at Household Industry
Wor-kers in Non-Household
Industry
Divisions of 1. S. I. C. Persons Males Females Males Females Males Females
2 3
JAMNAGAR TALUKA
All Divisions
Division 0 Agriculture, Livestock, Forestry, Fishing and Hunting 1 Mining and Quarrying
2&3 Manufacturing 4 Construction . • . • 5 Electricity. Gas, Water and Sanitary Services
6 Trade and Commerce 7 Transport, Storage and Communication 8 Services . . . 9 Activities not adequately described
10,164
2,111 41
3,087 819 14
897 260
2,869 66
All Divisions
DHROL TALUKA
2,238
Division 0 Agriculture, Livestock, Forestry, Fishing and Hunting 1 Mining and Quarrying
871 1
624 66
162
2&3 Manufacturing 4 Construction 6 Trade and Commerce •
7 Transport, Storage and Communication 8 Services • . . 9 Activities not adequately described
All Divisions
27 485
2
JODIY A MAHAL
4,603
Division 0 Agriculture, Livestock, Forestry, Fishing and Hunting 947 I Mining and Quarrying . . • . 20
2&3 Manufacturing 1,129 4 Construction . . . " 304 5 Electricity, Gas, Water and Sanitary Services 5
6 Trade and Commerce . 7 Transport, Storage and Communication 8 Services . . . 9 Activities not adequately described
450 60
1,682 6
8,099
1,812 39
2,273 578 14
881 260
2,190 52
1,551
509 1
437 58
161 27
356 2
3,719
816 13
945 240
5
418 60
1,216 6
KALAVAD TALUKA
A.1I Divisions
Division 0 Agriculture, Livestock, Forestry, Fishing and Hunting 1 Mining and Quarrying
2&3 Manufacturing 4 Construction 6 Trade and Commerce
7 Transport, Storage and Communication 8 Services . . . . 9 Activities not adequately described .
5,326
1,601 181
1,549 127 490
38 1,332
8
LALPUR MAHAL
All Divisions
Division 0 Agriculture, LivestOCk, Forestry, Fishing and Hunting 1 Mining and Quarrying •
2&3 Manufacturing 4 Construction 6 Trade and Commerce
7 Transport, Storage and Communication 8 Services • . , • • 9 Activities not adequately described
43
3,546
1,259 145 883 74
301
82 796
6
4,377 1,208
171 ]'315
103 486
38 1,048
8
3,017
1,020 142 736 74
300
82 657
6
4
2,065
299 2
814 241
16
679 14
687
362
187 8 1
129
884
131 7
184 64
32
466
949
393 10
234 24
4
284
529
239 3
147
139
5
2,494
1,176
1,318
773 351
422
1,386
520
866
6
558
190
368
419
232
187
262
89
173
2,103 531
929 307 6
1,168 224
1,337
673
664
331
188
]43
7
5,605
636 39
955 578
14
88] 260
2,190 52
778
158 I
15 58
161
27 356
2
2,333
296 13 79
240 5
418 60
1,216 6
2,274
279 165 147 103 486
38 1,048
8
1,680
347 142 72 74
300
82 657
6
8
1,507
109 2
446 241
16
679 14
268
130
8 1
129
622
42 7
II 64
32
466
418
86 10 10 24
4
284
198
51 3 4
139
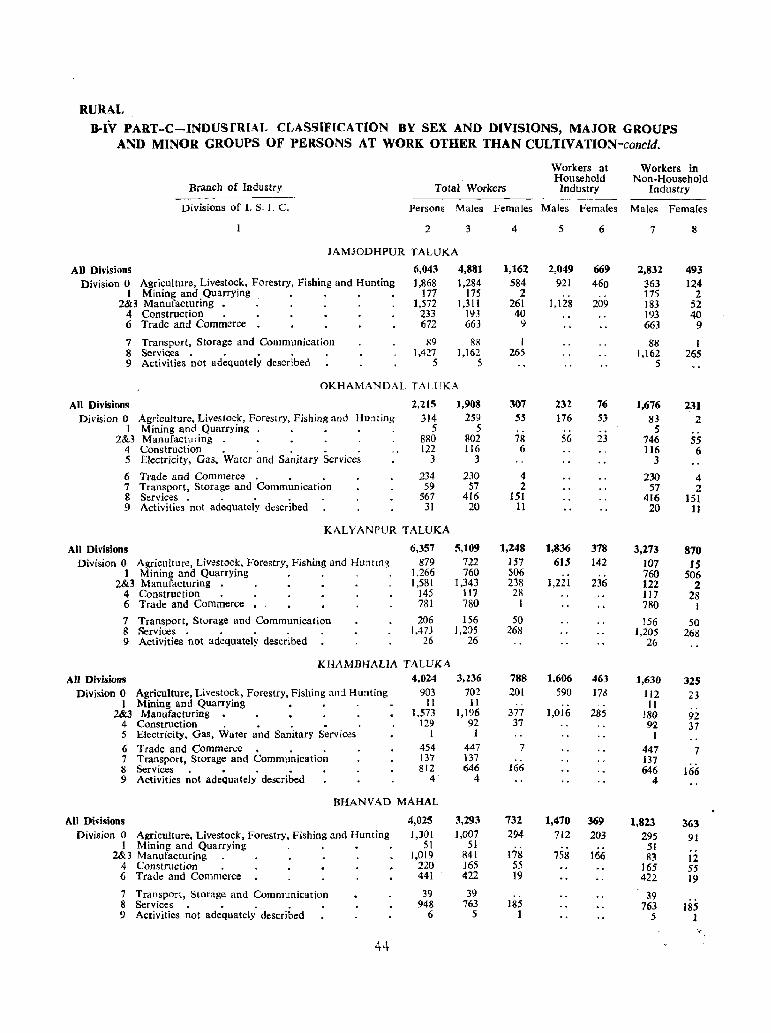
RURAL
B-IV PART-C-INDUSfRIAL CLASSIFICATION BY SEX AND DIVISIONS, MAJOR GROUPS AND MINOR GROUPS OF PERSONS AT WORK OTHER THAN CULTIVATION-concld.
Total Workers
Workers at Household
Industry
Workers in Non-Household
Industry Branch of Industry
Divisions of I. S. I. C. Persons Males Females Males Females Males Females
2 3
JAMJODHPUR TALUKA
All Divisions Division 0 Agriculture, Livestock, Forestry, Fishing and Hunting
1 Mining and Quarrying 2&3 Manufacturing •
4 Construction 6 Trade and Commerce
7 Transport, Storage and Communication 8 Services. . . • 9 Activities not adequately described
6,043 4,881 1,868 1.284
177 175 1,572 1,311
233 193 672 663
1';9 1,427
5
8R 1,162
5
OKHAMANDAL TALUKA
All Divisions Division 0 Agriculture, Livestock, Forestry, Fishing and HU:1ting
1 Mining and Quarrying 2&3 Manufacturing .
4 Construction. , , • . 5 Electricity, Gas. Water and Sanitary Services
6 Trade and Commerce. • . 7 Transport, Storage and Communication 8 Services • . • . 9 Activities not adeqUately described
2,215
314 5
880 122
3
234 59
567 31
KALYANPUR TALUKA
All Divisions Division 0 Agriculture, Livestock, Forestry, Fishing and HU:1tin:!
1 Mining and Quarrying 2&3 Manufacturing
4 Construction 6 Trade and Commerce •
7 Transport, Storage and Communication 8 Services. • • . 9 Activities not adequately described
6,357 879
],266 1,5S1
J45 7S1
206 IA7J
26
All Divisions
KHAMBHALlA TALVKA 4,024
Division 0 Agriculture, Livestock, Forestry, Fishing ,ud Hunting 1 Mining and Quarrying
2&3 Manufacturing • 4 Construction . • , • 5 Electricity, Gas, Water and Sanitary Services 6 Trade and Commerce. • . 7 Transport, Storage and Communication 8 Services. • • • 9 Activities not adequately described
903 11
J,573 129
I 454 137 812
4
BHANVAD MAHAL
All Divisions Division 0 Agriculture, Livestock, Forestry, Fishing and Hunting
] Mining and Quarrying 2&3 Manufacturing
4 Construction 6 Trade and Commerce
7 Transport, Storage and Communication 8 Services. • , . 9 Activities not adequately described
44
4,025 1,301
51 1,019
220 441
39 948
6
1,908 259
5 802 116
3
230 57
416 20
5,109 722 760
1,343 117 7S0
156 1.2:)5
26
3,236 702
11 1,196
92 1
447 137 646
4
3,293 1,007
51 841 J65 422
39 763
5
4
1,162 584
2 261 40
9
I 265
307 55
78 6
4 2
lSI 11
1,248 ]57 506 238 2S
I
50 268
788 201
377 37
7
166
732 294
178 55 19
" 185
1
5 6
2,049 669 921 460
.. 1,128 209
232
176
56
1,836 615
1,221
1.606 590
1,016
76 53
23
378 142
236
463
J7J
285
1,470 369 712 203
758 166
7
2,832 363 175 ]83 193 663
88 1,162
5
1,676 83
.5 746 116
3
230 57
416 20
3,273 107 760 122 J 17 780
156 1.205
26
1,630
1I2 II
180 92.
I 447 137 646
4
1,823 295
51 83
165 422
39 763
5
8
493 ]24
2 52 40
9
I 265
2.31 2
55 6
4 2
lSI II
870 rs
506 2
28 J
50 268
325 23 .. 92 37
7
166
363 91
12 55 19
185 J
.,'
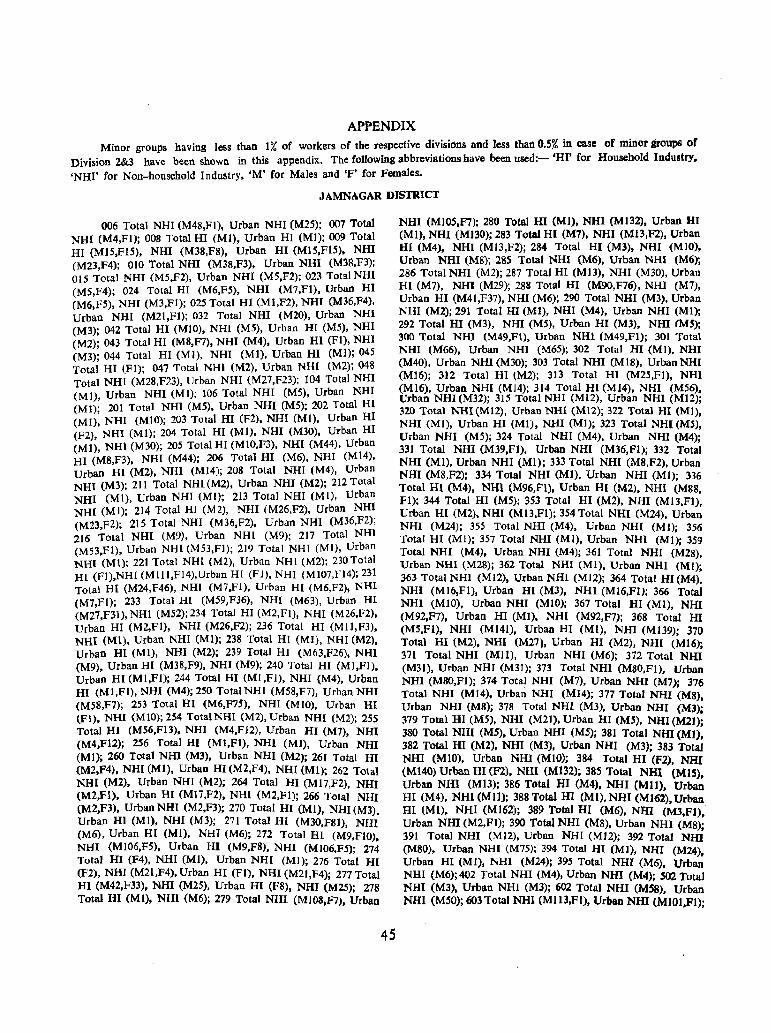
APPENDIX Minor groups having less than 1% of workers of the respective divisions and less than 0.5% in case of minor groups of
Division 2&3 have been shown in this appendix. The following abbreviations have been used:- 'HI' for Household Industry,
'NHI' for Non-household Industry, 'M' for Males and 'F' for Females.
JAMNAGAR DISTRICT
006 Total NHI (M48,FI). Urban NHI (M25); 007 Total NHI (M4,Fl); 008 Total HI (MI), Urban HI (MI); 009 Total HI (MI5,FlS), NHI (M38,F8), Urban HI (M15,F15), NHI (M23,F4); 010 Total NHI (M38,F3), Urban NHI (M38,F3); 015 Total NHI (M5,F2), Urban NHI (M5,F2); 023 Total NHI (M5,F4); 024 Total HI (M6,F5), NHI (M7,Fl), Urban HI (M6,F5), NHI (M3,Fl); 025 Total HI (Ml,F2), NHI (M36,F4), Urban NHI (M21,FI); 032 Total NHI (M20), Urban NHI (M3)' 042 Total HI (MIO), NHI (MS), Urban HI (M5), NHI (M2): 043 Total HI (M8,F7), NHI (M4), Urban HI (Fl), NHI (M3); 044 Total HI (MI), NHI (MI), Urban HI (Ml); 045 Total HI (FI); 047 Total NHI (M2), Urban NHI (M2); 048 Total NHI (M28,F23), Urban NHI (M27,F23); 104 Total NHI (MI), Urban NHI (MI); 106 Total NHI (MS), Urban NHI (Ml)' 201 Total NHI (M5), Urban NHI (MS); 202 Total HI (MI): NHI (MIO); 203 Total HI (F2). NHI (Ml). Urban HI (F2), NHI (MI); 204 Total HI (M!). NHI (M30), Urban HI (Ml), NHI (M30); 205 Total HI (MJO,F3). NHI (M44), Urban HI (M8,F3). NHI (M44); 206 Total HI (M6), NHI (M14), Urban HI (M2). NHI (MI4); 208 Total NHI (M4), Urban NHl (M3); 211 Total NHI (M2), Urban NHI (M2); 212 Total NHI (MI), Urban NHI (MI); 213 Total NHI (MI), Urban NHl (MI)' 214 Total HI (M2), NHI (M26,F2), Urban NHI (M23,F2);' 215 Total NHI (M36,F2), Urban NHI (M36,F2); 216 Total NHl (M9), Urban NHI (M9); 217 Total NHI (M53,FI). Urban NHI (M53,FI); 219 Total NHI (MI), Urban NH( (MI); 221 Total NHI (M2), Urban NHI (M2); 230Total HI (FI}.NHI (Mlll,F!4),Urban HI (Fl), NHI (MI07,F14); 231 Total HI (M24,F46), NHI (M7.Fl), Urban HI (M6,F2), NHl (M7,Fl); 233 Total HI (M59,F36), NHI (M63), Urban HI (M27,F31), NHI (M52); 234 Total HI (M2,Fl), NHI (M26,F2), Urban HI (M2,FI), NHI (M26,F2); 236 Total HI (MIl,F3), NHI (MI), Urban NHI (MI); 238 Total HI (MI), NHI (M2), Urban HI (MI), NHI (M2); 239 Total HI (M63,F26), NHI (M9). Urban HI (M3S,F9), NHI (M9); 240 Total HI (MI,FI). Urban HI (Ml,FI); 244 Total HI (MI,Fl), NHI (M4). Urban HI (MI,FI), NHI (M4); 250 Total NHI (M58,F7), Urban NHI (M58,F7); 253 Total HI (M6,F7S). NHI (MIO), Urban HI (FI), NHI (MlO); 254 TotalNHI (M2), Urban NHI (M2); 25S Total HI (M56,F13), NHI (M4.FI2), Urban HI eM7), NHI (M4,FI2); 256 Total HI (Ml.FI), NHI (MI), Urban NHI (MI): 260 Total NHI (M3). Urban NHI (M2); 261 Total HI (M2,F4), NHI (MI), Urban HI (M2,F4), NHl (Ml); 262 Total NHI (M2), Urban NHI (M2); 264 Total HI (MI7,F2), NHI (M2,Fl), Urban HI (MI7,F2), NHI (M2,FI); 266 Total NHI (M2.F3), Urban NHI (M2,F3); 270 Total HI (MI), NHI (M3), Urban HI (MI). NHI (M3); 271 Total HI (M30,F8I), NHI (M6), Urban HI (MI), NHI (M6); 272 Total HI (M9,FlO), NHI (MI06.F5). Urban HI (M9.F8). NHI (MI06,F5); 274 Total HI (F4). NHI (MI), Urban NHI (MI); 276 Total HI (F2). NHI (M21.F4), Urban HI (Fl). NHI (M21,F4); 277 Total HI (M42,F33), NHI (M2S), Urban HI (F8), NHI (M25): 278 Total HI (MI), NHI (M6); 279 Total NHI (MI08,F7). Urban
45
NHI (MI05,F7); 280 Total HI (MI), NHI (MI32), Urban HI (MI), NHI (MI30): 283 Total HI (M7), NHI (M13,F2), Urban HI (M4), NHI (MI3,F2); 284 Total HI (M3), NHI (MIO), Urban NHI (MS); 28S Total NHI (M6), Urban NHI (M6); 286 Total NHI (M2); 287 Total HI (MI3), NHl (M30), Urban HI (M7), Nm (M29); 288 Total HI (M90,F76), NHI (M7), Urban HI (M41,F37), NHl (M6); 290 Total NHI (M3), Urban NHI (M2); 291 Total HI (MI), NHI (M4). Urban NHI (MI); 292 Total HI (M3), NHI (MS), Urban HI (M3), NHI (MS); 300 Total NHI (M49,Fl), Urban NHI (M49,Fl); 301 Total NHI (M66), Urban NHI (M65); 302 Total HI (MI). NHI (M40), Urban NHI (M30); 303 Total NHI (MI8), Urban NHI (MI6); 312 Total HI (M2); 313 Total HI (M25,FI), NHI (M16), Urban NHI (MI4); 314 Total HI (MI4), NHI (M56), Urban NHI (M32); 315 Total NHI (MI2), Urban NHI (MI2); 320 Total NHI(MI2), Urban NHI (MI2); 322 Total HI (MI), NHI (MI), Urban HI (MI), NIH (MI); 323 Total NHI (MS). Urban NHI (MS); 324 Total NHI (M4), Urban NHI (M4); 331 Total NHI (M39,FI), Urban NHI (M36,FI); 332 Total NHI (MI), Urban NHI (MI); 333 Total NHI (M8,F2), Urban NHI (M8,F2); 334 Total NHI (MI), Urban NHI (MI); 336 Total HI (M4), NHI (M96,FI). Urban HI (M2), NHI (M88, FI); 344 Total HI (MS); 353 Total HI (M2), NHI (MI3,FI), Urban HI (M2), NHI (MI3,FI); 354 Total NHI (M24), Urban NHI (M24); 355 Total NHI (M4), Urban NHl (M!); 356 Total HI (MI); 357 Total NHI (Ml), Urban NHI (MI); 359 Total NHI (M4). Urban NHI (M4); 361 Total NHl (M28). Urban NHI (M28)j 362 Total NHl (MI), Urban NHI (Ml); 363 Total NHI (MI2), Urban NHI (MI2); 364 Total HI (M4). NHI (MI6,FI), Urban HI (M3), NHI (MI6,FI); 366 Total NHI (MIO), Urban NHI (MIO); 367 Total HI (MI), NHI (M92,F7), Urban HI (MI), NHI (M92,F7); 368 Total HI (MS,FI), NHI (M141), Urban HI (MI), NHI (MI39); 370 Total HI (M2), NHI (M27), Urban HI (M2), NHI (MI6); 371 Total NHI (MIl), Urban NHI (M6); 372 Total NHl (M31), Urban NHI (M31); 373 Total NHI (M80,FI), Urban NHI (M80,FI); 374 Total NHI (M7), Urban Nffi (M7); 376 Total NHI (MI4), Urban NHI (MI4); 377 Total NHI (M8), Urban NHI (MS); 378 Total NHI (M3), Urban NH! (M3)i 379 Total HI (M5), NHI (M21), Urban HI (MS), NH! {M21)i 380 Total NHI (MS), Urban NHI (MS); 381 Total NHI (Ml). 382 Total HI (M2), NHI (M3), Urban NHI (M3); 383 Total NHI (MIO), Urban NHI (MlO); 384 Total HI (F2), NHI (MI40) Urban HI (F2), NHI (M132); 385 Total NHI (MIS), Urban NHI (MI3); 386 Total HI (M4), NHI (MIl), Urban HI (M4), NHI (MIl); 388 Total HI (MI), NHI (M162), Urban HI (Ml). NHI (M162); 389 Total HI (M6), NHI (M3,FJ), Urban 'NHI (M2,FI); 390 Total NHI (MS). Urban NHI (MS); 391 Total NHI (MI2). Urban NHI (MI2); 392 Total NHI (M80). Urban NHI (M75); 394 Total HI (MI), NHI (M24), Urban HI (MI), NHI (M24); 395 Total NHI (M6), Urban NHI (M6); 402 Total NHI (M4), Urban NHI (M4); 502 Total NHI (M3), Urban NHI (M3); 602 Total NHI (MSB), Urban NHI (MSO); 603 Total NHI (M113,FI), Urban NHI (MIOI.FI);
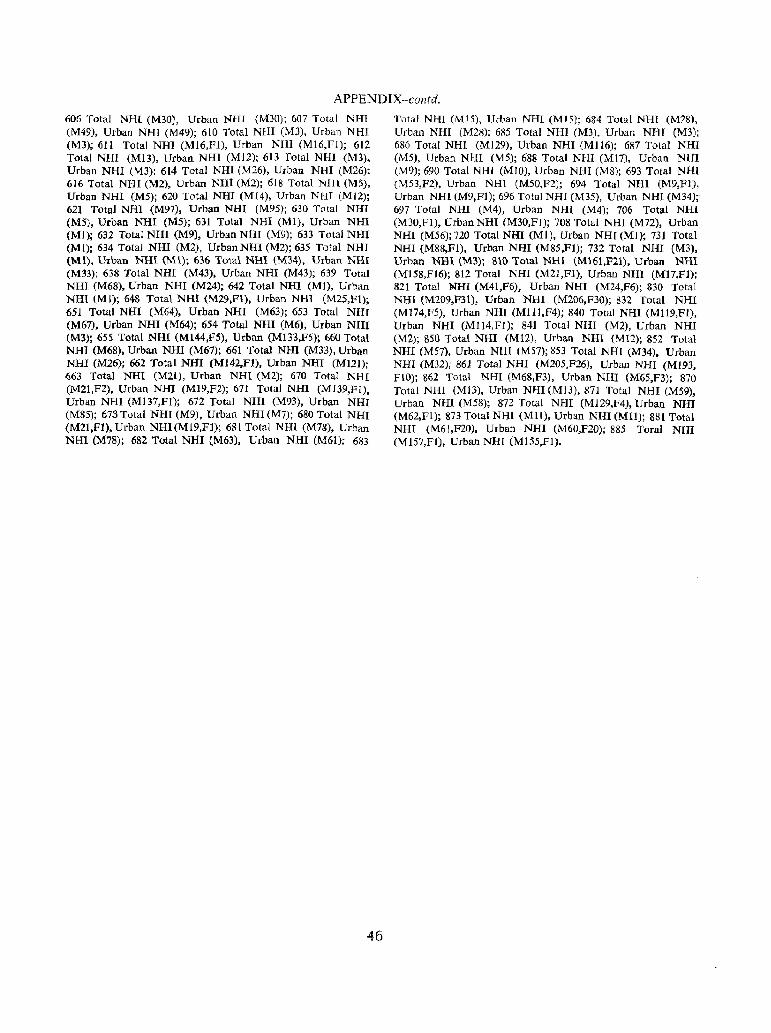
APPEND IX-contd.
606 Total NH[ (M30), Urban NHT (M30); 607 Total NHI (M49), Urban NHI (M49); 610 Total NHI (1'.13), Urban NHI (M3); 611 Total NHI (MI6,Fl), Urban NHl (MI6,FI); 612 Total NHI (1'.113), Urban NHI (1'.112); 613 Total NHI (M3). Urban NHI (1'.13); 614 Total NHI (M26), Urban NHI (M26); 616 Total NHI (M2), Urban NHI (M2); 618 Total NHI (MS). Urban NHI eM5); 620 Total NHI (MI4). Urban NHI (MI2); 621 Total NHI (M97), Urban NHI (M95); 630 Total NHI (M5), Urban NHI (M5); 631 Total NHI (MI), Urban NHI (MI); 632 Total NHl (M9), Urban NHI (M9); 633 Total NHI (MI); 634 Total NHI (M2), Urban NHI (M2); 635 Total NHI (Ml), Urban NHI {MI); 636 Total NHI (M34), Urban NHI (M33); 638 Total NHI (1'.143). Urban NHI (M43); 639 Total NHI (M68), Urban NHI (M24); 642 Total NHI (MI), Urban NHI (MI); 648 Total NHI (M29.Fl). Urban NHI (M2S,Fl); 651 Total NHI (M64). Urban. NHI (M63); 653 Total NHI (M67), Urban NHI (M64); 654 Total NHI (M6), Urban NHI (M3); 655 Total NHI (M144,F5), Urban (M133,F5); 660 Total NHI (M68). Urban NHI (1'.167); 661 Total NHI (M33), Urban NHI (M26); 662 Total NHI (M142,Fl), Urban NHI (MI21); 663 Total NHl CM2l), Urban NHI (M2); 670 Total NHI (M2I,F2), Urban NHI (M19,F,2); 671 Total NHI (M139,FI), Urban NHI (MI37,Fl); 672 Total NHI (M93), Urban NHI (M8S); 673 Total NHI (M9), Urban NHI (M7); 680 Total NHI (M2I,Fl), Urban NHI (MI9,FI); 681 Total NHI (M78), Urban NHI (M78); 682 Total NHI (M63), Urban NHI (M6I); 683
46
Total NHI (M1S), Urban NHI (MI5); 684 Total NHl (M28), Urban NHI (M28); 685 Total NHI (M3), Urban NHI eM3); 686 Total NHI (MI29), Urban NHI (1'.1116); 687 Total NHI (M5), Urban NHl (MS); 688 Total NHI (Ml7), Urban NHI (1'.19); 690 Total NHI (MIO), Urban NHI eM8); 693 Total NHI (M53,F2). Urban NHI (M50,F2); 694 Total NHl (M9,FI), Urban NHI (M9,F1); 696 Total NHI (M35), Urban NHl (M34); 697 Total NHI (M4), Urban NHI (M4); 706 Total NHI (M30,Fl), Urban NHI (M30,FI); 708 Total NHI (M72), Urban NHI (1'.156); 720 Total NHI (MI), Urban NH[ (MI); 731 Total NHI (M8S,FI), Urban NHI (M85,FI); 732 Total NHI (1'.13), Urban NHI (M3); 810 Total NHI (M161.F21), Urban NHI (MI58,FI6); 812 Total NHI (M21,Fl), Urban NHI (MI7,FI); 821 Total NHI (M41,F6), Urban NHI (M24,F6); 830 Total NHI (M209,F31), Urban NHI (M206,F30); 832 Total NHI (M174,F5), Urban NHI (Ml11,F4); 840 Total NHI (MI19,FI), Urban NHI (M114,Fl); 841 Total NHI (1'.12), Urban NHI (M2); 850 Total NHI (MI2), Urban NIH (MI2); 852 Total NHI (MS7), Urban NHI (MS7); 853 Total NHI (M34), Urban NHI (M32); 861 Total NHI (M205,F26), Urban NHI (M193, FlO); 862 Total NHI (M68,F3), Urban NHI (M65,F3); 870 Total Nill (M13), Urban NHI (MI3), 871 Total NHI (M59), Urban NHI (M58); 872 Total NHI (M129,F4). Urban NIH (M62,FI); 873 Total NHI (MIl), Urban NHI (MU); 881 Total NHI (M61,F20), Urban NHI (M60,F20); 885 Toral NHI (M157,Fi), Urban NUl (M155,Fl).
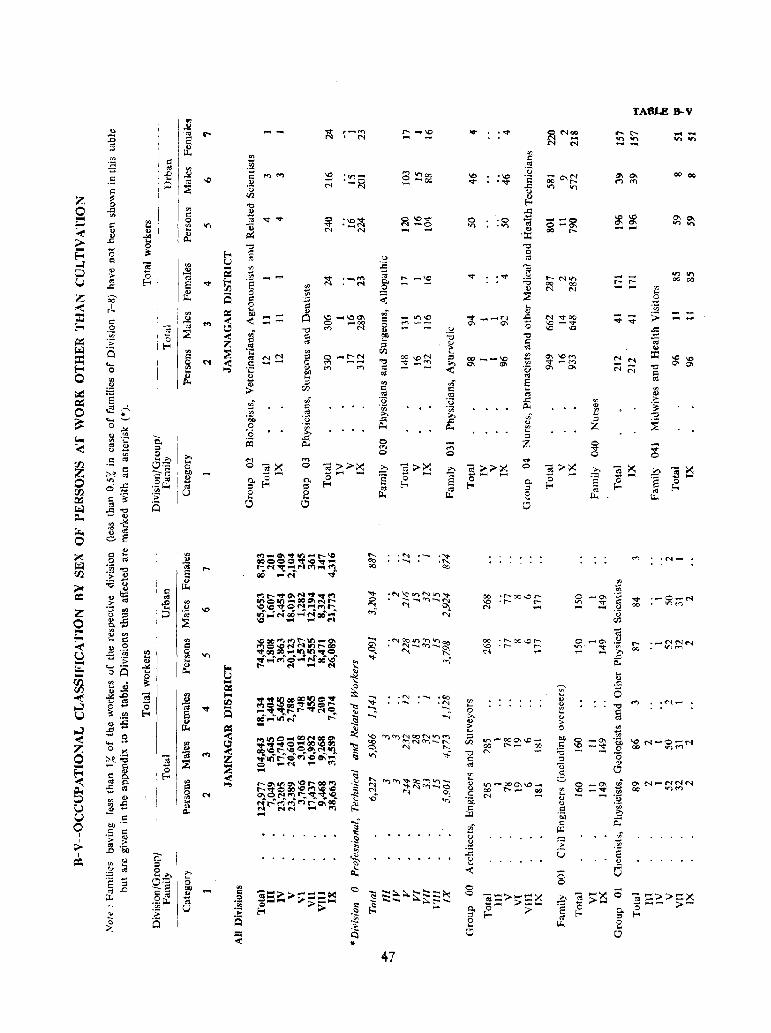
..
:~~!!~~~ "'I t...
47
. '" ......
",'
........ 100 .~
..:;
00
{) .~ ...<::
0. ::l 2 o
B .....• -<
to- NV) 00 00 N N
TABLE B-V
NN
~N
--V> V>
0000
on '" 00 00
=
("f'j 'N-
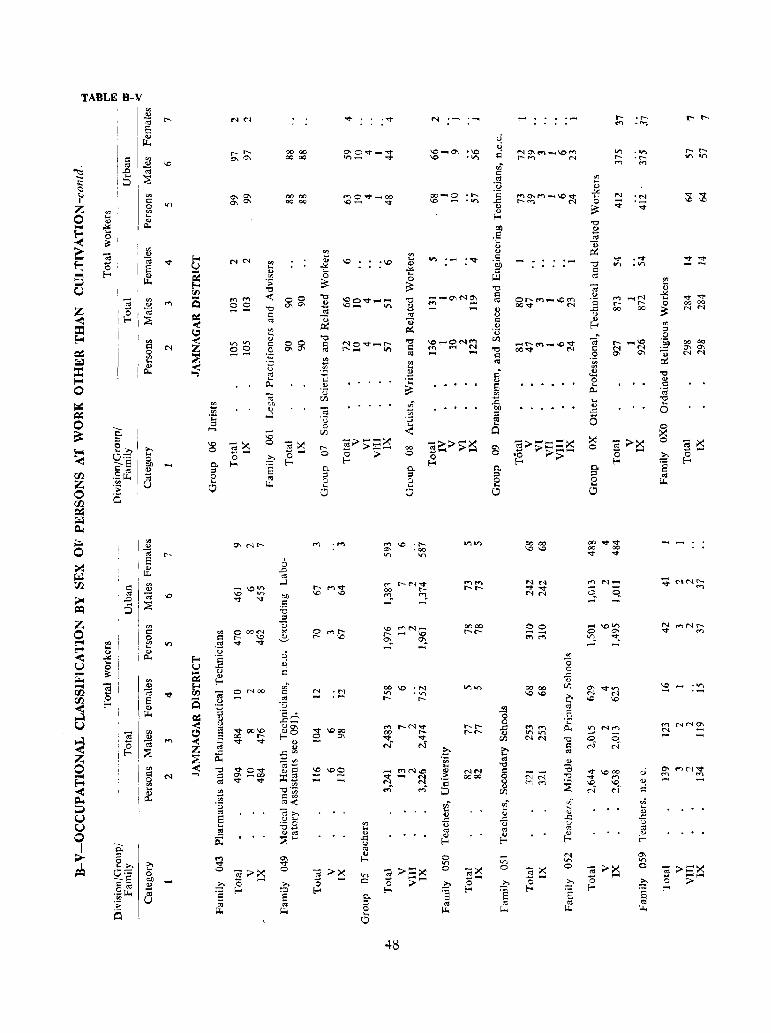
TABLE B-V
I
III I~
8 ., ~
t-
00 QO 00 00
00 00 OQ QO
M • ...,
'" -
c..
2 o
48
00 o
0-:0
2 o
00-0 .r--. \,0 -.~
00 00
"" ""
00 00
""""
• t-. ..,.,
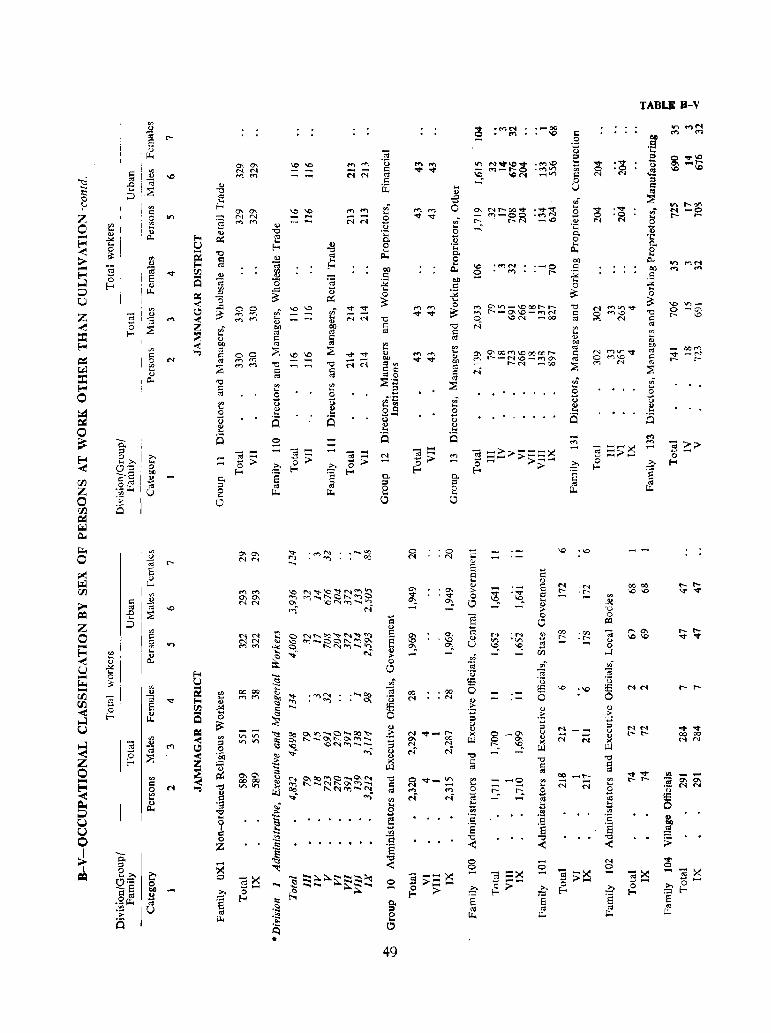
'" .., lii
18 " ILl.
......
Cl, ::l o o
"'''' co co .,.,on
I ., :> o D
49
0. = e o
·0 • N
· '" • "T
"'-
~ O'>tIj-\Ooo ..... f"'-oo r"'\ l"---O\\O_"""f'I o \rON ......... oQ
N
0;;
" E <= ... " :> o D
'0 c: '"
-~
.",
'" .!! "0 o ~
TABLE U-V
... r--
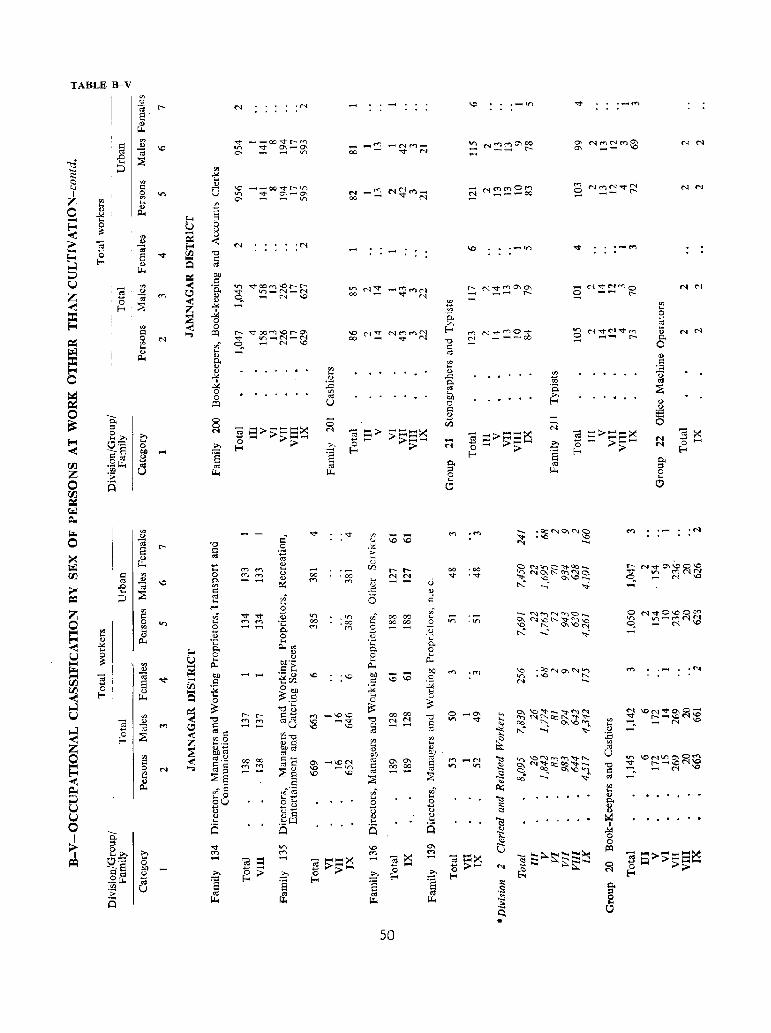
TABLE B-V
\0 __ OO"1't-V) V) -.::t 0. ......... 0\ ~ ,....... ,....... l.I')
..........
-Nrr'l_
"" N
...
50
......
. on
.(T)
8 E8 o
N N
NN
NN
r- N,¢O\\OO\O q an ~ C"qJ .....
. .,..
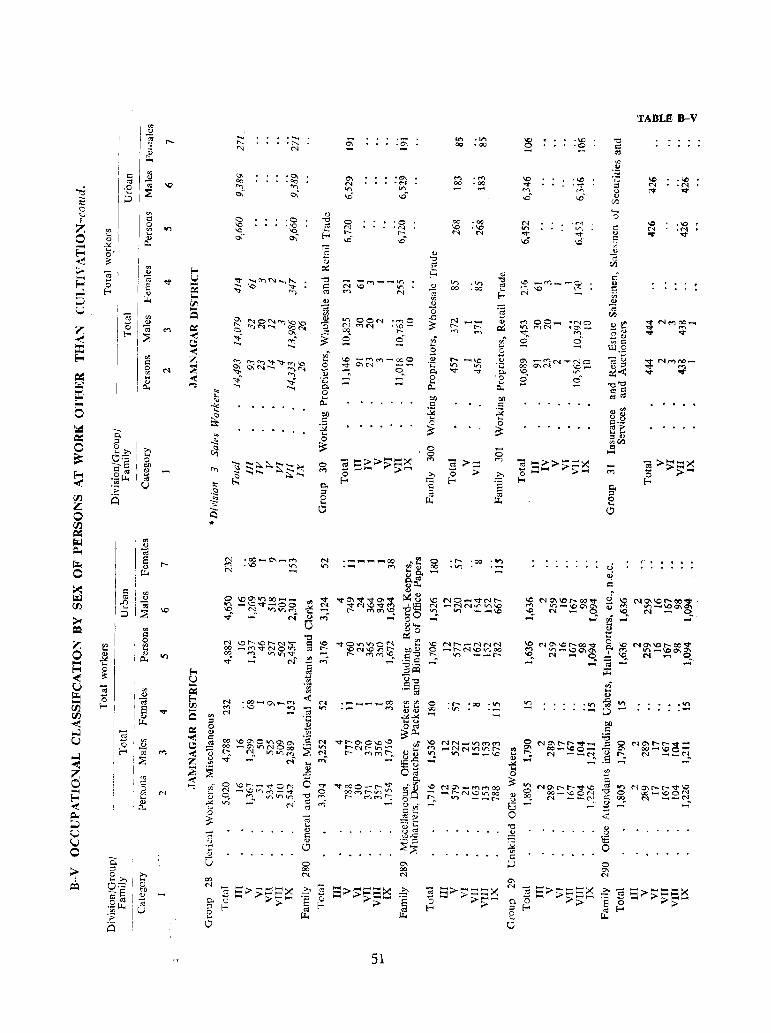
I'" 'v @ t1:
\0
" .~
.....
.('.. N
...
1) ..... ..
D
-'"
·,..,0 '\0-t-O
\0 -1"""\C1')-OOO
~ ~N O~-
-
~ ~»>~~ "O)-;r-i >1""""1 f-<
N .- ..... --00 I.r'....... M
51
o o '"
.r--
.11)
..... . .,.,
'00
'00
• II)
.'1'\
.\0 '0
8 IE o o 0-,
'"
TABLE 8-V
~ N~~~~~ ....
.." ....
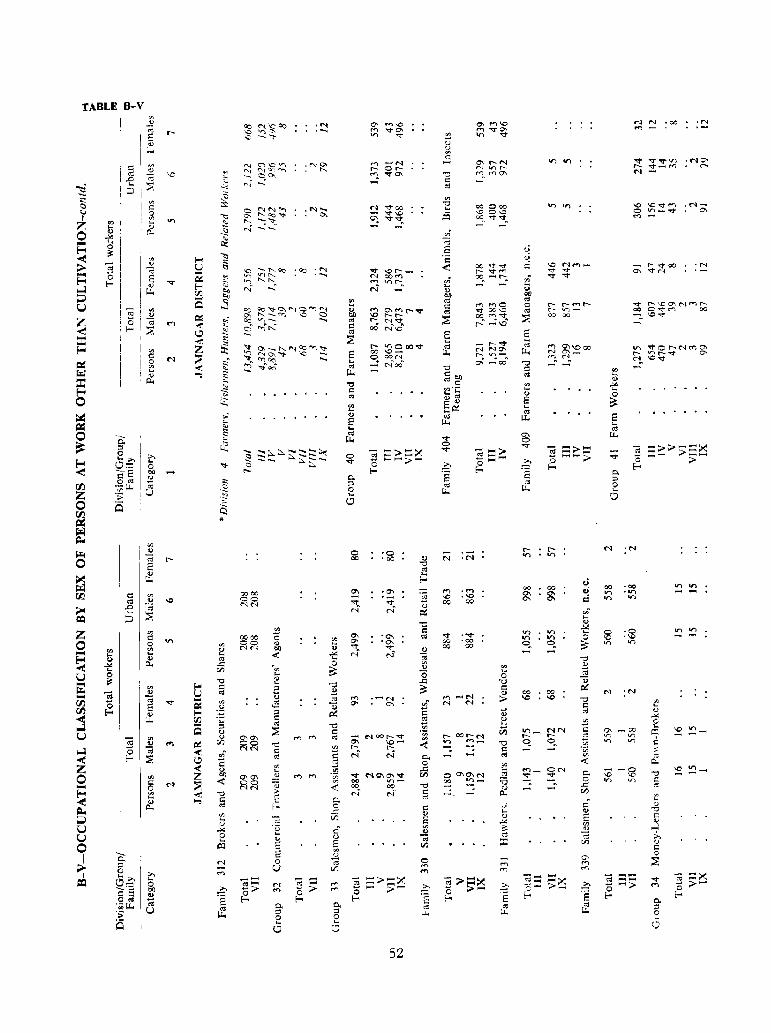
'fABLE 8-V
I
, <=:
'''' I .D ... !:::J
-is o [-
.§
.~
CS "
N a'CVJ
~ 6&.~ r-~ -:-
co oc 00 ('IN
..
.f'! ......
:00 :~
0. ::l o o
'0 • 00
52
'" . .., "" .", co co
'<t '"<T 00 '00 00 00
00\0\1'1 00 V)_
0. ::l o '-V
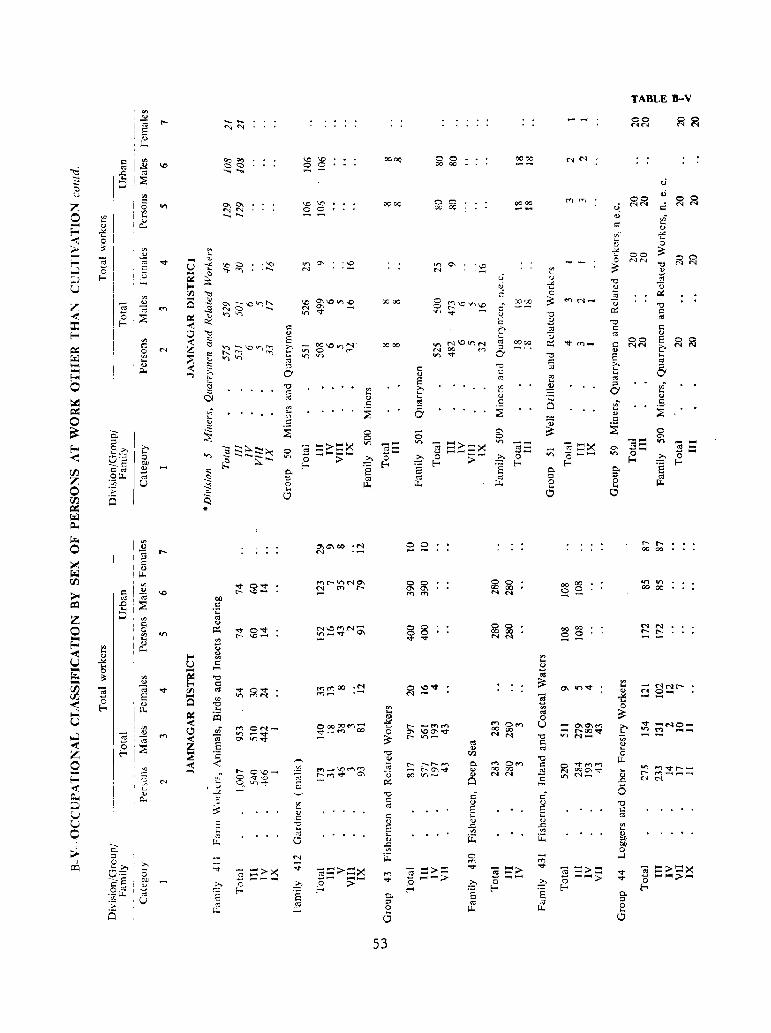
'" , c:: 10 , '" I I-<
~
~\O 00
.~ .-
53
00 00 00
00 00 00
c I)
E i:::
0000 --
00 <Xl
... '-"'l N\ClI"lt'"'l ~ N 00 ("'f)::I on ~ CI
"0 C oj
00 <Xl <Xl N N
.., 0.., 00"", <'IN
M 0.., 00 00 ~~
00 00
8°
TABLE D-V
00 ('IN
." .,., 0000
<"'IN ............ -
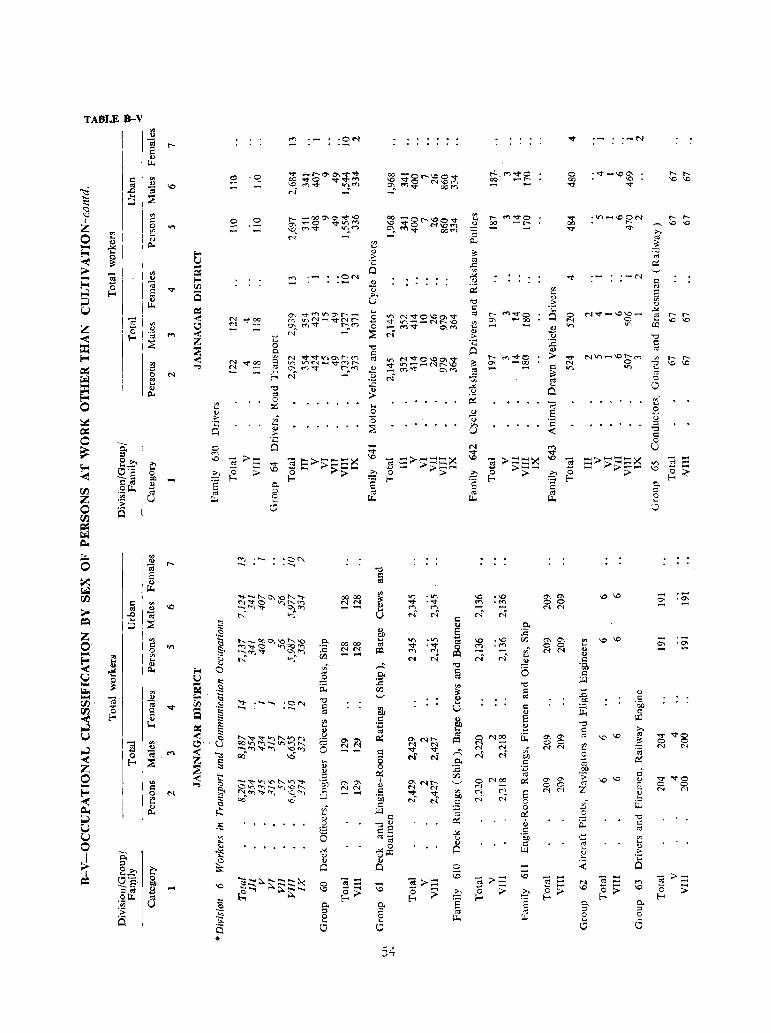
TABLE8--V
11
...
g \0
.§
.;:;
.i:; 0. •
r- :;;:~O\~;;;~ $ .. r'l....... v:..~ N ~
N "'::t'~lr)O\r---("Ij VI V')(",-I_'l:::tf"i r-~ ('1")"""," r-.. ~ N -
0000 N N --00 00 NN .......
" ""[ u
V) Noo:::tO\oO\V ~ I.I"')-....-i('lr--..IC ...-c ('I"'lV 0\('1") N
54
r;' 3 u
••• '. ::I '0
8
:~ -.g;
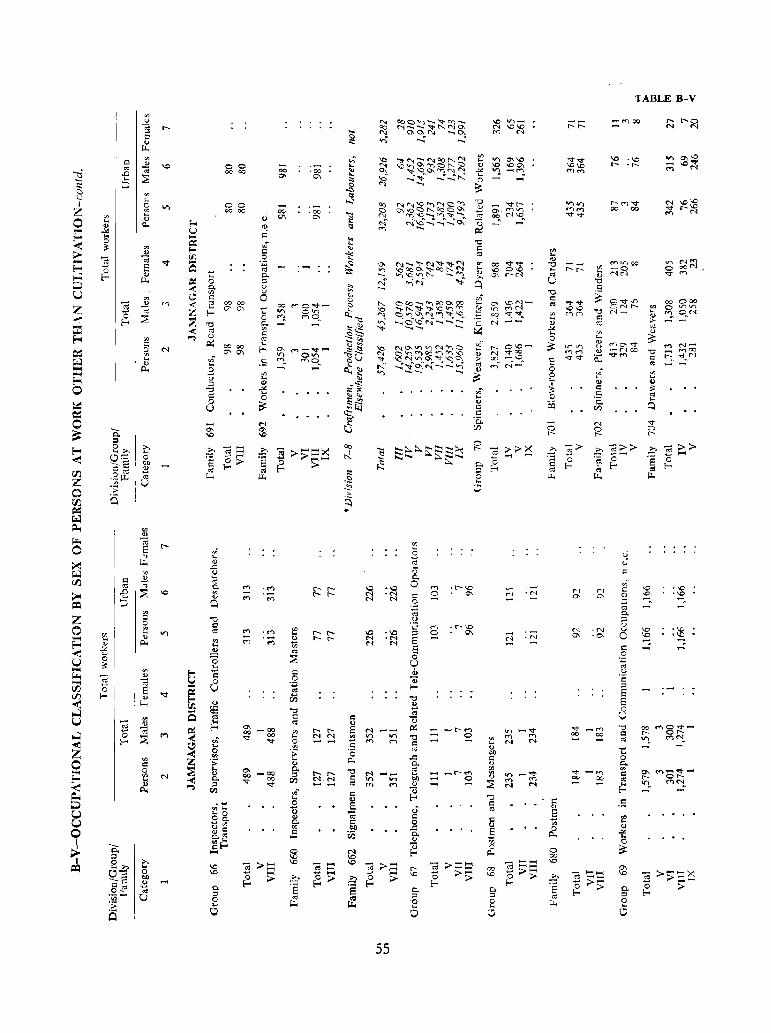
'" c; o
~
J;
B o :l
"0 c; o U
0\
'"
"0 C <Ii
'" '"
00 00 00
00 00 00
M ....
M ';;)
00
'"
55
~~~~~~~ "E ("fj'O""""tV'),~""" ~ ~~~~~~ ~ ,.., ~
"0 C <Ii
~ ~ ~~ ~ r:;-.. t-N
A
-N ,-·N
'N
£: o o .... ~ o ~
o co
'"
'''' '0,
-.j" -M 00 00 - -
'lABLE 8-V
:':(T) co
00 000 co 0 lIiV)
~ ("f') O ... N
'" ~
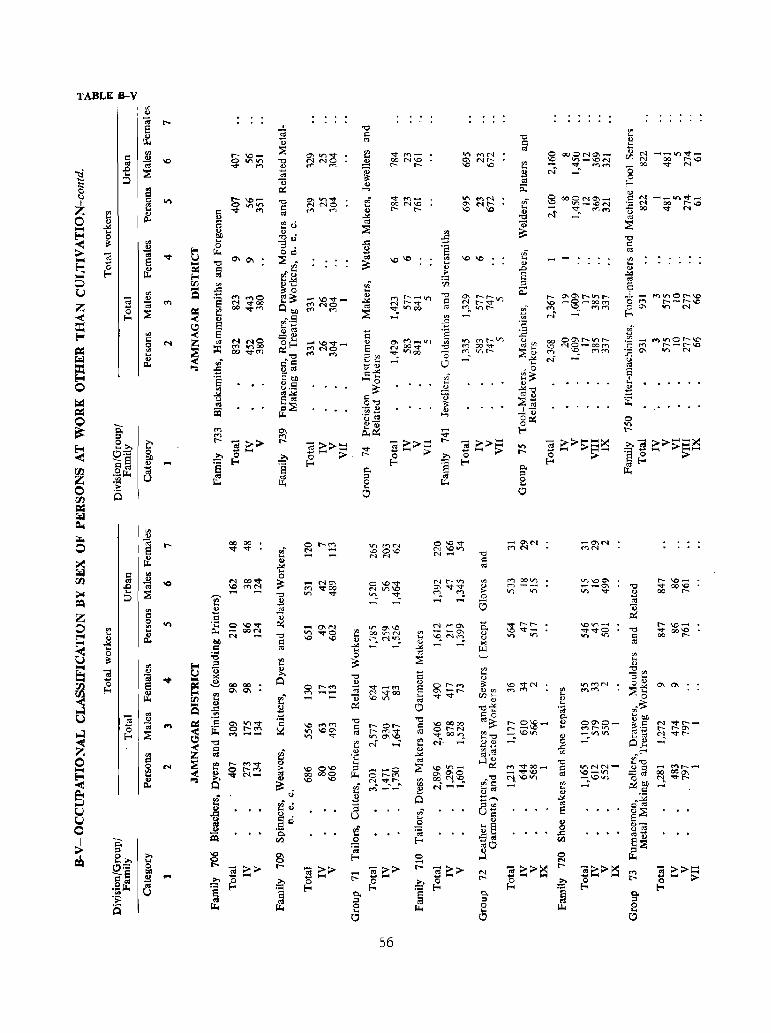
TABLE B--Y
...
COCO
"'""'"
56
............
~ ~g!::~~ (T) ~ f"1rr1
N
(B ~~~~~ ("'j '.q ('f')~ N-
Ol » .... ....... :> ~
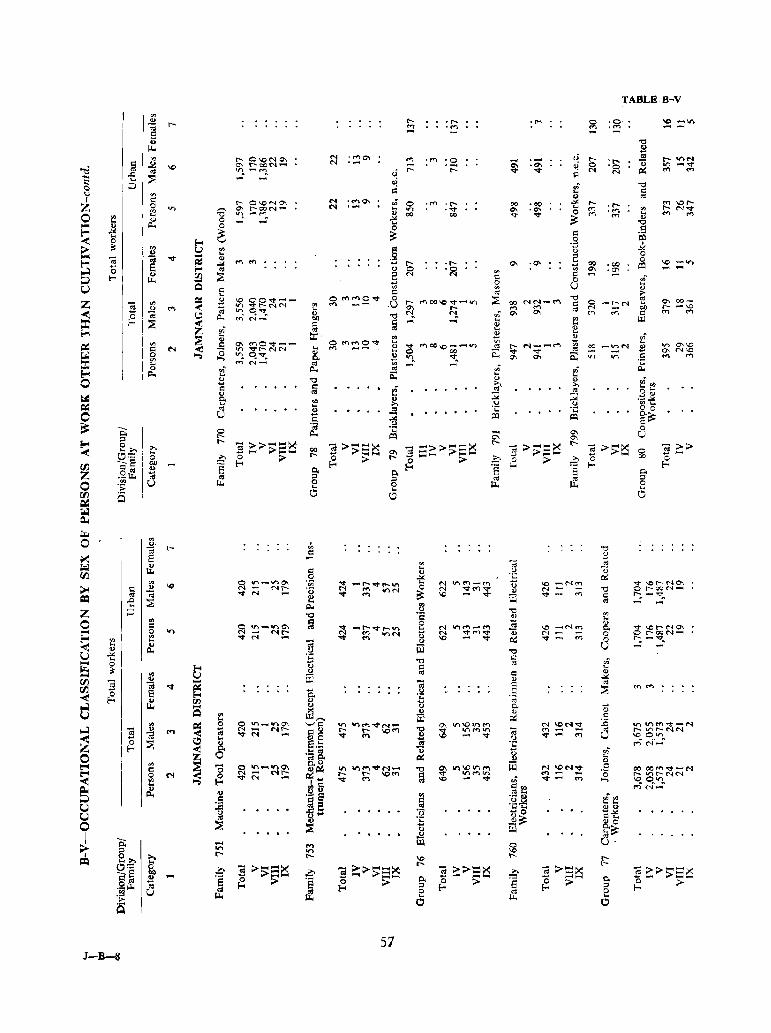
TABLe 8-V
'" t- \0 .2 t- ...... .t- 0 ·0 ;::11'> ~ :::1 'M :::1 ':::1 -8 " ."
>I. 2 '" ..... 014:>"10-, ~ :~O\ '" 'M :~
,; t- ~ r- .... '" § .2 0'1 r---oo~~ ~ :~ <i 0 ...... 0; Vl -..,.
"ci '" "1.-'""1 ;::: t- ..,. ..,. C'I '0 IX M ,., ~
CIS <) " <'l
~ ... ::2: <i ." <:) ;:J I:i r::: .:: ..,
'" ~ 0:: , .:: t""-- 0'-0......,0\ N ...... 0- r:: 0 ·M ...... 00' • OQ ..... . .... .." I.e"" Z 0 on ...... C)\ t"""-CON- C'I .... on . ..,. 0-, .0-, ... IT) . '" ~ t- N"<t '" ." lf1", _('O"'l" ... OQ co ..,. ..,. 0 M M M '" 0 ~ ~ ..><: :=: 0 .... ... ""0 ... ... 0 0 .8 !:-< -tl :=: :=: " -< 0 ~ '-' .~ 171 e; ~ '" u '" .g u .>0:
~ ; ... 2 0 .. ..,. ... 0 '" ~ ..... .., .., .... .,... 0-, . '" .. 00 .00 ~ ;:;'" '0 8 ~ CIS " 0 '0 '" ;:; .g: ....
0) gJ ~ 5 C'I N '" " ::J .... '"'"
c 8
"," 0 ....
U Q c '" '" " ... p CIS ;> c:= .l:l \0 ~o"<t- ... o t'f')f"")O'V 0 r- tf"'lOO\O<o::t ....... lt1 ::2: 00 ("&N-('I'\
." 0 "' '" co_
Z "§ '" ... _- .U P ...... ~N on <> ... -( ~ or. ..... MM ~ 0-, ..... '" '" CIS M t- -\0
-< (;l (.!) or. oo~ " "I. "!, '" 0-, 0-, r'l M C <'l ...
0 Il.. ,.; N- CI) ." ... e w ::t: I-- ::E -( I:: " ... ... ... z '" ~
CIS .... 1:: I-< ... .8 E '" :; '" 0 ~!::8~ ~ .., .... ~ '" .8 0\ ('f'iO<o:t-- ... ... ~ r')oc\C~._tn ..:2 ..... M-""'M '" 00 -","I .8
.,., a-'O c N -( tn "'d"f'NN <'\ ... V ~ 0:: a- N-o
r.l 0 ... 0 "'0 c<..,., ... ... t.n.. 'II:t .. 0- ~ c:: V) '" .S M M
'" ..., 0. ;;; ::z:: ... M N- CIS ... ... ,_; ~ <U Ii 0- '" '" Eo-< c.. p:; ... ... ... ." " " i!1" ~ 0 ~ >. >. c .::: Ii CIS' 0:: '" '" ::;;: ~
.8", ~ 8- '" ~ .--" <.> "'I.. =::: "', ...
.!i .;:: .;:: o 0 '" 0 u i5 ~ p:) !XI ~:=:
~ 0; R ~ 0-, 0
::s !XI ;; 0\ U
~ 0 r- .... ~>~=~ ca :> ......... ~ :::»;;:::~
.... :>;;:S~
I""- .. > .... ~ ca » »
~ 00 '3 ca .... >. ... - :>=== .... '" > .... g .... 0:::; ..... ~...... > 0 '0 ;§ 0 ~ :> ~ :> I""-
~ b :> ~
00 -8 "" -s 's I-- '8 I--c'" ~ c.. c.. 0-Z .21l. '" ;;l ;;l '" IZ ::l
0 '" U Il.. 0 0 11. 2 .:; ... ... 00 a 0 \:;I \:;I ~ ~ Q.,
'"" '" 0 . 2- ..... '" '0
'" .:: " ~ E .... -;;; ~ ~ ti! ~ = " .g " VJ 0 ~ cr; '" 10 ~ 1I"\_V'l0\ .;;; "'It" -t'-o"ltt-lI\ N II'\~-~ <> 14:> _N", ~"-Or--NO'I ;;;.. C .£ "'!::: '0 ON ~ VlN
0 N :!M~ ... N ." o r-ooM-
'" 0:: ..,. N ..,.
~ '" ill -.t ,., '" t---... -~ = -E ::8 ~ '" ~ Xl z ;:J '0
'" '0 § " ... 0 rIl
~ ~ <> I': ~ 4n_.,..,0\
~ ~""'oct' ...... V') ... N 't")r-f')-('f") '" _Nf'l 0. "11' \Qr--NO\ .... 0 on r:; N .... ~ tnN <> M ""<'>"," Q; N 0 o r-0CIC\t~
Eo< '" '" v - '" ..... ..,. Il:: v M 0 :"-::,, .... ca iii -< ... &: v '" .>! '" U -'< '" ... !:l '"0 CIS Ji ti:: 0
~ ~ c ...
~ '" I': ., ... '" U -'< " II)
VJ "§ -;;; ... ] E 0::
VJ "'1" ~ ::E .... ,., ~ 8 0. ....
-< ti! rn ~ tl -;; - .... c. -0
~ m " u '" Ill,.... ~ I': .... :E '" ~ 0 0 tI"I_,IOO"I '-'C on -nt'f"\VN ..... Cl\ V"I\DI,f)tf'l. N ~N:!; 1T'I\I"\f't"li"'l::t-f"o.1
~ 0; <> ..... 1d ON - "'!::: .,;:" I""- r- \OM ." ..,. Vl",,,, '2 ..... CIS r---. V'Jr-('.IN ca ..,. N ..,8 "'1" M CI)
'" v ..,. ... '" V \.0.., o~V) ...
~ ... .. .... (J 0 ~ 8- E.!:: .$ .;:: '" ('h'" b -( 0;& ., g Ii 0 z 0 Il::
'" ~ 0.'" ill
., ~ - 0 10 .... '00\ ~IX
.,.. "'.., '01" N- '"0 ~ "'10"' ..... "I ION..,. I:: 00 OOffl"'l:f'-M .::: 0 ON N C'I r- r- r- "' ... I': VlM '" .... ~ .... '0 t""- If) r-. iNC"'-t 0 N ~ -< '" "'" - ,'" """ ... '" '" - v Ji v - '" ,..., ~ ~"l ..
.~ ~ 1':", <'"IN_
~ &! .5 '" 01,",
Ji", .- '" je c .~fj ...... U .c: 0:: .,'"
i;! ·0 .... 0 .... ..>: U ~ ...
~ j;J:=: Q ... "0 0 ::g ::?: III S~ I "is; - ..., iii 0 '7 ;;l on on \0
e:-. ~ r- r- IO 't- I""-= r- ..... 0:-::: ~ '2 :>s:=x .a l >:>--x ca >:>l=iX ~ '3 :>:::~ .. :» ...... :::x ~S
'" 's .... ~- ~ >~ ...... 0. 0 .... ........ .....- 0. ~ ~ > ..... _ =", ~ 's >- ;;-- 's ~ :> {:. > :~~ a ;:! f- ;:!
'" IZ 8 t1. 0 Il.. ...
Q 0 0
57 J-B-8
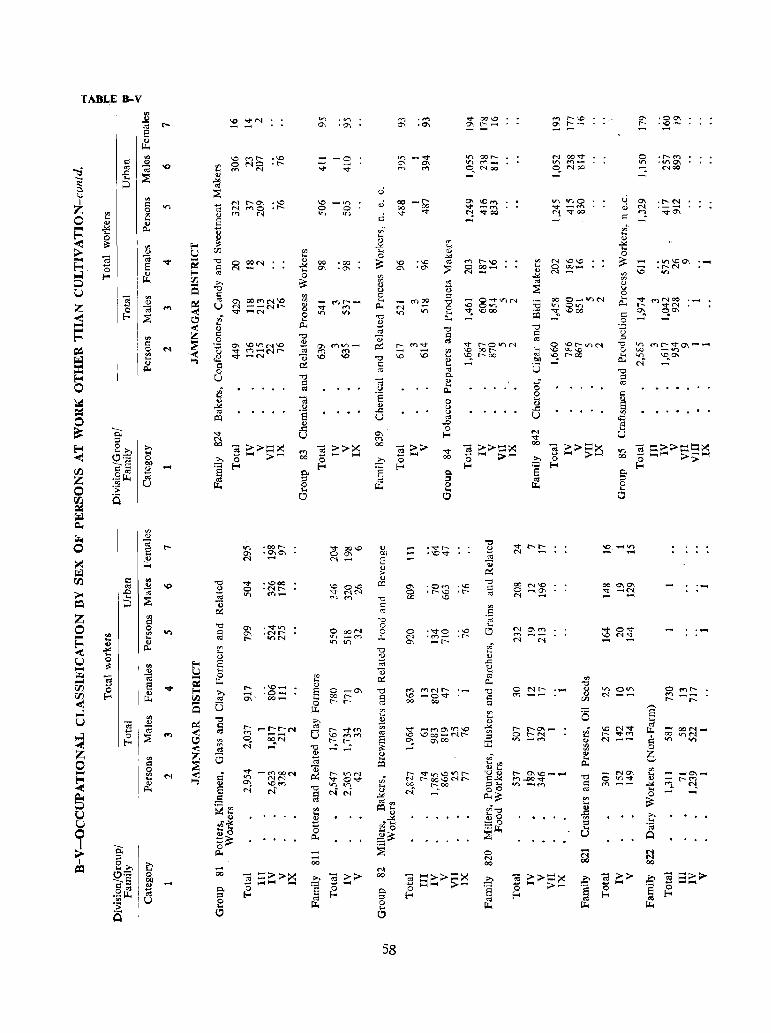
TABLE B'-V
til o o
\~
-00
--00
o ooN If\ _('f')
'" '"
58
--
~ ~62~~;e ~ ,,",00 -
.. ,
OJ :::»::::x: "'O~)o.o.! >~
f:-<
o N 00
c:i ex>
R OJ ~> .~ ~ Il.
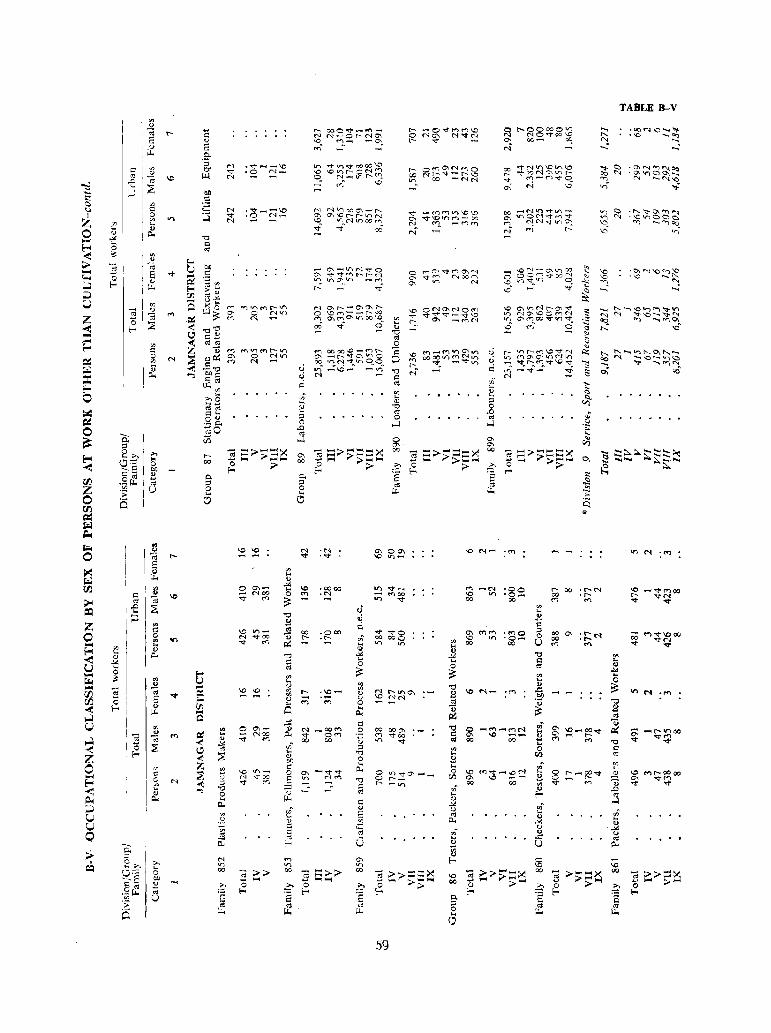
N
.~_-\O
.0 t"'-J ....... -
t:"--- 000-7-_f'I")_ N N-Or---No, ~.. ~,_ ....... 0;. ,., -
1"1 NV"IOOO\-r-'7\ 0\ \0 r-- [""-ol£) 1"'-..1 \0 V)('\JV"lWM
~ 'T" 00
.- O\-tJlN~O C'\ ~~r'it--r--N VI l.t')O'-V! _r""'}
r:"' -.tr
59
~ t--~8~£~ ~ 00...-1 os. N
"
TABLE B-V
B ~ :~;;;~;:;~ ,._, !"'I') ...... ~Cl:::l
\CO '"
'0\ f"'\l\o I\j '0 '\0 ...... ~
... ;
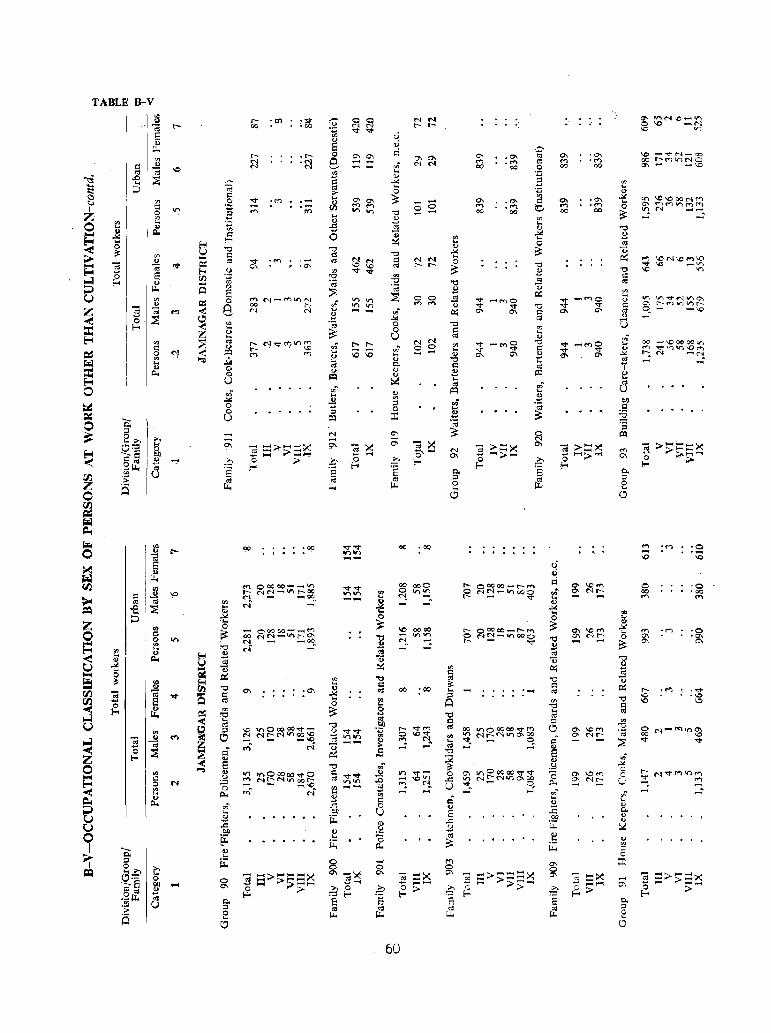
TABLE B-V
'3 --;a S ~
.",
'..0 .",oO",)oo'V~ ~ C',lI-N""'OO\O _ _ _\0
rri' N
O §! - ~
00 • 00
60
'" .0\ ..., .,.., 00 00
00 - \0 00 00 Irl "'" ~ ("'''1'1''1 \0 ro") 17-... N ....... C'"'!. -
:'"
o '0 00 '00 ..., ..,
'0 '0\
'"
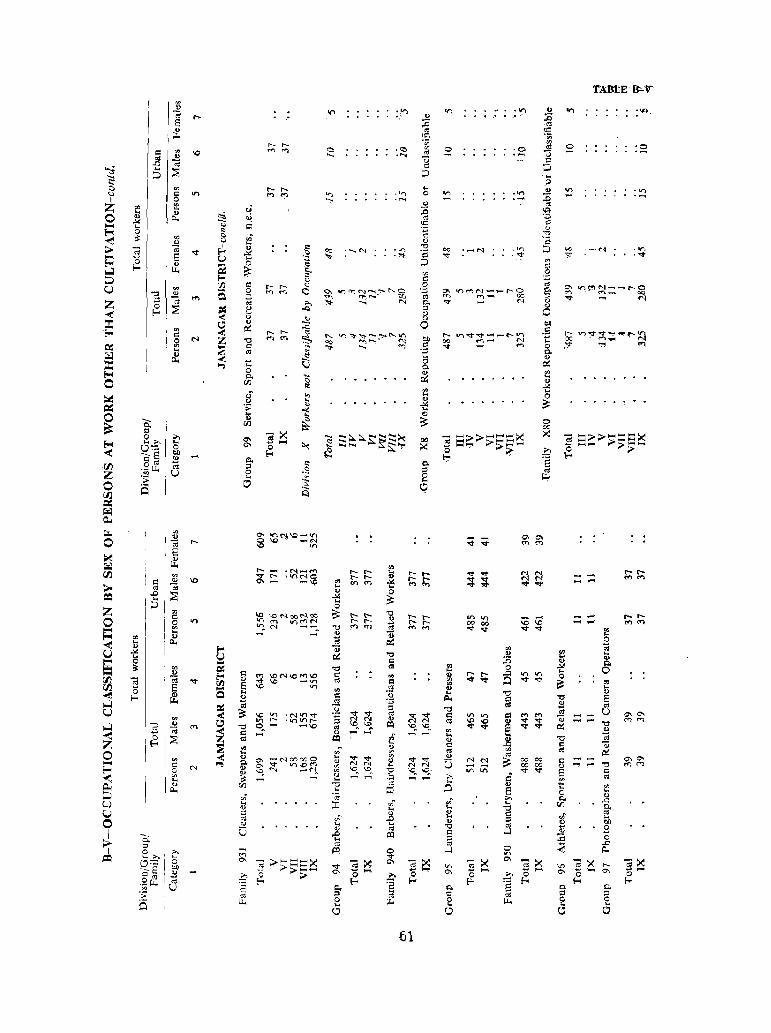
.~ ......
• ',> ......
~ l,tj~~~~~~~ ""':r- ....., ~
~ t!2 :~~~ -g 0.. '-'0
CO
61
.", . ' -
.<r>
:"'l .
:9
.v>
'00 -n~~~~~~ :;- ~ f"l
........ .... ....
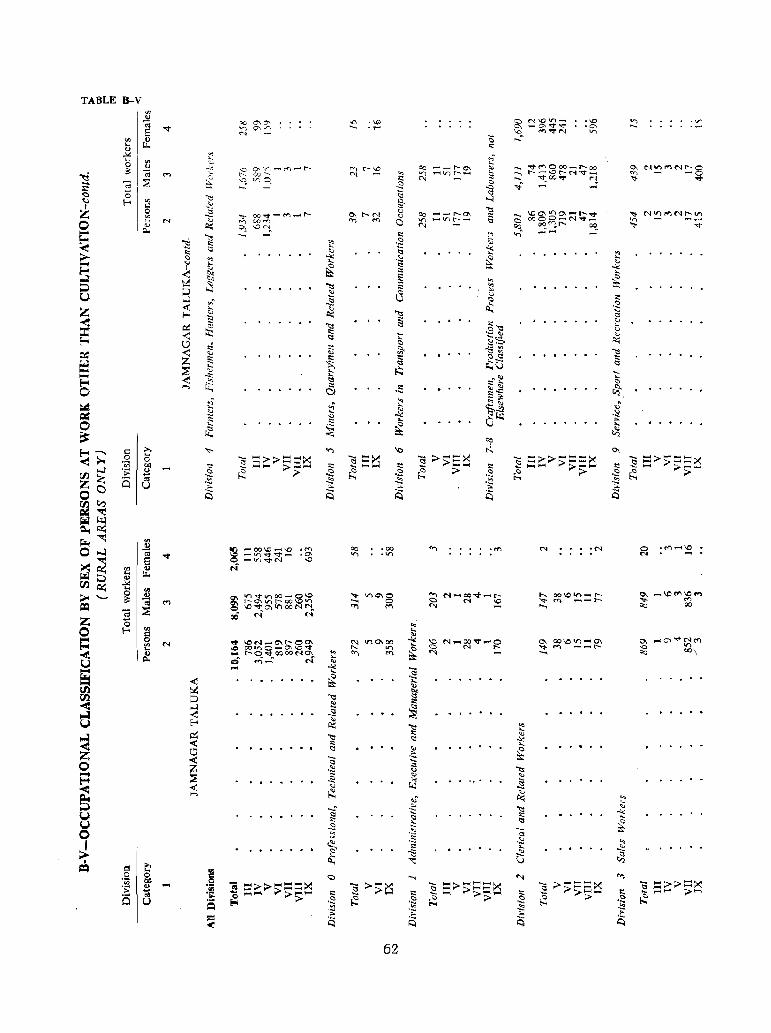
TABLE B-V <J> 'li "; '"" 0-,,,, 'C .", a N\CI,f)- • 'D ~ E ..". V)
'"' V)
..., ."... 0\ _0\""'-':;- '0-,
..... 'C. "''';-N V)
'" ~ <:; '""' ...
<!) '" ..I< t: '" '-<
'" 0 c. '-ss:
<!) ~ 'Cl o,VJ-M-f"'-.. "1 r-\O <0 -_t-O\ ;: ~ ~~OOO-I"---oo 0- NV')~~'n'_o
~ "; '"
,_ " oc r- '" ~ '" '" '1""""1 I.rl 1:-'1""""1 -, t-..-\Or--N-q-_
~ ~ ~o
:::E ,:J "'; V)O. :;:: '" ~ '" ""i.. """"oo~ ~ '<t
"; ± ·8 c :;:: "§ 't- -<::> 0 .", <=l ~ !-< VJ §<
....,
Z <:: ~ § ~ oo~_M ....... f' '" I--N " CO --f"--o,
.", \0 Q\ I.r) 0\ ... r··",,!~t ":to f'llf) r"H~\1 t'-- In .... " '" ...,
0 N " "'l 00 ,..., "1 «l 0 Vl ...... V)r-- <:! C OOOO_N~_ '" ~ --<!) ~ 0, \O"!. '" CO ~: __ r- ~ ":to "" Il-o f:: '"l:l '" '" <r)
":i '" l.': .8 " < " <:! " ~ "'" ;, ... ;:; <:> '" ....,
.~ ~ .... 'i' i:; ...
'" " f-! ~ ....,
< ~ '" .. S ~
::: '" "c <:> "<:! ::: '" :::: ;:J ...., ::: 13 '" u. u ...1
~ ~ ::> t:
Z < " Ii:; ·8 f-< ::: ~ "<:! <=l
-< ~ '" · " . :t: ~ "<:! <:! §'<l G
~ '" 1:: ._ '" '" E-< <:! ~$ ~ \.:) ,; c '" 1.;< '"5~
~ < '" ... . . · "<:! Z ~ . ~ '" c <:I t:
~ 2 <:! ~u <:!
= :::E '" !!; -..:::: f-! < ~
<:! .'" ... '" ... c
0 ,.., ::;j .;: . " ., ~ 01 i1:~
~ ~ ~ t: ,., '" .:; ~ '" ~
q;,~ .::: ~ '" 8~
0 · ~ .... · ,. . . ~
... · ~ ~ ~
00
E-< --. <:: :>. "I- .,.., '0 t!.. '" '-<
< >. .S: 0 'tj ::::;»:::::::~ .... :::~ Ci > .... :::;< ..., :::;» .... :::::::~ ..., :::;»~~~
~ '" b/) '" ~
........ ;>s: .... '" .l:! ........ '" ~ > ......... '" .l:! _ .... ;>;>_ .... t: ~ ~ ;;..-._,
00 .;;: ~ .;: .;: ~ .;: > .;: ~ > .8 ~ ;> (5 ~ .~ .~ .~ .~ .~ Z C u ;.. ;.. .::; .:;; .:;
0 i;i i;i ~ q ~ 00 ~ ~ ~ iioiI r.t.1 ~ >:.::;
~ ~ '"
0 ~ ~ 'It') ~oo\C_\.O .,..., "" .00 ..,., . ..., ..... 'N 0 .("I'j_\O ~ ..". 1.0 ....... lnq-...q-- .0\ '" .", N ~
§ £3 ~-",..". ..... '-0
~ '" <I) l"l .... ~ .., 00 ..I< >:.::; ...
'" ;;- .__ ~ ~ ~ lr'loo::::t"lI")OO-ol...O .... "'0\0
..,., N-co~_r--- r-.. oo\Otn_t'- 0- _\Qf'f'l\Cf"')
"" [-oO\tr)t-oo\OV"l ...... 0 C N IQ ..... <') ~~ ...... .... ..., ~ :::E <:> 1D",,:O\V)ooNN. ..,., M "l - ..... "" 00
"; ~ N ('I
Z 0 '" ~ 0 !-< <:: ~ E: ~ N
..,. ID..-.I_O\r--OO\ ~ "'''' 00 Ie N""",,OO~P""""IO 0- OO\O!lf1""'" 0'\ '" -cO\VN(1')
'"' ID COViO_O"II..O"d" '" ~ ~ N r-- .... '" -- ...... '0 on
-< ~ -1--0"<1"00001'10\ t ..,., M '""' 00 00') u. = ~.....:- N '" .... ~ .... s:: ... .l:! - < ~ ... . · · · CIl ~
II>
\I.! ;:J "<:! ~ -< ~ '" ....l ~ ~ < · -S! . · · . · U £-< II>
~ "<:! '" ~ :::: ... ~ "<:! II>
< :::: <:! '"'" i! . '- · \.:) · · ~ '" . ~ < 'tj
.::; 0
... Z .::: '" "<:!
i=! :::E t: ~ ~ . · ..:::: ~ ., . · . ~ « <> ~ ,.., ~ '" .;- ~ '" j;;;) '-,,' .;: "<:! '"' U · · ~ " · ....,
'-U " '" ~ .:;:: 0 '"' .~ ~
;l ~ .::; .:;: ~ · · · ~
.... . c ~ , ~
~ ~ v r5l ~ ~ '" .S: 0 .§ <;:) ..., '" '" b/)
'" <!) S .... ;>;> .... :::~~ "2 ;>s:e:s ..., =>--=:=>< Ci ;> ~-q::::g= ~ " S~;>~Q '> ~ ~ ::i_ ;>;>'""'- :::: :::: ~
- >;>;;- :::: ;»>'""' :::: ~ is Q ~ ~ U Eo< ;> .;: ~ ·2 .;: ·2
-:3 .~ .::J .:3
= " ~ "" .;: < i:S Ci c:.
62

RURAL
., ~ 00-. ~ ·0 . "" .-.t- ...., .., ~N~~N .1.0
'" Ol '<t ..,'" .'Q 'S .... QC v'O ..... \Otf"II .", ... ""' N 00 N v
E '" ~ ... :: ~ OJ
~ " -ci en i: "- "'N "- 00'" ~ ~ f1")8~~(1')\o~ '" ('1.., ...., ... ~ 0-.10"'00001'
t: 0 .,!,! ..,
~ ... on I' ""'
_ ... ... :::l '1"""1 OOQI:'"--~-\C~
a: '" "I- -N 2 '" ... ..... ("'"' ('!1C") Mv N
<;) :2 ~ .. '" _ ..
I:.> -;:a !"l '<:: "4 \ '0 ~ '" Z l- v-. ..s ~ § 0
s::: 'Q lI'\- '" "- <>C)o-. ~ ~~~;~'-O~ \0 Nv .... .... !"l OOQOOvOOf"') 0 N " ~ "".., '"
..., -..., "'l '" Q lO-.::t 0"1 a I.O\C> 0\ ..... .. I:< Nv 0 ~ I' €'I .... 1.0 ..,~ "",.. ~ ....
~ E- &! -.: ...;- ..; < '" '" :>- '" .2 :: ..... '1:i :: ti ~ :.: .S1 E- "i: .\1 '" ~
" i: ~ <:> ~ '" ~ ...:I ;;:J " '" '" ~ ~ I <;)
~ ~ l:l U « '-l
" - 0 ::t ~ .:; d <:> '" ~
2; :J ,_ Q:"t:I .~ ..s ~
...l "- ~ ~ 0: '"t! ",$ ::t ~ ~ '" ~ ~ ~
I- <::t .~ ~ ;: .<::; >-< ~ '" ...:I t: 13~ R:; ~ (5 ~ 0 .: <:> -§W '" ., flo "1::: ., 0 ~ ~
~ " <:>", § '" .....
~ ::r: <:s ct~ U A .., ~ ..,
t: -:it ~ 0 ~ .!:; ;::., <;)
"' ... ~ ~ ~ :.: ~ii1 .; :::
~- '" ~ '" ~ .;;: "i:: ~ C;SO
0 ... ~ 0'" t ~
~ ~ " ~ "" :.:: '" Eo< '"""'
"I- \0 ~ 0- '" -< ~ s::: ..... ~ =~ =» ..... ::n::~ - ~~
..... e .Q ... "ij -= S X .;;; Z =;:»~=~>< 0 ;: ... :: > ..... ;: ...... »> ..... ;:: ~ .§ ~ ,... .s: ....,..... >;;. ..........
rfJ ~ '" bJ) .::? ~ .~ ~ ;> .5:1 ~ .Si ~ ~ e .s; '" is > z is ~ .::, .::, .::, .::, .~ I-
0 0 u .;; '" .:; .:; .:; = ~ ~ ~ ~ ~ « rfJ 1/) =: ~ ~
p., ~ ... ~ ."
0 -..l <l.l
""' . '" fie 0'" ·co- .", "I- .-.t- .... -;:a or "'- 'N ..... ~ -.:: E ~ -v ~ § '"
OJ
'" ~ 00 (\)
C< ,;.:
.... .... ."
'- 0 (\) .., R: -("f\\C0'\ .. O'\ff"J"loc ....... t-oo ;:::: .... 0 o -"I!t1Ji .... -0 0- _00
~ a: ';;j N .... It) lI')r---.-V)\()NVl I' .... .... "> .,.. ~
Ill. .... [' ..-4 ff") .....
Z Ol ... '0 0 I-I~
~ .... :::i ~ -('f")\QC't QO O'!NIO'ONc-r--- '" --.t- ~ c --.;tv) -. -s <::> _OI E- N
N '" ~ OOOl .... IOIONoo oc "" ... ... .... ..... "" 'I)
-< ~ " N- - ~ ~ ~ ....,
;: f·f ...; U 8 ~ .... ~ """
I ... <C '" ~ .... .S:
,_ rfJ ::.: ~ ~ rfJ ::J <l ::.: "1:::
-< ...:I ~ ~ " ~ ~ .. ;;;l ..s ~ I- .. ...l U 0 ~ '" I:< "1::: t ~
~ ~ I- " ~ ...:I
'<:! <:l i: -< Cl . '" '" Z ~ 0 . . a .::: ~ ~ .0 p!; OJ 0 Z " ~
~ p:: .):t " "t:I .... )1 '" A =: " ~ E-< ~ '" . .;;: ~ ..s: ~
.l:! .. V ~ .; ~ ~
;;:J ~ 'ij ,. .... '"
U ~ '" ..,
=: a '. U l:: .S! .~ - ~ 0 ~ '" <:l
'" .::; .!:; '" I' ~ " .. ~ ~ ~ ~ '" .... -..:: li ~ .
~ I': .... .. 0 ...
~ 'in ~ j <::> .... '" ...,
.:; (\) -»=es - .... » .... ==>< - ~es .... ;> .... X ;>~ ~ :::~ a '" !: :I :=:.... »;:: ..... :: l':! =: 1:: > .... " ~ :.:: is .!:l ~ :; is ~ .!:l ~ .~ ~ .::? ~ .>? ~ ->
.r:J .::,
~ .~ .~
~ = .:; .:; .e;
< ~ I::) c::
63

TABLE. B-V
....
64
",N ....
'" . .,., .... . -
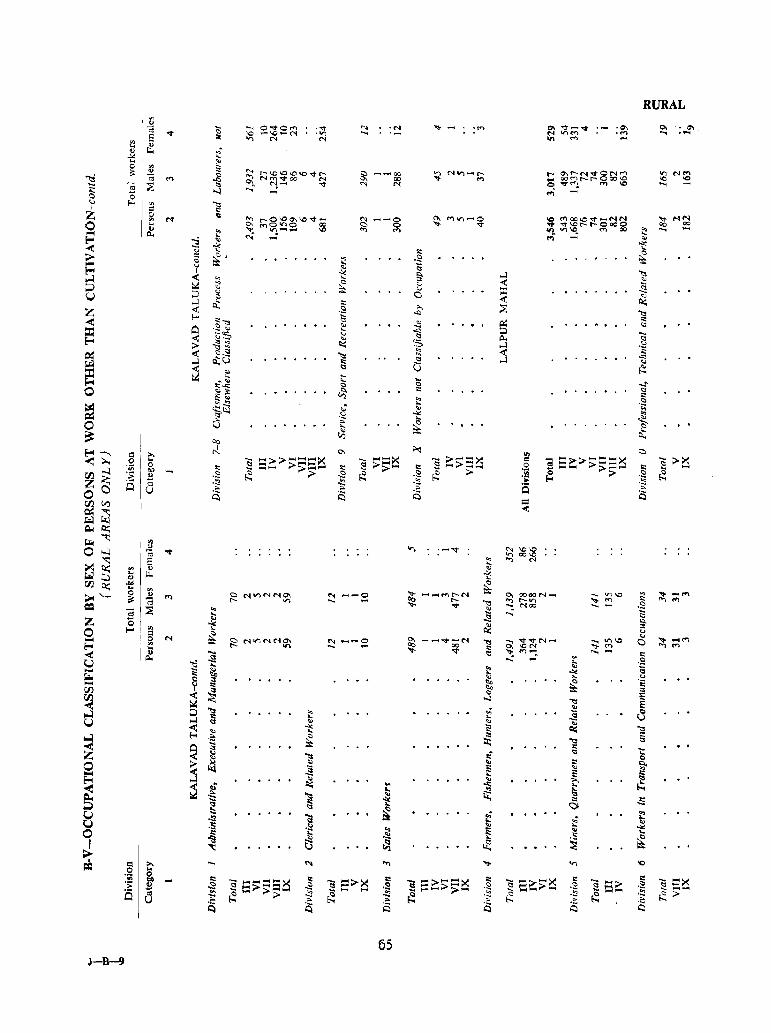
RURAL
" ct ~ '"" O-.tOM .",," '" 'N ~ - .,..., ~ """-v .0\ 0- '. 0\
""" '0 ..... I.,Q-~ ·on ..... "'...., ·M ..... .....
'" E it Or) '" N ~ M
'" d! ",' 0 -" ... ....
~ 0 '" ?:: 0) '" r-\CIr.C\.O\O~f' <::> ~-OO ~ ~'f')-""" I- "' .... N '<I" 0",,., :2 N((l ~ 0; <:l '" ..... ~
NMVOO N '" 00 M ... OQMr-r-OCOI"O
~ -;; ;Z '" "l,-""" '" N 0 "'3'~ f'I") \0 ..... -"'-l , ... ," ..; c a
" I- '" ~ I <= Z <:>
N I:
'" r-OI.O~\OVI""'l ~ ~ MI.t'\'I'""'IO \C ("I"jOCHo~_NN .... <'IN '" --0 0 ~
0- ("101(').0 00 0 '" .,. '<I"1Or-I-OooO 00 ~ .... ~ ":. "'1....-1...... \.0 '" ..... 1I't.1,()~ ~ CCI ~ ...... r-< ~ " '" .... <') ..
-t: ""< -< " :: .. :;> § ~. .
~ .~ ~ .... <.l Cl Eo< I ""< El< ..J 't:!
~ -( '" ,,_
" ;;> ~ '" ~ 0:; -( l§ '" " :I: ;:J '" v c 0 -< '" ..J d: .2 ~ z -( .2 ;z -< I-
~~ Cl .r:: ~
CI . '" ~ . \l
::t <:$ t; "'" :J .... E-o -( "
<:! Po <:! ;::. ~~ ~ % ...I .:,:
0:: < c,s '" < '" l ".,
"" ~ ..J Q;U . 0 ...I '"
::t -( .. <:s ~ ~
,,_ >:: E-o .'" '5 =:..., c -: 0 ~., . ~
=: . . '" =: ll:'" '" .:= ~ ~~ ..; ..
'" 1;l 0:: <:! .::: "t ~ 0 G '" ~ ....
~ ~ ~ 00
f-;--.... c:: >. r!. '" ;..:
'" a
<;:>.. 0 ... ] ..... ;::.;::. ............. ><: ....... ><: ] :> .... :::><: c
~ =~>~=~x ] :>~ .;;; 0 =: =~ ;»::=~ =: ."! :» ..... t! ....>~'""'" 0 'Ioo-t~ »~,...... =: .... ~
OIl 00. :~ .. .S: ~ :> .:= ~ .::1 ~ :> ';jl :> ·Sl ~ Z ~ .~ .~ .::; :e Eo< .~
0 C Q u .;: .::; .;: Q .:.: ~ ~ C) ~
00. CI) "< ~ ~ ~ ~ Q:;
~ ~ '" <J)
0 '-l 0; v .... :-~ ~ \0 . ., 00 1.0
"'li E ., N
X .. § '" 0) " ~
.... r... ""< 0) '-00. Q:; ... ~ ..
'" ;;.; '- 0 .. '" ~ C"IIJ")NNOI <"i ~-~ ~
.... ~~['.N '" 0000('1_ ..... 0£) 10 ., ~ -..... ~ C; '" ..... r- '" .... V') ~ "" s:: "" = ..,. 't:! ..... NOO ..... .:=
Cd ::E ::: ~ ...; <; Z 0 ~ ~ §-0 I- '" ~ <= ~ '"' .... ..... 0 M C NI.I'lNNOoI '" -~~ ~
-'I'""'4"'1t-N ~ ..... "IIt-vN- ..... "'10 0 ~ -'" E-o '" .... ..... .... 00
~ ION .... M ,., .... -< cl! .... ..,.
':! "'-:. ...... =: .l: ...; .... '" .S U "!:l ... ... '" ..... 1:: ~ ~ -"( '6
~ .. .~ ? <:s · ~ ~ ..... s:: =: 'JJ ~ '" -( c iE 'JJ "'-l '<:! -< ~
'I:s .; ~ E ,..;t ::> . '" . ~ ...I :: '- .... ~ U 1:1 '" ~ ..
fS -"( ct: 'I:s '" ..
,..;t .;: ~ ~ ::
'<:! <::
~ ~ -;; :: '" 'I:s r£ <:I !:: '" e
0 :> ~ ~ ~ :: f} :: '" E= j ~ t :: I:
'" ~ ~ < -( .~ ~ ., 'S !-;;; Iii .. ~ ~ 'I:s ~ '" g § ~ '" oS '01 U .
Ci ~ · . ~ ~ .!:l ~ U .!:; 0;: ~
0 -€ .,
~ ., ...
~ ~
~ ~ J '0:: . ti ~ · . ~ . § >. ..... <'0 ....,
"" '" 10 I:Q .. .;; ~ ., -=>==es lit
] =:>><: :: Q ... :> ..... ->:: =: ] S::-;>~ " ]
., ] :::>:: .:;: 2 .~ J:! .~
"" .... .S! t::1-1;>;;~ .S! .Sl ::::> .9 .... -i:S a .~ ~ .... :>s: .:"l ~ .~ ~ .~ ~ .~ ~
.... ,.., .~ ~ > .::; .;: .::; .;:, .;: .;: ~ ~ >=l >=l >=l Q
65 J-~
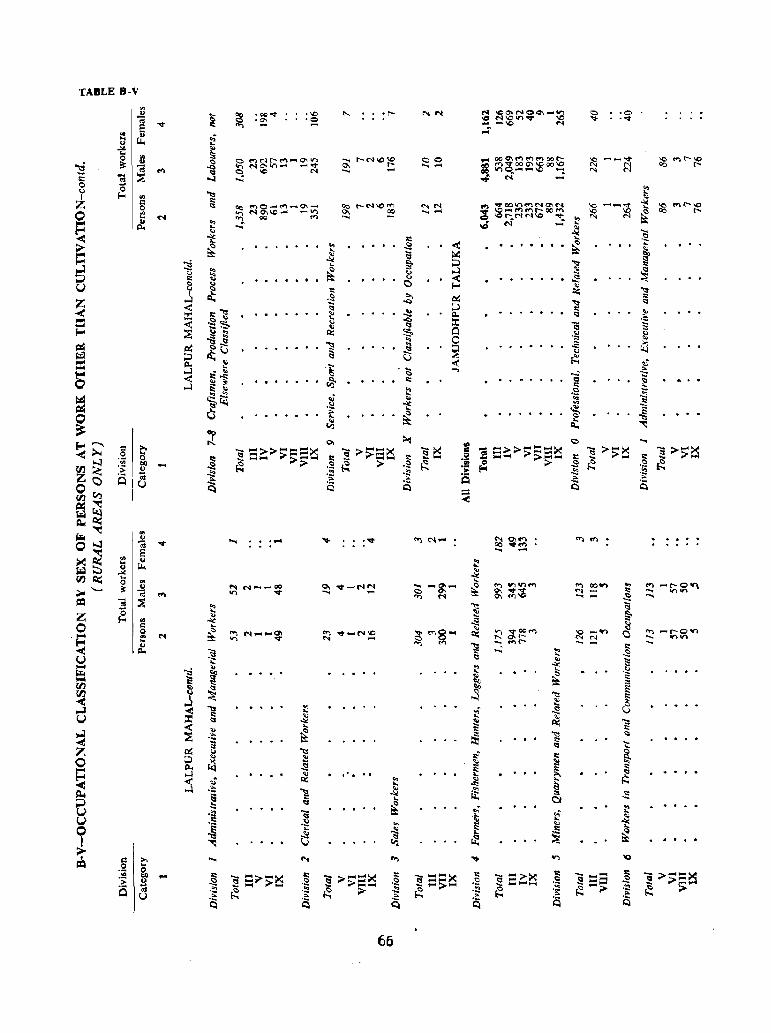
TABLE 8-V V>
" ~ ~ ·oo~ 'ID .... .r-- '"'IN N \OO\NOO\_~ C -0
«i ~
.;::: .~ ~ f'l\O"'''' \0 .... .~
E ,.. -\0 N ..
~ .; ....
~ '-.".
~ ... ., 0 ('f·I(·"~ r-- r"I ... 0"1 V) r--N"'~ OQO\t"')f""'IC'f')oot-
~ ~ .. ~ ~ .... CO ...
~ --~ ~ ... r--ID
~ Na..,Jn- "''<f' 0- ......... gg r;::&~~~~~ N .... .... <3 q ID N ..... - '" ;:: '3 ...;j .... ..; N -
0
" 0 ~ ~
I I-< ., Z § s:: ..
<3 CO f9\O ........ ~-O'.- CO t-NIC'" '"'IN ... OIIIS"OOIn~Nc!\« ~ -_'<I' ..\(
"" ..,r--\O
0 en ~ Na-.~ ....... -~ '" IX) ..... - .,. \O_rf'lf"l"lf""-oOOt'l"') ~ ~ CO r--... N oo ""
.... .::> IDr--N<'I'" ..... ~ ... ~
., ..; ~ C"i" ..:
~ ..
~ ~ ....
== . \:!
:: ~ - ~ .2 < :t .. ~ a ~ ~
~ ~ §- ::> ":! s::
';J <:.J
~ :t <> ..J ~ ~ :::: . . · . · <> < · . . .!:! U <:> 0
<.J I-< '" I ct ::: =c: ~
z: ..J .S! .s ~ '" < ... ::> l <;)
-< :::~ <:s
~ .. ::t: · · · ~ Q. · · . . <;;s
::c <:> '" .., .= < '~$ ~ c:s ::t: "a ::: f-4 ::E ~ ~ Ill:: ~ 0 .l; '"
~ "t'i,.!!_ ~ 0 ~ '" ~ J;U · · 1 ~ ~ · ~
::> " v ~ :::: jl.. ~ .t: «_ ,.; f-4 ..J iJ! ~ .... .~
-< <:> -.; 0 .. '" · · · ~ s:: · . . g ..J ~ ~
::::
~ .~ ~ .9 .~
~~ .. ., ~
..:.< ., .::: (> ... .. ~ .§ 0 · · . · · ~ ~ · . · . c
~ ;t ct ~
~>:' ~ QI ~ .. C .....
(:I
1! -» ........ -~ "§ >-::::x '2e5 III -; =» .... ::::::::x "§ > .... >< "a > .... x .2 0 ::: :::... »~ J:! ;> ....... ::: :; ...... » ....... I:: > .... Ii: > ....
{/J~ en OIl ·2 ~ .S: ~ > .S! ~ -s > .9 ~ .S; ~ .s: ~ .~ .~ .~ .2: I-< .!:) .~
ZC) is ot .~ .?; .i; Q .:::; ,.
~~ (,)
~ Q Q Q Ci ~
=~ ~C< ~~
I" f;I;t...:J I'; ..... ..... . ... ..... . ..,
"" ('4- ~ QI ..... ""'" . o~ E .... .,.~
;< § '" " ... ~ ~
~ ..
,..I( "" {/J C< ... ., ~ 0 ... "- ~ ~ '"'I ('1..-1","",00 QI v-I'I~ .... -8;- :t & .,.,"' .... ,... IX)tn ., .... -r--oV\ ... ... .,. ..... ~ ~$ .... s:: .... .,...,..
= ~ N ..... .~ ......
!! .. "<:! ~ Z 0 ... ..,
I-< ., ~ ... §-0 (:I ... .l:! '"
I! ~ "" N ...... ,...~ "" ~_N~ ~ "'8"" "" .,.., '<too ..... '0 _tn 0 "" ,"""C"OV'1 .... N t:c:
~ .,..,
'" "- o-r- ~ N ...... on on
"" '" 1'1 .... ..,r- .....
:"§ ...; ~ :::
U o::s .S; ... '" ~
6 "cl ~ . . . . :: . ~ .!,! i:! ~ ~ " rn t: >t
{/J ~ ~ ~ ~ ~
< j '-l '" ~
'" ~ a ~ ~ 1 .. ~ U <II <3 ...: ~ c.:; ":! < ..
~ '" ~ '" ~ .;:; ~ ":! <>
~ '" Z a:: '" "1::1 <::l t:
0 ::> .. '" " a:: ~ ~ .. '"
..,
~ jl.. ~ ~ ~ § ..J . . ~ . t-« ,; ~ '" t!:; .:, g
~ ..J .:;
l ~ ~ ;J g .. CI
.;: o::s
~ U .~ "a ",'
~ ~
U .5 .~ ·t ~
0 .§ ...
~ '" ~ a::
! ~
~ ~ ~ ~ "'"
I..i . . . . . .... • s:: >. .... .... .... .... .,., 10 = 0 ....
.;;; ~ - ;:: :::> .... x a:: ;;.- ..... :::x Ii: ::::::x ;:: "- :::>>< r:: -........ a:: 1 ;>;;:E~ :~ ,g .S:! '2 .£1 '2 ·s ] .S l:! :s ~
_ .... .9 ... > .... > ........ '"'> ... _ ........
-;; Q d .:;; ~
.:;; ~ ;;.- .~ ~ .~ ~ ~ .'::: ~ ;;.-
.:;:; .:;:; .:;:; .:;:; .i; .i; I:l I:l Q I:l Q Q
66
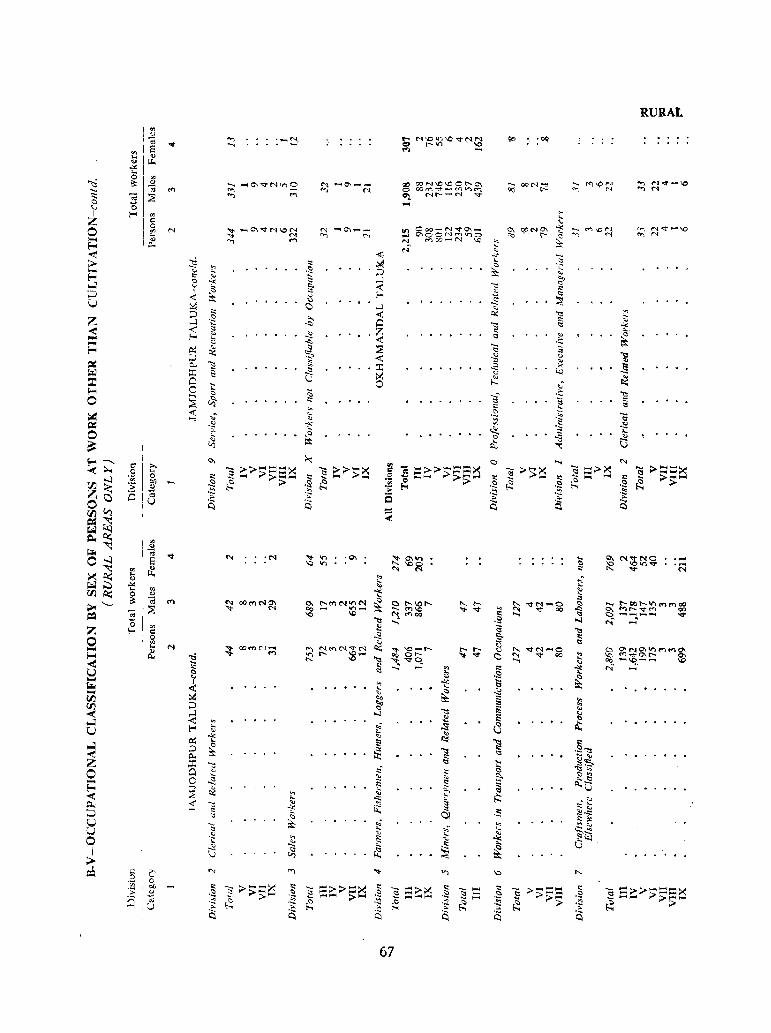
RURAL
111 ..., :-~ S N~:g\O..;-",~ 90 '00(1
'" "" ...,
'" E '" .... .,
" p;. ..:.: ....
'"<:l 0 "' N~-\O ~
., ..., .-I o\"'NIr') 0 ~ ~O'-. __
oc OON\CI\.OO","O"I ~ OONt=: .... ~\('~ ..., ... ~ <'I ::;; '" <:> OOr1"'l'oe::f"-MV":I~ ."., .,., N
::: -; ::E "" "l. r--tt--N "'" C> '0 .... <.)
~ I '"' I '" ... z § " Ooo_NvO\_ "'< <",>",N "" MV-\O 0 I~ N ~ _O\VN'O~ ~ -0'\ __
It) 0\ """'''' ... ~ N .... o-.OON('f')'nO co . '" ~ N ."., N ..... ' "" ."., «') N MCO-N \,,¢l " f-o !p... N '-
'" ~ ~, "" ~ :> ~ ::: ~ ~ .... " ::: ." ;::J ~ f-o " "- ~ ~ '"
.,., ...l ...;j u
~ §- -< .."
" '.:l I f-< "" ~ -< u
~ U " ~ <::> ...l '" ::J .§ ~ -< tl:; "" t:
Z ...l 0 0: "-'il "" '::! "" <t -< Z " ....
'"' '" .;:: <l '" ~ ~ " ..., -< "-
.?;! f-o ~ " <:! ::E <:l ':i
;:> tl:; ~ < ." " 1: ~ ~ "
'OJ p... "" :I: "" ~ li ~ :I: ::: .!:! u <:! U ::t! ~ '" ~ 0 ~ 0 ,,' I'>:; f-< 0 ...
<:: .~ ..... <:> ~ . "" 0 ::E ~ '" ~ " '" <:l "'1; '" '"
,':: ~ ,; '- ';;; .::; ~ ..... " ~ ." "'< .,
~ .~
:.. "- ..:::. ... 0 ~ ,<:> .
'" ~ ~
::: ~ "'I: V
~ - 0- :..: ., <:::> ..... '" >.. c: >. »,...~::::x > > ...... x ] ~»~~::=o »~ ] s>~ '2 >::::::x < .9 .... '"ii ] = ] 0 '" .... :>;;;- ......... '" .... > .... .e ~.... ;>;;;-:> " '" " >s: ......
S2 "' Ol) .~ ~ ;;;- .S:: ~ :e 0 .~ ~ .:;: ~ .S:: ~ 'JJ. .:;:
E Eo< Z is
.:; .~ .:; .:; .:; \:) as
'"' Q .::; ~ "" 0 u i:\ i:\ Q ;S rJj Co-)
~ c:: ~ ~
=- ~ "'
"" -.:: ~
oj
"" '" 'N "3- '1'1 .Q'I ~ ~ N'<tNO 0 ....:) S Q'lV) 'S Ie V) \00 10"' .... 'N ~ '" ~ '" N " .... fj ~
.... ::: €
., ..:.: " .... '" ~ ~ 'JJ. ~ 0 .,
'" :>; '- :l: til C'l '" OO«'>NO\
~ l"-M<'III'lN ~ C l"-\OI'- "'- r- "'- -.l'M-O <:> .... ~oct--V)C'lI"'lOO
::E "" M - "' .... ..... .... 10 "3- "" '" '" "" 00 "§ ~ r--~('I'"') 00 = Ol 10 '" <'100 ::: ..... ._-....... - "d"
'0 '1:! ....... ·9 '-l <-i .... Z f-< ~ ~ ~ '1:!
9 0 ..0:: g- " '" " <.l <l .... N ~ CXltf")N~ N<'IN'<tN .:.:: '<:)- ..... "'- ~N-O C O\NC'\~~ffjo\ ., "" "'I- ..... ..... <J
f-< p... ~ ..,
~ l' ~ ... 00 0 .... "3- "'" <::> '" ..,. 00 ::: '<:l M~o\r--. 0'1
< 1:: '1:! ~..qq ..... " 00 _~0"""1""" \Q
~ ..... '" t: .>( '" U <:> ... .:<;! ... '"
., ~ ....
<l: t .>( <:i roo. .... ....
~ ~ ~ .~
rJj ::: 1:l 0 ~ '" 00 '1:! ii: " < ~ '-l '" ~ E e
~ ., .
~ l-< .. ~ ~ d u " " .>(
~
~ ~ :... ~ "'= .§"" ::J ~ til ~ " p... '" ~'" . ::c "" '" 'i:: ~~
0 0 ~ t:: " '" " '" ~ ~ti .... 0 .!:! E: [ ~ I'I.,D ~ ..., " ,_ .
~ :2 tl:; t " ;- ,::; "" r£i:: § -< " " iE 1';
~ -:< '" .!; " '" ~ ClI E';::
U "i:; ..; ~
~ "";'; u ... " .;::_'" ." " <:1'-
0 '" ~ '" "i: ok) "- ~
~ I .;:: ~ ~ ;;.. V
I
'" ;;>. '" 'V) "'I- "" 'C ..:.. P=l 0 c; . iii .; CL :.: "i:; :> ....... x :.: -... ;::»:::x t: ] ~>>< " -... - " ~ >""",-"",", :.:
~ =>,>...-I~=>< 2 • S:: >;; .... .S;; \:! .S;; .S:: .::: - .2 ;> .... ,.... .9 i5 ~ ~
..... 1-1 > ...... .... ,.... .... ..... :> .... ~ -- ;>;;;-;;-d .:; .~ .~ ~ .:;
~ .~ ~ :> .::l ;,; ;.. .r:: .i:; .i:; i:S ~ i:\ ~ ;S Q
67
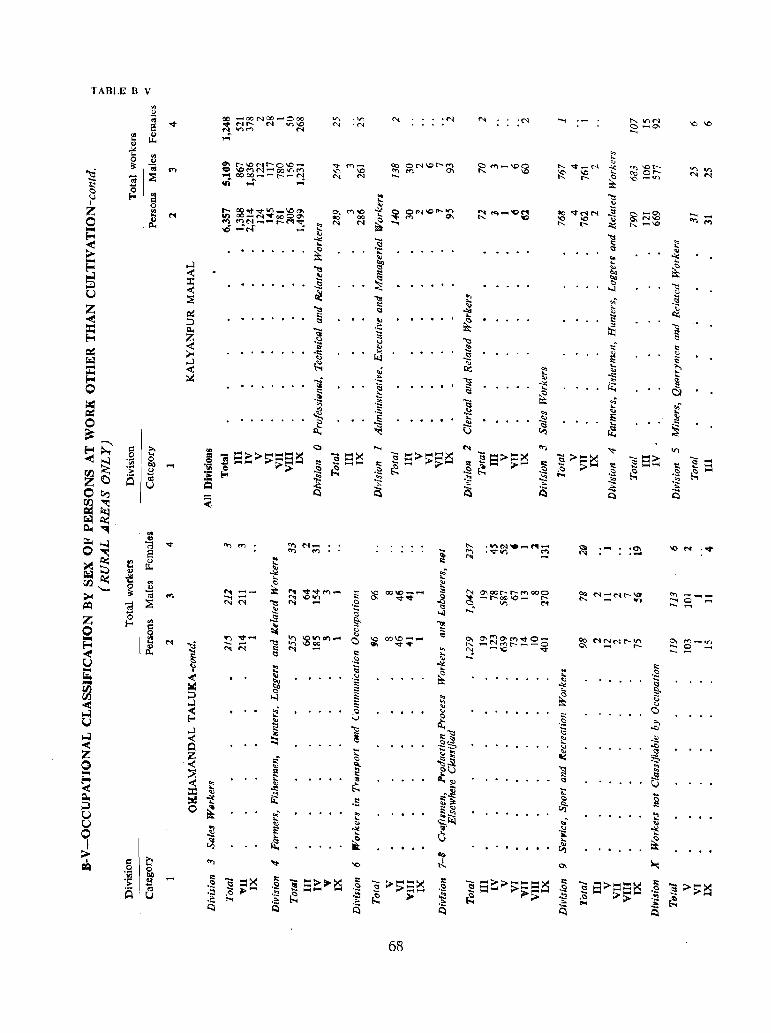
TABLE B-V
~ ~OOr--r-MQOO .... """"'11"'"--00\0_ r---a V'\ M ......
~ ~~~~:!~o '" -'" '<t ...:;
68
t: " ..... '<t"_N -'t
~ ~ ~
~ Qo ...... NN ~ ~ ~ ~
l
.0\ .-
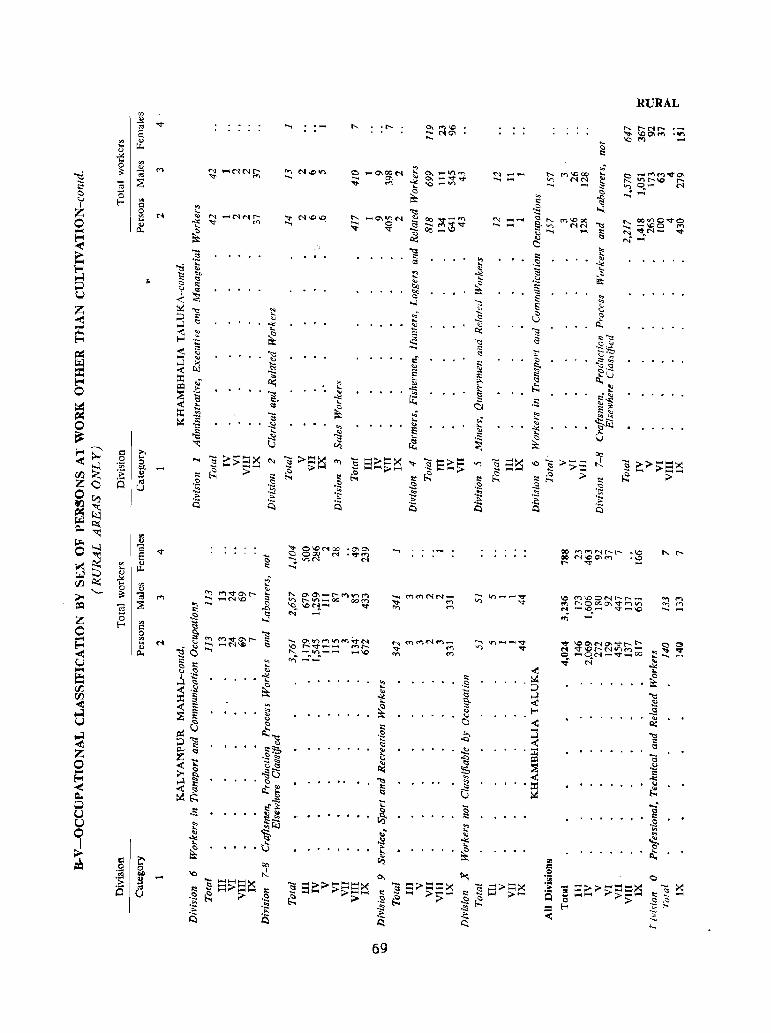
. .,_
~ ~~::!~~~~ r-.... -tn _ _. .-1\0 ~ ~ .. _:
69
RURAL
\C M\OON"""r-_ tf) f'-..;OOOo\"1"~V') ~ -\0 .......... V ...... 'o ..,
~ ~$~~~l;i!: o -ON~~-tOO ~ N
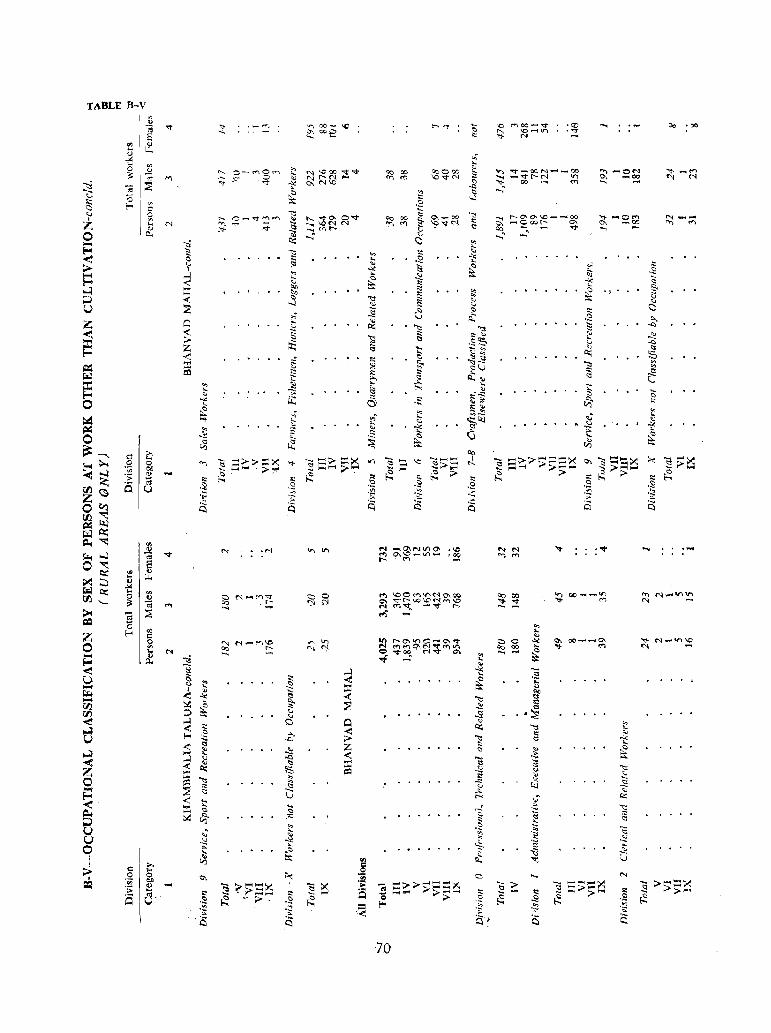
TABLE 8-V "' " .-~ .• 00-~ '<t '> 'r, '"
,..,..,. 'i; ~ MOC-..q- .ct> ...,
"" ."" '"" ", 002 \0 ..... on .::;
E -. 0: "1- N
~ J! ~ -;-0 '" ~ " "'- c;-.~Ol""'l '" 'Coo "<t'<t 00 oc 00000 "" ~-oc.N"""'''''''OO "" -ON "!- ..... "'" :: -;:; '"
. .._, ." C ~ & !'-<'I ...
'"' '" \()'<tN ::: ...... _vt---N V') 0>. -;?Z "l N
~ ::8 '" ..,.
~ N\O " .... 00 ..., -. :<i ~ .... ;
,", "0 ~ '" <:: ;;: 0:: '-4 C E-< ;S ·2 '-' 0 .._ C_~/"'Ii~ "1::
" '<:1"0. 0'<:1" ~ 0,-00 '"" ~C\a-.\C.,......-oo t '" ;:: 00 00 §- '"
..... .... .... 0'"" "< --... N "". ..,.. ;:;;: ..... \0<'1 N 'D '"" '9"1"<'1 0\ _OQl'Jor- 0\ '" _00 '" '" GJ :<>- ~ .... "" .... I.J <:I co - ..,. -. 0 Cl., ...; I.J ....,. _. ..... l
~ <::I ~ ~ "'" '" >:: " <: . ::: ... .!';: 't: y ,. '" >- ~ 1ii ~ '" " '"" >-l '" "- ·2 ... .>: OJ !-> ~ ~ ~ ::: "'" ~ '-....:l ::r: ::::
'" ~ .. ~ S ;:," ~ '" <J ;;J ~ ":l " U :::2
o...l ~ " '-'
..8 d ~ " <::I
Z 0 ~ '" ,~ ._2
.?:: ro:; ":l 't1 ~ <: <:
~ § ",,,, ~
~ :> ~ ,2~ ~
Z <::: '€ ~ '" '" <:S .(
<.l", ~ ;<; ::c '" '" ~ ~..8
._ ~ ;, ":l " '" :;:v '" IiIil IX) £: 0: :: § -8
'- "" <:I 1:>,,, v =: ~ " .. ~ '-~ ~
,._ " ~ ~ '" ."" <;
'" ,15 ~ '" ~ 0 Cll " ~
~~
~ f .; l:: "'- .: ] '" ... "" o;;.~ . . _~
~ "" " "'" <:S .. ~ ;.:;
~ ... G
,. '-
0 ._
~ " ~ ~........,. 0 tZ; ~
a >. co ... ";j :::::>~::::x - ~> =>< ~ ..... -.... ,.... I - ~»,....~~x ..... ~=x >.: <; .... ~
~ >.. 0 0 '" "'" ~~~;;>~
on .... 'C ~>~ h l:! :::H ;>;;. ......... 0\ ~ :> ....
~ .;;; O/J
~ ......... :>~ 1-< :>;;; .... ~ ':; Q) ~ ~ ;;. ~ ;;. ~ 0; '" '" £.;:; :e =: =: s:: >::
r/1 A u ,~ c :8 .S? .2 .2 .:'\< ~
.;;; ,~ .::; .~ .~ .~ Z ';: .~ '"
.,._ ,_ ._ .. ~ 0 v, Q Q q t:::l is i5
r/1 ~ ~ fi;I;"l 0::< ~ -.::
I~ N ·N .,., If> N -.O\Ntrl.O\ .\0 .... N .... ''<:1" ..... ~ ....;) "'<I' ,..., ~\O_I.r)_ ~~ ..., ..., 0 -.:: e .... ...,
Q:; ... ., ... IJ. ~ ~ <)
.>Ii ~ 0:; .... '" '" 100<">\()N 0, 00 00 0 .£ c r.J.-('fj~ Cl 0 ~ 00 ~ QO~~\I) ~ NI"""IVJ~ '- :;: "" .!: ':i ':I C\ Vt-OO~MM\C ;::!;
..., <d '" .... "i ~"d' ... '-"V r-.,. ..... ;;.. - ;; = g .., -
0 '" Z E-< (Jj .... I:: '"
0 0 '" f"'I_m\O '"
\() It) ['.0\ V'l.Q-O\q- C 0 -'< ~ QO_~O\ .... M~V1\O
'" "" .... '" '" N ~~O\~~"'l~ O;J ;?Z
,_ <"l '" '"' '" N ~ ~ .... " '""" '" .....
E-I Cl., ~ of '-
" <: g .... "'" ... .~ U <:>
~ i::! < ~ <> ·2 ..... J :::c: "" j;;r;, < ..!:< ~ < ~ - ~ :, ~
'1::! '" r/1 ~ ~
::> ~ " .~ V1 " ..>l -< ~ .§
a Cl " '" ,.;; <: ~ ~ ,_ E-< '" '" '" U ~ "" ;;. '1::! " "" <: z ~
.. ..:i '" ~
., ,<:l
::1 '- < .?;: =-I.J -c ..., <: ~ '" '" :::c: lij ~ z :::c:
~ I:; p:l .>: " "" '" =: " "-g t:!l '1::! '" ..:;, '" :§ >:: a '-' l.;j
E-< ::E <;: ?:: "-
-< <C ';;: ·f ro:;
:::c: ... "" ~ '" " ~
i:J ~ ~ ."=' '" ~ §
;:: .~ u .:; " ~ ,;:; <;
U .;;: "'" ,::; "
0 .. .... "& ~ ';::
.... ,<:> . -":
J t}5 =- ~ ~ "t V ;>,
C k .~ 0 0 0\ ;:..; CO> N I ';;; OJ) .~ ~ 2 "§ ~;;a~ "§ x ~>->~=::::x -> "ij =:s:=x -»~~ ':;: a· s:: ::: .... is ~ .... ~ », .... .,. .... ::: ::: ...... =:: ...... ;;. ...... >:: .':l
Q ,~ ~ .. ;;. . .!'; ~ Q :> ,S? ~ .:'\< ~ .S? ~ .~ .~ ~~
... .t: .~ ,~ .. .;; :. ". .. c; Q Qi ~ is
70
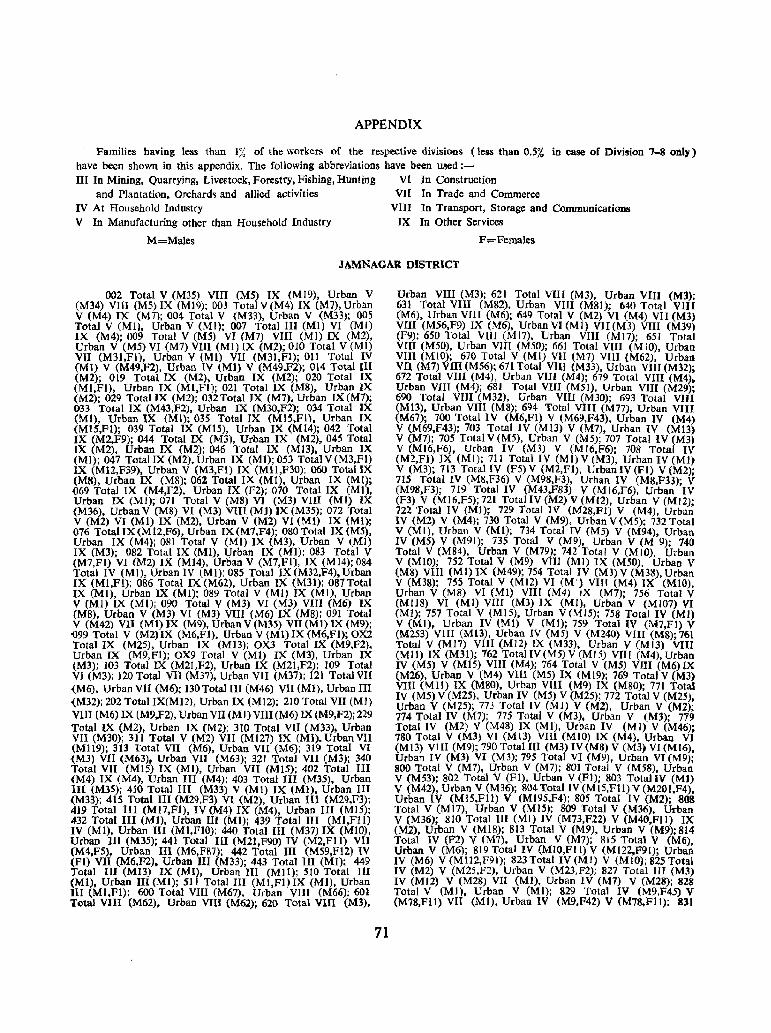
APPENDIX
Families having less than 1% of the workers of the respective divisions (less than O.S% in case of Division 7-8 011.1),) have been shown in this appendix. The following abbreviations have been used:-III In Mining, Quarrying, Livestock, Forestry, Fishing, Hunting VI In Construction
and Plantation, Orchard~ and allied activities VII In Trade and Commerce IV At Household Industry VIII In Transport. Storage and Communications V In Manufacturing other than Household Industry IX In Other Services
M=Males F=Females
JAMNAGAR DISTRICT
002 Total V (M35) VIII (M5) IX (M I 9), Urban V (M34) VIJI eMS) IX (MI9); 003 Total V (M4) IX (M7), Urban V (M4) IX eM7); OOt Total V (M33), Urban V (M33); OOS Total V (Ml), Urban V (MI); 007 Total III (MI) VI (MI) IX (1\14); 009 Total V (MS) VI (M7) VIII (MI) IX (M2), Urban V (M5) VI (M7) VIII (MI) IX (M2); 010 Total V (MI) VII (M3I,FI). Urban V (MI) VII (M3I,FI); 011 Total IV (MI) V (M49,F2), Urban IV ~MI) V (M49,F2); 014 Total III (M2); Ot9 Total IX (M2), Urban IX (M2); 020 Total IX (MI,FI), Urban IX (MI,FI); 021 Total IX (M8), Urban IX (M2); 029 Total IX (M2); 032 Total IX (M7). Urban IX (M7); 033 Total IX (M43,F2), Urban IX (M30,F2); 034 Total IX (Ml), Urban IX (MI); 035 Total IX (MI5,Fl), Urban IX (MIS,FI); 039 Total IX (MIS), Urban IX (M14); 042 Total IX (M2,F9); 044 Total IX (M3), Urban IX (M2), 045 Total IX (M2), Urban IX (M2); 046 Total IX (MI3), Urban IX (MI); 047 Total IX (M2), Urban IX (Mt); 053 Total V (M3.FI) IX (MI2,F39), Urban V (M3,FI) IX (Mll,F30); 060 Total IX (MS), Urban IX (MS); 061 Total IX (Ml), Urban IX (Ml); {)69 Total IX (M4,F2), Urban IX (F2); 070 Total IX (M!), Urban IX (M!); 071 Total V (M8) VI (M3) VIII (MI) IX (M36). Urban V (M8) VI (M3) VIII (MI) IX (M35); 072 Total V (M2) VI (MI) IX (M2), Urban V (M2) VI (M!) IX (Mi); 076 Total IX (MtZ,F6). Urban IX (M7,F4); 080 Total IX (M5), Urban IX (M4); 081 Total V (MI) IX (M3), Urban V (MI) IX (M3); 082 Total IX (M!), Urban IX (Ml); 083 Total V (M7,Fl) VI (M2) IX (M14), Urban V (M7,FI), IX (M14); 084 Total IV (MI), Urban IV tMl): 08S Total IX (M32,F4), Urban IX (Ml.F!); 086 Total IX (M62). Urban IX (M3!); 087Total IX (MI), Urban IX (MI); OS9 Total V (M!) IX (MI). Urban V (M!) IX (MI); 090 Total V (M3) VI (M3) VIII (M6) IX (MS). Urban V (M3) VI eM3) VIII (M6) IX (MS); 09! Total V (M42) VII (MI) IX (M9), Urban V (M35) VII (MI) IX (M9); ~99 Total V (M2) IX (M6,FI). Urban V (MI) IX (M6,FI); OX2 Total IX (M25). Urban IX (MD); OX3 Total IX (M9.F2), Urban IX (M9,Fl); OX9 Total V (MI) IX (M3), Urban IX (M3); 103 Total IX (M2I,F2), Urban IX (M21,F2); 109 Total VI (M3); 120 Total VII (M37), Urban VII (M37); 121 Total VII (M6), Urban VlI (M6); 130 Total III (M46) VII (MI), Urban III {M32); 202 Total IX(MI?), Urban IX (MI2); 210 Total VII (MI) VIII (M6) IX (M9,F2), Urban Vil (MI) VIII (M6) IX (M9,F2); 229 Total IX (M2). Urban IX (M2); 310 Total VII (M33), Urban VII (M30); 311 Total V (M2) VII (MI27) IX (MI). Urban VII (M119); 313 Total VII (M6) , Urban VII (M6); 319 Total VI (M3) VII (M63), Urban VII (M63); 321 Total VII eM3); 340 Total VII (MI5) IX (MI), Urban VII (MIS); 402 Total III (M4) IX (M4), Urban III (M4); 403 Total III (M35). Urban HI (M3S); 410 Total III (M33) V (MI) IX (MI), Urban III (M33); 415 Total III (M29,F3) VI (M2), Urban III (M29,F3); 419 Total III (Ml7,Fl), IV (M4) IX (M4), Urban III (MIS); 432 Total III (MI), Urban III (MI); 439 Total III (MI.Fll) IV (MI). Urban III (MI,FIO); 440 Total III (M37) IX (MIO). Urban III (M35); 441 Total III (M21,F90) IV (M2,FII) VII (M4.F5), Urban III (M6,FB7): 442 Total III (M59,FIZ) IV (FI) VII (M6,F2). Urban III (M33); 443 Total III (Ml); 449 Total III (MI3) IX (MI), Urban III (MJl); 510 Total III (MI), Urban III (MI); 511 Total III (MI,FI) IX (MI), Urban III (MI,Fl); 600 Total VIII (M67), Urban VIII (M66); 601 Total VIII (M62). Urban VIII (M62); 620 Total VIII (M3),
71
Urban VIII (M3); 621 Total VUI eM3). Urban VIII (M3); 631 Total VIII (M82), Urban VIII (MSI); 640 Total VIII (M6), Urban VIII (M6); M9 Total V (M2) VI (M4) VII (M3) VIII (M56,F9) IX (M6), Urban VI (MI) VII (M3) VIII (M39) (F9); 650 Total VIII (MI7), Urban VIII (MI7); 651 Total VIII (M50). Urban VIn (MSO); 661 Total VIII (M 10), Urban VIII (MIO); 670 Total V (MI) VII (M7) VIII (M62). Urban VII (M7) VIII (M56); 671 Total VIII (M33), Urban VIII (M32); 672 Total VIII (M4), Urban VIII (M4); 679 Total VIII (M4). Urban VIII (M4); 6S1 Total VIII (MSI). Urban VIII (M29); 690 Total VIII (M32), Urban VIII (M30); 693 Total VIII (MI3), Urban VIII (M8); 694 Total VIII (M77). Urban VIII (M67); 700 Total IV (M6,FI) V (M69,F43), Urban IV (M4) V (M69,F43); 703 Total IV eM 13) V (M7), Urban IV (M13) V (M7); 705 Total V (M5), Urban V (M;); 707 Total IV (M3) V (MI6,F6), Urban IV (M3) V (MI6,F6): 708 Total IV (M2,FI) IX (MI); 711 Total IV (MI) V (M3), Urban IV (MI) V (M3); 713 Total IV (FS) V (M2,Fl), Urban IV (FI) V (M2); 715 Total IV (M8,F36) V (M98,F3), Urban IV (M8,F33); V (M98.F3); 719 Total IV (M43,F83) V (MI6,F6). Urban IV (F3) V (MI6,F5); 721 Total IV (M2) V (MI2), Urban V (MI2); 722 Tota] IV (MI); 729 Total IV (M28,FI) V (M4), Urban IV (M2) V (M4); 730 Total V (M9), Urban V(M5); 732 Total V (MI), Urban V (M!); 734 Total IV (M5) V (M94), Urban IV (MS) V (M91); 73S Total V (M9), Urban V (M 9); 740 Total V (M84), Urban V (M79); 742 Total V (MID). Urban V (MlO); 7S2 Total V (M9) VUI (MI) IX (M50), Urban V (M8) VIII (MI) IX (M49); 754 Total IV (M]) V (M38), Urban V (M38); 755 Total V (MI2) VI eM') VUI (M4) IX (MIO), Urban V (MS) VI (MI) VII! (M4) IX (M7); 756 Total V (MilS) VI (MI) VIII (M3) IX (MI), Urban V (MI07) VI (MI); 757 Total V (MIS), Urban V (MIS); 758 Total IV (MI) V (MI), Urban IV (MI) V (MI); 759 Total IV (M7,FI) V (MZ53) VlII (MI3), Urban IV (MS) V (M240) VIII (M8); 761 Total V (MI7) VlII (MI2) IX eM33), Urban V (MI3) VIII (Mil) IX (M31); 762 TotallV (MS) V (MIS) VIn (M4). Urban IV (MS) V (MI5) VlII (M4); 764 Total V (MS) VIII (M6) IX (M26), Urban V (M4) VlIl (M5) IX (M 19); 769 Total V (M3) VIII (MIl) IX (MBO), Urban VIII (M9) IX (M80); 771 Total IV (M5) V (M25). Urban IV eMS) V (M25); 772 Total V (M25), Urban V (M25); 773 Total IV (MI) V (M2), Urban V (M2); 774 Total IV (M7); 775 Total V (M3), Urban V (M3); 779 Total IV (M2) V (M48) IX (MI), Urban IV (MI) V (M46); 780 Total V (M3) VI (MI3) VIII (MIO) IX (M4), Urban VI (MI3) VIII (M9); 790 Total III (M3) IV (MS) V (M3) VI (MI6). Urban IV (M3) VI (M3); 795 Total VI (M9), Urban VI (M9); 800 Total V (M7), Urban V (M7); 801 Total V (M58). Urban V (MS3); 802 Total V (PI), Urban V (FI); 803 Total IV (M1) V (M42), Urban V (M36); 804 Total IV (M 15,Ft I) V (M201.F4), Urban IV (MI5,Fll) V (MI95,F4); 805 Total IV (M2); 808 Total V (MI7), Urban V (MI5); 809 Total V (M36), Urban V (M36); 810 Total III (MI) IV (M73,F22) V (M40,FIl) IX (M2). Urban V (MI8); 813 Total V (M9), Urban V (M9); 814 Total IV (F2) V (M7), Urban V (M7); 815 Total V (M6), Urban V (M6); 819 Total IV (MIO,FII) V (MIZ2,F9I); Urban IV (M6) V(M1l2,F91); 823Total IV(M!) V (MI0);825Total IV (M2) V (M25,F2), Urban V (M23,F2); 827 Total III (M3) IV (MI2) V (M28) VII (M!). Urban IV (M7) V (M28); 828 Total V (MI), Urban V eMI); 829 Total IV (M9,F45) V (M78,Fll) VII (MI). Urban IV (M9,F42) V (M78,Fl1); 831
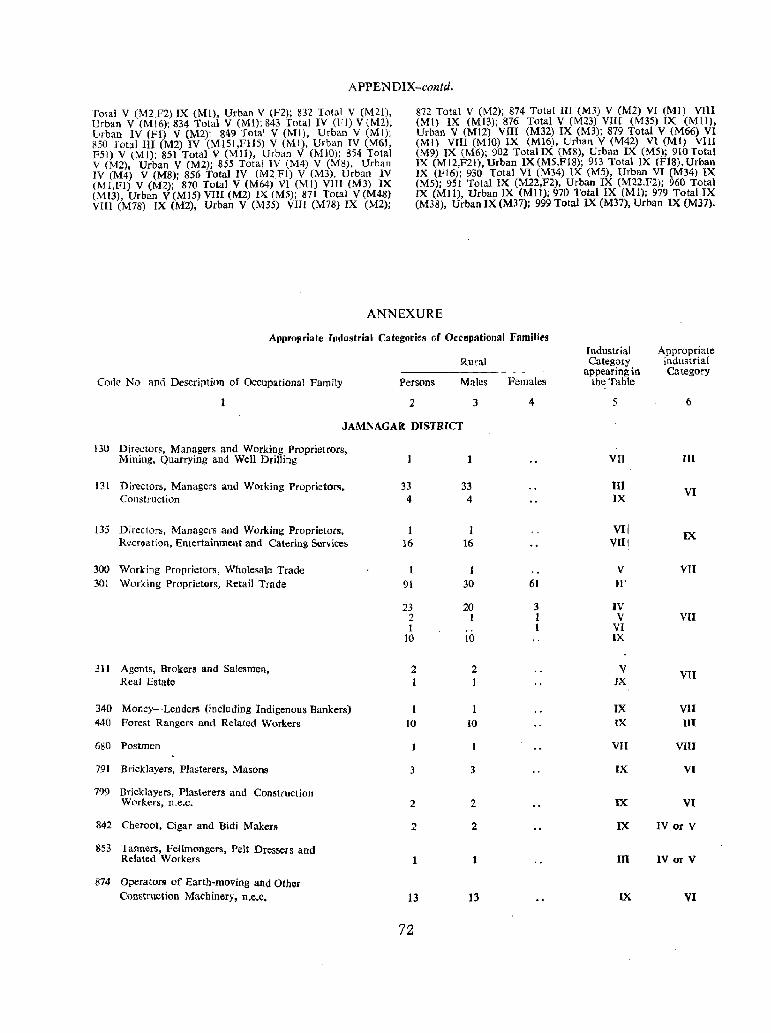
APPENDIX-contd.
Total V (M2_F2) IX (MI), Urban V (F2); 832 Total V (M21), Urban V (MI6); 834 Total V (MI); 843 Total IV (F I) V (M2); Urban IV (Fl) V (M2); 849 Total V (MI), Urban V eMI); 850 Total III (M2) IV (MISI,FllS) V (MI), Urban IV (M61, PSl) V (M1); 851 Total V (Mll), Urban V (MlO); 8'54 Total V (M2), Urban V (M2); 855 Tota! IV (M4) V (M8), Urban IV (M4) V (M8); 856 Total IV (M2 Fl) V (M3), Urban IV (Ml,Fl) V (M2); 870 Total V (M64) VI (MI) VlII (M3) IX (M13), Urban V(MI5) VIII (M2) IX (M5); 871 Total V(M48) VIII (M78) IX (M2), Urban V (M35) VIII (M78) IX (M2);
872 Total V (M2); 874 Total III (M3) V (M2) VI (MI) VIII (M!) IX (M13); 876 Total V CM23) VII[ (M35) IX (MIl), Urban V (MI2) VIII (M32) IX (M3); 879 Total V (M66) VI (MI) VIII (MIO) IX (MI6), Urban V (M42) VI (MI) VIII (M9) IX (M6); 902 Total IX (M8), Urban IX (M5); 910 Total IX (M12,F21), Urban IX eM5,Flg); 913 Total IX (FIS), Urban IX (F16); 930 Total VI (M34) IX (MS), Urban VI (M34) IX (M5): 951 Total IX (M22,F2), Urban IX (M22,F2); 960 Total IX (Mil), Urban IX (Mll): 970 Total IX (MI); 979 Total IX (M38), Urban IX (M37); 999 Total IX (M37), Urban IX (M37).
ANNEXURE
Appropriate Indllstrial Categories of Occllpational Families Industrial Appropriate
Rural CategoIY industrial appearing in Category
Colle No. and Description of Occupational Family Persons Males Females tbeTable
2 3 4 5 6
JAMNAGAR DISTRICT
130 Dire_ctors, Man::gers and Working Proprietrors, Mmmg, QuarryIfig and Well Drilling VII III
131 Directors, Managers and Working Proprietors. 33 33 III Construction 4 4 IX
VI
135 Directors, Managers and Working Proprietors, 1 VII Rccr(jCation, Entertainment and Catering Services 16 16 VIII
IX
300 Working Proprietors, Wholesale Trade I V VII 301 Working Proprietors, Retail Trade 91 30 61 JI'
23 20 3 IV 2 I I V vn 1 I VI
10 10 IX
311 Agents, Brokers and Salesmen, 2 2 V Real Estate I I JX
VII
340 Money-Lenders (including Indigenous Bankers) IX VII 440 Porest Rangers and Related Workers 10 10 IX HI
680 Postmen VII VIlI
791 Bricklayers, Plasterers, Masons 3 3 IX VI
799 Bricklayers, Plasterers and Construction Workers, D.e.c. 2 2 IX VI
842 Cheroot, Cigar and Bidi Makers 2 2 IX IV or V
853 Tanners, Fellmongers, Pelt Dressers and Related Workers 1 III IV or V
874 Operators of Earth-moving and Other Construction Machinery. n.e.C. 13 13 IX VI
72
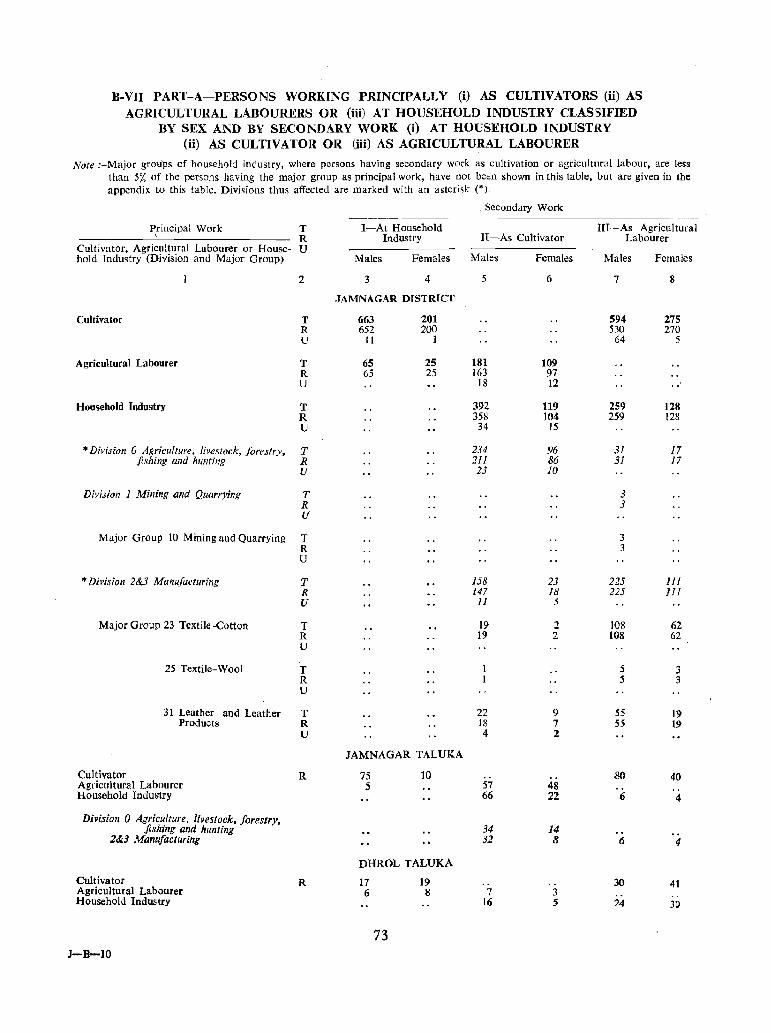
B-vn PART-A-PERSONS WORKING PRINCIPALLY (i) AS CULTIVATORS (ii) AS AGRICULTURAL LABOURERS OR (iii) AT HOUSEHOLD INDUSTRY CLASSIFIED
BY SEX AND BY SECONDARY WORK (i) AT HOUSEHOLD INDUSTRY (ii) AS CULTIVATOR OR (iii) AS AGRICULTURAL LABOURER
Note :-Major groups of household industry, where persons having secondary work as cultivation or agricultural labour, are less than 5% of the persons having the major group as principal work, have not bet:n shown in this table, but are given in the appendix to this table. Divisions thus affected are marked with an asterisk (*).
Secondary Work ~--------
P,rincipal Work T I-At Household III-As Agricultural R Industry II-As Cultivator Labourer
Cultivator, Agricultural Labourer or House- U hold Industry (Division and Major GrouP) Males Females Males Females Males Females
2 3 4 5 6 7 8
JAMNAGAR DISTRICT
Cultivator T 663 201 594 275 R 652 200 530 270 U 11 I 64 5
Agricultural Labourer T 65 25 181 109 R 65 25 163 97 U 18 12 .,
Household Industry T 392 119 259 128 R 358 104 259 128 U 34 15
* Division 0 Agriculture, livestock, forestry, T 234 96 31 17 fishing and hunting R 211 86 31 17
U 23 10
Division 1 Mining and Quarrying T 3 R 3 U
Major Group 10 Mining and Quarrying T 3 R 3 U
* Division 2&3 Manufacturing T 158 23 225 111 R 147 18 225 111 U 11 5
Major Group 23 Textile-Cotton T 19 2 108 62 R 19 2 108 62 U
25 Textile-Wool T j 3 R 5 3 U
31 Leather and Leather T 22 9 55 19 Products R jR 7 55 19
U 4 2
JAM NAGAR TALUKA
Cultivator R 75 10 .so 40 Agricultural Labourer 5 57 48 Household Industry 66 22 6 4
Division 0 Agriculture, livestock, forestry, fishing and hunting 34 14
2&3 Manufacturing 32 8 6 4
DHROL TALUKA
Cultivator R 17 19 30 41 Agricultural Labourer 6 8 7 3 Household Industry 16 5 14 30
73 J-B-IO
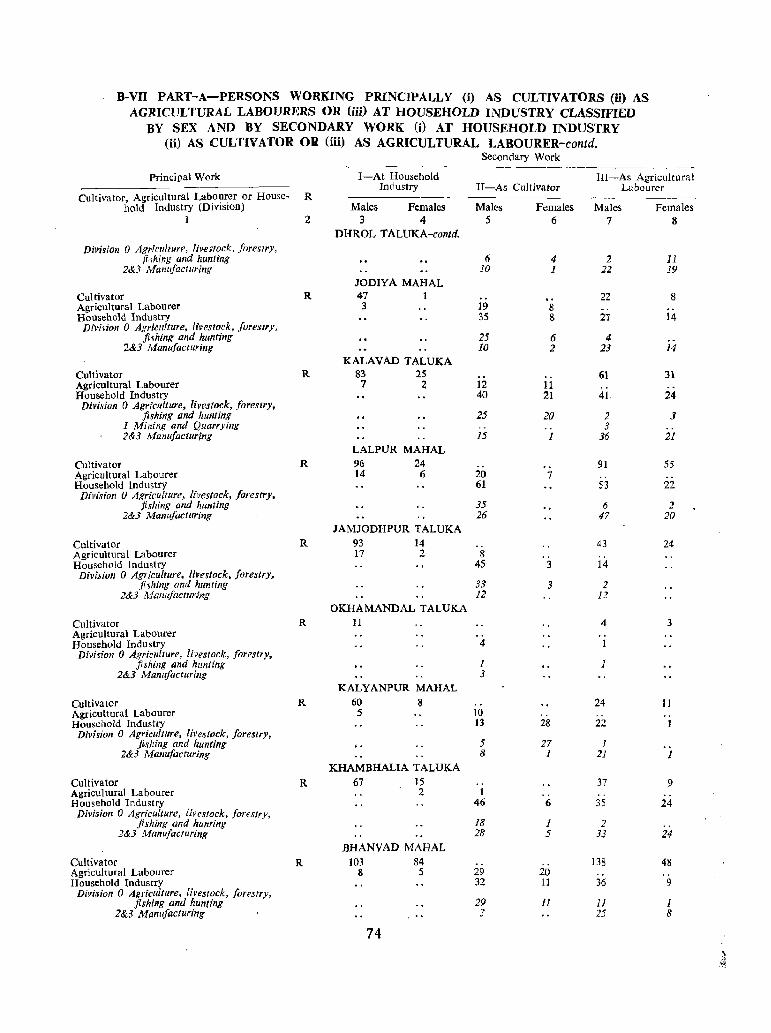
B-vn PART-A-PERSONS WORKING PRINClPALLY (i) AS CULTIVATORS (ii) AS AGRICULTURAL LABOURERS OR (iii) AT HOUSEHOLD INDUSTRY CLASSIFIED
BY SEX AND BY SECONDARY WORK (i) AT HOUSEHOLD INDUSTRY (ii) AS CUL TIV ATOR Oil (iii) AS AGRICULTURAL LABOURER-contd.
Secondary Work
Principal Work I-At Household Industry II-As Cultivator
III-As Agricultural Labourer
Cultivator, Agricultural Labou~er or House. R hold Industry (DlVlstOn)
1 2
Division 0 Agriculture, livestock, forestry, ,Plhing and hunUng
2&3 Manufacturing
Cultivator Agricultural Labourer Household Industry
DiVilion 0 Agriculture, livestock, forestry, fishing and hunting
2&3 Manufacturing
Cultivator Agricultural Labourer Household Industry
Division 0 Agriculture, livestock, forestry, fishing and hunting
1 Mining and Quarrying 2&3 Manufacturing
Cultivator Agricultural Labourer Household Industry
Division 0 Agriculture, lives/(Jck, j(Jrestry. fishing and hunting
2&3 Manufacturi'lg
Cultivator Agricultura 1 Labourer Household Industry
Division 0 Agriculture, livestock, forestry, fi~hing and hunting
2&3 Manufacturing
Cultivator Agricultural Labourer Household Industry
Division 0 Agriculture, livestock, forestry, fishing and hunting
2&3 Manufacturing
Cultivator Agricultural Labourer Household Industry
Division 0 Agricullllre, livestock, forestry, .fishing and hunting
2&3 Manufacturing
Cultivator Agricultural Labourer Household Industry
Division 0 Agriculture, livestock, forestry, fishing and hunting
2&3 Manufacturing
Cultivator Agricultural Labourer Household Industry
Division 0 Agriculture, livestock, forestry, fishing and hunting
2&3 Manufacturing
R
R
R
R
R
R
R
R
Males 3
Females 4
DHROL TALUKA-contd.
JODIYA MAHAL 47 3
KALAVAD TALUKA 83 2S 7 2
LALPUR MAHAL 96 24 14 6
JAMJODHPUR TALUKA 93 17
14 2
OKHAMANDAL TALUKA 11
KALY ANPUR MAHAL 60 8
Males 5
6 10
19 35
25 10
12 40
25
15
20 61
35 26
8 45
33 12
4
1 3
5 10
KHAMBHALIA TALUKA 67 15
13
5 8
2 1
BHANVAD MAHAL 103
8
74
84 5
46
18 28
29 32
29 3
Females 6
4 1
8 8
6 2
11 21
20
1
7
3
3
28
27 1
6
1 5
20 11
11
Males 7
2 22
22
21
4 23
61
41
2 3
36
91
53
6 47
43
14
2 ]2
4
1
24
22
]
21
37
35
2 33
138 .. 36
1J 25
Females 8
11 19
8
14
14
31
24
3
21
55
22
2 20
24
3
11
1
9
24
.. 24
48
9
1 8
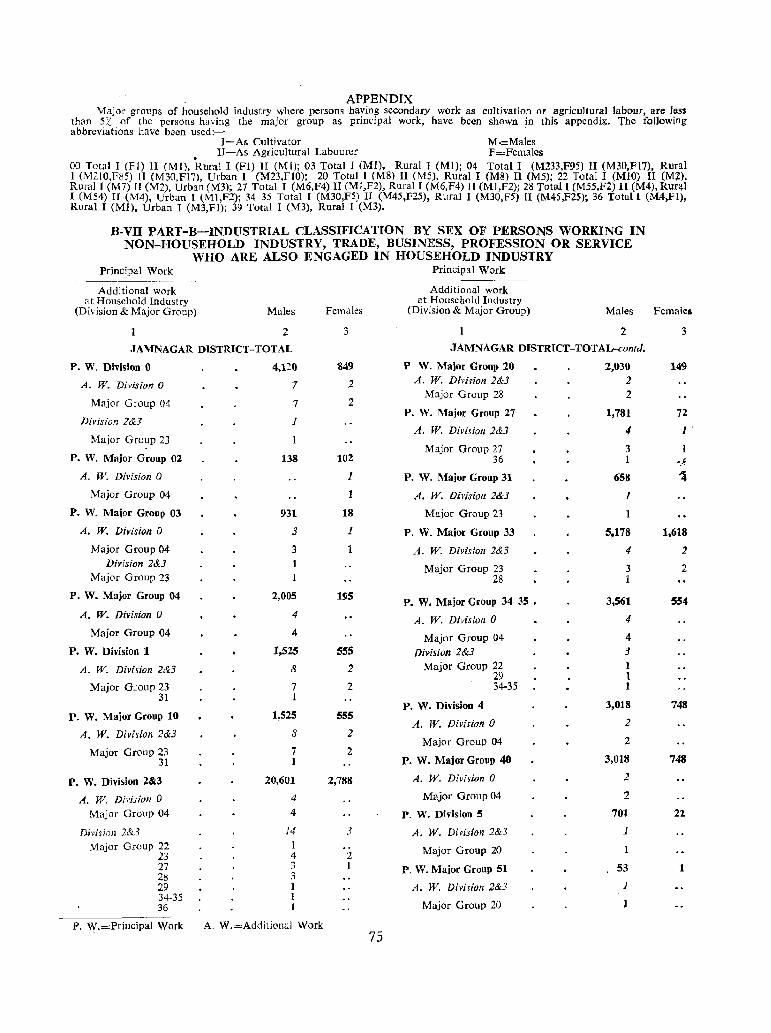
APPENDIX Major gronps of household industry where persons having secondary work as cultivation or agricultural labour, are less
than 5% of the persons having the major group as principal work, have been shown in this appendi". The following abbreviations have been used:-
I-As Cultivator M.=Males II-As Agricultural Labourer F=Females
00 Total I (FI) II (M!), ·Rural I (PI) II (M!); 03 Total I (Ml), Rural I (MI); 04 Total I (M233,F95) II (M30,FI7), Rural I (M210,F8S) II (M30,F17), Urban I (M23.FIO); 20 Total I (MS) II (MS). Rural I (Ma) II (MS); 22 Total I (MIO) II (M2). Rural 1 (M7) II (M2), Urban (M3); 27 Total I (M6,F4) II (Ml,F2), Rural I (M6,F4) II (Ml,F2); 28 Total I (M55,F2) II (M4), Run!-l I (M54) II (M4), Urban I (Ml,F2); 34-35 Total I (M30,F5) II (M45,F25), Rural I (M30,FS) II (M45,F25); 36 Total I (Mt4,Fl), Rural I (MI), Urban I (M3,Fl); 39 Total I (M3), Rural I (M3).
B-vn PART-B-INDUSTRIAL CLASSIFICATION BY SEX OF PERSONS WORKING IN NON-HOUSEHOLD INDUSTRY, TRADE, BUSINESS, PROFESSION OR SERVICE.
WHO ARE ALSO ENGAGED IN HOUSEHOLD INDUSTRY Principal Work Principal Work
.~~------------
Additional work Additional work at Household Industry at Household Industry
(Division & Major Group) Males Females (Division & Major Group) Males Females
2 3 2 3
JAMNAGAR DISTRICT-TOTAL JAMNAGAR DlSTRICT-TOTAL-contd.
P. W. Division 0 4,110 849 P W. Major Group 20 2,030 149
A. W. Division 0 7 2 A. W. Divi~ion 2&3 2 Major Group 28 2
Major Group 04 7 2 P. W. Major Group 27 1,781 72
Division 2&3 1 A. W. Division 2&3 4 1·
Major Group 23 Major Group 27 3
P. W. Major Group 02 138 102 36 1 •• _i/
A. W. Division 0 1 P. W. Major Group 31 658 '1 Major Group 04 A. W. Divisioll 2&3 1
P. W. Major Group 03 931 18 Major Group 23 1
A. W. Division 0 3 I P. W. Major Group 33 5,178 1,618
Major Group 04 3 A. W. Division 2&3 4 2 Division 2&3 Major Group 23 3 2
Major Group 23 28 I
P. W. Major Group 04 2,005 195 P. W. Major Group 34-35 • 3,561 554 A. W. Division 0 4 A. W. Divisioll 0 4
Major Group 04 4 Major Group 04 4 P. W. Di-wision 1 1,525 555 Division 2&3 3
A. W. Divisioll 2&3 8 2 Major Group 22 I 29 1
Major Group 23 7 2 34-35 1 31 1
P. W. Division 4 3,018 748 P. W. Major Group 10 1,525 555
A. W. Division 0 2 A. W. Division 2&3 8 2
2 Major Group 04 Major Group 23 7 2
3,018 '743 31 1 P. W. Major Group 40
P. W. Division 2&3 20,601 2,788 A. W. Division 0 2
A. W. DiPision 0 4 Major Group 04 2
Major Group 04 4 P. W. Division 5 701 22
Division 2&3 14 3 A. W. Division 2&3 1
Major Group 22 I Major Group 20 23 4 2 27 3 I P. W. Major Group 51 53 I 28 3 29 I A. W. Division 2&3 1 34-35 1 36 I Major Group 20
P. W.=Principal Work A. W.=Additional Work 75
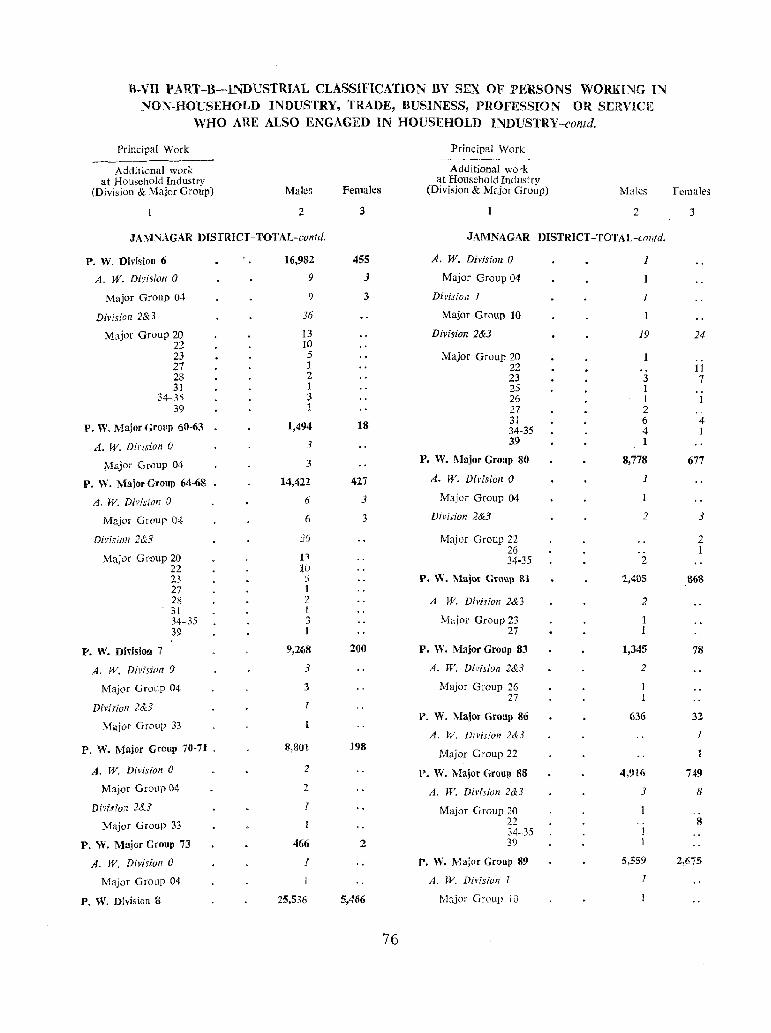
B~VII PART-B-INDUSTRIAL CLASSIFICATION BY SEX OF PER.SONS WORIUNG I?'<l NON-HOUSEHOLD INDUSTRY, TRADE, BUSINESS, PROFESSION OR SERVICE
WHO ARE ALSO ENGAGED IN HOUSEHOLD INDUSTRY-contd.
Principal Work
Additional work at Household Industry
(Division & Major Group) Males
2
JA\-f~AGAR DISTRICT - TOTAL-contc/.
P. W. Division 6
A. W. Division 0
Major Group 04
DiYislon 2&3
Maior Group 20 . 22
23 27 28 31
34-35 39
P. W. Major Group 60-63
A. W. Di,'isioll 0
Major Group 04
P. w. Major Group 64..fi&
A. W. DMsion 0
Major Group 04
DMsioJl 2&3
Major Gwup 20
P. W. Divisio!l 7
22 H 27 28 3l 34-35 39-
A. W. Dil'i,ion (j
Major Group 04
Division 2&:7
Mlljor Group 33
P. W. Major Group 70-71 .
A. W. Dit>ision 0
Major Group 04
Division 2&1
Major Group 33
P. W. Major Group 73
A. W. Divifion 0
Major Group 04-
P. W. Division S
16,982
9
9
36
13 iO 5 1 2 1 3 1
1,494
3
3
14,422
6
6
]6
n )0
1 2 I 3 I
9,268
3
3
J
8,801
2
2
466
1
25,536
Females
3
455
3
3
18
427
3
3
200
198
2
5,466
76
Principal Work
Additional work at Household Industry
(Division & Major Gruup) Males
2
JAMNAGAR DISTRICT-TOTAL-conld.
A. W. Division 0
Major Group 04
Division J
Major Group 10
DiviSion 2&3
Major Group 20 22 23 25 26 27 31 34-35 39
P. W. Major Group 80
A. W. Divi,iol1 0
Major Group 04
Dil'ision 2&3
Major Group 22 26 34-35
P. W. Majo[ Group &1
A W. Division 2&3
Major Group 23 27
P. W. Mlijor Group 83
A. W. Division 2&3
Major Group 26 27
P. W. Major Group 86
A. W. Division 2&3
Major Group 22
P. W. Major Group 88
A. W. Divi~ion 2&3
Major Group 20 22 34-35 39
P. W. MaIor Group 89
A. W. Division]
M~,jor G~()LlP 10
1
19
3 1 1 2 6 4 1
8,778
1
2
2
2,405
2
1,345
2
636
4,916
J
5,559
Females
3
24
11 7
4 I
677
2 1
78
32
J
749
8
8
2,675
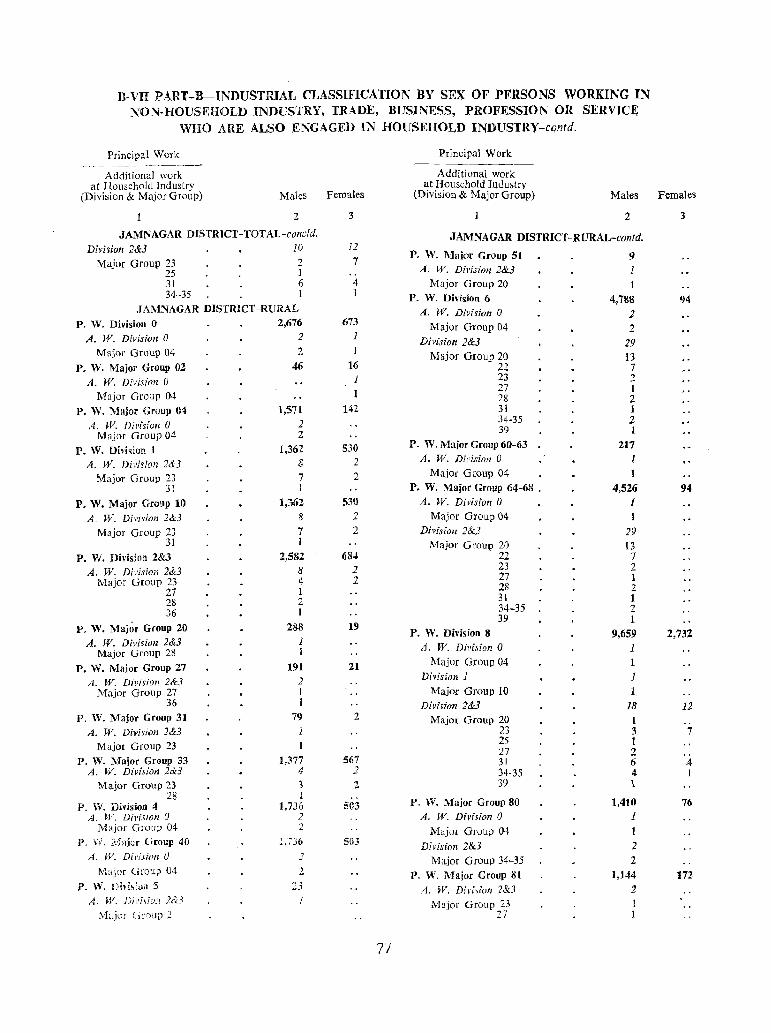
B-VII PART-B-INDUSTRIAL CLASSIFICATION BY SEX OF PERSONS WORKING IN NON·HOUSEHOLD INDUSTRY, TRADE, BUSINESS, PROFESSION OR SERVIC.E
WHO ARE ALSO ENGAGED IN HOUSEHOLD INDUSTRY-cQntd.
Principal Wor!( Principal Work -" -_----_ - ---.-~----.
Additional lVork Additional work at Household Industry at Household Industry
(Division & Major Group) Males Females (Division & Major Group) Males
2 3 2
JAMNAGAR DISTRICT-TOTAL-col1cld. JAMNAGAR DISTRICT-RURAL-contd. Divi1ion 2&3 10 12
Major Group 23 2 7 P. W. Major Group 51 9
25 J A. W. DiJlision 2&3 1 31 6 4 Major Group 20 34-35 1 1 P. W. Division 6 4,788
JAMNAGAR DISTRICT-RURAL A. W. Divi,ion 0 2 P. W. Division 0 2,676 673 Major Group 04 2
A. W. Divisioll 0 2 1 Division 2&3 29 Major Group 04 2 1 Major Group 20 13
P. W. Major Group 02 46 16 22 1 A. W. Divisioll 0 23 2
27 Major Group 04 28 :2
P. W. Major Group 04 1,571 142 31 1
A. W. Divisioll 0 2 34-35 :2 Major Group 04 2 39 1
P. W. Division 1 1,362 530 P. W, Major Group 60-63 217
A. W. Divi1ion 2&3 8 2 A. W. Division 0 1
Major Group 23 7 2 Major G~OUll 04 1 3] 1 P. W. Major Group 64-68 • 4,526
P. W. Major Group 10 1,362 530 A. W. Divisioll 0 J A, W. Division 2&3 8 2 Major Group 04
Major Group 23 7 2 Divisioll 2&) 29 31 I Major Group 20 13
P. W. Division 2&3 2,582 68"" 22 7
A, W. Divisioll 2&3 8 2 23 2 Major Group 23 4 2 27 1
27 1 28 2 28 2 31 1 36 1 34-35 2
P. W. Maj~r Group 20 288 19 39 1
P. W. Division 8 9,659 A. W. Divi5ion 2&3 1 A, W. Division 0 Major Group 28 1 I
P. W. Major Group 27 191 21 Major Group 04
A. W. Division 2&3 2 Division 1 1 Major Group 27 I Major Group 10 1
36 I Division 2&3 18 P. W. Major Group 31 79 2 Major Group 20 1
A. W. DiJlision 2&3 1 23 3 Major Group 23 25 I
27 2 P. W. Major Group 33 1,377 561 31 6
A. W. Divisioll 2&3 4 2 34-35 4 Major Group 23 1 2 39 1
28 P. W. Major Group 80 P. W. Division" 1,736 503 1,410
A. W. Division 0 2 A. W, Division 0 1 Major Group 04 2 Major Group 04
p, V~. ,o.'r Ujof Group 40 ],736 S03 Divisioll 2&3 2 A. W. Division 0 2 Major Group 34-35 2
Mel.ioe Group 04 2 P. W. Major Group 81 1,144 P. W. Dh,,'uil 5 2.1 A. W. Diviq'on 2&3 2
A, W. Dii'hiu!l 2&3 Major Group 23 Major (,r(luj) 2 27
77
Females
3
94
94
2,73:2
12
7
4 1
76
172
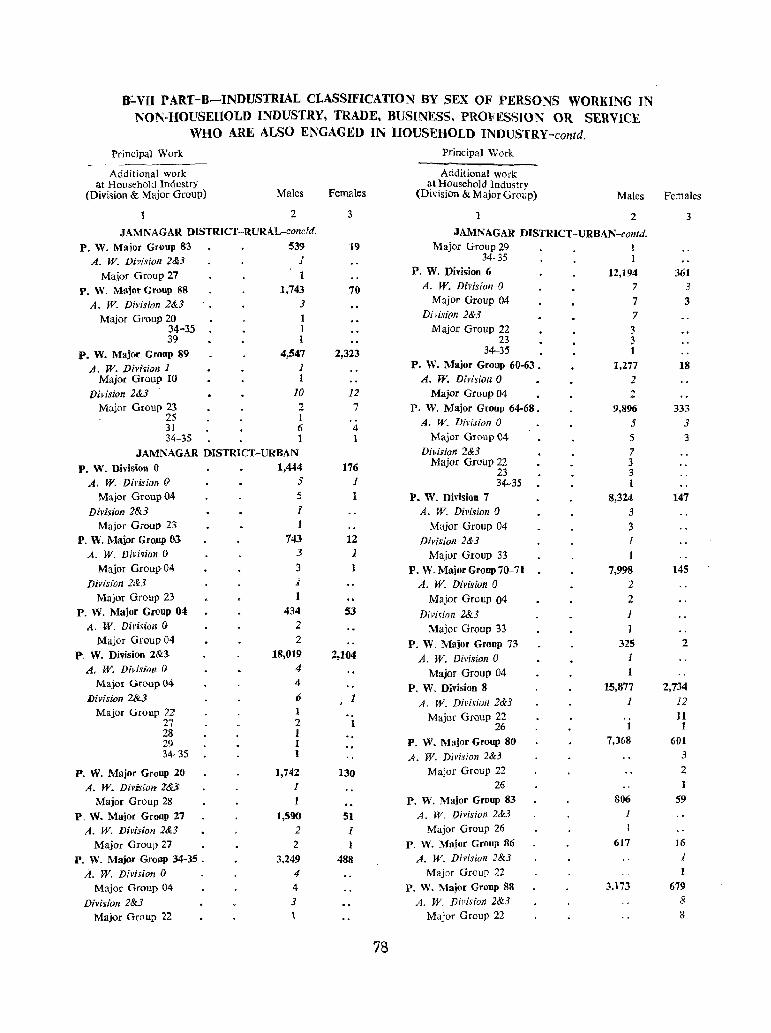
B::"'VII PART-B-IN1)USTRIAL CLASSIFICATION BY SEX OF PERSONS WORKING lN NON-HOUSEHOLD INDUSTRY, TRADE, BUSINESS, PROFESSJON OR SERVICE
WHO ARE ALSO ENGAGED IN HOUSEHOLD INDUSTRY -contd.
Principal Work Principal Work
Additional work Additional work at Household Industry at Household Industry
(Division & Major Group) Males Females (Division & Major Group) Males
2 3 1 2 JAMNAGAR DlSTRICT-RURAL-concld. JAMNAGAR DlSTRICT-URBAN-contd.
P. W. Major Group 83 539 19 Major Group 29 1 A. W. Division 2&3 I 34-35 I
Major Group 27 P. W. Division 6 12,194
P. W. Major Group 88 1,743 70 A. W. Division 0 7
A. W. Division 2&3 3 Major Group 04 7
Major Group 20 1 Division 2&3 7 34-35 1 Major Group 22 3 39 I 23 3
P. W. Major Group 89 4,547 2,323 34-35 1
A. W. Division 1 1 P. W. Major Group 60-63. 1,277 Major Group 10 1 A. W. Division 0 'l
Division 2&3 10 12 Major Group 04 2 Major Group 23 2 7 P. W. Major Group 64-68. 9,896
25 I A. W. Division 0 5 31 6 4 34-35 1 1 Major Group ()4 5
JAMNAGAR DISTRICT-URBAN DMsion 2&3 7
P. W. Division 0 1,444 176 Major Group 22 3 23 3
A. W. Division 0 5 I 34-35 1 Major Group 04 5 1 P. W. Division 7 8,324
Division 2&3 1 A. W. Division 0 3 Major Group 23 1 Major Group 04 3
P. W. Major Gronp n.3 743 12 Division 2&3 1 A. W. DiYi9ion () 3 1 Major Group 33 1
Major Grou\} 04 3 P. W. Major Group 70-71 7,998 Division 2&3 i A. W. Division 0 2
Major Group 23 1 Major Group 04 2 P. W. Major Group 04 434 53 Divirion 2&3 1
A. W. Divisioll 0. 2 Major Group 33 1 Majpr Group 04 2 P. W. Major Group 73 325
p. W. Division 2&3- 18,019 2,104 A. W. Division 0 1 A. W~ Division () 4 Major Group 04 I
Major Group 04 4 P. W. Division 8 15,877 Division 2&3 6 , 1 A. W. Division 2&3 1
Majo. GrollP 22 ] Major Group 22 27 2 26
28 1 29 I P. W. Major Group 80 7,368 34-35 1 A. W. Division 2&3
P. W. Major Group 20 ],742 130 Major Group 22
A. W. Division 2&3; 1 26
Major Group 28 1 P. W. Major Group 83 806
P. W. Maior Group 2'1 1,590 51 A. W. Division 2&3 1
A. W. Division 2&3 2 1 Major Group 26 1
Major Group 27 2 1 p. W. Ma.ior Group 86 617
P. W. Major Group 34-35 • 3,249 488 A. W. Division 2&3
A. W. Division () 4 Major Group 22
Major Group- 04 4 P. W. Major Group 88 3,173
Division 2&3 3 A. W. DiFisioli 2&3
Major Group 22 Major Group 22
78
Females
3
361 3
3
18
333 3
3
147
145
2
2,734 12 11 1
601 3
2 I
59
16
1 I
619 8
8
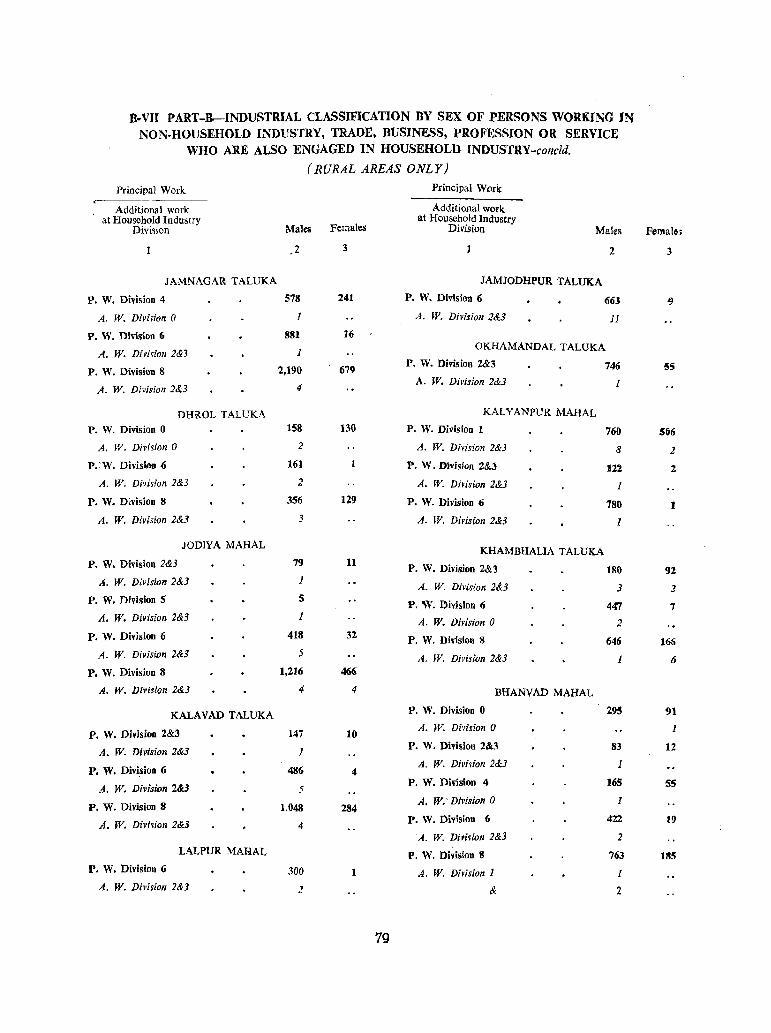
B.VII PART-B~INDUSTRIAL CLASSIFICATION BY SEX OF PERSONS WORKING IN NON-HOUSEHOLD INDUSTRY, TRADE, BUSINESS, PROFESSION OR SERVICE
WHO ARE ALSO ENGAGED IN HOUSEHOLD INDUSTRY-concld.
Principal Work
Additional work at Household Industry
Division
JAMNAGAR TALUKA
P. W. Division 4
A, W. Divirion 0
P. W. Division 6
A. W. DivMon 2&3
P. W. Division 8
A. W. Division 2&3
P. W. Division 0
A, W. Division 0
P.:W. Divisiml 6
DHROL TALUKA
A. W. Divi5ion 2&3
P. W. Dlvision 8
A. W. Division 2&3
JODlY A MAHAL
P. W. Division 2&3
A. W. Division 2&3
P. W. Division 5
A. W. Division 2&3
P. W. Division 6
A. W. Division 2&3
P. W. Division 8
A. W. Division 2&3
KALAVAD TALUKA
P. W. Division 2&3
A. W. Division 2&3
P. W. Division 6
A. W. Division 2&3
P. W. Division 8
A. W. Division 2&3
LALPUR MAHAL
P. W. Division 6
A. W. Division 2&3
(RURAL AREAS ONLY)
Males Females
,2
578
881
1
2,190
4
158
2
161
2
356
3
79
1
S
1
418
5
1,216
4
147
1
486
5
1,048
4
300
2
3
241
16
679
130
1
129
11
32
466
4
10
4
284
1
79
Principal WPrk
Additional work at Household Industry
Division Males
JAMJODHPUR TALUKA
P. W. Division 6
A, W. Division 2&3
2
663
1I
OKHAMANDALTALUKA
P. W. Division 2&3
A. W. Division 2&3
KAL Y ANPUR MAHAL
P. W. Division 1
A. W. Division 2&3
P. W. Division 2&3
A. W. Division 2&3
P. W. Division 6
A. W. Division 2&3
KHAMBHALIA TALUKA
P. W. Division 2&3
A. W. Division 2&3
p, W. Division 6
A. W. Division 0
P. W. Division 8
A. W. Division 2&3
BHANV AD MAHAL
P. W. Division 0
A. W. Division 0
P. W. Division 2&3
A. W. Divi~ion 2&3
P. W. Division 4
A. W. Division a P. W. Division 6
A. W. Division 2&3
P. W. Division 8
A. W. Division 1
&
746
I
760
8
III
I
780
1
180
3
447
2
646
1
295
83
1
165
1
422
2
763
I
2
Female.
3
55
5116
2
2
I
92
2
7
166
6
91
I
12
S5
19
185
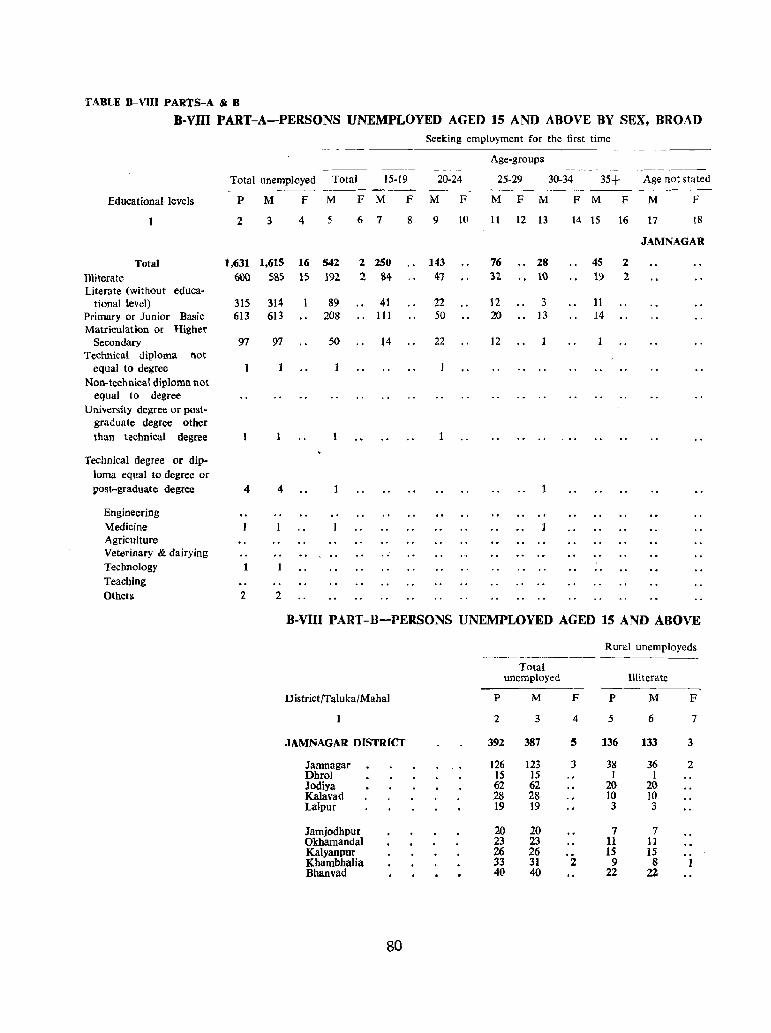
TABU 8-VIII PARTS-A 8c B
B-Vlll PART-A-PERSONS UNEMPLOYED AGED 15 AND ABOVE BY SEX, BROAD
Educational levels
Total }Uiteratc Literate (without educa
tional level) Primary or Junior Basic Matriculation or Higher
Secondary Technical diploma !'lot
equal to degree Non-technical diploma not
equal to degree University degree or pos.t
graduate degree other than technical degree
Technical degree or dip. lorna equal to degree or post-graduate degree
Engineering Medicine Agriculture Veterinary & dairying Technology Teaching Others
Seeking employment for the first time -- --
Age-groups
Total unemployed Total 15-19 20-24 25-29 30-34 35+ Age not stated -------~ --.-~ -_~- ---_--
P M F M F M F M F M F M F M F M F
2 3 4 5 6 7 8 9 10 11 12 13 14 15 16 17 18
JAMNAGAR
1,(;31 1,615 16 542 2 250 143 76 28 45 2
600 585 15 192 2 S4 47 32 lQ 19 2
315 314 89 41 22 12 3 11 613 613 208 .. 111 50 20 13 14
97 97 50 H 22 12
4 4 1
2 2
B-VlII PART-B-PERSONS UNEMPLOYED AGED 15 AND ABOVE
Rural uncmployeds --~-----~~---------
Total unemployed Illiterate
--------_ District/Taluka/Mahal P M F P M F
2 3 4 5 6 7
JAMNAGAR DISTRICT 392 387 5 136 133 3
Jamnagar 126 123 3 38 36 2 Dhro) IS 15 1 I Jodiya 62 62 20 20 Kalavad 28 28 10 10 Lalpur 19 19 3 3
Jamjodhpur 20 20 7 7 Okhamandal 23 23 11 11 Kalyanpur 26 26 15 15 Khambhalia 33 31 2 9 8 .Bhanvad 40 40 22 22,
80
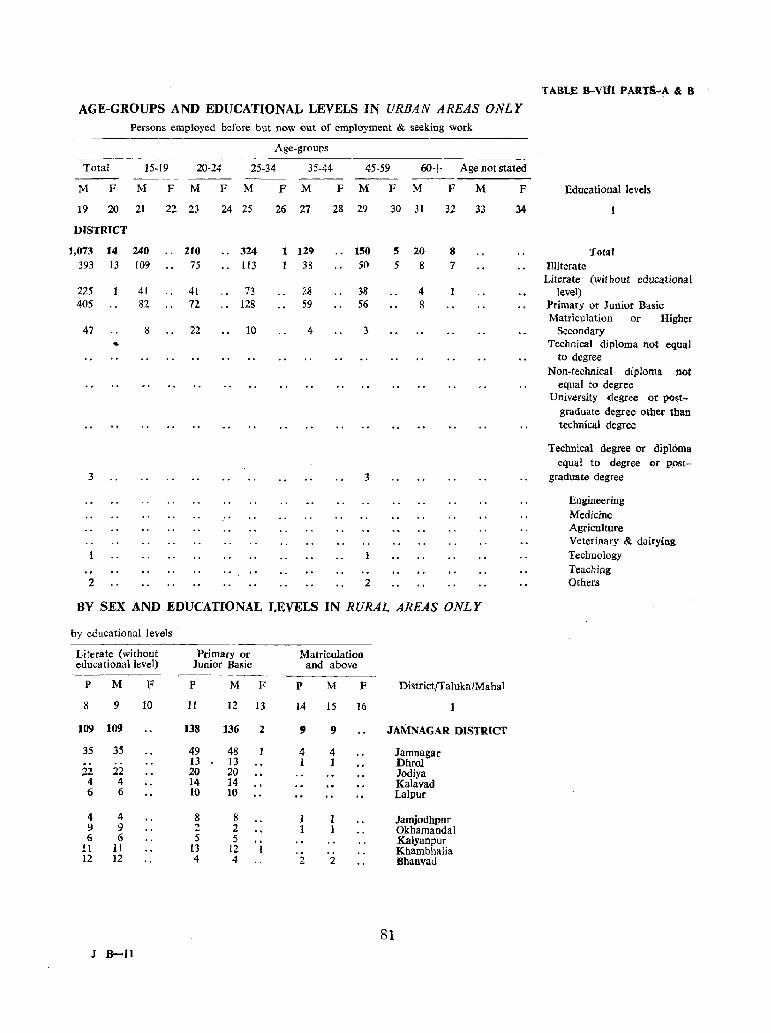
AGE-GROUPS AND EDUCATIONAL LEVELS IN URBAN AREAS ONLY Persons employed before but now out of employment & seeking work
Age-groups
Total 15-19 20-24 25-34 35-44 45-59 60+ Age not stated
M F M F M F M
19 20 21 22 23 24 25
DISTRICT
1,073 14 240 210 .. 324 393 13 109 75 .. 113
225 4! 4! 73 405 81 72 .. 12S
47 8 22 10 ~
3
2
F M
26 'l7
1 129 1 38
28 59
4
F
28
---M F
29 30
150 5 50 5
38 56
3
3
2
~~-~
M F M
31 32 33
20 8 8 7
4 8
BY SEX AND EDUCATIONAL LEVELS IN RURAL AREAS ONLY
by educational levels
Literate (without Primary or educational level) Junior Basic
p M F P M
8 9 10 II 12
109 109 138 136
35 3S 49 48 13 13
22 22 20 20 4 4 14 14 6 6 10 10
4 4 8 8 9 9 2 2 6 6 5 5
!1 II 13 12 12 12 4 4
J B-Il
Matriculation and above
F p M F
13 14 15 16
Z 9 9
4 4 I 1
.. 2 2
DistrictjTaJuka/M ahal
JAMNAGAR DISTRICT
81
Jamnagar DhroJ Jodiya Kalavad Lalpur
Jamjodhpnr Okhamandal Kalyanpur Khambhalia Bhanvad
F
34
TABLE B--Vm P ARTfi-A & B
Educational levels
Total Illiterate Literate (without educational
level) Primary or Junior Basic Matriculation or Higher
Secondary Technical diploma not equal
to degree Non-technical diploma not
equal to degree University degree or post
graduate degree other than technical degree
Technical degree or diploma equal to degree or post
graduate degree
Engineering Medicine Agriculture Veterinary & dairying Technology Teaching Others
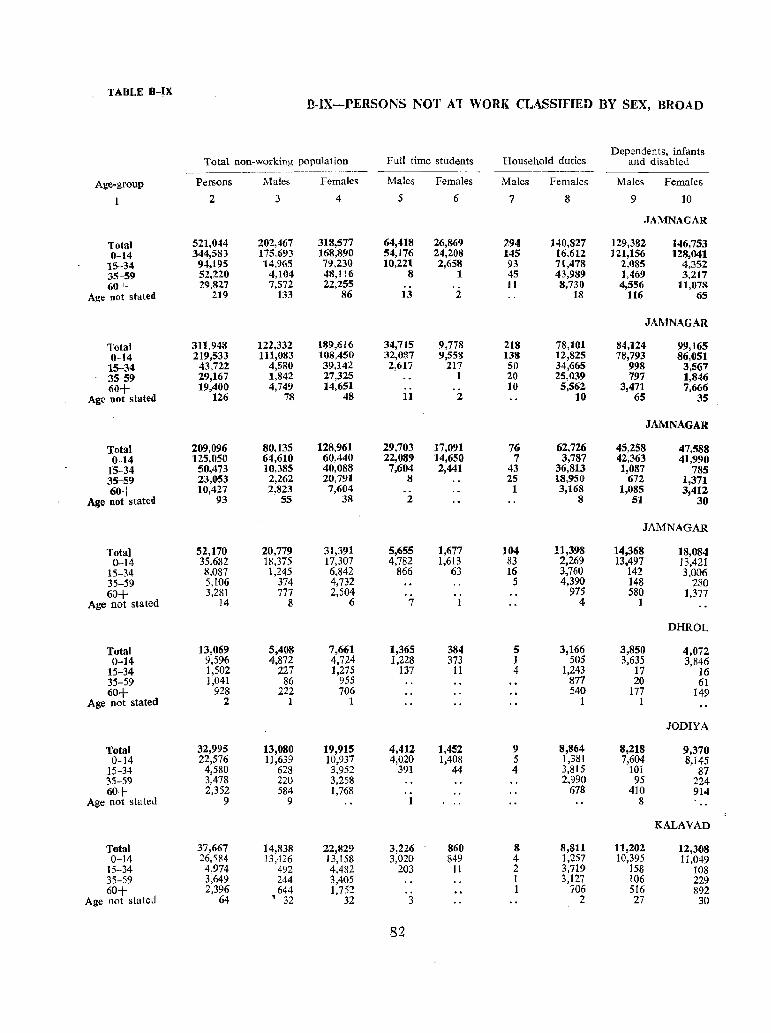
TABLE B-IX B-IX-PERSONS NOT AT WORK CLASSIFIED BY SEX, BROAD
Total non-working population Full time students Household duties Dependents, infants
and disabled --~------- -----------~-
- __ -_----
Age-group Persons Males Females Males Females Males Females Males Females
1 2 3 4 5 6 7 8 9 10
.JAMNAGAR
Total 521,044 202,467 318,577 64,418 26,869 294 140,827 ]29,382 146,753 0-14 344,583 175,693 168,890 54,176 24,208 145 16,612 121,156 128,041
15-34 94,195 14,965 79,230 10,221 2,658 93 71,478 2,085 4,352 35-59 52,220 4,104 48,116 8 1 45 43,989 1,469 3,217 60+ 29,827 7,572 22.255 1l 8,7~O 4,556 11,078
Age not stated 219 133 86 13 2 18 116 65
JAIVINAGAR
Total 311,948 122,332 189,616 34,715 9,778 218 78,101 84,124 99,165 0-14 219,533 111,083 108,450 32,mn 9,558 138 12,825 78,793 86,051
15-34 43,722 4,580 39,142 2,617 217 50 34,665 998 3,567 35-59 29,167 1,842 27,325 1 20 25,039 797 1,846 60+ 19,400 4,749 14,651 10 5,562 3,471 7,666
Age not stated 126 78 48 11 2 10 65 35
JAMNAGAR
Total 209,096 80,135 128.961 29,703 17,091 76 62,726 45,258 47,588 0-14 125,050 64,610 60,440 22,089 14,650 7 3,787 42,363 41,990
15-34 50,473 10,385 40,088 7,604 2,441 43 36,813 1,087 785 35-59 23,053 2,262 20,79. 8 25 18,950 672 1,371 601- 10,427 2,823 7,604 1 3,168 1,085 3,412
Age Dot stated 93 55 38 2 8 51 30
JAM NAGAR
Total 52,170 20,779 31,391 5,655 1,677 104 11,398 14,368 18,084 0-14 35,682 18,375 17,307 4,782 1,613 83 2,269 13,497 13,421
15-34 8,087 1,245 6,842 866 63 16 3,760 142 3,006 35-59 5,106 374 4,732 5 4,390 148 280 60+ 3,281 777 2,504 975 580 1,377
Age not stated 14 8 6 7 4 1
DHROL
Total 13,069 5,408 7,661 1,365 384 5 3,166 3,850 4,072 0-14 9,596 4,872 4,724 1,228 373 1 505 3,635 3,846
15-34 1,502 227 1,275 137 11 4 1,243 17 16 35-59 1,041 86 955 877 20 61 60+ 928 222 706 540 177 149
Age not stated 2 1 1 1 1
JODIYA
Total 32,995 13,080 19,915 4,412 1,452 9 8,864 8,218 9,370 0-14 22,576 11,639 10,937 4,020 1,408 5 1,381 7,604 8,145
15-34 4,580 628 3,952 391 44 4 3,815 101 87 35-59 3,478 220 3,258 2,990 95 224 60+ 2,352 584 1,768 678 410 914
Age not stated 9 9 8
KALAVAD
Total 37,667 14,838 22,829 3,226 860 8 8,811 11,202 12,308 0-14 26,584 13,426 13,158 3,020 849 4 1,257 10,395 11,049
15-34 4,974 492 4,482 203 11 2 3,7l9 158 108 35-59 3,649 244 3,405 1 3,127 106 229 60+ 2,396 644 1,752 1 706 516 892
Age not stated 64 ' 32 32 3 2 27 30
82
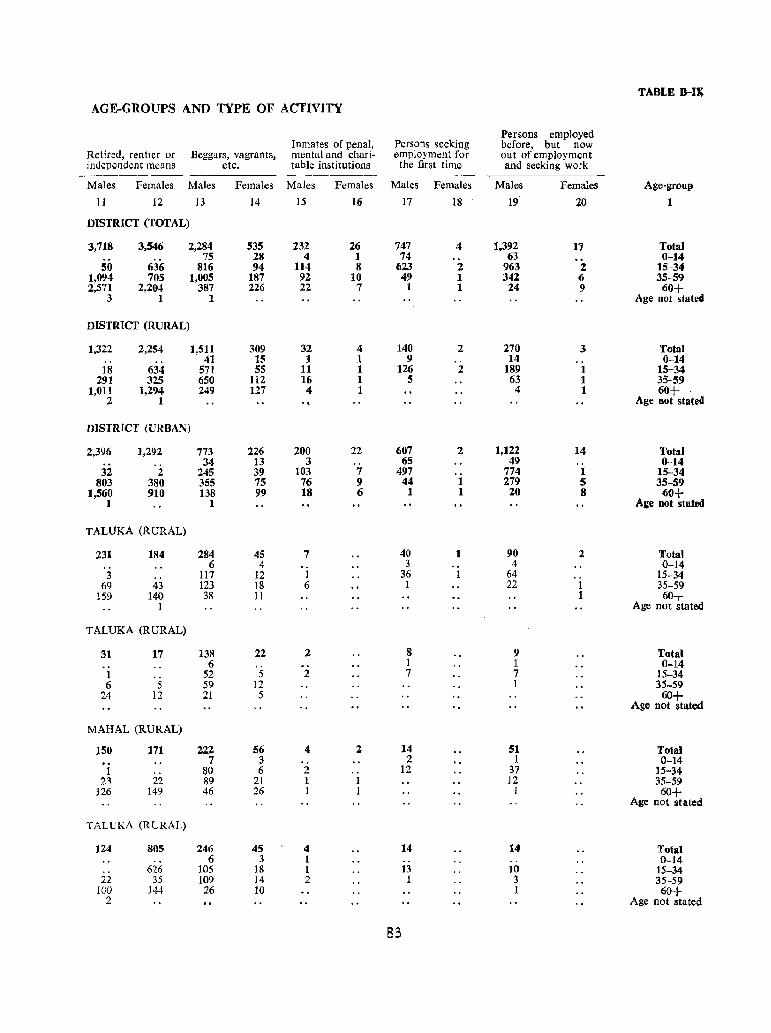
TABLE B-II AGE-GROUPS AND TYPE OF ACTIVITY
Persons employed Inmates of penal, Persons seeking before, but now
Retired, rentier or Beggars, vagrants, mental and chari· employment for out of employment independent means etc. table institutions the first time and seeking work
~----------- ---------_
Males Females Males Females Males Females Males Females Males Females Age -gc-ou II
11 12 13 14 15 16 17 18 ~ 19 ;ZO 1
DISTRICT (TOTAL)
3,718 3,546 2,284 535 232 26 747 4 1,392 17 Tota} 75 28 4 1 74 63 0-14
50 636 816 94 114 8 623 2 963 2 15~34 1,094 705 1,005 187 92 10 49 1 342 6 35-59 2,571 2,204 387 226 22 7 1 1 24 9 60+
3 1 1 Age not stated
DISTRICT (RURAL)
1,322 2,254 1,511 309 32 4 140 2 270 3 Total .. 41 15 1 1 9 14 0-14 18 634 571 55 11 1 126 2 189 1 15~34
291 325 650 112 16 1 5 63 1 35-59 1,011 1,294 249 127 4 1 4 1 60+
2 1 Age Dot stated
DISTRICT {URBAN)
2,396 1,292 773 226 200 22 607 2 1,122 14 Total 34 13 3 65 49 0-14
32 2 245 39 103 7 497 774 1 15-34 803 380 355 75 76 9 44 1 279 S 35-59
1,560 910 138 99 18 6 1 1 20 8 60+ 1 1 Age not stated
TALUKA (RURAL)
231 184 284 45 7 40 1 90 2 Total 6 4 3 4 0-14
3 117 12 1 36 64 15-34 69 43 123 18 6 1 22 1 35-59
159 140 38 11 1 60+ 1 Age Dot stated
TALUKA (RURAL)
31 17 138 22 2 8 9 Total 6 1 1 0-14
1 .. 52 5 2 7 7 15-34 6 5 59 12 1 35-59
24 12 21 5 60+ Age not stated
MAHAL (RURAL)
150 171 222 56 4 2- 14 51 Total 7 ;; 2 1 0-14
1 .. SO 6 2 .. 12 37 15-34 23 22 89 21 1 1 12 35-59
126 149 46 26 1 1 I 60+ Age not stated
TALUKA (RURAL)
124 805 246 45 4 14 14 Total .. 6 3 I .. .. 0-14
.. 626 105 18 1 13 10 15-34 22 35 109 14 2 1 3 35-59
J(JO 144 26 10 I 60+ 2 Age not stated
83
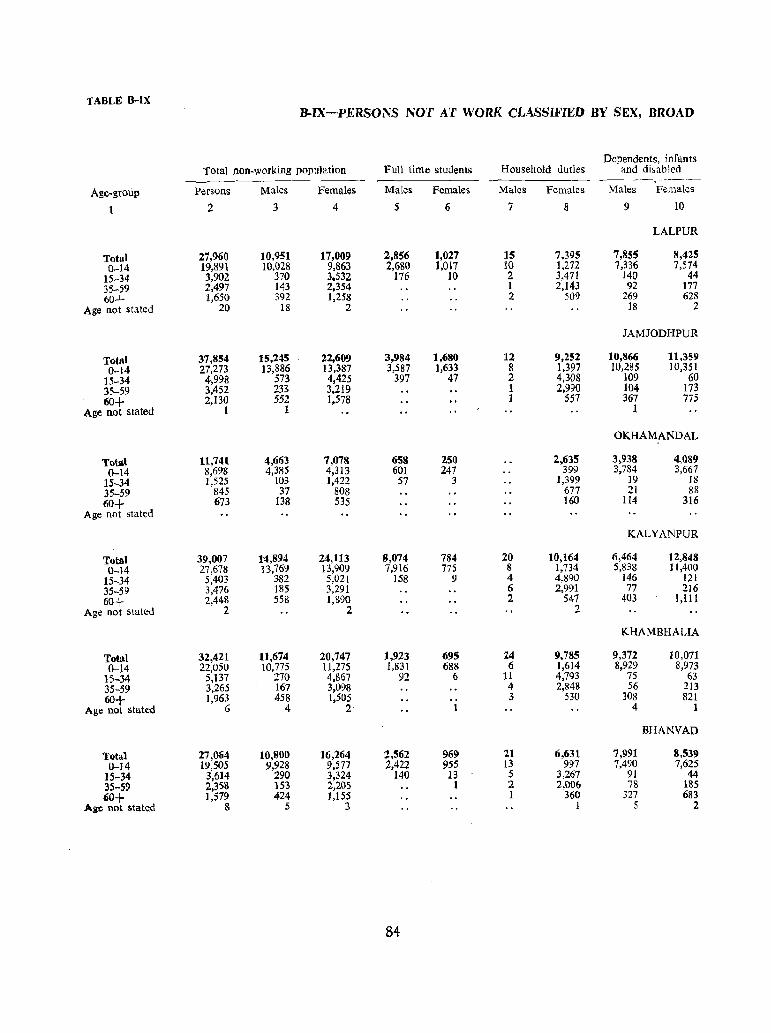
'fABLE 8-IX B-IX-'PERSONS NOT AT WORK CLASSIFIED BY SEX, BROAD
Dependents, infants Total non· working population Full time students Household duties and disabled
Age-group Persons Males Females Males Females Males Females Males Females
1 2 3 4 5 6 7 8 9 10
LALPUR
Total 2'1,960 10,951 17,009 2,856 1,027 IS 7,395 7,855 8,425 0-14 19,891 10,028 9,863 2,680 1,011 10 1,272 7,336 7,574
15-34 3,902 .370 3.532 176 10 2 3,471 140 44 35-59 2,497 143 2,354 1 2,143 92 177 60+ 1,650 392 1,258 2 509 269 628
Age not stated 20 18 2 18 2
JAMJODHPUR
Total 37,854 15,245 22,609 3,984 1,680 12 9,252 10,866 11,359 0-14 27,273 13,886 13,387 3,587 1,633 8 1,397 10,285 10,351
15-34 4,998 573 4,425 397 47 2 4,308 109 60 35-59 3,452 233 3,219 1 2,990 104 173
60+ 2,130 552 1,578 1 557 367 775 Age not stated I 1 1
OKHAMANDAL
Tot.l\\ 11,741 4,663 7,078 658 250 2,635 3,938 4,089 0-14 8,698 4,3R5 4,313 601 247 399 3,784 3,667
15-34 1,525 103 1,422 57 3 1,399 19 18 35-59 845 37 808 677 21 88 60+ 673 138 535 160 114 316
Age not stated
KALYANPUR
Total 39,007 14,894 24,113 8,074 784 20 10,164 6,464 12,848 0-14 27,678 13,769 13,909 7,916 775 8 1,734 5,838 11,400
15-34 5,403 382 5,021 158 9 4 4,890 146 121 35-59 3,476 185 3,291 6 2,991 77 216
60+ 2,448 558 1,890 2 547 403 1,111 Age not stated 2 2 2
KHAMBHALIA
Total 32,421 11,674 20,747 1,923 695 24 9,785 9,372 10,071 0---14 22,050 10,775 11,275 1,831 688 6 1,614 8,929 8,973
15-34 5,137 270 4,867 92 6 11 4,793 7S 63 35-59 3,265 167 3,098 4 2,848 56 213
60+ 1,963 458 1,505 .. 3 530 308 821 Age not stated 6 4 2' I 4 1
BHANVAD
Total 27,004 10,800 16,264 :l,562 969 21 6,631 7,991 8,539 0-14 19,505 9,928 9,577 2,422 955 13 997 7,490 7,625
15-34 3,614 290 3,324 140 13 5 3,267 91 44 35-59 2,358 153 2,205 1 2 2,006 7ll 185 60+ 1,579 424 1,155 1 360 327 683
A~ not stated 8 5 3 I 5 2
84
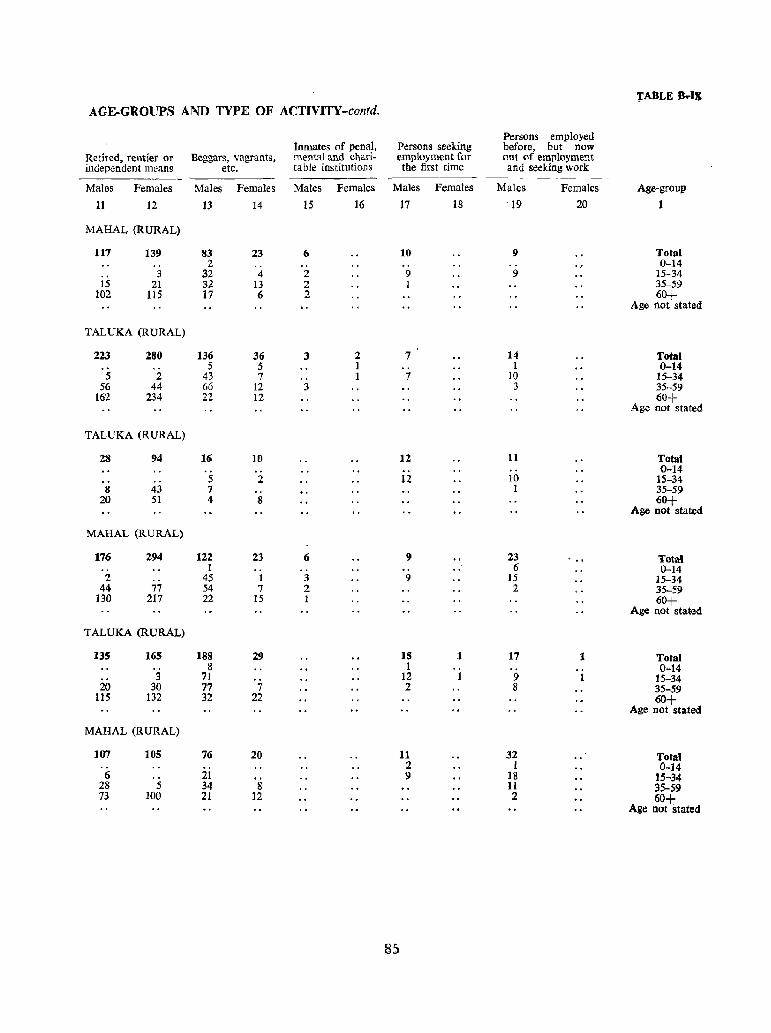
rABLE B ... I$ AGE-GROUPS AND TYPE OF ACTIVITY-contd.
Persons employed Inmates of penal, Persons seeking before, but now
Retired, rentier or Beggars, vagrants, mental and chari- employment for out ()f employment independent means etc. table institutions the first time and seeking work
Males Females Males Females Males Females Males Females Males Females Age-group
11 12 13 14 15 16 17 18 19 20 1
MAHAL (RURAL)
117 139 83 23 6 10 9 Total .. 2 .. 0-14 3 32 4 2 9 9 15-34
15 21 32 13 2 1 35-59 102 115 17 6 2 60+
Age not stated
TALUKA (RURAL)
223 280 136 36 3 2 7 14 Total 5 5 1 1 0-14
5 2 43 7 1 7 10 15-34 56 44 66 12 3 3 35-59
162 234 22 12 60+ Age not stated
TALUKA (RURAL)
28 94 16 10 12 11 Total 0-14
5 2 12 10 15-34 S 43 7 .. 1 35-59
20 51 4 S 60+ Age oot stated
MAHAL (RURAL)
176 294 122 23 6 9 23 ... Totat I .. .. 6 0-14
2 45 1 3 9 15 15-34 44 77 54 7 2 2 35-59
130 217 22 15 1 60+ Age not stated
TALUKA (RURAL)
135 165 188 29 15 1 17 1 Total 8 1 0-14
3 71 12 9 15-34 20 30 77 7 2 8 35-59
115 132 32 22 60+ Age not stated
MAHAL (RURAL)
107 105 76 20 11 32 Total 2 I 0-14
6 21 9 18 15-34 28 5 34 8 II 35-59 73 100 21 12 2 60+
Age not stated
8:;
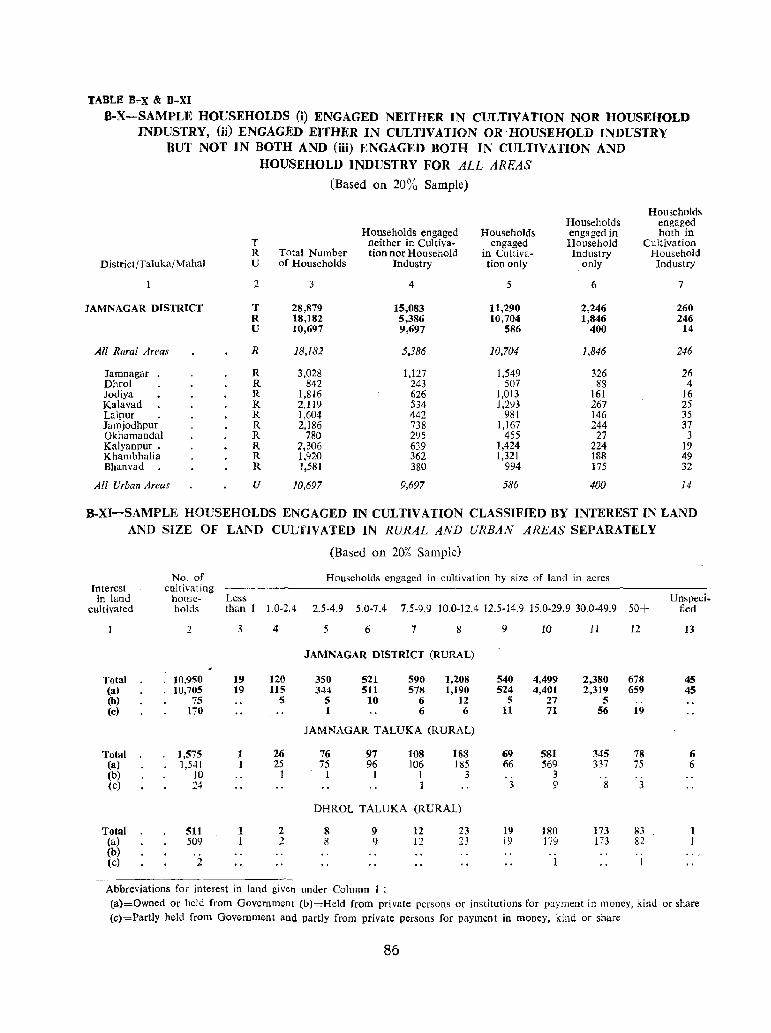
TABLE B,..X & B~XI
8-X-SAMPLE HOUSEHOLDS (i) ENGAGED NEITHER IN CULTIVATION NOR HOUSEHOLD INDUSTRY, (ij) ENGAGED EITHER IN CULTIVATION OR 'HOUSEHOLD INDUSTRY
RUT NOT IN BOTH AND (iii) ENGAGED BOTH IN CUI,TlVATION AND HOUSEHOLD INDUSTRY FOR ALL AREAS
(Based on 20% Sample)
Households Households engaged
Households engaged Households engaged in both in T neither in Cultiva- engaged Household Cultivation R Total Number tion nor Household in Cultiva- Industry Household
District[Talukaj Mahal U of Households Industry tion only only Industry
2 3 4 5 6 7
JAMNAGAR DISTRICT T 28,879 15,083 11,290 2,246 260 R 18,182 5,386 10,704 1,846 246 U 10,697 9,697 586 400 14
All Rural Areas R 18,182 5.386 10,704 },846 246
Jamnagar R 3,028 1,127 1,549 326 26 Dhrol R 842 243 507 88 4 Jodiya R 1,816 626 1,013 161 16 Kalavad R 2,119 534 J ,293 267 25 Lalpur R 1,604 442 981 146 35 Jamjodhpur R 2,186 738 1,167 244 37 Okhamandal R 780 295 455 27 3 Kalyanpur. R Z,306 639 1,424 224 19 Khambhalia R 1,920 362 1,321 188 49 Bhanvad R 1,581 380 994 175 32
All Urban Areas U 10,697 9,697 586 400 14
B-XI-SAMPLE HOUSEHOLDS ENGAGED IN CULTIVATION CLASSIFIED BY INTEREST IN LAND AND SIZE OF LAND CULTIVATED IN RURAL AND URBAN AREAS SEPARATELY
(Based on 20% Sample)
No. of Households engaged in cultivation by size of land in acres Interest cultivating in land house- Less Unspeci-
cultivated holds than I 1.0-2.4 2.5·4.9 5.0-7.4 7.5-9.9 10.0-12.4 12.5·14.9 15.0-29.9 30.0-49.9 50+ fied
2 3 4 5 6 7 8 9 10 11 12 13
JAMNAGAR DISTRICT (RURAL)
Total 10,950 19 120 350 521 590 1,208 540 4,499 2,380 678 45 (a) IU,705 19 115 344 511 578 1,190 524 4,401 2,319 659 45 (b) 75 5 5 10 6 12 5 27 5 (c) 170 1 6 6 11 71 56 19
JAMNAGAR TALUKA (RURAL)
Total ],575 t 26 76 97 108 188 69 581 345 78 6 (a) 1,541 1 25 75 96 106 185 66 '569 337 75 6 (b) to I I J 1 3 .. 3 (c) 24 I 3 9 8 3
DHROL TALUKA (RURAL)
Total 511 1 2 8 9 ]2 23 19 ]80 ]73 In 1 (a) 509 1 2 8 9 12 23 Il) 179 173 82 1 (b) (c) 2 I I
Abbreviations for interest in land given under Column I : (a)=Owned or held from Government (b)=Held from private persons or institutions for payment in money, kind or share (c)=Partly held from Government and partly from private persons for payment in money, kind or share
86
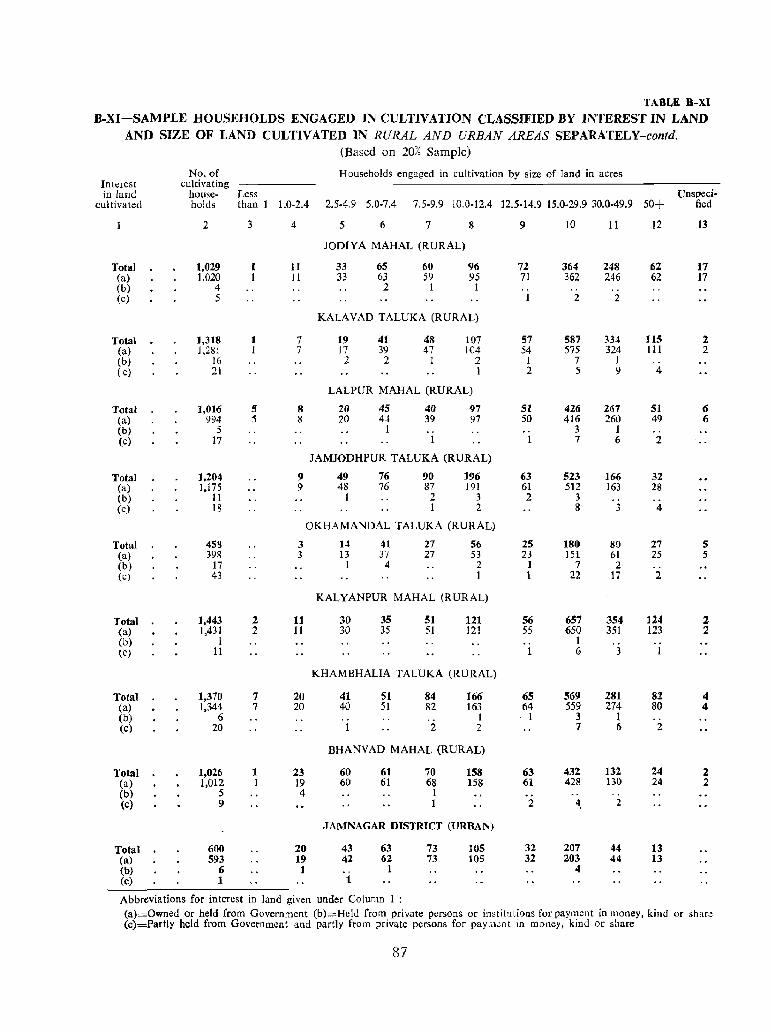
TABLE 8-XI
B-XI-SAMPLE HOUSEHOLDS ENGAGED IN CULTIVATION CLASSIFIED BY INTEREST IN LAND AND SIZE OF LAND CULTIVATED IN RURAL AND URBAN AREAS SEPARATELY-contd.
(Based on 20% Sample)
No. of Households engaged in cultivation by size of land in acres Interest cultivating in land house- Less Unspeci-
cultivated holds than 1 1.0-2.4 2.5-4.9 5.0-7.4 7.5-9.9 10.0-12.4 12.5-14.9 15.0-29.9 30.0-49.9 50+ fied
2 3 4 5 6 7 8 9 10 11 12 13
JODIYA MAHAL (RURAL)
Total 1,029 11 33 65 60 96 72 364 248 62 17 (a) 1,020 II 33 63 59 95 71 362 246 62 17 (b) 4 2 1 1 .. .. .. (c) 5 1 2 2
KALAVAD TALUKA (RURAL)
Tvtal 1,318 1 7 19 41 48 107 57 587 334 115 2 (a) 1,281 I 7 17 39 47 104 54 575 324 III 2 (b) 16 2 2 1 2 I 7 I .. ( c) 21 I 2 5 9 4
LALPUR MAHAL (RURAL)
Total 1,016 5 8 20 45 40 97 51 426 267 51 6 (a) 994 5 8 20 44 39 97 50 416 260 49 6 (b) 5 I 3 I .. (c) 17 1 7 6 2
JAMJODHPUR TALUKA (RURAL)
Total 1.204 9 49 76 90 196 63 523 166 32 (a) 1.175 9 48 76 87 191 61 512 163 28 (b) 11 I 2 3 2 3 (c) 18 I 2 8 3 4
OKHAMANDAL TALUKA (RURAL)
Total 458 3 14 41 27 56 25 180 80 27 5 (a) 398 3 13 37 27 53 23 lSI 61 25 5 (b) 17 I 4 2 I 7 2 (c) 43 1 1 22 17 2
KALYANPUR MAHAL (RURAL)
Total 1.443 2 11 30 35 51 121 56 657 354 124 2 (a) 1,431 2 11 30 3S 51 121 55 650 351 123 2 (b) 1 1 (c) 11 1 6 3 1
KHAMBHALIA TALUKA (RURAL)
Total 1,370 7 20 41 51 84 166 (IS 569 281 82 4 (a) 1,344 7 20 40 51 82 163 64 559 274 80 4 (b) 6 1 1 3 1 (c) 20 1 2 2 7 6 2
BHANVAD MAHAL (RURAL)
Total 1,026 1 23 60 61 70 158 63 432 132 24 2 (a) 1,012 1 19 60 61 68 158 t51 428 l3() 24 2 (b) 5 4 1 -' .. (c) 9 1 2 4, 2
JAMNAGAR DISTRICT (URBAN)
Total 600 20 43 63 73 105 32 207 44 13 (a) 593 19 42 62 73 105 32 203 44 13 (b) 6 1 1 4 (c) 1 1
Abbreviations for interest in land given under Column I : (a)=Owned or held from Government (b)=Held from private persons or institutious for payment in money, kind or shan! (c)=Partly held from Government and partly from private persons for paYI.ktlt in money, kind or share
87
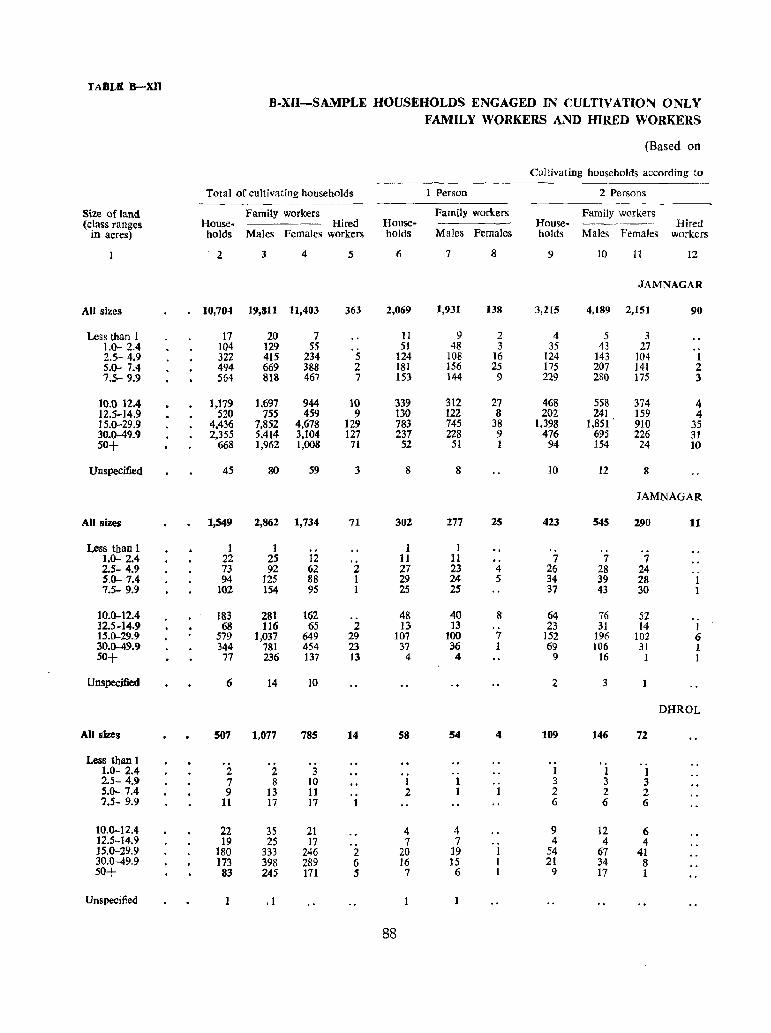
TABLE B--XII
B·XII-SAMPLE HOUSEHOLDS ENGAGED IN CULTIVATION ONLY FAMILY WORKERS AND HIRED WORKERS
(Based on
Cultivating households according to
Total of cultivating households 1 Person 2 Persons
Size ()f land Family workers Family workers Family workers (class ranges House- Hired House- House- ~- ~- ------- Hired
in acres) holds Males Females workers holds Males Females holds Males Females workers
2 3 4 5 6 7 8 9 10 11 12
JAMNAGAR
All sizes 10,704 19,811 11,403 363 2,069 1,931 138 3,215 4,189 2,151 90
Less than 1 17 20 7 II 9 2 4 5 3 1.0- 2.4 104 129 55 51 48 3 35 43 27 2.5- 4.9 3Z2 415 234 5 124 108 16 124 143 104 1 5.0- 7.4 494 669 388 2 181 156 25 175 207 141 2 7.5- 9.9 564 813 467 7 153 144 9 229 280 175 3
10.0 ]2.4 1,]79 1,697 944 ]0 339 312 27 468 558 374 4 12.5-14.9 520 755 459 9 130 122 8 202 241 159 4 15.0-29.9 4.436 7,852 4,678 ]29 783 745 38 1.398 1,851 ' 910 35 30.Q-49.9 2,355 5,414 3,104 127 237 228 9 476 695 226 31 50+ 668 1,962 1,008 71 52 51 I 94 154 24 10
Unspecified 45 80 59 3 8 8 10 12 8
JAMNAGAR
All sizes 1,549 2,862 1,734 71 302 277 25 423 S45 290 11
Less than 1 ] ] 1 1 " 1.0- 2.4 22 25 12 11 11 7 7 7 2.S- 4.9 73 92 62 2 27 23 4 26 28 24 5.0- 7.4 94 125 88 1 29 24 5 34 39 28 1 7.S- 9.9 102 154 95 1 25 25 37 43 30 1
10.0-12.4 183 281 162 48 40 8 64 76 52 .. 12.5-14.9 68 116 65 2 J3. 13 23 31 14 1 15.0-29.9 579 1,037 649 29 107 100 7 152 196 102 6 30.0-49.9 344 781 454 23 37 36 1 69 106 31 1 50+ 77 236 137 13 4 4 9 16 1 1
Unspecified 6 14 10 2 3
DHROL
All sizes 507 1.077 785 14 58 54 4 109 146 72
Less than 1 1.0- 2.4 2 2 3 l 1 1 2.5- 4.9 7 8 10 I 1 3 3 3 S.O- 7.4 9 13 11 .. 2 1 I 2 2 2 7.5- 9.9 11 17 17 1 6 6 6
10.0-12.4 22 35 21 4 4 9 12 6 ]2.5-14.9 19 25 17 7 7 4 4 4 15.0-29.9 180 333 246 2 20 19 1 54 67 41 30.0-49.9 173 398 289 6 16 15 1 21 34 8 50+ 83 245 171 5 7 6 1 9 17 1
Unspecified 1 .1
88
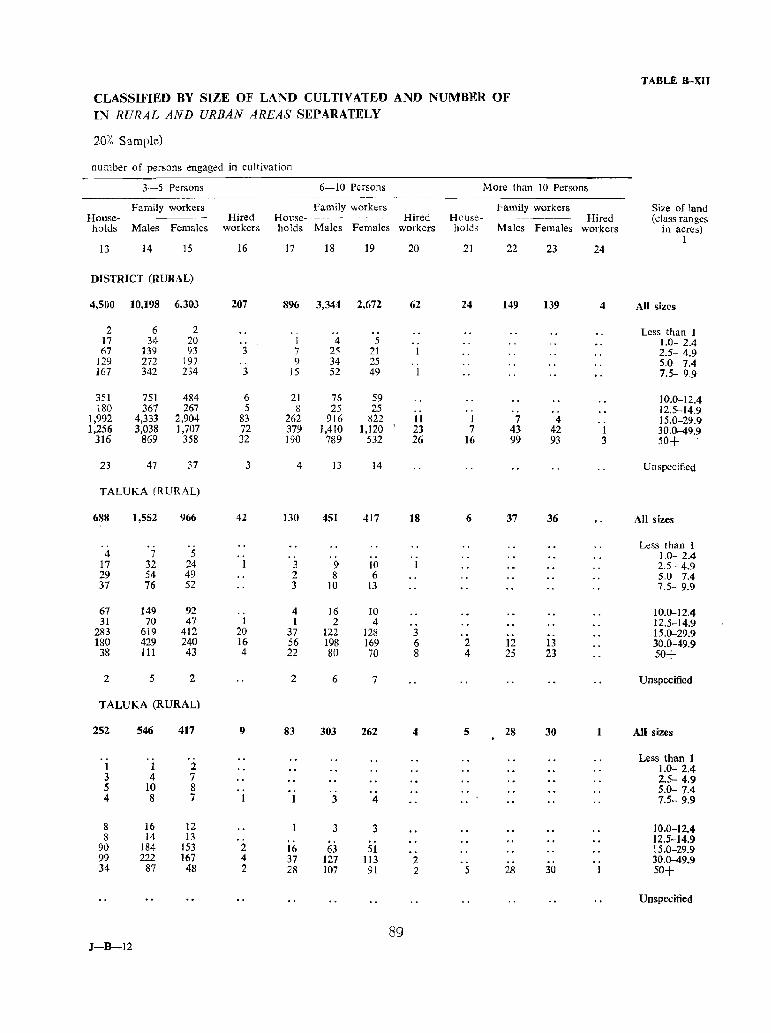
TABLE B-XII
CLASSIFIED BY SIZE OF LAND CULTIVATED AND NUMBER OF IN RURAL AND URBAN AREAS SEPARATELY
20% Sample)
number of persons engaged in cultivation
3-5 Persons 6-10 Persons More than 10 Persons --~------------
Family workers Family workers Family workers Size of land House- Hired House- --------- - Hired House- _._------_ Hired (class ranges holds Males Females workers holds Males Females workers holds Males Females workers in acres)
1 13 14 15 16 17 18 19 20 21 22 23 24
DISTRICT (RURAL)
4,S{){) 10,198 6,303 207 896 3,344 2,672 62 24 149 139 4 All sizes
2 6 2 . . .. Less than I 17 34 20 1 4 5 1.0- 2.4 67 139 93 3 7 25 21 2.5- 4.9
129 272 197 .. 9 34 25 .. 5.0- 7.4 ]67 342 234 3 15 52 49 I 7.5- 99
351 751 484 6 21 75 59 10.0-12.4 180 367 267 5 8 25 25 .. .. 12.5-14.9
1,992 4,333 2,904 83 262 916 822 11 1 7 4 15.0-29.9 1,256 3,038 1,707 72 379 1,410 1,120
, 23 7 43 42 1 30.0-49.9
316 869 358 32 190 789 532 26 16 99 93 3 50+
23 47 37 3 4 13 14 Unspecified
TALUKA (RURAL)
688 1,552 966 42 130 451 417 18 6 37 36 All sizes
Less Ihan 1 4 7 5 .. 1.0- 2.4
17 32 24 1 3 9 10 1 2.5- 4.9 29 54 49 2 8 6 5.0 7.4 37 76 52 3 10 13 7.5- 9.9
67 149 92 .. 4 16 10 10.0-12.4 31 70 47 1 1 2 4 12.5-14.9
283 6i9 412 20 37 122 128 3 15.0-29.9 180 429 240 16 56 198 169 6 2 12 13 30.0-49.9 38 111 43 4 22 80 70 8 4 25 23 50+
2 5 2 2 6 7 Unspecified
T ALUKA (RURAL)
252 546 417 9 83 303 262 4 5 28 30 All sizes
Less than 1 1 1 2 1.0- 2.4 3 4 7 2.5- 4.9 5 lO 8 5.0- 7.4 4 8 7 3 4 7.5- 9.9
8 16 12 3 3 10.0-12.4 8 14 13 .. 12.5-14.9
90 184 153 2 16 63 51 15.0-29.9 99 222 167 4 37 127 113 2 .. .. 30.0-49.9 34 87 48 2 28 107 91 2 5 28 30 50+
Unspecified
89 J-B-12
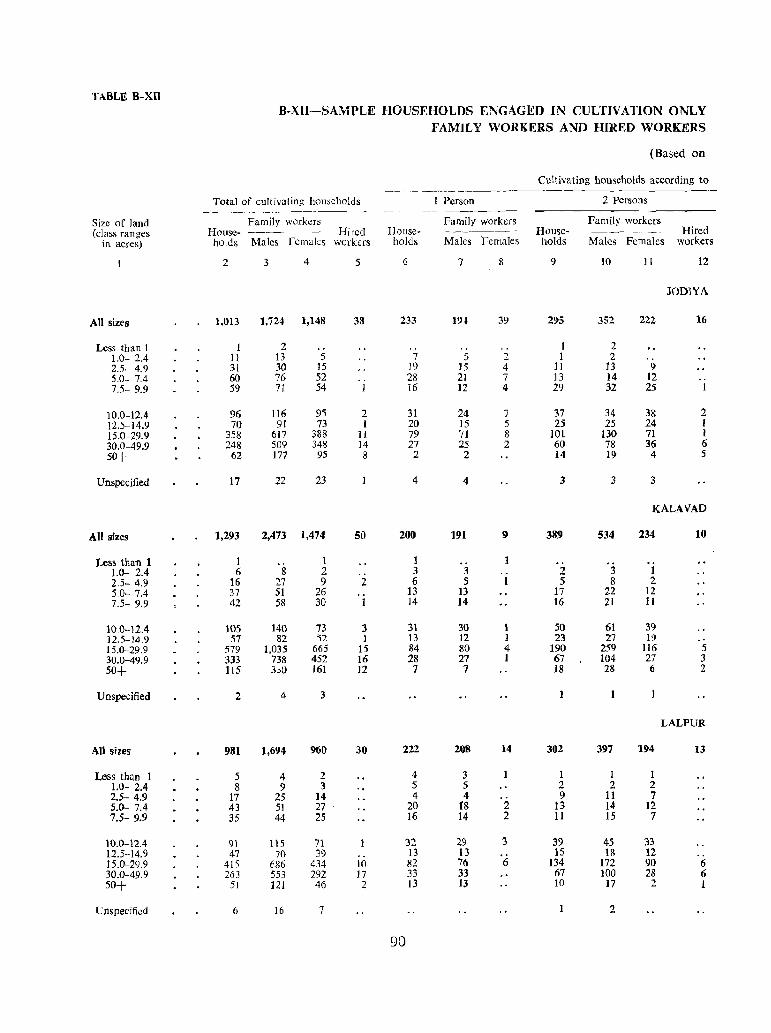
l'ABLE B-XU B·XII-SAMPLE HOUSEHOLDS ENGAGED IN CULTIVATION ONLY
FAMILY WORKERS AND HIRED WORKERS
(Based on
Cultivating households according to
Total of cultivating households 1 Person 2 persons
Size of land Family workers Family workers Family workers (class ranges House- ---- Hired House- House- Hired
in acres) holds Males fcmaks workers holds Males 'Females holds Males Females workers
2 3 4 5 6 7 8 9 10 11 12
JODIYA
All sizes 1,()l3 1,724 1,148 38 233 19 .. 39 295 352 222 16
Less than 1 1 2 ., .. " .. 1 2 1.0- 2.4 11 13 5 7 5 2 1 2 2.5- 4.9 31 30 15 19 15 4 11 13 9 5.0- 7.4 60 76 52 .. 28 21 7 13 14 12 7.5- 9.9 59 71 54 1 16 12 4 29 32 25 1
10.0-12.4 96 116 9S 2 31 24 7 37 34 38 2 12.5-14.9 70 91 73 I 20 15 5 25 25 24 1 15.0-29.9 358 617 388 11 79 71 8 101 130 71 I 30.0-49.9 248 509 348 14 27 25 2 60 78 36 6 50+ 62 177 95 8 2 2 14 19 4 5
Unspecified 17 22 23 4 4 3 3 3
KALAVAD
All sizes 1,293 2,473 1,474 50 200 191 9 389 534 234 10
Less than 1 1 1 1 1.0- 2.4 6 8 2 3 3 2 3 1 2.5- 4.9 16 27 9 2 6 5 1 5 8 2 5.0- 7.4 37 51 26 13 13 17 22 12 7.5- 9.9 42 58 30 1 14 14 16 21 11
100-12.4 105 140 73 3 31 30 I 50 61 39 12.5-14.9 57 82 52 1 13 12 1 23 27 19 .' 15.0-29.9 579 1,035 665 15 84 80 4 190 259 116 5 30.0-49.9 333 738 452 16 28 27 I 67 104 27 3 50+ )15 3.:>1I 161 12 7 7 18 28 6 2
Unspecified 2 4 3
LALPUR
All sizes 981 1,694 960 30 222 208 14 302 397 194 13
Less than 1 5 4 2 4 3 1 1 1 1.0- 2.4 8 9 3 5 5 2 2 2 2.5- 4.9 17 25 14 4 4 9 11 7 5.0- 7.4 43 51 27 20 fS 2 13 14 12 7.5- 9.9 35 44 25 16 14 2 11 15 7
10.0--12.4 91 115 71 32 2<f 3 39 45 33 12.5-14.9 47 70 39 .. 13 13 15 18 12 15.0-29.9 415 686 434 10 82 76 6 134 In 90 6 30.0--49.9 263 553 292 17 33 33 67 100 28 6 50+ 51 121 46 2 13 13 10 17 2 1
Unspecified 6 16 7 2
90
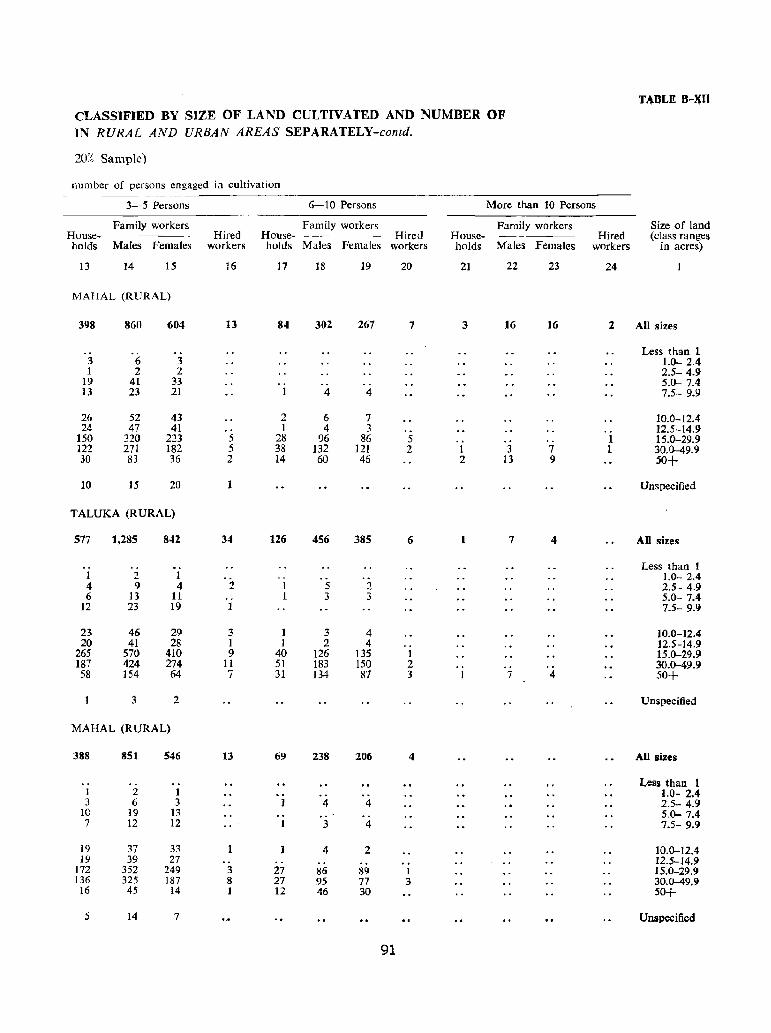
TABLE 8-'Ul CLASSIFIED BY SIZE OF LAND CULTIVATED AND NUMBER OF IN RURAL AND URBAN AREAS SEPARATELY-contd.
20% Sample)
number of persons engaged in cultivation
3-5 Persons 6-10 Persons More than 10 Persons
Family workers Family workers Family workers Size of land House- Hired House· Hired House- Hired (class ranges holds Males Females workers holds Males Females workers holds Males Females workers in acres)
13 14 15 16 17 18 19 20 21 22 23 24
MAHAL (RURAL)
398 860 604 13 84 302 267 7 3 16 16 2 All sizes
Less than 1 3 6 3 1.0- 2.4 1 2 2 2.5- 4.9
19 41 33 5.0- 7.4 13 23 21 1 4 4 7.5- 9.9
26 52 43 2 6 7 10.0-12.4 24 47 41 1 4 3 12.5-14.9
150 320 223 5 28 96 86 5 1 15.0-29.9 122 271 182 5 38 132 121 2 1 3 7 1 30.0-49.9 30 83 36 2 14 60 46 2 13 9 50+
10 15 20 1 Unspecified
TALUKA (RURAL)
577 1,285 842 34 126 456 385 6 1 7 4 All sizes
.. Less than 1 1 2 1 1.0- 2.4 4 9 4 2 5 2 2.5- 4.9 6 13 11 3 3 5.0- 7.4
12 23 19 1 7.5- 9.9
23 46 29 3 1 3 4 10.0-12.4 20 41 28 1 1 2 4 12.5-14.9
265 570 410 9 40 126 135 1 15.0-29.9 187 424 274 11 51 183 150 2 30.0-49.9 58 154 64 7 31 134 87 3 7 4 50+
3 2 Unspecified
MAHAL (RURAL)
388 851 546 13 69 238 206 4 AU sizes
Less than 1 1 2 1 1.0- 2.4 3 6 3 4 4 2.5- 4.9
10 19 13 .. 5.0- 7.4 7 12 12 1 3 4 7.5- 9.9
19 37 33 4 2 10.0-12.4 19 39 27 12.5-14.9
172 352 249 3 27 86 89 1 15.0-29.9 136 325 187 8 27 95 77 3 30.0-49.9
16 45 14 1 12 46 30 50+
5 14 7 Unspecified
91
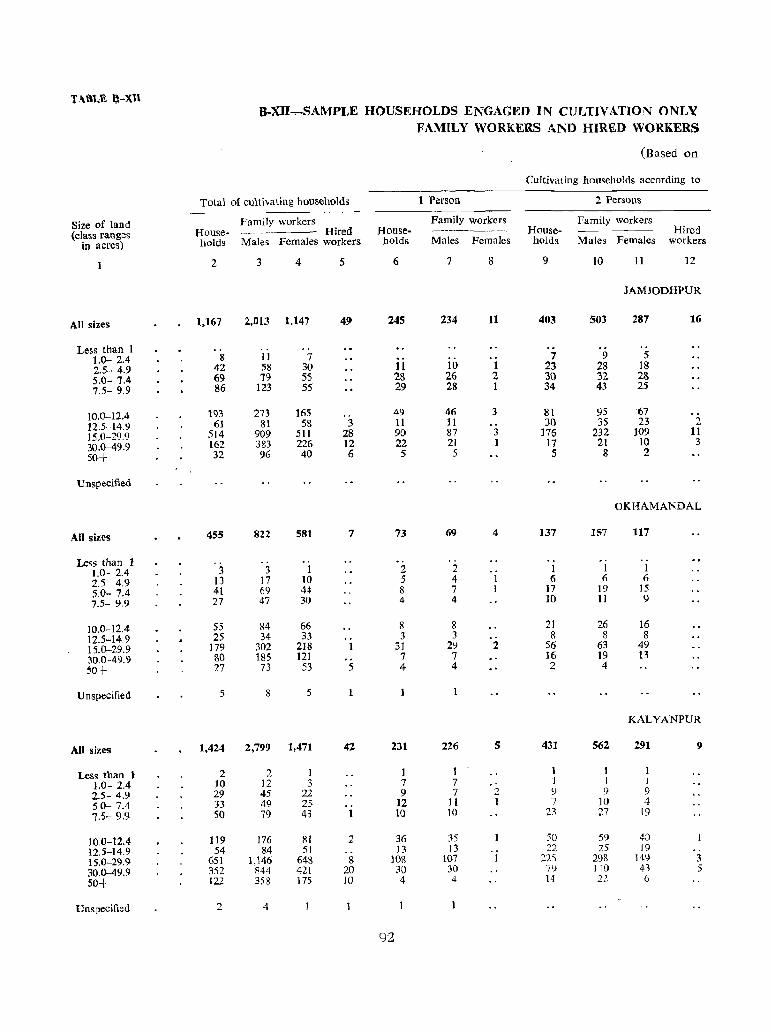
TABLE I)-xn B-XII...,...SAMPLE HOUSEHOLDS ENGAGED IN CULTIVATION ONLY
FAMILY WORKERS AND HIRED WORKERS
(Based on
Cultivating households according to
Total of cultivating households 1 Person 2 PerSOllS
Size of land Family workers Family workers Family workers (class ranges House- Hired House- ,-------- --- House- Hird
in acres) holds Males Females workers holds Males Females holds Males Females workers
2 3 4 5 6 7 8 9 10 11 12
JAMJODHPUR
All sizes 1,167 2,813 1.147 49 245 234 11 403 503 287 16
Less than 1 1.0- 2.4 8 11 7 7 9 5
2.5- 4.9 42 58 30 11 10 1 23 28 18 5.0- 7.4 69 79 5S 23 26 2 3() 32 23 7.5- 9.9 86 123 55 29 28 1 34 43 25
10.0-12.4 193 273 165 49 46 3 81 95 67
12.5· 14.9 61 81 58 3 11 11 30 3S 23 2
15.0-29.9 514 909 511 28 90 87 3 176 232 109 11
30.0-49.9 162 383 226 12 22 21 1 17 21 10 3
50+ 32 96 40 6 5 5 5 8 2
Unspecified
OKHAMANDAL
All sizes 455 822 581 7 73 69 4 137 157 117
Less than 1 1.0- 2.4 3 3 1 2 2 I 1 1
2.5 4.9 13 17 10 5 4 6 6 6
5.0- 7.4 41 69 44 8 7 17 19 15 7.5- 9.9 27 47 30 4 4 10 11 9
10.0-12.4 55 84 66 8 8 21 26 16 12.5-14.9 25 34 33 3 3 8 8 8
15.0-29.9 179 302 218 31 29 2 56 63 49 30.0-49.9 80 185 121 7 7 16 )9 13
50+ 27 73 S3 5 4 4 2 4
Unspecified 5 8 5 1
KALYANPUR
All sizes 1.424 2,799 1,471 42 231 226 5 431 562 291 9
Less than 1 2 2 1 ] 1 1 1 1 1.0- 2.4 10 12 3 7 7 ] 1 I
2.5- 4.9 29 45 22 9 7 2 9 9 9
5.0- 7.4 33 49 25 12 J I I 7 10 4
7.5- 9.9 50 79 43 1 10 10 23 27 19
10.0-12.4 119 176 III 2 36 35 50 59 40
12.5-14.9 54 84 51 13 13 22 25 19 15.0-29.9 651 1,146 648 8 108 107 I 225 298 149 3 30.0-49.9 352 844 421 20 30 30 79 110 43 5
50+ 122 358 175 10 4 4 14 22 G
Unspecified 2 4
92
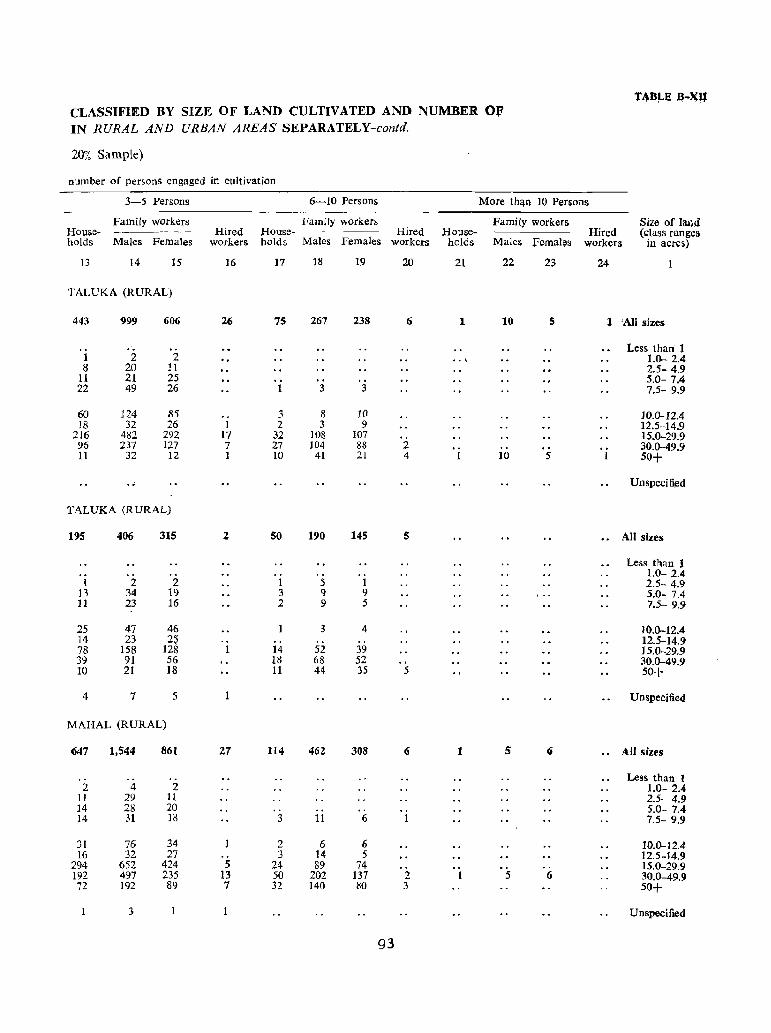
.... ~8~E ij-~IJ CLASSIFIED BY SIZE OF LAND CULTIVATED AND NUMBER O.f' IN RURAL AND URBAN AREAS SEPARATELY-contd.
20% Sample)
number of personS engaged in cultivation
3-5 Persons 6-10 Persons More th<!.n 10 Persons
Family workers Family workers Family workers Size of latH! House- --~~~-- Hired House- Hired House- Hired (class ranges holds Males Females workers holds Males Females workers holds Males females workers in acres)
13 14 15 16 17 18 19 20 21 22 23 24
TALUKA (RURAL)
443 999 606 26 75 267 238 6 1 10 5 1 'All sizes
1 2 2 Less than 1
•• 1 1.0-- 2.4 8 20 11 2.5- 4.9
11 21 25 5.0- 7.4 22 49 26 3 3 7.5- 9.9
60 124 85 3 8 10 10.0--12.4 18 32 26 1 2 3 9 12.5-14.9
216 482 292 17 32 108 107 15.0-29.9 96 237 127 7 27 104 88 2 30.0-49.9 11 32 12 1 10 41 21 4 1 IO 5 1 50+
.. Unspecified
TALUKA (RURAL)
195 406 315 2 50 190 145 5 All sizes
Less than I .. 1.0- 2.4 1 2 2 I 5 1 2.5- 4.9
13 34 19 3 9 9 I" 5.0- 7.4 11 23 16 2 9 5 7.5- 9.9
25 47 46 3 4 10.0--12.4 14 23 2~ 12.5-14.9 78 158 ]28 1 14 52 39 15.0-29.9 39 91 56 18 68 52 30.0-49.9 10 21 18 11 44 35 5 50+
4 7 5 Unspecified
MAHAL (RURAL)
647 1.544 861 27 114 46Z 308 (j 1 5 6 AU sizes
Less than 1 2 4 2 1.0- 2.4
11 29 II 2.5- 4.9 ]4 28 20 .. 5.0- 7.4 ]4 31 10 3 11 6 1 7.5- 9.9
31 76 34 2 6 6 10.0--12.4 16 32 27 3 14 5 12.5-14.9
294 652 424 5 24 89 74 15.0-29.9 192 497 235 13 50 202 137 2 5 6 30.0-49.9 72 ]92 89 7 32 140 80 3 50+
3 Unspecified
93
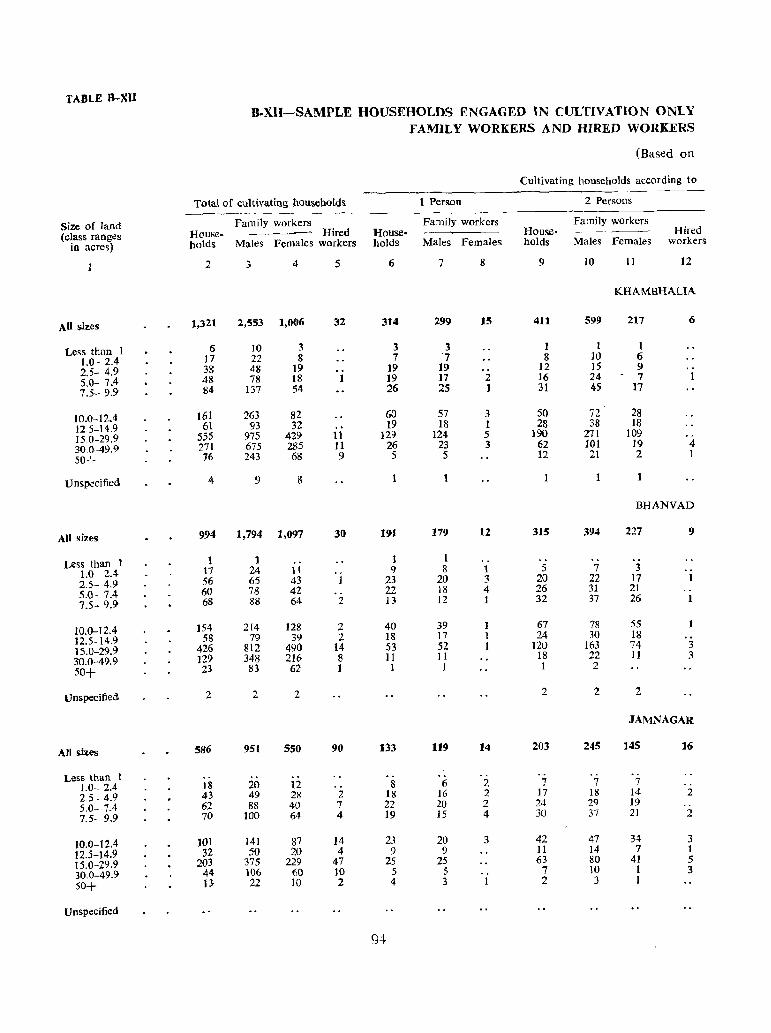
TABLE B-XU B.XII-SAMPLE HOUSEHOLDS ENGAGED IN CULTIVATION ONLY
FAMILY WORKERS AND HIRED WORKERS
(Based on
Cultivating households according to
Total of cultivating householda 1 Pers.on 2 Persons -~------
Size of land Family workers Family workers Family workers
(class ranges House- Hired House- House- - ---- Hired
in acres) hoJds Males Females workers holds Males Females holds Males Females workers
2 3 4 5 6 7 8 9 10 II 12
KHAMBHALlA
All sizes 1,321 2,553 1,006 32 314 299 15 411 599 217 6
Less than I 6 10 3 3 3 I 1 1
1.0- 2.4 17 22 8 7 7 8 10 6
2.5- 4.9 38 48 19 19 19 12 15 9 .. 5.0- 7.4 48 7l! 18 19 17 2 16 24 - 7 1
7.5- 9.9 84 137 54 26 25 1 31 45 17
10.0-12.4 161 263 82 60 57 3 50 72 28 12.5-14.9 61 93 32 19 18 1 28 38 18
15.0-29.9 555 975 429 11 129 124 5 190 271 109
30.0-49.9 271 675 285 11 26 23 3 62 101 19 4
50+ 16 243 68 9 5 5 12 21 2 1
Unspecified 4 9 8
BHANVAD
All sizes 994 1,794 1,097 30 191 179 12 315 394 227 9
Less than 1 1 1 1 1 .. 1.0 2.4 \7 24 11 9 8 1 5 7 3
2.5- 4.9 56 65 43 1 23 20 3 20 22 17
5.0- 7.4 60 78 42 22 18 4 26 31 21 .,
7.5- 9.9 68 88 64 2 13 12 I 32 37 26 1
10.0-12.4 J54 214 128 2 40 39 67 78 55
12.5-14.9 58 79 39 2 18 17 24 30 18
15.0-29.9 426 812 490 14 53 52 120 163 74 3
30.0-49.9 129 348 216 8 11 II 18 22 11 3
50+ 23 83 62 I 1 1 1 2
Unspecified 2 2 2 2 2 2
JAMNAGAR
All sizes 586 951 550 90 133 119 14 203 245 145 16
Less than 1 1.0- 2.4 18 20 12 8 6 2 7 7 7 .. 2.5- 4.9 43 49 28 2 18 J6 2 17 18 ]4 2
5.0- 7.4 62 88 40 7 22 20 2 24 2<) 19 .. 7.5- 9.9 70 100 64 4 19 15 4 30 37 21 2
10.0-12.4 101 141 87 14 23 20 3 42 47 34 3
12.5-14.9 32 50 20 4 9 9 11 14 7 ]
15.0-29.9 203 375 229 47 25 25 63 80 41 5
30.0-49.9 44 106 60 10 5 S 7 10 I 3
50+ n 22 10 2 4 3 2 3 1
Unspecified
94
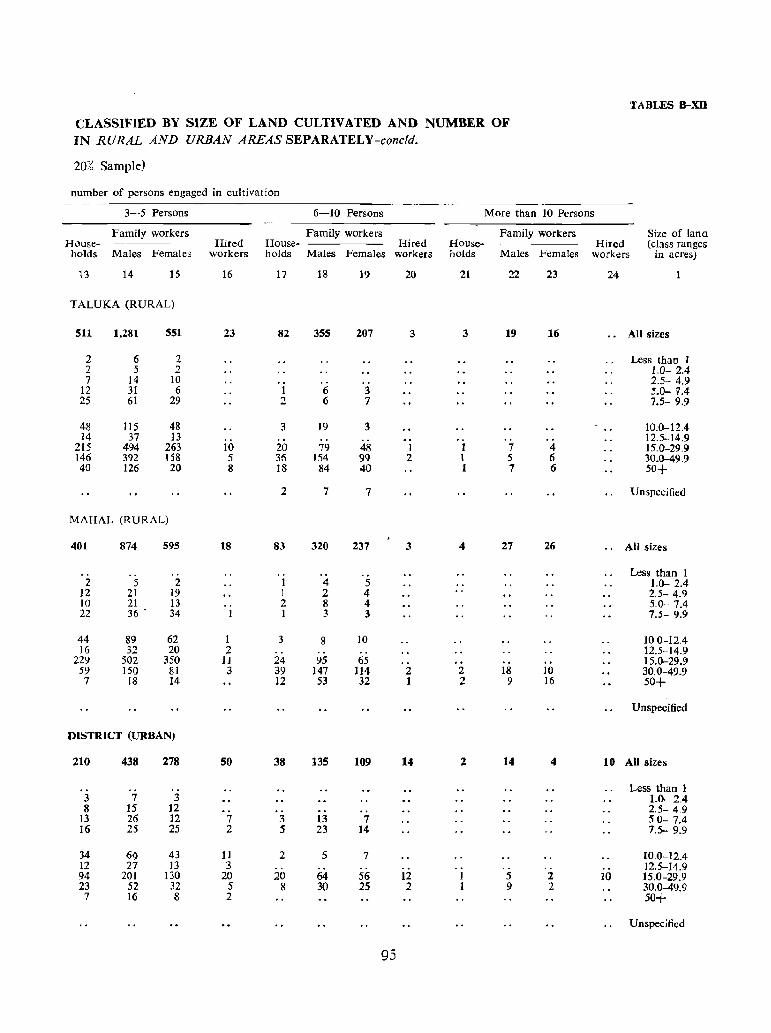
TABLES B-Xn
CLASSIFIED BY SIZE OF LAND CULTIVATED AND NUMBER OF IN RURAL AND URBAN AREAS SEPARATELY-concld.
20% Sample)
number of persons engaged in cultivation
3-5 Persons 6-10 Persons More than 10 Persons
Family workers Family workers Family workers Size of land House- Hired House- Hired House- Hired (class ranges
holds Males Female. workers holds Males Females workers holds Males Females workers in acres)
13 14 15 16 17 18 19 20 21 22 23 24
TALUKA (RURAL)
511 1,281 551 23 82 355 207 3 3 19 16 All sizes
2 6 2 Less than I 2 5 2 1.0- 2.4 7 14 10 2.5- 4.9
12 31 6 1 6 3 5.0- '1.4 25 61 29 2 6 7 7.5- 9.9
48 115 48 3 19 3 10.0-12.4 14 37 13 12.5-14.9
215 494 263 10 20 79 48 1 I 7 4 15.0-29.9 146 392 158 5 35 154 99 2 1 5 6 30.0-49.9 40 126 20 8 18 84 40 1 7 6 50+
2 7 7 Unspecified
MAHAL (RURAL)
401 874 595 18 83 320 237 3 4 27 26 .. All sizes
Less than 1 2 5 2 1 4 5 1.0- 2.4
12 21 19 1 2 4 2.5- 4.9 10 21 13 .. 2 8 4 5.0- 7.4 22 36 . 34 1 I 3 3 7.5- 9.9
44 89 62 1 3 9 10 10 0-12.4 16 32 20 2 .. 12.5-14.9
229 502 350 11 24 95 65 .. 15.0-29.9 59 ISO 81 3 39 147 114 2 2 18 ]0 30.0-49.9 7 18 14 12 53 32 1 2 9 16 50+
Unspecified
DISTRICT (URBAN)
210 438 278 50 38 135 109 14 2 14 4 10 All sizes
Less than 1 3 7 3 1.0-- 2.4 8 15 12 2.5- 4.9
13 26 12 7 3 13 7 50- 7.4 16 25 25 2 5 23 14 7.5- 9.9
34 69 43 11 2 5 7 10.0-12.4 12 27 13 3 .. .. . . 12.5-14.9 94 201 130 20 20 64 56 12 5 2 IO 15.0-29.9 23 52 32 5 8 30 25 2 9 2 30.0-49.9 7 16 8 2 50+
Unspecified
95
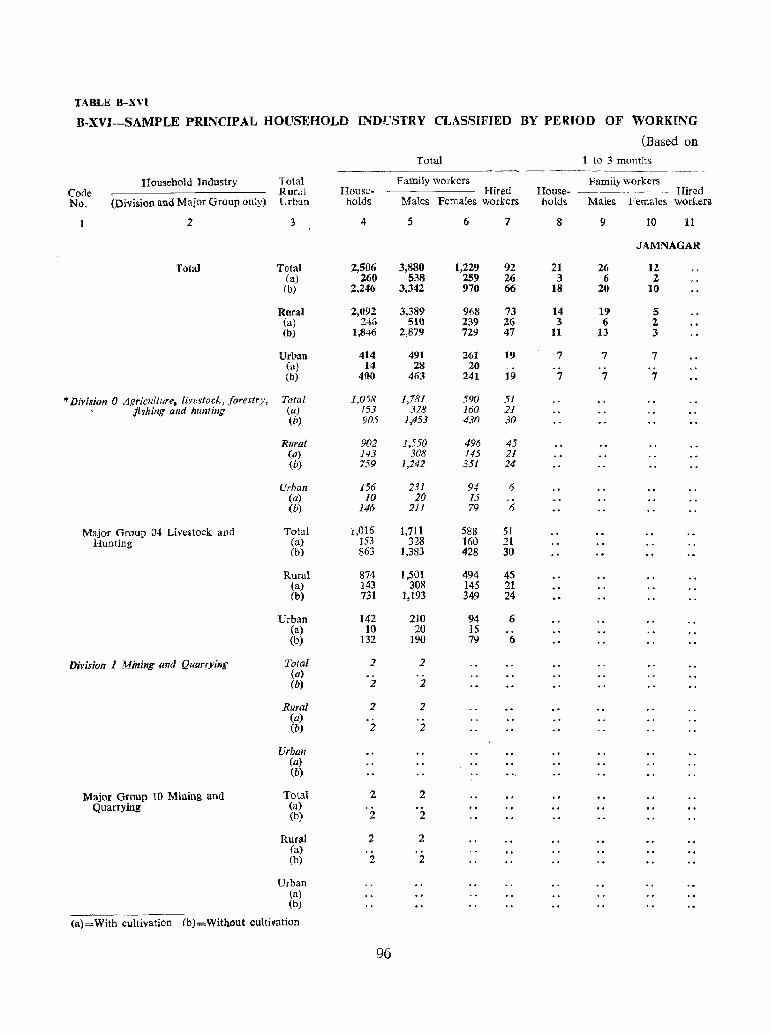
TABLE B-XVI
B·XVI-SAMPLE PRINCIPAL HOUSEHOLD INDUSTRY CLASSIFIED BY PERIOD OF WORKING
(Based on Total 1 to 3 months
---------------Household Industry Total Family workers Family workers
Code Rural House· -~-.. ~~~- Hired House- ~------ Hired No. (Divi&ion and Major Group only) Urban holds Males Females workers holds Males Females workers
2 4 5 6 7 8 9 10 11
JAMNAGAR
Total Total 2,506 3,880 1,229 92 21 26 12 (a) 260 538 259 26 3 6 2 (b) 2,246 3,342 970 66 18 20 10
Rural 2,(192 3,389 %8 73 14 19 5 (a) 246 510 239 26 3 6 2 (b) 1,845 2,879 729 47 11 13 3
Urban 414 491 261 19 7 7 7 (a) 14 28 20 (b) 400 463 241 19 7 7 7
* Division a Agriculture, livertock) forestry, Total 1,058 1,781 590 51 fiyhing and hunting (a) 153 328 160 21
(b) 905 1,453 430 30
Rural 902 1,550 496 45 (a) 143 308 145 21 (b) 759 1,242 351 24
Urban 156 231 94 6 (a) 10 20 15 (b) 146 211 79 6
Major Group 04 Live~tock and Total 1,016 1,711 588 51 Hunting (a) 153 328 toO 21
(b) 863 1,383 428 30
Rural 874 1,501 494 4S (a) 143 308 145 21 (b) 731 1,193 349 24
Urban ]42 210 94 6 (a) 10 20 15 (b) 132 190 79 6
Division 1 Mining and Quarrying Total 2 2 (a) (b) 2 2
Rural 2 2 (a) (b) 2 2
Urban (a) (b)
Major Group 10 Mining and Total 2 2 Quarrying Ca)
(b) 2 2
Rural 2 2 (a) (b) 2 2
Urban (a) (b)
(a)= With cultivation {b)=Without cultivation
96
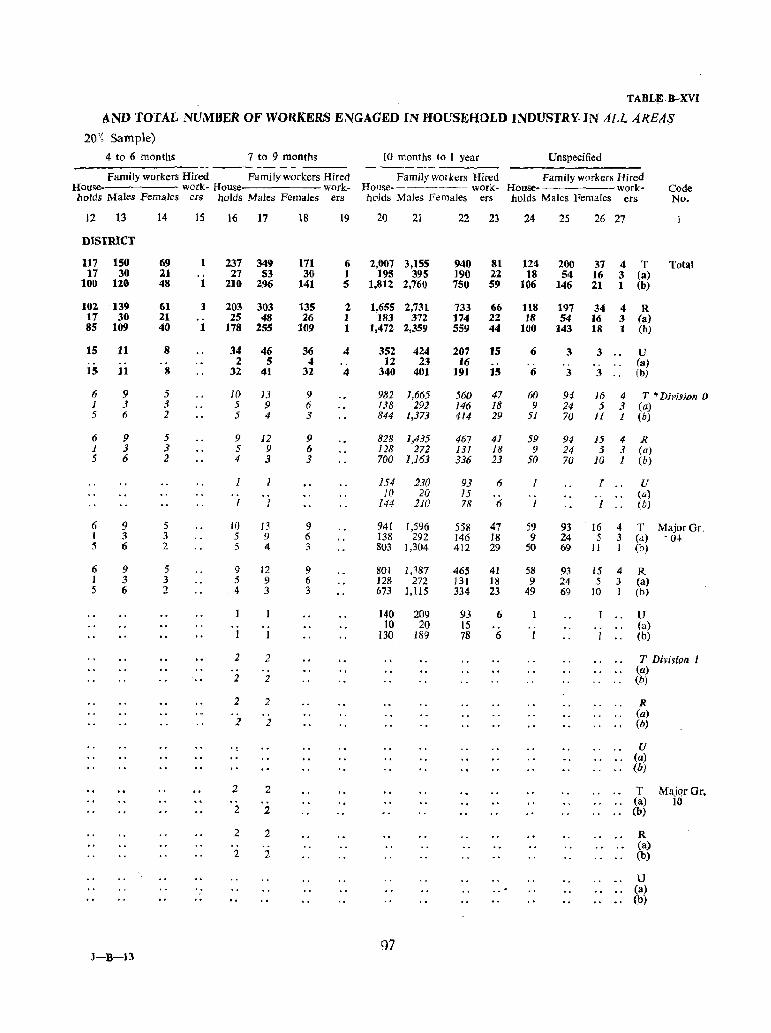
TABLE B-XVI
AND TOTAL NUMBER OF WORKERS ENGAGED IN HOUSEHOLD INDUSTRY- IN ALL AREAS
20'~ Sample)
4 to 6 months 7 to 9 months 10 months to I year Unspecified
Family workers Hired Family workers Hired Family workers Hired Family workers Hired House- work- House work- House- work. House- work- Code holds Males Females ers holds Males Females ers holds Males Females ers holds MaJes Females ers No.
12 13 14 15 16 17 18 19 20 21 22 23 24 25 26 27
DISTRICT
117 150 69 1 237 349 171 6 2,007 3,155 940 81 124 200 37 4 T Total 17 30 :U 27 53 30 1 195 395 190 22 18 54 16 3 (a)
100 120 48 1 210 296 141 5 1,812 2,760 750 59 100 146 21 1 (b)
102 139 61 1 203 303 135 2 1,655 2,731 733 66 118 197 34 4 R 17 30 21 25 48 26 1 183 372 174 22 18 54 16 3 (a) 85 109 40 1 178 255 109 1 1,472 2,359 559 44 100 143 18 1 (b)
15 11 8 34 46 36 4 352 424 207 15 6 3 3 " U .. 2 5 4 .. 12 23 16 .. .. " (a) ]5 11 8 32 41 32 4 340 401 ]91 15 6 3 3 .. (b)
6 9 5 10 JJ 9 982 1,665 560 47 60 94 J6 4 T * Djpision 0 J J 3 5 9 6 138 292 /46 18 9 24 5 3 (a) 5 6 2 5 4 J 844 1,373 414 29 51 70 Jl 1 (b)
6 9 5 9 12 9 828 1,435 467 41 59 94 15 4 R 1 3 3 5 9 6 128 272 131 18 9 24 5 3 Ca) 5 6 2 4 3 3 700 I,163 336 23 50 70 10 I (b)
1 1 154 230 93 6 I .. U 10 20 15 (a)
1 1 144 210 78 6 I 1 .. (b)
6 9 5 10 13 9 941 [,596 558 47 59 93 16 4 T MajorGr. I 3 3 5 9 6 138 292 146 18 9 24 5 3 Cal . 04 5 6 2 5 4 3 803 1,304 412 29 50 69 11 1 (b)
6 9 5 9 12 9 801 1,387 465 41 58 93 15 4 R 1 :3 3 5 9 6 128 272 131 18 9 24 5 3 (a) 5 6 2 4 3 3 673 1,IlS 334 23 49 69 10 J (b)
140 209 93 6 I " U .. 10 20 15 .. . . (a) 1 1 130 189 78 6 I I .. (b)
2 2 T Divi5ion 1 " (a) .. 2 2 (b)
2 2 R .. (a) 1 2 (b)
. U (a)
.. .. (b)
2 2 T Major Gr. (a) 10
2 2 (b)
2 2 R
2 (a)
2 (b)
U (a) (b)
97 J-8-13
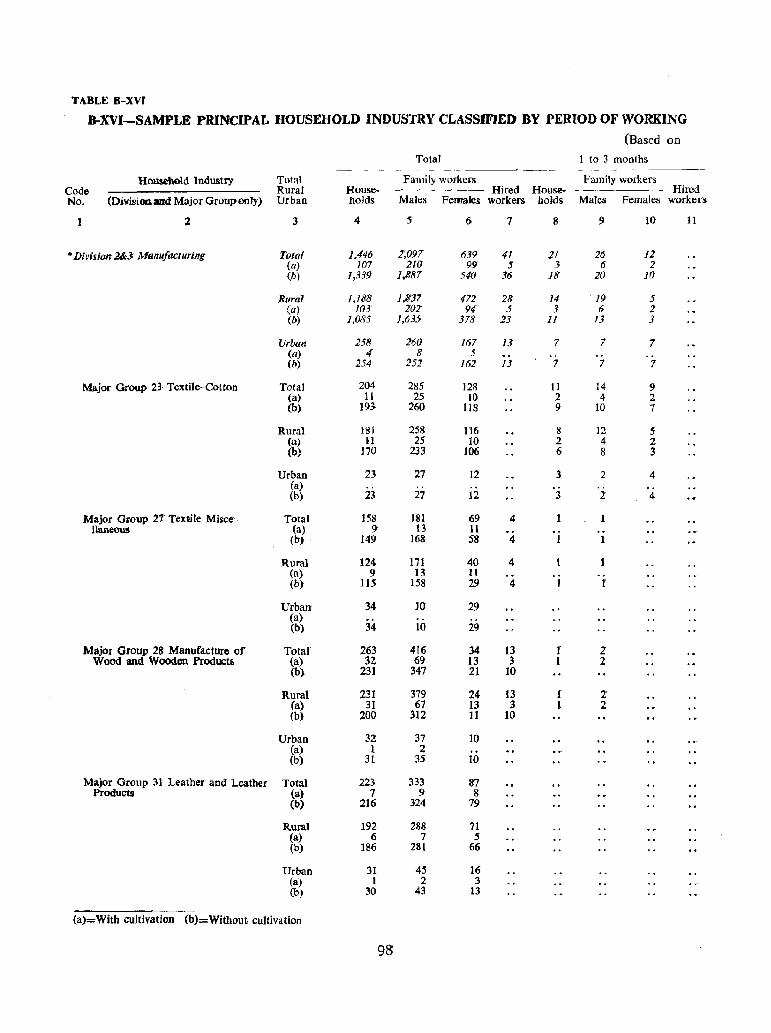
TABLE B-XVI
B-XVI-SAMPLE PRINCIPAL HOUSEHOLD INDUSTRY CLASSIDED BY PERIOD OF WORKING
(Based on
Total 1 to 3 months - --------- -
Household Industry Total Family wolken Family workers Code Rural House- Hired House- Hired No. (D.iYisioo and Major Group only) Urban holds Males Females workers holds Males Females workers
:1 3 4 5 6 7 8 9 10 11
.. Division .left); MctnuJacturing Total 1.446 1;097 639 41 21 26 12 (a) 107 210 99 5 3 6 2 (b) 1,339 1,887 540 36 18 20 10
Rural 1,]88 1,837 471 28 14 ·19 5 {a} 103 202 94 5 3 6 2 (b) 1,085 1,635 318 23 11 11 3
Urban 258 260 167 JJ 7 7 7 (a) 4 8 5 (h) 254 252 162 13 7 7 7
Major Group 2), Textile-Cotton Total 204 285 128 11 14 9 (a) 11 25 10 2 4 2 (b) 193 260 118 9 10 7
Rural ]81 258 116 8 12 5 (a) II 25 10 2 4 2 (b) 170 233 106 6 8 3
Urban 23 27 12 3 2 4 (a) .. .. (b) 23 27 12 3 2 4
Major Grotlp 21 Textile Mi~ce Total 158 181 69 4 Haneous (a) 9 13 11
(b) 149 168 58 4
Rural 124 171 40 4 (a) 9 13 II (0) 115 158 29 4 1
Urban 34 10 29 (a) (b) 34 10 29
Major Group 28 Manufacture of Total 263 416 34 13 r Z Wood and WoodOll Products (a) 32 69 13 3 1 2
(0) 231 347 21 10
Rural 231 379 24 13 r 2 (a) 31 67 13 3 1 2 (b) 200 312 11 10
Urban 32 37 10 (a) 1 2 (b) 31 35 10
Major Group 31 Leather and Leather Total 223 333 87 Products (a) 7 9 8
(b) 216 324 79
Rural 192 288 71 (a) 6 7 5 (b) 186 281 66
Urban 31 45 16 (a) 1 2 3 (b) 30 43 13
(a)=With cultivation (b)=Without cultivation
98
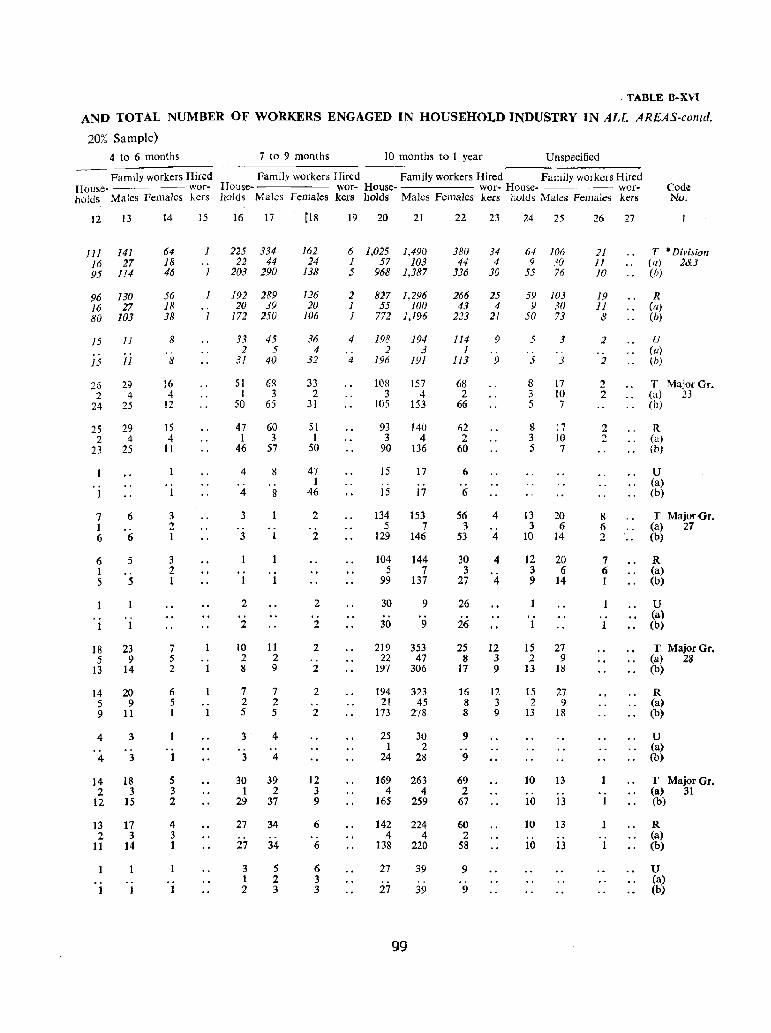
· TABLE B-XVI
AND TOTAL NUMBER OF WORKERS ENGAGED IN HOUSEHOLD INDUSTRY IN ALL AREAS-contd.
20~s Sample) 4 to 6 months 7 to 9 months 10 months to I year Unspecified
Family workers Hired Family workers Hired Family workers Hired Family workers Hired House- war- House- WOf- House- WOf- House- WOf- Code holds Males Females kers holds Males Females kers holds Males Females kees holds Males Females kers No.
12 13
111 141 16 27 95 114
96 130 16 27 80 103
15
15
JJ
11
26 29 2 4
24 25
25 29 2 4
23 25
7 1 6
6 1 5
6
6
5
5
18 23 5 9
13 14
14 20 5 9 9 11
4
4
3
3
14 18 2 3
12 15
13 17 2 3
11 14
14
64 18 46
56 18 38
8 .. 8
16 4
J2
15 4 II
3 2 I
3 2 1
7 5 2
6 5 1
5 3 2
4 3 1
15
1
1
.. 1
.. I
16 17
225 334 22 44
203 290
192 289 20 39
172 250
33 45 2 5
31 40
51 G~ 1 3
50 65
47 60 1 3
46 57
4
4
3 .. 3
2
2
8
8
10 11 2 2 8 9
7 7 2 2 5 5
3 .. 3
4
4
30 39 1 2
29 37
27 34
27 34
3 1 2
5 2 3
tIS
162 24
138
126 20
106
36 4
32
33 2
31
51 I
50
47 1
46
"
2
2
2
2
2
2
2 .. 2
12 3 9
6 .. 6
6 3 3
19 20 21
6 1,025 1,490 1 57 103 5 968 1,387
2 827 1,296 1 55 100 1 772 1,196
4
4
198 194 2 3
196 191
108 157 3 4
105 153
93 140 3 4
90 136
15 17 .. .. 15 17
134 153 5 7
129 146
104 144 5 7
99 137
30
30
9
9
219 353 22 47
197 306
194 323 21 45
173 278
25 1
24
30 2
28
169 263 4 4
165 259
142 224 4 4
138 220
27
27
99
39 .. 39
22 23
380 34 44 4
336 30
266 25 43 4
223 21
114 1
II]
68 2
66
62 2
60
6 .. 6
56 3
53
30 3
27
26
26
9
9
4
4
4
4
25 12 8 3
17 9
16 12 8 3 8 9
9
9
69 2
67
60 2
58
9
9
24 25
64 106 9 30
55 76
59 103 9 30
50 73
5 3 .. .. 5 J
8 17 3 10 5 7
8 17 3 10 5 7
13 20 3 6
10 14
12 20 3 6 9 14
15 27 2 9
13 18
15 27 2 9
13 18
10 13 .. 10 13
10 13
10 13
26 27
21 J! 10
19 11 8
]
. . 2
2 2
2 2
8 6 2
7 6 I
T "Division (a) 2&3 (b)
R (a) (b)
U (a) (6)
T Major Gr. Cal 23 (b)
R (al (b)
U Ca) (b)
T MajorGr_ (a) 27 (b)
R (a) (b)
U (a) (b)
T Major Gr. (a) 28 (b)
R (a) (b)
U (a) (b)
T Major Gr. (a) 31 (b)
R (a) (b)
U (a) (b)
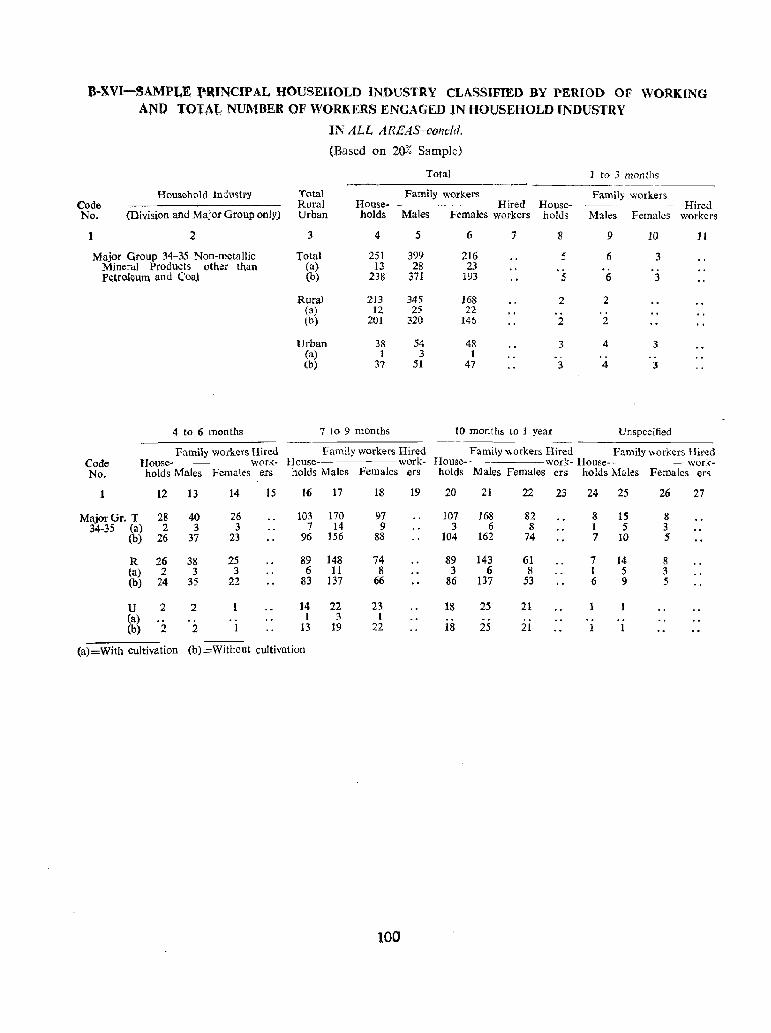
'8,.XVI-~AMPLE f'IUNCIP AL HOUSEHOLD INDUSTRY CLASSIFIED BY PERIOD OF WORKING AND TOTAL NUMBER OF WORKERS ENGAGED IN HOUSEHOLD INDUSTRY
IN ALL AREAS-cofield.
(Based on 20% Sample)
Total 1 to 3 months
Household Industry Total Family workers Family workers Code Rural House- Hired House- ~---~~--- Hired No. (Division and Major Group onlYJ Urban holds Males Females workers holds Males Females workers
1 ~ 3 4 5 6 7 8 9 10 11
Major Group 34-35 Non-metallic Total 251 399 216 5 6 3 Mineral Products other than ea) 13 28 23 Plttrol\;um and eoa] (b) 238 371 193 5 6 3
Rural 213 345 168 2 2 (a) 12 25 22 (b) 201 320 146 2 2
Urban 38 54 48 3 4 3 (a) 1 3 1 (b) 37 51 47 3 4 3
4 to 6 months 7 1.0 9 months 10 months to 1 year Unspecified --~--~----~-
Family workers Hired Family workers Hired Family workers Hired Family workers Hired Code House- --- work- House- work- House- work- House--- work-No. holds Males Females ers holds Males Fe-males ers holds Males Females ers holds Males Females erg'
12 13 14 15 16 17 18 19 20 21 22 23 24 25 26 27
Major Gr. T 28 40 26 103 170 97 107 168 82 8 15 8 34-35 (a) 2 3 3 7 14 9 3 6 8 1 5 3
(b) 26 37 23 96 156 88 104 162 74 7 10 5
R 26 38 25 89 148 74 89 143 61 7 14 8 (a) 2 3 3 6 11 8 3 6 8 1 5 3 (b) 24 35 22 83 137 66 86 137 53 6 9 5
U 2 2 14 22 23 18 2S 21 (a) 1 3 1 (b) 2 2 13 19 22 18 25 21
(a)=With cultivation (b)=Without cultivation
100
APPENDIX
Major groups of Household Industry which are less than 10 per cent of the respective divisions have not been shown in the main table which shows such divisions by an asterisk. Major groups thu~ dropped from the main table are given run on in this Appendix. The figure preceding the bracket represents the code number of the major group dropped from the table. Alphabets given in brackets are abbreviations. meant for different ranges of period of working in the Household Industries 'with' or 'without' cultivation as explained below. The numerical figure given after alphabet denotes the number of households in that particular range indicated by that alphabet.
Class Range of Class Range of Abbreviation Period of Working Abbreviation Period of Working
with without
A means cultivation I to 3 months E means cultivation 1 to 3 months B "
4 to 6 " F
" ,. 4 to 6
" C " "
7 to 9 " G
" " 7 to 9
" D " "
10 months to I year H " "
10 montns to I year X
" " Unspecified months y
" " Unspecified months
For example:-District Jamnagar-Rural 20 (B-6, C-l, E-l, X-I, Y-1)
Figure 20 stands for major group 20 relating to 'foodstuffs', B-6 means that there are 6 households working in the class range of '4 to 6 months' in the household industry with cultivation. C-l means that there is 1 household working in the class range of '7 to 9 months' in the household industry with cultivation and B-1 means that there is 1 household working in the class range of'l to 3 months' -in the household industry without cultivation; X-I means that there is one household working for 'unspecified months' in the Household Industry with cultivation and Y -4 means that there are 4 households working for 'unspecified months' in the household industry without cultivation in the 'foodstuffs' industry in the rural areas of J amnagar district.
JAMNAGAR DISTRICT
TOTAL
03 (H-41. Y-l); 20 (B-1, C-8, D-12; E-I, F-7, G-9, H-43. Y-I); 22 (B-2, D-5; G-2, H-105, Y-4); 25(H-2); 26 (H-4); 29 (E-l, G-l, H-I, Y-I); 30 (H-J); 33(C-I; G--l, H-4); 36 (C-I, D-3; F-4, G-2, H-46, Y-3); 39 (B-1, C-l; E-I, F-3, G-2, H-62, Y-l).
RURAL
03 CH-27, Y-l); 20 (B-1, C-8; D-12, E-l, F-3, G-5, H-34, Y -I); 22 (B-2, D-4; 0-2, H-48, Y-2); 25 (H-2); 33 (C-I; H-l); 36 (C-l, D-3; F-2, 0-2, H-41, Y-3); 39 ( B-1, C-l; E-l, F-3. 0-1; H-60, Y-I),
URBAN
03 CH-14); 20 (F-4, 0-4, H-9); 22 (0-1; H-57. Y-2); 26 (H-4); 29 (E-l, 0-1, H-J, Y-l); 30 (H-l); 33 (G-I, B-3); 36 (F-2, H-5), 39 (0-1, H-2).
101
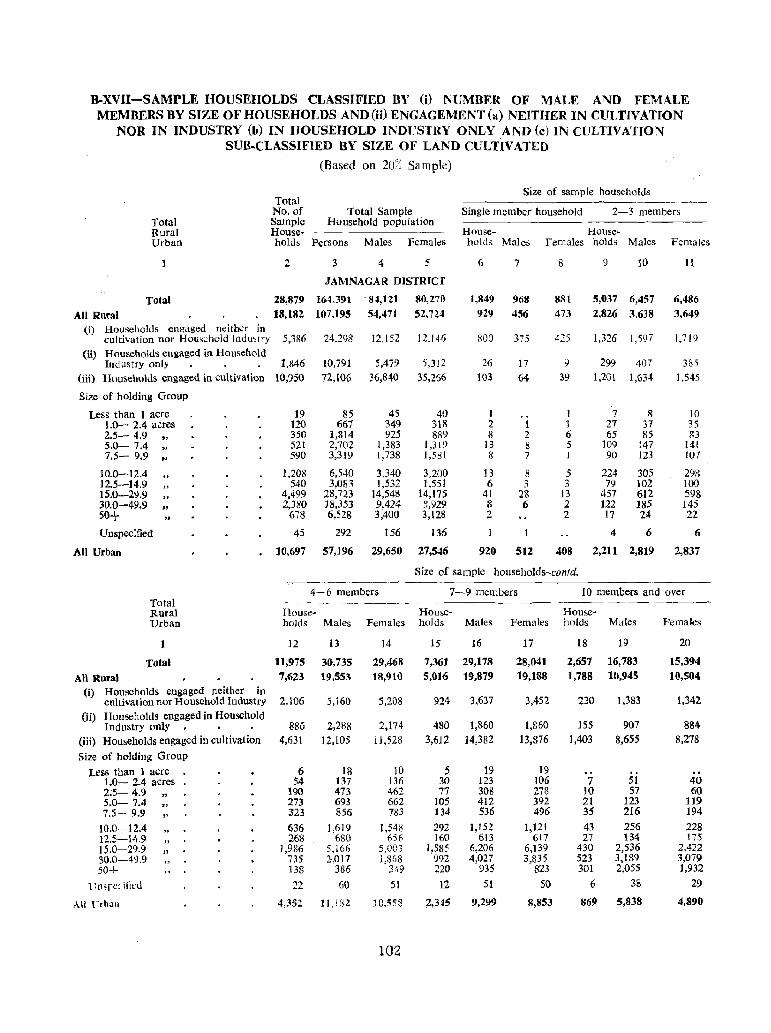
B-XVII-SAMPLE HOUSEHOLDS CLASSIFIED BY CO NUMBER OF MALE AND FEMALE MEMBERS BY SIZE OF HOUSEHOLDS AND (ii) ENGAGEMENT (a) NEITHER IN CUI"TIVATION
NOR IN INDUSTRY (b) IN HOUSEHOLD INDUSTRY ONLY AND (c) IN CULTIVATION SUB·CLASSIFIED BY SIZE OF LAND CULTIVATED
(Based on 20~{ Sa mple)
Total Size of sample households
No. of Total Sample Single member household 2-3 members Total Sample Household population Rural House- House- House-Urban holds Persons Males Females holds Males Females holds Males Females
2 3 4 5 6 7 8 9 10 11
JAMNAGAR DISTRICT
Total 28,879 164,391 -84,121 80,270 ],849 968 881 5,037 6,457 6,486
All Rural 18,llU 107,195 54.471 52,724 929 456 473 2,826 3,638 3.649
(i) Households engaged neither in cultivation nor Household Indu~try 5.386 24.298 12,152 12.14G 800 375 425 1,326 1,597 1,719
(ii) Households engaged in Household Industry only. • . 1.846 10.791 5,479 5,312 26 17 9 299 407 385
(iii) Household:; engaged in cultivation 10,950 72,106 36,840 35,266 103 64 39 1,20l 1,634 1,545
Size of holding Group
Less than 1 acre 19 85 45 40 I I 7 8 10 1.0- 2.4 acres 110 667 349 318 2 1 1 21 37 35 2.5- 4.9 "
350 1,814 925 8R9 8 2 6 65 85 83 5.0- 7.4 "
521 2,702 1,383 1,319 13 8 5 109 147 14! 7.5- 9.9 ., 590 3,319 1,738 1,581 8 7 90 123 107
10.0-12,4 1,208 6,540 3,340 3,200 13 8 5 224 305 298 12.5-14.9 540 3,083 1,532 1,551 6 3 3 79 102 100 15.0-29.9 4,499 28,723 14,548 14,115 41 28 13 457 612 598 30.0-49.9 2,380 J8,353 9,424 ~,929 8 6 2 122 185 145 50+ 678 6,528 3,400 3,128 2 2 17 24 22
Unspecified 45 292 156 136 4 6 6
All Urban 10,697 57,196 29,650 27,546 920 51Z 408 2,211 2,819 2,837
Size of sample bouseholds-con/d.
4- 6 members 7-9 members 10 members and over Total ~----"-
Rural House- House- House-Urban holds Males Females holds Males Females holds Males Females
]2 13 14 15 16 17 18 19 20
Total 11,975 30,735 29,468 7,361 29,178 28,041 2,657 16,783 15,394
All Rural 7,623 19,553 18,910 5,Ql6 19,879 19,188 1,788 10,945 10,504
(i) Households engaged neither in cultivation nor Household Indu&try 2,106 5,160 5,208 924 3,637 3,452 230 1,383 1,342
(ii) Households engaged in Household Industry only . 886 2,288 2,174 480 1,860 1,860 155 907 884
(iii) Households engaged in cultivation 4,631 12,105 11,528 3,612 14,382 13,876 1,403 8,655 8,278
Size of holding Group
Le£s than I acre 6 18 10 5 19 19 1.0- 2.4 acres 54 137 136 30 123 to6 7 51 40 2;5- 4.9 ., 190 473 462 77 308 278 10 51 60 5.0- 1.4 273 693 662 105 412 392 21 123 119 7.5- 9.9 323 856 783 134 536 496 35 216 194
10.0-12.4 636 1,619 1,548 292 1,152 1,121 43 256 228 12.5-\4.9 268 68U 656 160 613 617 27 134 17S 15.0-29.9 "
1,986 5,166 5,003 ],585 6.206 6,139 430 2,536 2,422 30.0-49.9 735 2-,017 1,868 992 4;027 3,835 523 3,189 3,079 50+ 138 386 349 220 935 823 301 2,055 1,932
Unsj1Cc ilieu 22 60 51 12 51 50 6 38 29
Ali p,hall 4,352 II.! '>2 10,558 2,345 9,299 8,853 869 5,838 4,890
102
C-SOCJAL AND eUL TURAL TABLES
This series contains 8 tables of which Table C-I has been prepared from Household Schedules, on the basis of 20 per cent sample. It gives information about composition of sample households according to marital status. All the other tables in this series are based on full count and give age, sex and education, separately for rural and urban areas, single year age returns, mother tongue in alphabetical order, religion and classification by literacy and industrial category of workers and non-workers among Scheduled Castes and Scheduled Tribes. All the tables of this series except Table C-VI have been reproduced in the District Census Handbook.
TABLE C-I-COMPOSITION OF SAMPLE HOUSEHOLDS BY RELATIONSHIP TO HEAD OF FAMILY CLASSIFIED BY SIZE OF LAND CULTIVATED
(Based on 20% Sample)
The table is prepared from Part II Census Population Record of the Household Schedules for total, rural and urban areas of the district. A household means the entire groups of persons who commonly live together in the same census house and uSllally take their meals from a common mess. It thus includes outsiders residing with the family during enumeration. This table, therefore, gives the composition of a household by family Ilnd non-family member. Besides, the heads of the households and their spouses, other family members Ilke married sons and other relations are given separately by sex and marital status.
TABLE C-II-AGE AND MARITAL STATUS
This table is presented for the district with rural/urban break-up wbile those for taluka/mahal for mral areas only. It corresponds to Table C-III of 1951 which was prepared on a 10,% sample of the slips taken out at the time of initial stage of sorting, while this table is prepared on full count according to the quinquennial age-groups recommended by the United Nations Organisation. In Table C-III of 1951 there were 3 categories of marital status, viz., unmarried, married and Divorced(Separated, whereas in this table are given five categories of marital status, viz., (1) never married, (2) married, (3) widowed, (4) divorced/separated and (5) unspecified. In 1951, the information regarding widowed or divorced was given jointly, whereas these two types of marital status are compiled separately this time.
Columns 14 and 15 relating to unspecified status have' been deleted from the table. Such persons 3 in numbers-l male and 2 females are returned from rural areas.
TABLE C-III-AGE, SEX AND EDUCATION
It corresponds to Table C-IV of 1951 which was prepared on 10% sample. This table is prepared on full count this time and is presented in two parts-A and B for the district. In Part-A broad educational levels upto matriclliation and above are given for all areas. In Part-B educational levels are given in details with technical and non-technical diplomas, university degrees and technical degrees in urban areas only. In 1951, only, sum total of all literate and illiterate persons was given, whereas in 1961, educational levels for literate persons are given in details.
TABLE C-IV-SINGLE YEAR AGE RETURNS
The Table is presented for the district with total/rural/urban break-up.
It corresponds to Table C-V of 1951 Census which was prepared on 10% sample. This table has been 'prepared on full count in 1961. The age in years completed on 1st March, 1961 has been given but the infants who did not complete one year on 1-3-1961 have been shown under the age group "0".
TABLE C-V-MOTHER TONGUE
This table corresponds to Table D-I-(i) of 1951 in which languages and dialects as returned were shown in the descending order of number of speakers. This time all the languages as actually returned are arranged in the alphabetical order with popUlation, persons, males, females. for' total, rural and urban areas for the district and for rural areas for taluka/mahal.
103
'Mother tongue'is the language spoken in childhood by the person's mother to the persons or the language spoken in the household.
TABLE C-VII-RELIGION
It is prepared separately for total, rural and urban areas of the ~istrict and for rural areas of talukas and mahals. This table corresponds to Table D-ll of 1951, in which the :figures of religions other than the eight main religions were grouped in the residuary category 'other religions', whereas in this table data are given for eight main religions only, viz., Budhist, Christian, Hindu, Jain, Jew, Muslim, Sikh and Zoroastrian and persons returned as professing other religions, sects and beliefs which could not be classified under any of the religions have been grouped under 'Indefinite beliefs's. Details of religions grouped under 'Indefinite beliefs', are also given in the foot-note below the table.
TABLE C-VIII-SCHEDULED CASTES AND SCHEDULED TRIBES
PART-A-CLASSIFICATION BY LITERACY AND INDUSTRIAL CATEGORY OF WORKERS AND
NON-WORKERS AMONG SCHEDULED CASTES
PART-B-CLASSIFICATION BY LITERACY AND INDUSTRIAL CATEGORY OF WORKERS AND
NON-WORKERS AMONG SCHEDULED TRIBES
This table is presented for the district with total/rural/urban break-up and for taluka/mahal for rural areas only.
I~ this table total population of Scheduled CastesfScheduled Tribes and theit distribution by nine industrial· categoifes of workers and also non-workers adopted in the Primary Census Abstract are shown by literate and illiterate.
Part-A relates to SchedUled Castes and Part-B to Scheduled Tribes.
104
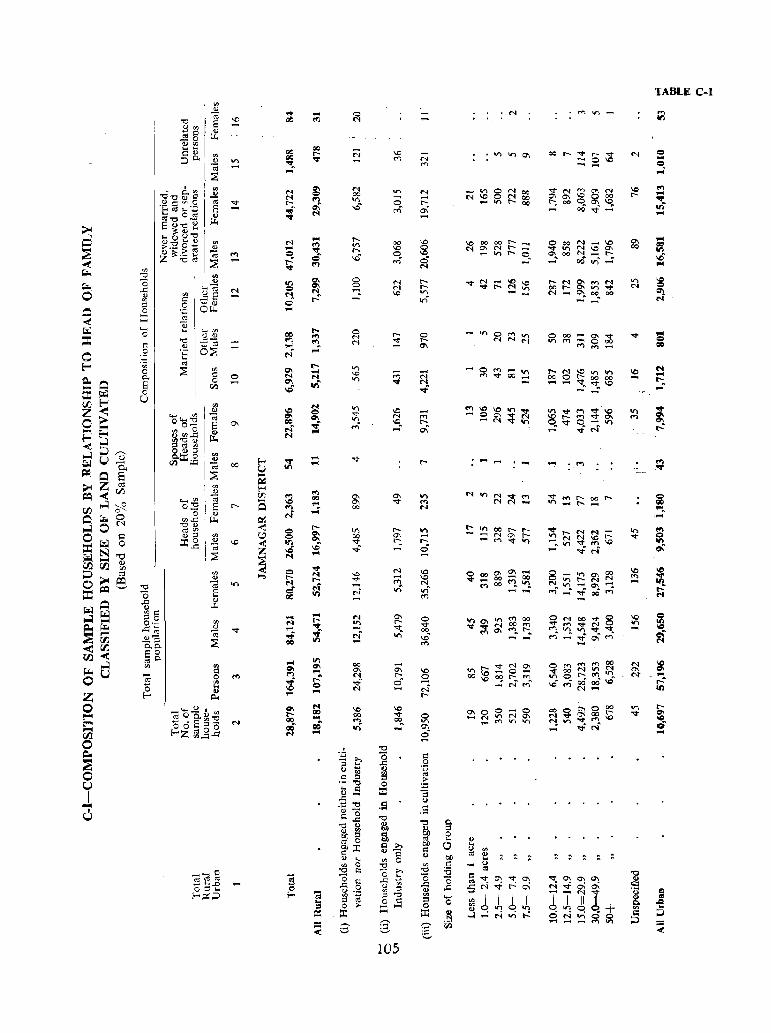
rIl o o <Zl
<'l .....
o ....
..,. 11\
N o 0). .., ... ,.... ... .... QO ,.. ....
N CO ... ~ ...
o '" '"
'" \C or,
0\ 0\ 00
~ 1 o ::c .5
'D N 'D • .....
105
........
~~~~~~ ..... .....
~8l?et/')~ '""" 1"""1 ~,,~ \0 .....
TABLE C-I
o ... o , ..
... o co
N .... l"-. ...
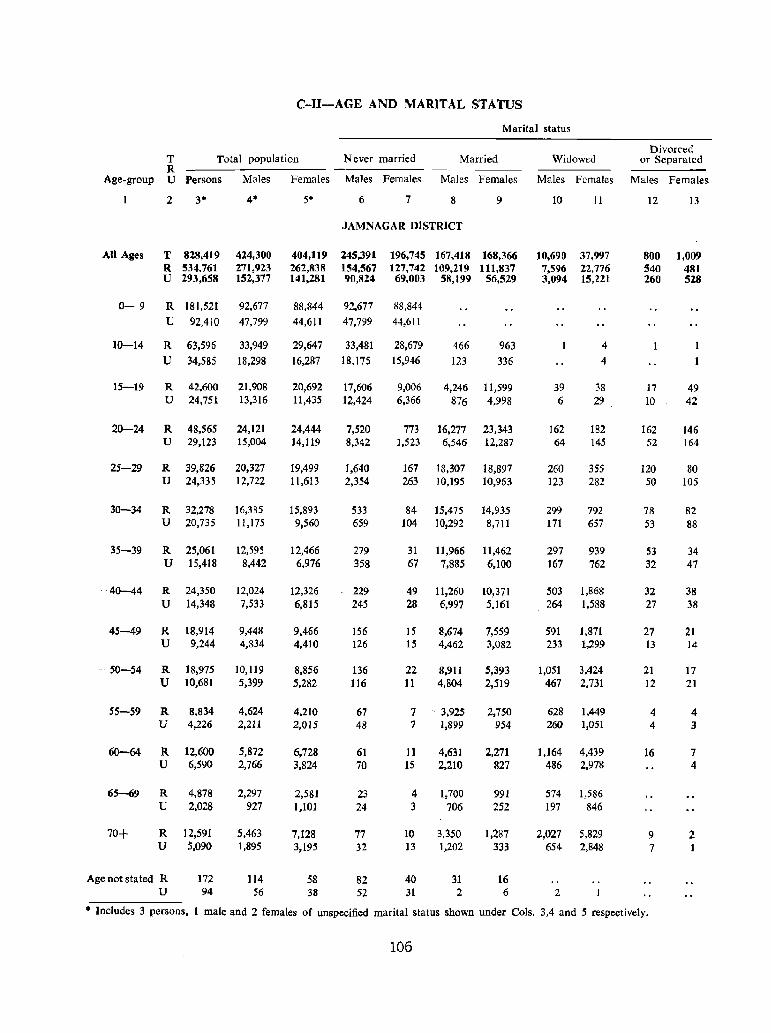
C-n-AGE AND MARITAL STATUS
Marital status
Divorced T Total population Never married Married Widowed or Separated R
Age-group U Persons Males Females Males Females Males Females Males Females Males Females
All Ages
0- 9
10-14
15-19
20-24
25-29
30-34
35-39
40-44
45-49
50-54
55-59
60-64
2
T 828,419 R 534.761 U 293,6S8
R 181,521
U 92,4]0
R 63,596
U 34,585
R U
R U
R U
R U
R U
R U
R U
R U
R U
R U
42,600 24,751
48,565 29,123
39,826 24,335
32,278 20,735
25.061 15,418
24,350 14,348
18.914 9,244
18,975 10,681
8.834 4,226
12,600 6,590
65-69 R 4,878 U 2,028
R 12,591 U 5,090
Age not stated R U
172 94
4*
424,300 271,923 152,377
92,677
47,799
33,949
18,298
21,908 13,316
24,121 15,004
20,327 12.722
16,385 11,175
12,595 8,442
12,024 7,533
9,448 4,834
10,119 5,399
4,624 2,211
5,872 2,766
2,297 927
5,463 1,895
114 56
5* 6 7 8 9
JAMNAGAR DISTRICT
404,119 245,391 196,745 167,418 168,366 262,838 154,567 127,742 109,219 111,837 141,281 90,824 69,003 58,199 56,529
88,844 92,677 88,844
44,611 47,799 44,611
29,647
16,287
20,692 11,435
24,444 14,119
19,499 11,613
15,893 9,560
12,466 6,976
12,326 6,815
9,466 4,410
8,856 5,282
4.210 2.015
6.728 3,824
2,581 1,101
7,128 3,195
58 38
33,481 18.175
17,606 12,424
7,520 8,342
1,640 2,354
533 659
279 358
229 245
156 126
136 116
67 48
61 70
23 24
77 32
82 52
28,679
15,946
9,006 6,366
773 1,523
167 263
84 104
31 67
49 28
15 15
22 11
7 7
11 15
4 3
10 13
40 31
466 123
4,246 876
16,277 6,546
18,307 10,195
15,475 10,292
11,966 7,885
11,260 6,997
8,674 4,462
8,911 4,804
, 3.925 1,899
4.631 2,210
1,700 706
3,350 1,202
31 2
963
336
11,599 4.998
23,343 12,287
18,897 10,963
14,935 8,711
11,462 6,100
7,559 3,082
5,393 2,519
2,750 954
2,271 827
991 252
1,287 333
16 6
10 II
10,690 37,997 7,596 22,776 3,094 15,221
39 6
162 64
260 123
299 171
297 167
503 264
591 233
1,051 467
628 260
1,164 486
4 4
38
29 ,
182 145
355 282
792 657
939 762
1,868 1,588
1,871 1,299
3,424 2,731
1,449 1,051
4,439 2,978
574 1,586 197 846
2,027 5,829 654 2,848
2
12 13
800 1,009 540 481 260 528
17 10
162 52
120 50
78 53
53 32
32 27
27 13
21 12
4 4
16
9 7
49 42
146 164
80 105
82 88
34 47
38 38
21 14
17 21
4 3
7 4
2 1
• Includes 3 persons. I male and 2 females of unspecified marital status shown under Cols. 3,4 and 5 respectively.
106
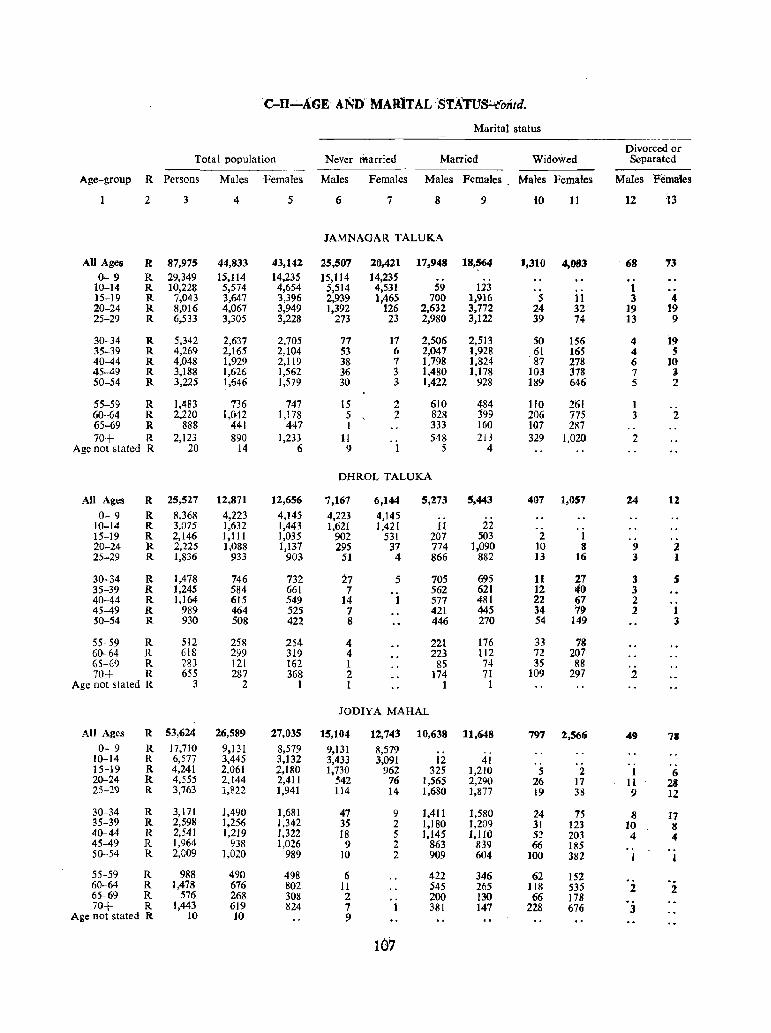
C-Il-AGE ANI) MARITAL ·STATUS~"ntd.
Marital status
Divorced or Total population Never married Married Widowed Separated
-------Age-group R Persons Males Females Males Females Males Females Males Females Males Females
2 3 4 5 6 7 8 9 10 11 12 13
JAMNAGAR TALUKA
AU Ages R 87,975 44,833 43,142 25.507 20,421 17,948 18,564 1,310 4,083 68 7J 0--9 R 29,349 15,114 14,235 15,114 14,235
10-14 R 10,228 5,574 4,654 5,514 4,531 59 123 1 15-19 R 7,043 3,647 3,396 2,939 1,465 700 1,916 5 11 3 4 20-24 R 8,016 4,067 3,949 1,392 126 2,632 3,772 24 32 19 19 25-29 R 6,533 3,305 3,228 273 23 2,980 3,122 39 74 13 9
30-34 R 5,342 2,637 2.705 77 17 2,506 2,513 50 156 4 19 35-39 R 4,269 2,165 2.104 53 6 2,047 1,928 61 165 4 5 40-44 R 4,048 1,929 2,119 38 7 1,798 1,824 87 278 6 10 45-49 R 3,188 1,626 1,562 36 3 1,480 1,178 103 378 7 1 50-54 R 3,225 1,646 1,579 30 3 1,422 928 189 646 5 2
55-59 R 1,483 736 747 15 2 610 484 110 261 t 60-64 R 2,220 1,042 1,178 5 , 2 82& 399 206 775 3 2 65-69 R 888 441 447 1 333 160 107 287 70+ R 2,123 890 1,2,)3 11 548 213 329 1,020 2
Age not stated R 20 14 6 9 1 5 4
DHROL TALUKA
All Ages R 25,527 12.871 12,656 7,167 6,144 5,273 5,443 407 1,057 24 12 0- 9 R 8,368 4,223 4,145 4,223 4,145 ..
10-14 R 3,075 1,632 1,443 1,621 1,421 1l 22 15-19 R 2,146 1,111 1,035 902 53l 207 503 2 1 20-24 R 2,225 1,088 1,137 295 37 774 1,090 10 8 9 2 25-29 R 1,836 933 903 51 4 866 882 13 16 3 1
30-34 R 1,478 746 732 27 5 705 695 11 27 3 S 35-39 R 1,245 584 661 7 562 621 12 40 3 40-44 R 1,164 615 549 ]4 577 481 22 67 2 45-49 R 989 464 525 7 421 445 34 7() 2 1 50-54 R 930 508 422 8 446 270 54 149 3
55-59 R 512 258 254 4 221 176 33 78 60-64 R 618 299 319 4 223 112 72 207 65-69 R 183 121 162 1 8S 74 35 88 70+ R 655 287 368 2 174 71 109 297 2
Age not stated R 3 2 1 1 1 1
JODIYA MAHAL
All Ages R S3,624 26,589 27,03S 15,164 12,743 10,638 11,648 797 2,566 49 7. 0- 9 R 17,710 9,131 8,579 9,131 8,579
10-14 R 6,577 3,445 3,132 3,433 3,091 12 41 .. 15-19 R 4,241 2.061 2,180 1,730 962 325 1,210 5 2 I 6 20-24 R 4,555 2,144 2,411 542 76 1,565 2,290 26 17 II 28 25-29 R 3,763 1,822 1,941 114 14 1,680 1,877 19 38 9 12
30-34 R 3,171 1,490 1,681 47 9 1,411 1,580 24 7S 8 17 35-39 R 2,598 1,256 1.342 35 2 1,180 1,209 31 121 10 8 40-44 R 2,541 1,219 1,322 18 5 1,145 1,1 JO 52 203 4 4 45-49 R 1,964 938 1,026 9 2 863 839 66 185 50-54 R 2,D09 1,020 989 10 2 909 604 100 382
55-59 R 988 490 498 6 422 346 62 152 60-64 R 1,478 676 802 11 545 265 118 535 2 2 65-69 R 576 268 308 2 200 130 66 178 70+ R 1,443 619 824 7 1 381 147 228 676 J
Age not stated R 10 10 9
107
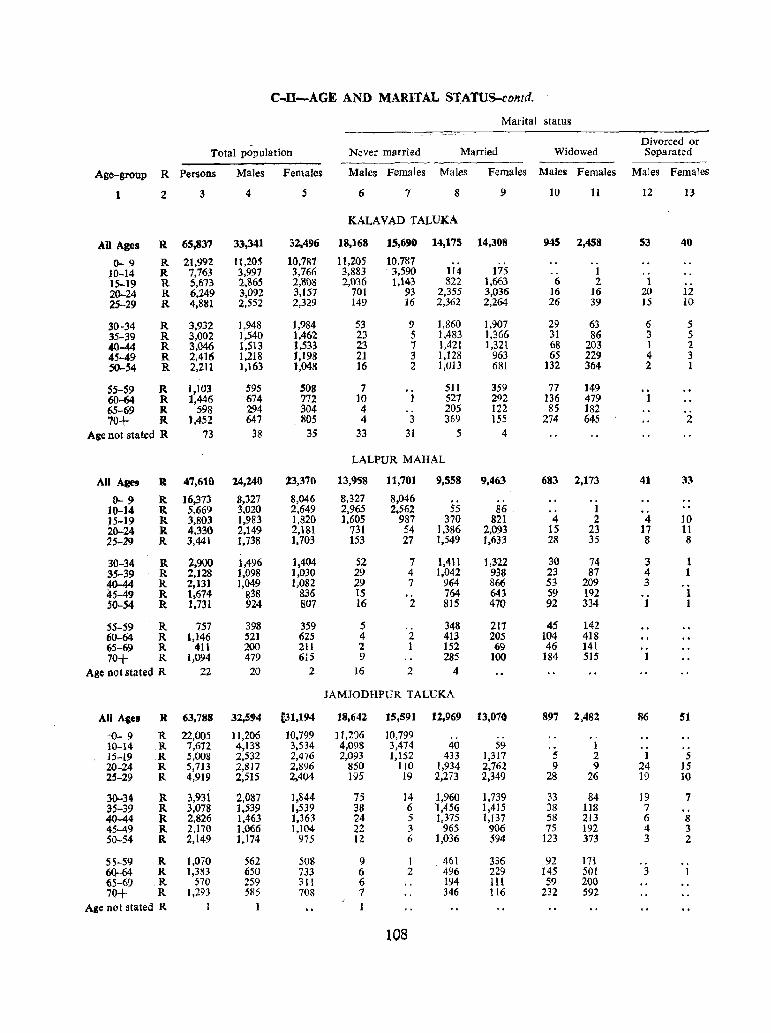
C-II-AGE AND MARITAL STATUS-contd.
Marital status
Divorced or Total population Never married Married Widowed Separated
Age-group R Persons Males Females Males Females Males Females Males Females Males Females
1 2 3 4 5 6 7 8 9 10 11 12 13
KALAVAD TALUKA
AU Ages R 65,837 33,341 32,496 18,168 15,690 14,175 14,308 945 2,458 S3 40
0-9 R 21,992 11.205 10.787 11.205 10.787 )0-14 R 7,763 3,997 3,766 3,883 3.590 114 175 .. 1 .. 15-19 R 5,673 2,865 2,808 2,036 1,143 822 1,663 6 2 1 20-24 R 6,249 3,092 3,157 701 93 2,355 3,036 16 16 20 12 25-29 R 4,881 2,552 2,329 149 16 2,362 2,264 26 39 15 10
30-34 R 3,932 1.948 1,984 53 9 1,860 1,907 29 63 6 5 35-39 R 3,002 1,540 1,462 23 5 1,483 1,366 31 86 3 5 40-44 R 3,046 1,513 1,533 23 7 1,421 1,321 68 203 I 2 45-49 R 2,416 1,218 1,198 21 3 1,128 963 65 229 4 3 50-54 R 2,211 1,163 1,048 16 2 1,013 681 132 364 2 1
S5-S9 R 1,103 595 508 7 Sl1 359 77 149 60-64 R 1,446 674 772 ]0 1 527 292 136 479 1 65-69 R 598 294 304 4 205 122 85 182 70+ R 1,452 647 805 4 3 369 155 274 645 2
Age not stated R 73 38 35 33 31 5 4
LALPUR MAHAL
All Ages R 4',610 24,240 23,370 13,958 11,701 9,558 9,463 683 2,173 41 33
6-9 R 16,373 8,327 8,046 8,327 8,046 10-14 R 5,669 3.020 2,649 2,965 2,562 5S 86 . 1 15-19 R 3,803 1,983 1,820 1,605 987 370 821 4 2 4 10 20-24 R 4,330 2,149 2,181 731 54 1,386 2,093 15 23 17 11 25-29 R 3,441 1,738 1,703 153 27 1,549 1,633 28 35 8 8
30-34 R 2,900 1,496 ],404 52 7 ],411 1,322 30 74 3 1 35-39 R 2,128 1,098 1,030 29 4 1,042 938 23 87 4 1 40-44 R 2,13] 1,049 1,082 29 7 964 866 53 209 3 4.5-49 R 1,674 838 836 15 764 643 59 192 1 50-54 R 1,731 924 807 16 2 815 470 92 334 1 I
55-59 R 757 398 359 5 348 217 45 142 60-64 R ],146 52] 625 4 2 413 205 104 4]8 65-69 R 411 200 211 2 1 152 69 46 141 70+ R 1,094 479 615 9 285 100 184 515 1
Age not stated R 22 20 2 16 2 4
JAMJODHPUR TALUKA
All Ages R 63,788 32,594 [31,194 18,642 15,591 12,969 13,070 897 2,482 86 51
:(j... 9 R 22,005 11,206 10,799 Jl,206 10,799 .. 10-14 .R 7,672 4,138 3,534 4,098 3,474 40 59 .. 1 .. 15-19 R 5,008 2,532 2,476 2,093 1,152 433 1,317 .5 2 1 S 20-24 R 5,713 2,817 2,896 850 110 1,934 2,762 9 9 24 15 25-29 R 4,919 2,515 2,404 ]95 19 2,273 2,349 28 26 19 ]0
30-34 R 3,931 2,087 1,844 75 14 1,960 1,739 33 84 19 7 35-39 R 3,078 1,539 1,539 38 6 1,456 1,415 38 118 7 40-44 R 2,826 1,463 1,363 24 5 1,375 1,137 58 213 6 8 45-49 R 2.170 1,066 1,104 22 3 965 906 75 192 4 3 50-54 R 2,149 1,174 975 12 6 1,036 594 123 373 3 2
55-59 R 1,070 562 508 9 I 461 336 92 171 60--64 R ),383 650 733 6 2 496 229 145 501 3 1 65-69 .R 570 259 311 6 194 11l 59 200 70+ R 1,293 585 708 7 346 116 232 592
Aile not stated R 1 1 I
108
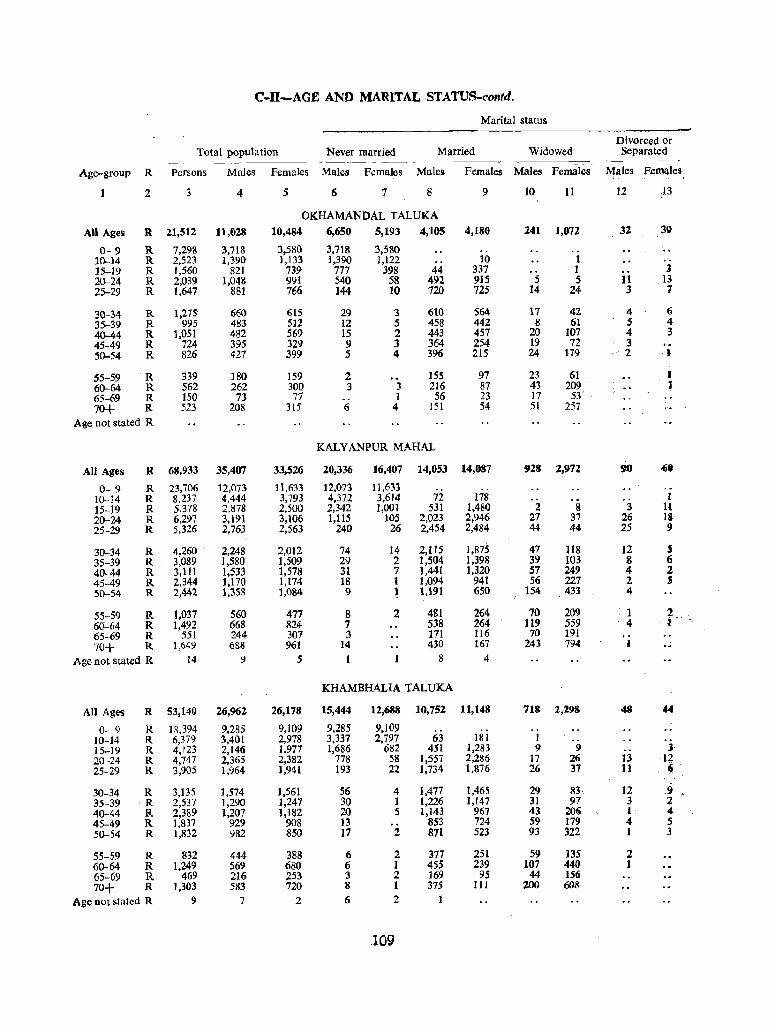
C-n-AGE AND MARITAL STATUS-contd.
Marital status
Divorced or Total population Never married Married Widowed Separated
------- -~
Age-group R Persons Males Females Males Females Males Females Males Females Males Females
2 3 4 5 6 7 8 9 10 11 12 }3
OKHAMANDAL TALUKA
All Ages R 21,512 11,028 10,484 6,650 5,193 4,105 4,180 241 1,072 32 31)
0- 9 R 7,298 3,718 3,580 3,718 3,580 o.
10-14 R 2,523 1,390 1,133 1,390 1,122 10 1 o ~.
15-19 R 1,560 821 739 771 398 44 337 I l 20-24 R 2m9 1,048 991 540 58 492 915 5 5 11 13 25-29 R 1,647 881 766 144 10 720 725 14 24 3 7
30-34 R 1,275 660 615 29 3 610 564 11 42 4 6 35-39 R 995 483 512 12 5 458 442 8 61 5 4 40-44 R 1,051 482 569 15 2 443 457 20 107 4 3 45-49 R 724 395 329 9 3 364 254 19 72 3 50-54 R 826 427 399 5 4 396 215 24 179 >c 2 -I
55-59 R 339 180 159 2 ISS 97 23 61 I 60-64 R 562 262 300 3 3 216 87 43 209 ~ 65-69 R 150 73 77 o. 1 56 23 17 53 70+ R 523 208 315 6 4 lSI 54 51 257
Age not stated R
KAL Y ANPUR MAHAL
All Ages R 68,933 35,407 33,526 20,336 16,407 14,OS3 14,087 928 2,972 90 -6U
0- 9 R 23,706 12,073 11.633 12,073 11,633 10-14 R 8,237 4,444 3,793 4,372 3,614 72 178 I 15-19 R 5,378 2.878 2,500 2,342 1,001 531 1,480 2 g 3 11 20-24 R 6,297 3,191 3,106 1,115 lOS 2,023 2,946 27 37 26 18 25-29 R 5,326 2,763 2,563 240 26 2,454 2,484 44 44 25 9
30-34 R 4,260 2,248 2,012 74 14 2,115 1,875 47 118 12 J 35-39 R 3,089 1,580 1,509 29 2 1,504 1,398 39 103 8 6 40-44 R 3,111 1,533 1,578 31 7 1,441 1,320 57 249 4 2 45-49 R 2,344 1,170 1,174 18 1 1,094 941 56 227 2 S SO-54 R 2,442 1,358 1,084 9 1 1,191 650 154 433 4
55-59 R 1,037 560 477 8 2 481 264 70 209 1 2 60-64 R 1,492 668 824 7 538 264 119 559 4 t 65-69 R 551 244 307 3 171 116 70 191
70+ R 1,649 688 961 14 430 167 243 794 1
Age not stated R 14 9 5 1 8 4
KHAMBHALIA TALUKA
All Ages R 53,140 26,962 26,178 15,444 12,688 10,752 11,148 718 2,298 48 44
0- 9 R 18.394 9,285 9,109 9.285 9,109 10-14 R 6,379 3,401 2,978 3,337 2,797 63 181 1 ]5-19 R 4,J23 2,146 1,977 1,686 682 451 1,283 9 9 00 J 20-24 R 4,747 2,365 2,382 178 58 1,557 2,286 11 26 13 U 25-29 R 3,905 1,964 1,941 193 22 1,734 1,876 26 37 11 ~
30-34 R 3,135 1,574 1,561 56 4 1,477 1,465 29 81 12 .9 35-39 ·R 2,537 1,290 1,247 30 1 1,226 1,147 31 97 3 2 40-44 R 2,389 1,207 1,182 20 5 1,143 967 43 20(t I, 4 45-49 R 1,837 929 908 13 853 724 59 179 4 S 50--54 R 1,832 982 850 17 2 871 523 93 322 1 3
55-59 R 832 444 388 6 2 377 251 S9 135 2 {i0-64 R 1,249 569 680 6 1 455 239 107 440 1 65-69 R 469 216 253 3 2 169 95 44 156 70+ R 1.303 583 720 8 I 375 111 200 608
Age not stated R 9 7 2 6 2 1
109
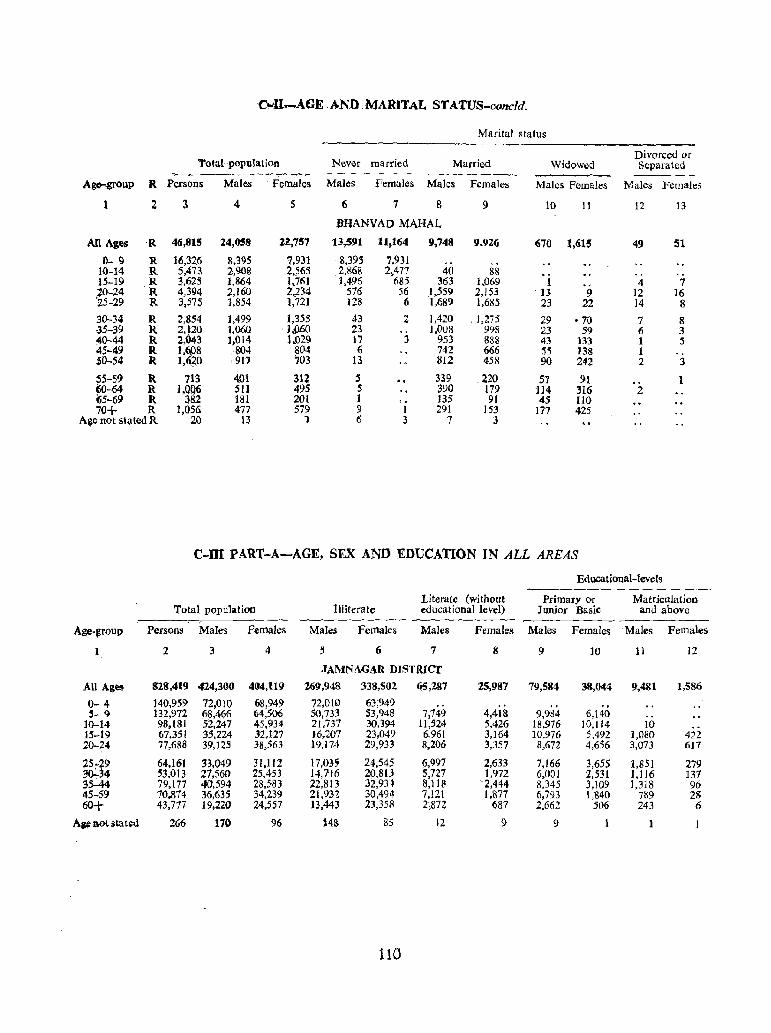
c....Il~GE cA~n . MARITAL ST ATUS .. concld.
Marital status
T{)tt\l population Never married Divorced or
Married Widowed Separated --Ago-.group R Persons Males Females Males Females Males Females Males Females Males Females
2 ;\ 4 S 6 7 8 9 10 11 12 13
BHANVAI) MAHAL
All Ag~s R 46,815 24,058 2'1.,757 13,591 11,164 9,748 9.92(J 670 1,615 49 51 0- 9 R 16,326 8,395 7,931 8,395 7,931
10-14 R 5,473 2,908 2,563 2,868 2,477 40 88 .. 15-19 R 3,6125 ),864 1.761 1,496 685 363 1,069 1 4 7 ~0-24 R 4,394 2,160 4.134 576 56 1,559 2,153 13 9 12 16 '25-29 R 3,575 },854 1,721 128 6 1,689 1,685 23 22 14 8
30-34 R 2,854 1,499 1;355 43 2 1,420 1,275 29 ·70 7 8 ·35-39 R 2,120 1,060 I.~ 23 1,008 99-8 23 59 6 3 40-44 R 2,043 ],014 1~O29 17 3 953 88S 43 133 ] 5 45-49 R 1.®8 804 804 6 742 666 55 138 1 " $0-54 R. ],~20 917 ;03 13 812 458 90 242 2 3
55-59 R. 713 401 3.JZ 5 339 220 57 91 1 eJO-64 R 1,®6 511 495 5 390 179 114 316 2 65-69 R 382 181 201 1 135 91 45 IIO 70+ R 1,056 477 579 9 I 291 153 177 425
Ase not stated R 20 13 1 6 3 1 3
c-m PART-A-AGE, SEX AND EDUCATION IN ALL AREAS
Educational-levels
Literate (without Primary or Matriculation Total population Illiterate educational1evel) Junior Basic and above
Age-t\fOUP Persons Males Females Males Females Males Females Males Females Males Females
2 3 4 , 6 7 8 9 10 11 12
JAMNAGllR DISTRICT
All Ages 828,419 424,300 404,119 269,948 338,S()2 65,287 25,987 79,584 38,044 9,481 1,586
0- 4 140,959 72,010 68,949 72,010 63,949 ., ., S- 9 132,972 68,4{)6 64,506 50,133 53,948 7,749 4,418 9,984 6,140 ..
10-14 98,181 52,247 45,934 21,737 30,394 11,524 5,426 18,976 10,114 10 15-19 67,351 35,224 32,127 16,207 23,049 6,961 3.164 10,976 5,492 1,080 422 20-24 77,688 39,125 38,563 19,174 29,933 8.206 3,357 8,672 4,656 3,073 617
25,.29 64,161 33,049 31,112 17,03, 24,545 6,991 2,633 7,166 3,655 1.851 279 ~34 53.013 27,560 25.453 14,716 20,813 5,727 1,972 6,001 2,531 (116 137 35-44 79,l77 40,594 28,583 22,813 32,934 S,IIS -2,444 8,345 3,109 1,318 96 45-59 70,874 36,635 34,239 21,932 30,494 7,!21 1,877 6,793 1,840 789 28 60+ 43,177 19,220 24,557 13,443 23,358 2~872 687 2,662 506 243 6
Ai# not sta ted 266 170 96 14& 85 12 5} 9 1
110
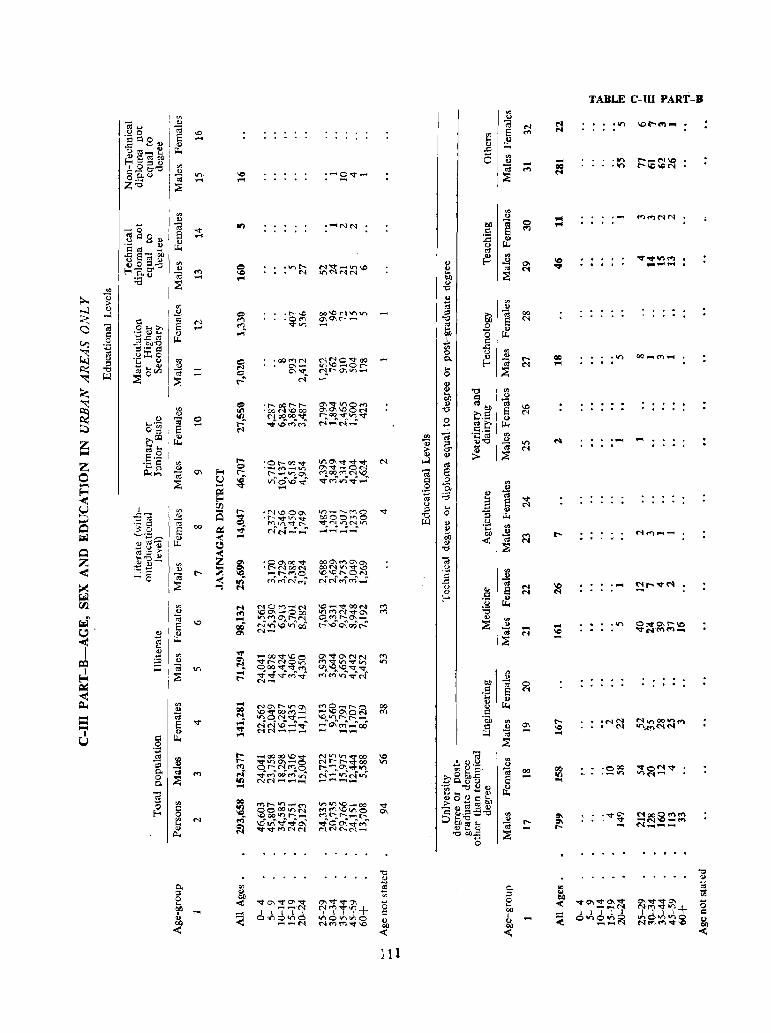
rJl
12 iE ~
M .....
.-<
.-<
~f6~C!;~ N .. l-O\V).....
tI"l-f"'--MO 0000,"",0 ~N .. ~C"'iV1 '!""""I-"_-
00 ('f)
111
N ....
... ...
... \C -
TABLE C-IU PART-B
. .,.,
.",
.1(")
.",
....
."",", . ~
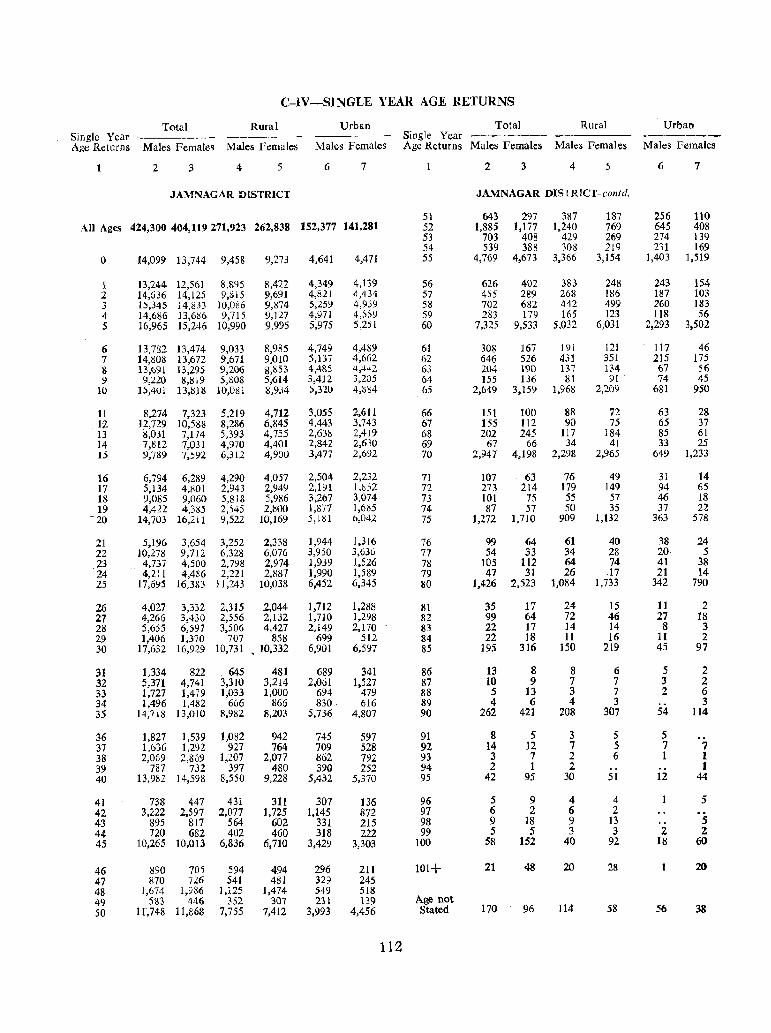
C-IV-SINGLE YEAR AGE RETURNS
Total Rural Urban Total Rural Urban Single Year Single Year Age Returns Males Female~ Males Females Males Females Age Returns Males Females Males Femal es Males Females
2 3 4 5 6 7 2 3 4 5 6 7
JAMNAGAR DISTRICT JAMNAGAR DIS rRICT-contd.
51 643 297 387 187 256 110 All Ages 424,300 404,119271,923 262,838 152,377 141,281 52 1,885 1,177 1,240 769 645 408
53 703 408 429 269 274 139 54 539 388 308 219 231 169
0 ]4,099 13,744 9,458 9,273 4,641 4,471 55 4,769 4,673 3,366 3,154 1,403 1,519
1 13,244 12,561 8,895 8,422 4,349 4,139 56 626 402 383 248 243 154 2 14,636 14,125 9,1::15 9,691 4,821 4,434 57 455 289 268 186 187 103 3 15,345 14,833 10,086 9,874 5,259 4,959 58 702 682 442 499 260 183 4 14,6g6 13,686 9,715 9,127 4,\171 4,559 59 283 179 165 123 118 56 5 16,965 15,246 10,990 9,995 5,975 5,251 60 7,325 9,533 5,032 6,031 2,293 3,502
6 13,782 13,474 9,033 8,985 4,749 4,489 61 308 167 191 121 117 46 7 14,808 13,672 9,671 9,OlD 5,137 4,662 62 646 526 431 351 215 175 8 13,691 13,295 9,206 8,853 4,485 4,442 63 204 190 137 134 67 56 9 9,220 8,819 5,808 5,614 3,412 3,205 64 155 136 81 91 74 45
10 . 15,401 13,iHS 10,081 8,934 5,320 4,884 65 2,649 3,159 1,968 2,209 681 950
11 8,274 7,323 5,219 4,712 3,055 2,611 66 151 100 88 72 63 28 11 12,729 10,58g 8,286 6,845 4,443 3,743 67 155 112 90 75 65 37 13 8,031 7,174 5,393 4,755 2,638 2,419 68 202 245 117 184 85 61 14 7,812 7,031 4,970 4,401 2,842 2,630 69 67 66 34 41 33 25 15 9,789 7,592 6,312 4,900 3,477 2,692 70 2,947 4,198 2,298 2,965 649 1,233
16 6,794 6,289 4,290 4,057 2,504 2,232 71 107 63 76 49 31 14 17 5,134 4,801 2,943 2,949 2,191 1,852 72 273 214 179 149 94 65 18 9,085 9,060 5,818 5,986 3,267 3,074 73 101 75 55 57 46 18 19 4,422 4,385 2,545 2,800 1,877 l,6d5 74 87 57 50 35 37 22
·20 14,703 16,211 9,522 10,169 5,181 6,042 75 1,272 1,710 909 1,132 363 578
21 5,196 3,654 3,252 2,338 1,944 1,316 76 99 64 61 40 38 24 22 10,278 9,712 6,328 6,076 3,950 3,636 77 54 33 34 28 20 5
.23 4,737 4,500 2,798 2,974 1,939 1,526 78 105 112 64 74 41 38 24 4,211 4,486 2,221 2,887 1,990 1,589 79 47 31 26 17 21 14 25 17,695 16,383 11,243 10,038 6,452 6,345 80 1,426 2,523 1,084 1,733 342 790
26 4,027 3,332 2,315 2,044 1,712 1,288 81 35 17 24 15 11 2 27 4,266 3,430 2,556 2,132 1,710 1,298 82 99 64 72 46 27 18 28 5,655 6,597 3,506 4,427 2,149 2,170 83 22 17 14 14 8 3 29 1,406 1,370 707 858 699 512 84 22 18 11 16 11 2 30 17,632 16,929 10,731 • 10,332 6,901 6.597 85 195 316 150 219 45 97
31 1,334 822 . 645 481 689 341 86 13 8 8 6 5 2 32 5,371 4,741 3,310 3,214 2,061 1,527 87 10 9 7 7 3 2 33 1,727 1,479 1,033 1,000 694 479 88 5 13 3 7 2 6 34 1,496 1,482 666 866 830. 616 89 4 6 4 3 3 35 14;718 13,010 8,982 8,203 5,736 4.807 90 262 421 208 307 54 114
36 1,827 1,539 1,082 942 745 597 91 8 5 3 5 5 37 },636 },2<}2 927 764 709 528 92 14 12 7 5 7 7 38 2,069 2,869 1,207 2,077 862 792 93 3 7 2 6 1 1 39 787 732 397 480 390 252 94 2 1 2 .. .. 1 40 13,982 14,598 8,550 9,228 5,432 5,370 95 42 95 30 51 12 44
41 738 447 431 311 307 136 96 5 9 4 4 5 42 3,=:22 2,597 2,077 1,725 1,145 872 97 6 2 6 2 43 895 817 564 602 331 215 98 9 18 9 13 5 44 720 682 402 460 318 222 99 5 5 3 3 2 2 45 10,265 10,013 6,836 6,710 3,429 3,303 100 58 152 40 92 18 60
46 890 705 594 494 296 211 101+ 21 48 20 28 20
47 870 726 541 481 329 245 48 1,674 1,986 l,i25 1,474 549 518 49 583 446 352 307 231 139 Age not 50 tr,748 11,868 7,755 7,412 3,993 4,456 Stated 170 96 114 58 56 38
112
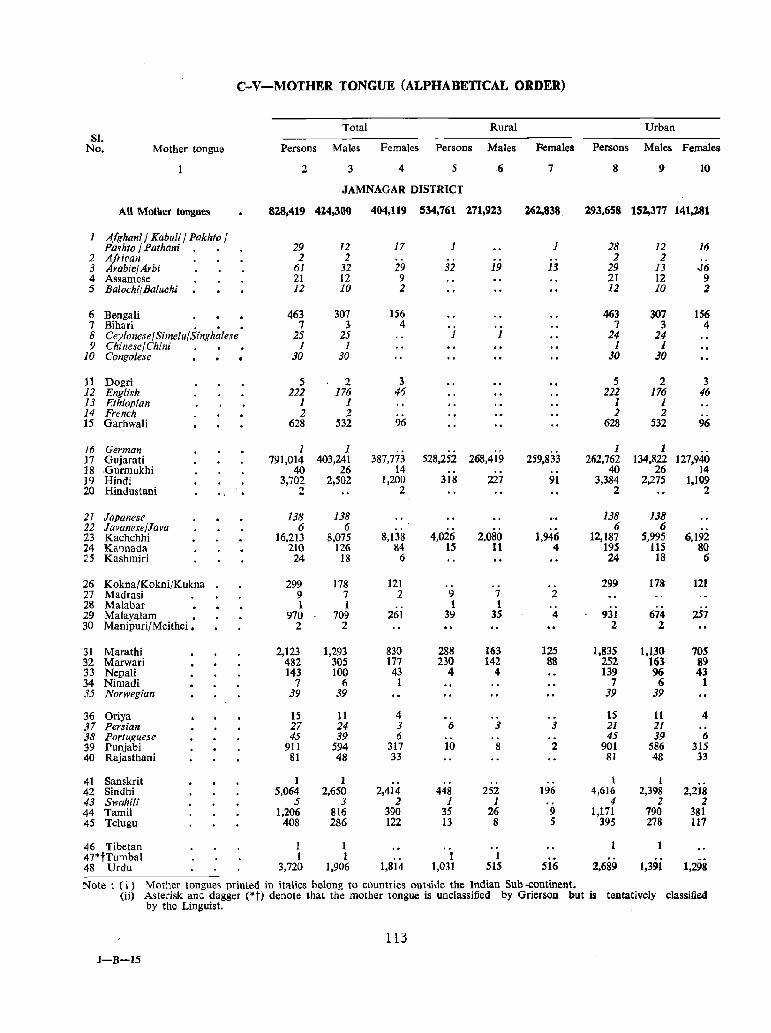
C-V-MOTHER TONGUE (ALPHABETICAL ORDER)
Total Rural Urban Sl.
No. Mother tongue Persons Males Females Persons Males Females Persons Males Females
All Mother tongues
1 Afghani / Kabuli / Pakhto / Parhto / Pathan;
2 African 3 Arabic! Arbi 4 Assamese 5 Balochi/Baluchi
6 Bengali 7 Bihari .•• 8 Ceyfonese/Simelu/Sillghafese 9 Chinese/Chini
10 Congolese
11 Dogri 12 English 13 Ethiopian 14 French 15 Garhwali
16 German 17 Gujarati 18 ,Gurmukhi 19 Hindi 20 Hindustani
21 Japanese 22 Javanese/Java 23 Kachchhi 24 Kannada 25 Kashmiri
26 Kokna(KoknijKukna 27 Madrasi 28 Malabar 29 Malayalam • 30 Manipuri/Meithei.
31 Marathi 32 Marwari 33 Nepali 34 Nimadi 35 Norwegian
36 Oriya 37 Persian 38 Portuguese 39 Punjabi 40 Rajasthani
41 Sanskrit 42 Sindhi 43 Swahili 44 Tamil 45 Telugu
46 Tibetan 47*tTumbal 48 Urdu
. ,
2 3 4 5 6
JAMNAGAR DISTRICr
828,419 4l4,300 404,119 534,761 2.71,92.3
29 2
61 21 12
463 7
25 J
30
5 222
J 2
628
1 791,014
40 3,702
2
138 6
16,213 210
24
299 9 1
970 2
2,123 482 143
7 39
15 27 45
911 81
1 5,064
5 1,206
408
1 I
3,720
J2 1
32 12 10
307 3
25 1
30
2 176
1 2
532
1 403,241
26 2,502
138 6
8,075 126
18
178 7 1
709 2
1,293 305 100
6 39
11 24 39
594 48
1 2,650
3 816 286
1 1
1,906
17
29 9 2
156 4
3 46
96
387,773 14
1,200 2
8,138 84
6
121 2
261
830 177 43 1
4 3 6
317 33
2,414 2
390 122
1,814
J
32
1
19
1
528,252 268,4i9
318 227
4,026 15
9 1
39
288 230
4
6
10
448 1
35 13
I 1,031
2,080 11
7 1
35
163 142
4
3
8
252 J
26 8
1 515
7
2.62..838
1
13
259,833
91
1.946 4
2
4
125 88
3
2
.. 196
9 5
516
8 9 10
2.93.658 15Z,377 141,281
28 2
29 21 12
463 7
24 1
30
5 222
1 2
628
1 262,762
40 3,384
2
138 6
12,187 195 24
299
931 2
1,835 252 139
7 39
15 21 45
901 81
I 4,616
4 1,171
395
2,689
12 2
13 12 10
307 3
24 I
30
2 176
1 2
532
I
J6
J6 9 2
156 4
3 46
96
134,822 127,940 26 14
2,275 1,109
138 6
5,995 115
18
178
674 2
1,130 163 96
6 39
11 21 39
586 48
I 2,398
2 790 278
1,3!Jl
2
6,192 80 6
121
257
10S 89 43
1
4
6 315
33
2,218 2
381 117
1,298
Note: (i) Mother tongues printed in italics belong to countries outside tile Indian Sub -continent. (ii) Asterisk and dagger (*t) denote that the mother tongue is unclassified by Grierson but is tentatively classified
by the Linguist.
113 J-B-15
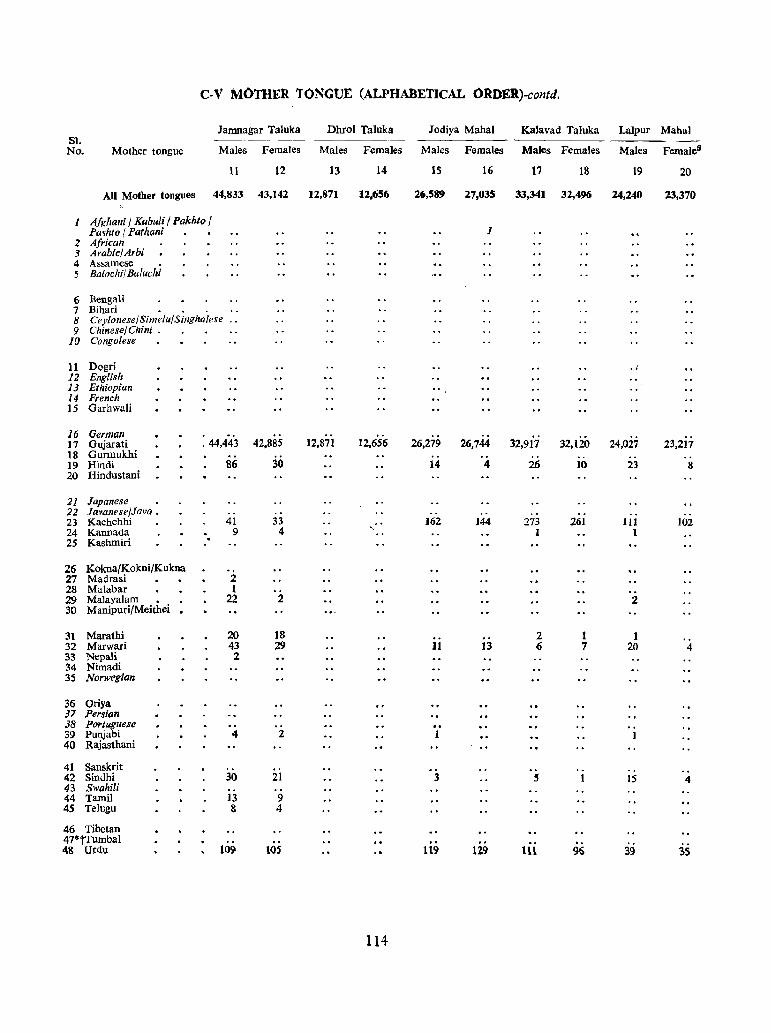
C-V MOTHER TONGUE (ALPHABETICAL ORDER)-contd.
Jan1Ragar Taluka Dhrol Taluka J odiya Mahal KaJavad Taluka Lalpur Mahal S1. ------ ---
No. Mother tongue Males Females Males Females Males Females Males Females Males Females
11 12 13 14 15 16 17 18 19 20
All Mother tongues 44,833 43,142 12,871 12,656 26,589 27,035 33,341 32,496 24,240 23,370
1 Afghani / Kabuli I Pakhto / Pa~hto I Path,mi 1
2 African 3 Arabic/ Arbi 4 Assamese 5 Balochi/ Baluchi
6 Bengali 7 Bihari . . . 8 CeylonesefSimelu/Siflghale~'e 9 Chinese/Chini •
10 Congolese
11 Dogri • I
12 English 13 Ethiopian .. 14 French 15 Garhwali
16 German 24,027 23,2i7 17 Gujarati .44,443 42,885 12,871 12,656 26,279 26,744 32,917 32,120
18 Gurmukhi 19 Hindi 86 30 14 4 26 10 23 8 20 Hindustani
21 Japanese • 22 Javanese/Java. 23 Kachchhi 41 33 ., 162 144 273 261 111 102 24 Kannada 9 4 '- I 1 25 Kashmiri
26 Kokna/Kokni/Kukna 27 Madrasi 2 28 Malabar 1 29 Malayalam • 22 2 2 30 Manipuri/Meithei
31 Marathi 20 18 2 1 1 32 Marwari 43 29 11 13 6 7 20 4 33 Nepali 2 34 Nimadi 35 Norwegian
36 Oriya 37 Persian 38 Portuguese 39 Punjabi 4 2 40 Rajasthani
41 Sanskrit 42 Sindhi 30 21 3 5 15 4 43 Swahili 44 Tamil 13 9 45 Te!ugu & 4
46 Tibetan 47*tTumbal 48 Urdu 10~ 1<15 119 129 HI % 39 35
114
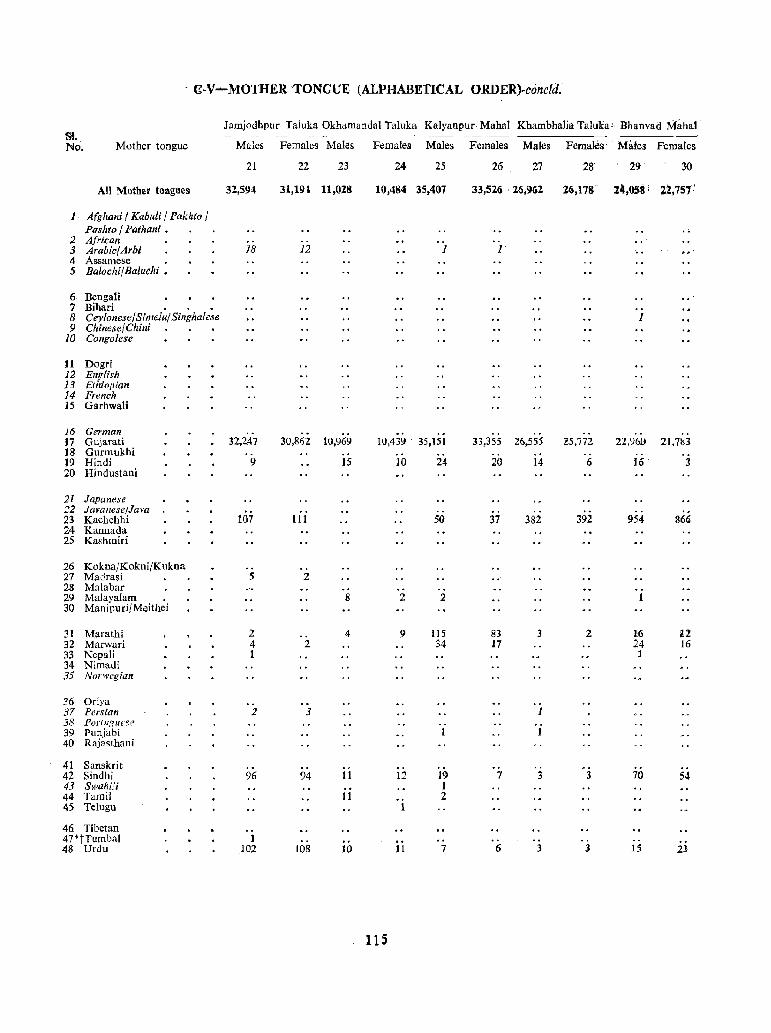
- ~-V-MOTHER 'TONGUE (ALPHABETICAL ORDERh,oncld.
Jamj.odhpur TaInka Okhdmandal Taluka Kalyanpur Mahal Khambhalia Taluka" Bhailvad Mahat' st. No'. Mother tongue Males Females Males Females Males Females Males Females" Mates Females
21 22 23 24 25 26 27 28 29' 30
All Mother tongues 32,594 31,19' 11,028 10,484 35,407 33,526 ' 26,962 26,178' 14,058 1 Zi,7S7:
1 Afghani I Kahuli I Pakhto I Pashto / Pathani •
2 African 3 Arabic/Arbi 18 12 1 1 4 Assamese 5 Balochi/Baluchi •
6 Dengali .. 7 Dihari . . . 8 Ceylonese/ Simelu/ Singhalese 1 9 Chinese/Chini
10 Congolese
11 Dogri 12 English 13 Ethiopian 14 French ]5 Garhwali
16 German J7 Gujarati 32,147 30,862 10,969 IQ,439 35,151 33,355 26,555 25,772 22,960 21,783 18 Gurmukhi 19 Hindi 9 15 10 24 20 14 6 16 3 20 Hindustani
21 Japanese 22 Javanese)Java 23 Kachchhi 107 111 50 37 382 392 954 866 24 Kannada 25 Kashmiri
26 Kokna/Kokni/Kukna 27 Madrasi 5 2 28 Malabar 29 Malayalam 8 2 2 30 Manipuri/ Meithei
31 Marathi 2 4 9 115 83 3 2 1.6 12 32 Marwari 4 2 34 17 24 16 33 Nepali 1 1 34 Nimadi 35 Norwegian
36 Oriya 37 Persian 2 3 1 38 Portugllne 39 Punjabi 40 Rajasthani
41 Sanskrit 42 Sindhi 96 94 11 12 19 7 3 3 70 54 43 Swahili 1 44 Tamil 11 2 45 Telugu
46 Tibetan 47·tTumbal 1 48 Urdu .102 108 10 11 7 6 3 3 15 2J
115
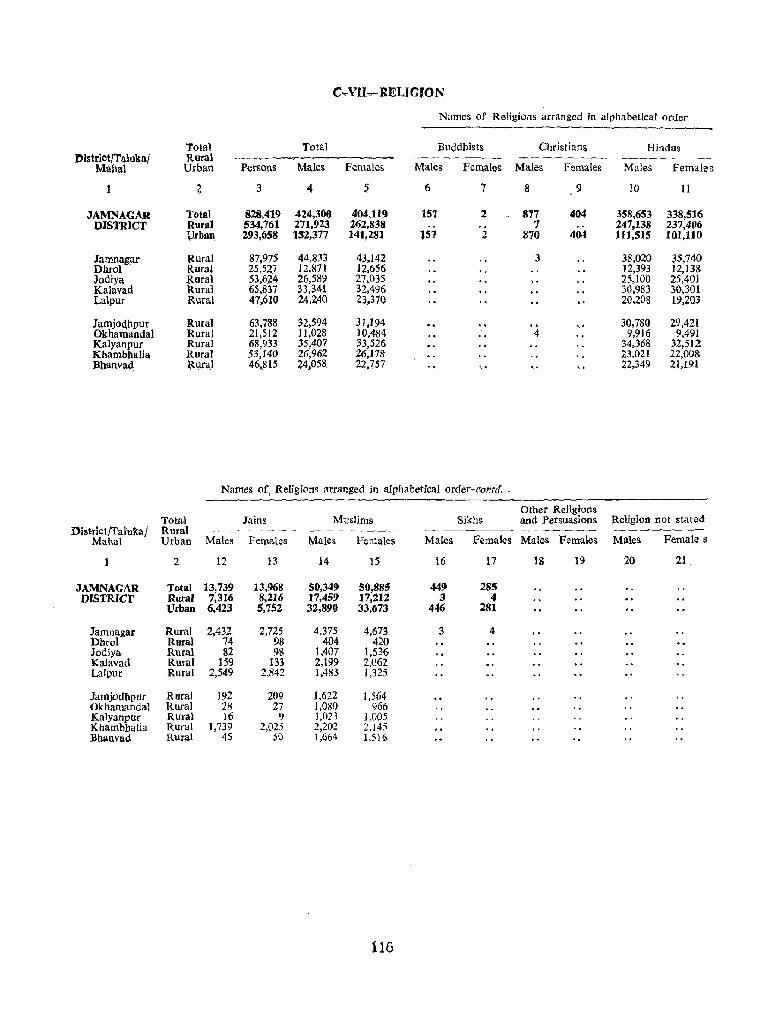
C.".VU."... RELIGIO N
Names of Religions arranged in alphabetical order
Total Total Buddhists Christian~ Hindus },)lstriot/Talukal Rural
Mahal Urban Persons Male~ Females Males females Males Females Males Females
Z 3 4 f5 6 7 8 9 10 11
JAMNAGAR Total 828,419 424,300 404,119 15'1 2 - 8'17 404 358,653 338,516 DISTRICT Rural 534,761 271,923 262,838 1 247,138 237,406
Vrban 293,658 lS2,377 141,281 151 2 870 4.04 1I1,SIS 101,110
Jamnag.ar ~ura] 87,975 44,833 43,142 3 38,020 35,740 Dhrol Rural 25,527 12,871 12,656 12,393 12,138 Jodiya Rural 53,624 26,589 27,035 25,100 25,401 Kalavad Rural 65,837 33,341 32,496 30,983 30,301 Lalpur Rural 47,610 24,240 23,370 20,208 19,203
Jamjoc\ltpur Rural 63,788 32,594 31,194 30,780 29,421 Okhamandal Rural 21,512 11,028 10.484 4 9,916 9,491 Kalyanpur Rural 68,933 35,407 33,526 34,368 32,512 Khambhaiia Rural 53,[40 26,962 26,178 23,021 22,008 lInanv\ld, ~u.ra) 46,81~ :;!4.058 22,757 22,349 41,191
Names o( Religions arranged in alphabetical order-conra. '
Total Jains Muslims Other Religions
Sikhs and Persuasions Religion not stated Disirict/Tal'tlkaJ Rural --- ---- -- ----~---~ .--~------
Mahal Urban Males Females Males Females Males Females Males F:males Males Female s
2 12 13 14 }5 16 17 18 19 20 21.
JAMNAGAR Total 13,739 13,968 50,349 50,885 449 285 DISTRICT Rural 7,316 8,216 17,459 17,212 3 4
Urban 6,423 5,752 32,890 33,673 446 281
Jamnagar Rural 2,432 2,725 4,375 4,673 3 4 Dhrol Rmal 74 98 404 420 Jodiya Rural 82 98 1,407 1,536 Kalavad Rural 159 133 2,199 2,062 Lalpur Rural 2,549 2,842 1,483 1,325
Jamjodbpur Rural 192 209 J,622 1,564 OkhamandaJ Rural 28 27 1,080 966 Kalyanpur Rural 16 9 1,023 ],005 Khambhalia Rural 1,739 2,025 2,202 2,145 .Bhanvad Rural 4S :\0 1,664 1,516
116
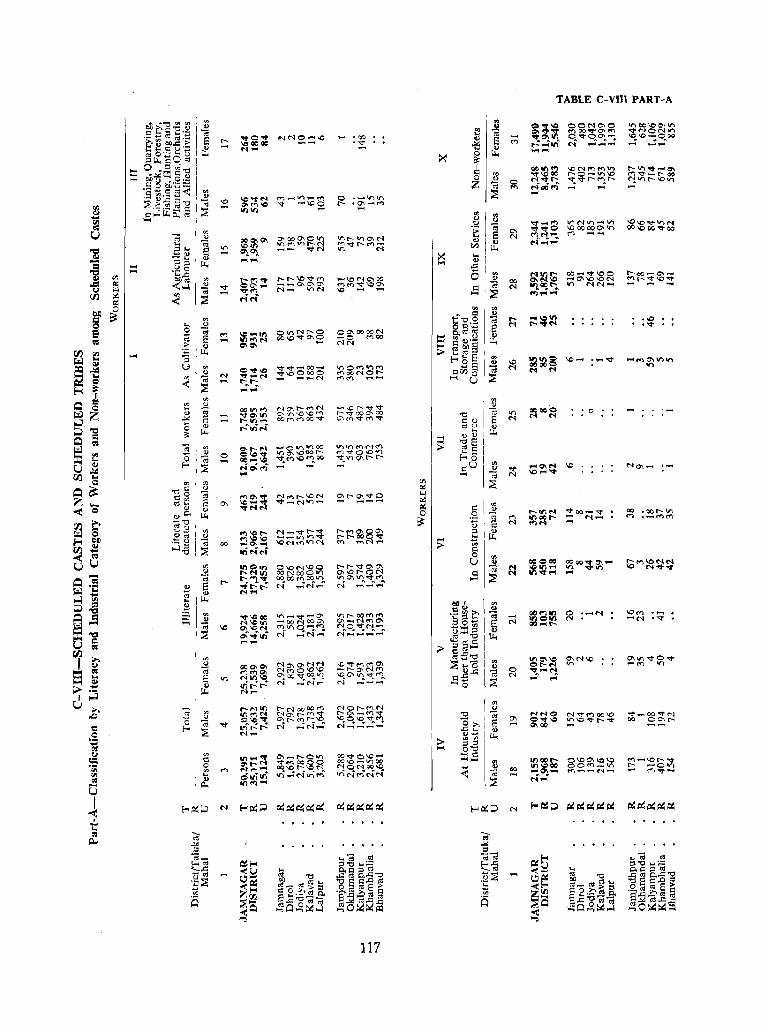
..... ....
N ....
o
<')'C ..... N_"¢ ..... """ (fj\C\Q __ 11')11")'"'1"
1"""i0\""'" \O('\("f)v)'N
an ", .. f lI><:>on 0",,,,100 .... "'on <>::)<"'1000.,., t--f"\~ ~oort;,~"l 'l!'!ir-:t-!' <'I ~~~ "' ....
• <Xl .~
OO\OOOON -0 Mgo <"'IN
ll"\l()~{,1t"\ MVO-..otrl ","_.,., 0\ .......... -
.......... ~O\'" o\1O ..... ON V;_0\"1.~~ M ,,""",'P"'!...-I
~~~~~ C'\lO~N~",-j~~r.....;~
117
> ....
.... '"
TABLE C-VDl PART-A
~,....,~ ViNV)~1I") .."...".0 100000011() (""H'''''I'''''I n --r-i """ .. ,..;-
oeoo<:> N N : 0
~~~ ~M\O ..,. .... <'1 ,.; ~
\I") CQ\C' 0' '" ~NONlt"l ":_IO-:qoo .... _ .... ~1r'I~-0\ Moo:t_f"--Q() "!iI')t---'Dtn -
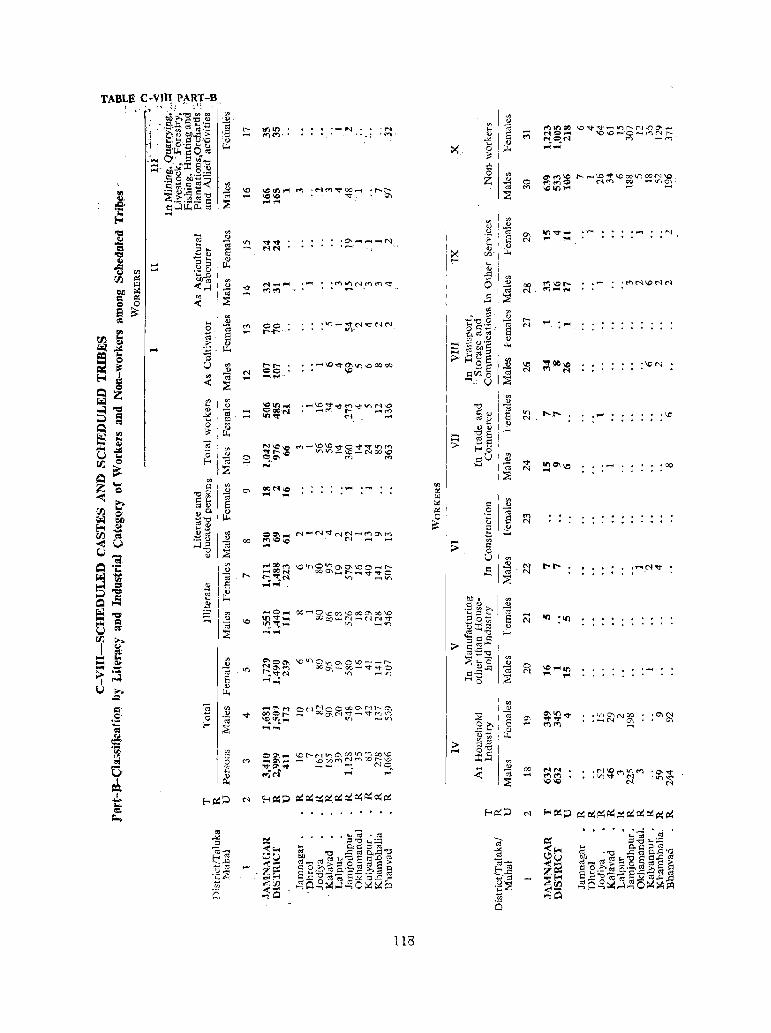
Ti\BLE c-vn~ PART-B, : 1- ',I' ", _t.,_" _. ,;l: .
'" . ~6'gE.~ '0) '" \Ii '" ()
'&.~-:n].~ :8 r- Ifllfl ;-N . ..., ... -;;; .... '" In =e \0 'Vv~ It") I'-N.,f) Q"I. . ..-..!
. 1 .... <'\ <') . " ., .",. Q 5 NO ..... ~\O-·O~(f"'I('\J r--
"'S Q 0:',:: '0) "'" M MOM '" -'" J ""
,.. " ..;,.; ~·/.l,·~O g X. 0 il< ..... Ct- ::;.%-0 ~
:::. ch'~:I: g;~ .!: .SEqf;;J~
0 '" ~~~ ,......-;\lJ~-.cOOtrlOON\O. '" Z ~ 0 . N~ ~ _1./l~
.S~:.ad .£ \0 ~1Il"" ..., 'NM"'!'j-OO~ . '"' r-
M ~I{)""
'" ::;; ~. ~.~.~~-g " ~~ -v • 0\
.c. ~ ,.., ....
is t::...lil<o.." ....
I~ '" '"
v 'l:l 0;
u loJ 0\ Ill." .... :N ~ 0) .;:; , E .... ... "a ... \Ii ." "'''1" -0' ............ _t"-.i .... C'I
E~ 8 NN .... - Q " 't::I ~ t/}. il<
~ ...... ::l::l &:: h
'5 '" ...... .~ Q <)
... ..0 ..<:: r.t:l ~ OIl" '" 0 '"
~ <...l 0) "<I-
M ......... :M~0l_(1)(1)<t' '" 00 "'~r-- ...... :"'N\Ot'lN QJi ~ \ii "'''' Cil N M ....... 1=1 ~ '" ::E '" ~ Q 0 < ......
a :s: '" '" '" " t::: " ~ ... V . V')-"'(f'M"'d"('-IN --00 \Ii r- ..... :"" ~. ca '" QQ o c: '.;:i _.' N fIl o:--t--. • 1/')- - S
rIl t s p,O;:od
~ ~ .... .?; ~ ~ ~ ~'S If
S ~ """"I cd ~:t
Q '" !-or- :-\O'<t$~l",Coooe
:> ~:5 S I~ "'!)e", i: " N QC c:<ii B l~
~ M t'I :\oN
~ g til Cil ...... ~..-;-" M 8 < ::E
I:l Z r.il '" '" '"
S -= ... .£ ~1lI ... ·-~'"d"-.:t~Vv)N\o 'tl ~ ., '" ~~N • -t'fj r- _\'"('I
~8 '" 1:1 ~ N .... E r--r-- .- .\D I:!l S N
I:l 0 .g~ V
'Ll ~ & i-l,
a .... .. '"
..... E!s 4l N\C'I:) t"'l-\O\O"'I\tO"l\t~l.f)('f") >-.:01 '" 1-'0 0 '" ~~~'Q V)V)~'..o_~OO\O .. ca 8 M ffl pU '" r.t:l 0 I-' 0)
~ ::E .... ..... ~ "'" !!l~1O .00 N
~ ... '" ::;;
Z t::: '" ~N\O '" 0 'tl~ 0> 0\ ~
<t! ca ... ... tIl ~ 0::: ... S ~ '" .. coO> ::: <U
r.t:l ~
vo. ~ ~ .~ '" ~
~-o ~ tl E ..,
2 od"" N
'"'- '" ::l 0)
e¢ .~ e 'I) Q=" .. N-N~NN-C"'I"'lO"lf') t: >.L.
-< U ...l::l ca 00 <'\\OIC
C'I __
.... '" ... >- I:i t..> -0 ::E 8 -;: OJ
'"
~ b \'" .. =e.., \OlOOI.rl~O\\!)O-:t-- .s ~ N r-.r-- .,......r"I '¢
11 r- .... OON ooa-._t--_~~o 0$ N
'" r-: "'""N V) ~." ~ =' 2 ...... "0
~ Q i:: >.L. 01), '" .... B :::0 ~
~ '0' '" .. 0 .... OO,....;O\oO")~OOO'-OO\O .s:: ~ C oj
N l:j' ;:::, " IC U')""::tlloll 0000"'" (',J,.....,n N"1' .E0~ S III : III
U c;. ;; \I'J~~",~ U) ~<r) Q~ :l 0)
::E .... ,.., .;;! "0 i-l, (/J >. ::l~~
I CJ >- c~1-I cQ: ctt';::"O .... ... '" ""Q", \Ol()8lr)o-,C\C;_'-r--- ::E ... c j~ .... ~ .£ 0 -- ~ ~~~ QG~-~......,~'¢O 0).<:; \0 ... III
~ .... od N ...l 8 '" ~<r) :::..t:: ::;; ... .... .. . HO
" ....
u ..... >.L. ,.Q
ca '" -""N o N r-\ 0 C 00 0'1 N f'-.. 0\ '" c' " .~ 0 ~ "'" OO0r-- ....... OOO\N~-"l"(~",) " ""2 0\ @~<t • "", 0\ N DO .0\('1
0$ ~"l~ on ~<r)
0» e ._("'.1 0; '" ~ .... ;?; _ .... ~ «)<')
~i " <J >.L. C;::' > .~ V)
001 ... \C 1:' ("'1 tJ') C\ 00 tn ...., 00 \.0 ..... 0", c ~ ...... !.'OS 0 M _"' ... _ '-Oc.o('1")Nf"r,'Xlr--.-.Q
'" C 'n """'''1- - NO '" 00 ... ttil'i ~ _.. ... ~ ";i 1'1'" .r",no('fjll")~ • o\-.j-
~ .... !"l!"l
I :::E • tn 'i" N '.,.,'<1"
~ . "'\0 N N
..!.. !-<~;:J N E-<~;;l ~~~~~Qi~~O::~ ... ~ f-<~::> N "'~;;l ~~~~o::~~c;:c;:~ ~
01 • &...~ • C\S .~ .;
~ ~
...._ 0:: ... '" .z ::1'"0","-;'::; oj ;::I~;...~
<,.. ~ -o]'§ i5.2"t1 <,.. ~ 0. r;:: ;:l C\;$ 01-
_,. '" .~ .q<;so..<;'<:)
1-'''' '-'u ::;I t.:Jv ~.<:: ~::2 od_ 0$ ~ ~(8 8 ~-e g: ";;;- < ..... :_ojg;:s"8S§..o~
~ro t:: '8.?) rn o..~ ~ >. ~ § 1-'''' ZC::: 0::: 0 >-. '" p,'~ 01 >, S l:l 'E~ '~H ~..Q5'"@"; ;_'£~..c ~
...._..<:: ~li]~\Ii§:§~~.a _0$ ~Ii: '" j2:ifJ "A-.~...l..,C;4~C:1 '5::;; ,..,O-.t:<...l,..,O lXl
C <- <-...,0 '" ..,0 i5
118
E-HOUSING TABLES
The present Housing Census is the first of its kind in the history of the Indian Census organized on a uniform basis throughout the country alongwith the population Census of t961. In the past censuses, house-listing was purely an administrative arrangement. Only residential houses were numbered and listed with the name of tbe head of the household. However, during 1961 Census a comprehensive house-list for collecting detailed information regarding each census house and industrial establishment formed part Df the statlltory census schedules. The house-list form brought into use during the current Census has recorded data on housing such as type of houses, tenure status, material of wall and roof, number of rooms in a census household and of persons residing therein as well as essen6al data relating to establishments. workshops and factories, such as name of the establishment or proprietor. name of products, number of ersons working and the kind of fuel or power, if machjnery is used.
The following five housing tables have been compiled from the house-lists :-
E-I-CenSlls Houses and the Ilses to which they are put
E-II-Tenure Status of Sample Census households living in Census houses used wholly or partly as dwelling
E-III-Census houses used as facteries and workshops classified by industry, power and no power used and size of employment
E-IV -Distribution of Sample households living in Census houses used wholly or partly as dwelling by predominant material of wall and predominant material of roof
E-V-Sample households classified by number of members and by number of rooms occupied
Out of the five tables stated above, Tables E-I and E-III have been prepared on full count and Tables E-II, IV and V on the basis of 20 per cent sampled households. For the purposes of drawing the sample. the house-lists were arranged separately in the order of location code numbers in case of (i) rural areas of a taluka/mahal and (ij) urban areas other than towns with population of 50,000 and over for a district and (iii) for every town with a population of 50,000 and over. The samples were marked continuously for all the house-lists thus arranged and the households left over at the end of the house-list after marking the last sample were carried over to the next house-list for sample selection.
Tables E-I, E-II, E-IV and E-V are given in the District Censlls Handbook for the district, taluka and towns with a population of 50,000 and over. But the data regarding number of establishments contained in Table E-III are separately compiled down to village and given in the Villagewise List of Industrial Establishments.
The explanatory note on each of the tables is given below :-
TABLE E-I-CENSUS HOUSES AND THE USES TO WHICH THEY ARE PUT
Table B-1 prepared on full count gives figures of census houses separately for total, rural and urban areas DC the district, talukas, cities and towns with population of 50,000 and over, classified into different -categories according to the uses to which they are put. Those found vacant at the time of house-listing have also been shown separately as such. The following are the various types of houses into which occupied houses have been classified :-
Dwellings, shop-cum-dwellings, workshop-cum-dwellings, hotels, hostels, sarais, dharamshalas, tourist homes and inspection houses, shops excluding eating houses, business houses and offices, factories registered
119

under the Factories Act and worksheds and workshops not so registered, schools and other educational institutions including training classes, coaching and shop classes, restaurants, sweetmeat shops and eating places, places of entertainment and community gathering (Panchayat Ghar), public "health and medical institutions, hospitals, health centres, doctors' clinics, dispensaries, etc.
Others
Occupied census houses which do not fall in any of the above categories have been classed as 'Others'.
With a view to understand tbe significance of statistics incorporated in E Series of Tables, the concepts and definitions of the terms occuring in the table are given below:-
Census house
" A Census house is a structure or part of a structure inhabited or vacant, or a dwelling, a shop, a shop-cwn-dwelling, or a place of business, workshop, school, etc., with a separate entrance."
Census household
" A household is a group of persons who commonly live together in the same census house and take their meals from a common mess unless the exigencies of work prevent them from doing so."
Shop
" A shop is a place where articles are sold for cash or for credit."
Workshop
" A workshop is a place where some kind of prodUction, processing, repair or servicing is undertaken or where goods or articles are made and sold, and is not a factory registered under the Factories Act."
Following are some of the instances :~
Paper-making, shoe-making, tailoring, cycle-repairing, motor-servicing, halwai's shop, potterymaking, goldsmith, blacksmith, etc.
Factory
" A factory is a large workshop which has been registered under the Indian Factories Act."
Business houses
Business houses are those premises where transactions in money or other articles are taking place. Detailed explanation of all these will be found in the Introductory Chapter of the Report on Housing and Establishments.
TABLE E-II-TENURE STATUS OF SAMPLE CENSUS HOUSEHOLDS LIVING IN CENSUS HOUSES USED WHOLLY OR PARTLY AS DWELLING
This table has been prepared on tbe basis of 20 per cent sample. Census households used as dwellings, shop·cum-dwellings. workshop~cwn~dwellings, and dwellings with other uses have been taken into account for the purpose of marking the samples. Shop-cum-dwellings and workshop-cum-dwellings are census houses which are partly used for residential or dwelling purposes and partly used as a shop or workshop. The total number of households given in columll 4 of this table gives the total of such samples classified into the aforementioned four categories of dwellings, which have been further classified according to their tenure statlls, whether owned or rented, Jor the district, talukas and towns with population of 50,000 or more as also for total/rural/urban.
120
TABLE E-IV-DISTRIBUTION :OF· ;,sAMPLE HOUSEHOLDS LIVING IN CENSUS HOUSES USED WHOLLY OR PARTLY AS DWELLING BY PREDOMINANT MATERIAL OF WALL AND PREDOMINANT MATERIAL OF ROOF
This table has been prepared on 20 per cent sample basis. Census households used as dwellings, shopcum-dwellings, workshop-cum-dwellings and dwellings with other uses have been taken into account for the purpose of marking the sample. The total number of houses given in column 3 of this table gives the totals of all such sampled households. The material out of which most of the' walls are made or where a house consists of separate structures, each of different materials, the material out of which the walls of the main bedrooms are made has been entered. The wall material has been classified into the following nine
cate¥ories ;-
(1) Grass, leaves, reeds or bamboo (2) Timber (3) Mud (4) Unburnt bricks (5) Burnt bricks
(6) C. 1. Sheets or other metal sheets (7) Stone (8) Cement concrete (9) All other material
The material out of which most of the outer roof exposed to the weather and not the ceiling is made, i.e., tiles, thatch, corrugated iron, zinc or asbestos cement sheets or concrete, etc., or in the case of multistoreyed building, the material out of which the intermediate floor or floors has been made, have been entered and classified into the following seven categories :-
(1) Grass, leaves, reeds, thatch, wood or bamboo (2) Tiles, slate, shingle (3) Corrugated iron, zinc or other metal sheets (4) Asbesto3 cement sheets (5) Brick and lime (6) Concrete and stone slabs (7) All other material
This table has been prepared for the district, talukas and cities and towns with population of 50,000 or more, as also for total/rural/urban.
TABLE E-V-SAMPLE HOUSEHOLDS CLASSIFIED BY NUMBER OF MEMBERS AND BY NUMBER OF ROOMS OCCUPIED
This table has been prepared on 20 per cent sample basis. Census Households used as dwellings, shopcum-dwellings, workshop-cum-dwellings and dwellings with other Uses have been taken mto account for the purpose of marking the samples. The figures given in Column 3 of this table are the totals of all such sampled households. The sex break-up of the total number of members occupying such sampled households as also the total number of rooms in the.se households are shown sep~rately. All the sampled households have been further classified into the following six categories :-
Households with
(i) no regular room lii) one room (iii) two rooms
(iv) three rooms (v) four rooms (vi) five rooms or more
This classification of households into the above categories gives not only the number of households in each category, but also the number of occupants by sex. The units for which this table has been compiled are districts, talukas and cities and towns with population of 50,000 or more, as also total/rural/urban.
121 J-B-J6
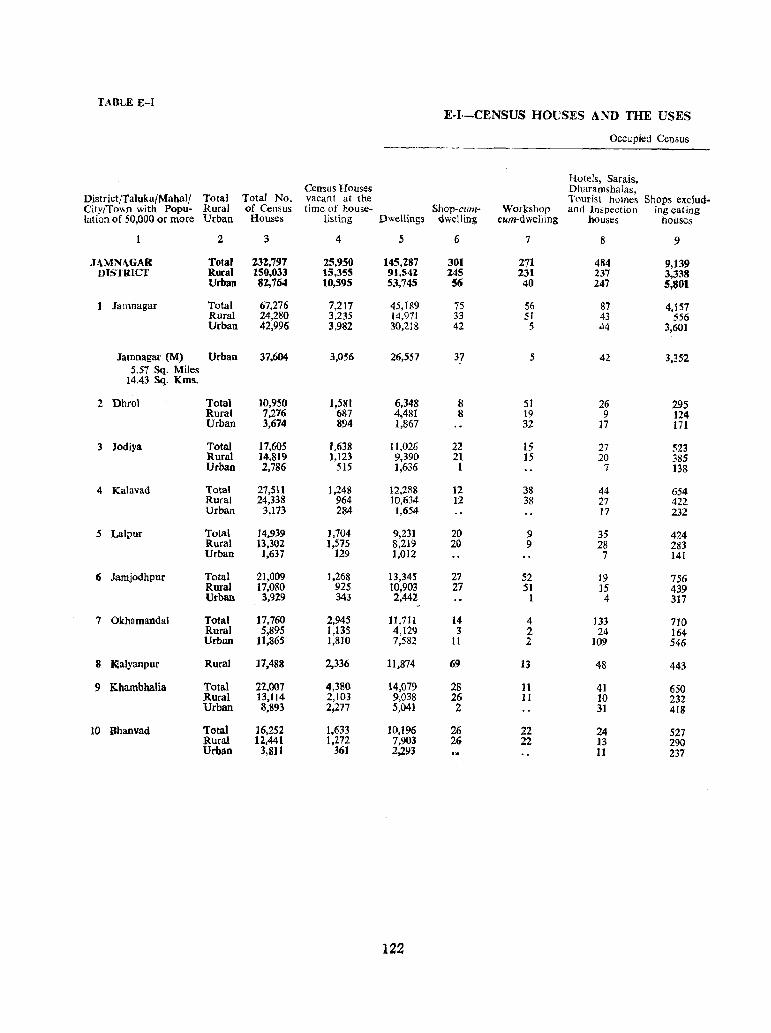
TABLE E-I E-I-CENSUS HOUSES AND THE USES
Occupied Census
Hotels, Sarais, Census Houses DharamshaJas,
District/Taluka/Mahall Total Total No. vacant at the Tourist homes Shops exclud-City/To~n with Popu- Rural of Census time of house- Shop-cum- Workshop and Inspection ing eating lation of 50,000 or more Urban Houses listing Dwellings Qwc!ling cum-dwelling houses houses
2 3 4 5 6 7 8 9
JAMNAGAR Total 232,797 25,950 145,287 301 271 484 9,139 DISTRICT Rural 150,033 15,355 91.542 245 231 237 3,338
Urban 82,764 10,595 53,745 56 40 247 5,801
1 Jamnagar Total 67,276 7,217 45,189 75 56 87 4,157 Rural 24,280 3,235 14,971 33 51 43 S56 Urban 42,996 3,982 30,21& 42 5 44 3,601
Jamnagal' (M) Urban 37,604 3,056 26,557 37 5 42 3,352 5.51 Sq. Miles
14.43 Sq. Kms.
2 Dhrol Total 10,950 ],581 6,348 8 51 26 295 Rural 7,276 687 4,481 8 19 9 124 Urban 3,674 894 1,867 3.2 17 171
3 Jodiya Total 17,605 1.638 ll,026 22 15 27 523 Rural 14,819 ),123 9,390 21 15 20 385 Urban 2,786 515 1,636 I 7 138
4 Kalavad Total 27,511 1,248 12,288 12 38 44 654 Rural 24,338 964 10,634 12 38 27 422 Urban 3,173 284 1,654 ]7 232
5 Lalpur Total 14,939 1,704 9,231 20 9 35 424 Rural 13,302 1,575 8,219 20 9 28 283 Urban 1,637 129 1,012 7 141
6 Jamjodhpur Total 21,009 1,268 13,345 27 52 19 756 Rural 17.080 925 10,903 27 51 15 439 Urban 3,929 343 2,442 I 4 317
7 Okhamandai Total 17,760 2,945 11,711 14 4 133 710 Rural 5,895 1,135 4,129 3 2 24 164 Urban 11,865 1,810 7,582 11 2 109 546
8 lC!alyanpur Rural 17,488 2,336 11,874 69 13 48 443
9 Khambhalia Total 22,001 4,380 14,079 28 11 4] 650 Rural 13;114 2,103 9,038 26 11 10 232 Urban 8,893 2;277 5,041 2 31 418
10 Bhanvad Total 16,252 1,633 10,196 26 22 24 527 Rural 12,441 1,212 7,903 26 22 13 290 Urban 3,811 361 2,293 11 237
122
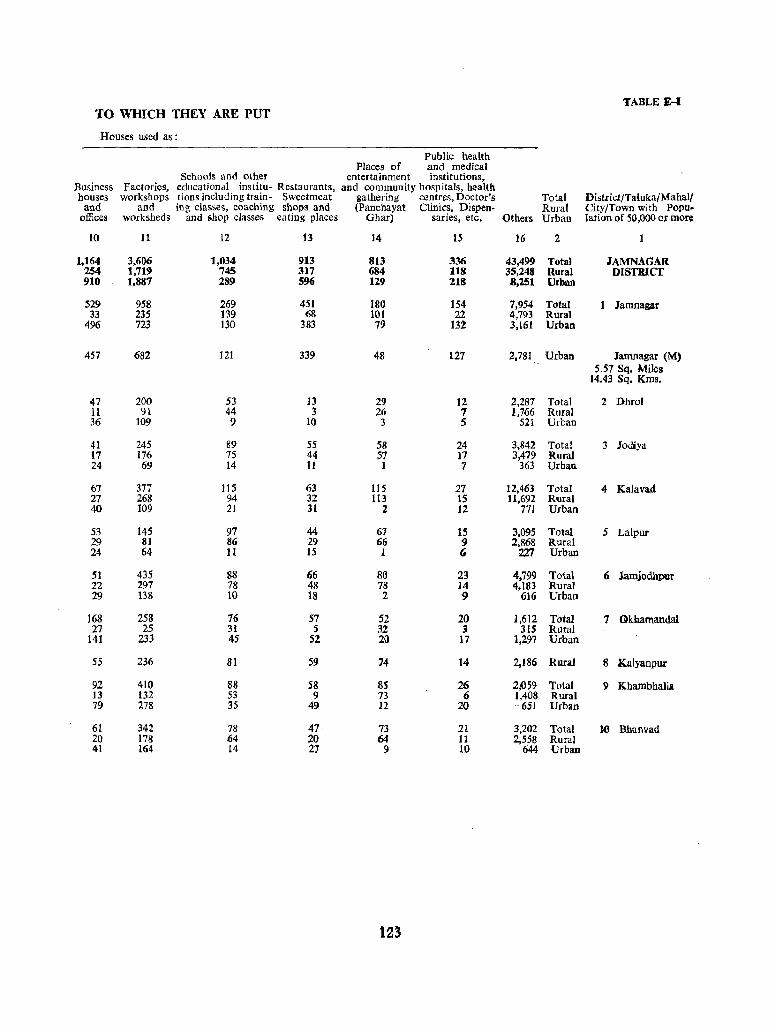
TABLE B-1 TO WHICH THEY ARE PUT
Houses used as:
Public health Places of and medical
Schools and other entertainmen t institutions, Business Factories, educational institu- Restaurants, and community hospitals, health houses workshops tions including train- Sweetmeat gathering centres, Doctor's Total District/Taiuka/Mahal/
and and ing classes, coaching shops and (Fanchayat Clinics, Dispen- Rural City/Town with Popu. offices worksheds and shop classes eating places Ghar) saries, etc. Others Urban lation of 50,000 or more
10 11 12 13 14 15 ]6 2
1,164 3,606 1,034 913 813 336 43,499 Total JAMNAGAK :254 1,719 745 317 684 118 35,248 Rural DISTRICT 910 1.887 289 S96 129 218 8,251 Urban
529 958 269 451 180 154 7,954 Total Jamnagar 33 235 139 68 101 22 4,793 Rural
496 723 130 383 79 132 3,161 Urban
457 682 121 339 48 127 2,781 Urban Jamnagar (M) S.57 Sq. Miles
14.43 Sq. Kms.
47 200 S3 13 29 12 2,287 Total 2 Dhrol 11 91 44 3 26 7 1.766 Rural 36 109 9 10 3 5 521 Urban
41 245 89 55 58 24 3,842 Total 3 Jodiya 17 176 75 44 57 17 3,479 Rural 24 69 14 11 1 7 363 Urban
67 377 115 63 ll5 27 12,463 Total 4 Kalavad 27 268 94 32 113 15 11,692 Rural 40 109 21 31 2 12 771 Urban
53 145 97 44 61 15 3,095 Total 5 Laipur 29 81 56 29 66 9 2,868 Rural 24 64 11 15 1 6 227 Urban
51 435 88 66 80 23 4.799 Total 6 Jamjodbpur 22 297 78 48 78 14 4,183 Rural 29 138 10 18 2 9 616 Urban
168 258 76 57 52 10 1,612 Total 1 Okbamandal 27 25 31 5 32 ; 315 Rural
141 233 45 52 20 17 1.297 Urban
55 236 81 S9 74 14 2,186 Rural 8 Kalyanpur
92 410 88 58 SS 16 2M9 Total 9 Khambhalil1 I3 132 53 9 73 6 1,408 Rural 79 278 35 49 12 2{) 651 Urban
61 342 78 47 73 21 3,202 Total 1() Bhanvad 20 178 64 20 64 II 2,558 Rural 41 164 14 27 9 10 644 Urban
123
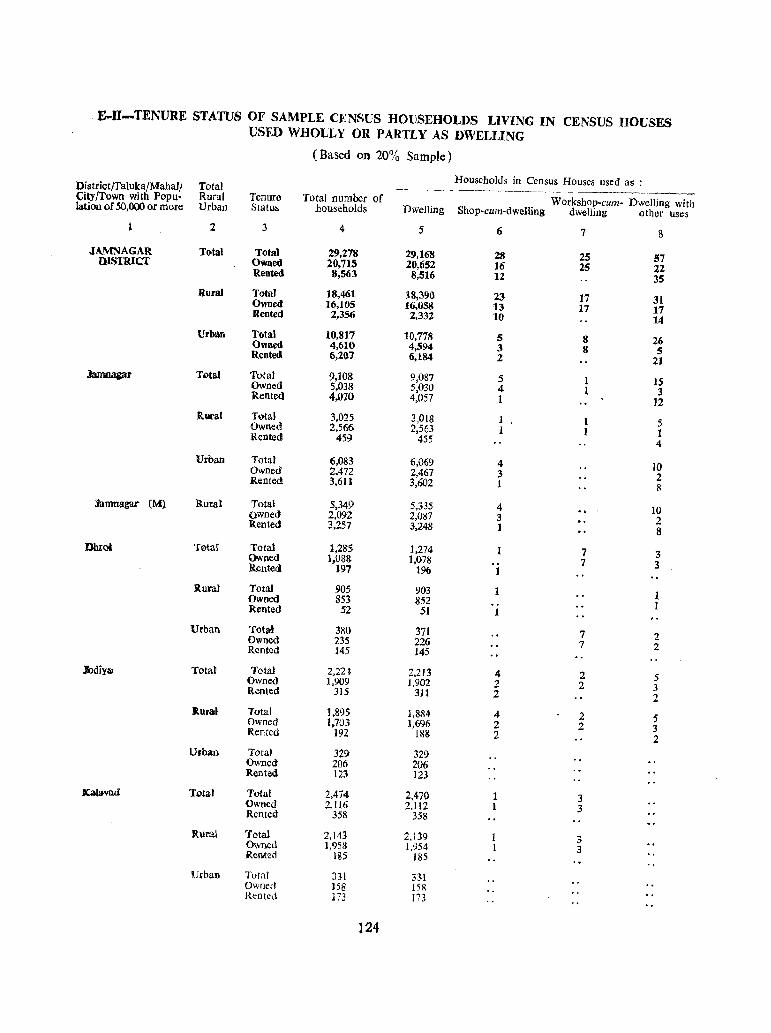
· E-ll-TENVRE STATUS OF SAMPLE CENSUS HOUSEHOLDS LIVING IN CENSUS HOUSES USED WHOLLY OR PARTLY AS DWELLING
(Based on 20% Sample)
Households in Census Houses used as : District!Taluka/Mahall Total City/Town with Popu- Rural Tenure Total number of Workshop-cum- Dwelling with lation of 50,000 or more Urban Status households Dwelling Shop-cum-dwelling dwelling other uses
2 3 4 5 6 7 8
JAMNAGAR Tl)tal Total 29,278 29,168 28 25 57 DISTRICT Owned 20,715 20,652 16 25 22 Rented 8,563 8,516 12 35 Rural Total 18,461 18,390 23 17 31 Owned 16,105 16,058 13 17 17 Rented 2,356 2,332 10 14 Urban Total 10,817 10,778 5 8 26 Owned 4,610 4,594 3 8 5 Rented 6,207 6,184 2 21 Total Tl>taI 9,108 9,087 5 15 Owned 5,038 5,030 4 3 Rented 4,070 4,057 1 12 Rural T~tal 3,025 3,018 1 5 Owned 2,566 2,563 1 1 Rented 459 455 4
Urban Total 6,083 6,069 4 10 Owned 2,472 2,467 3 2 Rented 3,611 3,602 1 8
lamnagar (M) Rural Total 5,349 5,335 4 10 owned 2,092 2,087 3 2 Rented 3,257 3,248 1 8
Dhrol Total Total 1,285 1,274 7 3 Owned 1,088 1,078 7 3 Rented 197 196 1
)lura.) Total 905 903 1 Owned 853 852 1 Rented 52 51
Uli'ban Total 380 371 7 2 Owned 235 226 7 2 Rented 145 145
JodfYal 'Iota} Total 2,2U 2,213 4 2 5 Owned 1,909 1,902 2 2 3 Rented 315 311 2 2 )tural Total 1,895 1,884 4 2 5 Owned 1.703 ],696 2 2 3 Rented 192 188 2 2
Ulban Total 329 329 Owned 206 206 Rented 123 123
JCalavad Total Total 2,474 2,470 1 3 Owned 2,116 2,112 1 3 Rented 358 358
Rural Total 2,143 :2,139 1 3 Owned ],958 1,954 1 3 Rented iS5 185
Urban Total 331 331 Owned 158 158 Rented 173 173
124
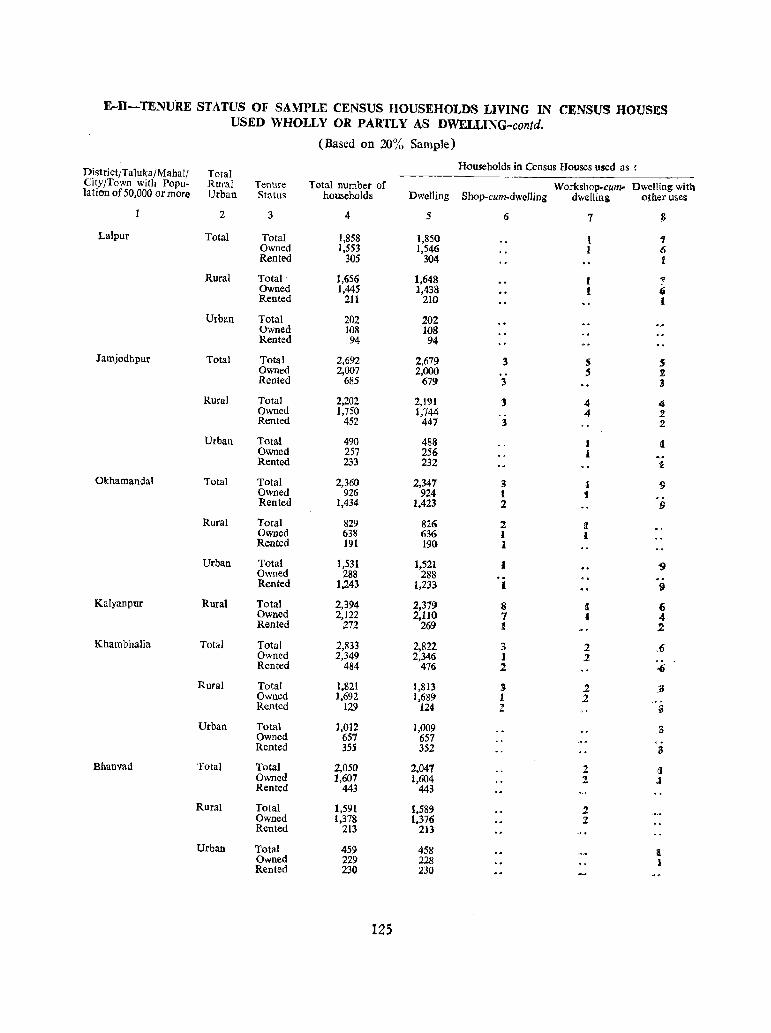
E-II-TENURE STATUS OF SAMPLE CENSUS HOUSEHOLDS LIVING IN CENSUs HOUSES USED WHOLLY OR PARTLY AS DWELLING-contd.
(Based on 20% Sample)
Households in Census Houses used as : District/Ta]uka/Mahal/ Total City/Town with Popu- Rural Tenure Total number of Workshop-cum- Dwelling with lation of 50,000 or more Urban Status households Dwelling Shop-cum-dwelling dwelling other uses
2 3 4 5 6 1 ~
Lalpur Total Total 1,858 1,850 '1 Owned 1,553 1,546 6 Rented 305 304 f
Rural Total· 1,656 1,648 I "! Owned 1,445 1,438 I (j Rented 211 210 l
Urban Total 202 202 Owned 108 108 Rented 94 94
Jamjodhpuf Total Total 2,692 2.679 3 S 5 Owned 2,007 2,000 .5 ! Rented 685 679 :3 3
Rural Total 2,202 2,191 3 -4 4 Owned 1,750 1,744 4 l Rented 452 447 1 .2
Urban Total 490 488 I t Owned 257 256 1 Rented 233 232 ~
Okhamandal Total Total 2,360 2,347 ~ t 9 Owned 926 924 I ! Rented 1,434 1,423 2 9
Rural Total 82<) 826 2 il Owned 638 636 1 I Rented 191 19() 1
Urban Total 1,531 Owned 288
1,521 288
1 '9
Rented 1,243 1,233 I 9
Kalyanpur Rural Total 2,394 2,379 8 :l 6 Owned 2,122 2,110 7 I 4 Rented 272 269 1 ...2
Khambhalia Total Total 2,833 2,822 3 2 ,n Owned 2,349 2,346 1 2 Rented 484 476 2 .()
Rural Total 1,821 1,813 3 .2 ~ Owned 1,692 1,689 1 2 Rented 129 124 2 " Urban Total 1,012 1,009 ;3 Owned 657 657 Rented 355 352 2
Bhanvad Total Total 2,050 2,047 2 d Owned 1,607 1,604 2 J Rented 443 443
Rural Total 1,591 1.589 2 Owned 1,37& 1.376 2 Rented 213 213
Urban Total 459 458 l Owned 229 228 1 Rented 230 230
125
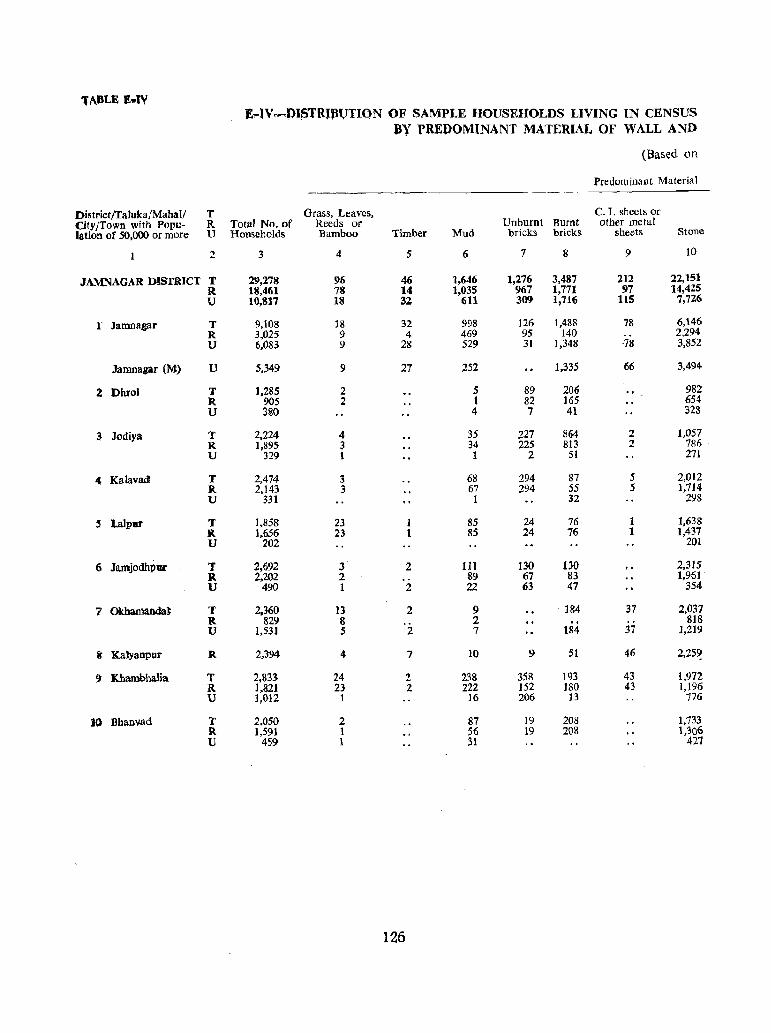
lADLE Jl: ... 1V ~,...lV,_.,PlSTRJ~1JTION OF SAMPLE HOUSEHOLDS LIVING IN CENSUS
BY PREDOMINANT MATERIAL OF WALL AND
(Based on
PredOnliJlant Material
District/Taluka/Mahal/ T Grass, Leaves, C. I. sheets or City/Town with Popu- R Total No. of Reeds or Unburnt Burnt- other metal lation of 50,000 or more U Households Bamboo Timber Mud bricks bricks sheets Stone
2 3 4 5 6 7 8 9 10
JAMNAGAR DISTRICT T 29,278 96 46 1,646 1,276 3,487 212 22,151 R 18,461 78 14 1,035 967 1,771 97 14,425 U 10,317 18 32 611 309 1,716 115 7,726
r Jamnagar T 9,108 18 32 998 126 1,488 78 6,146 R 3,025 9 4 469 95 140 2.294 U 6,083 9 28 529 31 1,348 ·78 3,852
lamnagar (M) U 5,349 9 27 252 1,335 66 3,494
2 Dhrol T 1,285 2 5 89 206 982 R 905 2 1 82 165 654 U 380 4 7 41 328
3 Jodiya T 2,224 4 35 227 864 2 1,057 R 1,895 3 34 225 813 2 786 -U 329 1 1 2 51 271
4 Kalavad T 2,474 3 68 294 87 5 2,012 R 2,143 3 67 294 55 5 1,714 U 331 1 32 298
S Lalpu T 1,858 23 85 24 76 1 1,638 R 1.656 23 85 24 76 1 1,437 U 202 101
6- JamjodhplIt T 2,692 3 2 llt 130 130 2,315 R 2,202 2 89 67 83 1,961-U 490 1 2 22 63 47 354
7 Okbatna.n.dal T 2,360 13 2 9 184 37 2,037 R 829 8 2 " 818 U 1,531 5 2 7 184 37 1,219
S" Ka)yanpuy R. 2,394 4 7 10 9 51 46 2,25~
9 Khambhalia T 2,833 24 2 238 358 193 43 1,972 R 1,821 23 2 222 152 180 43 1,196 U 1,012 1 16 206 13 776
10 Bhanvad T 2,050 2 87 19 208 1,733 R 1,591 1 56 19 208 1,306 U 459 1 31 421
126
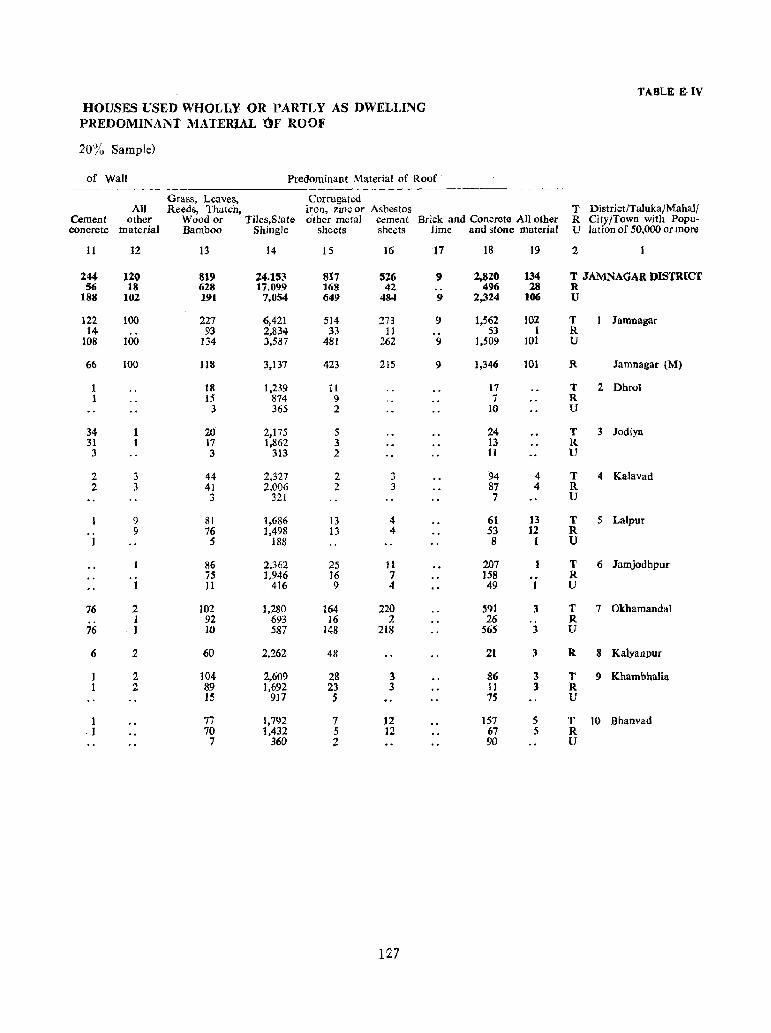
TABLE E IV
HOUSES USED WHOLLY OR PARTLY AS DWELUNG PREDOMINANT MATERlAL 'OF ROOF
20% Sample)
of Wall Predominant Material of Roof -----~
Grass, Leaves, Corrugated District/Taluka/Mahall All Reeds, Thatch, iron, :zinc or Asbestos T
Cement other Wood or Tiles,Slate o'ther metal c.:ment Brick and Concrete All other R City/Town with Popu-concrete material Bamboo Shingle sheets sheets lime and stone material U lation of 50,000 or more
11 12 13 14 15 16 17 18 19 2
244 120 819 24,153 817 526 9 2.820 134 T JAMNAGAR DISTRICT 56 18 628 17,099 168 42 496 28 R
188 102 191 7.054 649 484 9 2,324 106 U
122 100 227 6,421 514 273 9 1,562 102 T 1 Jamnagar 14 93 2,834 33 11 53 1 R
108 100 134 3,587 481 262 9 1,509 101 U
66 100 118 3,137 423 215 9 1,346 101 R Jamnagar (M)
18 1,239 11 17 T 2 Dhrol 15 874 9 7 R
3 365 2 10 U
34 20' 2,175 5 24 T 3 Jodiya 31 17 1,862 3 13 R
3 3 313 2 11 U
2 3 44 2,327 2 3 94 4 T 4 Kalavad 2 3 41 2,006 2 3 87 4 R
3 321 7 U
9 81 1,686 13 4 61 13 T 5 Lalpur 9 76 1,498 13 4 53 12 R
1 5 188 8 1 U
86 2,362 25 11 207 T 1) Jamjodhpur 75 1,946 ]6 7 158 R 11 416 9 4 49 U
76 2 102 1,280 164 220 591 3 T 7 Okhamandal 1 92 693 16 2 26 R
76 1 10 587 148 218 565 3 U
6 2 60 2,262 48 21 3 R 8 Kalyanpur
2 104 2,609 28 3 86 3 T 9 Khambhalia 2 89 1,692 23 3 II 3 R
IS 917 5 75 U
77 1,792 7 12 157 5 T 10 Bhanvad 70 ],432 5 12 67 5 R 7 360 2 90 U
127
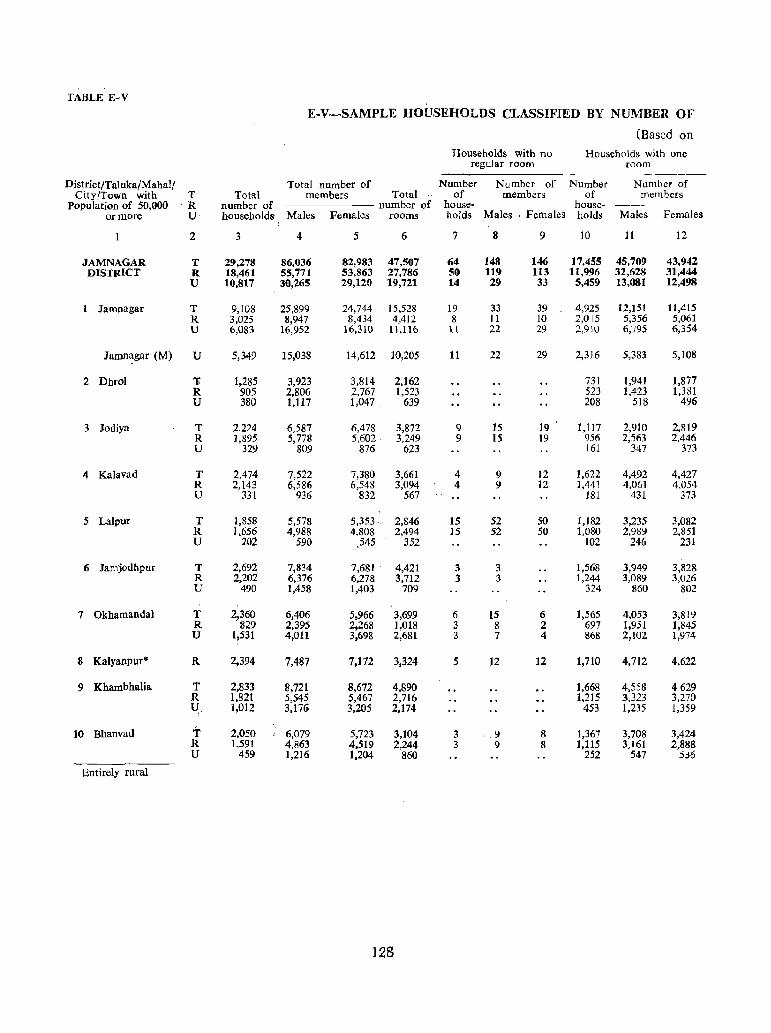
TABLE E-V
E-V-SAMPLE HOUSEHOLDS CLASSIFIED BY NUMBER OF
(Based on
Households with no Households with one regular room room
----District/Taluka/Mahall Total number of Number Number of Number Number of
City{Town with T Total members Total of members of members Population of 50,000 R number of number of house- - ~-------- house- -----------
or more U households Males Females rooms holds Males ' Females holds Males Females
2 3 4 5 6 7 8 9 10 11 12
JAMNAGAR T 29,278 86,036 82,983 47,507 64 148 146 17,455 45,709 43,942 DISTRICT R 18,461 55,771 53,863 27,786 50 119 113 11,996 32,628 31,444
U 10,817 30,265 29,120 19,721 14 29 33 5,459 13,081 12,498
1 Jamoagar T 9,108 25,899 24,744 15,528 19 33 39 4,925 12,151 11,415 R 3,025 8,947 8,434 4,412 8 11 10 2,015 5,356 5,061 U 6,083 16,952 16,310 11 ,116 11 22 29 2,910 6,795 6,354
Jamnagar (M) U 5,349 15,038 14,612 10,205 11 22 29 2,316 5,383 5,108
2 Dhrol 11 1.285 3,923 3,814 2,162 731 1,941 1,877 R 905 2,806 2,767 1,523 523 1,423 1,381 U 380 1,117 1,047 639 208 518 496
3 Jodiya T 2,224 6,587 6,478 3,872 9 15 19 1,1 I7 2,910 2,819 R 1,895 5,778 5,602. 3,249 9 15 19 956 2,563 2,446 U 329 809 876 623 161 347 373
4 Kalavad T 2,474 7,522 7,380 3,661 4 9 12 1,622 4,492 4,427 R 2,143 6,586 6,548 3,094 4 9 12 1,441 4,061 4,054 U 331 936 832 567 181 431 373
5 Lalpur T 1,858 5,578 5,353· 2,846 15 52 50 1,182 3,235 3,082 R 1,656 4,988 4,808 2,494 15 52 50 1,080 2,989 2,851 U 202 590 545 352 102 246 231
6 Jamjodhpur T 2,692 7,834 7,681 4,421 3 3 1,568 3,949 3,828 R 2,202 6,376 6,278 3,712 3 3 1,244 3,089 3,026 U 490 1,458 1,403 709 324 860 802
7 Okhamandal T 2,360 6,406 5,966 3,699 6 15 6 1,565 4,053 3,819 R 829 2,395 2,268 1,018 3 8 2 697 1,951 1,845 U 1,531 4,011 3,698 2,681 3 7 4 868 2,102 1,974
8 Kalyanpur* R 2,394 7,487 7,172 3,324 5 12 12 1,710 4,712 4,622
9 Khambhalia T 2,833 8,721 8,672 4,890 1,668 4,558 4629 R 1,821 5,545 5,467 2,716 1.215 3,323 3,270 U 1,012 3,176 3.205 2,174 453 1,235 1,359
10 Bhanvad T 2,050 6,079 5,723 3,104 3 9 8 1,367 3,708 3,424 R 1.591 4,863 4,519 2,244 3 9 8 1,115 3,161 2,888 U 459 1,216 1.204 860 252 547 5_;6
Entirely rural
128
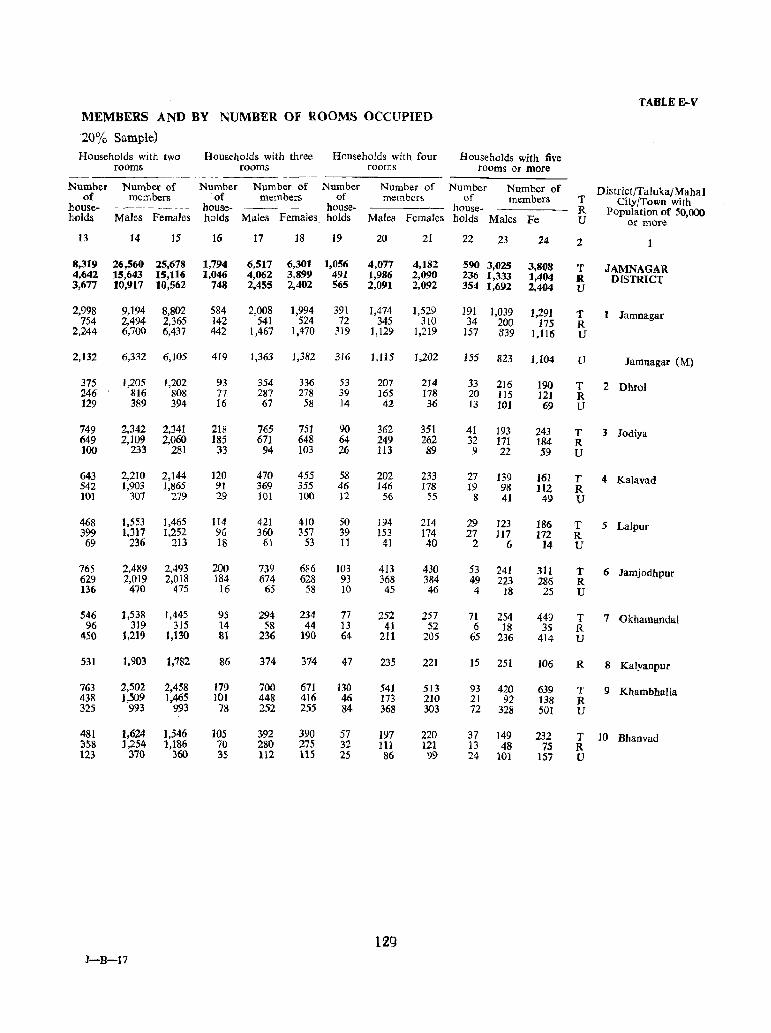
TABLE E-V MEMBJ!':RS AND BY NUMBER OF ROOMS OCCUPIED
20% Sample) Households with two Households with three Households with four Households with five
rooms rooms rooms rooms or more
Number Number of Number Number of Number Number of Number Number of District/Taluka/Mahal of members 'of members of members of members T City/Town with house- -~--~,~--- house- house- hause- R Population of 50,000 holds Males Females holds Males Females holds Males Females holds Males Fe U or more
13 14 15 16 17 18 19 20 21 22 23 24 2
8,319 26,560 25,678 1,794 6,517 6,301 1,056 4,077 4,182 590 3,025 3,808 T JAMNAGAR 4,642 15,643 15,116 1,046 4,062 3,899 491 1,986 2,090 236 1,333 1,404 R DlSTRICr 3,677 10,917 10,562 748 2,455 2,402 565 2,091 2,092 354 1,692 2,404 V
2,998 9,194 8,802 584 2,008 1,994 391 1,474 1,529 191 1,039 1,291 T 1 Jamnagar 754 2,494 2.365 142 541 524 72 345 310 34 200 175 R
2,244 6,700 6,437 442 1,467 1,470 319 1,129 1,219 157 839 1,116 V
2,132 6,3~2 6,105 419 1,363 1,382 316 1,115 1,202 155 823 1,104 IT Jamnagar (M)
375 1,205 1,202 93 354 336 53 207 214 33 216 190 T 2 Dhrol 246 816 808 77 287 278 39 165 178 20 lIS 121 R 129 389 394 16 67 58 14 42 36 13 101 69 U
749 2,342 2,341 218 765 751 90 362 351 41 193 243 T 3 Jodiya 649 2,109 2,060 185 671 648 64 249 262 32 171 184 R 100 233 281 33 94 103 26 113 89 9 22 59 U
643 2,210 2,144 120 470 455 58 202 233 27 139 161 T 4 Kalavad 542 1,903 1,865 91 369 355 46 146 178 19 98 112 R 101 307 279 29 101 100 12 56 55 8 41 49 U
468 1,553 1,465 114 421 410 50 194 214 29 123 186 T 5 LaJpur 399 1,317 1,252 9G 360 357 39 153 174 27 117 172 R 69 236 213 18 61 53 11 41 40 2 6 14 U
765 2,489 2,493 200 739 686 103 413 430 53 241 311 T 6 Jamjodhpur 629 2,019 2,018 184 674 628 93 368 384 49 223 286 R 136 470 475 16 65 58 10 45 46 4 18 25 U
546 },538 ],445 95 294 234 77 252 257 71 254 449 T 7 Okhamandal 96 319 315 14 58 44 13 41 52 6 ]8 35 R
450 1,219 1,130 81 236 190 64 211 205 65 236 414 U
531 1,903 1,782 86 374 374 47 235 221 15 251 to6 R 8 Kalyanpur
763 2,502 2,458 179 700 671 130 541 513 93 420 639 T 9 Khambhalia 438 1,509 1,465 101 448 416 46 173 210 21 92 138 R 325 993 993 78 252 255 84 368 303 72 328 501 V
481 1,624 ],546 105 392 390 57 197 220 37 149 232 T 10 Bhanvad 358 1,254 1,186 70 280 '2:75 32 111 121 13 48 75 R 123 370 360 35 112 115 2S 86 99 24 101 157 U
129 J-B-17

seT-SPECIAL TABLES FOR SCHEDULED CASTES AND SCHEDULED TRIBES
No special tables were prepared for Scheduled Castes and Scheduled Tribes in 1951. The only infor· mation that Table D-III of 1951 furnished was the aggregate strength of Scheduled Castes and Tribes for the district and certain arbitrary groups of talukas. In view, however, of the special safeguards provided for these classes under the Constitution, it was felt that a more detailed tabulation of the census data will furnish the basis necessary for the evaluation of the results of the various schemes implemented by the State under the Five Year Plans as also for the formulation of new ones. Special tables for Scheduled Castes and Schedu. led Tribes have, therefore, been devised and presented in a separate series called SCTjSCjST series.
Tbe table reproduced from this serieS is SCT-I-Parts-A & B, giving industrial classification of persons at work and non-workers by sex for Scheduled Castes and Scheduled Tribes. Total figures of Scheduled Castes and Scheduled Tribes have also been given for each village in the Village Directory.
Total population of Scheduled Castes and Scheduled Tribes for taluka/mahal with total/rural/urban break-up is given in Statements A and B.
131
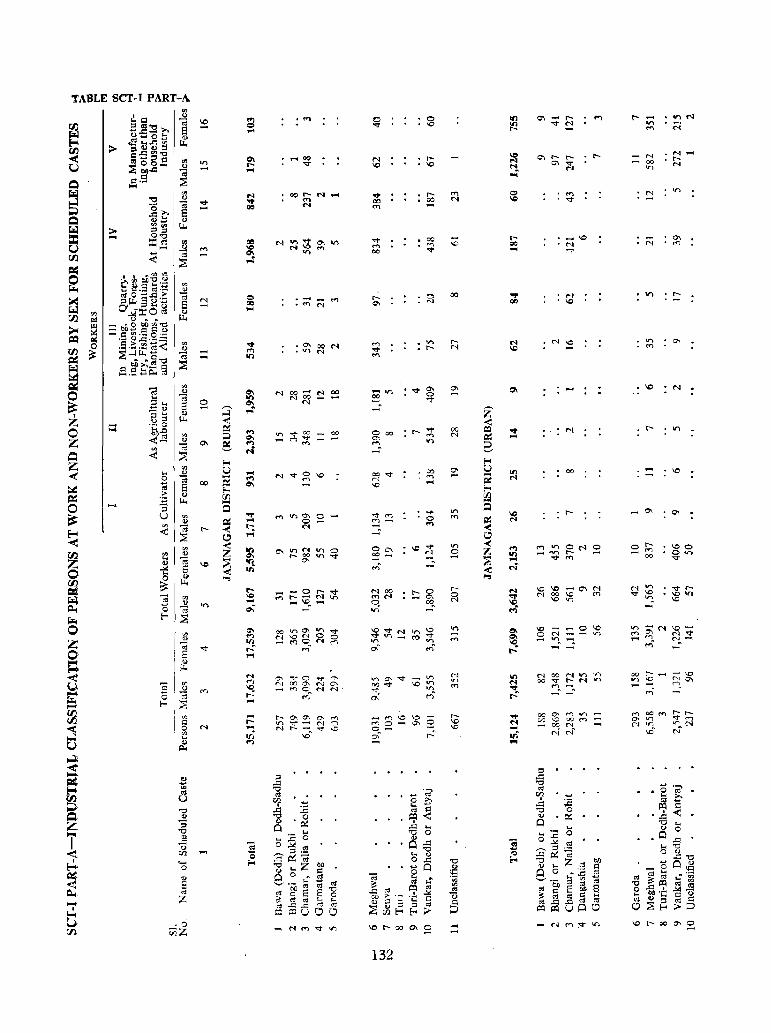
TABLE SCT-I PART-A
a ...
... r--It) '"
.....
132
00
rN
rao ...
N \C
N\C ...
.....
N
N --N
_01
or-"" 00
N rN
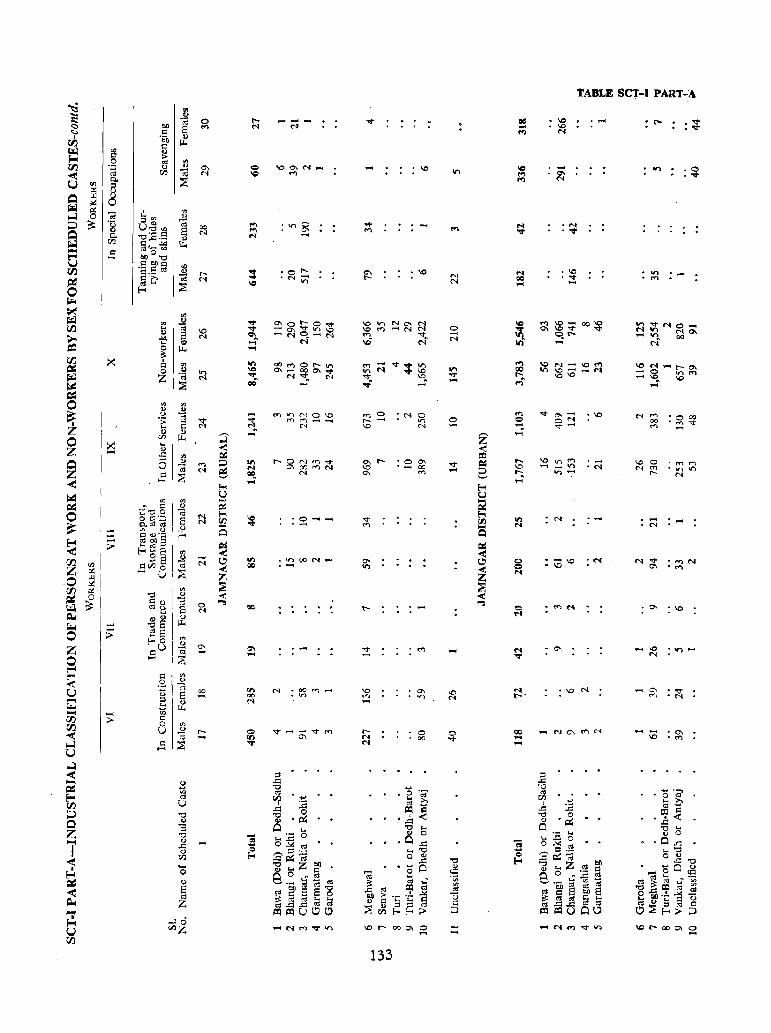
. ~ <:; ::3 .... til c o V c ....
I~
-o
S ~
":0 cnZ
o M
00 N
\0 N
r--
III ac
0\ ....
.VlOON ......
N .. OO~_ " on
.\0
~~~~f:} .., "<to 'l) N
133
• 0 '" "_ OC
'"
o 00
N N
o N
v ....
...
1.0 N
o v
.... ....
N 00 ....
00 ... ...
TABLE SCT-I PART ~A
'N .....
.\0 ..... ....
.~
• \0
. -'1'4
." .0 .....
N : ......
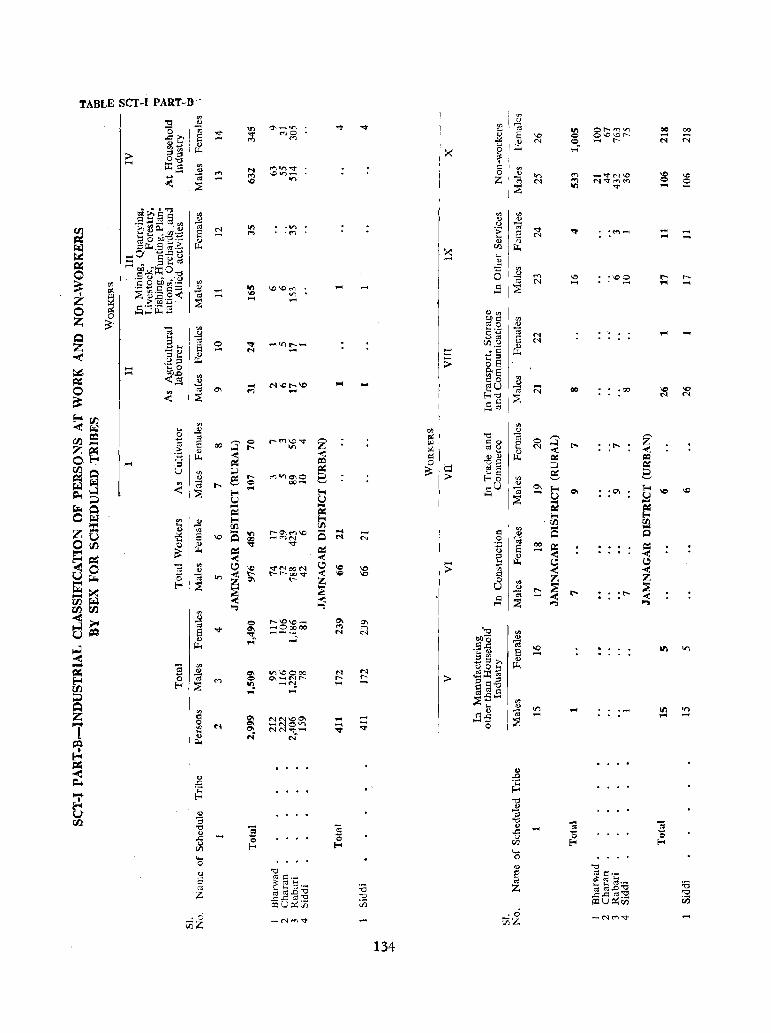
TABLE SCT-I PART-B-
.0-CiiZ
.... <'l
.... -"I'
...
.... N
:>
134
:('f"')-
'\00 . -
.00
:1'--
:t'-o
-0 ViZ
III .....
00
N
r-....
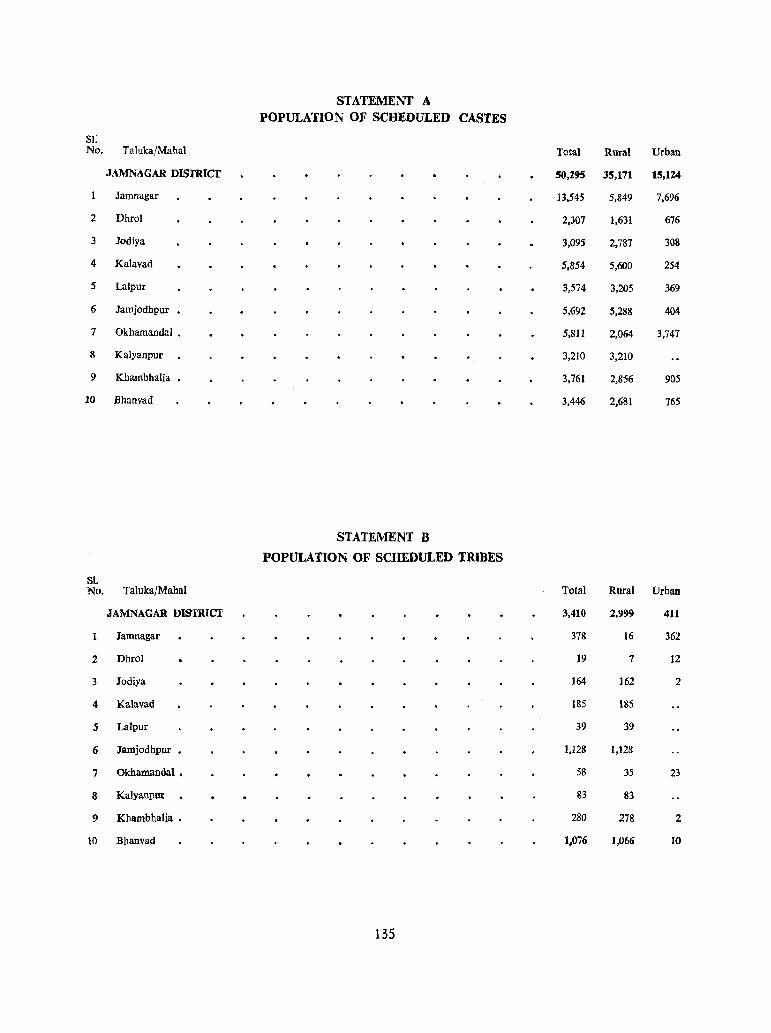
STATEMENT A POPULATION OF SCHEDULED CASTES
SI: No. Taluka/Mahal Total Rural Urban
JAMNAGAR DISTRICT 50,295 35,171 15,124
Jamnagar 13,545 5,849 7,696
2 Dhrol 2,307 1,631 676
3 Jodiya 3,095 2,787 308
4 Kalavad 5,854 5,600 254
5 Lalpur 3,574 3,205 369
6 Jarnjodhpur 5,692 5,288 404
7 OkhamandaI • 5,811 2,064 3,747
8 Kalyanpur 3,210 3,210
9 Kharnbhalia 3,761 2,856 905
10 Bhanvad 3,446 2,681 765
STATEMENT B
POPULATION OF SCHEDULED TRIBES
S1. No. Taluka/Mahal Total Rural Urban
JAMNAGAR DISTRICT 3,410 2,999 411
Jarnnagar 378 16 362
2 Dhrol 19 7 12
3 Jodiya 164 162 2
4 Kalavad 185 185
5 Lalpur 39 39
6 Jamjodhpur 1,128 1,128
7 Okhamandal • 58 35 23
8 Kalyanpur 83 83
9 Khambhalia • 280 278 2
10 Bhanvad 1,076 1,066 10
135

VILLAGE-WISE LlST OF INDUSTRIAL ESTABLISHMENTS
This table gives important information about the total number of industrial establishments arranged in ascending order of minor groups of industries. It is compiled from the house-lists and presented in run OIl
manner. Under the name of the district are arranged minor groups of industries showing total number of industrial establishments within brackets next to each minor group separately for total, rural and urban. The figures for taluka/mahal are likewise arranged separately for total/rural/urban. Then follows a list of villages in the order of the location code number given in the Village Directory, showing against each village minor group or groups of industries found in the village with the number of establishments shown within brackets against each minor group. Figures for towns are also shown separately in the sa'lle manner.
Industrial establishments have been classified according to the minor groups of industries given in .. he Standard Industri.al Classification adopted by the Government of India reproduced in the Annexure. This will enable the reader to identify the industry to which a particular minor group relates.
137
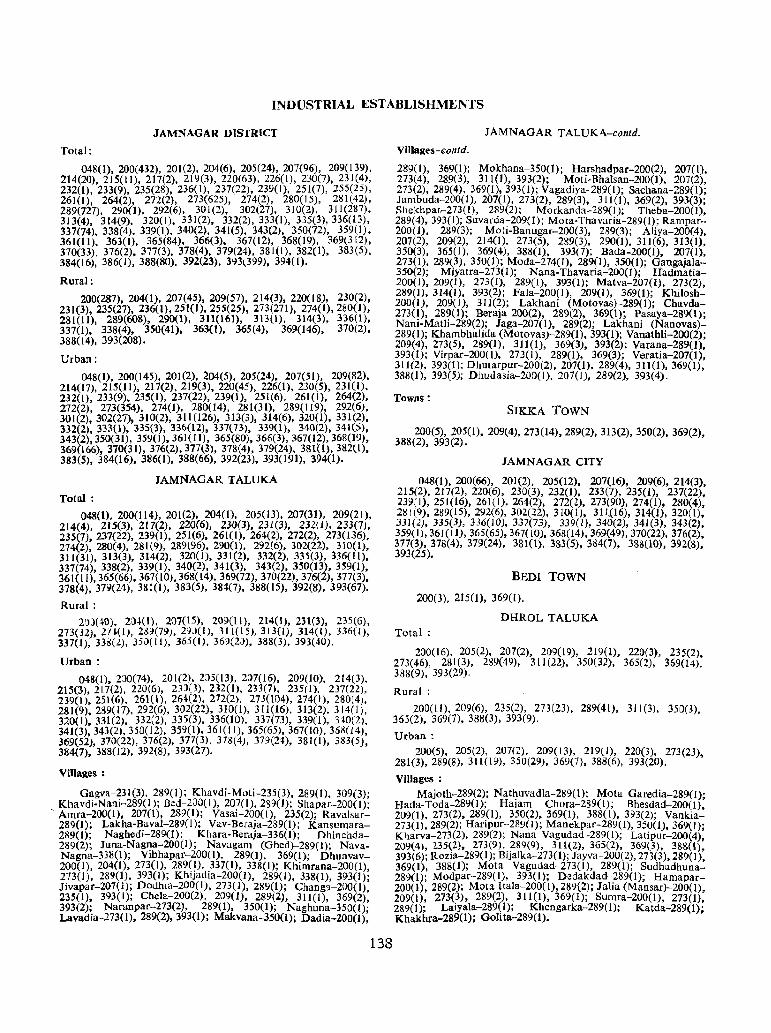
INDUSTRIAL ESTABLISHMENTS
JAMNAGAR DISTRICT
Total:
048(1), 200(432), 201(2), 204(6), 205(24), 207(96), 209(139), 214(20),215(11).217(2),219(3),220(63),226(1), 230(7), 231(4), 232(1), 233(9), 235(28). 236(1), 237(22). 239(1), 251(7), 255(25), 261(1), 264(2), 272(2), 273(625), 274(2), 280( 15), 281 (42), 289(727), 290(1), 292(6), 301(2). 302(27), 310(2), 311(287), 313(4), 314(9). 320(1). 331(2). 332(2),333(1), 335(3),336(13), 337(74). 338(4). 339(1), 340(2), 341(5), 343(2). 350(72). 359(1), 361(11). 363(1). 365(84). 366(3). 367(12), 368(19). 369(312). 370(33). 376(2). 377(3). 378(4), 379(24), 381(1), 382(1), 383(5), 384(16), 386(1), 388(80). 392(23), 393l399), 394(1).
Rural:
200(287). 204(1), 207(45), 209(57), 2[4(3). 220(18), 230(2), 231(3), 235(27), 236(1),251(1),255(25), 273(271), 274(1),280(1), 281(11), 289(608), 290(1), 311(161), 313(1). 314(3), 336(l}. 337(1), 338(4), 350(41), 363(1), 365(4), 369(146), 370(2), 388(14), 393(208).
Urban:
048(1). 200(145). 201(2). 204(5), 205(24). 207(5[), 209(82), 214(17), 215(11), 217(2),219(3),220(45), 226(1),230(5),231(1), 232(1), 233(9), 235(1), 237(22), 239(1), 251(6), 261(1), 264(2), 272(2), 273(354), 274(1). 280(14), 281(31), 289(119), 292(6), 301(2), 302(27), 310(2), 311 (126), 313(3), 314(6). 320(1), 331(2), 332(2), 333(1), 335(3), 336(12), 337(73), 339(1), 340(2), 341(5), 343(2),350(31), 359(1),361(11), 365(80),366(3), 367(12),368(19). 369(166), 370(31), 376(2),377(3), 378(4), 379(24), 381(1),382(1), 383(5), 384(16), 386(1), 388(66), 392(23), 393(191), 394(1).
JAMNAGAR TALUKA
Total :
048(1), 200(114), 201(2). 204(1), 205(13), 207(31), 209(ZI), 214(4), 215(3). 217(2), 220(6), 23Q(3). 231(3). 23Z(1). 233(7), 235(7). 237(22), 239(1), 251(6), 261(1), 264(2). 272(2), 273(136), 274(2), 280(4), 281(9), 289t96), 290(1), 292(6), 302(22), 310(1), 311(31), 313(3), 314(2), 320(1), 331(2), 332(2), 335(3), 336(11), 337(74). 338(2), 339(1). 340(2), 341(3), 343(2). 350(13), 359(1), 361(11),365(66),367(10),368(14),369(72).370(22), 376(2), 377(3), 378(4).379(24),381(1), 383(5), 38t(7), 388(15),392(8), 393(67).
Rural:
2~))(.j.0), 2:>4(1). 207(15), 209(11), ZI4(1). 231(3), 235(6), 273(32),21-1-(1),28,9(79), 29J(I), 311(15).313(1),314(1),336(1), 337(1), 33g(2), 351)(11), 365(1), 369(2), 388(3),393(40).
Urban:
048(1), 200(74), 201(2), 205(13), 207(16), 209(10), 2[4(3). 215(3),217(2), 220(6), 23)(3), 232([), 233(7), 235(1), 237(22), 239(1),251(6), 261(1), 26·H2), 272(2), 273(104),274(1), 280(4), 281(9),289([7),292(6),302(22),310(1),3[1(16).313(2).314(1), 320(1), 331(2), 332(2), 335(3), 336(10), 337(73), 339(1), HO(2), 341(3),343(2), 350( 12), 359(1). 361(11),365(65). 367(10), 36~(I4). 369(52), 370(22), 376(2), 377(3), 378(4), 379(2"t), 381(1), 383(5), 384(7), 388(12), 392(8), 393(27).
ViUages:
Gagva-23J(3), 289(1); Khavdi-Moti-235(3), 289(1), 309(3); Khavdi-Nani-289(1); Bcd-1JO(J). 207(1), 21l9(1); Shapar-200(1);
~ Amra-200(l). 207(1), 289(1); Vasai-200(1), 235(2); Ravalsar-289(1); Lakha-Baval-289(1); Vav-Beraja-239(1); Kansumara-289(1); Naghedi-289(l); Khara-Beraja-336(1); Dhinchda-289(2); Juna-NagJ?a-200(1); Navagam (Ghed)-289(1); NavaNagna-338(1); Vlbhapar-200(l), 289(1), 369(1); Dhunvav-200(1), 204(1). 273(1), 289(1), 337(1), 338(1); Khimrana-200(I) 273(1), 289(1), 393(1).; Khijadia-200(1), 289(1), 338(1), 393(1); Jivapar-207(l); Dodhm-200(1), 273(1). 289(1); Changl-200(1), 235(1), 393(1); Chela-200(2), 209(1), 289(2), 311(1), 369(2). 393(2); Naranpar-273(2), 289(1), 350(1); Naghuna-350(1); Lavadia-273(l), 289(2), 393(1); Makvana-350(1); Dadia-200(1),
138
JAMNAGAR TALUKA-contd.
Villages-contd.
289(1), 369(1); Mokhana-350(l); Harshadpar-200(2), 207(1), 273(4), 289(3), 311(1). 393(2); Moti-Bhalsan-200(l). 207(2), 273(2), 289(4), 369(1),393(1); Vagadiya-289([); Sachana-289(1); Jambuda-200(l), 207(1), 273(2), 289(3), 311(1), 369(2), 393(3); Shekhpat-273{1), 2tl9(2); Morkanda-289(1); Theba-200(1), 289(4),393(1); SLlvarda-209(1); Mota-Thavaria-289(1); Rampar-200(1), 289(3); Moti-Banugar-200(3), 289(3); Aliya-200(4), 207(2), 209(2). 214(1). 273(5), 289(3), 290(1). 311(6), 313(1), 350(3). 365(1), 369(4). 388(1), 393(7); Bada-200(J), 207(1), 273(1), 289(3), 350(1); Moda-274(1), 289(1). 350(1); Gangajala-350(2); Miyatra-273(I); Nana-Thavaria-200(1); ffadmatia-200(1}. 209(1), 273(1), 289(1), 393(J); Matva-207(1), 273(2), 289(1), 314(1), 393(2); Fala-200(l), 209(1). 369(1); Khilosh-200(1). 209(1), 311(2); Lakhani (Motovas)-289(1); Chavda-273(1), 289(1); Beraja 200(2), 289(2). 369(1); Pasaya-2S9(l); Nani-Matli-289(2); Jaga-207(1), 289(2); Lakhani (Nanovas)-289( I); Khambhalida (Motovas)-289(1), 393(1); Vanathli-200(2); 209(4), 273(5), 289(1), 311(1), 369(3), 393(2); Varana-289(l), 393(1); Virpar-200(1), 273(1), 289(1), 369(3); Veratia-207(1), 311(2), 393(1); Dhutarpur-200(2), 207(1). 289(4), 311(1), 369(1), 388(1), 393(5); Dhudasia-200(l), 207(1), 289(2), 393(4).
Towns: SIKKA TOWN
200(5), 205([), 209t4), 273(14),289(2). 313(2). 350(2), 369(2), 388(2), 393(2).
JAMNAGAR CITY
048(1), 200(66), 201(2), 205(12), 207(16), 209(6), 214(3), 215(2), 217(2), 220(6), 230(3), 232(1). 233(7}, 235(1). 237(22), 239(1), 251(16), 261( I), 264(2), 272(2), 273(90), 274(1), 280(4), 281(9),289(15),292(6),302(22),310(1), 311.(16),314(1),320(1), 3Jl(2}, 335(3), 336(10), 337(73), 339(1), 340(2), 341(3), 343(2). 359(1),361(11),365(65),367(10),368(14),369(49), 370(22), 376(2), 377(3), 378(4), 379(24), 381(1), 383(5), 384(7), 38&(10), 392(8), 393(25).
BEDI TOWN
200(3). 215(1), 369(1).
DHROL TALUKA
Total:
200(16), 205(2), 207(2), 209(19), 219(1), 220(3), 235(2), 273(46), 281(3), 2~9(49), 311(22), 350(32), 365(2}, 369(14), 388(9), 393(29).
Rural:
200(11), 209(6), 235(2), 273(23), 289(4[). 311(3), 350(3), 365(2), 369(7). 388(3), 393(9).
Urban:
200(5), 205(2), 207(2). 209(13), 219(1), 220(3), 273(23), 281(3),289(8), 311(19), 350(29), 369(7), 388(6), 393(20).
Villages:
Majoth-Z89(2); Nathuvadla-289(1); Mota Garedia-289(1)' Hada-Toda-289(1); Hajam Chora-289([); Bhesdad-200(l): 209(1). 273(2), 289(1), 350(2), 369(1). 388(1), 393(2); Vankia-273(1),289(2); Haripur-289(1); Maoekpar-289(1), 350(1), 369(1); KIJarva-273(2), 289(2); Nana Vagudad-289(1); Latipur-200(4), 209(4), 2.35(2), 273(9), 289(9), 3lt(2), 365(2), 369(3), 3&8.(1). 393{6); Rozia-Z89(1); Bijalka-273(1); Jayva-200(2), 273(3), 289(1), 369(1). 388(1); Mota Vagudad-273(1). 289(1); Sudhadhuna-289(1); Modpar-289(J), 393(1); Dedakdad-289(1); Hamapar-200(1), 289(2); Mota ltala-200(l), 289(2); Jalia (Mansar)-200(1), 209(1), 273(3), 289(2), 311(1), 369(1); SUmra-200(1), 273(1), 289(1); Laiyala-289(1); Khengarka-289(1); Katda-289(1); Khakhra-289(1); Golita-289(1).
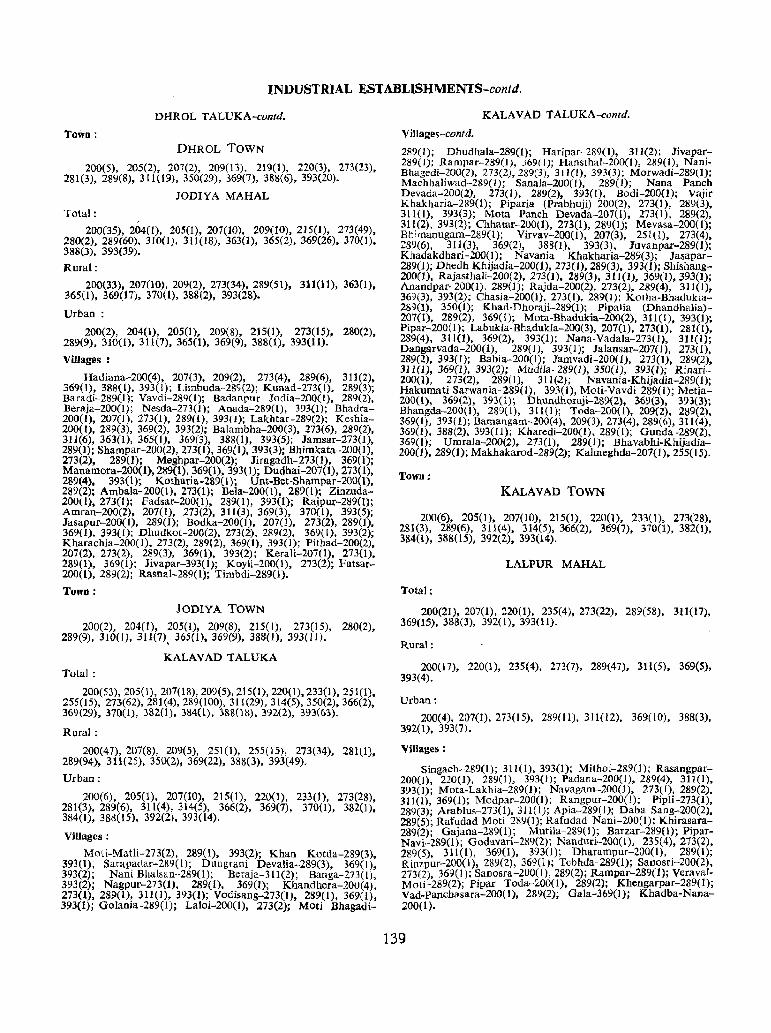
INDUSTRIAL ESTABLISHMENTS-contd.
DHROL TALUKA-contd.
Town: DHROL TOWN
200(5), 205(2), 207(2), 209(13). 219(1), 220(3), 273(23), 281(3), 289(8), 311 (19), 350(29), 369(7), 388(6), 393(20).
JODIYA MAHAL
Total:
200(35), 204(1), 205(1), 207(10). 209(10), 215(1), 273(49), 280(2), 289(60). 3100), 311(18). 363(1), 365(2), 369(26), 370(1), 388(3), 393(39).
Rural:
200(33), 207(10), 209(2), 273(34). 289(51), 311(11), 363(1), 365(1), 369(17), 370(1), 388(2), 393(28).
Urban:
200(2), 204(1), 205(1), 209(8), 215(1), 273(15), 280(2), 289(9), 310(1), 311(7), 365(1), 369(9), 388(1), 393(11).
Villages:
Hadiana-200(4), 207(3), 209(2), 273(4), 289(6), 311(2), 369(1), 388(1), 393(1); Limbuda-28S(2); Kunad-273(1). 289(3); Baradi-289(1); Vavdi-289(1); Badanpur Jodia-200(l), 289(2), Beraja-200(1); Nesda-273(l); Anada-289(1), 393(1); Bhadra-200(1), 207(1), 273(1), 289(1), 393(1); Lakhtar-289(2); Keshia-200(1), 289(3), 369(2), 393(2); Balambha-200(3), 273(6), 289(2), 311(6), 363(1), 365(1), 369(3), 388(1), 393(5}; Jamsar-273(1). 289(1); Shampar-200(2), 273(1), 369lJ). 393(3); Bhimkata-200(l), 273(2), 289(1); Meghpar-200(2); Jiragadh-273(J), 369(1); Manamora-200(1), 289(1),369(1), 393( I); Dudhai-207(l), 273(1), 289(4), 393( 1 ); Kotharia -289(1); Unt-Bet -Shampar -200(1), 289(2); Ambala-200(1), 273(1): Bela-2000). 289(1); Zinzuda-200(1). 273(1); Fadsar-200(1), 289(1), 393(1); Rajpur-289(l); Amran-200(2), 207(1), 273(2). 311(3), 369(3), 370(1), 393(5); Jasapur-200(1), 289(1); Bodka-200(l), 207(1), 273(2), 289(1), 369(1), 393(1}; Dhudkot-200(2), 273(2), 289(2), 369(1), 393(2); Kharachia-200(l), 273(2), 289(2), 369(1), 393(1); Pithad-200(2), 207(2), 273(2), 289(3), 369(1), 393(2); Kerali-207(1), 273(1), 289(1). 369(1); Jivapar-393(1); Koyli-200(l), 273(2); Fatsar-200(1), 289(2); Rasnal-289(J); Timbdi-289(l).
Town; JODIYA TOWN
200(2). 204(1), 205(1), 209(8), 215( I), 273(15), 280(2), 289(9), 310(1). 311(7), 36.5(1), 369(9). 388(1), 393(11).
KALAVAD TALUKA
Total:
200(53), 205(1), 207(18),209(5),215(1),220(1),233(1),251(1), 255(15), 273(62),281(4),289(100).311(29).314(5),350(2),366(2), 369(29), 370(1), 382(1), 384(1), 388(18), 392(2), 393(63).
Rural:
200(47), 207(8), 209(5), 251(1), 255(15), 273(34). 28111), 289(94), 311(25). 350(2), 369(22), 388(3). 393(49).
Urban;
200(6), 205(1), 207(10), 215(1), 220(1), 233(1), 273(28), 281(3), 289(6}, 311(4), 314(5), 366(2), 369(7), 370(1), 382(1). 384(1), 388( 15), 392(2), 393(14).
Villages:
Moti-Matli-273(2), 289(1), 393(2); Khan Kotda-289(3), 393(1); Sarapadar-289(1); Dungrani Devalia-289(3), 369(1), 393(2); Nani Bha]sall-289(l); Beraja-31l(2); Banga-273(l), 393(2); Nagpur-273(I), 289(1), 369(1); Khandhera-l00(4), 273(1),289(1),311(1), 393(1); Vodisang-273(lJ, 289(1), 369(1), 393(1); Golania-289(1); Laloi-200(l), 273(2); Moti Bhagadi-
KALAVAD TALUKA-c<Jntd.
Villages-contd.
289(1); Dhudhala-289(1); Haripar-289(J), 31 J(2); Jivapar-289(1); Rampar-289(l), 369(1); Hansthal-200(l), 289(1), Nanj· Bhagedi-200(2), 273(2),289(3), 311(1), 393(3); Morwadi-289(1); Machhaliwad-289(1); Sanala-200(1), 289(1); Nana Panch Devada-200(2), 273(1), 289(2), 393(1), Bodi-200(1); Vajir Khakharja-289(l); Piparia (Prabhuji)-200(2), 273(1), 289(3), 311(1), 393(3); Mota Panch Devada-207(l), 273(1), 289(2), 311(2), 393(2); Chhatar-200(1), 273(1), 289(1); Mevasa-200(l); Bhimanugam-289(1); Virvav-200(l), 207(3), 2510), 273(4), 289(6), 311(3), 369(2), 3SS(1), 393(3), Juvanpar-289(l); Khadakdhari-200(l); Navania Khakharia-289(3); Jasapar-289(1); Dhedh Khijadia-200(1). 273(1),289(3), 393(1); Shishang-200(1), Rajasthali-200(2), 273(1), 289(3), 311(1), 369(1),393(1); Anandpar-200(1). 289(1); Rajda-200(2), 273(2), 289(4), 311(1). 369(3), 393(2); Chasia-200(l). 273(1). 289(1); Kotha-Bhadukia-289(1). 350(1); Khad-Dhoraji-289(l); Pipalia (Dhandhalia)-207(1), 289(2). 369(1); Mota-Bhadukia-200(2), 311(1), 393(1); Pipar-200(I); Labukia-Bhadukia-200(3), 207(1), 273(1), 281(1), 289(4), 311(1), 369(2), 393(1); Nana-Vadala-273(l), 311(1); Dangarvada-200(J), 289(1), 393(1); Jalansar-207(l), 273(1), 289(2), 393(1); Babia-200(l); Jamvadi-200(I), 273(1). 289(2), 311(1), 369(1), 393(2); Mudila-289(1), 350(1). 393(1); Rinari-200(1), 273(2), 289(1), 311(.2); Navania-Khijadia-289(1); Hakumati Sarwania-289(l). 393(1), Moti-Vavdi 289(1); Metia-200(1), 369(2), 393(1); Dhundhoraji-2S9(2), 369(3). 393(3); Bhangda-200(l), 289(1), 311(l); Toda-200(l), 209(2). 289(2), 369(1), 393(1); Bamangam-200(4), 209(3),273(4),289(6), 311(4), 369(1), 388(2), 393(1l); Kharedi-200(1), 289(1); Gunda-289(2), 369(1); Umrala-200(2), 273(1), 289(1); Bhavabhi-Khijadia-2000),289(1); Makhakarod-289(2); Kalmeghda-207(1),255(15).
Town; KALAVAD TOWN
200(6), 205(1), 207(10). 215(1), 220(1), 233(1), 273(28), 281(3), 289(6), 311(4), 314(5), 366(2), 369(7), 370(1), 382(1), 384(1), 388(15), 392(2), 393(14).
LALPUR MAHAL
Total:
200(21), 207(1), 220(1), 235(4), 273(22), 289(58), 311(17), 369(15), 388(3), 392(1), 393(11).
Rural:
200(17), 220(1), 235(4), 273(7}, 289(47), 311(5), 369(5), 393(4).
Urban:
200(4), 207(0, 273(15), 289(11), 311(12), 369(10), 388(3), 392(1), 393(7).
Villages:
Singach-289(J); 311(1),393(1); Mithoi-289(1); Rasangpar-200(1), 220(1), 289(1), 393(1); Padana-200(l), 289(4). 311 (l), 393(1)' Mota-Lakhia-289(l); Navagam-200(1), 2730), 289(2), 311(1): 369(1); Modpar-200(l); R!lngpur-200(t); Pipli-273(1), 289(3); Arablus-273{l), 311(1); ApJa-289(1);. Daba Sang:-200(2), 289(5); Rafudad Moti-289(l); ~afudad Nalll-200(I); Khlras.ara-289(2)' Gajana-289(l); Munla-289(l); Barzar-289(l); PlparNavi-2S9(l); Godavari-289(2); Nanduri-200(1). 235(4), 273(2), 289(5), 311(1), 369(1), 393(1); Dharampur-200(1),. 289(1); Rinz:pur-200(1), 289(2), 369(1); Tcbhda·289(l); Sanosn-200(2), 273(2), 369(1); Sanosra-200(l), 289(2); Rampar-289(1); VeravalMoti-289(2); Pipar Toda-~OO(l), 289(2); Khengarpar-289(J); Vad-Panchasara-200(I), 289(2); Gala-369(1); Khadba-Nana-200(1).
139
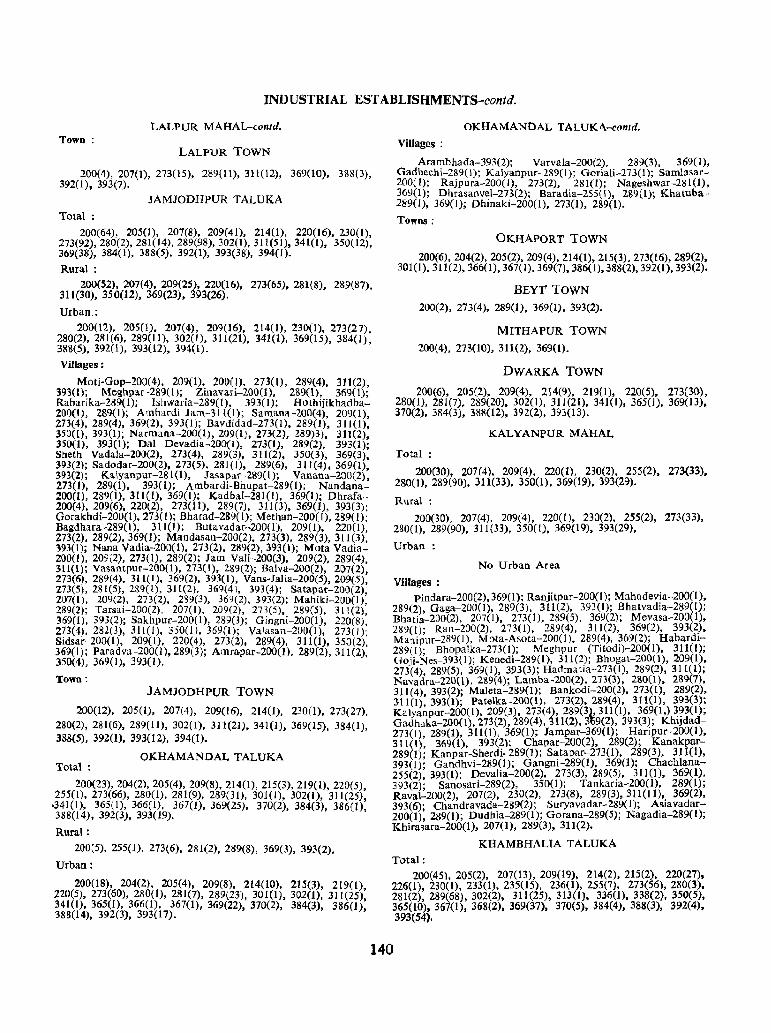
IND USTRIAL EST ABLISHMENTS-contd.
LALPUR MAHAL-contd. Town:
LALPUR TOWN
200(4), 207(1), 273(15). 289(11), 311(12), 369(10), 388(3), 392(1), 393(7).
JAMJODHPUR TALUKA
Total: 200(64), 205(1), 207(8), 209(41), 214(1). 220(16), 230(1),
273(92),280(2),281(14),289(98),302(1),311(51), 341(1), 350(12), 369(38), 384(1), 388(5), 392(1), 393(38), 394(1).
Rural: 200(52), 207(4), 209(25), 220(16), 273(65). 281(8), 289(87),
311(30), 350(12), 369(23), 393(26).
Urban.:
200(12), 205(1), 207(4), 209(16), 214(1), 230(1), 273(27), 280(2),281(6).289(11).302(1), 311(21), 341(1),369(15), 384(1), 388(5), 392(1), 393(12), 394(1).
Villages:
Moti-Gop-200(4). 209(1), 200(1), 273(1), 289(4). 311(2), 393(1); Meghpar-289(l); Zinavari-200(l), 289(1), 369(1); Rabarika-289(1); Ishwaria-289(1), 393(1); Hothijikhadba-201)(t), 289(1); Ambardi Jam-311(l); Samana-200(4), 209(1), 273(4).289(4), 369(2), 393(1); Bavdidad-273(l), 289(1), 311(1), 350(1), 393(1); Narmana-200(1), 209(1), 273(2), 289)3), 311(2) 350(1), 393(1); Dal Devadia-200(l), 273(1), 289(2), 393(1); Sheth. Vadala-20()(1), 273(4), 289(3), 311(2), 350(3), 369(3), 393(2); Sadodar-200(2), 273(5), 281(1), 289(6), 311(4), 369(1), 393(2); Ka\yanpur-28l(I), Jasapar-289(1); Vanana-200(2) 273(1), 289(1), 393(1); Ambardi-Bhupat-289(l); Nandana~ 2()0(1), 289(1). 311(1), 369(1); KadbaI-281(1), 369(1); Dhrafa-200(4), 209(6), 220(2), 273(11). 289(7), 311(3), 369(1), 393(3)' Gorakhdi-200(l), 273(1); Bharad-289(1); Methan-200(l), 289(1); Bagdhara-289(1), 311(1); Butavadar-200(l), 209(1), 220(1), 273(2). 289(2).369(1); Mandasan-200(2). 273(3), 289(3),31l(3) 393(1); Nana Vadia-200(1), 273(2), 289(2),393(1); Mota Vadia': 200(1), 209(2), 273(1). 289(2); Jam VaIi-200(3), 209(2), 289(4). 311(1); Vasantpur-200(1), 273(1), 289(2); Balva-200(2), 207(2), 273(6), 289(4), 311(1), 369(2), 393(1), Vans-Jalia-200(5), 209(5), 273(5), 281(5), 289(1), 31l(2), 369(41, 393(4); Satapar-200(2) 207(1), 209(2), 273(2), 2~9(3), 369(2), 393(2); Mahiki-200(I;' 289(2); Tarsai-200(2), 207(1), 209(2), 273(5), 289(5), 311(2)' 369(1), 393(2); Sakhpur-200(l), 289(3); Gingni-200(l), 220(8)' 273(4), 282(3), 3ll(I). 350(1),369(1); Valasan-200(1), 273(1): Sidsar-200(1), 209(1). 220(4). 273(2), 289(4), 311(1). 350(2): 369( I); Parad va-2000), 289(3); Amra.;Jar-200(I), 289(2), 311(2) 350(4), 369(1), 393(1), ,
Town: JAMJODHPUR TOWN
200(12), 205(1), 207(4), 209(16), 214(1), 230(1), 273(27), 280(2),281(6),289(11),302(1), 311(21),341(1),369(15), 384(1), 388(5), 392(1), 393(12), 394(1).
OKHAMANDAL TALUKA Total:
200(23),204(2),205(4),209(8),214(1),215(3), 219(1), 220(5), 255(1), 273(66), 280(1), 281(9). 289(31), 301(1), 302(1), 311(25)
.341(1), 365(1), 366(1), 367(J), 369(25), 370(2), 384(3), 386(1)' 388(14), 392(3), 393(J9). '
Rural: 2(}0(5), 255(1). 273(6), 281(2), 289(8), 369(3), 393(2),
Urban:
200(18), 204(2), 205(4), 209(8), 214(10), 215(3), 219(1) 220(5), 273(60), 280(1), 281(7), 289(23), 301(1). 302(1), 311(25)' 341(1). 365(1), 366(1). 367(1), 369(22), 370(2), 384(3). 386(1/ 388(14). 392(3), 393(17). '
OKHAMANDAL TALUKA-contd.
Villages:
Arambhada-393(2); Varvala-200(2), 289(3), 369(1), Gadhechi-289(1); Kalyanpur-289(1); Goriali-273(1); Samlasar-200( 1); Rajpura-200(l), 273(2), 281(1); Nageshwar-281(l), 369(1); Dhrasanvel-273(2); Baradia-255(1), 289(1); Khatuba 289(1). 369(1); Dhinaki-200(1), 273(1), 289(l}.
Towns:
OKHAPORT TOWN
200(6),204(2),205(2),209(4),214(1),215(3). 273(16), 289(2), 301(1),311(2),366(1),367(1),369(7),386(1), 388(2),392(1),393(2).
BEYI' TOWN
200(2), 273(4), 289(1). 369(1), 393(2).
MITHAPUR TOWN
200(4), 273(10), 311(2), 369(1).
DWARKA TOWN
200(6), 205(2), 209(4), 214(9), 219(1), 220(5), 273(30), 280(1), 281(7), 289(20), 302(1). 311(21). 341(1), 365(1). 369(13), 370(2). 384(3), 388(12). 392(2), 393(13).
KALYANPUR MAHAL
Total:
200(30), 207(4), 209(4), 220(1), 230(2), 255(2), 273(33). 280(1), 289(90), 311(33), 350(1), 369(19), 393(29).
Rural:
200(30), 207(4), 209(4). 220(1), 230(2), 255(2), 273(33), 2800), 289(90), 311(33), 350(1), 369(19), 393(29),
Urban;
No Urban Area
Villages: pindara-200(2),369(1); Ranjitpar-200(l); Mahadevia-200(l),
289(2), Gaga-200(l). 289(3), 311(2), 393(1); Bhatvadia-289(1); Bhatia-200(2), 207(1), 273(1), 289(5), 369(2); Mevasa-200(l), 289(1); Ran-200(2), 273(1). 289(4), 311(2), 369(2), 393(2). Manipur-289(l), Mota-Asota-200(1), 289(4), 369(2); Habardl-289(1)' Bhopalka-273(l); Meghpur (Titodi)-200(l), 311(1); Goji-Nes-393(l); Kenedi-289(1), 311(2); Bhogat-200(1), 209(1), 273(4).289(5). 369(1), 393(3); Hactmatia-273(J), 289(2), 311(1); Navadra-22G(l). 289(4); Lamba-2G0(2), 273(3), 280(1), 289(7). 311(4), 393(2); Maleta-289(l); Bankodi-200(2), 273(1), 289(2), 311(1),393(1); Patelka-200(l), 273(2), 289(4), 311(1), 393(3); Kalyanpur-200(l). 209(3), 273(4), 289(3),311(1). 369(1,) 393(1); Gadhaka-200(1), 273(2}, 289(4),311(2). 3li9(2), 393(3); Khijdad-273(1), 289(1), 311(1), 369(1); Jampar-369(1); Haripur-200(1), 311(1), 369(1), 393(2): Cl1apar-200(2), 289(2); Kanakpar-289(1)' Kanpar-Sherdi-289(1); Satapar-273(l). 289(3), 311(1), 393(1): Gandhvi-289(1); Gangni-289(l). 369(1); Chachlana-255(2)' 393(1); Devalia-200(2), 273(3). 289(5), 311(0, 369(1), 393(2); Sanosari-289(2), 350(1); Tankaria-200(l). 289(1); Raval-200(2), 207(2), 230(2), 273(8), 289(3),311(11), 369(2), 393(6)' Chandravada-289(2); Suryavadar-289(1); Asiavadar-200(1): 289(1); Dudhia-289(1); Gorana-289(5); Nagadia-289(1); Khirasara-200(1), 207(1), 289(3), 311(2).
KHAMBHALIA TALUKA
Total: 200(45), 205(2), 207(13), 209(19), 214(2), 215(2), 220(27),
226(1), 230(1), 233(1), 235(15), 236(1), 255(7), 273(56), 280(3). 281(2), 289(68), 302(2), 311(25), 313(1), 336(1), 338(2), 350(5), 365(10), 367(1), 368(2), 369(37), 370(5), 384(4), 388(3). 392(4), 393(54).
140
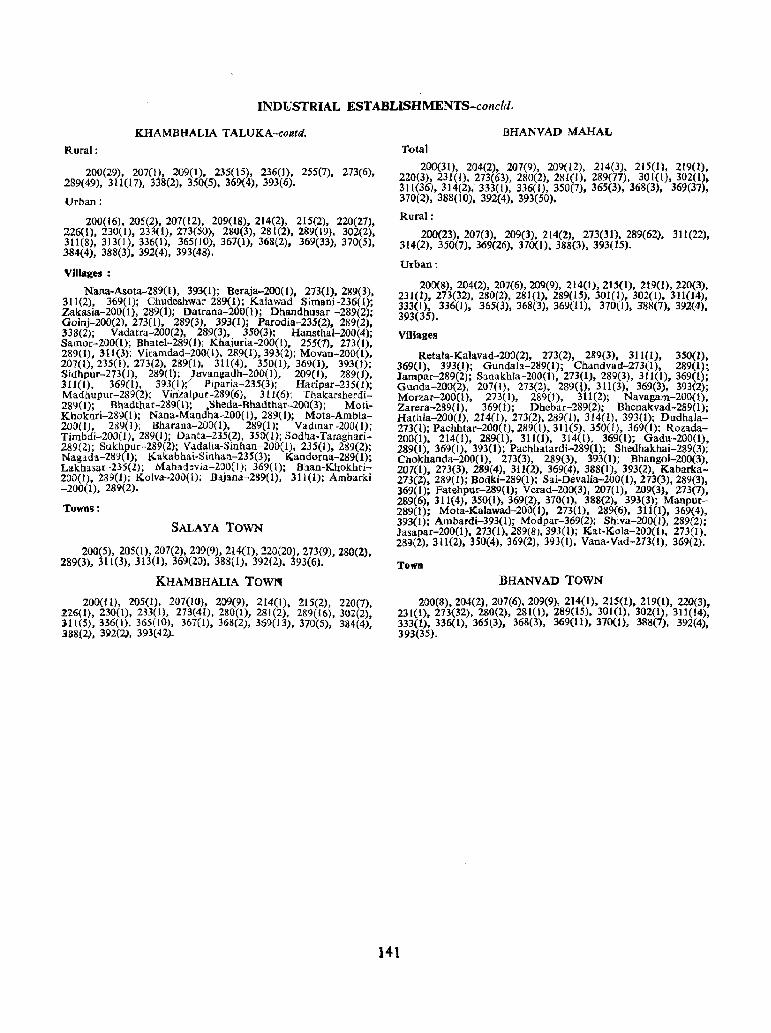
INDUSTRIAL ESTABLISHMENTS-cone/d.
KHAMBHALIA TALUKA--contti.
Rural:
200(29), 207(1), 209(1), 235(15), 236(1), 255(7). 273(6), 289( 49), 311(17), 338(2), 350(5), 369(4), 393(6).
Urban:
200(16), 205(2), 207(12), 209(18), 214(2), 215(2), 220(27), 226(1), 230(1), 233(1), 273(50), 280(3), 281(2), 289(19), 302(2), 311(8), 313(1), 336(1), 365( 10), 367(1), 368(2), 369(33), 370(5), 384(4), 388(3), 392(4), 393(48).
Villages:
Nana-Aoota-289(1), 393(1); Beraja-200(l), 273(1), 289(3), 311(2), 369(1); Chudeshwar 289(1); Kalawad Simani-236(1); Zakasia-200(l). 289(1); Datrana-200(1); Dhandhusar -289(2); Goinj-200(2), 273(1), 289(3), 393(1); Parodia-23S(2). 289(2), 338(2); Vadatra-200(2), 289(3), 350(3); Hansth.al-200(4); Samor-200(l); Bhatel-289(I); Kh.ajuria-200(1), 255(7), 273(1), 289(1), 311(3); Viramdad-200(1), 289(1),393(2); Movan-200(1), 207(1),235(1), 273(2), 239(1), 311(4), 350(1), 369(1), 393(l}; Sidhpur-273(1), 289(1); JtlVangadh-200(l), 209(1), 289(1), 311(1), 369(1), 393(1}( Piparia-235(3); Haripar-235(J); Madllupur-289(2); Virtzalpur-289(6), 311(6); Thakarsherdi-289(1); Bhadthar-289( I); .Sheda-Bhadthar-200(3); MoliKhokhri-289(1); Nana·Mandha-200(1), 289(1); Mota-Ambla-200{l), 289(1); Bharana-200(1), 289(1); Vadinar-200(1); Timbdi-200(IJ, 289(1); Danta-235(2), 350(1); Sodba-Taraghari-289(2); Sukilpur-289(2); V J.dalia-Sinhan-IOO(l), 235(1), 289(2); Nagada-289( I); K.akabhai-Sinh.an-235(3); Kaodorna-289(1); Lilkilasar-235(1); Manad~Yia-2(}()(I); 369(1); Bhan-Khokhri-200(1), 289(1); Ko1va-200(1); Bctjana-239(1), 311(1); Ambarki -200(1), 289(2).
Towns:
SALAYA TOWN
200(5), 205(1),207(2), 2()9(9). 214(1),220(20), 273{9), 280(2). 289(3), 31l(3}, 313(I}, 369(20), 388(1), 392(Z}. 393(6).
KHAMBHALIA Tow~
200(11), 205(1). 207(10), 209(9), 214(1), 215(2), 220(7), 1.26(1), 230(1), 233(1), 273(41), 280(1), 281(2), 289(16), 302(2), Jll(S}, 336(1), 365(10), 367(1), 368(2), 369(13), 370(5), 384(4), 3.88(2), 392(2), 393(42)..
BHANVAD MAHAL
Total
200(31), 204(2), 207(9), 209(12), 214(3), 2t5(1), 219(1). 220(3).231(1), 273(63),280(2),281(1), 289(77), 301(1),302(1), 311(36}, 314(2), 333(1). 336(1), 350(7), 365(3), 368(3), 369(37), 370(2), 388(10), 392(4), 393(50).
Rural:
200(23), 207(3), 209(3), 2t4(2), 273(31), 289(62). 311(22), 314(2). 350(7), 369(26). 370(1), 388(3), 393(15).
Urban:
200(8), 204(2), 207(6),209(9). 214(1),215(1), 2t9(l), 220(3), 231(J), 273(32), 28()(2), 281(1), 289(15), 301(1), 302(1). 311(14), 333(1), 336(1), 365(3), 368(3), 369(11), 370(1), 388(7). 392(4), 393(35).
Villages
Retala-Kalavad-200(2), 273(2), 289(3), 311(1), 350(1), 369{I}, 393(1); Gundalil-289(I}; Chandvad-273(1), 289(1); Jampar-289(2); Sanakhla-200(l), 273(1). 289(3). 311(1), 369(1); Gunda-200(2), 207(1), 273(2), 289m. 311(3). 369(3), 393(2}; Morzar-200(l), 273(1), 289(1). 311(2); Navagam-200(l), Zarera-289(1), 369( I); Dhebar-289(2); Bhenakvad-289(1); Hathla-200(l), 214(1). 273(2).289(1), 314(1). 393(1); Dudhala-273(l); Pachhtar-200(1), 289(1), 311(5), 350(1), 369(1); Rozada-200(1), 214(1), 289(1). 311(1), 314(1). 369(1); Gadu-200(I), 289(1), 369(1), 393(1); Pachhatardi-289(1); Shedhakhai-289(3); Chokhanda-200(l), 273(3), 289(3), 393(1); Bhangol-200(3), 207(1), 273(3), 289(4). 311(2). 369(4), 388(1), 393(2), Kabarka-273(2), 289(1); Bodki-289(1); Sai-Devalia-200(J), 273(3), 289(3), 369(1); Fatehpur-289(1); Verad-200(3), 207(1). 209(3). 273(7). 289(6), 311(4), 350(1), 369(2), 370(1), 388(2), 393(3); Manpur-289(1); Mota-Kalawad-200(1), 273(1), 289(6), 311(1), 369(4), 393(1); Ambardi-393(1); Modpar-369(2); Sl:tiva-200(I), 289(2); Jasapar-200(1). 273(1).289(8),393(1); Kat-Kola-20()(I), 273(1), 289(2), 3H(2), 350(4), 369(2). 393(1), Vana-Vad-273(1), 369(2).
Town BHANVAD TOWN
200(8),204(2), 207(6).209(9), 214(1), 215(1), 219(1), 220(3), 231(1), 273(32). 280(2), 281(1), 289(15), 301(1), 302(1), 311(14), 333(1), 336(1), 365(3), 368(3), 369(11), 370(1), 388(7), 392(4), 393(35).
141
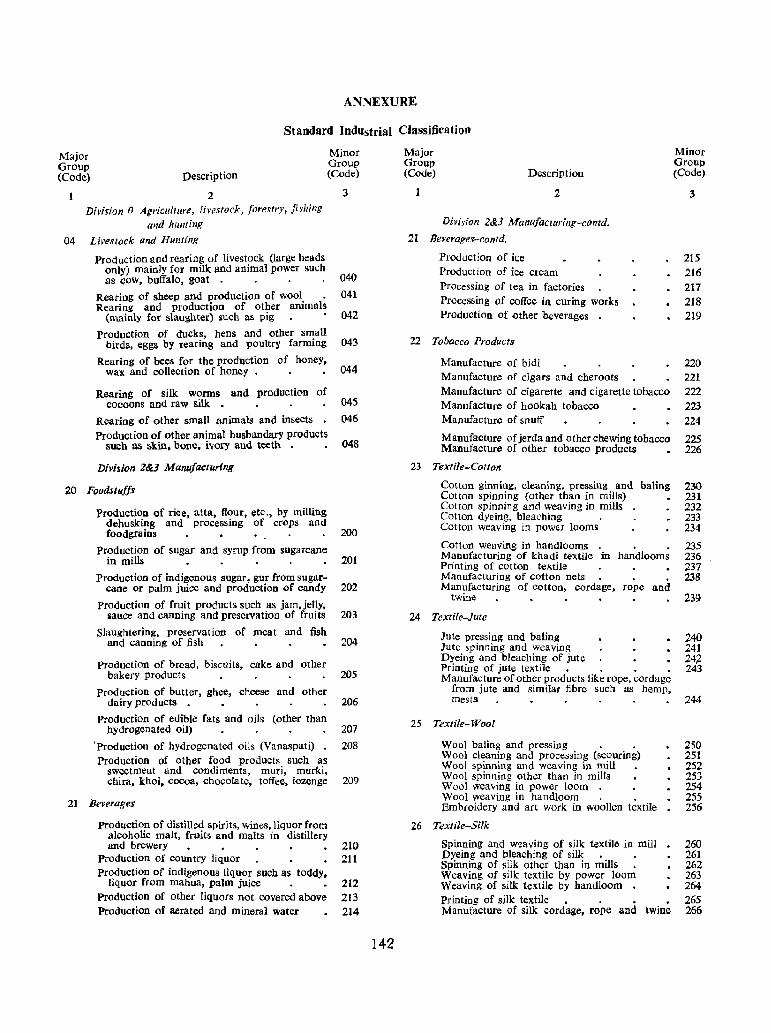
ANNEXURE
Standard Industrial Classification
Major Group (Code) Description
2
Minor Group (Code)
3
Division 0 Agriculture, livestock, forestry, fishing and hUllting
04 Livestock and Hunting
Production aod rearing of livestock (large heads only) mainly for milk and animal power such as cow, buffalo, goat. . . . 040
Rearing of sbeep and production of wool • 041 Rearing and production of other animals
(mainly for slaughter) such as pig 042
Production of ducks, hens and other small birds, eggs by rearing and poultry farming 043
Rearing of bees for the production of honey, wax and collection of honey 044
Rearing of silk worms and production of cocoons and raw silk • 045
Rearing of other small animais and insects 046 Production of other animal husbandary products
such as akin, bone, ivory and teeth 048
Division 2&3 Manufacturing
20 Foodstufff>
Production of rice, atta, fiour, etc., by milling dehusking and processing of crops and foodgrains 200
Production of sugar and syrup from sugarcane in mills . . • . •
Production of indig~nous sugar, gur from sugarcane or palm juice and production of candy
PrOduction of fruit products such as jam, jelly, Ilauce and canning and preservation of fruits
Slaughtering, preservation of meat and fish
20]
202
203
and canning of fish 204
Production of bread, biscuits, cake and other bakery products 205
Production of butter, ghce, cheese and other dairy products 206
Production of edible fats and oils (other than hydrogenated oil) 207
'Production of hydrogenated oils (Vanaspati). 208 Production of other food products such as
sweetmeat and condiments, muri, murki, cbira, khoi. cocoa, chocolate, toffee, lozenge 209
21 Beveragef>
Production of distilled spirits, wines, liquor from alcoholic malt, fruits and malts in distillery and brewery 210
Production of country liquor 211 Production of indigenous liquor such as toddy,
liquor from mahua, palm juice . • 212 Production of other liquors not covered above 213 Production of aerated and mineral water 214
142
Major Group (Code)
1
Description
2
Division 2&3 Manufacturing-contd.
Minor Group (Code)
3
21 Beverages-contd.
Production of ice Production of ice cream Processing of tea in factories Processing of coffee in curing works Production of other beverages
22 Tobacco Products
215 216 217
218 219
Manufacture of bidi 220 Manufacture of cigars and cheroots 221 Manufacture of cigarette and cigarette tobacco 222 Manufacture of hookah tobacco 223 Manufacture of snuff 224
Manufacture of jerda and other chewing tobacco 225 Manufacture of other tobacco products • 226
23 Textile-Cotton
Cotton ginning, cleaning, pressing and baling 230 Cotton spinning (other than in mills) • 231 Cotton spinning and weaving in mills 232 Cotton dyeing, bleaching. 233 Colton weaving in power looms 234
Cotton weaving in handlooms Manufacturing of khadi textile in Printing of cotton textile Manufacturing of cotton nets Manufacturing of cotton, cordage,
twine
24 Textife-Jute
. . handlooms
rope and
235 236 237 238
239
Jute pressing and baling 240 Jute spinning and weaving 241 Dyeing and bleaching of jute 24.2 Printing of jute textile. . . • 243 Manufacture of other products like rope, cordage
from jute and similar fibre such as hemp, mesta 244
25 Textile-Wool
Wool baling and pressing .. 250 Wool cleaning and processing (scouring) 251 Wool spinning and weaving in mill. 252 Wool spinning other than in mills 253 Wool weaving in power loom 254 Wool weaving in handloom.. 255 Embroidery and art work in woollen textile 256
26 Textile-Silk
Spinning and weaving of silk textile in mill • 260 Dyeing and bleaching of silk • 261 Spinning of silk other than in mills 262 Weaving of silk textile by power loom 263 Weaving of silk textile by handloom • 264 Printing of silk textile. .• 265 Manufacture of silk cordage, rope and twine 266
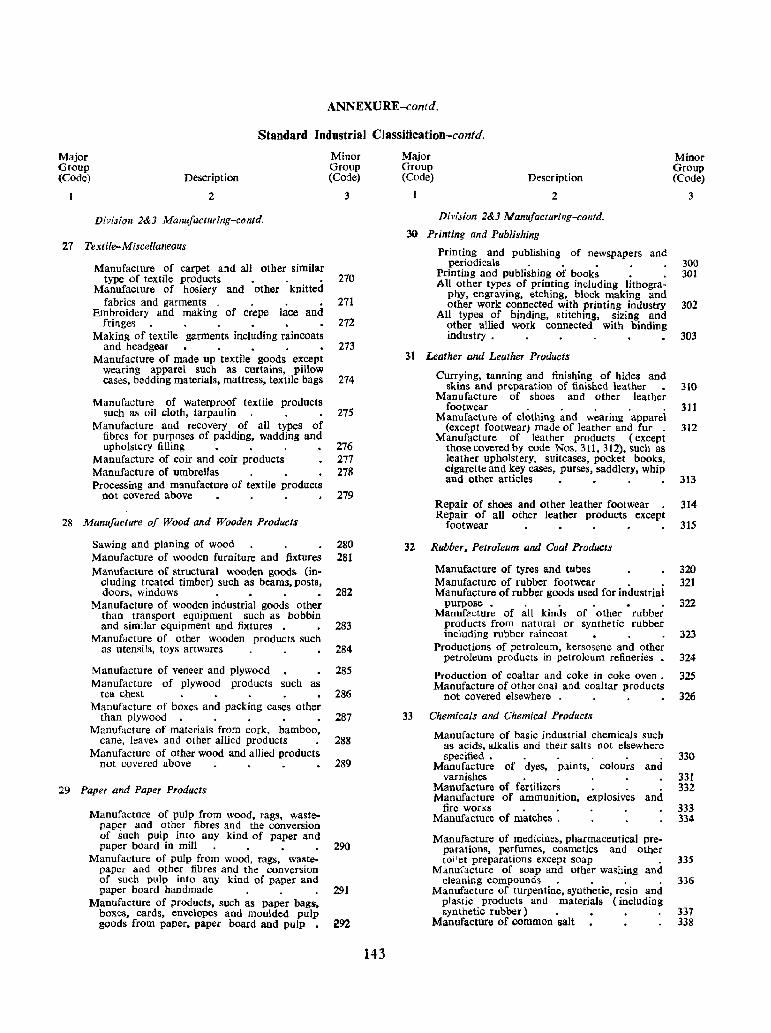
ANNEXURE-contd.
Standard Industrial Classification-contd.
Major Group (Code) Description
2
Division 2&3 Manufacturing-contd.
Minor Group (Coje)
3
27 Textile-Miscellaneous
Manufacture of carpet and all other similar type of textile products 270
Manufacture of hosiery and ·other ·knitted fabrics and garments 271
Embroidery and making of crepe lace and fringes 272
Making of textile garments including raincoats and headgear 273
Manufacture of made up textile goods except wearing apparel such as curtains, pillow cases, bedding materials, mattress, textile bags 274
Manufacture of waterproof textile products such as oil cloth, tarpaulin 275
Manufacture and recovery of all types of fibres for purposes of padding, wadding and upholstery filling 276
Manufacture of coir and coir products 277 Manufacture of umbrellas 278 Processing and manufacture of textile products
not covered above 279
28 Manufacture of Wood and Wooden Product:s
Sawing and planing of wood 280 Manufacture of wooden furniture and fixtures 281 Manufacture of structural wooden goods (in-
cluding treated timber) such as beams, posts, doors, windows 282
Manufacture of wooden industrial goods other than transport equipment such as bobbin and similar equipment and fixtures • 283
Manufacture of other wooden products such as utensils, toys artwares 284
Manufacture of veneer and plywood 285 Manufacture of plywood products such as
tea chest 286 Manufacture of boxes and packing cases other
than plywood 287 Manufacture of materials from cork, bamboo,
cane, leave~ and other allied products 288 Manufacture of other wood and allied products
not covered above 289
29 Paper and Paper Products
Manufacture of pulp from WOOd, rags, wastepaper and other fibres and the conversion of such pulp into any kind of paper and paper board in mill. • • • 290
Manufacture of pulp from wood, rags, waste· paper and other fibres and the conversion of such pulp into any kind of paper and paper board handmade 291
Manufacture of products, such as paper bags, boxes, cards, envelopes and moulded pulp goods from paper, paper board and pulp • 292
143
Major Group (Code) Description
2
Division 2&3 Manufacturing-contd.
30 Printing and Publishing
Minor Group (Code)
3
Printing and publishing of newspapers and periodicals _ 300
Printing and publishing of books • . 301 All other types of printing including lithogra-
phy, engraving, etching, block making and other work connected with printing industry 302
All types of binding, stitching, sizing and other allied work connected with binding industry . 303
31 Leather and Leather Products
Currying, tanning and finishing of hides and skins and preparation of fini&hed leather 310
Manufacture of shoes and other leather footwear .,. 311
Manufacture of clothing and wearing apparel (except footwear) made of leatber and fur 312
Manufacture of leather products ( except thosecoveredby code Nos. 311, 312), such as leather upholstery, suitcases, pocket books, cigarette and key cases, purses, saddlery. whip and other articles 313
Repair of shoes and other leather footwear 314 Repair of all other leather products except
footwear 315
32 Rubber, Petroleum and Coal Products
Manufacture of tyres and tubes 320 Manufacture of rubber footwear . . 321 Manufacture of rubber goods used for industrial
purpose • • 322 Manuf~cture of all kinds of other rubber
products from natural or synthetic rubber including rubber raincoat 323
Productions of petroleum, kersosene and other petroleum products in petroleum refineries. 324
Production of coal tar and coke in coke oven. 325 Manufacture of other coal and coaltar products
not covered elsewhere 326
33 Chemicals and Chemical Products
Manufacture of basic industrial chemicals such as acids, alkalis and their salts not elsewhere specified • 330
Manufacture of dyes, paints, colours and varnishes 331
Manufacture of fertilizers 332 Manufacture of ammunition, explosives and
fire works • . 333 Manufacture of matches . 334
Manufacture of medicines, pharmaceutical preparations, perfumes, cosmetics and other toilet preparations except soap 335
M anu·;acture of soap and other washing and cleaning compounds. . . . 336
Manufacture of turpentine, synthetic, resin and plastic products and materials (including synthetic rubber) • 337
Manufacture of common salt 338
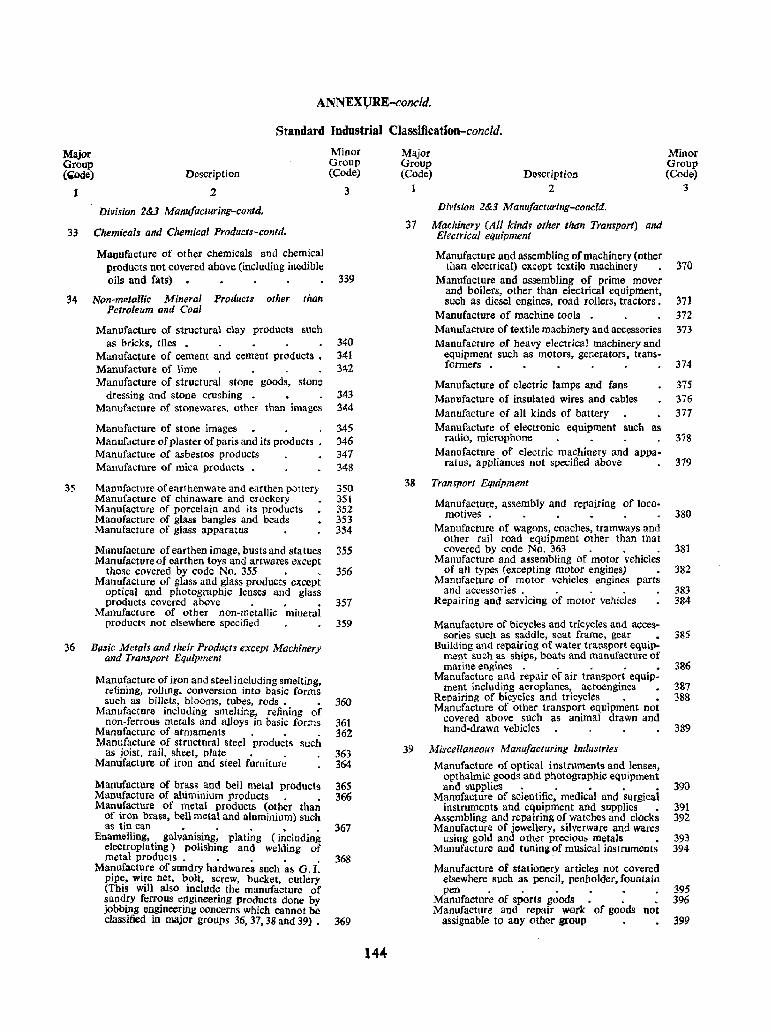
ANNEX'VRE-condd.
Standard Industrial Classification-concld.
Major Group (~de) Description
2
Division 2&:3 Manu/acturing-contd.
Minor Group (Code)
3
33 Chemicals and Chemical Products-contd.
Manufacture of other chemicals and chemical products not covered above (including inedible oils and fatS') 339
34 Non-metaUic Minerlll Products other than Petroleum and Coal
Manufacture of structural clay products such as bricks, tiles _ 340
Manufacture of cement and cement products. 341 Manufacture of lime 342 Manufacture of structural stone goods, ston:;)
dressing and stone crushing • 343 Manufacture of stonewares. other than images 344
Manufacture of stone images 345 Manufacture oCplaster of paris and its products. 346 Manufacture of asbestos products 347 Manufacture of mica products • 348
35 Manufacture of earthenware and earthen pottery 350 Manufacture of china ware and crockery 351 Manufacture of porcelain and its products 352 Manufacture of glass bangles and beads 353 Manufacture of glass apparatus 354
Manufacture of earthen image, busts and statues 355 Manufacture of earthen toys and artwares except
those covered by code No. 355 • • 356 Manufacture of glass and glass products except
optical and photographic lenses and glass products covered above. 357
Manufacture of other non-metallic mineral products not elsewhere specified 359
36 Basic Metals and their Products except Machinery and Transport Equipment
Manufacture of iron and steel including smelting, refining, rolling, conversion into basic forms such as billets, blooms, tubes, rods . • 360
Manufacture including smelting, refining of non-ferrous metals and alloys in basic forms 361
Manufacture of armaments .• 362 Manufacture of structural steel products such
as joist. rail, sheet, plate '. 363 Manufacture of iron and steel furniture 364
Manufacture of brass and bell metal products 365 Manufacture of aluminium products. . 366 Manufacture of metal products (other than
of iron brass, bell metal and aluminium) such as tin can • . • • . 367
Enamelling, galvanising, plating (including electroplating) polishing and welding of metal products. • . . . 368
Manufacture of sundry hard wares such as G. I. pipe, wire net, bolt, SCrew, bucket, cutlery (This will also inclUde the manufacture of ~und!y ferr,?us e~gineering products done by Jobbmg engmcenng concerns which cannot be classified in major groups 36, 37, 38 and 39). 369
144
Major Group (Code)
1 Description
2
Diviswn 2&3 MalUl/acturing-concld.
Minor Group (Code)
3
37 Machinery (All kind~ other than Transport) and Electrical equipment
Manufacture and assembling of machinery (other than electrical) ell.cept textile machinery 370
Manufacture and assembling of prime mover and boilers, other than electrical equipment, Buch as diesel engines, road rollers, tractors. 371
Manufacture of machine tools • :372 Manufacture of textile machinery and accessories 373 Manufacture of heavy electrical machinery and
equipment such as motors, generators, trans-formers 374
Manufacture of electric lamps and fans 375 Manufacture of insulated wires and cables 376
Manufacture of all kinds of battery 377 Manufacture of electronic equipment such as
radio, microphone 378 Manufacture of electric machinery and appa-
ratus, appliances not specified above 379
38 Transport Equipment
Manufacture, assembly and repairing of loco-motiveS . 380
Manufacture of wagons, coaches, tramways and other rail road equipment other than that covered by code No. 363 . • . 381
Manufacture and assembling of motor vehicles of all types (excepting motor engines) • 382
Manufacture of motor vehicles engines parts and accessories .. . 383
Repairing and servicing of motor vehicles 384
Manufacture of bicycles and tricycles and acces-sories sucb as saddle, seat frame, gear • 385
Building and repairing of water transport equip-ment such as ships, boats and manufacture of marine engines. . . . • 386
Manufacture and repair of air transport equip-ment including aeroplanes, aetoengines 387
Repairing of bicycles and tricycles . • 388 Manufacture of other transport equipment not
covered above such as animal drawn and hand-drawn vehicles 389
39 l\{iscellaneouw Manufacturing Industries
Manufacture I)f optical instruments and lenses, opthalmic goods and photographic equipment and supplies. . • . • 390
Manufacture of scientific, medical and surgical instruments and equipment and supplies • 391
Assembling and repairing of watches and clocks 392 Manufacture of jewellery, silverware and wares
using gold and other precious metals • 393 Manufacture and tuning of musical instruments 394
Manufacture of stationery articles not covered elsewbere such as pencil, penholder, fountain pen . • • 395
Manufacture of sports goods 396 Manufacture and repair work of goods not
assignable to any other group 399
LIST OF RuRAL CRAFTS AND NUMBER OF PERSONS EMPLOYED IN PRODUCTION
The handicraft table is a new feature introduced in the District Census Handbook, in 1961' Census.
A detailed handicraft survey has been undertaken as a part of the censal programme. In States like Gujarat where the survey was conducted for selected crafts in seJected centres, and not in each and every village, this handicraft table was to be compiled from the house-lists or the village notes. Accordingly, the information for this table was extracted from the house-lists adopting a 4 digit code for household industries circulated by Registrar General, India. The definition of household industry presented a problem, which was solved by inclUding, on an adhoc basis, household industries having less than 5 workers for this purpose.
The table shows the number of villages/towns in which particUlar crafts are practised and Dumber of persons engaged therein. The data are compiled separately for the rural and urban areas of each taluka/ mahal, for each city or town in the district and consolidated for rural and urban areas of the 9istrict. Where there is only one city/town in a talukajmahal, the data for the urban areas are given for the city/town as they are same for tal uka/mahal ,
145 J-19
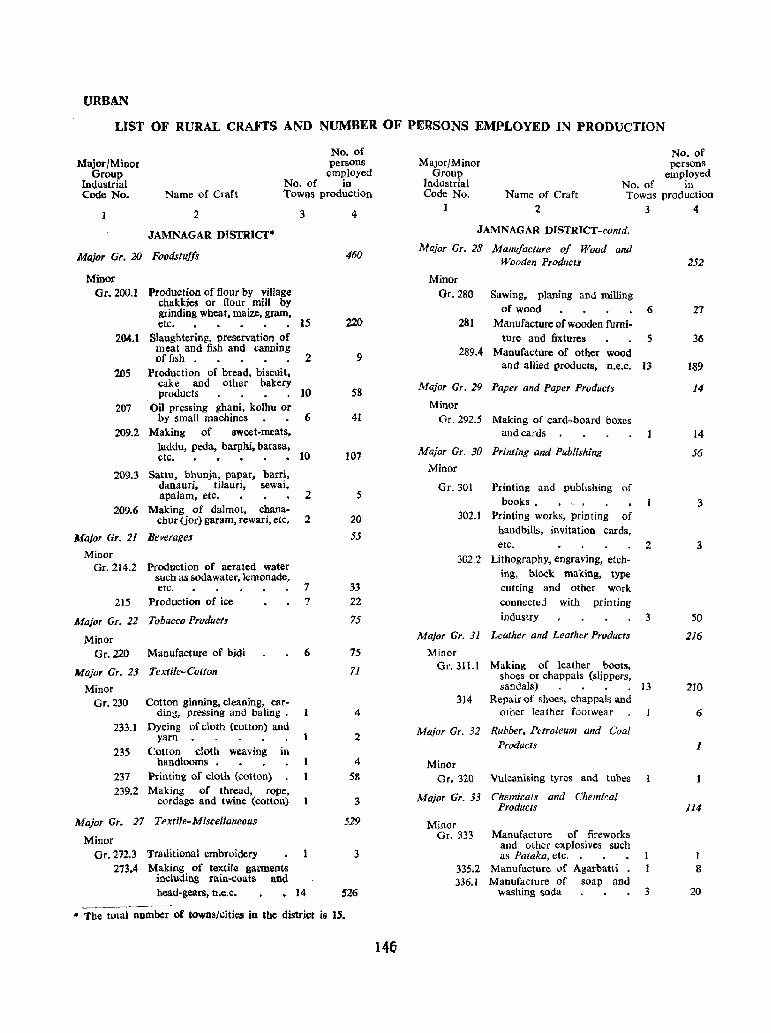
URBAN
LIST OF RURAL CRAFTS AND NUMBER OF PERSONS EMPLOYED IN PRODUCTION
No. of persons
employed Major/Minor
Group Industrial Code No.
No. of in Name of Craft Towns production
2 3 4
JAMNAGAR DISTRICT·
Major Gr. 20 Foodstuffs
Minor Gr. 200.1 Production of flour by village
chakkies or flour mill by grinding wheat, maize, gram, etc. 15
204.1 Slaughtering. preservation of meat and fish and canning of fish 2
205 Production of bread. biscuit, cake and other bakery products 10
207 Oil pressing ghani. kolhu or by small machines 6
209.2 Making of sweet-meats, laddu, peda, barpbi, batasa, etc. • 10
209.3 Sattu, bhunja, papar, barri, danauri, tilauri, sewai, apalam, etc.
209.6 Making of dalmot, chanachur (jor) garam, rewari, etc.
Major Gr. 11 Beverages
Minor Or. 214.2 Production of aerated water
such as soda water, lemonade, etc.
215 Production of ice
Major Gr. 22 Tobacco Product,
Minor Gr. 220 Manufacture of bidi
Major Gr. 23 Textile-Cotton
Minor Gr. 230
233.1
235
Cotton ginning, cleaning, carding, pressing and baling .
Dyeing of cloth (cotton) and yarn
Cotton cloth weaving in handlooms •
237 Printing of cloth (cotton) 239.2 Making of thread, rope,
cordage and twine (cotton)
Major Gr. 27 Textile-Miscellaneous
Minor Gr.272.3 Traditional embroidery
273.4 Making of textile garments including rain-coats and head-gears, n.e.c.
2
2
7
7
6
14
460
220
9
58
41
107
5
20
55
33 22
75
75
71
4
2
4
58
3
529
3
526
,. The total number of towns/cities in the district is IS.
No. of persons
employed Major/Minor
Group Industrial Code No.
No. of in Name of Craft
2
Towns prod uction t 3 4
JAMNAGAR DISTRICT-conld.
Major Gr. 28 Manu/acture 0/ Woad and Wooden Products
Minor Gr. 280 Sawing. planing and milling
of wood 6 281 Manufacture of wooden furni-
ture and fixtUres 5 289.4 Manufacture of other wood
and allied products, n.e.c. 13
Major Gr. 29 Paper and Paper Products
Minor Gr.292.5 Making of card-board boxes
and cards
Major Gr. 30 Printing and Publishing
Minor
Gr. 301 Printing and publishing of books.
302.1 Printing works, printing of handbills, invitation cards, etc.
302,2 Lithography, engraving, etch· ing, block making, type cutting and other work connected with printing industry
Major Gr. 31 Leather and Leather Products
Minor Gr. 311.1 Making of leather boots,
shoes or chappals (slippers. sandals)
314 Repairof shoes, chappals and other leather footwear
Major Gr. 32 Rubber. Petroleum and Coal Products
Minor Gr. 320 Vulcanising tyres and tubes
Major Gr. 33 Chemicals and Chemical Products
Minor Gr. 333
335.2 336.1
Manufacture of fireworks and other explosives such as Pataka, etc.
Manufacture of Agarbatti Manufacture of soap and
washing soda
2
3
13
1 1
3
252
21
36
U!9
14
14
56
3
3
50
216
210
6
1
114
1 8
20
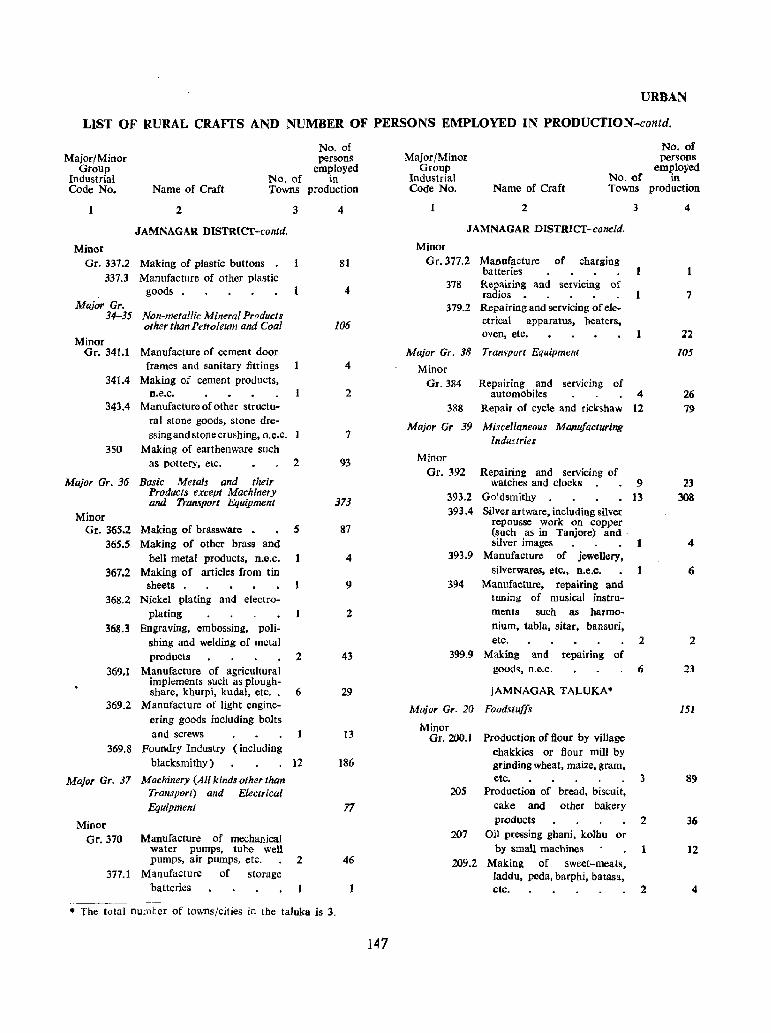
URBAN
LIST OF RURAL CRAFTS AND NUMBER OF PERSONS EMPLOYED IN PRODUCTION-contd.
No. of persons
employed MajorfMinor
Group Industrial Code No.
No. of in Name of Craft Towns production
2
JAMNAGAR DISTRICT-contd.
Minor Gr. 337.2 Making of plastic buttons
337.3 Manufacture of other plastic goods
Major Gr.
Minor
34-35 Non-metallic Mineral Products other than Petroleum and Coal
Gr. 341.1 Manufacture of cement door frames and sanitary fittings
341.4 Making of cement products, n.e.c.
343.4 Manufacture of other structural stone goods, stone dressingand stone crushing, D.e.C.
350 Making of earthenware such as pottery, etc.
Major Gr. 36 Basic Metals and their Products except Machinery and Transport Equipment
Minor Gr. 365.2 Making of brassware •
365.5 Making of other brass and bell metal products, n.e.c.
367.2 Making of articles from tin sheets
368.2 Nickel plating and electroplating
368.3 Engraving, embossing, polishing and welding of metal products
3
2
s
2 369.1 Manufacture of agricultural
implements such as ploughshare, khurpi, kudal, etc.. 6
369.2 Manufacture of light engineering goods including bolts and screws
369.8 Foundry Industry (including blacksmithy) 12
Major Gr. 37 Machinery (All kinds other than Transport) and Electrical Equipment
Minor Gr. 370
377.1
Manufacture of mechanical water pumps, tube well pumps, air pumps, etc.
Manufacture of storage batteries
2
4
81
4
106
4
2
7
93
373
87
4
9
2
43
29
13
186
77
46
• The total numter of towns/cities in the taluka is 3.
147
Major (Minor Group
Industrial Code No. Name of Craft
2
No. of Towns
JAMNAGAR DISTRJCI-conc/d.
Minor Gr.377.2 Manufacture of charging
batteries 378 Repairing and servicing of
radios 379.2 Repairing and servicing of ele
ctrical apparatus, heaters, oven, etc.
Major Gr. 38 Trampart Equipment
Minor Gr. 384 Repairing and servicing of
3
automobiles 4 388 Repair of cycle and rickshaw 12
Major Gr. 39 Miscellaneous Manu/acturing industries
Minor Or. 392 Repairing and servicing of
watches and clocks 393.2 Goldsmithy 393.4 Silver artware, including silver
repousse work on copper (such as in Taojore) and silver images
393.9 Manufacture of jewellery, silverwares, etc., n.e.c.
394 Manufacture, repairing and tuning of musical instruments such as harmonium, tabla, sitar, bansuri, etc.
399.9 Making and repairing' of
9 13
1
2
goods, n.e.c. 6
JAMNAGAR TALUKA*
Major Gr. 20 Foodstuffs
Minor Gr. 200.1 Production of flour by village
chakkies or flour mill by grinding wheat. maize, gram, etc. 3
20S Production of bread, biscuit, cake and other bakery products
207 Oil pressing ghani, kolhu or by small machines
209.2 Making of sweet-meats, laddu, peda, barphi, batasa, etc.
2
2
No. of persons
employed in
production
4
7
22
105
26 79
23 303
4
6
2
23
151
89
36
12
4
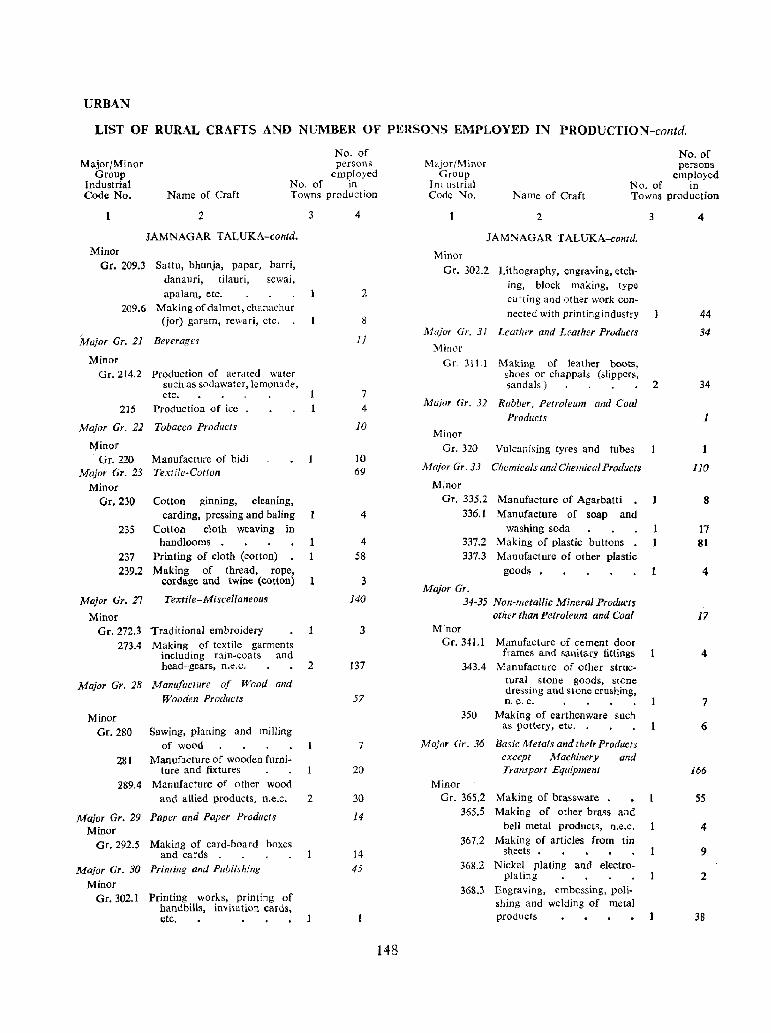
URBAN
LIST OF RURAL CRAFTS AND NUMBER OF PERSONS EMPLOYED IN PRODUCTION-contd.
No. of persons
employed Major/Minor
Group Industrial Code No.
No. of in Name of Craft Towns production
2
JAMNAGAR T ALUKA-cofltd. Minor
Gr. 2Q9.3 Satlu, bhunja, papar, barri, danauri, tilauri, sewai, apalam, etc.
209.6 Making of dalmot, chanachur (jor) garam, rewari, ctc.
Major Gr. 21 Beverages
Minor Gr.214.2 Production of aerated water
such as sodawater, lemonade, etc.
215 Production of ice
Major Gr. 22 Tobacco Products
~inor
Gr. 220 Manufacture of bidi Major Gr. 23 Textile-Cotton
Minor Or. 230 Cotton ginning, cleaning,
carding, pressing and baling 235
237 239.2
Cottoll cloth weaving in handlooms
Printing of cloth (cotton) Making of thread, rope,
cordage and twine (cotton)
Major Gr. 27 Textile- Mi seell aneons
Minor Or. 272.3 Traditional embroidery
273.4 Making of textile garments including rain-coats and head-gears, n.e.C.
Major Gr. 28 Manufacwre of Wood and Wooden Products
Minor Gr. 280 Sawing, planing and milling
of wood 281 Manufacture of wooden furni-
ture and fixtures 289.4 Manufacture of other wood
3
1
2
and allied products. n.e.c. 2
Major Gr. 29 Paper and Paper Prodacts Minor
Gr. 292.5 Making of card-board boxes and cards
Major Gr. 30 Printing and Publishing
Minor Gr. 302.1 Printing works, printing of
handbills, invitation cards, etc.
4
2
8
11
7 4
10
10 69
4
4 58
3
J40
3
137
57
7
20
30
14
14 45
148
MajorfMinor Group
No. of persons
employed I nd ustrial Code No.
No. of in Name of Craft Towns production
2
JAMNAGAR TALUKA-contd.
Minor Gr. 302.2 Lithography, engraving, etch·
ing, block making, type cutting and other work connected with printing industry
Major Gr. 31 Leather and Leather Products
Minor Gr. 3111 Making of leather boots,
shoes or chappals (slippers,
3
sandals) 2
Major Gr. 32 Rubber. Petroleum and Coal Products
Minor
Gr. 320 Vulcanising tyres and tubes
Major Gr. 33 Chemicals and Chemical Products
Minor Gr. 335.2 Manufacture of Agarbatti
336.1 Manufacture of soap and washing soda
337.2 Making of plastic buttons 337.3 Manufacture of other plastic
goods •
Major Gr. 34-35 Non-metallic Minerall'roducts
other than Petroleum and Coal Minor
Gr. 341.1 Manufacture of cement door frames and sanitary fittings
343.4 Manufacture of other structural stone goods, stone dressing and Stone crushing, n.e. c.
350 Making of earthenware such as pOltery, etc.
Major Gr. 36 Basic Metals and their Products except Machinery and Transport Equipment
Minor Gr. 365.2 Making of brassware
365.5 Making of other brass and bell metal products, n.e.c.
367.2 Making of articles from tin sheets
368.2 Nickel plating and electroplating
368.3 Engraving, embossing, polishing and welding of metal products
4
44
34
34
1
110
8
17 81
4
17
4
7
6
166
55
4
9
2
38
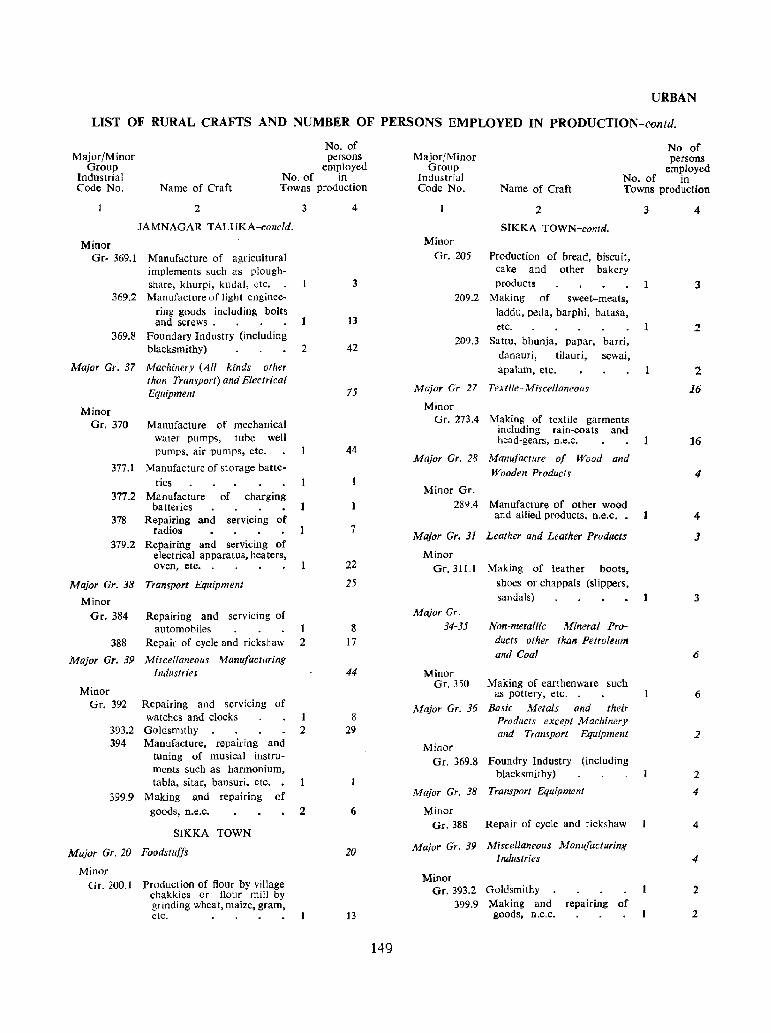
URBAN
LIST OF RURAL CRAFTS AND NUMBER OF PERSONS EMPLOYED IN PRODUCTION-con/d.
No. of persons
employed Major/Minor
Group Industrial Code No.
No. of in Name of Craft Towns production
2
JAMNAGAR TALUKA-concld.
Minor Gr- 369.1 Manufacture of agricultural
implements such as ploughshare, khurpi, kudal, etc.
369.2 Manufacture of light engineering goods including bolts and screws.
369.8 Foundary Industry (including
3
blacksmithy) 2
Major Gr. 37 Machinery (All kinds other than Tran5port) and Electrical Equipment
Minor Gr. 370
377.1
Manufacture of mechanical Water pump~, tube well pumps, air pumps, etc.
Manufacture of storage batle-ries
377.2 . Manufacture of charging batteries
378 Repairing and servicing of radios
379.2 Repairing and servIcIng of electrical apparatus, heaters, oven, etc. 1
Major Gr. 38 Tramport Equipment
Minor Gr. 384 Repairing and servicing of
automobiles 1 388 Repair of cycle and rickshaw 2
Major Gr. 39 Miscellaneous Manufacturing lndustries
Minor Gr. 392
393.2 394
399.9
Repairing and servicing of watches and clocks Goldsmithy Manufacture, repairing and
tuning of musical instruments such as harmonium, tabla, sitar, bansuri, ctc.
Making and repairing of gooos, n.e.c.
SIKKA TOWN
Major Gr. 20 Foodstuffs
Minor Gr. 200.1 Production of flour by village
chakkies or flour mill by grinding wheat, maize, gram, etc.
1 2
2
4
3
13
42
75
44
7
22
25
8 17
44
8 29
6
20
13
149
Major/Minor Group
Industrial Code No.
No of persons
emIlloyed No. of III
Name of Craft Towns production
2
SIKKA TOWN-contd. Minor
Gr. 205 Production of bread, biscuit, cake and other bakery products
209.2 Making of sweet-meats, laddu, peda, barphi, batasa, etc.
209.3 Sattu, bhunja, papar, barri, danauri, tilauri, scwai. apalam, ele.
Major Gr 27 Textile-Miscellaneous
Minor Gr. 273.4 Making of textile garments
including rain-coats and hea d-gears, n.e.c.
Major Gr. 28 Manufacture of Wood and Wooden Products
Minor Gr. 289.4 Manufacture of other wood
and allied products, n.e.c. •
Major Gr. 31 Leather and Leather Products
Minor Gr. 311.1 Making of leather boots,
shoes or chap pals (slippers, sandals)
Major Gr. 34-35 Non-metallic Mineral Pro-
Minor
ducts other thall Petroleum and Coal
Gr. 350 Making of earthenware such as pottery, etc.
Major Gr. 36 Basic Metals and their Products except Machinery and Transport Equipment
Minor Gr. 369.8 Foundry Industry (including
blacksmithy)
Major Gr. 38 Transport Equipment
Minor Gr. 388 Repair of cycle and rickshaw
Major Gr. 39 Miscellaneous Manufacturing Industries
Minor Gr.393.2 Goldsmithy
399.9 Making and repairing of goods, n.e.c.
3 4
3
2
2
16
16
4
4
3
3
6
6
2
2
4
4
4
2
2
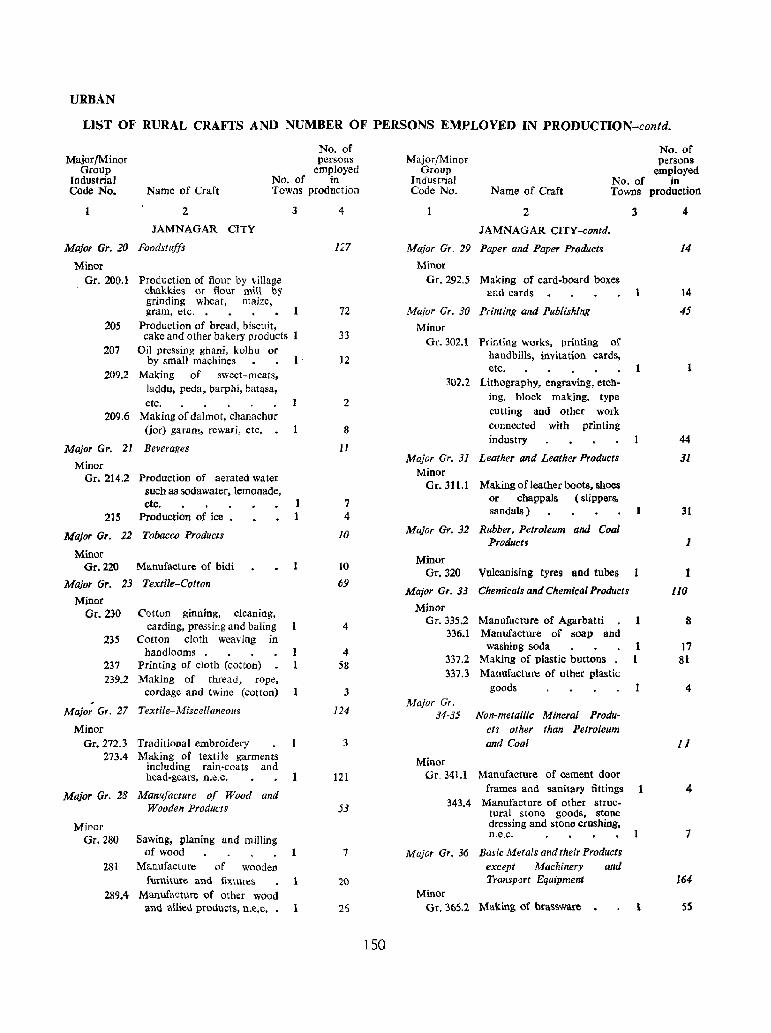
URBAN
LIST OF RURAL CRAFTS AND NUMBER OF PERSONS EMPLOYED IN PRODUCTION-contd.
No. of persons
employed Major/Minor
Group Industrial Code No.
No. of in Name of Craft Towns production
2
JAMNAGAR CITY
Major Gr. 20 Foodstuffs
Minor Gr. 200.1 Production of flour by village
chakkies or flour mm by grinding wheat, maize, gram, etc .•
205 Production of bread, biscuit, cake and other bakery products
207 Oil prcssing ghani, kolhu or by sman machines
209.2 Making of sweet-mcats, laddu, peda, barphi, balasa, etc.
209.6 Making of dalmot, chanachur (jor) garam, rcwari, etc.
Major Gr. 21 Beverages
Minor Gr. 214.2 Production of aerated water
such as sodawater, lemonade, etc.
215 Production of ice •
Major Gr. 22 Tobacco Products
Minor Gr. 220 Manufacture of bidi
Major Gr. 23 Textile-Cotton
Minor Gr. 230
235
237
239.2
Cotton ginning, cleaning, carding, pressing and baling
Cotton cloth weaving in handlooms
Printing of cloth (cotton) Making of thread, rope,
cordage and twine (cotton)
Major Gr. 27 Textile-Miscellaneous
Minor Gr.272.3 Traditional embroidery
273.4 Making of textile garments including rain-coats and head-gears, n.c.c.
Major Gr. 28 Manufacture of Wood and Wooden Products
Minor Gr. 280 Sawing, planing and milling
of wood 281 Manufacture of wooden
furniture and fixtures 289.4 Manufacture of other wood
and allied products, D.e.c ••
3
1 1
1
1 1
1
1
1
4
127
72
33
12
2
8
11
7 4
10
10
69
4
4 58
3
124
3
121
)3
7
20
25
150
No. of persons
employed Major/Minor
Group Industrial Code No.
No. of in Name of Craft Towns production
2
JAMNAGAR CITY-cantd.
Major Gr. 29 Paper and Paper Products
Minor Gr.292.5 Making of card-board boxes
and cards
Major Gr. 30 Printing and Publishing
Minor Gr. 302.1 Printing works, printing of
handbills, invitation cards, etc.
302.2 Lithography, engraving, etching, block making, type cutting and other work connected with printing industry
Major Gr. 31 Leather and Leather Products Minor
Gr. 311.1 Making ofleather boots, shoes or chappals ( slippers, sandals )
Major Gr. 32 Rubber. Petroleum and Coal Producu
Minor Gr. 320 Vulcanising tyres and tubes
Majl)r Gr. 33 Chemicals and Chemical Products
Minor Gr. 335.2 Manufacture of Agarbatti
336.1 Manufacture of soap and
3
1
washing soda 1 337.2 Making of plastic buttons 1 337.3 Manufacture of other plastic
goods Major Gr.
34-35 Non-metallic Mineral Products other than Petroleum and Coal
Minor Gr.341.1 Manufacture of cement door
frames and sanitary fittings 1 343.4 Manufacture of other struc
tural stone goods, stone dressing and stone crushing, n.e.c.
Major Gr. 36 Basic Metals andthe;r Products except Machinery and Transport Equipment
Minor Gr. 365.2 Mak.ing of bral'>sware 1
4
14
14
45
44
31
31
1
I
I1Q
8
17 81
4
/1
4
7
164
5S
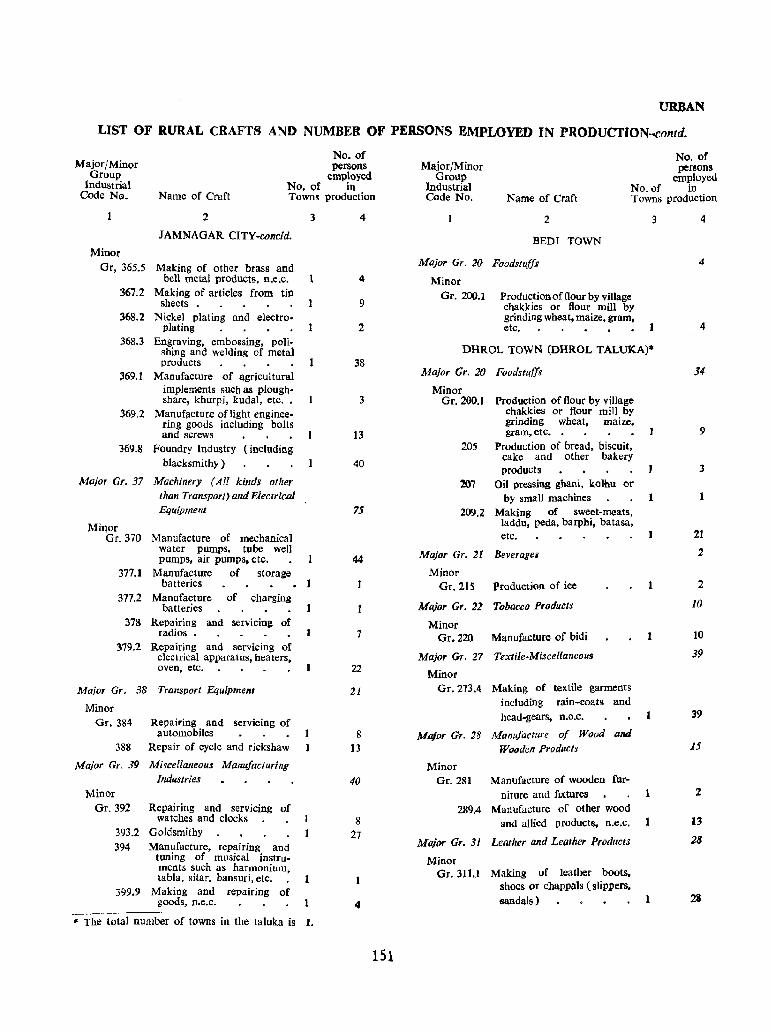
URBAN
LIST OF RURAL CRAFTS AND NUMBER OF PERSONS EMPLOYED IN PRODUCTION-cantd.
No. of persons
employed No. of in
Major/Minor Group
Industrial Code No. Name of Craft Towns production
2 3
JAMNAGAR CITY-concid.
Minor Gr, 365.5 Making of other brass and
bell metal products, n.e.c. 367.2 Making of articles from tin
sheets 368.2 Nickel plating and electro.
plating 368.3 Engraving, embossing, polio
shing and welding of metal products
369.1 Manufacture of agricultural implements such as ploughshare, khurpi, kudal, etc .•
369,2 Manufacture of light enginee· ring goods including bolts and screws
369.8 Foundry Industry (including blacksmithy)
Major Gr. 37 Machinery (All kinds other than Transport) and Electrical Equipment
Minor Gr. 370 Manufacture of mechanical
water pumps, tube we]] pumps, air pumps, etc.
377.1 Manufacture of storage batteries • 1
377.2 Manufacture of charging batteries
378
379.2
Repairing and servicing of radios.
Repairing and servicing of electrical apparatus, hea ters, oven, etc.
Major Gr. 38
Minor
Transport Equipment
Gr. 384 Repairing and servicing of automobiles
388 Repair of cycle and rickshaw
Major Gr. 39 Miscellaneous Manufacturing Industries
Minor Gr. 392 Repairing and servicing of
watches and clocks I 393.2 Goldsmithy 1 394 Manufacture, rcpairing and
tuning of musical instruments such as harmonium, tabla. sitar, bansuri, etc. 1
399.9 Making and repairing of goods, n.e.c.
.. The total number of towns in tbe taluka is J.
4
4
9
2
38
3
13
40
75
44
7
22
21
8 13
40
8 27
4
151
No. of pemons
employed Major/Minor
Group Industrial Code No.
No.vf in Name of Craft Towns production
2
BEDI TOWN
Major Gr. 20 Foodstuffs
Minor Gr. 200.1 Production of flour by village
chakkies or flour mill by grinding wheat, maize. gram, etc.
3
DHROL TOWN (DHROL TALUKA)*
Major Gr. 20 Foodstuffs
Minor Gr. 200.1 Production of flour by village
chakkies or flour mill by grinding wheat, maize, gram,etc.
205 Production of bread, biscuit, cake and other bakery products
~7 Oil pressing ghani, Kolhu or by small machines
209.2 Making of sweet-meats, laddu, peda, barphi, batasa, etc.
Major Gr. 2I Beverageii
Minor Gr. 215 Production of ice
Major Gr. 21 Tobacco Products
Minor Gr. 220 Manufacture of bidi
Major Gr. 27 Textile-Miscellaneous
Minor Gr.213.4 Making of telttile garments
including rain-coats and head-gears, n.e.c.
Major Gr. 28 Manufacture of Wood and Wooden Products
Minor Gr. 281
289.4
Manufacture of wooden furniture and flXtures
Manufacture of other wood and allied products, n.e.c.
Major Gr. 31 Leather and Leather Products
Minor Gr.311.1 Making of leather boots.
shoes or chappals (slippers, t;andals)
1
1
4
4
4
34
9
3
21
2
2
10
10
39
39
15
13
28
28
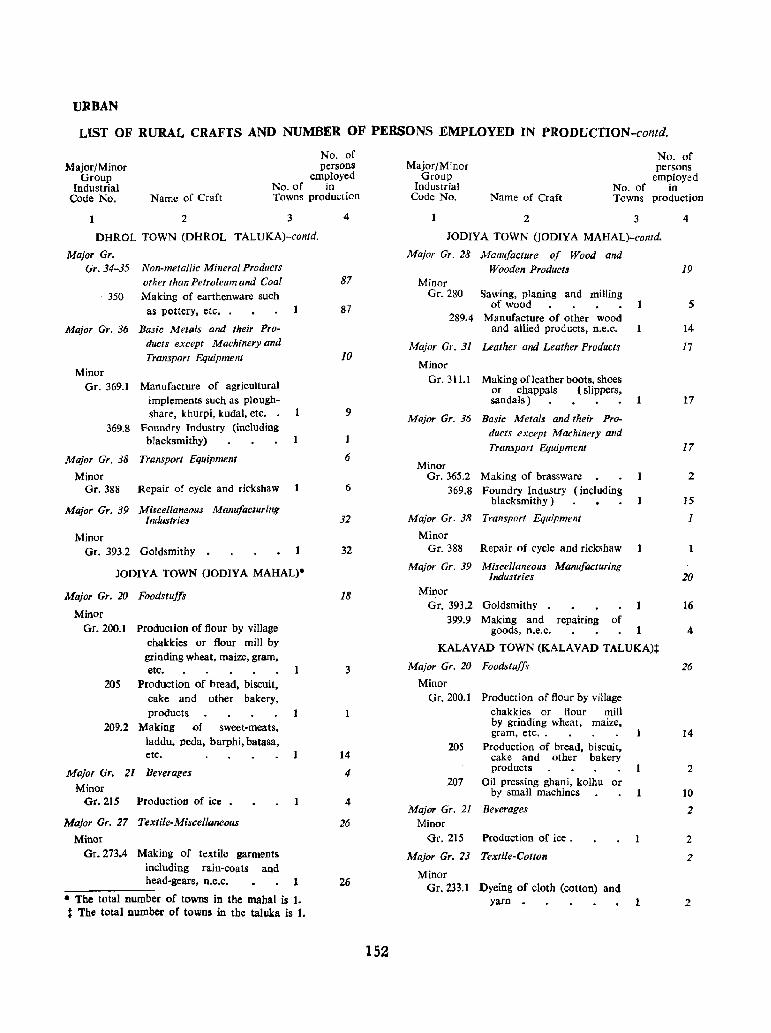
URBAN
LIST OF RURAL CRAFfS AND NUMBER OF PERSONS EMPLOYED IN PRODVCTION-contd.
No. of persons
employed Major/Minor
Group Industrial
Code No. No. of in
Name of Craft Towns production
1 2 3
DHROL TOWN (DHROL TALUKA)-conld.
Major Gr. Gr. 34-35 Non-metallic Mineral Products
other than Petroleum and Coal 350 Making of earthenware such
as pottery, etc.
Major Gr. 36 Basic Metals and their Products except Machinery and Transport Equipment
Minor Gr. 369.1 Manufacture of agricultural
implements such as ploughshare, khurpi, kudal. etc. •
369.8 Foundry Industry (including blacksmithy)
Major Gr. 38 Transport Equipment
Minor Gr. 388 Repair of cycle and rickshaw
Major Gr. 39 Miscellaneous Manufacturing lndustries
Minor Gr. 393.2 Goldsmithy
JODIYA TOWN (JODIY A MAHAL)*
Major Gr. 20 Foodstuffs
Minor Gr. 200.1 Production of flour by village
chakkies or flour mill by grinding wheat. maize, gram. etc.
205 Production of bread. biscuit, cake and other bakery, products
209.2 :Making of sweet-meats. laddu. oeda. barphi, batasa, etc.
Major Gr. 21 Beverages
Minor Gr. 215 Production ()f ice • 1
Major Gr. 27 Textile-Miscellaneous
Minor Gr.273.4 Making of textile garments
including rain-coats and head-gears, n.e.c. 1
-----~ • The total number of towns in the mabal is 1. t The total Dumber of towns in the taluka is I.
4
87
87
10
9
1
6
6
32
32
18
3
14
4
4
26
26
152
Major/Minor Group
Industrial Code No.
No. of persons
employed N(). of in
Name of Craft Towns production
2 3
JODIYA TOWN (JODlYA MAHAL)-contd.
Major Gr. 28 Manufacture of Wood and Wooden Products
Minor Gr. 280 Sawing, planing and milling
of wood 289.4 Manufacture of other wood
and allied products, D.e.C.
Major Gr. 31 Leather and Leather Products
Minor Gr. 311.1 Making ofleather boots, shoes
or chappals ( slippers. sandals)
Major Gr. 36 Basic Meta!$ and their Products except Machinery and Transport Equipment
Minor Gr. 365.2 Making of brassware
369.8 Foundry Industry (including blacksmithy)
Major Gr. 38 Transport Equipment
Minor Gr. 388 Repair of cycle and rickshaw
Major Gr. 39 Miscellaneous Manufacturing Industries
Minor Gr. 393.2 Goldsmithy
399.9 Making and repairing of goods, n.e.c.
KALAVAD TOWN (KALAVAD TALUKA)~
Major Gr. 20 Foodstufb
Minor Gr. 200.1 Production of flour by village
chakkies or flour mill by grinding wheat, maize, gram. etc ..
205 Production of bread, biscuit, cake and other bakery products
207 Oil pressing ghani, kolhu or by small machines
Major Gr. 21 Beverages Minor
Gr. 21S Production of ice .
Major Gr. 23 Textile-Cotton
Minor Gr. 233.1 Dyeing of cloth (cotton) and
yarn • 1
4
19
5
14
17
17
17
2
15
1
20
16
4
26
14
2
10
2
2
2
2
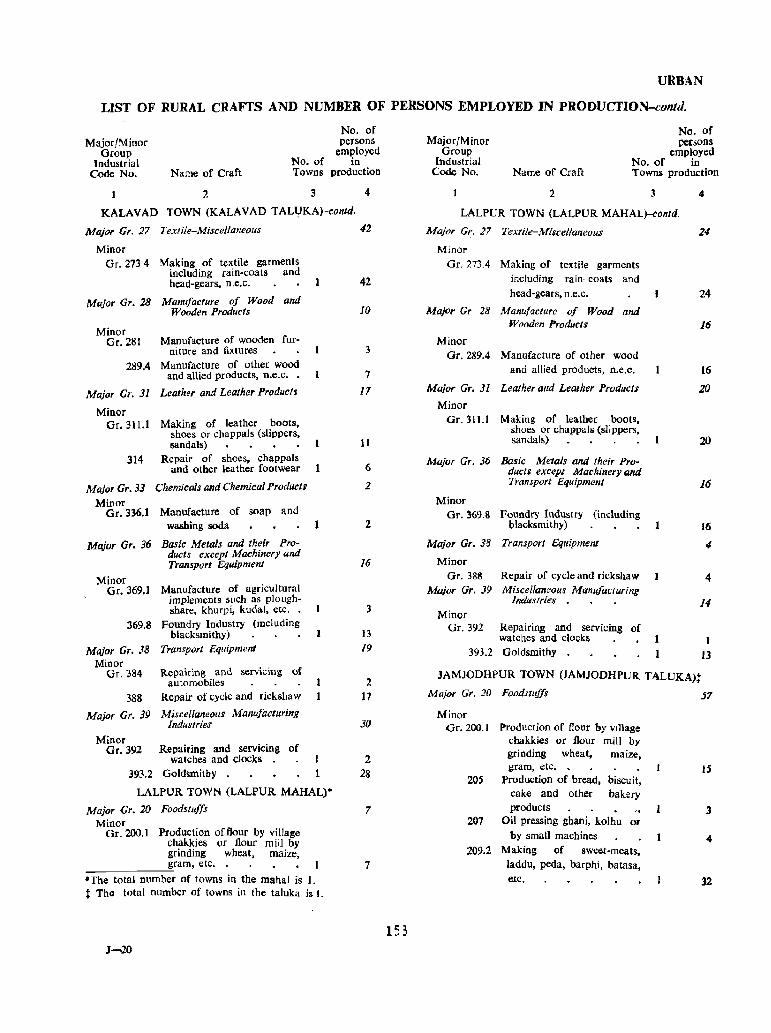
URBAN
LIST OF RURAL CRAFTS AND NUMBER OF PERSONS EMPLOYED IN PRO DUCTION-contd.
No. of persons
employed Major/Minor
Group Industrial
Code No. No. of in
Name of Craft Towns production
1 2 3
KALAVAD TOWN (KALAVAD TAU!KA)-conld.
MajOf' Gr. 27 Textile-Miscellaneous
Minor Gr. 273 4 Making of textile garments
including rain-coats and head-gears, n.e.c.
Major Gr. 28 Manufacture of Wood and Wooden Products
Minor Gr. 281
289.4
Major Gr. 31
Minor Gr. 311.1
314
Manufacture of wooden furniture and fixtures
Manufacture of other wood and allied products, D.e.C. .
Leather and Leather Products
Making of leather boots, shoes or chappals (slippers, sandals)
Repair of shoes, chappals and other leather footwear
Major Gr. 33 Chemicals and Chemical ProducJ&
Minor Gr. 336.1 Manufacture of soap and
washing soda
Major Gr. 36 Basic Metals and their Products except Machinery and Transport EguipmenJ
Minor Gr. 369.1
369.8
Major Gr. 38 Minor
Gr. 384
388
Manufacture of agricultural implements such as ploughshare, khurpi, kudal, etc. .
Foundry Industry (including blacksmithy)
Transport EquipmenJ
Repairing and servicing of automobiles
Repair of cycle and rickshaw
Major Gr. 39 Miscellaneous Manufacturing Industries
Minor Gr. 392 Repairing and servicing of
watches and clocks . 393.2 Goldsmith:; . 1
LALPUR TOWN (LALPUR MAHAL)*
Major Gr. 20 Foodstuffs Minor
Gr. 200.1 Production of flour by village chakkies or flour mill by grinding wheat, maize,
______ :-g"'ram, etc .• • The total number of towns in the mahal is I. t The total number of towns in the taluka is I.
4
42
42
10
3
7
17
6
2
2
/6
3
13 19
2 17
30
2 28
7
7
153
No. of per>ons
employed Major/Minor
Group Industrial
Code No. No. of in
Name of Craft Towns production
2 3
LALPUR TOWN (LALPUR MAHAL)-contd.
Major Gr. 21 Textile-Miscellaneous
Minor Gr. 273.4 Making of textile garments
including rain-coats and head-gears, n.e.c.
Major Gr 28 Manufacture of Wood and Wooden ProdUCI:i
Minor Gr. 289.4 Manufacture of other wood
and allied products, n.e.c.
Major Gr. 31 Leather and Leather Products
Minor Gr. 311.l Making of leather boots,
shoes or chappals (slippers, sandals)
Major Gr. 36 Basic Metals and their Product!i except Machinery and Transport Equipment
Minor Gr.369.8 Foundry Industry (including
blacksmithy)
Major Gr. 38 Transport EquipmenJ
Minor Gr. 388 Repair of cycle and rickshaw
Major Gr. 39 Miscellaneous Manufacturing Industries. . . .
Minor Gr.392 Repairing and servlcmg of
4
24
24
16
16
20
20
16
16
4
4
u
watches and clocks 1 I 393.2 Goldsmithy . I 13
JAMJODHPUR TOWN (JAMJODHPUR TALUKAH
Major Gr. 20 Foodstuffs
Minor Gr.200.l Production of flour by village
chakkies or flour mill by grinding wheat, maize, gram, etc ..
205 Production of bread, biscuit, cake and other bakery products
207 Oil pressing ghani, kolhu or by small machines
209.2 Making of sweet-meats, laddu, peda, barphi, batasa, etc.
57
IS
3
4
32
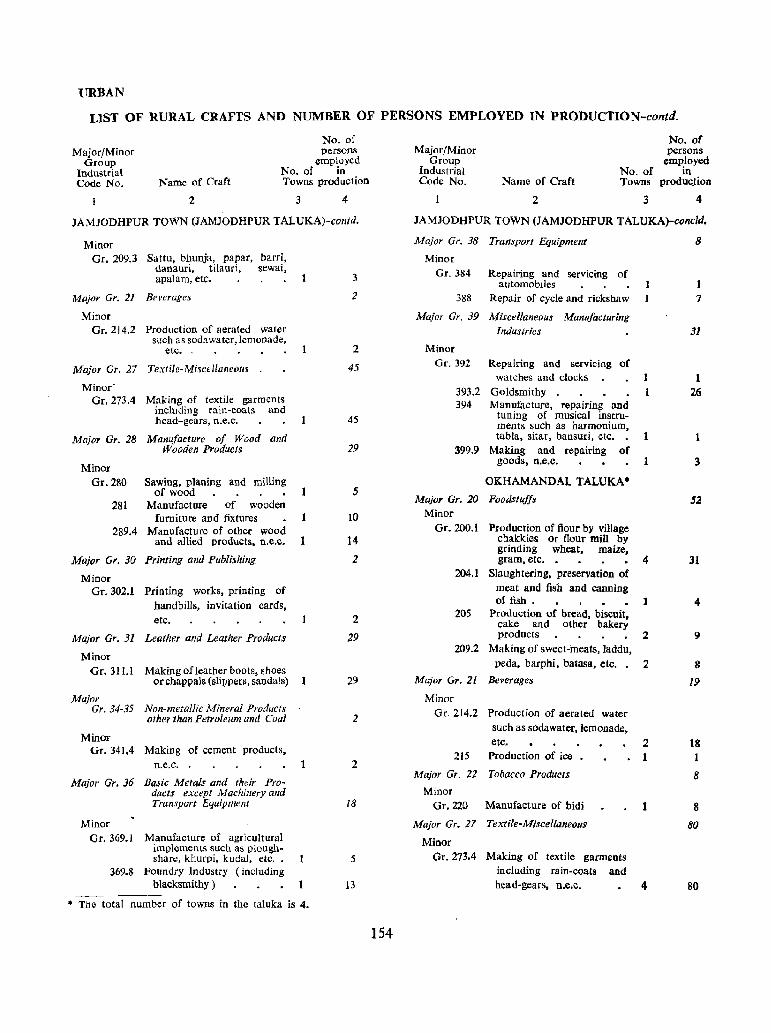
llRBAN
LIST OF RURAL CRAFTS AND NUMBER OF PERSONS EMPLOYED IN PRODUCTION-contd.
No. of persons
employed Major/Minor
Group Industrial Code No.
No. of in Name of Craft
2
Towns production
3 4
JAMJODHPUR TOWN (JAMJODHPUR TALUKA)-contd.
Minor Gr. 209.3 Sattu, bhunja, papar, barri,
danauri, tilauri, sewai, apalam, etc.
Major Gr. 21 Beverages
Minor Gr.214.2 Production of aerated water
such as sodawater,lemonade, etc.
Major Gr. 27 Textile-Miscellaneous
Minor' Gr.273.4 Making of textile garments
including rain-coats and head-gears, n.e.c.
Major Gr. 28 Manufacture of Wood and Wooden Products
Minor Gr. 280 Sawing, planing and milling
of wood 281 Manufacture of wooden
furniture and fixtures 289.4 Manufacture of other wood
and allied products, D.e.C. 1
Major Gr. 30 Printing and Publishing,
Minor Gr. 302.1 Printing works, printing of
handbills, invitation cards, etc.
Major Gr. 31 Leather and Leather Products
Minor Gr. 31 L1 Making of leather boots, shoes
or chappals (slippers, sandals)
Major Gr. 34-35 Non-metallic Mineral Products
other than Petroleum and Coal
Minor Gr.341.4 Making of cement products,
n.e.c.
Major Gr. 36 Basic Metals ana their Products except Machinery and Transport Equipment
Minor Gr. 369.1 Manufacture of agricultural
implements such as ploughshare, khurpi, kudal, etc, .
369.8 Foundry Industry (including blacksmithy) 1
------* The total number of towns in the taluka is 4.
3
2
2
45
45
29
5
10
14
2
2
29
29
2
2
18
5
13
154
No. of persons
employed Major/Minor
Group Industrial Code No.
No, of in Name of Craft Towns produc.tion
2 3 4
JAMJODHPUR TOWN (JAMJODHPUR TALUKA)-concld.
Major Gr. 38 Transport Equipment
Minor Gr,384
388
Repairing and servicing of automobiles
Repair of cycle and rickshaw
Major Gr. 39 Miscellaneous Manufacturing Industries
Minor Gr. 392
393.2 394
399.9
Repairing and servicing of watches and clocks
Goldsmithy Manufacture, repairing and
tuning of musical instruments such as harmonium, tabla, sitar, bansuri, etc.
Making and repairing of goods, n.e.c.
OKHAMANDAL TALUKA*
Major Gr. 20 Foodstuffs Minor
Gr. 200.1 Production of flour by village chakkies or flour mill by grinding wheat, maize.
1
1
1
gram, etc. • 4 204.1 Slaughtering, preservation of
meat and fish and canning of fish. 1
205 Production of bread, biscuit, cake and other bakery products 2
209.2 Making of sweet-meats, laddu, peda, barphi, batasa, etc. 2
Major Gr. 21 Beverages
Minor Gr.214.2 Production of aerated water
such as soda water, lemonade. e~ 2
215 Production of ice
Major Gr. 22 Tobacco Products
Minor Gr. 220 Manufacture of bidi
Major Gr. 27 Textile-Miscellaneous
Minor Gr. 273.4 Making of textile garments
including rain-coats and head-gears, n.e.c. 4
8
1
31
26
3
52
31
4
9
8
19
1& 1
8
8
80
80

URBAN
LIST OF RURAL CRAFTS AND NUMBER OF PERSONS EMPLOYED IN PRODUCTION-contd.
Major/Minor Group
Industrial Code No. Name of Craft
No. of Towns
2 3
OKHAMANDAL TALUKA-contd.
Major Gr. 28 Manufacture of Wood alld Wooden Products
Minor Gr. 280
289.4
Sawing, planing and milling of wood
Manufacture of other wood and allied products, D.e.C.
Major Gr. 3D Printing and Publishing
Minor Gr. 301 Printing and publishing of
books 302.2 Lithography, engraving, etch
ing, block making, type cutting and other work connected with printing industry
Major Gr. 31 Leather and Leather Products
Minor Gr. 311.1 Making of leather boots,
shoes or chappals (slippers,
3
gn~~ 3
Major Gr. 36 Basic Metals and thetr
Minor
Products except Machinery and Transport Equipment
Gr. 365.2 Making of brassware 369.1 Manufacture of agricultural
implements such as ploughsharc, khurpi,' kudal, etc.
369.8 Foundry Industry (including blacksmithy) 2
Major Gr. 37 Machinery (AU kinds other than Transport) and Electrical Equipment
Minor Or. 370
Major Gr. 38
Minor Gr. 384
Manufacture of mechanical water pumps, tube well pumps, air pumps, etc.
Transport Equipmellt
Repairing and servicing of automobiles
388 Repair of cyele and rickshaw 2 Major Gr. 39 Mi$cellaneoliS Manufacturing
Industries
Minor Gr. 39Z Repairing and servlclllg of
watches and clocks 2 393.2 Goldsmithy 3
No. of persons
employed in
production
4
42
2
40
7
3
4
33
33
30
7
22
2
2
19
4 15
30
3 27
155
No. of persons
employed Major/Minor
Group Industrial Code No.
No. of in Name of Craft Towns production
2
OKRA PORT TOWN
Major Gr. 20 Foodstuffs
Minor Gr. 200.1 Production of flour by village
chakkies or flour mill by grinding wheat. maize.
3
gram, etc. 1 204.1 Slaughtering, preservation of
meat and fish and canning of fish
205 Production of bread, biscuit, cake and other bakery products
209.2 Making of sweet-meats, iaddu. peda. barphi, batasa. etc.
Major Gr. 21 Beverages
Minor Gr. 214.2 Production of aerated water
such as sodawater, lemonade, etc.
Major Gr. 27 Textile-Miscellaneous
Minor Gr. 273.4 Making of textile garments
including rain-coats and head-gears. D.e.C.
Major Gr. 28 Manufacture of Wood and Wooden Products
Minor Gr.289.4 Manufacture of other wood
and allied products, n.e.c.
Major Gr. 30 Printing and Publishing
Minor Gr. 30t
Major Gr. 31
Minor Gr. 31 I.l
Printing and publishing of books
Leather and Leather Products
Making of leather lxlots, shoes or chappals (slippers, sandals)
Mnjor Gr. 36 Basic Metals and their Products except Machinery and Transport Equipment
Minor Gr. 369.1 Manufacture of agricultural
implements such as plough
share, khurpi, kudaJ, etc ..
4
22
7
4
4
6
6
28
28
3
3
J
3
4
4
7
7
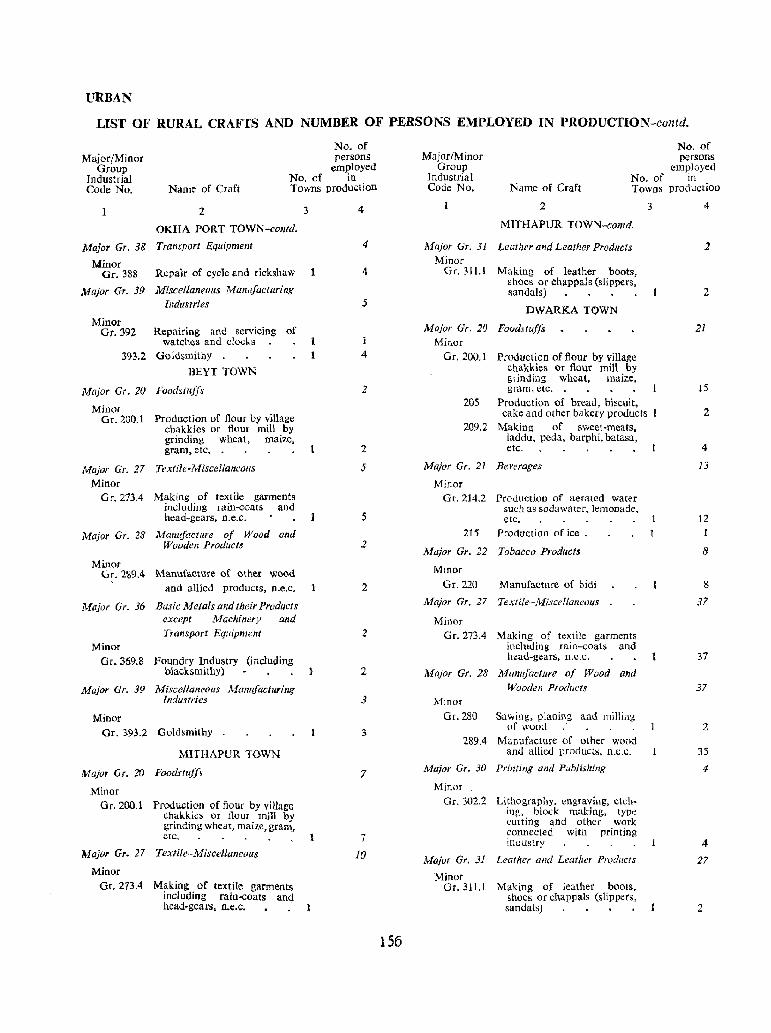
VRBAN
LIST OF RURAL CRAFTS AND NUMBER OF PERSONS EMPLOYED IN PRODUCTION-contd.
No. of persons
employed Major(Minor
Group Industrial Code No.
No. of in Name of Craft Towns production
1 2 3
OKRA PORT TOWN-contd.
Major Gr. 38 Transport Equipment
Minor Gr. 388 Repair of cycle and rickshaw 1
Major Gr. 39 Miscellaneolls Manufacturing Industries
Minor Gr. 392 Repairing and servicing of
watches and clocks
393.2 Goldsmithy
BEYT TOWN
Major Gr. 20 Foodstuffs
Minor Gr. 200.1 Production of flour by village
chakkies or flour mill by grinding wheat, maize, gram, etc.
Major Gr. 27 Textile-Miscellaneous
Minor
Gr. 273.4
Major Gr. 28
Minor
Making of textile garments including rain-coats and ht:ad-gears, n.e.c.
Mamifacture of Wood and Wooden Products
Or. 2\\9.4 Manufacture of other wood , and allied products, D.e.C.
Major Gr. 36 Basic Metals alld their Products except Machinery and
Transport Equipment Minor
Gr.369.8 Foundry Industry (including blacksmithy)
Major Gr. 39 Miscellaneolls Manufacturing Industries
Minor Gr. :'93.2 Goldsmithy
MITHAPUR TOWN
Major Gr. 20 Foodsfliffs
Minor Gr.200.1 Production of flour by village
chakkies or flour mill by grinding wheat, maize, gram, etc.
Major Gr. 27 Textile-Miscellaneous
Minor
Gr. 273.4 Making of textile garments including raiu-coats and head-gears. D.e.c.
4
" 4
5
4
2
2
.5
5
2
2
2
J
3
7
7
10
156
No. of persons
employed MajorfMinor
Group Industrial Code No.
No. of in Name of Craft
2
Towns production
MITHAPUR TOWN-con/d.
Major Gr. 31 Leather and Leather Products Minor
Gr. 31 l.l Making of leather boots, shoes or chappals (slippers, sandals)
DWARKA TOWN
Major Gr. 20 Foudstuffs Minor
Gr. 200.1 Production of flour by village chakkies or flour mill by gdndlng wheat, maize, gram, etc.
205 Production of bread, biscuit,
3
cake and other bakery products I 209.2 Making of sweet-meats,
laddu, peda, barphi, batasa, etc.
Major Gr. 21 Beverages
Minor Gr.214.2 Production of aerated water
such as Sod3w3ter, lemonade, etc.
215 Production of ice .
Major Gr. 22 Tobacco Products
Minor
Gr. 220 Manufacture of bidi
Major Gr. 27 Textile-Miscellaneous
Minor Gr. 273.4 Making of textile garments
including rain-coats and head-gears, n.e.c.
Major Gr. 18 Mamifacture of Wood and Wooden Products
Minor
Gr. 280 Sawing, planing and milling of wood
289.4 Manufacture of other wood and allied products, nx .1.:.
Major Gr. 30 Printing and P,lblishing
Minor Gr. 302.2 Lit11ography, engraving, etch
ing, block making, type cutting and other work connected with printing industry
Major Gr. 31 Leather and Leather Products
Minor Gr. 311.1 Making of leather bOOIS,
shoes or chappals (slippers, sandals)
4
1
2
21
15
2
4
13
12
8
8
37
37
37
2
3S
4
4
27
2
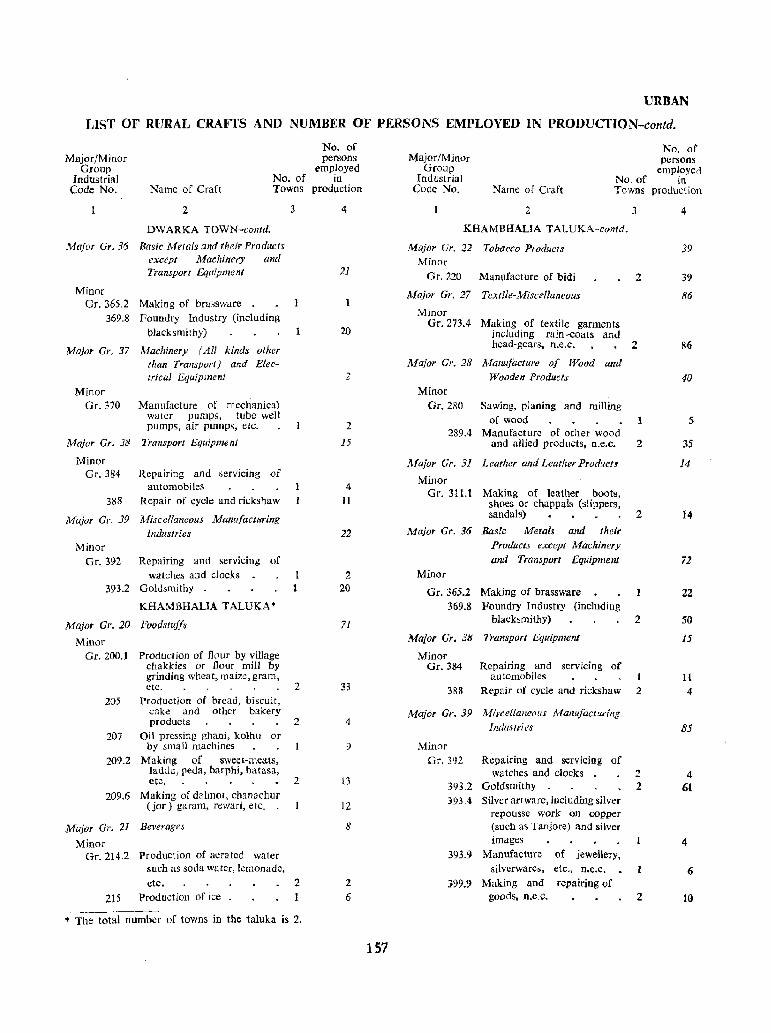
URBAN
LIST OF RURAL CRAFTS AND NUMBER OF PERSONS EMPLOYED IN PRODUCTION-contd.
No. of persons
employed Major/Minor
Group Industrial
Code No. No. of in
Name of Craft Towns production
2
DWARKA TOWN-contd.
Major Gr. 36 Basic Meta{s ant! their Producr.~ except Machinery and Transport Equipment
Minor Gr. 365.2 Making of brassware
369.8 Foundry Industry (including black smithy)
Major Gr. 37 Machinery (All kinds other than Transport) and Electrical Equipment
Minor Or. 370
Major Gr. 38
Minor Or. 384
388
Manufacture of mechanical water pumps, tube well pumps, air pumps, etc.
Transport Equipment
Repairing and servicing of automobiles
Repair of cycle and rickshaw
Major Gr. 39 Miscellaneous Manu[acttlring Industries
Minor Gr. 392 Repairing and servicing of
watches and clocks 393.2 Goldsmithy
KHAMBHALIA TALUKA*
Major Gr. 20 Poodstufh
Minor Gr. 200.1 Production of flour by village
chakkies or flour mill by griuding wheat, maize, gram, <:tc.
205 Production of bread, biscuit, cake and other bakery products
207 Oil pressing ghani, kolhll or by sma 11 machines
209.2 Making of sweet-mealS, Iaddu, peda, barphi, batasa, etc.
209.6 Making of daImot, chanachur (jor) garam, rewari, etc.
Major Gr. 21 Bel'erages
Minor Gr.214.2 Production of aerated water
such as soda water, lemonade,
3
I 1
2
2
2
etc. 2 215 Production of ice
'" The total number of towns in the taluka is 2.
4
21
20
2
2
15
4 11
22
2 20
71
33
4
9
13
12
8
2
6
157
No. of persons employe~
Major/Minor Group
Industrial Code No.
No. of in Name of Craft Towns production
2
KHAMBHALIA TALUKA-contd.
Major Gr. 22 Tobacco Products Minor
Gr. 220 Manufacture of bidi
Major Gr. 27 Textile-Miscellaneous
Minor Gr. 273.4 Making of textile garments
including rain -coats and
3
2
head·gcars. !l.C.C. 2
Major Gr. 28 Manufacture of Wood and Wooden Products
Minor Gr. 280 Sawing, planing and milling
of wood 289.4 Manufacture of other wood
and allied products, n.e.c.
Major Gr. 31 Leather and Leather Product~
Minor Gr. 3lLl Making of leathcr boots,
shoes or chappals (slippers,
2
sandals) 2
Major Gr. 36 Basic Metals and their
Minor
Products except Machinery
and Transport Equipment
Gr. 365.2 Making of brassware 369.8 Foundry Industry (including
blacksmithy)
Major Gr. 38 Transport Equipment
Minor Gr. 384 Repairing and servicing of
automobiles 38& Repair of cycle and rickshaw
Major Gr. 39 Miscellaneous Alanufacturing
Industries
Minor Gr. 392 Repairing and servIcing of
watches and clocks 393.2 Goldsmithy 393.4 Silver artware, including silver
repousse work on copper (such as Tanjore) and silver images
393.9 Manufacture of jeweller)" silverwares, etc., D.e.C.
399.9 Making and repairing of goods, n.e.c.
2
2
2 2
2
4
39
39
86
86
40
5
35
14
14
71
22
50
15
H 4
85
4 61
4
6
10
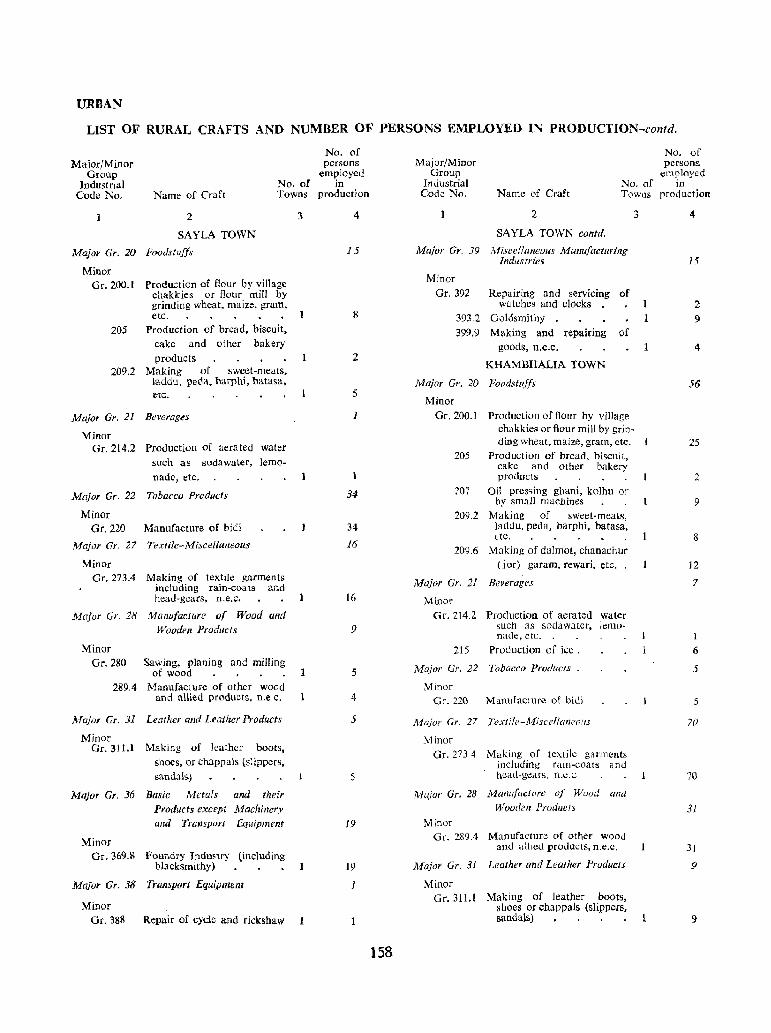
URBAN
LIST OF RURAL CRAFTS AND NUMBER OF PERSONS EMPLOYED IN PRODUCTION-contd.
Major/Minor Group
Industrial Code No. Name of Craft
No. of Towns
2
SAYLA TOWN
Major Gr. 20 Foodstuffs
Minor Gr. 200.1 Production of flour by village
chakkies or flour mill by grinding wheat, maize, gram, etc.
205 Production of bread, biscuit, cake and other bakery products
209.2 Making of sweet-meats, laddu, perla, barphi, batasa, etc.
Major Gr. 21 Beverages
Minor Gr.214.2 Production of aerated water
such as sodawatet, lemonade, etc.
Major Gr. 22 Tobacco Products
Minor Gr. 220 Manufacture of bidi
Major Gr. 27 Textile-Miscellaneous
Minor Gr. 273.4
Major Gr 28
Minor Gr. 280
Making of textile garments including rain-coats and head-gears, n .e.C.
Manufacture of Wood und
Wooden Products
Sawing, planing and milling of wood
289.4 Manufacture of other wood and allied products, n.e c.
kfajor Gr. 31 Leather and Leather Products
Minor Gr. 311.1 Making of leather boots,
shoes, or chappals (s:ippers, sandal!»
Major Gr. 36 Busic Metals and their
Minor
Products except .Machinery and Transport equipment
Gr.369.8 Foundry Industry (including blaeksmithy)
Major Gr. 38 Transport Equipment
Minor Gr. 388 Repair of cycle and rickshaw
3
No. of persons
employed in
production
4
15
8
2
5
1
34
34
16
16
9
5
4
5
5
19
19
1
158
Major/Minor Group
Industrial Code No.
No. of persons.
eml?loyed No. of III
Name of Craft Towns production
2
SA YLA TOWN-contd.
Major Gr. 39 j\,fisceliuneous Manufacturing Industrie5
Minor Gr. 392 Repairing and servIcing of
watches and clocks 393.2 Goldsmithy 399.9 Making amI repairing of
goods, n.e.c.
KHAMBHALIA TOWN
Major Gr. 20 Foodstuffs
Minor Gr. 200.1 Production of flour by village
cha kkies or flour mill by grinding wheat, maize, gram, etc.
205 Production of bread, biscuit, cake and other bakery products
207 Oil pressing ghani, kolhu or by small machines
209.2 Making of sweet-meats, laddu, peda, barphi, batasa, de.
209.6 Making of dalmot, chanachnf (jor) garam, rewari, etc.
A1ajor Gr. 21 Beverages
Minor Gr. 214.2 Production of aerated water
such as soda water, lemonade, etc.
215 Production or ice.
Major Gr. 22 Tobacco Products .
Minor Or. 220 Manufacture of bidi
Mujor Gr. 27 Textile-Miscellaneoils
Minor
Gr. 273 4 Making of textile gi1tments including rain-coats and head-gears. n.e.c
Mujor Gr. 28 Manufacture of Wood and Wooden Products
Minor Gr. 289.4 Manufacture of other wood
and allied products, n.e.c.
Major Gr. 31 Leather and Leather Products
Minor Gr. 311.1 Making of leather boots,
shoes or chappals (slippers, sandals)
3
1
1
4
15
2
9
4
56
25
2
9
8
J2
7
1
6
5
5
70
70
31
31
9
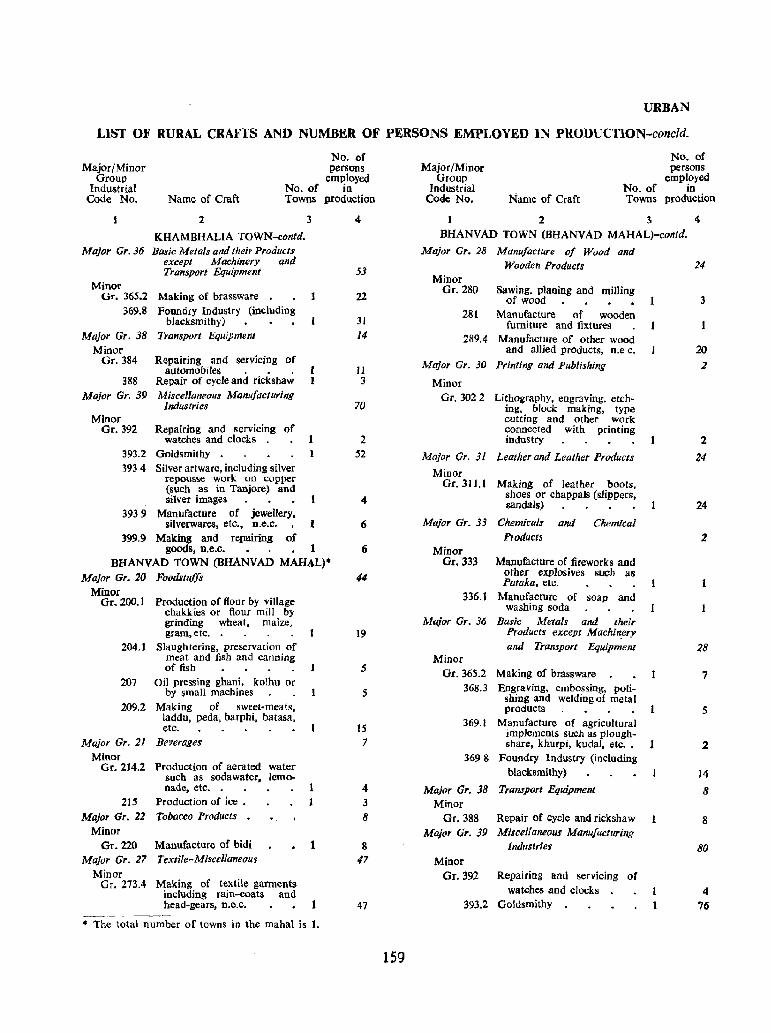
URBAN
LIST OF RURAL CRAFTS AND NUMBER OF PERSONS EMPLOYED IN PRODUCTION-concld.
No. of persons
employed MajorfMinor
Group Industrial
Code No. No. of in
Name of Craft Towns production
2 3
KHAMBHALIA TOWN-contd. Major Gr. 36 Basic Metals and their Products
except Machinery and Transport Equipment
Minor Gr. 365.2 Making of brassware
369.8 Foundry Industry (including blacksmithy)
Major Gr. 38 Transport Equipment
Minor Gr. 384 Repairing and servicing of
automobiles . • . 388 Repair of cycle and rickshaw
Major Gr. 39 Miscellaneous Manufacturing Industries
Minor Gr. 392 Repairing and servicing of
watches and clocks . 393.2 Goldsmilhy 1 393 4 Silver artware, including silver
repous!ie work on copper (such as in Tanjore) and silver images
393 9 Manufacture of jewellery, silverwares, etc., D.e.C.
399.9 Making and repairing of goods, n.e.c. 1
BHANVAD TOWN (BHANVAD MAHAL)* Major Gr. 20 Foodstuffs
Minor Gr. 200.1 Production of flour by village
chakkies or flour mill by grinding wheat, maize. gram, etc.
204.1 Slaughtering, preservation of meat and fish and canning of fish
207 Oil pressing ghani, kolhu or by small machines
209.2 Making of sweet-meats, laddu, peda, barphi, batasa, etc.
Major Gr. 21 Beverages
Minor Gr.214.2 Production of aerated water
such as soda water. lemonade, etc.
215 Production of ice . Major Gr. 22 Tobacco Products •
Minor Gr. 220 Manufacture or bidi 1
Major Gr. 27 Textile-Miscel/aneour
Minor Gr. 273.4 Making of textile garments
including rain-coats and head-gears, n.c.c.
-------.. The total number of towns in the mahal is 1.
4
53
22
31 14
11 3
70
2 52
4
6
6
44
19
5
15 7
4 3 8
8 47
47
159
MajorfMinor Group
Industrial Code No. Name of Craft
No. of Towns
No. of persons
employed in
production
) 2 3 4-
BHANV AD TOWN (BHANVAD MAHAL)-contd.
Major Gr. 28 Manufacture of Wood and Wooden Products 24
Minor Or. 280 Sawing. planing and milling
of wood • . 3 281 Manufacture of wooden
furniture and fixtures 289.4 Manufacture of other wood
and aWed products, n.e c. 20
Major Gr. 30 Printing and Publishing 2
Minor Gr. 302.2 Lithography. engraving, etch
ing, block making, type cutting and other work connected with printing industry 2
Major Gr. 31 Leather and Leather Products 24 Minor
Gr.311.1 Making of leather boots, shoes or chappals (slippers, sandals)
Major Gr. 33 Chemicals and Chemical
Minor Gr. 333
336.1
Major Gr. 36
Minor
Products
Manufacture of fireworks and other explosives such as Pataka. etc.
Manufacture of soap and washing soda
Basic Metals and their Products except Machin_ery
and Transport Equipment
Gr.365.2 Making of brassware 368.3 Engraving, embossing, poli
shing and welding of metal products
369.1 Manufacture of agricultural implements such as ploughshare, khurpi, kudal. etc. •
369 8 Foundry Industry (including blacksmithy)
Major Gr. 38 Transport Equipment Minor
Or. 388 Repair of cycle and rickshaw Major Gr. 39 Miscellaneous Manufacturing
Industries
Minor Or. 392
393.2
Repairing and servlcmg of watches and clocks
Goldsmithy
24
2
28
7
5
2
14
8
8
80
4 76
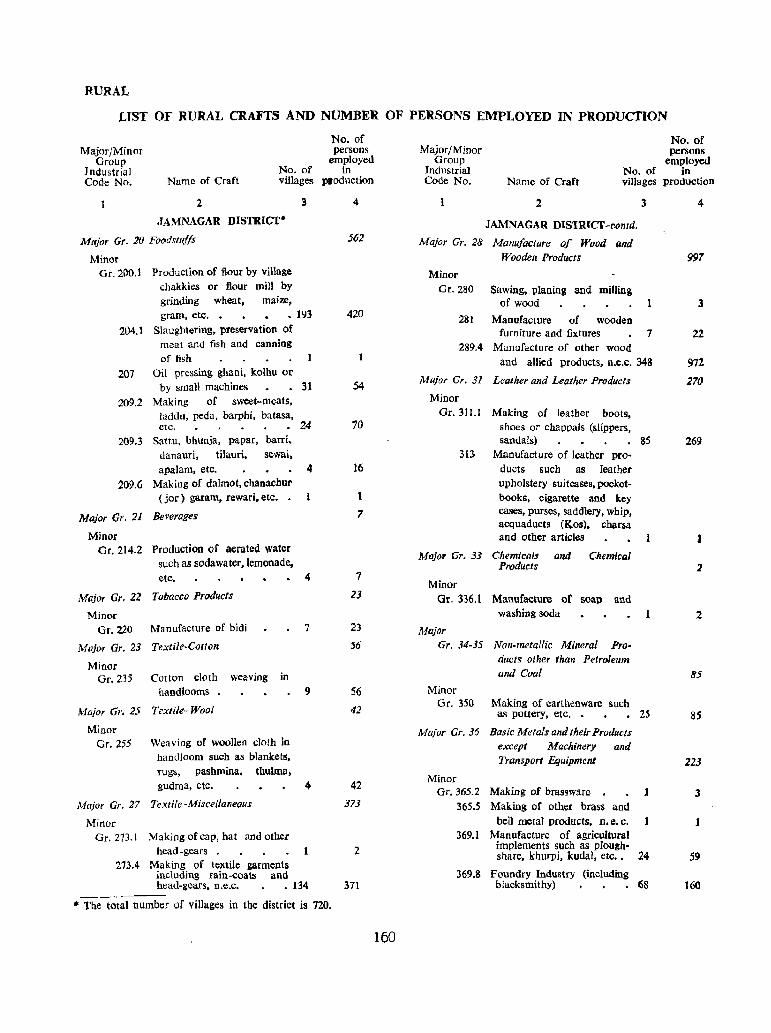
RURAL
LIST OF RURAL CRAFTS AND NUMBER OF PERSONS EMPLOYED IN PRODUCfION
Major/Minor Group
Industrial Code No. Name of Craft
No. of villages
2
JAMNAGAR DISTRICT·
Mtljor Gr. to Foodstllffs
Minor Gr.2oo.l Production of flour by village
chakkies or flour mill by grinding wheat, maize, gram, etc. • • 193
204.1 Slaughtering, preservation of meat and fish and canning of fish
207 Oil pressing ghani, kolhu or by small machines 31
209.2 Making of sweet-meats. laddu, peda. barphi, batasa, ~~ U
209.3 Sattu, bhunja, papae. barri. danauri, tilauri, sewai. apalam, etc. 4
209.6 Making of dalmot, chanachur (jor) garam, rewari, etc.
Major Gr. 21 Beverages
Minor Gr. 214.2 Production of aerated water
such as sodawater,lemonade, etc.
Major Gr. 22 Tobacco Products
Minor Gr. 220 Manufacture of bidi
Major Gr. 23 Textile-Cotton
Minor Gr. 235 Cotton cloth weaving in
handlooms
Major Gr. 25 Textile-Wool
Minor Gr. 255 Weaving of woollen cloth io
haodloom such as blankets, rugs, pashmina. thulma.
4
7
9
gudma, etc. 4
Major Gr. 27 Textile-Miscellaneous
Minor Gr. 273.1 Making of cap, hat and other
head-gears 213,4 Making of textile garments
including rain-coats and head-gears, n.e.c. • 134
No. of persons
employed in
ptoduction
4
562
420
54
70
16
I
7
7
23
23
56
S6
42
42
373
2
371 ----~-
... The total number of villages in the district is 720.
160
No. of persons
employed Major/Minor
Group Industrial Code No.
No. of in Name of Craft villages production
2
JAMNAGAR DlSTRICT-ct>ntd.
Major Gr. 28 Manufacture of Wood and
Wooden Products
Minor
Gr. 280 Sawing, planing and milling of wood
281 Manufacture of wooden
3
furniture and fixtures 7 289.4 Manufacture of other wood
and allied products, n.e.c. 348
Major Gr. 31 Leather and Leather Products
Minor Gr. 311.1 Making of leather boots.
shoes or chappals (slippers. sandals) 85
313 Manufacture of leather pro-ducts such as leather upholstery suitcases, pocketbooks, cigarette and key cases, purses, saddlery, whip, acquaducts (Kos). charsa and other articles
Major Gr. 33 Chemicals and Chemical Products
Minor Gr. 336.1 Manufacture of soap and
washing soda
Major
Gr. 34·35 Non-/1U!tallic Mineral Products other than Petroleum and Coal
Minor Gr. 350 Making of earthenware such
as pottery, etc. • 25
Major Gr. 36 Basic Metals and their Products except Machinery and Transport Equipment
Minor Gr. 365.2 Making of brassware
365.5 Making of other brass and bell metal products, n. e. c.
369.1 Manufacture of agricultural implements such as ploughshare, khurpi, kudal, etc. • 24
369.8 Foundry Industry (including blacksmithY) 68
997
3
22
972
270
269
1
2
85
85
223
3
1
59
160
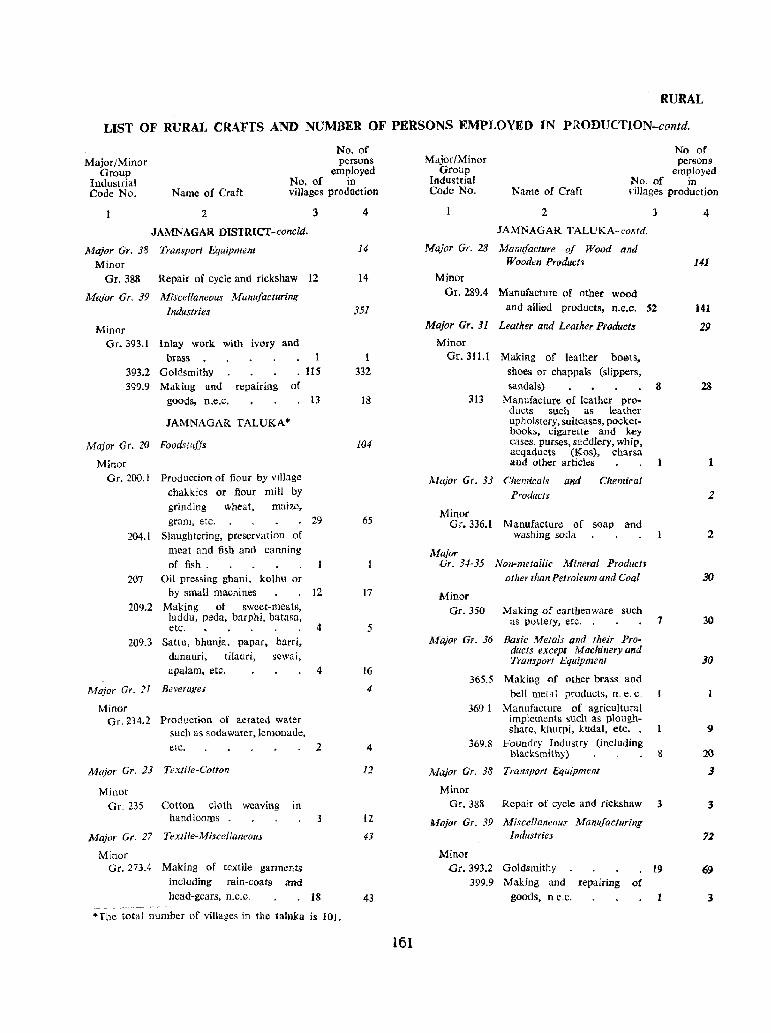
RURAL
LIST OF RURAL CRAFTS AND NUMBER OF PERSONS EMPLOYED IN PRODUCTlON-contd.
Major/Minor Group
Industrial Code No.
No. of persons
em ()loyed No. of In
Name of Craft villages production
2 3
JAMNAGAR DlSTRICT-concid.
Major Gr. 38 Transport Equipment Minor
Gr. 388 Repair of cycle and rickshaw 12
Major Gr. 39 Miscellaneous Manufacturing
Industries
Minor Gr. 393.1 Inlay work with ivory and
brass 393.2 Goldsmithy 399.9 Making and repairing of
1 lIS
goods, n.e.c. 13
JAMNAGAR TALUKA'"
Major Gr. 20 Foodstuffs
Minor Gr. 200. J Production of flour by vilJage
chakkies or flour mill by grinding wheat, maize, gram, etc. 29
204.1 Slaughtering, preservation of meat and fish and canning
of fish. 207 Oil pressing ghani. kolhu or
by small machines 12 209.2 Making of sweet-meats,
laddu, peda, barphi, batasa, e~. 4
209.3 Sattu, bhunja, papar, barri, danauri, tilauri, sewai, apalam, etc. 4
Major Gr. 2l B2verage~
Minor Or. l!14.2 Production of aerated water
such as soda water, lemonade, elC. 2
Major Gr. 23 Textile-Cotton
Millor Or. 235 Cotton cloth weaving in
handlooms
Major Gr. 27 Textile-Miscellaneous
Minor Gr. 27J.4 Making of textile garments
including rain-coats ami
3
head-gears, D.e.C. 18
"The total number of villages in the taluka is 10J.
4
14
14
351
1 332
18
lO4
65
17
5
16
...
4
12
12
4}
43
161
No of persons
employed Major/Minor
Group Industrial Code No.
No. of in Name of Cran villages production
2
JAMNAGAR TALlJKA-conrd.
Major Gr. 2.8 Manufacture of Wood and Wooden Products
Minor
Or. 289.4 Manufacture of other wood
J
and allied products, n.e.c. S2
Major Gr. 31 Leather and Leather Products
Minor Gr.3ILl Making of leather boets,
shoes or chappals (slippers, sandals) 8
313 Manufacture of leather pro-ducts such as leather upholstery, suitcases, pocketbooks. cigarette and key cases, purses, saddlery, whip. acqaducts (Kos), charsa and other articles
Major Gr. 33 Chemicals and Chemical Products
Minor Gr. 336.1 Manufacture of SQap a-nd
washing soda
Major Gr. 34-35 Non-metallic Mineral Products
other than Petroleum and Coal
Minor Gr. 350 Making of earthenware such
as pottery, etc. 7
Major Gr. 36 Basic MeJais and their Pm· ducts except Machineryand Transport Equipment
365.5 Making of other brass and bell met~1 products, n. e. c.
369 1 Manufacture of agricultural implements such as ploughshare, khurpi. kudal, etc. •
369.8 Foundry Industry (inclUding blacksmith),) 8
Major Gr. 38 Transport Equipment
Minor Gr. 38& Repair of cycle and rickshaw 3
Major Gr. 39 Miscellaneous Manufacturing Industries
Mino[ Gr.393.2 Ooldsmithy 19
399.9 Making and repairing of goods, n e.c.
4
141
141
29
28
2
2
30
30
30
9
2.0
3
72
69
3

RURAL
UTS OF RURAL CRAFTS AND NUMBER OF PERSONS EMPLOYED IN PRODUCTION-contd.
No. of persons employed
Major/Minor Group
Industrial Code No.
No. of in Name of Craft villages production
2
DHROL TALUKA*
Major Gr. 20 Foodstuffs
Minor Gr. 200.1 Production of flour by village
chakkies or flour mill by grinding wheat, maize,
3
gram, etc. 7 209.2 Making of sweet-meats,
laddu, peda, barphi, batasa, etc. 3
Major Gr. 23 Textile-Cotton
Minor Gr. 235 Cotton cloth weaving in
hand looms
Major Gr. 27 Textile-Miscellaneous
Minor Gr. 273.4 Making of textile garments
including rain-coats and head-gears, n.e.c. 9
Major Gr. 28 Manufacture 0/ Woad and Wooden Products
Minor Gr. 289.4 Manufacture of other wood
and allied products, n.e.c. 29
Major Gr. 31 Leather and Leather Products
Minor Gr.311.1 Making of leather boots,
shoes or chappals (slippers,
Major Gr. 34-35
Minor Gr. 350
sandals)
Non-metallic Mineral Products other than Petroleum and Coal
Making of earthenware such
2
as pottery, etc. 2
Major Gr. 36 Basic Metals and their Pro-
Minor
ducts excepJ Machinery and
Transport Equipment
Gr. 365.2 Making of brassware 369.1 Manufacture of agricultural
implements such as ploughshare, khurpi, kudal, etc. •
369.8 Foundry Industry (including blacksmithy) 4
• The total number of villages in the taluka is 41. t The total number of villages in the mahal is 53.
4
26
16
10
4
4
26
26
69
69
6
6
6
6
13
3
2
8
162
Major/Minor Group
Industrial Code No.
No. of persons
employed No. of in
Name of Craft villages production
1 2 3
DHROL TALUKA-conra.
Major Gr. 38 Transport Equipment Minor
Gr. 388 Repair of cycle and rickshaw 3 Major Gr. 39 Miscellaneous Manu/acturing
Industries Minor
Gr. 393.2 Goldsmithy 3
399.9 Making and repairing of goods, n.e.c. 1
JODIYA MAHALt
Major Gr. 20 Foodstuffs
Minor Gr. 200.1 Production of flour by village
chakkies or flour mill by grinding wheat, maize, gram, etc. 22
207 Oil pressing ghani, kolhu or by small machines 7
Major Gr. 27 Textile-Miscellaneous
Minor Gr. 273.4 Making of textile garments
including rain-coats and head-gears, n.e.c. 16
Major Gr. 28 Manu/acture 0/ Wood and Wooden Products
Minor Gr. 289.4 Manufacture of other wood
and allied products, D.e.C. 29
Major Gr. 31 Leather and Leather Products
Minor Gr. 311.1 Making of leather boots,
shoes or chappals (stippers, sandals) 3
Major Gr. 36 Basic Metals and their Products except Machinery and Transport Equipment
Minor Gr.369.8 Foundary Industry (including
blacksmithy) 12
Major Gr. 39 Miscellaneous Manufacturing Industries
Minor Gr. 393.2 Goldsmithy 14
4
4
4
14
13
1
56
44
12
34
34
63
63
11
11
29
29
35
3S
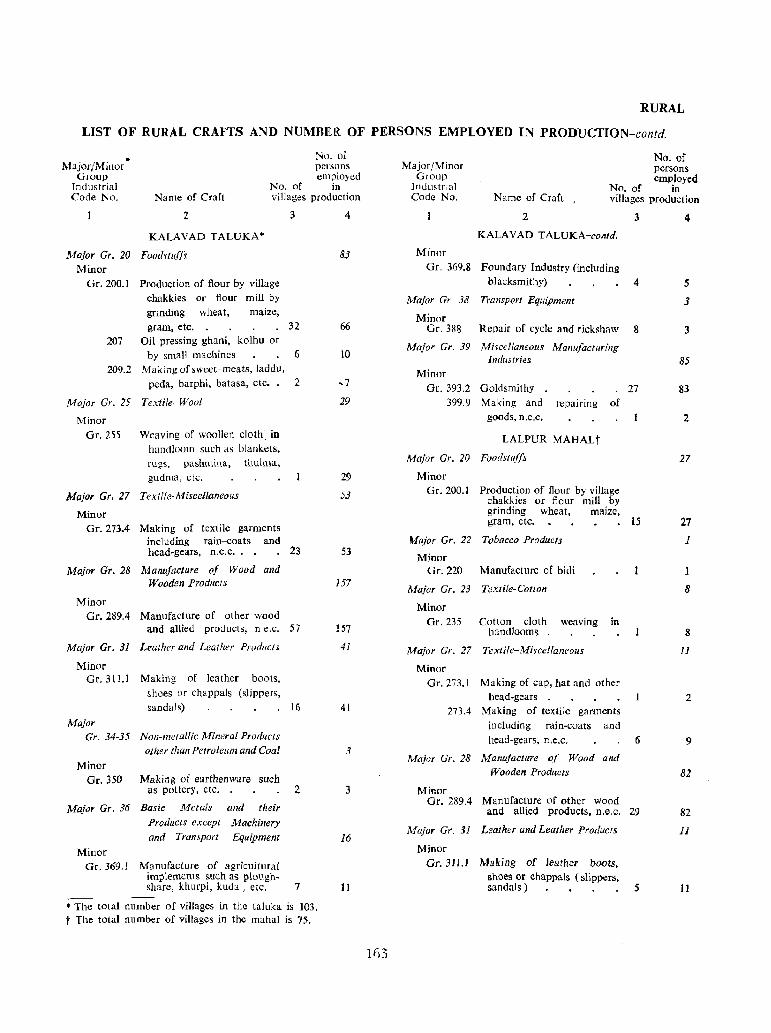
RURAL
LIST OF RURAL CRAFTS AND NUMRER OF PERSONS EMPLOYED IN PRODUCTION-contd.
No. of persons employed
Major/Minor· Group
Industrial Code No.
No. of in Name of Craft villages production
2
KALAVAD TALUKA*
Major Gr. 20 Foodltl(ffv Minor
Gr. 200.1 Production of flour by viJIage chakkies or flour mill by grinding wheat, maize,
3
gram, etc. 32 207 Oil pressing ghani, kolhu or
by small machines 6 209.2 Making of sweet- meats, laddu,
peda, barphi, batasa, ctc. 2
Major Gr. 25 Textile- Wool
Minor Gr. 255 Weaving of woollen cloth: in
handloom such as blankets, rugs, pashmina, thulma, gudma, ctc.
Major Gr. 27 Textile-Miscellaneous
Minor Gr. 273.4 Making of textile garments
including rain-coats and head-gears, n.c.c.. 23
Major Gr. 28 Manufacture of Wood and Wooden Products
Minor Gr. 289.4 Manufacture of other wood
and allied products, 11 e.c. 57
Major Gr. 31 Leather and Leather Products
Minor Gr. 311.1 Making of lea ther boots,
shoes or chappals (slippers, sandals)
Major Gr. 34-35 Non-metallic Mineral Products
other than Petroleum and Coal
Minor Gr. 350 Making of earthenware such
as pottery, ctc.
Major Gr. 36 Basic Metals and their Products except Machinery and Transport Equipment
Minor Gr. 369.1 Manufacture of agricultural
implements mch as plough.
16
2
share, khurpi, kudal, etc. 7 .-------* The total number of villages in the taluka is 103. t The total number of villages in the mahal is 75.
4
83
66
10
29
29
53
53
157
157
41
41
3
3
16
11
163
Major/Minor Group
Industrial Code No.
No. of persons employed
No. of in Name of Craft villages production
2 3
KALAVAD TALUKA-coJltd.
Minor Gr. 369_8 Foundary Industry (including
blacksmithy) 4
Major Gr 38 Transport Equipment
Minor Gr. 388 Repair of cycle and rickshaw 8
Major Gr. 39 Miycellaneous Nlanufacturing Industries
Minor Gr. 393.2 Goldsmithy 27
399.9 Making and repairing of goods, n.e.c.
LALPUR MAHAL t Major Gr. 20 Foodstuffs
Minor Gr. 200.1 Production of flour by village
chakkies or flour mill by grinding wheat, maize, gram, etc. 15
Wajor Gr. 22 Tobacco Products
Minor Gr. 220 Manufacture of bidi
Major Gr. 23 Textile-Cotton
Minor Gr. 235 Cotton cloth weaving in
handlooms
Major Gr. 27 Textile-Mircellaneous
Minor Gr. 273.1 Making of cap, hat and other
head-gears 273.4 Making of textile garments
including rain-coats and head-gears. n.e.c. 6
Major Gr. 28 Manufacture of Wood and Wooden Products
Minor Gr. 289.4 Manufacture of other wood
and allied products, n.e.c. 29
Major Gr. 31 Leather and Leather Producfs
Minor Gr. 311.1 Making of leather boots,
shoes ()I chappals (slippers, sandals) 5
4
5
3
3
85
83
2
27
27
1
8
8
Il
2
9
82
82
lJ
11
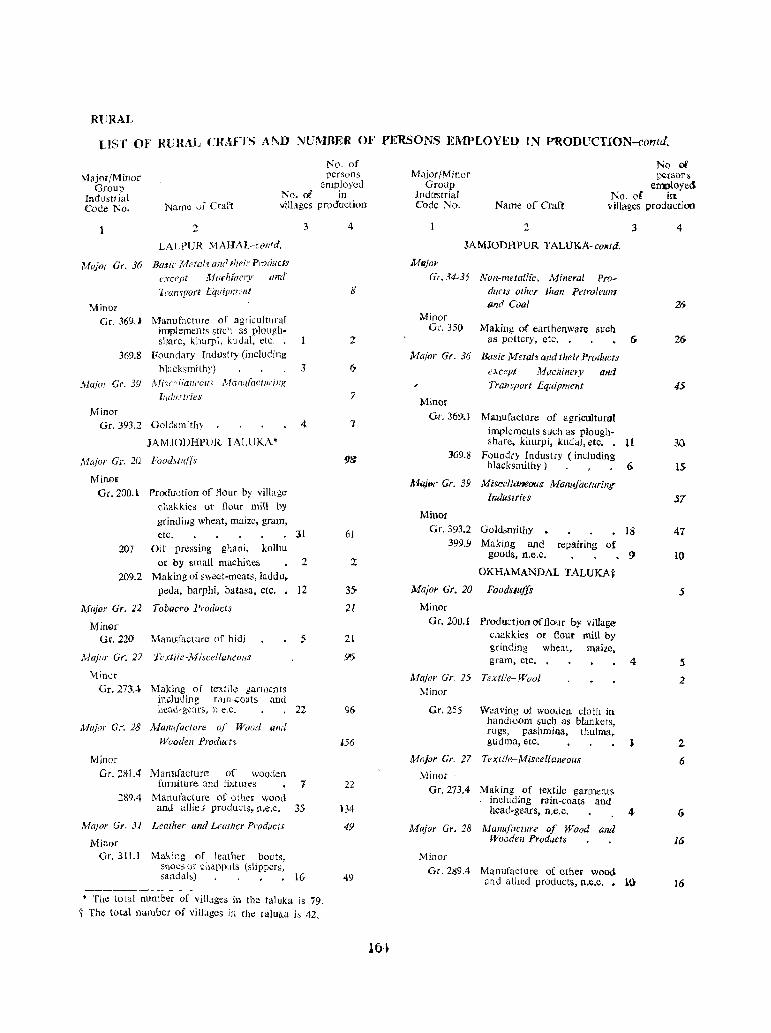
RlJRAL
LIST OF RURAL CR)i.j,~rS AND NVMBER OF PERSONS J~MPLOYED IN P'RODUCTION-coma.
No. of pcrsons
cmployed Major/Minor
Group Industrial Code No.
No. of In
Name of Craft villages prodlTctlon
2
LALPUR MAHAt~contd.
Major Cr. 36 BaJic Metals and fheir PIVrillcfs
Minor Gr. 369.}
369.8
MajO! Gr. 39
Minor
except fd(lrhillcry and'
Tmnwort Ei]ilipmcnt
Manufacture of agriculturaT ilTFplements such as plough· share, kburpi, kudal. etc. .
Foundary Industry (including hl8cksmithy)
t>.fiscciiallt'orls Mallli[ac/{lI';llg Industries
Gr. 393.2 Goldsmithy
JAMJODHPUR TALUKA'
Major Gr. 2Q Foods/uffs
Min.or Gr. 200.1 Prod'uctlon of flour by village
chakkies or flour mill by grinding wheat, maize, gram,
3
3
4
etc. 31 207 Oil' pressing ghani, kolhu
or by small machines 2 209.2 Making of sweet-meats, laddu.
peda, barphi, batasa, etc. 12
Major Gr. 22 Tobacco Products
Minor Gf.220 Manufacture of bidi
Major Gr. 27 TI!:xtile-j~fiscel1(Jl1eolis
Minor Gr.2H.4 Making of textile garments
inclUl.1ing raw,coats and
5
head-gears, n c.c. 22
Majm' Gr. 28 Manu/ac/ure of Wood and
Wooden Products
Minor Gr. 281.4 Manufacture of wooder.
furniture and fixtures 1 289.4 Manufacture of oth~r wood
and alliej products, 1.l.e'.C. 35
Major Gr. 31 Leather and Lea/her Products
Minor Gr. 31Ll Making of leather boots,
sho~s or cbappals (slippers, :;andals) . . • • 16
* The lotal number of villages in the tal uk a is 79. t The total number of villages in the taluka is 42.
4
g
2
7
7
61
z
35-
21
2L
%
9&
156
22
134
49
49
l64
No of persons
employ\!d MajorfMinor
Group lndtrstrial Code No.
No. of in Name of Craft villages productioo
2
JAMJODHPUR T ALUKA- contd.
Major
Gr.34-35 Non-metallic, Mineral Pro
d'lcts other than Petroleum and Coal
Minor Gr. 35() Making of earthenware such
3
as po((ery, etc. 6
Major Gr. 36 Basic :Metals amlthdr Products
except Machinery and
Transport Equipment
Minor
Gr. 369.1 Manufacture of agricultural implements such as ploughshure, khurpi, kudaJ, etc. • 11
369.8 Foundry Industry (including blacksmith), ) . , . 6
Major Gr. 39 MiseellilJ1eOw; Manufacturing
Industries
Minor
Gr.393.2 Goldsmithy 18 399.9 Making and repairing or
goods, n.e.c. 9
OKHAMANDAL TALUKAi;
Major Gr. 20 Foodstuffs
Minor Gr. 200.1 Production C1ffloor by village
cbakkies or flour mill by grinding wheat, maize, gram, etc.
Major Gr. 25 Textile-Wool Minor
Gr. 255 Weaving at woollen cloth in hand/oom such as blankets, rugs, pashmina. thulma,
4
gudma, etc. l
Major Gr. 27 Textile-Miscellaneous
Millor Gr. 273.4 Making of textile garments.
including rain-coats and head-gears, n.e.c. 4-
Major Gr. 28 Manufaclure of Wood and Wooden Products
Minor
Gr. 239.4 Manufacture of otber wood an d allied products, n.e.c. • 1(.)
4
26
26
45
15
57
47
IU
5
5
2
2
6
6
16
16
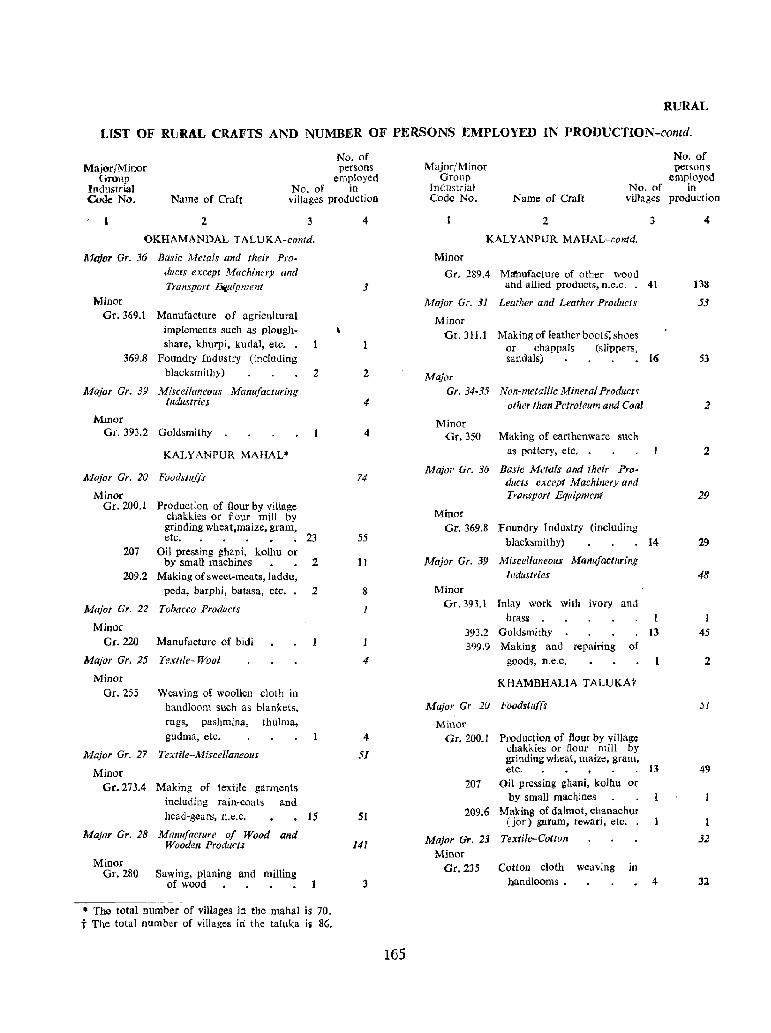
RURAL
LIST OF RURAL CRAFTS AND NUMBER OF PERSONS EMPLOYED IN PRODUCTION-contd.
No. of persons
employed Maj()r/Minor
Group Industrial Code No.
No. of in Name of Craft villages production
2 3
OKHAMANDAL TAL UKA -contd.
Mojor Gr. 36 Basic Metais and their Products except Machinery and Transport Ettuti'pment
Minor Gr. 369.1 Manufacture of agricultural
implements sllch as ploughshare, khurpi, kudal, etc.
369.8 Foundry Industry (including black smithy) 2
Major Gr. 39 Miscellaneous Manufacturing llidustrie s
Minor Gr. 393.2 Goldsmithy
KAL Y AN PUR MAHAL*
Major Gr. 20 Foodstllffs
Minor Gr. 200.1 Production of flour by village
chakkies or flour mill by grinding wheat,maize, gram, etc. 23
207 Oil pressing ghani, kolhu or by small machines 2
209.2 Making of sweet-meats, laddu, peda, barphi, batasa, etc. 2
Major Gr. 22 Tobacco Products
Minor Gr. 220 Manufacture of bidi
Major Gr. 25 Textile- Wool
Minor
Or. 255 Weaving of woollen c10th in handloom such as blankets, rugs, pashmina, thulma, gudma, etc.
Major Gr. 27 Textile-Miscellaneous
Minor Gr.273.4 Making of textile garments
including rain-coats and head-gears, n.e.c. 15
Major Gr. 28 Manufacture of Wood and Wooden Products
Minor Gr. 280 Sawing, planing and milling
of wood
• The total number of villages in the mahal is 70. t The total number of villages in the taluka is 86.
4
3
2
4
4
74
55
11
8
4
4
5/
51
141
3
165
Major/Minor Group
IndUstrial Code No. Name of Craft
No. of villages
2 3
KAL YANPUR MAHAL-contd.
Minor
Gr. 289.4 M:thufacture of other wood and allied products, n.e.c. 41
Major Gr. 31 Leather and Leather Products
Minor
Gr. 311.1 Making of leather boots: shoes or chap pals (slippers, sandals) 16
Major
Gr. 34-35 Non-metallic Mineral Productr other than Petroleum and Coal
Minor Gr. 350 Making of earthenware such
as pottery, etc. •
Major Gr. 36 Basic Metals and their Products except Machinery and Transport Equipment
Minor Gr. 369.8 Foundry Industry (including
blacksmithy) 14
Major Gr. 39 Miscellaneous Manufacturing Industries
Minor Gr. 393.1 Inlay work with ivory and
brass 393.2 Goldsmithy 13 399.9 Making and repairing of
gtJods, n.e .c.
KHAMBHALIA TALUKAt
Major Gr. 20 Foodstuffs
Minor Gr. 200.1 Production of flour by village
chakkies or flour mill by grinding wheat, maize, gram, etc. IJ
207 Oil pressing ghani, kolllu or by small machines
209.6 Making of dalmot, chanachur (jor) garam, rewari, etc.
Major Gr. 23 Textile-Cotton Minor
Gr. 235 Cotton cloth weaving in handlooms . 4
No. of persons
employed in
production
4
138
53
53
2
2
29
29
48
45
2
51
49
32
3l
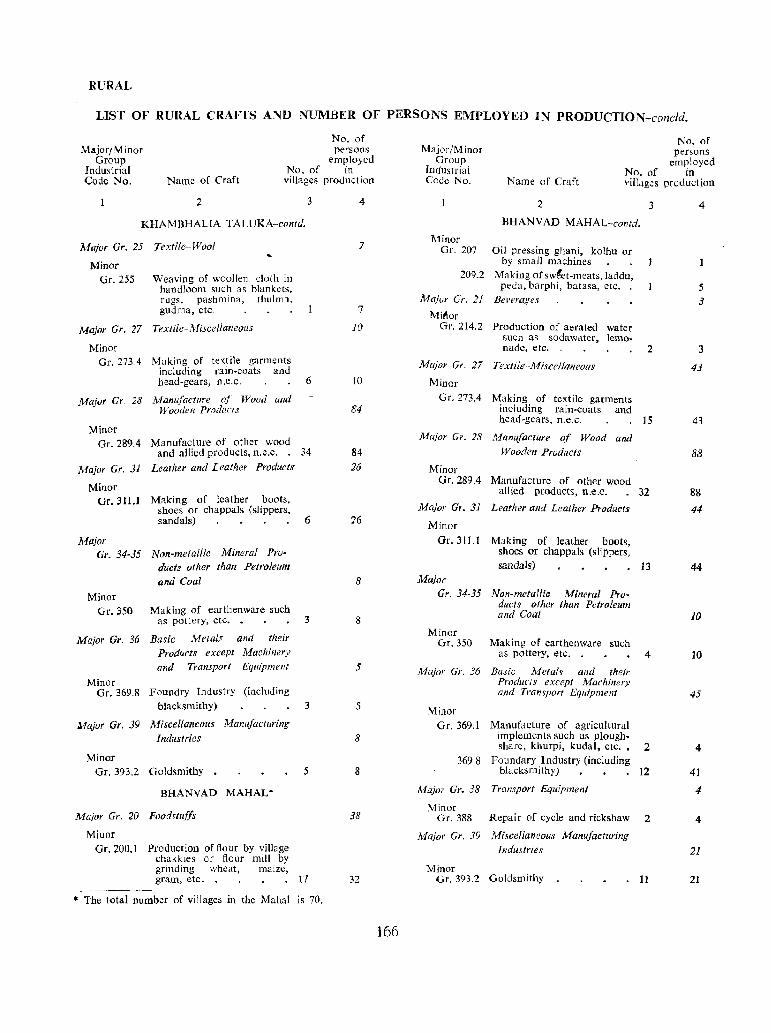
RURAl,
LIST OF RUUAL CRAfTS AND NUMBER OF PERSONS EMPLOYED IN PRODUCTION-concld.
No. of persons
employed Major/Minor
Group Industrial Code No.
No, of 10
Name of Craft villages product ion
2
KHAMBHALIA TALUKA-contd.
Major Gr. 25 Textile-Wool
Minor Gr. 255 Weaving of woollen clolh in
handloom such as blankets. rugs, pashmina, thulma, gudma, etc.
Major Gr. 27 Textile-Miscellaneous
Minor Gr. 273.4 Making of textile garments
including rain-coats aad head-gears, a.e.C.
Major Gr 28 Manufacture of Wood and Wooden Prot/urIS
Minor Gr.289.4 Manufacture of other wood
6
and allied products, n.e.c. 34 Major Gr. 31 Leather and Leather Products
Minor Gr.311.1 Making of leather boots,
shoes or chappals (slippers, sandals)
MaJor Gr. 34-35 Non-metallic Mineral Pro
ducts other than Petroleum and Coal
Minor Gr. 350 Making of earthenware such
as pottery, etc. •
Major Gr. 36 Basic Metals and their
Minor
Products except Machinery and Transport Equipment
Gr. 369.8 Foundry Industry (including
6
3
blacksmithy) 3
llajor Gr. 39 Miscellaneous Manufacturing Industries
Minor Gr. 393.2 Goldsmithy 5
BHANVAD MAHAL *
Major Gr. 20 Food,tu/ls
Miuor Gr. 200.1 Production of flour by village
chakkles or flour mill by grinding wheat, maIze, gram, etc. 17
... The total number of villages in the Mah~l is 70.
4
7
7
10
10
84
84 26
26
8
8
5
5
8
8
38
32
166
No. of persons
employed Major/Minor
Group Industrial Code No.
No. of in Name of Craft yillages production
Minor Gr. 207
209.2
2
BHANVAD MAHAL-contd.
Oil pressing ghani, kolhu or by small machines
Making of swlet-meats, laddu, peda, barphi, batasa, etc.
Ma/or Gr. 21 Beverages
Mi~or Gr. 214.2 Production of aerated water
sueh as sodawater, lemonade, etc.
Major Gr. 27 Texlile·-Miscellaneolls
Minor
Gr, 273.4 Making of textile garments including rain-coats and
3
2
head-gears, n.e.c. 15
Major Gr. 28 Manufacture of Wood and
Wooden Products
Minor Gr. 289.4 Manufacture of other wood
allied products, n.e.c. 32
Major Gr. 31 Leather and Leather Products
Minor
Gr.3ILl Making of leather boots, shoes or chappals (slippers, sandals) 13
Major Gr. 34-35 Non-metallic Mineral Pro
ducts other than Petroleum and Coal
Minor Gr. 350 Making of earthenware such
as pottery, etc. 4
Major Gr. 36 Basic Metals and their Products except Machinery and Tl"/1n~port Equipment
Minor Gr. 369.l Manufacture of agricultural
implements such as plough· share. khurpi, kudai, etc.. 2
369.8 Foundary Industry (including blacksmithy) 12
Major Gr. 38 Transport Equipment
Minor Or. 388 Repair of cycle and rickshaw 2
Major Gr. 39 Miscellaneous Manufacturing Industries
Minor Gr.393.2 Goldsmithy 11
4
5
3
3
43
43
88
88
44
44
10
10
45
4
41
4
4
21
21
PART I1-contd.
OFFICIAL STATISTICS
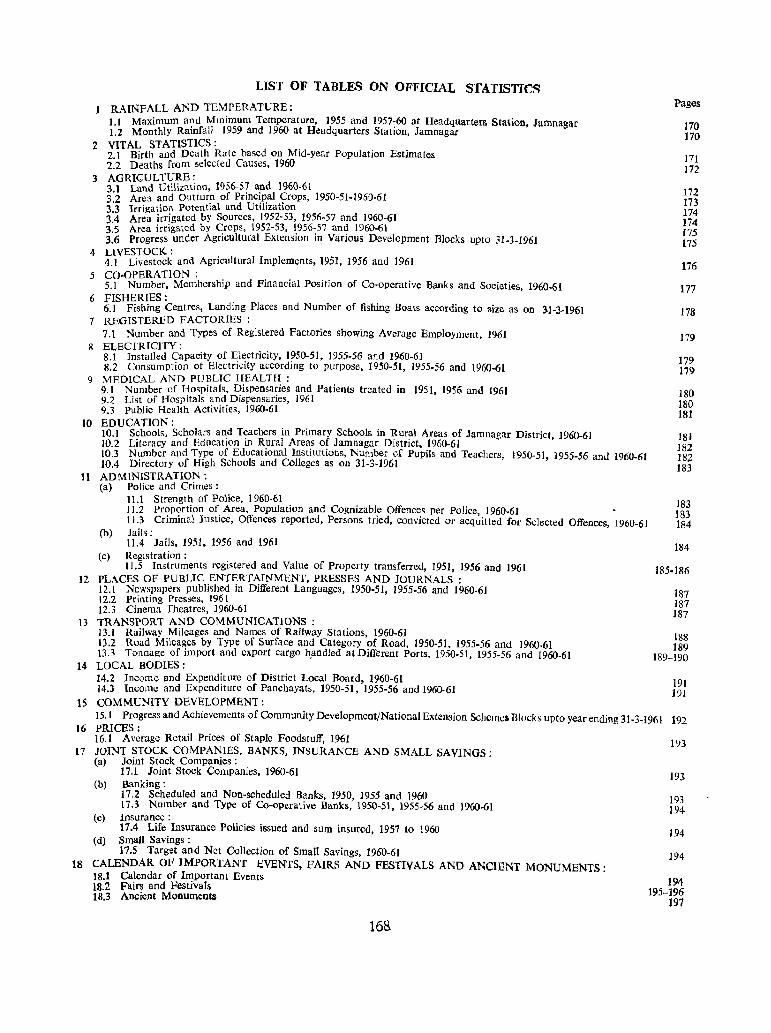
LIST OF TABLES ON OFFICIAL STATISTICS
RAINFALL AND TEMPERATURE: I 1 Maximum and Minimum Temperature. 1955 and 1957-60 at Hea,dquarters Station, Jamna{lar 1:2 Monthly Rainfall 1959 and 1960 at Headquarters Station, Jamnagar
2 VITAL STATISTICS: 2 1 Birth and Death Rate based on Mid-year Population Estimates 2:2 Deaths from selected Causes. 1960
3 AGRICULTURE: 3 1 Land Utilization, 1956-57 and 1960-61 3:2 Area and Outtur? of Princ\p.al <;rops, 1950-51-1960·61 3.3 Irrigatio!l PotentIal and Utlhzatlon 3.4 Area irrIgated by Sources, 1952-53, 1956-57 and 1960-61 35 Area irrigated by Crops, 1952-53, 1956-57 and 1960-61 3:6 Progress under Agricultural Extension in Various Development Blocks upto 31-3-1961
4 LlVESTOCK: 4.1 Livestock and Agricultural Implements, ]951, 1956 and 1961
5 CO·OPERATlON: 5.1 Number, Membership and Financial Position of Co-operative Banks and Societies, 1960-61
6 FISHERIES: 6.1 Fishing Centres, Landing Places and Number of fishing Boats according to size as on 31-3-1961
7 REGISTERED FACTORIES: 7.1 Number and Types of Registered Factories showing Average Employment, 1961
II ELECTRICITY: 8.1 Installed Capacity of E:l~ctricity, 1?50-51, 1955-56 and 1960-61 8.2 Consumption of ElectrICIty accordmg to purpose, 1950-51, 1955·56 and 1960.61
9 MEDICAL AND PUBLIC HEALTH: 9.1 Number of Hospitals, Dispensaries and Patients treated in 1951, 1956 and 1961 9.2 List of Hospitals and Dispensaries, 1961 9.3 Public Health Activities, 1960-61
10 EDUCATION: 10.1 Schools, Scholars and Teachers in Primary Schools. in Rural Areas of Jamnagar District, 1960-61 10 2 Literacy and Education in Rural Areas of Jamnagar District, 1960-61 10:3 Number and Type of Educational Institutions, Number of Pupils and Teachers, 1950-51, 1955-56 and 1960-61 10.4 Directory of High Schools and Colleges as on 31-3-1961
11 ADMINISTRATION: (a) Police and Crimes:
11.1 Strength of Police, 1960-61 11.2 Proportion of Area, Population and Cognizable Offences per Police, 1960-61 11.3 Criminal Justice, Offences reported, Persons tried, convicted or acquitted for Selected Offences, 1960-61
(b) Jails: 11.4 Jails, 1951, 1956 and 1961
(c) Registration: 11.5 Instruments registered and Value of Property transferred, 1951, 1956 and 1961
12 PLACES OF PUBUC ENTERTAINMENT, PRESSES AND JOURNALS: 12.1 Newspapers published in Different Languages, 1950·51, 1955.56 and 1960-61 12.2 Printing Presses, 1961 12.3 Cinema Theatres, 1960-61
13 TRANSPORT AND COMMUNICATIONS: 13.1 Railway Mileages and Names of Railway Stations, 1960-61 13.2 Road Mileages by Type of Surface and Category of Road, 1950-51, 1955·56 and 1960-61 133 Tonnage of import and export cargo h,andled at Different Ports, 1950-51, 1955·56 and 1960-61
14 LOCAL BODIES: 14.2 Income and Expenditure of District Local Board, 1960-61 14.3 Income and Expenditure of Panchayats, 1950-51, 1955-56 and 1960-61
15 COMMUNITY DEVELOPMENT:
Pages
170 170
171 172
In 173 174 174 ]75 175
176
177
178
179
179 179
180 180 181
181 182 182 183
183 183 184
184
185·186
187 187 ]87
188 189
189-190
191 191
15.1 Progress and Achievements of Community Development/National Extension Schemes Block s up to year ending 31-3-1961 16 PRICES:
192
16.1 Average Retail Prices of Staple Foodstuff, 1961 17 JOINT STOCK COMPANIES, BANKS, INSURANCE AND SMALL SAVINGS:
(a) Joint Stock Companies: 17.1 Joint Stock Companies, 1%0-61
(b) Banking: 17.2 Scheduled and Non-scheduled Banks, 1950, 1955 and 1960 17.3 Number and Type of Co-operative Banks, 1950-51, 1955-56 and 1960-61
(c) Insurance: 17.4 Life Insurance Policies issued and sum insured, 1957 to 1960
(d) Small Savings: 17.5 Target and Net Collection of Small Savings, 1960-61
18 CALENDAR OF IMPORTANT EVENTS. FAIRS AND FESTIVALS AND ANCIENT MONUMENTS: 18.1 Calendar of Important Events 18.2 Fairs and Festivals 18.3 Ancient Monuments
168
193
193
193 194
194
194
194 195-196
197
OFFICIAL STAT)STICS
Departmental statistics collected from various sources, viz., Administrative Departments, State and Central, Reserve Bank of India, Life Insurance Corporation, Gujarat Electricity Board, etc., have been included in the District Census Handbook for the first time, and distributed under 18 different sections listed below :-
Rainfall & Temperature 11 Administration 2 Vital Statistics 12 Public Entertainment and Presses and Journals 3 Agrkulture 13 Transport and Communications 4 Livestock 14 Local Bodies 5 Co-operation )5 Community Development 6 Fisheries 16 Prices 7 Factori"es 17 Joint Stock Companies, Insurance, Banks and 8 Electricity Co-operative Societies 9 Medical & Public Health 18 Important Events, Fairs and Festivals and Ancient
10 Education Monuments
Uniform table numbers have been adopted in all the Handbooks. Wherever a particular table is not applicable to or could not be compiled for want of requisite information for any district, there wiIJ be a break in the sequence, owing to the omission of such a table from the Handbook.
To facilitate further reference, the sourCe of the table as well as explanatory notes as to the units to which they refer and other particulars have been given at the foot of the table.
Abbreviations used are: N.A.=Not available; .. =Nil
169
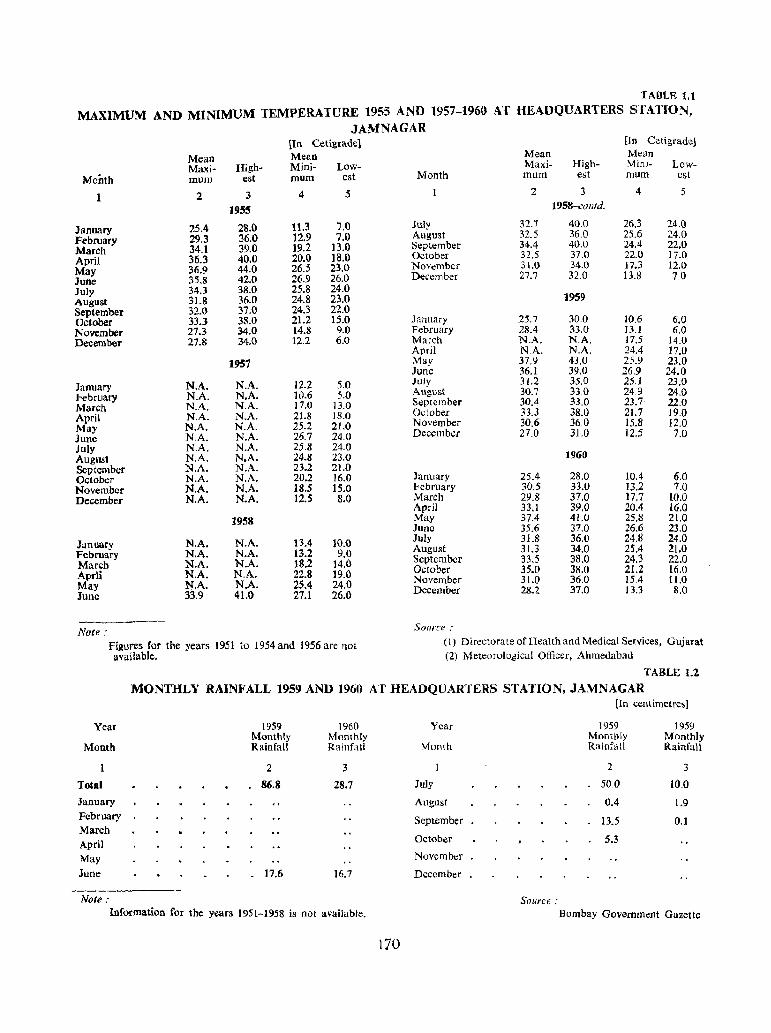
TABLE 1.1
MAXIMUM AND MINIMUM TEMPERATURE 1955 AND 1957-1960 AT HEADQUARTERS STATION, JAMNAGAR
[In Cetigrade] [In Cetigrade}
Mean Mean Mean Mean
Mmd- High- Mini- Low- Maxi- High- Mini- Low-
Month mum est mum est Month mum est mum est
2 3 4 5 2 3 4 5
1955 19S8-contd.
January 25.4 28.() 11.3 7.0 July 32-7 40.0 26.3 24.0
February 29.3 36.0 12.9 7.0 August 32.5 36.0 25.6 24.0
March 34.1 39.0 19.2 13.0 September 34.4 40.0 24.4 22.0
April 36.3 40.0 20.0 ]8.0 October 32.5 37.0 22.0 17.0
May 36.9 44.0 26.5 23.0 November 31.0 34.0 17.3 12.0
June 35.8 42.0 26.9 26.0 December 27.7 32.0 13.3 7.0
July 34.3 38.0 25.8 24.0 August 31.8 36.0 24.8 23.0 1959
September 32.0 37.0 24.3 22.0 October 33.3 33.0 lU 15.0 January 25.7 30.0 10.6 6.0 November 27.3 34.0 14.8 9.0 February 28.4 33.0 13.1 6.0 December 27.8 34.0 12.2 6.0 March N.A. NA. 17.5 14.0
April NA- N.A. 24.4 17.0 1957 May 37.9 43.0 25.9 23.0
June 36.1 39.0 26,9 24.0
January N.A. N.A. 12.2 5.0 July 31.2 35.0 25,1 23.0
February N.A. N.A. 10.6 5.0 August 30.7 33.0 249 24.0
March N.A. N.A. 17.0 13.0 September 30.4 33.0 23.7 22.0
April N.A. N.A. 21.8 ]8.0 October 33.3 38.0 21.7 19.0
May N.A. N.A. 25.2 21.0 November 30.6 36.0 15.8 12.0
June N,A. N.A. 26.7 24.0 December 27.0 31.0 12.5 7.0
July N.A. N.A. 25,8 24.0 August N.A. N.A. 24.8 23.0 1960
September N.A. N.A. 23.2 21.0 October N.A. N.A. 20.2 16.0 January 25.4 28.0 10.4 6.0 November N.A. N.A. 18.5 15.0 February 30.5 33.0 13.2 7.0 December N.A. N.A. 12.5 8.0 March 29.8 37.0 17.7 10.0
April 33.1 39.0 20.4 16.0 1958 May 37.4 41.0 25.8 21.0
June 35.6 37.0 26.6 23.0
January N.A. N.A. 13.4 10.0 July 31.8 36.0 24.8 24.0
February N.A. N.A. 13.2 9.0 August 31.3 34.0 25.4 21.0
March N.A. N.A. 18.2 14.0 September 33.5 38.0 24.3 22.0
Aprli N.A. N.A. 22.8 19.0 October 35.0 38.0 21.2 16.0
May N.A. N.A. 25.4 24.0 November 31.0 36.0 15.4 11.0
June 33.9 41.0 27.1 26.0 December 28.2 37.0 13.3 8.0
Note: Source:
Figures for the years 1951 to 1954 and 1956 are not (1) D irectora te of Health and Medical Services, Guj arat
available. (2) Meteorological Officer, Ahmedabad
TABLE 1.2
MONTHLY RAINFALL 1959 AND 1960 AT HEADQUAKfERS STATION, JAMNAGAR [In centimetres}
Year 1959 1960 Year 1959 1959
Month Monthly Monthly Monthly Monthly Rainfall Rainfall Month Rainfall Rainfall
2 3 2 3
Total 86.8 28.7 July 50.0 10,0
January August 0.4 1.9 February September 13.5 0.1 March April October 5.3
May November
June 17.6 16.7 December
Note: Source: Information for the years 1951-1958 is not available. Bombay Government Gazette
170
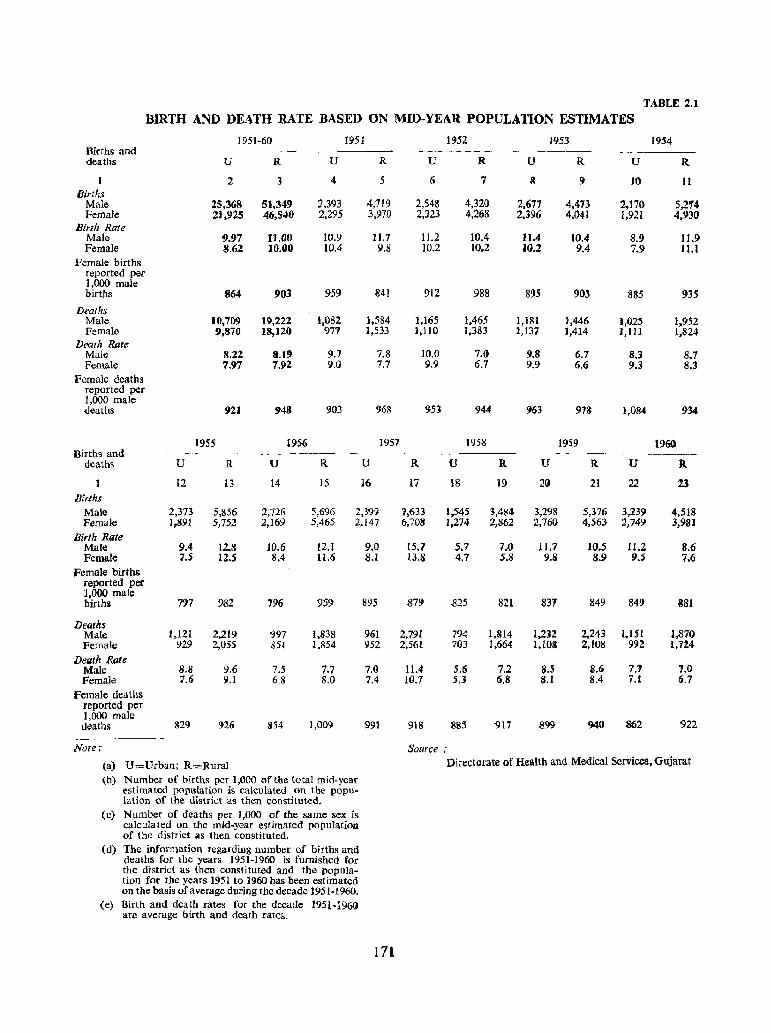
TABLE 2.1
BIRTH AND DEATH RATE BASED ON MID-YEAR POPULATION ESTIMATES
1951-60 1951 1952 1953 1954 Births and -_----deaths U R U R U R U R U R
2 3 4 5 6 7 8 C} 10 Il Births
Male 25,36& 51,349 2,393 4,719 2,548 4,32() 2,677 4,473 2.170 5,2,.4 Female 21,925 46,540 2,295 3,970 2,123 4,268 2.396 4.041 1.911 4,930
Birth Rate Male 9.97 11.00 10.9 ]1.7 ]1.2 10.4 11.4 10.4 8.9 11.9 Female 8.62 10.00 10.4 9.8 10.2 10.2 10.2 9.4 7.9 11.1
Female births reported per 1,000 male births 864 903 959 841 912 988 895 903 '835 935
Deaths Male 10,709 19,222 1,082 1,584 1,165 1,465 1,181 1,446 1,~25 1,952 Female 9,870 I8,12() 977 1,533 1,110 1,383 1,137 1,414 l,lll 1,824
Death Ratt! Male 8.22 8.11) 9.7 7.8 10.0 7.G 9.8 6.7 3.3 8.7 Female 7.97 7.92 9.0 7.7 9.9 6.1 9.9 6.6 9.3 8.3
Female deaths reported per 1,000 male .deaths 921 948 903 968 951 944 963 973 1,08" 934
1955 1956 1951 1958 1959 1960 Births and -----_ - ---.-~---_ ------ ~--------
deaths U R U R U R U R U R U R
12 13 14 15 16 17 18 19 2() 21 22 23 Births
Male 2,373 5,856 2,726 5,696 2,399 7,633 1,545 3,4l:l4 3,298 5,376 3,239 4,518 Female 1,891 5,752 2,169 5,465 2,147 6,708 1,274 2,862 2,760 4,563 2,749 3,981
Birth Rate Male 9.4 12.8 10.6 12.1 9.0 15.7 5.1 7.0 11.7 10.5 II.2 8.6 Female 7.5 12.s 8.4 11.(; 8.1 13.8 4.7 5.8 9.8 8.9 9.$ 7.6
Female births reported per 1,000 male births 797 982 796 959 895 87!J .825 821 831 849 84? 381
Deaths Male 1,12 [ 2,219 '997 1,838 961 2,791 794 UI4 1,232 2.243 1,lSl 1,870 Female 929 2,055 S51 1,854 952 2,561 703 1,664 1,103 2.108 992 1.7l4
Death Rate Male 8.8 9.6 7.5 7.7 7.0 11.4 5.6 7.2 8.5 8.6 7.1 7.0 Female 7.6 9.1 6.8 8.0 7.4 10.7 5.3 6.8 8.1 8.4 7.1 6.7
Female deaths reported per 1,000 male deaths 829 926 1154 1,00<;) 991 918 1185 917 899 940 .862 922 ------~-
Note: Source ..
(a) U=Urban; R=Rllral Directorate of Health and Medical Services. Gujarat
(b) Number of births per 1,000 of the total mid-year estimated population is calculated on the popu-lation of the district as then constituted.
(c) Number of deaths per 1,000 of the same sex is calculated on the mid.year estimated population of the distTict as then constituted.
(d) The information regarding number of births and deaths foQr the years 1951-1960 is furnished for the district as then constituted and the popula-tion for the years 1951 to 1960 has been estimated on the basis of average during the decade 1951-1960.
(e) Birth and death rates for the decade are average birth and death cate".
1951·196<l
171
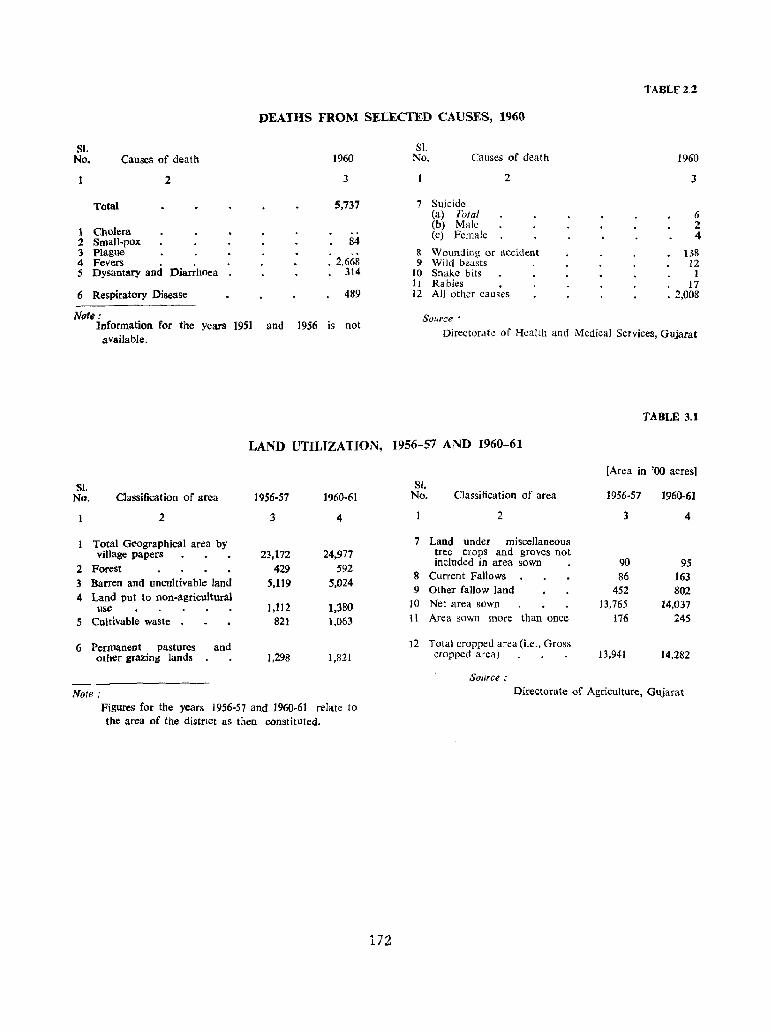
TABLE 2.2
DEATHS FROM SELECTED CAUSES, 1960
81. SL No, Causes of death 1960 No. Causes of death 1960
2 3 2 3
Total 15,737 7 Suicide (a) Total 6
1 Cholera (b) Male 2
2 Small-pox 84 (c) Female 4
3 Plague 1\ Wounding or accident 138 4 Fevers . 2,668 9 Wild beasts 12 5 Dysantary and Diarrhoea 314 10 Snake bits 1
11 Rabies 17 6 Respiratory Disease 489 12 All other causes .2,008
Note: Source· Information for the yearS 1951 and 1956 is not
available. Directorate of Health and Medical Services, Gujarat
TABLE 3.1
LAND UTILIZATION, 1956-57 AND 1960-61
[Area in '00 acres]
SI. Sl. No. Classification of area 1956-57 1960-61 No. Classification of area 1956-57 1960-61
2 3 4 2 3 4
Total Geographical area by 7 Land under miscellaneous village papers 23,172 24,977 tree cropS and groves not
2 Forest 429 592 included in area sown 90 95
3 Barren and uncultivable land 5,119 5,024 8 Current Fallows 86 163
4 Land put to non-agricultural 9 Other fallow land 452 802
use 1,112 1,380 10 Net area sown 13,765 14,037
5 Cultivable waste . 821 1,063 11 Area sown more than once 176 245
6 Perrmment pastures and 12 Total cropped area (i.e., Gross other grazing lands 1,298 1,821 cropped area) 13,941 14,282
Source;
Nate; Directorate of Agriculture, Gujarat
Figures for the years 1956-57 and 1960-61 relate to the area of the district as then constituted.
172
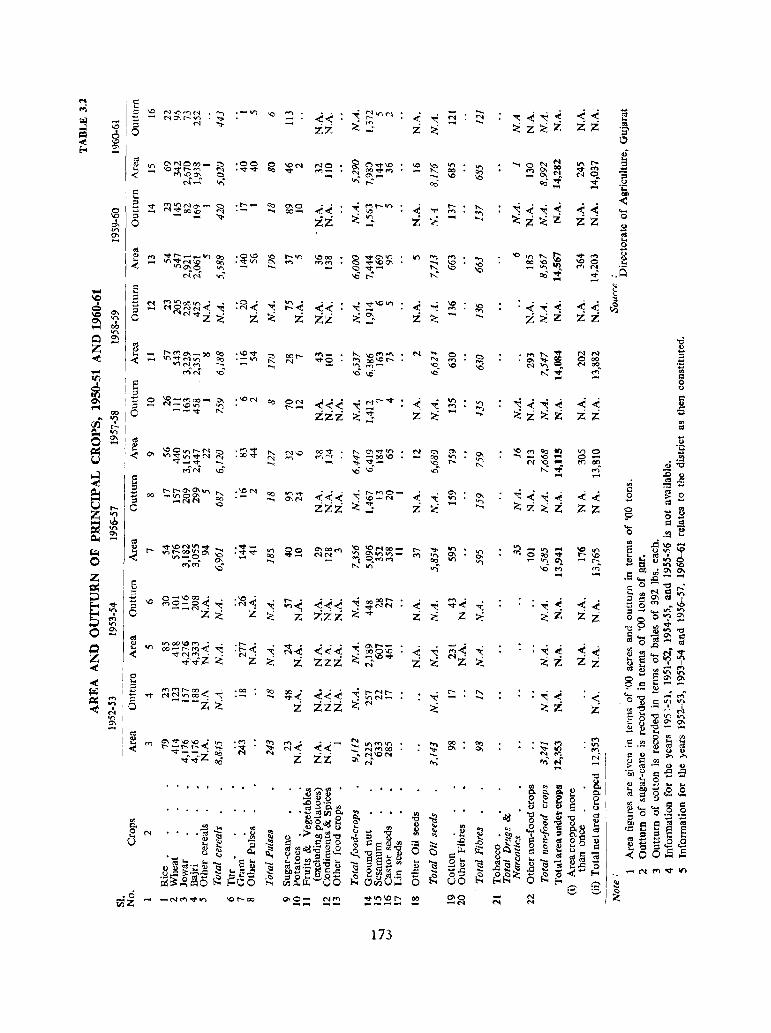
• 0 tiiZ
&:;~g;;;;oo ~ lIiNM .......
f'f'lN ~
0\ ~~~~~ ~ --:t_~ ......
f'f')N ...0
:1<l": ~ ~< i ~ i
t--... ~tf'\.H'\. tIf") 00'-0 tIl"') MI"""'1
'Ci \C~
173
-.... .....
-N
:qo~; -""l0).
'C ... ~ ...
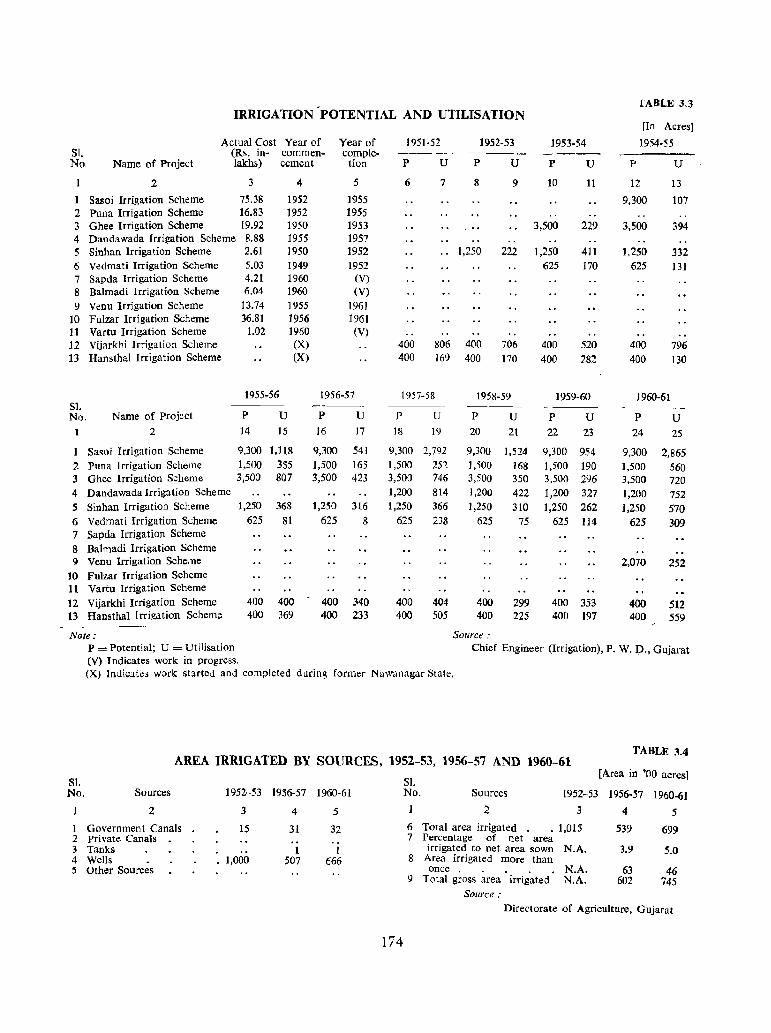
IRRIGATION 'POTENTIAL AND UTILISATION TABLE 3.3
fIn Acres]
Actual Cost Year of Year of 1951-52 1952-53 1953-54 1954-55 SI. (Rs. in- commen- comple· No. Name of Project 1akhs) cement tion P U P U P U P U
2 3 4 5 6 7 8 9 10 11 12 13
1 Sasoi Irrigation Scheme 75.38 1952 1955 9,300 107 2 Puna Irrigation Scheme 16.83 1952 1955 3 Ghee Irrigation Scheme 19.92 1950 1953 3,500 229 3,500 394 4 Dandawada Irrigation Scheme 8.88 1955 1957 5 Sinhan Irrigation Scheme 2.61 1950 1952 1,250 222 1,250 411 1,250 332 6 Vedmati Irrigation Scheme 5.03 1949 1952 625 170 625 131 7 Sapda Irrigation Scheme 4.21 1960 (V) 8 Balmadi Irrigation Scheme 6.04 1960 (V)
9 Venu Irrigation Scheme 13.74 1955 1961 10 Fulzar Irrigation Scheme 36.81 1956 1961 11 Vartu Irrigation Scheme 1.02 1960 (V) 12 Vijarkhi Irrigation Scheme (X) 400 806 400 706 400 520 400 796 13 Hansthal Irrigation Scheme (X) 400 169 400 170 400 282 400 130
1955-56 1956-57 1957-58 1958-59 1959-60 1960-61 SI. ----_. No. Name of Project P U P U P U P U P U P U
1 2 14 15 16 17 18 19 20 21 22 23 24 25
1 Sasoi Irrigation Scheme 9,300 1,118 9,300 541 9,300 2,792 9,300 1,524 9,300 954 9,300 2,865 2 Puna Irrigation Scheme 1,500 355 1,500 165 1,500 252 1,500 168 1,500 190 1,500 560 3 Ghee Irrigation Scheme 3,500 807 3,500 423 3,500 746 3,500 350 3,500 296 3.500 720 4 Dandawada Irrigation Scheme 1,200 814 1,200 422 1,200 327 1,200 752 5 Sinhan Irrigation Scheme 1,250 368 1,250 316 1,250 366 1,250 310 1,250 262 1,250 570 6 Vedmati Irrigation Scheme 625 81 625 8 625 238 625 75 625 114 625 309 7 Sapda Irrigation Scheme
8 Balmadi Irrigation Scheme 9 Venn Irrigation Scheme 2,070 252
10 Fuizar Irrigation Scheme 11 Vartn Irrigation Scheme
12 Vijarkhi Irrigation Scheme 400 400 400 340 400 404 400 299 400 353 400 512 13 Hansthal Irrigation Scheme 400 369 400 233 400 505 400 225 400 197 400 559
Note: Source,' P = Potential; U = Utilisation Chief Engineer (Irrigation), P. W. D., Gujarat (V) Indicates work in progress. (X) Indic:lte, work started and completed dllring former Nawanagar State.
AREA IRRIGATED BY SOURCES, 1952-53, 1956-57 AND 1960-61 TABLE 3.4
SI. SI. [Area in '00 acres]
No, Sources 1952-53 1956-57 1960-61 No. Sources 1952-53 1956-57 1960-61
2 3 4 5 2 3 4 5
1 Government Canals 15 31 32 6 Total area irrigated . 1,015 539 699 2 Private Canals 7 Percentage of net area 3 Tanks I I irrigated to net area sown N.A. 3.9 5.0 4 Wells 1,000 507 666 8 Area irrigated mOre than 5 Other Sources Once. N.A. 63 46
9 Total gross area irrigated N.A. 602 745 Source:
Directorate of Agriculture, Gujarat
174
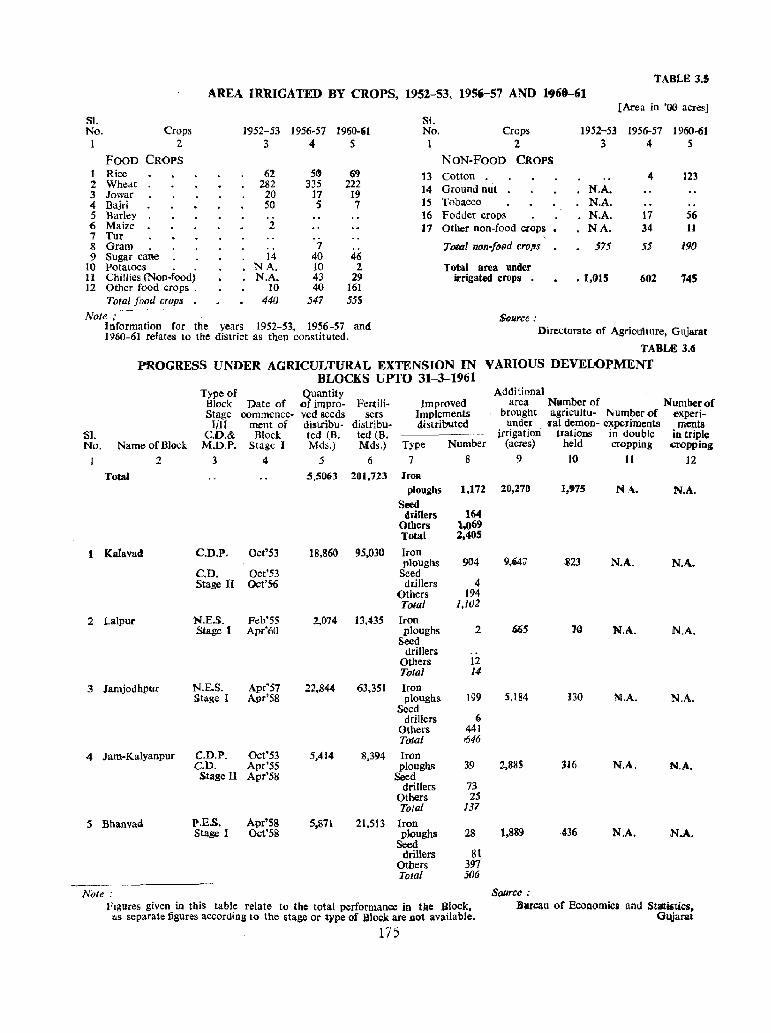
SI. No. Crops 1 2
FOOD CROPS 1 Rice 2 Wheat 3 Jowar 4 Bajri 5 Barley 6 Maize 7 Tnr 8 Gram 9 Sugar cane
10 Potatoes
TABLE 3.5 AREA IRRIGATED BY CROPS. 1952-53, 195ii-S7 AND lot61t-61
1'952-53 1956-57 1960-61 345
62 282 20 50
2
5<t 335
17 S
69 222
19 7
Si. No. Crops
1 2
NON-FoOD CROPS 13 Cotton 14 Ground nut 15 Tobacco 16 Fodder crops 17 Other non-food ClOpS
TOIUl[ non-foDd cro]'lS •
,[Area in '00 acres]
1952-53 1956-57 1960-61 345
M.A. N.A. N.A. N.A.
575
4
17 34
55
123
56 II
190
II Chillies (Non-food) 12 Other food crops .
14 NA. N.A.
10
7 40 10 43 40
46 2 2~
]61
Total area under irrigated crops • 1,015 602 745
Total food crops 440 547 555 Note:
I-nformatlon for the years 1952-53, 1956-57 and 1960-61 relates to the district as then constituted.
Source .. Dircctorate of Agricttlture, Gujarat
TABLE 3.6
PROGRESS UNDER AGRICULTURAL EXTENSION IN VARIOUS DEVELOPMENT BLOCKS UPTO 31-3-1961
Sl. No.
I
Name of Block
2
I Kalavad
2 ta\put
3 Jamjodhpur
Type of Quantity Block Date of of improStage oommence· ved seeds
Ill[ ment of disu-ibu-
Fertilisers
distributed (B. Mds.)
Improved Implements distributed
C.D.& Block ted (B. M.D.P. Stage I Mds.) Type Number
3 4 5 6 7 8
C.D.P. Oct'S]
C.D. Oct'53 Stage II Oct'56
N.E.S. Feb'55 Stage I Apc'cO
N.E.S. Apr'S7 Stage I Apr'58
5,5063 201,723 IrOR ploughs
Seed drillers
Others Total
18,S6G
2,,014
22,84-4
95,030 Iron ploughs
Seed drillers
Others Total
13,435 Iron ploughs
Seed drillers
Others Total
63,351 Iron ploughs
Seed drillers
Others To:to.l
1,172
164 1.069 2,405
904
4 194
],102
2
12 14
199
6 441 <646
Additional area Number of Number of
brought agricultu- Number of experi-under . fal demon- experiments ments
irrigation trations in double in triple (acres) held cropping !Cropping
9 10 11 ]2
20,276 1,'75 N.A. N.A.
9,047 .il23 N.A. N.A.
N.A. N.A.
5,184 130 M.A. N.A.
4 Jam-Kalyanpur C.D.P. Oct'53 C.D. Apr'55
5,414 8,394 Iron ploughs
Seed drillers
Others To/al
39 2,88S 316 N.A. N.A. Stage 11 Apr'58
5 Bllanvad P.E.S. Apr'S8 Stage I Oct'58
Note:
5,871 21,513 Iron ploughs
Seed drillers
Others Total
73 25
137
28 1,g8~
81 397 506
Source:
436 N.A. N.A.
Figures given in this table relate to the total performance in the Block, ns separate figures according to the stage or type of Block are not available.
Bwreau of Economics and Staltistics. Gujarat
175
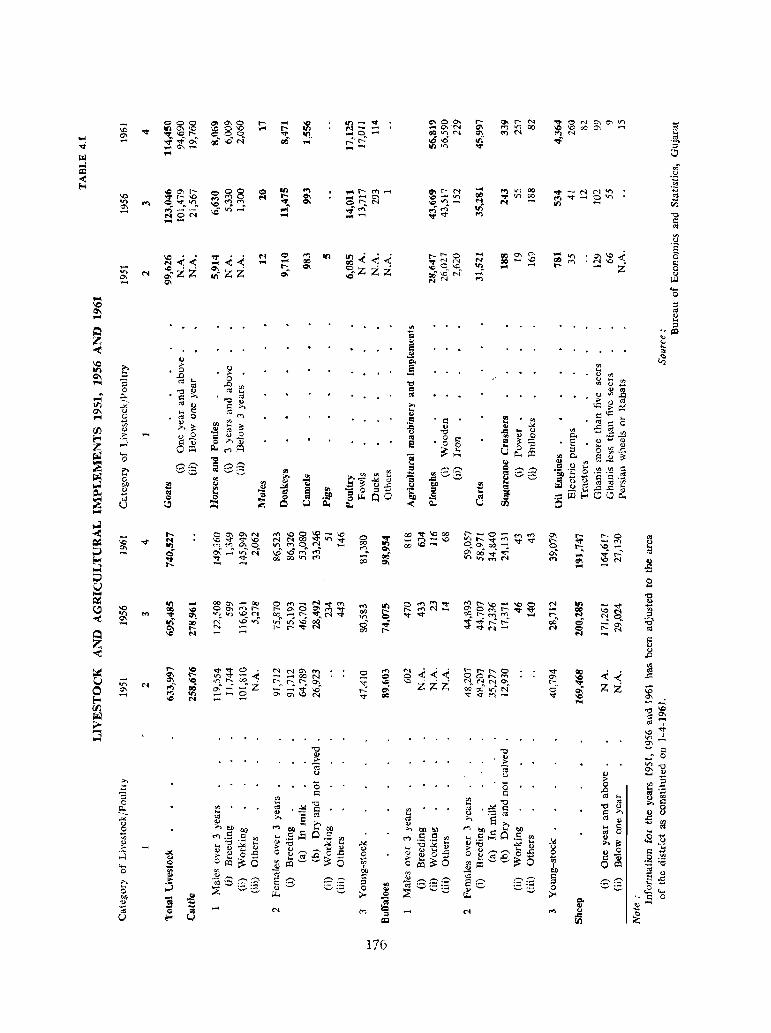
~, ....
... ~ ....
176
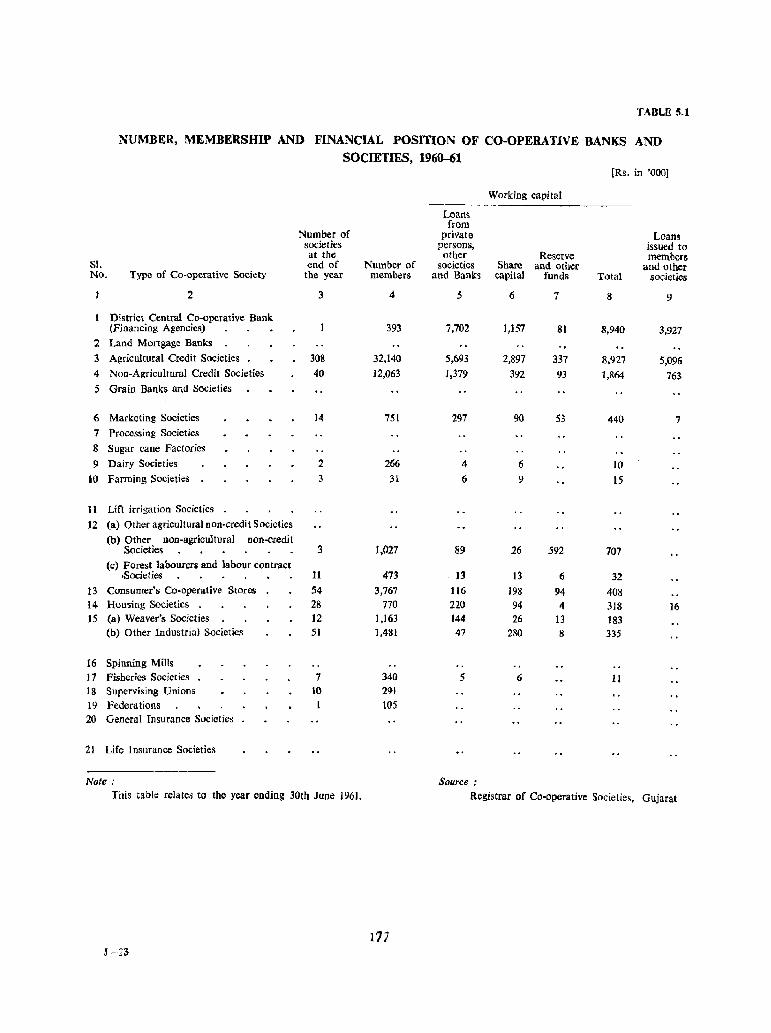
TABLE 5.1
NUMBER, MEMBERSHIP AND FINANCIAL POSITION OF CO-OPERATIVE BANKS AND SOCIETIES, 1960-61
[Rs. in '000]
Working capital
Loans from
Number of private Loans societies persons, issued to at the other Reserve memben
81. end of Number of societies Share and other and other No. Type of Co-operative Society the year members and Banks capital funds Total societies
2 3 4 5 6 7 8 9
District Central Co-operative Bank (Financing Agencies) 393 7,702 1,157 81 8,940 3,927
2 Land Mortgage Banks
3 Agricultural Credit Societies 308 32,140 5,693 2,897 337 8,927 5,096 4 Non-Agricultural Credit Societies 40 12,063 1,379 392 93 1,864 763 5 Grain Banks and Societies
6 Marketing Societies 14 75t 297 90 53 440 7 7 Process i ng Societ ies
8 Sugar cane Factories
9 Dairy Societies 2 266 4 6 10 10 Farming Societies 3 31 6 9 15
11 Lift irrigation Societies
12 (a) Other agricultural non-credit Societies
(b) Other Don-agricultural non-credit Societies 3 1,027 89 26 592 707
(c) Forest labourers and labour contract .Societies 11 473 13 13 6 32
13 Consumer's Co-operative Stores 54 3,767 116 198 94 408 14 Housing Societies 28 770 220 94 4 318 16 15 (a) Weaver's Societies 12 1,163 144 26 13 183
(b) Other Industrial Societies 51 1,481 47 280 8 335
16 Spinning Mills 17 Fisheries Societies 7 340 5 6 11 18 Supervising Unions 10 291
19 Federations 105 20 General Insurance Societies
21 Life Insurance Societies
Note: Source: This table relates to the year ending 30th June 1961. Registrar of Co-operative Societies, Gujarat
177 J-23
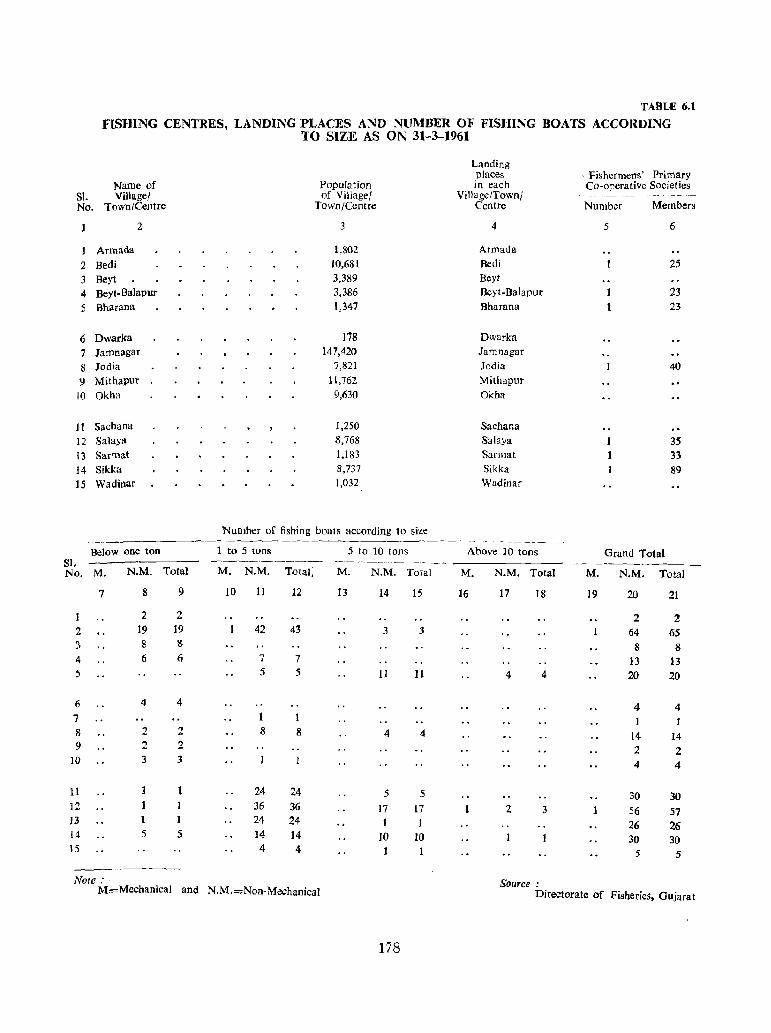
Sl.
TABLE 6.1
FISHING CENTRES, LANDING PLACES AND NUMBER OF FISHING BOATS ACCORDING
Name of Villagel
TO SIZE AS ON 31-3-1961
Landing place!>
Population in each of Village! Village/Townl
. Pishertnens' Primary Co-operative Societies
No. Town/Centre Town/Centre Centre Number Members
2 3
1 Armada 1,802
2 Bedi 10,681
3 Beyt 3,389
4 Beyt-Balapur 3,386
5 Bharana 1,347
6 Dwarka 178
7 lamnagar 147,420
8 Jodia 7,821
9 Mithapur ] 1,762
10 Okha 9,630
II Sachana 1,250
12 Salaya 8,768
13 Sarmat 1,183
14 Sikka 8,737
IS Wadinar 1,032
Number of fishing boats according to size
Below one ton 1 to 5 tons 5 to 10 tons Sl. ~-~-------- ------ -- --No. M. N.M. Total M. N.M. Totalj M. N.M. Total
7 8 9 10 II 12 13 14 15
1 2 2 2 19 19 42 43 3 3
:\ 8 8
4 6 6 7 7
5 5 5 11 II
6 4 4
7 8 2 2 8 8 4 4 9 2 2
10 3 3
11 24 24 5 5 12 36 36 17 17 13 1 1 24 24 1 14 5 5 14 14 10 10 15 4 4 1
Note; M=Mechanical and N.M,=Non-Mechanical
178
4
Armada Bedi Beyt Bcyt-Balapur Bharana
Dwarka Jamnagar Jodia
Mithapur Okha
Sachana Salaya Sarmat Sikka Wadinar
-- ---~---Above 10 tons
M. N.M. Total
16 17 18
4 4
2 3
Source:
M.
19
1
5 6
25
23 23
40
35 33 89
Grand Total
N.M. Total
20 21
2 2 64 65
8 8 13 13 20 20
4 4 I
14 14 2 2 4 4
30 30 56 57 26 26 30 30
5 5
Directorate of Fisheries, Gujarat
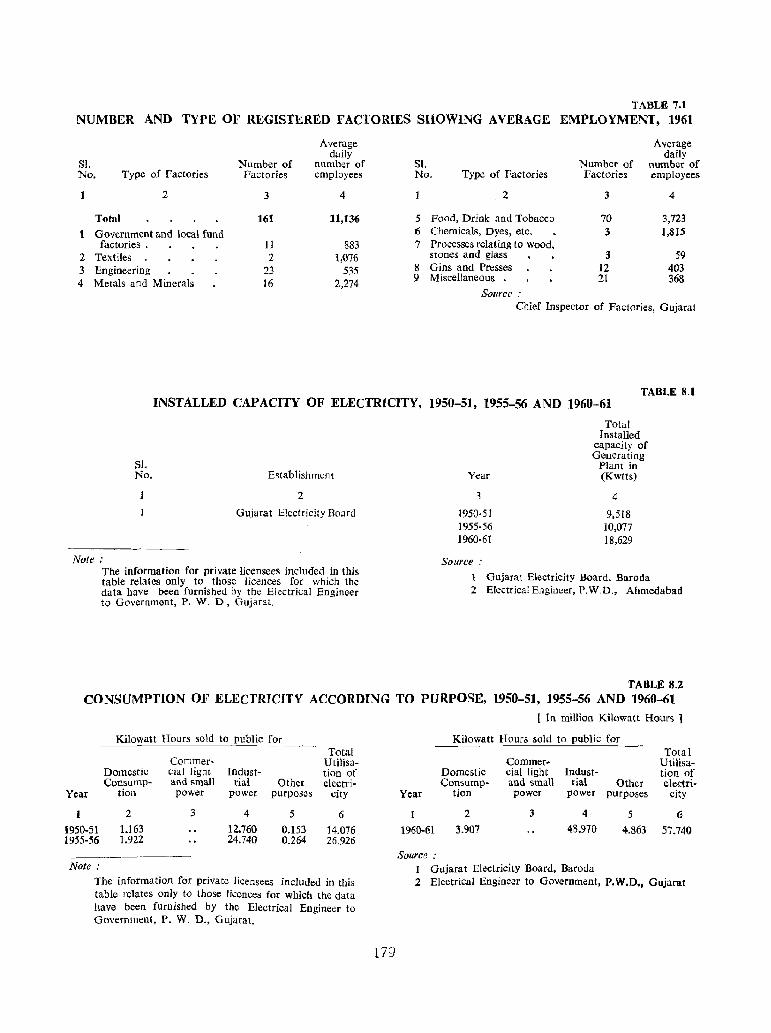
TABLE 7 .. 1
NUMBER AND TYPE OF REGISTERED FACTORIES SHOWING AVERAGE EMPLOYMENT. 1961
SI. Number of No. Type of Factories Factories
2 3
Total 161
Government and local fund factories. 11
2 Textiles 2 3 Engineering 23 4 Metals and Minerals 16
Average daily
number of employees
4
11,136
883 1,076
535 2,274
SI. No. Type of Factories
2
5 Food, Drink and Tobacco 6 Chemicals, Dyes, etc. 7 Processes relating to wood,
stones and glass 8 Gins and Presses 9 Miscellaneous •
Source:
Average daily
Number of number of Factories employees
3
70 3
3 12 21
4
3,723 1,815
59 403 368
Chief Inspector of Factories, Gujarat
TABLE 8.1 INSTALLED CAPACITY OF ELECTRICITY, 1950-51. 1955-56 AND 1960-61
Note:
SI. No. Establishment
2
Gujarat Electricity Bourd
The information for private licensees included in this table relates only to those licences for which the data have been furnished by the Electrical Engineer to Government, P. W. D., Gujarat.
Year
3
1950-51 1955·56 1960·61
Source:
Total Installed
capacity of Generating
Plant in (Kwtts)
4
9.518 10,077 18,629
Gujarat Electricity Board, Baroda 2 Electrical Engineer, P.W.D., Ahmedabad
TABLE 8.2 CONSUMPTION OF ELECTRICITY ACCORDING TO PURPOSE, 1950-51. 1955-56 AND 1960-61
Kilowatt Hours sold to public for Total
Commer· Utilisa-Domestic cial light Indust- tion of Consump- and small rial Other electri-
Year tion power power purposes city
2 3 4 5 6
J950·51 1.163 12.760 0.153 14.016 1955-56 1.922 24.740 0.264 26.926
Note: The information for private licensees included in this table relates only to those licences for which the data have been fUfIlished by the Electrical Engineer to Government, P. W. D., Gujaral.
179
Year
1
1960·61
Source:
[ In million Kilowatt Hours ]
Kilowatt Hours sold to public for Total
Commer- Utilisa-Domestic cial light Indust- tion of Consump- and small rial Other electri·
tion power power purposes city
2 3 4 5 6 3.907 48.970 4.863 57.740
Gujarat Electricity Board, Baroda 2 Electrical Engineer to Government, P.W.D., Gujarat
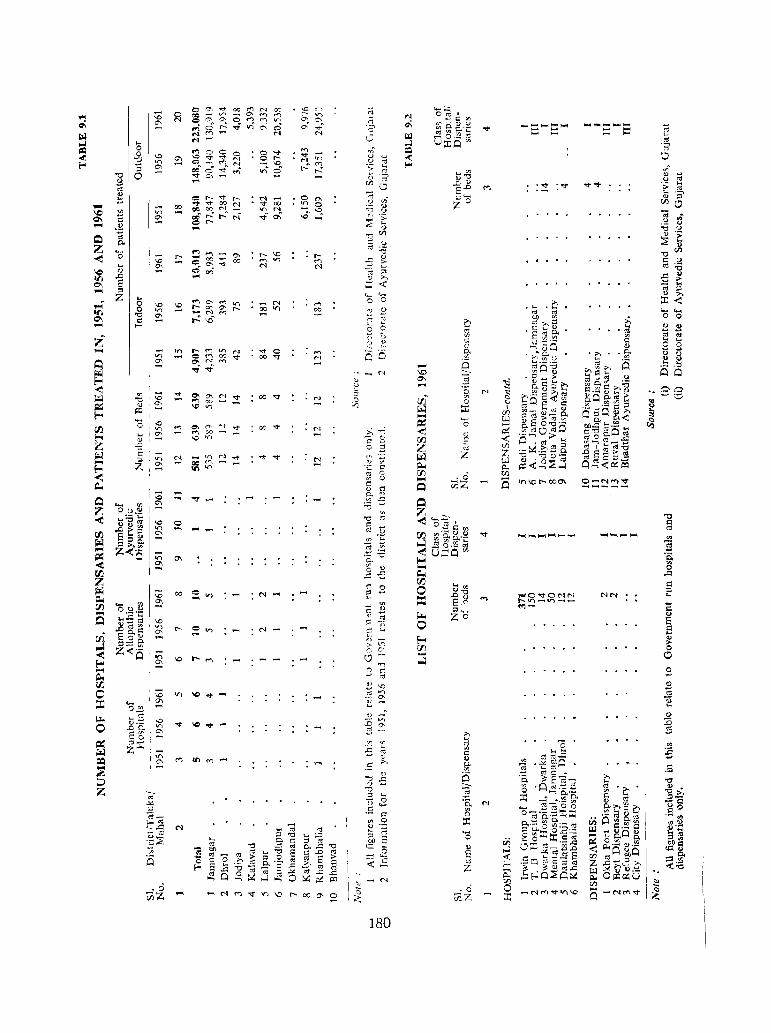
z ....
• ci tilZ
<'1-
<'1-
M 00
180
'0
'" E ~
Z
·0 (iiZ
....
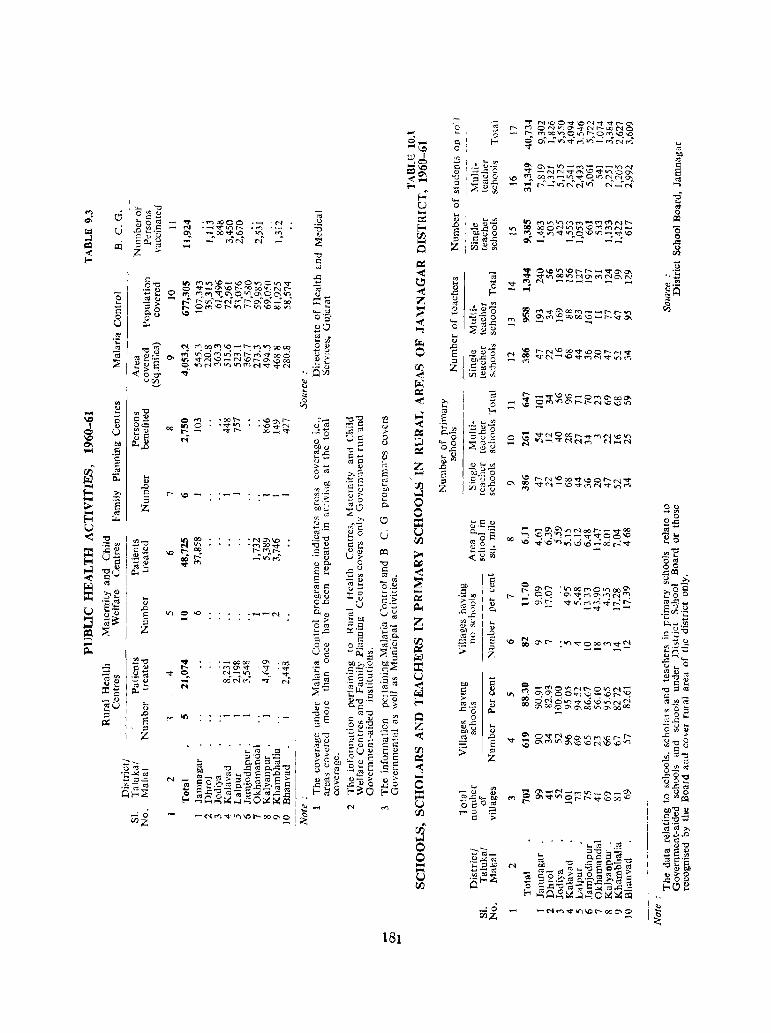
N r""'lOO~\O-t-(")""'COC()
t"i ~ci~lI'\,.....;r--:~~ 000 II') -:t"N\C) ....... ("\l\.Or-Q\\OCO Q \()N('tj\f')V)t""lN~VN
oi'
'--M
--0000 'MO'\.qN-OA OON"'~
o cj
Il4 "0
'" '" , -'" 2-~ §~~ u~
"'-'~[ -;;'u :2'§ ~~ '200 ';j ett
t~ Po;!:
181
<!)'-'''' - 0.>-O[)~ 0 CuO I ,~ ",.0::
J U') V U , -'"
... " .D E ;:l
Z
It) MII"'\V'\C')t""1-('P')<"'\Nt--tn 00 OCONtnV)\Or'H"1N_ ~ ~\II~v;,q\Dv)-r.~'-O 0-. __ __ _ ......
"'" O\CIll')\Or---r--....-.I"I:.1"O\O\ ~ oo:1't.()OOV)NO"It""'lNO\N v ttl N - ....... _- ....... _ - ...
\,0 ~ O\t- ·\f)~OOOMq-M . -- _,.....,
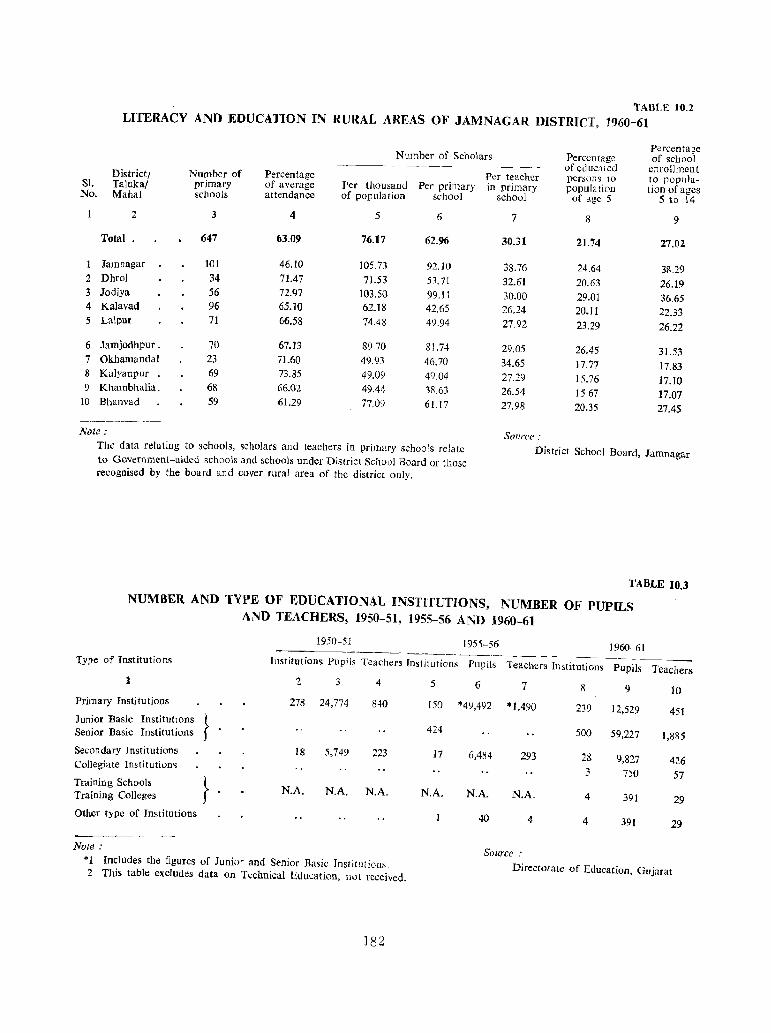
TABU: 10.2 LITERACY AND EDUCATION IN RURAL AlmAS OF JAMNAGAR DISTRICT, 1960-61
Percentage Number of Scholars Percentage of school
.----~- of educJled enrollment District/ Number of Percentage per teacher persons to to popula-Sl. Taluka/ primary of average per thousand Per primary in primary population tion of ages No. Mahal schools attendance of population school school of age 5 5 to 14
2 3 4 5 6 7 8 9
Total 647 63.09 76.17 62.96 30.31 21.74 27.02
Jamnagar 101 46.10 105.73 92.10 38.76 24.64 38.29 2 Dhrol 34 71.47 71.53 5.UI 32.61 20.63 26.19 3 Jodiya 56 72.97 103.50 99.11 30.00 29.01 36.65 4 Kalavad 96 65.lO 62.18 42.65 26.24 20. II 22.33 5 Lalpur 71 66.58 74.48 49.94 2792 23.29 26.22
6 Jamjodhpur . 70 67.13 89.70 81.74 29.05 26.45 31.53 7 Okhamandal 23 71.60 49.93 46.70 34.65 17.77 17.83 8 Kalyanpur 69 73.85 49.09 49.04 27.29 15.76 17.10 9 Khamhhalia. 68 66.02 49.4,1· 38.63 26.54 1567 17.07
10 Bhanvad 59 61.29 77.09 61.!7 27.98 20.35 27.45 ~----------
Note: Source: The data relating to schools, scholars and teachers in primary schools relate District School Board, Jamnagar to Government-aided schools and schools under District School Board or those recognised by the hoard and cover rural area of the district only.
TABLE 10.3
NUMBER AND TYPE OF EDUCATIONAL INSTITUTIONS, NUMBER OF PUPILS AND TEACHERS; 1950-51, 1955-56 AND 1960-61
1950-51 1955-56 1960-61 -~----Type of Institutions Institutions Pupils Teachers Institutions Pupils Teachers Institutions Pupils Teachers
1 3 4 5 6 7 8 9 10 Primary Institutions 278 24,774 840 150 *49,492 *1.490 239 12,529 451 Junior Basic Institutions } 424 Senior Basic Institutions 500 59,227 1,885 Secondary Institutions 18 5,749 223 17 6,484 293 2& 9,827 426 Collegiate Institution~
3 750 57 Training Schools } N.A. N.A. N.A. N.A. N.A. N.A. 4 391 Training Colleges 29 Other type of Institutions 40 4 4 39( 29
Note: Source:
*1 Includes the figures of Junior and Senior Basic Institutions. Directorate of Education, Gujarat 2 This table excludes data on Technical Education, not received.
182
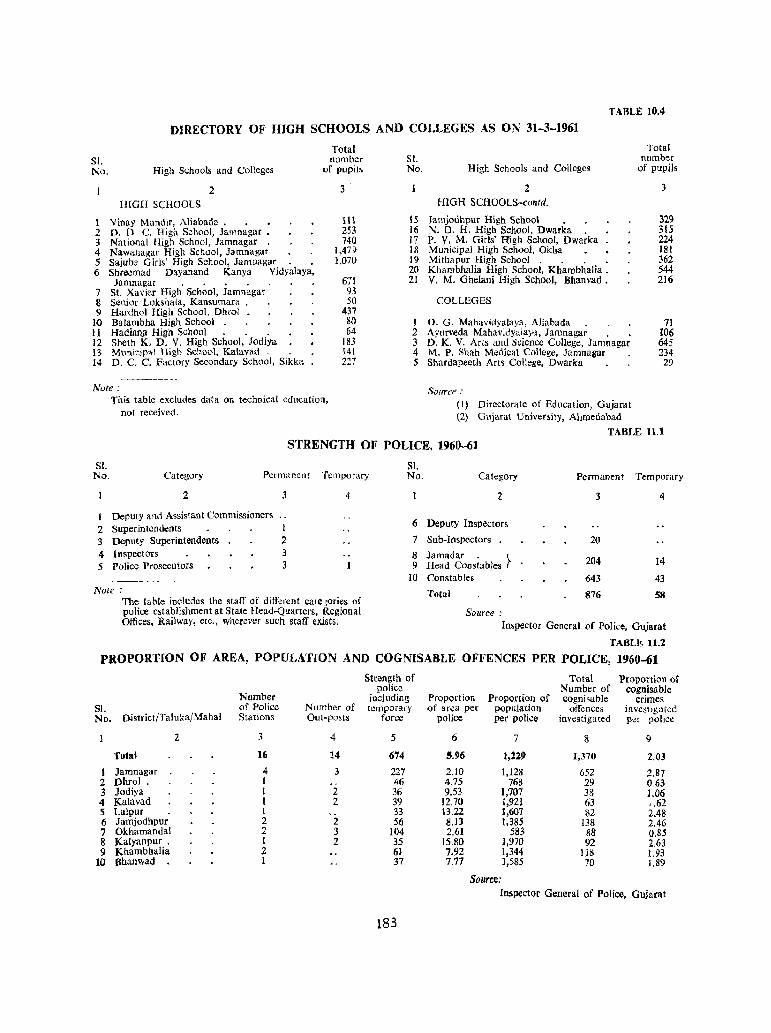
TABLE 10.4
DIRECTORY OF HIGH SCHOOLS AND COLLEGES AS ON 31-3-1961
SI. No. High Schools and Colleges
2 HlGH SCHOOLS
1 Vinay Mandir, Aliabada. • • 2 D. D C. High School, Jamnagar • 3 National High School, Jamnagar 4 Nawanagar High School, Jamnagar 5 Sajuba Girls' High School, Jamnagar. . 6 Shreemad Dayanand Kanya Vidyalaya,
Jamnagar . . . . 7 St. Xavier High School, Jamnagar 8 Senior Lokshaia, Kansumara . 9 Hardhol High School, Dhrol
10 Balambha High School 11 Hadian.ll High School . . . 12 Sheth K. D. V. High School, Jodiya 13 Municipal High Sc'~ool, Kalavad. . 14 D. C. C. Factory Secondary School, Sikka
Note:
Total number
of pupils
3
111 253 740
1,479 1,070
671 93 50
437 80 64
183 141 227
This table excludes data on technical education, not received.
SI. No. High Schools and Colleges
2 HIGH SCHOOLS-contd.
15 Jamjodhpur High School . 16 N. D. H. High School. Dwarka . 17 P. V. M. Girls' High School, Dwarka 18 Municipal High School, Okha 19 Mithapur High School. . . . 20 Khambhalia High School, Khambhalia . 21 V. M. Ghelani High School, Bhanvad.
COLLEGES
I D. G. Mahavidya1aya, Aliabada . 2 Ayurveda MahavidyalaY'l, Jamnagar . • 3 D. K. V. Arts and Science College, Jamnagar 4 M. P. Shah Medical College, Jamnagar 5 Shardapeeth Arts College, Dwarka
Source .-(1) Directorate of Education, Gujarat (2) Gujarat University, Ahmedabad
Total number
of pupils
3
329 315 224 181 362 544 216
71 106 645 234
29
TABLE 11.1
STRENGTH OF POLICE, 1960-61
SI. No. Category Permanent Temporary
S1. No. Category Permanent Temporary
2
I Deputy and Assistant Commissioners 2 Superintendents
3
3 Deputy Superintendents 2 4 Inspectors 3 5 Police Prosecutors 3
Note:
4
The table inc[udes the staff of different cale jories of police establishment at State Head-Quarters, Regional Offices, Railway, etc., wherever such staff exists.
6
7
8 9
10
2
Deputy Inspectors
Sub-Inspectors
lamadar. . t Head Constables Constable~
Total
Source:
3
20
204
643
876
4
14
43
58
Inspector General of Police, Gujarat
TABLE. U.2
PROPORTION OF AREA, POPULATION AND COGNISABLE OFFENCES PER POLICE, 1960-61
Strength of Total Proportion of police Number of cognisable
Number including Proportion Proportion of cognisable crimes S1. of Police Number of temporary of area per population offences investigated No. District (falu kaj Mahal Stations Out·posts force police per police investigated per police
Z 3 4 5 6 7 8 9
Total 16 14 674 5.96 1,229 1,370 2.03
I Jamnagar 4 3 227 2.10 1,128 652 2.87 2 Dhrol . 1 46 4.75 768 29 063 3 Jodiya 1 2 36 9.53 1,707 3& 1.06 4 Kalavad 1 2 39 12.70 1,921 63 •. 62 5 Lalpur I 33 13.22 1,607 82 2.48 6 Jamjodhpur 2 2 56 8.l3 1,385 138 2.46 7 Okhamandal 2 3 104 2.61 583 88 0.85 8 l(alyanpur. 1 2 35 15.80 1,970 92 2.63 9 Khambhalia 2 61 7.92 1,344 118 1.93
10 Bhanwad . 1 37 7.77 1,585 70 1.89
Source: Inspector General of Police, Gujarat
183
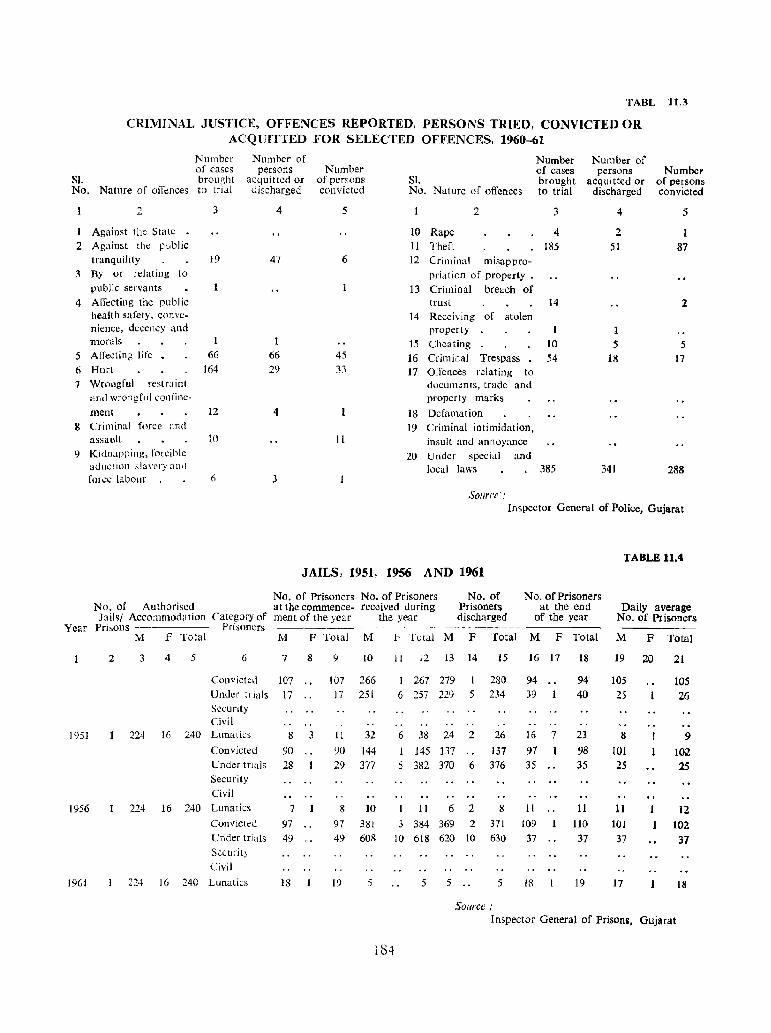
TABL 11.3
CRIMINAL JUSTICE, OFFENCES REPORTED, PERSONS TRIED, CONVICTED OR ACQUITTED FOR SELECTED OFFENCES, 1960-61
Number of cases
SI. brought No. Nature of offences to trial
2 :>
1 Against tbe State 2 Against the public
tranquility 19 3 By or relating to
public servants 4 Affecting the public
healt h safety, convenience, decency and morals
5 Affecting life • 66
6 Hurl 164 7 Wrongful restraint
and wrongful confinc-Inen! 12
8 Crim inal force 8nd assault 10
9 Kidna[lping, forcible aductioJ] slavery and
fOh'C labour 6
Number of persons
acqui !ted or discharged
4
47
66
29
4
3
Number of persons convicted
5
6
45
31
11
Number of cases
SI. brought No. Naturc of offences to trial
2 3
10 Rape 4 II Theft 185 12 Criminal misappro-
priation of property . 13 Criminal breach of
trust 14 14 Receiving of stolen
property 15 Cheating 10
16 Criminal Trespass 54 17 Offences relating to
documems, trade and property marks
18 Defamation 19 Criminal intimidation,
insult and annoyance 20 Under special and
local laws 385
SOllrcc-:
Number of persons
acquitted or discharged
4
2 51
1
5 18
341
Number of persons convicted
5
1 87
2
5 17
288
Inspector General of Police, Gujarat
TABLE 11.4 JAILS, 1951, 1956 AND 1961
Year
1951
1956
1961
No. of Authorised No. of Prisoners No. of Prisoners at the commence- received during
No. of Prisoners discharged
No. of Prisoners at the end
of the year Jails/ Accommodation Prisons ---
Category of ment of the year the year Prisoners --------
2
M F Total
3 4 5
M
6 7
Convicted 107 Under trials 17 Security Civil
F Total M
8 9 10
107 266
J7 251
224 16 240 Lunatics 8 3 11 32
Convicted 90 Under trials 28 Security Civil
224 16 240 Lunatics 7
Convicted 97 Under trials 49 Seeurit} Civil
224 I G 240 Lunatics IS
YO 144 29 377
8 10
97 381
49 60S
19 5
--~----- -----_ F Total M F Total M F Total
II 12 13 14 15
I 267 279 I 280
6 ~57 229 5 234
6 38 24 2 26
I 145 137 137 5 382 370 6 376
11 6 2 8
16 17
94 39
16 7
97 35
II
3 384 369 2 371 109
10 618 620 10 630 37
5 5 5 18
Source;
18
94 40
23
98 35
11
110
37
19
Daily average No. of Prisoners
M F Total
19 20
105
25
8
101 25
11 101
37
17
21
105 26
9
102
25
12
102
37
18
Inspector General of Prisoni. Gujllrat
184
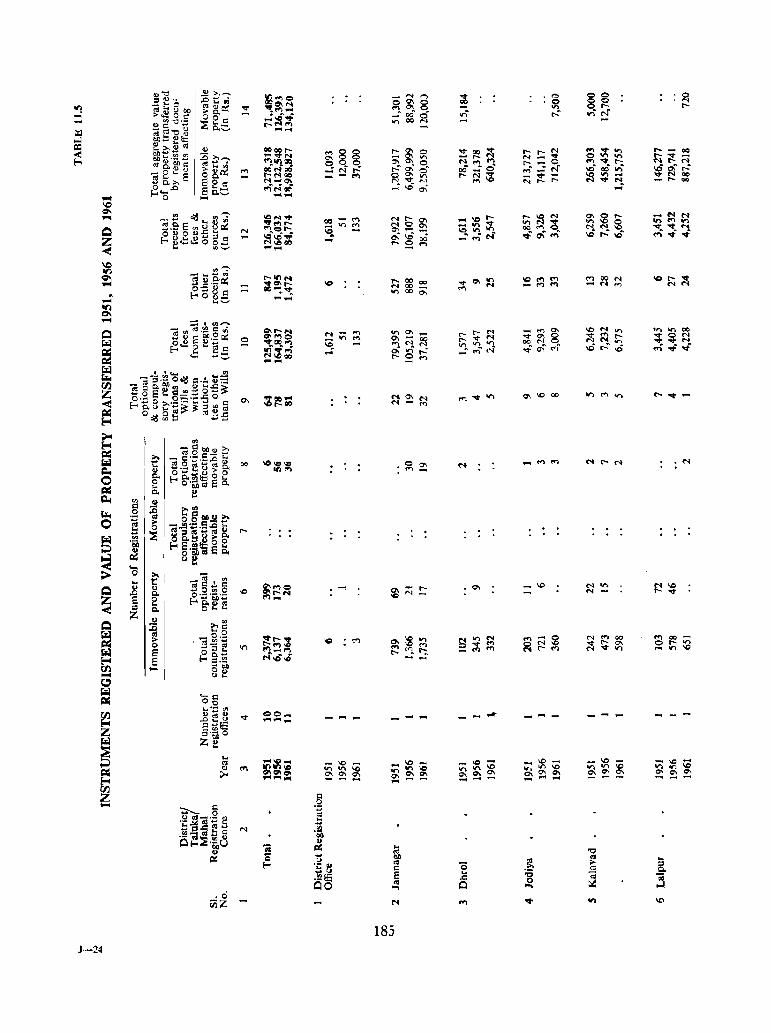
J-24
. 0 iiiZ
.... ....
QO .... ,...,,..., ....
0", .., .....
.... - .....
185
Q\IOOO
....-- _ .... - .... - .... .... _ .....
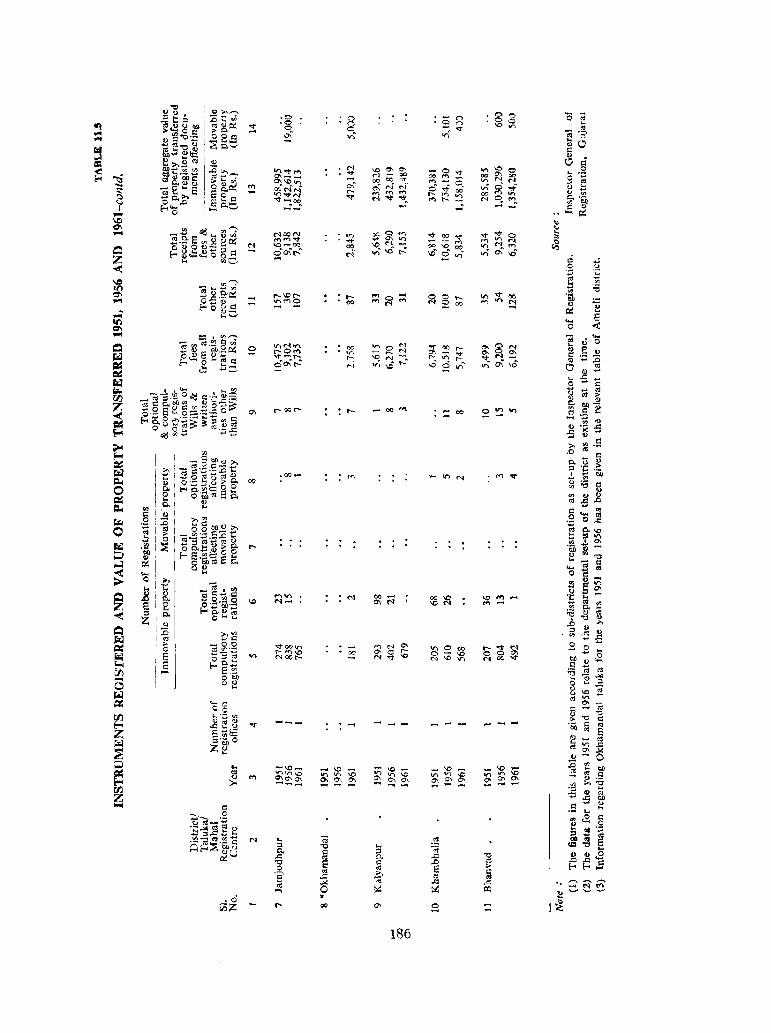
.0 CiiZ
.... ....
o ....
.00 ....
..... _-
..... 00
00
- --
:::
186
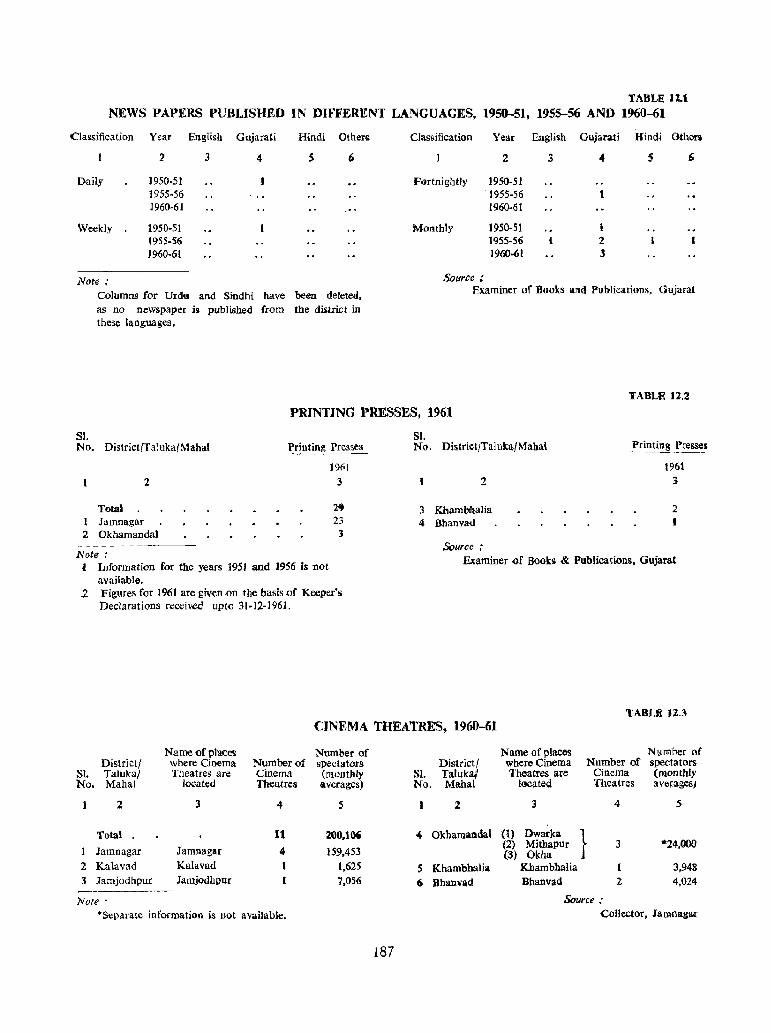
TABLE 11.1
NEWS PAPERS PUBLISHED IN DIFFERENT LANGUAGES, 1950-51, 1955-56 AND 1960-61
Classification Year English Gujarati Hindi Others
2 3 4 5 6
Daily 1950-51 1955·56 1960-61
Weekly 1950·S1 1955-56 1960-61
Note .. Columns for Urd« and Sincthi have been deleted. as no newspaper is published from the district in these languages.
Classifica tion Year English Gujaorati Hindi Otben
2 3 4 5 6
Fortnightly 1950·51 1955-56 t 1960·61
MOltthly 1950·51 1955·56 2 1960·61 3
Source: Examiner of Books alld Publications, Gujarat
TABLE 12.2
PRINTING PRESSES, 1961
81. No. District/T aluka( Mahal Printing Presses
2
Total 1 Jamnagar 2 Okhamandal
Note: ,1 Information ror the years 1951 and 1956 is nct
available.
191'1 3
24)
23 J
2 Figures f()r 1961 are given {)n the basis of Keeper's Declarations receiv«l up to 31·12-1961.
81. No. DistrietjTaluka/Malla\ Printing Presses
1961 2 :I
3 Khambhalia 2 4 Bhanva<l I
Source; Examiner {}f Boob & Pllblicatwns, Glljarat
TABLE tZ.3 CINEMA TIIEATRES~ 1960-61
Na~ of places Number of District/ where Cinema Number of spectators
SI. Taluka/ Theatres are Cinem.1 (monthly No. Mahal located Theatres averages)
2 l 4 5
Total 11 :roO,l06
1 Jamnagar Jamnagar 4 159,453 2 Kalavad Kalavad 1,625 3 Jamjodhpur Jamjodhpur 7,056
Note .' *Separate information is not available.
District! SI. Taluka.;' No. Mahal
2
-4 Okhamalldal
5 Khambhalia
6 Bhanvad
187
Name of places where Cinema Theatres are
located
3
(1) Dwarka (2) Mithapur (3) Okh.a
Khambhalia Bhanvad
Nurnber of Number of spectators
}
Cinema (monthly Theatres averages)
4
3
2
5
·24,000
3,948 4,Q24
Source .. Collector, Iamnagu

TABLE HI RAILWAY MILEAGES AND NAMES OF RAILWAY STATIONS, 1960-61
Jamnagar Talnka
S1. Name (If Railway No. Station
J 2 ~ 4 5 6
81. No.
1
1 2 3 4 S 6 7 8
2
Jamnagar Hapa Aliabada Jamvanthali Lakhabaval Dedi
Jamjodhpur Taluka
Name of Railway Station
7
Gop Gop Mota Sakhpur Tarsai Balva Vansjalia Jamjodhpur Kotdab-avishi
Railway mileages in the district
Broad gauge Metre gauge Narrow gauge Number of Railway Stations
Dhrol Taluka
Name of Railway Station
3
1 Dhrol 2 Javia 3 Jalia Devani
Okhamandal Taluka
Name of Railway Station
8
J Okhaport 2 Arambda 3 Mithapur 4 Varvala 5 Dwarka 6 Baradia 7 Gorinja 8 Kuranga 9 Okhamadhi
Miles Kilometres
241.88
Jodiya Mahal
Name of Railway Station
4
1 Jodiva 2 Bhadra
Kalyanpur Mahal
Name of Railway Station
9
1 Bhopalka 2 Bhatia
SOl/ree _.
389.18
47
KaJavad Taluka
Name of Railway Station
5
Nil
Khambhalia Taluka
Name of Railway Station
10
1 Khambhalia 2 Viramdad 3 Sinhan 4 Bhatel 5 SaJaya
Lalpur MahaJ
Name of Railway Station
6
t Piplia 2 Kanalus 3 Mudpar 4 Dabasang 5 Lalpur 6 Sanosari 7 Motikhavdi 8 Sikka
Bhanvad Mahat
Name of Railway Station
11
t Katkola 2 Verad 3 Bhanvad
4 Kalavad
(I) District Statistical Officer, Jamnagar (2) General Manager, Western Railway, Bombay
188
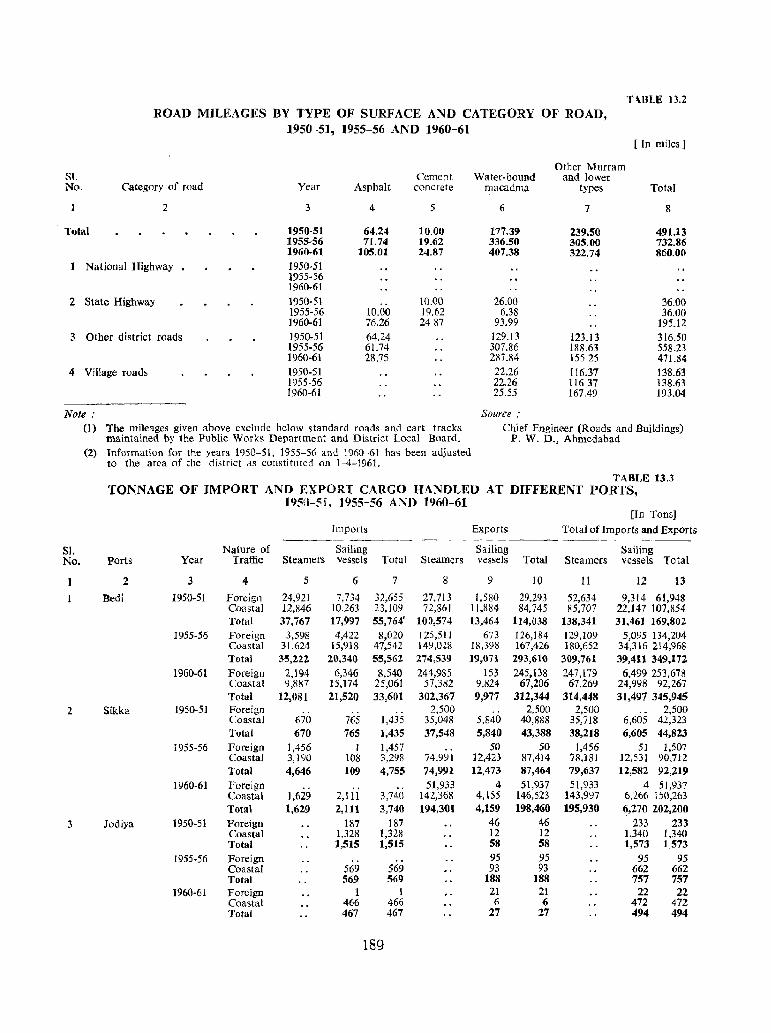
'HBLE 13.2 ROAD M1LEAGES BY TYPE OF SURFACE AND CATEGORY OF ROAD,
1950-51, 1955-56 AND 1960-61 [ In miles J
Other Murram Sl. Ceme[1t Water-bound and lower No. Category of road Year Asphalt concrete macadma types Total
2 3 4 5 6 7 8
Total 1950-51 64.24 10.00 177.39 239,50 491.13 1955-56 71.74 19.62 336.50 305.00 732.86 1960-61 105.01 24.87 407.38 322.74 860.00
National Highway 1950-51 1955-56 1960-61
2 State Highway 1950·51 10.00 26.00 36.00 1955-56 10.00 19.62 6.38 36.00 1950-61 76.26 2487 93.99 195.12
3 Other district roads 1950-51 64.24 12:9.13 123.13 316.50 1955-56 61.74 307.86 188.63 558.23 1960-61 28.75 287.R4 155.25 471.84
4 Village roads 1950-51 22.26 116.37 138.63 1955-56 22.26 116.37 138.63 1960-61 25.55 167.49 193.04
Note: Source: (I) The mileages given above excll1de below standard roads and cart tracks Chief Engineer (Roads and Buildings)
maintained by the Public Works Department and District Local Board_ P. W. D., Ahmedabad (2) Information for the years 1950-51, 1955-56 and 1963-61 has been adjusted
to the area of the district as constituted on 1-4-1961.
TABLE 13.3 TONNAGE OF IMPORT AND EXPORT CARGO HANDLED AT DIFFERENT PORTS,
1950-5], 1955-56 AND 1960-61 [In Tons]
Imports Exports Total of Imports and Exports ------
SI. Nature of Sailing Sailing Sailing No. Ports Year Traffic Steamers vessels Total Steamers vessels Total Steamers vessels Total
2 3 4 :5 6 7 8 9 10 11 12 13
Dedi 1950-51 Foreign 24,921 7,734 32,655 27,713 1,580 29,293 52,634 9,314 61,948 Coastal 12,846 10,263 23,109 72,861 11,884 84,745 85,707 22,]47 107,854 Total 37,767 17,997 55,764' 100,574 13,464 114,038 138,341 31,461 169,802
1955-56 Foreign 3,598 4,422 8,020 125,511 673 126,184 129,109 5,095 134,204 Coastal 31.624 15,918 47,542 149,028 18,398 167,426 180,652 34,316 214,968 T(ltal 35,222 20,340 55,562 274,539 19,07. 293,610 309,761 39,411 349,172
1960·61 Foreign 2,194 6,346 8.540 244,985 153 245,138 247,179 6,499 253,678 Coastal 9,887 15,174 25,061 57,382 9,824 67,206 67,269 24,998 92,267 Total 12,081 21,520 33,601 302,367 9,977 312,344 314,448 31,497 345,945
2 Sikka 1950-51 Foreign .. " 2,500 2,500 2,500 2,500 Coastal 670 765 1,435 35,048 5,840 40,888 35,718 6,605 42,323 Total 670 765 1,435 37,548 5,840 43,388 38,218 6,605 44,823
1955-56 Foreign 1,456 I 1,457 .. 50 50 1,456 51 1,507 Coastal 3,190 108 3,298 74,991 12,423 87,414 78,181 12,531 90,712 T(ltal 4,646 109 4,755 74,991 12,473 87,464 79,637 12,582 92,219
1960-61 Foreign .. 51,933 4 51,937 51,933 4 51,937 Coastal 1,629 2,111 3,740 142,368 4,155 146,523 143,997 6,266 150,263 Total 1,629 2,111 3,740 194,301 4,159 198,460 195,930 6,270 202,200
3 Jodiya 1950-51 Foreign 187 187 46 46 233 233 Coastal 1,328 1,328 12 12 1,340 1,340 T(ltal 1,515 1,515 58 58 1,573 1573
1955·56 Foreign 95 95 95 95 Coastal 569 569 93 93 662 662 Total 569 569 188 188 757 757
1960·61 Foreign 1 1 21 21 22 22 Coastal 466 466 6 6 472 472 T(ltal 467 467 27 27 494 494
189
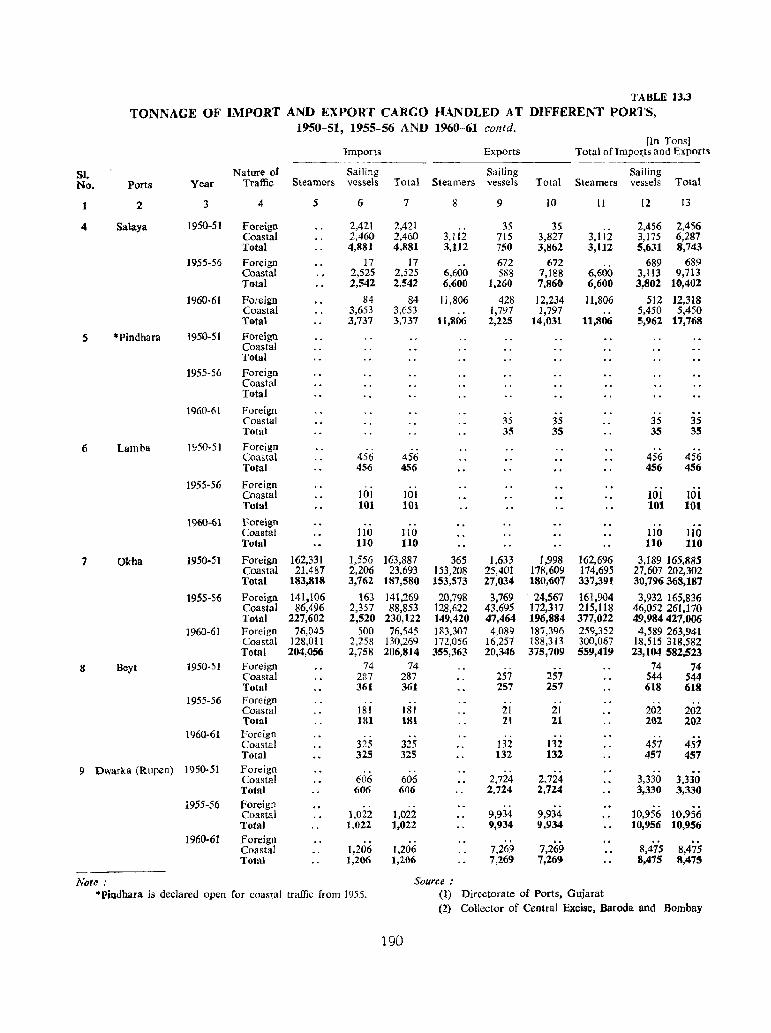
TABLE 13.3
TONNAGE OF IMPORT AND EXPORT CARGO HANDLED AT DIFFERENT PORTS, 1950-51, 1955-56 AND 1960-61-contd.
[In Tons) Imports Exports Total of1mpo~ts and Exports
--.----------SI. Nature of Sailing Sailing Sailing No. Ports Year Traffic Steamers vessels Total Steamers vessels Total Steamers vessels Total
2 3 4 5 6 7 8 9 10 11 12 13
4 Salaya 1950-51 Foreign 2,421 2,421 35 3S 2,456 2,456 Coastal 2,460 2,460 3,112 715 3,827 3.112 3,175 6,287 Total 4,881 4,881 3,112 750 3,862 3,112 5,631 8,743
1955-56 Foreign 17 17 672 672 689 689 Coastal 2,525 2.525 6,600 Sg8 7,188 6,600 3,113 9,113 Total 2,542 2,542 6,600 1,260 7,860 6,600 3,802 10,402
1960·61 Foreign 84 84 11.806 428 12,234 11,806 512 12.318 Coastal 3,653 3,653 1,797 1,797 5,450 5,450 Total 3,737 3,737 11,806 2,225 14,0:n 11,806 5,962 17,768
5 *Pindhara ]950-51 Foreign Coastal Total
1955-56 Foreign Coastal Total
1960-61 Foreign . , .. Coastal 35 35 35 35 Total 35 35 35 35
6 lamba 1950-51 Foreign .. .. Coastal 456 456 456 456 Total 456 456 456 456
1955-56 Foreign Coastal 101 ]01 101 101 Total 101 ]01 101 t01
1960-61 Foreign .. Coastal 110 110 110 110 Total 110 110 110 110
7 Okha 1950-51 Foreign 162,331 1,556 163,887 365 1,633 1,998 162,696 3,189 165,885 Coastal 21,487 2,206 23,693 153,208 25,401 178,609 174,695 27,607 202,302 Total 183,818 3,762 187,580 153,573 27,034 180,607 337,391 30,796368,181
1955-56 Foreign 141,106 163 141,269 20,798 3,769 . 24,567 161,904 3,932 165,836 Coastal 86,496 2,357 88,853 128,622 43,695 172,317 215,118 46,052 261,] 70 Total 227,602 2,520 230,122 149,420 47,464 196,884 377,022 49,984 427,006
1960-61 Foreign 76,045 500 76,545 183.307 4,089 187,396 259,352 4,589 263,941 Coastal 128,011 2,258 I30,269 172,056 16,257 188,313 300,067 18.515 318,582 Total 204,056 2,758 206,814 355,363 20,346 375,709 559,419 23,104 582,523
8 Beyt 1950-51 Foreign 74 74 .. 74 74 Coastal 237 287 257 257 544 544 Total 361 361 257 257 (i18 618
1955-56 Foreign . . .. Coastal 181 181 21 21 202 202 Total 181 181 21 21 202 202
1960-61 Foreign .. Coastal 325 325 132 132 457 457 Total 325 325 132 132 457 457
9 Dwarka (Rupen) 1950·51 Foreign .. "
Coastal 606 606 2,724 2,724 3,330 3,330 Total 606 606 2,724 2,724 3,330 3,330
1955-56 Foreign .. .. Coastal },022 1,022 9,934 9,934 ]0,956 10.956 Total 1,022 1,022 9,934 9,934 10,956 10,956
1960-61 Foreign Coastal 1,206 1,206 7,269 7,269 8,475 8,475 Total 1,206 1,106 7,269 7,269 8,475 8,475
N{)te : Source: *Pilldhara is declared open for coastal traffic from 1955. (I) Directorate of Ports, Gujarat
(2) Collector of Central Excise, Baroda and Bombay
190
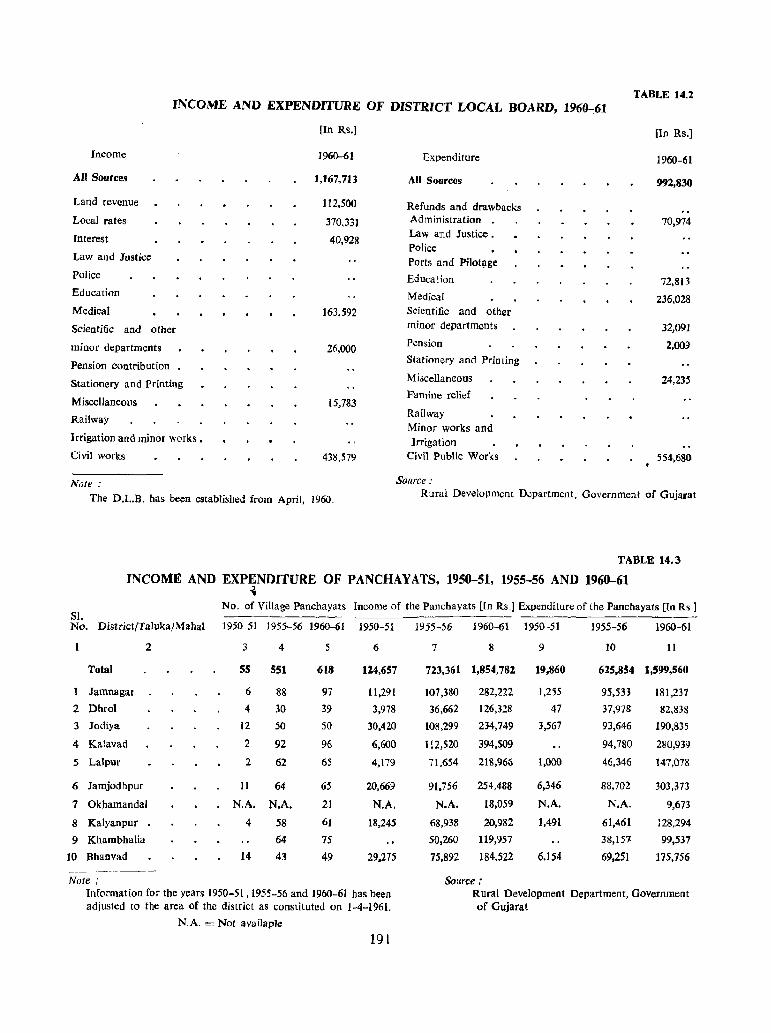
TABLE 14.2 INCOME AND EXPENDITURE OF DISTRICT LOCAL BOARD, 1960-:61
(In Rs.] [In Rs.]
Income
AJI Sources
Land revenue
Local rates
Interest
Law and Justice
Police
Education
Medical
Scientific and other
minor departments
Pension contribution
Stationery and Printing
Miscellaneous
Railway
Irrigation and minor works.
Civil works
]960-61
1,167,713
112,500
370,33]
40,928
163,592
26,000
15,783
438,579
Expenditure
All Sources
Refunds and drawbacks Administration • Law and Justice. Police Ports and Pilot!lge
Education
Medical SCientific and other minor departments
Pension
Stationery and Printing
Miscellaneous
Famine relief
Railway Minor works and Irrigation
Civil Public Works
1960-61
992,830
70,974
72,813
236,028
32,091
2,009
24,235
554,680
Note: Source:
The D.L.B. has been established from April, 1960. Rural Development DoJpartment, Government of Gujarat
TABLE 14.3
INCOME AND EXPENDITURE OF PANCHAYATS, 1950-51, 1955-56 AND 1960-61 ~
No. of Village Panchayats Income of the Panchayats [In Rs.] Expenditure of the Panchayats [In Rs.] SI. No. District/Taluka/Mahal 19;O~51 J955-56 1960-61 1950-51 1955-56 1960-61 1950 ·51 1955-56 1960~61
2 3 4 5 6 7 8 9 10 11
Total SS 551 618 124,657 723,361 1,854,782 19,860 625,854 1,599,560
1 Jamnagar 6 88 97 11,291 107,380 282,222 1.255 95,531 181,237
2 Dhrol 4 30 39 3,978 36,662 126,328 47 37,978 82,838
3 Jodiya 12 50 50 30,420 108,299 234,749 3,567 93,646 190,835
4 Kalavad 2 92 96 6,600 112,520 394,509 94,780 280,93:)
5 Lalpur 2 62 65 4,179 71,654 218,966 1,000 46,346 147,078
6 Jamjodhpur 11 64 65 20,669 91.756 254,488 6,346 88,702 303,373
7 Okhamandal N.A. N.A. 21 N.A. N.A. 18,059 N.A. N.A. 9,673
8 Kalyanpur . 4 58 61 18,245 68,938 20,982 1,491 61,461 128,294
9 Khambhalia 64 75 50,260 119,957 38,151 99,537
to Bhanvad 14 43 49 29.275 75,892 184,522 6,154 69.251 17.5,756 ~--------
Note; Source: Information for the years 1950-51,1955-56 and 1960-61 has been Rural Development Department, Government adjusted to the area of the district as constituted on 1-4-1961. of Gujarat
N.A. = Not availapJe
191
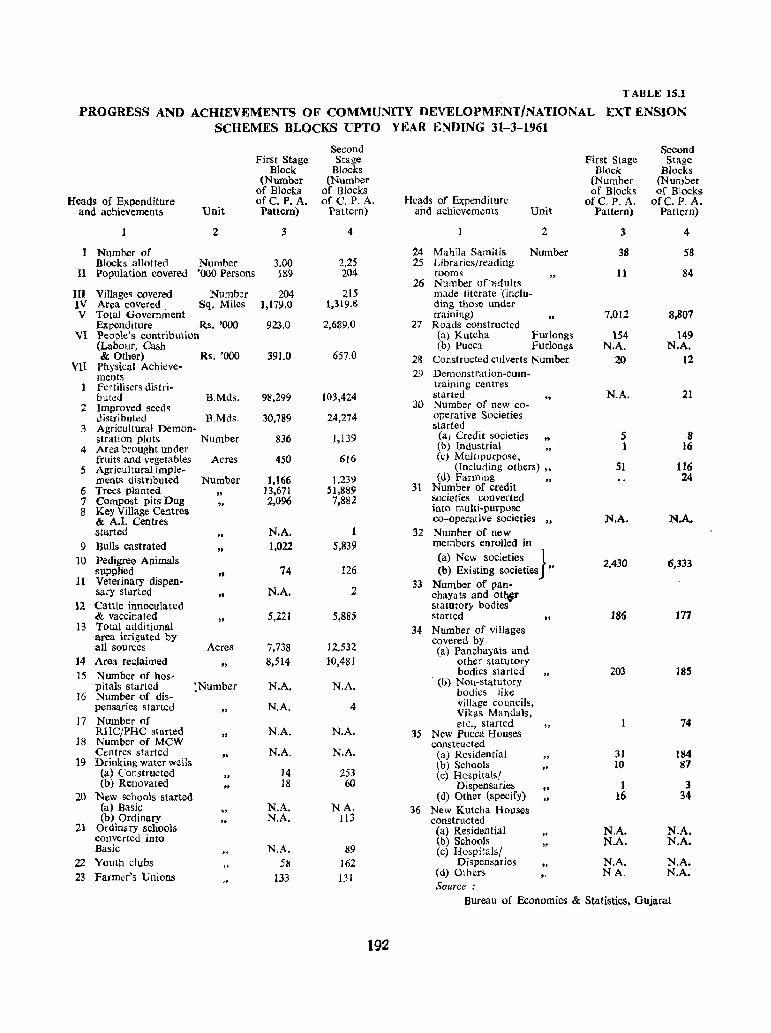
TABLE 15.1
PROGRESS AND ACHIEVEMENTS OF COMMUNITY DEVELOPMENT/NATIONAL EXTENSION SCHEMES BLOCKS UPTO YEAR ENDING 31-3-1961
Second Second First Stage Stage First Stage Stage
Block Blocks Block Blocks (Nl.lmber (Number (Number (Number
of Blocks of Blocks of Blocks of Blocks Heads of Expenditure ofC. P. A. of C. P. A. Heads of Expenditure ofC. P. A. orc. P. A.
and achievements Unit Pattern) Pattern) and achievements Unit Pattern) Pattern)
2 3 4 2 3 4
I Number of 24 Mahila Samitis Number 38 58 .Blocks allotted Number 3.00 2.25 25 Libraries/reading
II Population covered '000 Persons 1&9 204 rooms 11 84 26 Number of'&dults
III Villages covered Numb~r 204 215 made literate Cinclu-IV Area COvered Sq. Miles 1,179.0 1,319.8 ding those under V Total Government training)
" 7,012 8,807 Expenditure Rs. '000 923.0 2,689.0 27 Roads constructed
VI People's contribution (a) Kutcha Purlongs 154 149 (Labour. Cash (0) Pucca Furlongs N.A. N.A. & Other) Rs. '000 391.0 657.0 2& Constructed culverts Number 20 12
Vll PllY~ical Achieve-ments 29 Demonstration-cum-Fertilisers distri- training centres buted B.Mds. 98,299 103,424 started N.A. 21
2 Improved seeds 30 Number of new co-distributed B.Mds. 30,789 24,274 opera tive Societies
3 Agricultural Demon- started stration plots Number 836 1,139 (aJ Credit societies .. 5 8
4 Area brought under (b) Industrial 1 16 fruits and vegetables Acres 450 616 (c) Multipurpose,
5 Agricultural imple- (Including others) " 51 116 ments distributed Number 1,166 1.239 Cd) Farming .. 24
6 Trees planted 13,671 51,889 31 Number of credit ,. societies converted 7 Compost pits Dug
" 2.096 7,882 8 Key Village Centres iuto multi-purpose
&, A.I. Centres co-operat ive societies " N.A. N.A.
started N.A. 32 Number of new 9 Bulls castrated " 1,022 5,839 members enrolled in
10 Pedigree Animals (a) New societies } 2,430 6,333 supplied
" 74 126 (b) Existing SOcieties ..
11 Veterinary dispen· 33 Number of pan-sary started .. N.A. 2 chayats and oth$r
12 Cattle innoculated statutory bodies &, vaccinated 5,221 5,885 started .. 186 177
13 Total additional 34- Number of villages area irrigated by covered by all sources Acres 7,738 12,532 (a) Panchayats and
]4 Area reclaimed " 8,514 10,481 other statutory 15 Number of hos' bodies started 203 185
pitals started :Number N.A. N.A. . (0) Non-statutory
16 Number of dis- bodies like pensaries started N.A. 4 village councils,
" Vikas Mandals. 17 Number of etc., started 74
RHC/PHC started .. N.A. N.A. 35 New Pucca Houses 18 Number of MCW consttucted
C e n tres started N.A. N.A. (a) Residential 31 184 19 Drinking water wells
,. (b) Schools 10 87
(a) Constructed 14 253 " Cc} Hospitals! (b) Renovated 18 60 Dispensaries 1 3 I'
20 New schools started Cd) Other (specify) "
16 34 (a) Basic N.A. N.A. 36 New Kutcha Houses (b) Ordinary N.A. 113 constructed
21 Ordinary schools (a) Residential N.A. N.A • converted into ..
(b) Scbools N.A. N.A. Basic N.A. 89 (c) Hospitals/
22 Youth clubs 51l 162 Dispensaries .. N.A. N.A.
23 Farma's Unions 133 131 (d) Others NA. N.A. Source:
Bureau of Economics &; Statistics, Gujarat
192
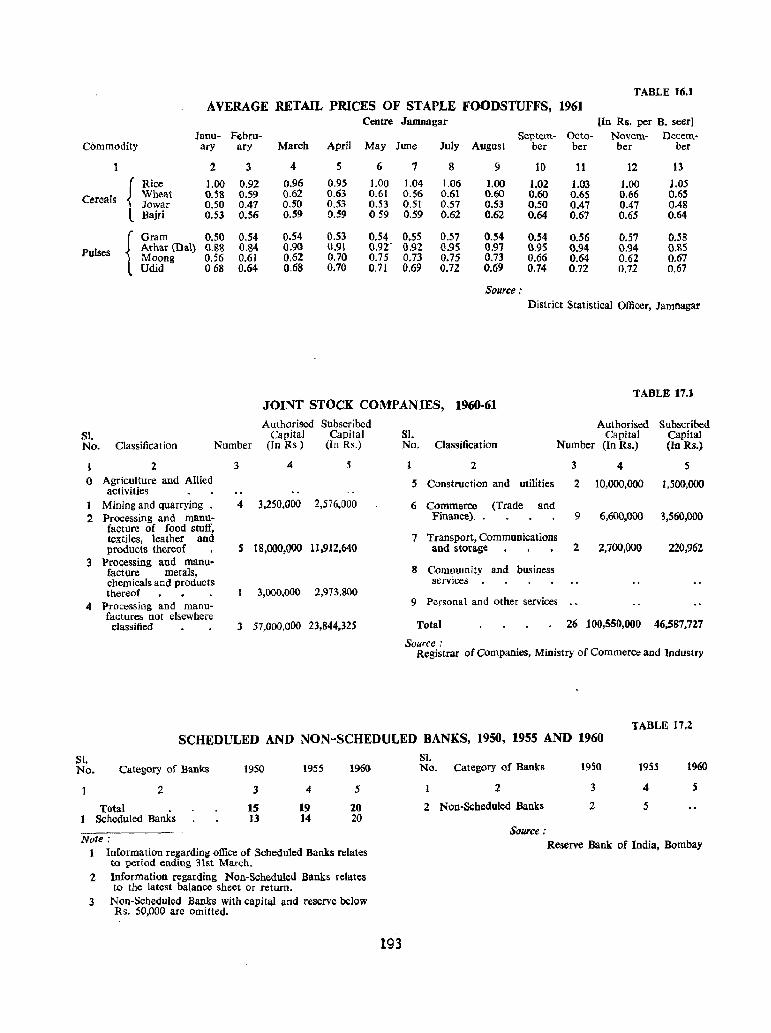
TABLE 16.1 AVERAGE RETAIL PRICES OF STAPLE FOODSTUFFS, 1961
Centre Jamnagar [In Rs. per B. seer] Janu- Febru- Septem- Octo- Novem- Decem·
Commodity ary ary March April May June July August ber ber ber ber
2 3 4 5 6 7 8 9 10 11 12 13
f Rice 1.00 0.92 0.96 0.95 1.00 1.04 1.06 1.00 1.02 1.03 1.00 1.05
Cereals Wheat 0.58 0.59 0.62 0.63 0.6\ 0.56 0.61 0.60 0.60 0.65 0.66 0.65 Jowar 0.50 0.47 0.50 0.53 0.53 0.51 0.57 0.53 0.50 0.47 0.47 0.48
L Bajri 0.53 0.56 0.59 0.59 0.59 0.59 0.62 0.62 0.64 0.67 0.65 0.64
J Gram 0.50 0.54 0.54 0.53 0.54 0.55 0.57 0.54 0.54 0.56 0.57 0.58
Pulses Arhar (Da1) G.BS 0.84 0.90 0.91 G.9r 0.92 0.95 0.97 0.95 0.94 0.94 0.85 Moong 0.56 0.61 0.62 0.70 0.75 0.73 0.75 0.73 0.66 0.64 0.62 0.67
l Udid 068 0.64 0.68 0.70 0.71 0.69 0.72 0.69 0.74 0.72 0.72 0.67
Source: District Statistical Officer, Jamnagar
TABLE 17.1 JOINT STOCK COMPANIES, 1960-61 Authorised Subscribed Authorised Subscrihed
Sl. No. Classification
Capital Capital Number (In Rs) (In Rs.)
S1. No. Classification
Capital Capital Number (In Rs.) (In Rs.)
2 3 4 5 2 3 4 5
0 Agriculture and Allied 5 Construction and utilities 2 10,000,000 1,500,000 activities
I Mining and quarrying • 4 3,250,000 2,576,000 6 Commerce (Trade and 2 Processing and manu- Finance). . 9 6,600,000 3,560,000
facture of food stuff, textiles, leather and 7 Transport, Communications products thereof S 18,000,000 11,912,640 and storage 2 2,700,000 220,962
3 Pro<;essing and manu-8 Community and business facture metals,
cbemicals and products services . thereof 3,000,000 2,973,800
4 Processing and manu- 9 Personal and other services factures not elsewhere classified 3 57,000,000 23,844,325 Total 26 100,550,000 46,S87,7Z7
Source .-Registrar of Companies, Ministry of Commerce and Industry
TABLE 17.2 SCHEDULED AND NON-SCHEDULED BANKS, 1950, 1955 AND 1960
Sl. No. Category of Banks 1950 1955 1960
2 3 4 5
Total 15 19 20 Scheduled Banks 13 14 20
Note: Information regarding office of Scheduled Banks relates to period ending 31st March.
Z Information regarding NOll-Scheduled Banks relates to the latest balance sheet or return.
3 Non-Scheduled Banks with capital and reserve below Rs. 50,000 are omitted.
SI. No. Category of Banks 1950 1955 1960
1 2 3 4 5
2 Non-Sl;heduled Banks 2 5
Source: Reserve Bank of India, Bombay
193
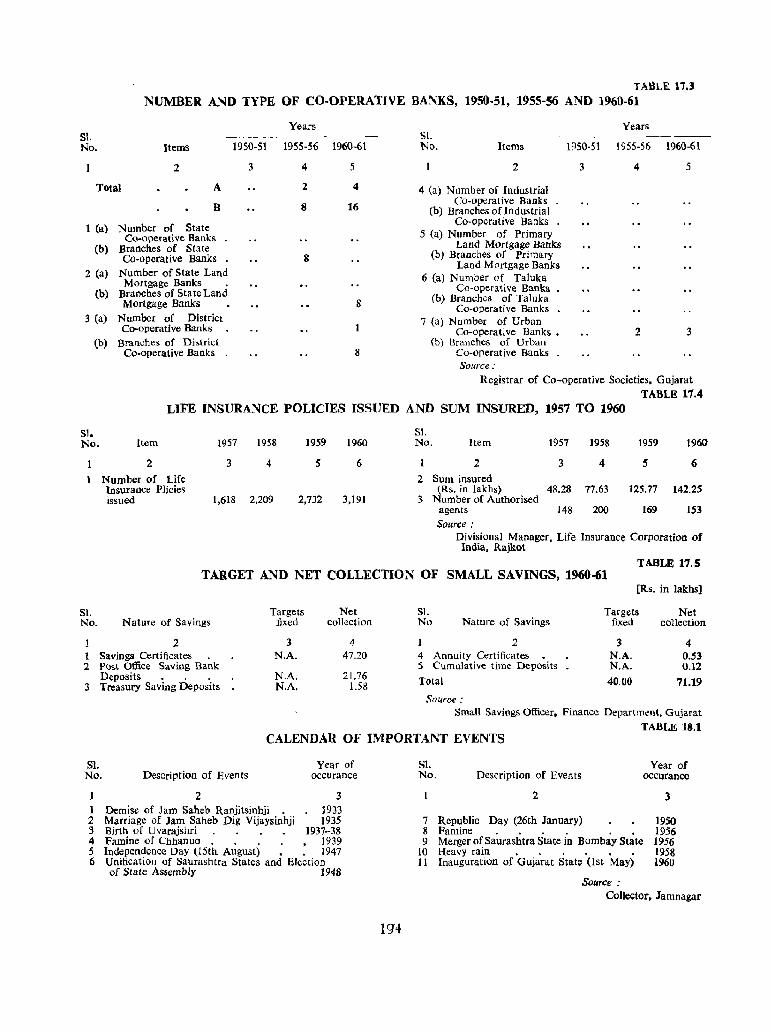
TAlll.£. 17.3
NUMBER AND TYPE OF CO-OPERATIVE BANKS, 1950·51, 1955-56 AND 1960-61
SI. No. Items
2
Total A
B
1 (a) Number of State Co-operative Banks
(b) Branches of State Co·operative Banks
2 (a) Number of State Land Mortgage Banks
(b) Branches of State Land Mortgage Banks
3 (a) Number of District Co-operative Banks
(b) Branches of Di:>trict Co-operative Banks
Years
1950·51 1955·56 1960·61
3 4
2
8
8
5
4
16
8
8
Sl. No. Items
2
4 (a) Number of Industrial Co.operative Banks
(b) Branches of Industrial Co-operative Banks
5 (a) Number of Primary Land Mortgage Banks
(b) Branches of Primary Land Mortgage Banks
6 (a) Number of Taluka Co-operative Banks
(b) Branches of Taluka Co-operative Banks
7 (a) Number of Urban Co-operative Banks •
(b) Branches of Urban Co-operative Banks . Source .-
Years
1950·51 1955·56 1960-61
3 4 5
2 3
Registrar of Co-operative Societies, Gujarat TABLE 17.4
LIFE INSURANCE POLICIES ISSUED AND SUM INSURED, 1957 TO 1960
SI. S!. No. Item 1957 1958 1959 1960 No. Item 1957 1958 1959 1960
2 3 4 S 6 I 2 3 4 S 6
Number of Life 2 Sum insured lnsuraoce PHcies (Rs. in lakhs) 48.28 77.63 125.77 142.25 issued 1,618 2,209 2,732 3,191 3 Number of Authorised
agents 148 200 169 153
SQurce : Divisional Manager, Life Insurance Corporation of
India, Rajkot
TABLE 17.5 TARGET AND NET COLLECTION OF SMALL SAVINGS, 1960-61
SI. Targets Net No. Nature of Savings fixed collection
2 3 4 1 Savings Certificates . N.A. 47.20 2 POst Office Saving Bank
N.A. 21.76 N.A. 1.58
Deposits • . . 3 Treasury Saving Deposits
[Rs. in Iakhs]
SI. Targets Net No Nature of Savings fixed collection
2 3 4 4 Annuity Certificates N.A. 0.53 5 Cumulative time Deposits N.A. 0.12
Total 40.00 71.19
Source: Small Savings Officer. Finance Department, Gujarat
TABLE 18.1 CALENDAR OF IMPORT ANT EVENTS
Sl. No. Description of Events
2
Year of ocCUrance
3 1 Demise of Jam Saheb Ranjitsinhji. 1933 2 Marriage of Jam Saheb Dig Vijaysinhji 1935 3 Birth of (Jvarajshri . 1937-38 4 Famine of Chhanuo. " 1939 5 Independence Day (L5th August) • . 1947 6 Unification of Saurashtra States and Election
of State Assembly 1948
SI. No. Description of Events
Year of occurance
2
7 Republic Day (26th January) 8 Famine . . " .• 9 Merger of Saurashtra State in Bombay State
10 Heavy rain • • . • • • 11 Inauguration of Gujarat State (1st May)
Source:
3
1950 1956 1956 1958 1960
Collector, Jamnagar

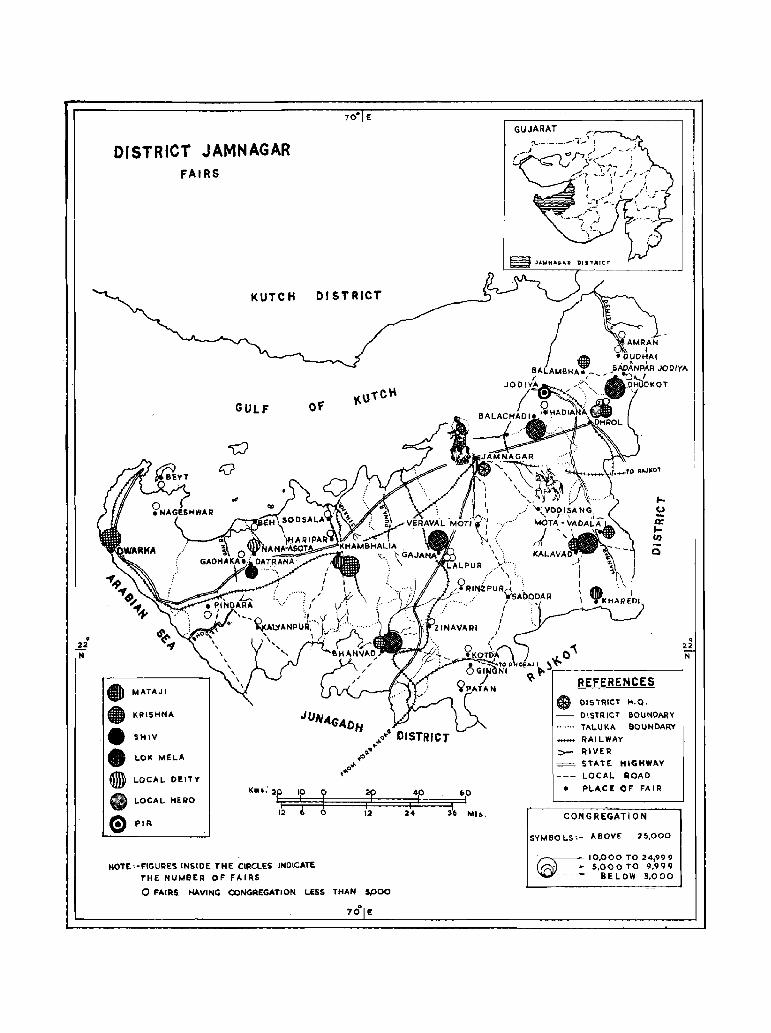
• 22 H
DISTRICT JAMNAGAR FAIRS
KUTCH
70· E
DISTRICT
GULF OF
• MATAJI
• KRISI-INA
• SHIV
• 1..01< MEL.A
®} L.OCAL. DEITY
• L.OCAL I1ERO
e PIA.
K ••• : 2~ IF 12 ~
tlOTE :-FIGURES INSIDE THE CIRCLES INOICATE
THE NUMBER OF FAIRS
r 0' o 12
o FAIRS HAVING CONGREGATION LESS THAN SPOQ
o 70 E
GUJARAT
,_ ~ a= lf/)
o
REFERENCES e DISTRICT H.O.
- DISTRICT aOU!'IOARY ....... TAI..UKA BOIJNDARY
RAILWAY
'>- RIVER STATE HIGMWA.Y
LOCAL ROAD • PLACE OF FAIR
CONGREGATION
SYMBOL.S:- ABOVE 25,000
~ 10,000 TO 24,999 S,OOOTO 9.999
BELOW 5,000
o 22 N
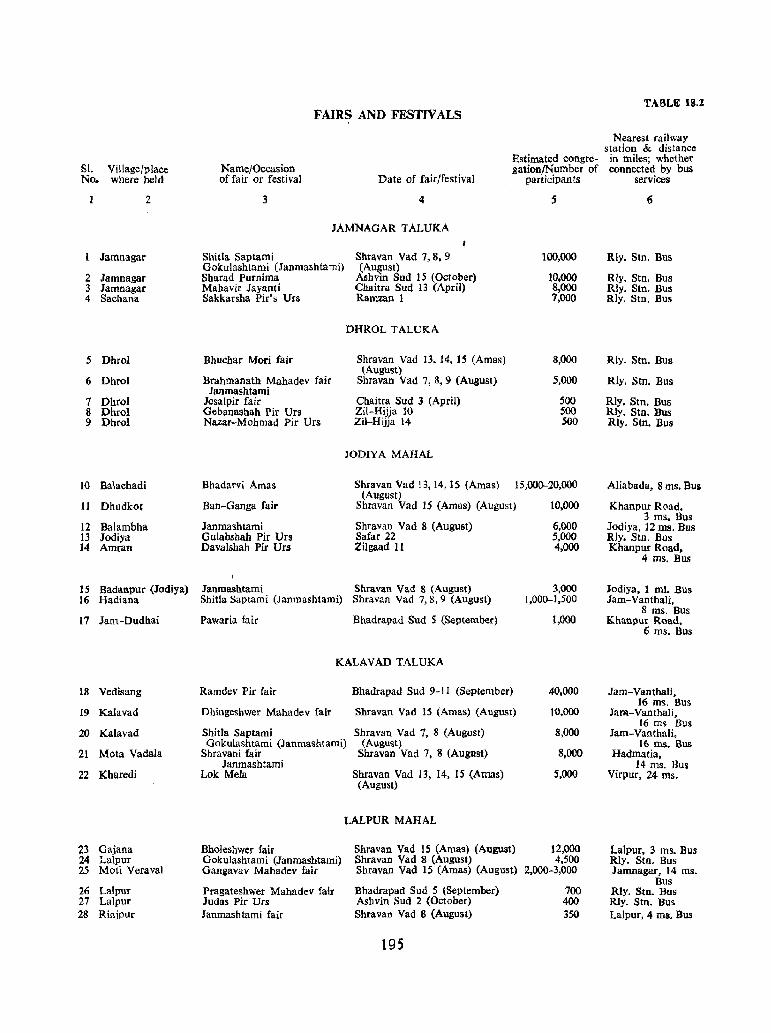
TABLE 18.1 FA1RS AND FESTIVALS
Nearest railway station & distance
Estimated congre- in miles; whether SI. Village / place Name/Occasion gationjNumber of connected by bus No. where held of fair or festival Date of fair/festival participants services
2 3 4 5 6
JAMNAGAR TALUKA
Jamnagar Shitla Saptami Shravan Vad 7,8, 9 100,000 Rly. Stn. Bus Gokulashtami (Janmashtami) (August)
2 Jamnagar Sharad Purnima Ashvin Sud IS (October) 10,000 Rly. Stn. Bus 3 Jamnagar Mahavir Jayanti Chaitra Sud 13 (April) 8,000 Rly. Stn. Bus 4 Sachana Sakkarsha Pir's Urs Rarnzan 1 7,000 Rly. Stu. Bus
DHROL TALUKA
5 Dhro! Bhuchar Mori fair Shravan Vad 13, 14, 15 (Amas) 8,000 Rly. Stn. BUll (August)
6 Dhrol Brahmanath Mahadev fair Shravan Vad 7, 8,9 (August) 5,000 Rly. Stn. Bus Janmashtami
7 Dhrol Jesalpir fair Cb.aitra Sud 3 (April) 500 Rly. Stn. Bus 8 Dhrol Gebanashah Pir Urs Zil-Hijja 10 500 Rly. Stll. Bus 9 Dhrol Nazar-Mohmad Pir Urs Zil-Hijja 14 500 Rly. Stn. Bus
JODIY A MAHAL
10 Balachadi Bhadarvi Amas Shravan Vad 13,14, IS (Amas) (August)
15,000-20,000 Aliabada, 8 ms. Bus
11 Dhudkot Ban-Ganga fair Shravan Vad 15 (Amas) (August) 10,000 Khanpur Road. 3 ms. Bus
12 Balambha Janmashtami Shravan Yad 8 (August) 6,000 Jodiya, 12 IDS. Bus 13 Jodiya Gulabshah Pir Urs Safar 22 5,000 RJy. Stn. Bus 14 Amran Davalshah Pir Urs Zilgaad 11 4,000 Khanpur Road.
4 ms. Bus
15 Badanpur (Jodiya) Janmashtami Shravan Vad 8 (August) 3,000 Jodiya, I mi. Bus 16 Hadiana Shitla Saptami (Janmashtami) Shravan Vad 7,8,9 (August) 1,000-1,500 Jam-Vanthali,
8 IDS. Bus 17 Jam-Dudb.ai Pawaria fair Bhadrapad Sud 5 (September) 1,000 Khanpur Read,
6 ms. Bus
KALAVAD TALUKA
18 Vedisang Ramdev Pir fair Bhadrapad Sud 9-11 (September) 40,000 Jam-Vanthali, 16 ms. Bus
19 Kalavad Dhingeshwer Mahadev fair Shravan Vad 15 (Amas) (August) J{).OOO Jam-Yanthali, 16 m~ Bus
20 Kalavad Shitla Saptami Shravan Vad 7, 8 (August) 8,000 Jam-Yanthali, Gokulashtami (Janmashtami) (August) 16 ms. Bus
21 Mota Vadala Shravani fair Shravan Vad 7, 8 (August) 8,000 Hadmatia, Janmashtami 14 ms. Bus
22 Kharedi Lok Mela Shravan Yad 13, 14, IS (Amas) 5,000 Virpur. 24 ms. (August)
LALPUR MAHAL
23 Gajana Bholeshwer fair Shravan Yad 15 (Amas) (August) 12,000 Lalpur, 3 ms. Bus 24 Lalpur Gokulashtami (Janrnashtami) Shravan Vad 8 (August) 4,500 Rly. Stn. Bus 25 Moti Veraval Gangavav Mahadev fair Shravan Vad IS (Amas) (August) 2.000-3,000 Jamnagar, 14 ms.
Bus 26 Lalpur Pragateshwer Mahadev fair Bhadrapad Sud 5 (September) 700 Rly. Stn. Bus 27 Lalpur Judas Pir Urs Ashvin Sud 2 (October) 400 Rly. Stn. Bus 28 Rinjpur Janmashtami fair Shravan Vad 8 (August) 3S() Lalpur, 4 ms. Bus
195
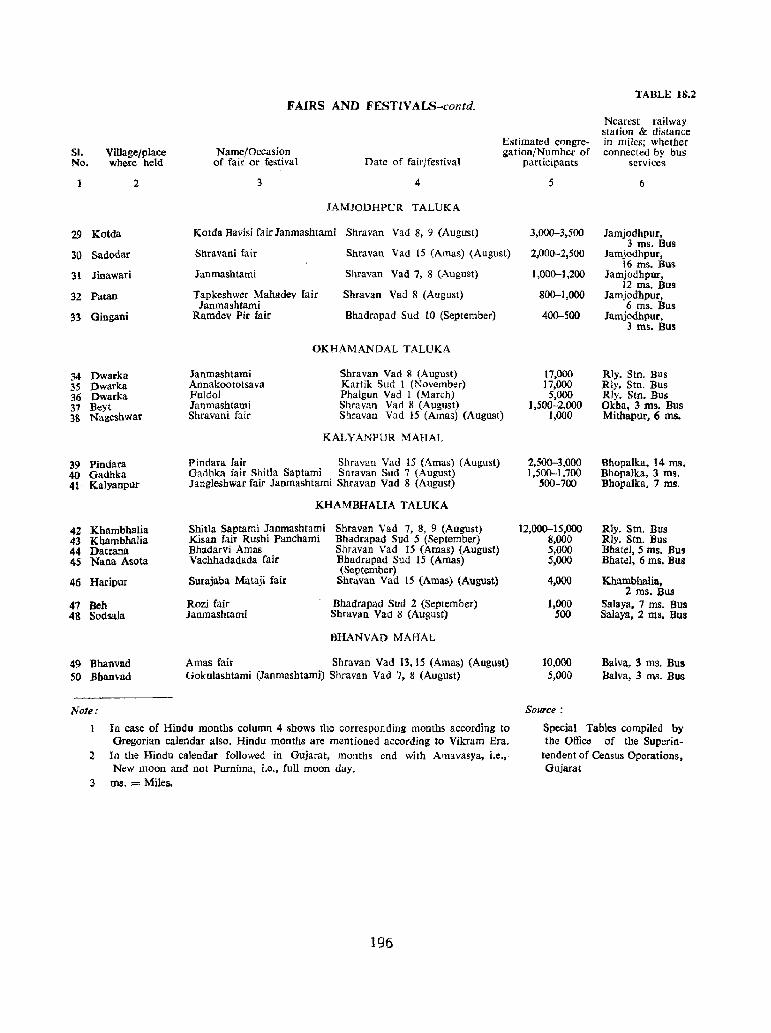
TABLE 18.2 FAIRS AND FESTIV ALS-contd.
Sl. No.
Village/place where held
Name/Occasion of fair or festival Date of fair/festival
Estimated congregation/Number of
participants
Nearest railway station & distance in miles; whether connected by bus
services
29 Kotda
30 Sadodar
31 Jinawari
32 Patan
33 Gingani
34 Dwarka 35 Dwarka 36 Dwarka 37 Beyt
2
38 Nagelihwar
39 Pindara 40 Gadhka 41 Kalyanpur
42 Khambhalia 43 Kbambhalia 44 Datraoa 45 Nana Asota
46 Haripur
47 Beh 4& Sodsala
49 Bhanvad SO Bbanvad
Note:
3 4
JAMJODHPUR TALUKA
Kotda Bavisi fair lanmashtami Shravan Vad 8, 9 (August)
Shravani fair
Janmashtami
Tapkeshwer Mahadev fair Janmashtami
Ramdev Pir fair
Shravan Vad 15 (Amas) (August)
Shravan Vad 7, 8 (August)
Shravan Vad 8 (August)
Bhadrapad Sud lO (September)
OKHAMANDAL TALUKA
Janmashtami Annakoototsava Fuldol lanmashtami Suravani fair
Shravan Vad 8 (August) Kartik SLId 1 (November) Phalgun Vad 1 (March) Shravan Vad 8 (August) Suravan Vad 15 (Amas) (August)
KALYANPUR MAHAL
Pindara fair Shravan Vad 15 (Amas) (August) Gadhka fair Shitla Saptami Shravan Sud 7 (August) Jangleshwar fair Janmashtami Shravan Vad 8 (August)
KHAMBHALIA TALUKA
Shitla Saptami lanmashtami Kisan fair Rushi Panchami Bhadarvi Amas Vachhadadada fair
Surajaba Mataji fair
Rozi fair Janmashtami
Shravan Vad 7, 8, 9 (August) Bhadrapad Sud 5 (September) Shravan Vad 15 (Amas) (August) Bhadrapad Sud 15 (Amas) (September)
Shravan Vad 15 (Amas) (August)
Bhadrapad Sud 2 (September) Shravan Vad 8 (August)
BHANVAD MAHAL
Amas fair Shravan Vad 13,15 (Amas) (August) Gokulashtami (Janmashtami) Shravan Vad 7, 8 (August)
In case of Hindu months column 4 shows the corresponding months according to Gregorian calendar also. Hindu months are mentioned according to Vikram Era.
2 In the Hindu calendar followed in Gujarat, months end with Amavasya, i.e." New moon and not Purnima, i.e., full moon day.
3 ms. = Miles.
196
5 6
3,000-3,500 Jamjodhpur, 3 ms. Bus
2,000-2,500 Jamjodhpur, 16 ms. Bus
1,000-1,200 Jamjodhpur, 12 ms. Bus
800-1,000 Jamjocihpur, 6 ms. Bus
400-500 Jamjocihpur,
17,000 17,000
5,000 1,500-2,000
1,000
2,500-3,000 1,500-1.700
500-700
12,000-15,000 8,000 5,000 5,000
4,000
1,000 500
10,000 5,000
Source:
3 ms. Bus
Rly. Stn. Bus Rly. Stn. Bus Rly. Stn. Bus Okba, 3 ms. Bus Mithapur, 6 ms.
Bhopalka, 14. ms. Bhopalka, 3 ms. Bhopalka, 7 ms.
Rly. Stn. Bus Rly. Stn. Bus Bhatel, 5 ms. Bus Bhatel, 6 ms. Bus
Kbambhalia, 2 ms. Bus
Salaya, 7 ms. Bus Salaya, 2 ms. Bus
Balva, 3 ms. Bus Balva, 3 ms. Bus
Special Tables compiled by the Office of the Superin
tendent of Census Operations, Gujarat
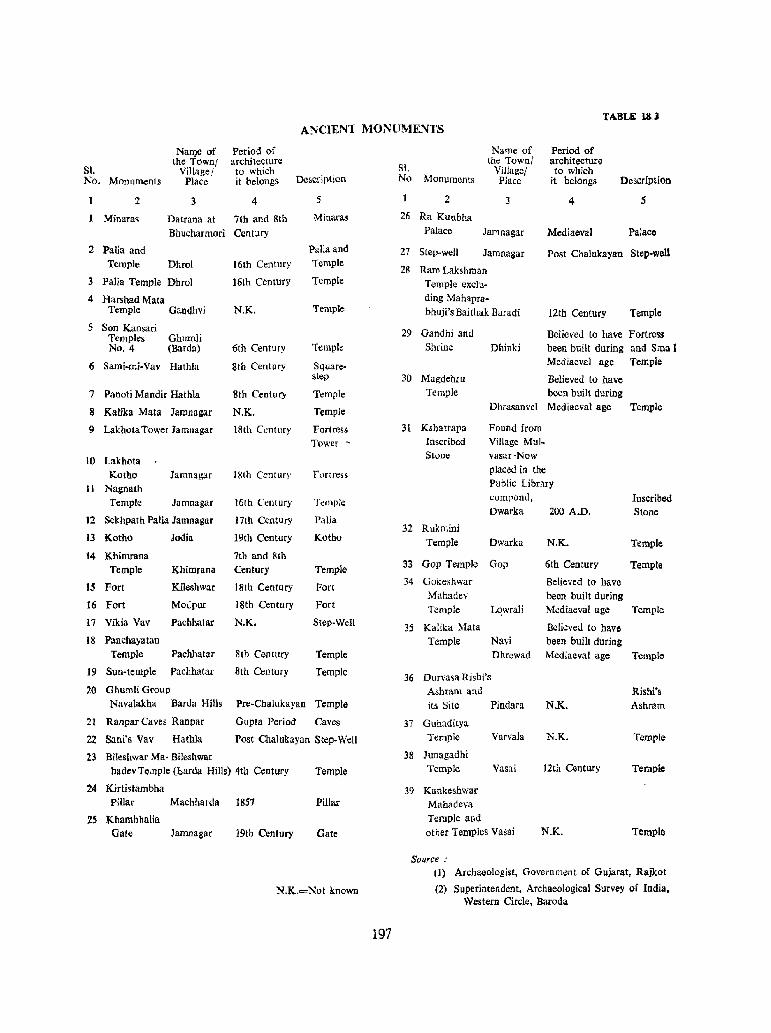
TABU lal ANCIENT MONUMENTS
Nal1)c of Period of Name of Period of the Town! architecture SL
the Townl architecture Sl. Village/ to which Village/ to which No, Monuments Place it belongs Description No. Monuments Place it belongs Description
2 3 4 5 2 3 4 5
MinaTa~ Datrana at 7th and 8th Minaras 26 Ra Kunbha
Bhucharmori Centlry Palace Jamnagar Mediaeval Palaeo
2 PaUa and Paliaand 27 Step-well Jarnnagar Post Chaluka.yan Step-well Temple Dhrol 16th Century Temple
28 Ram Laksbman 3 Palia Temple Dhrol 16th Century Temple Temple exclu-
4 Harshad Mala ding Mahapra-Temple Gandhvi N.K. Temple bhuji's Bailhak Baradi 12th Century Temple
5 Son Kansari 29 Gandhi and Believed to have Fortress Temples Ghumli No. 4 (Barda) 6th Century Temple Shrine Dhinki been built during and Sma I
6 Sami-mi-Vav Hathla 8th Century Square- Mediaeval age Temple
step 30 Magdehrll Believed to have
7 Panoti Mandir Hathla 8th Century Temple Temple been huilt during
8 Kalika Mala Jamnagar N.K. Temple Dhrasanvel Mediaeval age Temple
9 Lakhota Tower Jamnagar 18th C~ntury Fortress 31 Kshatrapa Found from
Tower - Inscribed Village Mul-
10 Lakhota Stone vasar·Now
Kotho Jarnnagar 18th Century r,Jrtress placed in the
II Nagnath Public Library
Temple Jamnagar 16th Century Temple compond, Inscribed Dwarka 200 A.D. Stone
12 Sekhpath Palia Jamnagar 17th Century Palia 32 Rllkn-.ini
13 Kotho Jodia 19th Century Kotho Temple Dwarka N.K. Temple 14 Khimrana 7th and 8th
Temple Khimrana Century Temple 33 Gop Temple Gop 6th Century Temple
15 Fort Kileshwar 18th Century Fort 34 Gokeshwar Believed to have Mahadev been built during
16 Fort Moepur 18th Century Fort Temple L'!wraJi Mediaeval age Temple 17 Vikia Vav Paehhatar N.K. Step-Well 35 Kalika Mala Believed to have 18 Panchayatan Temple Navi been built during
Temple Pachhatar 8th Century Temple Dhrewad Mediaeval age Temple
19 Sun-temple Pachhatar 8th Century Temple 36 Durvasa Rishi's
20 Ghumli Group Ashram and Rishi's Navalakha Barda Hills Pre-Chalukayan Temple its Site Pindara N.K. Ashram
21 Ranpar Caves Ranpar Gupta Period Caves 37 Guhaditya
22 Sani's Vav Hathla Post Chalukayan Step·Well Temple Varvala N.K. Temple
23 Bileshwar Ma- BiJeshwar 38 Junagadhi
badevTIMple (harda Hills) 4th Century Temple Temple Vasai 12th Century Temple
24 Kirtistambha 39 Kankeshwar Pillar Machharda 1&57 Pilla.r Mahadeva
25 Khambhalia Temple and
Gate Jamnagar 19th Century Gate other Temples Vasai N.K. Temple
Source,' (1) Archaeologist, Government of Gujarat, Rajkot
N.K.=Not known (2) Superintendent, Archaeologieal Survey of India, Western Circle, Baroda
197

PART III
VILLAGE DIRECTORY

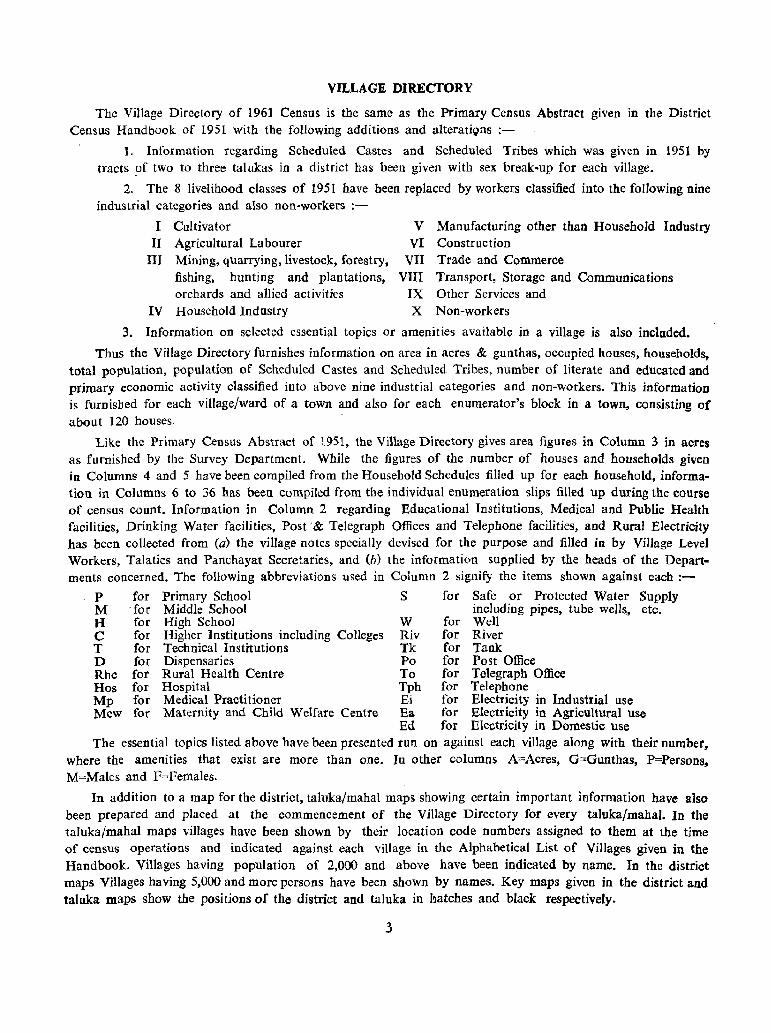
VILLAGE DIRECTORY
The Village Directory of 1961 Census is the same as the Primary Census Abstract given in the District Census Handbook of 1951 with the following additions and alteratiQns :-
1. Information regarding Scheduled Castes and Scheduled Tribes which was given in 1951 by tracts ?f two to three talukas in a district has been given with sex break-up for each village.
2. The 8 livelihood classes of 1951 have been replaced by workers classified into the foIlowing nine industrial categories and also non-workers :-
I Cultivator II Agricultural Labourer
III Mining, quarrying, livestock, forestry, fishing, hunting and plantations, orchards and allied activities
IV Household Industry
V Manufacturing other than Household Industry VI Construction
VII Trade and Commerce VIII Transport, Storage and Communications
IX Other Services and X Non-workers
3. Information on selected essential topics or amenities available in a village is also included.
Thus the Village Directory furnishes information on area in acres & gunthas, occupied houses, households, total population, population of Scheduled Castes and Scheduled Tribes, number of literate and educated and primary economic activity classified into above nine industrial categories and non-workers. This information is furnished for each village/ward of a town and also for each enumerator's block in a town, consisting of about 120 houses. '
Like the Primary Census Abstract of 1951, the Village Directory gives area figures in Column 3 in acres as furnished by the Survey Department. While the ligures of the number of houses and households given in Columns 4 and 5 have been compiled from the Household Schedules filled up for each household, information in Columns 6 to 36 has been compiled from the individual enumeration slips filled up during the course of census count. Information in Column 2 regarding Educational Institutions, Medical and Public Health facilities, Drinking Water facilities, Post '& Telegraph Offices and Telephone facilities, and Rural Electricity has been collected from (a) the village notes specially devised for the purpose and filled in by Village Level Workers, Talaties and Panchayat Secretaries, and (b) the information supplied by the heads of the Departments concerned. The following abbreviations used in Column 2 signify the items shown against each :-
P for Primary School S for Safe or Protected Water Supply M ' for Middle School including pipes, tube wells, etc. H for High School W for Well C for Higher Institutions including Colleges Riv for River T for Technical Institutions Tk for Tank D for Dispensaries Po for Post Office Rhc for Rural Health Centre To for Telegraph Office Hos for Hospital Tph for Telephone Mp for Medical Practitioner Ei for Electricity in Industrial use Mcw for Maternity and Child Welfare Centre Ea for Electricity in Agricultural Use
Ed for Electricity in Domestic Use The essential topics listed above have been presented run on against each village along with their number,
where the amenities that exist are more than one. In other columns A=Acres, G=Gunthas, P=Persons, M=Males and F=Females.
In addition to a map for the district, taluka/mabal maps showing certain important information bave also been prepared and placed at the commencement of the Village Directory for every taluka/mahal. In the taluka/mahal maps villages have been shown by their location code numbers assigned to them at the time of census operations and indicated against each village in the Alphabetical List of Villages given in the Handbook. Villages baving population of 2,000 and above have been indicated by name. In the district maps Villages having 5,000 and more persons have been shown by names. Key maps given in the district and taluka maps show the positions of the district and taluka in hatches and black respectively.
3


TALUKA :JAMNAGAR
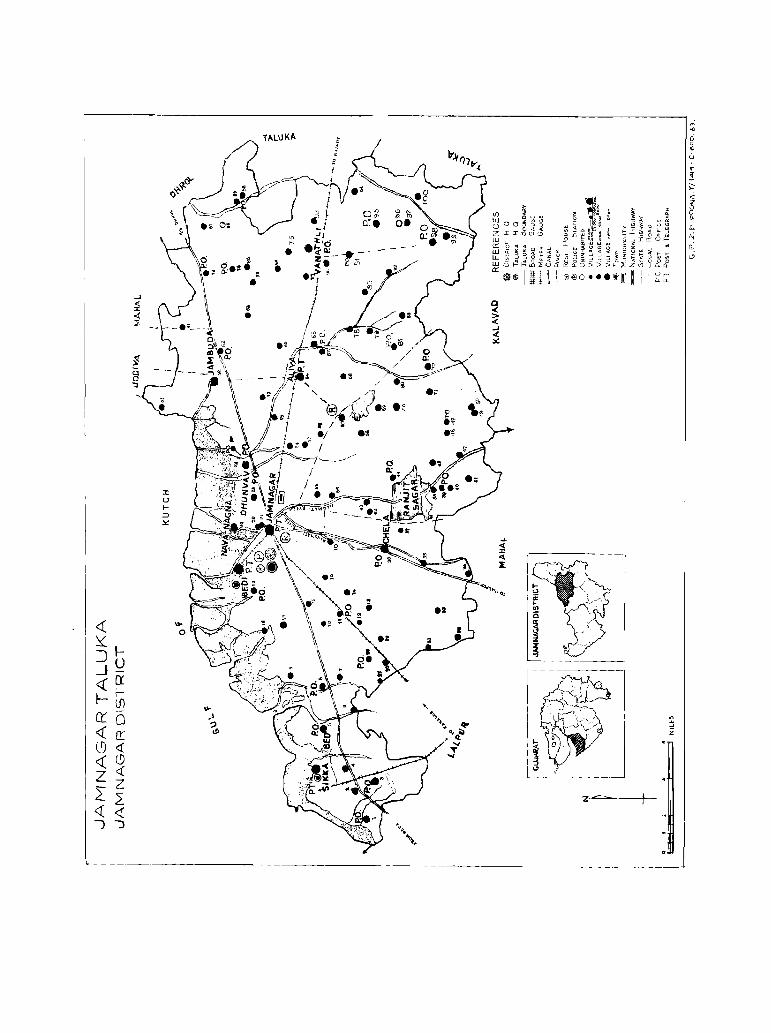
:;; 6 0 <;
u .;. l' >;
'" z , 0 It 0 3. ~ 0-il "' ~
~ ~ ~ 0-I
rfo~ '" :;! n: z g ~ ,_ ,_
'-" ~ ~ ~ ~ ~ o 0
I-- Z<I) 0.0.
if ~ I: 01--
:I: U t-=:> .lc:
.... « '" « E
t-o EX
i :n .: C5
I ~ "" z
« 0
~ .., ~I-:J U _j-«rx "-
:2
~~ '0,
'" ....
\' .. ~ "
ero .1
. .,~ ? « .., It
" ~ (9 <i " « (!)
z « 2; Li
<1: « JJ '. + • .....
TALUKA
JAMNAGAR
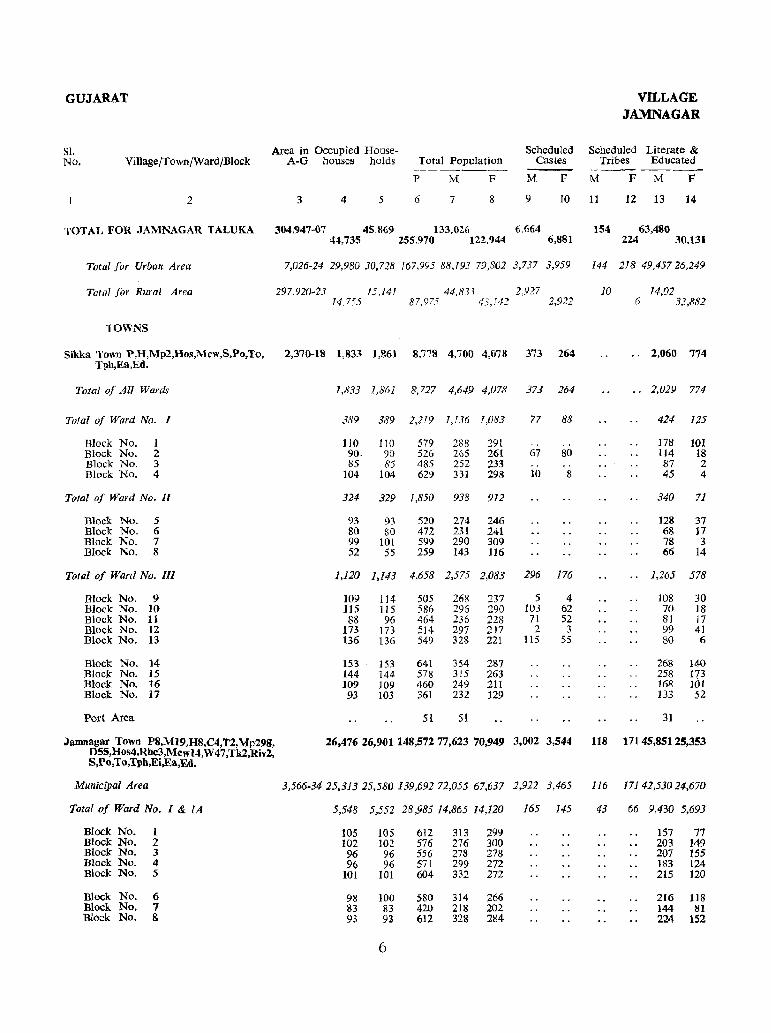
GUJARAT VILLAGE JAMNAGAR
Sl. Area in Occupied House- Scheduled Scheduled Literate & No. Village/Town/WardjBlock A-G houses holds Total Population castes Tribes Educated
--------p M F M P M F M F
2 3 4 5 6 7 8 9 10 11 12 13 14
TOTAL FOR JAMNAGAR TALUKA 3()4,947-()7 45,869 133,(}26 6,664 154 63,480 44,735 255,970 122,944 6,881 224 3(),131
Total for Urban Area 7,026-24 29,980 30,728 167,995 88,193 79,802 3,737 3,959 144 218 49,45726,249
Total for Rural Area 297, 92()-23 15,141 44,833 2,927 10 14,02 14.755 87,975 43,142 2,922 6 33,882
TOWNS
Sikka Town P,H,Mp2,Hos,Mcw,S,PI),To, 2,370-18 1,833 1,861 8,778 4,700 4,078 373 264 .. 2,060 774 Tph,Ea,Ed.
Total of All Wards 1,833 ],861 8,727 4,649 4,078 373 264 2,029 774
Total of Ward No. 1 389 389 2,219 1,l36 !,083 77 88 424 125
Block No. 1 110 110 579 288 291 . . .. 178 101 Block No. 2 90. 90 526 265 26l 67 80 114 18 Block No. 3 85 85 485 252 233 .. .. 87 2 Block No. 4 ]04 104 629 331 298 10 8 45 4
Total of Ward No. II 324 329 1,850 938 912 340 71
Block No. 5 93 93 520 274 246 128 37 Block No. 6 80 80 472 231 241 68 17 Block No. 7 99 lOt 599 290 309 78 3 Block No. g 52 55 259 143 116 66 14
Tofal of Ward No. III 1,120 1,143 4,658 2,575 2,083 296 176 .. 1,265 578
Block No. 9 109 114 505 268 237 5 4 108 30 Block No. 10 liS 115 586 296 290 103 62 70 ]8 Block No. 11 88 96 464 236 228 71 52 81 17 Block No. 12 173 173 514 297 Z17 2 3 99 41 Block No. 13 136 136 549 328 Z21 115 S5 80 6
Block No. 14 153 153 641 354 287 268 140 Block No. 15 144 144 578 315 263 258 173 Block No. 16 109 109 460 249 211 168 101 Block No. 17 93 103 361 232 129 133 52
Port Area 51 51 31
Jamnagar Town P8,M19,H8,C4,T2,Mp298, 26,476 26,901 148,57277,623 70,949 3,002 3,544 118 171 45,851 25,353 DSS,Hos4,Rhc3,Mcw14,W47,Tk2,Riv2, S,Po,To,Tph,Ei,Ea,Ed.
Municipal Area 3,566.3425,313 25,580 139,691 72,055 67,637 2,922 3,465 116 17141,53024,670
Total of Ward No. I & fA 5,548 5,552 28,985 14,865 14,120 165 145 43 66 9,430 5,693
Block No. 1 105 105 612 313 299 157 77 Block No. 2 102 102 576 276 300 203 149 Block No. 3 96 96 556 278 278 207 155 Block No. 4 96 96 571 299 272 183 124 Block No. S 101 101 604 332 272 215 120
Block No. 6 98 100 580 314 266 216 118 Block No. 7 83 83 420 218 202 144 81 Block No. S 93 93 612 328 284 224 152
6
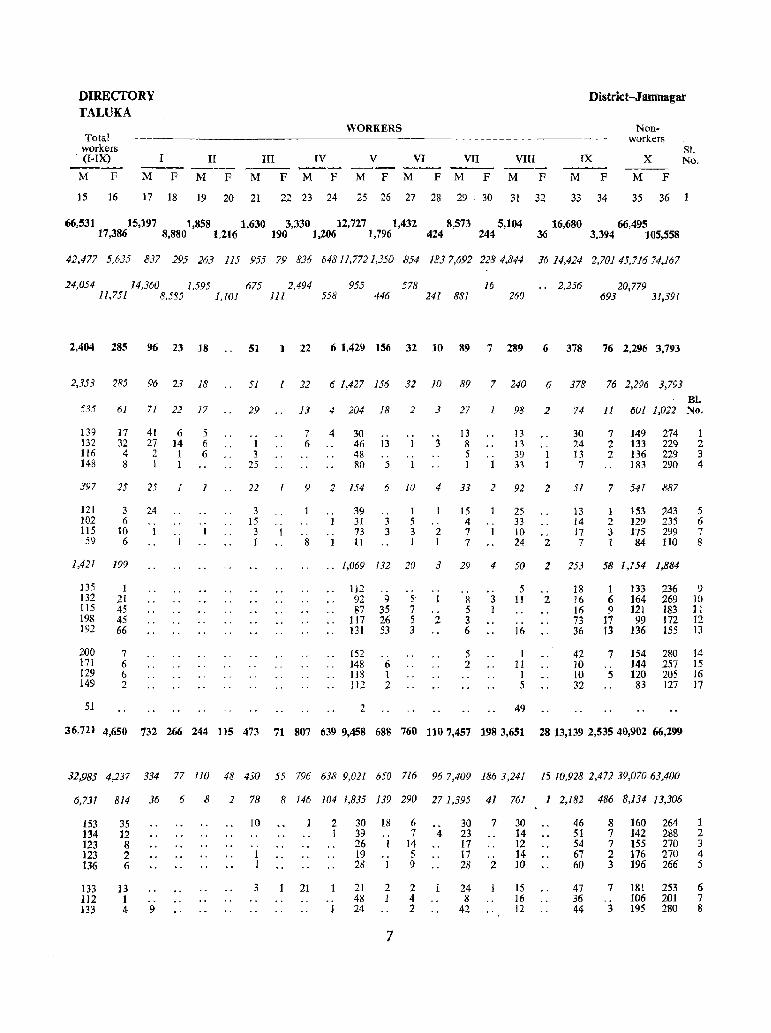
DIRECTORY fALUKA
Total workers (I-IX) I n --- ----
M F M F M F
III
M F
WORKERS
IV V VI VII VIII --- --- ----M F M F M F M F M F
15 16 17 18 19 20 21 22 23 24 25 26 27 28 29 30 31 32
District-Jamnagat
IX
M F
33 34
Nonworkers
x M F
3S 36
SI. No.
66,531 15,197 1,858 1,630 3,330 12,727 1,432 8,573 5,104 16,680 66,495 17,386 8,880 1,216 190 1,206 1,796 424 244 36 3,394 105,558
42,477 5,635 837 295 263 115 955 79 836 648 )],7721,35D 854 1837.692 2284,844 3614,424 2.70145.71674,167
24,054 14,360 1,595 675 2,494 955 578 16 .. 2,256 20,779 ll,751 8,585 1,101 111 558 446 241 881 260 693 31,391
2,404 285 96 23 18
2,353 285 96 23 18
535 6] 71 22 17
139 132 116 148
17 32
4 8
41 6 27 14
2 1 I I
397 25 25 1
121 102 liS 59
3 6
10 6
1,421 199
135 132 1]5 198 192
200 171 129 149
51
I 21 45 45 66
7 6 6 2
24 "
I "
j
5 6 6
,.
J
51 1 22 6 1,429 156 32 10 89 7 289 6 378 76 2,296 3,793
51 1 22 6 1,427 156 32 10 89 7 240 6 378 76 2,296 3,793
29
.. 1 3
25
13 4 204 18 2 3 27
7 6
4 30 46 48 80
13 . , j
.. I
.. 1
3 13 8 5 I
, ,
I
98 2
13 J 3 39 33
"
1 1
22 1 9 2 154 6 10 4 33 2 92 2
3 15 3 I
"
1 "
8
.. 1
"
I
39 31 73 It
, ,
3 3
1 5 3 I
, ,
2 1
15 4 7 7
"
1
2S 33 10 24
., 2
HI. 74 11 601 1,022 No.
30 24 13
7
51
13 14 17 7
7 2 2
149 133 136 183
274 229 229 290
7 541 887
1 2 3 1
153 129 175 84
243 235 299 110
1 2 3 4
5 6 7 8
,. 1,069 132 20 3 29 4 50 2 153 58 1,154 1,884
J12 92 87
117 131
152 148 llS ]]2
2
" 9
35 26 53
6 1 2
. , S 7 5 3
.. 1
2
,. 8 5 3 6
5 2
.. 3 1
5 11
16
1 11
I 5
49
2 18 16 16 73 36
42 10 10 32
1 6 9
17 13
7 "
S
133 164 121 99
136
236 9 269 10 183 II 172 12 155 13
154 280 14 144 257 15 120 205 J6 83 127 17
36,721 4,650 732 266 244 115 473 71 807 639 9,458 688 760 1107,457 198 3,651 28 13,139 2,53540,902 66,299
31,985 4,237 334 77 110 48 430 55 796 638 9,021 650 716 967,409 186 3,241 1510,928 2,47239,07063,400
6,731 8J4 36 6 ,8 2 78 8 146 104 1,835 139 290 271,395 41 761 1 2,182 486 8,134 13,306
153 134 123 123 136
133 112 133
35 12 8 2 6
13 I 4
10
3 21 .. 9
2 1
.. j
30 39 26 19 28
21 48 24
18
1 ,. 1
2 1
7
6 7
14 5 9
2 4 2
4 30 23 17 17 28
24 8
42
7
2
30 14 12 14 10
15 16 12
46 51 54 67 60
47 36 44
8 7 ? 2 3
7
3
160 142 15S 116 196
264 288 270 270 266
181 253 106 201 195 280
1 2 3 4 5
6 7 8
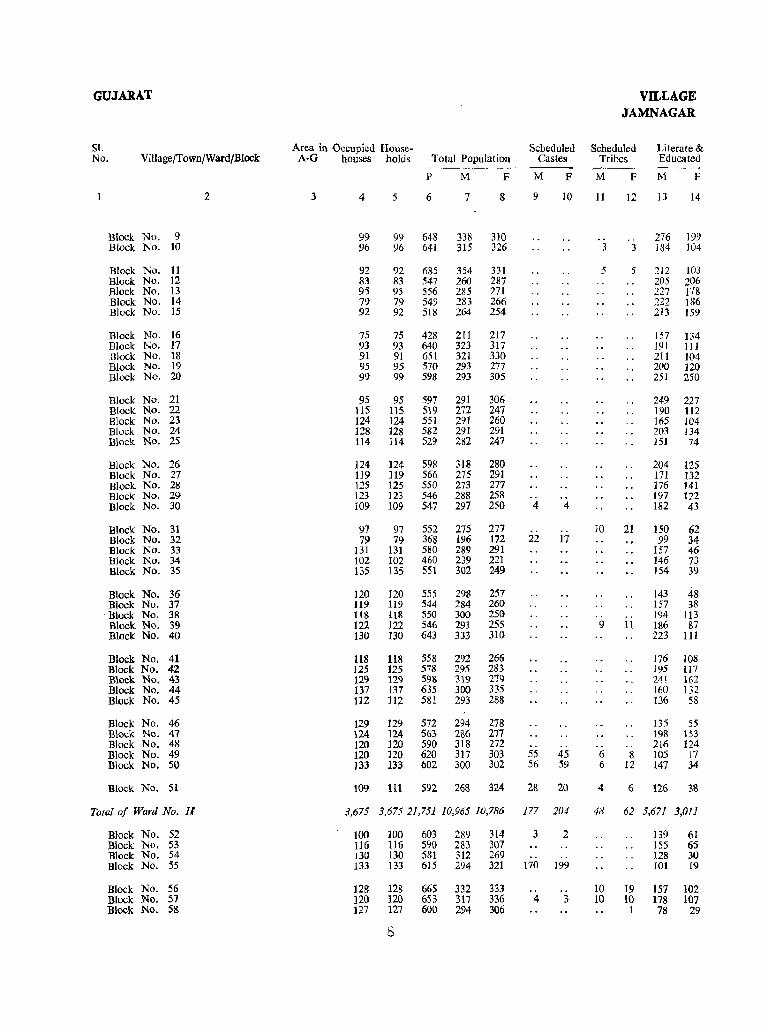
GUJARAT VILLAGE JAMNAGAR
SI. Area in Occupied House- Scheduled Scheduled Literate & No. Village/Town/Ward/B1ock A-G houses holds Total Population Castes Tribes Educated
p M F M F M F M F
2 3 4 5 6 7 8 9 10 11 12 13 14
Block No. g 99 99 648 338 310 276 199 Block No. 10 96 96 641 315 326 3 3 184 104
Block No. II 92 92 685 354 331 5 5 212 103 Block No. 12 83 83 547 260 287 205 206 Block No. l3 95 95 556 285 271 227 }78 Block No. 14 79 79 549 283 266 222 186 Block No. 15 92 92 518 264 254 213 159
Block No. 16 75 75 428 211 217 157 134 Block No. 17 93 93 640 323 317 191 III Block No. 18 91 91 651 321 330 211 104 Block No. 19 95 95 570 293 277 200 120 Block No. 20 99 99 598 293 305 251 250
Block No. 21 95 95 597 291 306 249 227 Block No. 22 115 115 519 272 247 190 112 Block No. 23 124 124 551 291 260 165 104 Block No. 24 128 128 582 291 291 203 134 Block No. 25 114 114 529 282 247 151 74
Block No. 26 124 124 598 318 280 204 125 Block No. 27 119 119 566 275 291 171 132 Block No. 28 125 125 550 273 277 176 141 Block No. 29 123 123 546 288 258 197 122 Block No. 30 109 109 547 297 250 4 4 182 43
Block No. 31 97 97 552 275 277 .. 10 21 150 62 Block No. 32 79 79 368 196 172 22 17 99 34 Block No. 33 131 131 580 289 291 157 46 Block No. 34 102 102 460 239 221 146 73 Block No. 35 135 135 551 302 249 154 39
Block No. 36 120 ]20 555 298 257 143 48 Block No. 37 119 119 544 284 260 157 38
. Block No. 38 118 118 550 300 250 .. 194 113 Block No. 39 122 122 546 291 255 9 11 186 87 Block No. 40 130 130 643 333 310 223 III
Block No. 41 U8 118 558 292 266 176 108 Block No. 42 125 125 578 295 283 195 117 Block No. 43 129 129 598 319 279 241 162 Block No. 44 137 137 635 300 335 160 132 Block No. 45 112 112 581 293 288 136 58
Block No. 46 129 129 572 294 278 135 55 Block No. 47 124 124 563 286 277 198 153 Block No. 48 120 120 590 318 272 .. .. 216 124 Block No. 49 120 120 620 317 303 55 45 6 8 105 )7 Block No. 50 133 133 602 300 302 56 59 6 12 147 34
Block No. 5i 109 111 592 268 324 28 20 4 6 126 38
Total of Ward No. II 3.675 3.67521,751 10,965 10,786 177 204 48 62 5,671 3,011
Block No. 52 100 100 603 289 314 3 2 139 61 Block No. 53 116 116 590 283 307 155 65 Block No. 54 130 130 581 312 269 .. 128 30 Block No. 55 133 133 615 294 321 170 199 101 19
Block No. 56 128 128 665 332 333 .. .. 10 19 157 102 Block No. 57 120 120 653 317 336 4 3 10 10 178 107 Block No. 58 127 127 600 294 306 1 78 29
8
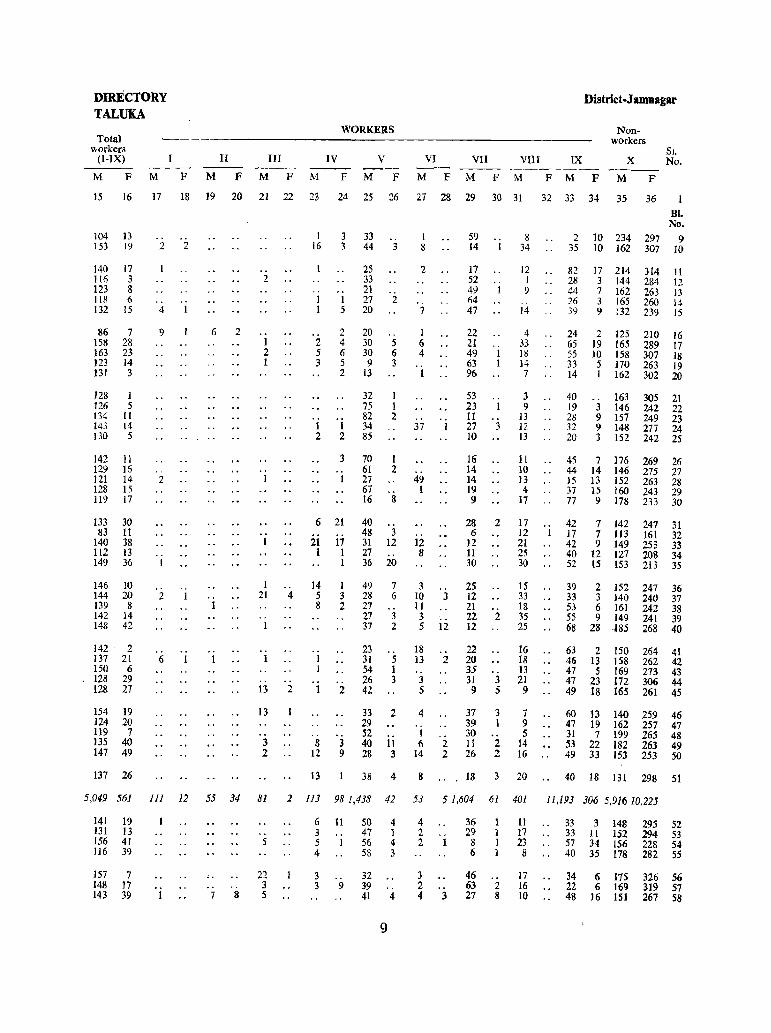
DWCTORY TALUKA
Total workers
(I-IX)
M F M
II
F M
WORKERS
III IV V
F M F M F M F
VI M F
VII
M F
District-Jamoagar
VIII IX -----M F M F
Nonworkers
X
M F
81. No.
15 16 ]7 18 ]9 20 21 22 23 24 25 26 27 28 29 30 31 32 33 34 35 36
104 13 153 19
140 17 116 3 123 8 ll8 6 132 15
86 7 158 28 163 23 123 14 131 3
128 126 134 143 130
1 5
II 14 5
142 11 129 16 121 14 128 15 119 17
133 83
140 112 149
30 11 38 I3 36
146 10 144 20 139 8 142 14 148 42
142' 2 137 21 150 6 128 29 128 27
154 19 124 20 119 7 135 40 147 49
137 26
.. 2 2
.. .. 4 I
9
2
.. I
2
.. 6 1
6 2
2
I 2 I
I 21
.. 1
"
13
13
3 2
.. 4
.. 2
I 16
o.
3 3
I I 1 5
2 5 3
I 2
2 4 6 5 2
1 2
3
I
6 21
21 17 1 1
14 5 8
..
1
1 3 2
2
S 3 12 9
13
33 44
25 33 21
.. 3
27 2 20
20 30 30 9
13
32 75 82 34 85
.. 5 6 3
1 1 2
70 1 61 2
1 8
'2
.. 7
1 6 4
I
37
27 49 67 1 16 8
40 48 31 27 36
49 28 27 27 37
23 31 54 26 42
3 12
20
7 6
3 2
5 1 3
33 2 29 52 40 11 28 3
38 4
12 8
3 10 II 3 5
18 13 .. 3 5
4 .. I
3
12
2
6 2 14 2
8
59 14 1
17 52 49 1 64 47
22 21 49 63 96
53 23 11 27 10
16 14 14 19 9
28 6
12 11 30
2S 12 21 22 12
22 20 35 31 9
.. 1 1
.. 1
3
2
2
3 5
31 3 39 I 30 11 2 26 2
8 34
12 1 9
14
4 33 IS 14 7
3 9
13 12 13
I I 10 13 4
17
17 12 21 25 30
15 33 18 35 25
16 18 13 21 9
7 9 5
14 16
18 3 20
BI. No.
2 10 234 297 9 35 10 162 307 10
82 17 214 314 II 28 3 144 284 12 44 7 162 263 13 26 3 165 260 14 39 9 132 239 15
24 2 125 210 16 65 19 165 289 17 55 10 158 307 18 33 5 170 263 19 14 1 162 302 20
40 19 28 32 20
.. 163 3 146 9 157 9 148 3 152
305 21 242 22 249 23 277 24 242 25
45 7 176 269 26 44 14 146 275 27 IS 13 152 263 28 37 15 160 243 29 77 9 178 233 30
42 17 42 40 52
39 33 5) 55 68
7 142 7 113 9 149
12 127 15 153
2 152 3 140 6 161 9 149
28 185
63 2 150 46 13 158 47 5 169 47 23 172 49 18 165
247 31 161 32 253 33 208 34 213 35
247 36 240 37 242 38 241 39 268 40
264 41 262 42 273 43 306 44 261 45
60 13 140 259 46 47 19 162 257 47 31 7 199 265 48 53 22 182 263 49 49 33 153 253 50
40 18 131 298 51
5,049 561 III 12 55 34 81 1 113 981,438 42 53 51,604 61 401 1I,193 306 5,91610.225
141 19 131 13 156 41 116 39
157 148 143
7 17 39
.. 7
.. 8
5
22 3 5
6 3 5 4
3 3
11 .. 1
.. 9
50 47 56 58
32 39 41
9
4 1 4 3
4
4 2 2
3 2 4
.. I
3
36 29
8 6
46 63 27
.. 2 8
11 17 23 8
17 16 10
33 3 148 33 11 152 57 34 156 40 35 178
34 6 175 22 6 169 48 16 151
295 52 294 53 228 54 282 55
326 56 319 57 267 58
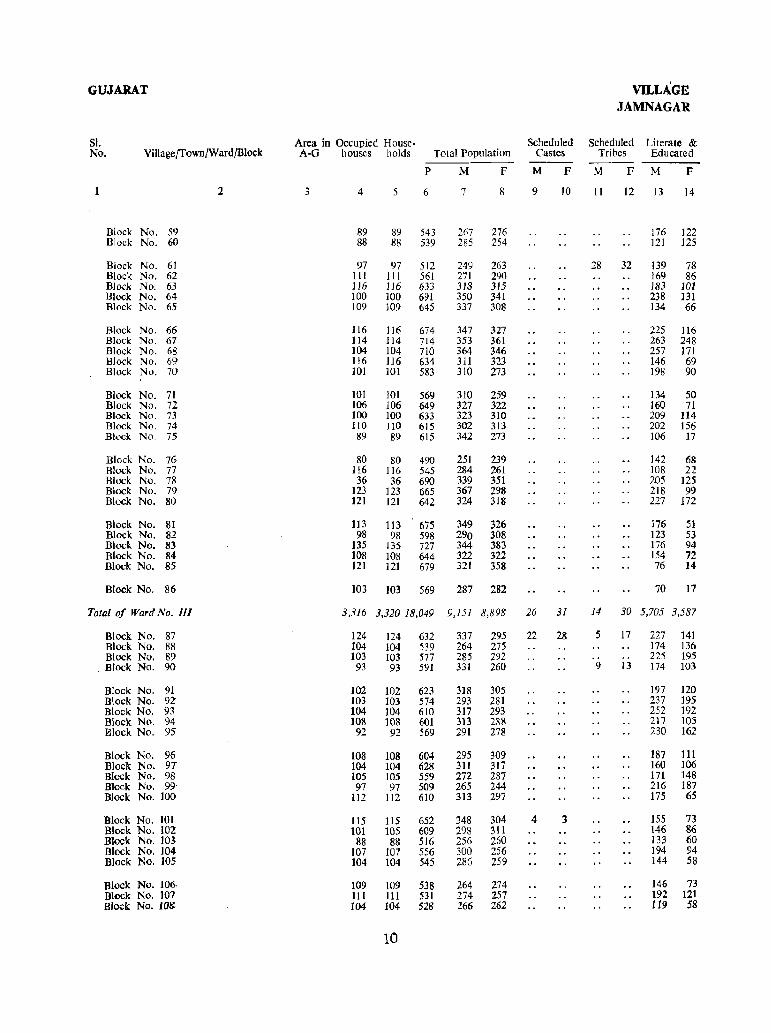
GUJARAT VILLAGE JAMNAGAR
SI. Area in Occupied House- Scheduled Scheduled Literate & No. ViIlage/Town/Ward/Block A-G houses holds Total Population Castes Tribes Educated ---p M F M F M F M F
2 3 4 5 6 7 8 9 10 II 12 13 14
Block No. 59 89 89 543 267 276 176 122 Block No. 60 88 88 539 285 254 121 125
Block No. 61 97 97 512 249 263 28 32 139 78 Block No. 62 111 111 561 271 290 169 86 Block No. 63 116 lJ6 633 318 315 183 101 Block No. 64 100 100 691 350 341 238 131 Block No. 65 109 109 645 337 308 134 66
Block No. 66 116 116 674 347 327 225 116 Block No. 67 114 114 714 353 361 263 248 Block No. 68 104 104 710 364 346 257 171 Block No. 69 116 116 634 31l 323 146 69 Block No. 70 101 101 583 310 273 198 90
Block No. 71 101 101 569 310 259 134 50 Block No. 12 106 106 649 327 322 160 71 Block No. 73 100 100 633 323 310 209 114 Block No. 74 110 ]]0 615 302 313 202 156 Block No. 75 89 89 615 342 273 106 17
Block No. 76 80 80 490 251 239 142 68 Block No. 77 116 116 545 284 261 108 22 Block No. 78 36 36 690 339 351 205 125 Block No. 79 123 123 665 367 298 218 99 Block No. 80 ]21 121 642 324 318 227 172
Block No. 81 113 113 675 349 326 176 51 Block No. 82 98 98 598 290 308 123 53 Block No. 83 135 135 727 344 383 176 94 Block No. 84 108 108 644 322 322 154 72 Block No. 85 121 121 679 321 358 76 14
Block No. 86 103 103 569 287 282 70 17
Total of Wart! No. III 3,316 3,320 18,049 9,151 8,898 26 31 14 30 5,705 3,587
Block No. 87 124 124 632 337 195 12 28 5 17 227 141 Block No. 88 104 104 539 264 175 174 136 Block No. 89 103 103 577 285 292 .. 225 195 Block No. 90 93 93 591 331 260 9 13 174 103
Block No. 91 102 102 62:1 318 305 197 120 Block No. 92 103 103 574 293 281 237 195 Block No. 93 104 104 610 317 293 252 192 Block No. 94 108 108 601 313 288 217 105 Block No. 95 92 92 569 291 278 230 162
Block No. 96 108 108 604 295 309 187 111 Block No. 97 104 104 628 311 317 160 106 Block No. 98 105 105 559 272 287 171 148 Block No. 99 97 97 509 265 244 216 187 Block No. 100 112 112 610 313 297 175 65
Block No. 101 115 115 652 348 304 4 3 155 73 Block No. 102 101 105 609 298 311 146 86 Block No. 103 88 88 516 256 260 133 60 Block No. 104 107 107 556 300 256 194 94 Block No. 105 104 104 545 286 259 144 58
Block No. 106· 109 109 538 264 Z74 146 73 Block No. 107 111 111 531 274 257 192 121 Block No. 109. 104 104 528 266 262 119 58
10
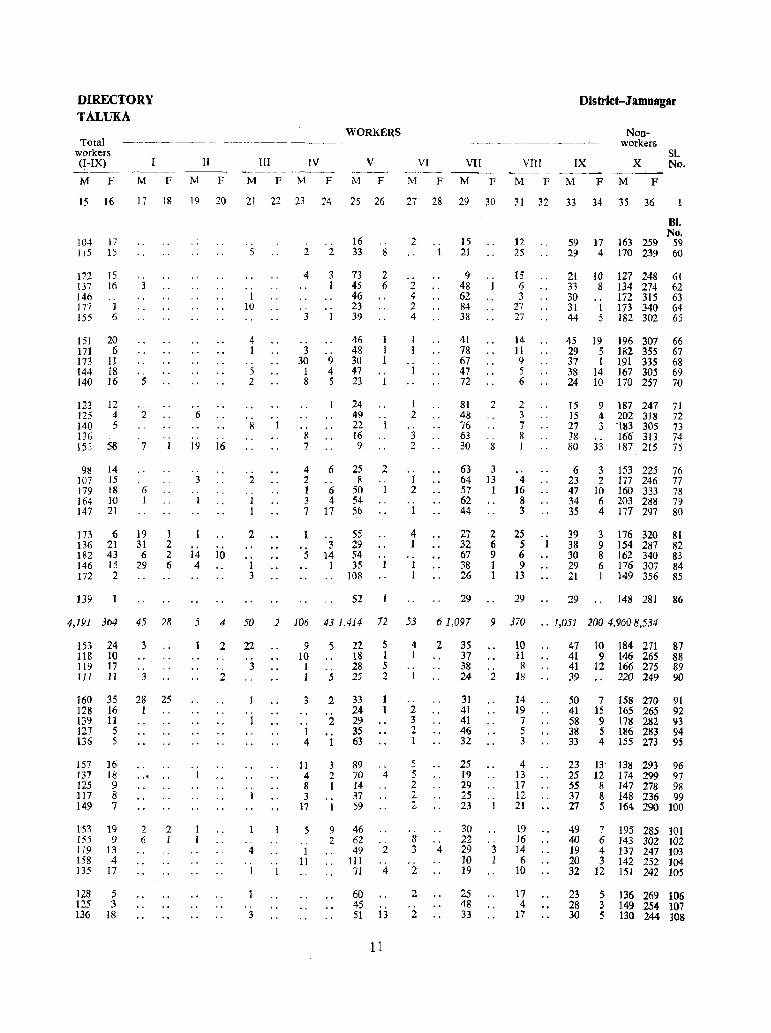
DIRECTORY TALUKA
Total workers (I-IX)
M F ~--
M F
II
M F
WORKERS
III TV v -------M F M F M F
VI
M F
VII
M
VIII
F M F
District-Jamnagar
IX
M F
Nonworkers
x M F
51. No.
15 16 17 18 19 20 21 22 23 24 25 26 27 28 29 30 31 32 33 34 35 36
104 17 115 15
122 137 146 177 155
15 16
I 6
151 20 171 6 173 11 144 18 140 16
123 125 140 136 153
12 4 5
58
98 14 107 15 179 18 164 10 ]47 21
173 6 136 21 182 43 146 15 172 2
139
5
.. 2
7
6 1
19 31 6
29
.. I
1 2 2 6
4,191 364 45 28
153 24 118 10 119 17 111 II
160 .35 128 16 139 11 127 5 136 S
157 16 137 18 125 9 117 8 149 7
153 19 155 9 119 13 158 4 135 17
128 5 125 3 136 18
3
3
28 25 1
2 6
2 I
.. 6
.. 19
.. 3
.. J
14 4
16
10
.. S
.. 1
10
4 I
.. S 2
.. 8
. . 2
.. 1 1
2
1 3
.. 1
.. "
2 2
4
., 3 1
3 30 9
1 4 8 5
.. 8 7
4 6 2 1 6 3 4 7 17
5 3
14 1
16 33
73 45 46 23 39
46 48 30 47
.. 8
2 6
23 1
24 49 22 16 9
25 8
50 54 56
5S 29 54 35
108
52
2 .. 1
.. 1
2
2 4 2 4
1 2
3 2
1 2 .. J
4 1
1 1
.. 1
15 21
9 48 62 84 38
41 7& 67 47 72
81 48 76 63 30
2
.. S
63 3 64 13 57 1 62 44
27 32 67 38 26
29
2 6 9 1 1
12 25
15 6 3
27 27
14 11 9 5 6
2 :> 7 8 I
4 ]6 8 3
25 5 6 9
13
29
81. No.
59 17 163 259 59 29 4 170 239 60
21 3, 30 31 44
10 8
1 5
127 248 61 134 274 62 172 315 63 173 340 64 182 302 65
4S 19 196 307 66 29 5 182 355 67 37 1 191 335 68 38 14 167 305 69 24 10 170 257 70
15 15 27 38 80
"
9 187 4 202 3 -183
33 166 187
247 71 318 72 305 73 313 74 215 75
6 3 153 225 76 23 2 177 246 77 47 10 160 333 78 34 6 203 288 79 35 4 177 297 80
39 38 30 29 21
29
3 176 320 81 9 154 287 82 8 162 340 83 6 176 307 84 1 149 356 85
148 281 86
5 4 50 2 106 431,414 72 53 61,097 9 370 .. 1,051 2004,9608,534
2
" 2
., 1
22
3
4
I
.. 3
.. 1
9 10 I I
1 4
11 4 8 3
17
5
1 11
5
.. 5
2
2
1
3 2 I
.. I
22 18 28 25
33 24 29 35 63
89 70 ]4 37 59
9 46 2 62
5 1 5 2
._ 4
4 1
.. 1
.. 2 3 2 1
5 5 2 2 2
.. 8
2
49 2 3 4 111 71 4 2
60 2 45 51 13 2
11
3S 37 38 24 2
31 41 41 46 32
25 19 29 25 23
30 22 29 3 10 1 19
25 48 33
10 11 8
]8
14 19 7 S 3
4 13 17 12 21
19 16 14 6
10
17 4
17
47 10 184 271 87 41 9 146 265 88 41 12 166 275 89 39 220 249 90
50 7 158 270 91 41 15 165 265 92 58 9 178 282 93 38 5 186 283 94 33 4 155 273 95
23 l3' 138 293 96 25 12 174 199 97 55 8 147 278 98 37 8 148 236 99 27 5 164 290 100
49 7 195 285 101 40 6 143 302 102 19 4 137 247 103 20 3 142 252 104 32 12 151 242 105
23 5 136 269 106 28 ~ 149 254 107 30 5 130 244 108
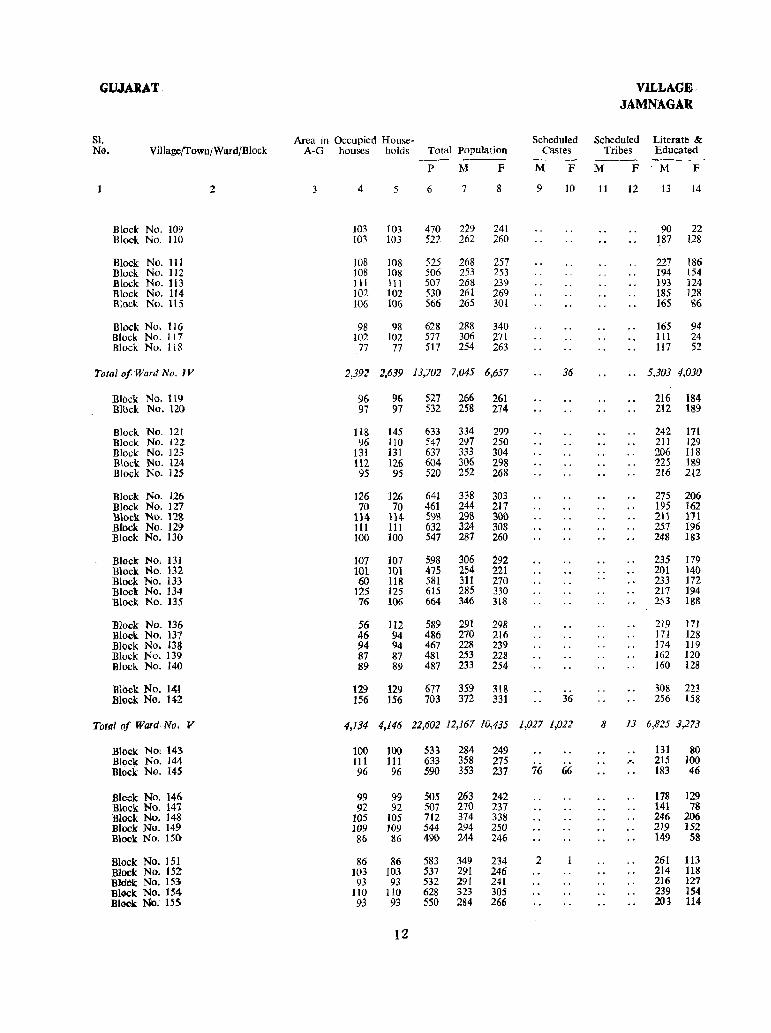
GWAJtAT VILLAGE· JAMNAGAR
Sl. Area in Occupied House- Scheduled Scheduled Literate & NG. Village(fownjWard/Block A-G houses holds Total Population Castes Tribes Educated
--- ---- ---P M F M F M F M F
2 3 4 5 6 7 8 9 10 11 12 13 14
Block No. 109 103 103 470 229 241 90 22 Block No. 110 103 103 522 262 260 ]87 128
Block No. 111 J08 108 525 268 257 227 186 Block No. ]12 108 108 506 253 253 ]94 154 Block No. ) 13 111 III 507 268 239 193 124 Block No. 114 102 102 530 261 269 185 128 Block No. 1 t 5 106 106 566 265 301 165 86
Block No. 116 98 98 628 288 340 165 94 Block No. 117 102 102 577 306 271 III 24 Block No. 1 j 8 77 77 517 254 263 117 52
Tota] o/Ward No. IV 2,392 2,639 13,702 7,045 6,657 36 .. 5,303 4,030
BlpCK No. 119 96 96 521 266 261 216 184 Block No. 120 97 97 532 258 274 212 189
Block No. 121 1I8 145 633 334 299 242 171 Block No. 122 96 110 547 297 250 211 129 Block No. 123 131 13J 637 333 304 206 I J 8 Block No. 124 Il2 126 604 306 298 225 189 Block No. 125 95 95 520 252 268 216 212
Block No. 126 126 126 641 338 303 275 206 Block No. 127 70 70 461 244 217 195 162 Block No. 128 114 114 598 298 300 211 171 Blbck No. 129 III 111 632 324 308 257 196 Block No. 130 100 100 547 287 260 248 183
Block No, 131 107 107 598 306 292 235 179 Block No. 132 101 101 475 254 221 201 ]40 Block No. 133 60 118 581 311 270 233 172 Block No. 134 125 125 615 285 330 217 194 Block No. 135 76 106 664 346 31S 253 188
Block No. 136 56 lI2 589 291 298 219 171 Block No. 137 46 94 486 270 216 171 128 Block No. 138 94 94 467 228 239 174 119 Block No. 139 87 87 4S1 253 228 162 J20 Block No. 140 89 89 487 233 254 160 128
Block No. 141 129 129 677 359 318 .. 308 223 Block No. 142 156 156 703 372 331 36 256 158
Total of Ward No. V 4,134 4,146 22,602 12,167 10,435 1,027 1,022 8 13 6,825 3,273
Block No: 143 100 100 533 284 249 131 80 Block No. 144 111 111 633 358 275 .'. 215 100 Block No. 145 96 96 590 353 237 76 66 183 46
Bleck No. 146 99 99 505 263 242 178 129 Block No. 147 92 92 501 270 231 141 78 Block No. 148 105 105 712 374 338 246 206 Block No. 14~ 109 J09 544 294 250 219 152 Block No. ISO, 86 86 490 244 246 149 58
Block No. 151 86 86 583 349 234 2 261 113 Block No. 152 103 103 537 291 246 214 118 BldCk No. 153 93 93 532 291 241 216 127 Block No. 154 110 110 628 323 305 239 154 Block No: I5S 93 93 550 284 266 203 114
12
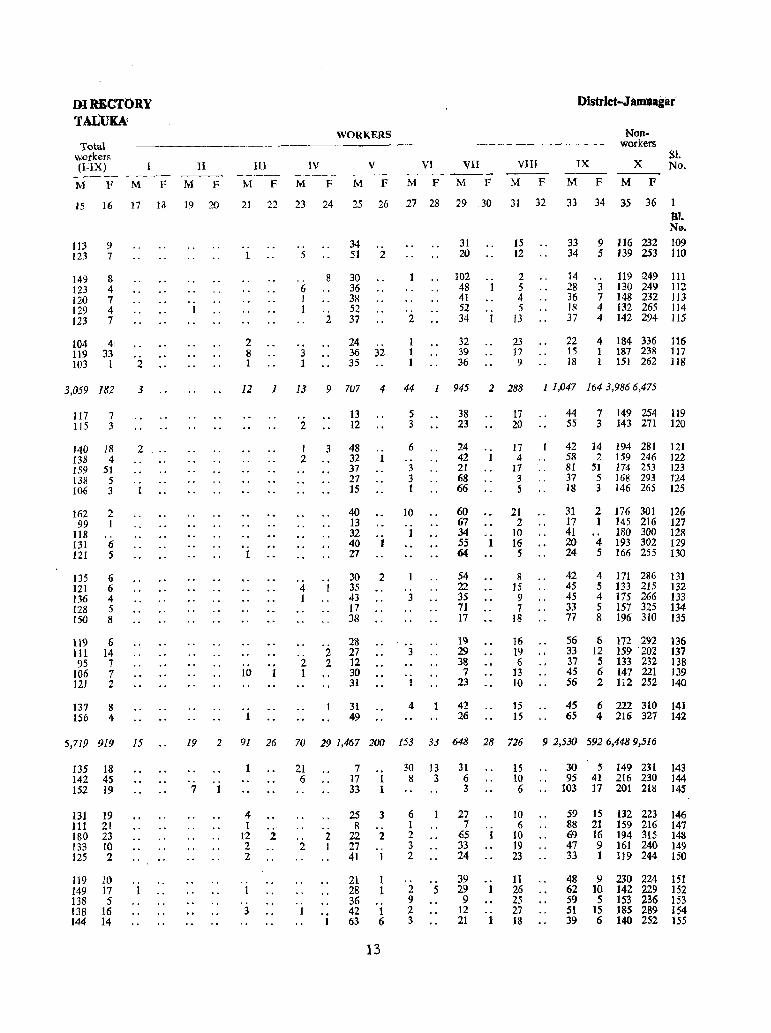
DIRECTORY TALUKk
'Ictal workers (}:IX) -~-
M F
J5 16
113 9 123 7
149 123 120 129 123
8 4 7 4 7
104 4: 119 33
M F
17 18
103 1 2
3,059 182
117 7 115 3
140 18 138 4 159 51 138 5 106 3
162 2 99 1
118 131 6 121 5
135 121 136 128 150
6 6 4 5 8
119 6 111 14 95 7
106 7 121 2
137 8 156 4
3
2
.. I
5,719 919 15
135 18 142 4S 152 19
I31 19 111 21 180 23 133 10 125 2
119 10 149 17 138 5 138 16 144 14
II
M F
19 20
III
M F
21 22
.. 1
2 8 1
WORKERS
IV V ---_ M F M F
23
.. S
6 1 1
3 1
24 25 26
8
.. 2
34 51 2
30 36 38 52 37
24 36 32 35
VI
M F
VII M F
27 28 29 30
2
31 20
102 48 41 52 34
32 39 36
.. I
.. 1
VIII
M F
31 32
15 12
2 5 4 5
13
23 J7 9
District-J aJDDagar
IX
Nonworkers
Sl. X No. ---
M F M F
33 34 35 36 1 BI. No.
33 9 116 232 109 34 5 139 253 110
14 28 36 18 37
.. 119 249 111 3 130 249 112 7 148 232 113 4 132 265 114 4 142 294 115
22 4 184 336 116 15 1 187 238 117 18 1 151 262 ]IS
12 1 13 9 707 4 44 1 945 2 288 1 1,047 164 3,9866,475
10
2
1 2
3
4 I I
2 I
2 2
13 12
48 32 37 27 15
40 13 32 40 27
.. J
30 2 35 43 17 38
28 27 12 30 31
31 49
5 3
6 ., 3 3 1
to
1
.. 3
3
4
38 23
24 42 21 68 66
.. J
17 20
17 4
17 3 5
60 21 67 2 34 10 S5 1 16 64 S
54 22 35 71 17
19 29 38 7
23
42 26
8 15 9 7
18
16 19 .• 6
13 10
15 15
44 7 149 254 119 55 3 143 271 120
42 ]4 194 281 121 58 2 159 246 122 81 51 174 253 123 37 5 168 293 124 18 3 146 265 125
31 2 176 301 126 17 1 145 216 127 41 180 300 128 20 4 193 302 129 24 5 166 255 130
42 45 45 33 77
4 171 286 131 5 133 215 132 4 175 266 133 5 157 325 134 8 196 310 135
56 6 172 2'91 136 33 12 159' 202 137 37 5 133 232 138 45 6 147 221 139 56 2 112 252 140
45 6 222 310 141 65 4 216 327 142
19 2 91 26 70 29 1,467 200 153 33 648 28 726 9 2,530 5926,4489,516
.. 7 1
4 I
12 2 2
1
3
2
21 6
2
..
"
2 1
1
7 17 1 33 1
25 8
22 27 41
3 .. 2
1
21 1 28 1 36 42 1 63 6
13
30 13 31 8 3 6
6 1 2 3 2
.. 2 9 2 3
5
3
27 7
65 33 24
39 29 9
12 21
., 1
.. 1
15 10 6
10 6
10 19 23
II 26 25 27 18
30 5 149 231 143 95 41 216 230 144
103 17 201 218 145
59 15 88 21 69 16 47 9 33 I
132 223 146 159 216 147 194 315 148 161 240 149 119 244 150
48 9 230 224 151 62 10 142 229 152 S9 5 153 236 153 51 15 HIS 289 154 39 6 140 252 155
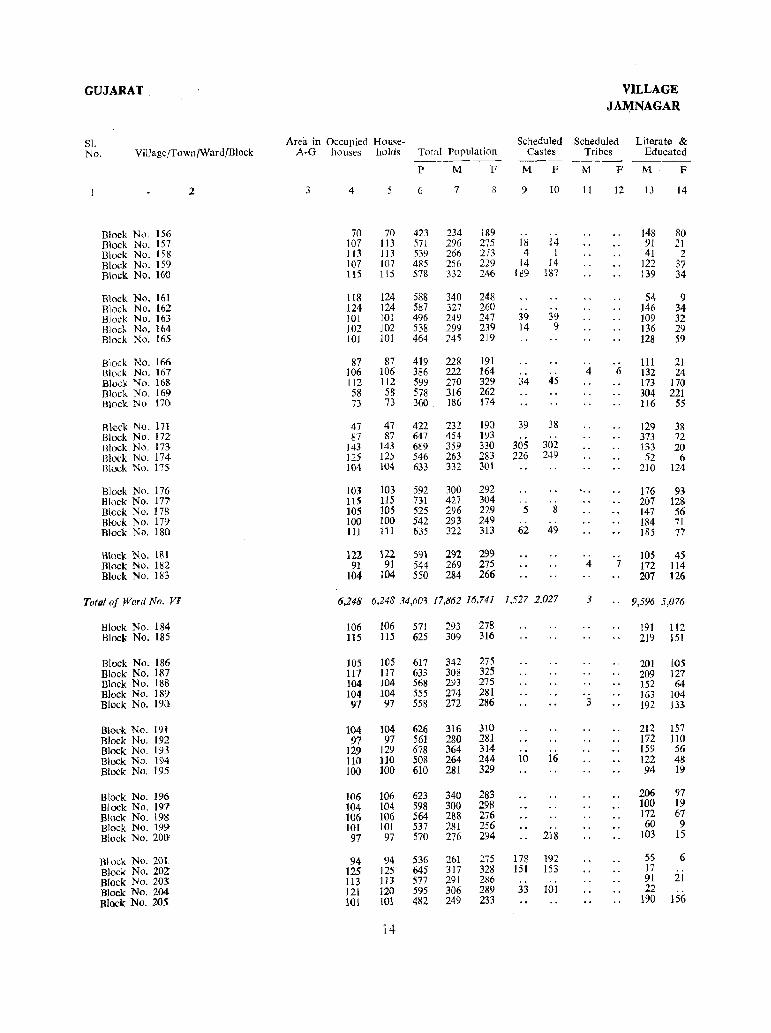
GUJARAT VILLAGE JAl\~NAGAR
S1. Area in Occupied House- Scheduled Scheduled Literate & No. VillagejTown/Ward/Block A-G houses holds Total Population Castes Tribes Educated
-------- --- --- ----P M F M F M F M F
2 4 6 7 9 10 11 12 1.\ 14
Block No. 156 70 70 423 234 189 .. .. 148 80 Block No. 157 107 ID 571 296 275 18 14 91 21 Block No. 158 113 113 539 266 273 4 I 41 2 Block No. 159 107 107 485 256 229 14 14 122 37 Block No. 160 115 115 578 332 246 189 187 139 34
Block No. 161 118 124 588 340 248 54 9 Rlock No. 162 124 124 587 327 260 .. " 146 34 Block No. 163 101 101 496 249 247 39 39 109 32 Block No. 164 102 102 538 299 239 14 9 136 29 Block No. 165 101 101 464 245 219 128 59
Block No. 166 87 87 419 228 191 111 21 Block No. 167 106 106 386 222 164 4 6 132 24 Block No. 168 112 112 599 270 329 34 45 173 170 Block No. 169 58 58 578 316 262 304 221 Block No 170 73 73 360 186 174 116 55
Block No. 171 47 47 422 232 190 39 38 129 38 Block No. 172 87 87 647 454 193 .. 373 72 Rlock No. In 143 143 689 359 330 305 302 133 20 Block No. 174 125 J25 546 263 283 226 249 52 6 Block No. 175 104 104 633 332 301 210 124
Block No. 176 103 103 592 300 292 176 93 Block No. 177 115 115 731 427 304 .. .. 207 128 Block No. 178 105 105 525 296 229 5 8 147 56 Block No. 179 100 100 542 293 249 .. .. 184 7[ Block No. 180 III 111 635 322 313 62 49 185 77
Block No. 181 122 122 591 292 299 .. 105 45 Block No. 182 91 91 544 269 275 4 7 172 114 Block No. IH3 104 104 550 284 266 207 126
Totolof Ward No. Vi 6,248 6,248 34,603 17,862 16,741 1,527 2,017 3 .. 9,596 5,076
Block No. 184 106 106 571 293 278 191 112 Block No. 185 ll5 lIS 625 309 316 219 lSI
Block No. 186 105 105 617 342 275 201 105 Block No. 187 117 117 633 308 325 209 127 Block No. 188 104 104 568 293 275 152 64 Block No. 189 104 104 555 274 281 163 104 Block No. 19(1 97 97 558 272 286 3 192 133-
Block No. 191 104 104 626 316 310 212 157 Block No. 192 97 97 561 280 281 172 110 Block No. 193 129 129 678 364 314 159 56 Block No. 194 110 110 508 264 244 10 16 122 48 Block No. 195 100 100 610 281 329 94 19
Block No. 196 106 106 623 340 283 206 97 Block No. 197 104 104 598 300 298 100 19 Block No. 198 106 106 564 288 276 172 67 Block No. 199- 101 101 537 281 256 60 9 Block No. 200 97 97 570 276 294 218 103 15
Block No. 201 94 94 536 261 275 178 192 55 6 Block No. 20Z 125 125 645 317 328 151 153 17 Block No. 203 113 113 577 291 286 .. 91 21
Block No. 204 121 120 595 306 289 33 101 22 Block No. 205 101 101 482 249 233 190 156
14
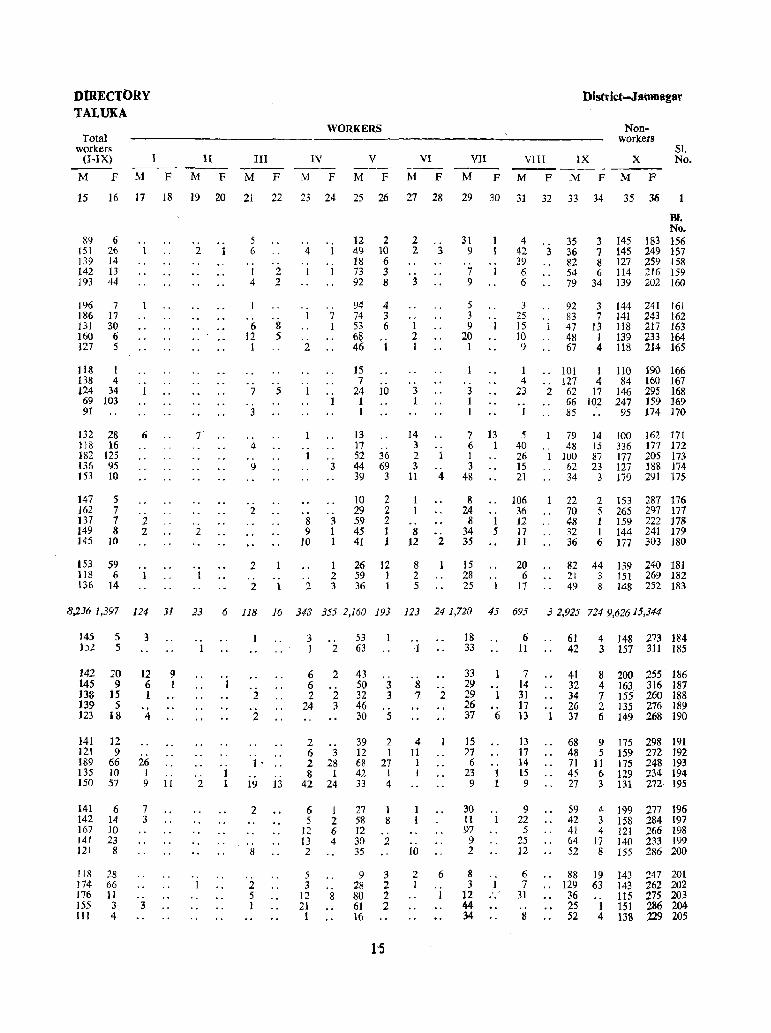
DIRECTORY TALUKA
Total workers
(I-IX)
M F M F
II
M F
III
M F
WORKERS
IV
M F
V
M F
VI
M F VII ---
M P
District-J &nmagar
Nonworkers
VIII IX X -M--P- --:-M--P -M--P-
SI. No.
15 16 17 18 19 20 21 22 23 24 25 26 27 28 29 30 31 32 33 34 35 36
89 6 151 26 139 14 142 13 193 44
196 7 186 17 m 30 160 6 127 5
118 I 138 4 124 34 69 103 91
132 28 118 16 182 125 136 95 153 10
147 162 137 149 145
5 7 7 8
10
153 59 118 6 136 14
.. 1
. -J
6
.. 2 2
" " 2 1
7
"
2
5 6
.. I 4
6 12 I
.. 7
" 3
.. 4 .. 9
2
2
.. 2 2
8 5
5
ao ••
2 1
.. 4 .. 1
2
.. S 9
10
.. 2
.. 7 1
3
.. 3 I 1
I 2 3
12 2 49 10 18 6 73 3 92 8
94 74 53 6~ 46
15 7
24 I 1
13 17
4 3 6
1
]0
52 36 44 69 39 3
10 29 59 45 41
2 2 2 1 1
26 12 59 I 36 1
2 2
3
1 2 1
.. 3 1
14 3 2 3
H
1 1
.. 8
12
8 2 5
3
.. 1
4
2
31 9
7 9
5 3 9
20 1
.. 3 1 1
7 6 1 3
48
8 24
8 34 3.5
15 28 25
13 1
" I 5
.. J
4 42 39 6 6
3 25 15 10 9
1 4
23
1
5 40 26 15 21
106 36 12 17 11
20 6
17
3
BI. No.
35 3 145 J83 156 36 7 145 249 157 82 g 127 259 158 54 6 114 216 159 79 34 139 202 160
92 83 47 48 67
3 144 241 161 7 141 243 162
13 118 217 163 I 139 233 164 4 118 214 165
.. 101 " 127 2 62
1 110 4 84
17 146
190 166 160 167 295 168 159 169 174 170
66 85
79 .. 48 1 100
62 34
22 70 48 32 36
102 247 95
14 100 162 171 15 336 J77 172 87 177 205 173 23 12i 18& 174 3 179 291 175
2 153 287 176 5 265 297 177 1 159 222 178 1 144 241 179 6 177 303 180
82 44 139 240 181 21 3 151 269 182 49 8 148 252 183
8,').36 1,397 124 31 23 6 118 16 348 355 2,160 193 123 241,720 45 695 32,925 7249,62615,344
145 5 ])2 5
142 20 145 9 138 ]5 139 5 123 18
141 ]21 189 135 150
12 9
66 10 57
141 6 142 14 167 10 141 23 121 8
118 28 J74 66 176 11 155 3 III 4
3
12 6 1
4
26 1 9
7 3
.. 3
9 1
.. 11
"
.. 1
.. 2
1
.. 1 I
2
2
1- .. .. .-19 13
2
, .. 8
2 5 I
3 53 1 2 63
6 2 6 2 2
24 3
2 6 3 2 28 8 1
42 24
6 5
12 13 2
5 3
12 21 1
1 2 6 4
.. 8
43 50 3 32 3 46 30 5
39 2 12 1 68 27 42 1 33 4
27 I 58 8 12 30 2 35
9 28 80 61 16
3 2 2 2
1'5
1
8 7
4 11 1 1
.. W
2 1
.. 2
6
1
18 33
33 29 29 1 26 37 6
15 27 6
23 9
30 II 97
9 2
8 3
12 44 34
-.
"
"
1 1
1
1
6 11
7 14 31 17 13
J3 17 14 15 9
9 22 5
25 12
6 7
31
8
61 4 148 273 184 42 3 157 311 185
41 32 34 26 37
68 48 71 45 27
8 200 255 186 4 163 316 187 7 155 260 188 2 135 276 189 6 149 268 190
9 175 298 191 5 159 272 192
11 175 248 193 6 129 234 194 3 131 272 195
59 4 199 277 196 42 3 158 284 197 41 4 121 266 198 64 17 140 233 199 52 8 155 286 200
88 19 143 247 201 129 63 143 262 202
36 115 275 203 25 1 151 286 204 52 4 138 129 205
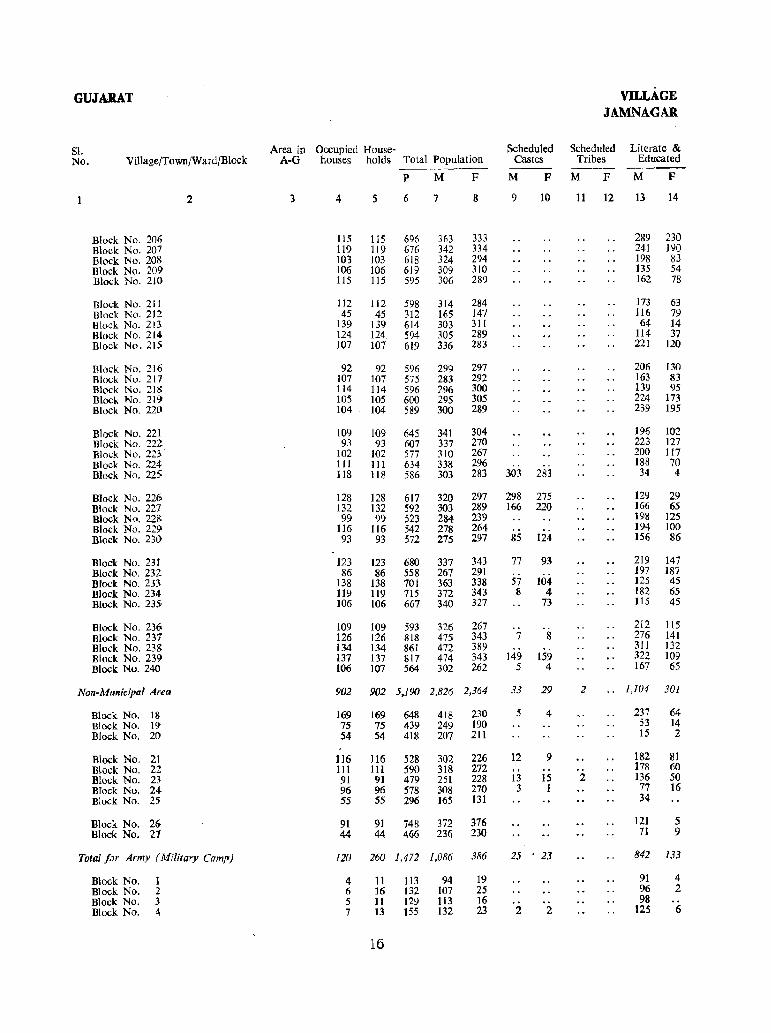
GUJARAT VILLAGE JAMNAGAR
SI. Area in Occupied House- Scheduled Scheduled Literate & No. ViIlage/TownjWardjBlock A-G houses holds Total Population Castes Tribes Educated -- -----
P M F M F M F M F
2 3 4 5 6 7 8 9 10 11 12 13 14
Block No. 206 J 15 115 696 363 333 289 230 Block No. 207 119 119 676 342 334 241 190 Block No. 208 103 103 618 324 294 198 83 Block No. 209 106 106 619 309 310 135 54 Block No. 210 115 115 595 306 289 162 78
Dlock No. 211 112 112 598 314 284 173 63 Block No. 212 45 45 312 165 147 116 79 Block No. 213 139 139 614 303 311 64 14 Block No. 214 124 124. 594 305 289 114 37 Block No. 215 107 107 619 336 283 22t 120
Rlock No. 2·16 92 92 596 299 297 206 130 Block No. 217 107 107 575 283 292 163 83 Block No. 218 114 114 596 296 300 139 95 Block No. 219 105 105 600 295 305 224 173 Block No. 220 104 104 589 300 289 239 195
Block No. 221 109 109 645 341 304 196 102 mock No. 222 93 93 607 337 270 223 127 Block No. 223>· 102 102 577 310 267 200 117 Block No. 224 III III 634 338 296 188 70 Block No. 225 118 118 586 303 283 303 283 34 4
Block No. 226 128 128 617 320 297 298 275 129 29 Block No. 227 132 132 592 303 289 166 220 166 65 Block No. 228 99 99 523 284 239 198 125 Block No. 229- 116 116 542 278 264 194 100 Block No. 230 93 93 572 275 297 85 124 156 86
Bloclc No. 231 123 123 680 337 343 77 93 219 147 Block No. 232 86 86 558 267 291 197 187 Block No. 233 138 138 701 363 338 57 104 125 45 Block No. 234 119 119 715 372 343 8 4 182 65 Block No. 235 106 106 667 340 327 73 115 45
Block No. 236 109 109 593 326 267 .. 212 115 Block No. 237 126 126 818 475 343 7 8 276 141 Block No. 238 134 134 861 472 389 311 132 Block No. 23<) 137 137 817 474 343 149 159 322 109 Block No. 240 106 107 564 302 262 5 4 167 65
Non-Municipal Area 902 902 5,190 2,826 2,364 33 29 2 .. J,104 301
Block No. 18 169 169 648 418 230 5 4 237 64 Block No. 19 75 75 439 249 190 53 14 Block No. 20 54 54 418 207 211 15 2
Block No. 21 116 116 528 302 226 12 9 182 31 Block No. 22 111 III 590 318 272 .. 178 60 Block No. 23 91 91 479 251 228 13 15 2 136 50 Block No. 24 96 96 578 308 270 3 1 77 16 Block No. 25 55 55 296 165 131 34
Block No. 26 91 91 748 372 376 121 5 Block No. 27 44 44 466 236 230 71 9
TotalliJr Army (Military Camp) 120 260 1,472 1,086 386 25 23 842 133
Block No. I 4 11 113 94 19 91 4 Block No. 2 6 16 132 107 25 96 2 Block No. 3 5 11 129 113 16 98 Block No. 4 7 13 155 132 23 2 2 125 6
16
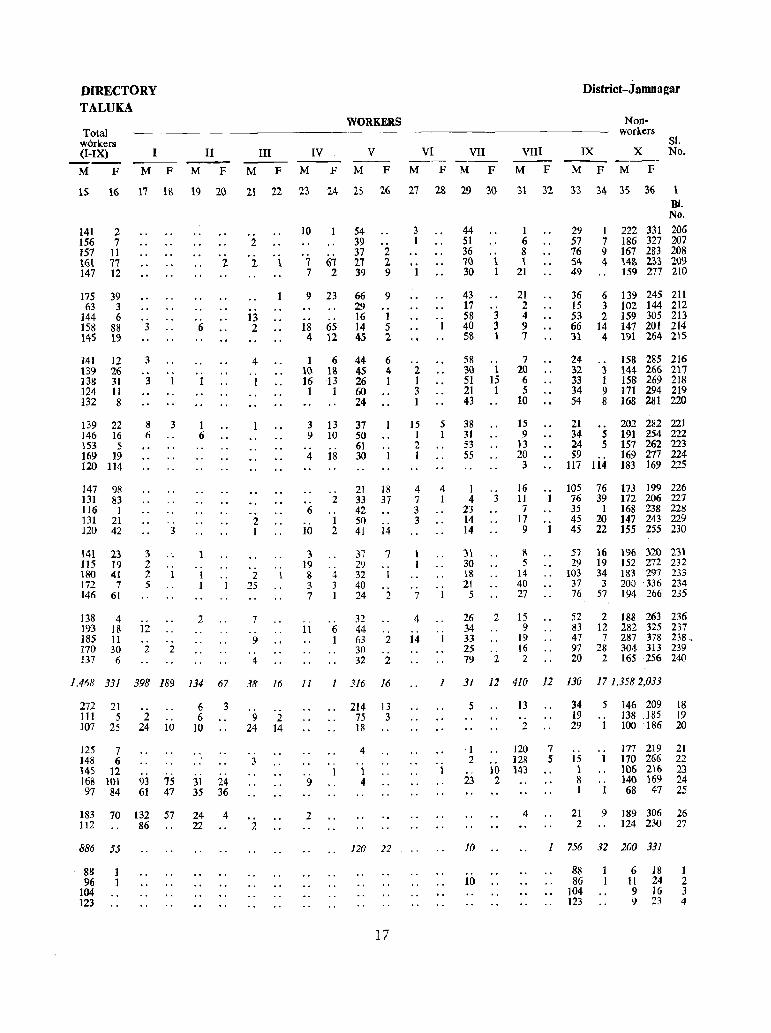
DIRECTORY TALUKA
Total wQrkers (I-IX)
M F
I
M
II
F M F
WORKERS
III IV V
M F M F M F
VI VII -----M F M F
VIII
M F
District-Jamnagar
IX
Nonworkers
x --- -_--M F M F
Sl. No.
15 16 17 IB 19 20 11 22 23 24 2S 26 27 1B 29 30 31 32 :.n 34 35 36 1
141 2 156 7 157 11 161 1'1 141 12
115 39 63 3
144 6 15S 88 145 19
141 12 139 26 138 31 124 11 132 8
139 22 146 16 153 .5 169 19 120 114
141 98 131 83 116 I 131 21 120 42
141 23 115 19 180 41 172 7 146 61
138 4 193 18 185 II ]70 30 131 6
3
3
3
8 6
3 2 2 5
12
2
.. I
3
.. 3
.. 1
.. 2
6
1 6
.. J I
2
.. I
2
2 1
13 2
4 .. 1
1
2 I
2 25
1 .. 9 . . 4
.. I
10
1 61 7 2
9 23
18 65 4 12
1 6 10 18 16 13
I 1
3 13 9 10
4 18
6
10
3 19 8 3 7
.. I1
2
I 2
4 3 1
6 I
],468 331 398 189 134 67 38 16 11
272 21 6 111 5 2 6 107 25 24 10 10
125 7 148 6 145 12 168 101 97 84
93 61
75 47
31 35
3
24 36
183 70 132 57 24 4
9 2 24 14
.. 3
]12 86 22 2
886 55
88 1 96 1
104 123
.. I
9
2
54 39 37 2 2"1 2 39 9
66 9 29 16 I 14 5 45 2
44 45 26 60 24
37 50 61
6 4 1
30 I
21 18 33 37 42 50 41 14
37 29 32 40 24
32 44 63 30 32
7 . . J
2
.. 2
2
316 16
214 13 75 3 18
4 .. 1 4
120 22
17
3 1
2 1 3 1
15 ]
2 I
4 7 3 3
.. 7
4
14
5 1
4 1
44 51 36 10 1 30 1
43 17 58 3 40 3 58 1
58 30 1 51 15 21 I 43
38 31 53 55
1 4
23 14 14
31 30 18 21
5
26 34 33 25 79
2
.. 2
1 6 8 1
21
21 2 4 9 7
7 20 6 5
10
15 9
13 20 3
16 11 1
17 9
8 5
14 40 27
15 9
19 16 2
.. ]
29 57 76 54 49
81. No.
1 222 331 206 7 186 327 207 9 167 283 208 4 i4\', 233 109
159 217 210
36 6 139 245 211 15 3 102 144 212 53 2 159 305 213 66 14 147 201 214 31 4 191 264 215
24 32 33 34 54
.. 158 285 216 3 144 266 217 1 158 269 218 9 171 294 219 8 168 281 220
21 • . 202 282 221 34 5 ]91 254 222 24 5 157 262 223 59 169 277 224
117 114 183 169 225
105 76 173 199 226 76 39 172 206 227 35 I 168 238 228 45 20 147 243 229 45 22 155 255 230
57 16 196 :\20 231 29 19 152 272 232
103 34 183 297 233 37 3 200' 336 234 76 57 194 266 235
52 2 188 263 236 83 12 282 325 237 47 7 287 378 238. 97 28 304 313 239 20 2 165 256 240
] 31 12 410 12 130 17 1,3582,033
5
1 2
23
10
10
J3
2
120 128
10 143 2
4
7 5
34 5 146 209 18 19 138 .185 19 29 1 100 186 20
15 1 8 1
177 219 21 170 266 22 106 2\6 23 140 169 24 68 47 25
21 9 189 306 26 2 124 230 27
1 756 32 200 331
88 86
104 123
6 18 1 11 24 2 9 16 3 9 23 4
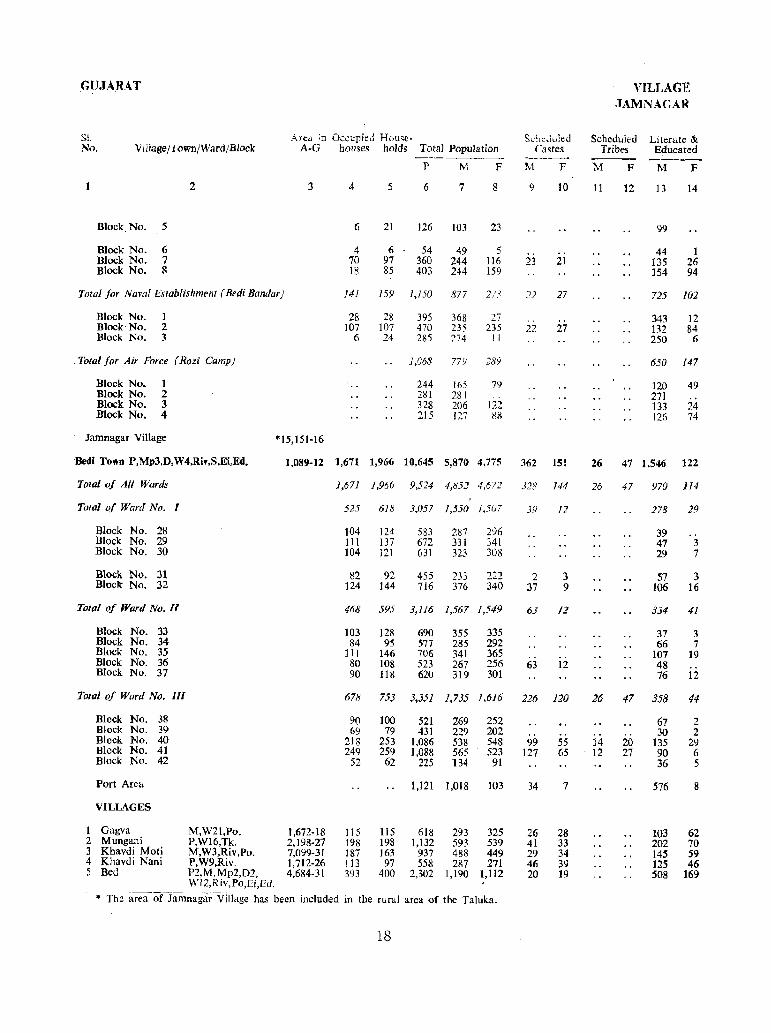
.GU.JARAT VILLAGE .JAMNAGAR
SI. Area ,n Occupied House- Sdleduied Scheduled Literate & No. Village/TownjWardjBlock A-G houses holds Total Population Castes Tribes Educated ---- -----P M F M F M F M F
2 3 4 5 6 7 8 9 10 11 12 13 14
Block. No. 5 6 21 126 103 23 99
Block No. 6 4 6 54 49 5 44 1 Block No. 7 70 97 360 244 116 23 21 135 26 Block No. g 18 85 403 244 159 154 94
Total for Naval Establishment (Bedi Bandar) 141 159 1,150 877 273 21 27 725 102
Block No. 1 28 28 395 368 27 . . 343 12 Block-No. 2 107 107 470 235 235 22 27 132 84 Block No. 3 6 24 285 274 11 250 6
. Total for Air Force (Rozi Camp) 1,068 779 289 650 147
Block No. 1 244 165 79 120 49 Block No. 2 281 281 .. 271 Block No. 3 328 206 122 133 24 Block No. 4 215 127 H8 Wi 74
Jamnagar Village *15,151·16
Bedi Town P,Mp3,D,W4,Ri",S,Ei,Ed. 1,089-12 1,671 1,966 10,645 5,870 4,775 362 151 26 47 1,546 122
Total of All Wards 1,671 i,966 9,524 4,8.52 4,672 32R 144 26 47 970 1I4
Total of Ward No. r 525 618 3,057 1,550 I,51l7 39 12 278 29
Block No. 28 104 124 583 287 296 39 Block No. 29 III 137 672 331 341 47 3 Block No. 30 104 121 631 323 308 29 7
Block No. 31 82 92 455 233 222 2 3 57 3 Block No. 32 124 144 716 376 340 37 9 106 16
Total 0/ Ward No. /1 468 595 3,116 1,567 1,549 63 f2 334 41
Block No. 33 103 128 690 355 335 37 3 Block No. 34 84 95 577 285 292 66 7 Block No. 35 Jll 146 706 341 365 107 19 Block No. 36 80 108 523 267 256 63 12 48 Block No. 37 90 118 620 319 301 76 12
Total 0/ Ward No. 1// 678 753 3,351 1,735 1,616 226 120 26 47 358 44
Block No. 38 90 100 521 269 252 67 2 Block No. 39 69 79 431 229 202 .. .. 30 2 Block No. 40 218 253 1,086 538 548 99 55 14 20 135 29 Block No. 41 249 259 1,088 565 523 127 65 12 27 90 6 Block No. 42 52 62 225 134 91 36 5
Port Area 1,121 1,018 103 34 7 576 8
VILLAGES
1 Gagva M,W21,Po. ],672-18 115 ] 15 618 293 325 26 28 103 62 2 Mungani P,W16,Tk. 2,198-27 198 198 1,132 593 539 41 33 202 70 3 Khavdi Moti M,W3,Riv,Po. 7,099·31 187 163 937 488 449 29 34 145 59 4 Khavdi Nani P,W9,Riv. 1,712-26 113 97 558 287 271 46 39 125 46 5 Bed P2,M,Mp2,D2, 4,684-31 393 400 2,302 1,190 ],112 20 ]9 508 169
WIZ,Riv,Po,Ei,Ed.
• The area of Jam nagar Vlilage has been included in the rural area of the Taluka.
18
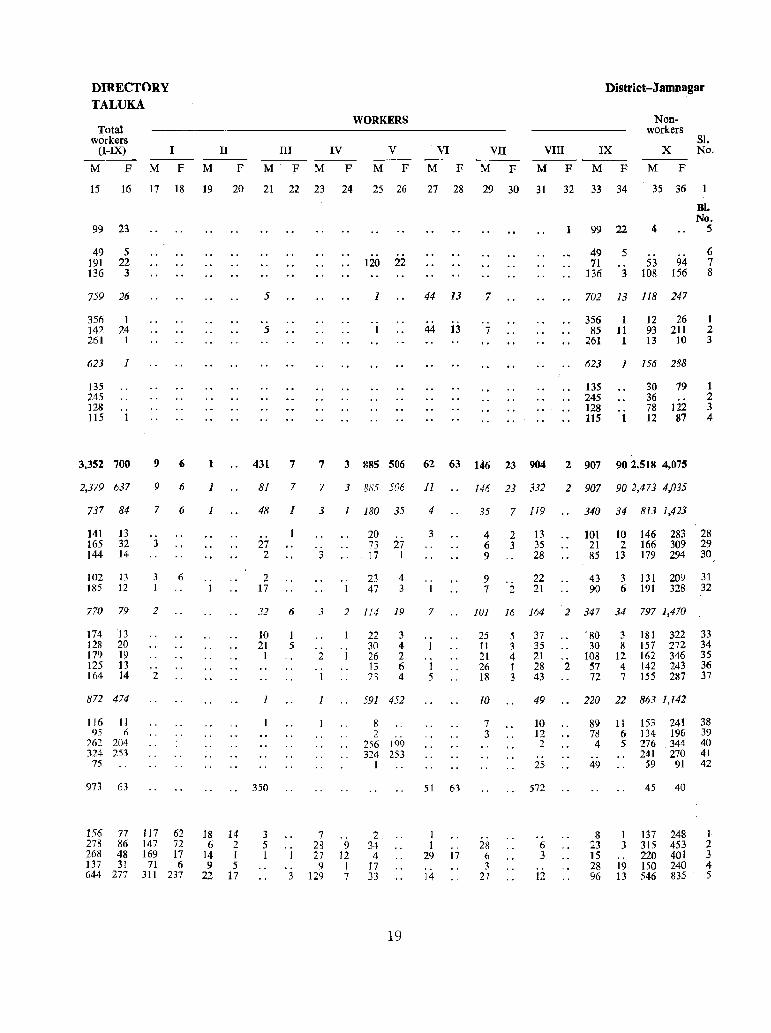
D1RECTOR.Y
TALUKA
Total workers
(I-IX) I
M F M F
WORKERS
II III IV V
M F M F M F M F
VI M F
VII
M F
VIII
M F
District-Jamnagar
IX
M F
Nonworkers
Sl. X No.
M F
15 16 17 18 19 20 21 22 23 24 25 26 27 28 29 30 31 32 33 34 35 36
99 23
49 191 136
5 22 3
759 26
356 1 142 24 261 1
623 1
135 245 128 115 I
3,352 700
2,379 637
737 84
141 13
9 6
9 6
7 6
165 32 3 144 14
102 13 185 12
770 79
174 13 128 20 179 19 125 13 164 14
872 474
116 II 95 fj
262 204 324 253
75
973 63
156 77 278 86 268 48 137 31 644 277
3 I
2
.. 2
6
117 62 147 72 169 17 71 6
311 237
1
1
1
18 6
14 9
22
14 2 1 5
17
5
.. S
431 7
81 7
48 I
27 2
2 17
32 6
10 21 1
1
350
3 5 1
I 5
120 22
1 44 13 7
.. .. 1 44 13 7
1 99 22
49 71
136
S
3
4
53 108
94 156
RI. No.
5
6 7 8
702 13 118 247
356 1 85 11
261 1
12 26 I 93 211 2 13 10 3
623 1 156 288
135 245 128 115 1
30 79 36 78 122 12 87
1 2 3 4
7 3 885 506 62 63 146 23 904 2 907 90 2,518 4,075
7 3 885 506 11
3
3
.. 1
180 35
20 73 27 17 1
23 47
4 3
3 2 ]]4 19
2
1
7 28 27 9
129
9 12
1 7
22 30 26 13 23
3 4 2 6 4
591 452
8 2
256 324
1
2. 34 4
17 33
.. 199 253
19
4
3
.. 1
7
.. I
.. I 5
51 63
1 1
29
14
.. 17
146 23 332 2 907 90 2,473 4,035
35 7 119
4 2 13 6 3 35 9 28
9 22 7 2 21
340 34 813 1,423
101 10 146 283 28 21 2 166 309 29 85 13 179 294 30
43 90
3 131 209 31 6 191 328 32
101 16 164 2 347 34 797 1,470
25 II 21 26 18
10
7 3
28 6 3
21
5 3 4 1 3
37 35 21 28 43
49
IO 12 2
25
572
6 3
12
.. 2
'80 30
108 57 72
3 181 322 8 157 272
12 162 346 4 142 243 7 155 287
220 22 863 1,142
89 78 4
49
8 23 15 28 96
11 6 5
1 3
19 13
153 241 134 196 276 344 241 . 270
59 91
45 40
137 315 220 150 546
248 453 401 240 835
33 34 35 36 37
38 39 40 41 42
I 2 3 4 5
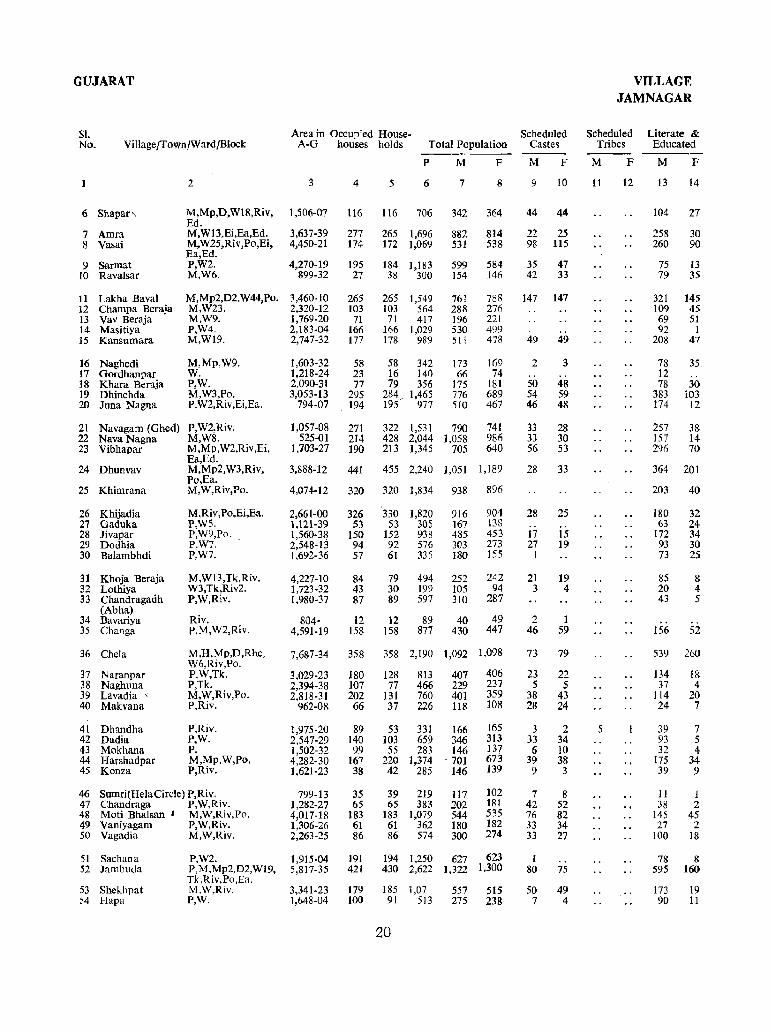
GUJARAT VILLAGE JAMNAGAR
Sf. Area in Occupied House- Scheduled Scheduled Literate & No. Village/Town/Ward/Block A·G houses holds Total Population Castes Tribes Educated --_.-
p M F M F M F M F
2 3 4 5 6 7 8 9 10 11 12 13 14
6 Shapar", M,Mp,D,W1S,Riv, 1,506·07 116 116 706 342 364 44 44 104 27 Ed.
7 Amra M,WI3,Ei,Ea,Ed. 3,637-39 277 265 1,696 882 814 22 25 258 30 8 Vasai M,W25,Riv,Po,Ei, 4,450-21 174 172 1,069 531 538 98 115 260 90
Ea,Ed. 9 Sarmat P,W2. 4,270-19 195 184 1,183 599 584 35 47 75 13
10 Ravalsar M,W6. 899-32 27 38 300 154 146 42 33 79 35
11 Lakha Baval M,Mp2,D2,W44,Po. ~,460-1O 265 265 1,549 761 788 147 147 321 145 12 Champa Beraja M,W23. 2,320-12 103 103 564 288 276 109 45 13 Vav Beraja M,w9. 1,769-20 71 71 417 196 221 69 51 14 Masitiya P,W4. 2,183-04 166 166 1,029 530 499 . . .. 91 1 15 Kansumara M,WI9. 2,747-32 177 178 989 511 478 49 49 208 47
16 Naghedi M,Mp,W9. 1,603-32 58 58 342 173 169 2 3 78 35 17 Gordhanpar W. 1,218-24 23 16 140 66 74 .. 12 18 Khara BeT3.ja P,W. 2,090-31 77 79 356 175 181 50 48 78 30 19 Dhinchda M,w3,Po, 3,053-13 295 284 1,465 776 689 54 59 383 103 20 Juna Nagna P,W2,Riv,Ei,Ea. 794-07 194 195/ 977 510 467 46 48 174 12
21 Navagam (Ghed) P,W2,Riv. 1,057-08 271 322 1,531 790 741 33 28 257 38 22 Nava Nagna M,WS. 525-01 214 428 2,044 1,058 986 33 30 157 14 23 Vibhapar M,Mp,W2,Riv,Ei, 1,703·27 190 213 1,345 705 640 56 53 296 70
Ea.,Ed. 24 Dhunvav M,Mp2,W3,Riv, 3,888-12 441 455 2,240 1,051 1,189 28 33 364 201
Po,Ea. 25 Khimra.na M,W,Riv,Po. 4,074-12 320 320 1,834 938 896 203 40
26 Khijadia M,Riv,Po,Ei,Ea. 2,661-00 326 330 1,820 916 904 28 25 ISO 32 27 Oaduka P,WS. 1,12.1-39 53 S3 305 \67 138 63 24 28 Jivapar P,W9,Po. 1,560-38 150 ]52 938 485 453 17 15 172 34 29 Dodhia P,W7. 2,548-13 94 92 576 303 273 27 19 93 30 30 Balambhdi P,W7. 1,692-36 57 61 335 180 155 1 73 25
31 Khoja Beraja M,WI3,Tk,Riv. 4,227-10 84 79 494 252 242 21 19 85 8 32 Lothiya W3,Tk,Riv2. 1,723-32 43 30 199 105 94 3 4 20 4 33 Chandragadh P,W,Riv. 1,980-37 87 89 597 310 287 43 5
(Abha) 49 34 Bavariya Riv. 804· 12 12 89 40 2 1
35 Changa P,M,W2,Riv. 4,591-19 158 158 877 430 447 46 59 156 52
36 Chela M,H,Mp,D,Rhc, 7,687-34 358 358 2,190 1,092 1,098 73 79 539 260 W6,Riv,Po.
37 Naranpar P,W,Tk. 3,029-23 180 128 813 407 406 23 22 134 18 38 Naghuna P,Tk. 2,394-38 107 77 466 229 237 5 5 37 4 39 Lavadia ' M,W,Riv,Po. 2,818-31 202 l3l 760 401 359 38 43 114 20 40 Makvana P,Riv. 962-08 66 37 226 118 108 28 24 24 7
41 Dhandha P,Riv. 1,975-20 89 53 331 166 165 3 2 5 39 7 42 Dadia P,W. 2,547-29 140 103 659 346 313 33 34 93 5 43 Mokhana P. 1,502-32 99 55 283 146 137 6 10 32 4 44 Harshadpar M,Mp,W,Po. 4,282-30 167 220 1,374 701 673 39 38 175 34 45 Konza P,Riv. 1,621-23 38 42 2S5 146 139 9 3 39 9
46 Sumri(HelaCircle) P,Riv. 799-13 35 39 219 117 102 7 8 11 1 47 Chandraga P,W,Riv. 1,282-27 65 65 383 202 181 42 52 38 2 48 Moti Bha1san , M,W,Riv,Po. 4,017-18 183 183 1,079 544 535 76 82 145 45 49 Vaniyagam P,W,Riv. 1,306-26 61 61 362 180 182 33 34 27 2 50 Vagadia M,W,Riv. 2,263-25 86 86 574 300 274 33 27 100 18
51 Sachana P,W2. 1,915-04 191 194 1,250 627 623 1 .. 78 8 52 Jambuda P,M.Mp2,D2,WI9, 5,817-35 421 430 2,622 ],322 1,300 80 75 595 160
Tk,Riv,Po,Ea. 53 Shekhpat M,W,Riv. 3,341-23 179 185 1,07 557 515 50 49 173 19 54 Hapa P,W. 1,648-04 100 91 513 275 238 7 4 90 II
20
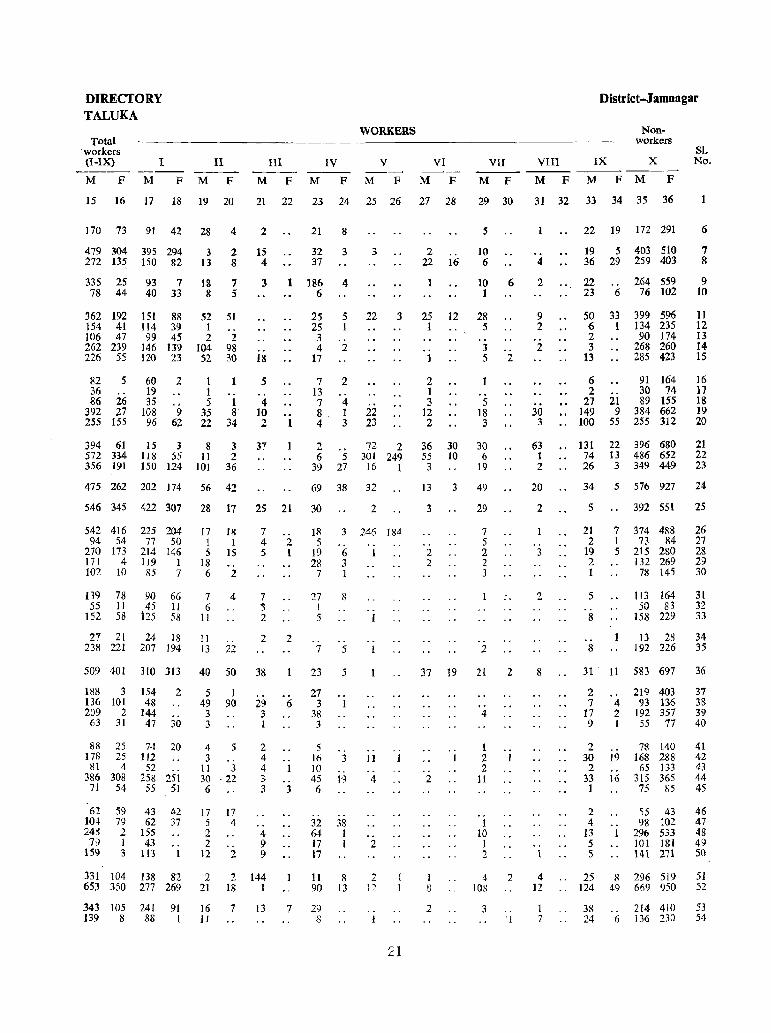
DIRECTORY TALUKA
Total 'workers (I-IX) ----M F
I
M F
II III IV ----
M F M F M F
WORKERS
V VI VII
M F M F M F
District-J amnagar
VIII IX
Nonworkers
X ------M F M F M F
Sl. No.
15 16 17 18 19 20 21 22 23 24 25 26 27 28 29 30 31 32 33 34 35 36
170 73 91 42 28 4 2
479 304 395 294 3 2 15 272 135 150 82 13 8 4
335 78
25 44
93 40
7 33
362 192 151 88 154 41 114 39 106 47 99 45 262 239 146 139 226 55 120 23
82 5 60 2 36 19 86 26 35
392 27 108 9 255 155 96 62
18 8
7 5
52 51 1 .. 2 2
104 98 52 30
1 1 5
35 22
1 8
34
394 61 572 334 356 191
15 3 8 3 2
36 ll~ 55 11 150 124 101
475 262 202 174 56 42
3
.. 18
5
4 10 2
37
21 8
32 3 3 37
186 6
25 2S 3 4
17
7 13 7 8 4
2 6
39
4
5 1
2
2
4 1 3
22
22 23
3
72 2 5 301 249
27 16 1
69 38 32
546 345 422 307 28 17 25 21 30 2
542 416 225 204-94 54 77 50
270 173 214 146 171 4 119 1 102 10 85 7
139 78 90 66 55 II
152 58 45 11
125 58
27 21 24 18 238 221 207 194
17 1 5
18 6
7 6
II
11 13
18 1
15 .. 2
4
.. 22
7 4 S
7 3 2
2
509 401 310 313 40 50 38
188 3 136 101 209 2 63 31
154 48
144 47
2
30
88 25 74 20 178 25 112 81 4 52
386 308 258 251 7 J 54 55 51
62 10~ 243
79 159
59 43 79 62 2 155 1 43 3 113
42 37
.. 1
5 49
3 3
1 90
4 5 3
11 3 30 ,22 6
17 5 2 2
12
17 4
.. 2
29 3 I
2 4 4 ::> 3
4 9 9
331 104 138 82 2 2 144 653 350 277 269 21 18 1
343 105 241 139 8 88
91 I
16 1 J
7 13
2 1
2
6
.. 1
3
7
18 5
19 28
7
3 246 184
27 I 5
7
6 3 1
:3
.. 5
23 5
27 3
38 3
5 16 10 45 6
32 64 17 17
.. J
3 "
n
.. 38 1 1
'. 1
.. 1
. . f
.. 11 .. 4
2
11 8 2 90 13 12
29 8
0.
1
.. 1
21
5
2 10 22 16 6
25 1
1
2 1 3
12 2
36 55
3
12
30 IO
10 1
28 5
3 5
5 18 3
30 6
19
13 3 49
3
.. 2 2
29
7 5 2 2 3
2
6
2
37 19 21 2
2
4
1 2 2 II
1 10 1 2
4
2
9 2
2
30 3
63 1 2
20
2
3
2
8
. . 1
1 4 2 4 " o
2
lOS 12
3 0,
°1 I 7
22 19 172 291
19 5 403 510 36 29 259 403
22 23
SO 6 2 3
13
6 2
27 .' 149 .' 100
" 131 74 26
6
33 I
264 559 76 102
399 596 134 235 90 174
268 260 285 423
91 164 30 74
21 89 IS5 9 384 662
55 255 312
22 396 680 13 486 652 3 349 449
6
7 8
9 10
11 12 13 14 15
16 17 18 19 20
21 22 23
34 5 576 927 24
5
21 2
19 2 1
5
8
8
392 5S1 25
7 374 488 1 73 84 5 215 280
132 269 78 145
113 164 50 83
158 229
13 28 192 226
26 27 28 29 30
3l 32 33
34 35
31 11 583 697 36
2 7
17 9
2 30 2
33 1
2 4
13 5 5
4 2 1
19
16
.. 1
219 403 93 136
192 357 55 77
78 140 168 288
65 133 315 365 75 85
55 43 98 102
296 533 101 181 141 271
31 38 39 40
41 42 43 44 45
46 47 48 49 50
25 8 296 519 51 124 49 669 950 52
38 24
.. 6
214 410 136 230
53 54
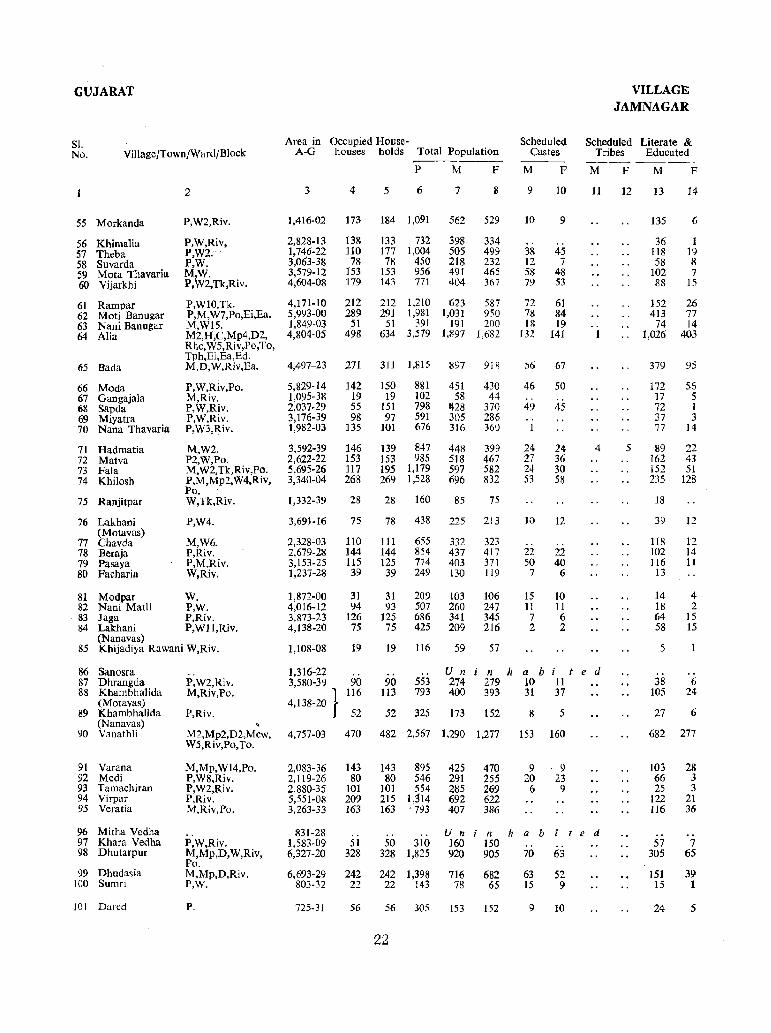
GUJARAT
SJ. No. Village/Town/Ward/Block
55 Morkanda
56 Khimalia 57 Theba 58 Suvarda 59 Mota Thavaria 60 Vijarkhi
61 Rampar 62 Moti Banugar
. 63 Nani Banugar 64 Alia
65 Bada
66 Moda 67 Gangajala 68 Sapda 69 Miyatra 70 Nana Thavaria
71 Hadmatia 72 Matva 73 Fala 74 Khilosh
75 Ranjitpar
76 Lakhani (Motavas)
77 Chavda 78 Beraja 79 Pasaya 80 Facharia
81 Modpar 82 Nani MatH 83 Jaga 84 Lakhani
(Nanavas)
2
P,W2,Rlv.
P,W,Riv, P,W2. P,W. M,W. P,W2,Tk,Riv.
P,WIO,Tk. P,M,W7,Po,Ei,Ea. M,WIS. M2,H,C,Mp4,D2, Rhc,W5,Riv,Po,To, Tph,Ei,Ea,Ed. M,D, W,Riv,Ea.
P,W,Riv,Po. M,Riv. P,W,Riv. P,W,Riv. P,W3,Riv.
M,W2. P2,W,Po. M, W2,Tk,Riv,Po. P,M,Mp2,W4,Riv, Po. W,Tk,Riv.
P,W4.
M,W6. P,Riv. P,M,Riv. W,Riv.
W. P,W. P,Riv. P,Wll,Riv.
85 Khijadiya Rawani W,Riv.
86 Sanosra 87 Dhrangda 88 Khambhalida
(Motavas) 89 Khambhalida
(Nanavas) 90 Vanathli
91 Varana 92 Medi 93 Tamachiran 94 Virpar 95 Veratia
96 Mitha Vedha 97 Khara Vedha 98 Dhutarpur
99 Dhudasia 100 Sumri
]01 Dared
P,W2,Riv. M,Riv,Po.
P,Riv.
" M2,Mp2,D2,Mcw, W5,Riv,Po,To.
M,Mp,WI4,Po. P,W8,Riv. P,W2,Riv. P,Riv. M,Riv,Po.
P,W,Riv. M,Mp,D,W,Riv, Po. M,Mp,D,Riv. P,W.
P.
VILLAGE JAMNAGAR
Area in Occupied House- Scheduled Scheduled Literate & A-G houses holds Total Population Castes Tribes Educated
3 4 5
P
6
M
7
F
II
1,416-02 173 184 1,091 562 529
2,828-13 1,746.22 3,063-38 3,579-12 4,604-08
4,171-10 5,993-00 1,849-03 4,804-0.5
4,497-23
5,829-14 1,095-38 2,037-29 3,176-39 1,982-03
3,592-39 2,622-22 5,695-26 3,340-04
1,332-39
3,691-16
2,328-03 2,679-28 3,153-25 1,237-28
1,872-00 4,016-12 3,873-23 4,138-20
1,108-08
138 110 78
153 179
212 289
51 498
271
142 19 55 98
135
146 153 117 268
23
75
110 144 115 39
133 712 177 1,004 78 450
153 956 143 771
398 505 218 491 404
334 499 232 465 367
212 1,210 623 587 291 1,981 1,031 950
51 391 191 200 634 3,579 1,897 1,682
31] 1,815 897 918
150 19
151 97
101
881 102 798 591 676
139 847 153 985 195 1,179 269 1,528
28 160
451 58
1128 305 316
448 518 597 696
85
430 44
370 286 360
399 467 582 832
75
78 438 225 213
111 655 332 323 144 854 437 417 125 774 403 371
39 249 130 119
31 31 209 103 106 94 93 507 260 247
126 125 686 341 345 75 75 425 209 216
19 19 116 59 57
M
9
10
38 12 58 79
72 78 18
132
56
46 .. 49 .. 1
24 27 24 53
Iv
22 50
7
15 11 7 2
F
10
9
45 7
48 53
61 84 19
141
67
50
45
24 36 30 58
12
.. 22 40
6
10 11 6 2
M
11
.. f
4
1,316-22 3,580-39 90
116 90
113 553 793
U n 274 400
n 279 393
habi ted 10 11
4,138-20 } 52
4,757-03 470
2,083-36 143 2,119-26 80 2,880-35 101 5,551-08 209 3,263-33 163
831-28 1,583-09 6,327-20
6,693-29 803-32
725-31
51 328
242 22
56
31 37
52 325 173 152 8 5
482 2,567 1,290 1,277 ]53 160
143 895 425 470 9 . 9 80 546 291 255 20 23
101 554 285 269 6 9 215 1,:114 692 622 163 . 793 407 386
.. U n ]60 920
n habited 50 310 150
328 1,825 905 70 63
242 1,398 716 682 63 52 22 143 78 65 15 9
56 305 153 152 9 10
22
F
12
5
M
13
135
36 118 58
102 88
152 413
74 1,026
379
172 17 72 37 77
89 162 152 235
18
39
118 102 116
13
14 18 64 58
5
38 105
27
682
103 66 25
122 l16
57 .305
151 15
24
F
14
6
1 19 8 7
15
26 77 14
403
9S
56 5 I 3
14
22 43 51
128
12
12 14 II
4 2
15 15
6 24
6
277
28 3 3
21 36
7 65
39 1
5
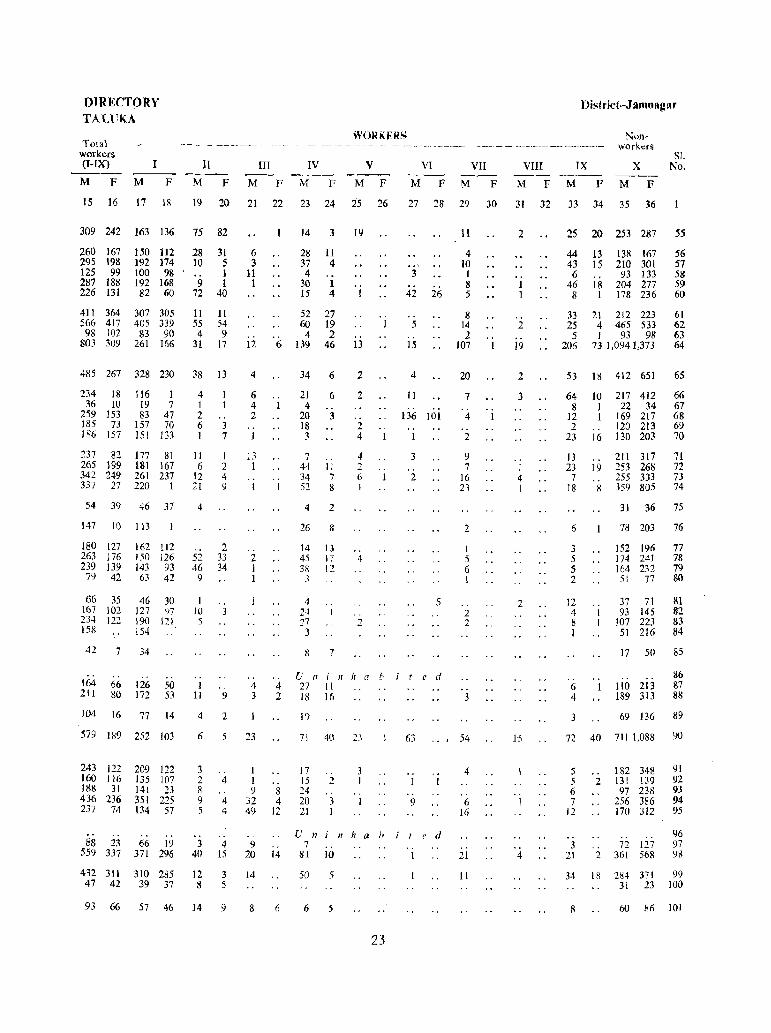
DIRECTORV TALUKA
Total workers (I-fX)
M F M
WORKBRS
II III IV v F M FMFM F M F
VI VII
M F M F
Dislrict-Jamnagar
VIII IX
1\1 F M F
Nonworkers
x M F
Sl. No.
IS 16 17 18 19 20 21 22 23 24 25 26 27 28 29 30 31 32 33 34 35 36
309 242 163 136 75 82
260 167 295 198 125 99 287 188 226 131
411 364 566 417 98 102
803 309
150 112 192 174 100 98 192 168 82 60
307 305 405 339 83 90
261 166
28 10
9 72
II 55 4
31
31 5 1 I
40
11 54 9
17
485 267 328 230 38 13
234 18 36 10
259 153 185 73 186 157
116 1 19 7 83 47
157 70 151 133
237 82 177 81 265 199 181 167 342 249 261 237 337 27 220 1
54 39 46 37
147 10 113
180 127 263 176 239 139
79 42
66 35 167 102 234 122 158
162 112 150 126 143 93 63 42
46 30 127 97 190 121 154
42 7 34
164 211
.. 66 126 80 172
50 53
4 1 2 6 1
II 6
12 21
4
.. 52 46
9
I 10 5
.. I
11
.. 3 7
I 2 4 9
2 33 34
.. 3
9
4 2
6 3
11 I
12
4
6 4 2 .. I
13 1
I
2 1 1
.. 4 3
104 16 77 14
579 189 252 103 6 5 23
243 122 160 116 188 31 436 236 237 74
209 122 135 107 141 23 351 225 134 57
.. 88 23 66 19
559 337 371 296
3 2 8 9 5
3 40
.. 4 .. 4 4
.. 4
15
I I 9
32 49
. . 9
20
432 311 310 285 12 3 14 47 42 39 37 8 5
14 3 19
28 37 4
30 15
52 60
11 4 .. J 4
4 6 139
27 19 2
46 13
.. 1
4 2
.. 8 4
12
14
34 6
21 4
20 18 3
7 44 34 52
6
3
.. II 7 8
4 2
26 8
14 45 38 3
4 24 27 3
n 17 12.
.. J
8 7
2
2
.. 2 4
4 2 6 1
4
.. 2
.. 1
U il i II h (I h 27 II 18 16
19
71 40 2..\
17 15 24 20 21
2
3 I
U n i 11 II a b 7
81 10
50 5
93 66 57 46 J4 9 8 (, 6 5
23
3
42
.. 5
15
4
II
26
136 101 .. J
3
2
5
ted
11
4 10 I 8 5
8 14 2
107
20
7
4
2
9 7
16 23
2
I 5 6 I
.. 2 2
3
(jJ ..• 54
.. I
.. 9
i 1 e d .. 1
4
6 16
21
II
2
2
19
2
3
.. 1 4 1
2.
15
. . J
4
25 20 253 287 55
44 43 6
46 8
33 25
5 206
13 138 167 15 210 301
93 133 18 204 277
I 178 236
21 212 223 4 465 533 1 93 98
73 1,0941,373
56 57 58 59 60
61 62 63 64
53 18 412 651 65
64 8
12 2
23
13 23
7 18
6
3 5 5 2
12 4 8 I
6 4
3
10 217 1 22 I 169
.. 16
120 130
412 34
217 213 203
211 317 19 253 268 .. 255 333 R 359 805
66 67 68 69 70
71 72 73 74
31 36 75
. . 1
78 203 76
152 196 174 241 164 232
51 77
37 71 93 145
107 223 51 216
77 78 79 SO
81 82 83 84
17 50 85
.. 110 213 189 313
86 87 88
69 136 89
72 40 7111,088 90
5 5 6 7
12
3 21
.. 2
182 348 131 139 97 238
256 386 170 312
.. 72 127
2 361 568
91 92 93 94 95
96 97 93
34 18 2H4 371 99 31 23 100
60 8n 101


TALUKA:DHROL
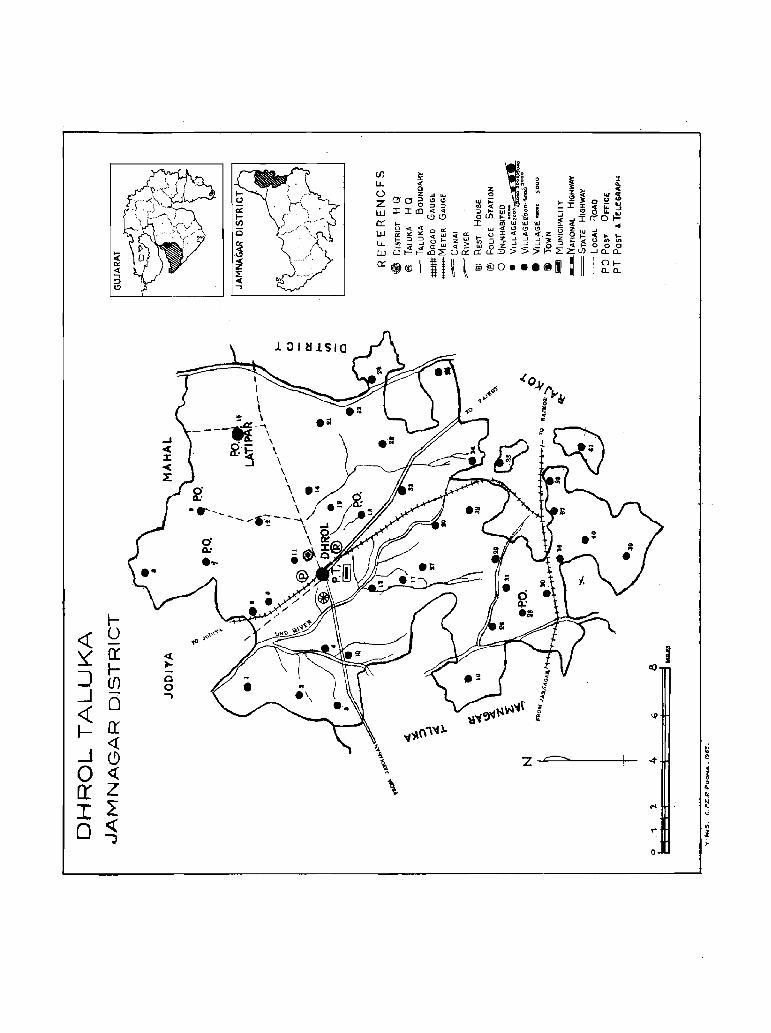
l-e:! u -
~ ~ !r « :Ii
~ )0- co
:J 0 (f) 0 _j - .,
0 '" « 0
II
~ IT '4')1.(\\~1. « ~ _j 0 z ,.--.._ -.t l!i
0 <:( l . rr z II. 0;
I 2: N ~ .,;
« .; 0 T" ~ J ~ 0
TALUKA
DHROL
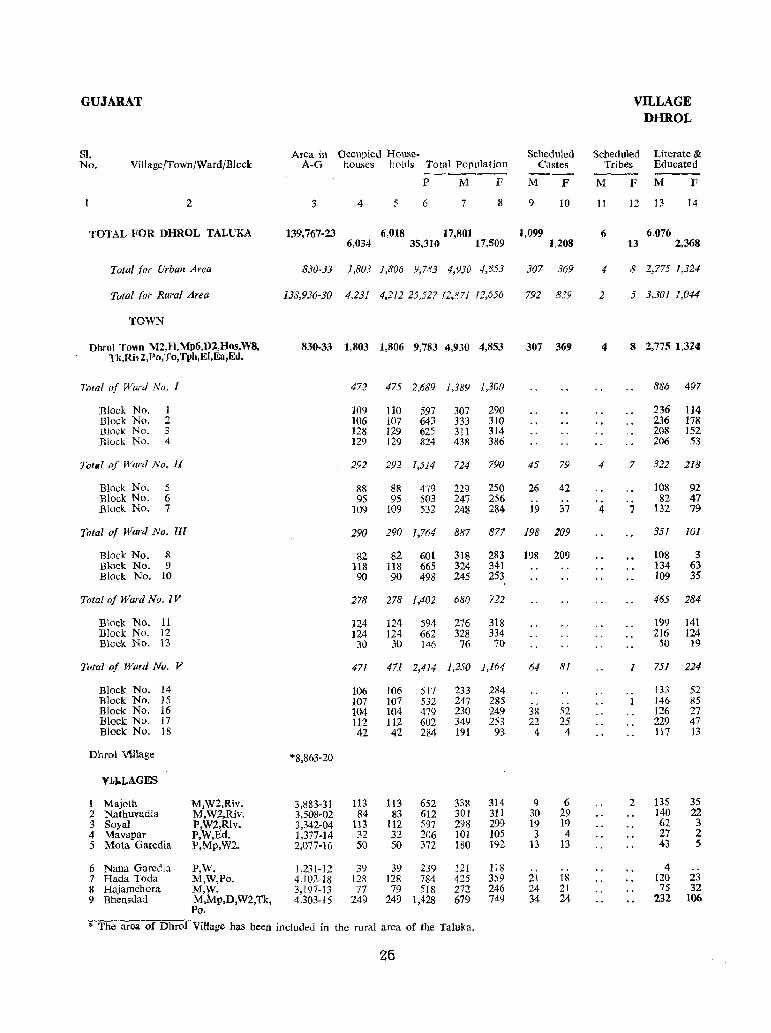
GUJARAT VILLAGE DHROL
Sl. Area in Occupied' House- Scheduled Scheduled Literate & No. Village/Town/Ward/Block A-G houses holds Total Population Castes Tribes Educated ----_ .. _ ----P M F M F M F M F
2 3 4 5 6 7 8 9 10 11 12 I3 14
TOTAL FOR DHROL TALUKA 139,767-23 6,018 17,801 1,099 6 6,076 6,034 35,310 17.509 1,208 13 2,368
Total for Urban Area 830-3] 1,803 1,806 9,783 4,9]0 4,85] 307 369 4 8 2,775 1,324
Total for Rural Area 138,936-30 4,231 4,212 25,527 12,871 12,656 792 839 2 5 3,301 1,044
TOWN
Dhrol Town M2,H,Mp6,D2,Hos.W8, Tk,Riv2, Po, To, Tph,Ei,Ea,Ed.
830-33 1,803 1,806 9,783 4,930 4,853 307 369 4 8 2,775 1,324
Total 4 Ward No. 1 472 475 2,689 1,389 1,300 886 497
Block No. 1 109 110 597 307 290 236 114 Block No. 2 106 107 643 333 310 236 178 llloCk No. 3 128 129 625 311 314 208 152 Block No. 4 129 129 824 438 386 206 53
Tot,,, of Ward No. II 292 292 1,514 724 790 45 79 4 7 322 218
Block No. 5 88 88 479 229 250 26 42 108 92 Block No. 6 95 95 503 247 256 .. .. 82 47 Block No. 7 109 109 532 248 284 19 37 4 7 132 79
Total of Ward No. 11l 290 290 1.764 887 877 198 209 351 101
Block No. 8 32 82 601 318 283 198 209 108 3 Block No. 9 118 118 665 324 341 134 63 Block No. 10 90 90 498 245 253 109 35
Total of Ward No. IV 278 278 1.402 680 722 465 284
Block No. 11 124 124 594 276 318 199 141 Block No. 12 124 124 662 328 334 216 124 Block No. 13 30 30 146 76 70 50 19
Total of Ward No. V 471 471 2,414 1,250 1,164 64 81 1 751 224
.Block No. 14 106 106 517 233 284 .. 133 52 Block No. 15 107 107 532 247 285 " .. I 146 85 Block No. 16 104 104 479 230 249 38 S2 126 27 Block No. 17 112 112 602 349 253 22 25 229 47 Block No. 18 42 42 284 191 93 4 4 117 13
Dhrol V'l.llage *8,863-20
Y1IoLAGES
1 Majoth M,W2,Ri'l. 3,883-31 113 113 652 338 314 9 6 2 135 35 2 NathuvadJa M,W2,RiV. 3,508-02 84 83 612 301 311 30 29 140 22 3 Soya! P,W2,Ri'l. 3,342-04 113 112 597 298 299 19 19 62 3 4 Mavapar P,W,Ed. 1,377-14 32 32 206 101 105 3 4 27 2 5 Mota Garedia P,Mp,W2. 2.077-16 50 50 372 180 In 13 13 43 5
6 Nana Garedia P,W. 1,231-12 39 39 239 121 118 " 4 7 Hada Toda M,W,Po. 4,102-[8 128 128 784 425 359 21 18 120 23 8 Hajamchora M,W· 3,197-13 77 79 518 272 246 24 21 75 32 9 Bhensdad M,Mp,D,W2,Tk, 4,303-15 249 249 1,428 679 749 34 24 232 106
Po.
* The area of Dhrol Vil1age has been included in the rural area of the Taluka.
26
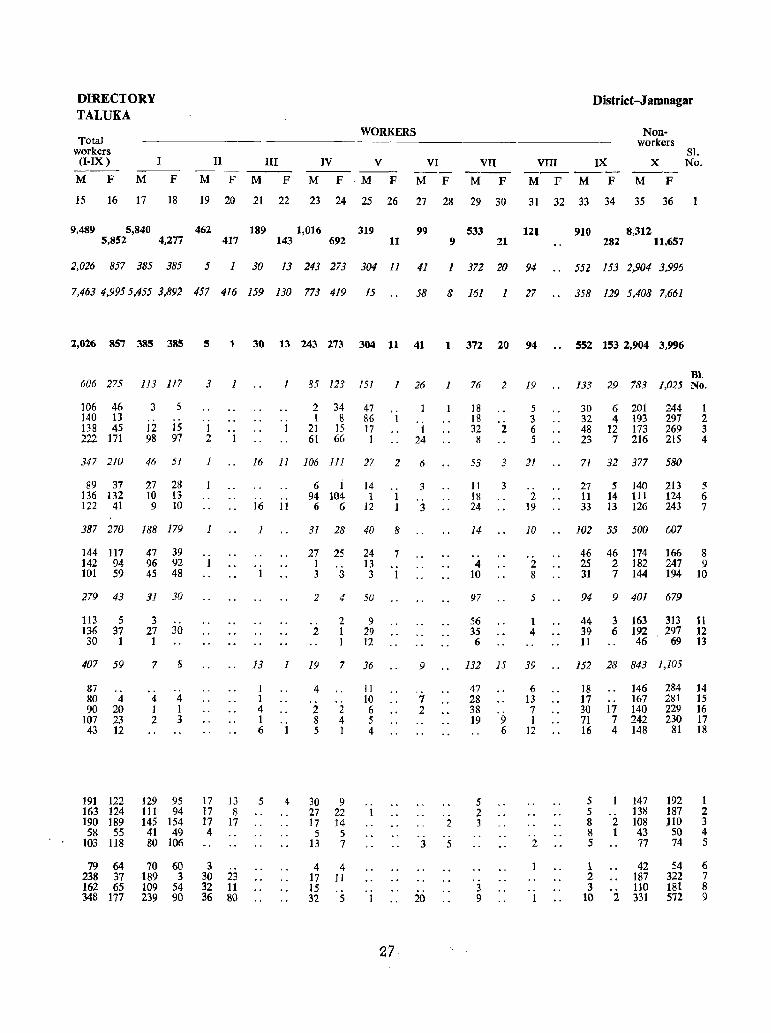
DIRECTORY TALUKA
Total workers (I-IX)
M F M
I
F
15 16 17 18
II III
M F M F M
WORKERS
IV V
F . M F
VI
M F
VII
M F
19 20 21 22 23 24 25 26 27 28 29 30
District -J amnagar
VIII IX ------M F M F
Nonworkers
X -_-M F
31 32 33 34 35 36
SI. No.
9,489 5,840 462 189 1,016 319 99 533 121 910 8,312 5,852 4,277 417 143 692 11 9 21 282 11,657
2,026 857 385 385 5 1 30 13 243 273 304 11 41 1 372 20 94 .. 552 153 2,904 3,996
7,463 4,9955,455 3,892 457 416 159 130 773 419 15 . . 58 8 161 1 27 358 129 5,408 7,661
2,026 857 385 385 5 1 30 13 243 273 304 11 41 1 372 20 94 . . 552 153 2,904 3,996
606 275 113 117
106 46 140 13 138 45 222 171
347 210
89 37 136 132 122 41
3 5
12 15 98 97
46 5f
27 28 10 13 9 10
387 270 188 179
144 117 142 94 101 59
279 43
113 5 136 37 30 1
407 59
87 80 4 90 20
107 23 43 12
191 122 163 124 190 189 58 55
103 118
79 64 238 37 162 65 348 177
47 39 96 92 45 48
31 30
3 27 30 1
7 8
4. 1 2
.. 4 1 3
129 95 111 94 145 154
41 49 80 106
70 60 189 3 109 54 239 90
3 1
1 2 1
1
1
.. 1
17 13 17 8 17 17 4
3 30 23 32 11 36 80
85 123 151 1 26 1 76 2 19
.. 1
2 34 1 8
21 15 61 66
47 86 1 17 1 1 24
16 11 106 111 27 2 6
.. 16 Jl
1
6 i 94 104 6 6
14 1
12
31 28 40 8
27 25 1
24 7 13
3 3 3 1
2 4 50
.. 2
2 9 I 29 1 12
13 1 19 7 36
J 1 4 1 6
5 4
4
2 8 5
2 4 1
30 9 27 22 17 14 5 5
II 10 6 5 4
.. 1
3
3
9
7 2
..
.. 2
13 7 3 5
4 4 17 11 15 3'2 5 20
27
18 18 32 2 8
5 3 6 5
53 3 21
II 18 24
14
4 10
97
56 35 6
3 .. 2
19
10
2 8
5
1 4
132 15 39
47 28 38 19
5 2 3
3 9
9 6
6 13 7 1
12
.. 2
Bl. 133 29 783 1,025 No.
30 6 201 244 32 4 193 297 48 12 173 269 23 7 216 215
71 32 377 580
27 II 33
5 140 14 ill I3 126
213 124 243
102 55 500 607
I 2 3 4
5 6 7
46 46 174 166 8 25 2 182 247 9 31 7 144 194 10
94 9 401 679
44 3 163 313 11 39 6 192 297 12 11 46 ' 69 13
152 28 843 1,105
18 146 17 .. 167 30 17 140 71 7 242
284 14 281 15 229 16 230 17
16 4 148 81 18
5 147 192 5 138 187 8 2 108 1I0 8 1 43 50 5 77 74
1 42 2 187 3 110
10 2 331
54 322 181 572
1 2 3 4 5
6 7 8 9
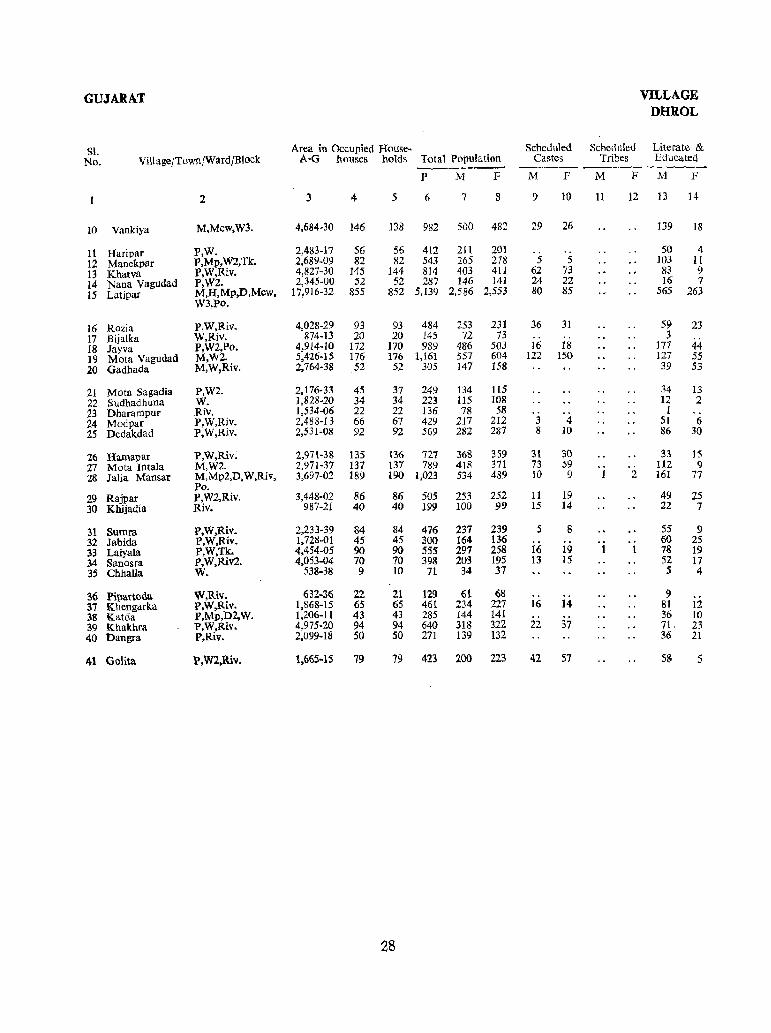
GUJARAT VILLAGE DHROL
SI. Area in Occupied House- Scheduled Scheduled Literate &
No. VillagejTown!Ward/Block A-G houses holds Total Population Castes Tribes Educated ----- ------~-
P M F M F M F 1\1 F
2 3 4 5 6 7 8 9 10 11 12 13 14
10 Vankiya M,Mcw,W3. 4,684-30 146 138 982 500 482 29 26 139 18
11 Haripar P,W. 2,483-17 56 56 412 211 201 " 50 4
12 Manekpar P,Mp,W2,Tk. 2,689-09 82 82 543 265 278 5 5 103 II 13 Khatva P,W,Riv. 4,827-30 145 144 814 403 411 62 73 83 9 14 Nana Vagudad P,W2. 2,345-00 52 52 287 146 141 24 22 16 7
15 Latipar M,H,Mp,D,Mcw, 17,916-32 855 852 5,139 2,586 2,553 80 85 565 263 W3,Po.
16 Rozia P,W,Riv. 4,028-29 93 93 484 253 231 36 31 59 . 23 17 Bijalka W,Riv. 874-13 20 20 145 72 73 .. .. 3 18 Jayva P,W2,Po. 4,914-10 172 170 989 486 503 16 18 177 44 19 Mota Vagudad M,W2. 5,426-15 176 176 1,161 557 604 122 150 127 55
20 Gadhada M,W,Riv. 2,764-38 52 52 305 147 158 39 53
21 Mota Sagadia P,W2. 2,176-33 45 37 249 134 115 34 13 22 Sudhadhuna W. 1,828-20 34 34 223 115 108 12 2 23 Dhararnpur Riv. 1,534-06 22 22 136 78 58 I 24 Modpar P,W,Riv. 2,488-13 66 67 429 217 212 3 4 51 6 25 Dedakdad P,W,Riv. 2,531·08 92 92- 569 282 287 8 10 86 30
26 Hamapar P,W,Riv. 2,971-38 135 136 727 368 359 31 30 33 15 27 Mota Intala M,W2. 2,971-37 137 137 789 418 371 73 59 112 9 28 Jalia Mansar M,Mp2,D,W,Riv, 3,697-02 189 190 1,023 534 489 10 9 1 2 161 77
Po. 29 Rajpar P,W2,Riv. 3,448-02 86 86 505 253 252 11 19 49 25 30 Khijadia Riv. 987-21 40 40 199 100 99 15 14 22 7
31 Sumra P,W,Riv. 2,233-39 84 84 476 237 239 5 8 55 9 32 Jabida P,W,Riv. 1,728-01 45 45 300 164 136 60 2S 33 Laiyala P,W,Tk. 4,454-05 90 90 555 297 258 16 19 1 1 78 19 34 Sanosra p,W,Riv2. 4,053-04 70 70 398 203 195 13 15 52 17 35 Chha1la W. 538-38 9 10 71 34 37 5 4
36 Pipartoda W,Riv. 632-36 22 21 129 61 68 9 37 Khengarka P,W,Riv. 1,868-15 65 65 461 234 227 16 14 81 12 38 Katda P,Mp,D2,W. 1,206-11 43 43 285 144 141 36 10 39 Khakhra P,W,Riv. 4,975-20 94 94 640 318 322 22 37 71. 23 40 Dangra P,Riv. 2,099-18 50 50 271 139 132 36 21
41 Golita P.W2,Riv. 1,665-15 79 79 423 200 223 42 51 53 5
28
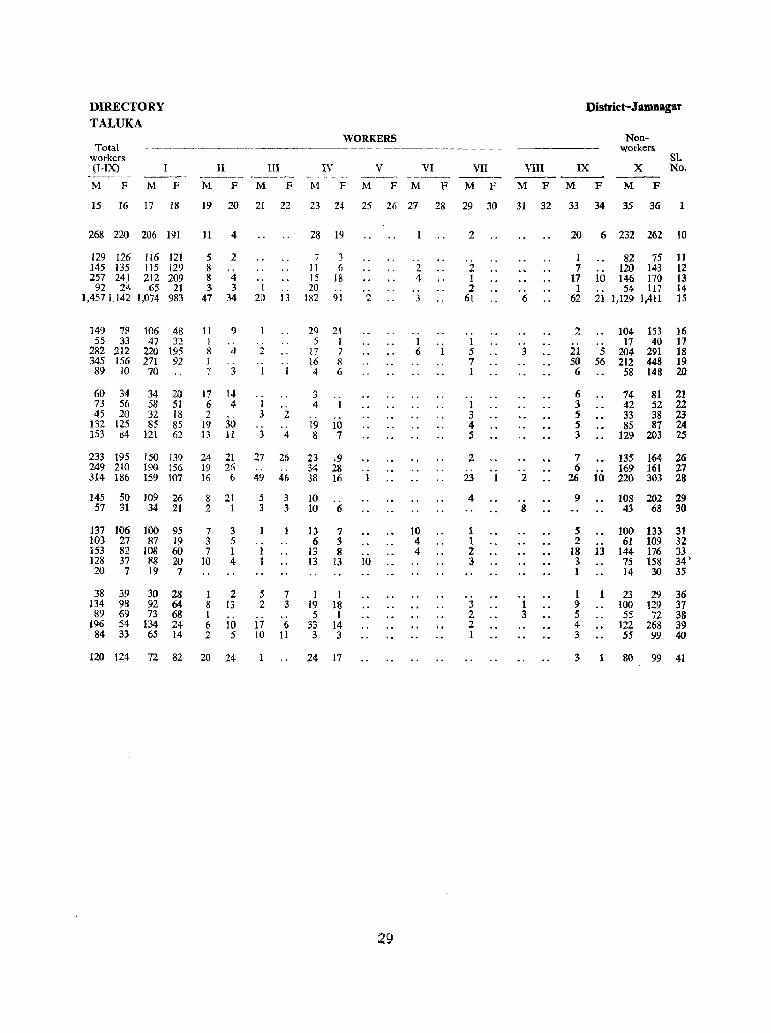
DIRECTORY District-J amnagar TALUKA
WORKERS Non-Total - ~--- -.-~-~----- -~~-. workers
workers Sl. (I-IX) II m IV V VI VII VIII IX X No. -~--- ---- --- _-- --- ---M F M F M F M F M F M F M F M F M F M F M F
15 16 17 18 19 20 21 22 23 24 25 26 27 28 29 30 31 32 33 34 35 36 1
268 220 206 191 11 4 28 19 2 20 6 232 262 10
129 126 116 121 5 2 7 3 .. 1 82 75 11 145 135 1I5 129 8 11 6 2 2 7 120 143 12 257 241 212 209 8 4 .. 15 18 4 1 17 10 146 170 13
92 24 65 21 3 3 I . - 20 .- 2 1 54 117 14 1,4571,142 1,074 983 47 34 20 13 182 91 2 3 61 6 62 21 1,129 1,411 15
149 78 106 48 11 9 29 21 .. 2 104 153 16 55 33 47 32 1 5 1 1 1 17 40 17
282 212 220 195 8 4 2 17 7 6 1 5 3 21 5 204 291 18 345 156 271 92 1 .. 16 8 7 50 56 212 448 19 89 10 70 7 3 I 4 6 1 6 58 148 20
60 34 34 20 17 14 .. 3 6 74 81 21 73 56 58 51 6 4 I .. 4 1 1 3 42 52 22 45 20 32 18 2 3 2 3 5 33 38 23
132 125 85 85 19 30 19 10 4 5 85 87 24 153 84 121 62 13 11 3 4 8 7 5 3 129 203 25
233 195 150 139 24 21 27 26 23 ,9 2 7 135 164 26 249 210 190 156 19 26 -. .. 34 28 .. . . .. 6 169 161 27 314 186 159 107 16 6 49 46 38 16 1 23 1 2 26 10 220 303 28
145 50 109 26 8 21 5 3 10 4 9 108 202 29 57 31 34 21 2 1 3 3 10 6 8 43 68 30
137 106 100 95 7 3 13 7 10 1 5 100 133 31 103 27 87 19 3 5 6 3 4 1 2 61 109 32 153 82 lOS 60 7 I I 13 8 .. 4 2 18 13 144 176 33 128 37 88 20 10 4 1 13 13 10 3 3 75 158 34' 20 7 19 7 1 14 30 35
38 39 30 28 1 2 5 7 1 1 1 23 29 36 134 98 92 64 8 13 2 3 19 IS 3 1 9 100 129 37 89 69 73 68 I " .. S 1 2 3 5 55 72 38
196 54 134 24 6 10 17 6 33 14 2 4 122 268 39 84 33 65 14 2 5 10 II 3 3 1 3 5S 99 40
120 124 72 82 20 24 24 17 3 80 99 41
29


MAHAL :jODIYA
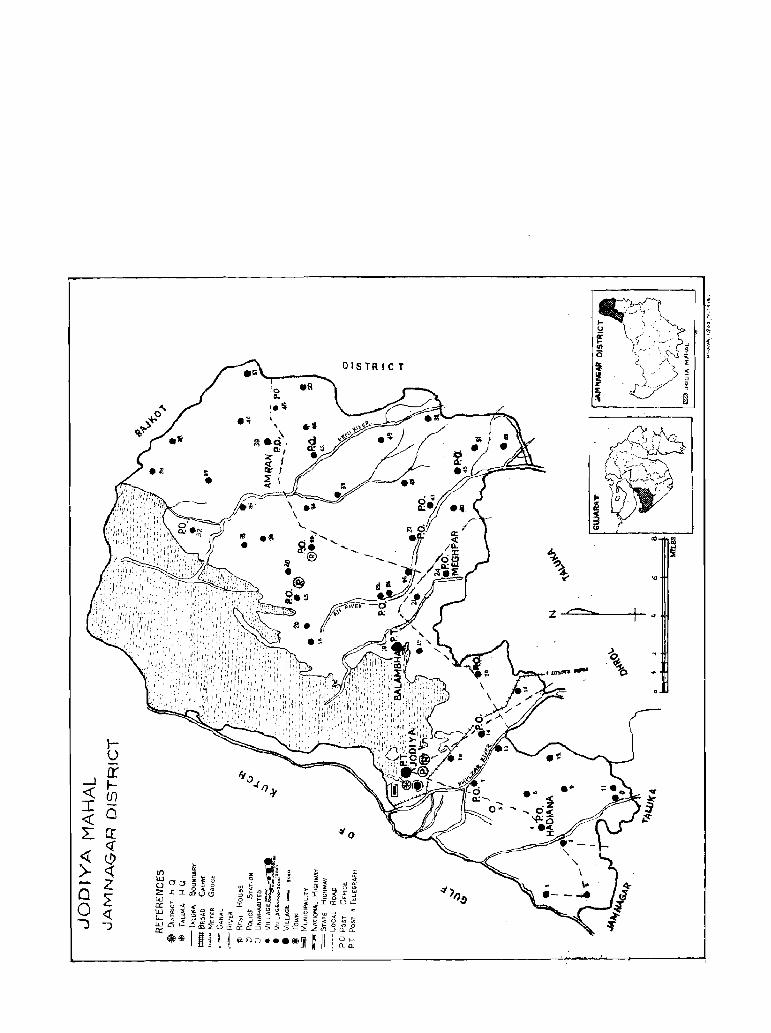
.~ , ... :'" QI
:z a: I
~' ~ r ccl
DISTRICT

MAHAL
JODIYA

GUJARAT VILLAGE JODIYA
51, Area in Occupied House- Scheduled Scheduled Literate & No, Village/Town/Ward/Block A-G houses holds Total Population Castes Tribes Educated
---------p M F M F M F M F
2 3 4 5 6 7 8 9 10 11 12 13 14
TOTAL FOR JODIYA MAHAL 219,561-25 9,777 61,445 31,167 1,560 80 4,104 10,640 30,278 1,535 84 11,802
Total for Urban Area 19,173-01 1,556 1,55!} 7.821 3,689 4,132 157 151 2 " 1.921 1,082
Total for Rural Area 200,388-24 8,221 9.082 53,62426.589 27,035 1.378 1,409 82 80 9,881 3,022
TOWN
Jodiya Town M3,H,Mp4,D4,Mcw, 19,173-01 1,556 1,558 7,821 3,689 4,132 157 151 2 " 1,921 1,082 W5,Riv,S.Po,To,Tph,Ei,Ea,Ed,
Total of Ward No, I 1,122 1,124 5,427 2,520 2,907 157 151 2 " 1,410 888
Block No, 1 117 119 577 280 297 206 145 Block No. 2 120 120 606 303 303 220 146 Block No. 3 121 121 600 257 343 17 14 149 91 Block No. 4 102 102 438 240 198 140 137 2 130 14 Block No. S 89 89 466 206 260 47 5
Block No. 6 105 105 508 206 302 21 8 Block No. 7 73 73 382 157 225 45 21 Block No. S 157 157 666 305 361 214 189 Block No. 9 114 114 573 274 299 191 135 Block No. 10 124 124 611 292 319 187 134
Total of Wllrd No. II 434 434 2,394 J,J69 1,225 511 194
Block No. 11 120 120 62] 302 319 152 91 Block No. 12 111 III 560 291 269 110 41 Block No. 13 116 116 596 288 308 153 41 Block No. 14 87 87 617 288 329 96 21
VILLAGES
1 Balachadi P,W6,Tk2. 2,922-25 72 72 427 225 202 2 I 56 12 2 Khiri P,W4. 2,253-11 56 46 140 162 178 34 22 38 27 3 Vadha W_ 521-06 11 11 79 42 37 7 4 Hadiana M2,H,Mp2,D2, 12,080-25 589 589
Hos,Mew, W35,Riv, 3,644 1,838 1,806 72 81 783 286
-Po. 5 Hirapur 1,409-08 U n i n h a b i t e d
6 Limbuda M,W6. 2,305-38 89 89 502 248 254 4 3 .. .. 51 6 7 Kunad M.W,Riv,Po,Ea. 4,066-39 207 208 1,242 629 613 65 75 6 5 225 22 8 Baradi P,W,Riv. 624-14 26 26 138 69 69 .. 12 5 9 Vavdi P,W2. 3,838-09 89 89 534 273 261 7 6 63 7
10 Badanpar Jodiya P,Rhc,W,Ei,Ea,Ed. 2,243-12 178 172 1,366 685 681 234 22
11 Beraja M,W2,Riv. 3,815-23 150 ISO 825 402 423 73 75 135 30 12 Nesda P,W. 2,151-28 87 88 534 275 259 85 15 13 Anada M,W,Riv. 1,691-28 75 75 492 254 238 18 13 84 16 14 Bhadra M,W,Riv,Po,Ea. 4,240-31 171 114 986 499 487 63 52 147 35 15 Lakhtar M,W,Riv,Ea. 2,288-31 124 162 998 513 485 82 85 152 3
16 Keshia M,W,Tk,Po. 10.076-31 137 242 1,556 786 770 55 71 216 34 17 Manpar M,W. 1,086-35 15 15 141 73 68 5 2 34 16 18 Ranjitpar M,Riv,S. * 68 67 433 205 22S 3 3 89 26
"The area of Ranjitpar Village has been included in the area of Badanpar Jodiya Village.
32
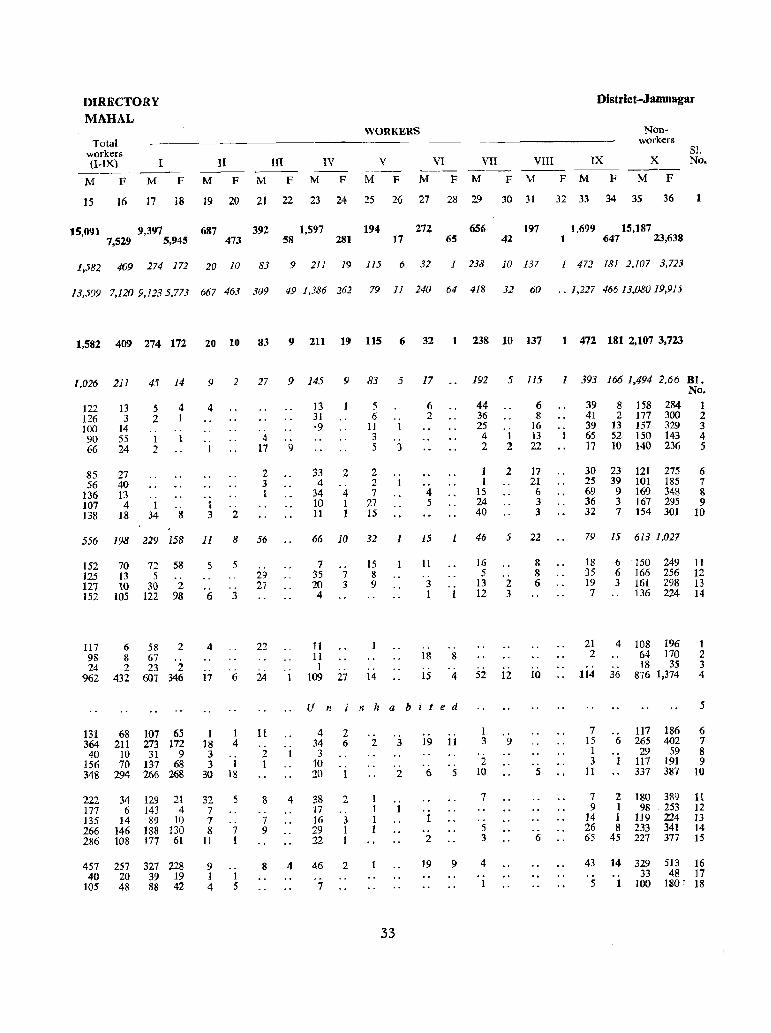
DIRECTORY MAHAL
Total workers (I-IX)
---M F
I
M
II
F M F
III
M F
IV
M F
WORKERS
V VI VII VIII
M F M F M F M F M
District-Jamnagar
IX
F
Nonworkers
x M F
81. No.
15 16 17 18 19 20 21 22 23 24 25 26 27 28 29 30 31 32 33 34 35 36
t5,091 9,397 687 392 1,597 194 272 656 197 7,519 5,945 473 58 281 17 65 42
1,699 15.187 1 647 23,638
1,582 409 274 172 20 10 83 9 211 19 115 6 32 1 238 10 137 I 472 181 2.107 3,723
13.509 7,120 9,1235.773 667 463 309 49 1,386 262 79 11 240 64 418 32 60 ,. 1,227 466 13,08019,915
1,581 409 274 172 20 10 83 9 211 19 115 6 32 1 238 10 137 1 472 181 2,107 3,723
J .026 211 45 14 9 2 27 9 145 9 83 5 17 192 5 115 1 393 166 1,494 2,66 BI.
122 126 100 90 66
85 56
136 107 138
13 3
14 55 24
27 40 13 4
18
5 2 .. 1 2
1 34
4 1
.. 8
4
.. 1
.. I 3
.. 2
4 17
2 3 1
556 198 229 158 11 8 56
152 125 127 152
70 72 13 5 10 30
105 122
58 .. 2
98
117 6 58 2 98 8 67 24 2 23 2
962 432 607 346
I3l 68 107 65 364 211 273 172
40 10 31 9 156 70 137 68 348 294 266 268
222 34 129 21 177 6 143 4 135 14 89 10 266 146 188 130 286 108 177 61
457 257 327 228 40 20 39 19
105 48 88 42
5 5
6 3
4
.. 17 6
1 I 18 4 3 3 1
30 18
32 7 7 8
11
9 1 4
.. 7 I
I 5
.. 29 27
22
24
11 .. 2 1
8 .. 7 9
8
.. 9
.'
1
4
4
13 31 ·9
33 4
34 10 11
2 .. 4 1 1
5 6
II 3 5
2 2 7
27 15
1
3
6 2
.. 4 5
44 36 25
4 1 2 2
1 1
15 24 40
2
6 8
16 13 22
17 21
6 3 3
66 10 32 1 15 1 46 5 22
7 35 20 4
11 11 I
109
U n
4 34 3
10 20
38 17 16 29 22
46
7
7 3
.. 27
"
2 6
2
3 1 1
2
15 8 9
.. 14
11 .. 3 1
.. 18 .. 15
.. 8
. . 4
nhablted
2 3
.. 2
33
19
6
1
2
19
11
.. S
9
16 5
13 12
52
1 3
2 10
7
.. 5 3
4
2 3
12
9
8 8 6
10
5
6
.. J
No. 39 8 158 284 1
2 3 4 5
41 2 177 300 39 13 157 329 6S 52 150 143 17 10 140 236
30 23 121 275 6 25 39 101 185 7 69 9 169 348 8 36 3 167 295 9 32 7 154 301 10
79 15 613 1,027
18 35 19 7
21 2
114
7 15
1 3
11
6 6 3
150 249 166 256 161 298 136 224
4 108 196 64 170
.. 18 35 36 876 1,374
Il 12 13 14
1 2 3 4
5
117 186 6 6 265 402 7
29 59 8 I 117 191 9
337 387 10
7 2 180 389 11 9 1 98 253 12
14 1 119 224 13 26 8 233 341 14 65 45 227 377 15
43
5
14 329 513 16 33 48 17
I 100 ISO: 18
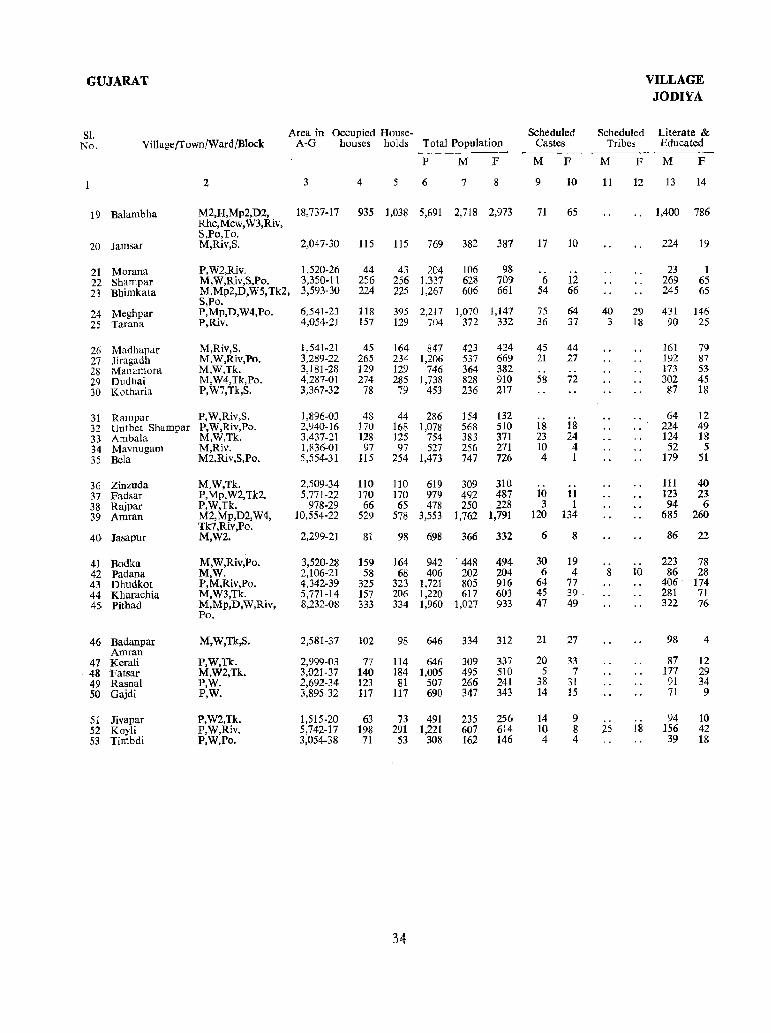
GUJARAT VILLAGE JODIYA
S1. Area in Occupied House- Scheduled Scheduled Literate & No. Village/Town/Ward/Block A-G huuses holds Total Population Castes Tribes Educated
p M F M F M F M F
2 3 4 5 6 7 8 9 10 11 12 13 14
19 Balambha M2,H,Mp2,D2, Rhc,Mcw,W3,Riv,
18,737-17 935 1,038 5,691 2,718 2,973 71 65 1,400 786
S,Po,To. 2D Jamsar M,Riv,S. 2,047-30 115 115 769 382 387 17 10 224 19
21 Morana P,W2,Riv. 1,520-26 44 43 204 106 98 .. 23 I 22 Shampar M,W,Riv,S.Po. 3,350-11 256 256 1,337 628 709 6 12 269 65 23 Bhimkata M,Mp2,D,W5, Tk2, 3,593-30 224 225 1,267 606 661 54 66 245 65
S,Po. 24 Meghpar P,Mp,D,W4,Po. 6,541-23 118 395 2,217 1,070 1,147 75 64 40 29 43l 146 25 Tarana P,Riv. 4,054-21 157 129 704 372 332 36 37 3 18 90 25
26 Madhapar M,Riv,S. 1,541-21 45 164 847 423 424 45 44 161 79 27 Jiragadh M,W,Riv,Po. 3,289-22 265 234 1,206 537 669 21 27 192 87 28 Manamora M,W,Tk. 3,181-28 129 129 746 364 382 .. 173 53 29 Dudhai M,W4,Tk,Po. 4,287-01 274 285 1,738 828 910 58 72 302 45 30 Kotharia P,W7,Tk,S. 3,367-32 78 79 453 236 217 87 18
31 Rampar P,W,Riv,S. 1,896-03 48 44 286 154 132 64 12 32 Untbet Shampar P,W,Riv,Po. 2,940-16 170 168 1,078 568 510 18 18 224 49 33 Ambala M,W,Tk. 3,437-21 128 125 754 383 371 23 24 124 18 34 Mavnugam M,Riv. 1,836-01 97 97 527 256 271 10 4 52 5 35 Bela M2,Riv,S,Po. 5,554-31 115 254 1,473 747 726 4 1 ]79 51
36 Zinzuda M,W,Tk. 2,509-34 110 110 619 309 310 ., III 40 37 Fadsar P,Mp,W2,Tk2. 5,771-22 ]70 170 979 492 487 ]0 11 123 23 38 Rajpar P,W,Tk. 978-29 66 65 478 250 228 3 1 94 6 39 Amran M2,Mp,D2,W4, ]0,554-22 529 578 3,553 1,762 1,791 120 134 685 260
Tk7,Riv,Po. 40 Jasapur M,W2. 2,299-21 81 98 698 366 332 6 8 86 22
41 Bodka M,W,Riv,Po. 3,520-28 159 164 942 . 448 494 30 19 .. 223 78 42 Pad ana M,W, 2,106-21 58 68 406 202 204 6 4 8 10 86 28 43 Dhudkot P,M,Riv,Po. 4,342-39 325 323 1,721 805 916 64 77 406 174 44 Kharachia M,W3,Tk. 5,771-14 157 206 1,220 617 603 45 39 . 281 71 45 Pithad M,Mp,D,W,Riv, 8,232-08 333 334 1,960 1,027 933 47 49 322 76
Po.
46 Badanpar M,W,Tk,S. 2,581-37 102 98 646 334 312 21 27 98 4 Amran
47 Kerali P,W,Tk. 2,999-03 77 114 646 309 337 20 33 87 12 48 Patsar M,W2,Tk. 3,021-37 140 184 1,005 495 510 5 7 177 29 49 Rasnal P,W. 2,692-34 123 81 507 266 241 38 31 91 34 50 Gajdi P,W. 3,895-32 117 117 690 347 343 14 15 71 9
51 Jivapar P,W2,Tk. 1,515-20 63 73 491 235 256 14 9 .. 94 10 52 Koyli P,W,Riv. 5,742-17 198 291 1,221 607 614 10 8 25 18 156 42 53 Timbdi P,W,Po. 3,054-38 71 S3 308 162 146 4 4 39 1&
34
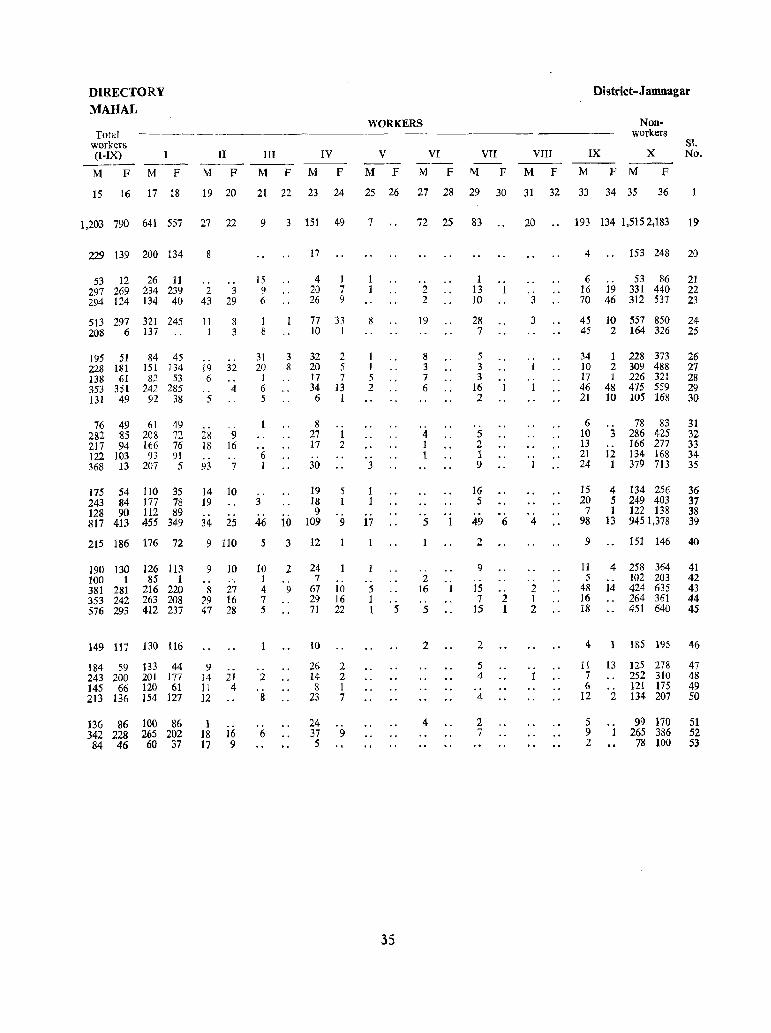
DIRECTORY MAHAL
Tot'll workers (I-IX) ----M F M F
II III IV
M F M F M F
WORKERS
V VI
M F M F
VII
M F
VIII
M F
District-J amnagar
IX
M
Nonworkers
x F M F
81. No.
15 16 17 18 19 20 21 22 23 24 25 26 27 28 29 30 31 32 33 34 35 36
1,203 790 641 557 27 22
229 139 200 134
53 12 26 11 297 269 234 239 294 124 134 40
8
.. .. 2 3
43 29
513 297 321 245 11 8 208 6 137 1 3
195 51 84 45 228 181 151 134 138 61 82 53 353 351 242 285 131 49 92 3S
76 49 61 49 282 85 208 72 217 94 166 76 122 103 93 91 368 13 207 5
175 54 110 35 243 84 177 78 128 90 112 89 817 413 455 349
215 186 176 72
190 130 100 1 381 281 353 242 576 293
126 113 85 I
216 220 263 208 412 237
149 117 130 116
184 59 133 44 243 200 201 177 145 66 120 61 213 136 154 127
136 86 100 86 342 228 265 202 84 46 60 37
.. 19 6 .. 5
28 18 .. 93
.. 32 .. 4
9 16 .. 7
14 10 19
34 25
9 110
9 10 ~ . . . 8 27
29 16 47 28
9 .• 14 21 11 4 12
1 18 17
16 9
9 3 151 49
15 9 6
I 8
31 20
1 6 5
6 I
3
46
3 8
17
4 20 26
I 7 9
77 33 10 1
32 2 20 5 17 7 34 13 6 1
8 27 17 .. 30
.. 1 2
19 18 9
10 109
5 I
9
5 3 12
10 1 4 7 5
.. 2
8
6
2 .. 9
24 7
67 29 71
to
26 14 8
23
24 37 5
.. 10 16 22
2 2 1 7
9
7
8
1 1 5 2
.. 3
17
.. 5 1 I 5
35
72 25 83
2 2
19
8 3 7 6
4 1 1
5
.. 2
16 .. 5
2
4
.. 1
1 13 I 10
28 7
5 3 3
16 2
5 2 1 9
16 5
.. 1
49 6
2
9
15 7
15
2
5 4
4
2 7
.. 2 1
20
3
3
.. 1
., 1
. . 1
4
. . 2 1 2
.. 1
193 134 1,5152,183 19
4 153 248 20
6 53 86 21 16 19 331 440 22 70 46 312 537 23
45 10 557 850 24 45 2 164 326 25
34 1 228 373 10 2 309 488 17 1 226 321 46 48 475 559 21 10 105 168
6 78 83 10 3 286 425 13 166 277 21 12 134 168 24 1 379 713
15 20 7
98
4 134 256 5 249 403 1 122 138
13 9451,378
26 27 28 29 30
31 32 33 34 35
36 37 38 39
9 151 146 40
11 5
48 16 18
4
4 258 364 102 203
14 424 635 264 361 451 640
41 42 43 44 45
ISS 195 46
11 13 125 278 47 7 252 310 48 6 121 175 49
12 2 134 207 50
5 9 2
99 170 265 386
78 100
51 52 53


TALUKA:KALAVAD
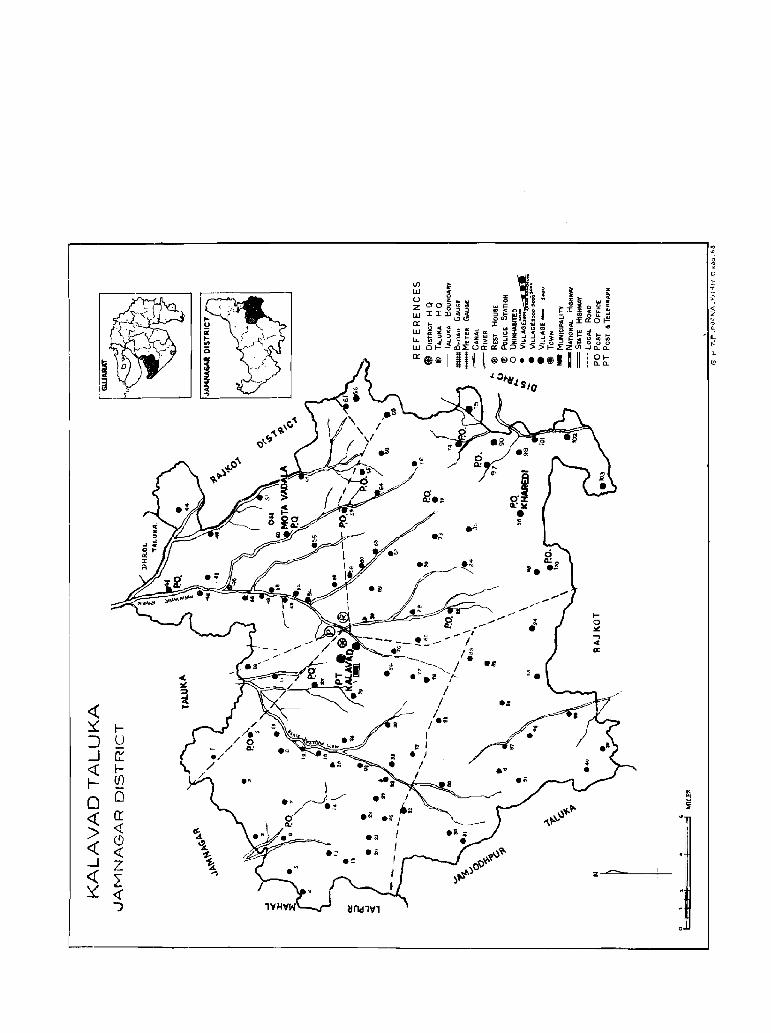
t-o lO!: .., ~ IIC
.1 .... :It
« ~ ... ." ::( I-:J u _j 0:: <t l-I-- (j)
0 0 ~
« a: ~'f.t- ~
> « ~ o(,t--':
0 .; « 'i « ~
.:- .~
_j Z .~
<{ A
~ .., z -=--
~ <f "')
L
TALUKA
KALAVAD
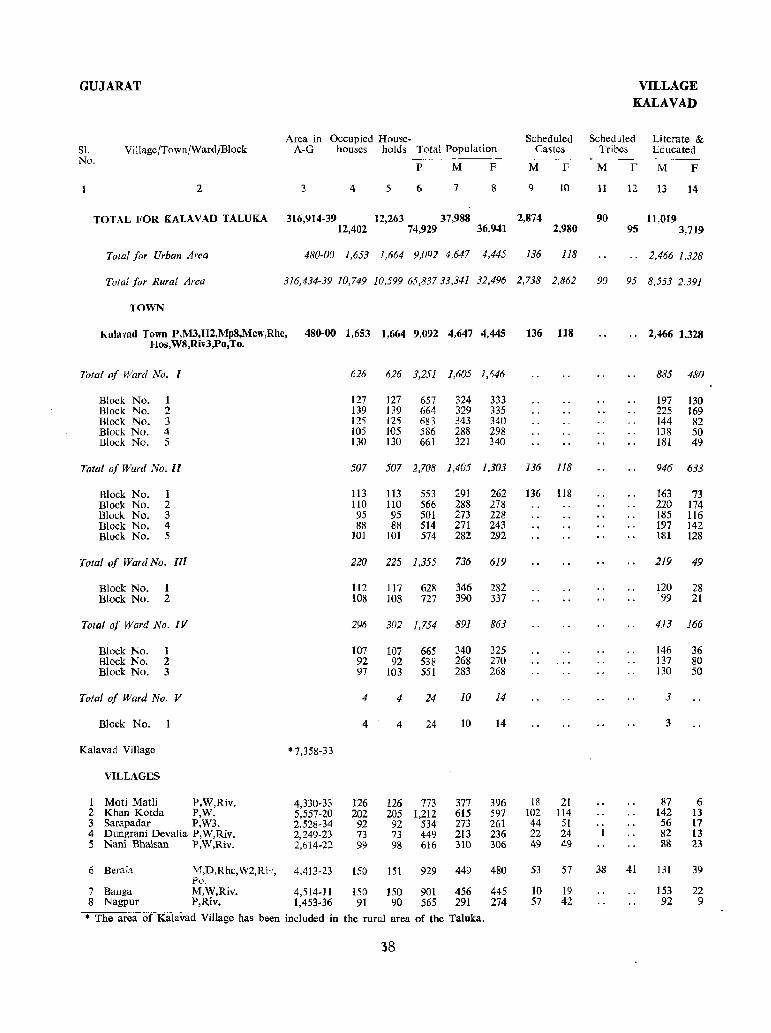
GUJARAT VILL,AGE KALAVAD
Area in Occupied House- Scheduled Scheduled Literate & Sl. Villagc!Town!WardjBlock A-G houses holds Total Population Castes Tribes Educated No.
M F P M F M F M F
2 3 4 5 6 7 8 9 10 11 12 13 14
TOTAL FOR KALA V AD TALUKA 316,914-39 12,263 37,988 2,874 90 11,019 12,402 74,929 36,941 2,980 95 3,719
Total for Urban Area 480-00 1,653 1,664 9,092 4,647 4,445 136 118 .. 2,466 1,328
Total for Rural Area 316,434-39 10,749 10,599 65,83733,341 32,496 2,738 2,862 90 95 8,553 2,391
TOWN
Kalavad Town P,M3,H2,Mp8,Mcw,Rhc, 480-00 1,653 1,664 9,092 4,647 4,445 136 118 .. 2,466 1,328 Hos,W8,Riv3,Po,To.
Total of Ward No. l 626 626 3,251 1,605 1,646 885 480
Block No. t 127 127 657 324 333 197 130 Block No. 2 139 139 664 329 335 225 169 Rlock No. 3 125 J25 683 343 340 144 82 Block No. 4 105 105 586 288 298 138 50 Block No. S 130 130 661 321 340 181 49
Total of Ward No. II 507 507 2,708 1,405 ].303 136 118 946 633
Block No. I 113 113 553 291 262 136 118 163 73 Block No. 2 110 110 566 288 278 220 174 Block No. 3 95 95 501 273 228 185 116 Block No. 4 88 88 514 271 243 197 142 Block No. S 101 101 574 282 292 181 128
Total of Ward No. III 220 225 1,355 736 619 219 49
Block No. 1 112 117 628 346 282 120 28 Block No. 2 108 108 727 390 337 99 21
Total of Ward No. IV 296 302 1,754 891 863 413 166
Block No. I 107 107 665 340 325 146 36 Block No. 2 92 92 538 268 270 137 80 Block No. 3 97 103 551 283 268 130 50
Total of Ward No. V 4 4 24 10 14 3
Block No. 4 4 24 10 14 3
Kalavad Village *7,358-33
VILLAGES
1 Moti Matli P,W,Riv. 4,330-33 126 126 773 377 396 18 21 87 6 2 Khan Kotda P,W. 5,557-20 202 205 1,212 615 597 102 114 142 13 3 Sarapadar P,W3. 2,528-34 92 92 534 273 261 44 51 .. 56 17 4 Dungrani Devalia P,W,Riv. 2,249-23 73 73 449 213 236 22 24 1 82 13 5 Nani Bhalsan P,W,Riv. 2,614-22 99 98 616 310 306 49 49 88 23
6 Berai;-\ M,D,Rhc,W2,Ri'l, 4,413-23 150 151 929 449 480 53 57 38 41 131 39 Po.
7 Banga M,W,Riv. 4,514-11 15() 150 9()1 456 445 10 19 153 22 8 Nagpur P,Riv. 1,453-36 91 90 565 291 274 57 42 92 9
* The area of Kalavad Village has been included in the rural area of the Ta1uka.
38
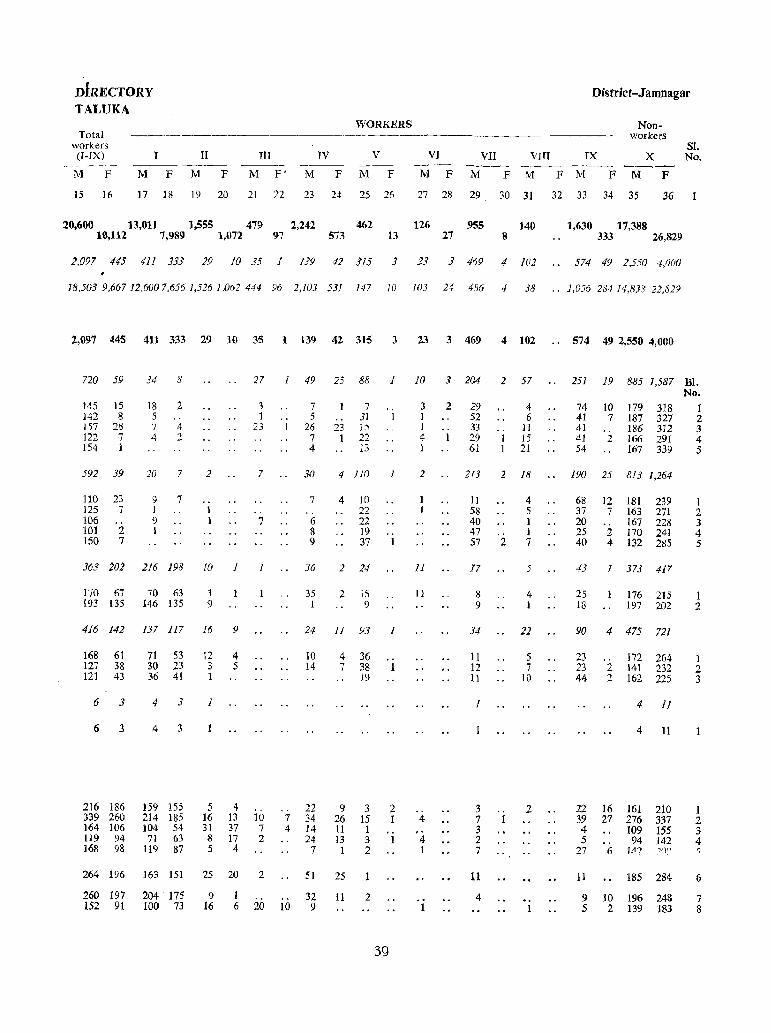
DIRECTORY TALUKA
District-J amnagar
Total workers (I-IX)
M F
15 16
WORKERS
II III IV V ----
M F M F M F' M F M F
17 18 19 20 21 22 23 24 25 26
VI
M F M
VII vrn IX -~-- ----
F M F M F
Nonworkers
x M F
27 28 29 30 31 32 33 34 35 36
20,600 13,011 1,555 479 2,242 462 126 955 140 1,630 17,388 10,112 7,989 1,072 97 573 13 27 8 333 2{),829
2,091 445 411 333 29 10 35 1 139 42 315 3 23 J 469 4 102 574 49 2,550 4,000
18,503 9,667 ]2,6007,656 1,526 1,062444 96 2,103 531 147 10 !O3 24 486 4 38 ,,1,056 284 14,83S 22,829
2,097 445 411 333 29 10 35 1 139 42 315 3 23 3 469 4 102 " 574 49 2,550 4,000
S1. No.
720 59 34 8 27 49 25 88 1 10 3 204 2 57 251 19 885 1,587 BI.
145 142 n7 122 154
15 8
28 7 1
592 39
110 125 106 101 150
23 7
2 7
18 5 7 4
2 , . 4 2
20 7
9 1 9 1
7
2
" 1 1
1 1
23
7
7
363 202 216 198 10 1 1
170 67 70 63 193 135 146 135
1 9
416 142 137 117 16 9
168 61 127 38 121 43
6 3
6 3
216 ]86 339 260 164 106 119 94 168 98
71 53 30 23 36 41
4 3
4 3
]59 155 214 185 104 54
71 63 119 87
12 3 1
1
5 16 3] 8 5
4 5
4 13 37 17 4
10 7 2
264 196 163 151 25 20 2
260 197 152 91
204' 175 100 73
9 16
1 6 20
"
"
1
7 4
10
7 5
26 7 4
30
7
6 8 9
36
35 1
23 1
7 31 J5 22 13
4 no
4 10 22 22 19 37
2 24
2 15 9
24 11 93 1
10 14
22 34 14 24
7
4 36 7 38
19
9 26 11 I3 1
3 15 I 3 2
51 25
32 9
11 2
39
2 I
1
3 1 I 4 1
2
1 1
II
11
4
4 1
2
,.
1
29 52 33 29 61
4 6
II 15 21
213 2 18
11 58 40 47 57
17
8 9
34
11 12 11
1
3 7 3 2 7
11
4
2
4 5 1 1 7
5
4 1
22
5 7
10
2
74 41 41 41 54
10 7
" 2
179 318 187 327 186 312 166 291 167 339
190 25 813 1,264
68 37 20 25 4()
12 7
" 2 4
181 239 163 271 167 228 170 241 132 285
43 1 373 417
25 18
176 , 215 197 202
90 4 475 721
23 23 44
22 39 4 5
27
11
9 5
2 2
172 264 141 232 162 225
4 11
4 11
16 161 27 276
109 94
1;1') " 6
210 337 155 142
185 284
10 196 248 2 139 183
No.
1 2 3 4 5
1 2 3 4 5
1 2
1 2 3
I 2 3 4
6
7 8
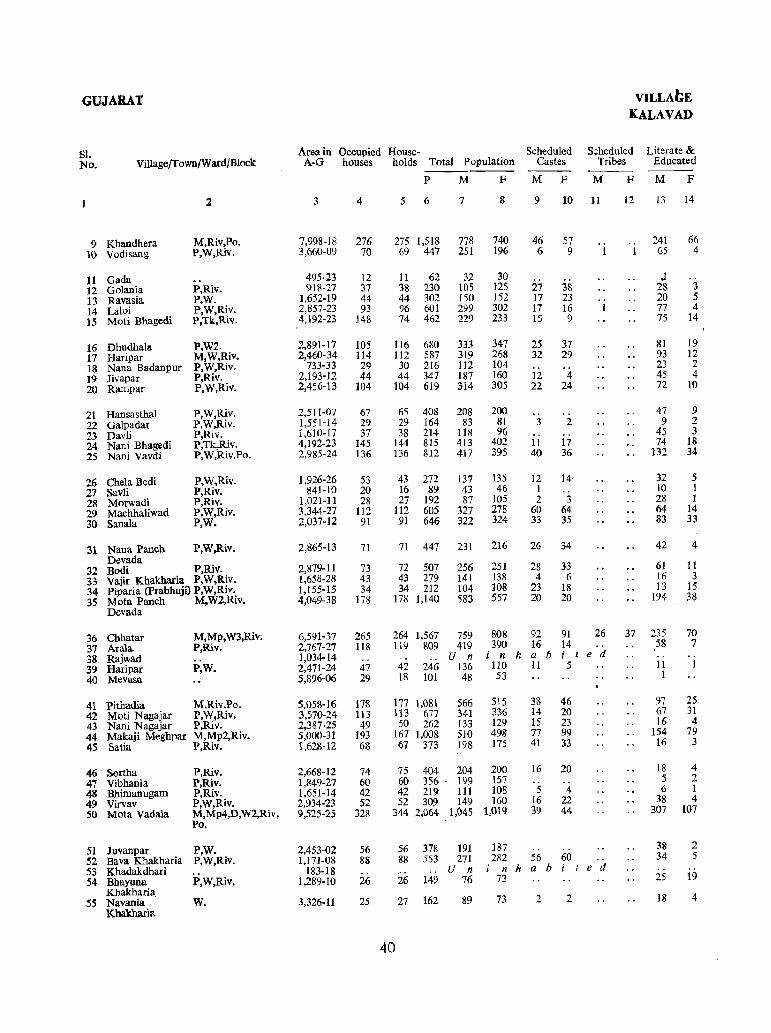
GUJARAT VILLAGE KALAVAD
51. Area in Occupied House- Scheduled Scheduled Literate & No. ViIlagejTown/Ward/Block A-G houses holds Total Population Castes Tribes Educated
P M F M F M F M F
2 3 4 5 6 7 8 9 10 11 12 13 14
9 Khandhera M,Riv,Po. 7,998-18 276 275 1,518 778 740 46 57 241 66
10 Vodisang P,W,Riv. 3,660-09 70 69 447 251 196 6 9 1 65 4
11 Gada 495-23 12 11 62 32 30 J 12 Golania P,Riv. 918-27 37 38 230 105 125 27 38 28 3
13 Ravasia P,W. ],652·19 44 44 302 150 152 17 23 20 5
14 Laloi P,W,Riv. 2,857-23 93 96 601 299 302 17 16 1 77 4
15 Moti Bhagedi P,Tk,Riv. 4,192-23 148 74 462 229 233 15 9 75 14
16 Dhudhall1 P,W2. 2,891·17 105 116 680 333 347 25 37 81 19
17 Haripar M,W,Riv. 2,460-34 114 112 587 319 268 32 29 93 12
18 Nana Badanpur P,W,Riv. 733-33 29 30 216 112 104 23 2
19 Jivapar P,Riv. 2,193-12 44 44 347 187 160 12 4 45 4
20 Rampar P,W,Riv. 2,456-13 104 104 619 314 305 22 24 72 10
21 Hansasthal P,W,Riv. 2,511-07 67 65 408 208 200 .. 47 9
22 Galpadar P,W,Riv. 1,551-14 29 29 164 83 81 3 2 9 2
23 Davli P,Riv. 1,610·17 37 38 214 118 96 .. 45 3
24 Nani Bhagedi P,Tk,Riv. 4,192-23 ]45 144 815 413 402 11 17 74 18
25 Nani Vavdi P,W,Riv,Po. 2,985-24 136 136 812 417 395 40 36 132 34
26 Chela Redi P,W,Riv. 1,926-26 53 43 272 137 135 12 14 32 5
27 Savli P,Riv. 841-10 20 16 89 43 46 1 10 1
28 Morwadi P,Riv. 1,021-11 28 27 192 87 105 2 3 28 1
29 Machhaliwad P,W,Riv. 3,344-27 112 112 605 327 278 60 64 64 14
30 Sanala P,W. 2,037-12 91 91 646 322 324 33 35 83 33
31 Nana Panch P,W,Riv. 2,865-13 71 71 447 231 216 26 34 42 4
Devada 32 Bodi P,Riv. 2,879·11 73 72 507 256 251 28 33 61 11
33 Vajir Khakharia P,W,Riv. 1,658-28 43 43 279 141 138 4 6 16 3
34 Piparia (Prabhuji) P,W,Riv. 1,155-15 34 34 212 104 108 23 18 13 15
3S Mota Panch M,W2,Riv. 4,049-38 178 178 1,140 583 557 20 20 194 38
Devada
36 Chhatar M,Mp,W3,Riv. 6,591-37 265 264 1,567 759 808 92 91 26 37 235 70
37 Arala. P,Riv. 2,767-27 118 119 809 419 390 16 14 .. 58 7
38 Rajwad 1,034·14 .. .. U n i n h a b i t e d . . 39 Haripar P,W. 2,471-24 47 42 246 136 110 11 5 II 1
40 Mevasa 5,896-06 29 18 101 48 53 1
41 Pithadia M,Riv,Po. 5,058-16 178 177 1,081 566 515 38 46 97 25
42 Moti Nagajar P,W,Riv. 3,570-24 113 113 677 341 336 14 20 67 31
43 Nani Nagajar P,Riv. 2,387-25 49 50 262 133 129 15 23 16 4
44 Makaji Meghpar M,Mp2,Riv. 5,000-31 193 167 ],008 510 498 77 99 154 79
4S Satia P,Riv. 1,628-12 68 67 373 198 175 41 33 16 3
46 Sortha P,Riv. 2,668-12 74 75 404 204 200 16 20 18 4
47 Vibhania P,Riv. 1,849·27 60 60 356 . 199 157 5 2
48 Bhimanugam P,Riv. 1,651·14 42 42 219 111 108 5 4 6 1
49 Virvav P,W,Riv. 2,934-23 52 52 309 149 160 16 22 38 4
50 Mota Vadala M,Mp4,D,W2,Riv, 9,525-25 328 344 2,064 1,045 1,019 39 44 307 107
Po.
51 Ju"anpar P,W. 2,453-02 56 56 378 191 187 .. ,. 38 2
52 Bava Khakharia P,W,Riv. 1,171-08 88 88 553 271 282 56 60 34 5
53 Khadakdhari 183-18 U n n h a b i t e d 54 Bhayuna P,W,Riv. 1,289-10 26 26 149 76 73 25 19
55 Khakharia Navania . W. 3,326-11 25 27 162 89 73 2 2 18 4
Khakharia
40
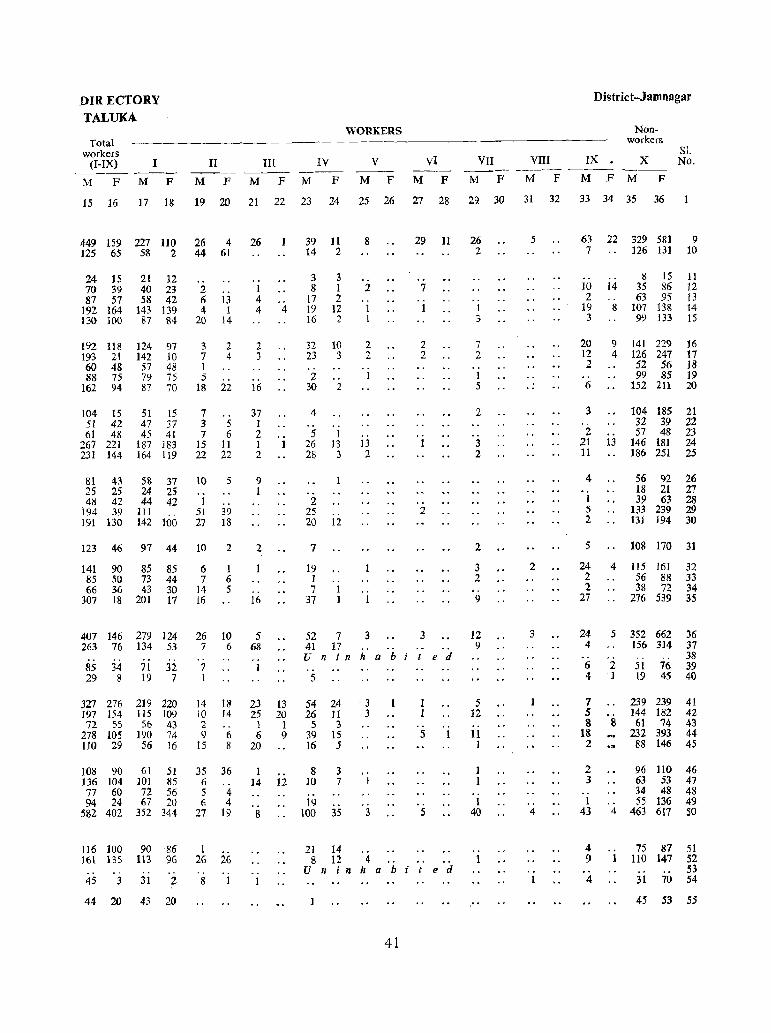
DIRECTORY TALUKA.
Total workers
(I-IX) I
M F M F
WORKERS
II ill N V ~ --- --- ----MFMFM F MFMF
District -Jam nagar
Nonworkers
SJ. VII VIII IX. X No.
--- ---- --- ---MF MF MFM F
15 16 17 18 19 20 21 22 23 24 25 26 27 28 29 30 31 32 33 34 35 36
449 159 227 110 26 4 26 125 65 58 2 44 61
24 15 21 12 70 39 40 23 87 57 58 42
192 164 143 139 130 100 87 84
192 118 193 21 60 48 88 75
162 94
104 15 51 42 61 48
267 221 231 144
81 43 25 25 48 42
194 39 191 130
124 97 142 10 57 48 79 75 87 70
51 15 47 37 45 41
187 183 164 119
58 37 24 25 44 42
111 142 100
.. 2 6 4
20
3 7 1 5
18
13 1
14
2 4
22
7 .. 3 5 7 6
15 ) 1 22 22
10
1 51 27
5
.. 39 18
123 46 97 44 10 2
141 90 85 85 85 50 73 44 66 36 43 30
307 18 201 17
407 146 279 124 263 76 134 53
85 34 71 32 29 8 19 7
327 276 197 154 72 55
278 105 110 29
108 90 136 104 77 60 94 24
582 402
116 100 161 13S
.. 45 3
219 220 115 109
56 43 190 74 56 16
61 51 101 85 72 56 67 20
352 344
90 86 ll3 96 .. .. 31 2
44 20 43 20
6 7
14 16
1 6 5
26 10 7 6 .. 7 1
14 10 2 9
15
35 6 5 6
27
1
13 14 " 6 8
36
4 4
19
26 26 "
8 1
1 4 4
2 3
16
37 I 2 1 2
9 1
2
16
5 68
1
23 25
1 6
20
1 14
8
.. 1
4
.. 1
13 20
1 9
.. 12
39 1l 14 2
8 29 11 26
3 8
17 19 16
32 23 .. ;2
30
4
5 26 28
2 25 20
7
19 1 7
37
3 1 2
12 2
10 3
.. 2
1 13
3
.. 12
.. 1 1
2 .. 1 1
2 2
1
13 2
.. 7 .. 1
2 2
2
52 7 3 3 41 17 Uninhabited
5
54 24 26 11
5 3 39 15 16 5
8 10
19 100
3 7
35
21 14
3
8 12 4 ..
.. .. 5 1
5
Uninhabited
41
2
.. I 3
7 2
1 5
2
.. 3 2
2
3 2 .. 9
12 9
5 12 .. 11 J
1 40
5
2
3
4
. . J
63 22 329 581 9 7 126 131 10
10 2
]9 3
20 12 2
.. 6
3 .. 2
21 11
4
J 5 2
5
24 2 2
27
24 4
.. 6 4
7 5 8
18 2
2 3
1 43
4 9
4
.. 14 .. 8
8 15 35 86 63 95
107 138 99 133
11 12 13 14 15
9 141 229 16 4 126 247 17
52 56 18 99 85 19
13
152 211 20
104 185 21 32 39 22 57 48 23
146 181 24 186 251 25
56 92 26 18 21 27 39 63 28
133 239 29 131 194 30
lOS 170 31
4 lIS 161 32 56 88 33 38 72 34
276 539 3S
5 352 662 36
2 ]
,. S
156 314 37 . . 51 76
38 39 40 19 45
239 239 41 144 182 42
61 74 43 232 393 44
88 146 45
96 63 34 55
110 46 53 47 48 48
136 49 4 463 617 SO
75 87 51 110 147 52
53 31 70 54
45 53 55
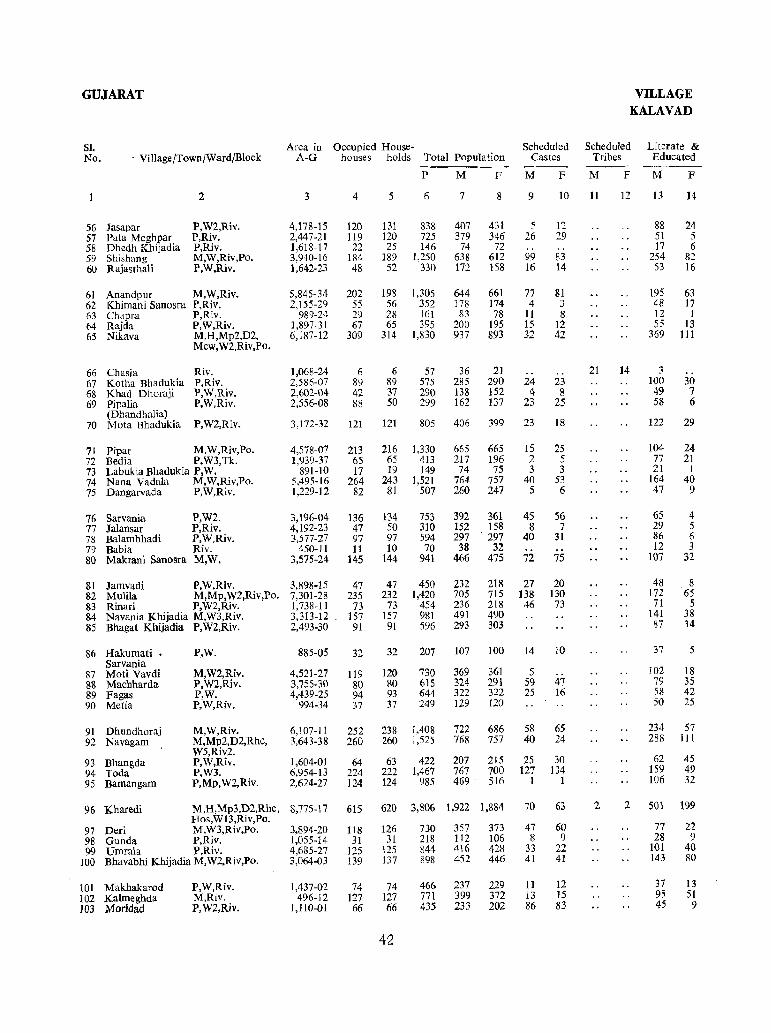
GUJARAT VILLAGE KALAVAD
SI. Area in Occupied House· Scheduled Scheduled Literate & No. - ViIIage!Town/Ward/Block A-G houses holds Total Population Castes Tribes Educlited --- ----
P M F M F M F M F
2 3 4 5 6 7 8 9 10 11 12 13 14
56 Jasapar P,W2,Riv. 4,178-15 120 131 838 407 431 5 12 88 24 57 Pata Meghpar P,Riv. 2,447-21 119 120 725 379 346 26 29 51 5 58 Dhedh Khijadia P,Riv. 1,618-17 22 25 146 74 72 -- -- 17 6 59 Shishang M,W,Riv,Po. 3,940-16 184 189 1,250 638 612 99 83 254 82 60 Rajasthali P,W,Riv. 1,642-23 48 52 330 172 158 16 14 53 16
61 Anandpur M,W,Riv. 5,845-34 202 19S 1,305 644 661 77 81 195 63 62 Khimani Sanosra P,Riv. 2,155-29 55 56 352 178 174 4 3 48 17 63 Chapra P,Riv. 989-24 29 28 161 83 78 11 8 12 1 64 Rajda P,W,Riv. 1,897-31 67 65 395 200 195 15 12 55 13 65 Nikava M,H,Mp2,D2, 6,187-12 309 314 1,830 937 893 32 42 369 111
Mcw,W2,Riv,Po.
66 Chasia Riv. 1,068-24 6 6 57 36 21 " .. 21 14 3 .. 67 Kotha Rhadukia P,Riv. 2,586-07 89 R9 575 285 290 24 23 100 30 68 Khad Dhoraji P,W,Riv. 2,602-04 42 37 290 138 152 4 8 49 7 69 Pipalia P,W,Riv. 2,556-08 88 50 299 162 137 23 25 58 6
70 (Dhandhalia) Mota Bhadukia P,W2,Riv. 3,172-32 121 121 805 406 399 23 18 122 29
71 Pipat M,W,Riv,Po. 4,578-07 213 216 1,330 665 665 15 25 104 24 72 Bedia P,W3,Tk. 1,939-37 65 65 413 217 196 2 5 77 21 73 Labukia Bhadukia p, W. 891-10 17 19 149 74 75 3 3 21 I
74 Nana Vadala M,W,Riv,Po. 5,495-16 264 243 1,521 764 757 40 53 164 40 75 Dangarvada P,W,Riv. 1,229-12 82 81 507 260 247 5 6 47 9
76 Sarvania P,W2. 3,196-04 136 134 753 392 361 4S 56 65 4 77 Jalansar P,Riv. 4,192-23 47 50 310 152 158 8 7 29 5 78 Balambhadi P,W,Riv. 3,577-27 97 97 594 297 297 40 31 86 6 79 Babia Riv. 450-11 11 10 70 38 32 .. 12 3 80 Makrani Sanosra M,W. 3,575-24 145 144 941 466 475 72 75 107 32
81 Jamvadi P,W,Riv. 3,898-15 47 47 450 232 218 27 20 48 8
82 Mulila M,Mp,W2,Riv,Po. 7,301-28 235 232 1,420 705 715 138 130 172 65 83 Rinari P,W2,Riv. 1,738-11 73 73 454 236 218 46 73 71 5 84 Navania Khijadia M,W3,Riv. 3,313-12 157 157 981 491 490 141 38
85 Bhagat Khijadia P,W2,Riv. 2,493-30 91 91 596 293 303 87 34
86 Hakumati • P,W. 885-05 32 32 207 107 100 14 10 37 5 Sarvania
87 Moti Vavdi M,W2,Riv. 4,521-27 119 120 730 369 361 5 102 18 88 Machharda P,W2,Riv. 3,755-30 80 80 615 324 291 59 47 79 35 89 Fagas P,W. 4,439-25 94 93 644 322 322 25 16 58 42
90 Metia P,W,Riv. 994-34 37 37 249 129 120 50 25
91 Dhundhoraj M,W,Riv. 6,107-11 252 238 1,408 722 686 58 65 234 57
92 Navagam M,Mp2,D2,Rhc, 3,643-38 260 260 1,525 768 757 40 24 288 111 W5,Riv2.
93 Bhangda P,W,Riv. 1,604-01 64 63 422 207 215 25 30 62 45
94 Toda P,W3. 6,954-13 224 222 1,467 767 700 127 134 159 49
95 Bamangam P,Mp,W2,Riv. 2,624-27 124 124 985 469 516 1 1 106 32
96 Kharedi M,H,Mp3,D2,Rhc, 8,775-17 615 620 3,806 1,922 1,884 70 63 2 2 501 199 Hos,W 13,Riv,Po.
97 Deri M,W3,Riv,Po. 3,894-20 118 126 730 357 373 47 60 77 22 98 Gunda P,Riv. 1,055-14 31 31 218 112 106 8 9 28 9
99 Umrala P,Riv. 4,685-27 125 125 844 416 428 33 22 101 40
100 Bhavabhi Khijadia M,W2,Riv,Po. 3,064-03 139 137 898 452 446 41 41 143 80
101 Makhakarod P,W,Riv. 1,437-02 74 74 466 237 229 11 12 37 13 102 Kalmeghda M,Riv. 496-12 127 127 771 399 372 13 15 95 51
103 Moridad P,W2,Riv. 1,110-01 66 66 435 233 202 86 83 45 9
42

DIRECTORY TALUKA
Total workers (I-IX)
M F
I ----M F
II III IV
M F M F M F
WORKERS
V VI
M F M F
VII
M F
VIII
M F
District-Jamnagar
IX
M F
Nonworkers
x M F
Sl. No.
15 16 17 18 19 20 21 22 23 24 25 26 27 28 29 30 31 32 33 34 35 36
232 175 207 65 42 1
306 132 87 72
353 217 100 48 45 34
110 1 462 184
19 5 182 98 72 36
100 56
178 155 173 65 40 1
195 74 66 62
254 180 70 41 33 22 74 1
279 157
6 2 149 87 54 35 76 44
6 2 1
47 5
12 8 6 7
27
2 16
5 3
7
51 4
22 5 5
.. S
1 11
241 140 185 132 17 5
358 112 84 6 42 12
428 245 134 68
260 102 62 1 35 12
331 213 lOt 56
217 172 160 144 79 83 58 29
162 28 112 23 22 5 19 5
245 61 152 59
127 104 382 71 121 107 272 178 173 95
59 57 249 53 94 98
228 156 129 61
54 31 42 31
182 62 148 62 200 50 108 17 190 97 146 81 86 33 47 17
42 8 3
31 9
6 5
32 7
3 .. 12 54
3 2
41 2
13 65 11 6
17
3
.. 13 23 13
14 II
8 8
28
.. 7
11 3
387 173 255 140 44 22 415 290 265 250 18 9
106 13 441 186 258 ]71
67 2 323 106 199 146
16 8 66 77 27 24
10
7
15
.. 3
3 1
1 12
.. 5 9
2
8
974 376 602 348 36 13 16
207 71 61 12
251 101 224 26
150 118 228 150 125 103
128 46 38 2
174 94 155 19
104 97 165 108 55 51
35 11 29 32
23 10 5 4
11 6 30 29 31 21
.. 4 3
6
.. 5
23 28
35 13
39 11 3
23 53
11 12 5 3
7
5 5
3 1 6
3
2 .. 1 2
25 3
32 6
.. 42 17
]5 5
39
33
47 25 7
23 14
14 32
1 10
4
5
8 .. 5
31 I 1
12 6
.. 9 I
2
6
4
2
6 .. 2
3
40 10 7 46 2 13
7 36 21
187
16 6
24 16
3 1
2
25 15 16 12 35 27
15
4
.. I
.. 1
.. 2
43
3
.. 1
4
.. 11
2
2
4 1
3
. . 10
3 2
6
II 3
3 36
.. I 1
4
9 2 3
10 2
5
., 5
I3
2 2
4 1 3
16 23
1 8 6
61
12 2 4 9
5 7
2
2
.. r
.. .. 3 3
.. 1
4
8 2 1
16 2
]75 256 172 281
32 71 1 332 480
85 86
29 12 291 444 7 1 78 126 2 1 38 44 3 90 194
40 . 16 475 709
4 7 3
l7 16 103 192 66 116 62 81
56 57 58 59 60
61 62 63 64 65
66 67 68 69
9 165 259 70
15 6 1
J3 5
307 553 133 190 32 63
336 512 126 179
30 20 3
175 ]89 73 75
4 1
12
; 9 3
11 11
135 269 16 27
221 414
105 114 2 323 644
.. 115 ill 1 219 312
120 208
71 72 73 74 75
76 77 78 79 80
81 82 83 84 85
9
13 46 12
53 69 86
7
17 4 8
187 299 124 241 132 225 43 87
• 87 88 89 90
21 .. 335 513 91 50 29 353 467 92
2 6 5
101 202 326 514 211 345
93 94 95
50 7 9481,508 96
13 4
12 8
5 8 4
150 302 .. 51 94 2 165 327 2 228 420
2
87 1lI 171 222 lOS 99
97 '?~ 99
100
101 102 103


MAHAL : LALPUR
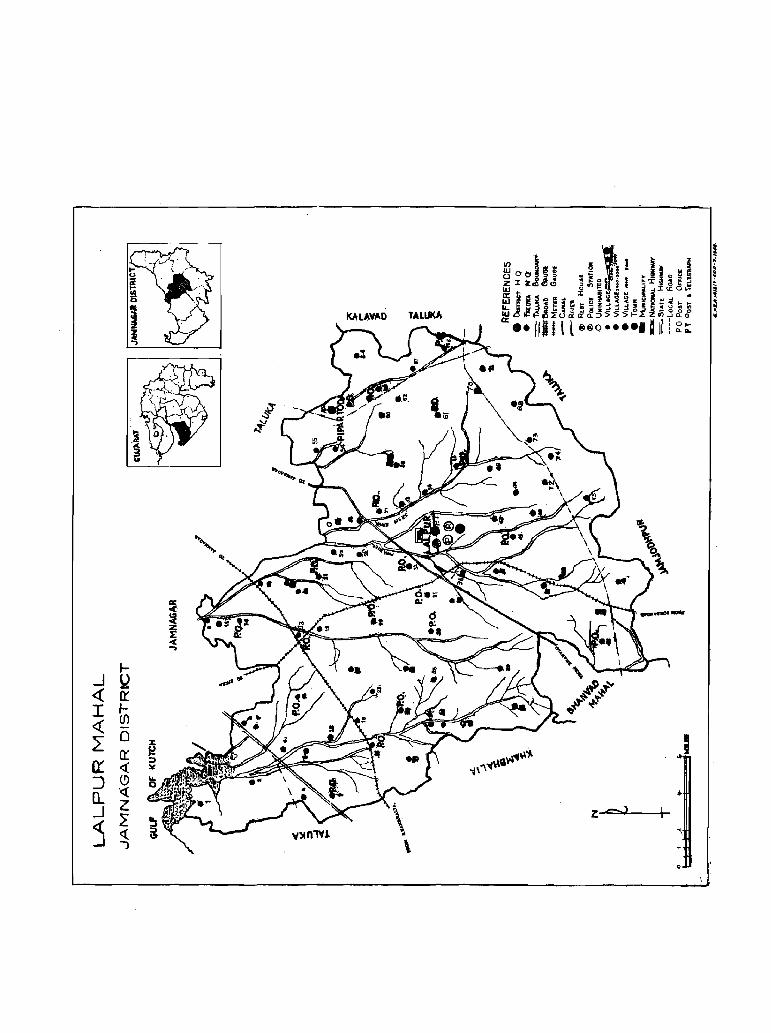
~ ~ z ::E « ..,
I-_J ~ <{ cr I I-
« If)
0 L J cr ~,,~'f. 0:: <:( ... ...,~Q
:J (.!) 'i\
0.. '« .. _j Z
« L z~
<:( ....I J
"',
MAHAL
LALPUR
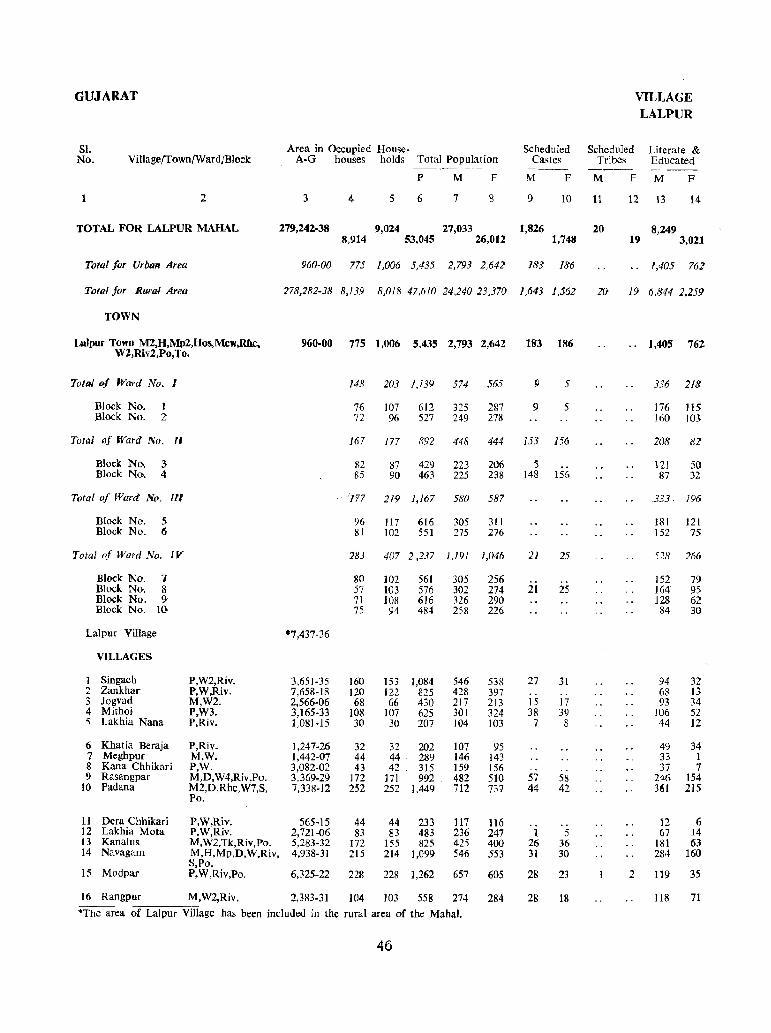
GUJARAT VILLAGE LALPUR
SI. Area in Occupied House- Scheduled Scheduled Literate & No. VilIage!Town/Ward/Block A-G houses holds Total Population Castes Tribes Educated
------ --- -~--
P M F M F M F M F
2 3 4 5 6 7 g 9 10 11 12 13 14-
TOTAL FOR LALPUR MAHAL 279,242-38 9,024 27,033 1,826 20 8,249 8,914 53,045 26,012 1,748 19 3,021
Total for Urban Area 960-00 775 1,006 5,435 2,793 2,642 183 186 {,405 761
Total for Rural Area 278,282-38 8,139 8,018 47,610 24.240 23,370 1,643 1,562 20 19 6,844 2,259
TOWN
Lalpur Town M2,H,Mp2,Hos,Mcw,Rhc, 960·00 W2,Riv2,Po,To.
775 1,006 5.435 2,793 2,642 183 186 .. 1,405 762
To/al of Ward No. I 148 203 1,139 574 565 9 5 336 218
Block No. t 76 107 612 325 287 9 5 176 liS Block No. 2 72 96 527 249 278 160 103
Total of Ward No. II 167 177 S92 448 444 153 156 208 81
Block No. 3 82 87 429 223 206 5 121 50 Block No. 4 85 90 463 225 238 148 156 87 32
Total of Ward' No. III '/77 219 1,167 580 587 .333~ 196
Block No. S 96 117 616 305 311 181 121 Block No. (, 81 102 551 275 276 152 75
Total of Ward No. IV 283 407 2,237 1,191 1,046 21 25 528 266
Block No. 1 80 102 561 305 256 152 79 Block No. S 57 103 576 302 274 21 25 164 95 Block No. 9- 71 108 616 326 290 128 62 Block No. 10 75 94 484 258 226 84 30
Lalpur Village ·7,437·36
VILLAGES
1 Singach P,W2,Riv. 3,651-35 160 153 1,084 546 53S 27 31 94 32 2 Zankhar P,W,Riv. 7,658-18 120 122 825 428 397 .. 68 13 3 Jogvad M,W2. 2,566-06 68 66 430 217 213 15 17 93 34 4 Mithoi P.W3. 3,165-33 108 107 625 301 324 38 39 106 52 5 Lakhia Nana P,Riv. 1,081-15 30 30 207 104 103 7 S 44 12
6 Khatia Beraja P,Riv. 1,247-26 32 32 202 107 95 49 34 7 Meghpur M.W. 1,442·07 44 44 289 146 143 33 1 8 Kana Chhikari P,W. 3,082·02 43 42 . 315 159 156 .. 37 7 9 Rasangpar M,D,W4,Riv,Po. 3,369-29 172 17l 992 482 510 57 58 246 154
10 Padana M2,D,Rhc,W7,S, 7,338-12 252 252 1,449 712 737 44 42 361 215 Po,
11 Dera Chhikari P,W,Riv. 565-15 44 44 233 117 116 12 6 12 Lakhia Mota P,W,Riv. 2,721-06 83 83 483 236 247 1 5 67 14 13 Kanalus M,W2.Tk,Riv,Po. 5,283-32 172 155 825 425 400 26 36 181 63 14 Navagam M,H,Mp.D,W,Riv, 4,938-31 215 214 1,099 546 553 31 30 284 160
S,Po. 15 Modpar P,W,Riv,Po. 6,325-22 228 228 1,262 657 605 28 23 2 119 35
16 Rangpur M,W2,Riv. 2,383-31 104 103 558 274 284 28 18 118 71
*The area of LaJpur Village has been included in the rural area of the Mahal.
46
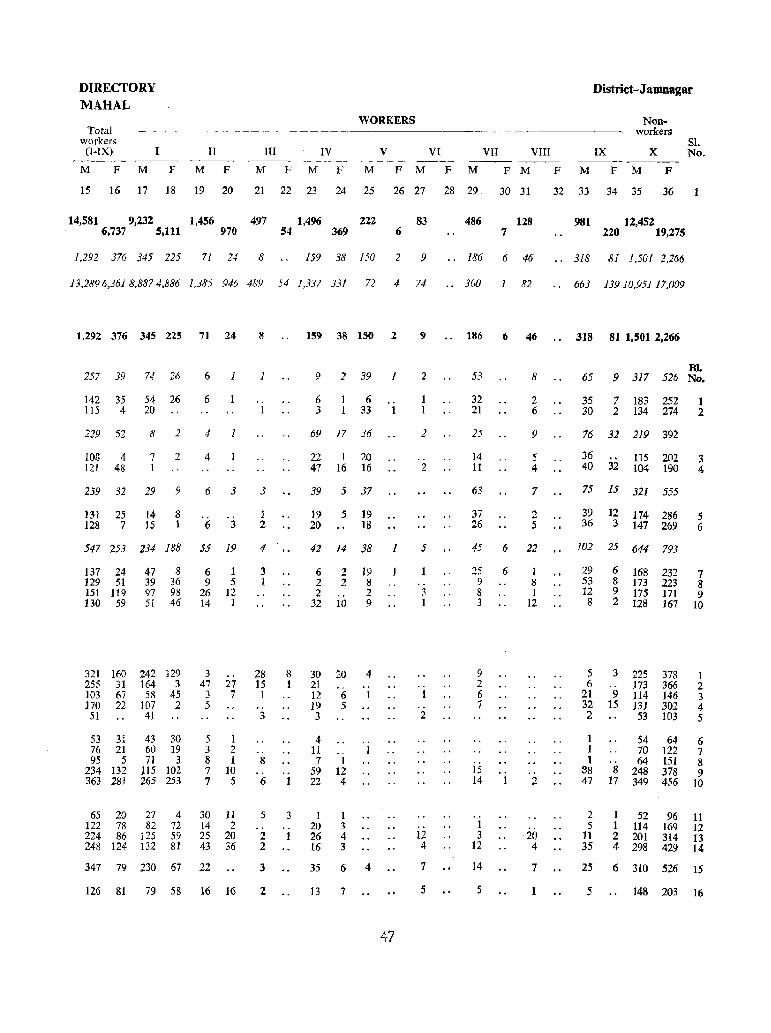
DIRECTORY MAHAL
Total workers
(I-IX) IT
M F M F M F
WORKERS
JIl IV V VI VII
M F M F M FM F M F M
15 16 17 18 19 20 21 22 23 24 25 26 27 28 29 30 31
VITI
14,581 9,232 1,456 497 1,496 222 83 486 128 6,737 5,111 970 54 369 6 7
District-J amnagar
Nonworkers
Sl. IX X No.
F M F M F
32 33 34 35 36
981 12,452 220 19,275
1,292 376 345 225 71 Z4 8 159 38 150 2 9 .. 186 6 46 .. 318 81 1,501 2,266
13,2896,361 8,8874,886 1,385 946 489 54 1,337 331 72 4 74 .. 300 1 82 .. 663 13910,951 17,009
1,292 376 345 225 71 24
257 39 74 26
142 35 54 26 115 4 20
229 52
108 4 121 48
8 2
7 1
2
259 32 29 9
131 25 14 8
6 1
6
4 1
4
6 3
128 7 15 1 6 3
547 253 234 188 55 19
137 24 129 51 151 119 130 59
47 g 39 36 97 98 51 46
321 160 242 129 255 31 164 3 103 67 58 45 170 22 107 2
51 41
53 31 76 21 95 5
234 132 363 281
43 30 60 19 71 3
115 102 265 253
65 20 27 4 122 78 82 72 224 86 125 59 248 124 132 81
6 9
26 14
1 5
12 1
3 .. 47 27
3 7 5
5 3 8 7 7
1 2 1
10 5
30 11 14 2 25 20 43 36
347 79 230 67 22
126 81 79 58 16 16
8
1
.. 1
3
1 2
4
3 1
28 15 1
.. 3
.. 8 .. 6
8 1
.. 1
5 3 .. 2 1 2
3
2
159 38 150 2
9 2 39
6 6 3 33 1
69 17 36
22 47
1 20 16 16
39 5 37
19 5 19 20 18
42 14 38 1
6 2 2
32
2 2 .. 10
30 20 21 12 6 19 5 3
4 11 7
59 22
1 20 26 16
I 12 4
I 3 4 3
19 8 2 9
4 .. 1
35 6 4
13 7
47
9 .. 186 6 46
2
2
..
"
2
5
3 1
.. 1
2
12 4
7
5
53
32 21
25
14 11
63
37 26
8
2 6
9
5 4
7
2 5
45 6 22
25 9 8 3
9 2 6 7
15 14
1 3
12
14
5
6 1 8 1
12
2
,20 4
7
318 81 1,501 2,266
BJ. 65 9 317 526 No.
35 7 183 252 1 .30 2 134 274 2
76 32 219 392
36 40 32
lI5 202 104 190
75 15 321 555
3 4
39 12 174 286 5 36 3 147 269 6
102 25 644 793
29 53 12 8
6 168 232 8 173 223 9 175 171 2 128 167
5 3 225 378 6 173 366
21 9 114 146 32 15 131 302 2 53 103
1 I 1
38 47
54 64 70 122 64 151
8 248 378 17 349 456
7 8 9
10
1 2 3 4 5
6 7 8 9
10
2 5
11 35
1 52 96 11 1 114 169 12 2 201 314 13 4 298 429 14
25 6 310 526 15
5 148 203 16
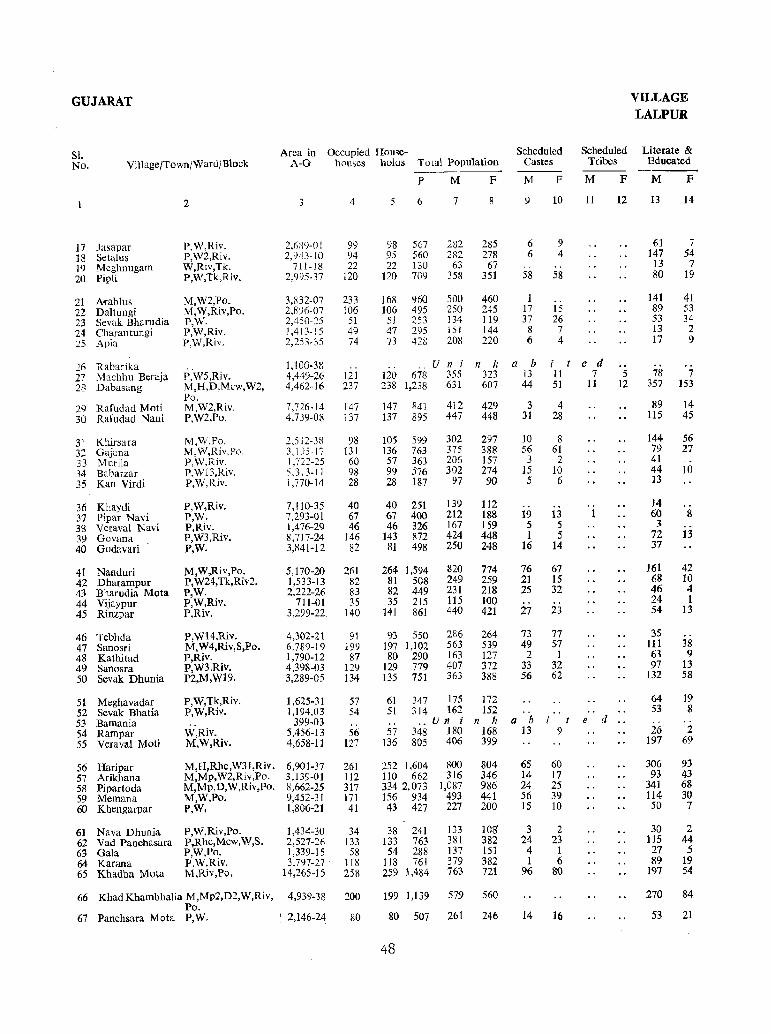
GUJARAT VILLAGE LALPUR
SI. Area in Occupied House- Scheduled Scheduled Literate &
No. Village/Town/WardjBlock A-G houses holds Tolal Population Castes Tribes Educated ----p M F M F M F M F
2 3 4 5 6 7 8 9 10 11 12 13 14
17 Jasapar P,W,Riv. 2,689-01 99 98 567 282 285 6 9 61 7
18 Setalus P,W2,Riv. 2,94-'-10 94 95 560 282 278 6 4 147 54
19 Meghnugam W,Riv,Tk. 711- 18 22 22 130 63 67 .. .. I3 7
20 Pipli P,W,Tk,Riv. 2,995·37 120 120 709 358 351 58 58 80 19
21 kablus M,W2,Po. 3,832-07 233 168 960 500 460 1 141 41
22 Daltungi M,W,Riv,Po. 2,896-07 106 106 495 250 245 17 15 89 53
23 Sevak Bharudia P,W. 2,450-25 51 51 253 134 119 37 26 53 34
24 Charantungi P,W,Riv. 1,413-15 49 47 295 15J 144 8 7 13 2
25 Apia P,W,Riv. 2,253-35 74 73 428 208 220 6 4 17 9
26 Rabarika 1,100·3); .. .. .. U n i n h a b i t e d 27 Machhu Beraja P,W5,Riv. 4,449-26 121 120 678 355 323 13 11 7 5 78 7
28 Dabasang M,H,D,Mcw,W2, 4,462-16 237 238 1,238 631 607 44 51 11 12 357 153 Po.
29 Rafudad Moti M,W2,Riv. 7,726-14 147 147 841 412 429 3 4 89 14
30 Rafudad Nani P,W2,Po. 4,739·08 137 137 895 447 448 31 28 115 45
31 Khirsara M,W,Po. 2,512-38 98 105 599 302 297 10 8 144 56
32 Gajana 1\1, W,Riv,Po. 3,195-17 131 136 763 375 388 56 61 79 27
33 Murila P,W,Riv. J ,722-25 60 57 363 206 157 3 2 41
34 Babarzar P,W13,Riv. 'i,3~3·ll 98 99 576 302 274 15 10 44 10 35 Kan Virdi P,W,Riv. 1,770-14 28 28 187 97 90 5 6 13
36 Khaydi P,W,Riv. 7,110-35 40 40 251 139 112 14
37 Pipar Navi P,W. 7,293-01 67 67 400 212 188 19 13 1 60 8 38 Veraval Navi P,Riv. 1,476-29 46 46 326 167 159 5 S 3
39 Govana P,W3,Riv. 8,717-24 146 143 872 424 448 1 5 72 13
40 Godavari p,W. 3,841-12 82 81 498 250 248 16 14 37
41 Nanduri M,W,Riv,Po. 5,170-20 261 264 1,594 820 774 76 67 161 42
42 Dharampur P,W24,Tk,Riv2. 1,533-13 82 81 508 249 259 21 15 68 10 43 Bharudia Mota P,W, 2,222-26 83 82 449 231 218 25 32 46 4
44 Vijaypur P,W,Riv. 711-01 3S 35 215 115 100 24 1
45 Rinzpar P,Riv. 3,299-22. 140 141 861 440 421 27 23 54 13
46 Tebhda P,W14,Riv. 4,302-21 91 93 550 286 264 73 77 35
47 Sanosri M,W4,Riv,S,Po. 6,789-19 199 197 1,102 563 539 49 57 111 38
48 Kathitad P,Riv. 1,790-12 87 80 290 J63 127 2 1 63 9 49 San(lsra p,W3,Riv. 4,398-03 129 129 779 407 372 33 32 97 13
50 Sevak Dhunia P2,M,W19. 3,289-05 134 135 751 363 388 56 62 132 58
51 Meghavadar P,W,Tk,Riv. 1,625-31 57 61 347 175 172 64 19
52 Scvak Bhatia P,W,Riv. 1,194,03 54 51 314 162 152 53 8
53 Bamania 399-03 .. .. UlI i 11 h a b t e d .. .. 54 Rampar W,Riv. 5,456-13 56 57 348 180 168 13 9 26 2 55 Veraval Moti M,W,Riv. 4,658-11 127 136 80S 406 399 197 69
56 Haripar M,H,Rhc,W31,Riv. 6,901-37 261 252 1,604 800 804 65 60 306 93
57 Arikhana M,Mp,W2,Riv,Po. 3,139-01 112 110 662 316 346 14 17 93 43
58 Pipartoda M,Mp,D,W,Riv,Po. g,662-25 317 334 2,073 1,087 986 24 25 341 68
59 Memana M,W,Po. 9,452-31 171 156 934 493 441 56 39 114 30
60 Khengarpar P,W. 1,806-21 41 43 427 227 200 15 10 50 7
61 Nava Dhunia P,W,Riv,Po. 1,434-30 34 38 241 133 lOs' 3 2 30 2
62 Vad Panchasara P,Rhc,Mcw,W,S. 2,527-26 133 133 763 381 382 24 23 115 44
63 Gala P,W,Po. 1,339-15 58 54 288 137 151 4 1 27 5 64 Karana P,W,Riv. 3,797-27 . 118 118 761 379 382 1 6 89 19
65 Khadba Mota M,Riv,Po. 14,265-15 258 259 1,484 763 721 96 80 197 S4
66 KhadKhambhalia M,Mp2,D2,W,Riv, 4,939-38 200 199 1,139 579 560 270 84 Po.
67 Panchsara Mota P,W. I 2,146-24 80 80 507 261 246 14 16 53 21
48
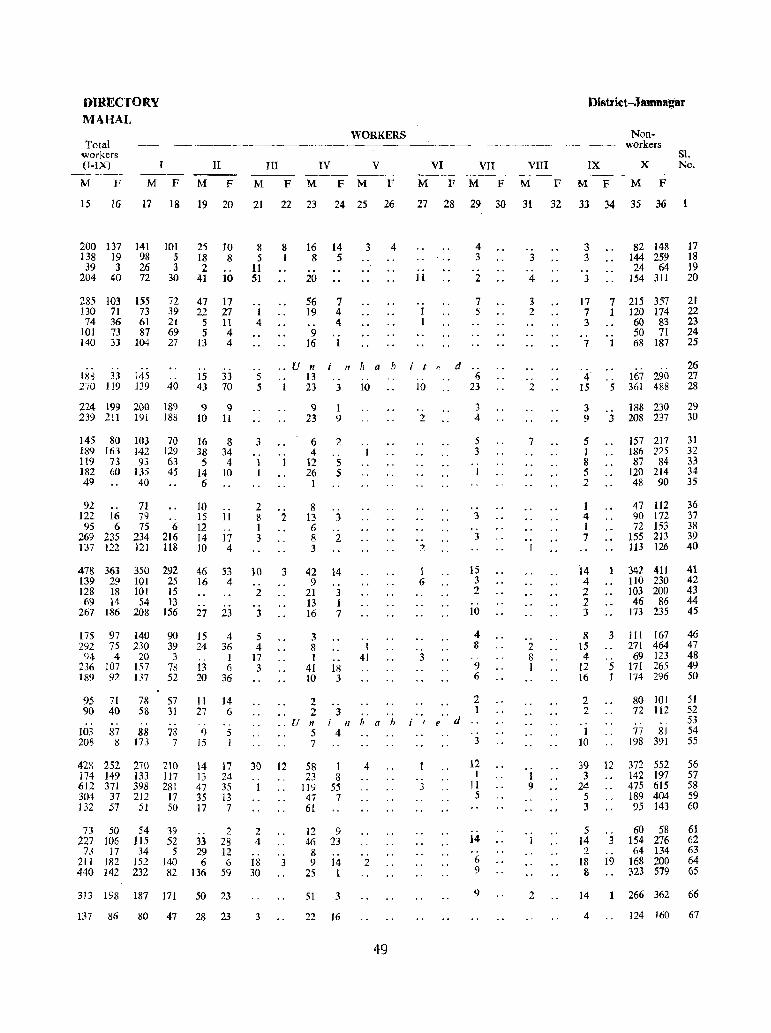
DIRECTORY MAHAL
Total workers (I-IX)
M F M
II
F M P
WORKERS
III IV V
M F M F M F
15 16 17 18 19 20 21 22 23 24 25 26
200 137 141 101 138 19 98 5 39 3 26 3
204 40 72 30
285 103 1.55 130 7I 73 74 36 61
101 73 87 140 33 104
188 33 270 119
145 139
224 199 200 239 211 I'll
72 39 21 69 27
.. 40
189 188
145 80 ]03 70 189 163 142 129 119 73 93 63 182 60 135 45 49 40
92: 122 95
269 137
.. 16 6
235 122
71 79 75
234 121
6 216 118
478 363 350 292 139 29 ]01 25 128 18 101 IS 69 14 54 13
267 186 208 156
175 97 140 292 75 230
94 4 20 236 107 157 189 92 137
95 90 ..
103 208
71 40 .. 87
8
78 58 . . 88
173
90 39
3 78 52
57 31
7& 7
42R 252 270 210 174 149 133 117 612 371 398 281 304 37 212 17 132 57 51 50
73 50 54 39 227 lOG 115 52
7.1 17 34 5 211 182 152 14D 440 142 232 82
25 lO 18 8 2
4] 10
47 17 22 27
5 11 5 4
I3 4
.. 15 43
9 10
33 70
9 11
16 8 38 34 5 4
14 10 6
10 15 12 14 IO
11 .. 17 4
46 53 16 4
27 23
15 24 .. J3 20
11 27 . . 9
15
4 36
1 6
36
14 6 .. 5 I
14 17 13 24 47 35 35 13 17 7
.. 33 29 6
136
2 28 12 6
59
3J3 198 187 171 50 23
137 86 80 47 28 23
8 5
II 51
1 4
.. 5 5
3
8 1
16 14 8 5
20
56 19 .. 9
16
7 4 4
1
3 4
.. U n i n II a b
.. 13 1 23
9 23
.. 3 10
1 9
6 2 .. .. .. 4 I 1 1 12 5 1
2 8 1 3
10 .. 2
3
5 4
17 3
30 . . I
2 4 .. 18 30
3
2
3
..
26 5 1
8 13 6 8 3
42 ')
21 13 16
3 8 1
41 to
2 2
.. 3 .. 2
14 .. 3 I 7
.. IS 3
3 .. lJ n
5 7
i n 4
12 58 1
. . 3
23 8 119 55 47 7 61
12 46
8 9
2S
9 23
14 1
51 3
22 16
.. I
41
.. . . k a h
4
" 2
49
VI VII VIII ----_
M F M F M F
Distrkt -.Jamnagar
IX
M F
Nonworkers
x M F
Sl. No.
27 28 29 30 31 32 33 34 35 36
11
i t e .. 10
2
..
"
2
1 6
3
j !
.. 3
4 3
.. 2
7 :;
d .. 6
23
3 4
5 3 .. I
3
3
15 3 2
10
4 8
9 6
2 1
3
12 I
11 5
14
6 9
9
3 .. 4
3 2
2
7
.. 1
.. 2 8 I
I 9
2
3 3
3
17 7 3
.. 7
4 15
3 9
5 I 8 5 2
I 4 1 7
14 4 2 2 3
8 15 4
12 16
2 2
1 10
82 148 144 259 24 64
154 311
7 215 357 ] 120 174
60 83 50 71
1 68 187
., 5
3
167 290 361 488
188 230 208 237
17 18 ]9 20
21 22 23 24 25
26 27 28
29 30
157 217 31
3
5 1
186 225 32 87 84 33
120 214 34 48 90 35
47 90 72
155 113
112 172 153 213 126
342 411 110 230 103 200 46 86
173 235
II I 167 271 464 69 123
171 265 174 296
80 101 72 112 ., o •
77 81 198 391
36 37 38 39 40
41 42 43 44 45
46 47 48 49 50
51 52 53 54 55
39 12 372 552 56 57 58 59 60
3 142 197 24 475 615
5 189 404 3 95 143
5 14 2
18 8
3
19
60 58 154 276 64 134
168 200 323 579
61 62 63 64 65
14
4
266 362 66
124 160 67
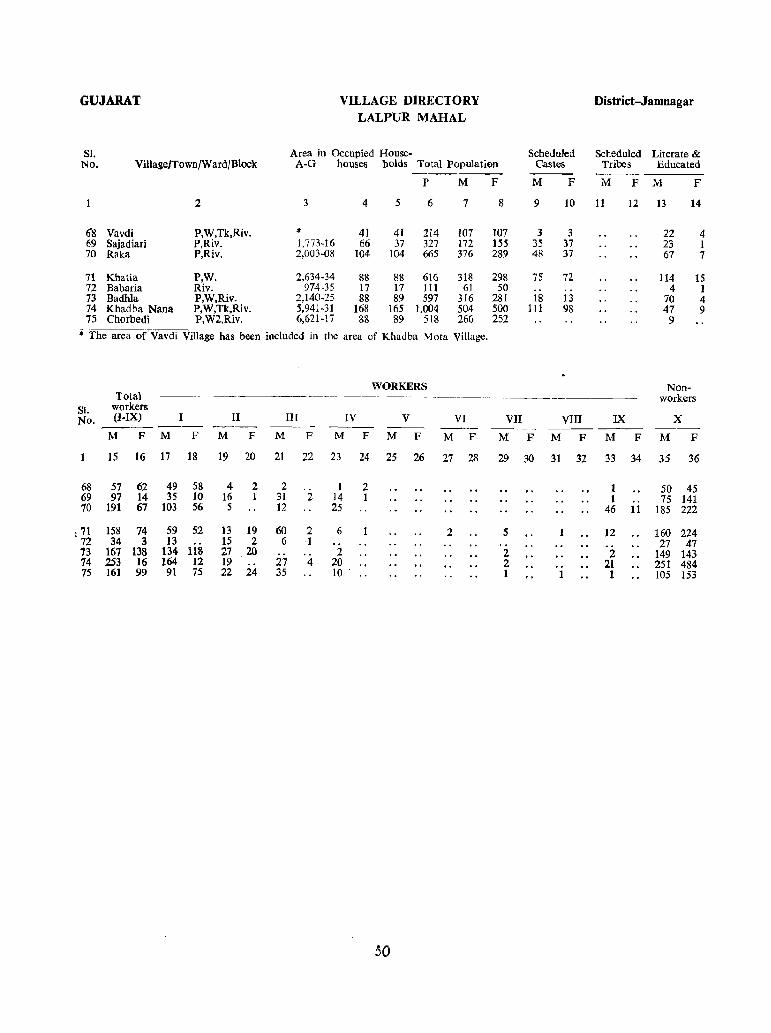
GUJARAT VILLAGE DIRECTORY District-Jamnagar LALPUR MAHAL
SI. Area in Occupied House- Scheduled Scheduled Literate & No. Village}TownjWard/Block A-G houses holds Total Population Castes Tribes Educated
p M F M F M F M F
2 3 4 5 6 7 8 9 10 11 12 13 14
68 Vavdi P,W,Tk,Riv. * 41 41 214 107 107 3 3 22 4 69 Sajadiari P,Riv. 1.773-16 66 37 327 172 155 35 37 23 I 70 Raka P,Riv. 2,003-08 ]04 104 665 376 289 48 37 67 7
71 Khatia P,W. 2,634-34 88 88 616 318 298 75 72 114 ]5 72 Babaria Riv. 974-35 17 17 111 61 50 4 1 73 Badhla P,W,Riv. 2,140-25 88 89 597 316 281 18 13 70 4 74 Khadba Nana P,W,Tk,Riv. 5,941-31 168 165 1,()()4 504 500 111 98 47 9 75 Chorbedi P,W2,Riv. 6,621-17 88 89 518 266 252 9
• The area of Vavdi Village has been illcluded in the area of Khadba Mota Village.
WORKERS Non-Total -------------"_. workers
SI. workers No. (1.IX) I II III IV V VI VII VIII IX X ~------- ---- ---- ---- ---_ -------- -_-
M F M F M F M F M F M F M F M F M F M F M F
]5 16 ]7 ]8 ]9 20 2] 22 23 24 25 26 27 28 29 30 31 32 33 34 35 36
68 57 62 49 58 4 2 2 1 2 1 50 45 69 97 14 35 10 16 1 31 2 14 1 1 .. 75 141 70 191 67 103 56 5 12 25 46 11 185 222
l71 158 74 59 52 13 19 60 2 6 2 5 12 160 224 72 34 3 13 15 2 6 1 27 47 73 167 138 134 118 27 20 .. 2 2 2 149 143 74 253 16 164 12 19 .. 27 4 20 2 21 25] 484 75 161 99 91 75 22 24 35 10 1 1 1 105 153
50

TALUKA:JAMJODHPUR
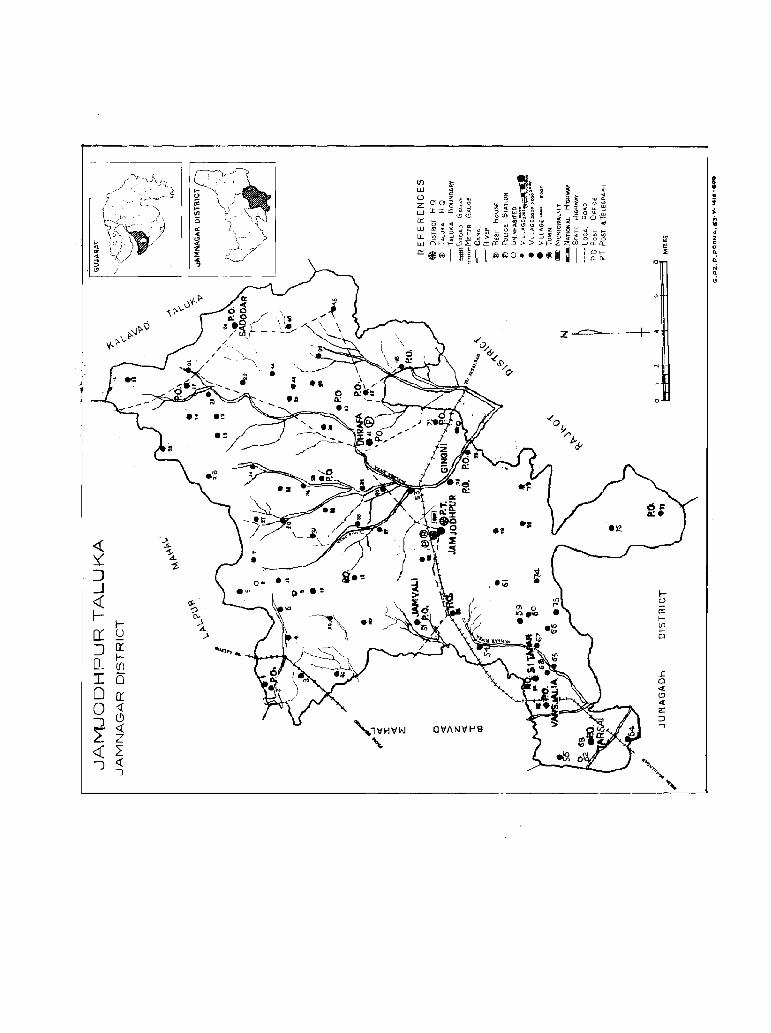
<!: -l ~ ~ ~
::J _j
<i !,S-
I- ?
i I-cr: u .)
:J cr 0_ I-
lfl :r: B 0 IT 0 1: ") <.9
<t: 2: z <i ~ ") c(
J
.'l!
.-, III
ell
...."., ...
'1VHVIII] OlfflNVHQ
'\.
e;!i
I-O
cr: l-(f)
0
I a <t: (!) « z :::l ...,
• 2 :; .. 0: N .. .;
TALUKA
JAMJODHPUR
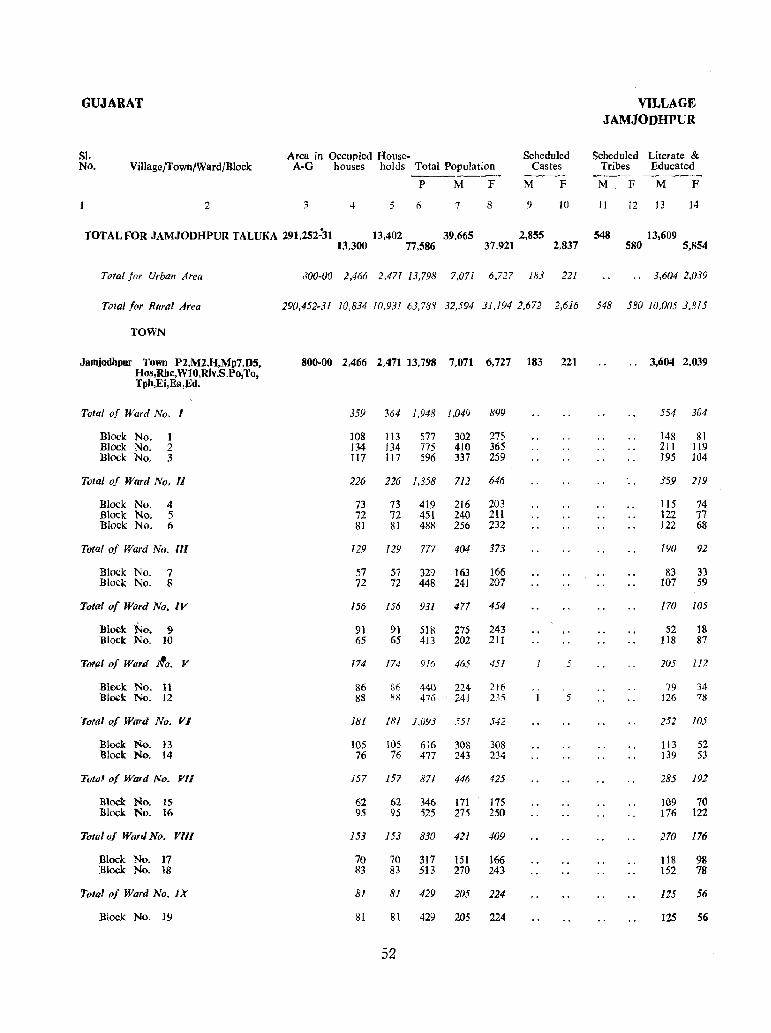
GUJARAT VILLAGE JAMJODHPUR
SI. Area in Occupied Housc- Scheduled Scheduled Literate & NO. VilIagejTown/Ward/Biock A-G houses holds Total Population Castes Tribes Educated ---- --- --.-~
P M F M F M F M F
2 3 4 5 (; 7 8 9 10 11 12 13 14
TOTAL FOR JAMJODHPUR TALUKA 291,252.:'31 13,402 39,665 2,855 548 13,609 13,300 77,586 37,921 2,837 580 5,854
Total for Urban Area JOO-OO 2,466 2,47! 13,798 7,071 6,727 183 221 ., 3,604 2,039
Total for Rural Area 290,452-31 10,834 [0,931 63,788 32,594 3J,l94 2,672 2,616 548 580 10,005 3,815
TOWN
Jamjodhpur Town P2,M2,H,Mp7,DS, 800-00 2,466 2,471 13,798 7,071 6,727 183 221 .. 3,604 2,039 Hos,Rhc,W10,Riv,S.Po,To, Tpb,Ei,Ea,Ed.
Total of Ward No. I 359 364 1,948 1,049 899 554 304
Block No. t 108 113 577 302 275 148 81 Block No. 2 134 134 775 410 365 211 119 Block No. 3 117 117 596 337 259 195 104
Total of Ward No. II 226 226 1,358 712 646 359 219
Block No. 4 73 73 419 216 203 115 74 Block No. S 72 72 451 240 211 122 77 Block No. 6 81 81 488 256 232 122 68
Total of Ward No. III 129 129 777 404 373 190 92
Block No. 7 57 57 329 163 166 83 33 Block No, 8 72 72 448 241 207 107 59
Total of Ward No. IV ]56 156 931 477 454 170 105
Block No. 9 91 91 518 275 243 52 18 Block No. 10 65 65 413 202 211 118 87
Total of Ward Au. V 174 174 910 465 451 5 205 112
Block No. II 86 86 440 224 216 79 34 Block No. 12 88 H8 476 241 235 5 126 78
Total of Ward No. VI ]81 181 1,093 551 542 252 105
Block No. 13 105 105 616 30S 308 }13 52 Block No. 14 76 76 477 243 234 139 53
Total of Ward No. 111/ 157 157 871 446 425 285 192
Block No. 15 62 62 346 171 175 J09 70 lllock No. 16 95 95 525 275 250 176 122
Totalof Ward No. J1111 153 153 830 421 409 270 176
Block No. 17 70 70 317 151 166 118 98 :Block No. ]8 83 83 513 270 243 152 78
Total of Ward No. lX 81 8] 429 205 224 125 56
Block No. 19 81 81 429 205 224 125 56
52
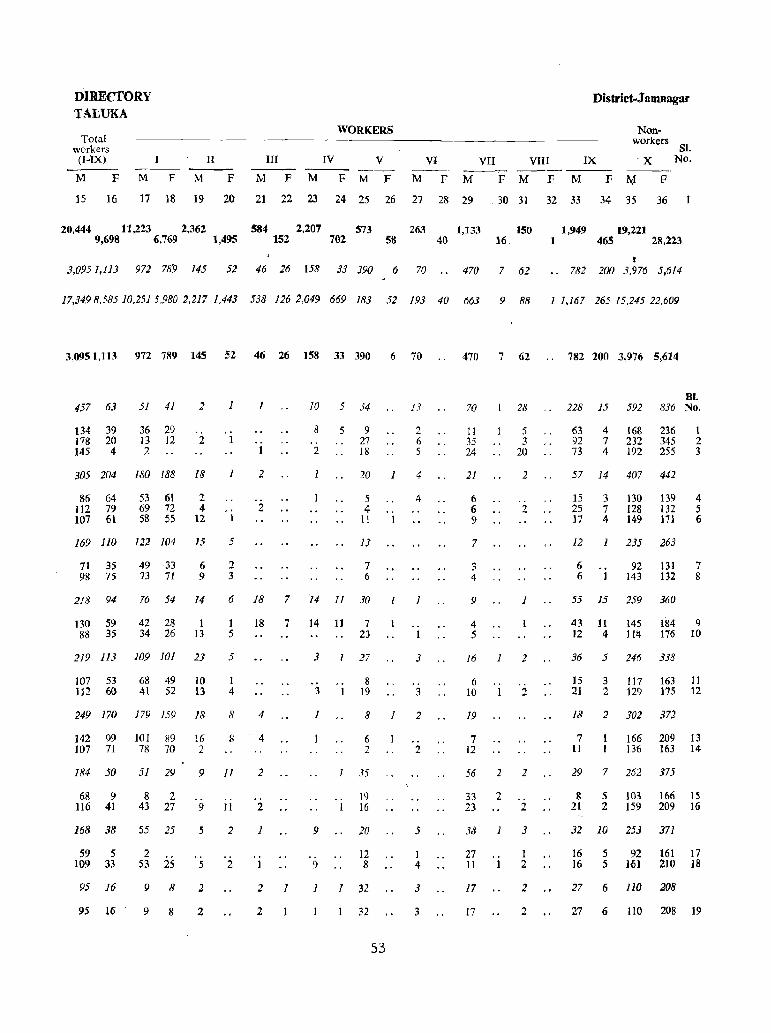
DIRECTORY TALUKA
TQtal workers
(I.JlX)
M F M F
II III
M F M F
WORKERS
IV V
M F M F
VI
M F
District.J amnagar
VII VIII IX -------
Nonworkers
SI. X No.
M FMFM F~ F
15 16 17 18 19 20 21 22 23 24 25 26 27 28 29 30 31 32 33 34 35 36
20,444 11,223 2,362 584 2.207 573 263 1,133 150 1.949 19,221 9,698 6,769 1.495 152 702 58 40 16 1 465 28,223
t 3,0951,113 972 78!J 145 52 46 26 158 33 390 6 70 .. 470 7 62 .. 782 200 3,976 5.614
17,3498,58510,2515,980 2,217 1,443 538 126 2,049 669 183 52 193 40 663 9 88 1 1,167 265 15,245 22,609
3,0951,113 972 789 145 52 46 26 ]58 33 390 6 70
51 4J 2 1 1 10 5 54
36 29 5 9
457 63
134 39 178 20 145 4
13 12 2 1 .. 8
2 27 18 2
305 204 180 188 18
86 64 112 79 107 61
53 61 69 72 58 55
2 4
12
169 110 122 104 15
71 35 98 75
218 94
49 ·33 73 7l
6 9
76 54 14
130 59 42 28 1 88 35 34 26 13
219 113 109 101 23
107 53 112 60
68 49 41 52
10 13
1
5
2 3
1
2
2
20
5 4
11
lJ
7 6
.. 1
6 18 7 14 11 30 1
1 18 7 14 11 7 5 23
5
1 4
3
3 1
27
8 1<}
I.?
2 6 5
4
4
.. 1
3
3
249 170 179 159 18 8 4 1 812
142 99 101 89 16 8 107 71 78 70 2
184 50 51 29 9 II
68 9 116 41
168 38
8 2 43 27
55 25
2
.. .. 9 11
5 2
4
2
.. 2
1
59 5 109 33 53 25 5 2 1
95 16 9 8 2 2 1
95 16 9 8 2 2
9
9
6 2
35
19 16
20
12 8
1 1 32
32
53
2
5
1 4
3
3
470 7 62 . . 782 200 3,976 5,614
70
II 35 24
21
6 6 9
7
3 4
9
4 5
28
5 3
20
2
2
I
16 1 2
6 10
19
7 12
2
56 2 2
33 23
38
2 2
3
27 1 11 1 2
17
17
2
2
81. 228 15 592 836 No.
63 4 168 236 1 92 7 232 345 2 73 4 192 255 3
57 14 407 442
]5 25 17
12
3 7 4
130 128 149
139 132 111
235 263
4 5 6
6 92 131 7 6 1 143 132 8
55 15 259 360
43 II 145 184 9 12 4 1111 176 10
36 5 246 3]8
15 21
3 2
117 129
163 11 175 12
18 2 J02 372
7 II
166 209 13 136 163 14
29 7 262 375
g 21
5 2
103 159
166 15 209 16
32 10 253 371
16 5 92 161 17 16 5 161 210 18
27 6 110 208
27 6 110 208 19
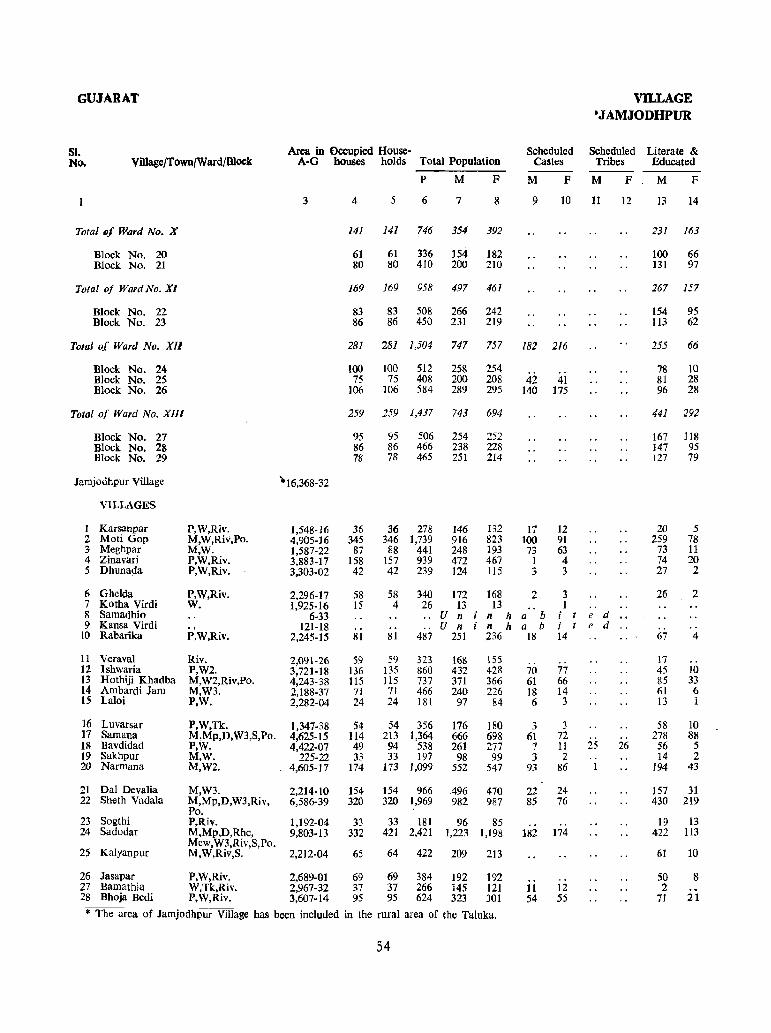
GUJARAT VILLAGE -JAMJODHPUR
51. Area in Occupied House· Scheduled Scheduled Literate & N(). Village/T()wu/Ward/Bloek A·G houses holds Total Population Castes Tribes Educated
p M F M F M F M F
3 4 5 6 7 8 9 10 II 12 13 14
Total of Ward No. X 141 141 746 354 392 231 163
Block No. 20 61 61 336 154 182 100 66 Block No. 21 80 80 410 200 210 131 97
Total of Ward No. XI 169 169 958 497 461 267 157
Block No. 22 83 83 508 266 242 154 95 Block No. 23 86 86 450 231 219 113 62
Total of Ward No. XII 281 281 1,504 747 757 182 216 255 66
Block No. 24 100 100 512 258 254 42
78 10 Block No. 25 75 75 408 200 208 41 81 28 Block No. 26 106 106 584 289 295 140 175 96 28
Total of Ward No. Xlli 259 159 1,437 743 694 441 292
Block No. 27 95 95 506 254 252 167 118 Block No. 2S 86 86 466 238 228 147 95 Block No. 29 78 78 465 251 214 127 79
Jamjodhpur Village *16.368-32
VILLAGES
1 Karsanpar P,W,Riv. 1,548-16 36 36 278 146 132 17 12 20 5 2 Moti Gop M,W,Riv,Po. 4,905-16 345 346 1,739 916 823 100 91 259 78 3 Meghpar M,w. 1,587-22 87 88 441 248 193 73 63 73 11 4 Zinavari P,W,Riv_ 3,883-17 158 157 939 472 467 1 4 74 20 5 Dhunada P,W,Riv_ 3,303-02 42 42 239 124 115 3 3 27 2
6 Ghelda P,W,Riv. 2,296-17 58 58 340 172 168 2 3 26 2 7 Kotha Virdi W_ 1,925-16 15 4 26 13 13 .. 1 8 Samadhio 6-33 U n i n h a b i t e d 9 Kansa Virdi 121-18 .. .. . . U n i n h a b i t e d .. ..
lO Rabarika P.W,Riv. 2,245-15 81 81 487 251 236 18 14 67 4
11 Veraval Riv. 2,091-26 59 59 323 168 155 17 .. 12 Ishwaria P,W2. 3,721-18 136 135 860 432 428 70 77 45 10 13 Hothiji Khadba M,W2,Riv,Po. 4,243-38 115 J15 737 371 366 61 66 85 33 14 Ambardi Jam M,W3. 2,188-37 71 71 466 240 226 18 14 61 6 15 Laloi P,W. 2,282-04 24 24 181 97 84 6 3 13 1
16 Luvarsar P,W,Tk. 1,347-38 54 54 356 176 180 3 3 58 10 17 Samana M,Mp,D,W3,S,Po. 4,625-15 114 213 1,364 666 698 61 72 .. 278 88 18 Bavdidad P,W_ 4,422-07 49 94 538 261 277 7 11 25 26 56 5 19 Sakhpur M,W. 225-22 33 33 197 98 99 3 2 14 2 20 Narmana M,W2. 4,605-17 174 173 1,099 552 547 93 86 194 43
21 Dal Devalia M,W3. 2,214-10 154 154 966 496 470 22 24 157 31 22 Sheth Vadala M,Mp,D,W3,Riv, 6,586-39 320 320 1,969 982 987 85 76 430 219
Po. 23 Sogthi P,Riv. 1,192-04 33 33 181 96 85 .. .. 19 13 24 Sadodar M,Mp,D,Rhc, 9,803-13 332 421 2,421 1,223 1,198 182 174 422 113
25 Kalyanpur Mew, W3,Riv,S,Po. M,W,Riv,S. 2,212-04 65 64 422 209 213 61 10
26 Jasapar P,W,Riv. 2,689-01 69 69 384 192 192 .. 50 8 27 Bamathia W.Tk,Riv. 2,967-32 37 37 266 145 121 11 12 2 28 Bhoja Bedi P,W,Riv. 3,607-14 95 95 624 323 301 54 55 71 21
* The area of Jamjodhpur Village has been included in the rural area of the Taluka.
54

DIRECTORY TALUKA
Total workers (I-IX)
M F
I
M F
II ---M F
III IV --~
M F M F
WORKERS
V
M F
VI
M F
District-Jamnagar
VII VIII IX --- --_ ----. M F M F M F
Nonworkers
X
M F
Sl. No.
15 16 17 18 19 20 21 22 23 24 25 26 27 28 29 30 31 32 33 34 35 36
142 15
66 9 76 6
235 85 94 63 38 12
126 45 51 35 24 6 109 40 43 28 14 6
344 102 15 7
137 11 93 17
114 74
11 4
5 2
9
7 2
1 39
20 19
4 3 13
.. .. 4 3
4 9
4 18 97 9 37
1 1 2 18
64 26 7
1 1 7
5 14 ]8
1
1
6
5 1
3
.. 3
17
10 1 6
68
27 41
37
17 20
41
14 16 11
.. 1
2
2
2
27 13 212 377 Bl. No.
12 8 88 173 20 15 5 124 204 21
35 7 262 376
22 4 140 197 22 13 3 122 179 23
7 . . 126 67 403 655
1 4 2
31 5 121 243 27 14 107 191 68 48 ]75 221
24 25 26
310 53 31 10 1 1 3 18 1 62 2 lJ 71 1 11 . . 100 38 433 641
107 23 92 14
111 16
.. 2
29
.. 2 8
76 68 59 65 547 313 265 192 139 85 75 44 242 136. 174 126 66 49 46 33
103 7
148
84 4
92
84 7I 7 4
85 64
110 86 96 78 229 125 186 109 210 115 162 82 136 97 104 89 55 6 52 6
99 90 331 160 148 122 62 33
309 172
91 90 195 136 86 95 45 26
214 147
5 3 54 57
3 1 9 8
15 15
11 13
27 12
12 8 18 15 28 26 5 3 1
15 10 10 2
.. 7 5 6 1
289 215 193 194 11 10
3 1 2
15
9
22 22 18
2 6 7
19 27 25
1 26 2 2
53 23 83 38 6 31 1
11
3 1
.. 2
5 2 15 2 2 1
5 ..
.. Uninhab
.. Uninhab 25 16
.. . .. 12 1 2 7
21 5
1 52 33 5
44
.. 8
12 1
16
3
49 38 3 5 1
o. o •
i ted .. i ted
4
"
6
9 6 2
1 28 3
14
472 305 246 235 28 24 3 62 5 66 20
3
1 2
4 42
63 26 37 18 640 261 341 217
106 71 88 65
103 48 81 57
181 122
85 46 45 27 98 80
23 45
7 15
2 3
2 7 6
30 32
2 37
2
12 17
1 83
5
14
]0 2 15 24 12 7
.. 1 19
.. 1 3
55
1
41
2
12
.. 1
.. 1
9 2
4
4 8
.. 7
50 20 27 11
147 229 146 214 140 198 23 7
2 25 2
28 2
2
'5
2 4 9 4 2
3 35 16 2
30
70 64 369 510 109 108 230 331 58 66
69 84 6 9
103 144
58 69 203 303 161 251 104 129 42 78
77 90 ·s 335 538 10 113 155 ., 36 66 8 243 375
27 28 29
1 2 3 4 5
6 7 8 9
10
11 12 13 ]4 ]5
16 17 18 19 20
14 6 207 255 21 77 26 510 682 22
66 13 33 59
583 937 23 24
8 2 103 142 25
4 2 8
89 144 64 64
142 179
26 27 28
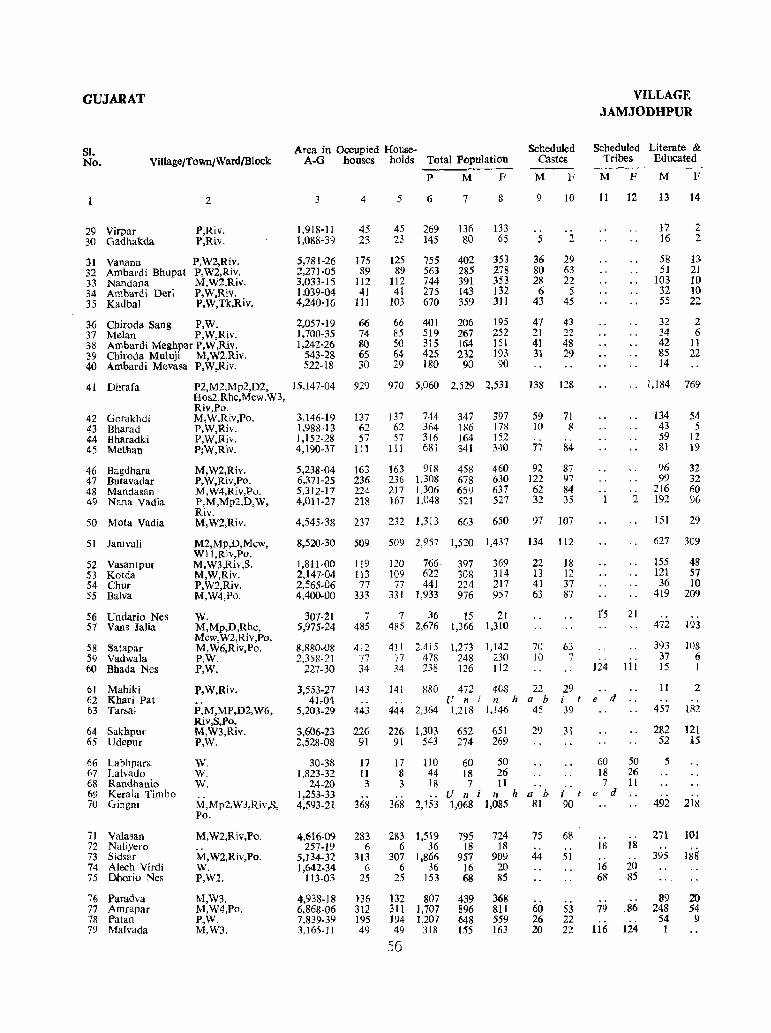
GUJARAT
SI. No. ViIlagejTownjWardlBlock
29 Virpar 30 Gadhakda
31 Vanana 32 Ambardi Bhupat 33 Nandana 34 Ambardi Deri 35 Kadbal
2
P,Riv. P,Riv.
P,W2,Riv. P,W2,Riv. M,W2,Riv. P,W,Riv. P,W,Tk,Riv.
36 Chiroda Sang P, W. 37 Melan P,W,Riv. 38 Ambardi Meghpar P,W,Riv. 39 Chiroda Muluji M,W2,Riv. 40 Ambardi Mevasa P,W,Riv.
41 Dhrafa
42 Gorakhdi 43 Bharad 44 Bharadki 45 Methan
46 Bagdhara 47 Butavadar 48 Mandasan 49 Nana Vadia
50 Mota Vadia
51 Jamvali
52 Vasanlpur 53 Kotda 54 Chur 55 Balva
56 Undario Nes 57 Vans Jalia
58 Satapar S9 Vadwala 60 Bhada Nes
61 Mahiki 62 Khari Pat 63 Tarsai
64 Sakhpur 65 Udepur
66 Labhpara 67 Lalvado 68 Randhanio 69 KeraJa Timbo 70 Gingni
71 Valasan 72 Naliyero 73 Sidsar 74 Alech Virdi 75 Dborio Nes
76 Paradva 77 Amrapar 78 Patan 79 Malvada
P2,M2,Mp2,D2, Hos2,Rhc,Mcw,W3, Riv,Po. M,W,Riv,Po. P,W,Riv. P,W,Riv. P;W,Riv.
M,W2,Riv. P,W,Riv,Po. M,W4,Riv,Po. P,M,Mp2,D,W, Riv. M,W2,Riv.
M2,Mp,D,Mcw, Wl1,Riv,Po. M.W3,Riv,S. M,W,Riv. P,W2,Riv. M,W4,Po.
W. M,Mp,D,Rhc, Mcw,W2,Riv,Po. M, W6,Riv,Po. P,W. P,W.
P,W,Riv.
P,M,MP,D2,W6, Riv,S,Po. M,W3,Riv. P,W.
W. W. W.
M,Mp2,W3,Riv,S, Po.
M,W2,Riv,Po.
M, W2,Riv,Po. W. P,W2.
M,W3. M,W4,Po. P,W. M,W3.
Area in Occupied House- Scheduled Castes A-G houses holds Total Population
3
1,918-II 1,088-39
5,781-26 2,271-05 3,Q33-IS 1,039-04 4,240-16
2,057-19 1,700-35 1,242-26
543-28 522-18
15,147-04
3,146-19 1,988-13 1,152-28 4,190-31
5,238·04 6,371·25 5,312-17 4,011-27
4,545-38
4
45 23
175 89
1I2 41
1 J 1
66 74 80 65 30
929
137 62 57
111
163 236 224 218
237
8,520-30 509
1,811-00 119 2,147-04 113 2,565-06 77 4,400-00 333
307-21 5,975·24
8,880-08 2,358·21
227-30
3,553-27 4Jr04
5,203-29
3,606-23 2,528-08
30-38 1,823-32
24·20 1,253-33 4,593·21
4,616-09 257-19
5,134·32 1,642-34
113-03
4,938-18 6,868-06 7,839-39 3,165-11
7 485
412 77 34
143
443
226 91
17 II 3
368
283 6
313 6
25
B6 312 195 49
P M F
5
45 23
125 89
112 41
103
6
269 145
755 563 744 275 670
7
136 80
402 285 391 143 359
8
133 65
353 278 353 132 311
66 401 206 195 85 519 267 252 50 315 164 151 64 425 232 193 29 180 90 90
970
137 62 57
111
5,060
744 364 316 681
163 918 236 1,308 217 1,306 167 1,048
232 1,313
2,529 2,531
347 397 186 17g 164 152 341 340
458 678 659 521
663
460 630 637 527
650
509 2,957 1,520 1,437
120 766. 397 369 109 622 308 314 77 441 224 217
331 1,933 976 957
7 36 15 21 485 2,676 1,366 t ,310
411 2,415 77 478 34 238
1,273 ],142 248 230 126 112
M F
9
5
36 80 28 6
43
10
2
29 63 22
5 45
47 43 21 22 41 48 31 29
138
59 10 . . 77
128
71 8
.. 84
92 87 122 97 62 84 32 35
97 107
134 112
22 18 13 12 41 37 63 87
10 lO
63 7
141 8S0 472 40B 22 29 .. Uni 11 hab
444 2,364 1,218 1,!46 45
226 1,303 652 651 29 91 543 274 269
17 110 60 50 8 44 18 26 3 18 7 11
U n j n h 368 2,153 1,068 1,085
283 1,519 6 36
307 1,866 6 36
25 153
132 807 311 1,707 194 1,207 49 318
56
795 18
957 16 68
439 896 648 155
724 18
909 20 85
3(jg 811 559 163
" a b
81
75
44
60 26 20
i t 39
31
.. j t 90
613 .. 51
53 22 22
VILLAGE JAMJODHPUR
Scheduled Literate & Tribes Educated -------
M F
II 12
M
13
17 16
58 51
103 32 55
F
14
2 2
13 21 10 10 22
32 2 34 6 42 11 8S 22 14
.. 1,184 769
.. .. 1 2
f5 21
.. 124 III
.. e d ..
60 18 7
e d
18
16 68
79
116
50 26 11
., 18
20 85
.86
124
134 43 59 81
96 99
216 192
151
54 5
12 19
32 32 60 96
29
627 309
155 48 121 57 36 ]0
419 209
.. 472 193
393 108 37 6 15 1
11
457
282 52
5
492
271 ..
395
89 248
54 1
2 "
182
121 15
218
101
188
20 54
9
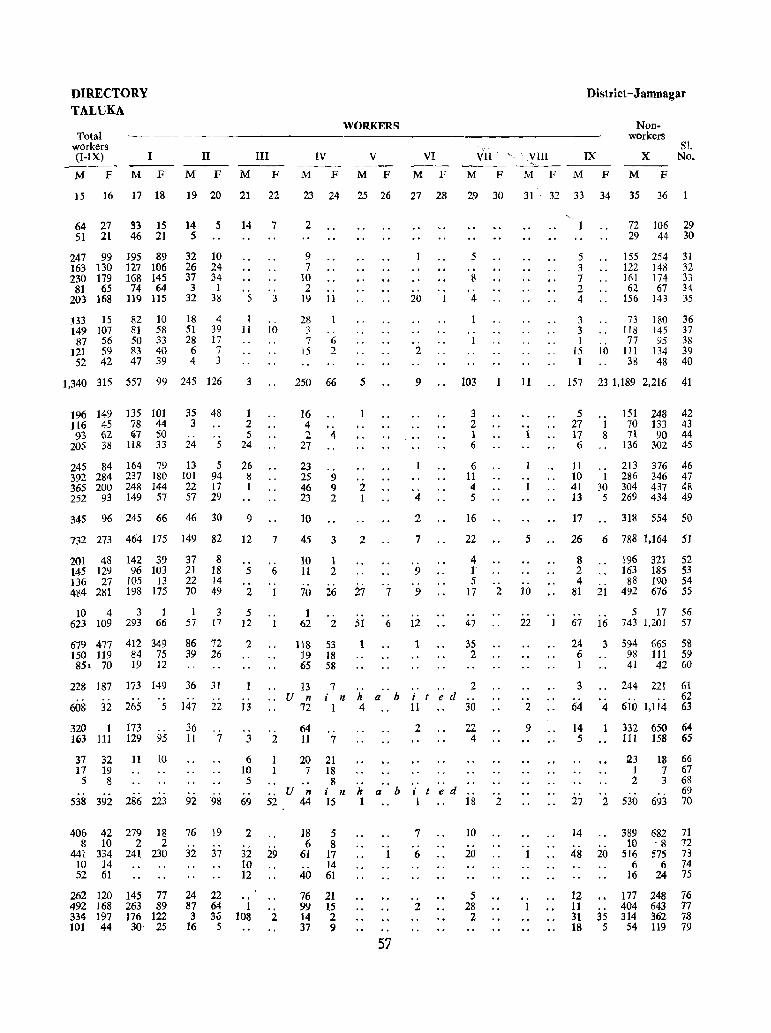
DIRECTORY TALUKA
Total workers (I-IX) I II III ---M F M F M F M F
15 16 17 18 19 20 21 22
64 27 33 15 14 5 14 7 51 21 46 21 5
247 99 163 130 230 179 81 65
203 168
133 15 149 107
87 56 121 59 52 42
195 89 127 106 168 145 74 64
119 115
82 10 81 58 50 33 83 40 47 39
32 26 37 3
32
18 51 28
6 4
10 24 34
1 38
4 39 17 7 3
1,340 315 557 99 245 126
196 149 135 101 Il6 45 78 44 93 62 ,.7 50
205 38 118 33
35 48 3 .. 24 5
245 84 164 79 13 5 392 284 237 180 101 94 365 200 248 144 22 J 7 252 93 149 57 57 29
345 96 245 66 46 30
5
I 11
3
1 2 5
24
26 8 1
9
3
10
WORKERS
IV V VI VII·· ---
M FMF MF M F
VIII
M F
District-Jamnagar
IX
M F
Nonworkers
SI. X No.
M F
23 24 25 26 27 28 29 30 31 32 33 34 35 36
2
9 7
10 2
19
28 3 7
15
11
.. 6 2
250 66
16 4 2
27
23 25 46 23
10
.. 4
.. 9 9 2
5
.. 2 1
20
2
9
5
8
4
.. I
103
3 2 1 6
6 11 4 5
5 3 7 2 4
3 3 1
15 1
10
72 [06 29 29 44 30
155 254 122 148 161 174 62 67
156 143
31 32 33 34 35
73 180 36 118 145 37 77 95 38
111 134 39 38 48 40
11 .. 157 23 1,189 2,216 41
.. 1
5 27 17 6
1 8
151 248 42 70 133 43 71 90 44
136 302 4S
11 213 376 46 10 1 286 346 47 41 30 304 437 48 13 5 269 434 49
17 318 554 50
732 273 464 175 149 82 12 7 45 3 2
4
2
7
16
22
4
5 26 6 788 1.164 51
201 48 142 39 145 129 96 103 136 27 105 13 484 281 198 175
10 4 3 1 623 109 293 66
37 8 21 18 22 14 70 49
I 3 57 17
679 477 412 349 86 72 150 119 84 75 39 26 85. 70 19 12
228 187 173 149
608 32 265 5
320 I 173 Hj3 111 129 95
37 32 11 10 I7 19 5 8
.. '. 538 392 286 223
406 42 279 18 8 10 2 2
441 334 241 230 10 ]4 52 61
36
147
36
31
22
11 7
.. 92 98
76
32
19 .. 37
24 22
5 .. 2
5 12
2
13
3
6 10 5
69
2
6 .. J
.. 1
2
52
32 29 10 12
262 120 145 77 492 168 263 89 334 197 176 122 101 44 30· 25
87 64 1 3 3.:i 108 2
16 5
10 1 11 2
70 26
1 62
.. 2
118 S3 19 18 65 58
13 U n
72
64 11
20 7
U n 44
7 i n
1
.. 7
21 18 8
i n 15
18 5 6 8
61 17 14
40 61
76 21 99 15 14 2 37 9
27 7
.. . . 51 6
1
9 .. 9
12
1
I 5
17
'. 47
35 2
2 h a·· h j ted 4 11 30
h Q'. h 1
57
2
., j ted 1
7
6
2
22 4
18
10
20
5 28 2
.. 2
.. 2
.. 10
22
2
9
.. 1
8 2 4
81 21
196 321 52 163 185 53
88 190 54 492 676 55
. . 5 17 56 67 16 743 1,201 57
24 3 594 665 58 6 98 111 59 1 41 42 60
3
64
14 5
27
14
48
244 221 61 62
4 610 1,114 63
1 332 650 64 1Il 158 65
123 18 66 1 7 67 2 3 68
69 2 530 693 70
389 682 71 10 ·8 72
20 516 575 73 6 6 74
16 24 75
12 177 248 76 11 404 643 77 31 35 314 362 78 18 5 54 119 79


TALUKA:OKHAMANDAL
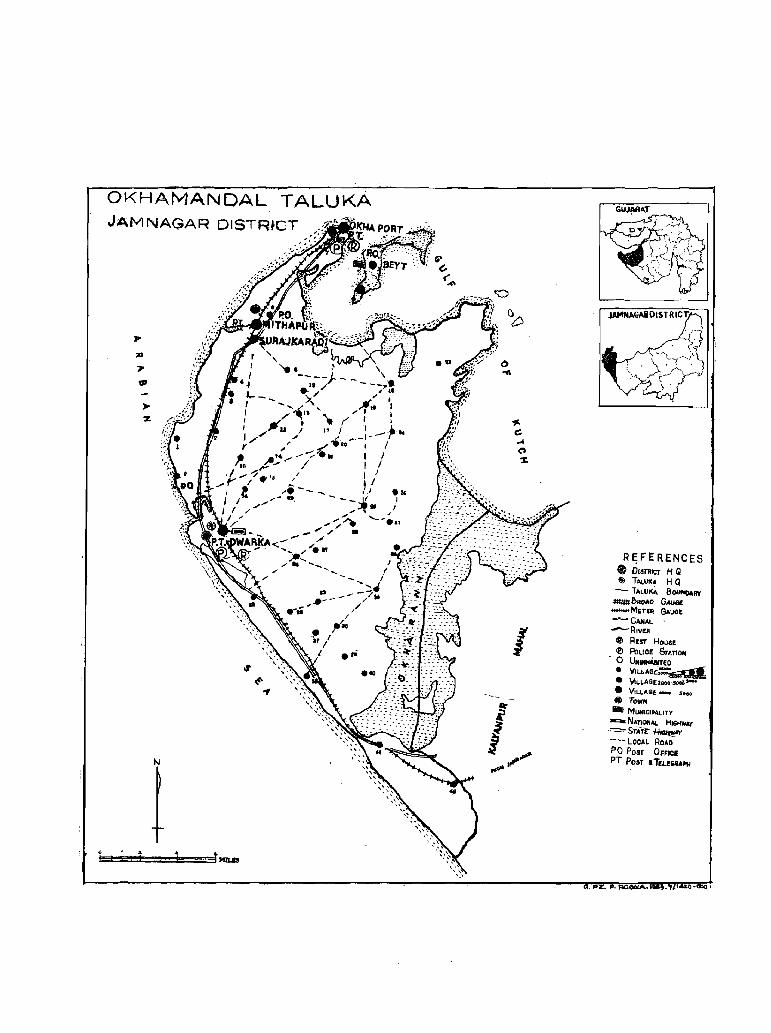
OKHAMANDAL TALUKA JAM NAGAR DISTR.CT
>%
C) 1'1
I
R HE RENCES • Df5Tltlc:r HQ $ TALUIC. H Q
- TALUK~ BOIlHDAR'f cI#Im~O GAUQ! -METEII GAUGE ~CAItAL
--RivER ill) REsr HOUSE
I!!l PoLICE SrATfOfl ·O~O
• 'tIILLAGi,~ • 'oILLAGE' ... -.... -• V,LLAGE _ ._
.. TOWN
- MUNlCI .... UTY
-=- i'lAnONAL HIGHWAY -= STArr--~Y ---- LOCAL ROAO
PO POST OFFICI PT Poar .Tflfi~'&""
TALUKA
OKHAMANDAL
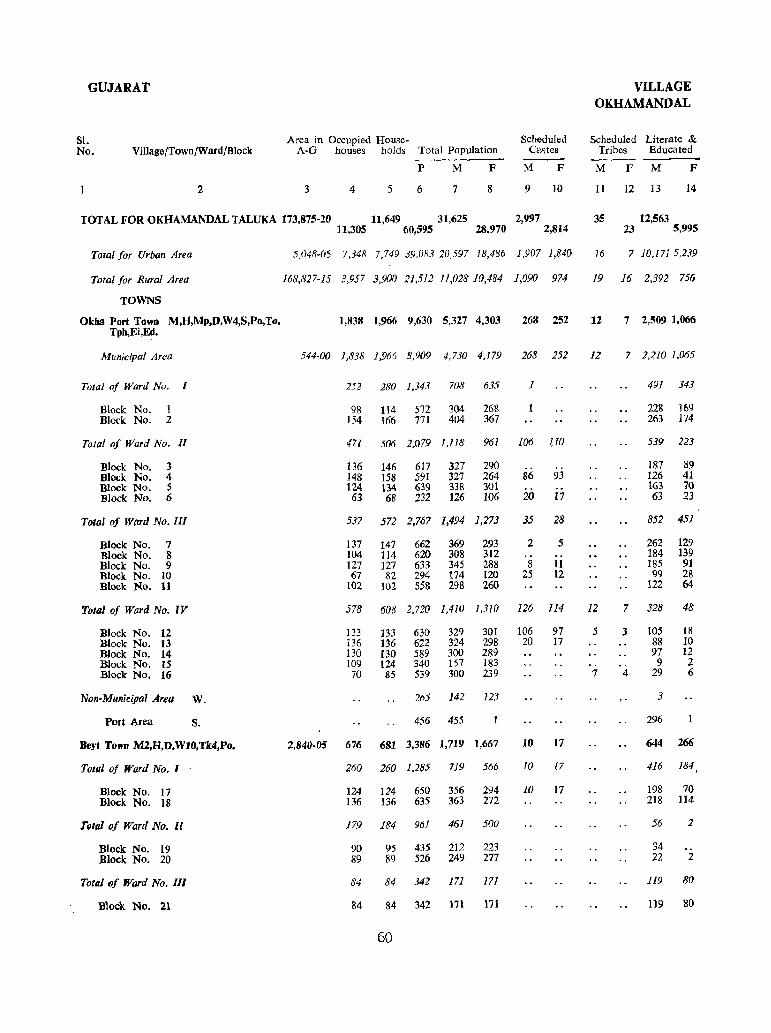
GUJARAT VILLAGE OKHAMANDAL
SI. Area in Occupied House- Scheduled Scheduled Literate & No. Village/Town/Ward/Block A-G houses bolds Total Population Ca~tes Tribes Educated
---P M F M F M F M F
2 3 4 5 6 7 8 9 10 II 12 13 14
TOTAL FOR OKHAMANDAL TALUKA 173,875-20 11,649 31,625 2,997 35 12,563 11,305 60,595 28,970 2,814 23 5,995
Total for Urban Area 5,048-05 7,348 7,749 39.083 20,597 18,486 1,907 1,840 16 7 10,171 5,239
Total for Rural Area 168,827-15 3,957 3,900 21,512 11,028 10,484 1,090 974 19 16 2,392 756
TOWNS
Okha Port Town M,H,Mp,D,W4,S,Po, To, 1,838 1,966 9,630 5,327 4,303 268 252 12 7 2,509 1,066 Tph,Ei,Ed.
Municipal Area 544-00 1,838 1,966 8,909 4,730 4,/79 268 252 12 7 1,210 1,065
Total of Ward No. T 252 280 1,343 708 635 1 491 343
Block No. 1 98 114 572 304 268 228 169 Block No. 2 154 166 771 404 367 263 174
Total of Ward No. II 471 506 2,079 1,1l8 961 106 110 539 223
Block No. 3 136 146 617 327 290 187 89 Block No. 4 148 158 591 327 264 86 93 126 41 Block No. 5 124 134 639 338 301 163 70 Block No. 6 63 68 232 126 106 20 17 63 23
Total of Ward No. III 537 572 2,767 1,494 1,273 35 28 852 451
Block No. 7 137 147 662 369 293 2 5 262 129 Block No. 8 104 114 620 308 312 184 139 Block No. 9 127 127 633 345 288 8 11 185 91 Block No. 10 67 82 294 174 120 25 12 99 28 Block No. 11 102 102 558 298 260 122 64
Total of Ward No. 1V 578 608 2,720 1,410 1,310 126 114 12 7 328 48
Block No. 12 133 133 630 329 301 106 97 5 3 105 18 Block No. 13 136 136 622 324 298 20 17 88 10 Block No. 14 130 130 589 300 289 97 12 Block No. 15 109 124 340 157 183 " 9 2 Block No. 16 70 85 539 300 239 7 4 29 6
Non-Municipal Area W. 265 142 123 3
Port Area S. 456 455 296
Bert Town M2,H,D,WIO,Tk4,Po. 2,840-05 676 681 3,386 1,719 1,667 10 17 644 266
Total of Ward No. 1 260 260 1,285 719 566 10 17 416 184 ,
Block No. 17 124 124 650 356 294 10 17 198 70 Block No. 18 136 136 635 363 272 218 114
Total of Ward No. 11 179 184 961 461 500 56 2
Block No. 19 90 95 435 212 223 34 Block No. 20 89 89 526 249 277 22 2
Total ()f Ward No. III 84 84 342 171 171 119 80
"Block No. 21 84 84 342 171 171 119 80
60
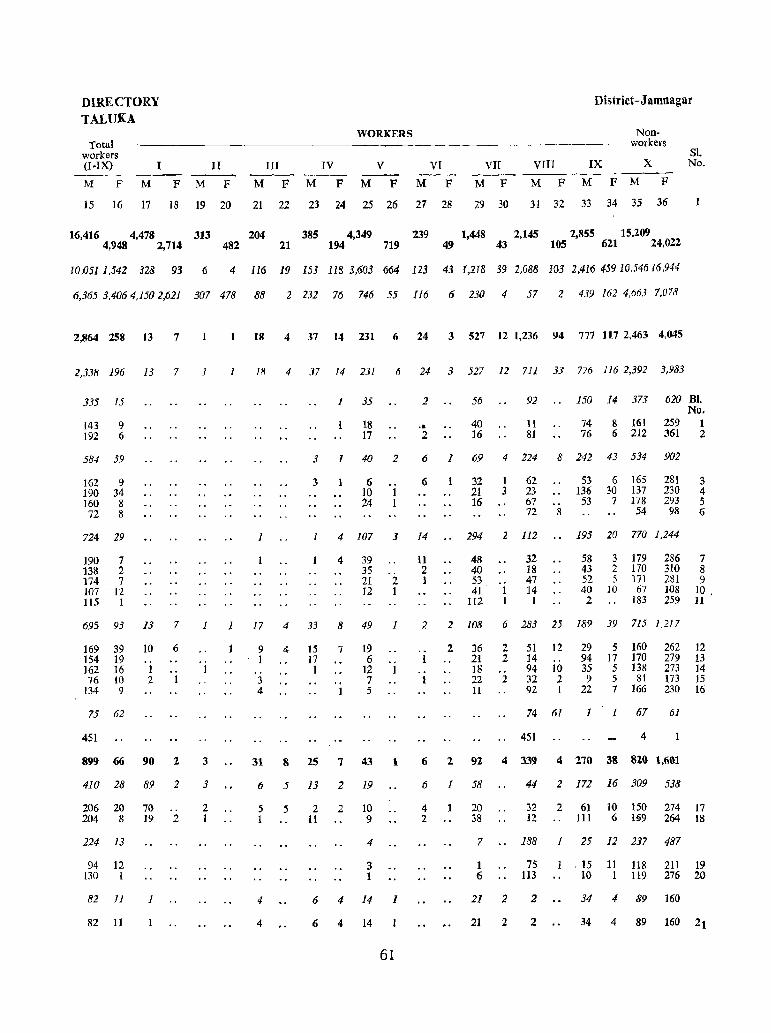
DIRECTORY TALUKA
Total workers (I-IX)
M F
I
M F
II III IV
M F M F M F
WORKERS
V VI
M F M F
VII
M F
VIII
M F
District-Jamnagar
IX
Nonworkers
x ------M F M F
Sl. No.
15 J6 17 IS 19 20 21 22 23 24 25 26 27 28 29 30 31 32 33 34 35 36
239 16,416 4,478 4,948 2,714
1,448 2,145 2,855 15,209 43 105 621 24,022 49 482 21
313 204 385 4,349 194 719
10,0511,542 328 93 6 4 Il6 19 153 111l 3,603 664 123 43 1,218 39 2,088 103 2,416 459 10,54616,944
6,365 3,4064,1502,621 307 478 88 2 232 76 746 55 116 6 230 4 57 2 439 162 4,663 7,078
2,864 258 13 7
2,338 196 13 7
335 ]5
143 9 J92 6
584 59
162 9 190 34 160 8 72 8
724 29
190 7 138 2 174 7 107 12 115 I
695 93 13 7
169 39 154 19 162 16 76 10
134 9
75 62
451
10 6
1 2 I
899 66 90 2
410 28 89 2
206 20 204 8
224 13
94 12 130 I
82 11
82 11
70 19
1
.. 2
1
1
1 18 4 37 14 231 6 24 3 527 12 1,236 94 777 117 2,463 4,045
18 4 .i7 14 231 6 24 3 527 12 711 3} 776 116 2,392 3,983
1
1 35
18 17
2
.. 2
56
40 16
92
11 81
150 14 373 620 BI. No.
74 8 161 259 1 76 6 212 361 2
3 1 40 2 6 1 69 4 224 8 242 43 534 902
3 6 10 24
6
1 4 107 3 14
4 39 35 21 2 12 1
11 2 1
32 21 16
1 3
62 23 67 72
294 2 112
48 40 53 41 1
112 1
32 18 47 14 1
,. S
53 6 165 136 30 137
53 7 178 54
281 230 293 98
3 4 5 6
195 20 770 1,244
58 3 179 286 7 43 2 170 310 8 52 5 171 281 9 40 10 67 108 10, 2 183 259 11
1 J 17 4 33 8 49 1 2 2 108 6 283 25 189 39 715 1,217
3
3
2 1
9 1
3 4
4 15 7 17 1
., 1
19 6
12 1 7 5
31 8 25 7 43 1
6 5 13 2 19
5 1
4
4
5 2 11
2 10 9
4
3 1
6 4 14 1
6 4 14
61
2 36 2 51 12 21 2 14 18 94 10 22 2 32 2 11 92 1
74 61
451
29 5 160 94 17 170 35 5 138
\} 5 81 22 7 166
262 12 279 13 273 14 173 15 230 16
1 J 67 61
4
6 2 92 4 339 4 270 38 820 1,601
6 1 58
4 2
20 38
7
1 6
21 2
21 2
44 2 172 16 309 538
32 12
2 61 111
10 150 6 1§9
274 17 264 18
188 1 25 12 237 487
75 113
2
2
,15 11 118 211 19 10 1 119 276 20
34 4 89 160
34 4 89 160 21
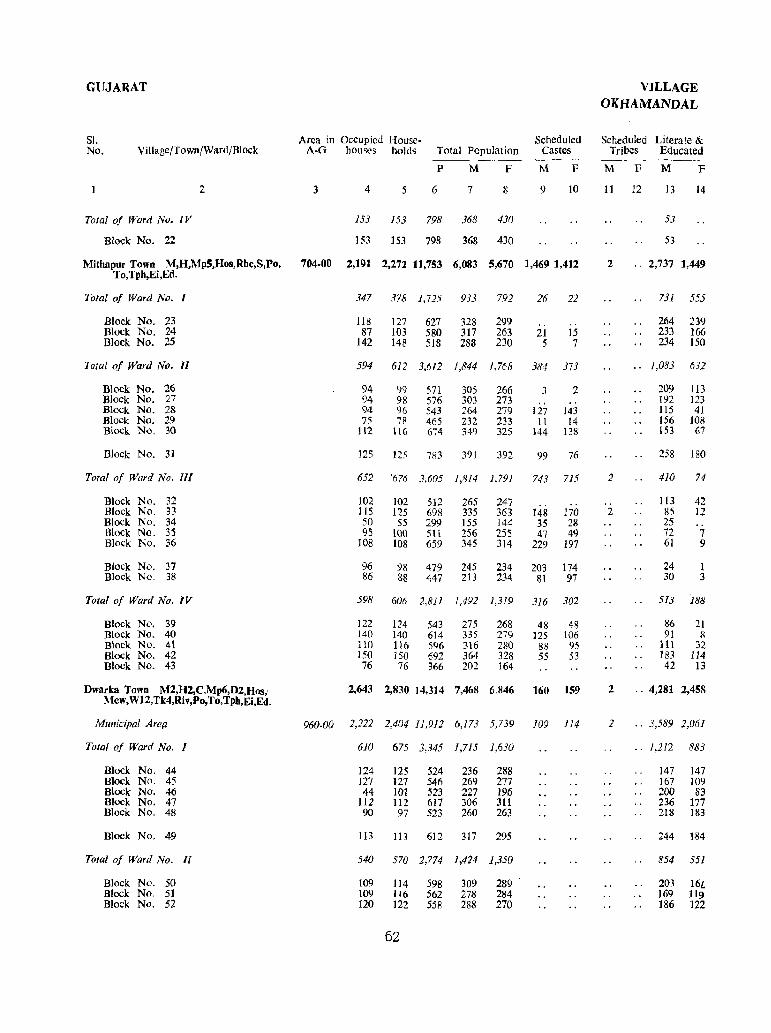
GUJARAT VILLAGE OKHAMANDAL
SI. Area in Occupied House· .Scheduled Scheduled Literate & No. Village/T own/Ward/Block A·G houses holds Total Population Castes Tribes Educated
-- ---P M F M F M F M F
2 3 4 5 6 7 8 9 10 11 12 13 14
Total of 'Ward No. IV 153 153 798 368 430 53
Block No. 22 153 153 798 368 430 53
Mithllpur Town M,H,MpS,Hos,Rhc,S,Po, 704-00 2,191 2,272 11,753 6,083 5,670 1,469 1,412 2 .. 2,737 1,449 To,Tph,Ei ,Ed.
Tolal of Ward No. 1 347 378 1,72.5 933 792 26 22 731 555
Block No. 23 118 127 627 328 299 .. ., 264 239 Block No. 24 87 103 580 317 263 21 15 233 166 Block No. 25 142 148 518 288 230 5 7 234 ISO
Total of Ward No. II 594 612 3,612 1,844 1,768 384 373 .. 1,083 632
Block No. 26 94 99 571 305 266 3 2 209 113 Block No. 27 94 98 576 303 273 .. In 123 Block No. 28 94 96 543 :'64 279 127 143 115 41 Block No. 29 75 78 465 232 233 11 14 156 108 Block No. 30 112 116 674 349 325 144 138 153 67
Block No. 31 125 125 783 391 392 99 76 258 180
Total of Ward No. III 652 '676 3,605 1,8/4 1,791 743 715 2 410 74
Block No. 32 102 102 512 265 247 113 42 Block No. 33 115 125 698 335 363 148 170 2 85 12 Block No. 34 50 55 299 155 144 35 28 25 .. Block No. 3S 9S 100 5{1 256 255 47 49 72 7 Block No. 36 108 108 659 345 314 229 197 61 9
Block No. 37 96 98 479 245 234 203 174 24 1 Block No. 38 86 88 447 213 234 81 97 30 3
Total of Ward No. IV 598 606 2,811 1,492 1,319 316 302 513 188
Block No. 39 122 124 543 275 268 48 48 86 21 Block No. 40 140 140 614 335 279 125 106 91 8 Block No. 41 110 ] 16 596 316 280 88 95 III 32 Block No. 42 150 150 692 364 328 55 53 183 114 Block No. 43 76 76 366 202 164 42 13
DWllrka Town M2,H2,C,Mp6,D2,Hos, 2,643 2,830 14,314 7,468 6.1146 160 159 2 .. 4,281 2,458 Mew, W12, Tk4,Riv,Po,To,Tph,Ei,Ed.
Municipal Arep 960-00 2,212 2,404 11,912 6,173 5,739 J09 114 2 .. 3,589 2,061
Total of Ward No. I 610 675 3,345 1,715 1,630 .. 1,2/2 883
Block No. 44 124 125 524 236 288 147 147 Block No. 45 127 ]27 546 269 277 167 109 Block No. 46 44 101 523 227 196 ZOO 83 Block No. 47 112 112 617 306 311 236 177 Block No. 48 90 97 523 260 263 218 183
Block No. 49 113 113 612 317 295 244 184
TOlal of Ward No. l[ 540 570 2,774 1,424 1,350 854 551
Block No. 50 109 114 598 309 289 203 16£ Block No. 51 109 1I6 562 278 284 169 119 Block No. 52 120 122 5SS 288 270 186 122
62
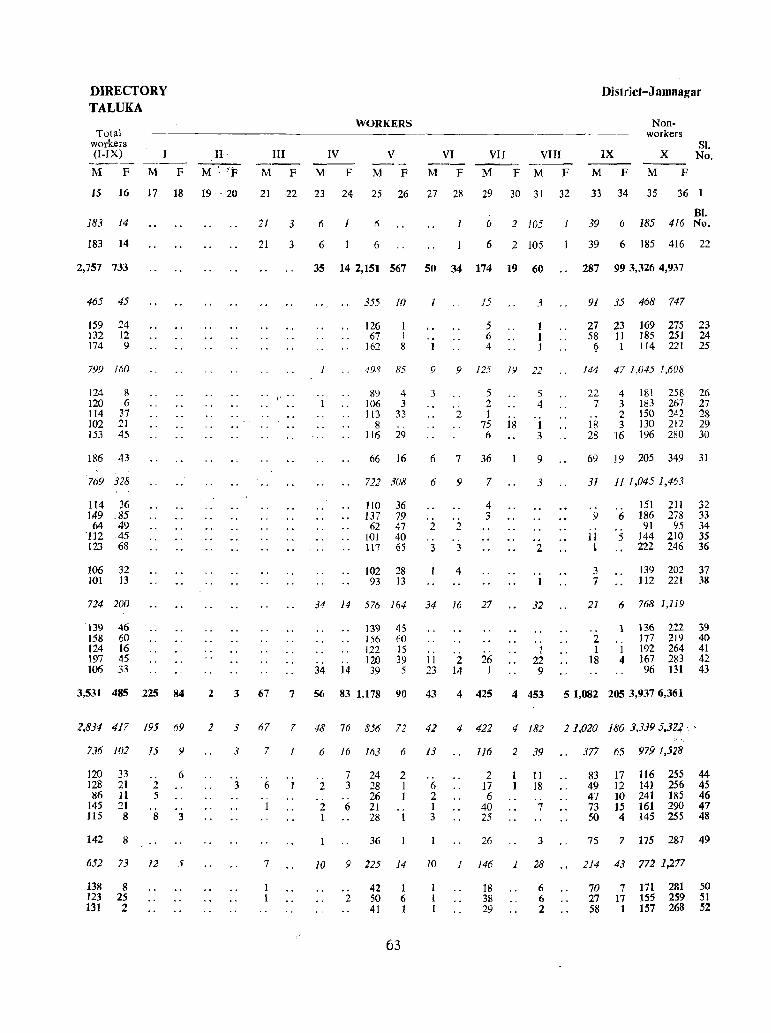
DIRECTORY TALUKA
Total workers (I-IX)
M F M F
II
M', "P
WORKERS
III IV V
M F M F M F
VI
M F
VII
M
VIII _ .. --F M F
District-J amnagar
IX
M F
Nonworkers
x M F
Sl. No.
15 16 17 18 19· 20 21 22 23 24 25 26 27 28 29 30 31 32 33 34 35 36 1
183 14
183 14
2,757 733
465 45
159 24 132 12 174 9
799 160
124 R 120 6 114 37 102 21 153 45
186 43
769 328
114 36 149 ,85 64 49
'112 45 123 68
106 32 101 13
724 200
139 46 158 60 124 16 197 45 106 33
3,531 485 225 84
2,834 417 195 69
736 102 15 9
120 128 86
145 115
33 21 11 21 8
142 8
2 5
8
6
3
652 73 12 5
138 8 123 25 131 2
21 3
21 3
... ' ..
BI. 6 1 6 1 6 2 105 J 39 6 185 416 No.
6 6 6 2 105
35 14 2,151 567 50 34 174 19 60
., 1
355 !O
126 67
162
1 1 8
498 85
R9 106 113
8 116
4 3
33 .. 29
66 16
722 308
110 36 137 79 62 47
101 40 117 65
102 28 93 13
1 15
5 6 4
3
9 9 125 19 22
3
2
5 2 1
75 6
6 7 36
6 9
2 2 .. .. 3 3
4
7
4 3
18
5 4
1 3
9
3
.. 2
.. I
34 14 576 164 34 16 27 32
.. 34 14
139 156 122 120 39
45 60 15 39 5
I I 23
2 14
26 I
.. 1
22 9
39 6 185 416 22
287 99 3,326 4,937
91 35 468 747
27 23 58 11
169 275 23 185 251 24
9 1 114 221 25
144 47 1,045 1,608
22 7
.. 18 28
4 181 258 26 3 183 267 27 2 ISO 242 28 3 130 212 29
16 196 280 30
69 19 205 349 31
31 1J 1,045 1,463
.. 9
11 l
3 7
151 211 32 6 186 278 33
91 95 34 5 144 210 35
222 246 36
139 202 37 112 221 38
21 6 768 1,119
.. 2 1
18
1 .. 1 4
136 222 39 177 219 40 192 264 41 167 283 42 96 131 43
2 3 67 7 56 83 1,178 90 43 4 425 4 453 5 1,082 205 3,937 6,361
2 3 67 7 48 76 856 72 42 4 422 4 182 21,020 180 3,339 5,3]:? .•
3 7 1
.. 3 6 1 ..
1
7
6 16 163 6 13
2 .. 2 I
7 3
. . 6
24 28 26 21 28
36
2 I I
.. I
.. 6 2 1 3
116 2 39
2 17 6
40 25
26
11 18 .. 7
3
10 9 225 14 10 1 146 1 28
.. 2
42 50 41
63
I 6 I
18 38 29
6 6 2
377 65 979 1,528
83 49 47 73 50
17 116 12 141 10 241 15 161 4 145
255 44 256 45 185 46 290 47 255 48
75 7 175 287 49
214 43 772 1,277
70 7 171 281 50 27 17 155 259 51 58 1 157 268 52
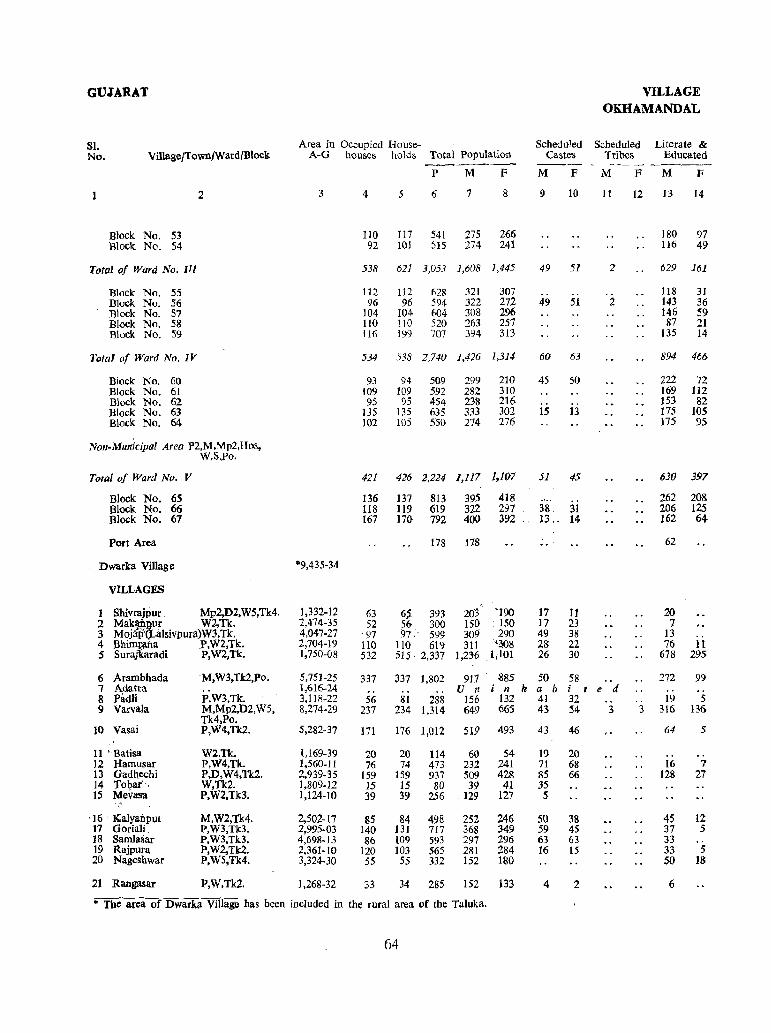
GU1ARAT VILLAGE OKHAMANDAL
Sl. Area in Occupied House- Scheduled Scheduled Literate & No. VilIage/Town/WardIBlock A-G houses holds Total population Castes Tribes Educated ------- --- ------ --------
P M F M F M F M F
2 3 4 5 6 7 8 9 10 11 12 I3 14
Block No. 53 110 117 541 275 266 180 97 Block No. 54 92 101 515 274 241 116 49
Total of Ward No. III 538 621 3,053 1,608 1,445 49 51 2 629 161
Block No. 55 112 112 628 321 307 118 31 Block No. 56 96 96 594 322 272 49 51 2 143 36 , Block No. 5? J04 104 604 308 296 146 59 Block No. 58 110 110 520 263 257 87 21 Block No. 59 116 199 707 394 313 135 14
Total of Ward No. IV 534 538 2,740 1,426 1,314 60 63 894 466
Block No. 60 93 94 509 299 210 45 50 222 72 Block No. 61 109 109 592 282 310 169 1I2 Block No. 62 95 95 454 238 216 153 82 Block No. 63 135 135 635 333 302 15 13 175 105 Block No. 64 102 105 550 274 276 175 95
Non-Municipal Area P2,M,Mp2,Hos, W,S,Po.
Total of Ward No. V 421 426 2,224 1,117 1.1fJ7 51 45 630 397
Block No. 65 136 137 813 395 418 262 208 Block No. 66 118 119 619 322 297 38 31 206 125 Block No. 67 167 l70 792 4{)() 392 13._ 14 162 64
Port Area 178 178 62
Dwarka Village "9,435-34
VILLAGES
1 Shivrajpur Mp2,D2, W5,Tk4. 1,332-12 63 6S 393 203 '}90 17 11 20 2 Ma~:m-fr W2,Tk. 2,474-35 52 56 300 150 150 17 23 7 3 Mo)al)" " aIsivpura)W3.Tk. 4,047-27 . 97 97." 599 309 290 49 38 13 4 Bhi1llta.na ,P,W2,Tk. 2,704-19 110 110 619 311 'aDs 28 22 76 11 5 Surajkaradi P,W2,Tk. 1,750-08 532 515 2,337 1,29-6 li101 26 30 678 295
6 Arambhada M,W3,Tk2,Po. 5,751-25 337 337 1,802 91.7 885 50 58 .. 272 99 7 Adatra 1,616-24 .. U /l i n h a b i , e d' o'
8 Fitdli P,W3,Tk. 3,118-22 56 81 288 156 132 41 32 .. 19 5 9 Varvala M,Mp2,D2,W5, 8,274-29 237 234 1,314 649 665 43 54 3 3 316 136
Tk4,Po. 10 Vasai P,W4,ru. 5,~2-37 171 176 1,012 519 493 43 46 64 5
11 'Batisa W2,Tk. 1,169-39 20 20 114 60 54 19 20 .. .. 12 Hamusar P,W4,Tk. 1,560-11 76 74 473 232 241 71 68 16 7 13 Gadh,echi P,D,W4,Tk2. 2,939-35 159 159 937 509 428 85 66 128 27 14 Tobar", W,Tk2. 1,809-12 15 15 80 39 41 35 15 Mevasa P,W2,Tk3. 1,124-10 39 39 256 129 127 5
" '16 Kalya.il.pUl M,W2,Tk4. 2,502-17 85 84 498 252 246 50 38 45 12 17 Goriali P,W3,Tk3. 2,995-03 140 131 717 368 349 59 45 37 5 18 Samlasar P.W3,Tk3. 4,698-13 86 109 593 297 296 63 63 33 19 Rajpura I>,W.2,Tk2. 2,361-10 120 103 565 281 284 16 15 33 5 20 Nageshwar P,W5,Tk4. 3,324-30 55 55 332 152 180 50 18
21 Rangasar P,W,Tk2. 1,268-32 33 34 285 152 133 4 2 6
.. The area of Dwarb Village has been included in the rural area of the Taluka.
64
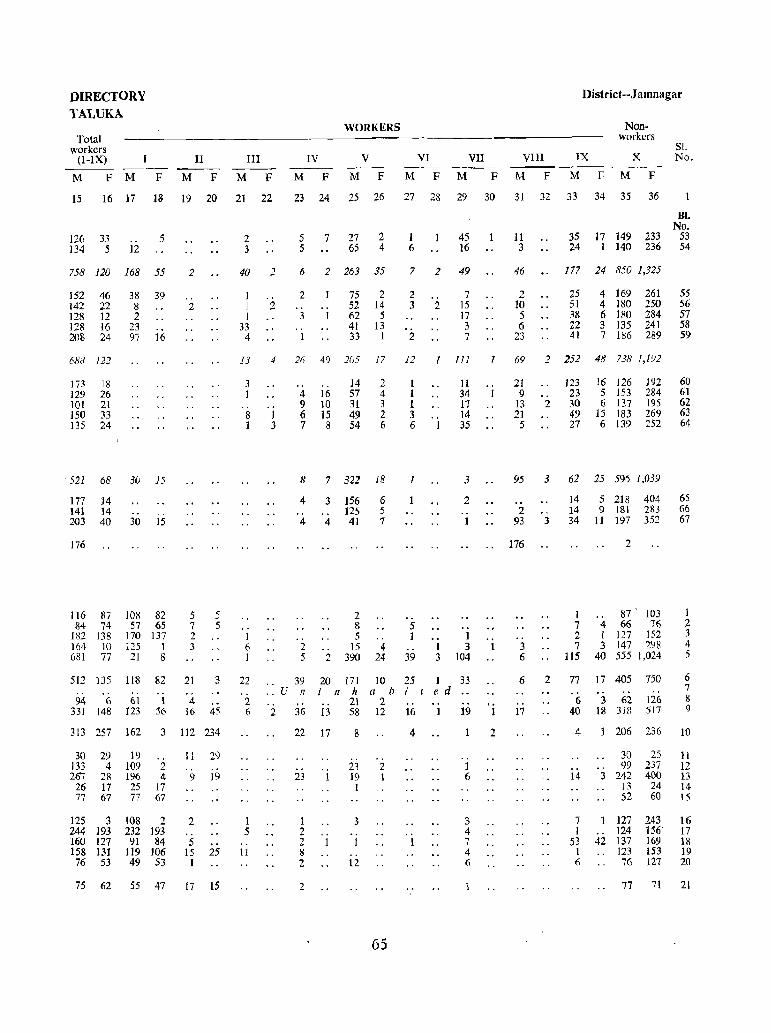
DIRECTORY TALUKA
Total workers
(I-IX)
M F M F
II III
M F M F
WORKERS
IV V VI
M F M F M F
VII ---M F
VIII
M F
District--J amnagar
IX
Nonworkers
X --- ----
M F M F
Sl. No.
15 16 17 18 19 20 21 22 23 24 25 26 27 28 29 30 31 32 33 34 35 36
126 33 5 134 5 12
758 120 168 55
152 46 142 22 128 12 128 16 208 24
688 122
173 ]8 129 26 101 21 150 33 135 24
38 39 8 2
23 97 16
'521 68 3(; IS
177 14 141 14 203 40
176
116 87 84 74
1:52 138 164 10 681 77
512 135
94 6 331 148
.. 30 15
108 82 57 65
]70 ]37 125 1 21 8
118 " 61
123
82
1 56
2
.. 2
5 7 2 3
21
4 16
5 5
3
45
313 257 162 3 112 234
30 29 19 133 4 109 2 267 28 196 4
26 17 25 17 77 67 77 67
125 3 244 193 160 127 158 131 76 53
108 2 232 193 91 84
119 106 49 53
11 29 " 9 19
2
5 15
1 25
75 62 55 47 17 15
2 3
40 2
1 ]
1 33
4
2
5 7 27 2 5 65 4
6 2 263 35
2
3
1
.. 1
75 2 52 14 62 5 41 13 33 1
1 6
45 16
7 2 49
2 3
2
2 7
15 17 3 7
11 3
46
2 10 5 6
23
BI. No.
35 17 149 233 53 24 1 140 236 54
177 24 850 1,325
25 51 38 22 41
4 169 261 4 180 250 6 180 284 3 135 241 7 186 289
55 56 57 58 59
13 4 26 49 205 17 12 1 111 1 69 2 252 48 738 1,192
3 1
.. S 1
.. I 6 1
22
2 6
1 5 .. 11
1 :3
..
.. 4 9 6 7
16 10 15 8
]4 57 31 49 54
2 4 3 2 6
8 7 322 18
4 .. 4
.. 2 5
39 U n
3 .. 4
156 ]25 41
2 8 5
.. 15 2 390
6 5 7
4 24
20 171 10
2 36
i n h a b 21 2 58 12 13
22 17
.. 23
1 2 2 8 2
2
8
23 19
I
3 .. 1
.,
12
.. 2 1
65
I I 1 3 6
J
5 1
39
25 i t .. 16
4
., 1
.. ]
3
1 e d . . 1
11 34 17 14 35
3
2 .. J
.. 1 3
104
33
.. 19
.. 1 6
3 4 7 4 6
.. 1
2
21 9
13 21
5
2
123 23 30 49 27
16 126 192 5 J53 284 6 137 195
15 183 269 6 139 252
60 61 62 63 64
95 3 62 25 59!) 1,039
2 93
176
.. 3 6
6
. . 17
.. 3
2
14 14 34
1 7 2 7
115
77
6 40
4
14
7 1
53 I 6
5 218 404 9 181 283
11 197 352
2
87 103 4 66 76 1 127 152 3 147 298
40 555 1,024
17 405 750
3 62 18 318
.. 126 517
65 66 67
1 2 3 4 5
6 7 8 9
206 236 10
30 25 99 237
3 242 400 13 24 52 60
127 243 124 156
42 137 169 .. 123 153
76 127
11 12 13 14 15
16 17 18 19 20
77 71 21
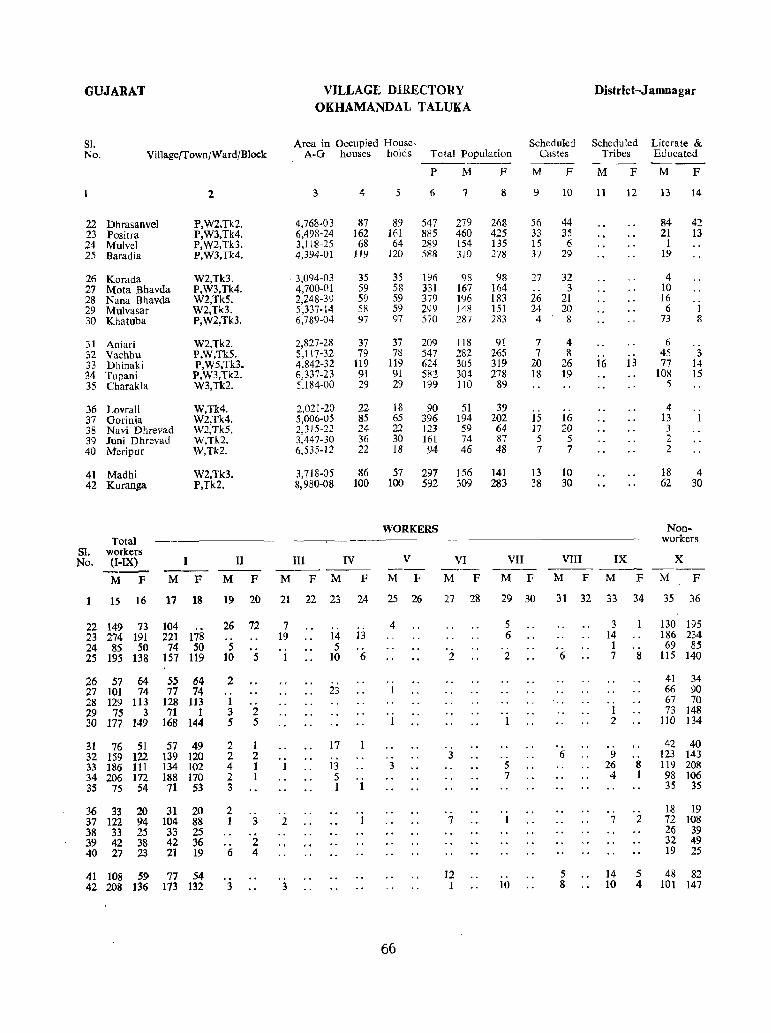
GUJARAT VILLAGE DIRECTORY District-J amna gar OKHAMANDAL TALUKA
SI. Area in Occupied House- Scheduled Scheduled Literate & No. Village/Town/Ward/B1ock A-G houses holds Total Population Castes Tribes Educated - ___ -----
P M F M F M F M F
2 3 4 6 7 8 9 10 11 12 13 14
22 Dhrasanvel P,W2,Tk2. 4,768-03 87 89 547 279 268 56 44 84 42 23 Positra P,W3,Tk4. 6,498-24 162 1M 885 460 425 33 35 21 13 24 Mulvel P,W2,Tk3. 3,118-25 68 64 289 154 135 15 6 1 25 Baradia P,W3,Tk4. 4,394-01 119 120 588 310 278 37 29 19
26 Korada W2,Tk3. 3,094-03 35 35 196 98 98 27 32 4 27 Mota Bhavda P,W3.Tk4. 4,700-01 59 58 331 167 164 3 10 28 Nana Bhavda W2,TkS. 2,248-39 59 59 379 196 183 26 21 16 29 Mulvasar W2,Tk3. 5,337-14 58 59 299 148 151 24 20 6 I 30 Khatuba P,W2,Tk3. 6,789-04 97 97 570 287 283 4 8 73 8
31 Aniari W2,Tk2. 2,827-28 37 37 209 118 91 7 4 6 .. 32 Vachhu P,W.TkS. 5,117-32 79 78 547 282 265 7 8 45 3 33 Dhinaki P,W5,Tk3. 4.842-32 119 119 624 305 319 20 26 16 13 77 14 34 Tupani P,W3,Tk2. 6,337-23 91 91 582 304 278 18 19 108 15 35 Charakla W3,Tk2. 5.184·00 29 29 199 110 89 5
36 Lovrali W,Tk4. 2.021-20 22 18 90 51 39 .. 4 .. 37 Gorinja W2,Tk4. 5,006-05 85 65 396 194 202 15 16 13 1 38 Navi Dhrevud W2,Tk5. 2,315-22 24 22 123 59 64 17 20 3 39 Juni Dhrevad W.Tk2. 3,447-30 36 30 161 74 87 5 5 2 40 Meripur W,Tk2. 6,535-12 22 18 94 46 48 7 7 2
41 Madhl W2,Tk3. 3,718-05 86 57 297 156 141 13 10 18 4 42 Kuranga P,Tk2. 8,980-08 100 100 592 309 283 38 30 62 30
WORKERS Non-Total workers
S1. workers No. (I-IX) II III IV V VI VII VIII IX X
-----M F M F M F M F M F M F M F M F M F M F M F
15 16 17 18 19 20 21 22 23 24 25 26 27 28 29 30 31 32 33 34 35 36
22 149 73 104 26 72 7 4 5 3 130 195 23 274 191 221 178 19 14 I3 6 14 186 234 24 85 50 74 50 5 5 1 69 85 25 195 138 157 119 10 5 1 10 6 2 2 6 7 8 115 140
26 57 64 55 64 2 .. 41 34 27 101 74 77 74 .. 23 1 66 90 28 129 113 128 113 1 .. 67 70 29 75 3 71 1 3 2 1 73 148 30 177 149 168 144 5 5 1 1 2 110 134
31 76 51 57 49 2 1 17 " .. 42 40 32 159 122 139 120 2 2 3 .. 6 9 123 143 33 186 III 134 102 4 1 13 3 5 26 8 119 208 34 206 172 188 170 2 1 5 7 4 1 98 106 35 75 54 71 53 3 1 1 35 35
36 33 20 31 20 2 .. " .. IS 19 37 122 94 104 88 1 3 2 1 7 1 7 2 72 108 38 33 25 33 25 26 39 39 42 38 42 36 2 32 49 40 27 23 21 19 6 4 19 25
41 108 59 77 54 12 .. 5 14 5 48 82 42 208 136 173 132 3 3 1 10 8 10 4 101 147
66

MAHAL:KALYANPUR
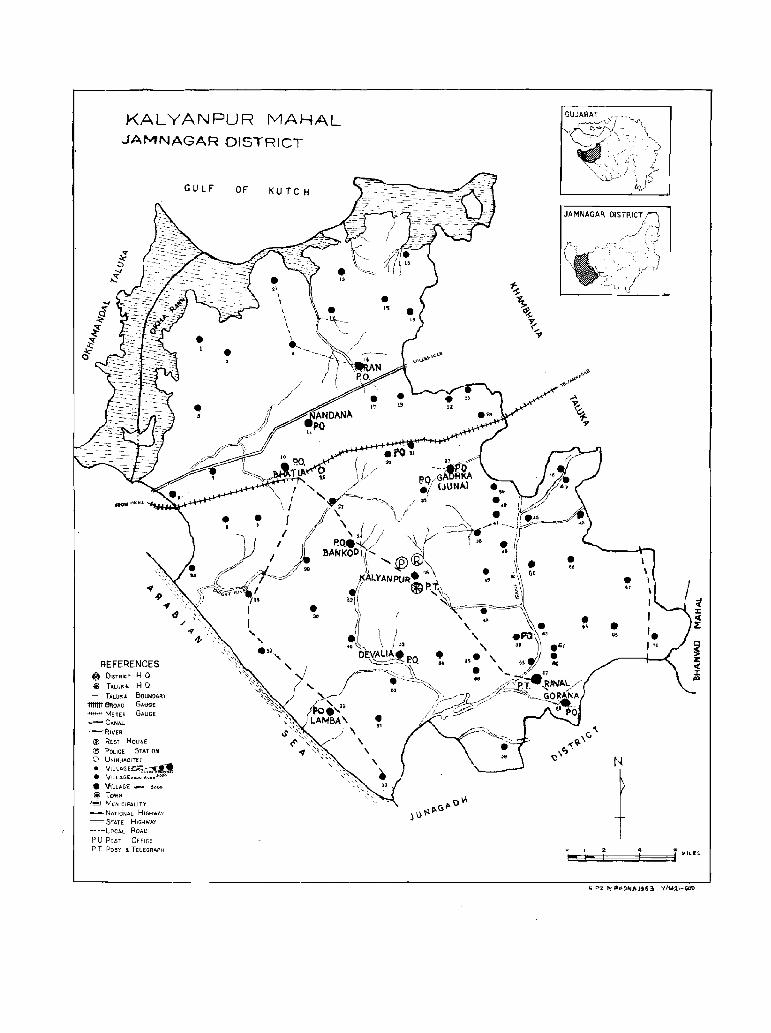
KALYANPUR MAHAL JAMNAGAR DISTRICT
REFERENCES o I)STRlCT H a * TAU~,c;"- H Q - TALUK.... BOUNDAR)
:ttmtt BltOAD 6At:rG£
+tt+H-t METER GAUGE
= CANAl.
,p-RIVER
® REST HOUSE
® POLICE 5TATION o UNINHA61TED
• V\LL~GE~~ • VILLAGE'loo<>o 5000-
5<)(111
• VILLAGE ._. SoC><> @ To,," ~ MUNICIPALITY
-=-= NATIONAL HIGHWAY
= STATE HIGHWAY
----LOCAL ROAD
PO PeST OFFICE P T POSy 01 TELEGRA.PH
GULF OF KU TC H
, , .~ •
• " • •• • "
• •• • ...
N
-, t
MAHAL
KALYANPUR
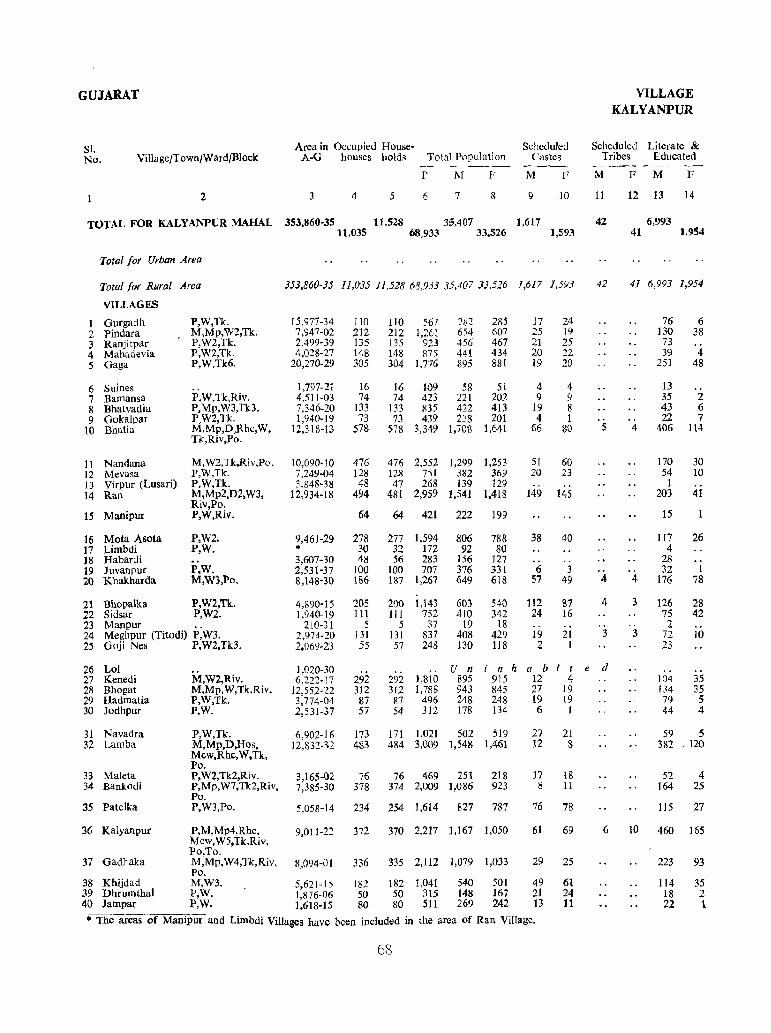
GUJARAT VILLAGE
KALYANPUR
SI. Area in Occupied House- Scheduled Scheduled Literate & No. ViUage/T ownjWard/Block A-G houses holds Total Population Castes Tribes Educated
-~
p M F M F M F M F
2 4 5 6 7 8 9 10 11 12 13 14
TOTA.L FOR KALYANPUR MAHAL 353,860-35 11,528 35,407 1,617 42 6,993 11,035 68,933 33.526 1,593 41 1,954
Total for Urban Area
Total for Rural Area 353,860-35 11,(;35 Il,528 68,933 35,407 33,526 1,617 1,593 42 41 6,993 1,954
VILLAGES
1 Gurgadh P,W,Tk. 15,977-34 110 110 567 282 285 17 24 76 6 2 Pindara M,Mp,W2,Tk. 7,947-02 :m 212 1,261 654 607 25 19 130 38 3 Ranjitpar P,W2,Tk. 2,499-39 135 135 923 456 467 21 25 73 4 Mahadevia P,W2,Tk. 4,028-27 148 148 875 441 434 20 22 39 4 5 Gaga P,W,Tk6. 20,270-29 305 304 1,776 895 881 ]9 20 251 48
6 Suines 1,797-21 16 16 J09 58 51 4 4 13 7 Bamansa P,W,Tk,Riv. 4,51 J -03 74 74 423 221 202 9 9 35 2 8 Bhatvadia P,Mp,W3,Tk3. 7,346-20 133 133 835 422 413 ]9 8 43 6 9 Gokalpar P_W2,Tk. 1,940-19 73 73 439 238 201 4 1 22 7
10 Bhatia M,Mp,D,Rbc,W, 12,318-13 578 578 3,349 1,708 1,641 66 80 5 4 406 114 Tk,Riv,Po.
11 Nandana M,W2,Tk,Riv,Po. 10,090-10 476 476 2,552 1,299 1,253 51 60 170 30 12 Mevasa P,W,Tk. 7,249-04 128 128 751 3S2 369 20 23 54 10 13 Virpur (Lusari) P.W,Tk. 3.848-38 48 47 268 139 129 1 14 Ran M,MpZ,D2,W3, 12,934-18 494 481 2,959 1,541 1,418 149 145 203 41
Riv,Po. 15 Manipur P,W,Riv. 64 64 421 222 199 15
16 Mota Asota P,W2. 9,461-29 278 277 1,594 806 788 38 40 117 26 17 Lirnbdi P,W. * 30 32 l72 92 80 4 18 Habardi 3,607-30 48 56 283 156 127 .. .. 28 19 Juvanpur P,W. 2,531-37 100 100 707 376 331 6 3 32 1 20 Khakharda M,W3,Po. 8,148-30 186 187 1,267 649 618 57 49 4 4 176 78
21 Bhopalkll P,W2,Tk. 4,890-15 205 200 1,143 603 540 112 87 4 3 126 28 22 Sidsar P,W2. 1,940-19 III 111 752 410 342 24 16 75 42 23 Manpur 210-31 5 5 37 19 18 .. .. 2 24 Megbpur (Titodi) P,W3. 2,974-20 J 31 131 837 408 429 19 21 3 3 72 10 2S Goji Nes P,W2,Tk3. 2,069-23 55 57 248 130 118 2 1 23
26 Lol 1,Q20-30 .. U n i n h a b t t e d . . 27 Kenedi M,W2,Riv. 6,222-17 292 292 1,810 895 915 12 4 104 35 28 Bhogat M,Mp,W,Tk,Riv. 12,552-22 312 312 1,788 943 845 27 19 134 35 29 Hadmatia P,W,Tk. 3,774-04 87 87 496 248 248 19 19 79 5 30 Jodhpur P,W. 2,531-37 57 54 312 178 134 6 I 44 4
31 Navadra P,W,Tk. 6,902-16 173 171 1,021 502 519 27 21 59 5 32 Lamba M,Mp.D,Hos, 12,832-32 483 484 3,009 1,548 1,461 12 8 382 ,120
Mcw,Rhc, W,Tk, Po.
33 Maleta P, W2,Tk2,Ri v. 3,165-02 76 76 469 251 218 17 18 52 4 34 Bankodi P,Mp,W7,Tk2,Riv, 7,385-30 378 374 2,009 1,086 923 8 11 164 25
Po. 35 Patelka P,W3,Po. 5,058-14 234 254 1,614 827 787 76 78 115 27
36 Kalyanput P,M,Mp4,Rhc, 9,011-22 372 370 2,217 1,167 1,050 61 69 6 10 460 165 Mew, W5,Tk,Riv, Po,To.
37 Gadbaka M,Mp,W4,Tk,Riv, Po.
8,094-01 336 335 2,112 1,079 1,033 29 25 223 93
38 Khijdad M,W3. 5,621-15 182 182 1,041 540 501 49 61 114 35 39 Dhrumthal P,W. 1,876-06 50 50 315 148 167 21 24 18 2 40 Jarnpar P,W. 1,618-15 80 80 511 269 242 13 11 22 }.
* The areas of Manipur and Limbdi Villages have been included in the area of Ran Village.
68
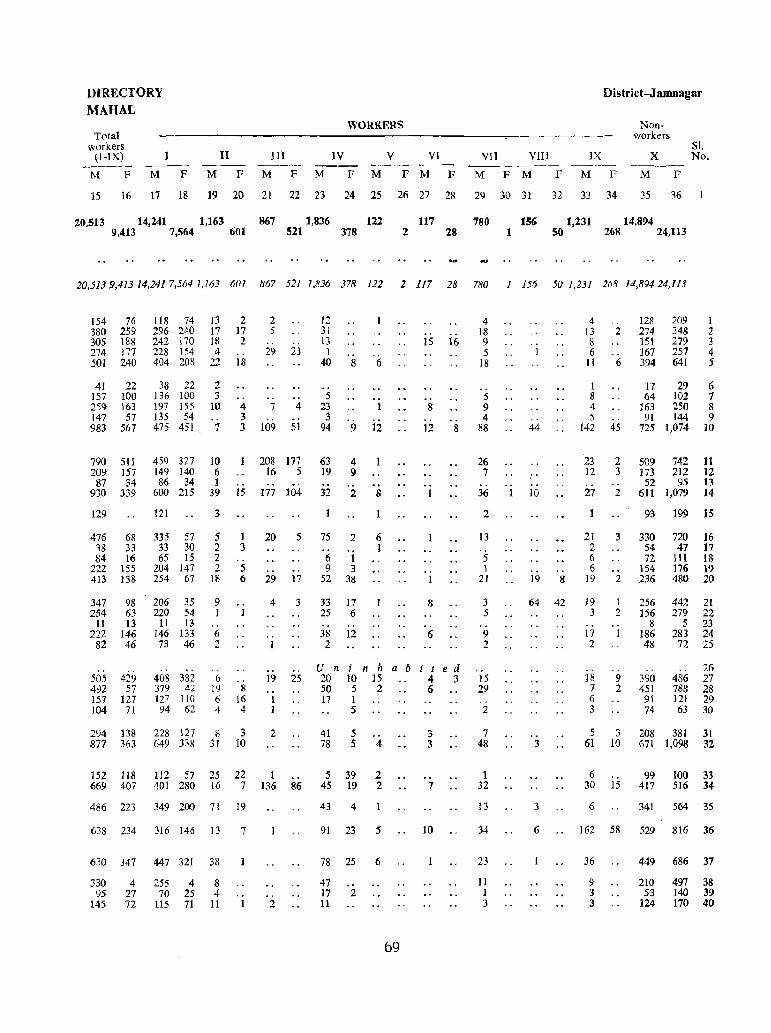
DIRECTORY MAHAL
Total workers
(I-IX) --'--
M F M
II
F M
III
F M F
WORKERS
IV V
M F M
VI
F M
VII Vl1l -------F M F M F
District-Jamnagar
IX
M F
Nonworkers
Sl. X No.
M F
15 16 17 18 19 20 21 22 23 24 25 26 27 28 29 30 31 32 33 34 35 36
20,513 14,241 1,163 9,413 7,564 601
867 1,836 521 378
122 2
117 780 28 1
156 1,231 50
14,894 268 24,113
20,513 9,413 14,2417,5641,163 601 867 521 1,836 378 122 2 117 28 780 1 156 50 1,231 268 14,89424,113
154 76 380 259 305 188 274 177 501 240
41 22 157 100 25<) 163 147 57 983 567
790 511 209 157
87 34 930 339
129
476 68 38 33 84 16
222 155 413 138
347 98 254 63
H 13 222 146
82 46
505 429 492 57 157 127 104 71
118 74 296 240 242 170 228 154 404 208
38 Z2 136 100 197 155 135 54 475 451
13 17 18 4
22
Z 3
10
7
2 17 2
. , 18
. , 4 3 3
2 5
.,
29
7
109
--23
.. 4
51
459 327 10 208 177 149 140 6 [6 5 86 34 1
600 215 39 15 177 104
121 3
335 57 5 33 30 2 65 15 2
204 147 2 254 67 18
206 35 220 54
11 13 146 133 73 46
4011 382 379 42 127 110 94 62
9 1 .. 6 2
, ,
6 19 6 4
1 3 .. 5 6
.. 1
8 16 4
2() 5
.. ... 29 17
4 3
.. 1
19 25
294 138 228 127 8 3 2 877 363 649 338 31 10
12 3 I 13
1 40
5 23 3
94
63 19
.. 8
9
4 9
--6
.. 1
12
.. .. 32 2 8
75 2
6 1 9 3
52 38
33 17 25 6
38 12 2
6 1
U n i n h 20 10 15 50 5 2 17 I
5
41 5 78 5 4
152 lIS 112 57 25 22 1 5 39 2 669 407 4()1 280 16 7 136 86 45 19 2
486 223 349 200 71 19
638 234 316 146 13 7
630 347 447 321 38
330 95
145
4 27 72
255 4 8 7() 25 4
115 71 11 .. 1
o. 2
43 4
91 23 5
78 25 6
47 17 2 11
15 16
O'
8 .. -. 12 S
.. 1
.. 1
8
.. 6
abited 4 3 6
69
3 3
.. 7
10
4 18 9 5
18
5 9 4
88
26 7
36
2
13
5 1
21
3 5 .. 9 2
15 29 .-2
7 48
1 32
13
34
23
11 1 3
,-I
.. 44
1 10
" 19 8
64 42
3
3
6
4 13 8 6
II
1 8 4 5
142
23 12
27
21 2 6 6
19
19 3
17 2
18 7 6 3
. , 2
.-6
45
2 3
.. 2
3
o.
2
I 2
1
9 2
128 209 1 2 3 4 5
274 348 151 279 167 257 394 641
17 29 64 102
6 7 8 9
163 250 91 ]44
725 1,074 10
509 742 11 173 212 12
52 95 l3 611 1,079 14
93 199 15
33() 54 n
154 236
720 16 47 17
III 13 176 19 480 20
256 442 21 ]56 279 22
8 5 23 186 283 24 48 72 25
., 390 451 91 74
26 486 27 788 28 121 29 63 30
5 3 208 381 31 61 I() 671 1,098 32
6 99 100 33 30 15 417 516 34
6 341 564 35
162 58 529 816 36
36
9 3 3
449 686 37
210 53
124
497 38 140 39 170 40
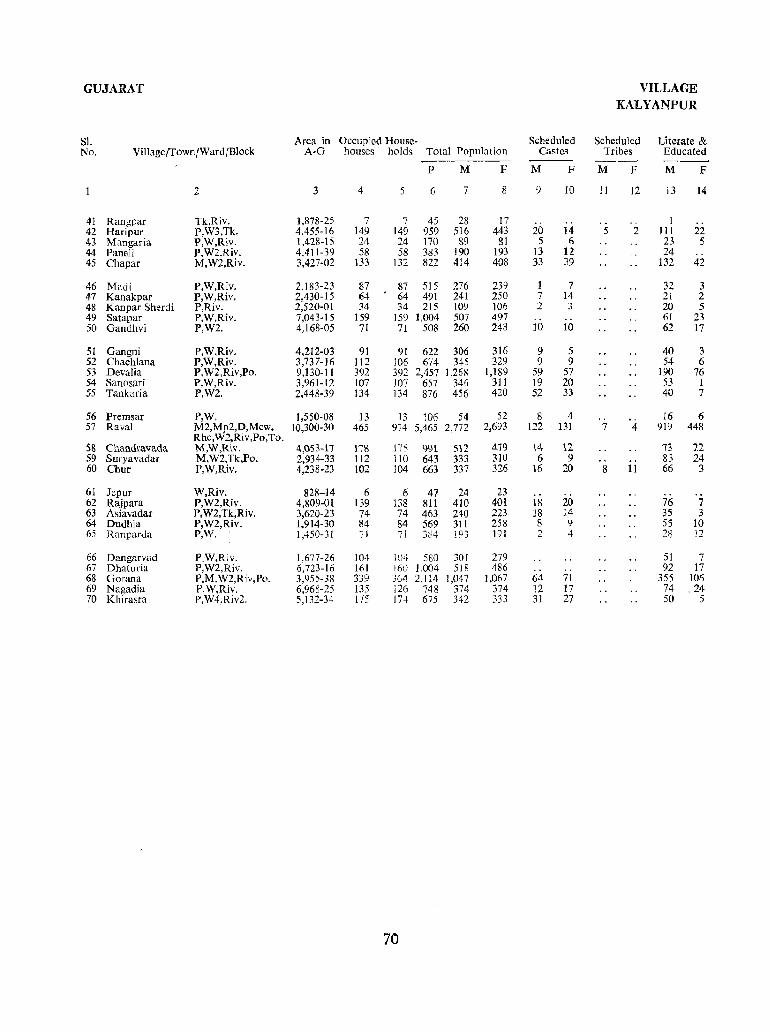
GUJARAT VILLAGE KALYANPUR
S1. Area in Occupied House- Scheduled Scheduled Literate & No. Villageffown/Ward/Block A-G houses holds Total Population Castes Tribes Educated
---- ----P M F M F M F M F
2 3 4 6 7 8 9 10 II 12 13 14
41 Rangpar Tk,Riv. 1,878-25 7 7 45 28 17 .. .. 1 42 Haripur P,W3,Tk. 4,455-16 149 149 959 516 443 20 14 5 2 III 22 43 Mangaria P,W,Riv. 1,428-15 24 24 170 89 III 5 6 23 5 44 Paneli P,W2,Riv. 4,411-39 58 58 383 190 193 13 12 24 .. 45 Chapar M,W2,Riv. 3,427-02 133 132 822 414 408 33 39 132 42
46 Madi P,W,Riv. 2,183-23 87 87 515 276 239 1 7 32 3 47 Kanakpar P,W,Riv. 2,430-15 64 64 491 Z41 250 7 14 21 2 48 Kanpar Sherdi P,Riv. 2,520-01 34 34 215 109 106 2 3 20 5 49 Satapar P,W,Riv. 7,043-15 159 159 1,004 507 497 61 23 50 Gandhvi P,W2. 4,168-05 71 71 508 Z60 248 10 10 62 17
51 Gangni P,W,Riv. 4,212-03 91 91 622 306 316 9 5 40 3 52 Chachlana P,W,Riv. 3,737-16 112 106 6'14 345 329 9 9 54 6 53 Devalia P,W2,Riv,Po. 9,130-11 392 392 2,457 1,268 1,189 59 57 190 76 54 Sanosari r,W,Riv. 3,961-12 107 107 657 346 311 19 20 53 1 55 Tankaria P,W2. 2,448-39 134 134 876 456 420 52 33 40 7
56 Premsar P,W. 1,550-08 13 13 106 54 52 8 4 .. 16 6 57 Raval M2,Mp2,D,Mcw. 10,300-30 465 974 5,465 2,772 2,693 122 131 7 4 919 448
Rhc,W2,Riv,Po,To. 58 Chandravada M,W,Rtv. 4,OS3-17 \18 115 99t 5\2 479 14 12 13 22 59 Suryavadar M,W2,Tk,Po. 2,934-33 112 110 643 333 310 6 9 .. 83 24 60 Chur P,W,Riv. 4,238-23 102 104 663 337 326 16 20 8 11 66 3
61 Jepur W,Riv. 828-14 6 6 47 24 23 ., 62 Rajpara P,W2,Riv. 4,809-01 139 138 811 410 401 18 20 76 7 63 Asiavadar P,W2,Tk,Riv. 3,620-23 74 74 463 240 223 18 14 35 3 64 Dudhia P,W2,Riv. 1,914-30 84 84 569 311 258 S 9 55 10 65 Ranparda P,W. 1,450-31 /1 7i "';("11 10,3 191 2 4 28 12 _lLi'f
66 Dangarvad P,W,Riv. 1,677-26 104 104 580 301 279 51 7 67 Dhaturia P,W2,Riv. 6,723-16 161 160 1,004 518 486 ., .. 92 17 68 Gorana P,M,W2,Riv,Po. 3,955-38 339 364 2,114 1,047 1,067 64 71 355 106 69 Nagadia P.W,Riv. 6,968-25 J3j 126 748 374 374 12 17 74 .24 70 Khirasra P,W4,Riv2. 5,132-34 175 17·1 675 342 333 3] 27 50 5
70
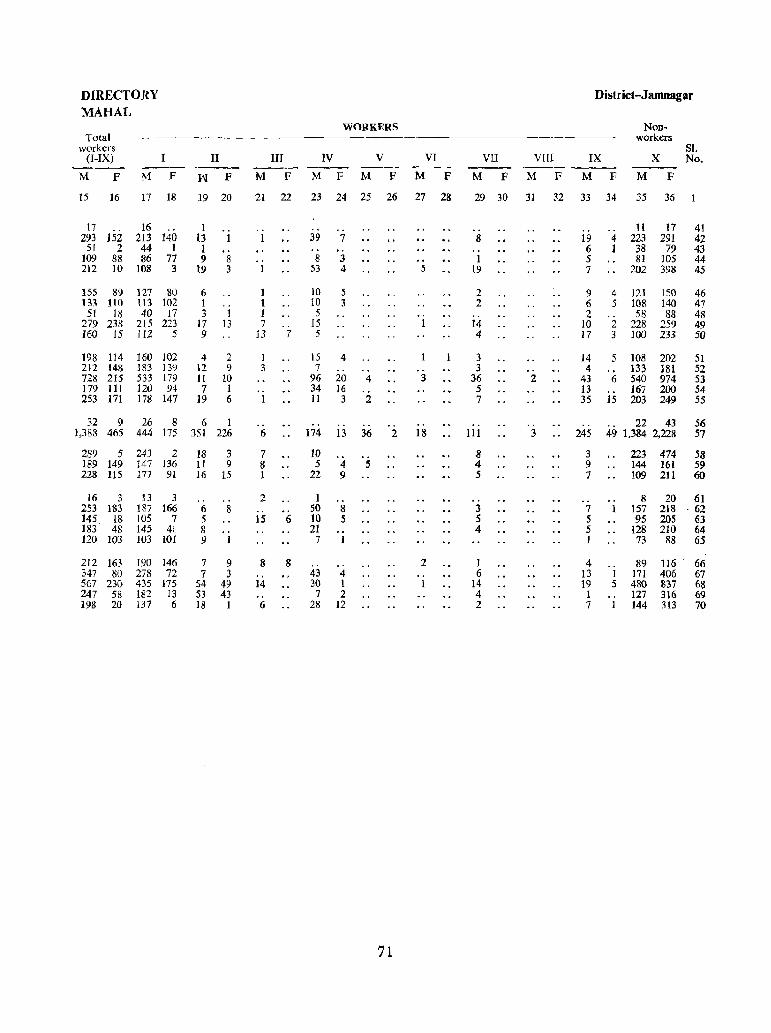
DIRECTORY District-J amnagar MAHAL
WORKERS Non-Total _---- workers
workers SI. (I-IX) II III IV V VI VII VIII IX X No. --- ---- --_ ---
M F M F W F M F M F M F M F M F M F M F M F
15 16 17 18 19 20 21 22 23 24 25 26 27 28 29 30 31 32 33 34 35 36
17 16 1 .. .. 11 17 41 293 152 213 140 13 1 1 39 7 8 19 4 223 291 42
51 2 44 I 1 .. 6 1 38 79 43 109 88 86 77 9 8 .. 8 3 .. J 5 81 105 44 212 10 108 3 19 3 1 53 4 5 19 7 202 398 45
]55 89 127 80 6 ] 10 5 2 9 4 121 150 46 133 110 113 102 I .. I 10 3 2 6 5 108 140 47
51 18 40 17 3 1 I 5 2 58 83 48 279 238 215 223 17 13 7 .. 15 1 14 10 2 228 259 49 160 15 112 5 9 13 7 5 4 17 3 100 233 50
198 114 160 102 4 2 1 15 4 3 14 5 108 202 51 212 148 183 139 12 9 3 7 .. 3 4 133 181 52 728 215 533 179 II 10 96 20 4 3 36 2 43 6 540 974 53 179 111 120 94 7 1 34 16 5 13 167 200 54 253 171 178 147 19 6 1 11 3 2 7 35 15 203 249 55
32 9 26 8 6 I .. .. 22 43 56 1,388 465 444 175 351 226 6 174 13 36 2 18 111 3 245 49 1.384 2,228 57
289 5 243 2 18 3 7 to 8 3 223 474 58 189 149 147 136 II 9 8 5 4 5 4 9 144 161 59 228 115 177 91 16 15 1 22 9 5 7 109 2Il 60
16 3 13 3 .. .. 2 1 .. 8 20 61 253 183 187 166 6 8 50 8 3 7 1 157 218 - 62 145 IS 105 7 5 15 6 10 5 5 5 95 205 63 183 48 145 4;, 8 21 4 5 128 210 64 120 103 103 101 9 1 7 1 1 73 88 65
212 163 190 146 7 9 8 8 2 1 4 89 116 - 66 347 80 278 72 7 3 43 4 6 13 1 171 406 67 567 230 435 175 54 49 14 30 1 1 14 19 5 480 837 68 247 58 182 13 S3 43 .. 7 2 4 1 .. 127 316 69 198 20 137 6 18 1 6 28 12 2 7 1 144 313 70
71


TALUKA: KHAMBHALIA
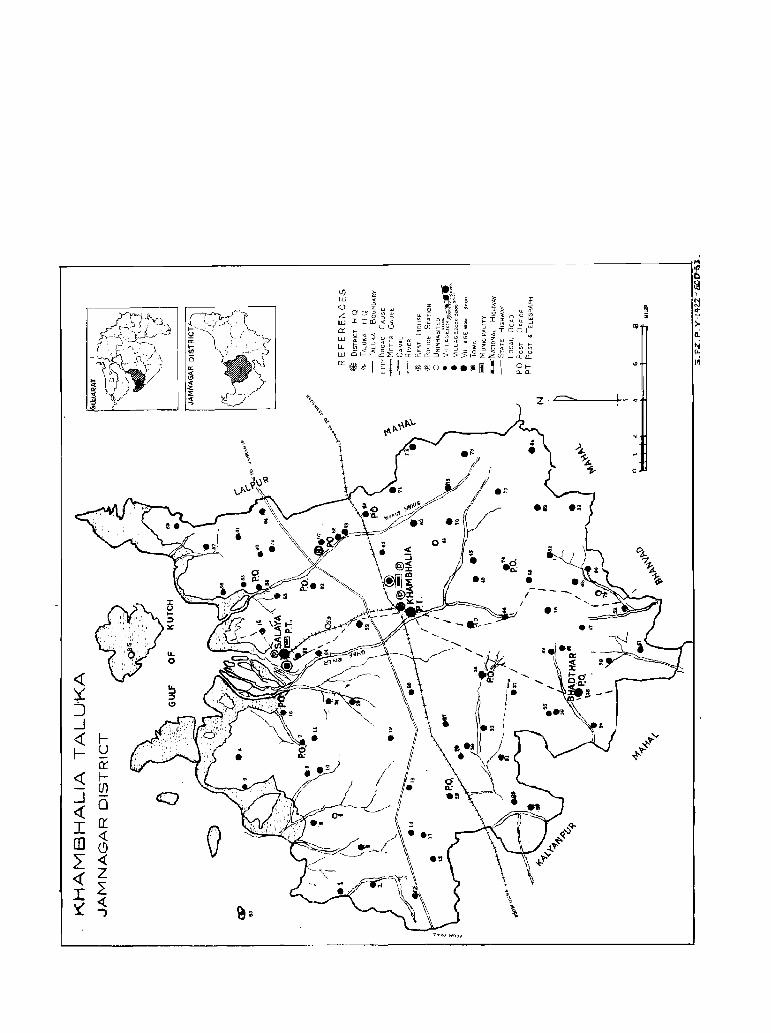
~ ~ l.j
i :!: CQ
). n: t.j p.
'" l'i

TALUKA
KHAMBHALIA
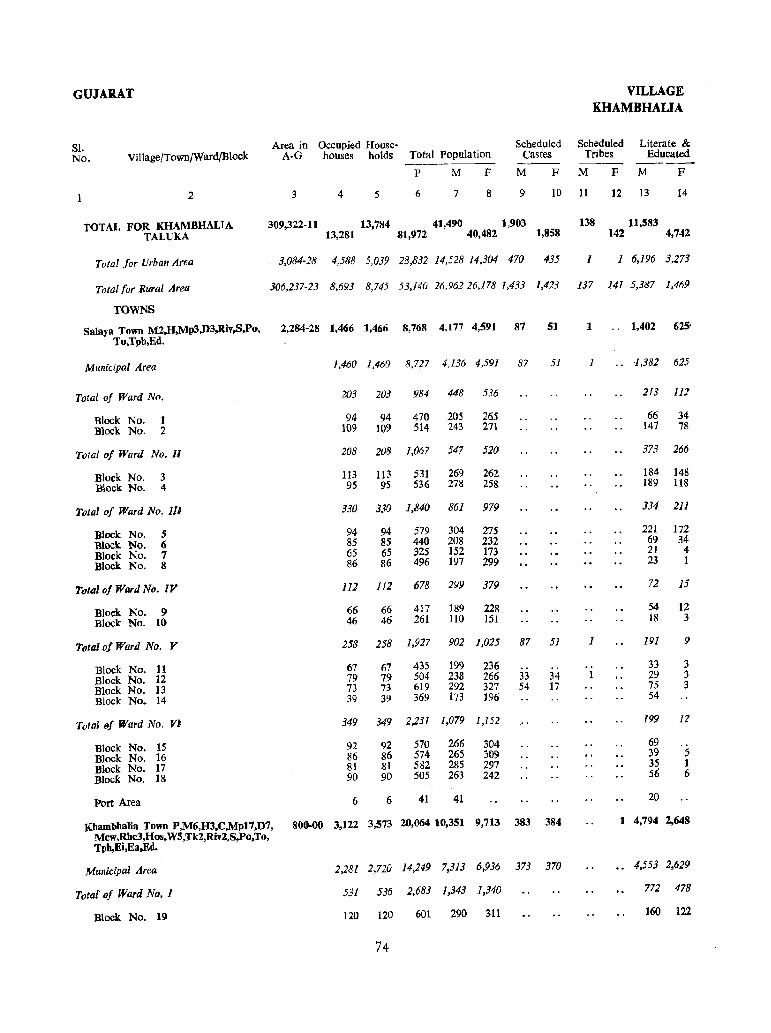
GUJARAT VILLAGE KHAMBHALIA
81. Area in Occupied House- Scheduled Scheduled Literate & No. Village/Town/Ward/Dlock A-G houses holds Total Population Castes Tribes Educated
--- ----P M F M F M F M F
2 3 4 5 6 7 8 9 10 11 ]2 13 14
TOTAL FOR KHAMBHALIA 309,322-]1 13,784 41,490 1,903 138 11,583 TALUKA 13,281 81,972 40,482 1,858 142 4,742
Total for Urban Area 3,084-28 4,588 5,039 28,832 14.528 14.304 470 435 1 1 6,196 3,273
Total for Rural Area 306,237-23 8,693 8,745 53,140 26,96226,178 1,433 1,423 137 141 5,387 1,469
TOWNS
Salaya Town M2,H,Mp3,D3,Riv,S,Po, 2,284-28 1,466 1,466 8,768 4,177 4,591 87 51 1 .. 1,402 625'
To,Tpb,Ed.
Municipal Area 1,460 1,460 8,727 4,136 4,591 87 51 1 .. 1,382 625
Total of Ward Na. 203 203 984 448 536 213 112
Block No. r 94 94 470 205 265 66 34
Block: No. 2 109 109 514 243 271 147 78
Total of Ward No. 11 208 208 1,067 547 520 373 266
Block No. 3 113 113 531 269 262 184 148
Bl.ock No. 4 95 9S 536 278 25& 189 118
Total of Ward No. III 330 330 1,840 861 979 334 211
Block No. 5 94 94 579 304 275 221 172
Block No. 6 85 85 440 208 232 69 34
Block No. 7 65 65 325 152 173 21 4
Block No. & 86 86 496 197 299 23 1
Total of Ward No. lJI 111 112 678 299 379 72 15
Block No. 9 66 66 417 189 228 54 12
Block No. 10 46 46 261 110 151 18 3
Total of Ward No. r 258 258 1,927 902 1,025 87 51 1 191 9
Block No. 11 67 67 435 199 236 33 3
Block No. 12 79 79 504 238 266 33 34 1 29 3 Block No. 13 73 73 619 292 327 54 17 75 3
Block No. 14 39 39 369 173 196 54
Total 9/ Ward No. VI 349 349 2,231 1,079 1,152 [99 1Z
Block No. 15 92 92 570 266 304 69
Block No. 16 86 86 574 265 309 39 5
Biock No. 17 81 81 582 285 297 35 1
BlOCK No. 1& 90 90 505 263 242 56 6
Port Area 6 6 41 41 20
J(bambhalia Town P,M6,H3,C,Mp17,D7, 800-00 3,122 3,573 20,064 10,351 9,713 383 384 1 4,794 2,648
Mcw.Rbc3,Hos,W5,Tk2,Riv2,S,Po,To, Tph,Ei,Ea,Ed.
Municipal Area 2,281 2,720 14,249 7,313 6,936 373 370 4,553 2,629
Total' of Ward No. I 531 536 2,683 1,343 1,340 772 478
Block No. 19 120 120 601 290 311 160 122
74
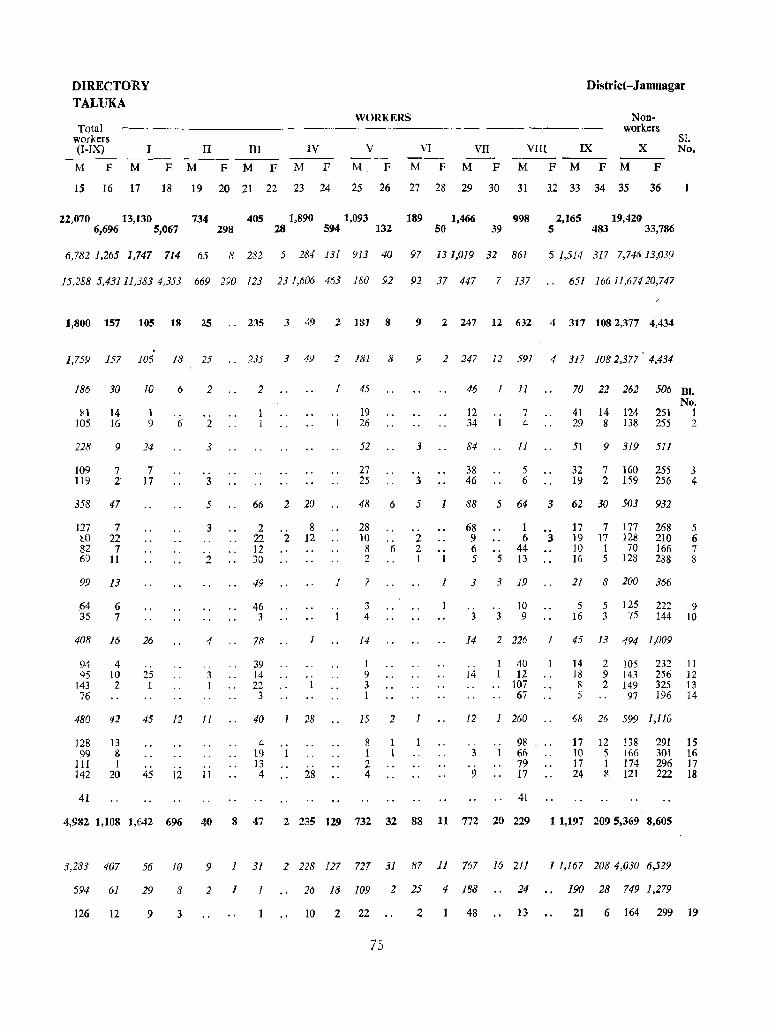
DIRECTORY TALUKA
Total workers (I-IX)
M F
I
M F M
II III IV
F M F M F
WORKERS
V VI
M_ F M F
VII
M F
District-J amnagar
VIII IX
M F M
Nonworkers
x F M F
SI. No.
15 16 17 18 19 20 21 22 23 24 25 26 27 28 29 30 31 32 33 34 35 36
22,070 13,130 734 405 1,890 1,093 189 1,466 998 2,165 19,420 6,696 5,067 298 28 594 132 SO 39 5 483 33,786
6,7821,265 1,747 714 65 R 282 5 284 131 913 40 97 131,019 32 861 5 1,514 317 7,74613,039
15,288 5,431 1l,J83 4,353 669 290 123 231,606 463 180 92 92 37 447 7 137 651 16611.67420,747
1,800 157 105 18 2S .. 235 3 49 2 181 8 9 2 247 12 632 4 317 1082,377 4,434
1,759 157 105 18 25 .. 235 3 49 2 181 8 9 2 247 12 591 4 317 1082,377 4,434
186
iiI 105
228
109 119
30
14 16
9
7 2·
358 47
127 to 82 69
7 22
7 11
99 13
64 35
6 7
10
1 9
14
7 17
6
.. 6
2
.. 2
3
3
5
3
2
408 16 26 4
94 95
143 76
4 10 2
480 41
128 99
111 142
41
13 8 1
20
-. 25 1
3 1
45 12 II
.. 45 12 11
2
66 2 20
2 22 12 30
49
46 3
78
39 14 22
3
40
4 19 13 4
2 8
12
1
28
28
1
.. 1
1
.. 1
45
19 26
52
27 25
3
3
46
12 34
84
38 46
1
. . J
11
7 4
!I
5 6
70 22 262 506 BI. No.
41 14 124 251 1 29 8 138 255 2
51 9 319 511
32 7 160 255 3 19 2 159 256 4
48 6 5 1 88 5 64 3 62 30 503 932
28 10 8 2
7
3 4
14
1 9 3 1
.. 6
.. 2 2 1
15 2 1
8 1 2 4
1
68 9 6 5 5
1 6
44 13
3 3 19
.. 3
. . 3
10 9
.. 3
17 19 10 16
7 17
1 5
177 128 70
128
268 210 166 288
5 6 7 8
21 8 200 366
5 16
5 125 3 75
222 9 144 10
14 2 226 1 45 13 494 1,009
__
14
12
.. 3
9
40 12
.. 107 67
., 1
260
98 66 79 17
41
14 18 8 5
2 105 9 143 2 149
97
232 11 256 12 325 13 196 14
68 26 599 1,110
17 12 138 10 5 166 17 1 174 24 R 121
291 15 301 16 296 17 222 18
4,982 1,108 1,642 6% 40 8 47 2 235 129 732 32 88 11 772 20 229 1 1,197 209 5,369 8,605
3,283 407 56 10
594 61
126 12
29
9
8
3
9 1 31 2 228 127 727 31 87 11 767 16 211 1 1,167 2084,030 6,529
2 1 1 26 18 109 2 25 4 188
10 2 22 .2 48
75
24
13
190 28 749 1,279
21 6 164 299 19

GUJARAT VILLAGE KHAMBHALIA
SI. Area in Occupied House- Scheduled Scheduled Literate & No. VillagetTown/Ward/Block A·G houses holds Total Population Castes Tribes Educated
~-p M F M F M F M F
2 3 4 5 6 7 8 9 10 II 12 13 14
Block No. W 96 98 540 268 272 149 81
Block No. Zl 104 104 554 288 266 .. 189 117 Block No. 22 122 122 528 258 270 135 67 Block No. Z3 89 92 460 239 221 139 91
Total of Ward No. II 901 958 5,119 2,628 2.491 295 309 .. 1,569 866
Block No. 24 120 120 585 274 311 189 136 Block No. 25 112 112 635 305 330 200 168
Block No. 20 104 104 540 269 271 3 5 167 124 Block No. 27 116 116 735 457 278 74 66 320 7~ Block No. 28 123 123 611 312 299 140 70 Block No. 29 83 108 589 306 283 184 112 Block No. 30 98 110 544 275 269 41 51 194 102
Block No. 31 95 107 578 286 292 102 107 133 73 Block No. 3Z 50 58 302 144 158 75 80 42 6
Total of Ward No. lI1 508 58l 2,926 1,455 1,471 ., 1,072 686
Block No. 33 109 123 622 315 307 235 157 Block No. 34 112 112 587 305 282 229 166 Block No. 35 102 132 593 279 314 210 142
Block No. 36 111 111 554 268 286 176 112 Block No. 37 74 103 570 288 282 222 109
Totol of Ward No. 11' 341 645 3,521 1,887 1,634 78 61 .. 1,140 599
Block No. 38 63 96 568 311 257 173 45 Block No. 39 89 164 870 450 420 303 184 :Block No. 40 65 119 630 317 313 210 137
Block No. 41 36 83 477 249 228 25 18 118 82 Block No. 42 45 124 674 400 274 53 43 250 92 Block No. 43 43 59 '302 160 142 86 59
Non-Municipal Area 841 853 5,815 3,038 2,777 }O 14 1 241 19
Block Np. 44 95 95 613 316 297 18 Block No. 45 107 107 706 355 351 3
Block No. 46 73 73 624 335 289 15 Block No. 47 97 97 569 278 291 2 4 43 2 Dlock No. 48 88 88 605 330 275 15 Block No. 49 77 77 606 340 266 .. .. 1 Block No, SO 77 77 544 250 294 8 10 51 7
Block No. 51 86 91 580 318 262 21 Block No. 52 92 99 618 329 289 39 3 Block No. 53 49 49 350 187 163 35 7
Khambhalia Village *26,791-36
VILLAGES
t Nana Asota P,W. 3,728·28 133 134 777 391 386 1 12 5 8 32 7 2 Beraja M,W2,Tk.Riv. 5,780-33 201 201 1,139 572 567 19 ]7 71 25
*the area of Khambhalia Village bas been included in the rural area of the Taluka.
76
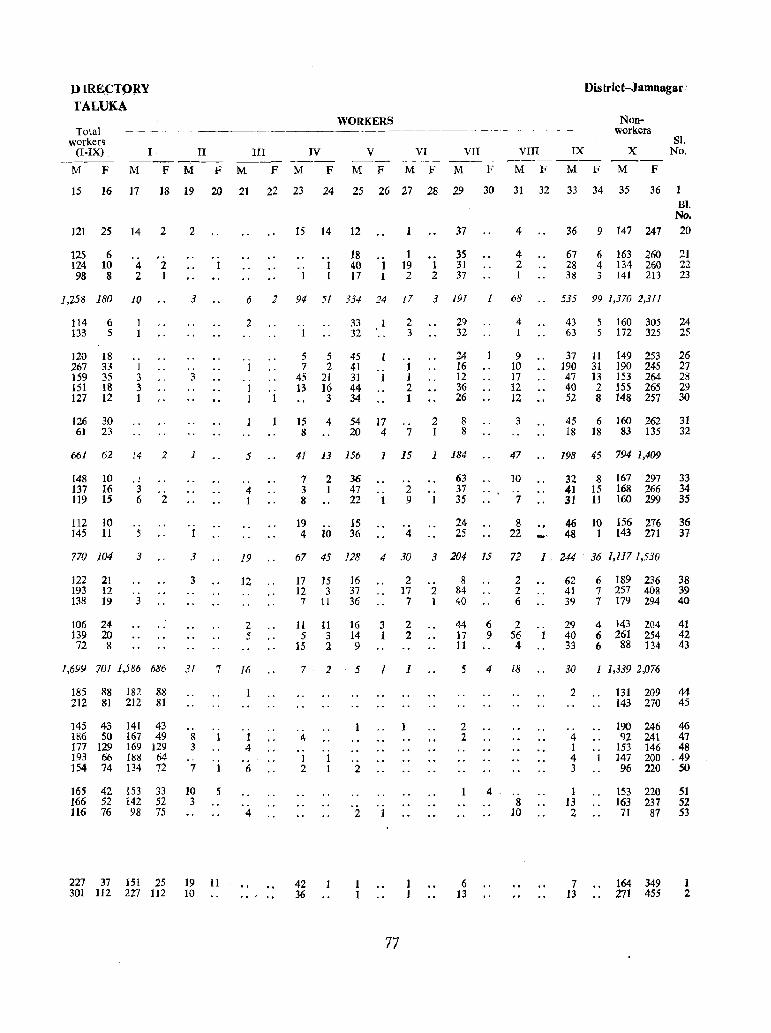
DlRE;CTPRY fALUKA
Total worken
(I-IX) ---
M F
I II III -~~~-- --M F M F M F
IV --M F
WORKERS
V VI VII
M F M F M
District-Jamnagar:
VIII IX
F M F M F
Nonworkers
X
M F
SI. No.
15 16 17 18 19 20 21 22 23 24 25 26 27 28 29 30 31 32 33 34 35 36
121 25 14 2
125 6 124 10 98 8
4 2 2 1
2
.. 1
15 14 12
18 ., 40 1 1 17 1
1 19 I 2 2
37
35 31 37
4
4 2 I
BI. No.
36 9 147 247 20
67 28 38
6 163 260 4 134 260 3 141 20
21 22 23
1,258 180 10 3 6 2 94 51 334 24 17 3 J91 I 68 535 99 1,370 2,3{ J
114 6 133 5
120 18 267 33 159 35 151 18 127 12
126 30 61 23
1 3 3 1
661 62 14 2
148 10 137 16 119 15
112 10 145 11
770 104
122 21 193 12 138 19
106 24 139 20 72 8
, 3 6
.. 5
3
3
2
.. 3
1
1
3
3
2
.. 1 I 1
5
.. 4 1
19
12
2 5
1,699 701 1,586 686 3! 7 16
185 88 182 88 212 81 212 81
145 43 141 43 186 50 167 49 177 129 169 129 193 66 188 64 154 74 134 72
165 42 153 33 166 52 142 52 116 76 98 75
.. S 3
.. 7
10 3
.. 1
5
227 37 151 25 19 11 301 112 227 112 10
1 4
6
4
.. ~ ..
5 5 7 2
45 21 13 16
3
33 32
45 41 31 I 44 34
2 3
1 1 2 1
15 4 54 17 2 8 20 4 7 I
29 32
24 16 12 36 26
8 8
41 13 156 1 15 1 184
7 3 8
2 I
36 47 22
19 15 4 10 36
"
I
.. 2 9
4
.. 1
63 37 35
24 25
4 1
9 10 17 12 12
3
47
10 .. 7
8 22
43 5 160 305 24 63 5 172 325 2S
37 11 149 253 190 31 190 245 47 13 153 264 40 2 155 265 52 8 148 257
26 27 28 29 30
45 6 160 262 31 18 18 83 135 32
198 45 794 1,409
32 8 167 297 41 15 168 266 31 II 160 299
33 34 3S
46 10 156 276 36 48 1 143 271 37
67 45 128 4 30 3 204 15 72 1 . 244 36 I,ll71,530
17 15 12 3 7 11
16 37 36
11 11 16 3 5 3 14 1
15 2 9
2 17 7
2 2
7 1 511
4
1 2
42 36
2
2 1
77
.. 2 1
8 84 40
2 2 6
,fA 6 2 17 9 56 1 11 4
5 4 18
2 2
6 13
4 .. 8
10
62 41 39
6 189 236 7 257 408 7 179 294
38 39 40
29 4 143 204 41 40 6 261 254 42 33 6 88 134 43
30 1 1,339 2,076
2
. . 4 1 4 3
1 13 2
7 13
.. 1
131 209 44 143 270 45
190 246 46 92 241 47
153 146 48 147 200 _ 49 96 220 50
153 220 51 163 237 52 71 87 53
164 349 271 455
1 2
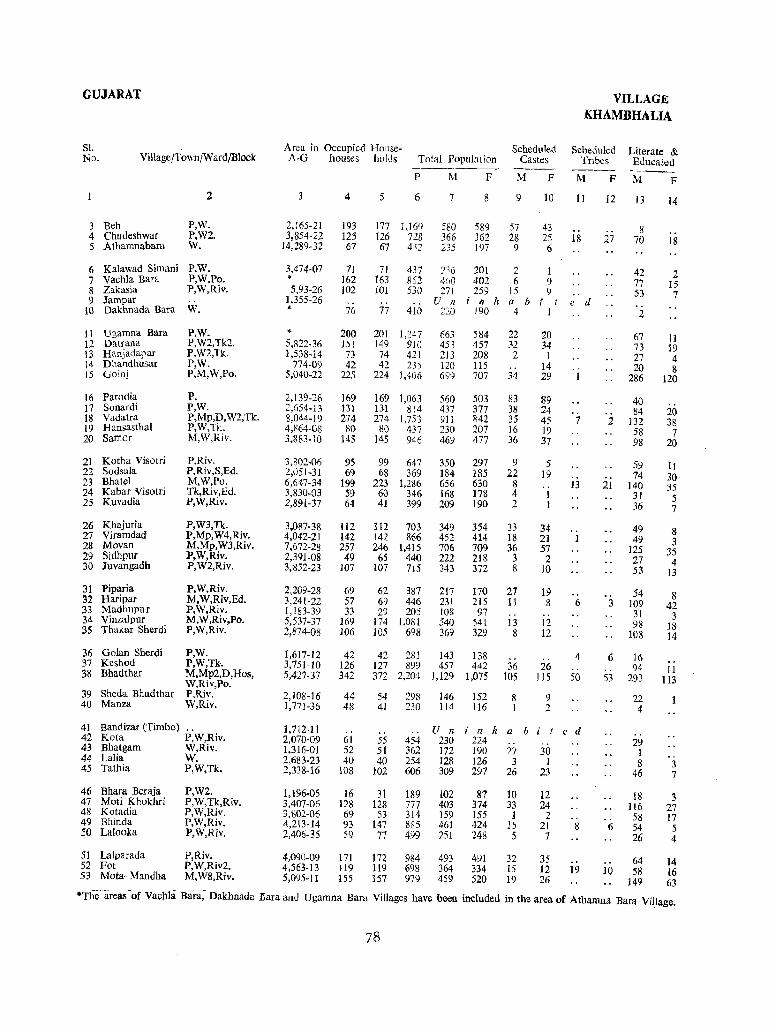
GUJARAT VILLAGE KHAMBHALIA
81. Area in Occupied House- Scheduled Scheduled Literate & No. VillagcjTov\,n/Ward/Block A·G houses holds Total Population Castes Tribes Educated -.--- ---- ---P M F M F M F M F
2 3 4 5 6 7 8 9 10 11 12 13 14
3 Beh P,W. 2,165-21 193 177 1,169 580 589 57 43 8 .. 4 Chudeshwar P,W2. 3,854-22 125 126 728 366 J62 28 2S 18 27 70 18 5 Athamnabara W. 14,289-32 67 67 432 235 197 9 6
6 Kalawad Simani P,W. 3,474-07 71 71 437 236 201 2 1 42 2 7 vachla Bara p,W.Po. • 162 163 862 460 402 6 9 77 15 8 Zakasia P,W,Riv. 5,93-26 102 101 530 271 259 15 9 .. 53 7 9 Jampar ] ,355-26 U n i n II a b i t e d
10 Dakhnada Bara W. * 76 77 410 221] 190 4 I 2
11 Ugamna Bara P,W. " 200 201 1,247 663 584 22 20 67 11 12 Datrana P,W2,Tk2. 5,822-36 151 149 910 453 457 32 34 73 19 13 Hanjadapar f,W2,Tk. 1,538-14 73 74 421 213 208 2 1 27 4 14 Dhal1dhusar P,W. 774-0') 42 42 235 120 115 14 .. 20 8 15 Goinj P,M,W,Po. 5,040-22 225 224 1,406 699 707 34 29 1 286 120
16 Parodia P. 2,139-26 169 169 1,063 560 503 83 89 40 17 Sonardi P,W. 2,654-13 I3l 131 814 437 377 38 24 84 20 18 Vadatra P,Mp,D, W2,Tk. 8,044-19 274 274 1,753 911 842 35 45 7 2 132 38 19 Hansasthal P,W,Tk. 4,864-08 80 80 437 230 207 16 19 58 7 20 Samor M,W,Riv. 3,883-10 145 145 9/' 469 477 36 37 98 20 .,0
21 Kotha Visotri P,Riv. 3,802-06 95 99 647 350 297 9 5 59 11 22 Sodsala P,Riv,S,Ed. 2,051-31 69 68 369 184 185 22 19 74 30 23 Bhatel M,W,Po. 6.647-34 199 223 1,286 656 630 8 13 21 140 35 24 Kabar Visotri Tk,Riv,Ed. 3,830-03 59 60 346 168 178 4 1 31 5 25 Kuvadia P,W,Riv. 2,891-37 64 41 399 209 190 2 1 36 7
26 Khajuria P,W3,Tk. 3,087-38 112 112 703 349 354 33 34 49 8 27 Viramdad P,Mp,W4,Riv. 4,042-21 142 142 866 452 414 18 21 1 49 3 28 Movan M,Mp,W3,Riv. 7,672-28 257 246 1,415 706 709 36 57 125 35 29 Sidhpur P,W,Riv. 2,391-08 49 65 440 222 218 3 2 27 4 30 Juvangadh P,W2,Riv. 3,852-23 107 107 715 343 372 8 JO 53 13
31 Piparia P,W,Riv. 2,209-28 69 62 387 217 170 27 19 .. 54 8 32 Haripar M,W,Riv,Ed. 3,241-22 57 69 446 231 215 11 8 6 3 109 42 33 Madhupur P,W,Riv. 1,183-39 33 29 20:5 108 97 31 3 34 Vinzalpur M,W,Riv,Po. 5,537-37 169 174 ]'081 540 541 13 12 98 18 35 Thakar Sherdi P,W,Riv. 2,874-08 106 105 698 369 329 8 12 ]08 14
36 Golan Sherdi P,W. 1,617-12 42 42 281 143 138 4 6 16 37 Keshod P,W,Tk,. 3,751-10 126 127 899 457 442 36 26 .. 94 II 38 Bhadthar M,Mp2,D,Hos, 5,427-37 342 372 2,204 1,129 1,075 105 115 50 53 293 113 W,Riv,Po. 39 Sheda Bhadthar P,Riv. 2,108-16 44 54 298 146 152 8 9 22 40 Manza W,Riv. 1,771-36 48 41 230 114 116 1 2 4
41 Bandizar (Timbo) " 1,712-1J .. U n j 11 II a b i t e d .. 42 Kota P,W,Riv. 2,070-09 61 55 454 230 224 .. 29 43 Bhatgam W,Riv. 1,316-01 52 51 362 172 190 27 30 1 .. 44 Lalia W. 2,683-23 40 40 254 128 126 3 1 8 3 45 Tathia P,W,Tk. 2,338-16 108 102 606 309 297 26 23 46 7
46 Bhara Beraja P,W2. 1,196-05 16 31 189 102 87 10 12 18 3 47 Moti Khokhri P,W,Tk,Riv. 3,407-06 128 128 777 403 374 33 24 1I6 27 48 Kotadia P,W,Riv. 3,802-06 69 53 314 159 155 1 2 .. 58 17 49 Bhinda P,W,Riv. 4,213-14 93 147 885 461 424 15 21 8 6 54 5 50 Lalooka P,W,Riv. 2,406-35 59 77 499 251 248 5 7 26 4
51 Lalparada P,Riv. 4,090-09 171 172 984 493 491 32 35 64 14 52 Fot P,W,Riv2. 4,563-13 119 119 698 364 334 15 12 19 10 58 16 53 Mota-Mandha M,W8,Riv. 5,095-11 155 157 979 459 520 19 26 149 63
"'The areaso(VachlaBara,- Dakhnada .!'lara and Ugamna Bara Villages have been induded in the area of Athamna Rara Village.
78
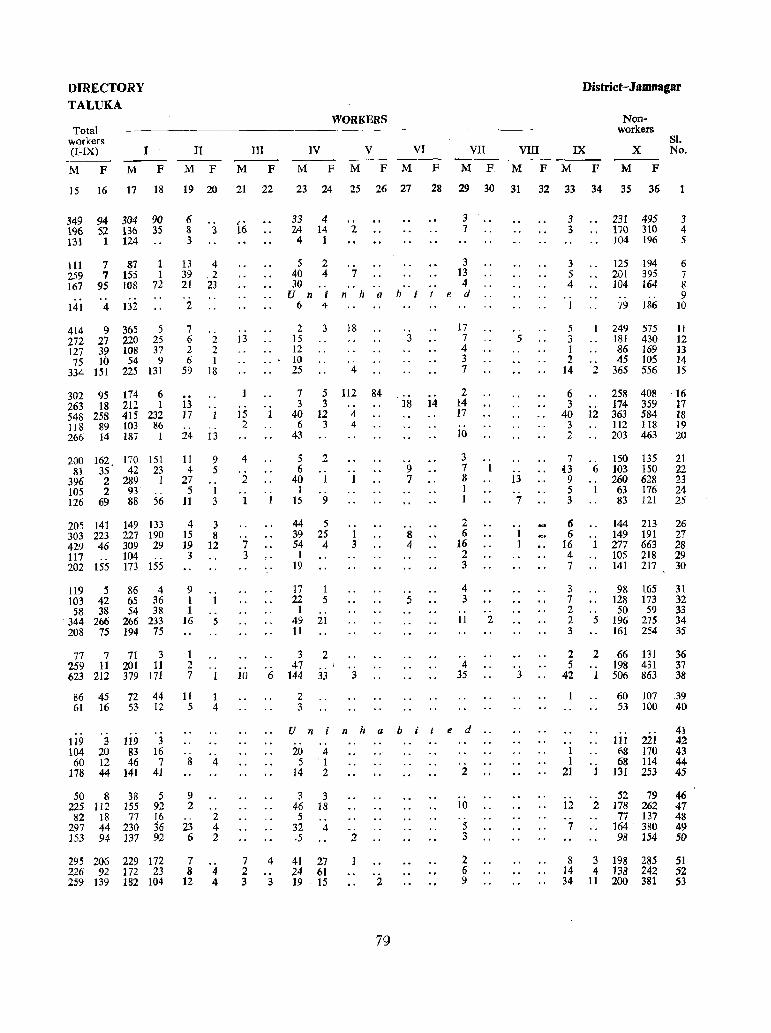
DIRECTORY TALUKA
Total workers (FIX)
M F
I
M
II III
F M F M F
15 16 17 18 19 20 21 22
349 94 304 90 196 52 136 35 131 1 124
111 7 87 259 7 155 167 95 108
... .. .. 141 4 132
1 1
72
414 9 365 5 272 27 220 25 127 39 108 37 75 10 54 9
334 151 225 131
302 95 174 6 263 18 212 1 548 258 415 232 118 89 103 86 266 14 187 1
200 162 170 151 81
396 IDS 126
35 42 23 2 289 1 2 93 ..
69 88 56
205 141 149 133 303 223 227 190 429 46 309 29 117 .. 104 202 155 173 155
119 5 103 42
58 38 ·344 266 208 75
86 4 65 36 54 38
266 233 194 75
77 7 71 3 259 11 201 11
6 8 3 16 3
13 39 21
2
7 6 2 6
59
13 17 .. 24
11 4
27 5
11
4 .2 23
.. 2 2 I
18
.. 1
.. 13
"
9 5
1 3
4 3 15 8 19 12
3
9 1 1
16
1 2
" 5
13
15 2
4
2 .. 1
7 3
..
.. 1
IV
M
WORKERS
V VI
F M F M F
VII
M F.
District-Jamnagar
VIII IX
M F M F
Nonworkers
x M F
Sl. No.
23 24 25 26 27 28 29 30 31 32 33 34 35 36
33 4 .. 24 14 2 4 1
5 2 40 4 7 30 Uninhabit
6 4
2 15 12 10 25
3 )8 3
4
7 5 112 84 3 3 - is
40 12 4 6 3 4
43
5 6
40 I
15
2 .. 1
9
44 5 39 25 54 4 1
19
17 1 22 5
1 .. 49 21 11
3 2 47
.. 1 3
9 7
.. S 4
5
14
3 7
3 13 4
e d
17 7 4 3 7
2 14 17
10
3 7 8 1 1
2 6
16 2 3
4 3 . , 11
5
.. 1
13 .-7
.. 2
3 3
3 5 4 .. 1
5 3 1 2
14
6 3
40 3 2
7 o
9 5 3
23l 495 170 310 104 196
125 194 201 395 104 164 .. 79 186
249 575 181 430 86 169 45 105
2 365 556
258 408 174 359
12 363 584 112 118 203 463
6 " 1
150 103 260
63 83
135 150 628 176 121
3 4 5
6 7 8 9
]0
11 12 13 14 ]5
16 17 18 19 20
21 22 23 24 25
6 144 213 26 6 149 191 27
16 1 277 663 28 4 105 218 29 7 141 217 30
3 7 2 2 3
98 165 128 173
" 50 59 5 196 275
161 254
2 2 66 131 5 .. 198 431
31 32 33 34 35
623 212 379 171 7 1 lD 6 144 33 3 4
35 3 42 1 506 863
36 37 38
86 45 72 44 11 1 61 16 53 12 5 4
119 3 119 3 104 20 83 16
60 12 46 7 178 44 141 41
50 8 38 5 225 112 155 92
82 18 77 16 297 44 230 36 153 94 137 92
295 206 229 172 226 92 172 23 259 139 182 104
.. S
9 2 .. 23 6
7
4
.. 2 4 2
8 4 12 4
7 2 3
4 .. 3
2 3
Uninhabited .. •• o.
20 4 5 1
14 2 2
3 46
5 32 .5
3 18 .. 4
41 27 24 61 19 . 15
.. 2
79
10
5 3
2 6 9
60 107 39 53 100 40
.. 1 1
2]
.. 12 . . 7
11l 221 68 170 68 114
131 253
.. 52 79 2 178 262
77 137 164 380 98 154
8 3 198 285 14 4 138 242 34 11 200 381
41 42 43 44 45
46 47 48 49 50
51 52 53
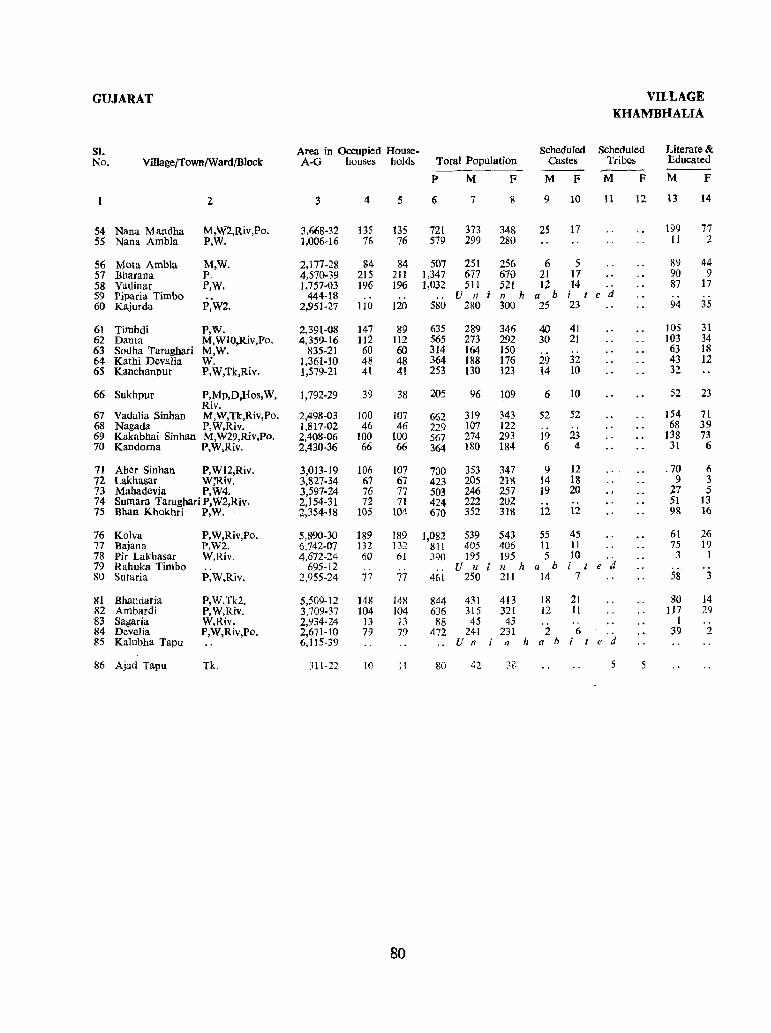
GUJARAT VILLAGE KHAMBHALIA
SI. Area in Occupied House. Scheduled Scheduled Literate & No. Village/Town/Ward/Block A·G houses holds Total Population Castes Tribes Educated
"------p M F M F M F M F
2 3 4 5 6 7 8 9 10 11 12 13 14
54 Nana Mandha M,W2,Riv,Po. 3,668·32 135 135 721 373 348 25 17 199 77 55 Nana AmbIa P,W. 1,006-16 76 76 579 299 280 II 2
56 Mota AmbIa M,W. 2,177-28 84 84 507 251 256 6 5 89 44 57 Bharana P. 4,570·39 215 211 ],347 677 670 21 17 90 9 58 Vadinar P,W. 1,757-03 196 196 1,032 511 521 12 14 87 17 59 Piparia Timbo 444-18 .. V It It h a b i t e d 60 Kajurda P,W2. 2,951-27 110 120 580 280 300 25 23 94 35
61 Timbdi P,W. 2,391-08 147 89 635 289 346 40 41 105 31 62 Danta M,WlO,Riv,Po. 4,359-16 Il2 112 565 273 292 30 21 103 34 63 Sodha Taraghari M,W. 835-21 60 60 314 164 150 63 18 64 Kathi Devalia W. 1,361-10 48 48 364 188 176 29 32 43 12 65 Kanchanpur P,W,Tk,Riv. 1,579-21 41 41 253 130 123 14 10 32
66 Sukhpur P,Mp,D,Hos, W, 1,792-29 39 38 205 96 109 6 10 52 23 Riv.
67 Vadalia Sinhan M,W,Tk,Riv,Po. 2,498-03 100 107 662 319 343 52 52 154 7L 68 Nagada P,W,Riv. 1,817-02 46 46 229 107 122 68 39 69 Kakabhai Sinhan M,W29,Riv,Po. 2,408-06 100 100 567 274 293 19 23 138 73 70 Kandoma P.W,Riv. 2,430-36 66 66 364 180 184 6 4 31 6
71 Aher Sinhan P,WI2,Riv. 3,013-19 106 107 700 :153 347 9 12 .70 6 n Lakhasar W;Riv. 3,827-34 67 67 423 205 218 14 18 9 3 73 Mahadcvia P,W4. 3,597-24 76 77 503 246 257 19 20 27 5 74 Sumara TaraghariP,W2,Riv. 2,154-31 72 71 424 222 202 51 13 75 Bhan Khokhri P, W. 2,354-18 105 104 670 352 318 12 12 98 16
76 Kolva P,W,Riv,Po. 5,890-30 189 189 1,082 539 543 55 45 61 26 77 Bajana P,W2. 6,742-07 132 132 811 405 405 11 11 75 19 78 Pir Lakhasar W,Riv. 4,672-24 60 61 390 195 195 5 10 3 1 79 Rahuka Timbo 695-12 ,. U n 11 h a b i I e d 80 Sutaria P,W,Riv. 2,955-24 77 77 461 250 211 14 7 58 3
81 Bhandaria P,W,Tk2. 5,509-12 148 148 844 431 413 18 21 80 14 82 Ambardi P,W,Riv. 3,709-37 104 104 636 315 321 12 II 117 29 83 Sagaria W,Riv. 2,934-24 13 13 88 45 43 1 .. 84 Devalia P,W,Riv,Po. 2,671-10 79 79 472 241 231 2 6 39 2 85 Kalubha Tapu 6,115-39 U n i It h a b i t e d
86 Ajad Tapu Tk. :llI-22 10 11 80 42 38 5
80
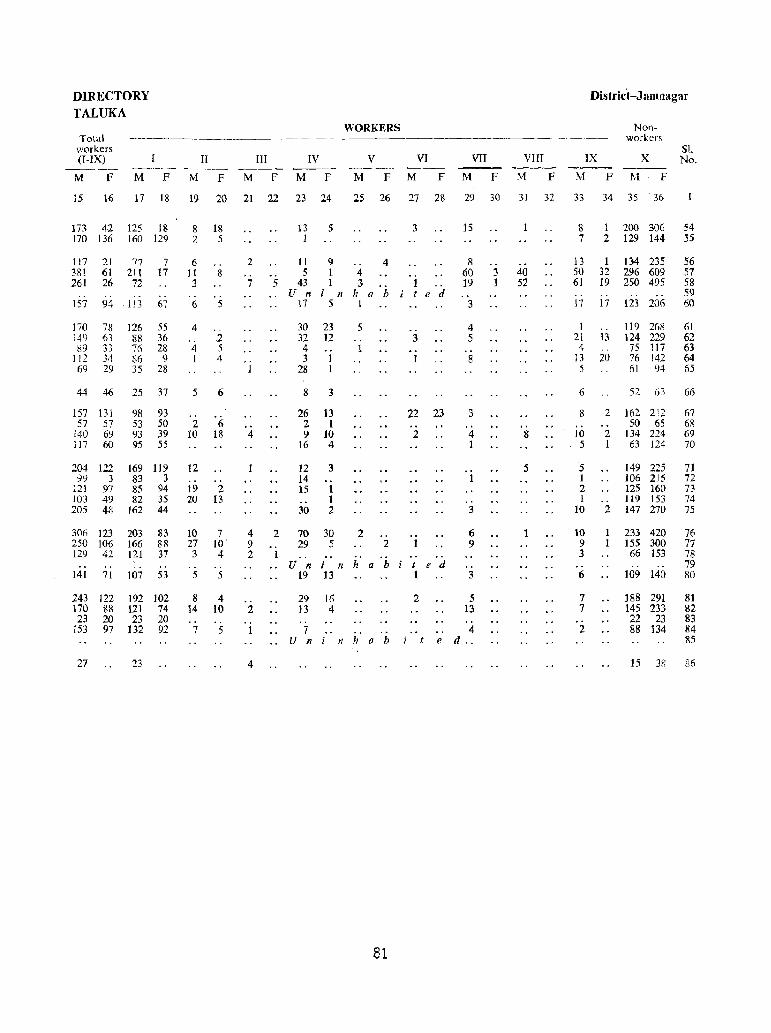
DIRECTORY Distric't -J amnagar
TALUKA WORKERS Non-
Total workers workers 5l. (I-IX) 1 II III IV V VI VII VIII IX X No.
---- _--_._- ----- --- --~---. -~-- ---M F M F M F M F M F M F M F M F M F M F M F
15 16 17 18 19 20 21 22 23 24 25 26 27 28 29 30 31 32 33 34 35 -36
173 42 125 18 8 18 13 5 3 15 8 1 200 306 54 170 136 160 129 2 5 1 7 2 129 144 55
117 21 77 7 6 .. 2 11 9 .. 4 8 .- 13 1 134 235 56 381 61 211 17 11 8 o. 5 1 4 60 3 40 50 32 296 609 57 261 26 72 3 7 5 43 1 3 19 1 52 61 19 250 495 5&
. , . . .. " . . U n i n h a b i t e d .. .- .. 59 157 94 113 67 6 5 17 S 1 3 17 17 123 206 60
170 78 126 55 4 .. 30 23 5 .. 4 1 .. 119 268 61 149 63 88 36 2 32 ]2 3 5 21 13 124 229 62 !l9 33 76 28 4 5 4 1 4 .. 75 117 63
112 34 :>6 9 1 4 3 8 13 20 76 142 64 69 29 35 28 1 28 5 61 94 65
44 46 25 37 5 6 8 3 6 52 63 66
157 131 98 93 26 13 22 23 3 8 2 162 212 67 57 57 53 50 2 6 2 1 .. SO 65 68
J40 69 93 39 10 18 4 9 10 2 4 8 10 2 134 224 69 117 60 95 55 16 4 1 5 1 63 124 70
204 122 169 119 12 12 3 5 5 149 225 71 99 3 83 3 14 .. 1 1 106 2J5 72
121 97 85 94 19 2 15 1 2 125 160 73 103 49 82 35 20 13 .. ) 1 .. 119 153 74 205 48 162 44 30 2 3 10 2 147 270 75
306 123 203 83 10 7 4 2 70 30 2 .. .. 6 1 10 233 420 76 250 106 166 88 27 10 9 " 29 5 2 1 9 9 155 300 77 129 42 121 37 3 4 2 1 .. 3 66 153 78 .. .. " .. U n i n h a b t e d .. .. .. 79
141 71 107 53 5 5 19 13 1 3 6 109 140 80
243 122 192 102 8 4 .. 29 16 2 5 7 188 291 81 170 88 121 74 14 10 2 !3 4 13 7 145 233 82 23 20 23 20 22 23 83
153 97 132 92 7 5 1 7 .. 4 2 88 134 84 U n i n h a b i t e d .. 85
27 23 4 15 3R 86
81


MAHAL : BHANVAD
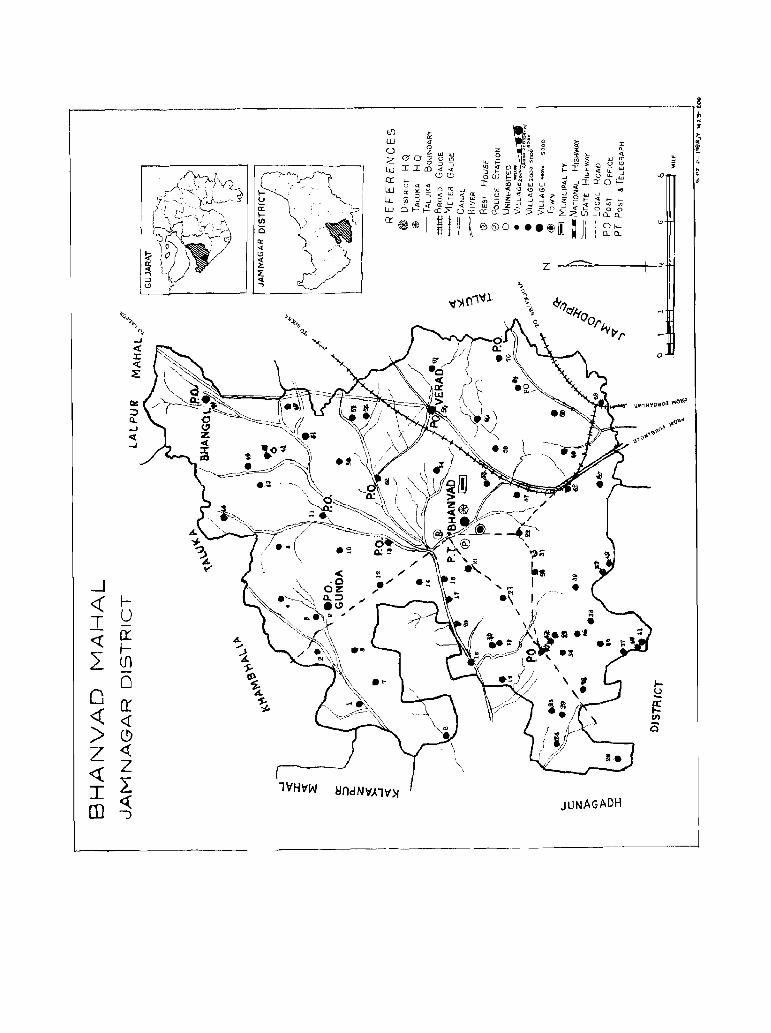
~ ~
" :t >;
! ~ , i .
N
'" • " .~ .. '.' .. . ..... / .. _ ~
. " .. ? ' , ...
. . ' ,
o
~
'" • _J
<t: l-
I u (X
~ l-I U)
,_ ~
0 ~
0 en
cr Q « «
> (.!) <t Z z <t 2: ~ndN\f)'lV)l
JUNAGADH I <{ OJ J
MAHAL
BHANVAD
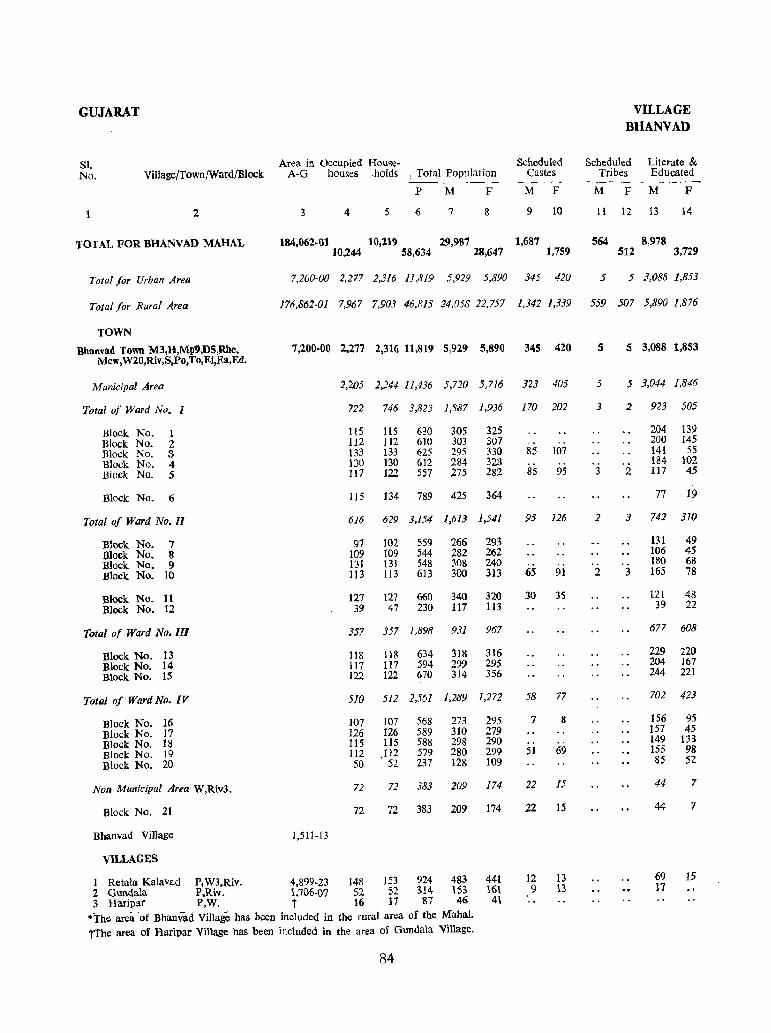
GUJARAT VILLAGE BHANVAD
SI. Area in Occupied House- Scheduled Scheduled Literate & No. Village/Town !Ward/Block A-G houses holds , Total Population Castes Tribes Educated
------ ---- ----P M F M F M F M F
2 3 4 5 6 7 8 9 10 11 12 13 14
TOTAL FOR BHANVAD MAHAL 184,062-01 10,11~ 29,98'1 1,68'7 S64 8,978 10,244 58,634 28,647 1,759 512 3,729
Total for Urban Area 7,200-00 2,277 2,316 11,819 5,929 5,890 345 420 5 5 3,088 1,853
Total for Rural Area 176,862-01 7,967 7,903 46,815 24.058 22,757 1,342 1,339 559 507 5,890 1,876
TOWN
Bhan"ad Town M3,H,Mp9,DS,Rhc, 7,200-00 2,277 2,316 11,819 5,929 5,890 345 420 S 5 3,088 1,853 Mew, W20,Riv,S,Po,To,Ei,Ea,Ed.
Municipal Area 2,205 2,244 11,436 5,720 5,716 323 405 5 5 3,044 1,846
Total of Ward No_ I 722 746 3,823 1,887 1,936 170 202 3 2 923 505
Block No. t 115 115 630 305 325 204 139
Block No. 2 112 112 610 303 307 .. -- 200 145
Block No. 3 133 133 625 295 330 85 107 141 55
Block No. 4 130 130 612 284 328 184 102
Block No. S 117 122 557 275 282 85 95 3 2 117 45
Block No. 6 115 134 789 425 364 77 19
Total of Ward No. II 616 629 3,154 1,613 1,541 95 126 2 3 742 310
Block No. 7 91 102 559 266 293 131 49
Block No. S 109 109 544 282 262 106 45
Block No_ 9 131 131 548 308 240 180 68
Block No. 10 113 113 613 300 313 65 91 2 3 165 78
Block No. 11 127 127 660 340 320 30 35 121 48
Block No. 12 39 47 230 117 113 39 22
Total of Ward No. III 357 357 ],898 931 967 677 608
Block No. 13 118 118 634 318 316 229 220
Block No. 14 117 117 594 299 295 204 167
Block No. 15 122 122 670 314 356 244 221
Total of Ward No. IV 510 512 2,561 1,289 1,272 58 77 702 423
Block No. 16 107 107 568 273 295 7 8 156 95
Block No. 17 126 126 589 310 279 157 45
Block No. 18 115 115 588 298 290 .. .- 149 133
Block No. 19 112 112 579 280 299 51 69 155 98
Block No. 20 50 52 237 128 109 85 52
Non- Municipal Area W,Riv3. 72 72 383 209 174 22 15 44 7
Block No. 21 72 72 383 209 174 22 15 44 7
Bhanvad Village 1,511-13
VILLAGES
I Retala Kalavad P,W3,Riv. 4,899·23 148 153 924 483 441 12 13 69 15
2 Gundala P,Riv. 1,706·07 52 52 3lt\. 153 161 9 13 17
3 Haripar P,W. t 16 17 87 46 41
*The are4 ofBhanva.d Village has been included in the rural area of the Mahal.
tThe area of Haripar Village has been included in the area of Gunda1a Village.
84
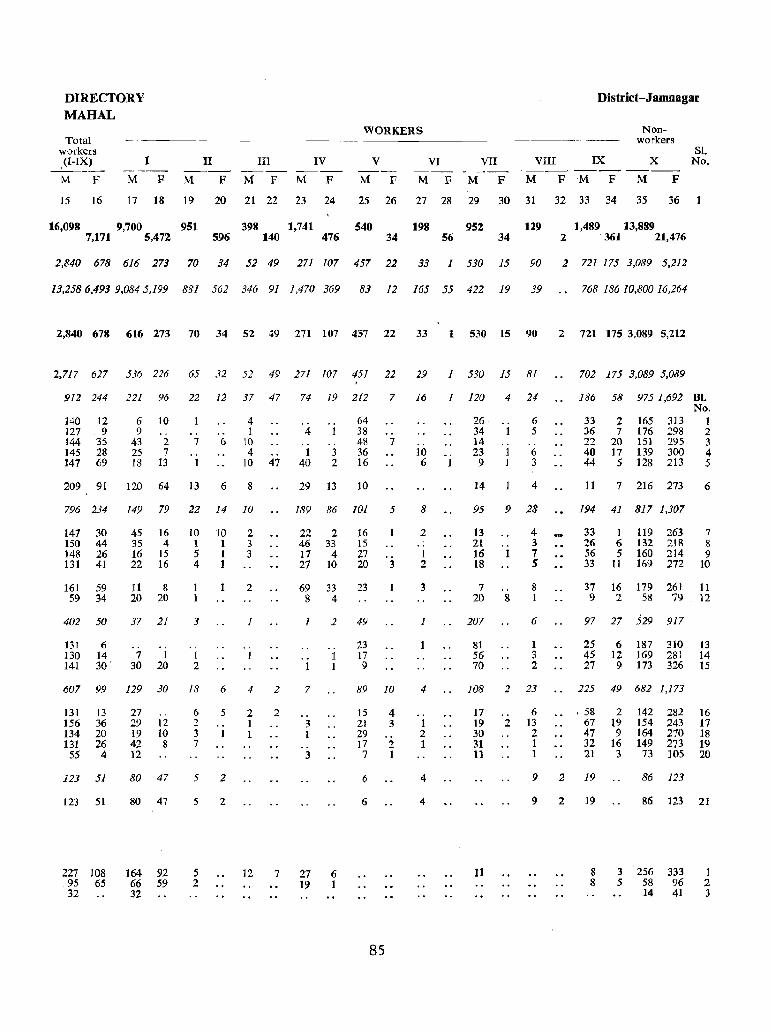
DIRECTORY MAHAL
Total workers (I-IX) 1
M F M F
II III IV ---- -- ----M F M F M F
WORKERS
V VI VII --M F M F M F
District-Jamnagar
Nonworkers
VIII IX X --- ---- ----M F M F M F
Sl. Noo
15 16 17 18 19 20 21 22 23 24 25 26 27 28 29 30 31 32 33 34 35 36
16,098 9,700 951 398 1,741 540 198 952 129 1,489 13,889 7,171 5,472 596 140 476 34 56 34 2 361 21,476
2,840 678 616 273 70 34 52 49 271 107 457 22 33 1 530 15 90 2 721 175 3,089 5,212
13,2586.493 9,0845,199 881 562 346 91 1.470 369 83 12 165 55 422 19 39 768 186 10,800 16.264
2,840 678 616 273 70 34 52 49 271 107 457 22 33 1 530 15 90 2 721 175 3,089 5,212
2,717 627 536 226 65 32 52 49 271 107 451 22 29 1 530 15 81 702 175 3,089 5.089
912 244 221 96 22 12 37 47
140 ]2 127 9 144 35 ]45 28 147 69
6 9
43 25 IS
]0 00
2 7
13
00
7 00
]
00
6
4 I
10 4
10
209 91 120 64 13 6 8
796 234 149 79 22 14 10
]47 30 150 44 ]48 26 131 41
]61 59 59 34
402 50
131 6 130 14 141 30'
45 ]6 35 4 16 15 22 ]6
11 8 20 20
37 21
00
7 1 30 20
10 ]0 1 1 5 1 4 1
3
00
I 2
2 3 3
2
1
.. 1
00
47
607 99 129 30 18 6 4 2
131 13 156 36 134 20 131 26
55 4
123 51
123 51
227 108 95 65 32
27 29 19 42 12
.. 12 10 8
80 47
80 47
164 92 66 59 32
6 2 3 7
5 .0 1
5 2
5 2
5 2
2 1 I
12
2
7
74
4 00
1 40
,
19 212
64 38 4ll 36 16
. . 3 2
29 13 10
7
00
7
189 86 /01 5
22 2 46 33 17 4 27 10
69 33 8 4
16 15 27 20 3
23
I 2 49
.0
1
7
00
3 I
3
27 19
o. 1 I
6 1
23 17 9
89 10
]5 21 29 17 7
6
6
85
4 3
2 1
16
10 6
8
2 00
1 2
3
1
4
00
1 2 1
4
4
1 120 4
26 .. 34 1 14 23 1 9 J
14
24
6 5
.. 6 3
4
95 9 28
13 2t 16 18
7 20
207
81 56 70
.0
1
00
8
4 3 7 5
8 1
6
1 3 2
J08 2 23
17 19 30 31 11
00
2 6
13 2 1 1
186
33 36 22 40 44
58 975 1,692 BI. Noo
Z 165 313 1 7 176 298 2
20 151 295 3 17 139 300 4
5 128 213 5
11 7 216 273 6
194 41 817 1,307
33 1 119 263 7 26 6 132 218 8 56 5 160 214 9 33 II 169 272 10
37 16 179 26l 11 9 2 58 79 12
97 27 529 917
25 6 187 310 13 45 12 169 281 14 27 9 173 326 15
225 49 682 1,173
. 58 2 142 282 16 67 19 154 243 17 47 9 164 270 18 32 16 149 273 19 21 3 73 105 20
9 2 19 86 123
11
9 2 19
8 8
86 123 21
3 . 256 333 5 58 96
14 41
1 2 3
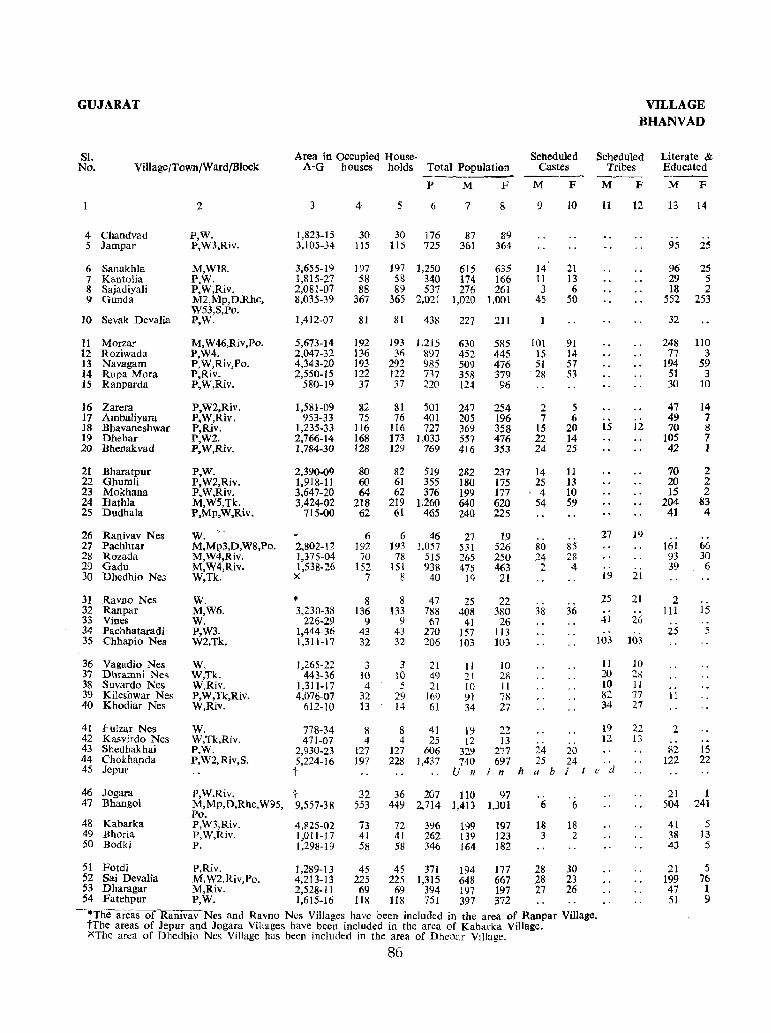
GUJARAT VILLAGE BHANVAD
SI. Area in Occupied House- Scheduled Scheduled Literate & No. Village/Town/Ward/Block A-G houses holds Total Population Castes Tribes Educated --- ----
P M F M F M F M F
2 3 4 5 <i 7 8 9 IO 11 12 13 14
4 Chandvad P,W. 1,823-15 30 30 176 87 89 5 Jampar P,W3,Riv. 3,105-34 115 115 725 361 364 95 25
6 Sanakhla M,WI8. 3,655-19 197 197 1,250 615 635 14 21 96 25 7 Kantolia P.W. 1,815-27 58 58 340 174 166 11 13 29 5 8 Sajadiyali P,W,Riv. 2,081-07 88 89 537 276 261 3 6 18 2 9 Gunda M2,Mp,D,Rbc, 8,035-39 367 365 2,021 1,020 1,001 45 50 55'2 253
W53,S,Po. JO Sevak Devalia P,W. 1,412-07 81 III 438 227 211 32
11 Morza!" M,W46,Riv,Po. 5,673-14 192 193 1,215 630 585 101 91 248 110 12 Roziwada P.W4. 2,047-32 136 36 897 452 445 15 14 77 3 I3 Navagam P,W,Riv,Po. 4,343-20 193 292 985 509 476 51 57 194 59 14 Rupa Mora P,Riv. 2,550-15 122 122 737 358 379 -28 53 51 3 15 Ranparda P,W,Riv, 580-19 37 37 220 124 96 30 10
16 Zarera P,W2,Riv. 1,581-09 82 81 501 247 254 2 5 47 14 17 Ambaliyara P,W,Riv. 953-33 7S 76 401 205 196 7 6 49 7 18 Bhavaneshwar P,Riv. 1,235-33 116 116 727 369 358 15 20 15 12 70 8 19 Dhebar P,W2. 2,766-14 168 173 ]'033 557 476 22 14 105 7 20 Bhenakvad P,W,Riv. 1.784-30 128 129 769 416 353 24 25 42 1
21 Bharatpur P,W. 2.390-09 80 82 519 282 237 14 11 70 2 22 Ghumli P,W2,Riv, 1,918-11 60 61 355 180 175 2S 13 20 2 23 Mokhana P,W,Riv. 3,647-20 64 62 376 199 177 , 4 10 15 2 24 Hathla M,W5,Tk, 3.424-02 218 219 1,260 640 620 54 59 204 83 2S Dudhala P,Mp,W,Riv. 715-00 62 61 465 240 225 41 4
26 Ranivav Nes W. ' '. 6 6 46 27 19 .. 27 19 27 Pachhtar M,Mp3,D,W8,Po. 2,802-12 192 ]93 1,057 531 526 80 85 161 66 28 Rozada M,W4,Riv. 1,375-04 70 78 515 265 250 24 28 93 30 29 Gadu M,W4,Riv. 1,538-26 152 lSI 938 475 463 2 4 39 6 30 Dhedhio Nes W,Tk. x 7 8 40 19 21 19 21
31 Ravno Nes W. * 8 8 47 25 22 25 21 2 32 Ranpar M,W6. 3,230-38 136 133 788 408 380 38 36 III 15 33 Vines W. W5-29 9 9 67 41 26 41 26 34 Pachhataradi P,W3. 1,444-36 43 43 270 157 113 25 5 35 Chhapio Nes W2,Tk. 1,311-17 32 32 206 103 103 103 103
36 Vagadio Nes W. 1,265-22 3 3' 21 II 10 11 10 37 Dhramni Nes W,Tk. 443-36 10 10 49 21 28 20 2ll 38 Suvardo Nes W,Riv. 1,311-17 4 5 21 10 ]I 10 II 39 Kileshwar Nes P,W,Tk,Riv. 4,076-07 32 29 169 91 78 82 77 11 40 Khodiar Nes W,Riv. 612-10 13 14 61 34 27 34 27
41 Fulzar Nes W. 778-34 8 8 41 19 22 19 22 2 42 Kasvirdo Nes W,Tk,Riv. 471-07 4 4 25 12 13 .. 12 13 43 Shedhakhai P,W. 2,930-23 127 127 606 329 277 24 20 82 15 44 Chokhapda P,W2,Riv,S. 5,224-16 197 228 1,437 740 697 25 24 122 22 45 Jepur t U n i n h a b i t e d
46 Jogara P,W,Riv. t 32 36 207 110 97 21 I 47 Bhangol M, Mp,D,Rhc, W95, 9.557-38 553 449 2,714 1,413 1,3Ul 6 6 504 241
Po. 48 Kabarka P,W3,Riv. 4.825-02 73 72 396 199 197 18 18 41 5 49 Bhoria P,W,Riv. 1,011-17 41 41 262 139 123 3 2 38 13 50 Bodki P. 1.298-19 58 58 346 164 182 43 5
51 Fotdi P,Riv, 1,289-13 45 45 371 194 177 28 30 21 5 52 Sai Devalia M, W2,Riv,Po. 4.213-13 225 225 1,315 648 667 28 23 199 76 53 Dharagar M,Riv. 2,528-11 69 69 394 197 197 27 26 47 1 54 Fatehpur P,W. 1,615-16 118 118 751 397 372 51 9
--*Theareas of Ramvav Nes and Ravno Nes Villages have been included in the area of Ranpar Village. tThe areas of Jepur and Jogara Villages have been included in the area of Kabarka Village. XThe area of Dhedhio Nes Village has been included in the area of Dhebar Village.
86
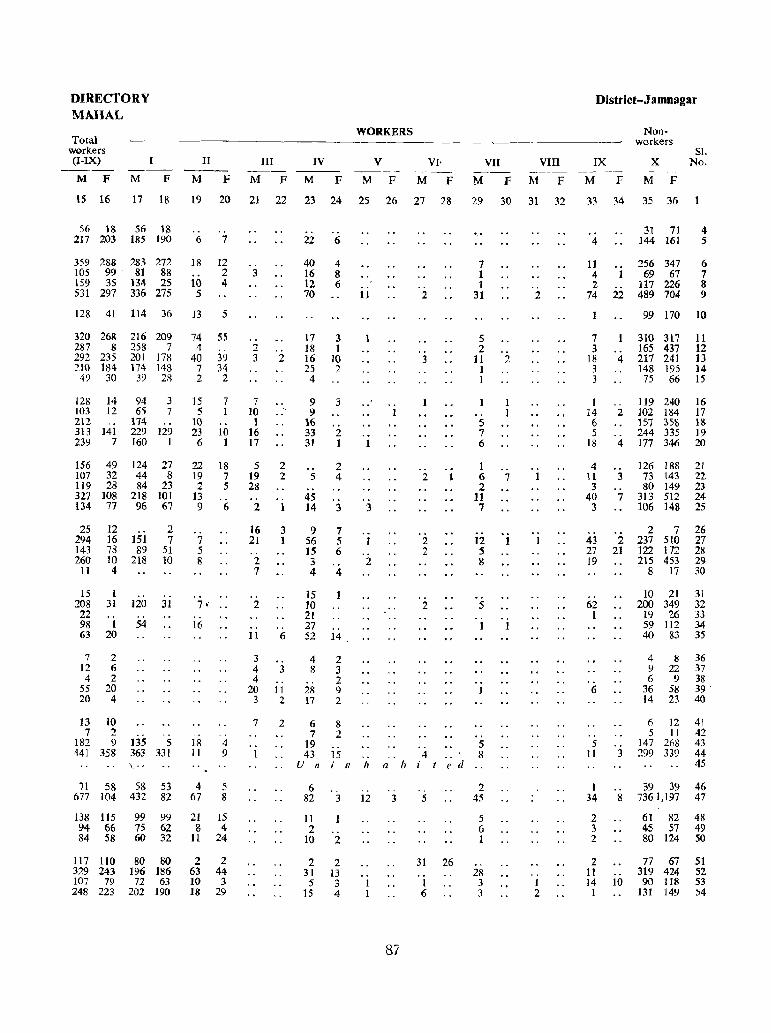
DIRECTORY MAHAL
Total w@rkers (I-IX)
M F
II
M F
III
M F
WORKERS
IV V VI: --~--.-
M F M F M F
VII
M F
VIII
M F M F
15 16 17 18 19 20 21 22 23 24 25 26 27 28 29 30 31 32
56 18 56 18 217 203 185 190
359 288 105 99 159 3S 531 297
283 272 81 88
134 2S 336 275
.. 6 7
18
10 5
12 2 4
128 41 114 36 13 5
320 268 287 8 292 235 210 184 49 30
216 209 258 7 201 178 174 148
39 2R
128 14 94 3 103 12 65 7 212 " .174 .. 313 141 229 129 239 7 160 1
156 49 107 32 119 28 327 108 134 77
25 12
124 27 44 8 84 23
218 101 96 67
294 16 ]51 2 7
51 10
143 78 89 260 10 218
11 4
15 208 22 98 63
I 31
I 20
7 2 12 6
4 2 55 20 20 4
13 10 7 2
182 9 441 358
.. " 120 31
54
'. 135 5 36} 331 \ ..
71 58 58 53 677 104 432 82
138 115 94 66 84 58
117 110 329 243 107 79 248 223
99 99 7'5 62 60 32
80 80 196 186 72 63
202 190
74 4
40 7 2
IS 5
10 23
6
22 19 2
13 9
7 5 8
55
39 34
2
7 I .. lD 1
18 7 5
6
7, ..
16
,. 18 1I
4 67
. . 4 9
5 8
21 15 8 4
11 24
2 63 10 18
2 44 3
29
.. 3
.. 2 3
7 10 1
16 17
5 19 28
2
]6 21
2 7
2
" 11
3 4 4
20 3
7
2
2 2
1
3 1
., 6
3 .. 11 2
2
.. .. 22 6
40 16 12 70
17 18 16 25 4
9 9
16 33 31
5
45 14
9 56 15 3 4
15 ]0 21 27 52
4 8
.. 28 17
6 7
19 43
U n
6 82
11 2
10
2 31
5 15
4 8 6
3 1
10 2
3
2 1
2 4
3
7 5 6
4
., ]4 .
2 3 2 9 2
8 2
15 i 11
.. 3
.. 2
2 13 3 4
11
., 1
3
]
2
.. 1
II a b
]2
0' I 1
.. 3
87
.. 2
3
.. 2
2 2
2
4 i ted
5
31
1 6
26
','
7 1 1
31
5 2
II 1 1
5 7 6
1 6 2
11 7
12 5 g
5
5 8
2 45
5 6 1
.. 28 3 3
2
1 1
., 7
2
1
.. 1 2
District-J amnagar
IX
M
Nonworkers
X
F M F
SI. No.
33 34 35 36
4
11 4 2
74
7 3
18 3 3
I 14 6 5
18
4 II 3
40 3
43 27 19
62 1
6
.. 5
11
I 34
2 3 2
2 11 14
1
31 71 144 161
4 5
256 347 69 67
117 226 22 489 704
6 7 8 9
4
.. 2
4
3
7
99 170 10
310 317 165 437 217 241 148 195
75 66
119 240 ]02 184 157 351) 244 335 ]77 346
126 ]88 73 143 80 149
313 512 106 148
2 7
11 12 13 14 15
16 17 1& 19 20
21 22, 23 24 25
2 237 510 21 122 172
215 453 8 17
26 27 28 29 30
3
.. 8
10
10 21 200 349
19 '26 59 112 40 83
31 32 33 34 35
4 8 36 9 22 37 6 9 38
36 58 39 14 23 40
() 12 5 II
147 268 299 339
39 39 7361,197
41 42 43 44 45
46 47
61 82 48 45 57 49 80 124 50
77 67 319 424 90 118
131 149
51 52 53 54
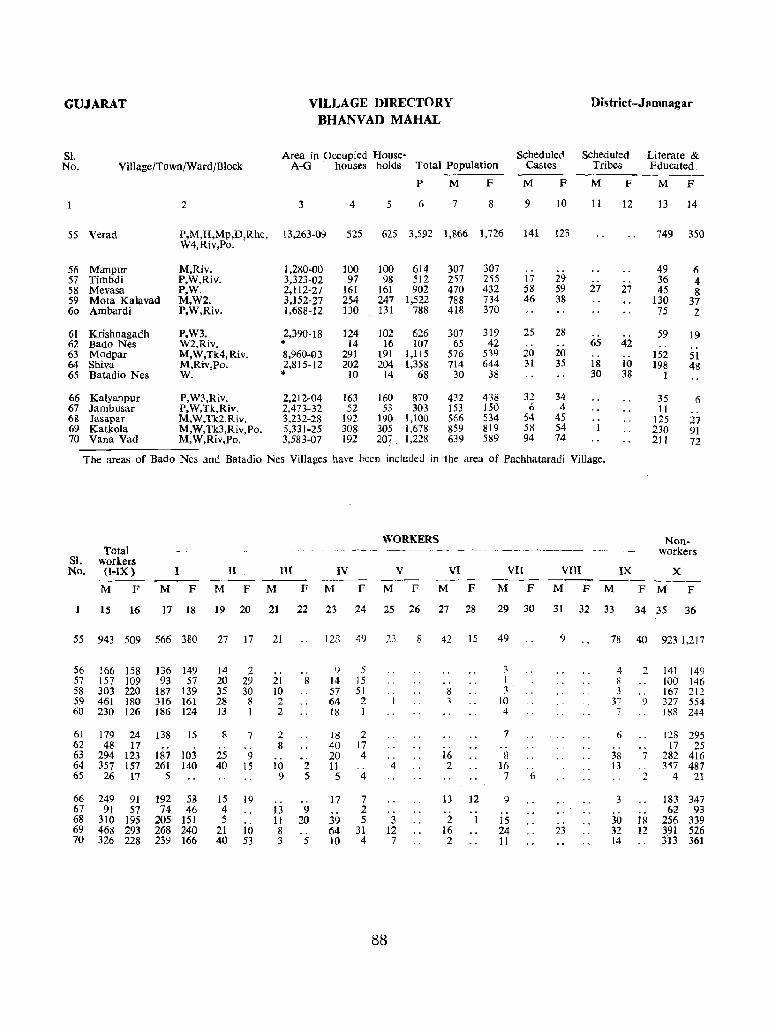
GUJARAT VILLAGE DIRECTORY BHANVAD MAHAL
District-Jamnagar
SI. No.
Area in Occupied House- Scheduled Scheduled Literate & A-G - houses holds Total population Castes Tribes Educated Village/Town/Ward/Block
2 3
55 Verad P,M,H,Mp,D,Rhe, 13,263-09
56 Manpur 57 Timbdi 58 Mevasa 59 Mota Kalavad 60 Ambardi
61 Krishnagadh 62 Bado Nes 63 Modpar 64 Shiva 65 Batadio Nes
66 Kalyanpur 67 lambusar 68 Jasa.par 69 Katkola 70 Vana Vad
W4,Riv,Po ..
M,Riv. P,W,Riv. P,W. M,W2. P,W,Riv.
P,W3. W2,Riv. M,W,Tk4,Riv. M,Riv,Po. W.
P,W3,Riv. P,W,Tk,Riv. M,W,Tk2.Riv. M,W,Tk3,Riv,Po. M,W,Riv,Po.
1,280-00 3,323-02 2,112-27 3,152-27 1,688-12
2,390-18 .. 8,960-93 2,815-12 .. 2,212-04 2,473-32 3,232-28 5,331-25 3,583-07
P
4 5 6
M
7
F
8
M
9
F
10
525 625 3,5~2 1,866 1,726 141 123
100 97
161 254 130
124 14
291 202 ]0
100 614 98 512
161 902 247 1,522 131 788
102 626 16 107
191 1,115 204 1,358
14 68
307 257 470 788 418
307 65
576 714
30
307 255 432 734 370
319 42
539 644
38
163 160 870 432 438 52 53 303 153 150
192 190 1,100 566 534 308 305 1,67& 859 819 192 207, 1,228 639 589
17 58 46
25 ., 20 31
32 6
54 58 94
29 59 38
28
20 35
34 4
45 54 74
M
11
27
65
18 30
The areas of Bado Nes and Batadio Nes Villages have been included in the area of Pachhataradi Village.
Sl. No.
Total workers (I-IX) I II III IV
WORKERS
V VI M F MFMFM FM FMF M F
IS 16 17 18 19 20 21 22 23 24 25 26 27 28
VII VIII
M F M F M
29 30 31 32 33
F
12
27
42
10 38
IX
M F
13 14
749 350
49 36 45
130 75
59
152 198
I
35 11
125 230 211
6 4 &
37 2
19
51 48
6 .. 27 91 72
Nonworkers
x F M F
34 35 36
55 943 509 566 380 27 J7 21 128 49 23 8 42 15 49 9 78 40 923 1,217
56 166 158 57 157 109 58 303 220 59 461 180 60 230 126
61 179 24 62 48 17 63 294 123 64 357 157 65 26 17
66 249 91 67 91 57 68 310 J95 69 468 293 70 326 228
136 149 93 57
187 139 316 161 186 124
138 15 ..
187 103 261 140
S
192 5~ 74 46
205 151 268 240 239 166
14 20 35 28 13
8
25 40
15 4 5
21 40
2 29 30 8 1
7
9 15
19
10 53
.. 21 10 2 2
2 8
10 9
13 11 8 3
.. 8
2 5
.. 9
20
5
t)
14 57 64 18
18 40 20 11
5
17
39 64 10
5 15 51 2 1
2 17 4
.. 4
7 2 5
31 4
88
.. 1
.. 4
.. 3
12 7
8 3
.. 16 2
13
2 16
2
12
3 I 3
10 4
7
8 16 7
9
15 24 11
6
23
4 h 3
37 7
6
38 13
3
30 32 14
2
9
.. 7
2
18 12
141 149 100 146 167 212 327 554 188 244
128 295 17 25
282 416 357 487
4 21
183 347 62 93
256 339 391 526 313 361

Copyright © 2022 FDOKUMEN