District Census Handbook, Yeotmal - Linguistic Survey Of India
301
CENSUS OF INDIA 1961 DISTRICT CENSUS HANDBOOK YEOTMAL Compiled by THE MAHARASHTRA CENSUS OFFICE BOMBAY I'rinted in India by the Manager, Government Press and Book Depot, Nagpur, and Published by the Director, Government Printing and Stationery Maharashtra State, BombaY-4 19 6 5 [Price-Rs. Eight]
-
Upload
khangminh22 -
Category
Documents
-
view
3 -
download
0
Transcript of District Census Handbook, Yeotmal - Linguistic Survey Of India

CENSUS OF INDIA 1961
DISTRICT CENSUS HANDBOOK YEOTMAL
Compiled by
THE MAHARASHTRA CENSUS OFFICE BOMBAY
I'rinted in India by the Manager, Government Press and Book Depot, Nagpur, and Published by the Director, Government Printing and Stationery
Maharashtra State, BombaY-4
1965
[Price-Rs. Eight]

CENSUS OF INDIA 196J
Central Government Publications
~sus Report, Volum!! X-Maharashtra, is published in the following Parts
I-A and B
I-C
II-A
II-B (i)
II-B (ii)
lI-C (i)
II-C (ii)
III
IV
V-A
V-B
VI (1--35)
VII-A
VII-B
VIII-A
VIII-B
IX
X (1-12)
General Report
Subsidiary Tables
General Popuiation Tables
General Economic Tables-Industrial Classification
General Economic Tables-Occupational Classification
Social and Cultural Tables
Migration Tables
Household Economic Tables
Report on Housing and Establishments
Scheduled Castes and Scheduled Tribes in Maharashtra-Tabf(s
Scheduled Castes and Scheduled Tribes in Maharashtra-Ethnographic Notes
Village Surveys (35 monographs on 35 selected villages)
Handicrafts in Maharashtra
Fairs and Festivals in Maharashtra
Administration Report-Enumeration (For official usc only)
Administration Report-Tabulation (For official use only)
Census Atlas of Maharashtra
Cities of Maharashtra
(15 Volumes-Four volumes on Greater Bombay and
One each on other eleven Cities)
State Government Publications
25 V oillmes of District Census Handbooks in English
25 Y olumes of District Census Handbooks in Marathi
Alphabetical List of Villages in ,.Maharashtra A-1812-i.b (Yeotmall

o '"
"
o
., " J i
'" J • U </I
\
t-
.. ' ,
_-t o
• •
/ '
Q
'I o

PREFACE
On the suggestion of the Census Commissioner, India, the Government' of -<Maharashtra .
decided to publish the District Census Handbooks on the basis of the material coll~ct.~~· during the 1961 Census for all the districts in Maharashtra. A Committee consisting of the"Execl!'tlve . Editor and Secretary of the District Gazetteers (Revision) Editorial Board, the Superintendent
of Census Ope'l:ations, Maharashtra, and the Director, Bureau of Economics and Statistfcs, Maharashtra, was appointed to determine the contents and review the drafts of each volume. This is one of the twenty-five volumes compiled in the Maharashtra Census Office and published
• under that scheme.
District Handbooks had been published from the 1951 Census data also. As in the past, the present volume contains a set of J 96 J Census Tables for the district and also presents basic demographic and economic information for each village separately. The following improvements have, however, been made in the 1961 series:-
(i) The addition of a eomprehensive note introducing the district;
(ii) The four-coloured map of the district;
(iii) Taluka maps showing the location of each village in the district supplemented by alphabetical lists of villages;
(iv) Supplementary information showing basic amenities available for each village; and
(v) Addition of Part III containing 33 Tables on other official statistics.
These new features will make the volume a valuable reference for the Central and State
Governments, District Administrators, departments engaged in planning and development work, legislators, private trade and business. Need for such material is far greater today as. the functions of planning and implementation of development schemes have now percolated: to district, taluka and village levels.
Marathi version of this volume is also being issued separately.
Part I of the volume presents villagewise statistics, Part II contains the 1961 Census Tables
prepared for the district and Part III cpntains official statistics on Climate, Rainfall, Agriculture, Industry, Education, Health and a few other aspects. An explanatory note is added
at the beginning of each par:t to describe the layout of the Tables and the terms or concepts
used. Parts I and II are based entirely on the data collected at the 1961 Census. Part III is based on the material furnished by the District Statistical Officer and the officers of the departments concerned. Villagewise populations shown in Part I are valid for Sunrise of 1 st March 1961 and are not adjusted for seasonal migration to or from other areas.
The introductory note at the beginning of the volume describes the present administrative set-up and some of the socio-economic facets of life in the district. It will illustrate how the statistics presented in the volume could be used for economic accounting or as controls of plan achievements in the district. F~rthis note, we have drawn heavily on the District Gazetteers
J-1812-ii-a (Yeotmal)

iv PREFACE
Survey and Settlement Reports, Annual Administration Reports and other Government publications. Some Heads of Departments also supplied the latest available material for the volume. We are indebted to them all.
Any views expressed in the introductory note or elsewhere in the volume are personal and the Government is not responsible for them.
In the Census Office, everyone has done something for this stupendous task of compilation and collation of statistics, preparation of notes and reading of proofs. I should specially
mention Shri N. Y. Gore, Tabulation Officer, for his sincere and thorough work on compilation and proof-reading of Part I, Shri G. S. Gokarn, Tabulation Officer, for his painstaking work
on MSS and proofs of Parts II and III, Shri S. K. Deshpande, Shri R. E. Chowdhary for assistance in preparing the introductory note, Shri S. Y. Pradhan and Shri B. M. Nagarkar, Draughtsmen, for Maps, Charts and Diagrams. Shri S. G. Deshpande of our office at Nagpur looked after the layout of the Tables and printing of the volume. Shri R. G. Phadke and Shri D. V. Rangnekar, Deputy Superintendents of Census Operations, and Shri G. M. Rajadhyaksha, Tabulation Officer, made valuable contributions at all stages and specially in the preparation of notes. Acknowledgments are due to Shri S. R. Desai, Manager, Government
Press and Book Depot, Nagpur, and Shri J. D. Gandhi, Manager, Government Photo
zincographic Press, Poona. In spite of heavy pressure of work on their presses they did their
best to print this volume speedily.
I am obliged to Shri Asok Mitra, I.e.s., Census Commissioner, India, for valuable
suggestions for improving this volume. I am also indebted to Shri Setu Madhava Rao and
Shri M. A. Telang, Members of the District Census Handbook Committee, who not only supplied useful material from their de~artments but also read through the MSS and encouraged
us through this venture,
BOMBAY: B. A. KULKARNI
The 3rd May 1965
J -1812-ii-B (Yeotmal)

CONTENTS
INTRODUCING THE DISTRICT Physical Features (I); Administrative Set-up (2); Zilla Parishad and Panchayat Samitis (5);
Village P3nchayats (8); Population (9); Languages (18); Religions (18); Scheduled Castes (19); Scheduled Tribes (2 T); Welface of Blckward Classes (22); Education (23); Health and Medical Amenities (27); Housing (28); Agriculture and Irrigatiol (29); Agrarian Structure and Land Reforms (37); Co-operation (38); Forests (41);
Fisheries(42); Mining and Quarrying (43); Indus~ries (43); Power (45); Trale and
Commerce (45); Communications and Transport (47); Construction (48); Other Services (48); Broad Aspects of Economy (49),
PART I-Village Directory
P ART II-Census Tables
PART III-Other Official Statistics
(Subjectwise Contents for Parts I, II and III may be seen at pages 2, 87 and 202, respectively)
LIST OF MAPS, CHARTS AND DIAGRAMS
Yeotmal District " ..
PAGES
(1)-(52)
1-83
8j-200
201-230
Frontispiece
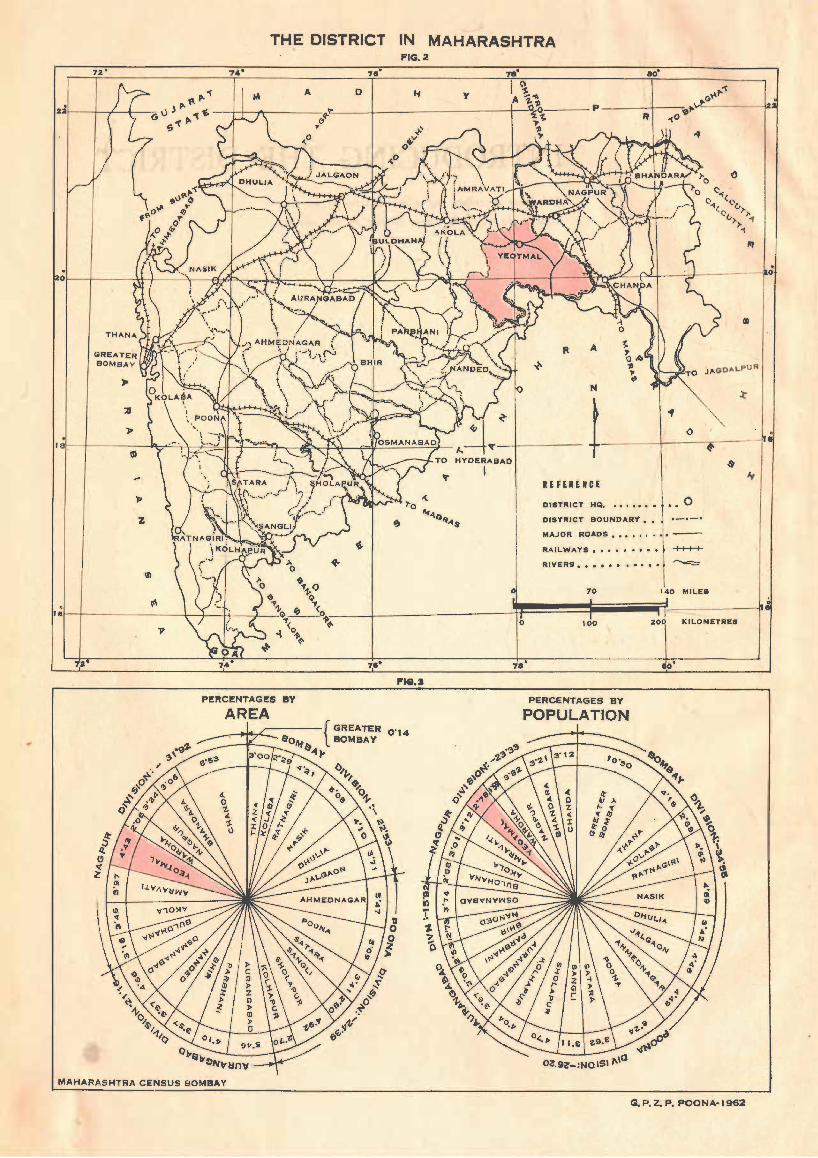
: : } Facing page ( I) The District in Maharashtra
Percentages by Area and Population
Population, 1901-1961 "
Variation in Population, 1951-1961
Density of Population, 1961
Distribution by Age-groups, 1961
Sex Ratio, 1901-1961
Marital Status, 1961
Literacy, 1901-1961
Literacy, 1961
Literacy and Educational Levels, 1961 .,
Land Utilisation
Crop Pattern
Distribution of Workers, 1961
Danvha Taluka
Yeotmal Taluka
Pusad Taluka
Kelapur Taluka
Wani Taluka
Weekly Markets
Fairs .. . .
(9)
(10)
(11)
(13)
(14)
(15)
(23)
(24}
(26)
(30)
(33)
(50)
Facing page 5
Facing page 21
Facing page 37
Facing page 53
Facing page 69
Facing page 228
Facing page 230


INTRODUCING THE DISTRICT This note describes the administrative set-up and
some socia-economic facets of life in the district
72 '
z
a
MAHARASHTRA CENSUS BOMBAY
THE DISTRICT IN MAHARASHTRA FIG. 2
7S' 7.' 80·
o y l~ A "i.~ ____ -+ __________________ -+ __ ~O------ p -------+---.
.,:~ 11 .,
CI
It A
~ J ... GD ... L-PUR
N .t
J ..
<)
REFEIIENCE
DISTRICT MQ. t 4 •• ••• •. 0 DIST"ICT BOUND ... RY ••
MAJOR ROADS ••• • •• • .I . --RAILWAYS... • • • .. • .. ... ++-t-t-
RIVERS ...... . .. . . . . 140 MIL-E.
110·
PERCENTAGES BY
POPULATION
G,P. z.P. POONA·rge2
INTRODUCING THE DISTRICT
PHYSICAL FEATURES
Most of the district belongs to the Balaghat, i.e., the southern plateau of Berar. On the north it extends into the Payanghat, i.e., the Berar valley and includes a small part of it which is a belt of plain from five to fourteen miles in breadth along the north of Yeotmal and Darwha talukas. This narrow belt is continued in the Wardha valley across the north of Kelapur taluka and the northern and eastern sides of Wani taluka.
Similarly, the Penganga river gives a strip of plain in many parts of its course on the southern border ?f the district. The tributaries of the Penganga agam have formed valleys often some miles in breadth through the hilly country.
The district lies between 19° 26' and 200 42' N. latitude and 77°18' and 79° 9' E, longitude. It is surrounded by Amravati district in the north, Chanda and Wardha districts in the east, Nanded district and Andhra Pradesh in the south and Akola and Parbhani districts in the west.
The area of the district is 5,219 square miles and its population in 1961 is 1,098,470. In terms of area and population it represents 4' 41 per cent and 2' 78 per cent of the State, respectively. The Figures facing this page show the position of the district in the State.
Hill Ranges The main system of hills is the Ajanta mountains.
The whole district is occupied by small east-west ranges of these mountains. The central portion of the district is a plateau with steep ghats, having an elevation of 1,000'-1,500' above mean sea level. The offshoots of the Ajanta ranges are at places broken by the broad valleys of the tributaries of the Penganga.
Important Rivers The chief rivers of the district are the Wardha
and the Penganga, both of which flow respectively along the northern and southern boundaries of the district. Each has numerous small tributaries.
The bed of the Wardha is broad and deep but the banks are sometimes overflowed in very large floods. The Wardha has two important tributaries, viz., the Bembala and Nirguda, both of them maintain flow throughout the year. The Bembala flows across the north of Yeotmal taluka below the ghats. The entire course of the Nirguda is in Wani taluka.
Penganga has six important tributaries, viz., the Pus, Arunavati, Adan, Waghadi, Khuni and Vidarbha. The Pus river flows through Pusad taluka, the Arunavati and Adan through Darwha
tal uk a, the Waghadi through Yeotmal and Kelapur tal uk as , the Khuni through Kelapur taluka and the Vidarbha through Wani taluka. These rivers maintain flow for the greater part of the year.
Climate Monthly temperature records are available only
for the station at Yeotmal (Table 1 in Part III).
The rainy season starts from June and lasts up to the end of October. It is followed by winter from November to February and summer from March to May. The climate is in general hot and dry with moderately cold winters. There is generally a breeze in hot season thus rendering it tolerable and pleasant.
Rainfall Table 2 in Part III shows figures of monthly
rainfall and number of rainy days for ten years from 1951 to 1960.
Rainfall is not uniform in all parts of the district. It increases from west to east. It is heaviest at Wani in the eastern region which gets an average of 1,125 mm. and lowest in Darwha in the west which gets 889 mm. of rain. The central region comprising Yeotmal taluka gets ),099'5 mm.
The rains start about the beginning of June and last till the end of October. The intensity of rainfall is heaviest in August.
Dependability of Rainfall and Scarcity Areas Mean rainfall at Pusad and Yeotmal is 928'88 mm.
and 1,074'93 mm. respectively. The standard deviation is 231'39 mm. and 239'52 mm. respectively. Coefficient of variability is 24'92 per cent and 22'29 per cent. Rainfall reliability is measured by the coefficient of variability. Variability is, in fact, inverse to reliability. The degree of reliability at these two stations in the district may, therefore, be said to be slightly high. The FactFinding Committee appointed by the Government of Bombay in 1960 had also reported that there is no tract in the district which can be regarded as a chronic scarcity or precarious area.
Soils , The soils of the district as a whole are uniformly
good in texture and vary in colour from black to dark brown. They are, however, slightly inferior in productive capacity to those in Akola and Amravati districts. Three defects are common all over the soils of the district, viz., (1) a mixture of pieces of chunkhadi (limestone), (2) sloping surface and (3) an excessive admixture of sand. However, the

(2) DISTRICT CENSUS HANDBOOK
soil varies from very fertile alluvial tracts in valleys to hilly and hard parts on the plateaus. The type of soil generally found in different parts of the district is detailed below;-
In Wani tal uk a, the soil is of uniform but coarse texture and of a reddish colour.
In Kelapur taluka and central and southern partS of Yeotmal taluka and hilly parts of Pus ad taluka, the soil is of coarse gravelly or loose friable texture and of a colour varying from light brown to grey.
In western part of Yeotmal taluka and middle portions of Darwha and Pusad talukas,Jich fertile alluvial soils are found.
Minerals Coal and limestone are the only important minerals
found in this district. There is a coalfield extending about 12 square miles in a tract starting from Pisgaon in Wani taluka and ending in Warora taluka in Chanda district. The reserves are estimated at 240 million tonnes. In 1960, about 68,000 tonnes of coal were mined in this taluka.· Deposits of limestone also occur in Wani taluka. In 1960, about 122,000 tonnes of limestone were mined. In 1954 a third mineral was explored and that was farashi stone. The farashi stone is located in Kelapur taluka and the production was about 13,000 tonnes in 1958.
Forests The forest area is spread in large patches over all
the talukas of the district. The total area under forests in the district is 1,510'18 sq. miles and accounts for nearly 29 per cent of the total geographical area of the district. The area under forests in the district is approximately 38 per cent of the total area under forests in Amravati Circle. Out of the total area of J,2J3'97 sq. miles under the Forl:st Department in 1961-62, the area under reserved forest was I, 141 . 02 sq. miles and unclassed forest was 72·95 sq. miles. An area of_ 296·2' sq. m.iles was under the Revenue Department.
The important forest produce of the district is teak, bamboo, grass and firewood.
Natural Zones The district can be divided into three broad natural
regions: (i) the Bembala-Wardha basin in the north, (ii) the plateau portion at the centre and in the south-west of the district, and (iii) the plain fertile lands of the Pusad-Penganga basin in the south.
The plateau has generally hard bar ad soils and grows cotton, tur and jowar. Both the valleys have very fertile soils and grow rich harvests of cotton and wheat.
Brief History ADMINISTRA TIVE SET-UP
Present Set-up Up to 1863, Yeotmal was a part of the East Berar
district. Talukas of Yeotmar: Darwha, Kelapur and Wun were separated from that district in 1864 to make a new district termed at first South-East Berar and afterwards Wun (Wani) district.
In 1905, the taluka of Pusad was transferred from Basim district to Wun district. The name of the district was changed in the same year from Wun to Yeotmal. Headquarters of the district had, however, always been at Yeotmal.
There were no major changes in the boundaries of the district or its talukas between 1911 and 1955.
With the reorganisation of States in 1956, the district was transferred from Madhya Pradesh to Bombay State. The district forms a part of Maharashtra since 1 st May 1960.
Name of District/Taluka Head quarters
(1) (2)
YEOTMAL DISTRICT .. Yeotmal 1 Darwha Taluka .. .. Darwha 2 Yeotmal Taluka .. .. Yeotmal 3 Pusad Taluka .. Pusad 4 Kelapur Taluka .. Pandharkaoda 5 Wani Taluka .. Wani
For administrative purposes, the district is at present divided in five talukas. The area, number of inhabited villages, number of towns, 1961 population and the position in the district by percentages of area and population for each taluka are as shown in the table below.
General Administration and Revenue The Collector is in charge of general administration,
law and order, treasury, land revenue and civil supplies. He is assisted by a Resident Deputy Collector in his office and five Deputy Collectors (working as Sub-Divisional Officers) who hold charge of the five revenue divisions and have their headquarters at Darwha, Yeotma}, Pusad, Kelapur and Wani, respectively. Each revenue division comprises one tahsil (taluka) which is in charge of a Tahsildar .. The Tahsildar is assisted by some Naib-Tahsildars.
Area in No. of No. of 1961 Percentage Percentage sq. miles In- towns population of of
haoited area population villages
(3) (4) (5) (6) (7) (8)
5,219 1,629 8 1,098,470 100·0 100·0 1,078 336 2 255,132 2M 23·2
908 317 1 207,366 17-4 18·9 1,285 319 2 265,033 24·6 24·1 1,086 336 2 197,270 20·8 18·0
862 321 1 173,669 16'5 15·8
)."EOTMAL: ADMINISTRATIVE SET-UP (3)
Land Revenue Settlements
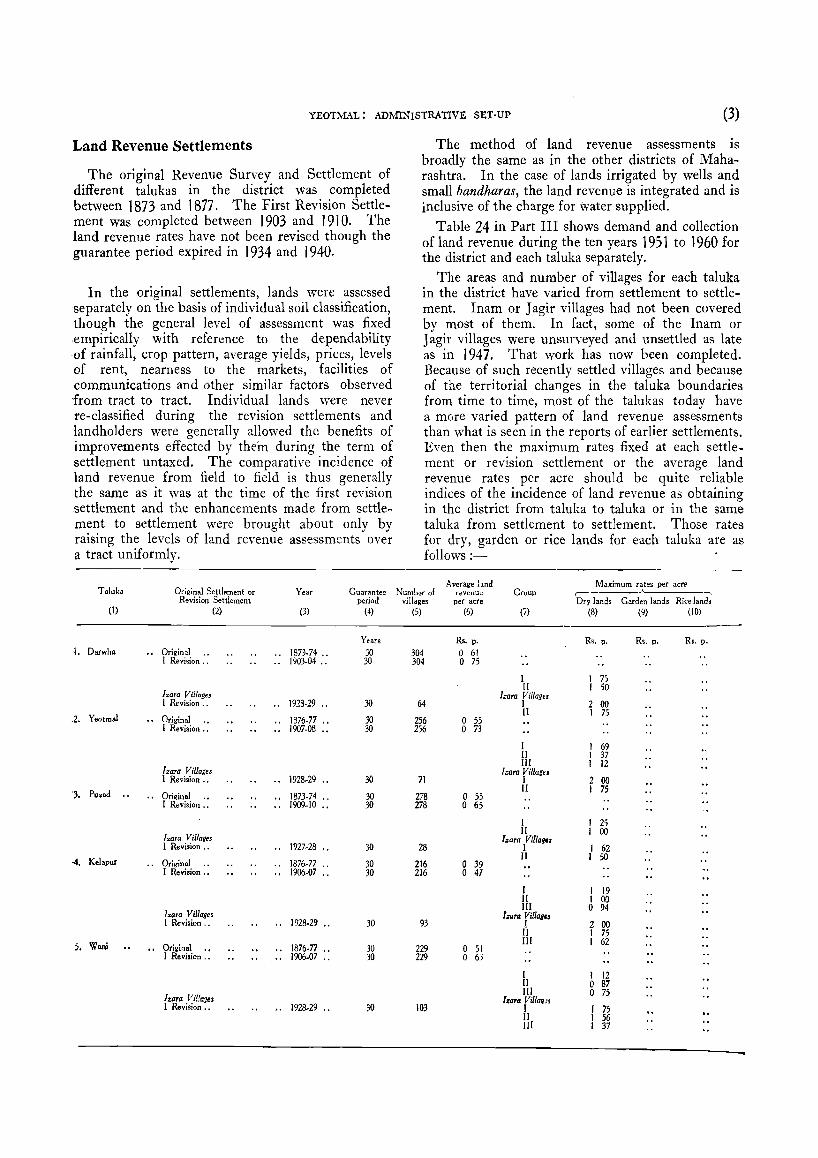
The original Revenue Survey and Settlement of ·different talukas in the district was completed between 1873 and 1877. The First Revision Settlement was completed between J 903 and J 9 J O. The land revenue rates have not been revised though the guarantee period expired in 1934 and J 940.
In the original settlements, lands were assessed separately on the basis of individual soil classification, though the general level of assessment was fixed empirically with reference to the dependability ·of rainfall, crop pattern, average yields, prices, levels of rent, nearness to the markets, facilities of communications and other similar factors observed from tract to tract. Individual lands were never re-classified during the revision settlements and landholders were generally allowed the benefits of improvements effected by them during the term of settlement untaxed. The comparative incidence of land revenue from field to field is thus generally the same as it was at the time of the first revision settlement and the enhancements made from settlement to settlement were brought about only by raising the levels of land revenue assessments over a tract uniformly.
Tahlka
(1)
. 1. Darwha
.2. Yeotmal
Original Settlement or Revision Settlement
•. Original .. I Revision ..
Izara V illag., I Revision ..
•• Original .• I Revision ..
Izara Vil/a;es I Revision ..
(2)
·3. Pu.ad • • • . Ori~inal .•
4. Kelapur
5. Wani
I Revision ..
Izara Villages I Revision .•
.. Ori~inal .. I Revision .•
Izara Villages I Revision .•
Original .• I Revision .•
Izara Vi!!~rlts I Revision .•
Year
(3)
.. 1873.74 .. .. 1903.04 ..
•• 1928·29 ..
.. 1876-77 ..
.. 1907·08 ..
.. 1928-29 •.
.. 1873.74 ..
.. 1909-10 ..
.. 1927.28 "
.. 1876.77 .. .. 1906-07 ..
.. 1928.29 ..
1876-77 .. 1906-07 ..
.. 1928-29 ..
Guarantee period
(4)
Years
30 30
30
30 30
30
30 30
30
30 30
30
30 30
30
The method of land revenue assessments is broadly the same as in the other districts of Maharashtra. In the case of lands irrigated by wells and small bandharas, the land revenue is integrated and is inclusive of the charge for \vater supplied.
Table 24 in Part III shows demand and collection of land revenue during the ten years 1951 to 1960 for the district and each tal uk a separately.
The areas and number of villages for each taluka in the district have varied from settlement to settlement. lnam or J agir villages had not been covered by most of them. In fact, some of the Inam or J agir villages were unsurveyed and unsettled as late as in 1947. That work has now been completed. Because of such recently settled villages and because of the territorial changes in the taluka boundaries from time to time, most of the talukas today have a more varied pattern of land revenue assessments than what is seen in the reports of earlier settlements. Even then the maximum rates fixed at each settlement or revision settlement or the average land revenue rates per acre should be quite reliable indices of the incidence of land revenue as obtaining in the district from taluka to taluka or in the same taluka from settlement to settlement. Those rates for dry, garden or rice lands for each taluka are as follows :-
Maximum rates per acre Number 01
villages
Average land revenue
per acre Group
~ _______ A---____ ~
Dry lan1s Garden lands Rice lands (5)
304 304
64
256 256
71
278 278
28
216 216
93
229 229
103
(6)
Rs. p .
o 61 o 75
0 55 0 73
0 55 0 65
0 39 0 47
0 51 0 63
(7)
I II
hara Villages I II
I II III
Izara Villages I II
I II
Izara Village, I II
[ II III
IZQra Villages ! II III
I II III
Izara Villaq~s I II III
(8) (9) (10)
Rs. p. R •. p. Rs. p.
75 50
2 00 1 75
69 37 12
2 00 1 75
1 25 1 00
1 62 I 50
1 19 1 00 0 94
2 00 1 75 1 62
1 12 0 87 0 75
75 56 37

(4) DISTRICT CENSUS HANDBOOK
Assembly and Parliamentary Constituencies
Since 1957 the district has eight Assembly constituencies. In 1957, Pusad and Wani constituencies were double-member constituencies with one of the two seats from Pusad reserved for Scheduled Castes and one of the two seats from Wani reserved for Scheduled Tribes. After abolition of the double-member constituencies in \ 961, the seat from U markhed is reserved for Scheduled Castes and the seat from Ye1abara is reserved for Scheduled Tribes.
The number of voters on rolls for each Assembly constituency in 1961 was as follows :-
No. of voters Assembly Constituency on rolls
1. Kelapur 64,783
2 Yeo:mal 65,027
3. Darwha 71,405
4. Digras 73,039
5. Pusad 71,205
6. Umarkhed 61,542
7. Wani 75,199
8. Yelabara 75,603
Total 557,803
In the 1962 General Elections, the Assembly constituencies of Kelapur, Yeotmal, Darwha, Digras, Pusad and U markhed together made one Parliamentary constituency called Yeotmal constituency and the remaining Assembly constituencies of Wani and Yelabara combined with Assembly constituencies of Hinganghat, Wardha, Pulgaon and Arvi from Wardha district made another Parliamentary constituency called Wardha constituency.
The total number of voters on rolls in the district in 1961 was 557,803. The total population aged 21 years and above according to 1961 Census is 548,246. Comparison can, however, be only approximate as the two figures relate to two different dates in the year 1961.
Administration of Justice
The District and Sessions Judge is the head of the Judicial Department in the district. The judiciary is entirely separated from the executive .. The Collector continues to be the District Magistrate and the Deputy Collectors and Tahsildars are vested with magisterial powers. But those powers are
limited to security proceedings under Chapter VIII, unlawful assembly under Chapter IX, public nuisances under Chapters X and XI and disputes as to immovable property under Chapter XII of the Criminal Procedure Code, and none of them ever tries any criminal case. The District Magistrate does not have any administrative control over the other magistrates who try crin-jnal cases in the district. This separation of the judiciary from the executive has been brought about in the district in the year 1959.
The District and Sessions Judge is assisted by one Civil Judge (Senior Division). He has jurisdiction over the entire district. He h'1s unlimited civil jurisdiction in the district.
There are five Civil Judges (Junior Division) and First Class Judicial Magistrates with headquarters at different taluka places. They have civil jurisdiction up to Rs. 10,000 and criminal powers.
Police
The Police force in the district functions under the (District) Superintendent of Police who is assisted by two Deputy Superintendents and two Circle Police Inspectors. There are 23 Police Stations in the district. Their headquarters and jurisdictions are shown below:-
Police Station No. of Headquarters Villages
Darwha Taluka 1. Darwha 96 2. Digras 60 3. Ladkhed 70 4. Ami 77 5. Ner 102
YeotmaI Taluka 6. YeotmaI 70 7. Kalamb 114 8. Babhulgaon " 103 9. Wadgaon 79
Pusad Taluka 10. Pusad 87 11. Jawla 53 12. Mahagaon 99 13. Umarkhed 74 14. Bittargaon 71
Kelapur Taluka 15. Pandharkaoda 119 16. Wadki 53 17. Ralegaon 75 18. Ghatanji 59 19. Parwa 80
Wani Taluka .. 20. Wani 83 21. Shirpur 84 22. Maregaon 111 23. Patan 100
Average number of villages and population per police station in the district is 83 and 47,760 against 69 and 62,547 in the State, respectively.
Crime statistics for the district for the years 1950. 1955 and 1960 have been shown in Table 28 in Part III.

YEOT;\IAL: ADMINISTRATIVE SET-UP (5) Municipalities
All the eight towns in the district have Municipal
Committees established under the Central Provinces
and Berar Municipalities Act, J 922. The year of
establishment, the year of the last general election,
the term of the elected body, the total nU1Y',ber of
elected councillors and the number of seats reserved
for Scheduled Castes and Scheduled Tribes and
for womw are shown below for each :\lunicipality separately.
The municipality at Yeotmal is the oldest of all. I t is more than sixty years old.
The eight municipalities together cover the entire
urban population or J 2' 61 per cent of the total J 96 J
population of the district.
Year of Year of Serial Name of the Municipality establish- ti,e last
No. mf'nt General Election
(1 ) (2) (3) (4)
Pandharkaoda 1931 1960
2 Digras 1924 1959
3 Wani 1924 1959
4 Gbatanji 1931 1959
5 Umarkhed ., 1939 1959
6 Pmad .. 1931 1961
7 Darwha 1931 1960
8 Yeatmal 1897 1960
The taxation level of each of the 'Uunicipalities is shown below :-
Year 1961-62
Name of the 1961 ----"--------..,
To~al Receipts Per capita Municipality Population ReceIpts from Municipal
Municipal tax talles
Rs. Rs, Rs. nP.
1 Darwha 11,540 17,745 93,583 8 10
2 Digras 15,525 3,09,374 81,141 5 23
3 Yeotmal 45,587 9,22,078 3,88,330 8 52
4 Pusad 18,002 5,55,636 2,55,023 14 17
5 Urnarkheci " 12,647 2,18,923 97,490 7 71
6 Ghatanji 6,443 1,69,806 38,934 6 04
7 Pandharkaoda 10,605 2,71,905 1,10,935 10 46
8 Wani 18,176 7,73,552 3,20,702 17 64
Statutory 1961 Total No. Seats reserved for term in Population of Muni- ~--,
years cipal Sche- Sche- Women Councillors duled duled
Castes Tribes
(5) (6) (7) (8) (9) (10)
5 10,605 11
5 15,525 15 2
5 18,176 14
j 6,443 14
5 12,647 13 2
5 18,002 16
5 11,540 11
5 45,587 24
ZILLA PARISHAD AND PANCHAYAT SAMITIS
With a VLew to promoting development of demo
<:ratic institutions and securing greater measure
of participation by the people in Development Plans
and in local and governmental affairs bv decentralisation of powers and functions, a Zilla • Parishad and J 4 Panchayat Samitis have been established in
the district in the year ) 962 under the Maharashtra Zilla Parishad and Panchayat Samitis Act of J 962.
The area under the jurisdiction of the Zilla Parishad
corresponds to the district boundaries except ror the J-1312-iii-a (Yectmal)
eight Municipal towns which are not covered by them. The Zilla Parishad covers 92'20 per cent of
the area and 87'39 per cent of the total population
of the district. The Zilla Parish ad covers the entire
rural population and does not include any urban
population. The number of villages and population
included under the Zilla Parishad and each
Panchayat Samiti are shown on page (6). The position of each Panchayat Samiti in the Zilla Parishad is also shown separately by percentages of area and population in J 96 J •

(6) DISTRICT CENSUS HANDBOOK
No. of in- No. of non- Population Percentage Percentage Name of Area in habited municipal in 1961 by by
Headquarters sq. miles villages towns area population
(I) (2) (3) (4) (5) (6) (7) (8)
Zilla Parishad, Yeotmal Yeotmal 4,811'9 1,629 959,945 100·0 100'0
I. Darwha Panchayat Samiti .. Da""ha 249·7 93 54,177 5·2 5-6
2. Ner Panchayat Samiti Ner 381·1 129 85,159 7-9 8'9
3. Digras Panchayat Samiti •. Digras 455·2 114 88,731 9·5 9'2
4. Yeotmal Panchayat Samiti Yeotmal 284·8 82 46,635 5·9 4-9
5. Babhulgaon Panchayat Babhulgaon 21702 97 52,978 4·5 50S Samiti.
6. Kalamb Panchayat Samiti Kalamb 349·8 138 62,166 7·3 6'5
7. Pusad Panchayat Samiti .. Pu~ad 377·5 105 74,463 7-8 7·8
8. Mahagaon Panchayat Mahagaon 383-5 105 79,171 8·0 8'2 Samiti.
9. Umarkhed Panchayat Umarkhed 353-8 109 80,750 7·4 8·4 Samiti.
10. Pandharkaoda Panchayat Pandharkaoda .. 255·0 105 51,911 5'3 5-4 Samiti.
11. Ralega on Panchayat Samit( Ralegaon 315·3 112 58,656 6·5 6·1
12. Ghatanji Panchayat Samiti Ghatanji 370·7 119 69,655 7'7 7·3
13. Wani Panchayat Samiti .. Wani 346·3 131 77,769 7·2 8·1
14. Maregaon Panchayat Samiti Maregaon 472-0 190 77,724 9·8 8·1
NOTE.-The area figures in column (3) are 'according to Blockwise Cens~s Abstract and do not agreewith .the figure given in Primary Census Abstract, Part II-A of the Maharashtra Census Report. The difference may be due to the mcluslOn of reserved forest areas in the latter.
Constitution
The Zilla Parishad has 49 directly elected councillors. Out of these 49 seats, 2 seats are reserved for Scheduled Castes and 5 for Scheduled Tribes. In addition, a woman councillor has been co-opted by the elected councillors. There are five associate councillors who are chairmen of five federal cooperative societies conducting business in the district. The elected chairmen of 14 Panchayat Samitis (block committees) are also ex-officio councillors.
At the Block level, the Panchayat Samiti consists of all elected and co-opted councillors from the area of the Block and a chairman of a co-operative society conducting the business of purchase and sale of agricultural produce in the area of the Block as an associate member and a chairman of a co-operative society conducting the business in agriculture in the area of the Block as a co-opted member. Sarpanchas elected by members of Village Panchavats are also elected members of the Panchayat Sa~iti. Their number is at the rate of two for each electoral division in the area of the Block.
J-1812-iii-b (Yeotmal)
Elections were held in the year J 962.' The term of office of the councillors is five years. The Zilla Parishad has elected the President and Vice-President from amongst the elected councillors.
An officer in the senior scale of LA.S. works as the Chief Executive Officer to the Zilla Parishad. The Parishad is also assisted by various departments and the heads of those departments at the district level are officers of Class I or Class II Service under the State Government. At the Block level. the Panchayat Samitis have elected Chairmen and Deputy Chairmen. The Block Development Officers work as Secretaries to the Panchayat Samitis. The executive authority for the purpose of carrying out the provisions of the Maharashtra Zilla Parishad and Panchayat Samitis Act vests in the Chief Executive Officer and the Block Development Officers. The Deputy Chief Executive Officer works as Secretary to the Zilla Parishad.
Committees and Office-bearers
The Zilla Parishad functions through a Standing Committee presided by the President and six Subject Committees for Finance, Works, Agriculture,

y£OTMAL: ZILLA PARISILm AND PANCHAYAT SAMITIS (7)
Co-operation, Education and Healt~. Tw~ Subject Committees are presided by the Vice-P.resIden~ and four by two Chairmen elected by the ZIlla Par~shad to preside over two specified Subject CommIttees each. The Deputy Chief Executive. Officer w.orks as Secretary of the Standing CommIttee, whIle t.he District Heads of Departments work as Secretanes to the Subject Commi~tees conce~ned. .Co-or?ination between the Subject CommIttees IS achIeved through the Standing Commi~tee which .includes the Chairmen of all the Subject CommIttees as members.
The Panchayat Samitis do not have Subject Committees.
The elected President of the Zilla Parishad is paid an honorarium of Rs. 500 per month. The VicePresident and the two Chairmen of the Subject Committees are paid an honorarium of Rs. 300 per month. The elected Chairmen and Deputy Chairmen of the Panchayat Samitis are paid an honorarium of Rs. 300 and Rs. 150 per month, respectively. All these persons are also provided with rent-free accommodation as is deemed suitable for them by the Zilla Parish ad.
Functions
The Divisional and State Officers of the Government continue to exercise technical supervision and give guidance to Zilla Parishad and Panchayat Samitis. The State Government has powers to give direction to the Zilla Parishad regarding works and schemes in the interest of National or State Development Plans. Inspection and supervision are carried out by the Divisional Commissioners.
Except for a few safeguards, the developmental and administrative functions of Government are now, with the creation of these democratic bodies at the district and block level, devolved on them. In other words, the State Government has divested itself of the responsibility of local activities which are now left to the people's initiative and resources.
The developmental and administrative subjects transferred to the Zilla Parish ad and Panchavat Samitis have been listed in Schedules I and I( to the Maharashtra Zilla Parishad and Panchayat Samitis Act. By and large, all functions of Government administration including development activities at the district level, but excluding matters relating to law and order, judicial and quasi-judicial functions and development functions involving high technical skill like Research Stations, etc., have been devolved on the Zilla Parish ad and Panchayat Samitis. All Class III and Class IV employees of the Government Departments now transferred to the Zilla Parish ads have been absorbed as employees of the Parishad. The Village Talati (or Patwari)
and the entire village establishment of the Revenue Department have been transferred to the Paris~ad through the Village Panchayats, though for collectIOn of land revenue and maintenance of Record of Rights they continue to work under the Revenue Officers.
The Zilla Parishad has replaced the erstwhile statutory bodies known as J anapad ?abhas and District Panchayat Mandai. The functIOns of nonstatutorv body known as the District Development Board h~ve of course been absorbed. Municipalities, however, remain unaffected as municipal areas are excluded from the jurisdiction of the Zilla Parishad.
Finance The law provides for levy of a cess at the rate of
twenty naye paise On every rupee of land revenue and at a rate not exceeding nineteen naye paise per rupee of water rate. The Zilla Parishad can levy taxes on profession, trade, calling or employment and taxes on water supply, public entertainments, amusements and pilgrims, special tax on land and buildings and other taxes. The stamp duty on transfer of certain immovable properties may be increased by one-half per cent by Government for payment to the Zilla Parishad.
The financial assistance .given by the State Government includes 70 per cent of the land revenue collected within the area of the Parishad. When, however, the amount of land revenue payable falls short of the amount arrived at on the basis of two rupees per capita of the population of the district as appearing in the Census of 1961, an equalisation grant covering the difference will be paid to the Zilla Parishad. Government also pays what are called purposive grants being grants for specific works and development schemes transferred to the Zilla Parish ad at the rate of not less than 75 per cent of the expenditure. An establishment grant equal to 75 per cent of the average annual cost on account of salaries and allowances is paid in respect of the posts held by the staff of Government transferred to the Parishad which are included in the District Technical Service (Class III) and District Service (Class III) and District Service (Class IV). The other grants include a deficit adjustment grant payable at full rates during the first five years and to be progressively reduced in the next ten years after which it will not be payable, incentive grants calculated to achieve speedier development and grants for Plan schemes. If in pursuance of the proposal of a Zilla Parishad or a Panchayat Samiti, a cess on land revenue at a rate in excess of the minimum rate prescribed by the Act is levied by the State Government in the whole of the district or in block, the Zilla Parish ad or the Panchayat Samiti, as the case may be, shall be paid every year by the State Government a grant called the local cess matching grant.

(8) DISTRICT CENSUS HANDBOOK
The total revenue receipts of the Zilla Parishad for the year 1963p64 are Rs. 128 lakhs. The major portion of the receipts is of receipts from Government. These are 97'5 per cent and the Zilla Parishad receipts are 2'5 per cent of the total revenue receipts. Major items of Zilla Parishad's receipts are local fund cess, cess on water rates and profession tax.
The total revenue expenditure is Rs. 132 lakhs. Following are the major items of expenditure :--
Per cent
General Administration .. 3"6
Education ., 49' 8 Community Development Project 10'9 Buildings and Communications ., 10'0 Miscellaneous 10'2 Other items 15' 5
The Zilla Parishad did not levy any new taxes in the first year in the budget for the year 1963p64 It has, however, considered to levy the following taxes in the near future :-
Tax on-(1) profession, trade, callings; and
(2) entertainment and amusements.
Similarly the Parishad h as decided to collect fees in the public markets in the district and it would share the revenue from this so urce with the respective Gram Panchayats in the rat io of 40: 60.
Per capita annual expenditure of the Zilla Parishad on different development heads is as follows :-
General Administration .. Education ., Community Development Buildings and Communications
Establishment
Rs. 0"49 6'78 1"49 )'36
The establishment of the Zilla Parishad comprises the gazetted and the nonpgazetted staff. The nonp
gazetted staff consists of the employees of the former local bodies and those of the various State Governp ment Departments now transferred to the Zilla Parishad.
There are 5 Class I and 38 Class II Gazetted Officers working under the Zilla Parishad. The total strength of the non-gazetted employees of Class III and Class IV categories is 7,663. Moreover, an establishment of 1,112 Gram Sevaks, 783 Talatis and 122 Village Panchayat Secretaries has been transferred from the Revenue Department to the Zilla Parish ad.
VILLAGE PANCHAYATS
The number of independent village panchayats in each taluka, the names of blocks in each taluka, the number of group village panchayats and the number of villages covered by group village pancha-yats are shown below :-
No. of No. of No. of No. of inhabit- indepen- group villages
Taluka Block ed dent village covered villages' village pancha- by group
pancha- yats village yats panchayats
( 1) (2) (3) (4) (5 ) (6) Darwha Darwha 93~
Ner 129 139 71 253 Digras 144J
2 Yeotmal Yeotmal 82, Babhulgaon 97 J 110 60 235 Kalamb 138
3 Pusad •. Pusad 105} Mahagaon .. 105 148 50 139 Umarkhed .. 109
4 Kelapur Pandharkaoda lOS} Ralegaon 112 114 86 282 Ghatanji 119
5 Wani .. Wani 13IL 78 69 197 Maregaon .'. 190J
Total .. 1,629 589 336 1,106
NOTE.-Thc figures in column (6) perhaps include hamlets. entries in columns (4) and (6) will not, therefore, tally with the entries in column (3).
The break-up of the total annual income of all the village panchayats in the district for the year 1961-62 is as follows :-
Item
Grants Tal!;es on houses and properties ..
Octroi
Other ta~es .. Total taxes .. Income from other sources
Total Income
Percentage Amount of total
(in' 000) income
Rs.
842 149
Nil 355 504
2 1,348
62'46 11·05
26'34 37'39 0·15
100'00
The first item includes the Government grant of 30 per cent of the land revenue collected in the village or one rupee per head of population whichever is more.
The yillage panchayats also get the entire local fund cess collected in the village. At present it is collected at 20 nP. per rupee of land revenue. The village panchayats can raise it with Government approval up to 100 nP. per rupee of land revenue .
All the 925 village panchayats have imposed taxes on houses and properties.
YEOThUL: YILLAGE PANCHAYATS (9)
The break-up of the total annual expenditure of all the village panchayats in the district for the year 1961-62 is as follows :~
Item
Administration Health and Sanitation Public Lighting Other itcm~ .. Total Expenditure ..
Amount (in '000)
Rs. 204
87 64
854 1,209
Percentage of total expcndi.
turc
\6·87 7·20 5·29
70·64 100·00
Other items include improvement of village roads, construction of new drinking water wells or repairs to old wells, construction of Panchayat Ghars, schools and such other buildings.
Functions of the Talati (Patwari), Village Panchayat Secretary and Assistant Gram Sevak are now combined in one official who now works under the Village Panchayat.
POPULATION
Table A-I in Part II shows the \961 population of the district and each taluka for total, rural and urban areas separately. Defini~ion of rural and urban areas may be seen in paragraphs 8 and 9 of the Explanatory Note to Part II. Table A-II shows the district population and its variation at each Census since 1901 and the variation in population for each taluka during 1951-1961.
Variation
The population of the district and decade variation rates since t 90 I are as follows :-
Year Population Decade Rate of Variation Variation
1901 577,101
1911 724,410 + 147,309 +25.53
1921 748.959 + 24,549 +3·39
1931 857,288 + 1 08,329 + 14·46
1941 887,738 +30,430 +3'55
1951 931,982 +44,244 +4·98
1961 ' .. 1,098,470 + 166,488 + 17·86
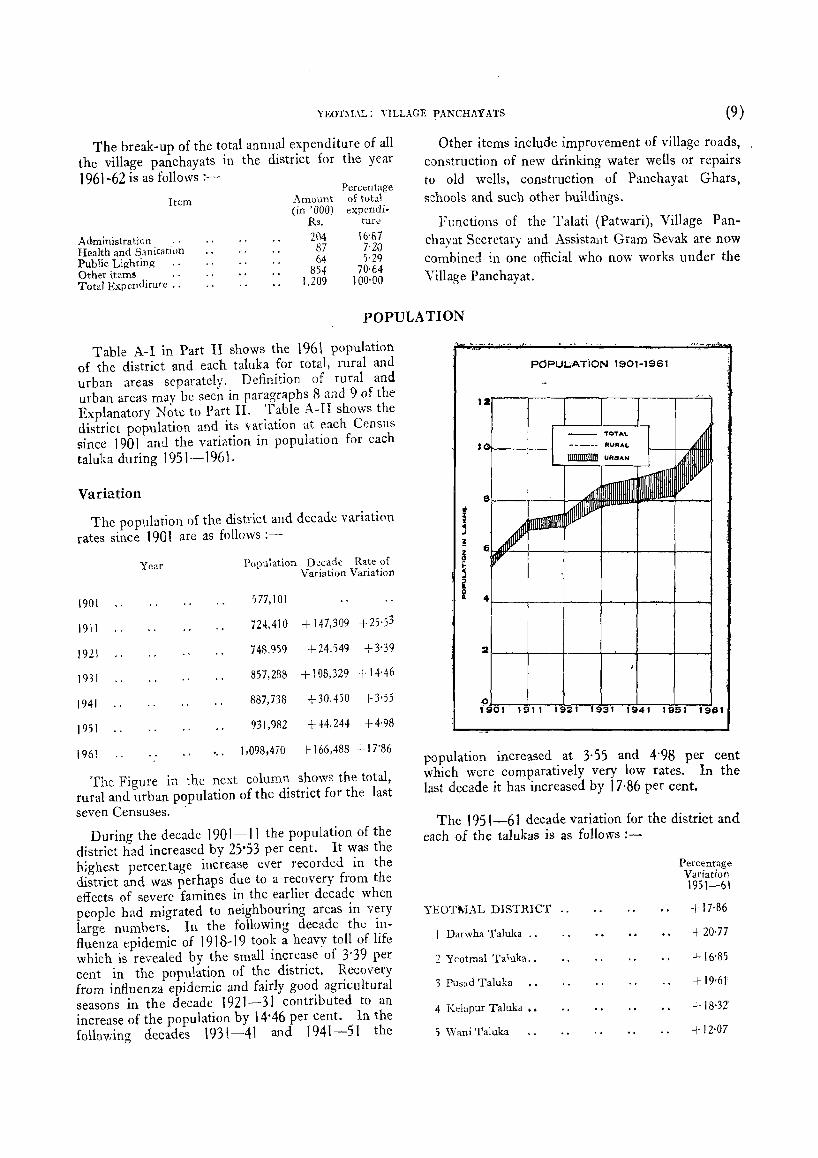
The Figure in the next column shows the total, rural and urban population of the district for the last seven Censuses.
During the decade 1901-11 the population of the district had increased by 25'53 per cent. It was the highest percentage increase ever recorded in the district and waS perhaps due to a recovery from the effects of severe famines in the earlier decade when people had migrated to neighbouring areas in very large numbers. In the following decade the influenza epidemic of 1918-19 took a heavy toll of life which is revealed by the small increase of 3-39 per cent in the population of the district. Recovery from influenza epidemic and fairly good agricultural seasons in the decade 1921-31 contributed to an increase of the population by 14'46 per cent, In the following decades \ 931 ~41 and 1941-51 the
PC;PUL.;ATiON 1901-1961
2r---r---r---+-~+---~--~
population increased at 3-55 and 4·98 per cent which were comparatively very low rates. In the last decade it has increased by 17·86 per cent.
The 1951-61 decade variation for the district and each of the talukas is as follows :-
YEOTMl-l.L DISTRICT
I Darwha Taluka ..
2 Yeotmal Taluka ..
3 Pusad Taluka
4 Kebpur Taluka ••
5 \Vani Taluka
Percentage Variation \951-61
+- 17-86
+20-77
+ 16·85
+ 19·61
+18·32'
+ 12·07

(10) DISTRICT CENSUS HANDBOOK
Figure to the right shows the areawise pattern of 1951--61 growth of population within the district.
There are wide differences in the decade rates of variation of different talukas. Darwha taluka
has recorded the highest
increase (20·8 per cent)
while Wani .taluka had the lowest increase (12' J per
cent) over 1951. Darwha,l i
Pusad and Kelapur talukas I
are above the district aver~ age and Yeotmal and Wani talukas are below that
average.
1 .. ....
YEOTMAL DISTRICT
VARIATION IN POPULATION
1951·1961
The net percentage in- k ... ··E311111111 10 I' 2:0 25 ~E:RCENT
crease~nceI90J, 1921 and ~~~~~~~~~~~~~~~~~~~~~~~~~~~~~~ 1951 for the district and the State has been as
follows:-
1901-1961 "
1921-1961 ..
1951-1961 ..
Yeotmal Maha~
District rashtra
90'34 103-97
46'67 89'71
17·86 23-60
The district growth rates have always been lower
than Maharashtra averages. A distinct feature of variation in population of the district is that it has
slowed down in the post 1921 period. The rapid growth before 1921 was perhaps partly due to the opening up of forest areas and immigration into the district in order to takeup land previously uncultivated. This had stopped in the post J 921 period. Malarious climate had perhaps kept population growth in check. Things have improved consider
ably in the 1951-61 decade because of the malaria
eradication and other public health campaigns.
Density of Population
The densities of population for Maharashtra, Yeotmal district and its talukas for 1951 and 1961 are as shown in the next column.
MAHARASHTRA
YEOTMAL DISTRICT .. I Darwha Taluka .. 2 Yeotmal Taluka .. 3 Pusad Taluka
4 Kelapur Taluka ..
5 Wani Taluka
Density per square Percentage mile of district
,---'-----., population 1951 1961 in 1961
271 334
179 210 100·00 196 237 23·22 195 228 18'88
172 206 24·13
154 182 17·96
180 201 15'81
The Figure on page (11) s~ows the approximate contours of density of population in 1961 within the district.
The density of population has increased sharply
from 144 to 210 during the last forty years.
The density in Yeotmal district has always been lower than the State average.
Density of population varies from 237 persons per square mile in Darwha taluka to 182 persons per square mile in Kelapur taluka. The differences correspond to those of topography and land utilisation.
The talukas which have high percentage of the district population are also the areas of relatively
higher density.
YEOTMAL: POPULATION (II)
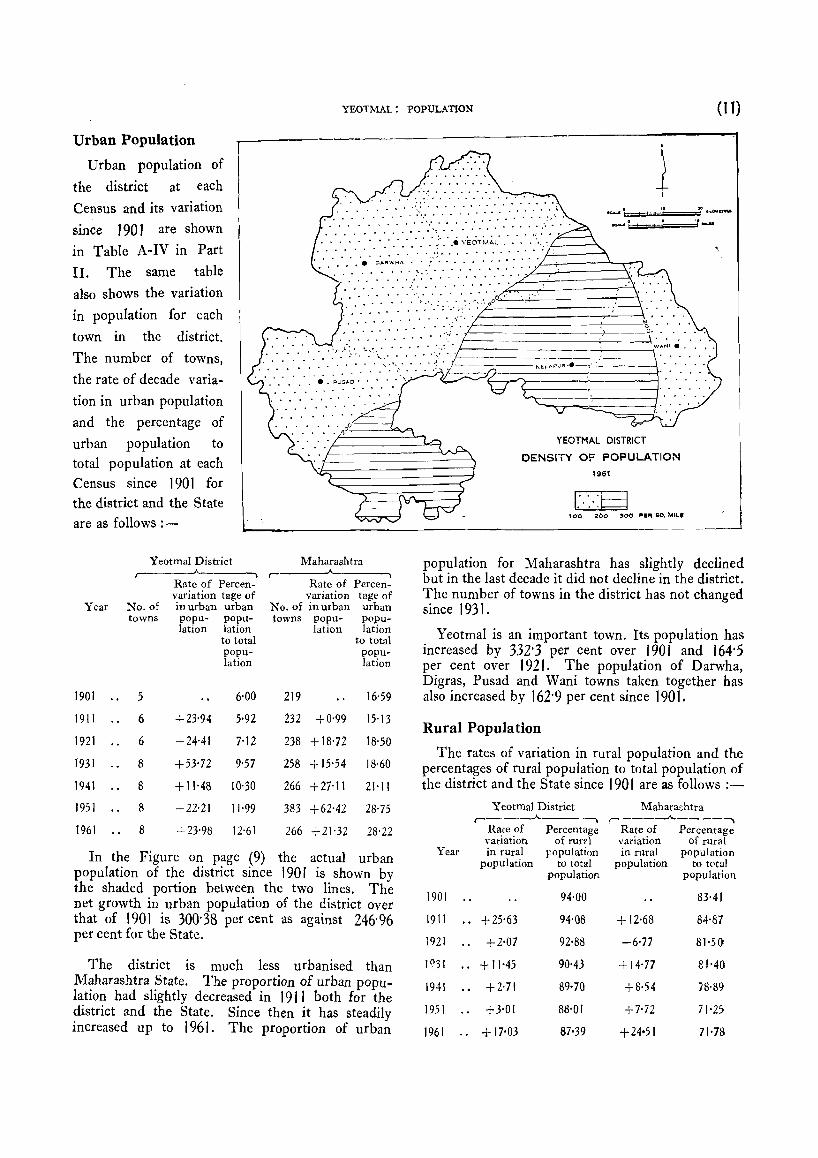
Urban Population .
! oe...< . 30 ~n.OMC7'IU
...... . I I I
" . . . . ........... .
.......
' ... ' ....... "',' " " .' .' : : : .' ';fr~~----:\ • _. - . .. :: ... :; .... ,::: .• :/-.,,::,..0 _______ -;--,
..... :' .. ,:---------_.,...---I
Urban population of
the district at each
Census and its variation
since J 90 J afe shown
in Table A-IV in Part
II. The same table
also shows the variation
in population for each
town in the district.
The number of towns,
the rate of decade varia
tion in urban population
and the percentage of
urban population to total population at each Census since 1901 for the district and the State
are as follows :-
. . ., ... ,:===============~===== . . . . . . . f
• '.1- J~ :. _ ,_ , ~.' • • • • • ............... :',.',. ~~.,.,.> ~ < ...
Yeotmal District Maharashtra 1 ~-----~----~
Rate of Percen- Rate of Percen-variation tage of variation tage of
Year No. of in urban urban No. of in urban urban towns pOPU- pOpU- towns pOPU- popu-
lation lation lation lation to total to total popu- popu-lation lation
1901 5 6·00 219 16'59
1911 6 +23-94 5·92 232 +0'99 15'13
1921 6 +24-41 7·12 238 +18'72 18'50
1931 8 +53-72 9·57 258 +15'54 18'60
1941 8 + 11'48 10-30 266 +27-11 21'11
1951 8 +22-21 11'99 383 +62-42 28'75
1961 8 +23-98 12-61 266 +21'32 28'22
In the Figure on page (9) the actual urban population of the district since 1901 is shown by the shaded portion between the two lines. The net growth in urban population of the district over that of 1901 is 300'38 per cent as against 246-96 per cent for the State.
The district is much less urbanised than Maharashtra State. The proportion of urban population had slightly decreased in 1911 both for the district and the State. Since then it has steadily increased up to 196 J. The proportion of urban
YEOTMAL DISTRICT
DENSITY OF POPULATION
1961
1:·:.:8 '0:0 200 ,~ PER SQ, NUL..!
population for Maharashtra has slightly declined but in the last decade it did not decline in the district. The number of towns in the district has not changed since 1931.
Yeotmal is an important town. Its population has increased by 332'3 per cent over 1901 and 164'5 per cent over 1921. The population of Darwha, Digras, Pusad and Wani towns taken together has also increased by 162'9 per cent since 1901.
Rural Population
The rates of variation in rural population and the percentages of rural population to total population of the district and the State since 190 I are as follows ;-
Yeotmal District Maharashtra r---~..A. , r----.._A.,--.--,
Rate of Percentage variation of rur? 1
Rate of Percentage variation of rural
Year in rural ropulation in rural population popUlation to total population to total
population popUlation
1901 94·00 83041
1911 +25'63 94'08 + 12-68 84-87
1921 +2-07 92-88 -6-77 8J050
1(\31 + 11'45 90'43 +14·77 81'40
1941 +2-71 89·70 +8·54 78·89
1951 +3-01 88-01 +7-72 71'25
1961 + 17·03 87·39 +24·51 71·78

( 12) DISTRICT CE"SeS IH:-JDBOOK
The net increase in rural population of the district has been 76'95 per cent over that of 1901 and 38'00 per cent over that of J 921. The c'lrrcs}),)ndin:?; figures for the State are 75'53 pcr cent and 67'08 per cent, respectively.
The rural population has had three peaks of rapid growth during the last 60 years. The first was in J 9! J, the second in J 931 and the third in 1961. These peaks represent recoycry from famines in 1911, from influenza in 1931 and from the ill effects of malaria in 1961. These peaks were preceded by periods of very low growth.
Size of Villages Table A- III in Part II shows for the district and
for each taluka the number of inhabited villages and their population for each class of villages. The distribution of population by size of villages for the district and the State is as follows :-
Size Class
Less than 500 500--999 1,000--- 1,999 2,000--4,999 5,000 and over ..
Yeotmal Dis:rict Maharashtra r--~-,A_- -----, ,-____ J-___ -,
Percentage Percentage Percentage Percentage Jf the num- of pOpU- i)f the num- of p,'pube- of inha- lation to be" of inha- lation to
bited villa- total rural hited \-illa- total n:ra] ges to total population gCS :,) total poplllati,.·n u',i!!1ber of number of inhabited inhabi ted \·jJ]ages viJ1ages
56,11 24017 47·i2 28·54 3-1-49 z.s·S5 12·52 27·52 16·62 2'58 ) ).)) 6')8 0'25 2·51 0·93
)5·02 25·71 28·55 2ND
3'32
Areu in State/District Taluka Sq. miles
(Rural)
(1) ( 2)
MAHARASHTRA 1 j j, 736-3 YEOTMAL DISTRICT 5, J64·4
1 Darwha Taluka ),06),6
2 Y"otrnai Taluka 904·8 3 Pusad Taluka .. 1,261·1 4 Kclapur Taluka 1,080,1
5 Wani Tnluka 856·8
Age Distribution
Tables C- II and C- IV in Part II show the distribution of the' district population by five-year age-groups and by single year .-:ges, respectively. Broad age-groups are also shown in Tables B-1, B-II and C- III. The proportions of popubtion by broad age-groups in i 961 fur th~ district and the State are shown in the next column separately for males and females compared with the corresponding proportions for 1951.
Villages with less than 1,000 population are
84'65 pcr cent of the total number of villages in the
district and have 58'86 per cent of the rural popula
tion. Villages with more than 1,000 population are
15'35 per cent of the total number of villages and
account for 41'14 per cent of the rural population.
The area, number of inhabited villages, total
rural population, average population per inhabited
village and the number of inhabited villages
per 100 square miles of rural area are shown below
for the State, district and each taluka separately.
Average population per inhabited village in 1961 is 589 in the district against 792 in Maharashtra.
The average population per village within the
district varies from 484 in Wani taluka to 735
III Pusad taluka. The number of inhabited
villages per 100 square miles 1S 32 in the
district and 31 in Maharashtra. In the western
talubs there are large villages away from each other
while in the central and eastern talukas there are
smaller villages situated close to each other.
Average No. of Numher ()f Rural population inhabited inhabited population per inhabi- vilIages villages ted per 100 sq.
village miles of Rural area
(3) ( 4) (5) (6)
3'),851 28,391,157 792 31 1,629 959,94':) 589 32
336 228,067 679 32 317 161,779 510 35 319 234,384 735 25 336 180,n2 536 31 32) 155,493 484 37
T'ercenca::;cs of population by age-groups ,.. ______ . ___ . __ . _______ . .A. _. ____ . _______ .,
Age-group 195) 1961 1961 District Total Disttiet Total JVbh~l'ashtra
o -4 5 -14 0+\ i;-q 3j--S9 15 -19 60+
,' __ . .A. ___ . ,
:YLvcs lCl:rf1aIcs
.. ]3,32 13·32 _. 2'5' '; 7 25·59 " 3S·\')9 38·') i " '[J·9S 32·j9 " 24·.ji 22·1:; " 5:l-4} 5.i·i2
)'61\ 6·37
,----...-A-_, ,.-_-----'--__ --, l\-b'('s Females Males Fc:nales
15'48 16·0S 2-H6 2nD 40';: i 40'9d 32<)3 32'09 22'6 .. 20·40 54-67 53·29 H9 5·73
)·H) 25·55 40·20 32·70 22'09 54·79 S·~l1
] 5·39 25-77 41· :6 33·13 20,16 53'29 5·55
Towl .. 100'On ) 00'00 100'00 100'00 100'00 100'00

YEOTMAL: POPULATION (13)
DISTRIBUTION BY AGE GROUPS
196\
MALE
40. 34% 0-'.
Figure above shows the distribution of the district population by broad age-groups for males and females separately.
During the last decade the proportion of children aged 0-4 increased from 13"32 per cent to 15'48 per cent for males and from 13"32 per cent to 16'08 per cent for females. The same trend is seen for age-group 0-14. In contrast, the proportion for 15-59 age-group decreased from 55'43 to 54'67 per cent for males and from 54'72 to 53'29 per cent for females. Similarly, the proportions for older agegroup have decreased both for males and females. The pattern of age distribution in the district is thus similar to that of the State as a whole. Dependency Ratio
The ratio between dependants (age-groups 0-14 and 60+) and 100 of supporting (age-group J 5-59) population has an economic significance. The dependency ratim and their two components of youth (0-14) and aged (60+) groups are shown below for J 951 and J 961 for the district and the State, separately:-
, Yeotmal District :'I Iaharashtra ,--_-"-~ _-., ,-__ --.A __ . ---,
Youth Aged Total Youth Aged To:al 1951 Total •. 70,6 10·9 81') 69·{) 9'3 79'2 1961 TOlal .. 75'3 9·9 85'2 75'2 9'7 8~·9
Rural " 75·9 10·0 85·9 80'6 10'S C; 1·4 U~ban .. 71-3 9·3 80'6 6}1 7'3 70,4
The dependency ratios arc higher in the district than those for Maharashtra. Both the components of youth and aged are lower than those
J-·J812-iv-a (yeotmal)
FEMALE
5 • 73'j'~ eo ... "BOVe:
of the State for rural areas. The dependency ratios for the State and the district are both higher in 1961 than those of 1951. Although youth dependency has increased the other component of dependency has decreased over 1951. The increase in dependency may be the result both of high fertility and declining mortality. The 1961 popUlation in the district thus has a larger load of dependants than that of J 951. The dependency load is, moreover, larger in rural areas than urban areas. It is the effect of the differences in age structures of rural and urban population resulting from the migration of working age (15-59) people from rural to urban areas within and outside the district.
Sex Ratios
The following have been the sex ratios (number of females per 1,000 male population) for the district and the State since 1901 for total, rural and urban areas separately :-
Yeotmal District Maharashtra
Year 1-----"--------, r---------"---~
Total Rural Urban Total Rural Urban
1901 988 994 899 978 1,002 866 1911 980 983 928 966 1,000 796 1921 968 973 909 950 994 776 1931 966 979 852 947 987 790 1941 978 985 923 949 990 !lIO 1951 989 997 931 941 1,000 807 1961 972 981 915 936 995 BOl

(14) DISTRICT CENSUS HANDBOOK
Figure below shows the variation in the sex ratios. since 1901 for the district total, rural and urban areas separately ;-
SEX RATIO 1901-1961
1"000 .......... _ r-"-- _ ..... , .... ···-K'QVAL;TY········
o
i 940r-~~--_,----+----+----~ __ ~ i /' "
f ~2or-~-ir'~·~~--_, ____ +-/ __ ~_'_,~ I // \ ,I ".
! \ i
.I I
$O'OI!-' --t--l
a~
TQl'AL.
--- --- RU"A~
-.-._.- URBAN
e50 f J' I '~9~O·I-.l~9·1~1~19~2~1~1~9~3~1~1~9~4·1~1~9~5~1~19~el
Since 1901, the sex ratio of the population of the district varied between 966 and 989 while that of Maharashtra varied between 936 and 978. At each Census, the district has had a higher sex ratio than the State average. The district had the highest sex ratio of 989 in 1951.
,-
Following are the sex ratios for different age-groups of population for the district total, rural and urban areas :-
Age-groups Total Rural Urban 0-14 988 991 963
15-34 998 1,019 874 35-59 876 878 857 60+ 1,118 1,121 1,099 All ages 972 981 915
For all tte age-groups, the sex ratios are higher in rural areas compared to those in urban areas. It is only for the older age-group that the sex ratio is higher than equality both for rural and urban areas. The higher rural sex ratio in the age-group 15-34 may indicate the out-migration of males to urban areas within and outside the district.
The sex ratios for each taluka in the district for total, rural and urban areas separately are as follows :- )\b
Total Rural Urban
YEOTMAL DISTRICT 972 981 915 I Darwha Taluka 963 967 931 2 Yeotmal Taluka 957 976 896 3 Pusad Taluka 974 980 926 4 Kelapur Taluka 995 1,003 916 S Wani Taluka 975 981 922
Only Kelapur taluka has a sex ratio which is near equality. Sex ratios of other talukas are close to each other. Urban sex ratio is least for Yeotmal taluka which contains the largest town of the district.
Marital Status
Table C-II in Part II shows the distribution of popUlation by marital status by five-year age-groups. The percentages of popUlation for broad agegroups classified by marital status are shown below compared to those of 1951 :-'- •
Marital Status
Year Age-group Total Never married Married Widowed ---:----..
Divorced or
( I)
1951 ..
1961 ..
(2)
0-14
15-34 ..
35-54 ..
55+ ..
All ages
0-14 ..
15-34 ..
35-54 .•
55+ ..
All ages
J-1812-iv-b (yeotmal)
(3)
100
100
100
100
100
100
100
100
100
100
,---A--____" Males Females
(4) (5)
98'06 90'05
33-61 7-74
1'95 0·82
2-62 0·36
49'17 37'75
99'64 96·44
35'39 5·05
1'56 0·18
J.04 0·14
51·95 41·25
r-----.A------. Males Females
(6) (7)
1·86 9·79
63-46 87-20
87'91 70'42
69-61 27·00
45'39 48'52
0·35 3·47
61'67 90,47
89'20 69·34
75'37 22-27
43·45 45·50
separated ~ ,-__..A.._-----.
Males Females Males Females
(8) (9) (I D) ( II)
0·05 0·14 0·03 0'02
2·37 4·46 0·56 0'60
9·39 28·32 0·75 0'44
25·23 72047 2·54 0'17
4-89 13-43 0·55 0'30
0·01 0'04 Negligible 0'05
1'80 2·91 1·14 1'57
7'94 29·08 1·30 HO 22'56 77·08 !-O3 0'51
3·90 IH2 0-70 0·83

YEOTMAL: POPULATION (15)
DISTRIBUTION BY MARITAL STATUS
'96'
MALE
o . 70 % OIVORCEO OR SEPARATED
Figure above shows the distribution of the district population by marita~ status for males and females separately.
During the 1951-61 decade, the proportion of never married has increased both for males and females. There had been a decrease in the proportion of widowed both for males and females. The proportion of divorced or separated showed an increase but the difference is not of any numerical importance. As may be expected, the proportions of married and widowed are higher in rural than in urban areas and the proportion of never married is higher in urban than rural population. It may be explained by the slightly higher age at marriage and the more youthful popUlation in urban areas. The rise in the age at marriage of the total population may be seen from the marital status distribution by age-groups. The proportion of never married in age-group 0-14 has increased both for males and females while for age-group 15-34 it h<1_s increased for males alone. It shows that the age at marriage has been lifted up to 14 years for females and much above 14 for males.
Child Woman Ratio The Table in the next column shows the
child woman ratios for J 951 and 1961, i.e., the number of children 0-4 years age-group for every.
FEMALE
41 • 25 'lo NEVER M"RRIEO
0·83 'Yo OIVORCEO OR SEPARATED
1,000 women of 15-44 years age-group as well as for every 1 ,000 married women of 15-44 years agegroup. The proportion of widows of 15-44 years age-group to 1,000 married women of 15-44 years age-group is also shown for comparison :-
1951 District Total .•
1961 District Total .. Rural .. Urban
Number of children
0-4 years age-group per 1,000
women of 15-44 years
age-group
595 737 745 686
Number of children
0-4 years age-group per 1,000 married wo~n of
15-44 years age-group
702 841 843 826
Number of widows per
1,000 married women (both in
15-44 years age-group)
103 77 78 72
The child woman ratio for rural areas is higher than that for urban areas even when standardised for married women of 15-44 years age-group. This may indicate either a higher fertility or a higher survival rate in rural areas of the district. Over the decade, the ratio has increased from 595 to 737. It may be due both to a substantial rcdurtion in infant mortality.
The number of widows per 1,000 married women in the age-group 15-44 is reduced from 103 in 1951 to 77 in 1961. The incidence of widowhood is higher in rural areas than in urban areas.

(16) DISTRICT CENSUS HANDBOOK
Migration
The 1961 Census showed the proportions of population enumerated as shown below :-
at places of birth and other places
Total population
(1) (2)
Persons 1,098,470
Males 557,010
Females 541,460
Percentage to total population-
Per~ons 100,00
Males 100·00
Females 100'00
54,51 per cent of the popUlation was enumerated at place of birth. This percentage for males is 63-54 but for females it is only 45·21. The differ~ ence is due to women married outside their places of birth. This movement of females on marriage appears to be mostly within the district. Even among persons born in other districts and outside Maharashtra, females, however, have higher proportions.
The sex ratios in the district popUlation by live-year age-groups for total, rural and urban areas are as follows :-
Sex Ratios Age-group
Total Rural Urban
All ages 972 981 915 0-4 1,010 1,011 997 5-9 1,016 1,019 991
10-14 920 925 892 15-19 915 953 733 10-24 1,217 1,258 990 25-29 997 1,007 924 30-34 864 863 871 35-39 850 849 855 40-44 917 920 900 45-49 893 898 851 50-54 893 898 861 55-59 809 813 778 60+ 1,118 1,121 1,099
I II III
( 1) (2) (3) (4)
District Total " 21·71 25·12 HI
Born at place of enumeration .. 2J·80 20'97 1'20
Elsewhere in the district .. ., 23-08 35·90 2·17
Outside the district .. 17·46 22·81 1·75
Outside the In place of Elsewhere in district but Outside
enumeration the district in Maharashtra Maharashtra
(3) (4) (5) (6)
597,526 358,938 119,368 20,413
353,324 148,120 44,714 9,897
244,202 210,818 74,654 10,516
54'51 32'74 10'89 1'86
63'54 26'64 8'04 1'78
45'21 39'03 13'82 1'94
The rural-urban differentials of sex ratios are less in younger and older age-groups, though rural sex ratio is almost always higher than urban sex ratio. These differences are more significant in adult agegroups, among which the age-group 20-24 has the highest ratio. The high sex ratio in the age-group 20-24 may be due to the movement of young adult males in search of jobs or for higher education outside the district. The balance is nearly attained in older age-groups. The sudden drop in the sex ratio for age-group 55-59 for total, rural and urban population may also be partly due to misreporting of ages of women of that group in the higher age-group.
The percentage distribution of male population born at the place of enumeration, born elsewhere within the district and born outside the district by nine categories of economic activity and nonworkers is shown below. An explanation of the nine categories will be found in the Explanatory Note to Part II, paragraphs 42 to 52.
Categories of Workers Non-
IV V VI VII VIII IX \vorkers
(5) (6) (7) (8) (9) (10) (11)
2'21 1·40 0·50 2'62 0'6-l 4'55 39'74
1'74 J'09 0'32 2'06 0'44 2·67 47·71
2'67 1'36 0'68 2-36 0'66 6'39 24'73
4-08 3-49 1·20 6'93 J'87 11·67 28·74
YEOTMAL: POPULATION (17)
The percentage of non-workers i~ lower i.n ~he population born elsewhere and outsIde the dIstnct. The percentage of agricultural labo~rers is ~ig~er among the people born .e1s:where In the dIstn~t. People born outside the dIstnct are engaged more m tertiary sector.
Size of the Household
Table C-I-A in Part II shows the distribution of sample households classified by size. Percentage proportions of different types of households are as follows :-
Total Rural Urban
Single member 7·33 6'97 9'93
2-3 members .. 27·37 27'34 27·54
4 -·6 members •. 46·47 47·17 41'45
7 -9 members .. 15·10 14'96 16-18
10 members and more 3-73 3·56 4'90
All siz('s 100·00 100'00 100-00
Among the different size groups, households with 4 to 6 members are more common (46·5 per cent) than others. The percentage distribution of rural and urban households by their size shows that only medium size households are more (47 per cent) in
rural areas than in urban areas (41 per cent). The average size of household is 4·6 in rural areas and 4-7 in urban areas.
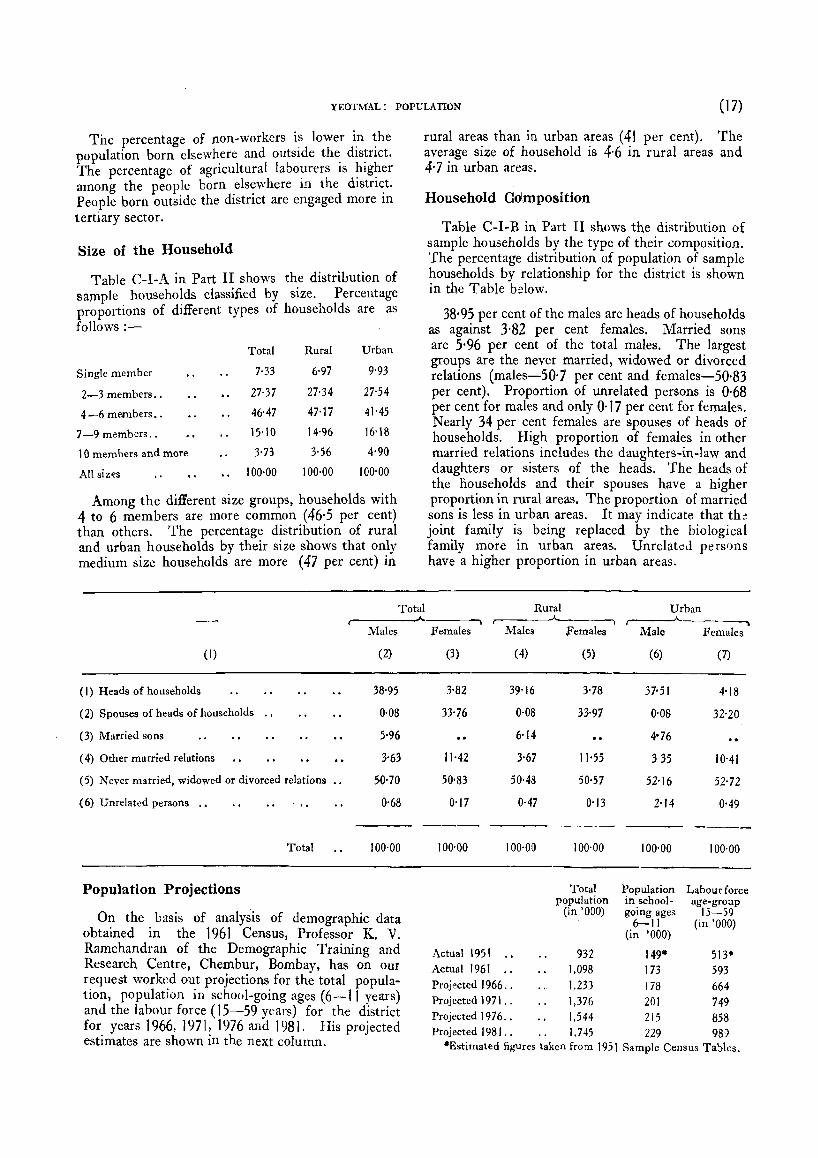
Household Cdmposition
Table C-I-B in Part II shows the distribution of sample households by the type of their composition. The percentage distribution of population of sample households by relationship for the district is shown in the Table below.
38·95 per cent of the males are heads of households as against J82 per cent females. Married sons are 5·96 per cent of the total males. The largest groups are the never married, widowed or divorced relations (males-50'7 per cent and females-50'B3 per cent). Proportion of unrelated persons is 0·68 per cent for males and only O· 17 per cent for females. Nearly 34 per cent females are spouses of heads of households. High proportion of females in other married relations includes the daughters-in-law and daughters or sisters of the heads. The heads of the households and their spouses have a higher proportion in rural areas. The proportion of married sons is less in urban areas. It may indicate that the! joint family is being replaced by the biological family more in urban areas. Unrelated persons have a higher proportion in urban areas.
Total Rural Urban
( I)
(I) Heads of households
(2) Spouses of heads of households ..
(3) Married sons
(4) Other married relations
(5) Never married, widowed or divorced relations ••
(6) Unrelated persons .•
Total
Population Projections
Males
(2)
38'95
0'08
5,96
%3
SO·70
0'68
100-00
On the basis of analysis of demographic data obtained in the 1961 Census, Professor K. V. Ramchandran of the Demographic Training and Research Centre, Chembur, Bombay, has on our request worked out projections for the total population, population in school-going ages (6-11 years) and the labour force (15-59 years) for the district for years 1966, 1971, 1976 and 198 J. His projected estimates are shown in the next column.
Females Males females Male Females
(3) (4) (5) (6) (7)
3-82 39·16 3'78 37·51 4'18
33-76 0-08 33-97 0'08 32-20
6·14 4'76
11'42 3067 11·55 335 10-41
50'83 50·48 50·57 52'16 52-72
0'17 0·47 0'13 2'14 0'49
--- ----100'00 100'00 100·00 100'00 100-00
Total Population Labour force popUlation in school- age-group
(in '000) going ages 15-59 6-11 (in '000)
(in '000)
Actual 1951 .• 932 149* 513* Actual 1961 .. 1,098 173 593 Projected 1966.. 1,233 178 664 Projected 1971.. 1,376 201 749 Projected 1976.. 1,544 215 858 Projected 198 I . . 1,745 229 989
*Estimated figures taken from 1951 Sample Census Ta';)!es.

(18) DISTRICT CENSUS HANDBOOK
LANGUAGES
Table C-V in Part II shows the population by nine major languages for the district and each taluka and town separately. The distribution of languages by rural and urban areas of the district is as follows :-
Language
Percentage to total population
,.----~ Total Rural Urban
Percentage of each language in
r---"-----------Rural Urban Areas Areas
(1) Banjari .. 9'40 10'72 0'30 99-60 0'40
(2) Gondi 4'37 4'89 0'78 97-74 2-26
(3) Gujarati 0'61 0'25 3'13 35'60 64'40
(4) Hindi 2'82 1'64 10·95 51'00 49·00
(5) Kolami "09 3'54 0'04 99'84 0·16
(6) Marathi 70·53 71'60 63-07 88'72 11·28
(7) Sindhi 0'16 0'01 1'23 3·14 96·86
(8) Telugu 3-06 3-07 2'97 87-75 12'25
(9) Urdu 5060 3'98 16'78 62·19 37'81
(10) Others 0'36 0'30 0·75 73'54 26'46
All languages •. 100'00 100'00 100'00 87·39 12-61
Marathi is the principal language and is the mothertongue of nearly 70·5 per cent of the population. In rural areas Marathi speakers account for 71·6 per cent of the population. They' make 63·1 per cent of the population in urban areas. Banjari has the second largest number of speakers. Its speakers account for 9·4 per cent of the total population of the district. It is spoken more in rural areas where its speakers are as much as 10· 7 per cent against only 0·3 per cent in urban areas. The
proportions of Gondi and Kolami speakers are higher in rural areas while the proportions of Guja. rati, Hindi, Sindhi and Urdu speakers are higher in urban areas. Telugu speakers are fairly distributed over rural and urban areas.
The comparative position of the languages in 1901, 1951 and 1961 is as follows;-
Language Percentage to total population
1901 1951 1961
(1) Banjari .. 7'72 9'56 NO (2) Gondi J 1'89 5-46 4'37 (3) Gujarati .. 0·23 0·54 0'61 (4) Hindi 1·71 2'88 2·82 (5) Kolami 3-39 3-09 (6) Marathi .. 68'94 69'35 70·53 (7) Sindhi 0'12 0·16-(8) Telugu .. 4·93 3-04 3-06 (9) Urdu 4·50 5,·09 5060
(10) Others 0'08 0'57 0'36 AUlanguages .. JOO'OO JOO'OO JOO'OO
The proportion of Marathi speakers has increased slightly. The proportion of Barjari speakers increased from 7·72 per cent in 1901 to 9·56 per cent in 1951, but declined slightly to 9·40 per cent in 1961. 'Gondi speakers showed a decrease in the last sixty years. Gujarati, Hindi and Telugu spe2.kers have more or less retained their respective proportions during the last decade. Proportion of Urdu spel.kers has increased during the last sixty years. The comparison with the 190 I proportions should however be made cautiously because the 1901 language proportions are pertaining to the Yeotmal district (then called Wun district) as it existed in 1901. The addition of Pusad in 1905 obviously improved the proportions of all languages except Gondi.
RELIGIONS Table C-VII in Part II shows the population
by religions for the district and each taluka and town separately. The distribution of religions by rural and urban areas of the district is as follows ;-
Percentage to total Percentage of each population religion in
, ,--A--. Total Rural Urban Rural Urban
Areas Areas
(1) Buddhists 8'82 %1 3-40 95'J4 4·86 (2) Christians 0, J I 0'06 0'43 49' J 5 50'85 (3) Hindus 84'19 85'35 76'19 88'59 J HI (4) Jains 0'51 0'33 J '71 57-49 42'5 J (5) Muslims 6'32 4-61 J8'J4 63'80 36'20 (6) Others .. 0'05 0'04 0·]3 59'57 40'43 All Religions .. JOO'OO JOO'OO JOO'OO 87'39 J2-61
84'2 per cent of the population reported their religion as Hindu. Buddhists account for 9'61 per cent in rural areas and 3'40 per cent in urban areas. Muslims are only 4'61 per cent in rural
areas but make as much as 18'14 per cent in urban areas. Christians are more numerous in urban areas. The Hindus and the Buddhists are more numerous in rural than in urban areas. The Christians are the most urbanised group and the Buddhists the least urbanised.
The comparative position of the religions in 1901 and 1961 is as follows :-
Percentage to total population
,.----_A__--, 190J J961
(I) Buddhists (2) Christians 0·04 (3) Hindus .. 78'83 (4) Jains 0'39 (5) Muslims 4'71 (6) Others .. 16'03* All Religions 100·00
*In 1901 out of 74,845 persons included in 74,750 reported their religion as "Animist".
8'82 O·J I
84'J9 0·51 6'32 0·05
100·00 others

YEOTMAL: RELIGIONS (19)
Christians, Jains and Muslims have higher percentages in 1961 than in 1901. The 1901 percentages however applied to the boundaries of the district as it existed then. Hindus had a lower percentage in 1901 compared to 196 J, probably because the Tribal people had been classified as c. Animists" and included in the group of " Others" which made 16'03 per cent in 1901. The combined percentage of Hindus and others in 1901 got substantially reduced in 1961 due to the conversion of large numbers from the erstwhile Hindu Scheduled Castes to Buddhism.
Sex ratio for each religion 1S as follows:-
Buddhists 1,016 Christians 838 Hindus 971 Jains 887 Muslims 940 All religions 972
Higher sex ratio for Buddhists indicates that more females were converted to Buddhism than males probably due to fear of losing concessions or opportunity of contesting elective posts available only for (Hindu) Scheduled Castes.
SCHEDULED CASTES
Table SCT-I-Part A in Part II shows the population and its distribution by workers and non-workers for each Scheduled Caste by sex for the district and each taluka separately. Actually, 16 castes are notified as Scheduled Castes in the district but only 10 were reported in the district in 1961.
The distribution of the Sch~duled Castes population by rural and urban areas of the district is as shown below.
-The remaining six Scheduled Castes for which no one was returned in the district in 1961 are as follows ;-
(1) Balahi, (2) Dom, (3) Ganda, (4) Ghasi, (5) Katia, . (6) Sansi.
Name of Scheduled Caste Population
Out of the ten Scheduled Castes reported in the district, the largest number is of Mangs who are concentrated in Pusad, Darwha and Yeotmal talukas. The second largest group is of Mahars who come mostly from the talukas of Darwha, Pusad, Kelapur and Wanl. Chambhars formed the third group and are concentrated in Darwha, Pusad and Wani talukas while Madgis who are mostly from Kelapur and Wani talukas are the fourth. Bhangis and Khatiks are fifth and sixth respectively. The remaining Scheduled Castes together form about 0'1 per cent of the total population. Bhangis are mostly concentrated in urban areas, which may be attributed to the scavenging and sweeping services with which they are traditionally associated.
Percentage to Percentage of each total population Scheduled Caste of the district population in
---. Males Females Rural Urban
Areas Areas
( I) (2) (3) (4) (5) (6)
-All Scheduled Castes .. 21,333 21,190 3,87 81,27 18,73
(I) Bahna 9 6 N 100,00
(2) Basor 432 437 0,08 44-65 55'35 (3) Bhangi 697 638 0·12 11'61 88·39 (4) Chambhar .. 3,160 3,029 0·56 82'37 17-63 0) Dohor 21 44 0·01 43,08 56'92 (6) Kaikadi 76 73 0,01 57,05 42'95 (7) Khatik 610 657 0·12 66,85 33·15 (8) Madgi 2,364 2,507 0'44 92'18 7-82 (9) Mahar 6,539 6,185 1·16 79-60 20'40
(10) Mangt 7,424 7,614 1-37 88'60 11'40
"'Inclusive of persons from the Scheduled Castes who have not repcrted their individual caste.
tInc1udes Mang-Garudi also. "N " denotes very negligible figure.

(20) DISTRICT CENSUS HANDBOOK
The comparative posItIOn of the Scheduled Castes population in 1951 and 1961 within the district is as follows :-
Percentage to total population in r-
Total Rural Urban
All Sche~led Castes-i.reas Areas Areas
1951 L.. .. .. 13-93 14'26 11'48 1961 3'87 )-60 5'75
The reduction of their proportion from 13'93 per cent in 1'951 to 3'87 per cent in 1961 is the result of a large number of persons from the Mahar Caste returning their religion in the J 96 J Census as Buddhists. Because of the change of religion they are not enumerated as Scheduled Castes, as the Scheduled Castes can be from Hindu and Sikh religions only. But for the change of religion, the total population of the Scheduled Castes would have made over 14 per cent of the district population in J 96 J.
Literacy
Tables SCT -III-Parts A (i) and B (i) in Part II show the literacy and educational levels for each Scheduled Caste.
. The percentages of literacy for the district total population, for all Scheduled Castes and each Scheduled Caste are as shown below;-
The Scheduled Castes as a group are not much behind in literacy than the general population of the district. Mangs, who are the predominant Scheduled Caste of the district, do not seem to have made much progress in literacy compared to the other major Scheduled Castes in the district. It does, however, appear that the Scheduled Castes are also taking advantage of the educational facilities and concessions available in the district.
Rural Urban Name of S<:heduled Caste ,-------'" ,,-_____ ..A.. ________ • _ \
Dhtricc Average
All Scheduled Castes
(1) Bahna (2) Basol' .. (3) Bhangi " (4) Chambhar (5) Dohor (6) Kaikadi " (7) Khatik " (8) Madgi (9) Mahar
(10) Mang
( I)
Economic Activity
Total
(2)
20·30 13'91
No Literates 11·60 23-87 17·40 10·71
9·41 25'27 5·17
19'91 10·23
The industrial classification of persons at work and non-workers for the district average, all Scheduled Castes and for each Scheduled Caste is as follows :-
Percentage of workers in categories
Cultiva- Agricul- All other Non-tion tura! activities workers
Labour
District Average 18·53 27·67 7'97 45·83 All SchedUled Castes 6·30 35·71 15'56 42'43
(I) Bahna 66'67 33-33 (2) Basor 1'84 14·50 38'32 45'34 (3) Bhangi 0'45 0·15 40·37 59·03 (4) Ch2tnbhar " 10· 28 27-02 18' 58 44'12 (5) Dohor 10'77 12'31 7-69 69'23 (6) Kaikadi 3'35 22·15 16·J J 58'39 (7) Khatik 9·15 17-21 20'36 53-28 (8) Madgi 3'76 4H2 16'14 36'48 (9) Mahar 9'90 33·59 12'34 44·17
(10) Mang 2-98 44' 72 12-91 39' 39
The proportion of, workers for the Scheduled Castes is more than the average in the district. But the proportion of cultivation is lower
Males Females Total Males Females
(3) (4) (5) (6) (7)
31·80 8·56 45·52 59·04 30·74 24·13 3·1') 23·71 37·70 8'75
.. 20·86 2'99 28'48 40'82 15'6R 38' iO 7-04 25') 1 42-41 7-23 29·59 4'72 23-28 37·08 8'68 27-27 No Literatc·s 2/'03 30·00 25'9} 20·59 j'96 35'94 52·38 4·55 40'47 9'59 21'67 37-22 10'00 9'65 0'91 4'72 9'55 0'49
33-68 5·88 31'01 45·70 13-02 18'24 2'44 14·53 25-82 }'26
and that in agricultural labour higher than the district average. This is due to the association of some Scheduled Castes with certain services as well as to a fewer persons owning lands amongst them.
Size of Land Cultivated Tables C-I and SCT-V-Part A in Part 11
show a broad classification of cultivating sample households bv size of land cultivated for the district rural population and all Scheduled Castes. The proportions are as follows;-
Size of land cultivated
All sizes ..
Less than 5 acres .. 5-9,9 acres
10-29'9 acres .. 30 acres and Over ..
District 'Rural population
,--------"--.--, No. of Percent-sample age
households
18,132 100·00 1,651 9'11 3,197 17-63 9,600 52-94 3,684 20'32
All Scheduled Castes , ___ .A. ___ -..
No. of Percen t;-
sliDlple ag(' households
406 100·00 65 16'01 91 22-41
198 48·77 52 12-81

YEOTMAL: SCHEDULED CASTES (21)
Out of a sample of 18,132 cultivating households, 406 or about 2'2 per cent households are from the Scheduled Castes in rural areas against their population which is 3'60 per cent of the total rural population of the district. 16'01 per cent of the cultivating households of the Scheduled Castes are cultivating less than five acres of land against the corresponding average of 9'11 per cent for the district. The
percentage of cultivating households cultivating land over five acres among the Scheduled Castes is 83'99 per cent against the corresponding average of 90'89 per cent for the district. The proportion of cultivating households is smaller in the case of Scheduled Castes and their participation in agriculture is more as agricultural labourers.
SCHEDULED TRIBES
Table SCT-I-Part B in Part II shows the population of Scheduled Tribes by each Scheduled Tribe separately. 32 Scheduled Tribes have been declared as such only for three talukas, viz., Wani, Kelapur and Yeotmal. Out of them 16 Scheduled Tribes were reported in the notified area in the 1961 Census. This section deals only with those tribes and that too limited to their population in the notified area. It should be noted that because of the area restrictions, there are no Scheduled Tribes in Pusad and Darwha talukas.
The distribution of their population by rural and urban areas is as shown below.
The remaining 16 Scheduled Tribes for which nO one was returned in the district in 1961 are as follows :-
(I) Baiga, (2) Bharia, (3) Bhunjia, (4) Gadaba, (5) Kamar, (6) Khairwar, (7) Kharia, (8) Kondh
(9) Korwa, (10) Majhwar,(1 I) Manda, (12) Nagesia, -(13) Nihal, (14) Parja, (15) Saoata and (16) Sa'vVlr.
Gond with 85,803 persons is the largest Scheduled Tribe in the district. Kolam with 41,013 persons is the second largest and Pardhan with 22,280 is the third. Andh and Pardhi with 4,313 and 1,236 penlOns, respectively, are the fourth and fifth. The other eleven Scheduled Tribes have very small population and together form less than 0'1 per Cent of the total population of the district. The first three major tribes are found in all the three notified talukas ofYeotmal, Kelapur and Wani. Andhs are concentrated more in Yeotmal taluka. Pardhis again are found in all the three notified talukas. The district did not have any Scheduled Tribes population in 1951. The declaration of Scheduled Tribes as such in the three talukas was made in 1956.
Percentage of each PercentaQ"e to total Scheduled Tribe population
Name of the Scheduled Tribe Population population of the in ,-___ --A. ____ ., district ,-__ ------A.
Males Females Rural Urban Areas Areas
(I) (2) (3) (4) (5) (0)
"'All Scheduled Tribes .. 77,315 78,294 14·17 97·35 2·65 (1) Andh 2,174 2,139 0·39 99'00 1'00 (2) Bhaina .. 7 5 N 100'00 (3) Bhattra I 2 N 100'00 (4) Bhil 23 26 N 89·8() 10·20 (5) BinjhwaJ' 7 N 100'00 (6) Birhul 15 7 N 100·00 (7) Dhanwar 26 14 N 100·00 (8) Gond 42,783 43,020 7'81 96·82 3·18 (9) Halba 331 343 0'06 71·51 28'49
(10) Kawar 56 45 0·01 100·00 (11) Kol 26 27 N 100'00 (12) Kolr.m 20,086 20,927 3-73 99·70 0·30 (13) Korku 2 N 100·00 (14) Oraon N 100·00 (15) Pardhan ., 11,119 11,161 2'03 95'43 4·57 (16) Pardhi 665 571 0·11 100·00
*I!lclusive of persons fro:n the Scheduled Tribes who have not reported their indi~'idual tribe. "N" denotes very negligible entry.
J-1812-V-a (Yeotmal).
(22) DISTRICT CENSUS HANDBOOK
Literacy and Education
The Scheduled Tribes are very much behind in
literacy and education than the general population
and even than the Scheduled Castes. Male literacy
for Pardhis is as low as O· 45 per cent. The female
literacy is negligible. Kolams, who are one of the major tribes, also appear to be a depressed group in
this respect.
Economic Activity More than 90 per cent of the workers from Sche
duled Tribes are working in agriculture. The proportion of workers in cultivation also compares favourably with that of the general population. The proportion of cultivating households is larger in the case of Scheduled Tribes and their participation in agriculture is thus more as cultivators and not as agricultural labourers like that of the Scheduled Castes.
WELFARE OF BACKWARD CLASSES The subject of welfare of Scheduled Castes,
Scheduled Tribes and other Backward Classes in the district is now in the purview of the Zilla Parishad. In the membership of Standing Committee which is the most powerful committee of the Zilla Parish ad at least two members from Scheduled Castes, Scheduled Tribes and other socially and educationally backward classes are required to be elected by the Parishad. This Standing Committee acts as the subject committee for that subject and the District Social Welfare Officer works under it. The Zilla Parishad is also legally required to spend adequate amounts for the amelioration of the condition of Scheduled Castes, Scheduled Tribes and of any socially and educationally backward classes and in particular for the removal of untouchability.
Various schemes for the welfare of Scheduled Castes, Scheduled Tribes and other educationally or socially backward classes are in operation in the district :-
(i) Educational.-These include schemes of grant. ing tuition fees at all stages of education irrespective of age and income, examination fees of recognised examinations and scholarships to the students from the Scheduled Castes, Scheduled Tribes, Nomadic and Semi-Nomadic Tribes, Vimukta J atis and the Backward Classes. The concession is awarded in the Primary Schools, High Schools or Technical Schools. 3,822 students benefited from and Rs. 1,95,837 were spent on these schemes during the year 1962-63. Rs. 2,95,492 were spent on 15 backward class hostels and 35 cosmopolitan hostels in the district during the year 1962-63.
(ii) Schemes for Economic Uplift.-These include schemes of granting loan-cum-subsidy for cottage industries and professions and of assistance for purchase of milch cattle to the Scheduled Castes and other backward classes. Under the scheme of loan-cum-subsidy for cottage industries and professions, Rs. 15,200 were given to 149 beneficiaries from the Scheduled Castes and Backward Classes from under-developed rural areas during the year 1962-63 and Rs. 6,600 were spent on 59 beneficiaries under the scheme of assistance for purchase of milch cattle.
J-18IZ-V-b (Ycotmlll).
(iii) Housing.-A number of housing societies of Backward Classes have been formed in the district. These societies construct houses for their members. Financial assistance in the form of loans and subsidies is given to these societies. Assistance in cash or kind for repairs to houses of Scheduled Castes and other backward classes is also provided. Under this scheme Rs. 64,600 were given on 139 beneficiaries during 1962-63.
(iv) Drin.king Water Wells.-An amount of Rs. 56,000 waS spent under this scheme. Out of this Rs. 18,500 were incurred for 12 drinking water wells for Scheduled Castes.
(v) Medical Aid to Scheduled Castes.-Monetary aid is given to deserving persons belonging to the Scheduled Castes and Rs. 600 were spent duri ng the year 1962-63.
(vi) Agricultural.-Financial assistance to poor deserving agriculturists from Scheduled Tribes. Vimukta J atis in under-developed rural areas and other backward classes to purchase ploughs, bullocks, implements, seeds, carts, etc., is given. Rs. 35,740 were spent on 256 beneficiaries under this scheme during the year 1962-63. This ineludes expenditure of Rs. 4,000 spent for the purchase of 3 oil engines and pumps.
(vii) Schemes for Removal of Untouchability.These include various schemes of publicity against untouchability. Sanskar Kendras and Balwadis are organised, film shows and gatherings are addressed at fairs and other places. Kirtan programmes and Melas, inter-caste dinners, celebration weeks and days are also arranged. Building sites. are given to Scheduled Castes in caste Hindu localities and subsidy is paid to caste Hindu landlords for letting their premises on hire to Scheduled Castes. Prizes are also awarded to villages. which show outstanding work for removal of untouchability. Rs. 5,341, were spent under the schemes during the year 1962-63-
The schemes which were already in operation before the Third Five-Year Plan are treated as committed schemes and those added under the Third Plan are separately treated as Plan schemes. There are in addition some more schemes sponsored by the Central Government.

YEOTMAL; WELFARE OF BACKWARD CLASSES (23)
Economic Criterion of Backwardness
Castewise basis of classification of " Other Backward Classes" has now been replaced by a new .classification based on income. The income limit was raised from Rs. 900 per annum to Rs. 1,200 per annum with effect from J st June J 960. All persons whose annual income from all sources does not exceed this limit are irrespective of their religion, -caste or community treated as belonging to .the "Other Backward Classes."
Concessions to Nav-Bauddhas
From 1st May 1960, the Scheduled Castes converts to Buddhism are treated as eligible for all
concessions and facilities available to Scheduled Castes except the statutory concessions under the Constitution and certain special schemes for removal
of untouchability, etc., which cannot by their very nature apply to non-Hindus .
EDUCATION
The district has made substantial progress in the ~sphere of primary education during the decade J 951-6 J. In 1960-6 J, all the villages having population of 250 and above have primary schools. In the field of higher education also, the district has been making a steady progress.
-Growth of Literacy Percentage of literacy in the district for total,
males and females since 1901 is as follows;-
Total Males Females
1901 2-94 5'65 0·17 1911 2-68 5'15 0·16 1921 3-66 6'84 0'37 1931 4-80 8-63 0·84 1941 10·43 17-67 3-02 1951 14'40 23·71 5-08 196T ZJ48 35'34 11·27
Figure to the right shows the growth of literacy in the district for total population, males and females separately.
The literacy percentage has increased five times during the last thirty years. The improvement has been very substantial in the decade 1951-61. The progress made is really outstanding in the context of a large tribal population and a small proportion of urban population. A scheme of compulsory primary education introduced by the State Government during the First Five-Year Plan may be one of the factors which helped to improve the level of literacy in the district.
The Primary Census Abstract in Part II shows the number of literate males and females for total, rural and urban areas of each taluka separately.
Total S:ate/District/Taluka
,-___ __..A. ____ -------.
Persons Males Females (I) (2) ( 3) (4)
MAHARASHTRA 29'82 42·04 16'76
YEOTMAL DISTRICT 23-48 35'34 11·27
1 Darwha Taluka .. 25-61 37·96 12'79 2 Yeotmal Taluka .. 27'58 38'46 16'22 3 Pusa:! Taluka __ - - 2J'40 33·,6 8·71 4 Kelapur Taluka -. 18'87 29-42 8'28 5 Wani Taluka .. .. 23-83 36'77 10'56
LITERACY 1901-1961
, , , J _- TQ7.C! !
30r---<---1 ______ "~~E' L--t---:'-'-1
I Y-I"'''~ 1./ I
24;---~--(--I+-}_/' I I I / I I I /
18~-~----+---.'--rt~·~--~
'
I I II /1' 1/1 t2~ __ ~_-+ __ ~r+'_/-+~L./~_~
,/' /"
- /',--,' / / //
6 -____ _' 1I
----~ ,,_-_._..~ /'
//
o _ _ _ __ ,_--- V
/ /
t 90 t 191 I 1921 1931 1941 t 95 t 1961
The Village Directory in Part I furnishes such numbers for each village and for each ward of every town separately. Percentage proportions out of the total population for males and females are shown below for total, rural and urban areas of each tal uk a separately :-
Rural Urban ,------"---------, , ___ --A.. __ -----,
Persons Males Females Persons Male Females
(5) t6) (7) (8) (9) (10)
21'46 33·51 9'34 51·07 61'62 3j·90
20·30 31·80 8'56 45·52 59·04 30'14
23-81 35·97 11·24 40'74 54·38 26·09 20·51 30·68 10·08 52-70 64·97 39·00 J8'69 30'05 6'48 42'J5 56'86 26'26 16'78 26'95 6'64 41'00 54-40 26'36 21-42 34'10 8'49 44'53 58·93 28·91

(24) DISTRICT CENSUS HANDBOOK
Figure to the rightr----------------------------------, shows the spread of lite-I racy in the district bYI isopleths.
The northern portion! which incidentally lies in the basin of the Wardha river is the most literate area in the district. II
The literacy rate drops I down beyond this region towards the south. The hilly and forest areaS in the extreme south in parts of Pusad and Kelapur talukas have the lowest rates of literacy. Within the district Yeotmal taluka has the highest literacy for total, males and females. But I Darwha taluka has the I highest literacy rate for rural areas. For urban i
areas also Yeotmal taluka: is the highest for total,
1 t=:;:;'===I:=t==::=ij" .._...
i;l;;t.:;;I;;;b=-=ij'j -.-
YEOTMAL DISTRICT
LITERACY 1961
[1 I I §§111 I' <;:0 30 PERCEN7
m~eand fum~e li~rKy.~-~~~~_~ ____ ~ __ ~~~~ ___ ~ ______ ~~~.
Literacy by Age
The percentages of literates by age-groups for the district total, rural and urban areas are as shown beloW'. Actual figures are shown in Table C-III-A, B and C in Part II which also gives figures for different educational levels separately.
Total Age-group ,
Persons Males Females
(1) (2) (3) ( 4)
All ages 23-48 35·34 11·27
0-4
5-14 33-11 42·91 26·21
15-34 .. 31'24 48·66 IHO
35-59 20·60 34·70 4-49
60 + 12·5\ 24·9\ \·43
Primary Education
Table 15 in Part III shows the num ber of primary schools and pupils in them for the district and each taluka in 1951, 1956 and 1961.
The number of primary schools and their classifi4 cation as on 31 st March 1962 are as shown in the next column.
That the education of women IS a recent development IS evident bv the comparatively higher literacy rate for females 10 the age-group 5-14 against that for males in the age-group 15-34.
Rural Urbao ~ -""\.
Persons Males
(5) (6)
20·30 31'80
29,59 38,96
26·75 4H3
17·50 30'58
10'37 21-13
Total No. of s::hools.
State Govern-mcnt.
Ziila Parishad Municipal , ,
Private
• . '
Females Persons Males Females
(7) (8) (9) (10)
8·56 45·52 59'04 30·74
18'9~ 57·38 62-92 51·52
9'98 60·43 77·76 40·60
2-61 42-65 63-69 18·10
0·77 28'05 52'05 6'22
Basic Non- basic , __ -,,-___ .-., ,-___ ..A. ___ --.
Total Se- Ju- Single Sin- I-IV MidniClr nior teach- gle muIti- die
basic basic er tea- teacher I-VII cher
1,219 65 82 42 574 340 116
28 5 5 15 2
1,113 60 81 42 559 265 106 52 1 47 4 26 9 13 4
YEOTMAL: EDUCATION (25)
There has been a very rapid growth in the number of primary schools in the district during the last ten yeltfs. The number increased from 464 in 1951 to 897 in 1956 and to 1, 168 in 1961. On 31 st March 1962, it stood at 1,219. Out of the 1,219 primary schools, 1,113 or 91' 30 per cent are managed by the Zilla Parishad and only 2'13 per cent are managed by private institutions. The State Government's share (in the year 1961-62) was 88'8 per cent of the total expenditure. The expenditure on primary educa· tion is incurred by the State Government through grants-in-aid to Zilla Parishad and building loans and grants to primary teachers' training colleges. Similarly, wards of parents whose annual income does not exceed Rs. 1,200 get free education. The cost borne by the schools on this account is reimbursed from the State Government. Students from Scheduled Castes and Scheduled Tribes and children of political sufferers and of landless labourers get free education at the cost of the Government. Scholarships are given to students from Scheduled Castes and Scheduled Tribes at the rate of Rs. 3 per year in I and II standards and Rs. 6 per year in III and IV standards. Government also gives aid to backward class and mixed hostels for meeting their cost on students belonging to Scheduled Castes and Scheduled Tribes.
The State Government's policy of converting primary schools into basic schools has also made steady progress in the district. In 1960-61 there were 157 basic schools in the district. On 31 st March 1962, the number stood at 189.
By 31 st March 1962, 8 towns and 1,115 villages in the district had primary schools and 230 villages had schooling facilities, i.e., primary schools situated within a mile from the village. 284 villages did not even have schooling facilities. Total number of teachers was 3,223. Out of them, I ,614 were trained teachers.
Other indices of the progresJ of primary education in the district compared with those of the State averages are as follows :-
(As on 31st March 1962)
Average population served by a primary school
Average area served by a primary school (sq. miles)
Pupils per teacher .. Pupils per school ..
Average annual salary per teacher (Rs.) Average annual expenditure per school (Rs.)
Average number of teachers per school .. Percentage of trained teachers
Yeotmal District
912
4-3 29 76
1,090 3, I 57
2-6 50· r
Maharashtra
I, I 35
3·4 38 127
1,250 4,903
3'3 64-8
The scheme of compulsory primary education was introduced during the First Five-Year Plan. Initially, it was applied to four towns in the district. During the Second Plan period, the scheme was extended to the remaining four towns, as well as to Community Development Blocks. Children in the age-group 6-10 were covered. One of the Third Plan schemes is to extend the scheme of compulsory primary education to children in the agegroup 6-11. A provision of Rs. 70'28 lakhs has been made for primary education in the Third Plan in the district. The additional 1,226 teachers would be appointed in primary schools during the Plan period. The number of students is expected to rise by 61,300. Similarly, 201 class-rooms are proposed to be built during this period.
Secondary Education
The number of institutions imparting secondary education and number of pupils both boys and girls for the years 1951, 1956 and 1961 are shown in Table 15 in Part III. A list of high schools with number of students for each of them may be seen in Table 16.
By 31 st March 1962, the number of institutions and their classification in the district are as follows ;-
Higher Secondary Voca- Schools Middle tional ,- ---"--.-., Second-
Total High Multi- Ordi- ary Schools purpose nary Schools
State 8 5 J.
Municipal 2
Private 48 6 33 9
Janapad (now 13 5 8 Zilla Parishad).
Total number of students on roll in the secondary schools as on 31st March 1962 was 20,829. Out of them, 16,339 were boys and 4,490 girls. Total number of teachers was 941. Out of them, 471 were trained teachers. Percentage of trained teachers was thus 50'0. Other indices of secondary education compared to the State averages are as follows :--
Population served by each secondary school Area served by secondary school (sq. miles) Pupil-teacher ratio .. Pupils per secondary school . . . . Average annual salary per teacher (Rs.) Average annual expenditure (direct)
per secondary sch::>ol . . (Rs.) Average number of teachers per secondary
school
Yeotmal District
15,659 73-9
22 293
1,724
29,215
13'2
Maharashtra
13,805 40'8
25 338
1,870.
39,543'
13'7
The Figure on page (26) shows the proportions for literates and different educational levels among males and females for rural and urban areas separately.

(26)
40· 96% ILLITERATE
TE:CHNICAL OEGREE
DISTRICT CE~SUS HA~DBOOK
LITERACY AND EDUCATIONAL LEVELS
1961
MALE
URBAN
I ,IIIIi I 34·.43%
PRIMARY OR
JUNIOR 6ASIC
0'2-5%
5·28% MATRICULATION OR
HIG>-iER SECONDARY
69'-26% 1I.1..ITERP.TE.
FEMALE
0'22':;;->-iIGHER SECONOA~V
o .83/.'
TECHNICAL & NON·TECHNICAL DIPLOMA NOT EQUAL TO DEGREE TECMNICAL & NON-TECHNICAl- DIPLOMA
UNIVERSITY. POSTGRAOUATE
UNIVERSITY. POSTGRADUATE
DEGREE
MALE
68·20% ILLITERATE
0'53% IVIATRICULATION AND ABOVe:'
RURAL
& TECHNICAl- DEGREES
FEMALE
PRIMARY OR JUNIOR !"ASIC AND ... eaVE
91 • 44Z ILl-ITERATE

YEOTMAL: EDUCATION (27)
This will show that the progress of secondary education has also been quite steady. The .number of secondary schools increased from 27 ~n 1951 to 35 in 1955-56 and to 59 in 1960-61. This figure stood at 71 on 31 st March 1962. The secondary schools are adequately dispersed throughout the district both in urban and rural areas. As per 1961 Wani taiuka has seven secondary schools which is the smallest number in the district. Darwha and Kelapur talukas each have as many as 15 secondary schools
Private institutions manage 67"6 per cent of the secondary schools in the district. The Government's share in the total expenditure on secondary education is (in 1961-62) 78'9 per cent and is. incurred, through different schemes of g:ants for .mamtenance, salaries, buildings, building sites, eqUlpt;nent, freeships, scholarships, loans, etc., and special. concessions to Scheduled Castes, Scheduled Tnbes and other Backward Class students.
Looking to the very fast growth in the number .of pupils in primary schools, the ~umber of pupils in the secondary schools may nse to 27,000 by 1965-66 and to 36,000 by 1970-71.
S. S. C. and Higher S. S. C. Examinations The Vidarbha Board of Secondary Education,
Nagpur, conducts public examinations at ~he .end of the secondary school course. Two exammatlOns are held every year in March and October, and Yeotmal, Umarkhed, Digras, Darwha, Pusad, Pandharkaoda, Wani, Ghatanji, Ralegao~ ~nd Nerparsopant (Darwha taluka) are the examlI~atlOn centres in the district. The number of candidates who appeared and passed from those centres during the year 1962 are as follows :-
Appeared Examination held in March 1962-
(a) S. S. C. 2,677 Higher S. S. C. 467
Examination held in October 1962-(a) S. S. C. 588 (b) Higher S. S. C. 103
Higher Education
Passed
1,450 273
225 15
Talukawise list of colleges is given in Table 16 in Part III along with the 1960-61 number of students
for each college. There were four colleges and the number of students was 805 in that year. The number of colleges has increased to seven in 19~2-63. The colleges now provide education in A~ts, SCI~nce, Commerce, Teaching and Law. There IS a pnvate Ayurved Mahavidyalaya and a Government recognised Homoeopathy College, b?th a~ Y.eotJ?al. All the colleges are managed by pnvate mstltutlOns and receive grants for maintenance, dearness, allowance and buildings from Government.
Technical Education There is one Technical High School at YeotmaI,
training students in technical subjects for S. S. C. Examination.
An Industrial Training Institute which is temporarily located at N agpur provides . facilities for training 128 trainees for two-year :ertlficate course in the following trades: Blacksmith, Carpenter, Electrician, Fitter, Turner, \Velder and Mechanic. The institute will be shifted to Yeotmal as soon as the new building, which is under construction, is completed.
A Polytechnic catering for diploma courses in engineering is also proposed to be started from June 1964 at Yeotmal.
Libraries
There are 13 libraries in the district which are recognised by the Government of Maharashtra as standing on 31 st March 1964.
Printing Presses, Journals and Newspapers There were 21 printing presses in the district
in 1960. Four periodicals are being published, out of which two are weeklies and two monthly journals.
Radio Licences
The number of radio licences in the district has been fluctuating in recent years. It decreased from 1,919 in 1954-55 to 1,609 in 1955-56. It increased to 2,852 in 1959-60 and has again declined to 2,408 in 1960-61.
Cinema Theatres There were 14 permanent and 4 touring cinema
theatres in the district on 21 st December 1963. HEALTH AND MEDICAL AMENITIES
The Health Department's work in the district is now in the purview of the Zilla Parishad. A Subject Committee looks after its working and the District Health Officer works as Secretary to that Committee as well as the Officer-in-charge of Health activities in the district.
Drinking Water Supply.
Column (5) of the Village Directory in Part I shows the sources and adequacy of drinking Water for each village in the district.
One town has protected water supply. Out of the remaining towns and villages, 199 villages draw drinking water from rivers, 73 villages from nallahs, 2 villages from tanks, 3 towns and 1,064 villages from wells and 4 towns and 291 villages from more thau one of these sources. The water supply is not adequate in summer in the case of 5 towns and 263 villages.
Malaria Eradication
Under the. National Malaria Control Programme. Malaria Control Unit was set up in this district in

(28) DISTRICT CENSUS HANDBOOK
October 1956. DDT spraying was carried out in almost all houses. Cattle sheds were sprayed in two rounds every year for four years. A special round was given to 68 flood affected villages of PUS2.d taluka in 1959. Since May 1958, the Malaria Control programme has been converted into Malaria Eradication programme. Under the new programme, each house is visited every fortnight to find out whether any person is suffaing from malaria.
Leprosy Control There is a Leprosy Clinic at Yeotmal with
a subsidiary centre at Darwha and five Survey, Education and Treatment Units for leprosy at Kalamb, Ner, Shirpur, Wani and Pandharkaoda.
Anti T. B. 25,590 persons were tested for B. C. G. and 9,446
were vaccinated during the year 1960.
Control of Small-pox Under the programme of mass vaccination
against 8mall-pox 24 vaccinators were appointed and 31 i ,537 children were vaccinated during 1960.
Family Planning Centres There are nine Family Planning Centres in the
district.
Medical Facilities Medical facilities available in the district are
shown in Table 17 in Part III. The figtlres in the Table relate to the facilities provided by Government and other aided institutions. The number of private practitioners, hospitals and dispensaries are not shown there.
The number of doctors and nurses, number of beds available and the number of indoor and outdoor patients treated have all increased between 1950-60. The number of doctors increased from 19 in 1950 to 29 in 1960. Similarly, the number of nurses increased from 9 in J 950 to 26 in 1955 and decreased
to 25 in 1960. The number of beds increased from 106 in 1950 to 199 in 1960. The number of indoor patients increased from 2,766 in 1950 to 7,618 in 1960. The number of outdoor patients also increased from 217,085 in 1950 to 298,165 in 1960.
Hospitals.-There were 12 hospitals in 1960. The main hospital at Yeotmal, which is now called the District Hospital, Yeotmal, and a private hospital at Umari, run by a Christian Mission, are well-equipped. Facilities for X-Ray a:1d pathological examination are available in both these hospitals. There is also one eye ward equipped .vith modern equipment in the District Hospital at Yeotmal. A T.B. ward 'with 50 beds has been attached to the hospital. There is also aT. B. Clinic with 10 beds. One big hospital known as Uttarwar Memorial Hospital has been started at Umarkhed during 1958-59.
Dispensaries.-In 1960, there were six Government or Government aided dispensaries. Besides, there are 24 Ayurvedic dispensaries and one Homoeopathic dispensary in the district.
Primary Health Centres.-At the end of 1960, there were seven Primary Health Centres functioning in the different development blocks in the district. Besides, about 242 first-aid centres have also been established in the same area.
There is one Women's Hospital at Yeotmal and two maternity and child welfare centres at Wani and Digras.
The total number of persons working as Physicians, Surgeons, Dentists, Nurses, Pharmacists and other health technicians in the district is 1,67 J.
The p~rsons returned in the 1961 Census as Physicians, Surgeons and Dentists and their classification by sex are shown in Table B-V in Part II. The number of medical personnel per one lakh population in the district is 39 as against 54 for Maharashtra.
HOUSING Tables E-I, E-II, E-IV and E-V in Part II present
material on different aspects of housing in rural and urban areas of the district and each taluka separately.
64·1 per cent of all the houses are used as dwellings, 23· 7 per cent as cattle sheds, etc., 5·9 per cent were vacant at the time of the Census and the remaining are used as shops, workshops or factories, schools, etc.
The density of residential houses per square mile in the district has increased along with the density ()f population per square mile from 38· 7 per cent
in 1951 to 44'9 per cent in 1961. The number of persons per residential house has also slightly increased from 4'62 in 1951 to 4·69 in 1961.
Classified by "owned" and "rented" categories 83 per cent of the dwellings in the district are owned and only 17 per cent are rented. The proportion of "owned" in the rural areas is slightly higher (88 per cent) and very much lower (48 per ~ent) in the urban areas. Even this low proportlOn of 48 per cent for the urban areas in the district is somewhat higher than the average of 30 per cent for all urban areas of Maharashtra.

YEOTMAL; HOUSING (29)
Out of the various materials used for walls, mud appears to be predominant in the district with a proportion of 48·0 per cent. The proportions in the talukas of Yeotmal and Kelapur are much lower and the difference is made up by grass, leaves, reeds or bamboos. Burnt bricks are used next to mud and grass, leaves, etc., as 6·3 per cent of the occupied dwellings are found to be of walls of this type, They are, however, more common in the urban (31'9 per cent) than in rural areas (2·8 per cent). Stone is not used much in the district as only 3· 1 per cent of the dwellings have stone walls.
Out of the material of roof, corrugated iron and zinc sheets (c. 1. sheets) are predominant in the district with a proportion of 39·0 per cent. C. I. sheets are, however, more common in urban areas. Their proportion in t~e urban areas is 52· 2 per cent against 37'1 per cent in rural areas. In the rural areas along with the C. 1. sheets, roofs of
grass, leaves, reeds, etc., are also common and have a proportion of 36·3 per cent. C, 1. sheet roofs are very common in the western part comprising Darwha and Pusad talukas. The roofs of grass, leaves, reeds, thatch, etc., are found mostly in the rural areas of Yeotmal and Kelapur talukas. The rainfall increases towards the eastern part of the district and the roofs in Wani taluka are, therefore, slopy and are of tiles, slate, shingle, etc. Their proportions in both rural (26'2 per cent) and urban (29'2 per cent) areas are very close.
Classified by the number of rooms occupied, 65· 3 per cent of households are occupying oneroom dwelling" and 23-1 per cent are occupying two-room dwellings. Households occupying larger number of rooms are more in urban areas than in rural areas. Average number of persons per room is }06 for total, 3- J 5 for rural and 2·57 for urban areas.
AGRICUL TURE AND IRRIGATION
Agriculture is the most important economic activity as it engages 85'30 pcr cent of the working population in the district. Many others also work in industries related to processing of agricultural produce or trade, transport and services ancillary to agriculture.
Tables 3 to lOin Part III present ten years statistics for land utilisation, crop pattern, IrrI
gation, wholesale and harvest prices, livestock and agricultural implements for the district and each taluka separately.
Cultivating Seasons
As in other areas of the State, there are two agricultural seasons, viz. Kharif and Rabi, in this district also, but the district is predominantly a kharif crop growing area. Kharif jowar, groundnut, .cotton and tur are the important crops of the khanf season whik the main crops of rabi season are wheat and gram.
Administrative Unit
(I)
MAHARASHTRA YEO,MAL DISTRICT
1 Darwb. Taluk ...
2 Yeotmal Taluk ...
3 Pu,act T aluka ..
4 Kelapur Taluk.
5 Wani T aluko
,---Total
geographical area
(2)
.. 100 100
.. 100 100
.. 100 100 100
J-1812-vi-a (Yeotmal)
Forests
(3)
17.54 22.76
20.08 23.50 27,73 21.75 19.19
Barren and Land put to unculturable non .. agricul·
land tUfal uses
(4) (5)
6.08 2.29 5.83 2.86 2.38 2.90 5.97 3.35 9.28 224 5,96 2.45 4.71 3.75
Sowing and harvesting periods of some of the principal crops are shown below ;-
Crop Sowing period (a) Kharif Seasan-
(I) J owar 2nd and 3rd week of July.
(2) Groundnut Last week of June to mid of July.
(3) Cotton
(4) Tur
.. 3rd week of June to mid of July.
31'd week of June to mid of July.
(b) Rabi Season-(I) Wheat Mid of October to
1 st week of November.
(2) Gram 3rd week of Septem-
Land Utilisation
ber to 1 st week of October.
Harvesting period
3rd week of December to I st week of January.
Last week of September to mid of October.
October, November, December.
Last week of J anuarv to mid of February.
March.
Last week of February to mid of March.
The pattern of land utilisation in the district a~d each of its talukas is shown below compared wlth that of the State. All the figures are based on the averages for three years from.1957-58 to 1959 60.
Percentage of geographical area
Cuhurable Permanent Miscellaneous Current Other Net area -,
Total gross waste pastures tree crops 1.llows ,allow land sown cropped area
and groves
(6) (7) (8) (9) (10) (II) (12)
2.80 4.75 0.62 3.77 4.46 57.69 60.55 2.22 2.90 1.73 2.11 5.48 54.11 54.51 2,31 2.37 0.23 1.60 7.70 60.43 60.64 2.26 2.42 1.27 2.08 4.04 55'11 55.52 1.23 3.82 0.\6 0.86 4.8\ 49.87 50.V 2.46 2.39 5.37 3.04 4,64 51.94 5253 3.24 3.36 1.87 345 6.23 54.20 54.57

(30)
VEOTMAL
DISTRICT
DARWHA
VEOTM"L
PUSAD
KEL"PUR
WANI
J-18IZ-vl.b (Yeotmal)
DISTRICT CENSUS HANDBOOK
LAND UTILISATION
1959-60
TALUKAWISE PERCENTAGES
50 60
REFERENCES S FORESTS
~ BARREN & ~ UNCUL.TURABL.E
LAND _
LANOPWT TO NON AGRICUL TURAL.
usl::s
~ CUL.TURABL.E
~ WASTE:
~ PERMANENT
~ PASTURES & OTHEA GRAZ'NG LAND
70 80 90
MISCEL.L.ANEOUS
TREE CROPS ETC.
CURRENT
FALLOWS
OTHER
FALLOW LAND
NET AREA
SOWN

YEOTMAL: AGRICULTURE AND IRRIGATION (31)
The Figure facing this page shows the land utilisation pattern for the district and each of its talukas separately for the year 1959-60.
Because of the higher proportion of area under forests the proportion of net area sown to the total geographical area (54·11 per cent) in the district is lower than the average for the State (57'69 per cent). In all other types of utilisation the district proportions are nearly at par with the State averages.
The percentages of net area sown to the total geographical area within the district vary from 49·87 per cent in Pusad taluka to 60·43 per cent in Darwha taluka. The proportion is more than the State average only in Darwha taluka, which, although is the taluka having slightly higher proportion of area under forests, has the least proportion of barren and unculturable lands. On the other hand Pusad taluka, in which the net sown area is nearly half of the geographical area, has a higher proportion of areas both under forests (27-73 per cent) and barren and unculturable categories (9·28 per cent). Only Kelapur taluka has a significant proportion under miscellaneous tree crops and groves. The proportions of areas under culturable waste are very low except in Wani taluka where it is higher than the State average.
Due to the change in the classification of land utilisation effected in 1950-51, camp arable statistics, prior to 1950, are not available. It is not, therefore, possible to study the changes in land utilisation over the last 40-50 years. It may, however, be of interest to note that according to the District Gazetteer in 1909-10, 23 per cent of geographical area was covered by forests, 1 per cent under permanent pastures, 4 per cent under culturable waste, 63 per cent was cropped area and 4 per cent was old fallows. The proportions do not appear to be comparable as in 1909-10 the areas were unsurveyed and the statistics had been collected on different definitions.
Details of cropped area
(1)
Gross Cropped Area •. Total area under food C101>3
Area under cereals Rice Wheat Jowar Bajri .. Other cereals
Area under pulses Sugarcane .• Other food crops •. Area ,-,"deT non-food crops Area under oil-seeds
Groundnut Other oilseed.
Cotton Tobacco .....•.. Other non-food crops indudin~ fodd.r crops
Maharashtra
(2)
100 00 69.88 52.97 6·67 4·68
30·95 Y·42 1·25
10.69 0·63 5·59
30·12 8·18 6·11 2·07
13·62 0·12 8·20
Yeotmal District
(3)
100'00 54·82 41·59
1·29 2·74
36·09 "39 0·08
12·42 0·03 0·78
45·18 6·01 3·77 2·24
38·52 O·OJ 0·64
Crop Pattern
The proportions of areas under important food and non-food crops for the district and each of its talukas are shown below compared with the corresponding figures for Maharashtra. All the figures are averages for the three years 1957-58 to 1959-60.
The Figure on page (33) shows the crop pattern
for the district and each taluka separately.
The ratio of areas under food crops to non-food
crops in the district is 55: 45. This pattern is different from the average for the State where 70 per cent of the gross cropped area is occupied by food crops.
Amongst the food crops, jowar with 36'09 per cent
of gross cropped area ranks first in the district. Pulses chief of which is tur cover another 12'42 per
cent and wheat 2'74 per cent. Compared to the State averages, the district has very low proportion of areas under rice (1'29 per cent), bajri (1'39 per cent),
other cereals (0'08 per cent), sugarcane (0'03 per cent) and other food crops (0'78 per cent).
Amongst non-food crops, the proportion of
area under cotton to the gross cropped area in the
district is nearly three times the average for the State. Cotton is the principal crop of the region and
occupies the largest area. Oilseeds cover 6 per cent
of the gross cropped area. Groundnut is the principal oilseed of the district occupying 56 per cent of
the area covered by oilseeds. The other oilseeds of importance from the average area are sesamum
and linseed. Tobacco is not an important crop in
the district and occupies almost negligible area and
that too only in one taluka, 'z:iz., Wani.
Percentage of gross cropped area in - ------~-------
Darwha Yeotrnal Pusad Kelapur Wani Taluka Taluka Taluka Taluka Taluk.
(4) (5) (6) (7) (8)
100."0 100.00 100.00 100.00 100.00 48·12 51'79 59.29 55.92 59.90 36·% 38·90 46.10 42.06 44.16 0·77 1'03 2.09 1.43 1.02 0·71 2·13 4.98 1.91 4.17
33'62 33·90 37.33 37.31 38.69 1·81 1·79 1.52 1.36 0.25 0·05 0·05 0.18 0.05 0.03
10·40 11.98 12.42 13.12 14.86 0·04
0'9'1 0,07 0.02 0.03
0'72 0,70 0.72 0.85 51'88 48·21 40.71 44.08 40.10 10·21 4·86 4.54 2.49 7.71 9'64 3'55 2.93 0.94 0,45 0·57 HI 1.61 1.55 7.26
41'23 42-64 35.28 41.02 31.74
0.44 o·ji 0.89 0.57 0.05 0.60

(32) DISTRlCT CENSUS HANDBOOK
Comparable statistics for the entire district prior
to year 1950-51 are not available. It is difficult
to study the change in the crop pattern in the dis
trict. According to the District Gazetteer it appears
that in J 909- J 0, 0'5 per cent of the cultivated
area was under rice, 41' 3 per cent under j owar,
6'1 per cent under tur, 31' 9 per cent under cotton,
2'5 per cent under til, 0'7 per cent under chillies,
2'6 per cent under wheat, Z'O per cent under gram
and 1'3 per cent under linseed. This broadly shows
that cotton has gained during the last fifty years at
the cost of jowar.
The crop pattern of the district in general is
poorer than the average for the State. The State's
crop pattern itself is poor, in the all-India setting'
because of higher proportion of jowar, bajri and other
low-value crops. The district proportions of rice
and wheat are considerably lower and that of jowar
is higher than the average for the State. The reliev
ing factors are the higher proportion of area under
cotton and better yields for jowar and tur.
Within the district only minor variations are
noticed in the cropping pattern. The proportion
of food crops is more than the non-food crops in all
the talukas except in Darwha taluka. Pusad and
Wani talukas have sizable proportions of areas under
rabi crops like wheat and gram. Pusad and Wani
talukas have comparatively lower proportions of
area under cotton. Groundnut is important in
Darwha taluka while Wani taluka has higher propor
tion of area under other oilseeds chiefly sesamum.
As described earlier tobacco occupies some area.
only in Wani taluka.
Nine-year average yields and 1958-59 acreages
and outturns of important crops are shown in the
next column compared with the corresponding figures for Maharashtra taken as J 00.
Crop Nine-year average 1958-59 1958-59
yields per acre area outturn
MAHARASHTRA
Rice
Wheat
}oWar
Tur
Gram
Groundnut
Cotton
Sesamum ..
Rape, mustard and linseed.
100.00
64.78
95.18
129.56
161.38
93.81
77.56
100.00
101.55
113.16
100.00 100.00
0.73 0.41
1.58 1.73
4.62 4.46
7.36 11.38
1.90 1.66
2.47 I. 56
11. 20 8.53
5.03 4.69
3.03 3.20
The district average yield of tur is 60 per cent higher th:m the average for the State and that of
jowar is more than 25 per cent higher than the State average. The average yield of groundnut is, however, considerably lower than the State average, The district has J 1'2 per cent of the total area under cotton in Maharashtra. The district contribution in the State's outturn of tur is 1 J '38 per cent.
The Techno-Economic Survey of Maharashtra has estimated gross value of output per aCre of
cropped area in 1955-56 at Rs. 50 for the district against Rs. 76 for the State and Rs. 126 for India.
The density of population, proportion of workers working on land to total workers, gross area sown per wJrker on land and the proportion of gross irrigated area to gross cropped area are shown below for the district and each of its talukas compared with the State averages:-
Administrative Unit
MAHARASHTRA "
Density of
popula_ tion per square
mile
334
YEOTMAL DISTRICT 210
Darwha Taluka " 237
Yeotmal Taluka .. " 228
Pusad Taluka 206
Kelapur Taluka .. 182 Wani TaJuka
" 201
Percent_ Gross age of area
workers sown per working worker on land on to total land workers (acres)
69·91 3·50
85·30 3·57
88·41 3-44
79·05 3-73
87·72 3·43
86·62 3-71
8294 3·66
Percent_ age of gross
irrigated area to gross
cropped area
6·23
037
0·29
068
0·31
0·33
0·30
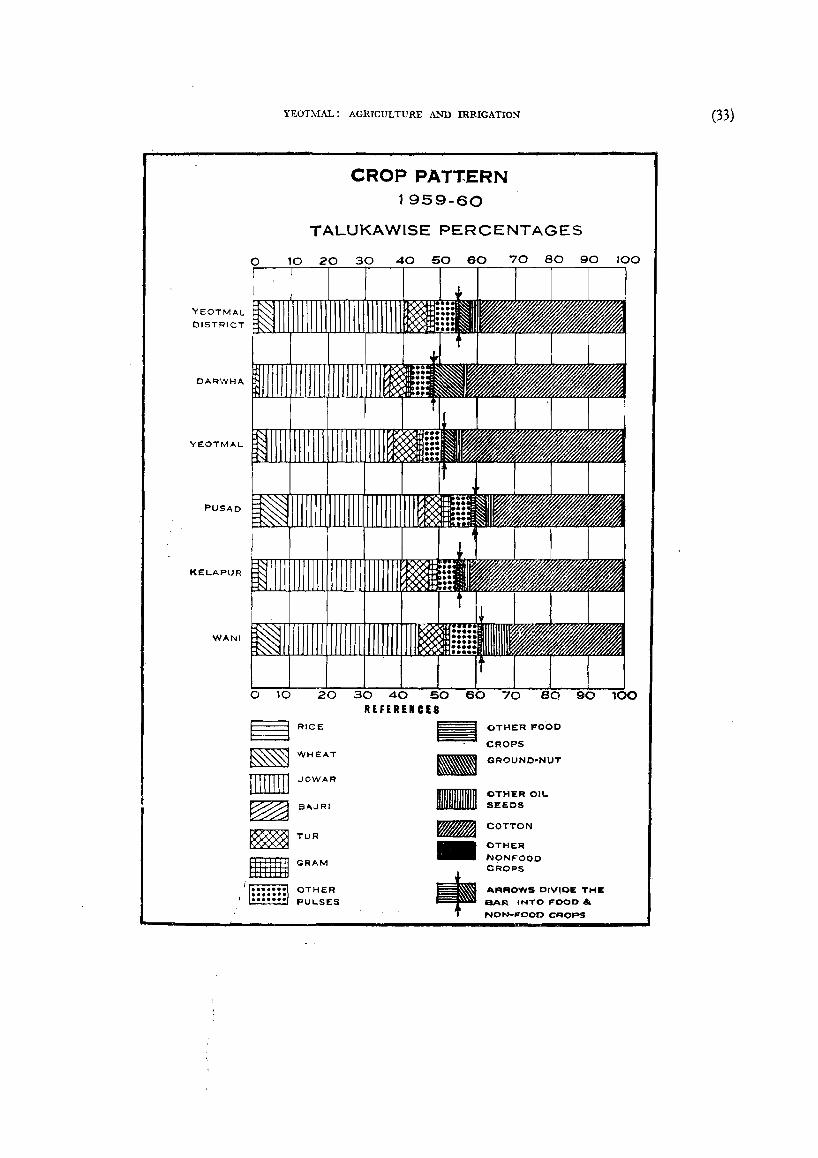
YEOTMAL
DISTRICT
CARWHA
YEOTMAL
PU5AO
KEL.APUR
WANI
YEOTMAL: AGRICULTURE AND IRRICATION
0 10
§ ~ -~ ~ -
CROP PAT'rERN 1959-60
TALUKAWlSE PERCENTAGES
20 30 REFERUCES
RICE ~ OTHER FOOD
CROPS WHEAT - GROUND-NUT
JOWAR - OTHER 011.
BAJRI SEEDS
~ COTTON TuR - OTHER
GRAM NONFOOD
• CROPS
OTHER ARROWS C,V,CE THE
PUL.SES BAR INTO FOOO'"
NON-FOOD CROPS
(33)

(34) DISTRICT CENSUS IIANDBOOK
85-30 per cent of total working population work on land of which 34'21 per cent are cultivators and 51-08 per cent are agricultural labourers_ This proportion is considerably higher than the average for the State (69'91 per cent). Correspondingly, however, the gross area sown per worker on land is not comparatively high.
The percentage of workers working on land to total workers does not vary much from taluka to taluka_ The proportion is considerably higher than the State average in each taluka. The gross area sown per worker on land also does not vary much from taluka to taluka.
Because of very low proportion of irrigated lands the district also has very low proportion of doublecropped area. In 1959-60 the proportion of area under double crops to the net area sown was only 0'87 per cent against the average of 5'05 per cent for the State. The double-cropped area has, however, gradually increased from 6,500 acres in 1950-51 to 15,600 acres in 1959-60. The proportion of double-cropped area is significant only in the talukas of Kelapur (1'20 per cent) and Pusad (1'02 per cent).
Irrigation
Compared to the State average the district has very small area under irrigation. The proportion of gross irrigated area to gross cropped area in the district during 1959-60 was only 0'37 per cent against 6' 23 per cent for Maharashtra. The proportion varies between 0-29 per cent for Darwha and O' 68 per cent for Yeotmal taluka. The construction of the projects on Pus and Penganga rivers is likely to change the face of the district in the near future.
Table 4 in Part III gives the break-up for irrigated areas by sources of irrigation for the district and each taluka separately. It is interesting to note that except for negligible portion of land which is irrigated by tanks (100 acres or 1'47 per cent) and by canals (200 acres or 2'94 per· cent) the entire irrigation is done by wells, canals and tanks as sources of irrigation appear in Wani taluka only.
The District Gazetteer reports that the area under irrigation during the period J 891 to 1900 fluctuated from year to year roundabout 3 thousand acres, and about 10 thousand acres from 1901 to 1910 "nd then again from 1910 to 1913 around 3 thousand acres_ Statistics for the period thereafter till 1950 are not readily available. In 1950-51 the irrigated area was
7'8 thousand acres (or 0'46 per cent of gross cropped area) but it fell to 6'8 thousand acres (or 0-37 per cent of gross cropped area) in J 959-60.
It is surprising that the irrigated area has actually decreased during the last decade, inspite of a substantial increase in the number of oil engines and electric pumps used for irrigation. The number of oil engines increased from 99 in 1951 to 413 in 1961 and the number of electric pumps increased from 19 in 1951 to 232 in 1961.
Crop Pattern under Irrigation
Table 5 in Part III gives the crop pattern under irrigation. In the year 1959-60, 85' 29 pe r ce nt of the irrigated area was occupied by food crops and 14' 71 per cent under non-food crops. Among food crops, rice covered 2 per Cent, wheat 8 per cent, sugarcane 12 per cent, condiments and spices (mainly chillies) 26 per cent and miscellaneous food crops including fruit orchards 52 per cent. Amongst non-food crops 40 per cent were covered by cotton and the remaining 60 per cent by other food crops including fodder crops.
Though in the year 1959-60, 8 per cent of gross irrigated area was under wheat, irrigated wheat in the district formed only 0'71 per cent of the total area under wheat. The entire area under sugarcane wasirrigated. The proportion of irrigated area to total area under condiments and spices was 19' 23 per cent .. The irrigated area under cotton was only 0'06 per cent of the total area under cotton.
Production
The annual outturn of principal crops in the district is shown in Table 6 in Part III. The average production of food crops between 1951-56 and 1956-60 compares with the production of 1951-52 as under:-
Crop
Rice __
Wheat
Jowar
Bajri
Other cereals
Total cereals
Total pulses
Total foodgrains
Groundnut "
Cotton
Average production in hundred tons for year
----,. 1951-52 1951-56 1956-60·
78 51 67 40 63 66
2,470 1,874 1,424
50 45 33
2,639 2,034 1,590
681 709 494
3,320 2,742 2,083
236 186 128
1,484 1,071 1,114

YEOTMAL: AGRICULTURE fu'JD IRRIGATION (35)
This comparison with a single year as a base may not however be quite reliable as the base year itself might either have been a very good or a bad agricultural season. As it is seen here, 1951-52 looks to have been a very favourable year. The comparison of the results in the achievements during the Plan periods should, however, be used with caution.
Excepting rice and wheat the average annual production of cereals and foodgrains is lower during the Second Plan period than that during the First Plan period. Compared to the year 1951-52, production of almost all the items is considerably lower during both the Plan periods. The production of foodgrains is lower by 17 per cent during the First Plan period and by 37 per cent during the Second Plan period than the production in J 951-52. The production of cotton increased by about 4 per cent during the Second Plan period over the production in the First Plan period.
Agricultural Implements
The number of agricultural implements for the district and for each of its talukas for the year 1951, 1956 and 1961 are separately shown in Section C of Table 9 in Part III.
The remarkable increase in the number of oil engines and electric pumps used for irrigation has already been described. Between 1951-61, the number of iron ploughs has more than doubled and the number of wooden ploughs has increased by 29'17 per cent. The number of sugarcane crushers operated by power decreased by one during the decade and those worked by bullocks declined from 81 to 56. The number of crushers of both types together reduced to about 22 per cent. The number of tractors increased from 30 in 195 J to 93 in 1956 but again declined to 68 in 1961.
By using standard average prices of the agricultural implements shown in Table 9 in Part III, the total outlay on them for the year 1961 may be estimated at Rs. 152 lakhs or Rs. 8'45 per acre of the net area sown. The agricultural implements not shown in the table may not together make more than Rs. 2 per acre. The total outlay on this item in the district may approximately be presumed to be less than Rs. 11 per acre.
Agricultural Extension
Agricultural development in the district is now looked after by the Zilla Parishad. A Subject Committee of the Zilla Parishad' deals with it and the
Agricultural Development Officer works as a Secretary to that Committee. There are Agricultural Extension Officers at tal uk a level working under the Block Development Officer. The latter works as a Secretary to the Taluka Samiti. Talatis and Gram Panchayat Secretaries work as Assistant Gram Sevaks. Village Panchayats are expected to work for agricultural extension at the village level.
Agricultural Research
The Agricultural Research Station at Yeotmal had been established in 1920. It has a farm area of J 05' 55 acres. Research is done in this station on cotton as principal crop and jowar and groundnul as subsidiary crops.
Agricultural Improvements
(i) Increasing the area under Irrigation.-The most important single item of increasing the agricultural production is enlarging the area under irrigation. Stress is therefore laid on irrigation projects in the Five-Year Plan schemes. There is however very little scope by way of major and medium irrigation projects in the district. Attention so far had been mainly focussed on minor irrigation works such as bandharas, wells and tanks. In the First Plan period more stress was laid on construction of new wells and repairs to old ones. In the Second Plan period the work of construction of eight new tanks and improvement to one old tank was completed. These tanks are, however, nut directly used for irrigation. They have indirectly helped in raising the water level of wells in nearby areas. Besides these works, construction of Durug tank in Yeotmal tal uk a, construction of bandharas at three places and construction of Ambona canal system in Pusad taluka were started during the Second Plan period and completed in the Third Plan period. These works have raised irrigation potential by about 2,800 acres. Apart from these spill over works, new works of construction of eight tanks and eight bandharas have been included in the Third Five-Year Plan. On completion of these schemes, irrigation potential will be increased by about 13,000 acres.
In addition to these minor ungation works, the Third Plan includes two medium irrigation projects known as (1) Pus river project and (2) Khuni river project. The former has an estimated irrigation potential of about 25,000 acres of which about 5,000 acres will be available by end of Third Plan period. The preliminary work has already started. The Khuni river project is likely to create irrigation potential of about 6,000 acres.

(36) DISTRICT CENSUS HANDBOOK
Construction of new wells and renovation to the old ones offer the cheapest and quickest means of increasing the irrigational potential. Between 1950-51 and the end of Second Plan period 1,276 new irrigation wells were constructed and 552 wells were repaired. The Third Plan envisages construction of 2,200 new wells and installation of 1,050 pumping sets.
With the increasing facilities for irrigation the question of the full utilisation of created potential is likely to assume importance. The statistics of the created potential and its current utilisation are however not readily available.
(ii) Improved Seeds.-Another item of improving food production is the recommendation of appropriate varieties or strains of crops suitable for the tract. The Agriculture Department has recommended the following improved varieties or strains of crops for the district :-
(I) Cotton Buri 147, Buri 394.
(2) Jowar Improved Saoner.
(3) Groundnut .. AK-12-24.
(4) Tur
(5) Wheat
Tur C-II, E-B-38, Hyderabad- 48.
Hy-65.
Seed farms have been established at 10 places in the district to provide improved seed to farmers. The combined area of all the seed farms is 662'43 acres.
(iii) Soil Conser'cation or Bunding.-During the Second Plan period an area of about 40,000 acres has been bunded. The Third Plan target is 1'08 lakh acres involving an outlay of Rs. 57-20 lakhs.
Livestock
The number of livestock for the years 1951, 1956 and 1961 have been shown separately for each taluka and the district in Table 9 in Part III.
There are 10-011akhs of livestock in the district in 1961. This makes 55 livestock per 100 acres of cultivated area. The corresponding figure for the State is 139.
The total bovine population in the district in 1961 is 79-84 per cent of the total livestock. The number of male bovines over three years are 2-8 lakhs. The area cultivated per pair of male bovines over three years is thus 13-16 acres as against 5-48 acres for Maharashtra_ There are 3 lakhs female bovines over three years in the district. That makes 273 female bovines over three years per 1,000 population, which is considerably higher than the average for Maharashtra (159).
The total livestock increased by 13'94 per cent during the decade 1951-61. During the first five years from 1951-1956, all types except horses, ponies and other livestock increased, but during the next five years there was a small reduction in the number of cattle aI).d also large decrease in sheep, horses, ponies and other livestock. This resulted in reducing the sheep population in 1961 to tWo-thirds of its size in 1951. Horses and ponies reduced to almost half the number during the decade. The number of goats has increased by 57 per cent. The number of poultry has increased by 167 per cent in the decade.
Veterinary Facilities
Veterinary dispensaries are located at the following 13 places in the district:-
(I) Yeotmal, (2) Darwha, (3) Pus ad, (4) Umarkhed, (5) Wani, (6) Pandharkaoda, (7) Digras, (8) Shambhalpipri, (9) Maregaon, (10) Patanbori, (11) Babhulgaon, (12) Ralegaon and (13) Ghatanji.
In addition, there are veterinary aid centres located at 32 different places in the district. Treatment of animal diseases, control of epidemics, castration of bovines and control and destruction of animal parasites are the main services rendered at these dispensaries.
Majority of cattle found in the district are of Gaolao breed. The Hariana breed is recommended and is found in Pusad and Darwha talukas and parts of Yeotmal taluka and the Gaolao breed in the remalmng areas. The buffalo breed is mostly of Nagpur type giving very rich milk. Murra animals are also found to a small extent.
Nine key village centres have been established in the First Five-Year Plan for improvement of cattle breed in the district. In the Second Plan period one more key village centre with six key village units was established. Two breeding bulls of Gaolao breed are maintained for natural and artificial insemination at each key village unit.
There is a cattle breeding farm at Yeotmal which has a capacity to accommodate 50 animals. In 1960-61 a herd of 42 Gao lao cows and two bulls was maintained at this farm. The selective breeding in Gaolao animals is now taken. up at this farm to develop the Gaolao breed which is a recognised breed of this region.
A poultry demonstration centre has been established at Yeotmal for development of poultry in the district. It has recently been converted into District Poultry Breeding Farm for taking up poultry development on a large scale.
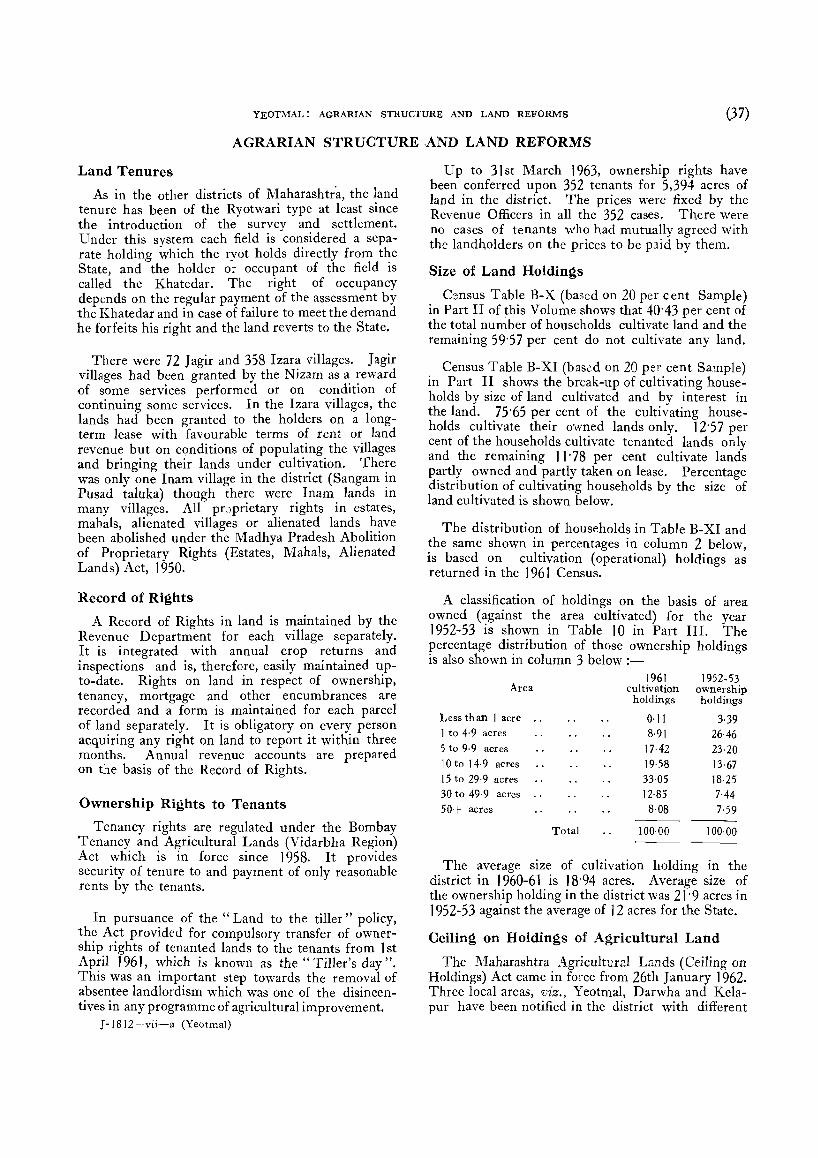
YEOTMAL: AGRARIAN STRUCTURE AND LAND REFORMS (37)
AGRARIAN STRUCTURE AND LAND REFORMS
Land Tenures
As in the other districts of Maharashtr'a, the land tenure has been of the Ryotwari type at least since the introduction of the survey and settlement. Under this system each field is co~sidered a separate holding which the ryot holds dIrectly from t~e State and the holder or occupant of the field IS called the Khatedar. The right of occupancy depends on the regular payment of the assessment by the Khatedar and in case of failure to meet the demand he forfeits his right and the land reverts to the State.
There were 72 J agir and 358 Izar~ villages. J agir villages had been granted by the Nlzam as ~ :eward of some services performed or on condItIOn of continuing some services. In the Izara villages, the lands had been granted to the holders on a longterm lease with favourable terms of rent or land revenue but on conditions of populating the villages and bringing their lands ~nder c~lti,:,ation. The:e was only one Inam village m the dlstnct (Sangam ~n Pusad taluka) though the~e were. Inam. lands III
many villages. All pr Jpnetary nghts m estates, mahals, alienated villages or alienated lands ~~ve been abolished under the Madhya Pradesh AbolItIOn of Proprietary Rights (Estates, Mahals, Alienated Lands) Act, 1950.
Record of Rights
A Record of Rights in land is maintained by the Revenue Department for each village separately. It is integrated. with annual ~rop :etu~ns and inspections and IS, therefore, eaSIly mamtamed upto-date. Rights on land in respect of ownershIp, tenancy, mortgage and other encumbrances are recorded and a form is maintained for each parcel of land separately. It is obligatory 01: ev.er~ person acquiring any right on land to report It wlthm three months. Annual revenue accounts are prepared on the basis of the Record of Rights.
Ownership Rights to Tenants
Tenancy rights are regulated under the Bombay Tenancy and Agricultural Lands (Vidarbha Reg!on) Act which is in force since 1958. It prOVIdes security of tenure to and payment of only reasonable rents by the tenants.
In pursuance of the" Land to the tiller" policy, the Act provided for compulsory transfer of ownership rights of tenanted lands to the tenants from 1 st April J 96 J, which is known as the" Tiller's day". This was an important step towards the removal of absentee landlordism which was one of the disincentives in any programme of agricultural improvement.
J- 1 8 12 ---vii-a (YeotmaI)
Up to 31 st March 1963, ownership rights have been conferred upon 352 tenants for 5,394 acres of land in the district. The prices were fixed by the Revenue Officers in all the 352 cases. There were no cases of tenants who had mutually agreed with the landholders on the prices to be paid by them.
Size of Land Holdings
C:::nsus Table B-X (based on 20 per cent Sample) in Part II of this Volume shows that 40"43 per cent of the total number of households cultivate land and the remaining 59'57 per cent do not cultivate any land.
Census Table B-XI (based on 20 per cent Sample) in Part II shows the break-up of cultivating households by size of land cultivated and by interest in the land. 75-65 per cent of the cultivating households cultivate their owned lands only. 12-57 per cent of the households cultivate tenanted lands only and the remaining 11- 78 per cent cultivate lands partly owned and partly taken on lease. Percentage distribution of cultivating households by the size of land cultivated is shown below.
The distribution of households in Table B-XI and the same shown in percentages in column 2 below, is based on cultivation (operational) holdings as returned in the 1961 Census.
A classification of holdings on the basis of area owned (against the area cultivated) for the year 1952-53 is shown in Table lOin Part III. The percentage distribution of those ownership holdings is also shown in column 3 below :-
Area
Less than 1 acre .. 1 to 4· 9 acres
5 to 9·9 acres
10 to 14·9 acres
15 to 29·9 acres
30 to 49·9 acres _.
50+ acres
Total
1961 cultivation
holdings
0- 11 8·91
17-42 19·58 33·05 12·85 8·08
100·00 ---
1952-53 ownership holdings
3·39 26·46 23·20 13-67 18·25 7·44 7·59
100·00 ---
The average size of cultivation holding in the district in 1960-61 is 18'94 acres. Average size of the ownership holding in the district was 21'9 acres in 1952-53 against the average of 12 acres for the State.
Ceiling on Holdings of Agricultural Land
The lVIaharashtra Agricultural Lands (Ceiling on Holdings) Act came in force from 26th January 1962. Three local areas, viz., Yeotmal, Darwha and Kelapur have been notified in the district with different

(38) DISTRICT CENSUS HANDBOOK
ceiling areas for dry crop land, viz., 108, 114 and 126 acres respectiyely. In the case of irrigated lands, the ceiling area is the same in all the three local areas, viz., 18 acres in the case of perennially irrigated areas, 27 acres in areas irrigated in two seasons and 48 acres in areas which get irrigation water for one season. Holders of land in excess of the ceiling areas are not now free to transfer or partition any land until the land in excess of the ceiling is determined under the Act. They were required to furnish returns of their holdings to the Collectors. The Collectors are to make enquiries to determine the surplus lands and take them over in . possession. Those lands shall afterwards Yest in the State Government. The Act also provides for payment of compensation to the holders at specified rates and for distribution of surplus lands to landless or other persons in the prescribed order of priority. At the moment, the enquiries to be made by the Collectors are in progress.
1947, were applied to the district in 1960 and work of consolidation of holdings was started in the same year in Yeotmal taluka. The scheme is to arrange mutual exchange of small and scattered fragments of holdings and to make the land holdings as compact as possible. Up to end of March 1963, execution work in respect of nine villages has been completed covering an area of 10,787 acres with 58 I holdings. This work is temporal ily suspended since September 1962, as the Record of Rights is not up-to-date.
The standard areas specified as minimum necessary for profitable cultivation under the Prevention of Fragmentation and Consolidation of Holdings Act are as follows :-
(i) Dry crop lands
(ii) Bagait tari lands
3·0 acres.
0'5 acre.
Consolidation of Holdings All plots of land, less in area than the standard The provisions of the Bombay Prevention of area, are treated as fragments and their transfer
Fragmentation and Consolidation of Holdings Act, except to holders of contiguous plots is prohibited.
CO-OPERATION Administra tion
The Deputy Registrar of Co-operative Societies is in charge of the co-operative movement in the district. He is assisted by two Assistant Registrars who have territorial jurisdiction and deal with all the aspects of the co-operative movement in the district. In addition an Assistant Registrar works under the Zilla Parishad. He carries out the duties of registration, deciding appeals against non-admission of members, approval to bye-laws and administrative supervision in respect of co-operative societies whose working capital does not exceed Rs. 5 lakhs and whose jurisdiction does not extend beyond the district. The Zilla Parishad also looks to the promotion and extension of co-operative movement in the district.
.The co-operative movement though originated in the second decade of the century lacked popular enthusiasm till attainment of independence. Concentrated efforts made during the last decade have resulted in a rapid progress in the co-operative movement in the district. All the villages in the district are now covered by rural co-operatives. Besides agricultural credit, the activities are. now extended to processing of agricultural products, dairying, farming, marketing, fisheries, etc.
The following description is based on the report for the year 1960-61.
Co-operative Credit (a) Agricultural Credit Societies.-The number
and membership of agricultural credit societies have increased at a rapid pace during the last decade especially during the Second Plan period.
J -1812-vii-b (Yeotmal)
The position of agricultural credit societies in 1957-58 and 1960-61 is as under:-
(I) Number of Agricultural Credit Societies ..
(2) Number of members .. ..
1957-58 1960-61
514 34,741
11·82 5·48
68·60
604 58,889
29·07 7·91
137·54
(3) Share capital ., .. (Rs. in lakhs) (4) Reserve and other funds(Rs. in lakhs) (5) Working capital .. (Rs. in lakhs) (6) Number of members to whom
loan \vas advanced . . . . 43,605 (7) Amount advanced (Rs. in Jakhs) 54·61 108·77 (8) Amount recovered (Rs. in lakhs) 32·90 116·10 (9) Loans outstanding (Rs. in lakhs) 56·89 108·69
(10)Overdues.. (Rs.inlakhs) 11·02 32·13
Average membership per primary society in the district is 97 against the average of 96 members for the State. All villages in the district have been covered.
Total owned funds (share capital plus reserve funds) of the primary ag:icultural credit societies in the district amounted III 1960-6 J to Rs. 36·98 lakhs and formed 26·89 per cent of their working capital against 26 per cent for the State.
The loan operations of all the primary agricultural societies in the district amounted to Rs. 108· 77 lakhs in 1960-61. The average amount of loan per borrowing member in the district worked out to Rs. 249 as against Rs. 329 for the State.
During the course of three years from J 958-59 to 1960-61, the number of societies has increased by 17'51 per cent, the membership has increased by 69'51 per cent, the share capital has multiplied almost one and half times and working capital has doubled. There is also an increase of Rs. 54·16 lakhs in the amount advanced as loans by the societies

YEOTMAL: CO-OPERATION (39)
in 1960-61 over the amount advanced in 1957-58. The rate of recovery of the loans has however not increased with the result that the proportion of overdues to the outstanding loans which was as high as 19'37 per cent in 1957-58 has risen still higher to 29' 56 per cent in 1960-61. This indeed points out the need of improving the recovenes.
Besides the financial activities good progress has also been made by agricultural credit societies in the sphere of services to agriculturists such as distribution of seeds, manure, etc., and in marketing of agricultural produce, etc.
(b) Central Co-operative Bank.-There were three Central Co-operative Banks working in the district. The Yeotmal Central Co-operative Bank Ltd. was established at Yeotmal in the year 19 J 3 having its area of operation extended over Yeotmal, Pandharkaoda and Wani talukas. The Darwha and the Pusad Banks were established at the respective places in 1930 and 1924 respectively and operate for these two talukas separately. These banks were working as federal financing agencies catering for the credit requirements of all the primary credit societies in the respective talukas. The three banks have from January J 962 amal!?,imated to form the Yeotmal District Central Co-operative Bank with headquarters at Yeotmal. The Zilla Parishad also transacts its financial business through this bank.
In the year 1960-61, the combined position of these three banks was as follows :-
(I) Number of members-(a) Individuals .. (b) So~ieties .. . .
(2) Paid-up share capital .. . .(Rs. in lakhs) (3) Reserve and other funds .. (Rs. in lakhs) (4) Deposits-
(a) Individuals . . . . (Rs. in lakhs) (b) Societies and Banks .. (Rs. in lakhs)
(5) Borrowings-(a) State Co-operative Bank and the Reserve
Bank of India .. (Rs. in lakhs) (b) Government .. (Rs. in lakhs) (c) Other sources .. (Rs. in lakhs)
(6) Working capital .. (Rs. in Jakhs) (7) Cash-
(a) On hand .. . .(Rs. in lakhs) (b) At Banks .. . . (Rs. in lakhs)
(8) Investments-Government and other Trustee securities
(Rs. in lakhs) (9) Percentage of cash in hand to deposits. . . .
(10) Percentage of investment to deposits. . . . ( II) Lo ans outstanding-
(a) Individuals . . . . (Rs. in lakhs) (b) Societies .. . . . . (Rs. in lakhs)
(12) Percentage of loans outstanding to deposits (13) Percentage of loans outstanding to working
capital.. . . (14) Overdues.. .. .. . .(Rs. in lakhs) (15) Percentage of overdues to loans outstanding (16) ~ost of management .. . .(Rs. in lakhs) (17) 1 "rcentage of cost of management to \yorking
capital .. (18) Profit .. .. .. ..(Rs inlakh's) (19) Nu;nb.er of branches and pay offi~es -in the
dlstnct ..
2,327 710
25·21 14·19
30-77 10·09
79·33 0-20 3·30
163-09
2·72 28·15
3-86 6·7 9·4
0-65 109-31 269· 2
67-4 20·05 18· 2
1·88
1·15 1·16
II
During the year 1960-61, the society membership of the Banks increased by 10·25 per cent but the individual membership decreased by 43·44 per cent than the previous year. On the whole there was a decrease of 36· J 7 per cent in the total membership. The share capital of the Banks more than doubled, there was an addition of Rs. 14·12 lakhs in the owned funds and the deposits increased by 34·02 per cent. There was however a reduction in the working capital by 5·94 per cent. The Banks advanced loans of Rs. 175·81 lakhs as against advances of Rs. 18 J '21 lakhs in the previous year. However there has been an improvement in the recoveries and the proportion of overdues to outstanding loans have decreased from 34'36 per cent to 18·22 per cent. The Banks made a profit of Rs. l' J 6 lakhs during the year as against a profit of Rs. 1'13 lakhs in the previous year. The Banks opened three new branches during the year. Besides providing crop finance the Banks have commenced advancing loans to Co-operative and Marketing Societies on an increasing scale. On the whole the progress of Banks during the year is fairly satisfactory.
(c) Land Mortgage Bank.-The Primary Land Mortgage Bank was established at the district headquarters in the year 1935 with a view to providing long .. term finance to the cultivators. In October 1956, the management of the Bank was transferred to the Vidarbha Co-operative Bank. The management was restored to the elected Board of Directors on 10th March 1961. In 1960-61, the membership of the Bank was J, 1 07, paid-up share capital Rs. 24,000 and working capital Rs. 4'60 lakhs. Loans amounting to Rs. 1'22 lakhs were advanced during the year. The Bank made a profit of Rs. 3,000 in the same year. The well and oil engine tagai schemes which were previously operated by the Revenue Department have been transferred to the Bank. This has made a favourable impact on its progress.
The Bank exceeded the target of Rs. 80,000 set for the district by the State Land Mortgage Bank in respect of rural debentures floated by the State Bank by Rs. 3, I 00.
(d) Urban Banks and Credit Societies.-There are in all 43 urban banks and credit societies in the district. Nine of them are urban credit societies, 32 are salary earners' societies and two are other types of societies. Their combined membership in J 960-61 was 2,828, paid-up share capital Rs. 1'69 lakhs and working capital Rs. 8-99 lakhs. The societies advanced loans of Rs. 7'68 lakhs during the year. Thirty-two societies made a profit of Rs. 15,000, six suffered loss of Rs. 3,000 and three others neither made profit nor loss. There is a proposal to organise Urban Co-operative Banks at Yeotmal, Wani, Pusad, etc.

(40) DISTRICT CENSUS HANDBOOK
Agricultural Processing Societies There are three cotton ginning and pressing
co-operative societies oq~anised in the .di~trict. Their combined membership 1S of 214 soc1etIes and 310 individuals. The paid-up capital is Rs. 3'74 lakhs and working capital Rs. 4'18 lakhs. Only two societies were in operation and during the year 63 620 cwts. of cotton was ginned by them. The so~ieties made a profit of Rs. 17,000 during the year.
Industrial Societies There are five weavers' societies and 59 other
industrial societies in the district. All the weavers' societies are handloom weavers' societies. Their combined membership is 465, share capital Rs. 9,000 and working capital Rs. 15,000.
The other types of industrial societies include 11 oil ghanis, 2 cane and bambJo workers, 6 tanning, 10 leather working, 2 carpentry and smithy, 15 pottery and brick-making, 3 neera and palm gur and 10 miscellaneous societies. Their combined membership is 1,426, share capital Rs. 93,000 and working capital Rs. 3·03 lakhs. The value of production by these societies is Rs. 3'53 lakhs and sales value Rs. 3'35 lakhs.
Forest Labourers'and Labour Contract Societies
There are 8 Forest Labourers' Co-operative Societies and 11 Labour Contract Co-operative Societies in the district all of which were registered during the year under report. These forest labourers co-operative societies have membership of 154, share capital Rs. 7,825 and working capital Rs. 10,754. They could not secure forest coupes during the year as they were registered late. However they have been allotted coupes during the year 1961-62.
The eleven labour contract societies have a combined membership of 295, share capital Rs. 9,000 and working capital Rs. 48,000. Five of them made a profit of Rs.19,000. Five suffered loss of Rs. 2,000 and one showed neither loss nor profit. Out of these 11 societies, 8 societies were provided work by P. W. D. authorities and Block Development Officers and other private concerns. The Labour Contract Co-operative Society Ltd., Maregaon, had an excellent performance during the year as without any financial assistance from Government or any Central Financing Agency it executed a large number of contracts. The society has purchased a truck of its own.
Co-operative Farming Societies There are 65 collective farming, 6 joint farming
and 4 Gram Swarajya societies. The collective farming societies have a membership of 1,112, Rs. 1'32 lakhs as share capital and Rs. 2'80 lakhs as working capital. The area under cultivation by these societies is 8,225 acres out of 10,620 acres under command.
The joint farming soc1etIes have 98 members, Rs. 23, 100 as share capital, Rs. 66,000 as working caiptal and 1,450 acres under command of which 1,206 acres are cultivated.
The Gram Swarajya societies have 43 members. and Rs. 20,000 as working capital. The area under cultivation by these societies is 343 acres out of 453 acres under command.
During 19EO-61, 21 societies made a profit of Rs. 26,175 and 31 societieS sustained a total loss of Rs. 29.495. The remaining 23 societi( s neither made any profit nor loss.
Lift Irrigation Societies Two co-operative lift irrigation societies have been
registered in this district, one at Hatala and the other at Digras. Their combined membership is 50, share capital Rs. 30,000 and working capital Rs. 66,000. The area under command of these societies is 425 acres. Both these societies are yet to start functioning. They have almost completed the civil portion of the works under the scheme.
Dairy Societies One dairy union and 20 milk supply societies
have been organised in the., district. The milk supply societies undertake to collect milk. It is distributed through the centres of milk union. The milk union extends credit facilities to the member soc1et1es. The union has the membership of six societies and 72 individuals, share capital of Rs. 6,000 and working capital of Rs. 28,000. The milk union sold milk and milk products worth Rs. 56,000 durir:g the year 1960-61.
The combined membership of the milk supply societies is 392 individuals, the paid-up capital Rs. 14,000 and working capital Rs. 17,000. Milk worth Rs. 40,000 was sold during the year. Twelve societies made a profit of Rs. 2,000, one suffered loss of Rs. 5,000 and seven others neither showed profit nor loss.
Fishermen's Societies There are three societies having membership of
132 and share capital of Rs. 1,595. These societies received Rs. 4,000 as loan from the Government. One of the societies made a nominal profit and two suffered a loss of Rs. 1,000 each. The value of catch by the societies during the year was Rs. 3'6 thousands. Purchase and Sales Societies
There are six purchase and sales societies in the district. These societies together have 444 society members and 3,581 individual members and Rs. 2'28 lakhs as share capital. The Government has contributed Rs. 1'06 lakhs in the share capital of the societies. The societies cover all the 15 regulated Mandies in the district. The societies own 5 and hire

YEOTM.\L : CO-OPERATION (41)
10 godowns. The sOCleties earned Rs. 35,000 as commission during 1960-61. Five of these societies made a profit of Rs. 72,000 and one suffered loss of Rs. 8,000.
The main business of the societies is to arrange for sale of agricultural produce and to distribute improved seeds, chemicals, fertilisers, agricultural implements, iron, steel, etc. Outright purchases of agricultural produce in the market on a limited basis have also been undertaken by some socIeties. Sale of agricultural produce through the Adat shops of these societies is being tried and the same is gaining momentum day by day.
Consunaers' ~oven1ent There are 20 primary consumers' stores in the dis
trict. Their combined membership is 2,024 and share capital Rs.29.000. During the year 1960-61 the value of sales of these societies amounted to Rs. 3'61 lakhs. Ten of these societies made a profit of Rs. 9,000, five suffered loss of Rs. 5,000 and five others neither showed profit nor loss.
Most of these stores are running in rural areas and are engaged in limited activities like running fair-price shops. Housing Societies
On 30th June J 961, there are 22 co-operative housing societies in the district. Their total membership is 1,179, share capital Rs. 1'67 lakhs and working capital Rs. 35'14 lakhs. The societies advanced loans of Rs. 4'52 lakhs during the year to members for constructional purposes. 298 independent houses valued at Rs. 36'99 lakhs have been constructed by the members of the societies. The societies also built 26 independent houses valued at Rs. 3·87 lakhs and 90 tenements valued at Rs. 5'12 lakhs up to the end of 1960-61.
Co-operative Activity for Backward Classes There are 22 farming societies and 16 housing
societies organised by Backward Class persons. In addition there are 17 agricultural credit societies wherein the percentage of members belonging to Backward Classes is more than 50 per cent.
The farming society has a membership of 570 individuals, share capital of Rs. 23,000 and working capital of Rs. 78,000. The area cultivated during the year by these societies is 943 acres. The societies received loans of Rs. 48,000 and subsidy of Rs. 20,000 from the Government.
The housing societies have 410 members. Their share capital is Rs. 9,000 and working capital Rs. 1·96 lakhs. The societies have constructed 23 tenements so far. The DaEt Griha Nirman Sahakari Society Ltd., Yeotmal, received financial assistance of Rs. 89,000 as loan and Rs. 45,000 as subsidy from the Government.
Audit Classification The audit classification of diffaent types of
societies in the district on 30th June 1961 is as follows :-
Number of societies Type of society classified as
,-A B C D
(I)Central Co- 2 operative Banks.
(2) Agricultural 7 415 140 11 Credit Socie-ties.
(3) NOll-Agricul- 4 21 7 2 tural Credit Societies.
(4) Primary Land " Mortgage Bank.
No. of No. of socie- socie
ties ties not not Total
c!assi- audi-£led ted
3
31 604
9 43
FORESTS
The district has an area of 1510·18 square miles under forests, of which 1,213'97 square miles are in charge of Forest Department and rem.aining 296'21 square miles are in charge of Revenue Department. The forest area forms 28'94 p~r cent of total geographical area as against 17'56 per cent for the State.
Of the forests in charge of Forest Department 840'32 sq. miles occupied by reserved forests of Class 'A' are one of the well-managed and most valuable forests of the State. The area of 300'70 sq. miles are treated as ' C ' class reserved forests. These are meant specially for grazing purpose. The remaining area of 72'95 sq. miles comprising protected forests represent the ex-proprietary forests vested in the State.
The forests are distributed all over the district but Pusad taluka has the maximum concentration in the southern portion. This portion along the bank of Penganga river has also the concentration of superior quality.
The forests are administered by the Divisional Forest Officer, Yeotmal Forest Division, who has headquarters at Yeotma!. The Division works under the Conservator of Forests, Amravati Circle .. The forests in charge of Revenue Department are looked after by the Collector of the district.
The forests in the district belong to the South India Tropical Dry (Mixed) deciduous type. The forests can broadly be classed as (i) Good quality teak forests, (ii) Poor quality teak forests and (iii) Mixed forests.

(42) DISTRICT CENSUS HANDBOOK
(i) The good quality teak forests are mainly found in the southern portion of Pusad taluka. Teak is the main species of this type of forests. Trces of 5' girth and a few of eYen 6' girth are found. The other associates of teak found are Ain, Bel, K".jaIT'.b, Tiwas, Lendia, Dhawda, Tendu, Sernal, Bhiwa, etc.
(ii) The poor quality teak forests occur over most of the area. Teak forms over 50 per cent of the crop and in mar.y <'.reas it is almost pure. The other associates of teak in this :lre<l are Dhawda, Salai, Ain, Lendia, Tendu, Achar, etc.
(iii) The mixed forests occur in patches, mostly in south-east of Wani taluka. Teak is Lot found. The species found arc Ain, Lendia, Dhawda, Tendu, Gevrai, Char, Bija, Beheda, Kalani, Khair, etc.
The forest produce in the district is exploited mainly through the ngency of COJ:1.tractors. Since 1961-62, the forest labourers' co-operative societies have also been entrusted with the work. Forest produce worth about Rs. 40 lakhs are explcited annually. Almost all the work is carried out by forest villagers. There are 34 inhabited forest villages in the district. The Forest Division also looks to the welfare of these villagers. Accordir.g to the 1961 Census 651 persons are working in forestry and logg;ing. Their distribution for minor industrial groups is shown if'. Table B~IV -C in Part II.
The exploitation of fcrests in charge of Forest Department is regulated by scientifically prepared working plans. Accordinl? to the working plan, the forests are divided into seven working circles: (1) Penganga selection-wm-improvement working
circle, (2) Coppice-with-reserves working circle, (3) Important working circle, (4) Plantation working circle, (5) Pasture improvement working circle, (6) Bamboo overlapping working circle and (7) Miscellaneous working circle. Major portion of the forest is worked under coppice-with-reserves working system 'Under which each patch of forest is treated according to treatment suited to it. PlantaticH.s in suitable areas are mostly raised under agri -silviculture.
The follo'wing important schemes have been included among others for development of forests :
(1) Plantation of valuable trees.-Plantation of Teak, Semal and Eucalyptus trees in 350 acres involving outlay of Rs. 0'46 lakhs.
(2) Afforestation for soil conservation.-200 acres to be afforested involving outlay of Rs. 0'56 lakhs.
(3) Development of forest pastures.-Plantation to be raised in 75 acres for which Rs. 0'37 lakhs have been sanctioned. Besides, Rs. 20,000 have been allotted to assist village panchayats for afforestation and development of pastures in the district.
Besides the valuable flora, the district forests are fairly well representative in larger forest blocks. Panthers are common all over the forests. Hyaenas, wolves and wild dogs are restricted to certain areas only. Blue bull, antelope, wild pigs and chinkara are fOUI'.d in a good number throughout the district. Sambhar and cheetal however are found only in some areas. Black buck and barking deer are very rare. Hare, porcupine, peafowl, partridge, quail, blue rock and green pigeons are common throughout the district.
FISHERIES Fishing activities in the district are naturally
restricted to inland waters only, rivers, tanks and ponds being the chief sources. The total length of perennial rivers in the district is abo'Llt 650 kms. There are also 20 perennial tanks and 80 seasonal tanks and ponds which provide 797 acres of waterspread area, which is adequate for development of fishing ir.dustry.
The commercially important. varie~ies of fish found in the district arc IVIurrel, Dhadkya, Botri, Padhan, Tambu, Karvadi, Poshti, Dhoara, Gar..e or Kanheri, Chela, Katva, Seenghan, Chandrj, Mahaseer, Kolus, Magur and Zinga.
These varieties are however not of the fast~ growing type. As such, under Fiye-Year Plan Schemes, quick-growing "Bengal Carps" are stocked annually in the perenni 11 water tanks for propaga~ tion of pisciculture. The varieties stocked arc Catl~ Catla, Rohu, Mrigal and Cyprinus Carpio. Durwg the Second Five-Year Plan period about 2·92 lakhs of Carp Fry was stocked while during only the first two years of the Third Plan period the quantity stocked amounted to 2·98 lakhs.
In the 1961 Census, 1,883 persons are reported as enga~cd in ushing as principal work; 1,684 of them are males and 199 females. Fishermen in the district belong to the communities known as Dheemer, Bhoi and Kahar. As the fishinl5 industry has a limited scope, some of the fishermen take jobs in workshops and few others in seasonal agriculturc. Fishing is generally done with the help of gill nets known as Udan or Tangar, cast nets called Bhawan Jal, drag nets or Odhe Jal and Long lines (Dawan). The nets are mostly made of cotton twine but these days nylon is also effectively used. Under the fishery requisites scheme unancial assistance in the form of subsidy is given for purchase of nylon and cotton twine.
Six co~operative societies of ushermcn have been organised in the district and more societieS are likely to be organised for ri verine fisheries. These societies are given financial assistanc . in the form of loans and subsidy. They are also assisted in securing tanks and ponds on lease for pisciculture.

YEOTMAL: MINING AND QUARRYING (43)
MINING AND QUARRYING The district is one of the important mineral pro
ducing districts of Maharashtra. It is endowed with very rich deposits of coal of non-cocking type which has, however, been exploited only to a small extent so far. The coal fields geologically belong to the Barakar stage of the Damuda series of Gondwana system. The district also has extensive deposits of good quality limestone belofl.ging to Vindhyan system. Barytes has also beef'. reported to occUr in a coal seam at Wani. The deposit may, however, not be of much economic importmlce.
Following is the brief account of the important mineral deposits found in the district :-
(1) Coal.-There are two groups of coal fields in the district :-(i) The Wani area and (ii) A part of Ghugus-Telwasa field. In the Wani area called Rajur cr Wani fields, the coalfield extends over about 12 sq .miles from Pisgaon to Warora (in Chanda district). The coal reserves are estimated at 240 million. tons. The field contains three seams 18 to 31 feet thick. The quality of coal is fair. The Ghugus-Telwasa field contains a number of seams. One of the seams is 59 feet thick. The coal reserves are estimated at 1,500 million tOl":S and are being exploited presently. Leases for mining of coal were granted in 1960-61 to two colliery companies covering an area of about 4,318 acres. One of the companies was, however, not working. 97,300 metric tonnes of coal valued at Rs. 20·58 lakhs was extracted during that year.
(2) Limestone.-The deposits occUr in three major contiguous belts :-(i) Rajur belt, (ii) KhekariMauli-Gaurala belt and (iii) Kurli-Pardi-Pathri belt. The belts are generally situated in an area flanked on both sides either by Gondwanas or Deccan
Trap. The limestones are fine grained, hard compact, dark grey and give foetid smell of petroleum when freshly broken. No bituminous layer or lenses are however noted. At some places the limestones are found to be siliceous.
The Rajur belt is extended over about six miles in length and two miles in breadth. The workable oPen cast dcpth is about 60 feet. The estimated reserves of workable limestone are over 1,000 million tonnes. The magnesia and silica contents are low and the limestone is suitable for manufacture of cem('nt. About 32 quarries are in active operation in the belt.
The Khekari-lVIauli-Gaurala belt is also about six miles lor:.g and two miles broad. Limestone deposits suitable for m,mufacture of cement are estimated at 1,000 million tonnes. At present no mines or qU:lXries :!re working in this area.
The Kurli-Pardi-Pathri belt is approximately eight miles long and two miles broad. D.';po.sit reserves of good quality limestone suitable for manufacture of cement are estimated at about 2,000 million tonnes.
During the year 1960-61, 1·22 lakh tonn,;s of limestone valued at Rs. 4·80 lakhs was extracted as against the output of only 50 thousand tonnes in the previous year.
Large are'lS of the district are covered with Deccan Trap and stone is quarried at a number of places. In. the 1961 Census, 1,004 persons are reported as engaged in mining and quarrying activitie,: ; 713 of them are males and 291 females. Their distribution for industrial minor groups is shown in Table B-IV-C in Part II.
INDUSTRIES There are practically no large-scale industries,
except an oil mill, in the district. The existing industries are mostly of medium and small scale like cotton ginning and pressing, oil mills, weaving, brick-making, etc. The employment in non-agricultural sector leans heavily towards vill2.ge and cottage industries, i.e., the village artisans working on traditional lines with locally available raw materials or for local derll.and. The expansion of the Khaparkheda Power Station to supply more power to this district and the establishment of an industrial estate for large-scale and small-scale industries during the Third Five-Year Plan are good auguries for further industrial development in the district in future.
There are in all 24,402 workers engaged in industries, 14,796 or 60'6.3 per cent of them are in household industries and 9,606 or 39·37 per cent in noJl.household industeirs. The total number of workers
in the registered factories in 1961 is 4,472 which makes 18'33 per cent of all workers engaged in industries, or only 4 factory workers per thousand of total population against 20 per thousand of totat population of Maharashtra.
The distribution of workers engaged in each industry major and minor group is shown in Table B- IV -C in Part II. The number of establishments and the number of ,vorkers for each industry minor group prepared from the houselists are also shown separately, for each village, in the Village Industries Table presented at the end of Part I L
Large-scale Factories The only large-scale industry in the district
employin.g 54 workers and using power is the Yeotmal Oil Mill10cated at Yeotma1. Apart from this, there are no large-scale registered units in the district.

(44) DISTRICT CENSUS HANDBOOK
Small-scale Registered Factories
There are 224 small-scale establishments like general engineering, soap manufacture, wooden furniture, cotton ginning and pressing, oil mills, rice mills, dal and flour mills, saw mills, bidi-making, etc. Only 58 out of them are registered and t.he rest are working as unregistered units. Among the general engineering units, repair workshops and fabrication are quantitatively the most importar.t in the district. There are about 98 cotton ginning and pressing units and oil mills.
In addition, there are a number of rice mills, dal and flour mills and saw mills. Saw mills in the district cut timbcr of all varieties produced especially in Chanda district. The sawn timber is used in building construction activity and the local wood processing industries.
The total number of registered factories has decreased from 77 in 1956 to 58 in 1961. The number of workers in registered factories has also gone down from 5,043 in 1956 to 4,472 in 1961. This may be attributed to the temporary closure of ccrtain seasonal processing industries like rice or flour mills, dal mills and oil mills.
According to the Census of Manufacturing Industries in 1959, the manufacturing industries in the district had a combined fixed capital of Rs. 30'2 lakhs and working capital of Rs. 13·5 lakhs.
The total value of annual production was Rs. 50'3 lakhs and the value added by manufacture was Rs. 14·0 lakhs. These figures relate only to the industries covered by the Census of Manufacturing Industries Act.
The value added by manufacture in the district in 1959 is only 0·3 per cent of the total for Maharashtra.
Small-scale and Cottage Industries
In the cottage and small-scale industries sector, handloom, Khadi and village industries, handicrafts, cane and bamboo works, oil ghanis, brick-making, pottery, leather and tafl.ning, carpentry and smithy, etc., are some of the important industries in the district. These industries are, by and by, coming more and more under the co-operative fold. The manufacturing industries corning under this sector are traditional crafts conducted as household and cottage industries. Under the supervision of the District Industrial Co-operative Associatiop., the following primary societies have been organised in the sphere of cotta~e industries in the district :(1) Weavers' Societies, (2) Oil pressing, (3) Cane and bamboo works, (4) Leather working and tap.nip.g, (5) Carpentry) (6) Pottery, bricks and tiles,
(7) Soap manufacture, (8) Neera, Tad-gul, (9) Nail manufacturing, (10) Forest Societies and (I 1) Gramodyog Mandals.
Production and rearing of livestock for milk and animal power engages 5,556 workers. The district is known for its cattle wealth. Th persons ep,gaged specially in breeding the cattle are known as " Gadi "in this district. Cattle of good breed are also exported to other districts of Vidarbha. Digras, Ncr, Ghatanji and Wani arc some of the well-known cattle markets in the district.
3,904 persons are engaged in the manufacture of miscellaneous textiles out of which 3,628 persons are tailors engaged in making garments for men and women.
Cotton ginning and pressing engages 2,235 workers. These processing industries are spread all over the district. The ginning and pressing units also combine oil extraction work for providing work almost all the year round.
Production of fish by fishing in inland waters engages 1,883 persons. Fishing operations are mostly carried through ponds and tanks. Two co-operative fishing societies have been established during the Second Five-Year Plan in the district.
3,649 persons are working as carpenters, joiners and cabinet makers in the district. They are the carpenters who manufacture, fix or repair doors and door-frames, wooden roof beams, carts, furniture and agricultural implements. A fair amount of furniture is made in Yeotmal town.
1,709 persons are working as blacksmiths. They are the persons who do the iron, work required for ordinary agricultural implements. 1,610 workers are engaged as potters. They are the village potters most of whom still work on the traditional baluta system under which they get a fixed quantity of foodgrains at the harvest time for supplying earthenware during the year.
Quarrying of limestone around Wani-Manjri in the district is carried out on an extensive scale. Lime kilns have been established around Rajur, the main limestone bearing area.
A licence under the Industries (Development and Regulation) Act is granted by the Government of India for a cement factory in the district with an installed capacity of 2'4 lakh tons annually.
Wool-weaving is also common at Some places in the district and coarse blankets of wool are prepared. Darwha and Yeotmal are known for looms for cotton. Dyeing is also carried on at N er in Darwha taluka. Cotton fabrics are stamped for use as table cloths and floor cloths at Wani. Rough hand paintings on cloth are also done at that place.

Total workers (I-IX)
M F
(20) (21)
430 212 115 177 66
375 173 116 162 55
199 177 374 295 364 217 365 240 501 130
430 162 202 185
16 15 437 218 109 78
32 25 170 126
Uninhabited, 273 127 311 66
469 301 171 162 103 83
Uninhabited, 293 185
408 251 38 29
306 194 630 259 316 26
350 30 356 26 75 7
Uninhabited, 79 79
334 342 43 33
159 154 250 207 86 41
732 535 79 77
202 1% 140 149
Uninhabited,
200 246 260 103
61
56 123 155 300 134
126 172 73 4
92
29 66
230 255 360
158 185 62 71 29
50 112 134 282 132
117 134 64 4
76
21 58
203 230 274
159 118 91 53
837 552 285 232 118 126
33 24 157 118 135 90
Uninhabited, Uninhabited,
M
(22)
F
(23)
II
M F
(24) (25)
238 220 183 88 59 55 19
154 72 66 46 15
108 97 49 50
118 116 41 40
130 150 173 134 144
131 83 II
168 41
14 61
155 132
226 82 17
115
139 22
155 236 127
131 151 36
68
173 21 94
141 32
282 43 97 79
59 63 87 35 48
28 72 72
172 63
82 99 28 4
31
6 32 41
118 167
65 II
178 155 90
21 109 74
120 120 90 4
38
93 12 14 23
10 33
13 13
85 72 II
10
23 14 96 43 4
7 2 2
58
184 16 99
113
62 204 169 191 211)
217 99 4
202 55
18 62
97 154
204 81 74
153
193 16
117 276 160
155 168 37
10
120 20 58 87 52
167 370 26 32
105 91 86 55
42 44 10 12 19
26 66 68
141 53
80 74 26 4
20
is 14
119 93
113 123 123 63 10
27 49 80
104 52
39 64 34
S7 19 32
144 97
170
56 175 127 224
85
156 92 3
191 55
15 71
113 50
213 90 70
172
227 15 94
209 19
23 23 5
21
155 17 55 87 41
365 51 91 62
115 130 50 58 10
24 46 66
141 75
37 60 38
S6 21 30
188 102 177
9 87 109 5 61 48
123 322 381 80 87 138 92 25 34
12 10 12 73 30 34 27 51 63
J-1812-1-7-A-(Yeot,)
III
M F
(26) (27)
2
2
20
~ I
4 1
'7 13 7
5
17
'i
2
I 2
3 7
II
1
'i
2 7
'j 7 6
I 33
I
2
'j
is
45
WORKERS
IV V
M F M F
(28) (29) (30) 01)
, 5 3
RURAL AREA---amld,
1
4
1 5 3
15 41
13
22 3
'9 4
10
8 I
13
10
II 21 9
14 II I
10 I 3 9
12
I
5 10 22
'i 8
2 3
4 6
'9 5
3
3
'j I I
3
3 2 4
23
15 7
'j
8
3
7
1 8
9 2
3
12
'3
~ '(, 1 2
I
3 3
'i I
~ '2 70 16 9 20 14
I
ii ii 2
3
VI
M F
(32) (33)
I 4 I
4 1
4
'i 3 3 3
2
3
I 6
7 8
'j 2
2
1 14 1
10 38 7 I
'j
'j
']
VII VIII
M F M F
(34) (35) 06) 07)
3 I
'j
2 6 2
10 50 2
14 2
is 11
'5 4 2
5 I
3
8
6 32 6
8 10 I
4
19
5
'j
I I
'j I
'j II 3
2
'i I
'i
3 2
2
2
2 3
103 '4 's 6
I 2 2
3 PUSAD TALUKA
IX
NONWORKERS
----Serial M F M FNo,
(38) (39) (40) (41) (1)
5 4 2 I 2
4 4 8
10 2 29
J6 10 I
20 10
ii ii 6 8
10 2 9
4
46
8 36 7
22 13
6 I 2 8 2
34 4 4 3
5 2
I~ '5 6 5 1 I
I 2 I 7
12
4 4 I
'4 I I
28 'j 6 5 I
3 3
79 's 9 I
I 3 5
289 98 69 83 28
114 228 253 192 335
282 143
4 2%
57
26 98
187 232
300 101 59
J82
325 19
173 538 195
186 229 39
58
209 23
117 177 65
501 48
J09 119
105 152 J79 65 41
31 91 89
156 77
59 110 42
6 55
16 27
128 162 182
97 44
542 162 78
26 87 94
338 151 126 152 53 153
118 154 33 155
125 [56 294 157 348 [58 298 159 693 160
515 161 150 162
4 163 492 164
88 165
24 166 148 167
168 316 169 504 170
418 171 142 J72 70 173
174 284 175
488 176 46 177
235 178 702 179 459 180
507 18[ 531 182 144 183
184 73 185
203 186 21 187
117 188 184 189 103 190
679 191 48 192
179 193 92 194
195
140 1% 184 197 328 198
71 199 46 200
40 201 81 202
133 203 169 204 63 205
69 206 132 207 34 208 7 209
78 210
17 211 38 212
166 213 174 214 245 215
153 216 38 217
758 218 216 219
81 220
39 221 100 222 133 223
224 225

(46) DISTRICT CENSUS HANDBOOK
Pedlars and hawkers set up booths on market days. Agriculturists from the nearby villages also bring their farm produce. In addition, the traders and shopkeepers belonging to the market places also set up temporary stalls. Buyers come from nearby villages within 4-5 miles. The weekly markets start in the morning and after a slack of an hour .or so in the afternoon close by six in the evening to enable both the buyers and sellers to reach home before it is dark.
Column (7) of the Village Directory in Part I sho\vs for' each village in the district if a weekly market is held and if so on which day of the week. A list of weekly markets in the district given in Table 32 in Part III shows the location and the day on which each bazar is held. The map facing page 228 shows the locations of all these markets and also the days on which they are held.
The District Gazetteer had reported 116 weekly and bi-weekly markets for the district in 1908. Their number in 1960-61 has increased to 206 (this includes 4 bi-weekly markets also) cut of which 18 are also cattle markets. 29 markets are held on Sunday, 23 on Monday, 22 on Tuesday, 36 on Wednesday, 36 on Thursday, 33 on Friday and 27 on Saturday.
The map facing page 228 will show that five to eight weekly markets cluster as subsidiaries around a central village. Each place has its bazar on one of the week days keeping the pedlars and hawkers engaged throughout the week and also providing a choice to buyers to go to one nearby market or the other.
Fairs
Fairs vary little from weekly markets and Sometimes consist of a gathering hardly known to persons outside the respective villages. Most of the fairs held in the district are associated with important religious festivals. So far as trade is concerned fairs are complementary to the weekly markets. Considerable quantities of agricultural produce, other articles of daily use and cattle are brought for sale. A list of fairs held in the district showing their locations, duration, dates and approximate number of persons attending is presented in Table 33 in Part III. The map facing page 230 shows location of all the fairs in the district having 1,000 or more gatherings. A volume giving details regarding fairs and festivals is also issued separately.
Trade Centres
Apart from the 'weekly markets and' fairs (I) Yeotmal, (2) Digras, (3) Darwha, (4) Ghatanji, (5) Wani, (6) Pusad, (7) Bori, (8) Pandharkaoda, and (9) Umarkhed are important trade centres in the district, as far as collection and export of agricultural
J-1812--viii-b (Yeotmal)
produce are concerned. Agricultural produce markets at these places are regulated under the Central Provinces and Berar Agricultural Produce :Markets Act, 1935, and the Central Provinces and Berar Cotton Market Act, 1932, and they are known as principal market yards.
Yeotmal, _ Darwha, Ghatanji, Wani, Pandharkaoda and Umarkhed are the centres where cotton is mainly sold. The combined turnover of commodities (by value in rupees) in all the centres during the year 1958-59 was as follows :-
Market Committee Total Value in Rs.
Yeotmal 4,22,465
Digras 2,92,076 Darwha 1;62,643
Ghatanji 1,12,446
Wan: 3,99,438
Pusad 1,80,075
Bori 72,128
Pandharkaoda 1,07,623
Umarkhed .. 84,898
Total 18,33,792
Workers in Trade and Commerce
The total number of persons engaged in trade and commerce in the district is 15,939 out of which 7,687 or 48'23 per cent are in rural areas and 8,252 or 51'77 per cent are in urban areas. The number of workers in trade and commerce makes 2-68 per cent of all the workers in the district. Darwha, Yeotmal and Pusad talukas contain respectively 22'54 per cent, 23'75 per cent and 22'75 per cent of the district number.
Only 4'34 per cent of the workers in trade and commerce are in wholesale trade, 92'80 per cent in retail trade and 2'86 per cent in miscellaneous trade and commerce. 93 per cent of the wholesalers are in urban areas.
The number of wholesalers trading exclusively in cereals and pulses is only 102. Mostly, the wholesale trade of cereals and pulses appears to be combined with wholesale trade of gur, sugar, spices, oil, etc., as the number for this group is 168 for the district.
A detailed break-up of workers in trade and commerce by industry major groups and minor groups is shown in Table B-IV -C in Part II.

YEOTMAL: TRADE A1'-.'D CO:\1MERCE (47)
Banking Offices A list of banking offices with their years of estab
lishment, type and location is given in Table 23 in Part III. Their break-up by talukas and type is shown below;-
Number of Banking Offices -----..
Sehe- Co-opera- Total duled tjve
DISTRICT TOTAL 11 7 18 1 Darwha Taluka 2 2 4 2 Yeotmal Taluka ') 1 6 3 Pusad Taluka 2 2 4 4 Kelapur Taluka .. 5 Wani Taluka 2 2 4
Yeotmal taluka containing Yeotmal town which is the headquarters of the district and also an important cotton trading centre, has one-third of the total number of banking offices in the district. The Central Co-operative Bank has at least one branch office in each taluka except Kelapur taluka which has no banking office at all. Moreover, there are no offices of non-scheduled banks in the district.
The State Bank of India works for the treasury in the district and has branches at Darwha, Digras, Yeotmal, Pusad and Wani.
COMMUNICATIONS AND TRANSPORT
A broad gauge line of 10'39 miles of Rajur-Wani joining to Nagpur-Madras main line at Majri and a narrow gauge line of 41'01 miles linking Murtazapur on Bombay-Calcutta line with Yeotmal, both of Central Railway, pass through the talukas of \Vani, Yeotmal and Darwha. Thus the total railway line in the district is only 51'40 miles. The narrow gauge line has nine stations, viz., Yeotmal, Lasina, Ling, Ladkhed, Tapona, Dharwha-Motibag, Bhandegaon, Warud khed and Sangvi, while Rajur and Wani are the only two stations on the broad gauge section in the district.
Existing railway mileage in the district is hardly 0'98 miles per J 00 sq. miles of area against 2'66 miles in the State.
Table 21 in Part III shows the existing road mileage in the district as well as its break-up by the type of road surface. The district map facing the title page shows all those roads.
Even though, the important centres in the district are well connected by roads with the adjoining districts of N anded, Parbhani, Akola, Amravati, \,y ardha, Chanda and the State of Andhra Pradesh, some of the interior places do not possess good metalled roads to afford easy and quick transport facilities. The district headquarters is connected by roads with all the taluka headquarters. Major portion of the district is hilly and contains broad and deep valleys and the roads are, therefore, fewer in Vvani, Kelapur and Pusad talukas. The National Highway No.7, i.e., Nagpur-Adilabad section of the Banaras-Cape Camorin Highway, p'asses through the district and has a mileage of 38'87 miles.
During the period 1951-61, the National Highways increased by 32'87 miles, the State Highways by 246'12 mi1es, the major District roads and Village roads by 39'11 miles and J 29'33 miles, respectively. The other District roads, however, decreased by 4' 75 miles. Thus the total increase in all types of roads (excluding municipal roads) is 442'68 miles.
Under the N agpur Plan the district should have 1,936 miles of roads. On 31 st March 1961 it was short of that target by I, 141'82 miles.
New Roads The following roads are being improved (as on
31 st March 1962) :-(1) Yeotmal-Kalamb road. (2) Yeotmal-Amravati road. (3) Umri-Pandharkaoda road.
New Bridges Work on the following important bridges is in
progress (as on 31st March 1962):-(1) On Penganga river (in Marlegaon-Hatgaon
road. (2) On Penganga river on Shembalpimpri
Kalamnuri road.
(3) On Penganga river on Dhanora-Mahur road~
Posts, Telegraphs and Telephones The district is included in the East Berar Postal
Division. Head Post Office is situated at Yeotmal and sub-offices at taluka headquarters and towns. The bigger villages have branch post offices. During the year 1961-62 there were 14 sub-post offices and 226 branch post offices.
There are Telegraph offices at the following ten places :-
(1) Yeotmal ; (2) Darwha; (3) Dhanki ; (4) Digras ~. (5) Ghatanji; (6) Pandharkaoda; (7) Pusad ;, (8) Umarkhed; (9) Wun (Wani); (10) Wun Bazar.
The following nine places have Telephone connections :--
(1) Yeotmal (H. 0.); (2) Darwha; (3) Digras (4) Ghatanji; (5) Pandharkaoda; (6) Pusad; (7) Umarkhed; (8) Wun(Wani);(9)Yeotmal town;

(48) DISTRICT CENSUS HANDBOOK:
Passenger Road Transport
During the Plan periods, a number of roads connecting the villages were constructed in the district and the buses of the Transferred Road Transport Undertaking were running regularly on these roads. With effect from I st July J 961, the erstwhile undertaking was abolished and has been amalgamated with the Maharashtra State Road Transport Corporation.
The district is included in the jurisdiction of N agpur division. The State Transport operations in the district are maintained through the depot at Yeotmal. No separate figures for passenger transport are available for the district. The depot at Yeotmal runs buses on 22 routes which make J 38 single trips per day. The district has three temporary bus stations.
Nationalisation of passenger road transport in the district was 34 per cent by the end of Second Five-Year Plan and is expected to achieve 53 per cent by the end of Third Five-Year Plan. In addition the Third Five-Year Plap schemes include expansion
of the service to new places on public demand, construction of additional bus stations and pick-up st.ands and provision of other facilities for the travelling public.
Goods Transport Separate figures for lorries operated in the district
are not available as the Regional Transport Officer working at Nagpur keeps combined records for his region including N agpur, Akola, Amravati, Buldhana, Yeotmal, Wardha, Bhandara and Chanda districts.
Workers in Transport and Communications
2,985 persons are engaged in transport and 468 in postal, telegraphic and telephone communications in the district. Out of the workers in transport, 357 are in railway transport, I, 186 in motor and bus transport and 1,442 in other kinds of transport like bullock-carts, horses on hire, coolies, etc.
The Village Directory in Part I gives information for each village in the district whether it is served by a railway or a road or has a post office or not.
CONSTRUCTION The total number of persons engaged in
construction is 3,20], 2,803 are males and 398 are females. Their distribution by minor groups is shown in Table B-IV-C in Part II.
, 5' 3 J per cent of the workers are engaged in construction and maintenance of dams, waterways, canals, etc., 20'33 per cent in construction and maintenance of roads, bridges, etc., 0'16 per cent in construction and maintenance of telegraph and telephone lines and 74'20 per cent in construction and maintenance of buildings. The large proportion
engaged in the construction of buildings is mainly due to the construction of buildings for residential, administrative and industrial purposes. These include in addition to private houses, the construction of houses for backward classes, low-income group, schools, Government offices, health centres, etc., in the district.
All the workers engaged in construction together make only 0'54 per cent of the total workers in the district.
OTHER SERVICES 30,993 persons are engaged in the district in "Other
Services". 25,335 are males and 5,658 are females. Major categories out of them are: (i) Public Services; (ii) Educational Services; and (iii) Personal Services. "Public Services" include administrative employees of Central, State and Local Governments, " Educational Services" include all classes of teachers and " Personal Services" include domestic servants as well as barbers, washermen and others rendering services to persons or households. The distribution of workers in other services by minor groups is shown in Table B-IV-C in Part II.
5· 21 per cent of the total workers in the district are engaged in "Other Services" as against 8·53 per cent for the State. 26'92 per cent of the total workers in "Other Services" in the district are engaged in " Public Services" and 14' 7 6 per cent in " Educational Services". Both these proportions are higher than the corresponding proportions (23'86 per cent and 12'40 per cent) for Maharashtra. This may be so
because the district does not have large urban centres and there are hardly any comparable business centres, labour associations or recreation services. Even the proportion of "Personal Services" in the district 27'42 per cent is slightly higher than the State average of 27'15 per cent.
The number of domestic servants is 2,373 or one for about 463 population. The number of barbers is 2,154. The number of persons in laundry services (including washermen) is 1,556. There are 553 legal practitioners and 1,598 persons working in medical and health services excluding veterinary services.
The number of persons including the teaching staff in technical schools and colleges is 21 and that in other schools and colleges is 4,553.
The number of State Government employees including those now working under the Zilla Parishad is 6,778.

YEOTMAL: BROAD ASPECTS OF ECONOMY (49)
BROAD ASPECTS OF ECONOMY
Individual sectors of economy of the district have so far been described separately. A few broad aspects may now be discussed for the economy as a whole.
Labour Participation Rate The proportions of workers to total population,
males and females, for the district and each tal uk a are as follows:-
MAHARASHTRA YEOTMAL DISTRICT
1 Darwha Taluka 2 Yeotmal Taluka 3 Pusad Taluka 4 Kelapur Taluka 5 Wani Taluka
Percentage proportion of workers
Total Males Females
47·91 57·09 38·10 54·17 60·26 47·91 53-95 60·54 47·10 52·54 59·96 44·78 52·10 59·71 44·29 56·93 61·00 52·84 56·47 60·22 52-62
Labour participation rate varies from 52'10 in Pusad taluka to 56'93 in Kelapur taluka. In all the talukas of Yeotmal district the labour participation rates are higher than those for the State. This is so, both for males and females. Kelapur tal uk a has the highest labour participation rate in the district both for males and females. Higher labour participation rates in the district are due to the extreme dependence on agriculture and a generally backward economy.
Primary, Secondary and Tertiary Sectors The P~imary Census Abstract shows the distribu
tion of workers in the nine categories of economic activity. Table B-IV -C in Part II shows detailed industrial classification of all workers other than those at cultivation. The percentage distribution of workers in primary, secondary and tertiary activities for the district and the State is as follows :-
Maharashtra-Total " Rural Urban ..
Yeotmal District-Total .. Rural Urban ..
Total workers
100'00 100·00 100·00
100'00 100'00 100'00
I
Primary Secondary Tertiary
72-25 88·73 11'97
86'83 92·24 26'72
II
12'34 5-68
36'69
4-68 3'28
20'26
III
15'41 5'59
51'34
8'49 4'48
53-02
IV V
The primary sector is predominant in the district with 86'83 per cent of the workers engaged against the State average of 72'25 per cent. The proportion engaged in the secondary sector is almost one-third of the State average. Even the proportion (8'49 per ~ent) of workers ~ngaged in tertiary sector is consIderably lower than the corresponding State average (15'41 per cent). It may also be seen that the workers engaged in tertiary sector in urban areas of the district have a higher percentage than that for urban average of the State.
Categories of Economic Activity The distribution of workers, males and females, by
nine categories of economic activities for the district and the State is as follows :-
MAHARASl-ITRA YEOTMAL DISTRICT r----~----l r---A-----, Person. M.I.. Females Person. Mel •• Female.
I Cultivation.. .. .. 46 .11 II Agricultural Labour. . .. 23.80
III Mining, Quarrying, Livestock, 2.16 Fishing, etc.
IV Household Inpustry .. 4 .39 V Manufacturing other than 6.8S
Household Industry. VI Construction.. .• 1.24
VII Trade .nd Commerce 4.52 V[lI Transport. StoraJe a~d 2.36
Communications. IX Other Servires 8.54
4O.6Q 54.79 34.21 36.02 31.87 18.12 32.90 51.08 41.68 63.25 2.97 0.86 1.58 2.51 0.37
4.80 3.74 10.22 1.54
1.69 0.53
U~ k~~ 11.25 4.18
2.49 1.61
0.54 2.66 0.60
5.21
3.68 2.32
0.83 4.35 1.06
7.55
0.95 0.70
0.15 0.52 0.01
2.18
Total Workers .. 100.00 100.00 100.00 100.00 100.00 100.00
Although the proportion of workers engaged in cultivation is less in the district than that of the State, the proportion of workers engaged as agricultural labourers is more than double in the district than the State average. For both taken together the district has a much larger proportion than the State average. The proportions of both males and females engaged in agricultural labour are much higher in the district than those of the State average. These larger proportions are due to the land tenures. larger sizes of holdings and mainly to crop pattern dominated by labour intensive crops like cotton.
The proportion in manufacturing other than household industry in the district is extremely low when compared to the State average.
Talukawise distribution of workers in nine categories of economic activities is shown below. Corresponding figures for the State and the district are also shown for comparison :-
VI VII VllI IX State!Di,trict/T sluka Cultivator Arlricultural Mining, Household Manufacturing Constructlon Trade and Transport. Other Total
quarrying, livestock, fishing,
(I) (2) (3) huntinq-. etc.
(4)
industry other than Commerce Storage and services household Communications industn
(5) (6) (7) (8) (9) (10) (Ill
MAHARASl-ITRA 46.11 23.80 2.16 YEOTMALDfSTRlcr: : 34.21 51.08 1.58
I Darwha Taluk. 32.17 56.23 0.89 2 Yeotmal T aluk. 26.68 52.37 2.06 3 Pusad Taluka 39.13 48.59 0.95 4 Kelapur T aluka 30.95 55.67 1.98 5 Wani Taluka 42.26 40.68 2.43
4.39 6.88 1.24 4.52 2.36 8.54 100.00 2.49 1.61 0.54 2.68 0.60 5.21 100.00 1.89 1.49 0.35 2.61 0.51 3.86 100.00 2.72 2.53 0.67 3.47 1.41 8.09 100.00 2.21 1.15 0.67 2.63 0.36 4.31 100.00 2.47 0.90 0.54 2.08 OJI 5.10 100.00 3.48 2.25 0.47 2.65 0.50 5.28 100.00

(50)
WORKERS AS PERCENTAGES OF THE TOTAL
POPULATION
DISTRICT CENSUS IiANDBOOK
TAL.UKAWISE DISTRIBUTION
OF WORKERS
1961
REFERENCES
SCULTIVATOR
'~ AGRICULTURAl..
LAaOURER
MANUFACTUR
ING OTHER THAlli
~OUSEHOl.D
INDUSTRY
_MINING, l.IVESTOCK ETC.
~ HOUSEHOLD INDUSTRY
Eid1 CONSTRUCTION
~ THAD:;: AND
~ COMMERCE
m~illiillrj ~~~~:;~:T~D COMMUNICA-
_OTHER
SERVICES
TIONS

YEOTMAL: BROAD ASPECTS OF ECONOMY (5 J)
Dis~ribution of workers by broad nine categories of -economic activities is also shown in the Figure facing this page for the district and each taluka separately.
The proportions of cultivators and agricultural labourers differ considerably from taluka to taluka. The proportion of cultivators varies between 26'68 per cent for Yeotmal taluka and 42'26 per cent for Wani taluka. The proportion for agricultural labourers varies from 40·68 per cent in Wani taluka to 56·23 per cent in Darwha taluka. Such wide variations within the district are due to the differences in the fertility of soils and resulting cropping and land holding patterns. Talukas with larger areas under cotton have larger proportions of agricultural labourers.
Labour Participation by Age
The labour participation rates by broad age-groups are shown below for the district for total, males and females separately. Corresponding figures for the State are also shown for comparison :-
Yeotmal District Maharashtra Age- ,-_--A--
groups Total Males Females Total Males Females
All ages 54·17 60'26 47-91 47-91 57·09 38·10 0-14 .. 13-33 11'88 14·79 8·72 8'62 8·84
15-34 .. 82-02 91·43 72-59 74·53 87-45 60·90 3~-59 .. 87'97 97'98 76·55 81·57 96'86 63-68 60 + .. 59'93 80'69 41'36 49·13 72-82 26'28
Participation rates in the district are higher than the corresponding State averages both for males and females and for all age-groups. This may be an index of the under-developed economy of the district.
Workers by Educational Levels
The distribution of workers by educational levels shown in Table B-III is shown below by percentages for the district total, rural and urban areas separately. Corresponding figures for the State are also shown for comparison :-
Maharashtra
Yeotmal District ..
Literate Illiterate (without
educationallevel)
68·65
76·59
14·11
11·30
Primary or
Junior Basic
13-91
11·05
Matriculation and
above
3'33
1·06
Because of lower literacy rates in the district the proportion (76·59 per cent) of illiterate workers to total workers is much higher than the State average of 68·65 per cent.
The proportions of literates without educational level are consequently lower than those for the State. The proportion of Matriculation and above is less than one-third of the State average.
Status of Employment
Table B-IV-B in Part II shows the distribution of workers by status of employment for non-household industries. The percentage proportions of employers, employees, single workers and family workers in the district for total, rural and urban areas are as follows. Corresponding figures for Maharashtra are also shown for comparison. The four classes of workers are defined in paragraph 58 in the Explanatory Note to Part II :-
Class of workers Total S
workers Emplo- Emplo- /ngle Family yers yees workers workers
Maharashtra-Total 100 3-96 62·18 26'52 7'34 Rural 100 1-57 46·47 38·58 13-38 Urban 100 4-98 68·90 21·37 4'75
Yeotmal District-Total 100 3-33 46'31 39'95 10-41 Rural 100 1'73 41·71 44'27 12'29 Urban 100 5·12 5l-44 35'13 8'31 • Family workers and single workers have larger
proportions in the district than the State average. Those differences are more marked in urban areas. This is a reflection of the traditional crafts dominating the scene. The proportions of employers are low as a consequence of the predominance of single workers and family workers .. It is even so for rural and urban areas of the district compared to those of the State.
Percentage Distribution in Household Industry by Employees and Others
The proportion of employees, i.e., hired workers and others in household industries in the district total, rural and urban areas is shown in Table B-IV-A in Part II. The percentage distribution. with corresponding figures for Maharashtra is as follows :-
Total Emplo- Others workers yees
Maharashtra .. Total . . 100·00 8·18 91'82 Rural .. 100'00 4-91 95'09 Urban .. 100'00 16'35 83-65
Yeotmal District .. Total .. 100·00 3-68 96'32 Rural .. 100'00 3'18 96'82 Urban .. 100·00 6·24 93·76
Household industries in the district also work more with family workers and the proportion of hired workers is only 3·68 per cent against the average of 8·18 per cent for the State. The same difference persists for household industries both in rural and urban areas but it is little more significant for urban areas in the district than that in the State.

(52) DISTRICT CENSUS HANDBOOK
Secondary Work
The proportions of workers also engaged in some other secondary economic activity for three categories of principal work for Maharashtra and the district are as follows (Actual figures are shown in Table B-VII·A in Part II):-
Principal work Total Rural Urba~
Percentage of total workers by categories of secondary work
~ __ ----A-______ ~ I II IV
MAHARASI-ITRA-I Cultivation .. " To!.1 17.85 1,97
Rural .. 18.03 1,98 Urban " 10.54 1,32
II Agr.cul tural Labour " Total 13.17 0,94 Rural 13,46 0.97 Urb.n .. 7.12 0.31
IV Hous.hold Industry .. Total 14.78 6.97 Rural .. 19.61 9.38 U.ban .. 2.70 0.95
YEOTMAL D ISTRlCi -, Cultivation .. " Total 17.10 0.95 Rural .. 17.35 0.91 Urban .. 5.72 1.38
II A.-ricultural Labour " Total 2.90 0.41 Rural 2.96 0.41 Urban .. 0.75 0.26
IV Hou ... bold Industry .. Total 8.24 7.34 Rural .. 9.83 8.56 Urban .. O.OB 1.07
The proportion of cultivators also working as agricultural labourers as secondary work for the district is almost equal to that of the State average. Proportions of agricultural labourers also engaged in cultivation as secondary work are however much lower than the State average. Most of the workers engaged in household industries also work as cultivators and agricultural labourers as secondary work.
Occupational Classification
Table B· V in Part II shows the distribution' of non-agricultural workers by occupation. The percentage distribution for the State and the district is as follows. The occupational classification is described in the Explanatory Note to Part II :-
Occupational Division
a Professional, technical and related workers. .
Administrative, Executive and Managerial workers.
2 Clerical and related workers 3 Sales workers 4 Farmers, fishermen, hunters, loggers
and related workers. 5 Miners, quarrymen and related
workers. 6 Workers in Transport and Communi
cation occupations, 7 & 8 Craftsmen, production process
workers and labourers not elsewhere classified.
Maha- Yeotmal rashtra District
6'42 8'38
3·89 6'62
9·13 7-88 12'23 15'49 7-64 10'27
0·75 0'96
3'57 3'05
45'99 35'55
9 Service, sport and recreation 10'27 10'70 workers.
X Workers not classifiable by 0'11 1'10 occupation.
Total 100'00 100'00
The proportion for the fourth occupational division is higher in the district than for Maharashtra mainly because of the comparatively larger number of hunters and loggers. They are higher in divisions 3, 0, 1 and X also and slightly higher in divisions 9 and 5. Much lower proportions are seen in divisions 7 and 8 for the district and almost same in division 6. Corresponding proportions are not available for 1951 and the 1961 pattern cannot therefore be compared with that of 1951 and earlier Censuses.
Non-workers
The distribution of non-workers by eight broad categories is shown in Table B-IX in Part II. Percentage distribution for the district is shown below:-
(I) Full.time students .. (21 Housebol d duti •• (3) Dependents, infants and d'isal:l~d (4) Retited. rentjers or persons of
independent means. (5) Beggars \'a~rants. etc, .... (6) Inrnates o} institutions.. .•
!)i);trict total Rural Urban ,---~ ,----~ r--A- J
Males Females Mal .. Females Males Females
30.55 10.08 27.62 B.3Q 46.26 17.10 0.14 28.89 0.15 25.49 0.07 43.10
67.38 60.54 70.75 65.63 49.31 39.31 0.28 0.14 0.16 0.14 0.94 0.14
0.74 0.31 0.72 0.31 0.84 0.31 0.03 N 0.01 N 0.09
(i."01 (7) Persons seekin~ employment for 0.54 0.02 0.40 0.03 1.33 the first time.
(8) Unernplo}e<l but ,eeking work •. 0.34 00,2 0.19 0.01 1.16 0.03 --- -- -- --- --
Total .. 100,00 100.00 100.00 100.00 100.00 100.0(} -- -- -- -- --
N= Negligible.
There is a marked difference in the distribution pattern for non-workers among males and females. 30·55 per cent out of male non-workers are full-time students while the corresponding proportion for females is 10·08. The reason is that 28·89 per cent females who are engaged in household duties are also included as non-workers. Male dependants have a higher percentage than female dependants to their respective non-working population.
Other categories have less than one per cent of non-working population each. There are rural urban differences in the proportion of dependants. They are due to the large proportion of females in urban areas as non-workers. The rural urban differences are similar both for males and females. Both in urban and rural areas the percentage of dependants is higher and that for full-time students lower. The percentage of females engaged in household duties is higher in urban areas than in rural areas. The percentage of unemployed is 2·49 and 0·59 for males in urban and rural areas and almost negligible in both cases for females. Proportions of full-time students among females are lower both in urban and rural areas. The difference is not, however, entirely due to the social custom of attending more to the education of boys than that of girls. The proportions for females are lower also because the group of non-workers contains a large number of adult women engaged in household duties.

J-18i2-I-I-A-Yeot.
PART I
VILLAGE DIRECTORY This Directory renders an aCCOU>lt of
each Village and each ward of Town

CONTENTS PAGE
Explanatory Note 3 1 Darwha Taluka 5 2 Yeotmal Taluka 21 3 Pusad Taluka 37
4 Kelapur Taluka 53 5 Wani Taluka 69
EXPLANATORY NOTE
This Part I presents 1961 Population Census -figures for all villages and towns in the district In the case of towns, the figures are also presented separately for each ward. These basic statistics are not published for such small administrative units in any other country in the world.
2. For each village, ward or town are shown its area, number of occupied residential houses, number of households, total population and its break-up by sex, literacy, Scheduled Castes, Scheduled Tribes, workers and non-workers. The figures for workers are further split up by sex and by a broad classification of industrial activity in nine categories described in paragraph 16 below.
3. In the village directory, the villages are presented talukawise and within a taluka in the order of their location code numbers. These code numbers had been assigned to them for organising 1961 Census work and follow a regular north-west to south-east direction. The taluka map shows approximate locations of all villages with their code numbers. An alphabetical list of villages will be found facing each taluka map. It shows the code number for each village and its population in 1951 and 1961. The taluka map and the alphabetical list will together facilitate location of any village in the village directory as well as on the spot.
4. A" village" is a statutorily recognised village
having a defined boundary and separate land records. Hamlets, wadies or padas have, therefore, not been shown separately. On the other hand, statutorily recognised villages having no population have been shown 'with sep;,rate code numbers but with word <I uninhabited" shown against them.
5. Forest villages, however, make an exception. They 8.rc population cen~res situated \vithin resep;" d forest areas. Their population mainly
consists of forest labourers and their families. Most of them are, however, permanent localities and also have attached cultivated areas leased out by the Forest Department under certain conditions Their land records are nut maintained by the Revenue Department. Statistics for these forest villages have also been presented in the villag,~ directory. They may, however, be distinguished from other statutory revenue villages from the letters" (FV) " suffixed after their names.
6. Survey of India maps, taluka maps, previous Census Handbooks and many other official sources have been referred both to secure accurate coverage and to get the correct spellings of village names. A very high standard of accuracy may now be claimed for both.
7. Urban areas or towns are places which either have a municipality or cantonment or have been treated as towns because they have-
(a) a popUlation of over 5,000 ; and
(b) 75 per cent or more of male workers engaged in non-agricultural occupations.
Census figures for ail these towns are presented wardwise after the completion of rural portion. Their names will also be found in the alphabetical lists of villages in capita! letters with code numbers shown inroman figures. They are also shown on the taluka map.
8. The taluka maps and the alphabetical lists are both improvements over the 1951 District Census Handbooks. The village figures are, moreover,
extracted directly from Census r-:ccrds and r,od as was done in 1951, from their copies prepared for some other purposes. The fi[~ures presented in the village directory, therefore, tally with the taluka and district Census tables perfectly.

9. Information contained in columns (3) to (7) of the village directory is based on village enumeration reports prepared by the Talaties or Patwaries during October/November, 1960, at the time of house numbering and house listing for 1961 Census. Because of the geographical arrangement of the villages these five columns indicate the general pattern of distribution of some basic amenities within a taluka. Village enumeration reports contained many more useful items of information on the villages, which could not be presented in the village directory for want of space. They are preserved in the offices of the District Statistical Officers.
10. The area figures in column (8) have been obtained either from the Mamlatdars/Tahsildars or taken from the 1951 Census Handbooks.
11. In column (9) of the village directory, th~ occupied houses include houses used as dwelling 1
4
or partly as dwellings and partly for some other purposes, e.g., shop-cum-dwellings, etc.
12. Columns (14) to (17) of the village directory present, for the first time, villagewise figures of population of Scheduled Castes and Scheduled Tribes.
13. For columns (18) and (19) a "literate" IS
a person who knows both reading and writing.
14. For the definition of a" worker" or a "nonworker" and for a detailed description of industrial categories the Explanatory Note to Part II may have to be referred.
15. The villagewise figures for industries and the number of workers have been presented in a separate table appearing in Part II of the Handbook.
16. The following abbreviations have been used
in the village directory :-
ABBREVIATIONS AND SYMBOLS USED
IN COLUMN HEADINGS IN NOTATIONS IN NOTATIONS
F for Females. In Column (2) In Column (5)
M for Males. E for Electricity. C for Canal.
P for Persons. FV for Forest Village. N for Nallah.
Working as Cultivator. In Column (3) Riv for River.
II Working as Agricultural Labourer.
Po for Post Office. S for Protected W:lter Supply.
R for Connected by Road. Sp for Spring. III Working III Mining, Quarrying,
Livestock, Forestry, Fishing, Rh for Rest-houses and Choultries. Tk for Tank, Hunting and Plantations,
W for Well. Orchards and allied activities. Rly for Connected by Railway.
IY Working at Household Industry. To fOI Telegraph Office. X for Inadequacy of Drinking Water.
V Working III lVlanufacturing other In Column(4) In Column (6) than Household Industry. C for Higher Institutions including D for Dispensaries. VI Working in Construction. Colleges.
VII Working in Trade and H for High School. Hos for Hospital.
Commerce. Mp for Medical Practitioner M for Middle School.
VIII Working in Transport, Storage and Communications. p Jar Primary School. In Column (8)
IX Working in Other Services. T f01 Technical Institutions. NA for Not Available.

Darwha Taluka

6.
II .13
•• 6'7 14
• '08
• alB 17.
• ~ 30 101"'. 104 18 • elOO 'C~iOe e
AKOLA DISTRICT
ftEfiREKCES
TALUKA BOUNDARY_
el6
e 1?4
TALUKA HEAD QUARTER ___ .. __ l~
VILLAGE CODE NUMP-.ER 5 POPUlATIUN ABOVE lOOO. ___ _
FOPUlATION BELOW 2000 ____ • UNINHNlITED ... __________ 0
RO ... D. ______________ = R,~llWAY__ ____________ H_ RIVI'R_ ______________ ~
PRE~AR£O BY Ct',NSU5 OF"FfCE BOMBA '(
119
PUSAD
TALUr.A
•
359 e --_
371 e
.370
379
•
/
380
373 e
• .381
390
383 o
.383
DARWHA TALUKA YEOTMAL DISTRICT
YEOTMAL TALUKA
KELAPUR TALUKA
385 • 391 _.
• .388 389 ~
,r~ " 387! PAl""~ ,;!J
_/-/~ NANDED DISTRI C'T' __./
6.F z .P.PoONA,H/S 30·650- 63.

Name of village
Ad,aon
Ajani
Ajanti
Ajepur
Akol.
Am.l.
Am ani
(1)
AmbodaKh.
Amshet
Aniankhed (Shari)
Antargaon
Antargaon
Arambhi
Arni
Asara
Ashta
Aurangpur
Bagapur
Bagwadi
Balapur
Bale""on
Banayat
Bangaon
Barbadi
Bavhala
Beed
BeIora
Bhalki
Bhandari
Bhandegaon
Bharad
Bhawarkhed
Bhileshwar
Bhopapur
Bhulai
Bijora
Bodegaon
BorgaQn
Borgaon
Borgaon
Borgaon
Bori
Bori Bk.
BoriKh.
Boriai
Population Code---
No. 1951 1961
(2) (3) (4)
10 1.254 1.180
14 99 173
69 602 856
110
318 174 235
316 692 983
361 185 143
388 589 582
242 95 209
382 590 1,165
164 347 373
374 739 900
324 1,357 1.953
360 4.610 6.107
375 192 423
296 204 289
193 4
167
152 158 195
179
59 289 385
235 463 454
119 730 1.088
29 34 64
199
325 64 224
279 262 264
16 19 17
348 109 100
48 997 1,374
85
112
314
135 252 314
133 634 758
148 157 193
27 533 684
49 84 100
83
201 464 709
378 626 1.421'
265 192 210
213 856 918
2 I 6 2,564 2,778
238 440 546
J-1812-1-2-A (Yeot).
5
ALPHABETICAL LIST OF VILLAGES AND TOWNS
1 DARWHA TALUKA
[Entries in capital letters are for Towns and Urban areas J
(I)
Both
Bothbodan
Bothgawhan
Bramhanath
Bramhanwada
Bramhanwada
Bramhanwada
Bramhanwada
Bramhapuri
Bramhi
Chandani (FV)
Chani
Chikani
Chikani
Chi kani Kasba
Chikhali
Chikhali
Chi khali Kanhob.
Chinchgaon
Chincholi
Chinchpatra
Chirkuta
Chorkhopdi
Chorodi
Dabha
Dabhadi
Dagad Dhanora
Daheli
Dahifal
DARWHA Urban Area
Daryapur
Dawargaon
Dehani
Deogaon
Deogiri
Deulgaon
Deurwada
Deurwadi
Deurwadi
Deurwadi
Dhamangaon Bk ..•
D:larnangaon Kh, ••
Dhanaj
Dhanora Bk.
Population Code No. 1951 1961
(2) (3) (4)
147 504 616
239 446 642
233 208 274
160 330 625
8 538 685
90 860 935
197 88 34
330 811 903
82
209 580 579
333 75 166
224 858 1,121
100 1,174 1,261
236 735 760
345 393 481
358 645 683
41 1.044 1.272
95 1.247 1,245
176 556 828
267 1,066 1.299
295 210 234
336 501 571
47 317 411
130
323 14 20
365 855 1,094
52 495 621
304 452 595
192 985 877
I 10.074 11,540
301 5 48
75
368 2,122 2,329
327 213 385
138
165 616 584
278 1.049 1,161
320 990 1,029
359 914 1,000
272 202 289
34 358 398
33 454 575
86 1.121 1,192
268 200 236
• Uninhabited.
Population Name of village Cod,~ ---
No. 1951 1961
(I) (2) (3) (4)
Dhanora Kh.
Dhaw.lsar
Dhulapur
277 318 565
211 134 195
150 187 312
DIGRAS Urban Area II 12.614 15,525
Dab 170 5 •
Dodki 54
Dolamba
Dolhari
Dolhari
Dolhari
Domga
Donad
Donad
Donwada
Dorli
Dudhsaon
F attepur
F attepur
Fubgaon
Ganeshpur
GaneshpuT
Gangaon
GauIan
Gaulpend
GaWana
Ghanapur
Gharephal
Ghatkinhi
Ghonsara Owaleshwar ).
Ghui
Gondes-aon
Gondsawhan
COTegaon
Harsul
Haru
Hatgaon
Hatni
Hatola
Hirapur
Husnapur
Ichori
Idholi
Imampur
357 379 498
127 353 416
163 410 491
354 27 45
20 246 210
300 366
253
390 146 175
257
229 783 912
178 74 168
70 * 122 962 1.139
137 265 302
221
321 448 413
88
141 236 274
334 65 58
126 133 215
25 563 691
128 489 652
379 145 792
202 621 729
174 712 679
107 77 131
44 427 570
252 1,834 1. ~82
303 531 644
204 844 860
158 533 551
22 883 969
80
151
228 182 403
376 332 433
120
Name of village
(1)
!ndrathana
Injapur
!rthal
Isapur (Dattapuri
[shrampur
!thala
!tholi
Jam!:>
lambhora
Jawal.
Jawal.
lawala
Jawalsaon
logaldari
Kakaddara
Kalsaon
Kalsa
Karnandeo
Kamathwada
Kandali
Kanhergaon
Kanzara Bk,
Kanzara Kh.
Kapsi
Karajgaon
Karkheda
Karmala
Kathoda
Kati
Kawatha
Kelzara
Khalana
Khanapur
Khandala
Khandala
Kharadgaon
KhardatFV)
Kharv;
Khed
Khed
Khekadi
Kholapuri
Khopadi Bk.
Khopadi Kh.
Population Codo --
No. 1951 1961
(2) (3) (4)
180 469 531
106
50 558 695
275 569 797
124
293 1.110 1.369
285 610 668
341 300 391
198 377 451
161 477 578
286
329 2.423 2.884
195 680 77I
339 45 143
335 II 8
2S0 2.027 2,208
264 877 878
203 97 189
223 735 729
297 771 1.018
5
208 362 355
206
200 229 236
38 i58 872
15 890 944
245 107 173
349 395 353
269 603 750
389 1.006 1.000
384 489 594
4 250 337
7 79 99
55 47 127
328 283 529
3 1.077 1.197
281
118 302 322
172 368 383
326 786 983
255 115 237
18 279 383
159 667 905
315 261 382

Name of village
(I)
Khutafali
Ki,hi
Kinhiwadgi
Kohala
Kohala
Ko1bai
Kolur.
Kolura
Krishnapur
Kumbharkinhi
Kund
Kurha (Bhansara)
Kurhad
Kurhad Bk.
Kurhe~aon
Ladkhed
L.kh Khind
L.kh Rayachi
L.lapor
Lanknalh
Lasina
Laygawhan
Linga
Lingbori
Lingi
Lohatwadi
Lohi
Lonadi
Lonbehol
Loni
Loni
Loni
Mahagaon
Mahagaon Kasba ••
Mahajanpur
Mahalungi
Mahamedpur
Mabatoli
Mahuli
Makrampur
M ale l1aon
Malhiwara
Malkapur
Population Cod. No. 1951 1961
(2) (3) (4)
116 17 10
364 % 420
153 633 607
35 574 805
51 463 616
43 529 483
108 950 837
283 154 210
356 478 437
386 547 581
74
146 627 55'
39
373 691 1,263
32 128 ZI4
155 380 474
94 47 27
ZIO 2.350 2,696
171 680 834
288 1,201 1,424
121 18 17
84
ISS 981 1,176
258 146 200
212 273 255
302
347 234 221
101 230 3Z7
23 2,176 2.414
114 165 171
370 493 738
77 306 342
319 1,974 2.133
33S 294 336
352 433 458
311 2.124 2.534
12 * 343 887 1.146
217
310 512 602
134 189 201
96
157 168 226
369 516 1.233
78
J-1312-1-2-B (Yeot.)
Name of village
(1)
Malkhed Bk.
Malkhed Kh.
Mall,pur
Mandawgad
Mandwa
Mangkinhi
Mam:,la
Mangladevi
Mangrul
Mangrul
Manikwnda
Manki
MankOPara
Marwadi
Mokh
Morgawhan
Morkhecl
Mozar
Moza:
Muktyarpur
Mukundpur
Mundhal
Nababpur
Naigaon
Nakhegaon
NandgaWhan
Nandrr,wh.n
NandgaWhan
Narkund
Nathrad
Ner
Nilona
Nimbha
Nimbha
Nimbhal a
Nirap:.J.T
Pachwad
Pahur
Palodi
Palsi
Pandhari
Pandhurna
Pandhurn• (Pob.!)
6
1 DARWHA TALUKA-coll(d.
Code No. 1951 1961
(2) (3) (4)
183 1.262 1.303
184 978 1,143
266
61 54 57
262 694 937
145 1.084 1,149
309 195 170
92 2,240 2,365
98 303 4(,3
383
89 1,773 1,711
42 130 \87
40 295 406
65 136 101
351 121 168
331 767 1.209
259 1.381 1,762
220 138 200
251 144 257
68 1,505 1.454
243 450 905
87 251 313
177 262 310
142 82 131
109 2.541 2.904
308 380 695
31 511 669
154 234 458
222 31 49
280 227 263
237 73 100
66 36 46
72 4.949 6.263
156 146 220
276 546 669
300 286 297
246
102 37 26
194 31 63
367 930 1,355
129 767 791
169 683 858
545 682
219 639 733
371 739 1.101
Name of vjll~~e
Pang-ari
Parjana
Panoda
Pathrad
Pathrad
Pekarda
Pendhara
(1)
Phetri (FV)
Pimpalad
Pjmpalgaon
Pirnpalgaon
Pimpalgaon Duba
Pirnpalgaon Kala .•
Pirnpalkhula
Pimpari
Pjmpari
Pimpari
Pimpari Bk.
Pimpari Kalaga
Pimpa,i Kh.
Rahati
Raini (FV)
.({ajura
Ramgaon
Ramgaon
RaTllgaon
RaTllgaon
Ranidh anora
.Ratnapur
Renkarmr
Rohana
Rudrapur
Rui
Saidani
Saikhed
Saikhed
Sajega')n
Sakar.
Sakri
Sakur
Sanga!wadl
San~wi
Sarangpur
Sarata
, Uninhabi led
POllulatio'l Cod, No 1911 1961
(2) (3) (4)
366 391 682
" 101 138
346 259 301
240 373 474
79 1,136 1.366
140 457 475
191 51 59
284 256 449
73
37 267 276
207 128 170
113 773 920
58 277 366
144 748 844
181 247 371
355 120 159
377
313
56 1,022 1.277
299 2Rl 366
274 542 654
71 41 13
244
149 149 238
2 98 140
26 1,459 1,649
256 174 251
306 325 585
391 766 720
103 2~8 348
81 32 30
263 470 517
350 144 150
282 743 957
205
344 323 356
175 697 799
293 431 527
254 1.190 1.342
292 224 182
387 557 468
28 270 265
21 527 641
196 320 432
93
Name of villa!l'e
Satara
Satefal
Saw.la
Sawali
(I)
Sawa.nga
Sawanga Bk.
Sawang .. J<h.
Sawangi
Sawargaon
Snabaspur
Shahapur
Shekal~.on
Shelodi
Shelu
Shendri B~.
Shendri Kh.
Shendur .. ni
Shirasgaon
Shiwni
Sidakpur
Sindkhed
Sin.ad
Sonkh.s
Sonwadhona
Sukali (Lahankolaw)
Taka1i Bk.
Takali Kh.
Ta kali Salami
Talegaon
Tapona
Tarnoli
Taroda
Taroda
Teldhari
TelRawh.n
Tembhi
Ternbhi
Tendo1i
Tiwri
Tornala
T upta<ali
UChev'8on
UJapur
Population Cod.
Nn. 1951 1961
(2) (3) (4)
342 233 253
24 1.227 1,511
247 390 456
215 231 316
337 852 1.126
273 398 476
111 246 244
248 231 145
836 1.011
76
190 273 463
332 442 506
139 762 895
381 1,015 1.097
132 387 390
131 276 303
380 539 730
i3 502 651
317 298 430
104 2
162 332 483
115 560 671
291 775 .1,457
187 423 575
185 1,286 1,433
372 1.049 1,331
173 390 437
189 171 192
91 432 464
125 1,932 2.018
218 151 209
30 1,806 1,83\
168 282 399
322 704 736
166
46 137 243
19 342 362
97 25
362 400 557
261 856 901
225 887 987
45 4g8 674
287 1.92; 1,~44
307 730 916
123 392 427

7
1 DARWHA T ALUKA-concld.
population Population Population Popuiaiion r\a."l1e of village Code Name 01 village Code Name of village Code Name of village Code----
No. 1951 1961 No. 1951 1961 No. 1951 1961 No. 1951 1961
(1) (2) (3) (4) (1) (2) (3) (4) (I) (2) (3) (4) (I) (2) (3) (4)
Ujona 232 341 367 Viivihir 63 Wai 117 270 306 W.rol 250 187 194
Ukali 271 28 Vyahali 67 293 367 Wai 289 324 496 Watf.li 62 951 1.147
Umarda Bk.lFV) .• 227 14 Wailingi 260 577 849 Watphal 53 339 469
Um,ri 363 548 698 Wadgaon 249 915 1,049 W.k.d Bk. 143 458 636 Wirgawhan 182 196 355
Umari 305 260 417 Wadllaon 353 312 414 W.ki 231 Yenna!(Heti) 385 414 751
Umaripathar 340 468 1,136 Wadul 234 239 216 Walki 64 258 299
Umartha 17 712 829 Wagad Kh. 312 480 543 W.nat~h.d 57 Zomb.~i 60 67 329
Urnartha Kh. (FVI 241 Waghal 214 73 114 Warandeli 294 1.015 1.504 ----Umarvihir 99 Wa.hul 230 28 73 Warjai 226 402 533 t 1951 TOTAL •• 209.995
Uttarwadhona 186 1.205 1.418 Wai 105 670 719 War1jd 36 585 691 1961 TOTAL .. 255.132
• Uninhabi ted. tThe 1951 population of the Taluka .. given in this list differs from that mentioned in Table A-ii.

VILLAGE DIRECTORY
Serial ViIJ.aRe j Town! No. Ward
(I) (2)
I Don.d 2 Ramgaon 3 KhaTadgaon 4 Khalana 5 Kanhergaon
6 Pandhari 7 Khan.pur 8 Bramhanwada 9 Sawargaon
10 Adgaon
II Parjan' 12 Mahajanpur 13 Sbirasgaon 14 Ajani 15 Karkheda
16 Bhalki 17 Urn.rlha 18 Khol.pcri 19 Tembhi 20 Domga
21 Sangwi 22 Ha!ola(E) 23 Lohi (/::) 24 Sate!al 25 Gharephal
26 Rarngaon 27 Bodegaon (E) 28 Sangalwadi 29 Barbadi 30 Tarnali (E)
31 Nakheeaon (El 32 Kurhad 33 Dh"mang"on Kh. 34 Dhamangaon Bk. 35 Kohala
36 Warud 37 Pimpalgaon 38 Karaigaon 39 Kund 40 Mankopara
41 Chikhali (E) 42 Manki 43 Kolbai 44 Goregaon 45 Tornala
4C Telgawhan 47 Chorkhopdi 48 Bhandegaon 49 Borgaon 50 lrthal
51 Kohala 52 Dagad Dhanora 53 Watphal 54 Dodki 55 Kh.nd.la
56 Pimp.ri Kal.ga 57 Wanarkhed 58 Pimpalgaon Kala 59 Balegaon 60 Zomb.di
61 Mandawgad 62 Walfali 63 Viivihir 64 Walki 65 Marwedi
66 Nathrad 67 Vyahali 68 Mozor 69 Ai.nti 70 Fattepur
71 Raipur n Ner(E) 73 Pimp.lad 74 Kriohnapur 75 Dawargaon
T rano- Educa-p!lrt and tional Drinking
Postal lnstitu.. water facilities tions supply
(3)
.. R1yRPo
., RP~ Po
•. RPo R
Po" .• Po
.. Rly
.• Po"
•• R
R
•• R
Po
RP~
R R
R R RPo RPo
R RPo
(4)
P
M P
P p' P M
i-i j:;
p' P P
p P H M p
M p p
M P
p' i:;
P P M p'
M p' p P
P P M
P P P
M p' p
M j/
j:' M P
(5)
W W W W
W Wx Wx Wx W
Wx Ri~W WN W
W W Wx Wx W
W Wx W W W
W RivW W W W
W Wx W Wx W
W Wx W
Ri~W
WS RivW W W W
wx W W Wx Wx W Wx W W··
Wx W" W W
W W
W" W
W W W W
W W
8
Area in Sq. Medical
facilities Bazar Day Miles
Occu .. pied
houses House" holds
(6) (7) (8) (9) (10)
RURAL AREA
M~6
Sun'day Wednesday
Sat';;day
Tue;day Sunday
Monday
MpHosD Wed. & Sat
M~'
Mp Sunday
Wed~esday
1.3 81 81 0.5 3B 38 2.7 274 279 2.1 83 83 1.0 Uninhabited.
2.7 I.B 4.0 3.9 5.5
0.7 0.7 5.3 1.5 1.6
0.7 1.3 3.2 1.4 1.2
2.1 6.9 6.6 6,7 3.5
6.6 2.9 2.3 0.9 6.7
0.9 2.1 2.6 4.1 2.4
1.6 2.0 2.1 2.9 2.3
3.7 1.3 2.1 2.0 3.0
1.9 2.4 3.6 1.4 2.2
3.1 2.6 0.9 0.9 1.8
5.8 0.1 2.8 2.1 1.2
3.3 2.8 0.8 1.8 1.8
0.8 1.8 5.5 4.1 0.9
146 146 26 26
159 159 24B 248 266 268
25 25 Uninhabited.
142 142 37 37
211 221
3 168 72 77 46
140 212 499 340 125
330 131 47 16
375
3 176 78 77 48
142 212 515 341 157
390 156 57 16
391
144 150 36 36
113 113 95 95
156 156
155 155 54 54
178 179 Uninhabited.
98 98
270 275 33 33
104 107 118 118 104 127
33 44 77 97
219 262 17 20
126 137
150 154 138 139 102 103
Uninhabited. 28 31
293 293 Uninhabited.
83 83 93 96 67 67
13 13 250 250
Uninhabited. 62 62 27 27
15 15 79 79
332 333 201 201
Uninhabited.
1.1 3 3 4.8 1.071 1,304 0.5 Uninhabited. 0.3 Uninhabited. 0.7 Uninhabited.
Total Population Scheduled
Castes
P M F M F
(11)
366 140
1.197 337
682 99
685 1,011 1.180
138
651 173 944
17 829 383 362 210
641 969
2.414 1.511
691
1.649 684 265 64
1.831
669 214 575 398 80S
691 276 872
406
1.272 187 483 570 614
243 411
1.374 100 695
616 621 469
127
1.277
366 385 329
57 1.147
299 101
46 367
1.454 856
13 6.263
(12)
187 77
638 161
348 ~7
355 512 602
74
380 96
495
10 411 185 192 109
323 480
1.258 732 358
806 347 149 34
916
342 108 301 203 389
349 138 444
218
641 103 242 272 345
122 209 713 47
368
303 321 238
66
673
188 181 liO
35 602
146 56
22. 195 739 434
6 3,312
(13) (14) (15)
179 2 9 63
559 24 2i 170
334 42
330 499 578
64
271 77
449
7 418 198 170 101
318 489
1.156 779 333
843 337 116 30
915
327 106 274 195 416
342 138 42B
188
631 84
241 298 329
121 202 661 53
327
313 300 231
61
604
178 204 159
22 545
153 45
24 172 715 422
35 9
142 44
48
iz
22 5
IS2 41
6
'6
'2 'j
'2 'j
126 30
176 19
29 12 13
6
20 10 14 13 2
1 6 ;)
40
13 6 4 5 'J
26
2
'z 8
16
123 32
160 14
37 9
15
'9 31 11 14 4 2
's 1
34
17 10 3 3
10
98 'j,
21
4
'i 12 14
7 2,951 17i 159
Scheduled Literate and Tribes educated
M F M F
(16) (17) (18) (19)
-
90 25 33 7
307 92 68 27
104 12
119 194 287
3
239 20
180
36 3
42 47
115
67 5
42
4 124 26
61 7 72 26 66 18
140 220 548 358 141
415 105 60 18
381
161 24
125 102 132
159 54
179
93
255 26 94
102 95
19 77
325 20
137
131 127 79
12
280
58 58 31
11 297
41 15
7 79
349 127
42 80
232 153 34
103 13 14 4
168
54 3
38 26 28
41 29 37
16
89 6
31 10 24
5 17
114 4
18
34 40 37
1
97
29 20
5
4 8S
12 3
1 28
136 31

Total workers (I-IX)
M F
(20) (21)
109 87 39 39
370 279 108 88
.Uninhabited,
207 169 38 18
216 112 333 255 368 230
45 39 .Uninhabited,
184 144 55 43
335 239
9 260 119
12 64
176 328 676 439 226
474 209
97 23
551
193 70
188 124 232
3 198 lOB 97 41
131 222 448 422 191
376 179 66 17
435
142 62
162 97
255
219 164 81 50
268 195 .Uninhabited,
134 122
397 324 59 49
159 148 184 190 206 204
71 133 403 , 26 213
56 117 277
31 179
196 184 203 90 145 117
./ 'ninhahited, 45 39
394 283 :(] ninhabited,
111 82 123 110 97 64
21 15 348 255
Vninhabited 94 89 39 27
16 13 119 90 451 353 267 234
Uninhabited,
4 1,760 721
Uninhabited, Uninhabited, Uninhabited,
M
(22)
48 16
146 35
59 13 73
129 81
27
54 27
117
3 69 67 56 34
44 145 234 159 72
217 67 27 11
168
70 28 52 31 99
79 27
105
36
136 30 75 83
101
29 49
119 6
104
102 97 56
10
140
44 38 44
I 173
31 3
2 47
159 102
2 325
II
F
(23)
M F
(24) (25)
25 16
100 9
7 I
23 46 22
9
26 19 80
2 27 55 35 16
5 93 94
150 61
28 71 28 10
128
34 24 42 10
131
56 13 84
30
84 30 70 81
105
54 22
170 69
130 25
137 180 226
18
86 22
184
5 164 46 49 24
94 158 282 226 129
216 92 51 II
314
101 40
121 82
122
114 38
136
88
209 24 70 97 95
62 23
172 79
161 17 89
207 201
30
115 24
157
I liD 53 61 25
120 127 339 272 129
347 104 34
7 305
107 38
120 87
120
106 37
108
92
230 19 73
109 98
28 33 12 3
93
39 28 74 84
226 261 18 23 92 84
50 82 11 93 22 65
4 33
83 201
B 63 14 75 32 36
104 19 3
2 34 85 24
27
18 139
61 30
14 66
226 141
2 694
128 79 95
35
195
74 93 31
15 149
70 24
II 55
260 207
3 646
III
M F
(26) (27)
ii 2
'2 3
'(, 3
'4 2 2 4
8 3 4 5 7
'5 17
'j
8
'j
4 3 6
2 2 4
'6 2
ii
io
4
'j
2
9
WORKERS
IV V
M F M F
(28) (29) (30) (31)
RURAL AREA
2
12 I 'j I
II
ij '2 16 2
16
jj
'2 I 3 I
'j 3 2
"
I 5
36 I '3 8 27
II 5
13 4
.3
2 3
24 6
'2 I
'j ii
5 I
11
3
17 1 2 I 3
'2 16
'i
4
'j
'7 '2 5 4 3 3
20 3
~ 'j 2
'j
2
2
'2 12 'i '9 6 I
24 '2 103
'j
VI
M F
(32) (33)
'j
'j
':3 4
4
2
'j 'j
1 DARWHA TALUKA
VII VIII IX
M F M F M F
(34) (35) (36) (37) (38) (39)
'5 25 '5
3
'5
'j
8 3
29 7 3
6 6
jj
5
2 2 2
9
'2 I I
',2 25
'2
'2 8
7
js 2
zji
'j
'j
'j
'j
'j I 1
'j
14
'j 1
2 I
'j
9 10 1
'j I
29
3 I
17 '2 I
7
'5 3
14
24 2
j2 'j
I 6 3 2
6 11 63 27 6
18 28 2 I
21
2 2
13 7 I
4 I 7
'3
'j
9 2 2 9
2
16 4
~ '2 2 6
2 3
17 '4 2 8
4 5 7
2
20
2 2 9 'j
i9 'j
I 6
'4 18 7
3iiJ
'j 1
36
NONWORKERS
---Serial M F No,
(40) (41) (I)
78 38
268 59
141 19
139 179 234
29
196 41
160
I 151 65 80 45
147 152 582 293 132
332 138 52 II
365
149 38
113 79
157
130 57
176
84
244 44 83 88
139
51 76
310 21
155
107 118 93
21
279
77 58 73
14 254
52 17
6 76
288 167
92 I 24 2
280 3 82 4
5
165 6 24 7
218 B 244 9 348 10
25 II 12
127 13 34 14
210 15
4 16 220 17
90 18 73 19 60 20
187 21 267 22 708 23 357 24 142 25
467 26 158 27 50 28 13 29
480 30
185 31 44 32
112 33 93 34
161 35
178 36 88 37
233 38 39
66 40
307 41 35 42 93 43
108 44 125 45
65 46 85 47
384 48 22 49
148 50
129 51 210 52 114 53
54 22 55
321 56 57
96 58 94 59 95 60
7 61 290 62
63 64 64 18 65
II 65 82 67
362 68 18d 69
7iJ
2 1 71 1,552 2.230 7Z
i3 74 ,s

VILLAGE DIRECTORY
Serial No.
(I)
Village/T own/ Ward
(2)
76 Shabaspur 77 Loni 78 Malkapur 79 Pathrad 80 Hitapur
81 Renkapur 82 Br.mhopuri 83 Borgaon 84 Lanknath 85 Bharad
86 Dhanoj 87 Muktyarpur 88 Gaulon 89 Mani kwada 90 Bramhanwada
91 T akali Salami 92 Mangladevi 93 Sarata 94 Kurhe.aon 95 Chikh.li Kanhoba
96 Makrampur 97 Tembhi 98 Man"rul 99 Umarvihir
100 Chikani
101 Lohatwadi 102 Nirapur 103 Ralnapur 104 Sidakpur 105 Wai
106 Iniapur \07 Gondgawhan 108 Kolura 109 Nababpur 110 Aiepur
111 Sawanga Kh. 112 Bhawarkhed
Transport and Postal
facilities
(3)
R
.. Po" Po
RP~ " R
113 Pimpalgaon Duba .• 114 Lonadi 115 Sindkhed
II 6 Khutafali 117 WaitE) 118 Kharvi 119 Bangaon 120 [mampur
121 Lalapur 122 F ubgaon (E) 123 Udapur 124 [shrampur 125 Talegaon
126 Ghan"pur 127 Dolhari 128 Ghatkinhi 129 Palodi 130 Chorodi
131 Shendr; Kh. 132 Shendri Bk. 133 Bhulai 134 Mahuli (E) 135 Bhopapur
136 Darwha 137 Ganeshpur 138 Deogir; 139 Shelodi (E) 140 Pekarda
141 Gaulpend 142 Mundh.l 143 Wakad Bk. 144 Pimpalkhuta 145 Mang kinhi
)46 Kumbhar kinhi 147 Both 148 Bijora 149 Raiur. ISO Dhulapur
Po" •. RlyR .. R
Educational
Institutions
(4)
p' M
p P
p' P
P P
p'
p'
!Vi P
p' p
p
pj
p
p' P P
M P
M p P P P
P M P P P
p'
M P
p' P M
P P
p'
Drinking water supply
(5)
W"
Ri~W
Riv
W RivW
W" W
W W
W" W
W"
W"
W W W W W
W" W W
W
W" Wx W
W W W W
Medical facilities
(6)
RivWx W M~' W
W" M~'
W RivW W W Mp'
W RivW Wx W W
W" W" W
Wx RivWx W W RivW
W W W RivW W
BazarDay
(7)
10
Area in
Sq. Miles
(8)
Occupied
houses
(9)
Households
(10)
RURAL AREA-eonld.
Friday
Mo~day Thursday
Sunday Saturday
Wed~esd.y
Wed~esday
Wed~e.day
Thu'r~d.y
Friday
0.5 Uninhabited. 1.1 76 80 0.8 Uninhabited. 3.4 290 308 0.4 Uninhabited.
0.8 10 10 0.4 Uninhabited. 0.6 Uninhabited. 0.6 Uninhabited. 0.9 Uninhabited.
4.9 1.9 1.4 3.9 1.8
2.0 7.1 0.8 1.2 2.4
276 280 79 80
Uninhabited, 413 538 224 224
113 113 575 575
Uninhabited. 8 8
312 312
0.8 Uninhabited. 0.9 Uninhabited, 1.4 88 97 2.4 Uninhabited. 2.9 252 286
1.8 1.0 1.8 0.6 1.7
70 5
77 I
151
70 5
77 I
151
3.2 Uninhabited. 0.4 23 23 3.5 174 186 3.7 537 568 0.3 Uninhabited.
2.1 57 57 I • 2 Uninhabited. 2.7 190 190 3.6 37 37 3.8 154 156
2.4 4 5 1.0 50 58 2.4 77 80 5.3 220 231 0.4 Uninhabited.
0.9 6 6 3.3 250 265 1.6 108 109 1 .1 Uninhabited. 6.7 363 431
1.5 46 50 1.9 90 103 3.0 88 110 5.5 147 173 0.7 Uninhabited.
1.8 1.5 1.9 2.5 1.2
2.0 1.1 2.8 2.1
1.3 1.0 2.5 3.1 5.2
3.3 2.0 0.4 2.1 0.8
53 84
157 4S 71
54 87
157 45 71
Urban Area I. 66 67
Uninhabited. 180 188 117 117
58 68 24 24
110 121 137 172 221 244
107 125 112 131 33 33 53 53 62 62
Scheduled Scheduled Literate and' Total Population Castes Tribes educated
PM FMFM FMF
(II) (12) (13) (14) (15) (16) (17) (18) (19)
342
1,366
30
1,192 313
1,711 935
464 2,365
27 1.245
463
1,261
327 26
348 2
719
131 837
2,904
244
920 171 671
10 306 322
1,088
17 1,139
427
2,018
215 416 652 791
303 390 758 201 314
302
895 475
274 131 636 844
1,149
557 616 193 238 312
171
667
18
601 154
860 474
233 1,218
13 625
232
621
154 7
173 2
379
70 431
1,484
III
476 90
346
6 153 173 581
II 584 218
1,055
117 213 333 392
151 216 386 102 159
152
445 246
139 66
312 430 589
270 308 97
118 163
171
699
12
591 159
851 461
231 1,147
14 620
231
640
173 19
175
34D
74
10 14
34
2
6
89
23 17
39
2
4g~ io io 1,420 67 76
133
444 6 9
3~1 4 '3 4
153 149 24 28 507 25 19
653 555 7 9 209 20 29
963 23 21
98
~n i7 i3 399 8 7
152 174 372
99 155
150
450 229
135 65
324 414 560
287 308 96
120 149
8 14
II 14 18 22 8
4
'7 21
9 12
II 17 23 18 9
2
;0 21
60 II),
264 II,}'
4
229 70
395 168
80 500
6 248
54
244
66· 19·
174 60
18 199
13
57
62 16 5 2
61 II
139 3~
15 2 180 53 677 276
39 19
199 45 18
103 ii
3~ '2 30 7
132 26
4 I 235 7& 54 28
464 165.
39 15 107 42 109 20 173 55
27 8 % 20
141 38 57 13 54 9
~1
199 91
48 18 71
115 196
92 131 35 18 33
7
84 25
22 1 <}
21 3<>
27 53 13 4 2

Total wcrkers (I-IX)
M F
(20) (21)
'uninhabited. 108 87
Uninhabited. 401 353
Uninhabited.
11 Uninhabited. Uninhabitedo Uninhabited. Uninhabited.
364 293 102 83
'uninhabited. 530 358 291 230
144 99 779 520
Uninhabitedo 7 8
424 320
Uninhabitedo Uninhabitedo
147 140 oUninhabitedo
369 325
96 76 5 5
106 81
d 13i Uninhabited.
40 27 255 237 845 405
Uninhabitedo
66 77 Uninhabitedo
269 254 56 52
212 172
4 2 89 102
107 86 335 288
Uninhabitedo
9 6 354 250 140 12
Uninhabitedo 636 347
75 53 135 95 189 178 252 215
Uninhabitedo
93 140 236
67 107
70 103 188 61
103
Urban Area I. 91 92
Uninhabitedo 274 206 164 115
91 45
187 276 373
167 190 60 81 98
72 40
190 254 279
154 120 56 72 82
II
M F M F
(22) (23) (24) (25)
36
161
122 50
177 96
84 255
3 147
71
136
55 I
54
69
25 83
183
32
119 39 85
2 41 41
141
3 107 42
253
32 43 60
114
36 56 86 21 23
49
121 55
41 25 93 87
129
50 55 28 20 35
I 68
114 216
8
64 166 8 48
69 258 5 171
3 60 103 418
4 3 64 241
61
9
37
jj °2
16 7 4
10
112 39 44
S3 33
121
48
203
37 3
46 2
135
15 128 400
28
129 16
110
2 45 61
153
5 4 60 208 5 90
80 322
20 41 14 82 61 119 60 112
34 45 32 15 14
46
69 I
38 66
119 42 84
34
120 104
4 44 1 17
90 90 54 158 80 206
52 8
23 12 41
114 124 30 55 62
86
238
5
220 73
281 220
96 409
4 249
79
315
39 5
50
129
11 227 388
67
141 13
128
2 49 53
154
I 189 67
261
33 79
115 154
36 57
155 46 89
45
135 113
68 39 99
200 195
99 112 33 60 41
III
M F
(26) (27)
11
'3
'2
'j 4
3
5 I I
OJ
21
'j
°2
io
OJ
'(,
'j
11
WORKERS
IV V
M F M F
(28) (29) (30) (31)
RURAL AREA-contdo
I
II
11
25 6
6 2
2 I
4
42 '2 °4
i3 3
10
's
18
OJ
I
is 'j 'j 64 11 28
7 Os
3
'9 OJ OJ
22 'j 1
II 2
'4 OJ 4 2 8 1
'4 9
7 3
2
8
14
2
'2 OJ °2 23 9 'j
3 7 I 5
3
OJ
VI
M F
(32) (33)
°3
°5 17
2
OJ
5
1 DARWHA TALUKA
VII VIII IX
M F M F M F
(34) (3j) (35) (37) (38) (39)
25
18 2
2i
°7 °i
°6
104 °i
2 °2
OJ
3
°3 I
14
OJ
2
I 2
5
2
2
OJ
4
2 I
2
OJ
10
OJ
OJ
'2 9
'2 6 "j 'j
'2
OJ
8
17 3
40 6
10
11
3 °3 °4
6 4
ii; '2 35
3
4
'6
'3 3 6
2 12 6
24
2 4 5
16
2
~ 'j 8 I 4
16 2
2 I
°6 II OJ
'2 I I
NONWORKERS
---- Serial M F No.
(40) (41) (I)
63
266
7
237 52
330 183
89 439
6 201
35
252
58 2
67
157
76 84 77
78 345 79
80
7 81 82 83 84 85
298 86 76 87
88 493 89 231 90
132 91 627 92
93 6 94
300 95
96 97
91 98 99
315 100
97 101 14 102 94 103
104 209 105
106 30 34 101
176 169 108 639 1.015 109
45
207 34
134
2 64 66
246
2 230
78
419
42 78
144 140
58 10
150 35 52
61
171 82
48 21
125 154 216
103 118 37 37 65
110
56 III 112
190 113 29 114
153 115
2 116 51 117 63 118
219 119 120
121 305 122 137 123
124 616 125
45 126 108 127 141 128 184 129
130
82 131 71 132
184 133 38 134 52 135
136 58 137
138 244 139 114 140
63 141 25 142
134 143 160 "144 281 145
133 146 188 147 40 148 48 149 67 150

VILLAGE DIRECTORY
Serial No.
Villa~/Town / .. ad
(1)
151 Husnapur 152 Bagwadi
(2)
153 Kinhiwadgi 154 Nandgawhan 155 Kurhad Bk.
156 Nilona 157 Malegaon 158 Hatni 159 Khopadi Bk. 160 Bramhanath
161 Jawala 162 Sindhi 163 Dolhari 164 Antargaen 165 Deul,aon
166 T eldhari 167 Bagapur 168 Taroda 169 Palsi 170 Doh
171 Lakh Khind (E) 172 Khed 173 TakaliBk. 174 Gondegaon 175 Saikhed
176 Chinch.aon 177 Mukundpur 178 Fa ttepur 179 Balapur 180 Indra thana
181 Pimpari 182 Wirgawhan 183 Malkhed Bk. 184 Malkhed Kh. 185 Sonwadhon.
186 U ttarwadhon. 187 Sonkhas ISS L.sin. 189 Takali Kh. 190 Shahapur
191 Pendh.ra 192 Dahi!al 193 Aurangpur 194 Pachwad 195 Jawalgaon
196 Sarangpur 197 Bramhanwada 198 J ambhora 199 Bavha1a 200 Kapsi
201 &rgaon 202 Ghui 203 Kamandeo 204 Hatgaon 205 Saidani
206 Kanzara Kh. 207 Pimpal.aon 208 Kanzara Bk. 209 Bramhi 210 Ladkhed (E)
21 I Dhawalsar 212 Linga 213 Bori Bk. (E) 214 Waghal 215 Sawali
216 Bod Kh. 217 MahamedpUf 218 Tapona 219 Pandhurna 220 Morgawhan
221 Ganeshpur 222 Nandgawhan 223 Kama thwada 224 Chani 225 Tiwsa
Transport and
Postal facilities
(3)
.. R
.. RPo
.. R
.. R .. pd' .. R
Educational
Institu-tions
p' P P
p P P
P P P P P
p' P
P P P M p
M
p' P
(4)
.. Po" M
.. RPo P
.. R M
.. RPo P
.. R P •. RlyRRh P
.. R
.. R
p'
p'
p' p
p' p'
P P
p'
p' .. R P •. RlyRPo M
" Rl~' .. R
" RI~'
RPo
R .. RPo .. Po •• R
M
p'
M M P
Drinking water supply
(5)
W W Wx Wx
W W W W W
W W Wx Wx W
W W
Wx Wx W W W
W Wx Wx
Wx W Wx W W W
W W W W W
W W W W Wx
W Wx Wx W"
Wx W Wx RivW
WOO W W W
W W RivW Riv W
RivW WOO W W
W" W W W
Medical facilities
(6)
M~D
Bazar Day
(7)
12
Area in
Sq. Miles
(8)
Occupied
houses
(9)
House holds
(10)
RURAL AREA-conld.
Sund'ay Wednesday Thursday
Frid.y
S.t~;d.y
Frid.y Saturd.y
Tuesday
Mo~day
0.5 Uninhabited. 2.1 29 37 4. I 135 136 2.2 62 94 3.7 82 117
2.1 2.1 1.4 6.0 2.3
39 36
104 152 107
49 41
124 185 130
4. I 92 125 2.8 75 96 2.8 80 92 1.4 87 90 1.8 122 133
1.2 Uninhabited. 1.0 Uninhabited. \.6 68 91 4.7 171 174 1.5 Uninhabited.
4.8 189 189 2.4 73 73 1.6 98 105 J.5 160 165 1.1 162 167
4.3 161 176 \.6 60 64 1.0 41 48 0.3 Uninhabited. 2.2 124 130
3.4 1.3 5.6 5.4 5.1
6.1 5.5 6.8 1.5 O.S
1.1 3.5 0.6 \,4 4.6
100 70
270 237 268
320 116 280
45 80
10 178
2 12
166
100 72
299 250 273
320 116 284
49 88
II 195
2 13
181
2.2 83 100 0.8 6 7 1.5 100 116 0.5 Uninhabited. \.3 52 58
3.8 151 171 3.9 163 176 0.2 38 38 3.4 199 213 0.1 Uninhabited.
0.6 Uninhabited. 0.6 40 40 0.8 76 76 2.1 145 147 7. I 542 596
1.1 0.9 2.3 \,1 1.7
46 60
162 19 61
46 60
215 23 69
1.6 517 600 0.5 Uninhabited. \.8 28 41 1.9 125 158 0.9 32 37
O.S Uninhabited. 1.8 13 14 3.0 161 175 2.0 246 246 5.2 214 214
S~heduled Scheduled Literate Total Population Castes Tribes and
educated
P M F M F M F M F
(11) (12) (13) (14) (15) (16) (17) (18) (19)
195 607 458 474
220 226 551 905 625
578 483 491 373 584
399 858
834 383 437 679 799
828 310 168
531
371 355
1,303 1,143 1,433
1,418 575
1,176 192 463
59 877
4 68
771
432 34
451
236
709 729 189 860
170 355 579
2,696
195 255 918 114 316
2,778
209 738 200
49 729
1,121 937
98 312 225 234
102 110 288 472 302
303 239 233 181 293
195 423
432 200 217 339 415
447 152 82
271
191 170 637 566 736
710 273 596 94
246
36 480
3 34
383
220 16
221
108
363 367
90 462
75 182 297
1,398
93 130 503 59
166
1,432
101 373 100
26 387 570 498
97 4 295 I I 233 I 240 5
lIS 116
2 9 I 4
263 3 3 433 41 51 323 2
275 31 28 244 4 8
1~~ 'j 291
402 24 21 183 2 I
~ig 108 105 384 77 75
381 35 24 158 38 38 86 I 4
260 3 12
180 185 666 577 697
708 302 580 98
217
23 397
I 34
388
212
7i 4
14 9
55 2
I 8
21~ ji 128
69 5
28
" 34
I 10
lie)
ii;
~~~ ii ii 99
398 ij i3
95
m i2 i5 1,298 148 150
102 125 415 30 26 55 2 I
150 9 10
1,346 127 115
j~~ i4 i5 100
23 342 551 489
ii 41 7
i2 46 8
d 40 68 13 91 22
25 6 26 J
132 33 154 46 95 10
96 23 60 9 60 B 54 14 65 17
54 6 153 79
138 54 89
ISO 157
228 35 13
100
62 46
230 263 218
230 67
159 31 63
3 188
3 4
147
45 I
IS· S:' 52
72 3 2
37
20, II 71 90 41
86 16 34 7 9
46 'i 49
95 24
3 " 99 47
34 24
127 21 106 16
5 I 194 44
32 8 78 21
140 52 638 254
22 11 41 5
246 83 21 6 89 26
725 310
30 16 140 29 29
9 157 248
95
1 53 85 13

Total workers (i-IX)
M F
(20) (21)
Uninhabited, 64 58
194 142 143 133 160 148
64 46 65 67
174 165 305 208 182 182
176 149 128 118 148 134 117 103 191 182
Uninhabited, Uninhabited,
131 123 267 184
Uninhabiled,
280 226 127 93 142 117 202 198 240 214
246 93 100 89 52 52
Uninhabited, 159 146
118 95
435 341 451
455 170 397
65 148
105 83
359 248 426
412 160 367 70
125
22 17 301 162
2 I 26 23
249 212
148 126 10 II
148 113 Uninhabited,
76 56
232 200 243 193
65 63 286 190
Uninhabited,
Uninhabited, 46 43
110 84 198 138 853 366
62 53 87 74
301 217 33 25 89 59
824 511 Uninhabited,
60 45 220 207 56 62
Un;nha~ited, HI 13
:124 174 320 268 318 313
II
M F M F
(22) (23) (24) (25)
26 72 77 86
43 39 36 94 75
56 70 83 30 52
29 103
71 54 49 60 90
83 36 13
85
59 37
131 87
220
148 60
125 17 49
7 127
;5 93
71 6
45
29
62 105 25
110
25 50
108 295
24 33 70 15 47
218
31 73 21
8 38
110 93
23 38 35 47 110 95 79 60 54 68 64 80
36 18 10 35 23 32 37 121 124 61 180 147 56 96 125
34 111 115 62 55 56 72 61 62 21 82 81 29 128 153
16 89 34 131
63 159 45 65 33 84 45 114 87 104
2 130 32 61 7 39
69 54
48 24 73 46
228
110 36 98 18 46
4 50
;3 60
50 7
13
14
35 66 25 61
15 30 63 72
15 28 39 9
26
98
16 60 26
54 57
265 205 184
266 95
239 30 59
13 147
2 II
137
77 4
88
41
145 129 37
147
10 48 77
371
37 49
140 17 25
332
18 138 35
105 147
161 47 84
153 126
88 57 45
73
57 59
281 194 195
299 110 265 42 76
13 109
I 10
150
72 4
95
41
163 127 38
123
16 49 74
293
38 46
160 16 32
391
29 144 36
6 7
84 92
7 7 154 161 149 179 195 219
J-1812-1-3-A-(Yeot,)
III
M F
(26) (27)
2 I
9 I
jj 19
2
'2 8 I
I 6 2 3 3
'j
9
'4 2
jj I I
20
I 5 7 4
j4
'j
'j
WORKERS
IV
M F
(28) (29)
13
V
M F
(30) (31)
VI VII
1 DARWHA TALUKA
VIIl IX
NONWORKERS
---- ---- ------ ---- Serial M F M FMFMF M FNo,
(32) (33) (34) (35) (36) (37) (38) (39) (40) (41) (I)
RURAL AREA-amid,
'7 'j '2 3 8 3
I I ~ 'j 6 'j
is '3
13 6 4 3 4 I
13 I 2
4 3
ji 10 7
13 3 6
I
'j
4
'2 8
I 9 2
24
I
j7
22
'j
'4 '; 2
12 5
2
'j
3 4
'j 4
12
2 I 2 8
28
2 9
'j
'j
2
'j 15
'j 18 'j
59
'2 'j 's 4 17 5 4
jb
'j
'j
2
'j
2
6
2
'2 3
3
4
'2 6
'j 2
4
'j
'i
'2 I 'j 3 'j 4 'j
2
'j
4 6
6 'j I 2
4
3
2
'9 6 7
II I 7 I
'j
3 'j 8
'j
65
'6 'j
73
'j
'5 12 2
9
OJ
'j
'j 3
'j
j9
'j 5 jj
26
9
4 3 5
2 I 5
15 4
5 I I 2 3
2 6
15 I 4
10 16
16 I
9
2 I
15 16 17
II 4
12 6 8
'6 2
13
I 2 4 I
56
'j 23 , :3
73
2 7
'j
I
9
I 15 'j 20 I 13 I
151 34 39 152
118 153 153 82 100 154 74 92 155
38 72 156 45 49 157
114 98 158 167 225 159 120 141 160
127 126 161 III 126 162 85 124 163 64 89 164
102 109 165
166 167
64 81 168 156 251 169
170
152 176 171 73 90 172 75 103 173
137 142 174 175 170 175
201 288 176 52 09 177 30 34 171.!
179 112 114 180
73 75
202 225 285
255 103 199 29 98
14 179
I 8
134
72 6
73
32
131 124 25
176
29 72 99
545
31 43
202 26 77
608
41 153 44
75 181 102 182 307 183 329 184 271 185
296 186 142 187 213 18S 28 189 92 190
6 191 235 192
jj m 176 195
86 1% 7 197
117 198 199
72 ZOO
146 201 169 202 36 203
208 204 2U5
206 52 207 89 208
144 209 932 210
49 211 51 212
198 213 30 214 91 215
835 216 LI7
63 218 158 LI9 38 ;ao
221 8 10 222
163 168 L23 250 283 224 180 176 225

VILLAGE DIRECTORY
Serial No.
(1)
Yillage /Town/ Ward
(2)
Trans .. port and Postal
facilities
(3)
226 \Varjai .. R 227 Umarda Bk. (FY) R 228 ichori 229 Dudhffaon 230 Waghul
231 Waki 232 Uiona 233 Bothgawhan 234 Wadul 235 Banayat
236 Chikani 237 Narkund 238 Boriai 239 Bo thbodan 240 Pathrad .. Rh' 241 Umurtha Kh.(FV) .. 242 Amshet 243 Mozar 244 Raini \FY) 245 Karmala
246 Nimbhala : 47 Sawala .48 Sawangi : 49 Wadgaon ; 50 Warul
;51 Morlhed : 52 Harsul '53 Dor-nd ~ 54 Sakara 255 Kllekadi
256 Ramgaon 257 Dorli 258 Laygawhan 259 Mokh 260 Wailingi (E)
261 Tiwri 262 Mandwa 263 Rohana 264 Kalsa 265 Bori (E)
266 267 268 269 270
271 272 273 274 275
Mallapur Chincholi Dhanora Bk. Kati Digras
Uk.li Deurwadi Sawanga Bk. Rahati Isapur (Dattapur)
276 Nimbha 277 Dhanora Kh. 278 Deurwada 279 Belora 280 Nandgawhan
281 Kharda (FYi 282 Rui 283 Kolura 284 Phdri (FY) 285 Itholi
286 Jawala 287 T uptakali (E) 288 Lakh Rayachi 289 Wei 290 Kalgaon (E)
291 Singad (E) 292 Sakri 293 !thala 294 Warandali 295 \_thinchpatra
296 Ash,a 297 KandaJi 298 S.iegaon 299 Pimpari Kh, 300 Nimbh.
.. RP~
.. R
.. RPo
.. Po"
.. R
.. RP~
.. R
.. RP~
RP~
.. RPo Rh
" Po" " Po
R
J -1812--1-3-B-(Yeot.)
Educational
Institu .. tions
(4)
p
j; p
i; p' p
P
p' P P
P M
!Vi
p
p' P
M P P P M
p' P P
p' p
p p P P
!Vi P P M
P p' M P
p' P P P
Drinking water
supply
(5)
W \V \V W W
w W Nx W
W W W W RivW
w Wx
Ri~'
w W Riv W
RivW W
W" w \'t/ Ri~N N W
W N WN WN Riv
Ri~\V W RivW
W Riv RivW RivW WN
W W RivW W W
\V W W W
W W W W
W W W W W
Medical facilities
(6)
W WN M~' RivWx Rivx RivWx M~'
Bazar Day
(7)
14
Area in Sq.
Miles
(8)
Occu .. pied
houses
(9)
House ... holds
(10)
RURAL AREA-contd.
Th~r~day
Wed~esday
Tue~day
Sun~iay
Wednesday
3.3 1.3 3.1 3.1 0.6
109 3
92 145
15
0.9 Uninhabited.
109 3
93 203
18
1.5 69 87 1.3 48 58 0.8 37 42 1.8 100 106
3.6 1.7 5.4 5.8 3.3
157 20
110 150 103
N A Uninhabited.
168 24
114 152 112
3.0 40 47 6.0 199 212
N A Uninhabited. 2.3 45 45
0.6 Uninhabited. 1.9 118 118 1.7 40 40 3.2 246 247 I. 1 43 43
2.2 49 50 9.1 378 418 0.8 Uninhabited. 2.7 255 267 1.7 39 44
2.4 50 53 0.9 Uninhabited. 1.1 35 37 5.5 328 359 3.4 162 181
6.6 3.4 3.5 0.2 1.2
173 176 113 168 53
0.5 Uninhabited, 5.9 234 0.9 51 2.5 148
Urban Area I I.
1.6 2 3.1 60 2.0 108 2.9 128 3.1 161
193 225 113 179 53
279 54
163
2 60
108 131 163
5.6 136 138 3.4 114 119 2.0 207 235 0.8 52 62 1.7 44 61
NA Uninhabited. 6.3 116 121 1.7 47 47 0.9 105 107 2.3 102 118
1.5 Uninhabited. 6.6 363 426 5.6 301 310 2.1 101 123 3,9 342 439
7.1 295 295 33 34 34 6,9 280 280 3.3 252 280 2.2' 42 42
2,7 :5.9 1.7 1.0 1.6
53 189 110 70 60
57 217 110 70 60
p
(II)
533 14
403 9i2
73
367 274 216 454
760 100 546 642 474
209 905
173
456 145
1,049 194
257 1,982
1,342 237
251
200 1,762
849
901 937 517 878 210
1,299 236 750
4 289 476 654 797
669 565
1,161 264 263
957 210 449 668
1,944 1,424
496 2,208
1,457 182
1,369 1,504
234
289 1,018
527 366 297
Scheduled Scheduled Literate and Total Population Castes Tribes educated
M F M F M F M F
(12) (13) (14) (1S) (16) (17) (18) (19)
275 7
206 467 32
173 136 108 232
419 54
290 325 236
106 464
91
224 67
524 92
122 9%
674 124
133
105 910 431
457 473 249 454 III
622 125 375
3 147 222 335 419
322 289 568 140 133
489 III 233 334
972 728 239
1,125
750 89
681 790 110
152 :522 266 182 153
258 9 4 7
197 445 iz iz
41
194 16 21 138 6 6 108 16 18 222 36 36
341 33 29 46 1 4
256 53 48 317 238
103 441
82
232 78
525 102
135 986
668 113
118
95 852 418
9
13
'9 2
13 96
5
19
29 61 16
8
16 . 9
I
17 88
II
17 49 18
444 70 64 464 268 36 34 424 35 43 99 32 28
677 III 375
I 142 254 319 378
92 15 13
is 43 6
99 14 13
20 40 8
347 10 15 276 13 20 593 19 14 124 10 9 130 7 15
468 13 10 99 m 10 ·s
972 696 257
1,083
707 93
688 714 124
70 18 3
40
87 19 13 44
137 496 261 i:'> '7 184 35 29 144 9 10
77 20
31 '3 161 53
2 5
61 19 35 7 36 12 82 35
97 27 9
92 19 48 4 59 (>
29 89
30
88 23
170 14
24 437
238 26
26
23 251 141
2 19
33 4
65 7
17 156
47 5
4 50 3S
170 28 GO 38 82 26
159 51 39 II
173 33
101
1 12 52 37
106
31 5
16
I 3
10 2 8
80 14 84 18
225 71 47 7 37 2'
66 4 4 1
45 4 73 22
425 264
92 542
235 32
178 205
49
129 75 25
169
2 .. II 19 19 II
31 1 221 97 104 17 50 13 69 28

Total workers (I-IX)
M F
(20) (21)
157 <;
134 297
25
135
l'~S 139
19
Uninhabited, 117 99 91 60 59 44
1)9 IUD
245 202 39 35
180 167 207 154 162 137
Uninhabited, 64 6B
298 274 Uninhabited
57 47
,Uninhabit,d, Jj2 113 53 43
344 300 69 65
80 85 560 464
Uninhabited, 398 376
74 69
82 81 Uninhabited,
59 60 573 454 236 224
304 273 286 149 171 122 284 217
69 58
Uninhabited. 358 396
84 76 202 166
Urban Area I I.
2 71
156 209 245
201 176 332 92 79
I 78
129 223 205
185 161 253
71 79
Uninhabiled, 317 299
66 60 143 149 197 205
Unin/,abiled, 620 532 469 370 156 145 660 405
382 352 56 43
417 370 440 447
73 68
92 326 158 120 87
80 231 139 110 75
M
(22)
57
47 165
60 58 25 41
59 7
77 95 63
23 102
18
57 12
153 30
58 145
184 38
59
23 251
82
122 89 42 69 35
130 14 69
22 55 86 39
33 85
113 46 48
112 3
32 73
229 138 85
197
193 14
135 257
38
60 105 84 57 27
F
(23)
48
54 98
48 35
'4 4 7
72 76 46
19 85
II
35 10
114 31
60 69
185 34
56
23 164 87
113 I 2
31 30
155 9
62
io 37
100 36
14 89 58
47
117
'3 78
106 51 84 37
147 3
103 294 34
59 65 85 61 14
II
M
(24)
79 1
84 104 25
54 28 31 84
171 32 92 86 79
39 179
37
76 39
152 35
15 329
180 33
18
35 279 1.19
151 186 113 201 28
206 66 85
I 46 89
120 176
134 77
179 42 29
203 63 III III
307 287 60
305
167 22
246 149 30
30 188 52 60 43
F
(25)
79
86 90 19
51 25 44 96
198 28 95 73 86
48 188
35
76 32
179 33
25 387
185 35
24
37 287 126
160 148 120 185 28
236 67
101
68 92
122 166
162 71
191 71 32
180 60
146 127
421 316 61
356
197 39
263 151 34
21 155 53 49 52
III
M F
(26) (27)
4 4
I
ij 3
I 2
2
2
i4 2
4
iti
4
'4
'i 3
6
'2 'j
II 2 3
II
2 8 2
'j
3
'j
OJ
'(, I
2
'3
'i
15
WORKERS
IV
M F M
(28) (29) (30)
V
F
(31)
RURAL AREA-conld,
10 8
'3 '2 3 3
'j 5
10
'4 2 '5
10 I
6 i 6 'j
2~ '4 '4 15 6 1
j.j 'i 'j 6 3
II 2 3 6 2
4 3
i6 '2
'i '2
3 2 I
'2 I
~ 'i 10 2 in 2
21 12
22 16 4
II 9 3
2
4 2
3
7 I 4
l~ '4 16
5 I I
13
2 3 9
~ '3 'j
'j
'j
VI
M F
(32) (33)
'j
'j
'j
'4
's 10
2
's I 2 2
8
1 DARWHA TALUKA
VII VIII IX
M F
(34) (35)
M F M F
(36) (37) (38) (39)
2
i6
'3 3 '2 1
3
'6 'j 'j
20 '2 'j
6
jll
3 3
'3 1
I
t 'j 5 '4 5 1 6
14 13 I
55
'j 4 2
2 I
'2
'i
4
I 2 2 2
4
'4 5 2
8 I
10 2
'j
35 '2 II 1
3
I~ '2 12 I
16 6
II 4 3
8 2
21
'j 3 1 8
10
I~ 'j 2 I
29 15 6
50
3 3
13 14 2
I
'j
4
7 6 'i 2 2
NON. WORKERS
Serial M F No,
(-10) (41) (I)
liS 2
72 170
7
56 45 49 93
174 15
110 1 IS 74
42 166
34
72 14
180 23
42 436
276 50
51
46 337 195
153 187 78
170 42
264 41
173
I 76 66
126 174
121 113 236
48 54
172 45 90
137
352 259 83
465
368 33
264 350 37
123 226 7 227
52 2ZB 256 229 22 230
231 95 232 78 233 64 234
122 235
139 236 1 I 237 89 238
163 239 101 240
241 35 L42
167 243 244
35 245
246 119 247 35 248
225 249 37 250
50 251 522 252
253 292 254
44 255
37 256 257
35 258 398 259 194 260
171 261 315 262 146 263 207 264
41 265
266 281 267 35 268
209 269 270
271 64 272
125 273 96 274
173 275
162 276 115 277 340 278 53 279 51 280
281 169 282 39 283 67 284
129 285
286 440 287 326 288 112 289 678 290
355 291 50 292
318 293 267 294
56 295
60 57 296 196 265 297 108 122 298 62 74 29~ 66 69 300

VILLAGE DIRECTORY
Serial No.
Village I Town I Ward
(I)
'01 Dary,pur 302 Lingbori 303 Haru 304 Daheli 305 Umari
306 R.mg.on 307 Uchegaon 308 Naigaon 309 Mangla 3 I 0 Mahatoli
(2)
3 I I Mahagaon Kasba 312 Wag,d Kh. 313 Pimpari Bk. 3 I 4 Bhileshwar 315 Khopadi Kh.
316 Amal. 317 Shiwni 318 Akola 319 Loni 320 Deurwadi
321 Gangaon 322 Tarod. 323 D.bha 324 Arambhi 325 Beed
326 Khed 327 Deogaon 328 Khandala 329 Jawal. 330 Bramhanwada
331 Mhasola 332 Shekalgaon 333 Chandani (FV) 334 Gawana 335 Kakaddara
336 Chirkut. 337 S ... anl1' 338 Loni 339 Jogaldari 340 Umaripathar
341 Jamb 342 Satar. 343 Mahalunii 344 Saikhed 345 Chikani Kasba
346 Parsoda 347 Lingi 348 Bhandari 349 Kathod. 350 Rudrapur
351 Mendhi 352 Mahagaon 353 Wadgaon 354 Dolhari 355 Pimpari
356 357 358 359 360
361 362 363 364 365
366 367 368 369 370
Kopara Dolamba Chikhali (E) Deurwadi Arni
Amani Tendoli Umad Kinhi Dabhadi
Pangari Pahur Dehani (E) M.lhiwara Lonbehel
Tran .... port and
Postal facilities
(3)
.. R
.. RPo
.. RP~
•• R
., Po"
•• R
., RP~
.. Po"
.. Po
371 372 373 374 375
Pandhurna (Pabal) .• Sukali (Lahankolaw) Po" Kurha (Bhansara) Antargaon Asara
Educational Institutions
(4)
!Vi P
p P P
p' M p
p p
!Vi p
P P
p'
p
p' M p
p p P
P P P
P
j:' p' P P
p'
p P P P H
p' P p p
P M M p M p p P P P
Drinking water
supply
(5)
Rivx
Ri~W RivWx Wx
WN RivWx W W W
W RivW
W" Wx Wx Wx W W
W Riv W W W
W W W W W
Wx Rivx Wx WN W
RivW W Riv W W
Wx W W RivW RivW
W
Medical facilities
(6)
M~b
Riv RivWN RivW M~' Wx
W W W W W
W W WN W RivW
RivW W W W W
W Wx WN Wx W
W W W RivW W
Bazar Day
(7)
16
Ar .. in Sq.
Miles
(8)
Occupied
houses
(9)
Households
(10)
RURAL AREA-contd.
Wednesday
Th';r~day Sunday Tuesday Wednesday
1.0 0.3 4.2 1.9 2.6
2.7 4.7 0.6 1.9 2.2
I 1.5 2.0 0.9 1.3 1.9
6.5 5.7 1.8 5.5 1.3
1.1 2.9 1.5 9.4 2.0
3.0 1.7 3.3 8.1 5.1
8.9 4.3 NA 1.5 1.3
2.6 3.1 2.4 1.1 8.7
1.9 2.2 2.0 0.6 4.6
2.1 0.5 1.3 1.0 0.4
1.5 2.7 0.4 0.7 0.6
1.9 3.2 3.2 4.0
10.7
1.6 1.6 3.3 1.3 6.7
5.1 6.2
10.9 6.7 5.2
12.0 5.4 6.2 3.8 0.9
9 9 Uninhabited.
162 162 130 130 68 68
120 125 201 202 145 148 25 27
110 117
546 554 124 124
Uninhabited. Uninhabited.
84 84
202 203 100 100 53 53
304 305 216 233
86 161
5 386 48
lOa 74
125 672 167
190 93 30 15 2
101 209
76 35
215
81 61
197 75
115
64 43 21 83 33
29 83 73 9
25
88 85
160 213
1,349
26 113 138 76
250
136 302 492 289 147
207 281 305 190 90
86 161
5 391 48
203 74
125 704 204
235 110 33 16 2
119 236 87 35
223
86 66
222 80
115
64 54 22 83 33
39 120 76 II 37
III 103 162 217
1,369
26 113 138 76
253
138 307 499 289 147
207 281 314 190 92
Scheduled Scheduled Literate and Total Population Castes Tribe. educated
P M (11) (12)
48
644 595 417
585 916 695 170 602
2,534 543
382
983 430 235
2,133 1.029
413 736 20
1.953 224
983 385 529
2.884 903
1,209 506 166 58 8
571 1,126
336 143
1,136
391 253
1,146 356 481
301 221 100 353 ISO
168 458 414 45
159
437 498 683
1.000 6,107
143 557 698 420
1,094
682 1.355 2.329 1,233
738
1,101 1,331 1,263
900 423
24
314 314 224
292 464 335 97
296
1,287 268
188
510 217 117
1,075 499
210 364
12 963 115
485 189 269
1,455 462
634 258 86 28 5
274 586 179 68
555
186 122 575 161 252
154 106 44
170 78
89 243 207 26 73
199 243 334 493
3.190
73 269 354 218 543
362 697
1,204 616 387
546 688 630 472 216
F MFMFMF
(13) (14) (15) (16) (17) (18) (19)
24
330 281 193
293 452 360
73 306
1,247 275
194
473 213 118
1.058 530
46 18
21 84 20 19 40
87 35
53 38 18 43 16
44 17
19 89 22 16 46
92 25
50 35 18 49 19
203 48 51 372
8 990 'z 'j 109
498 4 2 196 5 3 260 55 57
1,429 20 28 441 48 49
575 2'7' 248 21 80 30 3
297 540 1'6' 157
75 15 581
205 131 3'6' 571 195 7 229 8
147 '4' 115 56
183 22 72
79 3 215 45 207
19 86
238 255 349 507
2,917
70 288 344 202 551
320 658
1,125 617 351
555 643 633 428 207
6 3
io 145
i7 4 6
48 3
12 6
23
'i 10 13
4i 2 6
2 45
10 6
·s 145
23
49 3
14 7
26
2
121 100 65
49 125 85 19
m 444
75
31
159 53 23
520 160
45 18 4
13 28 18 4
33
146 22
2
30 21 2
163 52
88 25 155 46
2i4 46 14
121 17 31 7 79 18
700 275, 167 42
241 53 75 II> 22 2 7 4 3
91 24 130 15 46 " li~ 25 67 24 40 16
126 22 32 15 87 2;
33 6 29 8 17 6 46 8 7
28 6 85 18, 29 3
~ ·z 59 99
125 172
•• 1,478
18 78
103 60
184
104 203 478
75 158
252 246 194 136 50
6 10 33 66
495
10, 18 14 43
23 73
171 4
50
67 65 60 13 11

T ot.1 workers (I-IX)
M F
(20) (21)
17 16 Uninhabited,
203 179 210 176 130 138
177 169 306 246 234 238
55 28 192 159
M
(22)
9
66 83 79
80 113 105
19 76
821 577 265 183 167 92
Uninhabited. Uninhabikd.
119 94 56
298 172 170 132 114 64 78 65 43
598 575 228 332 295 131
138 215
7 588 82
324 119 178 903 295
450 161 64 20 2
173 363 123 44
364
109 84
347 104 152
98 71 27
109 57
59 162 129
17 43
93 237
6 565
73
271 115 122 589 229
335 132 54 20 2
161 302 86 34
363
115 85
327 96
119
88 37 24
110 49
47 119 124 17 55
149 150 158 118 229 216 328 284
1,840 1,132
45 183 210 126 364
224 437 704 386 223
334 423 394 307 141
42 91
159 114 312
177 341 542 375 196
333 155 333 270 132
74 104
3 258 29
157 55 98
259 90
136 72 40 10 1
98 197 43 22
214
53 31
182 46 49
33 22 12 21 17
31 61 59 4
28
51 70 60
137 393
30 89
110 61
130
99 140 244 241
90
167 219 149 120 66
F
(23)
It}
50 32
75 88
106 9
58
II
M F
(24) (25)
8
106 III 47
90 169 120 30
102
6
127 f44 138
9'4 158 131 IS 99
103 378 442 79 83 87
39 55 53
43 106 123 31 62 83 21 35 44
186 301 384 116 183 179
32 110
2 194
12
84 52 66 99 60
116 58 38 6 1
87 130
13 6
223
56 37
155 27 16
20 2 7 9 7
28 40 53 5
32
52
20 109 168
25 56 80 46
102
46 84
122 229
74
152 63
109 102 46
60 97 4
285 41
159 63 76
433 153
184 78 19 9
67 144 66 21
133
51 48
130 50 82
59 32 13 72 40
24 84 65 12 15
85 80
152 157 689
14 87 95 62
197
108 239 333 136 94
146 164 228 147 64
61 126
4 369 58
187 63 56
472 160
199 73 16 14 1
70 168
71 28
140
59 48
163 68
103
68 35 17 97 42
19 79 71 12 23
92 118 194 169 915
17 35 79 68
203
129 241 407 145 108
181 91
224 167 82
1II
M F
(26) (27)
6 4
r 5 f
22
4
'2 2
20 19
23 3 3 1 1
'j
'4
'6 8
1 14 2 6
'j 1
io 50
'(l,
3, 27 21
ii 1 3, I !),
2
'2 2
2
'j
'j 3
15 6
'j
f7
WOOKERS
IV V
M F M
(28) (29) (30)
F
(31)
IUlRAL AREA-amid.
16 J. 2
I
~ 'j
~ 'j
·2 'j
52 5 9 4 I
3'> 2
9 4
'4 'j if 12
~ '6 '6 OJ jil 2 3
2 2
48 '2 29 16 2
12 2 5 I 2 , ~ 3
10 3 > I
2
'9 's
'j OJ
'j
3 3 7 9
115
OJ 2 t
15
4 13 9 2
12 .. lel 5 7 5,
OJ 6
's 2
°i "s
OJ
Os
I I
" 0. 2
'j
I 2
6
,.
2 I
22 2
'j .j I
3
'j
6
':2 I
VI
M
(32)
':2
'j
3
'2 2
'7
's 3
4
'j
'j
'j
'i
'2 ii
I 4 2
'i
'4
F
(33)
°i
'j
VII VIII
1 DARWHA TALUKA
IX
NONWORKERS
M F M F M F ----Serial
M F No.
(34) (35) (36) (37) (38) (39) (40) (41) (il
5
'4 OJ
3
48 1
9 2
3 I
j2
OJ 'j
'6
49 0'7 I °5
26 I 'j
I 3 4
'2
'j
°z '6
254
'2 44 2 I
3 14 4 7 I
'j I
'j
'j
OJ
'j
OJ
'j
'j
52
'j
OJ
'j
10 7 2
4 7 5 3 7
7
III 104 94
115 158 101 42
104
8 301 302
151 303 105 304 55 305
124 306 206 307 122 308 45 309
147 310
42 17 466 670 311 3 85 108 312
2 5
33 4 4
2 5
i3 I
3 I
5~ j4 13
60 16 4 I
4 6 3 1 6
2 3 9 2 9
2 2
'3
2 8 I
3 3 7 9
191
1 6 3 2
10
7 II 29 3
12
4 8 7
10 4
'j
'2 4
3Z
'j
'j
313 314
69 100 315
212 85 39
477 167
72 149
5 375 33
161 70 91
552 167
184 97 22 8 3
101 223 56 24
191
77 38
228 57
100
56 35 17 61 21
30 81 78 9
30
301 316 9'9 317 53 318
483 319 235 320
110 321 135 322
2 323 425 324
36 325
227 326 81 327
138 328 840 329 212 330
240 331 116 332 26 333 10 334 I 335
136 336 238 337
71 338 41 339
218 340
90 341 46 342
244 343 99 344
110 345
59 346 78 347 32 348 73 349 23 350
32 351 96 352 83 353 2 354
31 355
50 88 356 85 137 357
105 133 358 165 223 359
1,350 1,785 360
28 86
144 92
179
138 260 500 230 164
212 265 236 165 75
28 361 197 362 185 363 88 364
239 365
143 366 317 367 583 368 242 369 155 370
222 371 488 372 3eo ,73 158 374 75 375

'18 VILLAGE DIRECTORY
Scheduled Scheduled Literate and Trans- Educa- Area Total Popuhtion Castes Tribes educated
port and tional Drinking in Occu-
Serial YiilagejTov,m/ Postal Institu- water Medical Sq, pied House- -----------No. Ward facilities tions supply facilities Bazar Day Miles houses holds P M F M F /,! F M F
(I) (2) (3) (4) (5) (6) (7) (8) (9) (10) (II) (12) (13) (14) (15) (!6) (17) (i8) (19)
RURAL AREA-coneld,
376 Idholi P RivW L6 98 98 433 223 210 6 51 14 377 Pimpari M;' Sunday
2.0 Uninhabited. 378 Borgaon .. p W 3.8 328 331 1,426 715 711 6 8 134 45 379 Ghonsara (Iwaleshv;ar) P Wx
M~' 5.4 154 157 792 395 397 2 3 153 29
380 Sher..dufsani P W 4.4 153 154 730 368 362 18 15 10J 21
381 She!u " Po M Wx Mp 3.0 239 249 1.097 547 550 22 25 179 52 382 Anjankhed (Shari) P W 12.6 246 258 1,165 584 581 23 15 177 34 383 Man.rul p' 0.2 Uninhabited, 384 Kelznra W 4.4 137 137 594 312 282 4 3 77 8 385 Yermal (Heti) P W 3.3 148 148 751 364 337 76 30
386 Kosz-dani " P W Mp 4.1 111 111 581 312 269 10 14 116 36 387 Sakur " Po P W 1.7 101 101 468 247 221 3 4 98 34 388 Amboda Kh. " P WN
M~' Frid~y 2.7 109 109 582 287 295 I I 116 30
389 K&watha " Po M RivWX 3.1 238 241 1.000 523 477 41 36 190 38 390 Donwada W 2.2 48 48 175 90 85 I 22 3
591 RanidhanQra P Ri\' Mp 3.6 158 158 720 371 349 9 II 137 33
URBAN AREA
Darwha MUllicipali ty Rh-RToRh H \\'X Mp Hos D Sunday 10.9 2.277 2.287 11,540 6,035 5,505 222 274 " ],412 1,718 (E).
W.rd I 232 232 1.083 578 505 58 83 206 80 Ward 2 206 207 1,060 542 518 5 10 275 84 Ward 3 197 197 1,007 527 480 6 II 2'11 136 Ward 4 194 198 1,069 545 524 286 184 \Vard 5 190 193 1,000 504 496
'4 274 146 \Varct 6 193 193 1,015 530 485 3 379 226 \\larJ 7 408 408 2,199 1,135 1,064 96 11O 575 262 Ward 8 204 204 1,007 537 470 23 24 365 209 Ward 9 453 455 2,100 1,137 963 30 33 761 391
II Digras Municipality RPoRh H Riv'v/ Mp Has D Friday, (El. Saturday
5.5 3,257 3,333 15,525 7,981 7.541 305 293 " 4,210 1,687
Ward 1 382 396 1,566 818 748 43 51 326 91 Ward 2 211 . 219 921 471 4')0 2 4 283 117 Ward; 212 212 1,113 579 534 9 6 326 149 Ward 4 436 445 2,225 1,165 1,060 185 167 613 218 Ward 5 171 181 80B 432 376 32 28 290 131 Ward 6 310 311 1,649 819 830
'3 '6 537 287 Ward 7 192 193 797 414 383 285 122 Ward 8 340 342 1,666 837 829 4 I 533 290 Ward 9 362 362 1.615 821 79~ 21 20 314 76 Ward 10 160 IB9 950 485 465 5 6 160 43 Ward II 160 161 848 448 400 'j 210 i6 \Vard 12 221 222 960 491 469 4 277 77 Siv<.l.pur 100 100 407 201 206 56 10
(Total-Rural .. 1.061.6 46,593 49,723 228,067 115,960 112,107 5,242 5,232 " 41,713 12,600
I --- -DARWHA TAWKA "\ Total-Urban" 16.4 5,534 5,620 27,065 14.016 13,049 527 567 " 7,622 3,405
- - -l Grand Total " 1.078.0 52,127 55,3H 255,132 m,976 125,155 5,769 5,799 " 49,335 16,005
-----* SivapUf was attached to Die-rasMunicipality for p'JrpJ~~3 of 1951 Col.)Sl1S th,Yll:' it is oUBjd~ th~ limit3 of Digras Municipality,

Total workers (I-IX) II III
M F M F M F iVi F
(20) (21) (22) (23) (24) (25) (26) (27)
19
WORKERS
IV V
M F M F
(28) (29) (30) (31)
VI VII VIII
M F 1\1 F ~,1 F
1 DARWHA TALlTKA
IX
1\1 F
NONWORKERS
---- SCfial !\1 F r-~o.
(32) (33) (34) (3j) (36) (37) (53) (39) (41) (41) (1)
RURAL AREA-concld.
137 114 Vninhabilt:d.
473 365 246 222 235 190
341 297 356 325
UnirJ/whitcd. 200 184 226 230
196 158 165 316 59
2'Jq
168 120 190 243
49
167
3,201 1,071
334 308 269 2Sl) 274 261 6()1 287 587
114 213
76 64
133 34
197 57
183
4,376 1,504
508 274 317 (01 217 ';22 ~C6 416 ~E7 2e9 L25 297 137
295 78 70
199 24 35 64
112 W3 112 87
119 126
46 33
268 202 104 124 105 94
101 64 132 120
58 43 107 110
78 41 75 94 10
84
483
18 55 45 59 S9 45 71 30 61
387
II 27 22 16 '0
Ii)! 21 57 10 63 II 16 2
77 33 <)2 51
21
165
4 40 y 5
65 b 9 3
24
53
4
'3 2 8 6 7 I
19 I I I
76
180 99
110
202 191
129 110
109 96 73
147 44
137
624
50 144 iO 69 41 25 96 33 96
728
159 28 8
i7
79 17 56
121 32 33 15
1(J3
80
163 95 88
230 203
141 115
89 85 93
188 49
144
691
55 168 63 56 58 15
117 29
130
824
202 15 23
113
j7 26 67 74 31 59 72
125
71,112.06.37826,38716,8083',8363R,697
7,577 2,575 ~70 218 1,352 1,51S
2 24
'2 12 5 2
42
6 5 5 3 3
9 2 9
107
17 3
12 9 I 6 3 2
10 18 I
12 13
943
149
78,1)89 58,951 27,257 17,021) 37,188 40,212 I,on
9
12 6 3 6 2 '2
I~ '2
2 8 2
17
6
's 2 I I
~ is
URBAN AREA
154 38 209
27 5 4
22 6
22 33 16 19
9
I 2 4
13 6 3
6 19 21 13 19 I) to 23 33
172 47 h71
13 II 3
30 24 22
9 12 II 6
13 13 5
13 3 , 5 3
'5 5 I 6 6
164 45 :;2 74 16 28 44 69 68 24 35 51 I
127 1,885 300 871
4 326 85 880
131 2,212 38) 1,?51
22
j4 2 6
210
68 18 22 20 'j 18 8
29 I 5
20
60
232
292
2 I 2
'~
64
5 IS 4 4
'j 9 6
17
100
9 13 21 16 4 3 5 4
II I 6 7
279
164
443
3
'j
3
8 5
ij
4
'j
j
558 28 233
47 20 :,d 52 49 79
1,,8 4-1 81
4 .j
'j 4 I
14
72 5
13 25 I
12 50 33 22
1,066 115 176
52 64 57
204 79 q9 41
103 127 85 69 84 2
'3 '4 I I 6 6
34 58 I I
IS 12 19 19 7 9 5 7
42 9 6
23 3
35 1,733 92 295
12 10
7
86 96 376 377
242 346 378 149 175 379 133 172 380
206 253 381 228 256 382
383 112 'i8 384 138 157 385
116 89
122 2U7
31
132
101 386 101 337 105 388 234 389
36 390
182 391
8:;4 i 21 2,834 4,434
103 40 37 I 69 4 33 I 56 I 62 8
125 29 100 17 249 20
244 234 758 265 230 269 534 250 550
391 30j 404 460 363 451 867 413 780
969 251 3,605 6,O~O II
(8 71
123 156 56 75 61
106 87 31 51 76 8
II 35 25 51 18 8 8
19 40
7
15 19
310 197 262 564 215 397 208 421 334 216 223 194 64
453 372 464 861 352 795 319 717 611 353 313 350 80
I 2,882 258 44,848 55,729
6 1,624 143 409 .. 1,803 372 6,439 10,474
41 3,357 235 704 I 4,685 630 51287 (6203
---------------------------------------------------------------------------------------

Yeotmal Taluka

YEOTMAL "TALUKA YEOTMAL DISTRICT
.. 6
SCALE OF MILES
AMRAVATI DISTRIC'T'
53.
DARWHA TALUKA
Fl'M~AiltI!C BY CENSUS OFFICE. BOMBAY.
54 • 55 •
827
• .56
303 •
'1()
•
304. 306 •
• 61
69 • • 7'
• 305
71 • 76 •
S77 •
Ruunell TALUKA BOUNDARY. _______ _
DISTRICT HEAD QUARTER. __ [!J TALUKA HEAD QUARTER . ____ ~ VILLAGE CODE NUMBER ____ 5 POPULATION ABOVE lOOJl- ___ _ POPULATION BELOW 2000. ___ • UNINHA8ITED _________ 0 ROAD._. ___________ = RAILWAY ____________ _
RIVER ________ ------=0..
WARDHA DIS'I'RICT
KELAPUR TALUKA
G. P.Z R POOIIIA.. H 153 0 - 650- sa.
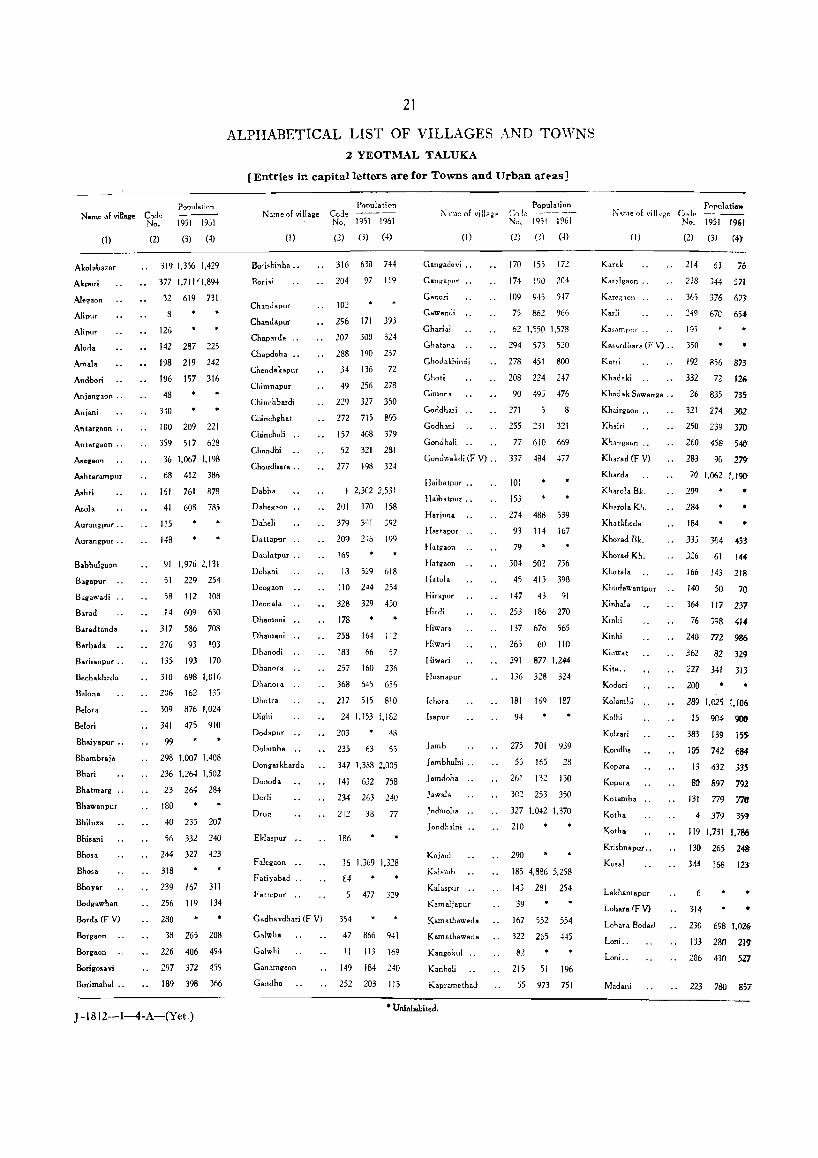
Name of viUage
(I)
Akol.bazar
Akpuri
Aleqaon
Alipur
Alipur
Aloda
Am,l.
Andbori
Anjangaon ..
Aniani
Antargaon .•
Antargaon ..
Asegao'1
Ashtal'ampur
A.hti
kola
Aurangpur' ..
Aurangpur .•
B.bhulgnon
Bagapur
Bagawadi
Barad
Baradtanda
Barb.d.
Barhanpul' ..
Bechakhed.
Belons
Belora
Belori
Bhaiyapur ..
Bhambraia
Bhari
Bhotmarg ..
Bhawanpur
Bhiluxa
Bhisani
Bhos.
Bhoso
Bhoy"
Bodgawhan
Borda (F V)
Borgaon
Borgaon
Borigosavi
Borimohol ..
P~oulatio:1 Cod, No. 1951 1961
(2) (3) (4)
319 1.356 1,429
377 1.711/1,894
32 619 731
8
126
142 287 225
198 219 242
196 157 316
48
3-.tO
100 209 221
359 517 628
36 1,067 1,198
68 412 386
161 761 878
41 608 i85
115
148
91 1,976 2,131
51 229 254
58 112 108
14 609 630
317 536 708
276 93 103
135 193 170
310 698 1,016
206 162 m 309 876 1,024
341 475 910
99
298 1,007 1.408
236 1,264 1,502
23 264 284
ISO
40 235 207
56 332 240
244 327 423
318
239 167 311
256 119 134
280
38 265 203
226 406 494
297 372 459
189 398 366
J-1812-1-4-A-(Yet.)
21
ALPHABETICAL LIST OF VILLAGES AND TOWNS 2 YEOTMAL TALUKA
[Entries in capitalletters are for Towns and Urban artas]
Nome of viIla~e
(I)
Bo;,hinha ..
Chandapur
Ch.nd,p~r
Chopardo
Ch.pdoh.
Chendakapur
Chimnapur
Chinch'>ardi
Chinchgh.t
Chincholi
Chondhi
Choudharo ..
D.bh.
Daheg~on
Daheli
Dattapur
Daulatpur ..
Dehani
Deogaon
Deonala
Dhatrlnni
Dhamani
Dhanodi
Dhanora
DhanOl8
Dhotr.
Dighi
Dodapur
Dolamba
Dong.rkhord.
Donoda
Dorli
Drug
Ekla~pur
Falegaon
Fatiyabad
Fattepur ..
G.dhavdhari (F V)
Galwha
Galwhi
Ganamgaon
Gandho
Cnd, No,
(2)
Population
1951 1961
(3) (4)
316 630 744
204 97 119
102
2S6 171 393
207 300 324
288 190 257
34 136 72
49 256 278
229 327 350
272 715 895
157 408 379
52 321 281
277 198 324
2,302 2,531
201 170 158
379 3g 1 ~Q2
209 246 199
169
18 529 618
110 244 254
328 329 450
178
258 164 112
183 66 57
257 160 236
368 645 656
217 515 810
24 1.153 1,182
203 d8
235 63 55
347 1,388 2,005
141 632 758
234 263 240
212 38 77
186
16 1,369 1,328
84
477 329
354
47 866 941
11 113 169
149 184 240
252 203 113
0J .. niC of village
(I)
Gangadevi .0
G&Tlgaptl[
Ganori
Gawandi
Gharlal
Ghatana
Ghodakhi"di
Choti
Gimor.1I.
Goddh.ri
Godhani
Goncihali
Gondw.kdi (F V) ..
Haibatpur ..
J laibatpur ..
Harjuna
HMtapur ..
Hatgaon
Hatgaon
Hotola
Hirapur
Hirdi
Hiwara
Hiwari
Hiwari
Husnapur
Ichora
I~apur
Jamb
Jambhulni ..
Jamdoha
.laval.
Jodmo!'a
J0I1dhaini
Kajani
Kal8mb
Kalaspur
Kamaljapur
Kamathaweda
Kamathawada
Kongokul
Kanholi
Kapramethad
• Uninhabited.
Population Cn_I,:: -_._- --No. 1951 1961
(2) 0) H)
170 155 J72
174 1901 204
109 945 917
75 862 966
62 1,550 1.578
294 573 520
2i8 451 800
208 224 247
90 49') 476
271 8
255 231 321
77 610 669
337 484 4i7
101
is}
274 488 539
93 114 167
79
304 502 736
45 413 398
147 43 91
253 186 270
137 676 565
265 60 110
291 877 1,244
136 328 324
181 1m 187
94
275 701 939
5} 165 28
261 132 130
30~ 253 350
327 1,042 1,370
210
290
185 4,886 5,258
143 281 254
39
167 552 554
322 265 445
82
215 51 196
55 973 751
Populatiolll i\''3.me of vill .. g-e C/Jd~
No, 1951 1961
(I) (2) (3) (4)
Karr.k
KaraIgaon "
KarCi!llon
Karli
Kar,ampl:( "
Kc\~~Tdbar21 (F V) .,
Katri
Kh.daki
Khlldak Sawanga .•
Khairgaon ..
Kh.iri
Kharod (F V)
Khardo
Kharola Bk.
Kharolo Kh.
Khatld.eda
Kharod Bk.
Kharad Kh.
Khota1.
Khudawantpur
Kinh.l.
Kinhi
Kinhi
Kinwat
Kito ..
Kodori
KoJambi
Kolhi
Kolzari
KOlldha
Kopara
Kopera
Kotamba
KOlho
Koth.
Kri shn spur ..
Kusal
Lakhamapur
Loharo 'FV)
Loh ara Bodad
Loni ..
Loni ..
Madani
214 63 76
218 344 571
365 3i6 613
149 67G 654
193
350
192 856 873
332 72 Ile
26 835 73:;
321 274 30-2
250 239 370
260 458 50
283 90 279-
70 1,062 1,190'
29'l
284
184
..
335 304 453
326 61 144
166 143 218
140 50 71}
364 117 237
76 398 414
240 772 986
362 82 32~
227 341 313
200 •
289 1,025 1,106
15 904 900
383 139 15S
105 742 6&f
13 432 335
80 897 792
131 779 77fJ
4 379 35~
119 1,731 1,786-
130 265 243
344 168 123
6
314
230 698 1,02&
133 280 219'
286 430 521
223 780 851

Name of village
(1)
Code No.
(2)
Population
1951 1961
(3) (4)
Madkona .,
lVIaham.dpur
Mahamadpur
Mahitapur .,
238 475 588
60 328 296
116
150 112 90
Mahuli
.Malapur
Malkapur
Manakapur
Manakapur
Mangrul
Manarul
Mangrul
19 361 345
20 375 359
188 100 91
III 50 66
146 305 294
154 131 131
162
89 140 153
Mangrul 30B 400 6B3
Mang Sawangi 92 548 525
Maniarda ., 320 328 411
Manjaroghal 194 249 292
Manpur 273 285 417
Manza 331 1.160 1.301
Maralapur .• 127 54 49
MarathaWakdi (F V) 336
Maregaon 363
Markanda 375 130 241
M~tegaon
Mawalani
Mendh.la
Metikheda _
Mhasola
Mhasola
.Mitzapur
Mitanapur ••
MitanapUT •• ,
176 445 462
168 386 433
224 531 665
356 628 928
190 20 24
282 463 674
113
103 606 656
17 \62 213
225 693 1041
262 87 95
,
Moha
Mohadhari ••
Mubarakpur
Mubarakpur
Muradabad
Mutadpur
Murzadi
MUTzadi
Murzadi
.Musal
Mustab.ad
Nagargaon .•
Nagargaon .•
87 357 394
151
83 62 70
145 48 88
237 133 129
279 449 672
366 179 295
345 216 31 I
95 355 371
21 363 376
97 *
J-1812-1~4-B-(Yeot.)
22
2 YEOTMAL TALUKA-contd.
Name of village
(I)
Nagari
Nagthana.
Naigaon
Nakatipardi
Nandesawtmgi
Nandura Bk.
Nandura Kh.
Narapur
Narsapur
Nil.j
Nilona
Nimbora
Code No.
(2)
Population
1951 1961
(3) (4)
22 139 128
358 16
112 637 581
355 122 268
98 704 ii2
81 613 691
134 346 462
7
182 445 508
165 281 197
26B 260 330
199 305 336
Nimgawhan 334 111 153
Pachakhed 72 767 824
Pahoor 12 3.053 2.804
Pahoo!" Jambhulani 374 1.008 1.496
Paloti 360 542 638
Paloti 74 90 96
Panas 29 110 95
Panchagawhan 128 237 300
Pandhurna 42 196 294
Pangari
Pangdi
Paonman
Parawa
Pardi
Pardinaka ..
Parscdi
Parsodi Bk.
P."odi Kh.
Patharad
Pidha
Pilkhana
Pimp.lgaon
Pimpalgaon
Pimpalgaon
241
382 111 220
324
245 506 607
139 821 808
293 797 1.044
61 491 527
202 867 854
ISS 275 251
195 225 268
329 190 147
357 64 90
27 44
37 274 247
163 78 193
Pimpalgaon 173
Pimpalgaon (I) Rural 232
882 766
372 594
Pimpalgaon (2)
Pimpalkbuti
Pimpalkhuti
Pimpalkbuti
Pimpari
Pimpari
Partly included in Urban Area 1.
2 878 946
159 286 237
330 35 66
228 100 139
132 534 604
Name of village
(I)
Pimpari
Pimpari
Pofalni
Potgawhan
Pradhan Bori
Pratappur ..
Rahimatpur
Rajur
Ramgaon
Rani Umaravati
Rasa
Rasulpur
Rasulpur
Ratchandana
Rauldhari ..
Raut Sawangi
Renakapur
Rohan.(F V)
Roh.tek
Rui .'
Rustampur
Ruth.
Saikhcda Bk.
Saikhcda Kh.
Saikhcda Kb. (F V)
Sakur
Salod
Sarapdhari
Sarati
Sarfali
Sarul
Sasladevi (F V)
Satef.l
Saujana
Savitti (F V)
Sawalapur ..
Sawangi
Sawar
Sawargad
Sawargaon .•
Shankarpur
Shekapur
Sheli
Sher.d
• Uninhabi ted.
Population Code ---No. 1951 1961
(2) (3) (4)
43 205 199
295 525 732
251 183 192
333 557 651
343 427 348
73 9 14
3
216 300 286
371 60 161
35 1.500 1.559
211 181 162
30
120 38 22
270 141 285
287
88 180 176
64 184 217
285
380 515 606
312 1.427 1.626
9
342 376 458
378 436 518
315 325 309
351 199 240
307 219 269
303 884 969
213 130 156
346
69 616 593
59 875 1.004
338
144 217 277
67 298 315
349
122 83 31
156 200 186
46 1.781 1.895
269 512 758
177 1.426 199
179 172 175
10
325 ]03 184
263 314 541
Name of village
(1)
PopuIatio Code ----No. 1951 1961
(2) (3) (4
Shindhi 63 40] 456
Shingnapur .. 187 178 212
Shiw.ndhari (F V). . 281
Shiwani Bk. 259 186 175
Shiwani Kh. 254 351 446
Sohagpur
Sonegaon ..
Sonkhas
Sonkhas
Subhanpur
Suk.li
Subli
Suk.li
Takalgaon .•
Takali
Talegaon
Talegaon
Tambha
Tanapur
Taroda
Tarod.
Taslot
Tembhurni
Thalegaon
Tirzada
Tukapur
Tuljapur
Tul;apur
Umaravati .•
Umarda
Umari
Umari
Umari
Umari(FV)
Umari Bk. (F V)
Umarsara (I) Rural
Um.rsara (2)
Umarvihir (F V)
Veni .•
Veni .•
Virkhed
Wadgaon
Wad •• on
104
172 531 577
171 132 109
353 76 100
125
220 399 475
369 102 167
138 2B2 319
28 484 480
57 89 68
158 165 243
247 982 1.017
108 508 515
118
164 208 177
219 333 200
267 31
54 234 294
25 370 396
197 484 596
117
160
175 108 111
107
124
50
205
248
301
313
* 178 180
372 369
616 759
•
243 115 731
Included in Urban Area I.
373 *
106 1.571 1,474
123
85 684 619
78 59 124
191 129 176

23
2 YEOTMAL TALUKA-concld.
Population Population Population Population Name of village Code ---- Name of village Code ---- Name of village Code ---- Name of village Code
No. 1951 1961 No. 1951 1961 No. 1951 1961 No. 1951 1%1
(I) (2) (3) (4) (I) (2) (3) (4) (I) (2) (3) (4) (1) (2) (3) (4)
W.dgaon 242 1.434 1.929 Waki 246 304 453 Watkhed Kh. 96 623 533 Yerad 264 401 60;-
'Wadgaon 367 804 987 Waki 381 189 283 Yerandgaon 71 620 732 Yashawantpur 121
Wadhona Kh. 266 161 272 Walidadpur 65 163 178 Yawali 33 490 608 Zadki~hi .. 361 426 496
Wagada Kh. 352 380 378 Wandali 152 574 560 Yawali 348 996 1.457 Zapatkbeda 129 72 6,
Waghapur •• 114 Warud 66 205 217 Yelabara 370 1.130 1.373 Zola 221 73 611
Waghapur •• 231 329 427 Warud 305 189 337 Yela Kh. (F V) 372
,. * Zola 292 ' .
Wai. .. 44 50S 58B Warzadi 323 393 520 Yeoti 306 196 309 Zuli .• 376 286 396'
Wai 222 172 153 Watbori 339 320 350 Yeotmal Rural 233 NA 114 ----
Wai 311 833 1.055 Watkhed 300 201 245 tl951 TOTAL 177.460 YEOTMAL Urban I 35.98045.587
Waijapur 31 104 114 Watkhed Bk. 86 966 908 Area. 1961 TOTAL 207.366
• Uninhabited. NA = Not Available. t The 1951 pcpulation of the Taluka as given in this list differs from thut mentioned in Table A-II.
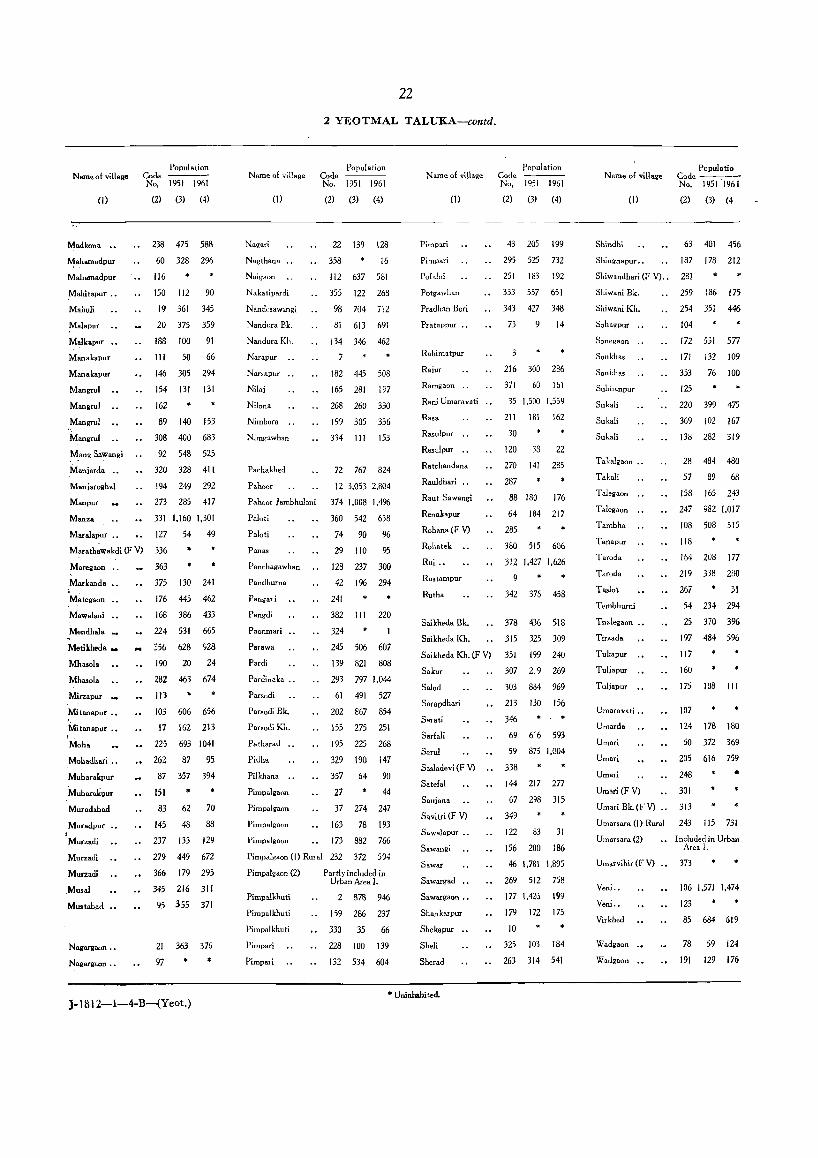
Population Name of village Code
(I)
Madkona
Mahamadpur
Mahamadpur
Mahitapur .•
Mahuli
!"i.I.put
M.lk.put
Manakapur
Manakapur
Mangrul
Mangtul
Mangrul
Mangtul
Mang S,wangi
Mauiarda ..
Maniaroghal
Manpur
Manza
Maralapur .•
M.tathaw.kdi (F V)
Maregaon
Markand.
Mategaon
Mawalani
Mendhala
Metikheda _
Mh...,la
Mhasola
Mirzapur
Mitanapur ••
Mitanapur •• , Moha
Moh.dhari .•
Mubarakpur
Mubarakpur
Murad.bad
Muradput , Murzadi
Murzadi
Murzadi
.Musal
Muatah.ad
Nagargaon ..
Nagargaon ••
No, 1951 1961
(2) (3) (4)
238 475 588
60 328 296
116
150 112 90
19 361 345
20 375 359
188 100 91
III 50 66
146 305 294
154 131 131
162
89 140 153
308 400 683
92 548 525
320 328 41l
194 249 292
273 285 417
331 1,160 1,301
127 54 49
336
363
375 130 241
176 445 462
168 386 433
224 531 665
356 628 928
190 20 24
282 463 674
113 * 103 606 656
17 162 213
225 693 1041
262 87 95
87 357 394
151
83 62 70
145 48 88
237 133 129
279 449 672
366 179 295
345 216 311
95 355 371
21 363 376
97
J-I B 12-I~4-B-(Yeot.)
Name of village
(I)
Nagari
Nagthana
Naigaon
Nakatipardi
Nandesawangi
Nandura Ek.
Nandura Kh.
Narapur
Narsapur
Nilai
Nilona
Nimbora
Nimgawhan
Pachakhed
Pahoor
Pahoor lambhulani
Paloti
Paloti
Panas
Panchagawhan
Pandhurna
Pangari
Pangdi
Paonmari
Parawa
Pardi
Pardinaka "
Parsodi
Parsodi Bk.
Parsodi Kh.
Patharad
Pidha
Pilkhana
Pimpalgaon
Pimpalgaon
Pimpalgaon
Pimpalgaon
22
2 YEOTMAL TALUKA-contd.
Population Code ----No, 1951 1961
(2) (3) (4)
22 139 128
358 16
112 637 581
355 122 268
98 704 7i2
81 613 691
134 346 462
7
182 445 508
165 281 197
268 260 330
199 305 336
334 III 153
72 767 824
12 3,053 2,804
374 1,008 1,496
360 542 638
74 90 96
29 110 95
128 237 300
42 196 294
241
382 III 220
324 I
245 506 607
139 821 808
293 797 1,044
61 491 527
202 867 854
155 275 251
195 225 268
329 190 147
357 64 90
27 44
37 274 247
163 78 193
173 882 766
Name of village
(I)
Pimpari
Pimpari
Pofalni
Potgawhan
Pradhan Bori
PratapPUT ••
Rahima.tpur
Rajur
Ramgaon ..
Rani Umaravati
Rasa
Rasulpur
Rasulpur
Ratchandana
Rauldhari ..
Raut Sawangi
Renakapur
Rohana (F V)
Rohatek
Rui ..
Rustampur
Rutha
Saikheda Bk.
Saikheda Kh.
Saikheda Kh. (F V)
Sakur
Salod
Sarapdhari
Sarati
Sarfali
Sarul
Sasladevi (F V)
Sate!.l
Saujana
Savitti (F V)
Pimpalgaon (I) Rural 232 372 594
Sawa}apur ••
Sawangi
Sawar Pimpalgaon (2)
Pimpalkhuti
Pimpalkhuti
Pimpalkhuti
Pimpari
Pimpari
Partly included in Urban Area I.
2 878 946
159 286 237
330 35 66
228 100 139
132 534 604
Sawargad
Sawargaon ••
Shankarpur
Shek.pur
SheIi
Sherad
• Uninhabited.
Population Code ---No, 1951 1961
(2) (3) (4)
43 205 199
295 525 732
251 183 192
333 557 651
343 427 348
73 9 14
3
216 300 286
371 60 161
35 1,500 1,559
211 181 162
30
120 38 22
270 141 285
287 * 88 180 176
64 184 217
285
380 515 606
312 1.427 1,626
9
342 375 458
378 436 518
315 325 309
351 199 240
307 219 269
303 884 969
213 130 156
346
69 616 593
59 875 1,004
338
144 217 277
67 298 315
349
122 83 31
156 200 186
46 1,781 1,895
269 512 758
177 1,42" 199
179 172 175
10
325 103 184
263 314 541
N arne of village
(I)
Populatio Code ---.-No, 1951 1961
(2) (3) (4
Shindhi 63 401 456
Shingnapur.. 187 178 212
Shiwandhari (F V).. 281
Shiwani Bk. 259 186 175
Shiwani Kh. 254 351 446
Sohagpur 104
Sonegaon 172 531 577
Sonkha, 171 132 109
Sonkhas 353 76 100
Subhanpur 125
Sukali
Sukali
Sukali
Takalgaon ..
Takali
Talegaon
Talegaon
Tambha
Tanapur
Taroda
Taroda
Ta,lot
Tembhurni
Tbalegaon .•
Tirzada
Tukapur
Tuljapur
Tuljapur
Umaravati ••
Umarda
Umari
Umari
Umari
Umari(F V)
220
369
138
28
57
158
247
108
118
164
219
ZfJ7
54
25
197
117
160
175
107
124
50
205
248
301
399 475
102 167
282 319
484 480
89 68
165 243
982 1,017
508 515
208 177
338 2aO
31
234 294
370 396
484 596
* 108 III
178 180
372 369
616 759
•
Umari Bk. (F V) 313
Umarsara (I) Rural 243 115 731
Umarsara (2) .. Included in Urban Area 1.
Umarvihir (F V) 373
Veni.. 106 1.571 1,474
Veni.. 123
Virkhed
Wadgaon
Wadgaon
85 684 619
78 59 124
191 129 176

23
2 YEOTMAL TALUKA-concld.
Population Population Population Population Name of village Code ---- Name of village Code Name of viIlage Code Name of village Code
No, 1951 1961 No, 1951 1961 No, 1951 1961 No, 1951 1961
(I) (2) (3) (4) (I) (2) (3) (4) (I) (2) (3) (4) (I) (2) (3) (4)
Wadgaon 242 1,434 1,929 Waki 246 304 453 Watkhed Kh. 96 628 533 Yerad 264 401 607
'Wadgaon 367 804 987 Waki 381 189 283 Yerandgaon 71 620 732 Yashawantpur 121 *
Wadhona Kh. 266 161 272 Walidadpur 65 168 178 Yawali 33 490 608 Zadki~hi .. 361 426 496
Wag.da Kh. 352 380 378 Wandali 152 574 560 Yawali 348 996 1,457 Zapatkheda 129 72 61
Waghapur •• 114 Warud 66 205 217 Yelabara .. 370 1,130 1,373 Zola 221 73 68
Waghapur •• 231 329 427 Warud 305 189 337 Yela Kh. (F V) 372 Zola 292
Wai - 44 505 588 Warzadi 323 393 520 Yeoti 306 196 309 Zuli •• 376 286 396'
Wai 222 172 153 Watbori 339 320 350 Yeotmal Rural 233 NA 114 ----
Wai 311 833 1,055 Watkhed 300 201 245 tl951 TOTAL 177,460 YEOTMAL Urban I 35,98045,587
Waiiapur 31 104 114 Watkhed Bk. 86 966 908 Area. 1961 TOTAL 207,366
• Uninhabited. NA = Not Available.
t The 19j1 pcpulation of the Taluka as given in this list differs from that mentioned in Table A-II.

YILLAGE DIRECTORY
Serial l'io.
(I)
Villaa-e/ Town/ W"rd (2)
I Dahha(E) 2 Pimpaldluti
c3 R!Ulimatpuf -4 Koth. 5 Fattepur
~ Lakham_pur 'l Norapur 8 Alipur 9 Rustampur
1(,) Shek.pur
II Gdwhi 12 Pahoor(E) 13 Kopara 14 Barad 15 Ko.hi
Hj F alegaon (E) 17 JI.!itanapur 18 Deh.ni 19 Mohuli 20 Malapur
21 N.gargaon 12 Nagar; 23 Bhatmarg 24 Digh; 25 TnaleJoon
26 Khadak S.wanga 27 Pimpalgaon 28 T akal"aon 29 Panas 30 Rasulpur
31 Waijapur .32 Alegaon .33 YawaJi 34 Chondakapur 35 Rani Umaravati
.36 Aoegaon
.37 Pim"algaon ;38 Borgaon 39 Kamaljapur -'IU Bl>iluxa
-41 Aiola ·42 Pandhurna :43 Pimpari M W"; -45 Hatala
46 SaWar 47 G1lwh. 48 Anjangaon 49 Chimnapur .50 Urn.ri
5-1 Sagapur 52 Chondhi 53 ]"",bhulni 54 Tembhurni 55 Kapramethad
56 Bhisani 57 Takali 58 B.g"w.di ;9 Sard (E) W fV1J.namadpur
61 P.rsodi 62 Gaadal (E) 63 Shindi 64 Reroakapur II.i \\iutidadpur
66 Warud 67 Saujana 48 ASAatampur 69 SarI.li 70 Kll.rda
71 Yerandea<tn .~ t'acb.khed I,J Pratappur 14 Paloti 75 Caw.adi
Tramport and Postal
facilities
(3)
Po
.. RP~
.. Po
Po" .. Po
.. Po
.. RPo
R R
Educational
Institutions
(4)
H p
i; P
M ii P
P
t; P
P
P
P
p'
P P
M p
M
P
M P
ji
P
P H p
p'
P
P P P
P P
p'
Drinking water supply
W RivW
Ri~W W
w W W W wx w w W W W
W W W Ri. W
Ri. Riv W Hi.
W W W Ri. W
W W W
W
Medical facilities
(6)
Mp
W I\1p W \V RivWx W
W MpD W
W Wx
W W W RivW W
Wx Riv W W W
W W W W W
W Ri. Riv W W
W W RivW W HivW
&ZarDa,
(7)
24
Area in
Sq. Miles
(3)
Occupied
houses
(9)
Household,
(10)
RURAL AREA
Friday
Wed,;.sday
Mo~d.y
Saturday
Wedne,day
Tue~d.y Wedne,day
We,kesday
8.6 531 549 3.t! 103 234 0.5 Uninhabited. 1.2 87 100 1.2 77 81
0.6 Uninhabited. v.7 Uninhabited. V.I Uninhabited. 0.9 Uninhabited. (i. I Uninhabited.
1.8 7.4 1.0 1.8 4.1>
3.6 1.3 3.7 i.5 I.~
1.3 0.0 1.2 2.5 j.V
26 541
61 142 IYj
3" 51 147 83 81
94 24 62
276 Ii3
35 667
71 150 204
315 51
147 83 81
94 :<4 62
276 117
1.6 186 186 U.5 I I I I 1.1 114 119 u.7 21 25 O.~ Uninhabited.
0.5 ;).9 2'> 1.0 5.5
3.3 2.2 J.L O.L 1.5
6.1 1.4 2.2 1.3 0.9
3.6 4.2 O.Y 0.3 2.6
0.5 1.2 4.5 4.5 8.4
5.8 2.6 l.) 3.1 1.5
2.1 3.8 2.3 1.4 0.8
0.7 1.0 2.2 }.:; 4.6
3.0 4.0 1.4 1.9 2.7
26 26 129 162 125 140 IS id
361 361
271 271 60 60 46 48
Uninhabited. 37 45
148 160 60 61 52 53
103 116 7d 80
359 455 185 230
Uninhabited. 54 70 81 84
60 64 59 65
7 7 W 7i
1(>7 171
66 24 26
245 'i,
129 337 106 52 31
39 60 18 lJ,
230
175 194
5 5
206
66 24 26
245 7j
129 3,7 106 52 39
42 70 89
140 251
183 196
5 21
220
Total Population
P M
(II)
2,531 946
359 3::9
169 2,804
335 630 900
1,328 213 618 345 359
376 128 284
1,182 396
735 44
480 95
114 731 608
72 1,559
1,198 247 208
207
785 294 199 588 398
I,BY5 941
278 369
254 281 28
294 751
240 68
108 1,004
296
527 1,578
456 217 178
217 315 386 593
1,190
732 824
14 96
966
(12)
1,308 4'17
181 178
88 1,437
169 323 446
693 109 319 190 182
189 60
135 615 200
343 24
247 49
58 359 307
37 767
625 114 106
95
399 152 WO 299 195
970 481
139 191
125 132
14 153 404
117 37 60
529 154
27D 791 229 IU3 H4
112 150 197 305 593
389 419
6 46
477
F
(13)
1,223 4~~
178 151
81 1,367
166 307 454
635 104 299 155 177
187 E8
149 567 1%
387 20
233 46
56 372 301
35 792
573 133 102
112
386 142 99
289 203
925 460
139 178
129 149 14
141 347
123 31 48
475 142
251 787 227 114 94
105 165 189 288 597
343 405
8 50
489
Scheduled Castes
M F
Scheduled Literate and Tribes educated
M F 1\1 F
(14) (i5) (16) (17) (18) (19)
35 8
9 5
76
"5 23
15 3 J 3 4
'il 5
I 2 4
23 22 10
2
15 26
3 6
'2 3 5
i'l 8
13 3
37 3
18
·2 6
35
8 5
3:' 7
9 3
68 ·'5 23
II 5 3 4 I
ii 5
113 55
14 26
I 132
~o 16
61 31 ?")
80 46
57 I
64 112
7
118 423 209 45 IBI 79
17 69 20 27 67 23
I 120
'3S 15
56 22 24 71 49
30 II 514 453 30 12
109 42 164 58
281 100 36 18
135 32 56 13 51 22
61 62 27 2
12 100
3 13 84 34
105 247 6 77 16
5 92 100 106 32 4 5 5 9 3 44 39 102 40
8 7 10
2
24
21 8
2
19 22
"3 '4 I
2
i9 5
4 16 44 2
20
j 8
37
7 5
40 20
181 33 94
122 26 2'1
43
22 66 63 6
94
142 89
25 31
7 33
65 149
105 27
94 90
54 86 65 37 2
is 51 76
112 105
6 53
34 8 16 130
173 85 30 I 90 288
106 219 36 22 22 31
43 29
14 58 56 10
110
127 99
22 28
8 48
59 159
114 27
96 91
44 157 63 46
j
23 43 62
106 102
3 39
122 26 24 86 52
421 157
53 51
41 37
ii 105
II 5
18 216 43
115 320 84 35 40
48 58 65
138 232
157 138
4 8
155
I 49 18
104 73 3 4
II
34 7 2
23 12
182 46
12 15
17 14
I 27
I 86
35 123 32 14 6
13 16 30 52 85
41 46
70
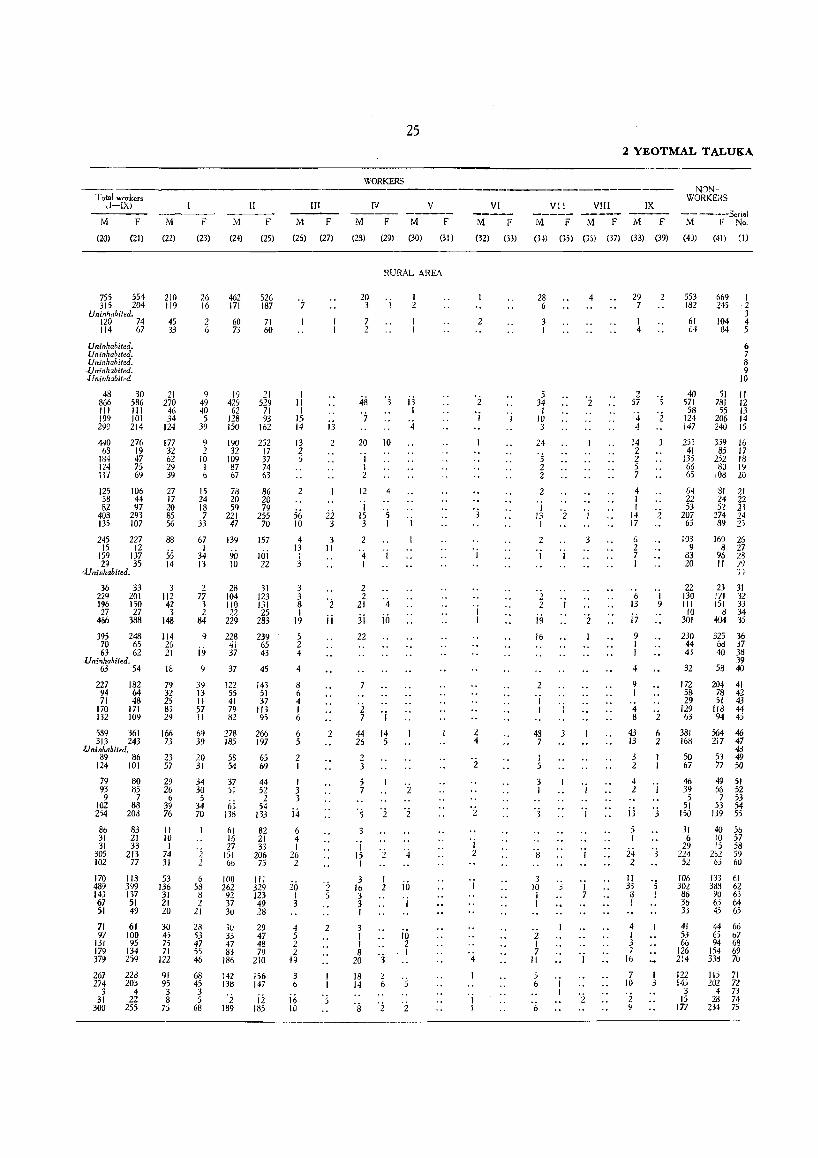
Total workers -I-IX)
M F
(20) (21)
755 554 315 204
Uninhabited. 120 74 114 67
Uninhabitedo Uninhabitedo Uninhabited" "Uninhabited" .lfninhabited.
48 866 III 199 299
440 63 1~4 124 117
30 586 III 101 214
276 19 47 75 69
125 106 38 44 82 97
408 293 135 107
245 227 15 12
159 137 29 35
",Uninhabitedo
36 229 196 27
466
33 201 150 27
388
395 248 70 65 63 62
,Uninhabited" 63 54
227 182 94 64 71 48
170 171 132 109
589 361 313 243
Uninhnbited" 89 86
124 101
79 80 93 83 9 7
102 88 254 203
86 83 31 21 31 33
305 213 102 77
170 489 143 67 51
71 97
131 J79 379
267 274
3 31
300
118 399 137 51 49
61 100 95
134 259
228 203
4 22
255
M
(22)
210 119
45 33
21 270 46 34
124
177 32 62 29 39
27 17 20 85 56
88
55 14
3 112 42
3 148
114 26 21
18
79 32 2S 83 29
166 73
23 57
29 26
6 39 76
I! 10 I
74 31
53 136 31 21 20
30 4; 75 71
122
91 95 3 8
75
F
(23)
26 16
2 6
9 49 40 5
39
9 , 4
10 I 6
M
(24)
462 171
60 73
19 429
62 128 150
190 32
109 87 67
II
F
(25)
526 187
71 60
21 529
71 93
162
252 17 37 74 63
15 78 86 24 20 20 18 59 79 7 221 255
33 47 70
67 139 157
3i 90 uii 13 10 22
2 77 3 2
84
9
i<i
39 13 II 57
" 69 39
20 31
34 30 5
34 70
-L 2
6 58 8 2
21
28 53 47 55 46
68 45
3. 5
68
28 104 110 22
229
228 41 37
37
122 55 41 79 82
278 185
58 54
37 51
63 138
61 16 27
151 66
100 262
92 37 30
30 3.3 47 83
186
142 138
"2 189
31 123 131 25
283
239 65 43
45
143 51 37
113 95
266 197
65 69
44 52 2
54 J33
82 21 33
206 75
III 329 123 49 28
29 47 48 79
210
156 147
i2 185
M
(26)
I II I
15 14
13 2 5
2
56 10
4 13 I 3
3 3 8 I
19
5 2 4
4
8 6 4 I 6
6 5
2 I
I 3 3
i4 6 4 I
26 2
20 I 3
4 5 2 :2
19
3 /)
16 10
III
F
(27)
13
2
ii 3
3 II
0:2
ji
2
2
25
WORKERS
IV V
M F M F
(23) (29) (30) (31)
RUHAL AREA
20 3 I
7 2
I 2
i3 I
4
20 10
"i I 2
12 4
"i IS "S 3 I I
2
"4 "j I
2
zf "4 :ii in 22
7
"i 7 I
44 14 26 5
2 3
~ "z
"5 "2 2
3
I~ 2 "4 I
3 16 3 3
1 in
I
3 I I
2~ °3
"j
10 2 I
18 2 14 6 Os
M
(32)
2
2
I
3
2 4
2
"i 2
°i
VI
2 YEOTMAL TAL UK A
VII
F M F
VIlI
M F
IX
M F
(3}) (31) (m (]S) (37) (33) (39)
28 6
3 I
5 34
I 10 3
24
5 2 2
2
I 13 2 I I
4
2 3
I I
2 2 I
i9 ".2
16
2
I I I
48 7
I 5
3 I
3
8
3 10 I 1
j I
2 I 7
II
5 6 1
I
6
7
2
29 7
I 4
2 57
4 4
14 2 2 5 7
4 I I
2
2
3
14 2 17
6 2 7 I
6 I 13 9
i7 9 I I
4
9 1
~ °2 43 6 13 2
3 2
4 2 I
ij "j
5 I
24 3 2
II 33 5 3 I I
4 I 3 7
16
7 10
2 'J
I 3
N0NWORKEaS
-----Serial M F No"
(4j) (41) (I)
553 182
61 64
40 571
58 124 147
253 41
135 66 65
64 22 53
207 65
103 9
83 20
22 130 III
10 301
230 44 43
32
172 58 29
129 63
381 168
50 67
46 39 5
51 150
31 6
29 224 5,:
106 30': 86 36 33
41 53 66
126 2:4
122 14j
3 15
177
669 I 245 2
3 104 4 84 5
6 7 8 9
10
51 II 781 12 55 13
206 14 240 15
359 16 85 17
252 18 80 19
108 2i)
BI 21 24 22 52 23
274 24 89 2j
160 25 8 27
96 2~ II N
::)
23 31 171 32 151 33
8 34 404 35
325 36 68 37 40 38
39 53 40
204 41 78 42 51 43
118 44 94 45
564 46 217 47
4d 53 49 77 50
49 51 66 52 7 53
53 54 139 55
40 5& 10 57 15 58
2&2 59 "j 60
133 61 383 62 90 63 63 64 4:) 65
44 66 65 67 94 68
154 69 333 70
II:; 71 202 72
4 73 28 74
234 75

VILLAGE DIRECTORY
Serial No.
(I)
Village / Town/ Ward
(2)
76 Kinhi 77 Condhali 78 Wadgaon 79 Hatgaon 80 Kopara
81 Nandura Bk. 82 Kangokul 83 Muradabad 84 Fatiyabad 85 Virkhed
86 Watkhed Bk. 87 Mubarakpur 88 Raut Sawangi 89 Mangrul 90 Gimona
91 Babhulgaon (E) 92 Mang Sawangi 93 Hastapur 94 Isapur 95 Mustabad
96 Watkhed Kh. 97 Nagargaon 98 Nandesawangj 99 Bhaiyapur
100 An targaon
101 Haibatpur 102 Chandapur 103 Mi tanapur 104 Sohagpur 105 Kondha
106 Veni 107 Umaravati 108 Tambha 109 Canori 110 Deogaon
11 I Manakapur 112 Naigaon "3 Mirzapur 114 Waghapur 115 Aurangpur
116 Mahamadpur 117 Tukapur 118 Tanapur 119 Kotha 120 Rasulpur
121 Yashawantpur 122 Sawal.pur 123 Veni 124 Urnarda 125 Subhanpur
126 Alipur 127 Maral.pur 128 Panchagawhan 129 Zapatkheda 130 Krishnapur
131 Kotamba 132 Pirnp.ri 133 Loni 134 Nandura Kh. 135 Barhanpur
136 Husn.pur 137 Hiwara 138 Sukali 139 Pardi 140 Khud,wantpur
141 Donoda 142 Aloda 143 Kalaspur 144 Sate!.1 145 Muradpur
146 Manakapur 147 Hirapur 148 Aurangpur 149 Canamgaon 150 Mahi topur
Trans}Jart and Postal
facilities
(3)
R
Po
RPo
R
R
RP~
R
Educational
Institutions
(4)
j:;
j:;
P
j:;
M
j:;
M P
P
p'
p' p' p
p' P
p'
P P
p'
M
P
Drinking water supply
(5)
RivWX W W
W"
RivWx
W
W
W Riv Riv RivW RivW
WN RivW RivW
Ri~'
Riv
Ri~'
Ri~W
W"
Ri~W
Medical facilities
(6)
W
Ri~' W M~' WNx
Riv W M~'
W
w" M~'
W" W W W
W W W W Riv
Riv Riv WN WN W
W W W Riv Riv
Riv Riv
Ri~W W
Mp
Bazar Day
(7)
Area in Sq.
26
Miles
(8)
OCCupied
houses
(9)
Households
(10)
RURAL AREA-conld.
Thursday
Friday
Monday
2.5 75 94 2.7 110 144 1.2 26 29 0.9 Uninhabited. 1.5 166 166
1.7 137 167 0.6 Uninhabited. 0.6 12 16 0.9 Uninhabited. 1.2 117 136
3.1 209 215 0.9 89 89 0.7 36 44 I. I 34 37 1.2 93 105
0.9 447 521 1.2 121 130 1.4 28 35 0.4 Uninhabited. 1.0 71 81
2.2 101 109 6.4 Uninhabited. 1.4 164 164 0.6 Uninhabited. 1.6 52 52
0.3 Uninhabited. 0.2 Uninhabited. 0.8 134 135 0.7 U ni nhabited. 1.5 161 182
1.7 342 342 0.5 Uninhabited. 2.3 119 119 5.4 223 223 0.9 57 57
0.4 4 16 2.2 129 129 0.4 Uninhabited. 0.2 Uninhabited. 0.6 Uninhabited.
0.8 Uninhabited. 0.3 Uninhabited. 0.5 Uninhabited. 3.0 408 408 0.7 6 6
0.3 Uninhabited. 0.6 7 7 0.6 Uninhabited. 1.7 50 50 0.8 Uninhabited.
0.4 Uninhabited. 0.4 II II 1.4 78 78 0.7 17 17 0.8 56 56
1.7 3.4 1.6 2.3 0.6
185 141 46 95 31
185 147 50 98 41
0.5 70 80 2.3 139 140 0.8 57 71 2.0 191 194 0.4 19 21
2.6 141 175 0.5 41 55 1.0 51 59 0.8 58 69 0.5 17 18
0.7 55 67 0.5 10 18 0.3 Uninhabited. 1.7 37 53 0.7 16 17
Total Population
P M
(11) (12)
414 669 124
792
691
70
619
908 394 176 153 476
2,131 525 167
371
533
712
221
656
684
1,474
515 947 254
66 581
1,786 22
31
180
49 300
69 248
770 604 219 462 170
324 565 319 808
70
758 225 254 277 88
294 91
240 90
219 326
59
394
313
37
308
453 198 89 83
230
1,052 284
76
176
266
354
99
334
352
719
255 485 129
34 281
900 14
15
97
29 158 34
119
373 300 121 232 88
161 292 160 429
35
377 115 113 139 49
140 43
122 49
F
(13)
195 343
65
398
Scheduled Scheduled Literate and Castes Tribes educated
M F M F M F
(14) (15) (16) (17) (18) (19)
I 6
3 49 52 69 18 8 87 108 93 27
34 43 7 2
76 75 173 66
378 37 45 63 74 I 19 63
33 9 15 5
311 2 122 128 117 40
455 196 87 70
246
1,079 241
91
195
267
358
122
27 I I 2
26
54 19
5
18
10
8
17 I
'3 25
67 15
4
18
15
6
114 116 31 . 35 13 16 28 21 8 7
97 95 42 36 35 40
78 89
67 60
46 47
15 8
156 56 82 23 22 6 26 7 89 31
509 214 81 30 12
41 6
108 38
134 39
27 II
322
332
755
260 462 125
5
5
30
6 87 88 100 26
8 58 56 II I 46
32 300
886 8
16
83
20 142 35
129
397 304 98
230 82
~
28 16
iii
42
's I I
26
I 24 12
37
's I I
!~j '7 '4 159 19 16 379 4 3 35
381 2 4
I!? 23 38 138 2 I 39
154 48
118 41
86 89 308 109
32 29 84 28 97 93 ISS 63 36 43 38 15
25 20 5 3 61 85 137 61
54 50 423 168 2 2
3 4 6
75 7i 34 35 14 14
72 89 174 165 II II 29 34 25 20
28 3
13 47 3
44
178 71 29 64 37
6 13
·s 52 26 7
35· 8
35 32 77 18 55 71 117 28 22 19 36 29 46 49 178 51 10 10 12 3
60 73 140 45 10 12 36 10 39 40 17 4 10 15 39 6 6 6 16 4-
81 95 51 15 20 20 6 3
7 II 36 12 48 41 19 2

Total workers (I-IX)
M F M
(20) (21) (22)
133 79 206 180 37 38
Uninhabited, 247 234
196 223 Uninhabited,
23 18 Uninhabited.
194 169
279 110 64 53
155
242 112 43 48
153
589 398 183 152 51 40
Uninhabited, 114 115
185 139 Uninhabited.
237 235 Uninhabited,
67 75
. Uninhabited, Uninhabited,
210 116 Uninhabited,
217 168
454 384 Uninhabited,
172 155 288 213 80 74
26 19 184 125
Uninhabited, Uninhabited. Uninhabited,
Uninhabited, Uninhabited, Uninhabited,
527 394 7 2
Uninhabited, 1 I 9
Uninhabited, 61 50
Uninhabited.
Uninhabited. 17 14 97 85 27 21 70 69
245 209
65 146 46
102 194 49
286 22
228 173 59
133 39
77 159 56
174 16
233 199 66 55 73 77 88 66 32 19
85 73 26 50
.uninhabited. 74 68 30 31
56 83 12
75
54
5
63
62 49 26 8
46
117 37 17
35
53
82
24
63
47
144
39 72 43
3 46
157 5
5
22
3 44 10 26
75 66 35 65 15
26 77 45
125 10
72 12 3
28 d
20 8
20 15
II
F
(23)
M F
(24) (25)
15 53 9
47
54
8
43
32 19 II 13 44
41 34 9
24
24
69
33
64 103 18
122
115
17
116
176 54 32 39 90
231 113 28
67
99
105
38
4 125
124
117 213
29 112 22 185 41 33
67 I
3
9
35 8
28
3 95
224 I
6
37
13 45 17 39
20 152 47 107 27 26 55 67 9 17
7 44 53 96 16 2 5 120 1 10
22 II 7
20 2
15 14
12 7
109 48 62 50 6
45 II
42 14
64 126 27
183
166
10
124
209 91 32 35
106
293 110 31
90
114
151
40
III
156
251
124 183 33
4 108
307 I
6
41
14 49 13 41
207 126 30 78 30
68 105 39
160 15
161 44 70 46 7
62 17
49 17
III
M F
(26) (27)
3 2 4
5
8 2 2 3 3
13 13 5
7
2
25
15
15
6
19 7
8 I
if,
'j
7 6
'2
8
'2 2
16
8 6
4
9
2
15
2
27
WORKERS
IV V VI
M F M F M F
(28) (29) (30) (31) (32) (33)
RURAL AREA-conld,
4 5
15
4
10 2 3
's
'j
4
28 34 3 3 I 10
3
13
" 4 2
6 2
13 2
35 8
I~ 's 'j I
48 10
2
7 7
'5 8 4
's 5 3 4 2
6
'j
5
ja I 6
4
3 Z I 5
2
I 2
2
2
7
I
3
3
2
'j
'j 7
7
'j
I 3
4
2 YEOTMAL T ALUKA
VII Vlll IX
M F M F M F
(34) (35) (36) (37) (38) (39)
2 3 2 I
9 2
3
'j I 4 Z
86 6 2
8
4 2
3
4
25
2 4 I
42
'j
2 2 I 2
I 3
4
2
2
9
3
'9 '2 'j
4
'j
4 8 I
14
II
I
16 3
'i
2
2
5 I
99 23 5 I I
2
7
9
2
~o
14
20
8 II 2
5
5
z1 '6
44
'3 'j
6 9 2 6 6
14 8
4
I~ 'j 2
27 3 2 5 I
5 I
3 I
6
NONWORKERS
---- Serial M F No.
(40) (41)' (I)
86 120 22
147
117
14
114
174 88 25 30 75
463 101 25
62
81
JI7
32
124
135
265
83 197 49
8 97
373 7
4
36
12 61
7 49
128 91 56 86 42
59 9d
III 143 13
144 49 40 51 17
55 17
48 19
116 76 163 77 27 78
79 164 80
155 81 82
15 83 84
!42 85
213 86 84 87 44 88 ZZ 89 93 90
681 91 89 92 51 93
94 80 95
128 96 97
123 98 99
47 100
101 102
206 103 104
164 105
371 106 107
105 108 249 109
51 110
13 III 175 112
113 114 115
116 117 118
492 119 6 120
121 7 122
123 33 124
12)
126 6 127
57 128 14 J:i9 60 130
169 131 131 I:l2 39 133 97 134 43 135
86 136 114 137 103 138 205 139
19 140
182 141 55 142 64 143 72 144 20 145
79 146 18 147
14d 50 149 10 150

VILLAGE DIRECTORY
Serial No.
Village! Town! Ward '
(I) (2)
151 Mdb.rakpur 152 Wandali 153 H ,ibatpur 154 Mangrul 155 Pnrsodi Kh,
156 S,wangi 157 Chincholi 158 Talogaon 159 Pirnpalkhuti 160 Tuijapur
161 Ashti 162 Mangrul 163 Pimpalgaon 164 Tarod, 165 Nilai
166 Khotal, 167 KamathaWad, 163 Mawalani 169 Daulatpur 170 Gang,devi
171 Sonkhas 172 Sonegoon 173 Pimpalgaon 174 Gangapur 175 T uljapur
176 Mategaon 177 SaW.rgaon 178 Dh.mani 179 Shankarpur 180 B;,awar.pur
lSI Ichora 182 Narsapur 183 Dh.nodi 184 Khatkheda 185 Kal.ntb (E)
186 Eklaspur 187 Shingn,pur 188 M,lkapur 189 Borirnahal 190 Mhosola
191 Wadgaon 192 Katri 193 K.,ampur 194 ivlanjaroghal 195 Patharad
196 Andbori 197 Titzada 198 Amal. 199 Nimhora 200 Kadori
201 Dabegaon 202 Parsodi Bk. 203 Dodapur 204 Borjai 205 Vmari
206 Belona 207 Chaparda 203 Ghoti 209 Dattapur 210 Jondhalni
211 Rasa 212 Drug 213 Sarapdhari 214 Kacak 215 Kanholi
216 Rajur 217 Dhotr. 218 Karalgaon 219 Tarod. 220 Sukali
221 ZoJa 222 Wei 223 Madani 224 Mendhala 225 Moh.
Transport and Postal
facilities
(3)
.. R " Po
.. p';'
,. RP~
., Po
R
.. R R
R
•• R .. R
" Po" ,. RPo .. R
Educational
Institutions
(4)
P
p' M
P P
P
p' P
p' P P
Drinkin~ water
supply
(5)
Ri~'
Ri~· Riv
Riv Riv Riv Riv
W
W" W W
W W W
W··
W W W W W
RivW W
W
W W W
W"
W" Wx WN W
W W
'W W
W W W W
W W W W W
WNx Wx N W
Riv Riv W W Nx
W Wx Wx W \V
Wx W WN W W
Medical facilities
(6)
Bazar Da.
(7)
28
Area in
Sq, Miles
(8)
Occupied
house~
(9)
Households
(10)
RURAL AREA-contd.
WeJ~e.day Sunday
Tue~day
Wed~esday
0.3 U ninhabiled. 1.2 131 131 0.3 Uninhabited. 0.7 29 29 0.7 47 53
1.3 36 36 2.0 85 85 0.8 58 58 1.1 49 61 0.5 Uninhabited.
4,1 198 198 0,7 Uninhabited. 2,0 41 41 1.1 51 51 1.2 46 46
1.1 44 44 1,5 134 134 1.5 103 103 0.4 Uninhabited. 0.4 33 36
0,5 2.3 2,0 0.7 0.3
2.2 4,0 0.9 1,9 0,2
19 19 136 135 114 114 44 44 24 24
110 110 274 276
Uninhabited. 42 42
Uninhabited.
1.3 47 47 3,2 125 125 0.5 16 16 1.0 Uninhabited.
12,9 988 1,178
0,3 Uninhabited. 1.3 47 SO 0.4 16 18 1,5 77 86 0,8 8 8
1.0 33 45 1,7 168 191 0.3 Uninhabited. 1.0 4~ 66 1.5 57 57
1.5 61 61 2.4 115 126 1.5 55 57 1.8 70 79 0,9 Uninhabited.
3'0 1.5 0,7 0.4 2.1
29 202
26 148
32 210 II 27
155
4, I 27 28 4,0 66 66 5,5 51 56 5.0 51 52 0,9 Uninhabited.
1.2 5'0
2.3 1.1 2.0
5.6 3.4 3.5 1.8 1.1
1,4 o )
3); 11.2 9,2
34 18 50 16 35
62 148 JJ4 75
120
15 36
209 154 241
41 18 50 16 37
63 133 135 75
120
15 3r,
209 157 257
P
(II)
560
131 251
186 379 243 237
878
193 177 197
218 554 433
172
109 577 766 204 III
462 1.199
175
187 508
57
5,258
212 91
366 24
176 873
292 268
316 596 242 336
158 854
4d 119 759
135 324 247 199
162 77
156 76
196
286 8!0 571 280 475
68 !53 857 665
1.041
Total Population.
M F
(12) (13)
288
71 120
99 194 123 120
272
60 131
87 185 120 117
Scheduled Scheduled Literate a"d Castes' Tribes educated
M F M F M F
(14) (15) (16) (17) (18) (19)
II 17
22 is
48
23
25 12 8
34
47
27
24 17 II 50
95
25 45
27 51 43 21
41
1 25
5 10 16 3
444. 434 to 17 189 189 101 24
93 100 4 53 53 12 3 87 90 I 35 47 27 I 99 98 45 47 26 6
120 256 228
85
52 277 400 104 50
228 600
82
94 266 28
2,681
110 52
178 10
86 440
155 133
153 308 127 165
79 421 28 65
385
71 170 123 103
81 40 74 37 99
148 391 276 150 248
30 78
444 331 520
98 298 205
87
57 300 366 100 61
234 599
93
2i
6 31 14 17
7 23
is
5 28 13 14
4 31
75 103 29
48
20 50 17 48 25
64 23
28
50 129 28
51
20 60 13 49 27
54 20
37
16 99 53
14
16 125 174 20 10
69 187
20
7 32 i
3
4 2S 53 6 8
29 61
93 39 35 22 7 242 144 126 69 21 29 28 29
2,577 126 133 428 411 1,226 600
102 39
188 14
90 433
137 135
163 288 115 171
79 433 20 54
374
64 154 124 96
81 37 82 39 97
138 419 295 130 227
38 75
413 334 521
II
4 II
4 17
'i 3
2 2
5 10 9
18 4
'4 15 13 20
. ';
3 7
'2 22
2
4
3 II II 17 2
3 22 10 16
79
39 5
23 20
39 26
36 25 50 90
2J lOS 28 42 47
27 123 BI 81
60 28 41 5
91
56 199 70 43 52
20 35
123 169 366
72
47 7
28 13 49
28 29 29 186
38 51 29 49
30 16 37 113 40 44 83 :i6
23 101 20 36 48
33 118 83 77
55 29 48
9 89
56 211
70 31 50
16 35
118 185 381
14 141
i,; 102
18 52 20 15
15 6
14 12 3
41 161 86 43 50
6 20
135 84 99
7
ij
9 58
5 8
jQ II 6
3 46 'j 34
5 17 5 4
I J 1 4
3 51 39 JI 13
2 2
39 28 30

Total workers (I-IX)
M F
(20) (21)
Uninhabited. 173 124
Uninhabiled. 50 38 81 48
56 50 120 87 74 55 79 63
Uninhabiled.
284 252 Uninhabiled,
61 64 68 57 59 60
81 56 171 173 139 133
Uninhabited, 66 47
34 25 177 160 246 175
76 62 33 33
145 120 394 272
Uninhabited, 53 53
Uninhabited,
72 47 162 140 20 19
Uninhabited, 1,583 1,038
Uninhahited, 73 56 28 24
124 116 7 12
53 53 251 212
Uninhabited, 92 80 78 78
100 91 180 163 87 60 96 84
Uninh.bited,
53 35 269 232
16 12 35 34
214 218
43 33 108 90 83 71 61 46
Uri inhabited,
52 22 21 II 55 42 26 19 58 61
94 81 188 226 173 152 101 74 164 121
24 50
299 224 363
20 44
239 194 311
M
(22)
38
12 29
21 45 36 24
96
39 33 II
20 50 53
22
14 60 74 9 5
45 110
30
24 54 3
397
10 22 53
19 93
36 30
35 101 39 22
24 106
ij 79
15 60 25 32
13 II 17 9
32
36 86 46 17 61
5 32 89 96
163
II
F
(23)
M F
(24) (25)
51
5 8
13 25 23 12
65
30 21 5
12 38 26
3
10 65 2
4 22
27
14 52 3
166
5 19 51 4
24 70
26 27
21 78 18 6
84
28 45
23 51 26 38
148
21 29 41
18 82 69
37
18 88 93 56 23
82 202
18
44 76 16
747
60 6
62 6
29 106
42 45
30 56 38 66
4 24 53 135
ii 23 92 102
5j 'j
iii 32
27 4S 23
4 38
6
67 54
103
22 40 51 23
20 3
32 11 14
40 62
106 75 81
17 17
157 100 141
70
33 38
37 60 31 50
179
34 36 55
26 127 107
44
15 92
167 61 33
112 245
30
32 87 16
799
51 5
63 8
29 138
49 48
67 85 42 78
31 179
22 123
32 38 71 32
18 8
28 8
22
51 175 128 70 83
14 44
160 137 196
J-1812-I-5-A-(Yeot,)
III --_ M F
(26) (27)
26
7 :>
10 8 5 7
13
'j .3
38 13 3
.3
'3 9 8 I
6 31
I
2 20
41
3
4 I
7 6
'j
1
i6 '7 I 5
" 4
9
" 2 3 7
7 10 I 2
j4 15 22
2
8 I
'j I
'j
.3 I
ji
j3
I 3
14 OJ
3
29
WORKERS
IV V
M F M F
(28) (29) (30) (31)
RURAL AREA-contd,
6
2 I
1 'j 'j I
16 5
'2 2
jj '4
" I
~ 'j 23 4
2i '3
75
is
'2 I 6 2
" 3 8
9
2
2
'j 3
5 6 4 I 6
II
'j 6
4 2 2
'j
2
12
'j
'j 3
'j
'j
io 6 '7 ~ f 'j
'j
'j
VI
M F
(32) (33)
'j
'j
II
'(,
.3
2 I I
6 'j
2
2
2 YEOTMAL TALUKA
VII VIII IX
M F M F M F
(34) (35) (36) (37) (38) (39)
" '3 I I
6
'j
'4 I
'j, 17 2 2
3 6
127
iil I
'3 'j
10
'j
'j 5 'j
I 4 3 4
12
';' 3 2
'j
20
'j
'j
'j I
I
'3
15
5
I 2 2
I 7 7
3
I 10 30 I 2
7 21
2
2 6
153
3
'3 I
2 16
6
27 6 5 2
I 20
'j I
4 I
'j
61
'i
3
ii '2
~ 'j 2 2
2 3 3 I 2
5 19 'i 9 2 2
I I
13 OJ
2~ 's
NONWORKERS
----Seri.1 M F No,
(40) (41) (I)
115
21 39
43 74 49 41
160
32 19 40
39 85 89
19
18 100 154 28 17
83 206
29
151 148 152
153 22 154 83 155
37 156 98 157 65 158 54 159
160
182 161 162
36 163 33 164 38 165
42 166 125 167 72 168
169 40 170
32 171 140 172 191 173 38 174 28 m
114 176 327 177
178 35 179
180
22 46 181 104 102 182
8 10 183 184
1,098 1,539 185
37 24 54 3
33 189
63 55
53 128 40 69
186 46 187 15 188 72 189 2 190
37 191 221 192
193 57 194 57 195
72 196 125 197 55 198 87 199
200
26 44 201 152 201 202
12 8 203 30 20 204
171 156 205
28 62 40 42
29 19 19 II 41
54 203 103 49 84
6 28
145 107 157
31 206 64 207 ~B 208 50 209
210
59 211 26 212 40 213 20 214 36 215
57 216 193 217 143 218 56 219
106 220
18 221 31 222
174 223 140 224 210 225

VILLAGE DIRECTORY
Serial No.
(I)
Village I Town I Ward
(2)
Borgaon Kita Pimpari Chinchbardi
TransPOrt and
Postal facilities
(3)
226 227 228 229 230 Lohara Bodad . . R
231 232
Waghapur R Pimpalgaon (1) R
233
234 235
Pimpalgaon (2) Yeotmal (1) Rural .. R Yeotmal (2) Urban .. Dorli Dolamba .• R
236 Bhari 237 Murzadi 238 Madkona 239 Bhoyar 240 Kinhi
241 Pangari 242 Wadgaon 243 Umarsara (1)
Umatsara (2) 244 Bhosa 245 Parawa
246 Waki 247 Talegaon 248 Umari 249 Karli 250 Khairi
251 Pofalni 252 Gandha 253 Hirdi 254 Shiwani Kh. 255 Godhani
2)6 BodgaWhan 257 Dhanora 258 Dhamani 259 Shiwani Bk. 260 Khangaon
261 Jamdoha 262 Mohadhari 263 Sherad 264 Yerad 265 Hiwari
266 Wadhona Kh. 267 Taslot 268 Nilona 269 Sawargad ~70 Ratchandana
271 Goddhari 272 Chinchahat 273 Manpur 274 Harjuna 275 Jamb
276 Barbada 177 Choudhara 278 Ghodakhindi 279 Murzadi 280 Bord. (F V)
.• RPo
•• R .. R .• R
.• R
•• R .. R
.. RP~
.. R
.. R
.. R
.. R
.. R
.. RP~
281 Shiwandhari (F V) .. 282 Mhasol. 283 Kharad (F V) 284 Khatola Kh. 285 Rohana (F V)
286 Loni 287 Rauldhari 288 Chapdoh. 289 Kolambi 290 Kajani
291 Hiwari 292 Zola 293 Pardinaka 294 Ghatan. 295 Pimpari
296 Chandapur 297 Borigos.vi 298 Bhambr.j. 299 Kharol. Bk. 300 W.tkhed
.. RRh
.. Po"
.. RP~
J-1812-1-5-B-(Yeot,)
Educa-tional Drinkinfl
Institu.. water Medical tions supply facilities Bazar Day
(4)
P P ji P
p
p' p P
p' H
ji
ji p
ji
p. p
p. P P P
ji P
p' P
p
p' P P
p. M
(5)
w W W W W
W W
W W·,
W
W Wx W W W
W W
w·· W
W W W·· W
wx Wx W W W
Wx W W W W
W W W W wx Wx RivX W W W
W WX WNx W W
Wx W wx WX
Wx W
W
Ri~'x W
W
W W W
W Riv W
W
(6) (7)
30
Area in
SQ. Miles
(8)
Uccupied
houses
(9)
RURALAREA-contd.
Households
(10)
5.3 116 122 3.7 75 82 1.3 37 41 3.6 80 80 8.0 236 239
0.9 105 105 2.4 135 140 Included in Urban Area I. 3.2 20 26 Urban Area I, 2.1 52 61 0.7 14 14
0.6 3.8 2.7 2.5 4.5
385 32
182 72
188
0.3 Uninhabited.
385 32
182 72
212
P
(11)
494 313 139 350
1,026
427 594
114
240 55
1,502 129 588 311 986
3.0 357 422 1,929 1.3 143 152 731 Included in Urban Arca I. 2.6 101 110 423 2.3 130 142 607
1.5 99 105 3.4 217 236 I . I Uninhabited. 3.2 153 157 1.7 87 87
1.6 45 45 1.2 25 28 1.4 54 54 2.3 96 96 2.3 80 80
1.0 2.2 1.3 3.5 1.8
0.4 1.2 1.5 2.4 2.2
2.2 0.9 1.2 3.4 1.1
0.4 8.3 4.3 2.8 7.3
34 60 27 38
108
28 24
125 149 27
65 6
85 180 59
2 197 101 116 201
34 60 27 38
108
28 24
125 149 27
65 6
85 180 59
2 197 101 116 201
1.2 20 23 1.7 64 65 5.9 176 176 4.9 157 157 3,9 Uninhabited.
2.9 Uninhabited. 3.3 122 133 4.4 58 63 2.0 Uninhabited. 3,4 Uninhabited.
2.1 117 117 5.5 Uninhabited. 5.2 52 52 8.0 236 257 0.5 Uninhabited.
6.2 280 280 I .5 Uninhabited. 2.8 178 212 2.6 101 109 2.4 1;9 176
3.4 76 85 2.8 106 106 4.4 262 299 0.8 Uninhabited. 4.1 63 63
453 1,017
654 370
192 113 270 446 321
134 236 112 175 540
130 95
541 607 110
272 31
330 758 285
8 895 417 539 939
103 324 800 672
674 279
527
257 1,106
1,244
1,044 520 732
393 459
1,408
245
Total Population
M
(12)
239 155 64
168 535
218 308
59
124 29
767 63
307 144 501
1,012 408
219 291
242 498
346 193
93 57
136 230 156
63 127 56 79
279
59 50
276 289
61
142 15
173 386 149
3 462 214 288 461
44 169 405 346
349 136
243
129 569
629
539 272 367
198 226 748
118
Scheduled Scheduled Litemte and Castes Tribe. educated
F M F M F M F
(13) (14) (15) (16) (17) (18) (19)
255 158 75
182 491
209 286
55
116 26
735 66
281 167 485
'i ·s 22
15
5
15
'j
917 18 323 8
~n io 211 519
308 177
99 56
134 ~16 165
71 109 56 %
261
71 45
265 318 49
130 16
157 372 136
5 433 203 251 478
59 155 395 326
325 143
I 9
jj
'2
3
3
4
.j I
3
97 'i 137
44 9 120
19 260
18 131 87
3 63 2
13 257 49
'i lf~ ... 218
96 134 51
127 236
123 80
2
66 2
228 54
107 129 222
42 9 4
43 189
53 104
13
20 I
223 3
71 31
127
12 1
jj 44
18 29
3
2 1
60
2i 16 30
18 287 279 447 221 4 54 62 177 61
124 80
142 96
69 87
6 12
I 85 74 63 15 9 271 291 124 25
'5 I
.j
264 240 62 6 918344 8
55 66 15 4 47 48 4
124 123 8 '5 183 183 52 8 125 142 23 3
37 52 38 13 87
47 45 41 II 87
37 42 32 29
103 107 102 117 41 34
123 109 15 16 72 78
197 209 101 91
16i 155 188 186 109 103 307 315
6 12
13 24 II 9
66
13 8
46 58 5
5
42 93 37
84 50 88 83
9
3 5 2 1
12
'7 12 I
:I
'7 17 10
jj 4
22 9
.j 3i3 307 2 241 237
32 62 90
·7 8
15
3 190 172 83 25 106 116 18 7
284 164 181 53
128 3 5 92 94 14 3 537 23 19 248 251 191 41
615
505 13 248 2 365 5
195 4 233 10 660 25
127
280 278 238
17 207 5 128 3 179
I~ 27 22 76
105
1% 206 124 70 173 116
45 28 80 82 266
118 20
65
37 14 24
6 25 53
2

Total workerS (I-X)
M F
(20) (21)
151 109 54
109 335
162 93 26 90
227
M
(22)
60 25 19 29 69
128 121 5 175 94 13
Included in Urban Area I.
F
(23)
47
30 16
M
(24)
44 78 32 50
132
100 120
II
F
(25)
113 93 26 59
199
121 85
38 20 18 12 9
47 10
8 Urban Are. I.
87 68 25 15 53 12 19 16 8 4
498 42
190 84
335
497 32 92
102 268
Uninhabited,
95 20 69 13
102
72
'5 20 71
336 21
105 69
198
391 32 87 82
193
577 345 78 35 202 4
284 9 230 109 12 4
Included in Urban Area I. 145 127 15 12 107
146 114 164 185 191 27 25
149 131 3D9 300
Uninhabited, 239 2\6 1~4 115
66 38 84
11& I(JH
40 76 44 58
174
34 31
186 193
41
96 8
106 237
94
56 33 73
122 104
45 71 37 70
155
42 31
180 173 23
95 8
93 212
91
2 5 304 272 152 119 177 143 302 303
34 30 97 79
260 235 232 189
Uninhabited,
U ninhabiled, 231 211
76 74 Uninhabiled, Uninhabiled,
173 176 Uninhabited,
82 83 3% 294
Uninhabited,
419 359 Uninhabiled,
338 273 166 129 254 199
135 101 147 130 455 380
Uninhabited, 84 77
52 68
127 54
39 18 45 40 31
15 23 21 33 59
11 9
87 105
19
56 4
47 92 43
liD 63 55
112
18 57
141 118
74 32
75
65 110
145
87 41 57
85 35
146
45
37 67
95 39
32 15 31 40 25
14 23 13 39 50
19 II 78 83 II
54 5
37 81 41
97 37 35 94
19 48
134 92
77 13
71
67 84
84 94 183 223
91 105 55 76
23 15 35 55 70
14 31 23 24 92
17 22 93 58 13
30 4
52 115 47
152 79
100 183
16 38
105 92
149 17
88
12 220
24 18 42 80 79
31 48 24 31
105
23 20
102 84 12
33 3
56 129 50
167 82
105 208
II 31
100 96
134 61
105
16 209
120 212 236
58 202 209 24 100 103 32 177 160
65 46 36 2 95 128
85 208 295
39 36 37
III
M F
(26) (27)
9
I II
6 9
2
3
2
jj
17 48
2
8 9
IS 3
I I 5 5
I 5
I 9
5
I 13 9
'j 10
2 25 2 2 I
3 26
2 12
19
9 15 2
'7
2
2
36
3
16
2
5 7
WORKERS
IV
l\1 F
(23) (29)
31
M
(30)
V
F
(31)
RURAL AREA-eonld, 6 4 I 6
34 ii I
I 3
15
'9 '7
8 6
I 6
3
3 13
7
'j
41 43
7 I
I~ 'j '4
3
I 1 2 5 'j 'j
'j
1 'j
2 4 I
'4 3 4
's 4
3
2 18
17
20 2
2 2
'5
'j
8 '4 I
'5 65
'7
2 17
'j
M
(32)
j:i
4
22 3
3
'j
8
'j
3
'j I
'j
2
'j
'6
VI
F
(33)
8
'j
'j
2 YEOTMAL TALUKA
VII VIII IX
M
(34)
F M F M F
(35) (36) (37) (38) (39)
9
2 I
5
12
'5 'j
, S 17
49 50
5 57 4 15
'5 'j I
'j
2 '2
'2 6 '3
']
'5 2
'3
7
7
'j
OJ
I
'j
'4 'j
I
'j
ji 'j
32 2
I~ 'j 29
I~ '2 4
6 I
24 31 I 4
11 'j
103 49
4 2
I
15 39
15 4
I 8
3 3 I 7 I
10 15
3
'2 8 'j
I
'j 7 I
'7 2
14 2
'j 5
14
2 I
3
I 30
17
12 3 10 2 4 2
3 5
17
NONWORKERS
Selia! M F No,
(40) (41) (I)
88 46 10 59
200
90 133
21
37 10
269 21
117 60
166
435 178
74 106
93 189
107 69
27 19 52
112 48
23 51 12 21
105
25 19 90 96 20
46 7
67 149 55
I 158 62
III 159
10 72
145 114
118 60
70
47 173
93 226 65 227 49 228 92 229
264 230
88 231 192 232
35 233
48 234 10 235
238 236 34 237
189 238 65 239
217 240
241 572 242 214 243
77 244 125 245
80 246 219 247
248 92 249 62 250
43 251 23 252 61 253 94 254 61 255
26 256 38 257 19 258 26 259
106 260
29 261 14 262 85 263
145 264 26 265
35 266 8 267
64 268 160 269 45 270
16j m 84 273
108 274 175 275
29 276 76 277
160 278 137 279
280
281 114 282 69 283
284 285
108 286 287
45 288 243 289
290
210 256 291 292
201 232 293 106 119 294 113 166 295
63 9~ 29<i 79 ]1)3 297
293 280 298 299
34 50 300

VILLAGE DIRECTORY
Serial No.
Vmage/T own/ Ward
Trans· port and
Postal facilities
(1) (2)
301 Umari (F V) 302 Jawala 303 Salod 304 Hatgaon 305 Warud
306 Yeoti 307 Sakur 308 Mangrul 309 Be10ra 310 Bechakheda
(3)
•• R " Po
311 Wai 312 Rui •• Po" 313 Umari Bk. (F V) 314 Lohara (F V) 31:; Saikheda Kh.
316 Borishinha 317 B.radtanda 318 Bhosa 319 Akolabazar 320 Maniarda
.. Po"
321 K!.airgaon 322 Kamathawada 323 W.rzodi 324 Paonmari 325 Sheli
326 Khorad Kh. 327 Jodmoha 328 Deonala 329 Pidha 330 Pimpa1khuti
331 Manzo 332 Kh.d.ki 333 Potgawhan 334 Nimgawhan 335 Khorad Bk.
336 Mar.th.w.kdi (F V) •• 337 Condwakdi (F V) 338 Sa,ladevi (F V)
Po
339 Watbori .. R 340 Anjan;
341 Belon 342 Rutha 343 Pradhan Bori 344 Ku.al 345 Mu.al
346 347 348 349 350
5:-:~rkharda .. Po" Yawali .• Po Savitri (F V) Ka.ordhara (F V) ••
351 352 353 354 355
Saikheda Kh. (F V) .• Wagad. Kh. .. R Sonkhas .. R Cadhavdhari (F V) .• Nakatipardi .• R
356 Metikheda 357 Pilkhana 358 Nagthana 359 Antargaon 360 Paloti
361 Zadkinhi 362 KioWat 363 Maregaon 364 Kinhala 365 Karegaon
366 Murzadi 367 Wadgaon 368 Dhanora 369 Sukali 370 Velabara
371 Ramgaon
.. RPo
.• R
.. R1yRPo
372 Yela Kh (F V) •• 373 Umarvihir (F V) .• 374 Pahoor J ambhulani .. 375 Markanda
Educa· tional Im~titu ..
titms
(4)
p' p P
ii M P
P M
P P
M
p
P ji
P
p' P
M
P' p
P
M P
M
Drinking Water supply
(5)
WN WN WN W
W Riv RivW RivW WN
W RivW
Wx W W
W" W
W W W W W
Wx W Wx W W
W W W W W
WOO
Wx Wx Wx RivWx Wx Wx
wx RivW
W W WN
Wx W Rivx Nx W RivW
W W W·· W
Wx RivW
W W RivW
W
W W
Medical facilities
(6)
M~b
Bazar Day
(7)
32
Area in
Sq. Miles
(8)
Occupied
houses
(9)
Households
(to)
RURAL AREA-contd.
Th';"~day
Wed~esd.y
Wed.;,e.day
1.9 Uninhabited. 3.7 68 70 5.6 2J2 212 3.2 171 171 2.3 77 77
2.6 75 76 2.3 60 62 2.2 159 159 4.5 207 227 4.2 247 247
2.7 231 232 6.6 337 337 2.0 Uninhabited. 2.9 Uninhabited. 2.1 68 68
3.7 17j 180 3.4 143 144 2.5 Uninhabited. 2.5 325 330 1.2 93 93
2.0 1.2 4.2 1.0 10
0.9 4.2 2.9 1.6 1.6
13.0 2.0 5.3 1.6 3.7
67 80
108 1
44
28 270 100 36 15
236 46
159 31
104
68 81
110 I
44
28 303 101 36 15
244 46
159 31
104
3.1 Uninhabited. 1.9 95 97 1.5 Uninhabited. 1.7 85 85 4.2 Uninhabited.
5.6 1.9 2.2 0.8 2.1
0.3 16.5 7.7 4.7 4.2
3.1 2.5 5.2 1.9 2.8
1.7 1.1 \.0 5.6 1.6
3.2 2.4 1.3 1.5 3.9
3.2 4.2 3.2 1.9 5.0
1.7 2.8 2.1 8.9 2.2
194 101 75 27 73
Uninhabited.
194 IOJ 75 32 73
422 424 274 295
Uninhabited. Uninhabited.
52 52 80 80 4 33
Uninhabited. 48 54
172 191 15 17 5 5
135 145 118 133
85 102 66 67
Uninhabited. 47 47
143 147
73 76 225 235 124 143 33 37
262 305
3j 37 Uninhabited. Uninhabited.
326 343 40 46
P
(11)
350 %9 736 337
309 269 683
1.024 1.016
1.055 1.626
309
744 708
1.429 411
302 445 520
I 184
144 1.370
450 147 66
1.301 126 651 153 453
477
350
910 458 348 123 311
2.005 1.457
240 378 100
268
928 90 16
628 638
496 329
237 673
295 987 656 167
1.373
161
1.496 241
Total Population Sr..heduled Scheduled Literate and
Castes Tribe. educated
!vi F M F M F !vi F
(t2) (13) (14) (IS) (16) (17) (i8) (19)
178 48B 366 155
161 130 356 528 518
525 831
157
370 358
728 204
143 227 261
1 %
68 707 231
73 27
639 56
312 76
227
238
171
450 222 164 61
151
998 765
115 186 56
135
505 4S 10
319 332
257 155
129 346
152 512 325 86
741
80
748 127
172 481 370 182
148 139 327 496 498
530 795
152
374 350
701 207
159 218 259
88 76
663 219
74 39
662 70
339 77
226
239
179
460 236 184 62
160
1.007 692
125 192 44
133
423 45 6
309 306
239 174
108 327
143 475 331
81 632
81
748 114
7 \I 38
i9 6
30 3
9
61
4
3
2
10
I
4
8 8
'i 3
4
2
'j
ij
8
6 71 8 187
71 34 173 J42 125 135 53 48
48 99
28 J3 21 3
46
28 31 45 14 13 50
121 115 107 73 79 248
193 196 139
80 95 200 . 6 227 224 332
6 101 89 25
69 71 II3 112 107 87
57 J56 ISO 261
'3
34 38 42
15 6
25
50
14 14 22
59
29 40 63
I 8
35 40 4 '3 224 209 139
47 52 40 2 51 50 10
13 21 5
10 443 492 113 38 54 10
147 182 62 58 59
141 152 45
76 70 49
4 48 57 44
8 30 29 22
6 10 19 96 20
59 93
3
33 8
85 5
6 8 9
·s 2
31 2 4 4
13
is 2
14
6
8
282 265 56 16 103 III 40 .. 124 146 II
11 14 17 I 96 112 29 II
6 465 4 207
'j 4
2
98 86 31
57
265
'4 162 125
23 57
22 45
121 I 60
160 45
J5 225
68
13 392 68
450 1%
110 90 29
64
213
'5 167 III
16 62
27 43
141 146
8 36 6
23
176 6 4
57 69
76 13
21 106
109 19 56 221
173 70 47 20
17B 309
73 8
394 91 58 21
28 20
4
35 2
i3 18
15 3
3 34
6 87 17 5
8S
17 I
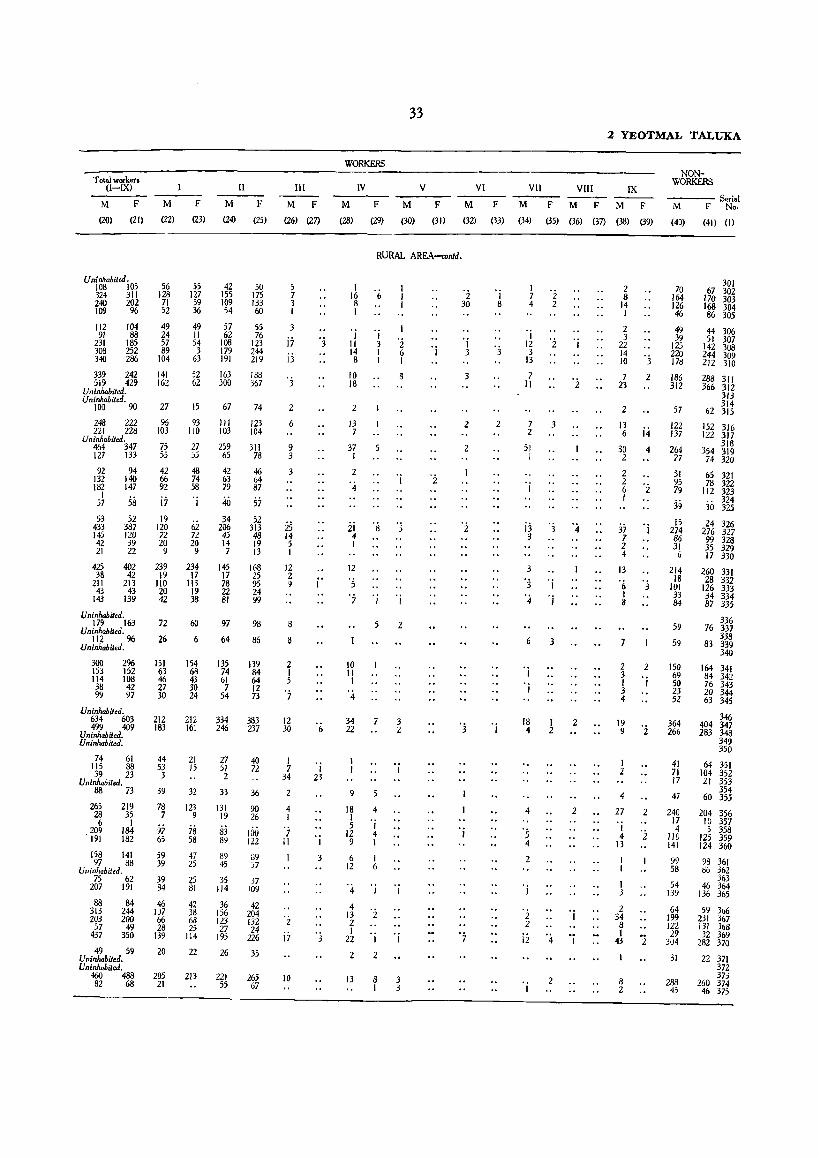
Total workers (I-IX)
M F
(20) (21)
Uninhabited, 108 105 324 311 240 202 109 96
112 104 91 88
231 185 308 252 340 286
339 242 519 429
Uninhahited, Uninhahiled,
100 90
248 222 221 228
Uninhabited, 464 347 127 133
92 94 132 140 182 147
5~ 58 53
433 145 42 21
425 38
211 43
143
52 387 120 39 22
402 42
213 43
139
Vninhahited, 179 163
Uninhahited, 112 96
Vninhahiled,
300 153 114 38 99
296 152 108 42 97
Uninhabited,
M
(22)
56 128
71 52
49 24 57 89
104
141 162
27
% 103
75 55
42 66 92
i7
F
(23)
55 127 59 36
49 II 54 3
63
52 62
15
93 110
27 jj
48 74 58
I
lig 62 72 72 20 20 9 9
239 234 19 17
110 113 20 19 42 38
72
26
151 63 46 27 30
60
6
154 68 43 30 24
M
(24)
42 155 109 54
57 62
108 179 191
163 300
67
III 103
259 65
42 63 79
40 34
206 45 14 7
145 17 78 22 BI
97
64
135 74 61
7 54
634 603 212 499 409 183
212 334
Uninhabited, Uninhabited,
74 61 44 115 88 53 39 23 3
Uninhabited, 88 73 39
265 219 28 35 6 I
209 184 . 191 182
158 141 97 88
Uninhabited. 75 62
207 191
88 84 313 244 203 200
57 49 437 350
49 59 Uninhabited, Uninhabiled,
460 488 82 68
78 7
97 65
59 39
39 84
46 107 66 28
139
20
205 21
161 246
21 27 15 51
2
32 33
123 9
78 58
47 25
25 81
42 38 66 25
114
22
213
131 19
83 89
89 45
35 114
36 156 123 27
195
26
221 55
II
F
(25)
50 175 133 60
55 76
123 244 2i9
188 367
74
123 104
311 78
46 64 87
57 52
313 48 19 13
168 25 95 24 99
98
86
139 84 64 12 73
383 237
40 72
36
90 26
100 122
39 37
37 109
42 204 132 24
226
35
265 67
III
M F
(26) (27)
5 7 3 I
3
i7 i3
2
6
9 3
3
25 14 5 I
12 2 9
8
8
2 I 5
'7
12 30
I 7
34
4 I
'] II
z i 7
10
'j
j'
'j 23
I
3
WORKERS
IV
M F
(28) (29)
33
M
(30)
V
F
(31)
VI
M
(32)
RURAL AREA-contd,
I~ '(, 8 I
I I II 3 14 I 8 I
10 18
2
13 7
37 1
2
4
2 6 I
2i °8 's 4 I
12 °5 '7 'i I
iO II I
'4
5
34 22
7 3
9
18 4 I 5 I
12 4 9 J
6 I 12 6
°4 I
Ij '2 1
21 ° i 2 2
13 8 I
2
3 3
'j
'i 30
'j 3
3
2
2
'j
'j
F
(33)
'j 8
2
'i
2 YEOTMAL TALUKA
VII VIII IX
M
(34)
F M F M F
(35) (36) (37) (38) (39)
} 'i 4 2
'j 12 3
13
'2 'j
7
" 7 2
51 I
'j
3
i3 'j '4 3
'j 'j
'4 I
'j
'j
3
18 I .. 2
4
'5 4
2
°2 2
2
2
'j
i2 '4 'i
2
2 8
14 1
2 3
22
:~ OJ
7 2 23
2
13 6 j4
3D 4 2
2
~ °z I
37 'j 7 2 4
13
'6 'j I 8
2 2 3 I 'j 3 4
19 9 '2
I 2
4
27
I 4
13
I 3
2 34 8 I
43
8 2
2
i
NONWORKERS
---- Serial M F No,
(40) (41) (I)
70 164 126 46
49 39
125 220 178
186 312
57
122 137
264 77
51 95 79
39 15
274 86 31
214 18
101 33 84
59
59
150 69 50 23 52
364 266
41 71 17
47
240 17 4
JlO 141
99 58
54 139
64 199 122 29
304
31
288 45
301 67 302
170 303 168 304 86 305
44 306 51 307
142 308 244 309 212 310
288 311 366 312
313 314
62 315
152 316 122 317
318 354 319
74 320
65 321 78 322
112 323
30 m 24 326
276 327 99 328 35 329 17 330
260 331 28 332
126 333 34 334 B7 335
336 76 337
338 83 339
340
164 341 84 342 76 343 20 344 63 345
346 404 347 283 348
349 350
64 351 104 352 21 353
354 60 355
204 356 10 357 5 358
125 359 124 360
98 361 d6 362
363 46 364
136 365
59 366 231 367 131 368 32 369
282 370
22 371 372 373
260 374 46 375
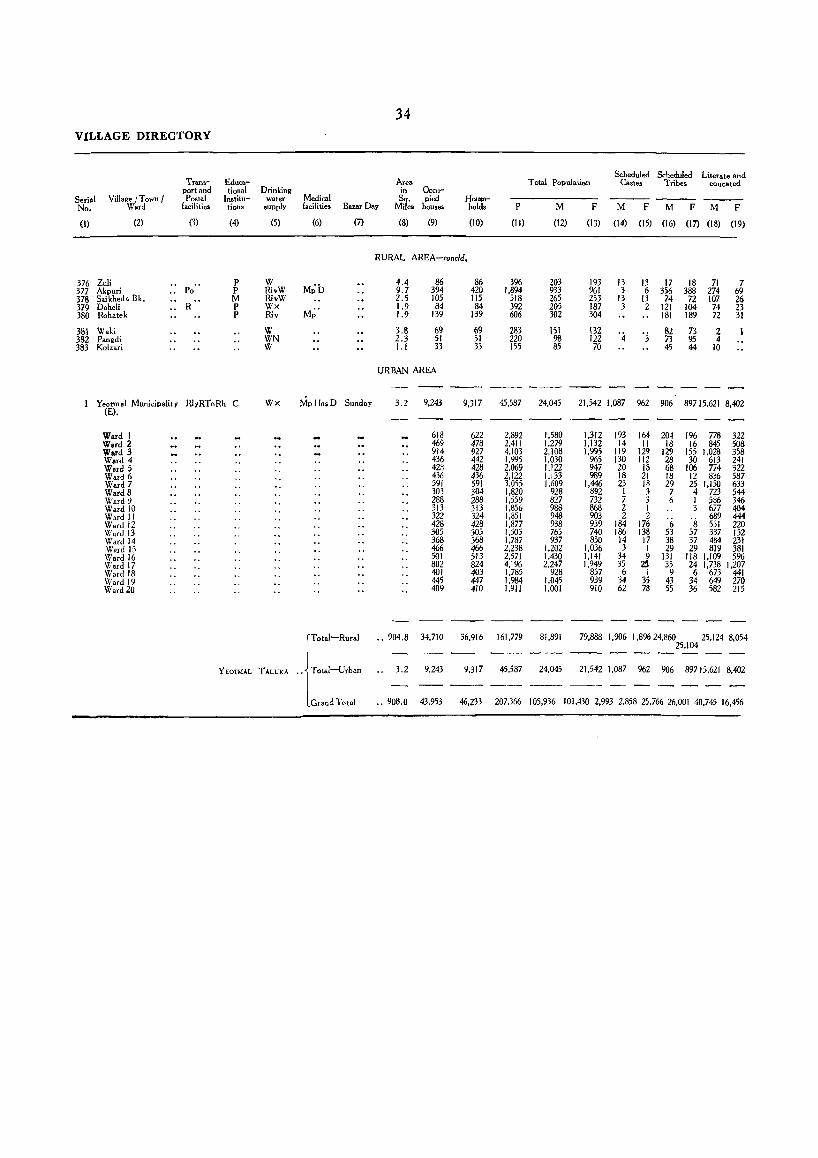
34 VILLAGE DIRECTORY
Scheduled Scheduled Literate and Trans- Educa- Area Total Populaiien Castes Tribes educated
port and tional Drinking in Occu-Serial Village /Town I Postal Institu- water Medical Sq. pied House- --- ----No. Ward facilities tions supply facilities Bazar Day Miles houses holds P M F M F M F M F
(I) (2) (3) (4) (5) (6) (7) (8) (9) (10) (11) (12) (13) (14) (15) (16) (17) (18) (19)
RURAL AREA-coneld.
376 Zuli .. P W M;b
4.4 86 86 396 203 193 13 13 17 18 71 7 377 Akpuri .. Po P RivW 9.7 394 420 1,894 933 961 3 6 356 388 274 69 378 Saikheda Bk. M RivW 2.5 105 115 518 265 253 13 13 74 72 107 2& 379 Daheli .. R P Wx
M~' 1.9 84 84 392 205 187 3 2 121 104 74 23
380 Rohatek P Riv 1.9 139 139 606 302 304 181 189 72 31
381 Waki W 3.8 69 69 283 151 132 '4 '3 82 73 2 382 Pangdi WN 2.3 51 51 220 98 122 73 95 4 383 Kolzari W 1.1 33 33 155 85 70 45 44 10
URBAN AREA
--- -- ----Yeotm.l Municipality RlyRToRh C Wx MpHosD Sunday 3.2 9.243
(E). 9,317 45,587 24.045 2],542 1,087 962 906 897 15.621 8.402
Ward I 618 622 2,892 1,580 1,312 193 164 204 196 778 322 Ward 2 469 478 2,411 1,279 1.132 14 II 18 16 845 508 Ward 3 914 927 4,103 2,108 1,995 119 129 129 155 1,028 358 Ward 4 436 442 1,995 1.030 965 130 112 28 30 613 241 Ward 5 428 428 2,069 ]'122 947 20 18 68 106 774 322 Ward 6 436 436 2.122 1.133 989 18 21 18 12 836 587 Ward 7 591 591 3,055 1,609 1.446 23 18 29 25 1,150 633 Ward 8 303 304 1.820 928 892 I 3 7 4 723 544 Ward '} 288 288 1.559 827 732 7 3 6 I 586 346 Ward 10 313 313 1.856 988 868 2 1 3 677 404 Ward II 322 324 1.851 948 903 2 2 '(, ·s 689 444 Ward 12 428 428 1.877 938 939 184 176 531 220 Ward 13 305 305 1.505 765 740 186 138 53 57 337 132 Ward 14 368 368 1.787 937 850 14 17 38 37 484 231 Ward 15 466 466 2.238 1.202 1,036 3 I 29 29 819 381 Ward 16 501 513 2.571 1,430 1,141 34 9 131 118 1.109 596 Ward 17 802 824 4.196 2,247 1.949 35 25 35 24 1,738 1.207 Ward 18 401 403 1,785 928 857 6 1 9 6 673 441 Ward 19 445 447 1,984 1,045 939 34 35 43 34 649 270 Ward 20 409 410 1.911 1.001 910 62 78 55 36 582 215
------rTotaI-Rural .. 904.8 34.710 36.916 161,779 81.891 79,888 1,906 1.89624.860 25.124 8,054
j To,",-u,b~ 25,104 --- -- ---YEOTMAL TALUKA 3.2 9,243 9.317 45,587 24.045 21.542 ]'087 %2 906 89715.621 8.402
--- -- ----lGrand Total .. 908.0 43,953 46.233 207,366 105.936 101.430 2.993 2,858 25,766 26.001 40.745 16.456

35 2 YEOTMAL TALUKA
WORKERS -------- NON-T ot.1 workers WORKERS
(I-IX) II III IV V VI VII VIII IX ----- ---- --- -------- Set
M F M F M F M F M F M F M F M F M F M F M F Nolal
(20) (21) (22) (23) (24) (25) (26) (27) (28) (29) (30) (31) (32) (33) (34) (3) (36) (37) (33) (39) (40) (41) (1)
RURAL AREA-concld,
136 107 95 74 36 32 1 4 I 67 86 376 597 553 206 170 294 374 30 1 12 "3 ii I 'i I '8 2 33 3 336 408 377 163 143 68 54 71 85 3 9 2 I 'z 9 3 102 110 378 124 120 57 61 56 58 2 2 5 I 81 67 379 193 155 67 21 109 130 6 2 2 I I 2 6 I 109 149 380
102 90 45 8 35 72 9 12 7 I 2 49 42 381 64 67 13 9 15 17 II 5 6 20 35 34 55 382 49 45 9 I 19 8 4 I I 15 36 36 25 383
URBAN AREA
---11,931 2,770 570 136 297 456 104 563 210 1,904 460 350 67 2,260 163 1,317 II 4,566 1,266 12,114 18,772
821 345 67 33 80 114 20 22 4 136 18 27 43 6 126 300 166 759 967 601 155 41 15 18 64 2 13
ii 115 20 8 97 4 71 236 52 678 977
1,184 466 34 19 80 107 20 75 319 139 32 2 156 28 132 '4 336 159 924 1,529 541 222 8
i9 14 64 12 72 4 178 69 39 7 56 18 48 114 56 489 743
543 103 23 9 II 7 13 5 74 5 19 I 143 3 82 I 173 58 579 844 524 63 33 4 '7 '5 I 13
ii 36 2 2 '4 85 '7 41 313 57 609 926
818 109 35 2 4 77 107 5 45 186 69 288 75 791 1,337 467 31 24 2 I 'j I 18 I 48 I 3 178 5 15 179 22 461 861 401 22 18 2 2 1 30 I 43 I 2 'j 180 I 14 III 14 426 710 454 47 20 2 3 3 I 19 7 62 3
'j 146 5 99 I 104 25 534 821
459 35 50 4 8 2 4 5 2 53 5 'z 163 9 63 '2 110 13 489 868
486 294 II 2 2 2 35 51 173 126 20 51 28 44 150 81 452 645 390 254 3 3 2 3 I 50 61 62 50 23 2 38 6 32 179 129 375 486 507 126 18 4 II 5 2 25 27 lOa 8 8 2 63 6 84 196 74 430 724 568 55 16 2
i9 I 4 7 I 62 2 17 I 187 8 51 224 40 634 981
576 109 36 3 25 9 16 I 47 18 5 59 4 69 'j 303 71 854 1.032 1,043 97 85 12 23 4 I 5 I 76 II I 156 4 51 635 74 1,204 1,852
445 48 19 4 5 15 I 14 3 68 '2 17 3 86 I 43 192 22 483 809 568 107 13 3 3 24 6 41 14 73 26 10 86 10 88 'z 230 44 477 832 535 82 16 I 10 4 7 13 4 70 4 30 23 101 10 95 193 34 466 828
51,592 42,655 17,329 11,030 25,991 30,314 1,818 317 1,834 355 350 45 264 45 1,250 113 208 " 2,548 436 30,299 37,233
11,931 2,770 570 136 297 456 104 563 210 1,904 460 350 67 2,260 163 1,317 II 4,566 1,266 12,114 18,772
---63,523 45,425 17,899 11,166 26,288 30,770 1,922 318 2,397 565 2,254 505 614 112 3,510 276 1,525 II 7,114 1,702 42,413 56,005

Pusad Taluka

Ol
~ •
O~
gj.
~ i
~ !i. ~
• ~ o ~ •
• .. !f. t.
III ~
• • ~.
!!! i
:l: i
!II i
'i ~ .. ~
~. ~ ;;
• lil • . ~
11\ ~.
~o
<> :;:0
'" l\l
'" • ~ 0
~O
~.
~.
~ II) ., ~ .
•
~ •
en o;t
~. ~.
" ~.
:t
i " !iI •
a !!S z: <t: z:

(1)
Adad
Ada.on
Akali
Amoni Bk.
AmaniKh.
Amati
Ambal.
Ambali
Ambllawhan
Ambgawhan
Amboda
Amdapur
Amdari
Amdari
Ana~twadi
Ansing
Are~'lc.n
Asoli
Asc·!i£FV) .•
Baldi
Bansi
Bar ..
Beldari
Belzawhan (FV)
Belkhed
Belura
Bhamb
Bhambarkheda
Bhandari ..
Bhatamba ..
Bhawani
Bhoiala
Bho,.
Bibi
Biiora
Bi ttargaon ••
Bi ttargaon .•
Bodkha(FY)
Bondhara
Borllaon
Bori(FV)
Bari Izara ..
Bori Kh ...
Population Code No. 1951 1961
(2) (3) (4)
103 112 225
72 756 943
309 451 714
193 686 686
194 384 500
66 417 402
247 592
239 572 770
257 14
265 37 15
164 1,295 1,443
293 521 559
98 89 133
244 48 54
196 480 603
86 200 315
110 578 785
133 702 83d
348 752
271 1,120 I,OG3
20 863 1,010
240 543 627
188 432 547
24 264 462
242 1.292 1,389
59 2,142 2,491
206 221 371
221 125 122
373 504
113 85 114
323 950 993
37 1.609 1.826
199 336 310
106 521 588
202 321 407
254 491 477
314 2.019 2,341
319
150 110 138
318 347 307
350 278 414
116 635 1,472
49 1.206 1,175
J-1812-1-6-A-(Yeot.)
37
ALPHABETICAL LIST OF VILLAGES AND TOWNS
3 PUSAD TALUKA
[ Entries in capital letters are for Towns and Urban areas]
Population Name of villaie Code
No. 1951 1961
(I) (2) (3) (4)
Bori Maehhindar ,. 52 848 1078
Bori Najik Chatara
Botha
Botha(FV) ..
Brahmana-aon
Brahmaniaon
Brahmi
Buti ]zara ••
Chalgani
Chat.ri
Chikani
Chi khol i
Chikhali (FV)
Chilgawhan
Chilli Izara
Chincholi
Chineholi
Chi:1Choli Sangam
Chinehpad ..
Chondhi
Churmur'
Dagad Dh,nora
DagadTh.r
Dahagaon .•
Daheli(FV)
Dahisawali
Dahiwad BL:.
DahiwadKh.
Darati
Deosari
Deothana
Dhamsari (FY)
Dhanai
Dhanl<i
Dhanoda
Dhanora
Dhanora (FY)
301 553 652
172 444 576
245 144 265
9 689 963
287 1.975 2.207
32 334 522
91 151 272
274 820 836
300 1.975 2,364
136 221 250
16 194 240
322 279 320
153 347 353
213 495 727
217 265 226
308 200 325
252 849 831
130 206 285
21 509 651
258 510 611
101 467 594
212 140 189
249 343 374
340
198 774 829
134 693 611
144 335 446
346 1.200 1.340
2g4 1.147 1.326
83 594 1,098
358
219 832 895
289 5,272 6.451
197 577 767
34 575 834
347
Dhanora (Saehaldeo) 283 729 787
DhansalMansal.. 45 1.043 1.358
Dhareh.tari 299
Dharlmnh. 139 201 135
Dharmoha .. 186 964 1,088
N arne of village
(1)
Dighadi
Diaras(FY)
Dindala
Dongargaon
Dongargaon
Dorli
Fetra
Fulsawangi
G.di
Gadi
Gag-anrnal
Gahuli
Ganjegaon .•
Gaul
Gaul Bk.
Gaul Kh.
Gaul Manjari
Ghadcli
Ghanmukh
Ghatodi
Ghonsara Iiara
Ghurphali
Guni
Hard.da
Harshi
Hatala
Hingani
Hiwalani
Hiwalani
Population Code No. 1951 1961
(2) (3) (4)
297 862 1.049
333
261 193 377
159 1.120 1,095
313 244 270
224
71 517 661
218 2,352 2.689
81
352 71 90
237 143 205
12 534 1.072
305 809 848
168 •
99 515 344
158 1.035 1,182
85 261 242
325 147 197
203 400 511
30 637 750
154 301 540
269 26
141 1.746 1.900
284 251 366
132 1.190 1.276
232 389 526
190 268 295
68 661 897
155 110 182
Hiwalani Palampat 97 524 590
Hiwara 179 1.961 2.129
Hiwardari 148 7-4
Hiwardari 195
Hiwari 127 450 486
Harkad
Hudi
Ijani
Inapur
Isapur
Isapur
Itawa
69 229 251
123 1.923 2,041
180 870 996
104 171 136
93 1.247 1,455
279 111 272
108 229 202
• Uninhabited,
Name of villa2'e
(1)
]agapur
Jamb
Jamb Bazar
Jamb Naik
Jamni Dhundi
Januna
lanuna
Januna
Jaoli
J awarala (FY)
Jawla
Jewali
Kadoli
Kalambula
Kaleshwar ••
Kalgaon
K.li
Kali
Kanha
Karanii
Karanji
Karanikhed
Karhol
Karkhed
Karla
Karodi
Kasar Behal
Kasola
Kati(FV)
Katkheda
Population Code No. 1951 1961
(2) (3) (4)
100 291 334
317 24 47
35 2,090 2,347
82 1.135 1,220
23 741 1.067
39 401 468
177 70 132
236 361 453
76 524 601
345 34 152
77 546 754
327 714 1.055
78 17
233 530 599
253 3
162 766 680
129 2.490 3,049
214 561 821
140 1.124 1,160
149 576 610
307 382 488
178 992 908
7 280 470
295 525 587
48 461 851
246 22 22
207 510 548
125 486 613
332 69
115 594 654
Kaudgaon .• 126 316 467
Kaurwadi Izora 163 156 39
Kaurwadi Izara 166 49 107
Kawath. (FY) 341 133
Kawath. Jahaair ,. 208 282 213
Keli
Khadak.
Khadakdari
Khairkhed.
Khandala
Kharbi
Kharshi
Kharus Bk.
225
167 512 542
53 930 1.178
75 200 299
73 461 632
360 957 1.0%
54 245 323
272 741 856

Name of villalle
(1)
Kharus Kh.
Khatkala
Kolha
Kondari Ijata
Kondh.i
Kopr. Bk ...
Kopra Bk. "
KopraKh.
Kopra Kh.
Korta(f'V)
Kosamhi (FY)
Kothari
Krishnapur ..
Kumbh.ri "
Kupti
Kurhadi
Kurli
Lakhi Jah'lIir
Lew.
Limbgawhan
Lingi
Lohar.
Lohara liar.
Lohara Kh.
Loni ••
Mabag.on
Mabism.l
Malasoli
Malegaon
Malkapur
Malkinhi
Malwakad
Mandwa
Manikdoha
Maniariawala
Mankesnwat
Manyali
Marlegaon
Matsui
Marsul
Mary,adi Bk.
Marwadi Kh.
Population Code ---No. 1951 1961
(2) (3) (4)
290 380 462
55
95 34 62
157 785 1.191
121 457 429
112 586 464
302 229 260
28 83 107
285 276 325
331 833 1.016
330 110
189 751 818
286 1.381 1,681
62 460 680
241
26
311
169
458 502
958 1.313
909 1.426
869 903
263 289 298
335 236 139
296 395 413
87 804 1,480
173 192 315
109 152 182
176 1,346 1,472
8 304 490
105 218 432
143 507 655
183 181 265
142 813 896
156 430 615
51 688 953
47 497 785
57 503 658
303 363 386
315 284 460
262 1,029 994
15 490 594
243 731 882
64 701 1.316
58 403 408
J-1812-1-6-B-(Yeot.)
38
3 PUSAD TALUKA-contd.
Name of village
(1)
Masalaga (FV)
Mohadi
Moh.di
Mohadi (FY)
Moha Ijara
Mokhad
Mop
Morath J ahagir
Morchandi (FV)
Mudana
MuIawa
Mungshi
Murli
Nagapur
Nageshwadi
Nanand Iiara
Nandala
Nandgawhan
Nandura Ijara
Nani (FV) "
NaTali
Nimbi
Population Code ---No. 1951 1961
(2) (3) (4)
316
145 686 1,028
220 179 403
339
31 1,086 1,522
11 303 450
74 729 740
160 1,648 1,659
329 333 748
191 2.286 2,447
227 3,167 3,348
19 622 854
334 428 539
256
250
79
231
200
65
8
411
494
133
223
349 17
27
433
849
177
399
Ningnoor J aha2'ir ..
292 621 796
44 I,m 1.307
278 1,755 2,224
Pachkuduk
Pahunmari
Palasi
Palodi
Pandhurna Bk.
Pandhuma Kh.
Panhala
Paradh
Pardi
Pardi
Pardi (FY)
Pardi (Bangala)
Parjana
Paroti Bk. (FVI
Paroti Kh. (rV)
Parwa
Pawanala (FV)
Pendha
Pendhi
88 285 294
230
238 1,067 1,203
114 70 111
61 388 477
13 705 987
56 330 421
6 490 826
41 1,406 1,630
259 139 173
321 137
228 502 503
275 424 466
343 145 234
342
14 695 896
344 47
326 29
151 870 1,432
* Uninhabited.
Name of village
(I)
Population Code ----No. 1951 1961
(2) (3) (4)
Pimpa1dari (FV) .. 184 95
Pimpaldari Palampat 102 491 564
Pimpalgaon 3 134
Pimpalgaon 27 294 390
Pimpalgaon 137 498 648
Pimpalgaon 205 454 406
Pimpalgaon (FV) .• 320 227 382
Pimpalgaon Ii,ra .. 67 280 479
Pimpalkhuta 22 406 576
Pimpalwadi
Pimpari
PimpriDiwat
Piranji
Pohondul
Pokhari
Pokhari
Pophali
Pusad NonHMunicipal Area.
PUSAD Urban Area
Rahur
Rajana Jabagir
Rajapur
Rajura
Rambha
Rangoli
Rohda
Sai hara
Sakara
Sandwa
Sanllam
Sarkinhi
Satala (FV)
Satelal
Sattarmal
Sawaleshwar
SaWana
Sawangi
118 95 103
192 292 252
234 473 515
277 484 623
181 1,115 1,073
122 430 358
170 1,018 1,113
235 1,039 1,149
107 N A 1,079
I 15,129 18,002
281 732 903
2 737 897
264 78 82
201 117 177
18 58 49
248
63 1,280 1,229
117 684 1,121
273 908 1.053
50 433 757
211 125 83
138 280 301
310
89 238 208
60 128 210
306 734 998
147 2.181 2.251
38 328 274
Sawargaon .. 337
SaWargaon Bangala 92 353 650
Sawargaon Ijara Gore 80 548 820
81 120 Senand 187
Shelu Bk. 111 861 971
N A = Not Available.
Pooulation Name of village Code ---
No. 1951 1961
(1) (2) (3) (4)
Shelu Kh ...
Shembalpimpri
Shilona
Shirfuli
Shirmal
Shirpur
Shiwani
Sindgi
Soit ..
Soit ..
Sondabhi
Sukali
Sukali Jahagir
Takali
Takali
Takali (FV)
Taroda
Tarodi
Tembhi
Tembhurdara
Tembuldar.
Thar Bk. .•
Thar Bk. (FV)
Thar Kh, ••
Therdi (Fy)
Titawi (FY)
Tiwadi
TiWarang
Tiwarang
Udadi
Udapur
Umari (FV)
36 227 263
96 2,769 3,043
171 1,288 1,488
282 459 489
312 152 214
152 499 609
70 337 429
304 238 258
288 413 477
324 162 218
338 329 575
84 1,109 1.234
251 1,932 2,069
268 410 546
280 269 362
356 675 747
229 1,050 1,208
124 39 9
215 933 1,061
185 154 289
291 393 733
210 288 301
353 89
209 16 21
351 301 465
354
267 499 518
182 895 1,142
226 610 609
4 443 625
336
355 110
Umarkhed Non- 255 46 89 Municipal Area.
UMARKHEDUrban II 10,596 12.647 Area.
Unchawadad
Uti
Uti
Vidul
Wadad
Wadad
298 396 474
90 10 47
175 1,035 944
270 4,012 4,154
33 915 940
204 553 907

39
3 PUSAD TALUKA-concld.
Population Population Population Population Name of village Code --- Nam~ of village Code Name of village Code Name of village Code
No. 1951 1961 No. 1951 1961 No. i951 1961 No. 1951 1%1
(I) (2) (3) (4) (I) (2) (3) (4) (I) (2) (3) (4) (I) (2) (3) (4)
Wadgaon .. 25 753 I,OIt) Wanegaon .. 223 463 452 Warwat 120 Veranda 29 129 220
Wadgaon (FV) 359 Wanoli Izara 131 294 658 Wasgawhan Deogaon 94 199 197 Yerandi (FV) 357
W.dsad 46 307 342 Wanwarla .. 17 1,213 1,252 Weni Bk. 146 912 1,002
Waghanath 165 376 332 Wardadi (FV) 276 Weni Kh. 119 980 981 Zadgaon 222 479 462
Wakad Kh. 128 166 390 Warud 43 814 909 Zadgaon 266 44 45 Yehala 135 259 262
Wakodi 161 1,379 1,389 Warud Bibi 260 358 396
Waltur 42 350 339 Warudi 216 509 527 Yekamba (FV) 328 155 246 t 1951 TOTAL 222,542
WaltudTamble) 10 504 767 Waruna 174 Yeldari Gajipur 40 719 830 1%1 TOTAL 2~5,O33
* Uninhabited. tThe 1951 population of the Taluka as given in this list differs from that mentioned in Table A-II.

VILLAGE DIRECTORY
Trans- Educa-
Village!T<JIfI1! port and tiona! Drinking
Po,ta! IllItitu- water Medical Seda! No. Ward tacilitie tions supply facilities
(l) (2)
1 Lakhi J ahagir 2 Rajana J ahallir 3 Pimpalgaon
(3)
4 Udadi •• R 5 Bhandari • • Po
6 Paradh .• Rh 7 Korho! 8 Mahismal 9 Brahmangaon
10 Waltur(Tamble)
" Mokhad 12 Gahuli .• RP~ 13 Pandhurna Kh. 14 Parwa 15 Marsul
16 Chikhali 17 Wanwart. 18 Rambha
13 r-g~~.~hi . . Po' •
21 Chondhi 22 Pimpalkhut. 23 J amni Dhundi . . R 24 Belgawhan (FV) . • R 25 Wadgaon
26 Kurhadi 27 Pimpalgaon 28 Kopra Kh. 29 Yeranda o Gh.todi •. R
31 Moh. liar. " Po 32 Brahmi 33 Wudad 34 Dh.nora 35 Jamb Bazar .. RP~
36 Shelu Kh. •. R 37 Sho;ala .. RPo 38 Sawang; 39 Januna 40 Yeldari Gaiipur
41 Pardi 42 Waltur 43 Warud (E) 44 Nimbi 45 Dhansal Man.a!
46 Wadsad 47 Mani kdoh. 48 Karla 49 Bori Kh. 50 Sandwa
51 Mandwa
.. R
.. RPo
.. R
.. R
.. R
.. R
.. Po
52 Bori Machhindar .. 53 Khadakdari 54 Kharshi 55 Khatkala
56 57 58 59 60
Panh.l. Maniariawale. Marwadi Kh. Beluta Sattannal
61 Pandhuma Bk. 62 Kumbhari 63 Rohda 64 Marwadi Bk. 65 Nandur. Ij.n
66 Amati
.. R
.. RRh
.. RPo
" RPd .. R
67 Pimpalgaon Ijara .. 68 Hiwalani .. R 69 Horkad 70 Shiw.ni
71 Felr. 72 Adgaon 73 Khandala 74 Mop 75 Khairkheda
.. R
.. R
.. RPo
(4)
p
p' p
p' P
M j. p
P" p' p
P
p'
P
p' P P
M p P P
p' P P
P M P P
P P P
p P P
I> p'
p' P M
(5)
Wfk W W Wx W
W Wx Wx Nx Riv
(6)
Wx W Mp'O WNx W Riv
RivW RivW M;' Riv RivWx W
WN WN WN WN W
W" Riv Riv WN
WN WNx Wx W W
W WS MpD Riv WX W
W RivW W WS W
W W W W Nx
NX Nx W W
w W \Vx W M~' W
Riv Riv W WTkx Sp
RivW W TkX Riv Riv
WX W W W wx
40
Area in
Sq_ Bazar Day Miles
Occupied
houses Hous:hOlds
(7)
Tue~day
Mo~day
(8) (9)
RURAL AREA
6.8 4.6 1.4 6·1 1.9
7·2 6.1 1.9 4.3 2.7
6·0 5.7 7.8 3.8 2.S
287 179 27
120 98
173 85
105 202 155
101 211 197 167 118
(IQ)
287 185 30
120 100
173 87
105 202 155
101 211 197 190 118
1.9 49 49 2.7 271 301 0.9 13 13 3.4 167 167 4.8 189 207
4.4 127 127 3.5 102 126 6.8 191 191 1·1 91 91
2.9 202 202
0.9 Uninhabited. 1·0 91 91
0.6 19 19 1.1 48 48 3.8 169 169
4.5 291 291 5'0 102 102 7·2 m 177 3.7 161 161 7.1 479 481
1.8 56 57 2.9 360 411 1'1 54 57
0.6 100 105 6.5 144 176
4.9 1.3 2.7 6·0
10.7
2·0 4.6 1.2 1·2
6.0
340 75
190 256 243
70 161 159 206 137
340 75
201 286 248
70 161 170 232 137
4.4 108 200 2·5 186 186 7.6 231 231 3.7 58 58 0.4 Uninhabited.
2.0 96 96 3·3 123 123 3.1 98 98 10·2 313 328 4.5 42 44
2.6 130 145 2.8 131 131 4.8 246 284 4.5 3i4 314 5.0 88 89
2·2 4·0 3·0 1.4 2.4
2.3 3.1 }·O 3·0 2.3
89 103 172 49 85
125 175 143 159 59
89 104 184 52 98
125 175 149 170
61
Scheduled Scheduled Li ter.t. and Tot3.1 PO;lPttation Castes Tribes educated
P M F M F M F M F
(II)
1.426 897 134 625 504
826 470 490 963 767
450 1,072
987 896 594
240 1.252
49 854
1.010
651 576
1,067 462
1.010
390 107 220 750
1.522 522 940 834
2.347
263 1,826
274 468 830
1,630 339 909
1,307 1.358
342 785 851
1.175 757
953 1.078 1.178
323
421 658 408
2.491 210
477 680
1.229 1.316
399
402 479 897 251 429
661 943 632 740 299
(12)
729 448
66 319 257
424 224 263 475 377
211 553 508 458 291
103 652 24
418 502
327 274 565 250 514
191 47
114 373
759 266 462 436
1.185
130 911 137 250 403
834 170 451 660 701
169 387 444 621 375
477 564 598 172
209 330 202
1.252 100
234 344 607 724 207
206 252 459 137 208
337 436 344 409 154
(13) (14) (15) (16) (17) (18) (19)
697 14 i3 449 68
306 I 247 5 ·s 402 246
~ '5 390 4 '4 239 519 479 438 303
137 600
7 2 2
II
25 436 508 24 33 324 4 5 302 I 2 502 212 496 '3
199 60 '3 's 1~~ 2 '5 763 256 '5 'j 478 4 13 398
1.162
133 7 9 915 42 48 137 2 3 218 427
796 10 10 169 29 33 458 647 38 35 657
173 398
~~ 2 '5 382
476 23 514 580 I'll
212 8 328 206
1.239 is 110
243
~~~ is :i92 12 192 I
28
5
is
4
13 16 3
1~ '7 ii 438 114 3; 26 221 4 7
324 4 3 507 288 i3 24 331 13 10 145 2 2
172 7 98 20 13 2 50 I 42 8
90 8 52 6 53 3
159 7 70 24
60 6 234 47
77 2 84 12 67 5
17 2 164 34
109 is 171 25
146 47 66 19
138 15 55 7
lOS 23
55 16 21 4 30 ..
116 14
192 16 63 ..
134 H 80 17
331 58
44 16 435 172
61 13 59 5
128 24
356 74 59 17
144 25 165 24 179 38
60 9 III 9 145 34 227 42 44 2
137 26 112 12 139 14 44 ..
67 33 70 10
299 74 23 4
66 12 49 I
223 35 157 22 31 I
38 6 56 4
102 16 15 I 52 4
42 4 141 20 113 17 130 22
17

Total workers (l-lX)
M F
(20) (21)
427 281 37
184 148
376 266 44
126 129
255 250 135 93 156 146 277 253 205 153
132 '155 313 287 304 279 285 255 166 157
65 435
16 253 330
176 181 324 144 304
Uninhabited.
57 290
13 242 199
138 136 235 105
41
123 113 31 28 74 60
235 220
420 163 2:;6 29j 733
72 528 87
145 250
521 101 256 406 427
102 2jJ 27& 332 235
387 155 220 2:l1 601
28 400 ill
III 243
440 70
175 386 374
104 241 178 83
183
30} 255 330 318 353 235 101 67
Uninhabited.
128 193 116 734 59
147 205 40j 450 135
128 162 272 87
150
211 261 202 257 85
112 178 20
593 40
134 18S 393 302 loa 107 134 274
79 130
209 235 102 219
90
M F
(22) (23)
253 158 27
1211 72
144 83
112 151 114
84 132 157 129 84
33 159
12 138 95
91 94
158 91
126
41 2l 38 92
202 83
180 135 303
IS 124 29
100 141
238 31 91
153 190
36 99 70
142 137
145 180 186
51
73 121 43
424 33
III 147 2-17 173 69
77 66
129 45 77
161 146 64 96 38
233 168 34 5B 60
154 4
109 5
28
103 128 105 114
4
18 59 8
152 18
67 58 58 70 2
4 ZO 40 92
203 67
128 III 193
I 46 27 70
125
139 lj 29
1)9 165
2
" j
48
93 177 lI8 23
58 15
283 17
m 133 225
80 45
65 29
138 47 72
172 83 2
83 35
11
M F
(24) (2\)
132 97 7
')7 65
137 94 9
67 68
91 96 50 89 38 35
107 248 82 125
42 50 152 148 136 174 119 J36 75 153
29 Z]6
4 90
180
64 80
bY 43
150
80 d
3:) 110
2u6 7j 6j
144 335
45 247 50 42
100
230 55
12) 225 205
63 144 113 16S 92
135 153 159 49
47 69 56
244 24
28 51
130 230 60
44 84
131 36 53
41 10·1 112 125 45
39 2jiJ
:, 77
17)
70 78
177 28 39
IO~ a
20 126
134 3$ 92 14~ 401
27 322 j2 41
116
285 51
145 226 206
102 235 159 83
135
155 141 167
44
54 163 20
307 23
33 SI
164 218 63
42 103 135 32 54
37 150 99
136 54
III
M F
(26) (27)
II 10
1 I
8
2 I
2 8 I
13
'4 2 I
58 3
2
I 4 4 5 3
OJ I
's 5 I
'j
2 4
2
2
7
'j
6
41
WORKERS
IV
M F M
(28) (29) (30)
V
F
(31)
RURAL AREA
18
I 1 3
4 2 4
\ 2
2
; '4 3 I
'5 2
I~ ':2 I
9 9
i5 () I
I 2
12
io '2 OJ
3 2 I 4 Z
14
I 12
'4
"7 I
15 13
'j I
U
I Jj
2
2 I 9 I I
10 3 13 3 I
I
I~ 8 14 'i I
II I 2
4
23 I
I 4
12 15 3
1
2
2
'4 2
3 2 5 I 3 ., 4
2 I 1 2
I
2
'4
'3
I 3 2
".
M
(32)
2
2 J , j
6
4
17
20
"(, 3 I
'j 5
'3 2
I 3 6
2
VI
F
(33)
3
3
3 PUSAD TALUKA
VII VlII IX
1\1
(34)
F M F 1\1 F
(35) (36) (37) (38) (39)
4 2
·i 2
6 I
, 3
I I 2 5 2 3
7
4 6
'i 3
42
2 15 I I
7 2 I
'j
OJ 6
10 2
2
2 I
2
4 II
'4 3 I
2 2 I
'(,
2
5 I
I
2
3 2
2 2
2
I
2
I 2
6 I 9 I
7 5 2 2 3
4 i
1. 4 2
3 14 2 b 4 4
3 14 I
ji) iiJ 25
6 3 3 I I £
']
6 2 3 6
23
5 38 2 2 3
14
9 I 6 2
19 5
II
2 4
60 18 12 3
9 2 7
2 5 5
20
7 3 8
10 'j Z
4 6 3 I 4
5 6
14 9 Z
NONWORJ(£RS
---- S,rial M f No.
(40) (41) (I)
302 107 29
\.); 109
321 I Id3 2 24 3
11111 4 IIIl 5
169 152 6 d~ IS3 7
107 61 d 19d Lb 9 172 Lii 10
79 84 II 240 23~ 12 204 ~Oil 13 173 Id3 14 ILj 140 15
33 217
d 16j 172
151 YJ
241 100 210
68 10 .jtJ
IJ6
339 103 206 141 4:;2
58 383 50
10; 153
313 69
195 254 274
67 137 168 269 140
80 16 31U 17
I": Id 194 19 j09 LO
186 21 I~b U 207 23 W7 :':4 4jj :b
26 86 27 32 Li! 40 U
15j 30
376 31 101 3l 2jll 33 137 34 561 :>5
105 36 515 37
56 38 107 39 11:14 40
356 41 99 42'
283 43 261 44 283 45
69 46 157 <47 229 48 466 49 199 5Q
174 221 51 228 196 5. 240 295 51
71 84 54
81 132 86
513 41
87 130 202 274
72
78 90
187 50 5S
126 175 142 152 69
5:;
100 56 150 5) 186 53 646 5~
70 60
89 61 150 62 229 63 290 64
84 65
89 66 93 67
164 68 35 69 ~\ J\l
115 71 272 72 186 73 112 74 55 75

VILLAGE DIRECTORY
Serial No.
Villa~e IT Qwnl Ward
Tral)s~ port and
Postal facilities
(I) (1)
76 laoli 77 Jawla .. R 78 Kadoli .. R 79 Nanand Ijar. .. R 80 Snwargaon Ijara Gore R
81 Cadi 82 Jamb Naik 83 Deothana 84 Sukali 85 GauJManjad
86 An,ing 87 Lohara Ijara 88 Pachkuduk 89 Satelal 90 Uti
.. R
.. R
91 Su ti lzara .. 92 SaWargaon Bangala .. R 93 isapur .. 94 Wa,ga"han Deogaon 95 Kolb.
(3)
96 Shembalpimpri .. RPo 97 Hiwalani Palampat .. 98 Amdari .. R 99 Gaul Bk.
100 Jagapur
10 I Dagad Dhanora .. 102 Pimpaldari Palampat 103 Adad 104 inapur 10) Mala,oli
IQ6 Bibi 107 Pusad (I)
Pusad (2) 108 !tawa .. R 109 Loni 110 Aregaon .. R
III Shelu Bk. 112 Kopra Bk. 113 Bbatamba 114 Palodi 115 Katkheda
116 Bori izara 117 Sai Izara 118 Pimpalwadi 119 WeniKb. 120 WaIWat
121 Kondhai 122 Pokhari 123 Hudi 124 Tarodi 125 Kasola
126 Kaudgaon 127 Hiwari 128 Wakad Kh 129 Kali 130 Chinchpad
131 Wanoli Iz.ra 132 Harshi 133 A,oli 134 Dahiwad Bk. 135 Yehala
136 Chikani 137 Pimpalgaon 138 Sarkinhi 139 Dharkanha 140 Kanha
141 Guni I·n Malkinhi 143 Malegaon 144 Dahiwad Kh. 145 Monadi
146 Weni Bk. 147 SaWana 148 Hiwurdari 149 Karanj; 150 Bondhara
.. R
.. R
.. RI~RPo
.. R
.. Po"
" RPo
" RP~
Educa. tional Drinking
Jnstitll~ Water tions suppl y
(4)
P
P p
ii P P
P P
p' P
M P
P P
P
ii P
p
p p
P
P M p'
P P
M
M p
P' p
M P P P P
p Vi
(5)
W Riv Sp WN Wx
Ri~W Wx Riv Riv
Nx Wx Riv Riv WNx
W WTkx Nx Hiv Riv
Wx W W Riv Riv
W W W Wx \".Ix
W RivW
W W W
W W W W W
W W W W
WN W Hi,'W W W
\\' Riv W WS W><
\V \1.,'5 W W Riv
Riv W W Riv RivW
W WN W W wN WX W Hiv W Nx
Medical facilities
(6)
Mp
42
Area in Sq.
Bazar Day Mile3
Occupied
houses Households
(7) (8) (9) (10)
RURAL h.REA-contd.
Frid~y
Sat~;day
2.3 3.0 0.8 4.9 3·0
123 148
3 179 143
0.8 Uninhabited.
123 165
3 179 157
7.7 246 246 6.6 197 219 3.4 205 239 2.5 47 49
3.4 57 65 6.0 267 275 1. I 46 55 1.1 47 48 2.0 10 10
2.0 4.8 3.6 0.5 0.4
51 129 277 28 17
51 129 290 40 17
Monday 4.8 523 114 26 75 60
594 116 26 75 82
Monday Thursday
2.5 2 .. 8 2.2 2.2
3.6 102 2.6 112 3.7 39 2.8 32 2.9 77
4.6 114 12.2 231 Urban Area I. 1.4 45 1.0 ?8 4.9 1)2
III 112
39 32 79
131 231
45 38
152
4.1 207 207 1.4 99 99 1.4 24 24 1.4 24 24 3.2 113 113
13.7 272 272 220 220 n 22 2;
3.1 198 199 1.2 Uninhabited.
2.5 1.7 5.7 1.6 2.9
4.7 1.1 1.7
18.2 3.5
4.4 2.1 3.3 5.3 2.5
1.0 3.7 3.7 1.6 5.7
5.0 4.5 3.6 3.1 1.3
5.2 3.6 0.4 30 0.5
93 89
424 I
121
102 105 85
635 57
128 258 172 m 47
50 US 60 32
239
412 1:;5 i33 107 19()
193 421
')
123 30
98 90
424 I
J21
102 103 85
641 57
128 258 172 133 47
50 13~ 60 32
239
412 155 134 107 196
202 421
9 126 30
T olal Population
p
(II)
601 754
17 849 820
1,220 1,098 1,234
242
315 1,480
294 208 47
272 650
1,455 197 62
3,043 590 133 344 334
594 564 225 106 432
588 1,079
202 182 78)
971 464 114 III 654
1,472 1.121
)03 9~1
429 353
2,04i <)
6iJ
467 486 3YO
3.0-19 28)
653 1,276
833 61 I 262
250 b48 301 135
1,160
1,900 896 655 446
1,028
1,002 2,251
74 610 133
M
(12)
283 374 il
439 413
621 553 605 126
156 665 146 104 25
129 328 719 97 37
1,571 275 63
179 169
295 279 115 68
222
288 :;48
111 92
414
480 237
51 64
341
744 560
43 486
197 176
1.067 5
303
234 243 197
1.562 i:)Q
325 623 430 310 U3
121 317 159 60
584
972 464 341 239 512
522 1.133
38 295
73
F
Scheduled Castes
M F
Scheduled Literate and Tribes educated
M F M F
(13) (14) (15) (16) (I~) (13) (19)
313 380
6 410 407
27 30
'j
599 IS 19 545 3 7 629 54 43 116
159 815 148 104 22
1i~ '9 '9 736 18 24
I~ I '3
1,472 315
70 165 165
299 285 110 68
210
300 531
91 90
371
491 227 63 47
313
728 561 W
495
232 182 97·\
4 310
23l 243 193
1,487 ISj
333 653 408 301 1":9
38 50 28 31 3 3 9 8
12 13
29 10 3
34
39 96
24 9
i6 10
9 21
43 19 41
57
42 3
29 9 4
36
39 96
34 15 2
10
" I:)
27
55 14 33
I
47
50 6
129 331 32 37 142 35 33
5~i i7 i4 928 80 92 432 2 314 2Q7 516
480 I,IIS
36 315
65 19 19
52 109
2 64
100
I 22
ii 7
210 32 137 7 247 49
41 3
47 7 81 6 44 3 29 5 7
17 56 '3
247 43 37 7 12
695 224 79 17 5 I
79 15 65 10
55 49 9
18 25
54 123
12 32 86
I" 46 5
14 82
115 92 9
143
72 42
313 I
63
46 76 28
603 21
67 212 153 79 13
5 4
'4 I
5 24
'5 8
29 3 2
13
26 8 6
42
I 13 69 3
13
5 17
193 I
12 40 23 6
52 3 29 9 52 8 21 4
190 56
349 91 152 27 65 8 60 II
1)6 33
178 517
14 99 6
48 135
4 24

Total worken (I-IX)
M F M F M
II III
F M F
(20) (21) (22) (23) (24) (25) (26) (27)
i82 75 221 163
(> 4 240 83 261 224
U.I nhabit,d. ;7) 321 340 32j 368 137
7d 75
92 79 354 218 IOU 74 70 55 19 10
90 81 17d 121 444 262 52 18 28 5
933 222 165 167 38 47
106 50 III 10
186 70 178 98 68 30 41 14
136 117
193 90 330 298
U"lan Areal. 64 61 52 57
232 222
291 281 136 114 31 33 43 27
207 130
430 415 318 342 24 25
300 266 Uni.\abit,d.
124 120 688
3 185
144 146 132 951
81
218 379 266 182 80
152 108 516
2 161
153 142 115 670 77
208 294 264 159
16
63 9 202 202 105 81 37 13
388 270
624 298 185 141 310
535 216 80
128 303
326 223 690 385
21 16 190 129 46 45
13" 10&
4 94
127
197 IY9 198 38
49 2)0 )0
30 16
65 102 159 38 3
342 79 25 50 41
85 91 49 28 93
93 75
30 32
134
141 45 20 21 94
224 175
10 100
68 52
245 2
90
86 73 57
307 43
122 116 112 83 30
29 66 44 20
142
297 1 So lOB 64
203
157 302
12 97 30
43 I
15 19
193 170
8 4
3 201 40 29
9
44 46 56
6
61 3
32 9 2
3 41 7
';iJ 43 65
26 23
119
134 36 20 10 45
216 182
13 90
72 49
147 2
89
93 66 54
230 30
126 2
131 61 1
2 61 IS
73 254 109
3 53
213
;~
88 2
l36 i22
142 lid 104 37
34 6d 35 25 2
20 70
174 14 12
285 74 12 53 31
59 79 16 13 41
79 200
34 20 87
127 68 10 18 95
194 130
12 163
50 53
369 I
85
57 70 73
403 36
87 215 m 95 50
34 131 56 10
192
251 115
74 74 99
7i 120
3 6~
205
122 149 127
71
75 17 34 26
I
36 75
198 12 3
141 Ib4
15 41 6
49 56 23 14 47
47 227
3S 34
103
144 77 13 17 85
195 158
12 168
80 56
359
71
60 76 61
422 47
80 282 124 93 15
7 139 62 13
195
264 104 77 70 90
79 137 141 37 290 336 R 6 8
68 85 61 30 16 15
3 12 20
I
4
2 j
I
2
II
31
io 11
15 I
4
3
i4
I 33 r
j.j
6
5 14
43
WORKERS
IV
M F M
(28) (29) (30)
V
F
(31)
RURAL AREA--collid.
s j
16 5
17
I 6 4
29 's 5
67 IU 4 4
10 I
~ . i I
I 13 5
12
2 2
15 ·6
I 28 6
4
.j
I
I 2 5
49 i6 i3 I
2 20 14
31 14 I
'j
II 20
2 8 9
3 2
·4 I
8 .j
3 2
3
2
VI
M F
(32) (33)
2 14
II
21 I
II
7
·5 I
2
I 2
VII VIII
M F M F
3 PUSAD TALUKA
IX
M F
NONWORKERS
M F Serial
No.
(34) (35) (36) (37) (38) (39) (40) (41) (1)
4 2
12 I
3 32
67 I
.:'
2 )
3 8 I
3
I~ . j
5 5
2 2
4
2 2 5 0 i
2 I
75 OJ j
3 II 4
·s 6 3
I
5 26
·4
.j
2
3 6 I
10 4
10 2
3 4 3 3
3 I
20 2
I I
109 19 2 I 3
14 I
13 17 2 2
2
2 19
7
10 4 I 2
18
4 3 2
II
2 5 I
20
2
I 3 I
63 7
3 II I 7 2
°i 3 3
13
27 5 I 3 6
7 30 4 3 3
:o~ 238 76 153 217 77
5 2 78 199 327 79 152 183 80
81 2-16 278 82 213 220 Il} 237 492 114
48 41 85
64 80 86 311 597 87
46 74 88 34 49 89 6 12 90
39 62 91 150 201 92 275 474 93
45 82 94 9 20 95
638 1.250 96 110 146 97 25 23 98 73 11599 58 155 100
109 229 101 101 187 102 47 80 103 27 54 104 86 93 105
95 218
47 40
182
189 101 20 21
134
314 242
19 186
73 56
379 2
118
90 97 65
611 49
107 244 164 128 53
210 106 233 107
30 108 33 109
)49 110
210 III 113 112 30 113 20 114
183 115
313 116 219 117 35 118
229 119 120
80 121 74 122
458 123 2 124
149 125
80 126 101 J27 78 128
817 129 78 130
125 131 359 132 144 133 142 134 113 135
53 120 136 115 129 137 54 61 138 23 62 139
196 30r; 140
3013 393 141 166 216 142 156 234 143 98 79 144
202 213 145
196 443
17 105 27
252 1,)6 733 147 20 148
186 149 20 150

VILLAGE DIRECTORY
Serial No.
Villa~e/T own{ Ward
(ll
151 Pendhi 152 Shirpur
(2)
153 Chilgawhan 154 Ghonsara Ijara 155 Hiwalani
156 Malwakad 157 Kondari Ijar. 158 Gaul Kh 159 Dongargaon 160 Morath Jahagir
Transport and Postal
facilities
(3)
R .. R
Po" .. R .. R .. RPo
161 Wakodi .. R 162 Kalgaon .. R 163 Kaurw&di Izara 164 Amboda .. Po" 165 Waghanath
166 Kaurwadi Izata . . R 167 Khadaka .. R 168 Gaul 169 Lewa .. Po" 170 Pokhari
171 Shilona 172 Botha 173 Lohara Kh. 174 Warun. 175 Uli
176 Mallagaon 177 Janun, 178 Karanjkhed 179 Hiwara 180 Ijani
181 Fo~o"dul 182 Tiwarang 183 M,lkapur 184 Pimpaldari (FV) 185 TembhuY'dara
186 DI,armoha 187 Smand 188 Beldari 189 Kothari 190 Hingani
191 Mudan. 192 Pimpari 193 Amani Bk. 194 A'nani Kh. 195 Hiwardari
196 Anan !Wadi 197 Dhanoda 198 Dahisawali 199 Bhosa 200 N andgawhan
201 Rajma
.. RPo
.. R
.. R
.. RPo
" RP~
.. Po
.. R
.. R
" RPo
.. R
.. R
.. R
.. R
202 Bijora .. R 203 Ghanmukh 204 Wadad 205 Pimpalgaon
206 Bhemb 207 Kasar Behal 208 Kawalh. Jahagir 209 Thar Kb. 210 Thor Bk.
211 Sangam 212 D •• ad Thar 213 Chilli Izara 214 Kali 215 Tembhi
216 Warudi 217 Chincholi 218 Fulsawangj 219 Dhanaj 220 Mchadi
221 Bhambarkheda 222 Z.dgaon 223 . Wanegaon 224 Dorli
'22~ Keli l.\'Ii:. •• _
Educational lnstitu~
tions
(4)
P P P P
P
M M P
P P
i; P
p'
M M
P
p'
ill
p' M P
M P
P
p' P P
M p' P
i; P P
p'
P P P
P
M P
i; P
Drinking water supply
(5)
W W Riv W W
WX WN Riv W RivW
RivW RivW W W Riv
Rivx P~v
W W
WNx W W
WN RivW Riv RivW RivW Wx
\IN \\;N \\iN
Nx' \'i'N Nx Nx W N
w w W \if
Riv Ri"W WN RivW N
WN N N WN WN
\\iN RivW Ri" Riv Riv
Riv WX WN WN W
W WI" WS Wx W
Medical facilities
(6)
Bazar Day
(7)
44
Area in
Sq. Miles
(8)
Occupied
houses
(9)
Households
(10)
RURAL AREA-contd.
Wed~esday
Sun;iay Tuesday
Friday
SlJnd~y Thursday Wednesday
Wednesday Thursday
Monday
6.5 3.7 1.2 3.7 3.7
1.4 8.5 5.6 5.0 1.3
281 137 72 87 39
125 205 218 226 339
281 137 72 87 39
125 205 218 226 348
3.4 280 284 1.9 128 128
~:~ 23~ 28; 1.4 69 69
1.8 27 27 2.7 107 108 o 2 Uninhabited. 3.6 172 172 5.9 215 215
12.4 303 303 2.7 III III 1.5 62 62 I 7 Uninhabited. 2) 187 188
3.1 2.4 3.5 S.1 5,2
1.8 4.2 0.7 1.4 4.0
5.6 5.5 3.9 2.4 1.7
336 339 25 25
162 i63 415 415 204 204
243 243 218 218 62 62
Uninhabited. 54 5·1
197 27
III 174 64
203 27
111 174 64
8 2 473 473 1.9 47 47 1.1 144 144 2.9 98 98 1.8 Uninhabited.
1.6 1.8 2.0 2,6 3.1
1.4 1.4 5.7 4.4 3.3
6.2 2,9 1.6 0.4 1.5
1.3 7.8 4.6 3.0 3.0
1.8 1.5 5.7 3.7 2.0
117 180 173 84 35
36 81 90
189 75
70 100 50 2
21
19 35
122 147 207
97 48
655 161 76
124 180 173 84 35
36 81 90
190 75
75 113 50 2
50
19 35
122 147 207
108 48
655 161 76
0.5 22 22 1.1 9b 9t) 0.9 97 97 0.9 Uninhabited. 0.7 Uninhabited.
Total Population
P M
(11) (12)
1,432 609 353 540 182
615 1.191 1.182 1.095 1.659
1.389 680
39 1.443
332
107 542
903 1.113
1.488 576 31)
944
1.472 ' 132 908
2.129 996
1,073 1.142
265
289
1.088 120 547 818 295
2,447 2;2 686 500
603 767 829 310 177
i77 ,teO 51 J 907 406
371 548 213
21 301
83 189 727 821
1,061
527 226
2.689 895 403
122 462 452
719 310 184 260
94
313 602 617 557 836
712 345 20
733 166
58 268
460 543
769 272 162
475
733 57
479 1.168
511
536 535 114
137
543 66
276 427 151
1.233 127 311 259
303 393 4:;9 163 102
87 214 244 456 211
185 282 115
10 147
45 93
358 417 542
256 135
1.379 447 196
59 244 229
Scheduled Scheduled Literate and Castes Tribes educated
F
(13)
M F M F M F
(14) (I;) (16) (17) (18) (19)
713 7 7 299 28 23 169 39 33 280 4 'i
88 13 19
302 589 565 538 823
10 101
7 103
677 46 44 335 27 31
19 710 52 68 166 21 24
49 I 3 274 36 40
443 33 38 570
719 10 10 304 33 40 153 I
469 39 40
739 75
429 961 485
537 557 151
23
16 46 35
33 3j
2
26
is 36 26
25 30
2
545 16 12 54
271 2 '3 fll 'i
1.214 125 I 375 11 241 S
j 9 2
298 37 35 369 4 3 390 70 58 142 8 7 75
90 19l 207 '(, '5 451 8 8 195 7 12
186 3 2 266 10 8
98 24 29
IU 'i 1
38 II 15 96 10 II
369 11 12 404 9 9 519 46 41
271 4 91
1.3 iO 48 46 448 8 9 207 2 2
63 210 17 223 15
'9 14
121 29 88 18 76 6 48 S 24
73 114 140 183 424
10 18 13 35
143
207 46 139 43
6 I 317 108 80 31
21 Z Il5 33
182 48 )52 30
228 32 60 3 21 2
190 46
368 12
191 562 229
192 174 3!
19
114 I
40 95 48
57 29 4
159 26 10 57 iii
107 23 55 10
455 75 47 20
1.,1 16 63 11
79 17 187 41 140 25 62 20 12
17 I 71 12 30 2
116 18 32 6
32 3 65 6 35 I 6 1
42 II
10 I 12 2 69 16
137 24 198 24
102 30 14 I
561 138 74 9 27 2
22 11 91 19
128 20

Total workers (I-[X)
M F
(20) (21)
430 2[2 115 [77 66
199 374 364 365 501
430 202
16 437 109
375 173 116 162 55
177 295 217 240 130
162 185
15 218 78
M
(22)
238 108 49
118 41
130 \50 173 134 \44
131 83 11
168 41
F
(23)
220 97 50
116 40
120 120 90 4
38
93 12 14 23
1I
M F
(24) (25)
183 ,88 59 55 19
62 204 169 191 210
217 99 4
202 55
154 72 66 46 15
56 175 127 224
85
156 92 3
191 55
32 25 14 10 18 15 170 126 61 33 62 71
Uninhabited, 273 127 155 13 97 113 311 66132 13 154 50
469 301 226 85 204 213 171 162 82 72 81 90 103 83 17 11 74 70
Uninhabited, 293 185 115 10 153 172
408 251 38 29
306 194 630 259 316 26
350 30 356 26 15 7
Uninhabited, 79 79
334 342 43 33
159 154 250 207 86 41
732 535 79 77
202 196 140 149
Uninhabited,
200 158 246 185 260 62 103 71
61 29
56 50 123 112 155 134 300 282 134 132
126 172 73 4
92
29 66
230 255 360
159 91
837 285 118
117 134 64 4
76
21 58
203 230 274
118 53
552 232 126
33 24 157 118 135 90
Uninhabited, Uninhabited,
139 23 193 227 22 14 16 15
155 96 117 94 236 43 276 209 127 4 160 19
131 7 155 23 151 2 168 23 36 2 37 5
68 58 10 21
In 1M 1M 1" 21 16 20 17 94 99 58 55
141 113 87 87 32 52 41
282 167 370 365 43 26 32 51 97 105 91 91 79 86 55 62
59 63 87 35 48
28 72 72
172 63
82 99 28 4
31
6 32 41
118 167
65 II
178 155
90
21 109 74
42 44 10 12 19
26 66 68
141 53
80 74 26 4
20
2S 14
119 93
9 5
123 80 92
12 73 27
113 115 123 130 123 50 63 58 10 10
27 24 49 46 80 66
104 141 52 75
39 64 34
57 19 32
144 97
170
87 61
322 87 25
10 30 51
37 60 38
56 21 30
188 102 177
109 48
381 138 34
12 34 63
J-1812-1-7-A-(Yeot,)
III
M F
(26) (27)
'i 2
20
's
"s
" I
4 I
'7 13 7
5
17
'i
2 'j 2
3 7
II
I
'i 7
'j 7 6
'j 33 I
2
'j
'j
45
WORKERS
IV V VI
M F M' F M F
(28) (29) (30) (31) (32) (33)
RURAL AREA----coTlld,
's 3
4
I 5 3
15 41
13
ii 3
1 4
'9 5
3
'j
'(,
"3 2 4
23
15 7 'j
'9 '2 4 I
10 3
8 3 8 I
13 3
10 7
i i '3 'i 21 I 8 9 I
14 9 II 2 1
10 3 3 I
~ '5 'j
12 12
'j 'j
5 10 22
~ '6 I 2
2 8
2 3
'5 1
13 '3 2
7g i6 20 14
I
ii ii 2
I
3 3
'i I
"i 9
'j 4 I
4 I
'4
2
3 3 3
2
3
'j 6
5 I
7 8
"3 2
2
I 14 I
[0 38 7 I
'j
'j
"3
VII VIII
M F M F
(34) (35) (36) (37)
3 1
'j
2 6 2
10 50
14 2
i5
's
2
I'
ii
1 I
'2
4 3 2 2
5 I
2
3
8 2
'(, J 32 I 2 6
8 10 I I
4
4 I
19
's I 'j
5 2 7 '2 3 9
3 I
3 II 3
2
103 6
I 2 2
'.
3 PUS AD TALUKA
IX
NONWORKERS
----Serial M F M F No,
(38) (39) (40) (41) (I)
5 4 2 I 2
4 4 8
10 29
16 10 J
20 10
2
ii ij 6 8
10 2 9
4
46
8 36 "5 7 2
22 13
6 I 2 8 2
34 4 4 3
I~ "5 6 5 'j I
1 2 I 7
12
4 4 I
'4 I J
28 I 6 5 I
3 3
79 '8 9 I
I 3 5
289 338 151 98 126 152 69 ' 53 153 83 118 154 28 33 155
114 125 156 228 294 157 253 348 158 192 298 159 335 693 160
282 515 161 143 150 162
4 4 163 296 492 164 57 88 165
26 24 166 98 148 167
168 187 316 169 232 504 170
300 418 171 101 142 172 59 70 173
174 182 284 175
325 488 176 19 46 177
173 235 178 538 702 179 195 459 180
186 507 181 229 531 182
39 144 183 1M
58 73 185
209 203 186 23 21 187
117 117 188 177 184 189 65 103 190
501 679 191 48 48 192
109 179 193 119 92 194
195
105 140 196 152 1M 197 179 328 198 65 71 199 41 46 200
31 91 89
156 77
59 110
42 6
55
16 27
128 162 182
97 44
542 162 78
26 87 94
40 201 81 202
133 203 169 204 63 205
69 206 132 207 34 208
7 209 78 210
17 211 38 212
166 213 174 214 245 215
153 216 38 217
758 218 216 219
81 220
39 221 100 222 133 223
224 225

VILLAG E DIRECTORY
Serial No.
(I)
Vilia2e /Town/ W.rd
(2)
Trans .. port and Postal
facilities
(3)
226 Tiwarang 227 Mul.wa .. RP~ 228 Pardi (Bang.la) 229 T aroda . . R 230 Pahunmari
231 Nandala 232 Hatala 233 Kalambula 234 Pimpri Diwat 235 Pophali
236 Januna 237 Gaga~mal 238 Pal.,i 239 Ambal; 240 Bar
241 Kupti 242 Belkhed 243 Marsul 244 Amdari 245 Botha (FV)
.. R
.. RP~
R .. Po
246 247 248 249 250
Karodi Ambala Rangoli Daha.aon .• R Nage$hWadi .. n
251 252 253 254 255
Sukali Jahagil ., RPo Chincholi Sangam .. Kal",hwar Bittargaon Umarkhed (1) Umarkhed(2)
256 Nagapur 257 Ambgawhan 258 Churmura 259 Pardi 260 Warud Bibi
261 Dindal. 262 Marlogaon 263 Limbgawhan 264 Rajapur 265 Ambgawhan
266 Zadgaon 267 Tiwadi 268 Takali 269 Ghurphali 270 Vidul
271 Baldi 272 Kharu. Bk, 273 Sakar, 274 Chalgani 275 Parj,no
276 Wardadi (FV) 277 Piranii
.. RP~
.. R
.. R
.. R
.. RP~
.. R
.. RPo
.. R
.. R
278 Ningnoor J .h8llir .. 279 Isapur 280 Takali
281 282 283 284 285
286 287 288 289 290
291 292 293 294 295
296 297 298 299 300
Rahur Shirluli '. Dhanor. (Sachaldeo) Hardada " R Kopr. Kh. " R
Krishnapur Brahm.ngaon Soit Dhanki Khorus Kh.
Tembuld.r. NaTali Amdapur Deosari Karkhed
Llhara Dighadi UnchaWadad Dharchatari Chatari
" RPo " RPo
.. rrr~
.. R
.. RP~
J- J812-1-7-B-(Yeot.)
Edue •• tionnl
bstitu .. tions
(4)
P P P M
p P M
p' P P
P P P
P
P P
p'
p' p'
P P
ii P
M P M M P P
p' P
P P p
M P P H p
p' P p p
p p p
M
Drinking Water supply
Medic,1 facilities
(5)
Riv W WN WN
W WX Riv W
W wx W W RivW
WN WS W Nx W
WN
\vN W
WS Riv Riv W W
W W W W W
W RivWX RivX W W
W RivWX WNx
(6)
WS M~'
W RivW RivW Riv W
N W W N
Riv Riv W W W
W WX W WN Nx
W WN WN RivWS Riv
RivW Riv Riv
Ri~W
Bazar Day
Tue~day
46
Area in
Sq. Mile.
(8)
Occupied houses
(9)
Households
(10)
RURAL AREA-conld.
3.4 128 128 5. I 691 691 1.6 99 100 2.8 221 230 2.2 Uninhabited.
0.6 Uninhabited. 0.4 104 104 2.0 121 122 2.1 117 117 1.9 222 224
1.4 2.1 3.4 5. I J.7
0.4 4.9 3.4 2.8 2.7
83 35
231 145 122
110 26D 154
9 54
83 35
231 150 131
110 267 154
9 56
0.9 5 5.1 Uninhabited. 0.2 Uninhabited. 0.4 66 69 1.0 83 83
2.2 379 386 2.1 174 174 0.4 I I 2.2 89 89 9.0 21 21 Urban Area II.
2.0 1.0 0.4 0.4 3.8
4.9 2.6 0.6 0.4 0.3
7 4
115 32 80
66 197 55 16 3
7 4
115 32 80
66 197 55 18 3
1.1 12 12 1.7 76 99 3.0 104 117 1.0 Uninhabited .
13.4 873 873
3.2 169 197 2.6 153 177 2.5 208 214 4.0 213 213 1.4 96 %
NA Uninhabited. 4.5 104 112
16.0 411 421 2.2 48 48 1.9 78 78
3.5 2.6 2.4 2.6 2.6
9.4 3.8 5.5
10.1 I.3
6.4 6.3 3.2 3.8 1.8
1.5 2.0 1.9 0.5 8.2
171 187 93 98
120 139 66 78 62 62
313 320 336 443
81 99 1,028 1,272
87 95
156 156 163 168 124 124 225 252 103 118
74 92 179 214
75 84 Uninhabited.
419 481
Total Population
P M
(II)
609 3,348
503 1.208
526 599 515
1.149
453 205
1,203 770 627
502 1,389
882 54
265
22
374 433
2,069 831
3 477 89
27 14
611 173 396
377 994 298 82 IS
45 518 546
4,154
1.068 856
1.053 836 466
623 2,224
272 362
903 489 787 366 325
1,681 2,207
477 6,451
462
733 796 559
1.326 587
413 1.049
474
2.364
(12)
314 1.683
254 607
254 293 251 567
242 91
589 385 319
272 695 450 25
141
IJ
177 226
1.069 406
2 244 50
17 9
304 87
206
1% 513 155 36 9
25 258 262
2,033
568 453 531 423 242
315 1,102
148 186
461 239 386 174 145
825 1.099
230 3,230
233
360 405 277 675 282
218 528 232
1,171
F
Scheduled Caste,
M F
Scheduled Literate ""d Tribes educated
M F M F
(13) (14) (15) (16) (17) (18) (19)
295 34 21 1.665 101 130
249 10 14 601 34 41
272 32 33 306 32 37 264 16 13 582 17 18
211
~:~ 23 i7 385 20 18 308 10 12
230 12 II 36 55
694 32 432 53
1~~ is i7 II
197 207
1,000 425
I 233 39
10 5
307 86
190
27 29
67
27 29
67
181 481 4i; 37 143 35 30 46 12 14 6
20 5 4 260 53 64 284 52 66
2,121 138 136
500 22 27 403 30 32 522 55 45 413 60 51 224 9 II
308 1.122
124 176
442 250 401 192 180
856 1.108
247 3,221
229
373 391 282 651 305
195 521 242
1,193
90 89 . il is 85 78 76 75
Iii lOS 4 6
39 23 12 23 20 26 7 . 6
21 19 46 50 33 44
79 80
116 27 767 275 106 27 257 83
98 29 132 25 107 30 246 71
50 4 14 6
204 61 146 28 104 10
85 221 166
8 20
98 63
331 Jl9
79 28
6 I
10 59 41 3 I
2
26 10
78 35
·s 4
58 8 6
77 i4 30
202 ji 52 I 6
6 106 29 80 13
806 271
255 39 189 37 231 48 172 36 79 II)
81 7 293 49 30 6 15
151 110 159
41 48
266 464
70 .. 1,409
63
71 120 123 255
64
72 116
61
499
33 32 28 2 9
65 106
18 375
10
6 7
14 51 7
7 24 4
162

Total workers (I-IX)
M F
(20) (21)
202 940 143 344
Uninhabited, Uninhabited,
124 570 95
234
165 131 174 132 134 30 352 273
142 136 56 70
350 293 262 258 174 160
161 132 416 328 288 258
15 17 80 82
6 9 Uninhabited, Uni nhabited,
107 118 133 80
625 552 228 160
I I 155 141 30 13
UrbAn Area II,
9 5 4
194 2ib 55 61
125 109
117 102 316 305
95 74 20 23 7 5
14 II 161 126 176 198
Uninhabited, 1.263 949
353 324 263 103 333 296 259 218 152 142
Uninhabited, 190 184 718 619
85 71 117 111
290 166 153 135 258 208 101 97 86 76
529 495 663 550 155 144
1.793 1.107 146 135
208 202 240 211 181 165 402 267 186 186
136 135 337 308 159 109
Uninhabited, 695 623
M
(22)
78 254
65 188
75 109 92
153
106 31
135 150 92
F
(23)
7 92 39
103
44 74 7
71
100 42 96
145 5
100 66 179 114 118 6
9 44 46 5 9
II
M F
(24) (25)
115 301
58 104
78 42 38
158
33 25
J37 87 72
117 427
53 125
85 55 23
194
36 28
186 III 155
43 66 190 211 141 251
6 17 34 36
43 40 57 78 82 30 37 50
275 237 297 305 84 I 129 159
I I 89 82 60 59 7 I 15 II
2
85 lis 43 45 55 46
76 68 182 141 56 43 9 13 I
3 103 96
374
182 163 135 122 96
92 308 26 34
127 49
139 65 38
202 307
71 508
5S
117 129 103 162 113
70 170 61
Z77
2 46
106
152
183 57
152 93 91
91 69
40 I
102 71
163 278 60
224 30
104 122 100 56
100
84 168 31
250
6 3
103 12 55
32 106 26 10 6
II 50 77
519
5
85 16 63
34 157 26 9 5
9 76 92
719
150 139 71 41
134 134 113 121 48 49
98 358 57 82
143 94 97 35 35
288 211 77
733 88
79 106 58
200 66
53 85 65
283
92 550
71 117
124 134 105 25 76
331 239 82
806 105
92 89 63
194 86
51 134 72
363
II!
M F'
(26) (27)
i5 8
15
7 7
4 3
15 3
71
I I 3 2 :>
2
'j
3 12
5j
3
'j 5 1
3 47 9
23
'i 2
I
'j
'i
47
WORKERS
IV V
M F M F
(28) (29) (30) (31)
RURAL AREA-conld,
I 79 6 9
;5 i8 : 'i
7 2 I 2
15 8 2
2
2S '5 'j 9 I I
20 16
I
3 9
II 2
I I
'4 'i 5
14 '5 2 I I I
'i I
6
I 4
16 85
II 10 27
I 'j 4 2
9 2
i6 I
13 4
'5
I 2
10 I 52 15 2 I
61 23
'6 14 '4
5 10 8
36
'4
6 14
ij
'z 4 2
s
3
2
VI
!VI F
(32) (33)
j 5 2 6
'z 4
2
9 5 I
7
4
17
:>
I I
I 8
36
3
'6 13
5
3
8
'j
'5 1
4
2
'j 6
3 PUSAD TALUKA
VI! VlU IX
M F !VI F M F
(34) (35) (36) (37) (38) (39)
2 132
I 7
'2
's
'9 'j
'z 3 4
7 5
'2 7 5 4
'j
j '2 1 1
127 18
I 3 I
18 '6 5
II
2 12 'j
9 26
20i
3 4 4 3 2
I 7 I
31
'3 ii
I 2 2
2
6 101
3 14
29
I
5 12 'z 2 9
38 '2 3 9
5 II 6 I
I
4 3
12 6
6 5
'2 'j
I 5 'i 2 3
'i 2
52 43
8 10 'z 14 7 2 2
16 I I
5 <I 6 I 4
9 32 io 5 I
172 40 3
I 2 I 7 I
11 9 2
3 11 '4 2
33 8
NONWORKER3
----Serial M F No,
(40) (41) (I)
112 171 226 743 1.095 227 III 154 228 263 367 229
230
231 89 141 232
119 174 233 117 234 234 215 309 235
100 75 236 35 44 237
239 321 238 123 127 239 145 148 240
III 279 162 10 61
98 241 366 242 174 243
12 244 42 24')
5 2 246 247 248
70 79 249 93 127 250
444 448 251 178 265 252
I 253 89 9i 254 20 26 255
8 5
110 32 81
19 197 60 16 2
II 97 86
770
215 190 198 164 90
5 256 5 257
97 258 25 259 81 260
79 261 176 262 69 263 23 264 I 265
9 266 134 267 86 268
269 1.172 270
176 271 300 272 226 273 195 274 82 275
276 125 124 277 384 503 278 63 53 279 69 59 280
171 276 28! 86 liS 282
128 193 283 73 95 284 59 104 285
296 361 286 436 558 287
75 103 288 1.437 2.114 289
87 94 290
152 171 291 165 180 292 96 117 293
273 384 294 96 119 295
82 60 296 191 213 297
73 133 298 299
476 570 300

VILLAGE DIRECTORY
Serial No.
(I)
Villag·' I Town / Ward
(2)
301 BoriNaiikChatara .. 302 Kopra Bk 303 M,nk.,hwar 304 Sinlgi 305 Galljcgaon
306 Sawaleshwar 307 Karanji
Transport and
Postal facilities
(3)
308 Chineholi 309 Akoli .. R 310 Satal. (FV)
Educational
Institutions
P P P
P
P
M M
(4)
311 Kurli .. Po P 312 Shinn "I 313 Dong".rgaon 314 Bittargaon 315 Manyali
M .. RP~Rh P
316 Ma,.laga (FY) 317 Jamb 3 i 8 IJoruaon 319 Bodkin (FV) 320 Pi",pal~aon (FY)
321 Pardi (FY) 322 Chihh,li (FV) 323 Bhawani 324 Soit 325 Ghadoli
326 Pendh. 3 U Jewali .. Po" 328 Yekamba (FV) 329 Morchan ,j (FV) .. Rh . 330 Kosambi (FV)
331 Karla (FV) 332 Kati (FV) 333 Dig,., (FV) 334 Muli 335 Ling;
336 Udapur 337 SaWargaon 338 Sondabh; 339 Mohadi (FV) 340 Daheii (FV)
341 KaWatL. (FYi .342 Paroti Kh. (FV) 343 Paroli Bk.(FV) 344 Pawanala (FV) 345 Jawarala WV,
.. Rh
.. Rho
346 Darati .. Po 347 Dhanora (FV) 348 Asoli (FY) 349 Nan; (FY) 350 Bori (FV)
351 Therdi (FY) 352 Gad; 353 Thar Bk. (FY) 354 Titawi (FV) 355 Urn." (FV)
356 Takali (FY) 357 Yerandi (FY) 358 Doamsuri (FV) 359 Wadgaon (FY) 360 Knurb; .. Rh'
i; p P
i;
P
P
P
P
Pu,.d Municipality RTo Rh C (E) Ward 1 Ward 2 Ward 3 Ward 4 Ward 5 Ward 6 \liard 7 WordS Wdrd 9 Ward 10 Ward 11 Ward 12 Ward 13
Drinking water Medical supply facilities
(5) (6)
RivWx W W Riv RivW
RivW W W W
W W Riv W W
N W
W
Wx' W Riv W
WNx
Ri~' Riv
Wx
W
RivW Riv
RivW
W
48
Area in Oc:cu·-Sq. pied
Bazar Day Miles houses
(7) (8) (9)
11ouseholds
(10)
RURAL AREA-cone/d.
Sun~iay
2.6 1.7 1.8 2.0 4.9
3.5 3.8 2.4 2.8 NA
6.9 0.4 2.7 2.2 6·0
NA 5.8 3.6 NA NA
NA NA 4.5 5.5 2. i
2. I 8.1 NA NA NA
NA NA NA 3.0 1.1
2.4 3.4 5.7 NA NA
NA 7.7 NA NA NA
3.6 NA NA NA 2.6
NA 5.1 NA NA NA
NA NA NA NA 6.2
140 44 74 53
160
I " c).
52 76 53
160
189 189 104 104 63 63
144 144 Uninhabited.
254 29 46
410 89
254 31 55
457 89
Uninhabited. 10 !O 83 83
Uninhabited. 55 55
Uninhabited. 65 65
198 199 32 32 3D 39
Uninhabited. 205 207
52 52 137 157
Uninhabited.
179 200 Uninhabited. Uninhabited
99 99 34 34
U'iinhabiied. Uninhabited,
117 117 Uninhabited. Uninhabited.
Uninhabited. Uninhabited .
41 41 Uninhabited.
28 28
277 281 Uninhabited. Uninhabited. UninhabIted.
77 81
102 106 14 14
Uninhabited. Uninhabited. Uninhabited.
127 142 Uninhabited. Uni"habit,d. Uninhabited. 216 222
URBAN AREA
To!al Population Scheduled Scheduled Literate and
Castes Tribes educated
P M F M F M F M F
(11) (12) (13) (14) (15) (16) (17) (18) (19)
652 760 386 253 848
998 488 325 714
1,313 214 270
2.341 460
47 307
382
320 998 218 197
1,055 246 748
1.016
539 139
575
234
152
1,340
414
465 90
747
1,096
317 136 186 129 413
488 253 156 357
666 103 137
1.206 223
26 149
198
159 523 121 106
553 128 391
512
271 77
301
120
87
662
202
246 45
378
553
335 20 19 124 I I 200 13 17 129 56 63 435 31 38
510 8 9 235 14 7 169 12 17 357 19 15
647 9 13 111 133
1.135 46 27 237
21 158
184
161 475 34 27 97 8 4 91 12 12
502 3 9 118 4 3 357 20 16
504
268 62
274 6 6
114 2 4
65 4 4
678 41 49
212
219 45
369
543
115 27 48 16 76 26 25 1
138 16
88 21 60 16 37 13
136 25
119 10 18 1 38 6
322 65 11 1
5~ °6 52 10
45 171 35 22
5 13 4
12
105 30 3
91 12
161 16
42 3 4 3
51
10
9
3
146 16
38 4
33 4
2
94 13
159 33
RivWx Mp Has 0 Sunday 13.3 3.857
248 319 605 450 304 184 190 406 230 239 230 154 292
3.91J 18.002 9,364
755 700
1,276 1.049
793
8,638 974 893 .. 5.640 2.558
248 1.330 334 1.341 607 2.590 457 2,030 315 1.392 187 976 195 942 412 1.737 236 1.103 241 1,176 230 1.121 154 778 297 1.486
548 482 897 551 610 560 3~9 754
575 53 19 b41
1.314 247 298 - 981 162 162
599 343 258 428 108 90 460 60 64 tl40 I I ~)2 566 561 . i 389 732
548 154 491 238 479 185 610 310 495 118 360 137 318 186 545 267 414 281 303 110 395 250 266 131 416 191

Total worlcers (I-IX)
M F
(20) (21)
195 190 76 80
116 113 75 89
265 218
295 277 168 120 87 52
224 198 Uninhabited.
385 56 91
729 129
Uninhabited.
388 57 64
589 132
16 12 86 14
Uninhabited. 13Z 107
Uninhabit,d. 89 88
342 271 61 41 55 44
Uninhobited. 317 263
81 75 240 181
Unirlhabited.
249 248 Uninhabited. Uninhabited.
162 139 45 40
Uninhabited. Uninhabited.
183 158 Uninhabited. Uninhabited.
Uninhabited. Uninhabitid.
80 68 Uninhabited.
55 45
409 386 Uninhabited. Uninhabited. Uninhabited.
118 99
143 123 25 24
Uninhabited. Uninhabited. Uninhabited.
245 229 Uninhabited. Uninhabited. Uninhabited.
330 311
4.745 1.380
336 330 706 538 361 269 235 461 263 345 308 202 391
45 86
414 164 192 55 63
127 30 52 51 33 63
M
(22)
III 39 61 30 91
93 56 30 73
169 39 52
419 76
4 52
55
24 12B 32 21
109 31
104
75
91 25
63
47
36
172
47
44 13
116
167
470
18 41 42 24 29 II 42 75 69 29 37 29 24
F
(23)
97 33 65 32 5
2
54
61
I 68 9
14
58
I 6
69 31 84
8
2
52
41
31
li2
8 14
116
155
108
I 12 7 8
20
9 24 8 . I
12 I 5
II
M F
(24) (25)
66 93 32 47 41 48 38 57
137 211
176 271 102 120 50 52
135 144
187 17 36
243 52
12 26
71
58 161
25 31
171 49
110
137
64 20
105
27
18
183
57
91 II
110
124
328
II 20 66 48 23
4 12 35
43 4 7
55
324 57 63
517 123
12
49
86 249
41 44
187 44 96
237
137 40
106
27
14
206
98
115 10
113
153
446
26 44 82 57 42 13 30 31
4; II 27 42
49
WORKERS
III IV V
M F M F M F
(26) (27) (28) (29) (30) (31)
'j 4
io
'j 1
4
I 5
2
ii
13
3
5
4
2
21
73
I 2
12 1 9
2 18 4 B 3 8 5
'j
4
'2 I
RURAL AREA--concld.
6
J 5
10
I
'9
9 I 2
6 2 4
i3 '4 '4
I 25 is
I 3
15
'3
4
3
6
19
2
2
6
6
2
3
3
URBAN AREA
243 77 568
20 4
45 57 19 43 8
28 6 3 9
'3' 54 33
29 102 2 47
12 48 8 II I 31 5 28
i4 .. 3
i; 55 49 2(, 69
162
I I
85 12 27 2
12 21
I
VI
M F
(32) (33)
2
2
'2 I
2
I
3
'j
3 PUSAD TALUKA
Vll Vlll IX
M F M F M F
(34) (35) (36) (37) (38) (39)
3 I 5 I 4
II 2
I II
2 II I
3 I 7
2
4
12
4
8
'j
2
7 3 2
II 'j
6 4 I 6
13
2 29
I
2
3
3 8 2
13
'3
16
2
2
17
3
8
4
NONWORKERS
----- Serial M F No.
(40) (41) (1)
122 60 70 54
148
193 85 69 m
145 301 44 302 87 305 40 304
217 30)
233 115 117 159
306 307 30~ 30S 310
281 259 311 47 54 312 46 69 313
477 546 314 94 105 315
10 63
66
70 181 60 51
236 47
151
316 9 317
144 318 319
77 320
321 73 322
204 323 56 324 47 325
326 239 327 43 328
176 329 330
263 256 331 332 333
109 129 334 32 22 335
118
40
32
336 337
116 338 339 340
341 342
46 343 344
20 345
253 292 346 347 348 349
84 113 350
103 20
96 351 21 352
353 354 355
140 356 357 358 359
232 360
135
10 10 25 15 24 14 5
13
17 1.101 75 283 .. 1.544 491 4.619 7,258
I 7
6 5
I 4 7 2 I 2
103 6 80 5
104 24 52 5 36 11 97 I 51 I 99 10 84 2
117 3 115 5 59 2
104
11 9
70 23 20 19 16 10 2
30
12 54
108 II 131 21
.. 240 184 271 76 153 72 70 29 68 9
155 33 82 20 53 6 84 9 55 8 74 13
419 370 570 511 432 279 247 436 288 265 252 187 363
530 555 900 817 407 373 397 713 522 514 510 331 to9

50 VILLAGE DIRECTORY
Scheduled Scheduled Literate and Trans- Educa- Area T ota! Population Castes Tribes edu~ted
Villlllle / Town / port and tiona! Drinking in Occu-
Se.-ial Postal lnstitu- water Medical SQ. pied House-No. Ward facilities tiona supply facilities Bazar Day Mile. houses hold. P M F M F M F M F
(1) (2) (3) (4) (5) (6) (7) (8) (9) (10) (11) (12) (3) (14) (15) (16) (17) (8) (19)
URBAN AREA-concld.
---Jl Umarkhed Munici- RTo Rh H Wx MpHo,D Wednesday 10.6
pality (E) 2,507 2,515 12,647 6,553 6,094 278 278 .. 3,411 1,310
Ward I 465 465 2,237 1,204 1,033 44 43 637 203 Ward 2 378 383 1.857 923 934 185 184 .. 339 71 Ward 3 155 155 757 391 366 '3 'i 166 36 Word 4 1% 1% 1,029 530 499 .. 274 92 Ward 5 215 216 1,052 539 513 2 3 .. 304 118 Ward 6 167 168 916 487 429 3 2 .. 238 78 Ward 7 198 198 1.037 524 513 .. 3% 279 Ward 8 164 164 860 460 400 3; 3; .. 327 169 Ward 9 176 176 834 419 415 184 50 Ward 10 168 169 974 511 463 3 .. 260 78 Ward II 225 225 1.094 565 529 10 10 .. 286 136
--- -- -- ---
r-R"~ .. 1.261·1 45.461 47.255 234,384 118.360 116.024 4.454 4.575 .• 36.279 7.516
--- ---- ---PUSAD TALUKA .. Total-Urban 23-9 6.364 6.428 30,649 15.917 14.732 1.252 1.171 .. 9.051 3.866
--- ---- ---GrandTot.1 .. 1.285·0 51.625 53.683 265.033 134.277 130.756 5.706 5.746 .. 45,330 11,384

51 3 PUSAD TALUKA
WORKERS
T otai workers (i-IX) II III IV V
NON-
VI VII VIIl WORKERS
IX Serial
M F M F M F M F M F M F M F M F M F M F M F No,
(20) (21) (22) (23) (24) (2j) (26) (27) (28) (29) (30) (31) (32) (33) (34) (35) (36) (37) (38) (39) (40) (41) (1)
URBAN AREA-concld,
-- -3.592 1.658 699 369 592 880 118 236 75 285 57 163 9 556 32 117 " 826 233 2.961 4.436 II
666 290 102 54 84 87 45 2 54 4 58 18 24 5 62 10 19 " 218 110 538 743 526 384 29 14 144 241 12 55 42 42 9 38 '4 73 10 19 114 68 397 550 226 137 41 51 43 59 6 3 's 23 19 13 40 3 13 44 1 165 229 296 166 63 43 45 105 5 22 29 4 41 58 4 3 30 2 234 333 281 131 68 31 26 67 10 14 12 16 10 81 2 3 53 19 258 382 257 96 84 41 33 52 3 II '3 17 I 16 42 I 13 38 I 230 333 255 26 84 7 8 6 's 14 20 I I 47 8 73 9 269 487 224 30 44 12 II 12
'j 30 I 12 '2 51 4 67 5 236 370 237 163 60 51 95 102 8 16 'j 9 2 14 3 30 7 182 252 302 106 69 33 46 67 6 8 31 I 5 48 'z 19 70 2 209 357 322 129 55 32 57 82 18 9 2 28 2 13 40 13 89 9 243 400
71.841 54.873 32.501 19,889 30.871 33.979 1.061 57 2.037 388 483 27 531 67 1.723 139 102 .. 2.532 327 46.519 61,151
8.337 3.038 1.169 477 920 1.326 191 479 152 853 219 298 26 1.657 107 400 .. 2.370 724 7.580 II ,694
80.178 57,911 33.670 20.366 31.791 35,305 1,252 64 2,516 540 1,336 246 829 93 3.380 246 502 .. 4.902 1.051 54.099 72.845


Kelapur Taluka

KELAPUR TALUKA YEOTMAL DISTRICT
.•
tiHUUCU
TALUKA BOUNDARY-.. .. __ ..... __
TAlUKA HEAD QUARTER.~ __ ~
VI'.LAGe COOE NUMBER ____ 5 POPULA1/ON ABOVE 100C1 __ ._
POpULATION BElOW 200CL ___ • UNINHABITED _____________ 0 ROAD __________ ... _____ ~
RAILWA'( ___________ 4++-t-
RIVfR _______________ .......__
URDA'" eOUHDMv_ ...... ___ _
NANDED DISTRICT
YEOTMAL TALUKA
181 11'1
• • ".
18? •
ANDHRA
l8e .. 196 .
DISTRICT
061
80"" . . • """ as .," .77
,;:, .S. 00
• 30 64
3~3~'i3
~".5a 106 •
38 · 068
069
... · I~ 71 ·
65.
•• 7
.73
~O
loa • '~~3 w,.. .106
'08 -103 .
• y.'. lOS
lOB "70
.19' ~ 108 ~,~,,~?
338 .,,.., 19? .
199 •
74.
101 • .,09
eu3
.so
93 • . 99
..~ • . 124
WANI TALUKA
G.PZ.P.PooOlA-H/531-f" - &s·

N l.me of village
(I)
PQ'.)·lhtion Code ----No. 19j1 19S1
(2) (3) (4)
Adni 120 118 363
Akoli Bk. .. 378 946 98?
Akoli Kh. .. 351 652 802
Ambez"i .. 161 831 769
Ambor. 357 133 118
Amdi 180 55! 592
Andharwadi 395 78 79
An;i 66 467 385
Anji 219 366 545
Anji (Nrusinh.).. 174 968 1.090
An!argaon .. 51 714 721
Aptirampur 62 399 384
Arli 331 863 1.020
Ashta 12 813 742
Ashton. 147 568 659
Asoli
Atmurdi
Ayata
Baggi
Bahathr .•
Balapur
Ballarpur ..
Baradgaon .•
Belura
Bclura (FV)
Be-fnri
Bhad Um.ri
Bhamb
Bhambor •.•
Bhandari ..
Bhulgad
Bilaya'
Bodad;
Borati (FV)
Borgaon
Borgaon
Sori
Bori
Bori-Ichod .•
Boriai
Borkh,di
Both
Bukai
156 391 385
92 496 670
256 858 829
366 119 261
302 225 236
146
383 133 165
5 145 172
154 442. 470
225 177 386
375 221 249
298 694 802
41 486 494
201 845 1,033
223 248 481
74 46 98
259 293 247
246 456 637
68
203 833 981
377 590 560
13 151 120
40 I 3.072 3,311
143 500 567
7
46
309 1,029 1.194
38 13 20
J-1BI2-I-B-A-(Yeot.)
53
ALPHABETICAL LIST OF. VILLAGES AND TOWNS
4 KELAPUR TALUKA
[ Entries in capital1etters are for Towns and Urban areas]
Name of villa~e
(1)
Cn.hand ..
Ch.lbardi ..
Chanai
Chanakha ..
Chat.ri (FY)
Chikhaldar.
Chikhali
ChiKhali
Chikhalwardha
Chikna
Chimta
Chincholi
Chincholi
Chincholi
Chincho!i (FV)
PQ,pulation Code No, T95f 1961
(2) (3) (4)
94 1.715 1.457
374 900 960
131 158 152
397 848 844
224
165 262 480
57 694 779
91 237 215
289 656 1,092
50 257 226
261 205 170
76 170 185
212 204 201
268
221
C:,ondhi 102 179 261
Chopan 273 42 106
Choramba .. 188 259 276
Chorkund .. 155 113 99
D.bha 167 223 407
Dahegaon 133 1.371 1.440
Dahegaon 177 558 740
D.heli 234 369 574
D.ngargaon 205 332 415
Dapor; Z r 228 100
D.pori 55 165 160
D.ryapur (FV) 328 102 139
Datodi 238 527 598
Deodh.ri 128 310 343
Deodh.ri 2b4 676 732
Db,nora .. 79 1.114 1.141
Dharmapur 53 16 6
Dbarna 342 470 665
Dhoki 382 503 572
Dhoki 344 146 315
Dhumak Chachor.. 127 536 464
Dhunki (FV) 316
Dongargaon 64 J 72 223
Dong,rllaon 358
Dongargaon (FV) .. 308
Dorli 283 339 254
Ekburji 43 486 204
• Uninhabit ,d.
N3.m~ of villag~
(I)
Gad.ghat ..
Ganeri
Caneshpur ..
Cod, No.
Population
1951 1961
(3) (4)
2 214 209
135 22 24
330 84 89
347 158 382
Gane~hpur .. 370
Gawa,a (FV)
Ghanmod .•
270
367 41 26
GHATANJI Urban Area 14.662 6.443
Ghati 172 Included in Urban Ar.oI.
Ghoddar. (FV) " 108 266 379
Ghomi 356 510 642
Ghoti 245 529 776
Ghubdi 337 120 255
Gondwakdi 373 80 108
Gudha
Gujari
Hiraput
Hiwardari (FV)
Hiwardhara
Hiwari
Hiwari
Hiwari
Honegaon (FV)
Hudki
Ibrampur
lehora
Ichora
Inzala
]nzapur
Iml
Jalar:ni
J,lk.
Jamb
] arang
Jatur
Jhaparwadi
Jhari (FV)
Jhunzarpur
Jira
JOilinkoh,l,
239 125 105
8 723 648
81
326
190 340 366
26 10 2
29
332 96 149
325
6 7
47
II 82 66
235 707 866
264 568 548
49 309 294
252 88 124
54 427 391
254 37 15
27 1,274 1,444
312 350 490
170 888 1.098
191 579 805
241 208 214
250
372 86 63
105 209 246
72 160 288
Name ot village
(I)
lunani
Kalamnet ..
Kaleshwar
Kap
Kap.~i
Karanji
Karanii
Karanwad;
Karegaon .•
Karegaon ..
Kategaon .•
Kartllaon
Karmana .•
KaWatha (FY)
K.wth.
Kawth. BIc.
Kawtha Kh.
Kegaon
KeI,pur
Kelzara
Khadka
Khadki
Kh.dki
Khadki sukli
Khairgaon
Khairgaon
Khairgaon
Khairgaon
Khairgaon Bk.
Khairgaon (K.,.,)
Khairi
Khairi
Khap,ri (FV)
Khapri
Kharoni (FV)
Khatara ..
Khemkund
Kinhala
Kinhi
Kinhi
Kinhi
Kinhi (FV)
Kochi
Kochi (FV)
Popula!i .... Code No. 1951 1961
(2) (3) (~).
179 15? 219
18 494 493
313 180 119
257 389 4~7
217 85 .7J.
86 537 532,
liS 756 1.141
197 340 564
95 269 238
163 696 849
334 330 495
220 78 313
lSI 224 21S
295
391 324 402
258 228 204
253 477 575
276 457 466
355 541 1.0%
231 486 915
260 426 481
181 24 '8S
97 562 4f"
63 341 2m
125 492 228
199 715 870
348 312 28t
360 182 .447
,386 .. ~
7.0 181 .686
14.1 2,826 2.'14.
336 74 m. 319 • . «
150 664 747.
281 '.
121 182 233·
109 384 521
107 163 281
132 787 80-
194 600 674.
211 860 9t'J2.
269 97 229
140 343 391
310 ..

Name of villar.
(1)
~dori
KoliBk,
Ktili Kh.
Kalwan
.Kondhi
Kond;al
Km>ghara
KOparnand vi
K9P_ara aliBi Khupta (FY)
Kopri
K~pri
Kopri Kh.
Kothod.
,Kri,hnapur ..
,K,umbhar; ..
Korba
,K, .... had
Kurli
Ku,.1
~hapur
.L~vhan.
J..in¥i
!.in"ti
4>ha,..
L..oni
Mob.andoli ,.
Malegaon ..
Maie~,oll Bk. (FV)
.M.aJ~aon Kh. (FV)
jVIalk,apur (fV)
PODulation Code
No, 1951 1961
(2) (3) (4)
403 812 793
215 362 417
214 393 451
35 77 78
364 225 254
148 93 106
340 236 298
390 422 446
189 2!3
44 235 218
244 143 354
267 536 499
118 318 432
166 198 289
175 378 384
200 672 971
204 554 584
292 1,395 1.453
272 39 30
32
152 54 49
213 76 62
192 582 608
155 235
67 529 9+4
379 92 100
236 770 813
327 246 357
320
275
Malki 48
Mandawa 34 83 54
mandawa .. 186 343 494
M8.ni"i 145 391 404
Maaili 34l 229 393
M'Djl',,_·Glg.on .. 321 4~2 742
Maj,gli (FV) 265
~urd. 362 511 795
Miniar; 247 366 476
Manoli 176 1,403 1,252
Manu.dh",;
,Miu"alhwakdi
255 454 507
381 217 224
J-18IZ-T--BB (Yeut,)
54
4 KELAPUR TALUKA-contd.
Name of vill.ge
(I)
Mare~aon
Maregaon ..
l\larweli
Malhani (rV)
Mejda
Mengapur
Mir.
Mog.r(FV)
Mohada
Mohadari
I\1orwa
Mowada
Muchi
Mudhapur
Mudhapur
Mudhati (rV)
Mukrarnpur
I\tlunzala
Muradgavh an (FV)
Murli
Nag~zari Bk.
Nallezari Kh.
N.gthana ..
Naiksuldi CFV)
Nandgaon
Nandpur
I\Iursin2'Pur
Nidh.
Nidha (rV)
Niljai
Nirnbarda
Nirndheli
Nokti
Padha
Pahapal
Pall'l.~hi
Palaskund ..
Paledi
Popuhtion Code No, 1951 1961
(2) (3) (4)
153 240 285
352 138 227
185
317 146 146
297 Jl5 213
15 205 li4
103 195 313
229
158 1.387 1.997
71 244 366
195 160 164
171 992 1.003
361 200 317
42
83 251 303
249
59
122 473 647
279
149 973 1.035
294 231 293
301 181 215
10 300 294
304
368 75
104
16
60 476 429
226
350 114 187
210 73 107
398
183 108 108
349 250 368
300 1,813 2.260
230 438 881
123 380· ;08
243 131 272
PANDHARKAODA II 8,00510.605 Urban Area.
PandharwaniBk,(FV) 363
Pandharwani Kh... 353
Pandhurna Bk. 208 692 732
Name of villare
(1)
Pandhurna Kh.
Pangadi
Pardi
Pardi
Pardi
PaTdiCFV) "
Parsoda
Parwa
Patapangra ..
Pathari
P.toda
Pendhari
Phefri
Pidpali (rV)
Pilkhana (rV)
Pil waheri (rV)
Pimpalapur
Pimpalapur
Pimpalgaon
Pimpalkhuti
PirnpaIkhuti
Pimpalkhuti (FV)
Pimpalshenda
Pimpaishends
Pimpalshenda
Pimpari
Pimpri
Pimpri
Pimpri
Pimpri ... DuTIl
R "dhapur (FY)
Rahati
Code No,
(2)
Population
1951 1961
(3) (4)
206 419 566
262 754 934
82 20 11
218 980 1,385
311 143 158
112
85 410 435
296 2,477 2,662
248 916 969
16S 389 689
299
305 192 178
134
306
393
329
98 919 906
346 145 159
89 400 403
404 359 383
30 869 892
280
160 214 246
75 870
333 66
263 451 531
359 612 732
402 395 542
144 343 419
33 526 5,9
389
286 122 126
Rajegaon(FV) 318
Rajurwadi 196 545 746
R.iegaon ., 22 4,058 4,458
Rampur.v Undarni 216 246 638
Ramtirlh 19 521 515
Ranod 87 146 121
Rasa (FV) 287 130 197
Ralnapur 23 31
Ralnapur " 251 157 321
Ra veri 31 758 769
Ridho,"
Rohini
99 703 657
80 104 104
• Uninhabit«l.
Name of village
(I)
Rudha
Runza
Sagad.
SailaI
Sakhara
Sakhara Bk.
Sakhara (FV)
Sakhara Kh.
Sakhi Bk.
S.khi Kh.
Sang-am
Saoli
Sarai
Sarati
Sasani
Sawangi
Sawangi
Sawarkhed
Sawitri
Sawner
Sayalkharda
Saykhed
Sheli
Sherad
Shindola
Shioor
Shiro)i
Shivni
Singaldip
Soit
Sonbardi
Sonorli
Sonorli (rV)
Sonurli
Sukli
Sunna
Surdevi
Susri
Tadsawali
Tadumari
Takli
TaUi VrindaW8()
Talni
Taroda
Code No,
(2)
Population
1951 1961
(3) (4)
399 386 344
164 738 1,023
323 462 552
291 503 534
380 152 182
341 170 251
227
184 698 947
110 406 501
159 188 387
14 17S lOS
237 1,474 2,105
58 537 572
69 455 752
209 374 538
45 1338 1,315
322 867 908
101 247 271
142 122 206
77 425 332
285 8o} 1.167
19; 776 1,043
61 427 382
314 253 241
136
222 284 334
178 1,382 1.702
162 1,256 1,598
129 293 264
36 192 231
354 767 846
317 511
232
130 486 700
400
387 861 1,074
119 82 215
303 266 266
290 766 840
376 368 492
78 248 252
169 484 515
202 767 1,004
293 642 723

N .me 01 village
(I)
Code No.
(2)
Population
1951 1961
(3) (4)
Tatapur 371 114 62
Tejani 65 380 393
Telangtukli 339 580 652
Tembhi 388 431 521
ThanegllOn 324 261 422
Tipe.hwar(FY) .. 307 206 277
Titwi 274 615 909
Tiw •• I. 207 438 553
Tiwsala (FY)
Tokwanjari ..
Umarvihir ..
Umred
Umri
Umri
Undri
Vihirgaon
• Uninhabited.
117
384
113 116 146
93 123 14Z
2~2 661 717
338 428 768
52 400 420
124 438 376
Name of village
Wadgaon
Wadhoda
Wadhod.
(I)
W.dho'l' .•
Wadhona ..
Wadhon. Bk.
Wadho'l' Kh.
Wadj"i
Wadki
Wadne,
Wadwat
Wagd.
Wagd.ra
Waghartakli
Wagholi
Wai
Waldhur
55
" KELAPUR TAL UKA--contld.
Cod. No.
(2)
Populatjon
1951 1961
(3) (4)
137 313 271
88 268 281
106 325 267
90 1.252 1.368
282 513 537
116 129 18i
III 64
24
138 1.093 1.264
277 41 32
335 67 156
198 391 542
9 11
31S 968 1.020
271 259 325
345 404 523
20 385 340
(I)
Walinagar •.
Waniari
Wanoja
Wardha
Warha
Warha
Warna
Warud
Warud
Warud
Wasari
~'asri
Watkhed
Wedad
W.d.hi
Wirul
t The 1951 population of the Taluka as given in this li,t differ. !torn that mentioned in Tabl. A-II.
Cod. No.
(2)
Population
1951 1961
(3) (4)
25 166 276
385 482 614
56 778 799
73 602 1.047
392 201 238
17 730 614
28 364 344
37 688 643
233 378 495
240 323 282
394 6
187 531 63()
4 460 428
365 84 103
100 797 885
139 6
Name of village
(I)
Y.dlapur (FV)
Yed,hi
Yekurli
Yeoti
Yeoti
Yerandgaon
Z.dgaon
Zargad
Zatala
lolapur (FV)
Zotingdara
luI;
lull ..
Popul.ti"" Code
No. 1951 I96J
(2) (3) '(fl .',
3% 191
228 86 1'>2
126 485 449
182 123; 108
84 UJ39 i.121
266 521 514
40 1.906 1,951
39 236 231
288 m ~20
114
157
278 842 I, (57
96 402 425
j 1951 TOTAL.. 167.414 1961 Total .. 197370

YILLAGE DIRECTORY
.$erial , 1'<0.
Villall~ I Town! Ward
(J)
I Lob.r. . 2 Eklara
.s Sonorli . 4 W.ikbed
(Z)
5 Barad~aon
G Hudki 7 Borjai 8 Gujari 9 Walldar.
10 N •• than.
II Ichor. II A,bt> B Bori 14 Smg,m 15 Me.'g.p'"r
l6 N'lfSini'pur 17 Warha 18 K.hma.er 19 Ra-ntiith 20 Waldhur
21 Daoori 22 RJegaon 23 RHnapclf 24 W.liai it5 Walin'iar
26 Hiwari 27 Jalka 28 Warn. 29 Hiwari 30 Pimpalkbu,i
31 Raveri 3l L.khaour 33 Porn,ci Ou," 34 Manla"'a .35 Kolwan
3& Soit 37 Warud 'l3 Bakai 39 Zaqad 4il Zadiaon
~ Bhamb 42 MUdhapur 43 Ekburji "'~ Kopri 45 S,wangi
4& Borkhadi 47 Ibrampur 48 Malki 411 [I'lzapur 5Q Chilrna
51 Antargaon 52 U,d,i 53 O'.rrnapur 54 Jagj.i 55 Dapori
$6 Wano;a 57 C'1ikhali ,3 S"a; 59 M lkrampur 60 Nidha
61 Shel, 62 Aptiramput 63 Kbalki Suldi 64 DonlargaOn 1i5 Tejani
66 Anji 67 L.,n' 68 Bor.,j (F V) 6? S~ati
Tran ..... port and Po,tal
facilities
.• R
.. R
(3)
Po
.. Po"
.. R
10 Khair.aon (Kasar) ..
71 Mohadari 1l Jo ,in 'oh.la 7l Wardh. 74 Bhuillad 75 Pim;>alshend.
Po
iducational
Institutions
(4)
i· P P P
i; p
i;
i;
p
P
P M P
p' p P
ii p' p
P
p' P
Drinkin~ water Medical
supply facilities
(5)
W W W W \V
w w Riv Riv Riv Ri. Nx
kiv Riv Riv W
W W
w W W5x W
W W
W W Wx
Wx W Wx W W:-.!
W
W w W
\V w W W W Rivx Riv
W W W
(6)
\V w w W M~' Wx l\1p Wx
W \V
W W
Wx W W W
56
Area in Occu-
&zarDay Sq. pied
Miles hOIJse!
(7) (S) (9)
Household,
(10)
RURAL AREA
Tue~dav
S.i~rday
3.0 1.7 1.4 1.7 1.9
0.4 0.7 2.1 0.8 1.3
O.R 2.0 0.8 5.3 1.0
0.2 1.8 1.3 1.3 0.6
1.5 0.7 0.7 0.7 1.5
~ .8 9.8 4.4 1.2 2.1
2.1 0.6 2.0 0.9 I.~
2.1 3.2 4.9 1.9 4.0
1.6 0.5 1.1 1.7 1.2
1.5 0.5 0.2 1.1 0.9
4.0 1.5 2.2 1.2 0.)
2.9 2.9 2.6 0.6 1.8
2.5 2.7 1.6 2.5 3.0
4.5 J .4 :-1'\ 1.7 1.6
2.8 1.5 6.7 3.4 2.7
55 47
105 77 34
55 47
107 100 34
Uninhahited. Uninhabited.
127 145 Uninhabited.
55 60
11 166 24 23 26
15 166 25 23 28
Uninhabit,d. !21 134 104 116 112 112 81 81
22 22 996 1.076
Uninhabited. Uninhabited.
53 56
I 2 331 363 85 85
Uninhabited. 195 193
147 171 Uninhabited.
95 120 10 13 17 17
38 130
7 42
401
40 144
7 44
456
95 106 Uninhabited.
40 40 49 53
236 286
Uninhabited. Uninhabited. Uninhabited.
63 67 43 54
145 79 2
74 33
168 90 2
79 36
171 185 163 167 122 124
Ul1irzhahited. 1e5 lOS
81 86 64 43 n
ill 86 64 43 79
91 91 2\\ 2\\
Uninhabited. 166 166 158 15a
83 83 60 60
241 241 21 21
Uninhabited.
Total PopUlation
i' M (II)
235 209 511 428 172
648
294
66 742 120 108 174
614 493 515
, 340
100 4,458
276
2 1.444
34-1
892
769
539 54 78
231 643 20
251 1.951
494
204 218
1,315
294 226
721 420
6 391 160
799 779 572
429
382 384 270 223 393
335 94'\
752 6%
366 288
1.047 98
(12)
120 93
270 215 97
334
164
31 385
56 53 88
314 245 259 163
46 2.183
133
2 715 177
448
375
285 30 35
I IS 326
10 134 99B
256
l03 98
645
148 104
361 204
3 196 84
363 Wi 288
209
200 203 143 111 207
197 4')\
378 3.12
195 137 532
51
F
(13)
115 116 241 213
75
Scheduled Castes
M F
Scheduled Literate and Tribes educated
M F M F
(14) (15) (16) (17) (IS) (i9)
47 65 86 73 7
41 37 89 21 75 75 69 90 8 26
6 I
19 34 2
314 2 2 78 66 134 35
130 31 35 53 51 $3 15
35 357
64 55 86
300 248 256 177
is 3 6
2 13 7
10
ii
7
is 2
10
5 95 10 5 4 39
13 56
iii 4
9
9 131
17 9
25
2S 2 2 5
89 110 35 9 91 24
38 77 30 57 63 20
54 7 6 27 31 18 5 2.275 136 148 397 395 1.164 444
143 28 33 J2 13
729 167
444
394
254 24 43
116 317
10 117 953
238
101 120 670
146 122
360 216
3 195 76
10 9
18
22
20
4 5
2
'8 2
19
ii
is
I 337 118
60
323 127
62
158 27
166
29 4
38
10 8 89 20
142 118 73 13 12 " 6 8 7 I
606920 I 176 157 75 18
4 4 2 85 77 22 '5 45 42 422 152
51 53 92 34
16 2Z 31 5 44 54 27 3
187 208 267 136
45 42 45 30 35 37
128 130 42 40
61 46 7 7
77 59 3
43 34
8 7
21 22 2
15 6
436 4 4 84 90 113 42 384 8 284 13
220
182 131 127 112 186
188 4)3
374 354
171 151 515
47
8 37 36 144 44 14 61 70 72 71
96 105 55 14
81 64 64 14 114 lui 52 14 76 59 32 2 35 27 .36 I
126 104 47 8
123 124 29 5 \ I;'} \()S g) 8
254 245 81 12 217 228 62 II
12l 114 82 93
354 345 51 47
40 25 89
I
4 10 19

Total workers (I-iX)
M F
(20) (21)
88 68
157 123 59
74 04
136 108 33
Uninhabited. Uninhabited. 2i2 107
Uninhabited. 94 71
20 24d
30 37 66
20 209
40 31 57
lJni nhabited. 204 151 155 140 170 126 107 Il8
31 22 I,U6 9)3 Uninhabited. Uninhabited.
79 93
44~ 378 122 108
Uninhabited. 277 207
242 243 ·U ninhabited.
Ibl 118 1,1 15 24 24
73 214
7 85
573
63 202
8 73
508
156 119 Uninhabited.
64 53 67 75
38d 335
Unin/ .. bited. Uninhabited. Uninhabited.
87 48 64 66
234 138
3 130 58
197 95
102 40
234 240 232 194 177 163
llninhabited. 136 10-1
119 123 85 72
136
75 105
77 70
119
126 132 311 297
UninhTlbited. 253 246 222 242
II 7 116 89 91
340 295 39 33
Uninhabited.
M
(22)
36 21 65 28 25
72
26
14 93 13 9
23
53 49 52 38
8 109
30
130 28
64
58
53 6
13
40 67
31 165
57
20 17 60
34 12
67 16 I
33 :>0
89 78 57
49
42 41 26 32 29
22 145
98 60
41 53
180 12
F
(23)
2 I
21 3
48
10
12 9(} 15 15 22
2 14
'6
112
35
5! 35
33
74
37 3
13
22 ~9
26 139
27
18 8
II
14 13
3 13
43 37 5
4
4 34 22 10 23
I 131
98 60
30 43
121 I
II
M
(24)
44 46 70 75 30
120
61
5 115
21 21 33
119 86 73 62
22 507
41
2 201
53
134
158
99 12 9
25 126
6 45
244
78
32 47
202
39 4~
120 102
73 2j
121 105 IOj
66
53 76 )3 34 8-1
91 Hj
125 144
64 31
109 15
F
(25)
72 83
114 105 33
114
61
8 119 25 16 34
147 U6 121 82
22 791
57
3ij 70
152
167
81 12 II
41 112
8 47
332
87
34 67
293
33 51
190 93
8S 33
191 155 158
100
68 71 55 60 9b
131 165
146 176
86 48
166 32
III
M F
(26) (27)
6 I 2 3 I
3
3 I 3 I
12 4
32
13
39 15
18
15
I
5 7
5 38
7
35
2
18 I
'5
9 I
5
8
I 13
4 ti
12
4 3
21 I
3
3
20
5
2
57
WORKERS
IV V
M F M F
(28) (29) (30) (31)
RURAL AREA
7 . i OJ
7
's I 2 6
4 2 I
i4 3
33
7
2
3 5
17
I
17
2
27
8 2
2~ 6 i3 II
I
3~ '5 3
12 3
'.2 I
13 ij I 3
3 4
3 8
8 7
I
2
I 2
1
2 I
I~ I I I
" KELAPUR TALUKA
VI VII VIII x M F M FMFMF
(32) (33) (34) (35) (36) (37) (33) (39)
I 3 2
2
8
9
4
2
'i
2
'i
6
10
4 3 3 I
5 I
10
4
2
30 2
2
12
2
iti II I
'i I
4 7 I
II
I 2
2
2 I
s· 7 I
10
I 18
2
3
3 1
12
" 6 3
I 229
33 20
12
'7 I
2
2
20
'j 2
2
4§ iii 8 2
3
~ ii
4 4 2
II 12
I~ '9 1
7 17 I 8
2
8 3 2 I 4
7 3
5 I 9 I
10
NONWORKERS
M F Serial
No.
(40) (41) (I)
32 41 I 25 32 2
113 105 92 105 4 38 42 5
122
70
II 137 20 16 22
6 7
147 B 9
59 10
15 II 148 12 24 13 24 14 29 15
16 110 149 17 90 lOll 18 BY 130 19 56 89 20
15 32 21 1.047 1.322 22
23 24
54 50 25
275 55
171
133
118 II II
42 112
3 49
425
100
39 31
257
61 40
127 66
66 26
129 163 III
73
81 80 '>7 39 71
71 150
125 110
78 48 In
12
35i ~~ 59 28
29 237 30
151 31 32
136 33 9 34
19 35
53 36 115 37
2 38 44 39
44.:i 40
119 41 42
48 43 45 44
335 4j
46 47 43
98 49 56 50
;63 51 121 52
3 53 93 54 30 55
195 56 /90 )7 121 5d
59 116 00
107 61 i" 02 50 oj 42 04 07 65
56 ~6 li" 07
cd 128 69 112 70
~5 71 00 72
220 73 14 74
7;

VILLAGE DIRECTORY
Serio! No.
Village I Town I Ward
(I)
76 Chincholi 77 Sawner 78 Takli 79 Dhanora SO Robini
81 Hirapur 82 Pardi 83 Mudhapur 84 Yeoti 85 Parsod.
86 Karanji 87 Ranoci
(2)
88 Wadhoda 89 Pimpalgson 90 Wadhon.
9! Chikhali 92 Atmurdi 93 Umred 94 ellahand 95 Karegaon
96 Zullar 97 Kh.dki 98 Pimpalapur 99 Ridhora
100 Wedshi
101 Sawarkhed 102 Chondhi 103 Mira 104 Nandpur 105 Jira
106 W.dhoda 107 Kinh.l. 108 Ghoddar. (FV) 109 Khemkund 110 S.khi Sk.
III Wadhona Kh. 112 Pardi (F V) 113 Umarvihir 114 Zolapur (F V) 115 Kat.nii
116 Wadhon. Sk, 117 Tiws.la (fV) 118 Kothoda 119 Surdevi 120 Adni
121 Khatara 122 Munzala 123 Palaskund 124 Vihirgaon 12:; K"airgaon
126 Yekurli 127 Dhumak Chachor 128 Deodhari 129 Si ngaldip 130 Sonurli
131 Chanai 13Z Kinhi 133 Dahegaon 134 Phelri 135 Gadeghat
136 Shindol. 137 Wadgaon 138 Wadki 139 Wirul 140 Kochi
141 Khairi 142 Sawitri 143 Bori-Iehod 144 Pimpri 145 Mangi
146 Balapur 147 Ashtona 148 Kondiai 149 Mudi 150 Khapri
Trs.nrport and Postal
facilities
(3)
.. Po
.. Po
Educational
Institutions
p'
!Vi
j; p
P
j:' M
P' !Vi P
P P P P P
M
P'
p
(4)
.. RP~Rh !Vi P
.. R
.. R
.. R
" R
.• R
.• R
.. RP~
.. Po
.. R
.. R
p' P P
p p
p
i· p
rVi
M
ji P P
ii p p
Drinkin!! water Medicol
suoply facilities
(5) (6)
W W W W Riv
Ri~' Riv Ri. W W
W W W W \V
Nx W W W Riv
Riv N W W W
Wx W Wx
\Vx WNx W W W W
N
WN W
WN WNx W WN
W WNx Wx WN WN
WN WN WNx W W
WN W WN w"
IV W Riv Riv
W W IV W W
W'·~ RivW HivW RivW
Mp
Mp
Baur D.y
(7)
58
Area in
SQ. Mile.
(8)
(1;cupied
houses
(9)
Household.
(10)
RURAL AREA-contd.
Thu'r~day Thursday
Weci~esd.y
Friday
2.8 2.6 1.3 3.8 0.6
O.G 0.8 5.5 3.0 8.6
2.0 1.1 2.3 1.7 4.8
4.6 1.6 1.3 4.8 1.4
1.3 1.8 2.1 2.4
13.7
2.0 2.0 1.1 2.0 2.8
4,3 2.6 1.1 4. I 3.1
0.9 NA 2.9 NA 4.2
1.9 NA 1.1 0.6 2.2
1.0 4.1 2.7 5.0 3.8
1.0 3.7 1,3 1.9 3.3
0.4 4.2 9.6 0.8 0.8
1.2 1.6 3.2 1.1 1.4
5.3 2.5 2.7 2.0 2.6
0.4 2.7 1.1 7.3 1.2
34 75 57
223 23
3S 75 60
248 25
Urlinhabifed. I 2
60 63 191 233 83 92
106 113 26 29 61 66 76 90
292 292
57 57 151 151 35 35
333 333 53 53
83 108 175 145 200
83 120 175 145 200
60 64 54 S4 65 65
Uninhahited. 5i 57
57 50 71
120 111
57 50 71
120 120
12 12 Uninhabited,
32 33 Uninhabited. 228 240
41 43 Uninhabited.
95 95 44 50 i8 85
55 126 155 88 57
55 126 158 88 57
106 106 116 116 51 54 58 59
133 157
34 34 133 145 357 357
Uninhabited. 6 6
Uninhabited. 64 64
281 281 2 2
64 79
498 38
121 86 88
615 40
126 86 89
U ninhabiteJ. 145 150
19 19 198 200 148 157
Total Population
P M F
(II) (12) (13)
185 332 252
1.141 104
11 303
1.121 435
532 121 281 403
1.368
215 670 142
1.457 238
425 419 906 657 885
271 261 313
246
267 281 379 521 SOl
64
146
1.147
185
432 215 363
233 647 708 376 228
449 464 343 264 700
152 840
1.440
24
271 1.264
6 397
2.714 206 567 419 404
659 106
1,035 747
97 157 129 549
53
8 150 538 210
265 57
135 188 679
108 341 68
743 123
210 210 457 348 452
131 132 158
129
127 147 198 263 253
27
70
595
102
219 116 178
122 325 362 189 116
233 235 165 122 335
68 422 727
10
136 646
3 205
1.372 102 290 207 210
338 50
504 379
88 175 123 592
51
3 153 583 225
267 64
146 215 689
107 329 74
714 115
215 209 449 309 433
140 129 155
117
140 134 181 258 248
37
76
552
83
213 99
185
III 322 346 187 112
216 229 178 142 365
84 418 713
14
135 618
3 192
1.342 104 277 212 194
321 56
531 368
Scheduled Scheduled Literate and Castes Tribes educated
M F M F M F
(14) (15) (16) (17) (18) (19)·
8
9 5
'7 ii
44
3 1 9
. 5 I
zi
is 3
24
'7
13
3
44
3
4
9
2
Z4
II
i4 '3 13
"3
ii
39 44 34 66 75 27 56 64 50 90 110 165 14 12 11
4S 78 62
77 17 19 51
194
8 146 36
160 19
34 30 78 78
106
si 1j 78 164 62 72
88 65 15 14 ,17 23 54 52
190 239
13 30 164 61 38 20
144 225 21 39
30 25 86 72
109
60 91'
148 114 142
2 14 18 45 I
'j 48 19
21
'2 18 76
8 17 3
68 12
15 25 44 30 33
71 77 20 J3 105 103 17 57 54 12 'i 84 79 5
108 126 9 3 34 38 32 4
137 131 47 240 242 22 'j 124 123 46 8
27 37
52 64
272 256
43
38 70
115
41
39 54
132
62 69 236 231 313 310 163 171
71 79
77 77 102 91 139 152 95 118
230 266
37 43 187 175 304 311
10 13
2
8
158
26
57 13 29
20 73 41 37 10
74 52 II 9
68
16 115 174
45 135
i6
45 40 126 327
I iiJ 58
41
10
5 4 5
5 19 5 4 5
14 12
'i 13
4 IS 20
5 81
iii 178 164 563 174 56 57 38 5 69 73 109 23 28 35 66 6 99 91 66 16
46 44 61 34 39 13
137 138 180 15 IS 121
15 2
63 29

Total workers ([-IX)
M F M F
(20) (21) (22) (23)
61 IO~ 76
330 32
57 103
71 322 2i
Uninhabited. 4 I
84 84 304 30~ 129 97
16j 41 93
122 402
72 219
43 436 84
148 45 89
113 388
71 219 )0
360 70
121 !03 124· 104 214 248 205 183 273 249
82 88 77 91 90 91
·Uninhabited. 86 76
81 84
116 166 153
80 75
116 152 l:i0
19 24 . Uninhabited.
44 52 Uninhabited. 347 285
69 50 Uninhabited.
134 120 77 52
126 97
74 209 233 130 68
74 211 224 117 73
134 132 161 142 112 IOd 79 82
205 207
46 48 263 246 477 422
Uninhabited. 9 10
Uninhabited. 89 83
374 303 2 I
117 119
85fS 55
175 130 140
729 53
155 143 120
Uninhabited. 207 167 54 35
308 298 204 207
32 14 14
127 13
3;' III 47
83 14 36 52 8B
35 99 Ii
135 27
52 55
108 57 86
50 39 28
44
22 51 34
103 63
18
106
18
56 20 55
20 III 140 43 10
42 37 67 29 82
15 71
222
4
40 IOd
60
301 2j 62 70 82
104 19
III 58
10 I. 3
120 j
30 115 23
73 21 33 41 60
3 lid
15 95
I 2:) 79 4'i 7
59 4; 31
41
18 46
34
3
55
17
50 IS 24
29 07
2 26 6a 24 82
10 76
208
4
37 3d
61
263 17 53 89 60
52 2l
135 22
II III
M F M F
(24) (25) (26) (27)
20 37 32
121 I:>
3 39
130 67
72 25 S3 59
200
33 98 28
203 35
51 35
135 ,114 150
29 31 61
39
38 18 75 53 82
14
24
141
42
47 19 61
35 7i 69 70 52
76 IJJ 59 40 85
27 165 190
4
39 143
50 4JO
26 80 40 40
73 14
153 Y5
47 92 68
195 24
I 51
182 74
75 24 56 72
324
67 99 34
250 68
102 77
167 136 241
29 48 60
35
:;9 22
116 152 116
23
49
211
32
62 19 73
38 124 220 117 68
ilS IOJ 47 58
III
38 17l) 205
6
46 203
I 58
454 36 99 54 59
112 12
155 157
• .3 I
20
I II
33 1 6 I
20 14
7 4 2 I 8
8 9 4 1
6
·9 6 5
·4 20
2
·9
4
16 .j 2 2
!2 7
2
2
I 6
j4
59
WORKERS
IV V VI
M F M F M F
VII Vlll
M F M F
.. KELAPUR TALUKA
IX
NONWOR.(ERS
--- ----- Serial MF M "No.
(26) (29) (30) (31) (32) (33) (34) (35) (36) (37) (33) (39) (40) (41) (I)
RUR\L AREA-contd.
·3 3
16 I
"j 26
6
3 3
18
I 8
I 9 .j
14
2b "(J 3 2 I
3 6 I
18 1 8
18 1
.j
2
6 I 2 3 5
16
2
6 I 2
2
8
7 ·4 4 2
5 y 2
I 9
30
I 8
.j J
:2
5 22 . (, 2
·4 44
I 5 6 '4
16
7 10 i j
I
·4 2
·6 I
10
12
.j
, 2
12 2
.. u I
; 24 I
3 2
20 . i "j I
I I 5 . i b 2
20
4
·2
I 3 9 I 2
3 Z I
3 4
5 7
3:' 1 ·4
30
~
I
j 6
·s I
9 49 25 28 ·3 3
J 2
19 ·2 7
4 2 1 5
25
2 j .j
28 8 3
4 17 6
18 5
3 3 I
4 5 I 4 3
2
4~ 10
8 I 30 18
I
15 o 2 6 2 2
4 I 2 7
I Jj 17
I
4
45 J
I I
57 4 1
II I j 4 I
8 I
16 3 15 2
36 49 53
219 21
4 66
234 81
100 16 42 60
271
36 122 25
}07 ;9
89 86
183 143 179
49 55 68
43
45 63 82 97
100
d
26
243
33
33 3;) 52
43 liD 129 j}
4d
9i 74 53 43
130
22 1,,9 2j[J
47 272
I 80
514 41
115 77 70
131 16
196 175
31 76 72 77 52 7d
270 7) 24 80
81 > 82
69 83 27j 84 128 85
119 86 19 137 57 &l
102 89 301 9J
36 91 110 92 24 95
3)4 94 43 9J
112 9b IOj 97 201 98 120 99 184 100
52 101 3d 102 64 103
104 41 105
60 106 59 101 6j hJd
106 10) 9~ 110
13 III 112
24 113 114
267 I t:i
33 116 117
93 1113 47 II~ 3d 120
37 121 III 122 122 123
711 124 39 W
d4 126 81 /.27 7ll I2d 60 12')
1)$ UU
35 131 172 132 291 133
134 Jjj
136 ':;2 137
31j I3d 1 Ii)
7j 1-)<1
613 141 :il 142 m 143 oj 144 74 14J
146 154 141
21 14d 233 14) 161 jjU

VILLAGE DIRECTORY
Serial No.
ViIl'fle/Town/ Ward
(I)
151 Karman. 152 Lavhana 153 Maregoon 154 Belur. 155 C;,orkund
156 A.oli
(2)
157 Zotingdar. 158 Monaca 159 Sakhi Kh. 160 Pimpal.henda
161 Ambezari 162 Shivni 163 Kafegaon 164 Runza 165 Chikhaldara
166 Krishnapur 167 Dabha 168 Pathari 169 T .kli Vrindaw.n 170 J.rang
171 Mowad. 172 Ghati 173 Ghatanji 174 Anii (Nrusinh.) 175 Kumbh,ri
176 Manoli (E) 177 DaheRaon 178 Shiroli 179 Junoni 180 Amdi
181 Kh.dki 182 Yeo!i 183 Nokti 184 Sakhara Kh. 185 M.rweli
186 Mandawa 187 Wasri
Trans .. port and Postal
facilities
(3)
.. RP~
.. RP~
,. RP~
.. R
•. R
.. R
188 Choramba . . . . 189 Kopar. alia. Khupta (FV) " 190 Hiwardhara . . . .
191 larur 192 Lingti 193 S.ylthed 194 Kinhi 195 Morw.
196 R.jurwadi 197 Karanwadi 198 Wegda 199 KhairQaon 200 Kurha
20 I Bhambor. 202 Talni 203 Borgaon 204 Kurh.d 205 Dangargaon
oO Po
206 Paodhurna Kh. 207 Tiwsal. 208 Pandhurn. Bk. .. Po" 209 Sa .. ni 210 Nimb.rda
211 Kinhi 212 o,incholi 213 Lingi 214 KoliKh. 215 Koli Bk.
216 R.mpurav Undarni .. 217 Kapshi 218 Pardi 219 Anji 220 Karegaon
221 Chincholi (FV) 222 Shioor 223 Bhandari 224 Chatari (FVj 225 Belura (FV) oO Rh'
Educa· tional
Inqtitu .. tioos
(4)
i; P
P P P M
ji P P
P
p' P
P P M f;
P P
j:;
P P M p
p P P P P
P p P
i;
P P M P P
P
p
P
]i.,i P
p'
P
Drinkini Water
supply
(5)
RivW W Wx W W
W woO \VI RivW
W W W W W
\V W WNx Riv W
W
W \V
W W \Vx W W
W Wx Wx W
Wx W W W W
W W W Wx W
W Wx W W W
W W W RivW RivW
Wx W W W Riv
\V W W Wx RivW
W W W W wx
Ri~· RivWx
w"
Medical facilities
(6)
M~b Mp
60
Area in
Sq.
Tot,1 Population
Bazar Day Miles
(7) (8)
Occupied
house!
(9)
Household.
(10)
P
(11)
RURAL AREA-contd.
Mo~day
Frid~y
Wednesday
sun;i.y Sunday Saturday
2.6 1.4 3,0 0.9 1.5
2.3 ).9 6,7 2.7 ).3
3,6 q.S 5.1 2.1 3.0
1.2 2.6 2.9 3.0 4.4
50 12 64 99 19
50 12 64 99 19
87 87 U ninholbited.
413 425 79 87 42 49
161 303 m 215 115
61 87
172 121 202
174 343 180 222 116
61 87
174 121 202
218 49
285 470
99
386
1.997 387 246
769 1.598
849 1.023
480
289 407 689 515
1.098
8.7 205 208 1.003 NA Included in Urban Area I. Urban Area I. 2.9 210 231 1.090 3.4 78 78 38~
4.1 248 4.1 154
U 3~: 4.6 116
1.3 t~ 1.3 22 U 196 1 .2 Un inhabit, ...
3.0 3.5 4.7 NA U
4.2 1.5 3.7 I.S 1.8
5,2 3.7 1.6 6.2 4.)
5,7 3.7 1.9 5.8 2.7
1.6 2.8 2.2 3.3 0.8
4.8 0.8 1.8 4.9 5.4
11.6 1.5 6.3 2.2 1.8
94 132 57 46 86
152 i05 227 131 37
157 91
104 146 207
198 203 204 140 103
137 127 149 114 24
185 48 15 97 87
127 14
298 112 70
NA Uninhabited.
248 154 367 48
118
15 24 2S
200
97 136 60 46 90
161 115 227 131 38
158 106 104 146 207
198 203 213 1-45 103
m 127 149 114 24
187 48 15 97 87
127 14
298 112 70
2,8 74 74 5.6 101 101 NA Uninhabited, 1.2 78 79
1.252 740
1.702 219 592
86 108 108 947
-494 630 276 213 366
805 608
1.043 674 164
746 564 542 870 971
1.033 1.004
981 584 415
566 553 732 538 107
902 201 62
451 -417
638 73
1.385 545 313
334 481
386
M
(12)
111 25
157 241 53
199
991 190 123
363 808 421 5ZZ 241
142 210 337 256 554
506
547 191
619 366 873 106 304
35 59 58
464
246 313 159 103 189
393 309 515 327 85
370 280 264 424 486
513 509 502 299 207
298 273 387 267 53
446 103 35
229 217
304 36
677 287 142
169 245
202
F
(13)
107 24
J28 229
46
187
I.OG6 197 123
406 790 428 5{l1 239
147 197 352 259 544
497
543 193
633 374 829 113 288
51 019 SO
<483
248 317 117 110 177
412 299 528 347
79
376 284 278 446 485
520 495 479 285 208
268 280 345 271 54
456 98 27
222 200
334 37
708 258 171
165 236
184
Scheduled Castes
Scheduled Literate and Tribes educated
M F M F M F
(14) (15) (16) (17) (18) (19)
i4 IS
36
7 10 8 6 6
6
38 I
'6 12 I
'3
6 6 5
'';
9
si 6 5
13
i4 3 9
17 12
ij 2
8 8
'j
16
'3 I 2
2 ..
4
iil 17
31 23
129 54
122
48 361 80 52
8 161 12 356 9 221 5 1~7 3 154
116 159 107 84 39
8 352
34 176 38
7 86 4 201 4 24
'3 7
-4i 9 2
38
33 29 5
93
54 126 63 95
106
170 152 100 103 70
12 242 70 67
i7 3~~ 5 64
II 60 18 69 6 65
iiJ 3
6 5
81
29 27 65 41 18
73 43 19 32
122
14 216 36
'3 267 7 17
33
30 24 III 69
16 I
18 88 2
106 50
288 256 96 35 61 29
191 71 342 119
,207 103 147 168 159 47
121 30 157 27 125 71 85 79 51 165
342 131
186 221 38 64
i;.j 205 26 28
49 23 3
82
53 127 56
100 97
179 139 132 110 58
221 82 75
326 68
73 62 69 67 86
35 31 53 37 19
79 39 17 44 97
202 37
252 17 46
235 115 288 29 79
4 14 23 81
41 62 41 .. 65
103 52
182 119 22
71 50 51
116 liS
116 166 147 99 66
121 40
135 69 4
65 24 6
30 68
61 8
191 41 53
4 34 29 31 I 12 17 18
178 159 31
2;
6
74 .. 2
11 12 23 69 9
1<4 4
24 27 26
Ii
7~ 20
58 18 74 6
2G
'3 2
13
5 6 8
i4 32 16 62 28 2
29 15 16 30 27
21 39 31 20 I.
21 I
41 16
13 5
1 21
18
4i 5 9
.. 3
3

Total worker. (I-IXl
M F
(20) (21)
74 67 ;7 17
99 94 149 104 29 27
130 115 Uninhabited.
609 510 126 ILl
71 70
232 4&! 248 291 144
235 455 253 169 138
M
(22)
34 2
49 25 13
40
162 )4 17
83 201 84 47 39
91 88 30 134 118 16 192 186 47 166 146 40 321 343 106
318 305 125 Included in Urban Area I.
Urban Area I. 299 271 81 109 85 50
374 396 144 234 240 135 538 442 178 68 57 32
198 !:is 90
22 25 6 39 33 22 34 29 10
296 27S 124 Uninhabited.
156 210 89 61
120
229 165 305 185 49
117 208
65 58
123
259 156 307 183 54
237 233 1~5 117 148 163 265 280 308 291
310 327 323 215 123
195 190 250 167 40
294 70 26
153 149
287 267 2j8 144 115
155 174 I~I 143 31
207 55 18
136 116
191 192 25 24
422 392 195 183 94 107
Uninhabited. 114 84 131 124
Uninhabited. 134 116
74 105 39 30 36
112 38 5; 61 18
72 87 65 97
147
117 110 130
73 58
93 82
100 71 18
139 29 12 86 83
91 14
129 76 36
51 58
53
J-1812-1-9-A (Yeot.)
F
(23)
30 5
39
jj
42
88 57 14
84 215
93 22 2
II
M
(24)
33 13 43 72 15
75
327 61 49
F
(25)
37 12 54
100 15
7,
417 66 56
127 148 207 21; 114 152 105 112 90 134
I 56 87 2 115 116 6 112 171 4 96 140 3 138 324
7
144 142 173
26 40
8 17
j
115
51 102 34 26 26
123 31 59 75 27
79 16 81 90
139
113 98 94 35 39
81 72 86 65 18
71 20
7 75 67
110 3
34 64 43
30 43
17
174
189 54
187 84
229 27 88
II IJ 2L
1)2
68 90 41 L3 77
105 114 138 86 30
138 52 72
146 137
161 174 165 117 54
74 101 121 81 19
138 36 14 60 58
83 II
255 112 52
55 62
75
297
259 8)
247 9&
242 29 Ii)
14 16 26
ISo
66 106 31 32 90
131 125 229 104 27
149 99 81
179 146
174 167 162 109 76
72 102 94 75 13
132 35 II 61 49
81 21
357 118 64
54 81
99
III
M F
(26) (27)
5 I 3
18 I
2
16 5 3
5 40 16 13 4
'(, 22 26
8 4
30 4
13
I 3
2
7
'(; I
I 4
12 S
2 I I 6 3
I
2
·s 4 2
2 I
I
2
2
2 I
2
'j I
2
ii 'j, I
'j
61
WORKERS
IV V
M F M F
(28) (29) (30) (31)
RURAL AREA-contd.
'j II
2
22 2
13
6 14 , 'j
If I j.j 2 I
2
~ '4 1& '4 3 5
3
9 2
25 3 2
'i 13
3 6 I I 2
3 I
28 5
I 12
6
'j
'i
'j
2 5
4 I 5 29 3 4 I I
14 6
10 15 13 16
7 2 5 4
9
3 1
8
'] 5
2 3
'j I
I 6 I
3
'4 2
3
'j
2
VI
M F
(32) (33)
4
'i 12 I
2 OJ
iii
I
8
4
2
3 3
2
'(,
2
2
VII VIII IX
M F M F M F
(34) (35) (36) (37) (33) (39)
'2 . j 2 I
28 2
3
8
6 2
4~ '6 's 4
'3 'j 3 2 6 I
4 I
2 2
29
'j
'i 3
i5 3
7
'j 2
I
:.1
5 I 3 4
4 8 4 2 5
3 2 2
'j
2
'j,
I
I 4
I I
I~ '2
9
29 2 2
8 2 15 2 12 I 46 21 4 I
3
~ 'j
3~ ii 10
17 4
16 7
37 2 5
3 I I I)
3 7 2 I 2
.:; 6
33 22 I
2
3 I 6
'j
9 4
12 4
~ 'j 7 10 6
9 12 6 7 5
13 3
12 3
'3 :;
4
i9 2 4
3 3
2
'j I
NONWORKERS
-.,...,__- Serial M F N~.,
(40) (41) (l} .•
37 8
53 92 24
69
382 64 52
40 m, 7 15Z .
34 153 125 154
19 155
72 156· 151.
4% 15S': 74 15~. 53 160,
131 17l 161 320 335 I ill , 173 175 163, 231 332 164:,
97 101 165-.
51 59 166· 16 79 161.
145 166 163. 90 113 169';
233 201 170',
188
248 82
24j 132 333
38 106
13 2() 24
la'!
90 103 70 42 69
164 144 210 142 36
133 95
116 159 17il
203 182 179 84 84
!O3 83
137 100
13
152 33 9
76 68
113 II
255 92 48
55 114
68
192 17f, 172, 173
272 174·. lOS 11><
237 17& 134 m 387 178'
55 IJ'IJ'. 133 180';
26 181', 16 ill,. 21 11t3
203 184 183 '
131 186' 109 181 52 183; 52 199": 54 1%'
153 191·, 14J 192 221 193 164 194· 2j 195·
143 196 167 197 115 199' 166 199' 194 200"
233 lOr 228 201·' 221 20> 141 204, 93 2i)5.'
113 2tl(t' 106 20,' 164 208· 128 209" 23 211t
249 211' 43 212 9 21>
86 21f' 84 21S
142 216-13 211'
316 213 75 219' 64 220·
~t 81 Zil,
112 223 2Z4 '
68 22S'

ViLLAGE IhRE(~TORY
5...-,.) No.'
VlHage ITown/ Ward
(~r (2)
m Nidh.(FV) 227 . Sakhara (F V) 228 i Yedshi . 229 ' Mo .. , (F V) 2311 Paia,hi
231 . Kelzara 232 . Sonorli (F V) 2~3 Warud 234 Daheli ,?35 . !chora
236 Melegaon 2~7 Saoli 238 Datedi 'n9 Gudha 240 Warud
241 Jhaparwadi 2lt2' Urnri 243 Pal6di 2l14' K:opri 245 Gl<>\i
246' Bodadi 241 lviWl;ar; 248' Pat.pangra 249: Mudhati (FV) 250 J hari (FY)
2>1 Ramapur 252 lrol 2)3 haWtha Kh. 254 jalandri ,255 iYlanusdbari
256 Ayata 157 Kap 258' KaWtha Uk. Z,59 Bilayat 261l. Khadh
261 Chimta 262 Pangadi 163 Pimpari 264 lnzala 265 lVIangli (FY j
266 Y.randgaan 267 KopriKh 268 Chincholi' 2(i9 Kinl" (FY) 2.10 Sswar. (FV)
211 Wagholi 2,,2' Kusd 213 Cllopan 214, 'l'itwi 275. Mi.Jkapur (FY)
216, Kegaon
._Transport and Postai
faeinties
.. Po"
.. Po
.. Po"
.. Po
.. R
~% J:.it"er .. Ii "$9 lVlu"d~avh!U! (FV) .. l?O f'impalki,uti(FY, ..
lSI K.'>uoni (FV) Z82 Wadhona 283 Oor); ~ Deodh.ri 235 Sayatkharda
286 Bahati 287 Rasa (i'VJ 288 Z.tala Z1l9' Chikhalwardha 290 ~adsawalj
291 S.ufal
~2 Kur]i 3 'r aroda
2'(4, ~agez6ri Bk. ;2.1I~. ~awath. (FV)
2iQ,' Parwa(E) z97 Mejd. 298 ' Bhllj:i Umari 2W,,' Patoda 3QQ .. Pahap.t (El
.. RPo
.. RP~
J-1812-1--9-B (Yeot.)
!,':ducationa!
Institutions
(4)
p'
M M M P P
!Vi ji P
P P P
P
p'
P
P P ji P
P P P p
P P
P
P
p'
j:' P
ji P P
P P P
M
p' j:,
Drinking water
sl'")ply
(i)
w W" W W
wx W Wx Wx W
Medical facilities
(6)
RivWx W Mp' W W ~-1p' wx W W W
WN W RivX 'W W
Wx RivWx Mp' W Rivx W
RivW Wx RivW RivW
RivW Riv
Wx \Vx Nx wx W
\V \V W
w w w wx W'x W WN W W
R~v W W v:..'
Wx W WX
w
M~' JVip
Bazar Day
(7)
62
Area in
Sq. . Miles
(8)
Occu~ pied
housf'::
(9)
House.. hjd,
(10)
RURAL AREA -cordd.
~rednesday
Monday Sunday
Monday
Thu:.;day
NA NA 1.1 NA 2.2
4.4 NA 3.6 4.6 2.6
6.0 10.4 3.3 1.3 2.7
1.4 3.9 3.3 1.0 6.8
2.9 1.4 8.4 NA NA 2.0 1.1 1.2 l.l 5.4
3.2 2.4 1.3 2.7 3.0
1.4 5.8 2.9 2.8 NA
2.5 3.6 0,1 0.8 NA 4.9 0.9 0.4 6.0 NA 0.3 2.2 5.3 NA NA
:'-iA 3.1 u.8 3.6 5.5
1.1 0.5 7.5 7.3 3.4
5. t 8.1 2.b 1.3 NA
10'0 1.3 4.5 1.0 7.S
Uninhabited. UninhaWed.
27 27 UninhabitEd. iJ7 193
197 197 Uninhabited.
129 129 i22 122 202 203
177 180 461 461 121 121 24 24 64 64
35 bo 55 76
!68
35 158 S9 77
16d
123 139 ~7 100
213 222 Uninhabited. Uninhabited.
113 3J I~O
2 106
181 lOS 48 50
!06
121 ,,0
128 2
lOti
194 105
48 50
106
31 31 169 185 104 114 l!O 117
Uninhabited.
103 120 96 96
Uninhabited. 46 46
Uninhabited.
62 74 6 6
19 19 186 IS7
Uninhabited.
101 103 5 5
264 269 Uninhabited. Uninhabited.
U ni nhabiied. J20 128
51 52 143 154 219 237
28 36
186 212 ItO
30 40
189 227 162
97 1)0 293 399 U3 165 47 49
Um',.habiled.
462 486 40 45
162 170 Uninhabited.
4,)4 .,iO
. Total Population
P M
(11)
132
881
916
495 574 866
813 2,105
598 !OJ 282
214 717 272 354 776
637 476 969
321 124 575
15 507
829 4)7 204 247 431
170 934 531 548
574 499
229
325 30
106 909
466 )2
1.157
537 2)4 732
1,167
126 197 ~20
1m2 b40
534 1,453
723 293
2.662 213 ~02
2,2&0
(12)
62
44&
468
251 271 443
401 1,038
319 61
148
99 354 140 173 395
319 231 455
153 64
291 6
241
420 2jJ 102 126 242
76 466 252 272
277 245
109
152 i8 55
440
225 lti
570
282 iJi 371 5iJ8
63 106 442 544 422
256 727 352 141
1.373 100 367
1,12&
Scheduled Castes
Scheduled Literate and Tribes educated
F M F M F M F
(13) (14) (15) (16) (17) (IS) (19)
70
435
448
244 303 423
412 1.067
279 44
134
2
32 7 )
28 80 38 5 6
115 2 363 15 132 S 181 2 381
318 245 514
168 60
234 9
266
409 224 102 121 239
94 468 279 276
3 3 2
3
14
'3 39
46 51 13
4 92 113 82 11
7
33 10 8
40 90 39
8 10
41
31 160 55
103 202 121.
9 52
51
26 171 33
1I3 212 125
j 4~
125
59 50
132
90 2d6 138 2G 45
13
6 8
16
16 47 32
2 16
5839520 I 14 154 177 97 24 5 54 52 20 2 6 103 110 30 3
228 228 S4 9
146 162 51 4 3 79 86 73 8 3 109 125 137 44
14 7
5 40
73 75 2 2
86 7) 6 q
139 161
23 I' ., 76
i94 I,,; 139 ;..) L\) 09 )0 "I 24 70 72 20
109 120 59
73 129 49
91 125 53
10 139 69 59
'i 17
9
31 22.
I 5 9
39 25 12
297 65 80 6; 22 254'9 100 116 43 15
]20 32 36 72 82
173 12 51
469
24 4
4 '3
107 30
241 14
587
J7j 186
205 zij 48 2
84
305 17 31 57 73 99 123 13 9 27 33 32 361 20 30 S3 65 140 579 19 19 47 60 183
63 91
478 548 418
'2 i<i 71
278 12 726 48 371 l)
1)2 4
1.289 113 43j
l,i34
103
is 85
3
i6 69
60 7tl
365 319
66
63 ]j
351 314 6,
3 12
107 124 b6
20 84 90 30 48 189 ItiO 170 12 15j 171 87 2 8 12 c9
99
.)
292 52
221
27i)
268 53
207
277
477 18 91
300
10 I 8
27 3
35 24
i4 27 59
4 45 8 I
171 3
14
91

Total workers (I-IX)
M F
(20) (21)
Uninr,:bited. Uninhabited. 39 37 Uninhabited. 276 265
283 267 Uninhabiled.
164 153 17S 187 276 261
256 653 195 37
103
63 217 82
113 245
2i9 522 H5 28 83
50 189 75
106 225
216 196 145 127 314 315
Uninhabited. Uninhabited.
97 104 36 32
210 180 4 6
154 161
253 136 68 80
152
212 123 62 76
140
45 54 287 266 148 149 176 142
Uninhabited.
176 178 158 163
Uninhabited. 62 63
Uninhabited.
103 106 13 10 35 32
274 259 Uninhabited.
m 137 10
358 328 Uninhabited. Uninhabited.
Uninhabited. 161 145 83 72
229 223 365 328
44 64
283 346 263
41 63
299 318 224
163 155 473 424 228 226 Bi 85
Uninhabited.
779 612 59 51
235 251 Uninhabited. 663 482
II
M F M F
(22) (23) (24) (25)
23
129
107
81 89
113
91 2,7
76 21 38
41 57 33 32
132
61 74
128
66 14 59 3
53
78 57 41 36 60
25 133 72 4)
5: i2
27
44
i7 126
55 5
105
78 21 90
167
22 42
141 135 86
66 174 95 4j
220 24
102
186
20
132
3
46 85 53
12
125
157
73 81
140
13
132
259
101 102 202
30 150 189 182 314 339
}O ,4 liD 16 10 12
2S 50 56
40 38 32 2S
124
58 68
133
74 10 52 2
63
55 41 36 40 49
25 136 69 I
51 71
I 114
62
73
67 15 87
147
22 44
132 126 64
71 138 75 47
158 19
104
92
i7 138 42 74
104
128 59
160
26 18
133 I
90
143 58 23 40 66
18 112 58
110
87 73
33
55 13 18
127
68 2
234
62 54
112 154
22 19
120 164 124
58 194 104 30
296 32
113
296
10 151 37 81
101
138 59
182
30 22
127 4
98
155 81 26 36 86
29 130 76
141
127 90
63
99 10 31
144
75 10
25j
77 57
135 175
19 19
165 183 151
80 277 149 36
406 32
145
362
III
M F
(26) (27)
4
2
1
2 9 II I
5
5 I 2
·7 2
i7
8 7 4
10 I
4 3
13 7
·i 3
19 6
23 23
6
27
4
33
4
2
WORKERS
IV
M F
(28) (29)
63
M
(30)
V
F
(31)
RURAL AREA -COn/d.
4
12
4
4 2 2 9 5 I
2
1~ ·4 3· i" 4 8
·2 2
I 5 4
1 2
2
9 2 2
2
~ ·s I
" 2 9
4 4
4
6
12
I 2
2 .;'
3 2
6 I 6 5 ·3 ·3
·4 8
15
I 2 3
6 39 ·z "j 15 I 2
54 17 I 5
42 4
2
.j
2
VI
M F
(32) (33)
.j I
7 .j
·9
2
I 7 3
"z 3
32
2
4
.j
r 8
5
4, KELAPU.R TALU~A
VII VIII IX
M F M F M F
(34) (33) (36) (37) (3S) (39)
4
·4
2 II 6 I
2
·2 I
2 4 4
.j 3
I
6 3
2
2 I 2
4 I
·2 I
.j
.j 10 .j I
·4 4 4
3 20 3
26 I 4
33 5
7
7
2 3 7
8 28 . j II j . j I
12 3 3 5
10 2 9
3 I 6
.;'
7 10 2
I
I~ ·4 5
13 5 2
2
2
5
10 4 7 .j
16 2
.j 6 7 I
21 6
7 20 8 4
4 6 I 2
110 17 r 7 2
68 17
NON" W'JRKERS
--. - Serial M F t'd.
(-W) (41) m
23
170
185
87 95
167
145 385 124 24 45
36 137 58 60
150
22& . 221
33 228 229,
170 ~
181 231 232
91 233 116 234 162 235
193 231i 545 231 134 23&
16 239-51 2., 65 241;
174 Z4~ 57 243 75 244
156. 24l·
!O3 122 24& 86 118 24]:
141 199 248 249 25Q
56 64 25~ 28 28 252 81 104 253 2 3 254
87 105 255;
167 97
·34 4ii 9G
}j 4r) 26.1. 179 202 ;(62 104 j30 26~ 96 134 264
101 87
47
49 5
20 166
265." 119 266 9l 267
268 57 269
270
67 271 2 272
19 275 210 274
27~
92 104 276 rr 4 277
212 259 278
121 48
142 22;1
19 42
159 193 159
93 254 124 54
594 41
132
453
27·9 2$Q
281 160 28t 51 283
138 2S4 251 l8~.
22 286 28 2ci1
179 288 2JO 2~ 194 2~P
123 29l 302 292 145 293 67 ~~
677 293 62 297
184 }~ 652 }OO
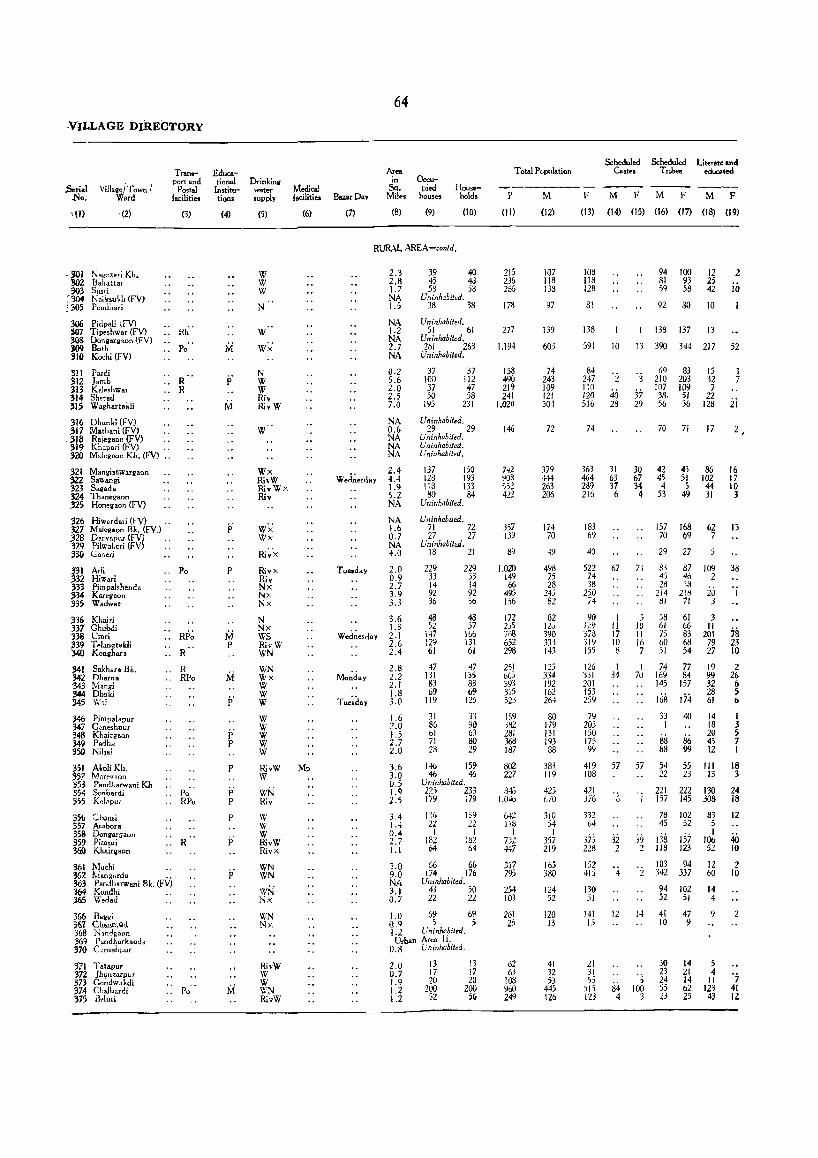
'VILLAGE DIRECTORY
.5erial .No.
1(1)
Village I Town I Ward
(2)
,~J r.;a.ez8Ti Kh. M2 Bahattar 303 S",ri
['304 Naiksukh (FV) '305 Pend"ari
Tnmsport and
Postal facilities
(3)
306 Pidp.li (tV) 307 Tipe,hwar (FV) . . Rh . 30S Doniargaon (FV) lO9 Soth .. Po' • 310 Kochi (FV)
'm Pardi SJ2 Jamb 313 Kr.bhwar 314 Sh,~ad 315 Wagh.rtakli
Dbunki (FV)
.. R
.. R
316 317 318 319 320
Mathani (FV) ~ajegaon (FV) Khapari (FV) .. Mdegaon Kh. (FV) ..
m 323 324 .325
326 327 328 329 330
331 .332 333 334 335
.336 337 338 339 340
~I 342 343 344 545
~ 348 >49 350
351 ,5? 353 354 355
MangisaWarllaon Sawangi Sagada Thanegaon Hone~aon (FV)
Hiwarda.i (FV) Malogaon Bk. (FV.) Daryapur (FV) !,ilw.l.ori (FV) Garleri
ATli Hiwati Pimpa],henca Karegaon W.dwat
Khairi Chubdi Umri Telanqtaldi KODihar.
S.khara Bk. Oharna ~/ia:HIi Dhoki Wli
Pim!)alll.puT C;;neshpur Khairgaon P.dha Niljai
Akoli KIl. M<1rep,'90n Pandhatwani Kh Sonbardi Kcltlpu{
356 ,_"OnSl 357 Ambor. $58 Dongar:;aon 359 Pimpri .S60 Khairg""n
361 Mucbi
.. Po
.. R
.. R
.. RPo
Po" .. RPo
.. R
362 Man"urda .. 363 Pandharwani Bk. (FV) 364 Kondhi .. J65 Wedad
366 Bag.i %7 GnanmQd 368 Nm-:Jgaon 369 PandhaTkaoda 370 C.:ne,hpur
311 Tat.pur 372 Jhu'lZarpuT 373 Gonclwakdi .374 CbJbardi 375 i3,]uri
Educational Institutions
(4)
p
M p
j; p
P
p' P
P
Drinkini water .upply
(5)
W W W
N
W
Wx N W W Riv RivW
W
WX RivW RivWx Riv
Wx Wx
Ri~'x
Rivx Riv Nx Nx Nx
N Nx WS RivW WN
WN wx W W W
W W W W W
RivW W
WN Riv
w W W RivW Rivx
WN WN
w:.i Nx
WN Nx
RivW W W WN RivW
M.dical facilitieJ
(6)
BozarDay
(7)
64
Ara in
Sq • Miles
(8)
Occupied
houses
(9)
Household.
(10)
RUR\1. AREA-con/d.
Wed~e,day
Tuesday
Wed~e,day
Mo~d.y
2.3 2.8 1.7 NA 1.5
NA 1.2 NA 2.7 NA
0.2 5.6 2.0' 2.5 7.0
NA 0.6 NA NA NA
2.4 4.4 1.9 5.2 NA
NA 1.6 0.7 NA 4.0
2.0 0.9 2.7 3.9 3.3
3.6 1.3 2.1 2.6 2.4
2.8 2.2 2.1 ],8 3.0'
1.6 2.0 1.5 2.7 2.0
3.6 3.0 0.5 1.9 2.5
3.4 1.4 0.4 2.7 LI
3.0 9.0' NA 3.1 0.7
39 40 45 40 53 58
Uninhabited. 38 38
Uninhabited. 51 61
Uninhahited. 261 263
Uninhabited.
37 112 47 58
37 loa 37 50
195 231
Uninhabited. 29 29
Uninhabited. Uninhabited. Uniahabited.
137 150 128 193 1\3 133 80 84
Uninhabited .
Uninhabited. 71 72 27 27
Uninhabited. 18 21
229 33 14 92 36
48 52
147 129 61
47 r;1 83 69
119
229 33 14 92 36
48 57
166 131 61
47 135 83 69
125
31 33 86 90 01 63 71 80 2~ 29
14b 159 46 46
Uninhabited. 22J 233 179 179
136 22
I 182 64
139 22
I 1~2 64
G6 66 174 176
Uninhabited. 43 50 22 22
1.0 69 69 Q.q 5 5 1.2 Uninhabited. Urban Area I L
0'.8 Uninhabited.
2.0' 0.7 1.9 1.2 1.1
13 17 20
200 52
13 17 20
200 56
Total Population
P M
(11) (12)
215 236 256
178
277
1.194
Is8 490' 219 241
1.020
146
742 90S 5Sl 422
357 139
89
1.020' 149 66
495 156
172 2j5 768 m 298
251 6(,5 393 315 523
159 j~2 2~1 368 187
80'2 227
345 i .046
6~2 liS
I 732 447
317 795
254 103
261 lei
62 63
108 960 249
107 118 133
97
139
60'3
74 243 10'9 121 50'4
72
379 444 263 206
174 70'
498 75 28
245 82
82 120 390' 333 143
125 334 192 162 264
80' 179 IJI 193 88
383 119
42:; 670'
310 54 I
357 219
165 380
124 52
120 13
41 32 53
445 126
F
(13)
108 118 128
81
138
591
84 247 1:0 120 516
74
363 464 2d9 215
183 69
4a
522 74 38
250 74
90 129 'ji'3 319 155
126 331 20'1 153 259
79 203 150 175 99
419 108
421 376
332 64
37j 228
152 415
130 51
141 i3
21 31 55
)15 123
Scheduled Scheduled Literat. and Castes T rib.. educsted
M F M F M F
(14) (15) (]6) (17) (18) (]9)
94 100 12 2 81 93 25 59 58 42 iii 92 80 10'
133 137 13
10 13 390 344 217 52
'2 40 28
31 63 37 6
67
I II 17 10 8
I 34
57
32 2
12
84 4
'3 37 29
30 67 34 4
73
3 10 II 16 7
I 70
39 2
69 83 210' 203 107 109 38, 51 56 36
70
42 45 4
53
157 70
29
8.l 4; 28
2i4 81
53 61 75 60' 51
74 169 145
168 33 I
88 isS
54 22
221 157
71
43 5! 5
49
168 69
27
87 46 33
2i1l 71
61 66 83 68 54
77 84
157
174 40
86 99
55 n
222 145
78 102 45 52
138 157 118 123
103 94 342 337
94 102 52 51
14 41 47
5 100
3
10 9
30 23 24 55 23
14 21 14 62 25
15 32 7
22 128
17
86 102 44 31
62 7
109 2
20 3
3 II
201 79 27
19 99 32 28 61
14 18 20 45 12
III 13
130 308
83 5 I
10'6 52
12 60'
14 4
9
5 4
II 123 43
3 7
21
2,
16 17 10 3
13
38
78 23 10
2 26 6 5 (>
I 3 5 7 I
18 3
24 18
12
40 10
2 10
2
'7 41 12

Total work." (i-IX)
M F (20) (21)
68 71 75 67 84 75
Uninhabited. 52 49
UninJw};it.d. 98 87
Uninhabited. 328 342
Uninhabited.
45 148 69 67
311
47 141 65 67
319
Uninhabited. 40 36
Uninhabited. Uninhabited, Uninhabited.
243 220 292 269 183 183 132 135
Uninhabited.
Uninhabited, 112 113
41 48 Uninhabited,
34 29
324 46 17
155 54
61 88
183 191 91
80 183 129 109 161
58 110
81 119 56
307 43 22
137 48
61 81
156 190 97
88 143 106 94
160
50 117 90
107 57
239 232 76 58
-Uninhabited. 24) 247 498 218
174 187 32 35 I
213 2iz 147 136
108 92 24; 212
Uninhabited. 75 17 35 31
M
(22)
20 20 32
15
63
117
7 49 37 34
115
22
130 94 58 53
72 18
22
97 21 2
58 21
27 51 28 66 26
47 51 22 28 28
31 31 43 46 36
59 1~
89 61
80 7
39 53
21 107
35 18
83 103 21 9 10
Uninhabited, Urban Area II, Uninhabitedo
21 22 34
255 74
16 18 28
237 77
3 2 7
48 24
F
(23)
13 26
16
53
94
6 52 32 17
107
20
133 10}
74 60
76 17
22
83 18 3
55 24
20 36 32 70 26
47 40
I 2
3 38 53 49 40
3 28
79 19
84 4
2
I 20
8 8
31
I 2 2 I
II
M F
(24) (25)
44 49 37
35
33
177
37 91 26 26
113
16
62 75 91 62
26 22
10
139 II 10 8i 20
21 26 47
102 46
18 90 84 68
114
25 bO 30 57 16
143 35
119 117
58 20 I
108 82
65 121
30 16
56 8
15 10 22
146 31
71 54 47
33
34
238
41 87 33 49
175
16
78 104 102 72
37 31
176 19 19 81 24
41 45 85
119 66
38 96
101 89
158
47 77 37 57 17
228 30
162 171
99 30
198 133
87 190
7 23
72 10
16 17 22
225 69
III
M F
(26) (27)
3 .. 3
I 4 3
36
7 48 10 2
6 I
29 8 4 6
II
9 9 8
ii
5 13 10 10
°9 4 8 3
5 12
15 3
8 I
2
26 II
OJ
24
2 6
2
WORKERS
IV
M F M
(Z8) (Z9) (30)
65
V
F
{m
RURAL AREA -conldo
1 I 7
8
3 I
2
ii OJ
22 2 44 17 14 2 I 2 I I
4
31 5 I 4
3 I 6
13
°5
3
I 3
5 I
'9 I 2
°i
17 I
12
2
1
OJ OJ
2
ii oS'S 3 2 I
Z 6 2
'i 4 I
3
VI
M F
(.32) (3J)
3
6 2 4
4
I 14
2 3
Os 3
2
3 °4
4 KELAPUR TALUKA
VII Vlll IX
M F M F M F
(H) (5) (36) (37) (8) (39)
I I OJ
4 I
4 2 2 4
2
5
OJ 1 4 2 I
6
I
6 4 I I I
I
5 I
6 I I
2 4
2 I
°z °i 4
'j 4 1
2
22 7
I 2 I 3 I
22 9
16 6 28 45 7 5 5 2
2
22 43 I
°4 I 2
I
71 35 6 5 I
4 13 OJ 2 2 °z 9
I 8 0.2 4 3 I I
9
18 6 243 II
20 2 I
22 "j I I
3 4
I
~ '4 32 9 5 2
NON WORKERS
----Seri.1 M F No.
HO) (41) (I)
39 43 54
45
41
275
29 95 40 54
193
32
136 152 80 74
62 29
15
174 29 II 90 23
21 38
207 142 52
45 151 63 53
103
22 69 50 74 32
144 43
180 172
136 22
144 72
37 301 51 302 53 303
304 32 305
306 51 307
308 249 309
310
37 311 106 312 45 313 53 314
197 315
316 38 317
318 319 320
143 321 195 3Z2 106 323
81 314 325
326 70 327 21 328
329 II 330
215 331 31 332 16 333
113 334 26 335
29 336 48 :m
2U 338 129 339 58 340
38 341 Hid 342 95 343 59 344 99 j4j
29 346 86 347 60 348 68 349 42 350
187 351 50 352
353 174 354 158 355
145 356 29 357
358 163 359 92 360
57 60 361 135 203 362
363 49 113 364 17 20 365
37 of
20 10 19
190 52
38 366 3 367
368 369 370
5 371 13 37. 27 373
278 374 46 375
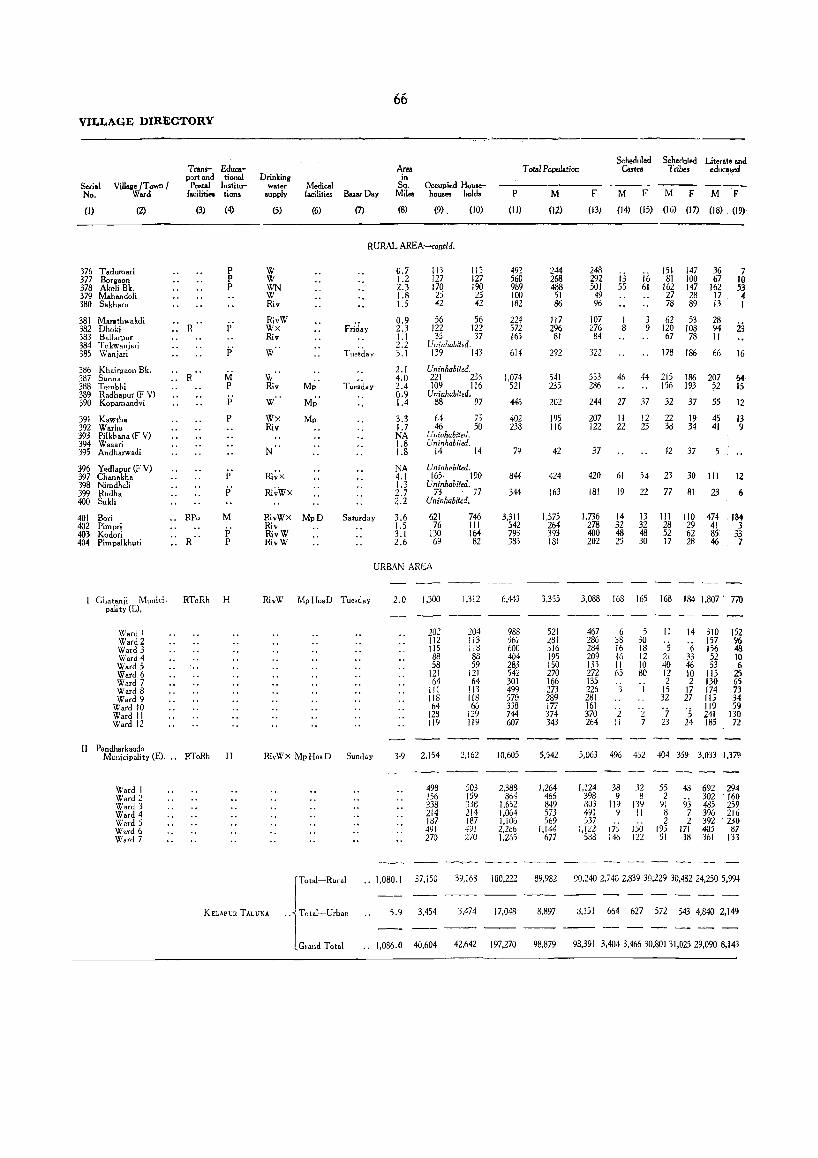
VILLAGE DIRECTORY
Seri.l No.
(I)
Village /Town / Ward
(2)
376 T adumari 377 Borgaon 378 Akoli Bk. 379 M.handoli 380 Sakhara
381 Marathwakdi 382 Dhoki 383 Ballarpur 384 Tokwanjari 385 \V anjari
386 Kh.irgaon Bk. 387 Sunna 388 Tembhi 389 R.dhapur (F V) 390 Kopamandvi
391 Kawtha 392 Warha 393 Pilkh.na (F V) 394 Wasari 395 Andharwadi
396 Yedlapur (F V) 397 Chanakha 398 Nimdheli 399 Rudha 400 Sukli
401 Bari 402 Pimpri 403 Kodori 404 Pimpalkhuti
Trans- &luer port and tiona!
Postal Institu{acilities tions
(3) {4}
.. R
.. R
.. RPo
R
p P P
ii
M P
p' P
M
p' P
Ghatanji Munici- RToRh H pality(E).
\'?ard r Ward 2 Ward 3 Ward 4 Ward 5 Ward 6 Ward 7 Ward 8 Ward 9
Ward 10 Ward II Ward 12
II Pandharkaoda Municipality (E)... RToRh H
Ward 1 Ward 2 Ward 3 Ward 4 Ward 5 Ward 6 Ward 7
Drinking water
supply
(5)
Medical facilities Bazar Day
(6) (7)
66
Ar .. in
SQ. Mil ..
(8)
Occupied Househou... holds
(9) (10)
RURAL AREA-concld.
W W WN W Riv
RivW Wx Riv
W
'W Riv
W
Wx Riv
N
Ri~x
Ri~WX
RivWx MpD Riv RivW RivW
Saturday
0.7 1.2 2.3 1.8 1.5
0.9 2.3 1.1 2.2 3.1
2.1 4.0 2.4 0.9 1.4
3.3 1.7 NA 1.8 1.8
NA 4.1 1.3 2.7 2.2
3.6 1.5 3.1 2.6
113 127 170 25 ~2
113 127 190 25 42
56 56 122 122 35 37
Uninhabited. 139 143
Uninhabited. 221 235 109 116
Uninhabited. 88 97
64 7:3 46 50
Ulliahabiled. Uninhabited.
14 14
Uninhabiled. 165 190
Uninhabited. 73 77
Unin,labi1eri.
621 76
130 69
746 111 1~ 82
URBAN AREA
RivW MpHosD Tuesday
RivWx MpHosD Sunday
2.0 1.300
202 112 115 88 58
121 64
111 118 64
128 119
3-9 2.154
498 J56 338 214 187 491 270
1,312
204 113 118 88 59
121 64
113 118 66
129 119
2,162
503 159 338 214 187 4'11 270
Scheduled Scheduled Literat. and Total Population Csstes Tribe. educ~",d
P M F M F M F M F
(11) (12) (13) (14) (15) (16) (17) (18). (l9)
492 560 989 100 182
224 572 165
614
1,074 521
446
402 238
79
844
344
3,311 542 793 383
6,443
988 567 600 404 28,3 542 301 499 570 338 744 607
10.605
2,388 8' " o~
1,652 1.064 l,i06 2.266 1,265
244 268 488
51 86
117 296
81
292
541 235
202
195 116
42
424
163
1.575 264 393 181
3,355
521 281 316 195 150 270 166 273 289 i77 374 343
5,542
1,264 466 849 573 569
1.144 677
248 292 501
49 %
i3 55
i6 61
151 147 81 100
162 147 27 28 78 89
36 67
162 17 13
7 10 53 4 I
107 276
I 8
3 62 53 28 9 120 108 94 23
84 67 78 I I
322 178 186 66 16
533 286
46 44 215 186 207 64 15 156 193 52
244
207 122
27 37 32 37 55 12
13 9
II 12 22 19 45 22 23 38 34 41
37 12 37 5
420 61 54 23 30 III 12
181 19 22 77 81 23 6
1.736 14 13 111 110 474 184 278 32 32 28 29 41 3 400 48 48 52 62 85 33 202 25 30 17 28 46 7
3,088 168 165 168 184 1,807 770
467 286 284 209 133 272 135 226 281 161 370 264
6 38 16 16 11 6j
'2 II
5 30 18 12 10 80
'j
2 7
II . ;, 21 40 12 2
15 32
'7 23
14 310
'6 l~~ 33 52 46 53 10 115 2 130
17 174 27 lIS
119 ·s 241 24 185
152 % 48 10 6
25 65 73 34 59
130 72
5,063 496 462 404 359 3,033 1,379
1.124 38 32 55 48 692 294 398 9 8 803 119 139
2 302 160 91 93 485 259
491 9 II 8 7 396 216 ~37
:.122 175 1;0 2 2 392 230
195 171 405 87 588 146 122 51 38 361 133
.. 1,080.1 37,150 39,163 180.222 89,982 90,240 2,740 2,839 30,229 30,482 24,250 5,994
KELAPUR TALuKA
tTotal-Rural
.. j To,.~U,b_ l Grand Total
5.9 3,454 3,474 17,048 8,897 3.151 664 627 572 543 4,840 2.149
.. 1,086.0 40,604 42,642 197,270 98,879 98,391 3,4043,46630,80131,02529,0908.143

Total worker. (I-IX)
M F
(20) (21)
158 162 286
35 53
163 154 190 30 20
75 69 187 152 4d 48
Uninhabited. 199 203
Uninhabited. 321 321 151 164
Uninhabited. 140 127
117 142 73 78
Uninhabited. Uninhabited.
24 21
277 249 Uninhabited.
116 103 Uninhabited.
904 164 235 112
1.757
261 146 164 120 86
169 78
140 139 83
190 181
614 171 179 124
868
59 66 90
113 67
1'>3 15 35
113 10 65 82
2.901 1.081
657 245 414 286 268 6:>8 373
170 24
192 5j 57
448 139
M
(22)
33 55 83 II 22
19 32 10
102
85 q)
52
40 15
10
104
35
151 78 jl 44
182
II 5
15 19 7
41 14 8 9 7
32 14
241
33 20 ,2 30 23 64 28
F
(23)
2 6 1
'2 14 25 8
100
101 52
60
62 18
87
21
86 80 jj 43
I 10 8
38 1
I 10 Z
is I y 3 I
32 23
II
M F
(24) (25)
95 86
140 15 20
36 88 35
81
159 145 180 30 18
53 109 40
94
158 202 70 112
59 53
68 47
12
130
72
333 70
125 49
251
19 19 7
21 30 29 9
16 49 4
22 26
393
m 2
91 2
15 1;6 42
79 59
16
151
80
381 87
139 75
494
26 ,7 32 54 25 78 12 24
110 I
51 44
620
120
14j 9
36 247
67
III
M F
(26) (27)
10 9
12 5 8
9 18 I
18 17
10
1 3
13
83 2
17 6
34
8
3 2 3
14
I 2
62
14
is 5 2
22 4
2
37
I
7
2
67
WORKERS
IV
M F M
(28) (29) (30)
V
F
(31)
RURAL AREA-coneld.
2 5 I
21 2 I 2
2 5 I
9 3
10
4
6
84 10 45 10 18 I 4
URBAN AREA
150 44 159
23 II 9
II I
45 3 7
12 9 7
12
2 3 3 4
24 3
I I 3
26 18 15 3 4 J 2 3 6 8
II 60
162 81 374
22 23 , 14 6
83 10
7
72 2
87 26 38 42 32 58 91
26
6 12 4
48
4
'5 7
is 17
55.655 50.044 19.703 14.482 26.634 34.125 1,909 205 2,028 305 387 19
4.658 1.949 423 157 644 i.114 96 9 312 I2j 533 74
60.313 51.993 20.126 14.639 27.278 35.239 2.005 214 2.340 430 920 93
VI VII VIII
M F M F M F
4 KELAPURTALUKA
IX
NONWORKERS
----Serial M F No.
(32) (33) (34) (35) (36) (37)
M F
(38) (39) (40) (41) (I)
12
9
3
19
2
37
8 2 6 I
'3 '4 9
70
6 9
23
2 23 7
402
107
509
9
'j
2
'j
I 3
12
5 4
2
5 2
3
86 2 3 I 7 2 I I
364 23 61
55 37 53 32
4 9
24 47 15 22 58 B
5 I 6 6
'3 2
15 10 6
'j 2 5
17 I 3 I
540 40 193
109 30 29 73
117 109
73
2 6 3
3 20
6
37 28 27 28 10 33 30
'j
12 4
14 3 I
4 2 25 II I
4
30 13 8
II II
3 4
17
5
100 88 3 4
16 3 4 5
86 lOS 202
16 33
42 109 33
93
220 84
62
73 43
IS
147
47
85 376 138 377 311 378
19 379 76 380
38 381 124 382 36 383
384 119 385
386 212 387 122 388
389 117 39il
65 391 44 392
393 394
16 395
396 171 397
398 78 399
400
671 1.122 401 100 107 402 1)8 UI 403 6Y 78 4114
519 201 1.598 2.220
96 20 44 12 50 34 31 41 37 36 24 II 24 I 50 4 21 I 32 6 56 2 54 33
260 135 I~? ,)
64 101 88
133 150 94
184 162
408 2LO 194 96 66
! I~ 120 191 168 151 305 132
866 202 2.641 3.982 II
223 101 !4) 92 61
150 88
28 17 32 25 17 59 24
607 221 4jj 287 301 486 304
934 374 611 440 480 674 449
91 1.234 136 93 .. 3.265 681 34.327 40.196
3 904 63 254 1.385 403 4.239 6,202
94 2.138 199 347 1 4,650 1.084 30.366 46.398

Wani Taluka

1:;0 '" ~.
• ~
!l! I .. '" •
'" g .+ 2 . • N ~
8 -. <n 2 . .fi
~ ~ • . ..
'" • " e iii • .~ 0
" "' a; • .
CD
'" •
!
fj. • '" a
'"
.., !:)'
N .., ..
~.
~.
0
'" ..
.. 51 .
w. '" . N ::I.
Ol B· '" ..
"' !:)
co . N
~. 0 ,,0 !l!
~ ~ Q
• .~
~. VI !:! •
'" ~ •• t II! • eo
.. ;); .
'" .. .'" . N III
o~ ~.
<To
::t"
"' <t 7
." '" ..,
'" .. «> •
~.
~o
. '" ~
'" i. m'
'" ~ • •
" <D
'" ~I
o~ ~ 0 .. , ~ ~
~ . ~., .., '! . .. -
!!2 " • gJ," o ~b. g.
~.
<t ~ '" '!1 '" • !!2 • Ill'
• 1!?
OJ S10
.~ •
'" II! ;. ~ . 0
F1 §
0
~. 0
~ 0 !!? • 0
N •
ro. • ~
.. !:) o "'0 '" •
.~
; •
o It, a
5 £ o o. co
::J " 0 .'" ill'"
0'" m .
o
'" " 0
l:: ~g '"
Iu
~ (f)
o
'" o Z
'" :r u
x (I) LIJ
~ cC 0..
'" ex: B z <{ u. 0 W
!< I-(I)
" « ID l! 0 ID
'" 0 iL IL 0
<II :l
'" Z .. U ,. " 0 .. IX « .. '" It ..

Name 01 village
(1)
Adellaon
Adkoli
Allashi
Aheralli
Aheri
Akapur
Akapur .•
Amb
Ambo •• ri
Amb •• ari Bk.
Ambe.ari Kh.
. Ambora (F V)
Amloan .•
Apti
Araiakawada
Ardh.wan
Arjuni
A.an
Awalgaon (F V) .•
Babapur
Bahilampur
Bamarda ..
Belghat (F V)
Belora
Besa
BhaliU
Bhalewadi
Bhandewad.
Bhendala
Bhimnola
Bhoikund (F V) .•
Bhorad (F V)
Bhurki ..
Bir.apeth
Bodad ..
Badad Bk.
Bopapur
Borda
Borllaon (F V)
Borllaon (F V) ••
Boraaon ••
Borll.on "
Bori
Bori Bt.
Population Code ---No. 1951 1961
(2) (3) (4)
251 1.074 2.251
208 292 340
292
191 336 390
301 527 495
63 479 463
376
203 22 4
106 65 67
165 83 66
164 99 89
82 •
377 151 194
61 437 481
180
237 456 489
121 312 259
139
84 73 248
327 338 422
248 96 142
42 119 167
135 • • 348 1,085 1,073
306 483 430
300 1,054 1,180
50 45
74 288 219
238 364 560
178 138
128
175
77 393 399
212 44 34
20 117 124
256 192 207
160 856 883
133 1,690 1,701
119 107
284
309 353 382
330 504 601
382 215 180
599 673
J-1812-1-10-A-(Yeot.)
69
ALPHABETICAL LIST OF VILLAGES AND TOWNS
5 WANI TALUKA
[ Entries in capital letters are for Towns and Urban areas]
Name of vill.lle
(1)
Bori Kh.
Botoni ..
Brahamani
Buranda
Buranda
Chalbardi
Chanakha
Chanoda
Chargaon
Chargaon
ChatWan
Chendkapur
Chikhaldoh
Chi khalgaon
Chikhali .•
Chilai(F V)
Chilai
Chinchala
Chinchghat
Chinchmandal
Chincholi
Chinchoni Botoni
Chopan
D.bh.
Dabh.di ••
D.bhapur
Dahegaon
Dahegaon
Dandg.on
Dapora
D.ra
Darara
DemadDevi
Dew.la .•
Dewarwad.
Dhakori .•
Dhamani ..
Dh.ndir ••
Dh.nora
Dhanor.
Dhoptola
Dhunaki
Code No.
(2)
Population
1951 1961
(3) (4)
31 311 330
103 91 188
280 548 585
24 574 671
88 354 388
205 217 289
370 260 302
31 214 227
73
304 537 640
179
326
176 257 316
266 1,001 1,117
387 413 401
118 •
361 370 349
52 453 467
155 327 290
7 870 934
373 273 285
83 659 803
29 1,134 1,109
190 352 399
189 279 349
277
142 88 68
151 938 1,023
58 444 522
6 181 179
161 481 423
137 133 151
186 245 224
18 578 702
381 81 130
367 496 562
35 250 331
299
4
235 936 956
290 90 100
363 25 287
Digras . . 222 477 394
Doldongarllaon •. 64 442 492
• Uninhabited.
Name of village
(1)
Dongargaon
Dongargaon
Dongargaon (F V)
Dongargaon
Dorli
Dorli
Dorli
Durbha .•
Durgad.
Durg.di ..
Fulora ..
G.degaon
Gadegaon
Gadeghat
Ganeshpur
Ganeshpur
Ganeshpur
Gangapur (F V) ••
GaWara ..
Cawarol.
Ghanpur
Chod.dhara
Choguldara
Ghonoa .•
Cirjapur (F V) ••
Codani ••
Gondhola
Gopalpur
Gopolpur
Coraj
Govindpur (F V)
Gowari
Gowan
Hatwanjri
Hirapur ••
Hiwara Barsa
Hiwaram ajra ••
Hiwardara
Inj .. an
Isapur ..
Jaglon
lalka
Population Code ---
No. 1951 1961
(2) (3) (4)
27
134
188
227
lIO
199
355
228
89
255
148
115 125
159 153
• 130 222
256 224
36 66
439 470
597 543
151 126
•
21 285 272
294 284 267
375 34 86
216 102 ff3
242 428 399
272 689 807
127 •
191 497 682
68 609 599
92
33 229 285
22 385 431
146 1.271 I,m
104
132 453 447
152
198 32 24
343 68 122
57 267 341
246
281 315 281
368 256 277
93 260 383
244 482 756
113 275 399
43 902 924
350 40 74
157 264 218
144 57 63
14(, •
80 657 793
NA = Not Available.
Name of viIlallO
(l)
lamani
Code No.
(2)
206
Jamni 380
Jugad 392
Junoda 310
Junoni(FV) .. -150
Junoni 171
Junoni 354
K.lamana 385
K.lamana Kh... 263
Kamalpur (F V) 232
Kamalwelli 210
Kanada .• 44
Kanh.lgaon 26
Kanh.lllaon 48
Kanhalgaon 85
K.ranwadi 95
Karellaon Kh. 166
Katli Borgaon 115
Kawad .. i 346
Kayar 317
Kellaon 12
Kegaon .. 122
K.oolapur 163
Ke.urli .• 305
Khadakdoh 209
Khadki 241
Khairllaon 1 I
Kbairgaon 86
Khandani 98
Khandl. 332
KhapTi .. 94
Kharbada 224
KhaTda (f V) 54
Population
1951 1961
(3) (4)
876 I.OS7
11
204 173
212 246
206 217
30 6
• •
571 533
218 256
384 429
355 366
• • 198 275
129 234
NA 859
508 651
72 261
451 415
917 998
475 370
199 257
339 334
189 309
217 187
454 516
213 38t
478 425
443 623
48 64
191 207
• • KhateT ...
Khed
253 339 424
378
Kbekadi .•
Kbekadi (F V) ••
Khekadwai
Kilona ••
Kinbalo ••
Kodpakhindi
Kolera .,
Kolgaon .•
Kolllaon .•
286 4
219
32 189 226
145
39 287 286
195 256 277
291 400 442
112 1,069 1,112
389 607 560

Name of villa2e
(1)
Kona
Korambi
Kosora
Kosar.
Population Code ---No. 1951 1961
(2) (3) (4)
275 615 677
285 131 179
2 634 656
234 712 636
Kothurla.. 10 221 312
Krishnanpur 5
Krishnanpur (F v) 218
Krishnapur 353 536 605
Kumbha 13 1.764 2.016
Kumbhari 349
Kumbharkhani.. 153 271 119
Kundi
Kundra
Kurai
KurU
Lakh3pur
Lalguda ..
Lathi
Lendhori ..
Lingti
Loni
Machindra
Madnapur
Mahadapur
Mahagaon
Mahakalpur
Majora "
Majara
Majara
M.lell.on
Mandar .•
Mandvi .•
Mandwa .•
Mangli
Mangli
Mangrul .•
Mangrul Bk.
Mangrul Kh.
Manki
Mardi
Maregaon
169 148
352 485 353
356 584 846
357 461 558
70 292 259
278 239 412
323 255 302
154 50 39
230 434 517
159
65 268 325
36
183 56 120
15 354 345
328 295 342
30 459 593
126 69 50
260 228 279
325 15
298 1.405 1.375
170 479 612
187 1I2 313
9 128 178
243 557 284
60 404 469
197 167 235
196 145 176
287 734 755
28 1.085 1.208
49 1.151 1.479
1-1812-I-l0-B-(Yeot.)
70
5 WANI TALUKA-contd.
Name of village
(1)
Maregaon (F V) ..
Marea-aon
Marki Bk.
MarkiKh.
Mathariun
Matholi "
Mendhani
Mendholi ..
Mhaisdodaka , ,
Mod-Majara
Mohoda .,
Mohorli .,
Muchi
Mudh.ti "
Mukta ..
Mukutban
MuL:awhan
Mundr •..
Mung-oli .,
Munjal •..
Murdhoni
Murti
Naga]a ..
Naigaon ..
Naigaon Kh.
Nandepera
Nandgaon
Narsala "
Narsoda ••
NawarQ'aon
NaWargaon
Population Code ---No. J951 1961
(2) (3) (4)
97
283 514 741
214 406 701
215 141 168
182 771 1,253
39] 113 115
91 274 374
3191.066 1,187
99 223 388
362 •
341 843 962
276 1.271 662
213 60 35
193 62 103
59 238 277
247 1.948 2.211
177 201 243
351
374 398 348
252 289 •
271 937 1.186
383 211 236
259 10 29
347 1.148 1.027
273 477 550
71 1.609 1,724
366
34 649 713
162
100 2.170 1.632
313 291 501
Nerad 338 803 821
Net 69
Nilapur 279
Nilj.i 337
Nim.ni .. 136
Nimbadevi 167
Nimb.la 257
Nimbala Bk, 365
Nimbal. Kh. 364
Nipani Pimpri (F V) 331
Niwati.. 322
311
335 457
192 967
345 393
402 318
345 440
485 440
482 416
Name of villalle
(I)
Pachpohar
Pahapal "
Palgaon ..
P.I.oni "
Population Code No. 1951 1961
(2) (3) (4)
105 239
25 417 617
102 86 50
265 1.153 1.257
Panchdhal 340
Pandhardevi (F V) 81 •
Pandharkawad' 53 285 310
Pandharkawada 226 561 568
Pandharwani 184 337 392
Pandwihir 79 28 32
Parambh. 172 •
Paramdoha
Pardi
Pardi
Pardi
Pardi
Pardi (F V)
Pardi
Parsoda .•
Parsoda "
Parsodi "
Patan
386 540 655
45 137 141
116 66 140
200
233
344
369
262 * 6
293 324 354
194 25 411
223 1.575 1,640
Pathari .. 51 197 204
Pathari 384 126 134
Patharpur 316 466 438
Pawnar(F V) .. 217 209 230
Pendh.ri 120 222 360
Petur 297 586 625
Pheparwada 56 113 144
Phiski (F V)
Pimprad (F V) "
Pimprad
Pimpri
Pimpri ..
Piwardol
Pohona ..
P okharni (F V) ..
Punwat
Purad
Purad
41
308
55
• 355 427
* 249 396 466
302 296 356
329 628 809
38 322 388
174 329 352
76 232 232
173
335 1.827 1.874
334 860 960
339 870 936
• Uninhabitedl
Name of villa2e
(I)
Raipur
Raipur ..
Rajani
RajuT
Rajur
Rameshwar
Rampeth
Rampur "
Rangana
Rasa
Rohapat. ,
Ruikot ..
Savnapur
Sakhara .,
Sakhara ..
Population Code No. 1951 1961
(2) (3) (4)
108 73 68
229 44 <43
125 70 248
245 281 292
258 3.189 2.568
17 40
204
114 147 65
78 610 608
282 1.645 1.683
107 240 386
240
109 266 412
390 546 664
156 1.707 1.623
Saha 14 123 157
Salebhatti (F V) 61 254 293
Sarati 87 305 428
Satpalli 202 846 812
Sawali 239
Saw.ngi " - 461 454
Sawangi " 360 660 775
Sawarla "
Shek.PUf
Shelu Bk.
Shelu Kh.
Shewala .•
Shibla
Shindi
Shindi-Wadhon.
Shindola
Shionala "
Shioni ..
Shioni Jh
Shirlliri
Shirola
Shirpur "
Somnala "
Son.pur ..
Sonegaon
Suknegaon
Surd.pur
Surdapur
274 540 648
225 94 liZ
321 379 545
72 756 m 345 148 147
1I7 180 287
16 312 0489
324 551 525
358 570 704
23 265 218
46 471 510
372 509 541
2% * 63
207 48 tOj
320 1.299 1,45
124 203 254
75 290 315
138 686 700
295 1.065 1,269
211
333
508 501 «

71
5 WANI TALUKA-concld.
Populatio. Population Populatioll Population Name of villave 0>de ---- Name of Till'ie 0>d. ---- Name of village 0>d. Name of villaiO Code"-
No. 1951 1961 No. 1951 1961 No. 1951 1961 No. 1951 1961
(1) (2) (3) (4) (1) (2) (3) (4) (1) (2) (3) (4) (l) (2) (3); (4)
Surla 131 554 608 Umarihat 147 101 84 Wadiapur 318 254 314 Wel.bai .• 342 1,062 n,423
Surla 158 Umari 192 66 17 Wadner(FV) 220 Welhala •• 307
Susari 130 132 138 Umari 312 407 580 Waadhara 90 195 432 Yeda,bi .. 250 347 326
Wagdhara 288 635 730 Takalkheda 101 393 391 Yedlapur 236 * Virlmnd •. 141 905 995 Walla.a 149 170 156 Taldi 8 399 387 Yenad 359 253 288
Vyankatapur 270 WAN I Urban Area I 14,67218.176 Taldi 185 433 412 Yena. 371 495 508
Waniri .. 264 1.161 1.318 T.ldi 388 400 341 Yeo!i 231 115 64
Wadani (F V) " 221 Wanoia 66 754 759 TarOO. 336 385 419
W.d~.on .jQ % 109 Wargaon 303 327 352 Zagd. 47 Tejapur •• 379 778 1.317
Wadll'aon 123 Warud .. 62 466 460 Zamkola 143 370 488 Tembhi .. 168 158 178
Wadiaon 289 Warzadi ., 314 350 393 Zarpat 261 151 203 Tukapur •. 19
Wadhona 129 252 323 Watholi •• 201 526 482 Zol. 269 480 535 --Uchat Devi (F V) 96 Wadhona (Pilki) 315 238 201 Wedad .. 254 222 298 1951 TOTAL t 153.727
Ukni 311 1.383 1.410 Wadhona (Tip) .• 268 252 307 Wegaon .• III 2,Q43 2.179 1961 TOTAL 173.669
• Uninhabited, tTh. 1951 population of the T.luk, as lIi.en in thi, lilt differs from that mentionOli in Table A-II.

VILLAGE DIRECTORY
Serial No.
Village J Town J Ward
(I)
1 Sawangi 2 Ko .. ra 3 Bori Bk. 4 Dhanora
(2)
, Krishnanpur
6 Dapara 7 Chinchmandal 8 Takli 9 Mangli
10 Kothurla
II Kh.irgaon 12 Kegaon 13 Kumbh. 14 Sakr. 15 Mahagaon
16 Shindi 17 Rameshwar 18 Dewala 19 Tukapur 20 Bodad
21 Gadegaon 22 Ghoguldara 23 Shionala 24 Butanda 2') p.h,pa\
26 Kanhalgaon 27 Dongargaon 28 Mardi 29 Chopan 30 Majora
31 Chanod. 32 Khekadwai 33 Ghodadhara 34 Narsa!a 35 Dhamani
36 Madnapur 37 BoriKh. 38 Pi.gaon 39 Kinhala 40 Wadgaon
41 Phiski (F V) 42 Bamarda 43 Hiwaramajra 44 K.nada 45 Pardi
46 Shioni 47 Zagda 48 Kanhalgaon 49 Maregaon 50 Bholewadi
51 Pathari 52 Chinchala 53 Pandharkawada 54 Kharda (F V) 55 pimprad (F V)
56 Pheparw.d. 57 Goraj 58 Dandg.on 59 Mukt. 60 Mangrul
Transport and Postal
facilities
(3)
.. Po
.. Po"
.. R
R
.. RP~
.. RP~ R
.. R
.. R
61 S.I.bhatti (F V) •• R 62 Warud 63 Akapur 64 Doldongargaon 65 Machindr.
{;6 Wanoj. 67 Apti 6B Gawarala 69 Net 70 Lakhapur
71 Nandepera n Shelu Kh. 73 Chargaon 74 Bhandewada 75 Sonapur
.. Po
Educational
Institu tiona
(4)
M p' P
p
M i, P
p'
M M P
p' P
p' P
P
p'
j,
P
p' P
p P P
M P
ji
Drinking-water Medical supply facilities
(5)
Riv Riv WN Riv
W Riv W W W
W Riv W WX Wx
W W W
WX Riv W WN W \V
w W W W
Riv W W Wx W
Wx W W W
W" W W Riv
(6)
M~D
Riv
W" W MpD N Mp
W Mp W Mp W
W WN RivWN Riv V'" 'II W WN WN WN
WN RivW W W Wx
WN Riv
W W
Bazor Day
(7)
72
Area in
Sq. Miles
(8)
Occupied
houses
(9)
Household.
(10)
RURAL AREA
1.6 108 108 3.1 144 144 3.8 172 172 0.6 I I 0.2 Uninhabited.
1.5 2.S 1.8 1.4 1.6
2.5 1*9
12.0 0.7 I 4
48 175
75 32 50
101 83
402 36 66
48 175
85 42 62
116 91
476 36 67
2.6 91 99 I 0 9 9 . 136 159
20'~ Uninhabited. . 29 29 1.6
1.2 4.2 40 2.8 2.6
62 82 54
131 104
I 3 Uninhabited.
62 96 55
138 115
· 23 24 .. 0.8 257 259
Wednesday 2.3 247 247
Sai~rd.y
Tuesday
U 145 14S
1.4 1.2 2.0 4.4 1.7
50 53 66
152 72
50 53 66
152 72
O 2 Uninhabited. · 71 71
1.2 80 80 1.2 50 55 n 20 20
NA Uninhabited. 1 6 39 39
· 210 210 3.4 83 83 U 26 26
2.8 83 83 0.7 Uninhabited. 1.3 60 60 3.9 356 356 2.1 14 14
0.8 40 46 1.8 92 98 1.4 63 75 NA Uninhabited. NA Uninhabited.
1.2 20 23 1.8 51 74 2.3 97 110 1.6 48 67 1.6 57 90
NA 2.5 1.5 2.0 II. !
64 92
109 106 76
64 92
109 106 76
5.9 175 175 2. I 109 109 3.2 128 134 1.1 65 71 1.2 45 57
5.4 323 365 1.9 167 167 0.7 Uninhabited. 0.9 45 50 1.1 65 65
Total Population
P M
(IT)
454 656 673
5
179 934 387 178 312
516 370
2,016 1157 345
489 40
702
124
272 431 218 671 617
125 1,208 1,109
593
227 226 285 713 331
330 388 286 109
167 924 366 141
510
275 1.479
45
204 467 310
144 341 522 277 469
293 460 463 492 325
759 481 599 311 259
1,724 777
219 325
(12)
227 329 35~ ..
84 471 193 89
168
251 183 990 84
174
246 ~I
353
61
130 210 114 357 322
66 616 572 295
TJ5 97
136 369 167
168 193 146 50
82 473 183 72
2)7
139 748 20
109 230 160
70 179 275 146 249
147 234 235 242 159
387 230 300 160 137
864 395
112 170
F
Scheduled Castes
M F
Scheduled Literate and Tribe. educated
M F M F
(13) (14) (15) (16) (17) (18) (19)
227 327 317
I
95 463 194 89
144
265 187
1,026 73
171
243
i6 15
37
13 19
39
40 36
102
37 36 86
62 Tl8 90
I
36 16 44 42 12
33 22 23 227 50 45 42 29 14 61
87 92 68 83
468 4~5 31 27 88 88
91 69
268 19 43
14 29 20
5 50 5
10 26
23 13 61 6 1
69 72 76 11 19
349 3'0 i.j 3 4 7 3 14 16 130 30
63
142 221 104 314 295
59 592 537 298
112 129 149 344 164
162 195 140 59
85 451 183 69
253
136 731 25
95 237 150
74 162 247 131 220
146 226 228 250 166
8
'3 I
is 8 1
'2
ii 'j
3
i4
ii I
II
372 5 251 299 151 122
860 20 382 7
107 1);;
4
'i 2
ii 3 5
2
'7
2
24
29 32 18 3
51 58 191 197 113 104 167 168 60 48
42 12 3
107 9Z
6 3
i6 5
16 12 32 8 90 89 274 103 78 78 294 72 68 73 96 20
37 43 95 128 38 48
158 175 50 51
43 7
37 119 60
3
'j, 30 17
106 lOS 56 9 38 38 70 14 55 58 55 5 9 10 18 6
7 7 25 8 49 52 206 59 40 46 60 II 18 17 26 8
70 64 125 37
51 56 50 5 III 101 385 149 20 25
3034343 69 69 95 24 40 42 52 10
27 41 15 2 57 65 46 4 5 7 123 25
20 19 59 10
94 92 45 40 91 83 76 88 59 65
129 34
13 65 81 77 57
8 16 16 4
10 35 29 187 43 6 10 86 20
114 112 76 8 52 41 48 12 565440 S
15 160 178 371 97 II 45 51 126 27
15 17 4S 9 75 72 55 II

'fotal worker. (I-IX)
M F
(20) (21)
M
(22)
F
(23)
II
M F
(24) (25)
144 130 54 43 73 91 200 i 95 ~ ~ 100 ID 235 219 99 117 95 102
2 Uninhabited.
2 I
54 54 18 24 29 29 307 296 114 128 116 168 121 110 48 41 59 67 49 52 12 14 33 37 94 80 48 48 33 31
lSI 167 69 86 70 79 106 117 22 19 65 97 646 625 245 256 281 345 54 49 35 27 IS 22
112 106 61 60 43 46
156 136 14 12
227 225 Uninhabited,
44 36
83 71 143 129
78 69 213 203 202 171
Uninhabited, 42 32
341 253 347 311 175 167
75 74 64 84 92 93
228 209 101 98
Uninhabited, 98 96
119 114 87 86 30 23
Uninhabited,
88 II
110
16
18 86 52
128 86
20 H)5 151 76
28 43 51
lOS 51
42 44 48 12
78 6
95
18
18 69 45
122 91
20 23
121 31
32 46
ii 56
40 43 42 13
52 47 22 9 263 259 110 132 1M I~ ~ ~
41 42 23 26
150 143 76 Uninhabited,
89 93 21 428 348 139
15 18 3
67 68 150 133 96 96
Uninhabited, Umnhabited,
21 58 44
82
28 142
2
24 68 51
38 49 33 38 1m 104 n M 1~ 146 Iffi 100 89 82 52 40
i35 III 60 50
91 86 34 37 136 116 56 52 Ie I~ 44 ~ ISZ I~ ~ e I~ IW ~ ~
233 236 108 III Ie 19 n " 192 130 62 29 lOS 65 44 88 44 34 j.j
47 2
91
15
47 34 18 60 51
21 129 130
81
36 20 29 81 44
45 61 24 17
57 6
129
18
51 58 24 81 63
12 213 182 135
42 38 89
198 42
56 71 44 10
27 38 106 124 37 70 15 16
51
43 156 II
40 58 43
59
52 197
16
44 60 42
4 II 21 26 31 44 24 42 61 61
54 48 30 62 69 101 90 94 39 65
73 112 56 74
112 100 40 60 34 23
511 505 177 103
133 21 I 328 2'\0 214
·']nim'abiled, 73 65 99 97
35 35
89 96 122
31 27 34 39 48 47
III
M F
(26) (27)
5 21 9
I 15 4
'i I
10 24
1
4
3 2 6
14 20
'5 21 2
2
3
5 2
'7 5
I 34 8 6
17
27
'4 I 2
4 24
1
'j
2
73
WORKERS
IV V
M F M F
(28) (29) ,(30) (31)
7 4
19
RURAL AREA
'i
2 37 4 I 4
5
1
3
3 31 j4 'j
I I 2
j7 I
8 13
'j; 19 ii
I 23 ij 23 4 9
9
~ '4 23 3
4 8 8
2 18 6 I
II
4
i4 'j
2
23 I I I
3 13 'j 4 2
~ I '3 to 2 3
10 I
's I I~ II '3 6 I
II 5 3 3 5 I 4 ii
40 5 32 17 2
4 3 4 8
3
'7 19
jo
VI
lII' F
(32) (33)
'j 2
2 9
3
'i 'j
2
'j
3
'j
3
5 WANI TALUKA
NONWORKERS
Vll VIII IX ---- Serial
M F M F M F M F No,
(34) (35) (36) (37) (38) (39) (40) (41) (l)
I 4 2
2 7
'3 I 2
'j
25 3 4
'i 3
2
3
ji 7
2 3
'(, 2
4
5 2 I 25 3 4
2
~ 'j
'j I 'j
'j I I
2 2
'4 I I
17 3 I I
4 7 9
2 14 6 I
~ 'j
~ 'j 31 7
'i 7
'7
I 8 I 2 3
23 1
jj 2 15 4 5
2
3 7 3
5 3
I
I 18 3 4 I 2
83 91 1 129 132 2 121 98 3
2 4 5
30 41 6 164 167 7 72 84 8 40 37 9 74 64 10
100 77
344 30 62
90 7
126
17
47 67 36
144 120
24 275 225 120
40 33 44
141 66
70 74 59 20
30 210
75 31
98 11 70 12
401 13 24 14 65 15
107 16 7 17
124 18 19
27 20
71 21 92 22 35 23
III 24 124 25
26 27 27
339 28 226 29 131 30
38 31 45 32 56 33
135 34 66 35
36 66 37 81 38 54 39 36 40
41 38 42
192 43 62 44 27 45
5 2 107 110 46
8 8 50 47
43 48 383 49 69 5 320
I 10 '4 3
'z 5 '2 3 3
I I 8 I 6 3 4 4
9 3 5 2 4
10 '4 2
30 16 9
~ 'j
5
42 80 64
7 50
27 51 104 52 54 53
54 55
32 25 56 74 58 57
114 101 58 57 49 59
114 109 60
56 60 61 98 110 62 90 86 63 90 112 64 53 46 65
154 136 66 87 82 67
100 169 68 55 86 69 49 78 70
353 145
39 71
355 71 168 72
73 42 74 58 75

VILLAGE DIRECTORY
Seri.1 No
Villa •• fTown! Ward
(I)
76 Pohon. n Bhurki 78 Ranllana 79 Pandwihir 80 ]atka
Trans .. port and Post.1
f.cilities
(3)
81 Pondhordevi (F V) .. 82 Ambo," (F V)
" RP~ •• R .. R
83 ('hinchoni Botoni 84 ;~ .. , algaon (F V) as l~._ar.halgo.on
86 KJ,c·itgaon 87 ~,,"ti 88 Bura.da " R c\! D1)r~ada 90 Waedhara
9i Mel.dbani 92 Goanflla 93 Hatwanjri 94 Khapri .. R 95 Karaow.di . . R
96 Uchat-Devi (F V) •. 97 Maregaon (F Vi 98 Khandani 99 Mhaisdodaka
100 Nawargaon .. Po"
101 Takalkheda 102 Palgaon 103 Botoni 104 Girjapur (F V) 105 Pa~hpoha,
106 Ambezari 107 Rohapat 108 Raipur 109 Sognapur 110 Dorii
111 Wegao. •• Po 112 Koigaon . • R I 13 Hiwar. Borsa 114 Rampur 115 Ka tli Borgaon
116 Pardi 117 Shibla 118 Chilai (F V) 119 Borgaon (F V) 120 Pendh.ri
121 Ariun; 122 Keg.o" 123 W.dgaon 124 Samnala 125 R.joni
126 127 128 129 130
131 132 133 134 135
Maj.,. Gang.pur (F V) Bhaikund (F V) W.dhon. Su,an
SurIa Godani Borda Don*,ataaon BeJllha t (F V)
136 Nimani 137 Dara,a 13S Sonoaoon 139 As.n 140 Jaglon
141 Virkund 142 D.hegaon 143 Zomkola 144 I.apur 145 Kilon.
146 Ghan •• 147 Umargh.t 148 Fulora 149 W.lIa •• 150 Junoni (F V)
.. Po"
RPo
Educa. tion.1
Institutions
p' p
M
(4)
i; p
p p M
P
M M P
P P
p' p
p' M
p' p
p
p'
M
Drinking water .upply
(5)
N Ri. Riv Nx W
WNx Wx W
W W WN WN WN
WN WX N W
W W RivW
W N WN Nx' W Nx W Wx W
RivW W W N W
W WN W" W
N W
Wx' W
N
W" W
W W WTkx Riv
W N W
WTkx N WN N
Medic.1 facUities
(6)
RivW Mp Ri y Mp
W W
74
Area in Occn ... Sq. pied
Bazar Dn Miles houses Household.
(1) (8) (9) (10)
RURAL AREA-contd.
Th';"~d.y
Friday
We.k •• doy
Friday
0.8 49 2.1 92 2.7 121 1.1 21 3.2 170
49 92
121 21
170
NA Uninhabited. NA Uninhabited. 4.9 ISO 180 O.R 49 49 1.2 53 53
2.2 89 69 2.& % 96 3.5 83 83 1.6 26 26 3.9 93 94
3.b 89 90 o I Uninhabited. 2:0 87 91 1.9 12 13 3.1 16J 184
NA Uninhahited. NA Uninhabited. 4.2 98 102 1.5 69 76 5.7 300 ~58
I 7 80 87 · 10 10
0.9 41 41 2.4 Uninhabited. NA 44 47 5.7
2 7 14 14 • 84 B4
3.3 14 14 1.6 86 89 U 55 55
6 3 432 432 • 222 222
3.2 79 79 2.8 13 13 ~:~ 55 55
2 I 30 30 · 58 58 ~1 Uninhabited. NA 18 18 2.6 72 72
33 63 63 · 56 56
21 . 51 Uninhabited. · 55 55
2.0 50 50 2.2
4·0 NA NA 3.3 2.2
4.2 3.1 2.6 1.6 NA
7 Uninhabited. Uninhabited.
70 29
138 93
368 33
Uninhabited.
70 29
138 93
368 33
3.3 88 94 I 3 26 34 · 159 159 : J Uninhabited.
0.4 Uninhabited.
5.6 216 216 1.8 16 16 2.0 104 104 1.5 12 12 1.1 Uninhabiled.
2.1 315 315 1.2 20 20 I .9 Uninhabited. 1.6 32 32 NA 47 47
Scheduled Scheduled Literate ... d Tot.1 Population Castes Tribe. educated
P lV' F M F M F M F
(I I) (12) (13) (14) (15) (6) (17) (IS) (l9)
232 399 6(18
82 793
S03 248 234
386 428 388 126 432
374
383 64
859
425 388
1,632
391 50
188
239
67 386 68
412 224
2,179 1.112
399 65
261
140 287
107 360
259 2J7
254 248
SO
3Z3 136
608 447
1.701 153
393 lSI 700
995 68
48B 63
1.177 84
156 217
119 207 303
39 373
390 122 116
186 200 1% 75
198
191
207 37
426
201 199 806
180 23
103
129
38 191 34
212 112
1,119 577 212 36
136
67 143
48 173
131 122
127 118
25
153 68
296 231 863
79
203 69
361
497 36
237 30
6)6 42
78 107
113 192 30;
43 420
413 126 118
200 228 )92 51
234
183
176 27
433
224 189 826
211 27 85
110
29 195 34
200 112
1,060 535 187 29
125
73 144
59 187
128 135
127 130
25
170 70
312 216 838 74
190 82
339
498 32
251 33
9 3 7
·s
5
i4
24 II
i3 2
'5 16
48 27
is
's
7
34 7
4i
6
·s
60 47 58 69 31 32 39 43
169 181
49 74 81 4
157
4 232 234 87 14 19 i5 1~~ 1~~
33 8
152 153 120 132 76 79 47 '28
148 163
m 177
93 8S 10 5
144 220
18 39 57 23 14
20
60 9
165
167 195 9 20 20 59
148 165 368
2 18 23 57
41 31
ii
21 26 3 81 60 20
103 % 8
35 28 6 165 174 12 34 34 5 49 40 61
41
182 191 408 46 35 288 75 70 72 36 29 2
114 104 23
67 73 8 131 139 27
48 59 5 172 187 II
100 94 19 j4 49 51 22
26 29 34 117 124 9
25 25
147 164 15 30 37 5
10 261 281 51
j.j m m ~ 3 47 53 10
IB4 172 68 82
jo 211 207
4
142 169 32 28
190 201 30 33
24 7
109
147 II 42
12 5
24
52
28 3 3
1 12 9 7 I
10 I
25
;4 140
25
'i
I I 1
13 10
105 91 18
2 5
3 <;
11 12
105
I 3
17
25
ii
561 171 157 253 73 42 42 42 4
78 ) 62 52 10 4 110 17 19 55 55 16 I

Total workers (i-IX)
M F
(20) (21)
71 130 192 25
230
71 122 168 27
204
Jninhabit.d, :.Ininhabit.d,
236 250 81 85 80 79
121 134 119 135 124 119 38 23
130 125
140 130 Uninhabited,
136 104 23 19
270 256
Uninhabited, Uninhabited,
142 137 122 100 470 420
101 lOS 17 12 68 53
Uninhabited, 80 55
26 120 22
1\9 60
641 3j5 121 24 93
21 118
19 112 66
616 305 107 16 83
44 46 98 98
Uninhabited, 30 33
122 134
88 89 79 tiS
Uninhabited, 82 71 7') 9Z
IS 16 Uninhabited, Uninhabited,
94 97 48 38
194 189 146 124 531 493 S5 45
Uninhabited,
129 132 47 49
219 206 Uninhabited, Uninhabited,
299 274 25 23
153 151 19 22
Uninhabited,
366 316 27 ~c
UnirJa.bited, 46 47 69 C4
M
(22)
21 57 93 10 77
103 43 36
45 57 47 13 89
92
71 IS
137
79 75
171
50 7
31
40
19 80 16 61 27
305 148 21 13 45
26 45
10 54
57 42
26 54
11
51 20
90 60
258 21
63 30 66
126 15 89 6
147 9
28 31
Ii
F
(23)
M F
(24) (25)
17 SO 81 8
25
123 41 31
45 69 55 4
59
l!8
56 11
128
90 70
206
50 5
31
30
24 62 69 14
103
92 36 40
65 55 61 18 37
23
53 6
103
47 34
136
32 10 31
25
18 4 82 33 15 3 64 50 34 25
314 232 145 116
17 65 6 9
95
19
52 51
18 62
12
56 20
89 46
256 20
66 31 74
125 14 99 9
141 10
2 I
31
17 42
20 57
28 34
48 20
4
39 15
79 71
181 33
54 14
125
147 9
54 13
131 15
18 36
46 71 85 19
176
125 44 48
84 66 64 19 66
36
46 8
127
47 30
197
50 7
22
22
3 36 4
42 32
282 155 88 10 69
46 2
33 115
36 37
52 30
4
41 18
99 78
211 25
60 18
131
145 9
51 13
154 16
45 63
III
M F
(26) (27)
19 1
13
6
20
'j
5
I
" 4
22
2
13
i9 z j'
Z 5 2 1 2
10 2
II I 7
'5
'9
I 9
6 5 6
5 .. 2
26 2
6
'2
4
6
3
II
'j
6
75
WORKERS
IV V
M F M F
(28) (29) (30) (31)
RURAL AREA-contd,
4 2 (,
10
11 'j '3
Z
2 I 7
12
'j
2
2~ 3 '4 2 2
4
'3 '5 I
39 3 14 46 4 I 9
1 '3 '3
2
'4 2
;0 I 1
2 2
11
10 2
4 1
18 4
'j '2
4 5
20 jj
VI
M F
(32) (33)
2 I
'i
3
•
5 WANI TALUKA
Vii Vlli IX
M F M F M F
(34) (35) (36) (37) (38) (39)
I 1
'8 I
2 2 2
I I
46 '6 '4
'j
15 6 3
'j
ij
2
'i
5 I
11 13
2
'j
! 'i 6 1
j9
II i I
2 4 5 3
2
3 I 5 I
2 5
56 6
'j
2
I 2
2
! 'j
" 22 15 12 '2 4 10
I
" I
2 2
2 I
2
10 5
24
3 I
II I
5 2 I 4
32 I
NONWORKERS
----Serial M F No.
(40) (41) (I)
48 42 76 77 70 77
III 137 78 14 16 79
143 216 80
154 41 36
65 81 72 37 68
51
7i 14
156
81 82
163 83 41 84 39 85
66 86 93 87 73 88 28 89
109 90
53 91 92
7Z 9, 8 94
177 95
96 97
59 87 9d 77 89 99
336 406 100
79 6
35
49
106 101 15 102 32 103
104 55 105
12 8 106 71 77 107 )2 )5 108 93 88 109 52 46 110
478 444 III 242 230 112
91 80 113 12 )3 114 43 42 115
23 45
)8 51
43 43
45 43
10
59 20
102 85
332 24
74 22
142
27 116 46 117
118 26 1)9 53 120
39 121 47 122
123 56 124 33 125
9 126 127 128
73 129 3Z 130
123 131 92 132
345 133 29 134
135
58 136 33 13,
133 138 139 140
198 224 141 II 9 142 84 100 143 11 II 144
250 15
32 38
145
245 146 16 147
148 3) 149 44 150

VILLAGE DIRECTORY
Serial No
(I)
Village IT ownl Ward
(2)
151 Dahegaon 152 Condhala 153 Kumbh.rkhani 154 Lendhori 155 Chinchghat
156 Sakh.ra 157 Injasan 158 Surla 159 Loni 160 Bopapur
161 Dara 162 Nar,oda 163 Ke,alapur 164 Ambezari Kh. 165 Ambezari Bk.
166 Karegaon Kh. 167 Nimbadevi 168 Tembhi 169 Kundi 170 Mandvi
171 Junoni 172 Parambha 173 Pokharni (F V) 174 Piwardol 175 Bhorad (F V)
176 Chikhaldoh 177 Mulgawhan 178 Bhimnala 179 Chatwan 180 Arajakawada
181 Cawara 182 Mathariun 183 Mahadapur 184 Pandharwani 185 Takli
186 Oem ad Devi 187 Mandwa
Transport and
Postal facilities
(3)
•. R
•. R
oo RPo
188 Dongar.aon (F V) .. 189 Dabhadi 190 Dabha
191 Aheralli 192 Umari 193 Mudhati 194 Parsodi 195 Kodp.khindi
196 Mangrul Kh. 197 Mangrul Bk. 198 Copalpur 199 Dorli 200 P.rdi
201 Watholi 202 S.tpalli 203 Amb 204 Rampeth 205 Chalbardi
206 lam.ni 207 Shirola 208 Adkoli 209 Khadakdoh 210 Kamalw.lli
211 212 213 214 215
Surdapur Birsapeth Muchi Marki Bk. MarkiKh.
Ganeshput 216 217 218 219 220
PaWnar (F V) Krishnanpur (F V) •• Khek.di (F V) Wadner(FV)
221 Wadani (F V) 222 Digraa 223 Patan 224 Kharbada 225 She kapur
.. R oo RPo oo R
Educational Institutions
(4)
P
j:i
M
p'
P
P
j:.
P
P M
p' P
P P
p P p'
P' p
ii
p' M
Drinking water Medical
supply facilities Bazar Day
(5) (6) (7)
76
Area in
Sq. Mile.
(8)
Occupied
houses
(9)
Households
(10)
RURAL AREA-conld.
W WOO Nx W
RivW W
W
WN
wi< Wx
W W WX Wx Riv
Nx
N
W W W
W WN N WNx RivN
W W
Wx Riv
RivW N W Nx W
W WN N Riv
RivW Riv Nx W"
W N W W WN W N N W Nx
W W
Ri~' W W W
Mp
Mp Wed~.sday
Sunday
1.8 213 213 1.4 Uninhabited. 1.4 30 30 0.7 II II 2.2 61 61
2.1 346 346 1.2 46 46 I • 4 Uninhabited. 1·0 Uninhabited. 1.2 170 170
1.6 88 88 0.7 Uninhabited. 0.5 Uninhabited. 3.5 18 18 2·0 18 18
2.3 131 131 2.8 67 67 13·2 28 28 1.6 28 28 2.5 132 136
1.3 2 2 2.5 Uninhabited. NA Uninhabited. 0·3 67 70 NA Uninhabited.
0.9 65 65 1.9 49 50 0.7 33 33 1.3 Uninhabited. 0.8 Uninhabited.
2.9 138 138 7.8 249 249 1.6 29 29 1.2 71 88 1.3 89 89
1.9 48 51 2·2 63 69 NA Uninhabited. 4.8 66 66 1·2 72 72
0.9 76 76 1.6 6 6 2.7 21 21 2.5 9 9 2.2 68 68
2.4 37 37 2·0 55 55 1.3 6 6 0.9 13 13 0.9 Uninhabited.
2.4 2·1 2.4 1.7 3.4
4.6 1·1 3.4 1·8 1·6
1·0 1.9 2.2 2.4 0.6
1.0 NA NA NA NA
95 95 169 174
1 1 Uninhabited.
51 51
213 21 74 55 91
124 6 6
162 38
25 44
Uninhabited. Uninhabited. Uninhabited.
219 21 74 61 91
124 6 6
162 38
25 44
NA Uninhabited. 2.4 86 104 3.7 366 366 2.0 44 4S 1.3 26 26
Scheduled Scheduled Literate and Total Population Castes Tribes educated
P M F M F M F M F
(11) (12) (13) (14) (IS) (16) (17) (18) (19)
1.023
119 39
290
1.623 218
883
423
89 66
651 318 178 148 612
6
352
316 243 138
682 1.253
120 392 412
224 313
348 399
390 17
103 46
277
176 235 24 66
482 812
4
289
1.057 105 340 309 429
501 34 35
707 168
113 230
394 1.640
207 112
532
57 18
151
830 122
460
208
48 33
313 158 94 75
293
2
186
162 121 67
357 624
58 187 193
103 162
161 205
189 7
53 23
124
85 114 14 33
240 376
4
144
500 63
168 155 209
247 18 16
345 85
59 116
191 782 110 54
491
62 21
139
793 96
423
215
41 33
338 160 84 73
319
4
166
154 122
71
35
66 11
14
35
66
27
80 15
12
37
78
52
41 17
116
188 52
153
56
43 32
163 128 94 45 52
2
32
58 227
44 17
1~~ jj
164 312 44 37
137 174
59
35 33
180 129 84 49 63
4
25
71
5 4
69 21 13 12 64
33
155 146 25 120 122 9 67 71 3
48
'(,
77 7
47
19
3
14 1
8
4 I
325 629
62 205 219
2
22
126 '2' 488 56
118 493 60
191 II
77 104
3 8
47
15 16
i<i 16~ 2 32
121 151
187 194
201 10 50 23
153
91 121 10 33
242 436
145
557 42
172 154 220
254 16 19
362 83
54 114
iii
18 41
j2 28 13
io
22 38
jj
27 10
203 34 33 858 80 76 97 2 1 58 2 2
61 160
161 29
71 147
187 28
13 2
13 72
2
1 13
37 44 84 26 7 10
53 50 23 23 I 91 115 23 '7 78 81 14 2
108 112 36 5 14 IO 1 22 23 10
7 25
143
7 32
145
258 283 45 30
126 128 122 127 52 54
34 5
16 139 53
25 57
35 6
19 140 57
27 54
64 81
26
155 10 56 32 39
71 5 I
113 20
18 28
20 15
3
26
14 3 (>
17
is 1
20 26 46 13 19 16 272 59 20 16 19 21 23 23 '6

Total workers (I-IX)
M F
(20) (21)
296 261 Uninhabited,
42 39 14 13 93 89
503 481 73 70
Uninhabited, Uninhabited.
282 261
132 138 Uninhabited, Uninhabited.
32 19 23 20
194 185 94 97 57 52 56 45
190 120
2 2 -Uninhabited, Uninhabited,
113 97 Uninhabited,
91 80 76 70 43 42
Uninhabited. Uninhabited,
219 203 411 393
35 35 115 131 126 55
69 44 103 100
.uninhabited, 113 113 129 123
119 116 6 5
33 24 II 10 90 102
59 57 73 78 10 7 i8 21
.Uninhabited,
152 92 241 172
2 Uninhabited,
90 96
304 320 40 28
112 92 101 95 133 97
152 116 9 II
13 II 226 218
59 59
39 35 76 66
Uninhabited, Uninhabited, Uninhabited,
Uninhabited. 134 116 467 354 59 31 31 32
M
(22)
122
27 5
61
161 20
129
47
5 13
109 48 40 43 66
2
44
27 44 31
72 242
33 73 49
21 57
71 60
53 2
25 8
25
25 24 6
II
59 92
43
147 14 31 39 39
52 4 4
110 38
24 49
41 108 25 15
F
(23)
62
20 4
54
189
148
53
3 12
100 51 38 36 32
2
50
'j
81 208
34 75 3
I 57
60 18
46 2
14 9
33
33 2
7 II
I
145 I 7 I
28
30 4 4
124 34
16 44
38 6
31 16
M
(24)
III
12 9
19
257 44
104
56
24 10
70 42 14 10 82
61
58 30 12
129 143
2 42 53
40 43
33 59
54 4 8 3
51
24 37 2 4
50 87 2
45
124 17 52 53 63
70 5 9
95 I j
8 22
55 221 29 10
J -1812-I-ll-A-(Yeot,)
II
F
(25)
190
18 9
35
275 67
112
85
16 8
84 46 14 9
70
47
79 69 42
122 179
I 56 51
41 43
53 105
65 3
10 I
69
24 76 7
20
80 138
95
173 26 83 94 61
77 7 7
89 25
18 22
61 314
i6
III
M
(26)
'9 5 4
II
'3 I
'7
6 I
'9 6 6 2 I
13 9
5 7 6 4 7
2 2
5 I
17 15
'4
F
(27)
'j
M
(28)
77
WORKERS
IV
(29)
M
(30)
V
F
(31)
RURAL AREA-contd,
35
2
1
44 3
16
18
8 3
2
6
23 i6
5
2
7 12 'j 'j
io 2 I
I 5
2
'j
I 2
jj ii
12 I 5
'4 19
'6 I
'i
I I
'2
3 33 i6 2 I
M
(32)
'j
iii
VI
F
(33)
5 WANI TALUKA
VII VlII IX
M
(34)
F M F M F
(35) (36) (37) (38) (39)
9
I
7
II
2
2 I
6
'2 2 7
2
2
'j
'i
2
'j
2 12 25 I '2
12
2
28 2
10
6
9 3
2 14 '2
9 II '5
'] 'j
6 2 2
8 5
'2 3 4
2 I
8 5 15 12
9 2 I I 6 2 3
12 '8 8 7
iii 4 2
16 5 63 16 3 1
NONWORKERS
---- Serial M F No,
(40) (41) (I)
236
15 4
58
327 49
178
76
16 10
119 64 37 19
103
73
71 45 24
138 213 23 72 67
34 59
48 76
70 I
20 12 34
26 41 4
15
88 135
2
54
196 23 56 54 76
95 9 3
119 26
20 40
57 315
51 23
230 151 152
23 153 8 154
50 155
312 156 26 157
158 159
162 160
77 161 162 163
22 164 13 165
153 166 63 167 32 168 28 169
199 170
2 171 172 1/3
69 174 175
74 176 52 177 29 178
179 180
122 181 236 182 27 183 74 184
164 185
77 186 51 187
188 74 189 71 190
85 191 5 192
26 193 13 194 51 195
34 196 43 197 3 19B
12 199 200
150 201 264 202
203 204
49 205
237 206 14 207 80 208 59 209
123 210
138 211 5 212 8 213
144 214 24 215
19 216 48 217
21B 219 220
221 87 222
504 223 66 224 26 225
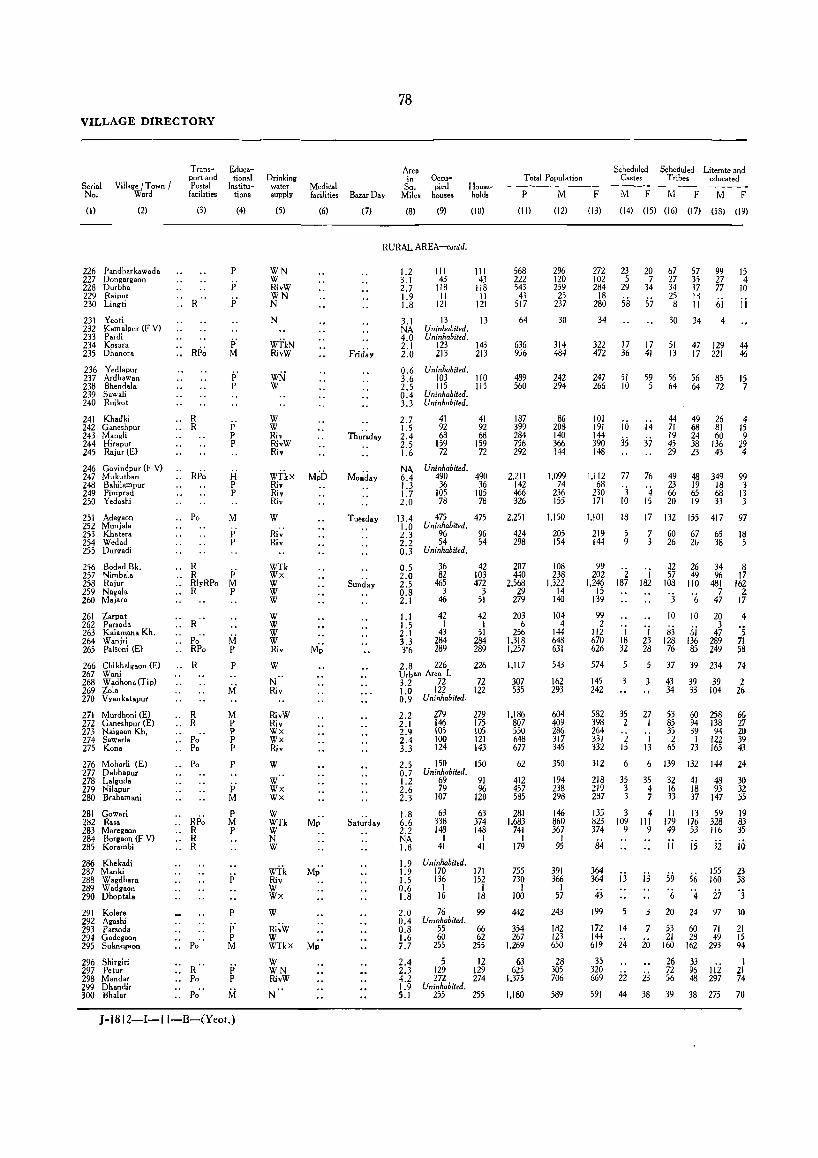
VILLAGE DIRECTORY
Serial No.
Village I Town I Ward
(I) (2)
226 Pandharkawada 227 Dongargaon 228 Durbha 229 Raipur 230 Lin.ti
231 Yeoti 232 Kamalpur (F V) 233 Pardi 234 Kosara 235 Dh,nor.
236 Vedlapur 237 Ardhawan 238 Bhendala 239 Sawali 240 Ruikot
241 Khadki 242 Ganeshpur 243 Mangli 244 Hirapur 245 Rajur (E)
Transport and Postal
facilities
(3)
.. R
., RP~
.. R
.. R
Educational
Institutions
(4)
P
p' p'
p' M
p' p
P P P
246 Govindpur (F V) 247 Mukutban .. RP~ i-i
p 248 Bahilampur 249 Pimprad 250 Yedashi
251 Adegaon 252 Munjala 253 Khatera 254 Wedad 255 Durgadi
256 Bodad Bk. 257 Nimbala 258 Rajur 259 Nagala 260 Majara
261 Zarpat 262 Parsoda 263 Kalamana Kh. 264 Wanjri 265 Palsoni (E)
.. Po
P
M
P P
.. R .. R p' .. RlyRPo M .. R P
.. R
.. Po"
.. RPo !Vi P
266 Chikhalgaon (E) .. R P 267 Wani 268 Wadhona (Tip) 269 Zola 270 Vyankatapur
271 Murdhoni (E) 272 Ganeshpur (E) 273 Naigaon Kh. 274 Sawarla 275 Kona
276 Mohorli (E) 277 Dabhapur 278 Lalguda 279 Nilapur 280 Braham ani
281 GO'lVari 282 Rooa 283 Maregaon 284 Borllaon (F V) 285 Korambi
286 Khekadi 287 Manki 288 Wagdhara 289 Wadgaon 290 Dhoptala
291 Kolera 292 Agashi 293 Parsoda 294 Gadegaon 295 Suknegaon
296 Shirgiri 297 Petur 298 Mandar 299 Dhandir 300 Bhalar
.. R
.. R
.. Po"
.. Po
.. Po
.. RP~
.. R
.. R
.. R
.. R
.. Po
.. Po"
Ivi
M P P P P
P
p' M
P M P
P
p' P M
p' P
!Vi
J-1812-I-II-B-(Yeot,)
Drinking water supply
(5)
WN W RivW WN N
N
wIkN RivW
WN W
W W Riv RivW Riv
Medical facilities
(6)
WTb M~D Riv Riv Riv
W
Ri~· Riv
WTk Wx W W W
W W W W Riv
W
N Riv
RivW Riv Wx Wx Riv
W
W Wx Wx
W WTk W N W
Wi'k Riv W WX
W
Ri~W W WTkx
W WN RivW
N
M~'
Bazar Day
(7)
78
Area in
SQ. Miles
(8)
Occupied
houses
(9)
Household,
(10)
RURAL AREA-amid.
Tuesday
1.2 3.1 2.7 1.9 1.8
III 43
118 11
121
111 43
118 11
121
3.1 13 13 NA Uninhabited. 4.0 Uninhabited. 2.1 123 143 2.0 213 213
0.6 Uninhabited. 3.6 103 110 2.5 115 liS 0.4 Uninhabited. 3.3 Uninhabited.
2.7 1.5 2.4 2.5 1.6
41 92 68
159 72
41 92 68
159 72
NA Uninhabited. 6.4 490 490 1.3 36 36 I. 7 105 105 2.0 78 78
13.4 475 475 1.0 Uninhabited. 2.3 96 96 2.2 54 54 0.3 Uninhabited.
0.5 2.0 2.5 0.8 2.1
1.1 1.5 2.1 3.3 3'6
36 82
465 3
46
42 I
43 284 289
42 103 472
3 51
42 1
51 284 289
2.8 226 226 Urban Area l. 3.2 72 72 1.0 122 122 0.9 Uninhabited,
2.2 2.1 2.9 2.4 3.3
279 146 105 100 124
279 175 105 121 143
2.5 150 150 0.7 Uninhabited. 1.2 69 91 2.6 79 96 2.3 107 120
1.8 63 63 6.6 338 374 2.2 148 148 NA I I 1.8 41 41
I. 9 Uninhabited, 1.9 170 171 1.5 136 152 0.6 I I 1.8 16 18
2.0 76 99 0.4 Uninhabited. 0.8 55 66 1.6 60 62 7.7 255 255
2.4 5 12 2.3 129 129 4.2 272 274 I. 9 Uninhabited. 5.1 255 255
Total Population
P M
(II)
568 222 543
43 517
64
636 956
489 560
187 399 284 756 292
2.211 142 466 326
2.251
424 298
207 440
2.568 29
279
203 6
256 1.318 1.257
1.117
307 535
1.186 807 550 648 677
62
412 457 585
281 1.683
741 I
179
755 730
1 100
442
354 267
1.269
63 625
1.375
1.180
(12)
296 120 259
25 237
30
314 484
242 294
86 208 140 366 144
1.099 74
236 155
1.150
205 154
108 238
1.322 14
140
104 4
144 648 631
543
162 293
604 409 286 317 345
350
194 238 298
146 860 367
I 95
391 366
I 57
243
182 123 650
28 305 706
589
Scheduled Castes
M F
Scheduled Literate and Tribes educated
III F M F F
(13) (14) (15) (16) (17) (18) (19)
272 23 20 102 5 7 284 29 34
21g 58 57 34
322 472
17 36
17 41
67 57 27 35 34 37 25 lB 8 II
99 27 77
iii 30 34 4
51 13
47 129 17 221
15 4
10
ij
44 46
247 51 59 56 56 85 15 266 10 5 64 64 72 7
101 191 144 390 148
1.112 68
230 171
10 i.j
is 37
77
3 10
76
'4 15
4449264 71 68 81 15 19 24 60 9 45 38 136 29 29 23 43 4
49 48 349 23 19 18 66 65 68 20 19 33
99 3
13 3
1.101 18 17 132 155 417 97
219 5 7 60 67 65 18 144 9 3 26 2G 38 5
26~ '2 'j 1.246 187 182
15 139
99 2
112 670 626
I 18 32
I 23 28
22 57
108
'3
26 34 49 96
110 481 7
6 47
10 10 20
83 6i 4~ 128 136 289 76 85 249
8 17
162 2
17
4
'5 71 58
37 39 234 74 574
145 242
3 43 39 39 2
582 35 27 398 2 I 264 331 2 I 332 15 13
312 6 6
218 35 35 219 3 4 287 3 7
135 3 4 823 109 III 374 9 9
84
364 364
43 199
172 144 619
35 320 669
591
ij
14
24
22
44
ij
3
7
20
23 38
34 33 104 2(>
53 60 258 6f, 85 94 138 27 35 39 94 20 2 I 122 39
65 73 165 43
139 132 144
32 41 48 16 18 93 33 37 147
II 13 59 179 176 328 49 53 116
ii is 32
S9 6
56 '.j
155 160
27 20 24 97
53 60 71 21 28 49
160 162 293
26 33 72 96 112 56 48 297
39 38 275
24
30 32 55
19 83 35
i~
23 38
'3 30
21 15 94
I 21 74
70

Total worker< (I-IX)
M F
(1.0) (21)
\89 169 77 56
lSI 167 IS 12
150 153
22 28 Uninhabited, Uninhabited,
199 162 293 261
,/J ninhabited, 168 165 170 144
Uninhabited, Uninhabited,
60 131 86
239 92
63 112 88
256 61
Uninhabited, 657 596
43 34 149 142 109 112
671 662 Uninhabited,
125 138 101 92
Uninhabited,
70 53 143 124 795 584
9 6 74 66
62 1 76
414 382
57 2
70 376 381
318 299 Urban Are. 1.
97 90 187 136
Uninhabited,
317 274 217 172 169 127 174 201 194 19B
228 200 Uninhabited,
84 79 \37 127 162 173
93 80 516 402 216 217
53 55 Uninhabited,
249 199 221 186
I 35 26
155 108 Uninhabited,
109 115 88 88
384 346
19 II 178 173 418 382
Uninhabited, 384 365
M
(22)
75 38 93
8 70
4
73 137
86 125
32 61 33
109 41
211 20 66 61
330
48 46
24 73
112 9
50
30
30 172 123
138
58 69
133 57 90
102 77
72
27 78 95
53 148 88
3j
116 91
2S 68
34 40
175
I 92
154
252
F
(1.3)
73 30 78 8
73
3
29 129
94 113
38 56 34
134
220 2
67 62
374
34 45
19 70
117 6
56
29
26 163 140
142
58 70
32 35 67
127 83
80
17 84
122
41 15
112
33
12 84
24 53
21 177
89 51
286
Il
M
(24)
67 33 65 7
60
17
65 96
57 21
21 53 33 85 39
209 21 60 35
226
50 49
21 56 72
ii 29
I 16 80
153
113
22 38
91 71
21 44 64
107
23 26 30
23 255
79
j 5
75 72 I 4
46
56 33
153
3 61
166
67
F
(25)
92 26 84 4
75
25
130 121
68 27
25 50 50
106 61
322 32 72 48
273
94 45
32 52
100
in 27 2
21 134 223
150
32 50
233 106 54 74 88
106
25 29 41
36 380 104
22
163 89
'2 52
115 66
151
7 81
292
65
1Il
M F
(26) (27)
19 2 7
18 13
'5
I 5 5 3 4
109
6 2
17
II
i2 91 15
3
4 J4
13
25 12 12
13
5 6
17
9 37 8
'3
26 13
23
10 6 4
12
23 10
21
22 63 I
'j
8
7
20
3
I
2
79
WORKERS
IV V
M F M
(28) (29) (30)
F
(3l)
VI
M F
(32) (33)
RURAL AREA-amId,
20 4
I~ 'j
12 I
33 16
7 9
S 9 I 4 I
21 7 3
40 4 I 7 I 8 I
44 5
4 4 3 2
1~ I 'j 41 23 273
9 7
28 16 7 6 1
14
7 18 8
js 16
I
20 10
2 I I
8 13 4
2 4
ii '9
'5
'8 8
19
'j
2 3
8
2 2 3
4 10
I 2
'4 2 ·7 31 28
28 4
'j I
'j 2 I
3
I
2
'j
I
'j
10
2
12
'j 4
3
42
4
'5 I
'j
8
2
I
VII VIIJ
M F M F
(34) (35) (36) (37)
3 3
, 5 II 1
2 2 I
35 26
'i I I
16
2 2 I
46 12
's 22
10
10 35 21 3
'6 5
3
7 13 I
I
j4 I I
'j
2 5
'j 6
43 I
'(, 2 I
3
I I 7
4
3
9 I
3 4
15 '] 'j
4 5
2
5 WANI T ALUKA
IX
M F
(38) (39)
7 2 6 i' 's '4
8 2 25 10
J3 7
3 4
I 2 'j 5
8 "" 4
42 I 5 2
34
10 2
3 8
41
'4 2
'j 29 29
29
3 15
38 34 \3 10 22
12
4 5 9
3 28 23
I
9 22
'2 8
4
16
'j I
7
4
'j 33
2 12
6
7 7 2
10
7
13 I 4
I 4 I
I 8
4 I 22 9
, 5 20
20
I I 3
3
NONWORKFRS
---- Seri.1 M F No,
(40) (41) (I)
107 43 78 10 87
8
115 191
74 124
26 77 54
127 52
442 31 87 46
479
80 53
38 95
527 5
66
42 3
68 234 249
225
65 106·
287 192 117 143 151
122
110 101 136
53 344 151
I 42
142 145
ii 88
73 35
266
9 127 288
205
103 226 46 227
117 228 6 229
127 230
6 231 232 233
160 234 211 235
236 82 237
122 238 239 240
38 241 79 242 56 243
134 244 87 245
246 516 247 34 248 88 249 59 250
439 251 252
81 253 52 254
255
46 256 78 257
662 258 9 259
73 260
42 261 262
42 263 294 264 245 265
275 266 267
55 268 106 269
270
308 271 226 272 137 273 130 274 134 275
112 276 277
139 278 92 279
114 280
55 281 421 282 157 283
284 29 285
286 165 287 178 288
289 i7 290
91 291 292
57 293 56 294
273 295
24 296 147 297 287 298
299 226 300

VILLAGE DIRECTORY
Seri.1 No.
Village I Town I Ward
(1)
301 Aberi 302 Pimpri 303 Wargaon 304 Chargaon 305 Kesurli
306 Bes.
(2)
307 Welhala 308 Pimpalgaon 309 Borgaon 310 Junoda
311 Ukni 312 Urnari 313 Nawargaon 314 Warzadi 315 Wadhona (Pilki)
316 Pathafpur 317 Kayar 318 Wadjapur 319 Mendholi 320 Shirpur
321 Shelu Bk, 322 Niwali 323 Lathi 324 Shindi-Wadhona 325 Malegaon
326 Cbendkapur 327 Babapur 328 Mahakalpur 329 Pimpri 330 Borgaon
Transport and Pootal
l,cHities
(3)
" Po
" RP~
.. RP~
.. R
331 Nipani-Pimpri (F V) .. 332 Khandla .• 333 Surdapur 334 Purad .. R 335 PunWat • . RPo
336 Taroda 337 Niljai 338 Nerad 339 Purad 340 Panchdh.l
341 Mohoda 342 Welabai 343 Gop.lpur 344 Pardi (F V) 345 Shewala
346 Kawadasi 347 Naigaon 348 Belora 349 Kumbhari 350 Hiw.rdar.
351 Mundr. 352 Kundra 353 Krishnapur 354 Junoni 355 Dorli
356 Kurai 357 Kurli 358 Shindol. 359 Yenad 360 Sawangi
361 Chilai 362 Mod-Maj.r. 363 Dhunaki 364 Nimbal. Kh. 365 Nimhal. Bk,
366 Nandgaon 367 Dhakori 368 Gowari 369 Pardi 370 Chanakh.
371 Yenak 372 Shioni Jh. 373 Chincholi 374 Mungoli 375 Gadegh. t
" RP~ .. R
.. RP~
.. R
.. Po
.. R
.. Po
Educa-· tional
In,titutions
(4)
P p' P
P
M p
P
P P
p' M
P P P P
p' P P
p' p' H
P P M P
M M
t; p M P
M P P
p'
p'
i;
P P
Drinking water supply
(5)
Riv Riv Riv Riv W
N
Ri~' Riv Riv
R,vW W WTkx W W
W W W W W
RivW Nx W W
Wx W W W
w" Ri~' RivW
WTk WTk Riv Riv
W W W
N
Riv W WTk W"
Wx W W"
W W W W Riv
W
Ri~'
W··
wN W W"
W Riv Riv W Riv
Medical facilities
(6)
Mp
M~b
Bazar Day
(7)
80
Area in
Sq. Mile,
(8)
Occupied
houses
(9)
Household,
(10)
RURAL AREA--contd.
2.2 103 103 0.7 73 73 2.0 79 79 2.2 141 141 1. 9 60 67
1.8 70 72 1.2 Uninhabited. 1.8 80 84 1.4 55 55 0.8 41 41
6.9 247 251 1.9 100 123 2.3 97 99 3.9 80 84 2.1 38 43
1.0 77 89 4.6 254 266 2.4 60 61 4.4 229 262 6.3 274 339
2.0 75 88 2.5 87 87 0.5 49 62 2.4 88 97 1.1 Uninhabited.
1.0 Uninlwbiled. 2.5 83 94 1.0 53 67 3.5 129 149 1.5 110 129
NA Uninhabited. 2.8 119 126 1.5 Uninhabited. 1.4 169 189 8.8 311 377
1.6 81 81 2.8 118 179 2.0 150 188 1.1 196 209 1.7 Uninhabited.
4.5 179 202 7.2 258 294 1·0 21 23 NA Uninhabited, 2.3 29 31
2.3 81 103 2.8 181 215 2.0 191 232 1.3 Uninhabited. 2.5 17 17
1.5 Uninhabited. 1.2 89 89 1.9 126 125 1.8 Uninhahited. 2.3 106 106
2.7 181 181 3.7 151 151 5'0 If 0 160 1.2 54 54 3.0 157 157
2.2 83 83 1.3 Uninhabited. 1.7 60 60 0.7 Un;'.hobited. 0.7 91 91
0.5 1.6 2.3 0.2 2.4
3.6 3.1 8.5 1.6 1.2
U ninhabilld. 112 1\8 54 59
Uninhabited. 57 63
100 116 B9 107 48 58 55 65 15 IS
Scheduled Scheduled Literate an Total Population Castes Tribes educated
P M F M F M F M F
(11) (12) (13) (14) (IS) (16) (17) (18)
495 356 352 640 334
430
427 382 246
1.410 580 501 393 201
438 998 314
1.187 1.457
5t 5 416 302 525
422 342 B09 601
623
960 I.B74
419 967 821 936
962 1,423
122
147
415 1,027 1,073
74
35~ 605
470
846 558 704 283 775
349
287
440
562 277
302
508 541 285 348 86
260 172 177 334 177
221
224 190 125
736 289 257 192 96
228 512 157 594 702
263 227 153 280
214 173 413 30~
320
509 993
200 495 425 484
487 734 60
73
203 510 570
42
le9 3G9
225
453 281 347 151 391
177
142
223
284 133
165
250 287 13B 167 43
235 184 175 306 157
209
203 192 121
674 291 244 201 105
210 486 157 593 755
282 189 149 245
208 169 396 292
303
451 881
10 3 3
33
2
'5 32
'8 7
22 i,a
103
24 i5
'4 I
11
20 39
219 10 472 42 396 27 452 31
475 689
62
74
212 517 503
32
164 296
245
393 277 357 137 3B4
172
145
217
278 144
137
258 254 147 181 43
21 47
11 17
9
4 11
7 6
23
38
5
10
11 2 I
7 3 I
27
4
2
25
io 6
24 is 96
24
i7
'(, 3
9
22 28
17 22 22 41 6
9
20 18 12
3 74 64 54 19
39 77 59
128 43
19 4 3 8
23 85 31 61 22 57 28 112 7 72
10 84
12 61 16 56 jj 32
3 87 67 7 ~3
290 79 6S 49 31
48 77 72 183 59 36
130 251 44 283
32 110 3 82 4 35 8 123
32 27 70 31 36 55
107 103 161 41 43 117
49 53 111
16 14 219 56 49 422
9 2 4 B6 39 25 28 159 25 88 102 175 32 58 64 199
25 46
i.j 10
8
8 12
4 4
ii
4
43
6
9
'5 3 I
123 i37
4
47
iO 29 62
16
83 14
72
66 133 101 40 50
35
104
44
54 65
25
49 14 21 19 7
132 195 138 291
I 18
37 15
14 86 39 294 68 241
14
86 52 19 142
89 68
49 200 132 82 109 121 30 29 57 103
44 57
111 22
40 78
58 61
21
41 12 28 22 5
119 40
58
80 118 32 44 14
13 8
17 30 15
21
13 II II
72 II 7 6 5
14 38 14 75 87
40 17 5
28
16 15 43 24
35
46 97
31 48 52 51
63 68 6
1
25 100 56
5 42
19
43 18 34 5
21
4
4
20
20 (,
17 40 10 10 2

T ctal workers. (I-IX) I ---------- -------
M F
(20) (21)
M
(22)
F
(23)
81
WORKERS .---------------M
(24)
II
F
(25)
M
(26)
III
F
(27)
M
(28)
IV
F
(29)
V VI
M F M
(30) (3l) (32)
F
(33)
VII
M
(34)
5 WANI TALUKA
VIII IX
F M F M F
(35) (36) 07) (38) (39)
NONWORKERS
--- Serial M F No
(40) (41) (I)
~-------------------------------------------------------------
151 1\4 i18 2\9 115
144 103 103 179 97
132 137 Uninhahited,
126 122 122 124 77 65
424 393 185 176 164 12Q 127 129 65 55
136 353
94 385 391
116 287
73 325 386
154 132 137 120 92 99
167 143 Uninhabited,
Uninhabited, 130 123 \12 81 244 224 195 166
Uninhabited, 180 174
Uninhabited, 287 238 562 470
117 118 297 238 267 217 294 236
Unil,habited,
308 281 435 394 29 32
Up-inhabited, 43 51
120 142 300 309 341 292
Uninhabited. 27 20
Uninhabited, 120 116 192 170
Uninhabited, 150 155
283 228 182 167 231 194 96 87
202 192
122 105 Uninhabited,
87 87 U ni nhabited,
141 04
Uninhabited, i68 168 89 85
Uninhabited, 90 85
154 162 87
102 28
154 140 85
100 20
90 54 61 85 66
78
72 60 48
186 84 83 76 44
59 119 33
164 166
92 86 71 97
89 63
127 126
102
172 271
78 162 98
104
122 218
24
29
80 165 156
41 124
92
114 98
130 65 83
64
46
67
67 47
55
70 76 34 55 19
I I
59 87 32
96
81 67 49
196 90 73 76 39
57 92 2
19 187
84 95 85 96
94 61
108 125
89
180 287
98 159 70 25
120 233 29
37
102 173 166
50 130
109
128 103 118 64 93
64
7
72 39
61
90 78 32 73 13
38 34 38 90 30
34
42 48 20
139 87 47 39 14
58 154 45
J72 84
45 32 13 50
27 34 88 49
143 99 31 79 58
33
36 52 16
181 82 25 49 16
57 183
71 301 129
48 23 14 44
29 20
115 34
54 78
56 36 144 133
25 17 81 77
113 139 III 203
117 139
3
12
14 81 9Z
19
54 33
38
79 67 70 15 61
51
32
54
73 26
23
48 54 34 20
8
153 144
3
14
40 119 III
IS
65 37
45
85 61 76 22 95
40
80
94
91 44
20
55 57 51 23 7
7 10 10 9 I
31
13 2
2 7 8 5
28
2 I
6 7 I 3
4
is
'51 16
22 2
5 5
22
3
12 II
3
28 3
jb 34
4
3
2
4 4 9
10
'j
'j
2
RURAL AREA-amId.
10 6
It '4 II 5
10
4 12 4
34 10 3 422
~ '2 2
13 '6' 19
2~ ·s 38 29
;2 I 2
II 'j
4 2
II II I
6
40 19 61 32
1 2 5
1~ f 'j 23 I 28 2
19 42 I
13 33 50
;6 JO '4
7 13
13 7
21
'4 3
2
7
15 5
3
19 10
J 2
I~ 'j
3 10
'j
3
'3
'j
'j
I 2
';'
6 2
'j
4
, 3 'j I 5 2 , 4
2
6 4 4 I I I 1 2
2 28 4 1
A i6
'j
2 '4 3 '2
2
5 1
I
'j I
19 7 I
1 5 6 'j
16 I
8 II
2 2 2
2 2
3
12 3 3
2
4
7 2 3
2 5 6 3 3
I
5 7 '2 4 12 9 5 6 2
2
5 4 2 5
22 7 4 I
13 21 I I 3
.. 2 2 24 2 3
4~ 25
~ 'j 5 8 2
2
I~ 'j 3 4
11
13 2 49 11
3
I~ '] 13 4
14 18 I
6 14 15
4 9
I 3
'j 5
35 14 4 I 7 3 'j
10 3
2
6 2
II II 4 2 I
4 2 2 2
109 58 59
115 62
91 301 81 302 72 303
127 304 60 305
89 72 306 307
98 81 308 68 68 309 48 56 310
312 276 311 104 115 312 93 124 313 65 72 314 31 50 315
92 159 63
209 311
109 90 61
113
84 61
169 114
140
222 431
83 198 158 190
179 299
31
30
83 210 229
15
69 117
75
170 99
116 55
189
55
55
82
Jl6 44
75
96 125 51 65 15
94 316 199 317 84 318
268 319 369 320
150 321 69 322 50 323
102 324 325
326 85 327 88 326
172 329 126 3,0
331 129 332
333 213 334 411 335
101 336 234 337 179 338 216 339
340
194 341 295 342 30 343
344 23 345
70 346 208 347 211 348
349 12 350
351 48 352
126 353 354
90 355
165 356 110 357 163 358 50 359
192 360
67 361 362
58 363 364
113 365
366 JlO 367 59 368
369 52 370
104 371 114 372 62 373 81 374 23 375

82 VILLAGE DIRECTORY
Scheduled Scheduled Literate and Trans- Educa- Are. Total Population Castes Tribes educated port and tional Drinking in Occu-
Serial Village/Town/ Postal Institu- water Medical Sq. pied House- ------No, Ward facilities tions supply facilities Bazar Day Miles houses hold, P M F M F M F 1\1 F
(Il (2) (3) (4) (5) (6) (7) (8) (9) (10) (II) (12) (13) (14) (15) (16) (17) (18) (19)
RURAL AREA-cone/d.
376 Akapur " 0.8 Uninhabited. 377 Amloan W 1.4 39 39 194 100 94 34 33 43 10 378 Khed 1.5 Uninhabited. 379 Tejapur p' Ri~' 1.9 281 281 1.317 666 651 45 44 23 24 255 57 380 Jamni Riv J.3 3 3 II 6 5 2 2 2
381 Dewarwada Riv J.5 30 30 130 65 65 26 25 5 382 Bori Riv 1.4 34 34 180 82 98 15 12 25 7 383 Murti Riv 2.2 54 54 236 121 115 2 2 55 8 384 Pathari p' Riv
M;' 3.4 28 28 134 65 69
is 24 II 13 21 5
385 Kalamana Riv 2.6 117 117 533 278 255 32 25 122 51
386 Paramdoha P Riv M;'
1.2 131 131 655 314 341 2 2 55 54 132 48 387 Chikhali M RivW 1.6 79 79 401 202 199 32 24 45 40 100 33 388 Takli P RivW
M~' 1.1 77 77 341 1133 158 12 10 36 30 68 19
389 KoJgaon Po"
Pi Riv 1.9 liZ 112 560 293 267 16 12 101 30 390 Sakhara .. M W Mp 2. I 122 122 664 328 336 4 9 16 21 162 48
391 Matho1i W 0.8 21 21 115 54 61 II 26 3 392 jugad Riv 0.7 39 39 173 83 90 4 2 24 3
URBAN AREA
--- --- --- --- - - ---Wani Municipality RlyRTo C S Mp Hos 0 Sunday 5.2 (E). Rh.
3.971 4.063 18.176 9,459 8.717 584 523 609 599 5,574 2,520
Ward I 652 654 2.893 1.578 1.315 215 184 184 163 855 305 Ward 2 507 510 2.198 1.174 1.024 123 104 34 35 683 279 Ward 3 526 526 2.372 1.199 1.173 II 6 106 91 811 442 Ward 4 458 490 2.362 ].207 1,155 88 91 52 47 753 407 Ward 5 620 625 2.690 1.387 1.303 58 59 106 113 722 262 Ward 6 364 403 1.933 993 940 9 8 36 40 589 302 Ward 7 408 416 1,786 903 883
80 ;oi 51 69 627 312 Ward 8 436 439 1.942 1.018 924 40 41 534 211
----- -- -- -- -- -- --[",.-RO' .. 856·8 31.661 33.247 155,493 78.483 77.010 2.877 2.798 20.13920.669 26.7656.535
---WANI TALUKA .. Total-Urban 5·2 3,971 4.063 18.176 9,459 8.717 584 523 609 599 5.574 2.520
I ---~-
lGrandTotaI 862·0 35.632 37.3 JO 173.669 87,942 85.727 3,461 3,321 20,748 21.26832.3399,055

83 5 WANI TALUKA
WORKERS NO:-.l-
Total workers WORKERS (I-IX) II III IV V VI VII VIII IX ---- ---- ---- Serial
M F M F M F M F M F M F M F M F M F M F M F No,
(20) (21) (22) (23) (24) (25) (26) (27) (28) (29) (30) (31) (32) (33) (34) (35) (36) (37) (38) (39) (40) (41) (I)
RURAL AREA-concid,
Uninhabited, 376 57 58 32 27 20 31 2 3 43 36 377
Uninhabited, 378 424 411 228 224 135 183 15 30 4 12 4 242 240 379
6 2 2 2 4 3 380
39 40 18 19 17 21 2 '6 '3 2 26 25 381 54 54 27 37 17 14 1 1 2 28 44 382 66 68 38 43 16 24 1 5 1 5 1 55 47 383 43 39 29 27 9 10 I 3 I 2 22 30 384
163 147 53 54 84 87 7 6 1 3 9 6 115 108 385
178 165 65 70 62 89 5 18 I 14 4 2 II 2 136 176 386 119 116 44 52 51 64 3 12 1 I 7 'j 83 83 387 106 97 62 65 30 29 2 6 2 'j I 5 77 61 388 175 170 86 94 64 71 3 15 2 1 'j 5 3 118 97 389 181 163 105 114 37 45 1 16 I 2 18 4 147 173 390
33 36 19 24 11 12 '4 'j 2 21 25 391 46 52 19 22 21 29 2 37 38 392
URBAN AREA
4.957 1,307 373 86 116 98 94 33 131 36 930 333 181 22 1,195 136 337 3 1.600 560 4.502 7,410
856 339 38 24 19 10 25 9 11 4 148 72 4 1 186 27 59 366 192 722 976 650 143 57 17 17 18 25 1 3
i4 188 73 57 6 72 3 56 1 175 24 524 881
584 149 54 5 16 16 7 15 104 28 9 10 174 17 43 162 59 615 1,024 613 141 66 14 2 2 4
i6 47 i,j 87 14 2 'j 184 42 8 1 213 68 594 1.014
711 228 49 11 26 37 17 29 117 35 47 216 21 32 178 91 676 1.015 518 66 53 5 13 " 4 8 I 51 " 169 23 27 182 26 475 874 465 103 38 9 8 2 7 7 3 , j 58 1O 33 '2 84 2 33 'i 201 73 438 780 560 138 18 1 IS 2 5 15 177 101 18 110 I 79 123 27 450 786
48.005 43.806 21.600 19.386 17.240 22.442 2.Q48 205 2.743 501 590 356 227 36 1,022 245 151 4 2.384 631 30,478 33,204
4,957 1,307 373 86 116 98 94 33 131 36 930 333 181 22 1.195 136 337 3 1.600 560 4,502 7.410
52.962 45.113 21.973 19,472 17,356 22,540 2,142 238 2.874 537 1.520 689 408 58 2,217 381 488 7 3,984 1.191 34.98(j .j 0.614


PART II
CENSUS TABLES These include General Population, Economic, Household Economic, Social, Cultural, Housing and other SPecial 'i'ables

J-1812-II-12-B (Yectmal.)

CONTENTS
PAGE
.EXPLANATORY NOTE (with Appendices I-III) 89
A-GENERAL POPULATION TABLES
A-I Area, Houses and Population III Appendix I-Statement showing 1951 Not
Territorial Units constituting the present Printed 1961 set-up of the District.
Appendix II-Number of Villages with a 112
A-II A-Ill A-IY
'Primary B-1 and B-I1
B-III
B-N
-B·Y
>B-VI
population of 5,000 and over and Towns with a population under 5,000.
Appendix I II-Houseless and Institutional Population.
Variation in population during sixty years Villages classified by Population .. Towns (and Town-groups) classified by
population in 1961 with Yariation since 1901.
B-ECONOMIC TABLES (i) General E<;onomic Tables
Census Abstract Workers and Non-workers in Talukas and
Towns classified by sex and by broad age-groups.
Industrial classification of workers and non-workers by educational levels-
Part A-District Total
Part B-District Rural Part C-District Urban
Part D-Talukawise Rural only
Part A-Industrial c1asslfication by sex and class of worker of persons at work at household industry.
Part B-Industrial classification by sex and class of worker of persons at work in non-household industry, trade, business, profession or service.
Part C-Industrial classification by sex and divisions, major groups and minor groups of persons at work other than cultivation.
Occupational classification by sex of persons at work other than cultivation.
Occupational divisions of persons at work other than cultivation classified by sex, broad age-groups and educational levels in Urban areas only.
B-VII _. Part A-Persons working principally (i) as cultivators, (ii) as agricultural labourers or (iii) at household industry classified by sex and by secondary work (i) at household industry, (ii) as culth'ator or (iii) as agricultural labourer.
Part B-Industrial classification by sex of persons working in non-household industry, trade, business, profession or service, who art' also engaged in household industry.
112
113 114
115
116
118
124 124 124 125
126
127
129
135
140
142
143
B-VIII
B-ECONOMIC TABLES-concld.
(I) General Economic Tables-loncld.
Part A-Persons unemployed, aged 15 and above, by sex, broad age-groups and eduCuttOnal levels in Urban Areas only.
Part B-Persons unemployed, aged 1 S and above, by sex and educational levels in Rural Areas only.
B-IX .. Persons not at work classified by sex, broad age-groups and type of activity.
B-X
B-XI ..
B-XII ..
B-XIII ..
B-XIY ..
B-XV .•
B-XV! ..
(Ii) Household Economic Tables Sample households (i) engaged neither in
cultivation nor household industry, (ii) engaged either in cultivation or household industry but not in both and (iii) engaged both in cultivation and household industry.
Sample households engaged in cultivation classified by interest in land and size of land cultivated.
Sample households engaged in cultivation only classified by size of land cultivated and number of family workers and hired workers.
Sample households engaged both in cultivation and household industry showing size of land cultivated classified by principal household industry.
Sample households engaged only in household industry classified by principal household industry-
Part A-Households classified by major groups of principal household industry and number of persons engaged.
Part B-Households classified by minor groups of principal household industry.
Sample households engaged both in cultivation and household industry classified by size of land.
Sample principal household industry classified by period of working and total number of workers engaged in household industry.
C-I
C-SOCIAL AND CUL TURAL TABLES Size and composition of sample house
holds-
PAGI
144
144
146
147
147
148
150
15J
152
153
156
Part A-Size of sample households 160 classified by participation in house-hold cultivation or industry.
Part B-Composition of sample 160 households.
C-I1 Age and Marital Status 161
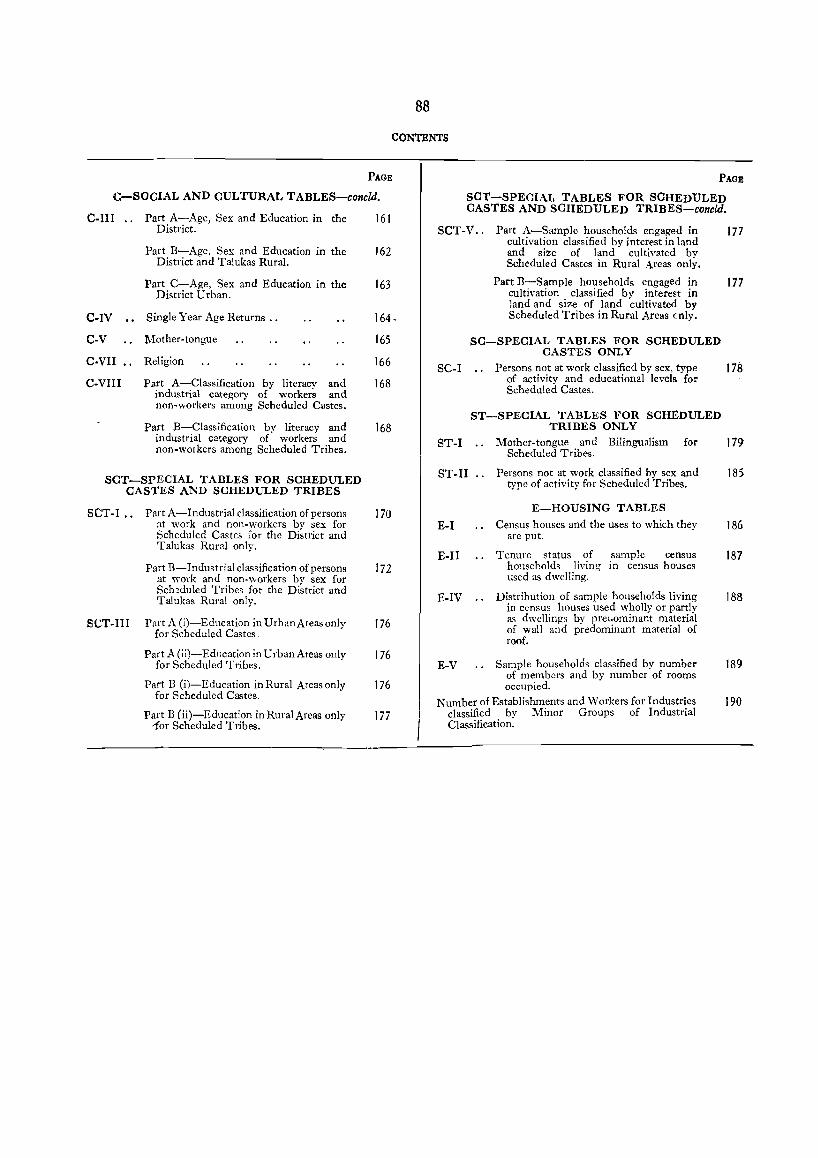
88
CONTENTS
PAGE
C-SOCIAL AND CULTURAL TABLES-concld.
C-IlI .. Part A-Age, Sex and Education in the 161 District.
Part B-Age, Sex and Education in the 162 District and Talukas Rural.
Part C-Age, Sex and Education in the 163
C-IV
C-V
C·VII
CoVIll
District Urban.
Single Year Age Returns. ,
Mother-tongue
Religion
Part A-Classification by literacy and industrial category of workers and non-workers among Scheduled Castes,
Part B-Classification by literacy and industrial category of workers and non-workers among Scheduled Tribes,
SCT-SPECIAL TABLES FOR SCHEDULED CASTES AND SCHEDULED TRIBES
S CT -I .• Part A-Industrial classification of persons at work and non-workers by sex for Scheduled Castes for the District and Talukas Rural only.
Part B-Industrial classification of persons at work and non-workers by sex for Sch~duled Tribes for the District and Talukas Rural only.
SCT-III Part A (i)-Education in Urban Areas only for Scheduled Castes
Part A (ii)-Education in Urban Areas only for Scheduled Tribes.
Part B (i)-Education in Rural Areas only for Scheduled Castes.
Part B (ii)-Education in Rural Areas only -for Scheduled Tribes.
164 -
165
166
168
168
170
172
176
176
176
177
PAGE
SCT-SPECIAL TABLES FOR SCHEDULED CASTES AND SCHEDULED TRIBES-concld.
SCT -V ., Part A-Sample households engaged in 177 cultivation classified by interest in land and size of land cultiV9ted by Scheduled Castes in Rural Areas only.
Part B-Sample households engaged in 177 cultivation classified by interest in land and size of land cultivated by Scheduled Tribes in Rural Areas only.
SC-SPECIAL TABLES FOR SCHEDULED CASTES ONLY
SC-I Persons not at work classified by sex, type 178 of activity and educational levels for Scheduled Castes.
ST-SPECIAL TABLES FOR SCHEDULED TRIBES ONLY
ST-I Mother-tongue and Bilingualism for 179
SToll
E-I
E-ll
E-IV
Scheduled Tribes.
Persons not at work classified bv sex and type of activity for SCheduled 'fribes.
E-HOUSING TABLES
Census houses and the uses to which they are put.
Tenure status of sample census household~ living in census houses used as dwelling.
Distribution of sample housellOlds living in census houses used wholly or partly as dwellings by prel.ominant material of wall and predominant material of roof.
E-V Sample households classified by number of members and by number of rooms occupied.
Number of Establishments and Workers for Industries classified by Minor Groups of Industrial Classification.
185
186
187
18S
189
190

BXPLANATORY NOTE
This Part contains 58 Tables presenting 1961 Census data for the district. 29 Tables also present material for each taluka and 6 for each town separately. These talukawise and townwise tables have been prepared specially for this volume.
2. A few Tables (e.g., A-IV, B-VI, B-VIII-A, etc.) present material for urban arcas only. An urban area is the aggregate of all towns in the district or in the taluka concerned. Ail the other tables present material for total, rural and urban areas separately. In a few cases (e.g., B-III-D, B-VIII-B, B-IX, C-III-B, etc.), talukawise break-up is given for rural areas only because the corresponding data for the urban areas had been compiled only for the district as a whole and not for each taluka separately.
3. Tables on migration and a few other topics could not be included in this volume for want of space. They will be found in the volumes of the Maharashtra Census Report.
4. An account of how the Census was taken and a description of the definitions and concepts followed will be found in Part II-A of the Maharashtra Census Report. The material presented here relates to the 1 st March 1961, which was the reference date fixed for the Census and which very closely approximated the completion of the Second Five-Year Plan. An analysis of this material will be found in the Introductory Note on the district at the beginning of this volume.
5. The following paragraphs contain brief notes on the tables included in this Part. Concepts and definitions of terms used are briefly described in the notes on the tables where those terms first appear in the Series. Each tahle starts with the entries for the district and the talukas follow in the order of their code numbers fixed by their geographical locations for purposes of the 1961 Census.
A SERIES GENERAL POPULATION TABLES
I 6. There are four General Population Tables and three Appendices in this Series. They are the basic population tables. They will be useful to study the variation of population, sex ratios, distribution by size of villages or towns and trends of urbanisation in the district.
Table A-I 7. This table presents area, density, number of
villages and towns, occupied residential houses and population total, males and females. Material is presented for the district and for each talUka (Tahsil or Mahal) for total, rural and urban areas separately. Towns are - shown immediately after the entries of the taluka in which they are situated.
8. A town or an urban area is a place which has a municipality, a cantonment or a civil line or a population of 5,000 or over and at least lths of male popUlation dependent on non-agricultural pursuits. A population enumerated in urban areas is urban population and the population enumerated in all other places is rural population. Total includes the population of both urban and rural areas.
9. Area figures have been obtained through Revenue and Municipal Officers. Rural a{ea is the difference between the Total and the Urban areas. The area figures for the district have been obtained from the Director of Land Records.
10. The term "village" has been explained in paragraphs 4 and 5 of the Explanatory Note to Part 1.
11. The figures for number of occupied residential houses include houses used partlY as dwellings and partly for some other purpose like shop, workshop, factory, etc., but do not incl\uk vacant residential houses where no person was fOlmd to be residing at the time of the Census.
Appendix I
12. There have been no territorial changes during the 'decade 1951-1961. Appendix I does not, therefore, appear here.
Appendl:,,( II
13. This shows the number of villages which in spite of a popUlation of 5,000 or oVer have not been treated as towns a!1d the number of towns which have less than 5,000 population but which have been treated as towns only because they have Municipalities. Columns (4) and (7) show the percentage of populations in villages of over 5,000 and towns of less than 5,000 to the respective rural or urban populations of the district or the taluka concerned.
Appendix III
14. Houseless Population.-Houseless persons were enumerated in all areas on the night of 28th February 1961. These include: (i) persons who might be doing domestic service or some other work with one or more households but who do not reside in any house and sleep in the corridors, verandahs or passages in buildings or on the streets; (ii) wandering or nomadic tribes found to be staying m temporary huts, rahooties, etc., or residing without any such huts just on the open grounds; aDd (iii) beggars, vagrants, tramps, sadhus, fakirs, lepers, etc., who are found on the footpaths, streets, otlas, in places like parks, gardens, seashore, railway yards, etc.
15. Institutional Population includes persons enumerated in penal, charitable or mental institutions, hostels, hotels, hospitals, boarding houses, etc.

Table A-II 16. This table presents population of the dis
trict for the seven Censuses from 1901 to 1961 and the variation by actual figures and percentages. Population figures for 1951 and 1961 and variation during the decade are presented for each talllka separately. The population figures for earlier Censuses shown in the table have been adjusted for the boundaries or areas of the district and talukas as they existed at the time of 1961 Census.
Table A-III 17. This table gives for the district and each
taluka the distribution of inhabited villages classified by seven population size groups which are: (i) less than 200; (ii) 200-499; (iii) 500-999 ; (iv) 1,000-1,999; (v) 2,000-4,999; (vi) 5,000-9,999 j and (vii) 10,000 and above.
18. Hamlets are included in the village. The classification here is on the basis of the combined population of the village and its hamlets if there are any. In ,other words, the classification is not strictly according to the size of each individual nucleus of rural population but is based on the size of population of the revenue village which may in some caSes be a single nucleus of population and in others a group of two or more scattered localities.
Table A~IV 19. This table shows the growth of each town
since 1901. It shows population for each town for the last seven Censuses. Towns are presented in the following six classes classified by their population in 1961. Within a class, the names of towns are arranged in the order of population:
Class I 100,000 and over. Class II 50,000 to 99,999. Class III 20,000 to 49,999. Class IV 10,000 to 19,999. Class V 5,000 to 9,999. Cla~~ VI Less than 5,000.
20. Where two or more towns are adjacent and together form a compact urban unit, the entire town group is classified with reference to the combined population of the group. In such cases, the total population of the group is shown along with the population of each of its constituent towns.
;21 • Where a town was not treated as a town in some earlier Census, its population at that Census had been included in rural population. It is not presented here as the table presents figures of urban population only.
22. The total urban population of the district and its variation in the last sixty years are shown at the beginning of the table.
90
B SERIES
(i) GENERAL ECONOMIC TABLES
23. There are 16 Tables in this Series showing the distribution of population by economic activity correlated with sex, age and educational levels. The classification by economic activity is first by workers and non-workers. The workers are then classified in nine broad categories of economic activity. A more elaborate classification of workers by industry under the Standard Industrial Classi~ fication Scheme is presented in Tables B·IV -A, Band C and by occupation under the National Occupational Classification in Table B-V. Two Tables B-VII-A and B-VII-B show the classification of workers by secondary work. The last three tables present distribution of non-workers by sex, age and eight broad classes.
24. In the 195) Census Reports, the population was classified into eight livelihood classes and each class was further divided with reference to economic status into-
(i) self-supporting persons;
(ii) earning dependents; and
(iii) non-earning dependents.
25. The concept of dependency has been abandoned for economic classification at the 1961 Census. Instead, the population is classified into workers and non-workers. The emphasis is now on work and not on income or economic dependence.
26. A person is classified as worker if-
(a) in case of seasonal work like cultivation, livestock, dairying, household industry, etc., he has had some regular work of more than one hour a day throughout the greater part of the working season; and
(b) in the case of regular employment in any trade, profession, service, business or commerce, he was employed during any of the fifteen days preceding the day of the enumerator's visit to the household.
27. A person who was working but was absent from his work during the fifteen days preceding the day on which enumerated or even exceeding the period of fifteen days due to illness or other causes has been treated as a worker. A person who had been offered work but had not actually joined has been treated as a non-worker.
28. "W ori," includes not only actual work but effective supervision and direction of work also.

29. Persons uncler training as apprentices with or without stipend or wages are regarded as workers.
30. An adult woman who was engaged in household duties but doing no other productive work to augment the family's resources has not been considered as working. If, however, in addition to her househola work she engaged herself in work such as rice pounding for sale or wages, or in domestic services for wages for others, in minding cattle or selling firewood or making and selling cowdung cakes, or grass, etc., or any such work she has been treated as a worker.
31. Persons like beggars, pensioners, agricul~ tura! or non-agricultural royalty, rent or dividend receivers, who earn an income but who are not participating in any productive work are not treated as workers unless they also work in cultivation, industry, trade, profession, business or commerce.
32. A public or social service worker who is engaged in public service actively or a political worker who is actively engaged in furthering the political activity of his party is regarded as a worker.
33. The popUlation classified as workers here is the economically active population including family workers but not including unemployed persons.
34. The Census Questionnaire did not have any question to determine the extent of full employment or under-employment.
35. Classification of workers doing two or more different types of work, has been done on the basis of their principal work, i.e., the work which COnsumes larger portion of their time and not necessarily the work which earns larger portion of their income.
Primary Census Abstract 36. This table shows 1961 summary figures
for the district and talukas, each for total, rural and urban areas separately. Similar details for each village, town and ward of a town are presented in Part r.
37. For each unit, the table shows area in square miles, number of occupied houses, number of households, total population, population of Scheduled Castes and Scheduled Tribes, number of literate and educated persons and number of workers and non-workers. The workers are shown further classified for nine categories of economic activity.
38. Column (5) shows the number of households for each unit. The" household" is slightly different from a " family". A" household" is a group of persons who commonly live together in the same house and take their meals from a
91
common kitchen unless the exigencies of work prevented any of them from doing so. A domestic servant residing and eating at the employer'S house is a member of the household. Similarly, a friend or a guest (related or unrelated) residing and eating with the host during the Census period is treated as a member of the (host) household. On the other hand, a son or a daughter residing in a hostel (may be in the same town) is not treated as a member of the household.
39. Columns (9) to (12) of the Primary Census Abstract show population of the Scheduled Castes and Scheduled Tribes, respectively, by males and females. The figures are related only to the two group totals of 311 Scheduled Castes and all Scheduled Tribes. Their break-up by individual Scheduled Caste or Scheduled Tribe will be found in Table SCT-I.
40. The limitations in coverage of these two groups may be mentioned here. The groups of Scheduled Castes or Scheduled Tribe3 do not include all backward castes or tribes living in the district. They include only the castes or tribes declared as Scheduled Castes or Scheduled Tribes in the district. In cases where a caste or a tribe is declared as a Scheduled Caste or a Scheduled Tribe for a specified area that caste or tribe has been separately presented only for that specified area and not for any other areas of the district.
41. Columns (13) and (14) show figures for literates and educated persons. A" literate" is a person who can both read and write a simple letter. Persons having higher education are also included in these figures. More material on literacy and education cross tabulated with age-groups is presented in Table C-lII.
42. The w~rkers are shown classified by sex and in the following nine categories of economic activity:-
I As Cultivator. II As Agr:cultural Labourer.
III In Mining, Quarrying, Livestock, Forestry I Fishing, Hunting and Plantations, Orchards and allied activities.
IV At Household Industry. V In Manufacturing other than Household
Industry. VI In Construction.
VII In Trade and Commerce. VIII In Transport, Storage and Communica
tions. IX In Other Services.
Category I 43. This category includes both the owner
cultivators and tenant cultivators. Along with workers personally doing work on land are also included persoll3 who are engaged in supervision or

direction of cultivation. All persons working in cultivation of land on which they have either ownership or tenancy rights are included in this category.
Category II 44. All other persons working on land as
labourers on wages without holding any right upon the land are classified as agricultural labourers and included in the second category. Category III
45. Workers in mining, quarrying, livestock, forestry, fishing, hunting, plantations, orchards and allied activities are included in this category. Category IV
46. A "Household Industry" is d(fir~ed as an industry conducted by the head of the household himself and/or mainly members of the household at home or within the village in rural areas and only at home in urban areas. A household industry is not run on the scale of a registered factory. Thus, the main criterion for a household industry is the participation of one or more members of a house~ hold in rural areas. In the urban areas, household industry is confined to the house.
47. A household industry relates to production, processing, servicing, repairing or making and selling of goods. It does not include professions such as pleader, doctor, barber, washerman or astrologer. Persons working in other person's household industry as paid employees are also treated as workers in household industry.
Category V 48. "Manufacturing" includes all types of pro
duction, processing, servicing or repairing of goods. This category does not include prodllction or processing which may be classified as household ind ustry.
Category VI 49. This category includes workers engaged in
construction and maintenance of buildings, roads, railways, bridges, telegraph, telephones, waterways, reservoirs, etc.
Category VI! 50. This category includes workers engaged in
any capacity in wholesale or retail trading activity and commercial transactions relating to imports and exports, real estates and properties, stocks and shares, insurance, moneylending, banking, etc.
Category VIII 51. This category includes workers engaged in
transport activities by air, rail, road or water and in services incidental to transport such as packing, carting, loading, llnloading, etc. Workers engaged in storage, \varehousing and communication services such as Posts, Telegraph, Telephones, Wireless Signalling, Information and Broadcasting are also inclllded in this category.
92
Category IX
52. This category includes (i) Public utility services like electricity or gas or water-supply, sanitary services; (ii) Central, State or Municipal employees; (iii) Professional services; (iv) Trade or labour associations, Recreation services, etc. Tables B-1 and B-II
53. This combined table gives break-up of the Primary Censlls Abstract distribution of workers in nine industrial categories and non-workers by four broad age-groups. The material is presented for the district and each taluka as well as for total, rural and urban areas separately. Towns are also shown immediately after the entries of the talukas in \vhich they are situated. For talukas which do not have any llrban areas, entries are given only for totals which correspond to those for rural areas.
Table B-III
54. This table gives break-up of the Primary Census Abstract distribution of workers in nine industrial categories and non-workers by educational levels. Material for the district is presented for total, rural and urban areas separately while that for the talukas is presented only for rural areas. The classification by edllcational levels is more elaborai:e in the case of the urban areas. Classification by educational leVels and age-groups will be found in Table C-III.
Industrial Classification 55. Industry of a worker is that branch of eco
nomic activity in which he is engaged in producing goods or services. Tables B-IV-A, B-IV-B, B-IV-C, B-VII-A and B-VII-B of the present Series and Tables B-XIII, B-XIV-A, B-XIV-B and B-XVI of the following Series show the distribution of workers by industry according to the Standard Industrial Classification which is reprodllced as Appendix I to thi~;:; note. For want of space it has not been possible to give description of each group of industry in the tables. They are shown only by industry codes in one, two or three digits as the case may be.
56. The nine categories shown in the Primary Census Abstract and Tables B-1, B-II and B-III conform to the industry divisions as follows :-
Category Industry Division
I Cultivator • • "1 Minor groups 000, 001, 002, )- 003 and 004 from Division
II III
IV
V VI
VII VIII
Agricultural Labourer .. J O. Mining, Quarrying, etc. Division 0 except minor groups
Household Industry
Manufacturing •• Construction Trade and Commerce .. Transport, Storage and
Communications.
000 to 004 and Division 1. Division 0 except minor groups
000 to 004, Divisions 1, 2 & 3.
Divisions 2 & 3. . Division 4.
Division 6. Division 7.
I X Other Services .. Divisions 5, 8 and 9.
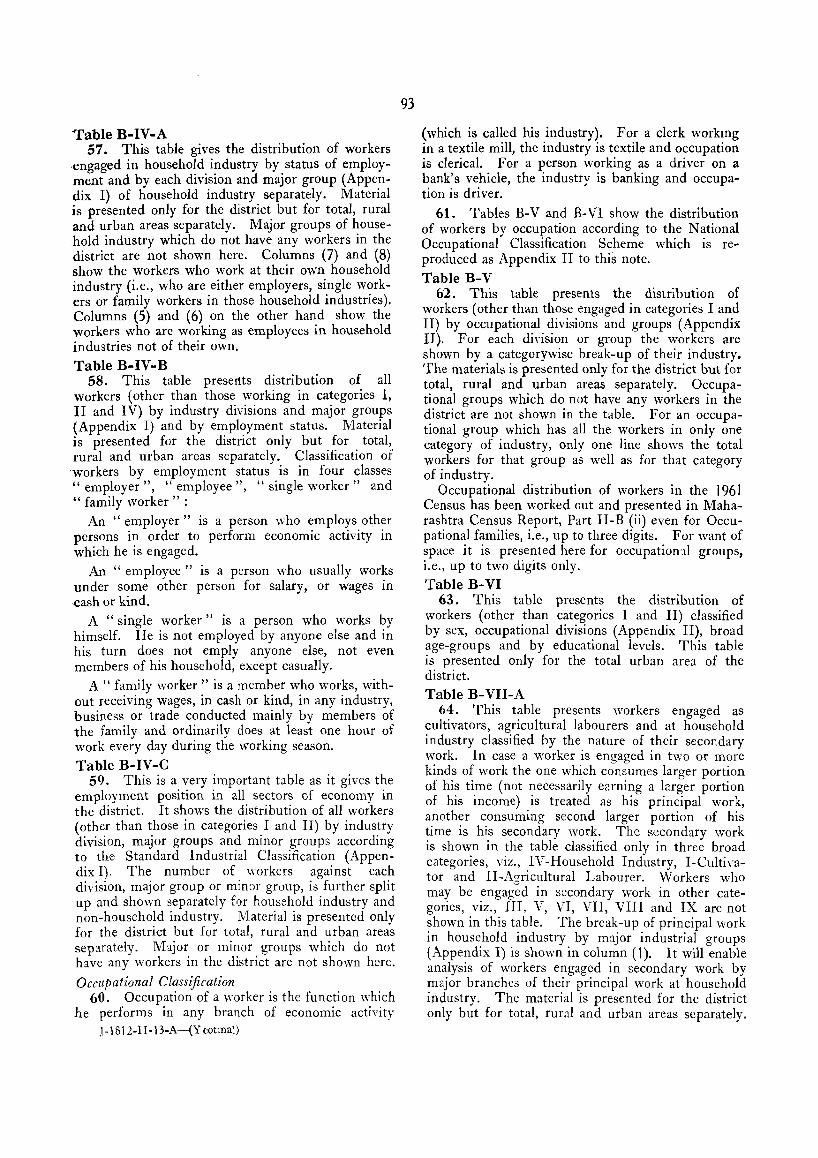
'Table B-IV-A 57. This table gives the distribution of workers
.engaged in household industry by status of employment and by each division and major group (Appe?dix I) of household industry separately. Matenal is presented only for the district but for total, rural and urban areas separately. Major groups of household industry which do not have any workers in the district are not shown here. Columns (7) and (8) show the workers who work at their own household industry (i.e., who are either employers, si.ngle w?rkers or family workers in those household mdustnes). Columns (5) and (6) on the other hand show the workers who are working as employees in household industries not of their own.
Table B-IV-B 58. This table presertts distribution of all
workers (other than those working in categories I, II and IV) by industry divisions and major groups (Appendix I) and by en:pl~yment status. Material is presented for the dIstnct only but for total, rural and urban areas separately. Classification of workers by employment status is in four classes " employer", "employee", "single worker" and " family worker" :
An "employer" is a person who employs other persons in order to perform economic activity in which he is engaged.
An "employee" is a person who usually works under some other person for salary, or wages in ·cash or kind.
A "single worker" is a person who works by himself. He is not employed by anyone else and in his turn does not emply anyone else, not even members of his household, except casually.
A " family worker" is a member who works, without receiving wages, in cash or kind, in any industry, business or trade conducted mainly by members of the family and ordinarily does at least one hour of work every day during the working season.
Table B-IV-C 59. This is a very important table as it gives the
employment position in all. se~tor~ of economy in the district. It shows the dIstributIOn of all workers (other than those in categories. I and II) by indus~ry division, major groups and mmor groups accordmg to the Standard Industrial Classification (Appendix I). The number of workers against each division, major group or minor group, is further split up and shown separately for household industry and non-household industry. Material is presented only for the district but for total, rural and urban areas separately. Major or minor groups which do not have any workers in the district are not shown here.
Occupational Classification 60. Occupation of a worker is the function which
he performs in any branch of economic actiyity J -1812-1 I -13-A-(Y eotma))
93
(which is called his industry). For a clerk workmg in a textile mill, the industry is textile and occupation is clerical. For a person working as a driver on a bank's vehicle, the industry is banking and occupation is driver.
61. Tables B-V and B-VI show the distribution of workers by occupation according to the National Occupational Classification Scheme which is reproduced as Appendix II to this note.
Table B-V 62. This table presents the distribution of
workers (other than those engaged in categories I and II) by occupational divisions and groups (Appendix II). For each diyision or group the workers are shown by a categorywise break-up of their industry. The materials is presented only for the district but for total, rural and urban areas separately. Occupational groups which do not have any workers in the district are not shown in the table. For an occupational group which has all the workers in only one category of industry, only one line shows the total workers for that group as well as for that category of industry.
Occupational distribution of workers in the 1961 Census has been worked out and presented in Maharashtra Census Report, Part II-B (ii) even for Occupational families, i.e., up to three digits .. For want of space it is presented here for occupatIOn '11 groups, i.e., up to two digits only. Table B-VI
63. This table presents the distribution of workers (other than categories I and II) classified by sex, occupational divisions (Appendix II), broad age-groups and by educational levels. This table is presented only for the total urban area of the district. Table B-VII-A
64. This table presents workers engaged as cultivators, agricultural labourers and at household industry classified by the nature of their secondary work. In case a worker is engaged in two or more kinds of work the one which consumes larger portion of his time (not necessarily earning a larger portion of his income) is treated as his principal work, another consuming second larger portion of his time is his secondary work. The secondary work is shown in the table classified only in three broad categories, viz., IV-Household Industry, I-Cultivator and II-Agricultural Labourer. Workers who may be engaged in secondary work in other categories, yiz., III, V, VI, VII, VIII and IX are not shown in this table. The break-up of principal work in household industry by major industrial groups (Appendix I) is shown in column (1). It will enable analysis of workers engaged in secondary work by major branches of their principal work at household industry. The material is presented for the district only but for total, rural and urban areas separately.

Table B-VII-B 65. This table shows workers engaged in non
household industry categories III and V to IX as principal work and doing some additional work in household industry. The additional work in household industry is classified by industrial divisions (Appendix I) only. Similarly, the break-up of principal industry in column (1) is also by industrial divisions only. Workers engaged in the industry divisions shown in column (1), but who are doing additional work in any sector other than household industry are not shown in this table. l\latcrial is presented for the district only but for total, rural and urban areas separately. Table B-VIII-A
66. This table pre.sents the distribution of unemployed persons aged 15 and above by agegroups and educational levels. The number of unemployed have been further split up by persons seeking employment for the first time· and persons employed before but now out of employment and seeking work. Material is presented only for the total urban area of the district. Such detailed information on the unemployed is compiled for the first time in the 1961 Census. Table B-VIII-B
67. This table presents the distribution of unemployed aged 15 and above in rural areas of the district by educational levels. The break-up of educational levels is not as elaborate as in Table B-Vln (Part A) and classification by age-groups or by persons seeking employment for the first time, etc., is not shown in this table. As a compensatory factor, the material is presented for the rural area of the district and each taluka separately. Table B-IX
68. This table presents the distribution of nonworking population by broad age-groups and eight classes of non-workers. Such information on the non-working population had neVer been compiled before. The material is presented for the district separately for total, rural and urban areas and for each taluka for rural areas only.
(ii) HOUSEHOLD ECONOMIC TABLES 69. Tables B-X to B-XVI present the economic
activity of the households as units. They relate to(i) the size of or interest in land cultivated and!
or the household industry conducted by the households ; and
(ii) the number of family workers and/or hired workers working in either of the two activities separately or combined in both.
70. In the case of countries of such economic status as ours where not all the goods produced enter the money market and where much of what is produced is consumed by the family itself, presentation of information on economic activity of individuals
J-1812-II-13-B-(Ytotma~).
94
alone is likely to be slightly misleading unless that information is supplemented by material relatin g to economic activity of the households as en tities. Such information i1 presented here for the first time. These tables 'are prepared from the house hold schedules specially introduced for that purpos e as one of the three Questionnaire forms in the 1961 Census. The tables have been prepared on a 2(} per cent sample of all the households in the district drawn for rural and urban areas separately.
71. Cultivation here includes cultivation both as owners ahd tenants. Size of holding shown is also of Operational holding, i.e., land actually cultivated and does not include land owned but not cultivated by the household. Table B-X
72. This table prese~ts distribution. of sample households by those-
(i) engaged neither in cultivation nor household industry;
(ii) engaged in cultivation only; (iii) engaged in household industry only; and (iv) engaged both in cultivation and household
industry. The material is presented for the district and each
taluka for total, rural and urban areas separately. TableB-XI
73. This is an important table. It shows the distribution of sample households engaged in cultivation classified by size of land and interest in land cultivated. Ten size-groups are shown horizontally while the interests in land are classified in three types, viz.-
(a) Entirely owned or held from Government. (b) Entirely held from private persons or
institut;,:ms for payment in money, kind or share.
(c) Partly held from Government and partly from private persons or institutions for payment in money, kind or share.
The material is presented separately for total. rural and urban areas of the district and only for rural areas of each taluka.
Table B-XII 74. This table shows the distribution of sample
households engaged in cultivation classified by size of land cultivated and the total number of family workers and hired -,vorkers. The material is presented for the district for total, rural and urban areas separately and only for rural areas of each taluka.
Table B-XIII 75. This table shows the distribution of sample
households engaged both in cultivation and household industry classified by size of land cultivated and by industry division and major group of the household industry (Appcnd;x I). The table shows the

sizes of cultivation holdil1gs and the branches of household in~u:"~ry for which the two household economic acttvities combine in varying degrees. The material is presented only for the district but for' rural and urban areas separately. Table B-XIV-A
76. This table shows the distribution of sample households engaged in household industry only by the number of workers engaged and by industry division and major groups of the household industry (Appendix I). Material is presented for the~istrict only but for total, rural and urban areas separately. Table B-XIV-B
77. This table shows the distribution of sample households engaged in household industry only classified by industry minor groups (Appendix I) for the household industry. The industry minor group is shown with a break-up in four-digit cod·~s in column (1). These four-digit codes are shown in Appendix III. The material is presented for the district only but for total, rural and urban areas separately. TableB-XV
78. This table shows the distribution of sample households engaged both in cultivation and household industry classified by size of land cultivated and the number of family workers and hired workers working in the two activit'ies combined. The material is presented for the district for total, rural and urban areas and for each taluka only for rural areas separately. Table B-XVI
79. This table shows the distribution of sample households engaged in household industry classified by the period for which the household industry is worked and by industry division and major groups (Appendix I) of the household industry. A further split-up of figures is shown for household industry combined with cultivation and without cultivation. The material is presented for the district only but for total, rural and urban areas separately.
C SERIES SOCIAL AND CULTURAL TABLES
80. There are 11 tables in this Series dealing with Social or Cultural aspects like sizes and composition of households, age, marital status, literacy and education, language, religion, Scheduled Cast{s and Scheduled Tribes. The first two Tables C-I-A and C-I-B relating to Size and Composition of Huuseholds are p:-epared from the household schedules on a 20 per cent sample. All the other tables are prcp:ued from individual slips and on a total count. Table C-I-A
81. This table presents distribution of sample households classified by their size and by economic activity, i.e., by work in cultivation or household
95
industry. Households working at cultivation are further classified by size of land holding. The material is presented only for the district but separately for total, rural and urban areas. Classification by economic activity as well as by size of land holding is presented only for rural areas and classification by size of the hOUSehold is alone presented for total and urban areas. This table is prepared from household schedules on a 20 per cent sample. This table appears as Table B-XVII in Part III of the Maharashtra Census Report.
82. The classification by size is as one member small (2 to 3), medium (4 to 6), large (7 to 9) and very large (over 10) households. By definition, a Census household is not the same as a family. The household also includes persons who are not members of the family but who were residing with the family during the C~nsus period. All the same the table will give a general idea of the family sizes as in the majority of families outsiders are not likely to be present.
Table C-I-B 83. This table presents distribution of popula
tion of sample households by heads of the households, spouses of heads of households, married relations, never married, widowed or divorced relations and unrelated persons. These details are also shown for sample households classified by economic activity, i.e., participation in cultivation or household industry. For cultivation, the sample households are further classified by size of land holdings. This table is prepared from the household schedules on a 20 per cent sample. Material is presented for the district only but for total, rural and urban areas separately. The classification of households by economic activity and size of land holding is, however, shown for rural areas only. This table is of sociological interest indicating the strength of the Joint family system.
Table C-II 84. This table presents distribution of popula
tion by sex, age and marital status. Classification of age between 10 and 70 years is by five-year age-groups. The other two groups are 0-9 years and 70 and over. The entire population in 0-9 years age-group has been treated as never married and no further classification by marital status is shown against them. The material is presented only for the district but for total, rural and urban areas separately. FroPl this table it may be ascertained whether proportions in various marital status groups have changed since the last Census and wh~ther any trend is observed in age of marriage. A corresponding table at the 1951 Census was prepared on a 10 per cent sample. This table is, however, prt'~ pared on a full count.

Tables C-III-A, Band C 85. These three tables present the distribution
by age, sex, literacy and educational levels. Classification by age is by five-year age-groups up to 59 years. Classification by educational levels is the same as in Table B-II!. It is more elaborate in the case of urban areas. Part A presents material only for the district total while Part B presents material for rural areas of the district and of each taluka separately. Part C presents material only for the district urban areas but with more elaborate classification by educational levels.
86. These tables are a measure of the growth of literacy in the total population as well as in the different age-groups since the last Census. They are also likely to furnish information on the spread of adult education. The corresponding table at the 1951 Census was prepared on a J 0 per cent sample. These tables have been prepared on a full count.
Table C-IV 87. This table presents distribution of the
district population by single year ages both for males and females separately. Figures presented are based on the actual returns recorded in the Census, i.e., they have not been smoothed or adjusted for preferences for digits 0, 5, etc. The material is presented only for the district total.
88. This is an important demographic table which is used for computing mortality rates. The corresponding table at the 195 J Census was prepared on a 10 per cent sample. This table has been prepared on a full count.
Table C-V 89. This table presents the distribution of
population by mother-tongues. The figures are presented only for 9 top ranking mother-tongues in the district. Figures for all the other mothertongues have been shown combined in the group " Others". Mother-tongues are arranged in the alphabetical order. Material is presented for total, rural and urban areas for the district and each taluka separately. At the end material is also presented for each town separately. A footnote is added to show the number of speakers in the district for each of the mother-tongues combined in the group" Others".
90. "Mother-tongue" is defined as a language spoken by the person's mother to the person in his childhood or mainly spoken in the house. Dialects have been included in the main languages on the basis of Grierson's Classification.
91. Another Table (C-VI) on bilingualism has been prepared in the 1961 Census. It is not included in this volume and may be found in Part II-C of the Maharashtra Census Report.
96
Table C-VII 92. This table presents distribution of popula
tion by religion. Eight main religions have been shown in their alphabetical order. All other religions returned in the Census are combined in the group " Others". Figures for various sects returned as religion during the Census have been combined with the main religions concerned.
Table C-VIII-A 93. This table presents the total population
of Scheduled Castes classified by literacy and by economic activity. Classification by economic activity is the same as in the Primary Census Abstract or Tables B-1 and B-1!. Material· is presented for total, rural and urban areas of the district separately and only for rural areas of each taluka separately. Paragraph 40 above, on Primary Census Abstract, may be seen for explanation of the special group treated as Scheduled Castes.
Table C-VIII-B 94. This table presents the total population
of Scheduled Tribes classified by literacy and by economic activity. Classification by economic activity is the same as in the Primary Census Abstract or Tables B-1 and B-1!. Material is presented for total, rural and urban areas of the district separately and only for rural areas of each taluka. Paragraph 40 above, on Primary Census· Abstract, may be seen for explanation of the special group treated as Scheduled Tribes.
SCT, SC & ST SERIES
SPECIAL TABLES FOR SCHEDULED CASTES AND SCHEDULED TRIBES
95. There are 11 Tables in this Series specially prepared for the population of Scheduled Castes and Scheduled Tribes in the district. These classes of people are declared by the President's orders issued under Articles 341 and 342 of the Constitution of India as Scheduled Castes or Scheduled Tribes. Under Article 46 of the Constitution) the State has to promote, with special care, the educational and economic interests of the weaker sections of the people and in particular of the Scheduled Castes and Scheduled Tribes and has to protect them from social injustice and all forms of exploitation. For ensuring adequate representation to these classes, seats are also reserved for them in the House of the People, State Legisla.;. ture and other elective bodies.
96. These special tables have been prepared to furnish data on the present socia-economic conditions of these people to be studied not only as a combined group as in 1951 but also for each Scheduled Caste and Scheduled Tribe separately.

97. These tables relate to economic activity, education, mother-tongue and classification of persons not at work. Material is presented for each Scheduled Caste and Scheduled Tribe separately. It will be useful information for formulating various schemes for their welfare.
9S. Classification by Castes and Tribes is on the basis of returns recorded in response to question 5 (c) of the 1961 Census Questionnaire. Every person was asked if he belonged to one of the Scheduled Castes or Scheduled Tribes notified for the district and in case he belonged to one of them he was asked the name of his caste or tribe. Paragraph 40 above on the Primary Census Abstract explains the limitations of these castewise or tribewise figures. The population of Scheduled Castes shown here is much less than that for the district in 1951 as many persons from that group have returned their religion as Buddhist or NavBuddha, and under the Constitution, there can be Scheduled Castes only among Hindus and Sikhs and in no other' religion.
99. Two more Tables SCT-II and SCT-IV on age, marital status and religion of the Scheduled Castes and Scheduled Tribes prepared in the 1961 Census are not presented here for want of space. They may be seen in Part V-A of the Maharashtra Census Report.
Table SCT -I-A 100. This table presents the distribution of
Scheduled Castes population by economic activity. Material is presented for the total of all Scheduled Castes as well as for each Scheduled Caste separately. Scheduled Castes are arranged in the alphabetical order. Classification by economic activity is in the same nine categories as in the Primary Census Abstract and Tables B-1 and B-1!. In a way, this table presents castewise break-up of the material presented in Table C-vln (Part A). The last group of castes" not stated" is of persons who were returned as belonging to Scheduled Castes but in whose case the name of the Scheduled Caste concerned had not been stated in the Census.
1 0 1. Columns (28) to (31 ) present Scheduled Castewise figures of persons engaged in unwholesome occupations like tanning, currying of hides and skins and scavenging. The number of workers shown in these occupations as well as in any other category is on the basis of principal work. Persons engaged in cultivation or any other activity as principal work and also engaged in tanning, currying or scavenging as secondary work are not included in the figures of columns (28) to (31).
102. The material is presented for total, rural and urban areas of the district separately and only for rural areas for each taluka.
97
103. There are some more castes declared as Scheduled Castes for the district. They are not shown in this table because no one belonging to those castes was enumerated in 1961 Census in the district. Table SCT-I-B
104. This table presents the distribution of Scheduled Tribes population by economic activity. Material is presented for the total of all Scheduled Tribes as well as for each Scheduled Tribe separately. Scheduled Tribes are arranged in the alphabetical order. Classification by economic activity is in the same nine categories as in the Primary Census Abstract and Tables B-1 and B-1!. In a way, this table presents tribewise break-up of the material presented in Table C-vln (Part B). The last group of tribes "not stated" is of persons who were returned as belonging to Scheduled Tribes but in whose case the name of the Scheduled Tribe concerned had not been stated in the Census.
1 05. The material is presented for total, rural and urban areas of the district seFfarately and only for rural areas for each taluka.
106. There arc some more Scheduled Tribes declared as Scheduled Tribes for the district. They are not shown in this table because no one belonging to those tribes was enumerated in 1961 Census in the district.
Table SCT-III-A (i) 107. This table presents the distribution of
each Scheduled Caste population by sex and educational levels. The table presents material for the district urban area only. The classification of educational levels is the same as in Tables B-III and C-III applicable for urban areas.
Table SCT -III-A (ii) lOS. This table presents the distribution of
each Scheduled Tribe population by sex and educational levels. The table presents material for the district urban area only. The classification of educational levels is the same as in Tables B~ II r and C-III applicable for urban areas.
Table SCT-III-B (i) 109. This table presents the distribution of
population for each Scheduled Caste by educational levels only for the district rural area. The classification by educational levels is somewhat reduced than that of Table SCT-III (Part A).
Table SCT -III-B (ii) 110. This table presents the distribution of
population for each Scheduled Tribe by educational levels only for the district rural area. The classification by educational levels is somewhat reduced than that of Table SCT-III (Part A).

Table SCT-V-A 111. This table presents the distribution of sample
Scheduled Caste households of the district (Rural) by interest in land cultivated and by size of land cultivated. The interests in land cultivated are shown in three categories ;-
(i) entirely owned or held from Government; (ii) entirely held from private persons or institu
tions for paymer.t in money, kind or share; and
(iii) partly held from Government and partly from private persons, etc.
Classification by size of land cultivated is the same as in th(_; B Series household economic tables. Material here is presented only for the district rural and for all the Scheduled Castes as a group. The table is prepared from the household schedules on i1 20 per cent sample. '
Table SCT-V-B 112. This table for Scheduled Tribes (same as
Part A) is presented only for the district rural. The tahle is prepartd from the household schedules on a 2D per cent sample.
Table SC-I 113. This table presents the total non-working
population of all the Scheduled Castes as a group classified by four categories of non-workers, v:z.--
(i) full-time students; (ii) perSO:lS seeking empbyment for the first
time; (iii) persons employed before but now out of
employment and seeking work; and (iv) others.
The non-working population is further classified by educational levels. The material is presented for the district only but for total, rural and urban areas separately.
Table ST-I 114. This table presents the distribution of
population of each Scheduled Tribe by mother..; tongue and the subsidiary languages spoken. Material is presented only for the district but for total, rural and urban areas separately. Scheduled Tribes are arranged in their alphabetical order and mother-tongues when there are more than one for any Scheduled Tribe are also ::;hown in the alphabetical order.
Table ST-H 115. This table presents the total non-working
popUlation of each Scheduled Tribe classified by four categories of non-workers, viz.-
(i) full-time students; (ii) persons seeking employment for the first
time;
98
(iii) persons employed before but now out of employment and seeking work; and
(iv) others. The m:lterial is presented for the district only but for total, rural and urban areas separately.
E SERIES HOUSING TABLES
116. There are five tables in this Series. Four of them relate to housing conditions and furnish data on the purposes for ,yhich the house:) are used, the tenures on which they are occupied by the households, material of construction of walls and roofs and the distribution of households by the number of rooms occupied. The last table relates to industries and thows the number of establishments and the number 0' workers for each industry classified by industry division, major groups and minor groups. Another Table (E-IIl) on industrial establishments prepared from the houselists gives a break-up by industry and the fuel used cross-tabulated by the size of the establishments. It is net lJresented here for want of space. It may be seen in Part IV of the Maharmchtra Census Report.
117. All the five tables of this Serie~ are prepared from the houselists which were prepared at the time of numbering of houses in SeptemberOctober 0:' 1960. Such data on homing conditio.as are furnished here or the first time.
118. A" house" was defined for purposes of the Census a; "a structure or part of a structure inhabited or vacant, a d\velling, a shop, a shop-cumdwelling or a place of business, workshop, school, etc., having a separate entrance. The entrance may be c1irectly on the road, street, or lane or to a common staircase, court-yard or a gate". Table E-I
119. This t:1 ble presents the distribution of house; class:fied by uses to which they are put to. The variom uses are shown in columns (4) to (16). Houses which were not being used for :my purpose at the time of h ouselisting were treated as vacant. A "workshop" is a place where some kind of production, processing, repair _, or servicing of goods goes on a commercial scale. Manufacturing or processing establishments registered under the Factories Act are treated as factories. When a house was used both as a shop and as a dwelling or workshop and as a dwelling it is treated as a shop-cum-dwelling or workshop-wm-dwelling. The houses which were used as schools, offices, factories, Of restaurants and also used by some people for residence, have been treated for purposes of this table as schools, offices, factories or restaurants and not as school-cum-dwelling, office-cum-dwelling and so on.

120. The last category of "Others" includeilo all purposes not included in columns (4) to (15) prominent among them being cattle-sheds, garages. show-rooms, locked houses, etc. Table E-I presents material for the district and each tal uk a and for total, rural and urban areas separately. The table is prepared from the houselists on a full count.
Table E-II 121. This table presents the ,listlicuticn of
sample Ccu~eholds by the tenure of hcuscs occupied bv them. Tenure here is of only ',Wo kinds, oWla:d 0; rented. " Rent free" or "Ca;ctaker" occupation is included in the" Rented" category. The houses occupied under each tenure are further classified by the !!3.ture of uses such as dwellings, shop-cumdwellings, etc. Tenure of occupation of nonresidential houses such as schools, hospitals, etc., is not shown here.
122. This table is prepared from ll-,e homelists and on a 20 per cent sample.
123. Material is presented for the district and each taluka and for total, rural and urban areas separately.
Table E-IV 124. This table presents distribution of sample
houses used wholly or partly as dwelling by material of wall and material of roof. The material of wall is the material out of which most of the walls of the house are constructed. \Vhere a house has separate portions each of different material, the material of the walls for this table is the one out of which the walls of the main bed-rooms are constructed. Similarly, the material of roof is one out of which most of the roof exposed to weather is constructed. In case of multi-storeyed buildings, the intermediate floor is treated as the roof of the lower storey.
125. Material is presented here for the district and each taluka and for total, rural and urban areas separately. This table is prepared from the houselists on a 20 per cent sample.
Table E-V 126. This table presents tht: distribution of
sample households classified by the number of rooms occupied. F or each class 0 c' households the total number of members or the households is shown by males and females separately. This will help measure congestion or over-crowding particularly in urban areas.
99
127. The table is prepared from the houselists on a 20 per cent sample. The material is presented for the district and each talub and for total, rural and urban areas separately.
128. The table relates only to the family households. Institu!ional households like hostels, boardings, prisons, etc., are not shown here.
129. A" room" has four walls wi:h a door aud a roof overhead and i3 not less than 6' X 6'. Unenclosed verandah, kitchen, store, garage, cattle-shed, etc., though used L)r resideltial purposes are not treated as rooms. Household, residing in cuch places are shown in columns (7) to (9) as hav:ng no regular room.
Table on Industrial Establishments and Workers
130. This is a very important table and presents the number of establishments and ncmber of workers for each branch of industry classified by· industry divisions and minor groups according to the Standard Industrial Clasiification (Appendix I). For each industry division, minor group figures are shown in the brackets first for the number of establishments and second. for the number of workers.
131. The table is prepared from the houselists on a full count. Material is presented here for the district and talukas for total, rural and urban areas as well as for each vill(jge and fown separately. The presentation is in the run-on style and the villages are shown both by their names and code numbers. These latter will help locate them in the taluka maps included in Part 1. Villages which do :not have any industrial establi"hments are not shown here. Similarly, for any village, town or taluka, the industry minor codes for which there are no establishments are not shown in the table.
132. The material presented here rdates to September-October of 1960. Establishments where processing, repairing or servicing of goods is done are also included along with the manufa<:turing establishments. The number of workers shown here includes the proprietor and/or the other household members if any were working in the industry during the week preceding the enumerator's visit.
133. The list of industries presented here may not include some seasonal industries which were not actually working during the period when house~ lists were prepared, viz., September-October I 96(l.

100
APPENDIX I STANDARD INDUSTRIAL CLASSIFICATION
This classification groups the industries into-9 Divisions
45 Major Groups 343 Minor Groups
The divisions major groups and minor groups with their Code numbers are listed below :-
DIVISIONS o Agriculture, livestock, forestry, fishing and hunting 1 Mining and Quarrying 2 & 3 Manufacturing 4 Construction 5 Electricity, Gas, Water and Sanitary Services 6 Trade and Commerce 7 Transport, Storage and Communication 8 Services 9 Activities not adequately described
MAJOR GROUPS Division O-Agriculture, livestock, forestry,
fishing and hunting 00 Field produce and Plantation crops o I Plantation crops 02 Forestry and Logging 03 Fishing 04 Livestock and Hunting
10
20 21 22 23 24 25 26 27 28 29 30 31 32 33 34-35
36
37
38 39
40
50 51
60-63 64-68
69
Division I-Mining and Quarrying Mining and Quarrying
Division 2 and 3-Manufacturing Foodstuffs Beverages Tobacco Products Textile-cotton Textile-jute Textile-wool Textile-silk Textile-miscellaneous Manufacture of wood and wooden products Paper and paper products Printing and publishing Leather and leather products Rubber, Petroleum and coal products Chemicals and chemical products Non-Metallic l'vIineral Products other than petroleum
and coal Basic Metals and their products except machinery and
transport equipment Machinery (all kinds other than Transport) and Elec
trical equipment Transport Equipment Miscellaneous i\1anufacturing Industries
Dhision 4-Construction Construction
Division 5-Electricity, Gas, Water and Sanitary Services
Electricity and Gas 'Water-supply and Sanitary Services
DIvision 6-Trade and Commerce
Wholesale Trade Retail Trade Trade and Commerce Miscellaneous
Division 7-Transport, Storage and Communication 10-71 Transport
12 Storage and \Varehousing l3 Communications
Division 8-Services 80 Public Services 8 I Educational and Scientific Services ;82 Medical and Health Services
Division 8-Services-concld.
83 Religious and Welfare Services 84 Legal Services 85 Business Services 86 Community Services and Trade and Labour
Associations 87 Recreation Services 88 Persunal Services 89 Services (oot elsewhere classified)
Division 9-Activities not adequately described
90 ActivIties unspecified and not adequately described (This includes new entrants to the labour market)
Major Group (Code)
(I)
MINOR GROUPS
Description
(2)
Minor Group
(Code) (3)
Division O-Agriculture, livestock, forestry, fishing and hunting
00 Field Produce and Plantation CroPs-Production of cereal crops (including Bengal
gram) such as rice, wheat,jowar, bajra, maize. Production of pulses, such as arhar, moong,
musur, urid, khesari, other gram. Production of raw jute and kindred fibre crops Production of raw cotton and kindred fibre
crops. Prod~ction of oilseeds, sugarcane and other
cash crops. Production of other crops (including vegetables)
not covered above. Production of fruits and nuts in plantation,
vines and orchards. Production of wood, bamboo, cane reeds, that
ching grass, etc. Production of juice by tapping palms .. Production of other agricultural produce (in
eluding fruits and nuts not covered by code number 006 and flowers) not covered above.
o I Plantation Crops--Production of tea in plantation Production of coffee in plantation Production of rubber in plantation Production of tobacco in p1antation Production of ganja, cinchona, opium Production of other plantation crops not
cO"ercd above.
02 Forestry and Logging-
000
001
002 003
004
005
006
007
008 009
OlD 011 012 013 014 015
Planting, replanting and conservation of forests 020 Felling and cutting of trees and transportation 02]
of logs. Preparation of timber 022 Production of fuel including charcoal by ex- 023
ploitation of forests. Production of fodder by exploitation of forests 024 Production of gums, resins, lac, barks, herbs, 025
wild fruits and leaves by the exploitation of forests.
Production and gathering of other forest pro- 026 ducts not covered above.
03 Fishing-Production of fish by fishing in sea 030 Production of fish by fishing in inland waters 031
including the operation of fish farms and fish hatcheries.
Production of pearls, conch, shells, sponges by 032 gathering or lifting from sea, river, ponds.

Major Group
(Code) (I)
Description
(2)
Division O-A~riculture, livestock, forestry, fishin~ and hunting-concld.
04 Livestock and Hunting-Production and rearing of livestock (large heads
only) mainly for milk and animal power such as cow, buffalo, goat.
Rearing of sheep and production of wool Rearing and production of other animals
(mainly for slaughter) such as pig. Production of ducks, hens and other small birds,
eggs by rearing and poultry farming. Rearing of bees for the production of honey,
wax and collection of honey. Rearing of silk worms and production of co-
coons and raw silk. Rearing of other small animlls and insects Trapping of animals or games propagation Production of other animal husbo:ndry products
such as skin, bone, ivory and teeth.
Division I-Mining and Quarrying
I 0 Mining and QuarryingMining of coal lVIining of iron ores Mining of go];i and silver ores Mining of manganese Mining of mica .. . . . . . . Mining of other non-ferrous metallic ores Mining of crude petroleum and natural gas ., Quarrying of stone (including slate), clay, sand,
gravel, limestone. Mining of chemical earth such as soda ash Mining and quarrying of non-metallic products
not classified above such as precious and semi-precious stones, asbestos, gypsum, sulphur, asphalt.
Division 2 and 3-Manufacturing
20 Foodttuffs-Production of rice, atta, flour, etc., by milling,
de-husking and processing of crops and foodgrains.
Production of sugar and syrup from sugarcane in mills.
Production of indigenous sugar, gur from sugarcane or palm juice and production of candy.
Production of fruit produ.::ts SJch as jam, jelly, .sauce and canning and preservation of fruits.
Slaughtering, preservation of meat and fish and canning of fish.
Production of bread, biscuits, cake and other bakery products.
Production of butter, ghee, cheese and other dairy products.
Production of edible fats and oils (other than hydrogenated oil).
Production of hydrogenated oils (Vanaspati) Production of other food products such as
sweetmeat and condiments, muri, murki, chira, khoi, cocoa, chocolate, toffee, lozenge.
2 1 Beverages-Production of distilled spirits, wines, liquor
from alcoholic malt, fruits and malts in distillery and brewery.
Production of country liquor .. Production of indigenous liquor such as toddy,
liquor from mahua, palm juice. Production of other liquors not covered above Production of aerated and mineral water Production of ice ProJu..:tlo.l of ice-cream Processing of tea in factories Processing of cotfee in curing works Production of other beverages
J-1812-II-14-A-(Yeotmal),
Minor Group (Code)
(3)
040
041 042
043
044
045
046 047 048
100 101 102 103 104 105 106 107
108 lD9
200
201
202
203
204
205
206
207
208 20~
210
21 I 212
213 214 215 216 217 218 219
101
Major Group (Code)
( I)
Description
(2)
Division 2 and 3-ManuIacturin~-contd.
22 Tobacco ProductsManufacture of bidi .lVlanufacture of cigars and cheroots . , Manufacture of cigarette and cigarette tobacco Manufacture of hookah tobacco Manufacture of snuff Manuhcture of jerda and other chewing
tobacco. Manufacture of other tobacco pro.iu~ts
23 Textile-Cotton Cotton ginning, deming, pressing and baling. , Cotton spinning (other than in mills) .. Cotton spinning and weaving in mills Cotton dyeing, bleaching Cotton weaving in powerlooms Cotton we.lVing in handlooms .. Manufacturing of khadi textile in handloom, .. Printing of cotton textile l\lanufacturing of cotton nets .. Manufacturing of cotton, cordage, rope and
twine.
24 Textile-Jute Jute pressing and baling Jute spinning and weaving Dyeing and bleaching of jute Printing of jute textile .. Manufacture of other products like rope, CO[c:
age fro:njute anJ similar fibre such as hemp, mesta.
25 Textile-Wool Wool baling and pressing Wool cleaning and processing (scouring) Wool spinning and weaving in mil[ Wool spinning other than in mills Wool weaving in powerloom Wool weaving in aandloom EmbrOidery and art work in woollen textile
26 Textile-Silk
Spinning and weaving of silk textile in mill Dyeing and bleaching of silk Spinning of silk other than in mills Weaving of silk textile by powerloom Weaving of silk textile by handloom Printing of silk textile .. . . Manufacture of silk cordage, rope and twine
27 Textile-cW iscellaneous lVlanufacture of carpet and all ocher similar type
of textile products. Manufacture ot hosiery and other knitted fab
rics and garments. Embroidery and making of crepe lace and
fringes Making of textile garments including rdineoats
and headgear. Manufacture of made up textile goods except
we.lring apparel such as curtains, pillow cases, bedding matelials, IUClttress, textile b.lgs.
l\lanufacture of waterproof textile products such as oil cloth, tarpaulin.
Manufacture and recovery of all types of fibres for purposes of padding, wadding and upholstery filling.
M:mufacture of coir and coif products Manufac.ture of umbrellas . , Processing and mc\nufacture of textile products
not covered above.
Minor Group (Code)
(3)
220 221 222 223 224 22)
230 231 232 233 234 23) 236 237 238 239
240 241 242 243 244
250 251 252 253 254 255 256
260 261 262 263 264 26; 266
270
271
272
273
274
27;
276
277 278 279

Major Group (Code)
Description Minor Group (Code)
(3) (I) (2)
Division 2 and 3-Manufacturing-contd.
28 Manufacture of wood and wooden Products-Sawing and planing of wood 280 Manufacture of wooden furniture and fhtures 281 Manufacture of structural wooden goods (in- 282
eluding treated timber such as beams posts, doors, windows.
Manufacture of wooden industrial goods other 283 than transport equipment such as bobbin and similar equipmenr and filltures.
Manufacture of other wooden products such as 284 utensils, toys, artwares.
Manufacture of veneer and plywood .. 285 Manufacture of plywood products such as tea 286
chest. . Manufacture of bOlles and packing cases other 287
than plvwood. Manufacture of materials from cork, bamboo, 288
cane, leaves and other allied products. Manufacture of other wood and allied products 289
not covered above.
29 Paper and Paper Products-Manufacture of pulp from wood, rags, waste- 290
paper and other fibres and the conversion of such pulp into any kind of paper and paper board in mill.
Manufacture of pulp from wood, rags, waste- 291 paper and other fibres and the conversion of such pulp into any kind of paper and paper board handmade.
Manufacture of products, such as paper bags, 292 bOlles, cards, envelopes and moulded pulp goods from paper,paper board and pulp.
30 Printing and Publishing-Printing and publishing of newspapers and 300
periodicals. Printing and publishing of books 301 All other types of printing including lithography, 302
engraving, etching, block making and other work connected with printing industry.
All types of binding, stitching, sizing and other 303 allied work connected with binding industry.
31 Leather and Leather Products-Currying, tanning and finishing of hides and 31 0
skins and preparation of finished leather. Manufacture of shoes and other leather foot- 311
wear. Manufacture of clothing and wearing apparel 312
(ellcept footwear) made of leather and fur. Manufacture of leather products (e.,.cept those 313
covered by code Nos. 311, 312), such as lea-ther upholstery, suitcases, pocket books, cigarette and key cases, purses, saddlery, whip and other articles.
Repair of shoes and other leather footwear 3 J 4 Repair of all other leather products 'except foot- 315
wear.
32 Rubber, Petroleum and Coal Products-Manufacture of tyres and tubes. . 320 Manufacture of rubber footwear 321 Manufacture of rubber goods used for industrial 322
purpose. Manufacture of all kinds of other rubber pro- 323
ducts from natural or synthetic rubber including rubber raincoat.
Productions of petroleum, kerosene and other 324 petroleum products in petroleum refineries.
Production of coaltar and coke in coke oven .. 325 Manufacture of other coal and coaltar products 326
not covered elsewhere.
J -1812-II-I4-B-(Y eotmal).
102
Major Group
(Code) Description
(I)
33
34
35
36
(2)
Division 2 and 3-ManUfacturing-contd. Chemicals and Chemical Products-
Manufacture of basic industrial chemicals such as acids alkalis and their salts not elsewhere specified.
Manufacture of dyes, paints, colours and varnishes.
Manufacture of fertilizers Manufacture of ammunition, ellplosives and
fireworks. Manufacture of matches . . . . Manufacture of medicines, pharmaceutical pre
parations, perfumes, cosmetics and other toilet preparations ellcept soap.
Manufacture of soap and other washing and cleaning compol.Ulds.
Manufacture of turpentine, synthetic, resin and plastic products and materials (including synthetic rubber).
Manufacture of common salt Manufacture of other chemicals and chemical
products notl covered above (including inedible oils and fats).
Non-metallic 1liineral Products other than Petroleum and Coal-Manufacture of structural clay products such
as bricks, tiles. Manufacture of cement and cement products Manufacture of lime . . . . . . . . Manufacture of structural stone goods, stone
dressing and stone crushing. Manufacture of stonewares, other than images Manufacture of stone images .. . . . . Manufacture of plaster of paris and its products Manufacture of asbestos products Manufacture of mica products
Manufacture of earthenware and earthen pottery Manufacture of chinaware and crockery Manufacture of porcelain and its products Manufacture of glass bangles and beads Manufacture of glass apparatus Manufacture of earthen image, busts and statues Manufacture of earthen toys and artwares
ellOCept those covered by code No. 355. Manufacture of glass and glass products ellOCept
optical and photographic lenses and glass products coyered above.
Manufacture of other non-metallic mineral products not elsewhere specified.
Basic Metals and their products except Machinery and Transport Equipment-Manufacture of iron and steel including smelt
ing, refining, rolling, conversion into basic forms such as billets, blooms, tubes, rods.
Manufacture including smelting, refining of non ferrous metals and alloys in basic forms.
Manufacture of armaments Manufacture of structural steel products such
as joist, rail, sheet, plate. Manufacture of iron and steel furniture Manufacture of brass and bell metal products .. Manufacture of aluminium products .. Manufacture of metal products (other than of
iron, brass, bell metal and aluminium) such as tin can.
Enamelling, galvanising, plating (including electroplating), polishing and welding of metal products.
Manufacture of sundry hardwares such as G. I. pipe, wire net, bolt screw, bucket, cutlery (This will also include the manufacture of sundry ferrous engineering products done by jobbing engineering concerns which cannot be classified in major groups 36, 37, 38 and 39).
Minor Group (Code)
(3)
330
331
332 333
334 335
336,
337
338-33CJo
340,
341 342 343
344" 345 346 347 34S 350 351 352 353 354 355 356
357
359
360
361
362 363
364 365 366 367
36S
369

Major Group (Code)
(1 )
Description
(2)
Minor Group (Code)
(3)
Division 2 and 3-Manufacturing-concld.
37 Machinery (All kinds other than Transport) and Electrical equipment-
Manufacture and assembling of machinery 370 (other than electrical) except textile machi-nery.
Manufacture and assembling of prime mover 371 and boilers, other than electrical equipment, such as diesel engines, road rollers, tractors.
Manufacture of machine tools. . 372 Manufacture of textile machinery and acccsso- 373
nes. Manufacture of heavy electrical machinery and 374
equipment such as motors, generators, transformers.
Manufacture of electric lamps and fans 375 Manufacture of insulated wires and cables 376 Manufacture of all kinds of battery 377 Manufacture of electronic equipment such as 378
radio, microphone. Manufacture of electric machinery and appara- 379
tus, appliances not specified above.
38 Transport Equipment-Manufacture, assembly and repairing of loco- 380
motinos. l.\:Ianufacture of wagons, coaches, tramways and 381
other rail road equipment other than that covered by code No. 363.
Manufacture and assembling of motor vehicles 382 of all types (e}<cepting motor engines).
Manufacture of motor vehicles engines, parts 383 and accessories.
Repairing and servicing of motor vehicles 384 Manufacture of bicycles and tricycles and 385
accessories such as saddle, seat frame, gear. Building and repairing of water transport equip- 386
ment such as ships, boats and manufacture of marine engines.
Manufacture and repair of air transport equip- 387 ment including aeroplanes, aero engines.
Repairing of bicycles and tricycles 388 Manufacture of other transport equipment not 389
covered above such as animal drawn and hand-drawn vehicles.
'39 Miscellaneous Manufacturing Industries-Manufacture of optical instruments and lenses, 390
opthalmic goods and)photographic equipment and supplies. .
Manufacture of scientific, medical and surgical 391 instruments and equipment and supplies.
Assembling and repairing of watches and clocks 392 Manufacture of jewellery, silverware and wares 393
using gold and other precious metals. Manufacture and tunning of musical instruments 394 Manufacture of stationery articles not covered 395
elsewhere such as pencil, penholder, fountain pen.
Manufacture of sports goods 396 Manufacture and repair work of goods not 399
assignable to any other group.
Division 4-Construction 40 Construction-
Construction and maintenance of buildings 400 including erection, flooring, decorative constructions, electrical and sanitary installations.
Construction and maintenance of roads, railways 401 bridges, tunnels.
Construction and maintenance of telegraph and 402 telephone lines.
Construction and maintenance of water ways 403 and water reservoirs such as bund, embankments, dam, canal, tank, tubewells, wells.
103
Major Group (Code)
(I)
Description
(2)
Division 5-Electricity, Gas, Water and Sanitary Services
Minor Group
(Code) (3)
50 Electricity and Gas-Generation and transmission of electric energy 500 Distribution of electric energy 501 Manufacture of gas in gas works and distribu- 502
tion to domestic and industrial consumers. 51 Water-Supply and Sanitary Services-
Collecti:.m, purification and distribution of 510 water to domestic and industrial consumers.
Garbage and sewage disposal, operation of 511 drainage system and all other types of work connected with public health and sanitation.
Division 6-Trade and Commerce 60 Wholesale Trade-
\"'holesale trading in cereals and pulses 600 \Vholesale trading in vegetables, fruits, sugar, 601
spices, oil, fish, dairy products, eggs, poultry and other foodstuff (not covered elsewhere).
Wholesale trading in all kinds of fabrics, and 602 textiles products such as garments, hessian, gunny bag, silk and woollen yam, shirtings, suitings, hosiery products.
\Vholesale trading in beverages, such as tea 603 (leaf), coffee (seed and powder), aerated water.
\Vholesale trading in into}<icants such as wines, 604 liquors.
Wholesale trading in other intoxoicants such as 605 opium, ganja, etc.
Wholesale trading in tobacco, bidi, cigarettes 606 and other tobacco products.
Wholesale trading in animals .. 607 \Vholesale trading in straw and fodder 608
61 Wholesale trading in medicines and chemicals 610 Wholesale trading in fuel and lighting products 611
such as coke, coal, kerosene, candle. Wholesale trading in toilets, perfumery and 6 J 2
cosmetics. Wholesale trading in metal, porcelain and glass 613
utensils, crockery, chinaware. Wholesale trading in wooden, steel and other 614
metallic furniture and fittings. Wholesale trading in footwear . . I 615 'Wholesale trading in tyres, tubes and allied 616
rubber products. Wholesale trading in petrol, mobil oil and allied 617
products. Wholesale trading in other household equipment 618
not covered above. 62 Wholesale trading in bricks, tiles and other 620
building materials. Wholesa1e trading in wood, bamboo, cane, 621
thatches and similar products. 63 Wholesale trading in paper and other stationery 630
goods. Wholesale trading in agricultural and industrial 631
machinery equipment and tools and applian-ces other than electrical.
Wholesale trading in electrical machinery and 632 equipment like motor, battery, electric fan, bulb.
Wholesale trading in all kinds of transport and 633 storage equipment.
Wholesale trading in skins, leather and fur 634 Wholesale trading in clocks, eye glasses, frames 635 Wholesale trading in hardware and sanitary 636
equipment. Wholesale trading in scientific, medical and 637
surgical instruments. \Vholesale trading in precious metals and stones, 638
gold and silverware and jewellery. Wholesale trading in all goods not covered 639
above.
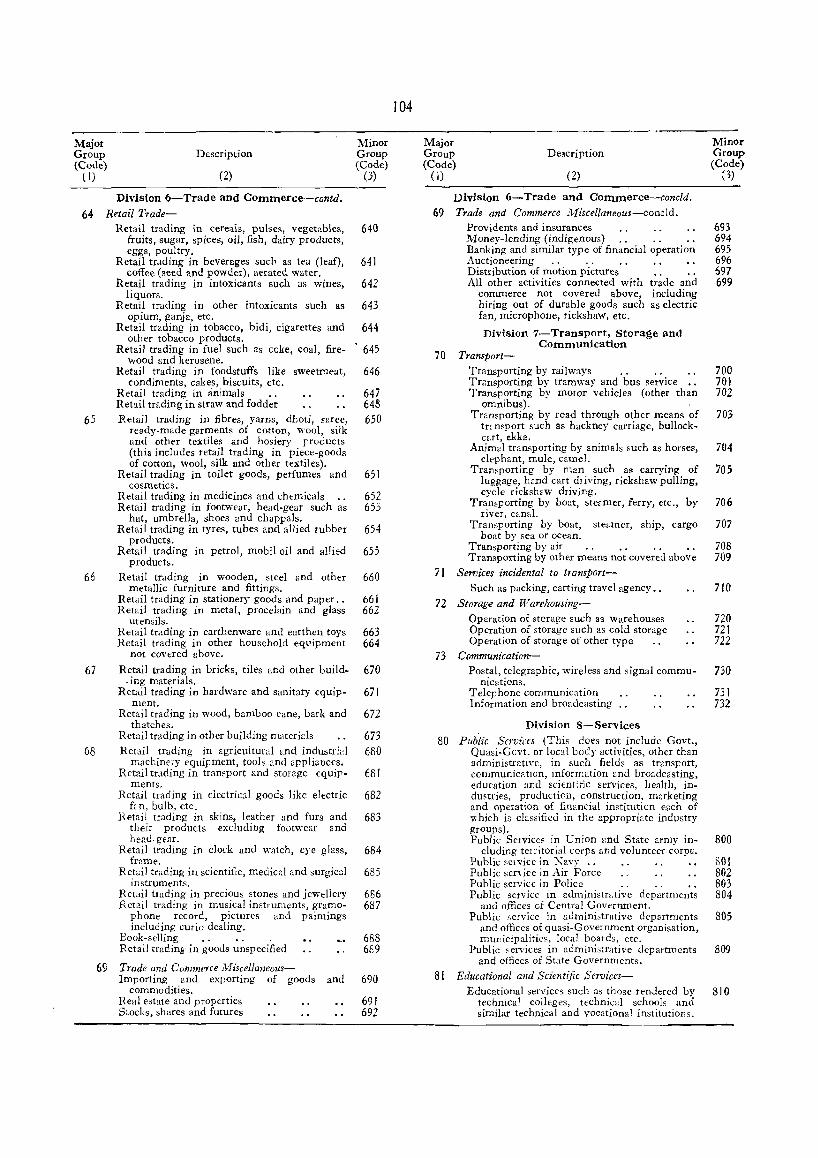
Major Group (Code)
t I)
Description
(2)
Minor Group (Code)
(3)
Division 6-Trade and Commerce·-contd. 64 Retail Trade-
65
66
Retail trading in cereais, pulses, vegetables, 640 fruits, sugar, spices, oil, fish, dairy products, eggs, poultry.
Retail trading in beverages such as tea (leaf), 641 coffee (seed and powder), aerated water.
Retail trading in intoxicants such as wines, 642 liquors.
Retail trading in other intoxicants such as 643 opium, ganja, etc.
Retail trading in tobacco, bidi, cigarettes and 644 other tobacco products.
Retail trading in fuel such as coke, coal, fire- 645 wood and kerosene.
Retail trading in foodstuffs like sweetmeat, 646 condiments, cakes, biscuits, etc.
Retail trading in animals 647 Retail trading in straw and fodder 648 Retail trading in fibres, yarns, dhoti, snree, 650
ready-made garments of c<J.tton, wool, silk find other textiles and hosiery products (this includes retail trading in piece-goods of cotton, wool, silk and otber textiles).
Retail trading in toilet goods, perfumes and 651 cosmetics.
Retail trading in medicines and chemicals 652 Retail trading in footwear, head-gear such as 653
bat, umbrella, sboes and cbappals. Retail trading in tyres, tubes and allied rubber 654
products. Retail trading in petrol, mobil oil and allied 655
products. Retail trading in wooden, steel and other 660
metallic furniture and fittings. Retail trading in stationery goods and paper. . 661 Retail trading in metal, procelain and glass 662
utensils. Retail trading in earthenware and eartben toys 663 Retail trading in other housebold equipment 664
not covered above.
67 Retail trading in bricks, tiles and other build- 670 ,ing materials.
Retail trading in bardware and sanitary equip- 671 ment.
Retail trading in wood, bamboo Cane, ba,k and 672 thatches.
Retui! trading in otber building materiEls 673 68 Retail trading in agricultural snd industrial 680
mschinery equipment, tools wd appliances. Retail trading in transport and storage equip- 68 J
ments. Retail trading in electrical goods like electric 682
f( n, bulb, etc. Hetail trading in skins, leather and furs and 683
tLeir products excluding footweGr and head-gear.
Retail trading in clock and watch, eye glass, 684 frame.
Ret;;il tniding in scientific, medicd and surgical 685 instruments.
Retail trading in precious stones and jeweJiery 686 Retail trading in musical instruments, gramo- 687
phone record, pictures and paintings including curio dealing.
Book-selling 688 Retail tradin~ in goods unspecified 689
69 Trade und Commerce 111iscellaneous-Importing and exporting of goods and 690
commodities. Real estate and properties 691 S~ocks, shares and futures 692
104
Major Group (Code)
( I)
De3cription
(2)
Division 6-Trade and Commerce-concld. 69 Trade and Commerce }11iscellaneous--concld.
Providents and insurances Money-lending (indigenous) Banking and similar type of financial operation Auctioneering .. Distribution of motion pictures All other activities connected with trade and
commerce not covered above, including biring out of durable goods such as electric fan, microphone, rickshaw, etc.
Division 7-Transport, Storage and Communication
70 Transport-Transporting by railways Transporting by tramway and bus service Transporting by motor vehicles (other than
omnibus). ' Transporting by road through other means of
tr, nsport sueb as hackney carriage, bullockcart, ekka.
Animal transporting by animals sucb as borses, elephant, mule, c~mel.
Transporting by man such as carrying of luggage, bwd cart driving, rickshaw pulling, cycle rickshaw driving.
Transporting by boat, ste~mer, ferry, etc., by river, c~,nal.
Transporting by boat, ste~mer, sbip, cargo boat by sea or ocean.
Transporting by air Transporting by other means not covered above
71 Services incidental to transport-Such as packing, carting travel agency ••
72 Storage and Warehousing-Operation of stcrage such as warehouses Operation of storage such as cold storage Operation of storage of other type
73 Communication-
Minor Group (Code)
(3)
693 694 695 696 697 699
700 701 702
703
704
705
706
707
708 709
710
720 721 722
Postal, telegraphic, wireless and signal commu- 730 nications.
Telepbone communication 731 Information and broadcasting 732
Division 8-Services
80 Public Sa'vices (This does not include Govt., Quasi-Gcvt. or local body activities, other tban administrative, in sucb fields as transport, communication, mform<.tion and broadcasting, education 2nd scienUic services, bealth, indmtries, productioll, construction. m8rketing and operation of financial institution each of wbich is classified in the appropri8te industry groups). Public Services in Union and State army in- 800
eluding teHitorial corps and volunteer corpt. Public service in Navv 801 Public sen ice in Air Force 802 Public service in Police 803 Public service in administr::.tive departments 804
and offices of Central Government. Public service in administrative departments 805
and offices of quasi-Government organisation, municipalities, local boards, etc.
Public services in administrative departments 809 and offices of State Governments.
81 Educational and Scientific Services-Educational services such as those renJered by 810
technical colleges, technical scbools and similar technical and vocational institutions.

Major Group (Code)
(I)
De~ription
(2)
Minor Group Code)
(3)
Division 8-Servi~~~;o~~d:--' ----
81 Educational and Scientific Services-concld.
Educational services such as those rendered by 81' colleges, schools and similar other institutions of non-technical type.
Scientific services and research institutions not 812 capable of classification under any individual group.
82 :Medical and Health Services-
Public health and medical services rendered by 820 organisations and individuals such as by hospitals, sanatoria. nursing nomes, mater-nity and cuild welfare clinic as also bv hakimi, unani, ayurvedic, allopathic an~i~ homeopathic practitioners.
Veterinary services rendered by organisations· sn and individuals.
83 Religious and Welfare Services-
Religious services rendered by religious orga- 83() nisations and their establisrunents inaintailled for worship or promotion of religious activi-ties this includes missions, ashrams and otIler allied organisations.
Religious and allied services rendered by pandit, 83. priest, preceptor, fakir, monk.
Welfare services rendered by organisation 832 operating on a non-profit hasis for the promotion of welfare of the communitv such as relief societies, red-cross organisat;';n for the collection and allocation of contributions for charity.
84 Legal Services-
Legal services rendered by barrister advocate 846 solicitor. mukteer, pleader, mukurie, munslii:
I"latrimonial services rendered by org-anisations 341 and individuals.
85 Business Services-
Engineering services rendered by professional 850 organisations or individuals.
Business services rendered by organisations of 851 accountants, auditors, book-keepers Of like individuals.
Business services rel}dered by professional or- 852 ganisatiOGs or individuals such as those of advertising and publicitv agencies.
Business services rendere'd by professional 853 organisations or individu~ls such as of those rendered by '1ews-agency, newspaper correspondent, ce!umnist, journalists, editors, authors.
105
--.--------------------Major Group (Code)
(I)
Description
(2)
Division 8-Services-concld.
Minor Group (Code)
(3;
86 Community Services and Trade and Labour Associations-Services rendered by trade associations, cham- 860
bers of commerce, trade unions and similar other organisations.
Services rendered by civic, social, cultural, 861 political and fraternal organisations such as rate p,lyers association, club, library.
Community services such as those rendered by 862 public libraries, museums, bota:1ical and zoological gardens, etc.
87 Recreation Services-Production of motion picture a:1d allied services 870
such as processing, editin~. etc. Recreation services rendered bv cinema hou~es 871
by exhibition of motion pictures. Recreation services rendered by orgmisations 872
and individuals such as those of theatres, opera co:npanies, ballet and dancing parties, musicians, exhibitions, circus, carnivals.
Recreation services rendered lw indoor and 873 outdoor sports by organisatio~s and indivi-duals including horse. motor, etc., racing.
88 Personal Services-Services rendered to households such as those 880'
by domestic servants, cooks. Services rendered to households :~ch as those 881
by governess, tutor, private secretary. Services rendered by hotels, boarding houses, 882
eating houses, cafes, restaurants and similar other orgamsations to provide lodging ane! boarding facilities.
Laundry services rendered by organisations and 883-individltals, this includes all types of cleaning, dyeing, bleaching, dry cleaning, services.
Hair dressing, other services rendered by 884 organisations and indiyiduals such as those by barber, hair dressing saloon and beauty shops.
Seryices rendered by portrait and commercial 885 photographic studios.
89 Ser~ices (Ilot elsewhere classified)-
90
Services rendered by organisations or indivi- 89() duals not elsewhere classified.
Division 9-Activities not adequately described Activities unspecl}ied and Wit adequately described-
Including activities of such individubs who fail to provide sufficient inform3tion about their industrial affi:iation to enable them to be cl assified.
Fresh entrants to the Labour :\1arket .
900
999: -----------------------------------------------------------------------

106
APPENDIX II
NATIONAL CLASSIFICATION OF OCCUPATIONS
A Code structure which classifies occupations into-11 Occupational Divisions (one-digit code numbers)
75 Occupational Groups (two-digit code numbers)
Note.-n. e. c. =not elsewhere classified.
DIVISIONS
o Professional, technical and related workers 1 Administrative, executive and managerial workers
2 Clerical and related workers 3 Sales workers 4 Farmers, fishermen, hunters, loggers and related
workers Miners, quarrymen and related workers Workers in transport and communication occupa
tions 7-8 Craftsmen, p~'oduction process workers, and
labourers not elsewhere classified 9 Service, sport and recreation workers
X Workers not classifiable by occupations
DIVISIONS AND GROUPS Professional, Technical and Related Workers
o Architects, Engineers and Surveyors 1 Physicists, Chemists, Geologists and other Physical
Scientists (]2 Biologists, Veterinarians, Agronomists and Related
Scientists 03 Physicians, Surgeons and Dentists {)4 Nurses, Pharmacists and other Medical and Health
Technicians 05 Teachers 06 Jurists 07 Social Scientists and Related Workers {)8 Artists, Writers, and Related Workers {)9 Draughtsmen, Science and Engineering Technicians,
n. e. c. OX Other Professional, Technical and Related Workers
Administrative, Executive and Managerial Workers
10 Administrators, and Executive Officials, Government 11 Directors and Managers, Wholesale and Retail Trade 12 Directors, Managers and Working Proprietors, Financial
Institutions 13 Directors, Managers and Working Proprietors, Other
Clerical and Related Workers
20 Book-Keepers and Cashiers 21 Stenographers and Typists 22 Office Machine Operators 2B Clerical Workers, Miscellaneous 29 Unskilled Office Workers
Sales Workers 30 Working Proprietors, Wholesale and Retail Trade 3 J Insurance and Real Estate Salesmen, Salesmen of
Securities and Services and Auctioneers 32 Commercial Travellers and Manufacturers' Agents 33 Salesmen, Shop Assistants and Related Workers 34 Money Lenders and Pawn Brokers
Farmers, Fishermen, Hunters, Loggers and~ Related Workers
40 Farmers and Farm Managers 41 Farm WorkerE 42 Hunters and Related Workers 43 Fishermen and Related Workers 44 Loggers and Other Forestry Workers
5 Miners, Quarrymen and Related Workers
50 Miners and Quarrymen 51 Well Drillers and Related Workers 52 Mineral Treaters 59 Miners, Quarrymen and Related \Vorkers, n. e. c.
6 Workers in Transport and Communication Occupations
60 Deck Officers, Engineer Officers and Pilots, Ship 61 Deck and Engine-Room Ratings (Ship), Barge Cr~ws
and Boatsmen. 62 Aircraft Pilots, Navigators and Flight Engineers 63 Drivers and Firemen, Railway Engine 64 Drivers Road Transport 65 Conductors, Guards and Brakesmen (Railway) 66 Inspectors, Supervisors, Traffic Controllers and
Despatchers. Transport 67 Telephone, Telegraph and Related Telecommunication
Operators . 68 Postmen and Messengers 69 \Yorkers in Transport and Communication Occupa
tions, n. e. c.
7-8 Craftsmen, Production Process 'Workers, and Labourers not elsewhere Classified
70 Spinners, \Veuvers, Knitters, Dyers and Related Workers 71 Tailors Cutters, Furriers and Related Workers 72 Leather Cutters, Lasters and Sewers (except Gloves and
Garments) and Related ,,yorkers 73 Furnacemen, Rollers, Drawers, Moulders and Related
Metal Making and Treating Workers 74 Precision Instrument Makers, Watch Makers, Jewellers
and Related Workers 75 Tool Makers, Machinists, Plumbers, Welders, Platers
and Related \Yorkers 76 Electricians and Related Electrical and Electronics
Workers 77 Carpenters, Joiners, Cabinet Makers, Coopers and
Related Workers 78 Painters and Paper Hangers 79 Bricklayers, Plasterers and Construction Workers,
n. e. c. 80 Compositors, Printers, Engravers, Book Binders and
Related Workers 81 Potters, Kilnmen, Glass and Clay Formers and Related
Workers 82 Millers, Bakers, Brewmasters and Related Food and
Beverage \\Torkers 83 Chemical and Related Process Workers 84 Tobacco Preparers and Products Makers 85 Craftsmen and Production Process Workers, n. e. c. 86 Testers, Packers, Sorters and Related Workers 87 Stationary Engine and Excavating, and Lifting Equip
ment Operators and Related Workers 89 Labourers, n. e. c.
9 Service, Sport and Recreation Workers
90 Fire Fighters, Policemen, Guards and Related Workers 91 House Keepers, Cooks, Maids and Related Workers 92 Waiters, Bartenders and Related Workers 93 Building Caretakers, Cleaners and Related Workers 94 Barbers, Hairdressers, Beauticians and Related
Workers 95 Launderers, Dry Cleaners and Pressers 96 Athletes, Sportsmen and Related Workers 97 Photographers and Related Camera Operators 99 Service, Spot and Recreation Workers, n. e. c.
X Workers not Classifiable by Occupations
XO Workers without occupations X8 Workers Reporting Occupations Unidentifiable
Inclassifiable X9 Workers not Reporting Occupations
or

107
APPENDIX III Common Household Industries with their Industrial Code Numbers
Note-n. e. c.=not elsewhere classified
Industrial Code
Number Household Industry
Major Group OO-Field Produce and Plantation Crops 005· I Production of Vegetables 005·2 Production of roots, etc., not included above 006·1 Production of fruits and nuts in plantation, vines and
006·2 007·1 007·2
orchards. Production of copra (from coconuts) Production of thatching grass. Production of wood, bamboo, cane reeds, etc. (CJiic!u
ding thatching grass) 008·1 Production of juice (Neera) by tapping coconut trees. 008· 2 Production of juice by tapping other palms like date
Palmyra n. e. c. 009·0 Production of other agricultural produce (including
fruits and nuts not covered by 006 and flowers) not covered above
Major Group Ol-Plantation Crops 013 Production of tobacco in plantation 015·1 Pan Cultivation 015·2 Plantation crops eJiiCept tea, coffee, rubber, tobacco,
ganja, cinchona, opium and pan
Major Group 02-Forestry and Logging 023· 1 Production of Charcoal 023·2 Production of other fuels by e:liiploitation of forests 024 Production of fodder by eJlOpJoitation of forests 025·1 Production of Kathha 025·1 Production of Lac 025· 3 Production of gum 025·4 Production of resins, barks, herbs, wild fruits, berries
and leaves, etc., n. e. c. 026 Production and gathering of other forest products not
covered above.
Major Group 03-Fishing 030 Production of fish by fishing in sea 031 Production of fish by fishing in inland waters and
ponds including fish farms and fish hatcheries. 032 Production of pearls, conch shells. sponges, sea herbs,
corals, etc., by gathering or lifting from sea, river, pond
Major Group 04-Livestock and Huntin~ 040·1 Rearing of goat for milk and animal power 040·2 Rearing of buffalo for milk and animal power 040· 3 Rearing of cows for milk and animal power 040·4 Rearing of camels and other big domestic animals 040·5 Production and rearing of livestock mainly for milk
041·1 041·2 042·1
and animal power n. c. c. Sheep breeding and rearing Production of wool Rearing and production of pigs and goats (mainly for
slaughter) 042·2 Rearing and production of other animals (mainly for
slaughter) n. e. c. 043-1 Poultry keeping and production of eggs 043·2 Rearing and production of ducks, hens, etc., and other
small birds, e.g., pigeons, parrots, peacock, maina,
0441 044·2 045
046·1 046·2 048·1 048·2 048·3 048·4
etc. Bee keeping for production of honey and wax Collection of wax and honey Rearing of tassar jeri/mulberry and other silk worms
and production of cocoons and raw silk Dog breeding, rearing of rabbits and guinea-pigs Rearing of other small animals and in.sects n. e. c. Collection of bones Manufacture of glue from animal carcasses. Manufacture of gut Production of other animal hUSbandry products such
as skin, ivory, teeth and hair, etc.
Industrial Code
Number Household Industry
Major Group lO-Mining and Quarryin~ 107·1 Extraction of chalk 107·2 Quarrying of lime-stone 107· 3 Stone and slate quarrying 107·4 Quarrying of sand, clay, gravel, etc., n. e. c.
Major Group 20-Foodstuffs 200·1 Production of flour by village chakkics or flour mill
by grinding wheat, maize, gram, etc. 200·2 Hand pounding of rice by Dhekhi or Ukhal 200·3 Production of rice by milling, dehusking and proces-
200·4 200·5 200·6 200·7
202·1 202·2 202-3
sing of paddy by rice mill. Grinding of chillies, turmeric, etc. Production of pulses Parching of grains Production and processing of other crops and food-
grains n. e. c. Gur and Khandsari making from sugarcane and palm Production of bhoora and candy Production of jaggery from coconut and palmyra
juice (neera) 202·4 Production of other indigenous products from sugar
203·1 203·2 203-3 203-4 203·5 20H 203·7
and jaggery n. e. c. Manufacture of achar, pickles, chutney and murabba Production of sauce, jam and jelly Processing of cashew nut Manufacture of kokam products Fruit preservation (canning of fruits) Making dried vegetables production of other fruit products and preservation
of fruits n. e. c. 204·1 Slaughtering, preservation of meat and fish and
canning of fish 204·2 Fish currying or curing and salting (currying applies
205
206
207 209·1 209·2
more to skin and hide) Production of bread, biscuit, cake and other bakery
products Production of butter, cream, ghee, cheese, chhana,
khowa and other dairy products Oil pressing ghani, kolhu or by small maahines Confectionery Making of sweetmeats, laddu, peda, barphi, batasa,
etc. 209·3 Sattu, bhunja, papar, barri, danauri, tilauri, sewai,
209·4 209·j 209·6 209,7 209'8
apalam, etc. Making of chura or chira, muri, murki, khoi Making of chat l'vIaking of dalmot, chanachur (jor) garam, rewari, etc. Making of other food products for residuary snacks. Production of other food products like cocoa, choco-
late, toffee, lozenge Major Group 21-Beverages
201·1 Manufacture of vinegar from coconut juice (neera) 210·2 lVlanufacture of distilled spirits, wines, liquor from
alcoholic malt, fruits and malts in distillery and
211 brewerY
Productidn of country liquor from material obtained from sources other than trees and shrubs
212·1 Production of indigenom liquor such as liquor, toddy. neera from mahua and palm trees
212·2 Production of other indigenous liquors from other materials from trees and shrubs
214·1 Production of mineral water 214·2 Production of aerated water such as sodawater,
lemonade, etc. 215 216
218 219·1 219·2 219·3
Production of ice Production of ice-cream, ice-candy or kulphimalai,
milk-shake, etc. Grinding of Coffee Preparation of sharbat and squashes Preparation of jeerapani Production of other beverages n. e. c.

Industrial Code
Number Household Industry
Major Group 22-Tobacco Products 220 Manufacture of bidi 221 Manufacture of cigars and cheroots 223 Manufacture of hookah tobacco 224 Manufacture of snuff
108
225 Manufacture of jerda, kimam, khaini and other chew_ ing tobacco
226 Manufacture of other tobacco products n. e. c.
Major Group 23-Textile-Cotton 230 Cotton ginning, cleaning, carding, pressing and
23! 233'1 233'2 233'3 234 235 236 237 238·1 238'2 238·3 239'1 239'2
baling Cotton spinning (by charkha and takali) Dyeing of cloth (cotton) and yarn Bleaching of cloth (cotton) and yarn Tie and dye (bandhani) of cloth and yarn Cotton cloth weaving in puwerloorns Cotton cloth weaving in hand looms lManufacture of khadi textile in handlooms Printing of cloth (cotton) Making of fishing net Making of mosquito net Making of other nets .l\laking of sacred thread l\1aking of thread, rope, cord:!ge and twine (cotton)
Major Group 24-Textile-Jute 240 Jute pressing and baling 241 J ute spinning and weaving of mats, asanis, etc. 242 Dyeing and bleaching of jute 244·1 Making of rope and cordage, out of hemp 244·2 Making of rope and cordage, out of jute 244·3 Making of rope by palm fibre 244·4 Making of rope by date palm fi;_'re 244·5 Making of fibre, sunn-hemp fibre 244·6 Making of other products from jute and similar fibres
such as hemp, mesta
Major Group 25-Textile-Wool 250 Wool baling and pressing 251 Cleaning, sorting, carding, scouring and processing
of wool 253 Spinning of wool hy charkha or takali 254 Weaving of woollen cloth in powerloom such as
blankets, asanis, etc. 255 Weaving of woollen cloth inhandloom such as blankets,
rugs, pashmina, thulma, ,gudma, etc. 256·1 Embroidery wi .. h various colours, combinations of
various threads and art work in woollen te,,-tile 256·2 Shawls (with traditional borders)
Major Group 26-Textile-Silk 261 Dyeing and bleaching of silk 'l62·1 Spinning of tussar, other than in mills 262' 2 Spinning of eri, other than in. mills 262·3 Spinning of silk, other than in mills r .. e. c. 263'1 Weaving of Traditional silk (Atlas) ty powerloom 263'2 Weaving of tussar by powerloom 263'3 Weaving of eri by powerloom 263·4 Weaving of silk and artificial silk in powerloom n. e. c. 264'1 Weaving of mashru, himroo, brocade, kinkhab by
264'2 265 .266·1 266·2
handloom Weaving of silk and artificial silk in handloom n, e. c. Printing of silk textile Goafmaking Making of silk cordage, rope and twine n. e. c.
Major Group 27- Textile- Miscellaneous 270·1 Making of durries 270'2 Making of carpet, and druggets 270'3 Manu"ucture of other similar textile products n. e. c, 271'1 Making of hosiery goods such as banyans, socks,
sweaters, mufflers, etc. 271'2 Making of nalas and azarbands 271') Makin(! of par;tnda, and chootelas
Industrial Code
Number Household Industry
Major Group 27-Textile-Miscellaneous-concld. 271-4 Manufacture of nosiery and other knitted fabrics and
272·1 272-2 272-3 272-4 272'.5 272-6 272-7 272-8 273'1 273'2 273'3 273-4
garments n. e. c. Embroidery and making of phulkari Making of jari thread, zardoshi Traditional embroidery Patchwork embroidery Lace garland making Making of fringes and crepe laces Making of kargota, main garlands, shell garlands, etc. Making of other embroidery products n. e. c. Making of cap, hat and other head-gear Traditional garments Chrochct work (bora caps) Making of textile garments including raincoats and
head -gears n. e. c. 274-1 Weaving of khes, bed covers, curtains, pillow cases
and tuble-c1oth, cloth bags, etc. 274·2 Making of ucwar 274·3 Manufacture of other made-up textile goods like
275
276·1 276·2 276·3 276·4 276·5
l77'1
277-2 277·3 277-4 277'5 1.78 279'1
279·2 279·3
mattress, quilt, rezai, etc., n. e. c. Manufacture of waterproof te,:tile products such as
oil cloth, tarpaulin, etc. Making of nawda felt Making of suzani (padded quilts) Processing of coconut fibre for upholstery Handicraft articles made of flax and fibre :lVIanufacture and recovery of all types of fibres for
purposes of padding, \vadding and upholstery filling rJ. c. c.
Manufacture of coir matting, cactus fibre for ropes and rope making from cocnnut fibre
l\laking of brush, broom, etc., from coconut fibre Coil' spinning Coconut curing Other allied products of coir industry n. e. c. Manufacture and repair of umbrellas Making of daura (thread) batua, cotton thread,
buttons IVlanufacture of dolls and toys (rags and cotton) Manufacture of other textile products not elsewhere
classified
Major (jroup 28-Manufacture of Wood and Wooden Products
280 281 282
283'1
2£3'2
284'1 284'2
284'3 284'4 284·5 284-6 284·7 284'8
284·9 28'i 287
288·1 288·2
288·3
288'4 288'5 28tH
Sawing, planing ancl milling of wood .Manufacture of wooden furniture and fixtures Manufacture of structural wooden goods (including
treated timber) such as beams, posts, doors, windows Carpentry works concerned with repairs of agricul
tural implements (wood) l\1unufacture of wooden industrial goods other than
transport equipment such as bobbin and similar <'quipments and fixtures.
Lecquerware (if on wood) lVlanufacture of wooden utensils, artware and deco-
rative wooden boxes (patras) l\lant;facture of wooden tOYS
Sandal wood and other wood carving Bend making from wood Sawdust and plaster figure making IHarquetry boxes (inlay work) IVI,mufacture of photo frames and framing of photo
paintings, etc. 1\1anufacture of other wooden products n. e. c. Manufacture of match splinters. plywood and veneers l\1anufacture of bOXes and packing cases other than
plywood !v1:aking of box from moonj grass Maki"!1g of rope mats, etc., from moonj and sawai
grass and making of cadjar for thatching purposes Making of mats, handfans and umbrellas from palm
leaves Making of sirki, moora and chhaj Making of baskets and broomsticks Making of donas (drone) and pattals (patravali) from
leaves

Industrial Code
Number Household Industry
Major Group 28-Manufacture of Wood and Wooden Products-concld.
288· 7 Caning of chairs 288·8 Making of chicks, cuscus.tatti and fans, sticks and
poles from bamboo 288·9 Manufacture of other articles from leaf, cane bamboo
289·1 289·2 289·3 289·4
cork and other allied products n. e. c. ' , Making of sticks and poles from wood Making of wooden kharaus and other wooden sandals Making of cartwheels Manu.facture of other wood and allied products n.e.c.
Major Group 29-Paper and Paper Products 291 Manufacture of pulp and paper by hand 292·1 Making of envelopes and paper bags. 292·2 Papier.mache articles 292·3 Making of kite 292·4 Paper decorations for homes 292·5 Making of card-board bOJi;es and cards 292·6 Making of paper toys 292·7 Making of paper flowers, etc. 292·8 Manufacture of other paper products from paper,
paper board and pulp n. e. c.
Major Group 30-Printing and Publishing 301 Printing and publishing of books 302·1 Printing works, printing of handbills, illvitation cards,
etc. 302·2 Lithography, engraving, etching, block making, type
cutting and other work connected with printing industry.
303 Book binding, stitching, sizing and other work Connected with book binding industry
Major Group 3I-Leather and Leather Products 310'1 Flying, processing of hides and skins including
taJi;idermy. 310·2 Currying, tanning and finishing of hides and skins
preparation of finished leather ' 310·3 Stuffed animals 311·1 Making of leather boots, shoes or chappals (slippers,
311·2 311·3 312
313
sandals) Making of Poola shoes Manufacture of other footwear n. e. c. l\1aking of clothing and wearing apparel (eJi;(;ept
footwear) made of leather and fur lVIanufacture of leather products such as leather up
holstery suitcases, pocket-books, cigarette and key cases, purses, saddlery, whip, acquaducts (Kos), charsa and other articles
3 J 4 Repair of shoes, chap pals and other leather footwear 3 J 5 Repair of all other leather products eJ4cept footwear
Major Group 32-Rubber, Petroleum and Coal Products 320 Vulcanising tyres and tubes 321 l\'lanufactllre of chappals from torn tyres and other
rubber footwear . 322 Manufacture of rubber products from n'ltural and
synthetic rubber including raim:oats, oil clothes, waterproof cloths, etc.
Major Group 33-Chemicals and Chemical Products 331·1 Manufacture of dyes, paints, colours, abir, sindoor,
331·2 332 333
334 335·1 335·2 335·3 335·4
varnish, etc. lVIanufactlire of indigo lVlanufacture of fertilizer (including from bones) lVlanufacture of fireworks and other e>lplosivcs such
as pataka, etc. l\lanufacture of matches l\lanufacture of incense and perfumes Manufacture of Agarbatti Manufacture of rose water l\lanufacture of powder, snow cream, bindi, tikali,
hair oil and nail polish 335·5 Manufacture of kum kum and hinglo 335·6 Manufacture of mascara and kajal
J-1812 II-15-A (Yeotmai)
109
Industrial Code
Number Household Industry
Major Group 33-Chemicals and Chemical ProductS ---coneld.
335· 7 Manufacture of medicines (ayurvedic, unani, etc.) and pharmaceutical preparations
335·8 l\lanufacture of perfumes, cosmetics and other toilet preparations n. e. c.
336· J l\lanufacture of soap and washing soda 336· 2 Mar:.ufacture of other washing and cleaning com·
337·1 337·2 337·3 337,4 337·5
pounds n. e. c. Manufacture of plastic toys Making of plastic buttons Manufacture of other plastic goods Making of celluloid goods Manufacture of turpentine, synthetic resin and
other materials n. e. c. 338 Salt production 339· J l\lanufacture of ink including fountain pen ink 339·2 Making of candles 339· 3 Making of tooth powder 339·4 Making of boot polish and inedible oils, etc. 339·5 Manufacture of other chemical products n. e. c.
Major Group 34-35-Non-mettalic Mineral Products other than Petroleum and Coal
340·1 Making of bricks 340·2 Manufacture of roofing tiles 340·3 Manufacture of oth"r clay products n. e. c. 341·1 lVlanufacture of cement door frames and sanitary
fittings 341·2 341·3 341·4 342·1 342·2 343·1 343-2 343·3 343·4
344
345 246·1 346·2
Manufacture of cement jali and tiles Making of cement statues l\laking of cement products n. e. c. Manufacture of lishu Manufacture of lime Stone carving Marble carving Granite carvin£)' Manufact~re ~f other structural stone goods stone
dressing and stone crushing n. e. c. ' Making of chakki, chakla, silaut. lorna, jainta, utensils
and other articles from stone Ma:1Ufactlire of stone images Hnd toys Making of images from soap stone Manufactre of imageS, toys and other aritcles of
p laster of paris 348·1 Mi',a splitting 348·2 Ma;mfacture of mica products, bduding mica
grinding 350 351 353·1 353·2 353·3
354 355
356·1 356·2 357
]\'1aking of earthenwa;'~ such as potterY, etc. l\lanufacture of crockery . Making of glass bangl~s Making of glass beads l\lanufacture of bead ga~1:nds (where making of
garlands is undertaken at the pla~e of manufacture of beads) (also see 399)
l\lanufacture of Laboratory glass apparatus l\laking of clay models, earthen images, busts and
statues Making of earth ~n toys and artware Decorative ceramics ]\Ianufacture of glass and glass products ex'~ept
optical and photographic lenses Major Group 36-Basic Metals and their Products except
Machinery and Transport Equipment 360·1 Re-rolling of ]\I. S. Rods 360·2 Malluf~cture of iron and steel. i_ncluding smelting,
rcfinmg, rollmg, etc., such as bIllets. blooms, tubes,
362
364 365·1 365·2 365·3
rods n. e. c. l\lanu~acturc of arms and weapons :md their repair
serVlce l\Ianuf::ictl)re of iron 8nd steel furniture Making of utensils of brass and bell metal Making of hJ"1ssware Making of bottom part of hookha from brass and
bell metal

Industrial Code
Num.ber Household Industry
Major Group 36-Basic Metals and their products except Machinery and Transport Equipment-concld.
365'4 365'5 366·1 366·2 367'1 367-2 367'3 367-4
367·5
368'1 368'2 368'3
368'4 368'5
359·1
369·2
369·3
369 .. 4 369·5 36% 369·j 369·8 369'9
Making of brass and bell metal ornaments Making of other brass and bell metal products n.e.c· Making of aluminium utensils. Making of other aluminium products n.e.c. Making of tin utensils. Making of articles from tin sheets. Copper utensils. Bronze works including bronze im"ges, medals and
articles of alloys Manufacture of other metal products (excluding iron
brass, bell metal, aluminium) n.e.c. Lacquerware (if on metal). Nickel plating and electroplating Engraving, ambossing, polishing and welding of
metal products. Encmelling and galvanizing of mdal products Plating (lnd electroplating of metal n.e.c. including
silverplating, goldplating, E. P. N. S., e c. :Manufacture of agricultural implements such as
p:oughshare, khurpi, kudal, etc. Manufactwe of light engineering goods including
bolts and SCl"eWS Making 0,£ iron utensils (e.g., buckets, etc.) and articles
from iron sheets. Making and repairing of locks and trunks. Cutlery Manufacture of pins lVlanufacture of scales, weights and measures Foundry Industry (including blacksmithy) Manufacture of other sundry hardware such as
G. 1. pipe, wire net, etc., n.e.c.
Major Group 37-J\1achinery (All kinds other than Transport) and Electrical Equipment
370
372
373 375 376
377·' 377-2 377'3
378 379" 379·2
l\J:anufacture of mechanical water pumps, tube well pumrs, air pumps, etc.
Manufacture of small machine tools and machine parts
Manufacture of sewing machine parts Repairing and servicing of fans Manufacture of insulated wires Manufacture of storage batteries Manufacture of charging batteries Manufacture of other batteries n.e.c. Repairing and servicing of radios Manufacture of domestic electrical appliances Repairing and servicing of electrical apparatus,
heaters, oven, etc.
Major Group 38-Transport Equipment
382
384
Manufacture of body of trucks and buses including carpentry and joinery work involved
Repairing and servicing of automobiles
J-1812-I1-15-B (Yeotmal)
110
Industrial Code
Number Household Industry
Major Group 38-Transport Equipmen1:--concld.
385·1 l\1anufacture of cycle parts and accessories such as saddle, seat frame and geall, etc.
385'2 Manufacture of rickshaw parts 386 Manufacture of boats and barges 388 Repair of cycle and rickshaw 389 ManufGcture of animal drawn and hand drawn
vehicles such as bullock cartj tamtam, lagadi, palaki, cab, wheelbarrow, handbarrow, etc.
Major Group 39-Miscellaneous Manufacturing Industries
390·1 Repair of spectacles 390'2 Manufacture of small photographic equipment 390·3 Manufacture of optical and photographic 'equipment
391 392
393·1 393-2 393·3
393-4
393·5 39% 393·7 393-8 393-9 394
395·1 395·2 395'3 395'4 395'5
396·1
396'2 396'3
399·1 399'2 399'3
399'4 399·5 399'6
399·7
399·8 399·9
n.e.c. :Munufacture of scientific goods Repairing and servicing of watches and clocks Inlnywo:k 'with jyory and brass Goldsmithy Manufacture 1 of jewe~lcry, silverware and wares using.
gold aud otacr preCIOUS metal and precious and semipr.!cious stones
Silver :;rtware, including silver repousse work on copper (such as in Tanjore) and silver images
Silver filigree industry l\lanufacutre of gold and silver leaves Gold coyering work (fancy jewellery) Bidriware industry Manufacture of je~ellery, silvcn_vares, etc., n.e.c. Manufacture, repamng und tU!1mg of musical instru-
ments such as hal'monium, table, sitar, bansuri, etc. IVlanufacture of chalk pieces Making of slate and slate pencil l\laking of rubber stamps l\lanufacture of fountain pen parts l\1anufacture of other stationery articles such as
pencils, penholders, etc. Manufacture of deshi sports goods such as lezzim
and dumbells Making of rubber balls and balloons Manufacture of other sports goods n.e.c. bats, rackets
balls, etc. Making of tikka and cowdung cakes Making of beads from conch shells and horn goods Making of traditional objects such as Orissa, Mysore
and Tanjore paintings, etc. Making of lac bangles Making of buttons (bone, shell, ivory) Making of gangavan (making of wig from human
hair) Making of garlands from flowers, camphor, sandal
wood shavings, seeds and other materials, like beads, etc.
Repair of petromax lights, etc. Making and repairing of goods n.e.c.
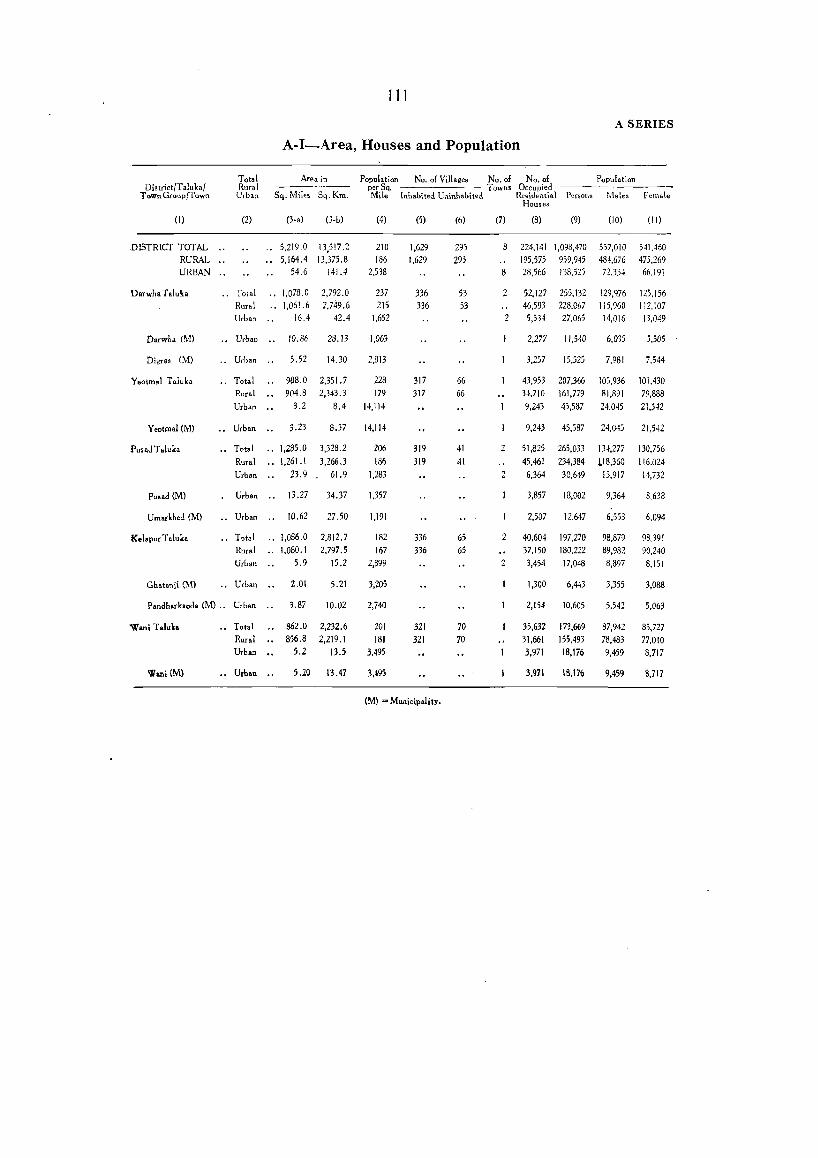
J J J
A SERIES
A-I-Area, Houses and Population
Total Area in Population No. of Villages No. of No. of Population District/Taluka/ Rural _----- per Sq. Towns Occupied
Town Group/Town Urban Sq. Miles Sq. Km. Mile Inhabited Uninhabited Residential P~rs()ns ~,,1ales Female Houses
(1) (2) (3-.) (Job) (4) (5) (6) (7) (8) (9) (10) (11)
DISTRICT TOTAL .. .. 5,219.0 13,517.2 210 1,629 295 8 224,141 1,098,470 557,010 541.460 RURAL .. .. 5,164.4 13,375.8 186 1,629 295 195,575 959,945 484,676 475,269 URBAN .. 54.6 141.4 2,538 8 28,566 138,525 72.334 66.191
Darwha Taluka .. Total .. 1,078.0 2,792.0 237 336 53 2 52,127 255,132 129,916 125.156 Rural .. 1,061.6 2.749.6 215 336 53 46,593 228.067 115,960 m.lD7 Urba'l .. 16.4 42.4 1,652 2 5,534 27,065 14,016 13,049
Darwh. ('..1) .. Urban .. 10.86 28.13 1,063 2,277 11,540 6.035 5,505
Oigras (M) .. Ur},." .. 5.52 14.30 2.313 3,257 15,525 7,981 7,544
Yeotmal Taluk. .. Total 908.0 2,351.7 228 317 66 43,953 207,366 105,936 101,430 Rural 904.8 2,343.3 179 317 66 34,710 161,779 81,891 79,888 Urban .. 3.2 8.4 14,114 9,243 45,587 24,045 21,542
Yeotmal(M) .. Urban .. 3.23 8.37 14,114 9,243 45,587 24,045 21,542
Pu,ad Taluk. .. Total .. 1,285.0 3,328.2 206 319 41 2 51,825 265,033 134,277 130,756 R'lral .. 1,261.1 3,266.3 186 319 41 45,461 234,384 l18,360 116.D24 Urban .. 23.9 61.9 1,283 2 6,364 30,649 15,917 14,732
Pu.ad (M) lirban .. 13.27 34.37 1.357 3,857 18,002 9,364 8,638
Umarkhed (M) .. Urban .. 10.62 27.50 1,191 2,507 12,647 6,553 6,094
Kel.pur Taluka .. T~tal .. 1,086.0 2,812.7 182 336 65 2 40,604 197,270 98,879 98.391 Rural .. 1,080.1 2.797.5 167 336 65 37,150 180,222 89,982 90,240 Urban .. 5.9 15.2 2,899 2 3,454 17,048 8,897 8,151
Ghatanii (Ml .. Urban .. 2.01 5.21 3,205 1,300 6,443 3,355 3,088
Pandharkaoda (M) .. Urban .. 3.87 10.02 2,740 2,154 10,605 5,542 5,063
Wani Taluka .. Total 862.0 2,232.6 201 321 70 35,632 m,669 87,942 85,727 Rural 856.8 2.219.1 181 321 70 31.661 155,493 78,483 77,010 Urb._., 5.2 13.5 3.495 3,971 18,176 9,459 8,717
Wani(M) Urban .. 5.20 13.47 3,495 3,971 IB,176 9,459 8,717
(M) = Municipality.

112
CENSUS TABLES
APPENDIX II
Number of Vil1a~es with a Population of 5,000 and over and Towns With a Population under 5,000
District/T aluka Village, with a Population of 5.000 and over Towns with a Population undet 5.000
Percentage of Percentage of Number Population Total Rural Number Population Tot.IUrban Population Population
(I) (2) (3) (4) (5) (6) (7)
DISTRICT TOTAL .. 4 24.079 2.5
Oarwh. T aluk. 2 12.370 5.4
YeotmalTaluka 5.258 3.3
Pusad T aluk. 6.451 2.8
KelapurT&lllka
W'anilaluka ..
APPENDIX III
Houseless and Institutional Population
Tot.l Houseles!o Population Institutional Population Oi,,,:ctlT aluk. Rur.1 Urban Persons M.les Females Persons Males Females
(I) (2) (3) (4) (5) (6) (7) (8)
DISTRICT TOTAL .. 5.576 3.161 2.415 2.143 1.914 229 RUR<\L " 4,904 2,750 2,154 853 753 100 URBAN .. 672 411 261 1.290 1,161 129
D.rwha Taluka .. .. Tota 757 440 317 333 289 44 Rural 677 396 281 243 219 24 Urban .. 80 44 36 90 70 20
Yeotm.l Taluka .. Tot.1 1,184 684 500 766 681 85 Rural 1,069 601 468 110 109 I Urban " 115 83 32 656 5/2 M
I'usad T aluks .. .. Total 883 501 382 427 408 19 Rural 817 462 355 129 126 3 Urban 66 39 27 298 282 16
Kelapur T.luk. .. Total 1,449 806 643 381 351 30 R""I 1,370 751 619 278 248 30 Urban 79 55 24 103 103
Wan; Tal"ka .. .. Total 1,303 730 573 236 185 51 Rural 971 540 431 93 51 42 Urban 332 .190 142 143 134 9

113
A SERIES
A-II-Variation in Population durin~ Sixty Years
T alukalOistriet Year Persons Decade Percentage Males Females Variation Decade Variation
(I) (2) (3) (4) (5) (6) (7)
DISTRICT TOTAL 1901 577,101 290,267 286,834
1911 724,410 + 147,309 +25.53 365,912 358,498
1921 748,959 +24,549 +3.39 380,545 368,414
1931 857,288 + 108,329 + 14.46 436,124 421,164
1941 887,738 +30,450 +3.55 448,724 439,014
1951 931,982 +44,244 +4.98 468,522 463,460
1961 1,098,470 + 166,488 +17.86 557,010 541,460
Darwha Ialub 1951 211,259 106,561 104,698 1961 255,132 +43,873 +20.77 129,976 125,156
Yeotmal Taluka 1951 177,457 90,099 87,358 1961 207,366 +29,909 +16.85 105,936 101,430
Pusad T .Iuka .. 1951 221,577 111,343 110,234 1961 265,033 +43,456 +19.61 134,277 130,756
Kelapur T .luka 1951 166,720 82,744 83,976 1961 197,270 +30,550 +18.32 98.879 98,391
WaniT.luka .. 1951 154,969 77,775 77,194 1961 173,669 + 18,700 +1207 87,942 85727

J 14
CENSUS TABLES
A-III-Villages classified by Population
I-Villages with less than 2,OCO Population
Total Rural PoP,dation Lessthan200 200-499 ---------------D;st,iot/Talvka Total Population Population
Number of Persons Males Females Number Number Inhabited Males Femal., Males Fem.ales Villages
(l) (2) (3) (4) (5) (6) (7) (8) (9) (10) (\1)
DlSTRICTTOTAL 1,629 959,945 484,676 475,269 324 17,2CO 16,880 590 100,477 99.395
Darwha Taluka 336 228,067 115,960 112,107 57 2,997 2,878 110 19,167 18,901
Yeotmal Taluka 317 161,779 81.891 79,838 84 4,882 4,853 114 18,649 18,416
Pus ad Taluka 319 234,384 118,360 116.024 43 2,167 2.079 96 17,072 16.723
Kelapur Taluka 336 180,222 89,982 90,240 66 3,470 3,433 130 21,532 21.566
Wani Talvka 321 155,493 78,483 77,010 74 3,684 3,637 140 24,057 21,789
A-III-concld.
I-Villages with less than 2,000 Popuiation-wncld. II-Villages with a Population of 2.000-9,999
Ill-Villages with a Popuiation of 10.000
and above
500-999 1.000-1.999 2.000-4,999 5.000-9.999 10;000 and above --------- ----------District/Taluka Population Population Population Population Population
Number Num------- Num- Num- Num-Males Females ber Males F ernales ber Males Females ber Males Females ber Males Femal.
~I) (12) (13) (14) (15) (16) (17) (18) (19) (20) (21) (22) (23) (24) (25) (26)
DISTRICT TOTAL 465 166,914 164.136 204 133,626 130.575 42 54.046 52,617 4 12,413 11.666
Darwha T .luka 102 37,655 36,213 54 35,648 34.975 11 13,991 13.272 2 6,502 5,868
Yeolmal Taluka 83 29,602 28,897 31 21282 20,469 4 4.795 4,676 2,681 2,577
Pu,ad Taluka 106 38,698 38,245 57 36,280 35,475 16 20,913 20,281 ),230 3,221
Kelapur T.luka 101 35,563 35,967 33 20,750 20.431 6 8,667 8.843
WaniTaluka 73 25,396 24.814 29 19.666 19.225 5 5.680 5,545

115
A SERIES
A-lV-Towns (and Town-groups) classified by Population in 1961 with Variation since 1901
Area DistrictfT .Iuk. Name of Town or Status of Town Year . Persons Decade Percen tage Decade Males Females
Town-groUp Sq. Mil.s Sq. Km. Variation Variation
(l) (2) (3) (4) (5) (6) (7) (8) (9) (10) (11)
DISTRICT CRBAN POPULATION 1901 34,598 +3,2.gZ +23.94 18,216 16,382
1911 42,88D 22,240 20,640 1921 53,348 + 10,468 +24.41 27,950 25,398 1931 82,008 +28,660 +53.72 44,283 37,725 1941 91,423 +9,415 +11.48 47,542 43,881 1951 111,732 +20,309 +22.21 57,859 53,873 1961 54.6 141,4 138,525 +26,793 +23.98 72,334 66,191
Class III-20,OOO to 49,999
Yeotmal Ta!uk. ., Yeotm.l (M) 1901 10,545 +2,980 +28.'16
5,547 4,998 J9JJ 13,525 7,249 6,276 J921 17,238 +3,713 +27.4j 9,298 7,940 1931 20,967 +3,729 +21.63 11,434 9,533 1941 26,555 +5,588 . +26.65 14,006 12,549 1951 35,980 +9,425 + 35,49 18,970 17,010 1961 3.23 8,37 45,587 +9,607 +26.70 24,045 21,541
Class IV-I0,OOO to 19,999
Wani Taluka .. Wani (M) 1901 6,109 +17j +3.83
3,506 2,603 1911 6,282 3,273 3,009 1921 6,841 +559 +8.90 3,451 3,390 1931 12,597 +5,756 +84.14 7,003 5,594' 1941 12,225 -372 -2.95 6,254 5,971 1951 14,672 +2,447 +20.02 7,503 7,169' 1961 5.20 13.47 18,176 +3,504 +23.88 9,459 8,717
Pu,.d Taluk. .. Pusad (M) 1901 6,742 +LiD +1.78
3,441 3,301 1911 6,862 3,448 3,414 1921 7,510 +648 +9.44 3,840 3,670' 1931 9,862 +2,3S2 +3\.32 S,IS\) 4,6SL 1941 11,372 +1,510 +15.31 5,891 5,481 1951 15,129 +3,757 +33.04 7,774 7,355 1961 13.Z7 34,37 18,OOZ +Z,873 +18,99 9,364 8,638
Darwha Ta!uka .. Digras (M) 1901 6,034 +445 +7:37
3,077 2,957 1911 6,479 3,355 3.124 1921 7,857 + 1,37B +21.27 4,235 3.622: 1931 9,398 +1,541 +19.61 4,954 4,444 1941 10,705 +),307 +13,91 5,607 5,098 1951 12,614 +1,909 +17.83 6,489 6,125 1961 5,52 14.30 15,525 +2,911 +23.08 7,981 7,544-
Pusad Tatuka .. Urr.'l!khcd (M) \9\ I 5822 +62'0 +10:65
2,908 2,914'
:§~l' 6,442 3,237 3,205· 7,957 +1,515 +23,52 4,092 3.86:-
1941 8,978 +1021 +12.83 4,60; 4,373 1951 10,596 +1,618 +18.02 5,458 5,138 1961 10,62 27.50 12,647 +2,051 +19.36 6,553 6,094
Darwha Taluka .. Darwha (M) 190\ 5168 -1,is'8 -24:34
2,645 2,523 1911 3,910 2,007 1,903 1921 7,460 +3,550 +90.79 3,889 3,571 1931 9,661 +2,201 +29.50 5,136 4,525 1941 8,776 -885 -9.16 4,554 4,222 1951 10,074 +1,298 +14.79 5,219 4,855 1961 10.86 28,13 11,540 +1,466 +14,55 6,035 5,505
Kelapur T .luka .. P.ndharL.oda eM) 1931 7,577 +859 +10.68
4,175 3,402 1941 ~ 386 4,352 4.034 J95\ b:005 -38\ -454 108S 3,917 1961 3,87 10.02 10,605 +2,600 +32.48 ,542 5,063-
Class V-5,OOO to 9,999
Kelapur T aluk. .. Chatanji (M) 1931 3.989 +4:i7 +10.96
2,309 1.680 1941 4,426 2,273 2,153 1951 4,662 +236 +5.33 2,358 2,304 1961 2,01 5,21 6,443 +1,781 +38.20 3,355 3,081}
eM) = Municipal ity.

116
CENSUS TABLES
Primary Census
WORKERS
Total Workers (I-IX) AsCu\tivator
S rial DistrictlTaluka Occupied Residential
Area Houses Total No. of persom enumerated . ~o. in square (including inmates of institu .. Scheduled Scheduled Li tera t. and
miles No.of No. of tions and bouseless persons) Castes 1 ribe. educated persons House:; Hou<;e- ------
holds Persons Male. Females M F M F M F M F M F
(I) (2) (3) (4) (5) (6) (7) (8) (9) (10) (11 ) (12) (13) (14) (15) (16) (17) (18)
DISTRICfTOTAL .. 5,219.0 224,141 235,211 1,098,470 557,010 541,460 21,333 ,
21,190 77,315 78,294 196,839 61,043 335,665 259,395 120,925 82,669
RURAL ,. 5,164.4 195,575 206,309 959,945 484,676 475,269 17,219 17,340 75,228 76,255 154,131 40,699 298,205 247,756 117,520 81,595
URBAN .. 54.6 28,%6 28,902 138,525 72,334 66,191 4,114 3,850 2,087 2,039 42,7C8 20,344 37,460 11 ,639 3,405 1,074
Darwh. Taluka
Total .. 1,078.0 52,127 55,343 255,132 129,976 125,156 5,769 5.799 49,335 16,(05 78,689 58,953 27,257 17,026 Rural .. 1,061.6 46,593 49,723 228,067 115,960 112,107 5,242 5,232 41,713 12,600 71,112 56,378 26,387 16,808 Urban 16.4 5,534 5,620 27,065 14,016 13,049 ,527 567 7,622 3,405 7,577 2,575 870 218
2 Yeotmal T aluka
Total .. 908.0 43,953 46,233 207,366 105,936 101,430 2,993 2,858 25,766 26,001 40,745 16,456 63,523 45,425 17,899 11,166 Rural 904.8 34,710 36,916 161,779 81,891 79,888 1,906 1,8% 24,860 25,104 25,124 8,054 51,592 42,655 17,329 11,030 Urban 3.2 9,243 9,317 45,587 24,045 21,542 1,037 962 906 897 15,621 8,402 11 ,931 2,770 570 136
3 Pu"d T.luka
Total ., 1,285.0 51,825 53,683 265,033 134,277 130,756 5,706 5,746 4S,330 11,384 80,178 57,911 33,670 20,366 Rural .. 1,261.1 45,461 47,255 234,384 118,360 1\ 6,024 4,454 4,575 36,279 7,516 71,841 54,873 32,501 19,889
Urban 23.9 6,364 6,428 30,649 15,917 14,732 1,252 1,171 9,051 3,868 8,337 3,038 1,169 477
4 Kelapur Taluka
Total .. i,C86.0 40,604 42,642 197,270 98,879 98,391 3,404 3,466 30,801 31,025 29,090 8,143 60,313 51,993 20,126 14,639
Rural " 1,080,1 37,150 39,168 180,222 89,982 90,240 2,740 2,839 30,229 30,482. 24,250 5,994 55,655 50,044 19,703 14,482
Urban 5.9 3,454 3,474 17,048 8,897 8,151 664 ~27 572 543 4,840 2,149 4,658 1,949 423 157
Wani Taluka
Total 862.0 35,632 37,310 173,669 87,942 85,727 3,461 3,321 • 20,748 21,268 32,339 9,055 52,962 45,113 2: 973 19,472
Rural ,. 856.8 31,661 33.247 155,493 78,483 77,010 2,877 2,798 20,139 20,669 26,765 6,535 48,005 43,806 21,600 19,386
Urb," 5.2 3,971 4,063 18,176 9,459 8,717 584 523 609 599 5,574 2,520 4,957 1.307 373 86

Jl7
PRIMARY CENSUS ABSTRACT
Abstract
WORKERS
II III IV V VI VII VII IX .As Agricultural
Labourer In Mining, At Household Quarrying, Indus try
In Manufactul :1g In Construction other than House ..
In Trade and Commerce
In T ranSpoTt, Storage and
Communications
In Other Services
X NON
WORKERS Livestock.
F orestry"Fishing, Hunting and Plantations,
Orchard. and aHied activities
hold Industry
M
(19)
F M F M F M F M
(20) (21) (22) (23) (24) (25) (26) (27)
139.901 164,066 8,413
136.572 159.557 7.n9
3.329 4.509 634
37,188 40.212 1.092
35.836 38,697 943
1.352 1,515 149
26.288 30.770 1,922
25.991 30.314 1.818 297 456 104
31,791 35,305 1.252
30,871 33.979 1.061
920 1.326 191
27.278 35,239 26.634 34,125
644 1.114
17,356 22.540
17.240 22,442
116 98
2,005
1.909
96
2.142
2,048
94
965 12,339 2,457 7,781
911 10,528 1.849 2.681
54 1.811 608 5,100
131 2.212
127 1.886
4 326
318 2,397
317 1,834
I 563
64 2,516
57 2,037
7 479
214 2,340
205 2.028 9 312
238 2.874
205 2,743
33 131
385 1,751
300 871
85 880
565 2,254
355 350 210 1,904
540 1.336
388 483 152 853
430 305
125
537
501
36
920
387
533
1.520 590
930
J-18IZ-II-16-A-(Yeotmal).
1.825
507
1,318
292
60
232
505
45
460
246
27
219
93
19
74
689
356
333
2,803
1,703
1.100
443
279
164
6!4
264
350
829
531
298
509
402 107
408
227
181
F M F M
(28) (29) (30) (31)
398 14,602
274 6,%2
124 7,640
41 3.357 35 1,733
6 1,624
112 3,510
45 1,250
67 2,260
93 3,380
67 , 1,723
26 1.657
94 91
3
2,138
1.234
904
58 2.217 36 1,022
22 1,195
1,337 3,566
725 849
612 2,717
235 704 92 29j
143 409
276 '1,525
113 208 163 1,317
246
139 107
199
136
63
381
245
136
502
102
400
347 93
254
488
151
337
F M F
Serial No.
Districtl Taluka
(32) (33)
F
(34)
M
(35) (36) (1) (2)
20 25,335
5 13.611
5.658 221,345 282,065 DISTRICT ,OTAL
2,333 186,471 227,513 RURAL
15 11.724 3,325 34.874 54.552
11
11
'I
4
3
4,68; 630 51,287 65,203
2,382 258 44,848 55.729
1,803 374 6,439 10,474
7,114 1,702 42,413 56,005
2,548 436 30.299 37,233
4,566 1,266 12.114 18,772
4.902 2,532
2,370
4,650
3,265
1,385
3.984
2.384
1,600
1,051 54,099 72.845
327 46,519 61,151
724 7,580 11,694
1,084 38,566 46.398
631 34,327 40,196
403 4,239 ,6202
1,191 34,980 40,614
631 30,478 33,204
560 4,502 7.410
URBAN
Oarwha Taluka
Total Rural
Urban
2 Y eotmal T aluka
Total
Rural
Urban
Pusad Taluka
Total
Rural
Urban
Kelapur Ta1uka
Total
Rural Urban
WaniTaluk.
Total
Rural
Urban

118
CENSCUS TABLES
B-1 and B-II-Workers and Non-workers iu Talukas and
WORKERS ------
I 1I III Total Workers As Cultivator As Agricultural In Mining.Quarrying
(I-IX) Labourer Livestock, Forestry' District/Taluka/ Total AgE- Fi"'hing, Hunting and
Town Rural group Total Pop'l!dioo Plantations,Orchards Urban. a:1d 2.11ied acti\'it~es
----------------- --------- -----------Persons Males Females Males FemaJes Males Females Males Females Males Females
(I) (2) (3) (4) (5) (6) (7) (8) (9) (10) (II ) (12) (13) (14)
DISTRICT TOTAL Toud 1,(98,470 557,010 541,460 335,665 259,395 12G,~25 82,669 1395GI 164,(66 8,413 965 0-14 415,427 224,599 22! ,828 26,687 32,804 5,760 8,270 17,375 23,875 2,172 98
15-34 356,392 173,347 178,045 163,064 129,234 53,C49 41,682 71,595 81,570 3,(86 455 35-59 236,438 126,048 1 iO,390 123,501 84,501 50,638 28,758 44,203 50,592 2,641 364 60+ 58,779 27,749 31,030 22,290 12,835 11,470 3,957 6,724 8,010 513 48
A>f,c not 434 267 167 23 21 8 2 4 19 I stated
RURAL " " Total 9)9,945 484,676 475,269 298,205 247,756 117,520 81,595 136,572 159,55i 7,779 911 0-14 391,750 196,744 195,006 25,736 32,245 5,725 8,221 17,170 23,538 2,047 97
15-34 308,804 152,956 155,848 143,997 124,OC4 51,853 41,265 70,077 79,540 2,853 437 35-59 2',17,332 110,376 96,956 108,464 79,396 48,998 28,246 42,843 48,712 2,412 332 60+ 51.656 24.356 27,300 19,989 12,090 10,93i 3,861 6,478 7,748 466 45 Age not 403 244 159 19 21 7 2 4 19 I
stated
URBAl'l .. .. Total 138,525 72,334 66,191 37,460 11,639 3,405 1,074 3,329 4.509 634 54 0-14 54,677 27,855 26,822 951 559 35 49 205 337 125 1
15-34 47,588 25,391 22,197 19,067 5,230 1,196 417 1,518 2,030 233 18 35-59 29,106 15,672 13,434 15,037 5,105 1,640 512 1,360 1,880 229 32 60+ 7,123 3,393 3,730 2,401 745 533 96 246 262 47 3
/ Age not 31 23 8 4 1 stated
DARWHA TAlUKA " T Total 255,132 129,976 125,156 78,689 58.953 27,157 17,026 37.188 40,212 1,092 131 0-14 103,283 52,093 51,190 5,875 7,821 1,260 1,793 4,238 5,954 147 14
15-34 82,707 41,287 41,420 38,089 29,C04 12,C09 8,443 18,608 19,765 415 50 35-59 54,898 29,664 25,234 29.082 19,061 11,314 5,931 12,240 12,445 437 57 60+ 14,162 6,872 7,290 5,637 3,062 2,673 858 2,100 2,044 93 10 Age not 82 60 22 6 5 I 1 2 4 stated
R Total 228,067 115,960 112,107 71,112 56,378 26,387 16,808 35,836 38,697 943 127 0-14 92,433 46,573 45,860 5,622 7,671 1,248 1,783 4,144 5,834 127 14
15-34 73,765 36,690 37,075 34,345 27,863 11,671 8,358 18,009 19,084 361 49 35-59 49,195 26540 22,655 26,071 17,960 10,928 5,828 11 ,697 11,827 377 54 60+ 12,593 6,098 6,495 5,C68 2,879 2,539 838 1,984 1,948 78 10 Age not 81 59 22 6 5 1 I 2 4 stated
U Total 27,065 14,016 13,049 7,577 2,575 870 218 1,352 1,515 149 4 0-14 10,850 5,520 5.330 253 150 12 10 94 120 20
15-34 8,942 4,597 4,345 3,744 1,141 338 85 599 681 54 'j 35~59 5,703 3,124 2,579 3,011 1,101 386 103 543 618 60 3 60+ 1,569 774 795 569 183 134 20 116 96 15 Age not stated
I I
Darwha(M) Total 11,540 6.C35 5,505 3,201 1,071 483 165 624 691 42 3 0-14 4,769 2,437 2,332 109 82 9 10 44 66 13 15~34 3,813 1,997 1,816 1,644 484 195 66 297 312 11 'j 35-59 2,2c5 1,237 1,028 1,187 433 204 77 218 269 14 2 60+ 692 363 329 261 72 75 12 65 44 4 Age root stateJ
I I
Digra. (M) Total 15,525 7,981 7,544 4,3i6 1,504 387 53 728 824 107 0-14 6,081 3,G83 2,998 144 68 3
i9 50 54 7
15-34 5,129 2.600 2,529 2,1CO 657 143 302 369 43 35-59 3,438 1.887 1,551 1,824 668 182 26 325 349 46 1 60+ 877 411 466 308 III 59 8 51 52 11 Age not stated
Y fOTMAL T ALUKA .. T Total 207,366 105,936 101,430 63.523 45,425 17,899 11,166 26,288 30,770 1,922 318 0-14 82,337 41,120 41,217 4,435 5,911 713 1,152 2,966 4,601 443 36
15-34 67,515 34,326 33,189 30,326 21,517 7,582 5,276 12,911 14,650 677 164 35-59 45,685 24,745 20,941 24,192 15,330 7,6'0 4,131 8,952 9,705 660 98 60+ 11,755 5,703 6,052 4,565 2,665 1.993 606 1,459 1,813 142 20 Age not 73 42 31 5 2 1 I 1 stated
R Total 161,779 81,891 79,883 51,592 42,655 17,329 11,030 25,991 30,314 . 1,818 317 0-14 6U{3 32,073 32,4n 4,255 5.832 708 1,146 2,960 4,581 432 36
15-34 51,416 25,532 25,884 24,122 20,339 7,420 5,237 12,765 14,478 642 163 35~59 36.247 19,660 16,587 19,362 13.993 7,317 4,052 8,832 9,470 612 98 60+ 9,519 4,600 4,919 3,852 2,489 1.884 594 1,434 1,784 132 20 A'J,p "ot 52 26 26 1 2 I I stated
U Total 45,587 24,045 21,542 11.931 2,770 5iO 136 297 456 104 0-14 17,792 9,047 8,745 180 79 5 6 6 20 II
15-34 16,099 8,794 7,305 6,204 1,178 162 39 146 172 35 35~59 9,439 5,085 4,354 4,S30 1,337 293 79 120 235 48 6H 2,236 1,103 1,133 713 176 109 12 25 29 10
Age not 21 16 5 4 1 " stated
(,1,1) ~:M'Jnicipa!ity,
J-rSr:2-II-r6-B-(Yeotmal).

119
B SER[ES
Towns classified by Sex and by Broad Age-groups
WORKERS
IV V VI VII VIlI IX X At Household In Manufacturing In Construction In Trade' and In Transport, In Oiher Services NON-WORKERS
Industry other than Commerce Storage and Age .. Total District!Taluka/ Household Communications group Rural Town
Industry Urban
-_----.---- ----- ------- -------Males Females Males Fema.les Males Females Males Females Moles Females Males Female, Males Female,
(15) (16) (17) (18) (19) (20) (21) (22) (23) (24) (25) (26) (27) (28) (3) (2) (1)
12,339 2,m 7,731 1,825 2,)\)3 398 14,602 1,337 3,565 20 25,33j 5,Sj3 22).14) 212,065 T~,tal DISTRICT TOTAL 350 128 135 103 84 24 263 26 18 2 52_) 21d Hj,012 idJ,J2-1 C-14
5,997 1,351 ,1,338 949 1,4,i 203 7,385 459 1,9J2 9 14,158 2,556 1.;,263 4S,SIl 15-34 5,073 834 2,883 697 1,111 IS~ 5,975 713 1,456 9 9,5! 6 2,376 2.5-17 h,809 3j-59
919 144 419 76 144 13 972 139 99 1,130 4-l~ 5,m 18,i 9j 6J+ 1 2 I 6 211 14& A'te not
"t1t~d
10,528 1,849 2,681 507 1,703 274 6,962 725 849 5 13,611 2,333 186,471 227.5 i3 Total RURAL 311 107 1,53~ 74 57 19 142 21 3 1 L20 167 171,008 162,761 0-14
5,108 1,01 I 253 863 153 3,545 245 503 3 7,657 1,097 8,959 jl,~44 15-34 4.321 621 940 16J 6~4 94 2,~j2 j75 327 I 5,097 8jj 1,912 17,j60 35-59
788 110 147 20 89 8 442 84 II 631 214 4,367 15,210 60+ 1 6 225 Uti A~e not
staled
1,811 608 5,100 1,318 1,100 124 7,640 612 2,717 15 11,724 3,325 34,874 54,552 Tot,1 URBAN 39 21 74 29 27 5 126 5 15 I 305 111 26,904 26,263 0-14
889 340 2,305 696 601 50 3,840 214 1,434 6 6,501 1,459 6,324 15,967 IS-34 752 213 1,948 537 417 64 3,143 338 1,129 8 4,419 l,jZI 635 6,329 35-59 131 34 272 56 55 5 530 55 ~8 499 234 992 2,985 60+
I I 1 19 8 A.:J'2 not stated
2,212 385 1,751 292 443 41 3,357 235 7M 4,685 6iO 51,287 65,203 Total T DARWHA TALuKA 36 22 31 8 10 4 45 3 6 102 23 46,218 43,36} 0-14
1,094 205 902 140 234 25 1,722 86 388 'i 2,637 UJ 3,198 12,416 15-34 905 129 652 121 178 12 1,361 117 292 1,703 n8 532 6,173 35-59 177 29 86 23 21 228 29 18 241 69 1,235 4,228 60+
I 2 5-1 17 Aienot statp.d
1,886 300 871 60 279 35 1,733 92 295 2,832 258 4j,~43 55,729 Totdl R 31 22 16 4 2 4 18 3 I 35 7 4J,951 33,189 0-14
942 161 520 31 133 22 905 2) 167 'i 1,635 129 2,345 9,212 15-34 765 96 292 17 130 9 70j 46 126 1,051 82 469 4,695 35-39 140 21 43 8 12 104 14 I 159 40 1,030 3,616 63+
I 2 53 17 A;r~ not stated
326 85 880 232 164 6 1,624 143 409 1,8J1 372 6,439 10,474 Total U 5
44 IS 4 8 27
57 5 67 16 5,267 5,I8J 0-14 152 4S2 109 99 3 817 221 1,002 161 853 5,1.0-1 1)-34 140 33 360 104 48 3 656 71 16S 6j2 166 III 1,47a 3j-H 29 8 43 15 9 124 15 17 82 2) 205 612 6J+
I A6'e not stltd
154 38 209 22 64 3 553 23 233 834 121 2,834 4,m ToLd Darwha (M) 5
i3 2
iz 6 'i 5
'6 3 22 6 2,323 2,2jJ 0-1-1 63 111 34 2~0 131 512 63 3jj 1,3.12 Ij-34 71 12 80 5 19 2 223 18 81 269 43 SJ j)j 3j -5) 15 3 16 5 5 40 -I 10 31 4 102 2)/ 60+
I AJe not ,t,t,d
172 47 671 210 100 3 1,066 115 176 959 251 3,605 6,0-10 Tab,! Digra.(i\1)
89 zi 13 4 2 '2 22
si 2 45 10 2,93:1 2,930 0-14
351 97 65 527 9J 4}0 93 jjO lol2 11-3-1 69 21 Z30 99 29 1 433 53 77 m I is 63 ~33 3j-S} 14 5 27 10 4 84 II 7 51 2i to, 3jj 6J+
Age not stated
z,3~7 565 2,254 505 614 112 3,510 276 1.525 11 7,114 1,70Z 42,413 56,005 Total T Y EOTMAL TAL UKA , 71 33 32 15 13 3 53 4 6 I 138 66 36,685 3;'306 0-14 1,147 307 1,288 272 329 51 1,696 79 824 6 3,872 712 4,~~£ 11,672 15-34
996 194 807 199 242 53 1,515 16B 649 4 2,761 778 5,611 3j-S~ Itl3 31 126 19 30 5 245 25 45 j';::: 146 1,138 3,W 60+
1 I I 1 37 29 Age not stat<'d
1834 355 350 45 264 45 1,250 113 208 2,548 436 30,299 37,233 Tota! R , 61 20 4 I 10 3 31 3 1 48 42 27,818 2J,64J 0-14 873 IR4 211 32 135 26 617 35 116 1,343 Id4 1,410 5,54j 15-34 755 126 115 10 107 15 526 62 87 1,IlII 160 298 2,m 3,)-59 145 25 20 2 12 I 76 13 4 145 50 743 2,4,0 60+
1 25 24 Age not stated
563 210 1,934 460 350 67 2,260 163 1,3,7 II 4,566 I,Z6b 12,114 13,772 T ~tdl U 10 13 28 14 3
25 22 I 5 I 90 24 ~,367 8,66S 0-14
274 123 1,077 240 194 1,079 44 708 6 2,529 52~ 2,;~0 6,127 15-34 241 68 692 IBY 135 38 989 106 562 4 1,750 618 255 3,017 35-S~ 38 6 106 17 18 4 169 12 41 197 96 390 957 60+
I I 1 12 5 A'Je dL·t
st3teu
(M) = Municipality, ,

120
CENSUS TABLES
B~I and B-II-Workers and Non~workers in, Talukas and
WORKERS
I II III Total Workers A. Culti .ator A, Agricultural In Mining, Quarrying"
(I-IX) Labourer Livestock, Forestry, Di,trict/T aluka! Total Age- Fishing, Hunting and
Town Rural IJ(OUP Plantatio"., Orchardl, Urban r otal Population and allied acti vi ti ••
Persons Mal •• Females Male. Femal •• Mal •• F.m.l •• Male, Female, Males Female.
(I) (2) (3) (4) (5) (6) (7) (8) (9) (10) (II) (12) (13) (14)
¥EOTMAL TALUKA-concld, 24,04S S70 136 297 456 Yeotmal(M) Total 43,587 21,542 11,931 2,770 104
0-14 17,792 9,047 8,745 180 79 5 6 6 20 II 'j IS-34 16,099 8,794 7,3()'; 6,204 1.178 162 39 146 172 35 35-S9 9,439 5,085 4,354 4,830 1,337 293 79 120 235 48 60+ 2,236 1,103 1,133 713 176 109 12 25 29 10
Age not 21 16 5 4 I stated
PUSAll T ALUKA .. T Total 265,033 134,277 130,756 SO,I7S 57,911 33,670 20,366 31,791 35,305 1,252 64 0-14 112,218 56,848 55,370 7.439 7,978 2,078 2,502 4,617 5,360 392 13
15-34 86,711 43,161 43,550 40,087 30,122 15,68) 10,742 16,603 18,2n 484 2') 35-59 53,857 28,804 25,053 28,273 17,511 13,487 6,366 9,347 10,272 322 19 60+ 12,201 5,424 6,777 4,376 2,298 2,424 756 1,222 1,399 ' 54 3 Age not 46 40 6 3 2 2 2 stated
R Total 234,384 118,360 116,024 71,841 54,873 32,501 19,889 30,871 33,979 1,061 57 0-14 99,999 50,584 49,415 7;187 7,803 2,060 2,478 4,553 5,255 342 13
15-34 76,050 37,531 38,519 35,745 28,710 15,220 10,534 16,172 17,666 399 25 35-59 47,618 25,444 22,174 25,022 16,267 12,955 6,164 8,980 9,741 276 16 60+ 10,677 4,765 5,912 3,884 2,091 2,266 713 1,164 1,315 44 3 Age not 40 36 4 3 2 2 2 stated
U Total 30,649 15,917 14,732 8,337 3,038 1,169 477 920 1,326 191 7 O-i4 12,219 6,264 5,955 252 175 18 24 64 105 50
'4 15-3~ 10,661 5,630 5,031 4,342 1,412 461 208 1131 606 85 35-59 6,239 3,360 2,879 3,251 1,244 532 202 367 531 46 3 60+ 1524 65~ 865 492 207 158 43 58 84 10
Age not 6 4 2 stated
Pusad (M) Total 18,002 9,364 8,638 4,745 1,380 470 108 328 446 73 4 0-14 7,069 3,631 3,438 89 52 2 4 20 23 13
OJ 15-34 6,315 3,354 2,961 2,473 604 171 33 150 198 32 35-59 3,697 1,971 1,726 1,8% 625 224 54 129 201 22 3 60+ 920 407 513 287 99 73 17 29 24 6 Age not I I slated
Umarkhed (M) Total 12,647 6,553 6,094 3,592 1,658 699 369 592 880 lIS 3 0-14 5,150 2,633 2,517 163 123 16 20 44 82 37 '3 15-34 4,346 2,276 2,070 1,869 808 290 175 281 408 53
35-59 2,542 1,389 1,153 1,355 619 308 148 238 330 24 60+ 604 252 352 205 108 85 26 29 60 4 Age not 5 3 2 stated
KlLAPUR T AWK. .. T Total 197,270 93,879 98,391 60,313 51,993 20,126 14,639 27,278 35,239 2,005 214 0-14 80,135 40,043 40,092 5,288 6,542 985 1,371 3,539 5,060 517 14
15-34 63,335 31,439 31,896 29,137 25,751 8,513 7,381 14,069 17,386 705 110 35-59 43,191 22,533 20,658 22,045 17,148 8,714 5,181 8,451 11,094 660 84 60+ 10,408 4,749 5,659 3,837 2,543 1,911 706 1,219 1,690 122 6 Age not 201 115 86 6 9 3 9 i stated
R Total 180,222 89,982 90,240 55,655 50,044 19,703 14,482 26,634 34,125 1.909 205 0-14 73,176 36,503 36,673 5,128 6,416 985 1,362 3,501 4,y74 503 14
15-34 57,745 28,410 29,335 26,802 24,863 8.379 7327 13,763 16,858 677 109 35-59 39,536 20,602 18,934 20180 16,316 8,488 5,096 8,193 10,645 615 76 6Q+ 9567 4,35~ 5,213 3,539 2,440 1,848 697 1,177 1,639 113 6 Age not '198 113 8) 6 9 3 9 I stated
U Total 17,048 8,897 8,151 4,658 1,949 423 157 644 1,114 96 9 0-14 6,959 3,5~0 3,419 160 126
134 9 38 86 14 'j 15-34 5,590 3,029 2,561 2,335 888 54 306 528 28
35-5~ 3,655 1,931 1,724 1,865 832 226 85 258 449 45 8 60+ 841 395 446 298 103 63 9 42 51 9 Aile not 3 2 I stated
Ghatanji (M) Total 6,443 3,355 3,088 1,757 868 182 n 251 494 34 7 0-14 2,668 1,338 1,330 64 65
S8 5 18 47 6
15-34 2,084 1,145 939 888 383 28 123 219 8 '7 35-59 1,365 713 652 688 370 100 35 93 198 17
60+ 324 157 167 117 50 24 4 17 30 3 Age pot 2 2 stated
Pandharkaoda (M) Total IO,6G5 5,542 5,063 2,901 1,081 241 85 393 620 62 2 0-14 4,:':91 2,202 2,G89 96 61
76 4 20 39 8 OJ 15-34 3,506 1,88. 1.622 1447 505 26 183 309 20
35-59 2,290 1,218 1,072 I,m 462 126 50 165 251 28 \ 60+ 517 238 279 181 53 39 5 25 21 6
Age not I I stated
(M)=Municipality,

121
B SERIES
Towns classified by Sex and by Broad Age-groups-contd,
WORKERS
IV V VI VII VIII IX X At Household InManufacturing In In Trade and In Transport, In Other Service. NON,WORKERS
District/T alukal' Industry other than Construction Commerce Storage and Age- Total Household Communications group Rural Town
Industry Urban
-------- ----- -----Males Females Males Females Males Females Males Females Males Fem.les M.le, Females Males Fem::;le'.l
(15) (16) (17) (13) (19) (20) (21) (22) (23) (24) (25) (26) (27) (28) (') (2) (1)
YEOTMAL TALuKA-concld, 563 210 1,904 460 3:i0 67 2,260 163 1,317 11 4,566 1,266 12,114 la,,?/" Tvtol .. Yeotmal(M)
10 \3 28 14 3 2S
22 1 S I 90 24 8,867 8,666 0-14 274 123 1,077 240 194 1,079 41 703 6 2,529 528 2,590 6,127 15-34 241 68 692 189 135 38 989 100 552 4 1,75J 618 255 3,017 35-59 38 6 106 17 18 4 169 12 41 197 96 390 957 60+
1 i 1 12 5 Age not stated
2,5~~ 540 1,336 246 829 93 3,3S0 246 502 4,902 1,051 54,099 72,845 Total T PUSAn TALUKA 25 28 4 20 8 87 11 2 118 55 49,409 47,392 0-14
1,220 290 730 127 467 51 1,787 86 294 2,821 525 3,074 13,428 15-34 1,008 192 510 104 309 31 1319 122 192 1,779 405 531 7,542 35-59
1\}1 33 68 II 33 3 187 27 14 183 66 l,MB 4,479 6\\+ 1 37 4 Age not
stated
2,037 388 483 27 531 67 1,723 139 102 2,532 327 46,519 61,1 jl Total R 83 21 14
ii 12 6 60 9
70 63 21 43,397 41,612 0-14
973 208 263 286 36 903 54 1459 176 1,786 9,809 15-34 815 137 178 IS 209 23 657 60 30 922 III 422 5907 35-59 166 22 28 I 24 2 103 16 2 87 19 881 ,821 60+
I 33 ' 2 Age not stated
479 152 853 219 298 26 1,657 107 400 2,370 724 7,580 11,694 Total U 14 4 14 4 8 2 27 2 2 55 34 6,012 5,780 0-14
247 82 467 116 181 15 884 32 224 1,362 349 1,288 3,619 15-34 193 55 332 89 100 8 662 62 162 857 294 109 1,635 35-59 25 11 40 10 9 I 84 11 12 96 47 167 658 60+
4 2 Age not stated
243 77 568 162 135 17 1,101 75 283 1,544 491 4,619 7,258 Total Po.ad (M). 8
34 7 4 2 2 12 1 2 23 18 3,542 3,386 0-14
113 308 95 80 10 589 19 157 873 214 881 2,357 15-34 108 37 226 57 51 4 440 45 114 582 224 75 1,101 35-59
14 6 27 6 2 1 60 10 10 66 35 120 414 60+ 1 Aie not
stated
236 75 285 57 163 9 556 32 117 826 233 2,961 4,436 Total UmaJ'khed'JMl 6 4 7
ij 6 '5 15 1 32 16 2,470 2,394 0-14
13-1 48 159 101 295 13 67 489 135 407 1,263 15-34 85 18 106 32 49 4 222 17 48 275 70 34 534 35-59 II 5 13 4 7 24 1 2 30 12 47 244 60+
3 2 Age not stated
2,340 430 920 93 509 94 2,138 199 347 4,650 1,084 38,566 46,398 Total T K £LAPUR TAl UK .. 47 16 5 4 32 5 57 4 4 102 68 34,755 33,550 0-14
1,167 226 514 52 235 49 1,086 61 210 'j 2,638 486 2,302 6,145 15-34 970 157 353 37 212 36 829 108 124 1,732 450 488 3,510 35-59 156 31 4S 30 4 \66 26 '} )76 81l \}\2 3,116 6D+
2 109 77 Age not staled
2,028 305 387 19 402 91 1,234 136 93 3,265 681 34,327 40,196 Total R 38 i3 4
io 25 5 21 3 I 50 45 31,375 30,257 0-14
1,003 159 224 190 49 620 41 57 1,&3:1 310 1,6J8 4,472 15-34 855 109 139 9 160 33 499 73 35 1,196 275 422 2,618 35-59 132 24 20 27 4 94 19 12d 51 8 ~:5 2,773 6J+
2 IOJ 76 Age not stateJ
312 123 533 74 107 3 904 63 254 1,385 403 4,239 6,202 Total U 9 3 1 4 7 36 1 3 52 23 3,380 3,293 0-14
164 67 290 42 45 ·3 466 20 153 749 176 694 1,673 15-34 l1S 48 214 28 52 330 35 89 'j 536 175 66 892 35-59 24 7 28 3 72 7 9 48 29 97 343 60+
2 I A'!.enot stated
150 44 159 26 37 364 23 61 519 201 1,598 2,220 Total Ghatanii (\.1) I 85 if,
3 15 I 1 20 12 1,274 1.265 0-14 S6 2S 18 'j 192 6 35 283 86 257 556 15-34 50 15 66 10 14 128 14 24 196 90 25 282 35-59 13 I 8 2 29 2 I 20 13 40 117 63+
2 Age not stated
162 81 374 48 70 2 540 40 193 866 202 2,641 3,982 T~tal Pandh.r kaoda (M) 8 3 1 4 4 21 2 32 II 2,106 2,028 0-14 78 39 205 26 27 274 j4 118 466 9iJ 437 1,117 15-34 65 33 148 18 38 2 202 21 65 'j 340 85 41 610 35-59 11 6 20 1 43 5 8 28 16 57 226 60+ I Age not
stated
(M)=Municipality,

122
CENSUS TABLES
B-1 and B-I1-Workers and Non-workers in Talukas and
WORKERS
I II III Iota IWorkers As Cultivator As Agricultural In r~1ining.QuarrYing.
District/Taluka/ Total Age- (I-IX) Labourer Livestock. ForestrY9 Town Rural group Fishing, Hunting and
Urban Plantations,Orchards Total Population and all ied acti vi ties
---------Persons Males Females Males Females Males Females Males Femajes Males F,ruales
(I) (2) (3) (4) (5) (6) (7) (8) (9) (10) (II) (12) (13) (14)
W ANI 1 ALUKA .. T Total 173.669 87.942 85.727 52.962 45.113 21.973 19.472 17,356 22.540 2.142 238 0-14 68.454 34,495 33.959 3,650 4,552 724 1,452 2.015 '.9CO 673 21
15-34 56.124 28.134 27.990 25.425 22.840 9.264 9.840 9.404 11.497 805 102 35--59 38.806 20,302 18.504 19.909 15.451 9.513 7.149 5.213 7.076 562 106 60+ 10.253 5.001 5.252 3.975 2.267 2,469 1.031 724 1.064 102 9 Age not 32 10 22 3 3 3 3 stated
R Total 155.493 78.483 77.010 48.005 43.806 21.600 19;386 17.240 22.442 2.048 205 0-14 61.597 31.011 30.586 3.544 4.523 724 1,452 2.012 2.894 643 20
15-34 49.828 24.793 25.035 22.983 22.229 9.163 9.809 9.368 11,454 774 91 35-59 34,736 IB.130 16.606 17.B29 14.860 9.310 7.106 5.141 7.029 532 88 60+ 9,300 4,539 4.761 3.646 2.191 2,400 1.019 719 1.062 99 6 Age not 32 10 22 3 3 3 3 stated
U Total 18.176 9.459 8.717 4.957 1.307 373 86 116 98 94 33 0-14 6.857 3.484 3.373 106 29
loi ji 3 6 30 I 15-34 6.296 3.341 2.955 2.442 611 36 43 31 II 35-59 4070 2.172 1.898 2.080 591 203 43 72 47 30 18 60+ '953 462 491 329 76 69 12 5 2 3 3 Age not >t.ted
Wani(M) Total 18.176 9.459 8.717 4.957 1.307 373 86 116 98 94 33 0-14 6.B57 3.484 3.373 106 29
loi ji 3 6 30 I 15-34 6,296 3.341 2955 2.442 611 36 43 31 II 35-59 4.070 2.172 1.898 2.080 591 203 43 n 47 30 18 60+ 953 462 491 329 76 69 12 5 2 3 3 Age not stated
(M)=Municipality;

123
B SERIES
Towns classified by Sex and by B.toad Age-groups-concld.
WDRKERS
IV V VI Vll VIII IX X At Household InMar:ufactuting In Construction In Trade and Inl JO.fl:::llort, In Otloer Services NON-WORKERS
Industry other than Commerce Storage tnict Age- Total District/T aluka/ Household Communicaiicns \?fOUP Rural Town
Indu'Str',' Urban
-~---- ---~--- ---- _--- ---- _--_ .. _--- ---~---- -- ----------Males Females Males Females l"~ lIes Fema!::-s Males Females Mabs FemaJes Males hn,des r\l~ale~ rUJ ,;n
(15) (16) (17) (18) (19) (20) (2:) (2:) (23) (2~) (25) Co) (27) (28) (3) (2) (l)
.2.874 537 1.520 689 408 58 2.217 381 488 7 3.984 1.191 34,980 40.614 Total T WANl TALUKA 99 32 39 72 9 4 26 4 1 65 66 30,845 29,407 0-14
1,369 323 824 353 199 27 1.094 147 276 3 2,190 543 2,709 5,150 15-34 1,194 162 566 236 170 26 951 198 199 3 1,')41 495 393 3,053 35-59
212 20 91 23 30 1 146 32 13 188 87 1,026 2985 60+ 7 19 Age not
stated
2,743 501 590 356 227 36 1,022 245 151 4 2,384 631 30,478 33,204 Total R 98 31 23 69 8 1 12 3
98 1 24 52 27,467 26,063 0-14
1,3 17 299 315 169 117 20 500 86 3 1,331 298 1,8}O 2,806 15-34 1,131 153 216 109 88 14 445 134 49 917 227 301 1,746 35-59
197 18 36 9 14 1 65 22 4 112 54 893 2,570 60+ 7 19 • Age pet
statej
131 36 930 333 181 22 1,195 136 337 1,600 560 4,502 7,410 Total U 1 1 16 3 I 3 14 1
178 41 14 3,378 3,344 0-14
52 24 509 189 82 7 594 61 859 245 899 2,344 15-34 63 9 350 127 82 12 506 64 150 3 624 268 92 1,307 35-59 15 2 55 14 16 81 10 9 76 33 133 415 60+
Age not stated
l31 35 930 333 181 22 1,193 136 337 3 1.600 560 4,502 7.410 Total WaniCM) 1 1 16 3 1 3 14 I
178 41 14 3,378 3,344 0""':14
52 24 509 189 82 7 594 61 859 245 899 2,344 15-'.34 63 9 350 127 82 12 506 64 150 3 624 268 92 1,307 35-59 15 2 55 14 16 81 10 9 76 33 133 415 60+
Age n9t st.t~d
. (M) = MuniciP!Jity.

CENSUS TABLES
~
os § .... .... tIS
~ .... rIJ r/J tIS -o
J..:i :..: Il::
x~
~
c .~ U -c;.! >-b C
U ~ I
"' .... 0-. ,'''''''' 0-'" N~~
"''''''' NN
"'''' "<1"_0 "' .... 0 _~~o-~ '--lll"'l['.. N-::""I
"'0 ",,,,,,, '-Dc ... -.o ~ .. ..¢ .....
"'N
-"'''' "'000-. r--:~"d No-.N N_
-N"" ........ '" .... ",N ...t)...o_" ~~M
.... I:J
.",
I-< .... fIl
~ o
124
o '"
'" '"
N
'" '"
... '"
'" N
N
N
....
o '"
'"
N N
'" N
o '"
..,.
N - - N
N ....
- N
'" 00
00 '"
- ....
....
... ... '" '"

IL>. N U
I
I:E g
IL>. 8
U
I I;! ~ I ;::;
I;! 2 \L>. .,.
12 ~ I
IL>. N
12 : I ::::.
}-18Iz-IJ-17-A-(yeotmal).
",,"00 'CI.()I ...... 0('.1' oorno "''''''' N-
125
$~~ ~~ NNV"\ ,,"":1:'1 «'I~ .....:
~~g:: F; -"''''' ..,:"" """"
q"0\_ "o:t"o 0...".0-. ll"I_ Nt.nl"f"'l ~ ~a5('1"'\" ""N
~~~ t--.N """N~ 051.1"\ ~"N~..n ~ft
B SERIES

]26 CENSUS TABLES
B-IV -Part A-Industrial Classification by Sex and Clas~ of Worker of Persons at Work at Household Industry
Branch of Industry Total Total Employee Others Branch of Industry Total Total Employee Others ----_--- Rural ---- ---- - .. ---- Rural ----Division and Maior Urhan Males Females Males Females Males Females Division and Maior Urban Males Females Males Females Males Females Group of I.S,I.C, Group of I.S,I.C,
(1) (2) (3) (4) (5) (6) (7) (8) (I) (2) (3) (4) (5) (6) (7) (8)
ALL DIVISIONS Total .. 12.339 2,457 482 62 11,857 2.395 Major Group 25 Total 6 16 6 16 Rural .. 10,528 1,849 340 53 10,188 1,796 Rural 6 16 6 16 Urban 1,811 608 142 9 1,669 599 Urban
Division 0 Total 608 146 60 548 146 27 Total 1,948 261 63 2 1,885 259 Rural 527 90 59 468 90 Rural 1,703 196 57 2 1.646 194 Urban 81 56 1 80 56 Urban 245 65 6 239 65
Major Group 00 Total 22 2 22 2 28 Total 4,014 443 85 5 3.929 438 Rural 16 2 16 2 Rural 3,440 272 33 3 3.407 269 Urban 6 6 Urban 574 171 52 2 522 169
02 Total 7 2 29 Total 16 15 Rural 7 2 Rural I I Urban Urban 15 I 14
03 Total 35 5 35 5 30 Total 3 3 Rural 35 4 35 4 Rural 2 2 Urban I 1 Urban I I
04 Total 544 139 55 489 139 31 Total 1,313 52 22 1.291 52 Rural 469 84 54 415 84 Rural 1,185 45 6 1.179 45 Urban 75 55 I 74 55 Urban 128 7 16 ., 112 7
Division 1~ Total 4 4 32 Total and Rural 4 4 Rural
Major Croup 10J Urban Urban
Division 2 and 3 Total .. 11,727 2,311 422 62 II ,305 2,249 33 Total 19 19 4 Rural 9,997 1,759 281 53 9.716 1.706 Rural 9
'4 9 Urban 1.730 552 141 9 1.589 543 Urban 10 10 '4
Major Group 20 Total 583 239 78 4 505 235 34 & 35 Total 1,182 680 95 37 1.087 643 Rural 431 182 60 2 371 180 Rural 1,069 593 82 35 987 558 Urban 152 57 18 2 134 55 Urban 113 87 13 2 100 85
21 Total 2 2 36 Total 1.564 181 27 2 1.537 179 Rural 'i
Rural 1,354 173 14 2 1,340 171 Urban 'i Urban 210 8 13 197 8
22 Total 86 143 8 4 78 139 3] Total 2 2 Rural 4 I 2 I 2 Rural Urban 82 142 6 3 76 1:39 Urban 2 'i
23 Total 262 251 4 3 258 248 38 Total 39 3 36 Rural 262 240 4 3 258 237 Rural 24 2 22 Urban II II Urban 15 I 14
24 Total 25 31 5 3 20 28 39 Total 662 10 31 2 631 8 Rural 25 31 5 3 20 28 Rural 481 10 16 2 465 8 Urban Urban 181 15 166
}-ISIZ-II-I7-B-(Yeotmal).

~ -o i UJ
=' o .d
= o Z d .... ~ l-<
~
-c:s .... l-< .... UJ
=' "d
= Joooj
I ~
o '"
:M N __ _
OOON 00'00-
'" '"
0000
"''''
~~~ ~~M "<:tNN ..... "'_ NN "'-.0 .... N .....:
'" <::> '" <:>
on
J '"
NN
T27
........ NN
=
00000 .... ....
.... "'..,.
NN
ONoO -"' ... '" N
... NN
... _:.; 5 .ea-f e:O::::J
.,,~
;'" ..,.g go :~.~ 0;2;
N N
c .~ ., is
-..,. .... N _
- ........ N -
'" N
NN
0000
NN
OOON -NoO N -
000'" -NOO N -
NN
"''''
B SERIES
C01J""lr"l"\ ...,.o<o:tN('('.O'\ N __ 00000-. N ('..J N -~
N--
..... N
:'"

CENSUS TABLES
0"' ..... ..,01:'1<:'<"\
""'''' t'n~ ..a..a
N.".'" --0-
'" .",
'" :~ is
:'"
N..,.",
=-~
:'"
(5 :0
128
NON ..".,0""," co 0-. 0'- 000"0'\ Of'-"N octt"f\O!:T ~...:-~
: : :
N--
-.co\,() ..00\0 o-.r-...N o--co -U"'I\O 0"-.00-CO['.,- ~ N.. -.::t-C1\ N N

.... C'l .... '"' .... f/)
= "0 I::
1-4
I o
~::g :('('\ :~ ~ ~ ~
.... '\.,"'\ l/'\
N- 011'\ N
~ ~ ~ :~:\O r.....
'" '" N'
-.0 gj ~ :~:re ~ ~ lS
""
......
.....
~ $ ~ -~ :~ ~ ~-:~ o '"
.", 'N
.~ r--.. Ln_ 'll'\ .",
.CO >D C"t'\ oN
:~-
. ",-':::!
:0\ :~
~ ~ S -~-~ ~ ~
as ~g)N~~~N '" N-
N O_N("f'\""'tJ"\'-O o NNNNNNN 0000000
129
~ ~~O\IO\C~~ 1.1"'1" ~
~ 6~~~"';~
"' '"
~ ;:g~::~""0!;~ N 1./"'1- V
>!5 '"
o N
o aN
:;:: N
ao "
o '" N
'" a-
'"
,0 " .'" 0 N '"
~ ~ ~- :~= :-~ :~ N
M N
·~OOlJ"\ .0\ N N • --" '('1"'\
'lI"'IC"f'\C"t'\-'--""'- ·0 N N 'N
N
°N"'l ... eo __ o • - N C"t'\
M N
N-~ ~ ~ ~CO~~$~~~:~ ~ \0 .... , cc;....o - -t'f'\ ..,..
~
B SERIEs o
•• N N" NN
0.. r....._NN
00 N N
NN "'ro
.... ....
('f'\ _--
'" '" "''''
.... ..,. NN
.......... ........
'" '" 00 00 M M
If'\ t'f"I-N N
'" '"
o co--r=::R

CENSUS TABLES
:2 N
=
o .... N
• ..0
:~---;;::; N~
.", ..... N
.~tt"I Nt<"'I \C
'" N
N ..0 N
'-N N'
.," ..... N
: ..... _
~ §r-..~ :_0\1.1'\ :N N N
...... __ I.t'\ ·ro _ ....
·I.t"'IN __ . ..,. N
a-. \I'\-.or--.O_\.O\O_f"oo
~ q-~- ~ -N N
~ ~ ~ ~
J J
130
:'"
'N 'VI N
aN
~ N~ :~.~ ·o~ 5 ..,;
~ l£~ :~~ :'" N N
o 000 'O"NNQ\ r::: 0\_ .~I.t'\
N N
~~N=~ :~~
"'-'"
~ ~~\O~EN~ln ~ ~
.....
.", N
'O:f' ~~&=\~CO'O'~N ~ 0\ ('1'\
~ ('I'\o\"":.~ \ON ~ '"
.a'N
N
~ _N __
'" '"
:'"
......
:-
:-

";j
I~ , 1 I ,
.",
0'\ - ._r...
N
---co ~ _ :-N
V _ :-N
:'"
2 ~~;::~lI"\:!I.t"\:('1) 'C "IN
i ~~~og:!~~r:::~N-.... ' COll""l- ~
N
'" N
131
'-'I!!'-. .....
co~o--~r-..-- - '"
NNf"oo. __ Cf'\O\CO - ....
NNf"oooo-_C1'\ 0"1 CO - ....
:~~~~ '-O-~ -"1
~ ~-)£~~~~ ~ ('.I - -Nll"l N
COC'f'\O--N"'IO\- - '"
oom---C't'\O'\- - '"
_~lI"I~~ :~~ ~ N
N
;--N :!::
N N
~ -~\C~~ :~(\"'\ ~
'" '"
..,. N
N
~ § J cJ
i ~
B SERIES

CENSUS TABLES
NO
"''''
ll'\ 0 0-'" 00 ",,,,
132
~~~ro-~~~N~-_N_~ ___ ~ _N
:'"
~ ~ ~§~~-~~~N~--N-~-NN~ ..,,:
:'"
. __ N
.--N
~ ~ ~~~OO_~~~N~ __ N_~_NN~ \0 -.0 __ N
i
~ ~ e~~OO-m~~N~--N-~_NN~
'" ~ ~ 80~~~~~~~=~~~~N~~~~
~ ~\O~\O\O\O~~\O\O\O\O\O~\O\O\O\O\O
go ~ ~ e
.~ 0 0
.~ ~ 8 o i ~
~ ~~~~~=~§~§~~~~;~~~~;~\ON~~ -.6 N _ ..
@ ~~S~~E-~~~ :--~~ :-m :~~ :N :~ \JS tt)
·NN
~ ~~\O~\O_~O~_~N~~~~~ON~\O\O_~~
~ ~~~~N=~~-2~m 2~ -N~ N ~ ~ M _
~ ~~~~~;S-~~~ ..,; '"
~ ~~~~~~_~~~ :-V~~N-~ :~=-N :~ ,.;: ....
~ ~=~~~*~~oo~~~~~~~oo~~~~~~ooR ~ ~ ~
~ ~=~~~~~~~~~~=~~=~~~~~~~oo~ oq." ,..: ...:

-~ .... ~ .... (/J
::s "'0
= 1-1
I o
1 I r: 'I I~ g I~ , ,~
I ;\~ e I-€'~ ,::J ,
I ,~
I € I e § ,~
CO-lJ"'I-ON - r-.. _0
'"
·0 N .... N
CO-lf"'I-(V")- 0 __ 0
- '"
.", N
.",
'OO-I.l"'\_ON _ r... _~
'00_'-0_0° - '" -;'A
:'"
: ....
.N ·0 N
'0 N ..... N
o::>_V"\_~_ _ 0 -0
- "" oo_O\_rt"I _ _ 0 _..,. - ":.
! g
:& J-I8IZ-II-18-A-(Yeotmal).
133
:'"
r:: G ~!3R~oo~ :I.l"'\~ N N
: ....
~ ,!; ~~~t9co~:l.l"'\o:l N-N
~ ; ~~~~co~:I.l"'\~ ~ ~~ N N
~ ~ ~~~~~~~co= ;!: rt'\ ~
~ ~ ~~~~~~~co~ ~
"" m
N --
N --
N __
N __
s: ~ ~2~~ ",'
-'" --;
- .... <X>
i ~ ~~~~ ~ ~~ ~ ~ ~ ~ N N
r... ~ ~Q_- - ~~ ~ ~ ~ ~ -~~ ~ ~ ~ ~
'"
B SERIES ~ N~N I
~ --N
'" '"

CENSUS TABLES
"1 ~-!: eo ~ C) ~
]1·Mu '0 ~g;;1 -..c I c.:: .
~ I·~~-..; :E'] 0 - QcG ~
J-181Z-II-18-B-(YeotmaI).
<Xl _"
::n ._ co _too.
::r:: "_ co _f"'oo
'" '"
.'o::t'~. .".
.'" .",
.........
.""'~
.~.. .".
134
-D ::g~~~N ("t'II .. N~ -00 N
~ ~c;:i~~:J:a N \O_~-lI"\_
'"
~~~~~~. - - N
~ ~~~~~~ 00 N N-N
N
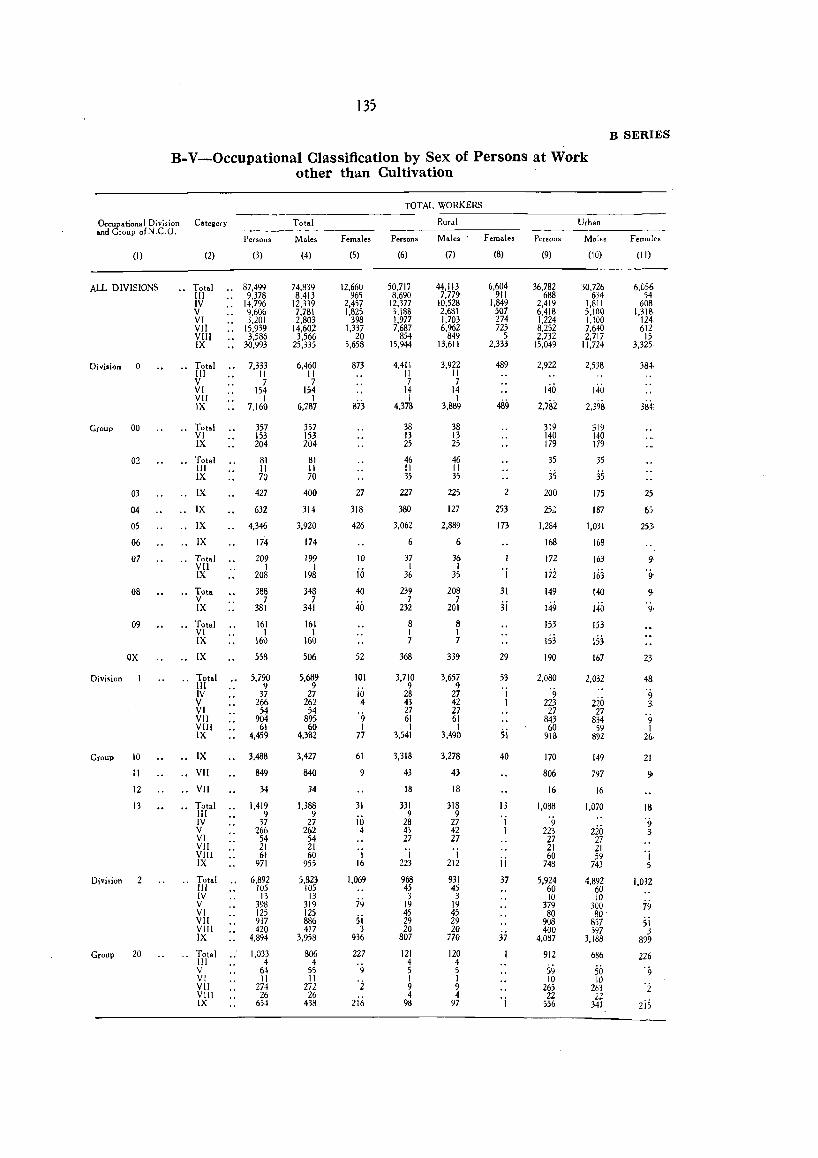
135
B-V-Occupational Classification by Sex of Persons at Work other than Cultivation
Occupational Division Category and Group ofN,C,O,
(I)
Au.. DIVISIONS
Division 0
Group 00
Division
02
03
04
05
06
07
08
09
ox
Group 10
11
12
13
Di\rision 2
Group 20
(2)
•• Total III IV V VI VII VIII IX
•• Total III V VI VII IX
.. Total VI IX
.. Total III IX
.. IX
.. IX
.. IX
.. IX
" Total VII IX
.. Tota V IX
.. Total VI IX
.. IX
.. Total III IV V VI VII VIII IX
.. IX
" VII .. VII
.. Total III IV V VI VII VIII IX
.. Total III IV V VI VII VIII IX
.. Total III V VI VII VIII IX
Persons
(3)
" 87,499 9,378
.. 14,796 9,606 3,201
" 15,939 3,586
'. 30,993
7,333 II 7
154 I
7,160
357 153 204
81 11 70
427
632
4,346
174
209 1
208
388 7
381
161 1
160
558
5,790 9
37 266
54 904
61 4,459
3,488
849
34
1.419 9
37 266
54 21 61
971
6,892 105
13 398 125 937 420
4,894
1,033 4
64 II
274 26
654
Total
Males
(4)
74,839 8,413
12,339 7,781 2,803
14,602 3,566
25,335
6,460 11 7
154 1
6,287
357 153 104
81 11 70
400
314
3,920
174
199 1
198
348 7
341
161 1
160
506
5,689 9
27 262 54
895 60
4,382
3,427
840
34
1,388 9
27 262
54 21 60
955
5,823 105
13 319 125 886 417
3,958
806 4
55 II
272 26
438
Females
(5)
12,660 965
2,457 1,825
398 1,337
20 5,658
873
873
27
318
426
10
iii 40
40
52
101
iii 4
'9 1
77
61
9
31
10 4
OJ
16
1,069
79 si 3
936
227
9
'2 2iti
TOTAL WORKERS
Persons
(6)
50,717 8,690
12,377 3,188 1,977 7,687
854 15,944
4,411 II 7
14 I
4,378
38 13 25
46 11 35
227
380
3,062
37 I
36
239 7
232
8 1 7
368
3,710 9
28 43 27 61 1
3541
3,318
43
18
331 9
28 43 27
'j 223
968 45 3
19 45 29 20
807
121 4 5 I 9 4
98
Rural
Males
(7)
44,113 7,779
10,528 2,681 1,703 6,962
849 13,611
3,922 11 7
14 I
3,889
38 13 25
46 II 35
225
127
2,889
6
36 I
35
208 7
201
8 1 7
339
3,657 9
27 42 27 61
I 3,490
3,278
43
18
318 9
27 42 27 'j
212
931 45 3
19 45 29 20
770
120 4 5 I 9 4
97
Females
(8)
6,604 911
1,849 507 274 725
5 2,333
489
2
253
173
'i 31
ji
29
53
1 1
si 40
13
1 1
ii 37
37
'i
Persons
(9)
36,782 688
2,419 6,418 1,224 8,252 2,732
15,049
2,922
140
2,782
319 140 179
35
35 200
25~
1,284
168
172
I'll 149
149
153
153 190
2,080
'9 223 27
843 60
918
170
806
16
1,088
9 223 27 21 60
748
5,924 60 10
379 80
9U8 400
4,087
912
S9 10
265 22
556
Urban
Mo.ies
(10)
30,726 634
1,811 5,100 1,100 7,640 2,717
11,724
2,538
140
2,398
319 140 179
35
35 175
187
1,031
168
163
163 140
140 153
IS3 167
2,032
220 27
834 59
892
149
797
16
1,070
220 27 21 59
743
4,892 60 la
300 8a
857 397
3,188
686
50 10
263 22
341
B SERIES
Fernales
(II)
6,056 54
608 1,318
124 612
15 3,325
384,
25
65
2530
23
48.
9 :>
'9 1
2(>
21
.. IS
'9 3
'i 5
1,032
79 si 3
899
226
'9 '2
2is

136
CENSUS TABLES
B-V-Occupational Classification by Sex of Persons at Work other than Cultivation-contd.
TOTAL WORKERS
Occupational Division andGroupofN.C.O.
Category Total Rural Urban
Persons Male. Females Persons Male. Female. Persons Male. Femalu
(I) (2) (3) (4) (5) (6) (7) (8) (9) (10) (II)
Group 21 .. Total 162 150 12 162 150 12 V 20 20 20 20 VI 10 10
'j, 10 10
'j, VII 26 20 26 20 VI[[ 20 20 '6
20 20 '6 IX 86 80 86 80
22 " IX 245 195 50 245 195 50
28 •• Total 4.341 3.607 734 478 470 8 3.863 3.137 726 II! 82 82 37 37 45 45 IV 13 13 si 3 3 10 10
52 V 250 198 13 13 237 185 VI 92 92
43 42 42 50 50
43 Vff 626 583 9 9 617 574 VIII 265 262 3 12 12 253 250 3 IX 3.013 2.377 636 362 354 8 2.651 2.023 628
29 .. Total 1.111 1.065 46 369 341 28 742 724 18 III 19 19
i8 4 4 15 15 is V 64 46 I I 63 45
VI 12 12 2 2 10 10 VII II 11 11 II
lIi5 Ui5 VIII 109 109 28
4 4 28 IX 896 868 347 319 549 549
Division .. Vll .. 13,552 12,275 1,277 7,592 6.867 725 5.960 5.408 552
-Group 30 .. VII 8.575 7.974 601 5.917 5.331 586 2.658 2.643 15
31 .. VII 38 38 6 6 32 32
32 ., Vll 1.000 1.000 10 10 990 990
33 .. VII 3.912 3.236 676 1.652 1.513 139 2.260 1.723 537
34 .. VII 27 27 7 7 20 20
Divhion 4 .. Total 8.991 8.180 811 8.252 7.550 702 739 630 109 III 8.222 7.567 655 7.615 7.013 602 607 554 53 IV 768 612 156 636 536 100 132 76 56 IX I I 1 I
Group 40 .. Total 365 359 6 50 44 6 315 315 III 351 351 .{, 37 37 314 314 IV 14 8 13 7 6 I I
41 .. Total 5.676 5.263 413 5.376 5.058 318 300 205 95 III 4.980 4.701 279 4.810 4.571 239 170 130 40 IV 695 561 134 565 486 79 130 75 55 IX I I I I
42 •• Total 497 405 92 497 405 92 III 485 404 8i 485 404 81 IV 12 I 11 12 1 11
43 .. Total 1.853 1.657 196 1.794 1.599 195 59 58 III 1.813 1.622 191 1.755 1.564 191 58 58 'j IV 40 35 5 39 35 4 I
44 .. Total 600 496 104 535 444 91 65 52 13 III 593 489 104 52B 437 91 65 52 13 IV 7 7 7 7
Division .. Total 842 644 198 821 624 197 21 20 III 785 587 198 764 567 197 21 20 IV 4 4 4 4 VI 53 53 53 53
GrouJ;> 50 " Total 820 623 197 819 623 196 III 763 566 197 762 566 196 IV 4 4 4 4 VI 53 53 53 53
59 .. III 22 21 2 20 20
Dimio" 6 .. Total 2.667 2.655 12 613 612 2.054 2.043 11 III 9 9 9 9 V 4 4 4 4 VI 2 2 2 2 Hi:j Hi5 Vil 107 107
ii 2 2 'j ii VIII 2.331 2.319 559 558 1.772 1.761
IX 214 214 37 37 177 177
GrouJ;> 60 .. IX 1
61 .. VIIl 15 15 15 15
63 .. VIII 54 54 11 II 43 43

137
B-V-Occupational Classification by Sex of Persons at Work other than Cultivation-contd.
Occupational Division and Group of N.C.O.
(I)
Group 64
65
66
67
68
69
Oi vision 7·8
. Group 70
71
72
13
74
7S
76
Category
(2)
., Total III V VI VII VIII IX
.• VIII
., VIII
.. Total VIII IX
•. Vlll
.• VIII
Persons
(3)
1.018 9 4 2
107 791 105
56
79
228 120 108
427
789
.• Total .• 31.106 III 221 IV.. 13.973 V 8.918 VI 2.769 VII 226 VIII 764 IX 4.235
.. Total IV V
.. Total IV V
•• Total IV V
•• Total IV V
•• Total IV V
.. Total 1Il IV V VI VIII IX
Total IV V VI
2.705 637
2.068
3.792 2.208 1.584
1.577 1.362
215
1.721 1.497
224
836 633 203
1.236
653 549
2 30
94 2
60 32
Total
Males
(4)
1.017 9
4
2 107 790 105
56
79
227 119 108
427
779
25.388 109
11.682 7.176 2.381
226 760
3.054
1.538 332
1.206
3.459 1.947 1.512
1.504 1.~12
192
1.545 1.349
196
828 626 202
1.201
619 548
1 2
30
94
2 . 60
32
Females
(5)
10
5.718 112
2.291 1.742
388
4 1.181
1.167 305 862
333 261
72
73 50 23
176 148 28
8
35
34
TOTAL WORKERS
Rural
Peroons Males F em.les
(6)
255 9 4
2
2 201 37
12
2 2
220
98
19.935 221
11.705 3.102 1.822
2 264
2.819
780 626
154
2.607 1.899
708
1.263 1.227
36
1.636 1.497
139
521 466
55
582 1
423 I'»)
1 2
2
(7)
255 9
4
2 2
201 37
12
2 2
220
97
16.565 109
9.957 2.596
1.548 2
260 2.093
463 332
131
2.369 1.703
666
1.218 1.184
34
1.463 1.349
114
513 459
54
555
397 154
I 2
3
1 2
(8)
3.370 112
1.748 506 274
4 726
317 294 23
238 196 42
45 43 2
173 148 25
8 7
27
26
Persons
(9)
763
105 590 68
56
67
226 118 108
207
691
11.171
2.268 5.816
947 224 500
1.416
1.925 II
1.914
1.185 309 876
314 135 179
85
315 167 148
654
230 394
30
91
2 59 30
Urhan
Male.
(10)
762
105 589 68
56
67
225 117 108
207
682
8.823
1.725 4,580
833 224 500 961
1.075
1.075
1,090 244 846
286 128 158
82
82
315 167 148
646
222 394
30
91 2
59 30
B SERIES
Females
(11)
9
2.348
543 1.236
114
455
850
11 839
95 65 30
28 7
21
3
3
8
8

138
CENSUS TABLES
B-V-Occupational Classification by Sex of Persons at Work other than Cultivation-contd.
Occupational Division and Category GroupofN.C.O.
(1)
Group 77
79
80
81
82
83
84
85
86
B7
89
(2)
.. Total IV V VI VIII
.. Total III IV
V VI
•• Total
IV V
Persons
(3)
4.085 3,195
S86 3 I
2,163 18 88 84
1,973
120
I 119
.. Total 1,730 1II 2 IV 1,595 V 133
.. Total .. 2.006 III 8 IV 767 V I,Z31
.. Total IV V
.. Total IV V
.. Total IV V IX
.. Total V IX
.. Total IV V VI VIll IX
.. Total III IV V VI VII VIII IX
40 29 II
705 226 479
1.376 1,035
267 74
9
8
50 I
17 22
3 7
6,%1 192 44
787 738 226 758
4.116
Total
Males
(4)
4.049 3,170
875
1,886
76 80
1,730
107 I
106
1,004 2
943 59
1,704
535 1,169
33 25 8
323 86
237
957 622 261
74
9
8
50 I
17 22
3
7
5.097 106 36
447 593 226 754
2.935
Females
(5)
36 25 11
277 18 12 4
243
13
13
726
652 74
302 8
232 62
7 4 3
382 140 242
419 413
6
1,764 86 8
340 145
4 1,181
TOTAL WORKERS
Persons
(6)
3,184 2.821
359
1,206 18 86 37
1,065
4
4
1,482
2 1,401
79
1,251 8
558 685
47 5
42
733 684
49
9
8
43 I
17 15
3
7
4,584 192
11 581 736
2 258
2,804
Rural
Males
(7)
3.162 2,801
357 3
1.041
74 33
934
4
4
890 2
834 54
1,052
381 671
24 4
20
473 429
44
9
8
43 1
17 15 3
7
3.283 106
9
241 593
2 254
2.078
Females
(8)
22 20 2
165 18 12 4
131
592
567 25
199 8
177 14
23
22
260 255
5
1,301 86 2
340 143
'" 726
Persons
(9)
901 374 527
957
2 47 908
116
115
248
194 54
755
Z09 546
40 29 II
658 221 437
643 351 218
74
7
7
2.277
33 206
2 224 500
1,312
Urban
Males
(10)
887 369 518
845
2 47 7%
103
1 102
114
109 5
652
154 498
33 25 8
299 82
217
484 193 217
74
7
7
1,814
27 206
224 500 857
Females
(II)
14 5 9
112
.. lIZ
13
13
134
85 49
[03
55 48
7 4 3
359 139 220
159 158
I
463
6
2
455

139
B SERIES
B-V-Occupational Classification by Sex of Persons at Work other than Cultivation-concld.
TOTAL WORKERS
, Occupational Division Category Total Rural Urban andGroupofN.C.O.
Persons Males Females Persons Males Females Persons Male. Females
(I) (2) (3) (4) (5) (6) (7) (8) (9) (10) (11)
Division 9 •• Total 9,366 6,811 2,555 4,377 3,348 1,029 4,989 3,463 1.526 1II 16 16 16 16 IV V 13 13 13 13 VI 44 34 10 14 14 30 20 10 VII 212 212 212 212 VIII 10 10 10 10 IX 9,070 6,525 2.545 4.323 3,294 1.029 4.747 3.231 1.516
··Group 90 •• Total 1.347 1,342 452 451 895 891 4
III 16 16 16 16 IV I 1 I V 10 10 10 10 VI 14 14 14 14 VII 212 212 212 212 VIII 7 7 7 7 IX 1.087 1,082 404 403 683 679 4
91 .. Total 2,765 1,329 1.436 882 494 388 1.883 835 1.048 V I I I IX 2,764 1.328 1.436 881 493 388 1.883 835 1.048
92 •• Total 910 857 53 99 98 811 759 52 V I I
IX 909 856 53 98 97 I 811 759 52
93 .. Total 372 212 160 119 87 32 253 125 128 V I VI 30 20 10 30 20 10
VIII 3 3 3 3 IX 338 188 150 115 83 32 223 105 118
94 .. IX 2,142 2,142 1,598 1,598 544 544
95 .. IX 1.550 655 895 1,152 550 602 398 105 293
96 .. IX 6 6 5
97 .. IX 80 80 2 2 78 78 ,..
99 .. IX 194 189 73 68 121 121
" \Division X .. IX 960 914 46 38 37 922 877- 45
lGroup X8 .. IX 959 913 46 37 36 922 877 45
X9 .. IX
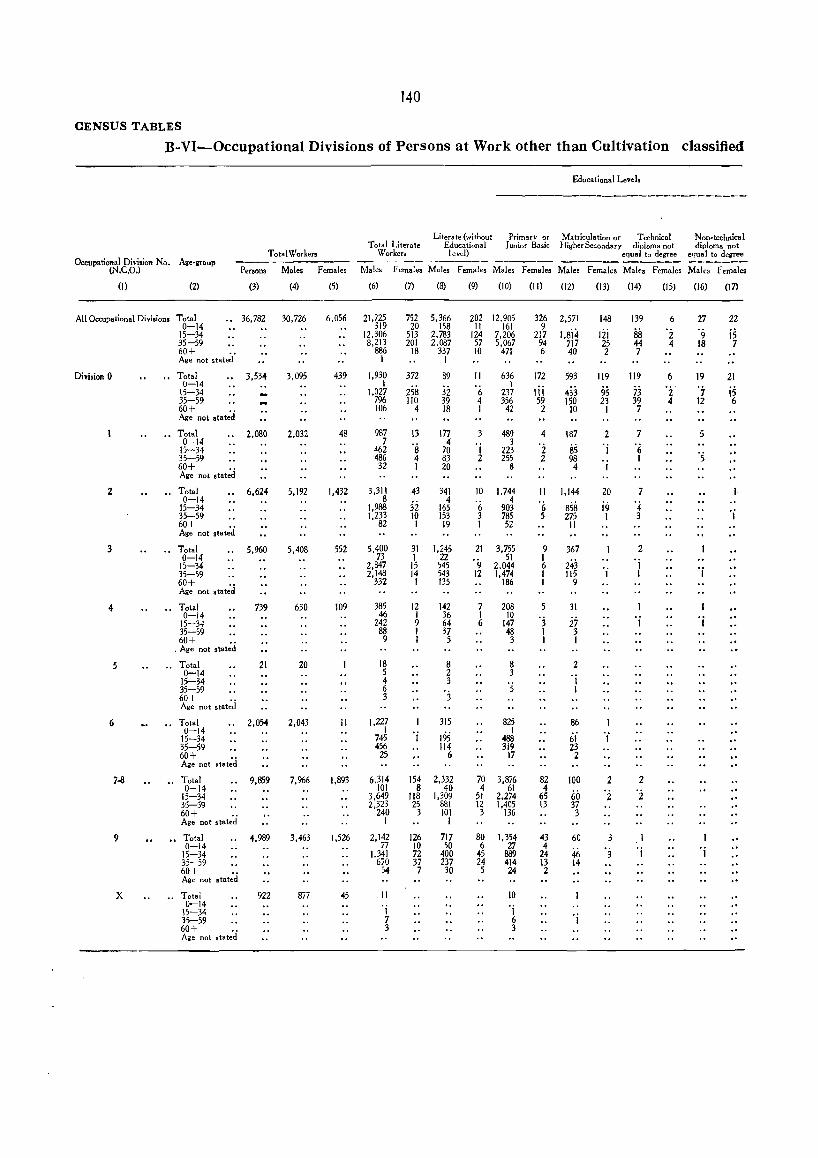
140
CENSUS TABLES
B-VI,-Occupational Divisions of Persons at Work other than Cultivation classified
Educational Levels
--------------------------
Literate (without Primary or Matriculation or Technical Non-technical r otal Literate Educational Junior Basic Higher Se:::ondary diploma not diploma J10t Total Workers Workers level) equal to degree equal to degree
OetUpational Division No. Age-group -_ .......... _...--- ----- ---~-- ---.....---- -------(N.C.O.) Persons Male. Female. Males Females Male. Fem.les Males Female. Males Females Males Female. Males Females
(1) (2) (3) (4) (5) (6) (7) (8) (9) (10) (II) (12) (13) (14) (15) (16) (17)
All Occupational Divisions Total 36.782 30.726 6.056 21.725 752 5.366 202 12.905 326 2.571 148 139 6 27 22 0-14 319 20 158 11 161 9
1.8i4 Iii 8il '2 '9 is 15-34 12.306 513 2.783 124 7.206 217 35-59 8.213 201 2.087 57 5.067 94 717 25 44 4 18 7 60+ 886 18 337 10 471 6 40 2 7 Age not stated· 1 I
Division 0 .. Total 3.534 3.095 439 1.930 372 89 11 636 172 593 119 119 6 19 21 0-14 1
3i 1
433 9S '7 is 15-34 1.027 258 6 237 111 73 2 35-59 796 110 39 4 356 59 150 23 39 4 12 6 60+ 106 4 18 I 42 2 10 I 7 Age not .tat~J
Total 2.080 2.032 48 987 13 In 3 489 4 187 2 7 5 0-14 7 ·s -4 'j 3 '2 85 '6 15-34 A62 70 223 1
'5 35-59 486 4 83 2 255 2 98 1 60+ Age not .tat~ci
32 1 20 8 4 I
2 .. Total 6.624 5.192 1.432 3.311 43 341 10 1.744 11 1.144 20 7 I, 0-14 8
32 4 '(, 4 '(, 858 '4 15-34 1.988 165 903 19 OJ 35-59 1.233 10 153 3 785 5 275 I 3
60+ 82 I 19 I 52 II Age not .tated
3 •• Total 5.960 5.408 552 5.400 31 1.245 21 3.755 9 367 2 0-14 73 I 22 '9 51 I
243 'j 15-34 2.847 15 545 2.044 6 'j 35-59 2.148 14 543 12 1.474 1 115 1 1 60+ 332 I 135 186 1 9 Age not stat;J
4 .. Total 739 630 109 385 12 142 7 208 5 31 I 0-14 46 I 36 I 10 '3 27 . i 'j 15-34 242 9 64 6 147
35-59 88 I 37 48 I 3 60+ 9 I 5 3 I I
. Age not .tat~J
5 •. Total 21 20 18 8 2 0-14 5 2 'j 15-34 4 3
'5 35-59 6 '3 I 60+ 3 Age not stat;J
6 .. Total 2.054 2.043 II 1.227 315 825 86 0-14 I 'j 195
I lij 'j 15-34 745 488
35-59 456 114 319 23 60+ 25 6 17 2 Age not St8t~J
7-8 Total 9.859 7.966 1.893 6.314 154 2.332 70 3.876 82 100 2 2 0-14 101 8 40 4 61 4
60 '2 '2 15-34 3.649 118 1.309 51 2.274 65 35-59 2,323 25 881 12 1.405 13 37 60+ 240 3 101 3 136 3 Age not stated I 1
9 f. Total 4.989 3.463 1.526 2.142 126 717 80 1.354 43 60 3 0-14 i7 10 50 6 27 4
46 'j 'j 15-34 1.341 72 400 45 889 24 3 35-59 670 37 237 24 414 13 14 60+ 54 7 30 5 24 2 Age not stat~J
X o. Total 922 877 45 II 10 0-14
15-34 I 1 'j 35-59 7 6 60+ Age not stated
3 3
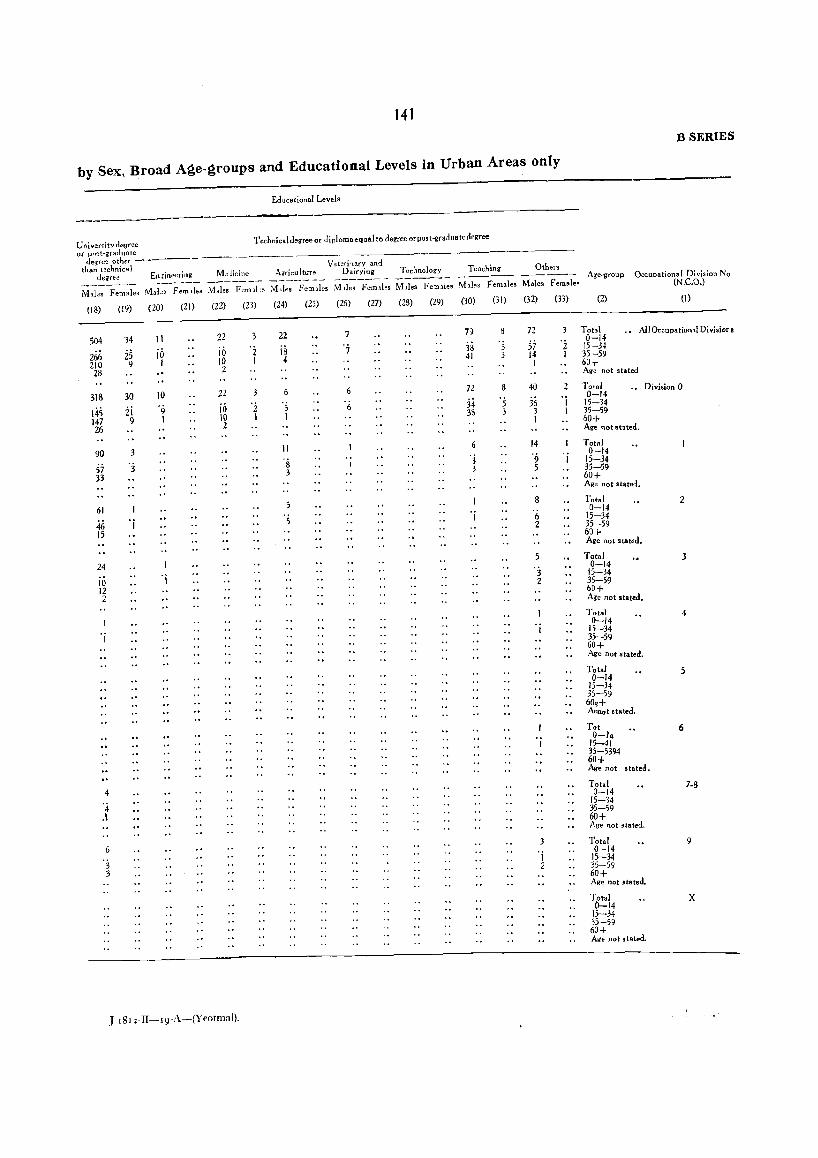
141 B SERIES
by Sex, Broad Age-groups and Educational Levels in Urban Areas only
Education,1 Levels
---------University degree Technicaldegree or dipiomaequal to degree orpost·graduate degree
or post~graduate degtee other
than technical V ~t~rhary and deqrec Erl~ineering Me::Iicine A~ricultuTe Dairying Technology Teaching Other'S _______________________________________ ~~ ________ ----- Age-g'toup
M'lles Females l'vlab~ Femlles Males Fern.}i 's :Vhles Fe:nlles :VLles Feffilbs Mlles Fe:Illles !\'bles females Males Female ..
Occuoationa I Dj vision No (N.CoOo)
(18)
504
266 210 28
318
145 147 26
90
57 33
61
46 15
24
10 12 2
OJ
4 °4 0\
6 °3 3
(19) (20) (21) (22)
34 11 22
2S io io 9 I 10
2
30 10 22
ii °9 io 9 1 10
2
3
"3
'j
OJ
]-1 81 2_II_19-A-(Yeotmal)0
(23) (24) (2» (26) (27) (28) (29) (30)
22 7~
°i iii 7 33 1 4 41
6 72
°2 °5 °6 34 I I 33
11
8 "j
3 3
5 Os 1
(31)
8
j
3
8 Os
3
(32)
72
57 14 1
40
36 3 1
14 °9 5
8 °6 2
5 °3 2
OJ
OJ
3 OJ
2
(33)
°z 1
OJ
I
(2) (I)
Total AIlOccupatioml Divisior. 0-14
15-34 35-59 60,.. Age not stated
Total '0 Division 0 0-14
15-34 35-59 60+ Age not stated.
Total 0-14
15-34 35-59 60+ Age not stated.
Total 2 0-14
15-34 35-59 60+ Are not stated.
Total 3 0-14
15-34 35-59 60+ Age not stated,
Total 4 0-14
15-34 35-59 60+ Age not stated.
Total 5 0-14
15-34 35-59 60g+ Aenot stated.
Tot 0-la
15-41 35-5394 60+ Age not s ta ted.
Total 0-14
15-34 35-59 60+ Age not stated.
Total 0-14
15-34 35-59 60+ Age not $tated.
6
7-B
9
Total X 0-14
15-34 35-59 60+ Age not ,tatedo

142
CENSUS TABLES
B-VII-Part A-Persons workin~ principally (i) as Cultivators, (ii) as Agricultura1 Labourers or (iii) at Household Industry classified by Sex and by Secondary Work (i) at Household. Industry, (ii) as Cultivator or (iii) as A~ricultural Labourer
Principal Work Secondary Work Principal Work Second .. y Work ~------ ----------------~-
Cultiva tor, Agricultural Total IV I II Cultivator, Agricultural Total IV II Labourer or Household Rural At House .. As CuI ti va tor As Agri .. Labourer or Household Rural At House- As Cultivator A, Agri-
Industry (Division Urban hold Industry cultural Labourer Industry (Division Urban hold Industry cultural Labourer and Maior Group) - _ ___.--.-_-
-----~-- --_------ and Maior Group) ------ --------- ~~--~--......_
Males Females M.le. Females Males Females Mal.s Females Males Females Males Females
(l) (2) (3) (4) (5) (6) (7) (8) (l) (2) (3) (4) (5) (6) (7) (8)
Cultivator Total .. l.m 222 14.824 19.982 lvb;or Group 24 Total .. 3 8 11 Rural .• 1.660 215 .. 14.692 19.858 Rural .. 3 8 II Urban .. 55 7 132 124 Urban ..
Agricultural L.bourer " Total •• 785 455 4,390 4,425 25 ., Total •• 2 2 4 Rural •. 779 441 4.361 4.395 Rural .. Z 2 4 Urban .• 6 14 29 30 Urban ..
HQ"".hold Industry .. Total .. l.llS 101 770 316 27 Total .• 248 9 40 17 Rural .• 1.116 101 768 292 Rural .. 248 9 40 15 Urban •• 2 2 24 Urban .. 2
28 Total •• 381 6 245 82 Division 0 " Total .• 30 27 12 Rural .• 379 6 245 66
Rural .• 30 27 12 Urban .. 2 16 Urban ••
30 Total •. Rural ..
MaiorGroup 00 Total •• 2 3 Urban .. Rural .. 2 3 Urban •• 31 Total .• 97 2 191 24
Rural .. 97 2 191 21 03 " Total .• 3 Urban .. 3
Rural .. 3 Urban ., 33 Total ••
Rural .. 04 Total •• 28 21 II Urban ..
Rural .• 28 21 II Urban •• 34 &35 Tot.l •. 95 32 120 106
Rural .. 95 32 120 103 Urban .. 3
Division 2 &: 3 Total .. 1.088 100 743 304 Rural .• 1.086 100 741 280 36 Tot.l .. 125 11 45 19 Urban ., 2 Z 24 Rural .. 125 II 4; 19
Urban ..
MaiorGroup 20 .. Total •• 47 17 27 9 38 .. Total •• 2 2 Rural .• 47 17 27 9 Rural .. 2 Z Urban .• Urban .•
23 Total .• 31 19 36 33 39 .. Total •• 57 23 3 Rural .. 31 19 36 33 Rural .. 57 21 3 Urban .. Urban .. 2
J'IBIz.fl-Ig·B-(Yeotmal).

143
B SERIES
B-VII-Part B-Industrial Classification by Sex of Persons working in Non-household Industry Trade, Business, Profession or Service who are also engaged in Household Industry
Principal Work Persons working additionally at Household Industry Principal Work Persons working additionally at Hou •• hold Industry Branch of Industry Branch of Indo,try ----------- --
Total Industry Industry Industry Total Indu5try Industry Industry Non-household Industry, Rural Division Division Division Non-household Industry Rural Division Division Division
Trade. Business, Urban 0 I 2&3 Trade. Business Urban 0 I 2&3 Ptofession or Service ------ -~---- ------ Profession or Service -~-~---- -----
Division Mal .. Femal .. Males Females Males Females Division Mdle. Fem.l., Males Females Male, Females
(I) (2) (3) (4) (5) (6) (7) (8) (I) (2) (3) (4) (5) (6) (7) (8)
Total Total .. 64 3 2 156 43 Division .. 4 Total .. 6
Rural .. 38 2 106 7 Rural .. 4
Urban •• 26 2 50 36 Urban ., 2
Division 0 Total .• 29 9 6 Total., 14 43 35
Rurol •• 27 9 Rural .. 3 29
Urban .• 2 Urban .. II 14 34
Total .• 2 3 7 Total .• 6 2
Rural .• 2 3 Rural., I
Urban ., Urban ., S
2&3 .. Total .. 5 30 8 Total .. 10 2 64 4
Rural .. Rural., 7 Sol 2
Urban .. 5 23 Urban .. 3 10 2

144
CENSUS TABLES
B..;VIII-Part A-Persons unemployed, aged 15 and above, by
Seeking employment for the lirst time
EducatioMI Level. Age·groups
----------------------------~--------------------Total Unemployed Total 15-19 20-24 25-29 30-34 35+ Age not stated
Persor.. Mal .. Females Male. Femal •• Males Female, Males Females Males Females Males Felll.les Males FemalesMalesFemales
(I) (2) (3) (4) (5) (6) (7) (8) (9) (10) (11) (12) (13) (14) (15) (16) (17) (IS)
DISTRICT URBAN TOTAL 833 810 23 431 6 185 3 171 2 37 21 17
Illiterate 117 112 5 25 1 12 3 2 3
Literate (without educational level) •• 89 86 3 34 13 13 4 2 2
Primary or Junior Basic 460 451 9 241 2 103 95 21 11 II
Matriculation or Higher Second.ry " 156 150 6 123 3 56 2 56 5 5 1
lecbnicaIdiploma not e<lualto degree 3 3 2
Non-tecbnicaldipIoma not equal to degree •• 2 2 2
Unil'ersity degree or post"'itaduate degree other than technical degree.
6 6 4 2 2
Technical del1l'ee or diploma equal to degree or posl-greduale degree-
Engineelinl'
Medicine .. Allficulture
Veterinary and Dair)'inll ••
TecbnoloJlY' •
Teaching
Olb.a
B-VIII-Part B-Persons unemployed, aged 15 and above,
Unemoloyed by Educational Levels
TotalUnemp!oyed Illiterate
District/Taluka Persons Males Females Persons Male. Females
(I) (2) (3) (4) (5) (6) (7)
DISTRICT RURAL TOTAL .. 1,089 1,007 82 274 199 75
Darwha Taluka 230 219 II 66 56 10
Yeotmal r.luka 204 187 17 55 43 12
PUled Taluka 237 192 45 100 56 44
K.lapur r aluka 188 185 3 23 20 3
W,niTaluk. 230 224 6 30 24 6

145
Sex, Broad Age-groups and Educational Levels in Urban Areas only
Pet50nsemployecl belate but now out of employment and. seeking work
Age-groups
Total 15-19 20-24 25-34 35-44 45-j9 60+ Age not shteo:l ----- ------
Males Female. Males Females Males Females Males Females Males Females Mal .. Female. Males Females Males F fmales
(19) (20) (21) (22) (23) (24)
379 17 74 84 2
87 4 12 14
52 3 13 5
210. 44 54
27 3 5 11
2
(25) (26) (27)
98 49
16 13
12 10
63 22
5 3
(28) (29)
46
15
8
3 22
(30)
4
2
(31)
28
17
4
5
2
by Sex and Educational Levels in Rural Areas only
Unemployed by Educational Levd.
Literate (without edu- Primary or Junior Basic Matriculation and. above cation. I lev. I)
Dislricl/T .Iuk. Persons Males Females Persons Males Females Persons Males Females
(8) (9) (10) (11) (12) (13) (14) (15) (16) (1)
101 101 - 593 588 5 121 119 2 DISTRICT RURAL TOTAL
16 16 119 119 29 28 D.rwbaT.luka
12 12 105 101 .. 32 31 Yeotm.1 r.luka
20 20 99 98 18 18 Pu.adTaluka
31 31 122 122 12 12 K.lapur T aluka
22 22 148 148 30 30 Wani T.luka
(32) (33)
2
2
(34)
B SERIES
Educational Levels
(I)
DISTRICT URBAN TOTAL
Illiterate.
Lite,.ate {without educationallevel},
Primary or Junior Basic.
Matriculation or Higher Secondary.
Technical diploma not equal to degree.
Non.technical diploma not equal to degree.
University degree or pos;t-ID"aduate degree other than technical degree.
Technical degree ot diploma equal to degree or post .. graduate degree--
Engineering.
Medicine.
Agriculture.
Veterinary and Dairying.
Technology,
Teaching,
Others,

CENSUS TABLES
.0. ~ 0 "0 <;
I ~
11 € 110-I • I~ e 1:2
I • ..!! 1 ~
--0 N--.... 0"" a:.;~r-:-~ NN
&::~~~ ;ff\ ",,,,,..., r--.."ll"i-" ...,"'-
~~~~~:;: tf"IO"NlI"'Ir""'\N _:r--:o.t{NlI'I~ N"'_ N_
8~~= ;r<"'I "'0 .... ,_:ll"'i\D~
"' .... M- ..... OOOO _1.O-.;;r\O-c-t'\ l.f"\r--..OOlI'lN_ t--.~~_:-r, ... \r·\" N'ClI"i""I-N-
'O!tO\MNr--..C'<"'I. oo\Oor-..f'-.1.Q o-r--.OO""f"lrH'"'1 ~MO~~ -1"i""I~--.... 0")
146
0\ O_\ON \r\ • -'"'f"

147
B SERIES
B-X-Sample Households (i) engaged neither in Cultivation nor Household Industry, (ii) engaged either in Cultivation or Household Industry but not in both, and (iii) engaged both in Cultivation and Household Industry
(Based on 20 per cent Sample)
Households engaged netther in ClltivJ_ -:on nor hO~l.sehold
HOLlsehvld:. enga'..;er1 both in HoUSe;ld\ls en<Jfl.2"2d in Households engag(:o Household Cl,L.;vuli~ l~ f:nn HOL:3ehold
C .l.ivdicn"onL: Intiud,y h(lustry Total Number of Households I ,Justry DiWict/Taluka
Total Rural Urban Total Rural Urban Total Hu(~d U:can
(I) (2) (3)
DISTRICT TOTAL 46,955 41,177
Darwha T,luh" 11,106 9,982
Yeotmal TaIuka 9,246
Pus.d T.luka .. 10,704
Kelapur Taluka" 8,413
Wani Taluka .. 7,486
7,384
9,419
7,718
6,674
(4) (5) (6)
5,778 26,477 21,698
1,124 6,467 5,558
1,862
1,285
695
812
5,886
5,445
5,003
3,676
4,269
4,457
4,427
2,987
(7) (8) (9)
4,779 18,416 17,695
909 4,260 4,098
1,617
983
576
689
2,925
4,859
3,028
3,344
2,771
4.641
2,944
3,2,!J
(!O)
721
162
154
218
84
103
Totul
(II)
1,492
271
320
284
295
3°'
Rural Urban T0tal
(12)
1,246
224
236
217
265
304
(13)
2.6
47
S.
67
30
18
(14)
57J
108
115
116
87
144
Hural
(i5)
'> 38
102
108
104
82
\42
B-XI-Sample Households engaged in Cultivation classified by Interest in Land and Size of Land Cultivated
(Based on 20 per cent ~ample)
Urban
\l6)
6
12
'(a)=Owned or held from Government. (b)=Held from private persons or institutions for payment in
money, kind or share.
(c)=Partly held from Government and pdrtly frem private persons or institutions for payment in money, kind or share.
No.of l-hu~~:,_)lds en:?3.~ej in Cultivation by S'ze of Land in Ac!es Interestin land cultivated Cclltivatlng
Households Less than I 1.0-2.4 2.5-4.9 5.0-7.4 7.5-9.9 10.0·-12.4 12.5-14.9 15.0-29.9 30.0-49.9
(1)
DISTRICT TOTAL (aJ (b) (c)
DISTRICT RURAL (a) (b) (c)
D1STR leT URBAN (a) (b) (c)
DARWHA TALUKA (0) (b) (c)
(2)
.. 18,986 .. 14,362
2,3H7 2,237
.. 18,233
.. 13,723 2,331 2,179
753 639 56 58
4,200 3,502
284 414
YEOTMAL TALUKA .• (a)
2,879 2,002
504 373
(b) (c)
PUSAD T ALUKA (a) (b) (c)
KELAPUR TALUKA .. (aJ (b) (c)
WANITALUKA (a) (b) Ie)
4,745 3,839
373 533
3,026 3,061
656 309
3,383 2,319
514 550
(3)
21 20 I
20 19 1
7 7
9 8 I
2 2
(4)
428 406 20 2
410 389 19 2
18 17 1
134 131
3
88 83 3 2
133 129
4
19 Iv 3
3. 30 6
(5)
1,253 1,177
63 13
1,221 1,146
62 13
32 31 I
406 379
19 8
212 195 17
383 369 II 3
68 64 3 I
152 139
12 I
(6)
1,913 1,742
122 49
1,858 1,6'15
117 46
55 47 5 3
(7)
1,375 1,193
115 67
1,339 1,161
112 66
36 32 3 I
(8)
2,432 1,~24 354 154
2,359 1,864
343 152
73 60 II 2
Talukawise Rural only
482 396 556 460 364 486
13 19 40 9 13 30
254 224 23 7
659 617 32 10
161 136 22 3
302 258 27 17
200 169 21 10
371 331 20 20
121 97 21 3
251 200
31 20
296 220 63 13
654 568 52 34
329 230 83 16
524 360 105 59
(9)
1,264 922 17Y 163
1,233 8~3 177 163
31 29 2
233 185
22 26
169 113 32 24
271 215
14 42
247 175 63 9
313 205 46 62
(10)
6,238 4,134 1,183
921
6,008 3,952 1,160
896
230 182 23 25
1,174 892 134 148
956 538 264 154
1434 1,022
161 251
1,248 766 374 108
1,196 734 227 235
(11)
2,426 I,m 317 532
2,300 1,478
307 515
126 99 10 17
476 335 30 111
398 240 74 84
542 349 74
119
495 323 78 94
389 231
51 107
50+
(12)
1,525 1,160
3U 335
1,384 l,u29
30 325
141 131
10
331 258
4 69
274 188
7 79
287 229
4 54
306 223
8 75
186 131
7 48
Unspecified
(13)
III 107
3 I
101 97 3 1
10 10
5 5
31 31
2 2
31 30 I
32 29 2 I
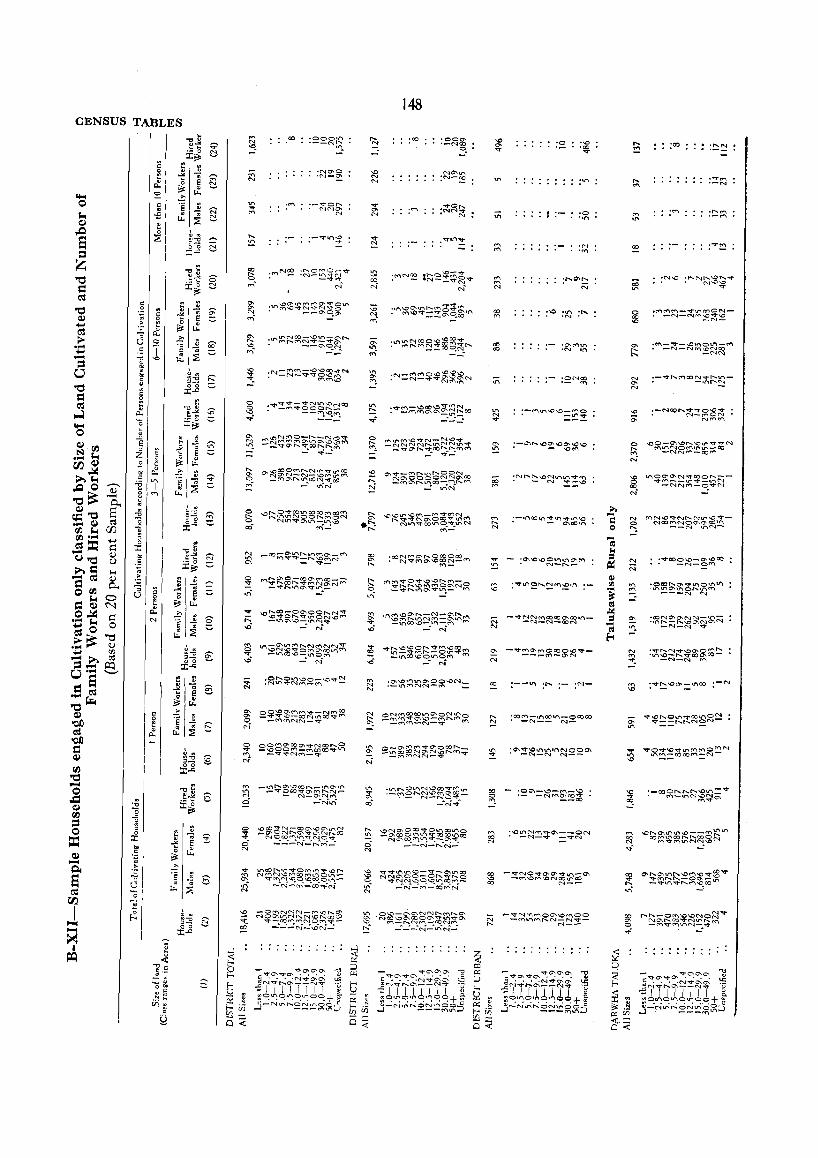
CENSUS TABLES
I I g
I~ I-I I I I
.. a ] ~ , ~ .s I ;,'1
~I 01 '01 -I
~I I
·oooll"l '--N~
·-'<:t'Or-... . NN'"
N
:N'\N~ :~S:B~~~ ".;
S \C~~~~~~~~~~ a:J~ f'i\"_:
~ ~§~~3~~§~~~ -.D _: NO,
:;;: N
g ~~*~~~~~~~~ '" ~ ~~8g~~~~22~~ ("1"\ -'O;f''''t"Nff'I_..:t' N
(t"\ _1/"It.....o....oCOr....._\l'\CJ'.1J"\ lI"'I _"VOCO"'1'O\('I1t'-.N""" ~ - N-Q"\('l("~ ci -:t,fll'\"
.".
'" N
148
:'"
:ti"\N~ 1~2~~~"=I"
'"
~~~*s~~~!.~~ "'-
~ ~~t;;~~~~~§3N~ '" ~ ~~~~[8~~=~~~ <.D _: N
~ ~~~~~~~g~~~ v:;j _" N
~ ~!6~~H3~~~~~;;
'" ~ :~~~iQ£i~~g~~ ttS -"N"';
eo '"
'" 00
'" ..... N
:'"
'0 .'"
~ - 'Cf\\O\oOO1.l"'tU"\O'~ V"! • N-r..._
·~('I"\-lI"IC:Oll'\-OOQOO . -N-- N-
'0'\"!f'\C)11''W,,\1I'\NOOO\ • -~-N N--
-"VN~("'f"\OO\\O('I"'\OO -ff'lUi('l"'\t-...N-Nv-
N--
:'"
R \()~V\~~~~:g:!05N ~ -r"H"'"t't"I-a.:>('('\
'" ~ lI"'I~~~~;':;~::~N-00 -C"H"'~C"I"'I-~"O::f'"("..J
N

0.. o
~
" ...,< c c ~,~
-~ _. ~ 0",
.~ ~ tfl~
:; g
" ~ S ::::. ~ ~ ..t ~ 8' 's ::E ;::. ~
]-18Iz-IJ-zo-A-(YeotmaI).
o .... N
'0 ..... N
,_,. ."'"
:::! :~~G5 ...
~ -oog~~~~~~~~
'" ~ -:£§3~~~~§!~~~ N
149
t£ N~~~gs~~~~= N
0rf:) __ .... N
'" 00
''''0 ...... ....
''''N . '"
:f('('IlO\~~~~ -N_
''VCO('''(\-N''\I1'''oCON\''(''\_ . -N-N-I.t"'\- -
?2 N~~~!::::~~~~~~ In.. --N"\N~\QC'!j
'"
~ -~~~~~o~?1;~~ ... --V('(1t-... .. r.....-qo
::it: -O'\M-MNo\r-..r-.. __
0'>.. -\O~:::~~~~~('f'\ N
..... '"
B SERIES
: : : ::2 :~
:'"
'0",,""1'" t'-.. No-.-.:t"-N"\f"o. ·--.:t"NNOO"'~"""ror-.._
--NNc:,~
N NC"f"'INr-...O\-ONMC'f'\O '-0 -['.,\.ONr--.NLt"'lN.-
--N-("t"'\
o N~:;;!i~~~~~~~ ~ -to'lN-..QM-......;,.-'" ....-

150
CENSUS TABLES
B-XIII-Sample Households engaged both in Cultivation and Household Industry showing Size of Land Cultivated classified by Principal Household Indus try
(Based on 20 per cent Sample)
NJ;nl)er of Househ0lds by Size in Acres of Land Cultivated Gode No. TotalNo.
of of house-I.S.I.C. holds Less than 1 1.0-2.4 2.5-4.9 5.0-7.4 7.5-9.9 10.0-12.4 12.5-14.9 15.0-29.9 30.0-49.9 50+ Unspecified
(I) (2) (3) (4) (5) (6) (7) (8) (9) (10) (II) (12) (13)
DISTRICT RURAL
All Industries 538 24 60 59 50 57 41 161 47 37 2
Division 0 94 4 3 6 8 4 34 15 15
Major Group 00 3 2
03 9 2 2
04 82 4 2 2 4 4 31 15 13
Division 2&3 444 19 56 56 44 49 37 127 32 22 2
Major Group 20 27 4 11
22
23 15 2 2 2 2 2
25
26
27 116 IS 13 11 13 11 37 12 3
28 135 8 19 19 IS 17 II 38 4 4
31 38 3 4 4 5 4 12 2
34 & 35 36 3 4 5 4 4 5 7 2
36 41 6 6 3 15 3
37 3 2
39 28 2 4 2 2 6 4 2
DISTRICT URBAN
Alllndustrie. 32 4 2 3 2 14 3
Division o 1 10 4 and
04 I Major Group
Division 2 & 3 22 3 2 2 2 10 2
Major Group 20 2
22
27 I
28 4
31 4 2
34 & 35 4 2 2
36 2
39
J-I8IZ-II-20-B-(Yeotmal).

151
B SERIES
B-XIV-Sample Households engaged only in Household Industry classified by Principal Household Industry
(Based on 20 per cent Sample)
Part A-Households classified by major groups of principal h01Usehold industry and number of persons engaged
Code No.of ISle
(I)
Total Total Ruta 1 number of Urban households
(2) (3)
DISTRICT TOTAL
AI I Industries T
R .. 1,492 .. 1,246
U .. 246
Divi'ion 0 T 138
Major Group
R U
113 25
00 T 5
02
03
04
R U
T R
U
T 27 R •• 27
U
T 105
R.. 81 U .. 24
Division 2&3 T 1,354 R .. 1,133
U
Major ~roup T
R U
21
22
T R U
T R .. U ..
221
68
43 25
2
2
16
16
23 T 38
24
R.. 38
U
T R .. U ..
3
3
Households engaged in Household Industry according to the number of persor,s engaged
1 2 3-5 6-10 More than Person Persons Persons Persons 10 persons
(4)
960 822 138
86 72 14
2
1
16
16
67 54 13
874 750
124
39
29 10
8
8
9 9
(5)
371 303
68
38
30 8
2
2
9
27 19
8
333 273
60
16
10 6
6
6
20 20
(6)
153 116 37
13 11
2
2
10 8
2
140 105 35
12
3 9
2
2
9 9
2 2
(7)
8 5
7
5 2
(8)
Code No.of ISIC
(I)
Major Group
Total, T 7taI _ RUf3.l. numoer ot Urban housdlOlds
(2) (3)
25 T 2 2 R ..
U ..
2b T
27
28
31
33
34-35
36
37
38
39
R .. U ..
T 193 R .. 165 U 28
T 500 R .• 423 U.. 77
T
R U
T R .. U ..
182
173 9
T 128 R 107
U .. 21
T 144 R .. 123
U .. 21
T R .. U
T R .. U
T 71
R.. 53 U.. 18
Households engaged in Household Industry acccrdinil to the number of persons engaged
3-5 6-10 More than Pl;!fSOn Persons Persons Persons 10 persons
(4)
2 2
149 128
21
344 303
41
136
130
6
37 26 11
89
79 10
54 41
13
(5)
40 35
112 88 24
37
36 1
44 42
41 31
10
14 10 4
(6)
4 2 2
44 32 12
42 36 6
13 12
2
(7)
3 2
(8)

152
CENSUS TABLES
B-XIV-Sample Households engaged only in Household Industry classified by Principal Household Industry~concld.
(Based on 20 per cent Sample) Part B-Households classified by minor groups of pI incipal household industry
Number of Households Numbe( of Households Number of Households Cod. No. Code No. Code No. of ISIC Total Rural Urban of ISIC Total R'-lral Urban of ISIC Total Rural Urban
(1) (2) (3) (4) (I) (2) (3) (4) (I) (2) (3) (4)
DISTRICT TOTAL 2::50 38 38 3402 5
2441' 3431 All Industries 1.492 1.246 246
2442 3434 9 9 0061 2446 3440 4 4
0072 2550 2 3500 78 64 14
0090 2641 3550 5 2 3
0232 2702 3561 3 2
0310 27 27 2732 166 147 19 3651
0401 18 16 2 2733 2 2 3654
0402 2 2734 13 13 3671 2 2
0403 3 2765 5 4 3672 4 3
0404 2 2 2771 3 3673 4 2 2
0405 52 35 17 2780 2 3675
0411 11 11 2792 3683 11 10
0421 3 ;800 . 3691 5
0422 28iD 220 181 39 3693
0431 2 2 2320 34 29 3694 2
0432 11 7 4 2831 125 124 3690
2001 2 2885 88 66 22 3698 110 95 15
2004 2886 4 4 3699
2041 4 4 2888 3 2 3720
2042 2 2 2889 25 16 9 3780
2060 4 4 3101 . 3880 2 2
2070 18 8 10 3102 3 3890
2092 15 10 5 3111 174 165 9 3932 49 35 14
2093 3130 2 3933 5 5
2096 15 7 8 3'40 3940 3 2
2097 5 3150 • 3997
2142 2 3361 3993
2200 16 16 3401 23 21 2 3999 12 10 2
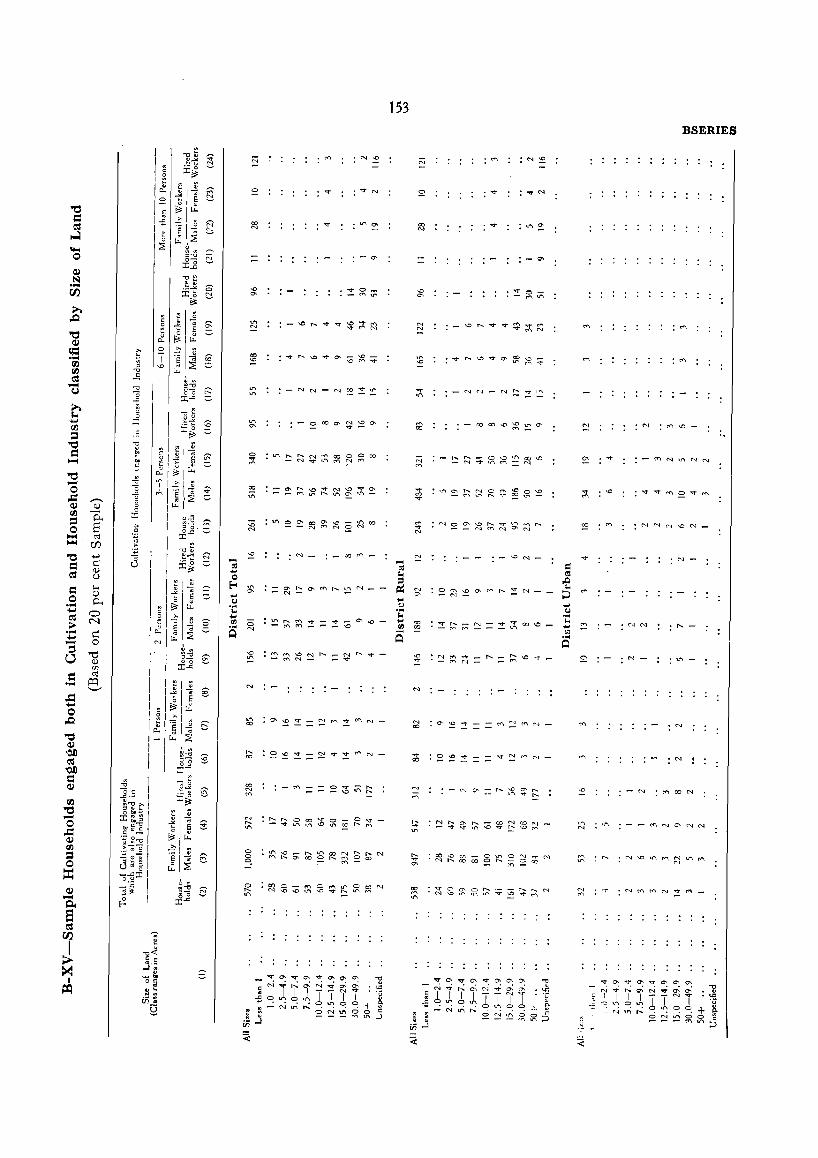
"tI -o .c: IV (/J
:s o == "tI d til
d o .... ..... til > .... ..... '3 o d ....
co N
"" '"
o '"' '"
:~
. .".
-NN-Nro:!~
'" N
'"
153
co N
..,.",
_'"
....,.. _ N ('-1 - N
'"
_\ON_
:N o
'" N
'" '"
BSERIES
N
-("('\Nl.f'INN
N -
.NN "-_
N _
- N
..:ro-:~a: N "'" f'o,. 0\
~ I I I I ...:::: o.r;~..r;
N \J"\ ......
N
,,",CON

CENSUS TABLES
't:I ..... o .= ~ UJ ::s o
::r:: 't:I = ~
= o .... ... ~ ;;.-.... ... ..... 8 = ....
'" N
'" '"
:"""
N""
- ...... - ~
""3"\0-_ NN
~a;~
'11'1 ~ ~ C! - Nor.
154
'"
N N
N
N
""
N N
N
cO o
N
:'"
N
_O\N-"':t'-.::t~-N
... --
'" ""
N
'"
..,. o
- N
""'_!:"'I"'\ 00 N
N .",
N
-N~ __ ·N
C'f'\-.::t"':t'- __ OON_
... --.-"d"-_
N
'"

."
1 :t
I
I , I 11 I " ,~
II I
00
"'
N N
N GO
155
N ....
N ....
- - "" N
..,. N
a N
B SERIES
N

156
CENSUS TABLES
B-XVI-Sample Principal Household Industry classified by Period of Workin~
(Based on 20 per
10tal Total 1 to 3 months 4 to 6 rnon tho Code No. Rural --~------------~--- -------------------
Household Industry Urban Family WorkerS Family Workers FamilyWorkers (Division andl\lajor (a) \Vith cultivation H01!se .. ----~- Hired House .. Hired House ... Hired
Group only) (b) Wi thou! cultivation holds Males Females Workers holds Males Females Workers holds MaJc, Females Workers
(I) (2) (3) (4) (S) (6) (7) (8) (9) (10) (II) (12) (13) (14)
DISTRICT TOTAL
AIIlndustrie ••• Tetal 2,062 2.770 983 397 47 56 36 15 241 352 160 81 (a) " 570 1.000 572 328 20 30 29 12 93 172 105 56 (b) " 1.492 1,770 411 69 27 26 7 3 148 180 55 25 Rural 1.784 2.444 844 354 41 49 30 12 219 323 149 76 (aJ " 538 947 547 312 18 26 25 12 85 161 fOl 51 (b) " 1,246 1.497 291 42 23 23 5 'j 134 162 48 25 Urban 278 326 139 43 II 7 6 22 29 11 5 (a) " 32 53 25 16 2 4 4 '3 8 11 4 5 (b) .. 246 273 114 27 4 3 2 14 18 7
Division 0 Total 242 328 179 126 3 4 3 34 48 32 IS (a) " 104 181 122 121 I 3 2 19 33 25 16 (bJ .. 138 147 57 5 2 I I 15 15 7 2 Rural, 207 282 161 119 1 3 2 31 44' 31 IS (a) ., 94 164 115 116 I 3 2 19 33 25 16 (b) .• 113 118 46 3 'i 'j 'j 12 II 6 2 Urban 35 46 18 7 3 4 1 (a) .. 10 17 7 5 (b) .• 25 29 11 2 2 I I 3 4 I
Mail, Group 00 Total 8 10 5 15 3 3 (a) " 3 4 2 15 '3 '3 (b) .• 5 6 3 is I Rural 7 9 5 2 2 1 (a) .. 3 4 2 IS '2 '2 (b) •. 4 5 3 1 Urban (b) I I I I
02 Rural (b) 1
03 Rural 36 45 19 3 2 9 II 7 (a) •. 9 14 10 3 2 5 7 6 (b) .. 27 31 9 4 4 I
04 To!al 197 272 155 110 i 21 33 24 J8 (a) •. 92 163 110 105 '2 'j 14 26 19 16 (~) " 105 109 45 5 I 7 7 5 2
Rural 163 227 137 103 19 30 23 18 (a) " 82 146 103 100 14 26 19 16 (b) " 81 81 34 3 'i 5 4 4 2 Urban 34 45 18 7 I I 2 3 I (a) •• 10 17 7 5 'i 'j 'j 'i '3 (b) " 24 28 II 2 1
Division 2 and 3 Total 1.820 2,442 804 271 44 52 33 15 207 304 128 63 (a) ., 466 819 450 207 19 27 27 12 74 139 SO 40 (b) .• 1.354 1.623 354 64 25 25 6 3 133 165 48 23 Rural 1,577 2.162 683 235 40 46 28 12 188 279 118 58 (a) ., 444 783 432 196 17 23 23 12 66 - 128 76 35 (h) .. 1.133 1.379 251 39 23 23 5 '3 J22 151 42 23 Urban 243 280 121 36 4 6 5 19 25 10 5 (a) " 22 36 18 II 2 4 4 '3 8 IJ 4 5 (b) " 221 244 103 25 2 2 1 II 14 6
Maio": Group 20 Total 97 136 44 100 5 7 5 3 10 18 19 (a) .. 29 57 18 86 2 4 4 'j 5 13 16 (0) " 68 79 26 14 3 3 I 5 5 3 Rural 70 105 22 91 2 2 I 10 18 1 19 (a) .. 27 53 14 86 '2 'j 5 13 1 16 (b) .• 43 52 8 5 2 '3 5 5 3 Urban 27 31 22 9 3 5 4 (a) '. 2 4 4 2 4 4 '3 (b) ., 25 27 18 9 I 1
21 Urban (h) .. 2 2
22 Total 18 15 19 3 3 (a) ., 2 4 3 3 3 lb) .• 16 11 16 Rural (a) •• I 1
Urban 17 14 19 3 3 (a) •• t 3 3 3 3 (h) .. 16 II 16
23 Rural 53 71 53 4 4 3 7 9 2 (a) ,. 15 24 23 3 3 3 I 2 I (b) •• 38 47 30 I 1 6 7 1
24 Rural (b) .. 3 4 3 2
25 Rural 5 7 7 2 4 5 2 2 (a) .. 3 5 7 t 3 5 I I (b) .. 2 2 I 1 1 I

157
B SERIES
and Total Number of Workers engaged in Household Industry
cent Sample)
7 to 9 month. 10 months to 1 year Months not stated
Family Workers Family Workers Family Workers Hired
Cod. No" etc., Household •. Hired HOlloehold. Hired Household.
Males Females Workers Maleo Females Workers Males Females Wor"ers
(15) (16) (17) (IS) (19) (20) (21) (22) (23) (24) (25) (26) (1) and (2)
DISTRICT TOTAL
IS3 227 125 29 1,4S3 1,984 596 263 lOS 151 66 9 AIIlnduotrie. Total 46 78 56 21 370 648 341 230 41 72 41 9 (a)
137 149 69 8 1,113 1,336 255 33 67 79 25 's (b) 166 209 114 23 1,253 1,717 486 235 105 146 65 Rural 44 75 54 21 351 615 326 220 40 70 41 8 (a)
122 134 60 2 902 1,102 160 15 65 76 24 'j (b)
17 18 11 6 230 267 110 28 3 5 1 Urban 2 3 2 '(, 19 33 15 10 I 2 'j 1 (a)
15 15 9 211 234 95 18 2 3 (b)
18 22 13 168 228 112 103 19 26 19 4 Division 0 Total 7 10 7 68 liB 74 100 9 17 14 .. (a)
11 12 6 'j 100 110 38 3 10 9 5 '4 (b)
16 20 12 140 189 97 96 19 26 19 Rural 6 9 6 I 59 102 68 95 9 17 14 4 (a)
10 II 6 81 87 29 I 10 9 5 (b) 2 2 I 28 39 15 7 Urban I I I 9 16 6 5 (a) I I 19 23 9 2 (b)
3 4 2 15 2 " Maior Group 00 Total
'I 'j 'j 2 2 I 15 2 (a) I 2 I
i5 '2 'j (b) 1 I I 3 4 2 1 Rural 'j 'j 'j 2 2 I 15 I 2 1 (a)
I 2 I (b) Urban (h)
02 Rural (b)
7 9 4 16 19 6 3 3 03 Rural 2 3 2 I I '(, (a) 5 6 2 15 18 3 3 (b)
10 12 8 149 205 104 88 15 21 18 4 04 Total 5 7 5 65 115 73 85 8 15 13 4 (a) 5 5 3 84 90 31 3 7 6 5 (b)
8 10 7 121 166 89 81 15 21 18 4 Rural 4 6 4 56 99 67 80 8 15 13 4 (a) 4 4 3 65 67 22 I 7 6 5 (b) 2 2 1 28 39 15 7 UrbllD 1 1 I 9 16 6 5 (a) 1 1 19 23 9 2 (h)
165 205 112 28 1,315 1,756 484 160 89 125 47 5 Divisions 2 and 3 Total 39 68 49 20 302 530 267 130 32 55 27 5 (a)
126 137 63 8 1,013 1,226 217 30 57 70 20 '4 (b) 150 189 102 22 1,113 1,528 389 139 86 120 46 Rural 38 66 48 20 292 513 258 125 31 53 27 4 (a)
112 123 54 2 821 1,015 131 14 55 67 19 'j (b) 15 16 10 6 202 228 95 21 3 5 I Urban I 2 1 '(, 10 17 9 5 I 2 I (a) 14 14 9 192 211 86 16 2 3 I (b)
5 6 4 14 71 96 32 64 6 9 2 " Major Group 20 Total 2 3 3 14 17 31 9 56 3 6 I (a) 3 3 I
i4 54 65 23 8 3 3 I (b)
4 5 3 48 71 15 58 6 9 2 Rural 2 3 3 14 17 31 9 56 3 6 I (u) 2 2 'j 31 40 6 2 3 3 I (b) I I 23 25 17 6 Urban
'j I I 23 i5 j7 '(, (a) (b)
2 2 21 Urban (b)
17 12 16 22 Tda! 1 I i6 (a)
16 II (b) I I Rural Ca)
16 II 16 Urban
iii ii iii (a) (b)
II 17 16 30 40 31 23 Rural 4 10 JO 6 8 8 (a) 7 7 6 24 32 23 (b) 2
24 Rural (b)
25 Rural (a) (b)
J-18IZ-II-ZI-A-(Yeotmal),

CENSUS TABLES
Code No, Household Industry
(Division and Majer Group only)
(1)
Major Group 26
27
28
31
33
34 and 35
36
37
38
39
158
B-XVI-Sample Principal Household Industry classified by Period of Working
(Based on 20 per
Total Rural Urban
(a) With cultivation (b) Without c,.Jtivation
Rural <a) " (b) "
Total (a) " (b) " Rural (a) " (b) " Urban (al .. (b) "
Total (a) " (b) " Rural (a) " (b) " Urban (a) " (b) "
Total (a) .. (b) " Rural Ca) " (b) " Urban <a) " (h) "
(2)
Urban (b)
Total Ca) " (b) ..
Rural (a) .. (b) "
Urban (a) " (b) "
Total Ca) .. Cb) .. Rural (a) .. (b) .. Urban (a) " (b) "
Total Ca) .. (b) " Rural (a) " (b) " Urban (b)
Total (b) Rural (b) Urban (b)
Total (a) .. (b) .. Rural (b) .. (b) " Urban (a) " (b) "
Total
Family Workers House.. -------
holds Males Females
(3)
2 I I
312 119 193 281 116 165 31 3
28
640 140 500 558 135 423 82 5
77
224 42
182 211 38
173 13 4 9
168 40
128
143 36
107
25 4
21
187 43
144 164 41
123 23 2
21
5 3 2 4 3 I I
100 29 71 81 28 53 19 I
18
(4)
4
417 203 214 383 198 185 34 5
29
841 239 602 747 232 515 94 7
87
299 81
218 280
75 205
i9 6
13
233 69
164
207 64
143
26 5
21
259 73
186 228
68 160 31 5
26
6 4 2 5 4 I I
3 I 2
144 57 87
119 56 63 25 I
24
(5)
121 98 23
112 97 IS 9 1 8
230 135 95
190 132 58 40 3
37
69 52 17 63 47 16 6 5 I
162 52
110
140 50 90
22 2
20
68 39 29 66 39 27 2
'i
'j I
24 21 3
24 21 3
Hired Workers
(6)
5 5
39 35 4
37 33 4 2 2
33 24 9
28 23 5 5 I 4
IS 13 2
12 10 2 3 3
44 '18 26
37 17 20
7 I 6
15 8 7 B 6 2 7 2 5
2 2
2 2
16 15 I
14 13 I 2 2
Households
(7)
5 2 3 5 2 3
18 6
12 18 6
12
'j I
3 1 2
2 I I
5 2 3 5 2 3
I to 3 months
Family Workers Hired
Males Females Workers
(8)
3 3
6 3 3 6 3 3
15 6 9
15 6 9
2 2
'2 2
6 I 5
5 I 4
'j
5 2 3 5 2 3
(9)
'j I
10 6 4
10 6 4
2 2
'2 2
3 2 1
2 2
'j
3 3
'3 3
(10)
5 5
4 4
'4 4
2 2
'2 2
'j I
Households
(II)
15 8 7
12 6 6 3 2 I
74 24 50 70 23 47 4 I 3
24 4
20 23 4 19 I
'j
54 17 37
46 14 32
S 3 5
5 3 2 5 3 2
13 9 4
II 8 3 2 I I
4 to 6 months
F emily Work.rs
Mab F emeleJ
(12)
23 15 8
IS 12 6 5 3 2
93 38 55 88 37 51 5 1 4
29 6
23 28 6
22 I
'j
89 31 58
81 28 53
8 3 5
9 7 2 9 7 2
2 2
2 2
26 21 5
23 20 3 3 I 2
(13)
7
'(, 6
I 1
43 29 14 42 29 13 I
'j
6 4 2 6 4 2
50 21 29
45 21 24
'5 6 6 '(, 6
'j I
6 6
'(, 6
Hired \l;'cr kers
(14)
'j 1
5 4 I 4 3 I I I
31 12 19
30 II 19
'j I
5 5
'j 3
'2 2
]-r812-II-2I-B-(Yeotmal),

159
B SlRIES and Total Number of Workers en~aged in Household Industry--concld.
cent Sample)
7 to 9 m';;'ths 10 months to 1 year Months not stated
Family Workers Family Workers Family Workers Code No,. etc, Households Hired Household. Hired Households ---------- Hired
Males Females Workers Males Females Workers Males Female, Workers
(15) (16) (17) (18) (19) (20) (21) (22) (23) (24) (25) (26) (1) and (2)
" Major Group 26 Rural 'j (a)
I I (b)
10 16 6 264 347 99 32 18 25 8 2 27 TetaI 6 11 6 97 164 79 28 6 10 5 2 (a) 4 5 167 183 20 4 12 1) 3 'j (b) 9 15 6 238 321 91 32 17 23 8 Rural 6 II 6 97 164 79 28 5 8 5 1 (a) 3 4 141 157 12 4 12 15 3 (b) 1 1 26 26 8 1 2 1 Urban
'j 26 26 '13 1 2 I (a) 1 (b) 42 44 23 475 650 141 27 31 39 13 28 Total 4 4 5 95 174 85 19 11 17 10 (a) 38 40 18 380 476 56 8 20 22 3 'j (b) 37 41 17 402 564 108 23 31 39 13 Rural 4 4 5 91 168 82 19 11 17 10 1 (a) 33 37 12 31 I 396 26 4 20 22 3 (b) 5 3 6 73 86 33 4 Urban '5 'j '(, 4 6 3 '4 (a)
69 80 30 (b) 28 34 5 165 222 51 II 6 12 31 Total 4 8 4 30 57 37 10 3 8 (a) 24 26 I I 135 165 14 1 3 4 '5 'j (b) 27 32 4 1 154 206 46 8 6 12 Rural 3 6 3 'j 27 53 33 7 3 8 5 I (a) 24 26 I 127 153 13 I 3 4 (b) 1 z I 11 16 5 3 Urban I 2 1 3 4 4 3 (a)
8 12 I (b)
33 Urban (6) 51 67 53 13 52 58 47 8 13 9 34 and 35 .. Total IS 27 20 6 6 8 7 I 2 2 (a) 36 40 33 7 46 50 40 7 11 7 (b)
47 62 51 7 41 48 34 7 II 8 Rural 15 27 20 6 5 6 5 I 2 2 (a} 32 35 31 I 36 42 29 6 9 6 (b) 4 5 2 6 11 10 13 2 Urban
'4 '5 '6 I 2 2 'j '2 'j (a) 2 10 8 II (b) 9 10 3 160 222 50 14 13 18 9 36 Total I I 35 59 30 7 4 6 3 (a) 8 9 3 125 163 20 7 9 12 6 (b) 7 7 3 139 194 48 7 13 18 9 Rural I I 33 54 30 5 4 6 3 (a) 6 6 3 106 140 18 2 9 12 6 (b) 2 3 21 28 2 7 Urban
'2 'j 2 5 2 (a) 19 23 2 5 (b)
3 3 37 Total I I (a) 'j 'j 2 2
'j (b) 2 2 Rural I I I I 1 (a) 1 1 (b) I J Urban (b) 3 3 38 Total (b) I I Rural (b) 2 2 Urban (b)
5 6 71 99 15 9 6 B 39 Total I 2 14 27 12 8 3 5 (a) 4 4 57 72 3 1 3 3 (b) 4 5 56 79 15 9 5 7 'j Rural I 2 14 27 12 8 3 5 1 (a) 3 3 42 52 3 I 2 2 (b) 1 I 15 20 I I Urban
I 'j is 20 'j 'i (a) (b)

CENSUS TABLES
00 0 ~ 0
"
lI'\ ~ q N N
" '" <ll :::0 00
. . . . . . . . . . ... . . .
160
~ ~ ~ ~ ~ N
~~:!~~~~~~~~ ~ .,,: ~

Ag .. lII'oup
(I)
0-9
10-14
15-19
20-24
25-29
30-34
35-39
40-44
45-49
SO-54
55-59
60-64
65-69
70+
Age not stated.
All ages 0-4 5-9
10-14 15-19 20-24 25-29 30-34 35-44 45-59 60+ .. Age not stated
Total Rural
Urban
(2)
Total .• Rural .• Urban .•
Total .• Rural .. Urban .•
Total .• Rural •• Urban ..
Total •• Rural .• Urban ..
Total,. Rural .. Urban. ,
Total .. Rural •• Urban ..
Total .• Rural .• Urban .•
Total .. Rural .• Urban ..
Total .. Rural .• Urban ..
Total .. Rural .• Urban ..
Total .• Rural .• Urban ..
Total .. Rural .. Urban ..
Total .. Rural .. Urban ..
Total .. Rural .. Urban .•
Total .. Rural., Urban .•
Total .. Rural .• Urban ..
Age-group
(1)
161
C-II-Age and Marital Status
Total Population Never Married Married
Marital Status
Widowed Divorced or
separated
Persons Males Females Mal.. Females Mal.. Femal.s Males Females Males Females (3) (4) (5) (6) (7) (8) (9) (10) (II) (12) (13)
.. 1,098,470 959,945 138,525
330,033 291,507 38,526
116,394 100,243
16,151
84,649 71,688 12,961
95,494 82,284 13,210
97,766 85,113 11,613
78,483 68,719 9,764
67,237 59,212 8,025
54,413 47,435 6,978
47,850 42,012
5,848
39,269 34,124 5,145
27,659 24,549 3,110
24.941 21,785
3,156
12,932 11,526 1.406
20,906 18,345 2,561
434 403
31
557,010 484.676
72,334
163,977 144,658 19,319
60,622 52,086 8,536
44,194 36,716
7,478
43.082 36,444 6,638
48,965 42,908
6,057
42,106 36.888 5,218
36,351 32,024 4.327
28,380 24,708
3,672
2-;,289 22,130 3,159
20,741 17,976 2,765
15,287 13,538
1,749
12,277 10,677
1,600
6,213 5.543
670
9,259 8,136 1,123
267 244 23
D1STR1CI' TOTAL
541,460 289,215 475,269 248,297 66,191 40.918
166,056 145,849 19,207
55,772 48,157 7,615
40,455 34,972
5,483
52.412 45,840 6,572
48,801 43,205
5,596
36,377 31,831 4,546
30,886 27,188 3.69a
26,033 22,727
3,306
22,571 19,882 2,689
18,528 16,148 2,380
12,372 11,011
1.361
12,664 11.108
1,556
6,719 5,983
736
11,647 10,209 1.438
167 159
8
163.977 144.658 19,319
59,760 51,319
8,441
39,010 31.892
7,118
18,092 14,027 4,065
4,615 3,464 1,151
1,356 1,027
329
712 552 160
429 334
95
352 276
76
228 187
41
~4 129 55
III 79 32
60 55 5
91 79 12
238 219
19
223,225 194,091 29,144
166,056 146,849 19,207
47,837 40,677
7,160
7,714 5.489 2,225
910 519 391
241 163
78
III 80 31
52 37 15
76 65 II
25 21 4
28 23
5
18 16 2
18 15
3
8 8
16 II 5
125 118
7
241,882 213,558 28,324
781 704
77
4,971 4,628
343
23,982 21,492 2,490
42,381 37,669
4,712
38,589 33.946 4,643
33,378 29,484
3,894
25,525 22.226
3,299
22,248 19.492 2,756
17,588 15,242 2,346
12,472 11,107 1.365
9.507 8,306 1,201
4,592 4,078
514
5,8jO 5,169
681
18 15 3
246,246 217,677 28.569
7,693 7,249
444
31,736 28,571 3,165
49,918 43,914 6,004
46,329 41.059
5,270
32.%0 28,845
4,115
26,072 22.890
3.182
18,986 16,482 2,504
14,067 12,364
1,703
8,800 7,669 1.131
4.460 3,968
492
2,861 2,522
339
1.234 1,113
121
1,110 1.012
98
20 19 I
21,711 19.051 2,660
13 II 2
93 88 5
470 428
42
1,140 1,021
119
1.505 1,335
170
1,733 1,518
215
2.047 1,819
228
2,383 2,093
290
2,624 2,271
353
2,468 2,157
311
2,535 2,182
353
1,488 1,340
148
3,211 2,787
424
67,195 59,252
7.943
3,925 3.547
378
81 4 80 I I 3
264 89 239 85 25 4
728 515 643 477
85 38
1,505 • 807 1,348 735
157 72
2.680 625 2,370 559
310 66
4.202 495 3,774 440
428 55
6,573 367 5,827 322
746 45
8,197 285 7,238 251
959 34
9,512 295 8,'293 271 1,219 24
7.799 156 6,938 138
861 18
9,712 122 8,503 110 1,209 12
5.444 68 4,832 66
612 2
10,487 97 9,156 92 1,331 5
11 II
C-III-Part A-Age, Sex and Education in the District
4.509 3,998
5It
122 116
6
697 633 64
811 722 89
689 601
88
598 509 89
539 470 69
382 339 43
271 248 23
179 155 24
93 87 6
73 68 5
28 26 2
26 23 3
C SERIES
Unspecified status
Males Female (14) (15)
277 223
54
64 51 13
31 23 8
23 20
3
22 19 3
31 21 10
33 30 3
12 7 5
21 18 3
6 5
1
7 7
2 ';1
5 4 I
10 9 I
10 9 I
275 251 24
39 35 4
44 40 4
45 42 3
37 34 3
28 27 I
21 17 4
16 14 2
11 II
9 8
2 2
5 4 I
8 7 I
10 10
Educational levels
Total Population
Persons (2)
.. 1,098,470 173,224 156,80') 116,394 81,649 95,4~4 97,765 78,483
121,650 114,788 58,779
434
557.010 86,195 77,782 60,622 41,194 43,082 43,955 4!,106 61,731 61,317 27,749
267
Females (4)
541,460 87,029 79,027 55,772 40,455 52,412 43,301 35,377 5S,919 53.471 31,030
167
Illiterate
Males Females (5) (6)
DISTRICT TOTAL
360,171 86,195 58,206 20,803 17,889 20,672 27,434 25,522 4Q,435 41,874 20,837
254
430,417 87,029 66,994 36,738 30,951 45,136 41,026 33,162 53,630 51.801 30,587
163
Liter.te (without educational level)
Males Females (7) (8)
93,760
19,328 21,789 7,374 8,302 9,775 7,957
11,381 9.340 3,510
4
35,916
11,82i 10,873 3,295 3,036 2,343 1,495 1.771
985 295
2
Primary or Junior Basic Matriculation and above
Males (9)
90,674
248 18,024 18,125 11,899 10,095 7,784
11.950 9,389 3.153
7
Females (10)
23,978
2iz 8,157 ;,841 3,854 2,259 1,412 1,440
656 145
2
Males (11)
7,405
'(, ~06
2.209 1,611
843 965 714 249
2
Females (12)
1,149
'4 368 386 173 108 78 29 3
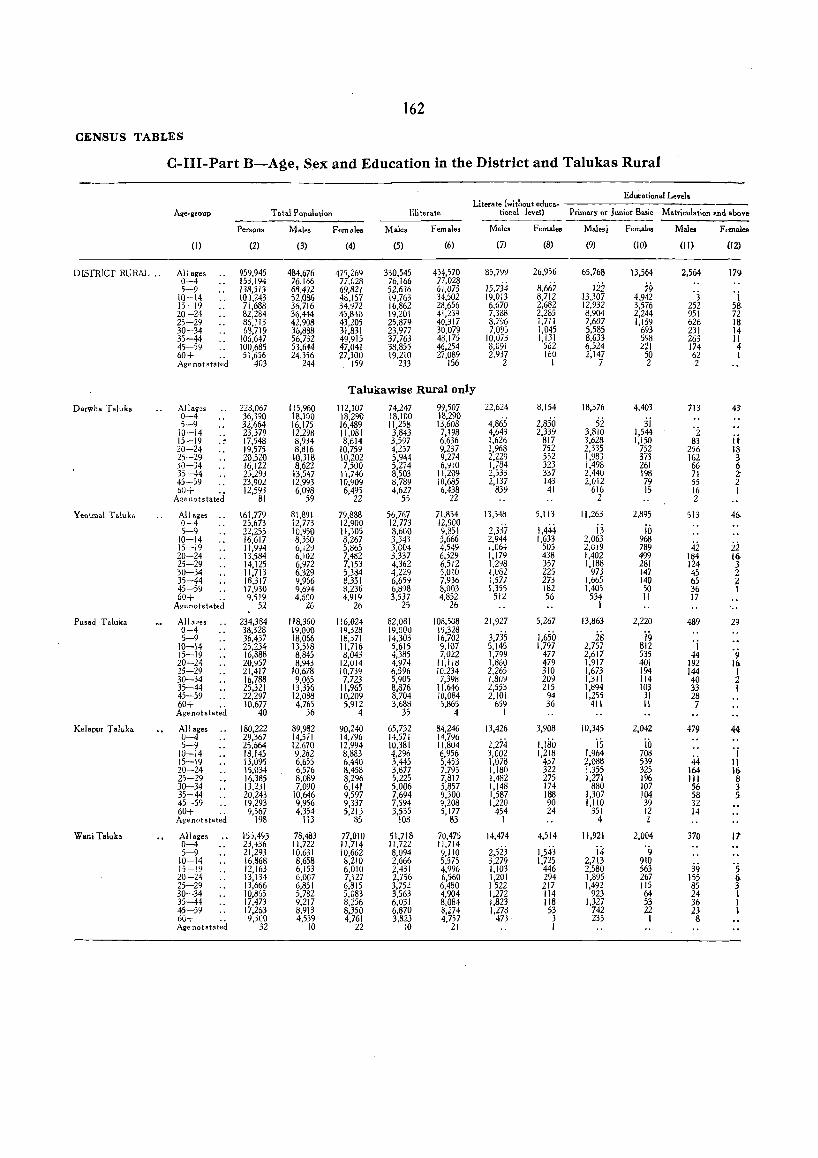
162
CENSUS TABLES
C-III-Part B-Age, Sex and Education in the District and Talukas Rural
Eduta tional Level. Li tera te (wi thou t educa-
Age-group Total Population Illiterate tional level) Primary or Junior Basic Matriculation and above
Persons Maie. Female. Males Females Males Females Males1 Fernal .. Males Females
(I) (2) (3) (4) (5) (6) (7) (8) (9) (10) (II) (12)
DISTRICT RURAL .. All ages 959,945 484,676 475,269 330,545 434,570 85,799 26,956 65,768 13,564 2,564 17'1 0-4 153.194 76.166 71,G28 76.166 77.028
15,734 8.667 122 79 5-9 138.313 68,492 69.821 52.636 61.075 '3 'j li}-14 IOJ,243 52.086 4",157 19,763 34,502 19,0;3 8,712 13.307 4,942 15-19 71.688 36,716 34,972 16.862 28.656 6,670 2,682 12.932 3,576 252 58 20-24 82,284 36,444 45.840 19,201 41239 7.388 2.285 8,904 2.244 951 72 25-29 86.113 42.908 43.205 25,879 40:317 8,796 i.711 7,607 1.159 626 18 30-34 63.719 %.888 31,831 23,977 30,079 7,095 1.045 5,585 693 231 14 35-44 105,647 56,732 49.915 37.763 48,175 10,073 1,131 8,633 598 263 Ii 45-59 100,685 53,644 47,041 38.855 46,254 8,091 562 6,524 221 174 4 60+ 51.656 24,356 27.300 19.210 27.089 2.937 160 2.147 50 62 1 Agenotstated 403 244 159 233 156 2 I 7 2 2
Talukawise Rural only
Darwha Taluka AI I ages 223,067 1l5,960 112.107 74.247 99.507 22.624 8.154 18,376 4.403 713 4J 0-4 36.390 lS.10n lB.290 lB.l00 18.290
4.865 2.850 52 3i 5-9 32.664 16.175 16,489 11.25h 13.608 '2 10-14 23.379 12,298 11.081 3,843 7,198 4,643 2,339 3,810 1,544
it 15-19 .. 17,548 8,934 8.614 3,597 6.636 1.626 817 3.628 1.150 83 20-24 19.575 8.816 10.759 4,257 9,237 1.968 752 2.335 752 256 18 2)-29 20.520 10.318 10.202 5.944 9.274 2.229 552 1.983 373 162 3 jO-34 16.122 8.622 7.500 5.274 6.~IO 1,784 323 1.498 261 66 6 35-44 2\293 13,547 11,746 8,503 11.209 2,'m 337 2,440 198 71 2 45-59 23.902 12,993 10.909 8,789 10.685 2.137 143 2.012 79 55 2 60+ 12.593 6,098 6.495 4.627 6.438 839 41 616 15 16 I
Agenotstated 81 59 22 55 22 2 2
Yeotmal T.luka All ages .. 161.779 81.891 79.888 56.767 71.834 13,348 5.lI3 11.263 2.895 513 46 0-4 25.673 12.773 12,900 12.773 12,900
2.3.~7 1.444 i3 i6 5-9 22.255 10.950 11,305 B.6DO 9.851 10-14 16,617 8,350 8,267 3.343 5.666 2.944 1.633 2,063 968
42 22 15-19 11,994 6,;2~ 5,865 3.004 4,549 1.064 505 2.0i9 789 20-24 13,584 6,102 7,482 3,337 6.529 1.179 438 1.402 499 184 16 25-29 14.125 6.972 7.153 4.362 6,512 1,298 357 1,188 281 124 3 30-34 11.713 6,329 5,384 4.229 5.010 I.U82 225 973 147 45 2 35-44 18.317 9,9(>6 8,351 6,659 7.936 1,577 273 1,665 140 65 2 45-59 17.930 9.694 8.236 6.898 8.003 1.355 182 1,405 50 36 1 60+ 9.519 4.6~0 4,919 3.537 4.852 512 56 534 II 17
Agenotstate·do 52 26 26 25 26 1 .. Pusad Taluka All ages 234,384 118,360 116.024 82,081 108.508 21.927 5,267 13.863 2,220 489 29
0-4 38,328 19.000 19.328 19.000 19,328 3.735 1,650 is i9 5-9 36.437 18,066 18.371 14.303 16.702
10-14 25.234 13.518 11)16 5.615 9.107 5.145 1,797 2)57 812 'j '9 15-19 16,888 8.845 8,043 4,385 7.022 1,799 477 2,617 535 44
20-24 20.957 8,943 12.014 4.974 11.118 1.860 479 1.917 401 192 16 25-29 21.417 10,678 10.739 6.596 10.234 2.265 310 1.673 194 144 I 30-34 16.788 9.065 7,723 5.905 7,398 1.809 209 1,311 114 40 2 35-44 25,321 13,356 11,965 8,876 11.646 2,553 215 1,894 103 33 I 45-59 22,297 12,088 10,209 8,704 10,084 2.101 94 1.255 31 28 60+ 10.677 4.765 5.912 3.688 5,865 659 36 411 11 7 Agenotstat~d 40 36 4 35 4 I
Kelapur Taluk. All ages 180,222 89.982 90,240 65,732 84.246 13,426 3,908 10,345 2,042 479 44 0-4 29.367 14.571 14/96 14.571 14.796
2.274 1.180 is io 5-9 25.664 12,670 12,994 10.381 11.804 'j 10-14 18.145 ~,262 8.883 4.296 6,956 3.002 1.218 1.964 708
44 15-19 13,095 6.6')5 6,440 3,445 5,453 1,078 437 2,088 539 11 20-24 15.034 6.576 8.458 3,877 7.795 1.180 322 1.355 325 164 If> 25-29 16.385 8.089 8.296 5,225 7.817 1.482 275 1,271 1% 111 8 30-34 13.231 7.090 6.141 5.006 5.857 1.148 174 880 107 56 3 35-44 20.243 10.646 9,597 7.694 9.300 1.587 188 1.307 104 58 5 45-59 19,293 9,956 9.337 7,594 9,208 1,220 90 1,110 39 32 60+ 9.567 4.354 5.213 3.535 5,177 454 24 351 12 14 Age not stated 198 113 85 108 83 I 4 2
Wan; Taluka All ages 155,493 78,483 77,010 51,718 70.475 14,474 4,514 11,921 2.004 370 17 0-4 23.436 11.722 11.714 11,722 11.714
2.523 1.543 i4 '9 5-9 21.293 10.631 10,662 8,094 9,110 10-14 16,868 8.658 8,210 2,666 5.575 3,279 1.725 2,713 910
39 's 15-19 12.163 6,153 6.010 2.431 4.996 1.103 446 2,580 563 20-24 13,134 G,007 7,127 2.756 6.%0 1.201 294 1,895 267 155 0 25-29 13.666 6.851 6.815 3.752 6.480 1522 217 1,492 115 85 3 30-34 10,855 5.782 5.083 3,563 4.904 1.272 114 923 64 24 I 35-44 17,473 9.217 8,256 6,031 8,084 1.823 118 1.327 53 36 I 45-59 17.263 8.913 8,350 6.870 8,274 1,278 53 742 22 23 I 60+ 9.300 4,539 4,761 3.823 4.757 473 3 235 1 8 Age notstat~d 32 10 22 10 21 I

163
C SERIES
C"III-Part C-Age, Sex and Education in the District Urban
Educational Levels
Literate without Primary or Junior Matriculation or Technical diploma Non .. tachnicaldiploma Total Population Illiterate educational level Basic, Higher Secondary not equal to degree not equal to degree
Age-l!l'ouP ---- ------ ------ ------Persons Males Females Males Females Males Females Males Females Males Females Males Females Males Females
(I) (2) (3) (4) (5) (6) (7) (8) -(9) (10) (11) (12) (13) (14) (IS) (16)
DISTRICT URBAN
All ages 138.525 72.334 66.191 29,626 45,847 12,961 8,960 24,906 10.414 3.818 828 150 31 30 0-4 20.030 10.029 10.001 10.029 10.001 5-9 18.496 9.290 9.206 5.570 5.919 3.594 3.154 126 133
10-14 16.151 8.536 7.615 1.040 2.236 2.776 2.161 4.717 3.215 3 3 15-19 12.%1 7.478 5.483 1.027 2.295 704 613 5.193 2.265 552 307 20-24 13.210 6.638 6.572 1.471 3.897 914 751 2.995 1.610 1.150 . 272 30 2 2 10 25-29 11.653 6.057 5.5% 1.605 3.709 979 632 2,488 1.100 718 117 48 4 7 30-34 9.764 5.218 4.546 1.545 3.283 862 450 2.199 719 416 68 13 5 4 35-44 15.003 7.999 7.004 2.672 5.455 1.308 640 3,317 842 501 46 25 2 9 9
·45-59 14.103 7.673 6.430 3.019 5.547 1.249 423 2.865 435 362 13 24 3 9 60+ 7.123 3.393 3.730 1.627 3.498 573 135 1.006 95 116 2 9 2 Age not stated 31 23 8 21 7
'C-III-Part C-concld,
University degree Technical degree or diploma equal to degree or post.-graduate degree oT post-graduate dClll'ee other than Veterinary and technical degree Engineering Me<!icine Agricul ture Dairying Technology Teaching Others
Age-l!l'ouP ------ ---- ------ ---_._- ------ ------- ------- --------Males Females Males Females Males Females Males Females Males Females Males Females Males Females Males Females
(I) (17) (18) (19) (20) (21) (22) (23) (24) (25) (26) (27) (28) (29) (30) (31) (32)
DISTRICT URBAN
All ages 600 87 13 25 4 27 9 84 9 84 0-4 5-9
10-14 15-19 3 1 20-24 49 27 3 3 3 1 18 2 25-29 143 27 8 9 S 17 2 30 30-34 121 18 2 6 8 24 2 16 35-44 124 7 5 26 2 12 45-59 111 5 10 1 17 2 5 60+ 52 2 3 2 Age not state<!

164
CENSUS TABLES
C-IV-Single Year Age Returns
Single Total Single Total Single Total Sing I. Total Year Year Year Year
Age Males Fem.I., Age Mal •• Female. Ai<' Mal.s Females Ag. Mal •• Femal •• Returns Returns Returns Returns
(1) (2) (3) (I) (2) (3) (I) (2) (3), (1) (2) (3)
DISTRICT TOTAL 24 7,727 8,529 50 9,592 9,493 76 369 451
Ali ages 557,010 541.460 25 15,896 18,714 51 2,873 2,369 77 161 166
0 20,504 20,442 26 10,031 9,305 52 4,206 3,390 78 246 375
I 15,049 15,300 27 7,853 6,778 53 1,761 1,269 79 196 211
2 17,251 17,177 28 9,655 8,954 54 2,309 2,007 80 873 1,173
3 16,637 17,397 29 5,530 5,050 55 7,607 6,177 81 182 267
4 16,754 16,713 30 15,988 16,114 56 2,885 2,189 82 247 275
5 16,910 16,787 31 5,808 4,923 57 1,592 1,217 83 67 85
6 16,367 16.173 32 11,674 8,673 58 1,838 1,550 84 82 118
7 18,174 19094 33 3,684 2,755 59 1,365 1,239 85 361 490
8 12,807 12,969 34 4,952 3,912 60 6,475 7,112 86 89 84
9 13,524 14,004 35 16,909 14,424 61 1,822 1,666 87 92 81
10 13,306 13,678 36 7,471 5,844 62 2,322 2,258 88 33 40
II 11,141 12,129 37 3,819 3,233 63 693 690 89 64 74
12 15,734 13,050 38 4,769 4,116 64 965 938 90 279 354
13 9,415 8,007 39 3,383 3,269 65 3,794 3,979 91 65 58 14 11,026 8,90S 40 12,388 12,492 66 744 797 92 46 88 IS 8,650 6,455 41 4,006 3,576 67 572 680 93 19 26 16 10,570 9.149 42 6,772 5,681 68 644 700 94 27 13 17 6.135 6,246 43 2,561 2,018 69 459 563 95 94 123 18 11,496 11,553 44 2,653 2,266 70 2,344 3,003 % 23 27 19 6,743 7,052 45 12,125 11,015 71 517 652 97 9 18 20 7,752 10,962 46 4,172 3,441 n 841 1,044 98 21 36 21 9,373 11,895 47 2,883 2,490 73 Z4Z 276 99 21 37 22 11,732 14,233 48 3,517 3,210 74 339 360 100+ 124 196 23 6,498 6.793 49 2,592 2,415 75 1,186 1,446 Aie not stated 267 167

"' ..... '" tr'",O\Lrl _("IX! NO-" co."."" "'''' "'-<>'" ~~u:\ N'r-.."trI" ",..,."" "'''' ~~~ r--."~
..... "'"'''''''' "'-'" [","0"[',,"
""""
-<>0'-0 _0_ ,,""'-0 I...r\NN
-.". ..... ..o~O ",0",
<"f~"~
"''''
0"''''' O'<J.;JW '\0\00 N-=-"
"''''''' OOOC)"'...., {<·,-::roo OO·~
f6S
==
'" 0 ..,. '" '" -N..o o co N '" co .... N..o
.... N
.... N
",,,, 0 .... '" -_ ~~
C SERIES

J66
CENSUS TABLES
C-VII-
Total TOTAL BUDDHISTS CHRISTIANS HINDUS District I Taluka Rural ---------- --------- -----------
Urban Persons Males Females Male, Females Males Females Male, Females
(I) (2) (3) (4) (S) (6) (7) (8) (9) (10) (11)
DISTRICT TOTAL .. 1,093.470 557,010 541,450 43.060 48.848 640 536 469.225 455.605 RURAL 9;9.945 494.676 475.269 45.718 46.485 295 283 413.881 405.407 URBAN 138.525 72.334 66.191 2.342 2.363 345 253 55.344 50.198
Darwha Taluka .. Total 255,132 129.976 125,156 13.259 13.203 42 40 103.379 99.712 Rural 223.067 113.960 112.107 12.956 12.988 29 35 94.116 90.975 Urban .. 27.065 14.016 13.049 293 215 13 5 9.263 8.737
'ieotmal Taluka .. Total 207.366 10;,936 101,430 9.953 10.222 276 202 88.532 84.501 Rural 161.779 81.891 79.888 8.736 8.864 40 34 69.274 67.446 Urban .. 4>.587 24.045 21.542 1.217 1.358 236 168 19.258 17.055
Pusad Taluka .. Total 255.033 134.277 130.756 15.051 ,IS.322 58 59 107.025 103.798 Rural 234.384 118.360 116.024 14.826 15.143 20 21 95.615 93.3% Urban .. 30.649 D.917 14.732 225 229 38 38 11.410 10.402
Kelapur Taluka .. Total 197.270 98.879 98.391 5.452 5.434 149 135 89.471 89.153 Rural 13).222 8),932 93.240 5,244 5.253 130 120 82.039 82.372 Urban .. 17.048 8.897 8.151 20B 181 19 15 7.432 6.781
Wan; Taluka .. Total 173.669 87,942 85.727 4.345 4.617 115 100 80.818 78.441 Rural 155.493 70.483 77.010 3.946 4.237 76 73 72;837 71.218 Urban .. 18.176 9.459 8.717 399 380 39 27 7,981 7.223
TOWNS
Darwha .. (M) 11,540 6.035 5.505 73 6 9 2 4.060 3.921
Digras .. (M) 15.525 7.981 7.544 220 209 4 ~ 5.203 4.816
Yeotm.l .. (M) 45.587 24.045 21.542 1.217 1.358 236 168 19.258 17.055
Pusad .. (M) 18.002 9.364 8.638 102 91 27 30 6.918 6.256
Umarkhed .. (M) 12.647 6.553 6.094 123 138 11 8 4,492 4,146
Ghat.n;; .. (M) 6.443 3.355 3.088 152 143 3 2.877 2.652
Pandharkaoda .. (M) 10.605 5,542 5.063 56 38 18 12 4.555 4.129
Wani .. (M) 18.176 9.459 8.717 399 380 39 27 7.981 7,223
----(M) =MWlicip.lity.
J-I812-II-22-B-(Yeotmal).

167
C SERIES
Religion
JAINS JEWS MUSLIMS SIKHS ZOROASTRIANS OTHERS Tetal ------- ------- --------- -_------ Rural District; Taluka Males Fem.les Males Females Males Females Males Females Males Females Males Females Urban
(12) (l3) (14) (15) (16) (17) (18) (19 (20) (21) (22) (23) (2) (I)
2.952 2,619 35,780 33,626 270 149 83 77 DISTRICT TOTAL 1.618 1.585 22.906 21,374 175 58 83 77 RURAL 1.334 1.034 12.8J4 12,252 95 91 URBAN
753 541 12,464 11,607 4 19 75 34 Total ,. Darwba Taluka 424 382 8,346 7.692 4 I 75 34 Rural 329 159 4,118 3,915 18 Urban
748 717 6,379 5.743 48 4; Total .. Y cotmd Tcluka, 39; 392 3.446 3,152
48 45 Rural
353 325 2.933 2.591 Urban
852 736 11.214 10.n9 17 12 Total .. Pusad Taluka. 490 476 7.402 6,987 7 1 Rural 362 260 3,872 3,792 10 11 Urban
277 286 3.435 3.284 87 5& 8 43 Total .. Kelapur Taluka 205 217 2.286 2.185 70 50 8 43 Rur.l
72 69 1.149 1.099 17 6 Urban
322 339 2.228 2.213 114 1] Total .. Wani T aluk •• 104 118 1.426 1,3;S 94 6 Rural 218 221 802 855 20 11 Uban
TOWNS
163 2 1,730 1.556, 18 (!'vi) Darwha.
166 157 2.388 2.359 (M) Digras.
353 325 2,933 2,591 48 4S (M) .. Yeotmal.
315 229 1,995 2;023 9 (M) .. Pusad.
47 31 1.877 1.769 2 (M) .. Umarkhed
16 19 306 271 3 (M) Ghatanii.
56 50 843 828 14 6 (M) Pandharkaoda.
218 221 802 BS5 20 II lM) - Wani.
(M);=Municipality.

168
CENSUS TABLES
C-VIII-Part A-Classification by Literacy and Industrial Category
Di'lrict/Taluka TOTAL lIIilerate Literate and educated persons
Total Worker. (I. IX )
WORKERS
I As Cultivator
II As Ailricul tural
Labourer
III In Mining. Quarrying I Livestock. Forestry.
Fishing, Hunting and Plantations. Orchards and allied activities
Person. Mal.. Femal.. Mal.. Femal.. Mal.. Femal.. Male. Fem.les Males Females Males Female, Males Femaies
(I)
DI.IlTRICTTOTAL ..
RURAL ..
URBAN ..
Darwh. r .Iuka ..
Yeotmal TaLtka
Pusad Tabk.
Kelapur Taluka
Wani Taluka
(2) (3) (4) (5) (6) (7) (8) (9) (10)
.. 42.523 21,333 21,190 15,627 20,202 5,706 983
651
337
12.748
10.716
2.032
II.110
10.303
1 .• 27
.. 31.55) 17.219 17.310 13.061 16, 'i3} 4.155
7,9M 4,111 3.850 2,553 3.m 15jl
•• 10.474
3.S02
9.0H
5.579
5.675
5.242
1.906
4.451
2,740
2.877
5.232 3.819
1.896 1,394
4,575 3.431
2,839 2.272
2.798 2,098
Talukawise Rural only
4,953 1,423 279 3.197 3,137
1,791 512 105 1,2n !.107
4.433 973 92 2.788 2.653
2,782 463 57 1,693 I.m
2,680 779 118 1,813 1,649
(II)
1';17
I,m
46
442
159
380
208
282
(12)
1,160
1,132
28
306
121
300
147
258
(13)
6,193
6,014
179
2,113
562
1,644
882
808
(14)
9,991
8,581
110
2,763
890
2,271
1,473
1,184
(15)
267
210
57
35
24
41
45
64
(16)
27
24
4
4
6
C-VIII-Part B-Classification by Literacy and Industrial Category
District I Taluka TOTAL Illiterate Literate and educated peJ'SOIII
Total Workers (I-IX)
WORKERS
I As Cultivator
II As All'icul tural
Labourer
III In Mining, Quarrying Livestock, Forestry. Fishing. Hun ting
and Plantations, Orchards and
allied activities
Persons Males Females Mal.. Females Males Femalea Males Females Males Females Males Female. Male, Feniales
(I) (2) (3) (4) (5) (6) (7) (8) (9) (10) (II) (\2) (13)
DISTRICT TOTAL.. .. 155,609 77.315 78,294 65,575 76,803 11,740 1,491 50,435 49,159 14,116 11,295 30,548
RURAL.. .. 151,483 7j,228 76,255 64,292 74,959 10.936 1,29649,3134<1,131 14,09611,28930,338
URBAN .. 4,126 2,087 2,039 1,283 1.844 804 195 1,122 728 20 210
Talukawise Rural only
YeotmalTaluka
Kelapur T aluka
Wani T.luka
.. 49,964 24,860 25,104 21,536 24,628
.. 60,711 30,229 30,482 26,325 30,144
40,808 20,139 20,669 16.431 20,187
3,324
3.904
3,708
476
338
482
16,574
19,718
13.021
16,244
19,037
13,150
4,068
5.610
4,418
3,258
4.186
3,845
10,918
12,394
7.026
(14)
36,491
36,214
277
12,671
14.618
8,925
(IS) (16)
2,148 317
2,119 310
29 -
762
698
659
136
71
103

169
C SERIES
of Workers and Non-workers among Scheduled Castes
IV At Household
Industry
Male.
(17)
1,799
l.479
320
185
180
361
298
455
Females
(18)
415
262
153
28
46
45
57
86
V VI In Manufacturing In Construction
other than Household Industry
WORKERS
VII In Trade and
Commerce
VIII In Transport, Storage and
Commun ications
IX X In Other Services NON-WORKERS
District / Taluka
Male. Females Male. Female, Male. F em.le, 1\1.1.. F emal.. Mal.. Female. Male, Female.
(19)
486
179
307
55
14
12
91
(20)
271
92
179
1
85
(21)
105
43
57
16
18
4
(22)
26
\I
15
6
(23)
261
137
124
(24)
48
14
34
(25)
153
55
98
(26)
2
Talukawise Rural only
(27)
1,967
1,123
844
24 1 22 309
51 229
12
29
21
2
4
4
8
6
11
312
196
77
(28)
790
187
603
32
41
33
58
23
(29)
8,585
6,503
2,082
2,045
683
1,666
1,045
1,064
(30)
9,460
7,037
2,423
(I)
DISTRICT TOTAL
RURAL
URBAN
2,095 Darwha Taluka,
789 Yeotmal Taluka.
1,917 Pusad Taluka
1,087 Kelapur Taluka.
1,149 Wani Taluka,
of Workers and Non-workers among Scheduled Tribes
IV At H,,,ehold
Industry
V In Manufacturing
other than Household Indu,try
VI In Construction
WORKERS -----VII
In Trade and Commerce
VIII In Transport. Storlllle and
Communications
IX In Other Services
X NON-WORKERS District / T aluh
M,les Females Male. Females Males Female, Male. Fem.le. Males Female. Males Females Male. Female.
(17)
625
603
22
227
197
179
(18)
93
91
32
19
40
(19)
283
147
136
41
28
78
(20)
149
68
81
66
(21)
223
167
56
6i
72
34
(22)
32
16
16
4
9
3
(23)
286
203
83
(24)
93
58
35
(25)
202
90
112
(26) (27)
4 2,004
2 1,550
454
Talukawise Rural only
51
67
85
16
8
34
33
20
37 2
413
632
505
(28) (29) (30) (I)
685 26,880 29,135 DISRTICT TOTAL
333 25,915 27,824 RURAL
302 965 1,311 URBAN
125
126
\32
8,286
10,511
7,118
8,860 YeotmaI Taluh.
11,445 Kehpur Taluka.
7,519 Wani Taluk •.

C ENSUS TABLES
Name of Scheduled Caste
(I)
Total Rural Urban
(2)
All Scheduled Ca"es
DISTRICT TOTAL RURAL .. URBAN
I. Baho) " T R U
2. B3Sor T R U
3. Bhang; " T R U
4, ChamLher." ,. T F~ U
5, Doh." .. T R U
6. Kaikadi •. .. T R U
7. Khatik .. T R U
8, Maog; .. T
9. Mahar
10. Mang
11 Caste not 5t3te-:J
DARWHA TALUKA 3, Bhangl 4, Ch,mbh,r 6. Kaikod j 7. Khatik 8. Madgi " 9. Mahar"
R U
.. J
R U
.. T R U T R U
10, Mang.. .. 1 I. Caetcnotstated
YEOTMAL TALUKA 2. Balor " 3. Bhan,,; 4, Chambhor 5, Dohar " o. Koikadi 7. Kh"ik 8 Maclgi., 9. Mah.r
10 Man~ .. PUSAD T ALUKA
2. BacLr " 3. Bhangi 4. Ch.mbh.r 6. Kaik.di 7. Khatik 9. Mah.r ..
10. Man." " KELAPUR TALUKA
I. Bahna" 2. Basor " 3, Bhang; 4, Chambhar S, Uahor" 6, Kaik.di 7, Khlt 8, Mad~j" 9, Mahor,.
10. M.og " WANI TALUKA
2, Basor " 3, Bhang; 4, Chambh.r 7, Khatil: B, Madgj .• 9, Mahar "
10. Mang ••
170
SCT-I-Part A-Industrial Classification of Persons at Work and Non-workers
Persons
(3)
42,523 34,559 7,964
15 15
869 388 481
1,335 155
I,ISC 6,189 5,098 I,C91
65 28 37
149 85 64
1,267 847 420
4,871 4,490
381 12,724 10,128 2,596
15,038 13,324 1,714
I I
10.474 34
1,069 25
423 70
3,858 4,994
1 3,802
10 45
798 23 3
324 21
728 1850 9,029
40 8
1,739 55 4
1,757 5,426 5,579
15 114
61 395
5 2
66 2.460 1,658
803 5,675
224 7
1,097 30
1,939 2,127
251
Popuiatioll
Males
(4)
21,333 17,219 4,114
9 <)
4;) 187 24j 697
S-t 613
3,160 2,599
561 Z\ II 10 76 34 42 610 430 180
2,364 2,186
178 6,539 5,110 1,429 7,424 6,568
856 I \
5,242 24
542 !O
2\6 35
1,939 2,475
1 1,906
2 24
420 8 3
163 9
362 915
4,454 12 3
866 21 2
894 2,656 2,740
9 63 30
201 3
33 1,178
824 399
2,877 110
3 570
16 964
1,091 123
FemaIe,
(5)
21,190 17340 3:850
6 6
437 201 236 638
71 567
3,029 2,499
530 44 17 27 73 51 22 657 417 240
2,507 2,304
203 6,I8j 5,018 1,167 7,614 6,756
858
5,232 .10
527 15
207 35
1,919 2,519
1.896 8
21 378
15
16i 12
366 935
4,575 28 5
873 34 2
863 2,770 2,819
6 51 31
194 2 2
33 1282
834 404
2,798 114
4 527
14 975
1,036 128
Total'\'l/orlt>fs (I-IX)
Males
(6)
12,748 10,716 2,032
6 6
264 127 137 318
45 273
1,944 1,647
297 12 8 4
30 20 10 323 237 86
\,552 1,443
109 3,676 3,033
643 4,622 4,149
473 \ I
Female;
(7)
\ 1,730 10,303 \,427
4 4
2'1\ 117 94
229 29
200 1,514 1,430
84 8 8
32 21 11 269 173 96
1,542 1,439
103 3,428 2,970
458 4,493 4,112
381
! As Culli" atar
Male.
(8)
11517 1,471
46
'1'1 II , (, 6
332 332 , 7
7 . S 3 2 74 56 18
100 97 3
720 702
18 262 257
5
Femalrs
(9)
1,160 1,132
28
. 5 4 1
'42 36
6 83
83
540 523
17 186 185
1
Talukawise Rural only 3,197
10 348
6 115 22
1,155 1,540
1 1,223
2 14
273 8 3
88 7
226 602
2,788 9 3
544 II 2
526 1,693 1,695
6 41 16
123
2i 777 468 243
1,813 75 2
359 II
637 658
71
3,137 442 306 5
307 'Sl 7
96 19
1,171 1532
1,107 2 8
224 8
68 10
201 586
2,658 6 3
507 12 2
450 1,678 1,752
4 37 13 96
'i 4
846 503 247
1,649 n
296 3
564 645 69
29 3
247 82
159 I 6
41 1 3
24
4i 36
380
104 128 208
OJ
'6
°z 59
129 II
282 9
56 I
35 181
is 2
176 59
Iii
38
ii 2
32 32
300
63 91
147
48 91 3
258 4
6i 1
31 161
\VORKERS
II As Agricultural
Labourer
III IV In Nlir:irlg,
QU':lHyillI, Li\''''~tock. At Household For:::stry, Fi',!ling, Industry
Hunting and Plo.nta~ tions. Orchards and
QJLed acti ... ·itits
V InManufacturing other than
Household Industry
Males
(10)
Female.
(II) Males
(12)
Females Males Females Mab Females
6,193 6,014
179
59 57
2 I 1
528 511 17
ii 11
'56 52 4
860 828
32 1,782 1,707
75 2,895 2,846
49 1 1
2,118
l'i3 6
37 10
733 1,198
1 562
90
i4 4
101 353
1,644 5
197 5 I
328 1,108
882
ii I
22
489 213 145 808 40
69 3is 332
42
8,991 8,581
410
67 63
4 I I
1,144 1,092
52 8 8
22 i3 9
162 135 27
1,265 1,212
53 2,492 2,340
152 3,830 3,717
113
2,763
25'1 7
78 15
987 1,425
890
170 8
si 8
162 491
2,271 3
356 4 2
379 1,527 1,473
'4 1
86
'2 4
i;5 397 224
1,184 56
2i9 434 41; 50
267 2!0 57 6 6
'2 2
27 27
"6 6
55 40 15 89 66 23 82 63 19
35 ° :,
OJ
"8 23
24
'4
'2 °9 9
41
10
's 23 46 6 I
'5
14 15 5
64 1
'5 3
26 26 3
(13) (14)
27 24 3 4 4
4
'3 I 1
'j 6 4
'6 I 2
1,799 1,479
320
162 50
112
807 735
72
'2 2
"8 5 3
356 346
10 93 5S 38
371 286 85
185
lib 4 5
16 40
180 I
134
°9 36
361 4
lsi 2
io 164 298
24 87
154 5
28 455 21
2i3 I
187 15 18
(15)
4i5 262 153
1:37 49 8S
28 28
'3 3
68 60 8
21 17 4
158 105 53
28 ° 3
2' 1 22
46 2
i5
29 45 3
3 3
'4 32 57
32 3
ii I 9
86 12
'4 46 II n
(16) (17)
486 179 307
, 2
'2 18 I
17 189 ;9
170
45 40 5
67 44 23
118 47 71 47 28 19
55
'9 30
'6 10 ';
'3 14
'2 10 12
'2
°5 I
'4 91
'j 6 1
43 39 1
271 92
179
i6 10 3 3
56 I
55 50 40 10
131 4S 86 21 3
18
3
'i
'j
'2
'j
'j I
OJ
85
'j 39 44 I

171
seT SERIES
by Sex for Scheduled Castes for the District and Talukas Rural only
WORKERS WORKERS IN SPECIAL OCCUPATIONS X
VI VIi VIII IX In Construction In Trade and In Transport, In Other S~ryices NON-WORKERS Tanning and Scavenging Total
Camn.!fce 3 [ora5'e a<ld Clrrying of HIdes Rural Name of Communicat~ons and Skins Urban Scheduled Caste
------ ------ ------- ------- ------- ------:Vbb F e:n lies Males Females M,les Females Males Females Males Females Males Females Males Females
(18) (19) (20) (21) (22) (23) (24) (25) (26) (27) (28) (29) (30) (31) (2) (1)
All Scheduled '::;estes-
!OS 26 261 48 153 1,967 790 8,585 9,460 37 10 73 102 " DISTRICT TOTAL 48 II 137 14 55 '2 1,123 187 6)03 7,037 34 10 33 22 I<lJRAL 57 II.i 124 34 98 844 603 2,OS~ 2,423 3 40 80
i URBAN
> 2 L Bahn", 3 2 R
'j '3 24 '2 168 226 U T 2. Basor.
7 I 60 84 R 'j 'j 17 1 103 142 U
9 2 12 272 216 379 409 33 22 T 3. Bhan~d. I 2 I 35 26 39 42 33 22 R
'3 8 II 237 19J 340 367 '4 '4 U
15 3 40 35 1,216 1,515 T 4, Chambhar, I '3 22 6 952 1,069 j 4 R
3 14 18 29 264 446 3 U 3 2 9 36 T 5' Dohor.
I 3 y R . ;. '3 I 6 27 U
4 5 3 46 41 T 6. Kaik[,di. 4 4 I 14 30 R 3 '2 Ji8 '5
5 i4
2 32 II U 2 2 287 388 T 7. Khatil<_
'2 75 I 3 '2 193 244 R 2 43 4 Ii 94 144
32 ,(, 20 U
6 5 4 4 I 99 65 812 965 T 8, Mad~i. 4 4 4 76 38 743 8Gi 32 6 R 2
i5 I 4 I 23 27 69 100 20 U
46 79 21 85 664 I~G 2,863 2,757 40 60 T 9. Mahar. 20 6 44 6 42 350 24 2,077 2,043
40 60 R
26 9 35 15 43 314 172 786 7u9 'j U
40 5 29 16 44 I 852 271 2,802 3,121 T 10. rv1ang. 20 I 12 5 g
'j 629 91 2,419 2,644 I R 20 4 17 II 36 223 180 383 477 U
T II, Cdste not stated, R U
Talukawise Rural only 24 22 309 32 2,045 2,095 4 DARWHA TALUKA
10 5 14 5 'i '2 4 3. Bh:m:(.
2 194 220 4. C~a:n""ar.
ii '2 4 8 6. Kaikadi.
101 111 7. Khatik.
's 'j 2;) 4 '3 13 16 1 8. MaJgi.
'2 115 784 743 9. Mahar. 5 4 2 176 24 935 987 10. Man~.
'j 5j 's 229 .ji 683 789 II. Caste not '>tated
3 8 8 ., YEOfM4L TALUKA
's '8 jn 6 ·s ·s 2. Rasor.
13 3. Bhanqi. 4 H7 154 4, Cham,har,
.j.j 1 7 5. Dohor.
73 93 6. Kaikadi.
'5 '8 :3 7. Kf':ltik.
'3 'j 'j 2 2 8. Md~j. 2 53 136 165 9. Mahar.
i6 '5 ji '2 's 160 30 313 349 'i '2 'j
10. Mang. 312 33 1,666 1,917 PUSAD T ALUKA
'3 '3 3 22 2. Bas,Jf.
32i 2 '2
3 3, Bhan~i,
'4 6 2 366 4. Chambhar,
4 'j I 10 22 6. Kaikadi.
'2 'z 63 '4 368 4i:i 7. Khatik.
'j 7 '2 'j
9. Mahar 10 4 6 240 23 963 1,092 '.j i.j 10. Mfl'l'l.
18 6 29 4 6 196 58 1,045 I,OS7 32 iO ., KELAPUR TALUKA
OJ 'j 3 2 I. Bahna.
'i '2 22 14 i4 in
2. SHor. 14 10 14 18 3. Bhan.oii.
1 2 73 98 4. Chambhar, 3 2 5, Doho(.
jj 'i iz 29 6, Kaikadi.
'4 '2 30 32 '4 7, Kh.tik
'6 3 '2 51 401 436 8. Madgi. 12 9 4 81 4 356 331 9. Mdhar. 2 2
ij 46 II 156 157
'j 10. Mang
4 21 4 :17 23 1,054 1,149 1 WANITALU:<A
'j 4 35 42 'j 2, Basor. I 4 3. Bhangi
·s 'j 10 2 211 231 4. Ch.mSh.r,
is 's 5 II 7. Khalik
'4 1 '3 2 327 411 'j 8. M.dJi.
IS 8 38 10 433 391 9. M,h". 7 3 52 59 10. Mal1ll.

172
CENSUS TABLES
SCT-I-Part B-Industrial Classification of Persons at Work and Non-workers
WORKERS ---------
Total Workers I II III (i-IX) A. Culti va tor As Agricultural
Labourer In Mining,
Quarrying, Livestock. F ores try. Fishing.
Nameo! Hunting and Plantations.
Total Orchard, and allied Scheduled Tribe Rural Population acti,·jties
Urban -------- -------- -----------Persons Males Female. Males Females Male. Females Males Females Male. Females
• (I) (2) (3) (4) (5) (6) (7) (8) (9) (10) (II) (12) (13)
All Scheduled Tribe.-
DISTRICT TOTAL 155,609 77,315 78,294 50,435 49,159 14,116 11,295 30,5~8 36,491 1~,1~8 317 RURAL 151,483 75,228 76.255 49.313 48.431 14.096 11.289 30.338 "36.214 2.119 310 URBAN 4.126 2.087 2.039 1.122 728 20 6 210 277 29 7
I. Andh .. T 4.313 2.174 2.139 1.485 1.374 545 469 857 891 35 R 4.270 2.156 2.114 1.470 1.362 545 469 852 881 35 U 43 18 25 15 12 5 10
2. Bhaina T 12 5 R
ii '5 'j u 7
3. Bhattr. T 3 2 2 2 R 3 2 2 2 U
4. Bhil .. T 49 23 26 18 17 14 17 R 44 18 26 14 17 14 17 U 5 5 4
5. Binihwar T 7 7 7 R 7 7 7 U
6. Birhul T 22 15 7 9 3 9 3 R 22 IS 7 9 3 9 3 U
7. Dhanw.r T 40 26 14 16 3 11 3 R 40 26 14 U
16 3 11 3
8. Gond .. T 85.803 42,783 43.020 27,%1 26,935 7.389 6,116 17.697 20.184 1.102 58 R 83.072 41,401 41.671 21.201 26.447 7.378 6.112 17.538 19.984 1.080 56 U 2.731 1,382 1.349 760 488 11 4 159 200 22 2
9. Halba T 674 331 343 182 157 55 42 82 102 3 R 482 234 248 142 144 53 42 76 99 3 U 192 97 95 40 13 2 6 3
10. Kawar T 101 56 45 33 26 19 17 II 8 R 101 56 45 33 26 19 17 II 8 U
11. Kol .. T 53 26 27 14 16 13 16 R 53 26 27 14 16 13 16 U
12. Kolam T 41.013 20.086 20.927 13.438 13.612 5.048 3.773 7.634 9.735 4C9 42 R 40.889 20.021 20.868 13,409 13,586 5,048 3.773 7.621 9.716 407 42 U 124 65 59 29 26 13 19 2
13. Korku T 2 2 R 2 2 U
14. Oraon T R U
15. Pardha" T 22.280 11,119 11.161 6,922 6.763 1,0.9 SS9 4.211 5.469 270 75. R 21.261 10.606 10.655 6.649 6.574 1.032 857 4.184 ,.424 265 70 U 1,019 513 506 273 189 7 2 27 45 5 5
16. P.r<lhi T 1.236 665 571 355 244 20 19 30 73 304 123 R 1,236 665 571 355 244 20 19 30 73 304 123 U

1~3
seT SERIES
by Sex for Scheduled Tribes for the District and Talukas Rural only
WORKERS
IV V VI VII VIII IX X At Household In Manuh..cturing In Construction In Trade and In Transrcrt, In Other Serv;c<s NON·WORKERS
Industry other than Commerce Storage and Household Comm1JOIcaticns Industry
Total N.meo{ Rural Scheduled Tribe
--------.-- ------ ------- ------- U,b.n '\tales Females Males Femal~s Males fenules Males Females Males Females Mal" F(male~ Males Fema:cs
(14) (15) (16) (17) (18) (19) (20) (21) (22) (23) (24) (25) (26) (27) (2) (1)
All Scheduled Tribes
625 93 283 149 223 32 286 93 202 4 2.004 685 26.880 29.135 DISTRICf TOTAL 603 91 147 68 167 16 203 58 90 2 1,550 383 25.915 27.824 RURAL 22 2 136 61 56 16 83 35 112 2 454 302 965 1.311 URBAl'\j
12 2 7 7 21 12 689 76; T 1. Anlh 12 2 1 5 13 10 686 752 R
2 8 2 3 13 U
6 5 T 2. Bhaina
'5 R 1 6 U
T 3. Bhatt". R U
(' 3 5 9 T 4. Bbii.
'i 4 9 R .. 3 1 U
T 5. Binihwa·. H U
6 4 ,. 6. Birh·,I 6 4 H
lJ
10 II T • 7. Dhanwar. 10 II R
U
322 46 166 87 III 20 166 51 150 3 858 370 14.822 16.085 T . 8. Gon~. 308 44 89 41 73 S 122 3S 63 1 550 163 14,200 15.224 R
14 2 77 46 38 12 44 13 87 2 308 207 622 861 U
3 3 3 3 17 3 15 5 149 186 T 9. Halb •. 2 3 '3 'i ii 'j 3 4 '5 92 104 R I 3 II 57 82 U
2 23 19 T '10. Kawar. 2 23 19 R
U
12 11 T II. Kol 12 11 R
U
168 4 14 3 5 9 2 149 54 6.648 7.315 T 12. Kolam. 168 4 10 '3 4 9 'j 2 140 51 6.612 7.282 R
4 I 9 3 36 33 U
2 T 13. ~orku 2 R
U
T 14 Ora(,r' R U
117 25 99 56 95 II 8i 2S 47 937 242 4.197 4.398 T .; i'),r '. III 25 47 27 79 8 67 5 22 842 157 3.957 4.081 R 6 52 29 16 3 20 20 25 115 85 240 317 U
12 15 2 310 327 T 16 Pardhi 12 15 2 3:0 327 R
u
]-ISJ2·IL-23·A-(Ycotmal).

t74 CENSUS TABLES
SeT-I-Part B-Industrial Classification of Persons at Work and Non-workers
WORKERS
I Ii III Total Workers As Culthator As Arricultural In Mining.
Name of Tot.l (I-IX) Labourer Quarryinll, livestO(:k,
Forealry. Fishing. Scheduled Tribe Rural Hontinll' and Plantations.
Urban papulation Orchards and allied activities ------
Persona Males Females Male. Females Mal .. F_ale. Male. F ..... 1es Male. Female.
(I) (2) (3) (4) (5) (6) (7) (8) (9) (10) (11) (12) (13)
Talukawise Rural only
YEOTMAL T ALUKA .. 49.964 24.86() 25.104 16.574 16.244 4,063 3.2S8 10,91& 11.671 762 136 I. Andb 4.061 2.049 2.012 1.400 1.292 504 428 324 852 35 7. Dhanw,r 9 6 3 5 j
8. Gond 22,412 11,314 11,098 7,m 7,119 1,526 l,2f>2 S,3S1 5,743 313 24 9. H.lLa 370 179 191 110 109 39 29 62 77 3
10. K.war .. 99 54 45 31 26 19 17 11 8 12. Kolam .. 18.743 9,077 9.666 6.167 6520 1,829 1.403 3.911 5.041 232 38 15. P.rdhan •. 3,853 1,960 1,893 1.175 1,114 149 119 754 947 68 25 16. Pardhj .. 417 221 196 115 64 2 3 111 49
KELAPUR TALUKA .• 60,711 30.229 30.482 19.718 19,037 5,610 4.186 12.394 14.618 698 71 I. Andh 209 107 102 70 70 41 41 28 29
3. Bh.ltra •• 3 2 1 2 2 4. Bhil 8 3 4 3 4
5. Binjhwar 7 7 7 7
6. Blrhol " .. 22 15 7 9 3 9 3
7. Dh.nw", 31 20 11 II 3 II 3 8. C()nd .. 38.277 19.087 19.190 12.497 12.115 3.560 2.835 8.107 9.215 405 5 9. Halba .. 108 53 55 31 33 14 13 14 20
10. Kawar .. 2 2 12. KoJam 12.321 6.052 6.269 4.020 3,827 1,576 983 2,264 2.838 97 2
13. Korku .. 2 2 15. Patdban •• 9.159 4.573 4586 2.915 2.853 400 304 1.954 2.452 59 2
16. Pardhi .. 562 312 250 158 121 19 to 14 49 125 59
WANI TALUKA .. 40.808 20.139 20,669 13.021 13,150 4,418 3.845 7.026 8,925 659 103
4. Bhil 36 13 23 10 14 10 14
8. Gond ... 22.383 11.000 11.383 7.133 7.213 2.292 2.015 4,080 5.026 362 27 9. Hatb. 4 2 2 1 2 2
11. Kol 53 26 27 14 16 13 12. Kolam 9.82; 4.89, 4.933 3.222 3,239 1.643 1,387 1.446 1.837 78 2 14, Omon I I IS. Pardhan .. w 8.249 4.073 4.176 2,559 2.607 483 434 1.476 2.025 138 43 16. Patdhi .. 257 132 125 82 59 9 14 21 68 15
J-IBIZ-Il-z3·B-cYeotmal).

175
seT SERIES'
by Sex for Scheduled Tribes for the District and Talukas Rural only-concld.
WORKERS ------------IV V vr VII VIIl IX X
At Household InManu{adul'ing [n Cons tructicn In Trode .r.d Tn Tnmrcrt, In Other Services ]\ON-\~OFKEFS
Industry other than Commerce Storage and
HOusehold Communications Name of Industry
Total Rural Scheduled Tribe Urban
-------- ------- -~------------Males Fem,les Males Fem.les Males Fern.k, Mal .. F(l'naI~s Males Females Males Females Mal •• Females
(14) (15) (16) (17) (18) (19) (20) (21) (22) (23) (24) (25) (26) (27) (2) (I)
Ta]ukawise Rural only
227 32 41 2 61 4 51 16 33 413 l2j 8.285 8.860 YEOTMAL TAWKA.
II 2 7 5 13 10 619 720 I. Andh.
1 3 7. Dh.nw.r.
88 13 33 2 32 2 33 4 H 16) 6, 3.743 3.979 8. Gond
2 2 69 S2 9. Halba.
1 23 19 10. Ka.., ...
Sg 4 3 4 6 94 34 2.910 3.145 12. Kalam.
36 9 4 17 2 7 2 133 12 735 7]) 15. pardhan.
1 12 106 132 16. Pardhi.
197 19 23 72 '} 67 8 20 632 IH 10.511 11.44') KEL.A.PUR T ALUKA.
I 37 32 1- Andh.
3. Bh.t~ra.
4. Bhil. 51 Binihw.r.
6 4 6. Birh·,I. '} 8 7. Dhanw.r.
9) 13 19 31 4 33 3 IJ 223 4J 6,590 7.07; 8. Goo,!.
I 2 22 22 9. H.Ib.
2 10. K.war.
51 31 4 2,032 2.442 12. Kolam•
2 13. Korku.
46 6 8 39 " 29 3 9 371 SI 1.653 1.733 15. P",dhan.
2 I IS~ 12~ .. 16. P"dhi •
17~ 40 73 6, 34 3 85 34 37 2 50; 132 7.118 7,519 WANl fALUI<A,
. , 3 9 4. Bhit •
121 18 37 39 10 2 51 31 24 156 54 3.867 4.170 S. Gonl
I 9. Halba 12 II II. [(of
29 6 3 2 IJ 13 1,670 1.694 12. Kola",. I 14. Orson.
29 10 35 27 23 31 2 II 333 64 1.514 1.569 15. Pardb.n.
12 50 66 16. Pardbi.

176
CENSUS TABLES
Name 01 Scheduhd C.,te
(1)
D:STRICT URBAN
2 Basor 3 Bbangi " 4 Chambhar "
5 Doher 6 Kaikadi 7 Khatik
BM.dg; 9 Mahar
10 ManJ
Name 01 Schedul<d
Trib.
(I)
DISTRICT URBAN
I Andh 2 Bhaina 4 Bhil
B Gond 9 Halba
12 Kol.m
15 Pardhan
Name 01 S,hed'1Ie1 C'iste
(1)
DISTRICT RURAL
I Bahna 2 Basor 3 Bhangi
4 Chamb:lar '. S Dotor 6 Kaikadi 7 Kh.tik
SMadl{i 9 Mahar
10 Mang
SeT-III-Part A (i)-Education in Urban Areas only for Scheduled Castes
TOTAL Ili.terate
Males Females M
(2)
4,114
245 613 561
10 42
180
178
1'~3~
(3) (4)
3,850 2,563
236 145 567 353 530 353
27 22
240
203 1.167
858
7 20
113
161 776 635
F
(5)
3,513
199 526 484
20 21
216
202 1.015
830
Literate (withcut educational
levell
M
(6)
619
50 157 91
1 8
23
12 166 106
F
(7)
195
23 32 27
6 1
16
I 71 18
Primary or Junior Ba~ic
M
(8)
872
47 99
113
2 14 3d
5 4'" liz
F
(9)
136
!4 9
18
76 10
Edueational Lev:l,
Matrieulation T eehnicaldiplcma or Higher not equal to Se('ondary deQree
M
(10)
60
3 4 4
'j
45 3
F M F
(1 I) (12) (13)
6
OJ
NOCl.technical diploma not
eqc.I3.1 to degree
M F
(14) (1';)
UJliversity degree or
post-graduate degree other
than technical
degree
M F
(16) (17)
Technical degree or
diploma eClual to degree or
post-graduate degree
M F
(18) (19)
SeT-III-Part A (ii)-Education in Urban Areas only for Scheduled Tribes
TOTAL
Mal.. Female.
(2)
2,G87
18 .. 7
5
1,382 97 65
513
(3)
2,039
25 5
1,349 95 59
506
Illiterate
M
(4)
1283
II 2
875 31 40
324
F
(5)
1.844
22 I
1.245 66 59
451
Literate (without educational
ioveD
M
(6)
2 1 I
204 15 6
73
F
(i)
119
73 13
31
Primary or J lmior Ba<;ic
M
(8)
474
5 2 4
287 42 19
lIS
F
(9)
75
1 4
30 16
24
Eluc.lioMI Level.
Matriculation Technicaldiploma or Higher not equal to Secondary degree
M
(10)
27
15 9
F M
(11) (12)
F
(13)
Non-technical diploma not
equal t.o degree
M F
(14) (IS)
University degree or
post .. graduate degree other
than technical degree
F
(16) (17)
Technical degree or
diploma equal to degree or post~raduate
degree
M F
(18), (19)
SeT-III-Part B (i)-Education in Rural Areas only for Scheduled Castes
TOTAL
Male, Female.
(2)
17,219
9 187 84
2,599 11 34
430
2,186 5,110 6,568
(3)
17,340
6 201
71
2,499 17 51
417
2,304 5,018 6,756
Illiterate
Males Female,
(4)
13,064
9 148 52
1,830 8
27 256
1.975 3.389 5,370
(5)
16,63'1
6 195 66
2.381 17 50
377
2,283 4,723 6591
Lit~rdC {without educational level}
Males F em.les
(6)
2.629
24 22
462 2 5
102
128 968 915
(7)
508
3 5
95 'j 34
20 216 134
Primary or Janior Basic
Males Females
(8)
1,490
is 10
304 I 2
70
83 725 283
(9)
142
23
'(,
I 78 31
Educ.ti"nal Loy.1s
Matriculation or Higher Secondary
Males Females
(10)
30
2
24 2
(11)
Above Matriculation of HiQ'berSecondary
Males Females
(12)
6
4 I
(13)
II Caste not stated "

177
seT SERIES
SCT -III-Part B (ii)-Education in Rural Areas only for Scheduled Tribes
Educational Levels
Literate (without Primary or Matriculation Name of ~cheduled TOTAL Illiterate educationalleveD lunior Ba5ic and above
Tribe Male. Fem,les Mal.s Fema!es Mal.s Females Males Female. Male. Female.
(l) (2) (3) (4) (5) (6) (7) (S) (9) (10) (II)
DISTRICT RURAL 75.228 76.255 64.292 74.959 7.577 1.084 3.328 211 31
1 Andh 2.156 2·"i 1.855 2.101 225 13 76 , Bhattra I I 2
'4 4 Bhil 18 26 14 26 5 Binihwar .. is 7 is 7 6 Birhul 7 7 'j 7 Dhanwar 26 14 24 13 I I
14i 29 8 Good 41,401 41.671 34,400 40.848 4.738 681 2.234 I 9 Halba 234 248 156 232 48 11 29 5 1
10 Kawar 56 45 52 44 3 1 I 11 Kol .. 26 27 IS 26 7 I I ';2 'j 12 Kolam 20.021 20868 19.050 20.770 799 96 171 13 Korku 2 2 140rMn I
10.655 I
10.3ii 1.750 280 Si4 63 15 Pardhan 10.606 8.042 16 Pardhi 665 571 662 571 2 I
SCT-V-Part A-Sample Households engaged in Cultivation classified by Interest in Land and Size of Land Cultivated by Scheduled Castes in Rural Areas only
(Based on 20 per cent Sample)
Interest in Land Cultivated Households engaged in Cultivation by Size of Land in Acret
Nom'>er ----------------------of
Cultivatinq Less 1.0- 2.5- 5.0- 7.5- 10.0- 12.5- 15.0- 30.0- 50+ Unspeci. Household. than I 2.4 4.9 7.4 9.9 12.4 14.9 29.9 49.9 lied
(I) (2) (3) (4) (5) (6) (7) (S) (9) (10) (II) (12) (13)
V1STRICT RURAL 406 20 45 55 36 65 23 110 32 20
<Owned or held from Government .. 308 19 41 51 33 53 15 65 15 16
Held from private persons Qr institutions for payment 58 3 2 2 • 9 25 10 in money, kind or share.
~.rtly held from Government and partly from private 40 2 3 3 20 7 3 persons or institutions for payment in money, }<.ind or share.
SCT-V-Part B-Sample Households engaged in Cultivation classified by Interest in Land and Size of Land Cultivated by Scheduled Tribes in Rural Areas only
(Pas(d all 20 per cent Sample)
Interest in Land Cultivated Households engaged in Cultivation by Size of Land in Acres
Number of
Cultivating Less 1.0- 2.5- 5.0- 7.5- 10.0- 12.5- 15.0- 30.0- 50+ Unspect-Households than I 2.4 4.9 7.4 9.9 12.4 14.9 29.9 49.9 fied
(I) (2) (3) (4) (5) (6) (7) '(8) (9) (10) (11) (12) (13)
DISTRICT RURAL 2.137 2S 70 142 112 322 172 910 269 63 48
Owned or held from Government. .. 1.114 22 59 106 75 181 95 398 103 29 45
Held from ;rivate persons or institutions for payment in money. kind 01' share.
S47 4 10 31 • 31 125 62 455 117 9 3
Partly held from Government and partly from private 176 2 6 persons or institutions for payment in money. kind
16 15 57 49 25
or share.

178
CENSUS TABLES
SC-J-P ersons not at Work classified by Sex, Type of Activity and Educational Levels for Scheduled Castes
Persons seeking Educational Level. Total Non-working Population full-time student. employment for the Unemployed
fir,t time but seeking work Others -_------- ------- ------- ----------Persons Male. Females Males Females Males Female. Males Females Males Femal ..
(I) (2) (3) (4) (5) (6) (7) (8) (9) (10) (II) (12)
DISTRICT TOTAL .. 18.045 8.585 9.460 2.329 578 38 31 6.187 8.880
Illiterate ,. 15.054 6.283 8.771 212 88 9 19 6.043 8.682
Literate (without educational level) 1.708 1.219 489 !.109 370 7 102 119
Primary or Junior Basic 1.256 1.059 197 990 118 19 10 40 78
Matriculation or Hillher Secondary •. 25 22 3 16 2 3 I 2 I
Abev. Matriculation or Hillh.r 2 2 2 Secondary.
DISTRICT RURAL 13.540 6.503 7.037 1.577 343 23 16 4,687 6.694
Illiterate .. 11.642 4.989 6.653 172 55 6 10 4.801 6.598
Literate (without educationallevell •• 1.216 909 307 843 239 5 61 68
Primary or Junior Basic 67"1 599 76 560 49 11 5 23 27
Matriculation or Hiiher Seeondary ., 5 4 1 2
Abov. Matriculation or High.r 2 2 2 Secondary,
DISTRICT URBAN 4.505 2.082 2.423 752 235 15 15 1.300 2.186
JJliterate 3.412 1.294 2.IlS 40 33 3 9 1.242 2.084
Literate (without education.llevel) •• 492 310 182 266 131 2 41 51
Primary or Junior Saoic 581 460 121 430 69 8 5 17 51
Matriculation or HiQoher Secondary 20 18 2 16 2 2
Move Matriculation Secondary.
or H;~er

Name of Scheduled Tribe
(I)
I. Andh
2. Bh.ina
3. Bhattr.
4. Bhil
'S Binjhwar .•
6. Birhul
7. Dhanwar .,
8. Gond
179
ST SERIES
ST-I-Mother-tongue and Bi-lingualism for Scheduled Tribes
Mother~tongue :
Total Total persons returned as
Subsidiary language speaking a language Rural Total Speakers subsidiary to that Urban shown horilOntally
Males Females Male, Females
(2) (3) (4) (5) (6) (7)
Banja,,·
Total Rural Urban
Condi Total Z 3 Z 3 Morathi (Males 2, Female. 3). Rural 2 3 2 3 Marathi (Male. 2, Female. 3). Urban
Hindi Total Marathi (FemaIe. I). Rural '2
M.rathi (Females I). Urban
Maralhi 1'otal 2,170 2,134 77 2 Engli.h (Males 2), Hindi (Males 75, Female. 2). Rural 2,154 2.109 76 I Engli.h(Males2). Hindi (Males 74. Female I). Urban 16 25 1 1 Hindj(Males I. Female. I).
Ma.athi
Total 5 Hindi (Mal., I). Rural '7 's 'j 'H;~di (Mal. 1). Urban
Marathi
Total 2 Rural 2 Urban
Hindi
Total Rural 'i Urban
Marathi Total 21 26 Hindi (Mal.s I). Rural 18 26 'j Hi~di (Mal.,n. Urban 3
Marathi Total 7 Rural 7 Urban
Hinai Total II 7 Rural II 7 Urban
LomanilLambadi Total 4 4 Marathi (Males 4). Rural 4 4 Marathi (Male. 4). Urban
Maralhi Total 26 14 11 Hindi (Mal., 11). Rural 26 14 11 Hindi (Male. II). Urban
Condi Total .. 20,575 21,781 15,363 14,086 English (Males 2). Hindi (M.I •• 72. Fem.le. II). Marathi (Mal •• 15,221
Female. 14.031), Teluau (Males 68. Female. 44). • Rural 20.220 21,456 15,174 13,933 English (Mal •• 2). Hindi (Males 51. Female. 7), Marath' : Males IS.0ll
Females I 3.882).Telugu (Males 68. Females 44). • Urban 355 325 189 IS3 Hindi (Mal.s 21, F em.!e. 4), Marathi (Male. 168, Females 149).
GQUJari
Total 2 Rural 2 Urban
Hindi Total 20 20 8 Morathi (Male. 8, Females I). Rural 2 2 I Maruhi (Mal.s I. F emal •• I). Urban 18 18 7 Marathi (Mal.s 7).
Ko/ami Total 14 49 4 12 Marathi (Male. 4. Femal •• 12). Rural 14 49 4 12 Marathi (Mal •• 4, Femal •• 12l. Urban

180
CENSUS TABLES
ST-I-Mother-tongue and Bi-lingualism for Scheduled Tribes-contd.
Name of Scheduled Tribe
(I)
8. Cond-tone/a.
9. Holbo
10. K.war
11. Kol
12. Kolam
Total Rural Urban
(2)
Total
Rural
Urban
Total Rural Urban
Total Rural Urban
Total Rural Urban
Total Rural Urban
Total Rural Urban
Total Rur.1 Urban
Total Rural Urban
Total Rural Urban
lotal Rural Urban
Total Rural Urban
Total Rural Urban
Total Rural Urban
Total
Rural
Urban
Total Speakers
Males Females
(3) (4)
22.145 21,138
21,153 20,145
992 993
. j
26 31 10 18 16 13
23 4
23 '.j
308 339 234 248
74 91
4 2 4 2
52 43 52 43
25 27 25 27
111 133 111 133
15,729 16,316
15,692 16,304
37 12
Mother-tongue: Total persons returned as speaking a language
subsidiary to that Subsidiary!anguate
shown horizontally
Males Females
(5) (6) (7)
MaratU
1.859 1,350 Banjari (M.les I, Females 1), English (Male, 22), Gondi (Males I,C74 Female, 1.18), Gujarati (Males I), Hindi (Male, 589 Females 142)-Kolami(Male, 125. Females 4), Telugu (M.les 47. Femal."23).
1,671 1,231 Banjari (Males I, Females 1), English (Males 9), Gondi (Males I,C65, Females 1,168) Cujarati (Males I). Hindi (Males 433, Females 35), Kolam;; (Males 12">, Females 4). Telullu (Males 37, Females 23).
188 119 E,glish(Males 13),Condi C\1ales9,Females IZ),Hindi(Males 156, Females 107). Telug.,(Males 10).
MevJari Marathi (Male. I).
'j M~;athi (Males I) •
relugu
II 12 Hindi(Fem,le. ll,M.dgi(Fem,les 1),Matathi(Males II, Females 10). 6 12 Hindi (Fern lies I), Madgi (Fem.les I), Marathi (Male$ 6, Females 10). 5 Marathi(M.les 5).
Hindi
Marathi (Males 5, Fem,les 3).
'5 'j r-:ia~~thi (Ma'es 5. Females 3).
Marathi
27 4 Enllish (Males Z), Hindi (Males 25. F etnales 2). Koshti-Morathi (Females 2). 14 3 Hindi (Males 14, Females I), Kohti-Morathi (Fernaj,. 2). 13 I Eng!;.h (Male. 2). Hindi (Males II, Fem.le, I).
Gujarali
3 Marathi (Males 3, Females I) 3 Marathi (Males 3, Female I
Lamanil Lambadi 51 43 Marathi (M.les 51, Females 43). 51 43 Marathi (Males S!. F ema es 43).
Hindi
3 3 Maratbi (Males 3, Females 3), 3 3 Marathi (Males 3, Fern. e, 3).
Te/ulu
I Marathi (M.les 1). 1 Marathi (Males I).
Banja,;
BeldaTi
Gondi 94 125 Marathi (Males 94, Fem.les 125). 94 125 Marathi (M.les 94, Females 125).
Gujarati
Marathi (Femal .. 1). Marathi (Females 1).
Ko/ami
10.219 9.907 Gondi (Males 67, Females 72), Hindi (M.les 16) Marathi (Males 10,13:
10,1% 9,902 Fem,l.s 9,829), Teltigu (Males 4. Female. 6). ' ,
Gondi (Male, 67, Fern.les 72), Hindi (Males 8). Marathi (M.ies 10,111 Females 9.824) Telegu (Males 4, Females 6). •
23 5 Hindi (Males B), Maratbi(Males IS, Females 51.
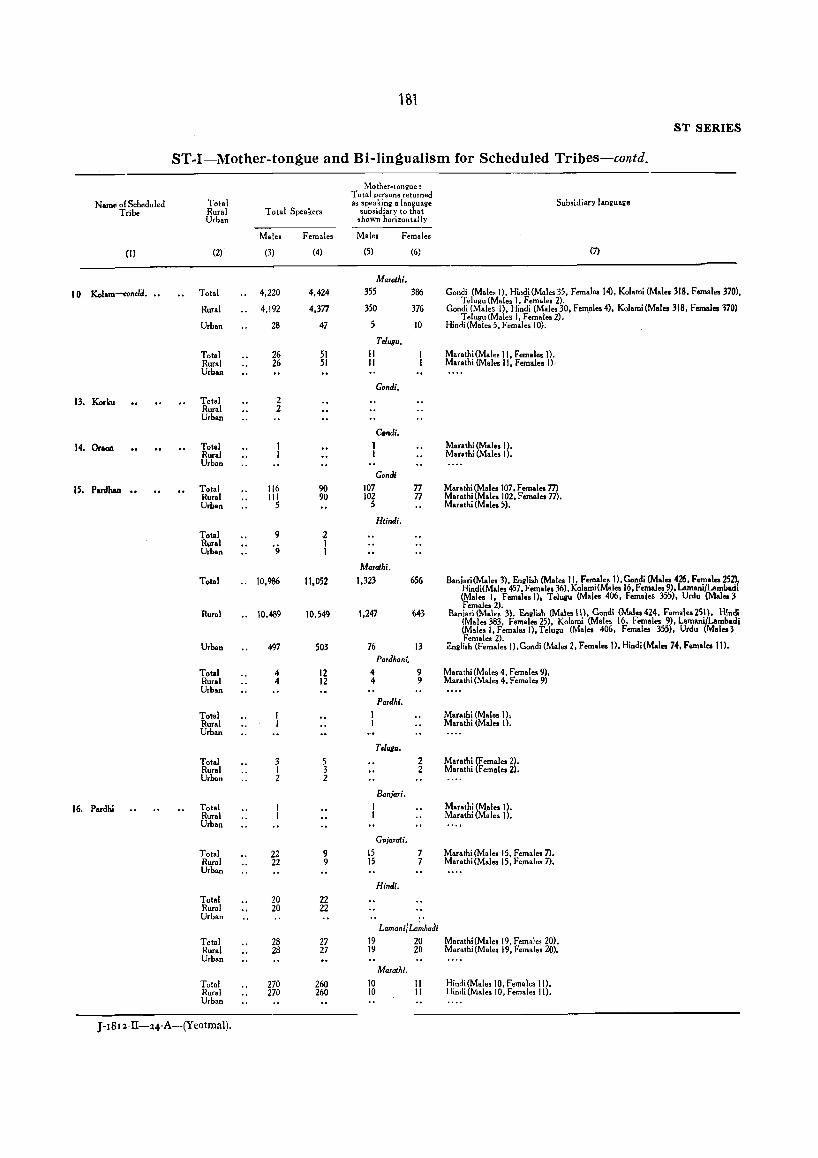
181
ST SERIES
ST~I-Mother-tongue and Bi-lingualism for Scheduled Tribes-contd.
Mother .. tongue : Total persons returned
Nam. of Scheduled Total as speaking a language Subsidiary language Tribe Rural Total Speakers subsidiary to that
Urban shown horizontally
Males Females Male. Females
(I) (2) (3) (4) (5) (6) (7)
MaroJhi.
(0, Kolam-concld. •• Total 4,220 4.424 355 386 Condi (Males 1), Hindi (Males 35, Females 14), Kolarni (Male. 318, Femal •• 370),
350 TelullU(Males 1, Females 2).
Rural 4,192 4.377 376 Condi (Males I), Hindi (Males 30, Females 4). Kolarni(Males 318, Fern.l .. 170J
5 TelullU(Males I. Female, 2).
Urban 28 47 10 Hindi (Males 5, Females 10).
T,luau. Total 26 51 II Marathi (Males 11, Females I). Rural 26 51 II Marathi (Males II. Female. I), Urban
GonJi.
13. Korku Total 2 Rural 2 Urban
C."di.
14. Oraon Total I Marathi (Male. I). Rural I Marathi (Male. I). Urban
GonJi
15, Pudban .. Total 116 90 107 77 Mara thi (Mal .. 107. Females 77) Rural 111 90 102 77 Marathj(Male. 102. Femal .. 77). Urban 5 5 Marathi (M .. l .. )J.
HlinJi.
Total 9 2 Rural '9 1 Urban 1
Marathi.
Total .. 10,986 11,052 1,323 656 Baniari(Maleo 3), Engli,h(Malesll. F.mal.sl),Condi(Mal .. 426. Females 2521, Hindi(Males 457. Female. 36), Kolami(Mal .. 16. Femal .. 9). Lamani/Lambadi (Mal •• I, Femol •• n, T.lulI\I (Mal •• 406, F.males 35~), Urdu (Mal .. 3 Femal .. 2).
Rural .. 10,489 10,549 1.247 '643 Baniari(Males 3). English (Maloom, Condi (Mal .. 424. Females 251), H!ndi (Males 383, Females 25), Kolami (Males 16, Femal .. 9), Lamani/Lambadi (Male, I. Fem,lesl), TelullU (Mal .. 406, Females 355), Urdu (Mal .. l Females 2). .
Urban 497 503 76 13 English (Females I).Condi (Males 2, Femal •• I), Hindi(Mal .. 74. Females 11).
Pardhani.
Total 4 12 " 9 Mar,thi(Males 4. Femal.s 9). Rural " 12 4 9 Mar.thi(Males 4. Female. 9) Urban
Pardhi.
Total I Mara thi (Mal .. I), Rural I Marathi (Males I). Urban
Teluaa. Total 3 5 2 Marathi (female. 2). Rural 1 3 2 Marathi (Females 2). Urban 2 2
Bani.,i.
16. Pardhi Total Marathi (Mal .. 1). Rural Marathi (Males I). Urban
GujaroJi.
Total 22 9 15 7 Marathi(Males 15. Females 7). Rural 22 9 15 7 Marathi(Malea 15, Females 7). Urban
Hindi.
Total 20 22 Rural 20 22 Urban
Lamani! La'mbadi
Total 28 27 19 20 Marathi (Males 19. Females 20). Rural 28 27 19 20 Marathi (Male. 19. Females 20). Urban
Marathi.
Total 270 260 10 1.1 Hindi (Male. 10, Female. 11). Rural 270 260 10 11 Hindi (l\Ilales 10. Females 11). Urban
J -ISlz-II-Z4-A-(Y eotm"l).

182
CENSUS TABLES
ST-I-Mother-tongue and Bi-lingualism for Scheduled Tribes-contd.
Name of Scheduled Tribe
(I)
12. Pardhi-concld.
Total Rural Urban
(2)
Total Rural Urban
TOtal Rural Urban
Total Speakers
-------Males
(3)
323 323
F etnales
(4)
253 253
l\,.1nther.tongl'e~ Total pC'fsons returned as speaking a language
subsicJitlty to that shown horizon tally ---------Mab F.:-males
(5) (6)
Pardhi 232 175 232 175
Tdugu
Subsidiary language
(7)
Hindi (Males 19), L.mani/Lamoadi (Males 3),Marathi (Males 210, Femal., 175). Hindi (Males 19), Lamani/Lembadi (Males 3), Maratbi (Mal .. 210, F emnles 175).
Talukawise Rural having 25 per cent or more Scheduled Tribe Population YEOTMAL TALVKA
I. Andh .. 2 3
2,047 2,008
7. Dhanwar 6 3
2,947 3,112
2
4
8,365 7,981
9. H.lb. 179 191
10. Kawar 2 2
52 43
2 26
5,672 6,037
3,403 3,603
15. Pardhllll 33 13
1,923 1,873
4 7
16. Pardbi 20 22
78 51
123 123
J-181:l.-lI- l 4-B-(YeotmaI).
Gondi 2 3 Marathi (M.les 2. Females 3).
Hind. Marathi (Females I).
Morathi 76 English (Maleo 2), Hindi (Male. 74, Female. I).
Morathi
Gandi 2.479 2.541 Hindi (Mal .. 26. Female. 6).Marathi(Mal .. 2.453. Females 2.535).
Gowari
Kolami 2 Marathi (Femal •• 2).
M.rathi 478
Marathi II
Gujaruli I
296
Lamani/Lamb"di
Banjari (Males I. Females I). English (Mal .. 5). Condi (Mal .. 234, Female. 267). Hindi (Males 233. Females 28). Kolami (Males 3). relugu (Male. 2).
HinJi (Male. II. Females I).
Marathi (Males I. Females I).
51 43 Marathi(Male. 51. Femal .. 43).
Gondi
2 2S
Kolami 4.264 4.350 Hindi (Mal .. 6).Marathi (Males 4.258. Females 4.350).
Marathi 261 280 Hindi (Mal .. 27, Femal .. 4), Kolami (Mal .. 234. Fernal .. 276).
Gondi 33 13 Marathi(Maleo 33, Femal .. 13).
Morathi 129 II Banjari (Males 3), English (Male I), Gond; (Mal .. 13. Femal .. 5), Hindi (Mal .. 112).
Femal .. 6).
PorJhant 4 4 Marathi (Mal .. 4. Femal .. 4).
Hindi
Morathi
ParJhi 98 99 Marathi (Males 98. Femal .. 99).

Name of S:heduled Tribe
(1)
KELAPUR TALUKA
I Andh
3 Bhattra
4 Bhil
5 Binihwar
6 Birhul
Dhanwar •.
8 Gond
9 Halb.
10 Kawar
12 Kolam
13. Korku ..
15. Pardhan
16. Pardbi
183
ST SERIES
ST-I-Mother-tongue and Bi-lingualism for Scheduled Tribes-contd.
Mother-tongue: Tota; p~rsons retlJrned
Total Tota I Speakers as 3peaking a language
Rural subJidiary t,) that shown
Urban horizon ta II y
Subsidiary language
---------Males Females Male. Females
(Z) (3) (4) (S) (6) (7)
Talukawise Rural havin~ 25 per cent or more Scheduled Tribe Population-contd.
107 101
2
5 3
7
II 7
4
20 II
12.%4 13.668
9
6.104 5.507
9 13
53 55
2
5.711 5.884
318 331
23 51
2
77 74
4.496 4.510
22 9
28 27
90 103
171 III
Banjari
Marathi
Marathi
Marathi.
Marathi.
Hindi.
LAmanii'Lambadi Marathi(Male.4). 4
11 . Marathi
Gondi. 9.281 7.805
Hindi.
Kolomi. I
Marathi. 420 356
Telugu 6 10
Maralhi. 3 2
Gujarati. 2
Banjari.
Beldari.
Gujrali. I
Kolami. 3.528 3.295
Marathi. 5
Tdulu. 9
Condi.
Condi. 68
Hindi.
Marathi.
61
703 394
T.Jugu,
Banjari. I Cujarali.
Hindi(Male. II).
English (Male I). Hindi (Mal •• IB)'. Marathi (Males 9.219. I;males 7.774). Telugu (Male. 43. Female. 31).
Marathi (Males I. Females I).
Marathi (Female I).
Eng.Iis~ (Male. 4). Gondi (Male! 299. Female. 338). Guiroti (Mal. II Htndt(Males 85. Fem,les 3). Kolamt (Males 3). TeluiU (Males 28. Females 15)
Madgi (Fernaies I). M.rathi (Male. 6. Female. 9).
Hindi (Male. 3). Ko.bti-Marathi (Females 2).
Marathi (Male. 2).
Marathi (Female I).
Gondi (Mal.. 14. F omales 24) relu"U IlVlales 4. Females 3). •
M,,"athi (Males
Hindi (Malesl). Kolami (Females 4). Tellllllt (Female. I).
Marathi (Males 9. Females I).
Marathi(Males 68, FemaLe. 61).
3.510. Females 3.268)
Engli.h (M~les 5), <;!ondi (Males 270. Fe,;"ales 148). Hindi (Males 173. Females 14), Kolamt(Males J. Females3), Lama~t!Lambadi (Males I. Female, I). Telugu (Males 248. Females 228). Urdu (Males I).
Marathi (Female, I).
Marathi (Males I).
IS Marathi(Males 15, Females 7).
Lamani! Lamhad 19 20 Marathi (Male. 19, Females 20).
Maralhi.
ParJhi. 107 58 Hindi (Males 19l.Marathi (Males 88. Females 58).

184
CENSUS TABLES
ST-I-Mother-tongue and Bi-lingualism for Scheduled Tribes-concld.
Name of Scheduled Tribe
(l)
WANITALUKA
4. Bhil ••
8. Gond ..
9. Halb.
11. KCIi
12. Kolam
14. Ouon
15. Pardhan
16. Pardhi
Total Rural Urban
(2)
Total Speakers
Males Female.
(3) (4)
Mother-tongue: Total persons returned as speaking a language
subsidiary to that shown hori.ontolly
Male. Females
(5) (6)
Subsidiary language
(7)
Talukawise Rural having 25 per cent or more Scheduled Tribe Population-concld.
13
4.309
5
6.684
2
25
109
4.309
471
3
4.070
102
29
23
4.676
44
6.657
2
27
107
4.383
443
4.166
5
2
106
19
Maralhi
Gondi 3.414 3.587
Hindi
Ko/ami 4 9
Maralhi 773 579
Teluta 2
Mara/hi
Hindi 3 3
Telulu I
Gond; 92 100
Kolaml 2,404 2.251
Maralhi 88 91
Telulu 2
Gondi I
GoncIi I 3 M.ralhi
415 238
ParcIhani
Pardhi I Telulu
Mara/hi
10 II Pardhi
27 18 T,/ulu
English (Males 1). Hindi (Males 7. Females 'I). Marathi:(Male. 3.381. Females 3.573) Telullu (Males 25. Female. 13).
M.rathi(Males 4. Females 9).
Gond; (Males 532. Females 563). Hindi (Male. 115. Female. (Male. 119. Femal.s 4). Telugu (Males 7. Females 8).
4). Kola""
Hindi (Female. I). Mar&thi <Female. I).
Marathi(Male. 3. Females 3).
Marathi (Male. I).
Marathi(Male. 92. Females 100).
Gondi (Mal •• 53. Females 48), Hindi Female. 2.206) Telugu (Female. 3).
(Male. 2), Marathi (Mal.. 2.34S)
Goodi (Male. I) Hindi (Male. 2). T.lull\I(Male. I. Female, I).
KolOlDi (M.I .. 84. Femel .. 90).
Marathi(Male.2).
Marathi (Male. I).
Maralhi (Male. I. Female. 3).
English (Male. 5). Gondi (Male. 141. Females 98). Hindi (M.les 98. Femal •• 5). Kol.mi (Male. II. Females 6). Telullu (Mal .. 158. Fem.l .. 127). Urdu
(Mal •• 2. Females2).
Marathi (Females 5).
M.rathi (Mal •• I).
Morathi (F emalel-I).
Hindi (Males 10. Females 11).
Larnani/Lambadi (Males 3). Mar.thi (M.le. 24. F emal •• IS).
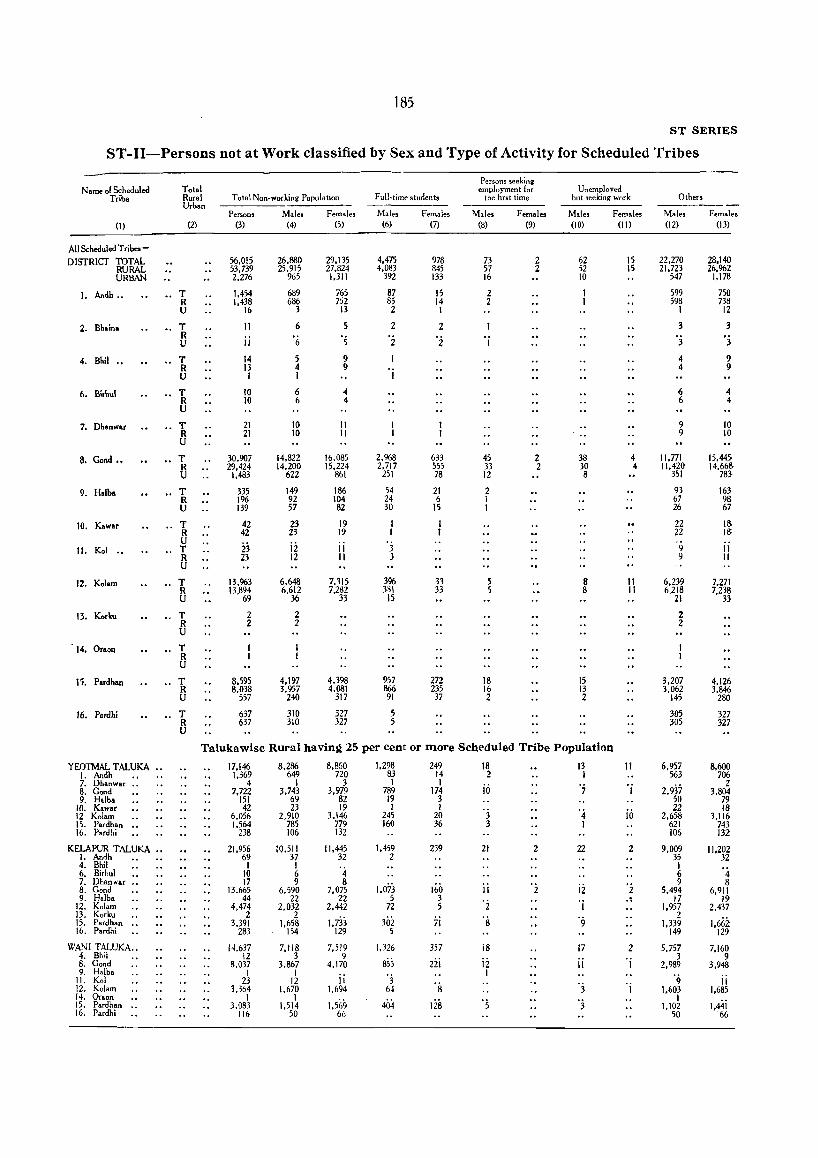
185
ST SERIES
ST-II-Persons not at Work classified by Sex and Type of Activity for Scheduled Tribes
Persons seeking Name 01 Scheduled Total employment for Unemployed
Tribe Rural Total Non-working Population Full-time students the first time but seeking work Other. Urban ------
Persons Males Females Male. Females Male. Females Males Females Male. Females
(1) (2) (3) (4) (5) (6) (7) (8) (9) (10) (II) (12) (13)
All Scheduled Tribes-
DISTRICT TOTAL 56.015 26.880 29.135 4.475 978 73 2 62 15 22.270 28.140 RURAL 53.739 25.915 27.824 4.083 845 57 2 52 15 21.723 26.962 URBAN 2.276 965 1.311 392 133 16 10 547 1.178
). Andb .. ., T 1.454 689 765 87 15 2 599 750 R 1.438 686 752 85 14 2 598 738 U 16 3 13 2 1 I 12
2. Bh.in. .. T II 6 5 2 2 3 3 R ii 'j, '5 '2 'j u 2 1 3
4. Bhil .. •• T 14 5 9 4 9 R 13 4 9 4 9 U 1 1 1
6. Birhul .. T 10 6 4 6 4 R 10 6 4 6 4 U
7. Dh.nw., .. T 21 10 11 9 10 R 21 10 11 9 10 U
8. Gond •• .. T 30.907 14.822 16.085 2.968 633 45 2 38 4 11.771 15.445 R 29.424 14.200 15.224 2.717 555 33 2 30 4 11.420 14.668-U 1.483 622 861 251 78 12 8 351 783
9. H.lba T 335 149 186 54 21 2 93 163 R 196 92 104 24 6 1 67 98, U 139 57 82 30 15 1 26 67
10. Kawar T 42 23 19 22 18-R 42 23 19 22 IS U 23 ii ii 'j 11. Kol .. T 9 11 R 23 12 11 3 9 11 U
12. Kolam .. T 13.963 6.648 7.315 396 33 8 11 6.239 7.271 R 13.894 6.612 7.282 3~1 33 8 11 6.218 7.238 U 69 36 33 15 21 33
13. Korku .. T 2 2 2 R 2 2 2 U
14. Oroon T R U
15. P.rdh.n .. T 8.595 4.197 4.398 957 272 18 15 3.207 4.126 R 8.038 3.957 4.081 866 235 16 13 3.062 3.846 U 557 240 317 91 37 2 2 145 280
16. P.rdhi .. T 637 310 327 5 305 327 R 637 310 327 5 305 327 U
Talukawise Rural havin~ 25 per Cent or more Scheduled Tribe PopUlation
YEOTMAL TALUKA .. 17.146 8.286 8.860 1.298 249 18 13 11 6.957 8.600 I. Andh 1.369 649 720 83 14 2 1 563 706 7. Dhanwar .. 4 1 3 1 1
iii '7 2.937 2
8. Gond 7,722 3.743 3.979 789 174 1 3.804 9. H.lb. 151 69 82 19 3 50 79
10. Kawar 42 23 19 I I • :3 22 III 12 Kolam 6.056 2.910 3.146 245 20 4 10 2.658 3.116 15. Pardhan .. 1.564 785 779 160 36 3 1 621 743 16. Pard!.i 238 106 132 106 132
KELAPUR TALUKA .. 21,956 IQ.511 11.445 1.459 239 21 2 22 2 9.009 11.202 1. Andh 69 37 32 2 35 32 4. Bhil I 1 1 6. Birhul 10 6 4 6 4 7. Dh.nNar .. 17 9 8
1.073 ii '2 9 8 8. Gond 13.665 6.590 7.075 160 11 2 5.494 6,911 9. H.lha 44 22 22 5 3 '2 'j
., 17 19 12. Kolam 4.474 2.032 2.442 72 5 1.957 2.437 13. Korku 2 2
1.733 302 7i 's '9 2 1.66i 15. Pardhan .. 3.391 1.658 1,339
16. Pardhi 283 154 129 5 149 129
WANI TALUKA .. 14.637 7.118 7.519 1.326 357 is 17 2 5.757 7.160 4. Bhil 12 3 9
855 z2i ii 3 9
8. Gond 8.037 3.867 4.170 II I 2.989 3.948 9. H.lb. I I
ii 'j I '9 ii II. Kol 23 12 's '3 'i 12. Kolam 3.364 1.670 1.694 64 1.603 1.685 14. Oraon I I
1.569 404 lis . 5 'j 1 1,44i 15. Pardhan .. 3.083 1.514 1.102
16. Pardhi 116 SO 66 50 '66

CENSUS TABLES
~ ~ ~ ~ ~ -:i
186

187 E SERIES
E-ll-Tenure Status of Sample Census Households living in Census Houses used as Dwelling
(Based on 20 per cent Sample)
Households in Census Houses Households in Census Houses To!al used as Total used as
District /Taluka Rural Tenure Total ----,------- District I Taluka Rural Tenure Total -----------~-Urban Status No. of Dwell· Shop· Work. Dwell. Urban Status No. of Dwell· Shop· Work. Dwell.
House~ ing cum- shop ingwith House~ ing cum- shop ingwith holds Dwell· cum- other holds Dwell. cum- other
ing Dwell. uses ing Dwell. uses ing lng
(l) (2) (3) (4) (5) (6) (7) (8) (I) (2) (3) (4) (5) (6) (7) (8)
DISTRICT TOTAL .. .. Total .. 47,044 46.453 247 238 106 Pu,ad T .luka .. Total .. Total .. 10.798 10,635 90 51 22 Owned . , 39.138 38.715 191 175 57 Owned .. 9,145 9,037 68 34 6 Rented .. 7,906 7.73B 56 63 49 Rented .. 1.653 1,598 22 17 16
RURAL •• .. Total .. 41.280 40.839 183 184 74 Rural .. Total 9.516 9,394 69 38 15 Owned .. 36.358 36.011 155 146 46 Owned
" 8.441 8.354 58 25 4 Rented .. 4.922 4.828 28 3B 28 Rented .. 1.075 1.040 II 13 11
URBAN •• Total 5.764 5.614 64 54 32 Urban .. Total 1.282 1,241 21 13 7 Owned .. 2.780 2.704 36 29 11 Owned .. 704 683 10 9 Z Rented .. 2.984 2.910 28 25 21 Rented .. 578 558 II 4 5.
Darwha T aluka .. Total .. Total .. 11,077 10,956 46 36 39 KelapurTaluka .. Total .. Total 8,441 8,311 37 62 31 Owned .. 9.2B5 9.193 3B 25 29 Owned .. 7.270 7.180 30 44 16, Rented .. 1.792 1,763 8 11 10 Rented .. 1,171 1.131 7 18 15-
Rural .. Total 9.947 9,852 39 25 31 Rural .. Total 7,751 7,655 30 40 26, Owned .. 8.640 8,561 32 21 26 Owned .. 6,894 6.822 25 33 14 Rented .. 1,307 1.291 7 4 5 Rented .. 857 833 5 7 12
Urban .. Total 1.130 1.\04 7 11 8 Urban .. Total 690 656 7 22 5 Owned .. 645 632 6 4 3 OWned .. 376 358 5 11 2 Rented .. 485 472 1 7 5 Rented .. 314 298 2 " 3
Y colmal T ,II,u .. Total .. Total 9.307 9.212 48 37 10 WaniTaluka .. Total .. To!al 7.421 7.339 26 52 4 Owned .. 7.201 7.135 32 28 6 Owned .. 6.237 6.170 23 44 Rented .. 2.106 2.077 16 9 4 Rented .. 1.184 1,169 3 8 4,
Rural Total 7.445 7.391 23 29 2 Rural .. Total 6.621 6.547 22 52 Owned .. 6,547 6,501 21 23 2 Owned .. 5,836 5.773 19 44 Rented .. 898 890 2 6 Rented .. 785 774 3 8
Urban .. Total 1.862 1.821 25 8 8 Urban .. Total BOO 792 4 4 Owned .. 654 634 " 5 4 Owned .. 401 397 4 Rented .. 1,208 1,187 14 3 4 Rented .. 399 395 ·4

CENSUS TABLES
..,."" N -
... . . .
188
NN

rn 8 o o
CE::
~ .... ~ ...
t:. '"' u -
is J -I 8 I 2-I1-25- (YeotmaI).
""''''0-;""'I~·ro x;~cq:J"-
N-
('I"I,r"\O 0,",,,," O-QCO «:ic<\ __ "'
r.....r ....... O "",":;:J"1" 0"'11 ..... rr\'''J~
u ... :::cr-... ........ 0"1" C'''N
_0_ ("-,I ~I'"\ r-.. Nl.t', c a:!,_:)-"'
V"'IO'i"'I ..,..,--~ ,......\.,0['..
00...6-"'
""'''' ",,,,,," r--.-tn NN~
"''''''"' NO>~ c,-...;)m r--.,-Mr-....;' <'IN
"'''',,'' '("'1 C". '.0 l1'\~c.q "'NN NN
v'.oO':) t-.l.. ..... -"'''-lI"'i...,."_:
-"'''' O...,~C'<"'I WlAN 1..I"i"'<!t""_"
189
00""'v_ <:f) t<~lf"'o
~~~
E SERIES
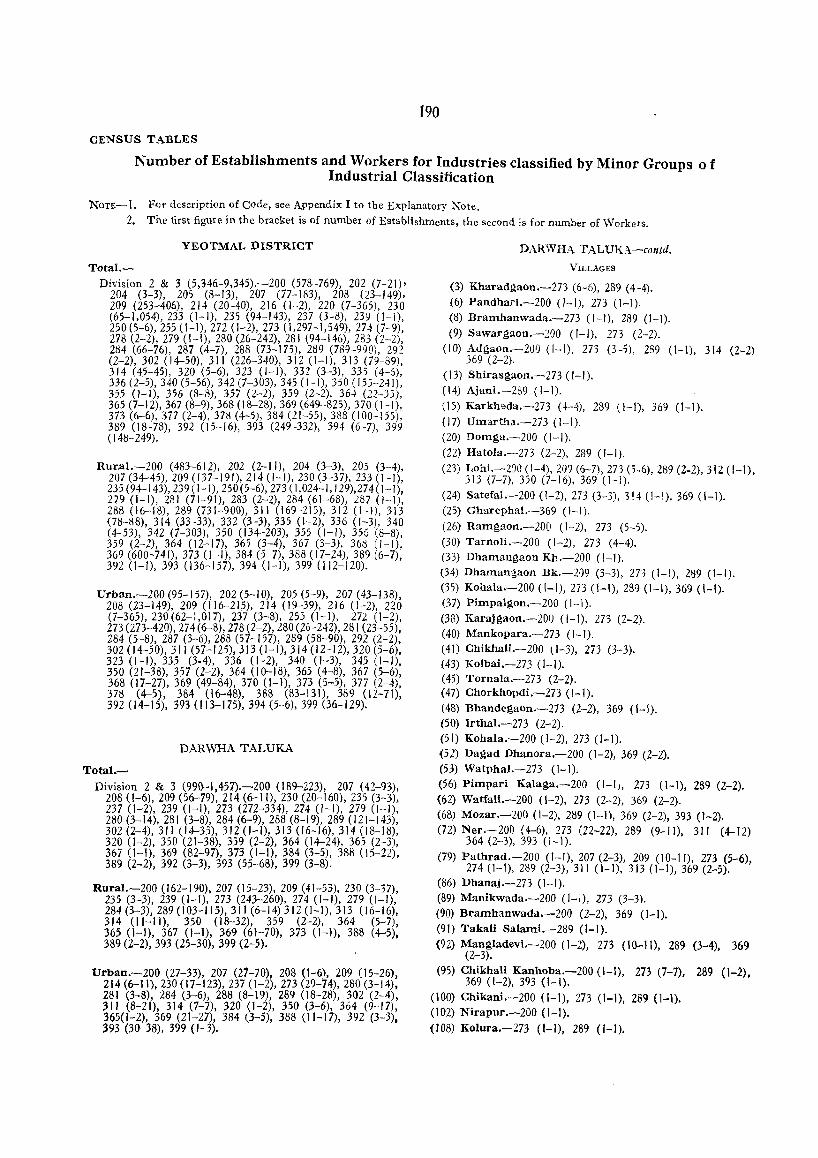
190
CENSUS TABLES
Number of Establishments and Workers for Industries classified by Minor Groups 0 f Industrial Classification
Non:-I. For description of Code, see APpendix I to the Explanatory Note.
2. The first figure in the bracket is of number of Establishments, the second is for number of Workers.
YEOTMAL DISTRICT
Total.-Division 2 & 3 (5,346-9,345).-200 (578-769), 202 (7-20'
204 (3-3), 205 (8-13), 207 (77-183), 208 (23-149), 209 (253-406), 214 (20-40), 216 (1-2), 220 (7-365), 230 (65-1,054),233 (I-I), 235 (94-143), 237 (3-8), 239 (I-I), 250 (5-6),255 (1-1),272 (1-2), 273 (1,297-1,549),274 (7-9), 278 (2-2), 279 (1-1), 280 (26-242), 281 (94-146), 283 (2-2), 284 (66-76), 287 (4-7), 288 (73-175), 289 (789-990), 292 (2-2),302 (14-50), 311 (226-340),312 (1-1),313 (79-89), 314 (45-45), 320 (5-6), 323 (I-I), 332 (3-3), 335 (4-6), 336 (2-5),340 (5-56),342 (7-303),345 (1-1),350 (155-241), 355 (1-1), 356 (8-8), 357 (2-2), 359 (2-2), 364 (22-:35), 365 (7-12),367 (8-9),368 (18-28),369 (649-825),370 (1-1), 373 (6-6), 377 (2-4), 378 (4-5), 384 (21-55), 388 (100-155), 389 (18-78), 392 (15-16), 393 (249-332), 394 (6-7), 399 ( 148-249).
Rural.-200 (483-612), 202 (2-11), 204 (3-3), 205 (3-4), 207 (34-45),209 (137-191),214 (1-1),230 (3-37),233 (H), 235 (94-143), 239 (1- 1),250 (5-6),273 (1,024-1,129),274 (1-1), 279 (1-1), 281 (71-91), 283 (2-2), 284 (61-68), 287 (1-1), 288 (16-18), 289 (731-900), 311 (169-215), 312 (I-I), 313 (78-88), 314 (33-33), 332 (3-3),335 (1-2), 336 (1-3), 340 (4-53), 342 (7-303), 350 (134-203), 355 (I-I), 356 (8-8), 359 (2-2), 364 (12-17), 365 (3-4), 367 (3-3), 368 (1-1), 369 (600-741),373 (1-1),384 (5-7),388 (17-24),389 (6-7), 392 (1-1), 393 (136-157), 394 (1-1), 399 (112-120).
Urban.-200 (95-157), 202 (5-10), 205 (5-9), 207 (43-138), 208 (23-149), 209 (116-215), 214 (19-39), 216 (1-2), 220 (7-365),230(62-1,017), 237 (3-8), 255 (1-1), 272 (1-2), 273 (273-420),274 (6-8),278 (2-Z), 280 (26-242),281 (23-55), 284 (5-8), 287 (3-6), 288 (57-157), 289 (58-90), 292 (2-2), 302 (14-50),311 (57-125),313 (I-I), 314 (IZ-12), 320 (5-6), 323 (1-1), 335 (3-4), 336 (1-2), 340 (1-3), 345 (1-1), 350 (21-38), 357 (2-2), 364 (10-18), 365 (4-8), 367 (5-6), 368 (17-27), 369 (49-84), 370 (1-1), 373 (5-5), 377 (Z-4), 378 (4-5), 384 (16-48), 388 (83-131), 389 (12-71), 392 (14-15), 393 (113-175), 394 (5-6), 399 (36-129).
DARWHA TALUKA
Total.-Division 2 & 3 (990-1,457).-200 (189-223), 207 (42-93),
208 (1-6),209 (56-79),214 (6-11),230 (20-160),235 (3-3), 237 (1-2), 239 (1-1), 273 (272-334), 274 (1-1), 279 (1-1), 280 (3-14),281 (3-8),284 (6-9),288 (8-19),289 (121-143), 302 (2-4),311 (14-35), 31Z (1-1),313 (16-16),314 (18-18), 320 (1-2), 350 (21-38), 359 (2-2), 364 (14-24), 365 (2-3), 367 (1-1), 369 (82-97), 373 (I-I), 384 (3-5), 388 (15-22), 389 (2-2), 392 (3-3), 393 (55-68), 399 (3-8).
Rural.-200 (162-190), 207 (15-23), 209 (41-53), 230 (3-37), 235 (3-3), 239 (I-I), 273 (243-260), 274 (1-1), 279 (I-I), 284 (3-3),289 (103-115),311 (6-14) 312 (1-1),313 (16-16), 314 (11-11), 350 (18-32), 359 (2-2), 364 (5-7), 365 (1-1), 367 (1-1), 369 (61-70), 373 (1-1), 383 (4-5), 389 (Z-2), 393 (Z5-30), 399 (2-5).
Urban.-200 (27-33), 207 (21-70), 208 (1-6), 209 (15-26), 214 (6-11),230 (17-123),237 (1-2),273 (29-74),280 (3-14), 281 (3-8), 284 (3-6), 288 (8-19), 289 (18-28), 302 (2-4), 311 (8-21), 314 (7-7), 320 (1-2), 350 (3-6), 364 (9-17), 365(1-2), 369 (21-27), 384 (3-5), 388 (1 H 7), 392 (3-3), 393 (30-38), 399 (1-3).
DARWHA TALUKA-contd.
VILLAGES
(3) Kharad~aon.-273 (6-6), 289 (4-4). (6) Pandhari.-ZOO (I-I), 273 (H).
(8) Bramhanwada.-273 (1-1), 289 (I-I). (9) Sawargaon.-200 (I-I), 273 (2-2).
(10) Adgaon.-20D (1-1), 273 (3-5), 289 (I-I), 314 (2-2) 369 (2-2).
(13) Shirasgaon.-273 (I-I). (14) Ajani.-Z89 (1-1). (15) Karkheda.-273 (4-4), 289 (1-1), 369 (1-1). (17) Umartha.-273 (I-I). (20) Domga.-200 (I-I). (22) Hatola.-Z73 (Z-2), 239 (I-I). (23) Lohi.-20Q (1-4),209 (6-7),273 (3-6),289 (2-2), 312 (I-I),
313 (7-7), 350 (7-16), 369 (1-1),
(24) Satefal.-200 (1-2), Z73 (3-3),314 (1-1),369 (I-I). (25) Gharephal.-369 (I-I). (26) Ramgaon.-200 (1-2), 273 (5-5). (30) Tarnoli.-200 (1-2), 273 (4-4). (33) Dhamangaon Kh.-200 (!-I).
(34) Dhamangaon Bk.-209 (3-3), 273 (1-1), 289 (I-I). (35) Kohala.-200 (1-1),273 (1-1),289 (1-1),369 (I-I). (37) Pimpalgon.-200 (1-1). (38) Karajgaon.-200 (1-1), 273 (2-2). (40) Mankopara.-273 (I-I). (41) Chikhali.-ZOO tH), 273 (3-3). (43) Kolbai.-273 (I-I). (45) Tornala.-273 (2-2). (47) Chorkhopdi.-273 (1-1). (48) Bhande~aon.-273 (2-2), 369 (1-1). (50) Irthal.-273 (2-2). (51) Kohala.-ZOO (1-2), 273 (1-1), (52) Dagad Dhanora.-200 (1-2), 369 (2-Z). (53) Watphal.-273 (I-I). (56) Pimpari Kalaga.-200 (1-1), Z73 (1-1), 289 (2-2). {62) Watfali.-200 (1-2), 273 (2-2), 369 (2-2). (68) Mozar.-200 (1-2), 289 (1-1), 369 (2-2), 393 (1-2). (72) Ner.-200 (4-6),273 (22-22), 289 (9-11), 311 (4-12)
364 (2-3), 393 (1-1).
(79) Pathrad.-200 (1-1),207 (2-3), 209 (10-11), 273 (5-6), 274 (1-1),289 (2-3),311 (1-1), 313 (1-1),369 (Z-5).
(86) Dhanaj.-273 (I-I). (89) Manikwada.-200 (1-1), 273 (3-3). (90) Bramhanwada.-200 (2-Z), 369 (1-1). (91) Takali Salami.-289 (I-I). (9Z) Mangladevi.-ZOO (1-2), 273 (1()""11), 289 (3-4), 369
(2-3).
(95) Chikhali Kanhoba.-200 (1-1), 273 (7-7), 289 (1-2), 369 (1-2), 393 (I-I).
(100) Chikani.-200 (1-1), 273 (1-1), 289 (1-1). (102) Nirapur.-200 (1-1). (108) Kolura.-273 (I-I), 289 (I-I).

191
E SERIES
Number of Establishments and Workers for Industries classified by Minor Groups of Industrial Classification-contd.
DARWHA TALUKA-contd.
VILLAGES-contd.
(109) Nababpur.-200 (1-2), 207 (I-I), 235 (3-3), 369 (I-I), 393 (I-I).
(113) PimpaIglWn Duba.-200 (1-1). (115) Sindkhed.-200 (1-1). (119) Bangaon.-200 (1-1),289 (1-1). (122) Fubgaon.-200 (1-1), 273 (2-2), 289 (2-2), 393 (2-2). (123) Udapur.-369 (1-1). (125) Talegaon.-200 (1-1), 273 (4-4), 289 (2-2), 313 (2-2),
369 (I-I), 393 (I-I').
(129) Palodi.-200 (2-2), 273 (1-2). (133) Bhulai.-200 (1-1), 273 (3-3). (134) Mahuli.-200 (1-1). (144) Pimpalkhuta 200 (1-1) (145) Mangkinhi.-200 (1-1). (146) Kumbharkinhi.-209 (3-3), 289 (2-3), 350 (2-2). (147) Both.-273 (1-1),289 (3-3). (148) Bijora.-Z89 (1-1). (153) Kinhiwadgi.-200 (2-2). (159) Khopadi Bk.-200 (1-1),367 (1-1),399 (2-5). (160) Bramhanath.-200 (1-1),289 (1-1), 393 (1-1). (161) Jawala.-289 (2-2),311 (1-1). (162) Sindhi.-Z89 (2-2). (163) Dolhari.-273 (1-1), 393 (1-1). (164) Antargaon.-273 (1-1), 393 (1-1). (165) Deulgaon.-273 (1-1).
(169) Palsi.-273 (1-1),369 (I-Z). (171) Lakhkhind.-200 (1-1), 289 (1-2),350 (1-1). (172) Khed.-393 (1-1). (173) Takali Bk.-273 (I-I), 289 (1-2), 350 (2-2). (174) Gondegaon.-Z89 (1-1),350 (1-1), 369 (1-2), 393 (1-2) (175) Saikhed.-273 (3-3), 289 (2-2). (J 76) Chinchgaon.-200 (1-1),273 (1-1),289 (1-2). (177) Mukundpur.-209 (2-4), 289 (1-1). (180) Indrathana.-289 (1-1). (1B1) Pimpari.-2B9 (1-1). (183) Malkhed Bk.-200 (1-1), 273 (2-2), 289 (I-I).
350 (1-4), 369 (1-1), 393 (1-1).
(184) Malkhed Kh.-ZOO (1-1),393 (1-1). (185) Sonwadhoona.-200 (1-1), Z73 (3-3). (186) Uttarwadhona.-ZOO (1-2), Z73 (1-1), 369 (1-1). (188) Lasina.-ZOO (2-Z). (192) Dahifal.-200 (1-1),209 (2-3),273 (2-2). 2B9 (2-2). (201) Borgaon.-ZOO (Z-2), 273 (1-1). (202) Ghui.-273 (1-1), 289 t2-2), 369 (2-2). (203) Kamandeo.-289 (1-1). (209) Bramhi.-289 (I-I). (210) Ladkhed.-200 (6-6), 273 (9-9), 314 (7-7), 369 (3-3)'
38!! (1-1), 389 (2-2). (211) Dhawalsar.-273 (1-1).
(213) Bori Bk.-207 (1-1),230 (2-Z), 239 (1-1). (216) ~ori Kh.-200 (5-5), 207 (1-2), 273 (4-4), 279 (I-I),
314 (1-1). (219) Pandhuma.-200 (1-1),273 (1-1), 289 (1-1).
DARWHA TALUKA-contd.
V ILLAGES-contd.
(223) Kamathwada.-273 (1-1). (224) Chani.-200 (2-2),273 (1-1),289 (1-1),369 (1-1). (225) Tiwsa.-200 (1-1). (229) Dudhgaon.-200 (1-1). (232) Ujona.-200 (1- I).
(234) Wadul.-289 (I-I). (238) Borjai.-393 (1-2). (243) Mozar.-ZOO (1-1),209 (2-3), 289 (1-1). (247) Sawala.-200 (1-1). (249) Wad~aon.-200 (1-1), 369 (1-1). (252) Hal."sul.-2()0 (1-2), 207 (1-2), 273 (6-6), 369 (1-1)
393 (1-1). (254) Sakara.-ZOO (4-4), 273 (4-6), 393 (1-2). (259) Mokh.-200 (I-I), 207 (1-1), 273 (7-7), Z89( 1-1),369 (1-1) (260) Wailingi.-289 (1-1). (Z61) Tiwri.-ZOO (2-Z), Z89 (1-2),369 (1-1). (26Z) Mandwa.-200 (2-2), 273 (1-1). (267) Chincholi.-ZOO (2-2), Z73 (1-1). (273) Sawanga Bk.-200 (1-1),273 (1-1). (278) Deurwada.-200 (4-4). (287) Tuptakali.-200 (3-3), 273 (2-2). (288) Lakh Rayachi.-200 (2-2). (290) Kal~aon.-200 (2-2), 273 (8-8), 289 (4-4), 350 (1-3),
369 (4-4), 393 (I-I). (291) Singad.-207 (3-3). (292) Sakri.-Z73 (I-I). (293) Ithala.-ZOO (4-4), 209 (3-4), 273 (2-2), 284 (3-3),
359 (2-2), 373 (1-1). (300) Nimbha.-ZOO (1-2). (303) Haru.-200 (1-1), 273 (1-1). (306) Ram~aon.-2()0 (2-4), 273 (1-1). (307) Uchegaon.-ZOO (2-2). (308) Naigaon.-200 (1-2). (309) Mangla.-200 (4-5). (310) Mahatoli.-200 (Z-Z). (311) Mahagaon Kasba.-200 (4-5). (312) Wagad Kh.-273 (1":1). (319) Loni.-200 (2-2), 273 (1-1). (320) Deurwadi-200 (2-2), 369 (I-I) (321) Gangaon.-200 (I-I). (322) Taroda,-200 (1-1). (324) Arambhi.-200 (2-2), 273 (2-2). ()26) Khed.-200 (2-2), 273 (2-2). (327) Deogaon.-Z89 (1 -1). (328) Khandala.-369 (1-1). (329) Jawala.-273 (Z-2). (330) Bramhanwada.-289 (1-1). (331) Mhasola.-200 (2-2), 209 (6-7). (336) Chirkuta.-Z73 (1-1). (337) Sawanga.-289 (1-1). (338) Loni.-200 (1-1).
(340) Umaripathar.-200 (2-2). (343) Mahalungi.-200 (1-2), 273 (3-3), 289 {I-I}o

192
CENSUS TABLES
Number of Establishments and Workers for Industries classified by Minor Groups of Industrial Classification-contd.
DARWHA TALUKA-concld. V ILLAGEcl-Concld.
(352) Mahagaon.-273 (I-I). (356) Kopara.-20Q (I-I). (357) Dolamba.-200 (I-I). (358) Chikhali.-200 (I-I). (359) Deurwadi.-200 (1-2). (360) Ami-200 (5-5), 207 (2-7), 209 (4-8), 230 (1-35), 273
(14-20), 289 (2-2), 313 (5-5), 369 (4-5), 388 0-4), 393 (5-6).
(364) Kinhi.-369 (1-2). (365) Dabhadi.-273 (2 -2). (366) Pangari.-273 (2-2), 289 (I-I), 350 (I-I), 393 (I-I). (367) Pahur.-200 (I-I), 207 (I-I), 273 (6-7), 289 (2-4),
369 (3-3), 393 (1-1). (368) Dehani.-200 (1-2),207 (I-I), 273 (I-I). (372) Sukali (Lahan kolaw).-200 (I-I), 273 (2-2), 364( 1-2),
369 (2-2). (374) Antargaon.-200 (1-2), 273 (2-2), 365 (I-I). (375) Asara.-273 (1-1). (376) Idholi.-200 (I-I), 364 (2-2). (378) Borgaon.-200 (1-1),273 (1-3), 289 (3-3), 369 (4-4). (379) Ghonsara (Iwaleshwar).-200 (I-I). (380) Shendursani.-200 (I-I), 273 (1-1), 289 (I-I). (381) Shelu.-200 (1-1),273 (3-3), 289 (6-6),369 (2-2). (385) Verma! (Heti).-200 (I-I), 369 (I-I). (386) Kosadani.-289 (I-I). (387) Sakur.-200 (I-I), 273 (2-2), 289 (2-2), 350 (1-1). (388) Ambodakh.-350 (I-I). . (389) Kawatha.-200 (2-2), 207 (I-I), 273 (2-2), 289 (2-2),
313 (1-1), 393 (I-I). (390) Donwada.-200 (I-I). (391) Rani dhanora.-200 (1-1),369 (I-I).
, URBAN
Darwha Municipality.-200 (11-14), 207 (8-13), 208 (1-6), 209 (9-15), 214 (1-2), 273 (13-35), 280 (2-10), 281 (3-8), 284 (2-4),288 (1-4),289 (7-9),311 (2-3), 314 (4-4), 320 (1-2), 364 (5-9), 365 (1-2), 369 (12-12), 388 (3-4), 392 (1-1), 393 (9-9).
Digras Municipality.-200 (16-19), 207 (19-57), 209 (6-11), 214 (5-9),230 (17-123),237 (1-2r, 273 (16-39), 280 (1-4), 284 (1-2), 288 (7-15), 289 (11-19), 302 (2-4), 311 (6-18), 314 (3-3),350 (3-6),364 (4-8),369 (9-15),384 (3-5),388 (8-13), 392 (2-2), 393 (21-29), 399 (1-3).
YEOTMALTALUKA Total.-
DiviSIOn 2 & 3 (1,397-3,044).-200 (151-195), 202 (5-10), 204 (3-3), 205 (6-10), 207 (6-58), 208 (12-72), 209 (60-86), 214 (6-14),216 (1-2),220 (7-365" 230 (15-479),235 (21-21), 255 (I-I), 273 (319-385),274 (1-2),280(11-74),281 (29-48), 283 (2- 2), 284 (34-37), 287 (2-3j, 288 (24-32), 289 (194-279), 302 (7-25), 311 (52-69), 313 (28-28), 314 (6-6" 320 (3-3), 332 (3-3), 335 (3-5), 336 (1-2), 340 (2-52), 350 (32-43), 364 (3-6), 36J (I-I), 368 (13-22), 369 (139-185), 373 (5-5), 377 (2-4), 3 78 ~3-4), 384 (14-39), 388 (38-62), 389 (7-62), 392 (6-6), 393 (53-81), 394 (4-4),399 (62-149).
Rural.-200 (125-158), 204 (3-3), 205 (2-3), 209 (34-56), 235 (21-21), 273 (236-272), 281 (18-21), 283 (2-2), 284 (32-35), 288 (16-18), 289 (186-270), 3" (41-47), 313 (28-28), 314 (I-I), 332 (3-3), 335 (1-2), 340 (1-49), 350 (32-43),364 (3-6),365 (1-1),369 (131-175),384 (4-6), 388 (3-7), 389 (1-1), 392 (I-I), 393 (24-24), 399 (45-45).
YEOTMAL TALUKA-contd. Urban.-200 (26-37), 202 (j-IO), 205 (4-7), 207 (6-58),
208 (12-72),209 (26-30), 214 (6-14), 216 (1-2),220 (7-365), 230 (15-479), 255 (I-I), 273 (83-113), 274 (1-2), 280 (11-74), 281 (11-27), 284 (2-2), 287 (2-3), 288 (8-14), 289 (8-9), 302 (7-25), 311 (11-22), 314 (5-5), 320 (3-3), 335 (2-3), 336 (1-2), 340 (1-3), 368 (13-22), 369 (8-10), 373 (5-5), 377 (2-4), 378 (3-4), 384 (10-33), 388 (35-55), 389 (6-61),. 392 (5-5), 393 (29-57), 394 (4-4), 399 (17-104).
VILLAGES
(I) Dabha.-200 (2-2), 273( 1-2), 289 (3-5), 313 (3-3), 350 (I-I), 369 (1-2).
(2) Pimpalkhuti.-200 (2-2),273 (1-2), 311 (16-20). (4) Kotha.-273 (1-1\ 311 (2-2),369 (1-2). (5) Fattepur.-273 (I-I), 289 (I-I).
(12) Pahoor.-200 (1-5),209 (2-4),273 (2-8),369 (4-4), 392 (1-1), 393 (6-6).
(14) Barad.-273 (I-I), 289 (1-1),369 (1-2). (15) Kolhi.-273 (3-3), 289 (1-2). (16) Falegaon.-200 (1-2), 209 (I-I), 273 (3-3), 281 (1-3),
289 (1-1), 369 (1-2). (18) Dehani.-273 (I-I). (19) Mahuli.-200 (1-1),289 (I-I). (21) Nagargaon.-273 (1-1), 289 (I-I). (24) Dighi.-200 (1-1),273 (1-41, 369 (1-2). (26) Khadaka Sawanga.-200 (I-n, 273 (I-I). (28) Takalgaon.-273 (I-I). (29) Panas.-200 (I-I). (32) Alegaon.-273 (1-2). (33) Yawali.-200 (1-1),273 (1-2),369 (1-1). (35) Rani Umaravati.-200 (3-3), 273 (1-4). (36) Asegaon.-200 (2-2), 273 (1-3), 289 (2-2), 313 (21-21),
369 (I-I). (41) Asola.-273 (2-3),289 (1-2), 369 (1-1). (45) Hatola.-399 (I-I). (46) Sawar.-200 (5-5),205(2-3),209 (1-2),273 (1-7), 289 {1-2h
369 (1-2). (47) Galwha.-273 (I-I). (49) Chimnapur.-200 (2-2). (50) Umari.-369 (I-I). (51) Bagapur.-209 (I-I), 273 (I-I). (52) Chondhi.-209 (1-1),273 (I-I), 369 (I-I). (55) Kapramethad.-200 (I-I), 369 (I-I). (59) Sarul.-200 (1-1),288 (8-8),311 (2-2),369 (4-4), 399 (36-36) (60) Mahamadpur.-289 (1-2). (61) Parsodi.-200 (1-1), 273 (2-2), 289 (1-3). (62) Gharfal.-200 (4-4),273 (II-II), 284 (15-16).369 (I-I). (66) Warud.-273 (2-2). (69) Sarfali.-200 (I-I), 273 (2-2), 288 (2-2), 289 (1-1),
311 (1-1),369 (1-1),393 (I-I). (70) Kharda.-200 (1-4), 273 (3-3), 288 (3-3), 289 (2-3),
350 (2-2), 369 (1-1), 393 (1-1). (71) Yerandgaon.-200 (I-I), 273 (3-3), 289 (1-3), 313 (I-I),
350 (1-1),369 (I-I). (72) Pachakhed-200 (I-I), 273 (3-3), 350 (3-4), 369
(I-I). (74) Paloti.-399 (1-1). (75) Gawandi.-200 (1-1), 273 (4-4), 289 (1-2), 369 (I-I),
393 (2-2), 399 (1-1).

J93
E SERIES
Number of Establishments and Workers for Industries classified by Minor Groups of Industrial Classification-contd.
-YEOTMAL TALUKA-contd.
VILLA.GES-Contd.
(76) Kinhi.-273 (I-I), 289 (1-2). (77) Gondhali.-200 (1-2), 204 (3-3), 273 (1-1),289 (I-I),
369 (I-I). (80) Kopara.-200 (2-2),273 (1-1),289 (1-1),399 (1-1). (81) Nandura Bk.-200 (1-1), 289 (1-2). (85) Virkhed.-200 (1-1).
(86) Watkhed Bk.-200 (1-1),273 (1-1), 284 (1-1), 289 (3-3). (87) Mubarakpur.-273 (1-1), 289 (I-I). (90) Gimona.-200 (H).
(91) Babhulgaon.-200 (2-2), 209 (4-13), 273 (12-15), 288 (2-4),289 (1-4), 350 (7-10),388 (1-1),393 (2-2).
(92) Man~sawan~i.-2j3 (1-1), 289 (I-I). (95) Mustabad.-273 (I-I), 369 (1-2). (96) Watkhed Kh.-ZOO (1-1), Z73 (1-1), 289 (1-2), 393 (I-I). (98) Nandesawangi.-200 (1-2),273 (2-2), Z83 (1-1), 369 (I-I)
(100) Antar~aon.-289 (I-I). . (103) Mitanapur.-200 (1-1),389 (1-2),369 (1-2). (IDS) Kon.-273 (1-1), 281 (2-3). (106) Veni.-200 (1-1),209 (1-3),273 (6-6), 283 (I-I), 289 (1-2),
369 (1-3). . (108) T ambha.-273 (1-1),289 (1-2). (109) Ganori.-273 (1-1), 289 (1-1).
(I I I) Manakapur.-273 (I-I). (112) Naigaon.-ZOO (I-I), 273 (I-I), 284 (I-I).
'119) Kotha.-200 (I-I), 209 (3-4), 273 (3-3), 284 (2-2), 289 (1-1), 369 (1-1), 393 (1-1), 399 (1-1).
(128) Panchagawhan.-200 (1-2), 289 (1-1).
(130) Krishnapur.-Z88 (I-I). (131) Kotamba.-200 (1-1),273 (I-I), 284 (I-I), 369 (I-I). (132) Pimpari.-273 (1-1), 289 (I-I), 369 (1-2).
(134) Nandura Kh.-273 (2-2), 289 (I-I), 369 (I-I). (135) Barhanpur.-273 (1-1),284 (I-I). (136) Husnapur.-273 (2-2), 284 (I-I).
(137) Hiwara.-200 (I-I), 284 (1-1), 289 (1-2). (138) SUkali.-ZOO (1-1), 289 (I-I). (139) Pardi.-200 (1-1),273 (3-3), 289 (1-1),369 (1-2). (141) Donoda.-200 (I-I), 273 (3-3), 369 (3-3). (142) Aloda.-289 (I-I). (143) Kalaspur.-289 (1-1), 311 (1-1),369 (I-I). (144) Satefal.-289 (1-2). (146) Manakapur.-273 (2-2), 369 (I-I). (152) Wandali.-200 (1-1), 273 (2-2), 289 (I_I). (154) Man~rul.-289 (I-I).
(161) Ashti.-200 (1-1), 273 (I-I), 289 (1-2), 313 (1-1), 369 (1-1).
(164) Taroda.-289 (I-I). (165) Nilaj.-284 (2-2).
(167) Kamathawada.-200 (I-I), 399 (I-I). (168) Mawalani.-200 (1-1), 289 (1-1). (172) Sonegaon.-393 (I-I).
(173) Pimpalgaon.-200 (2-2),273 (1-1),289 (I-I). (174) Gangapur.-200 (I-I). (176) Mategaon.-273 (1-1), 289 (I-I).
J-18 I 2-LI-26-A-(yeotmal).
YEOTMAL TALUKA-contd'
VILLA.PES-contd.
(177) Sawargaon.-200 (1-1),289 (1-1), %9 (1-1). (179) Shankarpur.-289 (1-1).
(182) Narsapur.-273 (3-3), 289 (1-2), 369 (I-I). (185) Kalamb.-200 (2-3), 273 (12-13), 281 (3-3), 289 (1-1),
311 (5-6), 369 (3-5), 388 (1-2). (192) Katri.-200 (1-2), 273 (3-3). (197) Tirzada.-289 (1-2), 369 (I-I). (199) Nimbora.-Z89 (1-2). (202) Farsodi Bk.-200 (1-1), 273 (1-1), 289 (1-3), 369 (2-3). (205) Umari.-200 (1-1),273 (1-1),281 (1-1),369 (l-I). (213) Sarapdhari.-369 (I-I). (214) Karak.-ZOO (1-1),369 (1-1). (216) Rajur.-289 (1-2), 369 (2-2). (217) Dhotra.-ZOO (1-1), 273 (2-2), 289 (1-1). (218) Karalgaon.-200 (2-3), 209 (1-2),273 (I-I), 281 (1-1)
289 (1-2), 3Q9 (2-4). (219) Taroda.-289 (I-I).
(220) Sukali.-200 (I-I), 273 (I-I), 311 (1-1),369 (1-2). (223) Madani.-273 (4-4). (224) Mendhala.-289 (1-1),311 (2-2). (225) Moha.-281 (I-I), 369 (2-4). (226) Borgaon.-289 (1-2), 369 (I-I). (227) Kita.--!.289 (1-2). (229) Chinchbardi.-289 (1-2). (230) Lohara Bodad.-340 (1-49), 369 (1-2). (236) Bhari.-200 (3-3), 209 (I-I), 273. (3-3), 281 (I-I),
289 (1-6), 369 (2-2), 388 (1-4), (238) Madkona.-200 (1-1), 289 (1-1). (239) Bhoyar.-289 (I-I). (240) Kinhi.-200 (1-1), 273 (2-2), 289 (1-1). 369 (2-2), (242) Wadgaon.-289 (1-2), 369 (1-1).
(243) Umarsara.-28I (I-I). (245) Parawa.-289 (1-1), m (;3-3).
(246) Waki.-289 (1-1).
(247) Talegaon.-200 (2-4), 273 (2-2), 369 (1-4), 389 (I-I). (249) Karli.-200 (1-2), 289 (1-2), 369 <1-2), (250) Khairi.-289 (1-1).
(251) Pofalni.-289 (I-I). (253) Hirdi.-289 (1-2). (254) Shiwani Kh.-289 (I-I). (259) Shiwani Bk.-289 (1-2).
(260) Khangaon.-200 (2-4), 273 (I-I), 289 (1-3). (268) Sherad.-289 (1-3). (264) Yerad.-200 (1-2). (268) Nilona.-289 (I-I). (270) Ratchandana.-273 (1-1), 289 (I-I). (212) Chinchghat.-200 (1-2), 273 (1-1), 289 (1-8).
(273) Manpur.-200 (I-I).
(274) Harjuna.-369 (I-I). 10
(275) Jamb.-200 (1-1), 289 (1-1), 369 (3-2).
(278) Ghodakhindi.-209 (5-5), 273 (1-1), 289 (I_I).
(282) Mhasola.-369 (2-2).
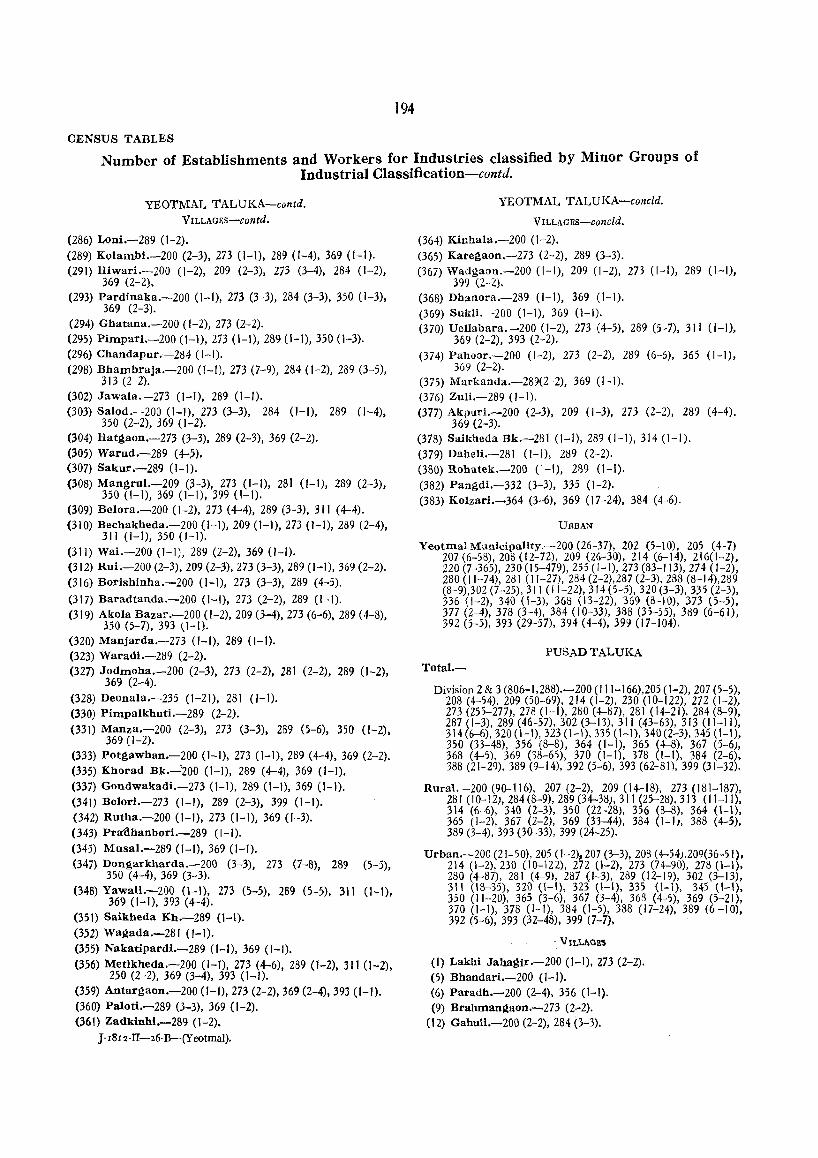
194
CENSUS TABLES
Number of Establishments and Workers for Industries classified by Minor Groups of Industrial Classification-contd.
YEOTlVIAL TALUKA-contd. VILLAGES-contd.
(Z86) Loni.-Z89 (I-Z). (289) Kolambi.-ZOO (2-3), 273 (I-I), 289 (1-4), 369 (1-1). (291) Hiwari.-200 (I-Z)' Z09 (2-3), 273 (3-4), 284 (1-2),
369 (2-2). (293) Pardinaka.-200 (1-1), 273 (3-3), 284 (3-3), 350 (1-3),
369 (2-3). (294) Ghatana.-200 (1-2), 27?J (2-2). (295) Pimpari.-200 (1-1),213 (1-1), 289 (1-1),350 (1-3). (296) Chandapur.-284 (1-1).
(Z98) Bhambraja.-200 (1-1), 273 (7-9), Z84 (1-2), 289 (3-5), 313 (2~2).
(302) Jawala.-273 (1-1), 289 (1-1). (303) Salod.-200 (1-1), 273 (3-3), 284 (1-1), 289 (1-4),
350 (2-2), 369 (1-2). (304) Hatgaon.-273 (3-3), 289 (Z-3), 369 (Z-2). (305) Warud.-289 (4-5). (307) Sakur.-289 (1-1).
(308) Mangrul.-209 (3-3), 273 (1-1), Z81 (1-1), Z89 (2-3), 350 (1-1), 369 (1-1), 399 (1-1).
(309) Belora.-200 (1-2),273 (4-4),289 (3-3),311 (4-4). (310) Bechakheda.-200 (1-1),209 (1-1), 273 (1-1), 289 (2-4),
311 (1~1), 350 (I-I). (311) Wai.-200 (1-1), 289 (2-Z), 369 (1-1). (312) RuL-200 (2-3),209 (2-3), 273 (3-3), 289 (1-1), 369 (2-2). (316) Borishinha.-200 (1-1), 273 (3-3), Z89 (4-5).
(317) Baradtanda.-200 (1-1), 273 (2-2), 289 (1-1). (319) Akola Bazar.-200 (1-2), Z09 (3-4), 273 (6-6),289 (4-8),
350 (5-7), 393 (1-1). (320) Manjarda.-273 (1-1), 289 (I-I). (323) Waradi.-289 (Z-2). (327) Jodmoha.-200 (Z-3), 273 (2-2), 281 (Z-2), 289 (1-2),
369 (2-4). (328) Deonala.-235 (1-21), 281 (I-I). (330) Pimpalkhuti.-289 (2-2). (331) Manza.-200 (2-3), 27?J (3-3), 289 (5-6), 350 (1-2),
369 (1-2). (333) Potgawhan.-200 (1-1), 273 (1-1), 289 (4-4), 369 (2-2). (335) Khorad Bk.-'zOO (1-1), 289 (4-4), 369 (I-I). (331) Gondwakadi.-273 (1-1), 289 (1-1), 369 (1-1). (341) Belori.-273 (1-1), 289 (2-3), 399 (1-1).
(342) Rutha.-200 (1-1), 273 (1-1), 369 (1-3). (343) Pra"dhanbori.-289 (1-1). (345) Musal.-289 (1-1), 369 (H). (341) Dongarkharda.-200 (3-3), 273 (7-8), 289 (5-5),
350 (4-4), 369 (3-3). (348) Yawali.-200 (1-1), 213 (5-5), 289 (5-5), 311 (1-1),
369 (1-1), ?J9?J (4-4). (351) Saikheda Kh.-289 (1-1). (352) Wagada.-281 (1-1).
(355) Nakatipardi.-289 (I-I), 369 (I-I). (356) Metikheda.-200 (1-1), 273 (4-6), 289 (1-2), 311 (1-2),
250 (2-2), 369 (3-4), 393 (I-I). (359) Antargaon.-200 (1-1),273 (2-2), 369 (2-4), 393 (I-I). (360) Paloti.-289 (3-3), 369 (1-2). (361) Zadkinhi;-289 (1-2).
J-18Iz-II-z6-B-(YeotmaI).
YEOTMAL TALUKA-concld.
VILLAGES-COllcld.
(364) Kinhala.-200 (1-2). (365) Karegaon.-273 (2-2), 289 (3-3). (367) Wadgaon.-200 (I-I), 209 (1-2), 273 (I-I), 289 (1-1),
399 (2-2). (368) Dhanora.-289 (I-I), 369 (1-1).
(369) Sukli.-200 (1-1), 369 (1-1). (370) Uellabara.-200 (1-2), 273 (4-5), 289 (5-7), 311 (I-I),
369 (2-2), 393 (2~2). (374) Pahoor.-200 (1-2), 273 (2-2), 289 (6-6), 365 (I-I),
369 (2-2). (375) Markanda.-289(2~2), 369 (1-1). (376) Zuli.-289 (1-1). (377) Akpuri.-200 (2-3), 209 (1-3), 273 (2-2), 289 (4-4).
369 (2-3). (378) Saikheda Bk.-281 (1-1),289 (1-1),314 (I-I). (379) Daheli.-281 (1-1), 289 (2-2). (380) Rohatek.-200 (1-1), 289 (1-1).
(382) Pangdi.-332 (3-3), 335 (1-2). (383) Kolzari.-364 (3-6), 369 (17-24), 384 (4~6).
URBAN
YeotmalManicipality.-200 (26-37), 202 (5-10), 205 (4-7) 207 (6-58),208 (12-72), 209 (26-30), 214 (6-14), 216(1-2), 220 (7-365), 230 (15-479), 255 (I-I), 273 (83-113), 274 (I -2), 280 (11-74),281 (11-27),284 (2-2),287 (2-3),288 (8-14),289 (8-9),302 (7-25), 311 (11-22),3 I 4 (5-5), 320 (3-3),335 (2-3), 336 (1-2), 340 (1-3), 368 (13-22), 369 (iHO), 373 (5-5), 377 (2-4), 378 (3-4), 384 (10-33), 388 (35-55), 389 (6-61), 392 (5-5), 393 (29-57), 394 (4-4), 399 (17-104). .
PUSADTALUKA Total.-
Division 2 & 3 (806-1,288).-200 (111-166),205 (1-2), 207 (5-5), 208 (4-54),209 (50-69),214 (1-2),230 (10-122),272 (1-2), 273 (255-277),278 (1-1),280 (4-87),28104-21),284 (8-9), 287 (1-3), 289 (46-57),302 (3-13),311 (43-63), 313 (11-11), 314 (6-6), 320 (1-1), 323 (1-1), 335 (1-1), 340 (2-3), 345 (1-1), 350 (33-48), 356 (8-8), 364 (1-1), 365 (4-8), 367 (5-6j, 368 (4-5), 369 (38-65), 370 (I-I), 378 (1-1), 384 (2-6), 388 (21- 29), 389 (9-14), 392 (5-6), 393 (62-81), 399 (3I-3Z).
Rura1.-200 (90-116), 201 (2-2), 209 (14-18), 273 (181-187), 281 (10-12), 284 (8-9), 289 (34-38), 311 (25-28), 313 (11-11), 314 (6--6), 340 (2-3), 350 (22-28), 356 (8-8), 364 (I-I), 365 (1-2), 367 (2-2), 369 (33-44), 384 (1-1), 388 (4-5), 389 (3-4), 393 (30-33), 399 (24-25).
Urban.-200 (21-50),205 (1-2),207 (3-3), 208 (4-54),209(36-51), 2 I 4 (1-2), 230 (10-122), 272 (1-2), 273 (74-90), 278 (1-1), 280 (4-87), 28 I (4-9), 287 (J-3), 289 (12-19), 302 (3-13), 311 (18-35), 320 (I-I), 323 (I-I), 335 (\-1), 345 (I-I), 350 (11-20), 365 (3-6), 367 (3~4), 368 (4-5), 369 (5-21), 370 (1-1), 378 (I-I), 384 (1-5), 388 (11-24), 389 (6 -10), 392 (5-6), 393 (32-48), 399 (7-7),
(I) Lakhi Jahagir.-200 (1-1), 273 (2-2). (5) Bhandari.-200 (1-1). (6) Paradh.-200 (2-4), 356 (1-1). (9) Brahmangaon.-273 (2-2).
(12) Gahuli.-200 (2-2),284 (3-3).

195
E SERIES
Number of Establishments and Workers for Industries classified by Minor Groups of Industrial Classification-contd.
PUSAn TALUKA-contd.
VILLAGES- contd.
(14) Parwa.-200 (I-I). (17) Wanwarla.-200 (1-2), 209 (3-3), 273 (3-3). (19) Mun~ahi.-200 (1-1). (20) Bansi.-200 (1-1),273 (2-2). (23) Jamni Dhundi.-200 (1-1), 273 (2-2). (25) Wad~aon.-350 (3-6),356 (I-I). (27) Pimpal~aon.-384 (1-1). (30) Ghatodi.-273 (2-2), 388 (2-3). (31) Moha Ijara.-200 (1-1). (34) Dhanora.-200 (I-I). (35) Jamb Bazar.-200 (I-I), 273 (3-3). (37) Bhojala.-200 (2-4), 273 (5-7). (41) Pardi.-200 (1-1). (43) Warud.-200 (I-I), 284 (3-4). (48) Karla.-200 (2-2), 340 (1-2). (49) Bori Kh.-200 (I-I). (51) Mandwa.-200 (I-I) (58) Marwadi Kh.-ZOO (1-1). (59) Belura.-273 (5~j), 311 (7-8),369 (4-4), 393 (2-3),399 (3-3). (63) Rohda.-200 (3-5), 369 (2-2). (64) Marwadi Bk.-200 (1-1),273 (2-2), 369 (2-2). (68) Hiwalani.-200 (I-I). (69) H()rkad.-200 (I-I). (70) Shiwani.-350 (3-3), 367 (2-2). (72) Ad~aon.-200 (1-1),356 (I-I). (74) Mop.-273 (5-5), 369 (2-2). (79) Nanand Ijara.-ZOO (1-1), 273 (4-4), 289 (I-I). (82) Jamb Naik.-289 (I-I), 393 (I-I). (83) Deothana.-369 (2-2). (84) Sukali.-200 (1- I), 273 (2-2), 289 (I-I), 369 (2-2). (87) Lohara Ijara.-200 (I-I). (93) Isapur.-200 (1-2), 273 (6- 6), 311 (I-I).
(96) Shembalpimpri.-200 (4-4) 273 (4-4) 289 (I-I), 393 (2-2). "
(106) Bibi.-289 (1-1), 356 (I-I). (III) Shelu Bk.-200 (I-I). (116) Bori Izara.-200 (I-I). (119) Weni Kh.-200 (I-I). (123) Hudi.-200 (1-1),273 (3-3), 311 (2~3), 313 (4-4), 350 (5-5),
393 (I-I). (125) KasoIa.-273 (1-1),393 (I-I). (129) Kati.-200 (I-I" 207 (2-2),273 (4-4),289 (5-5) 311 (3-3),
393 (2-2). '
(132' Harshi.-200 (1-1),209 (3-3). (134) Dahiwad Bk.-273 (4--4). (140) Kanha.-200 (1-1),273 (4--4),289 (1-1),369 (2-2). (141) Gunj.-273 (5-5), 313 (7-7), 350 (3-3),369 (2-2). (142) Malkinhi.-393 (2-2). 273 (1-1), 399 (4-4). (144) Dahiwad Kh.-273 (4--4). (145) Mohadi.-273 (2-2). (147) Sawana.-200 (2-3),273 (3-3), 369 (1-1),393 (I-I). (156) Malwal>ad.-200 (I-I), 273 (I-I).
PUSAn TALUKA-contd.
VILLAGES-contd.
(157) Kondari Ijara.-200 (1-2),281 (3-4). (158) Gaul Kh.-200 (I-I). (160) Morath Jahagtr.-200 (1-2), 273 (6-6), 356 (1-1).
369 (I-I). (161) Wakodi.-273 (2-2). (162) Kalgaon.-289 (I-I). (167) Khadaka.-200 (2-2), 356 (2-2). (169) Lewa.-200 (1-3),273 (I-I). (170) Pokhari.-200 (1-1),209 (1-1),273 (1-1),289 (I-I). (171) Shilona.-273 (I-I). (175) Uti.-273 (I-I), (176) Mahag,aon.-ZOO (1-2), 273 (3-3). (178) Karanj Khed.-356 (I-I), 369 (2-2), (179) Hiwara.-200 (2-4), 209 (3-7), (180) Ijani.-200 (1-2), 273 (3-3), 393 (I-I). (181) Pohondul.-213 (2-2), 284 (2-2),314 (4-4),399 (5-5). (182) Tiwarang.-273 (1-1). (183) Malkapur.-289 (1-1). (191) Mudana.-200 (2-2), 273 (4-4). (215) Tembhi.-273 (I-I). (218) Fulsawangi.-200 (1-1),273 (4-4). (219) Dhanaj.-200 (1-1),209 (2-2),281 (2-2). (220) Mohadi.-311 (I-I). (221) Bhambar kheda.-200 (I-I). (222) Zadgaon.-389 (3-4).
(227) Mulawa.-200 (3-5), 273 (6-6) 281 (1-2), 289 (I-I). 393(1-1). '
(22S) Pardi (Bang,ala).-200 (1-1). (229) Taroda.-273 (4-4). (235) Pophali.-289 (2-2). (Z38; Palasi.-200 (I-I), 273 (3~3), 399 (3-3). (239) Ambali.-273 (I-I). (241) Kupti.-273 (2-2). (242) Belkhed.-200 (1-1). (243) Marsul.-281 (I-I), 311 (1-2). (250) Nageshwadi.-311 (2-2).
(251) Sukali Jahagir.-200 (1-1),273 (1-1),28 I (1-1),350 (4--5) (255) Umarkhed.-340 (1-1). (262) Marlegaon.-273 (1-1), 311 (2-2). (270) Vidul.-200 (2-2), 273 (2-2). (272) Kharus Bk.-273 (1-1). (273) Sakara.-289 (I-I).
(274) Chal~ani.-273 (3-3), 289 (2-5). (275) Parjana.-273 (I-I). (278) Ningnoor Jahal1ir.-273 (3-3). (281) Rahur.-200 (1-2).
(286) Krishnapur.-289 (1-1), 314 (2-2), 369 (1-1),393 (I-I). (287) Brahaman~aon.-200 (3-4), 273 (5-5) 289 (1-1)
350 (2-2), 369 (I-I), 393 (2-2). ' ,
(289) Dhanki.-200 (6-11), 273 (16-18), 281 (1-1), 289 (1-1) 364 (I-I), 365 (1-2), 369 (3-9), 388 (2-2) 393 (2 3)' 399 (5-5). ' - ,
(294) Deosari.-200 (2-2), 273 (6-6).

196
CENSUS TABLES
Number of Establishments and Workers for Industries classified by Minor Groups of Industrial Classification-contd.
PUSAD TALUKA-concld.
VIL[ .. AGES-Concld.
(296) Lohara.-273 (2-2). (300) Chatari.-200 (I-I), 273 (5-7), 289 (4-5), 311 (3-3),
369 (2-6), 393 (6-6), 399 (4-5). (301) Bori Najik Chatara.-281 (I-n. (306) Sawaleshwar.-273 (2-2), 289 (3-3), 311 (I-I), 350 (1-1)'
369 (1- I), 393 (1-1).
(307) Karanji.-273 (1-1), 289 (2-2),393 (1-1). (311) Kurli.-369 (I-D. (314) Bittargaon.-200 (I-I), 273 (2-2). (323) Bhawani.-273 (1-1), 311 (2-2), 350 (1-3), 369 (I-n.
(324) Soit.-209 (I-I), 289 (I-I\, (327) Jewali.-200 (I-I), 273 (I-I), 393 (2-3). (338) Sondabhi.-209 (1-1), 273 (1-1). (346) Darati (F. V.).-20G (2-2),289 (I-I). (360) Kharbi."':"'369 (1-2),393 (I-I).
URBAN
Pusad Municipality.-200 (14-38), 207 (3-3), 208 (3-48), 209 (9-9), 214 (1-2), 230 (5-90), 272 (1-2), 273 (38-43), 280 (2-51),281 (1-2),287 (1-3),289 (4-4),302 (2-9), 311 (8-19), 320 (1-1),323 (1-1), 335 (H), 345 (1-1),350 (4-9) 367 (3- 4), 368 (2-2), 369 (3-17), 378 (I-I) 384 (1-5) 388 (14-20), 389 (3-5),392 (2-2),393 (13-27),399 (7-7).
Umarkhed Municipality.-200 (7-12), 205 (1-2), 208 (1-6), 209 (27-42), 230 (5-32), 213 (36-47), 280 (2-36),281 (3--7), 289 (8-15), 302 (1-4),311 (1G-16), 350 (7-11), 365 (3-6), 368 (2-3),369 (2-4),370 (I-I), 38B (3-4),389 (3-5),392 (3-4), 393 (14-21).
KELAPUR TALUKA
Total.-
Division 2 & 3 (1,142-1,811),200 (92-136),202 (1-1),207 (14-14), 209 (45-75), 214 (4-7),230 (10-208), 235 (I-IS), 273 (259-329),214 (1-1),278 (I-I), 280 (4-57), 281 (16-27),284 (10-13),287 (1-1),288 (40-122), 289 (231~270), 292 (2-2), 302 (1-2). 311 (64-104), 313 (5-8), 314 (1-1), 336 (1-3), 350 (5G-77), 357 (2-2), 364 (4-4), 367 (2-2), 369 (l52-176), 384 (1-1), 388 (15-20), 393 (65-78), 394 (2-3) 399 (45-51).
Rural.-200 (83-117), 202 (1-1), 207 (9-9), 209 (31-46),214 (I-I), 235 (1-15), 273 (200-231), 281 (12-20), 284 (10-13), 287 (1-1),289 (217-244),311 (4S--64), 313 (4-7),314 (I-I), 336 (1-3),350 (43-65),3640-3),369 (142-157),388 (6-7), 393 (51-56), 394 (I-I), 399 (36--40).
Urban.-200 (9-19), 207 (5-5), 209 (14-29), 214 (3-6), 230 (10-208),273 (59-98),274 (1-1),278 (1-1),280 (4-57),281 (4-7),288(40-122),289 (14-26),292 (2-2),302 (1-2), 311 (16-40),313 (1-1), 350 (7-12), 357 (2-2), 364 (1-1), 367 (2-2),369 (10-19), 384 (1-1), 388 (9-13), 393 (14-22), 394 (1-2), 399 (9-11).
VILLAGES
(3) Sonorli.-369 (2-2). (4) Watkhed.-200 (I-I). (8) Gujari.-200 (1-3),289 (14-16),369 (I-I).
(12) Ashta.-273 (3-3),289 (6-8),311 (1-1),369 (I-I). (14) Sangam.-209 (1-1),214 (I-D.
(15) M~n~alJ'lr.-~8?(1-2), 311 (16-16).
KELAPUR TALUKA-contd.
VILLAGES-tontd. (17) Warha.-273 (2-2),289 (3-3),369 (1-2). (18) Kalamner.-369 (I-I). (19) Ramtirth.-200 (1-1),369 (2-2). (22) Ralegaon.-200 (2-10),209 (13-22),273 (32-40),289 (4-5),
311 (4-4),350 (4-10), 369 (4-4), 388 (1-1), 393 (2-2), (27) Jalka.-200 (2-3). (30) Pimpalkhuti.-200 (2-2),273 (3-3), 289 (I-I), 311 (8-8),
350(12-12),369 (1-1). (31) Raveri.-200 (I-I), 273 (1-1),289 (3-3), 311 (I-I), 369
(I-I). (33) Pimpri Durg.-289 (2-2),369 (I-I). (36) Soit.-289 (1-2). (37) Warud.-273 (1-2), 369 (1-2). (40) Zadgaon.-200 (1-2),209 (1-1),273 (8-9), 393 (3-3). (41) Bhamb.-289 (3-3). (45) Sawangi.-200 (I-I), 209 (I-I), 273 (2-2), 281 (1-6),
289 (4-4),311 (6-11),369 (1-1). (49) Inzapur.-273 (I-I), 289 (1-2),399 (I-I). (51) Antargaon.-200 (I-I). (52) Undri.-200 (2-2),273 (I-i), 289 (2-2),393 (I-I). (55) Dapori.-273 (I-I). (56) Wanoja.-200 (1-1),289 (2-2),3(\9 (I-I). (57) Chikhali.-273 (1-2), 289 (3-3),311 (I-I), 350 (I-I),
369 (1-2),393 (1-1). (58) Sarai.-200 (1-1),273 (1-1),289 (1-2),369 (I-I). (60) Nidha.-273 (2-2),289 (2-2),369 (1-1). (61) Sheli.-273 (1-1), 289 (H). (62) Aptirampur.-200(1-1), 369(1-1). (67) Loni.-273 (1-1),289 (1-2),369 (I-I). (69) Sarati.-200 (H), 273 (1-1),289 (1-1).
(70) Khairgaon (Kasar).-273 (1-3), 239 (2-2), 369 (I-I). (71) Mohadari.-200 (2-2),209 (I-I). (73) Wardha.-369 (2-4). (79) Dhanora.-200 (3-5), 209 (2-2), 273 (6-6), 289 (4-5),
350 (1-2). (83) Mudhapur.-Z89 (3-3). (84) Yeoti.-289 (2-2). (86) Karanji.-289 (2-2). (88) Wadhoda.-289 (2-Z), 369 (I-I). (89) Pimpalgaon.-273 (I-I), 289 (3-3). (90) Wadhona.-200 (1-1), 209 (I-I), 273 (7-7), 289 (1-2),
369 (3-3). (91) Chikhali.-369 (I-I). (92) Atmurdi.-273 (1-1), 284 (1-2), 287 (1-1), 313 (1-1),
364 (2-2). (93) Umred.-273 (I-I). (94) Chahand.-200 (I-I), 209 (I-I), 273 (3-4), 289 (4-4),
311 (1-1),369 (2-2),393 (1-1). (95) Karegaon.-273 (I-I). (96) ZuIlar.-399 (3-3). (97) Khadki.-289 (3-3),369 (2-2), 399 (I-I). (98) Pimpalapur.-202 (1-1),289 (2-2),369 (2-2), 399 (I-I). (99) Ridhora.-200 (2-2),273 (3-3),369 (1-1).
(100) Wedshi.-200 (2-2), 273 (1-1), 284 (I-I), 364 (I-I), 369 (I-I).

197
E SERIES
Number of Establishments and Workers for Industries classified by Minor Groups of Industrial Classification-contd.
KELAPUR TALUKA-contd.
VILLAGES-contd,
( 102) Cbondhi.-289 (1-1),369 (I-I). (103) Mira.-289 (I-I). (106) Wadhoda.-369 (I-I).
(108) Ghoddara.-289 (2-2). (109) Khemkund.-369 (J-l).
(110) Sakhi Bk.-289 (I-I), 369 (I-I). (115) Karanji.-200 (I-I), 209 (2-4), 273 (2-2), 289 (2-2),
369 (2-2). (116) Wadhona Bk.-200 (1-1),289 (1-1),369 (1-1), 399 (I-I). (118) Kothoda.-209 (1-2),289 (1-2),311 (1-2),369 (10-10). (120) Adni.-273 (I-I), 289 (2-2),399 (4-5). (121) Khatara.-200 (1-1), 289 (I-I), 369 (I-I), 399 (I-I). (122) Munzala.-273 (2-3), 369 (3-3). (123) Palaskund.-Z84 (1-1),289 (I-I). (124) Vihirgaon.-289 (2-2), 369 (1-1). (125) Khair~aon.-369 (1-1). (126) Yekurli.-273 (2-2), 289 (2-2). (127) Dhumak Chachor.-273 (I-I), 289 (I-I). (128) Deodhar1. -289 (1-2). (130) Sonurli.-273 (I-I), 369 (2-2). (132) Kinhi.-200 (1-1),399 (3-3). (133) Daheg,aon.--273 (I-I), 239 (2-2), 314 (1-1), 369 (1-1),
393(1-1). (137) Wadgaon.-284 (1-3). (138) Wadki.-200 (I-I), 273 (3-4), 284 (I-I), 289 (3-5),
350 (2-4), 369 (2-3), 393 (10- I 1). (140) Kochi.-289 (J-2), 369 (1-1). (141) Khairi.-200 (4-6),207 (3-31, 273 (10-11),289 (13-16),
313 (2-5), 350 (5-6), 369 (2-2), 393 (1- I). (142) Sawltri.-Z89 (I-I). (143) Bori-Ichod.-200 (1-1),273 (2-3), 289 (2-Z), 313 (1-1),
369(1-2). (144) Pimpri.-273 (2-3), 289 (2-·2), 399 (1-2). (145) Mangi.-289 (2-2), 369 (1-1)-(147) Ashtona.-200 (1-2) 273 (1-1), 234 (1-1), 289 (I-I),
350 (1-2),369 (1-1),393 (1-1),399 (2-4). (149) Murli.-289 (3-3), 369 (2-2). (ISO) Khapri.-207 (1-1), :213 (1-1),369 (I-I). (156) Asoli.-Z89 (1-1), 369 (I -1). (158) Mohada.-200 (2-6), 209 (1-1), 273 (3-6),289 (3-3),
311 (1-1),350 (1-1),369 (2-2), 3g8 (3-4)_ (159) Sakhi Kh.-289 (I-I). (161) Ambezari.-369 (1-1). (162) Shivni.-200 (1-2),289 (1-2), 369 (I-I). (163) Karegaon.-200(!-2).
(164) Runza.-200 (1-2), 273 (I-I).
(167) Dabha.-200 (1-2).
(170) Jarang.-200 (1-1),273 (1-1),359 (3-3). (174) Anji(Nrusinha.)-200(1-2). (176) Manoli.-273 (1-'1), 289 (2-2), 369 (3-3). (177) Dahegaon.-369 (1- I).
(178) Shiroli.-200 (1-2),273 (2-2), 289 (8-8), 393 (11-13). (179) Junoni.-289 (1-1).
(184) Sakhara Kh.-200 (1-1), 289 (1-1), 369 (1-1).
KELAPUR TALUKA-contd.
VILLAGlIa-contd.
(186) Mandawa.-289 (2-2), 369 (I-I). (187) Wasri.-369 (2-2). (189) Kopara alias khupta.-289 (I-I). (190) Hiwardhara.-273 (I-I) ,289 (1-1), 369 (1-1). (191) Jarur.-289 (2-2), 273 (1-1). (192) Lingti.-239 (I-I). (193) Saykhed.-200 (2-3), 209 (1-1), 273 (I-I), 289 (I-I)
350 (4-5),369(2-3). (194) Kinhi.-200 (I-I), 289 (1-2),369 (1-2). (196) Rajurwadi.-289 (2-2), 369 (I-I). (197) Karanwadi.-369 (I-I). (198) Wagda.-289 (1-1).
(199) Khairgaon.-200 (I-I), 289 (1-1),369 (1-1).
(200) Kllrha.-273 (3-3), 289 (1-1). (201) Bhambora.-209 (1-1),273 (3-3), 289 (2-2), 393(1-1).
394 (I-I). (202) Talni.-200 (1-1), 273 (4--4), 393 (9-9). (203) Borgaon.-200 (1-2). (204) Kurhad.-Z73 (I-I), 369 (1-1). (206) Pandhurna Kh.-200 (1-2), 273 (I-I).
(208) Paadhllrna Bk.-200 (1-2), 289 (1-2). (211) Kinhi.-273 (1-1), 369 (2-2). (214) Koli Kh.-369 (1-1). (215) Koll Bk.-273 (1-1), 281 (1-1). (215) Ramp:Jrav Undarni.-273 (I-I), iSI (I-I), 289 (I-I),
369 (1-1). (218) Pardi.-200 (1-1), 273 (4-4), 281 (J-J), 289 (J-J),
369 (2-2). (219) Anji.-289 (I-I), 369 (1-2). (222) S11ioor.-239 (I-I), 369 (I-I). (Z25) Belura.-369 (1-1),393 (1-2), 399 (17-17). (228) Yedshi.-350 (3-4). (230) Palashi.-273 (2-2),289 (2-2), 35u (1-1),369 (1-2). (231) Kelzara.-273 (3-3), 284 (I-I), 369 (I-I). (233) Warud.-273 (2-2), 289 (2-3), 393 (I-I). (234) Daheli.-200 (I-I), 284 (2-2), 369 (1-2). (235) Ichora.-200 (I-I), 273 (3-5), 234 (1-1). (236) Malegaon.-200 (1-1),273 (I-I), ~69 (1-1).
(237) 8aol1.-200 (2-3), 273 (2-2), 289 (1-1), 393 (1-1)_ (238) Datodi.-273 (3-3), 350 (1-1), 393 (1-1). (239) Gudha.-273 (1-1). (Z42) Umri.-369 (1- I). (243) Palodi.-200 (1-1). (245) Ghoti.-200 (I-I), 369 (I-I). (247) Manjari. -369 (I-I). (253) Kawtha Kh.-200 (I-I), 273 (2-2), 289 (2-2). (256) Ayata.-200 (1-1), 273 (2-2), 239 (2-2), 369 (1-2). (262) Pangadi.-273 (I-I), 289 (1-1), 369 (I-I). (263) Pimpari. -369 (1-1). (264) Inzala.-289 (1-1). (267) Kopri Kh.-289 (2-2). (274) Titwi.-200 (1-1).
(283) Dorii.-207 (I-I).

198
CENSUS TABLES
Number of Establishments and Workers for Industries classified by Minor Groups of Industrial Classification-contd.
KELAPUR TALUKA-contd.
VU,;LAGES-contd.
(Z84) DeodMri.-zn (I-I), ~9~ (I-I). (285) Sayatkharda.-200 (I-I),~273 (2-4), ;39~ (I-I). (288) Zatala.-;369(1-1). (289) Chikhalwardha.-289 (1-1). (290) Tadsawali.-ZOO (2-2), Z07 (I-I). (Z92) KurU.-ZOO (I-I), 273 (I-I). (296) Perwa.-200 (1-2), Z07 (2-2), 235 (1-15), 2i3 (5-5).
289 (5-5), 350 (2-2)., 369 (3-3), 388 (1-1). (297) Mejda.-369 (1-1) (298) Bhad Umari 289 (1-1) (300) Pahapal.-273 (1-1),393 (1-1),312 Jamb(312) Jamh.-369 (1--1). (315) Waghal'taklL-273 (2-2)/369 (I-I). (327) Malegaon Bk.,-369 (I-I), (331) Arli.-273 (1-1),369 (1-1),393 (I-I). (332) Hiwari.-Z89 (1-1), (334) Karegaon.-289 (I-I), 369 (I-I). (337) Ghubdi.-289 (I-I) (338) Umri.-273 (2-Z), 281 (1-3). (339) Telangtakli-273 (I-I), 289 (H), 369 (I-I). (342) Dharna.-289 (2-2). (345) Wai.-200 (1-1),289 (I-I). (351) AkoliKh.-289 (I-I), 311 (1-10). (354) Sonbardi.-369 (1-1). (355) Kelapul'.-200 (1-1), 369 (I-I). (356) Ghonsi.-Z89 (2-2). (359) Pimpri.-273 (5-10),289 (1-2), 311 (2-3), 350 (3-12). (360) Khairgaon.-289 (2-4). (362) Mangurda.-369 (1-1). (366) Baggi.-369 (1-1). (374) Chalbardi.-200 (H).
(378) Akoli Bk.-200 (I-I), 2m (2-2), 289 (I-I), 369 (I-I). 393 (1-2). ~,.',
(380) Sakhara.-289 (1-1), 369 (I-I). (383) Ballarpur.-289 (1-1). (385) Wanjari.-350(2-2). (387) Sunna.-200 (1-2), 207 (I-I), 273 (1-1), 289 (2-2),
369 (1-1),388 (I-I). (388) Tembhi.-289 (2-2). (390) Kopamandvi.-289 (2-2). (391) Kawtha.-289 (1-1),369 (1-1). (397) Cbanakba.-311 (5-5). (401) BorL-200 (2-2),209 (4-7),273 (8-8), 281 (5-6),289 (2-3),
336 (1-3), 369 (2-3), 399 (l-I). (403) Kodori.-200 (1-1),281 (1-1),369 (2-4). (404) Pimpalkhuti.-28 1,( I -1).
URBAN
Ghatanji Municipality.-200 (5-12), 207 (3-5), 209 (7-18). 214 (1-3), 230 (3-13), 273 (19-24), 274 (I-I), 278 (I_I), 280 (1-7),281 (2-4),288 (6-13),289 (7-11), 311 (3-5), 369 (3-4), 388 (3-4),1393t(5-8), 394 (1-2), 399 (3-3).
Pandharkaoda Municipality.-200 (4-7), 207 (2-2), 209. (7-1 I), 214 (2-3), 230 (7-195), 273 (40-74), 280 (3-50), 281 (2- 3), 288 (34-109), 289 (7-15), 292 (2-2), 302 (1-2), 31 I (13-35), 313 (I-I), 350 (7-12), 357 (2-2), 364 (I_I), 367 (2-2), 369 (7- I 5), 384 (I-I), 388 (6-9), 393 (9- I 4) 399 (6-8). •
WANI TALUKA Total.-
Dh-ision 2 & 3 (1,011-1,745).-200 (35-49), 202 (1-10), 205 (1-1), 207 (10-13), 208 (6-17), 209 (42-97), 2 I 4 (3-6), 230 (I ().-85), 233 (1-1*), 235 (69-104), 237 (2-6), 250 (5-6),. 273 (192-224),274 (4-5),280 (4-10),281 (32-42), 284 (8-8), 288 (1-2), 289 (197-21), 302 (1-6), 31 I (53-69), 313 (19-26), 3\4 (14-14), 340 (I-I"') 342 (7-303),350 (19-35), 355 (1-\), 368 (1-1),369 (238-302),384 (1-4),388 (11-12),392 (I-I), 393 (14-24), 399 (7-9).
Rural.-200 (23-31), 202 (1-10), 205 (I-I), 207 (8-1 I), 209 (17-18), 233 (1-1), 235 (69-104), 250 (5-6),273 (164-179), 281 (31-38), 284 (8-8), 289 (191-233), 31 I (49- 62), 313 (19-26), 314 (14-14), 340 (1-1), 342 (7-303), 350 (19-35), 355 (I-I), 368 (1-1), 369 (233-295),393 (6-14), 399 (5-5).
Urban.-200 (12-18), 207 (2-2), 208 (6-17), 209 (25-79), 214 (3-6), 230 (10-85), 237 (2-6), 273 (28-45), 274 (4-5), 280 (4-10),281 (1-4),288 (1-2),289 (6-8), 302 (1-6),311 (4-7), 369 (5-7), 384 (1-4), 388 (11-22), 392 (I-I), 393 (8-10), 399 (2-4).
VILLAGES
(2) Kosara.-289 (3-4), 369 (1-2). (3) Bori Bk.-207 (1-2), 369 (I-I).
(7) Chinchrmandal.-200 (1-1), 273 (S-5), 369 (3-9). (8) Takli.-205 (1-1), 369 (2-2).
(10) Kothurla.-369 (2-4). (II) Khairgaon.-289 (2-2), 369 (2-2). (12) Kegaon.-289 (1-1), 369 (2-2). (13) Kumbha.-200 (1-2), 273 (2-2), 289 (1-1), 369 (5-5).
393 (1-2). (15) Mahagaon.-273 (2-2), 289 (2-2). (16) Shindi.-200 (I-I), 273 (1-2), 289 (3-3). (18) Dewala.-273 (3-3), 289 (4-4), 369 (1-1).
(21) Gadegaon.-2B4 (3-3), 311 (1-2), 369 (1-2). (24) Buranda.-273 (2-3), 369 (I-I). (27) Dongargaon.-233 (I-I), 369 (I-I). (28) Mardi.-200 (1-2),273 (4-4), 289 (2-3), 369 (2-2). (29) Chopan.-273 (I-I), 369 (2-4). (30) Majara.-273 (I-I), 369 (2-2). (31) Chanoda.-369 (1-1). (33) Ghodadhara.-369 (I-I). (34) Narsala.-289 (I-I), 369 (2-3). (35) Dhamani.-369 (1-1).
(38) Pisgaon.-Z73 (1-1), 369 (1-1). (39) Kinhala.-273 (I-I), 369 (1-1). (43) Hiwaramajra.-273 (6-6), 281 (4-4), 289 (1-2), 369
(1-4), 393 (1-2). (44) Kanada.-2S0 (5-6), 369 (2-2), (45) Pardi.-289 (I-I). (46) Shioni.-273 (3-3), 289 (2-3), 369 (2-2). (48) Kanhalgaon.-289 (1-3).
(49) Maregaon.-200 (I-I), 209 (I-I), 273 (6-6), 281 (1-2), 2B9 (2-2), 311~(1-1), 369 (3-3).
(51) Pathari.-369. (1-2). (52) Cninchala.-200 (I-I), 273 (2-3), 289 (2-2). (53) Pandharkawada.-369 (I_I). (58) Dandgaon.-369 (1-2). (59) Mukta.-289 (I-I),

199
E SERIES
Number of Establishments and Workers for Industries classified by Minor Groups of. Industrial Classification-contd.
WANI TALUKA-contd. VILLAGES-contd.
(60) Mangrul.-289 (1-1). (62) Warud.-289 (1-1), 311 (2-5). (63) Akapur.-235 (11-21), 289 (3-3), 369 (2-2). (64) Doldongargaon.-273 (3-4), 369 (2-5). (65) Machindra.-289 (2-4), 369 (1-2). (66) Wanoja.-235 (4-8), 273 (1-3), 289 (2-2), 369 (1-1). (67) Apti.-289 (2-2), 369 (1-2). (68) Gawarala.-273 (2-2), 289 (1-1), 369 (2-4). (69) Net.-273 (1-1), 289 (2-2), 393 (I-Z). (70) Lakhapur.-289 (1-1), 369 (1-1). (71) Nandepera.-200 tl-2), 281 (5-5), 289 (3-3),311 (1-7),
369 (3-3), 393 (1-3). (72) Shelu Kh.-Z81 (1-2),289 (1-1),369 (1-2). (74) Bhandewada.-289 (I-I), (75) Sonapur.-289 (1-1). (76) POhona.-369 (2-2). (77) Bhurki.-369 (3-4). (78) Rangana.- 289 (1-3), 369 (2-2). (80) Jalka.-209 (2-2), 289 (2-3), (83) Chinchoni Botoni.-273 l3-3), 369 (1-1). (86) Khairgaon.-289 (I-I), 369 (1-1). (87) Sarati.-369 (I-I). (83) Buranda.-289 (2-2), 369 (1-4). (93) Hatwanjri.-369 (2-2). (95) Karanwadi.-273 (5-5), 289 (3-5), (99) Mhaisdodaka.-289 (1-1), 369 (2-2).
(100) Nawargaon.-200 (1-3), 207 (2-4), 209 (3-4), 273 (8-8), 289 (1-1),369 (4-4).
{l01) Takalkheda.-369 (2-2). (109) Sagnapur.-289 (3-4), 314 (3-3).
(111) Wegaon.-ZOO (1-1), 273 (4-4), 289 (4-4), 311 (9-9), 369 (6--6).
(112) Kolgaon.-235 (2-2), 273 (4-4), 289 (4-4), 311 (4-5), 369 (2-6),
(113) Hiwara Barsa.-289 (1-4), 399 (1-1). (117) Shibla.-209 (3-3), 369 (2-2). (131) Surla.-289 (4-6).
(133) B:lrda.-200 (1-1), 239 (3-3), 3S9 (1-1), 399 (2-2). (136) Nimani.-239 (2-3). (138) Sonegaon.-369 (2-2).
{143) ZamkoJa.-369 (2-2).
(146) Ghonsa.-200 (1-2), 273 (4-6), 289 (2-4), 369 (2-5). (150) Junoni.-369 (1-1).
(151) Dahegaon.-209 (3-3), 273 (6-6), 289 (5-8), 311 (6-9), 369 (2-2).
(155) Chinchghat.-273 (3-3).
(156) Sakhara.-200 (1-2), 207 (1-1), 273 (9-11), 289 (7-9), 355 (I-I), 369 (1-1).
(157) Injasan.-289 (1-1),369 (1-2).
(160) Bopapur.-200 (I-I), 273 (1-1), 289 (1-1), 31 I (1-1), 369 (2-2).
(161) Dara.-289 (1-3), 369 (I-I). (166; Karegaon Kh.-369 (2-3). (167) Nimbadevi.-281 (3-3), 289 (I_I).
WANI TALUKA-conld.
VILLAGES-contd. (170) Mandvi.-281 (1-1), 289 (2-3), 369 (1-2). (174) Piwardol.-289 (2-2), 369 (1-1). (176) Chikbaldoh.-289 (I-I), 369 (1-2). (181) Gawara.-289 (I-I). (182) Matharjun.-209 (1-1), 289 (2-2), 369 (1-2). (184) Pandharwani.-369 (1-2). (185) Takli.-289 (1-1), 369 (1-1). (186) Demad Devi.-369 (I-I). (187) Mandwa.-284 (3-3), 369 (I-I). (189) Dabhadi.-239 (2-2). (190) Dabha.-289 (3-3), 369 (1-1). (195) Kodpakhindi.-289 (1-3), 369 (2-2). (202) Satpalli.-200 (I-I), 289 (1-1). (206) Jamani.-209 (2-2), 289 (2-2). (21(1) KamalweUi.-2.B9 (1-1>. (211) Surdapur.-207 (1-1),273 (I-I), 289 (3-4), 369 (1-1). (214) Marki Bk.-369 (1-1). (215) Marki Kh.-369 (1-1). (226) Pandharkawada.-273 (4-4), 289 (1-1), 369 (2-2). (228) Durbha.-369 (I-I). (230) Lingti.-369 (I-I). (234) Kosara.-273 (I-I), 369 (I-I). (235) Dhanora.-200 (I-I), 207 (2-2), 273 (2-2), 313 (3-3),
369 (2-2). (237) Ardhawan.-273 (1-1), 311 (1-1),313 (I-I), 369 (1-1). (238) Bhendala.-273 (I-I), 313 (1-3), 369 (1-3). (241) Khadki.-289 (1-1). (242) Ganeshpur.-273 (1-1), 313 (3-5). (243) Mangli.-273 (2-2) (244) Hirapur.-209 (I-I), 273 (4-4).
(247) Mukutban.-207 (I-I), 273 (2-2), 281 (1-1). 289 (1-1), 311 (4-5),399 (I-I).
(249) Pimprad.-273 (1-1), 311 (1-1). (250) Yedashi.-311 (1-0, 369 (1-1). (251) Adegaon.-235 (2-4), 273 (2-2), 3 I 3 (7-8), 369 (6-6). (253) Khatera.-281 (3-3), 239 (I-I). (2')4) Wedad.-273 (1-1),289 (1-1). (256) Bodad Bk.-369 (1-1). (257) Nimbala.-369 (1-1), (258) Raiur.-200 (1-1), 235 (4-4), 273 (5-5), 289 (2-2),
311 (4-4), 342 (7-303), 369 (2-3), 399 (1-1). (265) Palsoni'.-200 (1-1).
(271) Murdhoni.-200 (1-2), 298 (1-1). (272) Ganeshpur.-289 (I-I). (276) Mohorli.-273 (2-2). (278) Lalguda.-273 (2-2). (279) Milapur.-289 (2-2). (280) Brahamani.-273 (1-1), 369 (1-1). (282) Rasa.-273 (2-2), 281 (4-4), 369 (2-4). (Z87) Manki.-369 (2-2). (288) Wagdhara.-235 (2-4), 289 (I-I), 369 (4-5). (293) Parsoda.-273 (I-I), 281 (1-2), 369 (1-2). (294) Gadegaon.-281 (1-3), 369 (1-2).
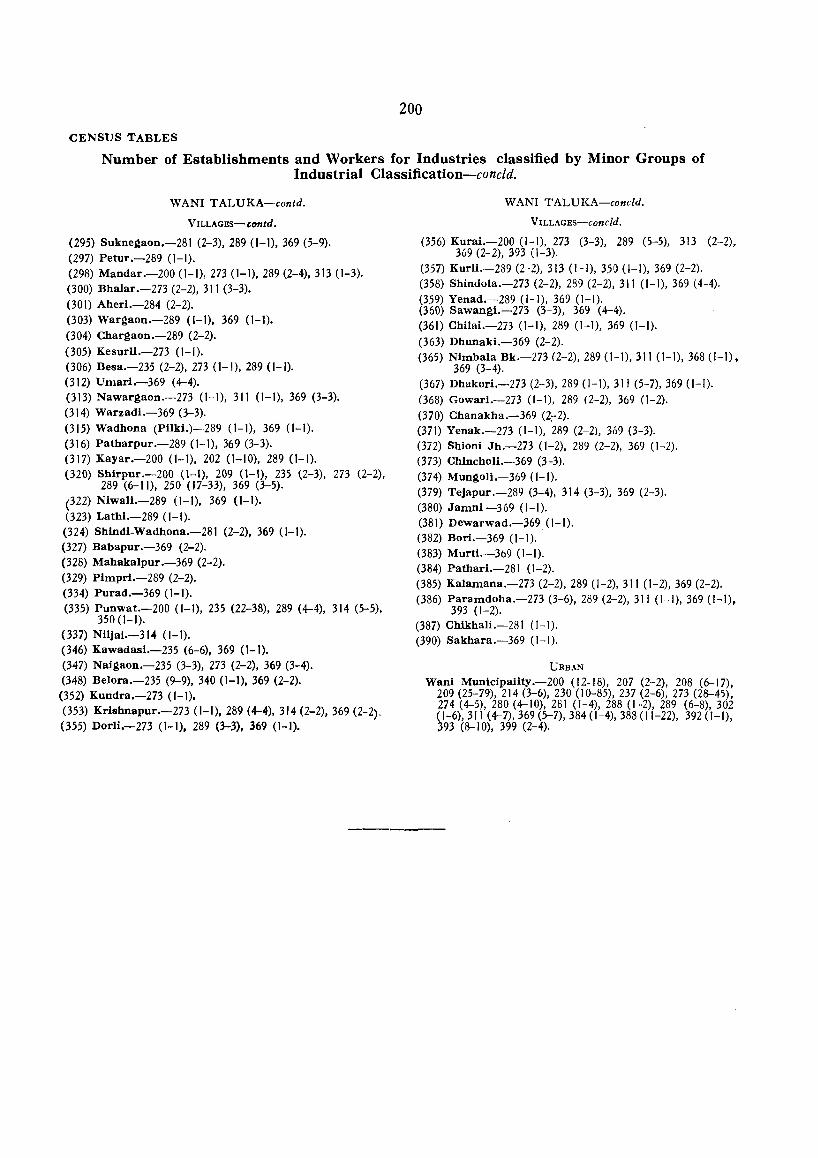
200
CENSUS TABLES
Number of Establishments and Workers for Industries classified by Minor Groups of Industrial Classification-concld.
WANI TALUKA-contd.
VILLAGIlS- contd.
(295) Suknegaon.-28I (2-3),289 (I-I), 369 (5-9). (297) Petur.-289 (I-I). (298) Mandar.-200 (1-1),273 (1-1),289 (2-4),313 (1-3). (300) Bhalar.-273 (2-2), 3 I I (3-3). (301) Aheri.-284 (2-2). (303) Wargaon.-289 (I-I), 369 (I-I). (304) Chargaon.-289 (2-2). (305) Kesurli.-273 (1-1).
(306) Besa.-235 (2-2), 273 (1- I), 289 (I-I). (3 I 2) U mari.-369 (4-4). (3 I 3) Nawargaon.-273 (1- I), 311 (I-I), 369 (3-3). (3 I 4) Warzadi.-369 (3-3). (3 I 5) Wadhona (PilkL)-289 (I-I), 369 (1- I). (316) Patharpur.-289 (1-1),369 (3-3). (317) Kayar.-200 (I-I), 202 (1-10), 289 (I-I). (320) Sbirpur.-200 (I-I), 209 (I-I), 235 (2-3), 273 (2-2),
289 (6-11), 250 (17-33), 369 (3-5). (322) NiwalL-289 (I-I), 369 (I-I). (323) Latbi.-289 (1-1). (324) Shindl-Wadbona.-28I (2-2), 369 (1-1). (327) Babapur.-369 (2-2). (328) Mabakalpur.-369 (2-2). (329) Plmpri.-289 (2-2). (334) Purad.-369 (I-I). (335) Punwat.-200 (1-1), 235 (22-38), 289 (4-4), 3 I 4 (5-5),
350 (I-I). (337) Niljai.-3104 (1-1). (346) Kawadasi.-235 (6-6), 369 (1-1). (347) Naigaon.-235 (3-3), 273 (2-2), 369 (3-4). (348) Belora.-235 (9-9), 340 (I-I), 369 (2-2). (352) Kundra.-273 (I-I). (353) Krishnapur.-273 (I-I), 289 (4-4),314 (2-2),369 (2-2). (355) Dorli.-273 (I-I), 289 (3-3), 369 (I-I).
WAN I TALUKA-concld.
VILLAGES-Concld.
(356) KuraL-200 (I-I), 273 (3-3), 289 (5-5), 313 (2-2). 369 (2- 2), 393 (1-3).
(357) Kurli.-289 (2-2),313 (1-1), 350 (1-1),369 (2-2). (358) Shindola.-273 (2-2), 289 (2-2), 311 (1-1), 369 (4-4). (359) Yenad.-289 (1-1), 369 (1-1). (360) sawangi.-273 (3-3), 369 (4-4). (361) Chilai.-273 (1-1), 289 (1-1), 369 (1-1). (363) Dhunaki.-369 (2-2). (365) Nimbala Bk.-273 (2-2), 289 (1-1),31 I (I-I), 368 (1-1),
369 (3-4). (367) Dhakori.-273 (2-3), 289 (1-1), 311 (5-7), 369 (1-1).
(368) Gowari.-273 (I-I), 289 (2-2), 369 (1-2). (370) Chanakha.-369 (2:-2). (371) Yenak.-273 (I-I), 289 (2-2), 369 (3-3). (372) Shioni Jh.-273 (1-2), 289 (2-2), 369 (1-2). (373) Chincholi.-369 (3-3). (374) Mungoli.-369 (1-1). (379) Tejapur .-289 (3-4), 3 14 (3-3), 369 (2-3). (380) Jamnl -369 (1-1). (381) Dewarwad.-369 (I-I). (382) Bori.-369 (I-I). (383) Murti.-369 (I-I). (384) Pathari.-281 (1-2). (385) Kalamana.-273 (2-2),289 (1-2),311 (1-2),369 (2-2). (386) Paramdoha.-273 (3-6),289 (2-2),311 (1-1),369 (I-I),
393 (1-2). (387) Chikhali.-281 (1-1). (390) Sakhara.-369 (1-1).
URBAN
Wani Municipality.-200 (12-18), 207 (2-2), 208 (6-17), 209 (25-79), 214 (3-6), 230 (10-85), 237 (2-6), 273 (28-45), 274 (4-5),280 (4-10),281 (1-4),288 (1-2),289 (6-8),302 (1-6),311 (4-7),369 (5-7),384 (1-4),388 (11-22), 392 (I-I), 393 (8-10), 399 (2-4).

PART III
OTHER OFFICIAL STATISTICS These include Statistics on Climate and Rainfall, Agriculture, Industry, Education, Health and few other aspecls

Explanatory Note ••
CLIMATE AND RAINFALL I. Highest and Lowest temperatures 2. Rainfall
AGRICULTURE
3. Land utilisation and area under different crops 4. Irrigated area classified by sources of water-
supply. 5. Acreage of crops under irrigation 6. Yield per acre and outturn of principal crops 7. Wholesale prices of principal crops ••
-B. Harvest prices •. '9. Livestock and agricultural implements
q O. Classification of land holdings according to size.
IINDUSTRIES II. Employment in factories 12. Distribution of factories according to products
and their working strength. J 3. Distribution of factories according to number
of days worked. 14. Manufacturing Industries
EDUCATION 15. Educational institutions by types and by
number of students enrolled. 16. Names of colleges and high schools with
location and number of students.
CONTENTS
PAGE
203
207 208
210 213
214 216 217 217 218 220
220 221
221
221
222
223
PUBLIC HEALTH
17. Medical facilities
J 8. Registered births, deaths and infant deaths
19. Registered deaths and causes of deaths
MISCELLANEOUS
20. Railway mileage and stations ••
21. Roads
22. Post offices, telegraph offices and radio licences.
23. Banks ... 24. Land Revenue ••
25. Sales tax and Entertainment tax
26. Dealers under Sales Tax Act ••
27. Documents registered and Value of property transferred.
28. Police force and Crime statistics
29, Cases decided in civil and criminal courts
30. Electrical energy generated, purchased and consumed.
3 J. Towns and villages electrified
32. Weekly markets and Cattle markets
33. Fairs
PAGE
224
224
224
225
225
225
225
226
226
226
226
227
227
227
227
228
230
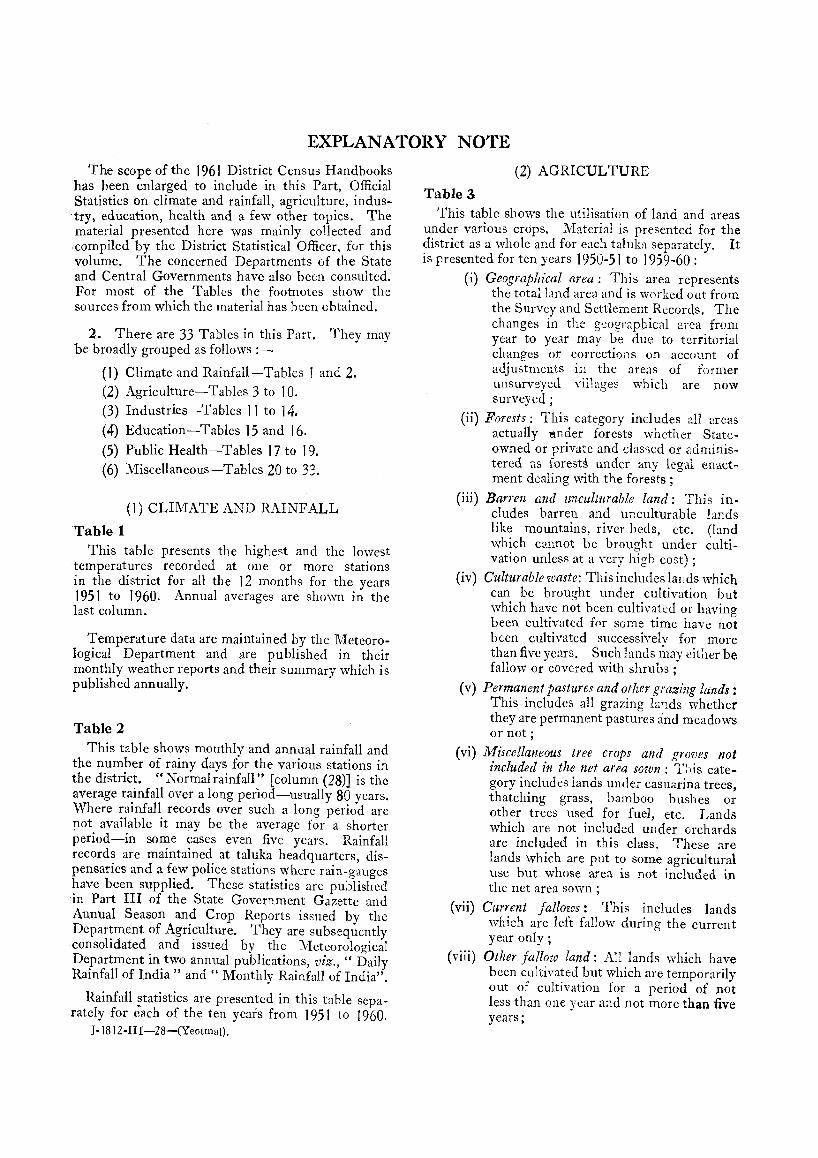
EXPLANATORY NOTE The scope of the 1961 District Census Handbooks
has heen enlarged to include in this Part, Official Statistics on climate and rainfall, agriculture, industry, education, health and a few other topics. The material presented here was mainly collected and compiled by the District Statistical Officer, for this volume. The concerned Departments of the State and Central Governments have also been consulted. For most of the Tables the footnotes show the sOUrces from which the material has been obtained.
2. There are 33 Tables in this Part. They may be broadly grouped as follows :-
(1) Climate and Rainfall-Tables 1 and 2. (2) Agriculture-Tables 3 to 10. (3) Industries-Tables 11 to 14. (4) Education-Tables 15 and 16. (5) Public Health-Tables 17 to 19. (6) Miscellaneons-Tables 20 to 33.
(1) CLIMATE AND RAINFALL
Table 1 This table presents the highest and the lowest
temperatures recorded at one or more stations in the district for all the J 2 months for the years 1951 to 1960. Annual averages are shown in the last column.
Temperature data are maintained by the Meteorological Department and are published in their monthly weather reports and their summary which is published annually.
Table 2 This table shows monthly and annual rainfall and
the number of rainy days for the varions stations in the district. "Normal rainfall " [column (28)] is the average rainfall over a long period-usually 80 years. Where rainfall records Over such a long period are not available it may be the average for a shorter period-in some cases even five years. Rainfall records are maintained at taluka headquarters, dispensaries and a few police stations where rain-gauges have been supplied. These statistics are published in Part III of the State Government Gazette and Annual Season and Crop Reports issued by the Department of Agricultnre. They are subsequently consolidated and issued by the Meteorological Department in two annual publications, viz., " Daily Rainfall of India" and" Monthly Rainfall of India".
Rainfall statistics are presented in this table separately for e<1ch of the ten years from 1951 to 1960.
J- 18 12-II1-28-(Yeotmal).
(2) AGRICULTURE
Table 3 This table shows the utilisation of land and areaS
under various crops. Material is presented for the district as a whole and for eac~ taluka separately. It is presented for ten years 1950-51 to 1959-60 :
(i) Geographical area: This area represents the total land area and is worked out from the Survey and Settlement Records. The changes in the geographical area from year to year may be due to territorial changes or correctiDns on account of adjustments in the are3S of former unsurveyed villages which are now surveyed;
(ii) Forests: This category includes all areas actuallv l'il1der forests whether Stateowned"or private and classed or administered as forest! nnder any legal enactment dealing with the forests;
(iii) Barren and lmcultttrable land: This includes barren and nncultnrable hr:ds like mountains, river beds, etc. (land which cannot be brought under ~ultivation unless at a very high cost) ;
(iv) Culturable waste: This includes lands which can be brought tmder cultivation but which have not been cultivated or having been cultivated £01' some time have not been cultivated successivelv for more than five years. Such lands l1wy either be fallow or covered with shrubs;
(v) Permanent pastures and other grazing lands: This includes all grazing hinds whether they are permanent pastures and meadows or not;
(vi) Miscellaneous tree crops and gro·ves not included in the net area sown: This category includes lands under casuarina trees, thatching grass, bamboo bushes or other trees tlsed for fuel, etc. Lands which are not included under orchards are included in this class. These are lands which are put to some agricultural use but whose area is not included in
(vii)
(viii)
the net area sown;
Current fallows: This includes lands which are left fallow during the current year only;
Other fallow land: Nl lands which have been cllitivated but which are temporarily out of cultivation for a period of not less than one year 3<ld not more than five years;

(ix) Net area sown: The net area sown is the actual area under crops counting areas sown more than once in the same year only once;
(x) Gross cropped area : This is the sum of areas under all crops and represents the sum of net area sown and area sown more than once in the year.
After the land utilisation statistics under section A in column (1) the table presents in section B the
, . 1'1 details of areas under dIfferent crops. .le crops are classified in two main groups, ",·iz., foodcrops and non-fooacrops. Foodcrops are further grouped by "cereals, puls~s and others". Non-foodcrops are similarlv shovm under "oilseeds and others".
o
The data on land utilisation and areas under crops are primarily prepared by the village officials of the Revenue Department. They are subsequently consolidated by the Agriculture Department.
Talukawise hnd utilisation and crop statistics are being presented for the first time in this volume. They have not been published so far any,yhere else.
Table 4 This table presents gross and net irrigated areas
and the distribution of net irrigated area by sources of irrigation. To facilitate comparison, the gross cropped area is also shown in column (3). The data are presented for three years, viz., 1950-51,. 1 ~56-57 and 1959-60. Presentation is for the dlstnct as a whole and for each taluka separately.
Table 5 This table shows the acreages of various crops
under irrigation for each year from 1950-51 to J 959-60. To facilitate comparison, the gross cropped area and the gross irrigated area are presented in the beginning. This is followed by acreages under irrigation for each crop.
The material is presented for the district as a whole and for each taluka separately.
Sources for the district and talukawise material are ditlerent and there may, therefore, be a few small discrepancies between the two sets of figures.
Table 6
204
This table presents the outturn and average yields per acre of principal crops in the district. The crops presented are foodcrops like rice, wheat, jowar, bajri, ragi, maize, tur, gram and sugarcane and nonfoodcrops like groundnut, sesamum, cotton and tabacco. Crops which are locally important are only shown in this table.
The outturn figures are in hundred tons while average yields are shown in pounds per acre.
The estimates of average yields and production in respect of rice, bajri (kharif and rabi), _jowar, wheat, gram, cotton, groundnut, tobacco, ~agl ~nd tur are based on the results of crop eshmatIon surveys conducted annually by the Agriculture Department. The estimates of yields for other remaining crop are based on the anna valuation figures and normal yields reported by the Revenue Officers. The figures relate to the years 1950-51 to 1950-60.
Table 7 This table presenttl wholesale prices of principal
crops. The material is presented for previous years by monthlv averages and for the last year separately for each ~nonth. The prices shown are for the places having regulated markets or for the District Headquarters.
Table 8 This table presents harvest prices of principal
crons. The "harvest price" is the average wholesale pri~e at which the commodity is disposed of by the producer to the trader at the village site during the specified harvest period. These prices are published in the Season and Crop Reports. The figures relate to the years 1950-51 to 1959-60.
Table 9
This table presents figures for livestock and agricultural implements for the district and each taluka separately for three years: 195), J 956 and 196!. The material is obtained from the three Llvestock Censuses conducted in those years. The reference date to which the data relate is the 15th April of the concerned year.
"Poultry" in section B of the table includes hens,. cocks, chicken, ducks, drakes and ducklets.
Section C presents statistics for agricultural implements. The figures for carts shown in the table arc in respect of carts used for agricultural purposes only.
The number of tractors is inclusive of those owned by the Government and those owned by private persons.
The material is presented for the district as a whole and for each taluka separately.
Table 10 This table presents the distribution of the number
of land holdings and their areas by size of holdings. The materi;d has been taken from the census of agricultural holdings conducted in the year 1952-53 or 1953-54 in different parts of the State.
The figures presented here are for ownership holdings and the area figures are in terms of converted dry acres, i.e., calculated after giving due weightage for irrigated lands.

Where the district has undergone major changes because of the reorganisation of States in 1956 or 1960, the material relates to the area of the district as it existed in the year 1952-53 or 1953-54.
(3) INDUSTRIES Table 11
This table presents, for each industry, the total number of working factories, the number of mandays for 'which they worked during the year and t~e average daily number of workers employed classIfied by adults (18 years and above), adoles~el:ts (J 5 to 17 years) and children (14 or less). Statlstlcs presented in columns (3) to (1 J) relate only to ~he reporting factories. The number of nO~1-reportmg factories and their estimated average datly number of workers are shown in columns (12) and (13). These details of factories are further split up by the type of industry shown under column (1) both by industry code and a brief description. The in~ dustry codes shown here (as well as in Table 12) are those used for compilation of data by the Chief Inspector of Factories. They are different from the Standard Industrial Classification used in the Census Tables and reproduced in Appendix I to the Explanatory Note to Part II.
The material is presented only for the district as a whole and only for one year, viz., 1961.
The word" factories" here includes only the registered factories. They are of three types :-
(i) Factories using no power but employing 20 or more workers ;
(ii) Factories using power and employing 10 or more workers, and
(iii) Factories not covered by (i) and (ii) above but notified by the Government as covered by the Factories Act.
The material presented in this table is for all the three types combined.
Table 12 This table presents the distribution of factories for
each type of industry by size of employment. For each size group, the number of factories and their total vvorking strength are shown for each industry separately. The material is presented only for the district as a whole and only for one year, viz., 1961.
Table 13 This table presents the distribution of factories
for each type of industry by the number of days worked during the year. The material is shown for each industry and the number of factories and their total workers are shown for each group of working periods. This will show the seasonal or perennial pattern of employment in industries in the district. Material is presented only for the district as a whole and relates to the year 1961.
205
Table 14 This table presents a summary of data regarding
the manufacturing industries as obtained through the annual Census of Manufacturing Industries cond~ ucted during the year 1958.
The 1958 Census had covered only 29 important industries. It moreover covered only the factories using power and employing 20 or more workers.
The figures for capital, etc., relate to 31 st December 1958. "Value" added by manufacture denotes the increase in the total value of commodities as calculated by deducting the cost of materials, supplies, containers, fuel, electric energy and depreciation of fixed assets from the total value of the products.
The table presents only the combined figures for the 29 industries covered in the 1958 Census.
Table 15 (4) EDUCATION
This table shows the number of different types of educational institutions in the district and the total number of pupils (boys and girls) and teachers for each type for the years 1951, 1956 and 1961. The material is presented for the district as a whole and for each taluka separately.
The number of institutions relates to the academic year ending June and the number of pupils is as. on 31 st March of the respective years.
Table 16 This table presents a list of colleges and high
schools in the district with their locations. The material relates to 31 st March 1961, and does not include institutions started after that date.
Lists are presented talukawise.
Table 17 (5) PUBLIC HEALTH
This table shows medical facilities available in the district. The material is presented for three years 1950, 1955 and 1960 and shov;'s the number of hospitals, maternity homes, dispensaries, rural health centres, doctors, nurses, beds available and indoor and outdoor patients treated.
Material is presented for each taluka separately.
The material presented here includes only civil hospitals and Government dispensaries, Local or Municipal Funds institutions, private-aided or Railway dispensaries. It does not cover private unaided institutions run by individuals or associations. Similarly, the number of doctors, nurses or patients shown in this table does not include that relati?~ to unaided hospitals, dispensaries or private practItIOners.

Table 18
This table shows data about births, deaths and infant deaths for the years 1951 to 1960. Wherever possible, figures for each taluka are also shown separately. For the districts of Aurangabad and Nagpur divisions, material is available and presented only for the years 1957 and onwards.
The figures of infant deaths relate to deaths of children below one year.
The coverage and reporting on births, deaths and epidemic diseases in the rural areas are incomplete in many respects. The material presented in Tables 18 and 19 should not, therefore, be treated as any accurate representation of actual conditions in the district and should be used only after allowing a margin for those limitations. The Department of Public Health is working on many schemes 'to improve the present position in respect of vital statistics.
Table 19
This table shows the number of deaths due to pri.ncipal causes in the district for the 10 years 195 J to 1960. The caUses of deaths shown are cholera, smallpox, plague, dysentery and diarrhoea, fever, respiratory diseases and other causes. The figures of fevers include deaths due to enteric fever, cerebro-spinal fever, malaria, influenza, typhus, etc. Respiratory diseases include pneumonia, pulmonary tuberculosis, whooping cough, etc. In the other causes are included diphtheria, chicken-pox, poliomyelitis, leprosy, cancer, deaths from child birth, etc.
206
(6) MISCELLANEOUS Tables 20 to 31
Tables 20 to 31 are self-explanatory and need no further clarification.
Table 32 This table presents tulukawise lists of weekly_
markets. The table also shows the day on which the weekly bazar is held. Places where cattle bazars are held are also indicated. The list is based on the information collected from the lVlamlatdar's offices and the Census enumerators' reports, prepared in September-October 1960.
Table 33 This table gives a talukawise list of villages where
different religious or cultural fairs are held. The list includes only those fairs which have a congregation of 1,000 or more. Information regarding-
(i) Location Code Number,
(ii) the name of the village in which the fair is held,
(iii) distance from Railway station and S. T. Bus stop,
(iv) name of the fair, and month and date of the fair, and
(v) average congregation
is furnished for each fair separately.
The list is prepared on the basis of inform.ation collected from the District Superintendents of Police, Municipalities and the Census enumerators' reports. The number of people gathering at the fair is based on eye estimates and should be treated as a broad approximation.

207
CLIMATE AND RAINFALL
Table 1-Highest and Lowest Temperatures
Year IT empera ture January February March April May June July
(8)
1951
1952
(I)
•• Mean Maximum Highest " Mean IVIinimurn Lowest
•• Mean Maximum Higbest '. Meanl\1inimum Lowest
1953 .. MeanMaximum
1954
1955
1956
1957
1958
1959
1960
Highest .. Mean Minimum Lowest
'0 MeanMaximum Highest " Mean Minimum Lowest
•• MeanMaximum Highest " Mean Minimum Lowest
" Mean Maximum Highest " Mean Minimum Lowest
• • Mean l'vlaximurn Highest ..
. Mean Minimum Lowest
'0 MeanMaximum Highest " Mean Minimum Lowest
•• MeanMaximum Highest " Mean Minimum Lowest
•• MeanMaximum !;Iighest .. Mean Minimum Lowest
(2)
26.9 31.1 14.5 11.1
29.8 31.7 15.8 12.8
28.7 32.2 15.1 12.8
27.9 32.2 18.7 10.6
28.5 31.1 18.4 9.4
28.7 30.6 15.8 12.8
29.6 31.3 16.3 12.2
29.8 32.1 16.6 11.1
27;9 30.9 16.5 12.3
27.3 31.0 15.3 11.8
]1812IIl-29-A (Yeotmal).
(3)
32.7 37.2 17.4 11.7
32.2 36.1 18.6 15.6
33.4 37.8 29.7 15.7
27.9 35.6 14.1 13.9
28.4 35.6 16.0 13.9
31.1 35.6 17.5 12.2
31.3 34.2 16.0 11.5
32.9 35.4 17.9 13.3
21.9 36.3 17.6 13.1
32.7 36.8 19.0 14.0
(4)
35.9 38.9 21.5 17.8
35.8 41.7 20.6 16.7
29.1 41.7 22.9 16.7
35.8 40.0 21.4 18.9
32.7 41.1 22.1 17.2
37.5 40.0 22.7 20.0
32.9 38.0 19.0 14.4
36.0 39.4 21.S 17.3
37.3 40.6 21.9 15. I
34.9 38.6 16.5 9.8
(5)
37.8 40.0 23.9 20.6
38.8 43.3 25.9 20.0
39.3 43.3 26.5 20.0
40.0 42.8 25.4 20.0
38.6 43.3 22.9 22.2
40.2 42.8 26.6 22.8
37.7 41.6 23.8 18.1
39.6 44.7 25.9 21.0
39.1 42.6 25.3 19.3
40.2 43.6 16.7 NA
(6)
YEOTMAL
41.9 45.0 27.4 22.8
42.6 44.4 28.1 24.4
42.5 45.0 29.2 24.4
39.0 48.1 29.6 26.7
41.1 44.4 28.0 26.1
40.0 44.4 27.2 21.7
41.4 43.7 26.9 23.8
42.1 45.3 2S.7 21.3
40.8 44.0 29.1 23.2
41.9 45.0 15.4 NA
(7)
37.2 42.8 24.7 21.7
37.3 42.2 25.4 22.2
3S.6 45.6 27.0 22.2
36.7 43.3 25.8 21.7
35.8 43.3 23.7 20.6
33.4 38.3 24.3 21.1
38.4 42.6 25.8 22.2
39.7 45,2 27.0 21.7
35.5 41.7 24.4 20.4
36.0 41.2 24.2
, 21.2
31.6 37,8 23.3 21.1
21.1 36.1 22.6 20.0
30.4 33.9 22.3 20.0
29.5 35.6 22.5 20.0
30.9 35.6 22.6 20.6
29.3 32.2 22.6 21.7
30.1 35.1 22.9 20.7
29.8 33.3 23.0 21.6
28.0 33.4 22.6 21.4
31.1 35.6 23.2 20.4
SIJUrr.e: Regional Meteorological Centre. Nagpur.
(Figures in Centigrade)
August September October November December Anrmal
(9)
30.0 33.9 22.1 21.7
29.3 31.7 21.8 19.4
29.0 32.7 21.5 19.4
30.4 34.4 22.5 20.6
28.1 31.1 21.9 21.1
30.4 33.9 22.4 20.6
28.8 31.4 22.5 21.4
29.3 34.2 22.9 21.2
26.7 31.2 22.4 21.7
30.2 32.4 22.1 20.6
(10)
31.7 34.4 21.4 20.0
30.8 32.7 21.8 20.0
31.0 32.2 21.8 20.0
(II)
32.6 35.0 24.7 17.8
31.5 33.9 20.2 13.9
30.0 32.7 19.6 13.9
27.6 29.8 30.0 31.7 21.7 18.4 20.0 17.2
29.0 29.2 32.2 30.6 21.5 19.7 20.6 14.4
29.7 30.1 33.9 32.2 21.8 20.2 20.6 16.1
31.4 • 32.1 33.8 35.4 21.6 20.0 20.0 15.0
29.3 30.3 31.9 32.7 22.2 20.4 21.0 16.8
28.9 30.7 32.8 32.8 21.8 21.0 20.4 17.8
31.6 31.0 35.1 34.0 22.3 19.8 20.6 15.1
(12)
30.3 32.7 16.9 13.3
29.6 31.1 15.0 13.3
29.7 32.7 16.0 13.3
29.2 30.6 15.2 13.3
27.5 30.0 14.2 10.0
27.1 30.6 16.9 12.2
35.7 32.8 17.5 14.3
28.8 31.2 IS. I 13.3
28.9 31.6 16.9 11.6
29.4 32.2 15.6 13.1
(13)
28.1 30.6 14.2 11.7
28.9 31.7 16.2 11.7
(14)
33.1 45.0 21.0 11.1
32.3 44.4 21.0
" .7 28.5 • 32.5 31.1 45.6 14.5 22.2 11.7 11.7
28.1 30.6 14.7 12.S
26.8 28.9 13.6 11.1
28.1 31.1 15.1 10.6
29.7 31.6 16.4 12.6
27.6 29.6 15.1 12.7
28.2 32.0 15.1 II .2
29.4 34.0 15.8 11.3
31.8 48.1 20.8 10.6
31.4 44.4 20.4 9.4
32.1 44.4 21.1 10.6
33.3 43.7 20.7 11.5
32.9 45.3 21.6 11.1
31.2 44.0 21.2 11.2
33.0 45.0 1'8.8 9.8

208
OTHER OFFICIAL STATISTICS
Table 2-
Station/Year January Februar1 March April May June ------- ------ -------- -----_--_ --------- -------_-----
Rainy Rain .. Rainy Rain- Rainy Rain- Rainy Rain- Rainy Rain .. Rainy Rain .. days fall days fall days fall days fall days fall days fall
(I) (2) (3) (4) (5) (6) (7) (8) (9) (10) (11) (lZ) (13)
DARWHA 1951 Nil Nil Nil Nil 1 0.5 2 14.2 3.8 10 213.6 1952 Nil Nil 2 13.2 Nil Nil 4 32.0 Nil. 6 67.3 1953 Nil Nil Nil Nil Nil Nil 3 13.5 Nil. 6 171.2 1954 Nil Nil 2 11.2 I 2.5 I 3.0 5 190.0 1955 3 9.2 Ni} Nil 2 7.5 2 40.0 II 128.7 1956
Nii Nil
Nil Nil
'6 Nil '6 Nil 4 69.5 II 305.6 1957 O.B Nil 82.0 33.5 2 21.3 II 147.1 1953 I 4.6 Nil Nil I 5.6 2 13.2 I 9.1 8 89.9 1959 I 5.6 Nil Nil Nil Nil 2 27.7 I 7.1 8 191.7 1960 3 22.6 Nil I 32.9 I 4.1 Nil. 13 216.6
YEOTMAL 1951 1.3 'i 12:9 3 32.5 3 27.7 2 10.9 11 164.1 1952 Nil I 56.9 2 1l.2 10 157.7 1953 Nil 1 1.0 'j 16:5
1 1.8 7 183.6 1954 '2 32:2 Nii Nil
2 11.5 'j lOj 6 <i6.5
1955 I 2.5 1 5.2 11 166.0 1956
3:i I 0.8 I 5,2 Nil Nil 5 83.5 10 297.5
1957 I 6 85.6 3 52.8 I 1.3 9 132.8 1958 I 2.0 2 27,9 2 8.5 1 15.7 II 160.6 1959 I 22.0
63:5 2 l7.4 I 4.6 12 337.2
1960 4 43.7 4 I 5.6 15 261.4
PUSAD 1951 'j 24:i
I 11.2 3 2.8 10 129.3 1952 I 2.5 2 8.1 9 83.4 19;3 'j 15:5
5 7.1 'i 1:5 11 194.3
1954 21 :6
3 35.3 9 176.5 195; 2 4 11.2 1 8,1 1 1.8 9 410.5 19)6 'j 25:9 'j 13:5 'j 30:5
3 43.9 14 271.8 1957 2 40.6 5 78.7 1958 2 9,1 3 22,3 I 9.1 7 132.5 1959
22:7 '3 120:8 5 23.2 I 1.7 13 166.2
1%0 3 I 7.5 9 152.6
WAN 1 1951 2.5 'i 1:3 7 95.0 11.9 2 19,1 7 116.1 1952 2.'> 7 67.8 1953
NA NA NA NA NA NA NA NA NA NA 6 53.3
1954 NA NA 1955
63:7 15 182.1
1956 '4 84:8 's 62:i 6 18 434.6 1957 8 120.7 1958 I 19:i 1 36.8 'j 6:i 'j 14:i
8 135.6 1959 'j 163:6
7 410.1 1%0 I 2:i 1 1.2 1 8.0 15 309.2
DIG liAS 1951 Nil Nil Nil Nil Nil Nil Nil I.G Nil Nil <} 193.3 1952 Nil Nil Nil Nil Nil Nil Nil Nil Nil Nil 9 82.5 1953 Nil Nil Nil Nil Nil Nil Nil Nil Nil Nil 6 3Q7.3 1954 NA NA NA NA NA NA NA NA NA NA NA. NA 1955 NA NA NA NA NA NA NA NA NA NA NA NA 1956 NA NA NA NA NA NA NA NA NA NA NA NA 1957 Nil Nil Nil Nil 5 42.7 3 16.3 Nil 1.8 8 75.7 1958 I 5.1 Nil Nil I 14.0 I 11.2 I 18,3 5 159,3 1959 Nil Nil Nil Nil Nil Nil 1 10.0 2 19.0 8 265.2 1960 1 9.0 Nil Nil 2 28.0 Nil. Nil. Nil. Nil, l) 178,(j
NA = Not available,
J-HI12-IIl-29-B-(Yeotmal).

209
CLIMA TE AND RAI NFALL
Rainfall (Fige,rcr ,;: rum.)
luly Augmt September October November December Annud Sta tionJ Yeat --------- ------- ------- -------- --_----- -------- Normal
Rainy Rain N Rainy Rain- Rainy Rain .. Rainy Rain .. Rainy Rain- Rainy Rain .. Rainy Rain .. Rainbll day, faU day, fan day, faU day, faU day. fall days. fan days fan
(14) (IS) (\6) (17) (l8) (\9) (20) (2l) (22) (23) (24) (25) (26) (27) (28) (Il
DARWHA 14 390.0 Nil. Nil Nil Nil Nil 28 622.1 B89 1951 12 240.5 '7 152.9 '7 109.2 2 33.S Nil Nil 40 648.6 1952 15 258.3 13 271.3 10 146.3 1 13.7 Nil Nil 48 874.3 1953 18 310.0 9 78.0 11 190.0 Nil Nil Nil 47 784.7 1954 12 285.0 19 275.0 12 237.0 "5 140.0 Nil Nil 66 1.122.4 1955 12 184.8 6 59.0 7 108.3 2 33.9 '4 41.5 1 2.5 47 805.1 1956 12 133.1 12 258.8 5 81.3 2 38.1 Nil Nil 56 796.0 1957 16 352.8 16 214.4 7 129.2 4 60.6 'j 19.6 Nil 59 899.0 1958 16 419.5 19 295.5 16 498.2 6 72.0 Nil Nil 69 1.517.3 1959 17 220'.3 II 198.4 8 75.5 4 49.6 Nil Nil 58 820.0 1960
YEOTMAL 14 284.5
282:2 34 521.0 NA 1951
15 287.3 9 ·s lSi? I 94:i 43 1.000.1 1952 14 291.9 12 376.4 11 112.5 3 20.1 49 987.3 1953 21 350.0 13 181.3 13 235.0 I 9.0 59 869.8 1934 18 390.5 19 432.5 14 314.0 6 133.0 'j . i 12:4
73 1.486.1 1955 16 238.4 7 150.3 8 182.0 3 52.4 17:0 55 1.039.5 1956 13 128.0 20 296.2 7 168.4 4 30.7 64 898.9 1957 17 305.5 18 464.7 II 154.8 5 57.6 68 1.197.3 1958 20 443.0 15 310.5 15 500.8 7 110.2 73 1.745.7 1959 13 413.6 \0 183.6 7 168.2 6 49.S 60 l.l89.4 196Cl
PUSAD, 18 273.8 21 137.9 6 116.8 8 55.9 67 727.7 932 1951 15 187.5 14 96.8 9 144.5 5 14.2 58 566.1 1932 22 211.3 15 270.8 9 145.() 2 21.3 64 850.3 1953 23 323.9 15 199.1 13 200.9 '9 89:9
68 952.7 19:;4 16 409.2 21 398.3 II 193.3 '5 52:6
74 1,543.9 1955 24 187.2 12 126.7 11 llO.() 4 55.9 73 848.1 1956 18 255.8 22 273.3 4 46.7 3 26.9 '4 61 :9
61 791.9 1957 19 424.1 20 404.2 3 160.2 4 37.6 63 1.261.0 1958 21 361.2 20 296.2 18 368.7 6 79.0 84 1.296.2 1959 13 223.2 14 110.7 II 99.8 4 2z.o 58 759.3 1960
WANt 14 260.6
257:i ·s l71:S '2 36:3 32 505.2 1.125 1951
14 261.9 II 44 798.4 1952 14 268.0 13 395.7 10 144.0 2 39.4
NA NA NA NA 45 900.4 1953 NA NA NA NA NA NA NA NA NA NA 1954
21 381.3 25 488.7 18 252.2 9 207.0 '2 49:8 '2 17:8 88 1.511.3 1955
25 465.8 6 85.6 14 300.2 4 96.() 77 1.513.5 1956-19 305.3 18 300.0 4 77.5 I 9.4
7:i 59 959.9 1957
19 563.0 18 440.6 9 150.8 4 30.4 I 61 1,383.4 1956 19 377.0 16 352.0 14 530.1 5 126.0 63 1,815.5 19W 12 268.3 7 88.4 8 199.9 3 31.4 55 1,072.2 1960
DIGRAS 16 408.4 's 99:8 108:5 .~ 63:5 Nit Nit Nil Nil
25 602.7 929 1951 10 m.2 7 35 509.5 1952 17 278.4 II 229.1 10 231.1 I 11.9 Nil Nil Nil Nil 45 1,057.8 1953 NA NA NA NA NA NA NA NA NA NA NA NA NA NA 1954 NA NA NA NA NA NA NA NA NA NA NA NA NA NA 1955 NA NA NA NA NA NA NA NA NA NA NA NA NA NA 195<> 14 192.5 16 150.1 4 52.3 3 28.7 Nil Nil Nil Nil 53 560.1 1957 13 421.2 19 454.6 6 82.8 5 97.0 2 15.0 Nil Ni' .54 1.278.5 1958 II 297.8 13 279.8 14 340.2 5 136.0 Nil Nil Nil Nil 54 1.348.0 1959 15 226.0 II 119.0 4 62.0 4 41.0 Nil Nil Nil Nil 46 663.0 1960
NA = Not ayailable. Source: The Statistician. Department of Agriculture, Poona

210
OTHER OFFICIAL STATISTICS
Table 3-Land Utilisation and Area under Different Crops
Classifit::8tion of Area
(1)
(Al TOTAL GEOGRAPHICAL AREA Forests .. •• ., .. Barren and Unculturablc ·land .• Land put to nonragricultural uses .. Culturable Waste .. . . .. Permanent Pastures and other
graz.ing 1 ands. Mi~c~1I aneous tree crops and groves
not induded jn area sown 1
1950·51
(2)
33.407 7.536 1.306 1.658
34
Curren t fallows . . • • Other bllow land .• Net area sown . . . • Total Gross Cropped Area .. Gross Irrigated Area
>- 6.090 .. J 16,783
16,848 78
(B) DETAILS OF CROPPED AREATotal area undet food Crops Area under ,:crca/s .• .•
Rice Wheat Jov."ar Bajri Ragi f\1aize .. Other cereals
Area under nulses •• Tur Gram " Other pulses
Sugarcane .• .. Fruits and vegetables Condiments and spices .. I\:Jiscellaneous food crops
Area under non~ff)od crops Area under oil~seeds •.
Groundnut ~esamum .. Other oi I·seeds
Cotton Tobacco ,. • .• Other non~food crops including
fodder crops 1.
9,860 7,623
275 324
6,748 253
23 2,065
828 157
1.080 13 60 98 1
6,988 1.350
945 214 191
5,517 I
120
(A) TOTAL GEOGRAPHICAL AREA 6,906 Forests .. .... 1.462 Barren and Unculturable land . • 72 Land put to non-agricultural uses 335 Culturable Waste.. .... I Permanent Pastures and other grazing lands •.• fvtiscellaneous tree crops and groves
not inrluded in area sown I, I Current fdHows.. .. >- 1.130 Other fallow land .. . • j Net area SOWrI • • • •
Total Gross Cropped Area .. Gross Irrigated Area
(B) DETAILS OF CROPPED AREA Totd area under /oodcrnps Area under cereals ••
Rice Wheat JotVar Bajri R.gi Maize ., Other cereals
Area under pulses .• Tur Cram ., Other pulses
Sugarcane ., •• Fruits and vegetables Condiments and spices •• Miscellaneous food crops
Area under non~food crops .• Area under oil· seed, ••
Groundnut Sesamum ., Other oil-seeds
Cotton Tob.cco.. .. .. Other non-food crops including
fodder crops.
3,906 3,913
22
2.214 1,750
51 10
1.605 82
2
425 166
9 250
4 13 21 I
1.699 449 424 23 2
1.231
i9
1951·52
(3)
33,407 7.536 1,306 1,658
34
5.918 16.955 17,076
76
9.768 7.507
266 341
6,628 253
i9 2.085
889 181
1.015 12 63
101
7.308 1.345
932 233 180
5.815 I
147
6,906 1.462
72 336
1.057 3.979 3,993
20
2.145 1.691
47 20
1.545 77
'2 416 173
16 227
4 12 22
1.848 437 411 22 4
1.386
25
1952·53
(4)
33.407 7,536 1,306 1.658
34
5.593 17.280 17,380
67
9,986 7.666
237 325
6,816 268
20 2,157
932 151
1.074 9
55 99
7.394 1.390
981 253 156
5.840 2
162
1953.54
(5)
DISTRICf TOTAL
33,407 7,536 1.948 1,025
564 838
1,244 r ~ 303 l 2.287
17.642 17,756
62
10,043 7,657
229 354
6.787 273
i4 2,233
984 152
1.097 6
54 93
7,713 1.298
904 256 138
6.269 2
144
DARWHA TALUKA
6.906 1.462
72 335
988 4,049 4,057
19
2.209 1.722
38 17
1,576 88
3
448 180
13 255
3 15 21
1,848 437 410 25 2
1.385
26
6.906 1,461
164 222 107 195 67
( ~ 13 l 556 4,121 4.131
19
2.259 1.776
39 17
1.626 92
'i 444 189
14 241
I 16 22
1,872 409 381 25 3
1,424
39
1954·55
(6)
33.407 7.536 1.948 1,025
564 858
1.244
283 2,152
17,797 17,893
65
10.028 7,613
210 392
6,724 272
is 2,266
984 187
1.095 5
54 90
7,865 1.342
893 277 172
6,383 I
139
6.906 1.461
163 222 107 195 67
17 499
4.175 4.185
25
2,224 1.720
28 Z2
1,5E8 79
3
466 185
19 262
i7 21
1.962 441 409 29 3
1.49'>
20
1955·56
(7)
33,407 8.091 1.948
928 599 937
692
339 2.005
17.868 18,298
71
10,145 7,630
211 594
6.556 252
i;r 2,361
983 301
1,077 5
54 95
8,153 1,296
799 250 247
6,715 2
140
6,906 1.486
164 200 114 212
14
21 461
4.234 4,251
26
2,155 1,639
33 31
1,492 81
'2 475 187 35
2j3 1
17 23
2.096 436 403 27 6
1.633
27
1956·57
(8)
33.407 7.790 1.948
956 646 987
636
4;9 2,057
17.928 13.069
61
10,078 7.682
218 522
6.678 242
22 2,251
990 236
1,025 5
49 91
7,991 1,113 ill 181 221
6.750 2
126
6.906 1.395
164 200 113 166
15
40 601
4.212 4,234
20
2.111 1.620
31 34
1.472 81
'i 455 190
31 234
2 14 20
2,123 448 420 24 4
1,654
21
(Area figures in hundred acres)
1957·58
(9)
33,407 7.684 1,943
956 748 967
615
491 1.961
18,037 18,152
62
9.925 7,568
236 462
6,608 248
i4 2.203 1.000
204 999
5 49
100
8,227 1.139
760 169 211
6.967 2
118
6.906 1,386
164 200 167 164 20
40 617
4.148 4,162
13
2.019 1,,52
32 2)
1.419 74
2
433 183 24
226
13 21
2.143 474 450 20 4
1,650
19
1958·59
(10)
33,4D7 7.562 1.948
956 738 970
561
)92 1.868
18,212 18.338
59
10.026 7,624
227 336
6,788 261
i2 2.255 1.026
200 1.029
6 48 93
8.312 1.090
709 182 199
7.103 I
118
6,906 1,387
164 200 156 163
14
48 565
4.209 4,222
13
2,003 1,551
31 21
1.419 78
'2 422 179
18 225
3 11 16
2.219 438 417
17 4
1.765
16
1959-60
(II)
3.3407 7.562 1,948
956 738 970
561
1.033 1.658
17.981 18.137
63
9.994 7.528
242 701
6.319 230
ii, 2,327
969 360 998
7 54 78
8,143 1.056
592 178 286
6.971 1
115
6,906 1.387
164 201 156 163
14
244 414
4,163 4.180
12
2.024 1,540
34 43
1.386 75
'2 452 179 49
224 2
13 17
2.156 311 344
17 10
1.765
20

211
AGRICUL TURE
Table 3-Land Utilisation and Area under Different Crops-contd.
Classification o( Area
(1)
(A) TOTAL GEOGRAPHICAL AREA Forests .. .. .. Barren and Unculturable land , , Land put to non~agricu}tural uses .. Culturable Waste .... Permanent Pastures and other
grazlnq' lands. tv1isccllmeO:lS tree crops and groves
not included in area sown. ) Curren t hUows d .. .. r Other fallow Ian , ' J Net area sown . . . . Total Gross Cropped Area" Gross Irrigated Area
(B) DETAIL'> OF CROPPED AREA Total area under food craps Area under cereals ..
Rice Wheat lowar i:hJrl Ragi M3ize " Other crreais
Area under /Julses Tur Gram " Other pulses
Sugarcane .. .. Fruits and vegetables Condiments and spices Miscellaneous food crops ..
Area under non~food crops .. Area urtder oil-secds
Groun::lnut Sesamum .. Other oil-seeds
Cotion Tobacco.. .. .. Other no,-food crops including
fodder cr-.)ps.
(A) TOTAL GEOGRAPHICAL AREA I. Fnrests .. .. .. Barren and Unculturable land .. Land put to non-agricultural uses .. Culturable W'aste .. .. .. Permanent Pastures and other
grazing lands. Miscellaneous tree crops and groves
not included in area .own. I Current 'allows " " >-Other fallow land " "j Net area sown . . .. Total Gross Cropped Area .. Gross I rriJa ted A ~ea
(B) DETAILS OF CROPPED AREA I, Total area und" {oodcroN Area under cuea;s .,
Rice Wheat lowor Bajri Ragi Maize ., Other cereals
Area under pulses .. Tur Gram " Other pulses
Sugarcane .. " Fruits and vegetables Condiments and spices Miscellaneou. food crops , ,
Area under non-food crops,. Area under cil-seeds
Groundnut Sesamum .. Other oil-seeds
Cotton Tobacco.. .. .. Other non-food crop, including
fodder crops.
1950-51
(2)
5,809 953 313 263
15
1.309 2,956 2,966
16
1.754 1.315
48 60
1.144 60
'3 409 158 33
218 I
10 19
1.212 205 147 25 33
985
22
8,222 2,575
324 565
6
963 3.789 3,813
20
2.221 1,731
74 8, 1,495
66
II
453 17 ..
51 228
6 14 17
1,592 219 147 55 17
1,344
29
1951-52
(3)
5,809 953 313 262
15
1.272 2,994 3,006
14
1,672 1,269
44 52
I, 110 61
'z 373 156 28
189 1 9
20
1,334 233 174 25 34
1,065
36
8,222 2,575
324 565
6
981 3,771 3,791
20
2,236 1,736
79 92
1,488 68
'9 464 184 58
222 5
13 18
1,555 197 132 49 16
1,327
31'
1952-53
(4)
1953-54
(5)
YEOTMAL TALUKA
5,809 953 3i3 263
15
1,221 3,044 3,0;8
17
1.761 1,340
47 50
1.179 61
'3 38" 160 26
203 I
10 21
1.297 224 169 25 30
1.030
43
8,222 2.575 32~ 565
6
923 3,829 3,856
13
2.253 1,765
67 83
1,535 68
ii 456 201 40
215 3
12 17
1,603 243 180 51 12
1.314 I
45
5,809 953 651 214 68
131
IDS r
~ 6 l 586 3,095 3,108
14
1.737 1.313
40 53
1,152 66
'2 39~ 171 23
200 1
11 18
1.371 196 149 28 19
1,133
42
PUSAD T ALUKA
8,222 2,576
338 201
68 293
278
{ 5n 3,815 3,850
II
2,192 1.699
67 97
1,464 63
's 467 189 42
236 3 8
15
1,658 238 183 44 11
1,393 1
26
1954-55
(6)
5,809 953 651 214
68 131
105
20 580
3.087 3,098
13
1,753 1,316
37 54
1.155 63
'i 408 177 25
206 1
10 18
1.345 169 121 30 18
1.137
39
8,222 2,576
339 201
68 293
278
63 525
3,879 3,909
10
2.180 1,682
70 III
1.422 73
';'
473 197 48
228 2 8
15
1,729 256 192 52 12
1,444 1
28
1955-56
(7)
5.809 1,141
651 194 72
143
45
24 378
3,161 3.180
16
1.718 1,2iZ
36 61
1.113 61
'j
415 182 28
205
ii 20
1.462 176 130 28 18
1,243
43
8,222 2,659
338 183
73 320
62
76 619
3,892 4,071
12
2,308 1,759
68 245
1.380 62
'4 522 192 104 226
2 9
16
1.763 239 169 46 24
1,494 I
29
1956-57
(8)
5,809 1,372
347 195 92
143
45
120 275
3,220 3,241
11
1,748 1.333
32 70
1,172 53
'j
385 188 30
168
io 19
1,493 154 119 18 17
1.313
26
8,222 2,320
763 184 101 321
62
58 485
3,928 3,958
16
2,377 1,847
77 180
1,527 54
'9 501 197 60
244 2 9
18
1,581 156 113 28 15
1,391
j.j
[Atea figures in hundred aeresl
1957-58
(9)
5,809 1.365
347 195 131 131
72
100 250
3.218 3,240
12
1,696 1,288
33 65
1,118 60
2
375 187
31 157
'9 24
1,544 160 120
15 25
1,360
24
8,222 2,280
763 184 105 320
13
65 447
4,045 4,070
17
2.386 1,853
89 164
1,534 58
's 501 205
61 235
3 11 18
1,684 176 129 27 20
1,472
36
1958-59
(10)
5,809 1,365
347 195 131 145
75
98 .249
3.204 3,224
13
1.671 1.259
33 58
1.109 58
'j
380 194
29 157
ii 21
1,553 151 119 16 16
1,380
22
8,222 2,280
763 184
99 311
13
63 371
4.138 4,170
16
2,476 1,932
80 154
1,625 66
'7 514 212
61 241
2 II 17
1,694 187 125 37 25
1,467
40
1959-60
(II)
5,809 1,365
347 194 131 145
75
165 20S
3,182 3.212
22
1,644 1,217
34 83
1.043 55
'2 404 201
61 142
9 14
1.568 159 104
15 40
1,386
23
8.222 2,280
703 184
99 311
13
86 369
4,117 4,159
13
2,489 1,931
90 300
1,470 64
525 182 112 231
3 12 18
1.670 200 109 40 51
1,435
:is

212
OTHER OFFICIAL STATISTICS
Table 3-Land Utilisation and Area under Different Crops-collcld.
Classification oi Area
(I)
(Al TOTAL GEOGRAPHICAL AREA. Forests ., " " Barren and Unculturable land .. Land put to non .. agrieultural uses .. Cultilrable Waste " " " Permanent Pastures and other
grazing lands. ,Miscellaneous tree crops and groves
not included in area sown. Curren t fallows .. ") Ott.er fallow land , , J Net area sown .. TotalGross Cropped a(ca " Gross Irrigat<d Area ..
(B) DETAILS OFCROPPED AREA. Total area undey food crops .. A rea under ':ereal S ••
Rke Wheat Jow.r Bajri Ragi
Maize .. Other cereals
Area under pulses Tur Gram .. Other pulses Sugarcane.. ..
Fruits and vegetables Condiments and. spices Miscellaneous food crops
Area under non""Jood crOf'/S ., Area undel oil seeds "
Groundnut Sesamum .. Other oil seeds
Cotton Tobacco.. .. .. Other non-food crops including
fodder crops.
(A)TOTAL GEOGRAPHICAL AREA. Forests " .. .. Barren and Unculturable land .. Land put to non-agricultural uses .. CuI turable Waste , , , , , , Permanent Pastures and other
grazing lands. Miscellaneous tree crops and groves
not included in area sown. Cllrrent faHows " Other hllow land ,. Net area sown . . , . Total Gross Cropped Area •• Gross irrigated area
..] ..
B) DETAILS OF CROPPED AREA. Total ~ea under food crops Area under cereals ..
Rice Wheat lowar Bairi Ragi
Maize ., Other cereals
Area under l.>Uhes .. T"r Gram ., Other pulses
Sugarcane ., .. F wi ts and veg~tablt"s Condiments and spices .. Miscellaneous food crops
ATea under non food crops" Area under oil leeds .,
Groundnut Sesamum " Other oi Iseeds
Cotton Tobacco . Other non-lood crops i~'cludi~~
fOdder crops.
1950·51
(2)
6,949 1,422
425 257
7
1,601
3,237 3,249
11
1.870 1.445
60 44
1,296 41
4 392 175 28
189 I 9
23
1,379 193 134 36 23
1,158
2S
5,521 1,124
172 238
5
1,087 2.895 2,907
9
1.801 1.382
42 125
1.208 4
386 155 36
195 I
14 18
1'1~ 93 75
116 799
I 22
1951.52
(3)
6,949 1,422
425 257
8
1,478
3.359 3.400
13
I.B96 1.435
56 48
1,285 42
'4 429 207
44 178
I 9
22
1,504 213 135 47 31
1.262
icj
5.521 1,124
172 238
5
1,130 2.852 2.886
9
1,819 1,376
40 129
1,200 S
403 J69 35
199 I
20 19
1.067 265
SO 90 95
775 I
26
1952·53
(4)
1953·54
(S)
KELAPUR T ALUKA
6,949 1,422
425 257
8
1,461
3.376 3.401
10
1.909 1.448
49 4;
1,308 45
'j
430 210
39 181
I S
22
1,492 211 140
48 23
1,256
is'
5.521 1.124
172 238
5
],000
2,982 3.008
8
1,854 1,391
36 130
1.218 6
434 181
33 220
I 10 18
1,154 275 82
104 89
855 I
23
6.949 1.422
535 181 162
124
617
r 150 L 221 3.537 3.568
10
1,958 1.471
48 45
1,332 45
I 455 224
38 193
I 10 21
1,610 191 120 52 19
1.397
z'z' WAN!TALUKA
5.521 1,124
260 207 159 115
177
( 54
351 3.074 3.099
8
1,897 1.398
35 142
1.213 7
473 211
35 227
9 17
1.202 264
71 107
86 922
1 15
1954·55
(6)
6,949 1.422
535 181 162 124
617
110 236
3.562 3,588
9
1,971 1.479
45 44
1.344 45
I 462 232 46
184 I 9
20
1,617 196 119 53 24
1,396
-i5'
5.521 1,124
260 207 159 115
177
73 312
3,094 3,112
8
1.900 1,416
30 161
1.215 7
3
457 193 49
215 I
10 16
1.212 280
52 113 115 911
21
1955·56
(7)
6.949 1.582
535 164 171
136
470
130 237
3,524 3,554
9
1,970 1,468
43 60
l.318 42
'5 476 223 74
179 I 6
19
1.584 140 62 49 29
1.421
23'
5,521 1.223
260 187 169 126
101
88 310
3,057 3,242
8
1.994 1.492
31 197
1,253 6
473 199 60
214 1
11 17
1.248 305
35 100 170 924
I 18
1956.57
(8)
6,949 1.567
414 170 171 166
413
180 352
3,516 3,558
7
2.005 1.504
48 78
1.342 35
'j
478 223 67
188 I 6
16
1,553 102 42 30 30
1,428
z'';'
5.521 ),136
260 207 169 19i
101
61 344
3,052 3,078
7
1,837 1,378
30 160
1.165 14
9
431 192 48
191
io 18
1.241 253
17 81
155 964
2 22
( Area figure, in hundred acres)
1957-58
(9)
6.949 1.535
414 170 171 166
415
176 317
3,585 3.624
t3
2,014 1,529
53 63
1,364 48
I 457 226 49
182 I 8
19
1,610 92 41 27 24
1,497
z'(
5,521 1.118
260 207 174 186
95
110 330
3.041 3.056
7
1.810 1.346
29 145
1.163 8
'j
437 199 39
199 1 8
18
1,246 238 20 80
138 988
2 18
1958·59
(10)
'6.949 1,500
414 170 171 166
352
204 298
3.674 3,714
9
2.097 1.582
52 56
1,421 52
I 486 243
51 192
9 20
1,617 86 35 26 25
1.510
z'(
5.521 1,030
260 207 181 185
107
179 385
2.987· 3,008
8
1.779 1,300
31 47
1.214 7
'i 453 198 41
214 I 6
19
1,229 228
13 86
129 981
I 19
1959-60
(11)
6,949 1,500
414 170 171 166
352
255 352
3.569 3.612
12
2.012 1,495
52 90
1,300 49
'4 493 220 84
189 I
12 II
1.600 95 27 24 44
1,485
26
5.521 1.030
260 207 181 185
107
283 318
2,950 2.974
9
1.825 1,345
32 185
1,120 7
'j
453 187 54
212 1 8
18
1.149 231
8 82
141 900
I 17
NOTE,-Figuredor currend.llow, and otherfallow land for the y.ars 1950.51 to 1952-53 are not available separately, Source: Se.son and Crop Reports and Land Records Department.

213
AGRICULTURE
Table 4-Irr~gated Area classified by Sources of Water Supply (Area figures in hundred aCTt"s)
Cross Gross Net Govern~ Private Total Tanks Tube Wells Other Wells Oth.r Di,trictlTaluka Year Cropped Irrigated Irrigated ment Canal Canal ------- -------- -------- Sn refS
Area Area Area Canal Area Area No. Area No. Are. No. Are. Area Area
(I) (2) (3) (4) (5) (6) (7) (8) (9) (10) (II) (12) (13) (14) (15)
DISTRICT TOTAL 1950-51 15,848 78 78 3 3 NA 72 3 1956-57 18,069 61 54 2 2 2 3,588 51 1 1959-60 18,137 68 62 2 2 I I 4,863 59
Darwha Taluk. .. 1950-51 3,913 22 22 NA 21 1956-57 4,234 20 17 1,464 17 1959-60 4,180 12 12 2,038 12
Yeolmal Taluka .. 1950-51 2,%6 16 16 NA 16 1956-57 3.241 II 12 848 12 1959-60 3,212 22 16 903 16
PusadTaluk. 1950-51 3,813 20 20 NA 19 1956-57 3·,958 16 13 547 12 19;9-60 4,159 13 13 1,05S 13
Kelapur Taluka .. 1950-51 3,249 II 11 NA II 1956-57 3,558 7 6 586 6 1959-60 3,612 12 12 697 12
WaniTaluka 1950-51 2.907 9 9 3 3 '2 NA 5 1956-57 3,078 7 6 2 2 'j 143 4 1959-60 2.974 9 9 2 2 I 167 6
NA=Not Available, Source: Season and Crop Reports and Land Records Department.

214
OTHER OFFICIAL STATISTICS
Table 5-Acreage of Crops under Irrigation
Crops irrigated
(I)
Gross CTOp,oed Area
Gross Irrigated Area
Irrigated Area under food croP!
Area under Cereals Rice Whe,t ]owar Bajri Ragi
Maize .• Other cereals .•
Area under Pul,es Tur Gram o'
Other Pulses ., Sugarcane ., Fruits and vej;!'etabIes Condiments and spices Miscellaneous food crops
Area under non~fDod crops Area under oil~seeds-
Groundnut Sesamum .• Othel oll seeds
Cotton •• Tobacco.. .• .. ., Other non~food crops including
fodder crops.
Gross Cropped Area
Gross Irrigated Area
Irrigaled Area under food croPs
Area under Cereals Rice Wheat lowar Baid ~ Rag)
Maize Other cereal,
Area under Pulses Tur ,. Gram.. " Other pulses "
Sugarca.ne " •• Fruits and vegetable, ., Condimen ts and spices Miscellaneous food. crops
Area uNd., non·food crop' Area under oil·seed,-
Ground nut •• Sesamum •• Other oil seeds
Cotton ,. Tobacco ., .. .. .. Other non.food crops including
lodder crops.
Gross Cropped Alta
Gross Irrigated Area
Irrigated A"a under food c'.p,
Area under Ctroal. Rice Wheat 10wor Bairi Rag; Maize •• Other cereals ..
1950-51
(2)
16,848
78
78
4 2 2
ij
ii 40
3,913
22
22
2
2
'5 '4 II
2,966
16
16
1951-52
(3)
17,076
i6
76
3 I 2
ii ii 39
3,993
20
20
2
'2
'4 '5 9
3,006
14
14
1952·53
(4)
17,380
67
67
3 I 2
'9
is 37
4,057
19
19
2
'2
'3 'j 13
3.058
17
17
1953-54
(5)
1954.55
(6)
DISTRICT TOTAL
17,756
62
62
5 2 3
'6 ii 34
17,893
65
65
3 I 2
'5 ji 38
2
DARWHA TALUKA
4.131
19
19
'j
'j
'5 12
4.186
25
23
2
'2
1
'5 15
2
'i
YEOTMAL TALUKA
3.108
14
14
3.098
13
13
1955.56
(7)
18,298
71
71
5 2 3
's i9 42
4.251
26
26
3
·3
'j
'7 15
3,180
16
16
1956-57
(8)
18,069
61
59
4 1 3
5
i7 33
2
2
,j,234
20
20
3
'3
'j
'5 II
3,241
II
II
1957·58
(9)
18,152
62
57
8 2 6
'j
'5 i6 27
5
'2 3
4,162
13
12
2
'2
I
'4 5
'i
3,240
12
12
(Area figufes in hundred J.cres).!
1958-59
(10)
18,338
59
57
6 2 4
'6 is 30
2
4,222
13
12
2
'2
I
'4 5
'j
3,224
13
12
1959-60
(\1)
18,137
68,
56
6 I 5
'j
is 30
10
'4 '(,.
4,180'
12
II
'j
'f ·s 4
I
'j
3.212
22
15

215
Table 5-Acreage of Crops under Irrigation-contd.
Craps irriaated
(I)
Area und.r Pal ... Tur Gram " Other pulses "
Sugarcane .. •• Fruits and vegetables '0 Condiments and spices Miscellaneous food crops
Area under tlDn-foodtrop. ATfa und.r oil·seeds-
Groundnut Sesamum " Other oil seeds
Cotton " Tobacco " " " " Other non-food crops inlcudin~
fodder crops,
Gross Cropped Area
Gross Irrigated Area
lrrigal.d Ar.a under food crop.
Area underC.reals Rice Wheat Jawar Bajri Ragi
Maize ., Other cereals, 0
Area under Pu/ ••• Tur Gram .. Other Pllse. " "
Sugarcane .. •• Fruits and vegetabl •• " Condiments and spices Mi,cel laneou, food crop.
Are. under non-food crop. Area under oil .. $feds-
Groundn. Sesamum •• Other oilseed.
Cotton " Tobacco " .. .. .. Other non.food crop. including fodder crops.
Gross Cropped Area
Gross Irrigated Area
Irrigated Area under food crop.
Area under Cereal. Rice Wheat Jowar Bajd Ragi Maize .. Other cereal$ ••
Area under Pulses Tur Gram .. Other pul,e, ..
Sugarcane .. .• F fults and vegetables " Condiments and spices Miscellaneous food crops
Are" under non-food (TOP' Are. under oi/-.. eds-
Groundnut •• Sesamum .. Other oil seeds
Cotton Tobacco.. .. .. .. OthEr non.food crop, including
fodder crops,
1950.51
(2)
'j
'j, 9
3,813
20
20
3,249
II
11
'j
'4 6
J-1812-1II-30-A (Yeotmal).
1951·52
(3)
'j
'j, 7
3,791
20
20
'5 '5 10
3,400
13
13
'j
'4 8
1952·53
(4)
I 'j, 10
3,856
13
13
'j
'5 5
3,401
10
10
OJ
'4 5
1953-54
(5)
1954·55
(6)
YEOTMAL TALUKA-concld.
'j
'j, 7
's 8
PUSAn T ALUKA
3,850
II
II
I 'j
'2 '2 6
3,909
10
!O
2
'j 5
KELAPUR TALUKA
3,568
10
10
I 'j
'j
'3 5
3.588
9
9
'j
'2 6
1955·56
(7)
'j
'5 10
4,071
12
12
'i '3 7
3.554
9
9
'j
'2 6
1956.57
(8)
'5 6
3.958
16
15
'2 '2 II
'j
3.558
7
6
'j
3 2
'j
1957-58
(9)
6 6
4,070
17
16
3 'j
I
'j
2
'i 8
OJ
3.624
13
10
I
'j
'j
'3 5
3
'2 'j
AGRICUL TURE
(Are. fii\lf" in hundred acres)
1958.59
(10)
'5 7
I
'j
4.170
16
16
3 I 2
'j
'j 9
3.714
9
'j
3 5
1959·60
(II)
'5 10
7
'j
'(,
4,159
13
13
'j
'4 , i 7
3.612
12
10
Z
'2
OJ
3 4
:2
2

216
OTHER OFFICIAL STATISTICS
Crops irrigated
(I)
Gr." Cropped Area
G,." IrriJlaled Area "
Irrigated Area under food <TOP'
Area un.der Cereals Rice Wheat Jo~~r BRJil Ragi Maize ., Other cer •• I •..
Area under Pulses Tur .. Gr'lm .. Other pulses .. . .
Sugarcane •. " Fruilsand vegetables .. Londiments and spices MiseellaneoUE food crops
A"a und., no •• jaod croP' Area under oi/·seeds-
Groundnut .0 Sesamum " Other oil·seeds
Cotton .. Tobacco.. .. " .. Other non·food crops including
fodder crops,
Table 5-Acreage of Crops under Irrigation-concld,
1950.51
(2)
2,907
9
9
2 2
I
'2 4
1951.52
(3)
2,886
9
9
I
'2 5
1952.53
(4)
3,008
8
8
I
'2 4
1953.54
(5)
1954-55
(6)
WANITALUKA
3,099
8
8
2 2
I
'j 4
3,112
8
'j
'2 4
1955.56
(7)
3,242
2 2
'2 4
Sou«e: Season and Crop Reports and Land Records Deportmenl.
1956.57
(8)
3,078
7
I
'2 3
1957·59
(9)
3,056
2 2
'j
'j 3
Table 6-Yield per Acre and Outturn of Principal Crops
(Area figures in hundred acre,)
1958.59
(10)
3,008
8
'j
'2 4
1959.60
(II)
9
I
'j 5
(Yield per acre in Ib" and Outlurn in hundred tons)
1950·51 1951.52 1932.53 1953.54 1954.55 1955.56 1956·57 1957-58 1958·59 1959-60 Principal Crops Yield
per acr~
Yield Out- Yield OLlt· turn
Yield OUI' Yield Out. Yield Out. Yield Out·· Yield Out. Yield Out- Yield Outturn :~~e turn :C~~ turn !% turn ~~~e turn
Rice
Wheat
jowar
Baiti
(I)
Total Cereals
Total Pulse,
Tur
Gram
Sugar.ane (Gut) ..
Total foodgtains "
Groundnut
Sesamum ,.
Rape, Mustard and linseed
Cotton (in bales o1392Ibs. each.)
(2)
NA
NA
NA
NA
NA
NA
NA
NA
NA
NA
NA
NA
NA
NA
pet turn acre
(3) (4) (5)
NA 657 78
NA 263 40
NA 835 2,470
NA 443 50
NA 737 2,639
NA 732 681
NA 1,338 531
NA 198 16
NA 2,427 13
NA 775 3,320
NA 567 236
NA 221 23
NA
NA
200 15
100 1,484
NA=Not available.
J-l8J2-III-:30-B (Yeotmal),
per acre
(6) (7)
652 69
324 47
762 2,319
451 54
727 2,489
1,118 1,077
816
267 18
2,240
813 3.566
377 165
213 24
per turn acre
(8) (9)
382 39
392 62
544 1,648
410 50
526 1,799
773 77i
1,364 599
363 25
2,240
582 2,570
555 224
201 23
204 13 229 13
962 75 1,120 60
per turn per Acre . acre
(10) (II) (12) (13) (14) (15) (16) (17) (18) (19) (2D) (21)
384 36
434 76
637 1,912
428 52
611 2,077
562 569
942 414
395 33
2,240
600 2,646
449 179
202 25
247 18
75 1,222
361 34 884 86 721 76 553 56 452 4B
343 91 206 48 228 47 473 71 363 97
348 1,019 755 2,250 462 1,362 471 1,428 233 654
187 21 426 46 199 22 283 33 268 29
342 J ,165 709 2,432 446 1,508 467 1,589 252 829
422 445 579 582 577 567 473 476 355 350
809 355 1,059 468 1,055 471 871 399 621 268
238 32 323 34 187 17 246 22 231 31
1,792 4 2,240 5 2,240 5 2,240 6 2,2~0
361 1,6iO 630 3.014 476 2,075 468 2.065 275 1,179
356 127 602 191 277 94 329 104 443 121
170 19 198 16 199 15 185 15 180 15
170
33
17 234 22 226 20 206 i7 216 27
566 83 1,421 80 1.424 58 1.055 31 554
Source: The Statistician, Department of Agriculture. Mahar.shlra State. Poona.

217
Table 7-Wholesale Prices of Principal Crops
Year/Month Rice Wheat
(I) (2) (3)
1959
1960
Monthly Average 44.92 24.13
20.45 36.77
January 1960 Actual .. 40.00 24.00
February 1960 37.00 20.00
March 1960
April 1960
May 1960
June 1950
Juiy 1960
August 1960
September 1960
October 1960
November 1960
December 1960
35.00 21.00
35.00 21.00
35.00 21.00
.. 40.00 23.00
40.00 24.00
40.00 20.00
.. 40.00 22.00
37.45 16.85
33.71 15.73
•• 28.09 16.85
Jowar
(4)
12.02
15.02
14.50
14.00
1-1.50
14.50
14.50
16.00
16.00
16.00
16.00
15.73
15.36
13.11
Sajri
(5)
15.19
15.86
15.00
15.00
15.25
15.50
16.00
16.50
16.50
17.00
17.00
16.10
15.73
14.79
Potatoes
(6)
17.90
17.72
15.00
19.00
19.00
I t.:;5
16.00
20.00
20.00
20.00
20.00
18.73
18.73
14.98
Gram
(7)
23.66
18.15
14.00
16.00
17.00
18.00
18.50
19.00
19.00
19.00
20.00
19.10
19.10
19.10
Tur
(8)
25.83
24.06
22.00
22.00
21.00
21.00
22.00
24.00
25.00
28.00
25.00
26.22
26.22
26.22
Gur
(9)
22.21
20.77
23.00
22.00
19.00
19.00
19.00
22.00
23.00
23.00
23.00
18.73
18.73
18.73
AGRICUL TURE
( Price, in R,. and nP. per Bengal maund)
Sugar
(10)
43.55
47.00
48.00
47.00
47.00
47.00
48.00
48.50
48.00
48.00
48.00
44.57
44.94
44.94
Cotton Onion (per khandi Dry Chillies
of 784Ibs.) (11) (12) (13)
9.17
8.81
10.00
8.00
6.00
5.00
5.00
8.00
10.00
10.00
10.00
11.24
11.24
11.24
334.57
360.43
361.00
368.00
396.00
411.00
336.00
322.00
329.00
60.00
99.82
80.00
BO.OO
120.00
130.00
140.00
100.00
95.0(}
100.00
100.00
84.27
B4.21
84.27
Source: The Ta'l'ildar, Yeotmal and The D.roga, Cotton and Agricultural Produce Market Committee. Yeotmal.
Rice ••
Wheal
JOWaI ..
Bairi ..
Turdal
Gram ..
Cotton
Crops
(I)
1955.56
(2)
R •• nP. 10 00
1600
950
JO 00
1600
1300
2787
1956.57
(3)
Rs.nP. 1600
1980
1230
1400
1750
1440
2860
1957-58
(4)
Rs.nP. II 00
19 57
11 90
1377
1385
1275
'I 95
Table 8-Harvest Prices
1958.59
(5)
Rs.nP. 1494
2474
10 85
14 93
3063
1693
33 73
1959.60
(6)
Rs.nP. 1256
23 29
1429
1497
27 16
1421
4099
Crops
(1)
Sugarcane
Groundnut ••
Castorseed ••
Linseed
Mustard
NoTE.-Fi8ures lot the years 1950.51 to 1954·55 are not available.
1955·56
(2)
Rs.nP.
11 50
27 00
1956-57
(3)
Rs o nP.
1850
2071
2800
Sou"o: Season and Crop Reportl.
(Prices per Bengal maund)
1957.58
(4)
R •• nP. 1822
1910
2467
2641
2894
I 95B.59
(5)
Rs.nP.
21 78
2476
2498
1959..60
(6)
R .. nP.
2353
2089
2241
2935

218
OTHER OFFICIAL STATISTICS
Table 9-Livestock and Agricultural Implements
Liye.toc~ Census Ite""
(1)
1961
(2)
DISTRICT TOTAL A.-LIVESTOCK (In hundr.d,l-
I. Cattle-(a) Males over 3 yean 2.725 (b) Female, over 3 yeor. 2,508 (c) Young stock 1.894
Total Cattl. •• 7,127
2. Butialoe.-(a) Males O.er 3 years 32 (b) females over 3 yean 493 (c) Young .tock 338
Total Buffalo.. 863
3 Sheep 45
4 Goats 1,855
5. Horses and ponie. 34
6. Otherl ive,tock 83
Total Liveotoeft 10,007
B.-POULTRY (In hundred.) 4,460
C.-AGRICULTURAL MACHINERY (Actual Nurnbers)-J. Ploughs--
(a) Wooden .• (b) [ron
2. Carts ••
3. SugarcaneCrushert(a) Worked by poWer (b) Worhd b" bul\oc~.
4. Oil Engine. (with pump. for irrigation purposes).
5. Electric Pump, (for irrillation pvrposes).
6. Tractors (used for al!ricuItural purposes only).
7, Ghanies-(a) Fi •• seer< and more (b) Less IhOIl nvc ,eers
74,527 14,142
60.956
36 56
413
232
68
56 24
DARWHA TALUKA A,-LlVESTOCK (In hundredo)-
I. Cattle-(a) M.les over 3 year. (b) Females DOer 3 year. (c) Young stock
Total Cattl, ..
2. Buffaloes-(a) Males over 3 years (b) Females OVer 3 yea" ., (t) Y oun:; stock
Total Buflalo ..
3. Sheep
4, Goats
5. Horses Bnd ponies
.6. Otherlive.lock
r atal Uv .. tock
B.-POULTRY (In hundred,l
532 568 426
1,526
7 !12 76
195
15
378
8
14
2,136
765
C.-AGRICUl.TURAL MACHINERY (Actu_1 Nurnbersl-
I. Ploughs(a) Wooden (b) Iron
2. Carts ..
3. SugarcaneCru.hers(a) Worked by pOWtr (b) Worked by bulloek.
10,984 5,736
12,757
9 9
1956
(3)
2.652 2.600 1.919
7.171
29 497 316
842
82
1,734
51
95
9.975
2,807
75.273 12.213
56,332
47 75
172
12
98
77 26
549 560 446
1.555
6 101 64
171
II
368
15
20
2.140
401
9.627 4,857
11.399
5 30
1951
(4)
2,262 2.485 1,600
6,547
26 517 281
824
68
1,183
65
96
8,783
1,673
57,695 6,904
53,136
37 81
99
19
30
76 33
NA NA NA
NA
NA NA NA NA
NA
NA NA
NA NA NA
NA NA
NA
NA NA
Livestock Census Items
(I)
1961
(2)
DARWHA TALUKA-concld.
4. Oil En~ines (with Pumps for irrilr.· 56 tion purposes).
5. Electde Pumps (for irrigation pur· 123 poses).
6. Tractors ("sed for .~ricultur.l pur- 16 poses only).
7. Ghanies-(0) Fiveseers and more 27 (b) Less than five seers 9
YEOTMAL TALUKA A.-LIVESTOCK (In hundred,)-
I. CattI.-(a) Male, over 3 years (6) Fero,l .. over 3 years .. (c) Younq stock
T olal Cattl. ..
2. Buffaloes-(a) Male, over 3 yea" (6) ",emiles over 3 years (c) Young stock
r otal Buffalo"
3. Sheep ..
4. Goals
5, Horses and ponies ••
6. Otherlivestock
Total Lio"foc~
464 401 341
1.206
6 78 52
136
II
340
II
25
1.729
1956
(3)
31
21
15 15
427 443 348
1.21S
6 80 ,53
139
48
315
14
23
I,m
B.-POULTRY On hundreds) 733 550
C.-AGRICULTURAL MACHINERY (Aatual Numbersl-J. Ploughs-
(a) Wooden .' 10.569 10.032 (b) lron 2,529 1,926
2. Carts .. 10.344 8,493
3. Sug3{cane Crnshers(0) Worked by power (b) Worked by bullocks
4. Oil Engines (with pumps for irrigation pLlrposes).
5. Electric Pumps (for irrigaton purposes).
6. Ttactors (used for agricultural purpose, only).
7. Ghanies-(a) FiVe Seers and mort (b) Less than live seers
6 3
97
77
9
13 4
PUSAD TAI..UKA A.-LIVESTOCK (In hundred.)-
I. Cattle-(a) Males over 3 years (b) Females over 3 year (c) Youna stock
TotalCattl. ..
2. Buffaloes-(a) Males over 3 years (b) Females over 3 years (c) Y ounQ' .tock
Tolal Buflaloes
3. Sheep
4. Goats •.
5. Hotses and ponies
6. Olhedivestock
Total Livestock,
602 629 455
1.686
6 111 80
197
3
463
6
18
2.373
9 2
65
21
584 662 450
1.696
6 121 73
200
5
363
8
20
2.292
NA=Not Available.
1951
(4)
NA
NA
NA
NA NA
NA NA NA NA
NA NA NA
NA NA
NA NA
NA NA
NA
NA NA NA.
NA NA
NA
NA
NA
NA NA
NA NA NA NA
NA NA NA
NA
NA NA NA
NA NA

219
AGRICULTURE
Table 9-Livestock and Agricultural Implements-concld.
Livestock Cen,uI Livestock Census lterna
1961 1956 1951 Items 1961 1956 1951
(I) (2) (3) (4) (I) (2) (3) (4)
PUSADTALUKA-concld. KELApUR TALUKA-condd.
B.-POULTRY (In hundreds) 751 441 NA 4. Oil Enaine. (with pumps fot irriia-tion purposes).
62 35 NA
,C.-AGRICULTURAL MACHINERY (Actual Numb.rsl- 5. Electric Pump, (for irrigation pur- 2 NA J. Ploughs- poses).
(a) Wooden .. 16.888 16.782 NA (6) Iron 2.641 2.608 NA 6. T ractots (u,ed for agricultural pur- 20 27 NA
poses only). 2. Carts .. 14.537 13.985 NA
7. Ghanies-3. SUiarcane Crushers- (a) Five seer. and more 10 8 NA
(a) Worked by power 8 21 NA (6) Less than five seet. 8 3 NA (6) Wotked by bullocks 22 30 NA
4. Oil Engines (with pumps lor irriga- 146 33 NA WANITALUKA tion purpose.). A.-LIVESTOCK (In hWldreds)-
5. Electric Pumps (lor irrigation pur- 20 NA r. Cattl.-pO,es). (a) Males over 3 yeats 569 547 NA
6. T tactors (used for agricultural put- 13 14 NA (6) Fem.les over 3 years 438 459 NA poses only). (c) Young stock 307 306 NA
7. Ghanies- Tot.ICattl. .. 1.314 1.312 NA (a) Five seers and more 6 33 NA
2. Buff.loes-(b) Less than nve seers NA (a) Mal .. over 3 years S 4 NA
KELAPUR TALUKA (b) Females over 3 years .. 102 108 NA (c) Y ounw stock 69 71 NA
A.-LIVESTOCK (In hundredsl-I. Cattle- Total Buffaloes 176 183 NA
(0) Males over 3 years 558 545 NA 3. Sheep 12 15 NA (6) Females over 3 years 472 476 NA (e) Young stock 365 369 NA 4. Goats 351 370 NA Total Cattle .. 1,395 1,390 NA 5. Horses and ponies 3 4 NA
2. Buffaloes- 6. Other livestock 8 13 NA <a) Males over 3 years 8 7 NA (6) Females over 3 year. 90 87 NA
Total Liveslock 1.864 1.897 NA (c) Young stock 61 55 NA
Total Buffaloes 159 149 NA B.-POULTRY (In hundreds) 1.184 771 NA
3, Sheep 4 3 NA C.-AGRICULTURAL MACHINERY (Actual Numbers)-
4. Coats 323 318 NA J. Plouahs-
(a) Wooden 21.138 21.153 NA
5. Horses and poni .. 6 10 NA (b) Iron 531 436 NA
6. Other livestock 18 19 NA 2. Carts .. 12,186 12.437 NA
Total Livestock 1.905 3. Sugarcane Crushers-
1.889 NA (a) Worked by power 3 3 NA
B.-POULTRY (In hundreds) 1.027 644 (b) Worked by bullocks 4 1 NA
NA
.c.-AGRICULTURAL MACHINERY (Actual Numbersl-4. Oil Engines (with pumps for irriga'
tion purposes). 52 S NA
I. Ploughs- 5. Electric Pumps (for irrigation pur· 7 2 NA (0) Woodeo .. 14,948 17,679 NA poses). (b) Iron 2.705 2.386 NA
6. Tractors (used for agricultural pur- 10 15 NA 2. Carts .. 11.132 10.018 NA poses only) •
3. Sugarcane Crushers- 7. Ghanies-(a) Worked by power JO 9 NA (a) Five seers and more 20 NA (6) Worked by bullocks ., 18 12 NA (b) Less t'lan five seers 3 7 NA
NA=Not available. Source : Bureau of Economics and Statistics, Bombay,

220
OTHER OFFICIAL STATISTICS
Table to-Classification of Land Holdings according to Size
Size of holding, (Acres)
(1)
Up to lac:e .. .. Exce<ding 1.00 but not Exceeding 2.50 but not Exceeding 5.00 but not Exceeding 7.50 bu t no t Exceeding 10.00 but ~ot Exceeding 12.50 but not Exceeding 15.00 but not Exceeding 17.50 but not Exceeding 20.00 out not Exceeding 25.00 bu t not Exceeding 30.00 but not Exceeding 35.00 but not
2.50 5.00 7.50
10.00 12.50 15.00 17.50 20.00 25.00 30.00 35.00 40.00
Number of Percentage Area holdings of holding. owned
(2)
3.263 9.325
16.137 12.349 9.984 7.079 6.085 4.433 3.496 5.376 4.259 2.712 1.884
(3)
3.39 9.69
16.77 12.83 10.37 7.35 6.32 4.61 3.63 5.59 4.42 2.82 ].96
(4)
1.924.55 16.740.20 59.106.28 76.823'51 85,529.66 79.265.30 83.252.35 71.559.55 65.301.24
119.356.23 117.072.72 87.707.54 70.552.27
Size of holdingg (Acres)
(1)
Exceeding 40.00 but not 45.00 Exceeding 45.00 but not 50.00 Exceeding 50.00 but not 60.00 Exceeding 60.00 but not 75.00 bcceed;ng 75.00 but not 100.00 Exceeding 100.00 but not 150.00 Exceeding 150.00 but not 200.00 Exceeding 200.00 but not 300 go E.~ceeding 300.00 but not 500 :00 E.ceeJing 500.00 but not 1.000.00 More t:,an 1.000 acres
TotAl
Source: Revenue Department
Table ll-Employment in Factories
Number Number Average daily number of workers employed
of of Adults Adolescents Children Code No Number 01 working man-days ----- ------ -------
and wotkinl1 factories worked Men ~romen Males Fomale, Boys Girls Description of Industry factories submitting during
returns the year
(I) (2) (3) (4) (5) (6) (7) (8) (9) (10)
010 Gins and pressPS--
(a) Cotton ginning and baling 31 22 377.964 1.525 1.124 3
205 Manufacture of grain mill products-
(a) Flour mill. 1 (c) Dal mills •• 2 2 18.655 63 4
209 Manufacture of miscellaneous food prepara tions-
(a) Manufacture of edible oil, (other 5 3 10.984 61 4
than hydrogenated oils.)
(i) Others
220 l' oboceo monufactur .. -
(a) Bidi 3 43.368 74 65
250 Manufacture of wood and cork except manufacture of furniture-
(a) Saw mills 6 10.920 29 6
339 Manufacture of non-metallic mineral products not elsewhere cl'$.i£ed-
(b) Asb .. tos products 27.360 40 55
(d) Othe ... .. 7 31.180 51 71
384 Repair 01 motor vehicles anJ ,yele.-
(a) Motor vehicles .. ----
Tot.l 58 33 520.431 1.843 1,329 3
NOTE.-Column (4) relate. only to those lactori •• submitting IillUresfor number of days for which the lactory w .. ",or king. Source Column (5) to (II) r,iate to working factories submitting relurns.
(Area in Acre.)'
Number of Percentage Area boldings of holding. owned
(2)
1.385 1.772 1.736 1.560 1.438 1.173
489 418 258 135 103 ----
96.249
Total
(II)
2.652
67
65
139
35
95 122
3.175
(3) (4)
1.44 58.793.48 1.22 55.331.17 1.80 95.211.21 1.62 103.994.65 1.49 124.445.29 1.22 140.680.02 0.51 83.891.29 0.43 101.678.71 0.27 96.649.31 0.14 93.298.48 0.11 219.940.14
100.00 2.108.105.21'
Working factories not submitting returns
E.timated No. average daily
No. of workers tnIployed
(12) (13)
9 890
15
'.,
2 24
• 2 73
5 121)
" 132
39
- -25 1.297
Chief In_tor of Factori ...

221 INDUSTRIES
Table 12-Distribution of Factories according to Products and their Working Strength
10 or more 200rmore 50 or more 100 or more 500 or more 1.000 or I100re 5.000 Less than but less than but less than but less than bude .. than bu t I ess than but less than orm::;.re
Code No. 10 workers 20 workers 50 workers 100 workers 500 workers 1.000 5,000 workers ann workers workers
DescriPtion of In~ustry ---- ------ -----A B A B A B A B A B A B A B A B
(I) (2) (3) (4) (5) (6) (7) (8) (9) (10) (II) (12) (13) (14) (15) (16) (17)
,01 Process allied to Aqriculture 2 28 2 51 520 11 2.053
20 Food except bever,"es 2 25 3 107
22 Tobacco 139
.25 Wood and cork except furniture 35
33 Non metallic mineral products (except products of 2 61 2 156 petroleum and coal.
Tot.1 4 53 8 254 9 676 12 2.192
A-Number of factories submittinll retums. B-Average number of workers employed daily. Souf02:-Chief Inspector of Factories.
Table 13-Distribution of Factories according to Number of Days Worked
More than Mote than Number of 60 but not 120 but not More than 180 More than 240
CodeNo. days not 60 days more than more than but not more but not more More than 300 and stated or less 120 day, 180 days than 240 days th.n 300 days days
Description of --- ----- ---_- --_--- -------Industry A B A B A B A B A B A B A B
(1) (2) (3) (4) (S) (6) (7) (8) (9) (10) (11) (12) (13) (14) (IS)
-----, _._------------01 Processes allied to Agriculture 6 397 413 7 969 3 464 409
20 Food extept be,.rages 2 54 II 47 20
22 Tobacco 139
25 Wood and cork except furniture .. 35
33 Non-metallic mineral products (except products of 4 217 petroleum .nd co.l).
Total 6 397 413 9 1.023 4 475 6 673 194
A= Number 01 Factories submitting returns. B=Average number 01 workers employed daily, Source: The Chief Inspector of F actori ...
Table 14-Manufacturing Industries
Number 01 N,"mber 01 Other than Total Fixed Working Total Value added by Number of Wor king Reporting Total
Factories Factori~s Workers Workers Employment Capital Capital Productive Value of Pro- Manufacture Capital duction
(1) (2) (3) (4) (5) (6) (7) (8) (9) (10)
Rs. R" Rs. Rs. Rs~
4 209 30 239 2,85.000 2,16.000 S,OI.000 15.83.000 %.000
SOUTCf: St.tistical Abstract of 1960-61, Mah.,.s1.tra State.

OTHER OFFICIAL STATISTICS
~ 6 I I
\("\"("..l0\,..... __ ooO\~ 11'\,,",0_
N m
~~~~~ ",~..o
-N 'Nc:"1"', 0-. .0'>0. _
222
~§~~~ -~i!C~ N N
00 __ ,.... _N~\,Q'V'
"\0("/"\-N ~
I.I"\CONO_"""...o«:rOO o~oo-
<'!'\ ~
~~~~~ rtJ~~g;~ _: N

= .~
.~ ..E '0 ~
E ~
Z
= 0
~~ Jl -0 ~
S .. Z
223
§
§
g -fi" tI)
I---------------------------------------------I~, I I
I I I
~ ,I I I
I
~ I 0
J-1812-II1-31-A-(Yeotmal).
EDUCATION

224 OTHER OFFICIAL STATISTICS
Table i7-Medical Facilities
Number of Bed. Indoor Patient. Treated Outdoor Patients Treated
District T aluka Years Hospi. Mater- Dispen- Rural Doctors Nurses Females tal. nity saries Health Males inch,ding Mal •• Females Children Male. Females Children
Homes Centres children
(I) (2) (3) (4) (5) (6) (7) (8) (9) (lO) (11) (12) (13) (14) (15) (16)
---------------..... DISTRICT TOTAL .• 1950 12 5 19 9 61 45 1,16:! 964 640 98,228 46,273 72,584
1955 12 6 '9 24 26 104 64 1,469 1,~84 917 125,896 50,357 97,543 1960 12 I 6 29 25 94 105 1,951 3,256 2,411 124,567 64,963 108,635
Darwha Taluh .. 1950 3 3 2 10 5 212 18 14 23,059 11,423 23,590 1955 . 3 '2 3 2 10 6 132 33 13 27,951 8,670 23,722 1960 2 I 3 1 5 13 62 214 149 17,010 9,358 11,746
YeotmalTaJoka .. 1950 4 6 5 33 25 576 868 583 20,047 14,103 ll,736 1955 4 'i 8 10 56 35 814 1,028 735 20,394 10,250 18,224 1960 4 10 12 51 59 1,215 2,469 1,770 19,887 17,833 27,290
Posad T aluka .. 19jO 2 1 4 1 ? 7 179 65 36 23,652 9,592 17,446 1955 2 I 4 4 16 5 175 120 84 24,414 10,375 17,159 1960 3 2 I 7 2 27 17 363 322 335 39,248 16,259 23,850
Kelal>ut T alub .. 1950 2 I 3 '8 7 2 120 5 2 17,565 6,373 11,168 1955 2 2
2 6 17 12 250 151 62 38,632 16,697 31,973
1960 2 Z 6 8 5 7 230 145 68 33,697 18,999 31,823
WaniTaluka .. .. 1950 2 3 1 5 6 75 8 5 13,905 4,782 8,644 1955 2 '3 3 2 5 6 98 52 23 14,505 4,365 6,465 1960 2 3 2 6 9 76 106 89 14,725 2,514 13,926
Source : The Director of Public Health.Mahar.shlra State, Poona.
Table is-Registered Births, Deaths and Infant Deaths
District! Years T.luka Births and Dealhs
1951 1932 1953 1954 1935 1956 1957 1958 1959 1960
(I) (2) (3) (4) (5) (6) (7) (8) (9) (10) (II) (12)
DISTRICT TOTAL .. Birth, .. NA NA NA NA NA 40,792 39,775 37,772 39,292 38,257 Deaths NA NA NA NA NA 21,491 27,622 27,357 24,987 20,749 Infant D~~ths .,
NOT E.-The T.luhwise Information is notav,il.bl., Source: lhe Director of Public Health,MaharashtraState, Poon ••
Table 19-Registered Deaths and Causes of Deaths
Cause. of Deaths 1951 1952 1953 1954 1955 1956 1957 1958 1959 1960
(I) (2) (3) (4) (5) (6) (7) (8) (9) (10) (II)
TOTAL DEATHS NA NA NA NA NA 21,491 27,622 27.357 24,987 20,749
Cholera NA NA NA NA NA 56 147 68
Smallpox .• NA NA NA NA NA 88 558 859
Plaglle NA NA NA NA NA
Fever NA NA NA NA NA 11.390 14,805 15,162 12,051 9.867
Dys.ptety and Diatrhoea NA NA NA NA NA 1,359 1,640 1,543 1,474 1,217
Respiratory rtiseMe. NA NA NA NA NA 756 1,700 1.270 850 824
Other causes NA NA NA NA NA 7.842 8.772 8.455 10.612 8,841
NA - Not a.ail.bl •. Source; The I)irector 01 Public Health, Mahar.shlra Stale, Poona.
J-1812-ur-31-B-(Yeotmal).

Table 20-Railway Mileage and Stations
I.-RAILWAY MILEAGE (In Miles) H.-RAILWAY STATIONS
(I) (2) Taluka Stations
Broad Gauge .. 10.39 (I) (2)
Metre Gauge Oarwha Taluka .• .. Linga. Ladkhed.
Narrow Gauge 41.01 Tapona.
--- Darwha Moti-Total 51.40 bagh
Bhandegaon. W.rudkhed SangWi. Lasina
Yeotmal Taluka .. .. Yeotmal
WaniTaluka ..
Source: CentralRailwayTimeTable
Table 21-Roads
Type of Roads
(I)
I.-SURFACEWISE
Cement Concrete
Black Topped
Water Bound Macadum
LowerType ..
Total
II.-CATEGORYWlSE
Type of Road. 1961 1956
(1) (2) (3)
National HighwayS 3S-87 6.00
Statc Highway. 246.12
Major District Roads •• 312.74 273.63>
Other District Roads .. 59.S8 85.67
Village Roads .. 136.57 8.75
Total 794. IS 374.05
Raiur. Wani
(Figures in Miles)
1961
(2)
191.83
513.35
89.00
794.18
195'
(4)
6,.00
273.63
64.63
7.24
351.50
225
SOUl'a: The Buildings and Communications DeP6rtrnent.Gowt. olMahara.htn. B..n.ba,l.
MISCELLANEOUS
Table 22-Post Offices, Telegraph Offices and Radio Licences
Radio Licences
Year Post Telegraph Letter Postmen Telephone Tele- in force Offices Ollices Boxes Offices phones on 31st
December
(I) (2) (3) (4) (5) (6) (7) (8)
195M1 .. 95 7 190 69 16 NA
1951-52 .. 97 200 68 46 NA
1952-53 .• 98 7 210 65 66 NA
1953-54 .. 102 7 218 66 89 NA
1954-55 .. 114 293 65 128 1.919
1955-56 .. 154 8 328 67 147 1.609
1956-57 .. 180 8 364 67 148 1.808
1957-58 .. 196 8 376 67 6 NA 2.190
1958-59 .. 206 8 389 67 6 NA 2.400
1959-60 .. 217 S 395 67 6 NA 2.852
1960·61 .. 233 S 414 67 6 NA 2.408
NA = Not avallable. Source: The Superintendent of Post Offices, Amravati.
Taluka
(I)
Table 23-Banks
Name 01 the Bank wi th LoCa tion
Year of Establishment
Type
(2) (3) (4) ------------------------------.-Darwha Taluka I.Oarwha Central Co-operative
Bank. Darwha.
2. State Banko£lndia.Darwha ..
3. Darwha Central Co-operative Bank. Digra •.
4. State Bank of India. Digra •. ,
Co-operative.
1-7-1955 Scheduled.
Co ... operative.
1-7-1955 Scheduled.
YeotmalTaluka t. Bank oIMahar.shtra. ¥eotm.l 16-9-1935 Scheduled.
2. Bank of Nagpur. Yeotmal 13.11-1937 Scheduled.
3. New Citizen Bank of India. 31-7-1937 Scheduled. Yeolmal.
4. Punjab National Bank.Yeotmal 19-5-1894 Schedul.cL
5. Stato Bank oflndia. Yeotma!'. 1-7-1955 Scheduled.
6. Yeolmal Central Co'operative Co-operative. Bank. Yeatmal.
PusadTaluka .. t. Punjab National Bank. Pusad 19-5-1894 Scheduled.
WaniTaluk.
2. Pusad Central Co-operative Co-operativ ... Bank. Pusad.
3. State Bank of India. Pusad •• 1-7-1955 Scheduled.
4. Pusad Central Co-operative Co-operativ" Bank. Umarlched.
I. Bank of Nagpur. Wani
2. Nasik District Central Cooperative Bankt Wani.
3. State Bank 01 India. Wani ••
4. Yeotmal Centr.1 Co-operative Bank. Wani.
13-11-1937 Scheduled.
Co-operative .
1-7-1955 Schedu'ed.
SOtrTct. Statistical T .bl .. rel.ting to Banks in India Ukerve Bank of India)'

228
OTHER OFFICIAL STATISTICS
Table 32-Weekly Markets and Cattle Markets
Serial I'\Q,
Name of village Location Code No, of village
(I)
1 SaWargaon
2 Adgaon 3 Shirasgaon
4 Umartba Lohi
6 Satelal 7 Ramgaon
B Cbikbal i 9 Bhandegaon "
J 0 Pimpari Kalag. 11 Watlali
12 Mozar 13 Ner 14 Dbanai 15 Manikwada .. 16 Brambanwada
17 Takali Salami 18 Maogladevi ..
(2)
19 Cbikbal i Kanhoba .. 20 Mangful 21 Chikani 22 Bangaon 23 Fubgaon 24 Talegaon
25 Kumbharkinhi 26 Malkhed Bk, 27 Malkhed Kd .. ,
28 Sonwadhona '. 29 Uttar wadhona 30 Lasina 31 Borgaon
32 Ghui 33 Ladkhed 34 Bori Kh. 35 Chani 36 HaTS,,1 37 Sakata 38 Mokh 39 Lakh Ray,chi
40 Kalgaon 41 Singad 42 Kandali 1,3 Dahe! i 44 Uchegaon 45 Mahagaon Kasba
46 Atambhi 47 Jaw,ia
48 Mahalungi 4~ Wad.aon
50 Arni 51 Pahut
52 Dehani 53 M.lhiwara 54 Lonbehel 55 Borgaon 56 KaWatha 57 DarwhaMunicipality 58 Digras Municipal i ty ..
(3)
DARWHA TALUKA
10
13 17 23 24 26 41
48 56 62 68
72 86 89 90 91 92
95 98
100 119 122 125 146 183 184 185 186 188 201
202 210
216 224 252 254
... 259 288 290 291 297 304
307 311 324 329 343 353 360 367 368 369 370 378
389 I
II
Bazar Day
(4)
Sunday. Wednesday, Satllrday.*
Friday. T uesday.*
Sunday, Monday,
Saturday & Wednesday Wednesday, Sunday.
Wednesday. Friday, Tuesday,' Friday,
Monday Thursday,
Sunday,
Saturday, Wednesday, Wednesday, Wednesday, Thursday, Friday, Monday,
Friday, Sunday, Wednesday, Thursday. Friday. Saturday,
Friday. Saturday, Saturday, Tuesday," Monday, Thursday. Wednesday, Friday, Tuesday,
Sunday. Wednesday, Friday, Thursday, Thursday, Wednesday,*
Sunday, Tuesday,"
Thursday, Sunday.
lIIlonday,' Thursday,
Sunday, Tuesday.
Wednesday, Sunday, Friday, Sunday, Friday, Saturday.
Serial No,
Name of village Location Code No, of village
(I)
Koth. Pahoor
Falegaon
(2)
4 Yaw.li 5 RaniUmaravati
6 A,egaon Sawar
8 Gharfal
9 Sarfali 10 Kharda II Pachakhed 12 Babhulgaon 13 Kotamha 14 Donoda 15 Wandali 16 Sonegaon
17 Pimpalgaon 18 SaWatgaon
19 Kalamb
20 Katd 21 Parsodi Bk, 22 Umar;
23 Madani 24 Yeotmal (Rural) 25 Kolambi 26 Bnrigosavi
27 Bhambtai.
28 Rui 29 Akol.bazar
30 Jodmoha 31 Khorad Bk. 32 Dongarkhard. 33 Wadgaon
34 Yelahara 35 Yeotmal Municipality
B:msi lamb Bazar
Bhoiala 4 Rohd. 5 Khandala
6 Jawl. 7 Nonand Ijata 8 Sh,mbalpimpri 9 Pimpaldari Palomo.t
10 Kali 11 Wanol i Izara .. 12 Harshi 13 ~aWan.
14 Kondari liara IS Morath Jahagir
16 Amboda
17 Lew.
18 Pokh.ri 19 Mahallaon 20 Karanikhed "
21 Hiwara
(3)
YEOTMAL TALUKA
4 12 16
33 35 36 46 62
69 70
72 91
131 141 152 172 173 177 185
192 202 205
223 233 289 297 298 312 319
327 335 347 357
370 I
PUSAD TALUKA
20 35 37
63 73 77 79
96 102
129 131 132 147 157 160
164 169 f70 176 178 179
"Also a C.ttle Mr.rket,
B.zar Day
(4)
Wednesday, Tue,day. Friday,
Wednesday, Monday,
Saturday. Wednesday, S.turd.y, Tuesday, Wednesday,
Wednesday, Thursday,' friday, Mond.y. Thursday,
Wedn"day, Sunday, Sunday. Tu"day, Friday,
Wedn"day, Saturday,
Saturday, Sunday,' Monday, Thursday.
Friday, Wednesday, Friday,
Friday, Thursday Wednesday Wednesday,
Th'Jrsday, Sunday,
Tu"day, Monday,
Thursday. Thursday, Friday, Friday, Saturday, Monday, Thursday, ThQrsday,
Monday. Thursday, ThJrsday; Wednesday, Friday,
Monday; Sunday,
Tuesday, Friday Sunday, Thursday.

-_.-_ _ .. _--,

229
MISCELLANEOU S
Table 32-Weekly Markets and Cattle Markets-concld.
Serial No.
Name 01 Village Location Code No. of village
(I)
22 [jani
23 Pohondul
24 Tiwarang 25 Mud.o. 26 Wadad 27 Kali 28 Fulsawangi 19 Mulawa
30 Vidul 31 Ningnoo:r' J ahagir
(2) (3)
PUSAn TALUKA-conc/d.
IBO lSI
182 191 204 214 218 227 270 278
32 Dhanki 289 33 Chat.ri 300 34 Bittargaon 314 35 lewali 327 36 Pu,ad Municipality.. I
97 UJ110rkhedMunicipality II
Ralegaon
lalka 3 Pimpalkhuti ..
4 Zadgaon 5 Sawangi '6 Wardha 7 Wadhona ·8 Ch.hand 9 Karanii
10 Munzala 11 Palaskund 12 Kinhi 13 Wadki 14 Khairi 15 Mohada 16 Shivni
11 Run •• ~8 Shiroli 19 Saykhed
20 Raiurwadi 21 Kurha 22 Bhambora
23 Talni 24 Pardi 25 Kelzar. 26 lehora 27 Saoli 28 Gboti
" .
KELAPUR TALUKA
22 27 30
40
45 73
90 94
liS 122 123 132 138 141 158 162
164
178 193 196 200 201
202 218 231
235 237 245
Ba,arDay
(4)
Wednesday. Weddesd.y.
Thuf,day.
Monday. Saturday.
Thursday. Thursday Tuesday. Saturday.
Friday,
Monday.' , Sunday. Saturday,
Sunday. Sunday.
Wednesday,
Friday.~
Sunday. Tuesday.
Saturday.
Tuesday,
Thu"day. Thursday." Thursday. Wednesday. Thur.d~y.
Thursday. Saturday. Wedne,day,
Friday. Saturday. Monday,
Friday,
Thursday. Saturday,
Wednesday. Sunday, Sunday,
Saturday, Monday,
Wedne,day. Saturday,
Thursday, Monday,
Serial No.
(I)
Name of village
(2)
Location CodeNo. 01 village
(3)
Bazar DaY
(4)
KELAPUR TAWKA-conclJ.
29 Ayata 31) Kap
31 Pangadi 32 Sa,atkbarda.,
33 Kurli 34 ParWa 35 Pahapal 36 SaWangi 37 ArJi
38 Urnri 39 Dharna
40 Wai
41 Dhoki 42 Wanj.ri 43 Tembhi 44 Bor;
4S Chatanji Municipality
46 Pandbarkaoda Municipality
I Chinchmaudal 2 Kumbha
3 Mardi 4 Mareg.on
5 Nandeper. 6 lalh 7 Chinchoni Botoni " 8 Nawargaon ..
9 -Weiaon 10 Katli8orl1aon 11 Borda 12 Chonsa
13 Mathariun 14 Satpalli
15 lamoni 16 Patan 17 Dhanoro
IB M.n~1i
19 Mukutban 20 Adegaon
21 Rajur
22 Rasa 23 Kayar 24 Shirpur
2S Dhakori
26 Wani Municipal i ty ..
"Also a Cattle Market,
256 Monday,
257 Sunday.
262 Thursday. 28, Friday.
292 Friday. 2% Monday,
300 Thursday. 322 Wednesday. 331 Tuesday,
338 Wedne'dJ"y. 342 345
382 385 38B 401
I 11
WANITALUKA
13 28 49
71 80 83 100 111 115 133 146 182 202 206 223
235 243 247 251
258 282 317 320 367
I
Monday,
Tuesday.
Friday. Tuesday. Tuesday. Saturday, Tuesday, Sunday,
Saturday. Sunday,'
Wednesday.
S.lurday. Tue,day.
Frid.y .' Tuesday.
Thursday." Friday, Wednesday,
Saturday.
Friday. Monday,
Wednesday. Sunday,
Thursday.
Friday.
Thursday Monday.
Tuesday.
Sunday.
Saturday,
Thursday.' Saturday, Wednesday.' Su nday.·
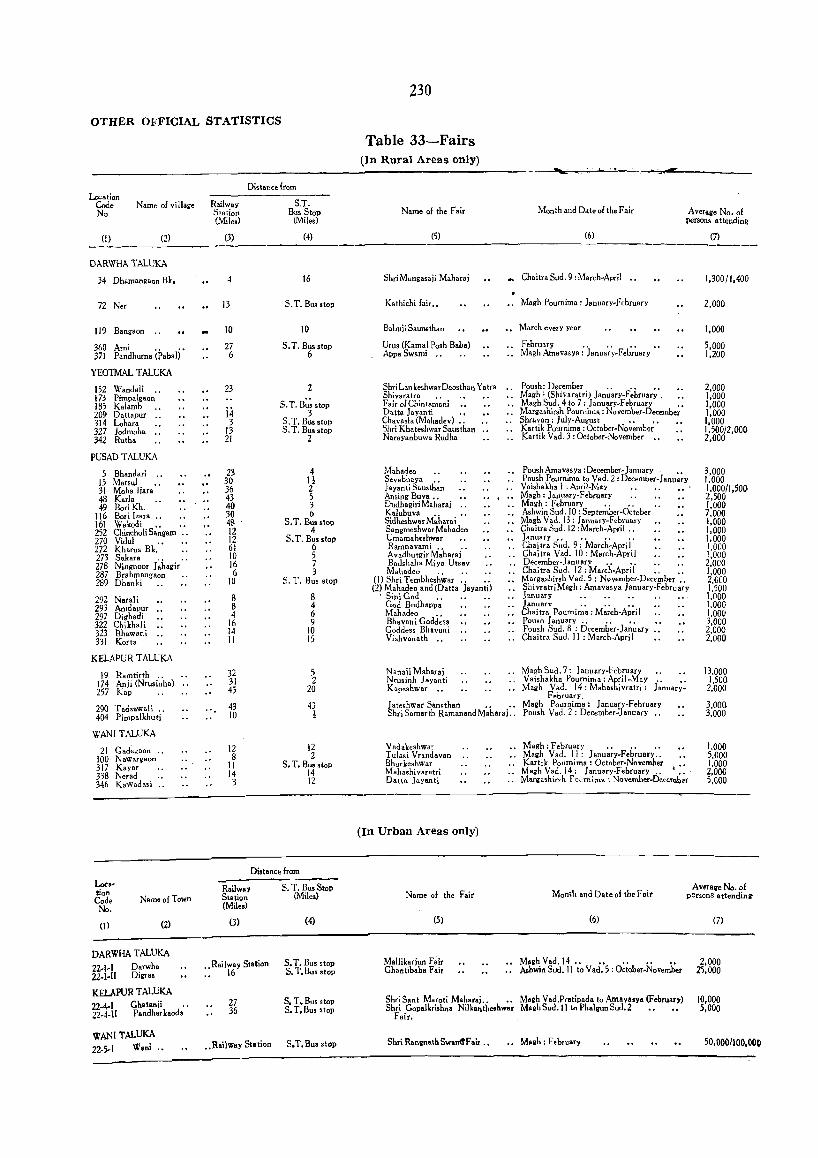
OTHER OFFICIAL STATISTICS
Distance from Lo-:ation
Code Name 01 vi lIage Railway S.T. No Station Bus Stop
(Mile,) (Miles)
(I) (2) (3) (4)
DARWHA TALUKA
34 Dhamangaon Bk. 16
72 Ner 13 5. T. Bus stop
119 Bangllon 10 10
360 Ami 27 5. T. Bus stop 371 Pandhuma (Paba I) • 6 6
YEOTMAL TALUKA
152 Wandali 23 2 173 Pimpalgaon' .
S.T.B~stop 185 Kalamb 209 Daltapur .. 14 3 314 Lohara 3 5. T. Bus stop 327 Jodmoha 13 5. T. BU$SloP 342 Rutha 21 2
PUSAD TALUKA
5 Bhandari .. 23 4 15 Marsul .. 30 H 31 Moha ljara 36 2 48 Karla 43 5 49 BoriKh. 40 3
116 Bori hata •• 30 6 161 Wakodi .. 48 S. T. Bu, stop 252 Chincholisangam 12 4 270 Vidul .. 12 5. T. Bus ,top 272 Kharu, Bk. 61 6 273 Sakara 10 5 278 Ningnoor J~hagir 16 7 287 Brahmangaon 6 3 289 Dhanki 10 5. T. Bus stop
292 Narali 8 8 293 Amdapur 8 4 297 Dighadi 4 6 322 Chikhali 16 9 323 Shaw.ni .. 14 10 331 Korta II 15
KELAPUR T ALUKA
19 Ramtirth 32 5 174 Anji (Nrusi;;ha) 31 2 257 Kap 45 20
290 Taos&wali .. ". 43 43 404 Pimpalkhuti 10 !
WANITALUKA
21 Gadegaon •• 12 12 100 NaWari8 0 n 8 2 317 Kayar II S. T. Bus stop 338 Nerad 14 14 346 Kawadasi .... 3 12
Distance from
Loc.· Railway S. T. BlI. StoP tlon Code Name of Town Station (Miles)
No. (Miles)
(I) (2) (3) (4)
DARWHA TALUKA
22·1-1 Darwha . . Railway Slation 5. T. Bus ,top
22-1·11 Digra. 16 S. T. Bus stop
KELAPUR TALUKA
22+1 Ghatanii 27 S. T. Bus ,top
2Z-4·1! Pandhar kaoda' • 36 S. T. Bus stop
WANITALUKA
22·5-1 Woni .. .. Railway Station S. T. Bus stop
230
Table 33-Fairs (In Rnral Areas only)
Name of the Fair
(5)
ShriMungasaji Maharaj
Kathichi fa:r ..
Bahuii Saunsthan
Urus (Kamal Posh Baba) AppaSwami •.
ShriLankeshwarDeosthan Yatra Shivaratra •• Fair of Chintamani Datta Joyanti •• Chavasla (Mahadev) •• Shri Khateshwar Sausthan Narayanbuwa Rudha
Moh.deo .. Sevabhaya .. Jayanti Sausthan Ansing Buva •• Dudhagiri Maharai K.lubuva .. •• Sidheshwar Mabarai S.ngmeshwar Mahadeo Umamaheshwar Ramnavami .. .• Avadhutgir Maharai Badshaha Mjya Utsav Mahadeo .. ..
(I) Shri Tembheshwar.. .. (2) Mahadeo and (Datta Jayanti)
. Sil>iGod .. .. .. God Budhapl>a Mahadeo •. Bhavani Goddess Goddess Bhavani Vishvanath ..
Nanaji Maharai Nrusinh ]ayanti Kapeshwar ••
. ..
Jateshwar samthan .. .. Shri samarth Ramanand Maharai. .
Vadakeshwar Tulasi Vrandavan Bhurkeshwar Mahashivaratri Datta Jayanti
(In Urban Areas only)
Name 01 the Fair
(5)
Mallikariun Fair Ghan tibaba Fair
Month and Date of the Fair Average No. of persons • ttendinQ
(6)
Chaitra Sud. 9 : March-April ••
Magh Pournima: January.February
March every year
February ........ Magh Amavasya : January-February
Poush: December .. .. Magh: (Shivaratri) January-Februar;', .. Magh Sud. 4 to 7: January-February • Margashirsh Pournima : November.Decembe~ Shravan: July·August •••• Kartik Poumima: October-Novem~er Kartik Vad. 3: October-November ••
PoushAmavasya :December-January Poush Pourn;ma to V.d. 2: December-Janu~~y Vaishakha 1 . April-May Magh: lonuary-February .. " Magh : February •. " • Ashwin Sud. 10: septemher-October . Magh Vad. 13: lanuary-February Chaitra Sud. 12 : March-April •. January.. .. .. .. Chaitra Sud. 9: March-A!,ril Chai tra Vad. 10: March-Apri I December .. January •• " " •• Chaitra Sud. 12: March-April .. .. l\1argashiroh Vad. 5 : November·Dec<mber .. ShivratriMagh: Amavasya January.February January .••.•. •. •• January .•..•• Chaitra poumima: March-April .. Poush hnuary.. .. .. .. Poush Sud. 8 : December·January .. Chaitra Sud. II : March-April
Magh Sud. 7: January-Februarv Vaishakh. Poumir".: April-May IVlagh Vad. 14: Mahashivratri: j;nuar;~
February. Magh Pournima: J anuary·F ebruary poush Vad. 2 : December:] anuary ..
Magh : F ebruan' . . . • • . l\1agh Vad. II': January.February .. Kartik Poumima : October-November • Magh Vad. 14: January·February.. ':. Margashinh rOt~rnima : November~Decem.ber
1.300/1.400
2.000
1.000
5.000 1,200
2,000 1,000 1,000 1,000 1.000 1.500/2,000 2,000
3,000 1.000 1,000/1,501.} 2,500 1.000 7.000 1,000 1,000 1.000 1.000 1.000 2.000 1,000 2.CCO 1,500 1.000 1,000 1.00(1 3.000 2,000 2,000
13.000 1.500
2,000
3,000 3,000
1.000 5.000 1.000 2,000 5,000
Month and Date of the Fair Averaqe No. 01
personS attending:
(6)
Magh Vad. 14.. .. .. .. .. Ashwin Sud. II to Vad. 5 : October-November
(7)
2,000 25,000
Shri Sant Maroti Maharai.. •• M.2h Vad.Pratipada to Amava.ya (February) Shri Gopalkrishna Nilkanth .. hwar MaRhSud.lI to Ph.ll1unSud.2 .. ..
10,000 5,000
Fair.
Shri RananathSwanltF.ir .. .. Mallb: F ehruary 50,0001100,000

')
I
')
ifblfllt/I ~ "Y--.
",~O~'o:IM"'" \
Q
a
.) ~ J..
~ .
;'
p
;;; "I •
'" 0 N .t<)
• . ~ CT) t'I (Y')
III (7).CI') (\j ('t
• ~ N
~
%-=U I

ERRATA
PART I-VILLAGE DIRECTORY
PaRe Column Line F., Read Page Column Line For Read (I) (2) (3) (4) (5) (I) (2) (3) (4) (5)
9 20 19 12 112 46 2 291 T .",buldars Tembhuldara 9 26 70 Blank 7
10 19 136 7 17 48 2 322 Prillt not dear Chikhali (FV) 14 I 247 Print not dear 247 49 36 Ward II Blank 7 14 I 248 Print not dear 248 56 12 to Print not clEal' 164 14 1 249 Print not clear 249 59 lO 77 103 108 14 I 250 Print not clear 250 61 20 152 7 17 16 1 301 01 301 66 16 395 12 42 17 30 350 Blank 69 2 Bori Bk. Blank 3 19 27 Total-Urban Blank 4 70 4 Shirpur 1.45 1.457 21 2 Kinhi Blank 76 71 1 Virkunda Virl.und Virkunda 22 4 Sawaraaon 199 1.199 72 8 12 1"9 1'9 27 21 146 73 75 72 II 14 1157 1157 27 21 147 50 30 72 5 S3 W WN 38 1 Tembhuldara Tembu!dara Tembhuldara 72 5 60 W WX 39 I WaS!iiaWhanDeogawhan Wasliiawhan Deogaon Wasgawhan 74 3 94 R 39 4 t' erand; (FV)
Deogawhan 74 2 141 Virkund Virkunda Blank •
41 28 74 2 12 78 II 270 62 662 42 2 94 Wasgawhan Deo- Wasge.\\ohan Deo- 81 21 365 04 104 Raon. «awhan.
PART II-CENSUS TABLES
Page Table Item Column Fo, Reod Page Tabl. Item Column Fo, Read (I) (2) (3) (4) (5) (6) (I) (2) (3) (4) IS) (6)
124 B-III Part A-Literate 24 21.539 29.539 171 SCT-I-Part A YeotmalTaluka-3 Bhangi 30 8 124 B-III Part A-Primary or Junior Basic 24 29.531 2o.s31 171 SGr-I-Part A YeotmalTaluka-3 Bhang; 31 8 124 B-Ill Part B-Illiterate 19 330 300 171 SCT-I-Part A Yeotm.1 Taluka-IO Mang 30 8 130 B-IV-PartC Minor Group 256 17 Blank I 171 SGr-I-Part A Yeotmal Taluka-IO Manll 31 8 130 B-IV-Part C MinarGroup 324 21 21 12 171 SCT -I-Part A WaniTaluka-S Madgi 29 I 146 B-IX WaniTaluka-0-14 5 26.03 26.063 171 SCT-I-Part A WaniT.:uka-8 Ma1gi 30 I 147 B-XI Kel.purTaluka..(.) 2 3.061 2.061 174 SCT-I-Part B Wani Taluka-II Kol 13 I If) 151 B-XlV-Part A Major Group 03-T 5 Blank 9 161 C-1I AIIAII .... Total 7 223.225 223,235 189 E-V Di,trict Urban 18 1.71 1.671
PART Ill-OTHER OFFICIAL STATISTICS
Page T.ble Item Column For ReaJ Page Table Item Column p", Read (I) (2) (3) (4) (5) (6) (I) (2) (3) (4) (5) (6)
204 6 The figures relate to the 1950-51 to 1950-60 1950-51 to 1959-60 223 16 KelapurTaluka :'Name 2 Patanbari Patan years •..•.•• oflnstitution No.7 & 8 217 8 Cotton 4 21 95 31 95 225 22 1953-54 6 Blank I 220 10 Exceeding 45.00 hut not 2 1.772 1,172 2;18 32 D.rwhaTaluka: Location 4 Tuesday· T u"daY and Thun-50.00. Code No. 216. day.-
J·1812 (Yeotmal). Errata.