Private schooling for low-income families: A census and comparative survey in East Delhi, India
15
International Journal of Educational Development 27 (2007) 205–219 Private schooling for low-income families: A census and comparative survey in East Delhi, India James Tooley , Pauline Dixon School of Education, Communication and Language Sciences, University of Newcastle Upon Tyne, Tyne NE1 7RU, England, UK Abstract A census and survey of schools in the slums of East Delhi, India, explored the nature and extent of private education serving low-income families, and compared inputs to public and private schooling. Around two-thirds of all schools were private unaided, with more unrecognised private than government schools. Teaching activity was found to be considerably higher in private unaided than government schools, although teacher absenteeism was lowest in government schools. Most inputs showed either comparable levels of provision in government and private unaided schools, or superiority in private unaided schools. Possible implications are explored, concerning targeted vouchers, increased regulation and self- regulation. r 2006 Elsevier Ltd. All rights reserved. Keywords: Comparative education; Development; Educational policy; Private education 1. Introduction The existence of a low-cost private education sector serving low-income families in developing countries is widely reported in the international development literature. The Oxfam Education Re- port reports ‘y the notion that private schools are servicing the needs of a small minority of wealthy parents is misplaced y a lower cost private sector has emerged to meet the demands of poor house- holds’ (Watkins, 2000, pp. 229–230). The Probe Team (1999) researching villages in four north Indian states reports that ‘even among poor families and disadvantaged communities, one finds parents who make great sacrifices to send some or all of their children to private schools, so disillusioned are they with government schools’ (p. 103). Dre`ze and Sen (2002) estimated that, even by 1994, some 30% of all 6–14 year olds in rural areas were enrolled in private schools, while 80% or more of this age group attend private schools in urban areas, including low-income families (p. 172). Reporting on evidence from Haryana, Uttar Pradesh and Rajasthan, De et al. (2002) note that ‘private schools have been expanding rapidly in recent years’ and that these ‘now include a large number of primary schools which charge low fees’, in urban as well as rural areas (p. 148). Alderman et al. (2001, 2003) report on similar findings from Pakistan. For the poor in Calcutta (Kolkata) there has been a ‘mushrooming of privately managed unregulated y primary schools’ (Nambissan, 2003, p. 52). Re- search in Haryana, India found that private unrecognised schools ‘are operating practically in every locality of the urban centres as well as in rural ARTICLE IN PRESS www.elsevier.com/locate/ijedudev 0738-0593/$ - see front matter r 2006 Elsevier Ltd. All rights reserved. doi:10.1016/j.ijedudev.2006.08.002 Corresponding author. Tel.: +44 191 222 6374. E-mail address: [email protected] (J. Tooley).
Transcript of Private schooling for low-income families: A census and comparative survey in East Delhi, India

ARTICLE IN PRESS
0738-0593/$ - se
doi:10.1016/j.ije
�CorrespondE-mail addr
International Journal of Educational Development 27 (2007) 205–219
www.elsevier.com/locate/ijedudev
Private schooling for low-income families: A census andcomparative survey in East Delhi, India
James Tooley�, Pauline Dixon
School of Education, Communication and Language Sciences, University of Newcastle Upon Tyne, Tyne NE1 7RU, England, UK
Abstract
A census and survey of schools in the slums of East Delhi, India, explored the nature and extent of private education
serving low-income families, and compared inputs to public and private schooling. Around two-thirds of all schools were
private unaided, with more unrecognised private than government schools. Teaching activity was found to be considerably
higher in private unaided than government schools, although teacher absenteeism was lowest in government schools. Most
inputs showed either comparable levels of provision in government and private unaided schools, or superiority in private
unaided schools. Possible implications are explored, concerning targeted vouchers, increased regulation and self-
regulation.
r 2006 Elsevier Ltd. All rights reserved.
Keywords: Comparative education; Development; Educational policy; Private education
1. Introduction
The existence of a low-cost private educationsector serving low-income families in developingcountries is widely reported in the internationaldevelopment literature. The Oxfam Education Re-
port reports ‘y the notion that private schools areservicing the needs of a small minority of wealthyparents is misplaced y a lower cost private sectorhas emerged to meet the demands of poor house-holds’ (Watkins, 2000, pp. 229–230). The ProbeTeam (1999) researching villages in four northIndian states reports that ‘even among poor familiesand disadvantaged communities, one finds parentswho make great sacrifices to send some or all oftheir children to private schools, so disillusioned are
e front matter r 2006 Elsevier Ltd. All rights reserved
dudev.2006.08.002
ing author. Tel.: +44191 222 6374.
ess: [email protected] (J. Tooley).
they with government schools’ (p. 103). Dreze andSen (2002) estimated that, even by 1994, some 30%of all 6–14 year olds in rural areas were enrolled inprivate schools, while 80% or more of this agegroup attend private schools in urban areas,including low-income families (p. 172). Reportingon evidence from Haryana, Uttar Pradesh andRajasthan, De et al. (2002) note that ‘privateschools have been expanding rapidly in recent years’and that these ‘now include a large number ofprimary schools which charge low fees’, in urban aswell as rural areas (p. 148). Alderman et al. (2001,2003) report on similar findings from Pakistan. Forthe poor in Calcutta (Kolkata) there has been a‘mushrooming of privately managed unregulated y
primary schools’ (Nambissan, 2003, p. 52). Re-search in Haryana, India found that privateunrecognised schools ‘are operating practically inevery locality of the urban centres as well as in rural
.
ARTICLE IN PRESSJ. Tooley, P. Dixon / International Journal of Educational Development 27 (2007) 205–219206
areas’ often located adjacent to a governmentschool (Aggarwal, 2000, p. 20). In Uganda andMalawi private schools have ‘mushroomed due tothe poor quality government primary schools’(Rose, 2002, p. 6; Rose, 2003, p. 80), while a ‘largeincrease’ of ‘fly-by-night’ private schools has beenreported in South Africa (Rose, 2002, p. 4). InKenya ‘the deteriorating quality of public educationy created demand for private alternatives’ (Baureret al., 2002).
Reasons given for this ‘mushrooming’ highlightthe low quality of government schools for the poor,including problems of teacher absenteeism and lackof teacher commitment. In government primaryschools in West Bengal it is reported that ‘teachersdo not teach’ and ‘teaching is the last priority forthe teachers’ (Rana et al., 2002, p. 64 and 67). TheProbe Team found that in their sample, only 53% ofgovernment schools was there any teaching goingon at all (The Probe Team, 1999). The Human
Development Report 2003 notes that in India andPakistan ‘poor households cited teacher absentee-ism in public schools as their main reason forchoosing private ones.’ (UNDP, 2003, p. 112). Acomprehensive survey of teacher absenteeism con-ducted by the World Bank in India (Kremer et al.,2004) looked at a nationally representative sampleof 20 Indian states, involving 3750 schools.Although public and private schools were investi-gated, like was not compared with like—urban andrural government schools were compared with ruralprivate schools only. In government schools,absenteeism rates were 25.2% in rural and 22.9%in urban schools, while in the rural private schools,absenteeism was about 22.8% (Kremer et al., 2004,p. 5 and p. 9). In 257 government, mosque andprivate schools in Pakistan there was an absencerate of 20% when researchers physically checked theattendance status of one randomly chosen teacher atthe school. In this same study the ‘official’ recordsshowed only an absence rate of 5% (Ali and Reed,1994). Studies of government teacher absence in sixcountries—Bangladesh, Ecuador, India, Indonesia,Peru and Uganda—found teacher absence rates tobe between 11% and 27% (Chaudhury et al., 2004a;Rogers et al., 2004, p.142; Akhamadi and Surya-darma, 2000). A study in two rural districts ofKenya found that government teachers were absentnearly 30% of the time and present at school butnot physically in the classroom 12.4% of thetime (Glewwe et al., 2004). Studies from PapuaNew Guinea and Zambia revealed absence rates of
15% and 17%, respectively (World Bank, 2004;Habyarimana et al., 2004).
Public education for the poor is also reported tosuffer from inadequate conditions. One governmentschool highlighted by the World Development
Report 2004, in north Bihar, India, describe‘horrific’ conditions (World Bank 2003, p. 24).Facilities in government primary schools in Calcut-ta were reported ‘by no means satisfactory’ (Nam-bissan, 2003, p. 20): of 11 primary schools only twohad safe drinking water for the children, nine had ageneral toilet, and only five had a playground.Listing major problems in their schools, head-teachers included the lack of electricity, space andfurniture (p. 21). A study of 100 governmentprimary schools in Bangladesh found that 81%had water, 39% electricity, 97% toilets, 76% aplayground and only 0.4% a library, while theaverage pupil–teacher ratio was 69:1. (Chaudhury etal., 2004b). The Probe Team in India found that outof 162 government primary schools, 59% had nofunctional water supply, 89% had no toilets, andonly 23% had a library, 48% a playground. Theaverage pupil teacher ratio was 68:1 (The ProbeTeam, 1999).
Finally, private schools in India provide (orpurport to provide) English medium instruction,which is desired by parents; government schoolsteach in state languages, not usually teachingEnglish until about Class 5 (Nambissan, 2003; Deet al., 2002). Moreover, in some countries publicschools have limited places, because of an increasein the number of school-age population without anincrease in government spending (Rose, 2002;Nwagwu, 1997).
However, whilst this literature indicates that oneof the reasons low-income parents send theirchildren to private schools is the perceived lowquality of public education, concerns are alsoexpressed about the quality of the private schoolsto which parents turn as alternatives, especiallythose that are not recognised by government. TheOxfam Education Report, for instance, notes thatwhile ‘there is no doubting the appalling standard ofprovision in public education systems’, the privateschools that poor parents are using instead are of‘inferior quality’, offering ‘a low-quality service’that will ‘restrict children’s future opportunities.’(Watkins, 2000, p. 230). Nambissan (2003) notesthat in Calcutta, ‘the mushrooming of privatelymanaged unregulated pre-primary and primaryschoolsy can have only deleterious consequences

ARTICLE IN PRESS
1http://www.pratham.org/documents/northshahdara.doc.
J. Tooley, P. Dixon / International Journal of Educational Development 27 (2007) 205–219 207
for the spread of education in general and amongthe poor in particular’ (p. 52), for the quality of theprivate schools is ‘often suspect’ (p. 15, footnote 25).Save the Children, although noting that poorparents in Nepal and Pakistan identify ‘irregularity,negligence and indiscipline of the teachers, largeclass sizes and a lower standard of English learning’as ‘the reasons why they decided against publicschools’ (Save the Children UK, South and CentralAsia, 2002, p. 8), is concerned that the privateschools they opt for offer ‘an extremely lowstandard of education’ (p. 13). Finally, Rose(2002) asks why poor parents in sub-Saharan Africaare paying ‘for poor quality education, when theycould be getting fee-free schooling in the statesector’? (p. 16); ‘the quality of education received isdebatable’ in the private sector (p. 7). However, theevidence given about poor quality private provision,and the relative quality of public and privateprovision for the poor in these sources is limited—either suggesting that ‘little hard evidence’ isavailable (Watkins, 2000, p. 230), or basing theconclusion on the observation that private schoolsemploy low paid teachers, in low-quality accom-modation, without comparing what is on offer inthe government alternative.
Our two-and a half year study (April 2003–Dec2005) aimed to contribute to the understanding ofprivate school provision for the poor, and itsrelative quality vis-a-vis government provision,through research in selected low-income areas inIndia (Delhi, Hyderabad and Mahbubnagar), Gha-na, Nigeria, Kenya and China. This paper reportson some of the findings from Delhi, India only. It isparticularly concerned with exploring some of theassumptions made about the nature of privateschooling for low-income families, and in compar-ing the inputs in these (including facilities, teachercommitment, etc.) with those in government schoolsin the same areas. (Further research conducteddetailed comparisons of the achievement of studentsin these schools, and pupil, parent and teachersatisfaction, reported elsewhere).
2. Method
The research reported here, conducted duringOctober 2004, consisted of two main parts: a censusof schools and survey of inputs, aimed to discoverthe extent of private schools in selected low-incomeareas and to compare their inputs with governmentschools serving the same populations.
In India, school management type is of threekinds: government, private aided and privateunaided. Government schools are funded andmanaged by some level of government, state orlocal. Private aided schools are privately managed,but usually have 100% of teacher salaries, plusother expenses, funded by government. Privateunaided schools are entirely privately managedand privately funded. Private unaided schools areof two types, recognised and unrecognised. Theformer have purportedly met the regulatory require-ments of the state. Unrecognised schools are ineffect operating in the informal sector of theeconomy. They have either not applied for recogni-tion, or have not succeeded in gaining recognitionfrom the government. The research was interested ininvestigating all these school types.
After consultation with government officials andnon-government organisations working in the city,the census was conducted in North Shahdara, EastDelhi, reported to be one of the poorest areas of thecity.1 North Shahdara covers an area of 40 km2, butonly the ‘‘notified slums’’ (according to the Censusof India, 2001) were researched, estimated to coverabout half this area. Permission was granted bygovernment officials for the research to be con-ducted. A team of 20 researchers recruited from alocal non-government organisation were trained inmethods of gaining access to schools, the use of aninterview schedule for school managers and head-teachers, and an observation schedule, which wastrialled to ensure reliability of observations made.Given that we were particularly interested in finding‘unrecognised’ private unaided schools, which are,by definition, not on any official list, the researcherswere asked to physically visit every street andalleyway in the area, during the morning of aschool day (except where it was indicated that aschool was operating in shifts, in which case theyreturned to this school in the afternoon too),looking for all schools, primary and secondary.(Nursery-only schools were excluded from thestudy, as were non-formal education provision,such as learning centres and after-school clubs).Government lists were used to check that allgovernment, private aided and recognised privateunaided schools were found.
When a school was located, the researcher calledunannounced and asked for a brief interview withthe headteacher or school manager, taking about
ARTICLE IN PRESSJ. Tooley, P. Dixon / International Journal of Educational Development 27 (2007) 205–219208
10minutes. After this, the researchers asked tomake a school visit, where they checked the facilitiesavailable in the school against a short check-list offacilities, and visited Class 4, to observe the activityof the teacher. This visit was made when a normallesson was timetabled—the researchers were in-structed to wait until such a lesson was scheduled ifthere were other activities (assembly, break, sports,etc.) taking place.
The total number of schools located (includingschools operating in shifts) was 265; in all schoolsthe researcher was able to ask at least someof the questions on the short interview schedule.Similarly, the researchers were able to answerat least one of the questions on the observationschedule in all 265 schools. (The tables belowindicate the exact numbers of observationsmade for each question). Data discussed in Section3 below came from the interview, while datadiscussed in Section 4 came from the observationschedule.
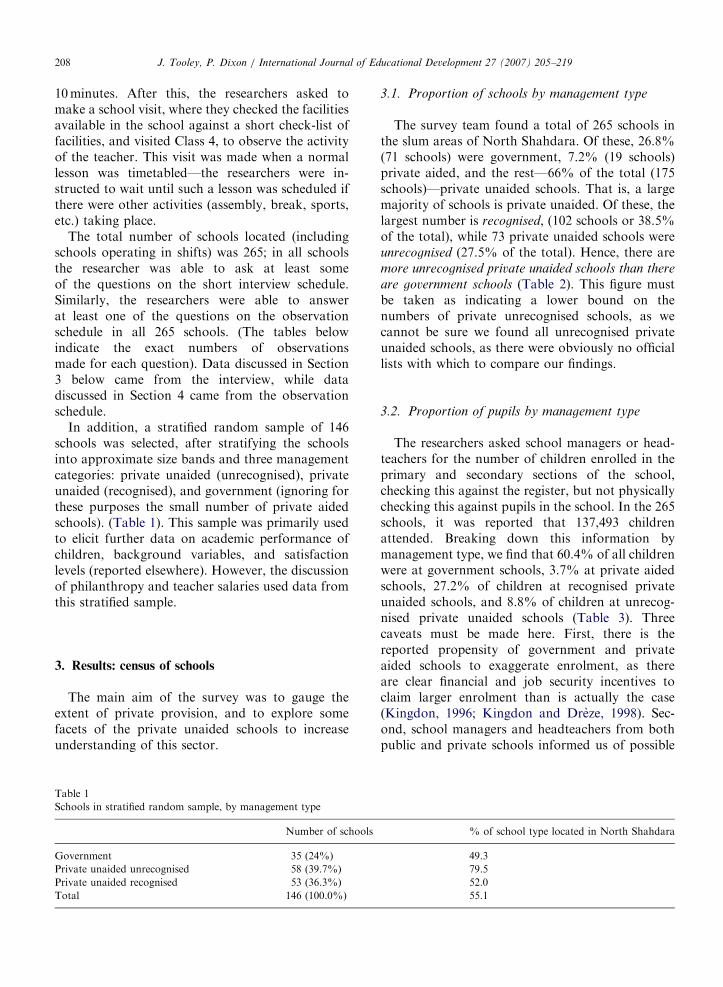
In addition, a stratified random sample of 146schools was selected, after stratifying the schoolsinto approximate size bands and three managementcategories: private unaided (unrecognised), privateunaided (recognised), and government (ignoring forthese purposes the small number of private aidedschools). (Table 1). This sample was primarily usedto elicit further data on academic performance ofchildren, background variables, and satisfactionlevels (reported elsewhere). However, the discussionof philanthropy and teacher salaries used data fromthis stratified sample.
3. Results: census of schools
The main aim of the survey was to gauge theextent of private provision, and to explore somefacets of the private unaided schools to increaseunderstanding of this sector.
Table 1
Schools in stratified random sample, by management type
Number of schools
Government 35 (24%)
Private unaided unrecognised 58 (39.7%)
Private unaided recognised 53 (36.3%)
Total 146 (100.0%)
3.1. Proportion of schools by management type
The survey team found a total of 265 schools inthe slum areas of North Shahdara. Of these, 26.8%(71 schools) were government, 7.2% (19 schools)private aided, and the rest—66% of the total (175schools)—private unaided schools. That is, a largemajority of schools is private unaided. Of these, thelargest number is recognised, (102 schools or 38.5%of the total), while 73 private unaided schools wereunrecognised (27.5% of the total). Hence, there aremore unrecognised private unaided schools than there
are government schools (Table 2). This figure mustbe taken as indicating a lower bound on thenumbers of private unrecognised schools, as wecannot be sure we found all unrecognised privateunaided schools, as there were obviously no officiallists with which to compare our findings.
3.2. Proportion of pupils by management type
The researchers asked school managers or head-teachers for the number of children enrolled in theprimary and secondary sections of the school,checking this against the register, but not physicallychecking this against pupils in the school. In the 265schools, it was reported that 137,493 childrenattended. Breaking down this information bymanagement type, we find that 60.4% of all childrenwere at government schools, 3.7% at private aidedschools, 27.2% of children at recognised privateunaided schools, and 8.8% of children at unrecog-nised private unaided schools (Table 3). Threecaveats must be made here. First, there is thereported propensity of government and privateaided schools to exaggerate enrolment, as thereare clear financial and job security incentives toclaim larger enrolment than is actually the case(Kingdon, 1996; Kingdon and Dreze, 1998). Sec-ond, school managers and headteachers from bothpublic and private schools informed us of possible
% of school type located in North Shahdara
49.3
79.5
52.0
55.1

ARTICLE IN PRESSJ. Tooley, P. Dixon / International Journal of Educational Development 27 (2007) 205–219 209
‘‘double counting’’ of pupils. Many children, wewere informed, are enrolled in both government andprivate schools, in order to benefit from mid-daymeals in government schools—children we were toldgo to private schools in the morning, and then go togovernment school for the mid-day meal. This hadthe additional benefit that children are able to takeexaminations as a government, rather than private,school pupil—which was particularly valuable ifchildren were enrolled at unrecognised privateschools. Third, again we note that all unrecognisedprivate unaided schools may not have been locatedby the researchers. For all these reasons, it issuggested that the data here may underestimate thetrue proportion in private unaided, especiallyunrecognised, schools.
Table 4
Gender of pupils by management type
Numbers reported % Enrolment
Government
Boys 328,46 39.6
Girls 50,148 60.4
Private aided
Boys 2848 55.8
3.3. Gender of pupils
Researchers asked schools for their studentnumbers by gender. It was reported overall that ahigher percentage of girls than boys was in school,with the average school having 46.5% boys and53.5% girls. However, more girls were reported ingovernment schools than boys, (60.4% girls and39.6%). In each of the other three school types,more boys attend than girls—in private aidedschools, there were 55.8% boys, private unaided
Table 2
Management type of schools
Frequency Percent
Government 71 26.8
Private aided 19 7.2
Private unrecognised 73 27.5
Private recognised 102 38.5
Total 265 100.0
Table 3
Pupil enrolment by management type
Number of
children in school
type
Number of
schools reportin
Government 829,94 71
Private aided 5108 19
Private unrecognised 12,038 73
Private recognised 37,353 102
Total 137,493 265
unrecognised 57.5% boys and private unaidedrecognised 56.9% boys (Table 4).
3.4. Teachers and pupil– teacher ratio
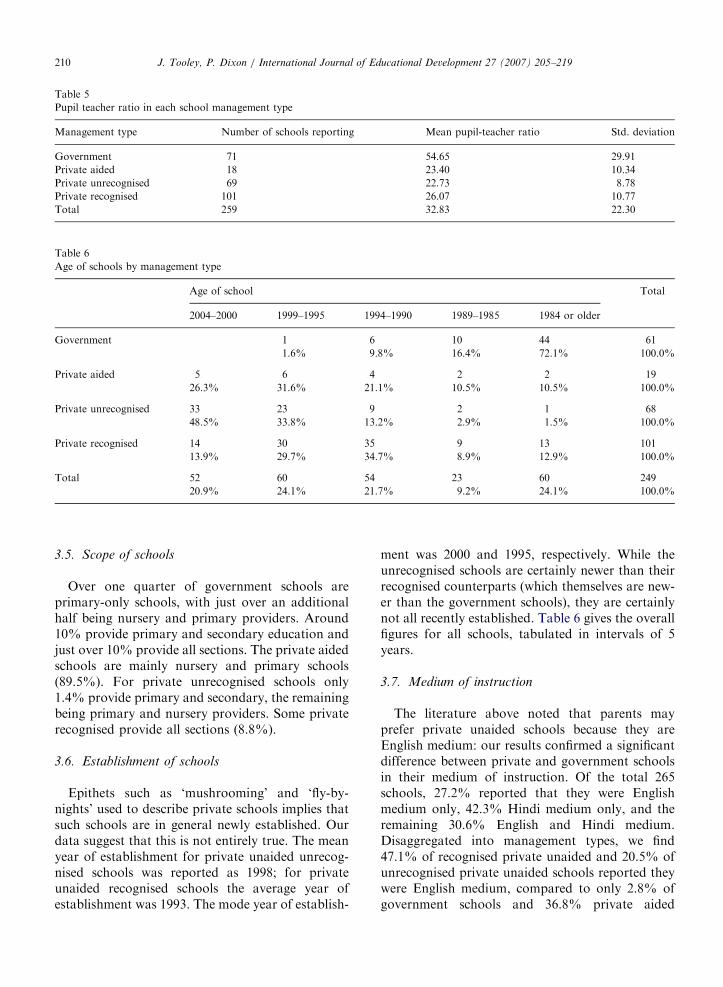
Researchers obtained data on the number ofteachers from 259 of the schools, by asking for thisinformation of the school manager or headteacher.The total number of teachers was 3511, with 51.3%working in private unaided schools, 5.2% in privateaided schools, and 43.5% in government schools.For the 259 schools reporting both their number ofchildren and teaching staff, we calculate an averagepupil–teacher ratio of 32.8 to 1. This was highest inthe government schools (54.7:1), followed by privaterecognised unaided schools (26.1:1), then privateaided (23.4:1) and lowest in the unrecognisedprivate unaided schools (22.7:1) (Table 5).
g
Mean number of
children in each
school
Std. deviation % of total number
of students
1168.93 1003.426 60.4
268.84 244.902 3.7
164.90 135.467 8.8
366.21 538.843 27.2
518.84 740.908 100.0
Girls 2260 44.2
Private unaided unrecognised
Boys 6926 57.5
Girls 5112 42.5
Private unaided recognised
Boys 21,272 56.9
Girls 16,081 43.1
Total
Boys 63,892 46.5
Girls 73,601 53.5
ARTICLE IN PRESS
Table 5
Pupil teacher ratio in each school management type
Management type Number of schools reporting Mean pupil-teacher ratio Std. deviation
Government 71 54.65 29.91
Private aided 18 23.40 10.34
Private unrecognised 69 22.73 8.78
Private recognised 101 26.07 10.77
Total 259 32.83 22.30
Table 6
Age of schools by management type
Age of school Total
2004–2000 1999–1995 1994–1990 1989–1985 1984 or older
Government 1 6 10 44 61
1.6% 9.8% 16.4% 72.1% 100.0%
Private aided 5 6 4 2 2 19
26.3% 31.6% 21.1% 10.5% 10.5% 100.0%
Private unrecognised 33 23 9 2 1 68
48.5% 33.8% 13.2% 2.9% 1.5% 100.0%
Private recognised 14 30 35 9 13 101
13.9% 29.7% 34.7% 8.9% 12.9% 100.0%
Total 52 60 54 23 60 249
20.9% 24.1% 21.7% 9.2% 24.1% 100.0%
J. Tooley, P. Dixon / International Journal of Educational Development 27 (2007) 205–219210
3.5. Scope of schools
Over one quarter of government schools areprimary-only schools, with just over an additionalhalf being nursery and primary providers. Around10% provide primary and secondary education andjust over 10% provide all sections. The private aidedschools are mainly nursery and primary schools(89.5%). For private unrecognised schools only1.4% provide primary and secondary, the remainingbeing primary and nursery providers. Some privaterecognised provide all sections (8.8%).
3.6. Establishment of schools
Epithets such as ‘mushrooming’ and ‘fly-by-nights’ used to describe private schools implies thatsuch schools are in general newly established. Ourdata suggest that this is not entirely true. The meanyear of establishment for private unaided unrecog-nised schools was reported as 1998; for privateunaided recognised schools the average year ofestablishment was 1993. The mode year of establish-
ment was 2000 and 1995, respectively. While theunrecognised schools are certainly newer than theirrecognised counterparts (which themselves are new-er than the government schools), they are certainlynot all recently established. Table 6 gives the overallfigures for all schools, tabulated in intervals of 5years.
3.7. Medium of instruction
The literature above noted that parents mayprefer private unaided schools because they areEnglish medium: our results confirmed a significantdifference between private and government schoolsin their medium of instruction. Of the total 265schools, 27.2% reported that they were Englishmedium only, 42.3% Hindi medium only, and theremaining 30.6% English and Hindi medium.Disaggregated into management types, we find47.1% of recognised private unaided and 20.5% ofunrecognised private unaided schools reported theywere English medium, compared to only 2.8% ofgovernment schools and 36.8% private aided

ARTICLE IN PRESS
Table 7
Number and % of free and concessionary seats in private unaided schools
Total seats Free seats % of free seats Concessionary seats % of concessionary seats
Private unrecognised 7591 591 8 409 5
Private recognised 14,551 454 3 775 5
22,142 1045 5 1184 5
J. Tooley, P. Dixon / International Journal of Educational Development 27 (2007) 205–219 211
schools. The majority of government schools wereHindi medium (80.3%). Many of the privateunrecognised schools are Hindi medium (45.2%)or provide both Hindi and English medium streams(34.2%).
3.8. Fees in private unaided schools
The private unaided schools were found to chargepredominantly monthly fees. The researchers askedschool managers for details of these fees, checkingthese where possible against written fee charges.There is a statistically significant difference in thefees charged in unrecognised and recognisedschools, with the former consistently lower thanthe latter, at each level. For example, for pre-primary grade, mean fees in recognised privateunaided schools are Rs. 190.25 (£2.442) per month,compared to Rs. 92.55 (£1.19) per month in theunrecognised schools. At primary grade, the samefigures are Rs. 227.60 (£2.92) compared to Rs.124.45 (£1.60). The median figures may be a moreuseful figure for comparison, given that a smallnumber of schools were found to be charging higherfees than others. At the primary level, these were Rs.100 (£1.28) for unrecognised and Rs. 192.50 (£2.47)for recognised schools.
The minimum wage for Delhi is set at Rs. 90.00(£1.15) per day (2001 figures, Labour Bureau,Government of India, 2005) which translates toabout Rs. 2160 (£27.69) per month (assuming 24days work per month). That is, the median fees forunrecognised schools are about 5% of the monthlywage for a breadwinner on the minimum wage,while recognised school fees are about 9%.
3.9. Private school philanthropy
However, not all students pay these fees. Anotable feature of the private unaided schools isthat, although they require fee incomes to survive,
2£1 ¼ Rs.78/- (11th October 2005 rate).
they also offer free or concessionary seats tochildren. We explored this issue with the smallernumber of private unaided schools in the stratifiedrandom sample. The researchers asked the schoolmanager how many students were admitted to theschool with free or concessionary seats, andtriangulated the results with questions on theparents, questionnaire. Of the 111 private unaidedschools participating in this part of the research, 94school managers gave information about thenumber of free and concessionary places. Of schoolsgiving information, 58% of the unrecognised and50% of the recognised private unaided schools offerfree places to some students in their schools.Regarding concessionary places, 46% of the un-recognised and 48% of the recognised privateunaided schools offer these. (In both cases, thedifference between school types was not statisticallysignificant).
The total number of free seats given was stated as1045 (591 in unrecognised and 454 in recognisedprivate unaided schools), while the total number ofconcessionary places was 1184 (409 in unrecognisedand 775 in recognised private unaided schools).That is, in these schools, 10% of all places wereprovided either free of charge or at a concessionaryrate �5% free and 5% concessionary. Unrecognisedschools were slightly more generous in this regardthan recognised schools—offering 8% of seats free,compared to 3% in the recognised schools (Table 7).
3.10. Teacher salaries
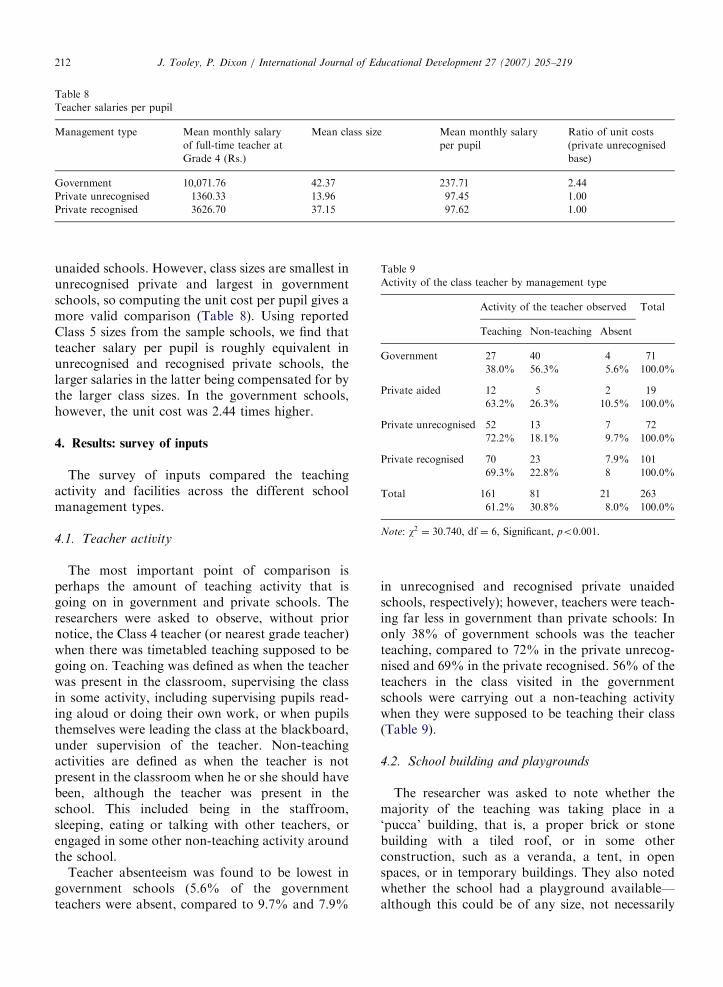
We also explored the issue of teacher salaries withthe Class 5 teacher from each of the stratifiedrandom sample of schools. The average monthlysalary of a full-time teacher in a government schoolwas reported to be Rs. 10,072, compared to Rs.1360 in unrecognised and Rs. 3627 in recognisedprivate unaided schools. The average salaries ingovernment schools are more than seven timeshigher than in the unrecognised, and more than twoand a half times those in the recognised private
ARTICLE IN PRESS
Table 8
Teacher salaries per pupil
Management type Mean monthly salary
of full-time teacher at
Grade 4 (Rs.)
Mean class size Mean monthly salary
per pupil
Ratio of unit costs
(private unrecognised
base)
Government 10,071.76 42.37 237.71 2.44
Private unrecognised 1360.33 13.96 97.45 1.00
Private recognised 3626.70 37.15 97.62 1.00
Table 9
Activity of the class teacher by management type
Activity of the teacher observed Total
Teaching Non-teaching Absent
Government 27 40 4 71
38.0% 56.3% 5.6% 100.0%
Private aided 12 5 2 19
63.2% 26.3% 10.5% 100.0%
Private unrecognised 52 13 7 72
72.2% 18.1% 9.7% 100.0%
Private recognised 70 23 7.9% 101
69.3% 22.8% 8 100.0%
Total 161 81 21 263
61.2% 30.8% 8.0% 100.0%
Note: w2 ¼ 30:740, df ¼ 6, Significant, po0.001.
J. Tooley, P. Dixon / International Journal of Educational Development 27 (2007) 205–219212
unaided schools. However, class sizes are smallest inunrecognised private and largest in governmentschools, so computing the unit cost per pupil gives amore valid comparison (Table 8). Using reportedClass 5 sizes from the sample schools, we find thatteacher salary per pupil is roughly equivalent inunrecognised and recognised private schools, thelarger salaries in the latter being compensated for bythe larger class sizes. In the government schools,however, the unit cost was 2.44 times higher.
4. Results: survey of inputs
The survey of inputs compared the teachingactivity and facilities across the different schoolmanagement types.
4.1. Teacher activity
The most important point of comparison isperhaps the amount of teaching activity that isgoing on in government and private schools. Theresearchers were asked to observe, without priornotice, the Class 4 teacher (or nearest grade teacher)when there was timetabled teaching supposed to begoing on. Teaching was defined as when the teacherwas present in the classroom, supervising the classin some activity, including supervising pupils read-ing aloud or doing their own work, or when pupilsthemselves were leading the class at the blackboard,under supervision of the teacher. Non-teachingactivities are defined as when the teacher is notpresent in the classroom when he or she should havebeen, although the teacher was present in theschool. This included being in the staffroom,sleeping, eating or talking with other teachers, orengaged in some other non-teaching activity aroundthe school.
Teacher absenteeism was found to be lowest ingovernment schools (5.6% of the governmentteachers were absent, compared to 9.7% and 7.9%
in unrecognised and recognised private unaidedschools, respectively); however, teachers were teach-ing far less in government than private schools: Inonly 38% of government schools was the teacherteaching, compared to 72% in the private unrecog-nised and 69% in the private recognised. 56% of theteachers in the class visited in the governmentschools were carrying out a non-teaching activitywhen they were supposed to be teaching their class(Table 9).
4.2. School building and playgrounds
The researcher was asked to note whether themajority of the teaching was taking place in a‘pucca’ building, that is, a proper brick or stonebuilding with a tiled roof, or in some otherconstruction, such as a veranda, a tent, in openspaces, or in temporary buildings. They also notedwhether the school had a playground available—although this could be of any size, not necessarily
ARTICLE IN PRESS
Table 10
School has a playground
Own playground Total
Available Unavailable
Government 49 21 70
70.0% 30.0% 100.0%
Private aided 1 18 19
5.3% 94.7% 100.0%
Private unrecognised 3 70 73
4.1% 95.9% 100.0%
Private recognised 16 86 102
15.7% 84.3% 100.0%
Total 69 195 264
26.1% 73.9% 100.0%
Note: w2 ¼ 98:168, df ¼ 3, Significant, po0.001.
Drinkingwaterb
Library
foruse
bychildrenc
Taperecordersd
Separate
toiletsforboysandgirlse
eAvailable
Unavailable
Available
Unavailable
Available
Unavailable
Available
Unavailable
62(88.6%)
8(11.4%
)26(37.7%)
43(62.3%)
23(32.9%
)47(67.1%)
34(79.1%
)9(20.9%
)
2(11.1%)
16(88.9%)
9(52.9%
)8(47.1%
)
70(95.9%)
3(4.1%
)22(36.7%)
38(63.3%)
14(19.4%
)58(80.6%)
11(17.7%
)51(82.3%
)
96(94.1%)
6(5.9%
)25(27.8%)
65(72.2%)
28(27.7%
)73(72.3%)
42(45.7%
)50(54.3%
)
228(93.1%)
17(6.9%
)75(31.6%)
162(68.4%)
65(26.7%
)178(73.3%)
96(44.9%
)118(55.1%
)
J. Tooley, P. Dixon / International Journal of Educational Development 27 (2007) 205–219 213
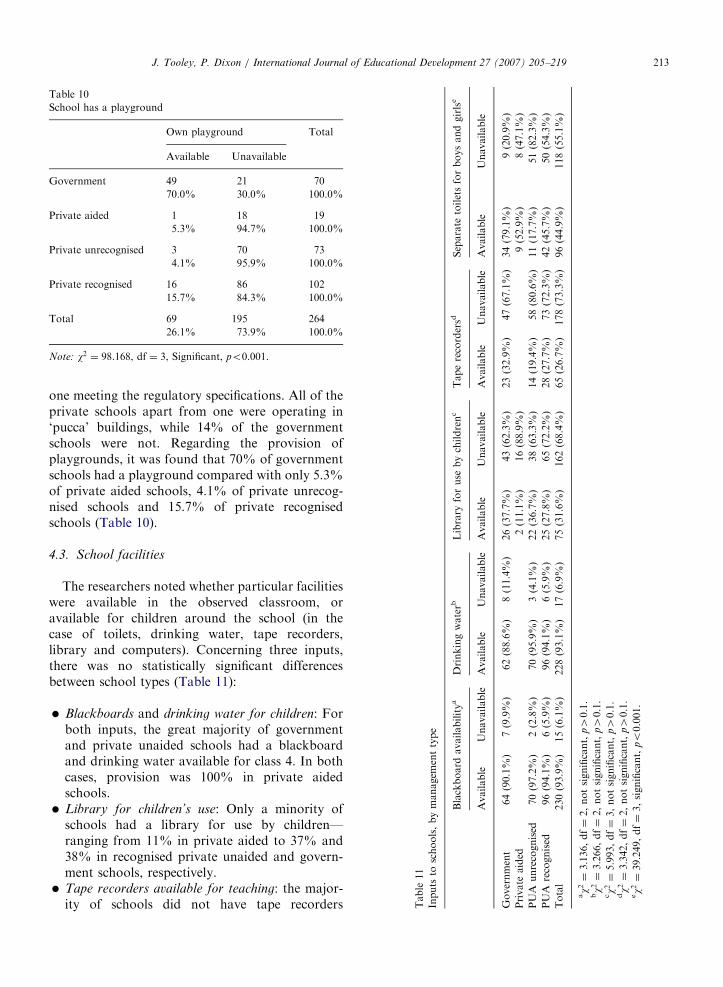
one meeting the regulatory specifications. All of theprivate schools apart from one were operating in‘pucca’ buildings, while 14% of the governmentschools were not. Regarding the provision ofplaygrounds, it was found that 70% of governmentschools had a playground compared with only 5.3%of private aided schools, 4.1% of private unrecog-nised schools and 15.7% of private recognisedschools (Table 10).
4.3. School facilities
The researchers noted whether particular facilitieswere available in the observed classroom, oravailable for children around the school (in thecase of toilets, drinking water, tape recorders,library and computers). Concerning three inputs,there was no statistically significant differencesbetween school types (Table 11):
lity
a
ailabl
.9%)
.8%)
.9%)
.1%)
0.1.
0.1.
0.1.
0.1.
01.
�
anagem
enttype
lackboard
availabi
vailable
Unav
4(90.1%)
7(9
0(97.2%)
2(2
6(94.1%)
6(5
0(93.9%)
15(6
otsignificant,
p4
otsignificant,
p4
otsignificant,
p4
otsignificant,
p4
significant,
po0.0
Blackboards and drinking water for children: Forboth inputs, the great majority of governmentand private unaided schools had a blackboardand drinking water available for class 4. In bothcases, provision was 100% in private aidedschools.
m B A
6 7 9
23
2,n
2,n
3,n
2,n
3,
�
11
sto
schools,by
nment
eaided
unrecognised
recognised
¼3:136,df¼
¼3:266,df¼
¼5:993,df¼
¼3:342,df¼
¼39:249,df¼
Library for children’s use: Only a minority ofschools had a library for use by children—ranging from 11% in private aided to 37% and38% in recognised private unaided and govern-ment schools, respectively.
ble ut
ver
vat
A A tal
w2 w2 w2 w2 w2
�Ta
Inp
Go
Pri
PU
PU
To a b c d e
Tape recorders available for teaching: the major-ity of schools did not have tape recorders

ARTICLE IN PRESS
ricity
intheclassroom
f
lable
Unavailable
73.5%)
18(26.5%)
94.7%)
1(5.3%)
94.1%)
4(5.9%)
89.0%)
11(11.0%
)
86.7%)
34(13.3%)
J. Tooley, P. Dixon / International Journal of Educational Development 27 (2007) 205–219214
available in any school type—ranging from 67%to 81% in government and private unaidedschools. (Only one private aided school had taperecorders available for teaching).
For one input, government schools had superiorinputs to private unaided schools (Table 11):
Elect
Avai
50(
18(
64(
89(
221(
�
omputerforchildren’suse
e
vailable
Unavailable
5(7.1%)
65(92.9%)
4(21.1%
)15(78.9%)
7(23.6%
)55(76.4%)
6(46.0%
)54(54.0%)
2(27.6%
)189(72.4%)
Separate toilets for boys and girls (excludingsingle sex schools): Only 46% of recognised and18% of unrecognised private unaided haveseparate toilets, compared with 79% of govern-ment schools.
However, for the majority of inputs researched,private unaided schools were superior in provisionto government schools (Table 12):
C
able
A
%)
)1
)4
)7
�
ldren’stoiletsd
ilable
Unavail
(80.3%)14(19.7
(97.3%)
2(2.7%
(93.1%)
7(6.9%
(90.7%)23(9.3%
Desks: In 87% of recognised and 90% ofunrecognised private unaided and private aidedschools, desks were available in the classroom,compared to only 67% of government class-rooms. That is, one third of the governmentclassrooms did not have desks available.
hi
va
57
71
95
23
�intheclassroom
cC
able
Unavailable
A
4.6%)18(25.4%)
4.4%)
1(5.6%)
3.1%)
5(6.9%)
9.1%)11(10.9%)
6.6%)35(13.4%)
2
Chairs or benches for children: In 87% ofrecognised and 94% of unrecognised schools,chairs or benches were available in the classroom,compared to 69% of government schools and79% of private aided schools; again, almost onethird of the government classrooms had no chairsor benches for their children.ns ail (7 (9 (9 (8 (8
�eclassroom
bFa
Unavailable
Av
)22(31.0%)
53
)4(21.1%)
17
)4(5.6%)
67
)13(12.9%)
90
)43(16.3%)
227
Fans: 75% of government classrooms had fans(although in three of these classrooms, theelectricity was not functioning), compared with93% of private unrecognised schools and 89%private recognised schools. 94% of private aidedschools had fans.
th % % % % %
�bymanagem
enttypes
lassroom
aChairsin
navailable
Available
3(32.9%)
49(69.0
2(10.5%)
15(78.9
7(9.7%)
68(94.4
3(13.0%)
88(87.1
5(17.2%)
220(83.7
nificant,
po0.001.
nificant,
po0.001.
nificant,
po0.01.
nificant,
p¼
0.01,
nificant,
po0.001.
ificant,
po0.005
Toilets for children: the majority of privateunaided and aided schools had toilet facilitiesfor the children—97% in unrecognised and 93%in recognised. All private aided schools hadtoilets for their children. However, only 80% ofgovernment schools had toilets provided forchildren’s use.
ls,
ec U
)2
) ) )1
)4
sig
sig
sig
sig
sig
sign
�
12
erinputs
toschoo
Desksin
th
Available
47(67.1%
17(89.5%
unrec
65(90.3%
rec
87(87.0%
216(82.8%
¼16:677,df¼
3,
¼18:455,df¼
3,
¼12:861,df¼
3,
¼13:514,df¼
2,
¼32:594,df¼
3,
¼14:965,df¼
3,
Computers for children’s use: About half of therecognised private unaided schools had one ormore computers for the use of their students,compared with 24% of unrecognised privateunaided schools and 21% of private aided, butonly 7% of government schools.
ble
rth
v A A tal
w2 w2 w2 w2 w2 w2
�Ta
Fu
Go
PA
PU
PU
To a b c d e f
Electricity: Only 74% of government schools hadelectricity available in the Class 4 classroom,

ARTICLE IN PRESS
Table
13
Inputs
toschools(1),private
unaided
schoolsonly
Activityoftheteacher
aBlackboardsin
theclassroom
bWherethemajority
of
teachingistakingplace
c
Desksin
theclassroom
dLibrary
e
Teaching
Non-teaching
Absent
Available
Unavailable
Puccabuilding
Other
Available
Unavailable
Available
Unavailable
Private
unrecognised
52(72.2%
)13(18.1%
)7(9.7%
)70(97.2%
)2(2.8%
)73(100%)
065(90.3%
)7(9.7%)
22(36.7%)
38(63.3%)
Private
recognised
70(69.3%
)23(22.8%
)8(7.9%
)96(94.1%
)6(5.9%
)101(99%)
1(1.0%)
87(87.0%
)13(13.0%
)25(27.8%)
65(72.2%)
Total
122(70.5%
)36(20.8%
)15(8.7%
)166(95.4%
)8(4.6%
)174(99.4%)
1(0.6%)
152(88.4%
)20(11.6%
)47(31.3%)
103(68.7%)
aw2¼
0:657,df¼
2,notsignificant,
p40.1.
bw2¼
0:927,df¼
1,notsignificant,
p40.1.
cw2¼
0:720,df¼
1,notsignificant,
p40.1.
dw2¼
0:438,df¼
1,notsignificant,
p40.1.
ew2¼
1:322,df¼
1,notsignificant,
p40.1.
J. Tooley, P. Dixon / International Journal of Educational Development 27 (2007) 205–219 215
compared to 95% of the private aided, 94% ofthe private unrecognised and 89% of the privaterecognised schools.
Tables 13–15 show these inputs comparingunrecognised and recognised private unaidedschools only, for consideration in the final section.
5. Conclusions and discussion
It is widely acknowledged that a low-cost privateeducation sector is now serving low-income familiesin developing countries. In part, it is suggested thatthis sector has emerged because of the low quality ofavailable government schools for the poor. How-ever, there are also doubts raised about therelatively quality of private provision for the poor,although data on this aspect are patchy. This paper,reporting on a study from the slums of East Delhi,explored the nature and extent of private schoolsserving low-income families, and compared theirinputs to those in government schools.
It would have been valuable to have been able tophysically count the numbers of children presentwithin the schools, to gain more realistic estimatesof proportions in each management type. Further-more, more than one unannounced visit would havebeen useful to gauge the extent to which teacherswere teaching over a prolonged period, and acomprehensive survey of facilities within the schoolconducted, rather than in just one classroom, tomake these findings more directly comparable withother literature. However, these were beyond theresources of this current study. Clearly, research onthe achievement levels of children in the differentschool types, controlled for background variables,and on satisfaction levels of pupils, parents andteachers, would add to our understanding of therelative quality of public and private provision forthe poor. The extended study explored these aspects(see Tooley and Dixon, 2006, 2007). Notwithstand-ing these limitations, however, the research reportedhere suggests that a more balanced appraisal of thecontribution, or potential contribution, of privateunaided schools for the poor may be justified thansometimes is found in the literature.
First, our study suggested that the sector iscertainly a significant provider for the poor. Theresearchers conducted a census in the notified slumsof North Shahdara, one of the poorest parts ofDelhi, and found that 66% of the 265 primary andsecondary schools were private unrecognised, with

ARTICLE IN PRESS
Table
14
Inputs
toschools(2),private
unaided
schoolsonly
Fansin
theclassroom
aChairsin
theclassroom
bElectricity
intheclassroom
cDrinkingwaterd
Toiletse
Available
Unavailable
Available
Unavailable
Available
Unavailable
Available
Unavailable
Available
Unavailable
Private
unrecognised
67(93.1%
)5(6.9%)
68(94.4%)
4(5.6%)
64(94.1%)
4(5.9%
)70(95.9%)
3(4.1%
)71(97.3%
)2(2.7%)
Private
recognised
90(89.1%
)11(10.9%)
88(87.1%)
13(12.9%)
89(89.0%)
11(11.0%
)96(94.1%)
6(5.9%
)95(93.1%
)7(6.9%)
Total
157(90.8%
)16(9.2%)
156(90.2%)
17(9.8%)
153(91.1%)
15(8.9%
)166(94.9%)
9(5.1%
)166(94.9%
)9(5.1%)
aw2¼
0:780,df¼
1,notsignificant,
p40.1.
bw2¼
2:539,df¼
1,notsignificant,
p40.1.
cw2¼
1:304,df¼
1,notsignificant,
p40.1.
dw2¼
0:274,df¼
1,notsignificant,
p40.1.
ew2¼
1:483,df¼
1,notsignificant,
p40.1.
J. Tooley, P. Dixon / International Journal of Educational Development 27 (2007) 205–219216
more unrecognised private unaided than governmentschools (28% compared to 27%). Given that wecannot be sure we found all the private unrecog-nised schools, this gives a lower bound for privatesector involvement. The private unrecognisedschools, however, were reported to be much smallerthan government schools, although it is recognisedthat there are difficulties with reported enrolmentfigures from government (and private aided)schools. Nevertheless, even on figures given to theresearchers, private unaided schools make up nearly40% of enrolment. These private schools are not allrecently established, as some of the criticisms seemto imply. The mean year of establishment was 1998and 1993 for unrecognised and recognised privateunaided schools, respectively.
Second, one of the criticisms of the existence ofprivate schools is that parents prefer to enrol theirboys rather than girls in them, so their presenceexacerbates gender inequality (see e.g., Save theChildren UK, South and Central Asia, 2002, p. 7).Our research confirmed that this was the case too inEast Delhi, with around 57–58% male enrolment inthe private unaided schools, although this wascomparable to the percentage in private aidedschools, which are heavily government subsidised(a subsidy supposedly justified in part because oftheir contribution to equity, Kingdon and Muzam-mil, 2003; World Bank, 2002a, b).
Third, we were able to compare some of theinputs to private and government schools. This gavea mixed picture. Regarding teaching activity, oursurvey showed considerably higher activity inprivate unaided than government schools. Whenresearchers called unannounced on classrooms, thepercentage of teachers teaching in private recog-nised schools was 69%, and 72% in privateunrecognised schools, compared to only 38% inthe government schools. However, teacher absen-teeism rates were higher in private unaided thangovernment schools, and in any case, our findingssuggest that although private unaided schoolteachers showed higher teaching commitment thangovernment teachers, there is considerable room forimprovement in private unaided schools. In thisregard it is interesting to note that there is nostatistically significant difference between privateunaided unrecognised and recognised schools in thelevels of teaching and absenteeism (see Table 13).That is, government regulations and associatedinspections do not seem to impact on raisingstandards in this regard. Indeed, only on four

ARTICLE IN PRESS
Table 15
Inputs to schools (3), private unaided schools only—significant differences
Own playgrounda Separate toilets for boys
and girls where necessarybTape recordersc School computers used by
childrend
Available Unavailable Available Unavailable Available Unavailable Available Unavailable
Private
unrecognised
3 (4.1%) 70 (95.9%) 11(17.7%) 51 (82.3%) 14 (38.9%) 22 (61.1%) 17 (23.6%) 55 (76.4%)
Private recognised 16 (15.7%) 86 (84.3%) 42 (45.7%) 50 (54.3%) 28 (65.1%) 15 (34.9%) 46 (46.0%) 54 (54.0%)
Total 19 (10.9%) 156 (89.1%) 53 (34.4%) 101 (65.6%) 42 (53.2%) 37 (46.8%) 63 (36.6%) 109 (63.4%)
aw2 ¼ 5:892, df ¼ 1, significant, po0.05.bw2 ¼ 12:783, df ¼ 1, significant, po0.01.cw2 ¼ 5:413, df ¼ 1, significant, po0.05.dw2 ¼ 9.040, df ¼ 1, significant, po0.01.
J. Tooley, P. Dixon / International Journal of Educational Development 27 (2007) 205–219 217
inputs was there any significant difference betweenrecognised and unrecognised private unaidedschools—tape recorders, computers, separate toiletsfor boys and girls and playgrounds, two of whichare not subject to government regulation—suggest-ing that, in general, it is not government regulationand inspections that leads to higher quality provi-sion (Tables 14 and 15).
On other inputs, private unaided schools ap-peared at least as good, or better than theirgovernment counterparts. Reported pupil–teacherratios were much more favourable to privateunaided than government schools—highest in gov-ernment schools, (at 55:1), more than twice as highas in both recognised and unrecognised privateunaided schools (23:1). On four inputs, (the avail-ability of blackboards, drinking water, library andtape recorders), government and private unaidedschools offered a comparable range of facilities. Forsix other inputs (desks, chairs, fans, toilets, compu-ters and electricity), private unaided schools, in-cluding unrecognised ones, offered these facilitiessignificantly more often than government schools.Only on two inputs—playgrounds and separatetoilets for boys and girls (single-sex schools ex-cluded) did government schools have superiorityover private unaided schools.
Three ways forward are suggested by thesefindings. First, concerning the gender imbalance inprivate unaided schools, one possible solution here,if attendance at private unaided schools is consid-ered to be a valuable good that is currentlydominated by boys, might be to consider theintroduction of targeted vouchers, aimed at girls.UNDP (2003) explores this as a possible wayforward: ‘To ensure that children from poor
families unable to pay school fees are able to attendprivate schools, governments could finance theireducation through vouchers.’ (UNDP, 2003,p. 115). The report gives examples of successfulschemes in Colombia and Pakistan, the latter aimedat disadvantaged girls, that may be transferable tothe Indian context. To a not insignificant extent, wefound that the private schools themselves werealready offering their own version of targetedvouchers—on average 10% of all places wereprovided free or at a concessionary rate—althoughfurther research is required to ascertain to whomthese were offered, and whether concern for girls’enrolment featured. (Other research has indicatedthat gender was one factor in the distribution ofscholarships in other parts of India, Tooley andDixon, 2005a). Ways of extending or enhancingsuch informal schemes might be considered avaluable way forward.
Second, concerning the variable standards inprivate unaided schools, others have argued thatgovernment regulation and inspection needs to bestrengthened in recognised private unaided schools,and unrecognised schools brought under thisregulatory remit (by ensuring that unrecognisedschools become recognised), (see for example,Nambissan, 2003; Rose, 2002). However, otherresearch has suggested that, in Hyderabad, India,government recognition may be achieved throughunofficial payments or bribes to inspectors,rather than achieving regulatory standards (Tooleyand Dixon, 2005b). If this is also the case in Delhi—and other sources suggest that the corruptionfound in Hyderabad is likely to be repeatedacross India (corruption is ‘endemic’ in India, Drezeand Sen, 2002, p. 53, which is ranked amongst

ARTICLE IN PRESSJ. Tooley, P. Dixon / International Journal of Educational Development 27 (2007) 205–219218
the top ten most corrupt nations in the worldMitra, 1998, Qp. 38), then this may not be animmediate way of raising standards in privateunaided schools. Third, an alternative approach(raised in Tooley and Dixon, 2005b), would be toconsider how private unaided schools could bebrought within systems of self-regulation andaccreditation to assist in school improvement, andso enhance the learning experiences of studentswithin them.
References
Aggarwal, Y., 2000. Public and Private Partnership in Primary
Education in India: A Study of Unrecognised Schools in
Haryana. National Institute of Educational Planning and
Administration, New Delhi.
Akhamadi, S.U., Suryadarma, D., 2000. When teachers are
absent: Where do they go and what is the impact on students?
SMERU Field Report. SMERU Research Institute,
Indonesia.
Alderman, H., Orazem, P.F., Paterno, E.M., 2001. School
quality, school cost and the public/private school choices of
low-income households in Pakistan. Journal of Human
Resources 36 (2), 304–326.
Alderman, H., Kim, J., Orazem, P.F., 2003. Design, evaluation,
and sustainability of private schools for the poor: the Pakistan
urban and rural fellowship school experiment. Economics of
Education Review 22, 265–274.
Ali, M., Reed, T., 1994. A school and Parental Survey of Book
Provision Issues in NWFP. International Book Development
Ltd.
Baurer, A., Brust, F., Hybbert, J., 2002. Entrepreneurship: a case
study in African enterprise growth, expanding private
education in Kenya: Mary Okelo and Makini Schools.
Columbia Business School. Chazen Web Journal of Interna-
tional Business, Fall.
Census of India, 2001. Primary Census Abstract: Haryana, Delhi
and Rajasthan, vol. 2. Government of India, Delhi.
Chaudhury, N., Hammer, J., Kremer, M., Muralidharan, K.,
Halsey Rogers, F., 2004a. Provider Absence in Schools and
Health Clinics (Available from: /http://worldbank.orgSaccessed October 2004].
Chaudhury, N., Hammer, J., Kremer, M., Mularidharan, K.,
Rogers, H., 2004b. Roll Call Teacher Absence in Bangladesh.
World Bank, Washington, DC.
De, A., Majumdar, M., Samson, M., Noronha, C., 2002. Private
schools and universal elementary education. In: Govinda, R.
(Ed.), India Education Report: A Profile of Basic Education.
Oxford University Press, Oxford and New Delhi,
pp. 131–150.
Dreze, J., Sen, A., 2002. India: Development and Participation,
second ed. Oxford University Press, New Delhi, Oxford.
Glewwe, P., Illias, N., Kremer, M., 2004. Teaching incentives.
National Bureau of Economic Research Working Paper.
Government of India, 2005. Labour Bureau, Minimum Wages,
(Available from /http://labourbureau.nic.in/wagetb/htmS)
accessed 10.10.05.
Habyarimana, J., Das, J., Dercon, S., Krishnan, P., 2004. Sense
and Absence: Absenteeism and Learning in Zambian Schools.
World Bank, Washington, DC.
Kingdon, G., 1996. Student achievement and teacher pay.
Discussion Paper, No. 74, STICERD, London School of
Economics, August.
Kingdon, G., Dreze, J., 1998. Biases in educational statistics. The
Hindu, 6 March.
Kingdon, G., Muzammil, M., 2003. The Political Economy of
Education in India: Teacher Politics in Uttar Pradesh. Oxford
University Press, New Delhi, Oxford, New York.
Kremer, M., Mularidharan, K., Chaudhury, N., Hammer, J.,
Rogers, H., 2004. Teacher Absence in India (Available
from: /http://econ.worldbank.org/files/36660_Absenteeism.
India.Schools.June.2004.pdfS accessed October 2004).
Mitra, C., 1998. The Corrupt Society: The Crimilization of India
from Independence to the 1990s. Viking Penguin India, New
Delhi, India.
Nambissan, G.B., 2003. Educational deprivation and primary
school provision: a study of providers in the city of Calcutta.
IDS Working Paper 187, Institute of Development Studies.
Nwagwu, C.C., 1997. The environment of crises in the Nigerian
Education System. Comparative Education 33 (1), 87–95.
Rana, K., Rafique, A., Sengupta, A., 2002. The Delivery of
Primary Education: A Study in West Bengal. TLM Books and
Pratichi (India) Trust, Delhi.
Rogers, H.F., Lopez-Calix, J., Chaudhury, N., Hammer, J.,
Cordoba, N., Kremer, M., Muralidharan, K., 2004. Teacher
absence and incentives in primary education: results from a
national teacher tracking survey in Ecuador. Ecuador:
Creating Fiscal Space for Poverty Reduction: A Fiscal
Management and Public Expenditure Review vol. 2,
136–162 (Chapter 6).
Rose, P., 2002. Is the non-state education sector serving the needs
of the poor? Evidence from East and Southern Africa. Paper
prepared for DfID Seminar in preparation for 2004, World
Development Report.
Rose, P., 2003. From the Washington to the Post-Washington
Consensus: the influence of international agendas on educa-
tion policy and practice in Malawi. Globalisation, Societies
and Education 1 (1), 67–86.
Save the Children UK, South and Central Asia, 2002. Private
sector involvement in education: a perspective from Nepal
and Pakistan. Submission to ‘‘The Private Sector as Service
Provider and its Role in Implementing Child Rights’’, Office
of the High Commissioner for Human Rights, Geneva, 20
September.
The Probe Team, 1999. Public Report on Basic Education in
India. Oxford University Press, Oxford and New Delhi.
Tooley, J., Dixon, P., 2005a. An inspector calls: the regulation of
‘budget’ private schools in Hyderabad, Andhra Pradesh,
India. International Journal of Educational Development 25,
269–285.
Tooley, J., Dixon, P., 2005b. Is there a conflict between
commercial gain and concern for the poor? Evidence from
private schools for the poor in India and Nigeria. Economic
Affairs 25 (2), 20–27.
Tooley, J., Dixon, P., 2006. ‘De Facto’ privatisation of education
and the poor: implications of a study from sub-Saharan
Africa and India, Compare 36(4).
Tooley, J., Dixon, P., 2007. Private education for low income
families: Research from a global research project. In:

ARTICLE IN PRESSJ. Tooley, P. Dixon / International Journal of Educational Development 27 (2007) 205–219 219
Srivastava, P., Walford, G. (Eds.), Private Schooling in Less
Economically Developed Countries: Asian and African
Perspective. Symposium Books, Didcot.
UNDP, 2003. Human Development Report 2003. United
Nations Development Programme, New York.
Watkins, K., 2000. The Oxfam Education Report. Oxfam in
Great Britain, Oxford.
World Bank, 2002a. India, Karnataka: secondary education and
the new agenda for economic growth. Human Development
Sector Unit, South Asia Region, Report No. 24208-IN,
June 13.
World Bank, 2002b. India, Karnataka: financing education in the
context of economic restructuring. Human Development
Sector Unit, South Asia Region, Report No. 24207-IN,
June 13.
World Bank, 2003. Making Services Work for Poor People:
World Development Report 2004. World Bank/Oxford
University Press, Washington, DC/Oxford.
World Bank, 2004. Papua New Guinea: Public Expenditure
and Service Delivery (Discussion Draft). World Bank,
Washington, DC.