census of india 1 991
362
CENSUS OF INDIA 1991 SERIES - 12 KERALA PART II-A GENERAL POPULATION TABLES DIRECTORATE OF CENSUS OPERATIONS, KERALA
-
Upload
khangminh22 -
Category
Documents
-
view
0 -
download
0
Transcript of census of india 1 991

CENSUS OF INDIA 1 991
SERIES - 12
KERALA
PART II-A
GENERAL
POPULATION
TABLES
DIRECTORATE OF CENSUS OPERATIONS, KERALA


--_
10"
9
75° EA ST OF GREENWICH
Based upon Survey 01 Ind ia map wilh the per mission 01 the Surveyor General 01 India,
"
76"
KERALA Q.II~I~q; ~
ADMINISTRATIVE DIVISIONS
1991
KILOMETRES 20 10 0 20 40
BOUNDARIES :
STATE /U.T ....... _._._
DISTRICT ... ... .. _ ._._
TAlUK .. ... ..... ... ~ ......... .. " HEADQUARTERS: .•.
STATE ......... . , .. * DiSTRiCT . .. . .. . .. .
.., TAlUK .... ...... .. .
@ o
c
60
r'
78"
10·
9°
78·
The tcrril()(ia l walers of India cxten<! into the sea 10 a distance of © Government 01 India Copyright. 1998 Iwelve l>CIutical rTiles measured frOfT' the aPPropriate base line .


.'" I .~ . . /
v ( "'l
i .... j
".
ARABIAN
SEA
f" .. ~
•
n'
RAJASTHAN
N
~ "".-
JoIt>ur .
A
.... UPOn Survey 01 l11dla 'Pap with the permission of the Su.n,eVor General of tndil
thal8mtaRal Wlters ~, ,ndia etIIond Int<! the L'" lit • di.tance of twetve _cal mil., meaftlled from tho appropriate base line.
.. ' .. ' ,i
INDIA POSITION OF KERALA
IN INDIA 1991 lOUfI)AAY.INTERJIAT'IC)ML .•••.• _._._ 1IOUIIWI1.ITATE'f'-llON TUlllnNty.
CAl'lTAL OF MIA... • cM.TAl fIF JTAT~ T .... "r1RY ..
..... , ... -100 lOG _
N
OF
BENGAL
The ~dmlnl.trall •• b.ad_Ier. af 'Chcindt,arh, Haryan. and Punlab or. 01 Chandl,arh.
P - PONDICHERRY
E A N
...
",'
. ..
._ .. • l.u.ul
, ..
..
Ii
The boundary of Megha!aya shov~n on this map is as Interpreted from the Nonh·EaslOrn Areas (Reorgan,sation) Act, 1971. Dut has yet to be verified.
C Government of India copyright. 1998.


CONTENTS
Page
PREFACE ix
GENERAL NOTE 1-8
A-1 : AREA, HOUSES AND POPULATION 9-72 Fly-leaf 11 T~A-1 37 Annexure.to A-1 Details of Urban Agglomerations lying in two taluks with its constituent units 51 Appendix 1 - Statement showing 199 t territorial units and changes during 198 t -91 53 Appendix 2 - Number and population of viDages with population of 5,000 and over and of
towns with population under 5,000 58 Appendix 3 - Houseless and institutional population 60 Annexure to Appendix 3 71
A-2: DECADAL VARIATION IN POPULATION SINCE 1901 73-96
Fly-leaf TableA-2 Appendix- State and districts at the 1991 census showing 1981 area and powlation
according to territorial jurisdktion in 1981, change in populatioil of 1981 adjusted to jurisdiction of 1991
A-3 : VILLAGES CLASSIFIED BY POPULATION SIZE
Fly-leaf TableA-3
A-4 : TOWNS AND URBAN AGGLOMERATIONS CLASSIFIED BY POPULATION IN 1991 WITH VARIATION SINCE 190 1
FIy--leaf TableA-4 Appendix 1 -Appendix 2 -Appendix 3-
Appendix 4 -
New towns added In 199 t and toWnS in 1981 declassified in t 991 Places with a population of under 5,000 classified as towns for the first time in t 991 Places with a population of under 5,000 in 1981 which were towns in 1981 but have been declassified in 1991 Changes between 198 t and t 991 in area and population of towns and reasons for change in area
A-5 : STANDARD URBAN AREAS
fly-Leaf TabieA-5
vB
75 93
96
97-109
99 104
111-163
112 J34 160 163
163
163
165-215
193 202

ANNEXURES
ANNEXURE A - SCHEDULES (i) Houselist (ii) Enterprise List (iii) Household Schedule (iv) Individual Slip (v) PGDHTP Schedule
Annexure BAnnexureCAnnexure D-
Instructions to Enumerators for filling up the Houselist Instructions to Enumerators for filling up the Enterprise list Instructions to Enumerators for filling up the Household schedule and Individualslip
MAPS
General
1. Administrative Divisions - 1991 2. Position of Kerala in India - 1991 3. Changes in Administrative Boundaries 1981 -1991 4. Urban Population - 1991 5. Density of Population - 1991 6. Sex ratio - 1 991 7. Growth of Population 1981 - 1991 8. Decadal Growth of Population 1901 - 1991 9. Growth of Urban Population 1981 - 1991
10. Decadal Growth of Urban Population 1901 - 1991
Standard Urban Area Maps
1. Kannur 2. Thalassery 3 Vadakara
4 Kozhikode 5. Palakkad 6. Thrissur 7. Kochi 8. Kottayam 9. Changanassery
10. Alappuzha 11. Kayamkulam 12. Kollam 13. Trivandrum
viii
217-
217 219 220 221 223 225 227 l63 273
iii v 13 25 33 35 .85 87
113 115
167-191
167 169 171 173 175 177 179 181 183 185 187 189 191

PREFACE
The 1991 census of population in Kerala was conducted in February-March 1991 with the sunrise of 1 st March 1991 as the reference date. The data collected in the census are being brought out through different series of publications and a wealth of information on the demographic, social and economic characteristics of the people of the state is available in these volumes.
This volume, Part-II A, presents general population tables viz. A-1 : Area, houses and population, A-2 : Decadal variation in population since 1901, A-3 : Villages classified by population size, A-4 : Towns and urban agglomerations classified by population size in 1991 with variation since 1901 and AS : Standard Urban Areas. These tables were tabulated manually on full count.
The Introductory Note in the beginning of the volume indicates the basis on which these data were collected. In the Annexure a copy of Houselist, Enterprises list, Household schedule, Individual slip and
PGD HTP schedule and the instructions to fill up these schedules have been given to facilitate the reader to know the methodology used during 1991 census to collect the data. Each (able has been introduced with a fly-leaf to appraise the reader the importance of the data presented therein.
~.
This publication is a glowing testimony to the competent leadership and personal involvement of Shri. N.M.Samuel, I.A.S., former Director of Census Operations, Kerala who conducted the 1991 Census. This volume is in fact the product of his dedication and hard work. Shri. N.M.Samuel had to go back to resume his duties under State Government before this volume could be finalised and printed. The entire credit for the successful operation of 1991 census goes to Shri. N.M. Samuel.
The data presented in this volume are the outcome of the census operations which were carried out through the agency of the State Government. The field operations were executed by District Collectors, Deputy Collectors, DFOs, Tahsildars, Municipal/Corporation Commissioners etc. who were designated as Principal Census Officers, District Census Officers, Charge Officers etc. I wish to express gratitude to the Government of Kerala for their help and support throughout the Census Operations.
The tables presented in this volume are mainly compiled from Primary Census Abstract. The tabulation of census data and preparation of PCA were initially done in the Regional Tabulation Offices under the supervision of Shri. K.Valsalan, Kum. Jiju George(Kannur), S/Shri. P.C.John(Palakkad), T.K\M. Pillai (Kochi), N.A.Krishnan Kutty (Kottayam) and S.Sukumaran(Trivandrum), Regional Deputy Directors. Their valuable contributions is acknowledged with extreme gratitude.
At the Census Directorate ShrLS.Jayashanker (retired), Shri. K.Gopinathan, Deputy Directors, Smt. C.Kamalam, Assistant Director and late Smt. K.Sulabhamma, Investigator did an excellent job in bringing out this volume with the remarkable assistance of Smt. M.K. Vilasini, Smt. R.Krishna Kumari, Statistical Assistants, Smt. S.Radhamoni, Smt. Jolly Sukesh and Smt. Graceamma John, Comp.utors. ShrL .B.B.Jain, Senior Geographer, Smt. N.S.Renuka Kumari, Geographer, Shri. S.Krishna Pill ai, Shri. N.Venu Nair, Shri. V.Thulaseedharan and Shri. A.Sadasivan Asari, Artists have prepared the maps in this volume.
The data entry and word processing for the volume was done by Shri. K. V. Vinod and Shri. V.M.Krishna Raju, Data Entry Operators Grade 'B' of this office. The printing and proof reading was attended by ShrLV.Rajasekharan Nair, Statistical Assistant, Smt. E.Rahima Beevi and Shri. T.Chandranandan Nair, Computors. Shri. N.Muralidharan Nair, Senior Hindi translator has done the translation for preparing the Hindi version. Several other members of this Directorate have ~ helped at different stages in brii1ging out this volume. The services rendered by all these persons are recorded with apprecia.don.
The Census operations are so vast an exercise that no single person can possibly lay ~Iaim to the credit. But I must express my deep sense of gratitude to Shri. A.R.Nanda, lAS, former Registrar General, India. All through the work of organising and conducting the census and tabulation we were sustained by
ix

his prompt guidance and all out support. I am also grateful to Dr. M.Vijayanunni, lAS, the present Registrar General, India for all the valuable help and guidance received subsequently. I am also grateful to the Deputy Registrar General(C&T), the Deputy Registrar General (SSt and the Deputy Registrar General (Map) and their staff for promptly scrutinising the tables and maps and offering valuable suggestions. Shri. H.K.)hamb, Printing Officer was very much helpful to make arrangements for printing this volume.
I also express my thanks to the Manager, Assistant Manager and Staff of the Government of India Press Koratty who have undertaken the task of printing this voluminous publication.
Trivandrum
14.05.1997
x
A.G.Bhaskaran
Deputy Director

GENERAL NOTE
The 1 991 Census enumeration was conducted during February - March 1991 with sunrise of 1 st March 1991 as the reference poine of time. The houseless persons were enumerated 011 the night of 28th February and a revisional round was conducted from 1 st March to 5th March, 1991.
Upto 1931, the census enumeration was done in one day. From 1941 onwards it was spread over a certain period. The latter procedure was followed in 1991 also. The enumeration commenced on 10th February and ended with 28th February, 1991. With a view to bring the count made during these days up-to-date as on 1 st March, 1 991, a revisional round was conducted from 1 st March to 5th March, i 991 during which the enumerator visited every household, cancelled the enumeration of any persons who died between the date of enumeration and the sunrise of 1 st March, 1991 and enumerated every child born during this period. If the enumerator came across a visitor in any household who had come to stay during the above period and had not been enumerated elsewhere he was also enumerated. But no notice was taken of any birth or death or visit occurring after the sunrise of 1 st March, 1991. In this way the enumeration though spread over a period of 20 days was brought upto date as on the sunrise of 1 st March, 1991. The house less persons were enumerated on the night of 28th February, 1991 at the places where they were found at that time. In respect of mobile population who were in transit throughout the period of enumeration were enumerated on the night of 26th February, 1991 provided they were not enumerated elsewhere. In the case of crew and passengers of any ship or any other vessels which touched any port or had already been in the port between 10th February, 1991 and sunrise of 1 st March, 1991 they were enumerated in the ship or other vessels provided they were not enumerated elsewhere in India. The temporary residents in hotels, touristbungalows and similar institutions of temporary halts were enumerated on 26th and 27th February, 1991 and those in residential hospitals, TB sanatorium, leprosy hospitals or asylums, jails, mental hosp-itals, penal institutions etc. were enumerated on the 26th and 27th February, 1991. The method of enumeration followed in the census was the canvasser method in which an enumerator himself called at every household or on every human being and noted down particulars relating to the household and individuals in appropriate forms.
Preparatory measures
The preparation for the 1 99 t census of India which commenced in 1987 took active part when 1 st Data Users Conference was held during April 18-20, 1988 to consider draft questionnaire, conceptional changes etc. The t>ata Users Conference was attended by representatives of the important Ministries of Government of India, Planning Commis-
sion, the State Government, Universities, demographic and population institutions, research institutions and individual experts and scholars. Based on the discussion in the conference the questionnaires were amended and placed before the Advisory Committee. The Advisory Committee vetted the census questionnaires which were listed in selected areas during November-December 1988 with the help of staff of census organisaton. In Kerala, the questionnaires in respect of Houselist, Houeshold Schedules and Individual Slips were pretested in the field in 1 3 blocks in rural areas and 7 blocks in urban areas in English. As a result of this first pretest certain changes were made in the Questionnaires which were again submitted to Advisory Committee for their opinion. Based on their recommendation, the second pretest was held during 19th June to 10th July, 1989 by using the staff drawn from among the local school teachers. All the instructions and schedules were in Malayalam. Based on the experiences from the two pretests, the questionnaires were again considered by the Advisory Committee in Nov. 1989 and finalised by the Government of India. The final questionnaires were of 3 forms (i) Houselist (Ii) Household schedule (iii) Individual slip.
The third economic census of the Central Statistical Organisation (CSO) was integrated with the houselisting operation and an enterprise list developed by eso was canvassed along with houselist. The filled in Enterprise List was handed over to the Department of Economics and Statistics for processing and dissemination of data.
Improvement made in the f 991 Census
The special features of the 1991 census as compared to the previous census are briefly given below.
(i) The houselist was expanded to cover some more information relating to housing and household amenities which was collected during the main census in 1981. "Type of fuel for cooking" and "Availability of toilet facility" to the household were introduced for the first time in the house list.
(Ii) 'Mother tongue' and 'Religion' were recorded in 'household schedule'. By using the Household Schedules (HHS) we could prepare the Primary Census Abstract (PCA) with 9 fold industrial categories upto village/town/ward level and mother tongue and religion data upto taluk/town level.
(iii) The basic census data will be presented for the first time for each CD. Block in rural areas in addition to other levels like taluk/districtlstate.
(iv) Question on Ex-service men and their status as pen-

sioner or non-pensioner was collected for the first time in this census.
(v) In the 1981 census, the children in the age group 0-4 were considered as illiterate where as in 1991 census the children below 6 years of age were considered as illiterate even if the child was going to school and might have picked up reading and writing a few odd words.
(vi) The concepts and definitions relating to economic questions adopted in 1981 were retained in 1991 also. But the questions were framed in such a way as to help netting the unpaid workers in farm or in family enterprise. Stress was given to the economic activity of women and children. For this the instructions to enumerators were expanded and emphasis was laid on the need to ask probing question regarding the work done at any time at all last year or any of the seasons in the reference period in the case of women.
(vii) It is proposed to tabulate cent per cent data on main workers other than cultivators and agricultural labourers, marginal workers and non-workers seeking/ avaIlable for work. In 1981 this tabulation was based on 20 percent.
(viii) The question on seeking/available for work was asked in the 1 991 census only in respect of non workers and not for marginal workers also as was done in 198 I census. Further in the case of those seeking/available for work, a question whether they had ever worked before was asked. This will help in knowing the numbers of fresh entrants to the labour force.
(ix) While collecting the information on reasons for migration two more reasons namely business and natural calamities like draught, flood etc. were added in 1991 census by assigning separate codes.
The basic data of 199 I census tabulated on full count are presented in this volume. They appear in S main tables.
Al - Area, houses and population
A2 - Decadal variation in population since 1901
A3 - Villages classified by population
A4 - Towns and urban agglomerations classified by population in 1991 with variation since 1901.
AS - Standard Urban Areas.
For all these tables (Except Table AS) some appendices have been included which either explain or elaborate the data included in the concerned tables. The Primary Census
2
Abstract (PCA) is another important general population table which gives particulars relating to area, occupied residential houses, households, population by sex, number of SC&ST, literate and educated persons, population in the age group 0-6, main workers by nine broad industrial categories, marginal workers and non-workers. The state PCA gives figures for State/district while the district PCA's give figures for district/CD Blocks/Cities/towns. Appendix to District PCA gives figures for districts and taluks. The PCA's and its appendices will form part II-B.
Houselist
It is quite essential to locate and to identify all the places which were occupied or used by people before the actual conduct of enumeration. Thus houselisting is a primary but it is a very important basic step in this census. The houselisting operations were conducted in the month of MayJune, 1990 in the state. The main objective of this operation was to collect some basic information which would help In forming the enumeration blocks for the census enumerator. The house list also served as a frame for listing the enterprises for which a separate Enterprise list was canvassed along with the houselisting operations. This data which was collected during the houselisting operation of 1991 census will be compiled and tabulated by Central Statistical Organisation at the national level and by the Bureau of Economics and Statistics, Kerala at the state level.
The houselist included questions about the purpose for which each census house is used, number of persons usually residing in each household, the materials used for construction of floors, walls and roofs and amenities available in the house such as drinking water, toilet, electricity, fuel used for cooking etc. Details about materials used for the construction of the house, amenities etc included in the household schedule of 1981 census were included in the houselist of 199 I census.
Enterprise list
The Enterprise list canvassed along with the houselist, contained details on various enterprises conducted in the census houses as well as in open space. The data collected in Economic census through the enterprise list will be published by the Central Statistical Organisation at the national level and by the Department of Economics and Statistics at the state level. The data included description of enterprises, agricultural or non-agricultural, seasonal or non-seasonal, ownership, fuel used, number of workers etc.
Household Schedule
This schedule was intended to give only basic data on the numerical strength of the household. The data in the household schedules were same as collected in the Individual Slip.

Individual Slip
This is the basic schedule of 1991 census. It was canvassed during the enumeration period in respect of every indMdual irrespective of age and sex. Ie contained 2 J questions
Demographic Sodal & Cultural
I. Relationship to head I. Marital Status 2. Sex 2. Mother Tongue
besides identification particulars of location code and serial number of household. The questions in the Individual slip are broadly categorized as demographic, social and cultural and economic as follows.
•
Economic Activity
t. Main activity 2. Secondary work
J. Age J. Two ocher laneuages known J. Marginal work 4. Migration 4. Religion 4. Seekinclavailable for work
a) Birth Place 5. SC/ST b) last residence 6. literacy Special Questions c) Reasons for migration 7. Educational attainments d) Duration of residence 8. Auending school/college . i) Ex-service men or not
5. Fertility i) For ever married women
a) Age at marriage b) No. of children
surviving c) No. of children ever
born alive Ii) For currently married
women. Any child born alive during las~ one year.
Post Graduate Degree Holders and Technical Personnel Schedule
A P. G. Degree Holders and Technical Personnel (PGDHTP) schedule was issued to every Post Graduate as also a person with a technical diplomaor degree and a person with acertif icate from the Industrial Training Institute (ITI). Th e items covered under the PGDHTP schedule were name, date of birth, designation and address, sex, details of academic qualifications, post graduate academic specialization, present status of emp loyment, income, visi t to abroad for study, training and employment. A specimen each of Houselist, Enterprise list, Household Schedule, Individul slip and PG Degree Holders and Technical Personnel Schedule is given in Annexure A. The detailed instructions for filling up the Houselist, Household Schedule and Individul Slip are given in Annexures B toD.
Preparation of maps
The preparation of maps at various levels is one of the preliminary task of census. It is the primary objective of census that every person in the country is enumerated only once and without any omission. In order to achieve this the entire state was mapped out for districts, taluks and ultimately every village and town was mapped which are the basic administrative areas of habitation.
The taluk map showing the boundaries of each village within the taluk were prepared and finalised in consultation with the Directorate of Survey and Land records. The jurisdictional changes such as amalgamation of villages, transfer of villages from one taluk to another were also corrected and verified on maps accordingly. Similarly the district maps
3
ii) If Ex-service men pensioner/non-pensioner
showing the updated boundaries of the districts and boundaries of taluk within the districts were also finalised for all the 1 4 distriCts.
The notional maps were prepared for each village/ town showing the location of enumeration blocks within the village or town. In the notional maps some topographical details, viz. permanent features and land marks such as the village site, well known roads carttracks, hills, river, names of hamlets etc. were shown. In addition to notional maps the layout sketch maps were prepared for each block. In the layout sketch maps every single building and house in the block was shown with pucca and kachcha houses with specific signs such as squares and triangles respectively. Such maps were prepared during both the stages of house listing and enumeration in respect of all the blocks in the state.
Rural/Urban Areas
It has been the practice in census to present data separately for rural and urban areas. Census statistics of the rural and urban population have many important uses. What constitutes an urban area in census is based on certain criteria adopted at each census. The basic unit for rural areas is the revenue village with definite surveyed boundaries.
The concept of town, urban agglomeration and standard urban areas have been given in detail in the fly-leaves to A series tables.
Census Hierarchy
Census is a Union subject under the charge of Ministry of Home Affairs. The Registrar General and Census

Commissioner of India is responsible for conducting the population census of the country. For each of the State/UT an officer designated as Director of Census Operations is appointed to cany out the census work. The arrangements for the census taking in Kerala were commenced in June 1987 taking steps to procure jurisdictiooal maps and list of villages/towns and constituent units. The Director of Census Operations, Kerala assumed office on 30th June, 1989 and thereafter the census work commenced in full swing. The notification issued by Government of India on the taking of census of india 1991 was republished in the State Gazette in
1989. In October1989, the state government issued notification under the Census Act 1948 appointing District Collectors, Deputy Collectors(General), Revenue Divisional Officers/Sub Collectors, Tahsildars, Divisional Forest Officers/ Wild Life Preservation Officers/Commissioner of Corporations, Municipalities, Executive Officers of T ownships/Cantonments etc. as census charge officers. The charge officers in turn appointed the enumerators and supervisors. The following organisation chart depicts the census hierarchy in Kerala.
ORGANISATION CHART
DIRECTOR OF CENSUS OPERATIONS, KERALA
PRINCIPAL CENSUS OFFICER (DISTRICT COLLECTOR)
ASSISTED BY
DISTRICT CENSUS OFFICER (DY.COLLECTOR,GENERAL)
SUB-DIVISIONAL CENSUS OFFICER (REVENUE DIVISIONAL OFFICER/SUB-COLLECTOR)
CENSUS CHARGE OFFICER
TAHSILDAR FOR TALUK (EXCLUDING MUNICIPAL AREAS, FOREST AREAS AND OTHER SPECIAL AREAS)
COMMISSIONER OF CORPORA TION/ MUNICIPALITY
EXECUTIVE OFFICER CANTONMENT / TOWNSHIP, TOWN PLANNER
DIVISIONAL FOREST OFFICER FOR RESERVE/ VESTED FOREST DIVISION/WILD LIFE PRESERVATION OFFICER
DESIGNATED OFFICER FOR MIUT ARY AREAS AND PORT
IDUKKI TOWNSHIP
CENSUS SUPERVISOR FOR CENSUS CIRCLE
CENSUS ENUMERATOR FOR CENSUS BLOCK
Training
The importance of training the officials at all levels who are in charge of the census enumeration work needs no emph(1sis. The quality of census data depends to a large extent on effectiveness of the training given to the field workers. The various concepts and the method of filling up the different schedules should be thoroughly understood by the enumeration personnel. With this objective a three tier training was programmed by the Directorate during both houselisting and enumeration. At the state level the officials of the Directorate, the Regional officers and other concerned personnel were first given detailed instruction. At the second stage, the training classes were conducted at the district head quarters and in the training the District Collectors and other district officials besides the charge officers (i.e. Tahsildars and Corporation/Municipal Commissioners) and their sub-ordinate staff associated with census participated. In the third stage charge officers or their deputies
4
conducted three rounds of training classes to all the Supervisors/Enumerators including those appointed as reserve Supervisors/Enumerators. The training schedules, which were printed in red ink were thoroughly scrutinized in the Census Directorate and detailed circulars pointing out the defects and suggestions were issued. On the whole the training given was a rewarding as the final results indicate.
The Census Act
The statutory frame for the census of India is the Census Act, 1948. The population census is conducted under the Census Act No.XXXVII of 1948 and under this Act various census functionaries are appointed. This Act empowers the central government to notify and conduct census in the whole or part of the country. The Registrar General, India and Director of Census operations are appointed for supervision and organization of the work of taking census in the whole country and in the state respectively. The act
also empowers the state or en1powered authority to appoint census officers at various level to aid in the census work. The Act authorises the census personnel to ask the prescribed census questions and every person of whom such question are asked shall be legally bound to answer the same to the best of his knowledge. Provisions exist in the Act for giving certain penalties for non-compliance of direction issued in connection with census taking. The law also lays down that the information collected at the census will be used only for statistical purposes and that information about individuals will be kept confidential and cannot be used as evidence even in a court of law.
Provisional Totals
As in the previous census the basic population data at the country, state, district levels and for big cities were compiled within a few days after the canvassing of schedules was over. The enumerators were asked to prepare working sheets giving certain basic data of every household covered by them. This had been done by them at the end of every day after the field work. On the basis of these worksheets an enumerators abstract had to be prepared for each enumerator block. The revisional round which took into account births, deaths etc. (which had occurred after the enumeration but before the sunrise of 1 st March, 1991) was completed on 5th March, 1991. The enumerators were asked to complete all the forms and hand them over to supervisors alongwith the abstract on 5th March, 1991 itself. The supervisors who are incharge of 5 blocks each were asked to check up the records fully and hand them over to charge officers on the following day. ie. 6th March, 1991. The charge officers were asked to compile the totals for taluks, municipalities etc., and communicate the same to the district census officers as well as to the Director of Census Operations by 10th March, 1991. The District Census Officers were all asked to arrive at district total figures and intimate the same both to the census directorate at Trivandrum as well as Registrar General, India at New Delhi by 10th March, 1991. The provisional population of Kerala was communicated to Registrar General India at 4.30 pm on 10th March, 1991. The provisional population figures for India and state were finalised by Registrar General, India at lOam on 1 Sth March, 1991. The provisional population data for state and districts were released by the Director of Census Operations on 27th March, 1991 through.a press conference.
I Post Enumeration Check "
In the history of census it is an usual practice to carry out a check survey immediately after the completion of enumeration work. The main objective of PEC survey was to quantify the likely omissions or duplications in census enumeration. The field work of PEC was carried out by the staff of Directorate during March 1 Sth to April, 1 Sth 1991. The filled in schedules were sentto RG's office for further processing.
S
Census Evaluation Study
The census evaluation study was conducted keeping up the same time schedule of the PEe. The objective of CES is to quantify' the extent of omission or duplication of children at the younger ages and to ascertain the correction of age reporting of children in census with the help of births recorded in Sample Registration System. In this study an attempt to measure the coverage error and content error in respect of children born to normal resident mothers was made in a sub- sample of SRS units. The filled in schedules were sent to RG, India for further processing and analysis.
Tabulation and Computerisation
As in the 1981 census, the entire data processing of 1991 census barring some minimum manual compilation is proposed to be carried out on computer. Except Primary Census Abstract and A-series tables all the other tables are processed on the computer. The Direct Data Entry system helps to speed up the input.
A comprehensive tabulation plan to bring out the housing stock, the quality of housing the I socio-economic', cultural and demographic profile of the population in general and of the SC&ST in particular and the household economic situation has been' drawn up to meet the requirement of various departments of government and other data users subject to the limitations of time and data input facilities.
According to the Tabulation Plan for the 1991 Census the following series of tables are to be prepared and published.
A Series- General Population Tables
B Series- General Economic Tables C Series- Social & Cultural Tables
D Series- Migration Tables
F Series- Fertility Tables
H Series- Tables on Houses and Household amenities
SC Series- Special Tables on SC
ST Series- Special Tables on ST
The A Series - General Population Tables, Primary Census Abstract and District Census Handbook Part A &
Part B for all districts are based on the cent percent manual tabulation and do not contain any tables generated on the computer. The following publications are based on full count.
Part-II A - General Population Tables
Part-II'B - Primary Census Abstract
Part-XII A & B - District Census Handbook
The present volume Part-II A contains S Tables-A 1

to AS as noted below.
Al - Area, houses and population
1\.2 - Decadal variation in population since 1901 A3 - Villages classified by population size
22. Sikkim
23. Tamil Nadu 24. Tripura
25. Uttar Pradesh
28. Chandigarh
29. Dadra & Nagar Haweli 30. Delhi
31. Daman & Diu
A 4 - Towns and urban agglomerations classified by population in 1991 with variation since 1901
26. West Bengal
27. Andaman & Nicobar 32. Lakshadweep
33. Pondicherry
AS - Standard Urban Areas. Islands
The 1991 census tables will be published in 33 separate series of volumes for All India and for each state and union territory.
In each of these series (for All India and each State/ UT) the different series of tables will be brought out as different parts. Apart from these, District Census Handbook will be published for each district in the country. This will contain Series Number
1. India
States and Union Territories
2. Andhra Pradesh 12. Kerala 3. Assam 13. Madhya Pradesh 4. Arunachal Pradesh 14. Maharashtra 5. Bihar 15. Manipur 6. Goa 16. Meghalaya 7. Gujarat 17. Mizoram 8. Haryana 18. Nagaland 9. Himachal Pradesh 19. Orissa
10. Jammu and Kashmir 20. Punjab 11. Karnataka 21. Rajasthan
Part No. and subject covered
Part-I - Administration Report (for official use only)
Part-II General Population Tables
Part-III General Economic Tables
Part-IV Social and Cultural Tables
a) District PCA (Development Block & Town) b) Village PCA for each taluk
c} Ward wise PCA for each town
d} District PCA for SC & ST {Development Block & Town}
e) PanchayatiWard PCA
o Village & Town Directories.
Village & Town Directories comprise compilation of statistics, external to census relating to the villages and towns, which in conjunction with census data will be very useful to data users.
For All India and for each State & UT the census tabulation and reports will be published according to the following·plan.
Sub-Part No. if any and the topics covered
2
Part-I A Administration Report-Enumeration Part-I B Administration Report-Tabulation
Part-II A General Population Tables-A Series.
Part-II B Primary Census Abstract.
Part-IIIA-B series tables of first stage which will be brought out on 10% sample in respect of major states and on full count in respect of smaller states and union territories.
Part-IIIB-B series tables of second stage which will be brought out on full count. The data relating HH I, OW, Marginal workers and Nonworkers seeking/available for work will be entered on full count basis
Part-IV A-C series tables of first stage covering age, sex and marital status composition of population, single year age returns, educational levels, school attendance and bilingualism.
Part-IVB-C Series tables covering mother tongue, religion of popUlation and household composition.
6

Part No. and subject covered
Part-V Migration Tables
Part-VI-Fertility Tables
Part-VII Tables on Houses and Household Amenities
Part-VIII special tables on Scheduled Castes & Scheduled Tribes
Part-IX Town Directory, Survey Report on Towns and Villages
Part-X
Part-XI Census Atlas
Part-XII District Census Handbook
Sub-Part No. if any and the topics covered
2
Part-V A-D Series tables of first stage covering tables based on 10% sample in respect of major states and on full count in respect of smaller states and union territories.
Part-V8-D series tables of second stage covering occupational classification of migrant workers. These tables are based on full count.
F-Series tables of first stage which will be brought out on 10% sample in respect of major states and on full count in respect of smaller states and union territories.
H-Series tables covering census houses and the uses to which these are put, construction material of wall, roof and floor of the census houses occupied by households, tenure status of the house occupied and number of living rooms, household size, housing facilities like drinking water, electricity and toilet available to households and fuel used by the household for cooking. These tables will also cover tables on scheduled castes and scheduled tribes. This volume will contain analytical notes also.
This part will contain SC and ST series of tables for Scheduled Castes and Scheduled Tribes respectively. The data relating to Scheduled Castes and Scheduled Tribes will be entered on full count basis in the third stage and Sc/ST tables will be processed on the computer on full count. These will cover population of each Scheduled Caste/Tribe, industrial categories of main and marginal workers, non-workers, seeking/available for work and those who never worked before, educational [evel, school level, school attendance, age, sex and marital status, composition of scheduled castes and scheduled tribes. In addition to these the fertility tables relating to SC/ST are also covered. These tables also cover for scheduled tJibes, their composition by religion, mother tongue and bilingualism.
Part-IX A - Town Directory
Part-IX B-Survey Report on selected towns Part-IX C-Survey Report on selected villages.
Ethnographic notes and special studies on Scheduled Castes and Scheduled Tribes.
Union and State/Union territory census atlas
Part-XIIA Village and Town Directory. Part-XII B Village and Town wise Primary Census Abstract.
Some special studies of t 99 t census data will be published as occasional papers of the t 991 census.
the basic data in machine readable forms such as magnetic tapes, diskettes, floppies etc.
It is also proposed to disseminate census tabulations and
7


A l-AREA, HOUSES AND POPULATION


A-I AREA, HOUSES AND POPULATION
Fly Leaf
Table A-1 is similar to the corresponding general population table of previous census. This table gives the area in square kilometre, density of population (per square kilometre), number of inhabited and uninhabited villages, number of towns, number of occupied residential houses, number of households and population by sex according to the 1991 census. The data are presented upto taluk level for rural areas and upto the town level for urban areas. This table has three appendices.
Appendix-[ shows the 1991 territorial units (districts and taluks) and the details of changes that have taken place to 1981 territorial units by addition or subtraction of areas during the intercensal period of 1981 to 1991. Only those units which have undergone changes during the intercensal period are shown in the appendix.
Appendix-2 shows the number and population of villages with population of 5000 and over in 1991 and the number of towns having population below 5000. Out of
Details of changes in Jurisdiction
1. Kasaragod district
1384 villages 1259 villages have a population of 5000 and above. In 1991 there is only one town with a population of less than 5000 Le. Kannur cantonment.
Appendix-3 gives houseless and institutional population along with the number of such households.
Changes in jurisdiction since 1981
The present Kerala State was formed on 1 st November 1956 under the State Re-organisation Act by the integration of Malabar district and Kasaragod taluk of South Kanara district of the erstwhile Madras State with Travancore Cochin State (excluding Thovala, Agastheeswaram, Kalkulam, Vilavancode and Shencotta taluks). After its f0n11ation there was no further changes in its jurisdiction at the state level. After 1981 Census two new districts (Kasaragod and Pathanamthitta) and four new taluks (Mallappally, Ranni, Kozhenchery and Adoor) were formed. Details of changes in jurisdiction are as follows:
Notification order No. and date
Kasaragod district was newly formed comprising of Kasaragod and Hosdurg taluks of erstwhile Kannur district.
G.O (MS) No. 520184/RD Dated 19.5.1984 (fom1edon24thMay 1984)
2. Kannur district
Kasaragod and Hosdurg taluks were transferred to the newly formed Kasaragod district.
3. Wayanad district
1. Mananthavady taluk A portion of Kuppathodu village of Manathavady taluk has been transferred to Sultan'S Battery taluk.
2 Vychiri taluk Nadavayai village of Vythiri taluk has been transferred to Sultan's Battery taluk.
:1 Sultan's Battery taluk ~ A portion of Kuppathodu village of Manathavady taluk and
Nadavayal village of Vythiri taluk have been added to Sultan'S Battery taJuk.
4. Kozhikode district
1. Quilandy taluk Velom village of Quilandy taluk was transferred to Badagara tal uk
2 Badagara taluk Velom village of Quilandy taluk was added to Badagara taluk.
11
G.O (MS) No. 520/84/RD Dated 19.5.1984 (fonnedon24thMay 1984)
G.O. (MS) No. 462185IRD Dated 8.5.1985
G.O. (MS) No. 460/8S/RD Dated 8.5. 1985.
Details of changes in Jurisdiction
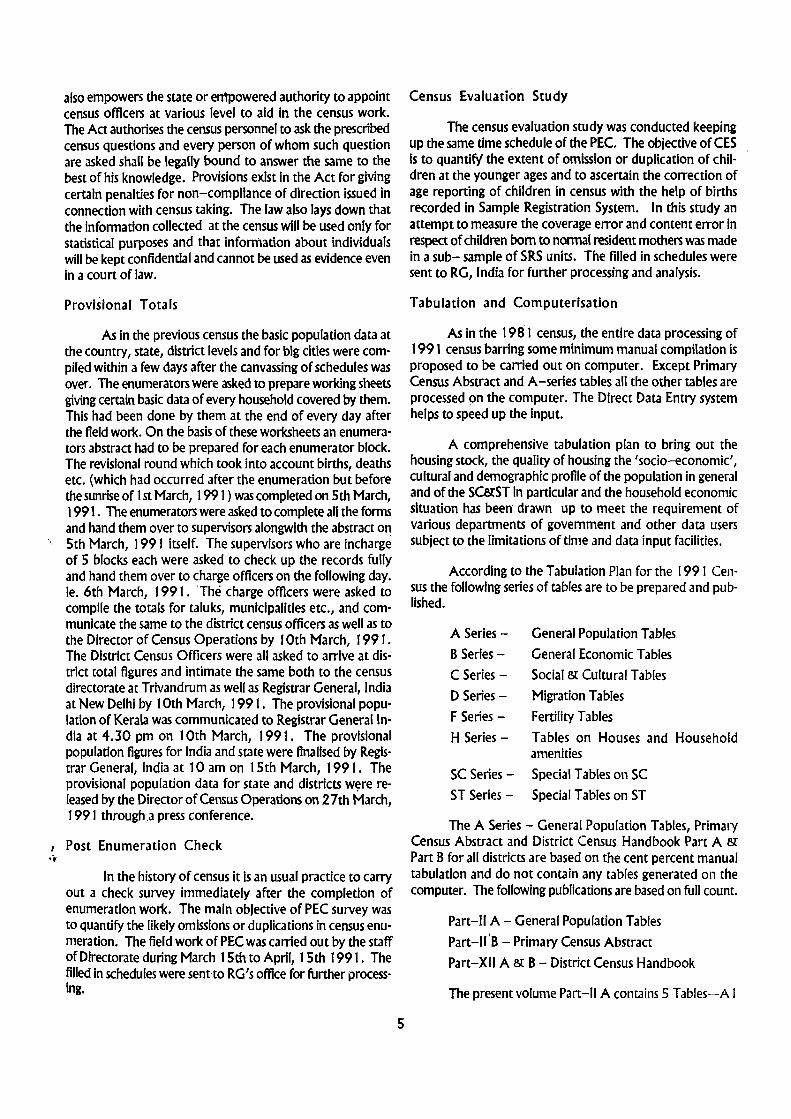
5. Malappuram district
A portion of Karuvarakundu village of Ernad taluk was transferred to Pudur village of Mannarghat taluk of Pal ghat district.
t. Ernad taluk
Notification order No. and date
G.O. (MS) No. 368/83/RD Dated 12.4. t 983
A portion of 505 acres of Karuvarakundu village of Emad taluk was G.O. (MS) No. 368/83/RD transferred to Pudur village of Mannarghat taluk of Pal ghat district. Dated 12.4.1983
6. . Palakkad district
A portion of Karuvarakundu village of ernad taluk of Malappuram Dis- G.O. (MS) No. 368/83/RD trict was added to Pudur village ofMannarghat taluk of Palghat district Dated 12.4. t 983
1. Mannarghat taluk
A portion of 505 acres of Karuvarakundu village of Ernad taluk of G.O. (MS) No. 368/83/RD Malappuram district was added to Pudur village of mannarghat taluk Dated 12.4. t 983. of Palghat district
7. Thrissur district
Kakkanadanthuruthu and Suklanthuruth of Puthenvelikkara village ofParur taluk (area 6.4225 hectares) ofEmakulam district have been added to Methala village of Kodungallurta(uk ofT richur district.
l 1. Kodungallur taluk
Kakkanadanthuruthu and Suklanthuruth of Puthenvelikkara village ofParurtaluk (area 6.4225 Hec) of Emakulam district have been added to Methala village of Kodungallur tal uk of Trichur district.
8. Ernakulam district
Kakkanadanthuruthu and Suklanthuruth of Puthenvelikkara village of Parur taluk have been transferred to Methala village of Kodungallur taluk ofT richur district.
1. Paravur taluk
G.O. (MS) No.881/85/RD 0;tOO20.9.1985
G.O. (MS) No. 881/85/RD Om! 20.9.1985
G.O. (MS) No. 881185IRD Om! 20.9.1985
Kakkanadanthuruthu and Suklanthuruth ofPuthenvelikkara village of G.O.(MS) No. 881/85/RO D<ted20.9.1985 Parur taluk have been transferred to Methala village of Kodungallur taluk of Trichur district.
Portions of Veliyathunadu and Kadungallurkara of Alwayewest village were included in Parur taluk (Office letter No. E 4420/88 dated 26.4.88)
2 Aluva taluk
Some portions of Kombanad village of Kunnathunad taluk (Plantation Corpn. area) was added to Ayyampuzha village. Portion ofVeliyathunadu and Kadungallurkara of Alwayewest village were transferred to Parur tal uk.
12
G.O. No. has not been mentioned.
G.O. No. has not been mentioned.

12·
".
9
Noiwly·lormed Ko.arago<! district compris*<i 10 Kosarogod and
h Hoodurg talule. 01 .rstwhil. "T Kannur district.
IJ\
A p<>rtion 01 KarthlgoppoHy !aluk 01 Alappuzho district transferred to Karunagappoliy toluk 01 Kollam district.
75' EA 5T OF GREENWICH
77·
KERALA ~-JI~r:tCfi #t'lJaTr ~. ql~qrl«t
CHANGES IN ADMINISTRATIVE BOUNDARIES
1981 - 91
KILOMETRES 20 10 0 20 40 60
BOUNDARIES:
STATE IUT. __ _ DISTRICT " ... __ ._._
<
c
12·
n·
Based upon Survey of India map with the permisSIon 01 the Surveyor General of IndIO
The teni~orial waters of looio extend inlo the seQ to Q distance of © Government of IndiaCopyright,1998 twelve nautical miltS_ measured from the appropriate baSI line.


Details of changes in Jurisdiction Notification order No. and date
3. Kunnathunad taluk
Some portion of Kombanad village of Kunnathunad taluk (Plantation Corpn. area) was added to Ayyampuzha village
9. Idukki district
North Pamba Valley area and areas around Sabarimala Sannidhanam of Mlappara village of Peennade taluk were transferred to Ranni taluk ofPathanamthitta district.
I. Peennade taluk
G.O. (MS) No.1 026182IRD Date:l23.1 0.1982.
North Pamba Valley area and areas around Sabarimala Sannidhanam of G.O. (MS) No.1 026/82IRD Date:l29.1 0.1982 Mlappara village were transferred to Ranni taluk of Pathanamthitta district.
10. Kottayam district
I. Meenachil taluk
Kootickal village was transferred from Meenachil taluk to Kanjirapally taluk.
2 Kanjirappally taluk
Kootickal village of Meenachil taluk was added to Kanjirappally ·taluk.
I 1 . Alappuzha district
A portion ofValiya Azheekal kara of Arattupuzha village in Karthigapally taluk has been transferred to Karunagappally taluk of Quilon district and four villages of Chengannur taluk, two villages of Mavelikkara taluk and Thiruvalla taluk as a whole have been transferred to the newly formed Pathanamthitta district
1. Karthigappally taluk
A portion of Valiya Azheekal kara of Arattupuzha village of Karthigappally taluk has been transferred to Karunagappally taluk of Quilon district.
2 Chengannur taluk
Aranmula, Kidangannoor, Mezhuveli and Kulanada villages were transferred to Kozhencherry taluk of Pathanamthitta district.
3. Mavelikkara taluk
Panda lam Thekkakara and Thonnallur villages were transferred to Adoor taluk of Pathanamthitta district.
15
G.O. (MS) No. 608/83/RD Date:lI.6.1983
G.O.(MS) No. 608/83/RD Dated 1.6.1983 and bysubsequentG.O. (MS) No.608/85/RDdated 12.6.1985
G.O. (MS) No. 1026/82IRD Dated 29. 10. 1982.
G.O. (MS) No. I 42185/RD Dated 12.2.1985
G.O. (MS) No. 1026/821RD dated 29.10.82 and G.O. (MS) No. I 028/821RD dated :D1QI982
G.O. (MS) No. 1026/82IRD Dated 29.10.1982.

Details of changes in Jurisdiction
4 Thiruvalla taluk
Thiruvalla taluk as a whole have been transferred to the newly fanned Pachanamchicca district.
1 2. Pathanamthitta district
Pathanamthitta district was newly fanned comprising the portions of Quilon, Alleppey and Idukki Districts.
1. Kozhencherry taluk
Kozhencherry taluk was newly constituted with 1 7 villaged from Pathanamthitta taluk of erstwhile Quilon district and 4 villages from Chengannur taluk of erstwhile Alleppey district.
Notification order No. and date
G.O. (MS) No.1 026182JRD Dated 29. 10. 1982
G.O. (MS) No.1 026/82/RD Dated 29.10.1982.
G.O. (MS) No. 6521831RD Dated 9.6.1983
A portion of Ranni village of Ranni ta[uk has also been transferred G.O. (MS) No.1 026/82/RD to Kozhencherry taluk. D<lEd29.10.1982
2. Ranni t..luk
Ranni taluk was newly constituted with nine villages of Pathanamthitta tal uk of erstwhile Quilon district and one village of Thiruvalla taluk of erstwhile Alleppey district.
North Pamba valley area and area around Sabarimala Sannidhanam ofMlappara village of Peennade taluk of Idukki district was added to Ranni taluk ofPathanamthitta district.
3 Adoor taluk
G.O. (MS) No. 652/83/RD Dated 9.6.1983
G.O.(MS) No.1 026/82/RD D<lEd29.10.1982.
Fonnation of a new taluk by name Adoor consisting of nine villages G.O. (P) No,6521831RD Dated 9.6.1983. from Kunnathur taluk of erst while Quilon district and two villages of Mavelikkara taluk of Alleppey district.
Pallikkal village was transferred from Kunnathur taluk G.O. (P) No. 126/901RD Dated 31.1.1990
4 Thiruvalla taluk
Thiruvalla taluk was re-constituted with nine vj[[ages. One viJ(age G.O. (P) No. 652/83/RD Dated 9.6.1983 transferred to Ranni taluk.
5 Mallappally taluk
Mallappally taluk was constituted with eight villages of fanner Thiruvalb taluk.
1 3. Kollam district
A porrion of Valia Azheekal kara of Arattupuzha village was added from Kanhigappally taluk of Alleppey district to AlJppad village of Karunagappally taluk of Quilon district.
Nine villages were transferred to Newly fanned Pathanamthitta district from Kunnathur taluk of Quilon district.
Kunnathur taluk is re-constituted with nine villages.
16
G.O. (P) No. 6521831RD Dated 9.6.1983
G.O. (MS) No. ) 42/85/RD Dated 12.L. 1985
G.O. (MS) No.1 026/821831RD D<ted29.10.1982.
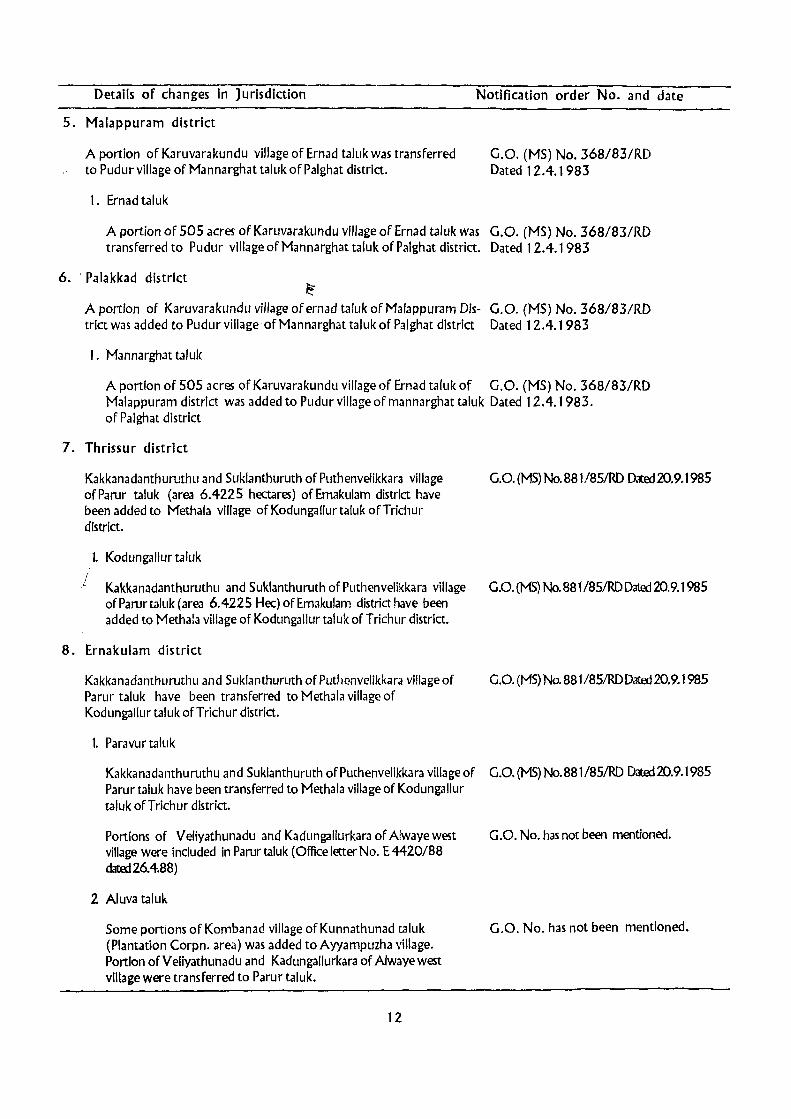
Details of changes in Jurisdiction Notification order No. and date
Pathanamthitta taluk was wholly transferred to newly formed Pathanal11thitta district.
1. Karunagappally taluk
G.O. (P) No. 652183IRD Dated 9.6.1983.
Mynagappally and Thevalakkara villages of Karunagappally taluk has G.O. (P) No. 652183JRD Dated 9.6.1983 been transferred to Kunnathur taluk
Thevalakkara village was re-transferred to Karunagappally taluk.
A portion of Valiya Azheekkal kara of Arattupuzha village in Karthigappally taluk has been transferred to Karunagappally taluk
2. Kunnathur taluk
Kunnathur taluk was reconstituted with nine villages. Nine villages were transferred to newly formed Pathanamthitta district. Thevalakkara village Re-transferred to Karunagappally taluk PaIIikkaI village transferred to Adoor taluk ofPathanamthitta district.
3. Kottarakkara taluk
An area of 110 Hectare 12 Ares 55 mtrs. from Ittiva village have been transferred to Alayamon and Channa petta villages of Pathanapuram taluk.
4 Pathanapuram taluk .
An area of 1 10 Hec.12 Ares 55mtrs. from Ittiva village have been added to Alayamon and Channa petta villages of Pathanapuram taluk.
14 Trivandrum District
G.O (P) No. 953/83/RD Dated 5.10.1983. G.O.{MS)No.142/85/RD Dated 12.2. 1985
G.O (P) No. 652/83/RD Dated 9.6.1983. G.O. (MS) No. 1026/82IRD Dated 29.1 0.1982 G.O.(p) No. 953/83/RD dated 5.10.1983 G.O. (MS) No. 126/90/RD Dated 31.1. 1990.
As per letter No A-4-3700/88 dated 6.5.88(From the Tahsildar Kottarakkara) G.O. has not been mentioned.
As per letter No.A-4-3700/88 dated 6.5.1988. G.O No. has not been mentioned.
No change at district and taluk level
Areas figures
The area figures of state and districts which are in integers are supplied by the Surveyor General of India through the Central Statistical Organisation and taken as such without any change. The tal uk/village/census town/urban outgrowth area figures in hectares are those supplied by the Director of Survey and Land Records of Kerala State. The area figures for statutory towns are those supplied by the local bodies. The area figures of individual towns are given in sq.km. upto 2
decimal places. The rural area figures of state/ districts/taluk are given by subtracting the total urban area of the concerned unit from the total. As the talukwise area figures and district wise area figures are based on two different sources, the area figures of taluks when added up may not tally with the district figures.
17
The following statement gives the district wise area figures supplied by the Surveyor General of I ndia, along with the ranks of each district in respect of area.
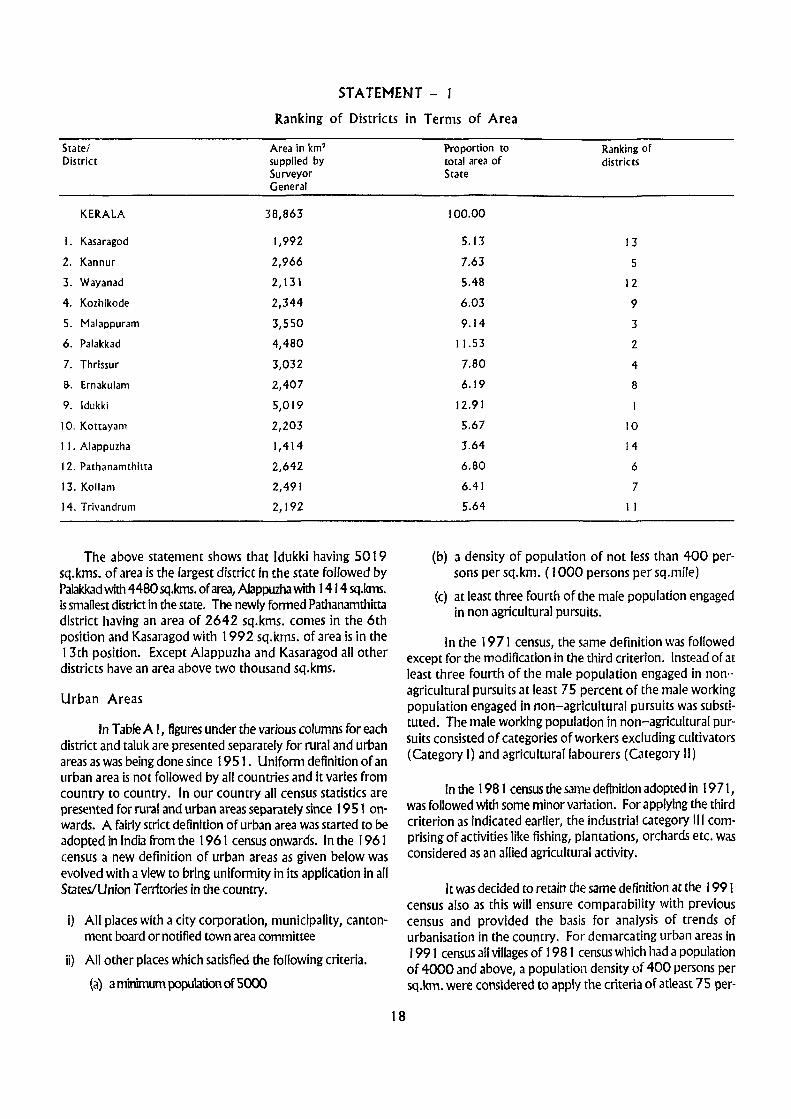
STATEMENT - 1
Ranking of Districts in Terms of Area
State/ District
KERALA
I. Kasaragod
2. Kannur
3. Wayanad
4. Kozhikode
5. Malappuram
6. Palakkad
7. Thrissur
8-. Ernakulam
9. Idukki
10. Kottayam
I I. Alappuzha
12. Pathanamthitta
13. Kollam
14. Trivandrum
Area in km2
supplied by Surveyor General
38,863
1,992
2,966
2,13 t
2,344
3,550
4,480
3,032
2,407
5,019
2,203
1,414
2,642
2,491
2,192
The above statement shows that Idukki having 5019 sq.kms. of area is the largest district In the state followed by Paiakkad with 4480 sq.kms. of area, A1appuzha with 1414 sq.kms. is smallest district in the state. The newly fonned Pathanamthitta district having an area of 2642 sq.kms. comes in the 6th position and Kasaragod with 1992 sq.kms. of area is in the 13th position. Except Alappuzha and Kasaragod all other districts have an area above two thousand sq.kms.
Urban Areas
In Table A I, figures under the various columns for each district and taluk are presented separately for rural and urban areas as was being done since 1951. Unifonn definition of an urban area is not followed by all countries and it varies from country to country. In our country all census statistics are presented for rural and urban areas separately since 1951 onwards. A fairly strict definition of urban area was started to be adopted in India from the 1961 census onwards. In the 1961 census a new definition of urban areas as given below was evolved with a view to bring unifonnity in its application in all States/Union Territories in the country.
i) All places with a city corporation, municipality, cantonment board or notified town area committee
ii) All other places which satisfied the following criteria.
(a) a minimum population of 5000
18
Proportion to total area of State
100.00
5.13
7.63
5.48
6.03
9.14
11.53
7.80
6.19
12.91
5.67
3.64
6.80
6.41
5.64
Ranking of districts
13
5
12
9
3
2
4
8
10
14
6
7
II
(b) a density of population of not less than 400 persons per sq.km. (1000 persons per sq.mile)
(c) at least three fourth of the male population engaged in non agricultural pursuits.
In the 1971 census, the same definition was followed except for the modification in the third criterion. Instead of at least three fourth of the male population engaged in nonagricultural pursuits at least 75 percent of the male working population engaged in non-agricultural pursuits was substituted. The male working population in non-agricultural pursuits consisted of categories of workers excluding cultivators (Category I) and agricultural labourers (Category II)
In the 198 1 census the same definition adopted in 1971, was followed with some minor variation. For applying the third criterion as indicated earlier, the industria! category III comprising of activities like fishing, plantations, orchards etc. was considered as an allied agricultural activity.
Ie was decided to retain the same definition at the 1991 census also as this will ensure comparability with previous census and provided the basis for analysis of trends of urbanisation in the country. For demarcating urban areas in 1991 census aU villages of 1981 census which had a population of 4000 and above, a population density of 400 persons per sq.km. were considered to apply the criteria of atleast 7S per-

cent of male main workers engaged in on agricultural pursuits. Workers in agricultural pursuits included workers in live stock, forestry, fishing, hunting and plantations in category III besides cultivators and agricultural labourers. As the Primary Census Abstract of 1981 census did not give separate figures for industrial category III special tabulation han to be undertaken to ascertain the number of male workers in this category in each village and town.
census towns for the 1 991 census.
The places which were treated as census towns for the first time in 1981 census and did not satisfy the above demographic criteria now, were declassified. The places which were continuing as census towns since 1971 or from earlier censuses were not considered for declassification.
This demographic test was also applied to those towns which had become census towns for the first time in the 1981 census and those towns which were denotified by the concerned authorities after the 1981 census. This was done to find out whether these towns could be considered for retention as
Thus all places which were found to satisfy the prescribed condition were considered as urban and remaining areas were treated as rural. The criteria f9r demarcating urban areas adopted in Indian census from 1891 to 1991 is given below in statement 2 to show the changing definition of urban area.
STATEMENT - 2
Test for Eligibility for Places to be treated as Towns 1891-1991
1991 1981 1971
2 3
1) All places with a municipality, corporation, 1. Municipal Corporation 1. Municipal Corporation cantonment board or notified town area com-mittee or townships etc. 2. Municipal Area 2. Municipal Area
2) All other places which satisfy the following 3. Town Committee 3. Town Committee criteria.
i) A minimum population of 5000 4. Notified Area Committee 4. Notified Area Committee ii) At least 75 percent of male working
population engaged in non-agricultural 5. Cantonment Board 5. Cantonment Board pursuits.
iii) A density of population of at least 400 6. All other Places satisfying 6. Selected places with persons per sq.km. the following criteria Besides, the Directors of Census Operations a) Density of population not less in states/union territories were allowed to ·a) Density of population of than 400 persons per km2
include in consultation with the concerned atleast 400 persons per State Government/Union Territory Administrat- sq.km. (i.e. 1000 persons b) A population of 5000 ion and Census Commissioner of India, some per sq. mile) places having distin'ct urban characteristics b) A minimum population of c) Three fourths of the working as urban even if such places did not strictly 5,000 population should be outside satisfy all the criterion mentioned under c) 75% of the male working agriculture category(2) above. Apart from these the out- population engaged in nan- d) Or any other place, which growths(OG's) of cities and towns have also agricultural (allied) according to the Director been treated as urban, as explained later under activities possesses pronounced urban Urban Agglomeration. characteristics and amenities
19

STATEMENT - 2 (Conrd.)
Test for Eligibility for places to be treated as Towns 1891-1991
1~1
4
1. Municipal Corporation 2. Municipal Area 3. Town Committee 4. Notified Area Committee 5. Cantonment Board 6. Selected places with
1931
5
1. Municipal Corporation 2. Municipal Area 3. Town Area Committee 4. All Civil lines not included in
Municipal limits 5. Cantonment
1941
6
1. Municipal Corporation 2. Municipal Area 3. All Civil lines not
included in Municipal limites
4. Cantonment a) Density of population not less than
1000 persons per sq.mile 6. Test prescribed for distinguishing
towns from villages in different 5. Every continuous collection of houses inhabited by not less
b) A population of 5000 c) Three fourths of the working population
should be working outside agriculture
states were based on ideas common to all states, but they were not identi-
d) Or any other place, which according to the Superintendent of the state possesses pronounced urban characteristics and amenities
cal nor had they been applied with meticulous uniformity. In the case of princely states the definition of town was applied a little indiscriminately
than 5000 persons which the provincial superintendent may decide to treat as a town
1931
7
1. Municipal Corporation 2. Municipal Area 3. All Civil lines not iilcluded
in Municipal limits 4. Cantonment
1921
8
1. Municipal Corporation 2. Municipal Area 3. All Civil lines not included
in Municipal limits 4. Cantonment
5. Every other continuous collection 5. Every other continuous collection of houses inhabited by not of houses, inhabited by not less than 5000 persons which less than 5000 persons which the provincial superintendent may decide to treat as an urban. In making this decision consideration was given to
a) The character of the population
b) Relative density of dwellings
c) Importance in trade historic associations and to avoid treating as towns overgrown viltages without urban characteristics
the provincial superintendent may decide to treat as town for census purpose. In Indian state where there were no municipalities, this definition was required to be extensively applied. Note: In dealing with questions arising under head( 6) the provincial superintendent will have regard to the character of the population the relative density of dwellings, the importance of the place as centre of trade and its historic associations and will bear in mind that it is undesirable to treat as towns overgrown-villages which have no urban characteristics.
20
1911
9
1. Municipal Corporation 2. Municipal Area 3. All Civil lines not included
in Municipal limits 4. Cantonment
5. Every other continuous collection of houses inhabited by not less than 5000 persons, which the provincial superintendent may decide to treat as town for census purposes. Note: However a few places chiefly in native states which did not satisfy the requirements were treated as towns for special purposes. The provincial superintendent were however instructed, when considering the question of treating places as towns on the basis of their population to take care to exclude such as are merely overgrown villages and have no urban features. It is true that the discretion thus allowed has occasionally led to a certain want of uniformity.

STATEMENT - 2 (Contd.)
Test for Bigibility for places to be treated as Towns 1891-1991
1901 1891
10 11
1. Municipal Corporation 1. Munldpal Corporation
2. Munidpal Area 2. Municipal Area of any place brought under some similar
3. All Ovllllnes not included regulation for police or sanitary purpose In Municipal limits 3. Cantonment
4. Cantonment 4. a) Every place where the proportion of the trading and 5. Every other continuous collection of houses perma- industrial population to the total Is equal to or
nently Inhabited by not less than 5000 persons which greater than that of the agricultural population. the provincial superintendent may decide to treat as b) Every other continuous group of houses inhabited by a town for census purposes not less than 5000 people
Statement-3 below gives the progress in the number of towns in the state and districts between 1901 and 1991.
STATEMENT - 3
Progress in the Number of Towns 1901 - 1991
State/District 1991 1981 1971 1961 1951 1941 1931 1921 1911 1901
2 3 4 5 6 7 8 9 10 11
KERALA 197(65) 106(48) 88(32) 92(30) 94(25) 62(23) 53(23) 44(23) 27(14) 21(9)
I. Kasaragod 6(2) 1 (1) 5(1) 5(-) 2(-) 1(-) 1(-) 1 (-) 1(-)
2. Kannur 45(7) 25(3) 8(3) 13(3) 2(2) .2(2) 2(2) 2(2) 2(2) 2(2)
3. Wayanad 1(1)
4. Kozhikode 18(2) 6(2) 10(2) 13(2) 4( 1) 4(1) 2( 1) 2(1) 2( 1) 2( 1)
5. Malappuram 5(5) 4(4) 5(1) 5(-) 4(-) 4(-) 2(-) 2(-) 2(-) 1(-)
6. Palakkad 9(5) 4(3) 8(2) 6(2) 9(2) 6(3) 3(2) 3(2) 4( 1) 3( 1)
7. Thrissur 40(7) 25(7) 9(5) 7(3) 10(3) 8(2) 6(1) 4(1) 3( 1) 3(-)
8. Emakulam 28(12) 16(8) 11(5) 12(7) 13(5) 9(5) 9(5) 7(5) 6(4) 4( 1)
9. Idukki 2(2) 2(2} 2(-} 4(-} 1(-} 1 (-)
10. Kottayam 8(5) 4(4) 8(4} 7(4) 10(4) 6(3) 6(3) 5(3) 2(1) 2( 1)
11. Alappuzha 14(5) 6(5) 6(4) 6(4) 7(3) 7(2) 7(4} 6(4) 2(2) 2( 1)
12. Pathanamthitta 4(4) 2(2) 2( 1) 2( 1) 5(1) 2( 1) 2( 1) 1 (1) 1(-)
13. Kollam 7(3) 5(2) 4( I} 3{ I} 6{ t) 4{1) 4{l} 4{1) l{ I) I { 1 }
1 4. Trivandrum 10{5) 6{5) 10(3) 13{3) 18(3) 8(3) 8(3) 7(3) l{ t) 1 (1)
Note: Number of Statutory towns are given within brackets.
21

From the Statement 3 it can be seen that the number Among the districts,the maximum increase in number of towns in Kerala has increased ten times since 1901. The of towns(20) during the last decade 1981-91 is in Kannur. number of statutory towns (Corporations, municipalities, can- Next comes Thrissur with 1 5, followed by Ernakulam with tonment, township etc.) also increased from 9 in 1901 to 12. Except Idukki all other districts have increase in the 65 in 1991. Till 199 t census Wayanad district had no town. number of towns. In total number of towns in 1991 Kannur In 1991 census Wayanad has one town viz. Kalpetta munici- comes first with 45, followed by Thrissur(40) and pality which is a statutory town. Significant increase in the Ernakulam(28). Number of statutory towns is highest in number of towns may be seen in the t 921, 195 t, 1981 Ernakulam( 12). Kannur and Thrissur comes in second and t 991 censuses. The adoption of a fairly strict definition position with 7 towns followed by Malappuram, Palakkad, of an urban area since 1961 census resulted in the Kottayam, Alappuzha and Trivandrum with 5 towns each. declassification of some towns of earlier census as rural ar- Out of 1 8 towns in Kozhikode only two are statutory towns. eas and recognition of new places as towns. This is reflected There is no change in the number of statutory towns in in the number of towns since 1961. The last decade 1981- Kozhikode, Thrissur, Idukki, Alappuzha and Trivandrum dis-91 witnessed the formation of largest number of 1 7 munici- tricts during the last decade 1 98 1 -91 . pal towns in the state. There were significant increase in number of statutory towns during 1911-21 and 1971-81 The statement 4 gives the progress in urban popula-also. tion of the state and district from 1901.
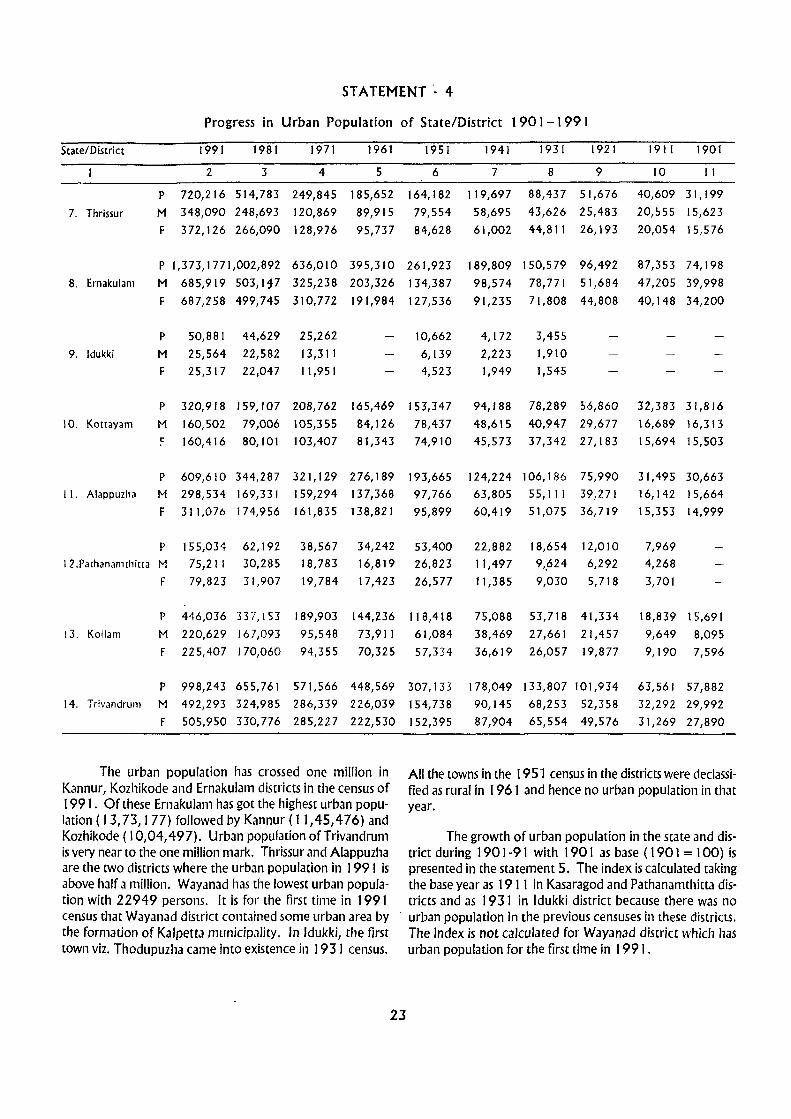
STATEMENT - 4
Progress in Urban Population of State/District 190 t --1 991
State/District 1991 1981 1971 1961 1951 1941 1931 1921 1911 1901
2 3 4 5 6 7 8 9 10 II
P 7,680,294 4,771,275 3,466,449 2,554,141 1,825,832 1,195,550 916,330 680,900 524,661 454,499
KERAlA M 3,776,207 2,360,350 1,735,501 1,282,759 916,671 604,130 466,646 347,824 268,100 232,753
F 3,904,087 2,410,925 1,730,948 1,271,382 909,161 591,420 449,684 333,076 256,561 221,746
P 176,226 43,137 113,929 88,924 42,013 11,566 9,169 7,314 8,295
I. Kasaragod M 86,155 21,448 56,662 43,716 20,585 5,892 4,611 3,755 4,153
F 90,071 21,689 57,267 45,208 21,428 5,674 4,558 3,559 4,142
P 1,145,476 612,659 210,975 211,193 82,471 70,969 64,585 55,281 58,215 55,694
2. Kannur M 553,225 300,569 105,129 105,626 40,052 35,153 31,145 26,249 28,S 16 27,368
F 592,251 312,090 105,846 105,567 42,419 35,816 33,440 29,032 29,699 28,326
P 22,949
3. Wayanad M 11,784
F 11,165
P 1,004,497 610,232 561,570 379,519 228,152 163,238 110,532 92,138 89,566 88,300
4. Kozhikode M 496,382 303,874 281,555 191,402 114,337 82,137 56,786 47,502 46,387 45,872
F 508,115 306,358 280,015 188,117 113,815 81,101 53,746 44,636 43,179 42,428
P 282,454 177,774 124,852 75,965 63,676 42,244 25,427 21,536 22,393 10,562
5. Malappuram M 138,862 87,748 61,487 36,955 30,969 20,390 12,256 10,578 11,058 5,281
F 143,592 90,026 63,365 39,010 32,707 21,854 13,171 10,958 11,335 5,281
P 374,577 206,669 214,079 148,873 146,790 99,424 73,492 68,335 63,983 58,494
6. Palakkad M 183,057 101,589 105,931 73,556 71,800 48,535 35,945 33,518 31,186 28,547
F 191,520 - 105,080 108,148 75,317 74,990 50,889 37,547 34,817 32,797 29,947
22
STATEMENT '- 4
Progress in Urban Population of State/District 1901-1991
State/District 1991 1981 1971 1961 1951 1941 1931 1921 1911 1901
2 3 4 5 6 7 8 9 10 II
P 720,216 514,783 249,845 185,652 164,182 119,697 88,437 51,676 40,609 31,199
7. Thrissur M 348,090 248,693 120,869 89,915 79,554 58,695 43,626 25,483 20,555 15,623
F 372,126 266,090 128,976 95,737 84,628 61,002 44,811 26,193 20,054 15,576
P 1,373,1771,002,892 636,010 395,310 261,923 189,809 150,579 96,492 87,353 74,198
8. Ernakulam M 685,919 503,117 325,238 203,326 134,387 98,574 78,771 51,684 47,205 39,998
F 687,258 499,745 310,772 191,984 127,536 91,235 71,808 44,808 40,148 34,200
P 50,881 44,629 25,262 10,662 4,172 3,455
9. Idukki M 25,564 22,582 13,311 6,139 2,223 1,910
F 25,317 22,047 11,951 4,523 1,949 1,545
P 320,918 159,107 208,762 165,469 153,347 94,188 78,289 56,860 32,383 31,816
10. Kottayam M 160,502 79,006 105,355 84,126 78,437 48,615 40,947 29,677 16,689 16,313
!= 160,416 80,101 103,407 81,343 74,910 45,573 37,342 27,183 15,694 15,503
P 609,610 344,287 321,129 276,189 193,665 124,224 106,186 75,990 31,495 30,663
I I. Alappuzha M 298,534 169,331 159,294 137,368 97,766 63,805 55, III 39,271 16,142 15,664
F 311,076 174,956 161,835 138,821 95,899 60,419 51,075 36,719 15,353 14,999
P 155,034 62,192 38,567 34,242 53,400 22,882 18,654 12,010 7,969
J 2.Pathanamthitta M 75,211 30,285 18,783 16,819 26,823 11,497 9,.624 6,292 4,268
F 79,823 31,907 19,784 17,423 26,577 11,385 9,030 5,718 3,701
P 446,036 337,153 189,903 144,236 118,418 75,088 53,718 41,334 18,839 15,691
13. Kollam M 220,629 167,093 95,548 73,911 61,084 38,469 27,661 21,457 9,649 8,095
F 225,407 170,060 94,355 70,325 57,334 36,619 26,057 19,877 9,190 7,596
P 998,243 655,761 571,566 448,569 307,133 178,049 133,807 101,934 63,561 57,882 14. Trivandrum M 492,293 324,985 286,339 226,039 154,738 90,145 68,253 52,358 32,292 29,992
F 505,950 330,776 285,227 222,530 152,395 87,904 65,554 49,576 31,269 27,890
The urban population has crossed one million in All the towns in the 1951 census in the districts were declassi-Kannur, Kozhikode and Ernakulam districts in the census of fied as rural in 1 96 1 and hence no urban population in that 1991. Of these Ernakulam has got the highest urban popu- year. lation (13,73,177) followed by Kannur (11,45,476) and Kozhikode (10,04,497). Urban population ofTrivandrum The growth of urban population in the state and dis-is very near to the one million mark. Thrissur and Alappuzha trict during 190 t -9 t with t 90 t as base (t 90 1 = 100) is are the two districts where the urban population in 1991 is presented in the statement 5. The index is calculated taking above half a million. Wayanad has the lowest urban popula- the base year as t 9 t 1 in Kasaragod and Pathanamthitta dis-tion with 22949 persons. It is for the first time in t 991 tricts and as 1931 in Idukki district because there was no census that Wayanad district contained some urban area by . urban population in the previous censuses in these districts. the formation of Kalpetta municipality. In Idukki, the first The index is not calculated for Wayanad district which has town viz. Thodupuzha came into existence in 1931 census. urban population for the first time in 1991.
23

STATEMENT - 5
Indices of Growth of Urban Population of State/District 1901-1991
State/District 1991 1981 1971 1961 1951 1941 1931 1921 1911 1901
2 3 4 5 6 7 8 9 10 11
KERALA 1,690 1,050 763 562 402 263 202 150 lIS 100 1. Kasaragod 2,124 520 1,373 1,072 506 139 111 88 100
2. Kannur 2,057 1,100 379 380 148 127 116 99 lOS 100
3. Wayanad 100
4. Kozhikode 1,138 691 6J6 4JO 258 185 125 104 101 100
5. Malappuram 2,674 1,683 1,182 719 603 400 241 204 212 100
6. Palakkad 640 353 366 255 251 170 126 117 109 100
7. Thrissur 2,308 1,650 801 595 526 384 283 166 130 100
8. Ernakulam 1,851 1,352 857 533 353 256 203 130 118 100
9. Idukki 1,473 1,292 731 J09 121 100 10. Kottayam 1,009 500 656 520 482 296 246 179 102 lOa
11. Alappuzha 1,988 1,123 1,047 901 632 405 346 248 103 100 12. Pathanamthitta 1,945 779 484 4JO 670 287 234 151 100
13. Kollam 2,843 2,149 1,210 919 755 479 342 263 120 100
14. Trivandrum 1,725 1,133 987 775 531 308 231 176 110 100
The urban index has steadily increased in the state and District wise number and population of places not treated as gone upto 1690 in 1991. From the above statement it is towns in 1981 but treated as such in 1991 are given in the also seen Chat almost all districts have shown considerable statement 6 classified according to different population sizes. increase in urban population during the decade 1981-91. Kollam district has got the largest index of growth during Class I (Known as cities) population 1,00,000 and 1901-81 with 2843 in 1991 followed by above. Malappuram(2674), Thrissur(2308), Kasaragod(2124) and Class II " 50,000 - 99,999 Kannur( 20 5 7}. All dle odler districts have an index of growth Class III " 20,000 - 49,999 below 2000. Palakkad district has the lowest index(640) Class IV " 10,000 - 19,999
Class V " 5,000 - 9,999 New towns in 1991 Census Class VI " less than 5,000
92 towns were newly added in the 1991 census.
ST A TEMENT - 6 Number and Population of Places not Treated as Towns in 1981 but Treated as such in 1991
Arranged by Districts and Size Class State/District Total Class I Class II Class III Class IV Class V Class VI
No. Popu- No. Popu- No. Popu- No. Popu- No. Popu- No. Popu- No. Popu-lation lation lation lation lation lation lation
2 3 4 5 6 7 8 9 10 11 12 13 14 15
KERAlA 92 2,150,419 3 177,594 48 1,413,306 29 466,385 12 93,134
1. Kasaragod 5 126,100 57,165 2 47,165 13,884 7,886
2. Kannur 20 448,316 64,032 6 177,551 13 206,733
3. Wayanad 22,949 22,949
4. Kozhikode 12 314,491 9 262,385 J 52,106
S. Malappuram I 39,027 1 39,027
6. Palakkad 5 119,657 2 70,230 3 49,427
7. Thrissur 15 149,532 I 23,510 3 40,774 II 85,248
8. Ernakulam 12 334,871 56,397 8 22-4,734 3 53,740
9. Idukki
24

rJ
.-f -9
4-"f
)'-
"f
""'HE (POND/CHERRy)
('
7
-f.
~
-:s:
'Y
d
~
~
~
"13
PERCENTAGE OF URBAN POPULATION TO TOTAl POPULATION
~
60·01 So ABOVE
40·01 60'00
25·01 - 40·00. STATE AVERAGE 26·39'
15·01 - 25'00
15·00
10·00 & BELOW
of'
EI'ITIRELY RURAL ~",,~,~:, '\ '.
""\. ; .( .... -
.. EAST OF GREENWICH
..,
KERALA Vidl(lll \J1crt~{olll
URBAN POPULATION 1991
KILOMETRES 20 10 0 ZO 40 60
BOUNDARIES:
STATE/U.l ...... _._._ DiSTRiCT .......... _._._
TALUK ............................. _
-.1
<
o
c
9"
Based upon Survey of India map with the permission of the Sur~yor General of India
TI)c ferritorial waters of India .. tend into the sea to a distance 01 © Government of IndioCopyrighl.199f twelvc l'\Quticoi miles measured from the appropriatf: bose line.


State/District Total
No. Popu-lation
Class I
No. Popu-lation
Class II
~Popuiation
Class III Class IV
},]o. Popu-:- No. Popu-!ation lation
Class V
No. Popu-lation
Cias~ VI
No. Population ----.. ----~.---- .. ----. ----------_
2 3 4 5 6 i --.--.---10. KotlaYJI11 4 135,170
1 I. Ai311Puz'n 9 217,246
12. Palil.ll1all1thltta 2 64,372
13. Kollam 2 56,773
14. Trivandrum 4 121,915
Rural Areas
As mentioned earlier it is a census tradition to present data by rural/urban break-up. By rural population we generally mean the population living in villages. The village generaHy foHows the limits of a revenue village which is recognised by the normal district administration. In ail the censuses urban area is defined and residuary area is considered as rural. The Kerala village has little resemblance to its counter part in the rest of the country. The isolated hamlet type setting is rarely seen in this state, except in some pocke~ In the dense forests, estates or in plantation areas. Most part of the state are inhabited and the settlement is almost continuous making it difficult to mark out a village or town from its adjoining villages or town.
Many of the revenue villages had sub-divisions known as desom in Malabar region, muri in Cochin region Jnd kara in Travancore region. In the Malabar Jrea de50m was reeogr:ised as Census villages in earlier census except in 1872 and 1881. In the former Cochin State, in all Censuses prior to 1 91 I, the census village was muri and from 1 91 1 onwards revenue village was the census village. Exc€pt in the 1891 census kara was recognised as the census villages in the Travancore area. In the 196 I census, a uniform definition was followed and the revenue village was treated as
8 9 10 11 12 13 14 15 -_.-«----4 135,170
6 167,525 3 49,721
2 64;37L
2 56,773
4 121,915
Census village and this concept was followed in the subsequent censuses. However the concept of desom/kara had not been completely abandoned and the Primar; Census Abstract was prepared for karas/murisl desoms also during I 961 to 1 98 1 as in reality these smaller units were comparable in size with the villages in the res[ of the country. But considering the growing importance of Panchayat Raj system it was decided to publish PanchaY;l[ ward wise figures in 1991 census abandoning karas/murisl desoms. Revenue village was adopted as Census villages in 1991 census. However in some districts like Kasaragod and Thrissur while groups of several smaller villages formed the reVEnue villages in the census, each of those small villages were treated as separate village. Consequently the number of revenue villages and census villages did not tally. Against 1452 revenue villages in the state in 1 991 there are 1640 villages in the census, Of these 256 villages .:e wholly in urban areas and 76 villages partly in rural and partly in urban areas.
Thus tIle rural areas compri~ed of 1 308 whole villages and portion of 76 villages lying outside towns. Many "evenue villages of 1981 were bifurcated in 1991. Total number of villages increased from 133 J in 1981 to 1640 in 1991, mainly due to the bifurcation of 1981 villages. The statement 7 gives the district wise number of raluks, CD blocks, viilages and towns in 1 991 .
STATEM£NT - 7 State-wise/District-wise Number of Taluks, CD Blocks, Villages and Towns in 1991
State/ Total No. of Total No. Total 'No of un- 1'.Ja. ·)f vili3ges in- No of No. of District taluks of CD No. of inhabited !;;.llJQ~.d 1 u_lQWill inhabited Towns
Blocks villages villages Fully Partly villages (rural)
2 3 4 5 6 7 8 9
KERALA 61- 151 1,640 256 76 1,384 197 1. KasJragod 2 4 127 11 ]16 6 2_ Kannllr 3 9 129 51 78 45 3. Wayal1ad 3 3 49 1 48 4. Kozhikode 3 12 117 30 87 18 5. Malappuram 4 14 135 12 1 123 5 6. PalakkJd 5 12 169 14 4 155 9 7. ThrissJr 5 17 254 45 9 209 40 8. Ernakularn 7 15 123 34 8 89 28 9. Idukki 4 8 65 7 6S 2 10. Kottayam 5 1 I 95 5 13 90 8 J t. Alappuzha 6 12 91 16 12 75 14 12. Pathanam,hitta 5 9 68 4 4 64 4 13. Kollam 5 13 103 11 2 92 7 14. Trivandrurn 4 12 115 22 16 93 10
27

Thrissil district has highest number of 209 census villages followed by Palakkad with 155 villages, Malappuram with 123 villages and Kasaragod with \ 16 villages. In the remaining districts the number of villages are below one hundred and the lowest number of 48 viilages is in Wayanad district. Out of the 256 villages fully included in towns one
fifth (51 villages) is in Kannur district, 45 villages in Thrissur and 34 in Ernakulam district.
The number of inhabited villages at each census from 1 901 to 1991 in rural areas of the state is given in the statement 8.
STATEMENT - 8
Number of Inhabited Villages at each Census 1 901-1991 Census Year
1901 1911 1921 1931 1941 1951 1961 1971 1981 1991
It nny be seen that there is an unusual decrease in the number of villages in 1961 from 1951. The main reason is that from 1 96 1 onwards revenue villages were uniformly adopted as census villages whereas in previous censuses no such unifol111 definition was followed and karas/muris/ desoms were also treated JS census villages. There is an increase in the r.un·;ber of villages during 1981-91. This is mainly due
28
No. of inhabited villages
5,725
5,383
5,362
4.910 4,35S
4,618
1,573 1,268
1,219 1,384
to the bifurcation of villages. In Kasaragod taluk while grouped villages were treated as censlIs villages in 1981, in 1991 census each of the constituent villages of the group were treated as census villages. This also had contributed to increase in number of villages. The rural populJtion of the state and district from J 90 1 to 199 t is given in statement 9.

STATEMENT· 9 Progress in Rural Population of State/Districts 1901·1991
State/District 1991 1981 1971 1961 1951 1941 1931 1921 1911 1901
2 3 4 5 6 7 8 9 10 II
P 21,418,224 20,682,405 17,880,926 14,349,574 11,723,286 9,835,991 8,590,720 7,121,227 M23,012 5,941,763
KERALA M 10,512,788 10,167,417 8,852,350 7,079,168 5,765,230 4,839,166 4,236,305 3,531,634 3,291,325 2,958,713
F 10,905,436 10,514,988 9,028,576 7,270,406 5,958,056 4,996,825 4,354,415 3,589,593 3,331,687 2,983,050
p 895,282 829,604 569,091 423,222 369,018 330,735 292,874 249,617 239,172 231,280
I. Kasaragod M 442,648 410,577 285,197 209,030 180,342 161,947 143,444 121,564 116,373 112,299
452,634 419,027 283,894 214,192 188,676 168,788 149,430 128,053 122,799 118,981
P 1,106,251 1,318,067 1,341,834 966,755 821,999 672,353 598,130 523,399 507,046 473,929
2. Kannur M 545,613 645,984 658,739 469,566 396,102 317,060 283,533 246,546 243,431 229,710
F 560,638 672,083 683,095 497,189 425,897 355,293 314,597 276,853 263,615 244,219
P 649,179 554,026 413,850 275,255 169,280 106,350 91,769 84,771 82,549 75,149
3. Wayanad M 330,174 284,261 215,338 144,635 92,099 57,952 50,877 47,473 45,489 41,632
319,005 269,765 198,512 130,620 77,181 48,398 40,892 37,298 37,060 33,517
P 1,615,444 1,635,033 1,260,164 1,023,894 888,239 728,840 686,349 585,984 565,280 521,758
4. Kozhikode M 796,383 807,535 627,482 507,986 438,692 354,366 335,331 285,269 277,510 257,790
F 819,061 827,498 632,682 515,908 449,547 374,474 351,018 300,715 287,770 263,968
P 2,813,876 2,224,927 1,731,505 1,311,405 1,086,042 934,841 849,077 742,602 725,536 671,589
5. Malappu ram M 1,369,418 1,083,030 848,023 637,382 528,562 453,372 412,567 364,588 359,145 332,936
F 1,444,458 1,141,897 883,482 674,023 557,480 481,469 436,510 378,OH 366,391 338,653
P 2,007,658 1,837,730 1,471,268 1,220,635 1,067,418 925,634 867,794 785,653 755,743 705,423
6. Palakkad M 972,765 892,607 713,645 585,661 510,588 444,460 416,825 379,263 367,273 345,536
F 1,034,893 945,123 757,623 634,974 556,830 481,174 450,969 406,390 388,470 359,887
P 2,017,095 1,92~,850 1,879,032 1,502,681 1,238,968 1,034,901 905,476 762,082 729,093 652,067
7. Thrlssur M 964,593 913,026 901,945 716,723 586,910 495,923 435,463 371,304 362,627 325,397
F 1,052,502 1,011,824 977,087 785,958 652,058 538,978 470,013 390,778 366,466 326,670
P 1,444,059 1,532,312 1,527,584 1,303,203 1,131,756 982,483 832,152 692,819 647,914 572,037
8. Ernakulam M 722,730 765,983 763,154 646,329 559,729 489,114 413,988 349,154 322,205 285,539
F 721,329 766,329 764,430 656,874 572,027 493,369 418,164 343,665 325)09 286,498

STATEMENT . 9
Progress in Rural Population of State/Districts 1901·1991 State/District 1991 1981 1971 1961 1951 1941 1931 1921 1911 1901
2 3 4 6 7 8 9 10 11
P 1,027,185 924,663 740,130 579,071 320,760 240,124 184,225 108,751 99,564 47,666
9, Idukki M 520,308 471,210 381,867 302,462 167,491 128,063 100,448 58,765 54,050 25,928
f 506,877 453,453 358,263 276,609 153,269 112,061 83,777 49,886 45,514 21,738
P 1,507,353 1,538,335 1,330,268 1,148,514 979,131 848,711 696,780 528,618 455,657 418,799
10, Kottayam M 752,358 769,456 667,827 576,911 491,565 430,903 353,287 270,958 231,112 213,025
f 754,995 768,879 662,441 571,603 487,566 417,808 343,493 257,660 224,545 205,774
P 1,391,607 1,521,168 1,350,157 1,128,080 972,180 858,960 759,036 617,548 553,599 478,882
11 , Alappuzha M 677,351 743,557 665,843 555,640 478,757 426,942 378,222 310,009 278,319 240,874
f 714,256 777,611 684,314 572,440 493,423 432,018 380,814 307,539 275,280 238,008
P 1,033,298 1,063,153 989,641 854,030 665,872 553,554 459,691 363,925 309,103 276,251
12, Palhanamthitta M 500,965 517,067 490,434 424,867 333,484 278,808 232,564 186,547 155,275 139,071
f 532,333 546,086 499,207 429,163 332,388 274,746 227,127 177,378 153,828 137,180
t.I P 1,961,530 1,838,186 1,649,362 1,316,867 991,944 781,497 644,323 510,999 446,845 390,322
o 13. Kollam M 962,181 908,959 824,019 658,131 494,983 387,070 320,250 256,174 224,612 196,276
F 999,349 929,227 825,343 658,736 496,961 394,427 324,073 254,825 222,233 194,046
P 1,948,407 1,940,351 1,627,040 1,295,962 1,020,679 837,008 723,044 564,459 505,911 426,611
14, TrivI1ntirum M 955,301 954,165 808,837 643,845 505,926 413,186 359,506 284,020 253,904 212,700
f 993,106 986,186 818,203 652,117 514,753 423,822 363,538 280,439 252,007 213,911
From the statement 9 it is observed that the rural population of the state has consistently increased from census to census. During the last 90 years the rural population has increased by 240.67 percent i.e. from 5941763 in 1901 to 21418224 in 1991. Consistent increase in the rural population from Census to Census has been observed in the districts of Kasaragod, Wayanad, Malappuram, Palakkad, Thrissur, Idukki, Kollam and Trivandrum. The decrease in rural population from 1981 to 1991 in the other districts is because several rural areas of 1981 in these districts were treated as towns in 1 991 census.
Density per sq.km
Column 4 of table A 1 gives the number of persons per sq.km. The density for urban areas of districts and taluks have been worked out by using the area figures corrected upto two decimal places obtained by adding the area of individual towns in the respective units.
Census houses and households
Column 8 and 9 of Table A 1 give the number of occupied residential houses and households. Occupied residential houses are census houses which are used wholly or partly for the purpose of residence by one or more households. At the 1991 census the following definition were adopted for census houses and census households.
Census House
A Census house is a building or part of a building having a separate main entrance from the roa'd or common court yard or staircase etc. used for or recognised as a separate unit. It may be occupied or vacant .. It may be used for residential or non residential purpose or both. If a building has a number of flats or blocks which are independent of one another having separate entrances of their own from the road or common courtyard leading to a main gate, they are considered as separate census houses. If within a large enclosed area there are separate buildings then each such bllilding is
31
taken as a separate census house. If all the structures within an enclosed compound are together treated as one building, then each such structure with a separate entrance is treated as a separate census house.
The figures of occupied residential houses shown in table A-I are those of census houses actually used for the purpose of residence (dwelling) alone or for residence in combination with other uses on the day of enumeration. Thus apart from the residential houses, the number of occupied residential houses include workshops, garages, shops, depots etc. where one or more persons were found to be residing at the time of enumeration. This does not include the houses which were vacant or used exclusively for non residential purposes.
Census household
A household is a group of persons who commonly live together and would take their meals from a common kitchen unless the exigencies of work prevented any of them from doing so. There may be a household of persons related by blood or a household of unrelated persons or having mix of both. Examples of unrelated households are boarding houses, messes, hostels, residential hotels, rescue homes, jails, ashram etc. These are called institutional households. There may be one member households, two member households, or multi member households. For census purpose each one of these types is regarded as a household. If a group of persons who are unrelated to each other live in census house but do not take their meals from a common kitchen, they would not constitute an institutional household. Each such person will be treated as a separate single member household. The important factor in deciding whether a group of persons living together constitute a household or not in a common kitchen.
Statement 10 gives the number of persons per 100 occupied residential houses, number of persons per 100 households, sex ratio, percentage of rural and urban population to total population in state and districts.

STATEMENT - 10
Persons per 100 Occupied Residential Census Houses and per 100 Households, Number of Females per 100 Males, Percentage of Rural and Urban Population to Total Population in State/Districts
Persons per 100 Persons per 100 No. of females Percentage of Rural and
State/District occupied residential households
census houses
T R U T R
2 3 4 5 6
KERAlA 533 525 555 528 522
1. Kasaragod 594 592 602 590 589
2. Kannur 612 577 651 607 573
3. Wayanad 505 505 492 499 500
4. Kozhikode 580 553 629 574 551
5. Malappuram 651 650 664 649 648
6. Palakkad 543 541 553 535 535
7. Thrissur 528 525 539 524 522
8. Ernakulam 513 507 520 507 505
9. Idukki 466 465 491 463 462
10. Kottayam 508 506 519 S05 504
11. Alappuzha 497 490 513 494 488
12. Pathanamthitta 459 457 475 458 456
13. Kollam 496 488 537 492 485
14. Trivandrum 486 478 503 476 471
The average number of persons per 100 census houses in 1991 in the state is 533. There are 555 persons in 100 houses in urban areas against 525 persons in rural areas. In
. 1981 the average number of persons per tOO census houses in the state was 592. It was 583 and 638 respectively in rural and urban areas. This indicated that the congestion in residential houses has decreased during the decade. In the districts of Kasaragod, Kannur, Kozhikode, Malappuram and Palakkad the number of persons per 100 occupied residential census houses are above the state average where as in the rest of the districts it is below state average. Generally in northern districts it is above the state average while in the southern districts it is below the state average.
The number of persons per 1 00 households on an average for the state is 528 for total, 522 for rural and 544 for urban areas. Thus average size of the household in the state is 5.28. As in the case of number of persons per residential house the northern districts excluding Wayanad having household size above state average while southern districts have household size below state average.
The average sex ratio of Kerala is t 036 females for 1000 males. It is 1037 in rural areas and 1034 in urban areas. Amongst the district the highest sex ratio 1085 is in Thr!ssur district as Jgainst the lowest sex ratio of 966 in Wayanad district Only in Wayanad and Idukki districts males out number females. In the rural areas of Ernakulam and urban areas of Kor~Jyam also males out number females. In the rural areas the highest sex ratio of 1091 is noticed in
per 1 000 males urban population to total
population
U T R U T R U
7 8 9 10 11 12 13
544 1,036 1,037 1,034 100 73.61 26.39
596 1,026 1,023 1,045 100 83.55 16.45
643 1,049 1,028 1,071 100 49.13 50.87
485 966 966 947 100 96.59 3.41
614 1,027 1,028 1,024 100 61.66 38.34
657 1,053 1,055 1,034 100 90.88 9.12
538 1,061 1,064 1,046 100 84.28 15.72
532 1,085 1,091 1,069 100 73.69 26.31
509 1,000 998 1,002 100 51.26 48.74
484 975 974 990 100 95.28 4.72
511 1,003 1,004 999 100 82.45 17.SS
508 1,051 1,054 1,042 100 69.S4 30.46
472 1,062 1,063 1,061 100 86.95 13.05
523 1,035 1,039 1,022 100 81.47 18.53
485 1,036 1,040 1,028 100 66.12 33.88
Thrissur district while in urban areas the highest sex ratio of 1071 is in Kannur district. It is observed that Kannur district has the highest percentage of urban population of 50.87 percent as against the lowest 3.41 percent in Wayanad district. Kannur is the only district in the state where more than 50 percent of the population live in urban areas. Except Kannur in all other districts the percentage of rural population is well above 50 percent of total population.
Presentation of data
In the presentation of figures of urban areas of Table A-1, the following procedure has been followed. This was necessitated due to the formation of Urban Agglomeration(UA) by including statutory towns, census towns, urban outgrowths etc.
1 ) If there is no UA, the presentation of data for towns is strictly in accordance with the location code order.
2) If there is an UA which falls entirely in a talJk, then the figures of UA is given first for the core town followed by its constituent units in the order of location code. For other towns (not covered in th" '_';A) the order of the location code is followed.
3) If the UA falls in more than one taluk the figures of individual towns are given in the order of location codes. However suitable foot note indicating the name of UA in which the town forms part, is given besides giving the-figures of UA in the annexure.
32
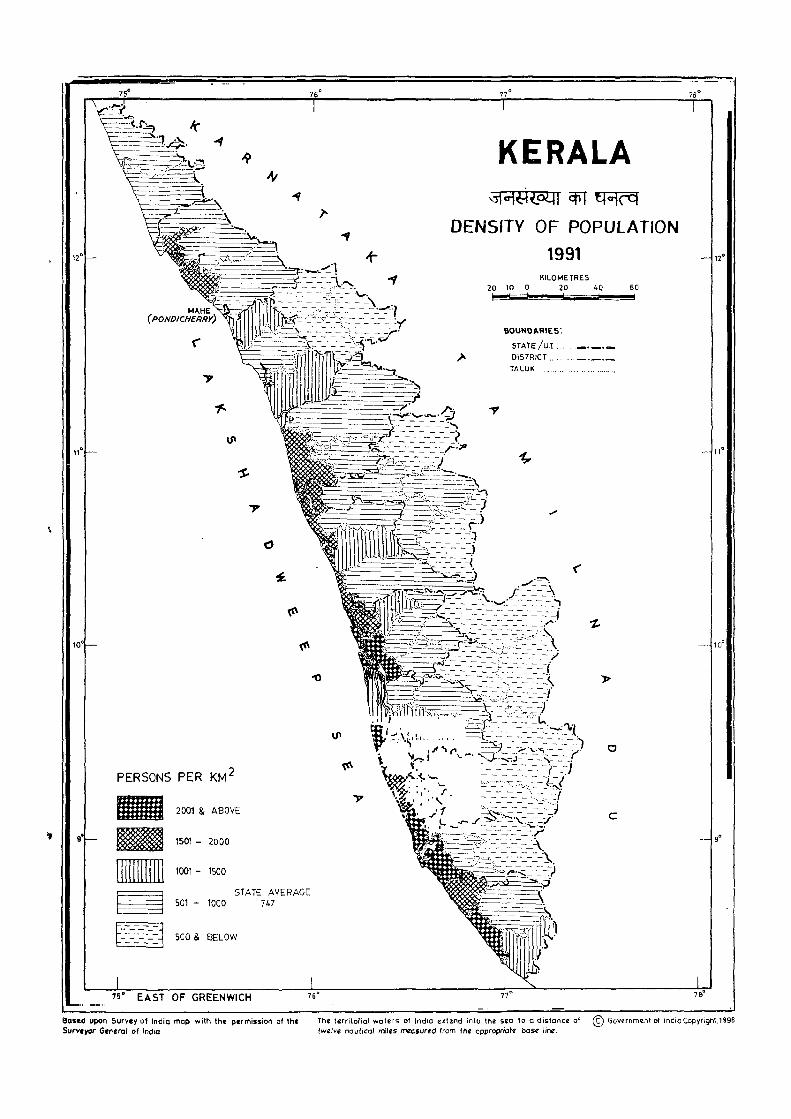
'" PERSONS PER KM 2
2001 & ABOVE c
1501 - 2000
1001 - 1500
STATE AVERAGE 501 - 1000 747
500 & BELOW
75 EAST OF GREENWICH
Based upon Survey of India map with the permission of the The territorial waters of India extend into the: sea to a distance of © Government of IndioCopyright,1996 Svrv .. yor General of India twelve nautical miles measured from the oppropriate base line.


:i
'*-\'('.
\II FEMALES PER 1000 MALES
~
1075 & ABOVE Y
1050 1074
77'
KERALA ~ -~ \31'jYlf1 SEX - RATIO
1991 KILOMETRE5
20 10 0 20 40 60
. -"',' ,\,
" .,,", _'-
" .J
, . . " .... . : "
, . ,',
.......... ' - , ,==:::J
BOUNDARIES:
STATE/U,T. ""."._,_._ DISTRICT .. ". "". ____ _
iALUK ...
<
o
c
1025 10"9 STATE AVERAGE
1000 102"
'999 & BELOW
EAST OF GREENWICH
Based upon Survey of India map with th. permission of the Surveyor Gctneral of India
1036
Tht territorial waters of India extend into the sea. to Q distance of © Government of IndlQCopyright,199S twelve nautical miles m~sured from the appropriate base linq:
_____ •• _ •• _ ........... s. "' ...... u, 1'1'"" ,,'V I" II l' -r ........ -t, 1 I r ~ 1QC-


St.1te/Disoic[/
TaluklUAI Ocy/Town
KERALA
Total/
Rural/ Urban
2
T
R
U
I. KASARAGOD T
DISTRICT R
U
I. Kasaragod (aluk T
Manjeshwar (CT)
Kasaragod (M)
2. Hosdurg taluk
Kanhangad UA
Kanhangad (M)
Perole (eT)
R U
U
U
T R
U
U
U
U
Nileshwar (eT) U
Cheruvathur (CT) U
2. KANNUR
DISTRICT
T
R
U
A-I AREA, HOUSES AND POPULATION
Area in Popul- No. of VlIlJges No. of No. of No. of Population
Km2 latlon Inha- Uninha- Towns occupied house- Persons Males Females per blted blted residential holds Km2 houses
3 4 5 6 7 8 9 10 II 12
3,8863.00 749
35,498.20 603
3,364.80 2,283
1,384
1,384
197
197
5,459,474 5,513,200 29,098,518 14,288,995 14,809,523
4,076,775 '1,102,167 21,418,224 10,512,788 10,905,436
1,382,699 1,411,033 7,680,294 3,776,207 3,904,087
1,992.00 538
1,887.22 474
104.78 1,682
972.59 556
951.95 507
20.64 2,811
3.96 1991
16.68 3,005
988.71 537
904.57 457
84.14 1,405
84.14 1,405
39.54 1,446
12.09 1,148
14.14 1,603
18.37 1,334
2,966.00 759
2,318.86 477
647.14 1,770
116
116
78
78
38
38
78
78
6
6
2
2
4
4
4
45
45
180,494
151,219
29,275
86,347
77,209
9,138
1,163
7,975
94,147
74,010
20,137
20,137
9,562
2,618
3,775
4,182
367,6611
191,740
175,928
181,667 1,071;508
152,107 895,282
29,560 176,226
86,935 . 540,274
77,714 '182,262
9,221 58,012
1,174
8,047
94,732
74,393
20,339
20,339
9,639
2,634
3,824
4,242
371,221
193,086
178,135
7,886
50,126
531,234
413,020
118,214
118,214
57,165
13,884
22,661
24,504
2,251,727
1,106,251
1,145,476
528,803 542,705
442,648 452,634
86,155 90,071
269,559 270,715
240,762 241,500
28,797 29,215
3,910
24,887
3,976
25,239
259,244 271,990
201,886 211,134
57,358 00,856
57,358
27,922
6,715
10,979
1',,42
1098,838
545,613
553,225
60,856
29,243
7,169
11,682
12,762
1,152,889
560,638
592,251
Kannur UA (Please See Annexure)
I . Taliparamba taluk T
R
U
Payyannur(M)
Taliparamba(M)
2. Kannur taluk
U
U
T
R
U
Cheruthdzhdm(CT) U
Cherukunnu (CT) U
Kannapuram(CT) U
* Kallfasserl(CT) U
Papplnlsseri(CT) U
1,330.56 502
1,232.85 441
97.71 1,272
54.63 1,172
43.08 1,398
430.80 1,627
126.05 986
304.75 1,893
32.18 718
15.37 1,057
14.38 1,263
15.73 1,590
15.24 2,018
41
41
7
7
2
2
27
27
37
118,341
97,983
20,358
10,885
9,473
106,783
18,702
88,081
4,138
2,625
3,130
4,118
4,793
119,472
98,609
20,863
10,960
9,903
108,332
19,116
89,216
4,166
2,669
3,177
4,143
4,820
668,046
543,788
124,258
64,032
60,226
701,074
124,264
576,810
23,099
16,246
18,158
25,005
30,754
330,810 337,236
270,045-., 273,743
60,765 63,493
30,971
29,794
33,061
30,432
340,182 360,892
59,848 64,416
280,334 296,476
11,092
7,473
8,414
12,016
15,186
12,007
8,773
9,744
12,989
15,568

A-I: AREA, HOUSES AND POPULATION
State/District!
TaluklUA/ OtylTown
Total/
Rural/ Urban
2
Azhikode North(eT) + U
Azhikode South(eT)+ U
Valapattanam (eT)+ U
Chlrakkal(eT) + U
K3nn3dip3r3mb.1(CT) U
V3um (eT) U
Hunder!(eT) U
* Kanhirode (eT) U
*Chelora (eT) U
Elayavoor(eT) + U
Puzhathi (eT)+ U
Pallikkunnu(CT)+ U
Kannur (M)+ U
Kannur Cantt. - U *Thottada (CT)- U
*Chala (eT) U
!river! (eT) U
Anch.1r3k3ndy (eT) U
• Peralasserl (CT) U
H.1vil.1yi(eT) U
*Kadachira (CT) U
• Muzhappilangad U
(eT)-
3. Thalassery taluk T
H3(tqnnurl,M)
PJduvil.1yi(CT)
PadliriY3d (CT)
*Pinarayi (eT)
Eruv.1tti(eT)
* Kottayam
R
U
U
U
u U
u U
Malabar( CT)
Koothuparamba(M) U
P.1ttiom (eT) U
K.1dirur (eT) U
*Eranholi (eT)- U
*Dharmadom(eT)+ U
Thalassery (M) - U
*New-Mahe (eT)+ U
P3nniy3nnur(CT) U
Perlng3churl,eT) U
Chockll (CT) U
Area in
Km 2
3
Popul
lation per Km 2
8.64 2,231
7.40 3,119
2.04 4,373
13.56 2,938
8.89 1,305
9.83 1,402
12.28 1,414
8.14 1,541
IUS 1,525
11.57 2,527
9.17 3,339
6.90 3,631
11.03 5,915
1.79 2,693
18.26 1,822
9.26 1,604
11.73 1,207
15.47 1,337
10.81 1,407
8.59 1,333
7.95 2,068
7.19 2,616
1,206.61 731
961.93 456
244.68 1,816
54.15 748
15.08 1,162
13.01 1,133
9.63 1,526
10.41 1,351
8.43 1,960
16.76 1,725
12.67 1,505
12.30 2,161
10.08 2,340
10.66 2,505
23.96 4,323
2.82 4,234
10.02 1,927
20.46 1,712
14.24 2,222
+ Part of Kannur Urban Agglomeration
No. of Villages No. of
Inha- Uninha- Towns bited bited
5
30
30
G 7
16
16
38
No. of
occupied residential
houses
8
2,856
3,468
946
6,003
1,725
1,969
2,567
1,795
2,619
4,575
4,440
3,897
9,357
696
5,313
2,131
2,126
3,402
2,474
1,768
2,509
2,641
142,544
75,055
67,489
6,261
2,602
2,341
2,451
2,358
2,345
4,407
3,123
4,184
3,874
4,119
14,743
1,493
3,092
5,350
4,746
No. of
households
9
2,860
3,497
1,114
6,070
1,725
2,002
2,570
1,837
2,619
4,640
4,506
3,937
9,698
698
5,320
2,139
2,135
3,408
2,493
1,792
2,516
2,665
143,417
75,361
68,056
6,280
2,620
2,341
2,451
2,358
2,350
4,443
3,160
4,207
3,875
4,120
15,068
1,533
3,097
5,364
4,789
Persons
10
19,277
23,077
8,920
39,838
11,599
13,777
17,358
12,543
17,314
29,239
30,616
25,057
65,238
4,820
33,261
14,854
14,162
20,683
15,209
11;453
16,441
18,812
882,607
438,199
444,408
40,506
17,517
14,737
14,696
14,063
16,526
28,907
19,074
26,586
23,584
26,705
103,579
11,939
19,312
35,035
31,642
Population
Males
11
9,408
11,170
4,580
19,370
5,646
6,632
8,315
6,084
8,484
13,938
15,559
12,098
32,043
3,024
15,880
7,184
6,858
10,086
7,323
5,532
7,867
9,072
427,846
215,720
212,126
20,162
8,635
7,138
7,061
6,810
8,047
13,806
8,990
12,553
11,118
12,802
49,879
5,585
8,794
16,201
14,545
Females
12
9,869
11,907
4,340
20,468
5,953
7,145
9,043
6,459
8,830
15,301
15,057
12,959
33,195
1,796
17,381
7,670
7,304
10,597
7,886
5,921
8,574
9,740
454,761
222,479
232,282
20,344
8,882
7,599
7,635
7,253
8,479
15,101
10,084
14,033
12,466
13,903
53,700
6,354
10,518
18,834
17,097

State/District!
Taluk/UA/ City/Town
3. WAYANAD
DISTRICT
1. Mananthavady
taluk
Total/
Rural/ Urban
2
T
R
U
T
R
U
2. Sulthan Bathery T
taluk R
3. Vythiri taluk
Kii/pett.1(M)
4. KOZHIKODE
DISTRICT
I. Vadakara
Taluk
Vadakara UA
a) Vadakara(M)
b) Vifliilpp.1l1y( CT)
NJd.1pllr.1m (CT)
2. Quilandy taluk
3. Kozhikode taluk
Kozhlkode UA
Kozhikode
(i) Kozhikode (C)
(ii) Puthiyangadi(OG)
(Ri)Elathur(OG)
KoJllv.rlIy{CT)
U
T
R
U
U
T
R
U
T
R
U
U
U
U
U
T
R
U
T
R
U
U
U
U
U
U
U
lUkkodi (CT) U
KlInn3m.mgJ/am(CT) U
Pantileer.1mk,1VIJ(CT) U
A-I: AREA, HOUSES AND POPULATION
Area in Popul- No. of Villages No. of No. of No. of
Km 2 lation Inha- Uninha- Towns occupied house-per blted bited residential holds Km 2 houses
3 4
2,1 31.00 315
2,096.86 310
34.14 672
742.13 274
742.13 274
772.24
772.24
331
331
611.29 348
577.15 329
34.14 672
34.14 672
2,344.00 1,118
2,004.33 806
339.67 2,957
575.56 1,052
516.44 906
59.12 2,329
38.68 2,648
21.33 3,396
17.35 1,729
20.44 1,724
731.11
731.11
1,026.57
746.02
280.55
877
877
1,338
679
3,090
232.95 3,439
96.25 4,744
82.68 5,078
0.03 12,567
13.54 1,689
14.61 1,610
18.59 1,615
24.26 1,411
10.11 1,584
5
48
48
16
16
15
15
17
17
87
87
24
24
36
36
27
27
6 7
18
18
3
3
2
15
15
12
39
8
133,165
128,497
4,668
39,451
39,451
52,150
52,150
41,564
36,896
4,668
4,668
451,627
292,003
159,624
102,599
81,174
21,425
15,698
10,695
5,003
5,727
116,721
116,721
2,32,307
94,108
138,199
126,336
70,568
64,842
40
5,686
3,956
5,386
5,938
2,866
9
134,654
129,927
4,727
39,822
39,822
52,937
52,937
41,895
37,168
4,727
4,727
456,673
293,134
163,539
103,212
81,418
21,794
16,024
10,981
5,043
5,770
117,224
117,224
236,237
94,492
141,745
129,751
73,397
67,468
60
5,869
3,962
5,422
5,946
2,878
Persons
10
672,128
649,179
22,949
203,701
203,701
255,397
255,397
213,030
190,081
22,949
22,949
2,619,941
1,615,444
1,004,497
605,701
468,026
137,675
102,430
72,434
29,996
35,245
640,965
640,965
1,373,275
506,453
866,822
801,190
456,618
419,831
377
36,410
23,524
30,024
34,228
16,016
Population
Males
11
341,958
330,174
11,784
102,940
102,940
131,581
131,581
107,437
95,653
11,784
11,784
1,292,765
796,383
496,382
295,090
227,898
67,192
50,192
35,579
14,613
17,CXXJ
316,279
316,279
681,396
252,206
429,190
396,189
225,073
207,016
195
17,862
11,639
14,785
17,812
7,996
Females
12
330,170
319,005
11,165
100,761
100,761
123,816
123,816
105,593
94,428
11,165
11,165
1,327,176
819,061
508,115
310,611
240,128
70,483
52,238
36,855
15,383
18,245
324,686
324,686
691,879
254,247
437,632
405,001
231,545
212,815
182
18,548
11,885
15,239
16,416
8,020

StatelDlstrlct!
Taluk/UAI QtylTown
Totall
Rural! Urban
2
RamJnattukara(CT) U
Olavanna(CT) U
Cheruvannur(CT) U
Beypore(CT) U
Karuv;mthuruthy(CT) U
Feroke(CT) U
Kadalundi (CT) U
Mavoor (CT) U
Kuttikkattoor (CT) U
Perumanna (CT) U
5. MALAPPURAM T
DISTRICT R
1. Ernad taluk
Malappuram UA
Malappuram
I) Malappuram(M)
Ii) Anakkayam(OG)
MJnjeriWf,
U
T
R
U
U
U
U
U
U
2. Perinth.;lm.lr.nJ T
u
PerintiJ.;iJn.inli.· 1M) U
3. Tirur taluk
Tirur (M)
4. Ponnani taluk
Ponnani (M)
6. PALAKKAD
DISTRICT
T
R
U
u
T
R
U
u
T
R
U
A-I : AREA, HOUSES AND POPULATION
Area In Popul- No. of Villages No. of No. of No. of
I<h"l2 lation Inha- Uninha- Towns occupied house- Persons per bited blted ·resldential holds Km2 houses
3 4
11.71 2,192
11.33 2,505
10.31 4,904
10.42 5,423
5.95 3,190
7.58 3,366
11.83 2,973
20.48 1,277
13.67 1,251
13.45 1,664
3,550.00 872
3,378.48 833
171.52 1,647
2,176.63 561
2,065.43 522
111.20 1,279
111.20 1,279
58.14 1,253
33.61 1,478
24.53 945
53.06 1,307
505.9! 895
471.50 878
34.411,134
34.41 1,134
664.29 1,659
647.70 1,625
16.59 2,981
16.59 2,981
199.42 1,609
190.10 1,416
9.32 5,555
9.32 5,555
4,480.00 532
4,258.15 471
221.85 1,688
5
123
123
SO
50
22
22
41
41
10
10
ISS
ISS
6 7
5
5
2
2
2
9
9
40
8
4,176
4,828
7,639
8,436
2,977
4,063
5,503
4,953
2,962
3,948
475,633
433,088
42,545
199,864
176,831
23,033
23,033
11,701
7,973
3,728
11,332
70,435
63,992
6,443
6,443
156,746
149,777
6,969
6,969
48,588
42,488
6,100
6,100
438,945
371,215
67,730
9
4,252
4,875
7,764
8,580
2,989
4,107
5,579
5,051
2,983
3,960
10
25,672
28,382
50,556
56,505
18,983
25,511
35,171
26,144
17,107
22,381
477,292 3,096,330
434,287 2,813,876
43,005 282,454
200,506 1,220,788
177,314 1,078,584
23,192 142,204
23,192
11,820
8,091
3,729
11,372
70,606
64,153
6,453
6,453
142,204
72,870
49,692
23,178
69,334
452,889
413,862
39,027
39,027
157,234 1,101,765
150,203 1,052,312
7,031 49,453
7,031
48,946
42,617
6,329
6,329
444,998
375,312
69,686
49,453
320,888
269,118
51,770
51,770
2,382,235
2,007,658
374,577
Population
Males
JI
12,866
13,967
25,032
27,829
9,375
12,731
17,084
13,l66
8,606
11,229
Females
12
12,806
14,415
25,524
28,676
9,608
12,780
18,087
12,978
8,501
11,152
1,508,280 1,588,050
1,369,418 1,444,458
138,862 143,592
601,632
531,143
70,489
70,489
36,019
24,612
11,407
34,470
220,040
201,129
18,911
18,911
619,156
547,441
71,715
71,715
36,851
25,080
11,771
34,864
232,849
212,733
20,116
20,116
532,330 569,435
507,916 544,396
24,414 25,039
24,414
154,278
129,230
25,048
25,048
25,039
166,610
139,888
26,722
26,722
1,155,8221,226,413
972,765 1,034,893
183,057 191,520

StatelDlstrict!
TaluklUAI Oty/Town
Totall
Rurall Urban
2
Ottappalam taluk T
R
U
Shoranur (M)
Ottappalam (M)
U
U
2 _ Mannarkad taluk T
R
U
Mannarkad (M)
3. Palakkad taluk
Palakkad UA
U
T R
U
U
Palakkad U
(i) Palakkad (M) U
(ii) Hemambika Nagar U
(OG)
Puthuppariyaram(CT) U
Marutharode (CT) U
4. Chittur taluk T
R
U
Chittur-Thamaman- U
galam UA
Chittur-Thathaman- U galam(M)
Koduvayur (CT) U
Puthunagaram (CT) U
S. Alathur taluk
7. THRISSUR
DISTRICT
T
R
U
T
R
U
1 _ T~lappilly taluk T
R
U
A-I : AREA, HOUSES AND POPULATION
Area In Popul- No_ of Villages No_ of No_ of No_ of
Km2 lation Inha- Uninha- Towns occupied house-per bited bited residential holds Km2 houses
3 4
845.80 886
780.86 852
64.94 1,289
32.28 1,225
32.66 1,353
1,185.57 261
1,122.19 235
63.38 717
63.38 717
720.32 718
661.27 510
59.05 3,049
59.05 3,049
29.60 4,701
26.60 4,635
3.00 5,282
19.93 1,245
9.52 1,6~0
1,155.10 354
1, 120.62 306
34.48 1,896
34.48 1,896
14.71 2,179
10.53 1,676
9.24 1,698
569.02 700
569.02 700
5
37
37
23
23
24
24
41
41
30
30
6 7
2
2
3
3
3
3
3
3
8 9
130,621 131,120
115,294 115,570
15,327,. 15,550
7,565
7,762
56,010
48,251
7,759
7,759
97,502
64,430
33,072
33,072
25,377
22,173
3,204
4,625
3,070
79,559
67,987
11,572
11,572
5,984
3,220
2,368
75,253
75,253
7,612
7,938
56,331
48,541
7,790
7,790
99,457
65,335
34,122
34,122
26,229
22,923
3,306
4,793
3,100
81,571
69,347
12,224
12,224
6,292
3,400
2,532
76,519
76,519
Persons
10
749,149
665,413
83,736
39,550
44,186
308,910
263,488
45,422
45,422
517,211
337,178
180,033
180,033
139,136
123,289
15,847
24,808
16,089
408,499
343,113
65,386
65,386
32,048
17,647
15,691
398,466
398,466
3,032.00 903 209
209
40 518,038
384,498
133,540
522,059 2,737,311
2,730.80 739
30.1.20 2,391
662.99 811
652.35 782
10.64 2,597
73
73
40
2
2
41
386,617 2,017,095
135,442 720,216
101,478 102,170
96, 140 96,748
5,338 5,422
537,560
509,932
27,628
Population
Males Females
11 12
356,557 392,592
316,723 348,690
39,834 43,902
19,021
20,813
151,656
129,375
22,281
22,281
20,529
23,373
157,254
134,113
23,141
23,141
254,068 263,143
165,161
88,907
88,907
68,817
61,047
7,770
12,141
7,949
172,017
91,126
91,126
70,319
62,242
8,077
1+,667
8,140
200,452 208,047
168,417
32,035
32,035
15,599
8,653
7,783
174,696
33,351
33,351
16,449
8,994
7,908
193,089 205,377
193,089 205,377
1,312,683 1,424,628
964,593 1,052,502
348,090 372,126
256,087 i8 1,473
242,923 267,009
13,164 14,464

State/District!
TaluklUAI OtYlTown
Totall
Rural! Urban
2
Kunnamkulam (M) U
Chelakkara (eT) U
2. Chavakkad taluk T
Guruvayoor UA
GuruvayoornS)
Pookode (CT)
Perakam(CT)
• Iringaprom( (T)
(havakkad (M)
Thaikkad (CT)
Pa/uva; (CT)
Pavaraily «(T)
VenmenJd (eT)
3. Thrissur taluk
Thri~ur UA
Thrissur
(i) Thri~ur (M)
R
U
U
U
U
U
U
U
U
U
U
U
T
R
U
U
u u
(Ii) Poonkunnam (OG) U
(ill)Perlngavu (OG) U
(Iv) Chembukaw (OG) U
(v) Thrlssur (OG) U
'Vilvaltom «(T) U
'Viyyur (eT) U
• Ayyanthole «(T) U
Nettissery (CT) U
* Mannuthy (CT) U
*Nadathara «(T) U
Ollur (CT) U
*(hiyyaram (CT) U
*Koorkkanchery(CT) U
* Aranarwkara(CT) U
Edakkunny (CT) U
KoLuhy (eT) U
Portore (eT) U
Kurroor(CT) U
:Pullazhi (CT) U
• Kanimangalam(CT) U
Palissery (eT) U
A-I: AREA, HOUSES AND POPULATION
Area in
Km2
3
Popul
lation per Km2
4
6.96 2,824
3.68 2,IM
234.26 1,823
183.97 1,676
50.29 2,359
50.29 2,359
6,49 3,1 IS
4.96 1,646
5.06 1,885
4.10 2,224
12.41 3,045
3.73 1,965
4.35 1,552
4.12 2,534
5.07 1,832
635.71 1,180
493.43 770
142.28 2,605
88,42 3,111
18.47 4,429
12.65 5,898
1.46 211
2.85 1,298
0.28 1,946
1.23 2,148
6.25 2,705
5.09 2,221
7.25 1,861
4.22 1,786
13.35 2,391
5.52 3,256
9.33 3,552
4.91 4,399
2.60 3,658
5.84 2,846
5.59 2,373
5.60 1,279
4.64 1,233
6.38 1,510
7.88 1,696
8.55 1,976
3.13 1,967
No_ of Villages No. of
Inha- Unlnha- Towns blted blted
5
20
20
50
SO
6 7
9
9
9
21
21
12
42
No. of
occupied residential
houses
8
3.852
1,486
73,398
53,752
19,646
19,646
3,534
1,407
\,697
1,653
5,795
1,195
1,114
1,667
1,584
144,058
74,066
69,992
52,120
15,343
13,849
71
756
11\
556
3,231
2,133
2,585
1,456
6,051
3,507
6,277
4,063
1,856
3,178
2,440
1,384
1,\17
1,742
2,507
3,177
1,169
No. of
households
9
3,913
1,509
74,090
54,061
20,029
20,029
3,757
1,407
1,705
1,654
5,860
1,245
1,121
1,682
1,598
145,535
74,541
70,994
52,991
15,848
14,348
71
762
III
556
3,245
2,167
2,647
1,456
6,083
3,544
6,407
4,066
1,864
3,193
2,471
1,405
1,124
1,742
2,520
3,212
1,119
Persons
10
19,657
7,971
426,976
308,344
118,632
118,632
20,216
8,162
9,540
9,120
37,789
7,329
6.750
10,439
9,287
750,352
379,698
370,654
275,053
81,798
74,604
308
3,699
545
2,642
16,904
11,303
13,492
7,536
31,914
!7,9/1
33,137
21,598
9,512
16,623
13,265
7,165
5,721
9,631
13,362
16,897
6,156
Population
Males
II
9,414
3,750
Females
12
10,243
4,221
200,219 226,757
144,715
55,504
55,504
9,365
3,827
4,472
4,345
17,759
3,446
3,135
4,811
4,344
163,629
63,128
63,128
10,851
4,335
5,068
4,775
20,030
3,883
3,615
5,628
4,943
364,161 386,191
183,304 \ 96,394
180,857 189,797
134,459
39,233
35,755
ISO
1,781
260
1,287
8,451
5,919
6,526
3,682
15,704
8,738
16,271
10,671
4,634
8,179
6,451
3,435
2,748
4,760
6,293
8,150
3,002
140,594
42,565
38,849
158
1,918
285
1,355
8,453
5,384
6,966
3,854
16,210
9,233
16,866
10,927
4,878
8,444
6,814
3,730
2,973
4,871
7,069
8,747
3,154

State/District!
TaluklUA/ Ory/Town
Total/
Rural/ Urban
2
* Avinissery (CT) U
* Chewoor (CT) U
*Marathakkara (CT) U
4. Kodungailur taluk T
R
U
Kodungallur UA
Kodungallur (M)
Eriyad (CT)
*Methala (CT)
Mathilakam (CT)
u U
U
U
U
5. Mukundapuram T
taluk R
* Puthukkad(CT)
IrlnJalakuda (M)
Chalakudy (M)
Koratcy (CT)
8. ERNAKULAM
DISTRICT
Koehl UA
Koehl (C)
U
U
U
U
U
T
R
U
U
U
I . Kunnathunad taluk T
R
U
Perumbavoor (M) U
2. Aluva taluk T
R
U
Angamaly (M) U
Aluva (M) + U
Choornikkara (CT)+ U
Edathala (CT) + U
3. Paravur taluk T
R
U
A-I : AREA, HOUSES AND POPULATION
Area in Popul- No. of Villages No. of No. of No. of
Km~ lation Inha- Uninha- Towns occupied house-per blted blted residential holds Km2 houses
3 4
4.69 2,251
6.08 2,265
6.91 1,785
145.07 1,956
100.09 1,812
44.98 2,276
38.62 2,296
17.30 1,806
9.51 2,472
11.8T 2,870
6.36 2,159
1,315.98 561
1,262.97 505
53.01 1,904
6.41 1,833
11.24 2,446
25.23 1,786
10.13 1,639
2,407.00
1,862.79
544.21
1,170
775
2,523
5
13
13
53
53
89
89
(Please See Annexure)
94.88 5,951
658.39 591
644.80 565
13.59 1,815
13.59 1,815
343.47 1,186
266.30 980
77.17 1,897
24.05 .1,264
7.18 3,450
17.02 2,047
28.92 1,950
193.60 1,810
70.75 1,118
122.85 2,208
23
23
16 16
4
4
6 7
4
4
3
4
4
28
28
4
4
to
10
43
8
1,968
2,505
2,303
52,737
33,690
19,047
16,511
5,984
4,005
6,522
2,536
146,367
126,850
19,517
2,225
5,239
8,626
3,427
549,268
285,055
264,213
103,751
78,676
73,616
5,060
5,060
79,465
51,393
28,072
6,038
4,949
6,522
10,563
68,842
15,344
53,498
9
1,969
2,533
2,319
52,894
33,774
19,120
16,574
6,027
4,010
6,537
2,546
147,370
127,493
19,877
2,229
5,393
8,807
3,448
555,657
286,022
269,635
108,924
78,905
73,823
5,082
5,082
79,954
51,831
28,123
6,052
4,977
6,529
10,565
68,902
15,350
53,552
Persons
10
10,559
13,773
12,337
283,765
181,378
102,387
88,655
31,249
23,510
33,896
13,732
738,658
637,743
100,915
11,752
27,491
45,069
16,603
2,817,236
1,444,059
1,373,177
564,589
389,287
364,620
24,667
24,667
407,318
260,919
146,399
30,391
24,774
34,837
56,397
350,364
79,126
271,238
Population
Males
1 I
5,324
6,568
6,118
134,675
85,732
48,943
42,537
15,024
11,180
16,333
6,406
357,541
307,919
49,622
5,650
13,423
22,303
8,246
1,408,649
722,730
685,919
Females
12
5,235
7,205
6,219
149,090
95,646
53,444
46,118
16,225
12,330
17,563
7,326
381,117
329,824
51,293
6,102
14,068
22,766
8,357
1,408,587
721,329
687,258
283,432 281,157
196,530
184,232
12,298
12,298
192,757
180,388
12,369
12,369
204, i 88 203,130
130,893 130,026
73,295 73,104
15,158
12,305
17,694
28,138
172,450
38,797
133,653
15,233
12,469
17,143
28,259
177,914
40,329
137,585

State/District!
TaluklUN OtylTown
Totall
Rural! Urban
2
'Vadakkekara (CT) U
Moothakunnam(CT) U
'Chendamang- U
alam (CT)
Paravur (M)+ U
Kedamangalam (CT) + U
~Kottuva"y(CT)+ U
Alangad (CT) + U , Varappuzha (CT)+\ U
Kadungalloor+ U
Eloor (M)+ U
4. Koehl taluk T
R
U
Kochi Corporation U
(Part)+
*Cheriyakadavu(CT)+ U
5. Kanayannur taluk T
R
U
Kochi Corp or- U
atlon(Part) +
Kakkanad (OG)+ U
Cheranalloor(CT)+ U
*Mulavukad(CT) + U
Kalamassery + U
Vazhakka/a (CT)+ U
Thiruvankulam( eT) + U
Thrippunlthura (M) + U
*Maradu (CT)+
6. Muvattupuzha
taluk
U
T
R
U
MuvatnJpuzha(M) U
Piravom (M) U
Koothattukulam (M) U
7. Kothamang
alam taluk
T
R
U
• Part of Koehl Urban Aagtomention
A-I : AREA, HOUSES AND POPULATION
Area In
Km2
3
Popul
ladon per Km2
4
6.88 2,758
9.83 2,701
10.83 2,477
9.02 3,094
7.66 2,415
21.00 1,641
21.02 1,695
7.74 2,909
14.66 1,735
14.21 2,425
140_85 3,436
97.15 2,224
43.70 6,132
39.58 6,583
4.12 1,796
322.75 2,168
141.61 1,004
181.14 3,079
55.30 5,498
14.59 1,234
10.59 2,021
19.27 1,158
27.00 2,013
12.87 2,577
10.49 1,755
18.69 2,733
12.34 2,836
433.53 696
367.81 631
65.72 1,059
13.18 2,094
29.36 858
23.18 726
284.96 649
244.92 609
40.04 887
No. of Villages No. of
Inha- Uninha- Towns blted blted
5
9
9
11
11
16
16
10
10
6 7
2
2
7
7
3
3
44
No. of
occupied residential
houses
8
3,620
5,267
5,333
5,446
3,622
6,686
6,769
4,370
4,828
7,557
85,103
40,437
44,666
43,296
1,370
140,359
28,525
111,834
60,455
3,778
4,104
4,247
11,430
6,670
3,966
10,415
6,769
60,407
46,167
14,240
5,465
5,201
3,574
36,416
29,573
6,843
No. of
households
9
3,621
5,271
5,336
5,450
3,623
6,686
6,802
4,372
4,831
7,560
89,259
40,441
48,818
47,448
1,370
141,521
28,618
112,903
61,476
3,787
4,106
4,248
11,436
6,681
3,966
10,434
6,769
60,526
46,273
14,253
5,468
5,204
3,581
36,590
29,686
6,904
Persons
10
18,975
26,553
26,825
27,906
18,500
34,457
35,620
22,514
25,433
34,455
484,004
216,040
267,964
260,563
7,401
699,867
142,119
557,748
304,026
17,999
21,407
22,322
54,342
33,167
18,412
51,078
34,995
301,591
231,965
69,626
27,595
25,203
16,828
184,805
149,270
35,535
Population
Males
11
9,135
12,758
12,901
13,596
8,989
16,795
17,719
10,993
12,814
17,953
Females
12
9,840
13,795
13,924
14,310
9,511
17,662
17,901
11,521
12,619
16,502
241,206 242,798
105,826 110,214
135,380 132,584
131,743
3,637
349,599
70,806
278,793
128,820
3,764
350,268
71,313
278,955
151,689 1,52,337
8,997 9,002
10,606 10,801
11,017
27,789
16,734
9,188
25,286
17,487
151,791
116,960
34,831
13,892
12,576
8,363
92,885
75,216
17,669
11,305
26,553
16,433
9,224
25,792
17,508
149,800
115,005
34,795
13,703
12,627
8,465
91,920
74,054
17,866

State/Disaicti
TaluklUN QtylTown
Total/
Rural/ Urban
2
Kothamangalam (M) U
9. IDUKKI
DISTRICT
·ldukk'Township
T
R
U
U
J • Deviklliam taluk T
R
U
2. Udumban- T
chola taluk R
U
ldukkl Townshlp(Part) U
3. Thodupuzha taluk T
R
U
Idukki township (Part) U
Thodupuzha (M) U
4 _ Peerumade taluk T
R
U
10. KOTTAYAM T
DISTRICT R
U
I . Meenachil taluk T
Palal (M)
Erattupetta(M)
2. Valkom taluk
Valkom (M)
R
U
U
U
T
R
U
U
A-I : AREA, HOUSES AND POPULATION
Area In
Km2
3'
Popul- No_ of Villages No_ of No. of
lation Inha- Unlnha- Towns occupied per blted bited residential Km2 houses
4 5 6 7 8
40.04 887 6,843
No. of
households
9
6,904
Persons
10
35,535
5,019.00 215 65
65
2 231,436 232,995 1,078,066
4,951.57 207
67.43 755
32.00 320
1,774.16 112
1,774.16 112
1,071. 40 369
1,067.55 369
3.85 544
3.85 544
973.29 308
909.71 276
63.58 767
28.15 289
35.43 1148
1,286.37
1,286.37
144
144
2,203.00 830
2,034.43 741
168.57 1904
692.87 555
662.70 SIS
30.17 1429
15.93 1374
14.24 1491
319.29 925
310.56 880
8.73 2496
8.73 2496
13
13
23
23
19
19
10
10
90
90
26
26
16
16
2
2
2
8
8
2
2
45
221,076 222,481 1,027,185
10,360 10,514 50,881
2,407
43,867
43,867
85,081
84,626
455
455
61,833
51,928
9,905
1,952
7,953
40,655
40,655
359,885
298,104
61,781
72,805
65,450
7,355
3,810
3,545
58,080
53,778
4,302
4,302
2,417
44,039
44,039
85,868
85,412
456
456
62,058
52,000
10,058
1,961
8,097
41,030
41,030
361,813
299,070
62,743
73,184
65,598
7,586
3,982
3,604
58,158
53,849
4,309
4,309
10,225
197,916
197,916
395,678
393,582
2,096
2,096
299,540
250,755
48,785
8,129
40,656
184,932
184,932
1,828,271
1,507,353
320,918
384,594
~41,478
43,116
21,890
21,226
295,218
273,430
21,788
21,788
Population
Males
II
17,669
545,872
520,308
25,564
5,263
101,022
101,022
200,891
199,816
1,075
1,075
150,895
126,406
24,489
4,188
20,301
93,064
93,064
912,860
752,358
160,502
193,161
Females
12
17,866
532,194
506,877
25,317
4,962
96,894
96,894
194,787
193,766
1,021
1,021
148,645
124,349
24,296
3,941
20,355
91,868
91,868
915,411
754,995
160,416
191,433
171,301 170,177
21,860 21,256
10,876
10,984
146,982
136,250
10,732
10,732
11,014
10,242
148,236
137,180
11,056
11,056

State/District!
TaluklUAI City/Town
Totall
Rurall Urban
2
3. Kottayam taluk T
R
U
Kottayam UA U
Kottayam U
(i) Kottayam (H) U
(Ii) Vijayapuram (OG) U
Perumbaikad (CT) U
Nattakam (CT) U
4. Changanassery T
tal uk R
U
Changanassery (H) U
5. Kaniirappally
taluk
T R
U
Kanjirappa/ly (CT) U
II.ALAPPUZHA
DISTRICT
1 . Cherthala taluk
Cherthala UA
Cherthala (H)
VaYJ/ar( CT)
Kokkothaman·
ga/Jm(CT)
Thanneer·
mukkom(CT)
Mlihamma (CT)
T
R
U
T
R
U
U
U
U
U
U
U
Aroor (Cn U
Arookutty (CT) U
Kodarnthllruthu (CT) U
2. Ambalappulha
taluk
T
R
U
A-I: AREA, HOUSES AND POPULATION
Area in Km2
Popul- No. of Villages No. of
ladon Inha- Uninha· Towns per bited bited Km2
3 4
499.90 1,172
436.20 962
63.70 2,615
63.70 2,615
27.33 ).,279
15.55 4,061
11.78 :2,247
14.04 2,804
22.33 1,682
261.78 1,234
248.28 1,090
13.50 3,885
13.50 3,885
421.60 568
369.13 548
52.47 705
52.47 705
1,414.00 1,415
1,125.92 1,236
288.08 2,116
320.44 1,491
190.80 1,465
129.64 1,530
92.59 1,435
16.18 2,678
14.45 1,549
11.29 1,409
23.91 1,202
26.76 842
15.14 2,090
11.10 1,414
10.81 1,677
178.81 2,280
67,81 1,738
111.00 2,612
5
22 22
14
14
12
12
75
75
13
13
6
6
6 7
3
3
3
14
14
8
8
5
3
3
46
No. of
occupied residential
houses
8
117,358
84,079
33,279
33,279
17,825
12,632
5,193
7,661
7,793
63,911
54,093
9,818
9,818
47,731
40,704
7,027
7,027
402,789
283,959
118,830
95,875
55,955
39,920
27,397
8,604
4,653
3,280
6,025
4,835
6,050
2,825
3,648
78,698
23,215
55,483
No. of
households
9
118,050
84,351
33,699
33,699
18,129
12,869
5,260
7,723
7,847
64,416
54,329
10,087
10,087
48,005
40,943
7,062
7,062
405,210
285,159
120,051
95,969
56,008
39,961
27,416
8,618
4,654
3,280
6,029
4,835
6,066
2,828
3,651
79,618
23,258
56,360
Persons
10
586,044
419,492
166,552
166,552
89,625
63, ISS
26,470
39,363
37,564
322,95 I
270,506
52,445
52,445
239,464
202,447
37,017
37,017
2,001,217
1,391,607
l>,09,610
477,819
279,477
198,342
132,883
43,326
22,384
15,904
28,728
22,541
31,642
15,693
18,124
407,772
117,826
289,946
Population
Hales Females
11 12
292,418 293,626
209,275 210,217
83,143 83,409
83,143
44,613
31,397
13,216
19,781
18,749
160,280
134,269
26,011
26,011
120,019
101,263
18,756
18,756
83,409
45,012
31,758
13,254
19,582
18,815
162,671
136,237
26,434
26,434
119,445
101,184
18,261
18,261
975,885 1,025,332
677,351 714,256
298,534 311,076
235,420 242,399
138,161 141,316
97,259
64,833
21,156
10,933
7,830
13,963
10,951
15,651
7,840
8,935
101,083
68,050
22,170
11,451
8,074
14,765
11,590
15,991
7,853
9,189
200,130 207,642
58,099 59,727
142,031 147,915

State/District!
Taluk/UN Clcy/Town
Alappuzha UA
Alappuzha
(I) Alappuzha (H)
(iI) Kalarkode (OG)
(III)Punnapra (OG)
Totall
Rural/ Urban
2
U
U
U
U
U
Koma/apuram (CT) U
Mannanchery (eT) U
3. Kuttanad taluk
4. Karthlkappally
taluk
Kayamkulam(H)
T
R
U
T
R
U
U
5. Chengannur taluk T
R
U
Chengannur(H) u
6. Havelikkara taluk T
R
U
Havelikkara (M) u
12.PATHANAHT- T
HITTA DISTRICT R
U
1 . Thlruvalla taluk T
Thiruvalla (H)
R
U
U
2. MalJappally taluk T
R
U
3 _ Ranni taluk T
R
U
A-I : AREA, HOUSES AND POPULATION
Area in
Km2
Popul- No. of Villages No. of
lation Inha- Uninha- Towns per bited bieed Km2
3 4
84.48 3,136
70.48 3,231
46.77 3,735
11.50 2,023
12.21 2,439
14.00 2,661
26.52 942
265.93
265.93
790
790
224.51 1,749
202.72 1,606
21.79 3,082
21.79 3,082
141.19 1,393
128.19 1,332
13.00' 1,990
13.00 1,990
230.37 1,373
217.72 1,323
12.65 2,237
12.65 2,237
2,642.00 450
2,541.72 407
100.28 1,546
164.62 1,378
136.68 1,259
27.94 1,961
27.94 1,961
156.12
156.12
1,067.48
1,067.48
846
846
196
196
5
14
14
17
17
II
II
14
14
64
64
10
10
9
9
11
11
6 7
2
4
4
47
No. of
occupied residential
houses
8
50,541
42,531
32,203
4,701
5,627
8,010
4,942
40,523
40,523
78,066
65,985
12,081
12,081
41,978
36,555
5,423
5,423
67,649
61,726
5,923
5,923
258,873
226,234
32,639
47,774
36,502
11,272
11,272
28,438
28,438
45,534
45,534
No. of
households
9
51,417
43,390
33,016
4,712
5,662
8,027
4,943
40,794
40,794
78,374
66,246
12,128
12,128
42,388
36,882
5,506
5,506
68,067
61,971
6,096
6,096
259,629
226,793
32,836
47,796
36,513
11,283
11,283
28,454
28,454
45,693
45,693
Persons
10
264,969
227,716
174,666
23,267
29,783
37,253
24,977
210,004
210,004
392,629
325,478
67,151
67,151
196,652
170,780
25,872
25,872
316,341
288,042
28,299
28,299
1,188,332
1,033,298
155,034
226,822
172,042
54,780
54,780
132,144
132,144
209,374
209,374
Population
Hales
II
129,770
111,520
85,699
11,220
14,601
18,250
12,261
103,620
103,620
Females
12
135,199
116,196
88,967
12,047
15,182
19,003
12,716
106,384
106,384
189,793 202,836
156,687 168,791
33,106 34,045
33,106
94,796
82,247
12,549
12,549
152,126
138,537
13,589
13,589
576,176
500,965
75,211
109,475
83,185
26,29U
26,290
64,046
64,046
103,522
103,522
34,045
101,856
88,533
13,323
13,323
164,215
149,505
14,710
14,710
612,156
532,333
79,823
117,347
88,1>57
28,490
28,490
68,098
68,098
105,852
105,852

Suce/District/
TawuAI Qty/Town
Totall
Rural/ Urban
2
4_ Kozhencherry talukT
R
U
Padlanamthitta (H) U
S. AdoClr taluk
Pandabm(H)
Adoor (M)
13. KOLLAM
DISTRICT
KoIlam UA
T
R
U
U
U
T
R
U
I • Karunagappally T
taluk R
U
Neendakara(OG)+ U
2. Kunnathur taluk T
3. PathOinapuram
taluk
Punalur(H)
4. Kottarakkara
taluk
5. Kollam taluk
R
U
T
R
U
U
T
R
.U
T
R
U
KoIIam(M) + U
Sakrhilrul.mgara ~OG) U
Hundakkal (OGj + U
M3ngad (CT) + U
A-I : AREA, HOUSES AND POPULATION
Area in Km%
3
Popul
latlon per Km2
4
1,015.33 331
991.83 303
23.50 1,527
23.50 1,527
327.16 867
278.32 787
48.84 1,318
28.42 1,328
20,42 1,305
2,491.00 967
2,372.56 827
118.44 3,766
No. of Villages No. of
Inha- Uninha- Towns blted bited
5
21
21
13
13
92
92
6 7
2
2
7
7
(Please See Annexure)
192.32 2,002
182.13 2,030
10.19 1,514
10.19 1,514
138.12 1,294
138.12 1,294
1,235.51 336
1,200.91 307
34.60 1,338
34.60 1,338
549.77 970
549.77 970
380.21 2,354
306.56 1,666
73.65 5,218
18.48 7,568
9.17 4,847
3.'45 6,168
6.55 4,323
16
16
7
7
21
21
27
27
21
21
6
6
48
No. of
occupied residential
houses
8
74,565
67,141
7,424
7,424
62,562
48,619
13,943
8,210
5,733
485,190
402,078
83,112
74,587
71,673
2,914
2,914
36,689
36,689
89,380
79,761
9,619
9,619
113,357
113,357
171,177
100,598
70,579
25,602
8,618
3,870
5,339
No. of
households
9
74,842
67,324
7,518
7,51e
62,844
48,809
14,035
8,265
5,770
489,774
404,517
85,257
74,979
71,995
2,984
2,984
37,041
37,041
89,788
80,138
9,650
9,650
113,470
113,470
174,496
101,873
72,623
26,713
8,831
3,904
5,391
Persons
10
336,498
300,616
35,882
35,882
283,494
219,122
64,372
37,733
26,639
2,407,566
1,961,530
446,036
385,103
369,679
15,424
15,424
178,665
178,665
415,247
368,968
46,279
46,279
533,447
533,447
895,104
510,771
384,333
139,852
44,451
21,280
28,317
Population
Hales
II
162,119
144,351
17,768
17,768
137,014
105,861
31,153
18,148
13,005
Females
12
174,379
156,265
18,114
18,114
146,480
113,261
33,219
19,585
13,634
1,182,810 1,224,756
962,181 999,349
220,629 225,407
191,149
183,422
7,727
7,727
88,259
88,259
193,954
186,257
7,697
7,697
90,406
90,406
204,182 211,065
181,308 187,660
22,874 23,405
22,874
258,811
258,811
23,405
274,636
274,636
440,409 454,695
250,381 260,390
190,028 19~,305
69,340
22,254
10,528
13,865
70,512
22,197
10,752
14,452

A-I : AREA, HOUSES AND POPULATION
State/District!
Taluk/UAI OcylTown
Kilikollur (CT)·
Total!
Rural! Urban
2
U
• Vadakkevila (CT)· U
* Eravipuram (eT)· U
* Paravoor (M) U
14. TRIVANDRUM
DISTRICT
Trivandrum UA
I . Chirayink
eezhu taluk
Varkala (M)
Vakkom (CT)
Attingal (M)
T
R
U
T
R
U
U
U
U
2. Nedumangad TalukT
R
U
Nedumangad (M) U
3. Trivandrum taluk T
R
U
UIloor (CT) ++
KlIdappanakunnu
(CT) ++
U
U
Anayara (CT) ++ U
Trivandrum (C)++ U
Kazhakkoottam U
(OG) ++
Thumba (OG) ++ U
Sreekaryam (OG) ++ U
Cheruvikkal U
(OG)++
Vattiyoorkavu U
(OG)++
Thlruvallam (OG) ++ U
Nemom (CT) ++ U
Area in Popul- No. of Villages No. of No. of
Km2 latlon Inha- Uninha- Towns occupied per bited bited residential Km2 houses
3 4
4.66 6,106
8.55 5,867
6.60 5,247
16.19 2,297
2,192.00 1,344
1,934.51 1,007
257.49 3,877
5
93
93
(Please See Annexure)
380.68 1,510
343.61 1,406
37.07 2,474
15.42 2,528
7.47 2,691
14.18 2,301
926.77 620
894.25 587
32.52 1,534
32.52 1,534
307.55 3,380
134.03 1,781
173.52 4,615
7.97 3,227
7.69 4,361
8.14 3,015
74.93 6,993
5.02 2,493
16.03 2,114
8.87 1,944
8.70 2,447
10.61 3,172
12.69 2,511
12.87 3,307
26
26
26
26
12
12
6 7
10
10
3
3
5
5
8
5,293
9,128
6,206
6,523
606,463
408,009
198,454
115,687
97,976
17,711
7,031
4,006
6,674
123,682
113,324
10,358
10,358
207,755
47,569
160,186
5,293
7,083
4,842
102,848
2,623
7,214
3,732
4,563
6,893
6,368
8,727
+ Pan of Kollam Urban Allglomeration
49
No. of
households
9
5,522
9,243
6,270
6,749
619,558
413,655
205,903
116,375
98,499
17,876
7,115
4,028
6,733
125,026
114,558
10,468
10,468
Persons
10
28,456
50,165
34,627
37,185
2,946,650
1,948,407
998,243
574,789
483,065
91,724
38,987
20,103
32,634
574,530
524,655
49,875
49,875
215,142 1,039,465
48,288 238,659
166,854
5,401
7,320
5,005
107,892
2,645
7,329
3,771
4,612
7,345
6,551
8,983
800,806
25,719
33,534
24,541
524,006
12,515
33,880
17,245
21,286
33,653
31,868
42,559
Population
Males
II
13,976
24,898
17,258
17,909
1,447,594
955,301
492,293
272,532
229,281
43,251
18,506
9,150
15,595
281,148
256,919
24,229
24,229
515,371
118,763
396,608
13,013
16,506
12,025
259,672
6,144
16,780
8,509
10,468
16,639
15,831
21,021
Females
12
14,480
25,267
17,369
19,276
1,499,056
993,106
505,950
302,257
253,784
48,473
20,481
10,953
17,039
293,382
267,736
25,646
25,646
524,094
119,896
404,198
12,706
17,028
12,516
264,334
6,371
17,100
8,736
10,818
17,014
16,037
21,538

A-I ; AREA, HOUSES AND POPULATION
State/Olstricu Totall Area In Popul- No. of Villages No. of
Taluk/UN Rurall Km2 ladon lnila- Uninha- Towns CitylTown Urban per Dited bited
Kml
2 3 4 5 6
4. Neyyattinkara T 570.91 1,327 29
tal uk R 556.53 1,261 29
U 14.38 3,883
Kovalam (OG)++ U 4.68 5,431
Neyyattinkara (M) U 9.70 3,136
+ + Part of Trivandrum Urban Agglomeration
Note: 1. The Number of towns given on Col. 7 excludes the 22 Urban Outgrowths.
2. Names of towns treated as such for the first time in 1 99 I Census have been given in italics.
3. Names of towns .:reated as such for the first time in 1981 Census have been marked with an asterisk (*) on their left.
4. 'dukki Township lies in two taluks Udumbanchola and Thodupuzha TaJuks.
5. Payyannur, Kunnamangalam, Perinthalmanna and Mannarkad Towns were treated as towns for the first time in 1971 but declassified in 1981. They are again treated as town in 1991.
6. Kakkanad and Mundakkal urban outgrowths were part o-f Thrikkakara (OG) and Eravipuram Census towns respectively of 1981 .
7. The following townslOGs of 1981 were bifurcated after 1981 Census.
Azhikode CT Bifurcated into Azhikode North CT
Azhikode South CT
Olavanna CT " Olavanna CT
Pantheeramkavu CT
Feroke CT " Feroke CT Karuvanthuruthy CT
Vadakkekara CT " Vadakkekara CT
Moothakunnam CT
EloorCT " EloorCT
" Varappuzha CT
Thtikkakara OG " Vazhakkala CT
Kakkanad OG
7
50
No. of No. of
occupied house-residential holds
houses
8 9
159,339 163,015
149,140 152,310
10,199 10,705
4,379 4,578
5,820 6,127
Eravipuram CT
Persons
10
757,866
702,028
55,838
25,419
30,419
"
Population
Males Females
II 12
378,543 379,323
350,338 351,690
28,205 27,633
13,051 12,368
15,154 15,265
Eravipuram CT
Mundakkal OG
8. Kodiyeri Census Town of 1981 which included portions of Kodiyeri and New Mahe Panchayats was split up and portion included in Kodiyeri panchayat merged with Thalassery Municipal town and New Mahe Panchayat poni"n became New Mahe Census town in 1 991 .
9. 1 6 Municipalities were newly formed in 1991 of which Koothuparamba, Taliparamba, Ottappalam, Kalamassery and Eloor were Census Towns in 1981 Census. Kilikollur outgrowth of 1981 became a Census town in 1 991. Thalassery and Thiruvalla Municipalities have got addition in area after 1981 Census.
10. For the procedure adopted in presenting the area figures for State/DistrictiTaluk/Statutory townl Census town and Urban Outgrowths see the flyleaf to this table.
11. For the procedure adopted in working out the density of population per sq.km see the fly leaf to this tJble
12. Out of the 16 urban agglomerations Kannur, Kochi, Kollam and Trivandrum agglomerations lie in two or more taluks.
13. The following abbreviatiom are used to denote the Civic status of towns.
C - Corporation
M - Municipal town
CT- Census Town (Non - municipal town)
TS- Township
Cantt. - Cantonment OG- Urban Outgrowth

A-I : AREA, HOUSES AND POPULATION ANNEXURE
Details of Urban Agglomerations lying in two taluks with its Constituent Units
Districtl Area Population No. of No. of No. of Population
U t./Constituent in Km? per Km 2 Town occupied house Persons Males Females Units residential holds
houses
2 3 4 5 6 7 8 9
KANNUR DISTRICT
Kannur UA 145.07 3,198 15 68,421 69,601 463,962 225,526 238,436
a) Kannur (M) 11.03 5,915 9,357 9,698 65,238 32,043 33,195
b) Kannur Cantt 1.79 2,693 696 698 4,820 3,024 1,796 c) Azhikode North(CT) 8.64 2,231 2,856 2,860 19,277 9,408 9,869
d) Azhikode South(CT) 7.40 3,119 3,468 3,497 23,077 11,170 11,907
e) Valapattanam (CT) 2.04 4,373 946 1,114 8,920 4,580 4,340
f) Chirakkal (CT) 13.56 2,938 6,003 6,070 39,838 19,370 20,468
g) Elayavoor (CT) 11.57 2,527 4,575 4,640 29,239 13,938 15,301
h) Puzhathi (CT) 9.17 3,339 4,440 4,506 30,616 15,559 15,057 i) Pallikkunnu (CT) 6.90 3,631 3,897 3,937 25,057 12,098 12,959
j) Thottada (CT) 18.26 1,822 5,313 5,320 33,261 15,880 17,381
k) Muzhappilangad(CT) 7.19 2,616 2,641 2,665 18,812 9,072 9,740 I) Eranholi (CT) 10.08 2,340 3,874 3,875 23,584 11,118 12,466
m) Dharmadom (CT) 10.66 2,505 4,119 4,120 26,705 12,802 13,903
n) Thalassery (M) 23.96 4,323 14,743 15,068 103,579 49,879 53,700 0) New Mahe (CT) 2.82 4,234 1,493 1,533 11,939 5,585 6,354
ERNAKULAM DISTRICT
Kochi UA 373.27 3,056 19 217,812 223,116 1,140,605 571,169 569,436 a) Kochi 109.47 5,322 107,529 112,711 582,588 292,429 290, 159
I) Kochi (C)' 94.88 5,951 103,751 108,924 564,589 283,432 281, 157 ii) Kakkanad (OG) 14.59 1,234 3,778 3,787 17,999 8,997 9,002
b) Aluva (M) 7.18 3,450 4,949 4,977 24,774 12,305 12,469 c) Choornikkara (CT) 17.02 2,047 6,522 6,529 34,837 17,694 17,143 d) Edathala (CT) 28.92 1,950 10,563 10,565 56,397 28,138 28,259 e) Paravur (M) 9.02 3,094 5,446 5,450 27,906 13,596 14,310 f) Kedamangalam (CT) 7.66 2,415 3,622 3,623 18,500 8,989 9,511 g) Kottuvally (CT) 21.00 1,641 6,686 6,686 34,457 16,795 17,662 h) Alangad (CT) 21.02 1,695 6,769 6,802 35,620 17,719 17,901 i) Varappuzha (CT) 7.74 2,909 4,370 4,372 22,514 10,993 11,521 i) Kadungalioor (CT) 14.66 1,735 4,828 4,831 25,433 12,814 12,619 k) Eloor (M) 14.21 2,425 7,557 7,560 34,455 17,953 16,502 I) Cherlyakadavu (CT) 4.12 1,796 1,370 1,370 7,401 3,637 3,764
m) Cheranalloor (CT) 10.59 2,021 4,104 4,106 21,407 10,606 10,801
n) Mulavukad (CT) 19.27 1, 158 4,247 4,248 22,322 11,017 11,305
0) Kalamassery (M) 27.00 2,013 11,430 11,436 54,342 27,789 26,553
p) Vazhakkala (CT) 12.87 2,577 6,670 6,681 33,167 16,734 16,433 q) Thiruvankulam(CT) 10.49 1,755 3,966 3,966 18,412 9,188 9,224
• In Kochi & Kanayannur taluks
S1

A-I: AREA, HOUSES AND POPULATION ANNEXURE
Details of Urban Agglomerations lying in two taluks with its Constituent Units
District/ Area Population No. of No. of No. of Population
UA/Constituent in Km2 per Km 2 Town occupied house Persons Males Females Units residential holds
houses
2 3 4 5 6 7 8 9
r) Thrippunithura (M) 18.69 2,733 10,415 10,434 51,078 25,286 25,792
s) Maradu (CT) 12.34 2,836 6,769 6,769 34,995 17,487 17,508
KOLlAM DISTRICT
Kollam UA 67.65 5,360 5 66,970 68,858 362,572 179,846 182,726 a) Kollam 41.29 5,353 41,004 42,432 221,007 109,849 111,158
iJ Kollam (M) 18.48 7,568 25,602 26,713 139,852 69,340 70,512
ii) Sakthikulangara(OG) 9.17 4,847 8,618 8,831 44,451 22,254 22,197 iii) Neendakara (OG) 10.19 1,514 2,914 2,984 15,424 7,727 7,697
iv) Mundakkal (OG) 3.45 6,168 3,870 3,904 21,280 10,528 10,752
b) MangOld (CT) 6.55 4,323 5,339 5,391 28,317 13,865 14,452 c) Kilikollur (CT) 4.66 6,106 5,293 5,522 28,456 13,976 14,480
d) Vadakkevila (CT) 8.55 5,867 9,128 9,243 50,165 24,898 25,267
e) Eravipuram (CT) 6.60 5,247 6,206 6,270 34,627 17,258 17,369
TRIVANDRUM DISTRICT
Trivandrum UA 178.20 4,637 5 164,565 171,432 826,225 409,659 416,566
a) Trivandrum 141.53 4,945 138,620 144,723 699,872 347,094 352,778
i) Trivandrum (C) 74.93 6,993 102,848 107,892 524,006 259,672 264,334
ii) Kazhakkoottam(OG) 5.02 2,493 2,623 2,645 12,515 6,144 6,371
iii) Thumba (OG) 16.03 2,114 7,214 7,329 33,880 16,780 17,100
iv) Sreekaryam (OG) 8.87 1,944 3,732 3,771 17,245 8,509 8,736
v) Cheruvikkal (OG) 8.70 2,447 4,563 4,612 21,286 10,468 10,818
vi) Vaniyoorkavu (OG) 10.61 3,172 6,893 7,345 33,653 16,639 17,014
vii) Thiruvallam (OG) 12.69 2,511 6,368 6,551 31,868 15,831 16,037
viii) Kovalam(OG) 4.68 5,43i 4,379 4,578 25,419 13,051 12,368
b) UlioOi' (eT) 7.97 3,227 5,293 5,401 25,719 13,013 12,706
c) Kudappanakunnu(CT) 7.69 4,361 7,083 7,320 33,534 16,506 17,028
d) Anayara (eT) 8.14 3,015 4,842 5,005 24,541 12,025 12,516
e) Nemom (eT) 12.87 3,307 8,727 8,983 42,559 21,021 21,538
52

A-I: AREA, HOUSES AND POPULATION
APPENDIX -I
Sldtcment showing i 991lerritorial units and changes during 1981-1991.
( The units which have not undergone any jurisdictional change have been excluded from this appendix. The area figures ~ven here are based on the area flgures supplied by the Director of ,1·
Survey and Land Records forthe 1991 Census).
State! 1981 Area added Name of Sbte! Area Subtracted Name of State! Net Area
District! T~rri(ariJ! Nlln~ ArcJ in distriCt!tlluk Name Area in dlstrlct/taluk change In taluk Unit Sq.km from which area sq. km. to which area sq. km.
is subtracted Is added (+ or-)
2 3 4 6 7 8 9
KERAlA Kasaragod Newly formed Newly formed district after 1981 i) Kasaragod taluk 1900,00 Kannur District + 1990.00
census ii) Hosdurg taluk
Kannur district Kannur district I) Kasaragod taluk 1990.00 Newly formed II) Hosdurg taluk Kasaragod district -1990.00
Wayanad district No changes in Jurisdiction
Mananthavady tJluk Mananthavady A portion of Kuppa- 5.27 Sultan 8athery - 5.27 III taluk thodu village to tal uk IH
Nadavayal village
Sultan 8athery Sulthan 8athery i) A portion of 5.27 Mananthavady + 5.27 taluk taluk KUppathodu taluk
village to NadJ-vayal village ii) Nadavayal 5.07 Vythiri taluk + 5.07 Village
Vythlri tJluk Vythiri taluk Nadavayal village 5.07 Sulthan Bathery - 5.07 tal uk
Kozhlkode district No changes in Jurisdiction
Vadakara taluk Vadakara tJluk Velom village 25.80 Quiland'; taluk + 25.80
Quilandy tal uk Qullandy taluk Velom village 25.80 Vadakara - 25.80
Thrlssur district Thrlssur district Kakkanadan Thuruth 0.16 Emakulam district + 0.16 and Su~am Thuruth of Puthenvelikkara village of Paravur taluk of Emakulam district
-_ ... ~--'-+~"+"'''-'-'""-
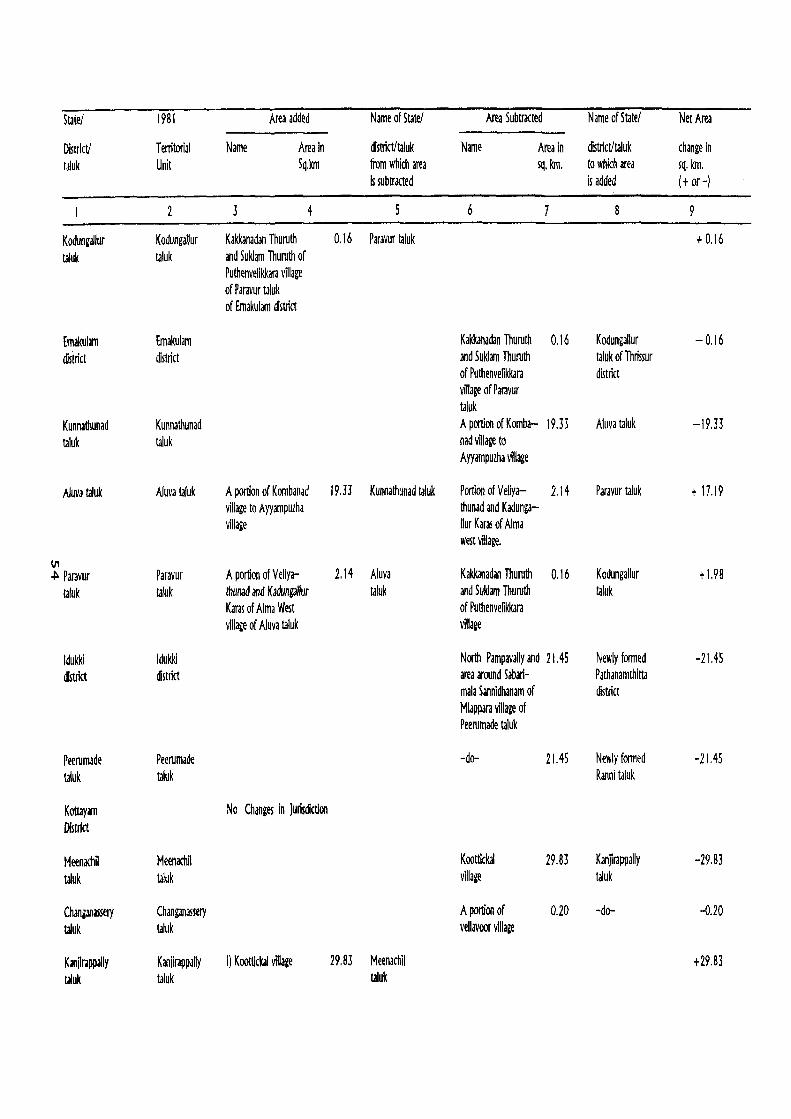
State! 1981 Area added Name of State/ Area Subtracted N arne of State! Net Area
District! Territorial Name Area in distrlct!ta1uk Name Area in distJict!taluk change in ta1uk Unit Sq,km from which area sq, km, to which area ~q, km,
Is subtracted is added (+ or-)
2 3 4 6 7 8 9
Kodun~allur Kodungallur Kakkanadan Thuruth 0,16 Paravur taluk + 0,16 taluk taluk and Su~am Thuruth of
Puthenvelikkara village of Paravur lJluk of Ernakulam district
Emakulam Emakulam Kakkanadan Thuruth 0,16 Kodungallur -0,16 district district and Su~arn Thuruth taluk of Thrissur
of Puthenvellkkara district village of Paravur taluk
Kunnathunad Kunnathunad A portion of Komba- 19.33 Aluva taluk -19.33 taluk taluk nad village to
Ayyampuzha village
Aluv3 taluk Aluva taluk A portion of Kombanad 19.3J Kunnathunad taluk Portion of Veliya- 2,14 Paravur taluk + 17,19 village to Ayyampuzha thunad and Kadunga-village lIur Karas of Alma
west village,
\n .to Paravur Paravur A portion of Veliya- 2,14 Aluva Kakkanadan Thuruth 0,16 Kodungallur + 1.98
taluk tJluk thunad and Kadungallur taluk and Suldam Thuruth taluk Karas of Alma West of Pultienvelikkara village of Aluva tal uk village
Idukki Idukki North Pampavallyand 21. 45 Newly fOl111ed -21. 45 district district area around Sabari- Pathanamthitta
mala Sannldhanam of district Mlappara village of Peerurnade taluk
Peerumade Peerumade -do- 21.45 Newly fOl111ed -21.45 taluk taluk Ranni taluk
Kottay.m No Changes in Jurisdiction District
Meenachil Meenachll Koottlckal 29.83 Kanjlrappally -29,83 taluk taluk vlllag~ tal uk
Chanian~sery Changanassery A portion of 0,20 -do- -0,20 taluk taluk vellavoor village
KMlpr~ppally Kanjirappally i) Koottkkai ~Ilage 29,83 Meenachil +29,83 ~uk taluk taluk

ii) A portion of 0.20 Changanassery +0.20 vellavoor village tlluk
Alappuzha Alappuzha i) Whole of Thiru- 346.50 Newly fonned district district valla taluk Pathanamthitta
ii) 3 villages of 59.97 district Chengannur taluk iii)2 villa~es of 53.78 -460.35 M ave':~kara taluk iv) A portion of 0.10 Kollam Valia Azheekka! district Kara of Arattu-puzha village of karthikapally taluk
Karthikappally Karthikappally A portion of _ 0.10 Karunagappally -0.10 tal uk taluk Valia Azheekkalkara tal uk
of Arattupuzha village
Chengannur Chengannur 3 villages, Aran- 59.97 Newly formed -59.97 taluk taluk mula, Mezhuvell Kozhencherry
and Kulanada tal uk
Mavelikkara Mavelikkara 2 villages-Thonna- 53.78 Newly formed -53.78 t.1luk tal uk lIur and Pandalam Adoor t.1luk
Thekkekara 111 111
Pathanamthitt.1 Newly formed Newly formed with +2728.82 district after 1981 i) Whole Thiruvalla 346.50
Census taluk ii) J villages-Aranmula 59.97 Mezhuveli and Kula- Alappuzha nada of Chengannur district taluk iii)2 villages- Thonna- 53.78 lIur and Pandalam Thekkekara of Mavelikkara tlluk Iv) Whole of Pathanam- 1975.60 thitta taluk v) 10 villages-Adoor, 271.52 Ezhamkulam, Erath, Kallam Peringanad, Kadam- district panad, Koodal, Enadimangalam, Kodumon, Angadlckal and pallickal of Kunnathur taluk vi) North Pampavally 21.45 Idukki and area around district Sabarimala Sanni-

Statel 1981 Area added Name of State/ Area Subtracted Name of State/ Net Area
District! Territorial Name Area in dismct!taluk Name Area In dlstrictltaluk change In
taluk Unit Sq,km from which area sq, km, to which area sq, km, Illubtracted Is added (+ or-)
2 3 4 5 6 7 8 9
dhanam of Mlappara village of Peen made tal uk of Idukki district
Thiruvalla Thiruvalla I) 8 villagel- 156,12 Newly fonned -156,12
taluk taluk Kaliooppara,Malla- Mallappal~
ppally, Anlcadu, taluk Kottangal, Perum-petty, Ezhumattoor Puramattom and Kunnamthanam villages II) Ayroor village 25,16 Newly fonned -25.16
Rannl tal uk
Mallappally Newly fonned Newly constituted 156,12 Thlruvalla + 156,12
taluk after 1981 with eight villages- taluk census K~loopara, Malla-
11I ppally, Anicadu, 0- Kottangal, Perumpetty
Ezhumattoor, Pura-mattom and Kunnam-thanam villages
Rannl Newly formed Newly constituted tal uk after 1981 with
censul i) North Pampavally and 21.45 Peerumade + 21.45 area around Saban- taluk mala Sannidhanam of 'Mlappara village II) Ayroor village 25.76 Thlruvalla taluk + 25.76 iii) 7 villages-Angadi, Pazhavangadl,Chetha- Pathanam- Portion of Rannl 5,80 Newly fonned +249,53 kkal,Perunad, Vadas- 255.33 thitta village Kozhencherry serikkara,Ranni and taluk taluk Cherukole
Kozhencherry Newly formed Newly constituted taluk after 1981 with
census i) 3 vlllages-Aranmula, 59,97 Chengannur +59,97 Mezhuveli & Kulanada taluk U) Portion of Rannl 5,80 Rannl +5,80 village taluk

III) 13 vi1lages-Pathana-mthitta, Naranganam, Mallapuzhassery, 8anthur,Cheneerkara, Omallur, Malayala- 1720.27 Pathanam- + 1720.27 puzha, Thannlthodu, thitta Konnaithazham,lravon, taluk KOIIni, Pramadom and Vallikkode
Adoor Newly foomed Newly constituted taluk afier 1981 with
census I) Thoonallur and 53.78 Mavelikkara + 53.78 Pandalam Thekkekara taluk ii) 10 villages - Adoor, Ezhamkulam, Erath, Peringanad, Kadampa- 271.52 Kunnathur +271.52 nad, Koodal, Enadl- taluk maQgalarn, Kodumon, Angadickal and Pallickal villages
Kollam Kallam A portion of Valla 0.10 Alappuzha I) Whole of Path a- 1975.60 Newly formed district district Azheekkal Kara of district namthitta taluk Pathanam-
Arattupuzha village il) 10 villages - Adoor, 271.52 thitta of Karthlkappal~ Ezhamkulam, Erath, district
111 taluk of Alappuzha Peringanad, Kadampa- - 224:r.02
..., district nad, Koodal, Enadi-mangalam, Kodumon, Angadickal and Pallickal villages
Karunagapp~~ Karunagappal~ A portion of 0.10 Karthlkapally Mynagapally village 19.70 Kunnathur -19.60 tlluk tlluk Valla Azheekkalkara taluk taluk
of Arattupuzha village
Kunnathur Kunnalhur Mynagapally village 19.70 Karunagappally 1 0 villages - Adoor, 271.5 2 Newly fonned -251.82 tlluk taluk taluk Ezhamkulam, Erath, Adoor taluk
Peringanad,Kadampa-nad, Koodal, Enadi-mangalam, Kodumon, Angadickal and Pallickal villages
Pathanapuram Pathanapuram Portloo of 2 villages 1.83 Kottarakkara + 1.83 taluk taluk Ittiva and Chltnara taluk
Kottarai<kara Kottarakkara Portion of 2 villages- 1.83 Pathanapuram -1.83 taluk tJluk Ittiva and Chithara taluk
Trivandrum No Changes in Jurisdiction dlst"ct

A-I : AREA, HOUSES AND POPULATION
APPENDIX - 2
Number and Population of villages with population of 5000 and over and of Towns with population under 5000
State/ districr/
taluk
KERALA
KASARAGOD DISTRICT
Kasaragod taluk
Hosdurg taluk
KANNUR DISTRICT
Taliparamba taluk
Kannur taluk
Thalassery taluk
WAY ANAD DISTRICT
Manamhavady taluk
Sulthan Barhery raluk
Vythiri raluk
KOZHIKODE DISTRICT
Vadakara raluk
Quilandy taluk
Kozhikode taluk
MAlAPPURAM DISTRICT
Ernad taluk
Perinthalmanna taluk
Tirur taluk
Ponnani taluk
PAlAKKAD DISTRICT
Ottappalam taluk
Mannarkkad raluk
Palakkad taluk
Chittur raluk
Alathur taluk
THRISSUR DISTRICT
Talappally taluk
Chavakkad taluk
Thrissur taluk
Kodungallur taluk
Mukundapuram taluk
ERNAKUlAM DISTRICT
Kunnathunad taluk
AluVd taluk
Paravur taluk
Koehi taluk
No.
2
1,259
73
40
33
78
41
7
30
47
16
15
16
85
22
36
27
123
50
22
41
10
139
37
23
24
25
30
167
51
19
36
12
49
86
22
IS
4
9
Villages with population Towns with a population of 5000 and over of under 5000
Population % of total rural No. Population % of total urban population of state population of state
3 4 5 6 7
21,008,840 98.09 4,820 0.06
762,753 3.56
367,823 1.12
394,930 1.84
1,106,251 5.17 4,820 0.06
543,788 2.54
124,264 0.58 4,820 0.06
438,199 2.05
647,407 3.02
203,701 0.95
255,397 1.19
188,309 0.88
1,606,944 7.50
459,526 2.15
640,965 2.99
506,453 2.36
2,813,876 13.14
1,078,584 5.04
413,862 1.93
1,052,312 4.91
269,118 1.26
1,942,917 9.07
665,413 3.11
263,488 1.23
337,178 1.57
278,372 1.30
398,466 1.86
1,867,825 8.72
434,619 2.03
304,061 1.42
328,050 1.53
177,589 0.83
623,506 2.91
1,436,791 6.71
362,476 1.69
260,745 1.22
79,126 0.37
216,040 1.01
58

A-I : AREA, HOUSES AND POPULATION
APPENDIX - 2
Number and Population of villages with population of 5000 and over and of Towns with population under 5000
State/ Villages with population Towns with J population district/ of 5000 and over of under 5000
taluk No. Population % of total rural No. Population % of total urban population of state population of state
2 3 4 5 6 7
Kanayannur taluk 10 137,169 0.64
Muvattupuzha taluk 16 231,965 1.08
Kothamangalam taluk 10 149,270 0.70
IDUKKI DISTRICT 59 1,012,688 4.73
Devikulam taluk 10 189,524 0.88
Udumbanchola taluk 22 388,839 1.82
Thodupuzha taluk 18 250,324 1.17
Peerumade taluk 9 184,001 0.86
KOTTAYAM DISTRICT 84 1,487,154 6.94
Meenachil taluk 25 337,166 1.57
Vaikom taluk 16 273,430 1.28
Kottayam taluk 20 416,651 1.94
Changanassery taluk 13 265,553 1.24
Kanjirappally taluk 10 194,354 0.91
AlAPPUZHA DISTRICT 73 1,389,048 6.49
Cherthala taluk 13 279,477 1.31
Ambalapuzha taluk 5 117,409 0.55
Kuttanad taluk 14 210,004 0.98
Karthikappally taluk 17 325,478 1.52
Chengannur taluk 10 168,638 0.79
Mavelikkara taluk 14 288,042 1.34
PATHANAMTHITTA 62 1,030,872 4.8'1
DISTRICT
Thiruvalla taluk 10 172,042 0.80
Maliappaliy taluk 9 132,144 0.62
Ranni taluk II 209,374 0.98
Kozhenchery taluk 20 300,072 1.40
Adoer taluk 12 217,240 1.01
KOllAM DISTRICT 92 1,961,530 9.16
Karunagappally taluk 16 369,679 1.73
Kunnathur taluk 7 178,665 0.83
Pathanapuram taluk 21 368,968 1.72 Kottarakkara taluk 27 533,447 2.49
Kollam taluk 21 510,771 2.39
TRIVANDRUM DISTRICT 91 1,942,784 9.07
Chirayinkeezhu taluk 25 478,610 2.23
Nedumangad taluk 26 524,655 2.45
Trivandrum taluk t 1 237,491 I. 11
Neyyattinkara taluk 29 702,028 3.28
59

A - I AREA, HOUSES AND POPULATION
APPENDIX - 3
Houseless and Institutional Population
State!District! Total Houseless Population Institutional Population
Taluk/UAlCiryl Rural No. of Persons Males Females No. of Persons Males Females Town Urban House House
holds holds
2 3 4 5 6 7 8 9 10
KERALA T 9,886 22,482 14,370 8,112 19,446 218,706 122,901 95,805 R 5,489 13,355 8.477 4,878 11,860 115,756 63,681 52,075 U 4,397 9,127 5,893 3,234 7,586 102,950 59,220 43,730
I. KASARAGOD T 426 1,240 766 474 1,224 7,147 5,806 1,341 DISTRICT R 242 674 446 228 869 4,917 4,147 770
U 184 566 320 246 355 2,230 1,659 571
I. Kasaragod taluk T 145 432 272 160 681 3,989 3,326 663 R 93 276 180 96 478 2,548 2,315 233 U 52 156 92 64 203 1,441 1,0\ I 430
Manjeshwar (CT) U 5 53 32 21 6 19 19 Kasaragod (M) U 47 103 60 43 197 1,422 992 430
2. Hosdurg taluk T 281 808 494 314 543 3,158 L,4BO 678 R 149 398 266 132 391 2,369 1,832 537 U 132 410 228 182 152 789 648 141
Kanhangad (UA) U 132 410 228 182 152 789 648 141 Kanhangad (Ml U 62 280 161 119 112 624 504 120 Perole (CTl U 3 7 7 11 40 28 12 Nileshwar (CT) U 29 71 40 31 23 104 95 9 Cheruvathur (CT) U 38 52 20 32 6 21 21
2. KANNUR DISTRICT T 1,055 2,875 1,726 1,149 1,708 16,845 12,101 4,744 R 370 1,087 635 452 662 5,942 3,417 2,525 U 685 1,788 1,091 697 1,046 10,903 8,684 2,219
Kannur (UA) U 325 840 548 292 608 6,952 5,822 1,130
1. Taliparamba taluk T 267 739 453 286 442 4,142 2,635 1,507 R 150 435 269 166 305 2,353 1,269 1,084 U 117 304 184 120 137 1,789 1,366 423
Payyannur (M) U 33 78 47 31 53 728 417 311 Taliparamba (M) U 84 226 137 89 84 1,061 949 112
2. Kannur taluk T 444 1,048 636 412 727 7,415 6,110 1,305 R 98 220 137 83 109 981 692 289 U 346 828 499 329 618 6,434 5,418 1,016
Cheruthazham (CT) U 14 62 29 33 16 109 53 56 Cherukunnu (CT) U 23 23 23 22 242 81 161 Kannapuram (CT) U 36 96 48 48 6 98 89 9 Kalliasseri (CT) U 4 10 6 4 20 60 60 Pappinisseri (CT) U 27 54 28 26 45 252 245 7 Azhikode North(CT)< U I 1 1 14 137 134 3 Azhikode South(CT)· U 4 4 4 5 20 20 Valapattanam (CT)+ U 29 71 49 22 18 157 151 6 Chirakkal (CT)· U 16 56 28 28 27 115 114 1 Kannadiparamba( CT) U 9 39 32 7 Varam (CT) U 2 2 1 12 52 52 Munderi (CT) u 1 1 I 10 33 30 3 Kanhirode (CT) U 3 3 3 7 43 43 Chelora (CT) u 4 13 13 Elayavoo( (CT)' U 21 51 31 20 34- 1~9 115 54
60

A-I : AREA, HOUSES AND POPULATION
APPENDIX - 3
Houseless and Institutional Population
S tatel District! Total Houseless Population Institutional Populatioll
Taluk/UA/Cityl Rural No. of Persons Males Females No. of Persons Males females Town Urban House House
hold~ holds
2 3 4 5 6 7 8 9 10
puzhathi (CT) + u 3 6 2 4 59 1,239 1,152 87 PaIHkkunnu (CT)+ U 1 1 1 23 94 89 5 Kannur (M)+ U 97 207 129 78 185 1,530 1,167 363 Kannur Cant. + U 42 1,747 1,513 2H Thottada (CT) + u 7 27 16 11 26 139 119 20 Chala (CT) U 3 21 21 lriveri (CT) U 5 15 9 6 3 13 13 Ancharakandy (CT) U 6 6 6 7 22 22 Peralassery (CT) U 13 21 13 8 10 48 48 Mavilayl (CT) U 22 53 36 17 1 2 2 Kadachira (CT) U 2 6 4 2 2 9 9 • Muzhappilangad(CT)+ U 9 52 31 21 8 31 31
3. Thalassery taluk T 344 1088 637 451 539 5,288 3,356 1,932 R 122 432 229 203 248 2,608 1,456 1,152 U 222 656 408 248 291 2,680 1,900 780
Mattannur (M) U 1 4 1 3 21 158 133 25 Paduvllayl (CT) U 2 8 6 2 6 44 44 Pathlrlyad ICT) u 3 15 15 Pinarayi (CT) U 2 1 1 1 1 Eruvatti (CT) u 1 7 7 Kottayam-Malabar (CT) U I 1 1 4 15 15 Koothuparamba (M) U 40 154 81 73 29 439 79 360 Patdom (CT) u 14 56 21 35 5 82 82 Kadirur (CT) u 14 30 20 10 16 78 57 21 Eranholi (CT) + u 6 36 36 Dharrnadom (CT) + U 3 12 7 5 16 130 93 37 Thalassery (M)+ U 120 315 223 92 135 1,357 1,039 318 New Mahe (CT)+ U 14 37 26 11 10 51 49 2 Panniyannur(CT) U 3 12 12 Peringathur( CT) U 5 13 7 6 20 175 173 2 Chockll (CT) U 8 26 15 11 14 70 55 15
3. WAYANAD DISTRICT T 569 1,057 718 339 1,136 8,696 5,873 2,823 R 547 1,011 690 321 1,024 8,048 5,380 2,668 U 22 46 28 18 112 648 493 155
1. Mananthavady taluk T 119 314 173 141 229 2,317 1,333 984 R 119 314 173 141 229 2,317 1,333 984 U
2. Sultanbathery taluk T 354 479 382 97 608 3,567 2,704 863 R 354 479 382 97 608 3,567 2,704 863 U
3. Vythiri taluk T 96 264 163 101 299 2,812 1,836 976 R 74 218 135 83 187 2,164 1,343 821 U 22 46 28 18 112 648 493 155
Kalpetta (M) U 22 46 28 18 112 648 493 155
4. KOZHIKODE DISTRICT T 1,204 3,360 2051 1,309 1364 22,181 14,659 7,522 R 574 1,761 1,051 710 680 8,318 5,712 2,606 U 630 1,599 1,000 599 684 13,863 8,947 4,916
+ Forms part of Kannur Urban Agglomeration Consolidated figures for Kannur UA along with its constituents are given at the end in Annexure.
61
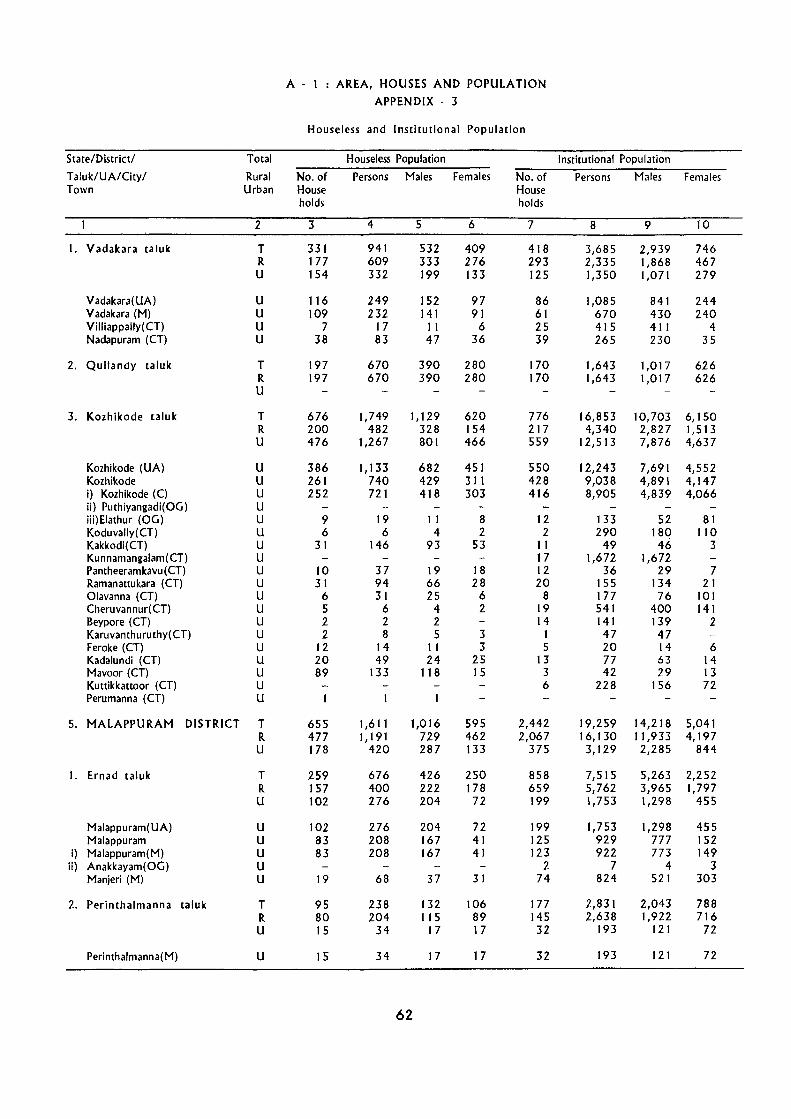
A-I : AREA, HOUSES AND POPULATION
APPENDIX - 3
Houseless and Institutional Population
State/District/ Total Houseless Population Institutional Population
Taluk/UAlCity/ Rural No. of Persons Males Females No. of Persons Males Females Town Urban House House
holds holds
2 3 4 5 6 7 8 9 10
I. Vadakara taluk T 331 941 532 409 418 3,685 2,939 746 R 177 609 333 276 293 2,335 1,868 467 U 154 332 199 133 125 1,350 1,071 279
Vadakara(UA) U 116 249 152 97 86 1,085 841 244 Vadakara (M) U 109 232 141 91 61 670 430 240 VilIiappally(CT) U 7 17 II 6 25 415 411 4 Nadapuram (CT) U 38 83 47 36 39 265 230 35
2. Qullandy taluk T 197 670 390 280 170 1,643 1,017 626 R 197 670 390 280 170 1,643 1,017 626 U
3. Kozhikode taluk T 676 1,749 1,129 620 776 16,853 10,703 6,150 R 200 482 328 154 217 4,340 2,827 1,513 U 476 1,267 801 466 559 12,513 7,876 4,637
Kozhikode (UA) U 386 1,133 682 451 550 12,243 7,691 4,552 Kozhikode U 261 740 429 311 428 9,038 4,891 4,147 I) Kozhikode (C) U 252 721 418 303 416 8,905 4,839 4,066 ii) Puthiyangadi(OG) U iii)Elathur (OG) U 9 19 11 8 12 133 52 81 Koduvally(CT) U 6 6 4 2 2 290 180 110 Kakkodl(CT) U 31 146 93 53 II 49 46 3 Kunnamangalam(CT) U 17 1,672 1,672 Pantheeramkavu( CT) U 10 37 19 18 12 36 29 7 Ramanattukara (CT) U 31 94 66 28 20 155 134 21 Olavanna (CT) U 6 31 25 6 8 177 76 101 Cheruvannur( CT) U 5 6 4 2 19 541 400 141 Beypore (CT) U 2 2 2 14 141 139 2 Karuvanthuruthy(CT) U 2 8 5 3 I 47 47 Feroke (CT) U 12 14 11 3 5 20 14 6 Kadalundi (CT) U 20 49 24 25 13 77 63 14 Mavoor (CT) U 89 133 118 15 3 42 29 13 Kuttikkattoor (CT) U 6 228 156 72 Perumanna (CT) U
5. MALAPPURAM DISTRICT T 655 1,611 1,016 595 2,442 19,259 14,218 5,041 R 477 1,191 729 462 2,067 16,130 11,933 4,197 U 178 420 287 133 375 3,129 2,285 844
I. Ernad taluk T 259 676 426 250 858 7,515 5,263 2,252 R 157 400 222 178 659 5,762 3,965 1,797 U \02 276 204 72 \99 1,753 1,298 455
Malappuram(UA) U 102 276 204 72 199 1,753 1,298 455 Malappuram U 83 208 167 41 125 929 777 152
i) Malappuram(M) U 83 208 167 41 123 922 773 149 Ii) Anakkayam(OG) U 2 7 4 3
Manjeri (M) U 19 68 37 31 74 824 521 303
2. Perinthalmanna taluk T 95 238 132 106 177 2,831 2,043 788 R 80 204 115 89 145 2,638 1,922 716 U 15 34 17 17 32 193 121 72
Perinthalmanna(M) U IS 34 17 17 32 193 121 72
62

A-I : AREA, HOUSES AND POPULATION
APPENDIX - 3
Houseless and Institutional Population
State/District/ Total Houseless Population Institutional Population
Taluk/UA1Cityl Rural No. of Persons Males Females No. of Persons Males Females Town Urban House House
holds holds
2 3 4 5 6 7 8 9 10
3. Tirur taluk T 213 537 338 199 1,236 7,513 5,782 1,731 R 155 430 274 156 1,131 6,673 5,186 1,487 U 58 107 64 43 105 840 596 244
Tirur (M) U 58 107 64 43 105 840 596 244
4. Ponnani taluk T 88 160 120 40 171 1,400 1,130 270 R 85 157 118 39 132 1,057 860 197 U 3 3 2 1 39 343 270 73
Ponnan! (M) U 3 3 2 39 343 270 73
6. PALAKKAD DISTRICT T 497 996 622 374 1,313 10,212 5,020 4,592 R 323 721 449 272 850 6,266 3,761 2,505 U 174 275 173 102 463 3,946 1,859 2,087
1. Ottappalam taluk T 131 239 157 82 286 2,103 1,352 751 R 92 189 125 64 124 1,034 841 193 U 39 50 32 18 162 1,069 511 558
Shoranur(M) U 27 36 21 15 45 330 142 188 Ottappalam (M) U 12 14 11 3 117 739 369 370
2. Mannarkad taluk T 28 50 29 21 151 2,247 928 1,319 R 26 48 28 20 114 1,961 737 1,224 U 2 12 1 1 37 286 191 95
Mannarkad (M) U 2 2 37 286 191 95
3. Palakkad taluk T 196 411 245 166 532 4,060 2,383 1,677 R 82 218 129 89 308 1,951 1,447 504 U 114 193 116 77 224 2,109 936 1,173
Palakkad(UA) U 114 193 116 77 224 2,109 936 1,173 Palakkad U 114 193 116 77 174 1,694 715 979 i) Palakkad (M) 'U 112 184 113 71 114 1,525 579 946 ii)Hemambika Nagar(OG) U 2 9 3 6 60 169 136 33 Puthuppariyaram(CT) U 19 217 93 124 Marutharode (CT) U 31 198 128 70
4. Chittur taluk T 60 110 78 32 194 1,088 636 452 R 41 80 54 26 154 606 415 191 U 19 30 24 6 40 482 221 261
Chittur-Thathamangalam(UAl U 19 30 24 6 40 482 221 261 Chittur-Thathamangalam(M) U 9 19 14 5 27 394 176 218 Koduvayur (CT) U 4 5 4 1 6 23 11 12 Puthunagaram (CT) U 6 6 6 7 65 34 31
5. Alathur taluk T 82 186 113 73 150 714 321 393 R 82 186 113 73 150 714 321 393 U
7. THRISSUR DISTRICT T 1,573 3,265 2,012 1,253 1,751 26,883 11,627 15,256 R 798 1,956 1,126 830 994 12,999 5,602 7,397 U 775 1,309 886 423 757 13,884 6,025 7,859
63

A - I : AREA, HOUSES AND POPULA nON
APPENDIX - 3
Houseless and Institutional Population
State/District! Total Houseless Population Institutional Population
Taluk/UAlCityl Rural No. of Persons Males Females No. of Persons Males Females Town Urban House House
holds holds
2 3 4 5 6 7 8 9 10
1. Talappilly taluk T 249 434 267 167 280 3,598 1,724 1,874 R 198 355 216 139 249 2,921 1,401 1,520 U 51 79 51 28 31 677 323 354
Kunnamkulam (M) U 43 71 48 23 24 520 296 224 Chelakkara (CT) U 8 8 3 5 7 157 27 130
2. Chavakkad Taluk T 381 1091 648 443 270 4,326 2,114 2,212 R 186 690 373 317 136 2,124 1,340 784 U 195 401 275 126 134 2,202 774 1,428
Guruvayoor (UA) U 195 401 275 126 134 2,202 774 1,428 Guruvayoor (TS) U 147 339 225 114 69 806 191 615 Chavakkad (M) U 29 34 26 8 34 305 226 79 Pookode (CT) U 8 247 189 58 Perakam (CT) U 2 5 5 2 6 6 lringaprom (CT) U 7 7 6 1 Thaikkad (CT) U 4 10 7 3 5 237 9 228 Paluvai (CT) U 2 110 13 97 Pavaratty (CT) U 6 6 6 13 488 137 351 Venmenad (CT) U 1 3 3
3. Thrissur taluk T 516 793 570 223 631 11,099 4,663 6,436 R 113 190 136 54 210 2,706 996 1,710 U 403 603 434 169 421 8,393 3,667 4,726
Thrissur (UA) U 379 564 406 158 390 7,197 3,537 3,660 Thrissur U 333 434 332 102 191 3,595 1,217 2,378 i) ThrissUr (M) U 328 424 328 96 186 3,566 1,188 2,378 ii) Poonkunnam(OG) U 1 11 11 iii}Peringaw(OG} U 1 2 2 iv) Chembukavu(OG) U 3 16 16 v) Thrissur(OG) U 5 10 4 6 Vivanom (CT) U 1 1 1 23 941 718 223 Vlyyur (CT) U 55 786 706 80 Ayyanthole(CT) U 7 7 7 7 66 33 33 Nettlssery( CT) U :3 24 I 23 Mannuthy (CT) U 6 21 10 I 1 46 835 487 348 Nadathara( CT) U 14 257 46 211 Ollur (CT) U 10 18 11 7 12 217 95 122 Chlyyaram( CT) U 1 1 134 40 94 'l<oorkkanchery( (..I) U 1 1 1 10 99 21 78 AranattUkara(CT) U 1 J I 12 149 149 Edakkunny (eT) U 20 81 43 38 6 94 24 70 Kolazhy (CT) U 7 9 6 3 4 132 4 128 Pottore (CT) U 7 20 12 8 Kuuoor (CT) U 3 27 2 25 Pullazhi (CT) U 7 559 62 497 Kanlmangalam(CT) U 4 130 1 129 Palissery(CT) U 3 3 3 Avinlssery(CT) U 2 51 51 Chevvoor (CT) U 3 3 3 8 233 9 224 Marathakkara(CT) U 4 4 4 3 64 1 63
4. Kodungallur taluk T 69 121 74 47 81 1,354 695 659 R 31 54 32 22 53 708 401 307 U 38 67 42 25 28 646 294 352
64
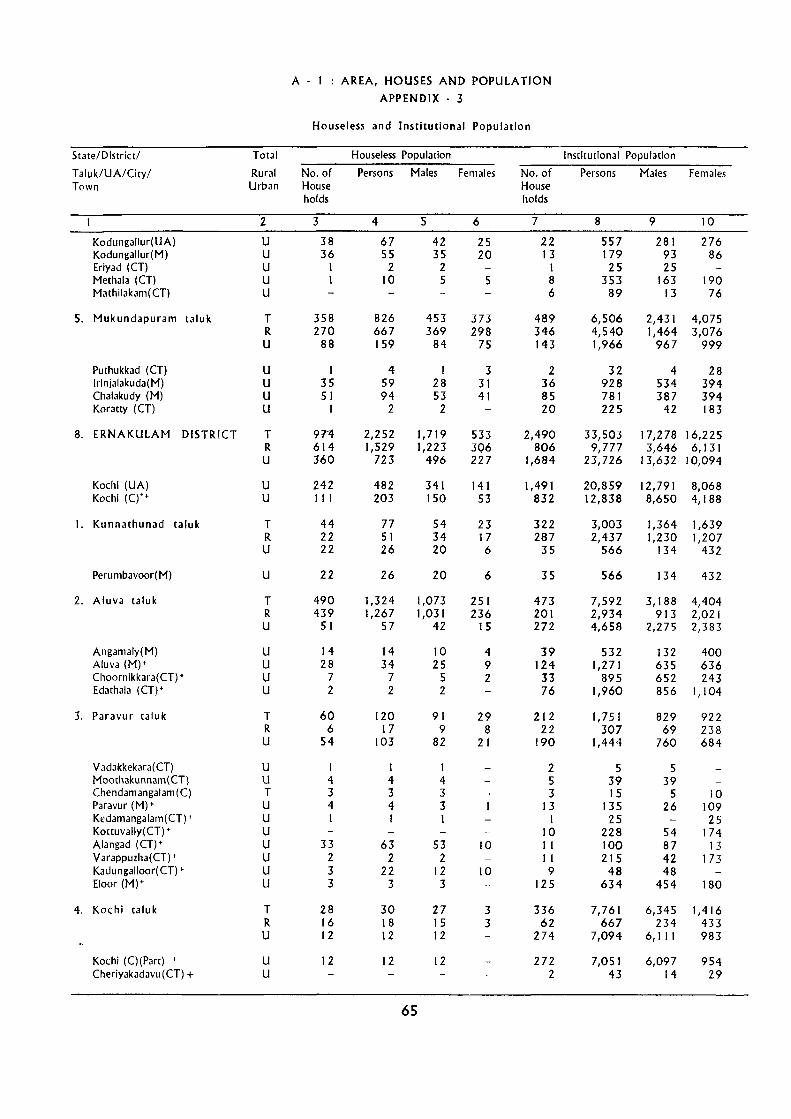
A-I AREA, HOUSES AND POPULATION
APPENDIX - 3
Houseless and Institutional Population
State/District/ Total Houseless Population Institutional Population
Taiuk/UA/Cityl Rural No. of Persons Males Females No. of Persons Males Females Town Urban House House
holds holds
2 3 4 5 6 7 8 9 10
Kodungallur(UA) U 38 67 42 25 22 557 281 276 Kodungallur(M) U 36 55 35 20 13 179 93 86 Eriyad (CT) U 1 2 2 1 25 25 Methala (CT) U 1 10 5 5 8 353 163 190 Mathilakam(CT) U 6 89 13 76
5. Mukundapuram taluk T 358 826 453 373 489 6,506 2,431 4,075 R 270 667 369 298 346 4,540 1,464 3,076 U 88 159 84 75 143 1,966 967 999
Puthukkad (CT) U 1 4 1 3 2 32 4 28 Irinjalakuda(M) U 35 59 28 31 36 928 534 394 Chalakudy (M) U 51 94 53 41 85 781 387 394 Koratty (CT) U 1 2 2 20 225 42 183
8. ERNAKULAM DISTRICT T 91'4 2,252 1,719 533 2,490 33,503 17,278 16,225 R 614 1,529 1,223 3Q6 806 9,777 3,646 6,131 U 360 723 496 227 1,684 23,726 13,632 10,094
Kochi (UA) U 242 482 341 141 1,491 20,859 12,791 8,068 Kochi (C)'+ U III 203 150 53 832 12,838 8,650 4,188
1. Kunnathunad taluk T 44 77 54 23 322 3,003 1,364 1,639 R 22 51 34 17 287 2,437 1,230 1,207 U 22 26 20 6 35 566 134 432
Perumbavoor(M) U 22 26 20 6 35 566 134 432
2. Aluva taluk T 490 1,324 1,073 251 473 7,592 3,188 4,404 R 439 1,267 1,031 236 201 2,934 913 2,021 U 51 57 42 15 272 4,658 2,275 2,383
Angamaly(M) U 14 14 10 4 39 532 132 400 Aluva (M)+ U 28 34 25 9 124 1,271 635 636 Ci1oornikkara(CT) ... U 7 7 5 2 33 895 652 243 Edathala (CT)+ U 2 2 2 76 1,960 856 1,104
3. Paravur taluk T 60 120 91 29 212 1,751 829 922 R 6 17 9 8 22 307 69 238 U 54 103 82 21 190 1,444 760 684
Vadakkekara( CT) U 1 I 1 2 5 5 Moothakunnam(CT) U 4 4 4 5 39 39 Cilendamangalam (C) T 3 3 3 3 15 5 10 Paravur (M)+ U 4 4 3 13 135 26 109 Kedamangalam( CT) + U 1 1 I I 25 25 Kottuvally( CT) + U 10 228 54 174 Alangad (CT)+ U 33 63 53 10 II 100 87 13 Varappuzha( CT) + U 2 2 2 II 215 42 173 Kadungalloor( CT)'" U 3 22 12 10 9 48 48 Eloor (M)+ U 3 3 3 125 634 454 180
4. Kochi taluk T 28 30 27 3 336 7,761 6,345 1,416 R 16 18 15 3 62 667 234 433 U 12 12 12 274 7,094 6,111 983
Kochi (C)(Part) + U 12 12 12 272 7,051 6,097 954 Cheriyakadavu (CT) + U 2 43 14 29
65

A " AREA, HOUSES AND POPULATION
APPENDIX" 3
Houseless and Institutional Population
State/District! Total Houseless Population Institutional Population
TaluklUA/Cityl Rural No. of Persons Males Females No. of Town Urban House House
holds holds
2 3 4 5 6 7
5. Kanayannur taluk T 172 361 243 118 872 R 25 29 20 9 68 U 147 332 227 109 804
Koehi (C)+ (Part) U 99 191 138 53 560
Kakkanad (OG) + U 9 20 11 9 16 Cheranalloor( CT) + U 2 2 2 11 Mulavukad(CT)+ U 1 1 1 10 Kalamassery (M)+ U 6 42 24 18 87 Vazhakkala(CT)+ U 11 11 11 48 Thimvankulam(CT) + U 25 ThriPlInithura(M) + U 19 65 36 29 41 Maradu (CT)+ U 6
6. Muvattupuzha taluk T 77 114 84 30 160 R 64 79 64 15 104 U 13 35 20 15 56
Muvattupuzha(M) U 3 3 3 31 Piravom (M) U 3 8 6 2 8 Koothattukulam(M) U 7 24 11 13 17
7. Kothamangalam taluk T 103 226 147 79 115 R 42 68 50 18 62 U 61 158 97 61 53
Kothamangalam(M) U 61 158 97 61 53
9. IDUKKI DISTRICT T 443 976 622 354 1,251 R 347 785 502 283 1,164 U 96 191 120 71 87
Idukki (TS)' U 10 18 15 3 29
I. Devikulam tal uk T 72 150 96 54 337 R 72 ISO 96 54 337 U
2. Udumbanchola taluk T 1,61 398 245 153 388 R 160 389 238 151 387 U 1 9 7 2 1
Idukki(TS)(Part) U 9 7 2
3. Thodupuzha tat uk T 156 332 214 118 306 R 61 150 101 49 220 U 95 182 113 69 86
Idukki(TS) (Part) U 9 9 8 1 28 Thodupuzha(M 1 U 86 173 105 68 58
+ Forms part of Kochi(UAj.(onsolidated figures for Kochi (UA) along with constituents are given at the end of Annexure. * Kochi Corporation lies in two taluks viz. Kochi and Kanayannur. The portions are shown under the respective taluks. * Idukki Township lies in two taluks viz. Udumbanchola and Thodupuzha. The portions are shown under the respective taluks.
66
Persons Males
8 9
8,808 4,159 554 333
8,254 3,826
5,787 2,553
162 61 44 27 50 45
890 495 808 329 117 108 363 194
33 14
2,291 652 1,667 446
624 206
359 142 86 21
179 43
2,297 741 1,211 421 1,086 320
1,086 320
9,406 4,634 8,457 4,317
949 317
175 109
1,993 1,320 1,993 1,320
2,343 1,109 2,341 1,107
2 2
2 2
3,604 1,356 2,657 1,041
947 315
173 107 774 208
F",males
10
4,649 221
4,428
3,234
101
5 395 479
9 169
19
1,639 1,221
418
217 65
136
1,556 790 766
766
4,772 4,140
632
66
673 673
1,234 1,234
2,248 1,616
632
66 566

A - I : AREA, HOUSES AND POPULA TJON
APPENDIX - 3
Houseless and Institutional Population
State/District/ Total Houseless Population Institutional Population
Ta1uk/UA/City/ Rural No. of Persons Males Females No. of Persons Males Females Town Urban House House
holds holds
2 3 4 5 6 7 8 9 10
~ " 4., Peerumade taluk T 54 96 67 29 220 1,466 849 617 R 54 96 67 29 220 1,466 849 617 U
10. KOTTAYAM DISTRICT T 765 1289 918 371 1,605 25,885 9,813 16,072 R 363 651 449 202 1,047 16,484 5,544 10,940 U 402 638 469 169 558 9,401 4,269 5,132
I. Meenachil taluk T 267 328 262 66 473 9,037 2,917 6,120 R 99 140 105 35 350 6,201 1,810 4,391 U 168 188 157 31 123 2,836 1,107 1,729
Palai (M) U 142 144 128 16 93 2,342 885 1,457 Erattupetta(M) U 26 44 29 15 30 494 222 272
2. Vaikom taluk T 66 137 84 53 119 1,622 390 1,232 R 61 131 79 52 110 1,549 374 1,175 U 5 6 5 I 9 73 16 57
Vaikom (M) U 5 6 5 9 73 16 57
3. Kottayam taluk T 216 435 312 123 608 9,262 4,438 4,824 R 98 192 136 56 319 4,598 2,053 2,545 U 118 243 176 67 289 4,664 2,385 2,279
Kottayam(UA) U 118 243 176 67 289 4,664 2,385 2,279 Kottayam U 91 119 96 23 196 3,697 1,943 1,754 i) Kottayam (M) U 55 83 60 23 166 2,387 1,201 1,186 ii) Vijayapuram(OG) U 36 36 36 30 1,310 742 568 Perumbaikad( CT) U 20 75 38 37 66 729 317 412 Nattakam (CT) U 7 49 42 7 27 238 125 113
4. Changanassery taluk T 132 258 161 97 219 3,456 1,258 2,198 R 38 103 60 43 130 2,187 815 1,372 U 94 ISS 101 54 89 1,269 443 826
Changanassery(M) U 94 155 101 54 89 1,269 443 826
5. Kanjirappally taluk T 84 131 99 32 186 2,508 810 1,698 R 67 85 69 16 138 1,949 492 1,457 U 17 46 30 16 48 559 318 241
Kanjirappally(CT) U 17 46 30 16 48 559 318 241
11. ALAPPUZHA DISTRICT T 351 749 471 278 819 7,454 3,577 3,877 R 188 404 248 156 470 4,264 2,084 2,180 U 163 345 223 122 349 3,190 1,493 1,697
1. Cherthala taluk T 49 147 88 59 133 1,587 437 1,150 R 27 85 51 34 78 764 249 515 U 22 62 37 25 55 823 188 635
Cherthala (UA) U 16 48 24 24 42 664 93 571 Cherthala (M) U 9 15 10 5 20 289 27 262 Vayalar (CT) U 1 1 1 5 36 3 33 Kokkothamangalam (CT) U 4 22 3 19 Thanneermukkom( CT) U 6 32 13 19 9 305 55 250 Muhamma (CT) U 4 12 5 7
67

A-I AREA, HOUSES AND POPULATION
APPENDIX - 3
Houseless and Institutional Population
State/District/ Total Houseless Population Institutional Population
Taluk/UA/City/ Rural No. of Persons Males Females No. of Persons Males Females Town Urban House House
holds holds
2 3 4 5 6 7 8 9 10
Aroor (CT) U 6 14 13 8 78 15 63 Arookutty (CT) U 3 77 77 Kodamthuruthu( CT) U 2 4 3
2. Ambalappuzha taluk T 86 213 135 78 237 1,519 870 649 R 9 42 23 19 47 193 84 109 U 77 171 112 59 190 1,326 786 540
Alappuzha (UA) U 76 165 109 56 186 1,288 778 510 Alappuzha U 76 165 109 56 126 1,177 670 507 i) Alappuzha (M) U 66 147 100 47 91 845 479 366 ii) Kafarkode(OG) U I 3 I 2 7 40 15 25 iii)Punnapra( OG) U 9 15 8 7 28 292 176 116 Komalapuram( CT) U 60 111 108 3 Mannancherry( CT) U 6 3 3 4 38 8 30
3. Kuttanad taluk T 60 129 72 57 135 763 220 543 R 60 129 72 57 135 763 220 543 U
4. Karthikappally taluk T 22 49 30 19 56 729 431 298 R 18 29 16 13 22 320 251 69 U 4 20 14 6 34 409 180 229
Kayamkulam (M) U 4 20 14 6 34 409 180 229
5. Chengannur taluk T 21 24 18 6 122 805 548 257 R 18 21 15 6 75 471 344 127 U 3 3 3 47 334 204 130
Chengannur (M) U 3 3 3 47 334 204 130
6. Mavelikkara taluk T 113 187 128 59 136 2,051 1,071 980 R 56 98 71 27 113 1,753 936 817 U 57 89 57 32 23 298 135 163
Mavelikkara(M) U 57 89 57 32 23 298 135 163
12. PATHANAMTHITTA T 343 623 458 165 790 8,173 4,857 3,316 DISTRICT R 214 457 327 130 575 5,455 3,583 1,872
U 129 166 131 35 215 2,718 1,274 1,444
1. Thiruvalla taluk T 36 51 42 9 251 3,137 1,547 1,590 R 25 40 32 8 122 1,086 755 331 U 11 11 10 1 129 2,051 792 1,259
Thlruvalla(M) U II 11 10 129 2,051 792 1,259
2. Mallappally taluk T 23 97 61 36 92 1,288 655 633 R 23 97 61 36 92 1,288 655 633 U
3. Ranni taluk T 112 181 131 50 143 1,392 945 447 R 112 181 131 50 143 1,392 945 447 U
68

A-I AREA, HOUSES AND POPULATION
APPENDIX - 3
Houseless and Institutional Population
State/District! Total Houseless Populadon Institutional Population TaluklUAlCity/ Rural No. of Persons Males Females No. of Persons Males Females Town Urban House House
holds holds
2 3 4 5 6 7 8 9 10 4. Kozhencherry taluk T 131 209 170 39 228 1,707 1,335 372
R 37 III 81 30 174 1,293 964 329 U 94 98 89 9 54 414 371 43
Pathanamthitta(M) U 94 98 89 9 54 414 371 43
5. Adoor taluk T 41 85 54 31 76 649 375 274 R 17 28 22 6 44 396 264 132 U 24 57 32 25 32 253 111 142
Pandalam(M) U 8 16 10 6 7 47 25 22 Adoor (M) U 16 41 22 19 25 206 86 120
13. KOllAM DISTRICT T 470 1,013 586 427 531 8,089 3,687 4,402 R 333 802 432 370 367 5,293 2,658 2,635 U 137 211 154 57 164 2,796 1,029 1,767
Kollam (UA) U 86 131 99 32 147 2,620 937 i,683
I. Karunagappally ta'uk T 172 378 203 175 46 741 395 346 R 172 378 203 175 39 551 362 189 U 7 190 33 157
Neendakara(OG) + U 7 190 33 157
2. Kunnathur taluk T 17 38 17 21 12 198 147 51 R 17 38 17 21 12 198 147 51 U
3. Pathanapuram taluk T 106 206 129 77 107 1,013 480 533 R 55 126 74 52 91 846 397 449 U 51 80 55 25 16 167 83 84
Puna/ur(M) U 51 80 55 25 16 167 83 84
4. Kottarakkara taluk T 23 36 25 11 87 1,419 824 $95 R 23 36 25 11 87 1,419 824 595 U
5. Kollam taluk T 152 355 212 143 279 4,718 1,841 2,877 R 66 224 113 III 138 2,279 928 1,351 U 86 131 99 32 141 2,439 913 1,526
KoIlam(M)+ U 76 119 90 29 104 2,095 734 1,361 Sakthlkulangara( OG) + U 7 7 6 I 13 76 38 38 Mundakkal (OG)+ U 2 99 7 9.2 Mangad (CT)+ U 4 37 3 H Kllikollur(CT) + U 2 2 2 3 53 52 I Vad3kkevila (CT) + u 1 3 I 2 II 56 56 Eravipuram (CT) + U 3 14 14 Paravoor (M) u I 9 9
14. TRIVANDRUM DISTRICT T 561 1,176 685 491 1,022 14,973 9,151 5,822 R 99 326 170 156 285 3,406 1,897 1,509 U 462 850 515 335 737 11,567 7,254 4,313
Trivandrum (UA) U 428 772 477 295 667 10,898 6,922 3,976
+ Forms part of Kollam(UAj.wnsolidated figures for Kollam(UA) along with constituents are given at the end of Annexure
69

A _ 1 AREA, HOUSES AND POPULATION
APPENDIX _ 3
Houseless and Institutional Population
State/Districtl Total Houseless Population Institutional Population
Taluk/UAICityl Rural No. of Persons Males Females No. of Persons Males Females Town Urban House House
holds holds
2 3 4 5 6 7 8 9 10
1. Chirayinkeezhu taluk T 51 152 74 78 148 837 513 324 R 36 103 50 53 101 420 331 89 U 15 49 24 25 47 417 182 235
Varkala (M) U 10 21 9 12 14 228 71 157 Vakkom (eT) U Attingal (M) U 5 28 15 13 33 189 111 78
2. Nedumangaad taluk T 21 58 35 23 57 860 418 442 R 20 57 35 22 46 726 329 397 U 1 1 I 11 134 89 45
Nedumangad (M) U 11 134 89 45
3. Trivandrum taluk T 427 746 463 283 711 11,934 7,690 4,244 R 9 18 9 9 62 1,094 816 278 U 418 728 454 274 649 10,840 6,874 3,966
Ulloor (CT)"'+ U 39 737 623 114 Kudappanakunnu(CT)++ U 18 348 177 171 Anayara (CT)++ U 4 64 12 52 Trivandrum (C)++ U 404 671 426 245 499 8,410 5,305 3,105 Kazhakkoottam (OG) ...... U 1 1 1 10 98 84 14 Thumba (OG)++ U 8 40 15 25 17 352 340 12 Sreekaryam(OG)++ U 17 144 99 45 Cheruvikkal(OG) ...... U 17 315 127 188 Vattiyoorkavu(OG) ++ U 19 59 50 9 Thiruvallam(OG)++ U 3 7 6 1 4 24 20 4 Nemom (CT)++ U 2 9 6 3 5 289 37 252
4. Neyyattinkara taluk T 62 220 113 107 106 1,342 530 812 R 34 148 76 72 76 1,166 421 745 U 28 72 37 35 30 176 109 67
Kovalam (OG)++ U 10 44 23 21 18 58 48 10 Neyyattinkara (M) U 18 28 14 14 12 118 61 57
"Forms part of Trivandrum UA_Ginsolidated figures for Trivandrum UA along with Its constituents are given at the end in Annexure.
70
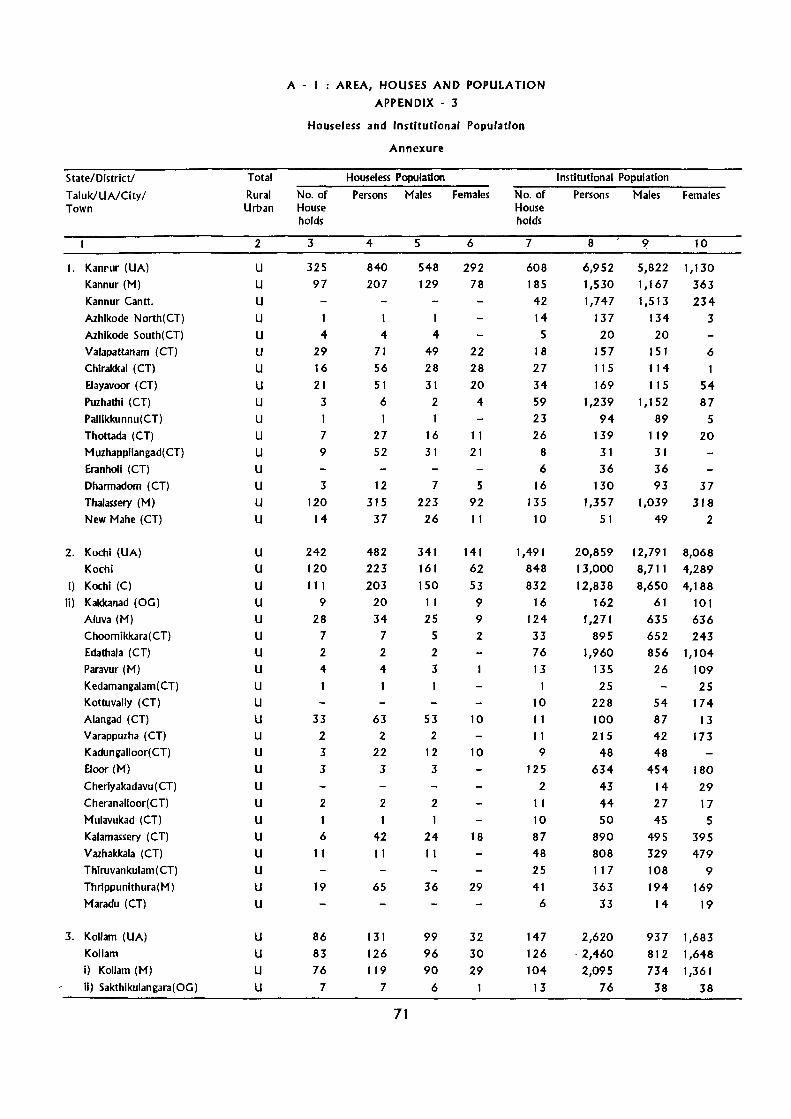
State/District!
TaluklUAlCity/ Town
1. Kanrur (UA)
Kannur (M)
Kannur Cantt.
Azhlkode North(CT)
Azhlkode South(CT)
Valapattanam (CT)
Chirakkal (CT)
Elayavoor (CT)
Puzhathl (CT)
Pallikkunnu(CT)
Thottada (CT)
Muzhappilangad(CT)
Eranholl (CT)
Dharmadom (CT)
Thalassery (M)
New Mahe (CT)
2. Kochi (UA)
Kochi
I) Koehl (C)
Ii) Kakkanad (OG)
Aluva (M)
Choomlkkara( CT)
Edathala (CT)
Paravur (M)
Kedamangalam(CT)
Kottuvaliy (CT)
Alangad (CT)
Varappuzha (CT)
Kadungalloor(CT)
Eloor(M)
Cherlyakadavu (CT)
Cheranalloor( CT)
Mulavukad (CT)
Kalamassery (CT)
Vazhakkala (CT)
Thlruvankulam (CT)
Thrippunlthura(M)
Maradu (CT)
3. Kollam (UA)
Kollam
I) Kollam (M)
II) Sakthikulangara(OG)
A-I : AREA, HOUSES AND POPULATION
APPENDIX - 3
Houseless and Institutional Population
Annexure
Total Houseless Population Institutional Population
Rural No. of Persons Males Females No. of Persons Males Females Urban House
2
U
U
U
U
U
U
U
U
U
U
U
U
U
U
U U
U
U U
U
U
U
U
U
U
U
U
U
U
U
U
U
U
U
U
U
U
U
U
U
U
U
holds
3
325 97
1
4 29 16
21 3
7
9
3
120 14
242 120 111
9 28
7 2
4
33 2
3 3
2
6
11
19
86 83 76
7
4
840 207
4
71 56 51 6
27 52
12 315
37
482 223 203
20 34
7 2
4
63
2
22 3
2
42 11
65
131 126 119
7
71
5
548 129
4
49 28 31
2
16 31
7 223
26
341
161 150
11 25
5
2
3
53 2
12 3
2
1 24 11
36
99 96
90 6
6
292 78
22 28 20
4
11
21
5
92 11
141
62 53
9
9
2
10
10
18
29
32 30 29
House holds
7
608 185
42 14
5
18 27 34 59 23 26
8
6
16 135
10
1,491 848 832
16 124
33
76 13
1
10 11 11
9
125 2
11 10 87 48 25 41
6
147 126
104 13
8
6,952 1,530 1,747
137 20
157 115 169
1,239 94
139 31 36
130 1,357
51
20,859 13,000 12,838
162 1,271
895 1,960
135 25
228 100 215
48 634
43 44 50
890 808 117 363
33
2,620 ·2,460
2,095 76
9
5,822 1,167 1,513
134
20 151 114
115 1,152
89 119
31 36 93
1,039 49
12,791 8,711 8,650
61 635 652 856
26
54 87 42 48
454
14 27 45
495 329 108 194
14
937 812 734
38
10
1,130 363 234
3
6
1 54 87
5
20
37 318
2
8,068 4,289 4,188
101 636
243 1,104
109 25
174
13 173
180 29 17
5
395 479
9
169
19
1,683 1,648 1,361
38

A-I : AREA, HOUSES AND POPULATION
APPENDIX - 3
Houseless and Institutional Population
Annexure
State/District! Total Houseless Population Institutional Population
Taluk/UAlClty/ Rural No. of Persons Males Females No. of Persons Males Females Town Urban House House
holds holds
2 3 4 5 6 7 8 9 10
iiI)Neendakara(OG) U 7 190 33 157
Iv) Mundakkal(OG) U 2 99 7 92
Mangad (CT) U 4 37 3 34 Kilikollur( CT) U 2 2 2 3 53 52
Vadakkevila(CT) U 3 2 11 56 56
Eravlpuram (CT) U 3 14 14
4. Trlvandrum (UA) U 428 772 477 295 667 10,898 6,922 3,976
Trivandrum U 426 763 471 292 601 9,460 6,073 3,387
I) Trivandrum(C) U 404 671 426 245 499 8,410 5,305 3,105
ii) Kazhakkoottam( OG ) U 10 98 84 14
iii) Thurnba (OG) U 8 40 15 25 17 352 340 12
Iv) Sreekaryam(OG) U 17 144 99 45
v) Cheruvlkkal(OG) U 17 315 127 188
vi) Vattiyoorkavu(OG) U 19 59 50 9
vif)Thlruvall~ (OG)'" ., ..... -
U 3 7 6 4 24 20 4
viii)Kovalam (OG) II 10 44 23 21 18 58 48 10
Ulloor (CT) U '39 737 623 114
Kudappanakunnu(CT) U , 18. 348 177 171
<'
Anayara (CT) Li 4 64 12 52
Nemom (CT) U 2 9 6 3 5 289 37 252
72

.A2 - DECADAL VARIATION IN POPULATION SINCE 1901


A-2 : DECADAL VARIATION IN POPULATION SINCE 1901
Fly leaf
Table A2 furnishes the population for ten censuses from 1901 to 1991 as well as the variation In population. This table is prepared on the basis of the territorial Jurisdiction of the districts as they stood as on 1 st March 199 t , thereby presenting comparable data on growth of population of state and districts during the last 90 years. During
~ the intercensal period of t 98 t -9 t there was no change in the area and jurisdiction of the State. At the district level two new disaicts- Kasaragod and Pathanamthitta were formed after t 981 Census. Of these Kasaragod was formed by taking whole of two taluks viz. Kasaragod and Hosdurg from erstwhile Kannur district while Pathanamthltta was formed by taking portions from Alappuzha, Kallam and Idukki districts. As a result of this change the number of taluks increased from 58 to 6 t in the state. Except Wayanad, Kozhikode, Kottayam and Trlvandrum districts all other districts have undergone changes in jurisdiction at the district level, during the last decade 198 t --9 t. The changes which have taken place at the district level are
(I) Two taluks - Kasaragod and Hosdurg of the erstwhile Kannur district were transferred from it to form. the new Kasaragod District comprising these two taluks. Present Kannur district comprises of the remaining Tallparamba, Kannur and Thalassery taluks of erstwhile Kannur district
(B) A Portion (silent valley) of Karuvarakundu village of Emad Taluk of Malappuram district was transferred to Pudur village of Mannarkad taluk of Palakkad dIstrict. This area is uninhabited.
(Iii) Kakkanadan Thuruth and Suklam Thuruth of Puthenvelikkara village of Parawr taluk of Ernakulam dlsoict was transferred to Methala Village of Kodungallur taluk of Thrissur district.
(Iv) North Pampa valley and area around Sabarimala Sannldhanam of Mlappara village of Peerumade taluk was transferred to newly formed Rannl taluk of the new Pathanamthltta district.
(v) Whole of Thiruvalla taluk, 4 villages (Aranmula, Mezhuvell, Kulanada and Kldangannur) of Chengannur Taluk and 2 villages (Pandalam Thekkekara and Thonnalloor) of Mavellkkara taluk of Alappuzha district were transferred to newly formed Pathanamthltta district.
(vi) Also, a portion of VallaAzheekkal Kara of Arattupuzha village of Karthlkappally taluk was transferred to Alappad village of Karunagappally taluk of Kallam district.
75
(vii) Whole ofPathanamthitta taluk and 10 villages (Koodal, Enadimangalam, Koduman, Adoor, Angadikkal, Ezhamkulam, Erath, Perlnganadu, Kadampanadu and Palllkkal villages) of erstwhile Kunnathur taluk of Kollam district were transferred to newly formed Pathanamthitta district.
Procedure adopted for adjusting population for earlier censuses
The population of unaffected districts or taluks for the previous censuses were adopted as given in the census reports of 198 t. The population of transferred portion according to 196 t, t 971 and t 98 t censuses were obtained from the census volumes of concerned censuses. The population of transferred area so obtained was subtracted from the respective census population oftalukldistrict from which the area was transferred and added to the talukl district in which the area was included to obtain the adjusted population of that census year. Wherever the figures are not readIly available prior to t 95 1, the population of transferred areas for census prior to 195 t was estimated in the following manner.
(I) The population of an area transferred in any particular census prior to 1951 was estimated on the assumption that the proportion of the population in the area transferred to the total population of dlstrictltaluk in which it was situated at the time of transfer was [he same in the particular census as it was in t 95 t .
(ii) Male-Female breakup of this estimated population of the transferred area for previous censuses were worked out on the basis of the male/female distribution of population In that particular previous census of the districtltaluk etc. In which It was situated at the time of transfer. Thus the following formulae was adopted for estimating the population for previous censuses.
The population of affected
portion In the 195 t Census Population of the entire
X unit in the earlier census
The population of the entire
unit in the 1951 Census acc
ording to t 98 t jurisdiction
Statement t shows the recast population figures of the districts for different censuses adjusted to Jurisdictional changes.
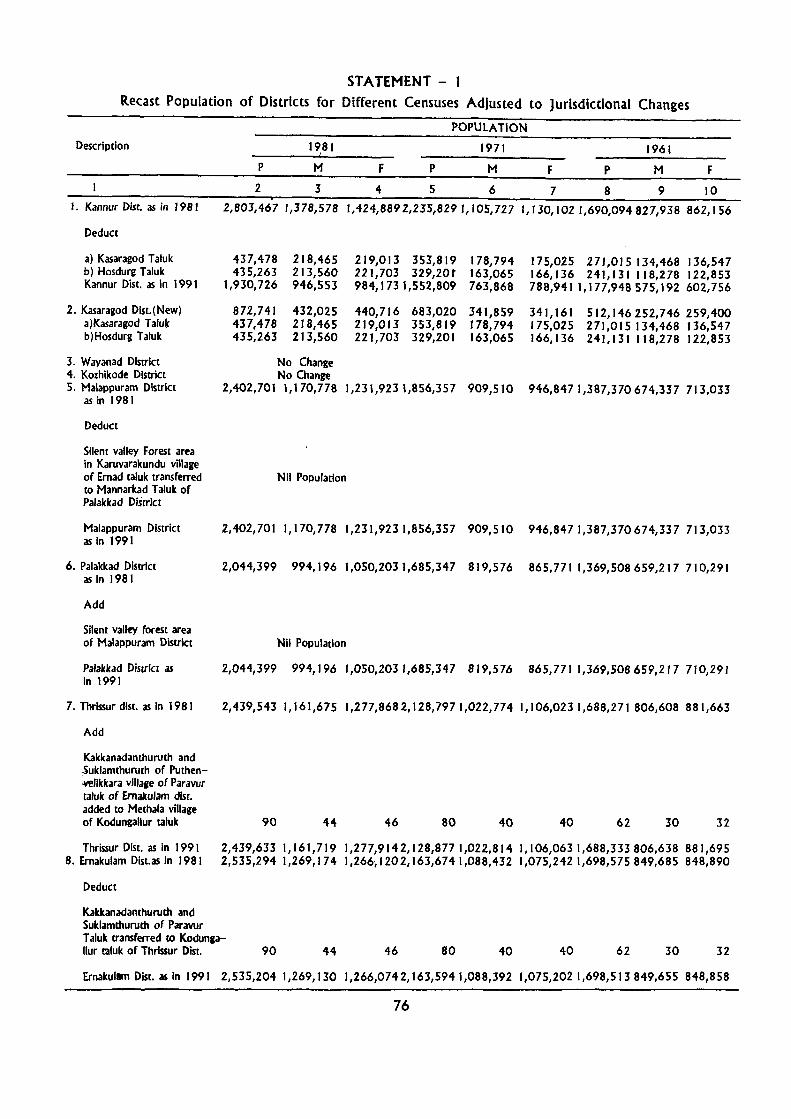
STATEMENT - 1 Recast Population of Districts for Different Censuses Adjusted to Jurisdictional Changes
POPULATION
Description 19,81 1971 1961
P M F P M F P M F
2 3 4 5 6 7 8 9 10 I. Kannur Disc. as in 1981 2,803,467 1,378,578 1,424,8892,235,829 1,105,727 1,130,1021,690,094827,938 862,156
Deduct
a) Kasaragod Taluk b) Hosdurg Taluk Kannur Dist. as In 1991
2. Kasaragod Dlst.(New) a)Kasaragod Talu~ b)Hosdurg Taluk
3. Wayanad District 4. Kozhikode District 5. Malappuram District
as in 1981
Deduct
Silent valley Forest area In Karuvarakundu village
437,478 218,465 435,263 213,560
1,930,726 946,553
872,741 432,025 437,478 218,465 435,263 213,560
No Change No Change
2,402,701 1,170,778
219,013 353,819 221,703 329,20r 984,173 1,552,809
440,716 683,020 219,013 353,819 221,703 329,201
1,231,923 1,856,357
of Ernad taluk transferred Nil Population to Mannarkad Taluk of Palakkad District
178,794 175,025 271,015134,468 136,547 163,065 166,136 241,131118,278 122,853 763,868 788,9411,177,948575,192 602,756
341,859 341,161 512,146252,746 259,400 178,794 175,025 271,015134,468 136,547 163,065 166,136 241,131118,278 122,853
909,510 946,8471,387,370674,337 713,033
Malappuram District 2,402,7011,170,778 1,231,9231,856,357 909,510 946,8471,387,370674,337713,033 as In 1991
6. Palakkad District as In 1981
2,044,399 994,196 1,050,2031,685,347 819,576 865,771 1,369,508659,217 710,291
Add
Silent valley forest area of Malappuram District Nil Population
Palakkad District as In 1991
2,044,399 994,196 1,050,2031,685,347 819,576 865,771 1,369,508659,217 710,291
7. Thrlssur dlst. as in 1981 2,439,543 1,161,675 1,277,8682,128,7971,022,774 1,106,0231,688,271806,608 881,663
Add
Kakkanadanthuruth and oSuklamthuruth of Puthen,yellkkara village of Paravur raluk of Ernalculam dlst. added to Methala village of Kodungallur taluk 90 44 46 80 40 40 62 30 32
Thrissur Dist. as in 1991 2,439,633 1,161,719 1,277,9142,128,8771,022,814 1,106,0631,688,333 806,638 881,695 8. Ernakulam Dist.as in 1981 2,535,294 1,269,174 1,266;1202,163,6741,088,432 1,075,2421,698,575849,685 848,890
Deduct
Kakkanadanthuruth and Suklamthuruth of Parawr Taluk transferred to KodungalIur taluk of Thrissur Oisr. 90 44 46 80 40 40 62 30 32
Ernakullm Dist. as in 1991 2,535,204 1,269,130 1,266,0742,163,5941,088,392 1,075,2021,698,513849,655 848,858
76

STATEMENT - 1 Recast Population of Districts for Different Censuses Adjusted to Jurisdictional Changes
Description
1. Kannur Dist. as in 1981
Deduct
a)Kasaragod Taluk b)Hosdurg Talult • Kannur Dist. as in 199 t
2. Kasa,·agod Dist.(New) a)Kasaragod Taluk b)Hosdurg Taluk
3. Wayanad District 4. Kozhikode Distriq 5. Malappuram Dist.
as in 1981
Deduct
Silent valley Forest area in Karuvarakundu village of Ernad taluk transferred to Mannarkad Taluk of Palakkad District
Malappuram District as in 1991
6. Palakkad District as in 1981
Add
Silent valley forest area of Malappuram District
Palakkad District as in 1991
7. Thrissur dist. as in 1981
Add
Kakkanadanthuruth and Suklamthuruth of Puthenvelikkara village of Paravur taluk of Ernakulam dist. added to Methala village of Kodungallur taluk
Thrissur Dist. as in 1991 8. Ernakulam Dist.as in 198-1
Deduct
P
II
1,315,501
224,015 187,016 904,470
411,031 224,015 187,016
1951
M
12
637,081
110,056 90,871
436,154
200,927 110,056 90,871
No Change No Change
POPULATION
1941
F M
13 14 f5
678,4201,085,623 520,052
113,959 186,557 91,474 96,145 155,744 76,365
468,316 743,322 352,213
210,104 342,301 113,959 186,557 96,145 155,744
167,839 91,474 76,365
1931
F P M F
16 17 18 19
565,571 964,758462,733 502,025
95,083 164,616 80,691 83,925 79,379 137,427 67,364 70,063
391,109 662,715314,678348,037
174,462 302,043 148,055 153,988 95,083 164,616 80,691 83,925 79,379 137,427 67,364 70,063
1,149,718 559,531 590,187 977,085 473,762 503,323 874,504424,823 449,681
Nil Population
1,149,718 559,531 590,187 977,085 473,762 503,323 874,504424,823 449,681
1,214,208 582,388 631,8201,025,058 492,995 532,063 941,286452,770 488,516
Nil Population
1,214208 582,388 631,8201,025,058 492,995 532,063 "941,286452,770 488,516
1,403,099 666,439 736,6601,154,555 554,597 599,958 993,875479,070 514,805
51
1,403,150 '1,393,730
25
666;464 69'4,141
26 43 21 22 38 19 19
736,6861,154,598 554,618 599,980 993,913479,089 514,824 699,5891,172,335 587,709 584,626 982;769492,778 489,991
Kakkanadanthuruth and Suklamthuruth of Paravur Taluk transferred to KodungalIur taluk of Thrissur Dist. 51 25 26 43 21 22 38 19 19
Ernakulam Dist. as in 1991 1,393,679 694,116 699,5631,172,292 587,688 584,604 982,731492,759 489,972
77
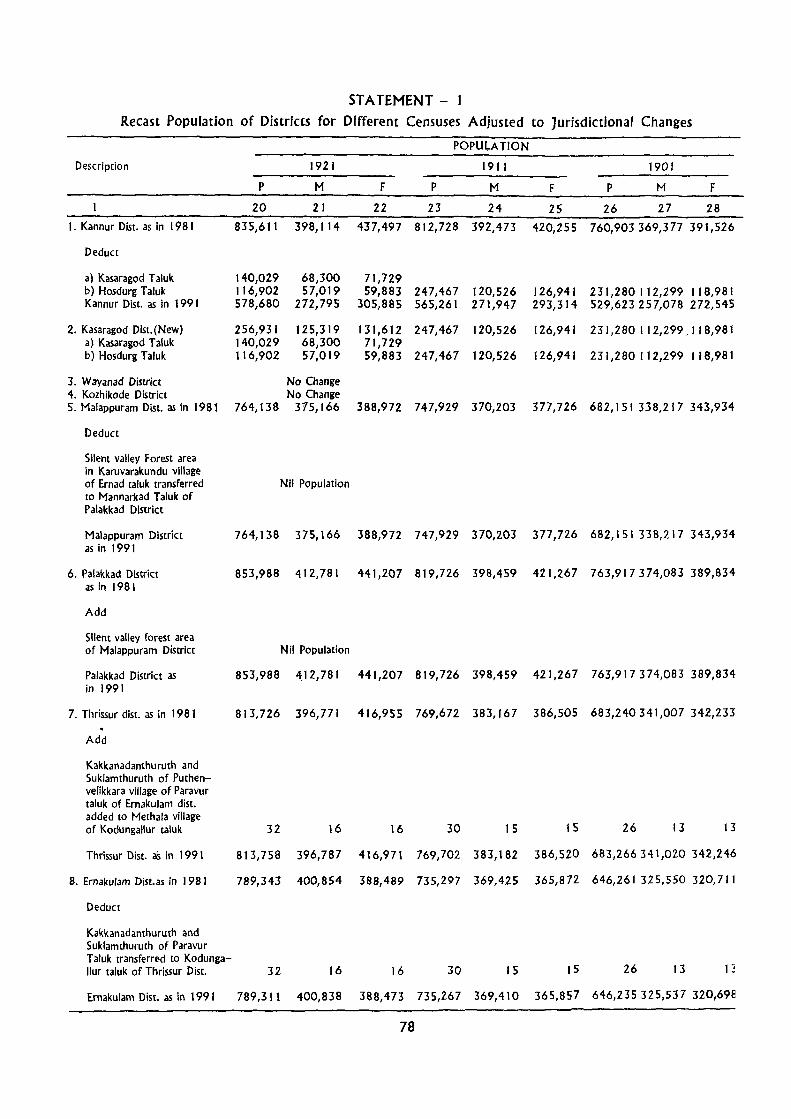
STATEMENT - 1 Recast Population of Districts for Different Censuses Adjusted to Jurisdictional Changes
Description
I. Kannur Dist. as In 1981
Deduct
a) Kasaragod Taluk b) Hosdurg Taluk Kannur Dist. as in 1991
2. Kasaragod Dist,(New) a) Kasaragod Taluk b) Hosdurg Taluk
J. Wayanad District 4. Kozhikode District 5. Malappuram Dist. as In 1981
Deduct
Silent valley Forest area in Karuvarakundu village of Ernad taluk transferred to Mannarkad Taluk of Palakkad District
Malappuram District as in 1991
6. Palakkad District as in 1981
Add
Silent valley forest area of Malappuram District
Palakkad District as in 1991
7. Thrissur dist. as in 1981
Add
Kakkanadanthuruth and Suklamthuruth of PuthenveJikkara village of Paravur taluk of Ernakulam dist. added to Methala village of Kodungallur taluk
Thrissur Dist. as in 1991
8. Ernakulam Dist.as in 1981
Deduct
Kakkanadanthuruth and Suklamthuruth of Paravur Taluk transferred to KodungalIur taluk of Thrissur Dist.
1921
P M
20 21
835,611 398,114
140,029 68,300 116,902 57,019 578,680 272,795
256,931 140,029 116,902
764,138
125,319 68,300 57,019
No Change No Change
375,166
Nil Population
POPUlATION
1911
F P M
22 23 24
437,497 812,728 392,473
71,729 59,883 247,467 120,526
305,885 565,261 271,947
131,612 247,467 120,526 71,729 59,883 247,467 120,526
388,972 747,929 370,203
1901
F P M F
25 26 27 28
420,255 760,903369,377 391,526
126,941 231,280112,299 118,981 293,314 529,623257,078 272,545
126,941 231,280 112,299.118,981
126,941 231,280112,299 118,981
377,726 682,151 338,217 343,934
764,138 375,166 388,972 747,929 370,203 377,726 682,151 338,217 343,934
853,988 412,781 441,207 819,726 398,459 421,267 763,917374,083 389,834
Nil Population
853,988 412,781 441,207 819,726 398,459 421,267 763,917374,083 389,834
813,726 396,771 416,955 769,672 383,167 386,505 683,240341,007 342,233
32 16 16 30 15 IS 26 13 13
813,758 396,787 416,971 769,702 383,182 386,520 683,266341,020 342,246
789,343 400,854 388,489 735,297 369,425 365,872 646,261 325,550 320,711
32 16 16 30 15 15 26 13 1 ~
Ernakulam Dist. as in 1991 789,311 400,838 388,473 735,267 369,410 365,857 646,235325,537 320,69S
78

STATEMENT - t Recast Population of Districts for Different Censuses Adjusted to Jurisdictional Changes
POPUlATION
DescriJ1(ion 1981 1971 1961
P M F P M F P M F
2 3 4 5 6 7 8 9 10
9. Idukki Disc. as in 1981 971,636 494,999 476,637 765,608 395,297 370,311 580,235303,106 277,129
Deduct
North Pampa valley area around Saba rim ala Sanni-dhanam of Mlappara Village of Peerumade Taluk trans-ferred to newly formed Pathanamthina District 2,344 1,207 1,137 216 119 97 1,164 644 520
Idukki Disc. as in 1991 969,292 493,792 475,500 765,392 395,178 370,214 579,071 302,462 276,609
10. Kottayam District No Change
11. Alappuzha Disc. as in 1981 2,350,145 1,146,407 1,203,7382,125,722 1,048,082 1,077,6401,805,517890,519 914,998
Deduct
a)portion transferred to new Pathanamthina Disc. 484,565 233,454 251,111 454,334 222,891 231,443 401,166197,468 203,698
i) Thiruvalla taluk 363,728 175,491 188,237 342,736 168,334 174,402 305,625 150,556 155,069 ii)3 Villages of Chengannur taluk 62,193 29,604 32,589 58,016 28,227 29,789 50,620 24,720 25,900 iii)2 Villages of 58,644 28,359 30,285 53,582 26,330 27,252 44,921 22,192 22,729 Mavelikkara taluk
b)A portion transferred to Kollam
i) A Portion of Valia Azhekkal 125 65 60 102 54 48 82 43 39 kara of Arartupuzha village of Karthikappally taluk transferred to Karunagap-pally taluk Alappuzha Disc. as in 1991 1,865,455 912,888 952,5671,671,286 825,137 846,1491,404,269693,008 711,261
12. Pathanamthitta Dist.(New) 1,125,345 547,352 577,9931,028,208 509,2 I 7 518,991 888,272 441,686 446,586
al Portion from erstwhile 484,565 233,454 25 1,111 454,334 222,891 231,443 401,166197,468 203,698 Alappuzha Dist.
i) Thiruvalla Taluk 363,728 175,491 188,237 342,736 168,334 174,402 305,625 150,556 155,069 ii) 3 Villages of Chengannur Taluk 62,193 29,604 32,589 58,016 28,227 29,789 50,620 24,720 25,900 iii) 2 Villages of 58,644 28,359 30,285 53,582 26,330 27,252 44,921 22,192 22,729 Mavelikkara taluk
b) Portion from erstwhile 638,436 312,691 325,745 573,658 286,207 287,451 485,942243,574 242,368 Kollam District
i) Pathanamthitta taluk 430,915 211,334 219,581 390,150 195,048 195,102 333,310 167,540 165,770 ii) 1 0 villages of 207,521 101,357 106,164 183,508 91,159 92,349 152,632 76,034 76,598 Kunnathur taluk
()Ponion from erstwhile 2,344 1,207 1,137 216 . 119 97 1,164 644 520 Idukki District
79

STATEMENT - 1
Recast Population of Districts for Different Censuses Adjusted to Jurisdictional Changes
POPULATION
Description 1951 1941 1931
P 'M F P M F P M F
11 12 13 14 15 16 17 18 19
9. ldukki Dist as in 1981 331,603 173,723 157,880 244,418 130,354 114,064 187,767102,408 85,359
. Deduct
North Pampa valley area around Sabarimaia Sanni-dhanam of Mlappara Village of Peerumade T aluk trans-femd to newly formed Pathanamthltta District 181 93 88 122 68 54 87 50 37
ldukki Dlst as in 1991 331,422 173,630 157,792 244,296 130,286 114,010 187,680102,358 85,322
10. Kottayam District No Change
1 1. Alappuzha Dist as in 1991 1,516,914 751,307 765,6071,270,366 635,132 635,2341,127,301565,757 561,544
Deduct
a) Portion transferred to new Pathanamthitta Dist. 351,003 174,751 176,252 287,127 144,358 142,769 262,028132,399 129,629
i) Thiruvalla taluk 273,030 135,945 137,085 222,777 112,206 110,571 203,671 103,088 100,583 i1) 3 Villages of Chengannur taluk 41,824 20,867 20,957 34,127 17,189 16,938 31,202 15,793 15,409 m)2 Villages of 36,149 17,939 18,210 30,223 14,963 15,260 27,155 13,518 13,637 Mavelikkara taluk
b) A portion transferred to Kallam
i) A Portion of Valia Azhekkal 66 33 33 55 27 28 51 25 26 kara of Arattupuzha vnlage of Karthikappally taluk transferred to Karunagap-pally taluk Alappuzha Dist as in 1 991 1,165,845 576,523 589,322 983,184 490,747 492,437 865,222433,333 431,889
12. Pathanamthltta Dist(New) 719,272 360,307 358,965 576,436 290,305 286,131 478,345242,188 236,157
a) Portion from erstwhile 351,003 174,751 176,252 287,127 144,358 142,769 262,028 132,399 129,629 Alappuzila Dist.
il Thiruvalla Taluk 273,030 135,945 137,085 222,777 112,206 110,571 203,671 103,088 100,583 i1) 3 vmages of Chengannur Taluk 41,824 20,867 20,957 34,127 17,189 16,938 31,202 15,793 15,409 ml2 Villages of 36,149 17,939 18,210 30,223 14,963 15,260 27,155 13,518 13,637 Mavelikkara taluk
b) Portion fiom erstwhile 368,088 t 85,463 182,625 289,187 145,879 143,308 216,230 109,7;39 106,491 Kallam District
I) Pathanamthltta tal uk 251,779 121,566 124,213 198,223 100,342 97,88' 142,632 72,863 69,769 ii) I 0 villages of 116,309 51,897 58,412 90,964 45,537 45,421 73,598 36,876 36,722 Kunnathur taluk
c) Portion from erstwhile 181 93 88 122 68 54 87 SO 37 I dukki District
80

STATEMENT - 1
Recast Population of Districts for Different Censuses AdJusted to Jurisdictional Changes
POPULATION
Description 1921 1911 1901
P M F P M F P M F
20 21 22 23 24 25 26 27 28
9. Idukki Dist. as In 1981 108,796 58,791 50,005 99,605 54,072 45,533 47,686 25,939 21,747
Deduct
North Pampa valley area around Sabarimala Sanni-dhanam of Mlappara Village of Peerumade Taluk trans-ferred to newly formed Pathanamthltta District 45 26 19 41 22 19 20 1 I 9
Idukkl Dist. as In 1991 108,751 58,765 49,986 99,564 54,050 45,514 47,666 25,928 21,738
10. Kottayam District
It. Alappuzha Dist. as in 1981 906,731 458,332 448,399 764,950 384,977 379,973 666,179 335,398 330,781
Deduct
a) Portion transferred to new Pathanamthitta Dist. 213,15.1 109,031 104,120 179,821 90,498 89,323 156,603 78,844 77,759
i) Thiruvalla taluk 165,239 84,673 80,566 139,401 70,156 69,245 121,402 61,122. 60,280 il) 3 Villages of Chengannur taluk 25,316 12,973 12,343 21,357 10,748 10,609 18,600 9,364 9,236 111)2 Villages of 22,596 11,385 11,211 19,063 9,594 9,469 16,601 8,358 8,243 Mavelikkara taluk
b)A portion transferred to Kollam
i)A Portion of Valia Azhekkal 42 21 21 35 18 17 31 16 15 karOl of Aratwpuzha village of Karthikappally taluk transferred to Karunagap-pally taluk Alappuzha Dist. as in 1 991 693,538 349,280 344,258 585,094 294,461 290,633 509,545256,538 253,007
12. Pathanamthitta Dist.(New) 375,935 192,839 183,096 317,072 159,543 157,529 276,251139,071 137,180
a)Portion from erstwhile 213,151 109,031 104,120 179,821 90,498 89,323 156,603 78,844 77,759 Alappuzha Dist.
i) Thiruvalla Taluk 165,239 84,673 80,566 139,401 70,156 69,245 121,402 61,122 60,280 ii) 3 Villages of Chengannur Taluk 25,316 12,973 12,343 21,357 10,748 10,609 18,600 9,364 9,236 iii)2 Villages of 22,596 11,385 11,211 19,063 9,594 9,469 16,601 8,358 8,243 Mavelikkara taluk
b) Pordon from erstwhile 162,739 83,782 78,957 137,210 69,023 68,187 119,628 60,216 59,412 Kollam District
i) Pathanamthitta taluk 104,002 53,980 50,022 87,687 44,111 43,576 76,451 38,482 37,969 i1) 10 villages of 58,737 29,802 28,935 49,523 24,912 24,611 43,177 21,734 21,443 Kunnathur taluk
c) Pordon from erstwhile 45 26 19 41 22 19 20 II 9 Idukki District
·81
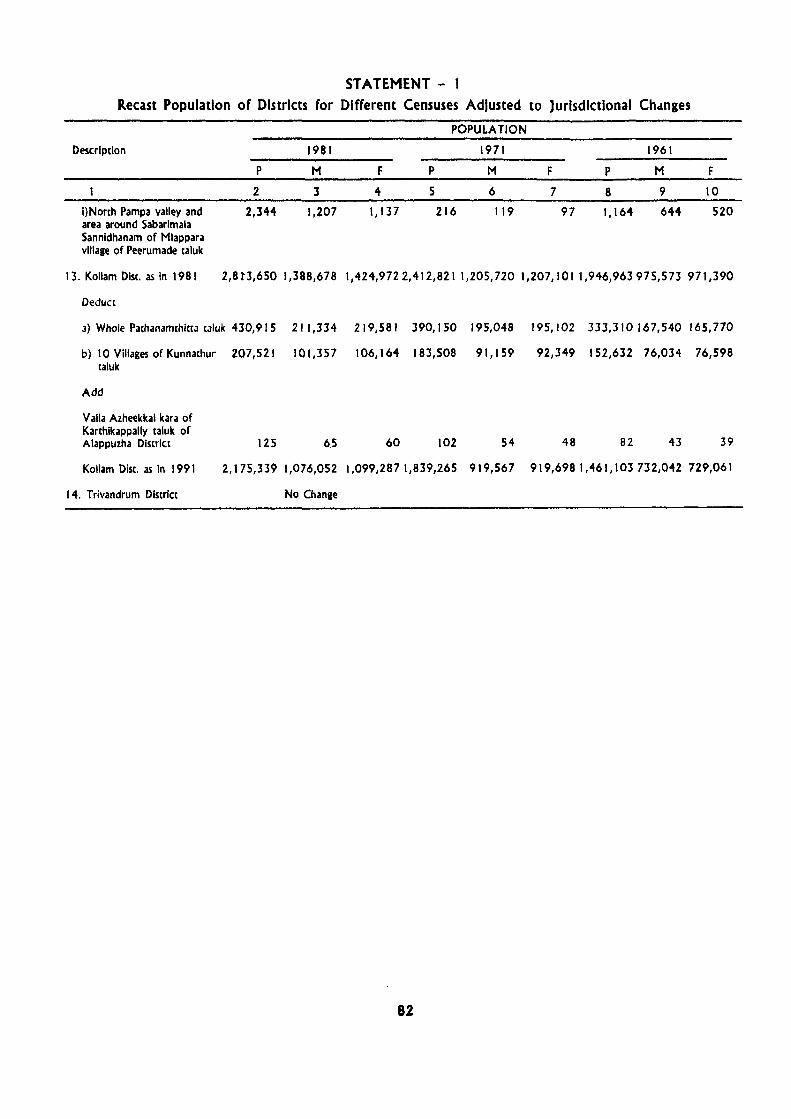
STATEMENT - t Recast Population of Districts for Different Censuses Adjusted to Jurisdictional Chdnges
Descrlptlon
I)North Pampa valley and area around Sabarlmala Sannidhanam of Mlappara village of Peerumade taluk
P
2
2,344
1981
M
3
1,207
F P
4 5
1,137
POPULATION
1971 1961
M F P M F
6 7 8 9 10
216 119 97 1,164 644 520
13. Kollam Dlst. as in 1981 2,8t3,650 1,388,678 1,424,9722,412,8211,205,720 1,207,1011,946,963975,573 971,390
Deduct
a) Whole Pathanamthitta taluk 430,915 211,334 219,581 390,150 195,048 195,102 333,310167,540 165,770
b) 10 Villages of Kunnathur 207,521 101,357 106,164 183,508 91,159 92,349 152,632 76,034 76,598 taluk
Add
Valla Azheekkal kara of Karthikappally taluk of Alappuzha District 125 6.5 60 102 54 48 82 43 39
Kollam Dist. as In I 991 2,175,339 1,076,052 1,099,287 1,839,265 919,567 919,6981,461,103732,042 729,061
14. Trivandrum District No Change
82

ST A TEHENT - , Recast Population of Districts for Different Censuses Adjusted to Jurisdictional Changes
POPULATION
Description 1951 1941 1931
P M F P M F P M F
I I 12 13 14 15 16 17 18 19
I) North P3lTlpa valley and 181 93 88 122 68 54 87 50 37 area around 5abarlmala 5.annldhanam of Mlappara vlllaae of Peenlmade taluk
13. Kollam Dist. as In 1981 1,478,384 741,497 736,8871,145,717 571,391 574,326 914,220457,625 456,595
Deduct
a) Whole Pathanamthltta taluk 251,779 127,566 124,213 198,223 100,342 97,881 142,632 72,863 69,769
.,) 10 Villaies o( Kunnathur 116,309 57,897 58,412 90,964 45,537 45,427 73,598 36,876 36,722 uluk
Add
Valia Azheekkal karOl of Karthlkappally taluk of Alappuzha District 66 33 33 55 27 28 51 25 26
Kollam Dist. as In 1991 1,110,362 556,067 554,295 856,585 425,539 431,046 698,041347,911 350,130
14. Trivandrum District No Change
83

STATEMENT - 1 Recast Population of Districts for Different Censuses Adjusted to Jurisdictional Changes
Description
I) North Pampa valley and area around Sabarimab Sannldhanam of Mlappara village of Peerumade taluk
3. Kollam Dist. as In 1981
Deduct
POPULATION
1921 1911 1901
P M F P M F P M F
20 21 22 23 24 25 26 27 28
4S 26 19 41 22 19 20 11 9
715,030 361,392 353,638 602,859 303,266 299,593 525,610264,571 261,039
a)Whole Pathanamthitta taluk 104,002 53,980 50,022 87,687 44,1 I I 43,576 76,45 I 38,482 37,969
b)10 Villages of KLmnathur taluk
Add
Valla Alheekkal kara of Kanhlkappally taluk of Alappulha DIstrict
Kollam Dist. as in ·1991
14. Trivandrum Disulct
58,737 29,802 28,935 49,523 24,912 24,611 43,17721,734 21,443
42 21 21 35 18 17 31 16 15
552,333 277,631 274,702 465,684 234,261 231,423 406,013204,371 201,642
No Chan ge
84

PERCENTAGE GROWTH OF POPULATION
-• k-=-:-3
20·01 a. ABOVE .".
15·01 - 20·00
10·01 - 15·00 STATE AVERAGE 14·32
~l L=' 10·00 & BELOW
EAST OF GREENWICH
B<1s"d upon Su .. "y of India map with Ih" ptrmisslon" of tht Surveyor General of India.
The te.rntorial wQl~rs of Indio e:d2nd into the sea to <l distancli of twelve nauticol miles measured from the Q I)ropriatc bQ' ~ line.
o
c
© Govt;rnmt;nt 01 Ind'(lCopyri9l"!t,IGG8


~------~==~~,~~~---------.-,-------------------------------------------.~, ==~----------------------~
15' 7S0
12"
11"
KERALA
9
CENSUS YEARS
75' EAST OF GREENWICH 76'
7S0
KERALA ~~Icf1~ \JfOifi(§~1 ~
DECADAl GROWTH OF POPULATION
1901-91
20 10 0 l::d.=t:
KILOMETRES 20
BOUNDARIES:
STATE JUT, DiSTRICT"
_" ........ . \ J .
77°
., ... ,)
\. ./
<
~O
c
60 d
7S'
12°
g'
Based, Ion c,urvcy of India IT ,with the permisSion 01 the - The territor" I waters of In 'Q 17xtQ:nd into the seQ to odic;.' nc:e of A riV' 'nrr it,' Intii-('r-. .... Ii,- • 11:


A statement Illustrating the method of estimation of populadon prior to 1951 involving two districts is appended herEM'ith. Similar procedure was adopted for other districts.
STATEMENT - 2
Table illustrating the Method of Estimation of Previous Census Population for Transferred Territories
Description
Th rlssu r District as in 1981 Added Portion Kakkanadanthuruth and Suldamthuruth of PuthenveJlkkara village of Parur Taluk of Emakulam District added to Methala Village of KodungaJlur taluk
1901 1911 1921
2 3 4
683,240 769,672 813,726
26 30 32 (8) (7) (6)
1931 1941 1951
5 6 7
993,875 1 J 154,555 1,403,099
38 43 51 (5) (4) (3)
1961 1971 1981 Remarks
8 9 10 11
1,688,271 2,128,797 2,439,543 (1)90X26,375 29,690
62 80 90 (2) 90X20,345 (2) (1 ) 29,690
Th rlssu r District as in 1991
683,266 769,702 813,758 993,913 1,154,598 1,403,150 1,688,333 2,128,877 2,439,633 (3) 90 X 16,808
Emakulam District as 646,261 735,297789,343 982,7691,172,3351,393,730 1,698,575 2,163,674 2,535,294
29,690
(4) 51 X 158,760 186,467
(5) 51 X 139,808 186,467
(6) 51 X 116,610 186,467
(7) 32X 735,297 789,343
In 1981 (8) 32 X 646,261 Deducted 789,343
Kakkanadanthuruthu and 26 Suklamthuruth of Paravur (8) Taluk transferred to KodungaJlur Taluk of Th rlssu r District
30 (7)
32 (6)
38 (5)
43 (4)
51 (3)
62 (2)
80 (1 )
90
Emakulam District as 646,235 735,267 789,311 982,731 1,172,292 1,393,679 1,698,513 2,163,594 2,535,204 in 1991
The following statement gives the percentage varladon in the total, rural and urban population separately from 190 1 to 1991 for State and districts.
STATEMENT - 3 Statement Showing the Percentage of Decadal Variation of Population 1901 to 1991
State/District T 1901 1981 1971 1961 1951 1941 1931 1921 1911 1901 R to to to to to to to to to to U 1991 1991 1981 1971 1961 1951 1941 1931 1921 1911
2 3 ... 5 6 7 8 9 10 11 12
KERALA T + 354.93 + 14.32 + 19.24 +26.29 + 24.76 + 22.82 +16.04 + 21.85 +9.16 + 11.75 R + 260.47 + 3.56 + 15.67 +24.61 + 22.40 + 19.19 +14.50 +20.64 + 7.52 + 11.47 U +1,589.84 +60.97 + 37.64 +35.72 + 39.89 + 52.72 +30.47 +34.58 +29.78 + 15.44
1. Kasaragod T + 363.29 + 22.78 + 27.78 +33.36 + 24.60 + 20.08 +13.33 + 17.56 + 3.82 + 7.00 R + 287.10 + 7.92 + 45.78 +34.47 + 14.69 + 11.58 +12.93 +17.33 +4.37 + 3.41 U - +308.53 -62.14 +28.12 + 111.66 + 263.25 +26.14 +25.36 -11.83
2. Kannur T + 325.16 + 16.63 + 24.34 +31.82 + 30.24 + 21.68 +12.16 + 14.52 +2.37 + 6.73 R + 133.42 -16.07 -1.77 +38.80 + 17.61 + 22.26 +12.41 + 14.28 +3.23 + 6.99 U +1,956.73 + 86.97 + 190.39 -0.10 +156.08 + 16.21 +9.88 + 16.83 -5.04 + 4.53
89

STATEMENT - 3
Statement Showing the Percentage of Decadal Variation of Population 1901 to 1991
State/District T 1901 1981 1971 1961 1951 1941 1931 1921 1911 1901 R to to to to to [,) to to to to U 1991 1991 1981 1971 1961 1951 1941 1931 1921 1911
2 3 4 5 6 7 8 9 10 II 12
3. Wa~anad T + 794.39 + 21.32 + 33.87 + 50.35 + 62.60 + 59.17 + 15.89 + 8.26 + 2.69 + 9.85 R + 763.86 ... 17.17 + 33.87 +50.35 + 62.60 + 59.17 + 15.89 + 8.26 + 2.69 + 9.85 U
4. KOlllikode T + 329.46 + 16.69 + 23.25 +29.81 +25.71 +25.14 + 11.95 + 17.51 + 3.55 + 7.34 R + 209.62 - 1.20 + 29.75 +23.08 + 15.72 + 21.87 + 6.19 + 17.13 + 3.66 + 8.34 U + 1,037.60 + 64.61 + 8.67 +47.97 + 66.34 + 39.77 +47.68 + 19.96 + 2.87 + 1.43
5. Ma/appuram T + 353.91 + 28.87 .... 29.43 +33.80 + 20.67 + 17.67 + 11.73 + 14.44 + 2.17 + 9.64 R + 318.99 + 26.47 + 28.50 +32.03 + 20.7'5 + 16.!7 + 10.10 + 14.34 + 2.35 + 8.03 U + 2,574.25 + 58.88 + 42.39 +64.35 + 19.30 + 50.73 +66.14 + 18.07 - 3.83 +112.01
6. Palakkaci T + 21184 + 16.52 + 21.30 +23.06 + 12.79 + 18.45 + 8,90 + 10.22 + 4.18 + 7.31 R + 184.60 + 9.25 + 24.91 +20.53 + 14.35 + 15.32 + 6,67 + 10.46 + 3.96 + 7.13 l.l + 540.37 + 81.24 - 3.46 +43.80 + 1.42 + 47.64 +35.29 + 7,55 + 6.80 + 9.38
7 ThrisSlIr T + 300.62 T 12.20 + 14.60 +26.09 + 20.32 + 21.53 + 16.17 + 22.14 + 5.72 + 12.65 R + 209.34 + 4.79 + 2.44 +25.05 + 21.28 + 19.72 + 14,29 + 18,82 + 4.52 + 11.81 U +:),208.46 + 39.91 + 106.04 +34.58 +13.08+37.16 + 35.35 + 71.14 +27.25 + 30.16
8. Ernakulal11 T + 335.95 + 11.12 .,.. 17.18 +27.38 + 21.87 + 18.88 + 19.29 + 24,50 + 7.35 + 13.78 R + 1')2.44 - 5.76 +0.31 + 17.22 + 15.15 + 15.19 + 18.07 -I- 20.11 + 6.93 -I- 13.26 U + 1,750.69 .... 36.92 + 57.68 +60.89 + 50.93 + 38.00 +26.05 + 56.05 + 10.46 + 17.73
9. !dukki T +2,161.71 + ! 1.12 + 26.64 +32.18 + 74.72 + 35.66 +30.17 + 72.58 + 9.23 + 108.88 R +2,054.96 + 11.09 + 24.93 +27.81 + 80.53 + 33.58 +30.34 + 69.40 + 9.23 + 108.88 U - + 14.01 + 76.66 -+ 155.56 +20.75
\ O. Kottayam T + 305.73 + 7.71 + \0.29 + \7.\3 + 16.03 + 20.\ \ +2\.65 + 32.38 T 19.97 + 8.3\ R + 259.92 - 2.01 + 15.64 + 15.83 +17.30+15.37 + 21.80 + 31.81 + 16.01 + 8.80 U + 908.67 +101.70 - 23.79 +26.16 + 7.90 + 62.81 +20.31 + 37.69 +75.59 + 1.78
1 I. Alappuzha T +292.75 + 7.28 + 11.62 + 19.01 + 20.45 + 18.58 + 13.63 .... 24.75 + 18.53 + 14.83 R + 190.59 - 8.52 + 12.67 + 19.69 + 16.04 + 13.18 + 13.16 + 22.91 + I 1.55 + 15.60 U + 1,888.10 + 77.06 + 7.21 + 16.27 + 42.61 + 55.90 + 16.99 + 39.74 + 141.28 + 2.71
12. P:lthanamthitta T ' 330.16 + 5.60 + 9.45 + 15.75 + 23.50 + 24.78 +20.51 + 27.24 + 18.56 + 14.78 R .;.. 274.04 - 2.81 + 7.43 + 15.88 + 28.26 + 20.29 +20.42 + 26.31 + 17.74 + 11 89 U - + 149.28 + 61.26 + 12.63 - 35.88 + 133.37 +22.67 + 55.32 +50.71
15. KolIJm T + 492.98 + 10.68 + 18.27 +25.88 + 31.59 + 29.63 +22.71 + 26.38 + 18.61 + 14.70 R + 402.54 + 6.71 + 11.45 +25.25 + 32.76 + 26.93 +21.29 + 26.09 + 14.36 + 14.48 U +2,742.62 + 32.29 + 77.54 +31.66 + 21.80 + 57.71 +39.78 + 29.96 +119.41 + 20.06
14. Trivandrum T + 508.19 + 13.50 + 18.08 +26.03 + 31.38 + 30.81 + 18.46 + 28.58 + 17.02 -I- 17.54 R + 356.72 + 0.42 + 19.26 +25.55 + 26.97 + 21.94 + 15.76 + 28.10 + ! 1.57 + 18.59 U + 1,624.62 + 52.23 + 14.73 +27.42 + 46.05 + 72.50 +33.06 + 31.27 +60.37 + 9.81
There has been increase in population during every est growth rate in total population is noticed in Malappuram decade starting from 1901 to 1991. The total population has distnct and lowest in Pathanamthitta with just 5.60 percent. In increased from 190 1 to 1 991 by 354.93 percent. The decadal (he case of urban population highest increase is in Kasaragod growth rate which was showing steady increase from 1931 distnctwith 308.53 percent and lowest in Idukki district with started declining from 1 971 onwards and reached 1 4.32 percent 14.01 percent during the last decade. The growth rate during 1981-91 is .less than that of the decade 1931-41. ThE.' growth rate of urban Sex Ratio population which was steadily increasing upto 1 921 - 31, de-clined during 1931-41. Then there was a phenomenal increase Sex ratio is an important demographic characteristic during 1941-51, but declined dunng next two decades. There- for studying population trend of :1 notion. It is always found after it was showing an increasing trend. During the decade that male and female births are not equal and therefore pre-1981-91 the increase of total population is 14.32 percent ponderance of males over females Oi' females over males are whereas the increase in urban population is 60.98 percent High- noticed. In India there has been preponderance of males over
90
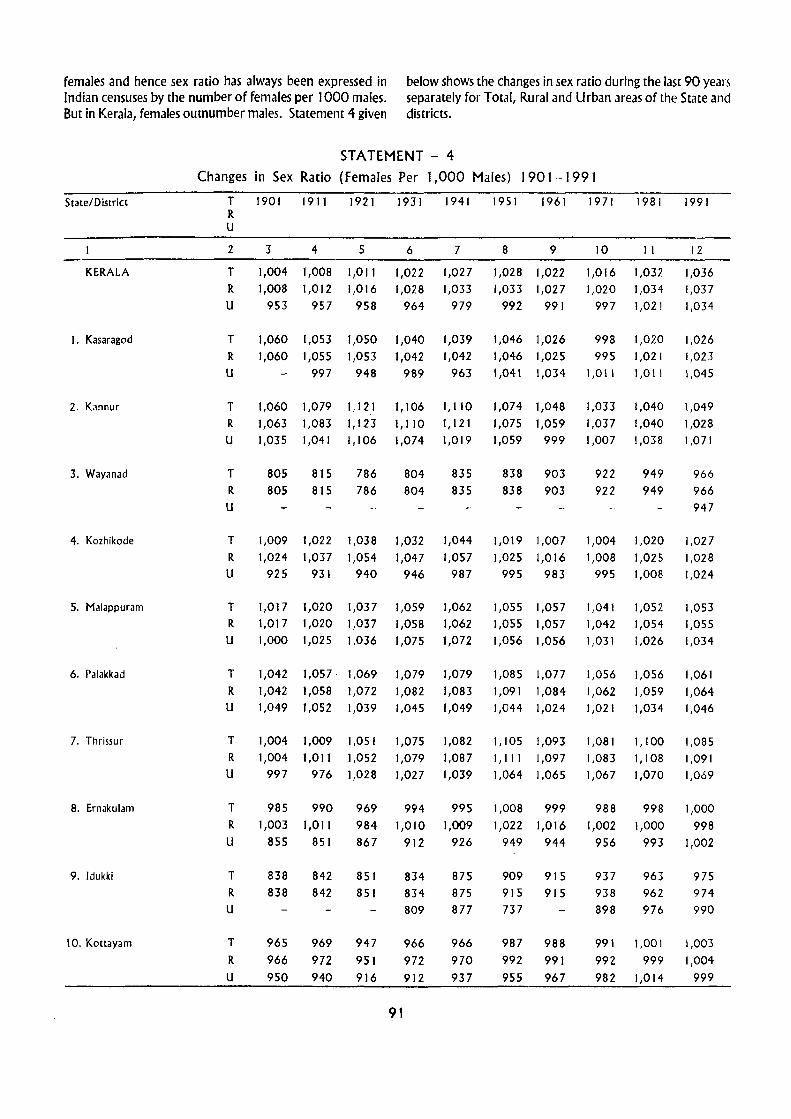
females and hence sex ratio has always been expressed in Indian censuses by the number of females per 1000 males. But in Kerala, females outnumber males. Statement 4 given
below shows the changes in sex ratio during the last 90 years separately for Total, Rural and Urban areas of the State and districts.
Scate/District
KERALA
I. Kasaragod
2. Kannur
3. Wayanad
4. Kozhikode
5. Malappuram
6. Palakkad
7. Thrissur
8. Ernakulam
9. Idukki
10. Kottayam
STATEMENT - 4
Changes in Sex Ratio (Females Per 1,000 Males) 1901-1991
T 1901 1911 1921 1931 1941 1951 1961 1971 1981 R U
2
T R
U
T R
U
T R U
T R
U
T R U
T R U
T R
3
1,004
1,008
953
1,060
1,060
4
1,008
1,012
957
1,053
1,055
997
1,060 1,079
1,063 1,083 1,035 1,041
805 815
805 815
1,009 1,022
1,024 1,037
925 931
5
1,011
1,016
958
1,050
1,053
948
1,12.1 1,123
1,106
786
786
1,038
1,054
940
6
1,022
1,028
964
1,040
1,042
989
1,106
1,110
1,074
804
804
1,032
1,047
946
7
1,027
1,033
979
1,039
1,042
963
1,110
1,121
1,019
835
835
1,044
1,057
987
1,017 1,020 1,037 1,059 1,062
1,017 1,020 1,037 1,058 1,062
1,000 1,025 1,036 1,075 1,072
1,042
1,042
1,057· 1,069
1,058 1,072
1,079
1,082
1,079
1,083
8 9
1,028 1,022
1,033 1,027
992 991
1,046 1,026
1,046 1,025
1,041 1,034
1,074 1,048
1,075 1,059
1,059 999
838 903
838 903
1,019 1,007
1,025 1,016
995 983
1,055 1,057
1,055 1,057
1,056 1,056
1,085 1,077
1,091 1,084
10
1,016
1,020
997
998
995
1,011
1,033
1,037
1,007
922
922
1,004
1,008
995
1,041
1,042
1,031
1,056
1,062
11
1,032
1,034
1,02 !
1,020
1,021
1,011
1,040
1,040
1,038
949
949
1,020
1,025
1,008
1,052
1,054
1,026
1,056
1,059
1991
12
1,036
1,037
1,034
1,026
1,023
1,045
1,049
1,028
1,071
966
966
947
1,027
1,028
1,024
1,053
1,055
1,034
1,061
1,064 U 1,049 1,052 1,039 1,045 1,049 1,044 1,024 1,021 1,034 1,046
T
R U
T R U
T R
U
T
R
U
1,004
1,004
997
985
1,003
855
838
838
965
966
950
1,009
1,011
976
990 1,011
851
842
842
969 972
940
1,051
1,052
1,028
969
984
867
851
851
947
951
916
1,075
1,079
1,027
994
1,010
912
91
834
834
809
966
972
912
1,082
1,087
1,039
995
1,009
926
875
875
877
966
970
937
I, 105 1,093
1,111 1,097
1,064 1,065
1,008 999
1,022 1,016
949 944
909 915
915 915
737
987 988
992 991
955 967
1,081
1,083
1,067
1,100
1,108
1,070
998
1,000
1,085
1,091
1,069
1,000
998
988
1,002
956 993 1,002
937 963
938 962
898 976
991 1,001
992 999
982 1,014
975
974
990
1,003
1,004
999

STATEMENT - 4 Changes in Sex Ratio (Females Per 1,000 Males) 1901-1991
State/DiStrict T 1901 1911 1921 1931 1941 1951 1961 1971 1981 1991 R U
2 3 4 5 6 7 8 9 10 II 12
11. Alappuzha T 986 987 986 997 1,003 1,022 1,026 1,025 1,043 1,051 R 988 989 992 1,007 1,012 1,031 1,030 1,028 1,046 1,054 U 958 951 935 927 947 981 1,011 1,016 1,033 1,042
12. Pathanamthltta T 986 987 949 975 986 996 1,011 1,019 1,056 1,062 R 988 991 951 977 985 997 1,010 1,018 1,056 1,063 U 867 909 938 990 991 1,036 ',053 ',054 ',061
13. Kollam T 987 988 989 1,006 1,013 997 996 1,000 1,022 1,035 R 989 989 995 1,012 1,019 1,004 1,001 1,002 1,022 1,039
U 938 952 926 942 952 939 951 988 1,018 1,022
14. Trivandrum T 996 990 981 1,003 1,017 1,010 1,005 1,008 1,030 1,036
R 1,006 993 987 1,011 1,026 1,017 1,013 1,012 1,034 1,040
U 930 968 947 960 975 985 984 996 1,018 1,028
The Statement shows that except in me case of hilly dis- the hilly districts of Wayan ad and Idukki the position is vice tricts there is a preponderance of females over males and In versa in 1991.
92

A-2 DECADAL VARIATION IN POPULATION SINCE 1901
State/ Year Persons Decade Percentage Males Females district variation Decade
variation
2 3 4 5 6 7
KERALA 1901 6,396,262 3,191,466 3,204,796 1911 7,147,673 + 75.1,4J I +11.75 3,559,425 3,588,~48
1921 7,802,127 + 654,454 + 9.16 3,879,458 3,922,669 1931 9,507,050 + 1,704,923 +21.85 4,702,951 4,804,099 1941 11,031,541 + 1,524,491 +16.04 5,443,296 5,588,245 1951 13,549,118 +2,5) 7,577 +22.82 6,681,901 6,867,217 1961 16,903,715 +3,354,597 +24.76 8,361,927 8,541,788 1971 21,347,375 +4,443,660 +26.29 10,587,851 10,759,524 1981 25,453,680 +4,106,305 + 19.24 12,527,767 12,925,913 1991 29,098,518 + 3,644,838 +, 4.32 14,288,995 14,809,523
KASARAGOD 1901 231,280 I t2,299 118,981 1911 247,467 + 16,187 + 7.00 120,526 126,941 1921 256,931 + 9,464 + 3.82 125,319 131,612 1931 302,043 + 45,112 +17.56 148,055 153,988 1941 342,301 + 40,258 + 13.33 167,839 174,462 1951 411,031 + 68,730 +20.08 200,927 210,104 1961 512,146 +101,115 +24.60 252,746 259,400 1971 683,020 + 170,874 +33.36 341,859 341,161 1981 872,741 +189,721 +27.78 432,025 440,716 1991 1,071,508 + 198,767 +22.78 528,803 542,705
KANNUR 1901 529,623 . 257,078 272;545 1911 565,261 + 35,638 + 6.73 271,947 293,314 1921 578,680 + 13,419 + 2.37 272,795 305,885 1931 662,715 + 84,035 + 14.52 314,678 348,037 1941 743,322 + 80,607 + 12.16 352,213 391,109 1951 904,470 + 161,148 +21.68 436,154 468,316 1961 1,177,948 +273,478 +30.24 575,192 602,756 1971 1,552,809 +374,861 +31.82 763,868 788,941 1981 1,930,726 +377,917 +24.34 946,553 984,173 1991 2,251,727 +321,001 +16.63 1,098,838 1,152,889
WAYANAD 1901 75,149 41,632 33,517 1911 82,549 + 7,400 + 9.85 45,489 37,06.0 1921 84,771 + 2,222 + 2.69 47,473 37,298 1931 91,769 + 6,998 + 8.26 50,877 40,892 1941 106,350 + 14,581 + 15.89 57,952 48,398 1951 169,280 + 62,930 +59.17 92,099 77,181 1961 275,255 + 105,975 +62.60 144,635 130,620 1971 413,850 + 138,595 +50.35 215,338 198,512 1981 554,026 + 140,176 +33.87 284,261 269,765 . 1991 672,128 + 118,102 +21.32 341,958 330,170
KOZHIKODE 1901 610,058 303,662 306,396 1911 654,846 + 44,788 + 7.34 323,897 330,949 1921 678,122 + 23,276 + 3.55 332,771 345,351 1931 796,881 + 118,759 + 17.51 392,117 404,764 1941 892,078 + 95,197 + 11.95 436,503 455,575 1951 1,116,391 +224,313 +25.14 553,029 563,362 1961 1,403,413 +287,022 +25.71 699,388 704,025 1971 1,821,734 +418,321 +29.81 909,037 912,697 1981 2,245,265 +423,531 +23.25 1,111,409 1,133,856 1991 2,619,941 +374,676 +16.69 1,292,765 1,327,176
93

A-2 DECADAL VARIATION IN POPULATION SINCE 190t
State/ Year Persons Decade Percentage Males Females district variation Decade
variation
2 3 4 5 6 7
MALAPPURAM 1901 682,151 338,217 343,934 1911 747,929 + 65,778 + 9.64 370,203 377,726 1921 764,138 + 16,209 + 2.17 375,166 388,972 1931 874,504 +110,366 + 14.44 424,823 449,681 1941 977,085 + 102,581 + 11.73 473,762 503,323 1951 1,149,718 + 172,633 + 17.67 559,531 590,187 1961 1,387,370 +237,652 +20.67 674,337 713,033 1971 1,856,357 +468,987 + 33.80 909,510 946,847 1981 2,402,701 +546,344 +29.43 I, 170,778 1,231,923 1991 3,096,330 +693,629 +28.87 1,508,280 1,588,050
PALAKKAD 1901 763,917 374,083 389,834 1911 819,726 + 55,809 + 7.31 398,459 421,267 1921 853,988 + 34,262 + 4.18 412,781 441,207 1931 941,286 + 87,298 +10.22 452,770 488,516 1941 1,025,058 + 83,772 + 8.90 492,995 532,063 1951 1,214,208 + 189,150 + 18.45 582,388 631,820 1961 1,369,508 + 155,300 + 12.79 659,217 710,291 1971 1,685,347 +315,839 +23.06 819,576 865,771 1981 2,044,399 +359,052 +21.30 994,196 1,050,203 1991 2,382,235 +337,836 + 16.53 1,155,822 1,226,413
THRISSUR 1901 683,266 341,020 342,246 1911 769,702 + 86,436 + 12.65 383,182 386,520 1921 813,758 + 44,056 + 5.72 396,787 416,971 1931 993,913 +180,155 +22.14 479,089 514,824 1941 1,154,598 + 160,685 + 16.17 554,618 599,980 1951 1,403,150 +248,552 +21.53 666,464 736,686 1961 1,688,333 +285,183 +20.32 806,638 881,695 1971 2,128,877 +440,544 +26.09 1,022,814 1,106,063 1981 2,439,633 +310,756 + 14.60 1,161,719 1,277,914 1991 2,737,311 +297,678 + 12.20 1,312,683 1,424,628
ERNAKULAM 1901 646,235 325,537 320,698 1911 735,267 + 89,032 + 13.78 369,410 365,857 1921 789,311 + 54,044 + 7.35 400,838 388,473 1931 982,731 + 193,420 +24.50 492,759 489,972 1941 1,172,292 +189,561 + 19.29 587,688 584,604 1951 1,393,679 +221,387 + 18.88 694, 116 699,563 1961 1,698,513 +304,834 +21.87 849,655 848,858 1971 2,163,594 +465,081 +27.38 1,088,392 1,075,202 1981 2,535,204 +371,610 + 17.18 1,269,130 1,266,074 1991 2,8 I 7,236 +282,032 + I l. I 3 1,408,649 1,408,587
IDUKKI 1901 47,666 25,928 21,738 1911 99,564 + 51,898 + 108.88 54,050 45,514 1921 108,751 + 9,187 + 9.23 58,765 49,986 1931 187,680 + 78,929 + 72.58 102,358 85,322 1941 244,296 + 56,616 + 30.17 130,286 114,010 1951 331,422 + 87,126 + 35.66 173,630 157,792 1961 579,071 +247,649 + 74.72 302,462 276,609 1971 765,392 + 186,32 I + 32. 18 395, I 78 370,2 I 4 1981 969,292 +203,900 + 26.64 493,792 475,500 1991 1,078,066 + 108,774 + 11.22 545,872 532,194
94
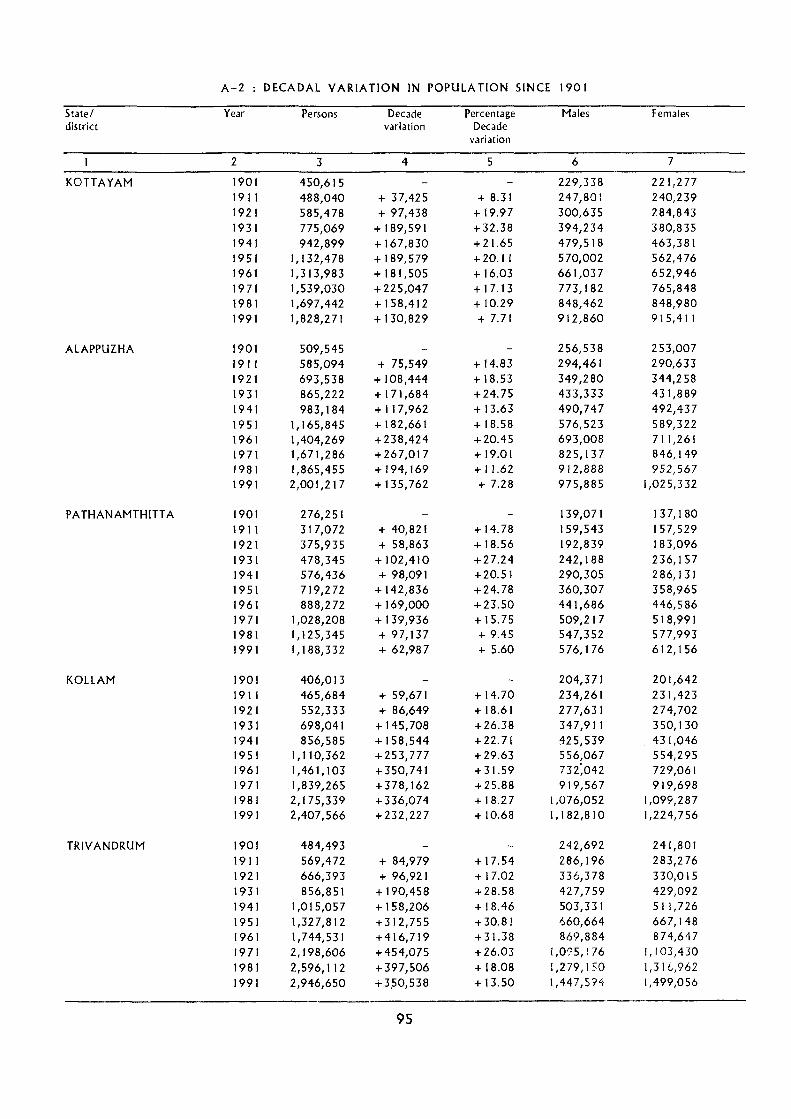
A-2 DECADAl VARIATION IN POPULATION SINCE 1901
State/ Year Persons Decade Percentage Males Females district variation Decade
variation
2 3 4 5 6 7
KOTTAYAM 1901 450,615 229,338 221,277 1911 488,040 + 37,425 + 8.31 247,801 240,239 1921 585,478 + 97,438 + 19.97 300,635 284,843 1931 775,069 +189,591 + 32.38 394,234 380,835 1941 942,899 + 167,830 +21.65 479,518 463,381 1951 1,132,478 + 189,579 +20.11 570,002 562,476 1961 1,313,983 +181,505 + 16.03 661,037 652,946 1971 1,539,030 +225,047 + 17.13 773,182 765,848 1981 1,697,442 +158,412 + 10.29 848,462 848,980 1991 1,828,271 + 130,829 + 7.71 912,860 915,411
AlAPPUZHA 1901 509,545 256,538 253,007 1911 585,094 + 75,549 + 14.83 294,461 290,633
1921 693,538 + 108,444 + 18.53 349,280 344,258 1931 865,222 +171,684 +24.75 433,333 431,889 1941 983,184 +117,962 + 13.63 490,747 492,437 1951 1,165,845 + 182,661 + 18.58 576,523 589,322 1961 1,404,269 +238,424 +20.45 693,008 711,261 1971 1,671,286 +267,017 +19.01 825,137 846,149 1981 1,865,455 + 194,169 + 11.62 912,888 952,567 1991 2,001,217 + 135,762 + 7.28 975,885 1,025,332
PATHANAMTHITTA 1901 276,251 139,071 137,180 1911 317,072 + 40,821 + 14.78 159,543 157,529 1921 375,935 + 58,863 + 18.56 192,839 183,096
1931 478,345 +102,410 +27.24 242,188 236,157 1941 576,436 + 98,091 +20.51 290,305 286, I 31 1951 719,272 + 142,836 +24.78 360,307 358,965 1961 888,272 + 169,000 +23.50 441,686 446,586 1971 1,028,208 + 139,936 + 15.75 509,217 518,991 1981 1,125,345 + 97,137 + 9.45 547,352 577,993 1991 1,188,332 + 62,987 + 5.60 576,176 612,156
KOllAM 1901 406,013 204,371 201,642 1911 465,684 + 59,671 + 14.70 234,261 231,423 1921 552,333 + 86,649 + 18.61 277,631 274,702 1931 698,041 + 145,708 +26.38 347,911 350,130 1941 856,585 + 158,544 +22.71 425,539 431,046 1951 1,110,362 +253,777 +29.63 556,067 554,295 1961 1,461,103 +350,741 + 31.59 732:042 729,061 1971 1,839,265 +378,162 + 25.88 919,567 919,698 1981 2,175,339 +336,074 + 18.27 i ,076,052 1,099,287 1991 2,407,566 +232,227 + 10.68 1,182,810 1,224,756
TRIVANDRUM 1901 484,493 242,692 241,801 1911 569,472 + 84,979 + 17.54 286,196 283,276 1921 666,393 + 96,921 + 17.02 336,378 330,015 1931 856,851 + 190,458 +28.58 427,759 429,092 1941 1,015,057 + 158,206 + 18.46 503,331 511,726 1951 1,327,812 +312,755 +30.81 660,664 667,148 1961 1,744,531 +416,719 + 31.38 869,884 874,647 1971 2,198,606 +454,075 +26.03 1,0'75,176 1,103,430 1981 2,596,112 +397,506 + 18.08 1,279,150 1,316,962 1991 2,946,650 +3.50,538 + 13.50 1,447,5?4 1,499,056
95

A-2 : DECADAL VARIATION IN POPULA TJON SINCE 190 I APPENDIX
State and districts at the 1991 census showing 1981 area and population according to territorial jurisdiction in 1981, change in population of 1981 adjusted to jurisdiction of 1991
SI. State/ Area in 1991 No. District 1991 Popul-
(Sq.Km) adon
2 3 4
KERALA 38,863 29,098,518
1. Kasaragodl' l 1,992 1,071,508
2. Kannurbl 2,966 2,251,727
3. Wayanad 2,131 672,128
4. Kozhikode 2,344 2,619,941
5. Malappuram 3,550 3,096,330
6. Palakkad 4,480 2,382,235
7. Thrissur1c1 3,032 2,737,311
8. Ernakulam1dl 2,407 2,817,236
9. IdukkiCel 5,019 1,078,066
10. K,Qltayam. 2,203 1,82~,271
It. Alap\lUzha1f} 1,414 2,001,217
12. Pathanamthitta(') 2,642 1,188,332
13. Kollam1hl 2,491 ·.2:407,566
14. Trivandrum 2,192 2,946,650
(a) As against (b) below
Area in 1981 popula-1981 tion accord-(Sq.Km) ing to juri-
sdiction pr-evailing in 1991
5 6
38,863 25,453,680
4,958 2,803,467
2,132 554,026
2,345 2,245,265
3,548 2,402,701
4,480 2,044,399
3,032 2,439,543
2,408 2,535,294
5,061 971,636
2,204 1,697,442
. 1,883 2,350,145
.4j620 . 2,81l,6~O> c
2,192 2,596,112
Population in 1981 adju-sted to juri-sdiction of 1991
7
25,453,680
872,741
1,930,726
554,026
2,245,265
2,402,701
2,044,399
2,439,633
2,535,204
969,292
1,697,442
1,865,455
1,125,345
2,175,339
2,596,112
Net increase or decrease between Cols. 6 & 7
8
+872,741
-872,741
+90
-90
-2,344
-484,690
+ 1,125,345
-638,311
(b) Entire Kasaragod and Hosdurg taluks with an area of 1990 sq. km and population 872,741 were transfered to form a new district - Kasaragod district on 24th May 1984 as per G.O. (MS) No. 520/84/RD dated 19.5.84
(c) As against (d) below.
(d) Kakkanadanthuruthu and Suklamthuruthu of Puthenvelikkara village of Paravur taluk with an area 6.4225 hectares and population 90 (1981 census) transferred to Methala village of Kodungallur Taluk of Thrissur district as per G.O. (MS) No. 881/85/Rd dated 20.9.1985.
(e) North Pampavally area and areas around Sabarimala Sannidhanam of Mlappara village of Peerumade taluk with an area 21.45 sq.km and population 2344 (1981 census) transferred to Ranni Taluk of newly formed Pathanamthitta district as per G.O. (MS) No. 1026/821RD dated 29.10.1982.
(t)(il Entire Thiruvalla taluk (Area - 346.5 SQ. km, Population - 363,728), 3 villages of Chengannur Taluk (Area 59.97 sq.km population -62,193) and two villages of Mavelikkara Taluk (Area 53.78 sQ.km, Population 58,644) have been transferred to newly formed Pathanamthitta district as per G.O. (MS) No. 1026/821RD Dated 29.10.1982 and G.O.M.S No. 1028/82/RD dated 30.10.1982.
(ii) A portion of Valiya Azheekkal Kara of Arattupuzha Village of Karthikappally Taluk with an area of 0.10 sq.km and population 125 (1981 census) was transferred to Alappad village of Karunagappally Taluk of Kollam District as per G.O. (MS) No. 142!85/RD dated 12.2.1985.
(g) As against (e) and (f}(i) above and (h) below.
(h) Whole of Pathanamthitta Taluk with area 1975.60 Sq.km. and population 430,915 (1981 census) and ten villages of Kunnathur Taluk area 271.52 sq.km and Population 207,521 wert: transferred to newly formed Pathanamthitta district as per G.O. (MS) No.1 026/82/RD dated 29.10.1982.
T'lere is no change in the jurisdiction of Kerala State since the 1981 Census. The district boundaries of Wayan ad, Kozhikode, Malappuram, P"lakkad, Kottayam and Trivandrum have not undergone any change since 1981 Census.
96

A3-VILLAGES CLASSIFIED BY POPULATION SIZE


A-3 VILLAGES CLASSIFIED BY POPULATION SIZE
Fly leaf
This table corresponds to the table A3 of 1981 Census and gives the total number of inhabited villages classified by ~even broad population ranges viz. (i) Less than 200 (ii) 200-499 (iii) 500-999 (iv) 1000-1999 (v) 2000-4999 (vi) 5000-9999 and (vii) t 0000 and above. The population data for villages .classified into these ranges have been bresented with sex breakup. The number of inhabited villages shown in this table is exclusive of those villages which make up urban areas and whose population is included in the
respective towns. In the case of villages partly lying in urbJn areas, the portion of villages which lie outside the urban limits have been reckoned as villages and their number and population are included in this table.
Statement t below gives the percemage of population living in villages of various population sizes to total rural population in 199 t •
STATEMENT -Population Living in Villages of Various Population Sizes as Percentage of the
Total Rural Population - 1991
SI. State! Population living in Villages of Various Population sizes as Percentage No. District Total
Les; than 200 200-499 500-999 1000- 1999 2000-4999 5000-9999 10000+
2 3 4 5 ------, KERf.LA 10000 N N
I. Kasarae,od 100.00
2. Kannur 100.00
3. W3yanad 100.()O
4. Kozhikocie 100.00
5. Maiappural11 100.00
6. Palakkad 100.00
7. Thrisslir 100.00 0.01
8. Ernakulam 100.00 0.01
9. Idukki 100.00 0.04
10. Kottayam 100.00
1 I. Alappuzha 100.00 0.03
12. Pathanamthitta 100.00
13. Kallam 100.00
14. Trivandrum 100.00
It is observed that small size villages are very few in Kerala. 88.98 percent of rural population of the state Jive in villages having population 10,000 and above. Only negligible proportion of rural population live in very small villages ~ith population less than 500. In Malappuram, Ernakulam, Kottayam, Alappuzha, Pathanan1thitta, Kollam and T rivandrum districts more than 90 percent of rural population live in large villages having popula~ion above 10,000. In Kollam district it is as high as 99.26 percent. Kasaragod and Thrissur are the two districts where the proportion of population living in large villages with population above 10,000 is comparatively low. In Kasaragod 53.42 percent and in Thrissur 60.74 percent of rural population live in
99
6 7 8 9 10
0.01 0.12 1.78 9.1 I 88.98
0.1 I 1.30 13.39 31. 78 53.42
13.71 86.29
0.27 19.74 79.99
0.53 3.16 96.31
I. 1 8 98.82
0.07 3.16 11.54 85.23
0.14 7.25 3: .86 60.74
0.49 5.60 93,90
0.09 0.18 LIO 10.80 87.79
0.19 1.15 8.44 90.22
0,16 2.43 97.38
0.05 0.18 2.42 97.35
0.74 99.26
0.06 0.23 1.84 97.87
villages of popularion size above 10,000. But in these two districts more than 30 percent of rural population rive in villages of population size 5,000-9,999. While the revenue: villages as such are treated as Census villages in all the other districts, in Kasaragod and Thrissur districts constituents of grouped villages are treated as Census villages and that is the reason for the comparatively smaller number of very large villages in these two districts. In the case of villages lying partly in towns anq partly outside towns the population of ponion lying outside the town only is taken as the population of the village and therefore such villages may figure as small population size villages. These limitations have to be taken into account while considering the figures in the above state-

ment. In Kannur, Malappuram and Kollam districts there is no village with population less than 5,000.
Kannan Devan Hills in Peerumade Taluk ofldukkl dIstrict has got the highest population of 70816 among the villages in the State. Edakkara village of Emad taluk having a population 46,516 Is the next largest village. Excluding K.D. Hills and Edakkara_ 4 more villages have population above 40,000. They are 'firuranga.i (43,645) and Thennala (41084) in Tirur taluk, Venganoor (40,284) in Trivandrum taluk and Kottukal (41,463) in Neyyattinkara tahik. While 74.24 percent of villages in the State containing 90.35 percent of rural population had population above 10,000 in t 981, in 1991 Census only 72.76 percent of villages containing 88-98 percent of rural population had population above t 0,000. This slight decrease in the number of very large villages may be attributed to the bifurcation of more than 200 revenue villages in the State during the intercensal period of 1981-91.
Statement 2 below gives the percentage of Villages and Population by size class of villages for the year t 98 t and t 991. In Kasaragod District, against 62.90 percent of villages in the population size group of 10,000 and above in 1981 there are only 30. 1 7 percent of such villages in 1991. At the same time while there were only 6.45 percent of villages in the size group 2000-4999 in 1981 there are 30.1 7 percent of such villages in 1991. The reduction in the number of large villages and the increase in the number of small villages in the districts is due to the following reasons. In Kasaragod Taluk there are groups of smallyillages and the group is treated as the revenue villages. In t 98 t Census the revenue villages were taken as the census villages. But in 1991 Census individual villages in the groups were treated as census villa~s as requested by local revenue authorities in the context of abandoning the desomwlse presentation, of data and following the pattern in Thrlssur district. Moreover, a few villages of t 98 1 were also bifurcated in this district during the intercensal period of t 98 t -91.
100

STA TEMENT - 2 Percentage of Villages and Population by Size Class of Villages in 1981 and 1991
State/District Year Less than 500 500-999
No. of villages as Population as perc en- No. of villages as Population as percen-percentage of total tage of total rural percentage of total tage of total rural No. of villages population No. of villages population
2 3 4 5 6
KERALA 1981 0.41 0.01 0.16 0.01 1991 0.29 N 0.22 0.01
Kasaragod 1981 1991 0.86 0.11
2 Kannur 1981 1991
3 Wayanad 1981 1991
4 Kozhikode 1981 1991
5 Malappuram 1981 1991
6 Palakkad 1981 0.04 1991
7 Thrissur 1981 0.94 0.01 1991 0.48 0.01
8 Ernakulam 1981 0.02 1991 1.12 0.01
9 Idukki 1981 2.38 0.05 1991 1.54 0.04 1.54 0.09
10 Kottayarrl 1981 1991
I 1 Alappuzha 1981 1.35 0.03 1991 1.33 0.03
12 Pathanamthitta 1981 1991 1.56 0.05
13 Kallam 1981 1.49 0.01 1991
I 4 Trivandrum 1981 2.32 0.12 1991
101

STATEMENT - 2 Percentage of Villages and Population by Size Class of Villages in 1981 and 1991
State/District Year Less than 1000-1999 2000-4999
No. of villages as Population as percen- No. of villages as Population as percen-percentage of total tage of total rural percentage of total rage of total rural No. of villages population No. of villages population
2 7 8 9 10
KERAlA 1981 1.07 0.10 5.91 1.33 1991 1.17 0.12 7.37 1.78
Kasaragod 1981 6.45 2.16 1991 6.04 1.30 30.17 13.39
2 Kannur 1981 1.14 0.35 1991
3 Wayanad 1981 1991 2.08 0.27
4 Kozhikode 1981 19~1 2.30 0.53
5 Malappuram 1981 1991
6 Palakkad 1981 0.69 0.06 6.16 1.97 1991 0.65 0.07 9.68 3.16
7 Thrissur 1981 2.82 0.44 23.47 9.47 1991 0.96 0.14 18.66 7.25
8 Ernakulam 1981 1.26 0.13 3.80 0.91 1991 2.25 0.49
9 Idukki 1981 4.76 0.26 7.14 1.01 1991 1.54 0.18 4.61 1.10
10 Kottayam 1981 1.35 0.09 1.35 0.30 199\ 2.22 0.19 4.44 1.15
11 Alappuzha 1981 1.35 0.13 1991 1.33 0.16
12 Pathanamthitta 1981 1991 1.56 0.18
13 Kallam 1981 1991
14 Trivandrum 1981 2.33 0.18 0.17 1991 1.07 0.06 1.08 0.23
102

STATEMENT - 2
Percentage of Villages and Population by Size Class of Villages in 1981 and 1991
State/District Year Less than 5000-9999 10000 +
No. of villages as Population as percen- No. of viHages as Population as perc en-percentage of total tage of total rural percentage of total rage of total rural No. of villages population No. of villages population
2 11 12 13 14
KERALA 1981 18.21 8.24 74.24 90.31 1991 18.21 9.11 72.76 88.98
Kasaragod 1981 30.65 17.51 62.90 80.33 1991 32.76 31.78 30.17 53.42
2 Kannur 1981 27.27 14.54 71.59 85.11 1991 24.36 13.71 75.64 86.29
3 Wayanad 1981 19.35 8.73 80.65 91.27 1991 31.25 19.74 66.67 79.99
4 Kozhikode 1981 8.99 3.96 91.01 96.04 1991 6.90 3.16 90.80 96.31
5 Malappuram 1981 7.83 3.46 92.17 96.54 1991 3.25 1.18 96.75 98.82
6 Palakkad 1981 25.34 16.34 67.81 81.59 1991 19.35 11.54 70.32 85.23
7 Thrissur 1981 43.19 34.34 29.58 55.74 1991 42.10 31.86 37.80 60.74
8 Ernakulam 1981 10.13 4.26 84.81 94:68 1991 11.24 5.60 85.39 93.90
9 Idukki 1981 11.91 4.38 73.81 94.30 1991 21.54 10.80 69.23 87.79
10 Kottayam 1981 4.06 1.34 93.24 98.27 1991 16.67 8.44 76.67 90.22
11 Alappuzha 1981 2.70 0.93 94.60 98.91 1991 5.34 2.43 92.00 97.38
12 Pathanamrhitta 1981 3.77 1.12 96.23 98.88 1991 4.69 2.42 92.19 97.35
13 Kollam 1981 1.49 0.54 97.02 99.45 1991 2.17 0.74 97.83 99.26
14 Trivandrum 1981 6.98 2.42 88.37 97.11 1991 4.30 1.84 93.55 97.87
103

A-3 VILLAGES CLASSIFIED
State/District! Total Less than 200 200-499 Taluk No. of Total rural population Population Population
inhabited villages Persons Males Females No. Males Females No. Males Females
l 3 " 5 f> 7' 8 9' to 11
KERALA 1384 21,418,224 10,512,788 10,905,436' 2 177 1 18 2 438 ilO
I. KASARAGOD 116 895,282 442,648 452,634 DISTRICT
1. Kasaragod taluk 78 482,262 240,762 241,500 2. Hosdurg taluk 38 413,020 201,886 211,131-
2. KANNUR 78 1,106,251 545,613 560,638 DISTRICT
I. Tallparamba taluk 41 543,788 270,045 273,743 2. Kannur caluk 7 124,264 59,848 61,416 3. Thalassery taluk 30 438,199 215,720 222,479
3. WAYANAD 48 649,179 330,174 319,005 DISTRICT
I. Mananthavady taluk 16 203,701 102,940 100,761 2. Sufrryan 8amery taluk IS 255,397 131,581 123,816 3, Vyd,iri taiuk 17 190,081 95,653 94,428
4. KOZHIKODE 87 1,615,444 796,383 819,061 DISTRICT
t. Vadakara taluk 24 468,026 227,898 240,128
2. Quilandy taluk 36 640,965 316,279 324,686
3. Kozhikode taluk 27 506,453 252,206 254,247
5. MAlAPPURAM 123 2,813,876 1,369,418 1,444,458 DISTRICT
t. Ernad taluk 50 1,078,584 531,143 547,441
2. Perinthaimanna taiuk 22 413,862 201,129 212,733
3. Tlrurtaluk 41 1,052,312 507,916 544,396
4. Ponnan; taluk 10 269,118 129,230 139,888
6. PALAKKAD 155 2,007,658 972,765 1,034,893
DISTIlICT
I. OttaPpa,lam taluk 37 665,413 316,723 348,690
2. Mannarkad taluk 23 263,488 t29,37~ 134,113
3. Palakkad taluk 24 337,178 165,161 172,017
4. Chlttur taluk 41 343,113 168,417 174.696
5. A1athur taluk 30 398,466 193,089 205,377
7. THRISSUR 209 2,017,095 964,593 1,052,502 69 52
DISTRICT
I. Talappilly taluk 73 509,932 242,923 267,009 69 52
104

BY POPULATION SIZE
500-999 1000-1999 2000-4999 5000-9999 10000+ Population Population Population Population Population
No. Males Females No. Males Females No. Males Females No. Males Females No. Males Females
12 13 14 15 16 17 18 19 20 21 22 23 24 25 26
3 1240 1215 16 12,677 12,827 102 186,249 194,033 252 957,407 993,827 1,0079,354,600 9,703,006
477 503 7 5,727 5,957 35 59,121 60,744 38 140,918 143,565 35 236,405 241,865
477 503 6 4,983 5,093 31 51,162 52,221 26 94,503 94,685 14 89,637 88,998 744 864 4 7,959 8,523 12 46,415 48,880 21 146,768 152,867
19 74,374 77,246 59 471,239 483,392
13 52,077 54,437 28 217,968 219,306 I 4,383 4,625 6 55,465 59,791 5 17,914 18,184 25 197,806 204,295
909 863 15 64,688 63,455 32 264,577 254,687
5 23,961 23,108 II 78,979 77,653 4,053 3,818 14 127,528 119,998
909 863 9 36,674 36,529 7 58,070 57,036
2 4,348 4,152 6 25,515 25,622 79 766,520 789,287
2 4,348 4,152 22 223,550 235,976 5 21,208 21,207 31 295,071 303,479
4,307 4,415 26 247,899 249,832
4 16,356 16,947 119 1,353,062 1,427,511
2 7,856 7,826 48 523,287 539,615 2 8,500 9,121 20 192,629 203,612
41 507,916 5<\<\,396 10 129,230 139,888
687 651 15 31,215 32,188 30 114,291 117,488 109 826,572 884,566
I 4,255 4,715 36 312,468 343,975 9 35,465 35,666 14 93,910 98,447 3 10,919 10,818 21 154,242 161,199
687 651 15 31,215 32,188 12 45,118 46,478 13 91,397 95,379 5 18,534 19,811 25 174,555 185,566
2 1,392 1,541 39 70,275 75,941 88 306,797 335,935 79 586,060 639,033
860 945 20 35,068 38,319 35 118,327 131,069 16 88,599 96,624
105

A-3 VILLAGES CLASSIFIED
State/District! Total less than 200 200-499 Taluk No. of Total rural population Population Population
inhabited villages Persons Males Females No. Males Females No. Males Females
2 3 4 5 6 7 8 9 10 11
2. Chavakkad taluk 20 308,344 144,715 163,629 3. Thrissur taluk 50 379,698 183,304 196,394 4. Kodungallur taluk 13 181,378 85,732 95,646 5. Mukundapuram taluk 53 637,743 307,919 329,824
8. ERNAKUlAM 89 1,44'1,059 722,730 721,329 108 66 DISTRICT
I. Kunnathunad taluk 23 364,620 184,232 180,388 2. Aluva taluk 16 260,919 130,893 130,026 108 66 3. Parawr taluk 4 79,126 38,797 40,329 4. Koehl taluk 9 216,040 105,826 110,214 5. Kanayannur taluk 11 142,119 70,806 71,313 6. Muvattupuzha taluk 16 231,965 116,960 115,005 7. Kothamangalam taluk 10 149,270 75,216 74,054
9. IDUKKI DISTRICT 65 1,027,185 520,308 506,877 224 207
I. Devikulam tal uk 13 197,916 101,022 96,894 2. Udumbanchola taluk 23 393,582 199,816 193,766 3. Thodupuzha taluk 19 250,755 126,406 124,349 224 207 4. Peerumade taluk 10 184,932 93,064 91,868
10. KOTTAYAM 90 1,507,353 752,358 754,995 DISTRICT
I. Meenachll taluk 26 341,478 171,301 170,177 2. Vaikom taluk 16 273,430 136,250 137,180
3. Kottayam taluk 22 419,492 209,275 210,217 4. Changanassery taluk 14 270,506 134,269 136,237 5. Kanjirappally taluk 12 202,447 101,263 101,184
I I. ALAPPUZHA 75 1,391,607 677,351 714,256 214 203 DISTRICT
I. Cherthala taluk 13 279,477 138,ltsl 141,316
2. Ambalappuzha taluk 6 117,826 58,099 59,727 214 203 3. Kuttanad taluk 14 210,004 '103,620 106,384
4. Karthlkappally taluk 17 325,478 156,687 168,791
5. Chengannur taluk II 170,780 82,247 88,533
6. Mavelikkara taluk 14 288,042 138,537 149,505
12. PA THANAM- 64 1,033,298 500,965 532,333
THITT A DISTRICT
I. Thlruvalla taluk 10 172,042 83,185 88,857
2. Malappally taluk 9 132,144 64,046 68,098
3. Rannl taluk II 209,374 103,522 105,852
4. Kozhencherry taluk 21 300,616 144,351 156,265
5. Adoor taluk 13 2.19,12.2 105,861 113,261
106

BY POPULATION SIZE
500-999 1000-1999 2000-4999 5000-9999 10000+ Populadon Population Populadon Population Popula~ion
No. Males Females No. Males Females No. Males Females No. Males Females No. Males Females
12 13 14 15 16 17 18 19 20 21 22 23 24 25 26
2,051 2,232 3 12,782 14,175 16 129,882 147,222 532 596 13 24,277 26,243 25 82,410 88,966 II 76,085 80,589
I 1,847 1,942 3 12,461 13,644 9 71,424 80,060 4 7,032 7,205 22 80,817 88,081 27 220,070 234,538
2 3,580 3,514 10 40,563 40,347 76 678,479 677,402
1,085 1,059 I 3,720 3,620 21 179,427 175,709 2 9,092 9,212 13 121,693 120,748
4,918 5,073 3 33,879 35,256 9 105,826 110,214
2,495 2,455 4 13,235 13,241 6 55,076 55,617 2 9,598 9,201 14 107,362 105,804
10 75,216 74,054
487 444 978 908 3 5,760 5,489 14 56,315 54,571 45 456,544 445,258
978 908 2 3,325 3,181 5 19,718 18,780 5 77,001 74,025 2,435 2,308 6 25,618 24,776 16 171,763 166,682
3 10,979 11,015 15 115,203 113,127 487 444 9 92,577 91,424
2 1,478 1,363 4 8,636 8,722 15 63,997 63,148 69 678,247 681,762
2,205 2,107 9 40,770 39,993 16 128,326 128,077 I 4,069 4,169 IS 132,181 133,011
2 1,478 1,363 2 6,205 6,240 18 201,592 202,614 2,468 2,485 13 131,801 133,752
2 3,963 4,130 3 12,953 12.746 7 84,347 84,308
1,137 1,005 " 16,845 17,025 69 659,155 696,023
4,651 4,701 12 133,510 136,615 5 57,885 59,524·
2 7,720 7,441 12 95,900 98,943 4,474 4,883 16 152,213 163,908
1,137 1,005 10 81,110 87,528 14 138,537 149,505
276 268 907 975 3 12,052 12,934 59 487,730 518,156
3,351 3,502 9 79,834 85,355 3,920 4,256 8 60,126 63,842
1I 103,522 105,852
276 268 4,781 5,176 19 139,294 150,821
907 975 12 104,954 112,286
107

A-3 VILLAGES CLASSIFIED
State/District/ Total less than 200 200-499 Taluk No. of Total rural population Population Population
inhabited villages Persons Males Females No. Males Females No. Males Females
2 3 4 5 6 7 8 9 10 11
13. KOLlAM 92 1,961,530 962,181 999,349
DISTRICT
I. Karunagappally taluk 16 369,679 183,422 186,257
2. Kunnathur taluk 7 178,665 88,259 90,406
3. Pathanapuram taluk 21 368,968 181,308 187,660
4. Kottarakkara taluk 27 533,447 258,811 274,636
5. Kollam taluk 21 510,771 250,381 260,390
14. TRIVANDRUM 93 1,948,407 955,301 993,106
DISTRICT
I. Chirayinkeezl1u taluk 26 483,065 229,281 253,784
2. Nedumangaad taluk 26 524,655 256,919 267,736
3. Trivandrum taluk 12 238,659 118,763 119,896
4. N eyyartl nkara taluk 29 702,028 350,338 351,690
108
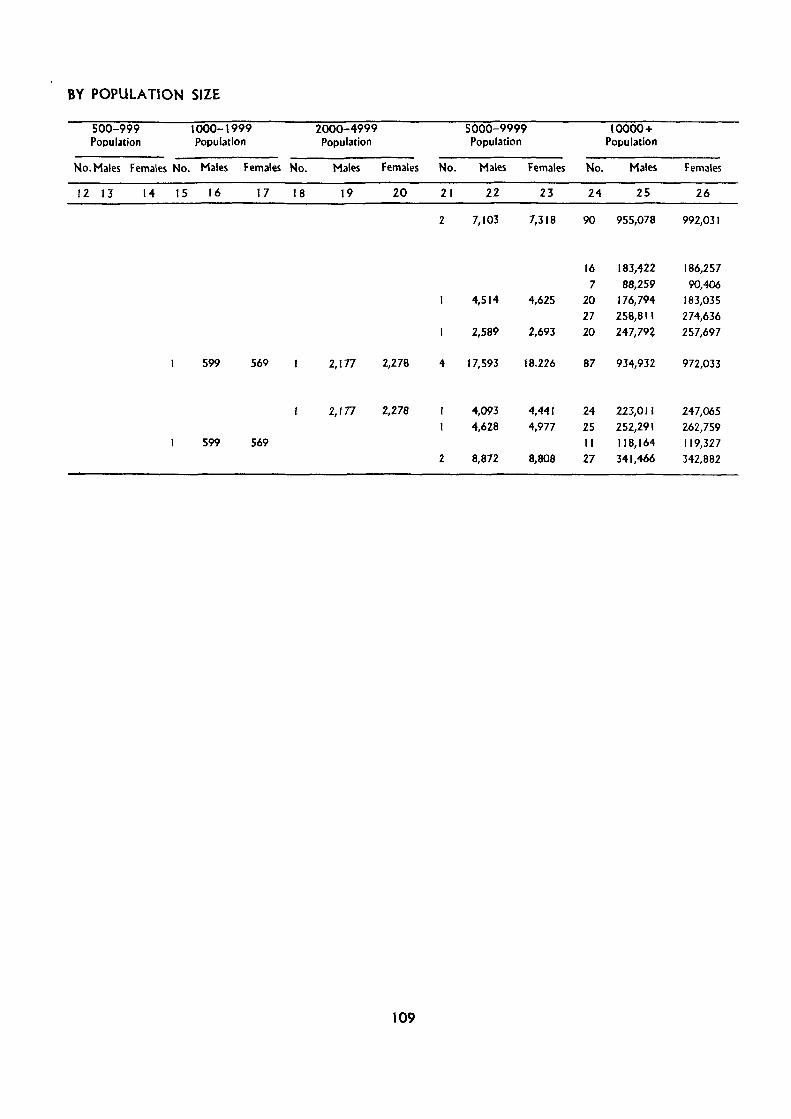
BY POPULATION SIZE
500-999 1000-1999 2000-4999 5000-9999 10000+ Population Population Population Population Population
No. Males Females No. Males Females No. Males Females No. Males Females No. Males Females
12 13 14 15 16 17 18 19 20 21 22 23 24 25 26
2 7,103 7,318 90 955,078 992,031
16 183,422 186,257
7 88,259 90,406 4,514 4,625 20 176,794 183,035
27 258,811 274,636 2,589 2,693 20 247,792,. 257,697
599 569 2,177 2,278 4 17,593 18.226 87 934,932 972,033
2,177 2,278 4,093 4,441 24 223,011 247,065 4,628 4,977 25 252,291 262,759
599 569 II 118,164 119,327 2 8,872 8,808 27 341,466 342,882
109


A4 - TOWNS AND URBAN AGGLOMERATIONS CLASSIFIED BY
POPULATION IN 1991 WITH VARIATION SINCE 1901

A-4 : TOWNS AND URBAN AGGLOMERATION CLASSIFIED BY POPULATION IN 1991 WITH VARIATION SINCE 1901
Fly-Leaf
This table corresponds to Table A4 of 1981 and previous eensuses and gives the population by sex, decade variation and percentage decade variation for each town and urban agglomeration during the past 90 years. The status of town and the area of towns and urban agglomerations are given in the table. The area figures (in Sq.km) confined to 1961 to 1991 census.
The UA's/towns have been arranged in the order of population size and class of towns. As in 1981 all towns and UA's have been grouped into the following size classes according to population size.
Class I - Population of 1,00,000 and above
Class 11- Population of 50,000 to 99,999
Class III - Population of 20,000 to 49,999
Class IV ~ Population of 10,000 to 19,999
Class V - Population of 5,000 to 9,999
Class VI - Population less than 5,000
The total urban population of Kerala for each census from 1901 to 1991 is given at the beginning of the table and is followed by similar figures for class I total and the towns included in class I arranged in the order of population size. Similarly the total for class II followed by figures of each town included in that class arranged in the order of population and so on are given. The population figures given in earlier censuses in this table are so recorded in the earlier censuses and not adjusted to conform to the present jurisdiction.
This table has been supplemented by the following four appendices.
Appendix 1 : This appendix gives the new towns of 1991, which were not treated as towns in 1 98 t and also the towns of 198, 1 which have been declas5ified as rural in 1991. For the new towns the area as of 1991 and for declassified towns the area as of t 98 t census are presented. The population of these areas in 1 981 and 1991 are also shown in the appendix. This appendix shows the change in ruraVurban status of places between 1981 nll991.
Appendix 2: This appendix gives places with less than 5000 population treated as towns for the first time in 1991 and their area and population.
Appendix 3 : This appendix gives towns of 1981 with less than 5000 population which have been declassified as rural in 1991 and their area and population in 1981.
Appendices 2 and 3 indicates the change in rural/ urban status of places with less than 5000 population from 1981 to 1991.
Appendix 4 : This appendix gives list of towns which have undergone change in area between 1981 and 1 991, their area and population at the two censuses, with reason for change in area.
Classification of towns given in this table is based on t 991 population. An urban agglomeration was formed by tak· ing into account the continuous urban spread constituting a town and its adjoining urban outgrowths or two or more physically contiguous towns together with continuous well recognised urban outgrowths, if any, of such towns.
As many towns have changed their size class since t 901 the class totals shown in the table for previous censuses are not the total of respective population of all towns given in that size class in t 991. The class totals for earlier censuses comprise of population of all towns that existed in the concerned census with the exception in the case of urban agglomeration. The UA with its constituent units is taken as single unit and classified accordingly for earlier censuses. As the table shows the growth of urban population alone, the figures for previous censuses against towns which are not treated as towns in those censuses are not given. If any place was treated as a town in some census and declassified as rural in subsequent censuses and again classified as town then, in such cases, trle population figures are given only for thos.e censuses in which it was a town and the word 'declassified' is recorded against other census years in which it was declassified.
The ~~ement below gives the number of towns and their popuJ3tiolhince 1901. In this case it is to be noted that the constituents of an urban agglomeration where the constituents were reckoned as separa~e towns in their own right have been classified according to their own population and not according to the population of UA. Where, however, UA's were formed with outgrowths, the population of the outgrowth(s) was added to the town whose outgrowth it was. The combined population of _vwn and outgrowth(s} was taken for determination of the class in the statement 1.
1 J 2

75"
... -'9
('
.,.
E GROWTH OF PERC ENTp~~ULATION URBAN
_ 100·01 & ABOVE
~ 75·01 - 100.00
76'
~
"" )-
[]]]] D
50·01 - . 7500 STATE AVERAGE
60·97
50. 00 & BELOW
D Nil
""
.,.
" <", 'V' 'of In " .' ~ n· .. , '(1 I rC', r" In ".~I
20 to 0 KILOME TRES 40
20
80UNDARIES:
STATE fur. ........ _.::: DISTRICT ......... _.
..,
c
60
fi:\ r.. .. v~ ..... _ .....
.0·
"'" , ..... :-",_.-=_ .... ttlil'Yl I


12"
10
9
50
25
_so
J:
oi- 200t • 1'15
'l:::l150
i... '15 (
~ '" KERALA
"
CENSUS YEARS
N _ Nogligible
7~· EAST OF GREENWICH
KERALA O1dlllrr iJ1vt~~:a1 ;r ~.14111l ~
DECADAL GROWTH OF URBAN POPULATION
1901 - 91 KilOMETRES
20 10 0 20 40 60
BOUNDARIES:
STATE /Ul ...... _._._
DISTRICT.
<
17·
. 78·
12·
II·
10·
') ~urvey '" 'In 'Q t1" ,wIth the 'ft" on of t~ , n, turi' .,' I wal rc:. of tr "Q t ~ into tf" ,I I tn d' I • of (r=) (' ,ve-rnrr ,t of Ir r ,yr' ,. 1998


STATEMENT - 1
No. of Cities and Towns and Their Population in State in 1901-1991
Census a) Number Oassl Oass ". Class III Class IV Class V Class VI All classes year b) Population
2 3 4 5 6 7 8 9
KERAlA STATE
1901 a 2 6 8 5 21
b 134,863 166,751 117,209 35,676 454,499
1911 a 2 8 6 8 3 27
b 141,978 216,499 90,137 62,244 13,803 524,661
1921 a 2 9 9 14 10 44 b 155,118 254,367 127,758 107,887 35,770 680,900
1931 a 2 11 15 17 8 53
b 195,289 385,422 192,463 115,416 27,740 916,330
1941 a 2 4 7 20 20 9 62
b 254,717 222,363 255,322 278,661 149,644 34,843 1,195,550
1951 a 3 5 12 29 27 18 94
b 461,933 341,332 356,274 417,469 186,237 62,587 1,825,832
1961 a 4 5 31 33 18 1 92
b 688,423 378,257 885,898 472,292 126,412 2,859 2,554,141 1971 a 5 7 40 25 9 2 88
b 1,467,046 463,704 1,101,417 350,630 74,520 9,132 3,466,449
1981 a 6 8 64 21 6 I 106
b 1,901,069 512,197 2,021,960 282,689 48,871 4,489 4,771,275 1991 a 7 20 100 53 16 1 197
b 2,430,516 1,228,037 3,067,020 821,814 128,087 4,820 ;,680,294
The above statement reveals that there is steady in- 11 is steadily increasing from 1901 onwards. Increase may crease in towns since 190 1 census until 1951. It has decreased be due to natural growth of population or industrial develop-in 1961 and 1971. In 1981 and 1991 the number of towns has ment pushing the towns into higher classes. In class V and increased. The variation in the application of concepts and VI towns there has been a considerable decrease in the number consequent de<!lassificadon of towns into rural since 1951 cen- of towns in 1961 because of the appCication of a uniform sus have resulted in wide changes in the number of towns in and rigid definition of urban areas adopted for first time in 1961,1971,1981 and 1991 censuses. There has been a net 1961 census. Prior to 1961 census the definition of urban increase of 91 towns during 1 981-'91. Similarly the ur- areas was flexible and varied from state to state. ban population has gone up from 4,771,275 to 7,680,294 during the decade. The highest increase is noticed in class III Statement 2 presents the number of towns and per-towns where the number of towns has increased from 64 to centage of population in each class to total urban population tOO during 1981-91. The number of towns in class I and from 190 1 to 1 991.
117

STATEMENT - 2 Number of Towns and Percentage of Population in Each Class to
Total Urban Population From 1901 - 1991 Total (I-VI) II 111 IV V VI
Census year
No. of popu- No. of % of No. of % of No. of % of No. of % of No. of % of No. of % of towns latlon towns popu- towns popu- towns popu- towns popu- towns popu- towns popu-
lation lation lation lation lation lation
1901 1911 1921 1931 1941 1951 1961 1971 1981 1991
2 3
21 454,499 27 524,661 44 680,900 53 916,330 62 1,195,550 94 1,825,832 92 2,554, I 41 88 3,466,449
106 4,771,275 197 7,680,294
4
2 3 4 5 6 7
5
21.30 25.30 26.95 42.32 39.84 31.65
6
2 2 2 2 4 5 5 7 8
20
7 8
29.67 6 27.06 8 22.78 9 21.31 11 18.60 7 18.70 12 14.81 31 13.38 40 10.74 64 15.99 100
It is observed from the above statement that the proportion of population living In class I towns is steadily increasing from 1 941 to 1 971 and then decreases in 198 1 and 1991. But when comparing 1941 and 1991 figures there is increase in percentage. The number of towns has increased steadily. In case of class II, though there is increase in number of towns, the percentage of population has decreased from 190 1 to 1 98 1 and increased in 1 99 1. It decreased from 29.67% in 1901 to 10.74% in 1981 and
9 to
36.69 8 41.27 6 37.36 9 42.06 IS 21.36 20 19.51 29 34.69 33 31.77 25 42.38 21 39.93 53
11
25.79 17.18 18.76 21.00 23.31 22.86 18.49 10.12 5.93
10.70
12 13 14
5 7.85 8 11.86 3
14 15.85 10 17 12.60 8 20 12.52 9 27 10.20 18 18 4.95 I 9 2.15 2 6
16 1.02 1.67
15
2.63 5.25 3.03 2.91 3.43 0.1 I 0.26 0.09 0.06
lation in class III towns. There is no steady increase in case of class IV towns and its population. In class V, the number of towns has increased from 1 901 to 1 95 1 and decreased in 1961 to 1981 and then again increased in 1991. Percentage of population increased from 1901 to 1921 and decreased upto 1981 and again increased in 1991. There is fluctuation in number of towns and percentage of population in case of class VI.
increased to 1 5.99% in 1991. Except for 1941, the number Statement 3 given below shows the percentage of area of towns has increased from 1 901 to 1991 in cases of class of town in each class to total urban area and density of popuIII towns. But there is fluctuation in case of percentage popu- lation per sq.km in each class for 1981 and 1991 censuses.
5T A TEMENT - 3 Area of Towns in Each Class as Percentage of Urban Areas of State and Density of
Population in Each Class
Class
All classes Class I Class II Class III Class IV Class V
Area as percentage of total urban area
2
100.00 15.25 13.78 53.65 15.31
2.01
1991
Density per km2
3
2283 4738 2503 1741 1597 1894
1981
Area as percentage Density of total urban area per km2
4 5
100.00 , 2669 34.79 4077
9.75 .&606 45.62 1864
7.41 1720 2.43 772
The above statement shows that except for class I and V the density of urban population in each class has decreased in t 991 as compared with density in 1981 census. The density of population also increased generally as towns moved from lower to higher class. This has been noticed in 1981 and 1991 censuses. Class III towns of 1991 census have the largest share of total urban area.
classes I to VI. Class I towns are sub divided into three categories viz.
Statement 4 gives the number of cities and towns along with population of 1 98 1 and 1991 census arranged in size
118
a) Cities with one million and above population b) Cities with 5,00,000 to 9,99,999 population c) Cities with 1,00,000 to 4,99,999 population
The statement 4 is intended to show the movement of cities and towns from one class to another between 1981 and 1991.

STATEMENT - 4
Number and Population of Cities and Towns of 1981 and 1991 Censuses Arranged In Six Classes I to VI
Sf,ilte Class of Towns 1991
No. of Total towns Popu-
lation
2 3 4
KERALA All Classes 197 7,680,294 Total Class I 7 2,430,516 a) Cities with one million and
above population b) Cities with 5,00,000 to 2 1,282,460
9,99,999 population c) Cities with 1,00,000 to 5 1,148,056
4,99,999 population Class II 20 1,228,037 Class III 100 3,067,020 Class IV 53 821,814 Class V 16 128,087 Class VI 1 4,820
None of the cities in Kerala has a population of one million and over. Trivandrum Is a new addition to the classification having population 5,00,000 to 9,99,999. Five cities (Alappuzha, Ko"am, Kozhlkode, Palakkad and Thalassery) have population ranging between 1,00,000 and 4,99,999 ofwhlch Thalassery Is a new addition to the list In 1991. There Is an addition of 12 towns In class II, 36 towns In class III, 32 towns In class IV and lOin class V. The net addition of 36 towns is In class III resulting In the largest Increase (10,45,060) In the urban population of the state. Even though there is no decrease In number of towns, there Is decrease In population In class I (C) I.e. cities with population 1,00,000 to 4,99,999.
1981 Increase or Increase or Percentage Decrease In decrease In Increase or
No. of Total No. of towns population decrease In towns Popu- population
latlon 1981-1991
5 6 7 8 9
1064,771,275 +91 +2,909,019 +60.97 6 1,901,069 + 1 + 529,447 + 27.85
551,567 +1 + 730,893 +132.51
5 1,349,502 -201,446 -14.93
8 512,197 +12 + 715,840 + 139.76 64 2,021,960 +36 + 1,045,060 +51.69 21 282,689 +32 +539,125 + 190.71
6 48,871 +10 + 79,216 + 162.09 J 4,489 +331 +7.37
Statement 5 Illustrates how cities and towns have moved up and down from one class to another from 1981 to 1991. The figures In (a) Indicate the population and number of towns which a particular class of 1991 has received by a process of decrement from the next higher class range(s), while those In (b) Indicate the population and number of towns which that particular class of 1991 has received by a process of Increment from the next lower or any other lower class range, and those In (c)indlcate the population and number of towns which that particular class of 1 981 Is passing down by process of decrement to the next lower class range(s) Qf 1991 .
119

STATEMENT
Movement of Cities and Towns from One
State! Cate-District gory of II III
,movement Class Num- , Population Class Num- Population (lass Num- Populatipn ber ber ber
1981 1991 1981 1991 1981 1991
2 3 4 5 6 7 8 9 10 11 12 13 14
Kerala b II 75,561 103,579 III 9 356,469 479,548 IV I 17,858 20,216 N 3 150,914 177,594 N 481,206,0261,413,306
c IV 2 74,857 30,914
Kasaragod b III 43,137 50,126 N 46,176 57,165 N 2 35,348 47,165
c
Kannur b III 29,901 60,226 II 75,561 103,579 N 53,992 64,032 N 6 149,719 177,551
c IV 32,590 11,939
Wayanad b N 17,808 22,949 c
a Kozhikode b III 2 79,887 107,061 N 9 218,067 262,385
(
Malappuram b III 43,226 51,770 N 19,721 39,027 (
Palakkad b N 2 57,242 70,230 c
Thrissur b IV 17,858 20,216 N 21,483 23,510
c
Ernakulam b III 2 87,413 105,420 N 50,746 56,397 N 8 193,540 224,734
c IV 42,267 18,975
a Idukki b
c
Kottayam b N 4 123,158 135,170 c
120

-5
Class to Another During 1981 - 1991
Class Num-
III V N
N
III N
N
N
V
N
III N
v
15
ber
16
2 2
29
I 13
3
3
I 3
I 3
IV V
Population Class Num-
1981
17
74,857 18,189
409,790
16,753
32,590 182,791
42,484
1·2,271
9,303 37,362
42,267 42,817
8,886
1991
18 19
30,914 20,784 N
466,385
13,884 N
11,939 206,733
52,106
49,427
10,559 40,774 N
18,975 53,740
10,225
ber
20
12
II
Not treared as town VI in 1991
Population Class Num- Population Class Num- Population ber ber
1981 1991 1981 1991 1981 1991
21 22 23 24 25 26 27 28 29 30
82,781 93,134
III 21,068 NA
6,566 7,886
76,215 85,248
121

STATEMENT
Movement of Cities and Towns from One
State/ Cate-District gory of II III
movement Class Num- Population Class Num- Population Class Num- Population ber ber ber
1981 1991 1981 1991 1981 1991
2 3 4 5 6 7 8 9 10 II 12 13 14
a Alappuzha b N 6 150,092 167,525
c
a Pathanamthltta b III 29,225 54,780 N 2 60,386 64,372
c
a Kollam b III 43,680 50,165 N 2 58,303 56,773
c
a Trivandrum b N 4 101,159 121,915
c
a Indicates number and population of towns which a parcicular class of 1991 has received by a process of decrement from the next higher class range(s) of 1981.
b Indicates number and population of towns which a particular class of 1991 has received Iri a process of Increment from the next lower or any other lower range of 1981.
c Indicates number and population of towns Which a particular class of 1981 has passed down by a process of decrement to the IWxt lower or any other lower range of IWl .
(Increment and decrement of towns in the statement relates to their territorial content in 1991)
122

- 5
Class to Another During 1981 - 1 991
Class Number
15 16
N 3
IV
Population
1981 1991
17 18
45,312 49,721
V
Class Number
19 20
Population
1981 1991
21 22
123
VI
Class Number
23 24
Population
1981 1991
Not treated as town in 1991
Class Num- Population ber
1981 1991
25 26 27 28 29 30
III 21,068 NA

The above statement reveals that 2 towns have come down from higher class in 1981 to lower class in J 991. 13 towns have moved up from lower class to higher class. 92 new toWnS
have come up in J 991.
Statement 6 gives the percentage variation of population between J 98 J and 1991 of newly added towns in 1991 census. It gives data of new towns where J 981 population is available.
STATEMENT - 6 Percentage Variation of Population 1981-1991 of Places which were not treated as
Towns in 1981 but treated as such in 1991 Classified by size Class
Class No.of Population Population Percentage variation towns 1981 1991 in 1991.
Population over 1981 ie. 1991-1981 x 100
1981
2 3 4 5
I
" 3 150,914 177,594 17.68 III 48 1,206,026 1,413,306 17.19 IV 29 409,790 V 12 82,781
The newly added towns in 1991 fall in size classes II, III, IV and V. Of the 92 new towns, majority belongs to class Ill. The'growth rate is also higher in this group. Lower growth rate is in class V towns.
466,385 13.81 931,134 12.51
Statement 7 gives the percentage variation in populations 1981-91 for declassified towns.
STATEMENT - 7 Percentage V;uiation of Population 1981-91 of Places treated as Towns in 1981
but removed from the list of Towns in 1991 Classified by Size Class
Number Population Class of in 1981
Towns
2 3
IU 21,068
In the State PathirappaJIy census town of J 98 J is declassified in 1991 ~ASuS as it was predominantly rural in character.
Population Percentage variation in 1991 in 1991 Population
ovP.r 198 I Population
4 5
NA NA
Statement 8 shows d:le PQpulation of cities/towns which are common to 198 1 and 1991 by their size classes and also give change of class ftom '98 1 to 1991.
124
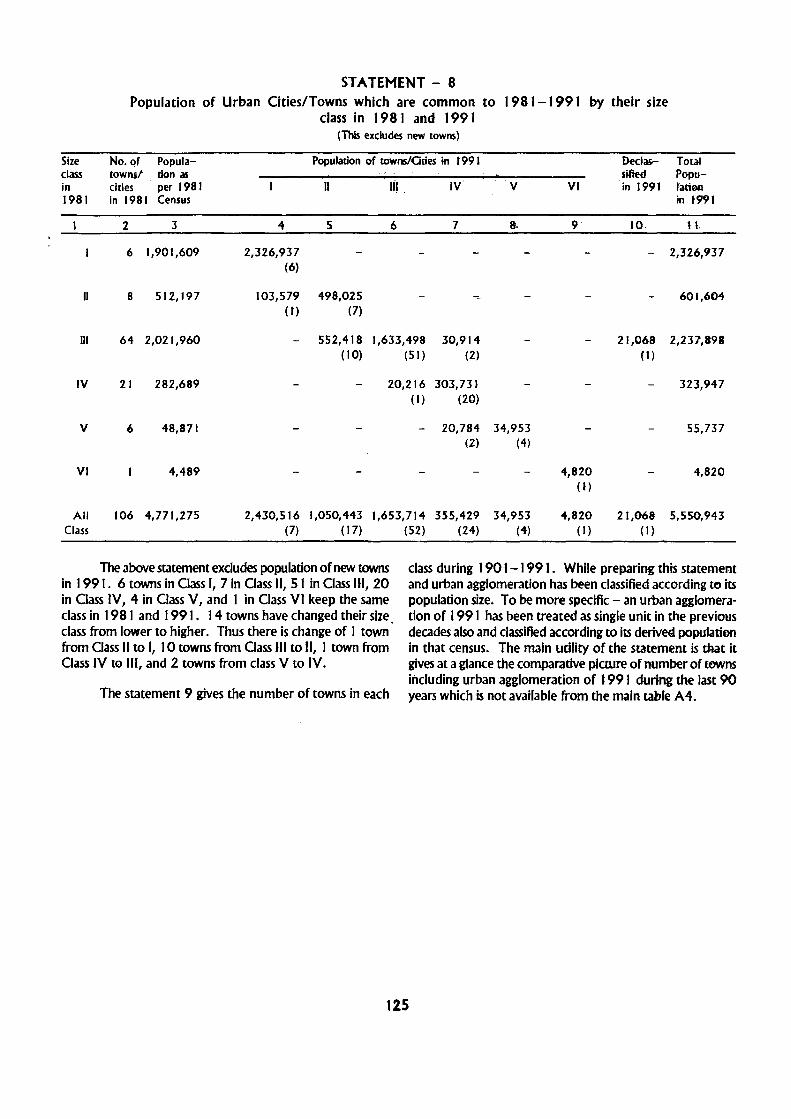
Size class in 1981
" 111
IV
V
VI
All Class
STATEMENT - 8 Population of Urban Cities/Towns which are common to 1981-1991 by their size
class in 1981 and 1991
No. of Populatowns! don 35
cities per 1981 in 1981 Census
2 3
6 1,901,609
8 512,197
64 2,021,960
21 282,689
6 48,87t
4,489
106 4,771,275
2,326,937 (6)
(This excludes new towns)
Population of townslCities in t 991
II IIi. IV
5 6 7
103,579 498,025 (t) (7)
552,418 1,633,498 (10) (51)
30,914 (2)
20,216 303,731 (t) (20)
V
8.
20,784 34,953 (2) (4)
2,430,516 1,050,443 1,653,714 355,429 34,953 (7) (17) (52) (24) (4)
VI
9
4,820 (I)
.. ,820 (1)
Dedarsified in 1991
10
Total Popufatioo in t991
l\.
- 2,326,937
601,604
21,068 2,231,898 (1)
323,947
55,737
4,820
21,068 5,550,943 (I)
The above statement excludes population of new towns in 1991. 6 towns in Class I, 7 in Class II, 51 in Class III, 20 in Class IV, 4 in Class V, and 1 in Class VI keep the same class in 1981 and 1991. 14 towns have changed their size. class from lower to higher. Thus there is change of 1 town from Class II to I, 10 towns from Class III to II, 1 town from Class IV to III, and 2 towns from class V to IV.
class during 1 90'1 - 1 991. While preparing this statement and urban agglomeration has been classified according to its population size. To be more specific - an urban agglomera' tion of 1 99 1 has been treated as single unit in the previous decades also and classified according to its derive4 population in that census. The main utility of the statement is that it gives at a glance the comparative picture of number of towns ittcluding urban agglomeration of 1991 during the last 90 years which is not available from the main table A4. The statement 9 gives the number of towns in each
125

5T A TEMENT - 9
Number of Towns of Each Class during 1901-1991
Statel 1991 1981 1971 1961 1951 1941 1931 1921 1911 1901 District
2 3 4 5 6 7 8 9 10 II
All Classes
KERALA 109 62 49 41 4J 38 35 30 18 16
Kasaragod 3 3 3 2
Kannur 31 12 5 3
Wayanad
Kozhikode 6 2 2 2 2 2 2 2 2 2
Malappuram 4 3 4 3 3 3
Palakkad 5 4 5 4 4 4 2 2 2 2
Thrlssur 19 12 5 S S 5 S 4 3 3
Ernakulam 10 7 5 4 5 3 3 2
ldukki 2 2
Kouayam 6 4 5 5 5 4 4 4 2 2
Alappuzha 9 5 5 5 5 5 5 4 2 2
Pathanamthitta4 2 2 2 3 2 2
Kollam 3 3 2 2 2 2 2
Trivandrum 6 5 5 4 5 5 6 6
Class I
KERALA 14 8 7 6 4 3
Kasaragod
Kannur
Wayanad
Kozhikode 2
Malappuram
Palakkad
Thrissur 2
Etnaltulam
klultki
Kouayam
Alappuzha 2
Pathanamthltta-
KoH-am
Trivandrum
126

STATEMENT - 9 Number of Towns of Each Class during 190-1-1991
Statel 1991 1981 1971 1961 1"951 1'941 1931 1921 1911 1901 District
2 3 4 5 6 7 B 9 10 II
Class II
KERALA 9 7 5 3 4 4 3 4 4 4
Kasaragod
Kannur 2
WayaRad
Kozhlkode
MalapPUfam
Palakkad
Thrissur 2
Ernakulam
Idukkl
Kottayam 2
Alappuzha
P-athanamthltta I
'Kollam
Trlvandrum
Class III
KERALA 46 32 25 IS 8 4 6 .. 3 2
Kasaragod 2
Kannur 9 4 2
Wayanad
Kozhlkode 3
Malappuram 2 2 3
Palakkad 3 3 3 2
Thrlssur 2 2 3 2
Emakulam 7 6 2
ldulckl
Kouayam 4 2 4 2 2 2
Alappuzha 4 3 2 3
Pathanamthltta3 2
KG11am 2 2
Tt"tvandrum 5 4 3 2

STA l'EM£NT - 9
Number of Towns of Each Class during 1901-1991 Statel 1991 1981 t971 1961· 19~1 1941 1931 192/1 1911 1901 Dl5trlct
l. 2 J 4 5 b 7 8 9 10 11
Class IV
KERALA 34 t3 1(t 1-5: 17 14 11 8 6 7
Kasangt>d
Kannur 19 7 2 2
W3¥"anad
KQzhiltede
~~ - 2 2
P~cl 2
Thfissur 9 6 2 .. 3 2
Ernakulam 2
IdHldtl
Kottayam 3 2 3 2 2
Alappuzha 2 3 3 3
PathaRamthitta- .-
Kolbm
TrivaAdrum 2 2
Class V
KUALA 6 2 2 2 9 8 8 8 5 3
Kasaragod
Kannwr
Wayanad
Kozhilcode
Malappuram 2
Palakkad 2
Thrissur 5 2 3 2 2
Ernakulam 3 2 2
ldukki
Kottayam
Alappuzha
Pathanamthltta- 2
Kollam
Trivandrum
128

STATEMENT - 9 Number of Towns of Each
State/ 1991 1981 1971 1961 1951 elstrict
. I 2 3 4 5 6
Class
KERALA
Kasaragod
Kannur
Wayanad
Ko1hlkode
Malappuram
Pal3kkad
Thri"ur
Ernakulam
Idukki
Kottayam
Alappuzha
Patttanamthitta-
Koflam
Tnvandrum
The statement reveals an increasing trend in the number ef lIOWllS from 190 t to 1951. The number bas gone up from 16 It, 190J to 43 in 1'951. In J 961 the number of towns decreased but again went up in t 97 t. In case of class
Class during 1901-1991
1941 1931 1921 1911 1901
7 8 9 10 II
VI
5 6 6
2 3 3
I, the number of towns bas continuously been rising from J 93 1 to 1 99 J. In all odler dasses mere is no continuity in increasing or decreasing trend.
J29

ALPHABETICAL LIST OF TOWNS/URBAN OUTGROWTHS
51. Name of District Size class/ Page SI. Name of District Size classl Page No. Town 51. No of No. No. Town SI. No of No.
TableA4 TableA4
(i) TOWNS 56 Kadirur Kannur 111/54 155
I Adoor Pathanamthltta 111/53 155 57 Kadungalloor Emakulam 11111 (I) 136
2 Alangad Emakulam 111/1 (e) 135 58 Kakkodl Kozhlkode 111/3(0 138
3 Alappuzha Alappuzha 1/7(a)(1) 144 59 Kalamassery Emakulam II/I (c) 135
4 Aluva Emakulam 111/1 (m) 136 60 Kalliasserl Kannur III/59 155
5 Anayara Trlvandrum 111/2 ( e) 137 61 Kalpetta Wayanad 111/63 156
6 Ancharakandy Kannur 111/68 156 62 Kanhangad Kasaragod 11/13(a} 148
7 Angamaly Emakulam 111/47 154 63 Kanhlrode Kannur IV/97 158
8 Aranattukara Thrlssur IV/6(g} 143 64 Kanlmangalam Thrlssur IV/80 157
9 Arookutty Alappuzha IV/86 157 65 Kanjlrappally Kottayam 111/37 153
10 Aroor Alappuzha 111/44 154 66 Kannadlparamba Kannur IV/loo 158
~ 11 Attingal Trlvandrum 111/42 153 67 Kannapuram Kannur IV174 157 0
12 Avlnlssery Thrlssur IV/102 158 68 Kannur Kannur 11/4(b) 139
13 Ayyanthole Thrlssur IV/6(h) 143 69 Kannur (Cantt.) Kannur VI/4(o) 141
14 Azhlkode North Kannur IVl4(k) 140 70 Karuvanthuruthy Kozhlkode IV/3(k) 139
15 Azhlkode South Kannur 11114(1) 140 71 Kasaragod Kasaragod 11/23 151
16 Beypore Kozhlkode 1I/3(b) 138 72 Kayamkulam Alappuzha 11/16 149
17 Chala Kannur IV/88 157 73 Kedamangalam Emakulam IV/l (q) 136
18 Chalakudy Thrlssur 111/28 152 74 KlIIkoliur Kollam 111/5(d} 142
19 Changanassery Kottayam 11121 150 75 Koehl Ernakulam III (a}(1) 135
20 Chavakkad Thrlssur 1II/12(a} 147 76 Kodamthuruthu Alappuzha IV/75 157
21 Chdakkara Thrlssur Vll05 159 77 Kodungallur Thrlssur 1II/15(a) 149
22 Chelora Kannur IY178 157 78 Koduvally Kozhlkode 111/3(J) 139
23 Chendamangalam Emakulam 111152 155 79 Koduvayur Palakkad IV/17(b} 150
24 Chengannur Alappuzha 111/57 155 80 Kokkothamangalam Alappuzha IV/ll(e) 147
25 Cheranalloor Emakulam 11111 (P) 136 81 Kolazhy Thrlssur V/107 159

26 CherlYJkadavu Emakulam V /1 (s) 136 82 Kollam Kollam 1/5(a)(l) 141
27 Cherthala Alappuzha 111/11 (a) 147 83 Komalapuram Alappuzha I11I7(b) 144
28 Cherukunnu Kannur IV/8S _l57 84 Koorkkanchery Thrlssur V/6(k) 144
29 Cheruthazham Kannur 111/62 155 85 Koothattukulam Emakulam IV/81 157
30 Cheruvannur Kozhlkode 11/3(c) 138 86 Koothuparamba Kannur 111148 154
31 Cheruvathur Kasaragod 111113(b) 148 87 Koratty Thrlssur IV/82 157
32 Chevvoor Thrlssur IV/94 1~ 88 Kothamangalam Emakulam 111139 153
33 Chirakkal Kannur 111/4(c) 140 89 Kottayam Kottayam 11/9(a){l) 146
34 Chlttur·Thathamanga~mPalakkad 1II/17(a) 150 90 Kottayam·Malabar Kannur IV/83 157
35 Chlyyaram Thrbsur 111/6(d) 143 91 Kottuvally Emakulam 1I1I1(h} 135
36 Chockll Kannur 111/43 154 92 Kozhlkode Kozhikode 1/3(a)(1) 138
37 Choornlkkara Emakulam 111/1 (g) 135 93 Kudappanakunnu Trlvandrum 11112(c) 137
38 Dhannadom Kannur 11114(g) 140 94 Kunnamangalam Kozhlkode 11113( e) 138
39 Edakkunny Thrlssur IV/6(1) 143 95 Kunnamkulam Thrlssur IV170 156
40 Edathala Emakulam 11/1 (b) 135 96 Kuttlkkattoor Kozhlkode IV/79 157
~ 41 Elayavoor Kannur II 114m 140 97 Kuttoor Thrlssur V/l04 159
... 42 Eloor Emakulam 111/1 (I) 135 98 Malappuram Malappuram 1111 1 O(a)(l) 146
43 Eranholl Kannur 111/4(1) 140 99 Mangad Kollam 111/5 ( e) 142
44 Erattupetta Kottayan, 111/67 156 100 Manjer! Malappuram 1I/10(b} 146
45 Eravlpuram Kollam 11I/5(c) 142 101 Manleshwar Kasaragod V/106 159
46 Erlyad Thrhsur HI/15(c) 149 102 Mannanchery Alappuzha 111/60 155
47 Eruvattl Kannur IV/92 158 103 Mannarkad Palakkad 111/27 152
4& Fetoke Kozh!kode 111/3 (I) 139 1 04 Mannuthy Thrlssur 1II/6(c) 143
49 Guruvayoor Thrlssur 1II/12(b) 147 105 Maradu Emakulam 11111 (0 135
50 Idukkl Idukkl IV/l03 158 1 06 Marathakkara Thrlssur IV/98 158
51 Irlngaprom Thr~sur V/12(n 147 107 Marutharode Palakkad IV/8(c) 145
52 Irlnlalakuda Thr~sur 111/51 154 108 Mathllakam Thrlssur IV/95 158
53 Irlverl Kannur IV/91 158 109 Mattannur Kannur 111/31 152 ..
54 Kadachlra Kannur IV/84 157 11 0 Mav~lkkara Alappuzha 111/49 154
55 Kadalundl Kozhlkode III/l(d) 138 111 Mavllayl Kannur IVIIOI IsS

ALPHABETICAL LIST OF TOWNS/URBAN OUTCROWTHS
SI. Name of D~trlct Size dassl Page 51. Name of Obtrlct Sizedusl Page No. Town 51. No of No. No. Town 51. Noof No.
Table A4 TableA4
112 Mavoor Kozhlkode 111/56 155 167 Puzhathl Kannur 111/4(e) 140
113 Hehth~a Thrlssur 111/15(b) 149 168 Ramanattukara Kozhlkode 1I1/1(h) 139
114 Moothakunnam Emakulam 111/55 155 169 Shoranur Palakkad IUlJ2 152
115 Muhamma Alappuzha 111/1 1 (c) 147 170 Tallparamaba KanlWr 11/19 ISO
116 Mulavukad Emakulam 111/1 (0) 116 171 Thalkkad Thrksur V/12(h) 147
117 Hunderl Kannur IV/77 157 172 Thalassery IUnnur It4(3) 139
118 Huvattupuma Ernakulam 111/50 154 173 Thann.~ukkom Alappuzha 111/11 (b) 147
119 Muzhappllangad Kannur IV/4(1) 140 174 Thlruvalla Pathanamthltta , 11120 150
120 Nadapuram Kozhlkode 111/40 153 175 Thlruvankulam Emakulam IV II (r) 136
121 Nadathara Thrlssur IV/6(e) 143 176 Thodu,uzha Idukkl IlInO 152
122 NatUkam Kottayam 111I9(c) 146 177 Thoaada Kannur 111/4(d) 140 ... ~ 123 Nedumangad Trivandrum 111/24 151 178 Thrlppunkhura Emakulam II/I (d) 135
124 Nemom Trtvandrum 111/2 (b) 137 179 Thrlssur Thrissur 11/6(a)(1) 142
125 Nettlssery Thrksur V/6(1) 144 180 T1rur Malappuram 111/25 151
126 NftY Mahe Kannur IVl4(m) 141 181 Trivandrum Trlvandrum 1/2(a)(l) 137
127 Neyyattlnkara Trlvandrum 111/46 154 182 Ulloor Trivandrum 111/2(d) 137
128 Nllahwar Kasaragod 11l/13(c) 148 183 Vadakara Kozhlkode 11/14(3) 148
129 Olavanna Kozhlkode 1I1/3(g) 139 184 Vadakkekara Emakulam IV173 157
1300llur Thrlssur 111/6(b) 143 185 Vad~kkevlla Kollam 11/5(b) 142
131 Ottappalam Palakkad 111129 152 186 Valkoln Kottayam 111/66 156
132 Paduvlla~ Kannur IV176 157 187 Vakkom Trivandrum 111/69 156
133 P~al Kottayam 111165 156 188 Valapattanam Kannur V/4(n) 141
134 Palakkad Palakkad 1/8(a)(l) 145 189 Varam Kannur IV/93 158
135 P~k'ery Thrlssur V/l08 149 190 Varappuzha Emakulam III/I (n) 136
136 P~llkkuMU Kannur 11114(h) 140 191 Varbla Trlvandrum 111134 153
137 Paluval Thr~sur VlI2(1) 147 192 Vaya~r Alappuzha 111/11 (d) 147

138 Pandalam Pathanamthltta 111/35 153 193 Vazhakkala Emakulam 111/1 (J) 135
139' Pannlyannur Kannur IV/71 157 194 Venmenad Thrlssur V/12(e) 147
140 Pantheeramkavu Kozhlkode IV/3(1) 139 195 Vllilappally Kozhlkode 1I1/14(b) 148
141 Papplnlsserl Kannur 111145 - 154 196 Vilvattom Thrlssur IV/6(O 143
142 Paravoor Kollam 111/36 153 197 Vlyyur Thrlssur IV/6(j) 143
143 Paravur Ernakulam 11111 (k) 135
144 Pathanamthltta Pathanamthltta 111/38 153 (Ii) URBAN OUTGROWTHS
145 Pathlrlyad Kannur IV/89 158 1 Anakkayam Malappuram II 1 O(a)(lI) 146
146 Pattlom Kannur IV/72 157 2 Chembukavu Thrlssur 1/6(a)(lv) 143
147 Pavaratty Thrlssur IV/12(c) 147 3 Cheruvlkkal Trtvandrum 112 (a)(vIJ 137
148 Payyannur Kannur 11/18 150 4 Elathur Kozhlkode 1/3(a)(lI) 138
149 Perakam Thrissur V/12(d) 147 5 Hemamblka Nagar Palakkad 1/8(a)(lI) 145
150 Peralasserl Kannur Iv/S7 157 6 Kakkanad Ernakulam 111 (3)(11) 135
151 Peringathur Kannur 111/41 153 7 Kalarkode Alappuzha II7(a)(lII) 144
152 Perlnthalmanna Malappuram 111/33 153 8 Kazhakkoottam Trlvandrum 1/2(a)(vlll) 137
~ 153 Perole Kasaragod IV/13(d) 148 9 Kovalam Trlvandrum II2(a)(v) 137 (1,1
154 Perumanna Kozhlkode 111/64 156 10 Munaakkal Kallam 1/5(a)(lII) 142
I S5 Perumbalkad Kottayam 111/9(b) 146 11 Neendakara Kollam 1/5/(a)(lv) 142
156 Perumbavoor Ernakulam 111/61 155 12 Perlngavu Thr~sur 1/6(a)(lI) 143
157 Pinarayl Kannur IV/90 158 13 Poonkunnam Thrlssur 1/6(a)(v) 143
1 sa Plravom Emakulam III/58 155 14 Punnapra Alappu2ha 1/7(a)(lI) 144
159 Ponnanl Malappuram 11/22 151 15 Puthlyangadl KOlhlkode 1/3(a)(iII) 138
160 Pookode Thrlssur V/12(g) 147 16 Sakthlkulangara Kollam 1/5(3)(11) 142
t 61 . Pottore ThrkM V/l09 159 17 Sreekatyam Ttlvandrum 1/2(a)(vlf) 137
162 Pullazhr Thrlssur IV/96 158 18 Thlruvallam TrlVa'hdrum 1/2(a)(lv) 137
163 Punalur Kollam 111126 152 19 Thrlssur Thrlssur 1/6(3)(111) 143
164 Puthukkad Thrlssur IV/99 158 20 Thumba Trlvahdrum 1/2(3)(11) 137
165 Puthunagaram Palakkad IV/17(c) 150 21 Vattlyoorkavu Trlvandrum 1/2(a)(lII) 137
1 M Puthupparlyaram Palakkad 1I1/8(b) 145 22 Vllayapuram Kottayam 1/9(a)(lI) 146

A-4 : TOWNS AND URBAN AGGLOMERATIONS CLASSIFIED BY POPULATION IN t 99 t WITH VARIATION SINCE t 90 t
SI. Name of Town/ State/ Status of 1\rea in Persons Decade Percentage Males Females No.Urban District Year town kmz Variation Decade
Agglomeration Variation
2 3 4 5 6 7 8 9 10 II
ALL CLASSES (16 Urban AgglomeratIons and 93 Towns)
ALL TOWNS AND URBAN KERAlA 1901 454,499 232,753 221,746
AGGLOMERATIONS 1911 524,661 + 70,162 + 15.44 268,100 256,561 1921 680,900 + 156,239 +29.78 347,824 333,076 1931 916,330 + 235,430 +34.58 466,646 449,684
1941 1,195,550 + 279,220 +30.47 604,130 591,420
1951 1,825,832 + 630,282 +52.72 916,671 909,161
1961 1,117.69 2,554,141 + 728,309 +39.89 1,282,759 1,271,382 1971 1,341.24 3,466,449 + 912,308 +35.72 1,735,501 1,730,948
1981 1,787.56 4,771,275 + 1,304,826 +37.64 2,360,350 2,410,925
1991 3,364.80 7,680,294 +2,909,019 +60.97 3,776,207 3,904,087
CLASS I (100,000 and above Population) (14 Urban Agglomerations)
ALL TOWNS AND URBAN KERALA 1901
AGGlOMERA TrONS 1911
1921
1931 132,615 69,597 63,018
1941 425,951 + 293,336 +221.19 218,733 207,218
1951 697,537 + 271,586 +63.76 356,773 340.]64
1961 401.99 1,362,771 + 665,234 + 95.37 692,709 670,062
1971 509.50 2,012,197 + 649,426 + 47.65 1,015,162 997,035
1981 838.51 3,094,386 + 1,082, 189 + 53.78 1,539,282 1,555,104
1991 1669.69 5,095,524 +2,001,138 + 64.67 2,517,044 2,578,480
1. Koehi Urban Emakulam 1901 74,198 39,998 34,200
Agglomeration 1911 87,353 + 13,155 + 17.73 47,205 40,148
1921 91,975 + 4,622 + 5.29 49,253 42,722
1931 132,615 + .40,640 + 44.19 69,597 63,018
1941 164,985 + 32,370 + 24.41 86,021 78,964
1951 211,729 + 46,744 + 28.33 109,503 102,226
1961 90.62 333,882 + 122,153 + 57.69 172,167 161,715
1971 147.95 554,298 +220,416 + 66.02 283,935 270,363
1981 261.72 824,926 +270,628 + 48.82 414,840 410,086
1991 373.27 1,140,605 +315,679 + 38.27 571,169 569,436
(a) Koehl Ernakulam 1901 61,236 33,227 28,009
1911 64,726 + 3,490 + 5.70 35,333 29,393
1921 68,493 + 3,767 + 5.82 36,793 31,700
1931 99,101 + 30,608 +44.69 52,238 46,863
1941 126,456 + 27,355 +27.60 66,304 60,152
1951 166,068 + 39,612 +31.32 86,521 79,547
1961 65.20 277,723 + 111,655 +67.23 143,895 133,828
1971 94.88 439,066 + 161,343 +58.09 224,992 214,074
1981 94.88 513,249 + 74,183 +16.90 258,323 254,926
1991 109.47 582,588 + 69,339 + 13.51 292,429 290,159
134

A-4 TOWNS AND URBAN AGGLOMERATIONS CLASSIFIED BY POPULATION IN 1991 WITH VARIATIOtfSINCE 1901
51. Name of Town/ No.Urban
Agglomeration
2
(i) Koehi'
(1I) Kakkanad OG2
(b) Ed,1(113/3
(c) Kalamassery3
(d) Thrlppunithura
(e) A/3ng3d
(f) "Maradu
(g) Choomikk3r3'
(h) "Kottuvally
(I) E100r'
(k) Paravur
State/ District
3
Year
4
Ernakulam 1901 1911 1921 1931 1941 1951 1961
1971 1981 1991
Ernakulam 1991 Ernakulam 1991 Ernakulam 1971
1981 1991
Ernakulam 1911 1921 1931 1941 1951 1961 1971 1981 1991
Ernakulam 1991 Ernakulam 1981
1991 Ernakulam 1991 Ernakulam 1981
1991
Ernakulam 1971 1981 1991
Ernakulam 1991
Ernakulam 1901 1911 1921 1931
Status of town
5
c c c
CT
CT CT
M CT
CT CT
CT CT CT CT M
M CT CT
CT
CT CT
CT
CT
CT
M CT
CT CT
M M
Area In 1an2
6
65.20
94.88 94.88 94.88
14.59 28.92 12.77 27.00 27.00
9.63 13.66 18.69 18.69 21.02 12.35
12.34 17.02 21.00 21.00
10.43 20.73 14.21 12.87
Persons
7
61,236 64,726 68,493 99,101
126,456 166,068
277,723 439,066
5i3,249 564,589
17,999 56,397 17,957 43,767 54,342
4,976
4,761 10,717 12,606
11,066
14,444 28,090 43,646 51,078 35,620 28,749 34,995 34,837 30,665 34,457
20,725 46,856 34,455 33,167
12,962 13,782 11,949 15,176
Decade Variation
8
+ 3,490 + 3,767
+ 30,608 + 27,355 + 39,612
+111,655 +161,343 +74,183 + 51,340
Percentage Decade
Variation
9
+ 5.70 + 5.82 +44.69 +27.60 +31.32 +67.23 +58.09 +16.90 +10.00
+25,810 +143.73 + 10,575 + 24.16
- 215 - 4.32 + 5,956 +125.10 + 1,889 + 17.63 -1,540 -12.22 + 3,378 + 30.53 + 13,646 + 94.48 + 15,556 + 55.38 + 7,432 + 17.03
+ 6,246 + 21.73
+ 3,792 + 12.37
+26,131 +126.08 -12,401 -26.47
+ 820 -1,833 + 3,227
+6.33 -13.30 +27.01
Males
10
33,227 35,333 36,793 52,238 66,304 86,521
143,895 224,992 258,323 283,432
8,997 28,138
9,505 22,801 27,789
2,702
2,426 5,404 6,373 5,450 7,007
13,825 21,652 25,286 17,719 14,306
17,487 17,694 15,191 16,795
11,192 23,976 17,953 16,734
6,771 7,067
6,320 7,686
Females
11
28,009 29,393 31,700 46,863 60,152 79,547
133,828 214,074 254,926 281,157
9,002 28,259
8,452 20,966 26,553
2,274
2,3J5 5,313 6,233 5,616 7,437
14,265 21,994 25,792 17,901 14,443 17,508 17,143 15,474 17,662
9,533 22,880 16,502 16,433
6,191 6,715 5,629 7,490
Koehl: Kochi Corporation was formed on 1 st November, 1967 by Including Fort Kochi, Mattancherry, Edappally, Ernakulam, Willlngdon Islands and Tnrippunithura (part) town of 196 1 census and some adjoining rural area. However, the population of Kochi for 1961 and earlier censuses have been built up by adding the population of five towns viz. Fort Koehl, Mattancherry, Edappally, Emakulam and Willlngdon Island which have been entirely merged into it.
2. The entire Thrikkakara South village of Kanayannur taluk ~ treated as an urban outgrowth of Kochi urban agglomeration in 1981. In 1991 this has been bifurcated into VazhakkaiaC. T. and Kakkand (O.G.).lt's 1981 population 38318 (M-l ?230, F-I9088) has been merged in Koehi UAin 1991.
1 In the 1971 census, Kalamassery town comprised of only a portion of Thrikkakara North village whereas in 1981 the entire North Village was treated as town
4. Kuttlkkattukara of Kadungallur village of Paravur tal uk which formed part of Elpor town of 1971 census has been declassified as rural In 1981. Istead, the entire Varapuzha village was treated as a town with the n~ Eloor. In 1991 census this has been bifurcated into two towns viz. Eloor (M) and Varapuzha C.T.
135
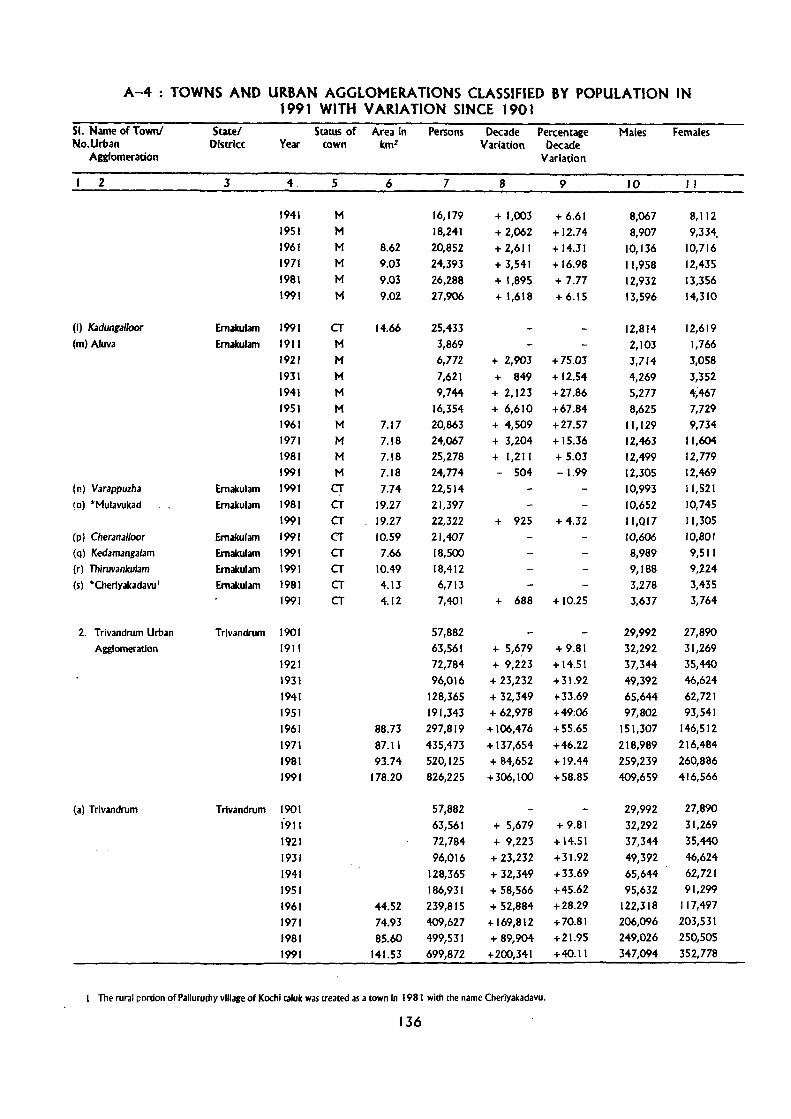
A-4 : TOWNS AND URBAN AGGLOMERATIONS CLASSIFIED BY POPULATION IN 1991 WITH VARIATION SINCE 1901
SI. Name of Town/ No.Urban
Agglomeration
2
(I) Kadunga/loor
(m) Aluva
(n) Varappuzha
(0) *Ml,llawkad
(p) Cheranalloor
(q) Kedamanga/am
(r) Thiruvankulam
(s) *Cheriyakadawl
2. Trivandrum Urban Agglomeration
(al Trivandrum
Status of Area in Persons Decade Percentage State/ District Year town km2 Variation Decade
Variation
3 4 5 6 7 8 9
1941 1951
1961 1971
1981 1991
EmakulOllll 1991
Emakulam 191 I 1921
1931
1941 1951 1961 1971 1981 1991
Emakulam 1991
Emakulam 1981 1991
Emakulam 1991
Emakulam 1991 Emakulam 1991 Emakulam 1981
1991
Trivandrum 1901 1911
1921 1931
1941 1951
1961 1971
1981 1991
T rivandrum 190 I 1911
1221
1931
1941 1951
1961 1971
1981 1991
M M M
M M
M
CT M M M M M M
M
M
M
CT CT CT CT CT CT CT CT
8.62
9.03
9.03
9.02
14.66
7.17 7.18 7.18 7.\8
7.74 19.27
19.27 10.59
7.66 10.49 4.13 4.12
88.73 87.11
93.74 178.20
44.52 74.93
85.60 141.53
16,179
18,241 20,852
24,393
2.6,2.88 27,906
25,433
3,869 6,772
7,62.1 9,74<1-
16,354 20,863 24,067
2.5,278 2.4,774 2.2,514
21,397 22,322 21,407
18,500 18,412 6,713 7,401
57,882 63,561 72,784
96,016 128,365 191,343 297,819
435,473 520,125 826,225
57,882
63,561
72,784
96,016
128,365 186,931
239,815 409,627 499,531 699,872
+ 1,003 + 6.61
+ 2,062 + 12.74 + 2,611
+ 3,541 + 1,895 + 1,618
+14.31
+16.98
+ 7.77 +6.15
+ 2,903 +75.03
+ 849 + 12.54 + 2,123 +27.86 + 6,610 +67.84 + 4,509 +27.57 + 3,204 + 1,211 - 504
+ 925
+ 688
+ 5,679 + 9,223
+ 23,232 + 32,349 + 62,978
+ 106,476
+ 137,654 + 84,652 +306,100
+ 5,679
+ 9,223
+ 23,232
+ 32,349
+ 58,566 + 52,884
+ 15.36 + 5.03 -1.99
+ 4.32
+10.25
+ 9.81
+14.51
+31.92 i-33.69 i-49:06
+55.65
+46.2.2 +19.44 +58.85
+ 9.81 +14.51
+31.92 +33.69 +45.62 +28.29
+169,812 +70.81 + 89,904 +21.95 + 200,341 + 40. II
I The rural portion of Palluruthy village of Koehl taluk was ueated as a town In 1981 with the name Cherlyakadavu.
tJ6
Males
10
8,067
8,907 10,136
11,958 12.,932. 13,596
12,814
2,103 3,714
4,269 5,277 8,625
11,129 12,463 12,499 12,305
10,993 10,652
11,017 10,606 8,989 9,188 3,278 3,637
29,992 32,292 37,344 49,392
65,644 97,802
151,307
218,989
259,239 409,659
29,992
32,292 37,344
49,392
65,644 95,632
122,318 206,096 249,026
347,094
Females
II
8,112
9,334. 10,716
12,435
\3,356 14,310
12,619
1,766
3,058
3,352 4,467 7,729 9,734
11,604 12,779 12,469 11,521
10,745 11,305
10,801
9,511 9,224 3,435 3,764
27,890 31,269
35,440 46,624
62,721 93,541
146,512
216,484
260,886 416,566
27,890 31,269
35,440
46,624 62,721 91,299
117,497
203,531
250,505
352,778

A-4 : TOWNS AND URBAN AGGLOMERATIONS CLASSIFIED BY POPULATION IN 1991 WITH VARIATION SINCE 1901
51. Name of Town/ State/ Status of Area 'in Persons Decade Percentage Males Females NO.Urban District Year town km2 Variation Decade
Agglomeration Variation
2 3 4 5 ·6 7 8 9 10 1 1
(I) Trlvandrum' Trlvandrum 1901 MC 57,882 29,992 27,890 1911 MC 63,561 + 5,679 + 9.81 32,292 31,269 1921 M 72,784 + 9,223 +14.51 37,344 35,440 1931 M 96,016 + 23,232 +31.92 49,392 46,624 1941 M 128,365 + 32,349 +33.69 65,644 62,721 1951 C 186,931 + 58,566 +45.62 95,632 91,299 1961 C 44.52 239,815 + 52,884 +28.29 122,318 117,497 1971 C 74.93 409,627 + 169,812 +70.81 206,096 203,531 1981 C 74.93 483,086 + 73,459 +17.93 240,928 242,158
1991 C 74.93 524,006 + 40,920 + 8.47 259,672 264,334 (iI) Thumba OG2 Trlvandrum 1981 10.67 16,445 8,098 8,347
1991 16.03 33,880 + 17,435 + 106.02 16,780 17,100 (iii) Vattiyoorkavu OG Trivandrum 1991 10.61 33,653 16,639 17,014 (Iv) Thlruvallam OG Trivandrum 1991 12.69 31,868 15,831 16,037 (v) Kovalam OG Trivandrum 1991 4.68 25,419 13,051 12,368 (vi) Cheruvlkkal OG Trivandrum 1991 8.70 21,286 10,468 10,818 (vii) Sreekaryam OG Trivandrum 1991 8.87 17,245 8,509 8,736 (viii) Kazhakkoottam 0(, Trlvandrum 1991 5.02 12,515 6,144 6,371
(b) Nemom Trlvandrum 1951 CT 4,412 2,170 2,242 1961 CT 33.00 35,516 + 31,104 +704.99 17,788 17,728 1971 CT 12.18 25,846 - 9,670 - 27.23 12,893 12,953 1981 Declassified 1991 CT 12.87 42,559 21,021 21,538
(c) Kudappanakunnu Trlvandrum 1991 CT 7.69 33,534 16,506 17,028 (d) Ulloor Trlvandrum 1991 CT 7.97 25,719 .13,013 12,706 (e) AnayaraJ \ Trlvandrum 1961 CT 11.21 22,488 11,201 11,287
1971 DeclassIfied 1981 CT 8.14 20,594 10,213 10,381 1991 CT 8.14 24,541 + 3,947 +19.17 12,025 12,516
3. Kozhlkode Kozhlkode 1901 76,981 39,986 36,995 Urban Agglome- 1911 7(417 + 1,436 + 1.87 40,680 37,737 ration 1921 82,334 + 3,917 + 5.00 42,527 39,807
1931 99,273 + 16,939 + 20.57 51,030 48,243 1941 132,601 + 33,328 + 33.57 67,068 65,533 1951 178,187 + 45,586 + 34.38 89,830 88,357 1961 87.38 299,610 + 121,423 + 68.14 151,708 147,902 1911 146.67 458,016 + 158,406 + 52.87 230,045 227,971 1981 138.35 546,058 + 88,042 + 19.22 272,064 273,994 1991 232.95 801,190 +255,132 + 46.72 396,189 405,001
(a) Kozhlkode Kozhlkode 1901 76,981 39,986 36,995 1911 78,417 + 1,436 + 1.87 40,680 37,737
Poonthura town of 1951 (Populadon: 5,662, M - 2,915; F-2,747) was merged with the Muttathura of J961 census. Pans of Kadabmpally and Mattathura towns of 1961 have been Included In Trlvandrum Corporadon while the remaining pans are declassified as rural In 1971.
2 This urban outgrowth comprises of Vayakkalam and Koliuru Karas of Atdpra village. These bras were part of Atdpra town of 1961 but dklasslfted as rural In 1971.
1 Poonthura town of 1951 (1'qIuIadon: 5,662, M-2,915; F-2,747) was merged with !he Kattathuraof 1961 Census. Pans of Kadakampally and Muttathura townS of 1961 have been Included In Trlvandrum Corporadon while the remaining pans are declassified as rural In 1971. In 1981 Census again Kadakampally re-appeared as a town and In 1991 this Is renamed as Anayara CT.
137

A-4 : TOWNS AND URBAN AGGLOMERATIONS CLASSIFIED BY POPULATION IN 1991 WITH VARIATION SINCE 1901
51. Name of Town/ State/ Staws of Area In Persons Decade Percentage Males Females No.Urban District Year town km2 Variation Decade
Agglomeration Variation
2 .3 4 5 6 7 8 9 10 II
1921 82,334 + 3,917 + 5.00 42,527 39,807
1931 99,273 + 16,939 + 20.57 51,030 48,243
19.41 126,352 + 27,079 + 27.28 63,998 62,354 1951 158,724 + 32,372 + 25.62 80,069 78,655 1961 44.00 220,943 + 62.219 + 39.20 112,025 108,918
1971 82.67 333,979 + 113,036 +51.16 168,009 165,970 1981 82.67 394,447 + 60,468 + 18.11 196,628 197,819 1991 96.25 456,618 + 62,171 + 15.76 225,073 231,545
(I) Kozhikode' Kozhikode 1901 MC 76,981 39,986 36,995
1911 MC 78,417 + 1,436 + 1.87 40,680 37,737
1921 M 82,334 + 3,917 + 5.00 42,527 39,807
1931 M 99,273 + 16,939 + 20.57 51,030 48,243
1941 M 126,352 +27,079 + 27.28 63,998 62,354
1951 M 158,724 + 32,372 + 25.62 80,069 78,655
1961 M 44.00 220,943 + 62,219 + 39.20 112,025 108,918
1971 C 82.67 333,979 + 113,036 +51.16 168,009 165,970
1981 C 82.67 394,447 + 60,468 + 18.11 196,628 197,819
1991 C 82.68 419,831 + 25,384 ." + 6.44 207,016 212,815
(ii) Elathur OG Kozhlkode 1991 13.54 36,410 17,862 18,548
(iii) Puthiyangadi OG Kozhlkode 1991 0.03 377 195 182
(b) Beypore2 Kozhikode 1961 CT 17.48 34,415 17,753 16,662
1971 CT 10.41 27,688 - 6,727 -19.55 14,032 13,656
1981 CT 10.41 40,946 + 13,258 + 47.88 20,326 20,620
1991 CT 10.42 56,505 + 15,559 + 38.00 27,829 28,676
(c) CheruvannurJ Kozhlkode 1971 CT 10.31 28,522 14,379 14,143
1981 CT 10.31 38,941 + 10,419 + 36.53 19,351 19,590
1991 CT 10.31 50,556 + 11,615 + 29.83 25,032 25,524
(d) Kadalundi Kozhlkode 1961 CT 5.28 12,287 5,890 6,397
1971 CT 5.33 15,555 + 3268 + 26.60 7,542 8,013
1981 Declassified
1991 CT 11.83 35,171 17,084 18,087
(e) Kunnamangalam Kozhlkode 1971 CT 24.42 21,756 10,789 10,967
r981 Declasslfed
1991 CT 24.26 34,228 17,812 16,416
(f) KJkkodi Kozhlkode 1991 CT 18.59 30,024 14,785 15,239
I The present Kozhlkode Corporation Includes Kozhikode, Edakkad, ParayancheJi, Nellikkode, Kommerl and part of Puthlyangadi towns of 1961 and some adjoining rural areas. However, the population of Kozhikode for 1961 was built up by adding the population of the towns Edakkad, Parayzncheri, kozhikode, Nelllkkode and KommeJi Which has been entirely merged Into It. Of these except Kozhkode all others were new towns of· 1961.
2. . Part of Beypore town of 1961 Is Included in Cheruvannur town of 1971 census.
1 See note under 2. above.
138

A-4 : TOWNS AND URBAN AGGLOMERATIONS CLASSIFIED BY POPULATION IN 1991 WITH VARIATION SINCE 1901
SI. Name of Town/ State/ Status of Area in Persons Decade Percentage Males Females NO.Urban District Year town km2 Variation Decade
Agglomeration Variation
2 3 4 5 6 7 8 9 10 II
(g) Olavanna ' Kozhlkode 1961 CT 7.10 7,841 3,955 3,886
1971 Declassified 1981 CT 21.43 34,004 16,998 17,006
1991 CT 11.33 28,382 - 5,622 - 16.53 13,967 14,415
(h) Ramanattukara Kozhlkode 1991 CT 11.71 25,672 12,866 12,806
(I) Feroke Kozhlkode 1941 CT 6.249 3,070 3,179
1951 CT 19,463 + 13,214 +211.46 9,761 9,702
1,961 CT 13.52 24,124 + 4,661 + 23.95 12,085 12,039
1971 CT 13.53 30,516 + 6,392 + 26.50 15,294 15,222
1981 CT 13.53 37,720 + 7,204 + 23.61 18,761 18,959
1991 CT 7.58 25,511 -12,209 - 32.37 12,731 12,780
(J) Koduvally Kozhikode 1991 CT 14.61 23,524 11,639 11,885
(k) Karuvanthuruthy Kozhlkode 1991 CT 5.95 18,983 9,375 9,608
(I) Pantheeramkavu Kozhlkode 1991 CT 10.11 16,016 7,996 8,020
4. Kannur Urban Kannur 1901 55,694 27,368 28,326
Agglomeration 1911 58,215 + 2,521 + 4.53 28,516 29,699
1921 55,281 - 2,934 - 5.04 26,249 29,032
1931 64,585 + 9,304 + 16.83 31,145 33,440
1941 70,969 + 6,384 + 9.88 35, t53 35,816
1951 82,471 + 11,502 + 16.21 40,052 42,419
1961 60.93 169,335 + 86,864 + 105.33 84,382 84,953
1971 30.21 135,967 - 33,368 -19.71 68,199 67,768
1981 145.09 417,185 +281,218 +206.83 204,709 212,476
1991 145.07 463,962 + 46,777 + 11.21 225,526 238,436
(a) Thalassery Kannur 1901 M 27,883 13,657 14,226
1911 M 29,258 + 1,375 + 4.93 14,275 14,983
1921 M 27,576 -1,682 - 5.75 13,090 14,486
1931 M 30,349 + 2,773 +10.06 14,211 16,138
1941 M 36,320 + 5,971 +19.67 18,580 17,740
1951 M 40,040 + 3,720 +10.24 19,360 20,680 1961 M 7.80 44,763 + 4,723 + 11.80 21,899 22,864 1971 M 15.35 68,759 +23,996 +53.61 33,738 35,021 1981 M 15.35 75,561 + 6,802 + 9.89 36,886 38,675 1991 M 23.96 103,579 +28,018 +37.08 49,879 53,700
(b) Kannur Kannur 1901 MC 27,811 13,711 14,100
1911 MC 28,957 +1,146 .. 4.12 14,241 14,716
1921 MC 27,705 -1,252 4.32 13,159 14,546
1931 MC 34,236 +6,531 +23.57 16,934 17,302
1941 MC 34,649 + 413 + 1.21 16,573 18,076
1 Olavanna, comprising of Olavanna amsom of Kozhlkode taluk was first tre~eed as a eown In 1961 and Ie was declassified as rural in 1971. In 1981 jurlsdlcelon of cown comprised of ehe entire reorganized Olav anna village. In 1991 Ie has been splle up Inco cwo eowns viz. Olavanna C.T. and Pancheeramkavu C. T.
139

A-4 : TOWNS AND URBAN AGGLOMERATIONS CLASSIFIED BY POPULATION IN 1991 WITH VARIA TION ~INCE 1901
51. Name of Town/ State/ Status of Area in Persons Decade Percentage Males Females No.Urban District Year town km2 Variation Decade
Agglomeration Variation
2 3 4 5 6 7 8 9 10 11
1951 MC 42,431 +7,782 +22.46 20,692 21,739 1961 M 10.83 46,101 +3,670 + 8.65 23,185 22,916 1971 M 11.03 55,162 +9,061 +19.65 27,907 27,255 1981 M 11.03 60,904 +5,742 +10.41 29,937 30,967 1991 M 11.03 65,238 +4,334 + 7.12 32,043 33,195
(c) Chlrakkal' Kannur 1961 CT 5.41 12,285 6,118 6,167 1971 Declassified 1981 CT 13.56 36,124 17,916 18,208 1991 CT 13.56 39,838 +3,714 +10.28 19,370 20,468
(d) * Thottlda Kannur 1981 CT 18.26 29,474 14,244 15,230 1991 CT 18.26 33,261 +3,787 + 12.85 15,880 17,381
(e) Puzhathi Kannur 1961 CT 9.12 15,214 7,651 7,563 1971 Declassified 1981 CT 9.17 26,099 13,397 12,702 1991 CT 9.17 30,616 +4,517 +17.31 15,559 15,057
(f) Elayavoor2 Kannur 1961 CT 3.08 6,345 3,077 3,268 1971 Declassified 1981 CT 11.57 25,481 12,389 13,092
1991 CT 11.57 29,239 +3,758 + 14.75 13,938 15,301
(g) 'Dharmadom Kannur 1981 CT 10.66 23,143 11,373 11,770
1991 CT 10.66 26,705 +3,562 +15.39 12,802 13,903
(h) Pailikkunnu l Kannur 1961 CT 4.82 11,810 5,838 5,972
1971 Declassified 1981 CT 6.90 22,101 10,883 11,218
1991 CT 6.90 25,057 +2,956 + 13.37 12,098 12,959
(I) * franholi Kannur 1981 CT 10.08 21,521 10,292 11,229
1991 CT 10.08 23,584 +2,063 + 9.59 11,118 12,466
(J) Azhlkode South' Kannur 1961 CT 16.03 24,212 12,204 12,008
1971 De classlfted 1981 CT 16.05 37,273 18,563 18,710
1991 CT 7.40 23,077 -1",1~ -38.09 11,170 11,907
(k) Azhikode North· Kannur 1991 CT 8.64 19,277 9,408 9,869
(I) *Muzhappllangad Kannur 1981 CT ,7.19 14,345 - 6,940 7,405
Chlrakkal town of 1961 comprised of Chlrakkal desom was declassl~ as rural In 1971. In 1981, !he e,nrIQ reol'lanlsed Chlrakkal village was ueated as a town.
2. Portion of Elayavoer village was nared as a toWn In 1961 wldllhe R3nM! ~, but dItdassIRt41D 1911 : ..... tn I" 1 lIle entire village Is utated as a toWn wId\ lIle name Elayavoor.i
1 Chalad desom ofPallikannu village was treated as a town In 1961 with the name Chalad but declasslfted In 1 '11. Alain In 1981 the entire Palllkunnu village Is treated as a town wllIl lIle name palllkunna.
4 Azhlkode was a town In 1961 but declassilled In 1971 and again ueated as a town In 198 I. In 1991 It Is bifurcated Ioto Azhlkode North and Azhlkode South.
140

A-4 : TOWNS AND URBAN AGGLOMERATIONS ClASSIFIED BY POPULATION I"", 1991 WITH VARIATION SINCE 1901
SI. Name or Town! No. Urban
Aalomeration
2
(m) "New Mahe
(n) Valapattanam l
(0) Kannu~
Cantooment
5. Kallam Urban Aglomeradon
(a) Kallam
(I) Kollam
State! District
3
Kannur
Kannur
Kannur
Ko"am
Kollam
Kollam
Slaws or Area in Persons Decade Percentap! Year town lan2 Variadon Decade
Varladon
... 5 6 7 8 9
1991
1981 1991
1961 1971 1981 1991
CT
CT
C1'
CT
CT
CT
CT
1961 Cann. 1971 Cann. 1981 Cann. 1991 Cann.
1901
1911 1921 1931 1941 1951 1961 1971 1981 1991
1901
1911 1921 1931 1941 1951 1961 1971 1981 1991
1901
191.
1921 1931 1941 1951 1961
1971
Me M M M M M
M M
7.19
11.44 2.82
2.05 2.04
2.04 2.04
1.79
1.79 1.79 1.79
27.55 29.69 42.97 67.65
16.34 18.48 18.48 41.29
16.34 18.48
18,812
32,590 11,939
5,716 7,296 8,080 8,920
2,859 4,750 4,489 4,820
15,691 18,839 25,135 33,739 49,498 66,126
123,291 166,079 258,552 362,572
15,691 18,839 25,135 33,739 49,498 66,126 91,018
124,208 '137,943
221,007
15,691 18,839 25,135 33,739 49,498 66,126 91,018
124,208
+ 4,167 +31.14
-20,651 -6337
+ 1,550 +26.98 + 784 +10.75 + 840 +10.40
+1,891 - 261 + 331
+66.14 -5.49 +7.37
+ 3,148 +20.06 + 6,296 +33.42 + 8,604 +34.23
+ 15,759 +46.7.1 + 16,628 + 57,165 + 42,788 + 92,473 +104,020
+33.59
+86.45 +34.70 +55.68 +40.23
+ 3,148 +20.06 + 6,296 +33.42 + 8,604 + 15,759 +16,628 +24,892 +33,190 +13,735 +83,064
+34.23 +46.71 +33.59 +37.64 +36.47 + 11.06 +60.22
+3,148 +20.06 + 6,296 +33.42 + 8,604 +34.23 + 15,759 +46.71 + 16,628 +33.59 +24,892 +37.64 +33,190 +36.47
1 Valapattanam toWn was known as II.... min 1961.
Males
10
9,072
15,166 5,585
2,923 3,718 4,091
4,580
1,487 2,836 2,632 3,024
8,095
9,649 13,065 17,381 25,314 34,271
63,168 83,573
128,506 179,816
8,095
9,649 13,065 17,381 25,314 34,271
46,807 62,545 68,5n
109,849
8,095
9,649 13,065 17,381 25,314 34,271 46,807 62,545
Females
11
9,740
17,424 6,354
2,823 3,578 3,989 4,340
1,372 1,914 1,857 1,796
7,596 9,190
12,070 16,358 24,184 31,855 60,123 82,506
130,016 182,726
7,596 9,190
12,070 16,358 24,184 31,855 44,211
61,663 69,366
111,158
7,596 9,190
12,070 16,358 24,184 31,855 44,211
61,663
2 It Is only In 1961 that Kannur Munlclpalky and Cantonment have been treated as sep;nte ~ In the pnMous censuses these formed one toWn only, though the cantonment was separated from the municipal Omits as early as I st January, 1938. Hence &om 190 I to 1951, Its popWdon has been Included In the fiaureof Kannur munldpal town.
141

A-4 : TOWNS AND URBAN AGGLOMERATIONS CLASSIFIED BY POPULATION IN 1991 WITH VARIATION SINCE t 90 t
SI. Name of Town/ State/ Status of Area in Persons Decade Percentage Males Females NO.Urban District Year town km2 Variation Decade
Agglomeration Variation
2 3 4 5 6 7 8 9 10 II
1981 M 18.48 137,943 + 13,735 + I 1.06 68,577 69,366 1991 M 18.48 139,852 + 1,909 + 1.38 69,340 70,512
(tI) Sakthlkulangara OG Kollam 1991 9.17 44,451 22,254 22,197 (ill) Mundakkal OG Kollam 1991 3.45 21,280 10,528 10,752 (Iv) Neendakara OG Kollam 1991 10.19 15,424 7,727 7,697
(!:I) °Vadakkevlla Kollam 1981 CT 8.55 43,680 21,828 21,852 1991 CT 8.55 50,165 + 6,485 + 14.85 24,898 25,267
(c) °Eravlpuram Kollam 1981 CT 10.06 47,274 23,505 23,769
1991 CT 6.60 34,627 -12,647 -26.75 17,258 17,369
(d) KlIikollur' Kollam 1961 CT 11.21 32,273 16,361 15,912
1971 CT 11.21 41,871 + 9,598 +29.74 21,028 20,843
1981 Declassified 1991 CT 4.66 28,456 13,976 14,480
(e) Mangad Kollam 1991 CT 6.55 28,317 13,865 14,452
6. Thrlssur Urban Thrlssur 1901· 15,585 7,932 7,653
Agglomeration 1911 23,574 + 7,989 + 51.26 12,089 11,485
1921 27,897 + 4,323 + 18.34 13,783 14,114
1931 45,658 + 17,761 + 63.67 22,840 22,818
1941 62,499 + 16,841 + 36.89 30,982 31,517
1951 75,342 + 12,843 + 20.55 36,782 38,560
1961 12.67 73,038 - 2,304 - 3.06 36,305 36,733
1971 21.10 102,198 +29,160 + 39.92 50,114 52,084
1981 79.28 239,614 +137,416 + 134.46 117,317 122,297
1991 88.42 275,053 + 35,439 +14.79 134,459 140,594
(a) Thrissur Thrissur 1901 15,585 7,932 7,653
1911 23,574 + 7,989 + 51.26 12,089 11,485
1921 27,897 + 4,323 + 18.34 13,783 14,114
1931 45,658 + 17,761 + 63.67 22,840 22,818
1941 57,524 + 11,866 + 25.99 28,574 28,950
1951 69,515 + 11,991 + 20.85 33,929 35,586
1961 12.67 73,038 +3,523 +5.07 36,305 36,733
1971 12.65 76,241 + 3,203 + 4.39 37,345 38,896
1981 13.55 79,886 + 3,645 + 4.78 38,518 41,368
1991 18.47 81,798 + 1,912 + 2.39 39,233 .42,565
(I) Thrissur Thrissur 1901 CT 15,585 7,932 7,653
1911 M 23,574 + 7,989 + 51.26 12,089 11,485
1921 M 27,897 + 4,323 + 18.34 13,783 14,114
1931 M 45,658 + 17,761 + 63.67 22,840 22,818
1941 M 57,524 + 11,866 + 25.99 28,574 28,950
In 1981 Kannimel and Killkollur karas of Klllkollur town of 1971 we~e together treated as urban outgrowth of Kollam urban agglomeration. The remaining karas of KiHkoliurtown of 1971 were dedassifled as rural. In 1991 Kilikollur has been split up into KilikollurC.r. and Mangad C.T.llS population 29655 (M-14596, F-15059) as C.G.in 1981 has been included in Kollam U.A.
142

A-4 lOWNS AND URBAN AGGLOMERA lIONS CLASSIFIED BY POPULA lION IN 1991 WITH VARIA lION SINCE 1901
51. Name of Town/ State/ Status of Area in Persons Decade Percentage Males Females No.Urban District Year town km2 Variation Decade
Agglomeration Variation
2 3 4 5 6 7 8 9 10 11
1951 M 69,515 + 11,991 + 20.85 33,929 35,586
1961 M 12.67 73,038 + 3,523 + 5.07 36,305 36,733
1971 M 12.65 76,241 + 3,203 + 4.39 37,345 38,896
1981 M 12.65 1'1,923 + 1,682 + 2.21 37,540 40,383
1991 M 12.65 74,604 - 3,319 - 4.,26 35,755 38,849
(II) Perlngaw' OG Thrissur 1981 0.90 1,963 978 985
1991 2.85 3,699 + 1,736 +88.44 1,781 1,918
(ii1)Thrissur OG Thrissur 1991 1.23 2,642 1,287 1,355
(Iv) Chembukaw OG Thrissur 1991 0.28 545 260 285
(v) Poonkunnam OG Thrissur 1991 1.46 308 150 158
(b) Oliur2 Thrissur 1941 CT 4,975 2,408 2,567
1951 CT 5,827 + 852 + 17.13 2,853 2,974
1961 Declassified
1971 CT 8.45 25,957 12,769 13,188
1981 CT 9.33 27,802 + 1,845 + 7.1I 13,712 14,090
1991 CT 9.33 33,137 + 5,335 +19.19 16,271 16,866
(c) *Mannuthy3 Thrlssur 1981 CT 13.35 25,474 12,617 12,857
1991 CT 13.35 31,914 + 6,440 +25.28 15,704 16,210
(d) *Chlyyaram Thrissur 1981 CT 4.91 20,315 10,026 10,289
1991 CT 4.91 21,598 + 1,283 + 6.32 10,671 10,927
(e) *Nadathara Thrissur 1981 CT 5.52 14,321 6,982 7,339
1991 CT 5.52 17,971 + 3,650 +25.49 8,738 9,233
(f) * Vilvattom Thrissur 1981 CT 6.25 13,704 6,583 7,121
1991 CT 6.25 16,904 +3,200 +23.35 8,451 8,453
(g) * Aranattukara Thrissur 1981 CT 5.84 14,397 7,190 7,207
1991 CT 5.84 16,623 +2,226 +15.46 8,179 8,444
(h) * Ayyanthole Thrlssur 1981 (T 7.25 11,767 5,718 6,049
1991 (T 7.25 13,492 + 1,725 +14.66 6,526 6,966
(I) * Edakkunny4 Thrissur 1981 (T 5.59 11,835 5,699 6,136
1991 (T 5.59 13,265 +1,430 + 12.08 6,451 6,814
(j) *Vlyyur Thrissur 1981 CT 5.09 11,489 6,029 5,460
1991 (T 5.09 11,303 - 186 -1.62 5,919 5,384
Peringavu urban outgrowth of Thrissur urban agglomeration comprises of Peringavu desom (portion outside municipal limits) of Perim"vu '-:::dge and bit of Chembukavu desom of Thrlssur village.
2. Panamkuttlchira and Edakkunny desoms of Edakkunny village which formed part ofOliur town in 1971, in 1981 form part of Edakkunny town. The entire village was treated as a separate town.
1 Ollukkara village is known as Mannuthy £own since 1981.
4. Panamkuttlchlra and Edakkunny desoms of Edakkunny village which formed part ofOliur town In 1971, formed pan of Edakkunny town in 1981. The entire Edakkunny village Is treated as Edakkunny town in 1981.
143

A-4 : TOWNS AND URBAN AGGLOMERATIONS CLASSIFIED BY POPULATION IN 1991 WITH VARIATION SINCE 1901
SI. Name of T ownl No.Urban
Agglomeration
2
(k) *Koorkkancherry
(I) Nettissery
7. Alappulha Urban ApIomeratlon
(a) Al<Ippuzha
(i) Alappuzha
(ii) Punnapra OG (III) Kalarkode OG
(b) Komalapuram
8. Palakkad Urban AgIomeration
StaWS of Area in Persons Decade Percentage Statel District Year town km2 Variation Decade
Variation
J 4 5 6 7 8 9
Thrissur 1981 1991
1991
Alappuzha 1901
1911 1921 1931 1941 1951 1961 1971 1981 1991
AJappuzha J 90 1 1911 1921 1931 1941 1951
1961 1971 1981 1991
Alappuzha 190 1 1911 1921 1931 1941 1951 1961 1971 1981
1991
Alappuzha 1991 Alappuzha 1991
Alappuzha 1991
PaJakkad 1901 1911
1921 1931 1941 1951
CT
CT
CT
M M M M
M
M M M M M
CT
2.60 2.60
4.22
46.78 46.77 46.77 84.48
46.78 46.77 46.77 70.48
46.78 46.77 46.77 46.77
12.21 11.50
14.00
\44
8,624 9,512
7,536
24,918 25,665 32,074 43,838 56,333
116,278 138,834 160,166 169,940 264,969
24,918 25,665 32,074 43,838 56,333
116,278 138,834 160,166 169,940 227,716
24,918 25,665 32,074 43,8J8 56,333
116,278
138,834 160,166 169,940 174,666
29,783 23,267
37,253
44,177 44,319
45,487 49,064 55,160 69,504
+ 888 + 10.30
+ 747 + 6,409 +11,764
+ 3.00 + 24.97 + 36.68
+ 12;495 + 28.50 +59,945 + 106.41 +22,556 +21,332 + 9,774 +95,029
+ 19.40 + 15.37 + 6.10
+ 55.92
+ 747 + 3.00 + 6,409 + 24.97
+ 11,764 + 36.68 + 12,495 +59,945 +22,556 +21,332 + 9,774
+57,776
+ 28.50 +106.41 + 19.40 + 15.37 + 6.10
+ 34.00
+ 747 + 3.00 + 6,409 + 24.97 + 11,764 + 36.68 + 12,495 + 28.50 +59,945 + 106.41 +22,556 + 19.40 +21,332 + 15.37 +9,774 + 6.10 + 4,726 + 2.78
+ 142 + 0.32
+ 1,168 + 2.64 + 3,577 + 7.86 + 6,096 + 12.42 + 14,344 + 26.00
Males
10
4,243 4,634
3,682
12,748 13,370 16,885 23,677 30,136 59,638 69,977 BO,307 84,012
129,770,
12,748 13,370 16,885 23,67.7 30,136 59,~38
69,977 BO,307 84,012
111,520
12,748 13,370 16,885 23,677 30,136 59,638 69,977 80,307 84,012 85,699
14,601 11,220
18,250
21,673 21,776 22,619 24,234 26,975 34,529
Females
II
4,381 4,878
3,854
12,170 12,295 15,189 20,161 26,197 56,640 68,857 79,859 85,928
135,199
12,170 12,295 15,189 20,161 26,197 56,640 68,857 79,859 85,928
116,196
12,170 12,295 15,189 20,161 26,197 56,640 68,857 79,859 85,928 88,967
15,182 12,047
19,003
22,504 22,543
22,868 24,830 28,185 34,975

A-4 : TOWNS AND URBAN AGGLOMERATIONS CLASSIFIED BY POPULATION IN 1991 WITH VARIATION SINCE 1901
SI. Name of Town/ State/ Status of Area in Persons Decade Percentage Males Females No.Urban District Year town km2 Variation Decade
Agglomeration VariatIon
2 3 4 5 6 7 8 9 10 11
1961 26.60 77,620 + 8,116 + 11.68 38,813 38,807
1971 26.60 95,788 +18,168 +23.41 47,776 48,012
1981 30.59 117,986 +22,198 +23.17 58,595 59,391 1991 59.05 180,033 +62,047 +52.59 88,907 91,126
(a) Palakkad Palakkad 1901 44,177 21,673 22,504
1911 44,319 + 142 +0.32 21,776 22,543
1921 45,487 + 1,168 +2.64 22,619 22,868
1931 49,064 + 3,577 + 7.86 24,234 24,830
1941 55,160 + 6,096 +12.42 26,975 28,185
1951 69,504 + 14,344 +26.00 34,529 34,975
1961 26.60 77,620 + 8,116 + 11.68 38,813 38,807
1971 26.60 95,788 +18,168 +23.41 47,776 48,012
1981 30.59 117,986 +22,198 +23.17 58,595 59,391
1991 29.60 139,136 +21,150 +17.93 68,817 70,319
(i) Palakkad Palakkad 1901 M 44,177 21,673 22,504
1911 M 44,319 + 142 +0.32 21,776 22,543
1921 M 45,487 + 1,168 + 2.64 22,619 22,868
1931 M 49,064 + 3,577 + 7.86 24,234 24,830
1941 M 55,160 + 6,096 +12.42 26,975 28,185
1951 M 69,504 +14,344 +26.00 34,529 34,975 1961 M 26.60 77,620 + 8,116 + 11.68 38,813 38,807
1971 M 26.60 95,788 +18,168 +23.41 47,776 48,012 1981 M 26.60 111,245 + 15,457 +16.14 55,222 56,023
1991 M 26.60 123,289 +12,044 +10.83 61,047 62,242
(ii) Hemambika Nagar' OG Palakkad 1981 3.99 6,741 3,373 3,368 1991 3.00 15,847 +9,106 +135.08 7,770 8,077
(b) Puthupp3riyar3m Palakkad 1991 CT 19.93 24,808 12,141 12,667
(e) M3ruth3rode Palakkad 1991 CT 9.52 16,089 7,949 8,140
9. Kottayam Urban Kottayam 1901 17,552 9,147 8,405 Agglomeration 1911 15,141 - 2,411 -13.74 7,863 7,278
1921 18,833 +3.692 + 24.38 9,855 8,978 1931 25,236 + 6,403 + 34.00 13,280 11,956 1941 33,364 + 8,128 + 32.21 17,380 15.984 1951 44,204 +10,840 + 32.49 22,549 21,655 1961 15.54 52,615 + ',481 + 19.19 26,850 25,835 1971 15.55 59,714 + 7,029 + 13.34 30,075 29,639 1981 15.55 64,431 + 4,717 + 7.90 32,281 32,150
1991 63.70 166,552 +102,121 + 158.50 83,143 83,409
(a) Kottayam Kottayam 1901 17,552 9,147 8,405 1911 15,141 -2,411 -13.74 7,863 7,278
1 Hemambikanagar census town (population 7,032, M-3592, F-3436) of 1971 was treated as an urban outgrowth ofPalakkad urban agglomeration in the 1981 census with the name Palghat Railway Colony. In 1991 it has been renamed as Hemambikanagar.
145

A-4 : TOWNS AND URBAN AGGLOMERATIONS CLASSIFIED BY POPULATION IN 1991 WITH VARIATION SINCE 1901
SI. Name of Town/ State/ Status of Area in Persons Decade Percentage Males Females NO.Urban District Year town km 2 Variation Decade
Agglomeration Variation
2 3 4 5 6 7 8 9 10 II
1921 18,833 +3,692 +24.38 9,855 8,978
1931 25,236 + 6,403 +34.00 13,280 11,956
1941 33,364 + 8,128 +32.21 17,380 15,984
1951 44,204 + 10,840 +32.49 22,54~ 21,655
1961 15.54 52,685 + 8,481 + 19.19 26,850 25,835
1971 15.55 59,714 + 7,029 + 13.34 30,075 29,639
1981 15.55 64,431 + 4,717 + 7.90 32,281 32,150
1991 27.33 89,625 +25,194 +39.10 44,613 45,012
(I) Kottayam Koccayam 1901 M 17,552 9,147 8,405
1911 M 15,141 -2,411 -13.74 7,863 7,278
1921 M 18,833 + 3,692 + 24.38 9,855 8,978
1931 M 25,236 + 6,403 + 34.00 13,280 11,956
1941 M 33,364 + 8,128 + 32.21 17,380 15,984
1951 M 44,204 + 10,840 e+- 32.49 22,549 21,655
1961 M 15.54 52,685 + 8,481 + 19.19 26,850 25,835
1971 M 15.55 59,714 + 7,029 + 13.34 30,075 29,639
1981 M 15.55 64,431 + 4,717 + 7.90 32,281 32,150
1991 M 15.55 63,155 -1,276 - 1.98 31,397 31,758
Iii) Vilayapuram OG Koccayam 1991 11.78 26,470 13,216 13,254
fb) Perumbaikad Koccayam 1991 CT 14.04 39,363 19,781 19,582
Xc) NJrtakam Koccayam 1991 CT 22.33 37,564 18,749 18,815
I 10. Malappuram Malappuram 1941 5,547 2,735 2,812
Urban Agglomeration 1951 10,357 + 4,810 + 86.71 5,042 5,315
1961 13.26 12,276 + 1,919 + 18.53 6,016 6,260
1971 46.87 47,736 +35,460 +288.86 23,589 24,147
1981 86.66 93,745 +46,009 + 96.38 46,778 46,967
1991 111.20 142,204 +48,459 + 51.69 70,489 71,715
(a) Malappuram Malappuram 1971 33.60 32,002 15,889 16,113
1981 33.60 39,786 + 7,784 +24.32 19,854 19,932
1991 58.14 72,870 +33,084 +S3.15 36,019 36,851
(I) Malappuram Malappuram 1971 M 33.60 32,002 15,889 16,113
1981 M 33.60 39,786 + 7,784 +24.32 19,854 19,932
1991 M 33.61 49,692 + 9,906 +24.90 24,612 25,080
(II) Anakkayam OG Malappuram 1991 24.53 23,178 11,407 11,771
(b) Manierl' Malappuram 1941 CT 5,547 2,735 2,812
1951 CT 10,357 + 4,810 + 86.71 5,042 5,315
1961 CT 13.26 12,276 + 1,919 + 18.53 6,016 6,260
1971 CT 13.27 15,734 + 3,458 + 28.17 7,700 8,034
1981 M 53.06 53,959 + 38,225 + 242.95 26,924 27,035
1 Manjeri cown of 1971 census was elevated as a municipal town on 1 s[ April 1978 by including some adjacent rural areas.
146

A-4 : TOWNS AND URBAN AGGLOMERATIONS CLASSIFIED BY POPULA TJON IN t 99 t WITH VARIATION SINCE 190 t
SI. Name of Town/ No.Urban
Agglomeration
2
1 I . Cherthala Urban Agglomeration
(a) Cherthala
(b) Tha. eermukkom
(e) Muhamma
(d) Vayaiaf
(e) Kokkothamangalam
12. Guruvayoor Urban
Agglomeratiol1
(a) Chavakkad'
(b) Guruvayoor'
Township
(c) P.lVafarry
(d) Perakam
(e) VenmenJd
(f) *Iringaprom
(g) Pookode
(h) Thaikkad
(i) Paiuvai
Status of Area in State/ District Year cown km2
3
Alappuzha
Alappuzha
4
1991
1921
1931
1941
1951
1961
1971
1981
1991
1921
1931
1941
1951
1961
1971
1981
1991
Alappuzha 1991
Alappuzha 1991
Alappuzha 1991
Alappuzha 1991
Thrissur
Thrissur
Thrissur
Thrissur
Thrissur
Thrissur
Thrissur
Thrissur
Thrissur
Thrissur
1961
1971
1981
1991
1961
1971
1981
1991
1971
1981
1991
1991
1991
1991
1981
1991
1991
1991
1991
5
M
CT
CT
CT
CT
M M
M
M
(T
CT
CT
CT
(T
(T
M
M TS TS TS CT
CT (T
(T
CT
CT
CT
CT
6
53.06
16.19
16.19
16.19
92.59
16.19
16.19
16.19
16.18
23.91
26.76
14.45
11.29
14.61
18.90
23.00
50.29
14.61
12.41
12.41
12.41
6.49
6.49
6.49
4.12
5.06
5.07
4.10
4.10
4.96
3.73
4.35
Persons Decade Percentage
7
69,334
4,781
5,940
6,765
7,116
31,155
36,752
40,492
132,883
4,781
5,940
6,765
7,116
31,155
36,752
40,492
43,326
28,728
22,541
22,384
15,904
28,903
45,306
59,467
118,632
28,903
29,443
34,344
37,789
15,863
17,858
20,216
10,439
9,540
9,287
7,265
9,120
8,162
7,329
6,750
Variation Decade
8
15,375
+ 1,159
+ 825
+ 351
+24,039
Variation
9
28.49
+ 24.24
+ 13.89
+ 5.19
+337.82
+ 5,597 + 17.97
+3,740 + 10.18
+92,391 +228.17
+ 1,159
+ 825
+ 351
+24,039
+ 5,597
+ 3,740
+ 2,834
+ 24.24
+ 13.89
+ 5.19
+337.82
+ 17.97
+ 10.18
+ 7.00
+ 16,403 +56.75
+ 14,16 I + 31.26
+59,165 +99.49
+ 540
+4,901
+J,445
+ 1,995
+2,358
+ 1.87
+ 16.65
+ 10.03
+ 12.58
+ 13.20
+1,855 +25.53
Males
10
34,470
2,586
3,078
3,406
3,579
15,382
18,164
20,132
64,833
2,586
3,078
3,406
3,579
15,382
18,164
20,132
21,156
13,963
10,951
10,933
7,830
13,454
21,094
27,218
55,504
13,454
13,643
15,846
17,759
7,451
8,045
9,365
4,81 I
4,472
4,344
3,327
4,345
3,827
3,446
3,135
Females
II
34,864
2,195
2,862
3,359
3,537
15,773
18,588
20,360
68,050
2,195
2,862
3,359
3,537
15,773
18,588
20,360
22,170
14,765
11,590
11,451
8,074
15,449
24,212
32,249
63,128
15,449
15,800
18,498
20,030
8,412
9,813
10,851
5,628
5,068
4,943
3,938
4,775
4,335
3,883
3,6 I 5
1 A Portion of Chow ghar (renamed as Chavakkad in 1971) rown of 1961 became parr of Guruvayoor Township In 1971. Chavakkad was elev.1Ced municipal rown on 1st 0adJer,1978.
2. See Note above.
147

A-4 : TOWNS AND URBAN AGGLOMERATIONS CLASSIFIED BY POPULATION IN 1991 WITH VARIATION SINCE 1901
SI. Name of Townl Statel Status of Area in Persons Decade Percentage Males Females No.Urban District Year town km2 Variation Decade
Agglomeration Variation
2 3 4 5 6 7 8 9 10 II
13. Kanhangad Urban Kasaragod 1951 19,305 9,498 9,807
Agglomeration \96\ 58.53 44,577 +25,272 + \30.91 2\,887 22,690
\97\ 58.57 57,\66 + \2,589 + 28.24 28,191 28,975
1981 Dectasslfied
1991 84.14 118,214 57,358 60,856
(a) Kanhangad Kasaragod 1951 CT 19,305 9,498 9,807
1961 CT 32.27 23,621 + 4,316 + 22.36 11,713 11,908
1971 CT 32.34 31,869 + 8,248 + 34.92 15,971 15,898
1981 Declassified
1991 M 39.54 57,165 27,922 29,243
(tI) Cheruvathur Kasaragod 1991 CT 18.37 24,504 \ 1,742 12,762
(c) Nlleshwar Kasaragod 1961 CT 26.26 20,956. 10,174 10,782
1971 CT 26.23 25,297 + 4,341 + 20.71 12,220 13,077
1981 Declassified
1991 CT 14.14 22,661 10,979 11,682
(d) Perole Kasaragod 1991 CT 12.09 13,884 6,715 7,169
14. Vadakara Urban Kozhlkode 1901 11,319 5,886 5,433
Agglomeration 1911 11,149 - 170 - 1.50 5,707 5,442
1921 9,804 -1,345 -12.06 4,975 4,829
1931 11,259 + 1,455 + 14.84 5,756 5,503
1941 17,924 + 6,665 + 59.20 8,944 8,980
1951 20,964 + 3,040 + 16.96 10,491 10,473
1961 21.34 43,908 +22,944 + 109.44 21,971 21,937
1971 21.34 53,938 +10,030 + 22.84 26,902 27,036
1981 21.34 64,174 + 10,236 + 18.98 31,810 32,364
1991 38.68 102,430 +38,256 + 59.61 50,192 52,238
(a) Vadakara Kozllikode [901 CT [ 1,3[9 5,886 5,433
1911 CT 11,149 - 170 - 1.50 5,707 5,442
1921 CT 9,804 -1,345 -12.06 4,975 4,829
1931 CT 11,259 + 1,455 + 14.84 5,756 5,503
1941 CT 17,924 + 6,665 + 59.20 8,944 8,980
1951 CT 20,964 + 3,040 + 16.96 10,491 10,473
1961 M 21.34 43,908 +22,944 + 109.44 21,971 21,937
1971 M 21.34 53,938 + 10,030 + 22.84 26,902 27,036
1981 M 21.34 64,174 + 10,236 + 18.98 31,810 32,364
1991 M 21.33 72,434 + 8,260 .+ 12.87 35,579 36,855
(b) Vi/liappally Kozhlkode 1991 CT 17.35 29,996 14,613 15,383
aASS -II (50,000 - 99,999 Population) (2 Urban aggtomeratlons and 7 Towns)
ALL TOWNS AND URBAN KERAlA 1901 264,755 137,344 127,411
AGGLOMERATIONS 1911 287,546 + 22,791 + 8.61 148,693 138,853
1921 302,374 + 14,828 + 5.16 155,373 147,001
1931 259,874 -42,500 -14.06 131,567 128,307
148
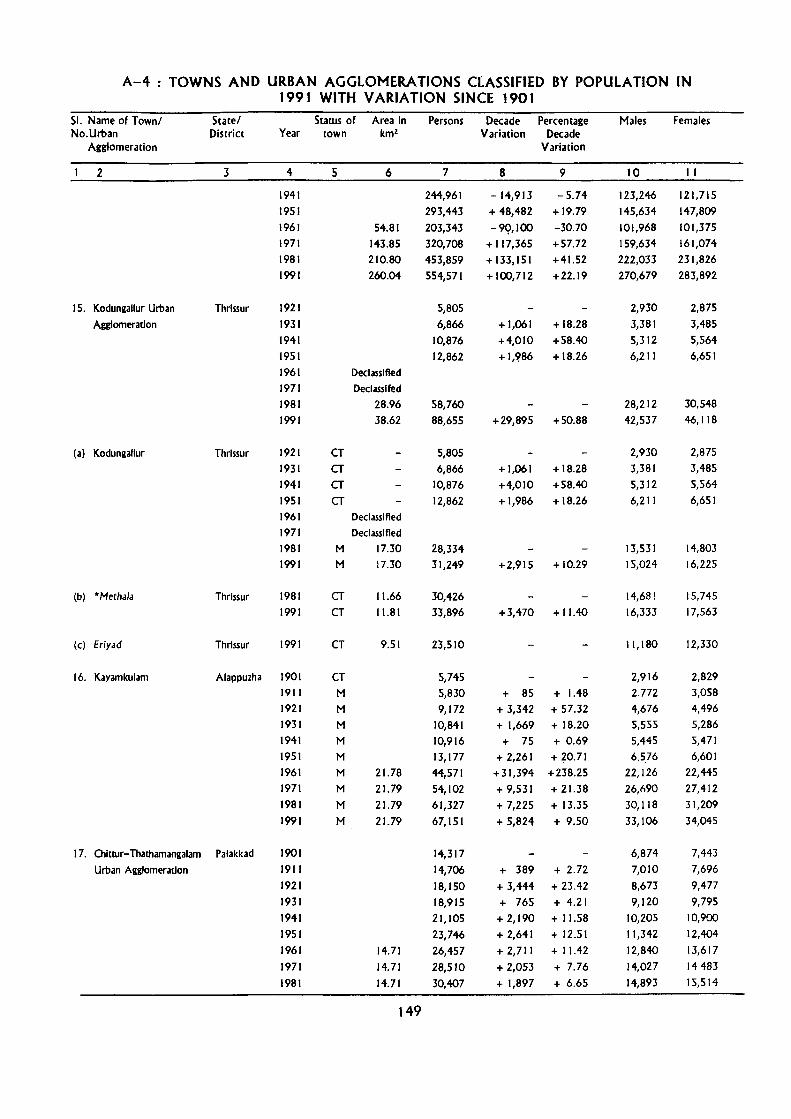
A-4 : TOWNS AND URBAN AGGLOMERATIONS CLASSIFIED BY POPVLATION IN 1991 WITH VARIATION SINCE 1901
SI. Name of Town/ No.Urban
Agglomeration
2
15. Kodungallur Urban
Agglomeration
(a) Kodungallur
(b) * Metha/a
(c) Erlyad
State/ District
3
Thrissur
Thrlssur
Thrlssur
Thrlssur
Staws of Area in Persons Decade Percentage Year town km2 Variation Decade
4
1941
1951
1961
1971 1981
1991
1921
1931
1941
1951
5 6
54.81
143.85 210.80
260.04
1961 Declassified
1971
1981
1991
1921
1931
1941
1951
CT CT CT CT
Declasslfed
28.96
38.62
1961 Declassified
1971 Declassified
1981 1991
1981
1991
1991
M
M
CT CT
CT
17.30
17.30
11.66
11.81
9.51
7
244,961
293,443
203,343
320,708
453,859
554,571
5,805
6,866
10,876
12,862
58,760
88,655
5,805
6,866
10,876
12,862
28,334
31,249
30,426
33,896
23,510
8
-14,913
+ 48,482
-99,100 + 117,365
+ 133,151
+ 100,712
Variation
9
-5.74
+19.79
-30.70
+57.72
+41.52
+22.19
+ 1,061 + 18.28
+4,010 +58.40
+ 1,~86 + 18.26
+ 29,895 + 50.88
+ 1,061 + 18.28
+4,010
+1,986
+58.40
+ 18.26
+2,915 + 10.29
+3,470 + 11.40
16. Kayamkulam Alappuzha 1901 CT M
M
M
M
M
M M
M
M
5,745
5,830
9,172
17. Chitwr-Thathamangalam Palakkad
Urban Agglomeration
1911
1921
1931
1941
1951
1961
1971
1981
1991
1901
1911
1921
1931
1941
1951
1961
1971
1981
21.78
21.79
21.79
21.79
14.71
14.71
14.71
149
10,841
10,916 13,177
44,571
54,102
61,327
67,151
14,317
14,706
18,150
18,915
21,105
23,746
26,457
28,510
30,407
+ 85 + 1.48
+ 3,342 + 57.32 + 1,669 + 18.20
+ 75 + 0.69
+2,261 +20.71
+31,394 +238.25
+ 9,531 + 21.38
+ 7,225 + 13.35
+ 5,824 + 9.50
+ 389 + 2.72
+ 3,444 + 23.42
+ 765
+ 2,190
+ 2,641
+ 2,711
+ 2,053
+ 1,897
+ 4.21
+ 11.58
+ 12.51
+ 11.42
+ 7.76
+ 6.65
Males
10
123,246
145,634
101,968
159,634
222,033 270,679
2,930
3,381
5,312
6,211
28,212
42,537
2,930
3,381
5,312
6,211
13,531
15,024
14,681
16,333
11,180
2,916
2772
4,676
5,555
5,445 6,576
22,126
26,690
30,118
33,106
6,874
7,010
8,673
9,120
10,205
11,342
12,840
14,027
14,893
Females
11
121,715
147,809
101,375
161,074 231,826
283,892
2,875
3,485
5,564
6,651
30,548
46,118
2,875
3,485
5,564
6,651
14,803
16,225
15.745
17,563
12,330
2,829
3,058
4,496
5,286 5,471
6,601 22,445
27,412
31,209
34,045
7,443
7,696
9,477
9,795
10,900
12,404
13,617
14483 15,514

A-4 : TOWNS AND URBAN AGGLOMERATIONS CLASSIFIED BY POPULATION IN t 99 t WITH VARIATION SINCE 1901
SI. Name of Town/ State/ Status of Area in Persons Decade Percentage Males Females NO.Urban District Year town km2 Variation Decade
Agglomeration Variation
2 3 4 5 6 7 8 9 10 II
1991 34.48 65,386 +34,979 + 115.04 32,035 33,351
(a) Chittur-Thathamangalam I Palakkad 1901 CT 14,317 6,874 7,443
1911 CT 14,706 + 389 + 2.72 7,010 7,696
1921 1'1 18,150 + 3,444 + 23.42 8,673 9,477
1931 1'1 18,915 + 765 + 4.21 9,120 9,795
1941 1'1 21,105 + 2,190 + 11.58 10,205 10,900
1951 1'1 23,746 + 2,641 + 12.51 11,342 12,404
1961 1'1 14.71 26,457 + 2,711 + 11.42 12,840 13,617
1971 1'1 14.71 28,510 + 2,053 + 7.76 14,027 14,483
1981 1'1 14.71 30,407 + 1,897 + 6.65 14,893 15,514
1991 1'1 14.71 32,048 + 1,641 + 5.40 15,599 16,449
(b) Koduvayur Palakkad 1991 CT 10.53 17,647 8,653 8,994
(c) Puthunagaram Palakkad 1991 CT 9.24 15,691 7,783 7,908
18. Payyannur Kannur 1971 CT 23.63 26,524 12,620 13,904
1981 Declassified
1991 1'1 54.63 64,032 30,971 33,061
19. Taliparamba2 Kannur 1961 CT 8.00 12,894 6,470 6,424
1971 CT 8.02 16,227 + 3,333 + 25.85 8,135 8,092
1981 CT 18.21 29,901 + 13,674 + 84.27 14,967 14,934
1991 1'1 43.08 60,226 +30,325 +101.42 29,794 30,432
20. Thilllvalia Pathanam- 1911 CT 7,969 4,268 3,701
thitta 1921 1'1 12,010 + 4,041 + 50.71 6,292 5,718
1931 1'1 14,489 + 2,479 + 20.64 7,458 7,031
1941 M 18,002 + 3,513 + 24.25 9,015 8,987
1951 1'1 20,709 + 2,707 + 15.04 10,212 10,497
1961 1'1 14.48 24,242 + 3,533 + 17.06 11,750 12,492
1971 1'1 14.47 26,683 + 2,441 + 10.07 12,912 13,771
1981 M 14.47 29,225 + 2,542 + 9.53 13,956 15,269
1991 1'1 27.94 54,780 +25,555 + 87.44 26,290 28,490
2 1. Changanassery Kottayam 1901 CT 14,264 7,166 7,098
1911 CT 17,242 + 2,978 + 20.88 8,826 8,416
1921 1'1 18,955 + 1,713 + 9.94 9,814 9,141
1931 1'1 24,201 + 5,246 + 27.68 12,615 11,586
1941 1'1 28,381 + 4,180 + 17.27 14,634 13,747
1951 1'1 36,289 + 7,908 + 27.86 18,764 17,525
1961 1'1 13.26 42,376 + 6,087 + 16.77 21,389 20,987
1971 M 13.50 48,545 + 6,169 + 14.56 24,195 24,350
In 1921, 1931 and 1951 censuses, Chlttur-Thathamangalam was treated as a single town by merging the twO towns Chittur and Thathal11angalam, (Chlttur -Population: 12,732, M-6127, F-6,605 in 1941;P-8,528, 1-1-4,078, F--4,450In 1911 andP-8,095, M-3,897, F-4,198 in 1901, Thatllamangalam-Population: 8,373, M -4,078, F-4,295In 1941; P-6, 178, 1'1-2,932, F-3,246 in 1911 andP- 6,222, M-2,977, F-3,24S in 1901). These towns are treated as a Single unit in all the censuses for working out the class totals.
2. Trlchambaram town of 196 J has been merged with Taliparamba town of r 97 r census.
150

A-4: TOWNS AND URBAN AGGLOMERATIONS CLASSIFIED BY POPULATION IN 1991 WITH VARIATION SINCE 1901
SI. Name of Town! No. Urban
Agglomeration
2
22. Ponnani'
23. Kasaragod
ALL TOWNS
24. Nedumangad
25. Tlrur2
Status of Area in Persons Decade Percentage State! District Year town km2 Variation Decade
Variation
3 4 S 6 7 ~ 9
1981 1991
Malappuram 1901
1911 1921 1931 1941 1951 1961 1971 1981 1991
Kasaragod 1911 1921 1931 1941 1951 1961 1971 1981 1991
M M
CT
CT
CT
CT
CT
CT
CT
CT
M M
CT
CT
CT
CT CT
CT
M M M
13.50 13.50
5.39 9.32 9.32 9.32
16.68 16.68 16.68 16.68
51,955 52,445
10,562 13,984 13,345 16,210 17,838 23,606
22,977 35,723 43,226 51,770
8,295 7,314 9,169
11,566 22,708 27,635 34,984 43,137 50,126
+ 3,41.0 + 7.02 + 490 + 0.94
+ 3,422 + 32.40 - 639 - 4.57
+ 2,865 + 21.47 + 1,628 + 5,768 - 629
+12,746 + 7,503 + 8,544
- 981 + 1,855 + 2,397 +11,142 + 4,927 + 7,349 + 8,153 + 6,989
+ 10.04 + 32.34 - 2.66
+ 55.47 + 21.00 + 19.77
-11.83 +25.36 +26.14 +90.33
+21.70 +26.59
+23.30 +16.20
CLASS - III (20,000 - 49,999 POPULATION) (46 TOWNS)
KERALA 1901 1911 1921 1931 1941 1951 1961 1971 1981 1991
Ttivandrum 1921 1931 1941 1951 1961 1971 1981 1991
Malappuram 1941
299.24
69,095 93,558
130,593 221,736 132,348 243,922 514,838
+ 24,463 + 35.40 + 37,035 + 39.59 +91,143 -89,388
+ 69.79 -40.31
+ 111,574 + 84.30 +270,916 + 111.07
454.54 776,417 +261,579 + 50.81 593.20 1031,868 +255,451 + 32.90
1,038.24 1465,006 +433,138 + 41.98
CT
CT
CT
CT
Dedassifled
CT 7.76 M 32.52 M 32.52
CT
1,833
2,231 2,538 3,<»8
14,643 43,989 49,875
9,489
+ 398 +21.71 + 307 +13.76 + 560 +22.06
+29,346 +200.41 + 5,886 + 13.38
I Ponnani was elevated to the status of municipal town on 15th November 1977.
2 Known as Trikkandiyurin 1941, 1951 and 1961 censuses. It becomes a municipality with effect from 1st October 1971.
151
Males
10
25,616 26,011
5,281 6,860 6,536 7,837 8,485
11,283 10,939 17,426 20,973 25,048
4,153 3,755 4,611 5,892
11,087 13,643 17,595 21,448 24,887
34,421 47,235 66,352
114,027 67,533
120,555 254,045
Females
11
26,339 26,434
5,281 7,124 6,809 8,373 9,353
12,323 12,038 18,297 22,253 26,722
4,142 3,559 4,558 5,674
11,621 13,992 17,389
21,689 25,239
34,674 46,323 64,241
107,709 64,815
123,367 260,793
382,953 393,464 506,144 525,724 715,281 749,725
941 1,141 1,250 1,556
7,247 21,557 24,229
4,667
892
1,090 1,288 1,542
7,396 22,432 25,646
4,822

A-4 : TOWNS AND URBAN AGGLOMERATIONS CLASSIFIED BY POPULATION IN 1991 WITH VARIATION SINCE 1901
SI. Name of Townl No.Urban
Agglomeration
2
26. Punalur
27. Mannarkad
28 Chalakudy
29. Ottappalam
30. Thodupuzha
31. Matcannur
32. Shoranur
.State/ District
3
Kollam
Palakkad
Thrlssur
Palakkad
Idukkl
Kannur
Palakkad
Year
4 1951
1961
1971
1981
1991
1921
1931
1941
1951
1961
1971
1981
1991
1971
1981
1991
1931
1941
1951 1961
1971
1981. 1991
1941
1951
1961
1971
1981
1991
1931 1941
1951
1961
1971
1981
1991
1991
1941
1951
1961
1971
1981
1991
Status of town
5 CT CT CT M M
CT CT CT CT
CT M M
C1
M
CT CT CT Cl M
M M
CT CT Cl CT CT M
CT CT CT
CT M M
M
CT CT CT CT M
M
Area in km2
6
8.65
16.59
16.59
16.59
Persons
7 11,830
13,397
32,272
40,803
49,453
6,442
8,442
12,249
18,995
Declassified
4.05 13,562
34.60 43,039
34.60 46,279
7.62 12,580
Declassified
63.38 45,422
8.91
25.23
25.23 25.23
10.93
22,18
16.98
32.66
5,886
7,429
10,847
16,864
37,562 41,894
45,069
8,281 22,695
10,782
24,823
23,156
44,186
3,455 4,172
5,141
Declassified
21.85 20,880
35.43 35,743
35.43 40,656
54.15
12.46
17.20
32.28
32.28
152
40,506
8,587
11,596
14,307
22,038
35,120
39,550
Decade Variation
8 + 2,341 + 1,567
+ 18,875
+ 8,531
Percentage Decade
Variation
9 + 24.67
+ 13.25
+140.89
+ 26.43
+ 8,650 + 21.20
+ 2,000 + 3,807
+ 6,746
+ 31.05
+ 45.10
+ 55.07
+29,477 +217.35
+ 3,240 + 7.53
+ 1,543 +26.21
+ 3,418 + 45,Oj
+ 6,017 + 55.47
+20,698 + 122.73
+ 4,332 + 11.53
+ 3,175 + 7.58
+14,414 -11,913
+14,041
-1,667
+21,030
+ 174.06 - 52.49
+ 130.23 - 6.72
+ 90.82
+ 717 + 20.75
+ 969 + 23.23
+ 14,863 + 71. 18
+ 4,913 + 13.75
+ 3,009
+ 2,711
+ 7,731
+ 13,082
+ 4,430
+35.04
+23.38
+54.04
+59.36
+12.61
Males
10 5,892
6,662
16,009
19,997
24,414
3,351
4,341
6,308
9,785
6,869
21,401
22,874
6,197
22,281
2,939
3,690
5,307
8,528
18,722
20,682
22,303
4,152 10,811
5,189
11,971
10,999
20,813
1,910
2,223
2,747
10,840
17,946
20,301
20,162
4,231
5,694
7,132
10,988
17,102
19,021
Females
II 5,938
6,735
16,263
20,806
25,039
3,091
4,101
5,941
9,210
6,693
21,638 23,405
6,383
23,141
2,947
3,739
5,540
8,336 18,840
21,212
22,766
4,129
11,884
5,593
12,852
12,157
23,373
1,545 1,949
2,39+
10,040
17,797
20,355
20,344
4,356
5,902
7,175
11,050
18,018
20,529

A-4 : TOWNS AND URBAN AGGLOMERATIONS CLASSIFIED BY POPULATION IN 1991 WITH VARIATION SINCE 1901
SI. Name of Town/ No.Urban
Agglomeration
2
33. PerimhalnlannJ
34. Varkala
35. Pandalam
36. *Paravoor
37. Kanjirappally
38. Pathanamthitta
39. Korhamangalam
4e'. N.'dapuram
41. p,>, ;ngathur
42. Auingal
Status of Area in State/ District Year town km'
3 4 5 6
Malappuram 1971
1981
1991
Trivalldrum 1921
1931
1941
1951
1961
1971
1981
1991
P athanamthitta 1951
1961
1971
1981
1991
Kollam
Kottayam
1981
1991
1951
1961
1971
1981
1991
Pathanamthiua 1931
1941
1951
1961
1971
1981
1991
Ernakulam 1951
1961
1971
1981
1991
Kozhikode 1991
Kannur 1991
Trivandrum 1921
1931
1941
1951
CT
M
CT CT CT
CT
CT CT M
M
CT CT CT
M
CT M
CT CT CT
M
CT CT CT
M
M
CT
CT M
M
CT
CT
M
M
M
M
5.10
34.41
4.09
10.28
15.42
15.42
7.30
9.50
28.42
16.19
16.19
30.48
26.42
52.47
23.50
23.50
5.77
37.45
40.04
20.44
20.46
Persons Decade Percentage Variation Decade
Variation
7 8 9
9,121
Declassified
39,027
3,612
4,293
4,898
5,666
7,560
20,365
34,009
38,987
7,674
10,000
11,884
Declassified
37,733
35,562
37,185
8,362
19,038
20,687
Declassified
37,017
4,165
4,880
5,846
Declassified
Declassified
32,967
35,882
7,657
Declassified
6,534
33,122
35,535
35,245
35,035
11,048
10,612
16,237
18,668
+ 681 + 18.85
+ 605 + 14.09
+ 768
+ 1,894
+ 12,805
+ 13,644
+ 4,978
+ 15.68
+ 33.43
+169.38
+ 67.00
+ 14.64
+2,326 +30.31
+1,884 +18.84
+ 1,623 + 4.56
+ 10,676 + 127.67
+ 1,649 + 8.66
+ 715
+ 966
+2,915
+26,588
+ 2,413
- 436
+ 17.17
+ 19.80
+ 8.84
+406.92
+ 7.29
- 3.95
+ 5,625 + 53.0 1
+2,431 +14.97
153
Males
10
4,463
18,911
1,852
2,094
2,308
2,702
3,579
9,869
16,041
18,506
3,905
5,069
5,871
18,148
17,186
17,909
4,285
9,779
10,675
18,756
2,166
2,482
3,044
16,329
17,768
3,796
3,271
16,625
17,669
17,000
16,201
5,654
5,313
7,985
9,219
Females
11
4,658
20,116
1,760
2,199
2,590
2,964
3,981
10,496
17,968
20,481
3,769
4,931
6,013
19,585
18,376
19,276
4,077
9,259
10,012
18,261
1,999
2,398
2,802
16,638
18,114
3,861
3,263
16,497
17,866
18,245
18,834
5,394
5,299
8,252
9,449

A-4 : TOWNS AND URBAN AGGLOMERATIONS CLASSIFIED BY POPULATION IN 1991 WITH VARIATION SINCE 190 I
SI. Name of Town/ No.Urban
Agglomeration
2
43. Chockli
44. ArDor.
45. Pappinisseri
46. Neyyattinkara
47. Angamaly
48. Koothuparamba
49. Mavelikkara
50. Muvattupuzha
51. Irinjalakuda
Status of Area in State/ District Year town kmz
3 4
1961
1971
1981
1991
Kannur 1991
Alappuzha 1991
Kannur 1961
1971
1981
1991
Trivandrum 1921
1931
1941
1951
1961
1971
1981
1991
Ernakulam 1971
Kal'l!'lur
1981
1991
1971
1981 1991
Alapppuzha 1921
Ernakulam
Thrissur
1931
1941
1951
1961
1971
1981
1991
1921
1931
1941
1951
1961
1971
1981
1991
1901
5
M
M
M
M
CT
CT
CT CT CT CT
M
M
M
M
M
M
M
M
CT M
M
CT CT M
M
M
CT M
M
M
M
M
CT CT CT CT M
M
M
M
CT
6
14.17
14.18
14.18
14.18
14.24
15.14
19.30
15.24
15.24
15.24
10.00
9.70
9.70
9.70
6.81
24.05
24.05
5.88 16.76
16.76
9.32
12.65
12.65 12.65
19.76
13.18
13.18
13.18
154
Persons Decade Percentage
7
22,051
27,052
29,645
32,634
31,642
31,642
16,420
21,952
27,062
30,754
8,033
9,264
13,830
16,376
20,268
23,983
27,993
30,419
12,932
28,307
30,391
10,305
24,690
28,907
12,209
14,194
16,022
17,274
18,974
25,648
26,598 28,299
4,517
5,626
9,079
10,159
22,900
22,137
25,313
27,595
8,420
Variation Decade
8
+3,383
+5,001
+2,593
+2,989
Variation
9
+ 18.12
+22.68
+ 9.59
+ 10.08
+ 5,532 + 33.69
+5,110 +23.28
+ 3,692 + 13.64
+ 1,231
+4,566
+2,546
+ 15.32
+49.29
+18.41
+3,892 +23.77
+3,715 + 18.33
+4,010 + 16.72
+2,426 + 8.67
+ 15,375 + 118.89
+ 2,084 + 7.36
+14,385 +139.59 + 4,217 + 17.08
+ 1,985
+ 1,828
+ 1,252
+1,700
+6,674
+ 950 +1,701
+ 1,109
+ 3,453
+ 1,080
+ 12,741
- 763
+ 3,176
+ 2,282
+ 16.26
+ 12.88
+ 7.81
+ 9.84
+35.17
+ 3.70 + 6.40
+ 24.55
+ 61.38
+ 11.90
+ 125.42
- 3.33
+ 14.35
+ 9.02
Males
10
10,914
13,274
14,164
15,595
14,545
15,651
8,200 11,039
13,525
15,186
4,176
4,670
6,885
8,183 10,219
11,963
13,984
15,154
6,431
14,012
15,158
5,136
12,007 13,806
6,263
7,032
7,969
8,465
9,161
12,416
12,765
13,589
2,431
2,991
... ,663
5,155
11,837 11,396
12,784
13,892
4,193
Females
II
11,137
13,718
15,481
17,039
17,097
15,991
8,220
10,913
13,537
15,568
3,857
4,594
6,945
8,193
10,049
12,020
14,009
15,265
6,501
14,295
15,233
5,169 12,683
15,101
5,946 7,162
8,053
8,809
9,813
13,232
13,833 14,710
2,086
2,635
4,416
5,004
11,063
10,741
12,529
13,703
4,227

A-4 : TOWNS AND URBAN AGGLOMERATIONS CLASSIFIED BY POPULATION IN 1991 WITH VARIATION SINCE 1901
SI. Name of Town/ No.Urban
Agglomeration
2
52. *Chendamangalam
53. Adoor
54. Kadirur
55. Moothakunnam
56. Mavoor
57. Chengannur
58. Piravom
59. *Kalliasseri
60. Mannancherry
'.:' 61. Perumbavoor
62. Cheruthazham
State/ District
Status of Area in Persons Decade Percentage Year town km2 Variation Decade
Variation
3 4 5 6 7 8 9
1911
1921
1931
1941
1951
1961
1971
1981
1991
Ernakulam 1981
1991
Pathanamthitta 1991
Kannur 1991
Ernakulam 1991
Kozhikode 1991
Alappuzha 1931
1941
1951
1961
1971
1981
1991
Ernakulam 1951
Kannur
1961
1971 1981
1991
1981 1991
Alappuzha 1991
Ernakulam
Kannur
1931
1941
1951
1961
1971
1981
1991
1991
CT CT CT M
M M
M
M
M
CT CT
M
CT
CT
CT
CT CT CT CT
CT M M
CT CT
M
CT CT
CT
CT CT
CT
M M M M
CT
12.10
11.24
11.24
11.24
10.83
10.83
20.42
12.30
9.83
20.48
11.09
5.60
13.00
13.00
8,699
9,457
11,047
17,330
19,804
22,335
25,405
26,096
27,491
25,893
26,825
26,639
26,586
26,553
26,144
10,738
12,543
14,561
22,277
13,316
24,862
25,872
5,242
8.26 6,604
Declassified Declassified
29.36 25,203
15.73
15.73
26.52
11.50 13.59
13.59
13.59
32.18
155
20,497
25,005
24,977
5,863
7,764
8,022
16,147
20,888
23,064
24,667
23,099
+ 279
+ 758
+1,590
+6,283
+2,474
+ 3.31
+ 8.71
+ 16.81
+ 56.88
+ 14.28
+2,531 + 12.78
+3,070 + 13.75
+ 691 + 2.72
+ 1,395 + 5.35
+ 932 + 3.60
+ 1,805 + 16.81
+ 2,018
+ 7,716 -8,961
+ 11,546
+ 1,010
+ 16.09
+52.99
-40.23
+86.71
+ 4.06
+ 1,362 +25.98
+4,508 +21.99
+ 1,901
+ 258
+ 8,125
+ 4,741
+ 2,176
+ 1,603
+ 32.42
+ 3.32
+ 101.28
+ 29.36
+ 0.42
+ 6.95
Males
10
4,402
4,644
5,391
8,383
9,678
10,747 12,315
12,498 13,423
12,573
12,901
13,005
12,553
12,758
13,166
5,577
6,307
7,268
10,850 6,591
11,922
12,549
2,564 3,267
12,576
9,872 12,016
12,261
2,981
3,991
3,927
8,353
10,755
11,748
12,298
11,092
Females
11
4,297
4,813
5,656
8,947
10,126
11,588
13,090
13,598
14,068
13,320
13,924
13,634
14,033
13,795
12,978
5,161
6,236
7,293
11,427
6,725
12,940
13,323
2,678 3,337
12,627
10,625 12,989
12,716
2,882
3,773
4,095
7,794
10,133
11,316
12,369
12,007

A-4 : TOWNS AND URBAN AGGLOMERATIONS CLASSIFIED BY POPULATION IN 1991 WITH VARIATION SINCE 1901
S!. Name of Town/ NO.Urban
Agglomeration
2
63. KaipereJ
64. Pen/manna
65. Palai'
66. Vaikom
67. Erattupetta
68. Ancharakandy
69. Vakkom
Status of Area in State/ District Year town kml
3 4
Wayanad 1991
Kozhikode 1991
Kottayam
Kottayam
1921
1931
1941
1951
1961
1971
1981
1991
1921
1931
1941
1951
1961
1971
1981
1991
Kottayam 1991
Kannur 1991
T rivandrum 1991
5
M
CT
CT CT CT M
M
M
M
M
M M
M
M
M
M
M
M
M
CT
CT
6
34.14
13.45
14.56
15.93
15.93
15.93
8.73
8.73
8.73
8.73
14.24
15.47
7.47
Persons Decade Percentage
7
22,949
22,38i
2,204
2,628
3,035
13,421
15,457
20,273
21,624
21,890
11,259
13,808
15,246
15,646
17,418
20,014
21,097
21,788
21,226
20,683
20,103
Variation Decade
8
+ 424
+ 407
+ 10,386
+ 2,036
+ 4,816
+ 1,351
+ 266
Variation
9
+ 19.24
+ 15.49
+342.21
+ 15.17
+31.16
+ 6.66
+ 1.23
+ 2,549 + 22.64
+ 1,438 + 10.41
+ 400
+ 1,772
+ 2,596
+ 1,083
+ 691
+ 2.62
+ 11.33
+ 14.90
+ 5.41
+ 3.28
CLASS - IV (10,000 - 19,999 Population) (34 Towns)
ALL TOWNS Kerala
70. Kunnamkulam Thrissur
1901
1911
1921
1931
1941
1951
1961
1971
1981
1991
1901
1911
1921
1931
1941
1951
CT CT CT CT
CT M
This (Own was known as Meenachil in 1921, 1931 and 1941 censuses.
302.84
161.46
108.36
369.44
156
99,290
91,061
115,809
166,570
237,144
352,345
408,025
285,521
172,973
520,663
7,194
8,336
8,517
13 .. 822
12,207
15,359
- 8,229 - 8.29
+ 24,748 +27.18
+ 50,761 +43.83
+ 70,574 +42.37
+ 115,201
+ 55,680
-122,504
-112,548
+4-8.58
+ 15.80
-30.02
-39.42
+347,690 +201.01
+ 1,142
+ 181
+5,305
+ 15.87
+ 2.17
+62.29
-1,615 -11.68
+3,152 +25.82
Males
10
11,784
11,229
1,266
1,457
1,600
6,799
7,937
10,292
10,728
10,876
5,840
7,077
7,690
7,826
8,685
9,855
10,381
10,732
10,984
10,086
9,150
50,381
45,915
58,927
82,840
117,059
174,045
201,727
141,831
83,655
251,598
3,498
4,064
4,126
6,532
5,772
7,120
Females
II
11,165
11,152
938
1,171
1,435
6,622
7,520
9,981
10,896
11,014
5,419
6,731
7,556
7,820
8,733
10,159
10,716
11,056
10,242
10,597
10,953
48,909
45,146
56,882
83,730
120,085
178,300
206,298
143,690
89,318
269,065
3,696
4,272
4,391
7,290
6,435
8,239

A-4 : TOWNS AND URBAN AGGLOMERATIONS CLASSIFIED BY Pr."ULATION IN 1991 WITH VARIATION SINCE 1901
51. Name of Town! No.Urban
Agglomeration
2
71. Panniyannur
72. Pattiom
73. *Vadakkekara
74. Kannapuram
75. Kodamthuruthu
76. Paduvi/ayi
77. Munderi
78. 'Chelora
79. Kuctikkattoor
80. 'Kanimangalam
8 I. Koothaccukulam
82. Koratty
83. * Kocrayam\ Malabar
84. *Kadachira I
85. Cherukunnu
86. Arookutty
87. ·Peralasseri2
88. ·Chala
State! District
Status of Area in Year town km2
3
Kannur
Kannur
4
1961
1971
1981
1991
1991
1991
Ernakulam 1981
1991
Kannur 1991
Alappuzha 1991
Kannur 1991
Kannur 1991
Kannur 1981
1991
Kozhikode 1991
Thrissur 1981
1991
Ernakulam 199 I
Thrissur 1991
Kal1nur
Kannur
1981
1991
1981
1991
Kannur 1991
Alappuzha 199 I
5
M
M
M
M
CT
CT
CT
CT
CT
CT
CT
CT
CT
CT
CT
CT
CT
M
CT
CT
CT
CT
CT
CT
CT
Kannur 1981 ' CT
1991 CT
Kannur 1981 CT
1991 CT
6
6.97
6.96
6.96
6.96
10.02
12.67
16.71
6.88
14.38
10.81
15.08
12.28
11.35
11.35
13.67
8.55
8.55
23.18
10.13
8.43
8.43
7.95
7.95
15.37
11.10
10.81
10.81
9.26
9.26
Persons Decade Percentage
7
16,268
18,367
19,440
19,657
19,312
19,074
42,267
18,975
18,158
18,124
17,517
17,358
14,549
17,314
17,107
15,084
16,897
16,828
16,603
14,519
16,526
14,782
16,441
16,246
15,693
13,395
15,209
12,645
14,854
Variation Decade Variation
8 9
+ 909 + 5.92
+2,099 +12.90
+ 1,073 + 5.84
+ 217 + 1.12
-23,292 -55.11
+2,765 + 19.00
+ 1,813 + 12.02
+2,007 +13.82
+ 1,659 + 11.22
+1,814 +13.54
+2,209 + 17.47
1 Entire Kadambur village of KJ~nur was treated as a town in 1981 with the name Kadachlra.
2 The entire Makrerl village of Cann;more taluk was treated as a town in 1981 with the name Peralasseri.
157
Males
10
7,565
8,623
9,237
9,414
8,794
8,990
20,565
9,135
8,414
8,935
8,635
8,315
7,207
8,484
8,606
7,290
8,I!l0
8,363
8,246
7,106
8.047
7,159
7,867
7,473
7,840
6,488
7,323
6,192
7,184
Females
11
8,703
9,744
10,203
10,243
10,518
10,084
21,702
9,840
9,744
9,189
8.882
9,043
7,342
8.830
8,50!
7,794
8,747
8,465
8,357
7,413
8,479
7,623
8,574
8,773
7,353
6,907
7,886
6,453
7,6/0

A-4 : TOWNS AND URBAN AGGLOMERATIONS CLASSIFIED BY POPULATION IN 1991 WITH VARIATION SINCE 1901
SI. Name of Town/ State/ Status of Area in Persons Decade Percentage Males Females No.Urban District Year town km2 Variation Decade
Agglomeration Variation
2 3 4 5 6 7 8 9 10 II
89. Pathiriyad Kannur 1991 CT 13.01 14,737 7,138 7,599
90. *Plnarayt Kannur 1981 CT 9.63 13,107 6,325 6,782
1991 CT 9.63 14,696 + 1,589 + 12.12 7,061 7,635
91. Iriveri Kannur 1991 CT 11.73 14,162 6,858 7,304
92. EruvJtti Kannur 1991 CT 10.41 14,063 6,810 7,253
93. Varam Kannur 1991 CT 9.83 13,777 6,632 7,145
94. *Chewoor Thrlssur 1981 CT 6.08 12,318 5,900 6,418
1991 CT 6.08 13,773 +1,455 + 11.81 6,568 7,205
95. MathilakJm Thrlssur 1991 CT· 6.36 13,732 6,406 7,326
96. *Pullazhl Thrlssur 1981 CT 7.88 10,759 5,026 5,733
1991 CT 7.88 13,362 +2,603 +24.19 6,293 7,069
97. *Kanhlrode Kannur 1981 CT 8.14 10,327 5,012 5,315
1991 CT 8.14 12,543 +2,216 +21.46 6,084 6,459
98. *Marllthakkara Thrissur 1981 CT 6.91 10,936 5,326 5,610
1991 CT 6.91 12,337 +1,401 + 12.81 6,118 6,219
99. *Puthukkad Thrlssur 1981 CT 6.41 11,112 5,387 5,725
1991 CT 6.41 11,752 + 640 + 5.76 5,650 6,102
100. KannadipJramba Kannur 1991 CT 8.89 11,599 5,646 5,953
101 . Mavi/Jyi Kannur 1991 CT 8.59 11,453 5,532 5,921
102. *Avlnlssery Thrlssur 1981 CT 4.69 9,303 4,600 4,703
1991 CT 4.69 10,559 +1,256 + 13.50 5,324 5,235
103. *Idukki Township' Idukkl 1981 TS 32.00 8,886 4,636 4,250
1991 TS 32.00 10,225 + 1,339 + 15.07 5,263 4,962
CLASS V (5,000-9,999 Population) (6 Towns)
ALL TOWNS Kerala 1901 21,359 10,607 10,752
1911 47,538 + 26,179 + 122.57 23,857 23,681
1921 1,01,115 + 53,577 + 112.70 51,065 50,050
1931 1,07,795 + 6,680 + 6.61 54,167 53,628
1941 1,25,278 + 17,483 + 16.22 62,624 62,654
1951 1,80,410 + 55,IJ2 + 44.01 90,021 90,389
1961 !l8.81 65,164 -1,152,46 - 63.88 32,310 32,854
1971 65.99 67,224 + 2,060 + 3.16 33,450 33,774
I Idukki township which was Formed In 1976 lies in twO taluks viz. Udumbanchola and Thodupuzha.
158

A-4 TOWNS AND URBAN AGGLOMERATIONS CLASSIFIED BY POPULATION IN 1991 WITH VARIATION SINCE 1901
SI. Name of Town! State! Status of Area in Persons Decade Percentage Males Females No. Urban District Year town km2 Variation Decade
Agglomeration Variation
2 3 4 5 6 i 8 9 10 11
1981 36.69 18,189 - 49,035 -72.94 9,236 8,953 1991 27.39 44,530 + 26,341 +144.82 21,605 22,925
104. Kuftoor Thrissur 1991 CT 6.38 9,631 4,760 4,871
J 05. Chebx.br3 ThrissUT 1991 CT 3.68 7,971 3,750 4,221
106. Manjeshwar Kasaragod 1961 CT 9.38 10,110 4,890 5,220 1971 CT 9.38 12,967 + 2,857 + 28.26 6,439 6,528 1981 Declassifled
1991 CT 3.96 7,886 3,910 3,976
107. KO/3Zhy Thrissur 1991 CT 5.60 7,165 3,435 3,730 ~
J 08. P311ssery Thrlssur 1991 CT 3.13 6,156 3,002 3,154
109. Pottore Thrlssur 1991 CT 4.64 5,721 2,748 2,973
CLASS VI
(LESS THAN 5,000 Population)
ALL TOWNS KERALA 1901
1911 4,958 2,400 2,558 1921 31,009 +26,051 +525.43 16,107 14,902 1931 27,740 -3,269 -10.54 14,448 13,292 1941 29,868 + 2,128 + 7.67 14,935 14,933 1951 58,175 +28,307 + 94.77 29,643 28,532 1961
1971 5.90 4,382 2,471 1,911
Note:
1 Names of towns treated as such for the first time In 1991 (Vide Co12) are printed In Italics.
2 Towns treated as such for the first time in the 1981 Census and continue as such in 1991 (Vide col. 2) have been marked with an asterisk (.) on their left.
I The following abbreviations are used to denote the civic status of towns.
C-Corporatlon; M-Munkipal town; Cann-Cantonment; TS-Township; OG-Outgrowth; CT -Census town (No;t-Municipal)
'l Area figures for 196 f, f 97 f, 198 f and f 991 are ~n In col.6 ofthe table for each town as supplied by the local authorities in the respective censuses. Wherever there is change in area between 198 I and 1 991, the reasons for the same have been given In Appendix 4 of this table.
159
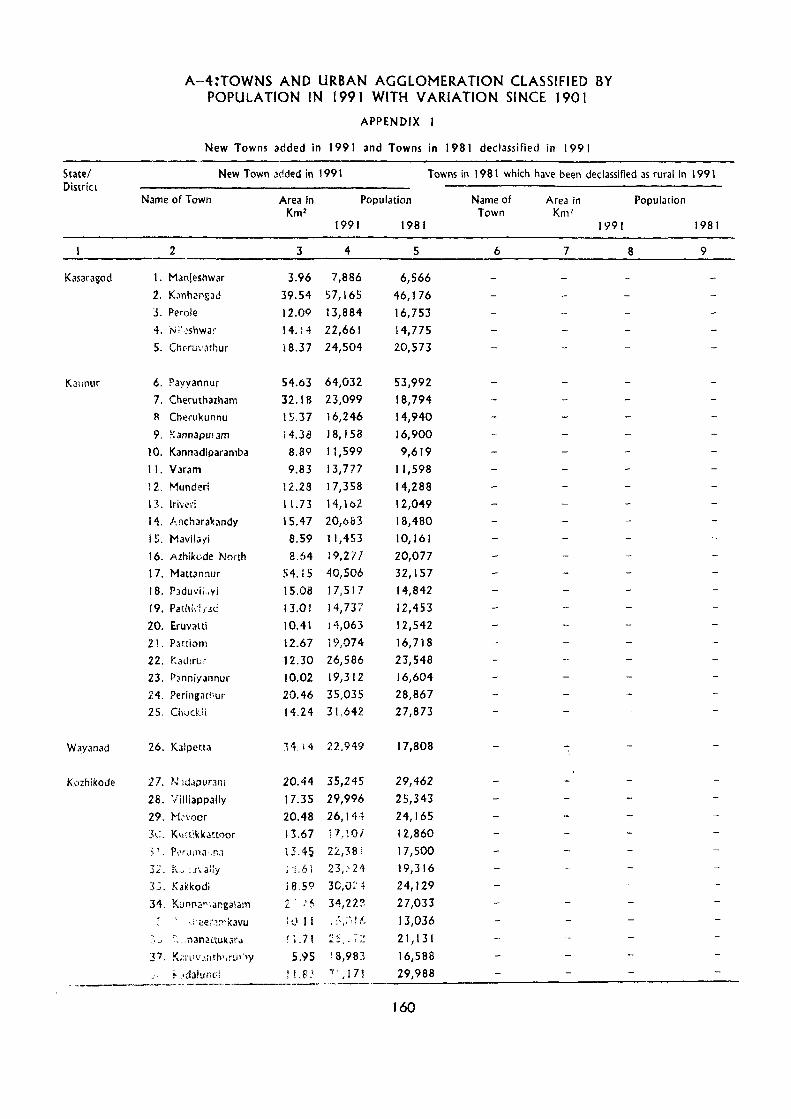
State/ District
Kasaragod
Kannur
Wayanad
K0zhikode
A-4:TOWNS AND URBAN AGGLOMERATION CLASSIFIED BY POPULATION IN 1991 WITH VARIATION SINCE 1901
APPENDIX 1
New Towns added in 1991 and Towns in 1981 declassified in 1991
New Town Jcded in 1991 Towns in 1981 which have been declassified as rural in 1991
Name of Town Area In Population Name of Area in Population Km 2 Town Km'
1991 1981 1991 1981
2 3 4 5 6 7 8 9
1. Manjeshwar 3.96 7,886 6,566
2. K}nhangad 39.54 57,165 46,176
3. Perole 12.09 13,884 16,753
4. N;' ~shwa\' 14.14 22,661 14,775
5. ChHu\,athur 18.37 24,504 20,573
6. ?ayyannur 54.63 64,032 53,992
7. Cheruthazham 32.18 23,099 18,794
R Cherukunnu I S.37 16,246 14,940
9. !{ annapur am 14.38 18,158 16,900
10. Kannadiparamba 8.89 11,599 9,619
I J. Varam 9.83 13,777 11,598
12. Munderi IZ.2S 17,358 14,288
13. iri .. eri 1l.73 14,162 12,049
14. Ancharai<andy 15.47 20,683 18,480
15. MavilJyi 8.59 11,453 10,161
16. Azhikode Narth 8.$4 19,271 20,077
17. Mattan!1ur 54.! 5 40,506 32,157
18. P3duvii .• yi 15.08 17,517 14,842
19. PathkhJd 13.01 14,737 12,453
20. Eruvatti 10.41 14,063 12,542
21. P,}ttiom 12.67 19,074 16,718
22. KadirLr 12.30 26,586 23,548
23. Panniyannur 10.02 19,312 16,604
24. Peringathur 20.46 35,035 28,867
25, ChockH 14.24 31,642 27,873
26. Kalpena 34. \ 4 22.949 17,808
27. ~J lU.lpUnn1 20.44 35,245 29,462
28. 'lilliappaliy 17.35 29,996 25,343
29. M~\'oor 20.48 26,144 24,165
3~:_ K,\,:t:kkanoor 13.67 P.~OI 12,860
~; '. P·.'ruma· .na iJ.45 22,38 ! 17,500
r ~_ K.~ : _,', al:y ; 'L61 23,::24 19,316
3':;. Kakkodi 18.59 3C,O:'4 24,129
34. KunI'l2".angal;,m 2. : ,'~ H,ll? 27,033
,.;'ee';~~kavu !U I I ; :;,;~ J t~ 13,036
~, ~, '~, .nananlll<ai;i 1; .71 Z~( ~ 72 21,131
37. K;:n:v ._HI~b1irtH~ly 5.95 ~ 8,983 16,588
~ .<laiunGf : !8.1 '7" ,171 29,988 _ -------, __ ' __ .. ~ -_._ ....... -
160

A-4;TOWNS AND URBAN AGGLOMERATION CLASSIFIED BY POPULATION IN 1991 WITH VARIATION SINCE 1901
APPENDIX I
New Towns added in 1991 and Towns in 1981 declassified in 1991
State! New Town added in 1991 Towns in 1981 which have been declassified as rural in 1991 District
Name of Town Area in Population Name of Area in Population Km 2 Town Km'
1991 1981 1991 1981
2 3 4 5 6 7 8 9
Malappuram 39. Perinthalmanna 34.41 39,027 19,72 I
Palakkad 40. Mannarkad 63.38 45,422 35,785
4 I. Puthuppariyaram 19.93 24,808 21,457
42. Marutharode 9.52 16,089 12,205
43. Koduvayur 10.53 17,647 17,723
44. Puthunagaram 9.24 15,691 12,343
Thrissur 45. Chelakkara 3.68 7,971 7,426
46. Pookode 4.96 8,162 7,487
47. Perakam 5.06 9,540 8,303
48. Thaikkad 3.73 7,329 5,861
49. Paluvai 4.35 6,750 6,303
50. Pavaratty 4.12 10,439 9,721
51. Venmenad 5.07 9,287 8,774
52. Kolazhy 5.60 7,165 5,572
53. Pottore 4.64 5,721 4,645
54. Kuttoor 6.38 9,631 8,858
55. Palissery 3.13 6,156 5,485
56. Nettissery 4.22 7,536 7,501
57. Mathilakam 6.36 13,732 12,657
58. Eriyad 9.51 23,510 21,483
59. Koratty 10.13 16,603 14,984
Ernakulam 60. Choornikkara 17.02 34,837 25,378
61. Edathala 28.92 56,397 50,746
62. Moothakunnam 9.83 26,553 24,796
63. Kedamangalam 7.66 18,500 12,243
64. Alangad 21.02 35,620 32,186
65. Varappuzha 7.74 22,514 20,627
66. Kadungalloor 14.66 25,433 27,877
67. Cheranalloor 10.59 21,407 18,381
68. Vazhakkala 12.87 33,167 20,247
69. Thiruvankulam 10.49 18,412 15,517
70. Piravom 29.36 25,203 24,048
71. Koothattukulam 23.18 16,828 15,057
Kotcayam 72. Eraccupetta 14.24 21,226 16,505
73. Perumbaikad 14.04 39,363 35,308
74. Nattakal11 22.33 37,564 34,799
75. Kanjirappally 52.47 37,017 36,546
161

State/ District
AlappLlzha
Pathanamthitta
Kollam
Trivandrum
A-4!TOWNS AND URBAN AGGLOMERATION CLASSIFIED BY POPULATION IN 1991 WITH VARIATION SINCE 1901
APPENDIX 1
New Towns added in 1991 and Towns in 1981 declassified in 1991
New Town added in 1991 Towns in 1981 which have neen declassified as rural in 1991
Name of Town Area ill Popul~tion Name of Area in Population Km 2 Town Km 2
1991 1981 1991 1981
2 3 4 5 6 7 8 9
76. Aroor 15.14 31,642 29,002 Pathirappally 5.91 NA 21068
77. ArookLitty 11. 10 15,693 14,079
78. Kodamthuruthu 10.81 18,124 16,705 • 79. Vayalar 14.45 22,384 20,698
80. Kokkothamangalam 11.29 15,904 14,528
81. Thanneermukkom 23.91 28,728 26,087
82. Muhamma 26.76 22,541 20,705
83. Mannanchery 26.52 24,977 27,085
84. Komalapuram 14.00 37,253 26,515
85. Pandalam 28.42 37,733 35,391
86. Adoor 20.42 26,639 24,995
87. Mangad 6.55 28,317 28,648
88. Kilikollur 4.66 28,456 29,655
89. Vakkom 7.47 20,103 20,444
90. Ulloor 7.97 25,719 20,309
91. Kudappanakunnu 7.69 33,534 27,118
92. Nemom 12.87 42,559 33,288
162

Towns
A-4:TOWNS AND URBAN AGGLOMERATION CLASSIFIED BY POPULATION IN 1991 WITH VARIATION SINCE 1901
APPENDIX - 2
Places with J population of under 5000 classified as (Owns for the first time ;n 1991
District Area in Km 2 in 1991
2 3
NIL
APPENDIX - 3
Population in 1991
4
Places with J population of lInder 5000 in 198 I which were towns in 1981 but have been declassified in '991.
Towns
SI.
No.
I.
2. 3. 4. 5. 6. 7. 8. 9.
10. 11. 12. 13. 14. 15. 16. 17. 18. 19.
20. 21.
District Area in Km2 in 1991
2 3
NIL
APPENDIX - 4
Population in 1991
4
Changes between 1981 and 1991 in area and Population of towns and reasons for change in area
Name of Town Area in Km2
(District)
1981 1991
2 3 4
Maradu (Ernakulam) 12.35 12.34 Eloo~ (Ernakulam) 20.73 14.21 Paravur (Ernakulam) 9.03 9.02 Cheriya~adavu (Ernakulam) 4.13 4.12 Kozhikode (Kozhikode) 82.67 82.68 Beypore (Kozhikode) 10.41 10.42 Olavanna (Kozhikode) 21.43 11.33 Feroke (Kozhikode) 13.53 7.58 Thalassery (Kannur) 15.35 23.96 Azhikode South (Kannur) 16.05 7.40 New Mahe (Kannur) 11.44 2.82 Eravipuram (Kollam) 10.06 6.60 Malappuram (Malappuram) 33.60 33.61 Cherthala (Alappuzha) 16.19 16.18 Vadakara (Kozhikode) 21.34 21.33 Methala (Thrissur) 11.66 11.81 Taliparamba (Kannur) 18.21 43.08 Thiruvalla (Pathanamthitta) 14.47 27.94 Ottappalam (Palakkad) 16.98 32.66 Kothamangalam (Ernakulam) 37.45 40.04 Vadakkekara (Ernakulam) 16.71 6.88
1981
5
28,749 46.856 26,288
6,713 394,447
40,946 34,004 37,720 75,561 37,273 32,590 47,274 39,786 40,492 64,174 30,426 29,901 29,225 23,156 33,122 42,267
163
Population in
1991
6
34,995 34,455 27,906
7,401 419,831
56,505 28,382 25,511
103,579 23,077 11,939 34,627 49,692 43,326 72,434 33,896 60,226 54,780 44,186 35,535 18,975
Reason for the
change in Area
7
Revised Computation
Change in jurisdiction
Revised Computation
Change in Jurisdiction
II "
Revised Computation
" "
Change in Jurisdiction
" "
Revised Computation
Change in Jurisdiction


AS-STANDARD URBAN AREAS

-~ "'~/''''''''''.~IOV 1l,I' ..... __ •• _/n.'7/"" .. "'\

\
GROWTH OF POPULATION" OF THE SUA 1981-91
t5
BOUNDARY,TALUK
URBAN STANDARD URB~ AREA ...
KANNUR ST ANDARD URBAN AREA
(District Kannur I Kerala)
Metres 1000 500 0 3 Kilometres ---_ ....... ;;;;;;;;j,--...
. .. -.... ~-. URBAN AGGLOMERATION / . _/_ .. _
o MUNICIPAL TOWN AREA. .., ... ------Growth rate excludes OTHER TOWN lPitlroyer urban ateas. I
C. T.(CENSUS TOWN) L ____ J Reali 9rowlh of URBAN BUILl UP / AREA .. , apec:ifl< utban comp-OII.n" on IN scalt RAILWAY, BROAD GAUGE ... of tM S.U.A.
NATIONAL HIGHW",., WITH NUMBER ...
OTHER ROADS ...
WATER BOOIES: LAKES/BACK WATERS ...
RIVER(TIOAL} AND TRIBUTARIES _
SPLl-OVER URBAN AREA ...
bATA NOT AVAILABLE .....
. ...
.. · .. ~/D M
NH·17
~ ~
I I N. A.
Based upon Survey of Indio map with the The territorial ~aters. of Indio ~xtend into the sea to a distant, of ~ Go ... rnment of Indio C6pyrlght,199. permission 01 the Surv~yor General of India. Iwel~e nauUca! miles rneasur~ from Ihe appropriate base line.


THALASSERY STANDARD URBAN AREA
(District Kannur, Keralo) o 2 Kilometr(>s
POND/CHERRY
CMAHE)
GROWTH OF POPULATION OF THE 5 U A 1981-91
20
§ II: 0 '" ... !-
o URBAN
Read qrowth of specific urban components on the scale of the SUA.
BOUNDARY, STATE I U. T. ... . .... _. ___ _ TAL UK ..... _._._._
STANDARD URBAN AREA ... .. .•.. ___ _
URBAN AGGLOMERATION. / MUNICIPAL TOWN AREA ... _/_ .. _ OTHER TOWN. C.T. (CENSUS TOWN) ... . .. C==::::J
URBAN BUILT UP / AREA ... ~'I:':': I RAIL WA Y, BROAD GAUGE ... .. __ -=oi'-=-~
NA TIONAL HIGHWAY WITH NUMBER NH fI
STATE HIGH.WAY... IH
OTHER ROADS ... ... WATER BODIES: LAKES/BACK WATERS... '" "~ RIVERS(TlDALl ANa TRIBUTARIES ." ... ~
DA T A NOT AVAILABLE ... ... ... ... ... ... .., ... ... ... ... .. ... N. A.
Based upon Survey of Indio map with the The territorial waters of India extend into © Government of India Copyright,1998 permission of the Surveyor General of India. the sea to a distance of twelve' nautical miles
measured from the appropriate base line.


I
LAKSHADWEEP SEA
-VADAKARA
STANDARD URBAN AREA (District Kozhikode, Kerala )
ME'tres 1000 50'0 0 2 3 Kilometres
to Noda:» uram
GROWTH OF POPULATION OF THE SUA 1981- 91
50
30
2"0 .... ffi u \0 a: LIJ 0..
-10
- 20
URBAN
·Growth ratE'S exclude Spill-over areas
Read Growth of urban component on the scalE' of the 5 U A.
BOUNDARY) TAlUK _.. .......... ... ... ... .... .. .
STANDARD URBAN AREA .......... .. '" ..... ----URBAN AGGLOMERATION I t:-1UNICIPAl TOWN AREA .. _/~ .. _
OTHER TOWN~ C.T. (CENSUS TOWN)... ... [:===_1 VILLAGE WITH LOCATION CODE NUMBER. . .. c=-~~~ _j
URBAN BUILT UP / AREA. _.. ... . .. ~ l:~:::<r RAILWAY. BROAD GAUGE. ... ... "AS
NATIONAL HIGHWAY WITH NUMBER NH-17
OTHER ROADS... '" ... ... . ..
WATER BODIES; LAKES ....... ..
RIVERS (tIDt\L) AND' TRIBUTARIES... '" ..... . . --.~
-.- .... -- ... ~ GROWTH FlATI;: OF RURAL POPUL-ATION 1981-,91
SPILL~OVER URBAN AREA ...
30 ·00 & BELOW ... DATA NOT AVAILABLE
~ N.A.
..·.._I __ ---I
Bciud upon Survey of India map with The territorial waters of India extend intoth. sea @Government of Indlu Copyi'ightJ.'.9ge the ~rmission of the Surveyor General to a distance of twelve nautical milts measured
"i ,- •


... _,...-"_.' • .!..!--
KO'ZHIKODE STANDARD URBAN AREA
Districts of Kozhikode 8.. Malappuram,Keralq )
GROWTH OF POPULATION OF THE 5 U ,A 1981-91
30
to
§ ffi -10 0/
i!! -20
-5
URBAN
..
RURAL
Grow1h rates exclude spill-owr an,as. Read Grow1h of specific urban components on tht scate of the SUA.
BOUNDARY, DIS TRICT •.
TAtUl< ... STANDARD ~BAN AREA. . ..
lRlAN AGGlOMERATION/CORPORATION· ..
aTHER TOW~. C.T.(CENSUS TOWN) ..... r:==:J VILLAGE WITH LOCATION COOE NUMBER ..... ['I-I-.TI.J
ADMI~STRAnVE HEAOOUARTERSOF TALUK,otStRlCT ... ®, •
URBAN BUILT Lf' / AREA ...
RAILWAY, BROAD GAUGE ...
NATIONAL HIGHWAY WITH NUMBER-.
STATE HIGHWAY-·
OTHER ROADS ...
WATER BODIES: LAKES, S':'CKWATERS ...
RIVERS (TlIlAL) AND TRIBUTARIES
OUT GROWTH ...
GROWTH RATE OF RpRAL POPULATION 1981- 91
.50·01 _, 70· 00 30-00 & BELOW
DATA NOT AVAILABLE
SPILj.- OVER URBAN AREA ..
...... ~'D NH-t7
SH
'_'.:'_'_'.~
... ~ O.G ....
... ~ N.A.
"LI __ -,
(e I_CORPORATION (P)-PART
-.. upon St.rvty r# India map with U. pfrmi:aon of the Thf territorial woters of Indio ~tend into the S6'Q to (I di::.tance of
--1:' m 1h,. a-.,ropriaw bese line·
I II II
II II I I
I! . I f . I
'l~ : ; , ,
C 60¥ft"rment of Indio Co~,199I

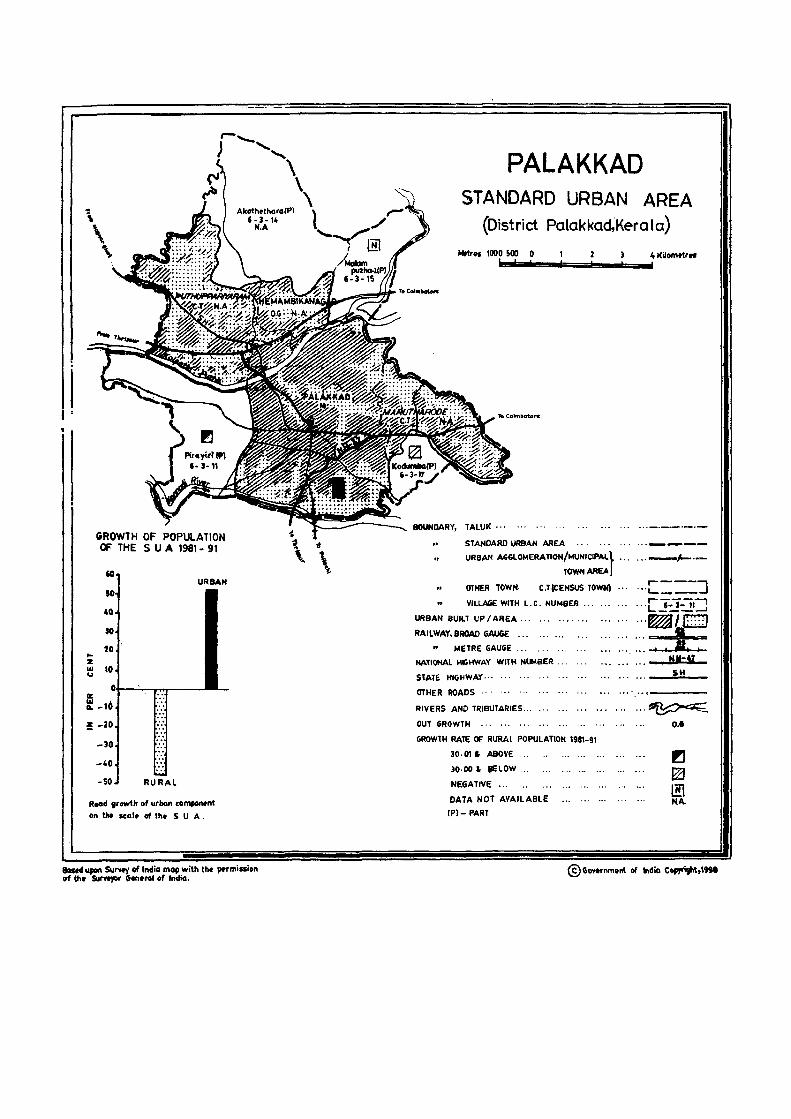
.. Z III ....
II: III IL
~
GROWTH OF POPULATION OF THE 5 U A 1981- 91
60 URBAN
so 40
30
20
10
0 --10 ..
.. _20 .. -30 .. -40 .. -50 RU>;AL
R.od ,rowtlr of urban tOlllpOlWnt on II.. scal. of til. SUA.
lased upon Su...y of India map with the .,.rmiuion of the 511 ...... Generol of India.
.g
\
PALAKKAD STANDARD URBAN AREA
(District Polokkod,'Kero 10)
TALUK •.• '" ...
STANDARD URBAN AREA
URBAN AGGl.OMERATION/MUNICIPAl\ '"
TOWNAREAj
OTHER TOWN· C.TICEHSUS TOWN)
VILLAGE WITH L.e. NUMBER •..
URBAN BUILT UP / AREA .. .
RAILWAY, BROAD GAUGE ... .... ..
METRE GAUGE '" .. .
NATIONAL Ht:;HWAY WIT H NUMBER ...
StAn:: HIGHWAY··· ... . .'
OTHER ROADS .. , .. .
RIVERS AND TRIBUTARIES ..
OUT GROWTH ., .... '"
GROWTH RAtE OF RURAl POPULATION 1981-91
30·01' ABOVE
]0·00 a. I!ELOW ...
NEGATIVE ...
DATA NOT AVAILABLE
(Pl- PART
... -1--.-
,----, .•. L-____ ...I
.. -[ ]":1-1 (J
... ~~~::::.,
MM-4l
SH
... ~ 0.6


GROWTH OF POPULATION OF THE 5 U A 1981-91
~ ::~ -
: ':~BAN Read Growth "I specific Urban components on the scale of the SUA.
The blank barS indicate ncgatiw growth of Urban population.
THRISSUR STANDARD URBAN AREA
(District Thrissur. Kerala)
M~(res 1000 500 0 3 4 K ilome(r~ _&iiI!!!!!~iiiiiiiiii~"""",",""""
BOUNDARY, TALUK
" STANDARD URBAN AREA. n 11
URBAN AGGLOMERATION/MUNICIPAL TOWN AREA __ /_ •. _
OTHER TOWNS, C. T. (CENSUS TOWN) ..... c===:::; URBAN ·SU1LT UP / AREA ..
RAILWAY, BROAD GAUGE.
NATIONAL HIGHWAY WITH NUMBER.
STATE HIGHWA~.
OTHER ROADS ...
RIVERS ·AND TRIBUTARIES ...
OUT GROWTH ........ .
8ATA NOT AVAILABLE _.
=1= ..~~L:...:..:..:.:J .ft
NIH'
,H
.. ~ O.G
N.A
Based upon Survfy.ol India map with the ~rmission of the Surnyor General ., India. C Govtrnm~t of India Copyright. 1998.


rr===---! !
GROWTH OF POPULATION OF THE 5 U A 1981-91
40 J
::u: U.eAN
'01 o I
-, 0 ~ i I ~ i I tj-20 ....
ffi-30 -; a.
i!O-40 1 P'URAL
-50 ~ -GO -i I
- 70-
-80 J Growth rah~5 e'llcludf' spIll-over area;;:
IWad Growth of speCifiC Urban
compone-nls on I"eo sea"e of 'h@ SUA
The blank bar Irldlcot€:S ncqatl'¥t growth (If Urban population
(CLCORPORA110N
KOCHI STANDARD URBAN AREA
(District Ernakulam, Kerala)
BOUNDARY, DISTRICT
TALUK
STANDARD URBAN AREA
URBAN AGGLOMERATION
CORPORA TlON/MUNICIPAL :rOWN AREA
OTHER TOWN. c.T.lcENSUS TOWN)
VILLAGE WITH LOCATION CODE NUMBER
ADMINISTRATIVE HEADQUARTERS OF TALUK
URB AN BUlL T UP / ARE A
RAILWAY .BROAD GAUGE
NATIONAL HIGHWAY WITH NUMBER
STATE HIGHWAY.
OTHER ROADS
WATER BODIES; LAKES, BACK WATERS.
RIVERS (TIDALl AND TRIBUTARIES
OUT GROWTH
DATA '"'01 AVAILABLE SPILL-OYER URBAN AREA
... --.-.-
EiffL~ ®
=lF01 ~~
NH- 47
SH
N A.
C=J Based upon Surve..,* of India ~ap With the Th'!' terr.torra! waters of India (";>"Iend Into the sea to a distance of twelve nculleal mites mt"Qs'.Ired © GO'l'<t>rnment of Ind.a copynqnt. 1996


KOTTAVAM STANDARD URBAN AREA
(District Kottayam, Kerala)
"h.·tr~s 1000 500 C 2 3 M~oll"lr~ GROWTH OF POPULA nON
OF THE SUA 1981- 91
The ~ar\k bar indicates negative growth 01 urban population.
100
80
60
40 URBAN
TO KANJIRAPPAllY
BOUNDARY, TALUK ..
IZ W U
a:: w Q_
20
O+-~--,__
-20
-40
..
,.
Ii:: ..
_80 J L
RURAL
Growth, 0(,,; ~xclud~
Spilt-ov",. arcus.' Read Grow',,", ot urile" componen t on the sec!, of the SUA.
STANDARD URBAN AREA... ." ...
URBAN AGGlOMERATION /MUNICIPAL TOWN AREA.
OTHER TOWN, C. T. (CENSUS TOWN)
VILLAGE WITH LOCATION CODE NUMBER
URBAN BUILT UP/AREA ..
RAILWAY, BROAD GAUGE
STATE HIGHWAY.
OTHER ROADS ...
WATER BOOtES; LAKE
RIVERS (TIDAl) AND TRIBUTARIES ..
OUT GROWTH
GROWTH RATE OF RURAL POPULATION 1981- 91
70.01 &- ABOYE
30.00& BELOW· .. ·
DATA NOT AVAILABLE ..
S"ILL-OVER URBAN AREA ...
(P) PART
SH
~ ~
O.G
• ~ N.A
Bos.d upon Surv.y of India map with the permission of the Surv.yor G.n.rol of India. © Government of India Copyright ,199&.


GROWTH OF POPULATION
OF THE SUA 1981·91 1.5
too
a 10 4.J
5
RURAL
Read ~ of urban component on tlw leelle of the 5 U A.
Ia," upan s-y t1f IndlG map with ~ pmniliSicr>
!if iha SoIrvcyor Gcncrol at India
CHANGANASSERY STANDARD URBAN AREA
District Kottayam, Ker~la
2 3 Kilometre5 4
BOUNDARY, "!'ALUI( •.. ... ... ... ... ... . .... _._._._
" STANDARD URBAN AREA... ... . ... ___ _
" MUNICIPAL TOWN AREA... '" ..... _ •• _ •• _
" VILLAGE WITH LOCATION CODE NUMBER['O-4- C URBAN BUILT UP{_ AREA .... :. ..' ...... ~/ 0 RAILWAY, BROAD GAUGE .. .
STATE HIGHWAY··· ... ... . ..
OTHER ROADS... ... ... .., ... . ..
RIVERS (TIDAL) AND TRIBUTARIES .. ,
RS ... '" ........ ..Ie ___
SH
.... "~
GROWTH RATE OF RURAL POPULATION 1981- 91
lO· 00 &. BELOW
NEGATIVE •..
(P) - PART
©Govcrtl~nt of India Copyright,,,,.


GROWTH OF POPULATION
rF THE S U • f!e1-91
I Growth rates t"cludt spijl- O'Itf (Il"fQS.
Plead (;rowth at urban component Qn the' scalt of the S. U. A.
Based upon Survey of India map with the permiS&ion 0( the Surveyor G,ntral of India,
ALAPPUZHA STANDARD URBAN ~REA
(District AlappuzhQ, Keralal
Metres 1000 500 0 .' .' _I _=-iiiii __ "'iiiiiii~1KilOmttrtS
'BOUNDARY, T AlUK •.
51 ANDARD URBAN AREA
" URBAN AGGlOMERATIONI }"" '" _/_ •. _ MUNICIP AL TOWN AREA t
C.T. (CENSUS TOWNI"'~::'""] I, fl
" VillAGE WITH 1.0CATION CODE NUMBER...[_1i-z-t:'J
URBAN BUilT UP IAREA .n ~I;:: :] I'
" OTHER TOWN,
I RAILWAY; BROAD GAUGE _
ritA TIONAl HIGHWAY WITH NUMBER ....
STATE HIGHWAY ...
OTHER ROADS n.
WATER BODIES: LAKES, ...
RIVERS(TIDAL) AND TRIBUTARIES
OUT GROWTH ...
SPILL -OVER URBAN AREA '"
OAT A NOT AV,II.ILABLE
(Pj-PART
tiH-47
sit
... -.~
...-.~¥FF§: ;;/
C.G
N.A.
I
The territorial waters of India elfttnd into the Sf<I to CI @Govtrnment of India Copyright;1998 distance of IwtIve nautical miles measured from the appropriate base line,


KAYAMKULAM STANDARD URBAN AREA
(District Alappuzha,Kerata) METRES
....
flO soo 0 ! !
2 !
GROWTH OF POPULATION OF THE SUA 1981-91
-40
Z 30 w RURAL u
20 cr w Cl. 10
Z 0
Read growth of urban component on the scale of the SUA.
3 I
Based upon Survey of India map with the permission of the Surveyor General of India.
DISTRICT KOLlAM •
BOUNDARY, DISTRICT ... ...
" " "
TALUK ...
STANDARD URBAN AREA··
MUNICIPAL TOWN AREA ..
.,. .. _-_ ....... _.-
.. ----VILLAGE WITH LOCATION CODE} r----,
"'L 11- 4 - 16J NUMBER ----
URBAN BUILT UP/AREA ..
RAILWAY, BROAD GAUGE
NATIONAL HIGHWAY WITH NUMBER
STAT£ HIGHWAY ...
OTHER ROADS .. ·
WATER BODrES: LAKE! BACKWATER ...
RIVERS (TIDAL) & TRIBUTARIES ...
'~/EJ"'''' .. ... ' ..... . .... .. ~ ~
NH-47
SH
~ ~
... ~-
GROWTH RATE OF RURAL POPULATION 1981-91
30·00 & BELOW", E2 (P)- PART
C Government of India Copyright) 1998.


()
GROWTH OF POPULATION OF THE 5 U A 1981-91 50
URBAN 40
30
20-... z
lO-w U
II: It
~ -10
z - -20
-30
-!,C.- .. ,
. "j ill -~o
-70 RIJRAL
R",od Growth of specific urban components on th'e scale of th. SUA. The blank bar indicat",s negative growth of urban population.
KOlLAM STANDARD URBAN AREA
(District Kollam, Keraf,)
s
BOUNDARY, TALUK ... ... '" ... . ........ '" .............. . " STANDARD URBAN AREA ............. , .0 •
J! URBAN AGGLOMERATION I MUNICIPAL TOWN AREA .....
" OTHER TOWN_, C.T (CENSUS TOWN).. . .. " VILLAGE WITH LOCATION CODE NUMBER... . ..
ADNI'NISJRATIVE HEADQUARTERS OF TAUJK ...
URBAH BUILT UP ........ .
RAILWAY. BROAD GAU6E
II METRE GAUGE
NATIONAL HIGHWAY WITH NUNBER .. .
STj.YE HIGHWAY... ... ... . ....... .
OTHi:.R RCAOS .. . ............ .
WATER BODIES: LAKES I BACI(WATE"~~
RIVERSITIDAL) AND TRIBUTAAJES; .... _ ..
OUT GROWTH.. '" .................... .
GROWTH RATE OF RURAL POPULATION 1981- 91
30·00 &. BELOW .. .
DATA NOT AVAILABI.E.. ... ... . ..... '" ......
. .. _-----···--1-··-C---· . .. ___ --J
[ iWi'i---, '" .l!!'"'J.:1i.-J f)
.. ~ oo __ . AI! d t
,,,,,.N ••• ,,":47
SH
... ~
... .,~~ - O.G.
~ N.A.
Bastel upon Surveyo( India mop with the r ",rmission of the Surveyor ~ntrGl of India.
The territorial waters of India extend into· the stQ
to a distance of twelv. nautical milts mfQSurtd from the appropriate bCllf lint.


GROWTH OF POPULATION OF THE 5 U A 1981-91
5Q
.5 URBAN
BOUNDARY, TALUK . .. ... ...
o .. CORPORATION AREA ..
~ ~. llj:.~:.. . OTHER TOWN. C.T.jCENSUS TOWN)
, VILLAGE WITH LOCATION CODE NUMB:=R
",.. AOI'IINISTRATIVE HEADOUARTERS OF TALUK ._
~-l Il~1 URBAN BUILT UP IAREA
z !:iRURAL RAILWAY, BROAD GAUGE - I .. · -501 iJ NATIONAL HIGHWAY WITH NUMBER ...
! !::: STATE HIGHWAY
1 1;:1 OTHER ROADS.. ..
-7541,::~:1, WATER BOOI_ES: LAKES/BACK WATERS ... I RIVERS{TIDALJ AND TRIBUTARIES,
I ;j
-looJ lJ <irowth rolfS t'xctudt Spill· over areas
OUT GROWTH
GROWTH RA TE OF RURAL POPULATION 1981-1991
30.00 & BELOW.
R.ad Growth of 'POGII;c Urban DA T A NOT AVAILABLE .... ~~,:,~;n;n~s AOfI tho s..u. SPILL-OVER URBAN AREA
TRIVANDRUM STANDARD URBAN AREA
District Trivandrum, Kerala
~/D Ai
NH - 1.7
SH
~ ~
O.G
N.A ,'--'] L ___ _
(Cl_CORPORATION (Pl_PART
Based upon Survey 01 India map with the permission of the Surveyor General of IndIa.
The terr;t.JNll waters of ,r,dia extend Iflte tne sea to 0 distance of .welve noutlcal mjle~ neo~ured from the app·~.:..r:ate base line
~ Government of Indio c.,yrl~t. 199.,


A-S STANDARD URBAN AREAS
Fly leaf
. Apart from providing census data on different aspects -for the administrative units like states, districts, taluks, -towns and villages in response to the ever growing demand of planners, administrators, scholars and others the census organisation has endeavored to tabulate and present census Statis~ics on certain well defined areas, delineated on the basis of a number of physical and demographic characteristics. An--attempt made in this direction was first made in 196 I Census to provide suitable data on trends of urbanisation by -adopting the concept of town groups which comprised of jndependent urban units not necessarily contiguous to one anotlter. [t was .subsequently observed that this concept suffered from some limitations. The data of one census could not'be compared with another census because of the changes in the boundaries of the towns and intermediate areas having been left out of reckoning. The town planners were finding it difficult to assemble census data for the urbanisable areas around the urban centres for preparing the master plans for cities and towns. Therefore, the concept of IT own group' and (ensus statistics derived therefrom were found to be of not much help for perspective planning for urban areas. To over-come this deficiency the Census organisation contemplated replacing the concept of IT own group' by a more suitable concept which could form the basis of a constant statistical spatial reporting unit and serve the need of preparation of master plans for cities or towns and for helping in urban developmental planning. The international Geographical conference held in New Delhi in 1969 had emphasised the desirability of evolving a suitable concept which would ensure comparability over space and time and help in urban planning.
The idea of standard urban area mooted in the first conference was developed and refined further in a series of meetings involving the Ministry of Works and Housing, Town and Country Planning Organisation and the office of the Registrar Gener~llndia. The concept of Town group was given up during 1'971 census and in its place the concept of Urban J\.ggIomeration and Standard Urban Area were evolved.
The distinction between Urban Agglomeration and Standard Urban Area is to be made clear. The Urban Agglomeration represents a contiguous urban spread constituting a town and its adjoining urban outgrowth or two or more physically contiguous towns together with contiguous well recognised urban outgrowths which may actually fall within the revenue limits of a village or villages. These (urbanised' villages or outgrowths deserved to be reckoned along with the town in confirmity with the continuous urban spread. The Urban Agglomeration represents a spatial urban spread at a given time.
The Standard Urban Area was defined as the projected growth area of a city or town as it would be in I 99 I taking
into account not only the towns and villages which are expected to get merged with it but also intervening rural areas -which are potentially urban. This covers all extra municipal growths sud! as suburbs(industrial and residential), railway colonies, civil lines, cantonments and villages and rural areas which are likely to be urbanised by I 99 I .
The concept of Standard Urban Area was adopted for the first time in 197 I census. It was a long time planning area and was to remain as a statistical reporting unit during the three successive censuses 197 I, 1981 and 1991. Like the Urban Agglomeration, Standard Urban Area is also an area unit which extended beyond the main city or town limit, municipal or otherwise. However, unlike in the case of Urban Agglomeration which represents the acwal urban spread at a given time, the Scimdard Urban Area is a large area unit which includes not merely urban areas lying in close proximity but all surrounding and intervening rural pockets which are likely to be urbanised by I 991 and this serve the role of a constant statistical reporting unit for these censuses, irrespective of the change in the local administrative boundaries of units within the Standard Urban Area. Thus the boundary of Standard Urban Area is not expected to undergo any change even though the limits of the existing town may change. Consequently, data generated by the censuses for the Standard Urban Area become more meaningful as it is comparable in different decades.
The characteristic features of a Standard Urban Area are given below:
-(i) It should have a core town with a minimum population of 50,000.
(ii) Contiguous areas made up of other urban as well as rural administrative units should have close muwal socio economic linkages with the core town.
(iii) The probability is that the entire area will get urbanised within a period of 2 to 3 decades. The Standard Urban Area has been identified with respect to administrative units such as Cities, towns or villages forming part of it. The boundary of Standard Urban Area remains co-terminous with the administrative boundaries of the peripheral units.
In 197 I, the delineation of Standard Urban Area was done jointly by the Census Directorate of Kerala and the Town Planning Department of Kerala, the office of the Registrar General India and the Central 1 own and Country Planning Organisation, New Delhi. They formulated tentative proposals showing the Urban areas, limits of cities and towns and the villages and towns on the pheriphery of the core
193

town/city which together were to constitute the Standard Urban Area tract. In identifying the unit the following yardsticks were used.
(a) A core town with a population of 50,000 and above in 1971 census.
(b) Predominant urban land use. The trends in the urban spread of the principal central town or city was taken note of. This involved the appreciation of the extent and the direction of urban growth and the recognition of any physical constraints such as topography, water bodies, marshes etc. to such urban expansion.
(c) Intensive interaction with urban centres as reflected in commutation for the purposes of work and secondary education facilities, extension of city bus services, sale of commodities like milk, dairy products, vegetables( other than those transported by train or truck) and purchase of food grains, cloth and general provision etc. by the consumers directly.
(d) Anticipated urban growth as a result of locational decision relating to industry, market, transport, and communication, administrative and servicing functions.
(e) Existence of big villages with a large proportion of working force engaged in non-agricultural industrial categories.
(f) The growth of villages and towns on the pherlpllery of the limits of the municipality/town and the prospects of their coalescence in future with the main city' was assessed. This implied the projection of their population and the extent of their physical growth upto 1991 .
(g) While including the village, the entire revenue area of the village then existing was brought with the Standard Urban Area and not merely the village site.
The standard Urban Area is a constant areal,statistical reporting unit and is not supposed to undergo changes after initial delineation and subsequent modification in terms of its boundaries. In the 1981 Census, d:e approach was that the boundaries of the Standard Urban Area fixed in the 1971 census should not be disturbed as far as possible because the area covered by the Standard Urban Area intended to serve as the basis of urban development planning for the concerned city or town upto 1991. The Chief Town Planner of Kerala was also consulted in finalising the Standard Urban Area for the t 981 census. In the 1981 census the definition of urban area was strtctly applied and consequently some of the cet;lsus towns of 1971 were declassified as rural in 1981 and sOfTIe places were treated as new towns. In 1 991 no census town
of 1981 was declassified as rural. But some rural areas of 1981 were treated as new towns in 1991. This resulted in some changes in mral and urban components of the Standard Urban Area of 1991 over that of 1981 census. However, the following 13 Standard Urban Areas which were delineated in 1971 continued in 1981 and 1991 also.
1. Kannl1r 2. Thalassery 3. Kozhikode 4. Vadakara 5. Palakkad
6. Thrissur 7. Kochi 8. Changanassery
9. Kottayam 10. Alappuzha 11. Kayamkulam 12. Kollam
13. Trivandrum
These Standard Urban Areas are presented in the AS Table in this volume. This table provides basic data like civic status, Area in Km2, density, occupied residential houses,· number of households and population by sex for' total population, houseiess population and institutional populationl
for the Standard Urban Areas as well as its components. It also provides the total population o(the last 3 censuses for such areas. The districts are arranged in the order of location code numbers. The Standard Urban Areas are arranged in alphabetical order within the district if there are more than one Standard Urban Area in a district. The data is presented in the sequence oft otaVUrban/Rural as was done in previous censuses The urban components have been arranged in descending order of the 1 991 population and outgrowths are shown with Roman numbers under the respective townsto which they belong. The rural components are arranged in the order of their 1991 census location code numbers.
The changes in the boundaries of the Standard Urban Areas are kept to the minimum to serve the needs for urban development planning besides functioning as a constant statistical reporting unit. The Standard Urban Area concept as stipulated in 1971 implied that the Standard Urban Areas boundaries as far as possible should be kept fixed till 1991 . Only in very exceptional cases the changes are made.
29 villages (whole or part) falling in 9 Standard Urban Areas of 1981 were treated as towns/urban outgrowths in the 1991 census. Their detaiis are given on next page.
194

Name of stand-ard urban area
Kozhikode
Vadakara
Pa:akkad
. Thrissur
Koehl
Kottayam
Alappuzha '-.
Kollam
Trivandrum
New Towns/Urban outgrowths in the 1991 Census formed from among Rural Components of Standard Urban Areas of 1981
Name of rural component 1981 Name of urban com-ponent town ( 1991 )
Village Whole/Part
2 3 4
Elathur Whole Elathur (OG) & Puthiyangadl (OG)
Ramanattukara Whole Ramanattukara(CT) Kadalundi Whole Kadalundi(CT) Perumanna Part Kuttlkkatoor( CT)
Villiappally Part Villiappally( CT)
Puduppariyaram Part Puthuppariyaram( CT) Marutharode Whole Marutharode( CT)
Poonkunnam Whole Poonkunnam(OG) Trichur Part Thrissur(OG) &
Chembukavu (OG) Peringavu Part Peringavu(OG) Nettissery Part N ettissery( CT)
Kadungalloor Whole Kadungalloor( CT) A1waye Part Edathala(CT)
Choornikkara( CT)
Cheranallur Part Cheranalloor( CT) Thlruvankulam Whole Thiruvankulam( CT)
Vijayapuram Part Vljayapuram( OG) Perumbaikad Part Perumbaikad(CT) Nattakam Part Nattakam( CT)
Punnapra Part Kalarcode( OG)
Thekkumbhagam Part Neendakara(OG) Kllikollur Part Mangad(CT) Quilon Part Sakthikulangara(OG)
Cheruvikkal Part Cheruvikkal(OG) Ulloor Part Ulloor(CT) Chettivilakam Part Kudappanakunnu(CT) Nemom Part Nemom(CT) Thiruvallam Part Thiruvallam( OG) Randamada Part } Anchamada Part Vattiyoorkavu (OG)
A statement showing the changes in the constituent units of urban components In Standard Urban Areas of 1 981
indudingthe changes in the boundary between 1981 and 1991 and nature and reason of change is furnished.
195

Changes In Urban Components ofSbndard Urban Areas Lylngwkhln the SUA Boundary During 1981·1991 and Nature and Reason(s) of Change
Urban Components in 1981 1991 Nature and reason(s) of
Name of SUA Name(Sbtus) Area Population Name(Status) Area Population change during 1981-91
1 2 3 4 5 6 7 8
I. Kannur 1. Cannanore(M) 11.03 60,904 ,1. Kannur(M) 11.03 65,238 I. Azhikode(NM) of 1981 2. Azhlkode(NM) 16.05 37,273 2. Chirakkal( CT) . 13.56 39,838 was bifurcated Into 3. Chlrakk~(NM) 13.56 36,124 3. Thottada( eT) 18.26 33,261 Azhlkode North (eT) 8[
4. Edakkad(NM) 18.26 '29,474 4. Puzhathi(CT) 9.17 30,616 Azhikode South (eT) 5. Puzhathl(NM) 9.17 26,099 5. Bayavoor(CT) 11.57 29,239 in 1991. 6. Bayavo~(NM) 11.57 25,481 6. Pallikkunnu(CT) 6.90 25,057 2. Edakkad (NM) of 1981 7. Palllkunnu(NM) 6.90 22,101 7. Azhikode'South(CT)
, .. . , . 7.40 23,077 was renamed as Thottada 8. Valapattanam(NM) 2.04 8,080 8. Azhikode North(CT) 8.64 19,277 (eT) iii 1991. 9. Canllanore Cantonment 1.79 4,489 9. Valapattanam(CT) 2.04 8,920
(Cantt) 10. Kannur ~nton!11ent (Cantt) 1.79 4,820
... ~ 2"Th~assery 1. TelUcherry(M) 15.35 75,561 1. Th~assery(M) 23.96 103,579 1. Kodlyeri Panchayat 8[
2. Kodlyeri(NM) 11.44 32,590 2. Dhannadom(CT) 10.66 26;705 New Mahe Panchayat 3. Dhannadom(NM) 10.66 23,143 3. Era~h~l( CT) , 10.08 23,584 were parts of Kodlyeri 4. Eranholl(NM) 10.08 21,521 4. New Mahe(CT) 2.82 11 ,939 ,(NM) in 1981. But In 1991
Kodlyeri Panchayat of Ko~yeri (NM) merged with Thalassery
(M) and New Mahe Panchayat of Kodiyeri (NM) became an In-dependent town with the name New Mahe(CT).
3. Kozhlkode 1. Callcut( C) 82.67 394,447 1. Kozhikode(C) 82.68 419,831 1. Feroke (NM) of 1981 2. 8eypore( NM) 10.41 40,946 i) Elathur (OG) 13.54 36,410 was bifurcated Into
"
3. CheruvannunNM) 10,31 38,941 ii)Puthlyangadi(OG) 0.Q3 377. Feroke (el) and . 4, Feroke(NM) . 13.53 37,720 2. 8eypore(CT) lQ.42 56,505 Karuvanthuruthy(CT) 5. Olavanna(NMj 2L43 34,004 3. ChenlVannur(CT) 10.31 50,556 in 1991
4. Kadalundi(CT)· 11.83 35,171 t Olavanna(NM) ofJ981 5. Olavanna(.CT) 11.33 28,382 was bifurcated into 6. Ramanattukara( CT) 11.71 2,5,672 Olavanna( CT) and 7. Feroke[CT) 7.58 25,511 Pantheeramkavu(CT) In·1991

8. Kanivllthuruthy{CT) 5.95 18,983 9. Pantheeramkavu(CT) 10.11 16,016
10. Kuttikkattoor{CT) 9.94 13,127
4. Vadakara Badaeara 21.34 64,m I. V ~d3kara{M) 21.33 72,434 2. Vllllappally{CT) 10.33 19,085
S. Pal&k.ad 1. Palihat{M) 26.60 111,245 1. P~akkad (M) 26.60 123,289 l.P~ahat RaIlway
2. Pali!1at RaIlway (I)Hemamblka Nagar(OG) 3.00 15,847 CoIooy (OG) of 1981
Colony (OG) 3.99 6,741 2. Puthupparlyaram(CT) 19.93 24,808 was renamed as Hemamb-
3. Marutharode(Cn 9.52 16,089 lka Napr (OG) In 1991
6. Thrfssur I. Trichur(M) 12.65 77,923 1. Thrissu~M) 12.65 74,604
I) Perini3\'u{OG) 0.90 1,963 I) Peringavu( OG) 2.85 3,699
2. Ollur{NM) 9.33 27,802 II) Thrissur (OG) 1.23 2,642
3. Mannuthy{NM) 13.35 25,474 III)Chembukavu lOG) 0.28 545
4. Chlyym(NM) 4.91 20,315 Iv) Ponkunnam lOG) 1.46 308
5. Arilattukara(NM) 5.84 14,397 2. Ollur(CT) 9.33 33,137
6. Nadathara(NM) 5.52 14,321 3. Mannuthy(CT) 13.35 31,914
7. Vllvattom(NM) 6.25 13,704 4. Chlyyaram{CT) 4.91 21,598
8. Edakkunny(NM) 5,59 11,835 5. Nadathara{CT) 5.52 17,971 .... 9. Ayyanthole(NM) 7.25 11,767 6. Vllvattom(CT) 6.25 16,904 I() ""I 10. Vlyyur{NM) 5.09 11,489 7. Aranattukara(CT) 5.84 16,623
11. Koortkancherry(NM) 2.60 8,624 8. Ayyanthole{ Cn 7.25 13,492 9. Edakkunny(CT) 5.59 13,265
10. Vlyyu~CT) 5.09 11,303 11. KOOIkkancherry( CT) 2.60 9,512 12. Nettlssery(CT) 4.22 7,536
7. Koehl 1. Cochln(C) 94.88 513,249 1. Kochl(C) 94.88 564,589 1. 800r(NM) of
i) Thrikkakara(OG) 27.46 38,318 i) Kakkanad( OG ) 14,59 17,999 1981 was blful"
2. 800r{NM) 20.73 46,856 2. Edatha~(CT) 28.92 56,397 cated Into 800r(M)
3. Kaiamassery(NM) 27.00 43,767 3, Kalamassery(M) 27.00 54,342 and Vrappuzha(CT)
4. Thrippunlthura(M) 18.69 43,646 4, Thrippunithura(Ml 18.69 51,078 2. Thrikkakara(OG)
5. Maraoo(NM) 12.35 28,749 5. Mara~li(CT) 11..I't 34,995 of 1981 was
6. Alwaye(M) 7.18 25,278 6. Choornlkkara(CT) 17.02 34,837 bifurcated Into
7. Mulavucad(NM) 19.27 21,397 7. 8oor(M) 14.21 34,455 Kakkllad(OG) &
O. Chtrlyakadavu(NM) 4.13 6,713 8. Vazhakkaia(CT) 12.87 33,167 Vazhakkala(CT) 9. Kadungalloor( eT) 14.66 25,433
10. A1uva(M) 7.18 24,774 11. V arappuzha( eTI 7.74 22,514 12. Mulawkad(CT) 19.27 22,322

Changes In Urban Components of Standard Urba'l\Areas lylngwlthln/the SUA Boundary During 1981·1991 and Nature and Reason(s) of Change
Urban Components in
1981 1991 Nature and reason(s) of Name of SUA Name( Status) Area Population . Name(Status) Area Population change dur1ng 1981·91
/
1 2 3 4 5 6 7 8 13. Cheran~loorl el) 10.59 21,407 14. Thlruvankulam( eTl 10.49 18,412 1 S. Cheriyakadavu(CT) 4.12 7,401
8. Kottayam Kottayam(Mj 15,55 64,431 I. KottJyam(Ml 15.55 63,155 I) Vliayapurant(OGj 11.19 24,387
2. Perumbalkad( CTI 11.02 33,006 3. Nattakam(CT) 13.50 22,903
9. Alappuzha 1. Alleppey(M) 46.77 169,940 I. Alappuzha(M) 46.77 174,666 lIn 1981, Pathirappa"v 2. PathirappalMNM) 5.91 21,068 I) Kalarkode( OG) 6.50 14,834 (NM) was fonned by a port·
_. 2. Kbmalapuram(CT) 6.00 20,847 ion of Aryad South Village. In I() co 1991, a portion of this village,
alon~ with a portion of Aryad North viflage fonned a new vII· lage by name Komalapuram which ~ec3me Census town. Only a part of Komalapuram (eT) treated 31 uttan compo-nent of the SUA.
to. Kollam I. Quilon(M) 18.48 137,943 I. KoIlam(M) 18.48 139,852 1 Eravipuram(NMj of l) KlIIkoIlur! OG.) 5.88 29,655 I) Sakthllrulang· 1981 was bifurcated
2. Eravlpuram(NM) 10.06 47,274 ara (OG) 9.17 44,451 into Eravlpuram( CT) 3. Vadakkevlla(NM} 8.55 43,680 H) Mundakkal(OG) 3.45 21,280 and Mundakkal(OG)
lUI Neendakat'a (OG) 10,19 15,424 of Kollant(MJ. 2. Vadakkevila (CT) 8.55 50,165 2 Kllikollur(OG j of Quilon(M) 3. Eravlpuram(CTI 6.60 34,627 with Killkollur Village 4, KUikoliur (CT) 4.66 28,456 (Portion J of 1981 was bifur· S. Mangad(CT) 6.55 28,311 cated Into two Villages, Ie,
Kilikollur and Mangad Both

!he _ have been treated
as census _In 1991.
11. Trtvandrum 1. Trivandrum(C) 74.93 483,086 I. Trivandlllm(C) 74.93 524,006 1 Kadakampally (NM) of 1981 1) Thumba(OG) 10.67 16,445 ' I) Vattlyoorkavu(OG) 10.61 33,653 was renamed as Anayara (eT)
2. Kadakampally(NM) 8.14 20,594 II) Thumba(OG) 11.87 22,720 In 1991. III) ChenJvlkkaI (OG) 8.70 21,286 Iv) Thlruvallam(OG) 6.54 15,910
2. Kud~pan~kunnu(CT) 7.69 33,534 . 3. Nemom(CTj 8.83 30,117 4. Ulloor(CT) 7.97 25,719 5. Anayara(CT) 8.14 24,541

As the standard urban area has to serve the need for urban development planning besides functioning as a constant statistical reporting unit, the existing boundaries of the SUA are not disturbed as far as possible. But as a result of the state government's decision to extend the Jurisdiction of the town the SUA boundary also had to be modified to accommodate such statutory extension of the urban units. Besides this the urban agglomeration formed In the respective census also affects the boundary of SUA. The urban agglomeration of a city/town shows the urban spread of the core town. The SUA Is a wider unit which depicts not only the present urban spread but potentially of the urban spread of the core town over a period of time. The urban agglomeration are therefore, normally to be covered by the relevant standard urban area. In the case of urban agglomeration the component units may Include a few outgrowths In addition to Independent towns. Sometimes the outgrowth of a town
may not fall within the standard urban area boundary when the core town Is located with In the standard urban area boundary. In such cases, minor modifications are required In the standard urban area limit to ensure that the relevant urban agglomeration with all oflts components Is covered In the standard urban area. Wherever the urban spread of UAs has transcended the boundaries of SUA's which were flxed In 1971, such transcended area are considered as spill over urban areas. The data relating to the spill over urban area and those lying with In the standard urban area boundary will be given separately.
There are 22 units of spill over urban areas In 7 standard urban areas. The nature of the spillover area Is given In the following statement.
Nature of Spill-Over Urban Areas Lying Outside the Standard Urban Area Boundary
Name of SUA
Kannur
Kozhlkode
Vadakara
Koehl
Kottayam
Alappuzha
Name of spill over urban area
2
Muzhappilangad( CT}
Kuttikkattoor(P)( CT}
Koduvally (Cn Kunnamangalam (Cn Kak~odl.(CT)
Villlappally(P)( CT)
A1angad (Cn Kottuvally (CT) Kedamangaiam (CT) Parawr (Parur)(M)
Perumbalkad(P}( CT} Vljayapuram (P)(OG) Nattakam(P)(CT)
Komalapuram(P) (Cn Kalarkode(P) (OG)
200
Nature of spill over urban area
3
Town lying outside SUA boundary but now a constituent unit of UA (lying In SUA)
Portion which was rural In 1981 now statutorily merged with Kuttlkkattoor (CT) of the SUA bu.t lying outside SUA boundary
Towns lying outside SUA boundary but n?_f. a constituent unit of UA (lying In SUA)
Whole town Included In UA but a portion of this lying outside SUA boundary.
Towns Iyfng outside SUA boundary but now a constituent unit of UA (lying In SUA)
Whole toWnS Inc:luded In UA but the portion of these lying outside SUA boundary
Whole towns Included In UA but portion of these lying outside SUA boundary.

Nature of Spill - Over Urban Areas Lying Outside the Standard Urban Area Boundary
Name of SUA Name of spill over urban area Nature of spill over urban area
Trivandrum
2
Punnapra (OG)
Kazhakkoottam( OG) Sreekaryam (OG) Kovalam (OG) Thumba(P)(OG) Thil1lvallam(P) (OG) Nemom (P) (CT)
A comparison of different standard urban areas with reference to some of the demographic characteristics such as area, population size, density of population, sex ratio, density of occupied residential houses, proportion of households to occupied residential houses and household size, is made in the following paragraphs.
Area
Kochi standard urban area having an area of 429.56 Sq.Km. is the largest standard urban area in Kerala. Kozhikode come second with an area of 293.56 Sq. Km. followed by Trivandrum with t 79. t 2 Sq.Km. and Palakkad with 137.52 Sq.Km. of area. Rest of the standard urban areas have an extent of less than 100 Sq.Km. the smallest being Kayamkulam with 32.43 Sq.Km.
Population
As in the case of area, Kochi standard urban area come first in respect of population also with I, t 85,589 persons in 1 991 census. Kozhikode comes in the second place with 884,935 persons followed by Trivandrum with 827,393 persons. Changanassery standard urban area is smallest in population with 75,675 persons. Kayamkulam is another standard urban area with population less than 1 lakl1. Other standard urban areas have population varying between t lakh and 3 lakhs in the census of 1 99 t .
Density of population
Kollam standard urban area leads all other standard urban areas in density with 4,829 persons per Sq. Km. followed by Trivandrum( 4,6 t 9), Thalassery(3,489), Alappuzha(3, t 42), Thrissur(3, tIt) and Kozhikode(3,OI4). All other standard urban areas have got density less than 3,000. The lowest density of population is in Palakkad standard urban area (1,599).
Sex ratio
3
OG of a town of SUA but lying outside of SUA boundary
OGs of the town of SUA but lying outside SUA boundary
Whole town/OGs included in UA but the portion of these lying outside the SUA boundary
In all SUAs except Kochi, females out number males, as per 1991 census. The highest sex ratio is in Thalassery SUA with t ,089 females per 1,000 males followed by Thrissur, Vadakara and Alappuzha. The sex ratio in Kochi is only 996 females per 1,000 males which is in favour of males.
Density of occupied residential houses
Trivandrum SUA claims the first position with 920 occupied residential houses per Sq. Km. followed by Kollam(896), Alappuzha(600), Thrissur(589), Kochi(529), Kayamkulam(519) and Thalassery(SI 0). All other SUAs have less than 500 occupied residential houses per Sq. Km. The lowest position in this respect is held by Palakkad with 293 residential houses in one Sq. Km. of are'a.
House-Household ratio
There are 1 04 households per 1 00 occupied residential houses in Trivandrum standard urban area. The lowest household to house ratio is in Kottayam with 101 households per 100 houses
Household size
Four standard urban areas viz. Kannur, Thalassery, Vadakara and Kozhikode have more than 6 persons per household on an a,verage while Palakkad, Thrissur, Kochi, Changanassery, Alappuzha, Kayamkulam and Kollam have the household size above 5 and below 6. The average household size in Kottayam and Trivandrum standard urban areas is above 4 but below 5. The lowest household size is 4.82 persons per household in Trivandrum standard urban area, the highest in Thalasser'y with 6.74 persons per household on an average.
201

A-5 : STANDARD
State/ Standard Urban Area and Component Civic Area Popu- Number Houseless Populadon District Units Status In latlon of
Km2 per occupied No. 0( Males Females Km2 residential house-
houses holds
2 3 4 5 6 7 8 9
KERAlA All Standard Urban Areas a) Areas lyin, within the SUA boundary
Total 1,438.06 3,208 831,243 2,264 3,004 1611
Urban 1,175.76 3,666 776,184 2,264 3,004 1611
Rural 262.30 1,154 55,059
b) Spill-over Urban Areas 204.67 2,005 77,491 104 217 115
KANNUR 1. Kannur (Cannanore) Standard Urban Area (CANNA- a) Areas lying within the SUA boundary NORE) Total 90.36 3,091 41,551 179 261 163
Urban Components 1. Kannur (Cannanore) M 11.03 5,915 9,357 97 129 78 2. Chlrakkal CT 13.56 2,938 6,003 16 28 28 3. Thottada (Edakkad) CT 18.26 1,822 5,313 7 16 11 4. Puzhathl CT 9.17 3,339 4,440 3 2 4 5. Elayavoor CT 11.57 2,527 4,575 21 31 20 6. Palllkkunnu CT 6.90 3,631 3,897 1 1 7. Azhlkode South • CT 7.40 3,119 3,468 4 4 8. Azhlkode North • CT 8.64 2,231 2,856 1 1 9. Yalapattanam CT 2.04 4,373 946 29 49 22
10. Kannur(Cannanore) Cantonment Cantt 1.79 2,693 696 Total Urban Group 90.36 3,091 41,551 179 261 163 Rural Components Nil Total Rural Group
b) Spill-over Urban Areas 1. Town !yIn, outside SUA boundary but now a
constituent unit of Kannur UA (lyini In SUA) Muzh3l)pllangad CT 7.19 2,616 2,641 9 31 21 Total Spill-over Urban Areas 7.19 2,616 2,641 9 31 21
2. Thalassery (TelJlcherry) Standard Urban Area a) Areas lyin, within the SUA boundary
Total 47.52 3,489 24,229 137 256 108 Urban Components
1. Thalassery (Teilicherry) M 23.96 4,323 14,743 120 223 92 2. Dharmadom CT 10.66 2,505 4,119 3 7 5 3. Eranholl CT 10.08 2,340 3,874 4. New Malle (Kodlyerl) CT 2.82 4,234 1,493 14 26 11
Total Urban Group 47.52 3,489 24,229 137 256 108 Rural Components Nil Total Rural Group b) Spill-over Urban Areas. Nil
* Azhlkode (N M) of 198 1 has been bifurcated Into two census townS namely Azhlkode South and Azhlkode North. Separate population figures of 198 1 Is not available for both the towns 50 that combined population figures has been prest"ttd In Column 18 of the table.
202

URBAN AREA
Institutional Population
No. of Males Females households
10
4,621
4,621
146
433
185 27 26 59 34 23
5 14 18 42
433
8 8
167
135 16 6
10 167
II
40,916
40,916
2,503
4,574
1,167 114 119
1,152 115
89 20
134 1'51
1,513 4,574
31 31
1,217
1,039 93 36 49
1,217
12
27,783
27,783
619
773
363 1
20 87 54
5
3 6
234 773
357
318 37
2 357
Total Populatlon(lncludlng Institutional and houseless population)
No. of Males Females 1961 households
13 14 15 16
853,824 2,283,545 2,329,169 NA
Population during 1961-1991
1~,1 1981 1991
17 18 19
2,448,450 3,521,956 4,612,714 (2,830,347) (4,112,950)
798,114 2,133,402 2,176,468 NA 2,243,766 3,264,975 4,309,870
55,710
78,095
42,340
9,698 6,070 5,320 4,506 4,640 3,937 3,497 2,860 1,114
698 42,340
2,665 2,665
24,596
15,068 4,120 3,875 1,533
24,596
150,143
203,181
137,070
32,043 19,370 15,880 15,559 13,938 12,098 11,170 9,408 4,580 3,024
137,070
9,072 9,072
79,384
49,879 12,802 11,118
5,585 79,384
203
152,701
207,243
142,273
33,195 20,4G8 17,381 15,057 15,301 12,959 11,907 9,869 4,340 1,796
142,273
9,740 9,740
86,423
53,700 13,903 12,466 6,354
86,423
NA 204,684 (586,581)
20,852 24,393
NA 67,208 -
NA 55,162
NA ...,
5,746 7,296 2,859 4,750
NA 67,208
NA 68,759
NA 68,759
NA 68,759
(3,286,043) 256,981
(826,907) 71,298
250,025
60,904 36,124 29,474 26,099 25,481 22,101 37,273
8,080 4,489
250,025
14,345 14,345
152,815
75,561 23,143 21,521 32,590
152,815
302,844
410,424
279,343
65,238 39,838 33,261 30,616 29,239 25,057 23,077 19,277
8,920 4,820
279,343
18,812 18,812
165,807
103,579 26,705 23,584 11,939
165,807

A-5 : STANDARD
Statef Standard Urban Area and Component Civic Area Popu- Number Houseless Population District. Units Status in latlon of
Kmz per occupied No. of Males Females Kmz resi dential house-
houses holds
2 3 4 5 6 7 8 9
KOZHIKODE 3. Kozhikode (Calicut) Standard Urban Area and a) Areas lying within the SUA boundary MALAP- Total 232.37 3,413 124,166 349 585 396 PURAM
Urban Components KOZHIKODE 1. Kozhlkode (Callcut) C 82.68 5,078 64,842 252 418 303
I) Elathur OG 13.54 2,689 5,686 9 II 8 II) Puthiyangadi OG 0.03 12,567 40 2. Beypore CT 10.42 5,421 8,436 2 2 3. Cheruvannur CT 10.31 4,904 7,639 5 4 2 4. Kadalundi CT 11.83 2,973 5,503 20 24 25 5. Olavanna *. CT 11.33 2,505 4,828 6 25 6 6. Ramanattukara CT 11.71 2,192 4,176 31 66 28 7. Feroke ** CT 7.58 3,366 4,063 12 1 1 3 8. Karuvanthuruthy * * CT 5.95 3,190 2,977 2 5 3 9. Pantheeramkavu * CT 10.11 1,584 2,866 10 19 18
10. Kuttikkattoor{P) CT 9.94 1,321 2,252 Total Urban Group 185.43 3,918 113,308 349 585 396
MALAP- Rural Components PURAM
In Emad Talule 1. Chelambra Village 12-5-1-12{10-3-1-20) 15.81 1,560 4,031 2. Pallikkal Vlllage(P) 12-5-1-13{10-3-1-21) 13.81 1,363 2,922
'1'1 Tlrur Taluk 3. Thenhippalam Village 12-5-3-3 (10-3-3-2) 17.32 1,337 3,905
Total Rural Group 46.94 1,420 10,858
b) Spill-over Urban Areas KOZHIKODE 1. Portion statutorily merged with
Kuttlkkattoor (CT) of SUA but lying outside SUA boundary
I. Kuttikkattoor{P) CT 3.73 1,067 710 2. Towns lying outside SUA boundary but
now constituent units of Kozhikode UA (lying In SUA)
1. Kunnamangalam CT 24.26 1,411 5,938 2. Kakkodl CT 18.59 1,615 5,386 31 93 53 3. Koduvally CT 14.61 1,610 3,956 6 4 2
Total Spill-over Urban Areas 61.19 1,500 15,990 37 97 55 4. Vadakara (Badagara) Standard Urban Area a) Areas lying within the SUA boundary
Total 50.38 2,802 21,671 116 152 97 Urban Components
1. Vadakara (Badagara) M 21.33 3,396 10,695 109 141 91 2. VlIIlappally{P) CT 10.33 1,848 3,143 7 11 6
Total Urban Group 31.66 2,891 13,838 116 152 97 Rural Components
* Olavanna(NM) of 1981 census has been bifurcated Into Olavanna(CT) and Pantheeramkavu(CT) In 1991 census and population of earlier censuses have been shown aralnst Olavanna(CT) as separate populadon of each town Is not available
* Feroke(NM) of 1981 census has been bifurcated into Feroke(CT) and Karuvanthuruthy{CT) In 1991 census and population of earlier censuses have been shown arainst Feroke(CT) as separate population of each town Is not available
204

URBAN AREA
Institutional Population
No. of Males Females households
10 11 12
526 5,949 4,511
416 4,839 4,066 12 52 81
14 139 2 19 400 141 13 63 14
8 76 101 20 134 21
5 14 6 1 47
12 29 7 6 156 72
526 5949 4,511
17 1,672 11 46 3 2 180 110
30 1,898 113
86 841 244
61 430 240 25 411 4 86 841 244
Total Population(including Institutional and houseless population)
No. of households
13
127,574
67,468 5,869
60 8,580 7,764 5,579 4,875 4,252 4,107 2,989 2,878 2,273
116,694
4,035 2,926
3,919 10,880
710
5,946 5,422 3,962
16,040
22,005
10,981 3,157
14,138
Males
, 14
391,726
207,016 17,862
195 27,829 25,032 17,084 13,967 12,866 12,731 9,375 7,996 6,635
358,588
12,260 9,333
11,545 33,138
1,971
17,812 14,785 11,639 46,207
69,080
35,579 9,368
44,947
Females 1961
15 16
401,453 NA
212,815 (NA) 18,548
182 28,676 NA 25,524 21,434 18,087 14,415 7,841 12,806 12,780 24,124 9,608 8,020 6,492
367,953 NA
12,403 10,851 9,485 7,240
11,612 9,723 33,500 27,814
(NA)
2,009
16,416 15,239 11,885 45,549
72,060 70,541 (80,879)
36,855 43,908 9,717
46,572 43,908
205
Population during 1961-) 99)
1971 1981 1991
17 18 19
458,522 596,289 793,179 (507,091) (689,640)
333,979 394,447 419,831 36,410
377 27,688 40,946 56,505 28,522 38,941 50,556
35,171 34,004 28,382
25,672 30,516 37,720 25,51 I
18,983 16,016 13,127
420,705 546,058 726,541
14,896 19,492 24,663 9,865 12,319 18,818
13,056 18,420 23,157 37,817 150,231 66,638
(863,86) (143,582)
3,980
34,228 30,024 23,524 91,756
87,671 105,316 141,140 (101,047) (121,993)
53,938 64,174 72,434 19,085
53,938 64,174 91,519

A-S : STANDARD
State! Standard Urban Area and Component Civic Area Popu- Number Houseless Population District Units Status In lation of
Km2 per occupied No. of Males Females Km 2 residential house-
houses holds
2 3 4 5 6 7 8 9
1. Onchlyam Village(P)12-4-1-2(10-2-1-2) 4.90 2,914 2,251 2. Chorode Vlllage(P)12-4-1-3(10-2-1-3) 8.28 3,357 4,262 3. Palayad Village(P) 12-4-1-14( 10-2-1-21) 5.54 1,362 1,320
Total Rural Group 18.72 2,651 7,833
b) Spill-over Urban Areas 1. Portion statutorily merged with
Villiappally (CT) of the SUA but lying outside SUA boundary Vllllappally(P) CT 7.02 1,554 1,860 Total Spill-over Urban Areas 7.02 1,554 1,860
PALAKKAD 5. Palakkad (Palghat) Standard Urban (PALGHAT) Area.
a) Areas lying within the SUA boundary Total 137.52 1,599 40,317 114 116 77
Urban Components 1. Palakkad(Palghat) M 26.60 4,635 22,173 112 113 71 i) Hemamblka Nagar OG 3.00 5,282 3,204 2 3 6
2. Puthuppariyaram CT 19.93 1,245 4,625 3. Marutharode CT 9.52 1,690 3,070
Total Urban Group 59.05 3,049 33,072 114 116 77 Rural Components
I. Pirayiri Village(P) 12-6-3-11 (10-4-3-19) 10.26 2,272 3,925 2. Akathethara Village(P) 12-6-3-14( 10-4-3-12) 19.00 298 1,108 3. Malampuzha I Village (PI 12-6-3-15 {I 0-4-3-13) 45.80 151 1,458 4. Kodumba Village (P) 12-6-3-17 (10-4-3-22) 3.41 1,15 t 754
Total Rural Group 78.47 508 7,245
b) Spill-over Urban Areas Nil
THRISSUR 6. Thrlssur (Trlchur) Standard Urban Area (TRICHUR) a) Areas lying within the SUA boundary
Total 88.42 3,11 t 52,120 379 406 158
Urban Components 1. Thrlssur (Trichur) M 12,65 5,898 13,849. 328 328 96 I) Peringavu OG 2.85 1,298 756 Ii) Thrlssur (Trichur) OG 1.23 2,148 556 5 4 6
iii) Chembukavu OG 0.28 1,946 111 Iv) Poonkunnam OG 1.46 211 71 2.01lur C1 9.33 3,552- 6,277 10 1\ 7 3. Mannuthy CT 13.35 2,391 6,051 6 10 II 4. Chiyyaram CT 4.91 4,399 4,063 5. Nadathara CT 5.52 3,256 3,507 6. Vilvattom CT 6.25 2,705 3,231 7. Aranattukara CT 5.84 2,846 3,178 1 1
8. Ayyanthole C1 7.25 1,861 2,585 7 7 9. Edakkunny CT 5.59 2,373 2,440 20 43 38
10. Viyyur C1 5.09 2,221 2,133 IT. Koorkkanchery CT 2.60 3,658 1,856
206

URBAN AREA
Institutional Population
No. of Males Females households
10 11 12
224 936 1,173
114 579 946 60 136 33 19 93 124 31 128 70
224 936 1,173
390 3,5'37 3,660
186 1,188 2,378 I 2
3 16 1 11
12 95 122 46 487 348 11 40 94 14 46 211 23 718 223 12 149
7 33 33 6 24 70
55 706 80 10 21 78
Total Population(including 1stitutional
No. of households
13
2,256 4,286 1,325 7,867
1,886 1,886
41,417
22,923 3,306 4,793 3,100
34,122
3,959 1,118 1,459
759 7,295
52,991
14,348 762 556 I 1 1
71 6,407 6,083 4,066 3,544 3,245 3,193 2,647 2,471 2,167 1,864
and house less population)
Males
14
6,935 13,532
3,666 24,133
5,245 5,245
108,729
61,047 7,770
12,141 7,949
88,907
11,504 2,894 3,514 1,910
19,822
134,459
35,755 1,781 1,287
260 i50
16,271 15,704 10,671
8,738 8,451 8,179 6,526. 6,451 5,919 4,634
207
Females
15
7,345 14,261
3,882 25,488
5,666 5,666
111,128
62,242 8,077
12,667 8,140
91,126
11,804 2,773 3,409 2,016
20,002
140,594
38,849 1,918 1,355
285 158
16,866 16,210 10,927 9,233 8,i53 8,444 6,966 6,814 5,384 1.878
1961
16
8,215 13,973 4,445
26,633 (36,971)
NA
77,620 NA
NA
8,141 NA NA
2,028 NA
NA
NA
NA
Population during 1961 -1991
1971 1981
17 18
10,197 12,480 17,816 21,572
5,720 7,090 33,733 41,142
(47,109) (57,819)
131,902 160,196 (156,428) (190,084)
95,788 111,245 7,032 6,741
102,820 117,986
12,229 16,214 8,725 14,850 5,786 7,894 2,342 3,252
29,082 42,210 (53,608) (72,098)
102,198 239,614 (110,654) (249,553)
76,241 77,923 1,963
25,957 27,802 25,474 20,315 14,321 13,70i 14,397 11,767 11,835 11,489 8,624
1991
19
14,280 27,793
7,548 49,621
10,911 10,911
219,857
123,289 15,847 24,808 16,089
180,033
23,308 5,667 6,923 3,926
39,82"4
p5,053
74,604 3,699 2,642
545 308
33,137 31,914 21,598 17,971 16,904 16,623 13,492 13,265 11,303 9,512

A-S : STANDARD
Statel Standard Urban Area and Component Civic Area Popu- Number Houseless Population District Units Status in latlon of
Km 2 per occupied No. of Males Females Km2 residential house-
houses holds
2 3 4. 5 6 7 8 9
12. Nettlssery CT 4.22 1,786 1,456 Total Urban Group 88.42 3,111 52,120 379 406 158 Rural components Nil Total Rural Group
b) Spill-over Urban Areas Nil
ERNAKUlAM 7. Kochi (Cochln) Standard Urban Aru a) Areas lying within the SUA boundary
Total 370.86 2,883 204,807 204 284 130 Urban Components
1. Koehl (Cochln) C 94.88 5,951 103,751 111 150 53 I) Kakkanad ** OG 14.59 1,234 3,778 9 II 9 2. Edathala CT 28.92 1,950 10,563 2 2 3. Kalamassery M 27.00 2,013 11,430 6 24 18 4. Thrippunithura M 18.69 2,733 10,415 19 36 29 5. Maradu CT 12.34 2,836 6,769 6. Choornikkara CT 17.02 2,047 6,522 7 5 2 7. Boor* M 14.21 2,425 7,557 3 3 8. Vazhakkala ** CT 12.87 2,577 6,670 II II 9. Kadungalioor CT 14.66 1,735 4,828 3 12 10
10. Aluva (Alwaye) M 7.18 3,450 4,949 28 25 9 11. Varappuzha * CT 7.74 2,909 4,370 2 2 12. Mulavukad CT 19.27 1,158 4,247 I I t 3. Cheranalioor CT 10.59 2,021 4,104 2 2 14. Thlruvankulam CT 10.49 1,755 3,966 I 5. Cherlyakadaw CT 4.12 1,796 1,370
Total Urban Group 314.57 3,256 195,289 204 284 130 Rural Components
1. Puthencruz village 12-8-1-19(10-6-3-14)+ 28.10 831 5,020 2. Thlruvanlyoor village 12-8-1-23 (10-6-3-14)+ 28.19 767 4,498
Total Rural Group 56 .. 29 799 9,518 b) SplII-over Urban Areas 1. Towns lying outside SUA boundary but
now constituent units of Koehl UA (lying in SUA)
I. Alangad CT 21.02 1,695 6,769 33 53 10 2 Kottuvally CT 21.00 1,641 6,686 3. ParaVlir (Parur) M 9.02 3,094 5,446 4 3 4. Kedamangalam :::T 7.66 2,415 3,622 I I
Tou! Spill-over Urban Areas 58.70 1,984 22r523 38 57 11
KOTTAYAM 8. Changanassery (Changanacherry) Standard Urban Area
a) Areas lying within the SUA boundary Total 37.72 2,006 14,01.<. 94 101 54
• EIoor(CT) of 1981 ce!lSllS has bten bifurcated Into EIoor (H) and Varapuzha (CT) in 1991 census and populadon of earlier censuses have been shown against Boor (CT) as separate population of each town is not available.
• TMldtakara(OG) of 1981 census has beenblrurcated Into K*kanad (OG) and Vazhakkala (CT) In 1991 census. Seperate populadon figures of 1981 is notavallable for bOth CT and OG so that combined population figures lias been presented against Kakkanad COG) In Column 18 of the table.
+ In Kunnathanad Taluk, OIemmanad vltage of 1981 census was bifurcated Into two villages In 1991 viz Puthencruz and Thlruvaniyoor. Seperale population figures of 1971 s: 1981 are not avaBabie for bodIlhe vln3l'S so that combined population flgures luve been presented in Column I 7 and I 8 of the table.
208

URBAN AREA
Institutional Population
No, of Males Females households
10
3 390
1,456
832 16 76 87 41
6 33
125 48
9 124
11 10 11 25
2 1,456
11 10 13
1 35
89
II
3,537
12,624
8650 61
856 495 194
14 652 454 329
48 635
42 45 27
108 14
12,624
87 54 26
167
443
12
23 3,660
7,747
4,188 101
1,104 395 169
19 243 180 479
636 173
5 17 9
29 7,747
13 174 109
25 321
826
Total Populacion(lncludlng insdtutlonal and houseless population) Population during 1961-1991
No,of Males Females 1961 1971 1981 1991 households
d 14 15 16 17 18 19
1,456 3,682 3,854 7,536 52,991 134,459 140,594 NA 102,198 239,614 275,053
(NA) (8,456) (9,939)
210,095 536,975 532,131 (NA) 563,884 809,209 ',069,106 (666,178) (947,108)
108,924 283,432 281,157 277,723 439,066 513,249 564,589 3,787 8,997 9,002 38,318 17,999
10,565 28,138 28,259 56,397 11,436 27,789 26,553 17,957 43,767 54,342 10,434 25,286 25,792 14,444 28,090 43,646 51,078 6,769 17,487 17,508 28,749 34,995 6,529 17,694 17,143 34,837 7,560 17,953 16,502 20,725 46,856 34,455 6,681 16,734 16,433 33,167 4,831 12,814 12,619 25,433 4,977 12,305 12,469 20,863 24,067 25,278 24,774 4,372 10,993 11,521 22,514 4,248 11,017 11,305 21,397 22,322 4,106 10,606 10,801 21,407 3,966 9,188 9,224 18,412 1,370 3,637 3,764 6,713 7,401
200,555 514,070 510,052 313,030 529,905 767,973 1,024.122 (NA)
5,033 12,033 11,329 NA 33,979 41,236 23,362 4,507 10,872 10,750 21,622 9,540 22,905 22,079 NA 33,979 41,236 44,984
(136,273) (179,135)
6,802 17,719 17,901 35,620 6,686 16,795 17,662 30,665 34,457 5,450 13,596 1.4,310 20,852 24,393 26,288 27,906 3,623 8,989 9,511 18,500
22,561 57,099 59,384 20,852 24,393 56,953 116,483
14,318 37,436 38,239 56,469 66,533 73,046 75,'675
1209

A-S : STANDARD
State/ Standard Urban Area and Component Civic Area Popu- Number Houseless Population District Units Status In latlon of
Km2 per occupied No. of Males Females Km2 residential house-
houses holds
2 3 4 5 6 7 8 9
Urban Components 1. Changanassery (Changanacherry) M 13.50 3,885 9,818 94 101 54
Total Urban Group 13.50 3,885 9,818 94 101 54 Rural Components
1. Chethlpuzha village (Vazhappally East Village) 12-1D-4-3 (10-8-4-3) 11.04 1,970 3,907
2. Changanassery (Changanacherry) Village (P)12-10-4-5 (10-8-4-5) 13.18 113 287 Total Rural Group 24.22 959 4,194
b) Spill-over Urban Areas Nil
9. Kottayam Standard Urban Area a) Areas lying within the SUA boundary
Total 61.64 2,556 31,441 118 176 67
Urban Components 1. Kottayam M 15.55 4,061 12,632 55 60 23 I) VIJayapuram (P) OG 11.19 2,179 4,767 36 36
2. Perumbalkad (P) CT 11.02 2,995 6,490 20 38 37 3. Nattakam (P) CT 13.50 1,697 4,727 7 42 7
Total Urban Group 51.26 2,798 28,616 118 176 67 Rural Components
1. Aimanam Village (P}12-1D-3-13(10-8-3-13) 2.82 2,993 1,682 2. Veloor Village (P)(12-10-3-17(1D-8-6-16) 3.40 458 307 3. Panachlkkad Village (P}12-10-3-1S(10-S-3-IS) LOS 2,593 5S5 4. Muttampalam Village(P) 12-1 0-3-19 3.08 417 251
Total Rural Group 10.38 1,357 2,825
b. Spill-over Urban Areas I. Portion statutorily merged with Nattakam
and Perumbalkad census towns and Vllaya-puram (OG) of Kottayam(M} of,the SUA but lying outside SUA boundary
1. Nattakam(P) CT S.S3 1,660 3,066 2. Perumbaikad(P) CT 3.02 2,105 1,171 3. Vllayapuram(P) OG 0.59 3,531 426
Total Spill-over Urban Areas 12.44 1,857 4,663
ALAPPUZHA I O. Alappuzha (Alleppey) Standard Urban Area (ALLEPPEY) a) Areas lying within the SUA boundary
Total 60.14 3,551 40,236 67 101 49
Urban Components I. Alappuzha (Alleppey), M 46.77 3,735 32,203 66 100 47 I) Kalarkode (P) OG 6.50 2,282 2,997 1 2 2. Komalapuram (P) CT 6.00 3,475 4,379
Total Urban Group 59.27 3,549 39,579 67 101 49
Rural components Pathlrappally village (P) 12-11-2-2 0.87 3,674 657 Total Rural Group 0.S7 3,674 657
210

URBAN AREA
Institutional Population
No. of Males Females households
10 11 12
89 443 826 89 443 826
289 2,385 2,279
166 1,201 1,186 30 742 568 66 317 412 27 125 113
289 2,385 2,279
158 602 394
91 479 366 7 15 25
60 108 3 158 602 394
Total Population(including institutional
No. of households
13
10,087 10,087
3,936
295 4,231
31,846
12,869 4,799 6,537 4,780
28,985
1,714 307 588 252
2,861
3,067 1,186
461 4,714
41,067
33,016 3,006 4,388
40,410
657 657
and houseless population)
Males
14
26,011 26,011
10,686
739 11,425
78,649
31,397 12,181 16,591 11,385 71,554
4,209 807
1,408 671
7,095
7,364 3,190 1,035
11,589
104,694
85,699 7,184
10,255 103,138
1,556 1,556
211
Females
IS
26,434 26,434
11,061
744 11,805
78,884
31,758 12,206 16,415 11,518 71,897
4,232 749
1,392 614
6,987
7,297 3,167 1,048
11,512
1961
16
42,376 42,376
12,782
1,311 14,093
NA
52,685
52,685
4,963 NA 521
NA
108,849 138,834 (145,259)
88,967 138,834 7,650
10,592 107,209 138,834
1,640 1,640
(6,425)
Population during 1961-1991
1971 1981
17 18
48,545 51,955 48,545 51,955
16,532 19,313
1,456 1,778 17,988 21,091
68,344 74,053 (124,245) (140,176)
59,714 64,431
59,714 64,431
6,760 7,461 1,198 1,418
672 743
8,630 9,622 (64,531) (75,745)
160,166 169,940 (168,737) (201,069)
160,166 169,940
160,166 169,940 (191,008)
(8,571) (10,061)
1991
19
52,445 52,445
21,747
1,483 23,230
157,533
63,155 24,387 33,006 22,903
143,451
8,441 1,556 2,800 1,285
14,082
14,661 6,357 2,083
23,101
213,543
174,666 14,834 20,847
210,347
3,196 3,196

A-5 : STANDARD
State/ Standard Urban Area and Component Civic Area Popu- Number Houseless Population District Units Status in lation of
Km 2 per occupied No. of Males Females Km 2 residential house-
houses holds
2 3 4 5 6 7 8 9
b) Spill-over Urban Areas 1. Ponion statutorily merged with Komala-
puram (CT) and Kalarkode (OG) of Alappuzha (M) of the SUA but lying outside SUA boundary
1. Komalapuram (P) C1 8.00 2,051 3,631
2. Kalarkode(P) 'OG 5.00 1,687 1,704 2. OG of Alappuzha (M) of SUA but lying
outside SUA boundary 1. Punnapra OG 12.21 2,439 5,627 9 8 7
Total Spill-over Urban Areas 25.21 2,167 10,962 9 8 7 AlAPPUZHA 11. Kayamkulam Standard Urban Area (AllEPPEY) a) Areas lying within the SUA boundary
Total 32.43 2,818 16,815 4 14 6 Urban Components
1. Kayamkulam M 21.79 3,082 12,081 4 14 6 Total Urban Group 21.79 3,082 12,081 4 14 6 Rural Components
1. Krishnapuram village (P) 14-1 1-4-16( 10-9-6-17) 10.64 2,278 4,734 Total Rural Group 10.64 2,278 4,734
b) Spill-over Urban Areas Nil
KOllAM 12. Kollam (Quilon) Standard Urban Area (QUILON) a) Areas lying with in the SUA boundary
Total 82.50 4,829 73,960 86 99 32 Urban Components
l. Kollam (Quilon) M 18.48 7,568 25,602 76 90 29 i) Sakthikulangara OG 9.17 4,847 8,618 7 6
ii) Mundakkal* OG 3.45 6,168 3,870 iii) Neendakara OG 10.19 1,514 2,914 2. Vadakkevila CT 8.55 5,867 "9,128 2 3. Eravipuram * CT 6.60 5,247 6,206 4. Kilikollur CT 4.66 6,106 5,293 2 2 5. Mangad CT 6.55 4,323 5,339
Total Urban Group 67.65 5,360 66,970 86 99 32 Rural Components
l. Thrikkadavoor Village 12-13-5-7 (10-10-6-7) 14.85 2,415 6,990 Total Rural Group 14.85 2,415 6,990
b) Spill-over Urban Areas Nil
TRIVANDRUMI3. Trivandrum Standard Urban Area
a) Areas lying within the SUA boundary Total 146.20 5,011 145,918 417 453 274 Urban Components
l. Trivandrum C 74.93 6,993 102,848 404 426 245 i) Vattiyoorkavu OG 10.61 3,172 6,893
ii) Thumba (P) OG 11.87 1,914 4,811 8 15 25
Eravipuram (CT) of 1981 has been bifurcated Into Mundakkal (OG) & Eravlpuram (CT). Separate population figures of 1981 Is not available for both OG and CT. So that combined population figures has been presented against Eravlpuram(CT) in in Column 18 of the table
212

URBAN AREA
Institutional Population
No. of Males Females households
10
28 28
34
34 34
147
104 13 2 7
11 3 3 4
147
622
499 19 17
11
176 176
180
180 180
937
734 38
7 33 56 14
'52 3
937
6691
5,305 50
340
12
116 116
229
229 229
1,683
1,361 38 92
157
34 1,683
3,907
3,105 9
12
Total Population{including institutional and houseless population)
No. of Males Females 1961 households
13
3,639
1,706
5,662 11,007
16,899
12,128 12,128
4,771 4,771
76,261
26,713 8,831 3,904 2,984 9,243 6,270 5,522 5,391
68,858
7,403 7,403
152,415
107,892 7,345 4,915
14
7,995
4,036
14,601 26,632
44,884
33,106 33,106
11,778 11,778
197,538
69,340 22,254 10,528
7,727 24,898 17,258 13,976 13,865
179,846
17,692 17,692
362,921
259,672 16,639 11,270
15 16
8,411
4,397
15,182 27,990
46,509 58,905
34,045 44,571 34,045 44,571
12,464 14,334 12,464 14,334
200,893 NA
70,512 NA 22,197 10,752
7,697 25,267 17,369 14,480 32,273 14,452
182,726 NA
18,167 21,437 18,167 21,437
(53,704)
369,733 NA
264,334 NA 17,014 11,450
213
Population during 1961-1991
1971 1981 1991
17 18 19
16,406
8,433
29,783 54,622
71,177 80,552 91,393
54,102 61,327 67,151 54,102 61,327 67,151
17,075 19,225 24,242 17,075 19,225 24,242
191,463 289,788 398,431 (233,473) (363,049)
124,208 137,943 139,852 44,451 21,280 15,424
43,680 50,165 47,274 34,627
41,871 29,655 28,456 28,317
166,079 258,552 362,572
25,384 31,236 35,859 25,384 31,236 35,859
(67,394) (104,497)
410,623 521,113 732,654 (488,817) (653,840)
409,627 483,086 524,006 33,653
16,445 22,720

A-S : STANDARD
State/ Standard Urban Area and Component Civic Area Popu- Number Houseless Population District Units Shtus In ladon of
Km2 per occupied No. of Males Females Km 2 residential house-
houses holds
2 3 4 5 6 7 8 9
iii) Cheruvikkal OG 8.70 2,447 4,563 Iv) Thlruvallam (P) OG 6.54 2,433 3,230 3 6 2. Kudappanakunnu CT 7.69 4,361 7,083 3. Nemom(P) CT 8.83 3,411 6,150 2 6 3 4. Ulloor CT 7.97 3,227 5,293 5. Anayara CT 8.14 3,015 4,842
Total Urban Group 145.28 5,035 145,713 417 453 274 Rural Components
l. Muttathura Village(P) 12-14-3-1 O( 10-11-3-17) 0.92 1,270 205 Total Rural Group 0.92 1,270 205
b) Spill-over Urban Areas l. Porcion statutorily merged with Thumba(OG)
and Thiruvailom (OG) of Trivandrum (C) and Nemom (CT) of the SUA but lying outside SUA boundary
1) Thumba(P) bG 4.16 2,683 2,403 2) Thiruvallam (P) OG 6.15 2,595 3,138 + 3) Nemom (P) CT 4.04 3,080 2,577 2. OGs of Trivandrum (e) of the SUA but
iying outside SUA boundary I) Kovalam OG 4.68 5,431 4,379 10 23 21 2) Sreekaryam OG 8.87 1,944 3,732 3} Kazhakkoottam OG 5.02 2,493 2,623
Total Spill-over Urban Areas. 32.92 2,878 18,852 II 24 21
Second set of population data shown under columS. 16, I 7 & '8 within brackelS are those published In 1981. The difference In area figures of some SUA's be(\veen 198 I and 1991 Is due to the revised computation of area fitures supplied by Director of Survey and Land Records and Lotal bodies.
214

URBAN AREA
Total Population(including institutional Institutional Population and houseless population) Population during 1961-1991
No. of Males Females No. of Males Females 1961 1971 1981 1991 households households
10 11 12 13 14 IS 16 17 18 19
17 127 188 4,612 10,468 10,818 21,286 4 20 4 3,321 7,931 7,979 15,910
18 177 171 7,320 16,506 17,028 33,534 5 37 252 6,399 14,798 15,319 30,117
39 623 114 5,401 13,013 12,706 25,719 4 12 52 5,005 12,025 12,516 20,594 24,541
622 6,691 3,907 152,210 362,322 369,164 NA 409,627 520,125 731,486
205 599 569 NA 996 988 1,168 205 599 569 NA 996 988 1,168
(79,190) (133,715)
2,414 5,510 5,650 11,160 3,230 7,900 8,058 15,958 2,584 6,223 6,219 12,442
18 48 10 4,578 13,051 12,368 25,419 17 99 45 3,771 8,509 8,736 17,245 10 84 14 2,645 6,144 6,371 12,515
45 231 69 19,222 47,337 47,402 94,739
215


ANNEXURE - A
SCHEDULES (i) House List
(ii) Enterprise list
(Iii) Household Schedule
( iv) Individual Slip
(v) PGDHTP Schedule

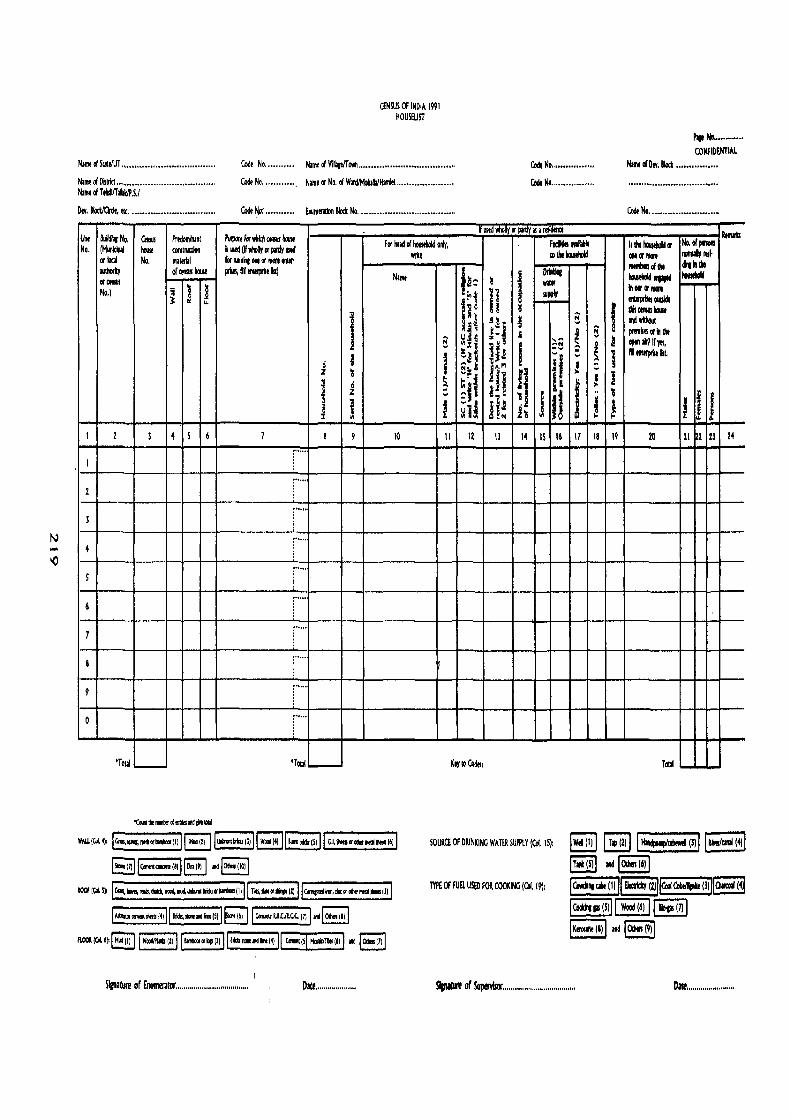
...
NIIDI01 SCltIlUT" ............................ " ... " .. ""." .......... ..
Nal1ll 01 Dklrict ........................................................ "". NamtalTIhlIllTIiIiJP.S.I
0". 11ocIIGt~, !Ie ................................................... ..
UIII BuUdilfNo. C!fIsIIl I'ndomlnln( No. (HIII\~1 haul! consuualon
llIioclI No. material IIIIf10rly oI(e!KIII haul! 111«l11li$ .. 1 No.) 1 8
3: I< LI.
1 2 3 4 S 6
1
I
I
4
5
6
7
8
9
0
'Toul...._
'Caoithe..,t.rdIllUl<lMdtl¥tl:U
aNSUS OF INDIA 1991 HOUSEI,IST
Codl No. ................. Name of VIIIae!IT own ........................................................... .
Code No. .................. NIIDI or No. of Wl'dMoh.llla/Hamlet .................................. ..
Code 1\1:' .................. Enilllnion Block No .......................................................... ..
PlIIJIOIlrorwltk/lCllllllillvll Fill hladolhoultholdolff, ilKldlhW,llIp!lliyui!d
illite lor IUhn~ II1II III mon W" prile,tlienlllpri'.t)
NmI'
] 5 ! 1 d
Z ~ '.I 0 ~
1 z -~ ~ :I: III
7 8 9 10 11
...... ,.
.........
, ........
.... , ....
f~: f! li ~h ~!] _'" ~l:t ~.
dj ~1 12
'Toul_ Key til Codes:
Plat No •••• _ .....
COMIIO~NTlAl Code No ......................... . Nam.oIDIV.IIodI ................. " ...... ..
Code No ...... " .. " ............ ..
Code No ..... " .................................. .
Ule.l WhOI~ III pani'f ~ I r!!14!1I:' RInurb F.mIIabIe IIIhI hoiotIdd cr No.olPflOlll til IhI houH1d:I IIIIIcrlllOrt IIOIIIIIlJ ,,~
lIItIIIbIJoIlhI 611 III 1M
I Oritq hoIIIIIIoIdllRlll houMtioId ! - 1n0ll'1II'_
11 IIIpp1y r-~
f 1IUriIIIIfI000iIkM dlkctMIIIlllllni
!~I ! ~ IIIdwldlaut !~ J ~ ~ pnmillcr~ tilt
... ~ ! opIIIaIr?lljII,
I!! I =~ ~ if
- 1 IIIIt111rprhe.L
~
(I -
JiI !II I ~ 1 .. '$
j J !l~ ~ ! I h \l 14 IS 16 11 18 19 20 11 ~ %l 24
To~
WAllICO.4): IGrm.leIvoI,r1OIIorilllb.wllll~ G-b!IcIJ!l)]lwaodI4) I (;b!IcIJ Isd I CJ.IIotuOfolllr __ !6d 50URC£OFDP.lNKINGWATERSUPPlYI~ IS): lWei (I) II TIP 12" ~1IIbIwtR (3)1 ~CIIIII 14d
[3IC--IIII~ NEE] 1001 Ito. 511 5 ....... ,1hIIIII, wood,""',""'""b!IcIJ« ...... ll~ r-11I;;-,I1II;-«-.-I'""'IIIIIc.m,.talrDn,dUoIIIr ....... I!U
&_tillt"4dl'rlcls,""'''''''S'18Ic-u~Jl.c.c.1n I"d~ flOOl lto.6J:S iWoollllotll'I'II"",,"d,'l,IE""'''''''4J I~t!i[ HOIlkIIIoI61].d 100000inj
Slanature of Enumerator ................................... .. Dace ................... .
~ II1II 10dtrI 16i1
TYPE Of FUEl USED FOR COOKING (Col. 19): [1AwdI" ale (1)11 £Iearkiy @lCGIIC«.(JH§-'4j I Cooklll PI (5)11 Wood (6) II BIo-ps In I I Ktnmn! (8l1 and 10dI4n (9D
$IpIIn of Su.-.................................... . Date ................ , ..... ..

~ N o
CENSUS OF INDIA 1991 (ECONOMIC CENSUS)
ENTERPRISE LIST
Page No ....................... ..
1. State/Union Territory .................................................................. Code No. .......................................... 5. Name or No. ofWardlMohalla/Hamlet....................... Code No ................................. ..
2. District ....................................................................................... Code No. .......................................... 6. Enumerator's Block No ........................................... ..
3. Tahlll/TalukalP.~.IDev. Block/Circle etc ......................................... Code No. .......................................... 7. CD. Block............................................................... Code No .................................. .
4, Village/Town ............................................................................. , Code No .......................................... , B. RurallUrban ............................................................ Code No.
.. 51. No. of <II !! 't i enterprbe e~ 0 ::I .... <III 0..1 Z:J
... ~ :eX :J I:Sc
<II X 1II1'l ...... :J :t ... 1 0 0 ; ... I Description of activity of o e
0 0 .. 0 ..... ... 0 enterprise c c III • .1:1') 0
" o , E-::18
., ,
" 0-w ...
::1'0 I'll 1: ..... ~ U ~ ~~ "0 II III .....
~:! c U u .:'. ..... Code ::J 0
1 1(1) 3 4 4(1) 5
[a] la] [b]
totaH xx xxx x
to13I·2 xx x x xxx x
Signawre of Enumerator ..... " ....................... , ........... , ......... ,., .............. , ........ date 51gnawre of Supervisor ............ , .................................................................. date
(a) count number of entries and give total (b) count number of entries with code 1 and give total (cl give total of entries with code 1 in col.5 (d) count number of all entries In col. 17 and give total In the bracket
'"' ~ c.!. o I'l wI: ~ 0 <II ~ Q,<II 0'" ... ... 0, <II;; Io-J C ... e I'lll
Z~ Q, .....
6
[b]
x
(e) count number of entries In col. 17 corresponding to code lin col, 5 and ~ve total In the bracket (0 ~ve total of all entries.
10'"' <IIi"I
~ i ~ 10
.E Q,
:E 0<11 .I: 'tl
l:! ..... <II. 00 <II "'. e Q, • ~~
~ ::I~ 0 ' <II') .. t--.. Ill\/) 2·-," 0 ";;jflllA'" ~~ ~
<II
~u ~ ~
~ 1: 0 Ill\/) Q. .....
7 8 9 10
[b] [b] [b] [ij
x x x [e]
Number of persons usually working dal~
Total (Including unpaid workers) Hired Remarks
'" III ;; E II u.
11
In
Ie]
c I: III ~ <II .. 10
:l2
~ '" ;; :l2 ;; <II E :c ;; :c w
1: <II 0 U u. U t--
12 13 14 15 16 11 18
[ij [0 [ij [ij to lmd]
[c] [e] [c] [c] [c] [clle]
"Type of ownership-private· 1 , c~radvfo2, public· 3
"Power/fuel used-without power· 1 , electricfty·2, coal/soft coke·3,
petrol/dleseJ.4, gas·5, nrewood-6, blogas·7,
animal power·B, others·9.

CENSUS OF Boot No .... " .......... ".... Fonn No .. ' ...... ltlll .... , ..
Locadon code .......... 1 ...................... '.,11 ........ 1,.'1
Serial nuriter of household ".'._ ...• 1 .... "' ...... " ..... ,. HOUSEHOLD
51. Name Relationship ...iL Ale Mother tonlUe Rel~on ,...
Name or Male .. J
.... schedu~d No. to head M F u~ "' .... caste/tribe Entry In Entry In t foo
! -s'" ~ i 14A 148
f 15 ! ~ ! Yes No Yes No
1 2 1 4 5 6 7 8 9 10 II 12 IJ 14 15 16 17
Total" _ ..... SC ST
t tin the boxes ~ve the total after coundlll the entries. M
F
p
Slll'1tureofEnwnerator,' .... ,.II' .. , •• ,.~"'.tI ... U" .. "tI, ...

INDIA 1991 CONFIDENTIAL
Type of household (Institutional or Houseless)* ." ............... ""."."""." ...... " ....... ,, ... ..
SCHEDULE Code No. ofDevelopmentBlock ................................................................ , ................ .
51. Male Female If OW in ISA indicate No.
Entry in 1SA EntfY in Entry In Entry In 1 SA Name of establ~hment Nature of Industry, Description of work ~ $ 14A 14B trade or service ...
'" ~ I. ~ ~ C AL HHI OW ...
Yes No Yes No C AL HHI OW ::i
1 18 19 20 21 22 23 24 25 26 27 28 29 30 31 32 33 34 , .........
....... ,,'
." ... 0".
1"" .... ,
otalH For office use only * For Institutional write 1 I~ 3tegory M Category M F Category M F For House\ess WTlte 0
Checked and found correct III VI IX
IV Vll Marginal Workers
V(b) VIII X Non· Workers
SignatureofSupervlsor .......... " .... "' .. ' .... " .... "'" .. ".,,, ... n'III"I., ~ign3tureof Coder ......................
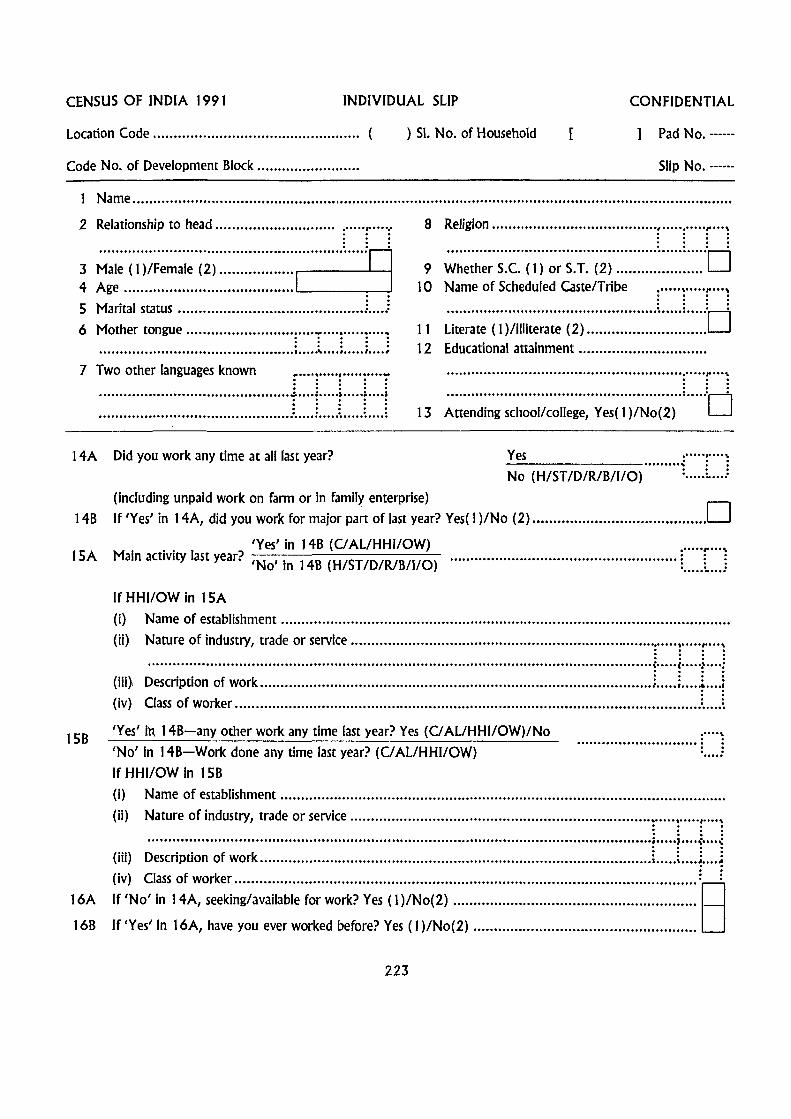
CENSUS OF INDIA 1991 INDIVIDUAL SLIP CONFIDENTIAL
Location Code ................................................. . } SI. No. of Household [ ] Pad No. ------
Code No. of Development Block ........................ . Slip No. ------
Name .............................................................................................. , ................................................. .
2 Relationship to head......... ........... ......... :'" .. ! ..... ~ 8 Religion ........................................ ~ ..... : ..... ! .... ~ . . . . . . · . . . · . . .
! ~~~ :~:~ ~:.~~:~~~:~~ ~:: ::::::: :::::::::: j ................. : 9 · . . . ...................................................... ·········0 9 Whether S.c. (1) or S. T. (2) •.••.................
10 Name of Scheduled Caste/Tribe :·····~·····r···~ · .. 5 Marital status ............................................. : ..... : · .. ................................................... ~ .. ···:····:0 6 Mother tongue .......................... !' ... : .... ;-.... ;-... : 11 Literate (1 }/illiterate (2) .•.•.•.•••.•....•..•.........
12 Educational attainment ......•........................ . . . . . • , .......................................................•••••••• 1 •••• '
7 Two other languages known f····r····~·····r···:
............................................................... ,. ... " · . . · . · . .............................................. -: .... ! .. ... ~ ..... : .... ! : : : : : ...................................................................... 13 ~~~~~~;~~·~~~~~;~~~I~~~~:·~:·;i;·;~~~~;·)··:···· .. O
14A Did you work any time at all last year? Yes : ..... ~ .... ~ ._------......... , . No (H/ST/D/RIB/I/O) ...... :. ... :
(including unpaid work on farm or in family enterprise) 14B If 'Yes' in 14A, did you work for major part of last year? Yes( 1 )/No (2) .......................................... 0
'Yes'in 14B (CiALlHHIIOW) 15A Main activity last year? 'No' in 14B (H/ST /D/RlB/I/O)
...... ,. ... , · . . ........................................................ . . · . . · . . ...........
15B
16A
16B
If HHI/OW in 15A
(i) Name of establishment ............................................................................................................ .
(ii) Nature of industry, trade or service ......................................................................... r .. T .. T ... 1 .......................................................................................................................... ! ..... ~ ..... ~ .... ~
(iii), Description of work ...................................................... ......................................... : ..... i •••• .; .••• ! . . (iv) Class of worker ................................................................................•................................ : ..... ~
'Yes'in. 14B-any other work any time last year? Yes (CiALlHHIIOW)/No
'No' in 14B-Work done any time last year? (C/ AL/HHIIOW) If HHIIOW in 15B
..... "
(i) Name of establishment ........................................................................................................... .
(ii) Nature of industry, trade or service ............................................................................... , ..... , .... , : : : : . . . . ., ........................................................................................................................ ! ..... ~ .... ~ .... ~
(I'I'I') D .. f k : : : : escnptlon 0 wor ............................................................................................... : ..... , .... ~ .... ~ . . (iv) Class of worker ................................................................................................................ :8: If 'No' in 14A, seeking/available for work? Yes (1 )/No(2) .......................................................... .
If 'Yes' in 16A, have you ever worked before? Yes (1 )/No(2) ..................................................... .
223

17 A Whether you are an Ex-selViceman? Yes( 1 )/No(2) ••...•......•.•...•.•...•..•.•...........•••••••••••.•••....••••.•.... 17B If 'Yes' in 17 A, Pensioner( 1 )lNon-Pensioner(2) ....••.•...•..•.•••...•.......•..•..•...•..•••••••••••••••.•••••.••...•••. B 18 Birth place : .... ~
(a) Place of birth ................................... 0: :
(b) Rural (1 )/Urban{2) .................... -:-.... • (c) District ................................ - .... i .... L ... i . . . . (d) State/Country ...................... .:.. ... L ... L.J
19 Last residence C"': (a) Place of last residence ........................ :0: (b) Rural (1 )/Urban (2) .................. ~ .... .. . . .. (c) District ................................•.... l .... i .... i (d) State/Country ...................... L ... L ... L.J
20 Reasons for migration from place D of last residence (Code) * ........................ .
21 Duration of residence at the village or I town of enumeration ........................ '--_...J
22 For all ever-married women only
(a) Age at marriage •••••••••••••••••••••••••. I~ _---' (b) Number of children surviving
at present
HaleD Female 0 (c) Number of children ever born alive
Male D Female D 23 For currently married women only
Total D
Total D
Any child born alive during : .... ~. last one year .......................................... ,; .... ;
I Employment (1) I Business (2) Education (3) I Family moved (4) I Marriage (5) Natural calamities like drought, floods, etc. (6) Others (7)
224

CONFIDENTIAL CENSUS OF IteD1A-1991
POSTGRADUATE DEGREE HOLDERS & TECHNICAL PERSONNEl SURVEY
LOCATION CODE, __ _ (To be filled In by the enumerator)
INSTRUCTIONS FOR FILLING UP THE FORM:
Please fill up this form if you are holding
I. Postgraduate degree in any subject, or
Rural/Urban [Please tick (-1) one 1
2. Technical Degree/Diploma in Engineering, Technology, Medicine (Allopathy, Homoeopathy, Ayurvedic, Unani), Agriculture, Pharmacy, Architecture, Education, Veterinary Science, Dentistry, Nursing, Applied ArtS, Management, law, library Science, Physical Education, Computer Science, or
3. ITI Certificate IMPORTANT: Please tick (--II correct information about yourself against the questions marked*: 4, 5, 6(a), --I
6(b), 7(b), 9, 10 col. (4),12 (c), 14 (a). For example If you are female-Male/Female
1. Name __________________________________ _ 2. Mailing address ___________________________ _
3. Date of bIrth 4 Sex* Male/Female 5. Are you married*: YesINo. 6 (a) Do you belong to Scheduled Caste/Tribe* : YesINo
6(b) If Yes* (SC/ST) 7(a} Home State: (the State to which you belong) (7b) location of your residence *Rural/Urban
8. Educational Qualifications (Please start with highest level of qualification)
(i)
(ii)
(iii)
Degree/Diplomal Certificate
Subject Year of Passing
Division Unlversltyllnstitution/ Professional Body
9. Activity status*: (a) Employee (b) Self employed (c) Student (d) Trainee / Apprentice (e) House-hold work
(f) Retired (g) Not employed (I) Seeking job (2) Available for job (3) Not available for job
State/Country
10. If employee (now or earlier), employment details [Enter code Nos (mentioned overleaf) for nature of activity of organisation, nature of work and sector1
Employment Name of the Location of the Nature of Sector of Nature of Year of Year of Total income organisation organisation activity employment work Joining leaving (including allowances)
of the (Mention Mention (Rs per month) State *Rural (R) Organisation Code no.) (Code No.)
Urban (U) (Mention code no) At entry Last drawn
1 2 3 4 5 6 7 8 9 10 11
Present (RlU) l>< Immediate (RlU) past
First , (RlU)
11. If self employed: (I) Since which year (ii) Average monthly earning Rs p.m. (iii) If employing others, number of persons employed (iv) Nature of activity of your organisation (v) Nature of your work (Please see overleaf the code numbers for iv & v)
12. If unemployed: (a) Duration of continuous unemployment (in months) (b) Please mention period, from (c) Would you like to be self employed* (-reslNo) If so, how _____________________________________________ _
13. Please Indicate your field of specialisation In order of priority (I ) _________________ (2) _______________ _
14. (a) Is nature of your present employment relevant to your field of specialisation * (YesINo) (b) If no, please Indicate the area/manner in which your expertlze could be best utilised, _______________________________________________ _
I S. Visits abroad for study/research/training and employment for more than 3 months stay: (a) Total number ofvisits ___ (b) Total stay (months)
(c) Details of two visits of longest duration:
Signature
Date
(i)
(U)
Purpose Country Duration (months)
IMPORTANT: Please return this form to the enumerator duly filled In, failing which post It.
225
Year of return

INSTRUCTIONS Fo~owlng code numbers have to be mentioned 'underemployment details In Item No. 10 and II for nature of activity of the organisations nature of work and sector of employment. A. NaMe of activity of the org3l11satlon [Enter the code number In Column No.5 of Items 10 and In Item II (Iv) J
Code No. Nature of activity of the organisation
1. Agrlculnlre, Forestry & F~hing 2. Mlnfng & Quarrying. 3. Manufacturlng, Processing Including plant maintenance. 4. Generation & Distribution of electricity, gas and water. 5. Construcdon. 6. Wholesale & Retail trade Including restaurant and hotels. 7. Transport, Storage and Communication Organisations. 8. Banking, Insurance and similar flnanclallnstltutlons. 9. Real Estates & Legal ServIces
10. Public Admlnlsuatlon. II. Education (Universities & Colleges). 12. Education (PolytechniC &, ITI). 13. Education (Schoo~). 14. Research & Development 15. Medical & Health Services. 16. Community, Social & Personal ServiCes Including Repair Services 17. All other activities not covered above (Please specify).
B. Nature of Your Work
N [(Enter the code number In Column No.7 ofkem 10 and Item 11 (v)]
N 0- CadeNo. Nature of work
I. Teaching 2. Teaching cum Research 3. Research 4. Professional work refated to fleld of your education for example:
En~neers, Medical Doctors. lawyers. Economists. etc. 5. Design & Developme'1tlT esdng/Quality Control 6. Repair & Maintenance 7. Mnln~tradonlManagement 8. OericallSecretarlal/ Accounting 9. Participating dlrecl~ In prodlctlon/processlng work.
10. Engaged In actMtles related to agrkulturelanlmal husbandry 11. Providing Community/Social/Personnel Sefllices 12. Others (Please specify)
C. Sector of Employment (Enter the code number In Column No.6 of Item 10)
Code No. Sector of employment
L Central Government 2. State Government 3. PubHc Sector Undertaking (Cenual) 4 Public Sector Undertaking (State) 5. local Bodies e.g. Municipal Corporation 6. Private Sector 7. Autonomous bodies (e.g. Unlversldes.ICAR CSIR ICSSR) 8. CooperatiVe & Joint Sector
'" .. ~ -t
'" 0 I'" 0
Postage will be paid by Addressee
BUSINESS REPLY INLAND LETTER
IARIP.O. NEW DELHI 110012
PERMIT NO. ORO (C) 162
Human Resource Development Group, CSIR Division for Scientific & Technical Personnel
CSIR Complex, NPL Campus, PUS3 New Deihl· 110012
No Postage necessary If posted In India
o ....I
~ -------THIRDFOLD _______ 0
8 11.1 VI
ANNEXURE - B
INSTRUCTIONS TO ENUMERATORS FOR FILLING UP THE HOUSE LIST

ANNEXURE - B
INSTRUCTIONS TO ENU}.1ERATORS FOR FILLING UP THE HOUSE LIST
'ntroductlon
Before the census ofthe population Is taken In 1991, It Is essential to locate and to Identify all places which are occupied or used or which are likely to be occupied or used by people. The houselistlng operations are mainly meant for this purpose and housellstlng is a primary but Important step In the census.
2. The housellst which Is proposed to be canvassed durIng the housellsdng operaOOns is given at the end of this book. It will be noticed that the form Is simple. It collects certain basic Information which will help In forming enumeration blocks for the census Itself. In addition, information on the amenities available to the census household is collected. The houselfst also serves as a frame for the enterprises for which a separate" Enterprise List" will have to be canvassed as part of the housellsting operations.
3. The manner in which the housellst has to be completed and the concepts and their explanation are described In detail In this book. It is absolutely essential for you to become thoroughly familiar with these Instructions since this job of housellsting Is an extremely important one. Apart from listing of houses you will also be collecting some useful data on the amenities available to the household which are required for planning purposes. The success of the housellstlng operations Is very much dependent on a thorough understanding of the concepts, definitions and instructions and on a faithful application of these concepts and definitions and your following the Instructions In the actual filling of the houselist form. If you have any doubt you should not hesitate to ask your Supervisor or your Charge Officer for clarification. As a census enumerator you havea great responsibility and there is no doubt that you will perform this task with pride and d~otion to duty.
4. The housellstlng operations will involve certain basic steps which may be briefly summarised as follows:
(1) The preparation of a notional map and a lay-out sketch ofthe area assigned to you.
(2) Numbering of buildings and census houses.
(3) Filling up the houselist itself.
(4) Preparation of the housellst abstract.
(5) FIlling up the Enterprise list for which separate Instructions have been Issued to you.
(6) Preparation of the abstract of the Enterprise list.
5. The preparation of notional map and the lay-out sketch is first described and after that the basic concepts relating to a building, a census house and the household are Indicated. Thereafter, the actual Instructions with regard to filling up of the housellst have been given.
Preparation of notional maps and lay-out sketches
6. In order to be able to complete the housellst it would be necessary to locate and Identify the buildings and hosues. This can only be done if you are thoroughly familiarwith the area assigned to you for these operations. The purpose of the lay-out sketch and the notional map Is essentially to ensure that your jurisdiction Is quite dear. Also, as will be seen later, It Is only If a lay-out sketch ii prepared that you will be able to allot census house numbers wherever necessary. The first step, therefore, is to prepare the notional map and lay-out sketch of the area assigned to you.
Notional Map
7. The notional map, as its very name indicates, is a map which is not drawn to scale. It Is prepared for the entire village or urban block and is meant to show the location of each enumeration block within the village or town. Whether It is for a village or an urban block, the notional map will have to show the general topographical details of the entire village or urban block. If a survey map is already available with the village revenue official, the preparation of the notional map will be easy because that can be copied out and the topographical details entered. The topographical details which should be indicated on the notional map would include permanent features and landmarks such as the village site, well-known roads, cart tracks, hills, rivers, nallas, etc., as also railway line and similar cearly recognizable features. It is important that the boundaries of panchayats, patwaris' crides or halkas or hamlets are distinguished If possible and the names of hamlets should also be entered wherever they are known by partlcular names. For the purpose of preparation of the notional map, you will be provided a seaprate sheet. Please use this for preparation of the notional map.
8. The notional map will In effect be an oudlne map of the village or urban block. Specimen notional maps for rural and urban areas may be seen at Annexes A and B.
9. In the case of very large villages when there are many blocks, it may be difficult to Indicate the outline of the entire village. In such cases, It Is sufficient If you show in the notional map the block assigned to you.
229

Lay-out Sketch
10. Having prepared the notional map, you would have to prepare the detailed lay-out sketch of your block. The layout sketch is in effect a detailed map of the block assigned to you in which will be shown the streets and the bildings on the streets. The main purpose of this lay-out sketch is to Clearly present the streets in the block and the buildings so that based on the lay-out sketch the operations can be carried out. As in the case of the notional map, in the lay-out sketch also important topographical details should be shown. This is not a document which is drawn to a scale. It is a free hand drawing. In order to be able to draw the lay-out sketch it would be necessary for you to go around the village or block assigned to you so that you become familiar with the area, the way the streets run and the main topographical features. Having gone around the village or block, you should start from one end of the village or block and draw a sketch.
It is important that the dividing lines between one blockand another should be clearly demarcated. Such dividing lines, besides following some natural boundaries wherever possible, should also be indicated by the survey numbers that fall on either side of the dividing line in cadastrally surveyed villages. In villages which are not cadastrally surveyed, the line can be indicated by the name of the owner of the field on either side of the line or by the name of the field, if any.
11.ln the lay-out sketch every sigle building or house should be shown. PucGland kutchahouses must be shown by signs like a square 0 for a PUCCI house and a triangle ~ for Kutcha house further classifying them as wholly or partly residential or wholly non-residential by shading as follows:
0- Pucc.] house, whether wholly or partly residential
§ - PucGlwholly non-residential
~ - Kutcha house, whether wholly or partly residential
A -Kutchawholly non-residential
12. It is difficult to give a comprehensive and detailed definition of the terms "Pucca"and "Kutcha"houses to cover different patterns of structures all over the country. The categorisation of the houses as Pucca or Kutcha for the purpose of depicting them on the lay-out sketches will facilitate their inentification. Also as Kutcha houses are not likely to be long-lasting, anyone referring to the lay-out sketches a few years later can easily distinguish settlement areas which are likely to have undergone a change. For the pupose of preparation of lay-out sketches, a PUCGl house may be treated as one which has its walls and roof made of the following materials:
Wall material: Burnt bricks, stone (duly packed with lime or cement), cement concrete or
timber, Ekra, etc.
Roof material : Tiles, GCI (galvanized corrugated iron) sheets, asbestos cement sheets, RBC (re-inforced brick concrete), RCC (reinforced cement concrete) and timber, etc.
Houses, the walls and/or roof of which are made of materials other than those mentioned abovaesuch as unbrunt bricks, bambooos, mud, grass, reeds, thatch, loosely packed stone, etc., may be treated as Kutcha houses.
13. When once the location of every building or house is demarcated on the sketch it will be so simple matter to decide on numbering the buildings/house in one series following certain principles. No hard and fast rule can be laid down as to the direction in which the house numbers should run i.e. left 0 right or in a clockwise order or north-west to southeast and so on. Much depends on the lay-out. So long as some convenient and intelligible order is followed it should be alright. The numbers allotted to each house should be marked on dthe sketch and with the help of arrow marks at convenient intervals, the direction in which the house numbers run should be indicated. This is particularly important when streets cut across one another and the house numbering series along a streest get interrupted. It will be of advantage if the numbers are roughlly marked in pencil on this sketch and later verified with the actual state of things on ground to see if the order of numbering given in the lay-out sketch would be convaenient or any change is needed, for after all the sketch is only a rough on and the actual state of buildings on ground may suggest a more convenient order of numbering at some places. Having satisfied yourself that the numbering has gone on right lines you may ink them. Specimen lay-out sketches for rural and urban areas may be seen at Annexes C and D.
1 4. Where villages are not cadastrally surveyed and the village boundaries not fixed by survey, it is essential that the, limits of each village are defined by some permanent features so that one is sure that any house falling in a particular area may be reckoned with reference to a particular village.
15.ln the forest areas, all habitations are not on a settled pattern. There are forest villages which may be just like other revenue villages or mauzas. For such villages, the normal procedure for preparing lay-out sketches may be followed. But apart from such villages, there could be clusters of habitations spread out in the forest. Your work will be facilitated if, fosr the purpose of netting such clusters, a lay-out plan is prepared of the forest area comprising the lowest administrative unit (such as, beat of a Forest Guard). Then the clusters should be drawn on the lay-out sketch. Name of the cluster should also be written, Ifit has a local name. If there is no name, then it would be necessary to identify it with reference to any known permanent feature slich as a stream,
230

a range of hills, road and so on. After drawing the boundaries of such cluster on the lay-out sketch, the laction of each house should be indicated on it and a number assigned to each house. Habitations (clusters) falling within the area of the smallest forest administrative unit shaul betaken as one village for the purpose of house numbering and houselisting.
16. Since it is likey that some of the tribal habitations may change their locations now and then, it is necessary to define the location of a habitation area with reference to any known permanent feature as indicated above in regard to the clusters in forest areas.
17. In the case of tea estates, coffee estates, plantations, etc., the pattern may be slightly different. You will be well advised to first contact the estate or plantation authroties, study the pattern of habitation and then decide on the lay-out plan and listing of villages. Listing of villages of such estates will have been done by your superior officers and a list may have been prepared already and such village or villages assigned to you with necessary code number and so on. In that case, your task is easy. You have only to find out from the estate or plantation authorities, ti1e boundaries of the village or drea allotted to you. You should then visit the area and decide on the layout sketch.
18. Urban areas: The preparation of notional maps and the lay-out sketches (containing house numbers) in urban areas should essentially follow the same procedure as in the urban "areas should essentially follow the same procedure as in the rural areas except that in most urban units the draughtsman of the Municipal Administration might have already prepared town maps perhaps even to scale, and these may come in extremely handy. It has been found from expreience that the boundaries of towns are often times loosely defined and not properly demarcated giving rise to severa) doubts regarding the areas lying on the outskirts of towns. It is important that the map should very clearly indicate the boundaries by means of definite survey numbers and also other permanent features. Sometimes, one'Sjde of the road may fall within the town limits and the other side get excluded as it may be outside the defined boundary of the town. All these points should be carefully verified on the ground before the maps are certified to be correct by the supervising authorities. Cases of sub-urban growth adjoining the limits of a town and such cases as one side of a street falling outside the limit of a town should be brought to the notice of the superior officers who will have to ensure that such built up areas are properly accounted for within the administrative unit in which they fall.
19.1n urban area very detailed plans showing the location of every building or house along every road and street in your block should be clearly prepared. In view of the very large number and close location of houses in urban-areas it may be necessary to have a number of sketches each covering a limited area. A lay-out sketch of your block should be prepared in which all the roads and streets should be clearly indicated
and their names also written. Then each building and house should be located on this sketch. It will fa ciliate your work and of others if the wholly non-residential houses are distinguished from the residential houses by hatching as indicated in paragraph 11. Here again the important permanent buildings such as say, town-hall, large oftlce building, court building, post office, hospital, school, church, market building, etc., should be indicated on the map.
20. For those towns which already have a satisfactory house-numbering system, you should adopt the same for preparation of house-numbering maps referred to above. The housenumbering can be brought up-to-date with the help of your lay-out map. But if there is no proper house-numbering system in the town, you will be required to assign numbers to the hosues in the lay-out sketch (es) of your jurisdiction in the manner Indicated below. Where a rationalised house-numbering system is proposed to be introduced for the first time these sketches will greatly help the authorities. •
Numbering of buildings and census houses in rural and urban areas
21. You have to give numbers to 'Buildings' and 'Census Houses in all areas. The instructions given hereafter will guide you to determine a building or a census house for the purpose of houselisting. A building Is a readly distinguishable structure or group of structures which is taken as the unit for house numbering. The entire building may be deemed one census house or sometimes part of it, as will be explained. Theobjective is to ultimately number and list out all physial units of constructions which are used for different purposes, residentialor othelWise.
22. Building: A building is generally a single structure on the ground. Sometimes it is made up of more than one component unit which are used or likely to be used or dwellings (residences) or establishments such as shops, business houses, offices, factories, workshops, worksheds, schools, places of entertainment, places of worship, god owns, stores, etc. It is also possible that buildings which have component unit may be used a combination of purposes such as shop-cum-resldence, workshop-cum-residence, office-cum-residence, etc.
23. Sometimes a series of different buildin~ may be found along a street which are joined with one another by common walls on either side looking like a continuous structure. These different units are practically independent of one another and likely to have been built at different times and owned by different persons. In such cases though the whole structure with all the adjoining units apparently appears to be one building, each portion should be treated as a separate building and given separate numbers. On the other hand, you may come across cases, particularly in large cities of multi-storeyed ownership flats. In t~ese cases while the structure looks like one buildin& the flats are owned by different persons. In case of such multistoreyed structures, having a number of flats owned by djf-
231

ferent persons, the entire structure should be treated as one building and each flat as a separate house. c'
24. Sometimes in metropolitan cities the local authorities may have considered the flats in a block or in large colonies as separate buildin~ and numbered them as such. If the house numbering system of the local authorities is adopted as such, you may treat each such flat as a separate building because this will avoid your having to renumber these.
25. If within a large enclosed area there are separate structures owned by different persons then each such structure should be treated as one or more separate buildings. Sometimes thete may be a number of structures witln an enclosed area or compound owned by an undertaking or company or government which are occupied by their employees. Each such structure should be treated as a separate building. If such buildings have a number of flats or blocks which are Independent of one another having separate entrance from a common courtyard or staircase and occupied by different households each such flat or block should be considered as a separate census house.
26. Usually a structure will have four walls and a roof. But In some areas the very nature of construction of houses Is such that there may not be any wall. For example, a conical roof almost touches the ground and an entrance Is also provided and therewill not be anywall as such. Such structures should be treated as buildings and census houses as the ase may be.
21. If there is more than onestructurewlthin an enclosed or open oompound (premises) belonging to the same person, e.g., the main house, the servant's quarter, the garage, etc., only one building number should be given for this group and each of the constituent separate structures assigned a subnumberlike 1(1),1(2), 1 (3) and soon provided these structures satisfy the definition of a 'Census House' given hereafter.
28. The buildgins should be numbered as follows:
(i) Ifin a village the locality consists of a number of streets, the buildings in the various streets should be numbered continuously. Streets should betaken in uniform order from Northwest to South-east. It has been observed that the best way of numbering the buildings is to continue with one consecutive serieal or one side of the street and complete numbering on that side before crossing over to the end of the other side of the street and continuing with the serial, stopping finally opposite to where the first numberbegan.
(ii) In a toWn!city enumeration block, the numbering will haveto run along the axis of the street and not in any arbitrary geographical direction.
(m) Arabic numerals, i.e., 1,2,3, ... etc., should be used for buildings numbers.
has been completed should be given a number in the serial.
(v) If a new builcUng either PUCQ or Kutchil is found after the house-numbering has been completed or in the midst of buildings already numbered, it should be given a new number which may bear a sub-number of the adjacent building number e.g., 10/1 ...
NOTE: These should bot be I'ly.nibered as 1 O( 1) or 10(2) etc., as such numbering would apply to census houses within the same building. On the other hand, 10/1 would mean a separate building that has come up after building No. 10.
Census House
29. A 'Census House'is a building or part of a building having a separate main entrance from the road or common CDUrtyard or stairase, etc. ,used, or recognied as a separate unit. It may be occupied or vacant. It may be used fosr a residential or non-residential purpose or both.
30. If a building has a number of flats or blocks which are independent of one another having separate entrances of their own from the road or a common staircase or a common courtyard leading to a main gate, they will be considered as separate census houses. If within a large enclosed area, there are separate buildings owned by different persons then each such building should be treated as one or more separate buildings. You may come across cases where within an enclosed compound there may be separate buildings owned by an undertaking or company or even government, actually in occupation of different persons. For example, 1.0.c. colony where the buildings are owned by the Corporation but these are in occupation of their empolyees. Each such building should be reckoned as a separate building. But if in anyone of these buildings there be flats in occupation of different households, each such flat should be treated as a separate census house.
31 . It may be difficult to apply the definlton of census house strialy in certain cases. For example, in an urban area, a flat has flve rooms each roOm having direct entrance to the common staircase or court-yard. By definition this has to be treated as flve census houses. If all these flve rooms are occupied by a single household It Is not realistic to treat them as five census houses. In such a case 'singleness' of use of these rooms alongwith the main house should be considered and the endre flat should be treated as one census house. On the other hand, If two Independent households occupy these flve rooms, the first household living In 3 rooms and the second household occupying 2 rooms, then considering the use the the first three rooms together should be treated as one census house and the remaining rooms as another census house. But If each room is OCCupied by an Independent household then each such room should be treated as a separate census house.
(iv) A building under construction, the roof of which
232
32. In case of hostels, hotels, etc., even If the door of
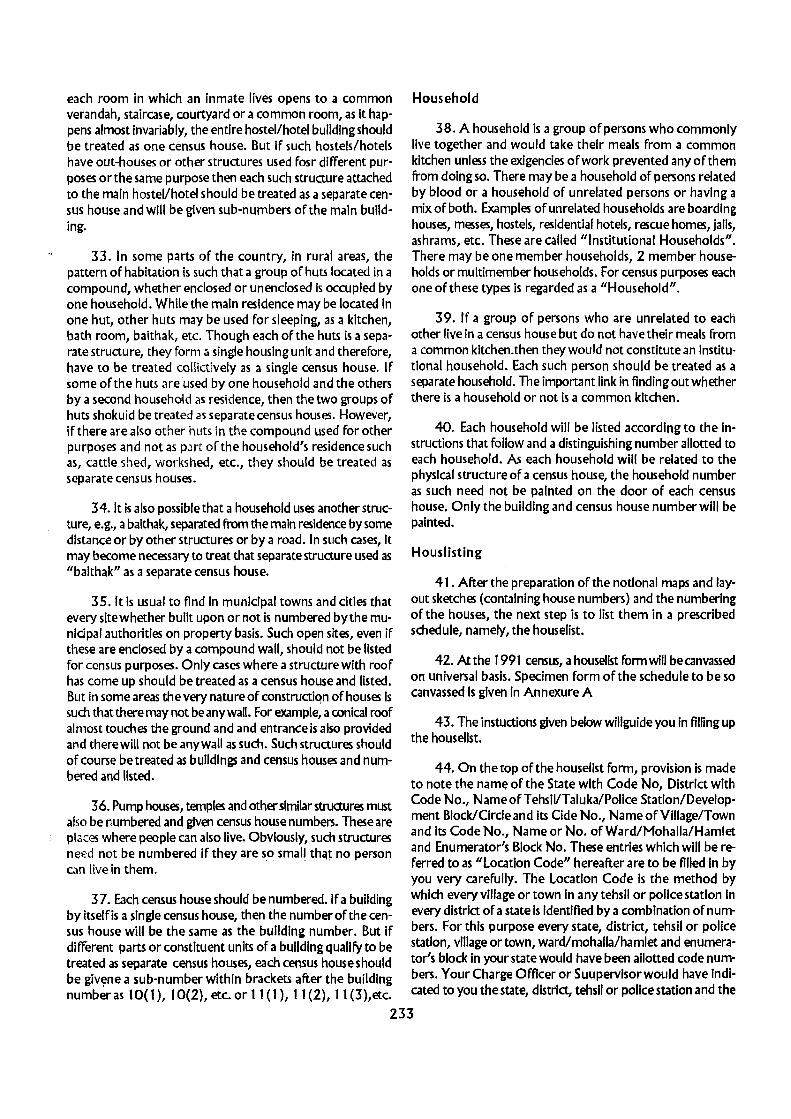
each room in which an inmate lives opens to a common verandah, staircase, courtyard or a common room, as it happens almost invariably, the entire hostel/hotel building should be treated as one census house. But if such hostels/hotels have out-houses or other structures used fosr different purposes or the same purpose then each such stru<:ture attached to the main hostel/hotel should be treated as a separate census house and will be given sub-numbers of the main building.
33. In some parts of the country, in rural areas, the pattern of habitation is such that a group of huts located in a compound, whether enclosed or unenclosed is occupied by one household. While the main residence may be located in one hut, other huts may be used for sleeping, as a kitchen, bath room, baithak, etc. Though each of the huts is a separate structure, they form a single housing unit and therefore, have to be treated collictlvely as a single census house. If some of the huts are used by one household and the others by a second household as residence, then the two groups of huts shokuid be treated as separate census houses. However, If there are also other huts in the compound used for other purposes and not as part of the household's residence such as, cattle shed, workshed, etc., they should be treated as separate census houses.
34. It is also possible that a household uses another structure, e.g., a baithak, separated from the main residence by some distance or by other structures or by a road. In such cases, it may become necessary to treat that separate structure used as "baithak" as a separate census house.
35. It is usual to find in municipal towns and cities that every site whether built upon or not is numbered by the municipal authorities on property basis. Such open sites, even if these are enclosed by a compound wall, should not be listed for census purposes. Only cases where a structure with roof has come up should be treated as a census house and listed. But in some areas th every natu re of constructiQn of houses is such that there may not be any wall. For example, a conical roof almost touches the ground and and entrance is also provided and therewill not be anywall as such. Such structures should of course be treated as buildings and census houses and numbered and listed.
36. Pump houses, temples and other similar structures must also be numbered and given census house numbers. These are places where people can also live. Obviously, such structures need not be numbered if they are so small thClt no person can live in them.
Household
38. A household is a group of persons who commonly live together and would take their meals from a common kitchen unless the exigencies of work prevented any of them from doing so. There may be a household of persons related by blood or a household of unrelated persons or having a mix of both. Examples of unrelated households are boarding houses, messes, hostels, residential hotels, rescue homes, jails, ashrams, etc. These are called "Institutional Households". There may be one member households, 2 member households or multimember households. For census purposes each one of these types is regarded as a "Household".
39. If a group of persons who are unrelated to each other live in a census house but do not have their meals from a common kitchen.then they would not constitute an Institutional household. Each such person should be treated as a separate household. The important link in finding out whether there is a household or not is a common kitchen.
40. Each household will be listed according to the instructions that follow and a distinguishing number allotted to each household. As each household will be related to the physical structure of a census house, the household number as such need not be painted on the door of each census house. Only the building and census house number will be painted.
Houslisting
41. After the preparation of the notional maps and layout sketches (containing house numbers) and the numbering of the houses, the next step is to list them in a prescribed schedule, namely, the houselist.
42. At the 1991 census, a houselist form will be canvassed on universal basis. Specimen form of the schedule to be so canvassed is given in Annexure A
43. The instuctions given below willguide you in frllingup the houselist.
44. On the top of the housellst form, provision is made to note the name of the State with Code No, District with Code No., NameofTehsiVTaluka/Police Station/Development Block/Circle and its Cide No., Name of Village/Town and Its Code No., Name or No. of Ward/Mohalla/Hamlet and Enumerator's Block No. These entries which will be referred to as "location Code" hereafter are to be filled in by you very carefully. The Location Code Is the method by
37. Each census house should be numbered. If a building which every village or town in anytehsil or police station In by itselfis a single census house, then the number of the cen- every district of a state Is Identified by a combination of num· sus house wilt be the same as the building number. But if bers. For this purpose every state, district, tehsil or police different parts or constituent units of a building qualify to be station, village or town, ward/mohalla/hamlet and enumeratreated as separate census houses, each census house should tor's block in your state would have been allotted code numbe giv~ne a sub-number within brackets after the building bers. Your Charge Officer or Suupervlsorwould have indinumberas 10(1), 10(2), etc. or t 1 (1), t t (2), t t (3),etc. cated to you the state, district, tehsil or police station and the
233

village ortown, ward/mohalla/hamlet and enumerator's block code numbers allotted to you. You will have to enter these numbers in the relevant spaces against the names of the various Jurisdictional units. Please note tlw the town number is to be given in /roman figures (I,. I~ III,. 110 etc.) to distingusih it from the village number which will be indiated bdy Arabic numerals ( 1,2,3,4, etc.}. You should enter page number of the houselist continuously for your block.
You will also be provided by your supervisor or charge officer the name of the development Block and its code number. You have ot enter the same in the space provided for this. In States/UTs where the Development Block is the next unit below the District, the name and the code number will be repeated here.
Col. I : line No.
45. Every line in the Houselist is to be numbered serially. The line numbers should be continuous for your block. Arabic numerals should be used for this purpose, e.g., 1, 2, 3, 4, etc.
Col. 2 : Building No. (municipal or local authority or census No.)
46. Some municipal towns may have a satisfactory system of numbering the buildings and after preparation of the lay-out sketch of your area, YOll would have given the same number to the building located on the sketch.
47. While preparing the lay-out sketch in the manner described earlier you will have asigned building numbers to each of the buildings shown in the lay-out sketch. Where the numbering system of the municipality or local authority is satisfactory, you would have adodpted it and given these numbers in the lay-out sketch. In cases, where this numbering system by the municipality or local authority is not satisfactory, you would have given numbers to the buildings in a systematic manner as described earlier and it is this numbering system adopted by you that would have to be indicated in the lay-out sketch. Of course, you might have had to merely update or revise the numbering system that already exists in some cases. There can also be cases where no numbering system existed earlier. In these cases you would have numbered the buildings and assigned them numbers in the lay-out sketch. Where the numbers in any of the systems have not been indicated on the buildings themselves, you would also have painted them as mentioned earlier. Irrespective of the situation, you would have assigned a number to every building in the lay-out sketch. .
48. The number which has beeen asigned in lay-out sketch in any of the system described above and which has already been put on the building or which might have been painted by you on the building should be entered in this column.
49. Arabic numbers (e.g., 1,2, 3,. ..... ) ShOUld be used
for building numbers. In CJses where there are null'lbers already present and painted or fixed, these instructions naturally will not apply. These instructions will apply entirely depending on local circumstances.
50. In many cases there may be large colonies or blocks of flats where continuo LIS serial numbering has been adopted by the local authorities. Strictly speaking, each building in which there may be a set of flats should be given a building number and the flats themselves given census house numbers. However,local authorities may have numbered the flats continuollslywithout reference to the separate buildings. Such situations exist in Delhi, Madras, Bombay, etc. and in offiCial colonies. In such cases we need not change the numbering system and may adopt it as such. In such cases you will obviously have to enter sthe same number in columns 2 and 3 of dthe houselist since a separate building number is now not being given. However, to ensure that all buildings have been covered, you shOUld put a bracket in column 2 enclosing all those flat numbers which are located in one single bUilding unit. The manner in which this is done is indicated below:-
Houselist
line Building No. (Municipal or local Census House No. authority or Census No.) No.
2 3
1 215 ] 215 2 216 216 3 217 217 4 218 218
5 219 ] 219 6 220 220 7 221 221 8 222 222
In the example given, each building consists of 4 flats.
Col. 3 : Census House No.
51 . What is a census house has already been described in detail earlier. To recall the definition a census house is a structure or part of a structure with a separate entrance which may be inhabited or vacant and what may be used for any purpose by human being such as dwelling, a shop, a shopcum-dwelling, a place of workshop or a place of business, workshop, school. etc.
52. In accordance with the instructions, you would have allotted census house number to a building or to part of a building. If there is only one census house in the building, then the number of the census house will be the same as the building number. This will be repeated in this column. If a building has a number of flats or blocks which have separate entrances of their own and are independent of each other giving on the
234

road or a common staircase or a common courtyard leading to the main gate, they will be considered as separate census houses. If all the structures within an enclosed compound are together treated as one building then each structure with a separate entrance should be treated as a separate census house. The order in which census houses within a building should be numbered, should be continuous, preferably clockwise or in any convenient manner if at all it is difficult to do it clockwise.
53. Sometimes a building which may form a single structure may be occupied in its different parts or suites of rooms or even some single rooms by different households. These individual parts are likely to havE! separate entrances from a common Verandah, staircase or a courtyard. Then each of these parts would assume the character of a separate census house.
54. The census house number to be noted in this (01-
umn will be the same as the building number already noted in column 2, if the building is by itself a single census house. But if the building is made up of portion each of which has been treated as a separate census houses according to the definition, then each of these census houses will bear the building number with a separate sub-number in brackets for each census house, e.g., 9( 1), 9(2) ... 12( 1), 12(2), 12(3) ... etc.
NOTE: You should not indicate the number as 9/1 or 9/2 etc., as this method will be used in the assignment of a number to a new building not previously numbered that has come up after building No.9 and before No.1 O.
Cols. 4, 5, & 6 : Predominant construction material of the census house
55. This question has been divided into three parts, i.e., (a) material of wall; (b) material of roof; (c) material of floor. For your convenience the descr'iption of the predominant construction material has been indicated at the bottom of houselist under each item i.e., wall, roof and floor. A numerical code for a group of materials has been indicated. What you have to do is to enquire abQut the material and enter the appropriate code in Cols. 4-6 for each of the materials of wall, roof and floor respectively.
Col. 4 : Material of wall
56. For material of wall, 10 codes have been provided which are indicated in the schedule itself. In order to determine the material of wall you have to take into account the material out of whch the major portions of the walls of the house are made and then select the appropriate code. The code thus selected should be entered in Col. 4. Dash (-) will be entered in case of structures with pillars without walls.
Col. 5 : Material of roof
57. For material of roof. 8 codes have been provided, These Jre indicated in the schedule itself. For determining the material of the roof, you have to take into aCCOllrH the material out of which the outer roof exposed to the weather and not the ceiling, is made, i.e., tiles, thatch, corrugaced iron, zinc or asbestos cement sheets, or concrete, wood, mud, etc. If the roof is mainly made of bricks and stone and has a mud plaster, cement plaster or lime plaster exposed to the sky, the material of roof in such cases will not be mud, cement or lime but it will be bricks, stone, etc., which constitute the fabric of the roof. In multistoreyed buildings the intervening floor will constitute the roof of the lower floor. After ascertaining the material of the roof you have to give the suitable numerical code in Col. 5.
Col. 6 : Material of floor
58. For material of floor, 7 codes have been provided as indicated in the schedule itself. For the material of floor you have again to take the maior Dortion of material out of which the floor of che house is made, for example, if in 3
house only the drawing room has mosaic floor while all other rooms and corridors have just cement flooring, the materi3! of floor to be recorded here will be 'cement', i.e., code 5. Again, if a house has tiled floor in the bath room and all other rooms have cement floor the material of floor will again be 'cement'. For multistoreyed buildings the floor of the upper storeys will be determined in the usual manner as discussed above. It may be noted that the material of the roof of the intervening floors of multi-storeyed buildings does not automatically become the material of floor of the upper storeys. The floor material of the upper storey could be different from the fabric of the roof for the lower storey. For example, in a two storeyed building, the roof of the ground floor could be RCC while the floor material of the first floor could be mosaic.
58.1 It is again emphasised that while recording the materials of wall, roof and floor, you have only to give the code number in the columns provided for this purpose and not description.
Col. 7 : Purpose for which census house is used. (If wholly or partly used for running one or more enterprises, fill enterprise list)
59. The actual use to which a census house is put has to be recorded in this column. As you will recall, a census house can be used for a single purpose or for various purposes at the same time. To illustrate the types of uses to which the census houses can be put, certain ex. 'nples are given below. These are illustrative and you should not feel that you should enter only what is mentioned here but it is important for you to use this as guideline and write the description of the purpose for which the census house is used as fully as possible.
235
(i) Residence, shop-cum-residence, workshop-cum-residence, etc.
(ii) Factory/workshop and workshed etc. "Factory" should be written ifit is registered under the Indian Factories Act (Please see Annexe 'I'). An establishment using power and employing 10 or more persons or which is run without use of power and employing 20 or more persons is a factory. A 'workshop' is a place where any kind of production, repair or servicing goes on or where goods and articles are made and sold, but is not large enough to be a factory. It is not necessary that some machinery should exist. Even a place where some household industry such as say, hand loom weaving, bidi rolling, papad making, toy making, etc., is carried on, should be noted as a workshop. If it is also used as a residence it should be noted as workshop-cum-residence. Make searching enquiry if a house is used for the purpose of production of any goods or for some processing or repairing even on a household industry basis, as these are not likely to be apparent to a casual observer.
(iii) Shop: A shop is a place where articles are bought and/or sold for cash or for credit.
(Iv) Office, business house, bank, etc. : Business house Is that where transactions in money or other articles take place.
(v) Hospital, dispensary, health centre, doctor's clinic, etc.
(vi) School and other educational institutions.
(vii) Hotel, sarai, dharmshala, tourist house, inspection house, etc.
(viii) Restaurant, sweetmeat shop and eating place: (A sweetmeat shop where sweetmeat Is being made and sold should be recorded as workshop).
(Ix) Place of entertainment:
Examples - Cinema house, theatre, community hall (panchayat ghar) etc.
(x) Place of worship, etc.:
Examples -Temple, church, mosque, gurudwara, etc.
(xi) Institution :
Examples -Orphange, rescue home, jail, reformatory, children's care home, etc.
(xii) Others :
Examples - Chattle-Shed, garage, godown, laundry, petrol filling station, passenger's shelter, etc.
(the exact use to be fully described In each case).
The entry under column 7 will have to be made on the line and not In the dotted box.
60. Column 7 refers to the purpose for which a census house is used. There will be some cases where census houses are used only for seasonal activities and at the time the houselisting is carried out by you, thi~ seasonal activity may not be taking place. Such seasonal activities would be ollmills (GhanI), Gur-makingin sheds, etc. It is necessary that the seasonal use of such census house for running of an establishment is recognised and that this seasonal use is noted in the column. You should, therefore, make enquirIes regarding such activities so that the complete picture regarding the use of the census house is available. However, at the time of houselisting, there may be cases where such census houses are being used for some other purpose such as a residence. Then the use to which this census house is being put at the time of your visit should of course, be noted. In the case of census houses where their seasonal use has been noted by ou in column 7 please write in the same column that this use is "Seasonal".
Important
61. If the census house is found vacant, Le., if no person is living in it at the time of houselisting and it is not being· used for any purpose, write 'vacant'in this column. The reason for vacancy such as 'dilapidated', under repair (incomplete constructlon'/want oftenant',etc., may be recorded in the 'Remarks' column.lf on the oth~ hand the census house is found locked because the occupants have gone on a journey or pilgrimage, then it should not be treated as 'vacant' but the use to which it is put should be recorded here and the fact that the occupants have gone on a journey or pilgrimage noted in the 'Remarks' column as 'House-occupants on journey/pilgrimagt:'etc. If a ~ensus house has more than one household in it, do not repe<1t the word 'residence'ln subsequent lines in column 7.
62. If a particular census house is wholly or partly used for runningoneor more enterprises, you must first enter the Use to
which it is put in this column. Having done so, you will have to go to the enterprise list and enter details of such enterprise or enterprises there as will be described in the instructions for filling up the enterprise list which have b;een supplied to you separatelly.
Enterprise
63. An enterprise is an undertaking engaged in production and/or distribution of goods and/or services not for sole purpose ofown consumption. The workers in an enterprise may consist of members of the household or hired workers or both. An enterprise may be owned and operated by one household or by several households Jointly (on a partnership
236

basis) or by an Institutional body. The activities of an enterprise may be carried on In a sIngle census house, In more than one census houses or In the open i. e."wlthout premises. The activIty of the enterprise may also be carried on only fosr a part of the year but on a fairly regular basis. Such cases should also be considered as an enterprise. In column 7 details of only those enterprises which are carried on within census houses should be entered.
64. It Is possible that more than one entrE!preneurial activIty Is carried on in the same census house. Ifthese activities are carried on by the same person or the same house hold but separate accounts are kept fosr each of these activities, they should be treated as separate enterprises. However, In cases where the activities cannot be distinguished from one another. there will be only one enterprise pertaining to the major activIty. The major activity can be recognised on the basis of the value of income, turnover or number of persons employed depending on the infosrmation readily available during you enquires. For example, if a tailor sells doth also but does not maintain separate accounts for his tailoring activity and selling of c1oth,then you should find out which Is the major actMty by Inquiring form which activty he gets a greater Income or In which he emplo)'5 more people, etc. This will be the activity of the enterprise.
65. Enterprises which are carried on In the open, i.e., whlthout premises will be entered In column 2n as we shall see later.
66. Please note that the growing of agricultural crops mentioned below should not be classified as enterprises:
Cereal crops (paddy, wheat, Jowar,baJra, maize, ragi, barley, etc.)
Pulses (aarhar, gram, moong, masur, urd, etc.)
Raw cotton
Raw lute, mesta
Sunnhemp and other kindred fibres
Producdlon of oil seeds such as sesamum, groundnuts, mustard, nnseed, castor, rape seed, etc.
Sugarcane
Roots and tubers, vegetables, singhara, chillies and spkes and flowers an parts of plants
Agricultural production not elsewhere classified
Tea
Coffee
Rubber
Tobacco
Pepper
Cardamom
Edible nuts, e.g., walnut, almond, cashewnut, etc.
ProductIon of coconut and arecanut
Production offrults, e.g., bananas, apples, grapes, mangoes, oranges etc.
Production of ga~ja, cinchona, opium, etc.
Crops of plantation, not else\Yhere classified (e.g., betel leaves, cocoa, etc.)
ImporUnt: Please note that while growing of tea, coffee, tobacco, etc., should not be classified as an enterprise, If In a census house these are processed, for example, curing of tea leaves, curing of tobacco, etc., then these activities of processing will have to be treated as enterprises. Similarly, manufacture of copra from coconut or the processIng of cash ewnuts will also be an enterprise.
67. Mining and quarrying or manufacturing, processIng, repair or servicing activity are enterprises. Similarly, activltes relating to generation andtransmlsslon and distribution of gas, steam, water supply, construction, wholesale or retail trade hotels and restaurants, transport, storage, warehousing, communication, financing, insurancel real estate and busines services, community, social and penonal services, public administration and defence services such as government offices, schools,hospltals,recreation and cultural services, community services such as temples, etc., will also be enterprises. In addition, you must note that the rearing of cattle and production of milk, rearing of sheep for production of wool, rearing or other animals such as pigs, rearing of bees and production of honey, rearing of srlk-worms and production of cocoons and raw silk, hunting, trapping, collection of fuel and other forest products and their sale, gathering of materials such as herbs, resins, etc., catching and seiling of flsh, providing agricultural services such as sprayIng, etc., are all enterprises. In other words, livestock production, agricultural services, hunting, trapping and game propagation, forestry and logging and fishingwill also have to be clssltled as enterprises.
Annex I]' gives allst of broad desCription of economic activities failing under the purview of Enterprise list of ec0-
nomic census which will also help you to Identify and distinguish between agricultural and non-agricultural enterprises.
68. You win notice that an enterprise can becan1ed on with a census house or outside the census house without premises or In the open. The entries you makewUI be either In CDlurm 7 or column 20 depending on whether these enterprises are carried on within the census house or outside a census without premises respectively.
237
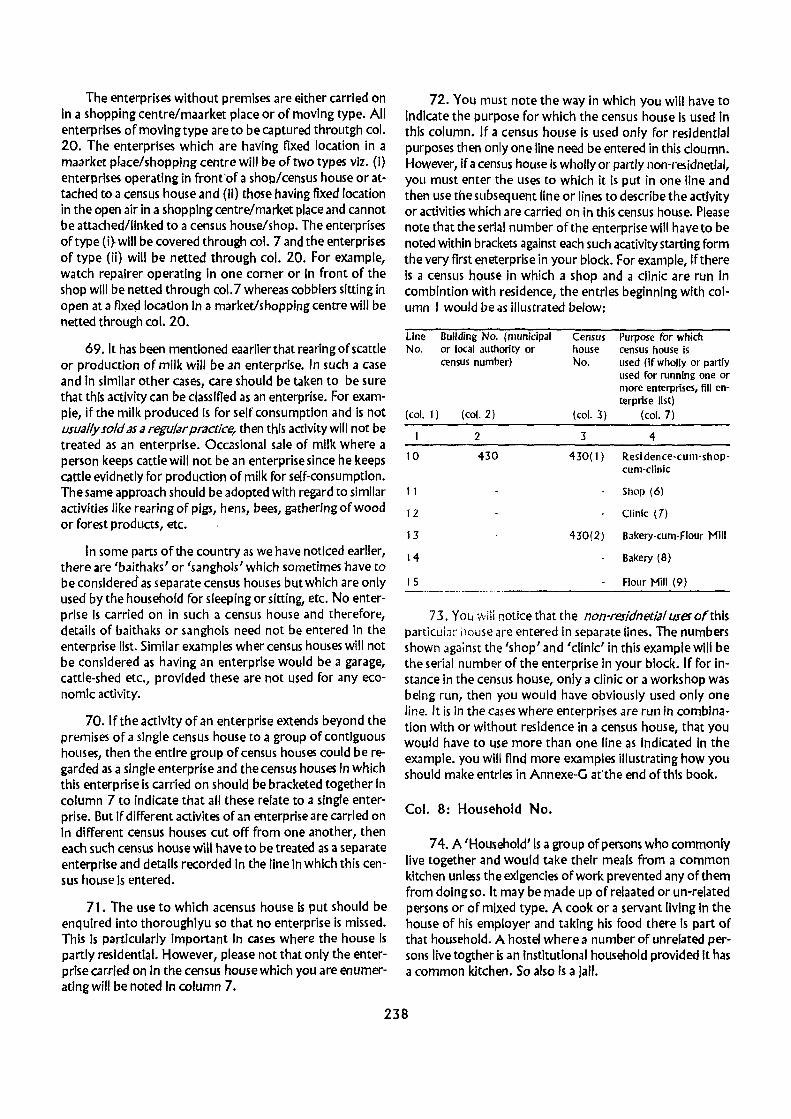
The enterprises without premises are either carried on in a shopping centre/maarket place or of moving type. All enterprises of moving type are to be captured throutgh col. 20. The enterprises which are having fixed location in a maarket place/shopping centre will be of two types viz. (i) enterprises operating in front 'of a shop/census house or attached to a census house and (II) those having fixed location in the open air in a shopping centre/market place and cannot be attached/linked to a census house/shop. The enterprises of type (i} will be covered through col. 7 and the enterprises of type (Ii) will be netted through col. 20. For example, watch repairer operating In one corner or In front of the shop will be netted through col.7 whereas cobblers sitting in open at a fixed location In a market/shopping centre will be netted through col. 20.
69. It has been mentioned eaarlier that rearing of scattle or production of milk will be an enterprise. In such a case and in similar other cases, care should be taken to be sure that this activity can be classified as an enterprise. For example, if the milk produced is for self consumption and is not usually sold as a regular practice, then this activity will not be treated as an enterprise. Occasional sale of milk where a person keeps cattle will not be an enterprise since he keeps cattle evidnetly for production of milk for self-consumption. The same approach should be adopted With regard to similar activities like rearing of pigs, hens, bees, gathering of wood or forest products, etc.
In some parts of the country as we have noticed earlier, there are Ibaithaks' or 'sanghois' which sometimes have to be considered as separate census houses but which are only used by the household for sleeping or sitting, etc. No enterprise Is carried on in such a census house and therefore, details of baithaks or sanghois need not be entered in the enterprise list. Similar examples wher census houses will not be considered as having an enterprise would be a garage, cattle-shed etc., provided these are not used for any economic activity.
70. I f the activity of an enterprise extends beyond the premises of a single census house to a group of contiguous houses, then the entire group of census houses could be regarded as a single enterprise and the census houses in which this enterprise is carried on should be bracketed together in column 7 to indicate that all these relate to a single enterprise. But if different activites of an enterprise are carried on in different census houses cut off from one another, then each such census house will have to be treated as a separate enterprise and details recorded In the line in which this census house is entered.
71. The use to which acensus house is put should be enquired into thoroughlyu so that no enterprise is missed. This Is particularly important In cases where the house Is partly residential. However, please not that only the enterprise carried on In the census house which you are enumerating will be noted In column 7.
72. You must note the way in which you will have to indicate the purpose for which the census house Is used In this column. If a census house is used only for residential purposes then only one line need be entered in this cloumn. However, if a census house is wholly or partly non-residnetlal, you must enter the Uses to which it is put in one line and then use the subsequent line or lines to describe the activity or activities which are carried on in this census house. Please note that the serial number of the enterprise will have to be noted within brackets against each such acativity starting form the very first eneterprise in your block. For example, If there Is a census house in which a shop and a clinic are run in combintion with residence, the entries beginning with column 1 would be (IS illustrated below:
Line Building No, (municipal Census Purpose for which No, or local authority or house census house is
census number) No. used (if wholly or partly used for running one or more enterprises, fill en-terprise list)
(col. 1) (col. 2) (col. 3) (col,7)
2 3 4
10 430 430(1 ) Resi dence-cum-shop-cllm-clinic
11 Shop (6)
12 Clinic (7)
13 430(2) Bakery-cum-Flour Mill
14 Bakery (8)
15 Flour Mill (9) -------.~-- --_
73. YOu wi!i notice that the non-residneti31 user of this particuiJr il0use are entered in separate lines. The numbers shown against the 'shop' and 'clinic' in this example will be the serial number of the enterprise in your block. If for instance in the censlls house, only a clinic or a workshop was being run, then you would have obviously used only one line. It is in the cases where enterprises are run in combination with or without residence in a census house, that you would have to use more than one line as indicated in the example. you will find more examples illustrating how you should make entries in Annexe-G at'the end of this book.
Col. 8: Household No.
74. A 'Household' is a group of persons who commonly live together and would take their meals from a common kitchen unless the exigencies of work prevented any of them from doing so. It may be made up of relaated or un-related persons or of mixed type. A cook or a servant living in the house of his employer and taking his food there is part of that household. A hostel where a number of unrelated persons live togther Is an Institutional household provided It has a common kitchen. So also Is a Jail.
238
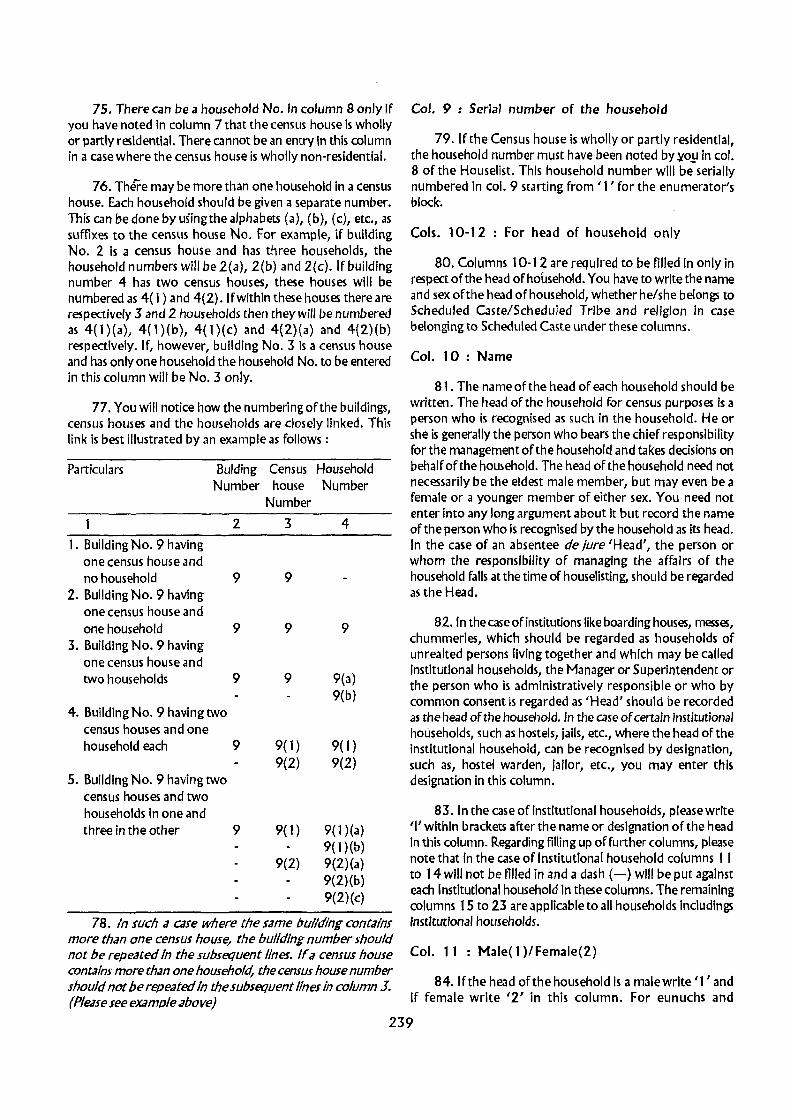
75. There can be a household No. in column 8 only If you have noted in column 7 that the census house is wholly or panly residential. There cannot be an entry in this column in a case where the census house is wholly non-residential.
76. There may be more than one household In a census house. Each household should be given a separate number. This can be done by using the alphabets (a), (b), (c), etc., as suffixes to the census house No. For example, if building No. 2 is a census house and has three households, the household numbers will be 2(a), 2{b) and 2{c). If building number 4 has two census houses, these houses will be numbered as 4( 1) and 4(2). If within these houses there are respectively 3 and 2 households then they will be numbered as 4( 1 )(a), 4( 1 )(b), 4( 1 )(e) and 4(2)(a) and 4(2){b) respectively. If, however, building No.3 is a census hOLlse and has only one household the household No. to be entered in this column will be No.3 only.
77. You will notice how the numbering of the buildings, census houses and the households are closely linked. This link is best illustrated by an example as follows:
Particulars
1. Building No.9 having one census house and no household
2. Building No.9 having one census house and one household
3. Building No.9 having one census house and two households
Bulding Census Household Number house Number
Number
2
9
9
9
3 4
9
9
9
9
9(a) 9{b)
4. Building No. 9 having two census houses and one household each
5. Building No.9 having two census houses and two households In one and three in the other
9
9
9(1) 9(2)
9(1) 9(2)
9( 1} 9( 1 )(a) 9(1 )(b)
9(2) 9(2)(a) 9(2)(b) 9(2)(c)
78. In suclT 3 C3se wlTere tlTe S.1me building cont.1ins more than one census house_, the building number should not be repe3ted in the subsequent lines. If a census house cont3fns more than one househokl, the census house number should not be repe.1ted In the subsequent lInes In column 3. (Ple3se see eJG3mple above)
Col. 9 : Serial number of the household
79. If the Census house is wholly or partly residential, the household number must have been noted by yo!' in col. S of the Houselist. This household number will be serially numbered in col. 9 starting from' I' for the enumerator's block.
Cols. 10-12 : For head of household only
80. Columns 10-12 are required to be filled in only in respect of the head of household. You have to write the name and sex of the head of household, whether he/she belongs to Scheduled Caste/Scheduled Tribe and religion in case belonging to Scheduled Caste under these columns.
Col. 10 : Name
81. The name of the head of each household should be written. The head of the household for census purposes is a person who is recognised as SLlCh in the household. He or she is generally the person who bears the chief responsibility for the management of the household and takes decisions on behalf of the household. The head of the household need not necessarily be the eldest male member, but may even be a female or a younger member of either sex. You need not enter into any long argument about it but record the name of the person who is recognised by the household as its head. In the case of an absentee de jure 'Head', the person or whom the responsIbility of managing the affairs of the household falls at the time of houselistlng, should be regarded as the Head.
82. In the case ofinstitutions like boarding houses, messes, chummeries, which should be regarded as households of unrealted persons living together and which may be called institutional households, the Manager or Superintendent or the person who is administratively responsible or who by common consent is regarded as 'Head' should be recorded as the head of the household. In the case of certain institutional households, such as hostels, jails, etc., where the head of the institutional household, can be recognised by designation, such as, hostel warden, jailor, etc., you may enter this designation in this column.
83. In the case of institutional households, please write 'I' within brackets after the name or designation of the head in this column. Regarding filling up of further columns, please note that in the case of Institutional household columns 11 to 14 will not be filled in and a dash (-) will be put agaInst each Institutional household in these columns. The remaining columns 15 to 23 are applicable to all households includings Institutional households.
Col. 11 : Male( 1 )/Female(2)
84. If the head ofthe household is a male write '1' and if female write '2' in this column. For eunuchs and
239

hermaphrodites, you have to write '1' in the column.
Col. 12 : SC( 1 )/ST(2) (If SC, ascertain religion and write 'H' for Hindus and '5' for Sikhs within brackets after Code 1)
85. You will be supplied with a list of Scheduled Castes (S.C.) and Scheduled Tribes (S. T.) In relation to your State! Union Territory by your supervisor. While filling this column of the Houselist, you will have to ascertain from the head of household whether he/she Is a member of a Scheduled Caste or a Scheduled Tribe. If in reply to this questi~n, the answer is In the affirmative, ascertain the name of caste!tribe. If the name of caste/tribe returned by the person appears in the list, you have to write '1' in case of Scheduled Caste or '2' In case of Scheduled Tribe In this column. If the head of household returns himself/herself as Scheduled Caste, you have to check his/her religion. He or she should belong to Hinduism or Sikhism. A person belonging to a Scheduled Caste cannot belong to any other religion. Persons who belong to a religion other than Hinduism and Sikhism will not e treated as members of any of the Scheduled Castes. But a member of a Scheduled Tribe may belong to any religion.
85.1 If the head of household belongs to Scheduled Caste, you have to write 'H' or'S' within brackets after code '1' in this column depending on whether he! she belongs to Hinduism or Sikhism. The entry 1 (H) In this column will mean that the head of the household is a Scheduled Caste and belon~ to Hinduism. likewise, the entry 1 (5) will mean that the head of household is a Scheduled Caste and belon~ to Sikhism. In case of institutional and non-SC/5T head of households, you have to put dash (-) in this column.
Col. 13 : Does the household live in owned or rented house? Write 1 for owned, 2 for rented and 3 for others
86. If a household is occupying a census house owned by itself and is not paying anything to anybody In the form of rent, then the household may be considered as living in owned house. This should be recorded by putting (1' In the column provided for this question. A household living in a flat or a house taken on 'ownership' basis on payment of Instalments, should be regarded as living in its own house, notwithstanding the filet that all Instalments have not been paid.
86.1 If the household lives in a rented house write '2' in the column. A housing unit is rented if rent is paid or contracted for, by the occupants in cash or in kind. Where an owner permits a hOllSenQld to live in a house, rent free, even t! ,en the househcd ShOl,!d be treated as living in a rented house, as for example, i."ent free accommodation provided to employees by Government, Institutions, Companies, etc. In such cases, you should write '2' In the column. For
institutional households, put a dash (-) in the column.
86.2 If the household lives in a house whleh is neither owned nor rented, code '3' ;nay be written In the column.
Col. 14 : Number of-living rooms in occupation of household
87. A room should hav~ four walls with a doorway with a roof over head and should be wide and long enough for a person to sleep in I.e., it sRould have a length of not less than 2 metres and breadth of atleast 1 '/2 metres and 2 metres In height. A room, however, which is used in common for sleeping, sitting, dining, storing and cooking, etc., should be regarded as a room. An unenclosed verandah, kitchen, store, garage, cattleshed, bathroom and latrine and rooms in which a household industry such as a handloom is located, which are not normally usable for living or sleeping are excluded from the definition of a living room for the purpose of this question.
87.1 One is likely to come across conical shaped hut or tent in which human beln~ reside. In such improvised accommodation, there will be no four walls to a room and therefore, the above definiti(in would not strictly apply to such types of accommodation. In such cases, the tent or conical hut, etc., may by itself be construed to be a room.
87.2 In certain parts of the country, particularly in rural areas, the pattern of housing may present some problems. For example, a household may be in occupation of several huts put to different uses such as main residence, sitting room, store and even for sleeping at night. By strict application of the definition each one will be reckoned as a census house, but this does not reflect the real situation. While huts used as store or cattleshed pose no problems, those used as sleeping rooms beyond the main residence, should be counted as rooms rather than separate census houses.
87.3 If a garage is used by a servant and he lives in It as a separate household, It should be reckoned as a room available to the servant's household. If the servant is considered as a member of the household then the garage room should be reckoned as an additional room of the household.fWrltethe number of room available to household in the column provided.
87.4 A ,living room which is shared by more than one household will not be counted for any of them. In other words, only living room exclusively In possession of the household will be counted. Fl)r example, if two households share a single living room and therefore neither has a living room exclusively, enter "0" in the column in the housellst of each of the households. If two households have a living room each but in addition also share a common living room, then common room will not be counted for either of the households. This question is not applicable to institutfonal
240

households. In the case of such households put a dash (-) in the column.
Cols. 15-18 : Facilities available to the household
88. This is divided into three parts, i.e., drinking water supply, electricity and toilet. This is applicable to institutional households also.
Cols. 1 5-16 : Drinking water supply
89. This question relating to drinkingwater supply has been divided into two sub-parts. The first sub-part deals with the source of drinking water supply. Six sources of drinking water supply have been given at the bottom of houselist alongwith international numerical code against each. You have to enter the appropriate numerical code in column 15.
89.1 If a household gets drinking water from two or more sources throughout the year, the source availed of during the greater part of the year should be recorded. After recording the numberical code in the column proceed further for recording the answer of the sub-part of the same question, namely, whether the drinking water supply is within the premises or outside premises. Ifthe water supply Is available within the premises, write L l' in column 16. If the water supply is not availabewithin the premises, write '2' in column 16.
89.2 You may have a problem in determining whether water supply Is available within the premises or not. local conditions vary tremendously in this country. We may have a well, a hand pump or tube-well within the house or even the backyard of the house openingto a river or canal. In all such cases, if within the house site the source of water is located, we may take it that drinking water supply is available within the premises. Otherwise it is not available within the premises.
Col. 1 7 : ElectriCtty
90. If electricity Is available to the household, enter '1' in the columni if it is not available record '.2' in the column. It should be noted that we are concerned with the availability of electricity to the household as distinct from actual use of electricity by the household. The household mayor may not be using electricity at the time of the visit but the fact that it is available is what we are interested in.
Col. 18 : Toilet
91. If toilet facilities are available to the household with in the premises of the house, write '1' in the column, otherwise record '2'.
91.1 There are, however, some buildings, which by design or structure may not have attached latrines but may have this facility at a little distance away within the same
floor or compound of the building. These latrines substitute the attached latrines. A household having such facility will also be treated as having such facility within the premises and code' l' should be recorded for such households.
Col. 1 9 : Type of fuel used for cooking
92. Nine types of fuel used for cooking along with their numerical codes have been gfven at the bottom of the houselist. You have to ascertain from the household the type of fuel used mostly for cooking and write an appropriate code In this column. If the household is using more than one fuel for cooking, the predominant fuel used for cooking may be recorded. Dash (-) will entered In this column in cash the household does not do any cooking.
Col. 20 : Is the Household or one or more members of the household engaged in one or more enterprises outside this census house and without premises or in the open air ? If yes, fill Enterprise List
93. You will recall that in the definition of an enterprise, it has been mentioned that an enterprise can be carried on outside the census house and without premises or in the open air (please see para 63). This column is meant to identify such enterprises.
94. There may be cases where a household lives In a census house and is engaged in an enterprise outside the census house in which they live and this enterprise may itself not be carried on within some other house. This column Is meant to record such cases. you will notice that it a household lives in one census house and carries on an enterprise in some other census house, then the census house in which the enterprise is carried on will be covered under column 71f the census house in which the enterprise is carried on is within your block. Even if it is not within your block, your colleague in the block in which the census house in which the enterprise is carried on will have covered it in column 7. What we are trying to cover In column 20 is a situation where a household carries on an enterprise outside the census house in which it lives, and this enterprise is carried on without any premises or in the open air. Such examples could be brick making, pottery, ropemaking in the open, cycle-repairing and shoerepairing on pavements, howkers, fishing, selling of newspapers, etc.
95. In such cases, where a household lives in the census house being covered by you, but carries on an enterprise outside the census house and without any premises you should note this fact in this column. All that you need say if such an enterprise is being carried on is "yes" and give the appropriate serial number of the enterprise within brackets. The numbering of enterprises in this column will run continuously for your block. Details of such enterprises will have to be entered in the enterprise list.
96. Where a household has more than one enterprise
241

which is carried on outside the census house in which it there will only be an entry in column 1 which relates to line lives and without any premises, it is necessary to cover such number and column 20. In all other columns relating to enterprises separately. For this purpose, you willi have to such entries please put a dash (-). In other words, building enter each of these enterprises In a separate line. Please note number, census house number, etc., will not be repeated. that in such cases YOll will have to give a line nllmber, since you will be using an extra line but there will be no entry 97. The manner in which the entries will be made in regarding building number, census hOllse number, use to cases where enterprises exist both in census houses (i.e. which the censlls house Is put, household number, name of column 7) and outside census houses without premises (i.e. head of household and columns 11 to 19. In such cases, column 20) is illustrated in the following examples.
Line Building Census Purpose for House Nameof Is the household No. No. house which census hold the head or one or more
(munici- No. house is lIsed No. ofhollse members of the pal or (if wholly or hold household engaged local partly used in one or more autority for running enterprises outside or census oneor more this census house No.) enterprises, and without premises
fill enterprise or In the open prise list) air? If yes, fill enter
prise list. (Col. 1 ) (CoI.2) (CoI.3) (Col.7) (Col. 8) (Col. 10) (Col.20)
2 3 4 5 6 7 434 434 T emple-cum- 434 Narayan
residence Sharma
2 Temple (1)
3 43~ 435(1 ) School-cum- 435(1) Devdas residence
4 School (2)
5 Canteen (3)
6 435(2) Residence 435(2) Ramnath Vyas Yes (1)
7 436 436 Cinema House(4)
8 437 437 Residence-cum- 437 Dr. Vimla
clinic Varma
9 Doctor's Clinic-
allopathic (5)
10 438 438(1 ) shop-cum-work 438(1 ) Rajan
shop-cum-residence
11 Workshop(6)
12 Shope (7)
13 438(2) Residence 438(2) Bhola Ram Yes (2)
14 439 439(1) Residence 439(1 ) Yadav Yes(3)
15 439(2) Silng!7oi
16 440 440 Residence 440 Keshav Yes (4)
17 Yes (5)
18 441 441 Boarding House 441 Ram Nath (I)
Total XX 11 XXX 9 XXX :xx 242

Cols. 21 to 23 : Number of persons normally residing in census household
98. Enter the number of males normally residing in the household in column 21, females in column 22 and total number of persons in column 23 (columsn 21 + 22).
98.1 In these columns normal residents are to be recorded even though some of them may be absent on the day of you visit. Casual visitors should be excluded as they will be considered at their respective places of normal residence. But a person who had stayed with the household for a period of 3 months or more should, however, be included, Correspondingly, normal residents absent for over 3 months or more should be excluded from the household in which they normally reside.
Tot;]1 of these columns should be struck ilt the end of eilch pilge.
Col. 24 : Remarks
99. This will provide space for any useful or significant information about the building, census house, census household and other particulars regarding the building inventory. This will provide interesting facts regarding observations made durin the houselisting operations.
100. I f there is any entry in column 7 as 'vacant' you have also to record the reason such as 'dilapidated', 'under repair', 'incomplete construction', 'want of tenant', etc., in this column. Also make a note in this column of likely places where houseless persons can be found.
General
101. Total of columns 3, 8 and 21 to 23 will have to struck for each page of the houselist. The manner in which the total is to be struck has been explained in the foot-note of the houselist form,. However, this is recapitulated below:
(a) The total of census hosues in column 3 will be the number of entries for each page. For example, if the entries in this column areA2/100, A2.100(1 ),A2/101 (2), A21 102, A2/103( I), A2/103(2), A2/1 03(3), A21 I 04 and A2IlOs, tlien the total forthis pagewould be 9.
(b) For total in column 8, if the entries are A21 I 00, A2/1 01 (1) (a), A2/1 01 (I )(b), A2/lO2, A2/1 03( 1) (a), A21 I 03( I )(b), A21 103(2), A21 I 04, A21 I OS, then the total number of households in this column will be 9.
(c) For columns 21, 22 and 23 there should be no difficulty~ It will be a simple total for each column separately.
Houselist Abstract
102. After filling the entries in the houselist i.e./ after
completing houselisting for your entire block, you have to prepare a Houselist Abstract so that certain figures of the number of census houses, households and other particulars collected in the houselist are easily available. The specimen of the Houselist Abstract is given at Annexe-F at the end of these instructions.
103. There should be no difficulty in preparing the abstract. However, certain indications as to how the abstract should be prepared are given here. In particular, you are requested to carefully read the instructions regarding filling of columns 3 to 8 of the houselist abstract which relate to the number of census houses on the basis of the lise to which they are put.
Col. 1 : Page No. of houselist
You will recall that you must number each page of the houselist, and you will have to arrange them serially. The page number recorded by you will be noted here one below the other.
Col. 2 : Total No. of Census houses (from Col. 3 of houselist)
As mentioned in the heading itself, this figure will be obtained from col. 3 of the houselist. Please note that in the houselist itself you have to total up entries in column 3 and enter the total at the bottom of each page. Please check this total and carry it over to the abstract.
Col. 3 to 7 : Number of Census houses by use
The purpose for which a census house is used will have been noted by you in column 7 of the houselist. The figures of columns 3, 4 and 6 of the abstract could be got by carefully adding up the different uses to which census houses are put from column 7 of the hOL!selist. You will have noted census houses by use as only residential, partly residential, vacant if not being used and census houses which are not used at all wholly or partly as residence but have other uses such as workshops, etc. You will have to separately add the census houses falling into each of these categories from col. 7 of the houselist and enterthem separately under columns 3,4 and 6 ofthe houselist abstract. Columns 5 and 7 of the houselist abstract are just totals and should present no difficulty.
Please note that if in a census house there is more than one household, there is still only one use to which this census house is put namely, "Residential" and you should L3ke CJre to see thilt no duplicilte counting tilkes plilce due to ilny confusion between census house and households.
Col. 8 : Census houses put to other uses (Col. 2 minus Col. 7)
This column refers to census house put to other uses.
243

The figures to be noted here will be derived by subtracting column 7 from column 2.
Col. 9 : Total No. of households
This figure will be obtained from the total at the bottom of column 8 of the houselist.
Cols. 10 to 12 : Total population
Under each of these columns, please enter the page total under the corresponding columns, i.e., columns 21 to 23 of the house1ist. Please see Annexe 'H' for a model of a filled in houselist abstract.
104. You should prepare a duplicate set of the houselist form giving all the pages and entries and submit both the copies to your supervisor along with the housellst abstract. It Is enough if one copy of the houselist abstract is prepared.
105. Please do not forget to note on the notional map, the lay-out sketch and on each page of the houselist and of the houselist abstract relevant location particulars of your block which will be supplied to you by your Charge Officer
or Supervisor. The location particulars must Include the details from the State down to your block.
106. After you have completed the houselisting operations of your block, you must have with you the following documents :
(a) Notional Map
(b) Layout Sketch
(c) Houselist forms, pinned together (2 sets)
(d) Houselist Abstract
(e) Enterprise Lists, pinned together
(f) Enterprise List Abstract
Please hand these over to your supervisor alongwith all untilled forms.
Instructions on this matter will be issued to you by your charge officer also.
244
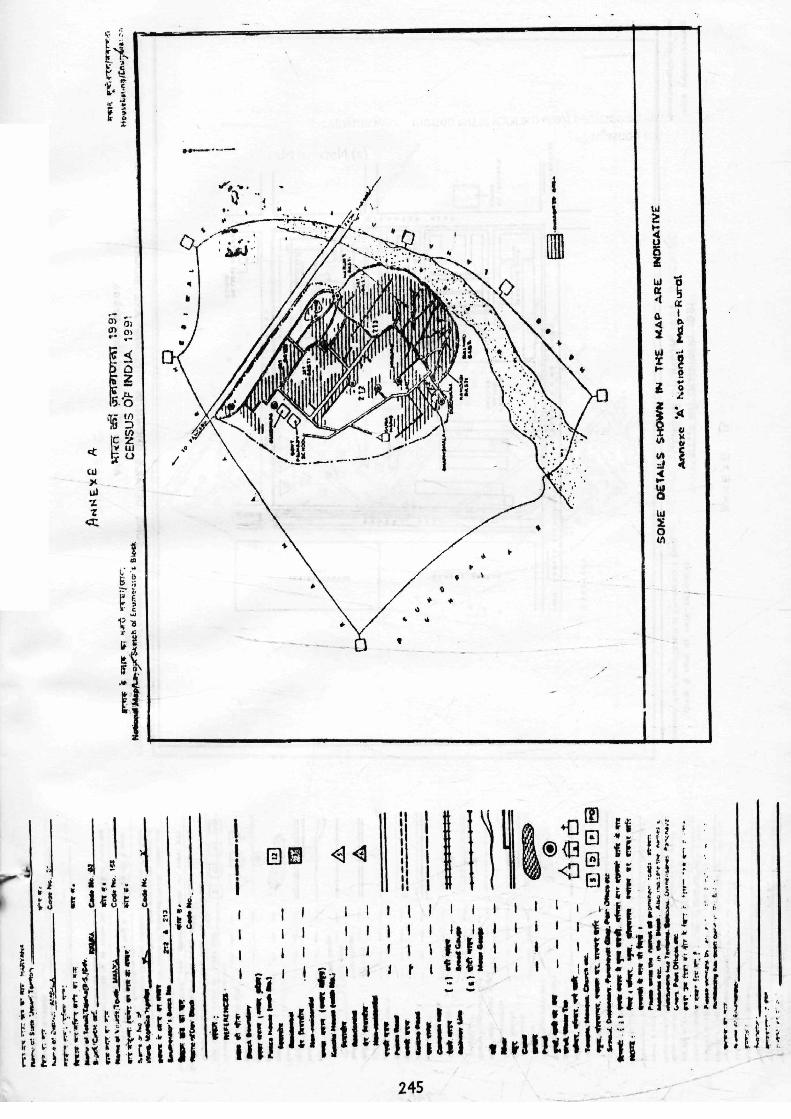
• .-.. ... _.y-
•
I
'" .,.
245
• . \
i
i l1ID
w ~ o 11\ .
. ,,.. -

;;
* .; § .. . ;;, .
/
U 'IS 3
d) ~~ ill ~ u x.. UJ -z -r.. 0:.
i III
~ '§
Ii f! Ii ~
Z} i! I
z __
r: _.--
Qi ._. _._. ~ ._.-._...-._
i hli:J nQ:!] 'f ~LJI ; I '0 1 Lf
;
i
• .. • •
· i ~ ~
I · .~ • Ii I I J:T. i Iii L- '- [ : I
• • 1
• • • • · :... 0
• • I I;: i CJ : I :
i a,= ( I : ~ : !,.. : .. - <J ; · :, 0 •
I ( 0 <J : I I ] fo <J
~ I ( <J :~ 0 ! ~''''''-'-'-'-';-~-'-;~-i=~-'-'-''::;-' • ~ ..
: ~l .. 1
•• P4 . .... , " ... , .. ", .... , ...... W
• • ... 0 ... :.
, /. I
/ I \ "
3J .:: ...
o 7.~ ________________ ~ ________ ~~~\ ____ ~
j ~ . i • ~ • ..
! · t • ~ iv~
g
i i u
246 \
\ \ \ \
1. •
UI ~
5 5 2'S c III " 0: ~ 0( ::t Il. • ~
0.
~ W ~ ~ .i ill ..
0 z z jrl ~
~ er )I fI
I/) ~ l ~ IjI 0
W f ~'" ::f:
0 III
. I
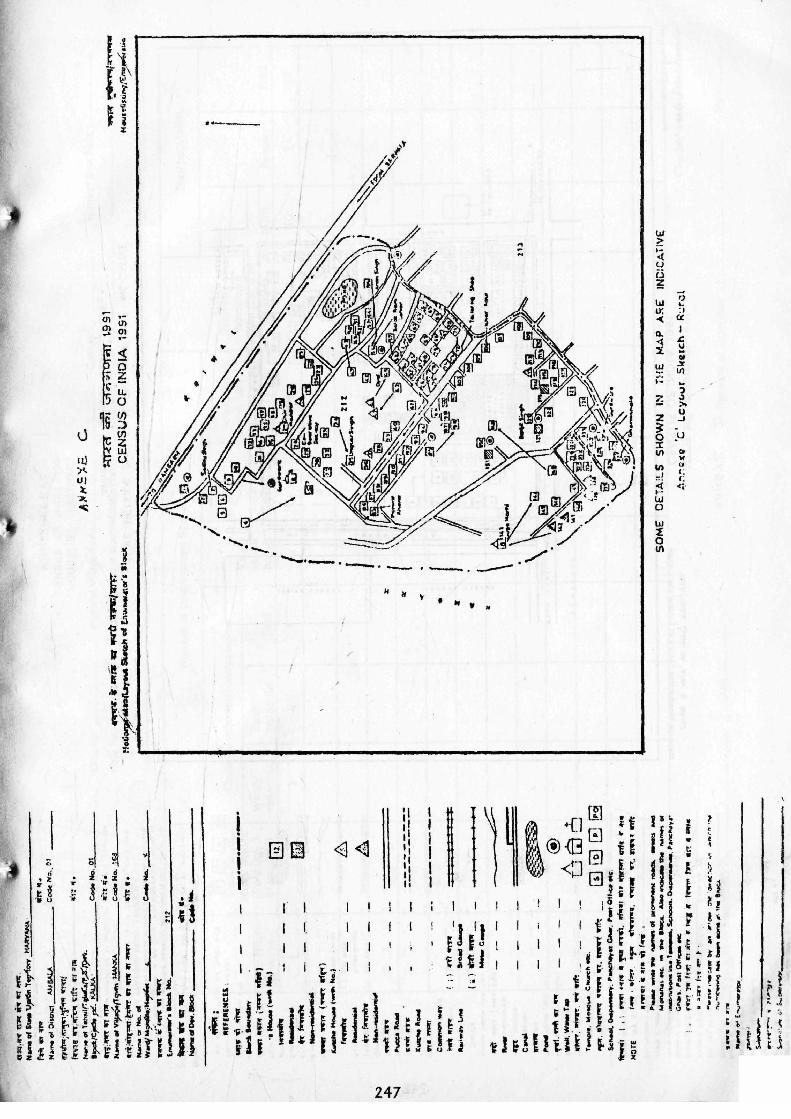
w .., ~ .-H 4 u C.l ;?:
~
UI r.l "-
0; y ..
en 0: :.
~?! ~ " a. I
~~ "1 s:. ~ ~
at W
:y
,- III
U.
r; ~
0 'l
~ .:I ::>0 rU) S :> 2 u
U ~~
.J
~ 0 .U
II}
:r III Qo
)1-
'I(
LlJ III ..
:t
_. ( .
~ c <l
t-",10;, UI "<: 0
w ~ 0
¥ 11\
ii
~ 's Ii
If II ~ , " " .5 "
il i:l r
,~l i"}, .
0
-=
. '.
i 'I I, I(
I 0mJ <B<1 I, . " I " " i " "
r I I , I I I I
247

A
IJ ;0<. I1J Z r if
F:~r------------------------------~ l. ~- ~ ,~ r ttl = If' ~::
: i :x
.... 0) .... 0)0) T"_ ~
U 1G~
~~
.i • ' i"i. -:::-,
E ~ ... 1:
u
IJ; II)
I! '5 I! Q
... 5 II
~ • I
z...__
· · · .. • .. ...
~l .. • · · ..
-~ 1m I~J
~~~~~] 100000~:I~J rl~0[}[~llp ~1 Li!JO@J0 -1 [;) ~JGGEEJ L.
."" ... ~ .... , .
Rl • I .: r~ ;
_111-'''' • ..... ., ,. ' 9NI
I \
j j n .
· I Ii , ,I " I film <8 <{1 I' · I II
I 1.1
, " .
I 'I
"
248
lJJ
?-/-
< (..1
U L ~ <'
.~
1J1 l.-
et. :::> <l: , 0.. r.
v <t .. ~ C'I
-" IJJ
1/)
:r .. f- "J
0
~ ; ... u ~
;;.: b ~
0 :r fI
(I) .. QI
VI C c:
:-1. -(
~ ~ t.~
\.tI ~ 0 Vl .J
\

ANNEXURE'I(A) CENSUS OF INDIA 1991 HOUSELIST ABSTRACT
Name of State/Union Territory """""""."".. Code No ... " ............ "......... Name of Village/Town .............................................. Code No ...................... ,....... Name of De'l:Block ....................... .
Name of Dktrlct ......................................... , Code No ................. :.......... Name or No. of Ward/Mahalia/Hamlet ...................... Code No. .............................. . .................................................. .
Name ofTah~I/T3luka/P.S.l Dev. Block/Orcle, etc. .................................. Code No. ........................... Enumerator's Block No ................................. ,........... .......................................... Code No ..................................... ..
Number of census houses by use Total population
Census Total No. of Occupied residential census houses houses put to Total No. of
census houses Vacant other uses households Page No. of (from Col. 3 Wholly Partly census Total of (Col. 2 minus (from Col. 8 of housells! of housel~!) residential residential Total houses Cols. 5 &6 Col. 7) houselist) Males Females Total
1 2 3 4 5 6 7 8 9 10 11 12
Total
Chec~ed and found correct
Signature of Enumerator .... ,,, .............. ,,.............. Date ............ .. Signature of Supervisor ... ".................................... Date ......... ..

ANNEXE-I
Definition of Factories
[THE FACTORIES ACT, 1948]
(As modified upto 1 st September, 1982)
1 . IIF actory" means any prenlises including the precinct:, thereof :-
(i) whereon ten or more workers are working, or were working on any day of the preceding twelve months, and in any part ofwhich J manufacturing process is being carried on with the aid of power, ('r is ordinarily so carried all, or
(ii) whereon twe:1ty or more workers are vliorking, or were '.\forklng on any day of the preceding twelve months, and In any part of W: ,!ell J manufacturing process is being carried on without ~he aid of power, or is oridnarily so carried on.
2. ii manufacturillg process" means any process for ;-
(i) makIng, altering, repairing, ort1al r.entingJ finishing, packing, oiling, wJshlng, cleaning, breaking up, demolishing or otherwise treating or adopting any article or substance with a view to its use, sale, transport, delivery or disposal; or
(ii) pumping oil, water, sewage or any other substance; or
(iii) generating, transforming or transmitting power; or
Extract
(iv) composing types for printing, printing by letter press, iithography, photogravure or other similar process or book binding;
(v) constructing, reconstructing, repairing, refitting, finishing or breaking up ships or vessels;
(vi) preserving or storing any article in cold storage.
3. "power" means electrical energy, or any other form of energy which is mechanically transmitted and is not generated by human or animal agency.
4. "worker" means a person employed, directly or by or through any agency (including a contractor) with or without the knowledge of the principal employer, whether for remuneration or not, in any manufacturing process, or in cleaning any part of the machinery or premises used for a manufacturing process, or in any other kind of work incidental to, or connected with, the manufacturing process, or the subject of the manufacturing process but does not include any member of the armed forces of the union.
250

ANNEXE - J
Description of Enterprises
AGRICUL rURAL ENTERPRISES
AGRICULTURE, LIVESTOCK, HUNTING, FORESTRY & FISHING
Raising of livestock
Cattle breeding, rearing and ranching, etc.; production of milk
Goat breeding, rearing, ranching, etc.; production of milk
Hunting, trJpping and game propagation other than for sport
forestry and Logging
Planting, replanting and conservation of forests
Logging-felling and cutting of trees and preparation of rough, round, hewn or riven logs (includingincidenta! hauling)
Production of firewood/fuel wood (including charcoal by Rearing of sheep and production of shorn woo! burning) by exploitation of forests
Rearing of horses, mliles, camels and other pack animals Gathering of fodder by exploitation of forests
Rearing of pigs and other animals not elsewhere ciasslfi'2d Gathering of uncultivated materials such as gums, resins, lac, barks, munjh, herbs, honey, wild fruits, lea'Ies, etc. by
Re2ring of ducks, hens and other birds; production of eggs exploitation of forests.
Rearing of bees; production of honey and wax (Collection of Forestry services n.e.c. honey is classified separately)
Fishing (including collection of sea products) Rearing of silk-worms; production of cocoons and raw silk
Ocean, sea and coastal fishing Rearing of livestock and-production of livestock products, not elsewhere classified Inland water fishing
Agricultural Services Pisciculture-rearing of fish, including fish hatcheries
Pest destroying, spraying and pruning ofinfeCl€G sfems; etc. CollKtion of pe:3ris, conchi2s, she:ls, ~por;g;;~ ;md other sea products
Operation <,>f irrigation systems
Animal shearing and livestock services n.e.c (other than veterinary servi~es)
Grading of agricultural products or livestock
Horticultural and nursery services
Soil conservation services
Scientific services like soli testing
Soi! deialination services
Agricultural services not eISeW11'::re classified (like harlesting and threashing, iand clearning and land draining services, etc.)
Hunting, Trapping and Game Propagation
251
Cultivation of oysters for pearls
Other allied activities and services incidental to fishing n.e.c.
NON-AGRICUl rURAL ENTERPRISES
MINING AND QUARRYING
Mining of Coal and Lignite; Extract of Peat
Mining and agglomeration of coal
Mining and agglomeration of lignite
Extract and agglomeration of peat
Extract of Crude Petrolt",mi Production of Natural Gas
Extraction of crude petroleum
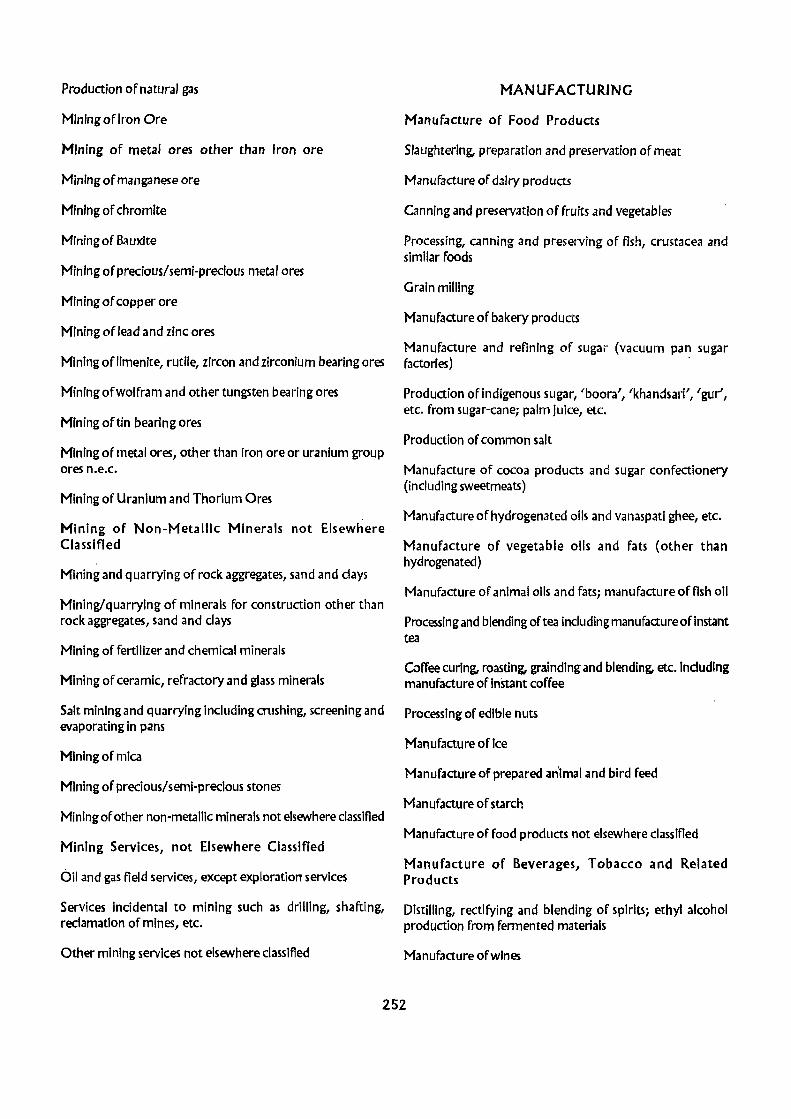
Production of natural gas
Mining of Iron Ore
Mining of metal ores other than Iron ore
Mining of manganese ore
Mining of chromite
Mining of Bauxite
Mining of precious/semi-precious metal ores
Mining of copper ore
Mining of lead and zinc ores
MANUFACTURING
Manufacture of Food Products
Slaughterln~ preparation and preservation of meat
Manufacture of dairy products
Canning and preservation of fruits and vegetables
Processing, canning and preserving of fish, crustacea and similar foods
Grain milling
Manufacture of bakery products
Manufacture and refining of sugar (vacuum pan sugar Mlningoflimenite, rutile, zircon and zirconium bearing ores factories) .
Mining ofwolfram and other tungsten bearing ores Production of indigenous sugar, 'boora', 'khandsari', 'gur',
Mining of tin bearing ores
Mining of metal ores, other than iron ore or uranium group ores n.e.c.
Mining of Uranium and Thorium Ores
Mining of Non-Metallic Minerals not Elsewhere Classified
Mining and quarrying of rock aggregates, sand and clays
Mining/quarrying of minerals for construction other than rock aggregates, sand and clays
Mining of fertilizer and chemical minerals
Mining of ceramic, refractory and glass minerals
Salt mining and quarrying including crushing, screening and evaporating in pans
Mining of mica
Mining of precious/semi-precious stones
Mining of other non-metallic minerals not elsewhere classified
Mining Services, not Elsewhere Classified
Oil and gas field services, except exploration services
Services incidental to mining such as drilling, shafting, reclamation of mines, etc.
Other mining services not elslWhere classified
etc. from sugar-cane; palm juice, etc.
Production of common salt
Manufacture of cocoa products and sugar confectionery (including sweetmeats)
Manufacture of hydrogenated oils and vanaspati ghee, etc.
Manufacture of vegetable oils and fats (other than hydrogenated)
Manufacture of animal oils and fats; manufacture of fish 011
Processing and blending of tea including manufacture of instant tea
Coffee curing, roasting, grainding and blending, etc. Including manufacture of instant coffee
Processing of edible nuts
Manufacture of ice
Manufacture of prepared animal and bird feed
Manufacture of starch
Manufacture of food products not elsewhere classified
Manufacture of Beverages l Tobacco and Related Products
Distilling, rectifying and blending of spirits; ethyl alcohol production from fermented materials
Manufacture ofwines
252

Manufacture of malt liquors and malt
Production of country liquor (arrack and toddy etc.)
Manufacture of soft drinks and syrups
Tobacco stemming, redrying and all other operations connected with preparing raw leaft tobacco
Manufacture of bidi
Manufacture of cigars, cigarettes, cheroots and cigarette tobacco
Manufacture of 'snuff', 'zarda', chewing tobacco and other tobacco products n.e.c. (except pan-masala containing tobacco)
Manufacture of pan-masala, catechu (kattha) and chewing lime .
Manufacture of cotton textiles
Cotton ginning, cleaning and baling
Cotton spinningotherthan in mills (charkha)
Weaving and finishing of cotton khadi
Weaving and finishing of cotton textiles on handlooms
Weaving and finishing of cotton textiles on pwerlooms
Cotton spinning, weaving and processing in mills
Bleaching, dyeing and printing of cotton textiles (This group includes bleaching, dyeing and printing of not self produced cotton tex~iles. No distinction is to be made between these activities carried out on a fee or contract basis or by purchasing the materials and selling the finished products)
Manufactur~ of wool, silk and man-made fibre textiles
Preparation of raw wool, silk and artificial/synthetic textile fibres for spinning
Wool spinning, weaving and finishing other than in mills
Wool spinning, weaving and processing in mills
Bleaching and dyeing of woollen textiles
Spinning, weaving and finishing of silk textiles other than in mills
Spinning, weaving and processing of silk textiles in mills
Bleaching, dyeing and printing of silk textiles
Spinning, weaving and processing of man-made textile fibres
Bleaching, dyeing and printing of artificial/synthetic textile fabrics
Manufacture of Jute and other vegetale fibre textiles except cotton
Jute and mesta pressing and baling
Preparatory operations (including carding and combing) on jute and mesta fibres
Preparatory operations (including carding and combing) on coir fibres
Preparatory operations (including carding and comliing) on sun hemp and other vegetable fibres n.e.c.
Spinning, weaving and finishing of jute and mesta textiles
Spinning, weaving and finishing of coir textiles
Spinning, weaving and finishing of sunhemp and other vegetable fibre textiles n.e.c.
Bleaching, dyeing and printing of jute and mesta textiles
Bleaching, dyeing and printing of coir textiles
Bleaching, dyeing and printing of other vegetable fibre textiles n.e.c.
Manufacture of textile products (including wearing apparel)
Manufacture of knitted or crocheted textile products
Manufacture of all types of threads, cordage, ropes, twines and nets, etc.
Embroidery work, zari work and making of ornamental trimmings
Manufacture of blankets, shawls, carpets, rugs and other similar textile products
Manufacture of floor coverings of jute, mesta sunhemp and other kindred fibres and of coir
Manufacture of all types of textile garments and clothing accessories n.e.c. (except by purely tailoring establishments) from not self-produced material (Note: in principle, the raw material is cut and sewn together in the establishments covered in this group)
Manufacture of rain coats, hats, caps and school bags etc. from waterproof textile fabrics or plastic sheetings
253

Manufacture of made-up textile articles; except apparel
Manufacture of waterproof textile fabrics
Manufacture of textiles/textile products not elsewhere classified like linoleum, padding, wadding, upholstering and filling, etc.
Manufacture of wood and wood products : furniture and fixtures
Sawing and planing of wood (other than plywood)
Manufacture of veneer sheets, plywood and their products
Manufacture of structural wooden goods (including treated timber) such as beams, posts, doors and windows (excluding hewing and rough shaping and poles, bolts and other wood material which Is classified under logging)
Manufacture of wooden and cane boxes, crates, drums, barrels and other containers, baskets and other wares made entirely or mainly of cane, rattan, reed, bamboo, willow, fibres, leaves and grass
Manufacture of wooden industrial goods n.e.c.
Manufacture of cork and cork products
Manufacture of wooden furniture and fixtures
Manufacture of bamboo and cane furniture and fixtures
Manufacture of products of wood, bamboo, cane, reed and grass (including articles made from coconut sheels, etc.) n.e.c.
Manufacture of paper and paper products and printing, publishing & allied industries
Manufacture' of pulp, paper and paper board including manufacture of newsprint
Manufacture of containers and boxes of paper or paper board
Manufacture of paper and paper board articles and pulp products not elsewhere classified
Manufacture of special purpose paper whether or not printed n.e.c.
Printing and publishing of newspapers
Printing and publishing of periodicals, books, joyrnals, dIrectories, atlases, maps, sheet music, schedules & pOlmphlets, etc.
Printing of bank notes, currency notes, postage stamps, securIty passes, stamp papers and other similar products
Engraving, etchIng and block-making, etc.
Book binding on account of others
Printing and allied activities not elsewhere classified
Manufacture of leather and products of leather, fur & substitutes of leather
Tanning, curing, finishing, embossing and japanning of leather
Manufacture of footwear (excluding repair) except of vulcanized or moulded rubber or plastic
Manufacture of wearing apparel of leather and substitutes of leather
Manufacture of consumer goods of leather and substitutes of leather; other than apparel and footwear (Note : Manufacture of school bags and travelling accessories from waterproof textile fabrics is included in a separate group)
Scrapping, currying, tanning, bleaching and dyeing of fur and other pelts for the trade .
Manufacture of wearing apparel of fur and pelts
Manufacture of fur and skin rugs and other similar artldes
Manufacture of leather and fur products n.e.c.
Manufacture of basic chemicals and chemical products (Except Products of Petroleum and Coal)
Manufacture of industrial organic and inorganic chemicals
Manufacture of fertilizers and pesticides
Manufacture of plastics in primary forms; manufacture of synthetic rubber
Manufacture of paints, varnishes and related products; artists' colours and ink
Manufacture of dru~, medicines and allied products
Manufacture of of perfumes, cosmetics, lotions, hair dressings, toothpastes, soap in any form, detergents, shampoos, shaving products, washing and cleaning preparations and other toilet preparations
Manufacture of man-made fibres
Manufacture of matches
Manufacture of explosivesj ammunition and fire-works
Manufacture of chemical products not elsewhere classified
254

Manufacture of Rubber, Plastic, Petroleum and Coal Products; Processing of Nuclear Fuels
Tyre and tubes industries
Manufacture of footwear made primarily of vulcanised or moulded rubber and plastics
Manufacture of rubber products not elsewhere classified
Manufacture of plastic products not elsewhere classified
Manufacture of refined petroleum products (this group indudes production of liq uids of gaseous fuels, illuminating oils, lubricating oils or greases or other products obtained from crude petroleum or their fractionation productions)
Bottling of natural gas or liquified petroleum gas
Manufacture of refined petroleum products not elsewhere classified (this group includes manufacture of variety of products extracted/obtained from the products or residues of petroleum refining)
Processing of nuclear fuels (this group includes extraction of uranium metals from pitch blende or other uranium bearing ores; manufacture of alloys or dispersions or mixtures of natural uranium or its compounds; manufacture of enriched uranium and its compounds; plutorium and its compounds; uranium depleted in U 235 and its compounds; thorium and its compounds; other radio active elements, isotops or compounds and non-irradiated fuel elements for use in nuclear reactors)
Manufacture of coke oven products (This group includes operation of coke ovens chiefly for the production of coke or • semi-coke from hardcoal and lignite, retort carbon and residual products such as coa'itar or pitch agglomeration of coke is included)
Manufacture o'fother coal and coaltar products not elsewhere classified
Manufacture of Non-metallic Mineral Produch
Manufacture of refractory products and structural clay products
Manufacture of glass and glass products
Manufacture of earthen and plaster products
Manufacture of non-structural ceramic ware
Manufacture of cement, lime and plaster
Manufacture of mica products
Stone dressing and crushing; manufacture of structural stone goods and stone ware
Manufacture of asbestos cement and other cement products
Manufacture of miscellaneous non-metallic minerai products not elsewhere classified
Basic Metal and Alloys Industries
Manufacture of iron and steel in primary/semi-finished forms
Manufacture of semi-finished iron and steel products In rerolling mills, cold-rolling mills and wire-drawing mills
Manufacture of ferro-alloys
Copper manufacturing
Brass manufacturing
Aluminium manufacturing
Zinc manufacturing
Casting of metals
ProcessingiRe-rolling in metal scraps other than iron and steep scraps
Other non-ferrous metal industries
Manufacture of Metal Products and Parts, Except Machinery and Equipment
Manufacture of fabricated structural metal products
Manufacture of fabricated metal products not elsewhere classified
Manufacture of furniture anf fixtures primarily of metal
Manufacture of hand tools, weighn and measures and general hardware
Forging, pressing, stamping and roll-forming of metal; powder metallurgy. (This group includes production of a wide variety of finished or semi-finished metal products, by means of the above activities which, Individually, would be characteristically produced in other activity categories)
Treatment or coating of metals; general mechanical engineering on a sub-contract basis. (This group includes plating, polishing, anodising, engraving, printing, hardening, buffing, deburring, sand blasting, welding or other specialised operations on metals on a fee or contract basis. The units classified here, generally, do not take ownership of the goods nor do they sell them to third parties)
255
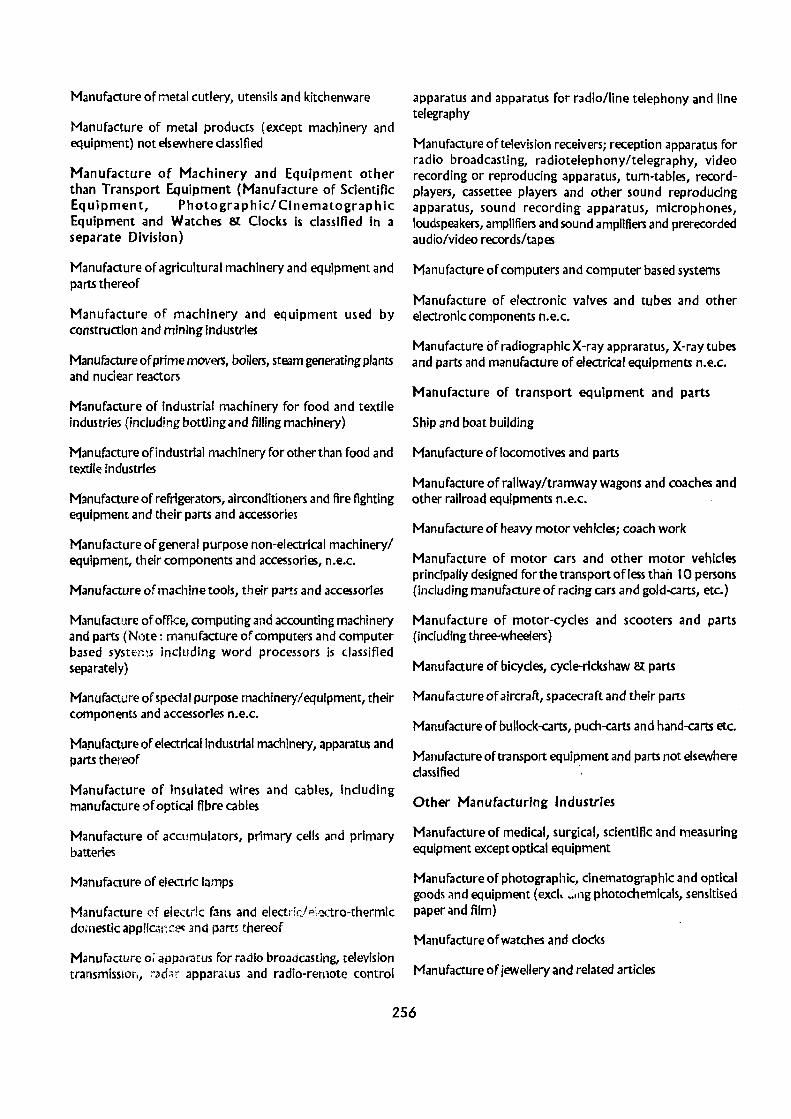
Manufacture of metal cutlery, utensils and kitchenware
Manufacture of metal products (except machinery and equipment) not elsewhere classified
Manufacture of Machinery and Equipment other than Transport Equipment (Manufacture of Scientific Eq uipment, Photographic/ Ci nematograp hic Equipment and Watches & Clocks is classified in a separate Division)
Manufacture of agricultural machinery and equipment and parts thereof
Manufacture of machinery and equipment used by construction and mining industries
Manufacture of prime movers, boilers, steam generating plants and nuclear reactors
Manufacture of industrial machinery for food and textile industries (including bottling and filling machinery)
Manufacture of industrial machinery for other than food and textile Industries
Manufacture of refrigerators, airconditioners and fire fighting equipment and their parts and accessories
Manufacture of general purpose non-electrical machinery/ equipment, their components and accessories, n.e.c.
Manufacture of machine tools, their pJrts and accessories
Manufacture of office, computing and accounting machinery and parts (Note; manufacture of computers and computer based systEms including word processors is classified separately)
Manufacture of special purpose machinery/equipment, their components and accessories n.e.c.
Manufacture of electrical industrial machinery, apparatus and parts thereof
Manufacture of Insulated wires and cables, Including manufacture of optical fibre cables
Manufacture of accumulators, primary cells and primary batteries
Manufacture of electric lamps
Manufacture of electric fans and electricl ei&tro-thermic domestic app!ic;;l~ (:e<; smd pam thereof
Manufacture or apparatus for radio broadcasting, television transmissioh, :",~d;F' apparatus and radio-remote control
apparatus and apparatus for radio/line telephony and line telegraphy
Manufacture of television receiversj reception apparatus for radio broadcasting, radiotelephonyltelegraphy, video recording or reproducing apparatus, turn-tables, recordplayers, cassettee players and other sound reproducing apparatus, sound recording apparatus, microphones, loudspeakers, amplifiers and sound amplifiers and prerecorded audio/video records/tapes
Manufacture of computers and computer based systems
Manufacture of electronic valves and tubes and other electronic components n.e.c.
Manufacture of radiographic X-ray appraratus, X-ray tubes and parts and manufacture of electrical equlpments n.e.c.
Manufacture of transport equipment and parts
Ship and boat building
Manufacture of locomotives and parts
Manufacture of railway/tramway wagons and coaches and other railroad equipments n.e.c.
Manufacture of heavy motor vehicles; coach work
Manufacture of motor cars and other motor vehicles principally designed for the transport of less than 10 persons (including manufacture of racing cars and gold-carts, etc.)
Manufacture of motor-cycles and scooters and parts (including three-wheelers)
Manufacture of bicycles, cycle-rickshaw & parts
Manufacture of aircraft, spacecraft and their parts
Manufacture of bullock-carts, puch-carts and hand-carts etc.
Manufacture of transport equipment and parts not elsewhere classified .
Other Manufacturing Industries
Manufacture of medical, surgical, scientific and measuring equipment except optical equipment
Manufacture of photographic, cinematographic and optical goods and equipment (excL.:.ng photochemlcals, sensitised paper and film)
Manufacture of watches and clocks
Manufacture of jewellery and related articles
256

Minting of c mency coins
ManufacturE of sports and athletic goods
Manufacture of musical instruments
Manufacture of stationery articles n.e.c.
Manufacture of items based on solar energy like solar cells, cookers, air and water heating systems and other related items
Manufacture of miscellaneous products not elsewhere classified
Repair of capital goods
(This Division includes repair and maintenance, other than by manufacturers of machinery and equipments which are generally used as investment goods by Industries. Repair of consumption goods is classified separately whether or not the consumers are households)
Repair of agricultural machinery/equipment
Repair of prime-movers, boilers, steamgenerating plants and nuclear reactors
Repair of machine tools
Repair of industrial machinery other than machine tools
Repair of office, computing and accounting machinery
to households, industrial, commercial and other users
Water Works and Supply
Water supply i.e. collection, purification and distribution of water
Non-conventional Distribution
Energy Generation and
Generation of solar energy
Generation and distribution ofbio-gas energy
Generation of energy through wind mills
Generation and distribution of other non-conventional energy n.e.c.
CONSTRUCTION
Construction
Construction and maintenance of buildings
Construction and maintenance of roads, rail beds, bridges, tunnels, pipelines, ropeways, ports, harbours and runways, etc.
Construction/erection and maintenance of power, telecommunication and transmission lines
Construction and maintenance of waterways and water Repair of electrical Industrial machinery and apparatus reservoirs such as bunds, embankments, dams, canals, tanks,
wells, tubewells and aquaducts, etc. Repair of apparatus for radio-broadcasting or television transmission, radar apparatus, radio remote control apparatus Construction and maintenance of hydro-electric projects and apparatus for radio/line telephony or line telegraphy
Construction and maintenance of power plants except hydro-Repair of locomotives and other railroad equipment electric projects
Repair of heavy motor vehicles Construction and maintenance of industrial plants excluding power plants
Repair of machinery and equipment not elsewhere classified Construction and maintenance not elsewhere classified
ELECTRICITY, GAS AND WATER Activities Allied to Construction
Electricity Generation, Transmission and Distribution Plumbing and drainage
Generation and transmission of electric energy
Distribution of electric energy to households, Industrial, commercial and other users
Gas and Steam Generation and Distribution through Pipes
Generation of gas In gas-works and distribution through mains
Heating and air-conditioning installation, lift installation, sound-proofing etc.
Setting of tiles, marble, bricks, glass and stone
Timber works (such as fixing of doors, windows, panels); structural stee work; R.C.C. work and binding of the bars and roof trusses
257

Electrical installation work for COl1ltructions
Painting and decorating work for comtruction
Other activities allied to construction not elsewhere classified
WHOLESALE AND RETAil TRADE AND RESTAURANTS AND HOTELS
Wholesale trade in Agricultural Raw Materials, live animals, food, beverages, intoxicants and textiles
Wholesale trade in cereais and puises
Wholesale trade in basic food-stuffs (other than cereals and pulses)
Wholesale trade in textile fibres of vegetable/animal origin
Wholesale trade in un-manufactured tobacco, pan leaves,
WholesJle trade in metal, porcelain and glass LI[E~sils, crockery and chinaware
Wholdale (; .1';(: in orE'S and metals
Wholesale trade in an Types of Machinery Equipment Including Transport Equipment
Wholesale trade in agricultural and industria! machinery
Wholesale trade in electrical rnachir.ery Jnd equipment
Wholesale trade in electronic e<ju!tjj1-,ent and ,1.::cessories
Wholesale trade in transport and storage equipnwnt
Wholesale trade not Elsewhere O;:lSSifi!?d
Wholesale trade in furniture and tlxtures
OplUr.l, ganja and cinchona, etc. Wholesale trade in rubber, plastic and their products
V/holesaie trade in straw, fodder and other ,In!rnal/poultry Wholesale trade in building materia is feed
Wholesale trade in live animals and poultry
Wholesale trade in manuiJctured foodstuffs
Wholesale trade in tea, coffee, cocoa, tobacco products and beverages other than intoxicants
Wholesa'ie trade in Intoxicants like wines and ilql,ors including incidental bottling
Whoiesa:e ti:'i:l(~ in textiles ;md textilE ~rodu(ts, like ,,:1 kird~ of yarn, tabrics, garments and other made-up articles, etc. (lndudingsecond-hand textile goods)
Wholesale trade in wood, paper, skin, ieather and fur, fuel, petroleum chemicals, perfumery, ceramics, glass and ores and metals
Wholesale trade in wood, cane, bamboo and thatches, etc.
Wholesale trade in paper and other st1tionery goods
Wholesale trade 1n skin, leather, fur and their products
Wholesale trade in fuel and lighting products
Wholesale trade in petrol, mobile oil and allied products
Wholesale trade in medicines and chemicals
Wholesale trade in fertilizers and pesticides
Wholesale trade in toiletry, perfumery and cosmetics
Wholesale trade in hardware and ~anitalY fi.xtures
Wholesale trade in household equipment, ,lPpliances n.e.c.
Who!e>Jle~r':;Ue in scie:"itk, medk,jj ",flu surgical instruments
Wholesah trade in wgches/(iocks, ey~ glasses and spectacle frames
V":holesaie trade in precious metals, stones znd jewellery
'Nho!esaie trade in wastes and metal scraps
Wholesale trade in miscellaneous goods not elsewh~re classified
Commission Agents
Commission agents dealing in agricultural raw materials, live animals food, beverages, intoxicants and texlile5
Commission agents dealing in wood, paper, skin, leather and fur, fuel, petroleum, chemicals, perfumery, cosmetics, glass, ores and metals
Commission agents dealing in machinery and equipment
Other commission agents n.e.c.
Retail Trade in Food and Food Articles, Beverages, r"bacco and Intoxicants
Spedaiised retail trade in c(;reais and pul\~! tea, coffee, spices, flour and other basic food items
258

Retail trade in vegetables and fruits
Retail trade in meat, fish and poultr/
Retail trade in sweetmeat, bakery products, dairy products and eggs
Retail trade in aerated water, soft drinks and Ice-cream
Retail trade in pan, bidi and cigarette
Retail trade in wine ann liquor, not consumed or. ':he spot
Retail trade in food and food articles, beverages, tobacco and intoxicants not elsewhere cLmified
Retail trade in Textiles
Retail trade in textiles
Retail trade in ready-made garments, hosiery/knitted garments, etc. (indudes retaii trade in second-hand garments)
Retail trade in fuels and other Household Utilities and Durables
Retai! trade in firewood, coai, kerosene oii and cooking gases
Retail trade in footwear
RetaH trade in crockery, glass-ware and plastic-ware
Retail trade in utensils (except those specialising in plastic wares)
Retail trade in furniture
Retail trade in electric/electronic equipment (including watches and clocks)
Retail trade in'i~ellery
Retail trade in fuel and other household utilities and durables not elsewhere classified
Retail trade N.E.C.
Retail trade in books, magazines and stationery (including distribution of newspapers)
Retail trade in agricultural inputs, viz. seeds, fertilizers and pesticides
Retail trade in motor fuels
Retail trade in building materials
Retail trade in agricultural machinery and equipment
Retail trade in industry machinery and equipment electrical and non-electrical
Retaii trade in transport e:juipment
Retail trade in pharmaceutical, medical and orthopaedic goods
Non-specialised retail trade Induding non-store rer.:;ii trade
Retail trade not elsewhere classified
Restaurants and Hotels
Restaurants, cafes and other eating and drinking places
(Note1: This group includes sales of prepared fJods and drinks for immediate consumption on the premises such as restaurants, cafes, lunch counters and refreshment stands. Also includes are catering activities and take-oLit activities as well as dinning-car activities ofrailwaycomllanies and other passenger transport facilities which a:'e operated as independent activities. Sales through vending machine, vending stalls, whether or not mobile, are included. Note 2 : The abOve mentioned activities, if carried out in connection with the provision of lodging, are to be classified separately)
Hotels, rooming houses, camps and other lodging places
TRANSPORT, STORAGE AND COMMUNICATION
Land Transport
Ra ilway transport
Passenger transport by bus (Including tramways)
Passenger transport by motor vehicles other than by bus
Freight transport by motor vehicles
Passenger or freight transport by hackney carriages, bullokcarts, ekkas, tongas, etc.
Transport by animals like horses, elephants, mules, camels, etc.
Transport by man (including rickshaw pullers, handcart pullers, porters, coolies, etc.)
Pipe-line transport
Supporting services to land transport, like operation of highway bridges, toll roads, vehicular tunnels, parking lots, etc.
Other land transport
Water Transport
259
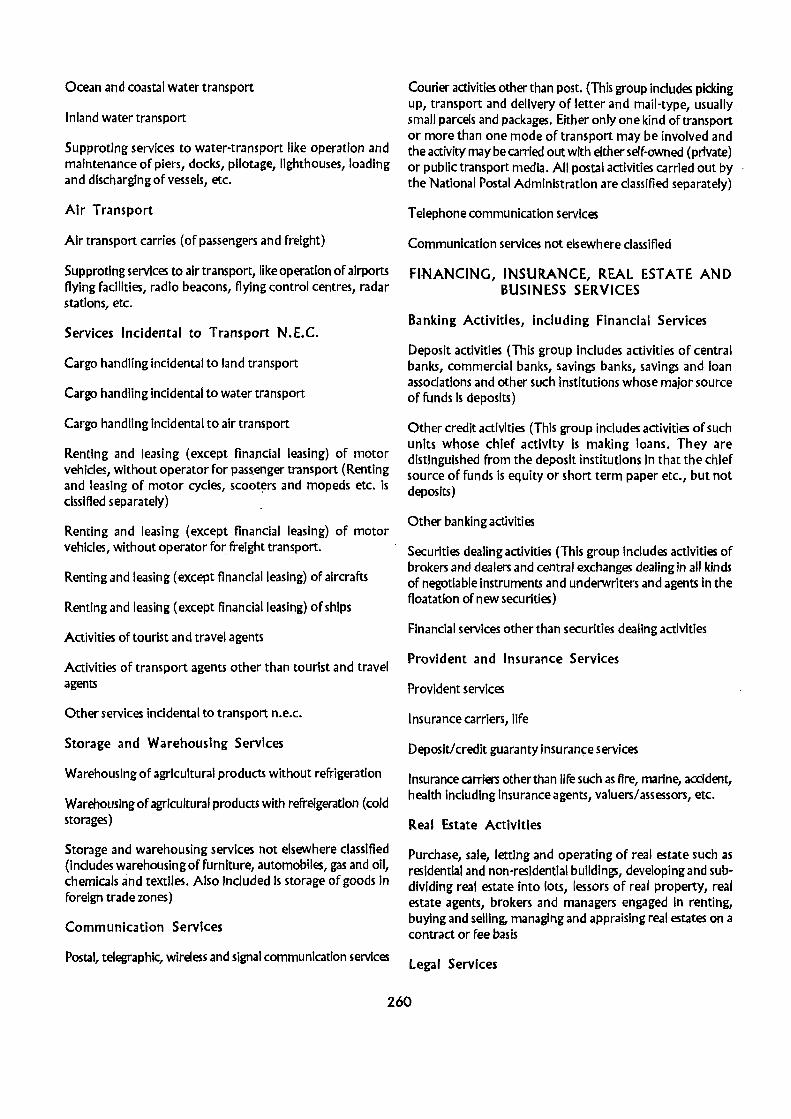
Ocean and coastal water transport
Inland water transport
Supproting services to water-transport like operation and maintenance of piers, docks, pilotage, lighthouses, loading and discharging of vessels, etc.
Air Transport
Air transport carries (of passengers and freight)
Supproting services to air transport, like operation of airports flying facilities, radio beacons, flying control centres, radar stations, etc.
Services Incidental to Transport N.E.C.
Cargo handling incidental to land transport
Cargo handling incidental to water transport
Cargo handling Incidental to air transport
Renting and leasing (except financial leasing) of motor vehicles, without operator for pass_enger transport (Renting and leasing of motor cycles, scooters and mopeds etc. is clssltled separately)
Renting and leasing (except financial leasing) of motor vehicles, without operator for freight transport.
Renting and leasing (except tlnancialleasing) of aircrafts
Renting and leasing (except financial leasing) of ships
Activities of tourist and travel agents
Activities of transport agents other than tourist and travel agents
Other services incidental to transport n.e.c.
Storage and Warehousing Services
Warehousing of agricultural products without refrigeration
Warehousing of agricultural products with refreigeration (cold storages)
Storage and warehousing services not elsewhere classified (Includes warehousing of furniture, automobiles, gas and oil, chemicals and textiles. Also Included is storage of goods In foreign trade zones)
Communication Services
Postal, telegraphic, wireless and signal communication services
Courier activities other than post. (This group includes picking up, transport and delivery of letter and mail-type, usually. small parcels and packages. Either only one kind of transport or more than one mode of transport may be involved and the activity may be carried out with either self-owned (private) or public transport media. All postal activities carried out by the National Postal Administration are classified separately)
Telephone communication services
Communication services not elsewhere classified
FINANCING, INSURANCE, REAL ESTATE AND BUSINESS SERVICES
Banking Activities, Including Financial Services
Deposit activities (This group includes activities of central banks, commercial banks, savings banks, savings and loan associations and other such institutions whose major source of funds is deposits)
Other credit activities (This group includes activities of such units whose chief activity is making loans. They are distinguished from the deposit institutions in that the chief source of funds is equity or short term paper etc., but not deposits)
Other banking activities
Securities dealing activities (This group includes activities of brokers and dealers and central exchanges dealing in all kinds of negotiable instruments and underwriters and agents in the floatation of new securities)
Financial services other than securities dealing activities
Provident and Insurance Services
Provident services
Insurance carriers, life
Deposit/credit guaranty insurance services
Insurance carriers other than life such as fire, marine, aCCident, health including insurance agents, valuers/assessors, etc.
Real Estate Activities
Purchase, sale, letting and operating of real estate such as residential and non-residential buildings, developing and subdividing real estate into lots, lessors of real property, real estate agents, brokers and managers engaged in renting, buying and selling, managing and appraising real estates on a contract or fee basis
legal Services
260
Legal services such as those rendered by advocates, barristers, solicitors, pleaders, mukhtiars, etc.
Operation of Lotteries
Bulk purchase and sale of lottery tickets
Sale of lottery tickets to individuals
Renting and Leasing (Financial Leasing is Classified in Financial Activities) Not Elsewhere Classified
Renting of transport equipment without operator n.e.c. (Includes shortterm rental as well as extended-term I·easing with or without maintenance)
Renting of agricultural machinery and equipments without operator
Renting of office, accounting and computing machinery and equipment, without opeator (Renting of computer time on an hourly or time-sharing basis is classified separately. Renting of computers or computer-related equipment with management or oepration is also classified separately)
Renting of other Industrial machinery and eq uipment (This group includes the renting or leasing of all kind of machinery which is generally used as investment goods by industries)
Renting of personal and household goods (This group Includes the rental of all kind of goods whether or not the customers are households. It involves the rental of such goods as textiles, wearing apparel and foot wear, furniture, pottery and glass, kitchen and tableware, electrical applicances and house-wares, jewellery, musical instruments and so on. Book rental is classified separately).
Business Services not Elsewhere Classified
Auctioneering services
Accounting, book-keeping and auditing activities, including tax consultancy services
Data processing, software development and computer consultancy services
Business and management consultancy activities
Architectural and engineering and other technical consultancy activities
Technical testing and analysis services (This group includes testing of all types of materials and products).
Advertising
Press agency activities (This group includes news syndicate
and news agency activities on a fee or contract basis. Indudes activities of independent news reporters, news writers, etc.)
Recruitment and provision of personnel
Other bUsiness services not elsewhere classified
COMMUNITY, SOCIAL AND PERSONAL SERVICES
Public Administration and Defence Services
Public services in the union government including defence services
Public services in state governments including police services
Public services in local bodies, departments and offices engaged in administration like local taxation and business regulations etc.
Public services in quasi-government bodies
Sanitary Services
Sanitation and similar services such as garbage and sewage disposal, operation of drainage systems and all other types of work connected with public health and sanitation
Education, Scientific and Rese,n::h Services
Educational services rendered by technical or vocational colleges, schools and other institutions
Educational services rendered by non-technical colleges, schools, lll1iversities and other insitutions
Research and scientific services not classified elsewhere such as those rendered by institutions and laboratories engaged in research in the biological, physical and social sciences, meteorological institutes and medical research organisations, etc.
Health and Medical Services
Health and medical services rendered by organisations and individuals such as hospitals, dispensaries, sanatoria, nursing homes, maternal and child welfare clinics by allopathic/ ayurvedic, unani, homoeopathic, etc. practitioners
Veterinary services (including birds' hospitals)
Community Services
Religious services rendered by organisations or individuals
Welfare services rendered by organisations operating on a no-profit basis forthe promotion of welfare of the community such as relief sociedes, creches, homes for the aged and
261

physically handicapped, etc. Hair dressing such as those done by barbers, hair dressing saloons and beauty shops etc.
Services rendered by business, professional and labour organisations n.e.c. Portrait and commercial photographic studios
Services rendered by cooperative societies n.e.c. Tailoring establishments
Community services not elsewhere classified Personal services not elsewhere classified
Recreational and Cultural Services Repair Services
Motion picture and video film production Repair of footwear and other leather goods
Motion picture distribution and projection services Repair of household electrical appliances
Stage production and related services Repair of TV, VCR, radio, transistor, taperecorder, refrigerator and other electronic appliances
Authors, music composers, singers, dancers, magicians and other independent artistes not elsewhere classifled Repair of watches, docks and jewellery
Radio and television broadcasting and related services Repair of motor vehicles and motor cycles except trucks, lorry and other heavy vehicles
Operation of circuses and race tracks Repair of bicycles and cycle rickshaws
Libraries, museums, botanical and zoological gardens, zoos, game sanctuaries, etc. Repair enterprises not elsewhere classified
Audio & video cassettee libraries International and other extra territorial bodies
Video parlours, electronic games and other amusement Services not elsewhere classified centres n.e.c.
ReCreational services n.e.c.
Persondl Services
Domestic services
Laundry, cleaning and dyeing services
Activities not adequately defined
Persons. without any affiliation to any particular_ Industry (including fresh entrants to labour force)
Activities not adequately defined (other than those persons without any affiliation to any particular industry Including fresh entrants to labour force)
262

ANNEXURE - C
INSTRUCTIONS TO ENUMERATORS FOR FILLING UP THE ENTERPRISE LIST


ANNEXURE-C
INSTRUCTIONS TO ENUMBERA TORS FOR FILLING ENTERPRISE LIST
INTRODUCTION
In the instructions for filling up the houselist (HL), it has been mentioned that HL. serves as a frame for the enterprises for which a separate Enterprise List (EL) will be prepared as part of the houselisting operations. After identifying the enterprises in colume 7 or 20 HL, enterprises and their selected characteristics will have to be recorded in EL forms supplied to you. This EL form is to be canvassed alongwith the HL immediately after an enterprise is identified either through column 7 or column 20 ofHL. The specimen form of EL is given at Annex. 1 . It will be observed that the form is simple and is designed to collect certain basic items of information for the identified enterprises.
2. This booklet illstrates (i) the manner in which EL is to be completed and (ii) the concepts and definitions to be followed and the explanations of various terms to be used. The success of EC operations is very much dependenton a thorough understanding of the concepts, definitions and instructions and on faithful applications of these concepts and definitions and your following these instructions in the actual filling of the EL form. If you have any doubt, please do not hesitate to ask your Supervisor/Charge Officer for necessary clarifications. As a cenus enumerator, you have great responsibility and there is no hdoubt that you will perform this task efficiently ""ith pride and devotion to duty.
3. The form is to be filled by eliciting the required information by contacting the head or any other repsonsible person of the enterprise and not through other sources. If you have doubt about the entry, you may put question mark (?) on the line in the remarks column of EL and subsequently incorporate changes, if necessary, after consulting your Supervisor in this regard. You should ensure that all question mar ~ are removed before handing over the forms to the Ch ':i:~2 Officer, Arabic numerals should be used in filling the fon" (i.e. 1,2,3,4, ........ ).
4. The instructions for filling EL are first described. La,;·! :he preparation of the Enterprise List Abstract (ELA) is dis'.~l;,~ed.
Before going into the details of the content of each of· .. :olumns in EL form, the concepts and definitions of thr .. c-(ms used In the form are given below.
CONCEPTS AND DEFINITIONS
ENTERPRISE
6. An enterprise is an undertaking engaged in production and/or distribution of goods and/or services not for the sole purpose of own consumption. The workers in an enter-
prise may consist of members of the household or hired workers or both. The activity of an enterprise may be carried out at one or more than one distinct location. The activity of the enterprise may also be carried out only for a part of the year but on fairly regular basis I.e. it should be In operation for the major part of season/year. Such cases should also be considered as enterprises. An enterprise may be owned or operated by a single household or by several households jointly (on a partnership basis) or by an institutional body or by Government.
Agricultural Enterprise
7. An agricultural enterprises for the purpose of economic census is defined as one engaged in livestock production, agricultural services, hunting, trapping and game propagation, forestry and logging and fishing. Enterprises engaged in activites pertaining to agricultural production and plantations will not be covered under the census.
Non agricultural Enterprise
8. Enterprises engaged in all other activities will be termed as non-agricultural enterprises.
9. The activities which are not to be treated as enterprises and which are to be treated as enterprises are illustrated In the booklet on "Instructions to enumerators for filling up the Houselist", supplied to you separately.
10. Certain situations pertaining to identification and classification of enterprises are indicated below.
(I) Persons doing different types of jobs depending on the availability of work e.g. loading unloading, helping a mason or a carpenter, doing earth work for a contractor should not be classified as running enterprises since they do work on wages.
(ii) Where the structure of an enterprise covers more than one village, the enterprise may be considered to be belonging to that village where the main entrance of the enterprise lies.
(iii) Brick kilns in the open will mormally be netted through column 20 of the Houselist.ln case where brick kiln activity is reported by one household, please enquire whether the activity is done on partnership basis. I f the partner is in the same enumeration block then the enterprise particulars are to be recorded against one household only with suitable remarks. If, however, the partners are living in different enumeration blocks then the enterprise particulars will be recorded against each of the house-
265

holds with sLlitable entry in the remarks column that the partners live in the different enumeration blocks.
(iv) Owners of tube wells, tractors and bullock carts who utilise their spare capacity to earn extra monty should not be classified as running enterprises if the spare capacity utilisation is on some occasions and not on regular basis.
(v) An enterpreneurial activity outside the cenus house and without premises may be carried out in a shopping centre/market place regularly or it may be of moving type. The enterprises without premises which are carried out in a shopping centre/market place regularly can broadly be classified into two categories viz.,
(a) those enterprises which are attached to the shop/ cenus house or operating in front of a shop in a shopping centre/market place; and
(b) those which are having fixed location in the open air in a shopping centre/market place and can not be attached/linked to any shop/census house.
The enterprises such as watch repairer operating in front of the shop, a hosiery outlet attached to a shop, panwal.1 sitting in front of a restaurant/hotel. etc. are examples of category (a) above. Examples of category (b) aie vegetable sellers sitting on the pavement, cobblers, ice-cream vendors reri-water etc. The enterprises of category (a) are to be covered through column 7 of Houselist (HL) and for such enterprises EL will be filled on the site of their location. The enterprises of category (b) above are to be netted through column 20 of HL and EL will be filled at the household itself. All the enterprises of moving type are to be netted through column 20 of HL and the EL have to be filled at the household itself.
ENTERPRISE LIST
11. On the top of EL form, provision is made to write identification particulars viz. name of State/Union Territory, District, Tehsii/Teluka/P.S.lDev. Block, Village/Town, name or number of Ward/Mohall a/Hamlet and Enumerator's Block Number. These items are to be copied by you from the H L form which you have already filled in. You have to enter the names and the coad numbers in the relevant spaces. In EL, record 'rural' or 'urban' against item 7 depending upon area of enumeration falling in a village or town. Give code 1 for rural and code 2 for urban. Also give the page number in the right hand corner at the top of the page of EL.
12. The detailed instructions for filling up various columns in EL are given below.
Coil: line number of HL (Col. 1 of HL)
13. Every line in HL must have been numbered by you serially in column 1 of Hl. Corresponding to the enterprise identified in the HL either in column 7 or c10umn 20 there Is a line number given i.e. entry in column 1 of H.I. This number is to be copied from column 1 of HL and entered in column 1 of EL.
Col 1 (i): Census house no.(col. 3 of HL)
14. Corresponding to the enterprise identified in column 7 or column 20 there is a cenus house number given in column 3 of HL. The census house numner need not necessarily be indicated in column 3 on the same line as that of the enterprise. It is possible that the census house number is indicated in column 3 against the first entry of column 7 or cloumn 20. It has to be ensured that the same census house number is copied from column 3 of HL and entered in column 1 (i) of EL.
Col. 2: Serial number of enterprise (col. 7 of HL)
15. A continuous serial number has been given within brackets by you for each enterprise identified in column 7 of HL. This number is to be copied and entered in column 2 of EL.
Col. 3: Serial number of enterprise (col. 20 of HL)
16. For each enterprise outside census house and without premises identified in column 20 of HL, a continuous serial number within brackets must have been given by you. This number is to be entered in column 3 of EL.
Col. 4: Description of activity of enterprise
17. For the enterprise serially numbered either in column 2 or column 3 of EL form, the description of the activity of the enterprise is to be written in this column. It is possible that more than one entrepreneurial activity is carried on in the same census house or outside the census house without premises. If these activites are carried on by the same person or the same household and separate accounts are kept for each of these activites, they should be treated as separate enterprises. However, in cases where the activities cannot be distinguished from one another, the major activity will be treated as the activity of the enterprise. The major activity should be decided on the basis of income or turnover or number of persons empolyed depending on the information readily available during your enquiry. For example, a tailor sells cloth also and does not maintain separte accounts for tailoring activity and selling of cloth. Some other examples where the activities might not be distinguished are flour mill and selling of commodities such as rice, wheat etcj furniture shop engaged in manufacture of furniture and renting of furniture; grocery shop also engaged as travel agent; etc.
18. Description of activity of the enterprise is one of the important items of information to be recorded and this
266

should be adequately elaborated to enable proper classification of the entrepeneurlal activity. Sufficient details of the activity of the enterprise should therefore be given. For instance, it is not enough to write simply 'shop' or the caption displayed on the signboard of the shop. It is necessary to give full description, such as 'electrical repair shop' 'medical shop; etc. It may be borne in mind that recording of broad description of activity as 'manufacture of dairy products' will not be sufficient but greater details such as (i) manufacture of milk powder, ice-cream powder, condensed milk, (jj) manufacture of baby milk food, (iii) manufacture of ice-cream and kulfi, (iv) manufacture of butter, cream, ghee etc. should be recorded in order to carry out proper coding of industrial activities.
19. A few examples of description of activities of the enterprises are listed below:
(i) cattle rearing and production of milk
(Ii) rearing of ducks, hens and other birds and production of egg
(iii) rearing of silk worms and production of cocoons and raw silk
(iv) animal shearing and livestock services (other than veteri na ry services )
(v) production of fuel by exploitation of forests
(vi) gathering of fodder by exploitation of forests
(vii) spinning yarn in Amber Charkha
(viii) flour making chakki
(ix) oil ghanl
(x) carpentry -manufacturing of wooden doors and win-dows
(xi) hair cutting
(xii) wholesale store for grains and cereals
(xiii) blacksmithy
(xiv) prod_uction of hosiery goods
(xv) stationery store
(xvi) earth ern ware and earthern pottery
(xvii) private tuition
(xviii)goods transport by motor truck
(xix) writing for papers and periodicals
(xx) health clinic
(xxi) inspection bungalows, dak bungalows, rest houses
20. Annex, J of the booklet on 'Instructions to enumerators for filling up the Houselist' gives an Illustrative list of broad description of activities and these have to be elaborated.
Col. 4(i) : Code
21. This column is to be left blank.
Col. 5 Classification of enterprise (agri-l, nonagri-2)
22. In this column, the enterprise is to be classified as agricultural or non-agricultural depending on the nature of the activity of the enterprise. Agricultural enterprise are those engaged in any of the activities relating to livestock production, agricultural services, hunting, trapping and game propagation, forestry and logging and fishing. The activites pertaining to crop production and plantations are not covered under this census. Thus, it will be observed that only certain specified agricultural activities broadly listed under the heading 'Agricultural Enterprises' in Annex-) ofthe instructions for filling up HL are taken into account. Non-agricultural enterprises are those which are engaged in any of the activities pertaining to
(I) Mining and Quarrying
(Ii) Manufacturing
(iii) Electricity, Gas and Water
(iv) Construction
(v) Wholesale & Retail Trade and Restaurants & Hotels
(vi) Transport, Storage and Communication Services
(vii) Financial, Insurance, Real Estate and Business Serv-ices
(viii)Community, Social and Personal Services
23. Activities relating to the processing of primary produce of agricultural and allied activities to make processed goods saleable and carried out fairly on regualr basis are to be treated as non-agricultural enterprises and not as agricultural enterprises. A few examples to indicate the distinction between agricultural and non-agricultural activities are given below:
Agricultural activity
(I) rearing of sheep and production of wool
(ii) production of milk
(iii) grading of agricultural products such as tea, tobacco, etc.
(Iv) rearing of cattle preservation of meat
(v) rearing of fish
(vi) logging-felling and cutting of trees
Non-agricultural activity
bailing and pressing of wool
collection of milk and selling, manufacturing of cream/butter etc.
curing of teal coffee leaves, curing of tobacco
slaughtering, preparation and
processing and sale of fish
sawing and planing of wood (other than plywood)
267
24. Person(s) engaged In activities such as provIdIng services of harvesting, threshing, spraying of Insecticides etc. on payment will be treated as running agricultural enterprises. However, if person(s) carrying out processing of agricultural produce on payment, will be treated as running non-agricultural enterprises. For example, rice and dal milling, processing and grinding of cereals, pulses etc, will be non-agricultural enterprises. For example, if a person/farmer sells part of his milk produce, this will be classified as an agricultural enterprise and the activity is 'milk production'. However, if he procures milk from others and sells it then the description of activity will be 'selling of milk' and will be classified as non-agricultural entperprise.
25. Government offices providing support/assistance for the activities like livestock production, forestry & logging fishing, etc. will be treated as non-agricultural enterprises.
26. Taking into account the description of activity given in col. 4 the enterprises may be classified as agricultural or non-agricultural according to the concepts and definitions given in the above paragraphs. If the enterprise is of agricultural type, code 1 is to be entered. If the enterprise is of nonagricultural type, code 2 is to be entered.
Col. 6 : Nature of operation (perennial-1, seasonal-2)
27. Against this column, information as to whether the enterprise runs more or less regularly throughout the year or in partucular season (s), is to be entered in terms of codes. For example, selling of cereals, pulses, etc, in a grocery shop running of a restaurant/hotel, etc. pertain to the perennial activity and for such activities code 1 is to be entered. Some activities such as beating of drum, band-wala, etc. are carried out only during marriages/functions, throughout the year. These activities are to be treated as perennial, since they are carried out in all the seasons. Similarly, a person giving tuitions on a fairly regular basis is also to be classified as perennial activity. If the activity such as gur making is carried out only during a part of the year, code 2 is to be recorded.
28. If a person is engaged as a part of his regular work In different seasonal enterprises in different parts of the year, the different activities will be listed as separate enterprises although at the time of enumeration he may be engaged only In one of the activities. For example, a person sells cane juice In one season and roasted groundnut/gram in another season. It Is expected that not more than two or three enterprises would thus be listed.
Col. 7 : Type of ownership
29. Type of ownership of the enterprise is to be entered in this column in accordance with the code list printed at the bottom of EL form. The enterprise may belong to (I) private sector, (II) co-opeartlve society and (iii) public (i.e. Central Government, State Government or run by local authodties like Municipal Boards, etc.).
30. An enterprise will be treated as private If It is being managed by single or a group of persons. If an enterprise takes loan from the Government, it should not be treated as a Government enterprise. The enterprises which will be classified under 'private' type of ownership will be (i) proprletory, (ii) partnership, (iii) private and public limited and (iv) Institution/trust. For these type of enterprises code 1 is to be entered. Examples with 'private' type of ownership are (I) a shop owned by a person, (ii) construction company under 'partnership' or 'private limited' and (iii) temples, churches, charitable dispensaries etc. run by Institutions/trusts.
31. All enterprises registered under the act of cooperative societies will be considered as 'cooperative' type of ownership. Code 2 is to be recorded aganist such enterprises.
32. 'Public' enterprises will cover those which have the ownership such as Central Governement, State Governments, Public Sector Undertakings, Local Bodies (Zila Parishad, City Corporation and Municipal Authority, etc.). Code 3 is to be entered for such enterprises.
33. Enterprises like universities, educational boards which are autonomous but are getting grants by Central or State Government or local bodies will also be included in the category of 'public'. Code 3 is to be recorded in such cases also.
Col 8 : Social group of owner (SC-l, ST-2, Other-3)
34. The code for the social group of owner of each enterprise will be recorded in this column. The codes are Scheduled Caste-l, Scheduled Trlbe-2 and Others-3.ln case of enterprises whose type of ownership is other than private, code-3 will be entered under this column. If the private enterprise is run on partnership and one of the partners is scheduled caste or scheduled tribe, the code corresponding to SC or ST should be given. If the enterprise is run on partnership basis by scheduled caste and scheduled tribe and others the code for social group of owner should relate to the weaker section viz. scheduled tribe. In case of enterpriseS belonging to trust/Institution the social group of owner will be 'other' and code 3 will be recorded.
Col 9 : Power/fuel used for activity
35. Underthecolumn power/fuel used in carrying out the entrepreneurial activity Is to be recorded in codes, the details of which are given at the bottom of EL. For example, electricity used for the purpose of lighting or for heating the premises of the enterprises Is not source of power/fuel used for the activities and should be ignored and code in such cases will be 1. On the other hand, if electricity is used as a souce of power in cooking in a hotel or restaurant, the code wil be 2. Other examples where code 1 Is appropriate are. offices, schools etc, In the case of an X-ray clinic which necessarily uses electricity, the code will be 2. But for nursing homes using electricity only for lighting etc., the code will be
268

1 . An enterprise using manual labour will be counted as enterprise without power. The coconut shells, dry leaves etc. used as source of power in heating the iron for pressing, preparing of tea/coffee, roasting of gram/nuts, etc. should be given code 6 pertaining to lfirewood'. Similarly/charcoal' used as source of power for the activity will be given code 3 used for coal/soft coke. For enterprises using solar/wind energy, code IO'wl1l be r~orded.
36. In case, more than one type of power/fuel is used for carrying oui the entrepreneurial activity the code will refer to the major source on which the more expenditure is incurred.
37. If an enterprise is engaged in more than one activity and which can not be distinguished the power/fuel used in such cases will pertain to the major activity recorded in column4.
Cols. 10, 11 & 1'2 : No. of persons usually working daily-total
38. In these columns, the total number of persons usually working daily in the enterprise with break-up into males and females is to be given. The number of persons to be recorded is these columns should include number of members of the household and other unpaid workers engaged in the activity as well as the number of workers hired from outside for the same activity. In cases where the enterprises Is engaged in more than one activity the number of persons usually working in that enterprise should relate to not merely the major activity but all activities of the enterprise.
Cols. 13, 14 &,15 : No. of persons usually working daily-hired
39. After filling the cols. 10 to 12 proceed to enquire from the informant as to how many of the total number of workers are hired and record this number is col. 1 5. Afterwards, ascertain the distribution of this total number according to males and females and put the corresponding figures In cols. 13 and 14 respectively. If these are no hired employees, put da~h {J in cols. 13 to 15.
40. The figures of number of persons should repres.ent, on an average, the number of persons usually working on a day during the last year of the activity of the enterprise. The figure should relate to the position in the last year for perennial enterprises and the last working season for the seasonal enterprises. Care should be taken to include all categories of workers both supervisory and primary. A worker need not mean that the same person should be continued but is should refer to the position. Apprentices, paid or unpaid, will be treated as hired workers. Part-time employees may be treated as employees as long as they are engaged on a regular basis. Persons receiving honorarium for the services rendered on fairly regular basis to the enterprises will betreated as hired workers.
41. Working members of the cooperative societies who often manage day-to-day work of the society will be consid-
ered as workers. In the case of Jails only the hired workers (employees of Jails ) will be shown as workers. If the inmates of Jail are made to work in the office of the Jail or in the workshed of the Jail, they will not be treated as workers for the purpose of EC.
42. lfa part-timeworker is engaged in. "ore than one enterprise he will be counted as a worker in all th ... enterprises even though it may Inflate the total number of workers.
Col. 16 : Remarks
43. In this column, any information which further elucidates the entries made In different cols. 2 to ISmay be noted, where necessary.
Totalling of Columns
44. After filling all the lines on the page, do totalling and make necessary entries thereof in columns 2, 3, 5 to 7 and 9 to 15. The manner in which the total is to be struck has been explained in the foot-note of El form. However, this is recapitulated below:
(i) count the number of entries In columns 2 and 3 of El and enter them at the bottom of corresponding columns in the ltotal' line
(n) in cols. 5 to 7 & 9, count the number of entries of code 1 only and give the total at the bottom of the respective columns.
(m) in coIs. 10, 11, 13 & 14 add up the figures In each of these columns and write the sum of figures at the bottom of the respective columns.
(iv) in col. 12 first add up the figures and write total at the bottom. Thereafter, write within bracket the number of figure which are added. For example, if the figures in col. 12 are I, 4, 2, 4, 1 and 2 the entry in the ltotal' line should be written as 1 41 ( 6)
(v) In col. IS, follow the same procedure as done for col. 12 as explained In (Iv) above
45. After completing the first page, proceed to next page in similar fashion but write the page number in the space provided on the right hand comer of the form. Proceed till the work of recordlngofinformation In respect of all the enterprises listed in Hl of your block is completed.
ENTERPRISE LIST ABSTRACT
46. After tilling the entries in the Enterprise List i.e. after completing the listing of the enterprises and recording their particulars for your entire block you have now to prepare an Enterprise list Abstract (ElA) so that the figures of th number of enterpriese with premises and without premises, number of agricultural and not-agricultural enterprises, number of enterprises owned privately, run perennially, operatingwithout power and employment In these enterprises
269
becomes easily available. A specimen copy of the ELA is given at Annex 2.
47. There should be no difficulty in preparing the Abstract. However, certain indications as to how the Abstract is to be prepared are given below.
48. The indentification particulars given at the top of ELA are to be copied from EL form. Further, write the total number of Enterprise List pages you have filled in your block on the right hand side corner of ELA.
Abstract Col. 1 : Page No. of Enterprise List (EL)
49. You will please reCJlI that you had to number each page of EL and arrange them serially. The page number recorded by you will be noted in this column one below the other.
50. The entries from columns 2 to 15 of ElA are to be copied from the 'total' line of the page of the Enterprise List.
Col. 2 : Total number of enterprises with premises
51. As indicated in the ~eading itself, this figure will be obtained from column 2 of EL. Please note that in EL itself, you must have counted the number of entries in column 2 and recorded the total at the bottom of each page. Please check this total and copy it in column 2 of the Abstract.
Col. 3 : Total number of enterprises without premises
52.· As mentioned in the heading Itself, this will be copied from column 3 of EL. Please check the total In EL and copy it In column 3 of the Abstract.
Col. 4 : Total number of agricultural enterprises
53. The number of entries with code 1 must have been counted in col. 5 and recorded at the bottom of the page of El in the 'total' line. Please check this total and record it in column 4oftheAbstract.
Col. 5 : Total number of enterprises-perennial
. 54. In cloumn 6 of EL, the entries with code 1 must have been counted and their total number recorded at the bottom in the 'total' line. This total may be ckeckeed and entered in col. 5 of the Abstract.
Col. 6 : Total number of enterprises-private
55. In col. 7 of EL, entries With code 1 must have been counted and their total number recorded in the 'total' line. This may be checked and entered in col. 6 ofthe abstract.
Col. 7 : Total number of enterprises-without power
56. In column 9 of EL, the entries with code 1 must have been counted and their total numnber recorded In the 'total' line. This total may be checked and entered in column 7 of the Abstract.
Cols. 8 to 10 : Total number of persons Including unpaid and hired workers usually working dally in agricultural and non~agricultural enterprises
57. In columns 10 to 12 of EL, the total number of persons and their distribution by sex must have been recorded in the corresponding columns of the 'total' line. These totals may be ckecked and entered In columns 8 to 10 of the Abstract respectively.
Col. 11 : Number of agricultural & non-agricultural enterprises
58. In column 12 of EL, number of enterprises corresponding to total number of persons working Is recorded at the bottom in the bracket. Copy this bracketed figure in column 11 of the Abstract.
Col. 12 to 14 : Number of hired persons usually worklni in agricultural and non-agricultural enterprises
59. In cQlumns 13 to 15 of EL, total number of hired pe,'Sons and their distribution by sex in agricultural and n('nagricultural enterprises must have been recorded in the 'total' line. These totals may be checked and entered in columns 12 to 14 of the Abstract.
Col. 15 : Number of agricultural & non-agricultural enterprises with hired employment
60. In column 1 5 of EL, the hired employment is recorded for the agricultural and non-agricultural enterprises Identified in col. 2 or col. 3 of EL. Corresponding to this, total number of such enterprises is put in bracket In the 'total' line under column 15 of EL. Copy this bracketed figure in column 1 5 of the Abstract.
6 t • After copying the totals for each page of EL of an Enumberation Block, add up the figures for each of the columns 2 to 15 of the Abstract and enter in the 'total' line of the Abstract .
62. If the ELA for an Enumeration Block runs to more than one page, the totals of the previous page should be carried over to the first line of the next page of the Abstract before filling-in the information for other pages of EL in the next page. In making such entries write the word '8/F' In Col. 1 of the Abstract.
63. Certain specimen entries of the Enterprise List and Enterprise List Abstract are given at Annexures 3 to 6.
64. Please hand over the filled up EL and ELA forms, pinned separately to your Supervisor alongwith all unfilled forms. Instructions In this regard will be Issued to you by your Charge Officer also.
270

ANNEXURE·!II(Aj
CENSUS OF INDIA 1991 (ECONOMIC CENSUS)
ENTERPRISE LIST ABSTRACT
Total No. of Enterprise list pages .. " ..... " .. "",
I. ~t~te/Union Territory .. " ................. " .... " ....... " .... "" .• : ........ ,, ....... Code No ...... " ................................... 5. Name or No. of WardlMohalia/Hamlet...................... Code No, .... " ........................... . 2. District .... , .... , ...... , ............... , ............ , ..... , ................ , .................. Code No ...... , .................. , ................ 6. Enumerator's Block No ................. , .. , ......... , ... "........ Code No ................................. .
3, Tah~l!TalukalP,S.lDev, Block/Grele etc. .......................... , .......... , .. Code No, .... , ..................................... , 7, C.D, Block .. " .. " ..... " .. ,,, .......... ,,, .............. ,,",, .... ,,.... Code No ..... , ...................... , .... ..
4, VIllage/Town 00''' .. 00'' .... '' .... , .. """"' .............. "" ... ,,,, .. , ..... ,, .. ,,,, .... Code No, .... " .. ,"' .. , .... , .. '''' .. " .. , .. ,''" .. ' 8, Rural/Urban ....... 00 ..... 00 .. "00 .. " ... " ..... " ....... "00 .......... ' Code No, ........ , .. , ....... " .... " ..... ..
Total No. of Total number of No, of persons usually working daily in No, of persons usually working daily in ,.J
enterprises enterprises agricultural & non·agrlcultural enterprises agricultural enterprises w "" "''''' ~ t;"" ~~ "'..J '"
_0 :.1 w 1: ch,.., "r.:
\11 .... e- Owned by 0- T 0(.11 no. of persons No, of hired persons Total no. of persons No. of hired persons e ...... o~" .. ~ ... o .,
~:; ,... Including unpaid workers usually working in including unpaid workers usually working in r: III ~'O ~c:_ .~
e-,.J
~ II II (1/
OIl ~w w enterprises enterprises ~ ~r.:: I) E'-" \11 ~:J ,'" Ii- t ......... ;;)\' .. 0 .... ..... iii 0. ~ 0 ~,g ~ c ~'" iO w .ll~ Ew 1(1 ,.., ,.J ~:; I..~GJ""'" w Q.-
~Ii- "In W ::l2l E'J ~Ei:l;::; Ii- h .. ...: ~'"' Ii- ~w ~c: -0 0.0 00 '0 0 0 .. Males Females (Total Males Females Total Males Female Total Males Females T OIal :l \11 >- • .!!1Ii~W
d a~ ,,1'1 o~ I) Y,.J Q. o .!!-.2Gi "'J U"
&...: "" -loll 10 ~ (Col. 10 (col. II col. 13 (Col. 14 (col. 15 (col. 17 (col. 10 (col. 11 (col. 13 (col. 14 (col, 15 (col.17 ~ ~ Co_; blQI"lO
Z h c: ;;j (II ..
I'l ::l E !!l " .. 100
~8 '0 0 ... - .0 " II iii 'E ~ 0 .I: of of of of of of of of of of of of "::~41 o.cc"
~~ .. ;. II till ~"" ~ c ...
~ 0::1'0.11 .£- .
" 'C El· El· El· El· El· El· El· El· El· EL· EL· El· I), \11 I), U . .!! QlI) ~.- ~'O 10 0" " " ~ 100 \I QI III Total·l) Total· I Total) Total· 1 Total·l) TotaH Total· I) Total·2) Total·2) TOta~2) Total·2) Total·2) :z bI- ..
I), ".1:.0
I 2 3 4 5 6 7 8 9 10 11 12 13 14 IS 16 17 18 19 20 21 22
Total
Checked and found correct ~~nlture of Enumerator , .... " .......................................... ,... Date .............................................. .
Signature of ~upef'lilOr .......................... , Date .... " ..... .


ANNEXURE - D
INSTRUCTIONS TO ENUMERATORS FOR FILLING UP THE HOUSEHOLD SCHEDULE
AND INDIVIDUAL SLIP


CHAPTER 1
STEPS PRIOR TO ENUMERATION AND FILLING UP OF THE HOUSEHOLD SCHEDULE
Population Census is a great national task which we are called upon to undertake every ten years. It provides valuat--'e information about the land and the people at a given point of time. It provides the trends in the population and Its various characteristics which are essential for planning. It has become indispensable for effective and efficient public administration besides serving the needs of scholars, businessmen, industrialists, planners and electoral authorities, etc. A Census, therefore, has become a regular feature in progressive countries, whatever be their size and political set-up, and it is conducted at regular intervals for fulfllling well-defined objectives.
2. As a census enumerator, you are performing a duty which is of great national importance. The data we provide through the census are very much needed by the public and government organisations for many aspects of economic and sodal planning and form the very basis for the delineation of electoral constituencies. You are privileged to be a census enumerator. At the same time, your responsibilities are great. You have to fulfil them with a sense of pride and devotioi1 to duty.
3. For your information, certain provisions of the Census Act, 1948, under which the census is conducted and which gives you the legal authority to canvass the census questionnaire and spells out your responsibilities, are reproduced below.
x x x
8( 1) A Census Officer may ask all such questions of all persons Within the limits of the local area for which he is appoined as, by instruction issued in this behalf by the State Government and pubUshed in the Offlcal Gazette, he may be directed to ask.
(2) Every person of whom any question is asked under sub-section (1) shall be legally bound to answer such question to the best of his knowledge or belief.
x
Provided that no person shall be bound to state the name of any female member of his household, and no woman shall be bound to state the name of her husband or deceased husband or of any other person whose name she is forbidden by custom to mention.
x x
1 O( 1) Subject to such orders as the state Government may issue in this behalf, a census officer may,
275
within the local area for which he is appointed, leave or cause to be left a Schedule at any dwelling-house or with the manager or any officer of any commercial or industrial establishment, for the purpose of its being filled up by the occupier of such house or of any specified part thereof or by such manager or officer with such particulars as the State Government may direct regarding the inmates of such house or part thereof, or the persons employed under such manager or officer, as the case may be, at the time of taking of the Census.
(2) When such schedule has been so left, the said occupier, manager or officer, as the case may be shall fill it up or cause it to be filled up to the best of his knowledge or belief so far as regards the inmates of such house or part therof or the persons employed under him, as the case may be, at the time aforesaid, and shall sign his name thereto and, when so required, shall deliver the scheduie so filled up and signed to the census officer or to such person, as the census officer may direct.
11 (1 )(a) Any census officer or any person lawfully required to give assistance towards the taking of a census who refuses or neglects to ue reasonable diligence in performing any duty imposed upon him or in obeying any order issued to him in accordance with this Act or any rule made thereunder or any person who hinders or obstructs another person in performing any such duty or in obeying any such order, or
(b) Any census officer who intentionally puts any offensive or improper question or knowingly makes any false return or without the previous sanction of the Central Government or the State Government discloses any information which he has received by means of, or for the purposes of a census return ............•..
x x x
(d) Any person who intentionally gives a false answer to, or refuses to answer to the best of his knowledge or belief, any question asked of him by a census officer which he is legally bound by
x
Section 8 to answer ......... .
x x
.....•......•.•.. shall be punishable with tine which may extend to one thousand rupees and in case

x
of a conviction under part (b) shall also be punishable with Imprisonment which may extend to six months.
x x
(2) Whoever abets any offence under sub-section( 1) shall be punishable with flnewhich may extend to one thousand rupees.
x x x
4. Please take note of the provisions of Sections 11 (1 )(a) and (b) which require you to perform your duty as a census officer diligently and to keep the information collected at the census confidential.
5. The Indian Census has a rich tradition and has enJoyed the reputation of being one of the best in the world. It is hoped that you will help in keeping up this good name.
6. You will recall that as a preliminary to the enumeration the housenumbering and houselisting operations have bee~ conducted sometlne ago. On the basis of the Houselists, enumeration blocks have been carved out, one of which has been allotted to you for enumeration during February-March 1 991 . You have also been provided with an Abridge Housellst in the prescribed form (specimen of the form may be seen at Annexe 1 to Appendix V at the end of this book) which furnishes the identification particulars of your enumeration block and the details of buildings, census houses, the uses to which census houses are put, household numbers, names of heads of households and the serial number of each household numbers, names of heads of households and the serial number of each household. In attition, in the remarks column certain details like reasons for vacancy and place(s) where houseless persons can be found, etc., have been noted.
7. It is quite likely that you may have been associated with the houselisting operations and you are already familiar with the preparation of Notional Map and Layout Sketch and the concepts and definitions of the terms like building, census house, census household, etc., and the manner in which the Houselist has been prepared. But in order to refresh your memory, these terms are explained below (pare 7.1 to 10.2). If you have not been associated with the houselisting operations, please read these instructions carefully more than once.
7.1 The Notional Map, as its very name indicates, is a map which Is not drawn to scale. It is prepared for the entire village or urban block and is meant to show the location of each enumeration block within the village or town. Whether it is for a village or an urban block, the Notional Map will have to show the general topographical details of the entire village or unban block. The topographical details which should be indicated on the Notional Map would include permanent features and land marks, such as the village site, well-known
roads, hills, rivers, nalas, etc., as also railway lines and similar clearly recognisable features. It Is Important that the boundaries of panchayats, patwarls' circles or halkasor hamlets are distinguished, If possible, and the names of hamlets would also be entered wherever known by a particular name. For the purposes of the preparation of Notional Map, you are provided with a separate sheet. Specimen Notional Maps for rural and urban areas may be seen at Appendices I and II. In the case of very large villages when there are many blocks, It may be difficult to indicate the outline of the entire village. In such cases, it is sufficient if you show in the Notional Map the block assigned to you.
7.2 Having prepared the Notional Map, you would have to prepare the detailed Layout Sketch of your block. The Layout Sketch is in fact a detailed map of the block assigned to you in which will be shown the streets and the building on the streets. The main purpose of this Layout Sketch is to clearly present the streets in the block and the buildin~, so that based on the Layout Sketch, enumeration can be carried out. As in the case of the Notional Map, In the Layout Sketch also, important topographical details should be shown. However, it is not a document which is drawn to a scale. It Is a free-hand drawing. In order to be able to draw the Layout Sketch, It would be necessary for you to go round the village or the block assigned to you, so that you become familiar with the area, the way the streets run and the main topographical fearures. Having gone round the village or block, you should start from one end of the village or block and draw a sketch. It is important that the dividing lines between one block and another should be clearly demarcated. Such dividing lines, besides following some natural boundaries~ ~erever possible, shoud also clearly demarcated. Such diViding lines, besides following some natural boundaries, wherever possible, shold also be indicated by the survey numbers that fall on either side of the dividing line in cadastrally surveyed villages. In villages which are not cadastraly surveyed, the line can be indicated by the name of the owner of the field on either side of the line or by the name of the field, if any.
7.3 In the Layout Sketch, every single building or house should be shown. Puca and Kutcha houses must be shown by signs like a square 0 for a Pucca house and a tringle ~ for a pUCCd house, further clas~ifyin~ them as ~hollY or partly residential or wholly non-residential by shading as follows: o Puca houses, whether wholly or partly residential
§ PUCCd houses, wholly non-residential
~ Kutcha houses, whether wholly or partly residential
A Kutcha houses, wholly non-resdiential
7.4 It Is difficult to give a compreshensive and detailed definition of the terms PUCG1 and Kutcha houses to ,
276

cover different patterns of structures all over the country. The categorisation of the houses as PUCGJ or Kutcha for the purpose of depicting them on the layout Sketches will faillitate their identification. Also as KutchJ houses are not likely to be long-lasting, anyone referring to the Layout Sketches a few years later can easily distinguish settlement areas which are likely to have undergone a change. For the purpose of preparation of Layout Sketches, a PUCGJ house may be treated as one which has its walls and roof made of the following materials:
Wall material- Burnt bricks, stone (duly packed with lime or cement), cement concrete or timber, Ekra, etc.
Roof material - Tiles, G .c.1. (galvanized corrugated iron) sheets, asbestos cement sheets, R.B.C. (reinforced brick concrete), R.C.C. (reinforced cement concrete) and timber, etc.
Houses, the walls and/or roof of which are made of materials other than those mentioned above such as unburnt bricks, bamboo, mud, grass, reeds, thatch, loosely packed stone, etc., may be treated as Kutcha houses.
Numbering of Buildings and Census Houses
8. When once the location of every building or house Is demarcated on the Sketch, it will be a simple matter to decide on numbering the building/houses In one series following certain numbers. No hard or fast rule can be laid down as to the direction in which the house numbers should run, i.e. left to right or in a clockwise order or North:west to South-east and so on. Much depends on the layout. So long as some convenient and intelligible order is followed, it should be alright. The numbers allotted to each house should be marked on the Sketch and with the help of arrow marked at convenient intervals, the diretion in which the house numbers run, sholJld be indicated. This is particularly important when streets cut across one another and the housenumberlng series along a street get interrupted. It will be of advantage if the numbers are roughly marked in pencil on this Sketch and later verified with the actual state of things on ground to see if the order of numbering given in the Layout Sketch would be convenient or any change is needed, for after all the Sketch is only a rough one and the actual Sketch of buildings 'on ground may suggest a more convenient order of numbering at some place. Having satisfied yourself that the numbering, has gone on right lines, you may ink them. Specimen Layout Sketches for rural and urban areas may be seen at Appendices III and IV
8.1 In urban areas, very detailed plans showing location of every building or house along every road and street in your block should be dearly prepared. In view of the very large humber and close location oc houses In urban areas, It may be necessary to have a number of sketches each cover-
Ing a limited area. A Layout Sketch of your block should be prepared in which all the roads and streets should be clearly indicated and their names also written. Then, each building and house should be located on this Sketch. It will facilitate your work and of others if the wholly non-residential houses are distinguished from the residential houses by hatching, as indicated earlier in this section. Here again, the important permanent buildings such as town hall, large office buildings, court building, post office, hostel, school, church, market building, etc. should be indicated on the map.
Definition of Building, Census House and Household
8.2 You have to give numbers to 'Buildings' and 'Census Houses' in all areas. The instructions given hereafterwill guide you to deternine what a building and a census house are for the purpose of houselisting. A building is readily distinguishable structure or group of structures which is taken as the unit for housenumering. The entire building may be deemed one census house or sonetimes part of it, as wil be explained. The objective is to ultimately number and list out all physical units of constructions which are used for different purposes, residential or otherwise.
8.3 Building: A building is generally a single structure on the ground. Sometimes it is made up of more than one component unit which are used or likely to be used as dwelings (residences) or establishments such as shops, business houses, offices, factories, worksheds, schools, places of entertainment, places of worship, godowns, stores, etc. It is also possible that buildings which have component units may be used for a combination of purposes such as shop-cumresidence, workshop-cumresidence, office-cumresidence, etc.
8.4 Sometimes a series of different buildings may be found along a street which are joined with one another by common walls on either side looking like a continuous structure. These different units are practically independent of one another and likely to have been built at different times and owned by different persons. In such cases, though the whole structure with all the adjoining units apparently appears to be one buildings, each portion should be treated as separate building and given a separate number. On the other hand, you may come across cases, particularly in large cities of multi-storeyed nwnership flats. tn these cases, while the structure looks like one building, the flats are owned by different persons. In case of such multi-storeyed structures, having a number of flats owned by different persons, the entire structure should be treated as one building and each flat as a separate census house.
8.S Somethimes in metropolitan cities the local authorities may have considered the flats in a block or in large colonies as separate buildings and numbered them as such. If the house numbering system of the local authorities is adopted as such, you may treat each such flat as a separate building because this would avoid your having to renumber these.
277

8.6 If within a large enclosed area there are separate structures owned by different persons then each such structure should be treated as one or more separate buildings. Sometines there may be a number of structures within an enclosed area or cumpound owned by an undertaking or company or government which are occupied by their employees. Each such structure should be treated as a separate building. If such buildings have a number of flats or blocks which are independent of one another having separate entrance from a common courtyard of staircase and occupied by different households each such flat or block should be considered as a separate census house.
8.7 Usually a structure will have four walls and a roof. But in some areas the very nature of construction of houses is such that there may not be any wall. For example, a conical roof almost touches the ground and an entrance is also provided and there will not be any wall as such. Such structures should be treated as buildings and census houses, as the case may be.
8.8 If there is more than one structure within an enclosed or open compound (premises) belongng to the same person, e.g.~ the main house, the servants' quarters, the garage, etc., only one building number should be given for this group and each of the constituent separate structures assigned a sub-number like 1 (1), 1 (2), 1 (3) and so on, provided these structures satisfy the definition of a 'Census House' given hereafter.
S.9 The buildings should be numbered as follows:
(I) If in a village ~he locality consists of a number of streets, buildings should be numbered continuously. Streets should be taken in uniform order from North-west to South-east. It has been ovserved that the best way of numbering the buildings is to continue with one consecutive serial on one side of the street and complete numbering on that side before crossing over to the end of the other side of the street and continue with the serial, stopping finally opposite to where the first number began.
(Ii) In a town/city enumeration block, the numbering will have to run along the axis of the street and not in any arbitrary geographical direction.
(iii) International numerals, i.e? l,2,3, •......... etc., should be used for building nllmbers.
(Iv) A building under construction, the roof of which has been completed should be given a numberin the serial.
NOTE : These should not be numbered as 1 O( 1) or I 0(2), etc.~ as such numbering would apply to census houses within the same building. On the other hand, 10/1 would mean a separate building that has come up after building No. 10.
9. Census House: A 'Census House' is a building or part of a building having a separate nain entrance from the road or common courtyard or staircase, etc.~ used or recoghised as a separate unit. It may be occupied or vacant. It may be used for a residential or non-residential purpose or both.
9.1 If a building has a number of flats or blocks which are independent of one another having separate entrances of their own from the road or a common staircase of a common courtyard leAldings to a main gate, they will be considered as separate census houses. If within a large enclosed area, there are separate buildings owned by different persons, then each such building should be treated as one or more separate buildings. You may come across cases where whithin an enclosed compound there may be separate buildings owned byan undertaking or company or even government, actually in occupation of different persons. For example. 1.0.c. colony where the buildings are owned by the Corporation but these are in occupation of their employees. Each such building should be reckoned as a separate building. But if in anyone of these buildings there be flats in occupation of different households, each such flat should be treated ~s a separate census house.
9.2 It may be difficult to apply the definition of census house strictly in certain cases. For example, in an urban area, a flat has five rooms, each room having direct entrance to the common staircase or courtyard. By definition this has to be treated as five census houses. If all these five rooms are occupied by a single household. it is not realistic to treat them as five census houses. In such a case, singleness of use of these rooms along with the main house should be considered and the entire flat should be treated as one census house. On the other hand, if two independent households occupy these five rooms, the first household living in 3 rooms and the second household occupying 2 rooms, then considering the use, the first three rooms together should be treated as one census house and the remaining rooms as another census house. But if each room is occupied by an independent household, then each such room should be treated as a separate census house.
9.3 In case of hostels, hotels, etc.~ even if the door of each room in which an inmate lives opens to a common verandah, stairase, courtyard or a common room, as it happens almost invariably, the entire hostel/hotel building should be treated as one censu's house. But if such hostels/hotels have out-houses or other structures used for different purposes or the same purpose then each structure attacted to
(v) If a new building either Pucca or Kutcha Is fOllnd after the hOllsenllmbering has been completed or in the midst of buildings already numbered, it should be given a new number which may bear a subnumber of the adjacent building number, e.g? 10/1.
the main hostel/hotel should be treated as a separate census 278

house and will be given sub-numbers ofthe main building. In some parts of the country, in rural areas, the pattern of habitation is such that a group of huts located in a compound, whether enclosed or unenclosed, is occupied by one household. While the main residence may be located in one hut, other huts may be used for sleeping, as a kitchen, bath room, b3ith3/{, etc. Though each oif the huts is a separate structure, they form a single housing unit and, therefore, have to be treated collectively as a single census house. If some of the huts are used by one household and the others by a second household as residence, then then two groups of huts should be treated as separate census bouses. However, if there are also other huts in the compound used for other purposes and not as part of the household's residence such as, cattleshed, workshed, etc./ they should be treated as separate census houses.
9.4 It is also possible that a household uses another structure, e.g./ a b3ithJk, separated from the main residence by some distance or by other structures or by a road. In such cases, it may become necessary to treat that separate structure used as baithakas a separate census !louse.
9.5 It is usuallo find in municipal towns and cities that every site, whether built upon or not, is numbered by the municipal authorities on property basis. Such open sites, even if they are enclosed by a compound wall, should not be listed for census purposes. Only cases where a structure with roof has come up should be treated as a census house and listed. But in some areas, the very nature of construction of houses is such that there may not be any wall. For example, a conical roof almost touches the ground and an entrance is also provided and there will not be any wall as such. Such structures should of course be treated as buildings and census houses and numbered and listed.
9.6 Pump houses, temples and other similar structures must also be numbered and given census house numbers. These are places where people can also live. Obviously, such structures need iTot be numbered if they are so small that no person can live in them.
9.7 Each census house should be numbered. If a building by itself is a single census house, then the number of the census house will be the same as the building number. But if different parts of constituent units of a building qualify to be treated as separate census houses, each census house should be given a sub-number within brackets after the building number as 1 O( 1), 10(2), etc./ or 11 (1), 11 (2), 11 (3), etc.
10. Household : A household is a group of persons who commonly live together and would take their meals from a commnon kitchen unless the exigencies of work prevented any of them from doing so. There may be a household of persons related by blood or a household of unrelated persons or having a mix of both. Examples of unrelated house-
holds are boarding houses, messes, hostels, residential hotels, rescue homes, jails, ashrdm~ etc. These are called 'Institutional Households'. There may be one member houeholds,2 member households or multi-member households. For census purposes, each one of these types is regarded as a 'Household'.
10.1 If a group of persons who are unrelated to each other live in census house but do not have their meals from the common kitchen, they would not constitute an institutional household. Each such person should be treated as a separate household. The important link in finding out whether there is a household or not is a common kitchen.
10.2 Each household will be listed according to the instrcutions that follow and a distinguishing number allotted to each household. As each household will be related to the physical structure of a census house, the household number as such need not be painted on the door of each census house. Only the building and census house number will be painted.
11. You have been provided with a filled in Abridged Houselist form for your enumeration block in which the identification particulars and Seetin 2 will have been filled. You will notice that SEction 2 rum from page 1 through page 14 of the Abridged Houselist booklet and pages 1 5 and 16 deal with Section 3. Section 1 on page 1 and Section 3 on pages 15 and 16 of the Abridged Houselist will have to be filled in by you as per instructions issued by your superior officers. The general instructions issued in this behalf are reproduced in Appendix V.
12. You will be required to canVJSS the Household Schedule for each household and Individual Slip containing 23 questions will parts for each individual in your jurisdiction. The operations will be carried out in two stages:
(a) Enumeration during the period February 9, 1991 to February 28, 1991 and
(b) Revisional round between March 1, 1991 and MArch 5, 1991.
These will involve the following steps:
(i) Preparation of Notional Map and Layout Sketch of your enumeration block,
(ii) Updating the Abridged Houselist,
(iii) Filling up of the Househoud Schedule, columns 1 to 7,
(iv) filling up of the Individual Slip for each individual in the household,
(v) Filling up of coloums 8 through 34 of Household
279

Schedule, with reference to the entires in Individual Slips filled for each member of the household,
(vi) Revisional round and updating of records,
(vii) Filing up of the Enumerator's Working Sheet for preparing the Enumerator's Abstract,
(viii) Filling up of the Enumerator's Abstract,
(ix) Filling up of Section 1 of the Abridged Houselist,
(x) Handing over all documents to your Supervisor, the documents being the Notional Map, the Layout Sketch, all filled in Household Schedules, all filled in Individual Slips filled in and updated Abridged Houselist, the working sheets for preparing Enumerator's Abstract, the filled in Enumerator's Abstract and all blank Household Schedule books, Individual Slip pads and other blank forms.
Reference Date and Enumeration Period
13. The reference date for the 1991 Census will be sunrise of March 1, 1 991 which implies that the census is expected to provide a snap shot of the population of the country as it exists on the sunris of March 1, 1991. It is obviously not possible to ascertain the particulars of every individual throughout the length and breadth of the country at this fixed point of time. Therefore, the enumeration perl,"'d has been fixed from February 9 to February 28. Thus, you will have to actually commence your work of enumeration on February 9 and complete thewo:-kon February 28, 1 99 f~ During this period you will have to cover your jurisdktlon and enumerate all household and every person living in houeholds as will be explained later in this booklet. On the night of February 28, 1991, you will be required to count the houseless households. Thereafter, in order to bring the information upto date with reference to the census moment, which is sunrise of March 1, 1991, you will have to quickly go round your jurisdiction on a re-visit form March 1 to March 5,1991 and enumerate any fresh arrivals in your jurisdiction who might not have already been enumerated elsewhere and also take account of any births that might have t_aken place in any of the households after your previous visit and beiore the sunrise of the said date, update the Household Schedule or flllin fresh Household Schedule if a whole household has moved Into your area and has not been enumerated elsewher~. Fill In fresh Individual Slips in appropriate cases. As a corollary, you will have also to cancel the Individual Slips relating to persons who may have unfortunately died since your last visit to a household but prior to the sunrise of March 1, 1991. Births or deaths and arrivals of visitors that had taken place after the sunrise of March I, 1991, need not be taken note of by you.
Preparation of Notional Map and Layout Sketch
14. You wm be required to prepare a Notional Map and Layout Sketch of your enumeration block for which nec-
essary drawing sheets have been supplied to you. The instructions for preparing the Notional Map and Layout Sketch have been given in paragraph 7.1 above. Please go through these instructions carefully and draw the Notional Map and Layout Sketch for your enumeration block.
14.1 While drawing the Layout Sketch you may come across new constructions which have not been reflected In the Abridged Houselist supplied to you. These constructions will have do be shown in the Layout Sketch at the appropriate places and assigned building numbering with oblique strokes. Thus, if a new building either PUCC1 or Kutcha is found in the midst of buildings already numbered it should be given a new number which may bear sub-number of the adjacent building number, e.g., 10/1. There new structures should not be numbered as t O( t ) or t 0(2), etc'7 as such numbering would apply to census houses within the same building. On the other hand, 10/1 would mean a separate building that has come up between building number 10 and building number 11.
Updating the Abridged Houselist
15. As mentioned in paragraph 11 above, you will have been provided with an Abridged Houselist for your enumeration block. In this form the identification particulars and Section 2 will have been filled. The general instructions as to how Section 2 and Section 3 must be updated are reproduced in Appendix V and doubtless you would have been trained in the procedure to dothis.
15.1 As you go round your enumeration block carrying out enumeration, you will have to correct Section 2 and fill Section 3 as the case may be, in the Abridged Houselist. Please carry out the corrections in Section 2 and additions in Sections 3 of the Abridged HOl)selist as you go round your block. Do not put this work off beca(Ue it is essential to ensure that no building, census house or household is missed or left out and that the present situation is fully reflected in the Abridged Houselist. Please read the Instructions given In Appendix V once more.
Filling up of Household St:hedule
16. Specimen of the Household Schedule is given at the end of this chapter. There are altogether 34columns in the Household Schedule. Columns 1 to 7 of this form should be filled up first before you take up the enumeration of the individual members of the household. It Is re-emphasised that it is absolutely necessary to fill up columns 1 to 7 of this form before you take up individual enumeration of the members of the household. This will mainly help you in counting all memebers of the household, missing none, and in recording age of the individuals more precisely.
16.1 Please note that this document is marked confidential which means that the particulars entered in this sched-
280

lIle will have to be treated as confidential. Your attention at this stage is invited to the relevant provisions of the Census Act, 1948 reproduced under paragraph 3 of this booklet.
Persons Eligible for Enumeration
17. The next question that arises is as to who are the persons to be enumerated in the household. In other words, it is necessary to know who are the persons who are eligible for enumeration. Generally speaking, persons who are present in the household during the entire period of enumeration or who are known to be usual residents of the household and have stayed there for part of the enumeration period orwho are expected to return before February 28, 1991 are eligible to be enumerated as members of the household concered. So also, visitors who may be present in the household which is being enumerated by you and who have been away from their place of usual residence during the entire enumeration period will also be treated as residents of the household.
1 7.1 Thus, when you visit a household for the purpose of enumeration, you will enumerate the following persons:
(I) All those who normally stay and are present in that household during the entire period of enumeration, i. e., from February 9 to February 28, 1991 (both days inclusive);
(Ii) Also those who are known to be normally residing and had actually stayed during a part of the enumeratioQ period (February 9-28, 1991) but are not present at the time of your visit:
(iii) Also those who are known to be normally residing and are not present at the time of your visit but are expected to return before February 28, 1991; and
(iv) Visitors who are present in the household censused by you and are away from the place(s) of their usual'residence during the entire enumeration period. Forthe purpose of enumeration such visitors will be treated as normal residents of the household where they are actually found during the enumeration period provided they have not been enumerated elsewhere.
17.2 Please note that if a person has been away from his r,ormal or usual place of residence throughout the enumer .ltion period, hewill not be eligible for enumeration as a merr,ber of the household in which he is a normal resident. He v/!i be enumerated wherever he is actually found during the E'lumeration period. Similarly, a person who would have norrn::!Iy resided at another place but has been absent from that place for the entire enumerateion period, will be enumerated by you if he is found in any household in your Jurisdiction as a visitor. Such persons should, be cautioned that they should not get themselves enumerated again, in case they move from this place.
Book No. and Form No.
18. Your have to write the Book No. and Form No. at the top left hand corner of this schedule. Book No. is given on the cover page of the Household Schedule book and you have merely to copy this number on each Household Schedule form. The Form No. will run serially from 1 for each book.
location Code
19. At the top on the left hand side of the schedule you will find Location Code. The Location Code numbers have been allotted to each State, District, Tehsil/Taluk!Police Station/Development Block! Circle or town, village (each separated byobique stroke) and enumeration block (E.B.) number within brackets. Your Charge Officer or Supervisor would have already indicated to you the complete Location Code number of the rural and urban block assigned to you and noted these particulars on the cover page of the booklet. You should enter on each form the complete Location Code number of your enumeration block, comprising State/District/Tehsil, etc, or town /village or ward and enumeration block numbers (within brackets). Please note that the code for town is to be given in Roman numbers while codes for all other units will be given in international numerals.
19.1 Location Code is a device by which every village or town In a Tehsii/Taluk!Police Station/Development Block! Circle of every District in a State/Union Territory is identified by a combination of numbers. The enumeration blocks for village and towns have also been assigned numbers and these constitute tha last element of the Location Code and is recorded in the Location Code within brackets. Bya combination of these numbers one can exactly identify the enumeration block within a village or a town. Thus, Code No. 2/10/3/46(138) would mean enumeration block No. 138 falling in village No. 46 in T ehsil No 3 of District No. lOin State No.2 Similarly, Location Code 1 O/6/1X/5(22) would mean enumeration block No. 22 falling in ward No.5 of town No. IX in District No.6 of State No. 10.
19.2 The code number of Development Block will also be supplied to you by your Charge Officer or Supervisor. You have to enter the same in the space provided in the schedule. In case of States/UTs where the Development Block has been taken as the next unit below district, the code number of the Development Block will be repeated here.
19.3 If you have, by any chance, been put in-charge of more than one rural or urban enumeration block, please make sure that your have sepiJr;Jte books iJnd PiJds for eiJch ruriJl or urbiJn enumeriJtion block. Do not use the same book or pad for different enumeration blocks even if blank forms are available in a particular book or pad.
19.4 Please check that the Location Code tallies with the Location Code indicated in the filled in Abridged Houselist
281

supplied to you. I f they do not tally, refer the matter immediately to your Supervisor for further instructions.
Serial Number of Household
20. The serial number of the household as given in column 7 of the Abridged Houselist will have to be entered in the Household Schedule at the appropriate place. As you will notice, serial number of household has bneen entered in Section 2 of the Abridged Houselist in a continuous manner. If, however, you come across a household in course of enumeration, which does not find mention in the Abridged Houselist, you should enter particulars of this household in Section 3 of the Abridged Houselist as per instructions given in Appendix V. You may come across a new household in the follOWing situations:
(i) A household has moved into a new building which has come up after the houselisting operations;
(ii) A household has moved into an existing building or census house which was not used for residential purposes before;
(iii) A new household has come in by sharing accommodation with other household(s) who were existing at the time of houselisting.
20.1 However, You may come across a new household which has replaced a household listed during the houselisting operations. In such a case, the serial number of the household given in column 7 ofthe Abridged Houselist need to be changed. You should merely change the name of the head of the household in column 6 in Section 2 and adopt the serial number already entered in cloumn 7 for this new household. Similarly, if the head of household has changed, you have merely to make change in column 6 of the Abridged Houselist and no change in the serial number given in column 7 of the Abridged Houselist is called for. Please do not forget to read the instructions for filling up the Abridged Houselist and updating the same as given in Appendix V before you start filling up the Household Schedule and the Individual Slip.
Type of Household
21. At the top right hand corner of the Household Schedule, you will have to record the type of household, whether instltuational or houseless by symbols as per instructions given in the foot note of the form itself. There are three type of households, ivz,/ normal, institutional and houseless. While you are enumerating the members of the household, you will come to know whether the household falls In the category of normal household or institutional household or houseless household. For institutional write 'I' and for houseless household write '0'. For normal household no entry need be made.
Col. 1 : Serial No.
22. This column retales to serial number and hardly calis for any explanation. However, in entering the members of the hOllsehold in the Household Schedule it would be better if some system is followed. After entering the name and other particulars of the head of the household (columns 1-7), you should cover the near relations such as wife or husband of the head of the household, sons and daughters, each son's wife and children, each daughter's husband and children, then other relations such as brothers, sisters, mother, father, etc., of the head of the household, then domestic servants, vistiors, boarders if any, etc. Please see that all these persons must form part of the household and must be entitled to be enumerated in terms of the eligibility criteria spelt out in the varioLis paragraphs. Such a system of listing and entering of particulars in the Household Schedule will ensure that omissions are avoided, particularly of small children. It will also help in cross-checking replies regarding age.
22.1 A word of caution - You must ask probing questions regarding relations such as unmarried sisters, parents, domestic servants and children. Otherwise, the head of the household may not indicate that there are such persons as members of the household. Please make repeated enquiries about infants and very young children because they are often liable to be left out of the count.
Col. 2 : Name
23. Again, this question hardly calls for any explanation. The name of the perosn enumerated, starting with the head of the household, should be entered here.
23.1 The head of household for census purposes is a-" person who is recognised as sllch in the household. He or she is generally the person who bears the chief responsibility for the management of the hosuehold and takes decision on behalf of the household. The head of household need not necessarily be the oldest male member, but may be a female or a younger member of either sex. It may please be remembered that there are female-headed household, in which case the head of household should be recorded accordingly. You need not enter into any argument about it but record the person who is recognised by the household as its head. In the case of an absentee de jure/Head', the person on whom the respondibility of managing the affairs of household falls at the time of enumeration should be regarded as the Head.
23.2 Do not insist on the name of the female member of the household If the respondent does not volunteer to give it. Similarly, do not insist on a female respondent giving the name of her husband or of any other relation if by custom she is forbidden to do do. In the case of infants also some times the name may not be forthcoming. In all such cases It should suffice if in this column, you write so and so's wife or sister or mother or father or son or daughter as the case may be. It needs hardly any re-emphasis that the members of the
282

household should be enumberated and entered in a systematic order as discussed above. In the case of an institutional household, there may be a non-resident 'Head'. He is not eligible to be enumerated as a member of this household.
23.3 Books containing Household Schedule forms would have been supplied to you in sufficient quantity. For each househoid you have to fill one form. Even if a form has been filled in for a one member household and there is enough space to enter particulars of another household you should not make further use of the form. You should take up a fresh form for each household. However, if in a large household there are more persons than that the Household Schedule form can accommodate, you should continue the entires on the next form, but do not forget to write the word' continued' on the top of the next Household Schedule which you will be using. The word 'continued' should be written in capital letter. Re-write the Location Code and Serial No. of the household in the second Household Schedule form also.
Col. 3 : Relationship to Head
24. In this column you will have to record the relationship to head in full. In the case of the head write 'head'. For others write the full relationship. Do not use words like 'nephew', 'niece' or 'uncle', 'aunt' but state whether brother's or sister's son or saughter (for nephew or niece) or father's or mother's brother, father's or mother's sister's husband (for uncle), or father's or mother's sister or father's or mother's borther's wife (for aunt). Son or daughter will include adopted son or adopted daughter or step son/ daughter. For brother-in-law, write wife's brother or sister's husband as the case may be. For grandson, write son's son or daughter's son as the case may be. In the case of visitors, boarders or domestic servants/cooks, etc., who are enumerated as mempers of the household, write visitor, boarder or domestic servant! cook, as the case may be. In the case of an institutional household, however, all the members of the household should be treated as unrelated. It is possible that in a hostel, the resident superintendent's son or daughter also happens to be a boarder, while the superintendent himself/herself is the head. Even here the relationship of his/her son/ daughter should be recorded as unrelated, because it is an institutional household.
Col. 4 & 5 : Sex
25. For males, put tick (.I) in column 4 and for females put tick(.I) in column 5 against the particular person. For eunuchs and hermaphrodites, put tick (.I) under column 4. Verify with reference to the name and relationship to head recorded under columns 2 and 3 respectively that you have noted the sex correctly. It is obvious that there cannot be a tick in both columns 4 and 5 in the same line.
Col. 6 : Age
pleted last birthday in the column. Very often there is a tendency on the part of individuals to return 'years running' rather than the 'year completed'. Make sure that only the actual number of years completed is recorded.
26.1 In respect of infants who might not have completed one year by the dayof enumeration, their age in completed years must be shown as '0', as they have not yet completed one year of age. As has been stated earlier make sure that infants even if one day old are invariably enumerated. You should not enter the age in months. The age of an infant who has not yet completed one year should invariably be noted as 10' only.
26.2 Age is one of the most Important items of demorgraphic data and you should ascertain the age with the greastest care. Many persons, particularly in the rural areas often times do not give their age correctly. They should be assisted to state the correct age by stimulating their memory with reference to any historical event, etc., well-known in the area. Sometimes the age can be ascertained with reference to the age of another person of a known age, who may be living in the same household or in the neighbouring household or that of a well-known person of the village such as Headman of the Village. A person can then easily say whether he was older or younger than such a person and by how many years. This will help you to record the age more precisely.
27. The advantage of recording all eligible members of the household in the Household Schedule columns 1 to 7 first should now be obvious to you. For, you will have an opportunity of checking the consistency of the age reported for each member of the household in relationship to the age of other members. In case of any doubt YOll can certainly check back with the respondent and ascertain correct age which should be recorded here.
Col. 7 : Marital Status
28. In answering this question use the following abbrequations :
NM for Never Married M for Currently Married W for Widowed S for Separated or Divorced 28.1 The entry is to be made in the manner indicated
below: (a) For a person who has never been married at any
time before, write 'NM'.
26. Record the age of the person in total years com-
283
(b) For a person cll~rently married, whether for the first or another time and whose marriage Is slIbsisting at the time of enumeration with the spouse living, write 'M'. Write 'M' also for persons who are recognised by custom or society as married and for the persons in stable de FJcto union. Even
if a marriage is disputed in the locality write 'M' if the person concerned says he or she Is married or is in stable de f.1aounion.
(c) For a widowed person whose husband or wife is dead, and who has not been married again, write 'W'.
(d) For a person who has been separated from wife or husband and is living apart with no apparent intention of living together again or who has been divorced either by decree of a law court or by an accepted social or religious custom but who has not remarried, write'S'.
(e) For an independent woman return her marital status as declared by her.
28.2 This question must be answered for all persons irrespective of age. For very young children, though we know that they may not be married, the appropriate abbreviation must be entered after enquiry.
28.3 'M' is the abbreviation for 'currently married'. The word 'currently' does not mean 'recently'. It only means 'at present'. For example, a man may be 80 years old and may have been married 50 years ago; if his wife is still alive and the marriage subsists, they are {currently married'.
28.4 The conditions for the marital status to be reckoned as 'currently married' are that the man and woman are both alive and that their marriage subsists i. e,/ they are not divorced or separated. Please note that we are not concerned with the legality of a union.
29. Having filled in colums 1 to 7 of the Household Schedule you are now set for taking up individual enumeration of all the members of the household listed in column 2 of the Household Schedule. Column 8 to column 34 of the Household Schedule are to be entered with reference to the entries made in the Individual Slip. The instructions for making the entries in column 8 to column 34 are given later, after the instructions on the Individual Slip (chapter IV).
284

CHAPTER"
FILLING UP OF THE INDIVIDUAL SLIP
30. In paragraph 12 of this booklet, you have been told that you will be required to canvass the Household Schedule for each household and an Individual Slip, containing 23 questions with parts, for each individual in the household enumerated in your jurisdiction. The operations wil be carried out in two stages, (a) enumeration during the period February 9, 1991 to February 28, 1991, and (b) revisional round between March 1, 1991 and March 5, 1991. You have also been told in paragraph 13 that the reference date for the 1991 Census will be the sunrise of March 1, 1 991. In the same paragraph, instructions have been given as to how the revisional round should be conducted.
31. In paragraph 17 of the booklet, you have been told as to who are the persons to be enumerated in a particular household of your jurisdiction. The instructions are briefly recapitulated below.
"Generally speaking persons who ae present in the household during the entire period of enumeration or who are known to be usual residents of the household and have stayed there for part of the enumeration period or who are expected to return before February 28, 1991 are eligible to be enumerated as members of the houeshold concerned. So also, visitors who may be present in the household which is being enumerated by you and who have been away from their place of usual residence during the entire enumeration period will also be treated as residents of the household.
Thus, when you visit a household for the purpose of enumeration, you will enumerate the following persons:
(i) All those who normally stay and are present in that household during the entire period of enumeration, i.e? from February 9 February to 28, 1991 (both days Inclusive).
(ii) Also those who are known to be normally residing and had actually stayed during a part of the enumeration period (February 9-28, 1991) but are not present at the time of your visit.
(iii) Also those who are known to be normally residing and are not present at the time of y_9ur visit, but are expected to return before February 28, 1991; and
(iv) Visitors who are present in the household censused by you and are away from the place(s) of their usual residence duringthe entire enumeration period. Forthe purpose of enumeration such visitors will be treated as normal residents of the house-
hold where they are actually found " .... ring the enumeration period provided they h.-fie not beefl enumerated elsewhere.
Please note that if a person has been away from his normal or usual place of residence throughout the enumeratIon period, he will not be eligible for enumeration as a member of the household in which he is normal resident. Hewill be enumerated wherever he is actually found during the enumeration period. Similarly, a person who whould have normally resided at another place but has been absent fro'n that place for the entire enumeration period, will be enumerated by you if he is found in any household in your jurisdiction as visitor. Such persons, should, however, be cautioned that they should not get themselves enumerated again, in case they move from this place.'"
32. In paragraph 16 of the booklet you have been told that columns 1 to 7 of the household schedule should be filled up first before you take up the enumeration of the individual members of the houeshold. In paragraphs 22 to 29, you have been told how columns 1 to 7 of the household schedule are to be filled. The concepts and definitions associated with each column have also been explained at appropriate places. You are now set for taking up the individual enumeration of all the members of the household listed in column 2 of the household schedule.
33. You will be required to fill up an Individual Slip for each member of the household. The instructions for filling up the Individual Slip are given hereafter.
INDIVIDUAL SLIP
34. A specimen of the Individual Slip is gi'.:en on pages 2' -22. Please note that this documents Is m;;rked JConfrdential' which means that the particulars e~tered in this sl1p will have to be treated as confidential. Your attcmion at thh stage is invited to the relevant provisions of the Census Act, 1948 reproduced under paragraph 3 of this booklet.
Pad No. and Slip No.
35. On the right hand top corner of the slip will be found Pad No. and Slip No. You will have to note the Pad No. on each slip of the pad. The Pad No. win have been Indicated on the cover page of the pad supplied to you by your Charge Officer/Supervisor. The Slip Nos. f;x each pad will run from 1 to 50 or 1 to 25 or 1 to 10 as the cse may be. In some pads, the actual number of Individual Slips may, by mistake in binding, be a little more or little less. The last serial number in such pads will therefore, very accordingly.
285

The idea is that every slip shold be alloted the Pad No. already assigned by your Charge Officer as well as the distinct serial number on each slip in a sequence starting from 1.
Location Code
35.1 You will have to note the Location Code on each slip, as per instructions given in paragraph 19 of this booklet. Your Charge Officer or Supervisor would have already indicated to you the complete location Code of the rural or urban block assigned to you and noted these particulars on the cover page of the pad. The Location Code consist of five elements, namely, StatelUnion Territory code, District code, T ehsil/T aluk/PSI Development Block/Circle or Town code, village or the ward code (each separated by oblique stroke) and enumeration block (EB) number within brackets. It is possible that the State, District and Charge code (Tehsil, etc.,. or town) would have been rubber stamped on each slip of the pads supplied to you. In such cases, you will have to enter the remaining two elements, namely, village or ward .md EB (Ode'. If, 110\-\ ever, no such rubber-stamping has been done, YOll will have to write the full Location Code consisting of the aforesaid five elements, as given by your Charge Officer or Supervisor, on each Individual Slip. It is advisable to note the Location Code on each slip at home before starting actual enumeration, so that you do not waste your valuable time in the field in filling up the Location Code. Please note that the code for town is to be given in Roman numbers, while codes for all other units will be giben in international numbera1s. For example, Location Code 2/ 10/3/46 ( 138) would mean enumeration block No. 138 falling in village No. 46 in T ehsil No. 3 of District No lOin State No.2 Similarly Location Code 1 0/6/IX/5(22) would mean enumeration block No. 22 falling in Ward No.5 oft own No. IX in District No.6 of State No. 10.
35.2 As indicated in para 19.2 you have also to write the code No. of Development Block at the appropriate place in each Individual Slip. This might have been rubber stamped by Charge Officer.
35.3 If by any chance, you have been put in-charge of more than one enumeration block, please m.3ke sure that you have separ.3te piJds for each enumeration block. Do not use the same pad for different enumeration blocks even if blank forms are available in a particular pad.
35.4 Please note that the Location Code tallies with the location Code indicated in the filled in Abridged Houselist and the Household Schedule on the basis of which you are enumerating the individuals in a particular household.
SI. No. of Household
36. The serial number of the household as given in column 7 of the Abridged Housellst supplied to you will have been entered by you in the Household Schedule at the
appropriate place. This number has to be entered on each slip of the members in relation to a particular household. It would be worthwhile your recalling the instruction given under paragraph 20 of this booklet at this stage.
Q 1 : Name
37. This question hardly calls for any explanation. It is obvious that the name of each member of the household will have to be filled against this question on different slips. At this point, you will be well-advised to recall the instructions in paragraphs 22-23.
3 8. Pleas~ r~member th-Jt you have to fill in on~ Individual Slip for each member of the household recorded in column 2 of he Houeshold Schedule. Please .3lso remember to fill the slips relating to the members of the household in the sequence in which the n.~mes of the members of the household have been entered in column 2 of the Household Schedule.
Q 2 : Relationship to Head
39. It will be noticed that enough space has been provided for writing the relationship to head. You should record the relationship to head in full. The instructions in this regard are given In paragraph 24 of this booklet, which may be read for refreshing your memory. In the case of the head of the household, write "Head". Please do not write anything in the dotted boxes.
Q 3 : Male (1 )/Female (2)
40. For male, write 11' and for female write '2' in the box provided against this question. For eunuchs and hermaphrodites, write' 1 ' in the box. Verify with reference to the name and replationship to head recorded under columns 2 and 3 respectively of the Householod Schedule that you have noted the sex correctly.
Q4:Age
41. Record the age of the person In total years completed last birthday in the rectangle provided against this question. The age should be recorded in international numerals. Very often, there is a tendency on the part of individuals to return 'years running' rather than 'years completed'. Make sure that only the actual number of year completed is recorded. In respect of infants who might not have completed one year by the day of enumeration, their age in completed years must be shown as '0' as they have not yet completed one year of age. Make sure that infants even if one day old are invariable enumerated. You should not enter the age in months. The age of an infant who have not yet completed one year should invariably be noted as '0' only. It will be useful to recall the instructions in paragraphs 26 and 27 of this booklet in this connection.
286

Q. 5 : Marital Status
42. Instructions given under paragraph 28 of the booklet may be followed. You will have to use the following abbreviations in answering this question:
NM for Never Married
M for Currently Married
W f.or Windowed
S for Seperated or Divorced
42.1 The entry as above will have to be made on the line and not in the dotted box.
NOTE: The entries in Question 1 to 5 correspond to the entries in columns 2 to 7 of the Household Schedule and you will be well-advised to make a tally qf the entries as and when you are filling up an Individual Slip for each of the members entered in column 2 of the Household Schedule.
Q. 6 : Mother Tongue
43. Mother tongue is the language spoken in childhood by the person's mother to the person. If the mother died in infancy, the language mainly spoken in the person's home in childhood will be the mother tongue. In the case of infants and deaf mutes. the language usually spoken by the mother should be recorded. In case of doubt, the language mainly spoken in the household may be recorded.
43.1 Record mother tongue in full, whatever be the name of the langu~ge returned by the respondent and do not use abbreviations. Please note the following:
(a) You are not expected to determine if the language return'ed by a person is a dialect of another language.
(b) You should not try to establish any relationship between religion and mother tongue.
(c) You are bound to record the language as returned by the person as his/her mother tongue and you should not enter into any argument with him/her and try to record any language other than what is returned, and
(d) If you have reasons to suspect that in any area due to any organised movement, the mother tongue is not being truthfully returned, you should record the mother tongue is not being truthfully returned, you should record the mother toungu as actually returned by the respondent and make a report to your supervisory officers for verification. You are
not authorised to make any correction on your own.
43.2 The mother tongue as returned by the respondent should be recorded in full on the lines. You should not write anything in the four dotted boxes provided against this question.
43.3 Since a household may consist of persons related by blood or of unrelated persons or a mix of both, it is abso· lutely necessary to ask of every person about his/her mother tongue because the mother tongue of each member of a household need not necessarily be the same-these may be different persons in the household.
Q. 7 : Two Other languages Known
44 You have recorded the mother tongue in Question 6. Enquire whether the person knows any other languages, Indian or foreign, and write languages returned by him/her on the lines and not is the dotted boxes, against this question. In case he/she does not know any language apart from his/her mother tongue, put cross (X) on th line against this question.
44.1 The number of languages recorded under this question should not be more than two. These languages should be other than the mother tongue of the person enumerated and these should be recorded one after the other in the order in which the person speaks and understands them best and can use with understanding in communicating with others. The person need not necessarily be able to read and write these langauages.lt is enough. if he/she has a working knowledge of these two langauges to enable him/her to converse in those languages with understanding. Please do not write 3nythlng In the dotted boxes.
Q. 8 : Religion
45. In answering this question, use the following abbreviations:
H for Hindus
M for Muslims
C for Christians
S for Sikhs
B for Buddh!st
for jains
For others, record the actual religion as returned fully.
45.1 If the person says tbJt he has no religion the answer may be recorded accordingly. Do not mistake religion for caste which will not be recorded here. You should also
287

not try to establish any relationship between religion and mother tongue. Do not write anything in the dotted boxes, but write on the line.
Q. 9 : Whether S.c. (1)/S.T. (2)
46. You have been furnished with a list of Schedules Castes and Scheduled Tribes in relation to your State/Union Territory. Ascertain if the person enumerated belongs to a Scheduled Caste or a Scheduled Tribe and jf he does, write '1' for Schedules Caste and '2' for Scheduled Tribe in the box provided against this question. For a person who is not a member of any Scheduled Caste or Scheduled Tribe, put 'X' in the box.
46.1 If the person belonging to a Scheduled Caste or a sched!l!ed Tribe returns his/her caste or tribe by a synonym or generic name of a caste or a tribe, it should be recokned as Scheduled Caste or Scheduled Tr!be only ifthe name finds place in the list furnished to you. Similarly, if the answer to this question is in genera! terms, like Harijan/Girijan or Achhutl Adivasi, you should not reckon the person enumerated as belonging to Scheduled Caste/Scheduled Tribe, as the case may be. In such a case, you should ascertain the name of the caste/tribe fully and if that name finds place in your list, YOll should reckon the person is negligent and insists on calling him$elf/herself merely 'Harijan' or Achhut' or' Adivasi' or 'Girijan', as the case may be, or repeats the synonym or generic name of a caste or tribe, please tell him! her that this description is not adequate for census purposes and persuade him/her to give the actual name of the Scheduled Caste or Scheduled Tribe. This may bring out the actual name of the Scheduled Caste or Scheduled Tribe, as the case may be, and record' l' or '2' in the box as may be applicable. If the person merely claims to be a Scheduled Caste or a Scheduled Tribe, but says that he/she does not belong to any of the notified communities applicable to the area, as reflected in the list supplied to you, he!she will not be reckoned as belo!igingto a Scheduled Caste or a Scheduled Tribe.
46.2 Scheduled Castes can belong to Hindu or Sikh or Buddhist religion. For a persrm returnit'lgas a SchedUled Caste, check whether you have recGHied either 'Ii; or '5' or 'B' in the answer to Question 8: Religion. However, Schedule Tribes can belong to any religion.
Q. 10 : Name of Scheduled Caste/Tribe
47. Forthe person recorded as a Scheduled Caste, i.e./ code '1 ' In the box Jgainst Qu€~tion 9, write the name of the caste in full on the line and not in the dott2d boxes. For those for whom code '2' (that i~ Scheduled Tnbf') is recorded in the box against Que-tion 9, write Lhe name (If the tribe in full on the line .;~:j not '" "he dOixed boxes.
47.1 Please (I-f:::k that the rame of caste/tribe, as the case mal be, 4i'ipe')r~ In the !l~t c.lf Scheduled ames/Scheduled Tribes supplll:d to yOll "Y your Supervisor.
47.2 Forthose persons for whom 'X' has been recorded againt Question 9, there will be no entry in Question 10 and you should put a cross (X) on the line.
Q 11 : literate (1 )/Illiterate (2)
48. Definition of !iterate : A person who can both read and write with understanding in any language is to be taken as literate. A person who can merely read but cannot write, is not literate. It is not mecessary that a person who is literate should have received any formal education or shOUld have passed any minimum educational standard.
48.1 For a person who is literate, i.e./ who can both read and write with understanding in any language write '1' in the box provided against this question. If there is any doubt about a person's ability to read or write, the test that may be applied for reading is his/her ability to read any portion of the printed matter in the Enumerator's Instruction Booklet (provided the person Is familiar with the language used In the booklet) and similarly, for writing he/she should be able to write a simple letter. Ability merely to sign one's name is not adequate to qualify a person as being able to write with understanding. If a person claims to be literate in some other language with which the enumerator is not acquained, the respondent's word has to be taken as correct. Other members of the household may also be able to testify to the literacy of the person enumerated.
48.2 For a person who is illiterate, i.e./ who can neither read nor write or can merely read but cannot write in any language write '2' in the box against this question. All children of the age of 6 years or less should be treated as illiterate even if the child is going to a school and may have picked up reading and writing a few odd words.
Q 12 : Education Attainment
49. This question will be asked of only those who are literate and for whom' l' has been recorded against QUestion 11. For a person who is illiterate and for whom '2' has been recorded in the answer to Question 11, there Is no question of ascertaining the educational attainment even If he/she had at sorrre stage attende<J school and passed a standard and had rel"psed into illiteracy. In such a case, you should put a dash (-). We are insisting that a dash (-) should be put if there is no educational attainment and not a cross (X), because we want to avoid a confusion with 10th standard which cross may signify. You will have to <ascertain and record the highest educational level attained by a person for literates, I. e,/ for whom' l' is recordp..j in answer to Question 11.
49.1 For a person who is still studying in a particular class, the highest education level attained by him!her be one that he/she has actually passed and not the one in which he! she is studying. For example_, a person studying in 1 st yar B.A. should be recorded as only 'PUC' or 'Higher Secondary's or 'Senior Secondary (10 + 2)' as the case may be.
288

Simltarly, for person studying say, Inthe 4th year ofM.B.B.S., his/her educational attainment should be 3rd year of M.B.B.S., which is the highest level he/she has actually attained. You must record tha actual sttandard passed such as, III standard, VIII standard, 1st year B.Com., etc. However, if a person merely says that he/she has passed primary, middle, matriculation, school final, higher secondary or senior secondary (1 0+ 2) or other definite levels, record him/her as such.
49.2 The highest educational level attained by the person enumerated should be recorded. When a person holds both general and technical qualifications, both of which are of equivalent level or of verying levels such as a B.Sc. (Zoology) and M.B.B.S., or B.A. (Math) and B.E. (Bachelor of Engineering) both the technical and general qualifications should be recorded against this question. In the case of pass courses, indicate the degree only.
49.3 In recording the educational level of a graduate or a post-garduate, the major subject such as B.Sc (Math), M.A. (Economics), M.Sc. (Botany), B.Se. (Agriculture), etc:: should be noted. You should not use abbreviations which are not in common use. In such cases, the degree or diploma should be spelt out fully, for example, M.A. (Hindi) and Diploma in Library Science or M.A. (Sociology) and Diploma in Labour Relations. Adequate space has been provided in the slip and you are urged to record the qualification accurately, and in sufficient detail. This information Is vital for manpower planning and should receive your careful attention.
50. Whenever'you come across post-graduates as also those with a technical degree or technical diploma and those with certificates form the Industrial Training Institutes (ITI), you will have to issue to such persons 'Post-graduate Degree Holder and Technical Peronnel Schedule' and ask the Person(s) concerned to fill the schedule which will be collected by you during your revisional round between March 1 to 5, 1991. You will be supplied with adequate number of Post-graduate Degree Holder and Technical Personnel Schedule' and you are urged to issue as many schedules as there might be post-graduates or technical degree or technical diploma holders in the household that you have enumerated. This information will be readily available when you have ascertained information regarding educational attainment against Question 12 of the Individual Slip. While issuing the Postgraduate Degree Holder and Technical Personnel Schedule for each eligible person in the household, you should note Location Code on the schedule while issuing it. You should put a tick (,/) against Question 12 of the person concerned for whom a Post-graduate Degree Holder and Technical Personned Schedule has been issued. You will be req uired to furnish a statement giving the number of blank schedules issued to you, number of schedules issu(!d to eligible persons, number of filled in schedules collected by you and number of schedules returned by you to your Supervisor. Therefore, it is necessary that you identify the persons, with
the help of a tick (,/) against Question 12 of the person concerned for whom a schdule has been Issued so that you can give an account of schedulees issued to eligible persons. During your revisional round between March 1 and 5, 1991 about which instructions are given in this booklet, you must please collect all the filled In Post-graduatte Degree Holder and Technical Personnel Schedules issued by you to the members of the households in your jurisdiction and hand them over to your Supervisor. While collecting the Post-graduate Degree Holder and Technical Personnel Schedule, you must put Cl reverse stroke (\) on the tick (I') against Question 12 of the individual concerned for whom you have put the tick, while issuing the schedule. When you do this, the marking will appear as (I') to signify that the filled In schedule in respect of that individual has been collected. If, however, any particular individual in a household says that he has not been able to find time to fill in the schedule, you may please request him to do so immediately and post it at the nearest post office or letter box. The individual may be told that he has to fold the form, paste and post it. No postage will be required as this will be paid by the addressee.
Q. 13 : Attending School/College, Yes (1 )/No (2)
51. After you have recorded the answer to Question 12, YOll have further to ask whether the person whom you are enumerating is attending any school or college. If the answer is 'Yes', you have to record 'I' in the box provided against this question. If the answer is 'No', you should record '2' in the box. Please note that illiterates (code 2 against Question f 1) an be found attending school. Therefore, this question should be asked of all persons, including elderly men and women.
51.1 In recording answers to this question you are not required to ascertain whethe the school/college, being attended by the person enumerated is a recognised or unrecognised institution. The choice should be left to the respondent as to whether the person is attending school/college. Thus, if a person is receiving education through a correspondence course or attending some vocational course or attending the Adult Education Programme and returns himself as attending school/college, he/she will be entered as such and code 11'will be recorded in the box against this question.
ECONOMIC QUESTIONS
52. It is proposed to adopt the same Economic QUestions as were adopted in the 1981 Census wi.:h only slight variation. The economic question consist of three parts, namely:
I Q. 14A Did you work any time at all last year? Yes
No (H/ST/D/R/BII/O) (including unpaid work on farm or in family enterprise)
289

Q. 14B If L.Yes' in 1 4A, did you work for major part of last year? Yes( 1 }/No(2)
II Q. 1 5A Main activity last year?
'Yes' in 14B (Ci ALlHHIIOW) 'No' IN 14B (H/ST /D/RIBII/O)
'Yes' in 14B-Any other work any time Q. 15B last year?Yes (C/Al/HHIIOW/}/No
'No' in 14B-Work done any time last year?(C/ AlIHH IIOW)
III Q. 16A If 'No' in 14A, seeking/available for work? Yes( 1 }/No(l)
Q. 16B If 'Yes' in 16A, have you ever worked before'? Yes( 1 )/No(2)
52.1 These questions must be canvassed for every person, irrespective of age or sex. Every person must be asked Question 14A, including the very young or very old and the answer to this question must be filled in. The other questions will have to be filled in the case of those to whom they are applicable. The instructions for filling these question follow.
52.2 These questions are meant to get details of the work done by the people with reference to last year. We may, therefore, first consider what is meant by 'work' and what the 'reference period' is.
Definition of Work
53. Work may be defined as participation in any economically productive activity. Such participation may be physical or mental in nature. Work involves not only actual work but also effective supervision and direction of work. It also includes unpaid work on farm or in family enterprise.
Reference Period
54. In all the questions except Question 16B, the reference period is the one year preceding the date of enumeration. Certain types of work such as agriculture, household industry like, gurmaking, etc? are carried on either throughout the year or only during certain seasons or parts of the year, depending on the local circumstances. In such cases what we are concerned with is the broad time-span of the agricultural seasons preceding the enumeration.
54.1 For Question 16B, the reference period is any time before one year preceding the date of enumeration.
Explanation
. 55. There should be no confusion regarding these questions. What we are trying to find Ollt is the number of workers and non-workers and among the workers those who had
worked for the major part of the year and those who did not work for the major part of the year. Details of their activity are also collected. The number of non-workers seeking/available for work and those among them who had '1ot worked before are also collected.
55.1 Question 14A seeks to find out if a person had done any work at all (including unpaid work on farm or in family enterprise) during the last year or whether he or she did not work at al! and if it is the latter how the person spent his/her time as a non-worker. Then Question 14B seeks to find out who among the persons returning 'Yes' in Question 14A had worked for the major part of the year. By major part of the year are termed as (183 days) or more. Those who had worked for the major part of the year are termed as 'main workers'. Those who have not worked for the major part of the year, i. e., those who had worked for less than six months (183 days) in the year are termed as 'marginal workers'. Those who had worked for six months or more, will answer 'Yes ' for Question 1 4B. For them code' l' has to be recorded in the box. But those who had worked for less than six months or 183 days will say 'No' and for them code '2' is to be recorded in the box for this question. Question 15A seeks to elicit information on the activity of the main workers in Question 14B, i.e., those for whom code '1' has been recorded in the box. It will also elicie information about the main activity of the 'marginal workers' covered in Question 14B, i.e." those who have returned 'No' and for whom code '2' has been recorded in the box against Question 14B.
55.2 A persons may have worked for six months or 183 days or more in one or more than one activity. If he/ she has worked for three months in cultivation, one month in gurmaking and three months as an agriclturallabourer in Question 15A, he/she is requried to indicate which of these three activities accroding to him/her was his/her main activity, i.e., in which capacity he/she spent more time. In the instant case since the person has spent three months each in cultivation and as agricultural labourer the choice as to which of these two would be his/her activity should be left to him/ her. The other work or the secondary work he/she engaged which has not been entered fn Question lSA would be entered in Question 15B. Those who have returned 'No' for Question 14B, i.e., those who have worked for less than six months or 183 days during the last year and for whom code '2' has been recorded in the box, will have to state whether according to them, they were engaged mainly in household duties, or as student, or dependent or as retired person, rentier, or begger or inmates of institutions, and if not in any of these categories, the person(s) should be put under 'Others' in Question 1 SA.
55.3 In Question 15B, details of secondary work or marginal work are sought to be obtained. Those who have worked for the major part of the year, i. e., those for whom code '1' has been recorded in the box against Question 14B, may have had secondary work and this should be entered In
290

Question 15B. In the example given in para 55.2, the secondary work will be cultivation if agricultural labour has been returned as main activity in Question I SA and vice-versa. Those who hav~ not worked for the major part of the year and for whom code '2' has been recorded in the box against Question 14B, must have done some marginal work and these details will be entered in Question ISB. It is important that probing questions are asked to ellct correct information.
55.4ln Question 16A, it is proposed to ask all persons returning 'No' in Question 14A, i.e., H/ST/D/RiB/1/0 in Question 14A,lwhether he or she has been seeking work or is available for work. Question 16B seeks to find out who among the non-workers returning 'Yes' in Question 16A had ever worked or not before. Those who had worked any time before will answer 'Yes' for Question 16B and for them code' I' has to be recorded in the box. But those who had not worked any time before will say 'No' and for them code '2' is to be recorded. The main purpc,se of this question is to elicit information regarding the fresh entrants in the labour market. Those returning code '2' for this question will be the fresh entrants in the labour market.
55.5 It will thus be seen that these questions on economic aspects have been so designed as to identify all the workers, main or marginal and non-workers with reference to the activities during the last one year prior to the date of enumeration. It is very important to remember that the period refered to in Quetions 14A, 14B, 1 SA and 1 5B is one year preceding the enumeration. Thus, if in some areas, a person has been a cultivator or an agricultural labourer, or has worked in ali industry, etc., only in one season, i.e., less than 6 months/ 183 days, he/she is not to be treated as a worker for Question 14B. His/her economic activity will be reflected in Question 15B. Thus, all those returning 'Yes' in Question 14A must be netted as f'( es' in Question 14B or in Question ,15B or both.
56. Certain important points that need special emphasis are the foH~wing and these should be kept in mind:
(i) A person who mormally works but has been absent from work during the reference period on account of illness, holiday, temporary closure, strike etc., must be treated as engaged in the work he/ she would otherwise have been doing but for his/ her temporary absence.
(ii) Persons under training such as apprentices, with or without stipends or wages, should be treated as workers.
(iii) A person who has merely been offered work but has not actually joined yet, should not be treated as engaged in this work.
(iv) If a person is engaged in some economic activity but all the same time does also attend to some
291
household chores or attends a school, etc., he or she would be treated basically as a worker.
(v) A person, who merely receives an income, such as a rent receiver or a pensioner who does not have to work for receiving the income, will not be treated as economically active unless the person is also engaged for some part of the year in some economic activity. Similarly, beggars, pensieners, receivers of agricultural or non-agricultural royalty or of rents or dividends who may be earning an income but who are not participating in any productivp. work should not be treated as working unless they also work in cultivation, industry, trade, profession, business or commerce.
(vi) A person who engages himself/herself in work such as rice pounding for sale or wages, or in domestic services for wages for others or minding cattle for wages or selling firewood or making and selling cowdung cakes or selling grass, etc., or any other work like cultivation, etc., he/she should be treated as working under Question 1 4A. However, any person who is engaged only in household duties but doing no other productive work to augment the family's resources should not be considered as working for the purpose of this question.
Important
Women are often classified as non-workers because of non-reporting of their work. It also happens that women who work for the major part of the year are reported as working for less than six months. You should, therefore, make special efforts for capturing women's work by asking probing questions.
(vii) A man or a woman may be producing or making something only for the domestic consumption of the household and not for sale. Such a person is not a worker, even though from his or her point of view the activity is productive.
(viii) For an undertrial prisoner enumerated in a jail, record the work he/she was dOing before he/she was apprehended. Similarly, for a person temporarily in a hospital or similar institution, record the kind of work he/she was doing before he/she was admitted into hospital or institution. But for convicts in a prison or for longterm inmates of penal or charitable or mental institutions, the persons' previous work should not be recorded, but 'I' should be recorded. For census purposes, inmates of penal or charitable or mental institutions if detained for six months or more should be treated as long term and 'I' should be recorded for them.

(ix) A public or social service worker who is engaged in public service activity or a political worker who is also engaged in furthering the political activity of his/her party will be recorded as a worker and entered accordingly. Such persons will include Members of Parliament, State Legislatures, Local Authorities, etc.
57. Each of the economic questions can now be considered in detail. Please study these instructions carefully. It will help if you read the general introduction given above and those that follow more than once so that the concepts and the scope of the questions are familiar to you.
Q. 14A : Did you work any time at all last year?
(including unpaid work in farm or in family enterprise)
Yes No (H/ST/O/RiB/I/O)
58. This question is intended to divide the population Into two broad streams on the basis of a liberal definition of work. The reference period is one year. This question is expected to net all workers irrespective of the amount of time they have spent on work. In other words, this question will find out the number of all workers which will include both main and marginal workers. Please note that unpaid workers in farms or In family enterprises and even workers whose contribution would otherwise be considered Insignificant should also be covered. But the workers in this question will not include those who produce goods for the self consumption of,the members of the household like persons who produce goods for the self consumption of the members of the household like persons collecting wood, preparingcowdung cakes, etc., for the domestic consumption. Thus the term 'unpaid worker' may not be confused with those who produce or make goods for domestic consumption. The latter category is to be taken as non-worker.
NOTE: Please note that persons who cultivate land to produce for domestic consumption only will be treated as workers.
59. The reference period is one year and this includes the agricultural seasons also. A person may have worked as a cultivator or as an agricultural labourer throughout the year or in some season such as only Kharif or rabi, or only for a few days. In all these cases this person has worked at some time in the year and the answer to this question should be 'Yes' . 'Yes' should be written on the line and not in the dotted boxes. One may have been a cultivator, an agricultural labourer, or engaged in a household industry or any other work. The definitions of these terms are given later, but the important point is that we are determining the fact that one has done some work some time during the last one year.
60. Obviously, probing questions will have to be asked specially in the case of those who are not regularworkers. It
is particularly important to ask such probing questions regarding the work done at any time last year or any of the seasons in the reference period in the case of women and children in the rural areas. Women and children in the rural areas work in the fields in the sowing, harvesting or other seasons and this may be on their own land or as labourers on someone else's land. Unless questions are asked about such work, the usual answer may be that they do not work.
61. It must be remembered that a man or a woman who is doing only household duties or making something only for domestic consumption (and not for sale) is not doing any work in census terminology.
62. In this question every worker (even marginal workers) will be Identified and in their cases the answer will be 'Yes'. You must enquire regarding each person whom you enumerate, whether he or she has worked any time at all during the last year. Even if the person has worked only for a few days, you have to record him/her as 'Yes', against this question.
Important
62.1 Before making any entry, make sure whether he or she is engaged even if only for a few days in a year in the following activities:
Work on the family farm; sale of home-made dairy products; rearing of poultry and sale of the products; sale of fruits, vegetables, etc.; sale of fish; making of cowdung cakes or collecting wood for fuel, fodder, grass and other forest produce and selling some of it; engaged in household industry such as weaving, spinning, bee-keeping, sericulture, tanning and making of leather products, pottery, leaf plate making, block printing, making cane-bamboo products, rope making, etc.; providing services on payment for others such as laundry, domestic work, hair cutting, tailoring, etc. or working on piece rate for making agarbathies, match boxes, bldi rolling, assembly of various parts, making and selling of garments, pickles, papad, masala, lam, snacks and other food products. Take care to net informal activities in urban and rural areas, e.g., rag picking, making of stationery items, sarifall and beading, sale of foods or snacks for festivals, running beauty parlour or giving secretarial assistance in family enterprise, giving tuitions, running music, dance, cookery, arts, crafts, etc., classes at home.
63. If the individual has not worked at all duringthe last year, the answer will be 'No'. Then ascertain how he or she spent his or her time and record 'H' or 1ST' or '0' or 'R' or 'B' or 'I' or '0', as the case may be, below the line against this question.
64. In question 14A, we are tryIng to find out whether a person has worked any time or has been a non-worker throughout. If he or she is a non-worker throughout, the
292
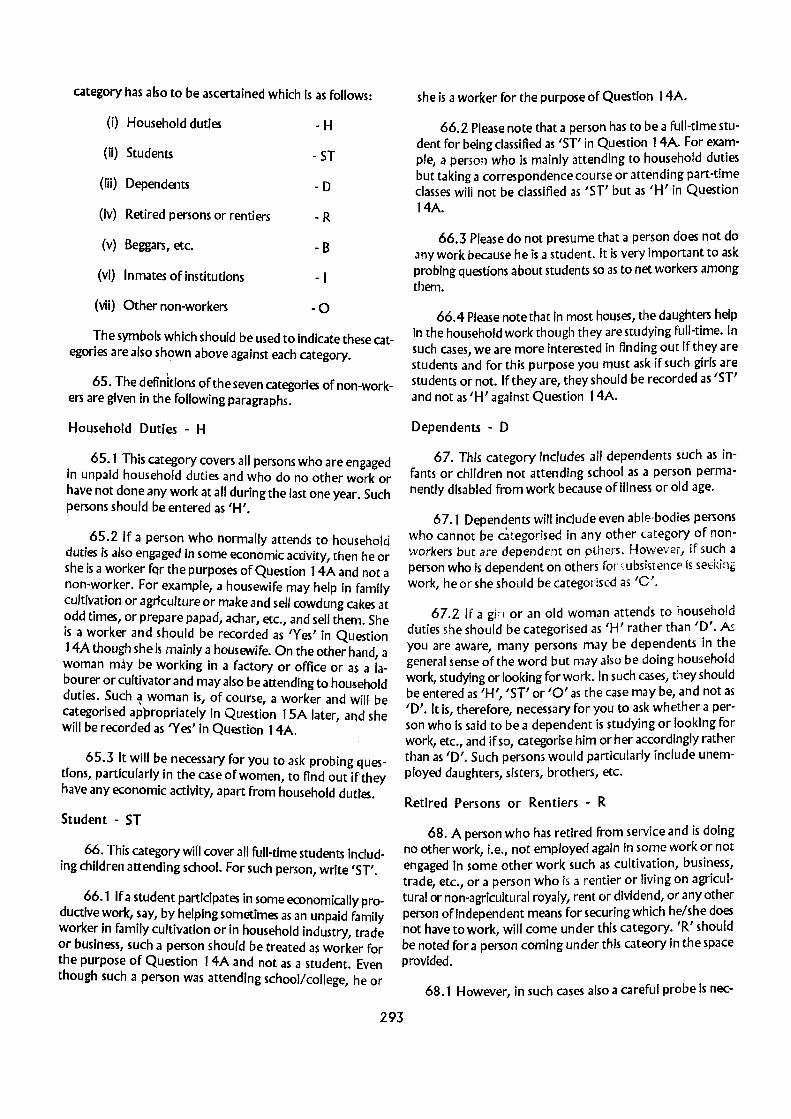
category has also to be ascertained which Is as follows:
(I) Household duties -H
(ii) Students - ST
(Iii) Dependents -D
(iv) Retired persons or rentiers -R
(v) Beggars, etc. -B
(vi) Inmates of institutions - I
(vii) Other non-workers -0
The symbols which should be used to indicate these categorres are also shown above against each category.
65. The definitions of the seven categories of non-workers are given in the following paragraphs.
Household Duties - H
. 65 •. 1 This category covers all persons who are engaged In unpaid household duties and who do no other work or have not done any work at all during the last one year. Such persons should be entered as 'H'.
. 6~.2 If a person who normally attends to household dutl~ IS also engaged In some economic activity, then he or she IS a worker fQr the purposes of Question 14A and not a non-worker. For example, a housewife may help in family cultivation or agriculture or make and sell cowdung cakes at ?dd times, or prepare papad, achar, etc., and sell them. She IS a worker and should be recorded as 'Yes' in Question 14A though she is mainly a housewife. On the other hand a woman may be working in a factory or office or as a iabo~rer or cultivator and may also be attending to household duties. Such ~ woman is, of course, a worker and will be ~tegorised appropriately in Question 1 SA later, and she Will be recorded as ryes' in Question 14A.
. 65.3 ~t will be necessary for you to ask probing questions, particularly in the case of women, to find out if they have any economic activity, apart from household dutra.
Student - ST
. 6~. This category will cover all full-time students includ-mg children attending school. For such person, write 'ST'.
66.1 If a student participates in some economically productive ~ork, ~ay, b~ hel?ing sometimes as an unpaid family worker m family cultivation or in household industry, trade or business, such a person should be treated as worker for the purpose of Question 14A and not as a student. Even though such a person was attending school/college, he or
she is a worker for the purpose of Question 14A.
66.2 Please note that a person has to be a full-time student for being classified as 'ST' in Question 1 4A. For example, a penon who is mainly attending to household duties but taking a correspondence course or attending part-time classes wili not be classified as 'ST' but as 'H' in Question 14A.
66.3 Please do not presume that a person does not do any work because he is a student. It is very important to ask probing questions about students so as to net workers among them.
66.4 Please note that in most houses, the daughters help in the household work though they are studying full-time. In such cases, we are more interested in finding out if they are students and for this purpose you must ask if such girls are students or not. If they are, they should be recorded as 'ST' and not as 'H' against Question 14A.
Dependents - 0
67. This category includes all dependents such as infants or children not attending school as a person permanently disabled from work because of illness or old age.
67.1 Dependents will include even able-bodies persons who cannot be categorised in any other category of nonworkers but are dependent on pthers. How€v<!r, if such a person who is dependent on others fo! subsistenc~ is seEki:lg work, he or she should be categorised as 'C'.
67.2 If a gh or an old woman attends to household duties she should be categorised as 'H' rather than 'D'. k you are aware, many persons may be dependents in the general sense of the word but may also be doing household work, studying or looking for work. In such cases, they should be entered as 'H', 'ST' or '0' as the case may be, and not as '0'. It is, therefore, necessary for you to ask whether a person who is said to be a dependent is studying or looking for work, etc., and if so, categorise him or her accordingly rather than as '0'. Such persons would particularly include unemployed daughters, sisters, brothers, etc.
Retired Persons or Rentiers - R
68. A person who has retired from service and is doing no other work, i.e., not employed again in some work or not engaged in some other work such as cultivation, business, trade, etc., or a person who is a rentier or living on agricultural or non-agricultural royaly, rent or dividend, or any other person ofindependent means for securing which he/she does not have to work, will come under this category. fR' should be noted for a person coming under this cateory in the space provided.
68.1 However, in such cases also a careful probe Is nec-
293

essary. A retired person may be drawing pension and be doing some work, as for example, a retired engineer may be working as a contractor. In such cases, he/she is a worker and should be entered as such.
Beggars, etc. - B
69. This category will cover beggars, vagrants or cases such as persons without indication of source of income and those with unspecified sources of subsistence who are not engaged in any economically productive work.
69.1 For such persons, 'B' should be written in the space provided.
Inmates of Institutions - I
70. This category will cover convicts in jails or inmates of a penal, mental or charitable insitutions, even if such persons are compelled to do some work such as carpentry, carpet weaving, vegetable growing, etc.} in sLich institutions. But an undertrial prisoner enumerated in a jail should be recorded for the work he/she was doing before he/she was apprehended. Similarly, a person temporarily in a hospital or simi!ar institution should be recorded for the kind of work he/ she VIas doing before he/she was admitted into the hospital or institution. But for a long-term undertrial prisoner or convict in a prison or for long-term inmates of penal or charitable or mental institutions, the persons' previous work should not be recorded, but 'I' should be recorded. A person will be considered as <l 'long-term' inmate if he or she is residing in such an institution for 6 months or more.
Other Non-workers - 0
71. This category will include all non-workers who may not come under any of the above six categories but who are looking for work. They should be noted as '0' in the space provided. A boyar girl who has completed education or has stopped studying and is looking for work will come under
. this category. A person who is merely spending his/her time at home as a dependent and is not doing any work and is not seeking any work will come under 'D' rather than '0'. A person irrespective of age and whether educated or not, if he or she reports that he or she is not engaged in any other activity but is seeking work will come under this category.
71.1 It must be noted that this category includes only those who do not fall into any of the other categories of nonworkers discussed earlier. There may be cases of students who may be seeking work and quite prepared to give up studies if they got a job. Such persons are students (ST) for Question 1 4A. The fact that they are seeking jobs will be reflected in Question 16. Thus, category '0' need not necessarily represent all those Who are seeking work.
Q. 14B : If 'Yes' in 14A, did you work for major
part of last year? Yes (1 }/No (2)
72. As mentioned earlier, through Question t 4A you have classified all people into two broad streams ofworkers and non-workers. Workers would include all those who have worked irrespective of the quentum of their contribution to the economy.
72.1 Having found out that the. person had worked any time at all during the last year (yes in 14A) you have now to ascertain whether the person worked for the major part of last year. By major part of last year is meant that the person had worked for six months or more, or in other words worked for 183 days or more. I f the answer to this question is in the affirn:ativeyou should record 'I' in the box against Question 14B. If the person has worked for less than six months or 183 days during the last year, you should record '2' for that person in the box against Question 14B. Cross (X) may be put in the box for those persons for whom 'No' has been recorded against Question 14A.
Important
72.2 G enerally women and children who have actually worked for major part of the last year are recorded or reported as having worked for less than six months or 183 days. You should, therefore, ask probing questions in this regard to elicit the correct information.
72.3 A person may have worked in different capacities during last year. For example he/she may have worked as a daily wage labourer for four months, as an agricultural labourer for one month and as a cultivator for two months. There could even be breaks in between the different types of work performed by him/her. In computing whether the person worked for major part of the year, you should reckon all the three spells of economic activity and if it satisfies the concept of work of major part of the year, treat him/her as 'Yes' for Question 146 and record 'I' in the box. Similarly if the total period of work falls short of six months or 183 days, treat him/her as 'No' and record '2' in the box for that person.
Q. 15A : Main activity last year? 'Yes' in 148 (C/ AL/HHIIOW) 'No' in 14B {H/ST/O/R/B/I/O}
73. In Question 14B you would have ascertained whether a person had worked for major part of the year or not. Now in Question 15A, you will be required to ascertain his or her mainf activity during last year. That is to say how he or she engaged himself or herself mostly. Main activity of a person who was engaged in more than one activity will be reckoned in terms of time disposition. For example, if a person has worked as a daily wage labourer for four months, as an agricultural labourer for one month and as cultivator for two months and for h1m/her, you have recorded '1' in the box
294
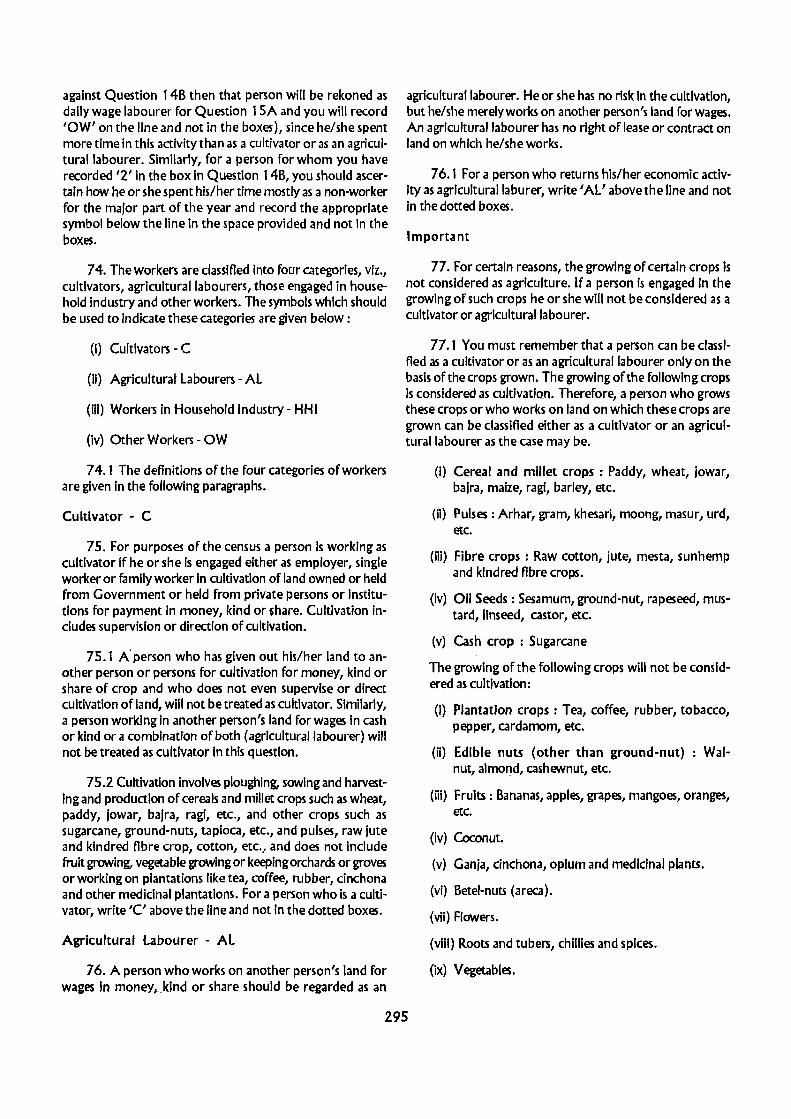
against Question 14B then that person will be rekoned as daily wage labourer for Question 1 SA and you will record 'OW' on the line and not in the boxes), since he/she spent more time in this activity than as a cultivator or as an agriculturallabourer. Similarly, for a person for whom you have recorded '2' in the box In Question 14B, you should ascertain how he or she spent his/her time mostly as a non-worker for the major part of the year and record the appropriate symbol below the line In the space provided and not in the boxes.
74. The workers are classified into four categories, viz., cultivators, agricultural labourers, those engaged in household Industry and other workers. The symbols which should be used to indicate these categories are given below:
(I) Cultivators - C
(iI) Agricultural Labourers -AL
(iii) Workers In Household Industry- HHI
(Iv) Other Workers - OW
74.1 The definitions of the four categories of workers are given in the following paragraphs.
Cultivator - C
75. For purposes of the census a person Is working as cultivator if he or she is engaged either as employer, single worker or family worker In cultivation of land owned or held from Government or held from private persons or Institutions for payment In money, kind or ~hare. Cultivation includes supervision or direction of cultivation.
75.1 A person who has given out his/her land to another person or persons for cultivation for money, kind or share of crop and who does not even supervise or direct cultivation of larid, will not be treated as cultivator. Similarly, a person working in another person's land for wages In cash or kind or a comblnatfon of both (agricultural labourer) will not be treated as cultivator in this question.
75.2 Cultivation involves ploughing, sowing and harvesting and production of cereals and millet crops such as wheat, paddy, lowar, balra, ragi, etc., and other crops such as sugarcane, ground-nuts, tapioca, etc., and pulses, raw jute and kindred fibre crop, cotton, etc., and does not include fruit growing, vegetable growing or keeping orchards or groves or working on plantations like tea, coffee, rubber, cinchona and other medicinal plantations. for a person who is a cultivator, write 'C' above the line and not In the dotted boxes.
Agricultural labourer - AL
76. A person who works on another person's land for wages in money,_klnd or share should be regarded as an
agricultural labourer. He or she has no risk in the cultivation, but he/she merelyworks on another person's land for wages. An agricultural labourer has no right of lease or contract on land on which he/she works.
76.1 For a person who returns his/her economic activity as agrlculturallaburer, write 'AL' above the line and not in the dotted boxes.
Important
77. For certain reasons, the growing of certain crops Is not considered as agriculture. If a person is engaged In the growing of such crops he or she will not be considered as a cultivator or agricultural labourer.
77.1 You must remember that a person can be classified as a cultivator or as an agricultural labourer only on the basis of the crops grown. The growing of the following crops is considered as cultivatlQn. Therefore, a person who grows these crops or who works on land on which these crops are grown can be classified either as a cultivator or an agrlculturallabourer as the case may be.
(I) Cereal and millet crops : Paddy, wheat, jowar, balra, maize, ragi, barley, etc.
(iI) Pulses: Arhar, gram, khesari, moong, masur, urd, etc.
(III) Fibre crops : Raw cotton, Jute, mesta, sunhemp and kindred flbre crops.
(iv) 011 Seeds: Sesamum, ground-nut, rapeseed, mus-tard, linseed, castor, etc.
(v) Cash crop : Sugarcane
The growing of the following crops will not be considered as cultivation:
(I) Plantation crops : Tea, coffee, rubber, tobacco, pepper, cardamom, etc.
(ii) Edible nuts (other than ground-nut) : Walnut, almond, cashewnut, etc.
(iii) Fruits: Bananas, apples, grapes, mangoes, oranges, etc.
(iv) Coconut.
(v) Ganja, cinchona, opium and medicinal plants.
(vi) Betel-nuts (areca).
(vii) Flowers.
(viii) Roots and tubers, chillies and spices.
(ix) Vegetables.
295

(x) Other crops not included under cultivation.
78. Please remember that you must use the abbreviations giv~n in the instructions, namely, 'e or 'ALI. It will be evident that you will have to ask a specific question regarding the crops grown in all cases where-()ne merely says he/she is a cultivator or an agricultural labourer.
Worker in Household Industry - HHI
79. For a person who returns his/her main activity as engaged in some production, processing, servicing or repair articles or goods such as handloom weaving, dyeing, carpentry, bidi rolling, pottery manufacture, bicycle repainng, blacksmlthy, tailoring, etc" it has to be ascertained if it is a household Industry, and If so, it should be indicated by the abbreviation 'HHI' above the line and not in the dotted boxes.
79.1 Household Industry is defined as an Industry conducted by the head of the household himself/herself and or by the members of the household at home or within the village in rural areas and only within the precincts of the house where the household lives in urban areas. The larger proportion of workers in household industry should consist of members of the household including the head. The industry should not be run on the scale of a registered factory which would qualify or has to be registered under the Indian Factories Act.
79.2 There may be an industry which is being run by a large joint family of more than to persons where power is used or more than 20 persons where power is not used. In such cases, though only family members are involved, this will not be treated as 'H H II. Thus, the meaning of the term 'run on the scale of a registered factory' refers to such cases even if these are not registered as such.
79.3 The main criterion of a Household Industry is the participation of one or more members of a household. This criterion will apply in urban areas too. Even if the industry is not actually located at home in rural areas there is greater possibility pf the members of the household participating even if it Is located anywhere within the village limits. In the urban areas where organised industry takes greater prominence, the Household Industry should be confined to the precincts of the house where the participants live. In urban areas even if the members of the household by themselves run an ind ustry but at a place away from the precincts of their home, it will not be considered as a Household Industry. It should be located within the precincts of the house where the members live in the case of urban areas.
79.4 Household Industry should relate to production, processing, servicing, repairing or making and selling (but not merely selling) of goods. It does not include professions such as a Pleader, Doctor, Barber, Musician, Dancer, Waterman, Dhobi, Astrologer, etc., or merely trade or business, even if such professions, trade or services are run at
home by members of the household. A list of a few typical Household Industries Is appended to these instructions as Appendix VI.
79.5 Sometimes it is likely that the person who may not be working in his/her own Household Industry may be working in another Household Industry. You should, therefore, enquire whether the person who is not working In his/her own Household Industry Is working In any other Household Industry and record as per instructions given above.
79.6 As mentioned earlier I Household Industry should relate to production, processing, servlcing, repairing or makIng and seiling of goods. However, a household can be engaged in certain other activities collectively but these may not qualify for being considered as HOU$ehold Industries.
79.7 Certain activities even though conducted by members of the same household will not constitute a Household Industry. These are indicated below and therefore the members of the family working in such Industries will be classified as 'OWl and not 'HHI'.
(I) Plantation work.
(ii) livestock maintenance and production such as cattle, goats, sheep breeding, poultry farms, bee-keeping, rearing of silk worm and production of cocoons and raw silk, production of milk, eggs, honey, wax, bones, etc.
(iii) Hunting, trapping and selling of the catch.
(Iv) Forestry and logging: log, fuel, charcoal production, ~therlng and seiling of fodder and other forest produce, etc.
(v) Fishing including rearing of fish, collection of pearls, shells, sea products, etc.
(vi) Mining and quarring.
79.8 In our country Household Industry is a very important part of our economy. We must get accurate data regarding those engaged in 'HHI'. You must carefully read these instructions and understand them. The main points are again Indicated below.
'HHI' stands for worker in Household Industry. The main characteristics of the Household Industry are the following:
(a) One or more members of the household must participate. Participation by hired labour must be minimum.
(b) The activity should relate to some production, processing I servidng, repairing or making and seiling of goods.
296
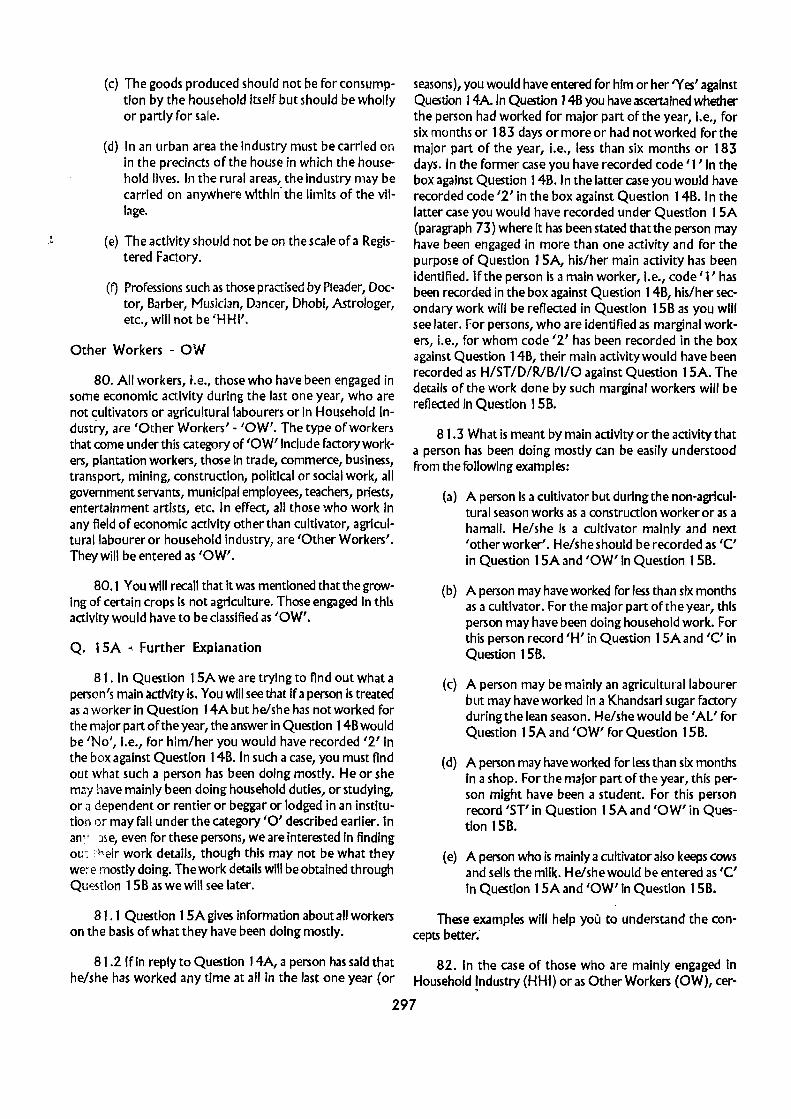
(c) The goods produced should not be for consumption by the household itself but should be wholly or partly for sale.
(d) In an urban area the Industry must be carried on in the precincts of the house in which the household lives. In the rural areas, the industry may be carried on anywhere within" the limits of the village.
(e) The activity should not be on the scale of a Registered Factory.
(0 Professions such as those practised by Pleader, Doctor, Barber, Musician, Dancer, Dhobi, Astrologer, etc., will not be iHHI'.
Other Workers - OW
80. All workers, t.e., those who have been engaged in some economic activity during the last one year, who are not cultivators or agricultural labourers or in Household Industrr, are 'Other Workers' - 'OW', The type of workers that come under this category of 'OW' include factory workers, plantation workers, those In trade, commerce, business, transport, mining, construction, political or social work, all government servants, municipal employees, teachers, priests, entertainment artists, etc. In effect, all those who work in any field of economic activity other than cultivator, agriculturallabourer or household industry, are IOther Workers'. Theywill be entered as 'OW'.
80.1 You will recall that it was mentioned that the growIng of certain crops is not agriculture. Those engaged in this activity would have to be classified as 'OW'.
Q. 15A .. Further Explanation
81. In Question 15A we are trying to find out what a person's main aaivity is. You will see that if a person is treated as a worker in Question 14A but he/she has not worked for the major part of the year, the answer in Question 14B would be 'No', i.e., for him/her you would have recorded '2' in the box against Question 14B. In such a case, you must find out what such a person has been doing mostly. He or she may have mainly been doing household duties, or studying, or J dependent or rentier or beggar or lodged in an institution or may fall under the category '0' described earlier. In anv ),e, even forthese persons, we are interested In finding ou: heir work details, though this may not be what they we~e mostly doing. The work details will be obtained through Question 15B as we will see later.
81.1 Question 15A gives Information about all workers on the basis of what they have been doing mostly.
8 t .2 Ifin reply to Question 14A, a person has said that he/she has worked any time at all In the last one year (or
seasons), you would have entered for him or her ~ es' against Question 14A. In Question 14B you have ascertained whether the person had worked for major part of the year, i.e., for six months or 183 days or more or had not worked for the major part of the year, i.e., less than six months or 183 days. In the former case you have recorded code' t' in the box against Question 1 4B. In the latter case you would have recorded code '2' in the box against Question 14B. In the latter case you would have recorded under Question 15A (paragraph 73) where It has been stated that the person may have been engaged in more than one activity and for the purpose of Question 1 SA, his/her main activity has been identified. If the person is a main worker, i.e., code '1' has been recorded in the box against Question 1 4B, his/her secondary work will be reflected in Question 15B as you will see later. For persons, who are identified as marginal workers, i.e., for whom code '2' has been recorded in the box against Question 14B, their main activity would have been recorded as H/ST /DIRIB/i/O against Question 15A. The details of the work done by such marginal workers will be reflected in Question 15B.
81.3 What is meant by main activity or the activity that a person has been doing mostly can be easily understood from the following examples:
(a) A person is a cultivator but during the non-agricultural season works as a construction worker or as a hamali. He/she is a cultivator mainly and next 'other worker'. He/she should be recorded as Ie' in Question 15A and 'OW' in Question 15B.
(b) A person may have worked for less than six months as a cultivator. For the major part of the year, this person may have been doing household work. For this person record 'H' in Question t 5Aand 'C'ln Question 1 5B.
(c) A person may be mainly an agricultural labourer but may have worked in a Khandsari sugar factory during the lean season. He/shewould be 'Al' for Question 15A and 'OW' for Question 15B.
(d) A person may have worked for less than six months In a shop. For the major part of the year, this person might have been a student. For this person record 'ST' in Question 15Aand 'OW' in Question 158.
(e) A person who is mainly a cultivator also keeps cows and sells the milk. He/she would be entered as Ie' in Question 15A and 'OW' in Question 1 5B.
These examples will help you to understand the concepts better;
82. In the case of those who are mainly engaged in Household !ndustry (HHI) or as Other Workers (OW), cer-
297

tain details should be collected regarding name of establishment, nature of industry, trade, profession or service, description of work, and class of worker. These details will have to be filled in Question 1 SA(i) to lSA(iv).
82.1 As you will see from the question itself, these parts are applicable to persons for whom you have recorded 'HHI' or 'OW' against Question 1 SA. If the economic activity has been shown as 'C' or 'AL' against Question 1 SA, there is no need to fill in the sub-sections (i) to (iv) of this question. Similarly, if an individual has replied 'No' against Question 14B, i.e., code '2' has been recorded in the box against Question 14B, and H/ST /D/RISII/O as the case may be, has been recorded in question 15A, sub-section (I) to (iv) will not apply. In such cases a cross (X) may be put on each of the lines against these sub-sections.
Q. 15A(i) : Name of Establishment
83. Record here the name of the factory, firm, workshop, business house, company, shop, office, etc. In respect of public offices you should clearly indicate whether they are Central or State Government or local body offices, etc. If the establishment does not have any definite name such as, in the case of a Household Industry, like hand pounding of rice, gur making, handloom weaving, potter's house, blacksmithy, etc., enter the proprietor's name and the type of shop so that if necessary a link can be established between the various sub-sections of this question. For example, instead oflNo particular name' the entry could read as IBabulal's Paint Shop'. For defence and other similar personnel as may be indicated to you, put a cross (X) on the line.
Q. 15A(Ii) : Nature of Industry, Trade or Service
84. The answer to this question wi!1 have to be given in detail to enable proper classification of the sector of economy in which the person is working. The sector of economy in which a person works may relate to (I) Plantation, Forestry, Fishing, Livestock, etc., (ii) Mining and/or Quarrying, (iii) Manufacturing, Processing, Servicing and Repairing, (iv) Construction, (v) Electricity, Gas or Water Supply, (vi) Transport and Communications, (vii) Trade and Commerce, (viii) Professions and Services. In order to enable us to classify a person properly, full details of the nature of the industry, trade, profession or service should be given. Please avoid vague answers. Full details of the type of industry, trade, profession or service in which the person is engaged will have to be recorded here. It is not enough to say 'plantation' or Ilivestock'. You should say whether it is tea plantation or banana plantation or sheep rearing or cattle breeding. Similarly, it is not enough to say Imanufacturing' or 'textile manufacturing'. You should say whether it is manufacturing of cotton textile in handloom or manufacturing khadi textile or manufacturing silk textile. Likewise mere 'trade' is not enough. It should be recorded as wholesale trading in food grains or pulses or retail trading in spices or grocery and so on. For defence and similar personnel, write IService'.
84.1 To help you to appreciate the details that may have to be furnished to classify the economic activity appropriately, illustrative description of various economic activities are furnished in Appendix YII, categorised under certain broad classification. It should, however, be noted that the list In Appendix YII is by no means exhaustive. You must describe the nature of industry, profession, trade or service or whatever it is, in as detailed a manner as possible. In the case of industries, the articles which are produced or serviced or processed should be given. In the case of service, please describe fuliy the nature of the service to which the person belongs, except in the case of defence or similar other personnel.
Q.15A(iii) : Description of Work
85. Under this question, the description of the actual work, i.e., the occupation that the person enumerated is doing is to be recorded irrespective of the type of industry trade, profession or service that he/she may be working in and which is to be recorded under sub-seaion (Ii) of Question 15A.
85.1 His/her actual work of occupation should always be given in sufficient detail. If, for example, a person is merely recorded as 'clerk'with no other details, itwill be impossible to properly catergorise him/her by the type of work he/she does. He/she may be a clerk attending to correspondence or book-keeping or accounting. Similarly, if a person were merely to be recorded as a technician, it will not help to determine what type of technician/mechanic he/she is, whether computer technician or a motor-mechanic or a locomotive-mechanic, etc. I f a person is recorded as doing leather work, it will not be sufficient. It should be clearly stated whether he is a tanner, pelt dresser, fellmonger, etc. Similarly, if a person says he/she is a sweeper you should find out whether he/she is a sweeper, dry; or a sweeper, wet; or a sweeper, sewer. The description of the actual work done by a person should be ascertained in adequate detail and recorded against this question. Similarly, in a trading establishment there could be a proprietor, cashier, book-keeper, salesman, etc.
85.2 It is necessary to describe the actual occupation adequately. It is not enough to say that one is a Government official. Whether one is a Bill-clerk or Section Officer, T ehsildar, Police Chowkidar or Research Officer, etc, has to be spelt out. There may be Assistant Directors, Deputy Directors, etc., doing different functions. It is necessary to describe the occupation adequately in their case for proper classification, e.g., Assistant Director (Agriculture), Assistant Director (Soil Conservation), Senior Research Officer (Vital Statistics), Deputy Director (Health), Sub-Inspector (Excise), Treasury Officer, Village Officer (Revenue), Panchayat Secretary, Malaria Control Officer, Traffic Inspector (Transport Department), etc.
85.3 To guide you in answering Question 15A (iii), the type of particulars that need to be ascertained in respect of a few typical occupations are given in Appendix VIII.
298

85.4 Appendix VIII is by no means exchaustive. This Just helps In bringing home the need to ascertain the full details of the particulars of work performed by an individual for being recorded against Question 15A (iii).
85.5 It has been found in the past that a very large number of persons are recorded merely as 'general labourers'. It is necessary to make a probe and find out in which type I9f work the person is mostly engaged as a labourer, such as a road mazdoor, a loader or an unloader in a market, a construction laboure, etc.
85.6 For those in defence and similar service, it is enough if it Is merely noted as 'Service'. Other details need not be given. For other Goverfnment servants full details must be given and the description of the work should be as detailed as possible.
Important
86. There need be no confusion as to the scope of Questions 15A (ii) and 15A (iii). Question 15A (ii) would represent the nature of industry, trade, profession or service, i.e., the sector of economy in which a person is engaged in work and Question 15A(iii) represents the occupation or the actual work the person performs in the industry, trade, profession or service in which he/she is engaged. Thus, for example, if the answer to Question 15A(ii) is 'cotton textile manufacture in mill', the answer to Question lSA(iii) could be 'chemical engineer' or ';bill clerk' or 'accountant' or 'labourer' or 'truck driver' or the 'managing director' of that industry and so on. Similarly, in Question 15A(ii) the nature of service may be some department of State Government Service and in Question 15A(iii) the description of work may be 'bill clerk' or 'accountant', 'director of the department', 'jeep driver' in the department, etc. Again, against Question 15A(iii) the answer may be 'private medical practice' and in Question 1 SA(iii) 'orthopaedic surgeon', or 'nurse' or a 'sweeper', etc., working in that private medical practitioner's nurSing home. The sample answers furnished in Appendix IX at the end of this booklet, the Industrial and Occupational Classifications in Appendices VII and VIII and the instructions given by your Supedrvisor and other Census Officers will help you to clear any doubts you may have regarding the scope of the questions relating to nature of industry, trade, profession or service covered by Question 1 SA(ii) and the description of actual work of the individual enumerated coverd by Question 15A(iii).
Q.15A(iv) : Class of Worker
87. For a person who is :
(i) an Employer, that is, who hires one or more persons in his/her work descrlnbed in Question 15A(iii), write ............ ER.
(Ii) an Employee, that is, who does his/her work deScribed in question 15A(iii) under others for wages or salary in cash or kind, write .................... EE
(iii) a Single Worker, that Is, who is doing his/her work described in Question 15A(lIi) without employing others except casually, and without the help of other member of the family except casually and a participant in work as member of cooperative, write ................... SW
(iv) a Family Worker, that is, who is doing his/her work described In Question 15A(Iii) in a family enterprise along with other membm of the family without wages or salary incash or kind, write .................... FW
Explanation
87.1 An Employer is a person who has to employ other persons in order to get the work mentioned in his/her case in Question 1 5A(iii) performed. That is to say, such a person is not only responsible for his/her own personal work but also for giving work to others for carrying out the activity mentioned in Question 15A(ii), Please note that a person who employs domestic servants for household duties is not an employer. So also, a person who has subordinates under him/her in an offlcewhere he/she himself/herself is employed by others, is not an employer, even if he/she has the power to appoint another person in his/her office on behalf of his/ her own employer. A head of department or a local manager of company may have the pwer to apoint people, but they are themeselves employees of someone else, in this case, government orthe main offkeofthecompany, and cannot, therefore, be an employer. A government servant irrespective of the post he/she holds is an 'Employee'.
87.2 An Employee is a person who usually works under some other person for salary or wages in cash or kind. There may be persons who are employed as managers, superintendents, agents, etc., and in that capacity employ or control other workers on behalf of their own employers. Such persons are only employees, as explained above, and should not be regarded as employers. Please note that a cook or domestic servant engaged by someone is an employee. The fact that his mast6er may himself/herself be an employee is irrelevant.
87.3 A Single Worker is a person who works by himself/herself. He/she is not employed by anyone else and in his/her turn does not employ anybody else. This definition of Single Worker will include a person who works in joint partnership with one or several persons hiring no employees, and also a member of a producer's cooperative. Ecach one of the partners or membm of such producer's cooperative should be recorded as 'Single Worker'. Political workers and social workers are to l..: treated as 'SW'.
87.4 A Family Worker is 1 member who works without receiving wages in cash or kind, in an industry, bUSiness, trade or service. For example, the working members in a family of dhobies where they all particiapte and each does not receive wages separately, will be family workers. There
299

may be family workers in industry, trade or professions as well. Family workers must be related by ties of blood or marriage but such workers can belong to different households. Thus, what is important is that such workers must necessarily be related even though they may be living in different households. The family workers mayor may not be entitled to a share of the profits in the work or the business carred on either by the person or head of the household or other relaive.
87.5 Please note the following important cases:
(a) In the case of persons engaged in Household Industry,Le., In the case of persons for whom the answer to Question 1 SA is 'HHI', therewill be three classes of workers generally, viz., Family Worker, Single Worker and Employee. There may not be a fonnal 'Employer'. Household Industry by its very definition is conducted by the head of the household himself/herself and/or other memebers of the household, the role of hired workers being secondary. If the head along with the members of the houselhold is working in a Household I ndustry employing hired worker, the head and other members who are working should be treated as 'Family Workers'. If the head alone is working with the occasional assistance of hired worker(s) whose role should be secondary as indicated above he/she should be treated as a 'Single Worker', although one might argue that in effect he/she becomes an employer. The hired workers are of course employees.
(b) Members of the household who help solely in household duties, i.e., economically non-productive work, should not be treated as Family Workers. In fact, they are not workers.
(c) Members of a producer's cooperative society who have no other occupation or work except this, should be categorised as Single Worker-SW.
(d) In the case of partnership in which all the partners are related, treat them as Family Worker-FW. The partnership firm mayor may not employ other, but this will not change the category of the partners. They would be 'FW'.
(e) In the case of a partnership firm in which some of the partners are not releated treat all the partners, including those that may be related, as Single Worker-SW. The firm mayor may not employ others,but this will not change the category of the partners. They will all be 'SW'.
(f) Political workers and social workers should be treated as ISW'.
(g) Doctors and lawyers who do not employ any person
should be treated as 'SW'. One may come across doctors and lawyers employing certain persons on regular basis in the doctor's dispensary or clinic or in the lawyer's office or chamber. In this case the doctor or lawyer would become an 'Employer' so 'ER'should be recorded. However, sometimes lawyers have been found to take the help of dearks who remain atached to them on a regular basis but without being formally employed on wages. The clerk usually earns his remuneration independently from the lawyer's clients. In such a case, both the lawyer and the clerk should be treated as Single WorkersSW.
88. Some illustrations for filling the Question 15Aare given in Appendix IX.
Q. 15B. 'Yes' in 14B-Any other work any time last ~ar?Yes (C/AlIHHI/OW) No ______ _ 'No' in 14B- Work done any time last year? (CI ALlHHI/OW)
89. You will recall that in Question J 4A you have identified all those who have done any work at all in the last one year. In Question 14B, you must have categorised them either F'( es', i.e., code' l' or 'No, i.e., code '2'. In question 15A you have divided these persons on the basis of what they have been mostly doing. It is quite possible that those who have been categorise as 'c' or 'AL' or 'HHI' or 'OW' in question 1 SA, based on the type of work they have been doing mostly, may have done some other work in addition to what they have been doing mostly. Similarly, a person who has spent major part of the year doing household duties or as a student or as a dependent or as a rentier or as a bagger or in the categories of'I' and '0' must have done some work at some time during the last one year. This is the information we are trying to get through Question 15B.
89.1 Please note the way in which Question 158 has been worded. This question deals with two separate situations. The first relates to those persons who have worked for the major part of last year and mayor may not have some other secondary work. The second part relates to persons who have worked at any time in the last year but not for the major part of the year. In case of those who hzveworked In the malor part last year, you would have entered code 'I' in Question 14B and you would have categorised them as Ie' or 'AL' or 'HHI' or 'OW' In Question 15A. Such persons mayor may not have had secondary work In addition to their main work. If, on inquiry, you find that such a person has had any other work any time last year, you would have to enter above the line, 'C' or I AL' or 'HHI' or 'OW', depending upon the type of work and score out the answer INo' printed on the line.
89.2 This question should be asked of every person who has returned 'Yes' against Question 14A. It Is re-emphasised that all those who have answered F'( es' against Ques-
300

tlon 14A and for whom you have recorded I'(es' or 'No', I.e., code 'I' or 12' In Question 148, this Question t 58, should be asked without fall.
89.3 For a person who has worked any time last year, but ha~ not worked for the major part of the last year, you would Have recorded code 12' In Question 148 and In Question 15A you would have categorised such a person as 'H' or 1ST' or 10' or IR' or 18' or 'I' or 10'. Such a person must have done some work any time last year and thIs Is the work which we are trying to catch In Question t 58 so far as such a person is concerned. For such a person after Inquiry, you will have to enter the appropriate category, viz., IC' or' Al' or 'HHI' or 'OW' below the line In Question 158.
89.4 In answer to this question ifthe main worker says 'Yes' then you should find out the type of work and categorise him or her as 'c' or 'Al' or 'HHI' or lOW' as the case may be. These abbreviatgions refer to Cultivators, Agricultural labourers, Household Industry and Other Workers and have been fully explained earlier in the instructions under Question 1 5A in paragraphs 75 to 80. You may refer to these again before recording the appropriate category above the line. It is sufficient If you write the category above the line. If the respondent gives reply in the negatlvelHhourif be indicated by the word 'No' above the line. Please do not make any entry in the dotted box.
89.5 This question is meant to elicit information on the secondary or marginal work which a person might have done any time at all during the last one Year, apart from the main work or other activity which will have corne out in Question 15A It Is obvious that, irrespective ofwhether-the answer is 'Yes' or 'No/,i.e., code II' or '2' in Question 148, there could be an answer in Question 1 58 because a main worker may have done some other work or a marginal worker who has not worked for the major part of the last year, might have done some work occasionally. This therefore, sould give us details of secondarywork or margianl work.
89.6 Ask of each person if, besides what he/she had already returned as his/her main activity against Question 15A, he/she participated in any other work or did any work any
product Is sold. A boy or a girl who Is categorised as a student under Question 15A, can have a marginal work, say, cultivation, If he! she helped the head of the household In the family cultivation during some parts of the season. But If a student, who is shown as 'ST' under Question 1 SA also helped In weaving cloth purely for domestic consumption on a loom at home, or helped In attendlngto hou~"hold chores, he/she will not be treated as having any marginal work.
S 9.7 Any other work or secondary, work will be reckoned only if the person Is engaged In some economically productive work, in addition to whatever is his/her activity under Question 1SA.lf a person whose economic activity Is shown as a clerk In a government office or a teacher, also atends to some cultivation even by way of direction or supervision or undertakes some tuition, this will be shown as 'any other work any time last year' under Question 158. A person's main activity may be cultivation and his secondary work may be money lending. Again, main activity may be agricultural labourer and secondary work could be sugar factory labourer or vice va'}a.
89.8 After it Is established that the person is doing some work and he or she has been recorded accordingly In Questgion 158 in any of the categories ofC, AL, HHI, OW, you have to proceed further and fill up the details of the subsections of Question 1 58(1) to (Iv) in respeet of entries 'HHI' or 'OW' only. The instructions for filling up the details in these sub-sections will be the same as given under Question 15A and are explained In detail In paragraphs 83 to 87. Please refer to Appendix IX for some illustrations for fillIng the Question 158. For those who are recorded as 'c' or 'AL' or for whom you have entered 'No'in Question 158, you have to put a cross 'X' against these sub-sections on the line.
90. Some illustrations for recording answers against Questions 15A and 158 are given in Appendix X. You are advised to study these instructions and illustrations before starting actual enumeration and also consult these and the instructions whenever you are in doubt during field operations about what to record as the answers.
time last year. A numnber of unpaid family workers participat- Important ing in household enterprises whose main activity has b'een recorded as 'H'or 'ST' or 'R' under Question 15A will be netted 91. It must particularly be noted that if there is an entry here for their involvement in such economic activity. Except in 'No',I.e., code '2' in Question 148 and H/ST 10/RlB/1/0 as the CUltivation, mere rendering of service for one's own home or case may be, in Question 15A, there mu~e an entry in Quesproduction of goods for purely domestic consumption are tlon t 58 and this cannot be blank or cross (X). This is because not to be treated as economic activity. For example, a serv- the work of a person who has worked any time at all last year, ant who works as a cook In his or her employer's home for and has been entered as 'Yes' in Question 14A, must be re-wages will be considered economically active but, a person fleeted somelNhere. Since the person has not worked in major even ifhe/she may work much more than a paid servant in part of the year as reHected by/2'ln Question 148and also HI having to cook for the family or looking after the household ST IO/RlB/I/O as the case may be, in Question 1 SA, the work will not be treated as economically active for the purposes of done by him/her and netted In Question 14A, must therefore, this classification. Siumilarly, persons who may produce cloth be reflected In Question 158. Again, for a person who has on a loom at home for domestic consumption will not be worked In major part of the year and for whom code 'I' has treated as economically active unless at least a part of the been recorded in Question 14&3, you may have recorded as
301

'C' or' AL' or 'HHI' or 'OW' for his main activity in Question I SA. It is quite possible that he/she may have done some other work, though not on the scale of main activity. This secondary work should also be reflected in Question 15B. You will thus appreciate that probing questions are essential and you must ask questions again and again to find out the secondary work of main workers and margianl work in the case of those for whom code '2' had been recorded in the box against Question 1 4B and record the same in Question t 5B.
91.1 It would follow that if the answer to Question 14A is 'No', i.e., you have recorded H/ST/D/RiB/I/O, as the case may be, there will be a cross (X) in the box for Question 14B and on the lines against each of the Questions 1 SA including sub-sections and 15B including sub-sections.
Q. 16A : If 'No' in 14A, seeking/availalble for work? Yes (t )/No (2)
92. This question is intended to elicit some information on the number of unemployed. If an individual has replied that helshe has not worked at all last year under Question 14A and you have recorded 'No' against this question you have to ask from him or her whether he or she is seeking work or available for work. This question should be asked of all persons for whom you have recorded H/ST /D/RiB/I/O in Question 14A. Seeking work means that the person may have got himseif/herself registered in the employment exchange or he/she may be applying for jobs or he/she may have made other efforts for a job, such as looking into the nlWspaper advertisements with a view to applying for a job, the intention being in suitable cases, this person will offer himself/herself as a candidate. It may be remembered that seeking work is more applicable in urban areas where there are facilities of employment exchanges and greater awareness about availability of jobs. In rural areas, there may be no facilities of employment exchanges. The person may be available for work but not actually seeking work either because of lack of knowledge of work being available or absence of employment exchanges.
92.1 As mentioned earlier, we are mainly interested in obtaining information on the unemployed. You may come across people who already held jobs or do not normally want to take up employment but may give you such general answers that they would not mind taking up work if the salary is attractive enough. We are not interested in such persons since they obviously are already employed or are not really job seekers. You will have to make a probe to get the facts. However, generally speaking, If in answer to this question, a person says that he is seeking or is available for work, you must enter code '1 ' In the box.
92.2 If the person replies that helshe is seeking or available for work, you have to record '1' in the box provided. In case his/her reply Is 'No' you have to record '2' in the box. Cross (X) may be put in the box in case the Question is not
applicable.
Q. 16B : If 'Yes' In 16A, have you ever worked before? Yes( 1 )/No(2)
93. This question will be asked of those persons who have replied 'Yes' In Question 16A. If the person replies that he/she had worked anytime before, you have to record 'I' in the bQX..Proyided. In case his/her reply is 'No' i.e., hel she had never worked any time, you have to record '2' In the box. Cross (X) may be put in the box in case the Question is not applicable.
Summary
94. It would be useful to summarise the main points with regard to the economic questions, i.e., Question 14A, 14B, 15A, 15B, 16Aand 16B. These are indic.1ted below:
(0 In question 14A we are finding out if a person has worked any time at all last year. The word 'year' Includes all the seasons for agricultural and associated activities. Even marginal workers and unpaid workers In farm or in family enterprise must be covered by this question.
(Ii) If the answer to Question 14A is 'No', then categorise as HIST ID/R/BII/O.
(iii) The work on the basis of which 'Yes' is recorded In Question 14A may be the main work of a person, i.e., what he/she had done for the major part of the last year. Ifso, 'Yes', i.e., code '1' in Question 14B and CI AL/HHI/OW,ln Question 15Awould have been recorded. If this person had not done this work for the malor part of the year 'No', i.e., code '2' in Question 14BandHiST/D/RiBlIIO,inQuestion 15A'AOOldhave been recorded. These details are recorded In Question lSA
(Iv) Secondary work or the marginal work of those recorded as CI AL/HHIIOW or as H/ST /DIRlB/I/O respea:ively In Question 15A is obtained through Question 15B.
(v) Note that if a person has been entered as 'Yes' In Question 14A, 'No', I.e., code '2' in Question 14B, there must be an entry such as CI AL/HHI/OW, in Question 15B.
(vI) Question 16A Is to be asked of all those for whom 'No' has been written In Question 1 4A.
(viI) Question 16B Is to be asked of those for whom 'Yes' has been written In Question 16A
(vlii)Detalls of name of establishment, industry, occupation and class of worker, in Questions 15Aand 15B need be entered only for 'HHI' and 'OW'.
302

Important
95. You must read the explanations and instructions on the economic questions very carefully, Questions 14A, 14B, 15A and 1 5B should be canvassed together, otherwise, the full and correct answers will not be available and you may have to make corrections. It is advisable to ask questions covering Questions 14A, 14B, 15A and 1 5B together and then fill up the details.
96. Certain situations would call for some explanation so that the enumerator is clear in his/her mind regarding classifying such activities. A few typical cases are indicated below:
(a) If a sweet-meat maker, i.e., a Halwai makes sweets and sells them also, this would be manufacturing and can be a 'H HI' too in appropriate cases.
(b) If a person only sells sweets, having brought them from some other place, he would be carrying on a trade and this would not be a manufacturing industry.
(c) In many cases there are what are called tea shops, dhabas, chat shops, etc., where eatables are prepared and sold. For example, in dhaba, substantial meals such as chapaties, dal, etc., are prepared and sold. This will not be an industry. It will be classified as service, namely, running eating place. Therefore, even if a household carried on this activity it will not be classified as 'HHI', but only as 'OW'.
(d) In many places, there are persons who keep small electrical or hand mixers or fruit crushers and crush fruits to sell the juice. In such cases since the juice is produced for consumption on the spot and is not bottled as ,uch for sale, such unit are carrying on trade and not manufacturing. Therefore, even if a household carries on this business this would not be 'HHI', but 'OW'. On the other hand, if there are manufacturing units, whether big or small, which bottle juice and sell it as bottled, this would be manufacturing and should be classified as industry.
(e) Tailoring is an industry and a member of household that carries on tailoring on househol,d industry basis can beclassitled as 'HHI'.
(f) There may be cases of a person who sells cloth and also provides tailoring services. In such cases, the person may be asked which activity he considers more Important, i.e., the one on which he spends more time. If he says that he considers selling of cloth Is more important than he is carrying on a trade. On the other hand, if the tailoring business is more important to him th" J1 the sale of cloth, such a person should then he considered as manufacturing. If a household carries on a business of this kind, the household members will be considered as 'HHI'
or non-HHI depending on whether the household Is Involved mainly In trade or manufacturing and taking into consideration the definition of 'HHI'.
Q. 17 A : Whether you are an Ex-Serviceman? Yes{ 1 )/No(2)
97. The answer to this question will have to be filled In respect of every person whether male or female. If the person says that he/she Is an ex-serviceman, the answer to this question will be 'Yes' and code '1' Is to be recorded In the box. On the contrary, if the answer to this question is 'No', code '2' is to be recorded in the box.
97.1 An' ex-servicernan' means a person who has served in the regular Army, Navy, Air Force or Territorial Army (but not dismissed or discharged on account of misconduct or inefficiency). It excludes the Assam Rifles, Defence Security Corps, General Reserve Engineering Force (GREF), Lok Sahayak Sena (LSS) and other para-military Forces like the Border Security Force (BSF), Central Industrial Security Force (CISF), Indo-Tibetan Border Police (ITBP) and the Central Reserve Police Force (CRPF).
Q. 17B: If IYes' in 17A, Pensioner (l)/Nonpensioner (2)
98. This question will be asked for ex-servicemen only i.e., those who have replied Iyes' in Question 1 7 A and for whom code '1 ' has been recorded in the box. If he/she Is receiving pension, code '1' is to be recorded in the box and if he/she is not receiving any pension, code '2' is to be recorded in the box. Cross (X) may be put In the box in case the Question is not applicable.
98.1 It may be noted that code '1' is to be recorded only in case of those who are receiving pension as ex-servicemen. A person who after serving regular Army, Navy, Air Force or Territorial Army has retired from a civil or private service and drawing pension only from his/her later employment will not be treated as 'Pensioner' for this Question. However, if a person is drawing pension both as ex-serviceman and civilian, he/she will be treated as Pensioner and code '1' will be recorded in the box.
98.2 Somequidelines for determining whether a person is an ex-serviceman are given in Appendix XII. This will help you in this regard. It will be seen from these quidelines that a person will be treated as an ex-serviceman ifhe/she has retired from service in regular Army, Navy, Air Force, etc., and is in receipt of pension or had received gratuity only and not pension at the time of his/her retirement. In case he/she is not in receipt of pension or had not received any gratuIty at the time of retirement, he/she will be treated as an exserviceman if he/she retired before 1st July, 1987 after rendering more than five years of service in Army, Navy Air Force, etc.
303
Important
98.3 After filling in the answers to Questions 1 7 A and 1 7B of the Individual Slip, you would know whether the person Is an ex-serviceman or not and if ex-servlceman, whether the person is drawing a pension or not.
98.4 You are now required to make certain entries in the Household Schedule for the purposes of tabulation. If code '1' has been recorded in Question 17 A of the Individual Slip, you have to put a tick mark (.t) in col. 1 of the Household Schedule against the serial number of the person being enumerated. Furtheryou havetowrite'P'withln brackets after the name of the person in col. 2 of the Household Schedule if the ex-serviceman is drawing a pension, i.e., code '1' has been recorded in Question 17B and 'NP' in case the ex-serviceman is not a pensioner, i.e., code '2' has been recorded in Question 17B of the Individual Slip.
98.S No entries are required to be made in the Household Schedule in case the person Is not an ex-serviceman, i.e., code '2' has been recorded in Question 1 7 A of the Individual Slip.
MIGRATION
Q. t 8 : Birth Place
99. Certain details regarding the place In which the person enumerated was bom are to be collected and entered in the sub"Parts of this question. For defence and similar personnel as may be indicated to you, this question and Its subparts are not applicable. The explanation and instructions as to how the four sub-parts are to be filled are as follows:
Q. 18(.1) : Place of Birth
100. Write 'PL' for person bomln village or town where he/she is being enumerated. Where 'PL' is noted against this question, cross (X) is to be put in the box against sub-part (b) and Oil the lines against sub-parts (c) and (d).
_ 100.1 For those born outside the village or town of enumeration write the actual name of the place against subpart (a) and till the other details against sub-parts (b), (c) and (d). For a person born on the high sea, put corss (X) on
(the lines against sub-parts (3) and (c) and in the box against sub-part (b) and record 'born at sea' against sub-part (d).
100.2 In Indicating the birth place, only full name of town or village would have to be Indicated and not hamlet or mohalla/ward names. The name of a ward/hamtet should not be entered but the name of the town/village to which it belongs should be entered.
Q. 18(b) : Rural (I)/Urban (2)
1 01. For those born outside the village or town of enumeration ascertain if the place of birth Is a village or town at present. To '.:nable a person to determine whether the place Is a town or a village, he/she rr.ay be required to indicate the
status of the place of birth In comparison with a know town In the neighbourhood of the place of enumeration. You may mention some Important urban characteristics to enable the person to make out If the place of his/her birth Is rural or urban, e.g., existence of a local administrative body, industrial townships declared as towns, etc.
For a person born in a village, write '1' in the box.
For a person born in a town/city, write '2' in the box.
For a person born In a foreign country, put 'X' In the box against this sub-part and also against sub-part (c) on the line.
101.1 If all efforts to classify the place of birth as rural/ urban fall, write 'not known' on the line.
Q. 18(c) : District
102. For a person who was born outside the village or t(MIn of enumeration, i.e., for whom 'PL' is not written against sub-part (a), you have to fill in this sub-part after enquiry.
102.1 For a person born outside the village or town of enumeration but within the district of enumeration, write 'D' on the line.
102.2 For a person born In another district of the State of enumeration, or in a district In some other State/Union Territory In the country, write the name of the district. Ifthe person cannot name the district, write 'not known'.
102.3 For a person born outside India, put cross (X) against this sub-part.
Q. 18(d) : State/Country
103. For persons born within the State of enumeration, write 'X' against this sub-part on the line. Make sure that the earlier entries made in sub-parts (a), (b) and (c) are consistent with such an answerj for example, 'Pl' might have already bt.'en written against sub-part (a) or 'D', Is written against sub-part (c) or any other district of the State of enumeration is mentioned against sub-part (c).
, t 03.1 For persons born outside the State of enumera
tion but within the country, write the name of the State/ Union Territory where born.
103.2 For those born outside India, note merely the name of the country and there is no need to enter the name of the constituent state of the foreign country. Where a person cannot name the country, the name of the continent imy be noted.
103.3 For a person born on the high seas, record 'born at sea', against this sub-part and put 'X' against sub-parts (a), (b) and (c).
103.4 If a person was born in a train, boat or bus or aircraft, etc., within the country write the particulars in subpart (a), (b) and (c) with reference to the administrative
304

territory where the event occured or was registered.
Q. 19 : last Residence
104. The answer to this question will have to be filled in respect of every person if he/she had another place of normal residence irrespective of his/her place of birth, before he/ she came to the present place where he/she is enumerated. Even if a person was born at the place of enumeration but because of his/her work or for studies, etc., he/she had shifted subsequently to another village or town and had come back again to the place of enumeration, he/she should be deemed to have had another place of residence prior to his/her enumeration here. For defence and similar personnel, this q uestion is not applicable.
104.1 The immediate previous village or town of residence is relevant only if he/she had been outside the village or town of enumeration and not simply in another house or locality in the same place. For example, if a person born in one part of Bombay City Is found residing in another part of Bombay at the time of enumeration, the change of residence should not be treated as change of place of residence because both the areas are within the same city of Bombay. Similarly a person born in hamlet 1 of village Rampur and found in hamlet 2 of the same village at the time of enumeration, should not be deemed to have had another place of residence than the village where he/she is enumeated. Where a person had merely gone out to another place or had been shifting from place to place purely on tour or pilgrimage or for temporary business purposes, he/she should not be deemed to have had another residence different from the place where he/she or his/her family normally resides. In the case of person who is enumerated elsewhere than in his normal place of residence because of eligibility criteria laid down in paragraph 1 7. t, the place of his Immediate previous normal residence will be recorded as the place of last residence. Similarly, If a person Is enumerated at a place other than his place of birth and if he had no other place of normal residence before coming to the place of enumeration, the place of birth would be the place of last residence.
t 04.2 It would not be possible to specify the duration 'Of stay which will qualify for reckoning last residence. The circumstances of each case would have to be taken Into consideration in deciding whether a person has had a last residence or not. For example, an officer who has been trans
place of last residence for the child, though the place where the hospital is, will not be the place of the last residence of the mother.
Q. 19(a) : Place of last Residence
105. For a person who has been in the village or town of enumeration continuously since birth (except for shifting to other place outside the village or town of enumeration for a purely temporary stay), write 'PL' against sub-part (a) and put cross (X) In the box against sub-part (b) and on the lines against sub-parts (c) and (d). But for a person who had his last previous residence at any place outside the village or town of enumeration (irrespective of his place of birth), write the actual name of the village or town or his actual previous residence against this sub-part (a) and fill the other details againstsub'parts (b), (c) and (d).
Q. t 9(b) : Rural (t )/Urban (2)
106. For a person who had previously resided outside the place of enumeration, ascertain if the place of last previous residence is rural or urban and record the answer. For a person whose last previous residence Is a town/city, write '2' in the box, and for 'Rural', write '1'. For a person who last resided in a foreign country, put cross (X) in the box.
106.1 For person whose immedite previous residence cannot be clssified, write 'not known'.
106.2 Rural or urban status has to be determined with reference to the status existing at the time of enumeration.
Q. t 9(c) : District
107. For a person who had previously resided in another pice, i.e., for whom 'Pl' is not written against sub-part (a) you have to fill in this sub-part after enquiry.
1 (fl. t For a person who previously resided in another villge or town within the district of enumeration, write 'D'.
107.2 For a person who previously resided in another district of the State/Union Territory of enumeration or in a district in any other State/Union Territory in the country, write the name of the district. If he/she cannot name the district, write 'not known'.
107.3 For a person whose last previous residence was outside India, write 'X' against this sub-part.
ferred for a short period must be considered as moving from Q. 19(d) : State/Country his/her place of previous posting which would become hls/ her place of last residence, irrespective of his/her stay in the 108. For a person whose last previous residence was new posting. However, temporary movement like women outside the village or town of enumeration but within the moving into a hospital for delivery, a person moving into a State or Union Territory of enumeration, put cross (X) against hospital for treatment, etc., at a place other than their usual this sub-part but if it was outside the State or Union Terriresidence, will be Ignored and these places will not be treated tory of enumeration but within the country write the name as the last residence. In the case of a child born In a hospital of the State/Union Territory. Make sure that the earlier eninto whcih the mother has moved temporarily for delivery tries made In sub-parts (a), (b) and (c) are consistent with which is different from the usual place of residence of the such an answer, for example, 'Pl' might have already been mother, the place where the hospital Is, will be treated as the written against sub-part (a) or 'D' is written against sub-part
305

(c) or any other district of the state of enumeration is mentioned against sub-part (c).
108.1 For a person whose last previous residence was outside the country write the name of the country and if name of the country is not forthcoming, write the name of the continent.
Q. 20 : Reasons for migration from place of last residence
109. The question will be asked in the case of a person for whom information has been recorded in Question 19 i.e., last residence. However, please notE! that this questio~ will not be canvassed in the case of those for whom you may have written 'PL' against pice of last residence. This is because they have had no pice of last residence. In all the other cases you must find out the reasons for migration from the place of 1st residence and note the reasons by entering the appropriate code. The codes which must be entered for the various reasons for migration are as follows:
(a) Employment
(b) Business 2
(c) Education 3
(d) Family moved 4
(e) Marriage 5
(f) Natural calamities like diought, floods, etc. 6
(g) Others '7
109.1 These codes have been printed at the bottom of the Slip. You must enter a code depending on the reasons for migration in the box against this question. For defence and similr personnel as may be indicated to you this question will also not apply, since you will not have canvassed the Questions 18 and 1 9 of the Slip. Cross (X) may be put in the box in case the Question is not applicalbe, i.e., 'PL' or cross (X) has been noted in Question 19(a).
110. A person will have moved for employment in the following cases:
(a) If he or she has moved in search of a job or hoping to get.a job.
(b) Because he/she has got a job and has moved to take up the job.
(c) Having already got a job, he/she has moved 'because of a transfer, even if this is on promotion:
110.1 I f a person has moved for any of these reasons, record code '1' in the box.
111. A person can be said to have moved for 'business' if he or she has moved to the place of enumeration from his/ her palce of last residence for joining a business or setting
up/running a business. The word 'business' refers to an economic activity involving risk-taking either on own account or in partnership with others. Please note 'business' is different from job or employment for which wages/salary is received In cash or kind. For 'business' you have to enter code 12' in the box.
112. A person can be said to have moved for educational purposes if he or she has moved to the pice of enumeration from his/her place of last residence, for joining a school/ college or any other type of educational institution either for the frrst time or for continuing his/her studies. For such a peson, code 13' has to be given. However, please note that if this particulr person has moved along with his/her family because the entire. family has moved due to any reason, you must note that thiS person has not moved for educational purposes. In such a case the right code to be entered will be code 14' namely IFamily moved'.
113. The reason 'Family moved' code '4' will refer to cases where the entire family moves. Such cases will come up if the head of the household or the person on whom the family is dependent has moved due to any reason such as transfer, etc. There are cases where one or more members of the family move along with the person who has moved in search of employment or education or for other reasons. While the person who has moved for a particulr reason will be assigned the appropriate code, the other members who moved along with that person will be assigned code '4', i.e., 'Family moved'.
114. If a person has moved consequent on getting married assign code '5' for that person. If a person has moved becaus~ of natural calamities like drought, floods, etc., assign code' 6' for that person.
115. Code 17' IOthers' will include all other reasons for migration not covered by employment, business, education, family moved, marriage and natural calamities like drought, floods, etc. This may include cases like movement due to retirement, displacement, etc.
116. It is Important to note that the reasons for migration are being noted for each person separately. Therefore, in the same household, there may be cases where the reasons for migration are different for different members of the household. For example, if the head of the household is promoted and transferred, in his/her slip against Question 20 you will have to assign code' l' because his/her movement is consequent on employment while the spouse and other dependents should be assigned code '4' because the family moves. There are also cases, particulrly from the rural areas to urban areas, where a boy or a girl moves to a town or city fJr higher studies and in order to look after him or her an elderly person also moves. In such a case, in the case of the person who moves for higher studies the reason for migration will be 'Education' code '3' while In the case of elderly person, the reason will be IOthers' code 17'. If in case the entire family has moved along with the student, for all the
306

other members of the family you will have to assign code '4' 'Family moved'. It is, therefore, necessary for you to make careful enquiries and not to get confused with the different reasons which may be applicalbe to different persons of the same household.
117. In particulr, please note that you must make detailed enquiries in the case of any unrelated members of the households, such as cook, servant, etc. In their cases, their movement from the pice of last residence may have been due to employment. Similarly, in the case of those members of the household who are rather distantly related to the head of the household, you must also make such detailed enquiries.
t t 8. It must be remembered that the reason 'Family moved' code '4' can only come up in cases where some other member of the family has moved for any of the other reasons mentioned in the Slip. The members of the family moved because either the head of the household or the person on whom the family depends has moved because of employment or for any other reason.
t 1 9. Please note that in the case of every person who has come into India from any other country as a result of partition or has been repatriated, the reasons for migration wili be noted as 'Others' cod.: 7' and not any other code.
Q. 2 i : Duration of residence at the village or town of enumeration
120. Note here the period in completed years of the continuous residence in the village or town where the person is being enumerated. This will apply even to a person born at the pice of enumeration. But this question does not apply to defence and similr personnel.
120.1 If he/she had left this villge or town and has lived elsewhere for sometime, i.e., in Question 19 another place of last residence is reported and has come back to this villge or town, then the duration of residence to be noted against this question is the period of the lateSt continuous residence. But If a person had been away on a temporary visit or tour, etc., that should not be taken as a break in the period of his/ her continuous residence here.
120.2 If the person was born at the place of enumeration and also had no other place of last residence, i.e., 'PL' has been noted in Question t 9(a), then cross (X) may be put against Question 2 t in the box.
t 20.3 For a person whose duration of continuous residence at the place of enumeration is less than t year, write '0' In the box.
FERTILITY
Q. 22 ! For all ever married women only
t 21. This question will be asked in the case of all evermarried women. It will not be asked for a woman who has
never been married. Please note that the term 'ever married' does not necessarily mean' currently married'. The 'evermarried' would include all women who may be currently married, the widowed, the separate and the divorced. This question, in other words, will be asked of all women except those who are 'Never Married'. For all women for whom 'M' or 'W' or '5' is entered in Question 5 of the Slip, this question will be asked. In the case of women who are 'NM' in Question 5 of the Slip, put cross (X) in the boxes In all parts of this question.
Q. 22(a) : Age at marriage
122. You should ascertain the age at which the woman, whom you are enumerating, was married and record that age in completed years. If a woman has been married more than once, the age at which she got married for the first time should be recorded.
Q. 22(b) : Number of children surviving at present
123. In this question, you will have to find out how many of the children born are still surviving, i.e., at the time of enumeration.
123.1 Please note that the children need not necessarily be staying with the mother, i.e., the woman you are enumerating. They may be elsewhere due to any reason. What is important is whether they are alive, not where they live. They may be any where, even outside the country. The important point is the number alive.
123.2 Having ascertained this number, enter the details by sex and total in the boxes provided.
t 23.3 If there are no male or female children surviving at the time of enumeration, write '0' in the appropriate box or boxes.
Q. 22{c) : Number of children ever born alive
124. You should ascertain the total number of children that the woman you are enumerating gave birth to from the time she got married. If married, more than once, all the children born to her should be ascertained.
124.1 The number of children born would include all children born alive, even if later unfortunately any child died. Many persons, specially older people may only count children living with them. It is, therefore, essential to enquire about the number of children living at home, those living elsewhere and also those who were born alive but who are unfortunately not alive now. Even if the child died within a flW hours ofhis/her birth, he/she should be included in the count. Still births, I.e., children born dead should not be included in counting this number of children ever born. You will have to ask politely but appropriate questions for getting this information.
124.2 You should ensure that all live births are ascertained irrespective of whether the children are alive now.
307

124.3 It is our experience that the birth of a child may not be reported readily if the child is not actually living at the time of enumeration. The children who are born but may have died before the enumeration may not be indicated by the respondent ur.ll~u<?u make detailed enquiries. This would be particularly true in the case of children who may have died as infants. There is, therefore, need for a detailed probe to ensure that you get the correct number.
124.4 Ascertain the number of children ever born alive . by sex and write the figures in international numerals in the
boxes provided. Also give the total in the box provided.
124.5 If the woman reports that she has had no male or female children born alive, write '0' in the appropriate box or boxes.
Q. 23 : For currently married women only
125. This question has to be answered in respect of all currently married women only, i.e., all women whose marital status is shown as 'M' against Question S of the Slip. For all others, a cross (X) may be put against this question on the line.
Any child born alive during last one year
126. You should ascertain if the currently married woman, whom you are enumerating, gave birth to a child in the last one year prior to the date of enumeration. If the respondent is not able to reckon one year, you can tlnd out if a child was born alive in 1990-91 to the woman you are enumerating on or after any of the festival indicated to you by the Director of Census Operations. Only if the child was born alive, and even if the child had died soon after birth, the answer should be 'Yes f
, to this question. Still birth, i.e., a child which is born dead should not be taken into account for this pUrpose. So while you should make sure that every case of birth of a child born alive, even if it is not alive on the date of enumeration, is reported, you should not reckon it if the child was born lifeless.
126. 1 It is common experience that the birth of the child may not be reported readily if the child is not actually surviving at the time of enumeration. Infant deaths are still high in the country. There is a chance of a number of such cases being missed unless specifically questioned about. It is necessary to record all live births even if the child has died soon thereafter or had not survived to the day of enumeration. Therefore, where the initial answer to this question is 'No', you should ask a specific question if there has been a case of a child having been born alive in the last one yeat and later dying before the enumeration date. This is a delicate question and should be asked with tact in a manner not to offend the sentiments of the respondent. Where a currently married woman first answers that she had no child born In the last or;e year, you may perhaps question her as follows:
"It has been found in some houses that a child was born and had died soon after or a few days or months later and such cases had not been reported. It is my hope that there are no such cases here. Am I right ?"
126.2 This may bring in the required response. If she reports 'No' then you can be slire that no birth has been missed. You have to make sure that any live birth that has occurred to the currently married owman in the last one year is netted whether the child is surviving till the date of enumeration or not. A similar probe to eliminate still births may also be necessary. For example, when the answer is 'Yes' under this question, you might ask if the child Is here in the house. If the answer is 'Yes', no further question is needed. If 'No', you might ask where the child has gone. The answer may be 'dead' or that it has gone elsewhere. If dead, then you might ask when the child died and this will bring out the fact whether or not it was a still birth. If the answer is 'Yes', then enter 'Yes' in the space below the question; If the answer is 'No' enter 'No'in the space. Do not write in the dotted box.
126.3 In a case where the woman has had twins or multiple births, please write 2, 3, etc., next to 'Yes' as the case may be thus 'Yes' (2) or 'Yes' (3).
127. On the reverse of AppendicesXI-l toXI-1S specimen entries in answer to questions reltingto ex-serviceman, migration and fertility have been shown for your facility.
NOTE: You may find on your revislonal round from March 1 to March 5, 1991 a child is born to a currently married woman is a household after your last visit but before the sunrise of March 1, 1991. You will have to take this into account and correct the answers against Question 23 accordingly. You must enquire sp:ecifically, if any such birth has taken place. While ignoring still births all other births where the child was born alive even if it did, not survive long should be taken into account.
128. HaVing filled in the Individual Slip, you may fin~ it rewarding to go through all the entries. This will enable you to cross check the information,' and gaps, if any, can be filled in then and there. This will obviate the need fo visit the household again to collect the missing information.
129. As stated in paragraph 33 you will be required to fill up Individual Slip for all members of the household. During the course of your day's work you will have covered a Irge number of households and filfect in the requisite number of Individual Slips. After completing the day's work, you must fill in columns 8 to 34 of the concerned household. Please do not allow this work to accumulate. Instructions for filling up columns 8 to 340fthe Household Schedulewill be found in Chapter IV (paragraphs 141 to 158). This will afford another opportunity to you to detect errors or gaps in the Information collected, which you can conveniently col-lect by re-vlsltingthe household(s).
308
CHAPTER III
ENUMERATION OF HOUSELESS POPULATION AND REVISIONAL ROUND
130. The enumeration of the houseless population will have to be carried out in the block assigned to you. The houseless popultion can be found in any place and they should not be omitted.
131. The Revlsional Round, the instructions for which are part of this chapter, must be carried out in your block. This Is because the revisional round Is an extremelylmportant and essential step in the total process of·enumeration and It is only after the revlslonal round is over that the correct popultlon figures will be availble. Therefore, do not neglect to carry out the revlslonal round of the block which you are enumerating ...
Enumeration of th~ Houseless
132. As stated earlier in paragraph 13 of this booklet, you will be required to enumerate the houseless popultion in your enumeration I1I0ck(s) on the night of February 28, 1991. In order to do this, it would be necessary for you to complete the enumeration of all the persons in all the households living in census houses in your jurisdiction between February 9 and February 28, 1991. During this period, you will have taken note of the possible places where houseless popultion is likely to live, such as on the roadside, pavements, in hume pipes, under staircases, or In the open, temple, mandaps, platforms and the like. On the night of February l8/March 1, 1991, but before sunrise of March 1, 1991, you will have to quickly cover all such houseless households and enumerate them. If there is likely to be a very Irge number of house less persons in your jurisdiction whom you may not be able to enumerate single-handed in one night, you should report to your Supervisor In advance, so that one or more extra enumerators can be deputed to assist you In the one-night enumeration of such houseless persons. You should keep particular watch on the large settlements of nomadic population who are likely to camp on the outskirts of the village. These people will have to be covered on the night of February 28, 1991. You should of course make sure that these persons have not been enumerated elsewhere.
133. At this point, please read the instructions about updating and filling up of the Abridged Houselist, given in Appendix V. You will be required to enter the details of the houseless households in Section 3 of the Abridged Houselist in the manner described therein. Also please recall the instructions given in paragraph 21 of this booklet where you have been told that for houseless households, you should record 'O'in bold letters. In giving the Serial number of the household, you will have to indicate the Serial number of the household with a prefix '0' separated by a dash (-), as explained In the instructions given in Appendix V.
134. Please remember that Household Schedule will be filled for each houseless household In the manner explained in paras 16 to 29 of this booklet. Thereafter, you will have to fill up the Individual Slip for each member of the household, as per instructions given In paragraphs 30 to 129. Thereafter, you will be required to fill in columns 8 to 34 of the Household Schedule as per instructions given later.
Revisional Round
135. You have been told under paragraph 12 and paragraph 13 of this booklet that in the next flvedays, i.e., from March 1, 1991 to March 5, 1991, you will have to revisit all the households in your jurisdiction and record any new births that had taken place after your last visit, but before the sunrise of March I, 1 991 and any visitor(s) that had moved into the household and who· had been away from his/her/ their pice of normal residence throughout the enumeration period, I.e., from February 9, 1991- to February 28, 1991, or an entire household that has moved into your jurisdiction during this period and which has not been enumerated anywhere before. At this point, you may recall the instructions given in paragraph 17 of this booklet where instructions about persons eligible to be enumerated in a particular household have been given.
136. It is important to remember the following in this connection:
(1) If you are enumerating a new household in your block during the revisional round, please recall the instructions given In paragraph 20 and Serial number of household and updating and filling up of Abridged Houselist, as given in Appendix V.
(2) In respect of every new birth, you should make sure that you give the correct Location Code including the Serial number of household, fill up an Individual Slip and make necessary entries in the Household Schedule concerned. Also correct the entry in QUestion 23 of the Slip pertaining to the mother of the child whom you are enumerating during the revlslonal round. Please make sure that the birth has taken pice before the sunrise of March 1, 1 991.
(3) You will have to ascertain if any death had unfortunately taken pice In any of the households since your 1st visit and the sunrise of March I, 1991 and cancel the Individual Slip of the dead person writing boldly across it as 'died'. Please remember to make necessary correction in the Household Schedule concerned.
309

137. If you have exhausted the entire Household Schedule for recording the particulrs of any household and it becomes necessary to record a new birth or visitor, then you will fill in another Household Schedule form in continuation of that Household Schedule, taking care that the Location Code and other partlculrs are noted in the second Household Schedule form properly. In such a case, please write on the top right hand corner of the fresh Household Schedule 'continued' and note the Book and Form number of the connected Household Schedule. Similrly, on the connected Schedule note the word 'continued' and give the Book and Form number of the additional Household Schedule form.
138. Changes made in the Household Schedule like additions for new births or recording of visitors or deletion of entry In respect of deaths, should be done neatly and consequential changes in the total should be made. It is this final total that must be entered in the bottom of the Household Schedule.
139. You are now set for taking up the desk work at home in connection with the census enumeration that you have just completed. These are, as you will recall from paragraph 12 of this booklet, (1 ) filling up of the Enumerator's
Working Sheet for preparing the Enumerator's Abstract, (2) filling up of the Enumerator's Abstract, (3) filling up of Section 1 of the Abridged Houselist and (4) handling over all documents to your Supervisor, the documents being the Notional Map, the Layout Sketch, all filled in Household Schedule books, all filled In Individual Slip pads, filled in and updated Abridged Houselist, the Working Sheets for preparing the Enumerator's Abstract, the filled in Enumerator's Abstract and all blank Household Schedule books, Individual Slip pads and other blank forms.
140. In addition, you have to collect the filled in Postgraduate Degree Holder and Technical Personnel Schedules from the households and individuals for whom you had issued these schedules vide instructions given in paragraph 50. You have to hand over the filled in scheduled to your Supervisor. You will also be required to return the blank Postgraduate Degree Holder and Technical Personnel Schedules remaining surplus with you together with a statement (in the form given at Appendix XI) giving an account of the number of blank forms given to you, number of forms issued to eligible persons in the households, number of filled in schedules collected and number of blank forms returned to the Supervisor.
310

CHAPTER IV
FILLING UP OF THE HOUSEHOLD SCHEDULE COLUMNS 8 TO 34
t 4 t . As mentioned in the instructions relating to the filling up of columns t to 7 of the Household Schedule, columns 8 to 34 of the Household Schedule have to be entered with reference to the entries in the Individual Slip. For each member of the household, you will have filled up an Individual Slip. You will be required to copy out or to enter the relevant particulars from the Individual Slip in the line relating to that person in column 8 to column 34 of the Household Schedule. The following instructions tell you how to do this.
142. Please note that you should not allow this work to fall into arrears. You must fill up these columns in the case of those households whom you have enumerated each day at the end of the day itself. This would save you a lot of trouble and will also ensure that there are no errors.
1 43. It would be noticed that columns 12 to 21 relate to males and columns 22 to 31 relate to females. Column 1 placed between columns 1 7 and 1 8 is a mere copy of column 1 already entered by YOll. This is repeated on the right side of the Household Schedule to facilitate your work, by obviating the need to trace back the entries for columns 18 onwards to column 1 on the left side of Household Schedule. The instructions that follow will indicate how the entries from the Individual Slip should be carried over to the appropriate columns (8-34) of the Household Schedule.
Cot. 8 : Mother Tongue
144. For the person entered in column 2 of Household Schedule, the /Tlother tongue written against Question 6 of the Individual Slip should be copied in Col. 8 of the Household Schedule.
Col. 9 : Religioh
145. For the person entered in column 2 of Household Schedule, check if H, M, C, S, Band J or actual religion returned by the person has been recorded in Question 8 of the Individual slip. If so, copy the same in Col. 9 of the Household Schedule.
Col. 10 : Whether SC( 1) or ST(2)
146. For each person recorded In column 2 of the Household Schedule, check whether in the corresponding Individual Slip, '1' or '2' or 'X' is recorded in the box against Question 9. If so, copy the same in column 10 of the Household Schedule.
Col. 11 : Name of Scheduled Caste/Tribe
147. For each person recorded in column 2 of Household Schedule, copy out in column 11, the name of the
Scheduled Caste or Scheduled Tribe written against Question 10 of the Individual Slip. Please do not make any mistake in copying out the correct spelling of the name of Scheduled Caste or Scheduled Tribe. Please also ensure that name of Scheduled Caste will be entered in column 11 of Household Schedule If Code 'I ' is copied in column 10 of Household Schedule. Similarly the name of the Scheduled Tribe will be entered in column 11 of Household Schedule if code '2' is copied in column 10 of Household Schedule.
t 48. It must be noted that if there Is a cross (X) against Question 9 of the Individual Slip for the person entered in column 2 of the Household Schedule the corresponding column t 1 of the Household Schedule should be left blank.
Cols. 12 & 22 : Literate
149. For the person entered in column 2 of Household Schedule, check from the corresponding Individual Slip whether '1' is recorded in the box against question 11. If so, put a tick (.I) under column 12 for male or a tick mark under Col. 22 for female in the corresponding line.
Cols. 13 & 23 : Illiterate
150 As in the previous paragraph, check if '2' is reo corded in the box against Question 11 of the Individual Slip for the person entered in column 2 of Household Schedule and if so, give tick (.I) mark under column 13 for male or a tick mark under Col. 23 for female in the corresponding line.
Cols. 14 & 24 : Entry in Q. 14A of Individual Slip IYes'
1 51. For the person entered in column 2, check whether 'Yes' is recorded against Question 14A of the corresponding Individual Slip. If the person is a male, put tick (/') under column 14 and if female, put tick (.I) under column 24.
Cols. 15 & 25 : Entry in Q. 14A of Individual Slip INo'
152. As in the preceding paragraph, check if 'No', i.e., 'H' or 'ST' or 'D' or 'R' or 'B' or 'I' or 'a' is entered against Question 14A of the Individual Slip for the person entf'red in column 2 of the Household Schedule. If so and if t:ic person is a male, put a tick (.I) under column 15 and if female, put a tick (.I) under column 25.
Cols. 16 & 26 : Entry in Q. 14B of Individual Slip 'Yes'
153. For the person entered in column 2 of the House-
311
hold Schedule, check against Question 1 4B of the corresponding Invidual Slip if'l' is entered in the box. If so, put a tick (.I) under column 16 for male, but if the person is a female, put the tick (.r) under column 261n the correspondingline.
Cols. 17 & 27 : Entry in Q. 14B of Individual Slip 'No'
154. Check if '2' is recorded in the box against Question 1 4B of the I ndividual Slip in respect of the person entered in column 2 of the Household Schedule. If so, put tick (.I) under column 171n the case of a male, but If the person is a female, put the tick (/) under column 27 in the corresponding line.
Cols. 18 & 28 : Entry in Q. 15A of Individual Slip 'C'
155. For the person entered in column 2 of the Household Schedule, check if 'C' is recorded against Question 15A of the corresponding Individual Slip and if so, put the tick (.I) under column 1 8 if male, and if the person is a female, put the tick (.r) under column 28 of the corresponding line.
Cols. 19 & 29,20 & 30, 21 & 31 : Entry In Q. 15A of Individual Slip 'Al'!'HHI'/'OW'
1 56. As in the previous paragraph, check from Question 15A of the Individual Slip relating to the person entered in column 2 of the Household Schedule whether 'AL' or 'HHI' or 'OW' is entered forthe person entered In column 2 of the Household Schedule. If so, a tick (.I) should be put under the appropriate column 1 9 or 20 or 21 , as the case may be, in case the person is a male and under column 29 or 30 or 3 t , as the case may be, if the person is a female.
Cols. 32, 33 & 34 : Entry in Q. 15A(i) to Q. 15A(iii)
1 57. For a person recorded in Col. 2 of the Household Schedule, check if tick mark (.I) has been put in column 21 for male or in column 31 for female. If so, the entries from the corresponding Individual Slip against Question 1 SA(i) to Question 1 SA(ili) are to be copied In the Household Schedule In the corresponding line.
158. HaVing entered these particulars in columns 8 to 34 for all the persons enumerated In the household, you will have to strike the totals wherever applicable. You will notice that a block for giving sex-wise totals of Scheduled Castes and Scheduled Tribes has been provided under column 10 of the Household Schedule. This block has to be filled in only if there is code '1' or '2' in column 10 for all or any member of the household. Please note that this block will not be filled in if all the members of the household do not belong to SC or ST. In such cases, the whole block should be crossed. You have to strike the total for column 10 very carefully and enter the same in this block as per Instructions below:
Count the number of tick marks (.I) in column 4 of HousEhold Schedule for whom code '1 ' is recorded in column lOin the corresponding line. These are male Scheduled Castes and enter the same in the block. Then count the number of tick marks (/) in column 5 of Household Schedule for whom code '1 ' Is recorded in column 10 of the corresponding line. These are female Scheduled Castes and enter the same In the block. A similar procedure has to be adopted for recording in the block the number of males and females belongingto Scheduled Tribes. Thereafter, the total for persons has to be struck by you adding males and females.
158.1 Having struck the totals, your job in respect of this Household Schedule form is over and you should sign at the bottom left hand corner and give date also.
3~2
CHAPTER V
FILLING UP OF THE ENUMERATOR'S WORKING SHEET AND THE ENUMERATOR'S ABSTRACT
159. The specimen form of the Working Sheet for preparing the Enumerator's Abstract is given on pages 72-73. This form will be supplied to you in sufficient quantities. You will be required to use separate form(s) for Normal households, Institutional households and Houseless households. On these you will have to strike totals for Normal households, Institutionsl households and Houseless households separately. Thereafter, on the last page ofthe Sheet(s) relating to the Normal households, you will have to carry over the totals relating to Institutional households and Houseless households to strike a grand total for each of the columns of the Working Sheet except for column 2. The total for column 2 will have to be derived by counting the entries and not just totalling the figures. At the end of your revisional round, you will have a" the filled in Household Schedule books comprising Normals households, Institutional households and Houseless households. For the Institutional households and Houseless hf)useholds, you will have indicated 'I' and '0' respectively at the right hand corner of the first page of the Household Schedu Ie. You will now be req uired to take the Household Schedule books and fill up the Working Sheet for preparing Enumerator's Abstract. The Working Sheet for preparing Enumerator's Abstract has 29 columns. You will be required to deal with Normal households, Institutional households and Houseless households in separate sheets, while filling up the Working Sheet from the entries given in the Household Schedule. Each line in the Working Sheet will contain the totals for one household.
PJge No.
160. On right hand top corner of the form, you will h,".'e to indicate page number. The page number will run (,' ,tinuously for each type of household. That is to say, for Nr :mal households, the page number of the Working Sheet \. I ,tart from 1, for Institutional households again the page ; I !lber will start from 1 and similarly for Houseless house-
:5, the page number will start from 1.
160.1 You will have to arrange your filled in Household " . dule books in ascending order of the book number. You ~: ,luld take up the first book and pdk up a form of Working -' ,t for entering the details. If you are dealing with a schedl' '. 'Jtingto a Normal household, you should enter details in " ': Working Sheet relating to 'Normal household'. During I i";~ (,)I..lrse of your work, if you come across a schedule re-1'[, . "0 an 'Institutional household', please do nto forget to iKI: liP a fresh Working Sheet and enter relevant details in tr 2 t "ieet after assigning the page number and other details separately. Similarly, when you come across a 'Houseless household', please pick up a fresh Working Sheet and enter the details in that sheet.
location Code
161. Location Code of your enumeration block should be copied from the Household Schedule and written here. This will have five elements, viz., State code, District code, Tehsil/Taluka/PS/Development Block/Circle or Town code, Village or Ward code and Enumeration Block number within brackets. location Code should be repeated on every page of the Working Sheet. You have also to write the code number of the C.D. Block in the space provided.
Number of Households by Type
162. It will be noticed that the same form is being supplied for entering details in respect ofNormal/lnstitutional1 Houseless households. At the right hand top, three types of households have been indicated. You will have to score out the entry which is not applicable. For eXample, if you are dealing with Normal households, please score out the entries 'Institutional' and 'Houseless'. Again, if you are dealing with 'Institutional households', please score out the entries 'Normal' and 'Houseless'. Similarly, when you deal with 'Houseless households', score out 'Normal' and 'Institutional'. If you are using more than one page for a particular type of household, please do nto forget to score out inapplicable types on each sheet, as indicated here.
162.1 For recording the number of households by type separately for Normal households, Institutional households and Houseless households, you will have to count the number of entries given in column 2 (Serial No. of Household) of the working sheet relating to each type of household and enter the figure here. For example, for determining the number of Normal households, you will count the number of entries in column 2 of the set of working sheets dealing with Normal households and enter the figure on the first page of the setdealing with normal households. Similar procedure will have to be followed for entering the number of Institutional households and Houseless households in theappropriate Working Sheets.
Name of Enumerator
163. This hardly calls for any explanation. You will be required to write your name here.
Col. 1 : line No.
f 64. As in the Houselist form, here also, line numbers are being provided. The lines have been numbered as 1,2, 3,4, 5, 6, 7, 8, 9,0 and repeated likewise. The idea is to reduce your scriptory work, so that when you go to the 10th line, you put 1 at the 10th place to make the line number read as 10. Similarly, write 1 In the 10th place on
313

Location code ........................... '" ........... . Name of Enumerator ..................................................... .
Line SI.No. '" ...
c QI 0 '" 'iij
No. of QI ~ iij E
house- QI l: QI Q" .....
hold
(Col. 2) (Col. i) (Col. 5)
1 2 3 4 S
1
2
3
4
S
6
7
8
9
0
1
2
3
4
- 5
6
7
8
9
0
Total @
@Count number of entries and give total.
Checked and found correct Signature of Circle Supervisor ............................... . Date ................................................................. ..
S.C. S.T.
Literates IIliter-
(Col. 10)** (Col. 10)** ates
M F M F (CoU2) (Col. 13)
6 7· 8 9 10 11
314
CENSUS OF
WORKING SHEET fOR PREPARING
(To be compiled from
Code No. of Development
MALES
'Yes'in 'No'in 'Yes'in 'No'in 14A 14A 148 148
(Col. 14) (CoI.1S (Col. 16) (CoI.17)
12 13 14 1 S
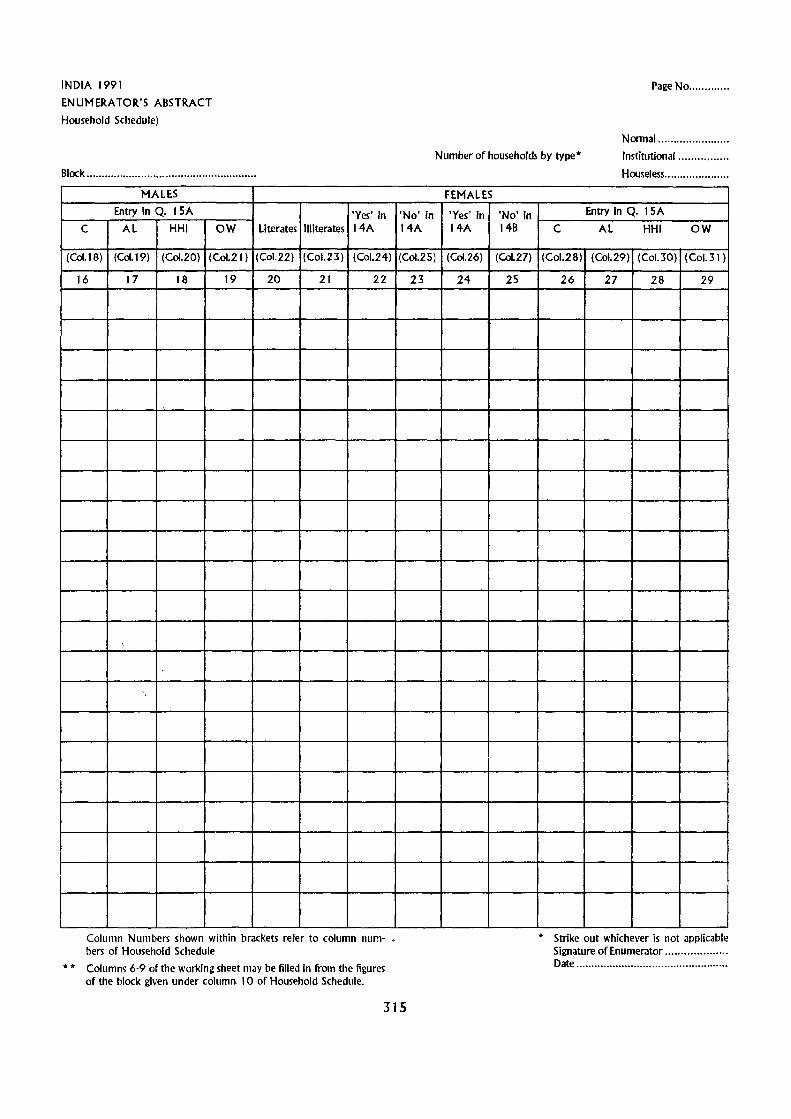
INDIA 1991
ENUMERATOR'S ABSTRACT
Household Schedule)
Block ................................................•.......
MALES
Entry in Q. 1 SA
C AL HHI OW 'Yes' in 'No'in
Literates Illiterates 14A 14A
Page No ............ .
Normal ...................... .
Number of households by type" Institutional ............... .
Houseless .................... .
FEMALES
'Yes'in 'No'in Entry in Q. 1 SA
14A 14B C AL HHI OW
(CoI.18) (CoI.19) (CoI.20) (CoI.21) (CoI.22) (CoI.23) (CoI.24) (CoI.2S) (CoI.26) (CoI.27) (CoI.28) (Col.29) (Col. 30) (Col.31)
16 17 18 19 20 21 22
,
Column Numbers shown within brackets refer to column numbers of Household Schedule
* * Column~ 6-9 of the working sheet may be filled in from the figures of the block given under column, 10 of Household Schedule.
315
23 24 25 26 27 28 29
j
* Strike out whichever is not applicable Signature of Enumerator ................... . Date ................................................. .

the next line to read as 11 and so on. You should not change the printed line number in case you have to score out a line owing to mistakes committed in.copying. The last line number will Incidentally give you the total number of households of a particular type entered in the Working Sheet which should tally the total of entries in column 2 which you are required to enter at the right hand top corner of the form under 'Number of households by type', but If you have scored out any line owing to some mistake in copying, then this tally cannto be achieved.
Col. 2 : SI. No. of Household
1 65. This number will be copied from the top of the Household Schedule form you are dealing with.
Cols. 3 to 5 : Persons, Males and Females
166. In these columns, enter total of columns 2, 4 and 5 respectively as struck by you in the concerned Household Schedule.
Cols. 6 to 29 of the Working Sheet
167. The colu!l1n headings are self-explanatory. Under each column, the column number of the Household Schedule has been indicated within brackets. You have merely to bke the total of the relevant column of the Household Schedule and post it under the appropriate column of the working sheet in respect of a particular household.
167.1 The figures in columns 6-9 may be filled in from the figures of block given under column 10 of Household Schedule. In case the block has been crossed in the Household Schedule, dash (-) may be entered in these columns.
Total
168. A separate line has been provided for entering the total. Total for columns 3 to 29 are straight forward totals. Total for column 2 will have to be derived by counting the entries, as indicated in the foot-note.
168.1 It is expected that you will be using more than one Working Sheet for Normal households. Therefore, you will have to derive the 'totals' for all the columns pertaining to the Working Sheets of Normal households on the last page. Identify this line (i.e. total) by writing 'Normal' in column 2 meaning thereby that these totals relate to Normal households.
168.2 Having struck totals for all columns relating to Normal households, Institutional households and Houseless households separately, you have to carry over the totals relatingto Institutional households and Houseless households on to the last page of the sheets pertaining to 'Normal households' and strike grand total. For doing so, please write 'Institutional' against the concerned line in column 2 of the
Working Sheet and 'Houseless' against the concerned line (in column 2 of the Working Sheet) and then strike the 'grand total' and write 'Grand total' in column 2. If, however, there be no space on the last page of the working sheet(s} relating to Normal households for-striking these totals, you may use a separate sheet for this purpose and attach it to the set of Working Sheets relating to Normal households.
169. A specimen of the Enumerator's Abstract form is given on the next page. The instructions are given hereafter.
INSTRUCTIONS FOR FILLING UP THE ENUMERATOR'S ABSTRACT FORM
location Code
170. The Location Code, as noted in the Working Sheet and in all your other documents, consisting of the frve elements, namely, State, District, Tehsil/Taluk/PS/Development BlockIOrde or Town, Village or Ward and Enumeration Block Number within brackets should be given here. You have also to write the Code No. of the C.D. Block in the space provided.
Name of Enumerator
I 71. You should write your name here.
Total Number of Occupied Residential Houses
172. You have merely to copy the figures noted in subsection B of Section 1 of the Abridged Houselist.
Number of Normal Households
1 73. You will recall that you have noted the number of households by type on the right-hand top corner of the first page of the working sheets' relating to Normal households. You have to take this figure for Normal households and post it here. '
Number of Institutional Households
1 74. You will again recall that you have noted the number of households by type on the right-hand top corner of the first page of the Working Sheets relating to Institutional households. You have to take this figure for Institutional households and post it here.
Number of Houseless Households
1 75. As in the case of number of Institutional households, you have to take the figure pertaining to Houseless households from the right-hand top corner of the Working Sheet for number of households by type and post it here.
NOTE: Please puta cross (X) againstthe Items 'Number of Institutional households' and 'Number of Houseless households', as the case may be, If
316

CENSUS OF INDIA 1991
ENUMERATOR'S ABSTRACT
(To be compHed from wor1dng sheet for Enumerator's Abstract)
location Code .....•..................•....................•.......•............................... Name of Enumerator .......••. 0 ••••••••••••••••••••••••••••••••••••••••••••••••••••••••••••••••
No. of normal households ................................................................... .
Total No. of occupied residential houses .•••••••.•.•••...••.•••••••...•..•••••••..•••.........•••••......•..•.•..•••.....
No. oflnstltutlonal households ..•...•.....••..........•.•...•...........•.••.••..•........ No. ofhouseless households •.....••.....•..............•..••.••••....•.•..•.••••.••••....... Total No. ofhcuseholds ..••.••..•••.••........••.•..•.••••••••..••.•.••....•.••..•...•••.•.•.
Code No. of Development Block •...••.•••.••...•••..••••.•••••....••.•..•...•.•....•.•...••
SI. No. Particulars Persons Males Females
1 2 3 4 5
1. Population induslve of population shown against serial Nos. 1 4 & 1 5 (Total of cals. 3, 4 and 5 of &rand total nne in the last page of wor1dng sheets for nonnal households)
2. Scheduled Caste (grand total of cals. 6 & 7)
3. Scheduled Tribe (grand total of cals. 8 & 9)
4. literate (grand total of cals. 10 & 20)
S. illiterate (grand total of cals 11 & 2 I )
6. 'Yes'ln 14A (grand total ofcals. 12 & 22)
7. 'No' in 14A (grand total of cals. 13 & 23)
8. 'Yes' in 141 (&rand total of cals. 14 & 24)
9. 't"40' in 148 (grand total of cals. 15 & 25)
10. 'C' in 15A (grand total of cals. 16 & 26)
II. 'AI' In 15A (grand total of cols. 17 & 27)
12. 'HHI' In ISA (grand total of coIs. 18 & 28)
13. 'OW' In I SA (grand total of cals. 19 & 29)
14. Insdtutlonal population (Total of insdtutlonal line cals. 3, 4 and 5 in last page of wor1dng sheet for normal households)
15. Houseless population (Total of houseless line cols. 3, 4 & 5 in last page of wor1dng sheet for normal households)
Checked and found correct
Signature of Supervisor .•.•..•••...•..........•.••••••.....•.......•.•.•••••..•..........•••.•.. Signature of Enumerator ..................................................................... .
Date •.•....•.•.......•................ ...................•.•.•.......•..•.......••.......•.•..•.......... Date .................................................................. ; ................................. .
Note : Columns mentioned under col. 2 within brackets are columns of wor1dng sheet from which data have to be posted.
317

there are no such households in your enumeration block.
Total Number of households
1 76. On the right hand top, you have noted the number of Normal households, Institutional households and Houseless households separately. You have merely to add them up and enter the figure here.
Cols. 1 to 5
177. The next section deals with 15 items and 5 Columns. The particulars are given under column 2 and the column number of the Working Sheet to which the particulars relate have been indicated within brackets in each case. For particulars noted against 51. Nos. 1 to 13, you have to take the relevant figures of the columns indicated within brakcets and post them under the appropriate columns 3, 4 and 5 of this form. The figures will be found on the last page of the Working Sheet dealingwith Normal households against the line representing 'Grand total'.
SI. No.1: Population inclusive of population shown against 51. Nos. 1 4 and 15 of the form
178. In columns 3, 4 and 5 of the Enumerator's Abstract form, You will have to give the grand totals of columsn 3,4 and 5 as derived on the last page of the Working Sheet dealing with Normal households and where you have struck total for all entries in respect of Normal households, Institutional households and Houseless households. These figures will be inclusive of the population figures reflected under columns 3, 4 and 5 against 51. Nos. 14 and 15 of this form.
SI. Nos. 2 to 13
179. These items hardly call for any explanation. The column numbers are indicated within brackets against each. You have merely to take the appropriate figure from the line representing 'Grand total' on the last page of the Working Sheet dealing with Normal households and post the appropriate figure under columns 4 and 5, as the casey may be, and derive total in column 3.
SI. No. 14 : Institutional Population
180. On the last page of the Working Sheet dealing with Normal households, you have entered the total In respect of the Institutional households. You have to take the figures of columns 3, 4 and 5 of the line in the Working Sheet representing the 'Institutional households' and enter the same in columns 3, 4 and 5 of the Enumerator's Abstract form.
51. No. 15 : Houseless Population
181 . Here again, you have to look to the last page of the Working Sheet dealing with Normal households and take the
figures given in columns 3, 4 and 5 of the line representing Homeless households and post them in columns 3, 4 and 5 of the Enumerator's Abstract form.
Please note that the Institutional population and Houseless popUlation indicated against SI. Nos. 14 and 15 are included in the total population of your enumeration block shown against SI. No.1.
182. It is needless to add that you should check the entries carefully and after satisfying yourself that everything is in order, you should sign the filled in Working Sheets and Enumerator's Abstract form. If you have, by any chance been put incharge of more than one enumeration block, please remember that you will have to prepare separate sets of Working Sheets and Enumerator's Abstract for each of the enumeration blocks assigned to you.
183. You have now to arrange all your records which would be as follows:
(1) Notional Map,
(2) Layout Sketch,
(3) Filled in and updated Abridged Houselist which you have updated as per Instructions given In paragraph 133,
(4) Filled in Household Schedule books,
(5) Filled in Individual Slip pads,
(6) - Working Sheets for Enumerator's Abstract in three sets tagged together,
(7) The Enumerator's Abstract form,
(8) Filled in Post-graduate Degree Holder and Technical Personnel Scnedules,
(9) Statement shOWing the number of Post-graduate Degree Holder and Technical Personnel Schedules received, issued, filled in Schedules collected and blank schedules returned (Appendix XI),
(10) Blank forms, Household Schedule books and Individual Slip pads referred to above.
(1 t) Blank Post-graduate Degree Holder and Technical Personnel Schedules.
184. You are now required tohand over all the documents with an Inventory which should contain the Book Nos. of Household Schedules and Pad Nos. of Individual Slips to your Supervisor. Having done so, you have completed your job in so far as the t 99 t Census operation is concerned and you can reasonably take pride in having performed a national task well.
318

APPENDICES
319


.--
.. " ...... cncn
Olen .......
n i~
- i~ >< I -Q Z u.l • c.. c..
!-I « 1 .. ~ -; -~
~ i ... i! •
a /
"u ,
\ E i I '
\
I
, i
11 Ii II
III
321
II II I ,
() .. ,)
i
.. ~
~ .. \
~
w >
. ~ o 5 z - iii 1&1 ... 0: :3 ~ a:
I
~ fi S :::i w 1ii J: C .... 0 z a - z z ~
. 0 ,~ J: U III C
(I)
Ul Q. ..J 0..
~ <{
W Q
W ~ 0 ~

~o; CI)CI) .. ~
I! '1~ - i~ ->< -0
Z III 0.. 0.. -<
J ,oj II Vi ' ~i it *:!.
i! & 'os 0 Z
z __
_ JL !-D LJL
~
II .. .. .. H c a _
: : ,_
i i i i 0~
8.0 .... ".)1 ..
'I 'I
" c;E)~ I, II II II II I.
322
..... ',"0"" •• If' ••
f I '
III ~
< 2 c: W 111 0: -e <t ::> 0.. I ~ 0. ,111 W ::! ~ ~ AI! .2 - (5 :z Z ~ . o ;::::: X 'x VI '0 III C .J (I) - a. :! a. I.lJ 4; o \II ~ o 1/1
\ \

..... 1-1 -~ -~ Z UJ p.. CI... <
~"J
, ~ r-------------------5.\ fLt t, ,·g
~.
i 1 • .. _--
Oi-C'l0'I ... 0'1 ...
~~ -u. :)0
15 ~
~~
... 1 10
~'a -~ I
II III
~ . .. E. • ,., "
y .. .:
UI
~o Ii! ~iIi
!! " \ i{ " ~ , .. ..
, 'r I, I,
I [§JE] ~<1 " . 'I I "
" i 'I II
32~
w > i=
'" u 0
~ ~ ~
::J W lX: lY. I oc(
i A. ~ ~ ~
w (J)
:t 15 ,_
! ~ 2 ~ -0 .~ :t III "'0
C tit 8. oJ
~ Q. <::
w 0
W ~ 0 1/1

~ j ,-----------------
f} z--'t, r i i
:z:
-. •
J lll.___ :~il-O~ w > j:: c(
~ u 5 .0 ~ ...
:::J
0; .... cn(J) ,...C!l ...
i! 0
m : ,. : 4
0 ...
'l&~ I 4
• ~ ~~.
~~ !i -•
X -~ g: ~ .~
w I a: .c c( 0 ... 0.. W c( ~
~ ""J)
I&J S I 0 I- .5 ~
.~ :z ~ .~ 0 1J I C III q)
III 0. 0.
:::! « ~ w 0
w ~
j .. ~I
CD .. Ii
.. .. ..,~ .. ouo .. INOHU .,,0." '110M' ';:-; • .. ~ ~
.. • .. 0 •
l! ..
.. If ;: !1lI
ill I "
\
\
0 en
I , 011
! !
324

APPENDIX V
INSTRUCTIONS TO ENUMERATORS FOR UPDATING SECTION 2, FILLING UP OF SECTION 3 AND FILLING UP OF SECTION 1 OF THE ABRIDGED HOUSElIST
Introduction
As in the 1981 Census, an Abridged Houselist will have to be prepared at the 1991 Census also. The Abridged Houselist estal3lishes an essential link between the Houselist and the population enumeration. It will serve as a frame for assigning household serial number to each household in an enumeration block, as will be seen later, and it will also serve as a frame for post-enumeration surveys and other surveys which may be taken up in the future. The Abridged Houselist will be prepared separately for each enumeration block. It is an important document and you must fill it up carefully after reading these instructions given in the notes to the Abridged Houselist form itself. A copy of the Abridged Houselist form comprising Section 1, 2 and 3 is enclosed (Annexe I).
2. You will be given one copy of the Abridged Houselist form for your block by your Supervisor. You will notice that identification particulars and Section 2 of the form are· already filled in (Annexe II). At the beginning will be given the identification particulars and location code of your block. Section -2 contains essentially a list of all census houses and households in your block copied from the Houselist. This list has to be updated by you as at the enumeration, because some changes might have taken place in your block since the houselisting operations. Some of the census houses which existed at the time of houselisting, might have been demolished and new census houses might have come up. Again, some of the households might have moved out and some new households might have moved in. All theSe will have to be taken care of by you in updating the Abridged Houselist. The new census houses and households will have to be listed by you in Section 3. Section 1 will be filled up at the end of the enumeration.
3. While going around your block for enumeration, you will have to check whether each census house and household listed in Section 2 of the Abridged Houselist is actually there. At the same time, you will also have to look for new census houses and new households which are not listed in Section 2. It is also possible that some of the census houses or households in Section 2 are still there but their particulars might have changed.
4. The following situations may arise:
(i) A household listed in Section 2 might have moved out leaving the census house or part occupied by it vacant,
(ii) A building or census house listed in Section 2 might no longer exist,
(iii) A household listed In Section 2 might have moved out and a new household might have moved In, In its place,
(iv) The fully residential, partly residential or non-residential use of a census house listed in Section 2 might have changed,
(v) The head of a household listed in Section 2 might have changed,
(vi) A new household might have moved into a vacant or non-residential census house,
(vii) A new building which is not listed in Section 2 might have come up,
(viii) A new census house might have come up in a building already listed in Section 2,
(Ix) A new household might have moved into or split in an already occupied residential house.
5. In case of situations (i) and (ii), the relevant entries in Section 2 will have to be deleted, in case of (iii), (iv), (v) and (vi) the entries in Section 2 will have to suitably amended and in case of (vii), (viii) and (Ix), Section 3 will have to be filled. The instrllctions for deleting or amending entries in Section 2 or for filling up Section 3 in each of these situations are given below.
Instructions for Recording Changes in Section 2
6. In the case of_first six situations mentioned in paragraph 4 above, necessary changes or corrections will have to be made in Section 2 as follows:
(I) If a household appearing in Section 2 has moved out leaving the census house or part occupied by it vacant then the entries in columns 5 to 8 relating to the household have to be deleted. In column 8 write in such cases "Household left". Please note that when any census house or household is deleted in Section 2, the serial number in column 1, house number, household number or the serial number of household in column 7 of subsequent houses and households should not bt! changed.
(ii) If you find that a building or census house appearing in Section 2 no longer exists, all the lines relating to the building or census house will have to be deleted. In this case also, the subsequent serial num-
325
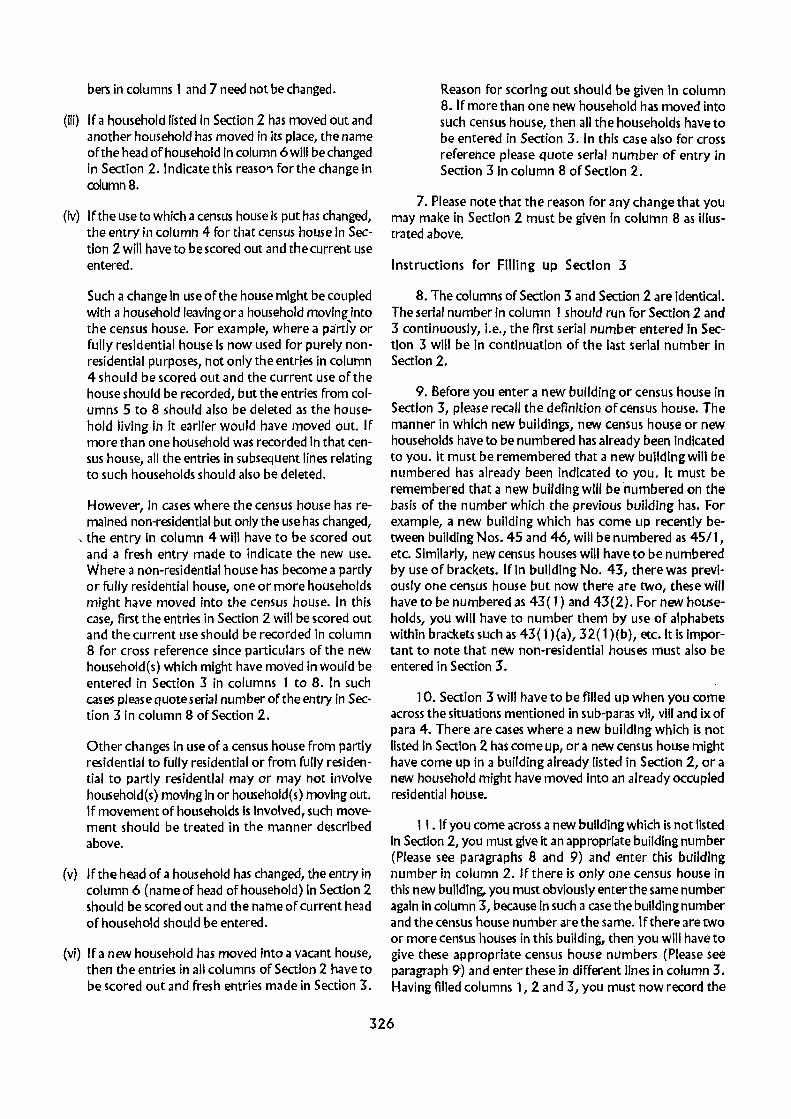
bers in columns 1 and 7 need not be changed.
(iii) If a household listed in Section 2 has moved out and another household has moved in its place, the name of the head of household in column 6 will be changed in Section 2. Indicate this reaso'1 for the change in column 8.
(iv) If the use to which a census house is put has changed, the entry in column 4 for that census house in Section 2 will have to be scored out and the current use entered.
Such a change in use of the house might be coupled with a household leaving or a household moving into the census house. For example, where a pa"rtly or fully residential house is now used for purely nonresidential purposes, not only the entries in column 4 should be scored out and the current use of the house should be recorded, but the entries from columns 5 to 8 should also be deleted as the household living in it earlier would have moved out. If more than one household was recorded in that census house, all the entries in subsequent lines relating to such households should also be deleted.
However, in cases where the census house has remained non-residential but only the use has changed,
, the entry in column 4 will have to be scored out and a fresh entry made to indicate the new use. Where a non-residential house has become a partly or fully residential house, one or more households might have moved into the census house. In this case, first the entries in Section 2 will be scored out and the current use should be recorded in column 8 for cross reference since particulars of the new household(s) which might have moved in would be entered in Section 3 in columns 1 to 8. In such cases please quote serial number of the entry in Section 3 in column 8 of Section 2.
Other changes in use of a census house from partly residential to fully residential or from fully residential to partly residential mayor may not involve household (5) moving in or household(s) moving out. If movement of households is involved, such movement shOUld be treated in the manner described above.
(v) If the head of a household has changed, the entry in column 6 (name of head of household) in Section 2 should be scored out and the name of current head of household should be entered.
(vi) I f a new household has moved into a vacant house, then the entries in all columns of Section 2 have to be scored out and fresh entries made in Section 3.
Reason for scoring out shOUld be given in column 8.lf more than one new household has moved into such census house, then all the households have to be entered in Section 3. In this case also for cross reference please quote serial number of entry In Section 3 in column 8 of Section 2.
7. Please note that the reason for any change that you may make in Section 2 must be given in column 8 as illustrated above.
Instructions for Filling up Section 3
8. The columns of Section 3 and Section 2 are identical. The serial number in column 1 should run for Section 2 and 3 continuously, i.e., the first serial number entered in Section 3 will be in continuation of the last serial number in Section 2.
9. Before you enter a new building or census house in Section 3, please recall the definition of census house. The manner in which new buildings, new census house or new households have to be numbered has already been indicated to you. It must be remembered that a new building will be numbered has already been indicated to you. It must be remembered that a new building will be numbered on the basis of the number which the previous building has. For example, a new building which has come up recently between building Nos. 45 and 46, will be numbered as 45/1, etc. Similarly, new census houses will have to be numbered by use of brackets. If in building No. 43, there was previously one census house but now there are two, these will have to be numbered as 43( 1) and 43(2). For new households, you will have to number them by use of alphabets within brackets such as 43( 1 )(a), 32( 1 )(b), etc. It Is important to note that new non~residential houses must also be entered in Section 3.
10. Section 3 will have to be filled up when you come across the situations mentioned in sub-paras vii, viii and ix of para 4. There are cases where a new building which is not listed in Section 2 has come up, or a new census house might have come up in a building already listed in Section 2, or a new household might have moved into an already occupied residential house.
11. If you come across a new buildingwhlch is not listed in Section 2, you must give it an appropriate building number (Please see paragraphs 8 and 9) and enter this building number in column 2. If there is only one census house in this new building, you must obviously enter the same number again in column 3, because in such a case the building number and the census house number are the same. If there are two or more census houses in this building, then you will have to give these appropriate census house numbers (Please see paragraph 9) and enter these in different lines in column 3. Having filled columns 1,2 and 3, you must now record the
326

use or uses to which this new building and the census house or houses in it is or are being put. Obviously If there Is more than one census house, you must record the use to which each one of these Is being put in column 41n the appropriate line. If the use is completely non-residential, then no furhter details need be entered In columns 5, 6 and 7 and you must only write dash (-) In these columns.
12. The new building or the census houses in It may be occupied by a household or more than one household. If there Is a household or more than one, you must give the household or households, a household number (Please see paragraphs 9 and 10) and enter this number in the appropriate line in column 5. Please note that if there is an entry in column 4 like "workshop-cum-residence", "residence", etc., then there must be an entry in column 5. In all such cases, columns 6 and 7 must also be completed.
t 3. In case of a new census house in a building already listed in Section 2, enter census house number in column 3. Please note that if the building in Section 2 had only one census house, its census house number will now have to be changed. For example, if building number 43, had one census house only in Section 2 numbered as 43, and if you now find another census house in this building, the census house number In Section 2 will have to be changed as 43( 1) and the new census house in Section 3 will be entered with number 43 (2). It should, however, be noted that if a new household has moved into a census house already listed in Section 2, the census house number should not be repeated in column 3 of Section 3. You need only to fill columns 5 and 6 of Section 3 and put dashes (-) in column 2, 3 and 4. Where more than one line relating to the same building or census house has to be filled, the building number or census house number should be entered only in the first line and in subsequent lines, wl\iteonly dash (-).
t 4. In column 4, the use of the census house should be recorded only for new census houses. For such census houses, the description of the purpose for which the census house is used, should be enquired and recorded in full, e.g., residence, workshop-cum-residence, shop-cum-residence, etc. This will be recorded only in the first line used for the census house against the census house number. If more than one line is used for the new census house, because there are more than one household, put dash (-) in column 4 in the second and subsequent lines.
15. In column 5, the household number will be recorded for each new household. For a new census house listed in Section 3, the households residing in it will be listed in each line startng from the first line. If the census house is nonresidential, write dash (-) in this column. Please note that where a new household has moved into a census house already listed in Section 2 with only one household residing in it, the number of the household listed in Section 2 will have to be changed. For example, if census house number 45 had
only one household'reslding in It and listed as number 45 In Section 2 and you now find more than one household In that census house, then you will have to change the number of the household In Section 2 to 45(a). The new households will be entered In Section 3 and numbered as 45{b), 45(c), etc., but there will be no entries In colUmns 2, 3 and 4, i.e., building number, census house number and use to which census house is put, relating to households 45(b) and 45{c). You should put dash (-) In columns 2, 3 and 4 and record new household in column 8 for these households.
16. In column 6, against a household number in column 5, write the name of head of household. Ifin column 5, there Is dash (....,...) I.e., If the use of the census house Is solely non-residential, repeat the dash (-) in column 6 also.
t 7. The serial number of household in column 7 should run continuously for the enumeration block. This means in Section 3, every household should be given a serial number in continuation of the serial number of the households in Section 2 (column 7).
t 8. You may remember that duringhouselisting, only those households which lived in census houses were listed. There are many households which live on pavements, etc., and do not live in census houses. These are HO;Jseless households. Such Houseless households will be noticed by you when you go around your enumeration block. You must enumerate the Houseless households as you would have been told, on the last day of the enumeration period, i.e., on the February 28, 1991, and this enumeration will be done late in the evening when these Houseless households settle down for the night. Every such household will have to be entered serially In Section 3 of the Abridged Houselist after all the census houses have been covered. For these households only dash (-) will be entered in columns 2 to 4 and '0' in column 5. The serial number in columns 1 and 7 will run continuouslyas mentioned earlier for these households also. The serial number of the household for these Houseless households will have a prefix '0', separated by a dash (-). Examples of how these numbers will be written are given at the end (Annexe III).
Instructions for Filling up Section 1
19. Section t relating to the population of the Enumerator's Block will have to be filled in by you at the end of the enumeration. After you have completed you Enumerators Abstract, you must enter the figures of population, number of occupied residential nouses and number of households against Parts A, Band C In Section 1. The instructions to fill in Parts A, Band C of Section 1 are described below.
20. Part A of Section 1 (Population of Enumerator's Block) will be copied from the Enumerator's Abstract which you will prepare after the revisional round has been completed in your enumeration block and totals struck. For fill-
327

ing up Part B of Section 1 (number of occupied re.idential houses) you will have to count the entries in column 3 (Census House No.) of both Section 2 and 3 of the Abridged Houselist. tt should be noted that in column 3 of the Abridged Houselist in Sections 2 and 3, not only residential houses, but non-residential houses would also have been entered. Therefore, in order to ascertain the number of occupied residential houses, you will have to check the entry in column 3 of Sections 2 and 3 with the corresponding entry in column 4 of the Abridged Houselist. A census house entered in column 3 will qualify to be counted as an occupied residential house, if there is a corresponding entry of either 'wholly residential' or 'partly residential' in column 4. For example, if Census House No.7 ( 1 ) in column 3 in described as 'residence' in column 4, it will be reckoned as an occupied residential house. Similarly, if Census House No.9 in column 3 is shown as workshop-cum-residence in the corresponding column 4, it will also be reckoned as an occupied residential house. On the other hand, if Census House No. 7( 1) Is shown as 'office' in column 4 and Census House No. 7(2) is shown as 'factory' in column 4 of either Section 2 or 3 of the Abridged Houselist, neither of these will qualify to be reckoned as an occupied residential house. It must be noted that census houses entered in column 3 against which the corresponding entries are 'vacant' in column 4, should not be reckoned as occupied residential houses. Normally, for every occupied residential house, there will be corresponding_ entries in column 5 (Household No.), column 6 (Name of the Head of the Household) and column 7 (SI. No. of the
Household), except In cases where the occupants of a residential house have gone on a temporary Journey/pilgrimage which fact will be noted In the Remarks column. In such a case, the entry in column 4 will doubtless be shown as 'residence'. Please note that If a residential census house has been entered more than once in column 3 through oversight it should not be counted more than once because It will Inflate the number of occupied residential houses.
21. Part C of Section 1 of the Abridged Houselist (Number of households), will have to be ascertained by countIng entries In column Sin Sections 2 and 3 which should be easy. The entries could be, say 1 or 1 {1 ) or '{a) or 1 (1 )( a) in column 5, depending on whether the household lives by itself in a house which is also a building or lives in a building which has more than one census house or is sharing the building with one or more households sharing the census house with one or more census households respectively. Needless to say, ther~ will be a corresponding entry In column 6 (Name of the Head of the Household) and column 7 (SI. No. of the Household) for all such households. You should count the number for your block and write the figure in Pact C of Section 1.
General
22. Before you hand over the completed Abridged Houselist, you must ensure that all the sections have been completed.
328
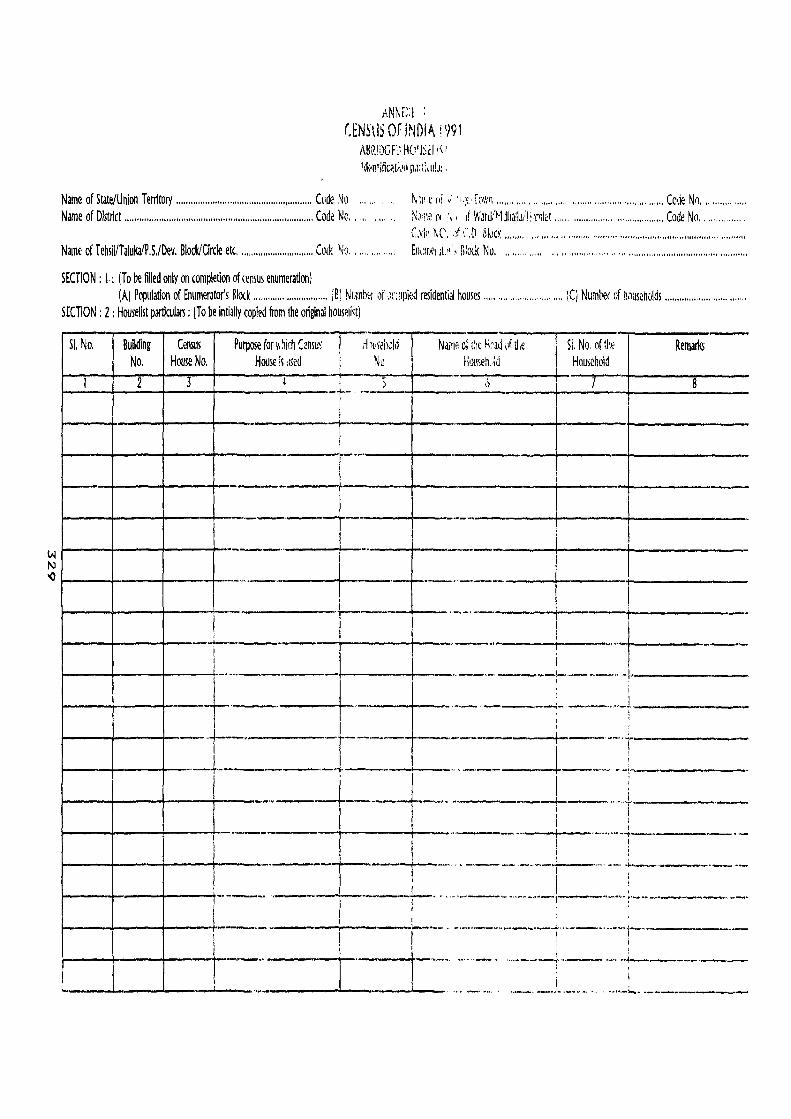
ANNE::f ; CENSUS OF lNOIA ! 991
AURii)GF') H(lINI!\: !~wiRcat;\.'11 pJ::;,LI!J: '
Name of State/Union Territo!)' ....................... "." .. " ......... " .. , ........ " Code No ~ ~Ir,( (II \: 'I):' rown ."",,,,"", " ,,,,, " ... ".,,'" ..... " .. "" ... "" .. ",, .. Cede No, " " ..... , .... . Name of District .... " ........ " ................ " ....... " ............ "." ........... " .... Code No, .. " , , ... '. K)ll\i~ 01 . ." Ii WJrJ/).,l,jha!IJiH·mii~t "", " .. ",,' .. "" """'"'''''''''' Code No. , """ ... " .
C.1(j:' 11.(" ,)f '::,0 Bklck ..... " ... " ". ,,, .. " .... ". " ..... " ... ""' ..... "'''"''''"" .... " ... ,,., ...... ,,,, .. Name of Tehsil/Taluka/P.S.lDev. Block/Circle etc. """ ............... , ..... ". Code No. , " ,,, '" EI)i:III~I.iL\1 " BIOlk No. "" .. ". "." .. " .. "." .... " '''" .,." .... " ... , .... " .. , .. " ............... ", .. ".
SECTION: 1·; (To be filled only on completion of (~nsus enumeration) (Al Population of Enumerator's Block .", ... " .... """" ..... ,," (8) Nlimb~l of Jcupied residential hOllses 'w. ""'"'' ... " .... ' .. " :C) Numbe!' of 11JlIS~holds .. " ....... " ... " ........ ''''''
SECTION; 2 : Houseli!t particulars: (To be inti311y copied from the original hOllseli~tl
~i(h Cznsu~ r~~lilehdd - ,_ -51. No, Building Census Purpose for ~ Naille 01 (he ~?ad of tl1e 51. No of th~ Remar1<s No. House No. HOUlE 11 dsed ! No H\lllleh.l:d Household
2 ~ .-~-
5 - b 8 I _! --t-···_ i 1-----+---
1---'-4---+----+-----'---r-"·'---+----------1r-----+-------J 1
1----1----1-----+---,_='--4-! --+--_.-__ ,.,_, __ --=-=-I ~_=-=_-w I-----l------+---+----=±- -----+--1 ---f----~ --.--,,--+---.-t--.. -.. ,------.---t----I------+----+--~-- - ~- ~=- :---+"~-l--:I-~=---= l.,_~+--t--___ +I '_~ __ . ----_._, ---._)~ ... -.-.--- -t' r-- .. --~ .. ---,.... .. _--+---._-- --,----..;- . _____ ",,_1 ______ ,_
I I i ----- ---,---_ ---.-.-.-.. -----+-'--... -.1'--'-----'-
---~ -----1'-" .. --.-- I _._. -,·1 .. -
1----+---+---;----,-.. ,- ---_J,_ ... ,. ".----+_ :t----I : I------l----+---+-.. ----------I-----+---... ,,--.. -.. -- -I -....... " ..... "t--.. ,-----.,-
I I! --+-1 _ ........ _'._--" .. -.. _ ... ,--- ! ,. .... --... ~-.-,.-----.- --
1----4----+----+-.--.- "---,--+--'"----+-. ·.,"------"., ... --1 ·· .. ····1--·-------·--· t
il i ;
1----+---+--- ----... - --- t --_ .. -1-----_ .. -,-··,--,,, .. ,, .. --·~-!·,,,,--·,··--·t-·--,----I! !: ._-_ ... ,--'---;---I '-_'.-l-'· .. ··.·.,·.··: __ -,~.·· ' .. ·--.. '--~ .. ·--"· .. ·-·~1· -------
... ~ T'~ __ " .. __ ... <1, __ .. ) .... ,,, ...... , .... '" , ..... "" .... i.... .. • _ ..... ____ _

w w o
m~4' 7111ttc'lilT1t
"~oIS"'''T~:.):I!!\~:..----ft~*1i!1f m~' " .... aI_ etA Ccdt No. GI
SECTION: 2 Conld.
51. No. Building Census Purpose for which Census No. House No. House is used
1 2 3 ,
4
Location Code ................................. " .. Page No .............. ..
Household Name of the Head of the SI. No, of the Remarks No. Household Household
5 6 7 8

S ECTIO N : 2 Contd. Location Code , .... '" .. ' .... , .......... , .. ' ...... , Page No ... " .. " .... ,,'
51. No. Building Census Purpose for which Censlls Household Name of the Head of the 51. No. of the R~marks No. House No, House is used No, Household Household
I 2 3 4 5 6 7 8
I , , I
- - -
" __ ,,,,--
.-=t _._-
--. ._-.
- ..-_ .... , ..
~. " .. ~
+ _._ ... I I
•.. ...1. ---~ .... __ ._ .. -__ .1
, i
- --_ ... ,.,_. ~ .... ~.," ..... ---!
--. .1 . __ ........ _, -I __ • __ J ___ •• ___ ~._ .•• __ ."
....... w ... _.
I I --t --- ... _-_._._. "--' _
__ At - --... ,,----
- ~
I - -"-, ...... '.',
~ ------
l-~- ... -.. ._-
-- ~ ~ ! I I
I -- .......... "'._ --Dalf':) S;~nJtllre of Checked and found correct D lid Signature of (h.llgl' O!hCf Clerk ...................... , ............ .. Chare Officer ,,,,, .. ,,,,,,,,,,,,,,,,,,.,, b\,Iil1f: t.ltor ..... "." .... " ... , ........... ..

1,;\~r.X;: II CENSUS Of INDIA 1991
ABRIDGED HOUSELIST Identification p3rticu~rs
Name of St3te/U~ Terrl;rf , , , , , . , , , , ~!~,~~, . , .. , , , , , , , , , , , Code No, , , , , ,5, , " Nam~ of Vi~gefj' ow , , ..... ~~~,~I~,~~ """ ... Code No, , , , , , ~l , , , ,
Name ofD~trict .. ,.,." ....... ,., ~~~.~l~.~~." ..... " .. ,,, Code No ..... 3,~., Name or No, of Wdr,!/i1000liaIHa)ill'et. ... ".,"'" " ..... ,' Code No. , , , .. ~.,., ,
Code No. of c.O Block, , , .. , , , , , :7":, • , , , , . '_" , , ..•• , • , , . , , , . , , .• , ...... .
120 Name oft ehsil/Taluka/P,S.lO€'1, Block/Circle etc. , , , . , . , , , .. , , , . , , , , , Code No, . , ,-:-: .. , , Enumerator's Block No, , , , , , , , , , , , , , , , , . , , , .. , . , , , , , , , , • , , , , , , , , .. , , . ,
SEGION : 1: (To be filled on~ on compl~tion of census enumeration)
(A) Population of Enumerator's Block, , , , . , , . , , , , , , , , , ,(B) Number of occupied residential houies , , , . , , , , . , , , , , " (e) Number of households. , , . , , . , , , , , , , , SrGION: 2: Housel~[ particular!: (To be initially copied from the original hauselist)
Census Purpose for which T Name of the Head of SI.No, of the i 51. No. Building No, House No, Censue House is used Household No. I the Household Household Remarks
-I 2 3 4 5 6 7 8
1. 182 182 (I) Residence 181 (I )(a) Bisheshar 1 I I
I 2, - - - 182 (I) (b) Ghanshyam 2 !
i I 3. - 182 (2) Residence·cum·wooohop 182(2) Ramsaran 3 I
I 4. 183 183 Vacant -. - - Incomplete I
(onmUction
i 5, 184 184 (I) i
Shop·cum·workshop·cum·residenc~ 184 (1) Abdul Kadar 4
! I
184 (2) Laundry I 6, - - - -L
l 7, 185 185(1) Docror'sciinic·Allopathic - - -
I 8, - 185 (2) Book binding workshop - - -
! 9, - 185 (3) Book Shop - - -
1
! I
186 186 Shop·cum·residence 186 Bishandayal 5 1 10. i I ,
, II. 187 167 Shop·cum·workshop·cum·residence 187 K~henlal 6
SECTION: 2ICondd.)
SI.No. Building No.
1 2
12. 188
13. 189
14. -IS. 190
16. -
17. 191
18. -
19. 192
20. -
21. 193
22. -
23. 194
24. -
25. 195
Dated Signawre of Sd/·
Charge Office Clerk .... , .....
Census House No.
3
188
189 (I)
189 (2)
190(1)
190 (2)
191 (I)
191(2)
192(1)
192(2)
193
-
:94(1)
194 (2)
195
. 5/141X1I4 (120) Locaoon Code" " " . " " .. "
Purpose for which Name of the Head of Censue House ~ used Household No. the Household
4 5 6
Schoo~·cum·residence 188 Shivcharan
CommunitY centre - -
Business house - -Shop·cum,residence 190(1) Govlnd Singh
Baithak - -
Workshop·cum·residence 191(1) Ramvati
Cattle shed - -Residence 192 (1) Chand Ram
Cattle shed'rearing for sale of milk - -
Residence 193 (a) Smt. Devika
- 193 (b) Sri Harish Chandra
Workshop·cum·resldence 194(1) Hari Ram
Workshop - -
Residence 195 Dukhiram
Checked and found correct
Charge Officer .•• , ••• W: ... ,
Page No" "..2.. ""
51. No. of the Household Remarks
7 8
7
-
-
8
-
9
-10
-
11
12
13
-
14
Dated Signature of Sd/·
Enumerator ,,,.,," ""

ANNEXEIIl CENSUS OF INDIA t991
ABRIDGED HOUSELIST Identification particulars
Name ofSute/U~ Terr~ .......... ~!~~~ ................ , Code No, .... ? ... Name ofYlJJa{e/Town ... .....•. ~~~~I.B.~~ •. , ........ Code No •.... ~( ..... . Name of Disuict. ., ... " ..... " ., ,~~~~I~.~~ .............. Code No .•.. ~~ ... Name or No. ofWard/Mo~lIa/Haflet ................... Code No ...... ~ .... ..
Code No. of C.D. Block .......... -:; ........................... , ........... .
Name ofTehsilfTaluK~Jll.S.lDev. Block/Circle etc ........ -;-; ........... Code No .. 7':":' •••.• Enumerator's Block No .......... ) ~.~ ................................ " ... .
SECTION: 1: (To be filled on~ on completion of census enumeration)
(A) Population of Enumerator's Block .•.... 1.~~ ......... (B) Number of occupied residential houses ....•... 1.3 ... , .. , . 19
(c) Number of households ....•...........
SECTION: 2: Housel~t particulars: (To be initially copied from the ori~nal housel~t)
Census Purpose for which Name of the Head of SI.No. of the 51. No. Building No. House No. Censue House is used Household No. the Household Household Remarks
1 2 3 ~. , 5 6 7 8
1. 182 182 (1) Residence 181( I) (a) B~heshar 1
2. - - - .j.8~ 0)\81 bRaAsW,aRl ~ Household left
3. - 182 (2) Residence·cum·workshop 182(2) Ramsaran 3
. lint
4. 183 m ¥aeAt - comp~dlndO!£llpitd. - ilt SI, 26 I( 27 InSIC.l.
5. 184 184 (1) Shop·cum·workshop·cum·residence 184 (1) Abdul Kadar 4
6. - 184 (2) Laundry - - -
7. 185 185(1) Doctor's clinic·Allopathic - - -
8. - 185 (2) Book binding workshop - - -
9. - 185 (3) Book Shop - - -
10. 186 186 Shop·cum·residence 186 Bishandayal 5
ll. 187 187 Shop·cum·workshop·cum·residence 187 Kishenlal 6

SECTION: 2 (Concld.)
SI.No. Building No,
1 2
12. 188
13. 189
14. -
15, 190
16, -
17. 191
18. -
19. 192
20, -
2.1. 193
22., -
23, 194
24, -
25, 195
Dated Signawre bt Sd/·
Charge OfficeDerk ...•.•. , ..
Census House No,
3
188
189 (1)
189 (2)
190(1)
~(2)
191 (1)
191(2)
192(1)
192(2)
193
-
194(1)
194 (2)
195
, 5/]4/X1I4 (120) Location Code " , .. , , ........ .. 2 Page No .. , • , .•.•.. ,
Purpose for which Name of the Head of 51. No, of the Censue House is used Household No. the Household Household Remarks
4 5 6 7 8
School·cum·residence 188 Shivcharan 7
Community centre - - -
Business house - Use changed. See - - 51, 29 In Sec 3,
Shop·cum·residence 190(1) Govind Singh 8
iaiIkak - - -
Workshop·cum·residence 191(1) Ramvati 9
IShop - - . Use has changed.
Residence 192 (I) Chand Ram 10
Cattle shed'rearing for sale of milk - - -
~(Teashop .w.;.w ~ ~ Use has changed and household left.
- ~ Sfi HaFisRERaREifa tt
WeFksAe~ ElIflfresid('nce -I#fB 1194(1) (a Hari Ram 13 Use has changed and another household moved in, See 51. 30,
Workshop - - -
Household Residence 195 Dukhiram 14 [ertl~orarily gone on
pligrimage
Checked and found correct Dated Signature of
Charge Officer ...... ~d!: •.... Enumerator .•..• ~~/: · •..

ANNEXEIII CENSUS OF INDIA 1991
ABRIDG£D HOUSEUST Identification particulars
,
Name of State/Ulan Te~ry •.•.....•• ~~~~~ •.....•..••.....• Code No .•••. ~ •..• Name ofVI~ge/Town , ....... , ~~~~~~~,~ , ........ . Code No ..•.•. ~.J .... .
Name of Distric ' .•....•......•... ~~.~I~~~ •.••.•••...... Code No •••• 3.~ •. , Name or No. of Ward/M~allalHam)it ...••...•.......... Code No ...•.•• 4 .••...
Code No, of CtD Block, . , •.. I , •• 7: I I I ••• I iI I If. 0 •• 1 I • I I ••• I i I •• I I I •• I I • I I
Name of TehsilfTalukalP.SJDev. Block/Circle etc ...• :7i' ••••••• , , ..... Code No ... --:-:. . ... Enumerator's Block No ............ ! ~.O ................................... . SECTION: 3: Addenda Section 2: (To record census house/households not covered in Section 2 but found by census enumerator during enumeration)
Census SI.No. BulidingNo. House No.
1 2 3
26. 183 183
27. - -
28. 185/1 185/1
29, - 190 (2)
JO. - -
31. - -
32. - -3J. - -
34. - -
Uated ~Ignawre ot 5d1-
Char~ Office Clerk ........ .
Purpose for which Censue House Is used
4
Residence
-Doctor'sclinic·homeopathic
Balthak·cum·residence
--...
....
-
Household No.
5
183 (a)
183 (b)
-
190(2)
194(1) (b)
0
0
0
0
Checked and found correct SdI'
Supervisor ....• , •••.•..•
Name of the Head of the Household
6
Deosharan
Shlvsharn
-
men Singh
Kishan Ram
Ramlal
Lakhmania
8asmatia
Kedar Singh
SI,No. of the Household Remaru
7 8
15 New household
16 New household
- Newhouse
17 New household
18 New household
0.19 Houseiell nousehold
O-ZO Houseiess ~ousei.~ld
0-21 Houselesshousehold
0·22 Houselell houJehold
Dated Signature of Sd/·
Enumerator ... .. ... .."

APPENDIX VI
LIST OF A FEW TYPICAL INDUSTRIES THAT CAN BE CONDUCTED ON A HOUSEHOLD INDUSTRY BASIS
Foodstuffs
Production of flour by village chakkis or flour mills; milling or dehusking of paddy; grinding of chillies, turmeric, etc.; production of gur, khandsari, boora, etc.; production of pickles, chutney, jams, etc.; processing of cashewnuts; making of dried vegetables; manufacture of sweet-meats and bakery products; production of butter, ghee, etc.; slaughtering and preservation of meat and fish; fish curing, etc.; oil pressing ghani.
Beverages
Manufacture of country liquor, toddy; production of soda water, ice, ice cream, sharebats, etc.; processing of coffee, etc.
Tobacco Products
Manufacture of bidi, cigars, cherroots, tobacco, snuff, etc.
Textile Cotton
Cotton ginning, carding, pressing and baling, spinning, etc.; dyeing and bleaching of cloth; weaving in handlooms or powerlooms or manufacture of khadi; cloth printing; making of fishing nets, mosquito nets, cotton thread, rope, twine, etc.
Textile Jute, Wool or Silk
Similar type of production or processing as mentio!1t:J under Textile Cotton but pertaining to the materia! conCerned.
T extite Miscell.meous
Making of durries, carpets, hosiery, embroidery work; lace garland making; manufacture of chrochet headgear; making of newar, bed covers, (curtains, pillow, pillow cases, etc.); making of mattress, quilt (rezai), etc.; makingofnamda felt, coconut fibre for upholstery; making of brushes, brooms, etc., from coconut fibres; coir spinning; manufacture and repair of umbrellas; manufacture of dols and toys (rags and cotton), etc.
Manufacture of Wood and Wood Products
Sawing and planing of wood, manufacture of wooden furniture, structural goods like beams, door and window frames, etc., wooden agricultural implements and their repair, 'wooden lacquerware, wooden toys, wood carving, sawdust and plaster figure making, inlay work; match splinters,
plywood and veneers, etc.; making palm leaf mats, fans, umbrellas, etc., baskets and broomsticks, caning of chairs; making of chicks and khas khas tatties; making of cart wheels, wooden sandals, etc.
Paper and Paper Products
Manufacture of pulp and paper by hand; making of ellvelopes} paper made articles, card board boxes, paper flower, paper kites, toys, etc.
Printing and Publishing
Printing works, lithography, block-making, book binding, etc.
Leather and Leather Products
Flaying and processing of hides and skins; making leather footwear, wearing apparel of leather and fur; repair of shoes or other leather products.
Rubber, Petroleum and Coal Products
Vulcan ising tyres and tubes; manufacture of chappals from torn tyres and other rubber footwear; manufacture of rubber products from natural and synthetic rubber.
Chemicals and Chemical Products
Manufacture of toys, paints, colours, etc.; manufacture of matches, fireworks, perfumes, cosmetics; manufacture of ayurvedic medicines, soap, plastic products, celluloid goods; manufacture of ink, candles, boot polish, etc.
Non-metallic Mineral Products - other than Petroleum and Coal
Making of bricks, roofing tiles, sanitary fittings, cement statues, stone or marble carvings,· manufacture of stone structurals, stone dressing and stone crushing, mica splitting and manufacture of other mica products; making of earthenware and pottery, crockery, glass beads and bangles, earthen toys; manufacture of glass products, etc.
Basic Metals and their Products except Machinery and Transport Equipment
Manufacture of iron arms and weapons and their service and repair, iron and steel furniture, brass, bell-metal utensils, aluminium utensils, tin utensils, copper utensils, etc.; nickeling and electroplating, blacksmithy; manufacture and repair of agricultural implements such as plough-share, etc.;
337
making Jnd repairing of locks and trunks, cutlery; manufacture of scales, weights and measures and foundry industry, etc.
Machinery (all kinds other than Transport) and Electrical Equipment
Manufacture of small machine tools and parts; repairing and servicing of fans, radios, domestic electrical appliances, etc.
Transport Equipment
Repairing and servicing of automobiles; manufacture of cycle parts, rickshaw parts, boats and barges; manufacture
JJ8
of animal-drawn and hand-drawn vehicles such as bullock carts, wheel barrow, etc.
Miscellaneous Manufacturing Industries
Repair of spectacles, photographic equipment; goldsmithy, silver filigree industry; gold covering work, bidriware; repair of musical instruments, fountain pens; making of cowdung cakes, manufacture of sports goods, repairing of petromax lights; making of buttons and beads from conchshell and horn goods.
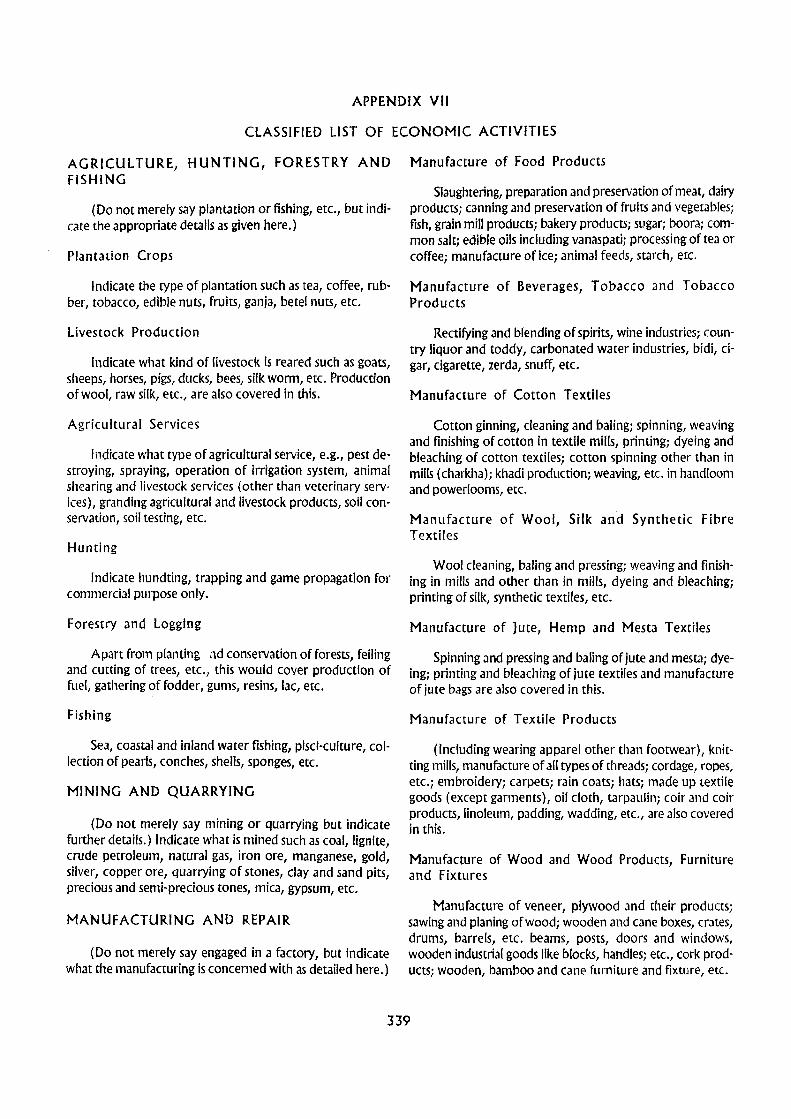
APPENDIX VII
CLASSIFIED LIST OF ECONOMIC ACTIVITIES
AGRICULTURE, HUNTING, FORESTRY AND FISHING
(Do not merely say plantation or fishing, etc., but indicate the appropriate details as given here.)
Plantation Crops
Indicate the type of plantation such as tea, coffee, rubber, tobacco, edible nuts, fruits, ganja, betel nuts, etc.
Livestock Production
Indicate what kind of livestock is reared such as goats, sheeps, horses, pigs, ducks, bees, silk worm, etc. Production of wool, raw silk, etc., are also covered in this.
Agricultural Services
Indicate what type of agricultural service, e.g., pest destroying, spraying, operation of irrigation system, animal shearing and livestock services (other than veterinary services), granding agricultural and livestock products, soil conservation, soil testing, etc.
Hunting
Indicate hundting, trapping and game propagation for commercial purpose only.
Forestry and Logging
Apart from planting ad conservation of forests, felling and cutting of trees, etc., this would cover production of fuel, gathering of fodder, gums, resins, lac, etc.
Fishing
Sea, coastal and inland water fishing, pisci-culture, collection of pearls, conches, shells, sponges, etc.
MINING AND QUARRYING
(Do not merely say mining or quarrying but indicate further details.) Indicate what is mined such as coal, lignite, crude petroleum, natural gas, iron ore, manganese, gold, silver, copper ore, quarrying of stones, clay and sand pits, precious and semi-precious tones, mica, gypsum, etc.
MANUFACTURING AND REPAIR
(Do not merely say engaged in a factory, but indicate what the manufacturing is concerned with as detailed here.)
Manufacture of Food Products
Slaughtering, preparation and preservation of meat, dairy products; canning and preservation of fruits and vegetables; fish, grain mill products; bakery products; sugar; boora; common salt; edible oils including vanaspatii processing of tea or coffee; manufacture of ice; animal feeds, starch, etc.
Manufacture of Beverages, Tobacco and Tobacco Products
Rectifying and blending of spirits, wine industries; country liquor and toddy, carbonated water industries, bidi, cigar, cigarette, zerda, snuff, etc.
Manufacture of Cotton Textiles
Cotton ginning, cleaning and balingj spinning, weaving and finishing of cotton in textile mills, printing; dyeing and bleaching of cotton textiles; cotton spinning other than in mills (charkha)j khadi productionj weaving, etc. in handloom and power(ooms, etc.
Manufacture of Wool, Silk and Synthetic Fibre Textiles
Wool cleaning, baling and pressing; weaving and finishing in mills and other than in mills, dyeing and bleaching; priming of silk, synthetic textiles, etc.
Manufacture of Jute, Hemp and Mesta Textiles
Spinning and pressing and baling of jute and mesta; dyeing; printing and bleaching of jute textiles and manufacture of jute bags are also covered in this.
Manufacture of Textile Products
(Including wearing apparel other than footwear), knitting mills, manufacture of all types of threads; cordage, ropes, etc.; embroidery; carpets; rain coats; hats; made up textile goods (except garments), oil cloth, tarpaulin; coir and coir products, linoleum, padding, wadding, etc., are also covered in this.
Manufacture of Wood and Wood Products, Furniture and Fixtures
Manufacture of veneer, plywood and their productsj sawing and planing of wood; wooden and cane boxes, crates, drums, barrels, etc. beams, posts, doors and windows, wooden industrial goods like blocks, handles; etc., cork products; wooden, bamboo and cane furniture and fixture, etc.
339

Paper and Paper Products and Printing, Publishing and Allied Industries
Manufacture of pulp; paper, paper boards and newsprints; container and paper boxes; printing and publishing of newspapers; periodicals, books, etc., engraving, block making, book binding, etc.
Leather ana Fur Products
Tanning, currying, etc., of leather; footwear (excluding repair); coats, gloves, currying, dyeing, etc., of fur, fur and skin rugs, etc.
Rubber, Plastic, Petroleum and Coal Products
Tyre and tube industries; footwear made of vulcanized or moulded rubber; rubber and plastic products; petroleum refineries; production of coaltar in coke ovens, etc.
Chemical and Chemical Products
Manufacture of chemicals such as acids, alkalis, gases, etc., fertilizers and pesticides; paints, varnishes, drugs and medicines; perfumes, cosmetics, lotions; synthetic resins, etc., explosive and ammunition and fireworks, etc.
Non-metallic Mineral Products
Structural clay products; glass and glass products; earchen ware and earthen pottery; china ware and porcelain ware, cement, lime and plaster; asbes[Os, cement, etc.
Basic Metal Jnd Alloys Industries
Iron and steel industries; casting foundries, ferroalloys; copper, brass, zinc and brass manufacturing, etc.
Metal Products and Parts except Machinery and Transport Equipment
Metal cans from tin-plate, sheets metal, barrels, drums, pails, safe, etc.; structural metal products; metal furniture and fixture; hand tools; utensils, cutlery, etc.
Machinery, Machine tools and Parts except Electrical Machinery
Agricultural machinery, cranes; road rollers; boilers, diesel engine; regrigerators, air conditioners, etc.
Electrical Machinery, Apparatus, Appliances and Supplies and Parts
E,Iectrical motors, generators, transformers, insulated wires and cables; dry and wet batteries; radio, television, etc.; X-ray apparatus; electric computers, etc.
Transport Equipment and Parts
Ship building and repairing locomotives and parts; Raiiway wagons; coaches, etc., rail road equipmentsi motor vehicles; bicycles; aircrafts; push-carts and hand-carts, etc.
Other Manufacturing Industries
Do not say other manufacturing industries but write clearly what is being manufactured like manufacture of medical, surgical and scientific equipments; photogDphic Jlld
optical goods; watches; minting of coins; musical inmunlent\, etc.
ELECTRICITY, GAS AND WATER
Indicate if generation and transmission of elenric €i 1-
ergy or distribution is involved, e.g., manufacture of gas in gas works and its distribution; water supply, i.e., colltction purification and distribution of water. llL
CONSTRUCTION
(Do not merely say engag('d in conmunion bur ~Ive further particulars. Cle.1r details of thf' type \)1 (OllStlTIClit)11
and maintenance such as buildings, road. r.lil,v.IY~, (1'(.':: '.Ipli, telephone, water ways Jllel warel l'flU \ CI " ! 1 1 '.,1;,~ fJ.'rtl k projects, industl'iJl plJnl.S, activities allied Lv (ol)<tru,:tior, su<.h as plumbillg, hcati'lg ,1nd air conditioning installation, setting of tiles, l11arble~, bl icks, ftC. constructioll of electrical installation, etc., should be given.)
WHOLESALE AND RETAIL 1 Ri\DE AND RESTAURANTS AND HOTlL ')
Food, Textiles, Live AIJilll.Jh, Beverages Jnd Intoxicants
Indicate clearly that the wholesale trade is done in cereals, pulses; foodstuff; textiles al1d textile products, e.g_, garments, shirting, etc., beverages, intoxicants like wines .. opium, ganja, tobacco, etc.; wholesale'trade in animals. Hraw and fodder is also covered in this.
Fuel, Light, Chemicals, Perfumery, Ceramics and Glass
Wholesale trade in medicines, cliemic.lls, fuel lighting products; toilets; porcelain, glass utensil, crockery, etc.
All types of Machinery, Equipment, including Transport and Electrical Equipment
Agricultural and industrial machinery, e.g., harvesters, threshers, etc.; electrical machinery; transport equipl11ents, etc.
340

Miscellaneous Manufacturing
Wholesale trade in furniture, rubber and rubber products, building materials; clocks, etc.; eye-glasses, etc.; medical and surgical instruments; precious metals, stones and jewellery, etc.
Retail Tradfe in Food and Food Articles, Beverages, Tobacco and Intoxicants
Indicate clearly that the retail trade is carried In grocery, vegetable, fruit selling, meat, poultry, bakery products, dairy products, pan, bidi, aerated water, etc.,
Retail Trade in Textiles
Do not merely say engaged in retail trade in Textile, but indicate clearly what the retail trade is concerned with. Dealers in textile (non ready-made), ready-made garments, are some examples.
Retail Trade in Others
Indicate clearly what kind of retail trade it is, like medical shops, booksellers, building material. etc.
Restaurants and Hotels
Restaurants, cafes and other eating places, hotels, rooming houses, camps and other lodging places.
TRANSPORT, STORAGE AND COMMUNICATION
(Do not merely say engaged in land, water, air transpon
341
but give funher paniculars.) Indicate what kind of transport such as rialways, tramways, motor buses, bullock carts, ekka, tonga, etc.; ocean and coastal water, inland water transport, air transpot, services rendered to transpon such as packing, crating, travel agencies, etc. It also includes storage, warehousing, communication such as postal, telegraph, wireless, telephone, etc.
FINANCING, INSURANCE, REAL ES'I ATE AND BUSINESS SERVICES
Indicate clearly whether services belong to banking; credit institutions other than banks, e.g., loan societies, agricultural credit institutions, etc., money lenders, financiers, etc. provident services, insurance carriers life, fire, marine, accident, health, etc. It also includes business services, e.g., purchase and sale agents and brokers; auctioneering, accounting; data processing, engineering; advenising services, etc.; legal services rendered by advocates, barristers, peladers, etc.
COMMUNITY, SOCIAL AND PERSONAL SERVICES
It should be clearly indicated whether service belongs to public administration, union government, state government, police service, quasi-government bodies, pnitary services, education, scientific and research, etc.
Personal Services
Do not merely say engaged in personal service but indicate clearly whether it is domestic service, services relating to laundaries, cleaning and dyeing plants, hair dressing photographic studios, international and other extra territorial bodies, etc.

APPENDIX VIII
CLASSIFIED LIST OF OCCUPATIONS i.e., DESCRIPTION OF WORK
(Questions 15A and 15B)
Professional, Technical and Related Workers
(Do not merely sayan Engineer, Doctor, Teacher, etc., in describing the work of an individual but furnish more precise particulars as given below.) Indicate clearly in respect of engineers [0 what branch they belong such as civil, mechanical, electrical, metallurgical, mining, etc. In respect of physicians, scare ifcheyare allopathic, ayurvedic, homoeopachic, etc. Physiologists and dentiSts, etc., should be recorded. As regards teachers, state if they are university teachers, secondary school, middle school, primary school or kindergarten teachers. There are various other types of chemists, physicists, archaeologists, nurses, pharmacists, health technicians, jurists, social scientists such as economists, statistiCians, geographers, historians, anthropologists, etc., as also artisits, writers, painters, sculptors, actors, etc., draughtsmen, laboratory assistants, librarians, ordained religious workers, astrologers, etc., who will have to be recorded with particulars of theirwork.
Administrative, Executive and Managerial Workers
(Do not merely say Government Officer, an officer in a private firm or concern but give further particulars.) They may be in government service or under a local body or in a business firm, manufacturing establishment or a catering establishment or a transport company and so on. Their full description should be recorded such as for example, Secretary to the Government of India, District Collector, Municipal Commissioner, Executive Officer of a Panchayat, Director of a firm, Manager of a business concern, Proprietor and Manager of a hotel, elected and legislative officials, aircrafts and ships officers, etc.
-Clerical Workers
(Do not merely denote the work of a person as clerk or office worker but furnish further particulars.) State clearly the type of work done such as, cashier, accountant, stenographer, typist, computing clerk, key punch operator, office assistant, guard, brakeman, traffic controller, railway ticket inspector, postman, telephone/teleprinter/wireless operator, record keeper, despatcher, etc., office workers would also include peons, daftries, etc.
Sale Workers
(Do not merely say a worker in a shop but give details.) It should be clearly recorded whether the proprietor of a business concern engages himself in wholesale or retail trade. Salesman or shop assistants, agents of insurance, brokers in
share, auctioneers, commercial, travellers, hawkers and street vendors, money lenders, pawn brokers, etc., wIll also be covered.
Service Workers
(There are all types of service workers such as those engaged as domestic servants or in personal services or in police service or watch and ward, etc. Give precise particulars.) Hotel and restaurant keepers, house-keepers, matrons, and stewards (domestic and institutional), cooks, waiters, bartenders and related workers (domestic and institutional) maids and related house-keeping service workers, building care-takers, sweepers, cleaners and related workers, launderers, dry cleaners and pressers, hair dressers, beauticians and related workers, protection service workers, such as watchmen, chowkidars, gate keepers, etc., other service workers.
Farmers, Fishermen, Hunters, Loggers, etc. and Related Workers
Deep sea fishermen, inland river water fishermen, shell gatherers, forest rangers, charcoal burners, forest product gatherers, plantation managers, farm machine operators, gardeners, toddy tappers, rubber tappers, hunters, bird trappers, etc., will be covered.
Production and Other Related Workers, Transport Equipment Operators and Labourers
(This may cover a very large variety of craftsmen and operators, etc., whose work will have to be given in adequate detail.) Examples: minerals, Quarrymen, well drillers, cotton ginners, spinners, dyers, knitters, lace makers, carpet makers, etc., tailors, cutters,· hat makers, embroiderers, shoe makers or repairers; saddle makers, leather cutters, etc., blacksmiths furnacemen, moulders, etc., cart builders, wheel wrights, cabinet makers, etc., stone cutters, bricklayers, masons, hut builders, thatchers, well diggers, etc., jewellers, goldsmiths, watch and clock makers or repairers, welders and plate cutters, sheet metal workers, machine tool operators, electricians, electrical and electronic wire fitters, radio mechanic, electric linemen, cable jOinters, carpenters, joiners, sawers, etc., printing type machine operators, proof readers, photo-litho operators, book binders, potters, moulders, firemen, kilnmen, blowers and makers of glass, millers, bakers, confectioners, sweetmeat makers, food canners, coffee or tea planters, tobacco curers, graders and blenders of tobacco, bidi or cigar makers, snuff or zarda makers, tyre builders, crane or hoist operators, loaders and unloaders, ecc.
342
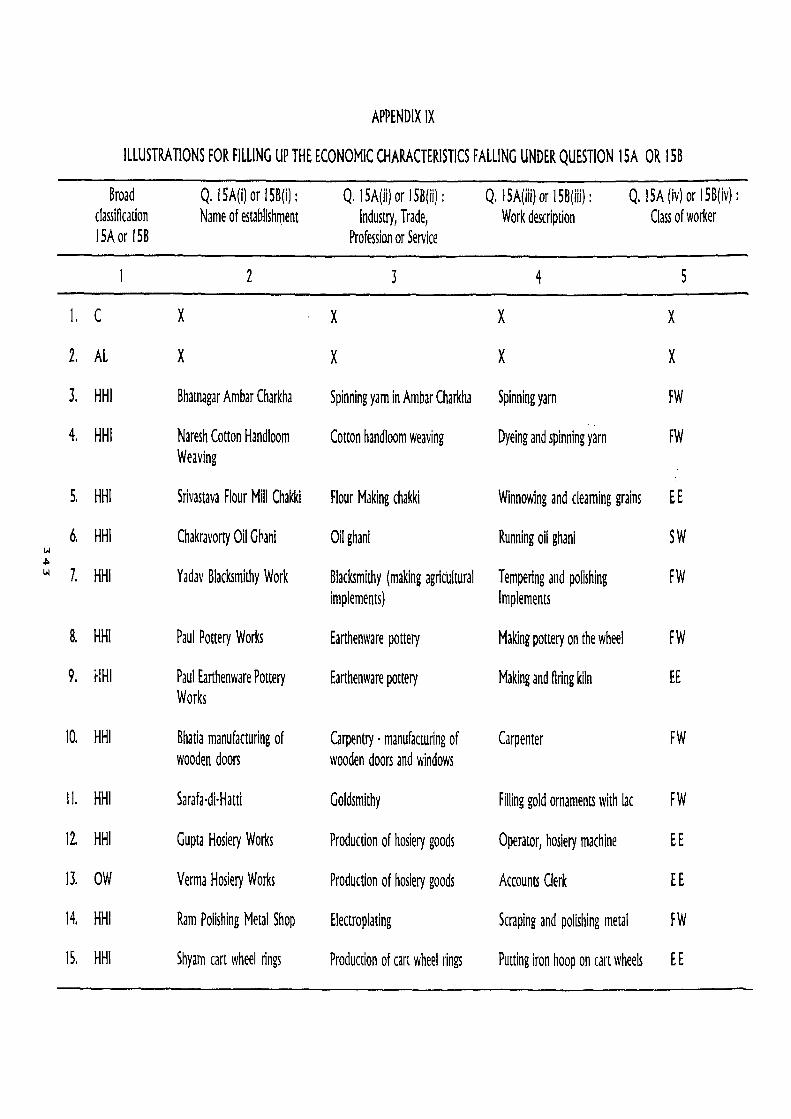
APPENDIX IX
ILLUSTRATIONS FOR FILLING UP THE ECONOMIC CHARACTERISTICS FALLING UNDER QUESTION lSA OR 158
Broad Q. I SA (i) or 15B(i) : Q. 15A(U) or 15B(ii) : Q. ISA(iIi) or ISB(iii) : Q. lSA (iv) or 15B(iv) : classification Name of establishment Industry, Trade, Work description Class of worker ISAor 15B Profession or Service
2 3 4 5
l. C X X X X
2. AL X X X X
3. HHI Bhatnagar Ambar Charkha Spinning yarn in Ambar Charkha Spinning yarn FW
4. HHI Naresh Cotton Handloom Cotton handloom weaving Dyeing and spinning yarn FW Weaving
5. HHI Srivastava Flour Mill Chakki Flour Making chakki Winnowing and ciearning grains EE
6. HHI Chakravorty Oil G~ani Oil ghani Running oil ghani SW t.I
'" t.I 7. HHI Yadav Blacksmithy Work 81acksmithy (making agricultural Tempering and polishing FW implements) Implements
8. HHI Paul Pottery Works Earthenware pottery Making pottery on the wheel FW
9. HHI Paul Earthenware Pottery Earthenware pottery Making and firing kiln EE Works
10. HHI Bhatia manufacturing of Carpentry· manufacturing of Carpenter FW wooden doors wooden doors and windows
II. HHI Sarafa·di·Hatti Goldsmithy Filling gold ornaments with lac FW
12. HHI Gupta Hosiery Works Production of hosiery goods Operator, hosiery machine EE
13. OW Verma Hosiery Works Production of hosiery goods Accounts Clerk EE
14. HHI Ram Polishing Metal Shop Electroplating Scraping and polishing metal FW
15. HHI Shyam cart wheel rings Production of cart wheel rings Putting iron hoop on cart wheels EE

APPENDIX IX
ILLUSTRATIONS FOR FILLING UP THE ECONOMIC CHARACTERISTICS FALLING UNDER QUESTION ISA OR ISB
Broad Q. 15A(i) or 158(1) : Q. 15A(ii) or J SBUI) : Q. 15A(iII) or 15B(IR) : Q. lSA (Iv) or 15BIlv) : classification Name of establishment Industry, Trade, Work description Class of worker 15Aor J5B Profession or Service
2 3 4 5
16. OW Ram Hair Cutting Saloon Hair Cutting Barber SW
17. OW Ram Bee-keeping Shop Production of honey Bee-keeping SW
18. OW Ram's livestock raising Livestock raising Tending cattle FW business
19. OW State Government Forest logging in forest Cutting trees in forest EE Department
20. OW Ramesh Tutorial Private tuition . primal)' classes Tutor SW
~ 21. OW Ram's gardening orchard Fruit growing-mango Gardener In mango orchard EE ~ ~
22. OW Muthuswamy Coffee Estate Coffee plantation Farm labourer EE
23. OW Northern Railway Rail transport Travelling Ticket Inspector EE
24. OW Indian Ceramic Institute Research in manufacturing of Senoir Sdentmc Officer EE ceramic products (Ceremlc Research)
25. OW Office of the Registrar Central government service Senior Research Officer EE General, India (Central Govt.) (Vital Statistics)
26. OW Gypsum Supply Co. Supplying gypsum on orders Contractor supplying gypsum to ER Sindri Fertilizer Factory
27. OW Chittaranjan Locomotives locomotive factory Accountant EE
28. OW Delhi Railway Station Rail transport Goods shed porter EE
29. OW C.P.W.D. Road Construction Manual labourer (on muster roll), EE digging earth

30. OW Ram1s house construction work House construction Labourer, brick laying EE
31. OW Vegetable market place Vegetable market labourer General labourer SW carrying goods
32. OW Delhi Electric Supply TransmissIon of electricity with Machine Operator, electricity EE Corporation Sub· Station the help of transformer (State Govt. Undertaking)
33. OW Madan Brothers Retail shop In stationery stores Shop Ass~tant FW
34. OW Sahu and Co, Wholesale store for grains and Proprietor, wholesale trade FW cereals
35. OW Dayanand and Sons Retail shop of readymade garments Salesman FW and hosiery
36. OW Kaka Agrico. Dealing In hardware Sales Manager EE
37. OW Indian Iron and Steel Company, Manufacturer of iron and steel Boiler room foreman EE Bumpur (Public Undertaking) structurals
1,H
38. OW Indian Airlines Corporation Air T ranspon Air Pilot EE ... UI (Public Undertaking)
39. OW State Motor Transport Motor Transport Service Bus Driver EE Undertaking
40, OW Prakash Transport Service Goods Transport by Motor Truck Working proprietor ER
41. OW Medical College, Calcutta Medical and Health Service Radiologist EE Radiology Department of state
42. OW LC.A,R. Pusa, Deihl (Autono· Plant Protection Research Plant Nutritionist EE mous Body under Central Govt,)
43. OW Bimla Sugar Factory Sugar Factory Chemist EE
44. OW Akash Chemical and Pharma· Manufacturer of antibiotics Chemist EE ceutleal Factory
45. OW 1.1.C. Delhi (Public Undertaking) life Insurance Business Secretary Administration EE

APPENDIX IX
ILLUSTRA TlONS FOR FILLING UP THE ECONOMIC CHARACTERISTICS FALLING UNDER QUESTION ISA OR 158
Broad Q. 15A(i) or 15B(i) : Q. 15A(ii) or 15B(H) : Q. 15A(iii) or 15B(iii) : Q. 15A (iv) or lSB(iv) : classification Name of establishment Industry, Trade, Work description Class of worker ISAor 15B Profession or Servlce
I 2 3 4 5
46. OW Government of T ami! Nadu State Government Service Assistant Secretary EE (Commerce and Industry Department)
47. OW -do· ·do· U.D.C. EE
48. OW Kundan Brothers, Jewellers, Jewellery works Supervisor FW ]aipur
49. OW Lalit's domestic servant Domestic Service Cook EE
SO. OW Ashoka Hotel, New Delhi Residential hotel Cook EE w .j\. 51. OW Club Recreation club Bearer EE 0..
52. OW Ram's Grocery shop Retail trade in grocery Working proprietor SW
53. OW BhHai Steel Plant (Publk Steel Proudction Chartered Accountant EE Enterprise)
54. OW Howrah Jute Mill Manufacture of lute product5 Accountant EE in mill
55. OW ABC Film Studio Production of feature films Cinema Actor SW
56. OW Ruparekha Company Commercial sign painting Sign Painter EE
57, OW Portland Cement Co. Cement manufacturing Canvass bag maker EE
58. OW ABC Stock Exchange Share broker Share broker in tea & jute SW
59. OW ABC Business House Ltd. Discounting of bills of business Managing Director ER firms

60. OW Ramchandra Engineering Co. General engineering works Die Caster EE
61. OW ABC Paint Factory Manufacture of paints Ochra Grinder EE
62. OW Solan Breweries Brewery factory Distillation Plant Operator EE
63. OW ABC Chemical Factory Manufacturing of hydro chloric Grinder E£ acid
64. OW ABC Re·Rolling Mills Steel re·rolllng works Cleaner EE
65. OW ABC Cinema Cinema house Gate Keeper EE
66. OW ABC Engineering Works Iron and steel foundry Moulder EE
67. OW ABCOi! Mill Manufacture of mustard oil Foreman, Packing Department EE
68. OW ABC Company Motor body building factory Foreman, Saw MlII EE
69. OW ABC Aluminium Company Aluminium FactOlY Foundry Caster EE
70. OW ABC Iron Factory Iron foundry works Furnaceman, Boiler Shop EE Vol 0/> ~ 71. OW State Government Printing Printing works Mono Operator EE
Press
72. OW ABC Small Tool Small tool production Brass Turner EE
73. OW ABC Social Welfare Board Social welfare organisation Honorary Social Worker SW
74. OW Lok Sabha, Delhi Parliamentary Work Member of Parliament SW
75. OW Ramkishan Writer Writing for newspapers and Freelance Journalist SW periodicals
76. OW ABC Party Promotion of party's political work Political worker SW
77. HHI Ramchandra & 50ns Manufacture of silver jewellery Polishing silver ornaments EE
78. HHI Ramchandra & Sons Manufacture of silver jewellery Making of silver ornaments FW
79. OW P.K. Blur & Co. Manufacture of silver jewellery Proprietor ER
80. OW P.K. BhJr & Co. Manufacture of silver jewel~ry Accountant EE

APPENDIX IX
ILLUSTRATIONS FOR FIlliNG UP THE ECONOMIC CHARACTERlSTICS fALLING UNDER QUESTION 15A OR 158
Broad Q, ISA(I) or 15B(I) : Q, I SAIlI) or 158(1) : Q. 1 SA(fti) or 15B(I«) : Q. lSA (iv) or 15B(1v) : classification Name of establishment Industry, Trade, Work description Class of worker ISAor 158 Profession or Service
2 3 4 5
81. OW P,K. Boor & Co. Manufacture of sliver jewellery Sales Worker FW
82. OW Office of the Divisional Rail Transport Accounts Clerk EE Superintendent, Northern Railway
83. OW Raj & Co. Readymade garment shop (Retail) Proprietor ER
84. OW Raj & Co. Readymade garment shop (Retail) Salesman EE
85. OW Raj & Co. Readymade Garment shop (Retail) Sales Worker FW
~ 86. OW Madras Stores Grocery shop (Retail) Owner and seller SW 0)
87, OW Chunilal Rameshwarlal Wholesellers in cotton textile Working Partner* SW
88. OW Chunilal Rameshwarlal Wholesellers in cotton textile Purchase Clerk EE
89, OW Chunilal Rameshwarlal Wholesellers In cotton textile Working Partner* SW
t A Sleeping partrer is not a worker.
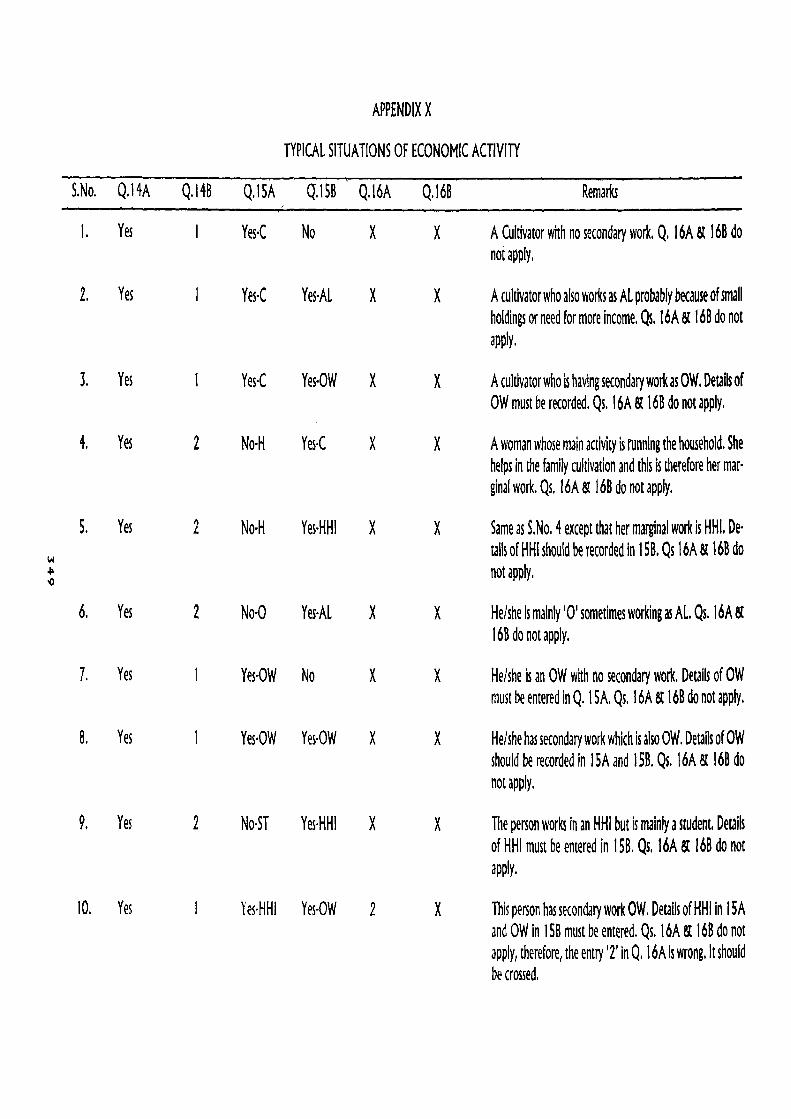
APPENDIX X
TYPICAL SITUATIONS OF ECONOMIC ACTIVITY
S.No. Q.14A Q.148 Q.15A 0.158 Q.16A Q.16B Remarks
I. Yes Yes{ No X X A Cultivator with no secondary work. Q. 16A & 168 do not apply.
2, Yes Yes{ Yes·AL X X A cultivator who also works as AL probably because of small holdings or need for more income. Qs. 16A & 168 do not apply.
3, Yes Yes.( Yes·OW X X A cultivator who is having secondary work as OW. Details of OW must be recorded, Qs, 16A & 168 do not apply,
4. Yes 2 No·H Yes{ X X A woman whose main activity is running the household. She helps in the family cultivation and this Is therefore her mar· ginal work. Qs. 16A & 168 do not apply.
5. Yes 2 No·H Yes·HHI X X Same as S.No. 4 except that her marginal work is HHI. De·
\i.i tails of HHI should be recorded In 158. Qs 16A & 168 do
~ not apply. ..,
6. Yes 2 No·O Yes·Al X X He/she is mainly 10' sometimes working a5 AL. Qs. 16A & 168 do not apply.
7. Yes Yes·OW No X X He/she Is an OW with no secondary work, Details of OW must be entered in Q. ISA, Qs. 16A & 168 do not apply.
B. Yes Yes·OW Yes·OW X X He/she has secondary work which is also OW. Details of OW should be recorded in 15A and 158. Qs, 16A & 168 do not apply.
9. Yes 2 No·ST Yes·HHI X X The person works in an HHI but is mainly a student, Details of HHI must be entered in 158. Qs. 16A & 168 do not apply.
10. Yes Yes·HHI Yes·OW 2 X This person has secondary work OW. Details of HHI in ISA and OW in 158 must be entered. Qs. 16A & 168 do not apply, therefore, the entry' 2' in Q. 16A is wrong, It should be crossed,

APPENDIX X
TYPICAL SITUA nONS OF ECONOMIC ACTIVITY
S.No. Q.14A Q.14B Q.15A Q.158 Q.16A Q.16B Remarks
II. NO-H 2 X A man with no economic activity and not looking out for a job.
12. No-H 2 Like S. No. II, except that he is looking for a job and has not worked before.
13. No-ST 2 X A full-time student not looking for a job.
14. No-R Yes-AL No 2 X This is an incorrect entry. If there is NO in Q. 14A there cannot be an entry in Q. ISA and 158. The entries in Qs. 16A and 16B are, however, correct.
IS. No-R Yes-OW No This is an incorrect entry for the same reasons as in S. No. 14. Either the entry in Q. 14A is wrong or that in Q. I SA. But if the entry in Q. 14A is right the entries in Qs. 16A & 168 can be correct. Needs re-questioning by the enumera-
~ tor, because it is likely that the person is doing some mar-V1 0 ginal work in which case the entry in Q. 14A would have
been Yes, 148 'No' i.e., '2', 15A 'No' i.e., 'R', 158 'Yes' I.e., 'OW' and Qs. 16A & 168 do not app~, While writing, the enumerator may have made a mistake initially.
16. Yes 2 No·H No X X The entry in 158 is wrong. It should be 'Yes', i.e., any of the four categories, because of 'Yes' in 14A and No-H in 15A. This is a person who is mainly doing household duties and has some marginal work. The latter as reflected in 14 A must be reflected in 15B. Note that Qs. 16A & 16B do not apply.
17. Yes Yes-HHI Yes{ X X If the person has mostly worked as HHI as recorded in I SA, then cultivation is evidently only secondary work. Qs. 16A & 16B do not apply.
18. Yes Yes-OW Yes{ X X The person is mainly OW but carries on cultivation as sec-ondary work. For example, he/she may be a government officer carrying on cultivation under his/her personal super-vision. Qs. 16A & 16B do not apply,

APPENDIX XI
STATEMENT SHOWING POST-GRADUATE DEGREE HOLDER AND TECHNICAL PERSONNEL SCHEDULES RECEIVED, ISSUED AND RETURNED
Name ofTownNlllage .......................................................... Location Code ........................ : ............................. ..
1. Total Number of fonus received -----------------------------------------------
2. Number of forms handed over to Households ----------------------------------------,
3. Number of filled in forms collected ---------------------------
4. Number of undistributed forms -----------------------------------------------
Dated Signature of Enumerator
351

APPENDIX XII
GUIDELINES FOR DETERMINING WHETHER A PERSON IS AN EX·SERVICEMAN
51. No. Question An~er Meaning Remarks
1. Are you an ex-serviceman? Yes Doubtful Needs verification
2. Are you in receipt of any Yes Confirmed No further pension? ex-serviceman verification
3. If 'No' to 2 Yes Confirmed No further Did you receive any ex-serviceman verifica tion gratuity at the time of retirement?
4. If 'No' to 3 Any date Confirmed he is No further When did you retire? after 1 st not an ex-serviceman verification
July, 87
Any date Doubtful Needs verification before 1 st July, 1987
5. If date b~fQre 1st ]1.11. 87 Dismissed or Confirmed not No further Why did you retire? Discharged an ex-serviceman verification
Took Doubtful Needs verification premawre retirement
6. How much service did Less than Confirmed not No further you do in Armed Forces? five years an ex-serviceman verification
More than Confirmed No further five years ex-serviceman verification