Census of India 2011 - KARNATAKA
190
Census of India 2011 KARNATAKA SERIES-30 PART XII-B DISTRICT CENSUS HANDBOOK KOPPAL VILLAGE AND TOWN WISE PRIMARY CENSUS ABSTRACT (PCA) DIRECTORATE OF CENSUS OPERATIONS KARNATAKA
-
Upload
khangminh22 -
Category
Documents
-
view
18 -
download
0
Transcript of Census of India 2011 - KARNATAKA

Census of India 2011
KARNATAKA
SERIES-30 PART XII-B
DISTRICT CENSUS HANDBOOK
KOPPAL
VILLAGE AND TOWN WISE
PRIMARY CENSUS ABSTRACT (PCA)
DIRECTORATE OF CENSUS OPERATIONS KARNATAKA


© Government of India copyright, 2014.
The maps included in this publication are under © Government of India copyright, 2014.
The responsibility for the correctness of internal details rests with the publisher.
The territorial water of India extend into the sea to a distance of twelve nautical miles measured from the appropriate base line.
The external boundaries and coastlines of India agree with the Record/Master Copy certified by Survey of India.


CENSUS OF INDIA 2011 KARNATAKA
SERIES-30 PART XII-B
DISTRICT CENSUS HANDBOOK KOPPAL
VILLAGE AND TOWN WISE
PRIMARY CENSUS ABSTRACT (PCA)
Directorate of Census Operations, KARNATAKA

MOTIF
PRE-HISTORIC SITE
This site is situated in a thick forest on the higher levels of a hill at
Hirebenkal village, 10 km. away from Gangawati taluk. Closely to the east of
the dolmens is a natural tank. Each dolmen originally consisted of ricked
slabs, four for the sides and one each for the top and the bottom. No mortar
has been used, but each slab is so arranged as to act as support for the
other. Cubic in form the dolmens vary in size, some of them measuring
about 9ft. each way. The slabs are about 6 inches thick and appear to have
been obtained by splitting rocks with the help of fire. Usually there is a
circular or semicircular hole in one of the side slabs, the purpose of which is
not known. The dolmens stand on the rocks and the remains of the dead,
along with a few pieces of pottery are found deposited beneath the bottom
slab.
Source-Archaeological Survey of India

Pages
1 1
2 3
3 4
4 6
5 8
6 16
7 17
8 19
9
(i) 24
(ii) 29
(iii) 37
(iv) 49
(v) 57
(vi) 65
(vii) 145
10 Section –II Tables based on Households Amenities and Assets (Rural/Urban) at District and Sub-District level.
(i) Table -1: Households by Ownership status and by Number of Dwellingrooms occupied in the District, 2011 161
Contents
Administrative setup and jurisdictional changes during the decade 2001-2011
Important Statistics
District Highlights - 2011 Census
Brief History of the District
Foreword
Preface
Acknowledgement
History and Scope of the District Census Handbook
Urban PCA-Town wise Primary Census Abstract
Section - I Primary Census Abstract (PCA)
Brief note on Primary Census Abstract
District Primary Census Abstract (General)
Appendix to District Primary Census Abstract Total, Scheduled Castes andScheduled Tribes Population - Urban Block wise
Primary Census Abstract for Scheduled Castes (SC)
Primary Census Abstract for Scheduled Tribes (ST)
Rural PCA-C.D. blocks wise Village Primary Census Abstract

(ii) Table -2: Percentage distribution of Households living in Permanent,Semi permanent and Temporary houses, 2011 162
(iii) Table -3: Number and Percentage of Households by main source ofDrinking water, 2011 164
(iv) Table -4: Number and Percentage of Households by main source ofLighting, 2011 166
(v) Table -5: Number and Percentage of Households by type of Latrinefacility, 2011 168
(vi) Table -6: Number and Percentage of Households by type of Drainageconnectivity for waste water outlet, 2011 170
(vii) Table -7: Number and Percentage of Households by availability ofKitchen facility, 2011 171
(viii) Table -8: Number and Percentage of Households by type of fuel used forCooking, 2011 172
(ix) Table -9:Number and Percentage of Households availing Bankingservices and number of Households having each of thespecified Assets, 2011
174

1
FOREWORD
The District Census Handbook (DCHB) is an important publication of the Census Organization since 1951. It contains both Census and non Census data of urban and rural areas for each District. The Census data provide information on demographic and socio-economic characteristics of population at the lowest administrative unit i.e. of each Village and Town and ward of the District. The Primary Census Abstract (PCA) part of this publication contains Census data including data on household amenities collected during 1st.phase of the Census i.e. House Listing and Housing Census. The non Census data presented in the DCHB is in the form of Village Directory and Town Directory contain information on various infrastructure facilities available in the village and town viz; education, medical, drinking water, communication and transport, post and telegraph, electricity, banking, and other miscellaneous facilities. Later on, the Telegraph Services were closed by the Government of India on 15th. July, 2013. The data of DCHB are of considerable importance in the context of planning and development at the grass-root level.
2. In the 1961 Census, DCHB provided a descriptive account of the District,administrative statistics, Census tables and Village and Town Directory including Primary Census Abstract. This pattern was changed in 1971 Census and the DCHB was published in three parts: Part-A related to Village and Town Directory, Part-B to Village and Town PCA and Part-C comprised analytical report, administrative statistics, District Census tables and certain analytical tables based on PCA and amenity data in respect of Villages. The 1981 Census DCHB was published in two parts: Part-A contained Village and Town Directory and Part-B the PCA of Village and Town including the SCs and STs PCA up to Tahsil/Town levels. New features along with restructuring of the formats of Village and Town Directory were added. In Village Directory, all amenities except electricity were brought together and if any amenity was not available in the referent Village, the distance in broad ranges from the nearest place having such an amenity, was given.
3. The pattern of 1981 Census was followed by and large for the DCHB of 1991Census except the format of PCA. It was restructured. Nine-fold industrial classification of main workers was given against the four-fold industrial classification presented in the 1981 Census. In addition, sex wise population in 0-6 age group was included in the PCA for the first time with a view to enable the data users to compile more realistic literacy rate as all children below 7 years of age had been treated as illiterate at the time of 1991 Census. One of the important innovations in the 1991 Census was the Community Development Block (CD Block) level presentation of Village Directory and PCA data instead of the traditional Tahsil/Taluk/PS level presentation.
4. As regards DCHB of 2001 Census, the scope of Village Directory was improvedby including some other amenities like banking, recreational and cultural facilities, newspapers & magazines and `most important commodity’ manufactured in a Village in addition to prescribed facilities of earlier Censuses. In Town Directory, the statement on Slums was modified and its coverage was enlarged by including details on all slums instead of ‘notified slums’.
5. The scope and coverage of Village Directory of 2011 DCHB has been widenedby including a number of new amenities in addition to those of 2001. These newly

2
added amenities are: Pre-Primary School, Engineering College, Medical College, Management Institute, Polytechnic, Non-formal Training Centre, Special School for Disabled, Community Health Centre, Veterinary Hospital, Mobile Health Clinic, Medical Practitioner with MBBS Degree, Medical Practitioner with no degree, Traditional Practitioner and faith Healer, Medicine Shop, Community Toilet, Rural Sanitary Mart or Sanitary Hardware Outlet in the Village, Community Bio- gas, Sub Post Office, Village Pin Code, Public Call Office, Mobile Phone Coverage, Internet Cafes/ Common Service Centre, Private Courier Facility, Auto/Modified Autos, Taxis and Vans, Tractors, Cycle-pulled Rickshaws, Carts driven by Animals, Village connected to National Highway, State Highway, Major District Road, and Other District Road, Availability of Water Bounded Macadam Roads in Village, ATM, Self-Help Group, Public Distribution System(PDS) Shop, Mandis/Regular Market, Weekly Haat, Agricultural Marketing Society, Nutritional Centers (ICDS), Anganwadi Centre, ASHA (Accredited Social Health Activist), Sports Field, Public Library, Public Reading Room, Assembly Polling station, Birth & Death Registration Office. In the Town Directory, seven Statements containing the details and the data of each Town have been presented viz.; (i)-Status and Growth History of Towns,(ii)- Physical Aspects and Location of Towns, (iii)-Civic and other Amenities, (iv)-Medical Facilities, (v)-Educational, Recreational & Cultural Facilities, (vi)- Industry & Banking, and (vii)- Civic & other amenities in Slums respectively. CD Block wise data of Village Directory and Village PCA have been presented in DCHB of 2011 Census as presented in earlier Census.
6. The data of DCHB 2011 Census have been presented in two parts, Part-Acontains Village and Town Directory and Part-B contains Village and Town wise Primary Census Abstract. Both the Parts have been published in separate volumes in 2011 Census.
7. The Village and Town level amenities data have been collected, compiled andcomputerized under the supervision of Sri T. K. Anil Kumar, Director of Census Operations, Karnataka. The task of Planning, Designing and Co-ordination of this publication was carried out by Dr. Pratibha Kumari, Assistant Registrar General (SS) under the guidance & supervision of Dr. R.C.Sethi, Ex-Addl. RGI and Shri Deepak Rastogi present Addl.RGI. Shri A.P. Singh, Deputy Registrar General, (Map) provided the technical guidance in the preparation of maps. Shri A.K. Arora, Joint Director of Data Processing Division under the overall supervision of Shri M.S.Thapa, Addl. Director (EDP) provided full cooperation in preparation of record structure for digitization and validity checking of Village and Town Directory data and the programme for the generation of Village Directory and Town Directory including various analytical inset tables as well as Primary Census Abstract (PCA). The work of preparation of DCHB, 2011 Census has been monitored in the Social Studies Division. I am thankful to all of them and others who have contributed to bring out this publication in time.
(C.Chandramouli) Registrar General &
Census Commissioner, India New Delhi. Dated:- 16-06-2014

3
PREFACE Dr. C. Chandramouli, I.A.S. the Registrar General & Census Commissioner, India
has traced the history of the district Census Handbooks in the foreword to the 2011 series of the District Census Handbooks (DCHBs). He has also succinctly explained the scope and coverage of the District Census Handbooks. These volumes contain salient data on the population for every village and town as revealed by 2011 Census. It also contains a wealth of information regarding villages and towns which throw some light on the circumstances in which people live and is therefore relevant to the data on the population. This information is also of considerable importance in the context of planned development.
The District Census Handbook is divided into two parts: Part A - contains information regarding each village and town (Village Directory and Town Directory – non census data collected from various sources) and Part B – containing the population data collected during 2011 Census - the Primary Census Abstract (PCA). The data published in Part B was collected during February-March 2011 in the Population Enumeration.
The process of data collection for the Village Directory and Town Directory (Part A)
commenced in 2009 and the reference date is 31.12.2009. The Village Directory formats were mailed to the Deputy Commissioners of Districts for obtaining the village wise particulars through Village Accountants. Similarly the Town Directory formats were mailed to the Commissioners of Corporations, Chief Officers of Town Municipal Councils, Town Panchayats, etc. The village wise and town wise data furnished by these officers were then examined exhaustively for consistency in reporting and comparability with the information published in the District Census Handbooks 2001. The Household Schedules, which were canvassed to collect the population data during 2011 Census, were scanned and data captured was processed electronically through ICR (Intelligent Character Recognition) Technology. The Primary Census Abstract (PCA) was generated centrally on the computers by the Office of the Registrar General, India.
In compilation of the District Census Handbooks, the Census Directorate had the
co-operation of various departments of the State/Central Government. The Census Directorate gratefully acknowledges their co-operation.
I take this opportunity to offer my thanks to Dr. C. Chandramouli, I.A.S. the
Registrar General & Census Commissioner, India for his valuable guidance and support. I appreciate the supervision and support given by Sri N. Manjini, Joint Director and also thankful to all the officers and officials of this Directorate who have been relentlessly involved in the compilation of this volume.
I am highly grateful to Dr. Pratibha Kumari, Assistant Registrar General (SS), Dr.
R.C.Sethi, Ex-Addl. RGI, Shri Deepak Rastogi Addl. RGI. for their guidance and Shri A.P. Singh, Deputy Registrar General (Map), who provided the technical guidance in the preparation of maps. My thanks are also due to Shri A.K. Arora, Joint Director of Data Processing Division for generating the final formats of this publication under the overall supervision of Shri M.S.Thapa, Addl. Director (EDP), ORGI.
Bangalore T.K. Anil Kumar Date: 16th June, 2014 Director
DCO, Karnataka

4
ACKNOWLEDGEMENTS FOR THE OFFICERS/OFFICIALS ASSOCIATED WITH THE PROJECT
Sri N. Manjini, Joint Director
DCHB SECTION:
Smt. D. Helen Premakumari, Deputy Director
Sri R. Vasudevan, Assistant Director
Dr. H. Marulusiddaiah, Assistant Director
Sri B.K. Ramanjanappa, Assistant Director
Smt. Sweta Nandwana, S. I. Gr. I
Smt. M. N. Rathna, S. I. Gr. I
Smt. S. M. Vasantha Kumari, S. I. Gr. I
Sri K.G. Girish Kumar, S. I. Gr. II
Sri P. Jayesh, S. I. Gr. II
Smt. P.K.Shiji, S. I. Gr. II
Sri Sujoy Das, S. I. Gr. II
Sri S. B. Syam Kumar, S. I. Gr. II
Sri K.S. Raviprakash, S. I. Gr. II
Sri K. M. Mallikarjuna Swamy, S. I. Gr. III
Sri B. S. Ravishankar, Senior Compiler
Sri P. Vimesh, Compiler
Sri Dinesh V. Ambade, Compiler
Smt. V. C. Nisha, Compiler
Sri M. Venkataramana, Assistant Compiler

5
C & T Section:
Sri K. V. Rajeswara Rao, Assistant Director
Smt. B. L. Sarala Devi, S. I. Gr. II
Sri R. Nagendra Prasad, S. I. Gr. II
Sri Traver John, Senior Compiler
Sri B. R. Raghu Nayak, Compiler
Sri C. V. Ram Kumar, Compiler
Map Section:
Smt. M. G. Mangala, Research Officer
Smt. Jyoti Singh, Senior Geographer
Sri N. Srinivas Murthy, Senior Geographer
Smt. A. A. Geetha, Senior Draftsman
Smt. M.S. Poornima, Senior Draftsman
Sri S. Rajendra Kumar, Senior Draftsman
Sri Shivakant Shekar, Draftsman
Sri M.S. Manjunatha, Compiler
ORGI- Data Processing Division
Shri Jaspal Singh Lamba, DD (EDP)
Ms. Usha, AD (EDP)
Shri Anurag Gupta, DPA Grade ‘A’
Shri Mukesh Kumar Mahawar, DPA Grade ‘A’
Ms. Shagufta Nasreen Bhat, DPA Grade ‘A’
Ms. Kiran Bala Saxena, Sr. Supervisor
Shri Khem Verma Jadon, Sr. Consultant Shri
Yashwant Singh , Jr. Consultant
Shri Shailender Kumar Vats, Jr. Consultant
Shri Pawan Kumar Sharma, Jr. Consultant
Shri Anuj Kumar, Jr. Consultant

6
HISTORY AND SCOPE OF THE DISTRICT CENSUS HANDBOOK
The need of data at the grass root level for the administrative and planning purposes at sub micro level as well as academic studies prompted the innovation of District Census Handbook. District Census Handbook is a unique publication from the Census organization which provides most authentic details of census and non-census information from village and town level to district level. The District Census Handbook was firstly introduced during the 1951 Census. It contains both census and non census data of urban as well as rural areas for each district. The census data contain several demographic and socio-economic characteristics of the lowest administrative unit i.e. of each village and town and ward of the district. The non census data comprise of data on availability of various civic amenities and infrastructural facilities etc. at the town and village level which constitute Village Directory and Town Directory part of the DCHB. The data of DCHB are of considerable importance in the context of planning and development at grass-root level.
In 1961 census DCHB provided a descriptive account of the district, administrative statistics, census tables and village and town directory including Primary Census Abstract. This pattern was changed in 1971 Census and the DCHB was published in three parts: Part-A related to village and town directory, Part-B to village and town PCA and Part-C comprised analytical report, administrative statistics, district census tables and certain analytical tables based on PCA and amenity data in respect of villages. The 1981 census DCHB was published in two parts: Part-A contained village and town directory and Part-B the PCA of village and town including the SCs and STs PCA up to tahsil/town levels. New features along with restructuring of the formats of village and town directory were added into it. In Village Directory, all amenities except electricity were brought together and if any amenity was not available in the referent village, the distance in broad ranges from the nearest place having such an amenity, was given. The pattern of 1981 census was followed by and large for the DCHB of 1991 Census except the format of PCA. It was restructured. Nine-fold industrial classification of main workers was given against the four-fold industrial classification presented in the 1981 census. In addition, sex wise population in 0-6 age group was included in the PCA for the first time with a view to enable the data users to compile more realistic literacy rate as all children below 7 years of age had been treated as illiterate at the time of 1991 census. One of the important innovations in the 1991 census was the Community Development Block (CD Block) level presentation of village directory and PCA data instead of the traditional tahsil/taluk/PS level presentation.
As regards DCHB of 2001 Census, the scope of Village Directory was improved by including some other amenities like banking, recreational and cultural facilities, newspapers & magazines and `most important commodity’

7
manufactured in a village in addition to prescribed facilities of earlier censuses. In Town Directory, the statement on Slums was modified and its coverage was enlarged by including details on all slums instead of ‘notified slums’.
The scope and coverage of Village Directory of 2011 DCHB has been widened by including a number of new amenities in addition to those of 2001. In the Town Directory, seven Statements containing the details and the data of each town have been presented viz.; (i) Status and Growth History of towns, (ii) Physical Aspects and Location of Towns, (iii) Civic and other Amenities, (iv) Medical Facilities, (v) Educational, Recreational & Cultural Facilities, (vi) Industry & Banking, and (vii) Civic & other amenities in Slums respectively. CD Block wise data of Village Directory and Village PCA have been presented in DCHB of 2011 census as presented in earlier census. The data of DCHB 2011 Census have been presented in two parts, Part-A contains Village and Town Directory and Part-B contains Village and Town wise Primary Census Abstract. Both the Parts have been published in separate volumes in 2011 Census.
--------------------------------------------------------

8
BRIEF HISTORY OF THE DISTRICT
The district, named after the headquarters town Koppal has a hoary past.
The entire tract of land on the banks of the river Tungabhadra here is identified
with Kishkindha, the kingdom of Vanaras. According to Jaina Ramayana, the
city of Kishkandha was founded by Srikantha Kumara, the brother-in- law of
Dhavala Kirti. It was while roaming about this part of the country during his
exile that Rama was accosted by Hanumantha. Kishkindha Kaanda, a section
of the epic Ramayana, narrates the events and episodes that took place in this
tract of land during those legendary days. In Mahabharata, Sahadeva, who led
the expedition to the south on the occasion of the Rajasuya yagya performed
by Yudhisthira, is said to have encamped for some time on the Kishkindha hill
where the Vanara chiefs Sushena and Vrishasena made friends with him.
These legendary references apart, archaeological evidences have amply
demonstrated that this area has been the abode of man since very early times.
The district abounds in pre-historic sites.The legendary accounts together with
these relics testify to the great antiquity of the area in this district.
Historically this district is known to have formed part of the Maurya empire.
In the Deccan, Suvarnagiri was then a seat of viceroyalty. This place is
identified with Kanakagiri in Gangawati taluk by some historians. Edicts of
Ashoka have been discovered at Gavimath and Palakigundu near Koppal. After
the death of Ashoka, however, the Maurya empire disintegrated. By about 230
B.C., the Satavahanas established their supremacy in the Deccan and held
their sway till 200 A.D., when the ruling family itself became extinct.
Thereafter the Vakatakas rose to power in this region and certain parts of the
district were ruled by the Chutus also. In about the middle of the sixth century
A.D. the Chalukyas of Badami established a strong kingdom and during the
reign of Pulikeshi II (610-642 A.D.) they succeeded to a great extent in their
attempt at unifying the Deccan. The Rashtrakutas of Malked, who flourished as
feudatories of the Chalukyas for a couple of centuries, assumed sovereignty

9
under Dantidurga in 753 A.D. His successor Krishna I (756-775 A.D.) extended
the kingdom and the present Koppal too became a part of the vast Rashtrakuta
empire. An inscription referring to the reign of Nripatunga Amoghavarsha I
(814-880 A.D.) has been discovered at Koppal. Krishna III (940-966 A.D.) was
also a powerful king who inflicted a crushing defeat on the Cholas in the south.
The rulers of Malva invaded Malked during the reign of Khottiga (967-972
A.D.). In 973 A.D. Taila II (973-997 A.D.) of the western Chalukya family
dethroned Karka II the successor of Khottiga and restored the ancient glory of
the Chalukyas. He ruled from Malked and consolidated his sway in the western
Deccan covering the entire area lying between the Narmada and the
Tungabhadra. An inscription found in Madinur village of Koppal taluk refers to
his reign and recounts his high sounding titles which are expressions of
extraordinary valour. His son and successor Satyashraya (997-1008 A.D.)
continued his expansive policy. The Cholas were the main contenders for power
and they were kept at bay. But the conflict between the Chalukyas and the
Cholas lasted for a long period. In 1019 A.D., Jayasimha II (1015-1042 A.D.)
scored a decisive victory at the battle of Maski in Koppal and compelled the
intruding Rajendra Chola to withdraw to the south of the Tungabhadra. His
successor Someshwara I (1042-1068 A.D.) was however humbled by
Rajadhiraja Chola who invaded the Chalukya kingdom thrice. During the reign
of Someshvara III (1126-1138 A.D.) Vishnuvardhana, the Hoysala king led an
unsuccessful attack on the Raichur doab. In 1157 A.D. Kalachuri Bijjala
wrested the sovereignty of the Deccan from Taila III. The Kalachuri rule lasted
for a brief period and during the reign of Sovideva, Madinur enjoyed the status
of an alternative capital. In 1181 A.D., the Chalukya supremacy was restored
by Someshvara IV, who however soon yielded place to Bhillama of the Devagiri
Yadava family. During this period, the Hoysalas too made inroads into the area
north of Tungabhadra. The conquests of Ballala II made him the master of
Puligere, Belvola, Kisukad and the neighbouring territories. He made
Erambargi (modern Yelbarga) his northern capital and resided there for
sometime during 1196 A.D. In 1211 A.D., the Yadava king Singhana

10
recaptured these territories and once again the Tungabhadra came to be
recognised as the border between these two kingdoms.
During the reign of Ramachandra (1271-1310 A.D.), Ala-ud-din Khilji
attacked Devagiri, pillaged the capital and thus dealt a severe blow to the
power and prestige of the Yadavas. Seizing this opportunity, Kakatiya
Prataparudra pushed the western border of his kingdom as far as Raichur. In
1307 A.D., Malik Kafur conquered the Yadava kingdom and reduced the king
into a vassal of the Delhi Sultan. During his next expedition in 1313 A.D.,
Malik Kafur killed Shankaradeva, the son of Ramachandra, and resumed the
government of Devagiri. His tenure was temporary, for as soon as he left for
Delhi a little later, Harapala the son-in-law of Ramachandra rose in revolt and
declared independence. But in 1317 A.D., Mubarak, the son and successor of
Ala-ud-din Khilji, recaptured Devagiri. In 1318 A.D., Harapala was flayed alive
for his defiance. In spite of these developments, the southern parts of Yadava
kingdom including Raichur area continued to offer resistance to the
Muhammadan rule. Last of such rebels was Kampilaraya who was finally
vanquished by Muhammad-Bin-Tughlak. After this victory, Muhammad-bin-
Tughlak remained at Devagiri for a short period and in 1329 A.D., after
appointing Kutlugh Khan as the viceroy of Deccan, he left for Delhi.
Immediately thereafter, the local leaders began to assert themselves. In 1331
A.D., Somadeva, of the Chalukyan dynasty revolted against the governor of
Kampli and seized the fort of Anegondi. Hoysala Ballala III, threw off his
allegiance to the Delhi Sultan and invaded the province of Kampli. The next few
years that followed these events witnessed the emergence of the Vijayanagar
empire with its capital close to the southern borders of Koppal and of the
Bahmani kingdom with its capital at Gulbarga and beyond the Krishna river in
the north. Thereafter, the district became a bone of contention between these
two powers and for a little more than two centuries this tract witnessed
intensive and almost incessant warfare in which scant respect was shown,
especially by the Bahmani rulers, to the life and properties of the civilians. The

11
region comprising Koppal district changed hands many times during this
period and its history is said to be so confusing as to put one at a loss to know
under whose control the area was during a particular period.
During the reign of Alla-ud-din I (1347-1358 A.D.), this area belonged to the
Bahmanis. The kingdom had been divided into four large divisions; Ashnabad-
Gulbarga, along with Raichur and Mudgal being one of these. Later, Bukka
Raya demanded the return of Raichur doab and, incensed by an insulting
episode, he crossed the Tungabhadra and seized Mudgal. Muhammed I (1358-
1375 A.D.) got wild and proceeded plundering the country and killing the
defenseless villagers. Bukka Raya had withdrawn to Adoni by now and was
pursued by Muhammed early in 1367 A.D. At the battle near Kauthal, Bukka
Raya faced defeat and resorted to guerrilla warfare for about three months
whereafter he shut himself up in his capital. Muhammed on the other hand
took to promiscuous slaughter of the inhabitants and thus compelled the
Vijayanagara king to honour his demands. At the time of ascension of Mujahid
(1375-1378 A.D.) the successor of Muhammed, some of the forts of Raichur
doab were held by Bukka Raya and some including Raichur and Mudgal were
held by the Bahmanis. Mujahid made an unsuccessful attempt on the
Vijayanagar kingdom. Similarly, during the reign of Muhammed II (1378-1397
A.D.), Harihara II made a futile attempt on Raichur. When Firoz Shah (1397-
1422 A.D.) and Harihara II (1377-1404 A.D.) were at the helm of affairs of the
two kingdoms, the latter started military operations for the recovery of Raichur
doab in 1398 and moved upto the Krishna, where he pitched the camp. Firoz
Shah marched against him and encamped on the northern bank. He resorted
to a stratagem by which his confidants could kill Harihara’s son and create
confusion in the Vijayanagar camp. Firoz crossed the river easily and pursued
the fleeing Harihara. After this victory Firoz separated the then undivided
Raichur district from Gulbarga province and appointed Fulad Khan as its first
military governor. Again, in 1406 A.D., the year in which Devaraya I (1406-
1422 A.D.) ascended the Vijayanagara throne, a serious war broke out when

12
Devaraya tried to secure the hand of a beautiful girl of Mudgal. Having failed in
his attempt to capture the city of Vijayanagar, Firoz withdrew and sent out his
men to ravage the country. Ultimately Devaraya had to make peace on the
terms laid down by Firoz. In 1418 A.D., Firoz Shah laid siege to Pangal and his
protracted efforts lasting for nearly two years did not bear fruit. Vijayanagara
scored a complete victory on this occasion and Firoz had to retreat leaving the
southern and eastern boundaries of his kingdom in the occupation of
Vijayanagara troops. This defeat was however avenged by his successor Sihab-
ud-din Ahmed I (1422-1436 A.D.) who resorted to indiscriminate slaughter,
enslavement of civilian population, destruction of temples and killing of cows to
compel Vijayaraya (1422-1426 A.D.) to pay a large sum as arrears of tribute.
During the reign of Ala-ud-din II (1436-1458 A.D.) his younger brother rose in
rebellion and captured some forts in the district. But this rebellion was put
down in time and the errant brother was made the governor of Raichur.
Deveraya II (1424-1446 A.D.) invaded the district in 1443 A.D., captured some
parts of the district. But, on the approach of Ala-ud-din, he withdrew and
Deveraya finally agreed to make peace and pay tributes regularly to the
Bahmani Sultan. Thereafter, for a short period till the Bahmani dynasty ceased
to be a power to reckon with, peace reigned in the district.
During the reign of Mohammed III (1463-1482 A.D.), the four administrative
units of the Bahmani kingdom were divided into eight by his Prime Minister
Khwaja Mahmud Gawan. The old province of Gulbarga was divided into two
parts, Gulbarge and Bijapur and the latter included Raichur doab. The
government of Bijapur was first given to Mahmud Gawan, and after his
execution in 1480 A.D., Yusuf Adil Khan was appointed as its Governor. In
1490 when Mahmud (1482-1518 A.D.) was a king only in name, Adil Khan
being unable to tolerate a weakling became an independent ruler and the
founder of the Adil Shahi dynasty of Bijapur. Narasa Nayaka, the regent of
Vijayanagara attacked Yusuf Adil Khan at the instigation of Kasim Barid, the
Prime Minister of Bidar. He captured Raichur and Mudgal. But not being able

13
to withstand the counter-attack and the treacherous strategy adopted by Adil
Khan, Narasa Nayaka had to accept defeat. However, it is said that Raichur
doab remained part of Vijayanagara empire till 1502 A.D., when as a result of a
Jehad undertaken by the Bahmani nobler, it passed into the hands of Yusuf
Adil Khan. Henceforth the history of Raichur ceased to have any relation with
that of the Bahmani’s of Bidar, which remained as a political power till 1527
A.D. Though Yusuf Adil Khan became an independent ruler for all practical
purposes from 1490 A.D., it is said that Yusuf Adil Khan assumed the Royal
titles only in 1535 A.D.
Yusuf Adil Khan was succeeded by his son Ismail Adil Khan (1510-1534
A.D.). This period coincides with the heyday of the Vijayanagara empire under
the able administration of the famous Krishnadevaraya (1509-1529) whose
reign has been hailed as the period of Vijayanagara’s greatest success, when its
armies were victorious everywhere, and the city was most prosperous.
Krishnadevaraya invaded the then Raichur doab and took Raichur fort in
1510-1511 A.D. and marched to Gulbarga, defeated Amir Barid, the minister
and gaoler of the Bahmani king Mahmud and took the city. From there he
proceeded to Bidar, captured it and reinstated Mahmud on the Bahmani
throne and assumed the title ‘establisher of Yavana kingdom’. But, a little later
Ismail Adil Khan recaptured the district. In 1520 however, Krishnadevaraya
scored a resounding victory on the forces of Ismail Adil Khan and annexed
Raichur. However, Ismail Adil Khan who survived Krishnadevaraya invaded
Raichur doab (1530-1542 A.D.) and seized Raichur and Mudgal before
Achuttaraya (1530-1542 A.D.) could do anything to prevent this adventure.
Four years later, immediately after the death of Ismail Adil Khan, Achuttaraya
invaded the Raichur doab and subdued the country as far north as the
Krishna. From 1534 A.D. upto 1565 A.D. the Raichur doab formed part of the
Vijayanagara empire. Ali Adil Shah (1557-1580 A.D.) made an alliance with
the king of Ahmadnagar which was later joined by the Sultan of Golkonda and
Berar. He demanded the restoration of Bagalkot and then Raichur doab from

14
Aliya Ramaraya (1543-1565 A.D.). When this was sternly refused, the
confederacy of the Sultans set out on its expedition against Ramaraya. In the
battle that took place at Rakkasa-Tangadi near Talikote, Ramaraya was killed
and the Vijayanagara forces were completely routed. Raichur doab henceforth
became an undisputed part of the Bijapur kingdom and remained
comparatively peaceful for over a century till 1686 A.D. During the reign of Ali
Adil Shah II (1656-1672 A.D.) in 1662 A.D., an African Amir named Siddi
Jauhar, rebelled in Kurnool. The Sultan marched through the doab to punish
the rebel. The royal forces encountered the rebel near Mudgal who on being
defeated fled to Raichur and from thence fled beyond Tungabhadra. Sikandar
(1672-1686 A.D.) was the last ruler of the Adil Shahi dynasty.
In 1685 A.D. Aurangazeb started his campaign against the Bijapur kingdom
and scored victory in October 1686 A.D. Thenceforth Raichur doab also
became a part of the Mughal empire. Rahulla Khan was appointed as the
Subedar of the new province of Bijapur and he was placed under the Mughal
emperor’s Subedar at Hyderabad. With the proclamation of independence by
the Nizam in 1724 A.D., the Bijapur province along with Raichur became a part
of the Nizam’s Dominions. Later, with the ascendancy of the British, the
Nizams accepted their overlordship. During the period of Nizam Ali (1761-1803
A.D.), the English became masters of large tracts of land in the Deccan. Under
a treaty entered into in 1853 A.D., Raichur district was assigned to the British.
In 1858, Raichur doab was restored to the Nizam and this position remained
unchanged till 1948. Achievement of independence was followed immediately
by an integration of the states. But the Nizam declared independence on 27th
August 1947 and refused to accede to the Indian union. This was followed by a
reign of terror, which was finally put down in a police action by the government
of India on 17th September 1948. Raichur became a part of the Hyderabad
state of the Indian union. As a consequence of the reorganisation of the states,
the then undivided Raichur district was incorporated into the new Mysore state
(that is, Karnataka) with effect from 1st November 1956.

15
The administrative history of the district reveals that till 1905, the Raichur
doab region consisted of two districts: Raichur and Lingsugur. The former
consisted of the taluks of Raichur, Yadgir, Yergera, Deodurg, Manvi, Alampur
and Gadwal while Lingsugur district consisted of the taluks of Lingsugur,
Kushtagi, Gangawati, Sindhanur, Shahpur and Shorapur. The taluks of Koppal
and Yelbarga constituted a separate Jagir district. In 1905, Lingsugur district
was abolished and all its taluks were transferred to Raichur district. At the
same time, the taluk of Shahpur, Shorapur and Yadgir were transferred to
Gulbarga district, and the villages of Yergera taluk were distributed among
Raichur, Manvi and Deodurg. The abolition of Jagirs in 1949 resulted in the
conversion of Koppal and Yelbarga into regular taluks of Raichur district. In
1956, Gadwal and Alampur were transferred to Andhra Pradesh. Thus at the
time of its accession to Mysore state, the district consisted of nine taluks and
this position has remained intact since then. During 2001 Census, the district
was further divided into two districts. Out of nine taluks, four taluks namely,
Kushtagi Gangawati, Yelbarga and Koppal were separated to form a new
district by name Koppal.

Adm
inis
trat
ive
setu
p an
d ju
risd
icti
onal
cha
nges
dur
ing
the
deca
de 2
001-
2011
Sl.
No.
N
ame
of th
e Ta
luk
Tota
l No.
of
villa
ges
acco
rdin
g to
the
List
fina
lized
for
Tota
l No.
of
tow
ns
acco
rdin
g to
the
List
fina
lized
for
Re
ason
for v
aria
tion
2011
Ce
nsus
20
01
Cens
us
2011
Ce
nsus
20
01
Cens
us
1 2
3 4
5 6
7
Kop
pal D
istr
ict
1 Y
elba
rga
144
144
1 1
2 K
usht
agi
177
177
1 1
The
civi
c st
atus
of K
usht
agi(T
P) c
hang
ed to
Kus
htag
i(TM
C) in
201
1 Ce
nsus
vid
e no
tific
atio
n N
o.U
DD
95
MLR
200
6(23
) dat
ed 3
1.12
.200
6.
3 G
anga
wat
i 15
7 15
7 1
1
4 K
oppa
l 15
1 15
1 2
2 Th
e ci
vic
stat
us o
f Kop
pal(T
MC)
cha
nged
to K
oppa
l(CM
C) in
201
1 Ce
nsus
vid
e no
tific
atio
n N
o.U
DD
55
MLR
200
3(P-
1) d
ated
05.
12.2
003.
16

17
DISTRICT HIGHLIGHTS 2011 CENSUS
Koppal with a total population of 1,389,920 stands in the 21st position in
terms of population in the State.
The district ranks 15th in terms of rural population and 27th in terms of
urban population.
Koppal district accounts for 2.3 percent of the total population of the
State.
With the decadal growth rate of 16.2 percent, it ranks 7th in the State in
terms of decadal growth rate.
The district with a Sex ratio of 986 holds 12th rank in the State.
The district with a Sex ratio of 958 among the child population in the age-
group 0-6 holds the 11th rank in the State, same rank as in 2001.
The proportion of child population, (0-6 age-group) is 14.5 percent in the
district and it ranks 4th in the State.
The district has a literacy rate of 68.1 percent and is placed at 24th rank in
the State.
The male literacy rate in the district is 78.5 percent and the female literacy
rate is 57.5 percent.
The male – female literacy gap in the district is 21.0 percentage points,
which is higher than the male – female literacy gap registered by the State
(14.4 percentage points).
The Scheduled Caste population contributes 18.6 percent to the total
population of the district and the Scheduled Tribe population contributes
11.8 percent.
The district has registered a work participation of 47.1 percent and stands
at 11th rank in the State.
The work participation rates for Male and Female population are 55.4 and
38.7 respectively in the district.
Among the total workers in the district 77.6 percent are Main workers and
22.4 percent are Marginal workers.
Major work force of 66.7 percent are engaged in Agricultural sector ie.,
Cultivators (25.0 percent) and Agricultural Labourers (41.7 percent).

18
Agricultural Labourers 41.7 percent of the total workers in the district and
the district holds 5th rank in the State.
In the district 2.9 percent of the total workers are engaged in Household
Industry and 30.5 percent are Other workers.
About 52.9 percent of the total population in the district is non-workers.
Koppal district with area figure of 5570 Sq.Km stands at 16th position in
the State in terms of area.
The population density for this district is 250 and holds 19th rank in the
State.
There are 629 villages, 4 Statutory Towns and 1 Census Town in the
district.

Number of Villages Total 29,340 629
Inhabited 27,397 595
Uninhabited 1,943 34
Number of Towns Statutory 220 4
Census 127 1
Total 347 5
Number of Households Normal 1,33,00,790 2,63,941
Institutional 34,812 438
Houseless 21,425 216
Population Total Persons 6,10,95,297 13,89,920
Males 3,09,66,657 6,99,926
Females 3,01,28,640 6,89,994
Rural Persons 3,74,69,335 11,56,216
Males 1,89,29,354 5,82,958
Females 1,85,39,981 5,73,258
Urban Persons 2,36,25,962 2,33,704
Males 1,20,37,303 1,16,968
Females 1,15,88,659 1,16,736
Percentage Urban Population 38.67 16.81
Number Percentage Number Percentage
Persons 82,44,735 15.60 1,93,831 16.21
Males 40,67,739 15.12 96,614 16.01
Females 41,76,996 16.10 97,217 16.40
Area (in sq Km.) 191791 5570.00
319 250
Sex Ratio Total 973 986
(Number of females per 1000 males) Rural 979 983
Urban 963 998
District
Important Statistics
Decadal Population Growth 2001-2011
Density of Population (Persons per sq Km.)
State
19

Important Statistics
Number Percentage Number Percentage
Literates Persons 4,06,47,322 75.36 8,09,085 68.09
Males 2,25,08,471 82.47 4,68,785 78.54
Females 1,81,38,851 68.08 3,40,300 57.55
Scheduled Castes Persons 1,04,74,992 17.15 2,58,608 18.61
Males 52,64,545 17 1,29,341 18.48
Females 52,10,447 17.29 1,29,267 18.73
Scheduled Tribes Persons 42,48,987 6.95 1,64,271 11.82
Males 21,34,754 6.89 82,761 11.82
Females 21,14,233 7.02 81,510 11.81
Workers and Non-WorkersPersons 2,78,72,597 45.62 6,54,766 47.11
Males 1,82,70,116 59 3,87,974 55.43
Females 96,02,481 31.87 2,66,792 38.67
(i) Main Workers Persons 2,33,97,181 38.3 5,08,089 36.56
Males 1,63,49,837 52.8 3,29,092 47.02
Females 70,47,344 23.39 1,78,997 25.94
(ii) Marginal Workers Persons 44,75,416 7.33 1,46,677 10.55
Males 19,20,279 6.2 58,882 8.41
Females 25,55,137 8.48 87,795 12.72
Non-Workers Persons 3,32,22,700 54.38 7,35,154 52.89
Males 1,26,96,541 41 3,11,952 44.57
Females 2,05,26,159 68.13 4,23,202 61.33
(i) Cultivators Persons 65,80,649 23.61 1,63,413 24.96
Males 47,53,708 26.02 1,20,405 31.03
Females 18,26,941 19.03 43,008 16.12
(ii)Agricultural Labourers Persons 71,55,963 25.67 2,73,016 41.70
Males 32,83,279 17.97 1,10,161 28.39
Females 38,72,684 40.33 1,62,855 61.04
Persons 9,13,227 3.28 18,794 2.87
Males 4,38,983 2.4 10,791 2.78
Females 4,74,244 4.94 8,003 3.00
(iv) Other Workers Persons 1,32,22,758 47.44 1,99,543 30.48
Males 97,94,146 53.61 1,46,617 37.79
Females 34,28,612 35.71 52,926 19.84
Total Workers (Main and Marginal)
Category of Workers (Main & Marginal)
(iii)Workers in household industry
State District
20


Section - I
Primary Census Abstract (PCA)

24
Brief Note on Primary Census Abstract
Introduction:
The Indian Census has the reputation of being one of the best in the world. The first Census in India was conducted in the year 1872. This was conducted at different points of time in different parts of the country. In 1881 a Census was taken for the entire country simultaneously. Since then, Census has been conducted every ten years, without a break. Thus, the Census of India 2011 was the fifteenth in this unbroken series since 1872, the seventh after independence and the second census of the third millennium and twenty first century. The census has been uninterruptedly continued despite of several adversities like wars, epidemics, natural calamities, political unrest, etc.
The Census of India is conducted under the provisions of the Census Act 1948 and the Census Rules, 1990. In Censuses until 1931, a synchronous de-facto method was adopted wherein the Census was conducted throughout the country on a single night. This being a very costly affair and involved the deployment of very large force at one point of time was given up in 1941. Since then the same methodology has been followed in all the Censuses. It is a gigantic operation and considered to be the single largest, complex, peace time administrative exercise in the world.
The Census Operation in India is carried out in two distinct but inter connected phases - the House listing and Housing Census followed by the Population Enumeration. During the first phase of Census 2011 i.e., House listing and Housing Census, the buildings, census houses and households were identified and systematically listed in the House Listing and Housing Census Schedule during the period April to September, 2010 in different States/Union Territories. Apart from listing of houses, some useful data on the amenities available to the households was also collected for assessing condition of human settlements, housing deficits etc.
Censuses prior to Census 2001 had the system of collecting the information through Individual Slip which was a key schedule for every individual. The information collected through slip was then compiled for a household. Some information was also collected in addition to this for the household. During 2001 Census a comprehensive Household Schedule was adopted replacing the individual slip concept. In 2011 Census also similar household schedule was used for canvassing. The scope of demographic, socio-economic parameters has been widened in every census.
2. Population Enumeration - Census 2011: The field work of the second phase i.e. Population Enumeration was carried out during February-March, 2011. One of the essential features of Population Enumeration in the second phase was that each person was enumerated and her/his individual particulars were collected at a well-defined point of time.
The Census moment and the reference date for the Census of India 2011 was 00:00 hours of 1st March, 2011. The enumeration was conducted from 9th February to

25
28th February, 2011 along with a revisional round from 1st March, 2011 to 5th March, 2011 synchronously all over the country except for few specific areas of the Jammu & Kashmir, Himachal Pradesh and Uttarakhand states that remain snowbound in February. In these locations the population enumeration was done from 11th September, 2010 to 30th September, 2010 along with a revisional round from 1st October, 2010 to 5th October, 2010. The reference date for the census in snow bound non-synchronous areas of these states was 00.00 hours of the first day of October, 2010. In addition to the coverage during House listing & Housing Census, the enumeration of the Houseless population was carried out on the night of 28th February, 2011, as has been the usual practice. For the purpose of Census, certain areas where the access of the civilian enumerators was not permissible due to security reasons termed as ‘Special Charges’ such as the Defence and strictly Military/Para-Military areas, including operational areas were also covered. Such areas were not covered during the House listing & Housing Census. In addition to the defence/para-military areas, Special Charges also included certain factory areas, certain colonies, sensitive areas, scientific establishments, etc. These also formed Special Charges as these were not accessible by the usual census enumerator.
3. Quality Assurance:A Task Force for Quality Assurance (TFQA) functioned under the chairmanship
of the RG & CCI. Experienced officers of the different divisions of the organization i.e. Heads and senior officers of the Census Division, Data Processing Division, Map Division, Demography Division and Social Studies Division comprised the TFQA. The Directors of Census Operations were co-opted as members whenever the TFQA discussed the data for their States/Union territories. The main objective of constituting the TFQA was to subject the data to stringent validation checks and ensure its quality before release as it was expedient to be satisfied itself about the quality of data before putting the same in public domain.
The Directors and their senior officers were involved at all levels with respect to the quality and the coverage of their states/Uts. The TFQA intensively scrutinized coverage and content parameters including edit and imputation logic. The most important aspect of the data quality was to ensure complete coverage of all geographical areas especially for the population enumeration phase where the data is disseminated right up to the village level in the rural areas and the ward level in the urban areas. Thus ensuring the complete coverage and correct geographical linkage of each enumeration block was one of the major planks of the quality control, especially for small area population statistics. The content was scrutinized mainly through the process of internal consistency, comparison with similar data in the past and also through validation with likewise data if available, from external sources. Quite often the local knowledge and perception was looked at to understand both the existing and the new emerging trends of population distribution and characteristics. A very comprehensive check and edit mechanism was put in place to objectively examine the preliminary Census 2011 Population Enumeration results and finally clear them for use. The population data was cleared only after the full possible satisfaction of the TFQA.

26
The entire work relating to the data validation and scrutiny was completed by all the States/Union territories under the overall supervision and monitoring of the Census Division of the Office of the Registrar General, India with active cooperation and support of the Social Studies Division, Data Processing Division, Data Dissemination Division and Map Division.
4. Primary Census Abstract:
The Primary Census Abstract which is important publication of 2011 Census gives basic information on Area, Total Number of Households, Total Population, Scheduled Castes, Scheduled Tribes Population, Population in the age group 0-6, Literates, Main Workers and Marginal Workers classified by the four broad industrial categories, namely, (i) Cultivators, (ii) Agricultural Labourers, (iii) Household Industry Workers, and (iv) Other Workers and also Non-Workers. The characteristics of the Total Population include Scheduled Castes, Scheduled Tribes, Institutional and Houseless Population and are presented by sex and rural-urban residence.
In 1981 census main workers were presented into four categories. As regards 1991 Census, the nine-fold industrial classification of main workers has been given in the Primary Census Abstract. One of the important features of the Primary Census Abstract of 1991 Census was the presentation of population of the age group 0-6 which is continued in 2001 and 2011 Census. All the children of age 6 years or less have been treated as illiterate even if the child is going to a school and may have picked up reading and writing. This will help the data users in better analysis and understanding of the literacy data as the literacy rate is calculated with 7 years and above population and it is referred as effective literacy rate. In 2001 and 2011 census four categories of main workers have been given in the Primary Census Abstract.
5. Level of Presentation of PCA data in District Census Handbooks:
The format of Primary Census Abstract (PCA) adopted in the DCHB of 2001 Census has been continued for 2011 Census as the data on four categories of works have been presented similar to 2001 census. The Primary Census Abstract data in different PCAs are presented at different levels. The level of presentation of Primary Census Abstracts in DCHB is as under: 1. District Primary Census Abstract -District/C.D. Block/Town.2. Primary Census Abstract for Scheduled Castes- District/C.D. Block/Town.3. Primary Census Abstract for Scheduled Tribes -District/C.D. Block/Town.4. Village Primary Census Abstract -C.D. Block/Village wise.5. Urban Primary Census Abstract- Town/Ward level.
The PCA Data for villages was presented C.D. Block wise for the first time in 1991 Census. This practice is continued in 2001 and 2011 Census. The term ‘Total Population’ includes the Scheduled Castes, the Scheduled Tribes, the Institutional and the Houseless populations. An appendix to District Primary Census Abstract has also been furnished showing urban enumeration block-wise particulars on Total Population, the Scheduled Castes Population and the Scheduled Tribes Population for each town.

27
6. Area Figures:
The area figures supplied by local revenue authorities of the district in respect of tahsils, Police Stations and by the local bodies in respect of towns are given in square kilometers. The area figures of the villages supplied by the Tahsildars in acres have been converted and shown in hectares. The area figures of the C.D. Block are the total of the village areas coming under each C.D. Block. The area figures for the district are the same as adopted by the Surveyor General of India to maintain uniformity at the national level.
-----------------------------------------------------------------


District Primary Census Abstract (General)

DISTRICT CENSUS HANDBOOK : KOPPAL
DISTRICT PRIMARY
Persons Males Females Persons Males Females1 2 3 4 5 6 7 8 9 10 11
560 Koppal - District Total 5,570.00 2,64,595 13,89,920 6,99,926 6,89,994 2,01,654 1,03,016 98,638 Rural 5,533.14 2,17,748 11,56,216 5,82,958 5,73,258 1,70,550 87,254 83,296 Urban 36.86 46,847 2,33,704 1,16,968 1,16,736 31,104 15,762 15,342
0032 Yelbarga Total 1,489.68 47,360 2,52,628 1,27,673 1,24,955 36,217 18,657 17,560 Rural 1,489.68 47,360 2,52,628 1,27,673 1,24,955 36,217 18,657 17,560 Urban 0.00 - - - - - - -
0033 Kushtagi Total 1,354.87 46,533 2,59,914 1,31,734 1,28,180 40,947 21,016 19,931 Rural 1,354.87 46,533 2,59,914 1,31,734 1,28,180 40,947 21,016 19,931 Urban 0.00 - - - - - - -
0034 Gangawati Total 1,318.41 68,480 3,54,376 1,76,938 1,77,438 50,729 25,902 24,827 Rural 1,318.41 66,620 3,45,263 1,72,397 1,72,866 49,559 25,313 24,246 Urban 0.00 1,860 9,113 4,541 4,572 1,170 589 581
803072
Waddarhatti (OG) WARD NO.-0032 (Rural MDDS CODE:601708)
Urban NA 1,860 9,113 4,541 4,572 1,170 589 581
0035 Koppal Total 1,368.61 59,091 3,07,083 1,55,547 1,51,536 44,882 22,809 22,073 Rural 1,364.18 57,235 2,98,411 1,51,154 1,47,257 43,827 22,268 21,559 Urban 4.43 1,856 8,672 4,393 4,279 1,055 541 514
601860Munirabad Project Area (CT) Urban 4.43 1,856 8,672 4,393 4,279 1,055 541 514 URBAN
803070 Yelbarga (TP) Urban 1.15 2,854 14,814 7,492 7,322 1,945 988 957 803071 Kushtagi (TMC) Urban 11.34 4,814 24,878 12,493 12,385 3,468 1,789 1,679
803072Gangawati (CMC + OG) Urban 9.21 23,265 1,14,642 57,230 57,412 14,971 7,625 7,346
803073 Koppal (CMC) Urban 10.73 14,058 70,698 35,360 35,338 9,665 4,819 4,846
601860Munirabad Project Area (CT) Urban 4.43 1,856 8,672 4,393 4,279 1,055 541 514
Location code
numberDistrict/ CD Block/
Town
Total/ Rural/ Urban
Area in Square
KilometreNumber of households
Total population (including institutional and houseless population) Population in the age-group 0-6
30

PRIMARY CENSUS ABSTRACT
CENSUS ABSTRACT
Persons Males Females Persons Males Females Persons Males Females12 13 14 15 16 17 18 19 20 3 2
2,58,608 1,29,341 1,29,267 1,64,271 82,761 81,510 8,09,085 4,68,785 3,40,300 Total Koppal - District2,22,935 1,11,858 1,11,077 1,52,563 76,987 75,576 6,51,001 3,82,270 2,68,731 Rural
35,673 17,483 18,190 11,708 5,774 5,934 1,58,084 86,515 71,569 Urban49,287 24,961 24,326 29,183 14,781 14,402 1,44,088 86,168 57,920 Total Yelbarga 49,287 24,961 24,326 29,183 14,781 14,402 1,44,088 86,168 57,920 Rural
- - - - - - - - - Urban40,222 20,354 19,868 37,445 19,142 18,303 1,43,070 85,529 57,541 Total Kushtagi 40,222 20,354 19,868 37,445 19,142 18,303 1,43,070 85,529 57,541 Rural
- - - - - - - - - Urban72,799 36,037 36,762 58,434 29,091 29,343 1,96,902 1,12,404 84,498 Total Gangawati 71,439 35,381 36,058 57,288 28,543 28,745 1,91,173 1,09,179 81,994 Rural1,360 656 704 1,146 548 598 5,729 3,225 2,504 Urban
1,360 656 704 1,146 548 598 5,729 3,225 2,504 Urban
Waddarhatti (OG) WARD NO.-0032 (Rural MDDS CODE:601708)
63,882 32,124 31,758 28,968 14,670 14,298 1,79,339 1,05,015 74,324 Total Koppal 61,987 31,162 30,825 28,647 14,521 14,126 1,72,670 1,01,394 71,276 Rural1,895 962 933 321 149 172 6,669 3,621 3,048 Urban
1,895 962 933 321 149 172 6,669 3,621 3,048 UrbanMunirabad Project Area (CT)URBAN
2,752 1,369 1,383 282 121 161 10,274 5,761 4,513 Urban Yelbarga (TP)5,044 2,485 2,559 1,022 517 505 17,413 9,437 7,976 Urban Kushtagi (TMC)
17,331 8,494 8,837 7,327 3,617 3,710 74,922 41,300 33,622 UrbanGangawati (CMC + OG)
8,651 4,173 4,478 2,756 1,370 1,386 48,806 26,396 22,410 Urban Koppal (CMC)
1,895 962 933 321 149 172 6,669 3,621 3,048 UrbanMunirabad Project Area (CT)
Scheduled Castes population Scheduled Tribes population LiteratesTotal/ Rural/ Urban
District/ CD Block/ Town
31

DISTRICT CENSUS HANDBOOK : KOPPAL
DISTRICT PRIMARY
Persons Males Females Persons Males Females Persons Males Females1 2 3 24 25 26 27 28 29 30 31 32
560 Koppal - District Total 6,54,766 3,87,974 2,66,792 5,08,089 3,29,092 1,78,997 1,52,288 1,15,558 36,730 Rural 5,67,783 3,23,887 2,43,896 4,34,543 2,72,414 1,62,129 1,49,510 1,13,228 36,282 Urban 86,983 64,087 22,896 73,546 56,678 16,868 2,778 2,330 448
0032 Yelbarga Total 1,31,703 71,452 60,251 98,028 58,866 39,162 37,106 27,094 10,012 Rural 1,31,703 71,452 60,251 98,028 58,866 39,162 37,106 27,094 10,012 Urban - - - - - - - - -
0033 Kushtagi Total 1,25,168 71,426 53,742 87,897 57,354 30,543 36,290 28,529 7,761 Rural 1,25,168 71,426 53,742 87,897 57,354 30,543 36,290 28,529 7,761 Urban - - - - - - - - -
0034 Gangawati Total 1,70,400 99,157 71,243 1,32,673 84,218 48,455 40,312 31,051 9,261 Rural 1,66,697 96,544 70,153 1,30,338 82,396 47,942 40,137 30,886 9,251 Urban 3,703 2,613 1,090 2,335 1,822 513 175 165 10
803072
Waddarhatti (OG) WARD NO.-0032 (Rural MDDS CODE:601708)
Urban 3,703 2,613 1,090 2,335 1,822 513 175 165 10
0035 Koppal Total 1,47,022 86,787 60,235 1,20,747 75,862 44,885 35,999 26,739 9,260 Rural 1,44,215 84,465 59,750 1,18,280 73,798 44,482 35,977 26,719 9,258 Urban 2,807 2,322 485 2,467 2,064 403 22 20 2
601860Munirabad Project Area (CT) Urban 2,807 2,322 485 2,467 2,064 403 22 20 2 URBAN
803070 Yelbarga (TP) Urban 6,312 3,815 2,497 5,237 3,533 1,704 329 292 37 803071 Kushtagi (TMC) Urban 8,939 6,545 2,394 7,897 5,991 1,906 614 488 126
803072Gangawati (CMC + OG) Urban 43,104 32,178 10,926 35,958 27,990 7,968 1,298 1,112 186
803073 Koppal (CMC) Urban 25,821 19,227 6,594 21,987 17,100 4,887 515 418 97
601860Munirabad Project Area (CT) Urban 2,807 2,322 485 2,467 2,064 403 22 20 2
CultivatorsDistrict/ CD Block/ Town
Total/ Rural/ Urban
Total workers Main workers
Industrial categoryLocation code number
32

PRIMARY CENSUS ABSTRACT
CENSUS ABSTRACT
Persons Males Females Persons Males Females Persons Males Females33 34 35 36 37 38 39 40 41 3 2
1,80,632 79,818 1,00,814 12,534 8,122 4,412 1,62,635 1,25,594 37,041 Total Koppal - District1,74,719 76,992 97,727 9,813 6,405 3,408 1,00,501 75,789 24,712 Rural
5,913 2,826 3,087 2,721 1,717 1,004 62,134 49,805 12,329 Urban40,256 16,743 23,513 2,186 1,463 723 18,480 13,566 4,914 Total Yelbarga 40,256 16,743 23,513 2,186 1,463 723 18,480 13,566 4,914 Rural
- - - - - - - - - Urban31,044 13,302 17,742 2,343 1,578 765 18,220 13,945 4,275 Total Kushtagi 31,044 13,302 17,742 2,343 1,578 765 18,220 13,945 4,275 Rural
- - - - - - - - - Urban58,950 28,219 30,731 2,344 1,475 869 31,067 23,473 7,594 Total Gangawati 58,509 27,971 30,538 2,302 1,444 858 29,390 22,095 7,295 Rural
441 248 193 42 31 11 1,677 1,378 299 Urban
441 248 193 42 31 11 1,677 1,378 299 Urban
Waddarhatti (OG) WARD NO.-0032 (Rural MDDS CODE:601708)
44,977 19,027 25,950 3,017 1,952 1,065 36,754 28,144 8,610 Total Koppal 44,910 18,976 25,934 2,982 1,920 1,062 34,411 26,183 8,228 Rural
67 51 16 35 32 3 2,343 1,961 382 Urban
67 51 16 35 32 3 2,343 1,961 382 UrbanMunirabad Project Area (CT)URBAN
845 380 465 272 196 76 3,791 2,665 1,126 Urban Yelbarga (TP)459 194 265 328 268 60 6,496 5,041 1,455 Urban Kushtagi (TMC)
3,953 1,970 1,983 860 516 344 29,847 24,392 5,455 UrbanGangawati (CMC + OG)
589 231 358 1,226 705 521 19,657 15,746 3,911 Urban Koppal (CMC)
67 51 16 35 32 3 2,343 1,961 382 UrbanMunirabad Project Area (CT)
Agricultural labourers Household industry workers Other workersTotal/ Rural/ Urban
District/ CD Block/ Town
of main workers
33

DISTRICT CENSUS HANDBOOK : KOPPAL
DISTRICT PRIMARY
Persons Males Females Persons Males Females Persons Males Females1 2 3 42 43 44 45 46 47 48 49 50
560 Koppal - District Total 1,46,677 58,882 87,795 11,125 4,847 6,278 92,384 30,343 62,041 Rural 1,33,240 51,473 81,767 10,914 4,712 6,202 89,257 29,203 60,054 Urban 13,437 7,409 6,028 211 135 76 3,127 1,140 1,987
0032 Yelbarga Total 33,675 12,586 21,089 2,418 997 1,421 24,399 8,056 16,343 Rural 33,675 12,586 21,089 2,418 997 1,421 24,399 8,056 16,343 Urban - - - - - - - - -
0033 Kushtagi Total 37,271 14,072 23,199 3,036 1,449 1,587 22,912 6,917 15,995 Rural 37,271 14,072 23,199 3,036 1,449 1,587 22,912 6,917 15,995 Urban - - - - - - - - -
0034 Gangawati Total 37,727 14,939 22,788 2,777 1,190 1,587 27,604 9,664 17,940 Rural 36,359 14,148 22,211 2,766 1,184 1,582 26,671 9,186 17,485 Urban 1,368 791 577 11 6 5 933 478 455
803072
Waddarhatti (OG) WARD NO.-0032 (Rural MDDS CODE:601708)
Urban 1,368 791 577 11 6 5 933 478 455
0035 Koppal Total 26,275 10,925 15,350 2,697 1,085 1,612 15,311 5,071 10,240 Rural 25,935 10,667 15,268 2,694 1,082 1,612 15,275 5,044 10,231 Urban 340 258 82 3 3 - 36 27 9
601860Munirabad Project Area (CT) Urban 340 258 82 3 3 - 36 27 9 URBAN
803070 Yelbarga (TP) Urban 1,075 282 793 25 15 10 214 30 184 803071 Kushtagi (TMC) Urban 1,042 554 488 46 25 21 208 48 160
803072Gangawati (CMC + OG) Urban 7,146 4,188 2,958 74 54 20 2,293 952 1,341
803073 Koppal (CMC) Urban 3,834 2,127 1,707 63 38 25 376 83 293
601860Munirabad Project Area (CT) Urban 340 258 82 3 3 - 36 27 9
Location code
numberDistrict/ CD Block/
Town
Total/ Rural/ Urban
Industrial category
Agricultural labourersMarginal workers Cultivators
34

PRIMARY CENSUS ABSTRACT
CENSUS ABSTRACT
Persons Males Females Persons Males Females Persons Males Females51 52 53 54 55 56 57 58 59 3 2 1
6,260 2,669 3,591 36,908 21,023 15,885 7,35,154 3,11,952 4,23,202 Total Koppal - District 5605,395 2,238 3,157 27,674 15,320 12,354 5,88,433 2,59,071 3,29,362 Rural
865 431 434 9,234 5,703 3,531 1,46,721 52,881 93,840 Urban1,238 508 730 5,620 3,025 2,595 1,20,925 56,221 64,704 Total Yelbarga 00321,238 508 730 5,620 3,025 2,595 1,20,925 56,221 64,704 Rural
- - - - - - - - - Urban2,292 949 1,343 9,031 4,757 4,274 1,34,746 60,308 74,438 Total Kushtagi 00332,292 949 1,343 9,031 4,757 4,274 1,34,746 60,308 74,438 Rural
- - - - - - - - - Urban1,029 419 610 6,317 3,666 2,651 1,83,976 77,781 1,06,195 Total Gangawati 0034
999 396 603 5,923 3,382 2,541 1,78,566 75,853 1,02,713 Rural30 23 7 394 284 110 5,410 1,928 3,482 Urban
30 23 7 394 284 110 5,410 1,928 3,482 Urban
Waddarhatti (OG) WARD NO.-0032 (Rural MDDS CODE:601708)
803072
928 442 486 7,339 4,327 3,012 1,60,061 68,760 91,301 Total Koppal 0035866 385 481 7,100 4,156 2,944 1,54,196 66,689 87,507 Rural62 57 5 239 171 68 5,865 2,071 3,794 Urban
62 57 5 239 171 68 5,865 2,071 3,794 UrbanMunirabad Project Area (CT) 601860URBAN
31 14 17 805 223 582 8,502 3,677 4,825 Urban Yelbarga (TP) 80307052 28 24 736 453 283 15,939 5,948 9,991 Urban Kushtagi (TMC) 803071
390 193 197 4,389 2,989 1,400 71,538 25,052 46,486 UrbanGangawati (CMC + OG) 803072
330 139 191 3,065 1,867 1,198 44,877 16,133 28,744 Urban Koppal (CMC) 803073
62 57 5 239 171 68 5,865 2,071 3,794 UrbanMunirabad Project Area (CT) 601860
Household industry workers Other workers Non-workers
of marginal workersTotal/ Rural/ Urban
District/ CD Block/ Town
Location code
number
35


Appendix to District Primary Census Abstract
Total, Scheduled Castes and Scheduled Tribes
Population - Urban Block wise

Location Code
Name of Town Name of Ward Boundaries of Urban Block / EB Number
Total Population
Scheduled Castes
Population
Schedu
1 2 3 4 5 6
803070 Yelbarga (TP) WARD No.-0001 EB No.-000100 322 8
803070 Yelbarga (TP) WARD No.-0001 EB No.-000200 398 -
803070 Yelbarga (TP) WARD No.-0002 EB No.-000300 268 -
803070 Yelbarga (TP) WARD No.-0002 EB No.-001000 438 53
803070 Yelbarga (TP) WARD No.-0003 EB No.-000800 576 327
803070 Yelbarga (TP) WARD No.-0003 EB No.-000900 366 164
803070 Yelbarga (TP) WARD No.-0004 EB No.-000400 494 7
803070 Yelbarga (TP) WARD No.-0004 EB No.-000500 521 -
803070 Yelbarga (TP) WARD No.-0004 EB No.-000600 371 1
803070 Yelbarga (TP) WARD No.-0004 EB No.-000700 575 169
803070 Yelbarga (TP) WARD No.-0005 EB No.-001100 612 3
803070 Yelbarga (TP) WARD No.-0006 EB No.-001500 795 11
803070 Yelbarga (TP) WARD No.-0007 EB No.-0014 SUB-EB No.01 614 23
803070 Yelbarga (TP) WARD No.-0007 EB No.-0014 SUB-EB No.02 327 -
803070 Yelbarga (TP) WARD No.-0008 EB No.-001200 427 11
803070 Yelbarga (TP) WARD No.-0009 EB No.-0013 SUB-EB No.01 646 20
803070 Yelbarga (TP) WARD No.-0009 EB No.-0013 SUB-EB No.02 398 -
803070 Yelbarga (TP) WARD No.-0009 EB No.-0016 SUB-EB No.01 774 111
803070 Yelbarga (TP) WARD No.-0009 EB No.-0016 SUB-EB No.02 267 49
803070 Yelbarga (TP) WARD No.-0010 EB No.-001700 1064 805
803070 Yelbarga (TP) WARD No.-0010 EB No.-001800 742 235
803070 Yelbarga (TP) WARD No.-0010 EB No.-001900 493 46
803070 Yelbarga (TP) WARD No.-0010 EB No.-002000 402 37
803070 Yelbarga (TP) WARD No.-0010 EB No.-002100 525 62
803070 Yelbarga (TP) WARD No.-0010 EB No.-002500 576 21
803070 Yelbarga (TP) WARD No.-0011 EB No.-002200 686 78
803070 Yelbarga (TP) WARD No.-0011 EB No.-002300 840 459
803070 Yelbarga (TP) WARD No.-0011 EB No.-002400 297 52
803071 Kushtagi (TMC) WARD No.-0001 EB No.-000100 562 73
803071 Kushtagi (TMC) WARD No.-0001 EB No.-000200 297 85
803071 Kushtagi (TMC) WARD No.-0001 EB No.-000300 752 149
803071 Kushtagi (TMC) WARD No.-0001 EB No.-000400 474 84
803071 Kushtagi (TMC) WARD No.-0002 EB No.-000500 640 93
803071 Kushtagi (TMC) WARD No.-0002 EB No.-000600 830 125
803071 Kushtagi (TMC) WARD No.-0003 EB No.-000700 864 145
803071 Kushtagi (TMC) WARD No.-0003 EB No.-000800 608 81
803071 Kushtagi (TMC) WARD No.-0004 EB No.-000900 545 40
803071 Kushtagi (TMC) WARD No.-0004 EB No.-0010 SUB-EB No.01 791 175
803071 Kushtagi (TMC) WARD No.-0004 EB No.-0010 SUB-EB No.02 665 90
803071 Kushtagi (TMC) WARD No.-0005 EB No.-0011 SUB-EB No.01 625 80
803071 Kushtagi (TMC) WARD No.-0005 EB No.-0011 SUB-EB No.02 605 90
803071 Kushtagi (TMC) WARD No.-0005 EB No.-001300 664 44
APPENDIX TO DISTRICT PRIMARY CENSUS ABSTRACT TOTAL, SCHEDULED CASTES AND SCHEDULED TRIBES POPULATION - URBAN BLOCK WISE
38

Location Code
Name of Town Name of Ward Boundaries of Urban Block / EB Number
Total Population
Scheduled Castes
Population
Schedu
1 2 3 4 5 6
APPENDIX TO DISTRICT PRIMARY CENSUS ABSTRACT TOTAL, SCHEDULED CASTES AND SCHEDULED TRIBES POPULATION - URBAN BLOCK WISE
803071 Kushtagi (TMC) WARD No.-0006 EB No.-0012 SUB-EB No.01 641 237
803071 Kushtagi (TMC) WARD No.-0006 EB No.-0012 SUB-EB No.02 445 100
803071 Kushtagi (TMC) WARD No.-0007 EB No.-001400 749 72
803071 Kushtagi (TMC) WARD No.-0008 EB No.-001500 430 127
803071 Kushtagi (TMC) WARD No.-0008 EB No.-001600 808 259
803071 Kushtagi (TMC) WARD No.-0009 EB No.-0017 SUB-EB No.01 779 78
803071 Kushtagi (TMC) WARD No.-0010 EB No.-0017 SUB-EB No.02 1032 46
803071 Kushtagi (TMC) WARD No.-0011 EB No.-001800 356 12
803071 Kushtagi (TMC) WARD No.-0011 EB No.-001900 347 45
803071 Kushtagi (TMC) WARD No.-0012 EB No.-002000 537 52
803071 Kushtagi (TMC) WARD No.-0013 EB No.-002100 643 93
803071 Kushtagi (TMC) WARD No.-0014 EB No.-0022 SUB-EB No.01 435 379
803071 Kushtagi (TMC) WARD No.-0014 EB No.-0022 SUB-EB No.02 722 530
803071 Kushtagi (TMC) WARD No.-0015 EB No.-002300 776 348
803071 Kushtagi (TMC) WARD No.-0015 EB No.-002400 160 92
803071 Kushtagi (TMC) WARD No.-0016 EB No.-0025 SUB-EB No.01 567 52
803071 Kushtagi (TMC) WARD No.-0016 EB No.-0025 SUB-EB No.02 495 44
803071 Kushtagi (TMC) WARD No.-0017 EB No.-002600 165 22
803071 Kushtagi (TMC) WARD No.-0017 EB No.-002700 416 14
803071 Kushtagi (TMC) WARD No.-0018 EB No.-0028 SUB-EB No.01 206 60
803071 Kushtagi (TMC) WARD No.-0018 EB No.-0028 SUB-EB No.02 778 119
803071 Kushtagi (TMC) WARD No.-0019 EB No.-002900 636 290
803071 Kushtagi (TMC) WARD No.-0020 EB No.-003000 421 37
803071 Kushtagi (TMC) WARD No.-0021 EB No.-003100 364 59
803071 Kushtagi (TMC) WARD No.-0021 EB No.-003200 381 63
803071 Kushtagi (TMC) WARD No.-0022 EB No.-003300 670 84
803071 Kushtagi (TMC) WARD No.-0023 EB No.-0034 SUB-EB No.01 532 67
803071 Kushtagi (TMC) WARD No.-0023 EB No.-0034 SUB-EB No.02 398 110
803071 Kushtagi (TMC) WARD No.-0023 EB No.-0035 SUB-EB No.01 202 21
803071 Kushtagi (TMC) WARD No.-0023 EB No.-0035 SUB-EB No.02 865 178
803072 Gangawati (CMC + OG) WARD No.-0001 EB No.-007100 804 30
803072 Gangawati (CMC + OG) WARD No.-0001 EB No.-007200 718 4
803072 Gangawati (CMC + OG) WARD No.-0001 EB No.-007300 515 33
803072 Gangawati (CMC + OG) WARD No.-0001 EB No.-007400 493 8
803072 Gangawati (CMC + OG) WARD No.-0001 EB No.-007500 615 -
803072 Gangawati (CMC + OG) WARD No.-0002 EB No.-0076 SUB-EB No.01 638 59
803072 Gangawati (CMC + OG) WARD No.-0002 EB No.-0076 SUB-EB No.02 650 14
803072 Gangawati (CMC + OG) WARD No.-0002 EB No.-007700 394 9
803072 Gangawati (CMC + OG) WARD No.-0002 EB No.-007800 553 9
803072 Gangawati (CMC + OG) WARD No.-0002 EB No.-007900 480 12
803072 Gangawati (CMC + OG) WARD No.-0002 EB No.-008000 549 -
803072 Gangawati (CMC + OG) WARD No.-0003 EB No.-008100 762 41
39

Location Code
Name of Town Name of Ward Boundaries of Urban Block / EB Number
Total Population
Scheduled Castes
Population
Schedu
1 2 3 4 5 6
APPENDIX TO DISTRICT PRIMARY CENSUS ABSTRACT TOTAL, SCHEDULED CASTES AND SCHEDULED TRIBES POPULATION - URBAN BLOCK WISE
803072 Gangawati (CMC + OG) WARD No.-0003 EB No.-0082 SUB-EB No.01 748 85
803072 Gangawati (CMC + OG) WARD No.-0003 EB No.-0082 SUB-EB No.02 320 27
803072 Gangawati (CMC + OG) WARD No.-0003 EB No.-008300 507 43
803072 Gangawati (CMC + OG) WARD No.-0003 EB No.-0084 SUB-EB No.01 656 208
803072 Gangawati (CMC + OG) WARD No.-0003 EB No.-0084 SUB-EB No.02 193 27
803072 Gangawati (CMC + OG) WARD No.-0003 EB No.-0085 SUB-EB No.01 699 25
803072 Gangawati (CMC + OG) WARD No.-0003 EB No.-0085 SUB-EB No.02 171 7
803072 Gangawati (CMC + OG) WARD No.-0003 EB No.-008600 469 -
803072 Gangawati (CMC + OG) WARD No.-0004 EB No.-008700 299 -
803072 Gangawati (CMC + OG) WARD No.-0004 EB No.-008800 300 18
803072 Gangawati (CMC + OG) WARD No.-0004 EB No.-008900 527 -
803072 Gangawati (CMC + OG) WARD No.-0004 EB No.-009000 695 -
803072 Gangawati (CMC + OG) WARD No.-0004 EB No.-009100 793 68
803072 Gangawati (CMC + OG) WARD No.-0005 EB No.-000100 492 34
803072 Gangawati (CMC + OG) WARD No.-0005 EB No.-000200 710 12
803072 Gangawati (CMC + OG) WARD No.-0005 EB No.-0003 SUB-EB No.01 732 -
803072 Gangawati (CMC + OG) WARD No.-0005 EB No.-0003 SUB-EB No.02 204 8
803072 Gangawati (CMC + OG) WARD No.-0005 EB No.-0004 SUB-EB No.01 581 5
803072 Gangawati (CMC + OG) WARD No.-0005 EB No.-0004 SUB-EB No.02 618 10
803072 Gangawati (CMC + OG) WARD No.-0005 EB No.-000500 706 19
803072 Gangawati (CMC + OG) WARD No.-0006 EB No.-0006 SUB-EB No.01 680 6
803072 Gangawati (CMC + OG) WARD No.-0006 EB No.-0006 SUB-EB No.02 257 -
803072 Gangawati (CMC + OG) WARD No.-0006 EB No.-000700 339 -
803072 Gangawati (CMC + OG) WARD No.-0006 EB No.-000800 815 8
803072 Gangawati (CMC + OG) WARD No.-0006 EB No.-000900 768 1
803072 Gangawati (CMC + OG) WARD No.-0006 EB No.-0010 SUB-EB No.01 843 25
803072 Gangawati (CMC + OG) WARD No.-0006 EB No.-0010 SUB-EB No.02 165 -
803072 Gangawati (CMC + OG) WARD No.-0006 EB No.-001100 581 28
803072 Gangawati (CMC + OG) WARD No.-0006 EB No.-001200 637 4
803072 Gangawati (CMC + OG) WARD No.-0006 EB No.-001300 719 131
803072 Gangawati (CMC + OG) WARD No.-0007 EB No.-0014 SUB-EB No.01 629 45
803072 Gangawati (CMC + OG) WARD No.-0007 EB No.-0014 SUB-EB No.02 264 6
803072 Gangawati (CMC + OG) WARD No.-0007 EB No.-0015 SUB-EB No.01 665 -
803072 Gangawati (CMC + OG) WARD No.-0007 EB No.-0015 SUB-EB No.02 148 -
803072 Gangawati (CMC + OG) WARD No.-0007 EB No.-0016 SUB-EB No.01 281 -
803072 Gangawati (CMC + OG) WARD No.-0007 EB No.-0016 SUB-EB No.02 456 28
803072 Gangawati (CMC + OG) WARD No.-0007 EB No.-001700 787 53
803072 Gangawati (CMC + OG) WARD No.-0007 EB No.-001800 823 92
803072 Gangawati (CMC + OG) WARD No.-0008 EB No.-001900 695 18
803072 Gangawati (CMC + OG) WARD No.-0008 EB No.-002000 340 4
803072 Gangawati (CMC + OG) WARD No.-0008 EB No.-002100 720 102
803072 Gangawati (CMC + OG) WARD No.-0008 EB No.-002200 707 43
40

Location Code
Name of Town Name of Ward Boundaries of Urban Block / EB Number
Total Population
Scheduled Castes
Population
Schedu
1 2 3 4 5 6
APPENDIX TO DISTRICT PRIMARY CENSUS ABSTRACT TOTAL, SCHEDULED CASTES AND SCHEDULED TRIBES POPULATION - URBAN BLOCK WISE
803072 Gangawati (CMC + OG) WARD No.-0008 EB No.-002300 591 6
803072 Gangawati (CMC + OG) WARD No.-0008 EB No.-002400 369 43
803072 Gangawati (CMC + OG) WARD No.-0008 EB No.-002500 651 296
803072 Gangawati (CMC + OG) WARD No.-0009 EB No.-0026 SUB-EB No.01 534 38
803072 Gangawati (CMC + OG) WARD No.-0009 EB No.-0026 SUB-EB No.02 453 -
803072 Gangawati (CMC + OG) WARD No.-0009 EB No.-002700 777 18
803072 Gangawati (CMC + OG) WARD No.-0009 EB No.-0028 SUB-EB No.01 721 83
803072 Gangawati (CMC + OG) WARD No.-0009 EB No.-0028 SUB-EB No.02 128 2
803072 Gangawati (CMC + OG) WARD No.-0009 EB No.-002900 829 68
803072 Gangawati (CMC + OG) WARD No.-0010 EB No.-003000 596 182
803072 Gangawati (CMC + OG) WARD No.-0010 EB No.-003100 469 16
803072 Gangawati (CMC + OG) WARD No.-0010 EB No.-003200 717 2
803072 Gangawati (CMC + OG) WARD No.-0010 EB No.-003300 481 19
803072 Gangawati (CMC + OG) WARD No.-0011 EB No.-003400 796 38
803072 Gangawati (CMC + OG) WARD No.-0011 EB No.-003500 599 65
803072 Gangawati (CMC + OG) WARD No.-0011 EB No.-003600 722 93
803072 Gangawati (CMC + OG) WARD No.-0011 EB No.-003700 476 22
803072 Gangawati (CMC + OG) WARD No.-0012 EB No.-0038 SUB-EB No.01 691 58
803072 Gangawati (CMC + OG) WARD No.-0012 EB No.-0038 SUB-EB No.02 209 3
803072 Gangawati (CMC + OG) WARD No.-0012 EB No.-0039 SUB-EB No.01 704 -
803072 Gangawati (CMC + OG) WARD No.-0012 EB No.-0039 SUB-EB No.02 202 13
803072 Gangawati (CMC + OG) WARD No.-0012 EB No.-004000 1013 49
803072 Gangawati (CMC + OG) WARD No.-0012 EB No.-004100 758 4
803072 Gangawati (CMC + OG) WARD No.-0012 EB No.-0042 SUB-EB No.01 828 4
803072 Gangawati (CMC + OG) WARD No.-0012 EB No.-0042 SUB-EB No.02 194 -
803072 Gangawati (CMC + OG) WARD No.-0013 EB No.-004300 579 20
803072 Gangawati (CMC + OG) WARD No.-0013 EB No.-0044 SUB-EB No.01 746 9
803072 Gangawati (CMC + OG) WARD No.-0013 EB No.-0044 SUB-EB No.02 145 9
803072 Gangawati (CMC + OG) WARD No.-0013 EB No.-004500 576 23
803072 Gangawati (CMC + OG) WARD No.-0013 EB No.-004600 697 22
803072 Gangawati (CMC + OG) WARD No.-0013 EB No.-004700 621 24
803072 Gangawati (CMC + OG) WARD No.-0014 EB No.-004800 432 10
803072 Gangawati (CMC + OG) WARD No.-0014 EB No.-004900 757 36
803072 Gangawati (CMC + OG) WARD No.-0014 EB No.-005000 441 29
803072 Gangawati (CMC + OG) WARD No.-0014 EB No.-005100 446 36
803072 Gangawati (CMC + OG) WARD No.-0014 EB No.-005200 512 24
803072 Gangawati (CMC + OG) WARD No.-0015 EB No.-005300 735 307
803072 Gangawati (CMC + OG) WARD No.-0015 EB No.-0054 SUB-EB No.01 389 -
803072 Gangawati (CMC + OG) WARD No.-0015 EB No.-0054 SUB-EB No.02 377 5
803072 Gangawati (CMC + OG) WARD No.-0015 EB No.-0055 SUB-EB No.01 661 25
803072 Gangawati (CMC + OG) WARD No.-0015 EB No.-0055 SUB-EB No.02 232 21
803072 Gangawati (CMC + OG) WARD No.-0015 EB No.-0056 SUB-EB No.01 717 14
41
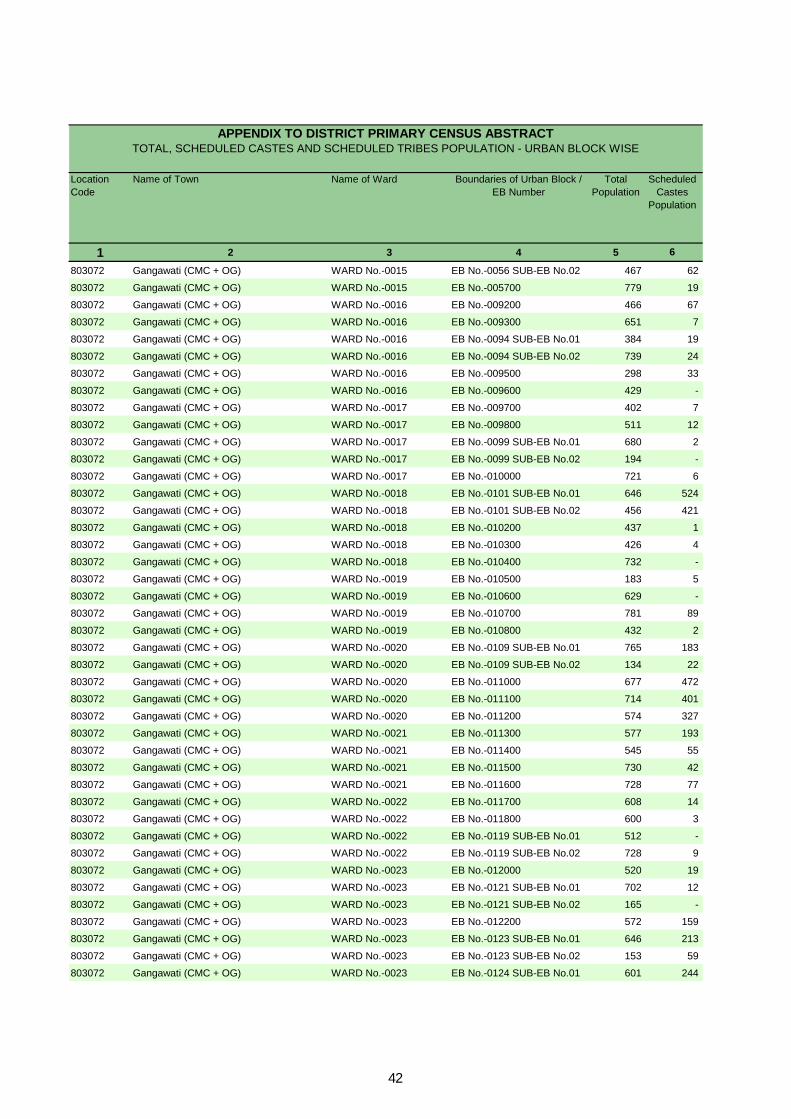
Location Code
Name of Town Name of Ward Boundaries of Urban Block / EB Number
Total Population
Scheduled Castes
Population
Schedu
1 2 3 4 5 6
APPENDIX TO DISTRICT PRIMARY CENSUS ABSTRACT TOTAL, SCHEDULED CASTES AND SCHEDULED TRIBES POPULATION - URBAN BLOCK WISE
803072 Gangawati (CMC + OG) WARD No.-0015 EB No.-0056 SUB-EB No.02 467 62
803072 Gangawati (CMC + OG) WARD No.-0015 EB No.-005700 779 19
803072 Gangawati (CMC + OG) WARD No.-0016 EB No.-009200 466 67
803072 Gangawati (CMC + OG) WARD No.-0016 EB No.-009300 651 7
803072 Gangawati (CMC + OG) WARD No.-0016 EB No.-0094 SUB-EB No.01 384 19
803072 Gangawati (CMC + OG) WARD No.-0016 EB No.-0094 SUB-EB No.02 739 24
803072 Gangawati (CMC + OG) WARD No.-0016 EB No.-009500 298 33
803072 Gangawati (CMC + OG) WARD No.-0016 EB No.-009600 429 -
803072 Gangawati (CMC + OG) WARD No.-0017 EB No.-009700 402 7
803072 Gangawati (CMC + OG) WARD No.-0017 EB No.-009800 511 12
803072 Gangawati (CMC + OG) WARD No.-0017 EB No.-0099 SUB-EB No.01 680 2
803072 Gangawati (CMC + OG) WARD No.-0017 EB No.-0099 SUB-EB No.02 194 -
803072 Gangawati (CMC + OG) WARD No.-0017 EB No.-010000 721 6
803072 Gangawati (CMC + OG) WARD No.-0018 EB No.-0101 SUB-EB No.01 646 524
803072 Gangawati (CMC + OG) WARD No.-0018 EB No.-0101 SUB-EB No.02 456 421
803072 Gangawati (CMC + OG) WARD No.-0018 EB No.-010200 437 1
803072 Gangawati (CMC + OG) WARD No.-0018 EB No.-010300 426 4
803072 Gangawati (CMC + OG) WARD No.-0018 EB No.-010400 732 -
803072 Gangawati (CMC + OG) WARD No.-0019 EB No.-010500 183 5
803072 Gangawati (CMC + OG) WARD No.-0019 EB No.-010600 629 -
803072 Gangawati (CMC + OG) WARD No.-0019 EB No.-010700 781 89
803072 Gangawati (CMC + OG) WARD No.-0019 EB No.-010800 432 2
803072 Gangawati (CMC + OG) WARD No.-0020 EB No.-0109 SUB-EB No.01 765 183
803072 Gangawati (CMC + OG) WARD No.-0020 EB No.-0109 SUB-EB No.02 134 22
803072 Gangawati (CMC + OG) WARD No.-0020 EB No.-011000 677 472
803072 Gangawati (CMC + OG) WARD No.-0020 EB No.-011100 714 401
803072 Gangawati (CMC + OG) WARD No.-0020 EB No.-011200 574 327
803072 Gangawati (CMC + OG) WARD No.-0021 EB No.-011300 577 193
803072 Gangawati (CMC + OG) WARD No.-0021 EB No.-011400 545 55
803072 Gangawati (CMC + OG) WARD No.-0021 EB No.-011500 730 42
803072 Gangawati (CMC + OG) WARD No.-0021 EB No.-011600 728 77
803072 Gangawati (CMC + OG) WARD No.-0022 EB No.-011700 608 14
803072 Gangawati (CMC + OG) WARD No.-0022 EB No.-011800 600 3
803072 Gangawati (CMC + OG) WARD No.-0022 EB No.-0119 SUB-EB No.01 512 -
803072 Gangawati (CMC + OG) WARD No.-0022 EB No.-0119 SUB-EB No.02 728 9
803072 Gangawati (CMC + OG) WARD No.-0023 EB No.-012000 520 19
803072 Gangawati (CMC + OG) WARD No.-0023 EB No.-0121 SUB-EB No.01 702 12
803072 Gangawati (CMC + OG) WARD No.-0023 EB No.-0121 SUB-EB No.02 165 -
803072 Gangawati (CMC + OG) WARD No.-0023 EB No.-012200 572 159
803072 Gangawati (CMC + OG) WARD No.-0023 EB No.-0123 SUB-EB No.01 646 213
803072 Gangawati (CMC + OG) WARD No.-0023 EB No.-0123 SUB-EB No.02 153 59
803072 Gangawati (CMC + OG) WARD No.-0023 EB No.-0124 SUB-EB No.01 601 244
42

Location Code
Name of Town Name of Ward Boundaries of Urban Block / EB Number
Total Population
Scheduled Castes
Population
Schedu
1 2 3 4 5 6
APPENDIX TO DISTRICT PRIMARY CENSUS ABSTRACT TOTAL, SCHEDULED CASTES AND SCHEDULED TRIBES POPULATION - URBAN BLOCK WISE
803072 Gangawati (CMC + OG) WARD No.-0023 EB No.-0124 SUB-EB No.02 401 140
803072 Gangawati (CMC + OG) WARD No.-0024 EB No.-0125 SUB-EB No.01 705 76
803072 Gangawati (CMC + OG) WARD No.-0024 EB No.-0125 SUB-EB No.02 360 32
803072 Gangawati (CMC + OG) WARD No.-0024 EB No.-012600 656 152
803072 Gangawati (CMC + OG) WARD No.-0024 EB No.-012700 718 281
803072 Gangawati (CMC + OG) WARD No.-0024 EB No.-0128 SUB-EB No.01 702 112
803072 Gangawati (CMC + OG) WARD No.-0024 EB No.-0128 SUB-EB No.02 131 7
803072 Gangawati (CMC + OG) WARD No.-0024 EB No.-012900 681 413
803072 Gangawati (CMC + OG) WARD No.-0025 EB No.-013000 452 31
803072 Gangawati (CMC + OG) WARD No.-0025 EB No.-0131 SUB-EB No.01 533 271
803072 Gangawati (CMC + OG) WARD No.-0025 EB No.-0131 SUB-EB No.02 644 22
803072 Gangawati (CMC + OG) WARD No.-0025 EB No.-013200 513 29
803072 Gangawati (CMC + OG) WARD No.-0025 EB No.-0133 SUB-EB No.01 638 195
803072 Gangawati (CMC + OG) WARD No.-0025 EB No.-0133 SUB-EB No.02 195 37
803072 Gangawati (CMC + OG) WARD No.-0025 EB No.-013400 564 42
803072 Gangawati (CMC + OG) WARD No.-0025 EB No.-013500 647 113
803072 Gangawati (CMC + OG) WARD No.-0026 EB No.-0136 SUB-EB No.01 620 33
803072 Gangawati (CMC + OG) WARD No.-0026 EB No.-0136 SUB-EB No.02 274 22
803072 Gangawati (CMC + OG) WARD No.-0026 EB No.-013700 388 4
803072 Gangawati (CMC + OG) WARD No.-0026 EB No.-0138 SUB-EB No.01 759 172
803072 Gangawati (CMC + OG) WARD No.-0026 EB No.-0138 SUB-EB No.02 189 47
803072 Gangawati (CMC + OG) WARD No.-0026 EB No.-013900 457 49
803072 Gangawati (CMC + OG) WARD No.-0026 EB No.-014000 515 79
803072 Gangawati (CMC + OG) WARD No.-0027 EB No.-0141 SUB-EB No.01 664 620
803072 Gangawati (CMC + OG) WARD No.-0027 EB No.-0141 SUB-EB No.02 784 771
803072 Gangawati (CMC + OG) WARD No.-0027 EB No.-014200 693 362
803072 Gangawati (CMC + OG) WARD No.-0027 EB No.-014300 421 252
803072 Gangawati (CMC + OG) WARD No.-0027 EB No.-014400 474 17
803072 Gangawati (CMC + OG) WARD No.-0027 EB No.-014500 691 124
803072 Gangawati (CMC + OG) WARD No.-0028 EB No.-0146 SUB-EB No.01 654 577
803072 Gangawati (CMC + OG) WARD No.-0028 EB No.-0146 SUB-EB No.02 164 148
803072 Gangawati (CMC + OG) WARD No.-0028 EB No.-0147 SUB-EB No.01 639 632
803072 Gangawati (CMC + OG) WARD No.-0028 EB No.-0147 SUB-EB No.02 327 322
803072 Gangawati (CMC + OG) WARD No.-0028 EB No.-014800 654 93
803072 Gangawati (CMC + OG) WARD No.-0028 EB No.-014900 747 42
803072 Gangawati (CMC + OG) WARD No.-0029 EB No.-015000 646 17
803072 Gangawati (CMC + OG) WARD No.-0029 EB No.-015100 523 28
803072 Gangawati (CMC + OG) WARD No.-0029 EB No.-0152 SUB-EB No.01 681 19
803072 Gangawati (CMC + OG) WARD No.-0029 EB No.-0152 SUB-EB No.02 176 24
803072 Gangawati (CMC + OG) WARD No.-0029 EB No.-015300 725 6
803072 Gangawati (CMC + OG) WARD No.-0030 EB No.-0154 SUB-EB No.01 557 74
803072 Gangawati (CMC + OG) WARD No.-0030 EB No.-0154 SUB-EB No.02 587 26
43

Location Code
Name of Town Name of Ward Boundaries of Urban Block / EB Number
Total Population
Scheduled Castes
Population
Schedu
1 2 3 4 5 6
APPENDIX TO DISTRICT PRIMARY CENSUS ABSTRACT TOTAL, SCHEDULED CASTES AND SCHEDULED TRIBES POPULATION - URBAN BLOCK WISE
803072 Gangawati (CMC + OG) WARD No.-0030 EB No.-0155 SUB-EB No.01 685 78
803072 Gangawati (CMC + OG) WARD No.-0030 EB No.-0155 SUB-EB No.02 317 8
803072 Gangawati (CMC + OG) WARD No.-0030 EB No.-0156 SUB-EB No.01 656 222
803072 Gangawati (CMC + OG) WARD No.-0030 EB No.-0156 SUB-EB No.02 287 70
803072 Gangawati (CMC + OG) WARD No.-0030 EB No.-015700 496 406
803072 Gangawati (CMC + OG) WARD No.-0030 EB No.-015800 405 129
803072 Gangawati (CMC + OG) WARD No.-0031 EB No.-015900 466 58
803072 Gangawati (CMC + OG) WARD No.-0031 EB No.-016000 449 41
803072 Gangawati (CMC + OG) WARD No.-0031 EB No.-016100 808 152
803072 Gangawati (CMC + OG) WARD No.-0031 EB No.-016200 741 561
803072 Gangawati (CMC + OG) WARD No.-0031 EB No.-0163 SUB-EB No.01 740 390
803072 Gangawati (CMC + OG) WARD No.-0031 EB No.-0163 SUB-EB No.02 265 201
803072 Gangawati (CMC + OG) WARD No.-0031 EB No.-016400 490 189
803072 Gangawati (CMC + OG) WARD No.-0032 EB No.-0058 SUB-EB No.01 821 22
803072 Gangawati (CMC + OG) WARD No.-0032 EB No.-0058 SUB-EB No.02 75 -
803072 Gangawati (CMC + OG) WARD No.-0032 EB No.-005900 588 57
803072 Gangawati (CMC + OG) WARD No.-0032 EB No.-006000 679 22
803072 Gangawati (CMC + OG) WARD No.-0032 EB No.-0061 SUB-EB No.01 568 -
803072 Gangawati (CMC + OG) WARD No.-0032 EB No.-0061 SUB-EB No.02 218 10
803072 Gangawati (CMC + OG) WARD No.-0032 EB No.-0062 SUB-EB No.01 562 279
803072 Gangawati (CMC + OG) WARD No.-0032 EB No.-0062 SUB-EB No.02 264 16
803072 Gangawati (CMC + OG) WARD No.-0032 EB No.-006300 608 12
803072 Gangawati (CMC + OG) WARD No.-0032 EB No.-006400 482 82
803072 Gangawati (CMC + OG) WARD No.-0032 EB No.-006500 450 44
803072 Gangawati (CMC + OG) WARD No.-0032 EB No.-006600 841 37
803072 Gangawati (CMC + OG) WARD No.-0032 EB No.-0067 SUB-EB No.01 555 247
803072 Gangawati (CMC + OG) WARD No.-0032 EB No.-0067 SUB-EB No.02 553 414
803072 Gangawati (CMC + OG) WARD No.-0032 EB No.-006800 232 -
803072 Gangawati (CMC + OG) WARD No.-0032 EB No.-0069 SUB-EB No.01 588 100
803072 Gangawati (CMC + OG) WARD No.-0032 EB No.-0069 SUB-EB No.02 214 11
803072 Gangawati (CMC + OG) WARD No.-0032 EB No.-0070 SUB-EB No.01 602 2
803072 Gangawati (CMC + OG) WARD No.-0032 EB No.-0070 SUB-EB No.02 213 5
803073 Koppal (CMC) WARD No.-0001 EB No.-000100 706 4
803073 Koppal (CMC) WARD No.-0001 EB No.-0002 SUB-EB No.01 477 -
803073 Koppal (CMC) WARD No.-0001 EB No.-0002 SUB-EB No.02 471 6
803073 Koppal (CMC) WARD No.-0001 EB No.-000300 764 36
803073 Koppal (CMC) WARD No.-0001 EB No.-000400 516 11
803073 Koppal (CMC) WARD No.-0002 EB No.-000500 560 79
803073 Koppal (CMC) WARD No.-0002 EB No.-000600 804 28
803073 Koppal (CMC) WARD No.-0003 EB No.-0007 SUB-EB No.01 497 17
803073 Koppal (CMC) WARD No.-0003 EB No.-0007 SUB-EB No.02 450 25
803073 Koppal (CMC) WARD No.-0003 EB No.-000800 693 48
44

Location Code
Name of Town Name of Ward Boundaries of Urban Block / EB Number
Total Population
Scheduled Castes
Population
Schedu
1 2 3 4 5 6
APPENDIX TO DISTRICT PRIMARY CENSUS ABSTRACT TOTAL, SCHEDULED CASTES AND SCHEDULED TRIBES POPULATION - URBAN BLOCK WISE
803073 Koppal (CMC) WARD No.-0003 EB No.-0009 SUB-EB No.01 767 67
803073 Koppal (CMC) WARD No.-0003 EB No.-0009 SUB-EB No.02 333 10
803073 Koppal (CMC) WARD No.-0003 EB No.-001000 618 101
803073 Koppal (CMC) WARD No.-0003 EB No.-001100 557 35
803073 Koppal (CMC) WARD No.-0003 EB No.-001200 578 41
803073 Koppal (CMC) WARD No.-0003 EB No.-001300 401 8
803073 Koppal (CMC) WARD No.-0003 EB No.-001400 299 23
803073 Koppal (CMC) WARD No.-0003 EB No.-001500 414 49
803073 Koppal (CMC) WARD No.-0003 EB No.-001600 397 19
803073 Koppal (CMC) WARD No.-0003 EB No.-001700 334 46
803073 Koppal (CMC) WARD No.-0004 EB No.-001800 764 263
803073 Koppal (CMC) WARD No.-0004 EB No.-0019 SUB-EB No.01 629 466
803073 Koppal (CMC) WARD No.-0004 EB No.-0019 SUB-EB No.02 203 65
803073 Koppal (CMC) WARD No.-0004 EB No.-0020 SUB-EB No.01 734 4
803073 Koppal (CMC) WARD No.-0004 EB No.-0020 SUB-EB No.02 227 7
803073 Koppal (CMC) WARD No.-0005 EB No.-002100 592 -
803073 Koppal (CMC) WARD No.-0005 EB No.-002200 360 5
803073 Koppal (CMC) WARD No.-0006 EB No.-002300 681 32
803073 Koppal (CMC) WARD No.-0006 EB No.-002400 671 -
803073 Koppal (CMC) WARD No.-0006 EB No.-0025 SUB-EB No.01 125 -
803073 Koppal (CMC) WARD No.-0006 EB No.-0025 SUB-EB No.02 696 -
803073 Koppal (CMC) WARD No.-0007 EB No.-0026 SUB-EB No.01 648 4
803073 Koppal (CMC) WARD No.-0007 EB No.-0026 SUB-EB No.02 335 -
803073 Koppal (CMC) WARD No.-0007 EB No.-002700 764 -
803073 Koppal (CMC) WARD No.-0007 EB No.-002800 498 -
803073 Koppal (CMC) WARD No.-0008 EB No.-002900 356 6
803073 Koppal (CMC) WARD No.-0008 EB No.-003000 452 -
803073 Koppal (CMC) WARD No.-0008 EB No.-003100 699 -
803073 Koppal (CMC) WARD No.-0009 EB No.-003200 459 11
803073 Koppal (CMC) WARD No.-0009 EB No.-0033 SUB-EB No.01 692 2
803073 Koppal (CMC) WARD No.-0009 EB No.-0033 SUB-EB No.02 171 -
803073 Koppal (CMC) WARD No.-0009 EB No.-003400 520 -
803073 Koppal (CMC) WARD No.-0010 EB No.-003500 845 4
803073 Koppal (CMC) WARD No.-0010 EB No.-003600 406 -
803073 Koppal (CMC) WARD No.-0011 EB No.-003700 487 -
803073 Koppal (CMC) WARD No.-0011 EB No.-003800 684 444
803073 Koppal (CMC) WARD No.-0012 EB No.-0039 SUB-EB No.01 628 407
803073 Koppal (CMC) WARD No.-0012 EB No.-0039 SUB-EB No.02 518 249
803073 Koppal (CMC) WARD No.-0012 EB No.-0039 SUB-EB No.03 689 622
803073 Koppal (CMC) WARD No.-0012 EB No.-0039 SUB-EB No.04 590 354
803073 Koppal (CMC) WARD No.-0013 EB No.-0040 SUB-EB No.01 689 25
803073 Koppal (CMC) WARD No.-0013 EB No.-0040 SUB-EB No.02 292 5
45

Location Code
Name of Town Name of Ward Boundaries of Urban Block / EB Number
Total Population
Scheduled Castes
Population
Schedu
1 2 3 4 5 6
APPENDIX TO DISTRICT PRIMARY CENSUS ABSTRACT TOTAL, SCHEDULED CASTES AND SCHEDULED TRIBES POPULATION - URBAN BLOCK WISE
803073 Koppal (CMC) WARD No.-0013 EB No.-0041 SUB-EB No.01 759 89
803073 Koppal (CMC) WARD No.-0013 EB No.-0041 SUB-EB No.02 649 276
803073 Koppal (CMC) WARD No.-0013 EB No.-0041 SUB-EB No.03 261 98
803073 Koppal (CMC) WARD No.-0014 EB No.-0042 SUB-EB No.01 670 6
803073 Koppal (CMC) WARD No.-0014 EB No.-0042 SUB-EB No.02 323 126
803073 Koppal (CMC) WARD No.-0014 EB No.-004300 778 8
803073 Koppal (CMC) WARD No.-0015 EB No.-004400 380 -
803073 Koppal (CMC) WARD No.-0015 EB No.-004500 709 81
803073 Koppal (CMC) WARD No.-0015 EB No.-0046 SUB-EB No.01 671 3
803073 Koppal (CMC) WARD No.-0015 EB No.-0046 SUB-EB No.02 703 -
803073 Koppal (CMC) WARD No.-0016 EB No.-004700 795 2
803073 Koppal (CMC) WARD No.-0016 EB No.-004800 866 46
803073 Koppal (CMC) WARD No.-0017 EB No.-0049 SUB-EB No.01 745 286
803073 Koppal (CMC) WARD No.-0017 EB No.-0049 SUB-EB No.02 532 54
803073 Koppal (CMC) WARD No.-0017 EB No.-005000 664 297
803073 Koppal (CMC) WARD No.-0018 EB No.-005100 722 7
803073 Koppal (CMC) WARD No.-0018 EB No.-0052 SUB-EB No.01 466 5
803073 Koppal (CMC) WARD No.-0018 EB No.-0052 SUB-EB No.02 589 6
803073 Koppal (CMC) WARD No.-0019 EB No.-0053 SUB-EB No.01 667 1
803073 Koppal (CMC) WARD No.-0019 EB No.-0053 SUB-EB No.02 649 5
803073 Koppal (CMC) WARD No.-0019 EB No.-0053 SUB-EB No.03 569 25
803073 Koppal (CMC) WARD No.-0020 EB No.-005400 700 33
803073 Koppal (CMC) WARD No.-0020 EB No.-0055 SUB-EB No.01 696 41
803073 Koppal (CMC) WARD No.-0020 EB No.-0055 SUB-EB No.02 458 -
803073 Koppal (CMC) WARD No.-0021 EB No.-005600 860 25
803073 Koppal (CMC) WARD No.-0021 EB No.-005700 340 5
803073 Koppal (CMC) WARD No.-0021 EB No.-005800 404 9
803073 Koppal (CMC) WARD No.-0021 EB No.-005900 365 18
803073 Koppal (CMC) WARD No.-0022 EB No.-006000 418 24
803073 Koppal (CMC) WARD No.-0022 EB No.-006100 565 109
803073 Koppal (CMC) WARD No.-0022 EB No.-0062 SUB-EB No.01 674 50
803073 Koppal (CMC) WARD No.-0022 EB No.-0062 SUB-EB No.02 631 29
803073 Koppal (CMC) WARD No.-0023 EB No.-006300 606 40
803073 Koppal (CMC) WARD No.-0023 EB No.-0064 SUB-EB No.01 649 279
803073 Koppal (CMC) WARD No.-0023 EB No.-0064 SUB-EB No.02 579 555
803073 Koppal (CMC) WARD No.-0023 EB No.-006500 523 72
803073 Koppal (CMC) WARD No.-0024 EB No.-006600 400 15
803073 Koppal (CMC) WARD No.-0024 EB No.-006700 358 67
803073 Koppal (CMC) WARD No.-0025 EB No.-006800 254 4
803073 Koppal (CMC) WARD No.-0025 EB No.-0069 SUB-EB No.01 550 19
803073 Koppal (CMC) WARD No.-0025 EB No.-0069 SUB-EB No.02 328 140
803073 Koppal (CMC) WARD No.-0025 EB No.-0070 SUB-EB No.01 588 96
46

Location Code
Name of Town Name of Ward Boundaries of Urban Block / EB Number
Total Population
Scheduled Castes
Population
Schedu
1 2 3 4 5 6
APPENDIX TO DISTRICT PRIMARY CENSUS ABSTRACT TOTAL, SCHEDULED CASTES AND SCHEDULED TRIBES POPULATION - URBAN BLOCK WISE
803073 Koppal (CMC) WARD No.-0025 EB No.-0070 SUB-EB No.02 578 70
803073 Koppal (CMC) WARD No.-0025 EB No.-007100 775 27
803073 Koppal (CMC) WARD No.-0025 EB No.-007200 623 41
803073 Koppal (CMC) WARD No.-0026 EB No.-007300 815 70
803073 Koppal (CMC) WARD No.-0026 EB No.-007400 497 89
803073 Koppal (CMC) WARD No.-0026 EB No.-007500 604 89
803073 Koppal (CMC) WARD No.-0026 EB No.-007600 553 30
803073 Koppal (CMC) WARD No.-0026 EB No.-0077 SUB-EB No.01 655 36
803073 Koppal (CMC) WARD No.-0026 EB No.-0077 SUB-EB No.02 310 26
803073 Koppal (CMC) WARD No.-0026 EB No.-007800 458 58
803073 Koppal (CMC) WARD No.-0026 EB No.-007900 556 109
803073 Koppal (CMC) WARD No.-0027 EB No.-008000 818 69
803073 Koppal (CMC) WARD No.-0027 EB No.-008100 721 31
803073 Koppal (CMC) WARD No.-0027 EB No.-008200 643 39
803073 Koppal (CMC) WARD No.-0027 EB No.-008300 428 42
803073 Koppal (CMC) WARD No.-0028 EB No.-008400 204 19
803073 Koppal (CMC) WARD No.-0028 EB No.-008500 602 36
803073 Koppal (CMC) WARD No.-0028 EB No.-008600 641 49
803073 Koppal (CMC) WARD No.-0028 EB No.-0087 SUB-EB No.01 477 244
803073 Koppal (CMC) WARD No.-0028 EB No.-0087 SUB-EB No.02 597 271
803073 Koppal (CMC) WARD No.-0029 EB No.-008800 607 57
803073 Koppal (CMC) WARD No.-0029 EB No.-008900 637 62
803073 Koppal (CMC) WARD No.-0029 EB No.-009000 513 47
803073 Koppal (CMC) WARD No.-0029 EB No.-009100 464 38
803073 Koppal (CMC) WARD No.-0029 EB No.-009200 246 15
803073 Koppal (CMC) WARD No.-0030 EB No.-0093 SUB-EB No.01 515 68
803073 Koppal (CMC) WARD No.-0030 EB No.-0093 SUB-EB No.02 602 57
803073 Koppal (CMC) WARD No.-0030 EB No.-0094 SUB-EB No.01 783 56
803073 Koppal (CMC) WARD No.-0030 EB No.-0094 SUB-EB No.02 505 13
803073 Koppal (CMC) WARD No.-0030 EB No.-0094 SUB-EB No.03 494 48
803073 Koppal (CMC) WARD No.-0031 EB No.-0095 SUB-EB No.01 652 33
803073 Koppal (CMC) WARD No.-0031 EB No.-0095 SUB-EB No.02 201 -
803073 Koppal (CMC) WARD No.-0031 EB No.-0096 SUB-EB No.01 624 31
803073 Koppal (CMC) WARD No.-0031 EB No.-0096 SUB-EB No.02 447 2
601860 Munirabad Project Area (CT) WARD No.-0001 EB No.-000100 561 71
601860 Munirabad Project Area (CT) WARD No.-0001 EB No.-000200 607 124
601860 Munirabad Project Area (CT) WARD No.-0001 EB No.-000300 388 179
601860 Munirabad Project Area (CT) WARD No.-0001 EB No.-000400 728 60
601860 Munirabad Project Area (CT) WARD No.-0001 EB No.-000500 619 51
601860 Munirabad Project Area (CT) WARD No.-0001 EB No.-000600 504 360
601860 Munirabad Project Area (CT) WARD No.-0001 EB No.-000700 632 198
601860 Munirabad Project Area (CT) WARD No.-0001 EB No.-000800 499 176
47

Location Code
Name of Town Name of Ward Boundaries of Urban Block / EB Number
Total Population
Scheduled Castes
Population
Schedu
1 2 3 4 5 6
APPENDIX TO DISTRICT PRIMARY CENSUS ABSTRACT TOTAL, SCHEDULED CASTES AND SCHEDULED TRIBES POPULATION - URBAN BLOCK WISE
601860 Munirabad Project Area (CT) WARD No.-0001 EB No.-000900 488 82
601860 Munirabad Project Area (CT) WARD No.-0001 EB No.-001000 498 190
601860 Munirabad Project Area (CT) WARD No.-0001 EB No.-001100 504 49
601860 Munirabad Project Area (CT) WARD No.-0001 EB No.-001200 754 72
601860 Munirabad Project Area (CT) WARD No.-0001 EB No.-0013 SUB-EB No.01 377 15
601860 Munirabad Project Area (CT) WARD No.-0001 EB No.-0013 SUB-EB No.02 605 85
601860 Munirabad Project Area (CT) WARD No.-0001 EB No.-001400 505 81
601860 Munirabad Project Area (CT) WARD No.-0001 EB No.-001500 403 102
48

Primary Census Abstract for Scheduled Castes (SC)

DISTRICT CENSUS HANDBOOK : KOPPAL
PRIMARY CENSUS ABSTRACT
Persons Males Females Persons Males Females1 2 3 4 5 6 7 8 9 10
560 Koppal - District Total 47,949 2,58,608 1,29,341 1,29,267 43,626 22,343 21,283 Rural 41,145 2,22,935 1,11,858 1,11,077 38,335 19,698 18,637 Urban 6,804 35,673 17,483 18,190 5,291 2,645 2,646
0032 Yelbarga Total 9,017 49,287 24,961 24,326 8,169 4,253 3,916 Rural 9,017 49,287 24,961 24,326 8,169 4,253 3,916 Urban - - - - - - -
0033 Kushtagi Total 7,179 40,222 20,354 19,868 7,303 3,799 3,504 Rural 7,179 40,222 20,354 19,868 7,303 3,799 3,504 Urban - - - - - - -
0034 Gangawati Total 13,746 72,799 36,037 36,762 12,217 6,226 5,991 Rural 13,486 71,439 35,381 36,058 12,045 6,142 5,903 Urban 260 1,360 656 704 172 84 88
0035 Koppal Total 11,863 63,882 32,124 31,758 11,062 5,634 5,428 Rural 11,463 61,987 31,162 30,825 10,818 5,504 5,314 Urban 400 1,895 962 933 244 130 114
URBAN803070 Yelbarga (TP) Urban 479 2,752 1,369 1,383 422 224 198 803071 Kushtagi (TMC) Urban 947 5,044 2,485 2,559 697 370 327
803072Gangawati (CMC + OG) Urban 3,345 17,331 8,494 8,837 2,591 1,281 1,310
803073 Koppal (CMC) Urban 1,633 8,651 4,173 4,478 1,337 640 697
601860Munirabad Project Area (CT) Urban 400 1,895 962 933 244 130 114
Location code
numberDistrict/ CD Block/
Town
Total/ Rural/ Urban
Number of households with SC as
head
Total population (including institutional and houseless population) Population in the age-group 0-6
50

PRIMARY CENSUS ABSTRACT
FOR SCHEDULED CASTES
Persons Males Females Persons Males Females Persons Males Females11 12 13 14 15 16 17 18 19 3 2
1,28,456 75,593 52,863 1,30,152 53,748 76,404 1,24,098 67,765 56,333 Total Koppal - District1,07,667 64,030 43,637 1,15,268 47,828 67,440 1,09,967 58,861 51,106 Rural
20,789 11,563 9,226 14,884 5,920 8,964 14,131 8,904 5,227 Urban24,626 14,928 9,698 24,661 10,033 14,628 25,309 13,324 11,985 Total Yelbarga 24,626 14,928 9,698 24,661 10,033 14,628 25,309 13,324 11,985 Rural
- - - - - - - - - Urban19,853 11,888 7,965 20,369 8,466 11,903 18,875 10,383 8,492 Total Kushtagi 19,853 11,888 7,965 20,369 8,466 11,903 18,875 10,383 8,492 Rural
- - - - - - - - - Urban33,661 19,575 14,086 39,138 16,462 22,676 36,452 19,247 17,205 Total Gangawati 32,946 19,179 13,767 38,493 16,202 22,291 35,756 18,855 16,901 Rural
715 396 319 645 260 385 696 392 304 Urban31,646 18,815 12,831 32,236 13,309 18,927 30,670 16,797 13,873 Total Koppal 30,242 18,035 12,207 31,745 13,127 18,618 30,027 16,299 13,728 Rural1,404 780 624 491 182 309 643 498 145 Urban
URBAN1,736 968 768 1,016 401 615 1,006 583 423 Urban Yelbarga (TP)3,421 1,836 1,585 1,623 649 974 1,758 1,214 544 Urban Kushtagi (TMC)
9,137 5,194 3,943 8,194 3,300 4,894 7,407 4,506 2,901 UrbanGangawati (CMC + OG)
5,091 2,785 2,306 3,560 1,388 2,172 3,317 2,103 1,214 Urban Koppal (CMC)
1,404 780 624 491 182 309 643 498 145 UrbanMunirabad Project Area (CT)
District/ CD Block/ Town
Total/ Rural/ Urban
Total workersLiterates Illiterates
51

DISTRICT CENSUS HANDBOOK : KOPPAL
PRIMARY CENSUS ABSTRACT
Persons Males Females Persons Males Females Persons Males Females1 2 3 20 21 22 23 24 25 26 27 28
560 Koppal - District Total 92,571 55,111 37,460 17,431 12,916 4,515 44,017 20,531 23,486 Rural 81,288 47,564 33,724 17,115 12,655 4,460 41,993 19,522 22,471 Urban 11,283 7,547 3,736 316 261 55 2,024 1,009 1,015
0032 Yelbarga Total 17,676 10,281 7,395 4,327 3,179 1,148 8,872 4,046 4,826 Rural 17,676 10,281 7,395 4,327 3,179 1,148 8,872 4,046 4,826 Urban - - - - - - - - -
0033 Kushtagi Total 12,573 7,795 4,778 3,350 2,561 789 5,335 2,375 2,960 Rural 12,573 7,795 4,778 3,350 2,561 789 5,335 2,375 2,960 Urban - - - - - - - - -
0034 Gangawati Total 27,502 15,897 11,605 5,221 3,746 1,475 15,715 7,677 8,038 Rural 27,317 15,773 11,544 5,209 3,738 1,471 15,647 7,635 8,012 Urban 185 124 61 12 8 4 68 42 26
0035 Koppal Total 24,291 14,163 10,128 4,237 3,185 1,052 12,155 5,478 6,677 Rural 23,722 13,715 10,007 4,229 3,177 1,052 12,139 5,466 6,673 Urban 569 448 121 8 8 - 16 12 4
URBAN803070 Yelbarga (TP) Urban 953 568 385 36 32 4 303 139 164 803071 Kushtagi (TMC) Urban 1,549 1,093 456 57 44 13 80 41 39
803072Gangawati (CMC + OG) Urban 5,405 3,586 1,819 184 150 34 1,547 765 782
803073 Koppal (CMC) Urban 2,807 1,852 955 31 27 4 78 52 26
601860Munirabad Project Area (CT) Urban 569 448 121 8 8 - 16 12 4
CultivatorsMain workersLocation
code number
District/ CD Block/ Town
Total/ Rural/ Urban
Industrial category
Agricultural labourers
52

PRIMARY CENSUS ABSTRACT
FOR SCHEDULED CASTES
Persons Males Females Persons Males Females Persons Males Females29 30 31 32 33 34 35 36 37 3 2
2,804 1,389 1,415 28,319 20,275 8,044 31,527 12,654 18,873 Total Koppal - District2,071 1,002 1,069 20,109 14,385 5,724 28,679 11,297 17,382 Rural
733 387 346 8,210 5,890 2,320 2,848 1,357 1,491 Urban681 334 347 3,796 2,722 1,074 7,633 3,043 4,590 Total Yelbarga 681 334 347 3,796 2,722 1,074 7,633 3,043 4,590 Rural- - - - - - - - - Urban331 203 128 3,557 2,656 901 6,302 2,588 3,714 Total Kushtagi 331 203 128 3,557 2,656 901 6,302 2,588 3,714 Rural- - - - - - - - - Urban545 217 328 6,021 4,257 1,764 8,950 3,350 5,600 Total Gangawati 544 216 328 5,917 4,184 1,733 8,439 3,082 5,357 Rural
1 1 - 104 73 31 511 268 243 Urban520 254 266 7,379 5,246 2,133 6,379 2,634 3,745 Total Koppal 515 249 266 6,839 4,823 2,016 6,305 2,584 3,721 Rural
5 5 - 540 423 117 74 50 24 UrbanURBAN
113 61 52 501 336 165 53 15 38 Urban Yelbarga (TP)74 54 20 1,338 954 384 209 121 88 Urban Kushtagi (TMC)
315 161 154 3,359 2,510 849 2,002 920 1,082 UrbanGangawati (CMC + OG)
226 106 120 2,472 1,667 805 510 251 259 Urban Koppal (CMC)
5 5 - 540 423 117 74 50 24 UrbanMunirabad Project Area (CT)
Household industry workers Marginal workersTotal/ Rural/ Urban
District/ CD Block/ Town
of main workers
Other workers
53

DISTRICT CENSUS HANDBOOK : KOPPAL
PRIMARY CENSUS ABSTRACT
Persons Males Females Persons Males Females Persons Males Females1 2 3 38 39 40 41 42 43 44 45 46
560 Koppal - District Total 1,397 607 790 21,183 7,314 13,869 1,515 617 898 Rural 1,378 598 780 19,863 6,825 13,038 1,311 514 797 Urban 19 9 10 1,320 489 831 204 103 101
0032 Yelbarga Total 223 93 130 5,877 2,097 3,780 409 191 218 Rural 223 93 130 5,877 2,097 3,780 409 191 218 Urban - - - - - - - - -
0033 Kushtagi Total 436 207 229 3,555 1,207 2,348 508 170 338 Rural 436 207 229 3,555 1,207 2,348 508 170 338 Urban - - - - - - - - -
0034 Gangawati Total 385 160 225 6,974 2,409 4,565 197 71 126 Rural 383 160 223 6,528 2,185 4,343 196 70 126 Urban 2 - 2 446 224 222 1 1 -
0035 Koppal Total 336 138 198 3,911 1,342 2,569 206 91 115 Rural 336 138 198 3,903 1,336 2,567 198 83 115 Urban - - - 8 6 2 8 8 -
URBAN803070 Yelbarga (TP) Urban 1 - 1 13 2 11 4 2 2 803071 Kushtagi (TMC) Urban 5 3 2 18 4 14 28 15 13
803072Gangawati (CMC + OG) Urban 9 4 5 1,219 456 763 127 65 62
803073 Koppal (CMC) Urban 4 2 2 62 21 41 37 13 24
601860Munirabad Project Area (CT) Urban - - - 8 6 2 8 8 -
Location code
numberDistrict/ CD Block/
Town
Total/ Rural/ Urban
Agricultural labourers
Industrial category of
Cultivators Household industry workers
54

PRIMARY CENSUS ABSTRACT
FOR SCHEDULED CASTES
Persons Males Females Persons Males Females47 48 49 50 51 52 3 2 1
7,432 4,116 3,316 1,34,510 61,576 72,934 Total Koppal - District 5606,127 3,360 2,767 1,12,968 52,997 59,971 Rural1,305 756 549 21,542 8,579 12,963 Urban1,124 662 462 23,978 11,637 12,341 Total Yelbarga 00321,124 662 462 23,978 11,637 12,341 Rural
- - - - - - Urban1,803 1,004 799 21,347 9,971 11,376 Total Kushtagi 00331,803 1,004 799 21,347 9,971 11,376 Rural
- - - - - - Urban1,394 710 684 36,347 16,790 19,557 Total Gangawati 00341,332 667 665 35,683 16,526 19,157 Rural
62 43 19 664 264 400 Urban1,926 1,063 863 33,212 15,327 17,885 Total Koppal 00351,868 1,027 841 31,960 14,863 17,097 Rural
58 36 22 1,252 464 788 UrbanURBAN
35 11 24 1,746 786 960 Urban Yelbarga (TP) 803070158 99 59 3,286 1,271 2,015 Urban Kushtagi (TMC) 803071
647 395 252 9,924 3,988 5,936 UrbanGangawati (CMC + OG) 803072
407 215 192 5,334 2,070 3,264 Urban Koppal (CMC) 803073
58 36 22 1,252 464 788 UrbanMunirabad Project Area (CT) 601860
Non-workersTotal/ Rural/ Urban
marginal workers
District/ CD Block/ Town
Location code
numberOther workers
55


Primary Census Abstract for Scheduled Tribes (ST)

DISTRICT CENSUS HANDBOOK : KOPPAL
PRIMARY CENSUS ABSTRACT
Persons Males Females Persons Males Females1 2 3 4 5 6 7 8 9 10
560 Koppal - District Total 29,765 1,64,271 82,761 81,510 25,409 12,867 12,542 Rural 27,439 1,52,563 76,987 75,576 23,860 12,051 11,809 Urban 2,326 11,708 5,774 5,934 1,549 816 733
0032 Yelbarga Total 5,095 29,183 14,781 14,402 4,686 2,362 2,324 Rural 5,095 29,183 14,781 14,402 4,686 2,362 2,324 Urban - - - - - - -
0033 Kushtagi Total 6,486 37,445 19,142 18,303 6,148 3,128 3,020 Rural 6,486 37,445 19,142 18,303 6,148 3,128 3,020 Urban - - - - - - -
0034 Gangawati Total 10,789 58,434 29,091 29,343 8,934 4,549 4,385 Rural 10,566 57,288 28,543 28,745 8,779 4,467 4,312 Urban 223 1,146 548 598 155 82 73
0035 Koppal Total 5,365 28,968 14,670 14,298 4,281 2,110 2,171 Rural 5,292 28,647 14,521 14,126 4,247 2,094 2,153 Urban 73 321 149 172 34 16 18
URBAN803070 Yelbarga (TP) Urban 49 282 121 161 32 17 15 803071 Kushtagi (TMC) Urban 197 1,022 517 505 151 80 71
803072Gangawati (CMC + OG) Urban 1,466 7,327 3,617 3,710 944 502 442
803073 Koppal (CMC) Urban 541 2,756 1,370 1,386 388 201 187
601860Munirabad Project Area (CT) Urban 73 321 149 172 34 16 18
Location code
numberDistrict/ CD Block/
Town
Total/ Rural/ Urban
Number of households with ST as
head
Total population (including institutional and houseless population) Population in the age-group 0-6
58

PRIMARY CENSUS ABSTRACT
FOR SCHEDULED TRIBES
Persons Males Females Persons Males Females Persons Males Females11 12 13 14 15 16 17 18 19 3 2
84,650 50,382 34,268 79,621 32,379 47,242 82,600 45,366 37,234 Total Koppal - District77,595 46,505 31,090 74,968 30,482 44,486 77,986 42,277 35,709 Rural7,055 3,877 3,178 4,653 1,897 2,756 4,614 3,089 1,525 Urban
14,490 8,903 5,587 14,693 5,878 8,815 15,548 8,155 7,393 Total Yelbarga 14,490 8,903 5,587 14,693 5,878 8,815 15,548 8,155 7,393 Rural
- - - - - - - - - Urban19,026 11,599 7,427 18,419 7,543 10,876 18,437 10,299 8,138 Total Kushtagi 19,026 11,599 7,427 18,419 7,543 10,876 18,437 10,299 8,138 Rural
- - - - - - - - - Urban28,972 16,910 12,062 29,462 12,181 17,281 30,044 16,062 13,982 Total Gangawati 28,322 16,555 11,767 28,966 11,988 16,978 29,559 15,749 13,810 Rural
650 355 295 496 193 303 485 313 172 Urban15,995 9,568 6,427 12,973 5,102 7,871 14,543 8,148 6,395 Total Koppal 15,757 9,448 6,309 12,890 5,073 7,817 14,442 8,074 6,368 Rural
238 120 118 83 29 54 101 74 27 UrbanURBAN
204 90 114 78 31 47 100 49 51 Urban Yelbarga (TP)655 364 291 367 153 214 382 259 123 Urban Kushtagi (TMC)
4,261 2,386 1,875 3,066 1,231 1,835 2,932 1,965 967 UrbanGangawati (CMC + OG)
1,697 917 780 1,059 453 606 1,099 742 357 Urban Koppal (CMC)
238 120 118 83 29 54 101 74 27 UrbanMunirabad Project Area (CT)
District/ CD Block/ Town
Total/ Rural/ Urban
Total workersLiterates Illiterates
59

DISTRICT CENSUS HANDBOOK : KOPPAL
PRIMARY CENSUS ABSTRACT
Persons Males Females Persons Males Females Persons Males Females1 2 3 20 21 22 23 24 25 26 27 28
560 Koppal - District Total 60,969 36,944 24,025 21,531 16,377 5,154 27,893 12,496 15,397 Rural 57,164 34,290 22,874 21,271 16,163 5,108 27,373 12,289 15,084 Urban 3,805 2,654 1,151 260 214 46 520 207 313
0032 Yelbarga Total 12,024 6,835 5,189 4,619 3,326 1,293 5,792 2,398 3,394 Rural 12,024 6,835 5,189 4,619 3,326 1,293 5,792 2,398 3,394 Urban - - - - - - - - -
0033 Kushtagi Total 12,475 7,966 4,509 5,579 4,471 1,108 5,066 2,285 2,781 Rural 12,475 7,966 4,509 5,579 4,471 1,108 5,066 2,285 2,781 Urban - - - - - - - - -
0034 Gangawati Total 21,380 12,798 8,582 7,154 5,466 1,688 11,413 5,409 6,004 Rural 20,988 12,540 8,448 7,134 5,446 1,688 11,315 5,363 5,952 Urban 392 258 134 20 20 - 98 46 52
0035 Koppal Total 11,762 7,016 4,746 3,940 2,921 1,019 5,207 2,249 2,958 Rural 11,677 6,949 4,728 3,939 2,920 1,019 5,200 2,243 2,957 Urban 85 67 18 1 1 - 7 6 1
URBAN803070 Yelbarga (TP) Urban 84 45 39 5 2 3 14 4 10 803071 Kushtagi (TMC) Urban 324 234 90 27 23 4 26 10 16
803072Gangawati (CMC + OG) Urban 2,376 1,642 734 190 161 29 429 177 252
803073 Koppal (CMC) Urban 936 666 270 37 27 10 44 10 34
601860Munirabad Project Area (CT) Urban 85 67 18 1 1 - 7 6 1
District/ CD Block/ Town
Total/ Rural/ Urban
Industrial category
Agricultural labourersMain workersLocation
code number
Cultivators
60

PRIMARY CENSUS ABSTRACT
FOR SCHEDULED TRIBES
Persons Males Females Persons Males Females Persons Males Females29 30 31 32 33 34 35 36 37 3 2
855 470 385 10,690 7,601 3,089 21,631 8,422 13,209 Total Koppal - District787 433 354 7,733 5,405 2,328 20,822 7,987 12,835 Rural68 37 31 2,957 2,196 761 809 435 374 Urban
104 68 36 1,509 1,043 466 3,524 1,320 2,204 Total Yelbarga 104 68 36 1,509 1,043 466 3,524 1,320 2,204 Rural- - - - - - - - - Urban299 134 165 1,531 1,076 455 5,962 2,333 3,629 Total Kushtagi 299 134 165 1,531 1,076 455 5,962 2,333 3,629 Rural- - - - - - - - - Urban187 121 66 2,626 1,802 824 8,664 3,264 5,400 Total Gangawati 186 121 65 2,353 1,610 743 8,571 3,209 5,362 Rural
1 - 1 273 192 81 93 55 38 Urban199 110 89 2,416 1,736 680 2,781 1,132 1,649 Total Koppal 198 110 88 2,340 1,676 664 2,765 1,125 1,640 Rural
1 - 1 76 60 16 16 7 9 UrbanURBAN
- - - 65 39 26 16 4 12 Urban Yelbarga (TP)6 3 3 265 198 67 58 25 33 Urban Kushtagi (TMC)
10 5 5 1,747 1,299 448 556 323 233 UrbanGangawati (CMC + OG)
51 29 22 804 600 204 163 76 87 Urban Koppal (CMC)
1 - 1 76 60 16 16 7 9 UrbanMunirabad Project Area (CT)
of main workers
Other workersHousehold industry workers Marginal workersTotal/ Rural/ Urban
District/ CD Block/ Town
61

DISTRICT CENSUS HANDBOOK : KOPPAL
PRIMARY CENSUS ABSTRACT
Persons Males Females Persons Males Females Persons Males Females1 2 3 38 39 40 41 42 43 44 45 46
560 Koppal - District Total 1,550 745 805 15,664 5,349 10,315 657 246 411 Rural 1,538 736 802 15,412 5,259 10,153 614 228 386 Urban 12 9 3 252 90 162 43 18 25
0032 Yelbarga Total 191 94 97 2,675 910 1,765 86 35 51 Rural 191 94 97 2,675 910 1,765 86 35 51 Urban - - - - - - - - -
0033 Kushtagi Total 558 296 262 3,829 1,230 2,599 232 86 146 Rural 558 296 262 3,829 1,230 2,599 232 86 146 Urban - - - - - - - - -
0034 Gangawati Total 576 262 314 6,994 2,455 4,539 230 72 158 Rural 575 261 314 6,935 2,425 4,510 230 72 158 Urban 1 1 - 59 30 29 - - -
0035 Koppal Total 214 85 129 1,975 695 1,280 68 36 32 Rural 214 85 129 1,973 694 1,279 66 35 31 Urban - - - 2 1 1 2 1 1
URBAN803070 Yelbarga (TP) Urban - - - 2 - 2 - - - 803071 Kushtagi (TMC) Urban 5 3 2 37 11 26 - - -
803072Gangawati (CMC + OG) Urban 5 5 - 179 71 108 10 3 7
803073 Koppal (CMC) Urban 2 1 1 32 7 25 31 14 17
601860Munirabad Project Area (CT) Urban - - - 2 1 1 2 1 1
Cultivators Household industry workersLocation
code number
District/ CD Block/ Town
Total/ Rural/ Urban
Agricultural labourers
Industrial category of
62

PRIMARY CENSUS ABSTRACT
FOR SCHEDULED TRIBES
Persons Males Females Persons Males Females47 48 49 50 51 52 3 2 1
3,760 2,082 1,678 81,671 37,395 44,276 Total Koppal - District 5603,258 1,764 1,494 74,577 34,710 39,867 Rural
502 318 184 7,094 2,685 4,409 Urban572 281 291 13,635 6,626 7,009 Total Yelbarga 0032572 281 291 13,635 6,626 7,009 Rural- - - - - - Urban
1,343 721 622 19,008 8,843 10,165 Total Kushtagi 00331,343 721 622 19,008 8,843 10,165 Rural
- - - - - - Urban864 475 389 28,390 13,029 15,361 Total Gangawati 0034831 451 380 27,729 12,794 14,935 Rural33 24 9 661 235 426 Urban
524 316 208 14,425 6,522 7,903 Total Koppal 0035512 311 201 14,205 6,447 7,758 Rural12 5 7 220 75 145 Urban
URBAN14 4 10 182 72 110 Urban Yelbarga (TP) 80307016 11 5 640 258 382 Urban Kushtagi (TMC) 803071
362 244 118 4,395 1,652 2,743 UrbanGangawati (CMC + OG) 803072
98 54 44 1,657 628 1,029 Urban Koppal (CMC) 803073
12 5 7 220 75 145 UrbanMunirabad Project Area (CT) 601860
District/ CD Block/ Town
Location code
numberOther workers Non-workers
Total/ Rural/ Urban
marginal workers
63


Rural PCA-C.D. blocks wise Village Primary Census
Abstract

DISTRICT CENSUS HANDBOOK : KOPPAL
VILLAGE PRIMARY
Persons Males Females Persons Males Females1 2 3 4 5 6 7 8 9 10
0032 Yelbarga (Total) 1,48,968.24 47,360 2,52,628 1,27,673 1,24,955 36,217 18,657 17,560 0032 Yelbarga (Rural) 1,48,968.24 47,360 2,52,628 1,27,673 1,24,955 36,217 18,657 17,560 0032 Yelbarga (Urban) 0.00 - - - - - - -
RURAL601230 Sankanur 1,087.77 451 2,193 1,064 1,129 286 138 148 601231 Katral 422.49 136 669 341 328 124 64 60 601232 Sirgumpi 1,121.29 249 1,313 670 643 200 106 94 601233 Sompur 524.03 212 959 484 475 115 68 47 601234 Hiremyageri 1,787.42 846 4,234 2,106 2,128 520 271 249 601235 Mudhol 4,160.83 1,436 6,896 3,429 3,467 886 475 411 601236 Chikoppa 509.57 228 1,258 654 604 222 110 112 601237 Tumurguddi 1,550.75 396 2,235 1,152 1,083 355 202 153 601238 Ballutgi 1,491.96 805 4,361 2,169 2,192 653 329 324 601239 Jhulkatti 412.38 157 821 420 401 117 67 50 601240 Bandi 1,030.70 469 2,429 1,255 1,174 330 167 163 601241 Kadbalkatti 282.21 53 345 186 159 56 33 23 601242 Chikbannigol 823.54 241 1,452 729 723 260 143 117 601243 Konasagar 1,406.73 361 2,058 1,032 1,026 312 154 158 601244 Hagedhal 430.37 155 874 445 429 145 75 70 601245 Bassapur 839.35 213 1,039 508 531 170 76 94 601246 Boon Koppa 445.21 89 506 238 268 83 43 40 601247 Dammur 822.09 331 1,948 972 976 361 191 170 601248 Vajra Bandi 1,397.23 367 2,125 1,072 1,053 416 221 195 601249 Makkahalli 629.03 64 385 195 190 60 36 24 601250 Salbhavi 368.42 120 801 406 395 165 86 79 601251 Madlur 228.49 164 913 450 463 148 71 77 601252 Lagalur 209.02 31 161 79 82 22 10 12 601253 G.Jarkunti 550.54 143 783 377 406 155 82 73 601254 G.Virapur 182.78 110 517 257 260 102 54 48 601255 Kudri Kotgi 879.98 197 1,107 559 548 164 79 85 601256 Maranhal 487.33 175 1,101 562 539 205 113 92 601257 Hosahalli 529.17 249 1,298 674 624 187 87 100 601258 Karmudi 3,959.74 633 3,025 1,524 1,501 396 213 183 601259 Bandihal 1,473.48 335 1,867 999 868 222 122 100 601260 Tondihal 2,177.07 396 2,029 1,021 1,008 260 134 126 601261 Sanganhal 4,619.37 606 2,886 1,501 1,385 343 193 150 601262 Yelburga 3,766.82601263 Malaksamudra 1,063.68 299 1,674 844 830 247 122 125 601264 Kudgunti 1,163.91 322 1,653 828 825 232 118 114 601265 Kallur 2,043.29 632 3,253 1,654 1,599 406 209 197 601266 Kalak Bandi 633.17 142 855 440 415 103 48 55 601267 Matrangi 312.81 108 583 290 293 87 47 40 601268 Hire Arlihalli 1,114.21 426 2,587 1,374 1,213 408 222 186 601269 Budakunti 321.04 187 1,102 554 548 153 68 85 601270 Putakmari 386.38 146 768 397 371 106 60 46 601271 Yeddoni 840.54 309 2,027 1,006 1,021 358 173 185 601272 Gule 369.97 88 523 262 261 87 41 46 601273 Budur 1,027.67 214 1,361 709 652 242 128 114 601274 Guntamadu 441.88 87 605 296 309 121 56 65 601275 Sidlabhavi 558.59 150 1,003 508 495 194 103 91 601276 Chikka Mannapur 718.04 187 982 489 493 180 76 104 601277 Vanjabhavi 292.12 71 450 229 221 75 37 38 601278 Markat 423.60 222 1,213 624 589 198 109 89 601279 Choudapur 350.35 163 881 441 440 126 66 60 601280 Kalbhavi 794.25 158 868 439 429 122 67 55 601281 Mataldinni 979.14 448 2,461 1,234 1,227 347 170 177 601282 Chikka Arlihalli 470.18601283 N.Jarkunti 166.49 103 684 345 339 106 52 54 601284 Biraldinni 550.42 130 789 419 370 124 68 56 601285 Hosur 544.21 167 1,054 544 510 147 75 72
Name of Village
Location code
number
Total population (including institutional and houseless
population)Area of
Village in hectares
Number of households
C D Block -
Population in the age-group 0-6
-------------Un-inhabited--------------
-------------Un-inhabited--------------
66

PRIMARY CENSUS ABSTRACT
CENSUS ABSTRACTYelbarga
Persons Males Females Persons Males Females Persons Males Females11 12 13 14 15 16 17 18 19 2
49,287 24,961 24,326 29,183 14,781 14,402 1,44,088 86,168 57,920 Yelbarga (Total)49,287 24,961 24,326 29,183 14,781 14,402 1,44,088 86,168 57,920 Yelbarga (Rural)
- - - - - - - - - Yelbarga (Urban)RURAL
409 196 213 74 36 38 1,315 752 563 Sankanur56 27 29 104 48 56 323 209 114 Katral77 36 41 3 2 1 694 437 257 Sirgumpi14 7 7 51 20 31 638 367 271 Sompur
610 310 300 128 62 66 2,627 1,520 1,107 Hiremyageri1,411 727 684 138 65 73 4,342 2,562 1,780 Mudhol
927 482 445 5 2 3 637 406 231 Chikoppa421 222 199 33 16 17 1,120 694 426 Tumurguddi
1,229 628 601 165 81 84 2,249 1,348 901 Ballutgi153 81 72 114 64 50 487 294 193 Jhulkatti341 180 161 112 62 50 1,524 913 611 Bandi- - - 22 12 10 240 137 103 Kadbalkatti656 315 341 64 32 32 718 438 280 Chikbannigol172 86 86 443 215 228 1,192 742 450 Konasagar51 26 25 328 166 162 456 296 160 Hagedhal
114 59 55 294 140 154 559 349 210 Bassapur2 1 1 20 10 10 333 186 147 Boon Koppa
399 189 210 3 2 1 877 535 342 Dammur515 264 251 698 349 349 1,050 640 410 Vajra Bandi28 18 10 93 46 47 157 94 63 Makkahalli57 25 32 555 298 257 281 184 97 Salbhavi
175 85 90 14 6 8 512 312 200 Madlur15 7 8 61 29 32 110 64 46 Lagalur68 33 35 357 166 191 422 244 178 G.Jarkunti83 41 42 - - - 263 164 99 G.Virapur
348 179 169 100 53 47 661 389 272 Kudri Kotgi459 226 233 26 14 12 504 303 201 Maranhal206 106 100 28 14 14 766 480 286 Hosahalli296 138 158 203 98 105 1,708 1,015 693 Karmudi310 184 126 79 41 38 1,128 708 420 Bandihal475 237 238 155 80 75 1,255 750 505 Tondihal493 247 246 141 80 61 1,777 1,075 702 Sanganhal
Yelburga146 82 64 69 34 35 1,001 601 400 Malaksamudra435 217 218 111 52 59 968 569 399 Kudgunti
1,120 565 555 112 56 56 1,957 1,183 774 Kallur40 22 18 47 24 23 599 357 242 Kalak Bandi
173 87 86 60 30 30 397 222 175 Matrangi237 138 99 302 158 144 1,431 916 515 Hire Arlihalli128 59 69 263 137 126 584 386 198 Budakunti13 8 5 434 232 202 433 271 162 Putakmari
103 50 53 597 301 296 991 608 383 Yeddoni93 46 47 160 79 81 289 185 104 Gule
119 52 67 57 24 33 674 432 242 Budur- - - 412 200 212 274 170 104 Guntamadu116 55 61 553 277 276 327 201 126 Sidlabhavi74 38 36 149 68 81 534 340 194 Chikka Mannapur24 14 10 24 11 13 247 155 92 Vanjabhavi
237 125 112 25 14 11 670 415 255 Markat80 43 37 5 3 2 477 295 182 Choudapur
175 88 87 193 110 83 495 300 195 Kalbhavi639 318 321 112 58 54 1,545 929 616 Mataldinni
Chikka Arlihalli80 44 36 518 259 259 352 225 127 N.Jarkunti
140 76 64 546 295 251 497 310 187 Biraldinni29 15 14 100 43 57 641 408 233 Hosur
Name of VillageLiteratesScheduled Castes population Scheduled Tribes population
-------------Un-inhabited--------------
-------------Un-inhabited--------------
67

DISTRICT CENSUS HANDBOOK : KOPPAL
VILLAGE PRIMARYC D Block -
Persons Males Females Persons Males Females Persons Males Females1 2 20 21 22 23 24 25 26 27 28
0032 Yelbarga (Total) 1,08,540 41,505 67,035 1,31,703 71,452 60,251 98,028 58,866 39,162 0032 Yelbarga (Rural) 1,08,540 41,505 67,035 1,31,703 71,452 60,251 98,028 58,866 39,162 0032 Yelbarga (Urban) - - - - - - - - -
RURAL601230 Sankanur 878 312 566 1,129 594 535 831 533 298 601231 Katral 346 132 214 347 184 163 279 160 119 601232 Sirgumpi 619 233 386 754 371 383 745 367 378 601233 Sompur 321 117 204 561 288 273 216 161 55 601234 Hiremyageri 1,607 586 1,021 2,294 1,182 1,112 1,243 836 407 601235 Mudhol 2,554 867 1,687 3,531 1,929 1,602 2,410 1,380 1,030 601236 Chikoppa 621 248 373 625 326 299 619 323 296 601237 Tumurguddi 1,115 458 657 1,167 600 567 582 445 137 601238 Ballutgi 2,112 821 1,291 2,292 1,207 1,085 1,826 1,080 746 601239 Jhulkatti 334 126 208 492 242 250 147 139 8 601240 Bandi 905 342 563 1,226 676 550 952 578 374 601241 Kadbalkatti 105 49 56 170 101 69 108 95 13 601242 Chikbannigol 734 291 443 883 434 449 226 184 42 601243 Konasagar 866 290 576 1,216 622 594 1,160 603 557 601244 Hagedhal 418 149 269 500 260 240 495 256 239 601245 Bassapur 480 159 321 620 313 307 134 128 6 601246 Boon Koppa 173 52 121 293 140 153 277 134 143 601247 Dammur 1,071 437 634 1,113 542 571 1,012 527 485 601248 Vajra Bandi 1,075 432 643 1,091 579 512 907 508 399 601249 Makkahalli 228 101 127 210 110 100 197 106 91 601250 Salbhavi 520 222 298 458 237 221 454 235 219 601251 Madlur 401 138 263 556 262 294 398 210 188 601252 Lagalur 51 15 36 92 45 47 40 33 7 601253 G.Jarkunti 361 133 228 425 205 220 387 189 198 601254 G.Virapur 254 93 161 291 145 146 273 142 131 601255 Kudri Kotgi 446 170 276 604 323 281 321 196 125 601256 Maranhal 597 259 338 590 322 268 435 273 162 601257 Hosahalli 532 194 338 685 424 261 496 347 149 601258 Karmudi 1,317 509 808 1,187 870 317 1,143 836 307 601259 Bandihal 739 291 448 649 517 132 594 494 100 601260 Tondihal 774 271 503 1,216 642 574 665 415 250 601261 Sanganhal 1,109 426 683 1,488 788 700 1,038 653 385 601262 Yelburga601263 Malaksamudra 673 243 430 982 513 469 719 446 273 601264 Kudgunti 685 259 426 941 495 446 523 316 207 601265 Kallur 1,296 471 825 1,767 950 817 1,155 797 358 601266 Kalak Bandi 256 83 173 524 276 248 451 259 192 601267 Matrangi 186 68 118 340 170 170 162 106 56 601268 Hire Arlihalli 1,156 458 698 1,284 669 615 842 464 378 601269 Budakunti 518 168 350 527 288 239 471 250 221 601270 Putakmari 335 126 209 413 227 186 196 165 31 601271 Yeddoni 1,036 398 638 1,028 525 503 974 503 471 601272 Gule 234 77 157 321 162 159 316 159 157 601273 Budur 687 277 410 693 363 330 693 363 330 601274 Guntamadu 331 126 205 338 159 179 329 155 174 601275 Sidlabhavi 676 307 369 546 262 284 541 260 281 601276 Chikka Mannapur 448 149 299 532 272 260 526 268 258 601277 Vanjabhavi 203 74 129 250 130 120 226 127 99 601278 Markat 543 209 334 638 329 309 498 315 183 601279 Choudapur 404 146 258 488 261 227 467 259 208 601280 Kalbhavi 373 139 234 442 227 215 369 206 163 601281 Mataldinni 916 305 611 1,262 675 587 667 537 130 601282 Chikka Arlihalli601283 N.Jarkunti 332 120 212 423 226 197 422 225 197 601284 Biraldinni 292 109 183 427 239 188 324 205 119 601285 Hosur 413 136 277 623 326 297 615 323 292
Name of Village
Location code
numberIlliterates Total workers Main workers
-------------Un-inhabited--------------
-------------Un-inhabited--------------
68

PRIMARY CENSUS ABSTRACT
CENSUS ABSTRACTYelbarga
Persons Males Females Persons Males Females Persons Males Females Persons Males Females29 30 31 32 33 34 35 36 37 38 39 40 2
37,106 27,094 10,012 40,256 16,743 23,513 2,186 1,463 723 18,480 13,566 4,914 Yelbarga (Total)37,106 27,094 10,012 40,256 16,743 23,513 2,186 1,463 723 18,480 13,566 4,914 Yelbarga (Rural)
- - - - - - - - - - - - Yelbarga (Urban)RURAL
437 355 82 334 132 202 4 4 - 56 42 14 Sankanur159 96 63 70 35 35 4 3 1 46 26 20 Katral255 251 4 431 68 363 - - - 59 48 11 Sirgumpi137 119 18 44 19 25 2 2 - 33 21 12 Sompur476 403 73 527 244 283 14 10 4 226 179 47 Hiremyageri719 639 80 1,261 402 859 46 28 18 384 311 73 Mudhol102 82 20 460 191 269 2 2 - 55 48 7 Chikoppa272 216 56 193 133 60 7 5 2 110 91 19 Tumurguddi389 361 28 1,150 487 663 31 23 8 256 209 47 Ballutgi102 100 2 23 23 - 1 1 - 21 15 6 Jhulkatti326 234 92 383 158 225 25 21 4 218 165 53 Bandi48 45 3 10 5 5 27 24 3 23 21 2 Kadbalkatti
187 162 25 8 6 2 4 2 2 27 14 13 Chikbannigol730 404 326 332 133 199 13 8 5 85 58 27 Konasagar151 70 81 260 123 137 8 6 2 76 57 19 Hagedhal60 59 1 55 54 1 1 - 1 18 15 3 Bassapur
- - - 265 129 136 3 2 1 9 3 6 Boon Koppa362 328 34 563 141 422 3 - 3 84 58 26 Dammur236 228 8 304 64 240 47 26 21 320 190 130 Vajra Bandi
2 1 1 189 102 87 - - - 6 3 3 Makkahalli32 28 4 382 184 198 - - - 40 23 17 Salbhavi50 47 3 14 10 4 9 3 6 325 150 175 Madlur19 19 - 10 8 2 - - - 11 6 5 Lagalur
249 137 112 112 37 75 3 2 1 23 13 10 G.Jarkunti84 79 5 166 48 118 2 1 1 21 14 7 G.Virapur
245 148 97 47 23 24 7 5 2 22 20 2 Kudri Kotgi169 152 17 239 104 135 - - - 27 17 10 Maranhal221 158 63 149 78 71 10 6 4 116 105 11 Hosahalli416 383 33 619 367 252 5 5 - 103 81 22 Karmudi343 325 18 124 63 61 3 3 - 124 103 21 Bandihal251 224 27 338 127 211 1 1 - 75 63 12 Tondihal304 230 74 536 269 267 45 31 14 153 123 30 Sanganhal
Yelburga296 213 83 193 98 95 12 10 2 218 125 93 Malaksamudra68 59 9 283 161 122 45 10 35 127 86 41 Kudgunti
412 384 28 541 236 305 12 10 2 190 167 23 Kallur160 145 15 175 15 160 4 4 - 112 95 17 Kalak Bandi26 21 5 92 50 42 1 1 - 43 34 9 Matrangi
218 207 11 379 63 316 54 47 7 191 147 44 Hire Arlihalli191 164 27 198 23 175 11 9 2 71 54 17 Budakunti68 65 3 85 64 21 3 3 - 40 33 7 Putakmari
557 345 212 292 57 235 3 2 1 122 99 23 Yeddoni170 87 83 103 48 55 27 15 12 16 9 7 Gule381 233 148 265 96 169 3 3 - 44 31 13 Budur30 24 6 288 125 163 1 1 - 10 5 5 Guntamadu
505 235 270 16 8 8 2 2 - 18 15 3 Sidlabhavi456 221 235 13 6 7 27 20 7 30 21 9 Chikka Mannapur167 93 74 32 19 13 10 5 5 17 10 7 Vanjabhavi195 191 4 89 84 5 - - - 214 40 174 Markat390 210 180 20 14 6 1 1 - 56 34 22 Choudapur245 146 99 81 31 50 - - - 43 29 14 Kalbhavi304 295 9 83 17 66 20 10 10 260 215 45 Mataldinni
Chikka Arlihalli68 47 21 314 144 170 - - - 40 34 6 N.Jarkunti
162 119 43 120 54 66 - - - 42 32 10 Biraldinni124 122 2 430 149 281 17 16 1 44 36 8 Hosur
CultivatorsName of Village
Household industry workersAgricultural labourers
Industrial category of main workers
Other workers
-------------Un-inhabited--------------
-------------Un-inhabited--------------
69

DISTRICT CENSUS HANDBOOK : KOPPAL
VILLAGE PRIMARYC D Block -
Persons Males Females Persons Males Females Persons Males Females1 2 41 42 43 44 45 46 47 48 49
0032 Yelbarga (Total) 33,675 12,586 21,089 2,418 997 1,421 24,399 8,056 16,343 0032 Yelbarga (Rural) 33,675 12,586 21,089 2,418 997 1,421 24,399 8,056 16,343 0032 Yelbarga (Urban) - - - - - - - - -
RURAL601230 Sankanur 298 61 237 8 6 2 277 46 231 601231 Katral 68 24 44 4 1 3 42 12 30 601232 Sirgumpi 9 4 5 2 1 1 4 - 4 601233 Sompur 345 127 218 7 1 6 331 121 210 601234 Hiremyageri 1,051 346 705 72 32 40 779 237 542 601235 Mudhol 1,121 549 572 39 24 15 800 305 495 601236 Chikoppa 6 3 3 - - - 2 1 1 601237 Tumurguddi 585 155 430 18 12 6 529 128 401 601238 Ballutgi 466 127 339 73 23 50 351 82 269 601239 Jhulkatti 345 103 242 16 13 3 304 76 228 601240 Bandi 274 98 176 9 5 4 123 36 87 601241 Kadbalkatti 62 6 56 2 - 2 37 2 35 601242 Chikbannigol 657 250 407 24 15 9 615 224 391 601243 Konasagar 56 19 37 35 12 23 18 6 12 601244 Hagedhal 5 4 1 - - - 5 4 1 601245 Bassapur 486 185 301 1 1 - 479 180 299 601246 Boon Koppa 16 6 10 - - - 15 6 9 601247 Dammur 101 15 86 6 4 2 56 7 49 601248 Vajra Bandi 184 71 113 1 1 - 5 2 3 601249 Makkahalli 13 4 9 3 1 2 7 2 5 601250 Salbhavi 4 2 2 - - - - - - 601251 Madlur 158 52 106 6 3 3 63 6 57 601252 Lagalur 52 12 40 3 3 - 30 1 29 601253 G.Jarkunti 38 16 22 - - - 35 14 21 601254 G.Virapur 18 3 15 4 1 3 10 1 9 601255 Kudri Kotgi 283 127 156 4 1 3 191 60 131 601256 Maranhal 155 49 106 9 2 7 116 33 83 601257 Hosahalli 189 77 112 74 19 55 65 30 35 601258 Karmudi 44 34 10 5 5 - 26 17 9 601259 Bandihal 55 23 32 9 3 6 38 13 25 601260 Tondihal 551 227 324 8 4 4 124 53 71 601261 Sanganhal 450 135 315 157 45 112 255 63 192 601262 Yelburga601263 Malaksamudra 263 67 196 12 9 3 175 29 146 601264 Kudgunti 418 179 239 3 2 1 335 150 185 601265 Kallur 612 153 459 111 11 100 475 125 350 601266 Kalak Bandi 73 17 56 7 5 2 60 10 50 601267 Matrangi 178 64 114 5 1 4 168 58 110 601268 Hire Arlihalli 442 205 237 1 1 - 376 152 224 601269 Budakunti 56 38 18 10 5 5 9 2 7 601270 Putakmari 217 62 155 10 5 5 166 42 124 601271 Yeddoni 54 22 32 9 3 6 41 16 25 601272 Gule 5 3 2 2 1 1 1 - 1 601273 Budur - - - - - - - - - 601274 Guntamadu 9 4 5 - - - 5 3 2 601275 Sidlabhavi 5 2 3 3 1 2 1 - 1 601276 Chikka Mannapur 6 4 2 3 2 1 - - - 601277 Vanjabhavi 24 3 21 15 - 15 6 1 5 601278 Markat 140 14 126 2 2 - 127 5 122 601279 Choudapur 21 2 19 4 - 4 12 1 11 601280 Kalbhavi 73 21 52 44 14 30 20 5 15 601281 Mataldinni 595 138 457 39 22 17 251 37 214 601282 Chikka Arlihalli601283 N.Jarkunti 1 1 - - - - - - - 601284 Biraldinni 103 34 69 24 6 18 69 22 47 601285 Hosur 8 3 5 - - - 4 1 3
Name of VillageMarginal workers Cultivators Agricultural labourers
Industrial category Location
code number
-------------Un-inhabited--------------
-------------Un-inhabited--------------
70

PRIMARY CENSUS ABSTRACT
CENSUS ABSTRACTYelbarga
Persons Males Females Persons Males Females Persons Males Females50 51 52 53 54 55 56 57 58 2 1
1,238 508 730 5,620 3,025 2,595 1,20,925 56,221 64,704 Yelbarga (Total) 00321,238 508 730 5,620 3,025 2,595 1,20,925 56,221 64,704 Yelbarga (Rural) 0032
- - - - - - - - - Yelbarga (Urban) 0032RURAL
2 1 1 11 8 3 1,064 470 594 Sankanur 6012302 2 - 20 9 11 322 157 165 Katral 6012311 1 - 2 2 - 559 299 260 Sirgumpi 601232
- - - 7 5 2 398 196 202 Sompur 60123364 12 52 136 65 71 1,940 924 1,016 Hiremyageri 60123461 39 22 221 181 40 3,365 1,500 1,865 Mudhol 601235
- - - 4 2 2 633 328 305 Chikoppa 6012364 3 1 34 12 22 1,068 552 516 Tumurguddi 6012379 3 6 33 19 14 2,069 962 1,107 Ballutgi 6012381 1 - 24 13 11 329 178 151 Jhulkatti 601239
33 9 24 109 48 61 1,203 579 624 Bandi 60124018 2 16 5 2 3 175 85 90 Kadbalkatti 6012415 3 2 13 8 5 569 295 274 Chikbannigol 6012421 - 1 2 1 1 842 410 432 Konasagar 601243
- - - - - - 374 185 189 Hagedhal 6012444 2 2 2 2 - 419 195 224 Bassapur 601245
- - - 1 - 1 213 98 115 Boon Koppa 6012461 - 1 38 4 34 835 430 405 Dammur 6012476 1 5 172 67 105 1,034 493 541 Vajra Bandi 601248
- - - 3 1 2 175 85 90 Makkahalli 6012494 2 2 - - - 343 169 174 Salbhavi 6012509 3 6 80 40 40 357 188 169 Madlur 6012511 1 - 18 7 11 69 34 35 Lagalur 601252
- - - 3 2 1 358 172 186 G.Jarkunti 601253- - - 4 1 3 226 112 114 G.Virapur 60125413 8 5 75 58 17 503 236 267 Kudri Kotgi 60125519 6 13 11 8 3 511 240 271 Maranhal 60125620 13 7 30 15 15 613 250 363 Hosahalli 601257
- - - 13 12 1 1,838 654 1,184 Karmudi 601258- - - 8 7 1 1,218 482 736 Bandihal 601259
4 1 3 415 169 246 813 379 434 Tondihal 6012606 3 3 32 24 8 1,398 713 685 Sanganhal 601261
Yelburga 60126218 7 11 58 22 36 692 331 361 Malaksamudra 60126354 10 44 26 17 9 712 333 379 Kudgunti 6012643 3 - 23 14 9 1,486 704 782 Kallur 601265
- - - 6 2 4 331 164 167 Kalak Bandi 601266- - - 5 5 - 243 120 123 Matrangi 601267
6 6 - 59 46 13 1,303 705 598 Hire Arlihalli 6012682 1 1 35 30 5 575 266 309 Budakunti 6012691 - 1 40 15 25 355 170 185 Putakmari 601270
- - - 4 3 1 999 481 518 Yeddoni 601271- - - 2 2 - 202 100 102 Gule 601272- - - - - - 668 346 322 Budur 601273
1 - 1 3 1 2 267 137 130 Guntamadu 601274- - - 1 1 - 457 246 211 Sidlabhavi 601275
3 2 1 - - - 450 217 233 Chikka Mannapur 6012761 - 1 2 2 - 200 99 101 Vanjabhavi 601277
- - - 11 7 4 575 295 280 Markat 6012781 1 - 4 - 4 393 180 213 Choudapur 601279
- - - 9 2 7 426 212 214 Kalbhavi 60128012 4 8 293 75 218 1,199 559 640 Mataldinni 601281
Chikka Arlihalli 601282- - - 1 1 - 261 119 142 N.Jarkunti 601283
1 - 1 9 6 3 362 180 182 Biraldinni 601284- - - 4 2 2 431 218 213 Hosur 601285
Location code
numberHousehold industry workers
Name of VillageOther workers Non-workers
of marginal workers
-------------Un-inhabited--------------
-------------Un-inhabited--------------
71

DISTRICT CENSUS HANDBOOK : KOPPAL
VILLAGE PRIMARY
Persons Males Females Persons Males Females1 2 3 4 5 6 7 8 9 10
Name of Village
Location code
number
Total population (including institutional and houseless
population)Area of
Village in hectares
Number of households
C D Block -
Population in the age-group 0-6
601286 Ningalbandi 763.65 365 2,160 1,092 1,068 376 209 167 601287 Mandalmari 454.71 133 838 419 419 142 71 71 601288 Taralkatti 1,108.25 451 2,465 1,207 1,258 359 174 185 601289 Yapaldinni 386.16 190 1,084 555 529 173 86 87 601290 Nilogal 374.25 161 848 426 422 95 51 44 601291 Uppaldinni 472.73 93 578 303 275 108 58 50 601292 Chikwankal Kunta 233.67 194 1,127 559 568 210 98 112 601293 Hire Wankal Kunta 570.25 640 3,410 1,745 1,665 456 234 222 601294 Talkere 885.86 579 3,124 1,589 1,535 440 240 200 601295 Gandhal 1,664.16 516 3,238 1,664 1,574 616 330 286 601296 Hire Waddarkal 1,659.92 343 2,124 1,065 1,059 375 184 191 601297 Katgihalli 676.59 210 1,354 699 655 254 125 129 601298 Tippanhal 438.73 179 1,125 561 564 212 104 108 601299 Uchalkunta 504.07 204 1,081 525 556 165 87 78 601300 Bukkanhatti 697.79 80 490 240 250 102 50 52 601301 Gunhalu 1,450.37 714 3,753 1,854 1,899 576 300 276 601302 Hunsihal 1,897.63 638 3,953 2,043 1,910 694 347 347 601303 Kolihal 750.58 264 1,458 750 708 195 80 115 601304 Myadneri 448.02 207 1,335 674 661 222 113 109 601305 Hanmapur 132.38 80 499 248 251 92 45 47 601306 Gedigera 1,297.69 493 2,702 1,333 1,369 493 259 234 601307 Talur 465.49 218 1,444 741 703 261 135 126 601308 Hulegudda 900.76 238 1,795 910 885 368 180 188 601309 Narsapur 466.65 115 743 362 381 120 55 65 601310 Murdi 2,017.23 604 3,375 1,722 1,653 572 302 270 601311 Guttur 700.86 220 1,225 606 619 178 93 85 601312 Lakmangule 794.35 173 909 472 437 142 75 67 601313 Chikmyageri 1,895.11 668 3,417 1,771 1,646 447 254 193 601314 Budgumpi 587.58 197 1,058 543 515 135 61 74 601315 Ryavanki 1,393.23 355 2,046 1,051 995 249 120 129 601316 Balapur 363.53601317 Vangera 1,272.39 603 3,212 1,612 1,600 428 209 219 601318 Bevoor 2,013.54 953 5,172 2,636 2,536 671 348 323 601319 Watparvi 609.23 387 2,187 1,127 1,060 365 188 177 601320 Nelgeri 774.09 257 1,460 738 722 215 106 109 601321 Bhairnaikanhalli 383.16 238 1,247 654 593 167 86 81 601322 Mangalore 2,781.00 1,655 8,372 4,212 4,160 1,021 513 508 601323 Kavalkere 366.99 89 425 215 210 76 44 32 601324 Sirur 861.83 319 1,687 852 835 216 124 92 601325 Bedwatti 789.28 193 915 462 453 106 55 51 601326 Yadiapur 580.59 374 2,082 1,074 1,008 311 180 131 601327 Balgera 1,943.07 507 2,736 1,399 1,337 455 224 231 601328 Tipparasanhalu 621.67 82 381 194 187 72 38 34 601329 Chendoor 1,222.13 238 1,244 628 616 145 76 69 601330 Arkeri 1,434.13 274 1,491 741 750 164 92 72 601331 Muthalu 483.92 128 633 305 328 67 31 36 601332 Kadar Halli 559.85 188 1,034 528 506 129 74 55 601333 Hirebeedinhalu 693.77 219 1,178 604 574 157 83 74 601334 Chikbeedinhalu 637.69 209 1,494 759 735 299 158 141 601335 Kudri Moti 1,834.17 713 4,261 2,104 2,157 685 352 333 601336 Chendinhal 443.56 106 502 249 253 64 26 38 601337 Honhunashi 428.95 157 922 470 452 150 78 72 601338 Yarihanchinal 3,447.00 647 3,188 1,601 1,587 368 192 176 601339 Binhal 1,489.62 455 2,347 1,174 1,173 317 163 154 601340 Chiken Koppa 692.42 343 1,782 881 901 208 95 113 601341 Dyampur 941.08 347 1,745 892 853 215 111 104 601342 Rajoor 1,591.80 543 2,671 1,360 1,311 320 177 143 601343 Adoor 1,096.94 358 1,706 865 841 175 94 81 601344 Chanpanhalli 412.51 107 570 288 282 72 32 40 601345 Konapur 264.03 132 661 342 319 104 55 49
-------------Un-inhabited--------------
72

PRIMARY CENSUS ABSTRACT
CENSUS ABSTRACTYelbarga
Persons Males Females Persons Males Females Persons Males Females11 12 13 14 15 16 17 18 19 2
Name of VillageLiteratesScheduled Castes population Scheduled Tribes population
367 180 187 728 370 358 1,037 620 417 Ningalbandi53 27 26 107 49 58 414 257 157 Mandalmari
718 365 353 410 202 208 1,252 766 486 Taralkatti106 49 57 310 170 140 607 386 221 Yapaldinni162 83 79 70 31 39 527 312 215 Nilogal- - - 31 15 16 311 201 110 Uppaldinni55 28 27 885 433 452 469 279 190 Chikwankal Kunta
966 487 479 271 154 117 2,269 1,305 964 Hire Wankal Kunta348 173 175 510 252 258 1,623 951 672 Talkere483 255 228 1,286 672 614 1,217 761 456 Gandhal787 396 391 240 111 129 854 557 297 Hire Waddarkal206 102 104 309 155 154 607 377 230 Katgihalli30 16 14 611 314 297 490 303 187 Tippanhal
220 92 128 309 150 159 546 333 213 Uchalkunta48 22 26 32 17 15 233 150 83 Bukkanhatti
460 232 228 780 413 367 1,918 1,131 787 Gunhalu1,246 664 582 195 104 91 1,680 1,077 603 Hunsihal
464 248 216 14 6 8 863 541 322 Kolihal100 45 55 178 86 92 736 443 293 Myadneri58 27 31 - - - 233 135 98 Hanmapur
1,027 514 513 150 75 75 1,377 842 535 Gedigera621 310 311 231 131 100 841 557 284 Talur114 61 53 797 411 386 677 440 237 Hulegudda104 42 62 4 3 1 295 171 124 Narsapur510 255 255 924 466 458 1,689 995 694 Murdi119 59 60 445 215 230 539 363 176 Guttur127 62 65 179 105 74 324 197 127 Lakmangule753 406 347 187 101 86 1,768 1,103 665 Chikmyageri258 141 117 - - - 610 380 230 Budgumpi291 157 134 54 27 27 1,238 767 471 Ryavanki
Balapur797 387 410 96 48 48 1,755 1,023 732 Vangera549 271 278 680 353 327 3,092 1,852 1,240 Bevoor
1,132 584 548 223 107 116 1,067 665 402 Watparvi158 84 74 20 7 13 836 509 327 Nelgeri285 148 137 113 52 61 746 485 261 Bhairnaikanhalli
2,063 1,021 1,042 575 293 282 5,001 2,891 2,110 Mangalore202 101 101 15 9 6 200 118 82 Kavalkere373 175 198 93 39 54 930 532 398 Sirur317 152 165 16 8 8 572 329 243 Bedwatti668 340 328 91 49 42 1,154 685 469 Yadiapur570 300 270 204 103 101 1,330 857 473 Balgera- - - 270 136 134 193 114 79 Tipparasanhalu236 122 114 30 17 13 698 411 287 Chendoor255 132 123 70 36 34 1,033 584 449 Arkeri42 20 22 34 16 18 404 226 178 Muthalu
249 124 125 63 29 34 598 365 233 Kadar Halli246 122 124 103 51 52 711 425 286 Hirebeedinhalu211 101 110 1,025 527 498 683 425 258 Chikbeedinhalu798 399 399 688 352 336 2,023 1,189 834 Kudri Moti20 10 10 23 9 14 251 143 108 Chendinhal
301 155 146 176 91 85 399 242 157 Honhunashi405 204 201 364 180 184 1,908 1,154 754 Yarihanchinal310 154 156 99 51 48 1,327 814 513 Binhal255 137 118 126 59 67 1,106 676 430 Chiken Koppa484 232 252 64 31 33 1,104 669 435 Dyampur481 256 225 70 35 35 1,718 1,019 699 Rajoor325 170 155 199 95 104 1,071 629 442 Adoor57 31 26 92 47 45 327 204 123 Chanpanhalli64 32 32 - - - 374 221 153 Konapur
-------------Un-inhabited--------------
73

DISTRICT CENSUS HANDBOOK : KOPPAL
VILLAGE PRIMARYC D Block -
Persons Males Females Persons Males Females Persons Males Females1 2 20 21 22 23 24 25 26 27 28
Name of Village
Location code
numberIlliterates Total workers Main workers
601286 Ningalbandi 1,123 472 651 1,055 605 450 808 533 275 601287 Mandalmari 424 162 262 343 227 116 298 211 87 601288 Taralkatti 1,213 441 772 1,388 675 713 1,325 655 670 601289 Yapaldinni 477 169 308 579 292 287 521 276 245 601290 Nilogal 321 114 207 493 240 253 443 223 220 601291 Uppaldinni 267 102 165 321 171 150 321 171 150 601292 Chikwankal Kunta 658 280 378 626 326 300 617 322 295 601293 Hire Wankal Kunta 1,141 440 701 1,350 929 421 1,144 818 326 601294 Talkere 1,501 638 863 1,819 928 891 849 601 248 601295 Gandhal 2,021 903 1,118 1,558 853 705 1,257 810 447 601296 Hire Waddarkal 1,270 508 762 1,061 607 454 1,040 594 446 601297 Katgihalli 747 322 425 696 373 323 685 367 318 601298 Tippanhal 635 258 377 559 276 283 549 272 277 601299 Uchalkunta 535 192 343 574 279 295 556 272 284 601300 Bukkanhatti 257 90 167 222 122 100 143 86 57 601301 Gunhalu 1,835 723 1,112 2,145 1,110 1,035 1,855 992 863 601302 Hunsihal 2,273 966 1,307 2,020 1,070 950 1,304 918 386 601303 Kolihal 595 209 386 856 457 399 821 451 370 601304 Myadneri 599 231 368 758 393 365 754 393 361 601305 Hanmapur 266 113 153 290 137 153 89 86 3 601306 Gedigera 1,325 491 834 1,490 719 771 1,473 716 757 601307 Talur 603 184 419 821 410 411 819 410 409 601308 Hulegudda 1,118 470 648 1,065 527 538 826 453 373 601309 Narsapur 448 191 257 425 209 216 419 208 211 601310 Murdi 1,686 727 959 1,723 991 732 1,536 920 616 601311 Guttur 686 243 443 726 355 371 404 260 144 601312 Lakmangule 585 275 310 576 299 277 575 299 276 601313 Chikmyageri 1,649 668 981 1,795 996 799 1,556 964 592 601314 Budgumpi 448 163 285 567 308 259 73 66 7 601315 Ryavanki 808 284 524 1,148 626 522 846 492 354 601316 Balapur601317 Vangera 1,457 589 868 1,873 957 916 1,258 782 476 601318 Bevoor 2,080 784 1,296 2,530 1,381 1,149 1,387 862 525 601319 Watparvi 1,120 462 658 1,182 634 548 1,022 554 468 601320 Nelgeri 624 229 395 724 399 325 583 322 261 601321 Bhairnaikanhalli 501 169 332 753 407 346 737 400 337 601322 Mangalore 3,371 1,321 2,050 3,875 2,374 1,501 2,186 1,494 692 601323 Kavalkere 225 97 128 215 115 100 56 43 13 601324 Sirur 757 320 437 896 464 432 597 370 227 601325 Bedwatti 343 133 210 504 255 249 83 57 26 601326 Yadiapur 928 389 539 959 568 391 377 301 76 601327 Balgera 1,406 542 864 1,559 842 717 662 519 143 601328 Tipparasanhalu 188 80 108 240 120 120 237 117 120 601329 Chendoor 546 217 329 631 339 292 114 99 15 601330 Arkeri 458 157 301 776 405 371 297 196 101 601331 Muthalu 229 79 150 317 170 147 315 169 146 601332 Kadar Halli 436 163 273 527 309 218 394 247 147 601333 Hirebeedinhalu 467 179 288 606 303 303 140 122 18 601334 Chikbeedinhalu 811 334 477 794 393 401 281 193 88 601335 Kudri Moti 2,238 915 1,323 2,164 1,124 1,040 1,772 938 834 601336 Chendinhal 251 106 145 284 157 127 282 157 125 601337 Honhunashi 523 228 295 449 256 193 192 127 65 601338 Yarihanchinal 1,280 447 833 1,866 971 895 1,639 886 753 601339 Binhal 1,020 360 660 1,287 626 661 1,104 540 564 601340 Chiken Koppa 676 205 471 940 474 466 864 452 412 601341 Dyampur 641 223 418 839 468 371 693 409 284 601342 Rajoor 953 341 612 1,413 757 656 1,337 715 622 601343 Adoor 635 236 399 978 508 470 852 424 428 601344 Chanpanhalli 243 84 159 327 179 148 321 174 147 601345 Konapur 287 121 166 350 180 170 300 168 132
-------------Un-inhabited--------------
74

PRIMARY CENSUS ABSTRACT
CENSUS ABSTRACTYelbarga
Persons Males Females Persons Males Females Persons Males Females Persons Males Females29 30 31 32 33 34 35 36 37 38 39 40 2
CultivatorsName of Village
Household industry workersAgricultural labourers
Industrial category of main workers
Other workers
293 249 44 284 122 162 102 57 45 129 105 24 Ningalbandi57 51 6 200 125 75 5 5 - 36 30 6 Mandalmari
708 487 221 510 106 404 6 6 - 101 56 45 Taralkatti193 153 40 297 101 196 12 9 3 19 13 6 Yapaldinni340 197 143 82 13 69 6 3 3 15 10 5 Nilogal174 89 85 121 62 59 1 1 - 25 19 6 Uppaldinni59 46 13 512 248 264 7 6 1 39 22 17 Chikwankal Kunta
339 290 49 287 144 143 56 31 25 462 353 109 Hire Wankal Kunta505 390 115 237 126 111 17 15 2 90 70 20 Talkere528 433 95 524 222 302 4 3 1 201 152 49 Gandhal546 367 179 386 136 250 14 12 2 94 79 15 Hire Waddarkal328 295 33 308 37 271 12 5 7 37 30 7 Katgihalli338 241 97 198 23 175 1 - 1 12 8 4 Tippanhal265 193 72 207 34 173 30 20 10 54 25 29 Uchalkunta119 72 47 2 - 2 1 1 - 21 13 8 Bukkanhatti
1,116 591 525 319 125 194 55 34 21 365 242 123 Gunhalu766 562 204 459 297 162 18 15 3 61 44 17 Hunsihal521 285 236 204 99 105 11 6 5 85 61 24 Kolihal278 242 36 449 129 320 8 8 - 19 14 5 Myadneri83 83 - 3 - 3 - - - 3 3 - Hanmapur
675 437 238 714 224 490 13 7 6 71 48 23 Gedigera231 225 6 567 168 399 - - - 21 17 4 Talur250 223 27 439 129 310 17 14 3 120 87 33 Hulegudda172 163 9 - - - 11 9 2 236 36 200 Narsapur840 639 201 402 182 220 18 14 4 276 85 191 Murdi115 91 24 166 53 113 5 4 1 118 112 6 Guttur560 287 273 - - - 1 1 - 14 11 3 Lakmangule669 465 204 699 359 340 11 8 3 177 132 45 Chikmyageri51 48 3 11 9 2 2 2 - 9 7 2 Budgumpi
157 136 21 638 320 318 28 20 8 23 16 7 RyavankiBalapur
468 410 58 561 194 367 45 33 12 184 145 39 Vangera591 447 144 419 182 237 27 23 4 350 210 140 Bevoor519 309 210 394 178 216 7 5 2 102 62 40 Watparvi311 188 123 201 73 128 3 3 - 68 58 10 Nelgeri206 175 31 433 150 283 - - - 98 75 23 Bhairnaikanhalli549 427 122 587 263 324 158 108 50 892 696 196 Mangalore25 22 3 17 10 7 - - - 14 11 3 Kavalkere
243 224 19 258 71 187 3 3 - 93 72 21 Sirur26 25 1 41 22 19 - - - 16 10 6 Bedwatti
173 162 11 10 6 4 45 12 33 149 121 28 Yadiapur274 248 26 154 60 94 3 2 1 231 209 22 Balgera56 55 1 170 54 116 1 1 - 10 7 3 Tipparasanhalu41 40 1 48 42 6 8 5 3 17 12 5 Chendoor79 69 10 180 94 86 7 6 1 31 27 4 Arkeri
186 115 71 83 17 66 3 2 1 43 35 8 Muthalu50 49 1 268 141 127 5 4 1 71 53 18 Kadar Halli49 48 1 21 15 6 7 6 1 63 53 10 Hirebeedinhalu89 88 1 169 89 80 5 3 2 18 13 5 Chikbeedinhalu
862 484 378 585 216 369 48 24 24 277 214 63 Kudri Moti69 68 1 175 56 119 2 1 1 36 32 4 Chendinhal89 78 11 88 39 49 3 1 2 12 9 3 Honhunashi
634 349 285 697 317 380 41 22 19 267 198 69 Yarihanchinal60 59 1 981 436 545 10 8 2 53 37 16 Binhal
337 206 131 431 177 254 5 2 3 91 67 24 Chiken Koppa83 53 30 474 237 237 10 5 5 126 114 12 Dyampur
579 282 297 447 182 265 44 23 21 267 228 39 Rajoor265 136 129 509 243 266 7 4 3 71 41 30 Adoor39 20 19 275 149 126 - - - 7 5 2 Chanpanhalli
198 125 73 76 20 56 2 1 1 24 22 2 Konapur
-------------Un-inhabited--------------
75

DISTRICT CENSUS HANDBOOK : KOPPAL
VILLAGE PRIMARYC D Block -
Persons Males Females Persons Males Females Persons Males Females1 2 41 42 43 44 45 46 47 48 49
Name of VillageMarginal workers Cultivators Agricultural labourers
Industrial category Location
code number
601286 Ningalbandi 247 72 175 14 8 6 192 36 156 601287 Mandalmari 45 16 29 4 2 2 35 11 24 601288 Taralkatti 63 20 43 26 8 18 36 11 25 601289 Yapaldinni 58 16 42 1 - 1 55 15 40 601290 Nilogal 50 17 33 3 3 - 45 12 33 601291 Uppaldinni - - - - - - - - - 601292 Chikwankal Kunta 9 4 5 2 1 1 6 2 4 601293 Hire Wankal Kunta 206 111 95 3 1 2 131 67 64 601294 Talkere 970 327 643 36 17 19 897 289 608 601295 Gandhal 301 43 258 13 5 8 276 31 245 601296 Hire Waddarkal 21 13 8 5 4 1 15 8 7 601297 Katgihalli 11 6 5 1 - 1 4 1 3 601298 Tippanhal 10 4 6 6 4 2 4 - 4 601299 Uchalkunta 18 7 11 4 1 3 7 1 6 601300 Bukkanhatti 79 36 43 26 9 17 31 10 21 601301 Gunhalu 290 118 172 112 61 51 113 33 80 601302 Hunsihal 716 152 564 46 17 29 643 125 518 601303 Kolihal 35 6 29 10 1 9 22 2 20 601304 Myadneri 4 - 4 - - - 3 - 3 601305 Hanmapur 201 51 150 2 1 1 190 41 149 601306 Gedigera 17 3 14 1 - 1 14 2 12 601307 Talur 2 - 2 - - - 1 - 1 601308 Hulegudda 239 74 165 2 1 1 32 8 24 601309 Narsapur 6 1 5 - - - - - - 601310 Murdi 187 71 116 13 6 7 151 47 104 601311 Guttur 322 95 227 5 5 - 308 84 224 601312 Lakmangule 1 - 1 1 - 1 - - - 601313 Chikmyageri 239 32 207 27 5 22 200 20 180 601314 Budgumpi 494 242 252 17 9 8 443 210 233 601315 Ryavanki 302 134 168 5 1 4 255 111 144 601316 Balapur601317 Vangera 615 175 440 30 17 13 492 113 379 601318 Bevoor 1,143 519 624 16 6 10 1,038 445 593 601319 Watparvi 160 80 80 14 4 10 123 64 59 601320 Nelgeri 141 77 64 11 6 5 127 70 57 601321 Bhairnaikanhalli 16 7 9 2 2 - 7 2 5 601322 Mangalore 1,689 880 809 50 36 14 1,086 520 566 601323 Kavalkere 159 72 87 - - - 109 54 55 601324 Sirur 299 94 205 30 25 5 245 49 196 601325 Bedwatti 421 198 223 10 7 3 360 162 198 601326 Yadiapur 582 267 315 13 8 5 452 206 246 601327 Balgera 897 323 574 52 20 32 741 219 522 601328 Tipparasanhalu 3 3 - - - - - - - 601329 Chendoor 517 240 277 27 25 2 464 195 269 601330 Arkeri 479 209 270 25 17 8 405 163 242 601331 Muthalu 2 1 1 - - - 1 1 - 601332 Kadar Halli 133 62 71 3 3 - 100 46 54 601333 Hirebeedinhalu 466 181 285 10 8 2 403 132 271 601334 Chikbeedinhalu 513 200 313 10 5 5 497 193 304 601335 Kudri Moti 392 186 206 10 7 3 336 150 186 601336 Chendinhal 2 - 2 - - - 2 - 2 601337 Honhunashi 257 129 128 1 1 - 252 124 128 601338 Yarihanchinal 227 85 142 43 19 24 133 40 93 601339 Binhal 183 86 97 1 - 1 137 54 83 601340 Chiken Koppa 76 22 54 14 8 6 43 7 36 601341 Dyampur 146 59 87 - - - 127 42 85 601342 Rajoor 76 42 34 20 9 11 24 10 14 601343 Adoor 126 84 42 6 2 4 12 4 8 601344 Chanpanhalli 6 5 1 - - - 6 5 1 601345 Konapur 50 12 38 9 4 5 35 3 32
-------------Un-inhabited--------------
76

PRIMARY CENSUS ABSTRACT
CENSUS ABSTRACTYelbarga
Persons Males Females Persons Males Females Persons Males Females50 51 52 53 54 55 56 57 58 2 1
Location code
numberHousehold industry workers
Name of VillageOther workers Non-workers
of marginal workers
12 7 5 29 21 8 1,105 487 618 Ningalbandi 601286- - - 6 3 3 495 192 303 Mandalmari 601287- - - 1 1 - 1,077 532 545 Taralkatti 601288
1 - 1 1 1 - 505 263 242 Yapaldinni 601289- - - 2 2 - 355 186 169 Nilogal 601290- - - - - - 257 132 125 Uppaldinni 601291- - - 1 1 - 501 233 268 Chikwankal Kunta 60129211 5 6 61 38 23 2,060 816 1,244 Hire Wankal Kunta 6012934 2 2 33 19 14 1,305 661 644 Talkere 6012941 - 1 11 7 4 1,680 811 869 Gandhal 6012951 1 - - - - 1,063 458 605 Hire Waddarkal 6012961 1 - 5 4 1 658 326 332 Katgihalli 601297
- - - - - - 566 285 281 Tippanhal 6012982 - 2 5 5 - 507 246 261 Uchalkunta 601299
- - - 22 17 5 268 118 150 Bukkanhatti 6013005 2 3 60 22 38 1,608 744 864 Gunhalu 6013018 1 7 19 9 10 1,933 973 960 Hunsihal 601302
- - - 3 3 - 602 293 309 Kolihal 601303- - - 1 - 1 577 281 296 Myadneri 601304- - - 9 9 - 209 111 98 Hanmapur 601305- - - 2 1 1 1,212 614 598 Gedigera 601306- - - 1 - 1 623 331 292 Talur 60130730 13 17 175 52 123 730 383 347 Hulegudda 601308
- - - 6 1 5 318 153 165 Narsapur 6013094 1 3 19 17 2 1,652 731 921 Murdi 601310
- - - 9 6 3 499 251 248 Guttur 601311- - - - - - 333 173 160 Lakmangule 601312
2 - 2 10 7 3 1,622 775 847 Chikmyageri 6013131 - 1 33 23 10 491 235 256 Budgumpi 6013143 1 2 39 21 18 898 425 473 Ryavanki 601315
Balapur 60131620 8 12 73 37 36 1,339 655 684 Vangera 60131713 10 3 76 58 18 2,642 1,255 1,387 Bevoor 6013181 - 1 22 12 10 1,005 493 512 Watparvi 601319
- - - 3 1 2 736 339 397 Nelgeri 601320- - - 7 3 4 494 247 247 Bhairnaikanhalli 601321244 113 131 309 211 98 4,497 1,838 2,659 Mangalore 601322- - - 50 18 32 210 100 110 Kavalkere 601323- - - 24 20 4 791 388 403 Sirur 60132430 15 15 21 14 7 411 207 204 Bedwatti 6013259 2 7 108 51 57 1,123 506 617 Yadiapur 6013264 3 1 100 81 19 1,177 557 620 Balgera 601327
- - - 3 3 - 141 74 67 Tipparasanhalu 6013285 4 1 21 16 5 613 289 324 Chendoor 601329
12 5 7 37 24 13 715 336 379 Arkeri 6013301 - 1 - - - 316 135 181 Muthalu 601331
12 3 9 18 10 8 507 219 288 Kadar Halli 60133210 4 6 43 37 6 572 301 271 Hirebeedinhalu 6013332 - 2 4 2 2 700 366 334 Chikbeedinhalu 601334
12 8 4 34 21 13 2,097 980 1,117 Kudri Moti 601335- - - - - - 218 92 126 Chendinhal 601336- - - 4 4 - 473 214 259 Honhunashi 60133714 3 11 37 23 14 1,322 630 692 Yarihanchinal 60133820 12 8 25 20 5 1,060 548 512 Binhal 6013391 1 - 18 6 12 842 407 435 Chiken Koppa 601340
- - - 19 17 2 906 424 482 Dyampur 6013411 - 1 31 23 8 1,258 603 655 Rajoor 601342
10 6 4 98 72 26 728 357 371 Adoor 601343- - - - - - 243 109 134 Chanpanhalli 601344
1 1 - 5 4 1 311 162 149 Konapur 601345
-------------Un-inhabited--------------
77

DISTRICT CENSUS HANDBOOK : KOPPAL
VILLAGE PRIMARY
Persons Males Females Persons Males Females1 2 3 4 5 6 7 8 9 10
Name of Village
Location code
number
Total population (including institutional and houseless
population)Area of
Village in hectares
Number of households
C D Block -
Population in the age-group 0-6
601346 Kakkihalli 502.84 296 1,471 745 726 275 151 124 601347 Harishankerbandi 156.13 56 225 117 108 32 21 11 601348 Kuknoor 3,647.33 3,659 18,033 9,075 8,958 2,225 1,139 1,086 601349 Gorelekoppa 185.41 96 520 252 268 85 42 43 601350 T.Virapapur 430.03601351 Bhatpanhalli 618.41 192 1,096 560 536 164 83 81 601352 Sidnekoppa 1,156.09 228 1,136 607 529 151 85 66 601353 Mandalgeri 2,218.62 494 2,147 1,066 1,081 220 118 102 601354 Itagi 3,203.00 854 4,180 2,149 2,031 532 257 275 601355 Masabhanchinhal 1,312.71 468 2,199 1,104 1,095 286 147 139 601356 Nittali 1,012.83 230 1,228 620 608 171 83 88 601357 Gavarhal 796.82 157 847 445 402 124 69 55 601358 Benakal 1,701.69 607 3,284 1,643 1,641 435 218 217 601359 Veerapur 1,494.60 366 1,836 932 904 242 119 123 601360 Bhanapur 894.66 294 1,265 619 646 140 78 62 601361 Talbal 1,081.76 165 842 420 422 128 55 73 601362 Ningapur 434.68 171 855 424 431 91 43 48 601363 Mannapur 805.46 238 1,108 542 566 160 89 71 601364 Anugondana Koppa 464.63601365 Kerihalli 36.92601366 Sompur 1,669.61 324 1,677 860 817 269 135 134 601367 Male Koppa 905.30 290 1,421 734 687 138 75 63 601368 Bannikoppa 2,790.27 576 2,707 1,363 1,344 261 140 121 601369 Advihalli 324.43 70 312 160 152 35 20 15 601370 Tadkal 5,662.04 1,375 6,998 3,487 3,511 857 438 419 601371 Lakmapur 944.90 313 1,554 779 775 179 90 89 601372 Chitapur 456.72 73 414 214 200 68 30 38 601373 Komlapur 764.59 248 1,246 605 641 171 80 91
-------------Un-inhabited--------------
-------------Un-inhabited---------------------------Un-inhabited--------------
78

PRIMARY CENSUS ABSTRACT
CENSUS ABSTRACTYelbarga
Persons Males Females Persons Males Females Persons Males Females11 12 13 14 15 16 17 18 19 2
Name of VillageLiteratesScheduled Castes population Scheduled Tribes population
953 475 478 10 6 4 759 451 308 Kakkihalli4 3 1 - - - 129 78 51 Harishankerbandi
3,802 1,927 1,875 936 471 465 12,081 6,732 5,349 Kuknoor387 190 197 3 1 2 356 199 157 Gorelekoppa
T.Virapapur118 67 51 21 11 10 636 380 256 Bhatpanhalli111 58 53 70 36 34 737 458 279 Sidnekoppa353 172 181 195 93 102 1,332 807 525 Mandalgeri799 431 368 182 88 94 2,771 1,649 1,122 Itagi357 184 173 208 106 102 1,395 827 568 Masabhanchinhal199 95 104 36 20 16 672 392 280 Nittali252 132 120 - - - 571 329 242 Gavarhal537 265 272 100 45 55 1,906 1,180 726 Benakal730 384 346 102 61 41 1,131 689 442 Veerapur126 65 61 87 40 47 837 483 354 Bhanapur33 14 19 113 52 61 502 313 189 Talbal
239 118 121 128 73 55 491 295 196 Ningapur460 243 217 15 6 9 634 359 275 Mannapur
Anugondana KoppaKerihalli
241 127 114 76 39 37 1,073 651 422 Sompur235 111 124 199 103 96 1,123 625 498 Male Koppa293 138 155 450 229 221 1,915 1,096 819 Bannikoppa- - - 163 86 77 191 118 73 Advihalli
1,338 659 679 427 213 214 4,581 2,593 1,988 Tadkal194 87 107 74 36 38 1,124 630 494 Lakmapur
2 2 - 115 55 60 267 165 102 Chitapur99 48 51 144 69 75 711 428 283 Komlapur
-------------Un-inhabited--------------
-------------Un-inhabited---------------------------Un-inhabited--------------
79

DISTRICT CENSUS HANDBOOK : KOPPAL
VILLAGE PRIMARYC D Block -
Persons Males Females Persons Males Females Persons Males Females1 2 20 21 22 23 24 25 26 27 28
Name of Village
Location code
numberIlliterates Total workers Main workers
601346 Kakkihalli 712 294 418 609 412 197 521 394 127 601347 Harishankerbandi 96 39 57 124 67 57 123 67 56 601348 Kuknoor 5,952 2,343 3,609 7,783 4,919 2,864 6,689 4,435 2,254 601349 Gorelekoppa 164 53 111 253 145 108 68 60 8 601350 T.Virapapur601351 Bhatpanhalli 460 180 280 554 284 270 507 262 245 601352 Sidnekoppa 399 149 250 565 317 248 536 301 235 601353 Mandalgeri 815 259 556 1,162 597 565 820 459 361 601354 Itagi 1,409 500 909 2,253 1,225 1,028 1,448 892 556 601355 Masabhanchinhal 804 277 527 1,168 649 519 461 413 48 601356 Nittali 556 228 328 829 412 417 651 365 286 601357 Gavarhal 276 116 160 436 266 170 399 251 148 601358 Benakal 1,378 463 915 1,722 925 797 420 333 87 601359 Veerapur 705 243 462 1,031 543 488 658 474 184 601360 Bhanapur 428 136 292 554 325 229 536 312 224 601361 Talbal 340 107 233 333 222 111 261 217 44 601362 Ningapur 364 129 235 454 236 218 440 230 210 601363 Mannapur 474 183 291 531 286 245 459 262 197 601364 Anugondana Koppa601365 Kerihalli601366 Sompur 604 209 395 923 488 435 670 447 223 601367 Male Koppa 298 109 189 860 451 409 318 292 26 601368 Bannikoppa 792 267 525 1,457 794 663 1,138 672 466 601369 Advihalli 121 42 79 211 110 101 209 109 100 601370 Tadkal 2,417 894 1,523 3,568 1,931 1,637 2,828 1,729 1,099 601371 Lakmapur 430 149 281 923 492 431 883 474 409 601372 Chitapur 147 49 98 271 137 134 267 135 132 601373 Komlapur 535 177 358 678 350 328 634 331 303
-------------Un-inhabited--------------
-------------Un-inhabited---------------------------Un-inhabited--------------
80

PRIMARY CENSUS ABSTRACT
CENSUS ABSTRACTYelbarga
Persons Males Females Persons Males Females Persons Males Females Persons Males Females29 30 31 32 33 34 35 36 37 38 39 40 2
CultivatorsName of Village
Household industry workersAgricultural labourers
Industrial category of main workers
Other workers
91 88 3 88 17 71 1 - 1 341 289 52 Kakkihalli19 10 9 71 37 34 - - - 33 20 13 Harishankerbandi
779 599 180 1,919 870 1,049 406 285 121 3,585 2,681 904 Kuknoor17 17 - 33 28 5 1 1 - 17 14 3 Gorelekoppa
T.Virapapur118 71 47 308 123 185 3 3 - 78 65 13 Bhatpanhalli266 150 116 213 105 108 4 4 - 53 42 11 Sidnekoppa284 201 83 292 66 226 11 4 7 233 188 45 Mandalgeri312 270 42 779 379 400 65 35 30 292 208 84 Itagi179 175 4 133 112 21 10 10 - 139 116 23 Masabhanchinhal332 186 146 262 147 115 11 5 6 46 27 19 Nittali71 62 9 177 63 114 7 6 1 144 120 24 Gavarhal
221 176 45 86 75 11 23 16 7 90 66 24 Benakal292 253 39 232 109 123 27 25 2 107 87 20 Veerapur135 83 52 228 88 140 2 1 1 171 140 31 Bhanapur123 121 2 96 57 39 - - - 42 39 3 Talbal87 52 35 295 131 164 9 8 1 49 39 10 Ningapur83 77 6 306 130 176 - - - 70 55 15 Mannapur
Anugondana KoppaKerihalli
548 363 185 56 32 24 3 3 - 63 49 14 Sompur145 144 1 104 86 18 2 2 - 67 60 7 Male Koppa614 361 253 324 156 168 18 16 2 182 139 43 Bannikoppa19 19 - 171 74 97 - - - 19 16 3 Advihalli
580 477 103 1,534 723 811 29 21 8 685 508 177 Tadkal286 235 51 467 133 334 2 2 - 128 104 24 Lakmapur37 29 8 195 79 116 1 - 1 34 27 7 Chitapur
316 175 141 220 68 152 - - - 98 88 10 Komlapur
-------------Un-inhabited--------------
-------------Un-inhabited---------------------------Un-inhabited--------------
81

DISTRICT CENSUS HANDBOOK : KOPPAL
VILLAGE PRIMARYC D Block -
Persons Males Females Persons Males Females Persons Males Females1 2 41 42 43 44 45 46 47 48 49
Name of VillageMarginal workers Cultivators Agricultural labourers
Industrial category Location
code number
601346 Kakkihalli 88 18 70 - - - 60 1 59 601347 Harishankerbandi 1 - 1 - - - 1 - 1 601348 Kuknoor 1,094 484 610 52 25 27 531 166 365 601349 Gorelekoppa 185 85 100 4 4 - 176 78 98 601350 T.Virapapur601351 Bhatpanhalli 47 22 25 9 7 2 28 5 23 601352 Sidnekoppa 29 16 13 5 3 2 19 10 9 601353 Mandalgeri 342 138 204 7 4 3 73 11 62 601354 Itagi 805 333 472 36 18 18 572 196 376 601355 Masabhanchinhal 707 236 471 22 7 15 617 176 441 601356 Nittali 178 47 131 8 1 7 158 37 121 601357 Gavarhal 37 15 22 1 - 1 9 - 9 601358 Benakal 1,302 592 710 372 150 222 568 263 305 601359 Veerapur 373 69 304 6 - 6 313 41 272 601360 Bhanapur 18 13 5 - - - 1 - 1 601361 Talbal 72 5 67 3 3 - 68 2 66 601362 Ningapur 14 6 8 1 - 1 9 3 6 601363 Mannapur 72 24 48 3 2 1 63 16 47 601364 Anugondana Koppa601365 Kerihalli601366 Sompur 253 41 212 73 2 71 166 31 135 601367 Male Koppa 542 159 383 14 9 5 502 142 360 601368 Bannikoppa 319 122 197 61 5 56 233 97 136 601369 Advihalli 2 1 1 1 - 1 - - - 601370 Tadkal 740 202 538 38 16 22 270 80 190 601371 Lakmapur 40 18 22 7 4 3 22 8 14 601372 Chitapur 4 2 2 - - - - - - 601373 Komlapur 44 19 25 - - - 41 16 25
-------------Un-inhabited--------------
-------------Un-inhabited---------------------------Un-inhabited--------------
82

PRIMARY CENSUS ABSTRACT
CENSUS ABSTRACTYelbarga
Persons Males Females Persons Males Females Persons Males Females50 51 52 53 54 55 56 57 58 2 1
Location code
numberHousehold industry workers
Name of VillageOther workers Non-workers
of marginal workers
- - - 28 17 11 862 333 529 Kakkihalli 601346- - - - - - 101 50 51 Harishankerbandi 60134739 11 28 472 282 190 10,250 4,156 6,094 Kuknoor 6013481 - 1 4 3 1 267 107 160 Gorelekoppa 601349
T.Virapapur 601350- - - 10 10 - 542 276 266 Bhatpanhalli 601351- - - 5 3 2 571 290 281 Sidnekoppa 60135228 16 12 234 107 127 985 469 516 Mandalgeri 60135341 24 17 156 95 61 1,927 924 1,003 Itagi 6013544 2 2 64 51 13 1,031 455 576 Masabhanchinhal 6013552 1 1 10 8 2 399 208 191 Nittali 6013562 - 2 25 15 10 411 179 232 Gavarhal 601357
131 62 69 231 117 114 1,562 718 844 Benakal 6013583 - 3 51 28 23 805 389 416 Veerapur 6013591 - 1 16 13 3 711 294 417 Bhanapur 601360
- - - 1 - 1 509 198 311 Talbal 601361- - - 4 3 1 401 188 213 Ningapur 601362- - - 6 6 - 577 256 321 Mannapur 601363
Anugondana Koppa 601364Kerihalli 601365
1 1 - 13 7 6 754 372 382 Sompur 6013663 2 1 23 6 17 561 283 278 Male Koppa 6013672 2 - 23 18 5 1,250 569 681 Bannikoppa 601368
- - - 1 1 - 101 50 51 Advihalli 60136979 4 75 353 102 251 3,430 1,556 1,874 Tadkal 6013701 - 1 10 6 4 631 287 344 Lakmapur 601371
- - - 4 2 2 143 77 66 Chitapur 6013721 1 - 2 2 - 568 255 313 Komlapur 601373
-------------Un-inhabited--------------
-------------Un-inhabited---------------------------Un-inhabited--------------
83

DISTRICT CENSUS HANDBOOK : KOPPAL
VILLAGE PRIMARY
Persons Males Females Persons Males Females1 2 3 4 5 6 7 8 9 10
0033 Kushtagi (Total) 1,35,486.66 46,533 2,59,914 1,31,734 1,28,180 40,947 21,016 19,931 0033 Kushtagi (Rural) 1,35,486.66 46,533 2,59,914 1,31,734 1,28,180 40,947 21,016 19,931 0033 Kushtagi (Urban) 0.00 - - - - - - -
RURAL601374 Rampur 1,050.98 164 953 468 485 159 77 82 601375 Vakkandurga 993.56 230 1,419 732 687 259 142 117 601376 Achnoor 825.70601377 Mittalkod 921.09 354 2,199 1,142 1,057 351 179 172 601378 Nilogal 551.24 782 4,274 2,190 2,084 768 390 378 601379 Bommanhal 460.16 232 1,208 627 581 179 96 83 601380 Basapur 195.36 129 774 420 354 133 75 58 601381 Bilekal 345.10 425 2,382 1,209 1,173 464 230 234 601382 Shadalgera 663.33 250 1,480 779 701 235 133 102 601383 Tuggaldoni 1,415.77 410 2,382 1,183 1,199 372 185 187 601384 Nirlakoppa 218.95 104 630 320 310 93 48 45 601385 Hanmanhal 738.16 780 4,218 2,156 2,062 611 307 304 601386 Masbinkurbanhal 463.64 65 284 140 144 54 23 31 601387 Kodatgeri 569.03 215 1,245 637 608 212 120 92 601388 Rangapur 401.11 146 877 454 423 126 68 58 601389 Kadival 321.33 186 1,028 535 493 184 95 89 601390 Pattalchinti 671.48 259 1,427 719 708 173 73 100 601391 Guddadadevalapur 498.22 312 1,664 854 810 224 111 113 601392 Konapur 292.62 141 1,008 494 514 205 101 104 601393 Paramanhatti 217.57 123 856 447 409 161 75 86 601394 Jagir Gadadur 674.90 495 2,347 1,246 1,101 359 182 177 601395 Mastkatti 404.02 167 987 511 476 171 88 83 601396 Akkeri 212.64601397 Malgitti 778.52 656 3,187 1,624 1,563 433 227 206 601398 Gadchinti 619.06 119 674 346 328 98 48 50 601399 Habalkatti 391.84 358 2,322 1,195 1,127 365 192 173 601400 K.Parsapur 206.92601401 Badimnhal 330.94 200 1,099 567 532 180 90 90 601402 Timmanhatti 330.70 56 367 194 173 69 34 35 601403 Venkatapur 194.52 197 1,243 646 597 219 117 102 601404 Gudadurkal 513.92 231 1,552 763 789 270 133 137 601405 Madnal 390.09 186 1,180 611 569 179 99 80 601406 Yerigeri 546.96 560 3,225 1,628 1,597 486 243 243 601407 Gorbihal 413.79 178 1,038 525 513 131 78 53 601408 Tumrikoppa 348.04 285 1,667 834 833 311 157 154 601409 Hiregonnagar 754.65 583 3,332 1,689 1,643 523 270 253 601410 Varikal 379.83 90 533 252 281 87 35 52 601411 Chickgonnagar 308.34 55 295 152 143 29 12 17 601412 Kumblavati 848.51 394 2,449 1,261 1,188 400 198 202 601413 Benkanhal 1,383.53 436 2,539 1,286 1,253 456 240 216 601414 Yelbunchi 1,016.25 362 2,388 1,197 1,191 450 230 220 601415 Mugnoor 683.54 369 2,223 1,116 1,107 331 162 169 601416 Katapur 1,467.17 545 2,866 1,462 1,404 463 231 232 601417 Kalgonhal 274.17 147 822 409 413 107 54 53 601418 Turkanur 181.22601419 Kadoor 447.85 75 418 213 205 57 28 29 601420 Yerigonhal 271.63 150 752 360 392 119 52 67 601421 Huchnoor 331.95 152 828 416 412 118 60 58 601422 Antarthana 485.07 180 850 427 423 120 61 59 601423 Puratageri 302.55 123 610 303 307 68 38 30 601424 Bandargal 565.80 240 1,346 709 637 192 116 76
Name of Village
Location code
number
Total population (including institutional and houseless
population)Area of
Village in hectares
Number of households
C D Block -
Population in the age-group 0-6
-------------Un-inhabited--------------
-------------Un-inhabited--------------
-------------Un-inhabited--------------
-------------Un-inhabited--------------
84

PRIMARY CENSUS ABSTRACT
CENSUS ABSTRACTKushtagi
Persons Males Females Persons Males Females Persons Males Females11 12 13 14 15 16 17 18 19 2
40,222 20,354 19,868 37,445 19,142 18,303 1,43,070 85,529 57,541 Kushtagi (Total)40,222 20,354 19,868 37,445 19,142 18,303 1,43,070 85,529 57,541 Kushtagi (Rural)
- - - - - - - - - Kushtagi (Urban)RURAL
65 34 31 28 16 12 498 292 206 Rampur91 44 47 474 243 231 714 444 270 Vakkandurga
Achnoor92 47 45 432 234 198 1,177 747 430 Mittalkod
337 174 163 882 470 412 2,085 1,272 813 Nilogal91 49 42 276 140 136 742 475 267 Bommanhal56 25 31 717 394 323 322 203 119 Basapur52 27 25 102 52 50 992 646 346 Bilekal51 28 23 146 82 64 799 522 277 Shadalgera
126 71 55 146 61 85 1,166 730 436 Tuggaldoni4 - 4 378 202 176 475 265 210 Nirlakoppa
622 336 286 901 479 422 2,558 1,503 1,055 Hanmanhal4 3 1 107 53 54 164 98 66 Masbinkurbanhal
137 70 67 599 312 287 552 344 208 Kodatgeri88 45 43 246 133 113 492 306 186 Rangapur
157 82 75 168 94 74 536 335 201 Kadival255 127 128 95 53 42 881 538 343 Pattalchinti117 54 63 663 362 301 862 556 306 Guddadadevalapur59 27 32 210 104 106 507 324 183 Konapur21 7 14 271 138 133 333 221 112 Paramanhatti
130 71 59 62 30 32 1,457 942 515 Jagir Gadadur 101 55 46 145 81 64 491 320 171 Mastkatti
Akkeri331 174 157 193 101 92 1,735 1,066 669 Malgitti43 21 22 230 130 100 293 181 112 Gadchinti
589 302 287 3 1 2 1,234 772 462 HabalkattiK.Parsapur
111 65 46 176 99 77 693 436 257 Badimnhal5 2 3 169 85 84 222 143 79 Timmanhatti
678 360 318 91 43 48 716 446 270 Venkatapur428 216 212 4 2 2 513 332 181 Gudadurkal152 81 71 319 157 162 639 409 230 Madnal256 134 122 347 165 182 1,708 1,056 652 Yerigeri20 10 10 745 374 371 600 365 235 Gorbihal
186 98 88 1,447 724 723 865 529 336 Tumrikoppa264 131 133 708 359 349 1,628 978 650 Hiregonnagar- - - 122 57 65 215 137 78 Varikal58 29 29 7 5 2 198 122 76 Chickgonnagar
224 113 111 382 189 193 1,007 661 346 Kumblavati415 205 210 291 151 140 1,294 780 514 Benkanhal202 94 108 47 23 24 1,125 691 434 Yelbunchi37 15 22 78 40 38 1,305 759 546 Mugnoor
469 233 236 33 16 17 1,424 901 523 Katapur54 27 27 36 18 18 454 295 159 Kalgonhal
Turkanur79 45 34 17 8 9 260 152 108 Kadoor51 23 28 13 4 9 470 275 195 Yerigonhal
141 70 71 29 15 14 495 310 185 Huchnoor119 54 65 121 65 56 458 291 167 Antarthana- - - 1 1 - 401 238 163 Puratageri150 71 79 22 9 13 833 501 332 Bandargal
Name of VillageLiteratesScheduled Castes population Scheduled Tribes population
-------------Un-inhabited--------------
-------------Un-inhabited--------------
-------------Un-inhabited--------------
-------------Un-inhabited--------------
85

DISTRICT CENSUS HANDBOOK : KOPPAL
VILLAGE PRIMARYC D Block -
Persons Males Females Persons Males Females Persons Males Females1 2 20 21 22 23 24 25 26 27 28
0033 Kushtagi (Total) 1,16,844 46,205 70,639 1,25,168 71,426 53,742 87,897 57,354 30,543 0033 Kushtagi (Rural) 1,16,844 46,205 70,639 1,25,168 71,426 53,742 87,897 57,354 30,543 0033 Kushtagi (Urban) - - - - - - - - -
RURAL601374 Rampur 455 176 279 606 291 315 568 283 285 601375 Vakkandurga 705 288 417 787 391 396 303 291 12 601376 Achnoor601377 Mittalkod 1,022 395 627 1,139 621 518 1,116 612 504 601378 Nilogal 2,189 918 1,271 1,972 1,119 853 1,392 944 448 601379 Bommanhal 466 152 314 629 343 286 172 161 11 601380 Basapur 452 217 235 407 230 177 407 230 177 601381 Bilekal 1,390 563 827 1,274 648 626 820 445 375 601382 Shadalgera 681 257 424 790 446 344 790 446 344 601383 Tuggaldoni 1,216 453 763 1,277 639 638 317 193 124 601384 Nirlakoppa 155 55 100 355 181 174 135 72 63 601385 Hanmanhal 1,660 653 1,007 1,815 1,102 713 1,548 1,046 502 601386 Masbinkurbanhal 120 42 78 139 74 65 132 74 58 601387 Kodatgeri 693 293 400 748 375 373 544 346 198 601388 Rangapur 385 148 237 495 258 237 369 197 172 601389 Kadival 492 200 292 536 293 243 533 290 243 601390 Pattalchinti 546 181 365 877 437 440 396 203 193 601391 Guddadadevalapur 802 298 504 553 452 101 155 143 12 601392 Konapur 501 170 331 557 270 287 463 247 216 601393 Paramanhatti 523 226 297 445 235 210 340 213 127 601394 Jagir Gadadur 890 304 586 1,045 634 411 766 607 159 601395 Mastkatti 496 191 305 522 281 241 496 265 231 601396 Akkeri601397 Malgitti 1,452 558 894 1,732 907 825 1,678 882 796 601398 Gadchinti 381 165 216 370 192 178 368 191 177 601399 Habalkatti 1,088 423 665 1,149 615 534 1,089 597 492 601400 K.Parsapur601401 Badimnhal 406 131 275 640 340 300 623 328 295 601402 Timmanhatti 145 51 94 200 108 92 186 99 87 601403 Venkatapur 527 200 327 638 318 320 331 239 92 601404 Gudadurkal 1,039 431 608 784 384 400 779 383 396 601405 Madnal 541 202 339 656 363 293 194 124 70 601406 Yerigeri 1,517 572 945 1,687 878 809 1,090 624 466 601407 Gorbihal 438 160 278 591 298 293 502 273 229 601408 Tumrikoppa 802 305 497 904 457 447 506 253 253 601409 Hiregonnagar 1,704 711 993 1,641 898 743 1,309 818 491 601410 Varikal 318 115 203 295 147 148 292 146 146 601411 Chickgonnagar 97 30 67 161 92 69 151 89 62 601412 Kumblavati 1,442 600 842 1,297 683 614 816 502 314 601413 Benkanhal 1,245 506 739 1,411 725 686 899 527 372 601414 Yelbunchi 1,263 506 757 1,181 643 538 1,082 612 470 601415 Mugnoor 918 357 561 1,016 614 402 776 512 264 601416 Katapur 1,442 561 881 1,457 761 696 645 593 52 601417 Kalgonhal 368 114 254 492 243 249 435 213 222 601418 Turkanur601419 Kadoor 158 61 97 175 120 55 99 86 13 601420 Yerigonhal 282 85 197 299 213 86 158 141 17 601421 Huchnoor 333 106 227 484 248 236 243 236 7 601422 Antarthana 392 136 256 505 262 243 146 112 34 601423 Puratageri 209 65 144 352 185 167 167 149 18 601424 Bandargal 513 208 305 817 415 402 235 203 32
Name of Village
Location code
numberIlliterates Total workers Main workers
-------------Un-inhabited--------------
-------------Un-inhabited--------------
-------------Un-inhabited--------------
-------------Un-inhabited--------------
86

PRIMARY CENSUS ABSTRACT
CENSUS ABSTRACTKushtagi
Persons Males Females Persons Males Females Persons Males Females Persons Males Females29 30 31 32 33 34 35 36 37 38 39 40 2
36,290 28,529 7,761 31,044 13,302 17,742 2,343 1,578 765 18,220 13,945 4,275 Kushtagi (Total)36,290 28,529 7,761 31,044 13,302 17,742 2,343 1,578 765 18,220 13,945 4,275 Kushtagi (Rural)
- - - - - - - - - - - - Kushtagi (Urban)RURAL
288 259 29 272 18 254 2 2 - 6 4 2 Rampur220 213 7 51 50 1 10 10 - 22 18 4 Vakkandurga
Achnoor592 400 192 450 158 292 12 11 1 62 43 19 Mittalkod367 324 43 639 319 320 16 12 4 370 289 81 Nilogal135 133 2 9 6 3 6 4 2 22 18 4 Bommanhal166 110 56 228 108 120 - - - 13 12 1 Basapur259 165 94 499 232 267 2 2 - 60 46 14 Bilekal129 105 24 559 251 308 1 - 1 101 90 11 Shadalgera83 57 26 180 95 85 11 8 3 43 33 10 Tuggaldoni18 16 2 109 50 59 - - - 8 6 2 Nirlakoppa
379 286 93 495 255 240 66 51 15 608 454 154 Hanmanhal57 38 19 55 23 32 5 4 1 15 9 6 Masbinkurbanhal
191 188 3 319 137 182 - - - 34 21 13 Kodatgeri182 97 85 178 95 83 - - - 9 5 4 Rangapur60 34 26 436 225 211 3 3 - 34 28 6 Kadival15 14 1 358 175 183 4 2 2 19 12 7 Pattalchinti
132 126 6 4 4 - - - - 19 13 6 Guddadadevalapur146 122 24 284 98 186 1 1 - 32 26 6 Konapur56 54 2 262 143 119 12 8 4 10 8 2 Paramanhatti
498 475 23 216 88 128 2 2 - 50 42 8 Jagir Gadadur 255 139 116 219 106 113 3 3 - 19 17 2 Mastkatti
Akkeri640 414 226 826 297 529 12 11 1 200 160 40 Malgitti175 90 85 172 87 85 1 - 1 20 14 6 Gadchinti404 246 158 573 266 307 23 15 8 89 70 19 Habalkatti
K.Parsapur520 299 221 76 9 67 - - - 27 20 7 Badimnhal23 23 - 155 72 83 - - - 8 4 4 Timmanhatti
142 126 16 127 59 68 6 6 - 56 48 8 Venkatapur66 60 6 691 314 377 14 2 12 8 7 1 Gudadurkal
131 86 45 36 23 13 8 2 6 19 13 6 Madnal522 354 168 395 150 245 28 14 14 145 106 39 Yerigeri216 186 30 190 67 123 73 1 72 23 19 4 Gorbihal23 16 7 277 139 138 173 80 93 33 18 15 Tumrikoppa
615 487 128 556 240 316 5 3 2 133 88 45 Hiregonnagar145 141 4 142 3 139 - - - 5 2 3 Varikal37 35 2 105 51 54 - - - 9 3 6 Chickgonnagar
466 365 101 73 43 30 10 6 4 267 88 179 Kumblavati347 282 65 354 95 259 11 6 5 187 144 43 Benkanhal411 306 105 544 203 341 22 20 2 105 83 22 Yelbunchi263 236 27 444 219 225 3 3 - 66 54 12 Mugnoor362 349 13 79 55 24 3 2 1 201 187 14 Katapur354 158 196 9 2 7 2 1 1 70 52 18 Kalgonhal
Turkanur20 19 1 17 15 2 - - - 62 52 10 Kadoor88 88 - 33 28 5 12 8 4 25 17 8 Yerigonhal
146 145 1 32 32 - 3 3 - 62 56 6 Huchnoor98 98 - 11 - 11 1 - 1 36 14 22 Antarthana
147 142 5 4 1 3 1 1 - 15 5 10 Puratageri98 84 14 23 13 10 6 5 1 108 101 7 Bandargal
CultivatorsName of Village
Household industry workersAgricultural labourers
Industrial category of main workers
Other workers
-------------Un-inhabited--------------
-------------Un-inhabited--------------
-------------Un-inhabited--------------
-------------Un-inhabited--------------
87

DISTRICT CENSUS HANDBOOK : KOPPAL
VILLAGE PRIMARYC D Block -
Persons Males Females Persons Males Females Persons Males Females1 2 41 42 43 44 45 46 47 48 49
0033 Kushtagi (Total) 37,271 14,072 23,199 3,036 1,449 1,587 22,912 6,917 15,995 0033 Kushtagi (Rural) 37,271 14,072 23,199 3,036 1,449 1,587 22,912 6,917 15,995 0033 Kushtagi (Urban) - - - - - - - - -
RURAL601374 Rampur 38 8 30 3 1 2 35 7 28 601375 Vakkandurga 484 100 384 16 9 7 454 80 374 601376 Achnoor601377 Mittalkod 23 9 14 3 1 2 10 1 9 601378 Nilogal 580 175 405 35 20 15 481 119 362 601379 Bommanhal 457 182 275 14 8 6 121 41 80 601380 Basapur - - - - - - - - - 601381 Bilekal 454 203 251 39 26 13 399 169 230 601382 Shadalgera - - - - - - - - - 601383 Tuggaldoni 960 446 514 41 26 15 444 202 242 601384 Nirlakoppa 220 109 111 2 1 1 36 18 18 601385 Hanmanhal 267 56 211 12 5 7 195 29 166 601386 Masbinkurbanhal 7 - 7 - - - 2 - 2 601387 Kodatgeri 204 29 175 7 7 - 191 18 173 601388 Rangapur 126 61 65 50 21 29 67 33 34 601389 Kadival 3 3 - - - - - - - 601390 Pattalchinti 481 234 247 471 226 245 8 6 2 601391 Guddadadevalapur 398 309 89 5 3 2 371 289 82 601392 Konapur 94 23 71 7 1 6 85 21 64 601393 Paramanhatti 105 22 83 7 3 4 81 16 65 601394 Jagir Gadadur 279 27 252 8 2 6 246 13 233 601395 Mastkatti 26 16 10 1 1 - 12 6 6 601396 Akkeri601397 Malgitti 54 25 29 10 3 7 35 16 19 601398 Gadchinti 2 1 1 - - - 1 1 - 601399 Habalkatti 60 18 42 13 3 10 28 7 21 601400 K.Parsapur601401 Badimnhal 17 12 5 3 3 - 3 1 2 601402 Timmanhatti 14 9 5 3 2 1 10 7 3 601403 Venkatapur 307 79 228 14 3 11 262 54 208 601404 Gudadurkal 5 1 4 - - - 4 1 3 601405 Madnal 462 239 223 9 5 4 446 229 217 601406 Yerigeri 597 254 343 6 5 1 558 227 331 601407 Gorbihal 89 25 64 5 3 2 71 20 51 601408 Tumrikoppa 398 204 194 10 9 1 10 5 5 601409 Hiregonnagar 332 80 252 9 4 5 280 72 208 601410 Varikal 3 1 2 1 - 1 2 1 1 601411 Chickgonnagar 10 3 7 1 1 - 8 2 6 601412 Kumblavati 481 181 300 5 3 2 377 142 235 601413 Benkanhal 512 198 314 13 5 8 475 186 289 601414 Yelbunchi 99 31 68 8 4 4 80 19 61 601415 Mugnoor 240 102 138 17 15 2 185 58 127 601416 Katapur 812 168 644 23 6 17 689 102 587 601417 Kalgonhal 57 30 27 6 3 3 8 1 7 601418 Turkanur601419 Kadoor 76 34 42 13 12 1 48 14 34 601420 Yerigonhal 141 72 69 15 12 3 72 44 28 601421 Huchnoor 241 12 229 2 2 - 230 6 224 601422 Antarthana 359 150 209 1 1 - 9 1 8 601423 Puratageri 185 36 149 8 5 3 10 6 4 601424 Bandargal 582 212 370 30 10 20 504 182 322
Name of VillageMarginal workers Cultivators Agricultural labourers
Industrial category Location
code number
-------------Un-inhabited--------------
-------------Un-inhabited--------------
-------------Un-inhabited--------------
-------------Un-inhabited--------------
88

PRIMARY CENSUS ABSTRACT
CENSUS ABSTRACTKushtagi
Persons Males Females Persons Males Females Persons Males Females50 51 52 53 54 55 56 57 58 2 1
2,292 949 1,343 9,031 4,757 4,274 1,34,746 60,308 74,438 Kushtagi (Total) 00332,292 949 1,343 9,031 4,757 4,274 1,34,746 60,308 74,438 Kushtagi (Rural) 0033
- - - - - - - - - Kushtagi (Urban) 0033RURAL
- - - - - - 347 177 170 Rampur 6013743 2 1 11 9 2 632 341 291 Vakkandurga 601375
Achnoor 6013761 1 - 9 6 3 1,060 521 539 Mittalkod 6013775 3 2 59 33 26 2,302 1,071 1,231 Nilogal 601378
14 11 3 308 122 186 579 284 295 Bommanhal 601379- - - - - - 367 190 177 Basapur 601380
3 - 3 13 8 5 1,108 561 547 Bilekal 601381- - - - - - 690 333 357 Shadalgera 601382322 149 173 153 69 84 1,105 544 561 Tuggaldoni 601383
6 3 3 176 87 89 275 139 136 Nirlakoppa 6013847 2 5 53 20 33 2,403 1,054 1,349 Hanmanhal 6013855 - 5 - - - 145 66 79 Masbinkurbanhal 601386
- - - 6 4 2 497 262 235 Kodatgeri 601387- - - 9 7 2 382 196 186 Rangapur 601388- - - 3 3 - 492 242 250 Kadival 601389- - - 2 2 - 550 282 268 Pattalchinti 60139014 13 1 8 4 4 1,111 402 709 Guddadadevalapur 601391
- - - 2 1 1 451 224 227 Konapur 60139212 1 11 5 2 3 411 212 199 Paramanhatti 60139315 7 8 10 5 5 1,302 612 690 Jagir Gadadur 601394
- - - 13 9 4 465 230 235 Mastkatti 601395Akkeri 601396
1 - 1 8 6 2 1,455 717 738 Malgitti 601397- - - 1 - 1 304 154 150 Gadchinti 60139810 2 8 9 6 3 1,173 580 593 Habalkatti 601399
K.Parsapur 6014004 3 1 7 5 2 459 227 232 Badimnhal 601401
- - - 1 - 1 167 86 81 Timmanhatti 60140210 7 3 21 15 6 605 328 277 Venkatapur 601403
- - - 1 - 1 768 379 389 Gudadurkal 6014046 5 1 1 - 1 524 248 276 Madnal 601405
10 4 6 23 18 5 1,538 750 788 Yerigeri 60140612 1 11 1 1 - 447 227 220 Gorbihal 60140719 6 13 359 184 175 763 377 386 Tumrikoppa 60140823 - 23 20 4 16 1,691 791 900 Hiregonnagar 601409
- - - - - - 238 105 133 Varikal 6014101 - 1 - - - 134 60 74 Chickgonnagar 6014117 1 6 92 35 57 1,152 578 574 Kumblavati 601412
10 3 7 14 4 10 1,128 561 567 Benkanhal 6014131 - 1 10 8 2 1,207 554 653 Yelbunchi 6014147 4 3 31 25 6 1,207 502 705 Mugnoor 6014157 3 4 93 57 36 1,409 701 708 Katapur 601416
- - - 43 26 17 330 166 164 Kalgonhal 601417Turkanur 601418
- - - 15 8 7 243 93 150 Kadoor 6014191 - 1 53 16 37 453 147 306 Yerigonhal 6014201 - 1 8 4 4 344 168 176 Huchnoor 601421
21 3 18 328 145 183 345 165 180 Antarthana 601422- - - 167 25 142 258 118 140 Puratageri 60142326 5 21 22 15 7 529 294 235 Bandargal 601424
Location code
numberHousehold industry workers
Name of VillageOther workers Non-workers
of marginal workers
-------------Un-inhabited--------------
-------------Un-inhabited--------------
-------------Un-inhabited--------------
-------------Un-inhabited--------------
89

DISTRICT CENSUS HANDBOOK : KOPPAL
VILLAGE PRIMARY
Persons Males Females Persons Males Females1 2 3 4 5 6 7 8 9 10
Name of Village
Location code
number
Total population (including institutional and houseless
population)Area of
Village in hectares
Number of households
C D Block -
Population in the age-group 0-6
601425 Tatakunti 105.92601426 Usalkoppa 300.12601427 Honmatti 284.57601428 Hulgera 3,647.91 1,105 5,605 2,755 2,850 875 435 440 601429 Sebankatti 935.42 240 1,274 624 650 199 92 107 601430 Mannerhal 878.11 437 2,125 1,103 1,022 315 167 148 601431 Beelagi 968.47 149 701 352 349 66 27 39 601432 Kabbargi 1,146.85 565 3,285 1,685 1,600 612 309 303 601433 Chandragiri 874.13 137 645 332 313 94 52 42 601434 Mavinitagi 1,068.19 176 1,012 506 506 183 102 81 601435 Hanamsagar 1,585.09 2,791 14,874 7,542 7,332 2,177 1,156 1,021 601436 Mudhotagi 1,494.24 114 629 325 304 101 54 47 601437 Develapur 300.48 95 570 279 291 116 54 62 601438 Hanamageri 296.88 110 686 338 348 145 78 67 601439 Miyapur 941.35 214 1,209 605 604 199 119 80 601440 Mensageri 1,024.79 320 1,705 861 844 338 181 157 601441 Kyadiguppa 1,663.66 499 2,651 1,327 1,324 394 191 203 601442 Kadekoppa 717.43 176 1,086 546 540 195 97 98 601443 Timmanhatti 217.39601444 Advibhavi 1,059.10 303 1,688 855 833 300 129 171 601445 Hulsegeri 527.24 202 1,119 561 558 227 123 104 601446 Malkapur 413.32 107 512 253 259 70 29 41 601447 Hosalli 331.99 269 1,320 681 639 215 117 98 601448 Zhunjalkoppa 382.85 127 513 269 244 82 42 40 601449 Madikera 698.78 280 1,888 933 955 341 165 176 601450 Zhoolkatti 634.43 239 1,020 501 519 168 74 94 601451 Chalgera 2,678.90 922 4,898 2,469 2,429 665 339 326 601452 Topalkatti 687.36 208 1,226 617 609 175 79 96 601453 Talugeri 1,512.05 520 2,704 1,361 1,343 361 214 147 601454 Kalalbandi 835.59 467 2,856 1,483 1,373 424 208 216 601455 Parasapur 669.86 150 783 414 369 96 53 43 601456 Bhingikoppa 170.72601457 Donnegudda 495.10 111 538 285 253 88 48 40 601458 Bisnhal 292.93 112 674 342 332 148 78 70 601459 Kankoppa 363.01 200 1,185 646 539 216 127 89 601460 Hirenandihal 1,394.77 396 1,948 979 969 293 136 157 601461 Kordakera 815.27 372 2,092 1,110 982 325 169 156 601462 Chicknandihal 356.35 161 952 478 474 153 77 76 601463 Hirebannigol 960.82 417 2,137 1,070 1,067 259 135 124 601464 Yelburthi 1,025.44 287 1,680 862 818 279 128 151 601465 Tonsihal 359.33 251 1,618 846 772 283 158 125 601466 Gotagi 1,693.30 398 1,973 966 1,007 283 139 144 601467 Sirguppa 1,612.08 218 1,180 586 594 195 95 100 601468 Megur 526.30 104 527 260 267 78 47 31 601469 Banhatti 278.39 67 372 199 173 45 24 21 601470 Benchamatti 317.38 31 190 95 95 36 20 16 601471 Mudenoor 786.02 287 1,486 784 702 182 98 84 601472 Kudloor 422.10 100 547 268 279 70 39 31 601473 Balutagi 995.70 278 1,687 870 817 264 132 132 601474 Jalihal 721.06 214 1,022 509 513 152 84 68 601475 Matur 645.87 47 300 158 142 37 14 23 601476 Dotihal 303.54 869 4,275 2,206 2,069 569 303 266 601477 Kesoor 368.23 388 2,121 1,074 1,047 271 141 130 601478 Nadavalkoppa 370.86 84 465 255 210 84 44 40 601479 Kalkeri 601.97 136 753 370 383 130 55 75
-------------Un-inhabited---------------------------Un-inhabited---------------------------Un-inhabited--------------
-------------Un-inhabited--------------
-------------Un-inhabited--------------
90

PRIMARY CENSUS ABSTRACT
CENSUS ABSTRACTKushtagi
Persons Males Females Persons Males Females Persons Males Females11 12 13 14 15 16 17 18 19 2
Name of VillageLiteratesScheduled Castes population Scheduled Tribes population
TatakuntiUsalkoppaHonmatti
1,423 702 721 567 278 289 2,981 1,759 1,222 Hulgera223 107 116 61 24 37 790 444 346 Sebankatti144 73 71 181 103 78 1,139 745 394 Mannerhal50 24 26 89 42 47 471 293 178 Beelagi
389 202 187 962 485 477 1,708 1,087 621 Kabbargi280 134 146 264 145 119 316 209 107 Chandragiri424 219 205 65 26 39 582 333 249 Mavinitagi
2,565 1,293 1,272 250 120 130 9,162 5,203 3,959 Hanamsagar257 133 124 6 2 4 357 223 134 Mudhotagi60 30 30 - - - 246 148 98 Develapur24 10 14 459 229 230 309 176 133 Hanamageri
109 58 51 13 6 7 541 337 204 Miyapur895 448 447 104 56 48 803 475 328 Mensageri398 184 214 245 127 118 1,475 881 594 Kyadiguppa248 122 126 109 57 52 596 361 235 Kadekoppa
Timmanhatti266 127 139 721 365 356 772 523 249 Advibhavi160 75 85 91 43 48 514 318 196 Hulsegeri101 48 53 - - - 296 185 111 Malkapur55 33 22 56 31 25 722 446 276 Hosalli78 42 36 6 3 3 263 163 100 Zhunjalkoppa
173 86 87 41 23 18 1,041 610 431 Madikera71 34 37 25 12 13 604 362 242 Zhoolkatti
1,001 505 496 426 214 212 2,718 1,572 1,146 Chalgera90 41 49 257 137 120 644 414 230 Topalkatti
308 144 164 260 134 126 1,717 966 751 Talugeri175 89 86 55 30 25 1,512 937 575 Kalalbandi
6 2 4 237 125 112 562 339 223 ParasapurBhingikoppa
158 80 78 41 24 17 280 189 91 Donnegudda58 29 29 538 279 259 304 197 107 Bisnhal27 14 13 - - - 579 389 190 Kankoppa
288 147 141 590 297 293 1,073 646 427 Hirenandihal228 120 108 438 243 195 1,269 817 452 Kordakera19 12 7 652 321 331 444 281 163 Chicknandihal
164 87 77 159 76 83 1,333 767 566 Hirebannigol158 82 76 592 294 298 958 591 367 Yelburthi
1,241 645 596 243 138 105 899 563 336 Tonsihal482 250 232 311 132 179 1,122 633 489 Gotagi225 111 114 63 28 35 697 417 280 Sirguppa47 21 26 - - - 370 201 169 Megur9 4 5 - - - 235 144 91 Banhatti
- - - - - - 101 55 46 Benchamatti270 145 125 49 23 26 990 597 393 Mudenoor28 12 16 - - - 332 191 141 Kudloor
178 86 92 57 26 31 992 602 390 Balutagi205 97 108 58 30 28 620 364 256 Jalihal
1 1 - - - - 163 114 49 Matur242 120 122 50 30 20 2,979 1,694 1,285 Dotihal249 125 124 162 83 79 1,499 840 659 Kesoor319 170 149 81 44 37 211 133 78 Nadavalkoppa198 94 104 243 124 119 413 231 182 Kalkeri
-------------Un-inhabited---------------------------Un-inhabited---------------------------Un-inhabited--------------
-------------Un-inhabited--------------
-------------Un-inhabited--------------
91

DISTRICT CENSUS HANDBOOK : KOPPAL
VILLAGE PRIMARYC D Block -
Persons Males Females Persons Males Females Persons Males Females1 2 20 21 22 23 24 25 26 27 28
Name of Village
Location code
numberIlliterates Total workers Main workers
601425 Tatakunti601426 Usalkoppa601427 Honmatti601428 Hulgera 2,624 996 1,628 2,583 1,530 1,053 1,738 1,166 572 601429 Sebankatti 484 180 304 728 369 359 18 10 8 601430 Mannerhal 986 358 628 1,232 626 606 933 562 371 601431 Beelagi 230 59 171 308 219 89 149 131 18 601432 Kabbargi 1,577 598 979 1,698 901 797 783 636 147 601433 Chandragiri 329 123 206 321 159 162 290 147 143 601434 Mavinitagi 430 173 257 477 253 224 308 202 106 601435 Hanamsagar 5,712 2,339 3,373 5,993 3,963 2,030 4,001 2,899 1,102 601436 Mudhotagi 272 102 170 309 167 142 121 113 8 601437 Develapur 324 131 193 297 163 134 288 162 126 601438 Hanamageri 377 162 215 223 165 58 223 165 58 601439 Miyapur 668 268 400 497 298 199 458 292 166 601440 Mensageri 902 386 516 824 441 383 440 294 146 601441 Kyadiguppa 1,176 446 730 1,293 726 567 950 644 306 601442 Kadekoppa 490 185 305 570 318 252 199 180 19 601443 Timmanhatti601444 Advibhavi 916 332 584 818 449 369 266 224 42 601445 Hulsegeri 605 243 362 590 281 309 275 259 16 601446 Malkapur 216 68 148 216 150 66 212 147 65 601447 Hosalli 598 235 363 696 382 314 137 115 22 601448 Zhunjalkoppa 250 106 144 185 164 21 91 88 3 601449 Madikera 847 323 524 821 487 334 806 480 326 601450 Zhoolkatti 416 139 277 466 271 195 338 259 79 601451 Chalgera 2,180 897 1,283 2,342 1,349 993 1,609 1,086 523 601452 Topalkatti 582 203 379 480 330 150 282 260 22 601453 Talugeri 987 395 592 1,170 726 444 1,146 708 438 601454 Kalalbandi 1,344 546 798 1,560 835 725 1,021 687 334 601455 Parasapur 221 75 146 408 221 187 405 220 185 601456 Bhingikoppa601457 Donnegudda 258 96 162 261 132 129 249 130 119 601458 Bisnhal 370 145 225 340 164 176 334 161 173 601459 Kankoppa 606 257 349 683 352 331 664 338 326 601460 Hirenandihal 875 333 542 814 567 247 492 456 36 601461 Kordakera 823 293 530 1,087 555 532 1,085 554 531 601462 Chicknandihal 508 197 311 358 222 136 88 83 5 601463 Hirebannigol 804 303 501 1,205 640 565 1,066 627 439 601464 Yelburthi 722 271 451 876 464 412 507 388 119 601465 Tonsihal 719 283 436 625 402 223 274 252 22 601466 Gotagi 851 333 518 1,066 532 534 634 411 223 601467 Sirguppa 483 169 314 591 300 291 579 295 284 601468 Megur 157 59 98 212 142 70 121 106 15 601469 Banhatti 137 55 82 145 106 39 83 65 18 601470 Benchamatti 89 40 49 76 53 23 33 29 4 601471 Mudenoor 496 187 309 771 448 323 458 404 54 601472 Kudloor 215 77 138 280 150 130 265 138 127 601473 Balutagi 695 268 427 699 473 226 609 424 185 601474 Jalihal 402 145 257 558 304 254 254 199 55 601475 Matur 137 44 93 108 82 26 107 81 26 601476 Dotihal 1,296 512 784 1,817 1,169 648 1,245 901 344 601477 Kesoor 622 234 388 886 558 328 476 351 125 601478 Nadavalkoppa 254 122 132 248 134 114 37 28 9 601479 Kalkeri 340 139 201 287 196 91 222 175 47
-------------Un-inhabited---------------------------Un-inhabited---------------------------Un-inhabited--------------
-------------Un-inhabited--------------
-------------Un-inhabited--------------
92

PRIMARY CENSUS ABSTRACT
CENSUS ABSTRACTKushtagi
Persons Males Females Persons Males Females Persons Males Females Persons Males Females29 30 31 32 33 34 35 36 37 38 39 40 2
CultivatorsName of Village
Household industry workersAgricultural labourers
Industrial category of main workers
Other workers
TatakuntiUsalkoppaHonmatti
509 331 178 424 128 296 67 56 11 738 651 87 Hulgera- - - 10 4 6 4 3 1 4 3 1 Sebankatti581 394 187 210 53 157 17 11 6 125 104 21 Mannerhal90 84 6 27 21 6 2 2 - 30 24 6 Beelagi
331 304 27 298 197 101 6 6 - 148 129 19 Kabbargi97 61 36 161 60 101 - - - 32 26 6 Chandragiri
118 95 23 82 41 41 2 2 - 106 64 42 Mavinitagi706 534 172 702 274 428 285 199 86 2,308 1,892 416 Hanamsagar73 71 2 21 20 1 1 1 - 26 21 5 Mudhotagi33 32 1 146 29 117 - - - 109 101 8 Develapur
120 105 15 58 20 38 - - - 45 40 5 Hanamageri160 157 3 246 121 125 5 4 1 47 10 37 Miyapur152 143 9 176 49 127 3 1 2 109 101 8 Mensageri359 323 36 330 110 220 25 17 8 236 194 42 Kyadiguppa89 84 5 47 40 7 4 4 - 59 52 7 Kadekoppa
Timmanhatti155 152 3 49 22 27 5 3 2 57 47 10 Advibhavi123 122 1 85 77 8 - - - 67 60 7 Hulsegeri22 22 - 173 112 61 - - - 17 13 4 Malkapur98 83 15 12 10 2 7 7 - 20 15 5 Hosalli37 37 - 30 29 1 1 - 1 23 22 1 Zhunjalkoppa
179 152 27 521 255 266 6 6 - 100 67 33 Madikera16 16 - 250 182 68 - - - 72 61 11 Zhoolkatti
659 515 144 457 169 288 27 21 6 466 381 85 Chalgera214 209 5 20 11 9 9 7 2 39 33 6 Topalkatti279 263 16 659 274 385 16 12 4 192 159 33 Talugeri354 334 20 443 180 263 44 25 19 180 148 32 Kalalbandi128 121 7 135 88 47 - - - 142 11 131 Parasapur
Bhingikoppa102 75 27 134 47 87 - - - 13 8 5 Donnegudda88 86 2 232 65 167 - - - 14 10 4 Bisnhal
291 269 22 330 32 298 1 1 - 42 36 6 Kankoppa273 266 7 68 54 14 3 2 1 148 134 14 Hirenandihal334 306 28 646 173 473 - - - 105 75 30 Kordakera70 67 3 12 11 1 - - - 6 5 1 Chicknandihal
440 324 116 475 184 291 8 7 1 143 112 31 Hirebannigol272 240 32 132 61 71 6 6 - 97 81 16 Yelburthi95 88 7 84 80 4 5 4 1 90 80 10 Tonsihal
290 243 47 158 57 101 21 13 8 165 98 67 Gotagi111 93 18 271 84 187 55 31 24 142 87 55 Sirguppa
9 7 2 83 74 9 1 1 - 28 24 4 Megur40 37 3 17 8 9 1 1 - 25 19 6 Banhatti24 22 2 - - - - - - 9 7 2 Benchamatti
238 230 8 112 104 8 34 21 13 74 49 25 Mudenoor121 62 59 107 48 59 - - - 37 28 9 Kudloor158 129 29 179 60 119 4 4 - 268 231 37 Balutagi89 84 5 107 64 43 9 8 1 49 43 6 Jalihal56 48 8 28 13 15 1 1 - 22 19 3 Matur
239 167 72 155 87 68 139 115 24 712 532 180 Dotihal128 98 30 50 19 31 43 37 6 255 197 58 Kesoor11 11 - 15 8 7 1 1 - 10 8 2 Nadavalkoppa56 35 21 33 28 5 9 8 1 124 104 20 Kalkeri
-------------Un-inhabited---------------------------Un-inhabited---------------------------Un-inhabited--------------
-------------Un-inhabited--------------
-------------Un-inhabited--------------
93

DISTRICT CENSUS HANDBOOK : KOPPAL
VILLAGE PRIMARYC D Block -
Persons Males Females Persons Males Females Persons Males Females1 2 41 42 43 44 45 46 47 48 49
Name of VillageMarginal workers Cultivators Agricultural labourers
Industrial category Location
code number
601425 Tatakunti601426 Usalkoppa601427 Honmatti601428 Hulgera 845 364 481 64 19 45 392 85 307 601429 Sebankatti 710 359 351 20 19 1 661 327 334 601430 Mannerhal 299 64 235 108 19 89 93 10 83 601431 Beelagi 159 88 71 - - - 2 2 - 601432 Kabbargi 915 265 650 53 13 40 798 210 588 601433 Chandragiri 31 12 19 3 1 2 24 7 17 601434 Mavinitagi 169 51 118 6 1 5 114 17 97 601435 Hanamsagar 1,992 1,064 928 73 44 29 729 243 486 601436 Mudhotagi 188 54 134 12 12 - 137 15 122 601437 Develapur 9 1 8 - - - 8 1 7 601438 Hanamageri - - - - - - - - - 601439 Miyapur 39 6 33 1 - 1 16 5 11 601440 Mensageri 384 147 237 23 10 13 258 57 201 601441 Kyadiguppa 343 82 261 89 22 67 224 39 185 601442 Kadekoppa 371 138 233 73 16 57 279 109 170 601443 Timmanhatti601444 Advibhavi 552 225 327 20 6 14 168 35 133 601445 Hulsegeri 315 22 293 3 - 3 310 21 289 601446 Malkapur 4 3 1 2 2 - 1 1 - 601447 Hosalli 559 267 292 11 10 1 460 201 259 601448 Zhunjalkoppa 94 76 18 20 20 - 49 39 10 601449 Madikera 15 7 8 2 1 1 8 3 5 601450 Zhoolkatti 128 12 116 5 1 4 114 9 105 601451 Chalgera 733 263 470 65 20 45 501 132 369 601452 Topalkatti 198 70 128 2 2 - 135 36 99 601453 Talugeri 24 18 6 2 1 1 8 5 3 601454 Kalalbandi 539 148 391 21 16 5 162 45 117 601455 Parasapur 3 1 2 1 1 - - - - 601456 Bhingikoppa601457 Donnegudda 12 2 10 1 - 1 11 2 9 601458 Bisnhal 6 3 3 1 - 1 4 2 2 601459 Kankoppa 19 14 5 - - - 1 - 1 601460 Hirenandihal 322 111 211 7 2 5 296 93 203 601461 Kordakera 2 1 1 - - - - - - 601462 Chicknandihal 270 139 131 57 56 1 184 75 109 601463 Hirebannigol 139 13 126 7 2 5 129 10 119 601464 Yelburthi 369 76 293 51 13 38 275 40 235 601465 Tonsihal 351 150 201 30 24 6 127 29 98 601466 Gotagi 432 121 311 43 27 16 133 28 105 601467 Sirguppa 12 5 7 1 1 - 7 4 3 601468 Megur 91 36 55 3 - 3 4 3 1 601469 Banhatti 62 41 21 1 1 - 23 13 10 601470 Benchamatti 43 24 19 - - - 28 11 17 601471 Mudenoor 313 44 269 11 3 8 173 31 142 601472 Kudloor 15 12 3 5 4 1 6 4 2 601473 Balutagi 90 49 41 3 2 1 39 9 30 601474 Jalihal 304 105 199 9 7 2 276 84 192 601475 Matur 1 1 - - - - - - - 601476 Dotihal 572 268 304 25 15 10 107 41 66 601477 Kesoor 410 207 203 32 12 20 33 10 23 601478 Nadavalkoppa 211 106 105 26 25 1 155 66 89 601479 Kalkeri 65 21 44 8 8 - 29 5 24
-------------Un-inhabited---------------------------Un-inhabited---------------------------Un-inhabited--------------
-------------Un-inhabited--------------
-------------Un-inhabited--------------
94

PRIMARY CENSUS ABSTRACT
CENSUS ABSTRACTKushtagi
Persons Males Females Persons Males Females Persons Males Females50 51 52 53 54 55 56 57 58 2 1
Location code
numberHousehold industry workers
Name of VillageOther workers Non-workers
of marginal workers
Tatakunti 601425Usalkoppa 601426Honmatti 601427
27 10 17 362 250 112 3,022 1,225 1,797 Hulgera 60142823 10 13 6 3 3 546 255 291 Sebankatti 6014292 - 2 96 35 61 893 477 416 Mannerhal 6014301 1 - 156 85 71 393 133 260 Beelagi 601431
15 7 8 49 35 14 1,587 784 803 Kabbargi 601432- - - 4 4 - 324 173 151 Chandragiri 601433- - - 49 33 16 535 253 282 Mavinitagi 601434338 158 180 852 619 233 8,881 3,579 5,302 Hanamsagar 601435
3 - 3 36 27 9 320 158 162 Mudhotagi 6014361 - 1 - - - 273 116 157 Develapur 601437
- - - - - - 463 173 290 Hanamageri 601438- - - 22 1 21 712 307 405 Miyapur 601439
2 2 - 101 78 23 881 420 461 Mensageri 6014401 - 1 29 21 8 1,358 601 757 Kyadiguppa 601441
- - - 19 13 6 516 228 288 Kadekoppa 601442Timmanhatti 601443
58 17 41 306 167 139 870 406 464 Advibhavi 601444- - - 2 1 1 529 280 249 Hulsegeri 601445- - - 1 - 1 296 103 193 Malkapur 601446
9 6 3 79 50 29 624 299 325 Hosalli 6014473 2 1 22 15 7 328 105 223 Zhunjalkoppa 601448
- - - 5 3 2 1,067 446 621 Madikera 601449- - - 9 2 7 554 230 324 Zhoolkatti 60145013 8 5 154 103 51 2,556 1,120 1,436 Chalgera 6014519 5 4 52 27 25 746 287 459 Topalkatti 6014522 2 - 12 10 2 1,534 635 899 Talugeri 601453
52 6 46 304 81 223 1,296 648 648 Kalalbandi 601454- - - 2 - 2 375 193 182 Parasapur 601455
Bhingikoppa 601456- - - - - - 277 153 124 Donnegudda 601457- - - 1 1 - 334 178 156 Bisnhal 601458- - - 18 14 4 502 294 208 Kankoppa 601459- - - 19 16 3 1,134 412 722 Hirenandihal 601460- - - 2 1 1 1,005 555 450 Kordakera 60146127 7 20 2 1 1 594 256 338 Chicknandihal 601462
- - - 3 1 2 932 430 502 Hirebannigol 6014638 1 7 35 22 13 804 398 406 Yelburthi 601464
28 15 13 166 82 84 993 444 549 Tonsihal 60146585 7 78 171 59 112 907 434 473 Gotagi 6014662 - 2 2 - 2 589 286 303 Sirguppa 601467
- - - 84 33 51 315 118 197 Megur 6014685 2 3 33 25 8 227 93 134 Banhatti 601469
- - - 15 13 2 114 42 72 Benchamatti 60147031 3 28 98 7 91 715 336 379 Mudenoor 601471
- - - 4 4 - 267 118 149 Kudloor 6014721 - 1 47 38 9 988 397 591 Balutagi 6014733 3 - 16 11 5 464 205 259 Jalihal 601474
- - - 1 1 - 192 76 116 Matur 60147592 35 57 348 177 171 2,458 1,037 1,421 Dotihal 601476
231 143 88 114 42 72 1,235 516 719 Kesoor 60147720 5 15 10 10 - 217 121 96 Nadavalkoppa 601478
- - - 28 8 20 466 174 292 Kalkeri 601479
-------------Un-inhabited---------------------------Un-inhabited---------------------------Un-inhabited--------------
-------------Un-inhabited--------------
-------------Un-inhabited--------------
95

DISTRICT CENSUS HANDBOOK : KOPPAL
VILLAGE PRIMARY
Persons Males Females Persons Males Females1 2 3 4 5 6 7 8 9 10
Name of Village
Location code
number
Total population (including institutional and houseless
population)Area of
Village in hectares
Number of households
C D Block -
Population in the age-group 0-6
601480 Upparbasapur 449.12601481 Kawalbodur 329.07 338 1,966 1,000 966 346 187 159 601482 Mankalkeri 327.36 34 164 78 86 21 9 12 601483 Hesrur 695.55 147 747 384 363 125 61 64 601484 Ryawanki 470.51 155 747 372 375 98 50 48 601485 Basapur(M) 475.70 51 262 122 140 51 22 29 601486 Gonhal(K) 605.77 67 397 215 182 53 28 25 601487 Teggihal 523.51 196 1,130 544 586 204 105 99 601488 Madapur 847.43 218 1,160 567 593 186 95 91 601489 Rampur(Jagir) 404.45 120 651 330 321 61 28 33 601490 Gudadur(M) 535.56 253 1,633 821 812 269 131 138 601491 Hosur(K) 491.48 99 520 256 264 75 39 36 601492 Tengunti 838.44 287 1,737 875 862 305 161 144 601493 Bijakal 2,173.39 446 2,583 1,332 1,251 465 236 229 601494 Vanageri 1,924.23 353 2,168 1,062 1,106 365 174 191 601495 Tekkalki 464.83 214 1,348 649 699 209 105 104 601496 Kushtagi(Rural) 3,041.37 6 25 11 14 8 4 4 601497 Nidsesi 1,113.15 485 2,613 1,352 1,261 432 240 192 601498 Gorvarbenchamatti 289.18 70 403 204 199 64 28 36 601499 Byalihal 700.58 131 784 378 406 138 67 71 601500 Madalgatti 474.62 85 515 266 249 103 53 50 601501 Shakapur 528.21 262 1,556 790 766 263 136 127 601502 Nerebenchi 500.68 225 1,209 603 606 168 92 76 601503 Kurbanhal 513.31 190 1,098 536 562 158 83 75 601504 Kandakur 2,505.59 695 4,092 2,104 1,988 650 343 307 601505 Gumgeri 1,150.59 341 1,931 988 943 301 163 138 601506 Ganganhal 564.53 202 998 498 500 166 86 80 601507 Hiremannapur 2,012.46 995 5,645 2,895 2,750 727 377 350 601508 Mayadhunsi 346.93 1 4 3 1 - - - 601509 Hanchinhal 1,458.58 200 1,017 510 507 159 85 74 601510 Nawalhalli 1,057.44 376 1,930 994 936 260 139 121 601511 Rampur(M) 309.89 80 541 273 268 73 35 38 601512 Neerloti 605.71 181 1,068 557 511 136 75 61 601513 Nagarhal 735.36 110 594 295 299 131 68 63 601514 Sasvihal 1,223.69 161 866 430 436 136 76 60 601515 Muddalgundi 800.68 136 789 406 383 103 51 52 601516 Advibhavi 478.88 141 838 420 418 120 56 64 601517 Myadardokki 1,597.91 205 1,276 659 617 243 136 107 601518 Kidadur 705.93 161 854 420 434 118 54 64 601519 Kalmalli 1,809.09 553 3,519 1,752 1,767 668 313 355 601520 Kilarhatti 1,022.76 246 1,341 680 661 255 128 127 601521 Konapur 504.69601522 Umlirampur 231.25 73 422 202 220 77 41 36 601523 Narinhal 934.82 169 1,176 590 586 221 113 108 601524 Garjanhal 834.64 230 1,609 830 779 281 152 129 601525 Zhoolkunti 692.66 183 1,141 577 564 187 88 99 601526 Hagaldhal 1,042.53 137 791 381 410 115 58 57 601527 Ainapur 351.15601528 Jumlapur 746.35 343 2,008 998 1,010 312 160 152 601529 Idlapur 483.34 175 995 485 510 151 69 82 601530 Nandapur 1,007.56 241 1,417 721 696 237 114 123 601531 Vithalapur 391.91 173 863 424 439 113 55 58 601532 Tawargera 5,958.18 3,051 16,647 8,411 8,236 2,402 1,267 1,135 601533 Huliyapur 1,104.85 324 1,827 926 901 266 132 134 601534 Gudadhanamsagar 617.94 212 1,338 677 661 244 126 118
-------------Un-inhabited--------------
-------------Un-inhabited--------------
-------------Un-inhabited--------------
96

PRIMARY CENSUS ABSTRACT
CENSUS ABSTRACTKushtagi
Persons Males Females Persons Males Females Persons Males Females11 12 13 14 15 16 17 18 19 2
Name of VillageLiteratesScheduled Castes population Scheduled Tribes population
Upparbasapur853 453 400 - - - 836 533 303 Kawalbodur56 30 26 17 9 8 62 40 22 Mankalkeri56 28 28 32 18 14 409 267 142 Hesrur
195 92 103 12 4 8 393 231 162 Ryawanki138 65 73 1 - 1 125 74 51 Basapur(M)40 20 20 11 8 3 246 157 89 Gonhal(K)
110 49 61 277 135 142 562 323 239 Teggihal151 72 79 3 1 2 701 406 295 Madapur- - - 5 2 3 468 277 191 Rampur(Jagir)235 120 115 23 13 10 1,136 639 497 Gudadur(M)129 61 68 40 18 22 290 174 116 Hosur(K)427 213 214 29 13 16 910 538 372 Tengunti538 269 269 248 132 116 1,338 807 531 Bijakal317 155 162 58 29 29 1,015 590 425 Vanageri190 95 95 9 4 5 660 378 282 Tekkalki- - - - - - 13 6 7 Kushtagi(Rural)384 196 188 75 30 45 1,572 921 651 Nidsesi- - - 14 9 5 210 138 72 Gorvarbenchamatti50 26 24 41 20 21 410 244 166 Byalihal
236 119 117 247 132 115 281 176 105 Madalgatti149 73 76 444 220 224 746 435 311 Shakapur80 40 40 36 16 20 647 364 283 Nerebenchi91 45 46 50 24 26 619 348 271 Kurbanhal
918 479 439 645 339 306 2,324 1,352 972 Kandakur269 138 131 - - - 1,040 627 413 Gumgeri137 71 66 679 332 347 507 312 195 Ganganhal920 468 452 1,807 952 855 3,401 1,978 1,423 Hiremannapur- - - - - - 4 3 1 Mayadhunsi366 188 178 4 1 3 563 319 244 Hanchinhal374 192 182 198 104 94 1,232 723 509 Nawalhalli64 29 35 264 138 126 293 173 120 Rampur(M)
102 58 44 144 80 64 601 366 235 Neerloti20 7 13 313 160 153 283 163 120 Nagarhal
143 69 74 72 40 32 486 272 214 Sasvihal183 92 91 24 14 10 435 264 171 Muddalgundi124 59 65 264 135 129 425 259 166 Advibhavi366 206 160 46 24 22 603 365 238 Myadardokki94 50 44 88 47 41 489 281 208 Kidadur
1,505 744 761 470 233 237 1,711 1,031 680 Kalmalli540 276 264 446 218 228 666 399 267 Kilarhatti
Konapur- - - 22 11 11 252 140 112 Umlirampur39 19 20 - - - 528 331 197 Narinhal
133 67 66 165 84 81 581 362 219 Garjanhal78 40 38 510 266 244 515 297 218 Zhoolkunti86 46 40 171 79 92 482 273 209 Hagaldhal
Ainapur284 140 144 547 268 279 966 576 390 Jumlapur98 52 46 547 261 286 533 309 224 Idlapur
247 131 116 126 60 66 751 488 263 Nandapur204 100 104 5 1 4 472 265 207 Vithalapur
3,052 1,570 1,482 788 400 388 10,468 5,902 4,566 Tawargera596 292 304 124 58 66 948 567 381 Huliyapur38 19 19 319 166 153 525 331 194 Gudadhanamsagar
-------------Un-inhabited--------------
-------------Un-inhabited--------------
-------------Un-inhabited--------------
97

DISTRICT CENSUS HANDBOOK : KOPPAL
VILLAGE PRIMARYC D Block -
Persons Males Females Persons Males Females Persons Males Females1 2 20 21 22 23 24 25 26 27 28
Name of Village
Location code
numberIlliterates Total workers Main workers
601480 Upparbasapur601481 Kawalbodur 1,130 467 663 850 490 360 738 466 272 601482 Mankalkeri 102 38 64 69 36 33 67 35 32 601483 Hesrur 338 117 221 434 229 205 164 134 30 601484 Ryawanki 354 141 213 458 238 220 458 238 220 601485 Basapur(M) 137 48 89 156 73 83 147 69 78 601486 Gonhal(K) 151 58 93 241 127 114 234 125 109 601487 Teggihal 568 221 347 450 285 165 388 253 135 601488 Madapur 459 161 298 613 303 310 311 282 29 601489 Rampur(Jagir) 183 53 130 231 180 51 203 177 26 601490 Gudadur(M) 497 182 315 979 504 475 974 501 473 601491 Hosur(K) 230 82 148 286 144 142 190 103 87 601492 Tengunti 827 337 490 841 444 397 388 301 87 601493 Bijakal 1,245 525 720 1,160 724 436 938 633 305 601494 Vanageri 1,153 472 681 1,030 562 468 913 523 390 601495 Tekkalki 688 271 417 680 350 330 329 207 122 601496 Kushtagi(Rural) 12 5 7 15 7 8 15 7 8 601497 Nidsesi 1,041 431 610 1,229 725 504 640 446 194 601498 Gorvarbenchamatti 193 66 127 245 122 123 55 50 5 601499 Byalihal 374 134 240 405 181 224 214 178 36 601500 Madalgatti 234 90 144 252 142 110 237 140 97 601501 Shakapur 810 355 455 594 333 261 195 159 36 601502 Nerebenchi 562 239 323 517 325 192 302 252 50 601503 Kurbanhal 479 188 291 582 311 271 522 256 266 601504 Kandakur 1,768 752 1,016 1,871 1,210 661 1,186 852 334 601505 Gumgeri 891 361 530 834 537 297 450 375 75 601506 Ganganhal 491 186 305 550 273 277 33 18 15 601507 Hiremannapur 2,244 917 1,327 2,665 1,555 1,110 2,249 1,448 801 601508 Mayadhunsi - - - 2 1 1 2 1 1 601509 Hanchinhal 454 191 263 455 286 169 279 221 58 601510 Nawalhalli 698 271 427 702 484 218 597 390 207 601511 Rampur(M) 248 100 148 277 158 119 273 156 117 601512 Neerloti 467 191 276 244 225 19 218 204 14 601513 Nagarhal 311 132 179 302 146 156 115 59 56 601514 Sasvihal 380 158 222 568 283 285 226 202 24 601515 Muddalgundi 354 142 212 397 205 192 395 204 191 601516 Advibhavi 413 161 252 332 270 62 285 256 29 601517 Myadardokki 673 294 379 703 362 341 695 359 336 601518 Kidadur 365 139 226 422 255 167 353 216 137 601519 Kalmalli 1,808 721 1,087 1,984 998 986 1,310 755 555 601520 Kilarhatti 675 281 394 634 349 285 572 344 228 601521 Konapur601522 Umlirampur 170 62 108 134 114 20 133 114 19 601523 Narinhal 648 259 389 677 337 340 675 336 339 601524 Garjanhal 1,028 468 560 381 345 36 352 322 30 601525 Zhoolkunti 626 280 346 621 317 304 218 199 19 601526 Hagaldhal 309 108 201 302 230 72 214 187 27 601527 Ainapur601528 Jumlapur 1,042 422 620 713 525 188 655 484 171 601529 Idlapur 462 176 286 553 299 254 553 299 254 601530 Nandapur 666 233 433 773 392 381 342 300 42 601531 Vithalapur 391 159 232 497 247 250 95 75 20 601532 Tawargera 6,179 2,509 3,670 6,885 4,520 2,365 5,585 3,866 1,719 601533 Huliyapur 879 359 520 969 526 443 933 514 419 601534 Gudadhanamsagar 813 346 467 433 360 73 308 288 20
-------------Un-inhabited--------------
-------------Un-inhabited--------------
-------------Un-inhabited--------------
98

PRIMARY CENSUS ABSTRACT
CENSUS ABSTRACTKushtagi
Persons Males Females Persons Males Females Persons Males Females Persons Males Females29 30 31 32 33 34 35 36 37 38 39 40 2
CultivatorsName of Village
Household industry workersAgricultural labourers
Industrial category of main workers
Other workers
Upparbasapur390 341 49 247 46 201 3 3 - 98 76 22 Kawalbodur33 30 3 31 3 28 - - - 3 2 1 Mankalkeri
118 117 1 30 11 19 - - - 16 6 10 Hesrur260 148 112 189 85 104 - - - 9 5 4 Ryawanki142 66 76 - - - - - - 5 3 2 Basapur(M)229 123 106 2 1 1 - - - 3 1 2 Gonhal(K)317 207 110 14 11 3 29 12 17 28 23 5 Teggihal186 172 14 74 64 10 2 1 1 49 45 4 Madapur172 160 12 - - - 4 4 - 27 13 14 Rampur(Jagir)502 274 228 354 155 199 1 - 1 117 72 45 Gudadur(M)82 59 23 85 30 55 9 5 4 14 9 5 Hosur(K)
333 265 68 32 19 13 - - - 23 17 6 Tengunti546 452 94 248 100 148 38 22 16 106 59 47 Bijakal509 308 201 277 115 162 4 - 4 123 100 23 Vanageri83 79 4 17 3 14 10 6 4 219 119 100 Tekkalki7 6 1 6 - 6 - - - 2 1 1 Kushtagi(Rural)
239 198 41 191 93 98 20 9 11 190 146 44 Nidsesi36 36 - 4 3 1 7 5 2 8 6 2 Gorvarbenchamatti
146 142 4 36 13 23 1 1 - 31 22 9 Byalihal71 65 6 148 62 86 - - - 18 13 5 Madalgatti
148 136 12 17 6 11 14 5 9 16 12 4 Shakapur215 192 23 21 18 3 6 5 1 60 37 23 Nerebenchi224 160 64 198 10 188 4 2 2 96 84 12 Kurbanhal804 570 234 49 23 26 7 6 1 326 253 73 Kandakur228 218 10 82 37 45 64 54 10 76 66 10 Gumgeri
9 4 5 13 7 6 4 1 3 7 6 1 Ganganhal775 598 177 789 333 456 77 57 20 608 460 148 Hiremannapur
2 1 1 - - - - - - - - - Mayadhunsi68 57 11 139 104 35 22 21 1 50 39 11 Hanchinhal
433 308 125 109 42 67 - - - 55 40 15 Nawalhalli85 82 3 131 27 104 - - - 57 47 10 Rampur(M)
208 198 10 4 3 1 - - - 6 3 3 Neerloti87 47 40 18 8 10 2 2 - 8 2 6 Nagarhal
153 151 2 12 8 4 11 5 6 50 38 12 Sasvihal111 77 34 272 119 153 1 1 - 11 7 4 Muddalgundi273 246 27 7 5 2 - - - 5 5 - Advibhavi200 173 27 493 186 307 - - - 2 - 2 Myadardokki138 109 29 195 94 101 2 2 - 18 11 7 Kidadur805 513 292 393 165 228 12 10 2 100 67 33 Kalmalli271 184 87 165 64 101 2 2 - 134 94 40 Kilarhatti
Konapur75 69 6 39 28 11 - - - 19 17 2 Umlirampur98 88 10 542 220 322 - - - 35 28 7 Narinhal
257 241 16 16 11 5 6 4 2 73 66 7 Garjanhal161 154 7 48 37 11 1 1 - 8 7 1 Zhoolkunti111 108 3 71 54 17 1 1 - 31 24 7 Hagaldhal
Ainapur527 394 133 67 37 30 13 13 - 48 40 8 Jumlapur289 166 123 191 78 113 - - - 73 55 18 Idlapur217 211 6 68 46 22 3 3 - 54 40 14 Nandapur57 52 5 33 20 13 - - - 5 3 2 Vithalapur
1,218 885 333 1,140 548 592 431 300 131 2,796 2,133 663 Tawargera477 291 186 278 100 178 13 4 9 165 119 46 Huliyapur257 247 10 2 1 1 - - - 49 40 9 Gudadhanamsagar
-------------Un-inhabited--------------
-------------Un-inhabited--------------
-------------Un-inhabited--------------
99

DISTRICT CENSUS HANDBOOK : KOPPAL
VILLAGE PRIMARYC D Block -
Persons Males Females Persons Males Females Persons Males Females1 2 41 42 43 44 45 46 47 48 49
Name of VillageMarginal workers Cultivators Agricultural labourers
Industrial category Location
code number
601480 Upparbasapur601481 Kawalbodur 112 24 88 10 9 1 86 5 81 601482 Mankalkeri 2 1 1 1 - 1 - - - 601483 Hesrur 270 95 175 15 8 7 254 86 168 601484 Ryawanki - - - - - - - - - 601485 Basapur(M) 9 4 5 2 2 - - - - 601486 Gonhal(K) 7 2 5 1 - 1 - - - 601487 Teggihal 62 32 30 15 10 5 23 6 17 601488 Madapur 302 21 281 7 2 5 282 7 275 601489 Rampur(Jagir) 28 3 25 2 - 2 - - - 601490 Gudadur(M) 5 3 2 2 2 - 3 1 2 601491 Hosur(K) 96 41 55 6 2 4 76 30 46 601492 Tengunti 453 143 310 38 10 28 404 126 278 601493 Bijakal 222 91 131 70 34 36 68 19 49 601494 Vanageri 117 39 78 6 2 4 103 32 71 601495 Tekkalki 351 143 208 67 40 27 127 17 110 601496 Kushtagi(Rural) - - - - - - - - - 601497 Nidsesi 589 279 310 22 12 10 296 112 184 601498 Gorvarbenchamatti 190 72 118 3 - 3 181 66 115 601499 Byalihal 191 3 188 10 - 10 177 2 175 601500 Madalgatti 15 2 13 1 1 - 14 1 13 601501 Shakapur 399 174 225 20 12 8 145 51 94 601502 Nerebenchi 215 73 142 17 7 10 21 16 5 601503 Kurbanhal 60 55 5 2 1 1 4 1 3 601504 Kandakur 685 358 327 64 29 35 92 16 76 601505 Gumgeri 384 162 222 17 9 8 262 67 195 601506 Ganganhal 517 255 262 190 95 95 269 136 133 601507 Hiremannapur 416 107 309 49 12 37 299 48 251 601508 Mayadhunsi - - - - - - - - - 601509 Hanchinhal 176 65 111 11 3 8 89 35 54 601510 Nawalhalli 105 94 11 5 4 1 63 61 2 601511 Rampur(M) 4 2 2 - - - 3 1 2 601512 Neerloti 26 21 5 3 3 - 9 6 3 601513 Nagarhal 187 87 100 8 5 3 167 76 91 601514 Sasvihal 342 81 261 11 2 9 303 71 232 601515 Muddalgundi 2 1 1 - - - 2 1 1 601516 Advibhavi 47 14 33 7 5 2 40 9 31 601517 Myadardokki 8 3 5 - - - 5 1 4 601518 Kidadur 69 39 30 23 18 5 46 21 25 601519 Kalmalli 674 243 431 80 35 45 562 190 372 601520 Kilarhatti 62 5 57 4 - 4 53 3 50 601521 Konapur601522 Umlirampur 1 - 1 - - - - - - 601523 Narinhal 2 1 1 - - - 2 1 1 601524 Garjanhal 29 23 6 4 3 1 5 3 2 601525 Zhoolkunti 403 118 285 28 22 6 369 93 276 601526 Hagaldhal 88 43 45 4 3 1 66 26 40 601527 Ainapur601528 Jumlapur 58 41 17 3 2 1 34 25 9 601529 Idlapur - - - - - - - - - 601530 Nandapur 431 92 339 19 5 14 400 79 321 601531 Vithalapur 402 172 230 23 9 14 375 161 214 601532 Tawargera 1,300 654 646 85 51 34 485 210 275 601533 Huliyapur 36 12 24 1 1 - 24 3 21 601534 Gudadhanamsagar 125 72 53 1 1 - 103 53 50
-------------Un-inhabited--------------
-------------Un-inhabited--------------
-------------Un-inhabited--------------
100
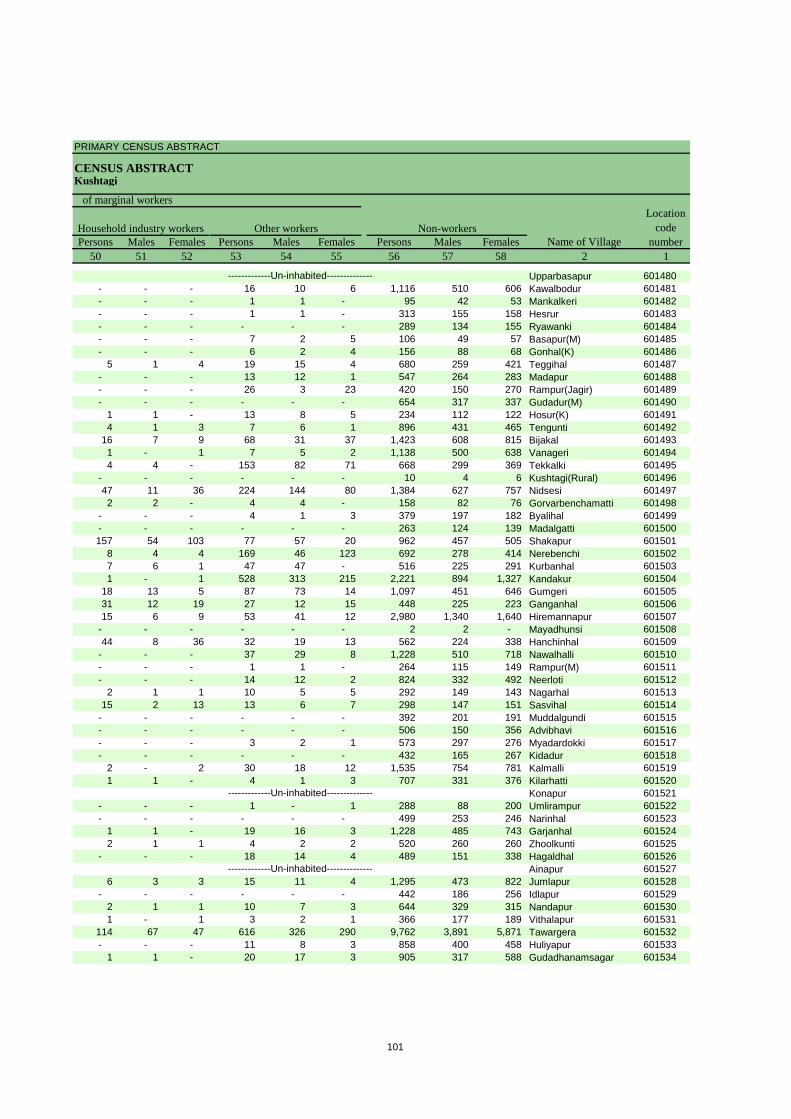
PRIMARY CENSUS ABSTRACT
CENSUS ABSTRACTKushtagi
Persons Males Females Persons Males Females Persons Males Females50 51 52 53 54 55 56 57 58 2 1
Location code
numberHousehold industry workers
Name of VillageOther workers Non-workers
of marginal workers
Upparbasapur 601480- - - 16 10 6 1,116 510 606 Kawalbodur 601481- - - 1 1 - 95 42 53 Mankalkeri 601482- - - 1 1 - 313 155 158 Hesrur 601483- - - - - - 289 134 155 Ryawanki 601484- - - 7 2 5 106 49 57 Basapur(M) 601485- - - 6 2 4 156 88 68 Gonhal(K) 601486
5 1 4 19 15 4 680 259 421 Teggihal 601487- - - 13 12 1 547 264 283 Madapur 601488- - - 26 3 23 420 150 270 Rampur(Jagir) 601489- - - - - - 654 317 337 Gudadur(M) 601490
1 1 - 13 8 5 234 112 122 Hosur(K) 6014914 1 3 7 6 1 896 431 465 Tengunti 601492
16 7 9 68 31 37 1,423 608 815 Bijakal 6014931 - 1 7 5 2 1,138 500 638 Vanageri 6014944 4 - 153 82 71 668 299 369 Tekkalki 601495
- - - - - - 10 4 6 Kushtagi(Rural) 60149647 11 36 224 144 80 1,384 627 757 Nidsesi 6014972 2 - 4 4 - 158 82 76 Gorvarbenchamatti 601498
- - - 4 1 3 379 197 182 Byalihal 601499- - - - - - 263 124 139 Madalgatti 601500157 54 103 77 57 20 962 457 505 Shakapur 601501
8 4 4 169 46 123 692 278 414 Nerebenchi 6015027 6 1 47 47 - 516 225 291 Kurbanhal 6015031 - 1 528 313 215 2,221 894 1,327 Kandakur 601504
18 13 5 87 73 14 1,097 451 646 Gumgeri 60150531 12 19 27 12 15 448 225 223 Ganganhal 60150615 6 9 53 41 12 2,980 1,340 1,640 Hiremannapur 601507
- - - - - - 2 2 - Mayadhunsi 60150844 8 36 32 19 13 562 224 338 Hanchinhal 601509
- - - 37 29 8 1,228 510 718 Nawalhalli 601510- - - 1 1 - 264 115 149 Rampur(M) 601511- - - 14 12 2 824 332 492 Neerloti 601512
2 1 1 10 5 5 292 149 143 Nagarhal 60151315 2 13 13 6 7 298 147 151 Sasvihal 601514
- - - - - - 392 201 191 Muddalgundi 601515- - - - - - 506 150 356 Advibhavi 601516- - - 3 2 1 573 297 276 Myadardokki 601517- - - - - - 432 165 267 Kidadur 601518
2 - 2 30 18 12 1,535 754 781 Kalmalli 6015191 1 - 4 1 3 707 331 376 Kilarhatti 601520
Konapur 601521- - - 1 - 1 288 88 200 Umlirampur 601522- - - - - - 499 253 246 Narinhal 601523
1 1 - 19 16 3 1,228 485 743 Garjanhal 6015242 1 1 4 2 2 520 260 260 Zhoolkunti 601525
- - - 18 14 4 489 151 338 Hagaldhal 601526Ainapur 601527
6 3 3 15 11 4 1,295 473 822 Jumlapur 601528- - - - - - 442 186 256 Idlapur 601529
2 1 1 10 7 3 644 329 315 Nandapur 6015301 - 1 3 2 1 366 177 189 Vithalapur 601531
114 67 47 616 326 290 9,762 3,891 5,871 Tawargera 601532- - - 11 8 3 858 400 458 Huliyapur 601533
1 1 - 20 17 3 905 317 588 Gudadhanamsagar 601534
-------------Un-inhabited--------------
-------------Un-inhabited--------------
-------------Un-inhabited--------------
101

DISTRICT CENSUS HANDBOOK : KOPPAL
VILLAGE PRIMARY
Persons Males Females Persons Males Females1 2 3 4 5 6 7 8 9 10
Name of Village
Location code
number
Total population (including institutional and houseless
population)Area of
Village in hectares
Number of households
C D Block -
Population in the age-group 0-6
601535 Bachinhal 374.23 186 934 471 463 154 83 71 601536 Chickmukrtinhal 352.40 53 335 158 177 62 25 37 601537 Manedhal 1,789.60 411 2,230 1,114 1,116 333 161 172 601538 Mettinhal 546.56 90 519 256 263 94 52 42 601539 Kanhal 956.15 84 492 249 243 90 53 37 601540 Pura 1,038.79 209 1,295 640 655 249 124 125 601541 Sanganhal 508.66 307 1,764 882 882 298 161 137 601542 Ganganhal 346.93 94 621 304 317 128 67 61 601543 Hiretemminhal 730.92 196 1,231 617 614 218 105 113 601544 Hadagli 293.07 47 328 173 155 55 26 29 601545 Virupapur 409.62 173 995 541 454 155 83 72 601546 Siddapur 616.71 106 618 313 305 107 58 49 601547 Hiremukartihal 525.45 177 908 465 443 184 102 82 601548 Lingadhalli 1,324.61 242 1,411 719 692 238 124 114 601549 Homminhal 758.94 156 886 428 458 136 69 67 601550 Hongaddi 276.30 129 641 308 333 100 49 51
102

PRIMARY CENSUS ABSTRACT
CENSUS ABSTRACTKushtagi
Persons Males Females Persons Males Females Persons Males Females11 12 13 14 15 16 17 18 19 2
Name of VillageLiteratesScheduled Castes population Scheduled Tribes population
239 120 119 165 88 77 461 278 183 Bachinhal- - - - - - 193 103 90 Chickmukrtinhal315 160 155 734 364 370 1,327 750 577 Manedhal25 9 16 327 166 161 223 123 100 Mettinhal
115 63 52 355 177 178 245 137 108 Kanhal306 153 153 41 21 20 689 398 291 Pura296 144 152 325 155 170 1,009 569 440 Sanganhal
1 1 - 113 60 53 306 169 137 Ganganhal105 49 56 411 206 205 525 331 194 Hiretemminhal44 23 21 284 150 134 168 104 64 Hadagli
184 98 86 543 295 248 433 280 153 Virupapur196 97 99 164 82 82 323 188 135 Siddapur132 64 68 504 256 248 591 330 261 Hiremukartihal299 143 156 306 157 149 698 415 283 Lingadhalli
2 2 - 157 74 83 456 259 197 Homminhal73 39 34 - - - 398 227 171 Hongaddi
103

DISTRICT CENSUS HANDBOOK : KOPPAL
VILLAGE PRIMARYC D Block -
Persons Males Females Persons Males Females Persons Males Females1 2 20 21 22 23 24 25 26 27 28
Name of Village
Location code
numberIlliterates Total workers Main workers
601535 Bachinhal 473 193 280 335 280 55 304 274 30 601536 Chickmukrtinhal 142 55 87 214 104 110 213 103 110 601537 Manedhal 903 364 539 1,180 649 531 878 527 351 601538 Mettinhal 296 133 163 202 108 94 193 101 92 601539 Kanhal 247 112 135 252 137 115 155 108 47 601540 Pura 606 242 364 653 356 297 436 294 142 601541 Sanganhal 755 313 442 963 496 467 621 433 188 601542 Ganganhal 315 135 180 304 154 150 268 146 122 601543 Hiretemminhal 706 286 420 720 363 357 263 237 26 601544 Hadagli 160 69 91 176 95 81 106 90 16 601545 Virupapur 562 261 301 514 303 211 501 302 199 601546 Siddapur 295 125 170 332 171 161 332 171 161 601547 Hiremukartihal 317 135 182 436 224 212 419 220 199 601548 Lingadhalli 713 304 409 808 400 408 645 378 267 601549 Homminhal 430 169 261 518 252 266 346 246 100 601550 Hongaddi 243 81 162 364 173 191 364 173 191
104

PRIMARY CENSUS ABSTRACT
CENSUS ABSTRACTKushtagi
Persons Males Females Persons Males Females Persons Males Females Persons Males Females29 30 31 32 33 34 35 36 37 38 39 40 2
CultivatorsName of Village
Household industry workersAgricultural labourers
Industrial category of main workers
Other workers
252 239 13 12 4 8 - - - 40 31 9 Bachinhal39 35 4 161 59 102 1 1 - 12 8 4 Chickmukrtinhal
313 271 42 473 189 284 20 14 6 72 53 19 Manedhal175 93 82 1 1 - - - - 17 7 10 Mettinhal41 38 3 95 61 34 13 6 7 6 3 3 Kanhal
198 185 13 177 63 114 1 - 1 60 46 14 Pura338 269 69 161 79 82 25 21 4 97 64 33 Sanganhal133 112 21 131 33 98 - - - 4 1 3 Ganganhal215 202 13 29 19 10 1 1 - 18 15 3 Hiretemminhal88 83 5 15 4 11 - - - 3 3 - Hadagli
210 139 71 236 121 115 2 2 - 53 40 13 Virupapur205 125 80 124 44 80 - - - 3 2 1 Siddapur105 66 39 303 148 155 2 2 - 9 4 5 Hiremukartihal328 293 35 262 48 214 3 3 - 52 34 18 Lingadhalli245 174 71 75 56 19 1 1 - 25 15 10 Homminhal119 106 13 236 64 172 - - - 9 3 6 Hongaddi
105

DISTRICT CENSUS HANDBOOK : KOPPAL
VILLAGE PRIMARYC D Block -
Persons Males Females Persons Males Females Persons Males Females1 2 41 42 43 44 45 46 47 48 49
Name of VillageMarginal workers Cultivators Agricultural labourers
Industrial category Location
code number
601535 Bachinhal 31 6 25 10 2 8 18 4 14 601536 Chickmukrtinhal 1 1 - - - - - - - 601537 Manedhal 302 122 180 18 9 9 203 65 138 601538 Mettinhal 9 7 2 - - - 2 2 - 601539 Kanhal 97 29 68 6 3 3 58 17 41 601540 Pura 217 62 155 3 1 2 73 19 54 601541 Sanganhal 342 63 279 19 6 13 61 32 29 601542 Ganganhal 36 8 28 1 - 1 17 4 13 601543 Hiretemminhal 457 126 331 30 10 20 410 105 305 601544 Hadagli 70 5 65 7 3 4 52 - 52 601545 Virupapur 13 1 12 5 - 5 6 - 6 601546 Siddapur - - - - - - - - - 601547 Hiremukartihal 17 4 13 3 1 2 14 3 11 601548 Lingadhalli 163 22 141 13 2 11 121 4 117 601549 Homminhal 172 6 166 18 3 15 152 2 150 601550 Hongaddi - - - - - - - - -
106
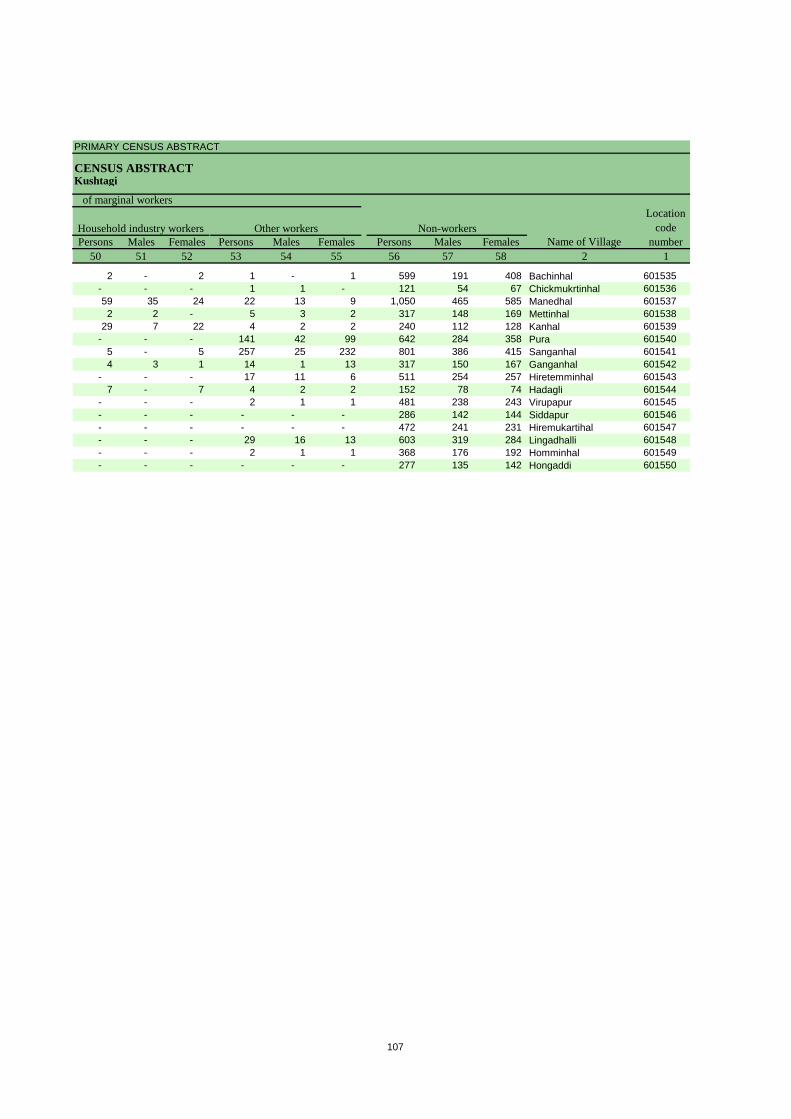
PRIMARY CENSUS ABSTRACT
CENSUS ABSTRACTKushtagi
Persons Males Females Persons Males Females Persons Males Females50 51 52 53 54 55 56 57 58 2 1
Location code
numberHousehold industry workers
Name of VillageOther workers Non-workers
of marginal workers
2 - 2 1 - 1 599 191 408 Bachinhal 601535- - - 1 1 - 121 54 67 Chickmukrtinhal 60153659 35 24 22 13 9 1,050 465 585 Manedhal 6015372 2 - 5 3 2 317 148 169 Mettinhal 601538
29 7 22 4 2 2 240 112 128 Kanhal 601539- - - 141 42 99 642 284 358 Pura 601540
5 - 5 257 25 232 801 386 415 Sanganhal 6015414 3 1 14 1 13 317 150 167 Ganganhal 601542
- - - 17 11 6 511 254 257 Hiretemminhal 6015437 - 7 4 2 2 152 78 74 Hadagli 601544
- - - 2 1 1 481 238 243 Virupapur 601545- - - - - - 286 142 144 Siddapur 601546- - - - - - 472 241 231 Hiremukartihal 601547- - - 29 16 13 603 319 284 Lingadhalli 601548- - - 2 1 1 368 176 192 Homminhal 601549- - - - - - 277 135 142 Hongaddi 601550
107

DISTRICT CENSUS HANDBOOK : KOPPAL
VILLAGE PRIMARY
Persons Males Females Persons Males Females1 2 3 4 5 6 7 8 9 10
0034 Gangawati (Total) 1,31,841.09 68,480 3,54,376 1,76,938 1,77,438 50,729 25,902 24,827 0034 Gangawati (Rural) 1,31,841.09 66,620 3,45,263 1,72,397 1,72,866 49,559 25,313 24,246 0034 Gangawati (Urban) 0.00 1,860 9,113 4,541 4,572 1,170 589 581
RURAL601551 Layadhunsi 939.16 251 1,416 706 710 214 103 111 601552 Hulihyder 1,516.77 770 4,475 2,301 2,174 703 363 340 601553 Hosgudda 362.85 89 674 360 314 145 85 60 601554 Godinal 1,180.21 184 1,137 566 571 211 114 97 601555 Guddadur 646.56 174 1,299 624 675 262 117 145 601556 Sirwar 870.72 185 1,322 654 668 249 138 111 601557 Hanmanhal 712.72 174 1,040 545 495 180 95 85 601558 Kanakapura 322.94 171 1,063 521 542 208 102 106 601559 Varankhed 582.68 48 329 162 167 69 38 31 601560 Bailakampur 621.84 134 862 440 422 144 78 66 601561 Gouripur 468.77 330 2,221 1,118 1,103 464 234 230 601562 Devlapur 657.50 150 1,004 487 517 196 87 109 601563 Chikka Wadderkal 670.81 28 164 87 77 32 18 14 601564 Basrihal 1,202.77 266 1,667 831 836 318 156 162 601565 Somsagara 860.59 240 1,340 660 680 225 109 116 601566 Advibhavi 873.42 332 2,285 1,151 1,134 441 220 221 601567 Hulsanhatti 427.33 186 1,123 552 571 172 79 93 601568 Ingaldal 318.54 141 851 421 430 169 81 88 601569 Parapur 317.84 96 564 286 278 97 48 49 601570 Kannermadu 1,020.27 176 1,069 522 547 176 86 90 601571 Muslapur 474.56 437 2,371 1,219 1,152 377 178 199 601572 Guddalakampur 449.08601573 Bommasagara 590.60 132 1,091 547 544 222 113 109 601574 Ramdurg 1,209.87 136 851 424 427 170 81 89 601575 Obalbanda 351.65 202 1,200 649 551 195 110 85 601576 Rampur 330.34 86 580 302 278 94 46 48 601577 Jalihuda 397.05 97 717 384 333 138 75 63 601578 Chikka Madinal 967.25 500 2,969 1,485 1,484 461 234 227 601579 Naglapur 671.81 81 535 278 257 108 63 45 601580 Kanakgiri 3,995.31 3,043 16,938 8,569 8,369 2,228 1,089 1,139 601581 Neerloti 574.31 93 601 315 286 100 53 47 601582 Chikka Khed 136.68 105 622 312 310 110 47 63 601583 Hire Khed 557.85 265 1,540 756 784 297 153 144 601584 Malligwad 449.07 131 791 408 383 115 65 50 601585 Bomchihal 247.83601586 Gorvihanchinal 271.32601587 Katapur (Khalsa) 537.00 142 797 428 369 128 69 59 601588 Kalkera 1,656.22 313 1,960 983 977 300 158 142 601589 Benkanhal 520.07 176 939 458 481 147 78 69 601590 Sulekal 1,395.76 451 2,454 1,229 1,225 398 196 202 601591 Tippanhal 444.05 206 1,173 596 577 208 122 86 601592 Bankapur 922.02 152 1,216 608 608 237 110 127 601593 Kardigudda 278.57 8 94 54 40 17 10 7 601594 Hire Madinal 760.43 144 935 447 488 197 91 106 601595 Hampasadurg 1,186.77 171 911 464 447 157 76 81 601596 Agoli 1,991.23 515 3,020 1,524 1,496 458 228 230 601597 Vithlapur 846.56 263 1,526 749 777 282 131 151 601598 Mallapura 671.45601599 Malkanmardi 904.40 321 1,754 843 911 250 126 124 601600 Arlahalli 555.27 152 707 353 354 95 46 49 601601 Battarnarsapur 712.48 168 951 465 486 144 69 75
Name of Village
Location code
number
Total population (including institutional and houseless
population)Area of
Village in hectares
Number of households
C D Block -
Population in the age-group 0-6
-------------Un-inhabited--------------
-------------Un-inhabited---------------------------Un-inhabited--------------
-------------Un-inhabited--------------
108

PRIMARY CENSUS ABSTRACT
CENSUS ABSTRACTGangawati
Persons Males Females Persons Males Females Persons Males Females11 12 13 14 15 16 17 18 19 2
72,799 36,037 36,762 58,434 29,091 29,343 1,96,902 1,12,404 84,498 Gangawati (Total)71,439 35,381 36,058 57,288 28,543 28,745 1,91,173 1,09,179 81,994 Gangawati (Rural)1,360 656 704 1,146 548 598 5,729 3,225 2,504 Gangawati (Urban)
RURAL127 68 59 818 410 408 643 389 254 Layadhunsi716 347 369 815 424 391 2,458 1,429 1,029 Hulihyder79 50 29 292 154 138 276 171 105 Hosgudda92 48 44 330 169 161 535 306 229 Godinal11 - 11 241 120 121 649 360 289 Guddadur
196 100 96 40 20 20 588 340 248 Sirwar90 43 47 193 100 93 502 306 196 Hanmanhal95 53 42 - - - 460 272 188 Kanakapura
- - - 299 149 150 147 93 54 Varankhed101 50 51 395 200 195 387 227 160 Bailakampur306 148 158 447 237 210 1,109 647 462 Gouripur48 22 26 92 44 48 522 296 226 Devlapur24 13 11 18 9 9 81 51 30 Chikka Wadderkal
120 59 61 1,389 692 697 775 483 292 Basrihal52 25 27 641 316 325 764 442 322 Somsagara
1,893 949 944 260 127 133 1,011 579 432 Advibhavi212 106 106 478 236 242 645 365 280 Hulsanhatti632 307 325 4 2 2 377 229 148 Ingaldal105 55 50 313 158 155 326 201 125 Parapur209 109 100 168 87 81 579 329 250 Kannermadu661 358 303 181 105 76 1,368 844 524 Muslapur
Guddalakampur940 465 475 11 4 7 409 238 171 Bommasagara13 5 8 198 101 97 359 217 142 Ramdurg
110 59 51 80 45 35 693 426 267 Obalbanda109 55 54 156 81 75 330 205 125 Rampur32 14 18 88 44 44 438 263 175 Jalihuda
248 120 128 859 421 438 1,421 840 581 Chikka Madinal 9 4 5 123 66 57 319 179 140 Naglapur
3,151 1,615 1,536 747 378 369 10,675 5,993 4,682 Kanakgiri38 18 20 64 34 30 347 222 125 Neerloti25 11 14 167 88 79 258 163 95 Chikka Khed
161 77 84 934 450 484 622 389 233 Hire Khed14 8 6 514 265 249 467 278 189 Malligwad
BomchihalGorvihanchinal
119 57 62 529 295 234 483 304 179 Katapur (Khalsa)370 177 193 117 61 56 1,071 633 438 Kalkera24 11 13 46 27 19 651 359 292 Benkanhal
343 156 187 174 93 81 1,080 655 425 Sulekal253 122 131 103 49 54 621 357 264 Tippanhal- - - 49 24 25 612 357 255 Bankapur- - - - - - 54 36 18 Kardigudda145 68 77 522 258 264 369 224 145 Hire Madinal 75 36 39 207 108 99 521 318 203 Hampasadurg
352 167 185 821 434 387 1,597 937 660 Agoli249 123 126 368 178 190 704 409 295 Vithlapur
Mallapura245 122 123 303 148 155 802 455 347 Malkanmardi377 183 194 25 13 12 489 284 205 Arlahalli64 32 32 88 45 43 484 276 208 Battarnarsapur
Name of VillageLiteratesScheduled Castes population Scheduled Tribes population
-------------Un-inhabited--------------
-------------Un-inhabited---------------------------Un-inhabited--------------
-------------Un-inhabited--------------
109

DISTRICT CENSUS HANDBOOK : KOPPAL
VILLAGE PRIMARYC D Block -
Persons Males Females Persons Males Females Persons Males Females1 2 20 21 22 23 24 25 26 27 28
0034 Gangawati (Total) 1,57,474 64,534 92,940 1,70,400 99,157 71,243 1,32,673 84,218 48,455 0034 Gangawati (Rural) 1,54,090 63,218 90,872 1,66,697 96,544 70,153 1,30,338 82,396 47,942 0034 Gangawati (Urban) 3,384 1,316 2,068 3,703 2,613 1,090 2,335 1,822 513
RURAL601551 Layadhunsi 773 317 456 793 402 391 301 280 21 601552 Hulihyder 2,017 872 1,145 2,112 1,242 870 1,061 749 312 601553 Hosgudda 398 189 209 364 196 168 225 134 91 601554 Godinal 602 260 342 688 330 358 544 255 289 601555 Guddadur 650 264 386 604 352 252 485 294 191 601556 Sirwar 734 314 420 730 355 375 717 354 363 601557 Hanmanhal 538 239 299 575 297 278 224 196 28 601558 Kanakapura 603 249 354 575 297 278 224 201 23 601559 Varankhed 182 69 113 167 90 77 81 76 5 601560 Bailakampur 475 213 262 470 245 225 321 203 118 601561 Gouripur 1,112 471 641 1,173 654 519 884 544 340 601562 Devlapur 482 191 291 491 270 221 195 175 20 601563 Chikka Wadderkal 83 36 47 96 49 47 35 30 5 601564 Basrihal 892 348 544 923 466 457 339 285 54 601565 Somsagara 576 218 358 779 390 389 489 317 172 601566 Advibhavi 1,274 572 702 1,276 634 642 1,121 578 543 601567 Hulsanhatti 478 187 291 561 292 269 264 231 33 601568 Ingaldal 474 192 282 498 260 238 200 167 33 601569 Parapur 238 85 153 334 169 165 103 99 4 601570 Kannermadu 490 193 297 442 295 147 357 272 85 601571 Muslapur 1,003 375 628 1,198 661 537 1,155 638 517 601572 Guddalakampur601573 Bommasagara 682 309 373 552 288 264 458 259 199 601574 Ramdurg 492 207 285 501 262 239 248 213 35 601575 Obalbanda 507 223 284 675 347 328 667 346 321 601576 Rampur 250 97 153 306 165 141 122 104 18 601577 Jalihuda 279 121 158 414 220 194 305 180 125 601578 Chikka Madinal 1,548 645 903 1,475 792 683 1,364 751 613 601579 Naglapur 216 99 117 285 145 140 280 145 135 601580 Kanakgiri 6,263 2,576 3,687 7,572 4,850 2,722 6,764 4,528 2,236 601581 Neerloti 254 93 161 319 163 156 299 151 148 601582 Chikka Khed 364 149 215 345 182 163 319 168 151 601583 Hire Khed 918 367 551 771 422 349 725 403 322 601584 Malligwad 324 130 194 472 245 227 134 114 20 601585 Bomchihal601586 Gorvihanchinal601587 Katapur (Khalsa) 314 124 190 445 232 213 176 165 11 601588 Kalkera 889 350 539 1,079 523 556 761 392 369 601589 Benkanhal 288 99 189 481 230 251 285 223 62 601590 Sulekal 1,374 574 800 1,311 698 613 1,194 683 511 601591 Tippanhal 552 239 313 584 303 281 497 289 208 601592 Bankapur 604 251 353 590 322 268 324 303 21 601593 Kardigudda 40 18 22 46 28 18 27 25 2 601594 Hire Madinal 566 223 343 430 207 223 21 17 4 601595 Hampasadurg 390 146 244 472 248 224 406 232 174 601596 Agoli 1,423 587 836 1,303 839 464 1,221 818 403 601597 Vithlapur 822 340 482 755 388 367 397 268 129 601598 Mallapura601599 Malkanmardi 952 388 564 950 482 468 832 465 367 601600 Arlahalli 218 69 149 375 191 184 352 177 175 601601 Battarnarsapur 467 189 278 507 249 258 197 126 71
Name of Village
Location code
numberIlliterates Total workers Main workers
-------------Un-inhabited--------------
-------------Un-inhabited---------------------------Un-inhabited--------------
-------------Un-inhabited--------------
110

PRIMARY CENSUS ABSTRACT
CENSUS ABSTRACTGangawati
Persons Males Females Persons Males Females Persons Males Females Persons Males Females29 30 31 32 33 34 35 36 37 38 39 40 2
40,312 31,051 9,261 58,950 28,219 30,731 2,344 1,475 869 31,067 23,473 7,594 Gangawati (Total)40,137 30,886 9,251 58,509 27,971 30,538 2,302 1,444 858 29,390 22,095 7,295 Gangawati (Rural)
175 165 10 441 248 193 42 31 11 1,677 1,378 299 Gangawati (Urban)RURAL
260 248 12 20 17 3 3 2 1 18 13 5 Layadhunsi615 478 137 146 53 93 5 3 2 295 215 80 Hulihyder200 114 86 7 5 2 - - - 18 15 3 Hosgudda454 230 224 72 17 55 4 3 1 14 5 9 Godinal239 190 49 150 42 108 10 10 - 86 52 34 Guddadur473 235 238 185 75 110 3 2 1 56 42 14 Sirwar190 176 14 22 14 8 3 2 1 9 4 5 Hanmanhal179 173 6 18 8 10 2 2 - 25 18 7 Kanakapura74 74 - 3 2 1 - - - 4 - 4 Varankhed
214 168 46 86 20 66 - - - 21 15 6 Bailakampur603 387 216 162 74 88 25 16 9 94 67 27 Gouripur145 143 2 24 12 12 2 2 - 24 18 6 Devlapur33 29 4 - - - - - - 2 1 1 Chikka Wadderkal
256 234 22 40 19 21 6 5 1 37 27 10 Basrihal196 187 9 253 102 151 12 9 3 28 19 9 Somsagara
1,065 555 510 15 8 7 - - - 41 15 26 Advibhavi169 157 12 35 29 6 2 2 - 58 43 15 Hulsanhatti108 104 4 47 32 15 9 7 2 36 24 12 Ingaldal75 74 1 26 23 3 - - - 2 2 - Parapur
223 207 16 111 45 66 1 1 - 22 19 3 Kannermadu399 218 181 470 216 254 33 28 5 253 176 77 Muslapur
Guddalakampur244 177 67 110 28 82 1 1 - 103 53 50 Bommasagara168 156 12 21 14 7 1 1 - 58 42 16 Ramdurg288 267 21 332 43 289 2 2 - 45 34 11 Obalbanda87 81 6 15 8 7 - - - 20 15 5 Rampur81 74 7 185 74 111 - - - 39 32 7 Jalihuda
907 565 342 376 131 245 4 3 1 77 52 25 Chikka Madinal 62 55 7 210 82 128 2 2 - 6 6 - Naglapur
1,416 1,086 330 1,993 919 1,074 395 167 228 2,960 2,356 604 Kanakgiri189 133 56 66 12 54 2 - 2 42 6 36 Neerloti
5 3 2 307 161 146 5 3 2 2 1 1 Chikka Khed193 165 28 443 177 266 15 12 3 74 49 25 Hire Khed89 86 3 35 21 14 6 5 1 4 2 2 Malligwad
BomchihalGorvihanchinal
14 12 2 152 146 6 6 4 2 4 3 1 Katapur (Khalsa)262 155 107 444 200 244 7 4 3 48 33 15 Kalkera191 176 15 79 36 43 1 1 - 14 10 4 Benkanhal176 138 38 845 410 435 13 9 4 160 126 34 Sulekal179 117 62 200 76 124 2 1 1 116 95 21 Tippanhal238 226 12 - - - - - - 86 77 9 Bankapur16 15 1 - - - - - - 11 10 1 Kardigudda7 7 - 6 4 2 2 2 - 6 4 2 Hire Madinal
137 129 8 190 55 135 5 5 - 74 43 31 Hampasadurg661 502 159 460 243 217 21 11 10 79 62 17 Agoli209 192 17 150 50 100 9 3 6 29 23 6 Vithlapur
Mallapura115 102 13 589 276 313 9 6 3 119 81 38 Malkanmardi31 24 7 293 134 159 1 - 1 27 19 8 Arlahalli46 42 4 134 78 56 3 1 2 14 5 9 Battarnarsapur
CultivatorsName of Village
Household industry workersAgricultural labourers
Industrial category of main workers
Other workers
-------------Un-inhabited--------------
-------------Un-inhabited---------------------------Un-inhabited--------------
-------------Un-inhabited--------------
111

DISTRICT CENSUS HANDBOOK : KOPPAL
VILLAGE PRIMARYC D Block -
Persons Males Females Persons Males Females Persons Males Females1 2 41 42 43 44 45 46 47 48 49
0034 Gangawati (Total) 37,727 14,939 22,788 2,777 1,190 1,587 27,604 9,664 17,940 0034 Gangawati (Rural) 36,359 14,148 22,211 2,766 1,184 1,582 26,671 9,186 17,485 0034 Gangawati (Urban) 1,368 791 577 11 6 5 933 478 455
RURAL601551 Layadhunsi 492 122 370 16 6 10 452 103 349 601552 Hulihyder 1,051 493 558 76 50 26 729 287 442 601553 Hosgudda 139 62 77 2 1 1 137 61 76 601554 Godinal 144 75 69 14 6 8 81 35 46 601555 Guddadur 119 58 61 10 8 2 13 4 9 601556 Sirwar 13 1 12 5 - 5 4 - 4 601557 Hanmanhal 351 101 250 16 4 12 314 84 230 601558 Kanakapura 351 96 255 11 6 5 305 64 241 601559 Varankhed 86 14 72 3 3 - 79 7 72 601560 Bailakampur 149 42 107 10 5 5 133 35 98 601561 Gouripur 289 110 179 9 5 4 256 92 164 601562 Devlapur 296 95 201 16 3 13 277 91 186 601563 Chikka Wadderkal 61 19 42 3 1 2 58 18 40 601564 Basrihal 584 181 403 25 10 15 522 145 377 601565 Somsagara 290 73 217 34 26 8 241 38 203 601566 Advibhavi 155 56 99 11 2 9 10 3 7 601567 Hulsanhatti 297 61 236 49 15 34 199 27 172 601568 Ingaldal 298 93 205 14 10 4 227 58 169 601569 Parapur 231 70 161 13 10 3 218 60 158 601570 Kannermadu 85 23 62 6 2 4 77 20 57 601571 Muslapur 43 23 20 5 3 2 26 10 16 601572 Guddalakampur601573 Bommasagara 94 29 65 54 12 42 34 13 21 601574 Ramdurg 253 49 204 70 4 66 161 29 132 601575 Obalbanda 8 1 7 - - - 7 - 7 601576 Rampur 184 61 123 8 2 6 169 52 117 601577 Jalihuda 109 40 69 11 8 3 95 30 65 601578 Chikka Madinal 111 41 70 7 3 4 86 26 60 601579 Naglapur 5 - 5 2 - 2 3 - 3 601580 Kanakgiri 808 322 486 60 39 21 447 141 306 601581 Neerloti 20 12 8 5 5 - 3 1 2 601582 Chikka Khed 26 14 12 1 1 - 3 1 2 601583 Hire Khed 46 19 27 2 1 1 36 14 22 601584 Malligwad 338 131 207 15 9 6 308 113 195 601585 Bomchihal601586 Gorvihanchinal601587 Katapur (Khalsa) 269 67 202 28 3 25 189 45 144 601588 Kalkera 318 131 187 9 2 7 278 105 173 601589 Benkanhal 196 7 189 14 1 13 179 5 174 601590 Sulekal 117 15 102 16 - 16 84 7 77 601591 Tippanhal 87 14 73 5 2 3 71 10 61 601592 Bankapur 266 19 247 248 17 231 2 1 1 601593 Kardigudda 19 3 16 19 3 16 - - - 601594 Hire Madinal 409 190 219 151 76 75 246 109 137 601595 Hampasadurg 66 16 50 1 1 - 44 9 35 601596 Agoli 82 21 61 8 3 5 70 14 56 601597 Vithlapur 358 120 238 57 13 44 285 98 187 601598 Mallapura601599 Malkanmardi 118 17 101 1 - 1 90 13 77 601600 Arlahalli 23 14 9 1 1 - 14 6 8 601601 Battarnarsapur 310 123 187 14 2 12 273 114 159
Name of VillageMarginal workers Cultivators Agricultural labourers
Industrial category Location
code number
-------------Un-inhabited--------------
-------------Un-inhabited---------------------------Un-inhabited--------------
-------------Un-inhabited--------------
112

PRIMARY CENSUS ABSTRACT
CENSUS ABSTRACTGangawati
Persons Males Females Persons Males Females Persons Males Females50 51 52 53 54 55 56 57 58 2 1
1,029 419 610 6,317 3,666 2,651 1,83,976 77,781 1,06,195 Gangawati (Total) 0034999 396 603 5,923 3,382 2,541 1,78,566 75,853 1,02,713 Gangawati (Rural) 003430 23 7 394 284 110 5,410 1,928 3,482 Gangawati (Urban) 0034
RURAL7 3 4 17 10 7 623 304 319 Layadhunsi 601551
22 13 9 224 143 81 2,363 1,059 1,304 Hulihyder 601552- - - - - - 310 164 146 Hosgudda 60155325 20 5 24 14 10 449 236 213 Godinal 6015541 - 1 95 46 49 695 272 423 Guddadur 601555
- - - 4 1 3 592 299 293 Sirwar 6015567 4 3 14 9 5 465 248 217 Hanmanhal 601557
- - - 35 26 9 488 224 264 Kanakapura 601558- - - 4 4 - 162 72 90 Varankhed 601559
1 1 - 5 1 4 392 195 197 Bailakampur 6015606 2 4 18 11 7 1,048 464 584 Gouripur 601561
- - - 3 1 2 513 217 296 Devlapur 601562- - - - - - 68 38 30 Chikka Wadderkal 601563
6 3 3 31 23 8 744 365 379 Basrihal 601564- - - 15 9 6 561 270 291 Somsagara 601565
2 1 1 132 50 82 1,009 517 492 Advibhavi 6015661 - 1 48 19 29 562 260 302 Hulsanhatti 6015672 2 - 55 23 32 353 161 192 Ingaldal 601568
- - - - - - 230 117 113 Parapur 601569- - - 2 1 1 627 227 400 Kannermadu 601570- - - 12 10 2 1,173 558 615 Muslapur 601571
Guddalakampur 6015721 - 1 5 4 1 539 259 280 Bommasagara 601573
- - - 22 16 6 350 162 188 Ramdurg 601574- - - 1 1 - 525 302 223 Obalbanda 601575
1 1 - 6 6 - 274 137 137 Rampur 6015763 2 1 - - - 303 164 139 Jalihuda 6015771 1 - 17 11 6 1,494 693 801 Chikka Madinal 601578
- - - - - - 250 133 117 Naglapur 60157952 18 34 249 124 125 9,366 3,719 5,647 Kanakgiri 6015801 - 1 11 6 5 282 152 130 Neerloti 6015813 2 1 19 10 9 277 130 147 Chikka Khed 6015821 1 - 7 3 4 769 334 435 Hire Khed 601583
10 5 5 5 4 1 319 163 156 Malligwad 601584Bomchihal 601585Gorvihanchinal 601586
51 18 33 1 1 - 352 196 156 Katapur (Khalsa) 6015872 2 - 29 22 7 881 460 421 Kalkera 6015881 - 1 2 1 1 458 228 230 Benkanhal 6015895 2 3 12 6 6 1,143 531 612 Sulekal 601590
- - - 11 2 9 589 293 296 Tippanhal 601591- - - 16 1 15 626 286 340 Bankapur 601592- - - - - - 48 26 22 Kardigudda 601593
4 2 2 8 3 5 505 240 265 Hire Madinal 6015945 1 4 16 5 11 439 216 223 Hampasadurg 6015951 1 - 3 3 - 1,717 685 1,032 Agoli 6015964 2 2 12 7 5 771 361 410 Vithlapur 601597
Mallapura 6015981 - 1 26 4 22 804 361 443 Malkanmardi 6015991 1 - 7 6 1 332 162 170 Arlahalli 6016003 2 1 20 5 15 444 216 228 Battarnarsapur 601601
Location code
numberHousehold industry workers
Name of VillageOther workers Non-workers
of marginal workers
-------------Un-inhabited--------------
-------------Un-inhabited---------------------------Un-inhabited--------------
-------------Un-inhabited--------------
113

DISTRICT CENSUS HANDBOOK : KOPPAL
VILLAGE PRIMARY
Persons Males Females Persons Males Females1 2 3 4 5 6 7 8 9 10
Name of Village
Location code
number
Total population (including institutional and houseless
population)Area of
Village in hectares
Number of households
C D Block -
Population in the age-group 0-6
601602 Kesarhatti 738.46 478 2,689 1,320 1,369 366 182 184 601603 Arhal 873.31 774 3,957 2,009 1,948 552 291 261 601604 Baglapura 338.97601605 Dasanhal 585.23 482 2,585 1,239 1,346 366 191 175 601606 Venkatagiri 1,122.66 532 3,048 1,559 1,489 561 299 262 601607 Udamkal 559.12 421 2,352 1,106 1,246 349 164 185 601608 Banderhal 505.07 148 902 457 445 139 72 67 601609 Gaddi 561.20 127 619 308 311 99 49 50 601610 Lingadhalli 447.31 155 866 441 425 144 75 69 601611 Yemmigudda 1,380.29 67 384 204 180 51 33 18 601612 Mukkumpi 196.76 418 2,589 1,320 1,269 407 208 199 601613 Hire Benkal 1,269.77 532 2,884 1,435 1,449 422 215 207 601614 Chikka Benkal 2,374.11 425 2,685 1,398 1,287 453 241 212 601615 Basapattana 1,261.94 1,647 8,972 4,528 4,444 1,338 688 650 601616 Laxmipur 1,010.44 46 185 97 88 27 14 13 601617 Rangapur 380.10 89 384 198 186 40 20 20 601618 Tirmalapur 283.58 74 281 136 145 33 17 16 601619 Sangapur 718.20 844 3,727 1,889 1,838 517 312 205 601620 Anjanhalli 192.43 67 295 150 145 42 22 20 601621 Virupapuragaddi 331.74 106 475 231 244 65 31 34 601622 Hanmanhalli 187.70 83 419 222 197 58 33 25 601623 Chickrampur 377.08 131 558 280 278 62 28 34 601624 Temba 711.54601625 Mallapur 953.97 610 3,115 1,551 1,564 488 243 245 601626 Rampur 330.34 428 2,089 1,060 1,029 289 141 148 601627 Krishnapur 81.67 26 92 40 52 13 6 7 601628 Sanapur 663.84 343 1,628 823 805 214 110 104 601629 Gangawati (Rural) 2,078.46601630 Hosalli 231.05 590 3,235 1,593 1,642 536 267 269 601631 Nagarhalli 181.66 146 719 359 360 139 76 63 601632 Jantkal (Kalan) 328.23601633 Vipra 316.28 131 678 417 261 84 49 35 601634 Virpapur 409.75601635 Rajapur 157.03 1 4 3 1 - - - 601636 Singangund 166.00 3 9 4 5 - - - 601637 Basvandurg 549.13 276 1,176 570 606 168 77 91 601638 Ramdurg 158.40 175 822 405 417 124 55 69 601639 Anegundi 721.70 838 3,733 1,812 1,921 480 234 246 601640 Kesakihanchnal 350.20 245 1,379 675 704 189 93 96 601641 Guldal 631.39 210 1,050 532 518 129 66 63 601642 Markumbi 309.89 342 1,720 868 852 245 126 119 601643 Herur 1,003.23 1,095 5,346 2,673 2,673 672 357 315 601644 Gonal 354.17 218 1,038 513 525 114 52 62 601645 Batterhanchnal 656.75 510 2,273 1,162 1,111 312 158 154 601646 Hanwal 2,410.90 1,154 6,334 3,135 3,199 864 441 423 601647 Hosekera 1,014.25 1,327 6,279 3,077 3,202 761 394 367 601648 Marli 1,133.11 1,061 5,102 2,528 2,574 559 288 271 601649 Sriramanagar 911.86 2,215 9,426 4,714 4,712 1,114 577 537 601650 Hebbal 989.30 453 2,096 1,025 1,071 322 156 166 601651 Acharnarsapur 400.82 510 2,526 1,253 1,273 313 156 157 601652 Danapur 707.71 680 3,603 1,770 1,833 506 276 230 601653 Jangamarkalgudi 814.68 1,017 4,835 2,386 2,449 620 314 306 601654 Achalapur 104.45 10 31 15 16 - - - 601655 Ayodhya 639.88 558 2,477 1,161 1,316 332 155 177 601656 Chikka Jantkal 595.16 753 3,761 1,800 1,961 579 310 269
-------------Un-inhabited--------------
-------------Un-inhabited--------------
-------------Un-inhabited--------------
-------------Un-inhabited--------------
-------------Un-inhabited--------------
114

PRIMARY CENSUS ABSTRACT
CENSUS ABSTRACTGangawati
Persons Males Females Persons Males Females Persons Males Females11 12 13 14 15 16 17 18 19 2
Name of VillageLiteratesScheduled Castes population Scheduled Tribes population
524 258 266 179 83 96 1,585 858 727 Kesarhatti827 414 413 624 347 277 2,241 1,319 922 Arhal
Baglapura340 148 192 373 160 213 1,583 838 745 Dasanhal655 334 321 234 120 114 1,485 856 629 Venkatagiri743 356 387 993 436 557 1,255 660 595 Udamkal20 8 12 137 69 68 431 249 182 Banderhal
138 64 74 134 66 68 338 194 144 Gaddi118 56 62 425 211 214 277 174 103 Lingadhalli48 19 29 252 142 110 141 84 57 Yemmigudda
266 129 137 839 418 421 1,242 753 489 Mukkumpi283 139 144 256 124 132 1,525 878 647 Hire Benkal 914 482 432 614 316 298 1,274 774 500 Chikka Benkal
1,549 786 763 1,535 754 781 5,201 2,939 2,262 Basapattana120 65 55 50 23 27 78 45 33 Laxmipur190 104 86 107 55 52 213 120 93 Rangapur88 44 44 80 38 42 130 72 58 Tirmalapur
1,898 967 931 244 127 117 2,072 1,133 939 Sangapur95 52 43 95 47 48 148 89 59 Anjanhalli
159 73 86 43 24 19 311 159 152 Virupapuragaddi32 14 18 142 74 68 240 140 100 Hanmanhalli
255 126 129 10 4 6 385 219 166 ChickrampurTemba
869 446 423 624 309 315 1,923 1,065 858 Mallapur981 501 480 472 229 243 1,083 606 477 Rampur74 35 39 - - - 42 21 21 Krishnapur
772 383 389 211 108 103 814 461 353 SanapurGangawati (Rural)
1,068 515 553 136 66 70 1,616 912 704 Hosalli205 102 103 40 19 21 272 164 108 Nagarhalli
Jantkal (Kalan)215 127 88 175 116 59 414 296 118 Vipra
Virpapur- - - 4 3 1 2 2 - Rajapur- - - - - - 9 4 5 Singangund445 212 233 318 156 162 649 367 282 Basvandurg211 101 110 124 60 64 471 264 207 Ramdurg560 260 300 772 370 402 2,136 1,149 987 Anegundi75 30 45 1,012 505 507 854 472 382 Kesakihanchnal
368 191 177 181 91 90 613 361 252 Guldal474 239 235 72 35 37 1,038 615 423 Markumbi
1,002 511 491 595 303 292 3,234 1,813 1,421 Herur257 123 134 187 101 86 682 374 308 Gonal758 387 371 72 36 36 1,250 685 565 Batterhanchnal911 440 471 610 316 294 3,644 2,033 1,611 Hanwal894 428 466 1,403 658 745 3,787 2,015 1,772 Hosekera669 326 343 459 218 241 3,129 1,764 1,365 Marli
2,353 1,151 1,202 457 207 250 6,094 3,281 2,813 Sriramanagar249 110 139 114 53 61 1,168 659 509 Hebbal228 110 118 719 369 350 1,561 890 671 Acharnarsapur845 402 443 89 46 43 2,089 1,166 923 Danapur544 278 266 396 185 211 2,879 1,568 1,311 Jangamarkalgudi11 6 5 - - - 22 11 11 Achalapur
579 258 321 114 58 56 1,551 798 753 Ayodhya1,269 588 681 420 204 216 1,825 1,011 814 Chikka Jantkal
-------------Un-inhabited--------------
-------------Un-inhabited--------------
-------------Un-inhabited--------------
-------------Un-inhabited--------------
-------------Un-inhabited--------------
115

DISTRICT CENSUS HANDBOOK : KOPPAL
VILLAGE PRIMARYC D Block -
Persons Males Females Persons Males Females Persons Males Females1 2 20 21 22 23 24 25 26 27 28
Name of Village
Location code
numberIlliterates Total workers Main workers
601602 Kesarhatti 1,104 462 642 1,201 781 420 507 420 87 601603 Arhal 1,716 690 1,026 1,970 1,083 887 1,111 708 403 601604 Baglapura601605 Dasanhal 1,002 401 601 1,165 653 512 796 551 245 601606 Venkatagiri 1,563 703 860 1,374 828 546 1,308 805 503 601607 Udamkal 1,097 446 651 1,073 584 489 808 471 337 601608 Banderhal 471 208 263 499 272 227 467 258 209 601609 Gaddi 281 114 167 313 170 143 25 12 13 601610 Lingadhalli 589 267 322 529 268 261 524 266 258 601611 Yemmigudda 243 120 123 236 116 120 234 114 120 601612 Mukkumpi 1,347 567 780 1,312 710 602 1,295 702 593 601613 Hire Benkal 1,359 557 802 1,381 758 623 1,219 696 523 601614 Chikka Benkal 1,411 624 787 1,244 707 537 1,218 702 516 601615 Basapattana 3,771 1,589 2,182 3,586 2,315 1,271 2,572 1,860 712 601616 Laxmipur 107 52 55 90 55 35 84 52 32 601617 Rangapur 171 78 93 194 114 80 173 101 72 601618 Tirmalapur 151 64 87 155 81 74 8 4 4 601619 Sangapur 1,655 756 899 1,858 1,085 773 1,699 1,045 654 601620 Anjanhalli 147 61 86 134 82 52 15 7 8 601621 Virupapuragaddi 164 72 92 195 120 75 178 109 69 601622 Hanmanhalli 179 82 97 202 120 82 190 112 78 601623 Chickrampur 173 61 112 269 159 110 250 155 95 601624 Temba601625 Mallapur 1,192 486 706 1,430 840 590 1,221 730 491 601626 Rampur 1,006 454 552 999 627 372 968 607 361 601627 Krishnapur 50 19 31 45 24 21 45 24 21 601628 Sanapur 814 362 452 676 432 244 512 326 186 601629 Gangawati (Rural)601630 Hosalli 1,619 681 938 1,642 919 723 924 534 390 601631 Nagarhalli 447 195 252 393 227 166 392 227 165 601632 Jantkal (Kalan)601633 Vipra 264 121 143 202 112 90 118 63 55 601634 Virpapur601635 Rajapur 2 1 1 1 1 - 1 1 - 601636 Singangund - - - 3 2 1 2 1 1 601637 Basvandurg 527 203 324 548 319 229 539 318 221 601638 Ramdurg 351 141 210 415 237 178 411 234 177 601639 Anegundi 1,597 663 934 1,934 1,091 843 1,138 762 376 601640 Kesakihanchnal 525 203 322 655 393 262 655 393 262 601641 Guldal 437 171 266 577 290 287 455 254 201 601642 Markumbi 682 253 429 952 505 447 498 290 208 601643 Herur 2,112 860 1,252 2,596 1,563 1,033 2,392 1,484 908 601644 Gonal 356 139 217 531 306 225 464 274 190 601645 Batterhanchnal 1,023 477 546 1,088 662 426 896 542 354 601646 Hanwal 2,690 1,102 1,588 3,425 1,768 1,657 2,735 1,501 1,234 601647 Hosekera 2,492 1,062 1,430 2,807 1,814 993 2,380 1,628 752 601648 Marli 1,973 764 1,209 2,582 1,483 1,099 2,469 1,435 1,034 601649 Sriramanagar 3,332 1,433 1,899 3,891 2,737 1,154 3,568 2,521 1,047 601650 Hebbal 928 366 562 1,105 605 500 1,077 592 485 601651 Acharnarsapur 965 363 602 1,283 727 556 1,150 691 459 601652 Danapur 1,514 604 910 1,582 956 626 746 537 209 601653 Jangamarkalgudi 1,956 818 1,138 2,283 1,405 878 1,395 1,011 384 601654 Achalapur 9 4 5 15 7 8 13 7 6 601655 Ayodhya 926 363 563 1,053 679 374 627 430 197 601656 Chikka Jantkal 1,936 789 1,147 1,597 1,076 521 1,261 949 312
-------------Un-inhabited--------------
-------------Un-inhabited--------------
-------------Un-inhabited--------------
-------------Un-inhabited--------------
-------------Un-inhabited--------------
116

PRIMARY CENSUS ABSTRACT
CENSUS ABSTRACTGangawati
Persons Males Females Persons Males Females Persons Males Females Persons Males Females29 30 31 32 33 34 35 36 37 38 39 40 2
CultivatorsName of Village
Household industry workersAgricultural labourers
Industrial category of main workers
Other workers
293 279 14 76 37 39 4 3 1 134 101 33 Kesarhatti299 253 46 570 261 309 18 11 7 224 183 41 Arhal
Baglapura136 112 24 234 132 102 12 11 1 414 296 118 Dasanhal77 64 13 771 437 334 3 2 1 457 302 155 Venkatagiri
287 192 95 311 137 174 10 4 6 200 138 62 Udamkal169 84 85 187 88 99 47 32 15 64 54 10 Banderhal
9 4 5 - - - - - - 16 8 8 Gaddi54 32 22 456 228 228 2 1 1 12 5 7 Lingadhalli8 3 5 212 104 108 3 2 1 11 5 6 Yemmigudda
137 112 25 1,091 536 555 1 1 - 66 53 13 Mukkumpi214 152 62 500 202 298 34 20 14 471 322 149 Hire Benkal 297 183 114 645 315 330 1 1 - 275 203 72 Chikka Benkal506 380 126 880 535 345 64 53 11 1,122 892 230 Basapattana- - - 60 29 31 - - - 24 23 1 Laxmipur26 20 6 132 68 64 3 2 1 12 11 1 Rangapur5 3 2 3 1 2 - - - - - - Tirmalapur
131 108 23 970 508 462 13 8 5 585 421 164 Sangapur8 5 3 6 1 5 1 1 - - - - Anjanhalli
15 12 3 90 49 41 8 5 3 65 43 22 Virupapuragaddi19 16 3 154 87 67 2 2 - 15 7 8 Hanmanhalli63 36 27 78 39 39 2 - 2 107 80 27 Chickrampur
Temba193 149 44 902 506 396 34 11 23 92 64 28 Mallapur165 145 20 609 307 302 9 8 1 185 147 38 Rampur
2 1 1 1 1 - - - - 42 22 20 Krishnapur74 69 5 294 143 151 60 46 14 84 68 16 Sanapur
Gangawati (Rural)141 89 52 549 267 282 56 31 25 178 147 31 Hosalli
1 1 - 387 223 164 2 1 1 2 2 - NagarhalliJantkal (Kalan)
5 3 2 87 47 40 5 3 2 21 10 11 VipraVirpapur
- - - - - - - - - 1 1 - Rajapur- - - 2 1 1 - - - - - - Singangund34 26 8 341 169 172 9 5 4 155 118 37 Basvandurg56 41 15 317 167 150 - - - 38 26 12 Ramdurg
308 232 76 414 244 170 9 6 3 407 280 127 Anegundi139 127 12 489 246 243 - - - 27 20 7 Kesakihanchnal171 119 52 229 92 137 2 1 1 53 42 11 Guldal188 125 63 236 111 125 - - - 74 54 20 Markumbi608 498 110 1,259 581 678 8 3 5 517 402 115 Herur53 42 11 368 203 165 7 3 4 36 26 10 Gonal
160 151 9 559 271 288 22 10 12 155 110 45 Batterhanchnal677 474 203 1,258 555 703 35 28 7 765 444 321 Hanwal646 567 79 1,385 791 594 60 46 14 289 224 65 Hosekera454 317 137 1,231 598 633 27 19 8 757 501 256 Marli637 551 86 1,485 783 702 122 89 33 1,324 1,098 226 Sriramanagar444 261 183 509 244 265 3 3 - 121 84 37 Hebbal530 365 165 464 198 266 1 - 1 155 128 27 Acharnarsapur332 277 55 233 113 120 12 10 2 169 137 32 Danapur437 389 48 576 310 266 3 3 - 379 309 70 Jangamarkalgudi
4 3 1 6 3 3 - - - 3 1 2 Achalapur207 180 27 294 165 129 10 6 4 116 79 37 Ayodhya174 141 33 841 600 241 32 24 8 214 184 30 Chikka Jantkal
-------------Un-inhabited--------------
-------------Un-inhabited--------------
-------------Un-inhabited--------------
-------------Un-inhabited--------------
-------------Un-inhabited--------------
117

DISTRICT CENSUS HANDBOOK : KOPPAL
VILLAGE PRIMARYC D Block -
Persons Males Females Persons Males Females Persons Males Females1 2 41 42 43 44 45 46 47 48 49
Name of VillageMarginal workers Cultivators Agricultural labourers
Industrial category Location
code number
601602 Kesarhatti 694 361 333 45 39 6 564 253 311 601603 Arhal 859 375 484 43 24 19 418 175 243 601604 Baglapura601605 Dasanhal 369 102 267 10 6 4 247 59 188 601606 Venkatagiri 66 23 43 6 3 3 30 10 20 601607 Udamkal 265 113 152 7 4 3 120 33 87 601608 Banderhal 32 14 18 - - - 18 7 11 601609 Gaddi 288 158 130 11 7 4 12 3 9 601610 Lingadhalli 5 2 3 1 1 - 1 - 1 601611 Yemmigudda 2 2 - - - - 2 2 - 601612 Mukkumpi 17 8 9 - - - 14 6 8 601613 Hire Benkal 162 62 100 10 2 8 53 10 43 601614 Chikka Benkal 26 5 21 5 2 3 3 - 3 601615 Basapattana 1,014 455 559 52 17 35 441 212 229 601616 Laxmipur 6 3 3 - - - 2 - 2 601617 Rangapur 21 13 8 1 - 1 18 12 6 601618 Tirmalapur 147 77 70 7 7 - 139 69 70 601619 Sangapur 159 40 119 3 1 2 109 13 96 601620 Anjanhalli 119 75 44 27 23 4 90 51 39 601621 Virupapuragaddi 17 11 6 3 2 1 6 3 3 601622 Hanmanhalli 12 8 4 2 1 1 9 6 3 601623 Chickrampur 19 4 15 - - - 9 1 8 601624 Temba601625 Mallapur 209 110 99 12 4 8 177 90 87 601626 Rampur 31 20 11 5 3 2 12 6 6 601627 Krishnapur - - - - - - - - - 601628 Sanapur 164 106 58 6 3 3 108 69 39 601629 Gangawati (Rural)601630 Hosalli 718 385 333 81 62 19 526 241 285 601631 Nagarhalli 1 - 1 - - - 1 - 1 601632 Jantkal (Kalan)601633 Vipra 84 49 35 3 2 1 - - - 601634 Virpapur601635 Rajapur - - - - - - - - - 601636 Singangund 1 1 - 1 1 - - - - 601637 Basvandurg 9 1 8 3 - 3 - - - 601638 Ramdurg 4 3 1 - - - 4 3 1 601639 Anegundi 796 329 467 16 5 11 631 255 376 601640 Kesakihanchnal - - - - - - - - - 601641 Guldal 122 36 86 8 3 5 108 32 76 601642 Markumbi 454 215 239 19 8 11 429 203 226 601643 Herur 204 79 125 7 2 5 141 41 100 601644 Gonal 67 32 35 10 8 2 44 14 30 601645 Batterhanchnal 192 120 72 22 18 4 146 86 60 601646 Hanwal 690 267 423 62 19 43 533 215 318 601647 Hosekera 427 186 241 17 6 11 393 168 225 601648 Marli 113 48 65 18 9 9 48 16 32 601649 Sriramanagar 323 216 107 30 23 7 169 119 50 601650 Hebbal 28 13 15 4 1 3 20 10 10 601651 Acharnarsapur 133 36 97 5 2 3 120 30 90 601652 Danapur 836 419 417 37 23 14 707 337 370 601653 Jangamarkalgudi 888 394 494 71 31 40 602 236 366 601654 Achalapur 2 - 2 - - - 2 - 2 601655 Ayodhya 426 249 177 23 13 10 325 181 144 601656 Chikka Jantkal 336 127 209 11 7 4 274 80 194
-------------Un-inhabited--------------
-------------Un-inhabited--------------
-------------Un-inhabited--------------
-------------Un-inhabited--------------
-------------Un-inhabited--------------
118

PRIMARY CENSUS ABSTRACT
CENSUS ABSTRACTGangawati
Persons Males Females Persons Males Females Persons Males Females50 51 52 53 54 55 56 57 58 2 1
Location code
numberHousehold industry workers
Name of VillageOther workers Non-workers
of marginal workers
2 2 - 83 67 16 1,488 539 949 Kesarhatti 60160228 13 15 370 163 207 1,987 926 1,061 Arhal 601603
Baglapura 6016049 3 6 103 34 69 1,420 586 834 Dasanhal 6016052 - 2 28 10 18 1,674 731 943 Venkatagiri 601606
38 13 25 100 63 37 1,279 522 757 Udamkal 6016074 2 2 10 5 5 403 185 218 Banderhal 6016081 1 - 264 147 117 306 138 168 Gaddi 601609
- - - 3 1 2 337 173 164 Lingadhalli 601610- - - - - - 148 88 60 Yemmigudda 601611- - - 3 2 1 1,277 610 667 Mukkumpi 601612
6 1 5 93 49 44 1,503 677 826 Hire Benkal 601613- - - 18 3 15 1,441 691 750 Chikka Benkal 601614164 36 128 357 190 167 5,386 2,213 3,173 Basapattana 601615- - - 4 3 1 95 42 53 Laxmipur 601616- - - 2 1 1 190 84 106 Rangapur 601617- - - 1 1 - 126 55 71 Tirmalapur 601618
3 1 2 44 25 19 1,869 804 1,065 Sangapur 6016192 1 1 - - - 161 68 93 Anjanhalli 6016201 1 - 7 5 2 280 111 169 Virupapuragaddi 601621
- - - 1 1 - 217 102 115 Hanmanhalli 601622- - - 10 3 7 289 121 168 Chickrampur 601623
Temba 6016242 1 1 18 15 3 1,685 711 974 Mallapur 6016251 1 - 13 10 3 1,090 433 657 Rampur 601626
- - - - - - 47 16 31 Krishnapur 6016274 3 1 46 31 15 952 391 561 Sanapur 601628
Gangawati (Rural) 60162910 6 4 101 76 25 1,593 674 919 Hosalli 601630
- - - - - - 326 132 194 Nagarhalli 601631Jantkal (Kalan) 601632
- - - 81 47 34 476 305 171 Vipra 601633Virpapur 601634
- - - - - - 3 2 1 Rajapur 601635- - - - - - 6 2 4 Singangund 601636- - - 6 1 5 628 251 377 Basvandurg 601637- - - - - - 407 168 239 Ramdurg 601638
4 - 4 145 69 76 1,799 721 1,078 Anegundi 601639- - - - - - 724 282 442 Kesakihanchnal 601640- - - 6 1 5 473 242 231 Guldal 601641- - - 6 4 2 768 363 405 Markumbi 601642
6 2 4 50 34 16 2,750 1,110 1,640 Herur 601643- - - 13 10 3 507 207 300 Gonal 601644- - - 24 16 8 1,185 500 685 Batterhanchnal 60164528 8 20 67 25 42 2,909 1,367 1,542 Hanwal 601646
- - - 17 12 5 3,472 1,263 2,209 Hosekera 6016472 - 2 45 23 22 2,520 1,045 1,475 Marli 601648
11 5 6 113 69 44 5,535 1,977 3,558 Sriramanagar 601649- - - 4 2 2 991 420 571 Hebbal 601650- - - 8 4 4 1,243 526 717 Acharnarsapur 60165116 10 6 76 49 27 2,021 814 1,207 Danapur 6016527 5 2 208 122 86 2,552 981 1,571 Jangamarkalgudi 601653
- - - - - - 16 8 8 Achalapur 6016545 3 2 73 52 21 1,424 482 942 Ayodhya 601655
17 12 5 34 28 6 2,164 724 1,440 Chikka Jantkal 601656
-------------Un-inhabited--------------
-------------Un-inhabited--------------
-------------Un-inhabited--------------
-------------Un-inhabited--------------
-------------Un-inhabited--------------
119

DISTRICT CENSUS HANDBOOK : KOPPAL
VILLAGE PRIMARY
Persons Males Females Persons Males Females1 2 3 4 5 6 7 8 9 10
Name of Village
Location code
number
Total population (including institutional and houseless
population)Area of
Village in hectares
Number of households
C D Block -
Population in the age-group 0-6
601657 Yettinhatti 894.29 98 532 259 273 93 45 48 601658 Bunhatti 509.29 75 401 199 202 50 23 27 601659 Eachanhal 478.97 157 917 467 450 162 77 85 601660 Uddihal 1,047.02 187 1,138 566 572 175 92 83 601661 Kyarihal 494.78 24 129 64 65 8 4 4 601662 Sankanhal 386.54 98 498 242 256 72 36 36 601663 Navali 3,513.80 1,023 5,723 2,908 2,815 871 451 420 601664 Kardona 1,148.08 191 1,039 521 518 158 80 78 601665 Mallapur 375.53 184 1,216 604 612 228 115 113 601666 Katapur (Umli) 530.50 132 867 448 419 186 100 86 601667 Akalkumpi 783.83 119 607 301 306 108 55 53 601668 Hatti 520.62 30 122 65 57 11 8 3 601669 Wadki 770.60 231 1,219 602 617 177 89 88 601670 Adapura 686.98 236 1,283 651 632 148 85 63 601671 Bhairapura 262.91 15 82 46 36 16 11 5 601672 Chirchanagudda 557.76 294 1,687 850 837 247 125 122 601673 Chikka Dankankal 557.87 317 1,570 797 773 229 118 111 601674 Jeeral 641.27 339 2,075 1,036 1,039 328 170 158 601675 Jeeralkalgudi 1,192.36 586 2,939 1,433 1,506 421 213 208 601676 Hire Dankankal 1,014.91 495 2,242 1,137 1,105 293 163 130 601677 Gudur 837.85 251 1,332 656 676 175 81 94 601678 Mylapur 1,867.69 641 3,057 1,555 1,502 382 226 156 601679 Bevinhal 1,673.40 948 4,763 2,331 2,432 686 331 355 601680 Pannapur 661.99 861 3,984 1,986 1,998 464 240 224 601681 Karatgi 2,987.70 6,051 29,991 15,087 14,904 3,947 2,018 1,929 601682 Challur 1,238.55 1,018 4,972 2,469 2,503 693 351 342 601683 Somanhal 1,386.88 482 2,565 1,306 1,259 338 177 161 601684 Tondihal 1,014.58 542 2,724 1,331 1,393 356 190 166 601685 Hagedal 546.70 225 1,145 575 570 167 78 89 601686 Juratgi 460.14 431 2,121 1,068 1,053 262 140 122 601687 Hulkihal 1,310.83 759 3,710 1,801 1,909 481 243 238 601688 Marlanahalli 610.29 1,167 5,334 2,619 2,715 687 352 335 601689 Yerdona 2,565.36 1,517 6,980 3,440 3,540 881 428 453 601690 Budugumpa 1,095.48 1,079 5,641 2,748 2,893 752 397 355 601691 Timmapur 1,139.14 265 1,283 640 643 160 85 75 601692 Halsamudra 628.36 302 1,398 711 687 141 70 71 601693 Singanhal 960.54 681 3,549 1,749 1,800 584 302 282 601694 Gundur 1,945.03 1,323 5,973 2,979 2,994 739 384 355 601695 Krishnapur 455.95 63 255 127 128 29 13 16 601696 Siddapur 1,494.79 1,916 9,815 4,895 4,920 1,397 741 656 601697 Bargur 743.15 456 2,327 1,147 1,180 335 170 165 601698 Mustur 2,199.02 1,112 5,150 2,545 2,605 668 336 332 601699 Kuntoji 1,520.68 614 2,861 1,435 1,426 415 205 210 601700 Kottankal 753.24 231 1,066 525 541 131 64 67 601701 Eliganoor 1,356.73 547 2,868 1,386 1,482 483 224 259 601702 Jamapur 859.46 254 1,755 882 873 245 128 117 601703 Ulenoor 1,693.49 606 3,271 1,660 1,611 471 244 227 601704 Bennur 1,625.71 449 2,350 1,159 1,191 377 181 196 601705 Nandihalli 878.46 361 1,810 924 886 248 144 104 601706 Kakkargol 2,135.13 360 1,892 930 962 238 126 112 601707 Shalignoor 433.44 91 455 241 214 81 54 27
URBAN
803072Waddarhatti (OG) WARD NO.-0032 (Rural MDDS CODE:601708)
1,860 9,113 4,541 4,572 1,170 589 581
120

PRIMARY CENSUS ABSTRACT
CENSUS ABSTRACTGangawati
Persons Males Females Persons Males Females Persons Males Females11 12 13 14 15 16 17 18 19 2
Name of VillageLiteratesScheduled Castes population Scheduled Tribes population
113 53 60 110 53 57 238 145 93 Yettinhatti40 23 17 157 83 74 213 136 77 Bunhatti54 31 23 70 38 32 422 269 153 Eachanhal61 24 37 46 20 26 545 346 199 Uddihal
- - - 128 64 64 82 45 37 Kyarihal16 6 10 283 134 149 321 186 135 Sankanhal
2,534 1,312 1,222 477 247 230 3,097 1,834 1,263 Navali115 62 53 283 142 141 563 331 232 Kardona28 16 12 751 370 381 403 242 161 Mallapur
242 129 113 214 105 109 577 317 260 Katapur (Umli)- - - 607 301 306 323 188 135 Akalkumpi- - - 83 42 41 81 46 35 Hatti122 51 71 955 484 471 591 349 242 Wadki111 53 58 264 139 125 648 370 278 Adapura- - - 82 46 36 38 22 16 Bhairapura
1,047 526 521 454 234 220 850 490 360 Chirchanagudda51 27 24 844 429 415 811 489 322 Chikka Dankankal
616 320 296 497 233 264 993 576 417 Jeeral905 438 467 328 171 157 1,654 930 724 Jeeralkalgudi510 237 273 514 274 240 1,240 708 532 Hire Dankankal101 44 57 682 340 342 744 436 308 Gudur364 185 179 1,112 563 549 1,738 1,007 731 Mylapur
1,065 539 526 376 175 201 2,728 1,540 1,188 Bevinhal832 407 425 175 95 80 2,646 1,433 1,213 Pannapur
4,977 2,468 2,509 3,376 1,661 1,715 18,561 10,458 8,103 Karatgi1,054 517 537 1,091 531 560 2,643 1,496 1,147 Challur
618 315 303 330 166 164 1,397 860 537 Somanhal253 126 127 1,419 695 724 1,524 836 688 Tondihal249 124 125 244 114 130 588 371 217 Hagedal402 188 214 1,062 534 528 1,178 693 485 Juratgi 665 312 353 666 327 339 2,019 1,154 865 Hulkihal
1,384 684 700 890 416 474 3,211 1,775 1,436 Marlanahalli1,022 506 516 752 358 394 3,849 2,220 1,629 Yerdona1,309 634 675 492 223 269 3,061 1,778 1,283 Budugumpa
118 56 62 - - - 753 469 284 Timmapur28 15 13 767 377 390 863 528 335 Halsamudra
667 318 349 746 372 374 1,629 962 667 Singanhal1,516 740 776 304 153 151 3,444 1,940 1,504 Gundur
81 38 43 6 3 3 168 91 77 Krishnapur3,037 1,535 1,502 434 218 216 5,447 3,140 2,307 Siddapur
643 318 325 32 14 18 1,182 694 488 Bargur884 436 448 281 142 139 2,745 1,549 1,196 Mustur
1,265 634 631 101 52 49 1,307 814 493 Kuntoji18 5 13 112 60 52 629 368 261 Kottankal
1,129 538 591 303 136 167 1,347 776 571 Eliganoor296 146 150 14 10 4 951 544 407 Jamapur262 125 137 1,351 688 663 1,477 910 567 Ulenoor680 315 365 259 127 132 884 548 336 Bennur286 145 141 413 213 200 752 460 292 Nandihalli226 118 108 496 242 254 724 424 300 Kakkargol60 29 31 6 1 5 210 130 80 Shalignoor
URBAN
1,360 656 704 1,146 548 598 5,729 3,225 2,504 Waddarhatti (OG) WARD NO.-0032 (Rural MDDS CODE:601708)
121

DISTRICT CENSUS HANDBOOK : KOPPAL
VILLAGE PRIMARYC D Block -
Persons Males Females Persons Males Females Persons Males Females1 2 20 21 22 23 24 25 26 27 28
Name of Village
Location code
numberIlliterates Total workers Main workers
601657 Yettinhatti 294 114 180 306 145 161 292 143 149 601658 Bunhatti 188 63 125 219 104 115 208 100 108 601659 Eachanhal 495 198 297 492 261 231 131 111 20 601660 Uddihal 593 220 373 677 337 340 654 324 330 601661 Kyarihal 47 19 28 68 32 36 68 32 36 601662 Sankanhal 177 56 121 304 154 150 303 153 150 601663 Navali 2,626 1,074 1,552 2,970 1,616 1,354 2,704 1,528 1,176 601664 Kardona 476 190 286 623 335 288 615 332 283 601665 Mallapur 813 362 451 637 323 314 277 235 42 601666 Katapur (Umli) 290 131 159 481 243 238 423 210 213 601667 Akalkumpi 284 113 171 360 183 177 360 183 177 601668 Hatti 41 19 22 75 41 34 75 41 34 601669 Wadki 628 253 375 667 333 334 69 39 30 601670 Adapura 635 281 354 778 406 372 725 379 346 601671 Bhairapura 44 24 20 54 32 22 50 30 20 601672 Chirchanagudda 837 360 477 1,111 554 557 674 390 284 601673 Chikka Dankankal 759 308 451 828 419 409 422 376 46 601674 Jeeral 1,082 460 622 1,061 572 489 890 541 349 601675 Jeeralkalgudi 1,285 503 782 1,524 821 703 1,305 764 541 601676 Hire Dankankal 1,002 429 573 1,097 650 447 349 298 51 601677 Gudur 588 220 368 653 350 303 459 267 192 601678 Mylapur 1,319 548 771 1,565 862 703 1,132 719 413 601679 Bevinhal 2,035 791 1,244 2,467 1,354 1,113 1,538 898 640 601680 Pannapur 1,338 553 785 1,847 1,148 699 1,453 949 504 601681 Karatgi 11,430 4,629 6,801 12,632 8,429 4,203 11,063 7,657 3,406 601682 Challur 2,329 973 1,356 2,460 1,390 1,070 1,994 1,166 828 601683 Somanhal 1,168 446 722 1,274 723 551 1,091 627 464 601684 Tondihal 1,200 495 705 1,308 756 552 1,054 685 369 601685 Hagedal 557 204 353 633 320 313 354 280 74 601686 Juratgi 943 375 568 878 557 321 552 416 136 601687 Hulkihal 1,691 647 1,044 1,844 1,038 806 1,544 877 667 601688 Marlanahalli 2,123 844 1,279 2,399 1,443 956 2,068 1,376 692 601689 Yerdona 3,131 1,220 1,911 3,457 1,943 1,514 3,246 1,856 1,390 601690 Budugumpa 2,580 970 1,610 2,509 1,499 1,010 2,256 1,458 798 601691 Timmapur 530 171 359 629 375 254 554 353 201 601692 Halsamudra 535 183 352 661 440 221 569 426 143 601693 Singanhal 1,920 787 1,133 1,590 950 640 1,151 875 276 601694 Gundur 2,529 1,039 1,490 2,835 1,655 1,180 2,405 1,485 920 601695 Krishnapur 87 36 51 93 56 37 73 48 25 601696 Siddapur 4,368 1,755 2,613 4,331 2,695 1,636 3,697 2,463 1,234 601697 Bargur 1,145 453 692 1,067 640 427 988 613 375 601698 Mustur 2,405 996 1,409 2,527 1,483 1,044 2,315 1,378 937 601699 Kuntoji 1,554 621 933 1,231 744 487 843 612 231 601700 Kottankal 437 157 280 573 312 261 552 302 250 601701 Eliganoor 1,521 610 911 1,522 792 730 1,438 753 685 601702 Jamapur 804 338 466 814 412 402 526 397 129 601703 Ulenoor 1,794 750 1,044 1,733 905 828 1,437 828 609 601704 Bennur 1,466 611 855 1,273 658 615 480 300 180 601705 Nandihalli 1,058 464 594 1,072 564 508 765 407 358 601706 Kakkargol 1,168 506 662 1,085 521 564 470 443 27 601707 Shalignoor 245 111 134 249 134 115 244 134 110
URBAN
803072Waddarhatti (OG) WARD NO.-0032 (Rural MDDS CODE:601708)
3,384 1,316 2,068 3,703 2,613 1,090 2,335 1,822 513
122

PRIMARY CENSUS ABSTRACT
CENSUS ABSTRACTGangawati
Persons Males Females Persons Males Females Persons Males Females Persons Males Females29 30 31 32 33 34 35 36 37 38 39 40 2
CultivatorsName of Village
Household industry workersAgricultural labourers
Industrial category of main workers
Other workers
60 56 4 217 78 139 - - - 15 9 6 Yettinhatti72 39 33 132 60 72 1 - 1 3 1 2 Bunhatti82 78 4 37 26 11 3 3 - 9 4 5 Eachanhal
309 217 92 216 46 170 34 17 17 95 44 51 Uddihal5 3 2 61 29 32 1 - 1 1 - 1 Kyarihal
125 78 47 174 75 99 - - - 4 - 4 Sankanhal637 462 175 1,288 533 755 32 20 12 747 513 234 Navali189 156 33 348 120 228 2 1 1 76 55 21 Kardona184 174 10 26 16 10 13 4 9 54 41 13 Mallapur173 157 16 216 42 174 - - - 34 11 23 Katapur (Umli)348 178 170 6 3 3 - - - 6 2 4 Akalkumpi64 34 30 9 6 3 - - - 2 1 1 Hatti10 7 3 32 11 21 8 8 - 19 13 6 Wadki
303 245 58 301 48 253 56 37 19 65 49 16 Adapura24 20 4 15 1 14 10 8 2 1 1 - Bhairapura81 75 6 547 280 267 4 2 2 42 33 9 Chirchanagudda
306 292 14 72 55 17 13 8 5 31 21 10 Chikka Dankankal 276 213 63 494 241 253 2 2 - 118 85 33 Jeeral464 342 122 658 322 336 50 4 46 133 96 37 Jeeralkalgudi215 199 16 74 57 17 - - - 60 42 18 Hire Dankankal107 83 24 297 144 153 2 2 - 53 38 15 Gudur269 234 35 736 385 351 14 10 4 113 90 23 Mylapur263 219 44 823 382 441 32 22 10 420 275 145 Bevinhal576 420 156 670 377 293 24 14 10 183 138 45 Pannapur
1,193 934 259 3,384 1,548 1,836 291 203 88 6,195 4,972 1,223 Karatgi716 624 92 1,143 446 697 3 1 2 132 95 37 Challur170 149 21 717 344 373 37 21 16 167 113 54 Somanhal419 354 65 556 279 277 12 8 4 67 44 23 Tondihal111 110 1 210 143 67 4 4 - 29 23 6 Hagedal201 194 7 237 127 110 7 6 1 107 89 18 Juratgi 493 433 60 676 243 433 26 16 10 349 185 164 Hulkihal358 291 67 1,070 576 494 30 20 10 610 489 121 Marlanahalli955 708 247 1,773 758 1,015 36 28 8 482 362 120 Yerdona981 769 212 922 415 507 21 17 4 332 257 75 Budugumpa298 239 59 209 79 130 8 5 3 39 30 9 Timmapur366 314 52 143 65 78 2 2 - 58 45 13 Halsamudra277 258 19 662 439 223 - - - 212 178 34 Singanhal844 610 234 1,312 691 621 14 14 - 235 170 65 Gundur22 20 2 30 20 10 4 2 2 17 6 11 Krishnapur
796 713 83 1,606 755 851 58 38 20 1,237 957 280 Siddapur292 249 43 539 241 298 11 8 3 146 115 31 Bargur586 470 116 1,486 727 759 17 15 2 226 166 60 Mustur468 419 49 296 134 162 5 5 - 74 54 20 Kuntoji320 229 91 200 50 150 - - - 32 23 9 Kottankal892 539 353 459 158 301 5 3 2 82 53 29 Eliganoor328 323 5 165 48 117 - - - 33 26 7 Jamapur
1,021 657 364 348 124 224 11 5 6 57 42 15 Ulenoor365 220 145 5 4 1 1 - 1 109 76 33 Bennur259 185 74 465 194 271 7 6 1 34 22 12 Nandihalli386 375 11 45 37 8 3 3 - 36 28 8 Kakkargol104 60 44 124 65 59 - - - 16 9 7 Shalignoor
URBAN
175 165 10 441 248 193 42 31 11 1,677 1,378 299 Waddarhatti (OG) WARD NO.-0032 (Rural MDDS CODE:601708)
123

DISTRICT CENSUS HANDBOOK : KOPPAL
VILLAGE PRIMARYC D Block -
Persons Males Females Persons Males Females Persons Males Females1 2 41 42 43 44 45 46 47 48 49
Name of VillageMarginal workers Cultivators Agricultural labourers
Industrial category Location
code number
601657 Yettinhatti 14 2 12 - - - 14 2 12 601658 Bunhatti 11 4 7 3 2 1 6 2 4 601659 Eachanhal 361 150 211 17 9 8 324 125 199 601660 Uddihal 23 13 10 6 3 3 7 3 4 601661 Kyarihal - - - - - - - - - 601662 Sankanhal 1 1 - - - - 1 1 - 601663 Navali 266 88 178 57 20 37 142 38 104 601664 Kardona 8 3 5 1 - 1 3 1 2 601665 Mallapur 360 88 272 7 4 3 201 48 153 601666 Katapur (Umli) 58 33 25 23 22 1 17 5 12 601667 Akalkumpi - - - - - - - - - 601668 Hatti - - - - - - - - - 601669 Wadki 598 294 304 10 6 4 583 284 299 601670 Adapura 53 27 26 10 9 1 18 5 13 601671 Bhairapura 4 2 2 1 1 - 1 - 1 601672 Chirchanagudda 437 164 273 71 23 48 338 123 215 601673 Chikka Dankankal 406 43 363 30 15 15 371 26 345 601674 Jeeral 171 31 140 3 - 3 118 22 96 601675 Jeeralkalgudi 219 57 162 22 10 12 188 43 145 601676 Hire Dankankal 748 352 396 30 15 15 709 333 376 601677 Gudur 194 83 111 7 4 3 179 76 103 601678 Mylapur 433 143 290 19 8 11 385 120 265 601679 Bevinhal 929 456 473 29 16 13 846 405 441 601680 Pannapur 394 199 195 28 23 5 274 111 163 601681 Karatgi 1,569 772 797 52 24 28 572 117 455 601682 Challur 466 224 242 29 6 23 391 191 200 601683 Somanhal 183 96 87 10 6 4 69 33 36 601684 Tondihal 254 71 183 26 13 13 217 54 163 601685 Hagedal 279 40 239 1 1 - 261 33 228 601686 Juratgi 326 141 185 1 1 - 301 129 172 601687 Hulkihal 300 161 139 2 1 1 219 95 124 601688 Marlanahalli 331 67 264 12 6 6 260 37 223 601689 Yerdona 211 87 124 24 10 14 83 29 54 601690 Budugumpa 253 41 212 50 11 39 188 21 167 601691 Timmapur 75 22 53 17 9 8 54 11 43 601692 Halsamudra 92 14 78 7 2 5 82 10 72 601693 Singanhal 439 75 364 8 4 4 410 62 348 601694 Gundur 430 170 260 23 9 14 358 121 237 601695 Krishnapur 20 8 12 3 2 1 12 5 7 601696 Siddapur 634 232 402 66 26 40 406 98 308 601697 Bargur 79 27 52 4 3 1 59 11 48 601698 Mustur 212 105 107 15 11 4 147 64 83 601699 Kuntoji 388 132 256 17 7 10 341 106 235 601700 Kottankal 21 10 11 2 1 1 13 5 8 601701 Eliganoor 84 39 45 3 - 3 71 33 38 601702 Jamapur 288 15 273 8 3 5 275 10 265 601703 Ulenoor 296 77 219 75 20 55 183 47 136 601704 Bennur 793 358 435 38 21 17 749 333 416 601705 Nandihalli 307 157 150 10 5 5 288 146 142 601706 Kakkargol 615 78 537 30 16 14 572 57 515 601707 Shalignoor 5 - 5 - - - 5 - 5
URBAN
803072Waddarhatti (OG) WARD NO.-0032 (Rural MDDS CODE:601708)
1,368 791 577 11 6 5 933 478 455
124

PRIMARY CENSUS ABSTRACT
CENSUS ABSTRACTGangawati
Persons Males Females Persons Males Females Persons Males Females50 51 52 53 54 55 56 57 58 2 1
Location code
numberHousehold industry workers
Name of VillageOther workers Non-workers
of marginal workers
- - - - - - 226 114 112 Yettinhatti 6016571 - 1 1 - 1 182 95 87 Bunhatti 601658
10 7 3 10 9 1 425 206 219 Eachanhal 6016591 - 1 9 7 2 461 229 232 Uddihal 601660
- - - - - - 61 32 29 Kyarihal 601661- - - - - - 194 88 106 Sankanhal 60166212 2 10 55 28 27 2,753 1,292 1,461 Navali 6016631 1 - 3 1 2 416 186 230 Kardona 601664
134 29 105 18 7 11 579 281 298 Mallapur 601665- - - 18 6 12 386 205 181 Katapur (Umli) 601666- - - - - - 247 118 129 Akalkumpi 601667- - - - - - 47 24 23 Hatti 601668
1 1 - 4 3 1 552 269 283 Wadki 60166910 6 4 15 7 8 505 245 260 Adapura 6016702 1 1 - - - 28 14 14 Bhairapura 6016715 1 4 23 17 6 576 296 280 Chirchanagudda 6016723 2 1 2 - 2 742 378 364 Chikka Dankankal 6016732 - 2 48 9 39 1,014 464 550 Jeeral 6016742 - 2 7 4 3 1,415 612 803 Jeeralkalgudi 601675
- - - 9 4 5 1,145 487 658 Hire Dankankal 601676- - - 8 3 5 679 306 373 Gudur 601677
3 - 3 26 15 11 1,492 693 799 Mylapur 6016785 3 2 49 32 17 2,296 977 1,319 Bevinhal 6016796 5 1 86 60 26 2,137 838 1,299 Pannapur 601680
40 18 22 905 613 292 17,359 6,658 10,701 Karatgi 6016815 2 3 41 25 16 2,512 1,079 1,433 Challur 601682
35 16 19 69 41 28 1,291 583 708 Somanhal 6016837 1 6 4 3 1 1,416 575 841 Tondihal 6016844 - 4 13 6 7 512 255 257 Hagedal 6016855 1 4 19 10 9 1,243 511 732 Juratgi 6016863 3 - 76 62 14 1,866 763 1,103 Hulkihal 6016872 1 1 57 23 34 2,935 1,176 1,759 Marlanahalli 601688
20 10 10 84 38 46 3,523 1,497 2,026 Yerdona 6016891 - 1 14 9 5 3,132 1,249 1,883 Budugumpa 6016901 - 1 3 2 1 654 265 389 Timmapur 6016911 1 - 2 1 1 737 271 466 Halsamudra 6016922 1 1 19 8 11 1,959 799 1,160 Singanhal 6016935 3 2 44 37 7 3,138 1,324 1,814 Gundur 601694
- - - 5 1 4 162 71 91 Krishnapur 60169541 30 11 121 78 43 5,484 2,200 3,284 Siddapur 601696
- - - 16 13 3 1,260 507 753 Bargur 6016978 2 6 42 28 14 2,623 1,062 1,561 Mustur 601698
- - - 30 19 11 1,630 691 939 Kuntoji 601699- - - 6 4 2 493 213 280 Kottankal 601700
1 - 1 9 6 3 1,346 594 752 Eliganoor 601701- - - 5 2 3 941 470 471 Jamapur 601702
6 3 3 32 7 25 1,538 755 783 Ulenoor 6017034 2 2 2 2 - 1,077 501 576 Bennur 6017042 1 1 7 5 2 738 360 378 Nandihalli 6017054 3 1 9 2 7 807 409 398 Kakkargol 601706
- - - - - - 206 107 99 Shalignoor 601707URBAN
30 23 7 394 284 110 5,410 1,928 3,482 Waddarhatti (OG) WARD NO.-0032 (Rural MDDS CODE:601708)
803072
125

DISTRICT CENSUS HANDBOOK : KOPPAL
VILLAGE PRIMARY
Persons Males Females Persons Males Females1 2 3 4 5 6 7 8 9 10
0035 Koppal (Total) 1,36,860.98 59,091 3,07,083 1,55,547 1,51,536 44,882 22,809 22,073 0035 Koppal (Rural) 1,36,417.98 57,235 2,98,411 1,51,154 1,47,257 43,827 22,268 21,559 0035 Koppal (Urban) 443.00 1,856 8,672 4,393 4,279 1,055 541 514
RURAL601709 Gudigera 151.81 189 988 497 491 154 79 75 601710 Kawaloor 10,307.48 1,554 7,252 3,642 3,610 1,036 531 505 601711 Handral 769.77 342 1,863 940 923 262 131 131 601712 Hanwal 829.15 154 800 392 408 93 50 43 601713 Wadganhal 598.25 468 2,296 1,180 1,116 320 165 155 601714 Halgera 2,019.05 743 3,730 1,851 1,879 450 225 225 601715 Katrahalli 977.14 189 1,024 495 529 158 72 86 601716 Narsipur 260.02601717 Hiresindogi 1,812.92 877 4,199 2,094 2,105 600 323 277 601718 Chiksindogi 696.45 260 1,387 694 693 209 102 107 601719 Dombarhalli 238.62 193 984 526 458 114 68 46 601720 Belur 785.57 380 1,890 1,000 890 280 151 129 601721 Bisarhalli 1,394.26 845 4,316 2,236 2,080 585 312 273 601722 Bikanhalli 796.95 166 855 437 418 120 65 55 601723 Mainahalli 824.83 399 2,029 1,037 992 252 134 118 601724 Alwandi 4,560.81 1,516 7,176 3,578 3,598 770 388 382 601725 Murlapur 633.38 121 592 296 296 65 32 33 601726 Allipur 467.62601727 Ghatreddihal 1,032.15 211 835 425 410 86 46 40 601728 Belgatti 497.08 245 1,416 734 682 180 100 80 601729 Hatti 830.10 410 2,400 1,215 1,185 348 179 169 601730 Raghunathanhalli 637.34 120 570 292 278 79 44 35 601731 Kalhalli 494.71601732 Hydernagar 421.34 267 1,510 743 767 255 120 135 601733 Keslapur 365.17 100 596 311 285 98 48 50 601734 Halwagali 670.54 281 1,453 730 723 208 90 118 601735 Nilogipur 1,064.10 303 1,522 758 764 238 108 130 601736 Tigari 1,130.57 433 2,333 1,200 1,133 330 171 159 601737 Hunkuntiakkapur 1,234.62 403 2,079 1,059 1,020 333 175 158 601738 Bochanhalli 827.42 577 3,139 1,589 1,550 482 256 226 601739 Bhairapur 848.81 212 1,010 515 495 157 86 71 601740 Kampli 380.80 128 676 354 322 80 50 30 601741 Moranhalli 780.63 283 1,639 827 812 250 130 120 601742 Betgera 3,307.23 993 4,342 2,149 2,193 438 236 202 601743 Katarkigudlanur 3,847.04 845 4,708 2,381 2,327 668 347 321 601744 Neeralgi 1,375.14 371 1,952 983 969 228 115 113 601745 Mattur 1,333.49 374 1,997 1,054 943 293 164 129 601746 Madinur 1,441.50 517 2,544 1,250 1,294 355 180 175 601747 Devlapur 340.13 66 417 215 202 63 27 36 601748 Kalkera 684.85 279 1,717 886 831 271 147 124 601749 Hatti 830.09 223 1,133 588 545 183 103 80 601750 Chilwadgi 830.23 397 2,204 1,119 1,085 362 176 186 601751 Naregal 1,105.86 344 1,595 815 780 236 114 122 601752 Yettinhatti 1,175.21 272 1,347 666 681 191 87 104 601753 Ojanhalli 974.35 490 2,536 1,284 1,252 367 182 185 601754 Tankankal 752.92 238 1,322 658 664 208 109 99 601755 Hanmanhalli 320.55 146 1,028 508 520 169 74 95 601756 Kutganhalli 696.50 170 900 470 430 152 87 65 601757 Gabbur 396.04 219 1,230 642 588 189 94 95 601758 Ginigera 952.52 1,863 8,449 4,509 3,940 1,334 672 662 601759 Lingadahalli 202.48 166 862 427 435 128 70 58
Name of Village
Location code
number
Total population (including institutional and houseless
population)Area of
Village in hectares
Number of households
C D Block -
Population in the age-group 0-6
-------------Un-inhabited--------------
-------------Un-inhabited--------------
-------------Un-inhabited--------------
126

PRIMARY CENSUS ABSTRACT
CENSUS ABSTRACTKoppal
Persons Males Females Persons Males Females Persons Males Females11 12 13 14 15 16 17 18 19 2
63,882 32,124 31,758 28,968 14,670 14,298 1,79,339 1,05,015 74,324 Koppal (Total)61,987 31,162 30,825 28,647 14,521 14,126 1,72,670 1,01,394 71,276 Koppal (Rural)1,895 962 933 321 149 172 6,669 3,621 3,048 Koppal (Urban)
RURAL328 161 167 20 11 9 586 344 242 Gudigera
1,948 931 1,017 707 359 348 4,176 2,468 1,708 Kawaloor189 97 92 219 108 111 1,173 706 467 Handral27 10 17 2 1 1 565 311 254 Hanwal
192 99 93 89 44 45 1,351 819 532 Wadganhal407 191 216 164 86 78 2,357 1,334 1,023 Halgera67 32 35 41 23 18 644 361 283 Katrahalli
Narsipur641 308 333 208 103 105 2,463 1,432 1,031 Hiresindogi89 45 44 86 42 44 771 478 293 Chiksindogi
129 72 57 108 58 50 707 420 287 Dombarhalli349 173 176 207 111 96 958 608 350 Belur
1,228 629 599 79 47 32 2,568 1,578 990 Bisarhalli261 135 126 40 15 25 550 321 229 Bikanhalli353 167 186 46 22 24 1,319 786 533 Mainahalli
1,466 725 741 360 167 193 4,927 2,763 2,164 Alwandi91 44 47 60 31 29 392 229 163 Murlapur
Allipur194 94 100 86 48 38 501 315 186 Ghatreddihal20 13 7 241 130 111 873 523 350 Belgatti25 13 12 211 107 104 1,327 786 541 Hatti85 40 45 2 2 - 363 218 145 Raghunathanhalli
Kalhalli1,337 662 675 59 27 32 712 423 289 Hydernagar
81 44 37 276 136 140 461 257 204 Keslapur171 76 95 196 104 92 851 503 348 Halwagali186 85 101 436 220 216 754 439 315 Nilogipur223 114 109 529 286 243 1,406 837 569 Tigari371 180 191 493 246 247 998 600 398 Hunkuntiakkapur436 214 222 813 407 406 1,712 1,026 686 Bochanhalli- - - 2 1 1 534 341 193 Bhairapur
3 1 2 21 12 9 490 280 210 Kampli3 1 2 - - - 943 580 363 Moranhalli
691 317 374 519 260 259 2,881 1,642 1,239 Betgera1,225 598 627 492 250 242 2,756 1,568 1,188 Katarkigudlanur
317 171 146 413 203 210 1,234 725 509 Neeralgi324 167 157 159 82 77 1,215 732 483 Mattur647 318 329 156 79 77 1,506 850 656 Madinur13 6 7 - - - 220 134 86 Devlapur
841 437 404 191 97 94 872 568 304 Kalkera178 95 83 330 164 166 732 424 308 Hatti308 158 150 622 311 311 1,130 706 424 Chilwadgi476 227 249 7 4 3 796 504 292 Naregal311 150 161 29 13 16 800 471 329 Yettinhatti364 175 189 122 64 58 1,500 914 586 Ojanhalli175 97 78 37 20 17 586 339 247 Tankankal112 54 58 556 272 284 437 259 178 Hanmanhalli46 25 21 156 82 74 492 299 193 Kutganhalli
234 128 106 5 2 3 641 397 244 Gabbur2,346 1,190 1,156 532 280 252 5,255 3,232 2,023 Ginigera
104 46 58 - - - 511 290 221 Lingadahalli
Name of VillageLiteratesScheduled Castes population Scheduled Tribes population
-------------Un-inhabited--------------
-------------Un-inhabited--------------
-------------Un-inhabited--------------
127
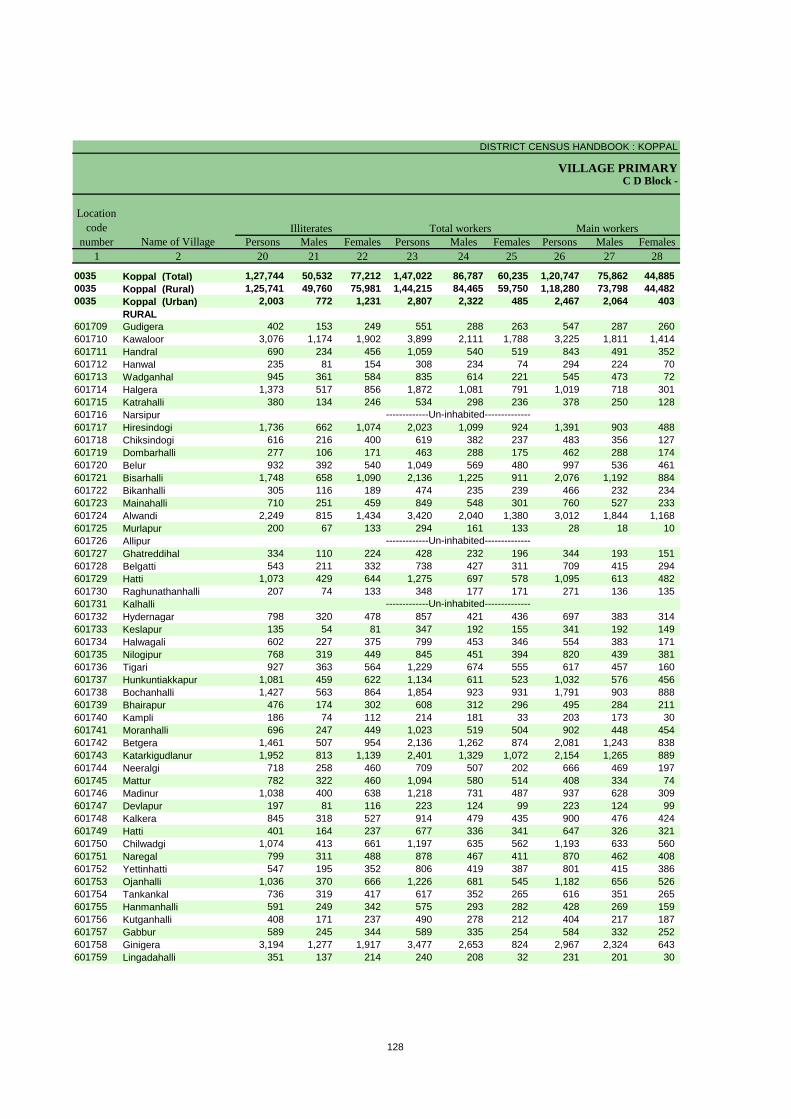
DISTRICT CENSUS HANDBOOK : KOPPAL
VILLAGE PRIMARYC D Block -
Persons Males Females Persons Males Females Persons Males Females1 2 20 21 22 23 24 25 26 27 28
0035 Koppal (Total) 1,27,744 50,532 77,212 1,47,022 86,787 60,235 1,20,747 75,862 44,885 0035 Koppal (Rural) 1,25,741 49,760 75,981 1,44,215 84,465 59,750 1,18,280 73,798 44,482 0035 Koppal (Urban) 2,003 772 1,231 2,807 2,322 485 2,467 2,064 403
RURAL601709 Gudigera 402 153 249 551 288 263 547 287 260 601710 Kawaloor 3,076 1,174 1,902 3,899 2,111 1,788 3,225 1,811 1,414 601711 Handral 690 234 456 1,059 540 519 843 491 352 601712 Hanwal 235 81 154 308 234 74 294 224 70 601713 Wadganhal 945 361 584 835 614 221 545 473 72 601714 Halgera 1,373 517 856 1,872 1,081 791 1,019 718 301 601715 Katrahalli 380 134 246 534 298 236 378 250 128 601716 Narsipur601717 Hiresindogi 1,736 662 1,074 2,023 1,099 924 1,391 903 488 601718 Chiksindogi 616 216 400 619 382 237 483 356 127 601719 Dombarhalli 277 106 171 463 288 175 462 288 174 601720 Belur 932 392 540 1,049 569 480 997 536 461 601721 Bisarhalli 1,748 658 1,090 2,136 1,225 911 2,076 1,192 884 601722 Bikanhalli 305 116 189 474 235 239 466 232 234 601723 Mainahalli 710 251 459 849 548 301 760 527 233 601724 Alwandi 2,249 815 1,434 3,420 2,040 1,380 3,012 1,844 1,168 601725 Murlapur 200 67 133 294 161 133 28 18 10 601726 Allipur601727 Ghatreddihal 334 110 224 428 232 196 344 193 151 601728 Belgatti 543 211 332 738 427 311 709 415 294 601729 Hatti 1,073 429 644 1,275 697 578 1,095 613 482 601730 Raghunathanhalli 207 74 133 348 177 171 271 136 135 601731 Kalhalli601732 Hydernagar 798 320 478 857 421 436 697 383 314 601733 Keslapur 135 54 81 347 192 155 341 192 149 601734 Halwagali 602 227 375 799 453 346 554 383 171 601735 Nilogipur 768 319 449 845 451 394 820 439 381 601736 Tigari 927 363 564 1,229 674 555 617 457 160 601737 Hunkuntiakkapur 1,081 459 622 1,134 611 523 1,032 576 456 601738 Bochanhalli 1,427 563 864 1,854 923 931 1,791 903 888 601739 Bhairapur 476 174 302 608 312 296 495 284 211 601740 Kampli 186 74 112 214 181 33 203 173 30 601741 Moranhalli 696 247 449 1,023 519 504 902 448 454 601742 Betgera 1,461 507 954 2,136 1,262 874 2,081 1,243 838 601743 Katarkigudlanur 1,952 813 1,139 2,401 1,329 1,072 2,154 1,265 889 601744 Neeralgi 718 258 460 709 507 202 666 469 197 601745 Mattur 782 322 460 1,094 580 514 408 334 74 601746 Madinur 1,038 400 638 1,218 731 487 937 628 309 601747 Devlapur 197 81 116 223 124 99 223 124 99 601748 Kalkera 845 318 527 914 479 435 900 476 424 601749 Hatti 401 164 237 677 336 341 647 326 321 601750 Chilwadgi 1,074 413 661 1,197 635 562 1,193 633 560 601751 Naregal 799 311 488 878 467 411 870 462 408 601752 Yettinhatti 547 195 352 806 419 387 801 415 386 601753 Ojanhalli 1,036 370 666 1,226 681 545 1,182 656 526 601754 Tankankal 736 319 417 617 352 265 616 351 265 601755 Hanmanhalli 591 249 342 575 293 282 428 269 159 601756 Kutganhalli 408 171 237 490 278 212 404 217 187 601757 Gabbur 589 245 344 589 335 254 584 332 252 601758 Ginigera 3,194 1,277 1,917 3,477 2,653 824 2,967 2,324 643 601759 Lingadahalli 351 137 214 240 208 32 231 201 30
Name of Village
Location code
numberIlliterates Total workers Main workers
-------------Un-inhabited--------------
-------------Un-inhabited--------------
-------------Un-inhabited--------------
128

PRIMARY CENSUS ABSTRACT
CENSUS ABSTRACTKoppal
Persons Males Females Persons Males Females Persons Males Females Persons Males Females29 30 31 32 33 34 35 36 37 38 39 40 2
35,999 26,739 9,260 44,977 19,027 25,950 3,017 1,952 1,065 36,754 28,144 8,610 Koppal (Total)35,977 26,719 9,258 44,910 18,976 25,934 2,982 1,920 1,062 34,411 26,183 8,228 Koppal (Rural)
22 20 2 67 51 16 35 32 3 2,343 1,961 382 Koppal (Urban)RURAL
220 201 19 304 74 230 - - - 23 12 11 Gudigera755 537 218 1,861 817 1,044 67 49 18 542 408 134 Kawaloor532 333 199 205 71 134 8 7 1 98 80 18 Handral88 80 8 132 78 54 - - - 74 66 8 Hanwal
383 360 23 90 53 37 - - - 72 60 12 Wadganhal358 315 43 383 179 204 22 17 5 256 207 49 Halgera147 122 25 110 51 59 31 23 8 90 54 36 Katrahalli
Narsipur559 402 157 366 146 220 28 17 11 438 338 100 Hiresindogi177 159 18 158 79 79 13 7 6 135 111 24 Chiksindogi263 188 75 164 76 88 2 2 - 33 22 11 Dombarhalli262 222 40 600 199 401 6 4 2 129 111 18 Belur734 467 267 992 474 518 107 63 44 243 188 55 Bisarhalli233 150 83 214 67 147 3 2 1 16 13 3 Bikanhalli536 394 142 153 76 77 5 4 1 66 53 13 Mainahalli688 524 164 1,268 612 656 131 90 41 925 618 307 Alwandi
3 3 - 13 7 6 3 2 1 9 6 3 MurlapurAllipur
288 163 125 15 4 11 - - - 41 26 15 Ghatreddihal309 213 96 332 155 177 14 10 4 54 37 17 Belgatti304 216 88 585 229 356 9 6 3 197 162 35 Hatti
8 5 3 246 123 123 7 3 4 10 5 5 RaghunathanhalliKalhalli
284 266 18 398 107 291 1 1 - 14 9 5 Hydernagar198 185 13 1 - 1 - - - 142 7 135 Keslapur150 142 8 359 217 142 7 4 3 38 20 18 Halwagali348 254 94 411 144 267 12 7 5 49 34 15 Nilogipur184 172 12 376 238 138 - - - 57 47 10 Tigari386 308 78 512 178 334 15 9 6 119 81 38 Hunkuntiakkapur647 474 173 1,057 374 683 35 23 12 52 32 20 Bochanhalli89 87 2 354 151 203 7 5 2 45 41 4 Bhairapur24 20 4 39 21 18 75 73 2 65 59 6 Kampli
221 220 1 589 163 426 10 5 5 82 60 22 Moranhalli650 515 135 1,166 521 645 59 43 16 206 164 42 Betgera
1,219 803 416 667 243 424 17 15 2 251 204 47 Katarkigudlanur437 347 90 209 103 106 5 5 - 15 14 1 Neeralgi268 223 45 89 67 22 19 18 1 32 26 6 Mattur337 298 39 430 190 240 16 16 - 154 124 30 Madinur67 40 27 134 71 63 2 1 1 20 12 8 Devlapur
347 172 175 380 164 216 - - - 173 140 33 Kalkera314 169 145 309 142 167 3 - 3 21 15 6 Hatti396 230 166 540 186 354 22 15 7 235 202 33 Chilwadgi320 166 154 306 121 185 9 7 2 235 168 67 Naregal107 105 2 349 68 281 17 15 2 328 227 101 Yettinhatti292 231 61 556 157 399 6 4 2 328 264 64 Ojanhalli358 214 144 89 33 56 20 13 7 149 91 58 Tankankal297 194 103 81 34 47 12 7 5 38 34 4 Hanmanhalli325 176 149 48 18 30 4 2 2 27 21 6 Kutganhalli243 168 75 305 132 173 13 10 3 23 22 1 Gabbur379 282 97 461 192 269 65 45 20 2,062 1,805 257 Ginigera34 33 1 148 128 20 - - - 49 40 9 Lingadahalli
CultivatorsName of Village
Household industry workersAgricultural labourers
Industrial category of main workers
Other workers
-------------Un-inhabited--------------
-------------Un-inhabited--------------
-------------Un-inhabited--------------
129

DISTRICT CENSUS HANDBOOK : KOPPAL
VILLAGE PRIMARYC D Block -
Persons Males Females Persons Males Females Persons Males Females1 2 41 42 43 44 45 46 47 48 49
0035 Koppal (Total) 26,275 10,925 15,350 2,697 1,085 1,612 15,311 5,071 10,240 0035 Koppal (Rural) 25,935 10,667 15,268 2,694 1,082 1,612 15,275 5,044 10,231 0035 Koppal (Urban) 340 258 82 3 3 - 36 27 9
RURAL601709 Gudigera 4 1 3 1 1 - 2 - 2 601710 Kawaloor 674 300 374 89 28 61 480 202 278 601711 Handral 216 49 167 10 1 9 189 41 148 601712 Hanwal 14 10 4 3 3 - 8 5 3 601713 Wadganhal 290 141 149 19 11 8 172 66 106 601714 Halgera 853 363 490 48 23 25 458 165 293 601715 Katrahalli 156 48 108 3 2 1 76 14 62 601716 Narsipur601717 Hiresindogi 632 196 436 110 31 79 354 74 280 601718 Chiksindogi 136 26 110 1 1 - 122 18 104 601719 Dombarhalli 1 - 1 - - - 1 - 1 601720 Belur 52 33 19 6 4 2 37 21 16 601721 Bisarhalli 60 33 27 12 5 7 18 6 12 601722 Bikanhalli 8 3 5 - - - 5 2 3 601723 Mainahalli 89 21 68 52 9 43 25 5 20 601724 Alwandi 408 196 212 68 32 36 155 60 95 601725 Murlapur 266 143 123 64 60 4 188 73 115 601726 Allipur601727 Ghatreddihal 84 39 45 63 28 35 3 1 2 601728 Belgatti 29 12 17 1 - 1 21 8 13 601729 Hatti 180 84 96 13 5 8 113 35 78 601730 Raghunathanhalli 77 41 36 8 4 4 22 13 9 601731 Kalhalli601732 Hydernagar 160 38 122 1 1 - 156 37 119 601733 Keslapur 6 - 6 - - - - - - 601734 Halwagali 245 70 175 22 12 10 76 20 56 601735 Nilogipur 25 12 13 5 5 - 14 4 10 601736 Tigari 612 217 395 51 33 18 530 160 370 601737 Hunkuntiakkapur 102 35 67 12 5 7 59 17 42 601738 Bochanhalli 63 20 43 13 5 8 34 8 26 601739 Bhairapur 113 28 85 3 2 1 98 15 83 601740 Kampli 11 8 3 1 1 - 1 1 - 601741 Moranhalli 121 71 50 - - - 116 67 49 601742 Betgera 55 19 36 8 4 4 38 8 30 601743 Katarkigudlanur 247 64 183 23 14 9 175 22 153 601744 Neeralgi 43 38 5 2 2 - 18 17 1 601745 Mattur 686 246 440 19 11 8 553 177 376 601746 Madinur 281 103 178 12 9 3 192 39 153 601747 Devlapur - - - - - - - - - 601748 Kalkera 14 3 11 1 - 1 6 2 4 601749 Hatti 30 10 20 - - - 29 10 19 601750 Chilwadgi 4 2 2 2 1 1 1 - 1 601751 Naregal 8 5 3 - - - 5 2 3 601752 Yettinhatti 5 4 1 - - - 1 1 - 601753 Ojanhalli 44 25 19 10 4 6 15 6 9 601754 Tankankal 1 1 - 1 1 - - - - 601755 Hanmanhalli 147 24 123 23 1 22 117 19 98 601756 Kutganhalli 86 61 25 5 1 4 51 34 17 601757 Gabbur 5 3 2 1 1 - 4 2 2 601758 Ginigera 510 329 181 18 10 8 61 13 48 601759 Lingadahalli 9 7 2 2 2 - 4 3 1
Name of VillageMarginal workers Cultivators Agricultural labourers
Industrial category Location
code number
-------------Un-inhabited--------------
-------------Un-inhabited--------------
-------------Un-inhabited--------------
130

PRIMARY CENSUS ABSTRACT
CENSUS ABSTRACTKoppal
Persons Males Females Persons Males Females Persons Males Females50 51 52 53 54 55 56 57 58 2 1
928 442 486 7,339 4,327 3,012 1,60,061 68,760 91,301 Koppal (Total) 0035866 385 481 7,100 4,156 2,944 1,54,196 66,689 87,507 Koppal (Rural) 003562 57 5 239 171 68 5,865 2,071 3,794 Koppal (Urban) 0035
RURAL- - - 1 - 1 437 209 228 Gudigera 60170924 12 12 81 58 23 3,353 1,531 1,822 Kawaloor 601710
- - - 17 7 10 804 400 404 Handral 6017111 1 - 2 1 1 492 158 334 Hanwal 601712
27 17 10 72 47 25 1,461 566 895 Wadganhal 60171347 19 28 300 156 144 1,858 770 1,088 Halgera 6017145 1 4 72 31 41 490 197 293 Katrahalli 601715
Narsipur 60171616 2 14 152 89 63 2,176 995 1,181 Hiresindogi 601717
- - - 13 7 6 768 312 456 Chiksindogi 601718- - - - - - 521 238 283 Dombarhalli 601719- - - 9 8 1 841 431 410 Belur 60172011 6 5 19 16 3 2,180 1,011 1,169 Bisarhalli 601721
- - - 3 1 2 381 202 179 Bikanhalli 6017221 - 1 11 7 4 1,180 489 691 Mainahalli 601723
120 54 66 65 50 15 3,756 1,538 2,218 Alwandi 6017241 - 1 13 10 3 298 135 163 Murlapur 601725
Allipur 6017265 1 4 13 9 4 407 193 214 Ghatreddihal 6017272 1 1 5 3 2 678 307 371 Belgatti 6017282 2 - 52 42 10 1,125 518 607 Hatti 601729
21 12 9 26 12 14 222 115 107 Raghunathanhalli 601730Kalhalli 601731
2 - 2 1 - 1 653 322 331 Hydernagar 601732- - - 6 - 6 249 119 130 Keslapur 601733
3 - 3 144 38 106 654 277 377 Halwagali 601734- - - 6 3 3 677 307 370 Nilogipur 601735
1 - 1 30 24 6 1,104 526 578 Tigari 6017364 - 4 27 13 14 945 448 497 Hunkuntiakkapur 6017372 - 2 14 7 7 1,285 666 619 Bochanhalli 6017382 2 - 10 9 1 402 203 199 Bhairapur 6017393 3 - 6 3 3 462 173 289 Kampli 6017403 2 1 2 2 - 616 308 308 Moranhalli 6017411 1 - 8 6 2 2,206 887 1,319 Betgera 6017426 5 1 43 23 20 2,307 1,052 1,255 Katarkigudlanur 6017434 4 - 19 15 4 1,243 476 767 Neeralgi 601744
16 4 12 98 54 44 903 474 429 Mattur 6017454 3 1 73 52 21 1,326 519 807 Madinur 601746
- - - - - - 194 91 103 Devlapur 601747- - - 7 1 6 803 407 396 Kalkera 601748- - - 1 - 1 456 252 204 Hatti 601749
1 1 - - - - 1,007 484 523 Chilwadgi 601750- - - 3 3 - 717 348 369 Naregal 601751- - - 4 3 1 541 247 294 Yettinhatti 601752- - - 19 15 4 1,310 603 707 Ojanhalli 601753- - - - - - 705 306 399 Tankankal 601754
2 2 - 5 2 3 453 215 238 Hanmanhalli 6017559 9 - 21 17 4 410 192 218 Kutganhalli 601756
- - - - - - 641 307 334 Gabbur 60175711 5 6 420 301 119 4,972 1,856 3,116 Ginigera 601758
- - - 3 2 1 622 219 403 Lingadahalli 601759
Location code
numberHousehold industry workers
Name of VillageOther workers Non-workers
of marginal workers
-------------Un-inhabited--------------
-------------Un-inhabited--------------
-------------Un-inhabited--------------
131

DISTRICT CENSUS HANDBOOK : KOPPAL
VILLAGE PRIMARY
Persons Males Females Persons Males Females1 2 3 4 5 6 7 8 9 10
Name of Village
Location code
number
Total population (including institutional and houseless
population)Area of
Village in hectares
Number of households
C D Block -
Population in the age-group 0-6
601760 Shahapur 376.71 369 1,978 982 996 323 161 162 601761 Rudrapura 295.99 44 173 88 85 22 10 12 601762 Kanakapur 651.19 505 2,543 1,319 1,224 389 191 198 601763 Allanagar 285.34 257 1,212 627 585 168 90 78 601764 Basapur 1,070.56 389 2,095 1,085 1,010 395 195 200 601765 Kidadhal 701.61 177 1,023 518 505 200 102 98 601766 Koppal (Rural) 3,500.18 3,806 18,988 9,629 9,359 2,409 1,249 1,160 601767 Dadegal 486.20 208 1,003 513 490 166 81 85 601768 Kolur 586.51 334 1,678 840 838 217 113 104 601769 Mangalapur 189.05 228 1,340 678 662 205 107 98 601770 Horthatanhal 271.79 179 1,001 488 513 148 62 86 601771 Gunhalli 333.00 164 869 423 446 139 74 65 601772 Chukankal 486.43 243 1,245 627 618 171 88 83 601773 Bahaddurbandi 788.10 504 2,872 1,505 1,367 419 243 176 601774 Huvinhal 571.29 159 885 427 458 146 73 73 601775 Halwarti 989.04 470 2,477 1,259 1,218 465 223 242 601776 Hireboganhal 1,427.84 471 2,411 1,271 1,140 359 202 157 601777 Kunikera 1,478.52 577 3,471 1,781 1,690 619 313 306 601778 Hoshalli 429.95 352 1,996 999 997 337 160 177 601779 Muddaballi 1,048.88 468 2,450 1,223 1,227 286 145 141 601780 Budihal 317.42 178 831 401 430 109 51 58 601781 Gondbal 1,516.95 818 4,341 2,258 2,083 501 246 255 601782 Hyati 1,952.86 399 2,314 1,164 1,150 340 177 163 601783 Mellikeri 549.62 82 484 237 247 93 43 50 601784 Lachankera 2,111.30 574 3,282 1,675 1,607 481 237 244 601785 Chikboganhal 1,223.27 266 1,488 768 720 265 122 143 601786 Karkihalli 4,636.13 407 2,428 1,221 1,207 391 205 186 601787 Sidaganhalli 371.99 66 472 239 233 98 43 55 601788 Hiresulikeri 915.18 258 1,869 956 913 381 189 192 601789 Achartimmapur 741.59 15 112 58 54 28 12 16 601790 Challari 612.62 287 1,567 789 778 316 156 160 601791 Hirebommanhal 1,189.03 400 2,424 1,252 1,172 401 204 197 601792 Chikbommanhal 767.23 330 2,012 1,027 985 309 169 140 601793 Ganganhal 377.98 139 890 472 418 159 86 73 601794 Uplapur 222.79 81 488 245 243 83 48 35 601795 Chiksulikeri 423.32 135 1,015 506 509 173 79 94 601796 Hasgal 662.68 246 1,316 673 643 162 103 59 601797 Hosur 637.88 148 1,008 501 507 190 86 104 601798 Chilkmukki 799.26 310 1,774 883 891 243 110 133 601799 Kodadhal 438.47 189 1,009 514 495 147 78 69 601800 Chamalapura 351.61 184 948 474 474 144 80 64 601801 Gosaldoddi 182.87 83 459 234 225 77 41 36 601802 Jinnapur 529.63 249 1,434 724 710 239 113 126 601803 Metgal 659.19 175 802 424 378 86 45 41 601804 Arsinkera 1,132.11 177 1,062 525 537 221 99 122 601805 Wanballary 1,005.14 392 2,436 1,225 1,211 442 236 206 601806 Hosahalli 286.13 6 28 13 15 3 2 1 601807 Kenchandoni 329.97 163 1,108 557 551 273 132 141 601808 Irkalgada 1,156.90 869 4,155 2,109 2,046 601 299 302 601809 Wadderhatti 189.56 104 616 290 326 83 39 44 601810 Hanmanhatti 481.43 167 861 432 429 148 67 81 601811 Mudlapur 284.33 117 555 272 283 86 39 47 601812 Kinhal 1,463.63 1,995 9,802 4,936 4,866 1,206 605 601 601813 Budsettinhal 610.03 252 1,241 639 602 184 85 99 601814 Taad Kanakapur 577.36 241 1,370 707 663 211 112 99
132

PRIMARY CENSUS ABSTRACT
CENSUS ABSTRACTKoppal
Persons Males Females Persons Males Females Persons Males Females11 12 13 14 15 16 17 18 19 2
Name of VillageLiteratesScheduled Castes population Scheduled Tribes population
269 138 131 8 4 4 1,010 607 403 Shahapur- - - 24 11 13 117 64 53 Rudrapura
1,020 523 497 224 111 113 1,652 981 671 Kanakapur174 76 98 43 20 23 703 403 300 Allanagar372 183 189 53 29 24 1,078 643 435 Basapur177 83 94 170 92 78 438 255 183 Kidadhal
3,652 1,915 1,737 648 311 337 13,229 7,311 5,918 Koppal (Rural)117 66 51 264 130 134 651 387 264 Dadegal95 42 53 72 37 35 1,135 650 485 Kolur
129 73 56 89 46 43 737 429 308 Mangalapur113 57 56 98 41 57 572 339 233 Horthatanhal66 33 33 99 52 47 435 258 177 Gunhalli
276 125 151 185 91 94 684 394 290 Chukankal209 105 104 159 84 75 1,707 1,025 682 Bahaddurbandi116 57 59 118 52 66 456 257 199 Huvinhal445 231 214 50 27 23 1,128 696 432 Halwarti313 170 143 42 26 16 1,457 846 611 Hireboganhal
2,010 1,012 998 217 109 108 1,644 1,047 597 Kunikera258 127 131 76 38 38 1,137 685 452 Hoshalli387 197 190 188 94 94 1,590 913 677 Muddaballi156 75 81 108 52 56 482 277 205 Budihal608 323 285 46 24 22 2,781 1,667 1,114 Gondbal304 150 154 427 220 207 1,414 799 615 Hyati225 118 107 49 22 27 252 143 109 Mellikeri705 343 362 848 434 414 1,931 1,176 755 Lachankera272 139 133 247 120 127 835 519 316 Chikboganhal530 264 266 108 63 45 1,204 727 477 Karkihalli58 29 29 349 172 177 274 168 106 Sidaganhalli
1,188 594 594 381 211 170 996 618 378 Hiresulikeri- - - 10 3 7 35 21 14 Achartimmapur82 43 39 374 191 183 764 480 284 Challari
327 160 167 39 23 16 1,233 774 459 Hirebommanhal244 134 110 596 298 298 1,094 634 460 Chikbommanhal57 30 27 272 151 121 504 324 180 Ganganhal6 4 2 81 48 33 210 125 85 Uplapur
29 14 15 439 223 216 441 281 160 Chiksulikeri311 156 155 46 23 23 827 473 354 Hasgal193 92 101 149 70 79 451 266 185 Hosur721 374 347 45 21 24 1,088 641 447 Chilkmukki279 144 135 6 4 2 583 357 226 Kodadhal148 82 66 54 22 32 444 252 192 Chamalapura105 52 53 1 1 - 177 108 69 Gosaldoddi951 488 463 2 1 1 683 427 256 Jinnapur330 177 153 14 7 7 537 339 198 Metgal349 173 176 238 116 122 566 333 233 Arsinkera197 101 96 406 209 197 1,022 634 388 Wanballary- - - - - - 18 8 10 Hosahalli
1,072 538 534 28 15 13 541 341 200 Kenchandoni543 289 254 623 316 307 2,180 1,274 906 Irkalgada
8 6 2 - - - 344 180 164 Wadderhatti215 109 106 13 5 8 448 279 169 Hanmanhatti168 73 95 3 1 2 334 206 128 Mudlapur
1,276 633 643 664 336 328 6,346 3,609 2,737 Kinhal137 72 65 339 172 167 707 460 247 Budsettinhal819 422 397 36 17 19 704 444 260 Taad Kanakapur
133

DISTRICT CENSUS HANDBOOK : KOPPAL
VILLAGE PRIMARYC D Block -
Persons Males Females Persons Males Females Persons Males Females1 2 20 21 22 23 24 25 26 27 28
Name of Village
Location code
numberIlliterates Total workers Main workers
601760 Shahapur 968 375 593 1,072 546 526 1,034 527 507 601761 Rudrapura 56 24 32 85 56 29 84 56 28 601762 Kanakapur 891 338 553 1,142 737 405 1,108 719 389 601763 Allanagar 509 224 285 575 364 211 414 289 125 601764 Basapur 1,017 442 575 804 525 279 770 502 268 601765 Kidadhal 585 263 322 496 288 208 491 284 207 601766 Koppal (Rural) 5,759 2,318 3,441 7,618 5,297 2,321 6,871 4,852 2,019 601767 Dadegal 352 126 226 587 304 283 582 301 281 601768 Kolur 543 190 353 892 460 432 881 456 425 601769 Mangalapur 603 249 354 595 393 202 582 382 200 601770 Horthatanhal 429 149 280 537 271 266 516 261 255 601771 Gunhalli 434 165 269 485 244 241 482 242 240 601772 Chukankal 561 233 328 632 363 269 458 281 177 601773 Bahaddurbandi 1,165 480 685 1,340 780 560 1,234 762 472 601774 Huvinhal 429 170 259 504 261 243 444 250 194 601775 Halwarti 1,349 563 786 1,298 683 615 1,252 666 586 601776 Hireboganhal 954 425 529 1,262 709 553 604 484 120 601777 Kunikera 1,827 734 1,093 1,718 956 762 1,362 871 491 601778 Hoshalli 859 314 545 1,017 544 473 395 270 125 601779 Muddaballi 860 310 550 1,233 745 488 978 655 323 601780 Budihal 349 124 225 433 214 219 429 213 216 601781 Gondbal 1,560 591 969 2,221 1,305 916 1,485 1,026 459 601782 Hyati 900 365 535 906 630 276 895 623 272 601783 Mellikeri 232 94 138 242 120 122 45 37 8 601784 Lachankera 1,351 499 852 1,880 975 905 1,682 894 788 601785 Chikboganhal 653 249 404 766 432 334 756 428 328 601786 Karkihalli 1,224 494 730 1,363 705 658 1,217 629 588 601787 Sidaganhalli 198 71 127 282 151 131 275 149 126 601788 Hiresulikeri 873 338 535 928 479 449 406 334 72 601789 Achartimmapur 77 37 40 61 33 28 61 33 28 601790 Challari 803 309 494 857 434 423 730 414 316 601791 Hirebommanhal 1,191 478 713 1,191 617 574 751 582 169 601792 Chikbommanhal 918 393 525 1,145 589 556 1,070 568 502 601793 Ganganhal 386 148 238 491 262 229 488 260 228 601794 Uplapur 278 120 158 293 138 155 293 138 155 601795 Chiksulikeri 574 225 349 588 309 279 347 208 139 601796 Hasgal 489 200 289 752 389 363 320 257 63 601797 Hosur 557 235 322 456 276 180 437 265 172 601798 Chilkmukki 686 242 444 893 494 399 336 241 95 601799 Kodadhal 426 157 269 547 295 252 384 274 110 601800 Chamalapura 504 222 282 463 272 191 463 272 191 601801 Gosaldoddi 282 126 156 275 142 133 254 140 114 601802 Jinnapur 751 297 454 727 368 359 689 350 339 601803 Metgal 265 85 180 491 259 232 476 257 219 601804 Arsinkera 496 192 304 560 283 277 474 261 213 601805 Wanballary 1,414 591 823 1,114 578 536 651 459 192 601806 Hosahalli 10 5 5 16 7 9 7 7 - 601807 Kenchandoni 567 216 351 594 304 290 285 248 37 601808 Irkalgada 1,975 835 1,140 1,901 1,160 741 1,759 1,086 673 601809 Wadderhatti 272 110 162 326 169 157 323 169 154 601810 Hanmanhatti 413 153 260 454 234 220 440 230 210 601811 Mudlapur 221 66 155 274 164 110 268 164 104 601812 Kinhal 3,456 1,327 2,129 4,549 2,758 1,791 4,046 2,542 1,504 601813 Budsettinhal 534 179 355 543 371 172 204 186 18 601814 Taad Kanakapur 666 263 403 670 369 301 640 359 281
134

PRIMARY CENSUS ABSTRACT
CENSUS ABSTRACTKoppal
Persons Males Females Persons Males Females Persons Males Females Persons Males Females29 30 31 32 33 34 35 36 37 38 39 40 2
CultivatorsName of Village
Household industry workersAgricultural labourers
Industrial category of main workers
Other workers
197 121 76 576 227 349 15 8 7 246 171 75 Shahapur12 5 7 3 2 1 - - - 69 49 20 Rudrapura
160 101 59 28 11 17 44 26 18 876 581 295 Kanakapur76 50 26 43 29 14 12 7 5 283 203 80 Allanagar
220 190 30 274 93 181 2 2 - 274 217 57 Basapur100 71 29 266 114 152 5 4 1 120 95 25 Kidadhal321 261 60 399 247 152 456 290 166 5,695 4,054 1,641 Koppal (Rural)55 48 7 496 228 268 4 2 2 27 23 4 Dadegal
293 154 139 509 233 276 1 1 - 78 68 10 Kolur100 70 30 147 29 118 2 1 1 333 282 51 Mangalapur209 105 104 171 80 91 17 9 8 119 67 52 Horthatanhal77 76 1 334 109 225 10 7 3 61 50 11 Gunhalli55 44 11 174 37 137 18 14 4 211 186 25 Chukankal
202 151 51 373 85 288 21 13 8 638 513 125 Bahaddurbandi76 75 1 118 21 97 - - - 250 154 96 Huvinhal
268 231 37 815 303 512 2 - 2 167 132 35 Halwarti206 185 21 130 71 59 17 16 1 251 212 39 Hireboganhal508 450 58 609 250 359 31 18 13 214 153 61 Kunikera170 127 43 101 54 47 4 1 3 120 88 32 Hoshalli363 325 38 470 215 255 13 9 4 132 106 26 Muddaballi143 132 11 230 35 195 - - - 56 46 10 Budihal398 329 69 613 311 302 45 30 15 429 356 73 Gondbal435 411 24 238 105 133 - - - 222 107 115 Hyati29 27 2 7 4 3 - - - 9 6 3 Mellikeri
143 123 20 1,361 636 725 15 5 10 163 130 33 Lachankera234 180 54 271 62 209 44 26 18 207 160 47 Chikboganhal755 379 376 336 152 184 8 7 1 118 91 27 Karkihalli24 15 9 249 133 116 - - - 2 1 1 Sidaganhalli
307 267 40 53 25 28 3 1 2 43 41 2 Hiresulikeri32 20 12 26 10 16 - - - 3 3 - Achartimmapur
358 314 44 301 51 250 9 7 2 62 42 20 Challari537 463 74 117 50 67 12 8 4 85 61 24 Hirebommanhal630 394 236 325 92 233 43 29 14 72 53 19 Chikbommanhal446 241 205 7 4 3 11 5 6 24 10 14 Ganganhal284 133 151 7 4 3 - - - 2 1 1 Uplapur138 126 12 203 77 126 3 2 1 3 3 - Chiksulikeri195 160 35 59 43 16 19 18 1 47 36 11 Hasgal212 110 102 76 20 56 1 1 - 148 134 14 Hosur115 95 20 113 70 43 2 2 - 106 74 32 Chilkmukki139 120 19 135 68 67 26 18 8 84 68 16 Kodadhal64 62 2 307 143 164 1 1 - 91 66 25 Chamalapura
139 76 63 61 23 38 18 15 3 36 26 10 Gosaldoddi120 112 8 508 198 310 2 1 1 59 39 20 Jinnapur120 112 8 292 92 200 - - - 64 53 11 Metgal202 181 21 265 75 190 2 2 - 5 3 2 Arsinkera552 401 151 47 29 18 - - - 52 29 23 Wanballary
7 7 - - - - - - - - - - Hosahalli132 130 2 151 117 34 - - - 2 1 1 Kenchandoni746 498 248 548 216 332 39 33 6 426 339 87 Irkalgada76 69 7 219 81 138 - - - 28 19 9 Wadderhatti
149 113 36 257 95 162 3 1 2 31 21 10 Hanmanhatti76 57 19 139 63 76 2 2 - 51 42 9 Mudlapur
466 337 129 1,045 460 585 365 201 164 2,170 1,544 626 Kinhal139 137 2 30 22 8 2 2 - 33 25 8 Budsettinhal170 139 31 384 153 231 - - - 86 67 19 Taad Kanakapur
135

DISTRICT CENSUS HANDBOOK : KOPPAL
VILLAGE PRIMARYC D Block -
Persons Males Females Persons Males Females Persons Males Females1 2 41 42 43 44 45 46 47 48 49
Name of VillageMarginal workers Cultivators Agricultural labourers
Industrial category Location
code number
601760 Shahapur 38 19 19 7 3 4 12 9 3 601761 Rudrapura 1 - 1 - - - - - - 601762 Kanakapur 34 18 16 3 2 1 2 - 2 601763 Allanagar 161 75 86 1 - 1 10 5 5 601764 Basapur 34 23 11 - - - 6 2 4 601765 Kidadhal 5 4 1 - - - - - - 601766 Koppal (Rural) 747 445 302 16 12 4 37 17 20 601767 Dadegal 5 3 2 2 2 - 1 - 1 601768 Kolur 11 4 7 2 2 - 3 1 2 601769 Mangalapur 13 11 2 2 2 - 5 3 2 601770 Horthatanhal 21 10 11 - - - 6 2 4 601771 Gunhalli 3 2 1 - - - 2 2 - 601772 Chukankal 174 82 92 3 1 2 62 11 51 601773 Bahaddurbandi 106 18 88 1 - 1 79 7 72 601774 Huvinhal 60 11 49 1 1 - 23 1 22 601775 Halwarti 46 17 29 9 3 6 26 9 17 601776 Hireboganhal 658 225 433 24 16 8 488 119 369 601777 Kunikera 356 85 271 14 9 5 239 33 206 601778 Hoshalli 622 274 348 25 17 8 328 106 222 601779 Muddaballi 255 90 165 21 13 8 201 56 145 601780 Budihal 4 1 3 - - - 3 - 3 601781 Gondbal 736 279 457 72 33 39 300 81 219 601782 Hyati 11 7 4 3 1 2 7 5 2 601783 Mellikeri 197 83 114 3 1 2 193 82 111 601784 Lachankera 198 81 117 9 4 5 163 62 101 601785 Chikboganhal 10 4 6 3 2 1 2 - 2 601786 Karkihalli 146 76 70 41 21 20 82 41 41 601787 Sidaganhalli 7 2 5 - - - 7 2 5 601788 Hiresulikeri 522 145 377 32 8 24 406 109 297 601789 Achartimmapur - - - - - - - - - 601790 Challari 127 20 107 1 - 1 122 19 103 601791 Hirebommanhal 440 35 405 392 21 371 19 4 15 601792 Chikbommanhal 75 21 54 13 3 10 45 15 30 601793 Ganganhal 3 2 1 1 1 - - - - 601794 Uplapur - - - - - - - - - 601795 Chiksulikeri 241 101 140 28 8 20 207 91 116 601796 Hasgal 432 132 300 40 13 27 378 119 259 601797 Hosur 19 11 8 4 1 3 8 6 2 601798 Chilkmukki 557 253 304 20 6 14 515 235 280 601799 Kodadhal 163 21 142 13 1 12 97 10 87 601800 Chamalapura - - - - - - - - - 601801 Gosaldoddi 21 2 19 11 1 10 9 - 9 601802 Jinnapur 38 18 20 1 1 - 33 14 19 601803 Metgal 15 2 13 - - - 11 1 10 601804 Arsinkera 86 22 64 3 1 2 81 20 61 601805 Wanballary 463 119 344 6 5 1 437 104 333 601806 Hosahalli 9 - 9 - - - 8 - 8 601807 Kenchandoni 309 56 253 7 5 2 300 50 250 601808 Irkalgada 142 74 68 13 11 2 111 50 61 601809 Wadderhatti 3 - 3 - - - 2 - 2 601810 Hanmanhatti 14 4 10 4 2 2 8 - 8 601811 Mudlapur 6 - 6 2 - 2 2 - 2 601812 Kinhal 503 216 287 18 9 9 202 58 144 601813 Budsettinhal 339 185 154 - - - 327 178 149 601814 Taad Kanakapur 30 10 20 4 3 1 22 5 17
136

PRIMARY CENSUS ABSTRACT
CENSUS ABSTRACTKoppal
Persons Males Females Persons Males Females Persons Males Females50 51 52 53 54 55 56 57 58 2 1
Location code
numberHousehold industry workers
Name of VillageOther workers Non-workers
of marginal workers
1 - 1 18 7 11 906 436 470 Shahapur 601760- - - 1 - 1 88 32 56 Rudrapura 601761
2 2 - 27 14 13 1,401 582 819 Kanakapur 601762- - - 150 70 80 637 263 374 Allanagar 601763- - - 28 21 7 1,291 560 731 Basapur 601764
1 1 - 4 3 1 527 230 297 Kidadhal 60176520 9 11 674 407 267 11,370 4,332 7,038 Koppal (Rural) 6017661 - 1 1 1 - 416 209 207 Dadegal 6017671 1 - 5 - 5 786 380 406 Kolur 601768
- - - 6 6 - 745 285 460 Mangalapur 6017692 1 1 13 7 6 464 217 247 Horthatanhal 601770
- - - 1 - 1 384 179 205 Gunhalli 60177111 5 6 98 65 33 613 264 349 Chukankal 6017723 - 3 23 11 12 1,532 725 807 Bahaddurbandi 601773
- - - 36 9 27 381 166 215 Huvinhal 6017741 - 1 10 5 5 1,179 576 603 Halwarti 601775
15 6 9 131 84 47 1,149 562 587 Hireboganhal 60177674 26 48 29 17 12 1,753 825 928 Kunikera 6017777 4 3 262 147 115 979 455 524 Hoshalli 6017785 5 - 28 16 12 1,217 478 739 Muddaballi 601779
- - - 1 1 - 398 187 211 Budihal 601780107 44 63 257 121 136 2,120 953 1,167 Gondbal 601781- - - 1 1 - 1,408 534 874 Hyati 601782- - - 1 - 1 242 117 125 Mellikeri 601783- - - 26 15 11 1,402 700 702 Lachankera 601784- - - 5 2 3 722 336 386 Chikboganhal 601785
6 3 3 17 11 6 1,065 516 549 Karkihalli 601786- - - - - - 190 88 102 Sidaganhalli 601787
3 1 2 81 27 54 941 477 464 Hiresulikeri 601788- - - - - - 51 25 26 Achartimmapur 601789
1 - 1 3 1 2 710 355 355 Challari 6017901 - 1 28 10 18 1,233 635 598 Hirebommanhal 6017917 - 7 10 3 7 867 438 429 Chikbommanhal 6017922 1 1 - - - 399 210 189 Ganganhal 601793
- - - - - - 195 107 88 Uplapur 6017946 2 4 - - - 427 197 230 Chiksulikeri 6017951 - 1 13 - 13 564 284 280 Hasgal 601796
- - - 7 4 3 552 225 327 Hosur 6017971 - 1 21 12 9 881 389 492 Chilkmukki 6017989 - 9 44 10 34 462 219 243 Kodadhal 601799
- - - - - - 485 202 283 Chamalapura 601800- - - 1 1 - 184 92 92 Gosaldoddi 601801
2 1 1 2 2 - 707 356 351 Jinnapur 6018021 1 - 3 - 3 311 165 146 Metgal 601803
- - - 2 1 1 502 242 260 Arsinkera 6018044 2 2 16 8 8 1,322 647 675 Wanballary 601805
- - - 1 - 1 12 6 6 Hosahalli 6018061 - 1 1 1 - 514 253 261 Kenchandoni 6018071 1 - 17 12 5 2,254 949 1,305 Irkalgada 601808
- - - 1 - 1 290 121 169 Wadderhatti 6018091 1 - 1 1 - 407 198 209 Hanmanhatti 6018101 - 1 1 - 1 281 108 173 Mudlapur 601811
28 11 17 255 138 117 5,253 2,178 3,075 Kinhal 601812- - - 12 7 5 698 268 430 Budsettinhal 601813- - - 4 2 2 700 338 362 Taad Kanakapur 601814
137

DISTRICT CENSUS HANDBOOK : KOPPAL
VILLAGE PRIMARY
Persons Males Females Persons Males Females1 2 3 4 5 6 7 8 9 10
Name of Village
Location code
number
Total population (including institutional and houseless
population)Area of
Village in hectares
Number of households
C D Block -
Population in the age-group 0-6
601815 Yelamgera 1,178.11 315 1,910 936 974 321 159 162 601816 Kardigudda 282.54601817 Abbigeri 477.90 255 1,370 698 672 203 105 98 601818 Kukanpalli 1,219.54 495 2,686 1,439 1,247 343 176 167 601819 Tawargera 1,469.35 248 1,236 598 638 163 73 90 601820 Kamanur 980.41 339 2,020 1,022 998 313 153 160 601821 Lebgera 777.37 349 2,005 1,001 1,004 301 166 135 601822 Sangapur 180.21 55 422 230 192 56 31 25 601823 Bhimanur 542.15 234 1,236 621 615 206 96 110 601824 Halahalli 650.00 282 1,624 817 807 310 154 156 601825 Dhangaldoddi 711.58 226 1,414 754 660 218 124 94 601826 Amarapur 216.42 28 132 69 63 17 7 10 601827 Budugumpa 538.29 790 4,342 2,276 2,066 704 361 343 601828 Bilebhavi 556.51 121 830 409 421 128 58 70 601829 Sulthanpur 323.52 4 17 12 5 1 - 1 601830 Chandragiri 348.36 78 518 256 262 123 66 57 601831 Nageshanahalli 668.76 263 1,503 752 751 278 149 129 601832 Indargi 3,668.67 972 5,594 2,852 2,742 917 461 456 601833 Jabbalgudda 948.53 299 1,694 884 810 302 159 143 601834 Kumar Ramankunta 1,689.96 2 9 5 4 2 2 - 601835 Halekunta 480.72 148 874 471 403 165 99 66 601836 Bandikunta 425.64601837 Guldahalli 746.15 521 2,752 1,390 1,362 458 226 232 601838 Kerihalli 962.25 301 1,713 887 826 332 170 162 601839 Achalapur 352.87 41 265 142 123 39 24 15 601840 Hussainpur 329.29601841 Basapur 493.12 395 1,968 976 992 285 158 127 601842 Rajarampet 106.76 26 122 55 67 16 4 12 601843 Narayanpet 180.09 37 163 93 70 14 9 5 601844 Ayodhya 97.78 25 115 53 62 21 10 11 601845 Attivatti 176.22 1 8 3 5 2 - 2 601846 Mohammad Nagar 423.88 211 1,011 514 497 134 72 62 601847 Bandiharlapur 641.22 1,096 5,414 2,695 2,719 775 390 385 601848 Shivapur 1,339.00 851 4,139 2,058 2,081 562 276 286 601849 Agalkera 629.38 958 4,895 2,429 2,466 667 316 351 601850 Bevinhalli 533.11 460 2,315 1,173 1,142 336 166 170 601851 Hirekhasankandi 952.65 311 1,804 897 907 315 169 146 601852 Chikkasankandi 700.50601853 Hitnal 579.58 1,113 5,608 2,820 2,788 810 406 404 601854 Bullapur 153.36 33 108 53 55 8 2 6 601855 Kampasagar 312.99 355 1,692 835 857 221 112 109 601856 Hulgi 389.11 1,003 4,859 2,437 2,422 633 322 311 601857 Munirabad (Rural) 413.59 609 2,893 1,412 1,481 419 224 195 601858 Hosahalli 532.95 2,419 11,601 5,705 5,896 1,702 814 888 601859 Holemudlapur 1,456.36 218 977 492 485 123 64 59
URBAN
601860Munirabad Project Area (CT) 443.00 1,856 8,672 4,393 4,279 1,055 541 514
-------------Un-inhabited--------------
-------------Un-inhabited--------------
-------------Un-inhabited--------------
-------------Un-inhabited--------------
138

PRIMARY CENSUS ABSTRACT
CENSUS ABSTRACTKoppal
Persons Males Females Persons Males Females Persons Males Females11 12 13 14 15 16 17 18 19 2
Name of VillageLiteratesScheduled Castes population Scheduled Tribes population
575 283 292 15 6 9 1,130 653 477 YelamgeraKardigudda
303 155 148 261 144 117 772 471 301 Abbigeri554 288 266 433 248 185 1,644 1,020 624 Kukanpalli148 69 79 99 50 49 735 422 313 Tawargera286 145 141 107 58 49 954 569 385 Kamanur174 93 81 44 21 23 1,231 695 536 Lebgera30 15 15 - - - 197 122 75 Sangapur
200 95 105 1 1 - 581 353 228 Bhimanur823 420 403 13 7 6 1,010 564 446 Halahalli72 41 31 4 3 1 713 450 263 Dhangaldoddi
- - - 8 4 4 64 38 26 Amarapur500 293 207 123 64 59 2,277 1,393 884 Budugumpa203 103 100 76 38 38 422 250 172 Bilebhavi11 7 4 - - - 10 8 2 Sulthanpur
404 194 210 2 1 1 154 107 47 Chandragiri394 205 189 149 77 72 663 412 251 Nageshanahalli
1,207 629 578 829 418 411 2,536 1,559 977 Indargi146 87 59 248 148 100 795 523 272 Jabbalgudda- - - 5 3 2 2 2 - Kumar Ramankunta258 142 116 444 234 210 314 208 106 Halekunta
Bandikunta513 260 253 208 101 107 1,544 902 642 Guldahalli614 322 292 131 70 61 791 477 314 Kerihalli228 121 107 - - - 96 52 44 Achalapur
Hussainpur636 321 315 418 214 204 953 524 429 Basapur18 8 10 78 36 42 55 34 21 Rajarampet56 29 27 2 2 - 117 75 42 Narayanpet43 19 24 34 15 19 46 23 23 Ayodhya
- - - - - - 2 1 1 Attivatti324 169 155 243 119 124 484 285 199 Mohammad Nagar
1,929 948 981 615 296 319 3,012 1,697 1,315 Bandiharlapur1,157 576 581 720 359 361 2,153 1,243 910 Shivapur1,303 630 673 238 123 115 2,883 1,661 1,222 Agalkera
226 113 113 178 92 86 1,370 801 569 Bevinhalli444 211 233 152 76 76 859 495 364 Hirekhasankandi
Chikkasankandi820 420 400 435 213 222 3,343 1,934 1,409 Hitnal- - - 6 4 2 72 38 34 Bullapur537 267 270 91 43 48 842 507 335 Kampasagar
1,130 566 564 310 153 157 3,111 1,754 1,357 Hulgi575 278 297 384 186 198 1,758 936 822 Munirabad (Rural)
2,592 1,249 1,343 1,275 623 652 7,378 4,100 3,278 Hosahalli131 62 69 273 138 135 591 342 249 Holemudlapur
URBAN
1,895 962 933 321 149 172 6,669 3,621 3,048 Munirabad Project Area (CT)
-------------Un-inhabited--------------
-------------Un-inhabited--------------
-------------Un-inhabited--------------
-------------Un-inhabited--------------
139

DISTRICT CENSUS HANDBOOK : KOPPAL
VILLAGE PRIMARYC D Block -
Persons Males Females Persons Males Females Persons Males Females1 2 20 21 22 23 24 25 26 27 28
Name of Village
Location code
numberIlliterates Total workers Main workers
601815 Yelamgera 780 283 497 1,038 521 517 1,011 512 499 601816 Kardigudda601817 Abbigeri 598 227 371 792 422 370 425 371 54 601818 Kukanpalli 1,042 419 623 1,319 750 569 1,232 718 514 601819 Tawargera 501 176 325 726 356 370 651 318 333 601820 Kamanur 1,066 453 613 1,127 612 515 687 538 149 601821 Lebgera 774 306 468 1,076 552 524 1,031 543 488 601822 Sangapur 225 108 117 251 138 113 85 75 10 601823 Bhimanur 655 268 387 680 364 316 540 318 222 601824 Halahalli 614 253 361 895 479 416 520 319 201 601825 Dhangaldoddi 701 304 397 603 370 233 490 319 171 601826 Amarapur 68 31 37 83 44 39 80 42 38 601827 Budugumpa 2,065 883 1,182 2,235 1,234 1,001 2,064 1,197 867 601828 Bilebhavi 408 159 249 487 247 240 487 247 240 601829 Sulthanpur 7 4 3 14 10 4 14 10 4 601830 Chandragiri 364 149 215 283 135 148 249 124 125 601831 Nageshanahalli 840 340 500 718 427 291 243 221 22 601832 Indargi 3,058 1,293 1,765 3,000 1,603 1,397 2,677 1,521 1,156 601833 Jabbalgudda 899 361 538 771 479 292 563 298 265 601834 Kumar Ramankunta 7 3 4 4 2 2 3 2 1 601835 Halekunta 560 263 297 449 258 191 334 240 94 601836 Bandikunta601837 Guldahalli 1,208 488 720 1,310 780 530 1,210 724 486 601838 Kerihalli 922 410 512 766 442 324 541 368 173 601839 Achalapur 169 90 79 165 85 80 164 84 80 601840 Hussainpur601841 Basapur 1,015 452 563 821 556 265 675 465 210 601842 Rajarampet 67 21 46 68 36 32 24 19 5 601843 Narayanpet 46 18 28 83 52 31 56 47 9 601844 Ayodhya 69 30 39 48 26 22 30 23 7 601845 Attivatti 6 2 4 4 2 2 2 2 - 601846 Mohammad Nagar 527 229 298 532 285 247 531 284 247 601847 Bandiharlapur 2,402 998 1,404 2,236 1,500 736 1,618 1,174 444 601848 Shivapur 1,986 815 1,171 2,041 1,212 829 1,215 807 408 601849 Agalkera 2,012 768 1,244 2,076 1,371 705 2,014 1,339 675 601850 Bevinhalli 945 372 573 1,066 666 400 917 605 312 601851 Hirekhasankandi 945 402 543 979 478 501 178 112 66 601852 Chikkasankandi601853 Hitnal 2,265 886 1,379 2,409 1,527 882 1,861 1,221 640 601854 Bullapur 36 15 21 52 37 15 52 37 15 601855 Kampasagar 850 328 522 984 508 476 661 424 237 601856 Hulgi 1,748 683 1,065 1,714 1,319 395 1,413 1,088 325 601857 Munirabad (Rural) 1,135 476 659 1,070 765 305 611 487 124 601858 Hosahalli 4,223 1,605 2,618 4,134 3,077 1,057 3,212 2,461 751 601859 Holemudlapur 386 150 236 411 275 136 292 211 81
URBAN
601860Munirabad Project Area (CT) 2,003 772 1,231 2,807 2,322 485 2,467 2,064 403
-------------Un-inhabited--------------
-------------Un-inhabited--------------
-------------Un-inhabited--------------
-------------Un-inhabited--------------
140

PRIMARY CENSUS ABSTRACT
CENSUS ABSTRACTKoppal
Persons Males Females Persons Males Females Persons Males Females Persons Males Females29 30 31 32 33 34 35 36 37 38 39 40 2
CultivatorsName of Village
Household industry workersAgricultural labourers
Industrial category of main workers
Other workers
230 208 22 699 260 439 19 5 14 63 39 24 YelamgeraKardigudda
180 168 12 175 142 33 1 1 - 69 60 9 Abbigeri400 344 56 680 250 430 3 3 - 149 121 28 Kukanpalli170 146 24 412 116 296 6 6 - 63 50 13 Tawargera484 380 104 98 71 27 17 12 5 88 75 13 Kamanur505 311 194 304 52 252 8 7 1 214 173 41 Lebgera38 35 3 2 1 1 - - - 45 39 6 Sangapur86 71 15 211 61 150 4 1 3 239 185 54 Bhimanur
234 157 77 128 64 64 90 39 51 68 59 9 Halahalli303 177 126 26 15 11 2 1 1 159 126 33 Dhangaldoddi27 21 6 44 14 30 - - - 9 7 2 Amarapur
707 387 320 693 290 403 29 15 14 635 505 130 Budugumpa115 59 56 362 180 182 - - - 10 8 2 Bilebhavi
2 1 1 4 2 2 - - - 8 7 1 Sulthanpur51 38 13 126 39 87 4 2 2 68 45 23 Chandragiri
125 121 4 6 5 1 11 9 2 101 86 15 Nageshanahalli1,000 682 318 1,085 399 686 29 14 15 563 426 137 Indargi
258 145 113 73 26 47 55 29 26 177 98 79 Jabbalgudda- - - 3 2 1 - - - - - - Kumar Ramankunta96 92 4 99 32 67 - - - 139 116 23 Halekunta
Bandikunta226 161 65 453 174 279 44 27 17 487 362 125 Guldahalli116 102 14 139 40 99 5 4 1 281 222 59 Kerihalli13 10 3 141 65 76 - - - 10 9 1 Achalapur
Hussainpur189 183 6 329 144 185 - - - 157 138 19 Basapur16 13 3 8 6 2 - - - - - - Rajarampet33 27 6 21 19 2 - - - 2 1 1 Narayanpet12 11 1 18 12 6 - - - - - - Ayodhya2 2 - - - - - - - - - - Attivatti
47 43 4 455 219 236 - - - 29 22 7 Mohammad Nagar255 218 37 545 272 273 12 6 6 806 678 128 Bandiharlapur243 208 35 595 316 279 31 6 25 346 277 69 Shivapur446 362 84 842 400 442 27 16 11 699 561 138 Agalkera256 160 96 60 38 22 8 6 2 593 401 192 Bevinhalli34 23 11 84 40 44 4 4 - 56 45 11 Hirekhasankandi
Chikkasankandi252 202 50 886 465 421 131 84 47 592 470 122 Hitnal- - - 13 5 8 - - - 39 32 7 Bullapur120 109 11 425 224 201 3 2 1 113 89 24 Kampasagar151 144 7 293 196 97 7 6 1 962 742 220 Hulgi38 30 8 45 35 10 55 40 15 473 382 91 Munirabad (Rural)
286 230 56 629 326 303 114 76 38 2,183 1,829 354 Hosahalli83 80 3 129 69 60 7 5 2 73 57 16 Holemudlapur
URBAN
22 20 2 67 51 16 35 32 3 2,343 1,961 382 Munirabad Project Area (CT)
-------------Un-inhabited--------------
-------------Un-inhabited--------------
-------------Un-inhabited--------------
-------------Un-inhabited--------------
141
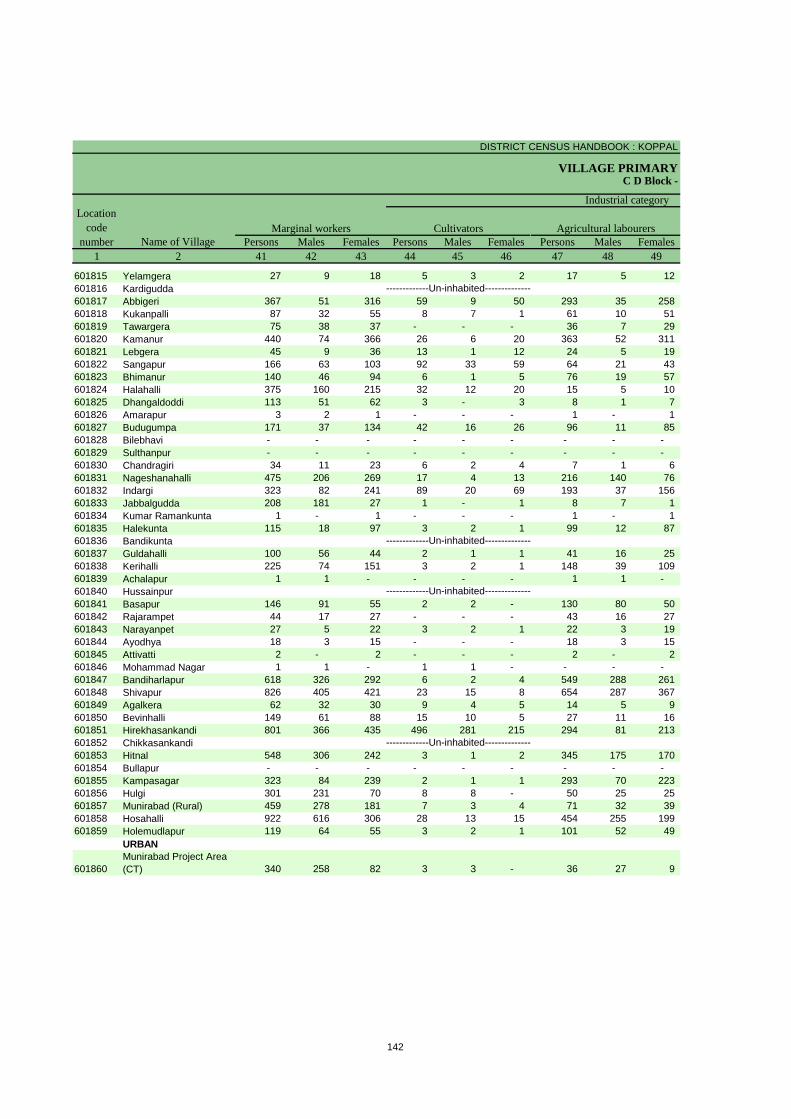
DISTRICT CENSUS HANDBOOK : KOPPAL
VILLAGE PRIMARYC D Block -
Persons Males Females Persons Males Females Persons Males Females1 2 41 42 43 44 45 46 47 48 49
Name of VillageMarginal workers Cultivators Agricultural labourers
Industrial category Location
code number
601815 Yelamgera 27 9 18 5 3 2 17 5 12 601816 Kardigudda601817 Abbigeri 367 51 316 59 9 50 293 35 258 601818 Kukanpalli 87 32 55 8 7 1 61 10 51 601819 Tawargera 75 38 37 - - - 36 7 29 601820 Kamanur 440 74 366 26 6 20 363 52 311 601821 Lebgera 45 9 36 13 1 12 24 5 19 601822 Sangapur 166 63 103 92 33 59 64 21 43 601823 Bhimanur 140 46 94 6 1 5 76 19 57 601824 Halahalli 375 160 215 32 12 20 15 5 10 601825 Dhangaldoddi 113 51 62 3 - 3 8 1 7 601826 Amarapur 3 2 1 - - - 1 - 1 601827 Budugumpa 171 37 134 42 16 26 96 11 85 601828 Bilebhavi - - - - - - - - - 601829 Sulthanpur - - - - - - - - - 601830 Chandragiri 34 11 23 6 2 4 7 1 6 601831 Nageshanahalli 475 206 269 17 4 13 216 140 76 601832 Indargi 323 82 241 89 20 69 193 37 156 601833 Jabbalgudda 208 181 27 1 - 1 8 7 1 601834 Kumar Ramankunta 1 - 1 - - - 1 - 1 601835 Halekunta 115 18 97 3 2 1 99 12 87 601836 Bandikunta601837 Guldahalli 100 56 44 2 1 1 41 16 25 601838 Kerihalli 225 74 151 3 2 1 148 39 109 601839 Achalapur 1 1 - - - - 1 1 - 601840 Hussainpur601841 Basapur 146 91 55 2 2 - 130 80 50 601842 Rajarampet 44 17 27 - - - 43 16 27 601843 Narayanpet 27 5 22 3 2 1 22 3 19 601844 Ayodhya 18 3 15 - - - 18 3 15 601845 Attivatti 2 - 2 - - - 2 - 2 601846 Mohammad Nagar 1 1 - 1 1 - - - - 601847 Bandiharlapur 618 326 292 6 2 4 549 288 261 601848 Shivapur 826 405 421 23 15 8 654 287 367 601849 Agalkera 62 32 30 9 4 5 14 5 9 601850 Bevinhalli 149 61 88 15 10 5 27 11 16 601851 Hirekhasankandi 801 366 435 496 281 215 294 81 213 601852 Chikkasankandi601853 Hitnal 548 306 242 3 1 2 345 175 170 601854 Bullapur - - - - - - - - - 601855 Kampasagar 323 84 239 2 1 1 293 70 223 601856 Hulgi 301 231 70 8 8 - 50 25 25 601857 Munirabad (Rural) 459 278 181 7 3 4 71 32 39 601858 Hosahalli 922 616 306 28 13 15 454 255 199 601859 Holemudlapur 119 64 55 3 2 1 101 52 49
URBAN
601860Munirabad Project Area (CT) 340 258 82 3 3 - 36 27 9
-------------Un-inhabited--------------
-------------Un-inhabited--------------
-------------Un-inhabited--------------
-------------Un-inhabited--------------
142

PRIMARY CENSUS ABSTRACT
CENSUS ABSTRACTKoppal
Persons Males Females Persons Males Females Persons Males Females50 51 52 53 54 55 56 57 58 2 1
Location code
numberHousehold industry workers
Name of VillageOther workers Non-workers
of marginal workers
1 - 1 4 1 3 872 415 457 Yelamgera 601815Kardigudda 601816
1 1 - 14 6 8 578 276 302 Abbigeri 6018174 4 - 14 11 3 1,367 689 678 Kukanpalli 6018184 1 3 35 30 5 510 242 268 Tawargera 601819
11 1 10 40 15 25 893 410 483 Kamanur 6018202 1 1 6 2 4 929 449 480 Lebgera 601821
- - - 10 9 1 171 92 79 Sangapur 601822- - - 58 26 32 556 257 299 Bhimanur 601823
9 4 5 319 139 180 729 338 391 Halahalli 601824- - - 102 50 52 811 384 427 Dhangaldoddi 601825- - - 2 2 - 49 25 24 Amarapur 601826- - - 33 10 23 2,107 1,042 1,065 Budugumpa 601827- - - - - - 343 162 181 Bilebhavi 601828- - - - - - 3 2 1 Sulthanpur 601829- - - 21 8 13 235 121 114 Chandragiri 60183011 3 8 231 59 172 785 325 460 Nageshanahalli 601831
- - - 41 25 16 2,594 1,249 1,345 Indargi 6018329 9 - 190 165 25 923 405 518 Jabbalgudda 601833
- - - - - - 5 3 2 Kumar Ramankunta 601834- - - 13 4 9 425 213 212 Halekunta 601835
Bandikunta 60183610 6 4 47 33 14 1,442 610 832 Guldahalli 6018375 4 1 69 29 40 947 445 502 Kerihalli 601838
- - - - - - 100 57 43 Achalapur 601839Hussainpur 601840
2 1 1 12 8 4 1,147 420 727 Basapur 601841- - - 1 1 - 54 19 35 Rajarampet 601842- - - 2 - 2 80 41 39 Narayanpet 601843- - - - - - 67 27 40 Ayodhya 601844- - - - - - 4 1 3 Attivatti 601845- - - - - - 479 229 250 Mohammad Nagar 601846
4 2 2 59 34 25 3,178 1,195 1,983 Bandiharlapur 60184715 5 10 134 98 36 2,098 846 1,252 Shivapur 6018481 1 - 38 22 16 2,819 1,058 1,761 Agalkera 601849
21 3 18 86 37 49 1,249 507 742 Bevinhalli 6018501 1 - 10 3 7 825 419 406 Hirekhasankandi 601851
Chikkasankandi 60185222 9 13 178 121 57 3,199 1,293 1,906 Hitnal 601853
- - - - - - 56 16 40 Bullapur 6018541 - 1 27 13 14 708 327 381 Kampasagar 601855
- - - 243 198 45 3,145 1,118 2,027 Hulgi 60185628 18 10 353 225 128 1,823 647 1,176 Munirabad (Rural) 60185717 12 5 423 336 87 7,467 2,628 4,839 Hosahalli 6018583 2 1 12 8 4 566 217 349 Holemudlapur 601859
URBAN
62 57 5 239 171 68 5,865 2,071 3,794 Munirabad Project Area (CT) 601860
-------------Un-inhabited--------------
-------------Un-inhabited--------------
-------------Un-inhabited--------------
-------------Un-inhabited--------------
143


Urban PCA-Town wise Primary Census Abstract

DISTRICT CENSUS HANDBOOK : KOPPAL
URBAN PRIMARY
Persons Males Females Persons Males Females1 2 3 4 5 6 7 8 9 10
803070 Yelbarga (TP) 1.15 2,854 14,814 7,492 7,322 1,945 988 957 0001 Ward No. 1 142 720 365 355 95 50 45 0002 Ward No. 2 132 706 339 367 89 44 45 0003 Ward No. 3 186 942 470 472 142 67 75 0004 Ward No. 4 368 1,961 989 972 262 124 138 0005 Ward No. 5 111 612 323 289 81 45 36 0006 Ward No. 6 153 795 410 385 83 44 39 0007 Ward No. 7 180 941 477 464 123 64 59 0008 Ward No. 8 101 427 218 209 47 26 21 0009 Ward No. 9 403 2,085 1,174 911 214 101 113 0010 Ward No. 10 723 3,802 1,776 2,026 520 272 248 0011 Ward No. 11 355 1,823 951 872 289 151 138 803071 Kushtagi (TMC) 11.34 4,814 24,878 12,493 12,385 3,468 1,789 1,679 0001 Ward No. 1 466 2,085 1,076 1,009 354 178 176 0002 Ward No. 2 325 1,470 768 702 182 89 93 0003 Ward No. 3 307 1,472 746 726 203 101 102 0004 Ward No. 4 417 2,001 993 1,008 299 148 151 0005 Ward No. 5 373 1,894 964 930 291 150 141 0006 Ward No. 6 217 1,086 524 562 156 81 75 0007 Ward No. 7 155 749 378 371 101 48 53 0008 Ward No. 8 219 1,238 635 603 198 111 87 0009 Ward No. 9 133 779 385 394 111 57 54 0010 Ward No. 10 158 1,032 523 509 167 91 76 0011 Ward No. 11 133 703 337 366 101 41 60 0012 Ward No. 12 90 537 249 288 51 24 27 0013 Ward No. 13 105 643 321 322 105 49 56 0014 Ward No. 14 205 1,157 555 602 146 82 64 0015 Ward No. 15 173 936 478 458 106 57 49 0016 Ward No. 16 203 1,062 526 536 132 68 64 0017 Ward No. 17 122 581 284 297 61 32 29 0018 Ward No. 18 180 984 502 482 126 67 59 0019 Ward No. 19 115 636 304 332 93 51 42 0020 Ward No. 20 70 421 216 205 40 27 13 0021 Ward No. 21 154 745 365 380 79 30 49 0022 Ward No. 22 131 670 323 347 95 54 41 0023 Ward No. 23 363 1,997 1,041 956 271 153 118
803072 Gangawati (CMC + OG) 9.21 23,265 1,14,642 57,230 57,412 14,971 7,625 7,346 0001 Ward No. 1 614 3,145 1,576 1,569 346 173 173 0002 Ward No. 2 660 3,264 1,628 1,636 336 176 160 0003 Ward No. 3 892 4,525 2,286 2,239 587 302 285 0004 Ward No. 4 521 2,614 1,292 1,322 341 171 170 0005 Ward No. 5 794 4,043 2,035 2,008 607 335 272 0006 Ward No. 6 1,153 5,804 2,957 2,847 851 424 427 0007 Ward No. 7 803 4,053 2,008 2,045 586 297 289 0008 Ward No. 8 806 4,073 2,068 2,005 521 255 266 0009 Ward No. 9 674 3,442 1,709 1,733 485 240 245 0010 Ward No. 10 471 2,263 1,128 1,135 303 152 151 0011 Ward No. 11 586 2,593 1,282 1,311 321 177 144 0012 Ward No. 12 931 4,599 2,292 2,307 587 296 291 0013 Ward No. 13 667 3,364 1,712 1,652 419 213 206 0014 Ward No. 14 558 2,588 1,336 1,252 380 213 167 0015 Ward No. 15 881 4,357 2,233 2,124 527 267 260 0016 Ward No. 16 599 2,967 1,473 1,494 396 207 189 0017 Ward No. 17 550 2,508 1,247 1,261 248 130 118 0018 Ward No. 18 498 2,697 1,341 1,356 363 183 180 0019 Ward No. 19 403 2,025 1,012 1,013 224 112 112 0020 Ward No. 20 568 2,864 1,406 1,458 408 196 212 0021 Ward No. 21 474 2,580 1,271 1,309 333 171 162 0022 Ward No. 22 506 2,448 1,198 1,250 345 162 183
Population in the age-group 0-6Number of householdsName of Town/ Ward
Location code
number
Total population (including institutional and houseless
population)
Area in Square
Kilometre
146

PRIMARY CENSUS ABSTRACT
CENSUS ABSTRACT
Persons Males Females Persons Males Females Persons Males Females11 12 13 14 15 16 17 18 19 2
2,752 1,369 1,383 282 121 161 10,274 5,761 4,513 Yelbarga (TP)8 3 5 19 9 10 523 290 233 Ward No. 1
53 26 27 44 17 27 493 262 231 Ward No. 2491 242 249 5 5 - 586 342 244 Ward No. 3177 89 88 42 18 24 1,258 743 515 Ward No. 4
3 3 - 1 - 1 437 248 189 Ward No. 511 5 6 15 4 11 501 306 195 Ward No. 623 11 12 - - - 608 363 245 Ward No. 711 4 7 - - - 283 163 120 Ward No. 8
180 120 60 28 20 8 1,476 950 526 Ward No. 91,206 543 663 91 30 61 2,863 1,390 1,473 Ward No. 10
589 323 266 37 18 19 1,246 704 542 Ward No. 115,044 2,485 2,559 1,022 517 505 17,413 9,437 7,976 Kushtagi (TMC)
391 194 197 38 21 17 1,411 787 624 Ward No. 1218 105 113 57 29 28 1,170 652 518 Ward No. 2226 106 120 26 12 14 1,131 607 524 Ward No. 3305 142 163 113 57 56 1,513 795 718 Ward No. 4214 99 115 36 18 18 1,393 758 635 Ward No. 5337 164 173 41 21 20 823 419 404 Ward No. 672 33 39 14 6 8 586 311 275 Ward No. 7
386 205 181 18 9 9 721 398 323 Ward No. 878 37 41 1 1 - 424 250 174 Ward No. 946 26 20 73 41 32 637 351 286 Ward No. 1057 28 29 43 22 21 462 251 211 Ward No. 1152 27 25 17 8 9 341 171 170 Ward No. 1293 50 43 3 2 1 392 212 180 Ward No. 13
909 432 477 8 4 4 777 395 382 Ward No. 14440 230 210 23 11 12 655 366 289 Ward No. 1596 49 47 30 17 13 808 433 375 Ward No. 1636 16 20 14 7 7 481 243 238 Ward No. 17
179 94 85 2 1 1 710 390 320 Ward No. 18290 138 152 32 12 20 385 212 173 Ward No. 1937 17 20 28 13 15 298 163 135 Ward No. 20
122 64 58 45 20 25 536 294 242 Ward No. 2184 37 47 16 8 8 509 253 256 Ward No. 22
376 192 184 344 177 167 1,250 726 524 Ward No. 23
17,331 8,494 8,837 7,327 3,617 3,710 74,922 41,300 33,622 Gangawati (CMC + OG)75 36 39 133 70 63 2,388 1,293 1,095 Ward No. 1
103 55 48 930 442 488 2,396 1,301 1,095 Ward No. 2463 230 233 829 407 422 3,199 1,741 1,458 Ward No. 386 47 39 128 55 73 1,879 1,017 862 Ward No. 488 43 45 187 82 105 2,527 1,382 1,145 Ward No. 5
203 109 94 171 87 84 3,401 1,942 1,459 Ward No. 6224 115 109 150 77 73 2,307 1,282 1,025 Ward No. 7512 264 248 94 56 38 3,001 1,623 1,378 Ward No. 8209 108 101 294 138 156 2,019 1,146 873 Ward No. 9219 108 111 210 112 98 1,175 674 501 Ward No. 10218 95 123 322 169 153 1,617 868 749 Ward No. 11131 61 70 281 141 140 3,233 1,734 1,499 Ward No. 12107 53 54 255 121 134 2,391 1,336 1,055 Ward No. 13135 71 64 102 59 43 1,632 933 699 Ward No. 14453 226 227 440 221 219 2,914 1,647 1,267 Ward No. 15150 73 77 105 55 50 1,967 1,051 916 Ward No. 1627 13 14 15 5 10 2,019 1,065 954 Ward No. 17
950 446 504 1 1 - 1,795 995 800 Ward No. 1896 54 42 26 15 11 1,562 839 723 Ward No. 19
1,405 679 726 47 21 26 1,812 1,012 800 Ward No. 20367 177 190 217 103 114 1,579 886 693 Ward No. 2126 13 13 65 31 34 1,536 856 680 Ward No. 22
Scheduled Castes population Scheduled Tribes population LiteratesName of Town/ Ward
147

DISTRICT CENSUS HANDBOOK : KOPPAL
URBAN PRIMARY
Persons Males Females Persons Males Females Persons Males Females1 2 20 21 22 23 24 25 26 27 28
803070 Yelbarga (TP) 4,540 1,731 2,809 6,312 3,815 2,497 5,237 3,533 1,704 0001 Ward No. 1 197 75 122 333 212 121 318 201 117 0002 Ward No. 2 213 77 136 315 192 123 294 176 118 0003 Ward No. 3 356 128 228 442 241 201 431 236 195 0004 Ward No. 4 703 246 457 940 555 385 683 506 177 0005 Ward No. 5 175 75 100 321 152 169 294 144 150 0006 Ward No. 6 294 104 190 384 252 132 229 190 39 0007 Ward No. 7 333 114 219 403 280 123 320 273 47 0008 Ward No. 8 144 55 89 216 139 77 193 128 65 0009 Ward No. 9 609 224 385 1,036 559 477 922 543 379 0010 Ward No. 10 939 386 553 1,293 806 487 1,009 755 254 0011 Ward No. 11 577 247 330 629 427 202 544 381 163 803071 Kushtagi (TMC) 7,465 3,056 4,409 8,939 6,545 2,394 7,897 5,991 1,906 0001 Ward No. 1 674 289 385 678 567 111 626 535 91 0002 Ward No. 2 300 116 184 494 398 96 461 369 92 0003 Ward No. 3 341 139 202 538 407 131 514 394 120 0004 Ward No. 4 488 198 290 705 540 165 624 479 145 0005 Ward No. 5 501 206 295 801 508 293 559 421 138 0006 Ward No. 6 263 105 158 365 272 93 269 213 56 0007 Ward No. 7 163 67 96 236 194 42 217 177 40 0008 Ward No. 8 517 237 280 514 348 166 509 347 162 0009 Ward No. 9 355 135 220 326 206 120 226 140 86 0010 Ward No. 10 395 172 223 328 256 72 322 255 67 0011 Ward No. 11 241 86 155 258 179 79 212 160 52 0012 Ward No. 12 196 78 118 197 151 46 193 148 45 0013 Ward No. 13 251 109 142 171 152 19 171 152 19 0014 Ward No. 14 380 160 220 420 284 136 401 276 125 0015 Ward No. 15 281 112 169 272 210 62 264 203 61 0016 Ward No. 16 254 93 161 402 293 109 381 281 100 0017 Ward No. 17 100 41 59 206 149 57 178 137 41 0018 Ward No. 18 274 112 162 371 271 100 289 240 49 0019 Ward No. 19 251 92 159 286 171 115 272 166 106 0020 Ward No. 20 123 53 70 172 118 54 167 116 51 0021 Ward No. 21 209 71 138 273 216 57 262 209 53 0022 Ward No. 22 161 70 91 205 155 50 155 119 36 0023 Ward No. 23 747 315 432 721 500 221 625 454 171
803072 Gangawati (CMC + OG) 39,720 15,930 23,790 43,104 32,178 10,926 35,958 27,990 7,968 0001 Ward No. 1 757 283 474 1,039 858 181 933 779 154 0002 Ward No. 2 868 327 541 1,159 929 230 1,149 924 225 0003 Ward No. 3 1,326 545 781 1,646 1,280 366 1,383 1,110 273 0004 Ward No. 4 735 275 460 938 724 214 807 673 134 0005 Ward No. 5 1,516 653 863 1,437 1,152 285 1,319 1,093 226 0006 Ward No. 6 2,403 1,015 1,388 2,134 1,719 415 1,787 1,457 330 0007 Ward No. 7 1,746 726 1,020 1,492 1,133 359 1,357 1,058 299 0008 Ward No. 8 1,072 445 627 1,523 1,207 316 1,354 1,103 251 0009 Ward No. 9 1,423 563 860 1,356 951 405 1,136 813 323 0010 Ward No. 10 1,088 454 634 1,122 644 478 617 375 242 0011 Ward No. 11 976 414 562 1,113 754 359 714 525 189 0012 Ward No. 12 1,366 558 808 1,570 1,304 266 1,449 1,198 251 0013 Ward No. 13 973 376 597 1,179 963 216 1,097 920 177 0014 Ward No. 14 956 403 553 1,052 765 287 1,005 747 258 0015 Ward No. 15 1,443 586 857 1,590 1,268 322 1,493 1,185 308 0016 Ward No. 16 1,000 422 578 927 796 131 641 560 81 0017 Ward No. 17 489 182 307 933 750 183 870 714 156 0018 Ward No. 18 902 346 556 977 706 271 750 574 176 0019 Ward No. 19 463 173 290 706 595 111 629 540 89 0020 Ward No. 20 1,052 394 658 1,086 788 298 845 645 200 0021 Ward No. 21 1,001 385 616 894 694 200 493 435 58 0022 Ward No. 22 912 342 570 776 658 118 732 631 101
Illiterates Total workers Main workersName of Town/ Ward
Location code
number
148

PRIMARY CENSUS ABSTRACT
CENSUS ABSTRACT
Persons Males Females Persons Males Females Persons Males Females Persons Males Females29 30 31 32 33 34 35 36 37 38 39 40 2
329 292 37 845 380 465 272 196 76 3,791 2,665 1,126 Yelbarga (TP)39 36 3 93 22 71 10 6 4 176 137 39 Ward No. 17 4 3 17 6 11 12 8 4 258 158 100 Ward No. 2
- - - 178 76 102 82 38 44 171 122 49 Ward No. 360 42 18 94 54 40 35 33 2 494 377 117 Ward No. 422 21 1 22 12 10 2 2 - 248 109 139 Ward No. 52 2 - 3 3 - 10 10 - 214 175 39 Ward No. 6
69 69 - 54 29 25 76 73 3 121 102 19 Ward No. 719 15 4 52 22 30 - - - 122 91 31 Ward No. 834 34 - 142 68 74 5 3 2 741 438 303 Ward No. 935 29 6 182 84 98 6 4 2 786 638 148 Ward No. 1042 40 2 8 4 4 34 19 15 460 318 142 Ward No. 11
614 488 126 459 194 265 328 268 60 6,496 5,041 1,455 Kushtagi (TMC)10 8 2 11 9 2 183 165 18 422 353 69 Ward No. 17 7 - 1 1 - 8 4 4 445 357 88 Ward No. 2
31 29 2 9 3 6 2 2 - 472 360 112 Ward No. 339 35 4 16 1 15 17 11 6 552 432 120 Ward No. 428 20 8 6 4 2 6 5 1 519 392 127 Ward No. 519 14 5 1 1 - 2 1 1 247 197 50 Ward No. 65 5 - 1 1 - 5 4 1 206 167 39 Ward No. 79 6 3 94 38 56 4 4 - 402 299 103 Ward No. 8
56 31 25 47 12 35 - - - 123 97 26 Ward No. 910 9 1 3 3 - 7 7 - 302 236 66 Ward No. 1044 31 13 12 4 8 1 1 - 155 124 31 Ward No. 11
- - - 10 6 4 1 1 - 182 141 41 Ward No. 1249 49 - - - - 3 2 1 119 101 18 Ward No. 139 7 2 13 8 5 31 21 10 348 240 108 Ward No. 14
20 15 5 13 7 6 25 17 8 206 164 42 Ward No. 1565 43 22 77 39 38 - - - 239 199 40 Ward No. 1613 10 3 3 2 1 4 2 2 158 123 35 Ward No. 1780 75 5 29 19 10 7 7 - 173 139 34 Ward No. 1840 31 9 33 4 29 8 3 5 191 128 63 Ward No. 1917 11 6 19 1 18 - - - 131 104 27 Ward No. 206 6 - 10 3 7 - - - 246 200 46 Ward No. 214 3 1 2 2 - - - - 149 114 35 Ward No. 22
53 43 10 49 26 23 14 11 3 509 374 135 Ward No. 23
1,298 1,112 186 3,953 1,970 1,983 860 516 344 29,847 24,392 5,455 Gangawati (CMC + OG)17 15 2 8 4 4 5 4 1 903 756 147 Ward No. 1
166 143 23 125 48 77 12 12 - 846 721 125 Ward No. 246 45 1 142 71 71 8 6 2 1,187 988 199 Ward No. 318 17 1 53 19 34 41 21 20 695 616 79 Ward No. 4
160 124 36 56 29 27 25 16 9 1,078 924 154 Ward No. 55 3 2 2 1 1 22 17 5 1,758 1,436 322 Ward No. 6
13 9 4 70 30 40 34 10 24 1,240 1,009 231 Ward No. 76 6 - 22 16 6 85 13 72 1,241 1,068 173 Ward No. 8
20 20 - 40 12 28 6 3 3 1,070 778 292 Ward No. 923 21 2 378 172 206 3 2 1 213 180 33 Ward No. 1058 56 2 121 44 77 18 8 10 517 417 100 Ward No. 118 8 - 13 7 6 6 6 - 1,422 1,177 245 Ward No. 12
24 24 - 4 1 3 15 9 6 1,054 886 168 Ward No. 1310 8 2 13 8 5 30 21 9 952 710 242 Ward No. 1411 11 - 88 35 53 18 6 12 1,376 1,133 243 Ward No. 159 8 1 22 15 7 25 20 5 585 517 68 Ward No. 16
23 20 3 16 12 4 23 13 10 808 669 139 Ward No. 1759 44 15 125 52 73 4 4 - 562 474 88 Ward No. 1812 12 - 1 1 - - - - 616 527 89 Ward No. 1964 53 11 92 52 40 17 10 7 672 530 142 Ward No. 204 4 - - - - 18 18 - 471 413 58 Ward No. 21
16 13 3 9 4 5 1 1 - 706 613 93 Ward No. 22
CultivatorsName of Town/ Ward
Household industry workersAgricultural labourers
Industrial category of main workers
Other workers
149

DISTRICT CENSUS HANDBOOK : KOPPAL
URBAN PRIMARY
Persons Males Females Persons Males Females Persons Males Females1 2 41 42 43 44 45 46 47 48 49
803070 Yelbarga (TP) 1,075 282 793 25 15 10 214 30 184 0001 Ward No. 1 15 11 4 1 1 - 1 1 - 0002 Ward No. 2 21 16 5 - - - - - - 0003 Ward No. 3 11 5 6 - - - 1 - 1 0004 Ward No. 4 257 49 208 4 3 1 92 16 76 0005 Ward No. 5 27 8 19 2 1 1 - - - 0006 Ward No. 6 155 62 93 4 4 - 14 2 12 0007 Ward No. 7 83 7 76 2 2 - 76 2 74 0008 Ward No. 8 23 11 12 5 2 3 8 3 5 0009 Ward No. 9 114 16 98 4 - 4 7 2 5 0010 Ward No. 10 284 51 233 - - - 8 2 6 0011 Ward No. 11 85 46 39 3 2 1 7 2 5 803071 Kushtagi (TMC) 1,042 554 488 46 25 21 208 48 160 0001 Ward No. 1 52 32 20 1 1 - 3 2 1 0002 Ward No. 2 33 29 4 - - - 1 1 - 0003 Ward No. 3 24 13 11 - - - 10 2 8 0004 Ward No. 4 81 61 20 1 1 - 6 - 6 0005 Ward No. 5 242 87 155 7 5 2 29 7 22 0006 Ward No. 6 96 59 37 1 - 1 6 6 - 0007 Ward No. 7 19 17 2 1 1 - 1 1 - 0008 Ward No. 8 5 1 4 - - - 3 - 3 0009 Ward No. 9 100 66 34 7 4 3 25 4 21 0010 Ward No. 10 6 1 5 - - - 1 - 1 0011 Ward No. 11 46 19 27 12 4 8 13 1 12 0012 Ward No. 12 4 3 1 - - - - - - 0013 Ward No. 13 - - - - - - - - - 0014 Ward No. 14 19 8 11 - - - - - - 0015 Ward No. 15 8 7 1 - - - - - - 0016 Ward No. 16 21 12 9 1 1 - 1 1 - 0017 Ward No. 17 28 12 16 1 1 - 13 3 10 0018 Ward No. 18 82 31 51 7 3 4 48 8 40 0019 Ward No. 19 14 5 9 - - - 4 - 4 0020 Ward No. 20 5 2 3 1 1 - - - - 0021 Ward No. 21 11 7 4 1 1 - - - - 0022 Ward No. 22 50 36 14 - - - 1 - 1 0023 Ward No. 23 96 46 50 5 2 3 43 12 31
803072 Gangawati (CMC + OG) 7,146 4,188 2,958 74 54 20 2,293 952 1,341 0001 Ward No. 1 106 79 27 1 1 - 1 - 1 0002 Ward No. 2 10 5 5 1 1 - 3 - 3 0003 Ward No. 3 263 170 93 7 6 1 76 41 35 0004 Ward No. 4 131 51 80 3 3 - 32 11 21 0005 Ward No. 5 118 59 59 4 4 - 17 5 12 0006 Ward No. 6 347 262 85 2 2 - 18 8 10 0007 Ward No. 7 135 75 60 3 2 1 12 5 7 0008 Ward No. 8 169 104 65 - - - 1 - 1 0009 Ward No. 9 220 138 82 4 3 1 6 3 3 0010 Ward No. 10 505 269 236 4 3 1 209 90 119 0011 Ward No. 11 399 229 170 3 3 - 112 35 77 0012 Ward No. 12 121 106 15 4 2 2 - - - 0013 Ward No. 13 82 43 39 1 1 - 14 2 12 0014 Ward No. 14 47 18 29 - - - 4 1 3 0015 Ward No. 15 97 83 14 1 1 - 2 - 2 0016 Ward No. 16 286 236 50 - - - 36 30 6 0017 Ward No. 17 63 36 27 1 1 - 4 4 - 0018 Ward No. 18 227 132 95 4 2 2 147 76 71 0019 Ward No. 19 77 55 22 - - - - - - 0020 Ward No. 20 241 143 98 1 1 - 84 33 51 0021 Ward No. 21 401 259 142 - - - 46 16 30 0022 Ward No. 22 44 27 17 1 - 1 9 2 7
Location code
number Name of Town/ WardMarginal workers Cultivators Agricultural labourers
Industrial category
150

PRIMARY CENSUS ABSTRACT
CENSUS ABSTRACT
Persons Males Females Persons Males Females Persons Males Females50 51 52 53 54 55 56 57 58 2 1
31 14 17 805 223 582 8,502 3,677 4,825 Yelbarga (TP) 8030702 1 1 11 8 3 387 153 234 Ward No. 1 0001
- - - 21 16 5 391 147 244 Ward No. 2 00022 1 1 8 4 4 500 229 271 Ward No. 3 00034 - 4 157 30 127 1,021 434 587 Ward No. 4 0004
- - - 25 7 18 291 171 120 Ward No. 5 00058 3 5 129 53 76 411 158 253 Ward No. 6 00063 1 2 2 2 - 538 197 341 Ward No. 7 0007
- - - 10 6 4 211 79 132 Ward No. 8 0008- - - 103 14 89 1,049 615 434 Ward No. 9 0009
2 2 - 274 47 227 2,509 970 1,539 Ward No. 10 001010 6 4 65 36 29 1,194 524 670 Ward No. 11 001152 28 24 736 453 283 15,939 5,948 9,991 Kushtagi (TMC) 80307126 15 11 22 14 8 1,407 509 898 Ward No. 1 0001
- - - 32 28 4 976 370 606 Ward No. 2 00021 - 1 13 11 2 934 339 595 Ward No. 3 00036 2 4 68 58 10 1,296 453 843 Ward No. 4 0004
11 7 4 195 68 127 1,093 456 637 Ward No. 5 00051 - 1 88 53 35 721 252 469 Ward No. 6 0006
- - - 17 15 2 513 184 329 Ward No. 7 0007- - - 2 1 1 724 287 437 Ward No. 8 0008- - - 68 58 10 453 179 274 Ward No. 9 0009- - - 5 1 4 704 267 437 Ward No. 10 0010- - - 21 14 7 445 158 287 Ward No. 11 0011- - - 4 3 1 340 98 242 Ward No. 12 0012- - - - - - 472 169 303 Ward No. 13 0013- - - 19 8 11 737 271 466 Ward No. 14 0014
1 1 - 7 6 1 664 268 396 Ward No. 15 00151 - 1 18 10 8 660 233 427 Ward No. 16 0016
- - - 14 8 6 375 135 240 Ward No. 17 00172 1 1 25 19 6 613 231 382 Ward No. 18 00181 1 - 9 4 5 350 133 217 Ward No. 19 0019
- - - 4 1 3 249 98 151 Ward No. 20 0020- - - 10 6 4 472 149 323 Ward No. 21 0021
1 - 1 48 36 12 465 168 297 Ward No. 22 00221 1 - 47 31 16 1,276 541 735 Ward No. 23 0023
390 193 197 4,389 2,989 1,400 71,538 25,052 46,486 Gangawati (CMC + OG) 803072- - - 104 78 26 2,106 718 1,388 Ward No. 1 0001
1 - 1 5 4 1 2,105 699 1,406 Ward No. 2 00022 - 2 178 123 55 2,879 1,006 1,873 Ward No. 3 00033 3 - 93 34 59 1,676 568 1,108 Ward No. 4 00043 2 1 94 48 46 2,606 883 1,723 Ward No. 5 00052 1 1 325 251 74 3,670 1,238 2,432 Ward No. 6 0006
18 - 18 102 68 34 2,561 875 1,686 Ward No. 7 00074 - 4 164 104 60 2,550 861 1,689 Ward No. 8 0008
57 31 26 153 101 52 2,086 758 1,328 Ward No. 9 000983 39 44 209 137 72 1,141 484 657 Ward No. 10 00106 1 5 278 190 88 1,480 528 952 Ward No. 11 0011
- - - 117 104 13 3,029 988 2,041 Ward No. 12 0012- - - 67 40 27 2,185 749 1,436 Ward No. 13 001310 4 6 33 13 20 1,536 571 965 Ward No. 14 00141 - 1 93 82 11 2,767 965 1,802 Ward No. 15 0015
17 16 1 233 190 43 2,040 677 1,363 Ward No. 16 00167 4 3 51 27 24 1,575 497 1,078 Ward No. 17 0017
27 16 11 49 38 11 1,720 635 1,085 Ward No. 18 0018- - - 77 55 22 1,319 417 902 Ward No. 19 0019
5 2 3 151 107 44 1,778 618 1,160 Ward No. 20 002026 17 9 329 226 103 1,686 577 1,109 Ward No. 21 0021
- - - 34 25 9 1,672 540 1,132 Ward No. 22 0022
Non-workersLocation
code number
Household industry workersName of Town/ Ward
Other workers
of marginal workers
151

DISTRICT CENSUS HANDBOOK : KOPPAL
URBAN PRIMARY
Persons Males Females Persons Males Females1 2 3 4 5 6 7 8 9 10
Population in the age-group 0-6Number of householdsName of Town/ Ward
Location code
number
Total population (including institutional and houseless
population)
Area in Square
Kilometre
0023 Ward No. 23 768 3,760 1,851 1,909 503 254 249 0024 Ward No. 24 845 3,953 1,953 2,000 483 249 234 0025 Ward No. 25 888 4,186 2,035 2,151 470 250 220 0026 Ward No. 26 707 3,202 1,656 1,546 325 177 148 0027 Ward No. 27 751 3,727 1,870 1,857 568 297 271 0028 Ward No. 28 619 3,185 1,528 1,657 516 254 262 0029 Ward No. 29 592 2,751 1,352 1,399 347 180 167 0030 Ward No. 30 823 3,990 1,950 2,040 549 278 271 0031 Ward No. 31 803 3,959 2,004 1,955 526 245 281 0032 Ward No. 32 1,860 9,113 4,541 4,572 1,170 589 581 803073 Koppal (CMC) 10.73 14,058 70,698 35,360 35,338 9,665 4,819 4,846 0001 Ward No. 1 528 2,934 1,433 1,501 414 196 218 0002 Ward No. 2 267 1,364 678 686 192 104 88 0003 Ward No. 3 1,318 6,338 3,263 3,075 992 478 514 0004 Ward No. 4 458 2,557 1,242 1,315 383 198 185 0005 Ward No. 5 177 952 477 475 103 50 53 0006 Ward No. 6 380 2,173 1,064 1,109 331 169 162 0007 Ward No. 7 386 2,245 1,137 1,108 350 163 187 0008 Ward No. 8 310 1,507 776 731 161 91 70 0009 Ward No. 9 338 1,842 928 914 268 127 141 0010 Ward No. 10 261 1,251 637 614 139 72 67 0011 Ward No. 11 225 1,171 570 601 139 72 67 0012 Ward No. 12 449 2,425 1,082 1,343 363 148 215 0013 Ward No. 13 512 2,650 1,309 1,341 371 202 169 0014 Ward No. 14 334 1,771 895 876 266 136 130 0015 Ward No. 15 482 2,463 1,197 1,266 341 159 182 0016 Ward No. 16 327 1,661 859 802 242 124 118 0017 Ward No. 17 361 1,941 948 993 269 125 144 0018 Ward No. 18 327 1,777 891 886 220 112 108 0019 Ward No. 19 359 1,885 943 942 245 121 124 0020 Ward No. 20 406 1,854 922 932 216 106 110 0021 Ward No. 21 436 1,969 1,010 959 239 122 117 0022 Ward No. 22 520 2,288 1,165 1,123 283 147 136 0023 Ward No. 23 468 2,357 1,201 1,156 365 192 173 0024 Ward No. 24 149 758 387 371 80 37 43 0025 Ward No. 25 797 3,696 1,891 1,805 458 235 223 0026 Ward No. 26 916 4,448 2,184 2,264 633 325 308 0027 Ward No. 27 550 2,610 1,309 1,301 277 144 133 0028 Ward No. 28 511 2,521 1,280 1,241 411 198 213 0029 Ward No. 29 551 2,467 1,232 1,235 260 122 138 0030 Ward No. 30 552 2,899 1,488 1,411 393 206 187 0031 Ward No. 31 403 1,924 962 962 261 138 123
601860Munirabad Project Area (CT) 4.43 1,856 8,672 4,393 4,279 1,055 541 514
0001 Ward No. 1 1,856 8,672 4,393 4,279 1,055 541 514
152

PRIMARY CENSUS ABSTRACT
CENSUS ABSTRACT
Persons Males Females Persons Males Females Persons Males Females11 12 13 14 15 16 17 18 19 2
Scheduled Castes population Scheduled Tribes population LiteratesName of Town/ Ward
846 410 436 120 60 60 2,393 1,321 1,072 Ward No. 231,073 534 539 197 89 108 2,542 1,378 1,164 Ward No. 24
740 351 389 88 42 46 3,138 1,639 1,499 Ward No. 25406 209 197 137 69 68 2,466 1,330 1,136 Ward No. 26
2,146 1,051 1,095 39 21 18 1,951 1,141 810 Ward No. 271,814 848 966 28 10 18 1,503 833 670 Ward No. 28
94 38 56 137 82 55 1,889 1,018 871 Ward No. 291,013 511 502 110 54 56 2,558 1,380 1,178 Ward No. 301,592 810 782 323 174 149 2,404 1,412 992 Ward No. 311,360 656 704 1,146 548 598 5,729 3,225 2,504 Ward No. 328,651 4,173 4,478 2,756 1,370 1,386 48,806 26,396 22,410 Koppal (CMC)
57 30 27 82 40 42 1,959 1,053 906 Ward No. 1107 59 48 68 35 33 970 521 449 Ward No. 2489 249 240 249 124 125 4,164 2,339 1,825 Ward No. 3805 383 422 28 16 12 1,506 797 709 Ward No. 4
5 - 5 - - - 799 417 382 Ward No. 532 15 17 16 9 7 1,248 678 570 Ward No. 64 4 - 14 10 4 1,329 779 550 Ward No. 76 4 2 34 20 14 1,021 574 447 Ward No. 8
13 7 6 125 61 64 1,063 607 456 Ward No. 94 1 3 7 3 4 977 527 450 Ward No. 10
444 203 241 3 2 1 900 467 433 Ward No. 111,632 694 938 95 44 51 1,375 695 680 Ward No. 12
493 230 263 73 36 37 1,639 881 758 Ward No. 13140 79 61 49 22 27 1,108 604 504 Ward No. 1484 43 41 84 41 43 1,524 825 699 Ward No. 1548 25 23 154 79 75 1,019 598 421 Ward No. 16
637 304 333 448 220 228 1,178 637 541 Ward No. 1718 11 7 13 6 7 1,298 706 592 Ward No. 1831 16 15 60 33 27 1,328 711 617 Ward No. 1974 36 38 32 15 17 1,455 758 697 Ward No. 2057 29 28 76 39 37 1,596 859 737 Ward No. 21
212 101 111 105 51 54 1,753 945 808 Ward No. 22946 476 470 43 23 20 1,569 883 686 Ward No. 2382 34 48 16 10 6 640 338 302 Ward No. 24
397 200 197 131 55 76 2,936 1,577 1,359 Ward No. 25507 261 246 230 114 116 3,373 1,729 1,644 Ward No. 26181 96 85 66 31 35 2,245 1,149 1,096 Ward No. 27619 310 309 81 42 39 1,611 893 718 Ward No. 28219 109 110 108 49 59 2,045 1,072 973 Ward No. 29242 127 115 143 81 62 1,778 1,027 751 Ward No. 3066 37 29 123 59 64 1,400 750 650 Ward No. 31
1,895 962 933 321 149 172 6,669 3,621 3,048 Munirabad Project Area (CT)
1,895 962 933 321 149 172 6,669 3,621 3,048 Ward No. 1
153

DISTRICT CENSUS HANDBOOK : KOPPAL
URBAN PRIMARY
Persons Males Females Persons Males Females Persons Males Females1 2 20 21 22 23 24 25 26 27 28
Illiterates Total workers Main workersName of Town/ Ward
Location code
number
0023 Ward No. 23 1,367 530 837 1,398 1,049 349 1,262 966 296 0024 Ward No. 24 1,411 575 836 1,575 1,108 467 1,364 999 365 0025 Ward No. 25 1,048 396 652 1,490 1,121 369 1,386 1,068 318 0026 Ward No. 26 736 326 410 1,082 915 167 1,010 861 149 0027 Ward No. 27 1,776 729 1,047 1,726 1,017 709 1,422 852 570 0028 Ward No. 28 1,682 695 987 1,359 800 559 936 683 253 0029 Ward No. 29 862 334 528 1,085 783 302 1,030 751 279 0030 Ward No. 30 1,432 570 862 1,631 1,109 522 1,466 1,032 434 0031 Ward No. 31 1,555 592 963 1,406 1,025 381 1,187 897 290 0032 Ward No. 32 3,384 1,316 2,068 3,703 2,613 1,090 2,335 1,822 513 803073 Koppal (CMC) 21,892 8,964 12,928 25,821 19,227 6,594 21,987 17,100 4,887 0001 Ward No. 1 975 380 595 1,035 787 248 968 770 198 0002 Ward No. 2 394 157 237 514 382 132 434 343 91 0003 Ward No. 3 2,174 924 1,250 2,335 1,799 536 2,009 1,640 369 0004 Ward No. 4 1,051 445 606 968 698 270 844 641 203 0005 Ward No. 5 153 60 93 344 288 56 323 280 43 0006 Ward No. 6 925 386 539 763 565 198 680 515 165 0007 Ward No. 7 916 358 558 966 656 310 913 619 294 0008 Ward No. 8 486 202 284 595 433 162 569 416 153 0009 Ward No. 9 779 321 458 688 529 159 421 349 72 0010 Ward No. 10 274 110 164 414 354 60 385 330 55 0011 Ward No. 11 271 103 168 379 321 58 375 318 57 0012 Ward No. 12 1,050 387 663 902 541 361 744 457 287 0013 Ward No. 13 1,011 428 583 981 717 264 510 399 111 0014 Ward No. 14 663 291 372 676 473 203 571 429 142 0015 Ward No. 15 939 372 567 921 664 257 627 485 142 0016 Ward No. 16 642 261 381 690 481 209 640 460 180 0017 Ward No. 17 763 311 452 685 512 173 562 443 119 0018 Ward No. 18 479 185 294 636 489 147 509 436 73 0019 Ward No. 19 557 232 325 575 469 106 495 414 81 0020 Ward No. 20 399 164 235 664 500 164 584 455 129 0021 Ward No. 21 373 151 222 652 532 120 594 493 101 0022 Ward No. 22 535 220 315 819 629 190 780 601 179 0023 Ward No. 23 788 318 470 909 616 293 849 584 265 0024 Ward No. 24 118 49 69 257 226 31 224 198 26 0025 Ward No. 25 760 314 446 1,327 996 331 1,038 845 193 0026 Ward No. 26 1,075 455 620 1,456 1,132 324 1,295 1,072 223 0027 Ward No. 27 365 160 205 859 706 153 787 655 132 0028 Ward No. 28 910 387 523 1,119 703 416 942 658 284 0029 Ward No. 29 422 160 262 819 643 176 719 577 142 0030 Ward No. 30 1,121 461 660 1,175 848 327 982 708 274 0031 Ward No. 31 524 212 312 698 538 160 614 510 104
601860Munirabad Project Area (CT) 2,003 772 1,231 2,807 2,322 485 2,467 2,064 403
0001 Ward No. 1 2,003 772 1,231 2,807 2,322 485 2,467 2,064 403
154

PRIMARY CENSUS ABSTRACT
CENSUS ABSTRACT
Persons Males Females Persons Males Females Persons Males Females Persons Males Females29 30 31 32 33 34 35 36 37 38 39 40 2
CultivatorsName of Town/ Ward
Household industry workersAgricultural labourers
Industrial category of main workers
Other workers
5 5 - 124 45 79 21 10 11 1,112 906 206 Ward No. 2330 27 3 97 28 69 17 6 11 1,220 938 282 Ward No. 244 4 - 7 6 1 67 47 20 1,308 1,011 297 Ward No. 25
19 19 - 6 3 3 10 10 - 975 829 146 Ward No. 2643 34 9 676 262 414 15 11 4 688 545 143 Ward No. 2733 27 6 636 450 186 10 9 1 257 197 60 Ward No. 2892 62 30 248 144 104 11 7 4 679 538 141 Ward No. 29
108 90 18 232 107 125 187 116 71 939 719 220 Ward No. 3017 15 2 86 44 42 64 49 15 1,020 789 231 Ward No. 31
175 165 10 441 248 193 42 31 11 1,677 1,378 299 Ward No. 32515 418 97 589 231 358 1,226 705 521 19,657 15,746 3,911 Koppal (CMC)39 35 4 25 10 15 12 10 2 892 715 177 Ward No. 119 13 6 6 2 4 6 3 3 403 325 78 Ward No. 237 25 12 33 7 26 54 20 34 1,885 1,588 297 Ward No. 31 1 - 4 3 1 35 10 25 804 627 177 Ward No. 41 1 - 3 1 2 6 4 2 313 274 39 Ward No. 5
28 21 7 37 14 23 98 74 24 517 406 111 Ward No. 616 11 5 48 14 34 155 35 120 694 559 135 Ward No. 742 33 9 16 3 13 39 25 14 472 355 117 Ward No. 837 36 1 12 2 10 42 27 15 330 284 46 Ward No. 912 11 1 16 4 12 22 18 4 335 297 38 Ward No. 108 8 - - - - 5 5 - 362 305 57 Ward No. 116 5 1 70 50 20 49 31 18 619 371 248 Ward No. 124 4 - 11 11 - 38 30 8 457 354 103 Ward No. 13
32 26 6 30 13 17 17 8 9 492 382 110 Ward No. 1435 30 5 23 1 22 42 29 13 527 425 102 Ward No. 1534 28 6 85 20 65 72 46 26 449 366 83 Ward No. 1612 8 4 3 1 2 16 11 5 531 423 108 Ward No. 174 4 - 4 3 1 95 72 23 406 357 49 Ward No. 18
- - - - - - 2 1 1 493 413 80 Ward No. 197 7 - 3 3 - 4 4 - 570 441 129 Ward No. 205 5 - 4 4 - 10 9 1 575 475 100 Ward No. 21
16 13 3 4 3 1 9 7 2 751 578 173 Ward No. 229 8 1 1 - 1 162 62 100 677 514 163 Ward No. 23
- - - 1 1 - - - - 223 197 26 Ward No. 249 8 1 7 5 2 29 24 5 993 808 185 Ward No. 25
33 24 9 34 12 22 30 17 13 1,198 1,019 179 Ward No. 268 6 2 6 6 - 22 14 8 751 629 122 Ward No. 27
36 28 8 57 14 43 1 1 - 848 615 233 Ward No. 289 6 3 3 3 - 9 5 4 698 563 135 Ward No. 29
10 8 2 29 10 19 92 58 34 851 632 219 Ward No. 306 5 1 14 11 3 53 45 8 541 449 92 Ward No. 31
22 20 2 67 51 16 35 32 3 2,343 1,961 382 Munirabad Project Area (CT)
22 20 2 67 51 16 35 32 3 2,343 1,961 382 Ward No. 1
155

DISTRICT CENSUS HANDBOOK : KOPPAL
URBAN PRIMARY
Persons Males Females Persons Males Females Persons Males Females1 2 41 42 43 44 45 46 47 48 49
Location code
number Name of Town/ WardMarginal workers Cultivators Agricultural labourers
Industrial category
0023 Ward No. 23 136 83 53 1 1 - 11 4 7 0024 Ward No. 24 211 109 102 1 1 - 15 2 13 0025 Ward No. 25 104 53 51 4 4 - 2 - 2 0026 Ward No. 26 72 54 18 1 1 - - - - 0027 Ward No. 27 304 165 139 3 2 1 75 14 61 0028 Ward No. 28 423 117 306 4 1 3 357 75 282 0029 Ward No. 29 55 32 23 2 1 1 10 2 8 0030 Ward No. 30 165 77 88 - - - 27 6 21 0031 Ward No. 31 219 128 91 2 1 1 30 9 21 0032 Ward No. 32 1,368 791 577 11 6 5 933 478 455 803073 Koppal (CMC) 3,834 2,127 1,707 63 38 25 376 83 293 0001 Ward No. 1 67 17 50 - - - 18 2 16 0002 Ward No. 2 80 39 41 - - - 32 4 28 0003 Ward No. 3 326 159 167 7 1 6 54 3 51 0004 Ward No. 4 124 57 67 - - - 2 - 2 0005 Ward No. 5 21 8 13 - - - 1 1 - 0006 Ward No. 6 83 50 33 2 2 - 3 - 3 0007 Ward No. 7 53 37 16 1 - 1 2 - 2 0008 Ward No. 8 26 17 9 - - - 2 - 2 0009 Ward No. 9 267 180 87 2 2 - 5 3 2 0010 Ward No. 10 29 24 5 - - - 2 2 - 0011 Ward No. 11 4 3 1 - - - - - - 0012 Ward No. 12 158 84 74 3 2 1 27 11 16 0013 Ward No. 13 471 318 153 2 2 - 18 11 7 0014 Ward No. 14 105 44 61 12 8 4 31 4 27 0015 Ward No. 15 294 179 115 - - - 19 3 16 0016 Ward No. 16 50 21 29 - - - 16 1 15 0017 Ward No. 17 123 69 54 - - - 6 1 5 0018 Ward No. 18 127 53 74 1 1 - 2 1 1 0019 Ward No. 19 80 55 25 - - - 2 2 - 0020 Ward No. 20 80 45 35 2 1 1 1 - 1 0021 Ward No. 21 58 39 19 - - - 3 2 1 0022 Ward No. 22 39 28 11 2 1 1 - - - 0023 Ward No. 23 60 32 28 5 5 - 3 2 1 0024 Ward No. 24 33 28 5 - - - - - - 0025 Ward No. 25 289 151 138 3 3 - 31 16 15 0026 Ward No. 26 161 60 101 3 1 2 18 1 17 0027 Ward No. 27 72 51 21 6 4 2 - - - 0028 Ward No. 28 177 45 132 10 3 7 71 10 61 0029 Ward No. 29 100 66 34 - - - 1 1 - 0030 Ward No. 30 193 140 53 - - - 1 1 - 0031 Ward No. 31 84 28 56 2 2 - 5 1 4
601860Munirabad Project Area (CT) 340 258 82 3 3 - 36 27 9
0001 Ward No. 1 340 258 82 3 3 - 36 27 9
156

PRIMARY CENSUS ABSTRACT
CENSUS ABSTRACT
Persons Males Females Persons Males Females Persons Males Females50 51 52 53 54 55 56 57 58 2 1
Non-workersLocation
code number
Household industry workersName of Town/ Ward
Other workers
of marginal workers
1 1 - 123 77 46 2,362 802 1,560 Ward No. 23 00231 1 - 194 105 89 2,378 845 1,533 Ward No. 24 00246 - 6 92 49 43 2,696 914 1,782 Ward No. 25 00258 3 5 63 50 13 2,120 741 1,379 Ward No. 26 0026
16 6 10 210 143 67 2,001 853 1,148 Ward No. 27 00271 - 1 61 41 20 1,826 728 1,098 Ward No. 28 00281 - 1 42 29 13 1,666 569 1,097 Ward No. 29 0029
27 5 22 111 66 45 2,359 841 1,518 Ward No. 30 003027 18 9 160 100 60 2,553 979 1,574 Ward No. 31 003130 23 7 394 284 110 5,410 1,928 3,482 Ward No. 32 0032
330 139 191 3,065 1,867 1,198 44,877 16,133 28,744 Koppal (CMC) 8030731 - 1 48 15 33 1,899 646 1,253 Ward No. 1 00011 1 - 47 34 13 850 296 554 Ward No. 2 0002
26 12 14 239 143 96 4,003 1,464 2,539 Ward No. 3 00032 1 1 120 56 64 1,589 544 1,045 Ward No. 4 0004
- - - 20 7 13 608 189 419 Ward No. 5 000510 3 7 68 45 23 1,410 499 911 Ward No. 6 000611 4 7 39 33 6 1,279 481 798 Ward No. 7 00072 1 1 22 16 6 912 343 569 Ward No. 8 0008
73 44 29 187 131 56 1,154 399 755 Ward No. 9 0009- - - 27 22 5 837 283 554 Ward No. 10 0010- - - 4 3 1 792 249 543 Ward No. 11 001114 8 6 114 63 51 1,523 541 982 Ward No. 12 00129 5 4 442 300 142 1,669 592 1,077 Ward No. 13 00134 1 3 58 31 27 1,095 422 673 Ward No. 14 0014
31 11 20 244 165 79 1,542 533 1,009 Ward No. 15 001512 3 9 22 17 5 971 378 593 Ward No. 16 001626 9 17 91 59 32 1,256 436 820 Ward No. 17 001717 8 9 107 43 64 1,141 402 739 Ward No. 18 00182 1 1 76 52 24 1,310 474 836 Ward No. 19 00194 2 2 73 42 31 1,190 422 768 Ward No. 20 00203 1 2 52 36 16 1,317 478 839 Ward No. 21 00212 2 - 35 25 10 1,469 536 933 Ward No. 22 0022
11 8 3 41 17 24 1,448 585 863 Ward No. 23 0023- - - 33 28 5 501 161 340 Ward No. 24 002412 4 8 243 128 115 2,369 895 1,474 Ward No. 25 002529 1 28 111 57 54 2,992 1,052 1,940 Ward No. 26 0026
- - - 66 47 19 1,751 603 1,148 Ward No. 27 0027- - - 96 32 64 1,402 577 825 Ward No. 28 0028
6 3 3 93 62 31 1,648 589 1,059 Ward No. 29 00298 4 4 184 135 49 1,724 640 1,084 Ward No. 30 0030
14 2 12 63 23 40 1,226 424 802 Ward No. 31 0031
62 57 5 239 171 68 5,865 2,071 3,794 Munirabad Project Area (CT) 601860
62 57 5 239 171 68 5,865 2,071 3,794 Ward No. 1 0001
157


Section – II
Tables based on Households Amenities and Assets
(Rural /Urban) at District and Sub-District level


Total Rural Urban Total Rural Urban Total Rural Urban1 2 3 4 5 6 7 8 9 10 11 12
Owned No exclusive room 49,819 48,313 1,506 10,276 9,830 446 6,917 6,821 96One room 84,409 74,701 9,708 17,326 15,214 2,112 12,074 11,388 686Two rooms 51,646 42,859 8,787 8,342 6,915 1,427 5,986 5,489 497Three rooms 15,837 11,737 4,100 1,667 1,246 421 1,130 969 1613+ rooms 10,773 7,021 3,752 874 585 289 519 423 96
Rented No exclusive room 7,327 6,290 1,037 834 719 115 641 597 44One room 15,706 9,814 5,892 1,764 1,210 554 1,358 1,004 354Two rooms 11,359 5,503 5,856 1,053 537 516 587 350 237Three rooms 4,722 1,551 3,171 397 117 280 195 71 1243+ rooms 1,998 527 1,471 143 32 111 88 23 65
Others No exclusive room 2,003 1,892 111 366 347 19 285 280 5One room 2,373 2,008 365 412 333 79 331 296 35Two rooms 966 710 256 106 79 27 85 66 19Three rooms 300 174 126 44 22 22 17 11 63+ rooms 158 117 41 17 15 2 8 6 2
Total No exclusive room 59,149 56,495 2,654 11,476 10,896 580 7,843 7,698 145One room 102,488 86,523 15,965 19,502 16,757 2,745 13,763 12,688 1,075Two rooms 63,971 49,072 14,899 9,501 7,531 1,970 6,658 5,905 753Three rooms 20,859 13,462 7,397 2,108 1,385 723 1,342 1,051 2913+ rooms 12,929 7,665 5,264 1,034 632 402 615 452 163
Data Source:-Census of India, 2011, HH- series Tables on Houses, Household amenities and assets.
District - Koppal (29560)
Table -1: Households by Ownership Status and by Number of Dwelling rooms occupied in the District, 2011
Name of district
Number of householdsTotal Scheduled Castes Scheduled Tribes
Ownership status
Number of dwelling rooms
161

Permanent Semi permanent Temporary Permanent
1 2 3 4 5 61 Sub-District - Yelbarga (2956005464) 17,876 (36.04%) 17,607 (35.5%) 13,515 (27.25%) 16,291 (34.81%)
2 Sub-District - Kushtagi (2956005465) 16,975 (33.97%) 23,915 (47.86%) 8,479 (16.97%) 13,868 (30.72%)
3 Sub-District - Gangawati (2956005466) 51,304 (58.12%) 22,660 (25.67%) 12,794 (14.49%) 35,873 (54.91%)
4 Sub-District - Koppal (2956005467) 43,063 (60.18%) 17,373 (24.28%) 10,038 (14.03%) 31,215 (55.8%)
District - Koppal (29560) 129,218 (49.81%) 81,555 (31.44%) 44,826 (17.28%) 97,247 (45.61%)
Note :
Sl. No. Name of Sub - District Total
1.Data Source:-Census of India, 2011, HH- series Tables on Houses, Household amenities and assets.
Permanent : Permanent houses refer to those houses whose walls & roofs are made of pucca materials, i.e., where burnt bricks, G.I. Sheets or other metal sheets, stone, cement, concrete is used for wall and tiles, slate, shingle, corrugated iron, zinc or other metal sheets, asbestos sheets, bricks, lime and stone and RBC/RCC concrete are used for roof.
Semi Permanent : Semi permanent houses refer to those houses made of other types of materials.
Temporary : Temporary houses refer to those houses having wall and roofs made of Kutcha materials, i.e., where, grass, leaves, reeds, bamboo, mud and unburnt bricks are used for the construction of walls and grass, leaves, reeds, bamboo thatch, mud, unburnt bricks and wood etc. are used for roofs.
Table - 2 : Percentage distribution of Households living in Permanent,
162

Semi permanent Temporary Permanent Semi permanent Temporary
7 8 9 10 11 216,902 (36.11%) 13,052 (27.89%) 1,585 (56.79%) 705 (25.26%) 463 (16.59%) Sub-District - Yelbarga (2956005464)
23,035 (51.03%) 7,734 (17.13%) 3,107 (64.33%) 880 (18.22%) 745 (15.42%) Sub-District - Kushtagi (2956005465)
17,075 (26.14%) 10,963 (16.78%) 15,431 (67.27%) 5,585 (24.35%) 1,831 (7.98%) Sub-District - Gangawati (2956005466)
14,808 (26.47%) 8,921 (15.95%) 11,848 (75.85%) 2,565 (16.42%) 1,117 (7.15%) Sub-District - Koppal (2956005467)
71,820 (33.68%) 40,670 (19.07%) 31,971 (69.23%) 9,735 (21.08%) 4,156 (9%) District - Koppal (29560)
Semi permanent and Temporary Houses , 2011Urban Name of Sub-DistrictRural
163

Tap water from treated source
Tap water from untreated source
Covered well Un-covered well
1 2 3 4 5 6 7 81 Total 49,595 9,447 (19.05%) 29,972 (60.43%) 132 (0.27%) 227 (0.46%)
Rural 46,804 9,276 (19.82%) 27,842 (59.49%) 128 (0.27%) 227 (0.49%)Urban 2,791 171 (6.13%) 2,130 (76.32%) 4 (0.14%) 0 (0%)
2 Total 49,972 9,381 (18.77%) 20,022 (40.07%) 512 (1.02%) 3,848 (7.7%)Rural 45,142 6,319 (14%) 18,813 (41.68%) 506 (1.12%) 3,848 (8.52%)Urban 4,830 3,062 (63.4%) 1,209 (25.03%) 6 (0.12%) 0 (0%)
3 Total 88,268 35,328 (40.02%) 26,159 (29.64%) 692 (0.78%) 769 (0.87%)Rural 65,330 19,783 (30.28%) 22,862 (34.99%) 638 (0.98%) 721 (1.1%)Urban 22,938 15,545 (67.77%) 3,297 (14.37%) 54 (0.24%) 48 (0.21%)
4 Total 71,561 37,348 (52.19%) 19,246 (26.89%) 113 (0.16%) 387 (0.54%)Rural 55,941 23,697 (42.36%) 17,994 (32.17%) 102 (0.18%) 368 (0.66%)Urban 15,620 13,651 (87.39%) 1,252 (8.02%) 11 (0.07%) 19 (0.12%)Total 259,396 91,504 (35.28%) 95,399 (36.78%) 1,449 (0.56%) 5,231 (2.02%)Rural 213,217 59,075 (27.71%) 87,511 (41.04%) 1,374 (0.64%) 5,164 (2.42%)Urban 46,179 32,429 (70.22%) 7,888 (17.08%) 75 (0.16%) 67 (0.15%)
Data Source:-Census of India, 2011, HH- series Tables on Houses, Household amenities and assets.
Table -3 : Number and Percentage of Households Sl. No.
Name of Sub-District Total/ Rural/ Urban
Total Number of households
Number and percentage of Household
Note: Percentage is given in brackets after the number of households.
Sub-District - Yelbarga (2956005464)
Sub-District - Kushtagi (2956005465)
Sub-District - Gangawati (2956005466)
Sub-District - Koppal (2956005467)
District - Koppal (29560)
164

Handpump Tubewell/borehole Spring River/ canal Tank/ pond/ lake
Other Sources
9 10 11 12 13 14 3 22,204 (4.44%) 4,373 (8.82%) 21 (0.04%) 101 (0.2%) 2,564 (5.17%) 554 (1.12%) Total2,196 (4.69%) 3,914 (8.36%) 16 (0.03%) 100 (0.21%) 2,564 (5.48%) 541 (1.16%) Rural
8 (0.29%) 459 (16.45%) 5 (0.18%) 1 (0.04%) 0 (0%) 13 (0.47%) Urban4,242 (8.49%) 11,492 (23%) 59 (0.12%) 30 (0.06%) 59 (0.12%) 327 (0.65%) Total4,120 (9.13%) 11,081 (24.55%) 53 (0.12%) 30 (0.07%) 55 (0.12%) 317 (0.7%) Rural
122 (2.53%) 411 (8.51%) 6 (0.12%) 0 (0%) 4 (0.08%) 10 (0.21%) Urban9,484 (10.74%) 12,492 (14.15%) 73 (0.08%) 1,297 (1.47%) 1,419 (1.61%) 555 (0.63%) Total8,324 (12.74%) 9,958 (15.24%) 48 (0.07%) 1,269 (1.94%) 1,407 (2.15%) 320 (0.49%) Rural1,160 (5.06%) 2,534 (11.05%) 25 (0.11%) 28 (0.12%) 12 (0.05%) 235 (1.02%) Urban1,476 (2.06%) 11,551 (16.14%) 75 (0.1%) 632 (0.88%) 461 (0.64%) 272 (0.38%) Total1,330 (2.38%) 11,259 (20.13%) 64 (0.11%) 482 (0.86%) 455 (0.81%) 190 (0.34%) Rural
146 (0.93%) 292 (1.87%) 11 (0.07%) 150 (0.96%) 6 (0.04%) 82 (0.52%) Urban17,406 (6.71%) 39,908 (15.38%) 228 (0.09%) 2,060 (0.79%) 4,503 (1.74%) 1,708 (0.66%) Total15,970 (7.49%) 36,212 (16.98%) 181 (0.08%) 1,881 (0.88%) 4,481 (2.1%) 1,368 (0.64%) Rural1,436 (3.11%) 3,696 (8%) 47 (0.1%) 179 (0.39%) 22 (0.05%) 340 (0.74%) Urban
by main source of Drinking water, 2011.Name of Sub-
Districthaving following source of drinking water Total/
Rural/ Urban
Sub-District - Yelbarga
(2956005464)
Sub-District - Kushtagi
(2956005465)
Sub-District - Gangawati
(2956005466)
Sub-District - Koppal (2956005467)
District - Koppal (29560)
165

Electricity Kerosene
1 2 3 4 5 61 Total 49,595 41,596 (83.87%) 7,214 (14.55%)
Rural 46,804 39,124 (83.59%) 7,013 (14.98%)Urban 2,791 2,472 (88.57%) 201 (7.2%)
2 Total 49,972 42,822 (85.69%) 6,559 (13.13%)Rural 45,142 38,449 (85.17%) 6,165 (13.66%)Urban 4,830 4,373 (90.54%) 394 (8.16%)
3 Total 88,268 76,922 (87.15%) 10,529 (11.93%)Rural 65,330 56,276 (86.14%) 8,391 (12.84%)Urban 22,938 20,646 (90.01%) 2,138 (9.32%)
4 Total 71,561 61,826 (86.4%) 8,919 (12.46%)Rural 55,941 47,310 (84.57%) 7,911 (14.14%)Urban 15,620 14,516 (92.93%) 1,008 (6.45%)Total 259,396 223,166 (86.03%) 33,221 (12.81%)Rural 213,217 181,159 (84.96%) 29,480 (13.83%)Urban 46,179 42,007 (90.97%) 3,741 (8.1%)
Data Source:-Census of India, 2011, HH- series Tables on Houses, Household amenities and assets.
Table- 4 : Number and Percentage of Households Sl. No.
Name of Sub-District Total/ Rural/ Urban
Total number of households
Number and Percentage of households
Note: Percentage is given in brackets after the number of households.
Sub-District - Yelbarga (2956005464)
Sub-District - Kushtagi (2956005465)
Sub-District - Gangawati (2956005466)
Sub-District - Koppal (2956005467)
District - Koppal (29560)
166

Solar Other oil Any other No lighting
7 8 9 10 3 288 (0.18%) 82 (0.17%) 20 (0.04%) 595 (1.2%) Total83 (0.18%) 81 (0.17%) 19 (0.04%) 484 (1.03%) Rural5 (0.18%) 1 (0.04%) 1 (0.04%) 111 (3.98%) Urban
97 (0.19%) 83 (0.17%) 27 (0.05%) 384 (0.77%) Total80 (0.18%) 81 (0.18%) 25 (0.06%) 342 (0.76%) Rural17 (0.35%) 2 (0.04%) 2 (0.04%) 42 (0.87%) Urban
129 (0.15%) 129 (0.15%) 41 (0.05%) 518 (0.59%) Total102 (0.16%) 109 (0.17%) 31 (0.05%) 421 (0.64%) Rural27 (0.12%) 20 (0.09%) 10 (0.04%) 97 (0.42%) Urban74 (0.1%) 235 (0.33%) 127 (0.18%) 380 (0.53%) Total
69 (0.12%) 205 (0.37%) 113 (0.2%) 333 (0.6%) Rural5 (0.03%) 30 (0.19%) 14 (0.09%) 47 (0.3%) Urban
388 (0.15%) 529 (0.2%) 215 (0.08%) 1,877 (0.72%) Total334 (0.16%) 476 (0.22%) 188 (0.09%) 1,580 (0.74%) Rural54 (0.12%) 53 (0.11%) 27 (0.06%) 297 (0.64%) Urban
Name of Sub-DistrictTable- 4 : Number and Percentage of Households by main source of Lighting, 2011.
having following main source of lightingNumber and Percentage of households Total/ Rural/ Urban
Sub-District - Yelbarga (2956005464)
Sub-District - Kushtagi (2956005465)
Sub-District - Gangawati (2956005466)
Sub-District - Koppal (2956005467)
District - Koppal (29560)
167

Piped sewer system Septic tank Other system
1 2 3 4 5 6 71 Total 49,595 387 (0.78%) 2,656 (5.36%) 389 (0.78%)
Rural 46,804 297 (0.63%) 1,859 (3.97%) 372 (0.79%)Urban 2,791 90 (3.22%) 797 (28.56%) 17 (0.61%)
2 Total 49,972 535 (1.07%) 3,113 (6.23%) 235 (0.47%)Rural 45,142 236 (0.52%) 1,372 (3.04%) 220 (0.49%)Urban 4,830 299 (6.19%) 1,741 (36.05%) 15 (0.31%)
3 Total 88,268 2,877 (3.26%) 14,885 (16.86%) 686 (0.78%)Rural 65,330 1,492 (2.28%) 6,584 (10.08%) 524 (0.8%)Urban 22,938 1,385 (6.04%) 8,301 (36.19%) 162 (0.71%)
4 Total 71,561 1,692 (2.36%) 11,290 (15.78%) 707 (0.99%)Rural 55,941 789 (1.41%) 4,290 (7.67%) 542 (0.97%)Urban 15,620 903 (5.78%) 7,000 (44.81%) 165 (1.06%)Total 259,396 5,491 (2.12%) 31,944 (12.31%) 2,017 (0.78%)Rural 213,217 2,814 (1.32%) 14,105 (6.62%) 1,658 (0.78%)Urban 46,179 2,677 (5.8%) 17,839 (38.63%) 359 (0.78%)
Data Source:-Census of India, 2011, HH- series Tables on Houses, Household amenities and assets.
Table -5 : Number and Percentage of Households Sl. No.
Name of Sub-District Total/ Rural/ Urban
Total number of households Flush/Pour latrine
Number and percentage of households
Note: Percentage is given in brackets after the number of households.
Sub-District - Yelbarga (2956005464)
Sub-District - Kushtagi (2956005465)
Sub-District - Gangawati (2956005466)
Sub-District - Koppal (2956005467)
District - Koppal (29560)
168

Pit LatrineWith
slab/Ventilated improved pit
Without slab/open pit
Night soil removed by
human
Night soil serviced by
animals
Public Latrine Open
8 9 10 11 12 13 14 3530 (1.07%) 13 (0.03%) 21 (0.04%) 0 (0%) 32 (0.06%) 3,718 (7.5%) 41,849 (84.38%) Total517 (1.1%) 9 (0.02%) 20 (0.04%) 0 (0%) 31 (0.07%) 3,195 (6.83%) 40,504 (86.54%) Rural13 (0.47%) 4 (0.14%) 1 (0.04%) 0 (0%) 1 (0.04%) 523 (18.74%) 1,345 (48.19%) Urban
841 (1.68%) 42 (0.08%) 20 (0.04%) 0 (0%) 48 (0.1%) 4,935 (9.88%) 40,203 (80.45%) Total625 (1.38%) 41 (0.09%) 19 (0.04%) 0 (0%) 42 (0.09%) 4,350 (9.64%) 38,237 (84.7%) Rural216 (4.47%) 1 (0.02%) 1 (0.02%) 0 (0%) 6 (0.12%) 585 (12.11%) 1,966 (40.7%) Urban
3,926 (4.45%) 137 (0.16%) 71 (0.08%) 0 (0%) 91 (0.1%) 16,699 (18.92%) 48,896 (55.39%) Total3,299 (5.05%) 64 (0.1%) 47 (0.07%) 0 (0%) 69 (0.11%) 10,349 (15.84%) 42,902 (65.67%) Rural
627 (2.73%) 73 (0.32%) 24 (0.1%) 0 (0%) 22 (0.1%) 6,350 (27.68%) 5,994 (26.13%) Urban2,418 (3.38%) 77 (0.11%) 103 (0.14%) 0 (0%) 109 (0.15%) 10,526 (14.71%) 44,639 (62.38%) Total2,024 (3.62%) 53 (0.09%) 31 (0.06%) 0 (0%) 97 (0.17%) 7,554 (13.5%) 40,561 (72.51%) Rural
394 (2.52%) 24 (0.15%) 72 (0.46%) 0 (0%) 12 (0.08%) 2,972 (19.03%) 4,078 (26.11%) Urban7,715 (2.97%) 269 (0.1%) 215 (0.08%) 0 (0%) 280 (0.11%) 35,878 (13.83%) 175,587 (67.69%) Total6,465 (3.03%) 167 (0.08%) 117 (0.05%) 0 (0%) 239 (0.11%) 25,448 (11.94%) 162,204 (76.07%) Rural1,250 (2.71%) 102 (0.22%) 98 (0.21%) 0 (0%) 41 (0.09%) 10,430 (22.59%) 13,383 (28.98%) Urban
Table -5 : Number and Percentage of Households by type of Latrine facility, 2011
No latrine within premisesNight Soil disposed into
open drain
Service Latrine having following type of latrine facility Number and percentage of households Total/
Rural/ Urban
169

Closed drainage Open drainage
1 2 3 4 5 61 Total 49,595 2,074 (4.18%) 15,044 (30.33%)
Rural 46,804 1,807 (3.86%) 13,118 (28.03%)Urban 2,791 267 (9.57%) 1,926 (69.01%)
2 Total 49,972 1,544 (3.09%) 8,221 (16.45%)Rural 45,142 1,271 (2.82%) 5,722 (12.68%)Urban 4,830 273 (5.65%) 2,499 (51.74%)
3 Total 88,268 5,620 (6.37%) 37,845 (42.88%)Rural 65,330 3,451 (5.28%) 20,388 (31.21%)Urban 22,938 2,169 (9.46%) 17,457 (76.11%)
4 Total 71,561 3,557 (4.97%) 33,205 (46.4%)Rural 55,941 2,475 (4.42%) 21,520 (38.47%)Urban 15,620 1,082 (6.93%) 11,685 (74.81%)Total 259,396 12,795 (4.93%) 94,315 (36.36%)Rural 213,217 9,004 (4.22%) 60,748 (28.49%)Urban 46,179 3,791 (8.21%) 33,567 (72.69%)
Data Source:-Census of India, 2011, HH- series Tables on Houses, Household amenities and assets.
Table -6 : Number and Percentage of Households by type of Drainage connectivity for waste water outlet , 2011 Sl. No. Name of Sub-District Total/ Rural/
UrbanTotal number of
households Number and Percentage of households by type of drainage connectivity for waste water outlet
Note: Percentage is given in brackets after the number of households.
Sub-District - Yelbarga (2956005464)
Sub-District - Kushtagi (2956005465)
Sub-District - Gangawati (2956005466)
Sub-District - Koppal (2956005467)
District - Koppal (29560)
170

Has kitchen Does not have kitchen Has kitchen
1 2 3 4 5 6 71 Total 49,595 40,989 (82.65%) 7,524 (15.17%) 213 (0.43%)
Rural 46,804 38,325 (81.88%) 7,433 (15.88%) 206 (0.44%)Urban 2,791 2,664 (95.45%) 91 (3.26%) 7 (0.25%)
2 Total 49,972 38,092 (76.23%) 10,764 (21.54%) 312 (0.62%)Rural 45,142 33,621 (74.48%) 10,604 (23.49%) 286 (0.63%)Urban 4,830 4,471 (92.57%) 160 (3.31%) 26 (0.54%)
3 Total 88,268 69,003 (78.17%) 9,751 (11.05%) 5,830 (6.6%)Rural 65,330 49,809 (76.24%) 7,416 (11.35%) 4,810 (7.36%)Urban 22,938 19,194 (83.68%) 2,335 (10.18%) 1,020 (4.45%)
4 Total 71,561 61,428 (85.84%) 7,797 (10.9%) 766 (1.07%)Rural 55,941 47,337 (84.62%) 6,509 (11.64%) 698 (1.25%)Urban 15,620 14,091 (90.21%) 1,288 (8.25%) 68 (0.44%)Total 259,396 209,512 (80.77%) 35,836 (13.82%) 7,121 (2.75%)Rural 213,217 169,092 (79.31%) 31,962 (14.99%) 6,000 (2.81%)Urban 46,179 40,420 (87.53%) 3,874 (8.39%) 1,121 (2.43%)
Data Source:-Census of India, 2011, HH- series Tables on Houses, Household amenities and assets.
Note: Percentage is given in brackets after the number of households.
Sub-District - Yelbarga (2956005464)
Sub-District - Kushtagi (2956005465)
Sub-District - Gangawati
(2956005466)
Sub-District - Koppal (2956005467)
District - Koppal (29560)
Table -7 : Number and Percentage of Households by availablity of Kitchen facility, 2011Sl. No.
Name of Sub-District Total/ Rural/ Urban
Total number of households
Number and Percentage of households having kitchenCooking inside house Cooking outside
house
171

Firewood Crop residue Cowdung cake Coal/ lignite/ charcoal
1 2 3 4 5 6 7 81 Total 49,595 46,118 (92.99%) 839 (1.69%) 16 (0.03%) 16 (0.03%)
Rural 46,804 44,045 (94.11%) 824 (1.76%) 15 (0.03%) 15 (0.03%)Urban 2,791 2,073 (74.27%) 15 (0.54%) 1 (0.04%) 1 (0.04%)
2 Total 49,972 45,898 (91.85%) 735 (1.47%) 13 (0.03%) 25 (0.05%)Rural 45,142 42,799 (94.81%) 671 (1.49%) 12 (0.03%) 24 (0.05%)Urban 4,830 3,099 (64.16%) 64 (1.33%) 1 (0.02%) 1 (0.02%)
3 Total 88,268 68,966 (78.13%) 1,350 (1.53%) 326 (0.37%) 93 (0.11%)Rural 65,330 55,025 (84.23%) 1,094 (1.67%) 301 (0.46%) 84 (0.13%)Urban 22,938 13,941 (60.78%) 256 (1.12%) 25 (0.11%) 9 (0.04%)
4 Total 71,561 57,300 (80.07%) 796 (1.11%) 55 (0.08%) 55 (0.08%)Rural 55,941 49,420 (88.34%) 652 (1.17%) 50 (0.09%) 47 (0.08%)Urban 15,620 7,880 (50.45%) 144 (0.92%) 5 (0.03%) 8 (0.05%)Total 259,396 218,282 (84.15%) 3,720 (1.43%) 410 (0.16%) 189 (0.07%)Rural 213,217 191,289 (89.72%) 3,241 (1.52%) 378 (0.18%) 170 (0.08%)Urban 46,179 26,993 (58.45%) 479 (1.04%) 32 (0.07%) 19 (0.04%)
Data Source:-Census of India, 2011, HH- series Tables on Houses, Household amenities and assets.
Number and percentage of households bySl. No.
Name of Sub-District Total/ Rural/ Urban
Total number of households
Table -8 : Number and Percentage of Households
Note: Percentage is given in brackets after the number of households.
Sub-District - Yelbarga (2956005464)
Sub-District - Kushtagi (2956005465)
Sub-District - Gangawati (2956005466)
Sub-District - Koppal (2956005467)
District - Koppal (29560)
172

Kerosene LPG/ PNG Electricity Bio-gas Any other No cooking
9 10 11 12 13 14 3 2150 (0.3%) 2,311 (4.66%) 43 (0.09%) 37 (0.07%) 8 (0.02%) 57 (0.11%) Total
128 (0.27%) 1,650 (3.53%) 36 (0.08%) 37 (0.08%) 8 (0.02%) 46 (0.1%) Rural22 (0.79%) 661 (23.68%) 7 (0.25%) 0 (0%) 0 (0%) 11 (0.39%) Urban
175 (0.35%) 2,847 (5.7%) 51 (0.1%) 113 (0.23%) 12 (0.02%) 103 (0.21%) Total98 (0.22%) 1,328 (2.94%) 34 (0.08%) 103 (0.23%) 11 (0.02%) 62 (0.14%) Rural77 (1.59%) 1,519 (31.45%) 17 (0.35%) 10 (0.21%) 1 (0.02%) 41 (0.85%) Urban1,761 (2%) 15,180 (17.2%) 108 (0.12%) 214 (0.24%) 47 (0.05%) 223 (0.25%) Total
602 (0.92%) 7,799 (11.94%) 92 (0.14%) 165 (0.25%) 32 (0.05%) 136 (0.21%) Rural1,159 (5.05%) 7,381 (32.18%) 16 (0.07%) 49 (0.21%) 15 (0.07%) 87 (0.38%) Urban1,157 (1.62%) 11,335 (15.84%) 162 (0.23%) 369 (0.52%) 111 (0.16%) 221 (0.31%) Total
627 (1.12%) 4,783 (8.55%) 42 (0.08%) 100 (0.18%) 107 (0.19%) 113 (0.2%) Rural530 (3.39%) 6,552 (41.95%) 120 (0.77%) 269 (1.72%) 4 (0.03%) 108 (0.69%) Urban
3,243 (1.25%) 31,673 (12.21%) 364 (0.14%) 733 (0.28%) 178 (0.07%) 604 (0.23%) Total1,455 (0.68%) 15,560 (7.3%) 204 (0.1%) 405 (0.19%) 158 (0.07%) 357 (0.17%) Rural1,788 (3.87%) 16,113 (34.89%) 160 (0.35%) 328 (0.71%) 20 (0.04%) 247 (0.53%) Urban
by type of fuel used for Cooking, 2011 availability of fuel used for cooking Name of Sub-
DistrictTotal/ Rural/ Urban
Sub-District - Yelbarga
(2956005464)
Sub-District - Kushtagi
(2956005465)
Sub-District - Gangawati
(2956005466)
Sub-District - Koppal
(2956005467)
District - Koppal (29560)
173

Radio/ Transistor Television Computer/ laptop- With Internet
Computer/ laptop- Without Internet
1 2 3 4 5 6 7 8 91 Total 49,595 36,342 (73.28%) 5,210 (10.51%) 17,202 (34.68%) 212 (0.43%) 2,195 (4.43%)
Rural 46,804 34,287 (73.26%) 4,937 (10.55%) 15,632 (33.4%) 159 (0.34%) 2,060 (4.4%)Urban 2,791 2,055 (73.63%) 273 (9.78%) 1,570 (56.25%) 53 (1.9%) 135 (4.84%)
2 Total 49,972 29,318 (58.67%) 4,237 (8.48%) 16,287 (32.59%) 234 (0.47%) 2,681 (5.37%)Rural 45,142 25,909 (57.39%) 3,896 (8.63%) 13,155 (29.14%) 143 (0.32%) 2,294 (5.08%)Urban 4,830 3,409 (70.58%) 341 (7.06%) 3,132 (64.84%) 91 (1.88%) 387 (8.01%)
3 Total 88,268 47,896 (54.26%) 8,592 (9.73%) 45,915 (52.02%) 879 (1%) 4,288 (4.86%)Rural 65,330 35,320 (54.06%) 6,034 (9.24%) 30,453 (46.61%) 393 (0.6%) 2,835 (4.34%)Urban 22,938 12,576 (54.83%) 2,558 (11.15%) 15,462 (67.41%) 486 (2.12%) 1,453 (6.33%)
4 Total 71,561 44,460 (62.13%) 9,853 (13.77%) 34,591 (48.34%) 810 (1.13%) 3,964 (5.54%)Rural 55,941 33,857 (60.52%) 6,863 (12.27%) 23,234 (41.53%) 398 (0.71%) 2,607 (4.66%)Urban 15,620 10,603 (67.88%) 2,990 (19.14%) 11,357 (72.71%) 412 (2.64%) 1,357 (8.69%)Total 259,396 158,016 (60.92%) 27,892 (10.75%) 113,995 (43.95%) 2,135 (0.82%) 13,128 (5.06%)Rural 213,217 129,373 (60.68%) 21,730 (10.19%) 82,474 (38.68%) 1,093 (0.51%) 9,796 (4.59%)Urban 46,179 28,643 (62.03%) 6,162 (13.34%) 31,521 (68.26%) 1,042 (2.26%) 3,332 (7.22%)
Data Source:-Census of India, 2011, HH- series Tables on Houses, Household amenities and assets.Note: Percentage is given in brackets after the number of households.
Sub-District - Yelbarga
(2956005464)
Sub-District - Kushtagi
(2956005465)
Sub-District - Gangawati
(2956005466)
Sub-District - Koppal
(2956005467)
District - Koppal (29560)
Table -9 : Number and Percentage of Households availing Banking services and Total
number of
households
Total number of households availing
banking services
Number and percentage of households Sl. No.
Name of Sub-District
Total/ Rural/ Urban
174

Land line Telephone
Mobile Telephone
Both Land line and
MobileTelephone
Bicycle Scooter/ Motor Cycle/ Moped
Car/ Jeep/ Van
None of the specified asset
10 11 12 13 14 15 16 3 21,574 (3.17%) 25,755 (51.93%) 1,440 (2.9%) 17,518 (35.32%) 5,114 (10.31%) 890 (1.79%) 12,750 (25.71%) Total1,454 (3.11%) 23,980 (51.23%) 1,297 (2.77%) 16,434 (35.11%) 4,540 (9.7%) 790 (1.69%) 12,330 (26.34%) Rural
120 (4.3%) 1,775 (63.6%) 143 (5.12%) 1,084 (38.84%) 574 (20.57%) 100 (3.58%) 420 (15.05%) Urban1,641 (3.28%) 27,111 (54.25%) 1,613 (3.23%) 14,774 (29.56%) 5,088 (10.18%) 888 (1.78%) 13,038 (26.09%) Total1,532 (3.39%) 23,761 (52.64%) 1,308 (2.9%) 12,894 (28.56%) 3,813 (8.45%) 661 (1.46%) 12,442 (27.56%) Rural
109 (2.26%) 3,350 (69.36%) 305 (6.31%) 1,880 (38.92%) 1,275 (26.4%) 227 (4.7%) 596 (12.34%) Urban3,312 (3.75%) 53,222 (60.3%) 3,329 (3.77%) 36,682 (41.56%) 20,028 (22.69%) 2,543 (2.88%) 15,453 (17.51%) Total2,416 (3.7%) 38,299 (58.62%) 2,420 (3.7%) 26,230 (40.15%) 13,457 (20.6%) 1,646 (2.52%) 12,657 (19.37%) Rural896 (3.91%) 14,923 (65.06%) 909 (3.96%) 10,452 (45.57%) 6,571 (28.65%) 897 (3.91%) 2,796 (12.19%) Urban
2,402 (3.36%) 42,114 (58.85%) 3,123 (4.36%) 28,603 (39.97%) 14,870 (20.78%) 1,890 (2.64%) 13,068 (18.26%) Total1,875 (3.35%) 31,248 (55.86%) 1,800 (3.22%) 22,007 (39.34%) 9,251 (16.54%) 1,177 (2.1%) 11,763 (21.03%) Rural
527 (3.37%) 10,866 (69.56%) 1,323 (8.47%) 6,596 (42.23%) 5,619 (35.97%) 713 (4.56%) 1,305 (8.35%) Urban8,929 (3.44%) 148,202 (57.13%) 9,505 (3.66%) 97,577 (37.62%) 45,100 (17.39%) 6,211 (2.39%) 54,309 (20.94%) Total7,277 (3.41%) 117,288 (55.01%) 6,825 (3.2%) 77,565 (36.38%) 31,061 (14.57%) 4,274 (2%) 49,192 (23.07%) Rural1,652 (3.58%) 30,914 (66.94%) 2,680 (5.8%) 20,012 (43.34%) 14,039 (30.4%) 1,937 (4.19%) 5,117 (11.08%) Urban
ss
Sub-District - Yelbarga
(2956005464)
Sub-District - Kushtagi
(2956005465)
Sub-District - Gangawati
(2956005466)
Sub-District - Koppal
(2956005467)
District - Koppal (29560)
number of Households having each of the specified assets in, 2011 having each of the following specified assets Name of Sub-
DistrictTotal/ Rural/ Urban
175


ORGI - KARNATAKA English - (10-2011)
Directorate of Census Operations, Karnataka Ministry of Home Affairs,
7th Floor, ‘E’ & ‘F’ Wing, Kendriya Sadan, 17th Main Road, II Block,
Koramangala, Bengaluru- 560034
Email: [email protected] Website: http://www.censusindia.gov.in