Niue Census of Population and Households 2011 - The ...
189
1 GOVERNMENT OF NIUE N N i i u u e e C C e e n n s s u u s s o o f f P P o o p p u u l l a a t t i i o o n n a a n n d d H H o o u u s s e e h h o o l l d d s s 2 2 0 0 1 1 1 1
-
Upload
khangminh22 -
Category
Documents
-
view
0 -
download
0
Transcript of Niue Census of Population and Households 2011 - The ...
1
GOVERNMENT OF NIUE
NNiiuuee CCeennssuuss ooff PPooppuullaattiioonn aanndd HHoouusseehhoollddss 22001111

2
© Copyright Statistics Niue, Government of Niue 2012 All rights for commercial and or for profit reproduction or translation, in any form is reserved. Statistics Niue authorises the partial reproduction or translation of this material for scientific, educational or research purposes, provided that Statistics Niue and the source document are properly acknowledged. Permission to reproduce the document and or translate in whole, in any form, whether for commercial / for profit or non-profit purposes, must be requested in writing. Original artwork may not be altered or separately published without permission.
Original text: English
Report prepared by Kimray Vaha, Statitics Niue, Department of Finance, Planning and Statistics, Government of Niue.

3
PPRREEFFAACCEE
A nation is people and people are the nation.
It is important for a nation to have a good account of its people and characteristics surrounding them as they are the fundamental part of any nation and the most crucial resource of the nation. Conducting a census or counting of population is as old as human civilization and the formal counting
of the population in Niue was done by the village elders, leaders and Christian Ministers after the introduction of Christianity. Niue began conducting official censuses in the 1900. Censuses conducted in 1902 to 1945 were conducted under New Zealand law and in the 1960s, under Cook Islands 1961 Census Regulations. Censuses after 1971 were conducted under the 1971 Niue Census Ordinance. This ordinance was later amended in 1978, and was still administered until the Statistics Act 2009 was enacted in 2009.
It is my privilege to introduce this report as it contains data and information relating to the 2011 Census. The report presents the demographic, social and economic characteristics of Niue and it provides a measure of Niue's development at a particular point in its national history. This report represents Niue's continuous effort to develop its national capability and confidence to produce quality information for evidence based decision making, policy formulation and planning purposes. Census activities are an integral part of this broad and long-term focus.
The Government and people of Niue also acknowledge the invaluable assistance of the Demography/Population Section in the Statistics and Development Programme of the Secretariat of the Pacific Community. We are particularly grateful to the assistance provided by Dr. Gerald Haberkorn and his team in collaborating with our team in Statistics Niue, not only in producing this report but also throughout the census project. Special thanks to Mr Mike Berry of Statistics New Zealand and his team for their assistance in this important undertaking. Fakaaue lahi mahaki, Thank you very much.
The report is like every other tool; it is only as good as what you make of it. The challenge for everyone, namely the policy makers and planners of Niue, is to use the report to shape the services to the people we serve. I am confident you will find statistics in this report user friendly, as well as helpful in addressing the priority issues facing Niue. Niue ke monuina. Fakaaue lahi. One may ask of what could be the most important resource of a nation, there is no dispute that its
people is the most important resource of a nation.
4
FFOORREEWWOORRDD
There is no overemphasizing the fact that the availability of statistical information is imperative in evidence-based policy and decision making. On the same token, the information also provides the underlying basis to sound planning and policy evaluation of development strategies. Here fore, the underpinning reason of conducting this Population and Household Census of Niue 2011 is the realisation of these facts for the benefit and betterment of the Government of Niue, the Niue Business community, the Civil Groups, and
Development Partners in the deliverance of goods and services for the prosperity of the Niue people. The information contained herein is also very useful in the monitoring and evaluation of the Niue National Strategic Plan 2009 – 2013, certain Millennium Development Goals (MDGs), the Pacific Plan and other international reporting commitments of Niue. On the 10th of September 2011, the Statistics Niue office conducted Niue’s 9th national census since 1971, under Niue’s Acts. Conducting a census is one of the major undertakings to national statistics offices; this Niue Census of Population and Household 2011 for Statistics Niue office was a big success. This success is attributed to the collaborated efforts of everyone on Niue, from the Leaders and Heads of Government of Niue, Leaders and Heads of Villages and Homes, and more importantly the commitment, dedication and hard work of enumerators and officers of the census and friends from abroad. Fakaaue lahi mahaki. The Niue Census of Population and Households 2011 is conducted in accordance with the provisions of the Niue Statistics Act 2009. A vote of thanks to Mr Haden Talagi and Mr Sauni Tongatule of the Pacific Adaptation to Climate Change program (PACC) of the Department of Environment for agreeing to co-fund this important project. We also like to acknowledge the great assistance we had from our friends of the Statistics and Demography Programme (SDP) of the Secretariat of the Pacific Community (SPC), Ms Leilua Taulealo and Mr Arthur Jorari and Mrs Adrienne Stringer of the Census Section of Statistics New Zealand (SNZ). Your assistance is greatly appreciated. Fakaaue Oue tulutulou. Last but not the least, a special thank you and appreciation to Fanuma Sioneholo for her outstanding tasks in ensuring that things are running smoothly at all times. Fakaaue lahi ma Numa. “Kia monuina e totouaga he tau fakamauaga mo e tau talahauaga nai. Kia fakatumau foki ke fakaaoga ke he tau fifiliaga mo e tau fakatokatokaaga ma e tau fekau mo e tau gahua kehekehe ma e holoaga mafola ho talua a motu fakahelehele ko Niue Fekai ma e tau momoui tagata kau takele mau ai”. Niue ke Monuina. Numela ke taki aki. Kimray Vaha Government Statistician Statistics Niue Department of Finance, Economic Planning and Statistics Government of Niue
5
o
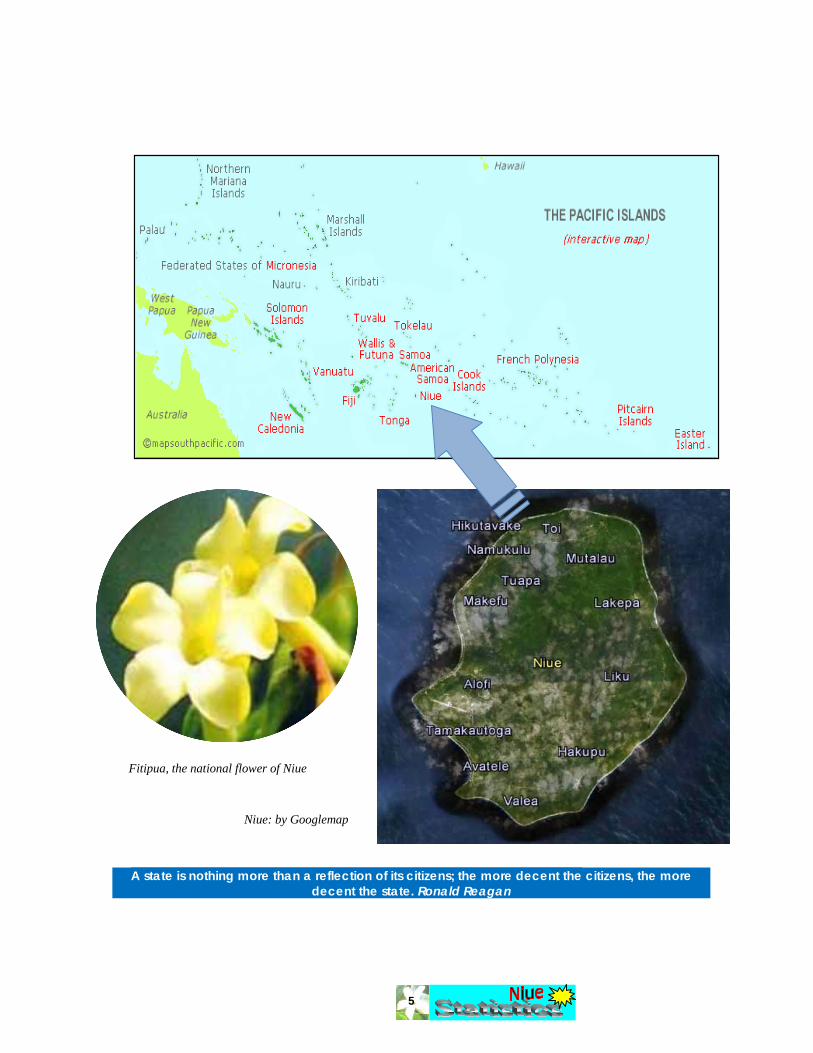
A state is nothing more than a reflection of its citizens; the more decent the citizens, the more
decent the state. Ronald Reagan
Fitipua, the national flower of Niue
Niue: by Googlemap

6
Contents Summary Results 9 Executive Summary 10 PART I – THE RESULTS AND THE ANALYSIS Chapter 1: Introduction 13
1.1 The Report 14 1.2 The Census 14 1.3 Census Night 15 1.4 The Census Counts 15 1.5 Census Schedules 15 1.6 The Population 15 1.7 Houses and Households 15 Chapter 2: Population Structure and Processes 16
2.1 Population Structure 16 2.1.1a Population Size: The Total Population 17 2.1.1b Population Size: The Total Residential Population 18 2.1.2a Geographical Distribution of the Total Population 19 2.1.2b Geographical Distribution of the Residential Population 21
2.1.3 Age and Sex Structure 22 2.2 Population Processes 27 2.2.1 Population Growth 27 2.2.2 Population Density 30 2.2.3 Fertility 30 2.2.4 Mortality 36 2.2.5 Migration 39 2.2.6 Population Growth by Immigration 43
Chapter 3: Social Characteristics 45
3.1 Ethnicity 45 3.2 Religion 46 3.3 Marital Status 47 3.4 Education 48 3.4.1 School Enrolments 49 3.4.2 Educational Attainment 51 3.4.3 Levels of Educational Qualifications 51 3.5 Family or Household Compositions 56 3.6 Language and Cultural Skills 56 3.6.1 Vagahau – Language 57 3.6.2 Culture: Basket weaving, Coconut husking and Cooking 59 3.7 Health: Disabilities and Non-communicable diseases (NCDs) 60 3.7.1 Disabilities 61 3.7.2 NCDs 61
7
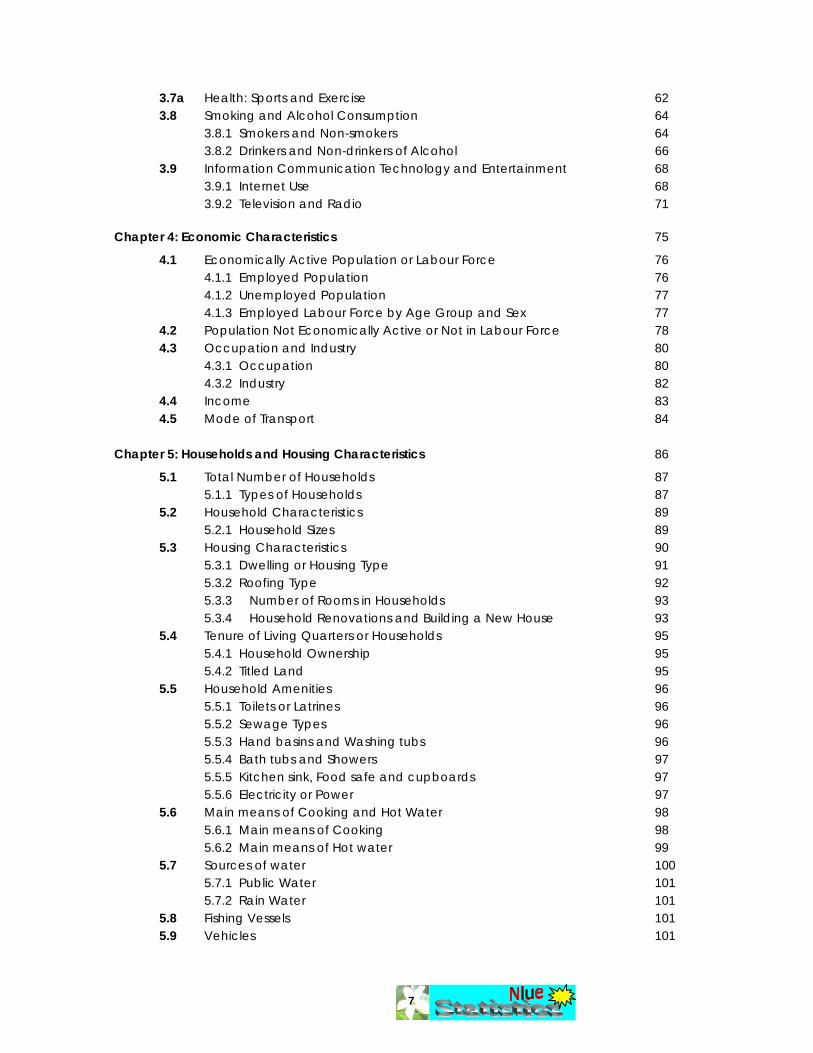
3.7a Health: Sports and Exercise 62 3.8 Smoking and Alcohol Consumption 64 3.8.1 Smokers and Non-smokers 64 3.8.2 Drinkers and Non-drinkers of Alcohol 66 3.9 Information Communication Technology and Entertainment 68 3.9.1 Internet Use 68 3.9.2 Television and Radio 71 Chapter 4: Economic Characteristics 75
4.1 Economically Active Population or Labour Force 76 4.1.1 Employed Population 76 4.1.2 Unemployed Population 77 4.1.3 Employed Labour Force by Age Group and Sex 77 4.2 Population Not Economically Active or Not in Labour Force 78 4.3 Occupation and Industry 80 4.3.1 Occupation 80 4.3.2 Industry 82 4.4 Income 83 4.5 Mode of Transport 84 Chapter 5: Households and Housing Characteristics 86
5.1 Total Number of Households 87 5.1.1 Types of Households 87 5.2 Household Characteristics 89 5.2.1 Household Sizes 89 5.3 Housing Characteristics 90 5.3.1 Dwelling or Housing Type 91 5.3.2 Roofing Type 92 5.3.3 Number of Rooms in Households 93 5.3.4 Household Renovations and Building a New House 93 5.4 Tenure of Living Quarters or Households 95 5.4.1 Household Ownership 95 5.4.2 Titled Land 95 5.5 Household Amenities 96 5.5.1 Toilets or Latrines 96 5.5.2 Sewage Types 96 5.5.3 Hand basins and Washing tubs 96 5.5.4 Bath tubs and Showers 97 5.5.5 Kitchen sink, Food safe and cupboards 97 5.5.6 Electricity or Power 97 5.6 Main means of Cooking and Hot Water 98 5.6.1 Main means of Cooking 98 5.6.2 Main means of Hot water 99 5.7 Sources of water 100 5.7.1 Public Water 101 5.7.2 Rain Water 101 5.8 Fishing Vessels 101 5.9 Vehicles 101
8
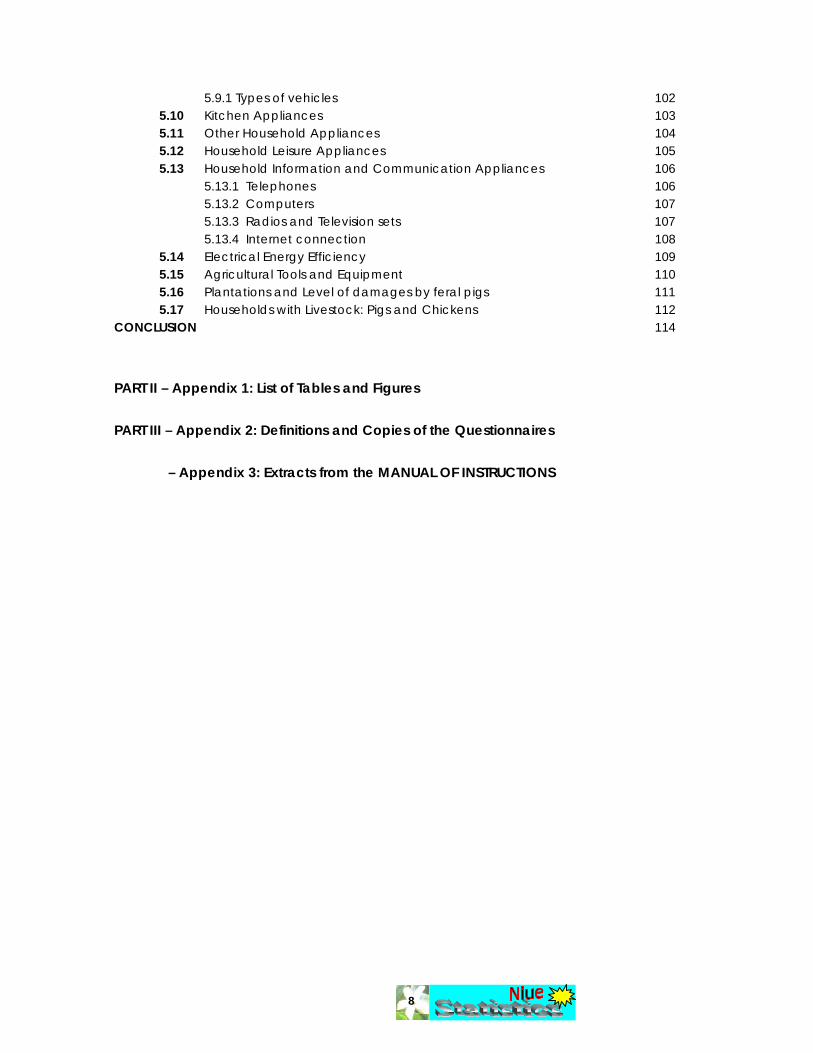
5.9.1 Types of vehicles 102 5.10 Kitchen Appliances 103 5.11 Other Household Appliances 104 5.12 Household Leisure Appliances 105 5.13 Household Information and Communication Appliances 106 5.13.1 Telephones 106 5.13.2 Computers 107 5.13.3 Radios and Television sets 107 5.13.4 Internet connection 108 5.14 Electrical Energy Efficiency 109 5.15 Agricultural Tools and Equipment 110 5.16 Plantations and Level of damages by feral pigs 111 5.17 Households with Livestock: Pigs and Chickens 112 CONCLUSION 114
PART II – Appendix 1: List of Tables and Figures
PART III – Appendix 2: Definitions and Copies of the Questionnaires
– Appendix 3: Extracts from the MANUAL OF INSTRUCTIONS
9
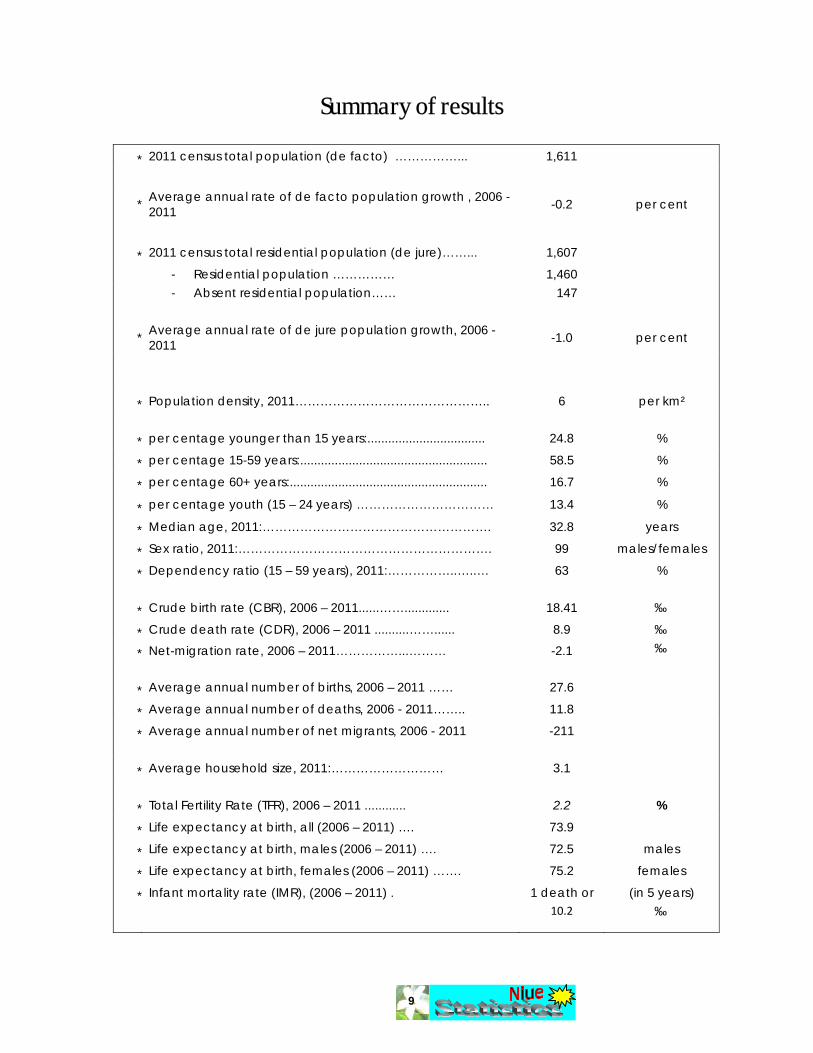
Summary of results
* 2011 census total population (de facto) ……………... 1,611
* Average annual rate of de facto population growth , 2006 - 2011 -0.2 per cent
* 2011 census total residential population (de jure)……... 1,607
- Residential population …………… 1,460 - Absent residential population…… 147
* Average annual rate of de jure population growth, 2006 - 2011 -1.0 per cent
* Population density, 2011……………………………………….. 6 per km²
* per centage younger than 15 years:.................................. 24.8 %
* per centage 15-59 years:...................................................... 58.5 %
* per centage 60+ years:......................................................... 16.7 %
* per centage youth (15 – 24 years) …………………………… 13.4 %
* Median age, 2011:………………………………………………. 32.8 years
* Sex ratio, 2011:……………………………………………………. 99 males/females
* Dependency ratio (15 – 59 years), 2011:……………..…..… 63 %
* Crude birth rate (CBR), 2006 – 2011......……............. 18.41 ‰
* Crude death rate (CDR), 2006 – 2011 ..........……...... 8.9 ‰
* Net-migration rate, 2006 – 2011……………...……… -2.1 ‰
* Average annual number of births, 2006 – 2011 …… 27.6
* Average annual number of deaths, 2006 - 2011…….. 11.8
* Average annual number of net migrants, 2006 - 2011 -211
* Average household size, 2011:……………………… 3.1
* Total Fertility Rate (TFR), 2006 – 2011 ............ 2.2 %
* Life expectancy at birth, all (2006 – 2011) …. 73.9
* Life expectancy at birth, males (2006 – 2011) …. 72.5 males
* Life expectancy at birth, females (2006 – 2011) ……. 75.2 females
* Infant mortality rate (IMR), (2006 – 2011) . 1 death or (in 5 years)
10.2 ‰
10
Executive Summary The main purpose of this report is to present the results and analysis of the census data from the recent population census of Niue – the 2011 Population and Housing Census. The report is intended to highlight key findings pertaining to:
• Niue’s population composition, structure and processes, to describe and explain recent demographic developments;
• An overview on education, to describe and explain the level of education of the population;
• Snapshots on language and culture skills, to describe and explain the level of usage of Niuean language and some basic cultural skills;
• Snapshots on disabilities, tobacco and alcohol consumption, and non-communicable diseases, to describe and explain the widespread of occurrences or prevalence rates across the population;
• Snapshots on population developments, to describe and explain the preference in increasing the population;
• An overview of labour market activities, to describe and explain the developments and quality of life of people ; and
• Some important household and housing characteristics, to explain and describe the developments and quality of life of the country.
A copy of the census questionnaires is appended at the back of this report, which outlines the broad spectrum of thematic issues covered by the census, and for which more specific and detailed information can be obtained, on request, from the Statistics Niue office. At the time of the 2011 census, 10 September 2011, Niue’s de facto population count stood at 1,611 people, residential population at 1,460 and de jure population at 1,607. This represents a decline of 4 persons in total, and 78 usual residents in just 5 years, continuing the gradual population decline Niue has experienced over the past four decades, from an all-time high of 5,194 in 1966. With a modest average of 27 births and 11 deaths per year between 2006 and 2011, underlining a small natural increase of 82 people per annum (or 5.6% of the population), Niue’s population decline over the past 4 decades is the result of sustained high net-emigration, averaging some 43 people per year since 2006. With migration emerging as the main driver of Niuean population dynamics, and population losses usually involving the younger population groups, it is not surprising that Niue currently has an old population, featuring a median age of 32.8 years. A median age of 32.8 years means, half of Niue’s population is younger, and half is older than 32.8 years. This is illustrated in the age-pyramids depicted on pages 28 - 29. This illustration also contains information on the relative number of males and females across various age-groups, pointing to a sex ratio of 99, which means, there are 99 males for every 100 females. In terms of major socio-demographic features, 80 per cent of the resident population is Niuean or Part-Niuean compared to 81 per cent 5 years ago and 83 per cent in the last decade. The vast majority is of Christian faith, remains predominant with the Ekalesia Kerisiano Niue accounting for
11
67 per cent of the population compared to 62 per cent 5 years ago. Most of Niue’s population of 15 years of age is married (55%) or living in a de facto union (8%), one in four (26%) is never-married (or single), 7 per cent is widowed, with divorce and separate accounting for 3 per cent. Looking at education, Niue has one of the highest, if not the highest educational enrolment rate in the Pacific islands, with every child under the age of 14 enrolled in school, with enrolment rates only showing a modest decline at ages 15 (94%), 16 (96%) and 17 (71%). Against this backdrop, the high rates of educational achievement of the Niue resident population are not surprising, with 66 per cent claiming to have some kind of education achievement or qualification. This is a steady increase from 51 per cent 5 years ago. Three out of four residents aged 4 years and older refer to the Vagahau or Niuean as their first language learned, with about 80 per cent claiming to speak it fluently and a further 13 per cent indicating some modest speaking proficiency. About 76 per cent of them who are proficient in reading, 75 per cent in writing and 81 per cent who are proficient in understanding the vagahau. Only a small minority does not speak, read, write or understand the Vagahau. At the household level, one in 3 households claim to converse in Niuean only, with 43 per cent stating they use both English and Niuean. In the context of health related questions, about 5 per cent of the resident who said to have some form of disability and on Non Communicable Diseases (NCDs) high blood pressure is more prevalent (15%), than diabetes (14%) and gout (11%). About 41 per cent of households participated in sports, 56 per cent do some walking and only 26 per cent do jogging. Not many households have exercise equipment. In terms of smokers and drinkers (considered risk factors) about 23 per cent of the population are smokers and 65 per cent are males; 59 per cent drink alcohol and 59 per cent are males. In the context of Niue’s age structure, a very high labour force participation rate of 68.6 per cent does not come as a surprise, with 38.4 per cent of males, and 30.3 per cent in the labour force. What may, however, surprise some is a slightly higher proportion of women aged 25 – 29, (58.8%) than men (41.3%) were working in paid employment. The most striking features of Niue’s occupational profile is the clear dominance of women in office works as clerks (84%); while men were very dominant as plant and machine operators and assemblers (94%) and Craft and related trade workers (87%). Looking at industries, professionals, scientific and technical activities normally performed by public administration (20.6%), (public) health and education services (16%) agriculture, forestry and fishing or primary industries (10.4 %), and wholesale/retail trade, repair of motor vehicles sectors (10.0%) emerge as the biggest employers. The census also provides some basic information on income, with one out of five (20%) Niueans in paid employment earn less than $ 10,000 in a year, by almost half (45%) earn between $10,000 and $20,000 and about one out of 3 (30%) earn more than $20,000 in a year. A dedicated chapter on population dynamics examines the relative contribution of births, deaths and migration to overall population growth. It also provides information on fertility, with Niue’s current TFR estimated at 2.2, which refers to the average number of children Niuean women can expect to have during their life-time, at prevailing fertility rates. Teenage fertility stands at about 30 (indicating 30 births/1,000 females aged 15-19 years of age). Average Life expectancy at birth has been estimated at around 72.5 years for men and 75.2 years for women. Infant mortality is very low, with only 1 single infant death reported between 2006 and 2011; set against 98 reported births, this would yield an IMR of 10.2/1,000, one of the very best figures in the Pacific region.
12
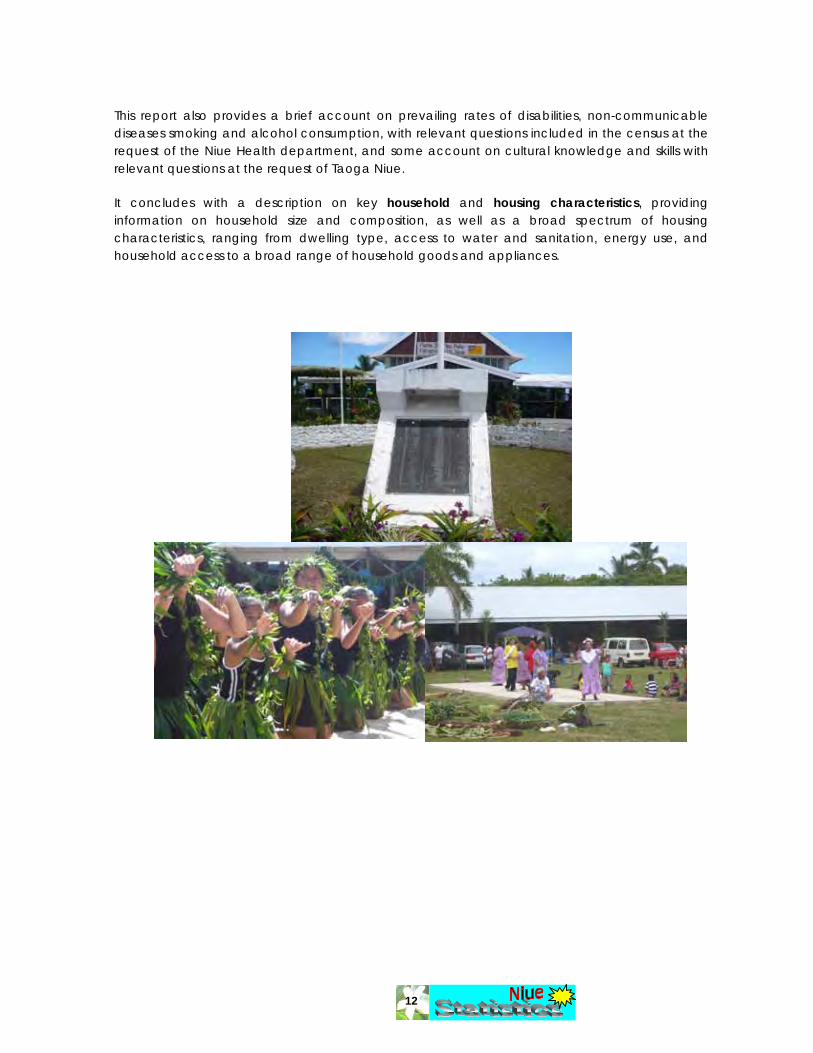
This report also provides a brief account on prevailing rates of disabilities, non-communicable diseases smoking and alcohol consumption, with relevant questions included in the census at the request of the Niue Health department, and some account on cultural knowledge and skills with relevant questions at the request of Taoga Niue. It concludes with a description on key household and housing characteristics, providing information on household size and composition, as well as a broad spectrum of housing characteristics, ranging from dwelling type, access to water and sanitation, energy use, and household access to a broad range of household goods and appliances.
13
PART I – THE RESULTS AND THE ANALYSIS
Chapter I
1. Introduction Just as effective development depends on reliable knowledge of natural and other resources, so does effective development planning depend upon natural knowledge of the composition, growth, and movement of population. Rafael Salas In realizing or effecting Niue’s economic and social developments, it is imperative that Niue requires detailed information about the characteristics of its population and about specific goals of government programs to improve people’s living conditions. Also required is some knowledge about the potential impact and effects of such programs on the society and its development. Population therefore plays a crucial role in shaping Niue’s economic and social developments. To know the true knowledge or the comprehensive account of the structure and processes of Niue’s population, the census is imperative. The Niue 2011 population and Household Census is the 23rd census of the population of Niue. The first official count of the population was conducted in 1900. However there were counts prior to 1900 by the serving ministers of the London Missionary Society (later called the Ekalesia Kerisiano Niue) and was recorded in their journals. The Government of Niue (GON) in its national development plan, the Niue National Strategic Plan, 2009 – 2013 (NNSP 09-13) under Development Pillar 4 on Social developments recognized a need for a population strategy for Niue to build up and maintain its population at a level that will support and enhance Niue’s economic, social and cultural systems. (NNSP 2009-2013, p12) The indicators highlighted in this strategy includes: i) Population to increase by 20% by 2013; and ii) Average population growth rate increased annually to at least 1% by 2013. GON also in its Millennium Development Goals have included an extra goal to the United Nations global goals to recognize the population developments of Niue: Goal 9. Promote Sustainable Population Developments. (MDGR 2007, p94) Target 19 of Niue MDGs highlighted: i) the de jure population of Niue to reach a total of 1,800 persons by 2015 (indicator 49); ii) Up to 200 of the people immigrating to live permanently by 2015 (indicator 50); and iii) the birth rate to reach 20% by 2015 (indicator 51). 1.1 The Report: As per stated above, “The main purpose of this report is to present the results and analysis of the census data from the recent population census of Niue – the 2011 Population and Housing Census”. This analytical report will provide the social and demographic indicators appropriate for monitoring and reviewing the progress of implementation of, not only the social and economic development policies and aspirations of the Government of Niue as per stipulated in the NNSP 2009 -2013, but also to realize the aims and objectives of the MDGs. In other words, this report is crucial in providing effective planning for the Government and people of Niue.
14
Another important aspect of the report (and the census in general) is to provide the necessary information for benchmarking and rebasing of certain statistics of Government Departments and Agencies, Village Councils and Non-Government Organisations. The information contained herein also is expected to be used by “users” for evidence based policy making decision making, the underlying purpose of producing statistics. The report includes the description of procedures or methods used in the analysis. The report has three parts:
• Part I contains the results of data analysis; • Part II contains the tables and definitions of terms used in the report; and • Part III contains copies of the questionnaires and manual of instructions.
Part I consist of five chapters as follows:
Chapter I Introduction Chapter II Population Structure and Processes Chapter III Social Characteristics Chapter IV Economic Characteristics Chapter V Household and Housing Characteristics
Part II presents the list of tables and list of figures in the report (Appendix 1 and 2).
Part III contains the copies of the questionnaires; Housing and Dwelling Schedule and the Personal Schedule; and an extract from the Manual of Instructions (Appendix 3 and 4)
It is also obvious that in the conduct of a statistical operation as large and complex as a
national census, it is inevitable that errors will occur due to questions being misunderstood, replies being incorrect or misinterpreted, etc. In fact, errors could have been introduced at all stages of the census, from planning, field operation stage, non-responses, non-call back to check on households that were missed during the actual enumeration and the training of enumerators (i.e. misunderstanding on the part of enumerators). Also errors could have been introduced at the data processing stage (editing, coding and data entry). In designing and carrying out the field procedures, including training procedures, considerable efforts were made in order to reduce the effects of such errors on the results. However, there is no guaranteed there are no errors in the report. 1.2 The Census. The Census of Population and Dwellings is an exercise of great significance to the Government of Niue and its people with the underlying purpose of providing a comprehensive account of the demographic and social information of the population of Niue, and also some economic information of the nation; making the fundamentals of policy formulation, evaluation and planning.
1.3 Census night. The Census was conducted on the 9th, 10th, 11th and 12th of September 2011. The Census moment or sometimes referred to as a “reference point in time” is 12 o’clock midnight that connects Saturday, 10 September with Sunday 11 September 2011. The Census is therefore the count of the population as at 12 o’clock midnight of that night.
15
1.4 The Census counts. The 2011 Census used three different population counts. These are: 1. the de-facto count, 2. the residential count, and 3. the de-jure count of the population at the time of census. Every structure used as a dwelling or a household was recorded and all persons living there, whether temporary or otherwise, on “Census Night” was recorded in detail. On 9, 10, and 11 September the enumerators commenced their field-work and enumerated the name and particulars of all persons in each enumeration area. On Monday 12 September they undertook another round of visits to each and every house to check their initial enumeration and to ascertain that the persons previously recorded were actually present on Census Night. And where appropriate add the newly born babies and arrivals or permanently moved households into the enumeration area but cancelled those who had died or permanently moved households out of the enumeration area. The enumeration was completed in four days. The de facto count is the usual resident population of Niue including visitors but excluding residents who were absent at the time of census – the Total Population. The residential count is the usual resident population excluding the visitors at the time of census – the Residential Population. The de jure count is the usual resident population including those who were absent at the time of census – the Total Residential Population. 1.5 Census schedules. The Census was collected with two types of schedules, the Household Schedule and the Population Schedule. The Household schedule consists of 33 questions which collects certain information pertaining the structure and contents of the dwelling and also records the members of the household that were absent during the time of census. The Population Schedule consists of 50 questions which collects detail information of the members of the household at the time of census. 1.6 The Population. A Total Population of 1,611 persons consisting of 802 males and 809 females were enumerated. Out of the total 1,611 persons, the Residential Population (usual residents) was 1,460 persons with 722 males and 738 females and a total of 151 visitors with 80 males and 71 females. A Total Residential Population of 1,607 consisting of 1,406 (722 males and 738 females) usual residents and 147 (73 males and 74 females) absent residents was counted at the time of census. 1.7 Houses and Households. A total of 1,193 houses and structures were counted and recorded from the 14 villages of Niue at the time of census. There were 477 households or private dwellings, 154 communal or community structures such as churches and halls, 163 houses just occupied or used as storage by residents and the 399 were empty and derelict. A total of 477 households or dwellings were enumerated from the 14 villages of Niue during the census. The details of housing, household and population characteristics will be discussed on later chapters.
16
Chapter II
2. Population Structure and Processes Labour is prior to, and independent of, capital. Capital is only the fruit of labour and could never have existed if labour had never first existed. Labour is the superior of capital, and deserves much higher consideration. Abraham Lincoln Population structure refers to population size; geographic distribution; age–sex structure; Population processes refer to population growth; fertility; mortality; and international migration, including internal migration. Apart from playing an important role in shaping a country’s economic and social development, population structure and processes can also be the direct result of development. This is quite evident in situations where policies are incorporated into development plans with the aim of altering specific population variables such as:
• Greater budget allocation to a country’s Ministry/Department of Health to strengthen and/or expand its maternal and child health and family planning services can lead to fewer deaths of infants, children and women;
• Greater budget allocation to a country’s Ministry/Department of Education to strengthen and/or expand its teaching and learning services that leads to an educated workforce which contributes to economic developments and improved standard of living;
• Greater budget allocation to a country’s Ministry/Department of Social Service or Community Affairs to strengthen and/or expand its delivery of services that ensures improved standard of living is enjoyed by all citizens;
• The promotion of employment opportunities and accessibility of services may prevent or discouraged people of emigrating.
Therefore, in accepting that population structures and processes are important components of development, and accepting the premise that development is ultimately about people (specifically, about improving people’s lives), it will be clear to everyone involved in planning and policy-making that incorporating population considerations into the planning process is at the very heart of planning and development.
2.1 Population Structure As the population is one of the, if not the major determinant of Niue’s overall developments and achievements, its structure: the size; geographic distribution; age–sex structure is of great significance to be considered, something in a population we need to know.

17
The socio-economic characteristics, such as ethnicity and marital status, levels of educational attainment and labour market activities will be discussed in Chapters III and IV.
2.1.1a Population Size: The Total Population
The final results of the census depicted in Table 2.1, saw the total enumerated population of Niue on census night of 1,611 persons with 802 males and 809 females and the sex ratio is 99 males per 100 females. This total population is composed of 1,460 (90.6%) usual residents and 151 (9.4%) visitors. Table 2.1: Total Population on census night, 2011 Census.
TOTAL POPULATION (de facto)
USUAL RESIDENTS VISITORS
Males Females Total Males Females Total Males Females Total
802 809 1,611 722 738 1,460 80 71 151
49.8% 50.2% - 49.5% 50.5% - 53.0% 47% -
Illustrating Niue’s population development over the past 100 years, the graph below highlights three distinct patterns: a period of relative stability from 1900 right up to mid-1930, with population numbers fluctuating between 3,800 – 4,000 residents; this was followed by a period of sustained population growth up until the mid-1960s, with Niue’s resident population tipping the 5,000 population mark in 1966.
The past four decades, witnessed the onset of on-going population decline, which following a massive drop 5,000 to 4,000 residents in just three years between 1971 – 1974, has steadily declined ever since to its current level of 1,611 persons. (Fig 2a)
Male49%
Female51%
Fig 2. Distribution of Residential Population by sex

18
Fig 2a. Total Population of Niue: 1900 - 2011
2.1.1b Population Size: The Total Residential Population The total residential population of Niue on census night was 1,607 comprised of 1,460 (722
males and 738 females) usual residents residing in country and 147 (73 males and 74 females) who were temporarily absent. The sex ratio for the total residential population is 98 males to 100 females. (Table 2.2) The temporarily absence of members of the household was verified by field enumerators with remaining relatives. The absent ratio for the total residential population of Niue on census night is 1:10 meaning for every 10 persons of the total resident population living in Niue on census night 1 person is away overseas. However this is different for each village as some ratios are higher than the national ratio while others are low. Refer table 2.4. Table 2.2: Total Residential Population on census night, 2011 Census.
TOTAL RESIDENTIAL POPULATION (de jure)
RESIDENTIAL POPULATION
ABSENT POPULATION
Males Females Total Males Females Total Males Females Total
795 812 1,607 722 738 1,460 73 74 147
49.5% 50.5% - 49.5% 50.5% - 49.7% 50.3% -
Sex ratio 98%
0
1,000
2,000
3,000
4,000
5,000
6,00019
00
1902
1906
1911
1916
1921
1926
1931
1936
1945
1951
1956
1961
1966
1971
1974
1976
1979
1981
1984
1986
1989
1991
1994
1996
1997
1999
2000
2001
2006
2011
Pop
ulat
ion
Years
Total Population by Gender
Population Males
Population Females
Population Total
19
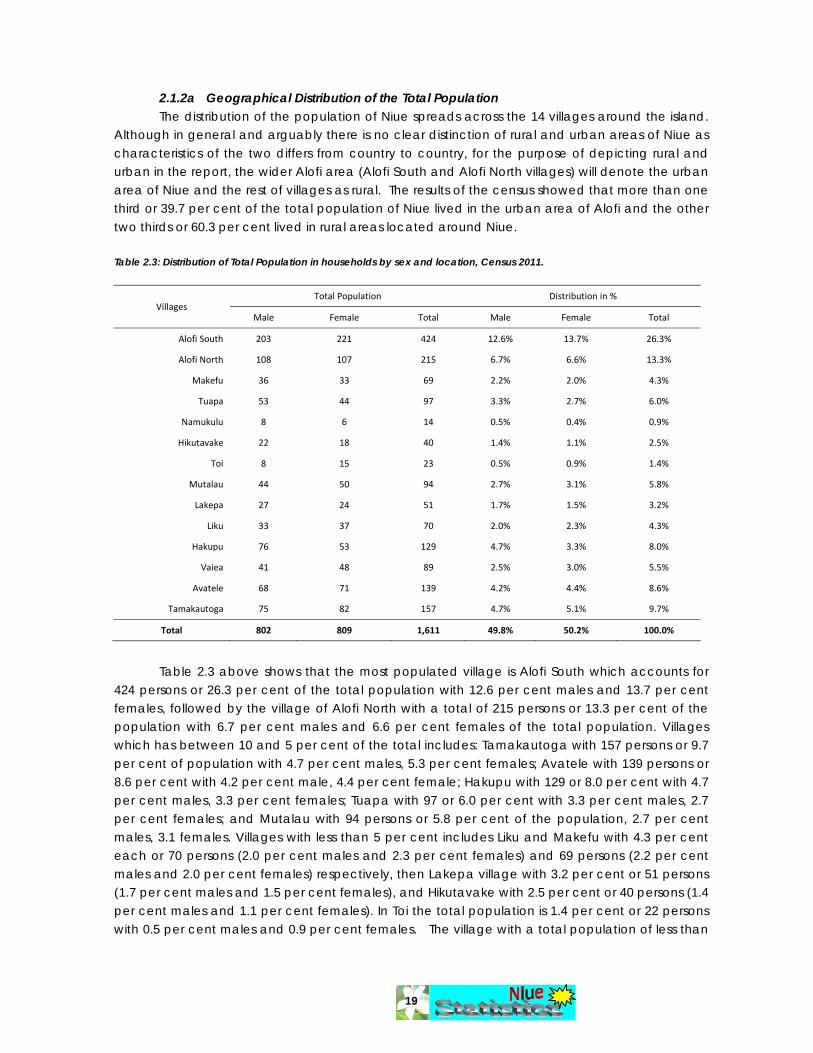
2.1.2a Geographical Distribution of the Total Population The distribution of the population of Niue spreads across the 14 villages around the island.
Although in general and arguably there is no clear distinction of rural and urban areas of Niue as characteristics of the two differs from country to country, for the purpose of depicting rural and urban in the report, the wider Alofi area (Alofi South and Alofi North villages) will denote the urban area of Niue and the rest of villages as rural. The results of the census showed that more than one third or 39.7 per cent of the total population of Niue lived in the urban area of Alofi and the other two thirds or 60.3 per cent lived in rural areas located around Niue.
Table 2.3: Distribution of Total Population in households by sex and location, Census 2011.
Villages Total Population Distribution in %
Male Female Total Male Female Total
Alofi South 203 221 424 12.6% 13.7% 26.3%
Alofi North 108 107 215 6.7% 6.6% 13.3%
Makefu 36 33 69 2.2% 2.0% 4.3%
Tuapa 53 44 97 3.3% 2.7% 6.0%
Namukulu 8 6 14 0.5% 0.4% 0.9%
Hikutavake 22 18 40 1.4% 1.1% 2.5%
Toi 8 15 23 0.5% 0.9% 1.4%
Mutalau 44 50 94 2.7% 3.1% 5.8%
Lakepa 27 24 51 1.7% 1.5% 3.2%
Liku 33 37 70 2.0% 2.3% 4.3%
Hakupu 76 53 129 4.7% 3.3% 8.0%
Vaiea 41 48 89 2.5% 3.0% 5.5%
Avatele 68 71 139 4.2% 4.4% 8.6%
Tamakautoga 75 82 157 4.7% 5.1% 9.7%
Total 802 809 1,611 49.8% 50.2% 100.0%
Table 2.3 above shows that the most populated village is Alofi South which accounts for
424 persons or 26.3 per cent of the total population with 12.6 per cent males and 13.7 per cent females, followed by the village of Alofi North with a total of 215 persons or 13.3 per cent of the population with 6.7 per cent males and 6.6 per cent females of the total population. Villages which has between 10 and 5 per cent of the total includes: Tamakautoga with 157 persons or 9.7 per cent of population with 4.7 per cent males, 5.3 per cent females; Avatele with 139 persons or 8.6 per cent with 4.2 per cent male, 4.4 per cent female; Hakupu with 129 or 8.0 per cent with 4.7 per cent males, 3.3 per cent females; Tuapa with 97 or 6.0 per cent with 3.3 per cent males, 2.7 per cent females; and Mutalau with 94 persons or 5.8 per cent of the population, 2.7 per cent males, 3.1 females. Villages with less than 5 per cent includes Liku and Makefu with 4.3 per cent each or 70 persons (2.0 per cent males and 2.3 per cent females) and 69 persons (2.2 per cent males and 2.0 per cent females) respectively, then Lakepa village with 3.2 per cent or 51 persons (1.7 per cent males and 1.5 per cent females), and Hikutavake with 2.5 per cent or 40 persons (1.4 per cent males and 1.1 per cent females). In Toi the total population is 1.4 per cent or 22 persons with 0.5 per cent males and 0.9 per cent females. The village with a total population of less than
20
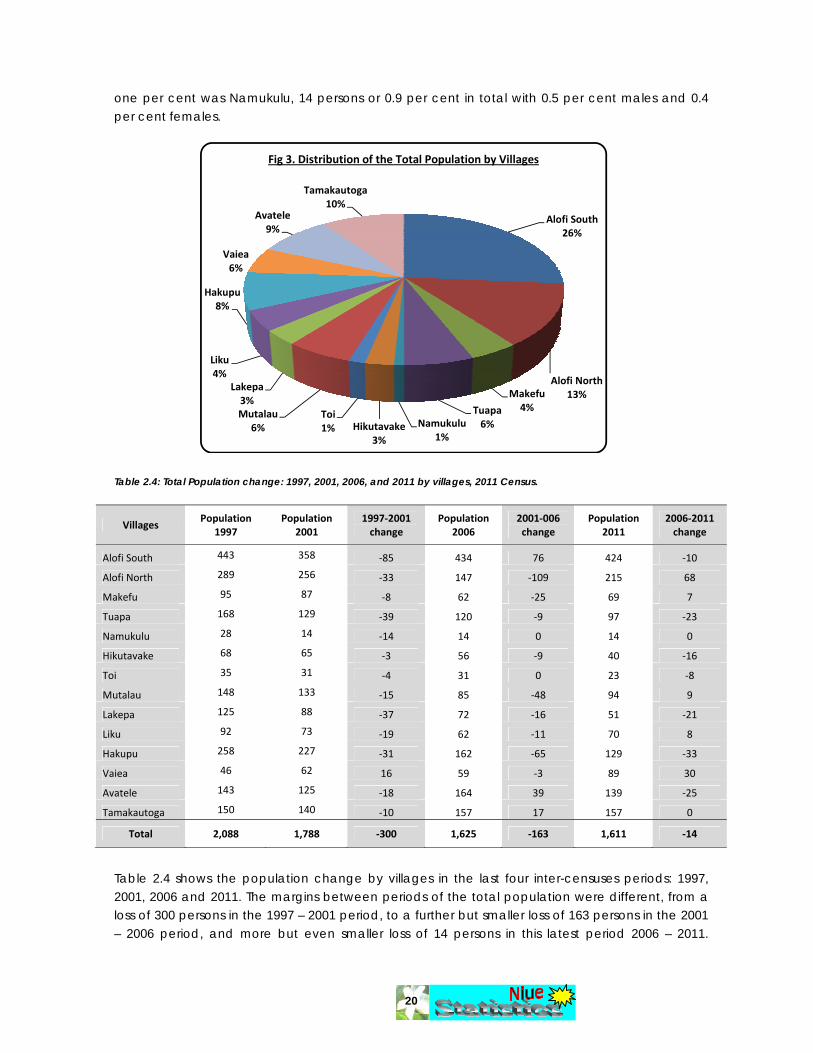
one per cent was Namukulu, 14 persons or 0.9 per cent in total with 0.5 per cent males and 0.4 per cent females.
Alofi South26%
Alofi North13%Makefu
4%Tuapa6%Namukulu
1%Hikutavake
3%
Toi1%
Mutalau6%
Lakepa3%
Liku4%
Hakupu8%
Vaiea6%
Avatele9%
Tamakautoga10%
Fig 3. Distribution of the Total Population by Villages
Table 2.4: Total Population change: 1997, 2001, 2006, and 2011 by villages, 2011 Census.
Villages Population
1997 Population
2001 1997‐2001 change
Population 2006
2001‐006 change
Population 2011
2006‐2011 change
Alofi South 443 358 ‐85 434 76 424 ‐10
Alofi North 289 256 ‐33 147 ‐109 215 68
Makefu 95 87 ‐8 62 ‐25 69 7
Tuapa 168 129 ‐39 120 ‐9 97 ‐23
Namukulu 28 14 ‐14 14 0 14 0
Hikutavake 68 65 ‐3 56 ‐9 40 ‐16
Toi 35 31 ‐4 31 0 23 ‐8
Mutalau 148 133 ‐15 85 ‐48 94 9
Lakepa 125 88 ‐37 72 ‐16 51 ‐21
Liku 92 73 ‐19 62 ‐11 70 8
Hakupu 258 227 ‐31 162 ‐65 129 ‐33
Vaiea 46 62 16 59 ‐3 89 30
Avatele 143 125 ‐18 164 39 139 ‐25
Tamakautoga 150 140 ‐10 157 17 157 0
Total 2,088 1,788 ‐300 1,625 ‐163 1,611 ‐14
Table 2.4 shows the population change by villages in the last four inter-censuses periods: 1997, 2001, 2006 and 2011. The margins between periods of the total population were different, from a loss of 300 persons in the 1997 – 2001 period, to a further but smaller loss of 163 persons in the 2001 – 2006 period, and more but even smaller loss of 14 persons in this latest period 2006 – 2011.
21
However for individual villages the patterns of changes were very different from one village to another and in periods. Since the last census (2006) the population change by villages saw 5 villages with gains in numbers: Alofi North with the most, 68 persons, Vaiea with 30, Mutalau with 9, Liku with 8 and Makefu with the least of 7 persons. The contra effect was seen in 7 villages: Hakupu with the highest loss of 33 persons, Avatele with 25, Tuapa with 23, Lakepa with 21, Hikutavake with 16, Alofi South with 10, and the least of 8 persons in Toi. There were no changes to the populations of Namukulu and Tamakautoga between the 2006 and 2011 censuses.
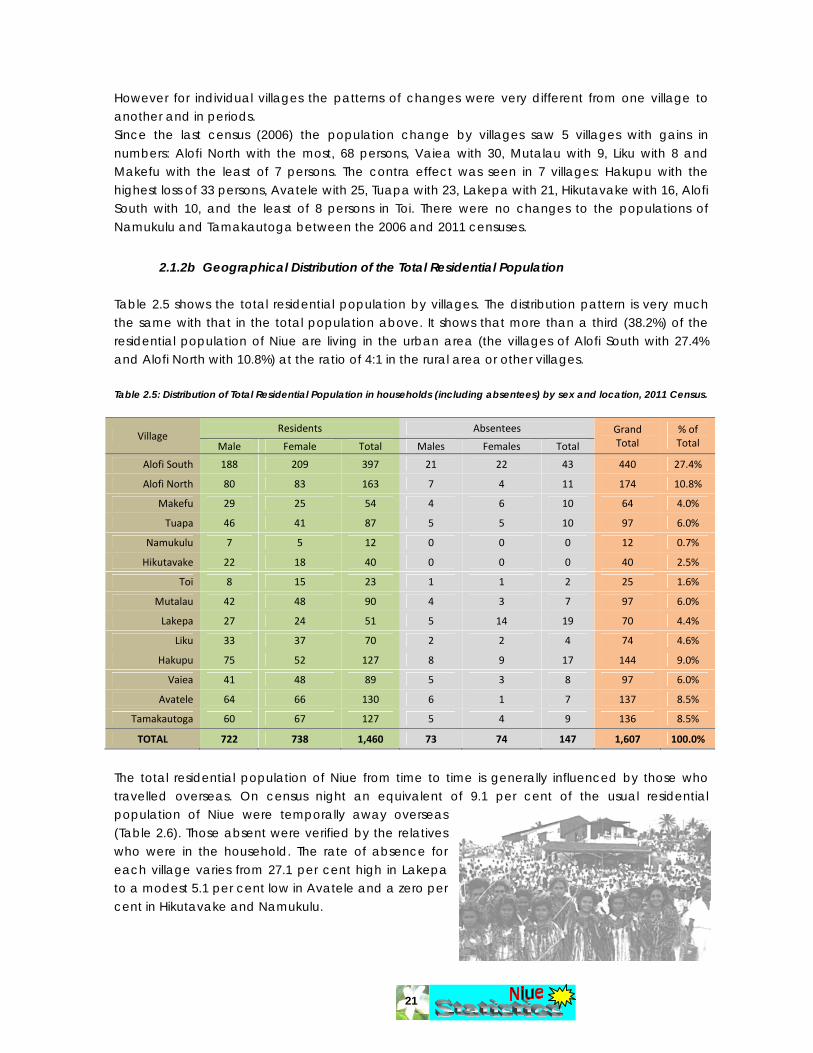
2.1.2b Geographical Distribution of the Total Residential Population
Table 2.5 shows the total residential population by villages. The distribution pattern is very much the same with that in the total population above. It shows that more than a third (38.2%) of the residential population of Niue are living in the urban area (the villages of Alofi South with 27.4% and Alofi North with 10.8%) at the ratio of 4:1 in the rural area or other villages. Table 2.5: Distribution of Total Residential Population in households (including absentees) by sex and location, 2011 Census.
Village Residents Absentees Grand
Total % of Total Male Female Total Males Females Total
Alofi South 188 209 397 21 22 43 440 27.4%
Alofi North 80 83 163 7 4 11 174 10.8%
Makefu 29 25 54 4 6 10 64 4.0%
Tuapa 46 41 87 5 5 10 97 6.0%
Namukulu 7 5 12 0 0 0 12 0.7%
Hikutavake 22 18 40 0 0 0 40 2.5%
Toi 8 15 23 1 1 2 25 1.6%
Mutalau 42 48 90 4 3 7 97 6.0%
Lakepa 27 24 51 5 14 19 70 4.4%
Liku 33 37 70 2 2 4 74 4.6%
Hakupu 75 52 127 8 9 17 144 9.0%
Vaiea 41 48 89 5 3 8 97 6.0%
Avatele 64 66 130 6 1 7 137 8.5%
Tamakautoga 60 67 127 5 4 9 136 8.5%
TOTAL 722 738 1,460 73 74 147 1,607 100.0%
The total residential population of Niue from time to time is generally influenced by those who travelled overseas. On census night an equivalent of 9.1 per cent of the usual residential population of Niue were temporally away overseas (Table 2.6). Those absent were verified by the relatives who were in the household. The rate of absence for each village varies from 27.1 per cent high in Lakepa to a modest 5.1 per cent low in Avatele and a zero per cent in Hikutavake and Namukulu.

22
Table 2.6: Proportion of Total Residential Population who were absent on census night by location, 2011 Census.
Village Total Res. Population Absent Population % Absent
Alofi South 440 43 9.8%
Alofi North 174 11 6.3%
Makefu 64 10 15.6%
Tuapa 97 10 10.3%
Namukulu 12 0 0.0%
Hikutavake 40 0 0.0%
Toi 25 2 8.0%
Mutalau 97 7 7.2%
Lakepa 70 19 27.1%
Liku 74 4 5.4%
Hakupu 144 17 11.8%
Vaiea 97 8 8.2%
Avatele 137 7 5.1%
Tamakautoga 136 9 6.6%
Total 1,607 147 9.1%
2.1.3 Age and Sex structure People pursue different activities and make different demands on services throughout
their lives, according to their ages: infants, children under five, adolescents, students, youth, workers in the labor force, the elderly, and women in their reproductive ages all have different needs. There is a very strong relationship between people’s needs and activities on one hand, and age on the other. To ensure the effectiveness and maximum impact of public policy and development activities in general, it is essential that policy analysts, planners and policy-makers have a good understanding of their population’s age structure. Furthermore, the gender make-up of a population, particularly the proportion of males and females in specific age-groups, also has important social and development implications. A large number of women at child-bearing age usually means high population growth rates; inversely, a more modest representation of women in their “peak” child-bearing ages (e.g. 25 – 34) means fewer births; a predominance of older women over older men usually suggest higher male mortality; and fewer men and women in early adult age groups (20 – 34) is usually indicative of easy mobility in search of better opportunities abroad. Taken together, a country’s age and sex structure and distribution is of critical importance to future plans and developments.
23
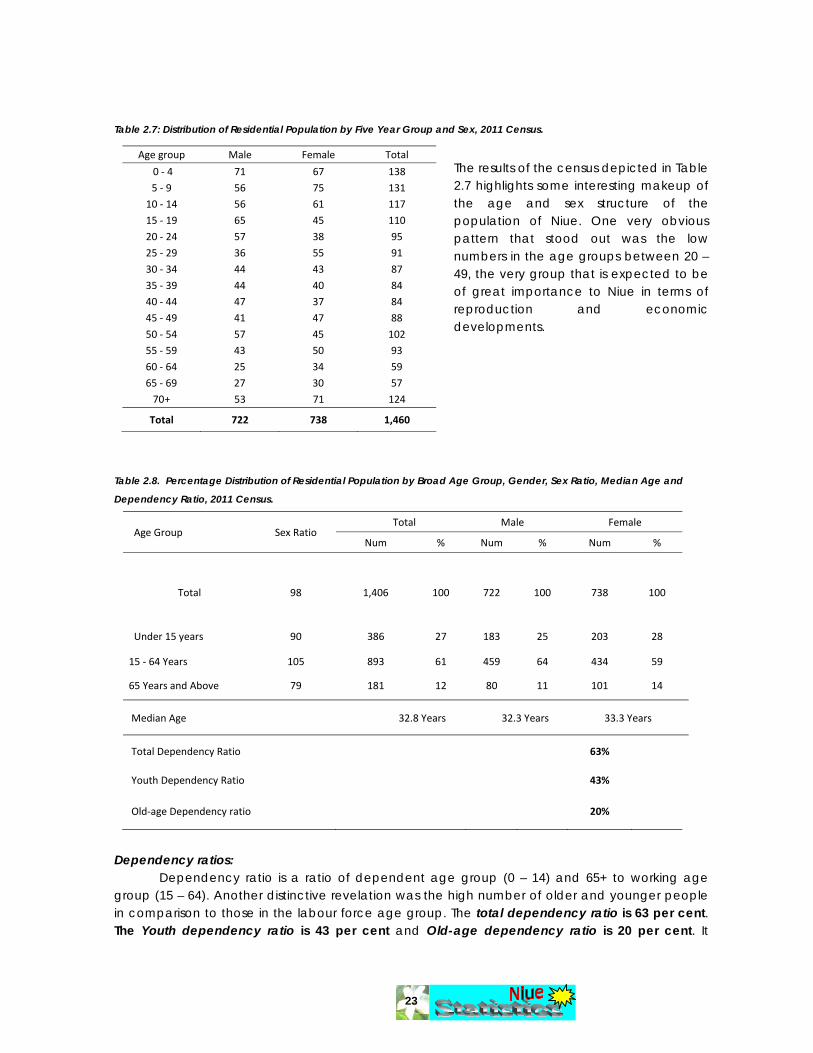
Table 2.7: Distribution of Residential Population by Five Year Group and Sex, 2011 Census.
The results of the census depicted in Table 2.7 highlights some interesting makeup of the age and sex structure of the population of Niue. One very obvious pattern that stood out was the low numbers in the age groups between 20 – 49, the very group that is expected to be of great importance to Niue in terms of reproduction and economic developments.
Table 2.8. Percentage Distribution of Residential Population by Broad Age Group, Gender, Sex Ratio, Median Age and
Dependency Ratio, 2011 Census.
Age Group Sex Ratio Total Male Female
Num % Num % Num %
Total 98 1,406 100 722 100 738 100
Under 15 years 90 386 27 183 25 203 28
15 ‐ 64 Years 105 893 61 459 64 434 59
65 Years and Above 79 181 12 80 11 101 14
Median Age
32.8 Years 32.3 Years 33.3 Years
Total Dependency Ratio 63%
Youth Dependency Ratio 43%
Old‐age Dependency ratio 20%
Dependency ratios: Dependency ratio is a ratio of dependent age group (0 – 14) and 65+ to working age group (15 – 64). Another distinctive revelation was the high number of older and younger people in comparison to those in the labour force age group. The total dependency ratio is 63 per cent. The Youth dependency ratio is 43 per cent and Old-age dependency ratio is 20 per cent. It
Age group Male Female Total
0 ‐ 4 71 67 138
5 ‐ 9 56 75 131
10 ‐ 14 56 61 117
15 ‐ 19 65 45 110
20 ‐ 24 57 38 95
25 ‐ 29 36 55 91
30 ‐ 34 44 43 87
35 ‐ 39 44 40 84
40 ‐ 44 47 37 84
45 ‐ 49 41 47 88
50 ‐ 54 57 45 102
55 ‐ 59 43 50 93
60 ‐ 64 25 34 59
65 ‐ 69 27 30 57
70+ 53 71 124
Total 722 738 1,460
24
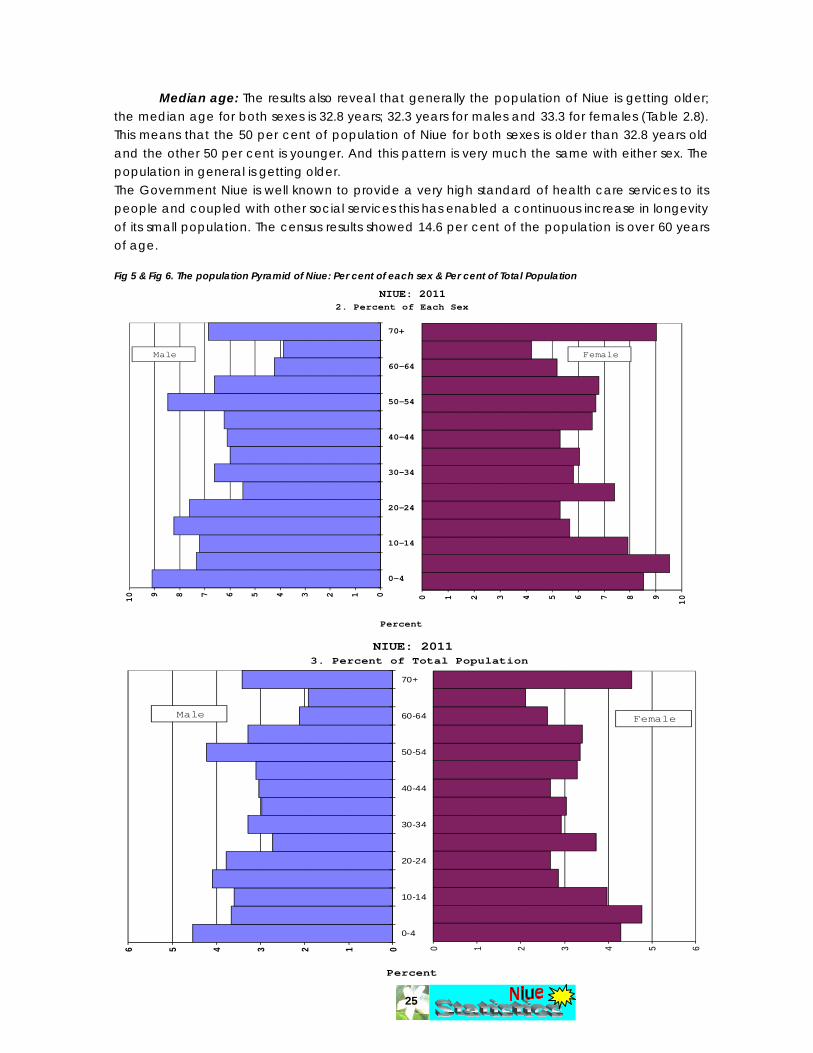
means that more people are entering into work than dependent even though the people in the working age group are migrating out. Ageing index:
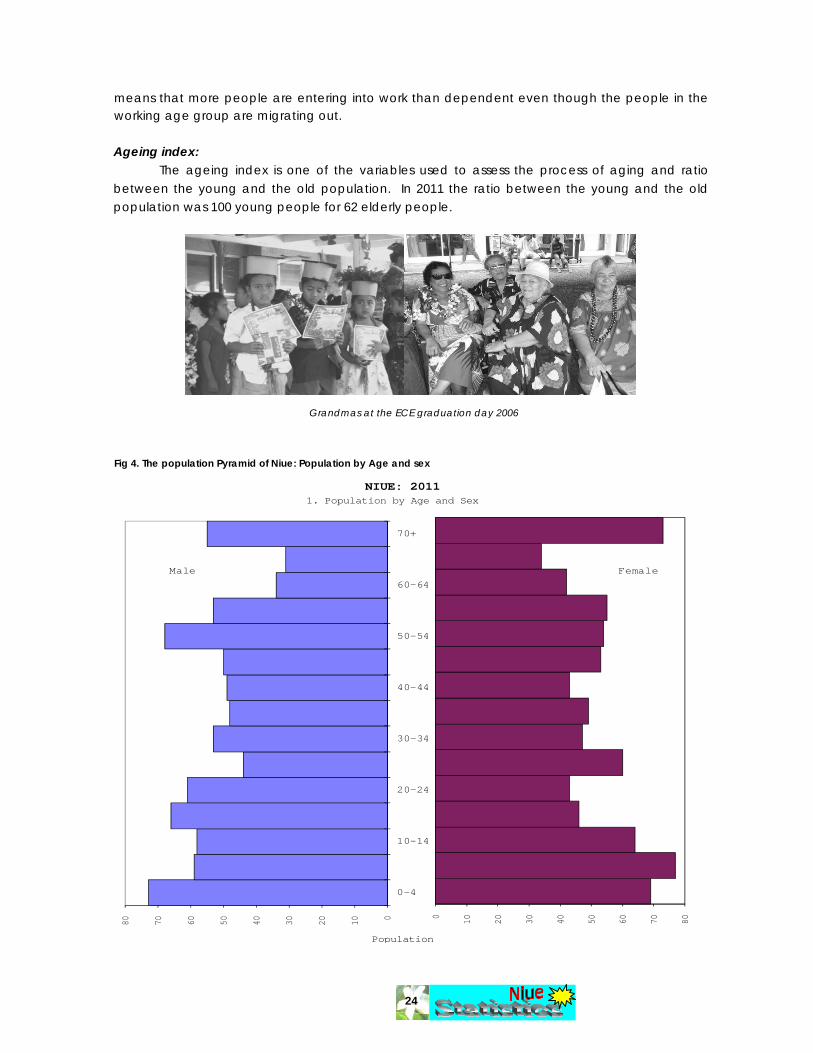
The ageing index is one of the variables used to assess the process of aging and ratio between the young and the old population. In 2011 the ratio between the young and the old population was 100 young people for 62 elderly people. Fig 4. The population Pyramid of Niue: Population by Age and sex
Grandmas at the ECE graduation day 2006
1. Population by Age and Sex
NIUE: 2011
Population
0 10 20 30 40 50 60 70 8001020304050607080
0-4
10-14
20-24
30-34
40-44
50-54
60-64
70+
Male Female
25
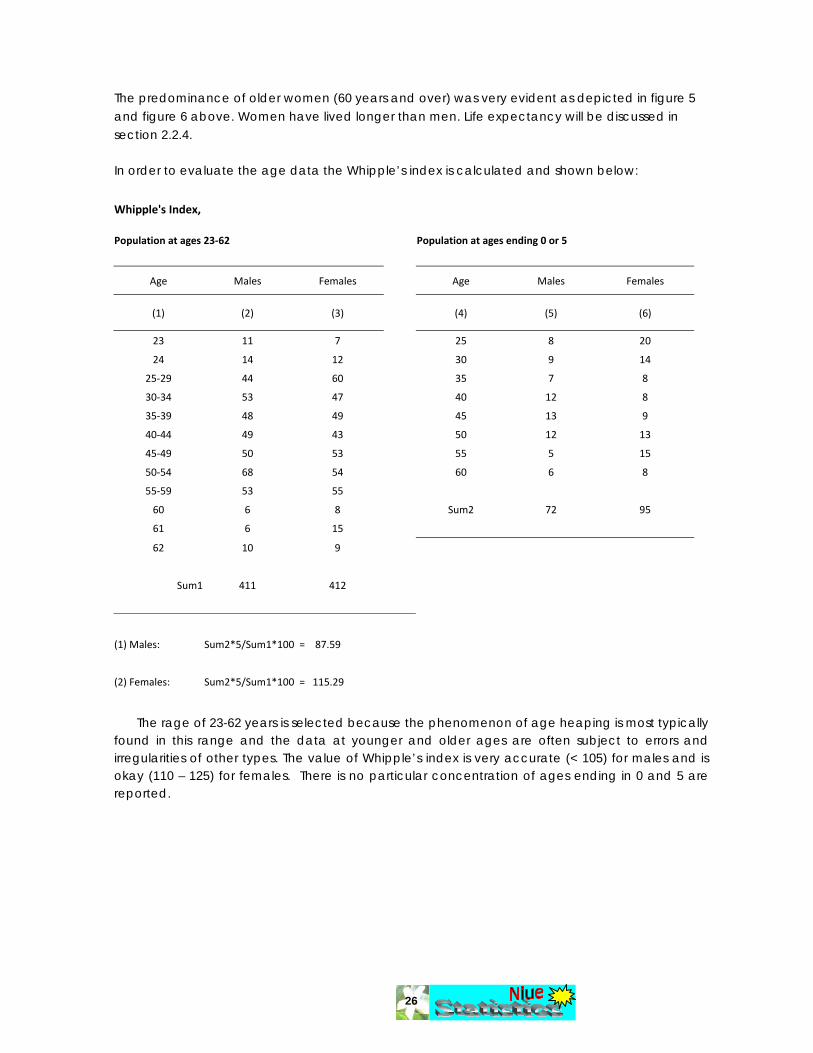
Median age: The results also reveal that generally the population of Niue is getting older; the median age for both sexes is 32.8 years; 32.3 years for males and 33.3 for females (Table 2.8). This means that the 50 per cent of population of Niue for both sexes is older than 32.8 years old and the other 50 per cent is younger. And this pattern is very much the same with either sex. The population in general is getting older. The Government Niue is well known to provide a very high standard of health care services to its people and coupled with other social services this has enabled a continuous increase in longevity of its small population. The census results showed 14.6 per cent of the population is over 60 years of age. Fig 5 & Fig 6. The population Pyramid of Niue: Per cent of each sex & Per cent of Total Population NIUE: 2011
2. Percent of Each Sex
Percent
0 1 2 3 4 5 6 7 8 9 10
012345678910
0-4
10-14
20-24
30-34
40-44
50-54
60-64
70+
Male Female
3. Percent of Total Population
NIUE: 2011
Percent
0 1 2 3 4 5 60123456
0-4
10-14
20-24
30-34
40-44
50-54
60-64
70+
Male Female
26
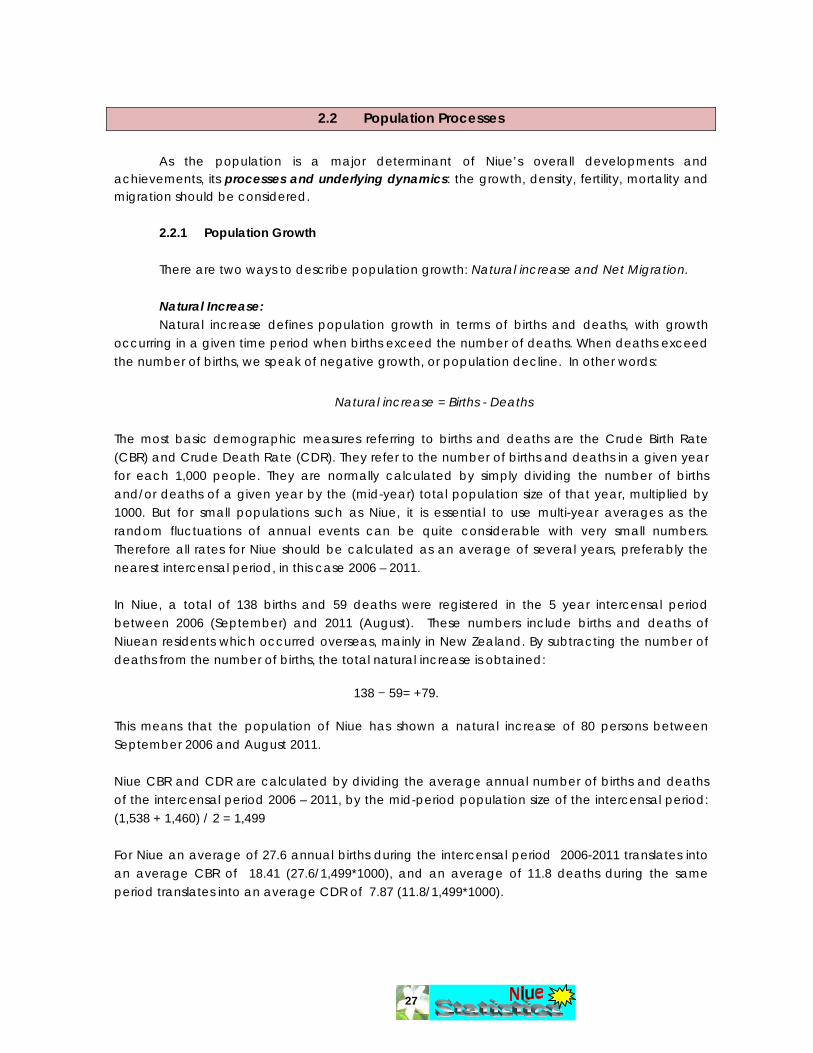
The predominance of older women (60 years and over) was very evident as depicted in figure 5 and figure 6 above. Women have lived longer than men. Life expectancy will be discussed in section 2.2.4. In order to evaluate the age data the Whipple’s index is calculated and shown below:
Whipple's Index,
Population at ages 23‐62 Population at ages ending 0 or 5
Age Males Females Age Males Females
(1) (2) (3) (4) (5) (6)
23 11 7 25 8 20
24 14 12 30 9 14
25‐29 44 60 35 7 8
30‐34 53 47 40 12 8
35‐39 48 49 45 13 9
40‐44 49 43 50 12 13
45‐49 50 53 55 5 15
50‐54 68 54 60 6 8
55‐59 53 55
60 6 8 Sum2 72 95
61 6 15
62 10 9
Sum1 411 412
(1) Males: Sum2*5/Sum1*100 = 87.59
(2) Females: Sum2*5/Sum1*100 = 115.29
The rage of 23-62 years is selected because the phenomenon of age heaping is most typically found in this range and the data at younger and older ages are often subject to errors and irregularities of other types. The value of Whipple’s index is very accurate (< 105) for males and is okay (110 – 125) for females. There is no particular concentration of ages ending in 0 and 5 are reported.
27
2.2 Population Processes
As the population is a major determinant of Niue’s overall developments and achievements, its processes and underlying dynamics: the growth, density, fertility, mortality and migration should be considered.
2.2.1 Population Growth There are two ways to describe population growth: Natural increase and Net Migration. Natural Increase: Natural increase defines population growth in terms of births and deaths, with growth
occurring in a given time period when births exceed the number of deaths. When deaths exceed the number of births, we speak of negative growth, or population decline. In other words:
Natural increase = Births - Deaths
The most basic demographic measures referring to births and deaths are the Crude Birth Rate (CBR) and Crude Death Rate (CDR). They refer to the number of births and deaths in a given year for each 1,000 people. They are normally calculated by simply dividing the number of births and/or deaths of a given year by the (mid-year) total population size of that year, multiplied by 1000. But for small populations such as Niue, it is essential to use multi-year averages as the random fluctuations of annual events can be quite considerable with very small numbers. Therefore all rates for Niue should be calculated as an average of several years, preferably the nearest intercensal period, in this case 2006 – 2011. In Niue, a total of 138 births and 59 deaths were registered in the 5 year intercensal period between 2006 (September) and 2011 (August). These numbers include births and deaths of Niuean residents which occurred overseas, mainly in New Zealand. By subtracting the number of deaths from the number of births, the total natural increase is obtained:
138 − 59= +79.
This means that the population of Niue has shown a natural increase of 80 persons between September 2006 and August 2011. Niue CBR and CDR are calculated by dividing the average annual number of births and deaths of the intercensal period 2006 – 2011, by the mid-period population size of the intercensal period: (1,538 + 1,460) / 2 = 1,499 For Niue an average of 27.6 annual births during the intercensal period 2006-2011 translates into an average CBR of 18.41 (27.6/1,499*1000), and an average of 11.8 deaths during the same period translates into an average CDR of 7.87 (11.8/1,499*1000).

28
By subtracting the CDR from the CBR, the rate of natural increase is obtained as stated above: CBR (18.41) – CDR (7.87) = 10.54 per 1000, or expressed in the more frequently used per centage term: 1.05 per cent per year.
Net Migration: Net migration defines population growth in terms of immigration and emigration, with
growth occurring in a given time period when immigration exceed the number of emigration. When emigrations exceed the number of immigration, we speak of negative growth, or population decline. In other words:
Net Migration = Immigration – Emigration:
In Niue where international migration is of great significance especially to New Zealand and Australia, we cannot only look at natural increase, with population growth shaped largely by emigration and immigration. Population growth hence defines the change in a country’s population as the net result of natural increase and net-migration, which is illustrated by the ‘balancing equation’:
Population growth = natural increase + net migration (immigration – emigration). Despite this small positive rate of natural increase, the resident population has declined from 1,538 to 1,406 between the two census enumerations in 2006 and 2011, resulting in a decrease of 132 people. The number of total net migrants of the intercensal period can be calculated by subtracting the natural growth of the population (+79) from the overall difference in population change between 2006 and 2011 (–132):
Total net migration = (-132) – (79) = -211 In other words, between 2006 and 2011, 211 more people have left Niue than have arrived, averaging about 42 persons per year, which is 8 persons lower to the situation prevailing a decade ago, when the annual net migration averaged 50 people between 2001 and 2006. By applying the corresponding rates in the intercensal period to the balancing equation outlined above, yields an annual (crude) net migration rate of -2.1%.
Population growth = Natural increase + Net-Migration - 1.0% = 1.1% + Net-Migration - 1.0% – 1.1% = Net-Migration - 2.1% = Net Migration
Niue continues to experience the declining of population in the total (defacto) population and the residential population. The annual intercensal average growth rate for the total population is negative 0.2 per cent (-0.2%) and a negative 1.0 per cent (-1.0%) for the resident population. Table 2.9

29
Table 2.9: Population Growth 1997 – 2011, 2011 Census.
Census Year 1997 2001 2006 2011
Total Resident Total Resident Total Resident Total Resident
Population 2,088 na 1,788 1,736 1,625 1,538 1,611 1,460
Difference na na ‐300 ‐ ‐163 ‐198 ‐14 ‐78
Growth na na ‐3.1% ‐ ‐1.8% ‐2.4% ‐0.2% ‐1.0%
na – not available
The table showed that even though the population of Niue continued to decline throughout the years the rate of declining is decreasing. For the residential population during the time of census it has decreased from -2.4 per cent in 2006 to -1.0 per cent in 2011. However, according to the findings of the censuses depicted in Table 2.10 the annual average growth rates of the population for each village vary remarkably from period to period and from village to village relatively to the national growth rate. In the 2011 census the growth rates (based on the 2006 census) range from a high of 9.3 per cent (a gain of 32 persons) for the village of Vaiea to a low of -6.7 per cent (a loss of 21 persons) for the village of Lakepa. The inconsistencies in the levels of growth rates clearly showed the ‘mobility state’ of the population of Niue as ‘very mobile’. The determinants of these movements are not very much of natural increase but more of net migration. Considering the fact that Niueans are also New Zealand citizens and holding New Zealand passports, this arrangement has enabled Niueans to migrate freely in and out of New Zealand as they please. Please note: the absentees at the time of census were excluded from this analysis. Table 2.10: Village Resident Population Annual Growth Rates: 2001 – 2011, 2011 Census.
Villages 2001 2006 Population Difference
% Ann. Growth 2011 Population
Difference % Ann. Growth
Alofi South 402 411 9 0.4 397 ‐14 ‐0.6
Alofi North 180 143 ‐37 ‐4.5 163 20 2.7
Makefu 84 57 ‐27 ‐7.5 54 ‐3 ‐1.1
Tuapa 129 98 ‐31 ‐5.3 87 ‐11 ‐2.4
Namukulu 12 14 2 3.1 12 ‐2 ‐3.0
Hikutavake 65 55 ‐10 ‐3.2 40 ‐15 ‐6.2
Toi 31 31 0 0 23 ‐8 ‐5.8
Mutalau 133 85 ‐48 ‐8.6 90 5 1.1
Lakepa 88 72 ‐16 ‐3.9 51 ‐21 ‐6.7
Liku 73 62 ‐11 ‐3.2 70 8 2.5
Hakupu 227 156 ‐71 ‐7.2 127 ‐29 ‐4.0
Vaiea 62 57 ‐5 ‐1.7 89 32 9.3
Avatele 125 160 35 5.1 130 ‐30 ‐4.1
Tamakautoga 125 137 12 1.9 127 ‐10 ‐1.5
Total 1,736 1,538 ‐198 ‐2.4 1,460 ‐78 ‐1.0

30
2.2.2 Population density
Population density shows number of people living in one square kilometre. Niue has a land area of 259 square kilometres with a residential population of 1,460. Therefore the population density of Niue is 5.6 person per square kilometre, (6.2 persons per/sqkm if to consider the de jure population).
2.2.3 Fertility
Fertility refers to the reproductive behaviour of a population, relating to the number of live births a woman has had. The fertility of a population depends on various factors:
• Demographic composition of the population (this refers particularly to number and age of women;
• Populations without many women, particularly women in child-bearing ages, will have fewer births than a population with a large number of women in child-bearing ages;
• Fecundity (biological/physiological ability to reproduce); • Age at cohabitation/marriage (as child-bearing, in most countries, is usually closely linked
to marriage or cohabitation, the age when men and women begin to live together has an obvious bearing on fertility);
• Availability and use of family planning (populations that have access to, and regularly use, family planning methods have lower fertility rates than those where access is limited or denied, thus interfering with regular/efficient use);
• Psycho-social and cultural context (this includes practices such as post-partum abstinence and breastfeeding, as well as value/belief systems concerning concepts of ideal family size, and the perceived ‘value’ of children);
• Economic development; • Status of women (place in society, level of education, work status; based on world-wide
empirical evidence, we know that higher levels of female education, and access to economic opportunities outside the household, are related to lower fertility and smaller families).
Fertility is the vital process that has the biggest impact on a country’s age–sex composition (unless there are high levels of migration as per the case of Niue), as the composition and size of different age-groups depend largely on birth rates. Populations become older with falling birth rates, since these reduce the proportion of children. All women older than 15 years of age were asked of how many live births they had ever had, how many of those were still living at the time of the census, and the date of their last birth in order to establish the number of births during the year prior to the census. In the 2011 Niue census, 25 children were counted under 1 year of age. This contrasts with 23 births recorded on Niue during the 12 months preceding the census. The difference of 2 infants are attributable both to migration, and to Niuean resident women having given birth to their child overseas, without this birth (again) registered with the Justice Department on Niue. During the 5 year intercensal period, from 1 September 2006 until 30 August 2011, 138 births were registered in Niue, which compares to a resident population under 6 years of age of 171 children.
31
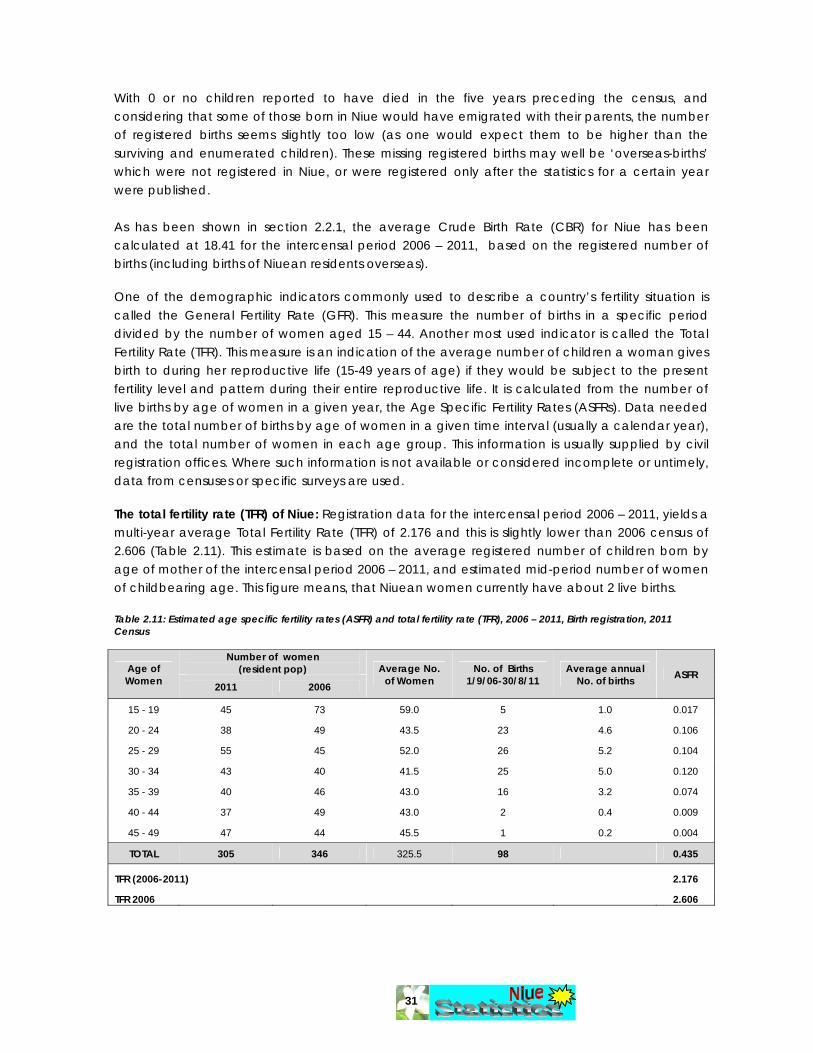
With 0 or no children reported to have died in the five years preceding the census, and considering that some of those born in Niue would have emigrated with their parents, the number of registered births seems slightly too low (as one would expect them to be higher than the surviving and enumerated children). These missing registered births may well be ‘overseas-births’ which were not registered in Niue, or were registered only after the statistics for a certain year were published. As has been shown in section 2.2.1, the average Crude Birth Rate (CBR) for Niue has been calculated at 18.41 for the intercensal period 2006 – 2011, based on the registered number of births (including births of Niuean residents overseas). One of the demographic indicators commonly used to describe a country’s fertility situation is called the General Fertility Rate (GFR). This measure the number of births in a specific period divided by the number of women aged 15 – 44. Another most used indicator is called the Total Fertility Rate (TFR). This measure is an indication of the average number of children a woman gives birth to during her reproductive life (15-49 years of age) if they would be subject to the present fertility level and pattern during their entire reproductive life. It is calculated from the number of live births by age of women in a given year, the Age Specific Fertility Rates (ASFRs). Data needed are the total number of births by age of women in a given time interval (usually a calendar year), and the total number of women in each age group. This information is usually supplied by civil registration offices. Where such information is not available or considered incomplete or untimely, data from censuses or specific surveys are used. The total fertility rate (TFR) of Niue: Registration data for the intercensal period 2006 – 2011, yields a multi-year average Total Fertility Rate (TFR) of 2.176 and this is slightly lower than 2006 census of 2.606 (Table 2.11). This estimate is based on the average registered number of children born by age of mother of the intercensal period 2006 – 2011, and estimated mid-period number of women of childbearing age. This figure means, that Niuean women currently have about 2 live births. Table 2.11: Estimated age specific fertility rates (ASFR) and total fertility rate (TFR), 2006 – 2011, Birth registration, 2011 Census
Age of Women
Number of women (resident pop) Average No.
of Women No. of Births
1/9/06-30/8/11 Average annual
No. of births ASFR 2011 2006
15 - 19 45 73 59.0 5 1.0 0.017
20 - 24 38 49 43.5 23 4.6 0.106
25 - 29 55 45 52.0 26 5.2 0.104
30 - 34 43 40 41.5 25 5.0 0.120
35 - 39 40 46 43.0 16 3.2 0.074
40 - 44 37 49 43.0 2 0.4 0.009
45 - 49 47 44 45.5 1 0.2 0.004
TOTAL 305 346 325.5 98 0.435
TFR (2006-2011) 2.176
TFR 2006 2.606

32
Another way to derive current fertility estimates is via the P/F ratio method, looking at the totality of children ever born by all current women of child-bearing age (Table 2.12). This method, as well as the own-children method, is usually employed in the absence of vital registration data; where the latter do exist, it serves a useful purpose to cross-validate the completeness of vital registration. The total number of children born alive to women aged 15 years and older was 1,582 (Table 2.12), with the average number of children born alive to all women (also called average parity) standing at 2.9 children per woman. Table2.12: Female Population 15 years and older by number of children ever born, 2011 Census.
Age No. of No. of women No. of children Average No. of Group women having given birth ever born children ever born 15 - 19 45 3 3 0.066 20 - 24 38 14 22 0.579 25 - 29 55 27 61 1.109 30 - 34 43 30 75 1.744 35 - 39 40 30 105 2.625 40 - 44 37 34 112 3.027 45 - 49 47 43 170 3.617 50 - 54 45 39 143 3.177 55 - 59 50 47 231 4.620 60 - 64 34 31 116 3.411
65+ 101 92 544 5.386 Total 15+ 535 390 1,582 2.957
The average parity increases with the age of women, from a low average of 0.066 children per 15 – 19 year old female, to 3.6 children amongst women aged 45 – 49 (considered to be the end of women’s child-bearing), to over 5 children amongst those older than 65. The lack of a gradual progression normally found through age, is largely the result of interplay between small numbers on one hand and the overall impact migration has on Niue’s population structure. Age Specific Fertility To look at the recent age structure of births, the age group of mothers can classify children born in the past year (or past 2-5 years if data permits). This tabulation enables the calculation of age specific fertility rates (ASFR) that is the average number of children born to each woman in an age group during the year (Table 2.13 below). Relating fertility experience to age provides a more detailed description of fertility behavior, or family formation, and provides a control for changes in age structure for comparative purposes. This report provides two methods for calculating age specific fertility rates. One involves current births reported in the census (direct calculation) and the other involves comparing current registered births to previous fertility (CEB) to check for under counting and making appropriate adjustments. The direct calculation is discussed and presented first.
33
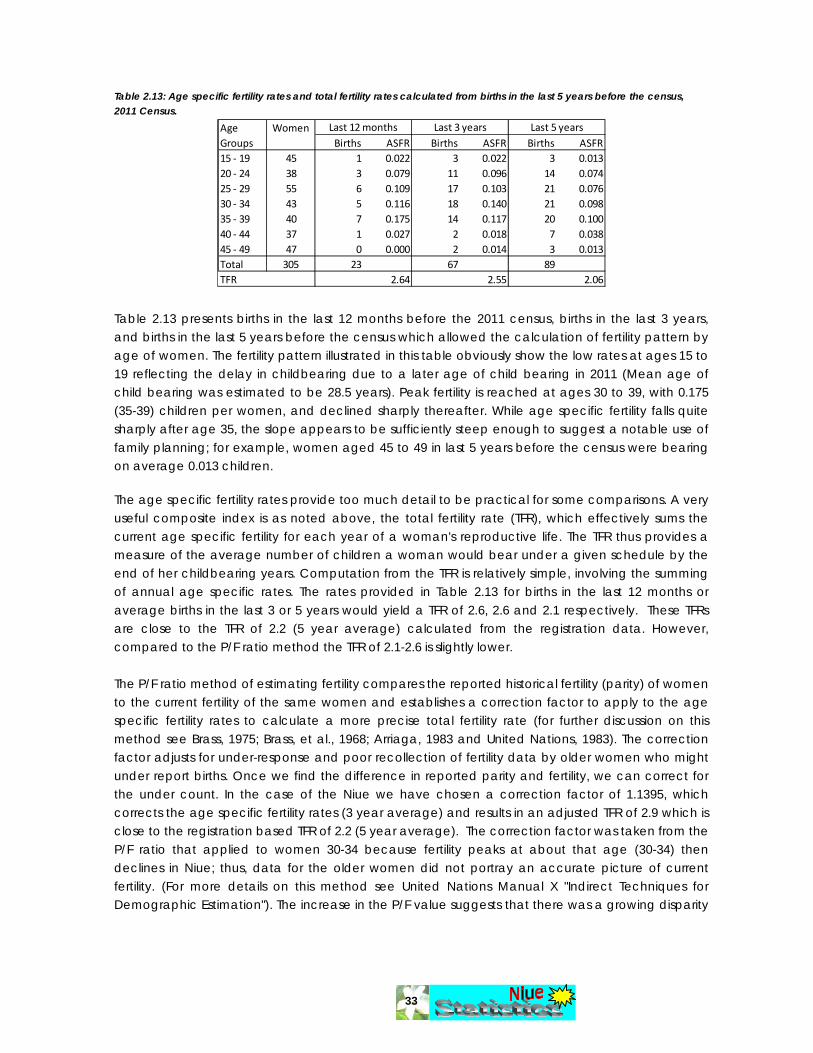
Table 2.13: Age specific fertility rates and total fertility rates calculated from births in the last 5 years before the census, 2011 Census.
Age WomenGroups Births ASFR Births ASFR Births ASFR15 ‐ 19 45 1 0.022 3 0.022 3 0.01320 ‐ 24 38 3 0.079 11 0.096 14 0.07425 ‐ 29 55 6 0.109 17 0.103 21 0.07630 ‐ 34 43 5 0.116 18 0.140 21 0.09835 ‐ 39 40 7 0.175 14 0.117 20 0.10040 ‐ 44 37 1 0.027 2 0.018 7 0.03845 ‐ 49 47 0 0.000 2 0.014 3 0.013Total 305 23 67 89TFR 2.64 2.55 2.06
Last 12 months Last 3 years Last 5 years
Table 2.13 presents births in the last 12 months before the 2011 census, births in the last 3 years, and births in the last 5 years before the census which allowed the calculation of fertility pattern by age of women. The fertility pattern illustrated in this table obviously show the low rates at ages 15 to 19 reflecting the delay in childbearing due to a later age of child bearing in 2011 (Mean age of child bearing was estimated to be 28.5 years). Peak fertility is reached at ages 30 to 39, with 0.175 (35-39) children per women, and declined sharply thereafter. While age specific fertility falls quite sharply after age 35, the slope appears to be sufficiently steep enough to suggest a notable use of family planning; for example, women aged 45 to 49 in last 5 years before the census were bearing on average 0.013 children. The age specific fertility rates provide too much detail to be practical for some comparisons. A very useful composite index is as noted above, the total fertility rate (TFR), which effectively sums the current age specific fertility for each year of a woman's reproductive life. The TFR thus provides a measure of the average number of children a woman would bear under a given schedule by the end of her childbearing years. Computation from the TFR is relatively simple, involving the summing of annual age specific rates. The rates provided in Table 2.13 for births in the last 12 months or average births in the last 3 or 5 years would yield a TFR of 2.6, 2.6 and 2.1 respectively. These TFRs are close to the TFR of 2.2 (5 year average) calculated from the registration data. However, compared to the P/F ratio method the TFR of 2.1-2.6 is slightly lower. The P/F ratio method of estimating fertility compares the reported historical fertility (parity) of women to the current fertility of the same women and establishes a correction factor to apply to the age specific fertility rates to calculate a more precise total fertility rate (for further discussion on this method see Brass, 1975; Brass, et al., 1968; Arriaga, 1983 and United Nations, 1983). The correction factor adjusts for under-response and poor recollection of fertility data by older women who might under report births. Once we find the difference in reported parity and fertility, we can correct for the under count. In the case of the Niue we have chosen a correction factor of 1.1395, which corrects the age specific fertility rates (3 year average) and results in an adjusted TFR of 2.9 which is close to the registration based TFR of 2.2 (5 year average). The correction factor was taken from the P/F ratio that applied to women 30-34 because fertility peaks at about that age (30-34) then declines in Niue; thus, data for the older women did not portray an accurate picture of current fertility. (For more details on this method see United Nations Manual X "Indirect Techniques for Demographic Estimation"). The increase in the P/F value suggests that there was a growing disparity

34
between current fertility and parity and supports the view that that current fertility is lower than previous fertility which implies that Niue fertility continues to decline. Table 2.14 Estimated Niuean Fertility based on Children ever born and births in the last 3 years before the census (2009-2011) (Trussell variant of Brass P/F Ratio Method, PFRATIO, US Census Bureau PAS program)
Reported Av erage Cumulativ eASFR* CEB fertility P/F P2/F2 P3/F3 P4/F4Av g(P3/F3,P4/F4)
Age f(i) P(i) Phi(i) F(i) ratio ASFR** 1.4659 1.2611 1.1395 1.200315-19 0.022 0.067 0.111 0.044 1.507 0.028 0.040 0.035 0.031 0.03320-24 0.096 0.579 0.594 0.395 1.466 0.101 0.148 0.127 0.115 0.12125-29 0.103 1.109 1.109 0.879 1.261 0.106 0.155 0.133 0.120 0.12730-34 0.140 1.744 1.806 1.531 1.139 0.140 0.205 0.177 0.160 0.16835-39 0.117 2.625 2.390 2.205 1.191 0.107 0.158 0.136 0.122 0.12940-44 0.018 3.027 2.480 2.424 1.249 0.017 0.024 0.021 0.019 0.02045-49 0.014 3.617 2.551 2.534 1.427 0.012 0.017 0.015 0.013 0.014TFR 2.551 2.551 3.739 3.217 2.906 3.062* 3 year av erage ASFR based on age of mother at the time of census** Pattern corrected for one-half year between birth and reporting.ASFR Age-specific fertility rate.CEB Av erage number of children ev er born.
Adjusted ASFR's
An application of the PF ratio method from Mortpak produces the following results which are consistent with the results from Table 2.14 above. Table 2.15 Estimated Niuean Fertility based on children ever born and births in the last 3 years before the census (2009-2011) (Trussell variant of Brass P/F Ratio Method, UN MORTPAK Program)
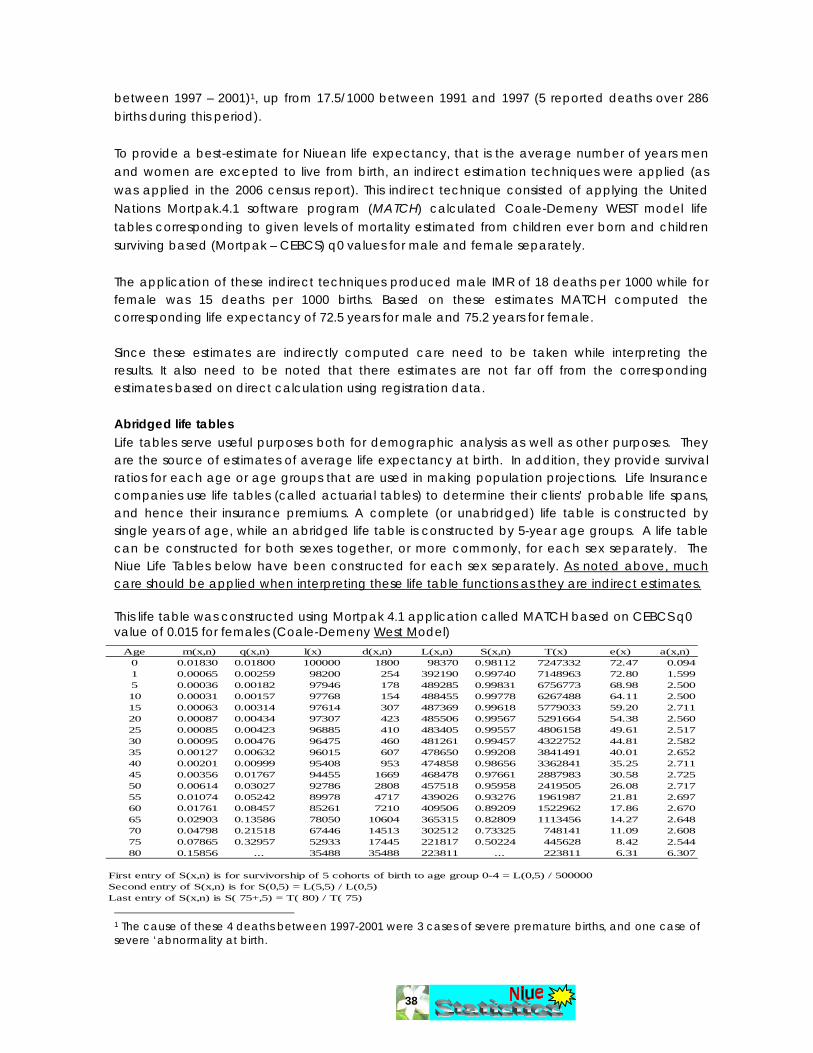
Age Specific Fertility Fertility Fertility Cumulation Age Group Children Fertility Consistent Pattern Pattern of Fertility Adjustment of Woman Ev er Born Pattern with C.E.B. by Age at by Age at A.S.F.R. Pattern by Factors
(A.S.F.P.) (A.S.F.R.) Surv ey Date Birth of Child Age at Birth 20 - 25 25 - 30 30 - 35 Recorded Calculated
15 - 20 0.067 0.022 0.055 0.022 0.027 0.055 0.027 2.009 0.033 0.029 0.031 20 - 25 0.579 0.096 0.101 0.096 0.101 0.156 0.128 1.216 0.122 0.109 0.116 25 - 30 1.109 0.103 0.097 0.103 0.106 0.252 0.234 1.080 0.128 0.114 0.121 30 - 35 1.744 0.140 0.112 0.140 0.141 0.365 0.374 0.975 0.171 0.152 0.161 35 - 40 2.625 0.117 0.098 0.117 0.108 0.462 0.482 0.960 0.131 0.116 0.124 40 - 45 3.027 0.018 0.042 0.018 0.017 0.504 0.498 1.011 0.020 0.018 0.019 45 - 50 3.617 0.014 0.015 0.014 0.012 0.520 0.510 1.019 0.014 0.012 0.013
Mean Age of Childbearing: 28.188 28.9Total Fertility Rate: 2.598 2.550 3.101 2.753 2.927
Age Specific Fertility based on adjustment factors
In addition, a third fertility estimates have been derived using the Arriaga method of estimation. The Arriaga technique (Arriaga, 1983) is similar to P/F ratios described above but links data for more than one date. The P/F ratio method assumes constant fertility in the past while the Arriaga method does not. For Niue, the application of the Arriaga technique considered both parity and age-specific fertility rates at two points in time, 2006 and 2011, yields an age-group adjusted (30-34 age group) TFR of 2.5 for 2011 (Table 2.16) which falls between the estimated level from the registration based TFR of 2,2 (5 year average) and the above PF Ratio based estimate of 2.9.

35
Table 2.16 Estimated Niuean Fertility based on Children ever born and births in the last 3 years before the census (2009-2011) (Arriaga Method, ARFE-2, US Census Bureau PAS program) Age ASFR from CEB ASFR pattern Adjusting Adjusted ASFR's based on age group
group ASFR Cumulativ e ASFR Cumulativ e factors 20-29 25-29 25-34 30-34
15-19 0.055 0.055 0.027 0.027 2.036 0.031 0.029 0.028 0.026
20-24 0.101 0.155 0.101 0.128 1.217 0.116 0.109 0.103 0.098
25-29 0.097 0.252 0.107 0.234 1.075 0.122 0.115 0.109 0.104
30-34 0.113 0.365 0.140 0.375 0.973 0.161 0.151 0.144 0.136
35-39 0.098 0.462 0.107 0.482 0.960 0.123 0.115 0.109 0.104
40-44 0.038 0.500 0.017 0.499 1.002 0.020 0.019 0.018 0.017
45-49 0.011 0.511 0.011 0.510 1.002 0.013 0.012 0.012 0.011
TFR 2.557 2.551 2.923 2.743 2.613 2.482
Mean age 30.41 Applying the different approaches to calculating the TFR – direct calculation from registration and census data, as well as two commonly used indirect methods, provides TFR estimate between 2.5 and 2.9 children per women. As noted above, both parity values and age-specific fertility rates show that fertility in Niue has been, and still is, declining. The calculated TFR is based on the number of births as reported during a specific reference period, a year, or a group of years; the reported TFR for 1985 was 4.8, the corresponding figure for 1991 was 3.5, and multi-year averages for the period 1991-1997 and 1997-2001 were 3.0, while for 2001-2006 was estimated to be 2.6 children per women which had increased had very slightly increased to 2.9 in the current period under study (2006-2011). Fig 7: Comparing three different estimates of fertility for the period 2002-2006 with estimates for 1997-2002, and 1991-1997
-0.050
0.000
0.050
0.100
0.150
0.200
15 20 25 30 35 40 45 50
Niue, 2006 and 2011 Censuses
Earlier date Later date
5. Single-Year ASFR's from CEB
36
Figure 7 describes the underlying age-specific fertility rates in single years for 2001-2006 (earlier date) and 2006-2011 (later date). Comparing the ASFR in the earlier and later periods, this graph illustrates quite clearly how and where Niuean fertility changed over the past 10 years, with declining fertility clearly the result of changing fertility patterns amongst 20-35 year old women. • With fertility levels peaking amongst 30-34 year olds during the earlier period, the age-specific
fertility rate of this age group is lower after 5 years later, but still comparatively higher than the other age groups in the later period.
• In the earlier period, teenage (17-19 years) fertility was high but had declined to a lower level in the recent period.
• And throughout the past 10 years, no major fertility change has taken place amongst women over forty years old, with child-bearing declining quite markedly, and age-specific fertility rates quite similar across the various age-groups over time as they obviously progress towards the end of their reproductive ages.
2.2.4 Mortality The mortality of a population depends on various factors, including: • demographic composition of the population (age and sex distribution); • health and medical services (immunisation programmes, maternal and child health care,
primary health care); • environmental conditions and availability of infrastructure such as housing, water supply,
sanitation, waste disposal; • exposure to risk factors, such as substance abuse (alcohol, tobacco); • work-related dangers; • exposure to events outside individual control (natural disasters, war); • social class.
The incidence of death reveals a lot about a population’s standard of living and its general state of health. Indicators such as infant mortality and life expectancy at birth are widely used to describe the overall development status of a country. The only question related to mortality in the 2011 census was the question on the number of children ever born and still alive. However, as this single data set based on a very small population would not be sufficient to calculate reliable infant and child mortality estimates, mortality estimates have to rely on Niue’s vital registration system, like in previous demographic analyses, which recorded deaths by age and sex. Fortunately, Niue’s registration of vital events such as births and deaths are considered fairly complete, and can be used to directly calculate a life table from data on deaths by five−year age groups. Because the possibility of random fluctuations is very high when dealing with very small numbers as is the case with the Niue data, it is imperative to work with multi-year averages to spell out meaningful indicators. But even when applying 5-year averages, for example, to span the exact 5-year inter-censal period, reported numbers of death are very low, as one would expect in a small population (Table 2.17), with some age-groups recording not a single death in 5 years. These figures yield a

37
crude death rate of 8.9/1000 for the period 2006-2011 (compared to 9.3/1000 for the period 2001-2006), meaning there were about 9 reported deaths per year per 1,000 populations since 2001. Crude death rates for males (10.8/1000) were higher than for females (7.0/1000). The corresponding rates for the period 2001-2006 was 10.8/1000 for males and 7.7/1000 for females. Table 2.17: Death registration data by age and sex, 2006 – 2011, 2011 Census
Age groups Reported Deaths Reference Population
Males Females Total Males Females Totals
under 1 1 0 1 15
1-4 0 0 0 123
5-9 0 0 0 56 75 131
10-14 0 0 0 56 61 117
15-19 2 0 2 65 45 110
20-24 0 0 0 57 38 95
25-29 2 1 3 36 55 91
30-34 0 0 0 44 43 87
35-39 1 0 1 44 40 84
40-44 0 0 0 47 37 84
45-49 0 0 0 41 47 88
50-54 2 1 3 57 45 102
55-59 3 1 4 43 50 93
60-64 1 2 3 25 34 59
65-69 4 8 12 27 30 57
70+ 23 13 36 53 71 124
Total 39 26 65 722 738 1,460
Note: to calculate Crude Death Rates, the respective number of deaths has to be divided by 5, to yield an annual figure (or the population totals have to be multiplied by 5, to give a “period total”).
While some demographers would question the validity to calculate life tables or apply indirect estimation techniques using model life tables under these circumstances, we prefer to take a more pragmatic approach: to provide Niue government officials and civil society with some feedback pertaining to the overall health status of the population, while advising to take these estimates with caution and regard them as “the best estimates” that can be provided under given circumstances. The potential difficulty to derive a meaningful assessment of infant mortality (IMR) is illustrated with just one death reported in 5 years (2006-2011). Set against 98 reported births during the same period, this yields an infant mortality rate of 10.2/1000 over five years, which puts Niue in good company with other low infant mortality countries around the world. The corresponding IMR for the period 2001-2006 was 7.8/1000. While good maternal and child health care provision on the island make such a low figure quite plausible, it is advisable not to over-interpret this figure, as only 10 years ago, Niue’s infant mortality stood at 29.4/1000 (the result of 4 infant deaths recorded
38
between 1997 – 2001)1, up from 17.5/1000 between 1991 and 1997 (5 reported deaths over 286 births during this period). To provide a best-estimate for Niuean life expectancy, that is the average number of years men and women are excepted to live from birth, an indirect estimation techniques were applied (as was applied in the 2006 census report). This indirect technique consisted of applying the United Nations Mortpak.4.1 software program (MATCH) calculated Coale-Demeny WEST model life tables corresponding to given levels of mortality estimated from children ever born and children surviving based (Mortpak – CEBCS) q0 values for male and female separately. The application of these indirect techniques produced male IMR of 18 deaths per 1000 while for female was 15 deaths per 1000 births. Based on these estimates MATCH computed the corresponding life expectancy of 72.5 years for male and 75.2 years for female. Since these estimates are indirectly computed care need to be taken while interpreting the results. It also need to be noted that there estimates are not far off from the corresponding estimates based on direct calculation using registration data. Abridged life tables Life tables serve useful purposes both for demographic analysis as well as other purposes. They are the source of estimates of average life expectancy at birth. In addition, they provide survival ratios for each age or age groups that are used in making population projections. Life Insurance companies use life tables (called actuarial tables) to determine their clients’ probable life spans, and hence their insurance premiums. A complete (or unabridged) life table is constructed by single years of age, while an abridged life table is constructed by 5-year age groups. A life table can be constructed for both sexes together, or more commonly, for each sex separately. The Niue Life Tables below have been constructed for each sex separately. As noted above, much care should be applied when interpreting these life table functions as they are indirect estimates. This life table was constructed using Mortpak 4.1 application called MATCH based on CEBCS q0 value of 0.015 for females (Coale-Demeny West Model)
1 The cause of these 4 deaths between 1997-2001 were 3 cases of severe premature births, and one case of severe ‘abnormality at birth.
Age m(x,n) q(x,n) l(x) d(x,n) L(x,n) S(x,n) T(x) e(x) a(x,n)0 0.01830 0.01800 100000 1800 98370 0.98112 7247332 72.47 0.0941 0.00065 0.00259 98200 254 392190 0.99740 7148963 72.80 1.5995 0.00036 0.00182 97946 178 489285 0.99831 6756773 68.98 2.50010 0.00031 0.00157 97768 154 488455 0.99778 6267488 64.11 2.50015 0.00063 0.00314 97614 307 487369 0.99618 5779033 59.20 2.71120 0.00087 0.00434 97307 423 485506 0.99567 5291664 54.38 2.56025 0.00085 0.00423 96885 410 483405 0.99557 4806158 49.61 2.51730 0.00095 0.00476 96475 460 481261 0.99457 4322752 44.81 2.58235 0.00127 0.00632 96015 607 478650 0.99208 3841491 40.01 2.65240 0.00201 0.00999 95408 953 474858 0.98656 3362841 35.25 2.71145 0.00356 0.01767 94455 1669 468478 0.97661 2887983 30.58 2.72550 0.00614 0.03027 92786 2808 457518 0.95958 2419505 26.08 2.71755 0.01074 0.05242 89978 4717 439026 0.93276 1961987 21.81 2.69760 0.01761 0.08457 85261 7210 409506 0.89209 1522962 17.86 2.67065 0.02903 0.13586 78050 10604 365315 0.82809 1113456 14.27 2.64870 0.04798 0.21518 67446 14513 302512 0.73325 748141 11.09 2.60875 0.07865 0.32957 52933 17445 221817 0.50224 445628 8.42 2.54480 0.15856 ... 35488 35488 223811 ... 223811 6.31 6.307
First entry of S(x,n) is for survivorship of 5 cohorts of birth to age group 0-4 = L(0,5) / 500000Second entry of S(x,n) is for S(0,5) = L(5,5) / L(0,5)Last entry of S(x,n) is S( 75+,5) = T( 80) / T( 75)

39
2.2.5 Migration Migration is the movement of people across a certain boundary. When this boundary is a national border, we speak of international migration; otherwise we refer to it as internal migration. The people involved are referred to as migrants. We speak of immigration if people are moving into a country and emigration if they are moving out of a country. When we refer to internal migration (movement within a country, between villages, for example), we speak of in-migrants and out-migrants. Apart from this spatial consideration, time plays a major role in the analysis of migration. Someone coming for a short visit (up to 30 days) can hardly be termed a migrant—he or she is a visitor. Apart from time, intent is also of crucial importance, as a visitor can turn into a migrant if confronted with sudden job opportunities, for example. Along the same lines, a person intending to migrate may turn into a visitor if, for example, if the expected job opportunities do not materialize. This highlights one of the key problems concerning migration. Whether or not a particular person qualifies as a migrant or not can only be established post facto (after the fact). Planners need to base their decisions on past and projected movements of people. International migration: With most countries assessing the importance of international migration across their borders through an analysis of passenger arrival and departure cards, population censuses can also provide some meaningful information, via questions on current previous residence. In the 2011 census this question was asked to residents 4 years and above to establish their place of stay in September 2010 and the reasons for coming to Niue at the time of census. Table 2.18 shows that 116 residents, or 8.6% of the Niuean population 4 years and older, did not live in Niue in 12 months prior to the 2011 census.
Age m(x,n) q(x,n) l(x) d(x,n) L(x,n) S(x,n) T(x) e(x) a(x,n)0 0.01521 0.01500 100000 1500 98642 0.98412 7517232 75.17 0.0951 0.00059 0.00236 98500 233 393418 0.99790 7418590 75.32 1.5005 0.00025 0.00125 98267 123 491028 0.99885 7025172 71.49 2.50010 0.00021 0.00104 98144 102 490464 0.99867 6534144 66.58 2.50015 0.00035 0.00175 98042 171 489812 0.99788 6043680 61.64 2.68220 0.00050 0.00250 97871 244 488772 0.99717 5553868 56.75 2.62425 0.00064 0.00318 97626 310 487387 0.99640 5065096 51.88 2.60230 0.00082 0.00409 97316 398 485634 0.99516 4577709 47.04 2.62235 0.00115 0.00575 96918 558 483284 0.99289 4092075 42.22 2.65740 0.00176 0.00878 96360 846 479848 0.98860 3608791 37.45 2.69045 0.00292 0.01449 95514 1384 474379 0.98171 3128943 32.76 2.69350 0.00458 0.02267 94130 2134 465702 0.97132 2654565 28.20 2.68155 0.00729 0.03582 91996 3296 452346 0.95425 2188863 23.79 2.68460 0.01192 0.05799 88700 5144 431652 0.92306 1736517 19.58 2.69665 0.02106 0.10042 83557 8391 398441 0.86723 1304865 15.62 2.69570 0.03747 0.17225 75166 12947 345540 0.77690 906424 12.06 2.66175 0.06621 0.28566 62219 17773 268449 0.52138 560884 9.01 2.60180 0.15198 ... 44445 44445 292435 ... 292435 6.58 6.580
First entry of S(x,n) is for survivorship of 5 cohorts of birth to age group 0-4 = L(0,5) / 500000Second entry of S(x,n) is for S(0,5) = L(5,5) / L(0,5)Last entry of S(x,n) is S( 75+,5) = T( 80) / T( 75)

40
Table 2.18: Population 4 years and older by place of residence in September 2010
Where in September 2010 Number % of Total
This Village 1,198 89.0
Another Village 33 2.4
Overseas 116 8.6
TOTAL 1,347 100.0
For the main reasons of coming to Niue 47 per cent stated they were returning residents, 25 per cent came to work, 22 per cent to join their families and 6 per cent have moved to Niue to live. (Table 2.19).
Table 2.19: Population Overseas in September 2010, by reasons of coming to Niue, 2011 Census
Reasons of coming Number
Returning Niuean residents 55
Work 29
Join Family 26
Move country 6
TOTAL 116
It was further asked of the countries of residence during the same period prior coming to Niue and was established that a total of 84 or 72.4 per cent stated to have come from New Zealand followed by those from the Pacific Islands 18 persons or 15.5 per cent and the rest from Asia and the Americas. (Table 2.20)
Table 2.20: Population Overseas in September 2010, by country/region of usual residence, 2011 Census.
Country/Region of residence Number
New Zealand 84
Australia 3
Pacific Islands 18
Asia 8
Americas 3
Europe/Others 0
TOTAL 116
This suggests at first sight, as much as residents of Niue continues to leave and emigrate overseas there is some extent of immigration to Niue. As stated above (Table 2.20) from the 116 persons that came to Niue after September 2010, 55 of them were returning residents and that means 61 of them were new residents of Niue.

41
Given the continued importance of migration in shaping Niue population dynamic, the census asked two further questions to 4 year olds and above regarding the likely and preferred place of residence, Niue or overseas, in 12 months’ time (September 2013). The results showed 107 or 7.9 per cent said they would be living overseas by then and 92 per cent remain to be living in Niue. (Table 2.21) With the exception of the villages of Hikutavake and Toi with no persons intending to leave immediately 12 months after the census, various proportions of residents of the other villages have stated they will be leaving. On the high side was Alofi South with 2.7 per cent of the total population followed by Avatele and Tamakautoga with 1.0 per cent each, to a low of 0.1 per cent in Mutalau and Vaiea. In the 2006 census a similar question was asked to 15 year olds about where you would be living in 2011. About 12.2 per cent stated they would likely to be living or moving overseas, 31.8 per cent unsure, and 55.8 per cent in Niue. Perhaps it is fair to say this is an improvement to the figures of those intending to migrate overseas. Table 2.21: Proportion of Population 4 years and older leaving in 12 months by village, 2011 Census.
Village Total Overseas % of Total
Total 1,347 107 7.9%
Alofi South 37 2.7%
Alofi North 8 0.6%
Makefu 5 0.4%
Tuapa 6 0.4%
Namukulu 4 0.3%
Hikutavake 0 0.0%
Toi 0 0.0%
Mutalau 2 0.1%
Lakepa 3 0.2%
Liku 7 0.5%
Hakupu 7 0.5%
Vaiea 2 0.1%
Avatele 13 1.0%
Tamakautoga 13 1.0%
Reasons of Leaving Niue. Considering the fact that residents of Niue can migrate freely to New Zealand (and Australia), it is important for the purpose of forward planning in economic, social and population developments to have some understanding of why are they leaving or what are the catalysts of their drawing to another country outside of Niue. Of the 107 residents intending to leave in 12 months the findings depicted a pattern whereby most residents are likely to be returning after or before the 12 months is over. These include travelling overseas to meet friends and relatives (58%), and for education (55%). Other options

42
that may see them away for a longer period featured slightly lower such as in search of employment (35%) with a better income (21%) and life style (20%) with good medical facilities (13%) and better benefits (14%), good entertainment (12%), environment (4%) and a suitable climate (2%). Those intending to go for shopping will only be away temporarily (10%). (Table 2.22) Table 2.22: Proportion of Population 4 years and older stating to leave Niue in 12 months after census by reasons of leaving, 2011 Census.
Internal migration: In terms of internal migration or mobility within Niue, the resident population appears rather stable: only 33 residents (2.4%) established their residence in another village in 12 months leading into the 2011 census with the vast majority, 89 per cent having lived at their current residence (Table 2.23). Table 2.23 provides a more dynamic picture, underlining the overall importance of on-going international migration and of a more internal life-cycle related mobility, associated with household formation, including marriage, and elderly people co-locating with their children.
Table 2.23: Resident population by usual residence and in another village in September 2010, 2011 Census.
Total Alf Sth
Alf Nth
Mkf Tup Nmk Hkt Toi Mtl Lak Lik Hkp Vai Avt Tmk
Total 1,347 359 146 50 86 12 36 21 87 49 69 119 71 125 117
Alf Sth 314 309 4 0 0 0 0 0 1 0 0 0 0 0 0
Alf Nth 140 0 129 0 7 0 0 0 1 1 0 0 0 1 1
Mkf 43 0 0 41 0 0 0 0 0 0 2 0 0 0 0
Tup 74 0 1 0 72 0 0 0 0 0 1 0 0 0 0
Nmk 9 0 0 0 0 8 0 0 0 0 0 1 0 0 0
Hkt 36 0 0 0 0 0 35 0 1 0 0 0 0 0 0
Toi 21 0 0 0 0 0 0 20 0 0 0 1 0 0 0
Mtl 75 1 0 0 0 0 0 0 73 0 1 0 0 0 0
Lak 47 2 0 0 0 0 0 0 0 45 0 0 0 0 0
Lik 62 0 0 0 0 0 0 0 0 0 62 0 0 0 0
Hkp 113 1 0 0 0 0 0 0 0 0 0 112 0 0 0
Vai 68 0 1 1 0 0 0 0 0 0 0 0 66 0 0
Avt 119 0 0 0 0 1 0 0 0 0 0 0 0 117 1
Tmk 110 0 0 0 1 0 0 0 0 0 0 0 0 0 109
O/s 116 46 11 8 6 3 1 1 11 3 3 5 5 7 6
Reason for Leaving Total %
Family/Friends 62 58% Education 55 51% Job/Employment 37 35% Income/Pay 23 21% Lifestyle 21 20% Benefits 15 14% Medical Facilities 14 13% Entertainment 13 12% Shopping/ Products Availability 11 10% Environment 4 4% Climate 2 2% Others 16 15%
Total 107 8%

43
2.2.6 Population Growth by Immigration The negative growth of the population of Niue for the last four and a half decades was
evidently the results of emigration as supposed to anything else. In 2011 census two questions were asked to residents 15 years and above of whether they agree that we should increase the population by allowing or enticing people from overseas to come and live in Niue (P44), and if they agree, what kind of people was preferred (P45).
Fig 8. Population increase by immigration Half of the residential population at the time of census responded favourably to the idea of increasing the population by allowing foreigners to come and live in Niue. About a third of them disagreed with the idea and the rest were unsure and stated ‘Don’t know’. (Fig 8) In terms of who agreed by age groups saw dominance of those aged 50 to 54 (61%) followed by
those aged 20 to 24 (57%) and those aged 25 – 29 (51%). Those disagreed were mainly in the age groups 60 and above. And those who were unsure were the young ones aged 15 to 24 (20% and 19%). (Table 2.24)
Table 2.24: Number of people who agree overseas people should be encouraged to live in Niue, for population aged 15 years and over, 2011 Census.
Age Groups Total Yes No Don’t Know
Number % Number % Number % Number %
15 ‐ 19 110 10% 51 46% 37 34% 22 20%
20 ‐ 24 95 9% 54 57% 23 24% 18 19%
25 ‐ 29 91 8% 47 52% 33 36% 11 12%
30 ‐ 34 87 8% 43 49% 31 36% 13 15%
35 ‐ 39 84 8% 43 51% 30 36% 11 13%
40 ‐ 44 84 8% 40 48% 36 43% 8 10%
45 ‐ 49 88 8% 44 50% 30 34% 14 16%
50 ‐ 54 102 9% 62 61% 30 29% 10 10%
55 ‐ 59 93 9% 42 45% 35 38% 16 17%
60 ‐ 64 59 5% 25 42% 26 44% 8 14%
65+ 181 17% 89 49% 81 45% 11 6%
Total 1,074 100% 540 50% 392 36% 142 13%
Yes50%
No37%
Dont Know13%
Increase Population by introducing Foreigners

44
Following the question of agreeing to come to Niue was the question of nationality preference of those to come. The findings overwhelmingly favoured the Niueans who are living overseas to return or come to Niue (42.2%) and highly preferred by those aged 45 and above, followed by those who said they had no particular preference of who to come (33.9%) and this group was highly favoured by those aged 25 to 44. There was a widespread of those in the next group, Pacific Islanders. (Table 2.25). Table 2.25: Nationality of overseas people preferred as new residents, for population aged 15 years and over, 2011 Census
Age groups Total Niueans Pacific Islands
European (inc.NZ/AUS)
Asians Americans Others Any/No
Preference
15 ‐ 19 51 22 4 3 1 1 2 18
20 ‐ 24 54 18 14 2 1 0 3 16
25 ‐ 29 47 19 9 1 0 1 0 17
30 ‐ 34 43 14 9 0 1 0 0 19
35 ‐ 39 43 12 3 2 1 0 2 23
40 ‐ 44 40 16 6 1 1 0 2 14
45 ‐ 49 44 22 6 1 1 0 0 14
50 ‐ 54 62 30 6 2 1 0 3 20
55 ‐ 59 42 18 9 1 1 0 4 9
60 ‐ 64 25 12 6 1 0 0 2 4
65+ 89 45 9 0 2 0 4 29
Total 540 228 81 14 10 2 22 183
Per cent 100% 42.2% 15.0% 2.6% 1.9% 0.4% 4.1% 33.9%
Age groups Niueans Pacific Is. European (NZ/AUS)
Asians Americans Others Any/No
Preference
15 ‐ 19 43% 8% 6% 2% 2% 4% 35%
20 ‐ 24 33% 26% 4% 2% 0% 6% 30%
25 ‐ 29 40% 19% 2% 0% 2% 0% 36%
30 ‐ 34 33% 21% 0% 2% 0% 0% 44%
35 ‐ 39 28% 7% 5% 2% 0% 5% 53%
40 ‐ 44 40% 15% 3% 3% 0% 5% 35%
45 ‐ 49 50% 14% 2% 2% 0% 0% 32%
50 ‐ 54 48% 10% 3% 2% 0% 5% 32%
55 ‐ 59 43% 21% 2% 2% 0% 10% 21%
60 ‐ 64 48% 24% 4% 0% 0% 8% 16%
65+ 51% 10% 0% 2% 0% 4% 33%
Total 42% 15% 3% 2% 0% 4% 34%
Niue under its national development strategies (NISP 09-13) and MDGs Goal 9 highlighted the need to build and maintain the population of Niue.

45
Chapter III 3 Social Characteristics
A nation’s culture resides in the hearts and in the soul of its people. Literary education is of no value, if it is not build up a sound character. It is health that is real wealth and not pieces of gold and silver. Mahatma Gandhi
This chapter of the report will highlight the socio-economic characteristics of the
population, such as ethnicity, religion, marital status, levels of educational attendance and attainment, certain cultural and health aspects, as well as communications and entertainment. The NNSP 09-13 promises for Niueans to enjoy a harmonious and healthy lifestyle in a thriving, educated and safe community that has access to a wider range of quality social services and healthy development opportunities.
3.1. Ethnicity
In 2011, of the 1,460 resident population of Niue, 971 or 66.5 per cent are of Niuean decent, 195 or 13.4 per cent of Part-Niuean descent and 294 or 20.1 per cent are Non-Niueans or from other ethnic groups. (Table 3.1) Pacific Islanders (8%, or 111) make up the single biggest group comprising of Tongans (38), Fijians (29), Tuvaluans (24), Samoans (18), and other Pacific Islanders (2). A further 12 per cent of the resident population is of European descent, and Asian. Table 3.1: Resident population by ethnicity and sex, 2011 Census.
The trend of Niueans (and Part Niueans) has been decreasing since the mid-1960s. Figure 9
depicted the situation from 1986 census to 2011. In 25 years the rate of decrease of Niueans is -2 per cent per annum. On the other hand the number of Non Niueans remains throughout the same period with only a slight decrease of -0.5 per cent per annum. Fig 9. Resident population by ethnicity 1986-2011
Ethnicity 2011
Total % Male % Female %
Total 1,460 100 722 49.5 738 50.5
Niuean 971 66.5 466 48.0 505 52.0
Part Niuean 195 13.4 101 51.8 94 48.2
Non Niuean 294 20.1 155 52.7 139 47.3
1986 1991 1997 2001 2006 2011
Niueans 2,199 1,962 1,779 1,469 1,246 1,166
Non Niueans 332 277 309 267 292 294
0
500
1,000
1,500
2,000
2,500
Num
ber o
f persons
Residents Population by Ethnicity: 1986 ‐ 2011
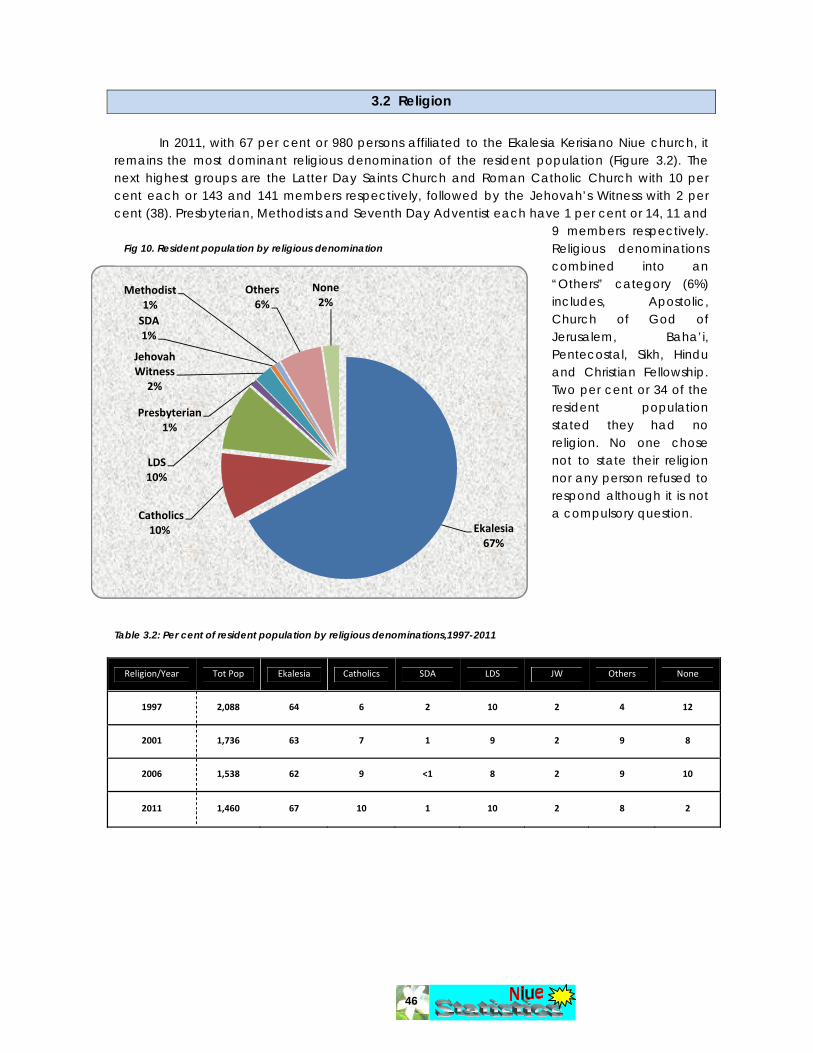
46
3.2 Religion
In 2011, with 67 per cent or 980 persons affiliated to the Ekalesia Kerisiano Niue church, it remains the most dominant religious denomination of the resident population (Figure 3.2). The next highest groups are the Latter Day Saints Church and Roman Catholic Church with 10 per cent each or 143 and 141 members respectively, followed by the Jehovah’s Witness with 2 per cent (38). Presbyterian, Methodists and Seventh Day Adventist each have 1 per cent or 14, 11 and
9 members respectively. Religious denominations combined into an “Others” category (6%) includes, Apostolic, Church of God of Jerusalem, Baha’i, Pentecostal, Sikh, Hindu and Christian Fellowship. Two per cent or 34 of the resident population stated they had no religion. No one chose not to state their religion nor any person refused to respond although it is not a compulsory question.
Table 3.2: Per cent of resident population by religious denominations,1997-2011
Religion/Year Tot Pop Ekalesia Catholics SDA LDS JW Others None
1997 2,088 64 6 2 10 2 4 12
2001 1,736 63 7 1 9 2 9 8
2006 1,538 62 9 <1 8 2 9 10
2011 1,460 67 10 1 10 2 8 2
Ekalesia67%
Catholics10%
LDS10%
Presbyterian1%
Jehovah Witness
2%
SDA1%
Methodist1%
Others6%
None2%
Fig 10. Resident population by religious denomination

47
3.3 Marital Status
All persons 15 years and older were asked to answer the question on their current marital status. The main reason this question is included in a census is that marriage (and de facto cohabitation) patterns can be important determinants of fertility, especially in societies where the use of modern contraceptives is limited, and marriage is regarded as entry into sexual union. The proportion of the population being married, together with the incidence of widowhood and divorce, have some impacts on the number of children born, with widowhood also seen as a useful indicator of mortality differences between males and females.
Christmas Day at the Catholic Church and White Sunday at the Ekalesia Kerisiano Niue Mutalau

48
Table 3.3: Distribution of residential population aged 15 years and over by age groups and marital status, 2011 Census.
Age group Married Never Married Widowed Separated/ Divorced/ De facto
Total
15 – 19 2 102 0 6 110
20 – 24 16 58 0 21 95
25 – 29 35 39 0 17 91
30 – 34 54 17 0 16 87
35 – 39 59 13 1 11 84
40 – 44 70 7 0 7 84
45 – 49 66 9 1 12 88
50 – 54 75 14 4 9 102
55 – 59 75 6 7 5 93
60 – 64 44 5 7 3 59
65 – 69 34 8 11 4 57
70+ 65 6 49 4 124
Total 595 284 80 115 1,074
% of Total 55.4% 26.4% 7.4% 10.7% 00.0%
Table 3.4: Distribution of residential population aged 15 years and over by Age groups, Sex and marital status, 2011Census.
Male Age Groups Total Married Never Married Widowed Separated Divorced De facto
15 ‐ 19 65 1 62 0 0 0 2
20 ‐ 24 57 9 38 0 0 0 10
25 ‐ 29 36 14 13 0 1 0 8
30 ‐ 34 44 29 10 0 0 0 5
35 ‐ 39 44 33 4 1 0 1 5
40 ‐ 44 47 39 4 0 0 0 4
45 ‐ 49 41 29 6 0 1 1 4
50 ‐ 54 57 42 8 1 2 2 2
55 ‐ 59 43 35 3 2 0 1 2
60 ‐ 64 25 23 1 0 0 1 0
65+ 80 55 4 18 0 1 2
Total 539 309 153 22 4 7 44
Female
Age Groups Total Married Never Married Widowed Separated Divorced De facto
15 ‐ 19 45 1 40 0 0 0 4
20 ‐ 24 38 7 20 0 0 0 11
25 ‐ 29 55 21 26 0 2 0 6
30 ‐ 34 43 25 7 0 1 2 8
35 ‐ 39 40 26 9 0 0 2 3
40 ‐ 44 37 31 3 0 1 0 2
45 ‐ 49 47 37 3 1 1 1 4
50 ‐ 54 45 33 6 3 2 0 1
55 ‐ 59 50 40 3 5 1 0 1
60 ‐ 64 34 21 4 7 1 1 0
65+ 101 44 10 42 0 4 1
Total 535 286 131 58 9 10 41
49
At the time of the census, 55.4 per cent of the Niuean resident population was married, with a further 7.9 per cent living in a de facto union/marriage, 26.4 per were never married, 7.4 per cent were widowed, and 1.6 per cent divorced. (Table 3.3) With a slightly greater proportion of men (65%) than women (61%) married or living in a de facto union, more marked differences between males and females emerge in a slightly higher proportion of never-married men (28%) than women (24%). This was the same pattern five years ago (2006 Census) with men (59%) and women (56%) married or living in a defector union and 36 per cent, 29 per cent for the latter (never married). While there are about three times as many widows as widowers, this is twice the times lower as five years ago.
3.4 Education Education levels and achievements are some of the key indicators of the development and quality of life of a country. Education plays an important role in development through its links with demographic, as well as economic and social factors. For example, there is a close and complex relationship between education, fertility, morbidity, mortality and mobility: when mothers are better educated, they tend to have fewer children, their children’s health status improves and their survival rates tend to increase. Higher levels of educational attainment also contribute to better qualified workforces and better economic performance than where the majority of people have had little to no formal education and training. The 2011 Niue Census contained three questions on education: school enrolment and the level of education attended, and the highest qualification formally attained (questions P16, P17 and P18). In Niue there are three formal educational institutions. Two Government schools: the Early Childhood Education and Niue Primary School (ECE/NPS) and the Niue High School (NHS); and thirdly the University of the South Pacific Extension centre Niue which offers education at the tertiary level. The ECE/NPS offers learning at ECE for 4 years olds and from Year 1 to Year 6 at NPS, and NHS offers learning from Year 7 until Year 13. However, there are pre-school centres around the villages that cater for children under 4 years old but they are yet to be formally included in the national education system. Other than that there are also Sunday schools for various religious learning existed in villages. For further education opportunities, scholarships under the Government award scheme are offered to Year 13 students on attaining National Certificate of Education Achievement (NCEA) Level 3 of the New Zealand Qualification Authority (NZQA) to attend tertiary institutions in New Zealand, Fiji or other countries. Some parents however, because of Niue’s constitutional arrangements with New Zealand send their children for secondary or tertiary education at Polytechnics and Universities in New Zealand on full private or joint Government sponsorships.
3.4.1 School enrolment “School age” defined in the Niue Education Act 1989 is from the age of 5 to 16. A “pupil”
is someone up to the age of 21. At age of 14 under section 29A of the Act the parents or guardians can keep the child from enrolling or attending school. With all these legal provisions regarding enrolment and attendance of children in schools of Niue, it is not surprising to realise
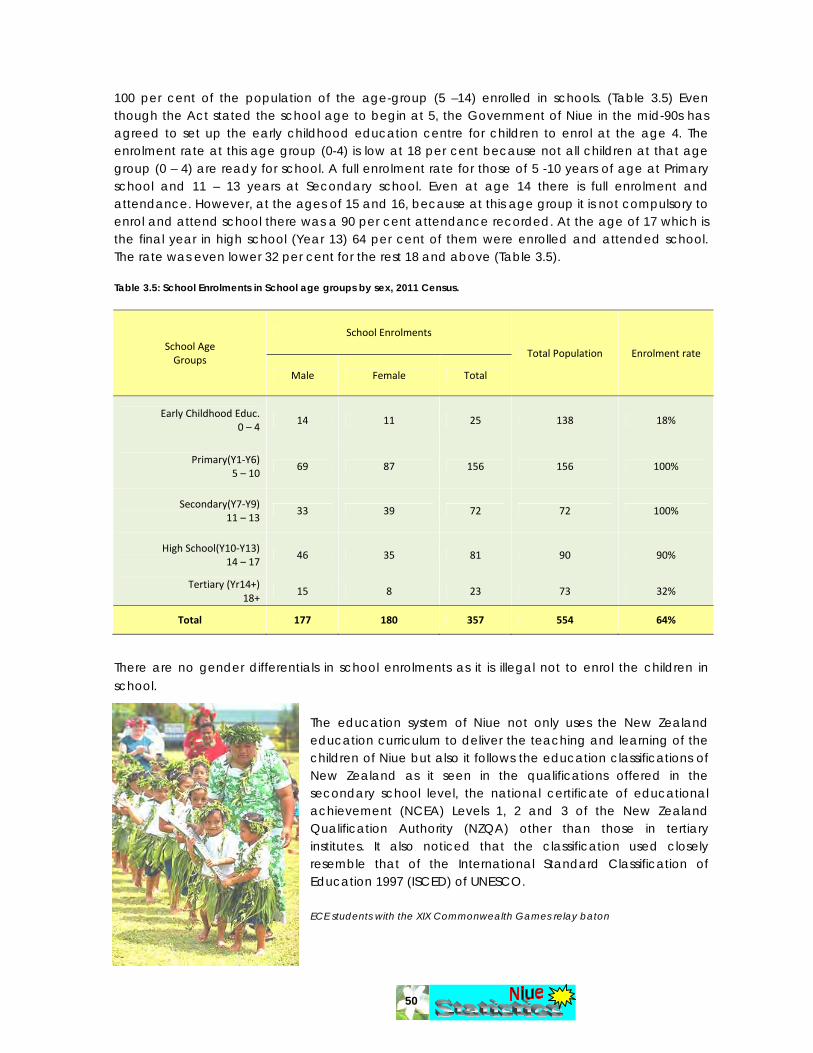
50
100 per cent of the population of the age-group (5 –14) enrolled in schools. (Table 3.5) Even though the Act stated the school age to begin at 5, the Government of Niue in the mid-90s has agreed to set up the early childhood education centre for children to enrol at the age 4. The enrolment rate at this age group (0-4) is low at 18 per cent because not all children at that age group (0 – 4) are ready for school. A full enrolment rate for those of 5 -10 years of age at Primary school and 11 – 13 years at Secondary school. Even at age 14 there is full enrolment and attendance. However, at the ages of 15 and 16, because at this age group it is not compulsory to enrol and attend school there was a 90 per cent attendance recorded. At the age of 17 which is the final year in high school (Year 13) 64 per cent of them were enrolled and attended school. The rate was even lower 32 per cent for the rest 18 and above (Table 3.5). Table 3.5: School Enrolments in School age groups by sex, 2011 Census.
School Age Groups
School Enrolments
Total Population Enrolment rate
Male Female Total
Early Childhood Educ. 0 – 4
14 11 25 138 18%
Primary(Y1‐Y6) 5 – 10
69 87 156 156 100%
Secondary(Y7‐Y9) 11 – 13
33 39 72 72 100%
High School(Y10‐Y13) 14 – 17
46 35 81 90 90%
Tertiary (Yr14+) 18+
15 8 23 73 32%
Total 177 180 357 554 64%
There are no gender differentials in school enrolments as it is illegal not to enrol the children in school.
The education system of Niue not only uses the New Zealand education curriculum to deliver the teaching and learning of the children of Niue but also it follows the education classifications of New Zealand as it seen in the qualifications offered in the secondary school level, the national certificate of educational achievement (NCEA) Levels 1, 2 and 3 of the New Zealand Qualification Authority (NZQA) other than those in tertiary institutes. It also noticed that the classification used closely resemble that of the International Standard Classification of Education 1997 (ISCED) of UNESCO. ECE students with the XIX Commonwealth Games relay baton
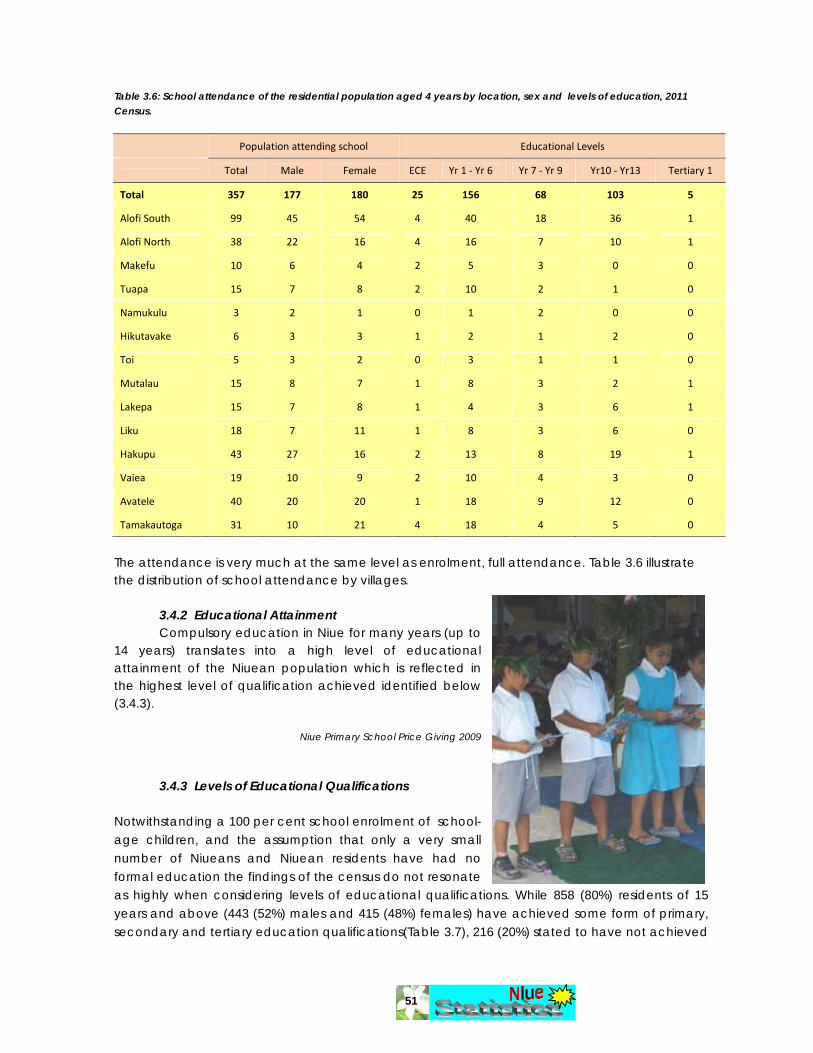
51
Table 3.6: School attendance of the residential population aged 4 years by location, sex and levels of education, 2011 Census.
Population attending school Educational Levels
Total Male Female ECE Yr 1 ‐ Yr 6 Yr 7 ‐ Yr 9 Yr10 ‐ Yr13 Tertiary 1
Total 357 177 180 25 156 68 103 5
Alofi South 99 45 54 4 40 18 36 1
Alofi North 38 22 16 4 16 7 10 1
Makefu 10 6 4 2 5 3 0 0
Tuapa 15 7 8 2 10 2 1 0
Namukulu 3 2 1 0 1 2 0 0
Hikutavake 6 3 3 1 2 1 2 0
Toi 5 3 2 0 3 1 1 0
Mutalau 15 8 7 1 8 3 2 1
Lakepa 15 7 8 1 4 3 6 1
Liku 18 7 11 1 8 3 6 0
Hakupu 43 27 16 2 13 8 19 1
Vaiea 19 10 9 2 10 4 3 0
Avatele 40 20 20 1 18 9 12 0
Tamakautoga 31 10 21 4 18 4 5 0
The attendance is very much at the same level as enrolment, full attendance. Table 3.6 illustrate the distribution of school attendance by villages.
3.4.2 Educational Attainment
Compulsory education in Niue for many years (up to 14 years) translates into a high level of educational attainment of the Niuean population which is reflected in the highest level of qualification achieved identified below (3.4.3).
Niue Primary School Price Giving 2009
3.4.3 Levels of Educational Qualifications
Notwithstanding a 100 per cent school enrolment of school-age children, and the assumption that only a very small number of Niueans and Niuean residents have had no formal education the findings of the census do not resonate as highly when considering levels of educational qualifications. While 858 (80%) residents of 15 years and above (443 (52%) males and 415 (48%) females) have achieved some form of primary, secondary and tertiary education qualifications(Table 3.7), 216 (20%) stated to have not achieved

52
any formal qualifications (9% males and 11% females) (Table 3.7a). Of those 80 per cent who have, 10 per cent had post-primary qualifications, 36 per cent had 5th or 6th form, university entrance certificates, or national certificates of educational achievements (NCEA) Levels 1, 2, and 3, with a further 11 per cent reporting trade certificates (90 or 17% males and 25 or 5% females). University level qualifications account for 25 per cent, with women (N=133) just seen slightly ahead of men 23 per cent (N=116) in diploma, degree and post-graduate qualifications. As noted earlier with school enrolment and levels of educational attainment, there are no substantial differences in the level of educational qualifications between men and women in any of the major categories, except amongst the small group of people with trade qualifications (N=115), where 90 or 8 per cent were males and 25 or 2 per cent were females reported (Table 3.6a). This gender parity reflects social change previously referred to, with males and females treated equally, and having access to similar opportunities. With tertiary-level qualifications also leading to tangible salary differentials, this would also have to be seen as having a strong impact on the recent increase in levels of tertiary education and qualifications. Table 3.7: Highest level of educational qualifications 15 years and above by sex, 2011 Census
Qualification Total Male Female
None 216 20% 96 18% 120 22%
Post Primary 104 10% 49 9% 55 10%
School Certificate 197 18% 87 16% 110 21%
UE/Bursary 45 4% 19 4% 26 5%
NCEA (Level1) 51 5% 34 6% 17 3%
NCEA Level 2) 56 5% 28 5% 28 5%
NCEA (Level 3) 41 4% 20 4% 21 4%
Trade Certificate 115 11% 90 17% 25 5%
Under graduate Diploma 94 9% 43 8% 51 10%
Graduate Degree 110 10% 52 10% 58 11%
Post Graduate Degree 45 4% 21 4% 24 4%
Doctorate Degree 0 0% 0 0% 0 0%
Other 0 0% 0 0% 0 0%
Total 1,074 100% 539 100% 535 100%
Considering the same feature, a highest level or educational qualification of people aged 15 years and over by age and sex, shows some interesting variations and contrasts (Table 3.8): • A close relationship between age and qualifications, with only 1 in 2 residents over 60 years of
age having achieved some educational qualifications, compared to an almost perfect rate of ≥ 90 per cent of those aged 15 to 34, followed by ≥ 80 per cent of those aged 35 to 54; and > 70 per cent for those aged 55 to 59. With this pattern most pronounced amongst women than men aged 15 to 49 and vice versa at age 50 and above (fig 11);

53
• Of all the 20 year-olds and above having achieved a diploma, a university degree or post-graduate degree or at least degree level, there were about 8 women for every 10 men; and
• With the exception of Trade Certificates where
men featured more than women (as stated above), women have achieved more than men in other tertiary qualifications by about eight men to every ten women.
Fig 11: Percentage Resident population with Educational Qualification by Sex in Age groups
0%
20%
40%
60%
80%
100%
Total 15‐19 20‐24 25‐29 30‐34 35‐39 40‐44 45‐49 50‐54 55‐59 60+
Percentage of Residents with Educational Qualification by Sex in Age Groups
National Male Female
Table 3.7a: Proportion of Highest level of educational qualifications by sex, 2011 Census.
Highest Qualification Achieved
Total Total % Males Females
None 216 20% 9% 11%Post Primary 104 10% 5% 5%
School Certificate 197 18% 8% 10%UE/Bursary 45 4% 2% 2%
NCEA (Level1) 51 5% 3% 2%NCEA Level 2) 56 5% 3% 3%NCEA (Level 3) 41 4% 2% 2%
Trade Certificate 115 11% 8% 2%Under graduate Diploma 94 9% 4% 5%
Graduate Degree 110 10% 5% 5%Post Graduate Degree 45 4% 2% 2%
Doctorate Degree 0 0% 0% 0%Other 0 0% 0% 0%
Total 1,074 100% 50% 50%
Graduation Ceremony 2003, Fale Fono Alofi NIUE
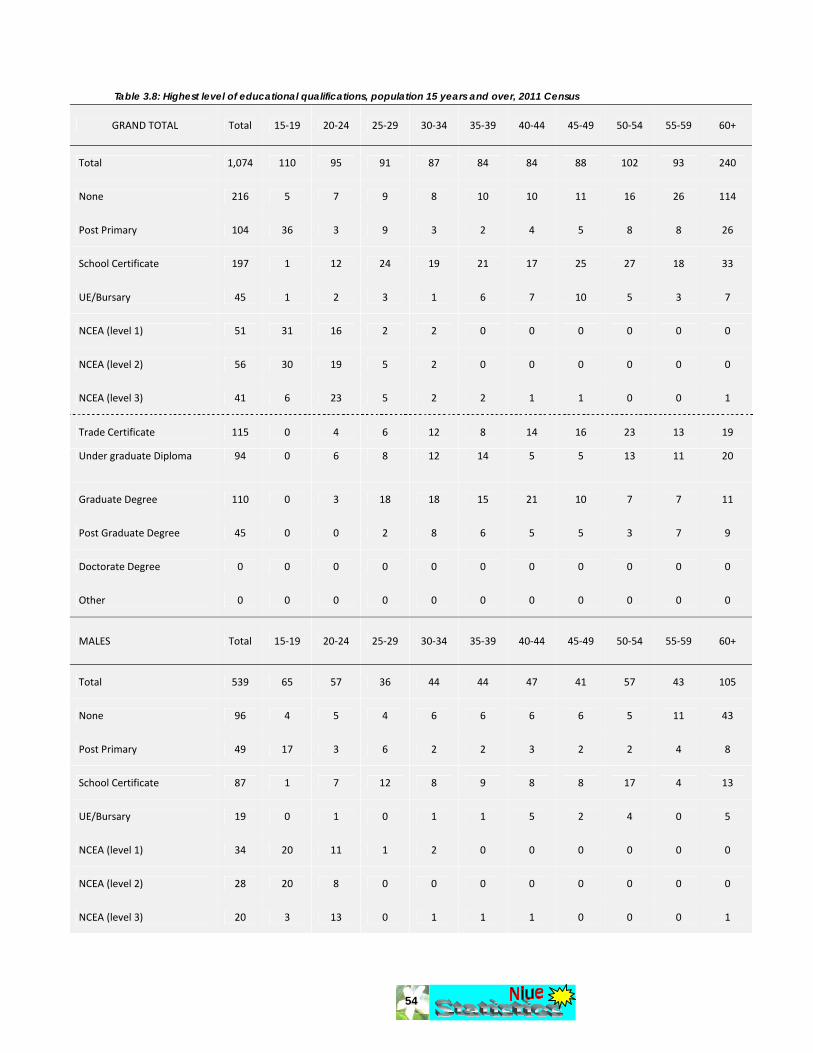
54
Table 3.8: Highest level of educational qualifications, population 15 years and over, 2011 Census
GRAND TOTAL Total 15‐19 20‐24 25‐29 30‐34 35‐39 40‐44 45‐49 50‐54 55‐59 60+
Total 1,074 110 95 91 87 84 84 88 102 93 240
None 216 5 7 9 8 10 10 11 16 26 114
Post Primary 104 36 3 9 3 2 4 5 8 8 26
School Certificate 197 1 12 24 19 21 17 25 27 18 33
UE/Bursary 45 1 2 3 1 6 7 10 5 3 7
NCEA (level 1) 51 31 16 2 2 0 0 0 0 0 0
NCEA (level 2) 56 30 19 5 2 0 0 0 0 0 0
NCEA (level 3) 41 6 23 5 2 2 1 1 0 0 1
Trade Certificate 115 0 4 6 12 8 14 16 23 13 19
Under graduate Diploma 94 0 6 8 12 14 5 5 13 11 20
Graduate Degree 110 0 3 18 18 15 21 10 7 7 11
Post Graduate Degree 45 0 0 2 8 6 5 5 3 7 9
Doctorate Degree 0 0 0 0 0 0 0 0 0 0 0
Other 0 0 0 0 0 0 0 0 0 0 0
MALES Total 15‐19 20‐24 25‐29 30‐34 35‐39 40‐44 45‐49 50‐54 55‐59 60+
Total 539 65 57 36 44 44 47 41 57 43 105
None 96 4 5 4 6 6 6 6 5 11 43
Post Primary 49 17 3 6 2 2 3 2 2 4 8
School Certificate 87 1 7 12 8 9 8 8 17 4 13
UE/Bursary 19 0 1 0 1 1 5 2 4 0 5
NCEA (level 1) 34 20 11 1 2 0 0 0 0 0 0
NCEA (level 2) 28 20 8 0 0 0 0 0 0 0 0
NCEA (level 3) 20 3 13 0 1 1 1 0 0 0 1
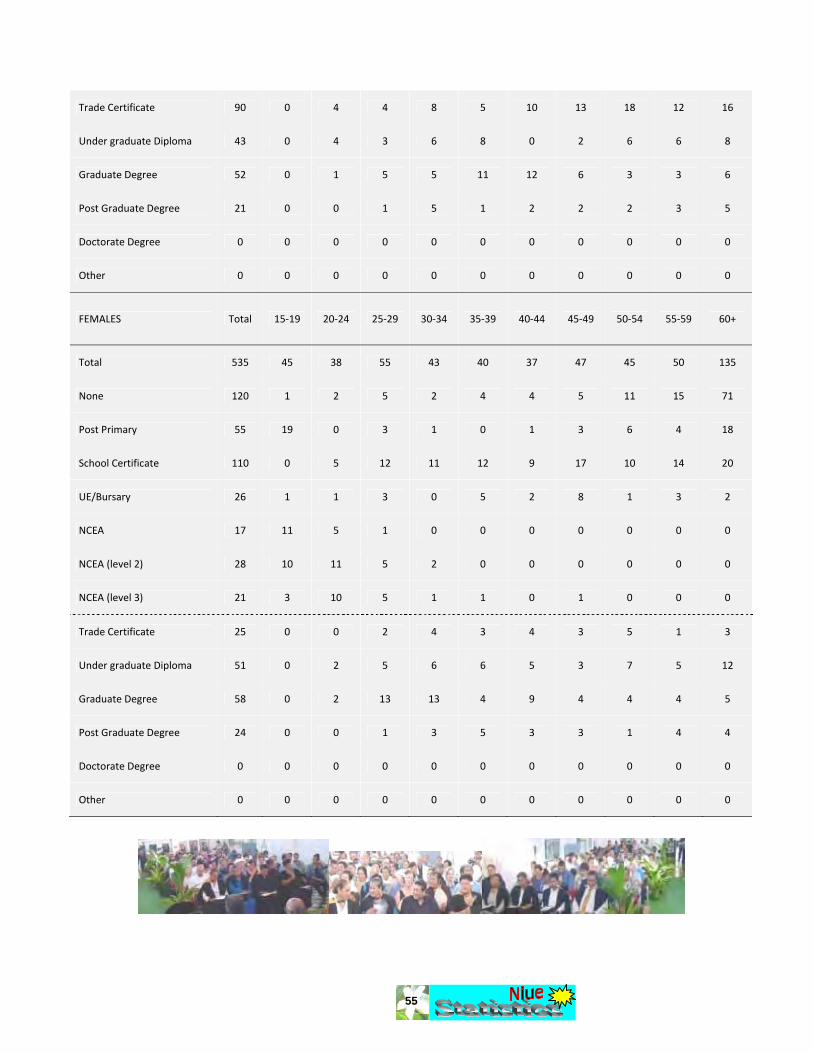
55
Trade Certificate 90 0 4 4 8 5 10 13 18 12 16
Under graduate Diploma 43 0 4 3 6 8 0 2 6 6 8
Graduate Degree 52 0 1 5 5 11 12 6 3 3 6
Post Graduate Degree 21 0 0 1 5 1 2 2 2 3 5
Doctorate Degree 0 0 0 0 0 0 0 0 0 0 0
Other 0 0 0 0 0 0 0 0 0 0 0
FEMALES Total 15‐19 20‐24 25‐29 30‐34 35‐39 40‐44 45‐49 50‐54 55‐59 60+
Total 535 45 38 55 43 40 37 47 45 50 135
None 120 1 2 5 2 4 4 5 11 15 71
Post Primary 55 19 0 3 1 0 1 3 6 4 18
School Certificate 110 0 5 12 11 12 9 17 10 14 20
UE/Bursary 26 1 1 3 0 5 2 8 1 3 2
NCEA 17 11 5 1 0 0 0 0 0 0 0
NCEA (level 2) 28 10 11 5 2 0 0 0 0 0 0
NCEA (level 3) 21 3 10 5 1 1 0 1 0 0 0
Trade Certificate 25 0 0 2 4 3 4 3 5 1 3
Under graduate Diploma 51 0 2 5 6 6 5 3 7 5 12
Graduate Degree 58 0 2 13 13 4 9 4 4 4 5
Post Graduate Degree 24 0 0 1 3 5 3 3 1 4 4
Doctorate Degree 0 0 0 0 0 0 0 0 0 0 0
Other 0 0 0 0 0 0 0 0 0 0 0
56
3.5 Family or Household Composition
Data on relationship to head of household was established by identifying a head of household who serves as a reference person to whom all other persons in the household, in terms of family membership, can be related. About 73 per cent of all heads of household in Niue were men and 27 per cent were women (Table 3.9)
Niueans referred to the oldest male person living in the household as the head of household, regardless of his ability to support the household members. The female heads of household were never married, widowed, divorced or separated or the heads of single-person households.
About 92 per cent of all household members belonged to nuclear families. The structure of a nuclear family generally consists of the parents (husband and wife) and children (including the married children still living together in the same household) of one generation. This is also true for a single parent family. However, the structure commonly found in island families can extent to more than one generation living together and in such instances we have grandchildren and great grandchildren. In the census there were 9.9 per cent grandchildren and/or great grandchildren of household heads. Other relation constitutes 3.4 per cent of all household members and a further 4.6 per cent were non-related household members.
Table 3.9: Percentage Distribution of Population by Relationship to Head of Household, 2011 Census.
Relation to Head of Household
Total Male Female % Total % Male % Female
Head 477 350 127 32.7% 73.4% 26.6%
Spouse 242 9 233 16.6% 3.7% 96.3%
Son/Daughter 445 218 227 30.5% 49.0% 51.0%
Son/Daughter In‐laws 34 17 17 2.3% 50.0% 50.0%
Grandchild 145 66 79 9.9% 45.5% 54.5%
Other Relative 50 34 16 3.4% 68.0% 32.0%
Not related 67 28 39 4.6% 41.8% 58.2%
Total Population 1,460 722 738 100.0% 49.5% 50.5%
3.6 Language and Cultural Skills Language and culture plays an important part in defining one’s identity and origins. The knowledge and skills of the vagahau and culture and the usage ensure not only its survival but also gives more meaning to life in Niue. There is some concern that the vagahau (Niuean language) and certain cultural skills are quickly disappearing, which is illustrated in anecdotal evidence of adults and children alike using English more than Niuean in everyday conversations, more frequent use of sacks, plastic bags and boxes for carrying things and the inability to husk a coconut and the local way of food preparations and cooking.

57
Therefore the questions on vagahau were once again asked in this 2011 census to the resident population aged 4 years and older as to obtain evidence on the prevailing situation. On the same token several basic cultural questions were asked to gauge the knowledge and skills in weaving a basket out of coconut leaves (kato-tapola) and husking a dry coconut. Questions of the umu(earth oven) was also asked of the households in order to measure the local methods of food preparation and cooking and also the level of maintaining this cooking method. It is anticipated that the results or findings may highlight the standing of these important aspects of a Niue way of living and areas of concern be acted upon appropriately. In other words in knowing this information the Government through Taoga Niue in partnership with the Department of Education and certain Non-government organisations (NGOs) will ensure of activities not to exacerbate the situation but interventions to maintain the knowledge and skills. 3.6.1 Vagahau - Language From the 2011 census, 3 out of 4 or 75 per cent of residents 4 years and older indicated that their mother tongue or first language is Niuean or vagahau (figure 12). Of the remaining 25 per cent, although vagahau is not their first language 41 per cent of them have already know how to communicate in the vagahau, 49 per cent were willing to learn and 10 per cent were unwilling to learn.
In regards to the proficiency level of the use of the vagahau, this was measured on the ability of the respondent to speak, read, write and understand. Speak: From the census, 1,053 or 79.6 per cent of the residents claimed to be fluently or proficient in speaking the vagahau, with a further 12.7 per cent or 168 who can speak basic Niuean and on the other hand 7.7 per cent indicating they cannot speak any Niuean at all. Read: For those who can be able to read the vagahau, 1,006 or 76 per cent claimed proficiency in reading the vagahau, with a further 179 or 13.6 per cent who can read basic vagahau while 137 or 10.4 per cent said they cannot read in Niuean. Write: In writing of the vagahau there were about 3 out of 4 or 75 per cent said they can write good Niuean, about 13 per cent or 168 who can write basic Niuean with about 12 per cent or 162 said that they cannot write in Niuean at all. Understanding: Understanding the vagahau featured more prominent in the findings with 1,067 or 80.7 per cent of the residents said they understood the vagahau pretty well, with 173 or 13.1 per
Yes75%
No25%
Vagahau Niue as mother tongue for residents 4 years and over, 2011
Fig 12. Vagahau Niue
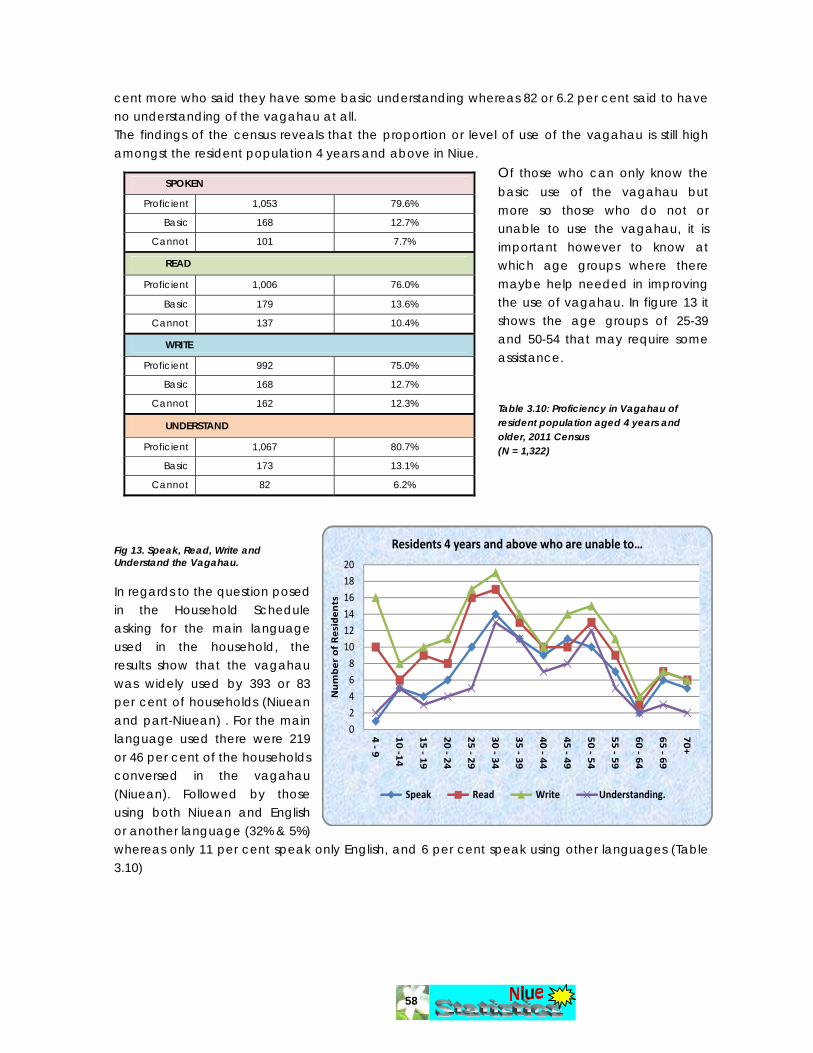
58
cent more who said they have some basic understanding whereas 82 or 6.2 per cent said to have no understanding of the vagahau at all. The findings of the census reveals that the proportion or level of use of the vagahau is still high amongst the resident population 4 years and above in Niue.
Of those who can only know the basic use of the vagahau but more so those who do not or unable to use the vagahau, it is important however to know at which age groups where there maybe help needed in improving the use of vagahau. In figure 13 it shows the age groups of 25-39 and 50-54 that may require some assistance. Table 3.10: Proficiency in Vagahau of resident population aged 4 years and older, 2011 Census (N = 1,322)
Fig 13. Speak, Read, Write and Understand the Vagahau.
In regards to the question posed in the Household Schedule asking for the main language used in the household, the results show that the vagahau was widely used by 393 or 83 per cent of households (Niuean and part-Niuean) . For the main language used there were 219 or 46 per cent of the households conversed in the vagahau (Niuean). Followed by those using both Niuean and English or another language (32% & 5%) whereas only 11 per cent speak only English, and 6 per cent speak using other languages (Table 3.10)
SPOKEN
Proficient 1,053 79.6%
Basic 168 12.7%
Cannot 101 7.7%
READ
Proficient 1,006 76.0%
Basic 179 13.6%
Cannot 137 10.4%
WRITE
Proficient 992 75.0%
Basic 168 12.7%
Cannot 162 12.3%
UNDERSTAND
Proficient 1,067 80.7%
Basic 173 13.1%
Cannot 82 6.2%
02468
101214161820
4 ‐ 9
10 ‐14
15 ‐ 19
20 ‐ 24
25 ‐ 29
30 ‐ 34
35 ‐ 39
40 ‐ 44
45 ‐ 49
50 ‐ 54
55 ‐ 59
60 ‐ 64
65 ‐ 69
70+
Number of Residen
ts
Residents 4 years and above who are unable to…
Speak Read Write Understanding.
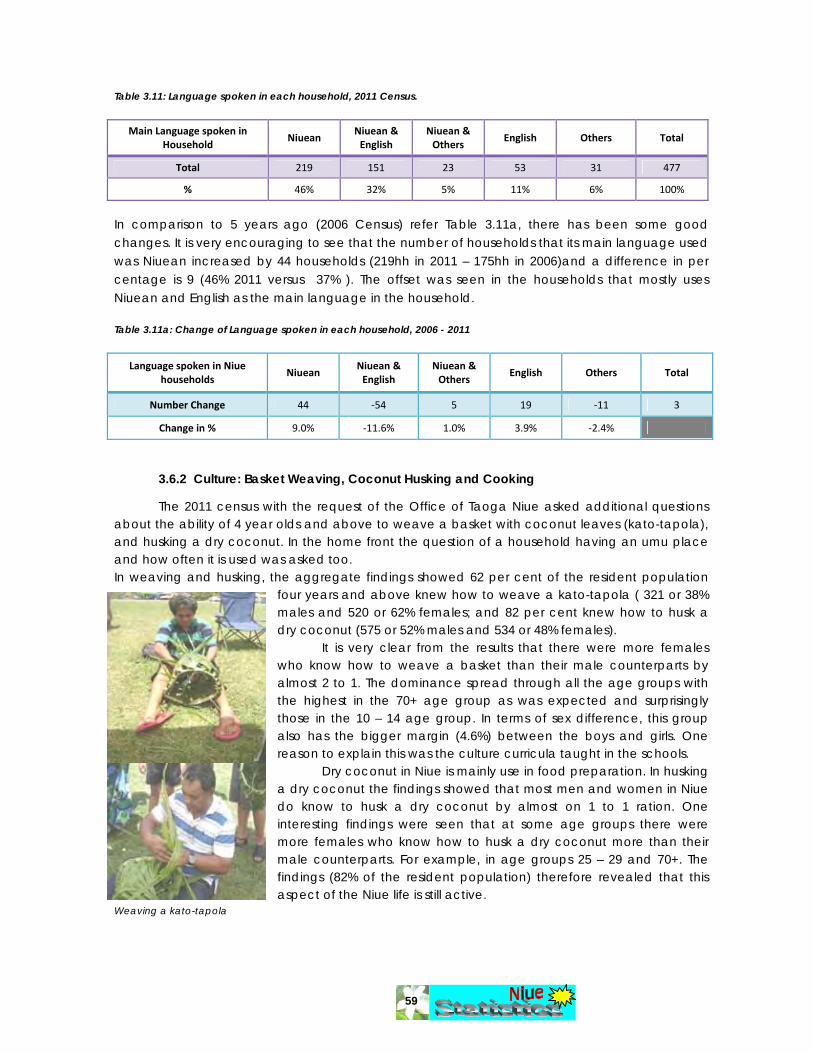
59
Table 3.11: Language spoken in each household, 2011 Census.
Main Language spoken in Household
Niuean Niuean & English
Niuean & Others
English Others Total
Total 219 151 23 53 31 477
% 46% 32% 5% 11% 6% 100%
In comparison to 5 years ago (2006 Census) refer Table 3.11a, there has been some good changes. It is very encouraging to see that the number of households that its main language used was Niuean increased by 44 households (219hh in 2011 – 175hh in 2006)and a difference in per centage is 9 (46% 2011 versus 37% ). The offset was seen in the households that mostly uses Niuean and English as the main language in the household.
Table 3.11a: Change of Language spoken in each household, 2006 - 2011
Language spoken in Niue households
Niuean Niuean & English
Niuean & Others
English Others Total
Number Change 44 ‐54 5 19 ‐11 3
Change in % 9.0% ‐11.6% 1.0% 3.9% ‐2.4%
3.6.2 Culture: Basket Weaving, Coconut Husking and Cooking
The 2011 census with the request of the Office of Taoga Niue asked additional questions
about the ability of 4 year olds and above to weave a basket with coconut leaves (kato-tapola), and husking a dry coconut. In the home front the question of a household having an umu place and how often it is used was asked too. In weaving and husking, the aggregate findings showed 62 per cent of the resident population
four years and above knew how to weave a kato-tapola ( 321 or 38% males and 520 or 62% females; and 82 per cent knew how to husk a dry coconut (575 or 52% males and 534 or 48% females).
It is very clear from the results that there were more females who know how to weave a basket than their male counterparts by almost 2 to 1. The dominance spread through all the age groups with the highest in the 70+ age group as was expected and surprisingly those in the 10 – 14 age group. In terms of sex difference, this group also has the bigger margin (4.6%) between the boys and girls. One reason to explain this was the culture curricula taught in the schools.
Dry coconut in Niue is mainly use in food preparation. In husking a dry coconut the findings showed that most men and women in Niue do know to husk a dry coconut by almost on 1 to 1 ration. One interesting findings were seen that at some age groups there were more females who know how to husk a dry coconut more than their male counterparts. For example, in age groups 25 – 29 and 70+. The findings (82% of the resident population) therefore revealed that this aspect of the Niue life is still active.
Weaving a kato-tapola

60
Table 3.12: Resident Population Age 4 and above who can weave a basket and husk a dry coconut by Age groups, 2011 Census.
Age Group Weave a basket Husk a Dry Coconut
Total Male Female Total Male Female 0 ‐ 4 0 0 0 0 0 0 5‐9 31 3 28 26 18 8 10‐14 59 10 49 91 49 42 15 ‐ 19 57 23 34 102 63 39 20 ‐ 24 59 28 31 89 54 35 25 ‐ 29 54 13 41 81 33 48 30 ‐ 34 48 20 28 76 40 36 35 ‐ 39 54 23 31 75 40 35 40 ‐ 44 57 27 30 78 45 33 45 ‐ 49 66 28 38 81 38 43 50 ‐ 54 71 35 36 96 55 41 55 ‐ 59 79 35 44 87 40 47 60 ‐ 64 51 18 33 55 24 31 65 ‐ 69 51 22 29 55 26 29 70+ 104 36 68 117 50 67 Total 841 321 520 1,109 575 534
Of the total 477 households of Niue, 77 per cent of them have an umu-place where they can use it for cooking and 23 per cent had none. The households with an umu-place were further asked of
how often it was used in the 4 weeks prior to the taking of the census. The findings showed that of the 368 households with an umu-place there were 105 or 29 per cent did not use it during the time of census, 121 or 33 per cent used it once or twice, 102 or 28 per cent used it thrice or four times and 40 or 11 per cent used it five times or more. The cultural way of cooking using the umu is still widely used in Niue for cooking. Therefore this cultural aspect of the Niue way of living is well maintained although there has been an
introduction of stove gases to most households from an EU energy saving project.
3.7 Health – Disabilities and Non Communicable Diseases (NCDs) Healthy people make a healthy nation and a healthy nation makes a healthy economy that ensures developments succeed. Ideally this is exactly Niue wants for its people, however this is not true in a real world as not everyone in any one country are free of disabilities and diseases, especially NCDs. NCDs was recognized in Niue’s MDGs as one of the health targets (MDGs, Goal 6, Target 8).
Yes77%
No23%
Households with a Umu‐place
Fig 14. Number of households with a umu-place
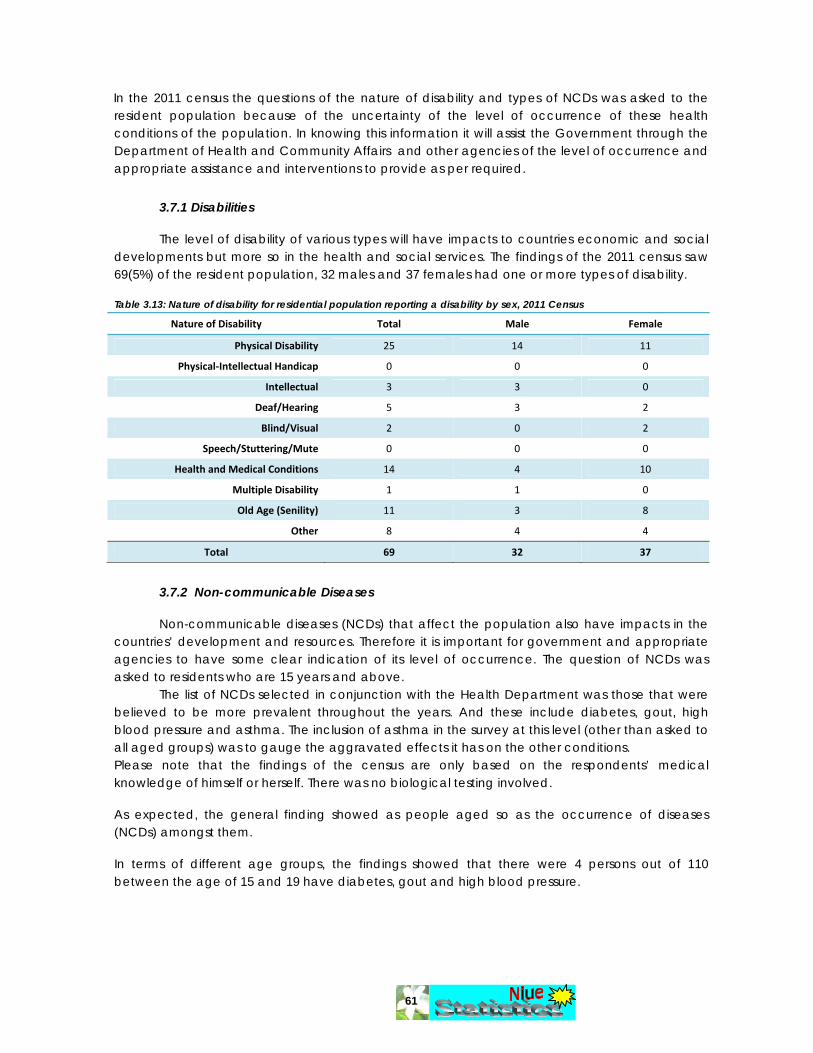
61
In the 2011 census the questions of the nature of disability and types of NCDs was asked to the resident population because of the uncertainty of the level of occurrence of these health conditions of the population. In knowing this information it will assist the Government through the Department of Health and Community Affairs and other agencies of the level of occurrence and appropriate assistance and interventions to provide as per required.
3.7.1 Disabilities The level of disability of various types will have impacts to countries economic and social
developments but more so in the health and social services. The findings of the 2011 census saw 69(5%) of the resident population, 32 males and 37 females had one or more types of disability. Table 3.13: Nature of disability for residential population reporting a disability by sex, 2011 Census
Nature of Disability Total Male Female
Physical Disability 25 14 11
Physical‐Intellectual Handicap 0 0 0
Intellectual 3 3 0
Deaf/Hearing 5 3 2
Blind/Visual 2 0 2
Speech/Stuttering/Mute 0 0 0
Health and Medical Conditions 14 4 10
Multiple Disability 1 1 0
Old Age (Senility) 11 3 8
Other 8 4 4
Total 69 32 37
3.7.2 Non-communicable Diseases Non-communicable diseases (NCDs) that affect the population also have impacts in the
countries’ development and resources. Therefore it is important for government and appropriate agencies to have some clear indication of its level of occurrence. The question of NCDs was asked to residents who are 15 years and above.
The list of NCDs selected in conjunction with the Health Department was those that were believed to be more prevalent throughout the years. And these include diabetes, gout, high blood pressure and asthma. The inclusion of asthma in the survey at this level (other than asked to all aged groups) was to gauge the aggravated effects it has on the other conditions. Please note that the findings of the census are only based on the respondents’ medical knowledge of himself or herself. There was no biological testing involved. As expected, the general finding showed as people aged so as the occurrence of diseases (NCDs) amongst them. In terms of different age groups, the findings showed that there were 4 persons out of 110 between the age of 15 and 19 have diabetes, gout and high blood pressure.
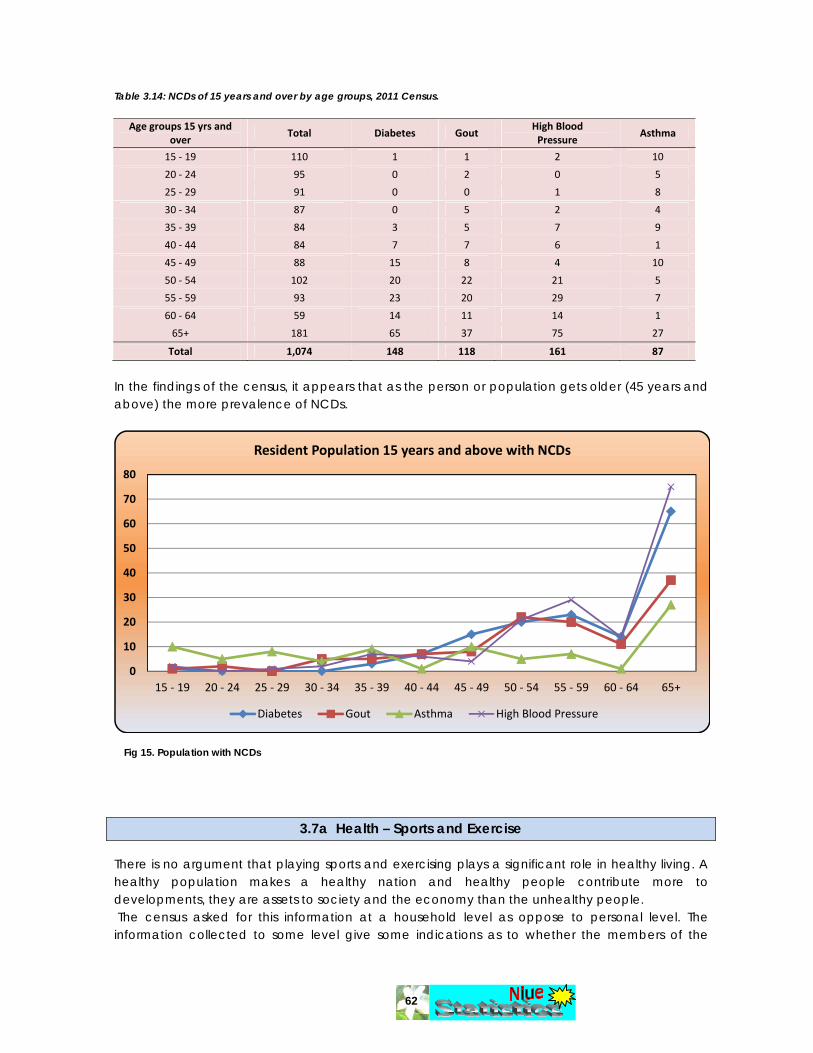
62
Table 3.14: NCDs of 15 years and over by age groups, 2011 Census.
Age groups 15 yrs and over
Total Diabetes Gout High Blood Pressure
Asthma
15 ‐ 19 110 1 1 2 10
20 ‐ 24 95 0 2 0 5
25 ‐ 29 91 0 0 1 8
30 ‐ 34 87 0 5 2 4
35 ‐ 39 84 3 5 7 9
40 ‐ 44 84 7 7 6 1
45 ‐ 49 88 15 8 4 10
50 ‐ 54 102 20 22 21 5
55 ‐ 59 93 23 20 29 7
60 ‐ 64 59 14 11 14 1
65+ 181 65 37 75 27
Total 1,074 148 118 161 87
In the findings of the census, it appears that as the person or population gets older (45 years and above) the more prevalence of NCDs.
0
10
20
30
40
50
60
70
80
15 ‐ 19 20 ‐ 24 25 ‐ 29 30 ‐ 34 35 ‐ 39 40 ‐ 44 45 ‐ 49 50 ‐ 54 55 ‐ 59 60 ‐ 64 65+
Resident Population 15 years and above with NCDs
Diabetes Gout Asthma High Blood Pressure
3.7a Health – Sports and Exercise There is no argument that playing sports and exercising plays a significant role in healthy living. A healthy population makes a healthy nation and healthy people contribute more to developments, they are assets to society and the economy than the unhealthy people. The census asked for this information at a household level as oppose to personal level. The information collected to some level give some indications as to whether the members of the
Fig 15. Population with NCDs
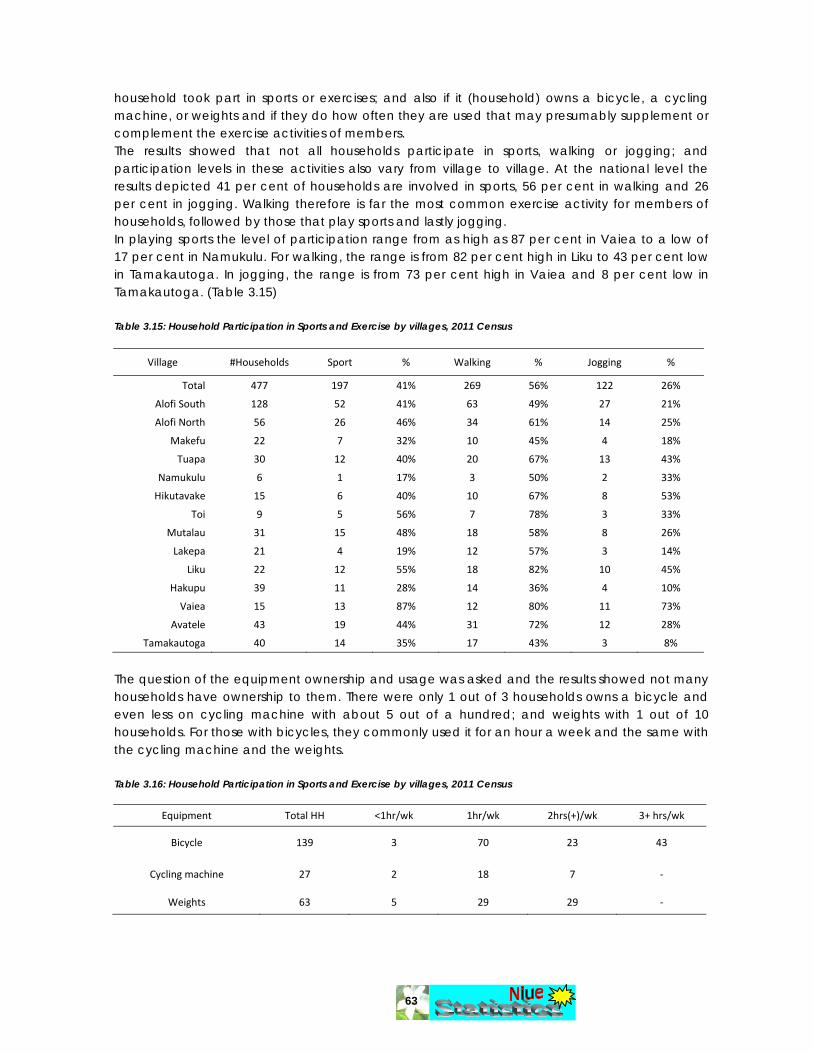
63
household took part in sports or exercises; and also if it (household) owns a bicycle, a cycling machine, or weights and if they do how often they are used that may presumably supplement or complement the exercise activities of members. The results showed that not all households participate in sports, walking or jogging; and participation levels in these activities also vary from village to village. At the national level the results depicted 41 per cent of households are involved in sports, 56 per cent in walking and 26 per cent in jogging. Walking therefore is far the most common exercise activity for members of households, followed by those that play sports and lastly jogging. In playing sports the level of participation range from as high as 87 per cent in Vaiea to a low of 17 per cent in Namukulu. For walking, the range is from 82 per cent high in Liku to 43 per cent low in Tamakautoga. In jogging, the range is from 73 per cent high in Vaiea and 8 per cent low in Tamakautoga. (Table 3.15) Table 3.15: Household Participation in Sports and Exercise by villages, 2011 Census
Village #Households Sport % Walking % Jogging %
Total 477 197 41% 269 56% 122 26%
Alofi South 128 52 41% 63 49% 27 21%
Alofi North 56 26 46% 34 61% 14 25%
Makefu 22 7 32% 10 45% 4 18%
Tuapa 30 12 40% 20 67% 13 43%
Namukulu 6 1 17% 3 50% 2 33%
Hikutavake 15 6 40% 10 67% 8 53%
Toi 9 5 56% 7 78% 3 33%
Mutalau 31 15 48% 18 58% 8 26%
Lakepa 21 4 19% 12 57% 3 14%
Liku 22 12 55% 18 82% 10 45%
Hakupu 39 11 28% 14 36% 4 10%
Vaiea 15 13 87% 12 80% 11 73%
Avatele 43 19 44% 31 72% 12 28%
Tamakautoga 40 14 35% 17 43% 3 8%
The question of the equipment ownership and usage was asked and the results showed not many households have ownership to them. There were only 1 out of 3 households owns a bicycle and even less on cycling machine with about 5 out of a hundred; and weights with 1 out of 10 households. For those with bicycles, they commonly used it for an hour a week and the same with the cycling machine and the weights. Table 3.16: Household Participation in Sports and Exercise by villages, 2011 Census
Equipment Total HH <1hr/wk 1hr/wk 2hrs(+)/wk 3+ hrs/wk
Bicycle 139 3 70 23 43
Cycling machine 27 2 18 7 ‐
Weights 63 5 29 29 ‐
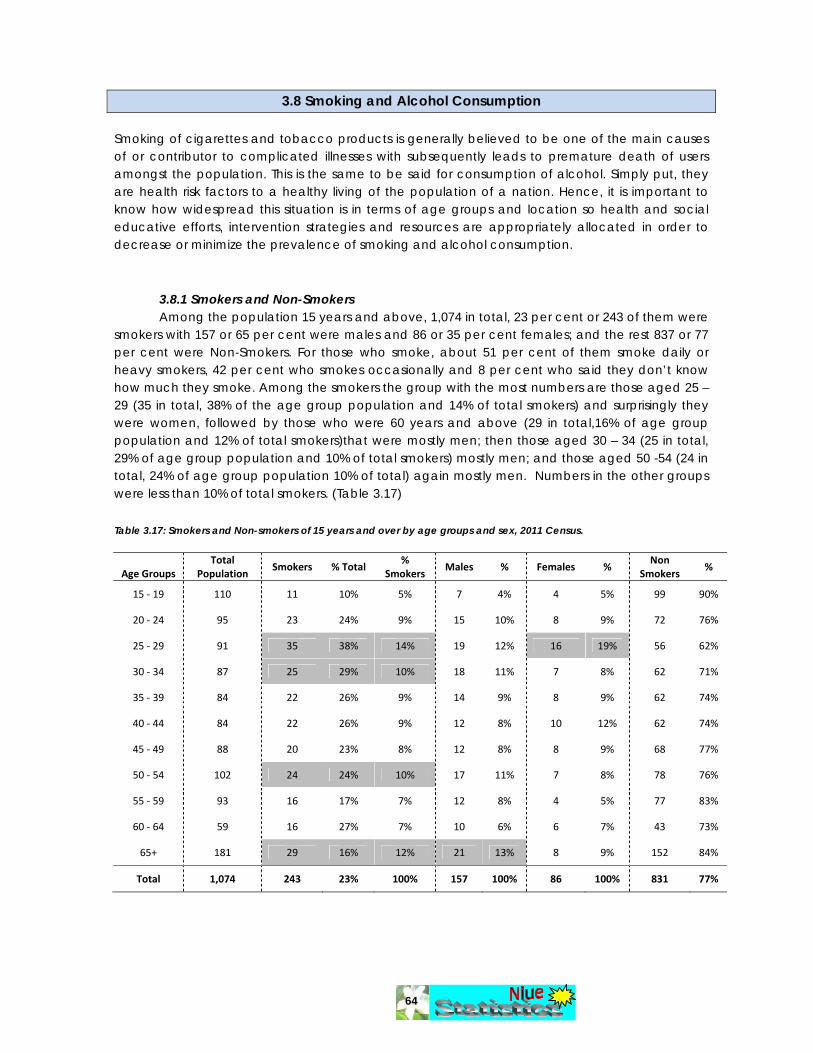
64
3.8 Smoking and Alcohol Consumption Smoking of cigarettes and tobacco products is generally believed to be one of the main causes of or contributor to complicated illnesses with subsequently leads to premature death of users amongst the population. This is the same to be said for consumption of alcohol. Simply put, they are health risk factors to a healthy living of the population of a nation. Hence, it is important to know how widespread this situation is in terms of age groups and location so health and social educative efforts, intervention strategies and resources are appropriately allocated in order to decrease or minimize the prevalence of smoking and alcohol consumption. 3.8.1 Smokers and Non-Smokers Among the population 15 years and above, 1,074 in total, 23 per cent or 243 of them were smokers with 157 or 65 per cent were males and 86 or 35 per cent females; and the rest 837 or 77 per cent were Non-Smokers. For those who smoke, about 51 per cent of them smoke daily or heavy smokers, 42 per cent who smokes occasionally and 8 per cent who said they don’t know how much they smoke. Among the smokers the group with the most numbers are those aged 25 – 29 (35 in total, 38% of the age group population and 14% of total smokers) and surprisingly they were women, followed by those who were 60 years and above (29 in total,16% of age group population and 12% of total smokers)that were mostly men; then those aged 30 – 34 (25 in total, 29% of age group population and 10% of total smokers) mostly men; and those aged 50 -54 (24 in total, 24% of age group population 10% of total) again mostly men. Numbers in the other groups were less than 10% of total smokers. (Table 3.17)
Table 3.17: Smokers and Non-smokers of 15 years and over by age groups and sex, 2011 Census.
Age Groups Total
Population Smokers % Total
% Smokers
Males % Females % Non
Smokers %
15 ‐ 19 110 11 10% 5% 7 4% 4 5% 99 90%
20 ‐ 24 95 23 24% 9% 15 10% 8 9% 72 76%
25 ‐ 29 91 35 38% 14% 19 12% 16 19% 56 62%
30 ‐ 34 87 25 29% 10% 18 11% 7 8% 62 71%
35 ‐ 39 84 22 26% 9% 14 9% 8 9% 62 74%
40 ‐ 44 84 22 26% 9% 12 8% 10 12% 62 74%
45 ‐ 49 88 20 23% 8% 12 8% 8 9% 68 77%
50 ‐ 54 102 24 24% 10% 17 11% 7 8% 78 76%
55 ‐ 59 93 16 17% 7% 12 8% 4 5% 77 83%
60 ‐ 64 59 16 27% 7% 10 6% 6 7% 43 73%
65+ 181 29 16% 12% 21 13% 8 9% 152 84%
Total 1,074 243 23% 100% 157 100% 86 100% 831 77%

65
By location it was seen that there was no village with a perfect record of 100 per cent of its population were Non-smokers. However, the records of Non Smokers per village all stood above
the 50 per cent mark of its population. Exceptional results saw seen for Toi with 89 per cent, followed by Avatele with 86 per cent and Hikutavake and Lakepa together with 85 per cent each. The 56 per cent low saw in Namukulu was the effects of the very small number of its population.
Looking back 10 years ago saw the prevalence of smoking amongst the total population went down by 2 per cent, 25 per cent in 2001, 23 per cent in 2006 and 23 per cent in 2011. The divide between the sexes saw male smokers though remains dominant, the movement fell slightly down from 2001 to 2006 (66% to 65%) and remain at the same level in 2011 (65%), while the female smokers saw the opposite, a slight increase by 1 per cent since 2001. (Fig16)
Fig 16. Proportion and trends of smokers: 2001 - 2011
Villages % Smokers % Non Smokers
Alofi South 23% 77%Alofi North 25% 75%Makefu 24% 76%Tuapa 24% 76%Namukulu 44% 56%Hikutavake 15% 85%Toi 11% 89%Mutalau 21% 79%Lakepa 15% 85%Liku 23% 77%Hakupu 33% 67%Vaiea 26% 74%Avatele 14% 86%Tamakautoga 20% 80%
Total 23% 77%
Table 3.17a: Smokers and Non-smokers of 15 years and over by location, 2011 Census.
2001 2006 2011
Total 25% 23% 23%
Male 66% 65% 65%
Female 34% 35% 35%
0%
10%
20%
30%
40%
50%
60%
70%
Proportion and trends of Smokers: 2001 ‐ 2011Trend line: Males
Trend line: Females
Trend line: Total
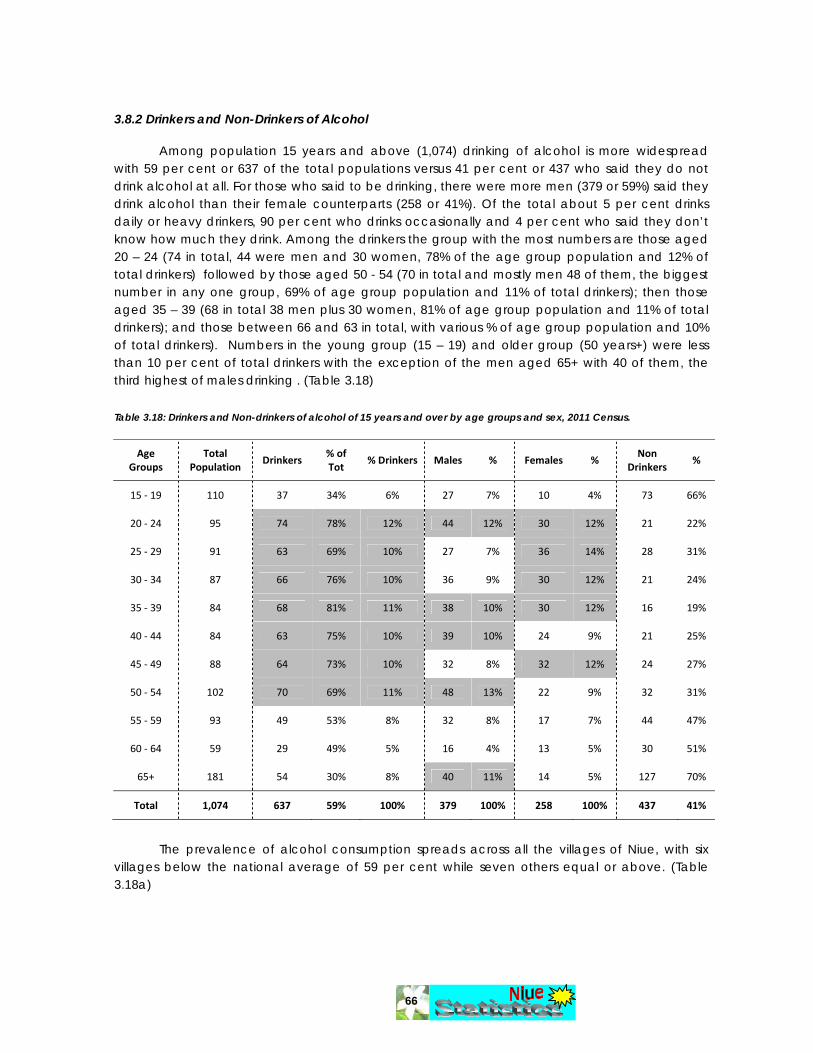
66
3.8.2 Drinkers and Non-Drinkers of Alcohol Among population 15 years and above (1,074) drinking of alcohol is more widespread with 59 per cent or 637 of the total populations versus 41 per cent or 437 who said they do not drink alcohol at all. For those who said to be drinking, there were more men (379 or 59%) said they drink alcohol than their female counterparts (258 or 41%). Of the total about 5 per cent drinks daily or heavy drinkers, 90 per cent who drinks occasionally and 4 per cent who said they don’t know how much they drink. Among the drinkers the group with the most numbers are those aged 20 – 24 (74 in total, 44 were men and 30 women, 78% of the age group population and 12% of total drinkers) followed by those aged 50 - 54 (70 in total and mostly men 48 of them, the biggest number in any one group, 69% of age group population and 11% of total drinkers); then those aged 35 – 39 (68 in total 38 men plus 30 women, 81% of age group population and 11% of total drinkers); and those between 66 and 63 in total, with various % of age group population and 10% of total drinkers). Numbers in the young group (15 – 19) and older group (50 years+) were less than 10 per cent of total drinkers with the exception of the men aged 65+ with 40 of them, the third highest of males drinking . (Table 3.18)
Table 3.18: Drinkers and Non-drinkers of alcohol of 15 years and over by age groups and sex, 2011 Census.
Age Groups
Total Population
Drinkers % of Tot
% Drinkers Males % Females % Non
Drinkers %
15 ‐ 19 110 37 34% 6% 27 7% 10 4% 73 66%
20 ‐ 24 95 74 78% 12% 44 12% 30 12% 21 22%
25 ‐ 29 91 63 69% 10% 27 7% 36 14% 28 31%
30 ‐ 34 87 66 76% 10% 36 9% 30 12% 21 24%
35 ‐ 39 84 68 81% 11% 38 10% 30 12% 16 19%
40 ‐ 44 84 63 75% 10% 39 10% 24 9% 21 25%
45 ‐ 49 88 64 73% 10% 32 8% 32 12% 24 27%
50 ‐ 54 102 70 69% 11% 48 13% 22 9% 32 31%
55 ‐ 59 93 49 53% 8% 32 8% 17 7% 44 47%
60 ‐ 64 59 29 49% 5% 16 4% 13 5% 30 51%
65+ 181 54 30% 8% 40 11% 14 5% 127 70%
Total 1,074 637 59% 100% 379 100% 258 100% 437 41%
The prevalence of alcohol consumption spreads across all the villages of Niue, with six
villages below the national average of 59 per cent while seven others equal or above. (Table 3.18a)

67
Looking back 10 years ago saw the prevalence of drinking alcohol amongst the total population increased from 47 per cent in 2001, up 3 per cent to 50 per cent in 2006, and a further 9 per cent to 59 per cent in 2011.
The divide between the sexes depicted where the movements existed. The figures showed that although the overall numbers of male drinkers remain dominant over the female counterparts throughout the 10 years, the makeup of the total saw the level of drinkers amongst men sliding from 64 per cent in 2001, to 62 per cent in 2006 and further down to 60% in 2011. This fall was taken up in the level of female drinkers. In 2001 there were 36 per cent of the total, it went up to 38 per cent in 2006 and top at 40 per cent in 2011. (Fig 17)
Fig 17. Proportion and trends of drinkers: 2001 - 2011
Table 3.18a: Alcohol Drinkers and Non drinkers of 15 years and over by location, 2011 Census. Villages Drinkers Non Drinkers
Alofi South 62% 38%
Alofi North 58% 42%
Makefu 61% 39%
Tuapa 59% 41%
Namukulu 67% 33%
Hikutavake 55% 45%
Toi 44% 56%
Mutalau 62% 38%
Lakepa 51% 49%
Liku 55% 45%
Hakupu 68% 32%
Vaiea 44% 56%
Avatele 61% 39%
Tamakautoga 61% 39%
Total 59% 41%
2001 2006 2011
Total 47% 50% 59%
Male 64% 62% 60%
Female 36% 38% 40%
0%
10%
20%
30%
40%
50%
60%
70%
Proportion and trends of Drinkers: 2001 ‐ 2011
Trend line: Males
Trend line: Total
Trend line: Females
68
3.9 Information Communication Technology and Entertainment Information communication technology (ICT) and entertainment is the integral part of life of the people of Niue in these modern days. Availability and access to ICT through internet connection and telephone enables people of Niue to maintain contact within country and those who were living outside of Niue. Internet connection is imperative to public servants, children’s education, research and development, and the business community. Having access to radio and television not only to be informed of information currently affairs in country and outside of Niue but also in times of disasters they will be well informed. In the 2011 census, seven questions (P23 – P29) were asked to respondents 4 years and above about television, radio and internet connection and use. For television and radio it asked about their programs of watching and listening and for internet it asked about its use and location of use.
3.9.1 Internet use This is the first time the questions of internet use are asked in the census. The questions
asked were as prescribed by the International Telecommunication Union (ITU) framework. In the census, asking these questions to children as young as 4 years of age is relatively low compared to the age of 15 required of the ITU & United Nations (UN) Information and Communication technologies (ICTs) core indicators. However, considering the involvement of Niue in the global ‘one laptop per child’ (OLPC) project, in 2008 all children in the schools (Early Childhood Education, Primary School and High School) were given a laptop computer each with the capability to connect to the internet. There are two internet service providers (ISPs) in Niue, the University of the South Pacific (USP) and the Internet User Society of Niue (IUSN). It is important to note that internet services or connection for Niue was provided for free by both ISPs, free usage for students in the case of USP and free for everyone from IUSN. However, there was a charge of $25 per computer for the wireless (wifi) internet access to the service provided by IUSN, a supplementary services provided by another business entity, Rocket Systems.
The census findings showed a total of 829 persons of 4 years and above used the internet at the time of census and there were more female (51%) than male (49%) users (Table 3.19). In terms of age groups, the big users of internet were from the age groups 10 - 14 to 20 – 24, and surprisingly there were more boys than girls by 10 to 8 (Age groups 10 – 14 and 15 – 19) who said they used the internet.

69
Table 3.19: Internet use of 4 years and above by age groups and sex, 2011 Census
Age Groups Total % Male % Female %
829 100 404 49 425 51
4 ‐ 9 40 5 12 1 28 4
10 ‐ 14 97 12 46 6 51 6
15 ‐ 19 103 12 58 7 45 5
20 ‐ 24 86 10 49 6 37 4
25 ‐ 29 77 9 25 3 52 6
30 ‐ 34 67 8 31 4 36 4
35 ‐ 39 71 9 35 4 36 5
40 ‐ 44 68 8 38 5 30 3
45 ‐ 49 67 8 30 3 37 5
50 ‐ 54 59 7 33 4 26 3
55 ‐ 59 40 5 19 2 21 3
60 ‐ 64 24 3 11 1 13 2
65 ‐ 69 15 2 8 1 7 1
70+ 15 2 9 1 6 1
Place of Use. Because internet connection for the general public is free and the access is available in all but 2 villages around Niue, this explained the wide used of internet amongst the population of Niue. Internet users can be able to have access in more places than one. For example, the place of use can be in the homes or another home or house (68% and 26% respectively) or at work. The use of internet at the work place totalled 405 or 49 per cent of those surveyed, 187 or 23 per cent at school or university, 155 or 19 per cent in other locations such as internet cafes, community halls or just under a coconut tree. (Table 3.20) Table 3.20: Place of internet use by 4 years and above, 2011 Census.
Total 829 %
Home 567 68%
Work 405 49%
Another Home 214 26%
School/University 187 23%
Other Locations 155 19%
Any place via Phone 17 2%
Any place via other Access 58 7%
Community Internet Access 159 19%
Commercial Internet Access 108 13%

70
Purpose of use. One might like to think that the purpose of the use of internet is infinite as it spread across all sectors of the economy and by all ages of the population. The census specifically asked for 15 purposes for what the internet is used. These include:
• Email • Education or Learning • Instant Messaging • Information about Goods and Services • Information on Health • Online Newspaper • Information from Government Organisations • Playing or Downloading Games • Interaction with General Government Organisation • Internet Banking • Purchasing/Ordering Goods • Downloading Movies Images • Downloading Software • Telephone over Internet • Others
According to the findings of the census the main or top uses of internet in Niue (with 50 per cent or more of the total who said yes) are those for Email (711 or 86%), Education and Learning (462 or 56%), Instant messaging (442 or 53%), and Information about Goods and Services (421, 51%). The other purposes were less than 50 per cent of those who said yes to it. (Table 3.21) Table 3.21: Purpose of internet use by 4 years and above, 2011 Census Purpose Total %
Email 711 86%
Education or Learning 462 56%
Instant Messaging 442 53%
Information about Goods and Services 421 51%
Information on Health 337 41%
Online Newspaper 311 38%
Information from Government Organisations 286 34%
Playing or Downloading Games 256 31%
Interaction with General Government Organisation 239 29%
Internet Banking 224 27%
Purchasing/Ordering Goods 218 26%
Downloading Movies Images 180 22%
Downloading Software 163 20%
Telephone over Internet 105 13%
Others 257 31%
Total Users 829 63%

71
3.9.2 Television and Radio Watching television and listening to the radio not only provides entertainment to the
population but equally important in knowing and be informed (information) of current affairs and disasters.
The questions asked in the census about television and radio was requested by the Broadcasting Corporation of Niue (BCN) in their bid to know the widespread of viewers and listeners of 4 years old and above throughout Niue and of what particular or favourite programs they were watching or listening to.
Of the total 1,347 4 years old and above, the findings of the census saw more television viewers (80% or 1,079) than radio listeners (71% or 950). (Table 3.22)
Television viewers Of the 1,079 television viewers it was very clear that the top television viewers were in age
group 10 – 14 years of age with a total of 106 viewers. They featured high in all areas of analyses (% viewers per age group; % viewers per total population; and % viewers by age group per total viewers). The next top groups in viewers per age groups were those in 65-69 years of age (89.5%), 45-49 (87.5%), 40-44 (86.9%), and 50-54 (85.3%). (Table 3.23) Table 3.23: Television viewers by 4 years and above in Age groups, 2011 Census Age groups Total
Population Watch
Television % viewers/Age
groups % viewers/Total
Population % viewers by age
group/Total Viewers 04 25 20 80.0% 1.5% 1.9%
05 ‐ 09 131 104 79.4% 7.7%(2) 9.6%(2)
10 ‐ 14 117 106 90.6%(1) 7.9%(1) 9.8%(1)
15 ‐ 19 110 89 80.9% 6.6%(4) 8.2%(4)
20 ‐ 24 95 72 75.8% 5.3% 6.7%
25 ‐ 29 91 61 67.0% 4.5% 5.7%
30 ‐ 34 87 61 70.1% 4.5% 5.7%
35 ‐ 39 84 64 76.2% 4.8% 5.9%
40 ‐ 44 84 73 86.9%(4) 5.4% 6.8%
45 ‐ 49 88 77 87.5%(3) 5.7% 7.1%
50 ‐ 54 102 87 85.3%(5) 6.5%(5) 8.1%(5)
55 ‐ 59 93 75 80.6% 5.6% 7.0%
60 ‐ 64 59 49 83.1% 3.6% 4.5%
65 ‐ 69 57 51 89.5%(2) 3.8% 4.7%
70+ 124 90 72.6% 6.7%(3) 8.3%(3)
Total 1,347 1,079 80.1% 80.1% 100.0%
Table 3.22: Total Television viewers and Radio listeners by 4 years and above in Age groups, 2011 Census
Yes % No %1,079 80.10% 268 19.90%
Yes % No %950 70.50% 397 29.50%
Listen to Radio
Watch Television
Total Population
1,347
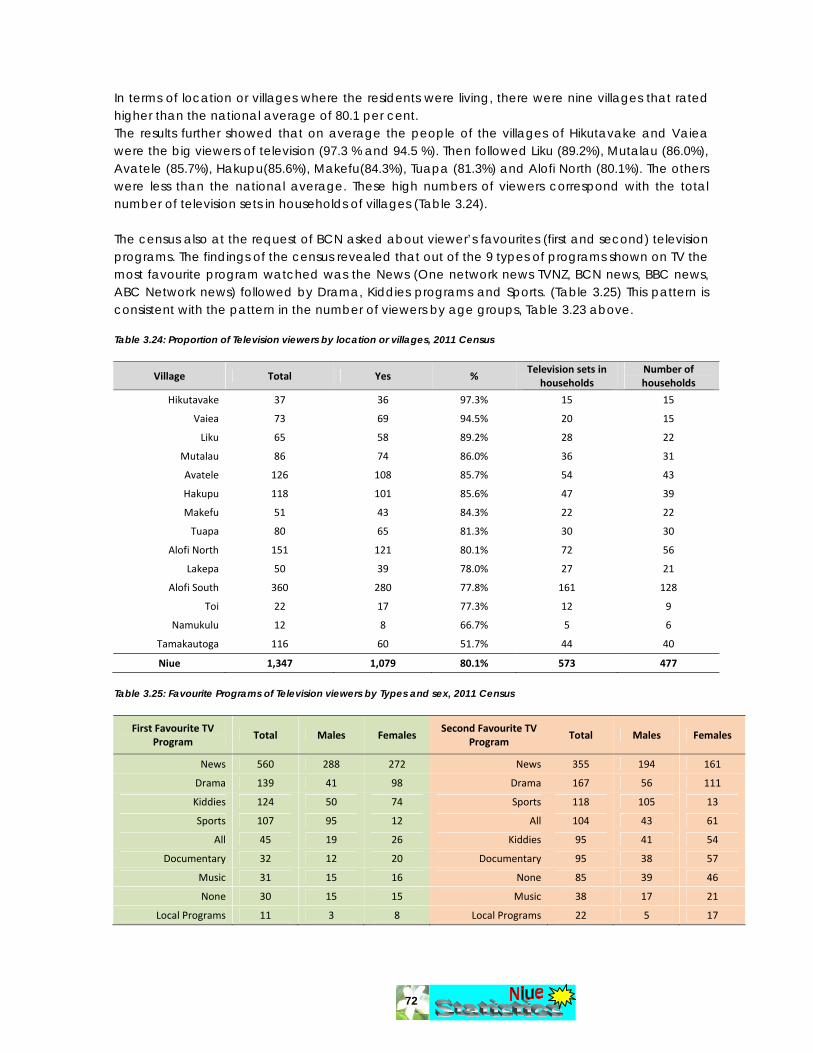
72
In terms of location or villages where the residents were living, there were nine villages that rated higher than the national average of 80.1 per cent. The results further showed that on average the people of the villages of Hikutavake and Vaiea were the big viewers of television (97.3 % and 94.5 %). Then followed Liku (89.2%), Mutalau (86.0%), Avatele (85.7%), Hakupu(85.6%), Makefu(84.3%), Tuapa (81.3%) and Alofi North (80.1%). The others were less than the national average. These high numbers of viewers correspond with the total number of television sets in households of villages (Table 3.24). The census also at the request of BCN asked about viewer’s favourites (first and second) television programs. The findings of the census revealed that out of the 9 types of programs shown on TV the most favourite program watched was the News (One network news TVNZ, BCN news, BBC news, ABC Network news) followed by Drama, Kiddies programs and Sports. (Table 3.25) This pattern is consistent with the pattern in the number of viewers by age groups, Table 3.23 above. Table 3.24: Proportion of Television viewers by location or villages, 2011 Census
Village Total Yes % Television sets in
households Number of households
Hikutavake 37 36 97.3% 15 15
Vaiea 73 69 94.5% 20 15
Liku 65 58 89.2% 28 22
Mutalau 86 74 86.0% 36 31
Avatele 126 108 85.7% 54 43
Hakupu 118 101 85.6% 47 39
Makefu 51 43 84.3% 22 22
Tuapa 80 65 81.3% 30 30
Alofi North 151 121 80.1% 72 56
Lakepa 50 39 78.0% 27 21
Alofi South 360 280 77.8% 161 128
Toi 22 17 77.3% 12 9
Namukulu 12 8 66.7% 5 6
Tamakautoga 116 60 51.7% 44 40
Niue 1,347 1,079 80.1% 573 477
Table 3.25: Favourite Programs of Television viewers by Types and sex, 2011 Census
First Favourite TV Program
Total Males Females Second Favourite TV
Program Total Males Females
News 560 288 272 News 355 194 161
Drama 139 41 98 Drama 167 56 111
Kiddies 124 50 74 Sports 118 105 13
Sports 107 95 12 All 104 43 61
All 45 19 26 Kiddies 95 41 54
Documentary 32 12 20 Documentary 95 38 57
Music 31 15 16 None 85 39 46
None 30 15 15 Music 38 17 21
Local Programs 11 3 8 Local Programs 22 5 17
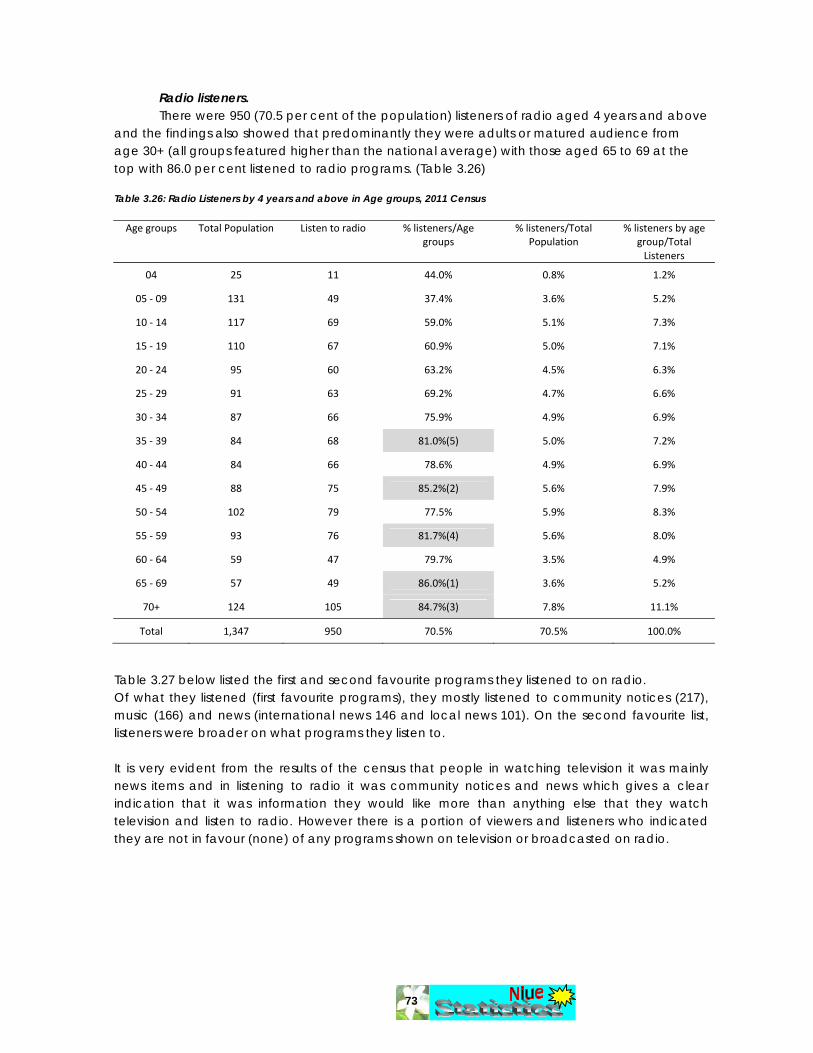
73
Radio listeners. There were 950 (70.5 per cent of the population) listeners of radio aged 4 years and above
and the findings also showed that predominantly they were adults or matured audience from age 30+ (all groups featured higher than the national average) with those aged 65 to 69 at the top with 86.0 per cent listened to radio programs. (Table 3.26) Table 3.26: Radio Listeners by 4 years and above in Age groups, 2011 Census Age groups Total Population Listen to radio % listeners/Age
groups % listeners/Total
Population % listeners by age
group/Total Listeners
04 25 11 44.0% 0.8% 1.2%
05 ‐ 09 131 49 37.4% 3.6% 5.2%
10 ‐ 14 117 69 59.0% 5.1% 7.3%
15 ‐ 19 110 67 60.9% 5.0% 7.1%
20 ‐ 24 95 60 63.2% 4.5% 6.3%
25 ‐ 29 91 63 69.2% 4.7% 6.6%
30 ‐ 34 87 66 75.9% 4.9% 6.9%
35 ‐ 39 84 68 81.0%(5) 5.0% 7.2%
40 ‐ 44 84 66 78.6% 4.9% 6.9%
45 ‐ 49 88 75 85.2%(2) 5.6% 7.9%
50 ‐ 54 102 79 77.5% 5.9% 8.3%
55 ‐ 59 93 76 81.7%(4) 5.6% 8.0%
60 ‐ 64 59 47 79.7% 3.5% 4.9%
65 ‐ 69 57 49 86.0%(1) 3.6% 5.2%
70+ 124 105 84.7%(3) 7.8% 11.1%
Total 1,347 950 70.5% 70.5% 100.0%
Table 3.27 below listed the first and second favourite programs they listened to on radio. Of what they listened (first favourite programs), they mostly listened to community notices (217), music (166) and news (international news 146 and local news 101). On the second favourite list, listeners were broader on what programs they listen to. It is very evident from the results of the census that people in watching television it was mainly news items and in listening to radio it was community notices and news which gives a clear indication that it was information they would like more than anything else that they watch television and listen to radio. However there is a portion of viewers and listeners who indicated they are not in favour (none) of any programs shown on television or broadcasted on radio.
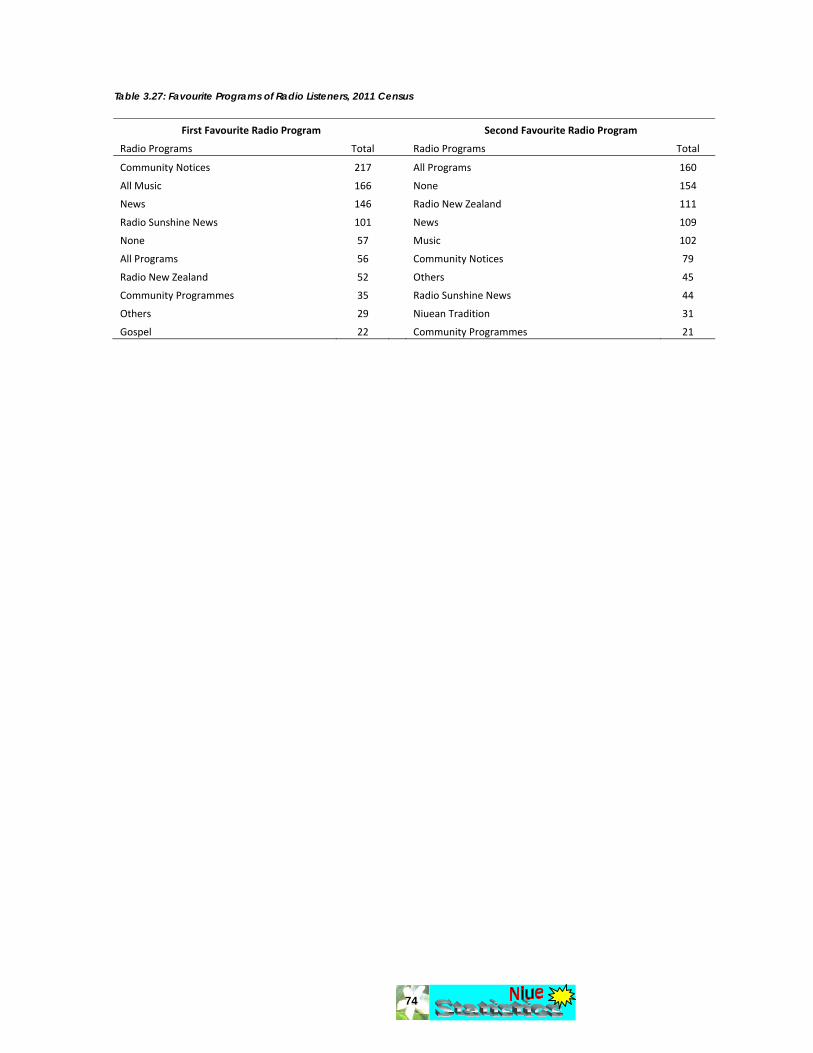
74
Table 3.27: Favourite Programs of Radio Listeners, 2011 Census
First Favourite Radio Program Second Favourite Radio Program
Radio Programs Total Radio Programs Total
Community Notices 217 All Programs 160
All Music 166 None 154
News 146 Radio New Zealand 111
Radio Sunshine News 101 News 109
None 57 Music 102
All Programs 56 Community Notices 79
Radio New Zealand 52 Others 45
Community Programmes 35 Radio Sunshine News 44
Others 29 Niuean Tradition 31
Gospel 22 Community Programmes 21
75
Chapter IV 4 Economic characteristics
Far and away the best prize that life has to offer is the chance to work hard at work worth doing. Theodore Roosevelt Nothing ever comes to one, that is worth having, except as a result of hard work. Booker T. Washington The everyday activities of the people of a country or community are closely interrelated with population change and patterns. Economic activity and employment are shaped not only by the size of the working-age population and the educational and skill level of the labour force, but also by the economic resources available to a country. In other words the economic characteristic of the population is an important insinuation for administrators, planners and policy makers to determine standard of living of the population of the country. Integrating population factors into economic and social development strategies is vital to achieve sustainable development outcomes and improving the quality of life of the people of Niue. To pursue such policy objectives policy and decision makers, planners and development partners require good data on economic and labour market activities, such as employment and unemployment, to both ascertain the standard of living of the population, and provide benchmarks and baseline information against which to monitor progress. To obtain such data and related information, the 2011 census included several questions on labour market activities undertaken by people over 15 years of age. There is some attempt in this census to collect the information on occupation and industry in accordance to international classifications, The International Labour Organisation (ILO) International Standard Classification Of occupations ’88 (ISCO 88) and International Standard Industrial Classification of All Economic Activities Revision 4 (ISIC Rev 4). In the 2011 census every person aged 15 years and over was asked to indicate their main activity in the week preceding the census, whether he or she: (a) an employer running a business and employing people; or (b) an employee working for pay in the private sector business or the government, or (c) self-employed producing goods for own or family consumption, or (d) working without pay in a family business or plantation, or (e) do voluntary work, or (f) a student, or (g) doing home duties, or (h) retired, or (i) did not work at all. (P30). People indicating student, doing home duties or retired be asked how many hours in a week they spend fishing, in a plantation or making handcrafts(P39) and those indicating not having done any work in the week prior to the census, were then asked if they went looking for paid work (P33); those replying in the affirmative, were subsequently asked to indicate if he/she is available to work if a job is available (P35), while those replying in the negative were asked of how many hours in a week they spend fishing, in a plantation or making handcrafts(P39) and if they do, asked how much money they make out of that activity(P40).

76
Table 4.1: Niue Labour market activity for 15 years and over, 2011 Census
Total % Male % Female %
Total 1,074 100.0% 539 50.2% 535 49.8%
Labour force participation rate 740 68.9% 413 38.5% 327 30.5%
Working for Pay 653 86.5% 353 54.1% 300 45.9%
Employee working for wages or salary in Private Sector or Government
557 85% 298 54% 259 46%
Self Employed Producing Goods and Services for Sale
89 14% 49 55% 40 45%
Employer 7 1% 6 86% 1 14%
Unpaid work 67 8.9% 49 73.1% 18 26.9%
Self Employed producing goods for own and/or family consumption
32 48% 23 72% 9 28%
Unpaid Worker in (family) business/plantation 17 25% 13 76% 4 24%
Voluntary Work 18 27% 13 72% 5 28%
Unemployed 20 2.7% 11 1.5% 9 1.2%
Not in Labour force 337 31.4% 127 11.8% 210 19.6%
Homemakers 153 45% 18 12% 135 88%
Students 89 26% 52 58% 37 42%
Retirees 64 19% 43 67% 21 33%
Disabled 13 4% 6 46% 7 54%
Others 15 4% 7 47% 8 53%
4.1 Economically Active Population or Labour Force
The economically active population (defines in the UNSD) comprises all persons of either
sex who provide the supply of labour who are either employed or unemployed.
4.1.1 Employed Population: The employed population comprises all persons above the minimum age specified for measurement of the economically active population who, during a short reference period of either one week (preferred option) or one day (a) performed some work for pay, profit or family gain, in cash or in kind; or (b) were temporarily absent from a job in which they had already worked and to which they maintained a formal attachment or from a self-employment activity such as a business enterprise, a farm or a service undertaking.
The results from the 2011 Census depicted 68.9 per cent or 740 residents (of 15 years and older) were in the Labour force with 38.5 per cent (413) males and 30.5 per cent (327) females. Of those in the labour force, a total of 653 (86.5%) were working for pay (54.1% males and 45.9% females) and 67 (8.9%) were doing un-paid work (73.1% males and 26.9% females).
77
Of those engaged in paid employment, 85 per cent were employees working for wages or salaries in private sector businesses or Government with 54 per cent males and 46 per cent females; further 14 per cent were Self-employed and/or producing goods and services for sale with 55 per cent males and 45 per cent females; and 1 per cent stated as employers and was well dominated by menfolk 6 to 1. Of those engaged in unpaid employment activities, 48 per cent were producing goods and services for own consumption with 72 per cent males and 28 per cent females; 25 per cent as unpaid workers in a family business and subsistence farming with 76 per cent males and 24 per cent females; and 27 per cent account for those doing voluntary work for families or community with 72 per cent males and 28 per cent females.
4.1.2 Unemployed Population: The unemployed population comprises all persons above the minimum age specified for measurement of the economically active population who during the reference period were:
(a) Without work, in other words, were not in paid employment or self-employment,where work is as defined above;
(b) Currently available for work, in other words, were available for paid employmentor self-employment during the reference period;
(c) Seeking work, in other words, had taken specific steps in a specified recent periodto seek paid employment or self-employment.
By definition the rate of unemployed residents in 2011 amounted to 17 with 10 males and 7 females. (Table 4.2)However there is some consideration on those who were not in the labour force as part of this group, especially those that stated their reasons of not working because they did not want to work, they believed there’s no paid work available, being discouraged from working, or because of the weather and transport reasons. Therefore to ascertain the gross unemployed population of Niue in 2011 these people were considered unemployed hence bringing the total number of people to 20 (11 males and 9 females).
4.1.3 Employed Labour Force by Age Groups and Sex: In the Census there were 720 residents in the labour force, 55.8 per cent or 402 were males
and 44.2 per cent or 318 females indicating employment. The concentration of those in employment were in age groups 20 to 59 years (>50% of total population of age group) and the least in 15-19 years as most of them were full time students hence not in the labour force. At the age 60 and above this pattern of low participation is also expected as the compulsory age of retiring for public servants is 55 years of age in which most of the employment is available. The Government is the biggest employer of Niue.
In terms of employment by sex and age, in general males have featured more prominent than their female counterparts in most age groups with an exception in the age 25 – 29 where the men are outnumbered by the rate of 10 to 14 women.
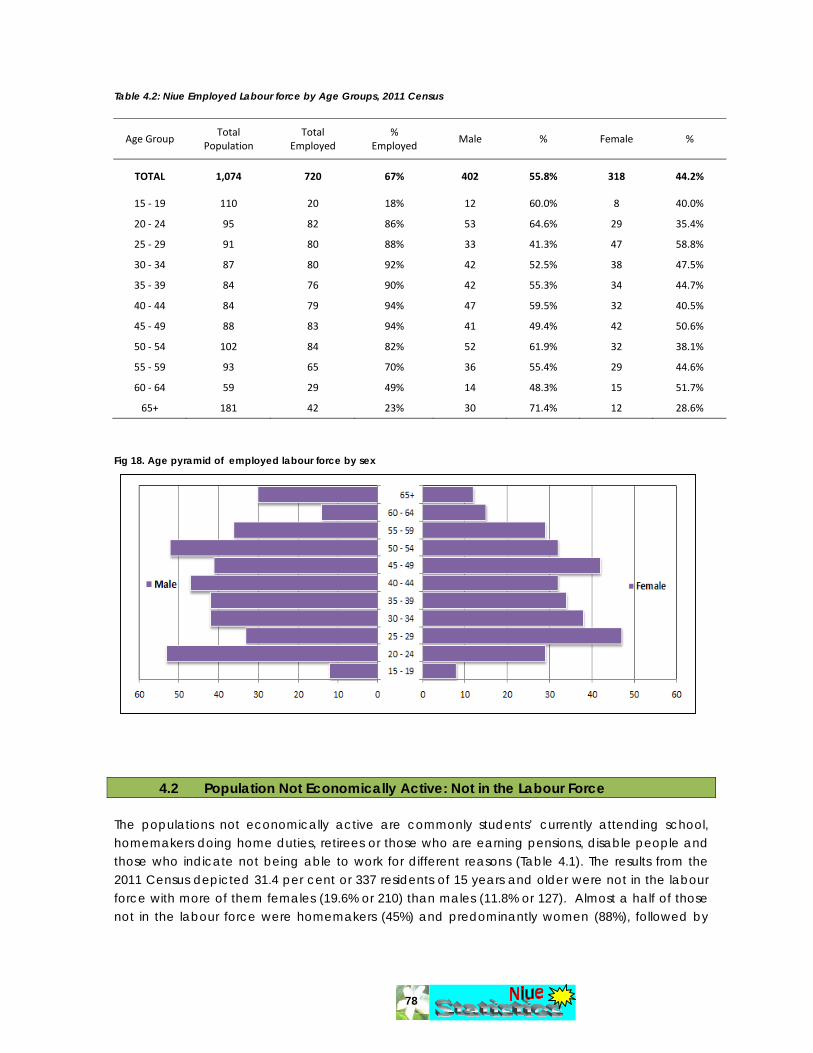
78
Table 4.2: Niue Employed Labour force by Age Groups, 2011 Census
Age Group Total
Population Total
Employed %
Employed Male % Female %
TOTAL 1,074 720 67% 402 55.8% 318 44.2%
15 ‐ 19 110 20 18% 12 60.0% 8 40.0%
20 ‐ 24 95 82 86% 53 64.6% 29 35.4%
25 ‐ 29 91 80 88% 33 41.3% 47 58.8%
30 ‐ 34 87 80 92% 42 52.5% 38 47.5%
35 ‐ 39 84 76 90% 42 55.3% 34 44.7%
40 ‐ 44 84 79 94% 47 59.5% 32 40.5%
45 ‐ 49 88 83 94% 41 49.4% 42 50.6%
50 ‐ 54 102 84 82% 52 61.9% 32 38.1%
55 ‐ 59 93 65 70% 36 55.4% 29 44.6%
60 ‐ 64 59 29 49% 14 48.3% 15 51.7%
65+ 181 42 23% 30 71.4% 12 28.6%
Fig 18. Age pyramid of employed labour force by sex
4.2 Population Not Economically Active: Not in the Labour Force The populations not economically active are commonly students’ currently attending school, homemakers doing home duties, retirees or those who are earning pensions, disable people and those who indicate not being able to work for different reasons (Table 4.1). The results from the 2011 Census depicted 31.4 per cent or 337 residents of 15 years and older were not in the labour force with more of them females (19.6% or 210) than males (11.8% or 127). Almost a half of those not in the labour force were homemakers (45%) and predominantly women (88%), followed by
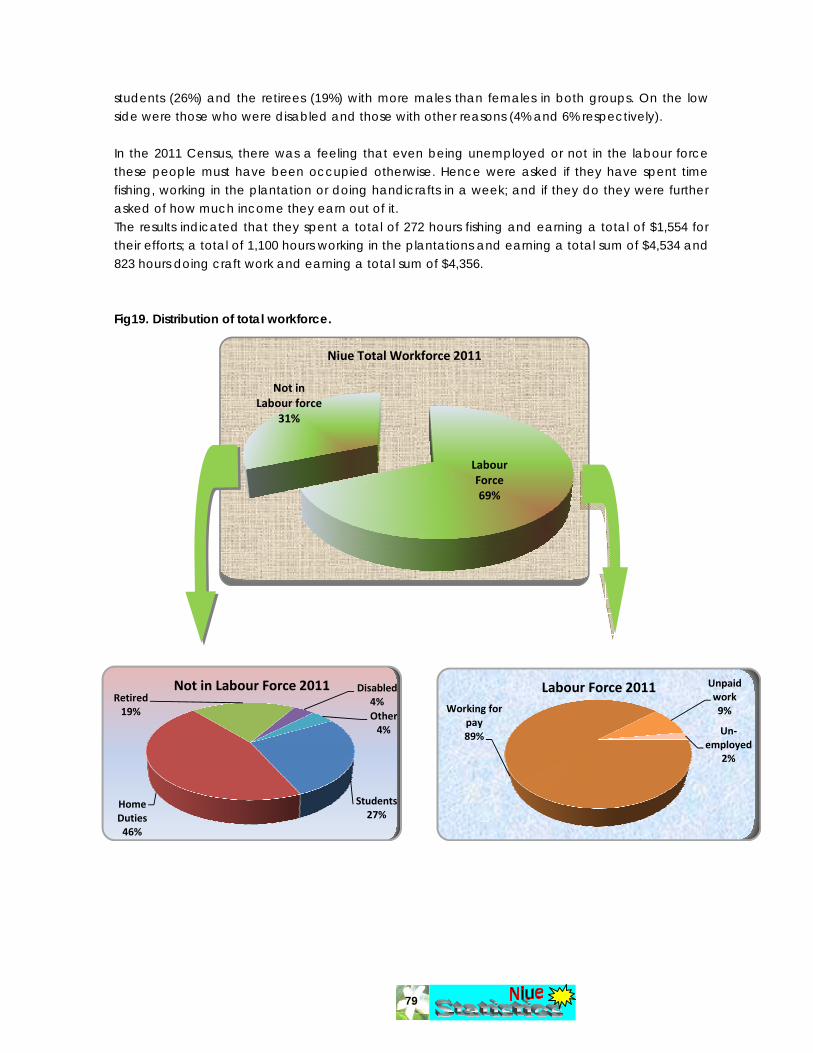
79
students (26%) and the retirees (19%) with more males than females in both groups. On the low side were those who were disabled and those with other reasons (4% and 6% respectively). In the 2011 Census, there was a feeling that even being unemployed or not in the labour force these people must have been occupied otherwise. Hence were asked if they have spent time fishing, working in the plantation or doing handicrafts in a week; and if they do they were further asked of how much income they earn out of it. The results indicated that they spent a total of 272 hours fishing and earning a total of $1,554 for their efforts; a total of 1,100 hours working in the plantations and earning a total sum of $4,534 and 823 hours doing craft work and earning a total sum of $4,356. Fig19. Distribution of total workforce.
Students27%
Home Duties46%
Retired19%
Disabled4%Other 4%
Not in Labour Force 2011
Labour Force69%
Not in Labour force
31%
Niue Total Workforce 2011
Working for pay89%
Unpaid work9%
Un‐employed
2%
Labour Force 2011
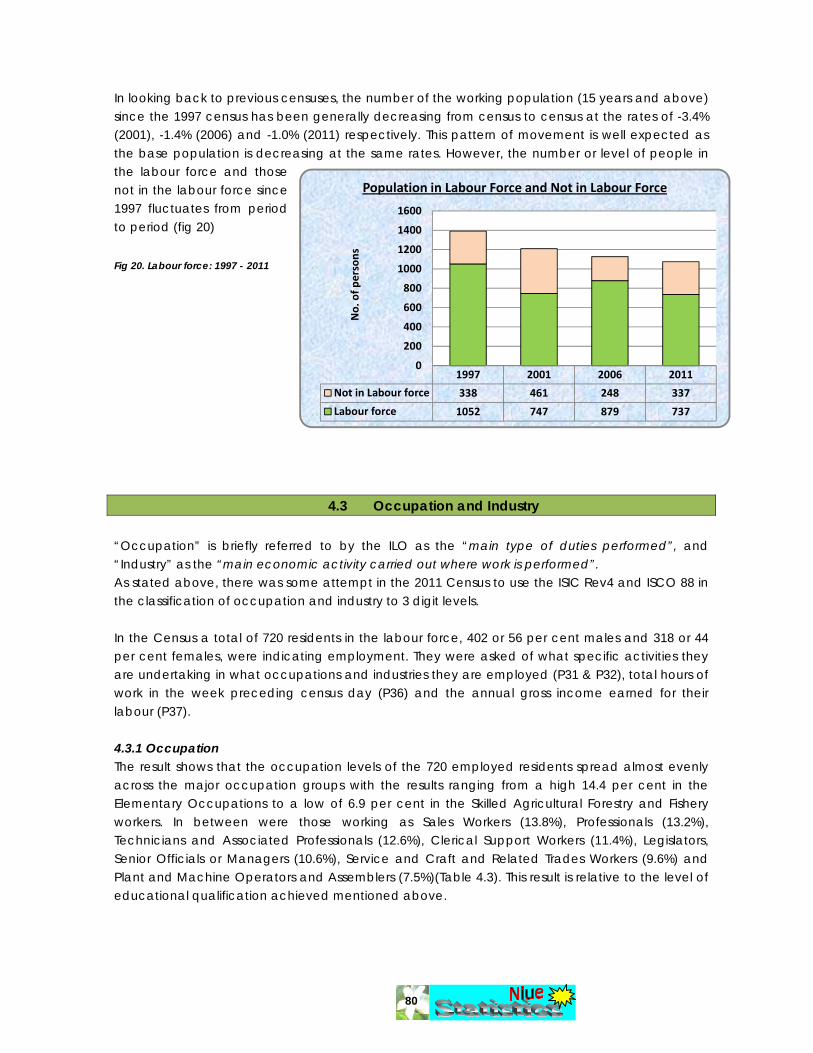
80
In looking back to previous censuses, the number of the working population (15 years and above) since the 1997 census has been generally decreasing from census to census at the rates of -3.4% (2001), -1.4% (2006) and -1.0% (2011) respectively. This pattern of movement is well expected as the base population is decreasing at the same rates. However, the number or level of people in the labour force and those not in the labour force since 1997 fluctuates from period to period (fig 20) Fig 20. Labour force: 1997 - 2011
4.3 Occupation and Industry “Occupation” is briefly referred to by the ILO as the “main type of duties performed”, and “Industry” as the “main economic activity carried out where work is performed”. As stated above, there was some attempt in the 2011 Census to use the ISIC Rev4 and ISCO 88 in the classification of occupation and industry to 3 digit levels. In the Census a total of 720 residents in the labour force, 402 or 56 per cent males and 318 or 44 per cent females, were indicating employment. They were asked of what specific activities they are undertaking in what occupations and industries they are employed (P31 & P32), total hours of work in the week preceding census day (P36) and the annual gross income earned for their labour (P37). 4.3.1 Occupation The result shows that the occupation levels of the 720 employed residents spread almost evenly across the major occupation groups with the results ranging from a high 14.4 per cent in the Elementary Occupations to a low of 6.9 per cent in the Skilled Agricultural Forestry and Fishery workers. In between were those working as Sales Workers (13.8%), Professionals (13.2%), Technicians and Associated Professionals (12.6%), Clerical Support Workers (11.4%), Legislators, Senior Officials or Managers (10.6%), Service and Craft and Related Trades Workers (9.6%) and Plant and Machine Operators and Assemblers (7.5%)(Table 4.3). This result is relative to the level of educational qualification achieved mentioned above.
1997 2001 2006 2011
Not in Labour force 338 461 248 337
Labour force 1052 747 879 737
0
200
400
600
800
1000
1200
1400
1600
No. of p
ersons
Population in Labour Force and Not in Labour Force
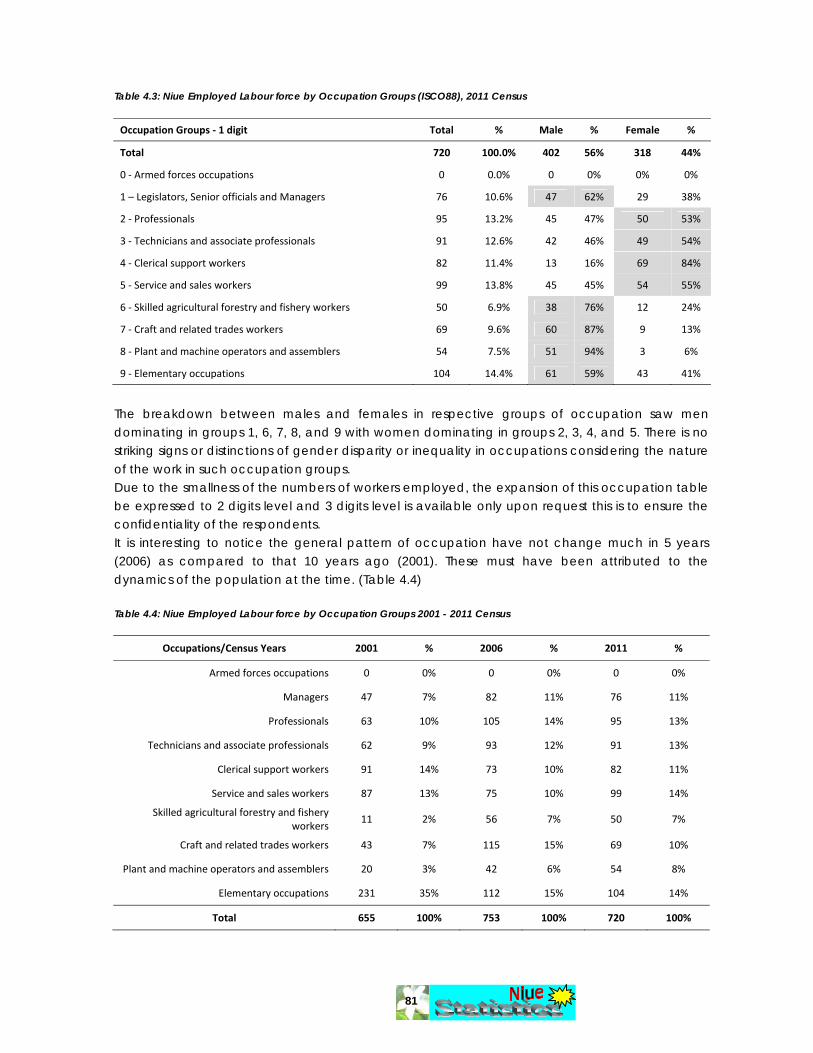
81
Table 4.3: Niue Employed Labour force by Occupation Groups (ISCO88), 2011 Census
Occupation Groups ‐ 1 digit Total % Male % Female %
Total 720 100.0% 402 56% 318 44%
0 ‐ Armed forces occupations 0 0.0% 0 0% 0% 0%
1 – Legislators, Senior officials and Managers 76 10.6% 47 62% 29 38%
2 ‐ Professionals 95 13.2% 45 47% 50 53%
3 ‐ Technicians and associate professionals 91 12.6% 42 46% 49 54%
4 ‐ Clerical support workers 82 11.4% 13 16% 69 84%
5 ‐ Service and sales workers 99 13.8% 45 45% 54 55%
6 ‐ Skilled agricultural forestry and fishery workers 50 6.9% 38 76% 12 24%
7 ‐ Craft and related trades workers 69 9.6% 60 87% 9 13%
8 ‐ Plant and machine operators and assemblers 54 7.5% 51 94% 3 6%
9 ‐ Elementary occupations 104 14.4% 61 59% 43 41%
The breakdown between males and females in respective groups of occupation saw men dominating in groups 1, 6, 7, 8, and 9 with women dominating in groups 2, 3, 4, and 5. There is no striking signs or distinctions of gender disparity or inequality in occupations considering the nature of the work in such occupation groups. Due to the smallness of the numbers of workers employed, the expansion of this occupation table be expressed to 2 digits level and 3 digits level is available only upon request this is to ensure the confidentiality of the respondents. It is interesting to notice the general pattern of occupation have not change much in 5 years (2006) as compared to that 10 years ago (2001). These must have been attributed to the dynamics of the population at the time. (Table 4.4) Table 4.4: Niue Employed Labour force by Occupation Groups 2001 - 2011 Census
Occupations/Census Years 2001 % 2006 % 2011 %
Armed forces occupations 0 0% 0 0% 0 0%
Managers 47 7% 82 11% 76 11%
Professionals 63 10% 105 14% 95 13%
Technicians and associate professionals 62 9% 93 12% 91 13%
Clerical support workers 91 14% 73 10% 82 11%
Service and sales workers 87 13% 75 10% 99 14%
Skilled agricultural forestry and fishery workers
11 2% 56 7% 50 7%
Craft and related trades workers 43 7% 115 15% 69 10%
Plant and machine operators and assemblers 20 3% 42 6% 54 8%
Elementary occupations 231 35% 112 15% 104 14%
Total 655 100% 753 100% 720 100%
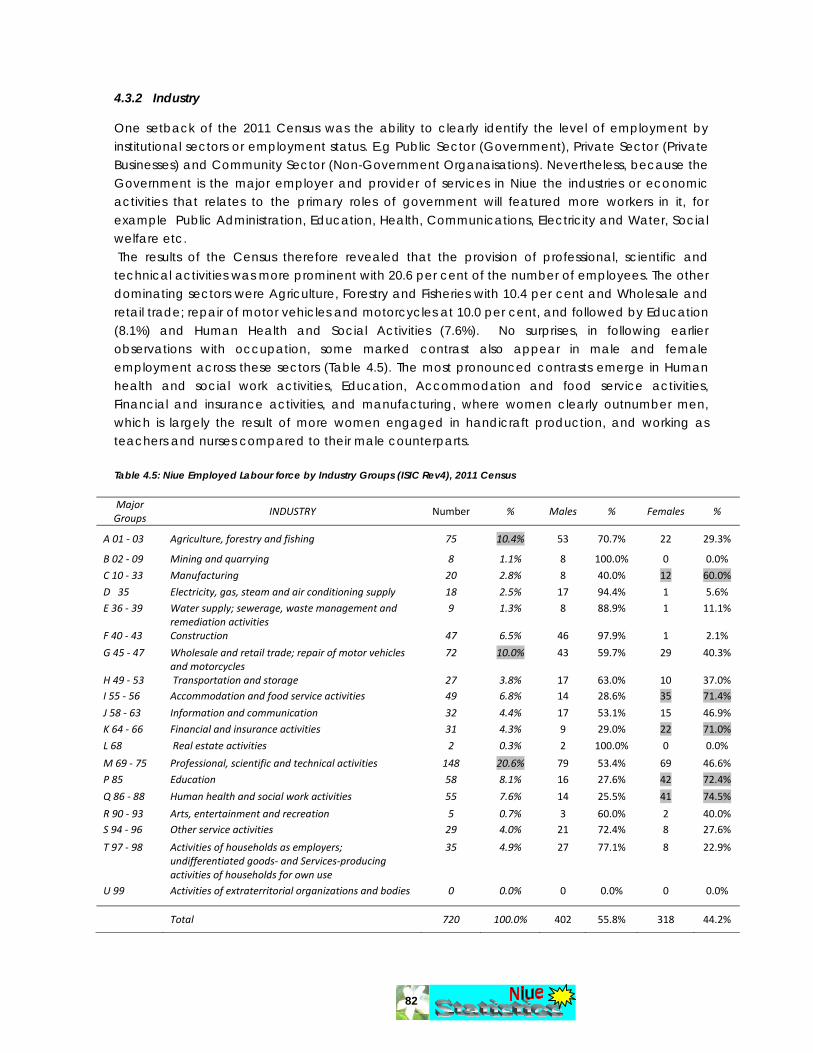
82
4.3.2 Industry One setback of the 2011 Census was the ability to clearly identify the level of employment by institutional sectors or employment status. E.g Public Sector (Government), Private Sector (Private Businesses) and Community Sector (Non-Government Organaisations). Nevertheless, because the Government is the major employer and provider of services in Niue the industries or economic activities that relates to the primary roles of government will featured more workers in it, for example Public Administration, Education, Health, Communications, Electricity and Water, Social welfare etc. The results of the Census therefore revealed that the provision of professional, scientific and technical activities was more prominent with 20.6 per cent of the number of employees. The other dominating sectors were Agriculture, Forestry and Fisheries with 10.4 per cent and Wholesale and retail trade; repair of motor vehicles and motorcycles at 10.0 per cent, and followed by Education (8.1%) and Human Health and Social Activities (7.6%). No surprises, in following earlier observations with occupation, some marked contrast also appear in male and female employment across these sectors (Table 4.5). The most pronounced contrasts emerge in Human health and social work activities, Education, Accommodation and food service activities, Financial and insurance activities, and manufacturing, where women clearly outnumber men, which is largely the result of more women engaged in handicraft production, and working as teachers and nurses compared to their male counterparts. Table 4.5: Niue Employed Labour force by Industry Groups (ISIC Rev4), 2011 Census Major Groups
INDUSTRY Number % Males % Females %
A 01 ‐ 03 Agriculture, forestry and fishing 75 10.4% 53 70.7% 22 29.3%
B 02 ‐ 09 Mining and quarrying 8 1.1% 8 100.0% 0 0.0%
C 10 ‐ 33 Manufacturing 20 2.8% 8 40.0% 12 60.0%
D 35 Electricity, gas, steam and air conditioning supply 18 2.5% 17 94.4% 1 5.6%
E 36 ‐ 39 Water supply; sewerage, waste management and remediation activities
9 1.3% 8 88.9% 1 11.1%
F 40 ‐ 43 Construction 47 6.5% 46 97.9% 1 2.1%
G 45 ‐ 47 Wholesale and retail trade; repair of motor vehicles and motorcycles
72 10.0% 43 59.7% 29 40.3%
H 49 ‐ 53 Transportation and storage 27 3.8% 17 63.0% 10 37.0% I 55 ‐ 56 Accommodation and food service activities 49 6.8% 14 28.6% 35 71.4%
J 58 ‐ 63 Information and communication 32 4.4% 17 53.1% 15 46.9%
K 64 ‐ 66 Financial and insurance activities 31 4.3% 9 29.0% 22 71.0%
L 68 Real estate activities 2 0.3% 2 100.0% 0 0.0%
M 69 ‐ 75 Professional, scientific and technical activities 148 20.6% 79 53.4% 69 46.6%
P 85 Education 58 8.1% 16 27.6% 42 72.4%
Q 86 ‐ 88 Human health and social work activities 55 7.6% 14 25.5% 41 74.5%
R 90 ‐ 93 Arts, entertainment and recreation 5 0.7% 3 60.0% 2 40.0% S 94 ‐ 96 Other service activities 29 4.0% 21 72.4% 8 27.6%
T 97 ‐ 98 Activities of households as employers; undifferentiated goods‐ and Services‐producing activities of households for own use
35 4.9% 27 77.1% 8 22.9%
U 99 Activities of extraterritorial organizations and bodies 0 0.0% 0 0.0% 0 0.0%
Total 720 100.0% 402 55.8% 318 44.2%
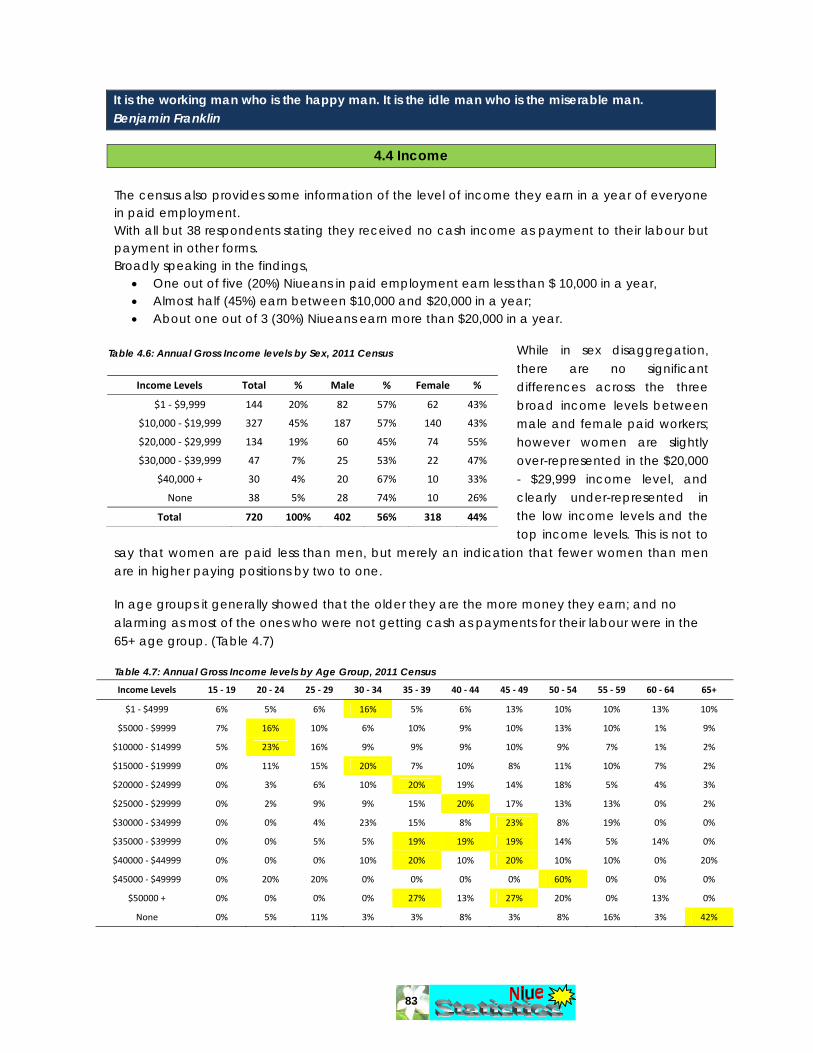
83
It is the working man who is the happy man. It is the idle man who is the miserable man. Benjamin Franklin
4.4 Income The census also provides some information of the level of income they earn in a year of everyone in paid employment. With all but 38 respondents stating they received no cash income as payment to their labour but payment in other forms. Broadly speaking in the findings,
• One out of five (20%) Niueans in paid employment earn less than $ 10,000 in a year, • Almost half (45%) earn between $10,000 and $20,000 in a year; • About one out of 3 (30%) Niueans earn more than $20,000 in a year.
While in sex disaggregation, there are no significant differences across the three broad income levels between male and female paid workers; however women are slightly over-represented in the $20,000 - $29,999 income level, and clearly under-represented in the low income levels and the top income levels. This is not to
say that women are paid less than men, but merely an indication that fewer women than men are in higher paying positions by two to one. In age groups it generally showed that the older they are the more money they earn; and no alarming as most of the ones who were not getting cash as payments for their labour were in the 65+ age group. (Table 4.7) Table 4.7: Annual Gross Income levels by Age Group, 2011 Census Income Levels 15 ‐ 19 20 ‐ 24 25 ‐ 29 30 ‐ 34 35 ‐ 39 40 ‐ 44 45 ‐ 49 50 ‐ 54 55 ‐ 59 60 ‐ 64 65+
$1 ‐ $4999 6% 5% 6% 16% 5% 6% 13% 10% 10% 13% 10%
$5000 ‐ $9999 7% 16% 10% 6% 10% 9% 10% 13% 10% 1% 9%
$10000 ‐ $14999 5% 23% 16% 9% 9% 9% 10% 9% 7% 1% 2%
$15000 ‐ $19999 0% 11% 15% 20% 7% 10% 8% 11% 10% 7% 2%
$20000 ‐ $24999 0% 3% 6% 10% 20% 19% 14% 18% 5% 4% 3%
$25000 ‐ $29999 0% 2% 9% 9% 15% 20% 17% 13% 13% 0% 2%
$30000 ‐ $34999 0% 0% 4% 23% 15% 8% 23% 8% 19% 0% 0%
$35000 ‐ $39999 0% 0% 5% 5% 19% 19% 19% 14% 5% 14% 0%
$40000 ‐ $44999 0% 0% 0% 10% 20% 10% 20% 10% 10% 0% 20%
$45000 ‐ $49999 0% 20% 20% 0% 0% 0% 0% 60% 0% 0% 0%
$50000 + 0% 0% 0% 0% 27% 13% 27% 20% 0% 13% 0%
None 0% 5% 11% 3% 3% 8% 3% 8% 16% 3% 42%
Table 4.6: Annual Gross Income levels by Sex, 2011 Census
Income Levels Total % Male % Female %
$1 ‐ $9,999 144 20% 82 57% 62 43%
$10,000 ‐ $19,999 327 45% 187 57% 140 43%
$20,000 ‐ $29,999 134 19% 60 45% 74 55%
$30,000 ‐ $39,999 47 7% 25 53% 22 47%
$40,000 + 30 4% 20 67% 10 33%
None 38 5% 28 74% 10 26%
Total 720 100% 402 56% 318 44%

84
A historical comparison of the levels of income earned by Niueans way back in 2001 was proportionally lower than that of 2006 and 2011. It means that ten years ago about half of the population were earning below $5,000 a year compared to distribution in 2006 which was 16 per cent and even lower in 2011 with 9 per cent.
0%
10%
20%
30%
40%
50%
60%
< $5
.0
$5.0 ‐ $9.9
$10.0 ‐ $
14.9
$15.0‐ $19.9
$20.0 ‐ $
29.9
$30.0 ‐ $
39.9
$40.0 +
Popu
lation
Distribution
Income Levels in $'000
Distribution of Annual Gross income: 2001 ‐ 2011
2001
2006
2011
Fig 21. Distribution of Annual Gross income: 2001 - 2011
4.5 Mode of Transport Transportation is the integral part of employment as employers and employees need some form of transport to get to their respective places of work. Alofi is the main place of work in Niue. Hence, the working population of Niue predominantly came from the outer villages travel to work in Alofi. The census asked this question in order to measure what was the main means of transportation people are using to get to work. There is no public transport system in Niue per se but there were car rentals renting out cars for the public to use. The results of the census indicated that travelling to and from work is very high in using own vehicle; 555 or 77.1 per cent of them said to travel by own cars, vans or trucks, and the spread is also wide ranging from the high 100 per cent (in Toi) to a low of 51 per cent (in Vaiea), even for those who lives in Alofi South and Alofi North travel by their own vehicles to and from work. Another 23 or 3.2 per cent came by motorbikes. Only 96 or 13.3 per cent of the workers said they share a vehicle when they travel to and from work and this is common for those who came from Vaiea (32%), Avatele and Liku (23%) and Tuapa (19%). There were 46 or 6.4 per cent used a bicycle or walk to work and the majority came from Alofi South (12%). (Table 4.8) There are a lot of vehicles (674 in total) used by people in Niue to get to and from their places of work as there is no other options available to them, such as public transport system available.
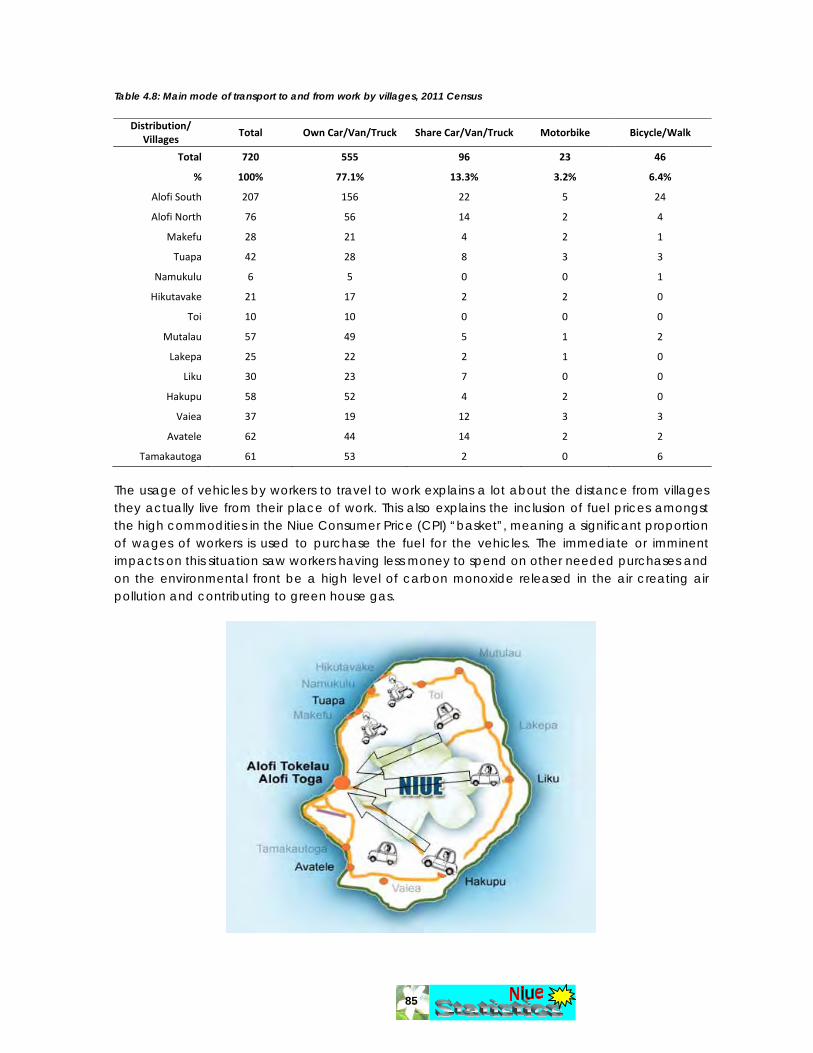
85
Table 4.8: Main mode of transport to and from work by villages, 2011 Census
Distribution/ Villages
Total Own Car/Van/Truck Share Car/Van/Truck Motorbike Bicycle/Walk
Total 720 555 96 23 46
% 100% 77.1% 13.3% 3.2% 6.4%
Alofi South 207 156 22 5 24
Alofi North 76 56 14 2 4
Makefu 28 21 4 2 1
Tuapa 42 28 8 3 3
Namukulu 6 5 0 0 1
Hikutavake 21 17 2 2 0
Toi 10 10 0 0 0
Mutalau 57 49 5 1 2
Lakepa 25 22 2 1 0
Liku 30 23 7 0 0
Hakupu 58 52 4 2 0
Vaiea 37 19 12 3 3
Avatele 62 44 14 2 2
Tamakautoga 61 53 2 0 6
The usage of vehicles by workers to travel to work explains a lot about the distance from villages they actually live from their place of work. This also explains the inclusion of fuel prices amongst the high commodities in the Niue Consumer Price (CPI) “basket”, meaning a significant proportion of wages of workers is used to purchase the fuel for the vehicles. The immediate or imminent impacts on this situation saw workers having less money to spend on other needed purchases and on the environmental front be a high level of carbon monoxide released in the air creating air pollution and contributing to green house gas.

86
Chapter V
5 Household and Housing Characteristics
Your House Is Your Home, Your Castle and Your Refuge
Have nothing in your house that you do not know to be useful, or believe to be beautiful. William Morris He is the happiest, be he king or peasant, who finds peace in his home. Johann Wolfgang Von Goethe He makes his home where the living is best. Latin Proverb The knowledge of Household and Housing Characteristics is of fundamental importance as it not only reveals (by proxy) the level of standard of living of the citizens of a country in terms of health, poverty and wealth, but also highlights the areas where events and activities can be done to promote and sustain good living; and at the same time minimize the detrimental factors to human life and the environment of their existence. The on-going issues of climate change for instance do have bearings on housing characteristics hence certain questions were asked. Data on households and housing are needed to assess related requirements on land management and allocation, energy and water consumption and management, waste and sewage management, telephones, communications and general infrastructure. This information is very crucial for decision makers, policy makers and planners to know.

87
5.1 Total Number of Households and Houses in Niue, 2011 Census The count of household and houses was done concurrently at the time of census. This was
done so the total number of houses and households in Niue is determined.
A household is classified as either:
(a) A one-person household, defined as an arrangement in which one personmakes provision for his or her own food or other essentials for living withoutcombining with any other person to form part of a multi-person householdor
(b) A multi-person household, defined as a group of two or more persons livingtogether who make common provision for food or other essentials for living.
The persons in the group may pool their incomes and have a common budget to a greater or lesser extent; they may be related or unrelated persons or a combination of persons both related and unrelated. This arrangement exemplifies the housekeeping concept. In an alternative definition used in many countries exemplifying the so-called household-dwelling concept, a household consists of all persons living together in a housing unit. (UNSD)
5.1.1 Types of Households. There are two main types of households in Niue:
1. Private households owned and run by individuals for private use on the island, and these includes ‘flats’; and
2. Non-private households which are houses or dwellings used for business purposes such as hotels and motels, and institutions that housed tenants for example prisons, hospitals, and elderly homes, and also vessels for example yachts.
For the purpose of the census and analysis regarding households, only the private households were considered.
A housing survey/count conducted at the same time of the census identified a total of 1,105
houses in the 14 villages of Niue with 477 occupied and are classified households and 538 empty houses. For the empty houses there were 184 still being used by families and 354 un-used. (Table 5.1) The distribution of houses or dwelling therefore 47 per cent are classified as households, 18 per cent empty but still in use by families as storage or temporally dwelling and about 35 per cent empty and not in use. This means that 3 out of 10 or a third of the houses in Niue are empty and unused in various states of disrepair and decay.
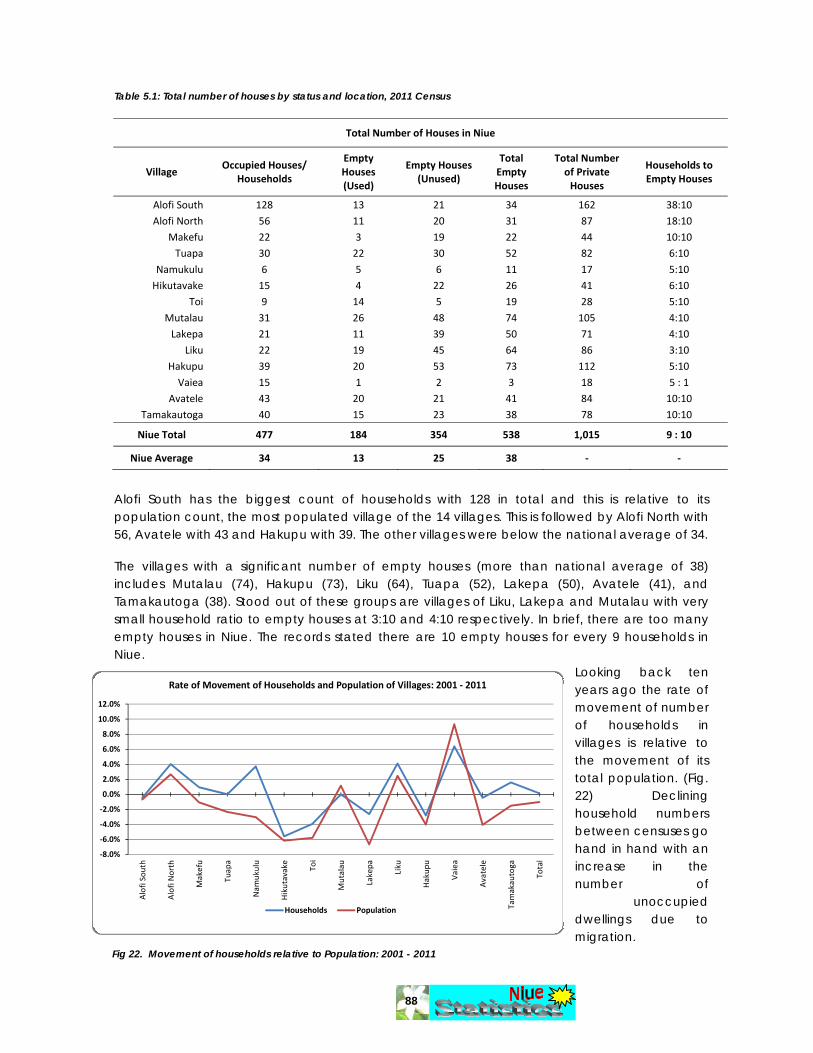
88
Table 5.1: Total number of houses by status and location, 2011 Census
Total Number of Houses in Niue
Village Occupied Houses/
Households
Empty Houses (Used)
Empty Houses(Unused)
Total Empty Houses
Total Number of Private Houses
Households to Empty Houses
Alofi South 128 13 21 34 162 38:10 Alofi North 56 11 20 31 87 18:10
Makefu 22 3 19 22 44 10:10 Tuapa 30 22 30 52 82 6:10
Namukulu 6 5 6 11 17 5:10 Hikutavake 15 4 22 26 41 6:10
Toi 9 14 5 19 28 5:10
Mutalau 31 26 48 74 105 4:10 Lakepa 21 11 39 50 71 4:10
Liku 22 19 45 64 86 3:10 Hakupu 39 20 53 73 112 5:10
Vaiea 15 1 2 3 18 5 : 1 Avatele 43 20 21 41 84 10:10
Tamakautoga 40 15 23 38 78 10:10
Niue Total 477 184 354 538 1,015 9 : 10
Niue Average 34 13 25 38 ‐ ‐
Alofi South has the biggest count of households with 128 in total and this is relative to its population count, the most populated village of the 14 villages. This is followed by Alofi North with 56, Avatele with 43 and Hakupu with 39. The other villages were below the national average of 34. The villages with a significant number of empty houses (more than national average of 38) includes Mutalau (74), Hakupu (73), Liku (64), Tuapa (52), Lakepa (50), Avatele (41), and Tamakautoga (38). Stood out of these groups are villages of Liku, Lakepa and Mutalau with very small household ratio to empty houses at 3:10 and 4:10 respectively. In brief, there are too many empty houses in Niue. The records stated there are 10 empty houses for every 9 households in Niue.
Looking back ten years ago the rate of movement of number of households in villages is relative to the movement of its total population. (Fig. 22) Declining household numbers between censuses go hand in hand with an increase in the number of
unoccupied dwellings due to migration.
‐8.0%
‐6.0%
‐4.0%
‐2.0%
0.0%
2.0%
4.0%
6.0%
8.0%
10.0%
12.0%
Alofi South
Alofi North
Makefu
Tuapa
Nam
ukulu
Hikutavake
Toi
Mutalau
Lakepa
Liku
Hakup
u
Vaiea
Avatele
Tamakautoga
Total
Rate of Movement of Households and Population of Villages: 2001 ‐ 2011
Households Population
Fig 22. Movement of households relative to Population: 2001 - 2011
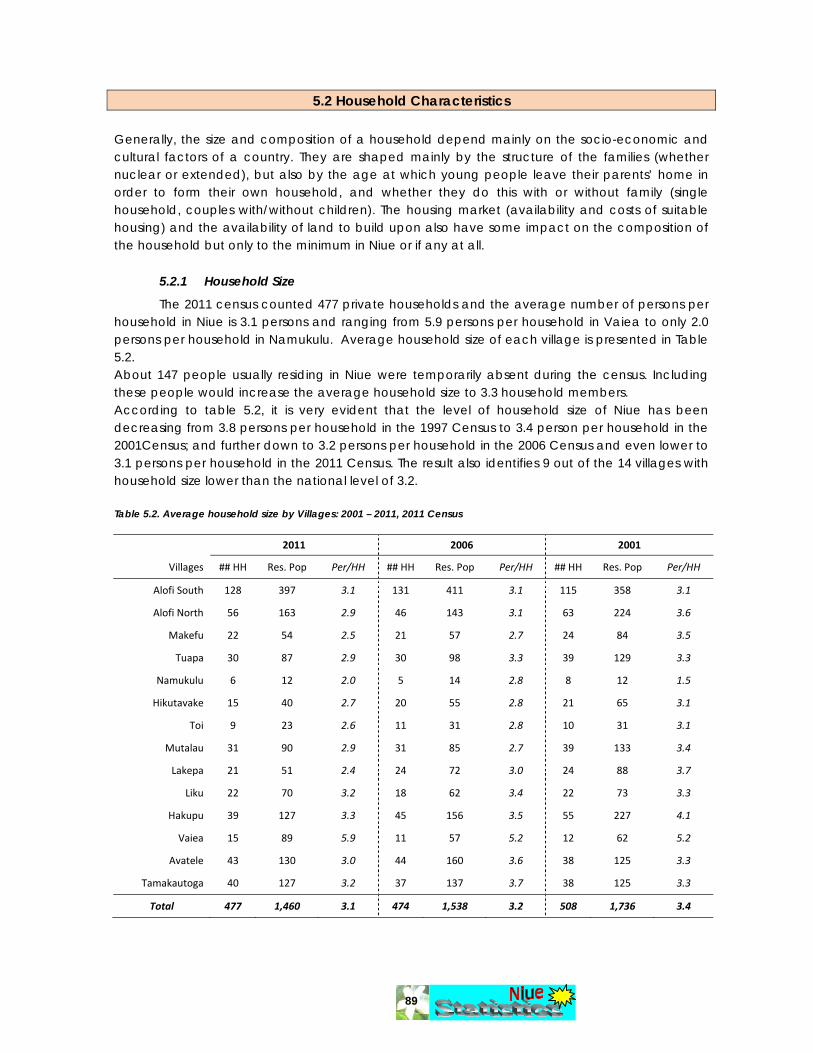
89
5.2 Household Characteristics Generally, the size and composition of a household depend mainly on the socio-economic and cultural factors of a country. They are shaped mainly by the structure of the families (whether nuclear or extended), but also by the age at which young people leave their parents’ home in order to form their own household, and whether they do this with or without family (single household, couples with/without children). The housing market (availability and costs of suitable housing) and the availability of land to build upon also have some impact on the composition of the household but only to the minimum in Niue or if any at all.
5.2.1 Household Size
The 2011 census counted 477 private households and the average number of persons per household in Niue is 3.1 persons and ranging from 5.9 persons per household in Vaiea to only 2.0 persons per household in Namukulu. Average household size of each village is presented in Table 5.2. About 147 people usually residing in Niue were temporarily absent during the census. Including these people would increase the average household size to 3.3 household members. According to table 5.2, it is very evident that the level of household size of Niue has been decreasing from 3.8 persons per household in the 1997 Census to 3.4 person per household in the 2001Census; and further down to 3.2 persons per household in the 2006 Census and even lower to 3.1 persons per household in the 2011 Census. The result also identifies 9 out of the 14 villages with household size lower than the national level of 3.2.
Table 5.2. Average household size by Villages: 2001 – 2011, 2011 Census
2011 2006 2001
Villages ## HH Res. Pop Per/HH ## HH Res. Pop Per/HH ## HH Res. Pop Per/HH
Alofi South 128 397 3.1 131 411 3.1 115 358 3.1
Alofi North 56 163 2.9 46 143 3.1 63 224 3.6
Makefu 22 54 2.5 21 57 2.7 24 84 3.5
Tuapa 30 87 2.9 30 98 3.3 39 129 3.3
Namukulu 6 12 2.0 5 14 2.8 8 12 1.5
Hikutavake 15 40 2.7 20 55 2.8 21 65 3.1
Toi 9 23 2.6 11 31 2.8 10 31 3.1
Mutalau 31 90 2.9 31 85 2.7 39 133 3.4
Lakepa 21 51 2.4 24 72 3.0 24 88 3.7
Liku 22 70 3.2 18 62 3.4 22 73 3.3
Hakupu 39 127 3.3 45 156 3.5 55 227 4.1
Vaiea 15 89 5.9 11 57 5.2 12 62 5.2
Avatele 43 130 3.0 44 160 3.6 38 125 3.3
Tamakautoga 40 127 3.2 37 137 3.7 38 125 3.3
Total 477 1,460 3.1 474 1,538 3.2 508 1,736 3.4

90
Not only the household size has decreased throughout the years but the distribution of household by number of persons also changed. As presented in Figure 23 and Table 5.3, 1 person and 2 person’s households is more the prevalent (21% and 26%) in 2011 census than any other census. On the other hand the opposite is to be said about the bigger size households, those with
5 members or more (down from 15% to 9% in a 5 member household and 21% to 12% in a 6 plus member household). Overall about half of the number of households in Niue is of one member or two member households, which is much fewer than ever before in Niue’s history.
Table 5.3: Percentage Distribution of Household Size, Niue 1997 – 2011
Household Size
Number and Per cent of Household
2011 2006 2001 1997
Number % Number % Number % Number %
1 Person 102 21.4% 90 19.0% 102 20.1% 74 13.6%
2 Persons 124 26.0% 109 23.0% 108 21.3% 97 17.9%
3 Persons 81 17.0% 75 15.8% 82 16.1% 99 18.2%
4 Persons 70 14.7% 80 16.9% 71 14.0% 81 14.9%
5 Persons 43 9.0% 49 10.3% 57 11.2% 79 14.5%
6 + Persons 57 11.9% 71 15.0% 88 17.3% 113 20.8%
Total 477 100.0% 474 100.0% 508 100.0% 543 100.0%
5.3 Housing Characteristics The information collected of the houses will also help characterized the level of standard of living of the people. The knowledge of types of dwelling, the tenure of living quarters, and the amenities will in some way highlight the healthy standards of the people. The information on power and water will identify accessibility to it. Information on vehicles will identify the transportation, tools and equipment and plantations to establish some basic level of food production and security. The information on various appliances will highlight the ability of the
0%
5%
10%
15%
20%
25%
30%
1997 2001 2006 2011
Level of Household Sizes: 1997 ‐ 2011
1 Person
2 Persons
3 Persons
4 Persons
5 Persons
6 + Persons
Fig 23. Household sizes: 1997 - 2011

91
household to maintain a good level of living, and at the same time be used to determine the expected demand for power use.
5.3.1 Dwelling or Housing Type.
Niuean houses are typically of three types: • the traditional puga house, • the hurricane house and • the modern house.
The puga house was constructed with traditional limestone plaster and timber well before the construction of hurricane houses. The hurricane houses were constructed in the early 1960s as part of the New Zealand aid to Niue, which specifically aimed at providing hurricane resistant houses to Niuean families. Most of the hurricane houses have concrete walls and fibrolite roofing made out of asbestos which most have been replaced by iron roofing after Cyclone Heta and after knowing that asbestos is not good for the health of the people. They commonly have three bedrooms and a sitting room, but most have no built-in toilet. However, most families have extended their houses and have added rooms, the toilets and kitchens. The fourth an additional category refers to houses build with corrugated iron and other building materials, something not common in Niue in these modern days. Of the 477, 49 per cent were modern houses, 33 per cent were hurricane houses with extensions, 15 per cent hurricane houses and the rest were the traditional puga houses and others. The building of modern houses was believed to be started in the early 1970s under the housing program of the Niue Housing Authority (now operating under the Niue Development Bank). The Niue Development Bank loaned money to families who wanted to build houses, and the structures were mainly made out of timber and sometimes concrete. The average number of bedrooms was also three, but in contrast to the hurricane houses, they included a kitchen and bathroom facilities. The Niue Development Bank also loans money to families or individuals for renovations of their hurricane houses, which includes extending the house to include a kitchen and bathroom facilities. According to results from the 2011 census it was in Alofi South where most of the modern houses were built totaled at 82 per cent of its total houses followed by numbers from Makefu with 59 per cent and Hakupu at 49 per cent even. The distributions in other villages were below the national average of 49 per cent.
Hurricane15%
Hurricane & Extension
33%
Modern House49%
Fale Pauga2%
Others1%
Types of Houses
Fig 24. Types of houses
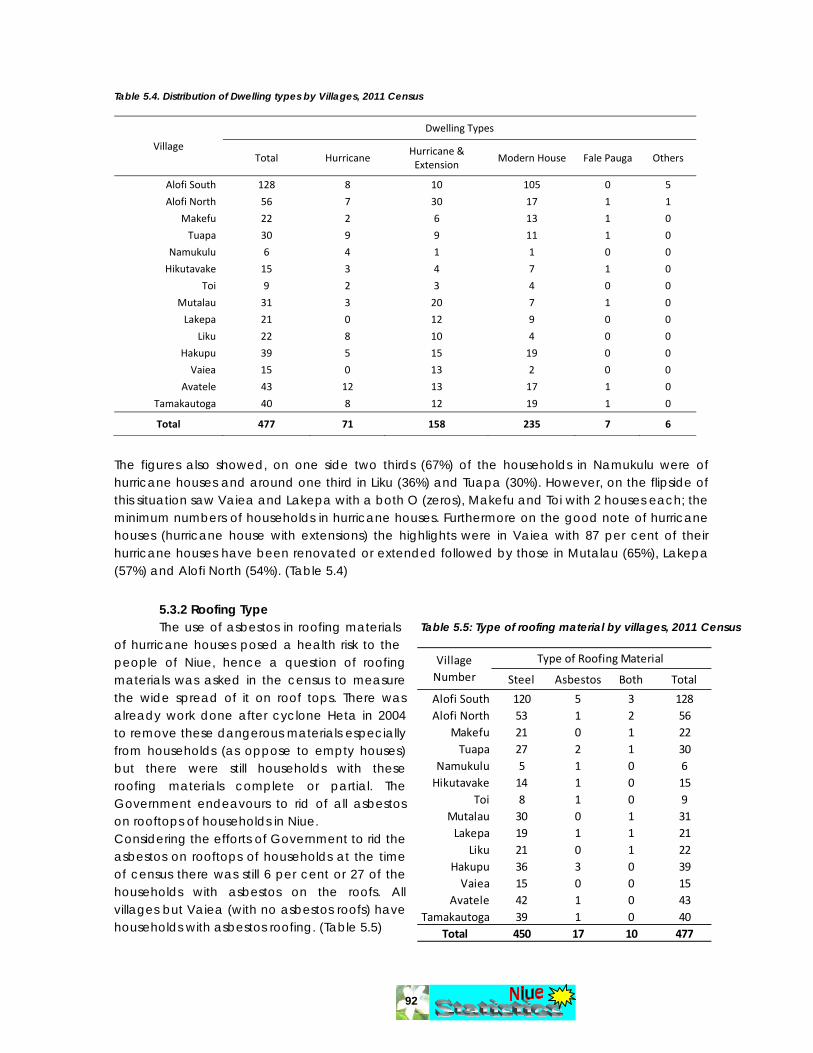
92
Table 5.4. Distribution of Dwelling types by Villages, 2011 Census
Village
Dwelling Types
Total Hurricane Hurricane & Extension
Modern House Fale Pauga Others
Alofi South 128 8 10 105 0 5
Alofi North 56 7 30 17 1 1
Makefu 22 2 6 13 1 0
Tuapa 30 9 9 11 1 0
Namukulu 6 4 1 1 0 0
Hikutavake 15 3 4 7 1 0
Toi 9 2 3 4 0 0
Mutalau 31 3 20 7 1 0
Lakepa 21 0 12 9 0 0
Liku 22 8 10 4 0 0
Hakupu 39 5 15 19 0 0
Vaiea 15 0 13 2 0 0
Avatele 43 12 13 17 1 0
Tamakautoga 40 8 12 19 1 0
Total 477 71 158 235 7 6
The figures also showed, on one side two thirds (67%) of the households in Namukulu were of hurricane houses and around one third in Liku (36%) and Tuapa (30%). However, on the flipside of this situation saw Vaiea and Lakepa with a both O (zeros), Makefu and Toi with 2 houses each; the minimum numbers of households in hurricane houses. Furthermore on the good note of hurricane houses (hurricane house with extensions) the highlights were in Vaiea with 87 per cent of their hurricane houses have been renovated or extended followed by those in Mutalau (65%), Lakepa (57%) and Alofi North (54%). (Table 5.4)
5.3.2 Roofing Type The use of asbestos in roofing materials
of hurricane houses posed a health risk to the people of Niue, hence a question of roofing materials was asked in the census to measure the wide spread of it on roof tops. There was already work done after cyclone Heta in 2004 to remove these dangerous materials especially from households (as oppose to empty houses) but there were still households with these roofing materials complete or partial. The Government endeavours to rid of all asbestos on rooftops of households in Niue. Considering the efforts of Government to rid the asbestos on rooftops of households at the time of census there was still 6 per cent or 27 of the households with asbestos on the roofs. All villages but Vaiea (with no asbestos roofs) have households with asbestos roofing. (Table 5.5)
Steel Asbestos Both Total
Alofi South 120 5 3 128Alofi North 53 1 2 56
Makefu 21 0 1 22Tuapa 27 2 1 30
Namukulu 5 1 0 6Hikutavake 14 1 0 15
Toi 8 1 0 9Mutalau 30 0 1 31Lakepa 19 1 1 21
Liku 21 0 1 22Hakupu 36 3 0 39Vaiea 15 0 0 15
Avatele 42 1 0 43Tamakautoga 39 1 0 40
Total 450 17 10 477
Village Number
Type of Roofing Material
Table 5.5: Type of roofing material by villages, 2011 Census
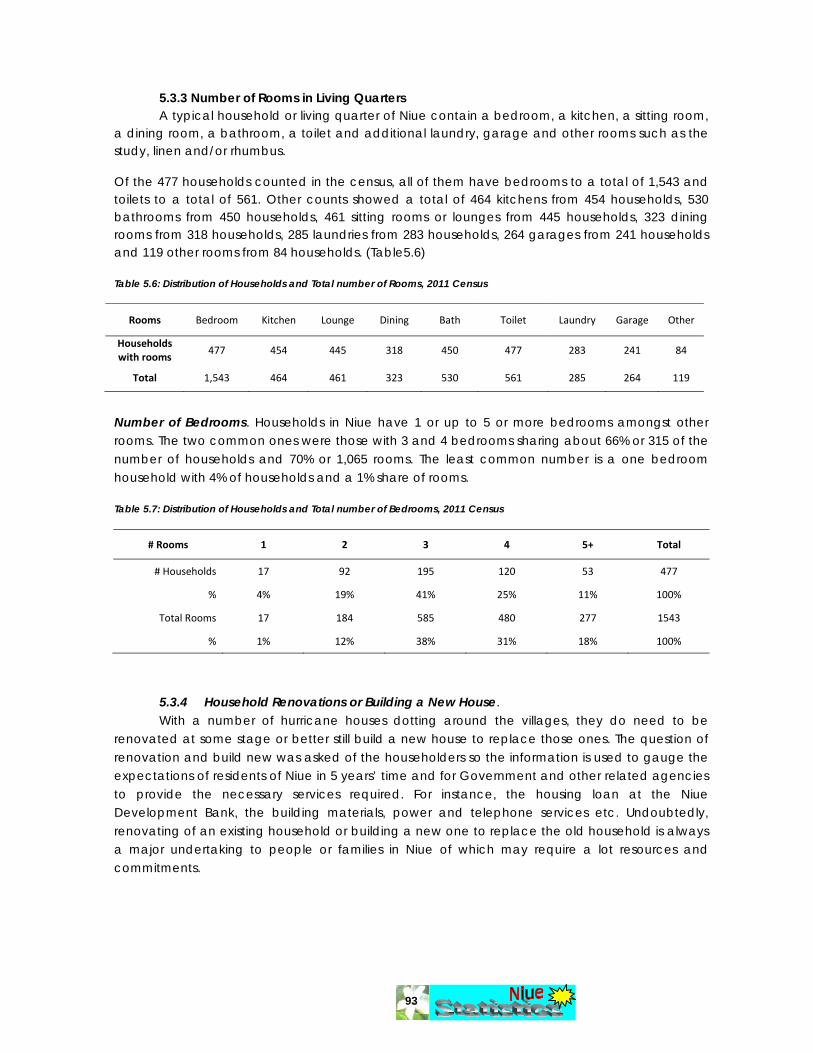
93
5.3.3 Number of Rooms in Living Quarters A typical household or living quarter of Niue contain a bedroom, a kitchen, a sitting room,
a dining room, a bathroom, a toilet and additional laundry, garage and other rooms such as the study, linen and/or rhumbus.
Of the 477 households counted in the census, all of them have bedrooms to a total of 1,543 and toilets to a total of 561. Other counts showed a total of 464 kitchens from 454 households, 530 bathrooms from 450 households, 461 sitting rooms or lounges from 445 households, 323 dining rooms from 318 households, 285 laundries from 283 households, 264 garages from 241 households and 119 other rooms from 84 households. (Table5.6) Table 5.6: Distribution of Households and Total number of Rooms, 2011 Census
Rooms Bedroom Kitchen Lounge Dining Bath Toilet Laundry Garage Other
Households with rooms
477 454 445 318 450 477 283 241 84
Total 1,543 464 461 323 530 561 285 264 119
Number of Bedrooms. Households in Niue have 1 or up to 5 or more bedrooms amongst other rooms. The two common ones were those with 3 and 4 bedrooms sharing about 66% or 315 of the number of households and 70% or 1,065 rooms. The least common number is a one bedroom household with 4% of households and a 1% share of rooms. Table 5.7: Distribution of Households and Total number of Bedrooms, 2011 Census
# Rooms 1 2 3 4 5+ Total
# Households 17 92 195 120 53 477
% 4% 19% 41% 25% 11% 100%
Total Rooms 17 184 585 480 277 1543
% 1% 12% 38% 31% 18% 100%
5.3.4 Household Renovations or Building a New House. With a number of hurricane houses dotting around the villages, they do need to be
renovated at some stage or better still build a new house to replace those ones. The question of renovation and build new was asked of the householders so the information is used to gauge the expectations of residents of Niue in 5 years’ time and for Government and other related agencies to provide the necessary services required. For instance, the housing loan at the Niue Development Bank, the building materials, power and telephone services etc. Undoubtedly, renovating of an existing household or building a new one to replace the old household is always a major undertaking to people or families in Niue of which may require a lot resources and commitments.
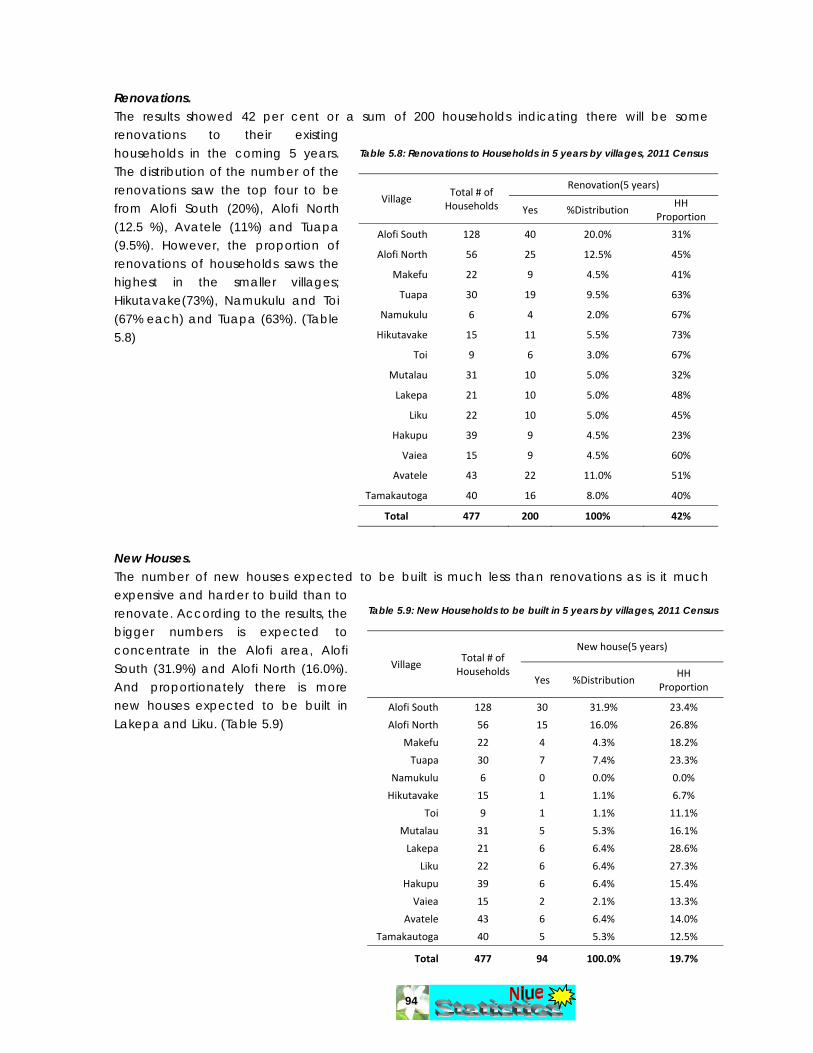
94
Renovations. The results showed 42 per cent or a sum of 200 households indicating there will be some renovations to their existing households in the coming 5 years. The distribution of the number of the renovations saw the top four to be from Alofi South (20%), Alofi North (12.5 %), Avatele (11%) and Tuapa (9.5%). However, the proportion of renovations of households saws the highest in the smaller villages; Hikutavake(73%), Namukulu and Toi (67% each) and Tuapa (63%). (Table 5.8)
New Houses. The number of new houses expected to be built is much less than renovations as is it much expensive and harder to build than to renovate. According to the results, the bigger numbers is expected to concentrate in the Alofi area, Alofi South (31.9%) and Alofi North (16.0%). And proportionately there is more new houses expected to be built in Lakepa and Liku. (Table 5.9)
Table 5.8: Renovations to Households in 5 years by villages, 2011 Census
Village Total # of Households
Renovation(5 years)
Yes %Distribution HH
Proportion
Alofi South 128 40 20.0% 31%
Alofi North 56 25 12.5% 45%
Makefu 22 9 4.5% 41%
Tuapa 30 19 9.5% 63%
Namukulu 6 4 2.0% 67%
Hikutavake 15 11 5.5% 73%
Toi 9 6 3.0% 67%
Mutalau 31 10 5.0% 32%
Lakepa 21 10 5.0% 48%
Liku 22 10 5.0% 45%
Hakupu 39 9 4.5% 23%
Vaiea 15 9 4.5% 60%
Avatele 43 22 11.0% 51%
Tamakautoga 40 16 8.0% 40%
Total 477 200 100% 42%
Table 5.9: New Households to be built in 5 years by villages, 2011 Census
Village Total # of Households
New house(5 years)
Yes %Distribution HH
Proportion
Alofi South 128 30 31.9% 23.4%
Alofi North 56 15 16.0% 26.8%
Makefu 22 4 4.3% 18.2%
Tuapa 30 7 7.4% 23.3%
Namukulu 6 0 0.0% 0.0%
Hikutavake 15 1 1.1% 6.7%
Toi 9 1 1.1% 11.1%
Mutalau 31 5 5.3% 16.1%
Lakepa 21 6 6.4% 28.6%
Liku 22 6 6.4% 27.3%
Hakupu 39 6 6.4% 15.4%
Vaiea 15 2 2.1% 13.3%
Avatele 43 6 6.4% 14.0%
Tamakautoga 40 5 5.3% 12.5%
Total 477 94 100.0% 19.7%
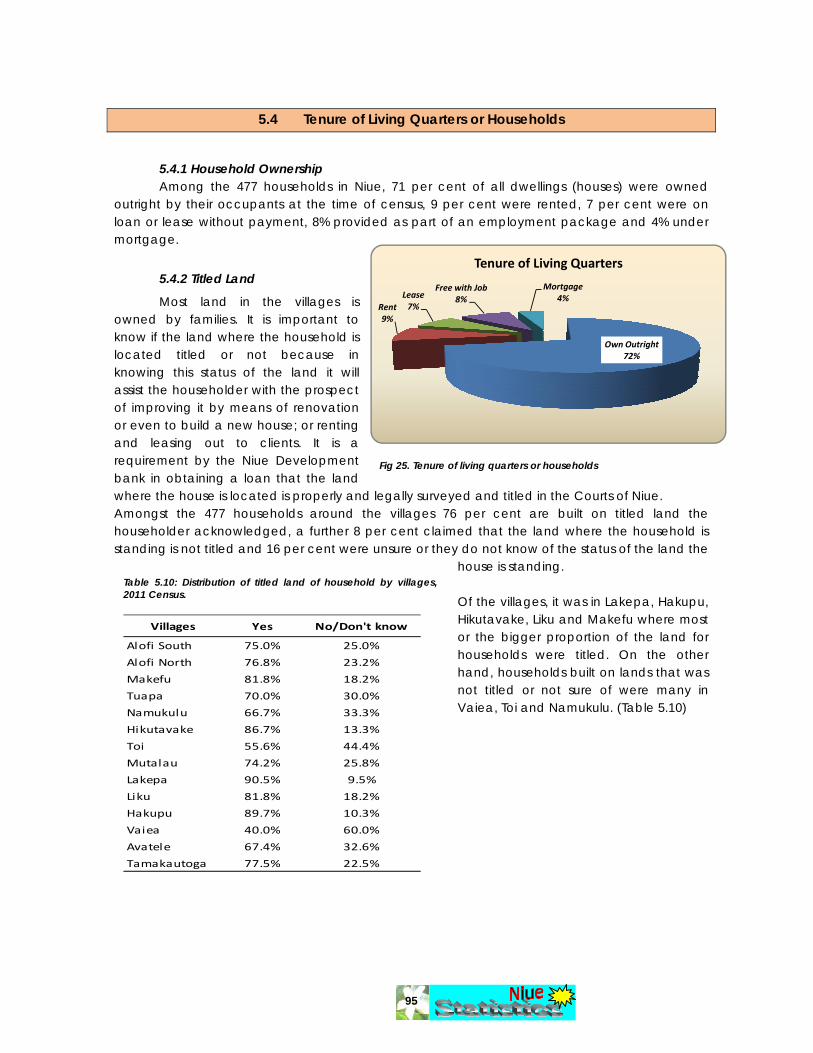
95
5.4 Tenure of Living Quarters or Households
5.4.1 Household Ownership Among the 477 households in Niue, 71 per cent of all dwellings (houses) were owned
outright by their occupants at the time of census, 9 per cent were rented, 7 per cent were on loan or lease without payment, 8% provided as part of an employment package and 4% under mortgage.
5.4.2 Titled Land
Most land in the villages is owned by families. It is important to know if the land where the household is located titled or not because in knowing this status of the land it will assist the householder with the prospect of improving it by means of renovation or even to build a new house; or renting and leasing out to clients. It is a requirement by the Niue Development bank in obtaining a loan that the land where the house is located is properly and legally surveyed and titled in the Courts of Niue. Amongst the 477 households around the villages 76 per cent are built on titled land the householder acknowledged, a further 8 per cent claimed that the land where the household is standing is not titled and 16 per cent were unsure or they do not know of the status of the land the
house is standing. Of the villages, it was in Lakepa, Hakupu, Hikutavake, Liku and Makefu where most or the bigger proportion of the land for households were titled. On the other hand, households built on lands that was not titled or not sure of were many in Vaiea, Toi and Namukulu. (Table 5.10)
Own Outright72%
Rent9%
Lease7%
Free with Job8%
Mortgage4%
Tenure of Living Quarters
Fig 25. Tenure of living quarters or households
Table 5.10: Distribution of titled land of household by villages, 2011 Census.
Villages Yes No/Don't know
Alofi South 75.0% 25.0%
Alofi North 76.8% 23.2%
Makefu 81.8% 18.2%
Tuapa 70.0% 30.0%
Namukulu 66.7% 33.3%
Hikutavake 86.7% 13.3%
Toi 55.6% 44.4%
Mutalau 74.2% 25.8%
Lakepa 90.5% 9.5%
Liku 81.8% 18.2%
Hakupu 89.7% 10.3%
Vaiea 40.0% 60.0%
Avatele 67.4% 32.6%
Tamakautoga 77.5% 22.5%
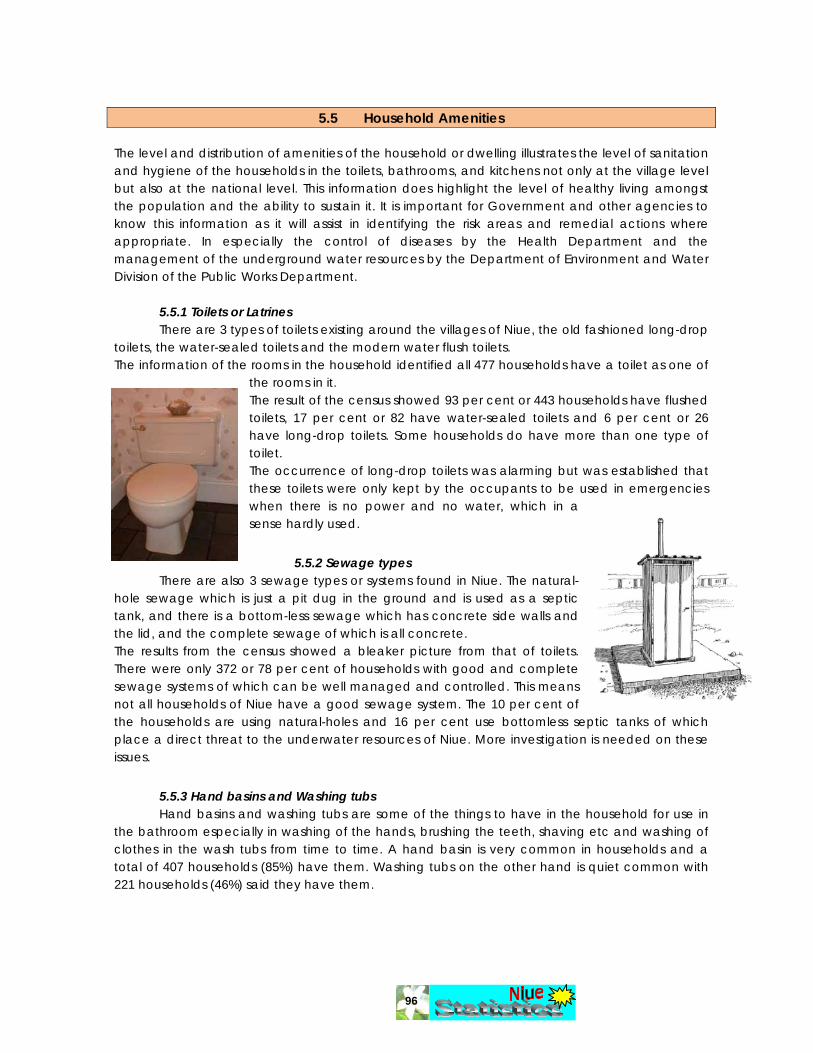
96
5.5 Household Amenities
The level and distribution of amenities of the household or dwelling illustrates the level of sanitation and hygiene of the households in the toilets, bathrooms, and kitchens not only at the village level but also at the national level. This information does highlight the level of healthy living amongst the population and the ability to sustain it. It is important for Government and other agencies to know this information as it will assist in identifying the risk areas and remedial actions where appropriate. In especially the control of diseases by the Health Department and the management of the underground water resources by the Department of Environment and Water Division of the Public Works Department.
5.5.1 Toilets or Latrines There are 3 types of toilets existing around the villages of Niue, the old fashioned long-drop
toilets, the water-sealed toilets and the modern water flush toilets. The information of the rooms in the household identified all 477 households have a toilet as one of
the rooms in it. The result of the census showed 93 per cent or 443 households have flushed toilets, 17 per cent or 82 have water-sealed toilets and 6 per cent or 26 have long-drop toilets. Some households do have more than one type of toilet. The occurrence of long-drop toilets was alarming but was established that these toilets were only kept by the occupants to be used in emergencies when there is no power and no water, which in a sense hardly used.
5.5.2 Sewage types There are also 3 sewage types or systems found in Niue. The natural-hole sewage which is just a pit dug in the ground and is used as a septic tank, and there is a bottom-less sewage which has concrete side walls and the lid, and the complete sewage of which is all concrete. The results from the census showed a bleaker picture from that of toilets. There were only 372 or 78 per cent of households with good and complete sewage systems of which can be well managed and controlled. This means not all households of Niue have a good sewage system. The 10 per cent of the households are using natural-holes and 16 per cent use bottomless septic tanks of which place a direct threat to the underwater resources of Niue. More investigation is needed on these issues.
5.5.3 Hand basins and Washing tubs Hand basins and washing tubs are some of the things to have in the household for use in the bathroom especially in washing of the hands, brushing the teeth, shaving etc and washing of clothes in the wash tubs from time to time. A hand basin is very common in households and a total of 407 households (85%) have them. Washing tubs on the other hand is quiet common with 221 households (46%) said they have them.
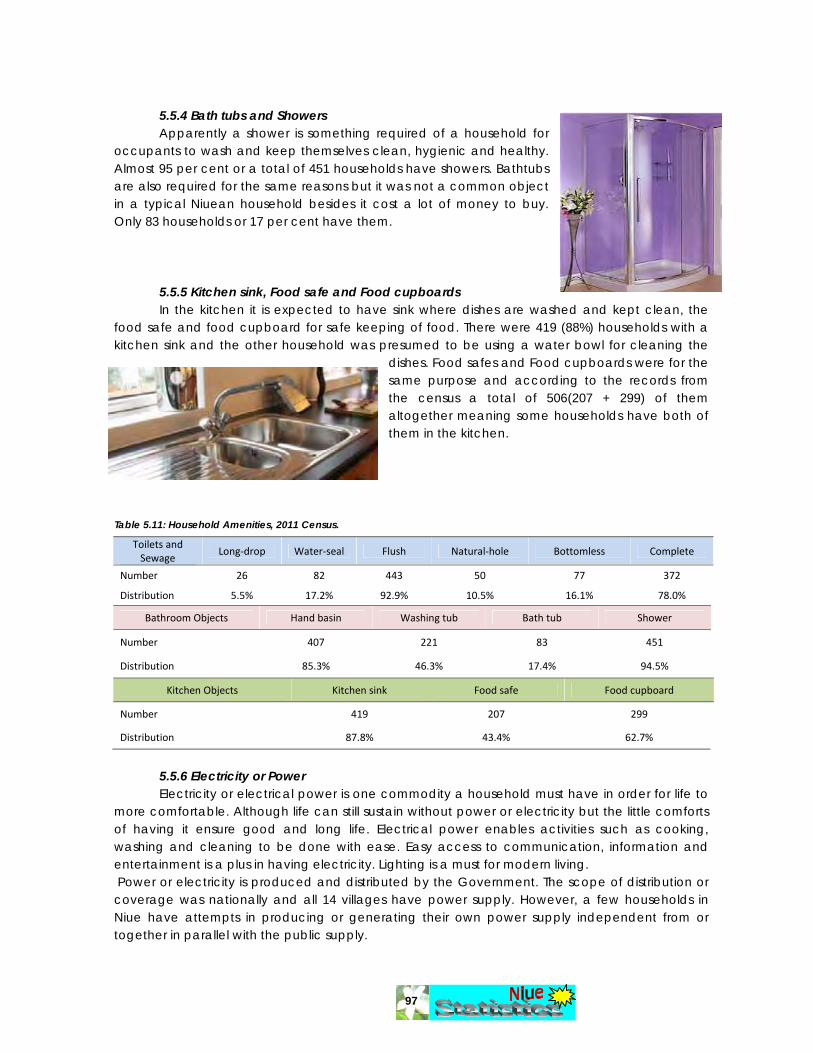
97
5.5.4 Bath tubs and Showers Apparently a shower is something required of a household for
occupants to wash and keep themselves clean, hygienic and healthy. Almost 95 per cent or a total of 451 households have showers. Bathtubs are also required for the same reasons but it was not a common object in a typical Niuean household besides it cost a lot of money to buy. Only 83 households or 17 per cent have them.
5.5.5 Kitchen sink, Food safe and Food cupboards
In the kitchen it is expected to have sink where dishes are washed and kept clean, the food safe and food cupboard for safe keeping of food. There were 419 (88%) households with a kitchen sink and the other household was presumed to be using a water bowl for cleaning the
dishes. Food safes and Food cupboards were for the same purpose and according to the records from the census a total of 506(207 + 299) of them altogether meaning some households have both of them in the kitchen.
Table 5.11: Household Amenities, 2011 Census.
Toilets and Sewage
Long‐drop Water‐seal Flush Natural‐hole Bottomless Complete
Number 26 82 443 50 77 372
Distribution 5.5% 17.2% 92.9% 10.5% 16.1% 78.0%
Bathroom Objects Hand basin Washing tub Bath tub Shower
Number 407 221 83 451
Distribution 85.3% 46.3% 17.4% 94.5%
Kitchen Objects Kitchen sink Food safe Food cupboard
Number 419 207 299
Distribution 87.8% 43.4% 62.7%
5.5.6 Electricity or Power Electricity or electrical power is one commodity a household must have in order for life to more comfortable. Although life can still sustain without power or electricity but the little comforts of having it ensure good and long life. Electrical power enables activities such as cooking, washing and cleaning to be done with ease. Easy access to communication, information and entertainment is a plus in having electricity. Lighting is a must for modern living. Power or electricity is produced and distributed by the Government. The scope of distribution or coverage was nationally and all 14 villages have power supply. However, a few households in Niue have attempts in producing or generating their own power supply independent from or together in parallel with the public supply.
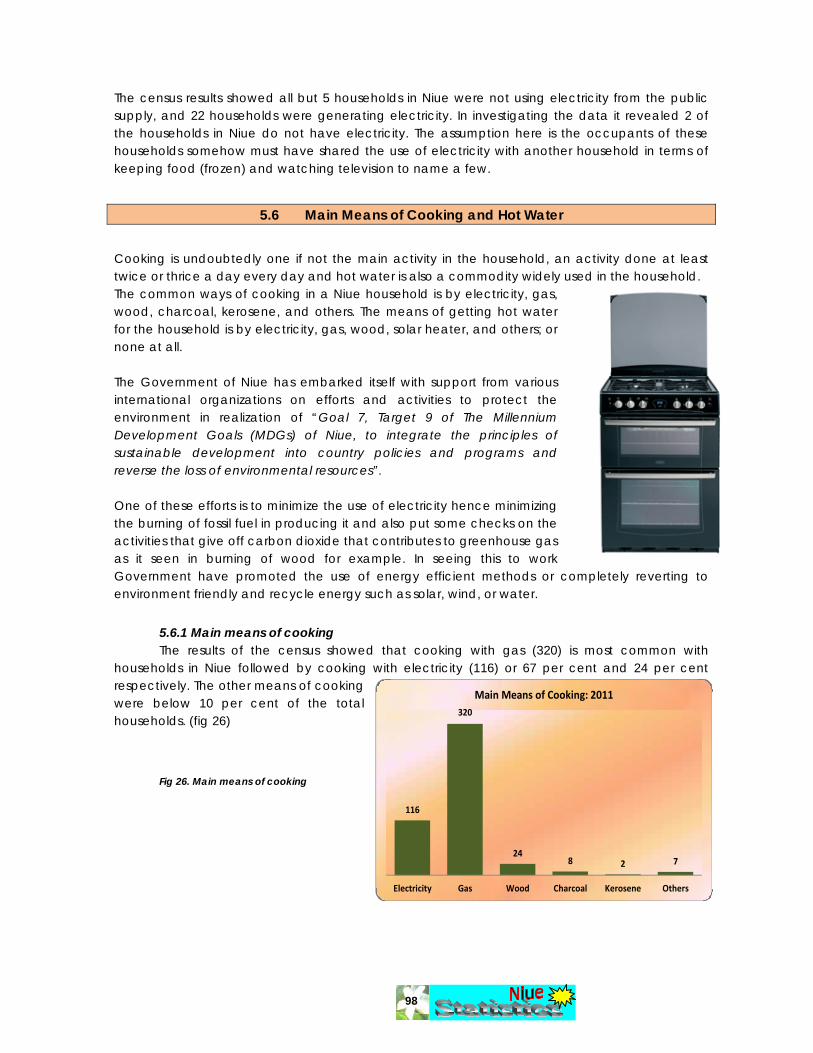
98
The census results showed all but 5 households in Niue were not using electricity from the public supply, and 22 households were generating electricity. In investigating the data it revealed 2 of the households in Niue do not have electricity. The assumption here is the occupants of these households somehow must have shared the use of electricity with another household in terms of keeping food (frozen) and watching television to name a few.
5.6 Main Means of Cooking and Hot Water Cooking is undoubtedly one if not the main activity in the household, an activity done at least twice or thrice a day every day and hot water is also a commodity widely used in the household. The common ways of cooking in a Niue household is by electricity, gas, wood, charcoal, kerosene, and others. The means of getting hot water for the household is by electricity, gas, wood, solar heater, and others; or none at all. The Government of Niue has embarked itself with support from various international organizations on efforts and activities to protect the environment in realization of “Goal 7, Target 9 of The Millennium Development Goals (MDGs) of Niue, to integrate the principles of sustainable development into country policies and programs and reverse the loss of environmental resources”. One of these efforts is to minimize the use of electricity hence minimizing the burning of fossil fuel in producing it and also put some checks on the activities that give off carbon dioxide that contributes to greenhouse gas as it seen in burning of wood for example. In seeing this to work Government have promoted the use of energy efficient methods or completely reverting to environment friendly and recycle energy such as solar, wind, or water.
5.6.1 Main means of cooking The results of the census showed that cooking with gas (320) is most common with
households in Niue followed by cooking with electricity (116) or 67 per cent and 24 per cent respectively. The other means of cooking were below 10 per cent of the total households. (fig 26)
Fig 26. Main means of cooking
116
320
248 2 7
Electricity Gas Wood Charcoal Kerosene Others
Main Means of Cooking: 2011
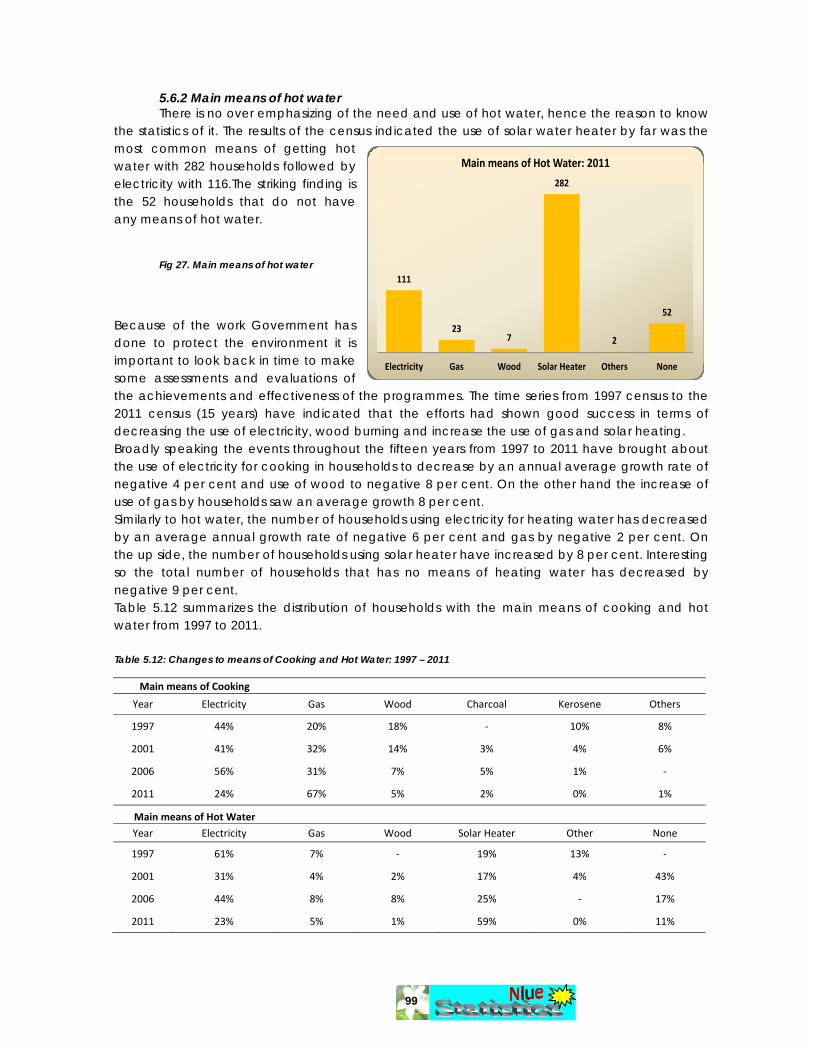
99
5.6.2 Main means of hot water There is no over emphasizing of the need and use of hot water, hence the reason to know the statistics of it. The results of the census indicated the use of solar water heater by far was the most common means of getting hot water with 282 households followed by electricity with 116.The striking finding is the 52 households that do not have any means of hot water.
Fig 27. Main means of hot water
Because of the work Government has done to protect the environment it is important to look back in time to make some assessments and evaluations of the achievements and effectiveness of the programmes. The time series from 1997 census to the 2011 census (15 years) have indicated that the efforts had shown good success in terms of decreasing the use of electricity, wood burning and increase the use of gas and solar heating. Broadly speaking the events throughout the fifteen years from 1997 to 2011 have brought about the use of electricity for cooking in households to decrease by an annual average growth rate of negative 4 per cent and use of wood to negative 8 per cent. On the other hand the increase of use of gas by households saw an average growth 8 per cent. Similarly to hot water, the number of households using electricity for heating water has decreased by an average annual growth rate of negative 6 per cent and gas by negative 2 per cent. On the up side, the number of households using solar heater have increased by 8 per cent. Interesting so the total number of households that has no means of heating water has decreased by negative 9 per cent. Table 5.12 summarizes the distribution of households with the main means of cooking and hot water from 1997 to 2011. Table 5.12: Changes to means of Cooking and Hot Water: 1997 – 2011
Main means of Cooking
Year Electricity Gas Wood Charcoal Kerosene Others
1997 44% 20% 18% ‐ 10% 8%
2001 41% 32% 14% 3% 4% 6%
2006 56% 31% 7% 5% 1% ‐
2011 24% 67% 5% 2% 0% 1%
Main means of Hot Water
Year Electricity Gas Wood Solar Heater Other None
1997 61% 7% ‐ 19% 13% ‐
2001 31% 4% 2% 17% 4% 43%
2006 44% 8% 8% 25% ‐ 17%
2011 23% 5% 1% 59% 0% 11%
111
237
282
2
52
Electricity Gas Wood Solar Heater Others None
Main means of Hot Water: 2011
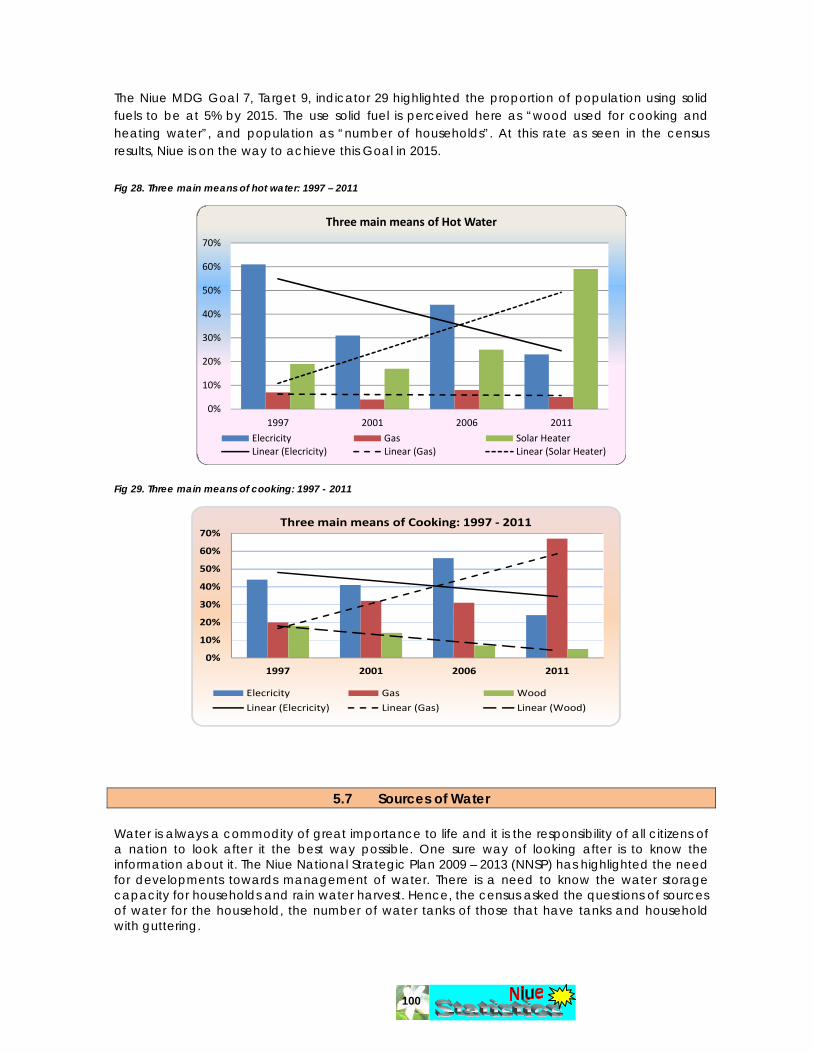
100
The Niue MDG Goal 7, Target 9, indicator 29 highlighted the proportion of population using solid fuels to be at 5% by 2015. The use solid fuel is perceived here as “wood used for cooking and heating water”, and population as “number of households”. At this rate as seen in the census results, Niue is on the way to achieve this Goal in 2015. Fig 28. Three main means of hot water: 1997 – 2011
0%
10%
20%
30%
40%
50%
60%
70%
1997 2001 2006 2011
Three main means of Hot Water
Elecricity Gas Solar HeaterLinear (Elecricity) Linear (Gas) Linear (Solar Heater)
Fig 29. Three main means of cooking: 1997 - 2011
0%
10%
20%
30%
40%
50%
60%
70%
1997 2001 2006 2011
Three main means of Cooking: 1997 ‐ 2011
Elecricity Gas Wood
Linear (Elecricity) Linear (Gas) Linear (Wood)
5.7 Sources of Water Water is always a commodity of great importance to life and it is the responsibility of all citizens of a nation to look after it the best way possible. One sure way of looking after is to know the information about it. The Niue National Strategic Plan 2009 – 2013 (NNSP) has highlighted the need for developments towards management of water. There is a need to know the water storage capacity for households and rain water harvest. Hence, the census asked the questions of sources of water for the household, the number of water tanks of those that have tanks and household with guttering.

101
In Niue the main water source is from the underground aquifer and it needs to be bump up to the surface and distributed to households. The Government is responsible for the supplying and distribution. This is what termed as “public water or connected to the public water system”. Water is piped to households all around the villages of Niue and the occupants of the households have the option of carrying it on inside the house, or into a water tank or kept it outside or have all.
5.7.1 Public water. Among the 477 households 98 per cent or 466 in total are connected to the public water
system. While 92 per cent or 437 had water outside the house, 90 per cent or 430 households piped it inside their houses. This means that 430 households were having both options (outside and inside house) with only 7 had the option of having water just outside the house. Water from the system is also piped into water tanks. From the census and 16 per cent or 77 of the households are doing this into 122 water tanks (50 single tanks + 72 double tanks).
5.7.2 Rain water: Another source of water for households in Niue is rain water. Rain water is collected in
water tanks and water wells. The results of census showed 126 households or 26 per cent collected rain water in 185 tanks (94 singles + 91 doubles) while only 22 or 5 per cent collected water into water wells. There were only 178 households have water guttering.
5.8 Fishing Vessels
Fishing vessels is acquired by households predominantly for catching fish for food. However there is always a possibility the surplus catch is used to supplement the household income.
Among 477 household, only 98 household with 142 canoes, 89 households with 115 aluminium dinghy, inflatable dinghy, and boats, 52 households with 85 outboard motors, and 9 households with 16 other vessels . Distribution of Household by Fishing Vessels is presented in Table 5.13. Table 5.13: Distribution of Household By Fishing Vessels, 2011 Census.
Vessels Canoes Dinghies & Boats Outboard motor Others
Number of Households 98 89 52 9
% Households 21% 19% 11% 2%
Number of Vessels 142 115 85 16
5.9 Vehicles
The introduction of vehicles has transformed the way of life of many Niueans in many respects. For instance transportation, people can easily move from place to place using vehicles. Timeliness, it takes less time to travel in a vehicle from place to place. Loading capacity, vehicles allows people to carry heavy loads from place to place, and Distance, vehicles can allow people to travel longer distances with ease. Therefore, vehicles play an important role in the life of the

102
people of Niue. In the absence of public transportation in Niue, this gives more reasons for a household in Niue to purchase and own a vehicle. The results from the census revealed that all 477 households in Niue own and operate a vehicle, a motorbike, a car, a van or a truck. The total number of vehicles privately owned by households came to 926 altogether. Briefly speaking a household in Niue on average own 2 vehicles each. Please note: vehicles own by businesses and Government are not included in the census. 5.9.1 Types of Vehicles owned The census asked for vehicles based on fuel type, petrol and diesel. Of the 926 vehicles 68 per cent or 629 runs on petrol and 32 per cent or 297 run on diesel. A total of 302 households own 399 cars (380 run on petrol + 19 run on diesel); 175 households own 184 vans (76 run on petrol + 108 run on diesel); 122 households own 130 trucks (42 run on petrol + 88 run on diesel); 111 households own 117 four wheel drives (44 run on petrol + 73 run on diesel) and 14 households own 16 other type of vehicles (7 run on petrol + 9 run on diesel). Table 5.14
Table 5.14: Type of Vehicles and Fuel types, 2011 Census.
According to findings the vehicles with big engine such as the vans, trucks and 4-wheel- drives runs on diesel fuel and mainly cars on petrol fuel. With these numbers of vehicles the quantity of fuel required is big and not to mention the greenhouse gas emission.
Table 5.15: Type of Vehicles by location, 2011 Census.
Village Car Van Motorbike Truck 4WD Others Total Households Vehicle/HH
Alofi South 122 45 28 28 27 4 254 128 2
Alofi North 49 12 5 16 14 1 97 56 2
Makefu 22 7 3 8 9 0 49 22 2
Tuapa 25 16 5 5 12 2 65 30 2
Namukulu 3 2 1 2 0 0 8 6 1
Hikutavake 8 6 5 3 2 0 24 15 2
Toi 8 3 3 3 2 1 20 9 2
Mutalau 31 15 5 6 13 0 70 31 2
Lakepa 11 11 1 12 6 0 41 21 2
Liku 18 16 6 4 4 0 48 22 2
Hakupu 40 13 8 19 3 1 84 39 2
Vaiea 6 4 2 4 6 0 22 15 1
Avatele 31 18 5 8 10 3 75 43 2
Tamakautoga 25 16 3 12 9 4 69 40 2
Total 399 184 80 130 117 16 926 477 2
Niue average 29 13 6 9 8 1 66 34 2
Vehicle Petrol Diesel Total Households
Motorbikes 80 0 80 67
Car 380 19 399 302
Van 76 108 184 175
Truck 42 88 130 122
4WD 44 73 117 111
Others 7 9 16 14
Total 629 297 926
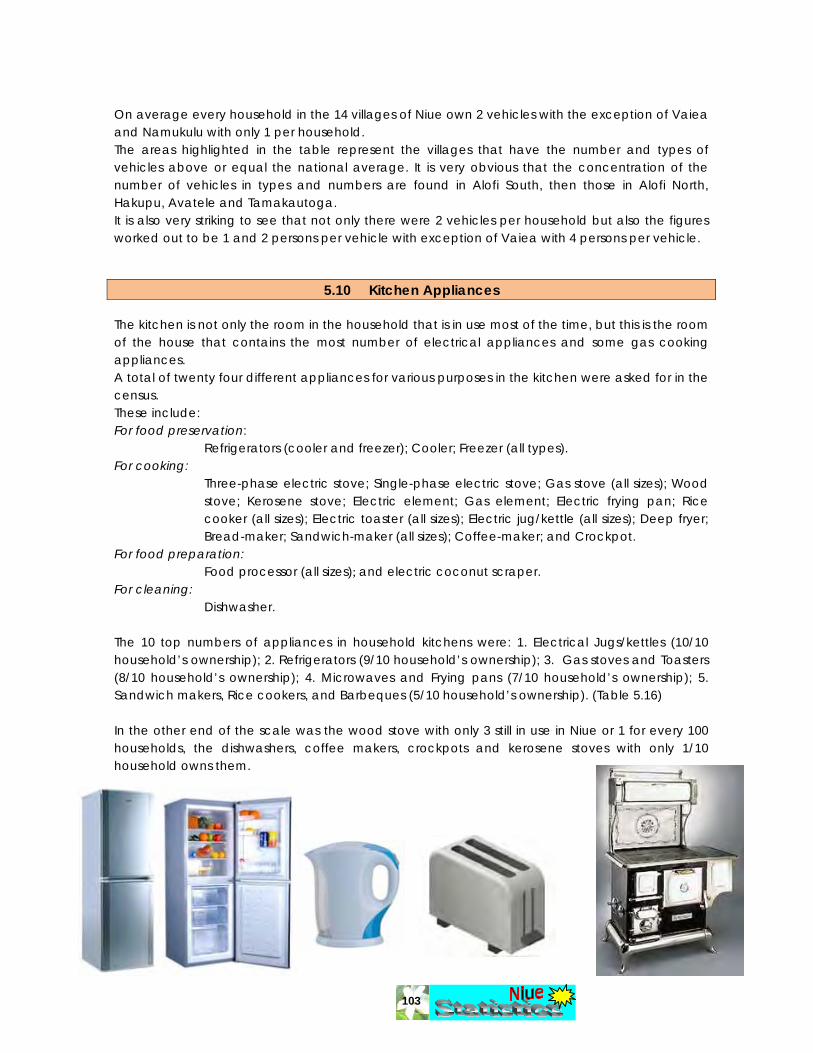
103
On average every household in the 14 villages of Niue own 2 vehicles with the exception of Vaiea and Namukulu with only 1 per household. The areas highlighted in the table represent the villages that have the number and types of vehicles above or equal the national average. It is very obvious that the concentration of the number of vehicles in types and numbers are found in Alofi South, then those in Alofi North, Hakupu, Avatele and Tamakautoga. It is also very striking to see that not only there were 2 vehicles per household but also the figures worked out to be 1 and 2 persons per vehicle with exception of Vaiea with 4 persons per vehicle.
5.10 Kitchen Appliances The kitchen is not only the room in the household that is in use most of the time, but this is the room of the house that contains the most number of electrical appliances and some gas cooking appliances. A total of twenty four different appliances for various purposes in the kitchen were asked for in the census. These include: For food preservation:
Refrigerators (cooler and freezer); Cooler; Freezer (all types). For cooking:
Three-phase electric stove; Single-phase electric stove; Gas stove (all sizes); Wood stove; Kerosene stove; Electric element; Gas element; Electric frying pan; Rice cooker (all sizes); Electric toaster (all sizes); Electric jug/kettle (all sizes); Deep fryer; Bread-maker; Sandwich-maker (all sizes); Coffee-maker; and Crockpot.
For food preparation: Food processor (all sizes); and electric coconut scraper.
For cleaning: Dishwasher.
The 10 top numbers of appliances in household kitchens were: 1. Electrical Jugs/kettles (10/10 household’s ownership); 2. Refrigerators (9/10 household’s ownership); 3. Gas stoves and Toasters (8/10 household’s ownership); 4. Microwaves and Frying pans (7/10 household’s ownership); 5. Sandwich makers, Rice cookers, and Barbeques (5/10 household’s ownership). (Table 5.16) In the other end of the scale was the wood stove with only 3 still in use in Niue or 1 for every 100 households, the dishwashers, coffee makers, crockpots and kerosene stoves with only 1/10 household owns them.

104
Table 5.16 : Total number of Kitchen Appliances, 2011 Census
Purpose Appliance Total # Appliance /10 HH
Food preservation 920
Refrigerator (freezer & cooler) 448 9
Cooler 119 2
Freezer 353 7
Cooking 3451
Gas Stoves 360 8
Three Phase Stove 56 1
Single Phase Stove 116 2
Wood Range Stove 3 0.1
Kerosene Stove 32 1
Electric Element 156 3
Gas Element 147 3
Barbeque 223 5
Electric Frying Pan 355 7
Rice Cooker 259 5
Electric Toaster 373 8
Microwave 347 7
Electric Jug/kettle 468 10
Deep Fryer 79 2
Bread Maker 87 2
Sandwich Maker 238 5
Crock‐pot 70 1
Coffee maker 86 1
Preparation 289
Food Processor 152 3
Electric Coconut Scraper 137 3
Cleaning 54
Dishwasher 54 1
Total Number of Households 477
5.11 Other Household Appliances Other household appliances considered in the census which is useful in supporting the wellbeing of the occupants. While some were more needed than others, for example a washing machine versus an air condition unit, it is still important to know the extent of their availability. The results from the census showed portable fans, irons and washing machines to be most popular with the households in Niue. There are 708 portable fans counted which is almost 2 fans for every household, 525 irons and that is slightly more than 1 each per household and 438 washing machine which almost every household in has one. (Table 5.17)
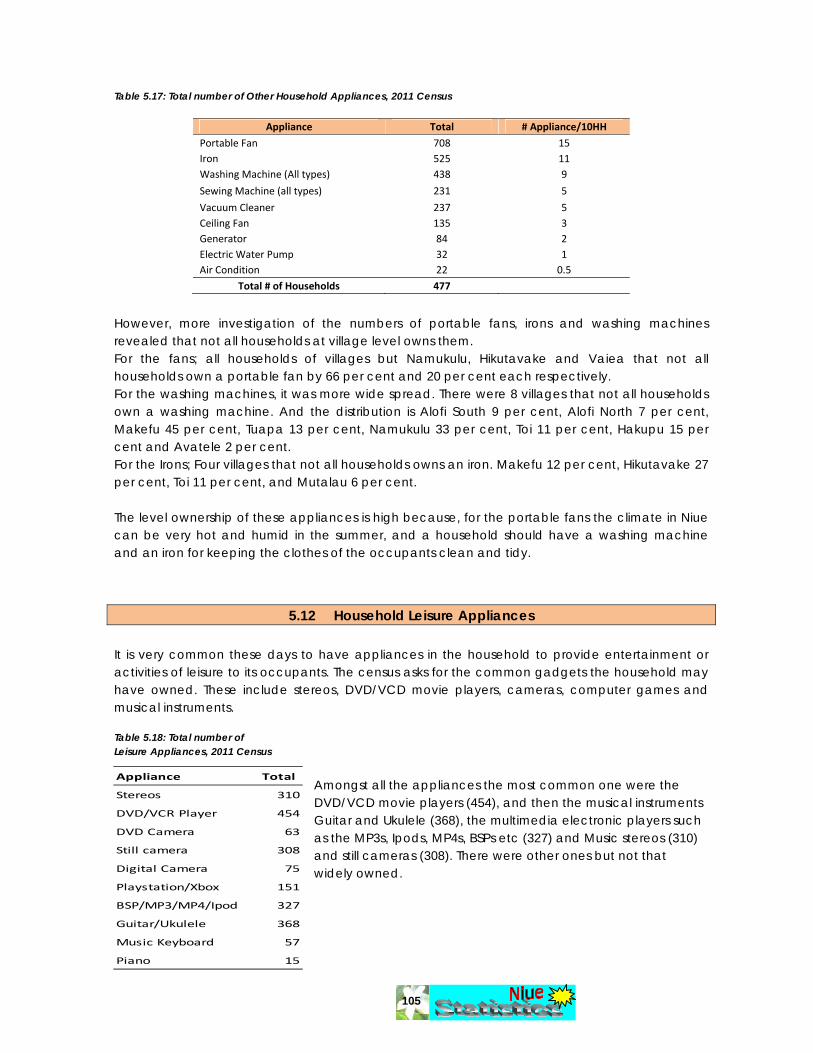
105
Table 5.17: Total number of Other Household Appliances, 2011 Census
Appliance Total # Appliance/10HH
Portable Fan 708 15 Iron 525 11 Washing Machine (All types) 438 9
Sewing Machine (all types) 231 5
Vacuum Cleaner 237 5 Ceiling Fan 135 3 Generator 84 2 Electric Water Pump 32 1 Air Condition 22 0.5
Total # of Households 477
However, more investigation of the numbers of portable fans, irons and washing machines revealed that not all households at village level owns them. For the fans; all households of villages but Namukulu, Hikutavake and Vaiea that not all households own a portable fan by 66 per cent and 20 per cent each respectively. For the washing machines, it was more wide spread. There were 8 villages that not all households own a washing machine. And the distribution is Alofi South 9 per cent, Alofi North 7 per cent, Makefu 45 per cent, Tuapa 13 per cent, Namukulu 33 per cent, Toi 11 per cent, Hakupu 15 per cent and Avatele 2 per cent. For the Irons; Four villages that not all households owns an iron. Makefu 12 per cent, Hikutavake 27 per cent, Toi 11 per cent, and Mutalau 6 per cent. The level ownership of these appliances is high because, for the portable fans the climate in Niue can be very hot and humid in the summer, and a household should have a washing machine and an iron for keeping the clothes of the occupants clean and tidy.
5.12 Household Leisure Appliances It is very common these days to have appliances in the household to provide entertainment or activities of leisure to its occupants. The census asks for the common gadgets the household may have owned. These include stereos, DVD/VCD movie players, cameras, computer games and musical instruments. Table 5.18: Total number of Leisure Appliances, 2011 Census
Amongst all the appliances the most common one were the DVD/VCD movie players (454), and then the musical instruments Guitar and Ukulele (368), the multimedia electronic players such as the MP3s, Ipods, MP4s, BSPs etc (327) and Music stereos (310) and still cameras (308). There were other ones but not that widely owned.
Appliance Total
Stereos 310
DVD/VCR Player 454
DVD Camera 63
Still camera 308
Digital Camera 75
Playstation/Xbox 151
BSP/MP3/MP4/Ipod 327
Guitar/Ukulele 368
Music Keyboard 57
Piano 15
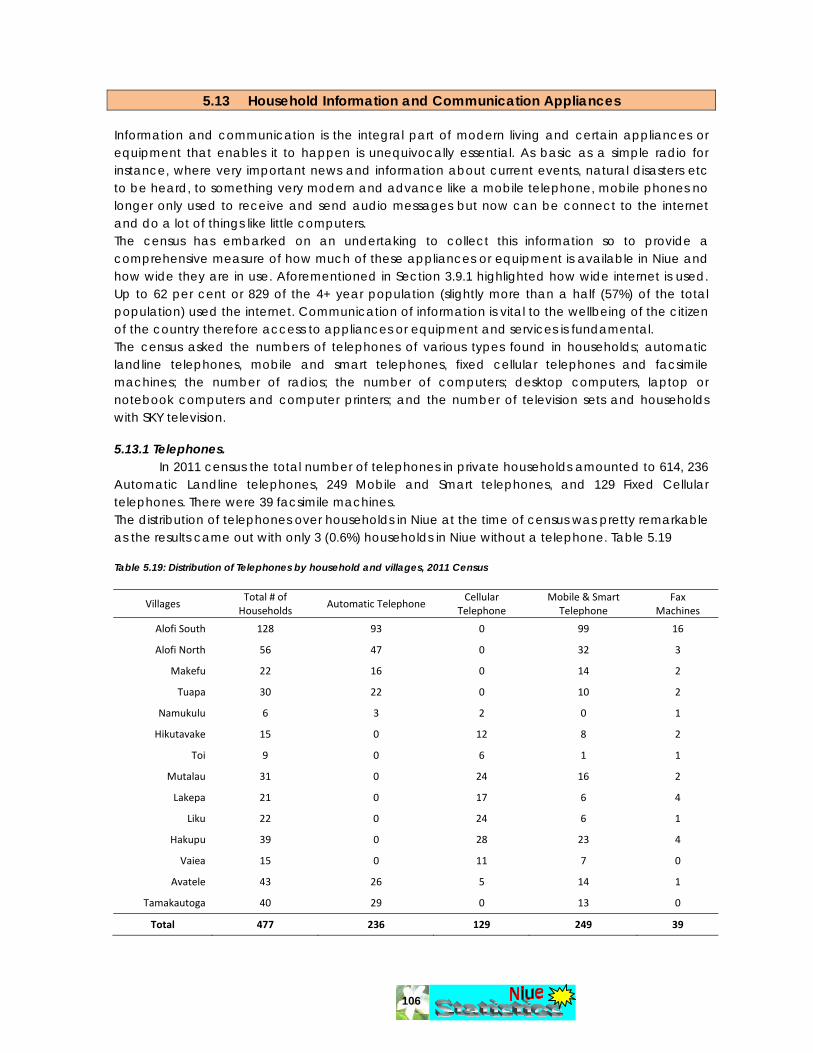
106
5.13 Household Information and Communication Appliances Information and communication is the integral part of modern living and certain appliances or equipment that enables it to happen is unequivocally essential. As basic as a simple radio for instance, where very important news and information about current events, natural disasters etc to be heard, to something very modern and advance like a mobile telephone, mobile phones no longer only used to receive and send audio messages but now can be connect to the internet and do a lot of things like little computers. The census has embarked on an undertaking to collect this information so to provide a comprehensive measure of how much of these appliances or equipment is available in Niue and how wide they are in use. Aforementioned in Section 3.9.1 highlighted how wide internet is used. Up to 62 per cent or 829 of the 4+ year population (slightly more than a half (57%) of the total population) used the internet. Communication of information is vital to the wellbeing of the citizen of the country therefore access to appliances or equipment and services is fundamental. The census asked the numbers of telephones of various types found in households; automatic landline telephones, mobile and smart telephones, fixed cellular telephones and facsimile machines; the number of radios; the number of computers; desktop computers, laptop or notebook computers and computer printers; and the number of television sets and households with SKY television. 5.13.1 Telephones. In 2011 census the total number of telephones in private households amounted to 614, 236 Automatic Landline telephones, 249 Mobile and Smart telephones, and 129 Fixed Cellular telephones. There were 39 facsimile machines. The distribution of telephones over households in Niue at the time of census was pretty remarkable as the results came out with only 3 (0.6%) households in Niue without a telephone. Table 5.19 Table 5.19: Distribution of Telephones by household and villages, 2011 Census
Villages Total # of Households
Automatic Telephone Cellular
Telephone Mobile & Smart
Telephone Fax
Machines
Alofi South 128 93 0 99 16
Alofi North 56 47 0 32 3
Makefu 22 16 0 14 2
Tuapa 30 22 0 10 2
Namukulu 6 3 2 0 1
Hikutavake 15 0 12 8 2
Toi 9 0 6 1 1
Mutalau 31 0 24 16 2
Lakepa 21 0 17 6 4
Liku 22 0 24 6 1
Hakupu 39 0 28 23 4
Vaiea 15 0 11 7 0
Avatele 43 26 5 14 1
Tamakautoga 40 29 0 13 0
Total 477 236 129 249 39
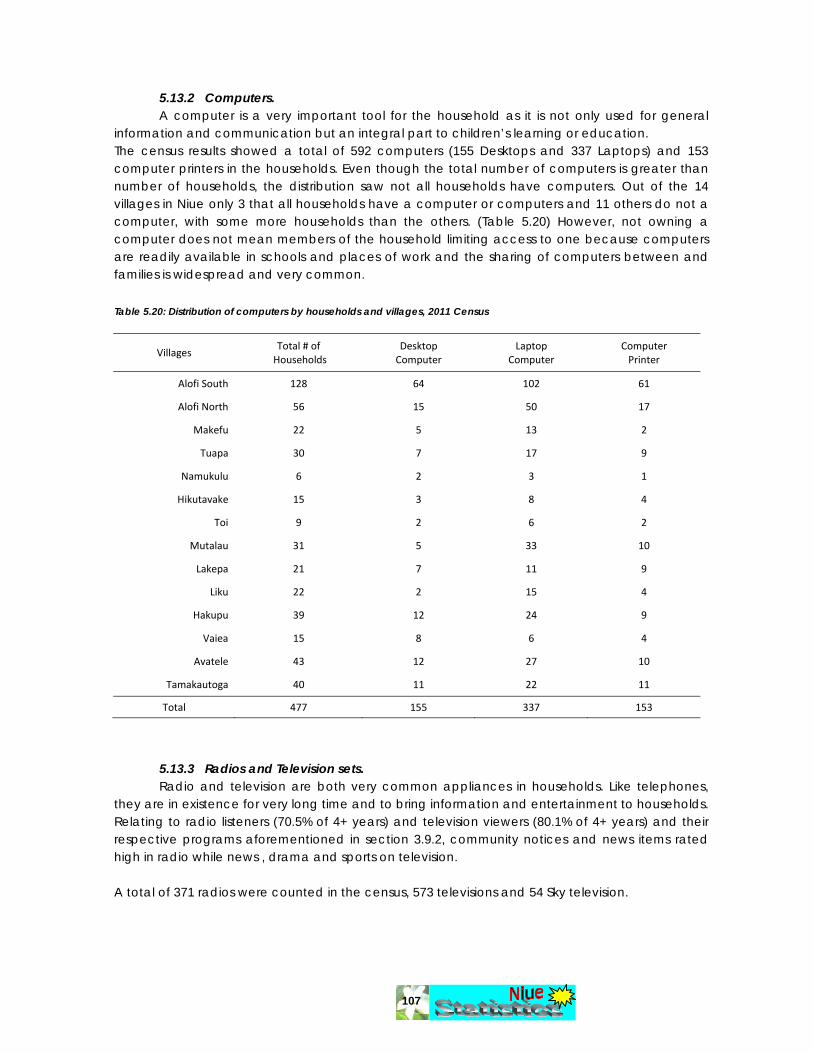
107
5.13.2 Computers. A computer is a very important tool for the household as it is not only used for general information and communication but an integral part to children’s learning or education. The census results showed a total of 592 computers (155 Desktops and 337 Laptops) and 153 computer printers in the households. Even though the total number of computers is greater than number of households, the distribution saw not all households have computers. Out of the 14 villages in Niue only 3 that all households have a computer or computers and 11 others do not a computer, with some more households than the others. (Table 5.20) However, not owning a computer does not mean members of the household limiting access to one because computers are readily available in schools and places of work and the sharing of computers between and families is widespread and very common. Table 5.20: Distribution of computers by households and villages, 2011 Census
Villages Total # of
Households Desktop Computer
Laptop Computer
Computer Printer
Alofi South 128 64 102 61
Alofi North 56 15 50 17
Makefu 22 5 13 2
Tuapa 30 7 17 9
Namukulu 6 2 3 1
Hikutavake 15 3 8 4
Toi 9 2 6 2
Mutalau 31 5 33 10
Lakepa 21 7 11 9
Liku 22 2 15 4
Hakupu 39 12 24 9
Vaiea 15 8 6 4
Avatele 43 12 27 10
Tamakautoga 40 11 22 11
Total 477 155 337 153
5.13.3 Radios and Television sets.
Radio and television are both very common appliances in households. Like telephones, they are in existence for very long time and to bring information and entertainment to households. Relating to radio listeners (70.5% of 4+ years) and television viewers (80.1% of 4+ years) and their respective programs aforementioned in section 3.9.2, community notices and news items rated high in radio while news , drama and sports on television. A total of 371 radios were counted in the census, 573 televisions and 54 Sky television.
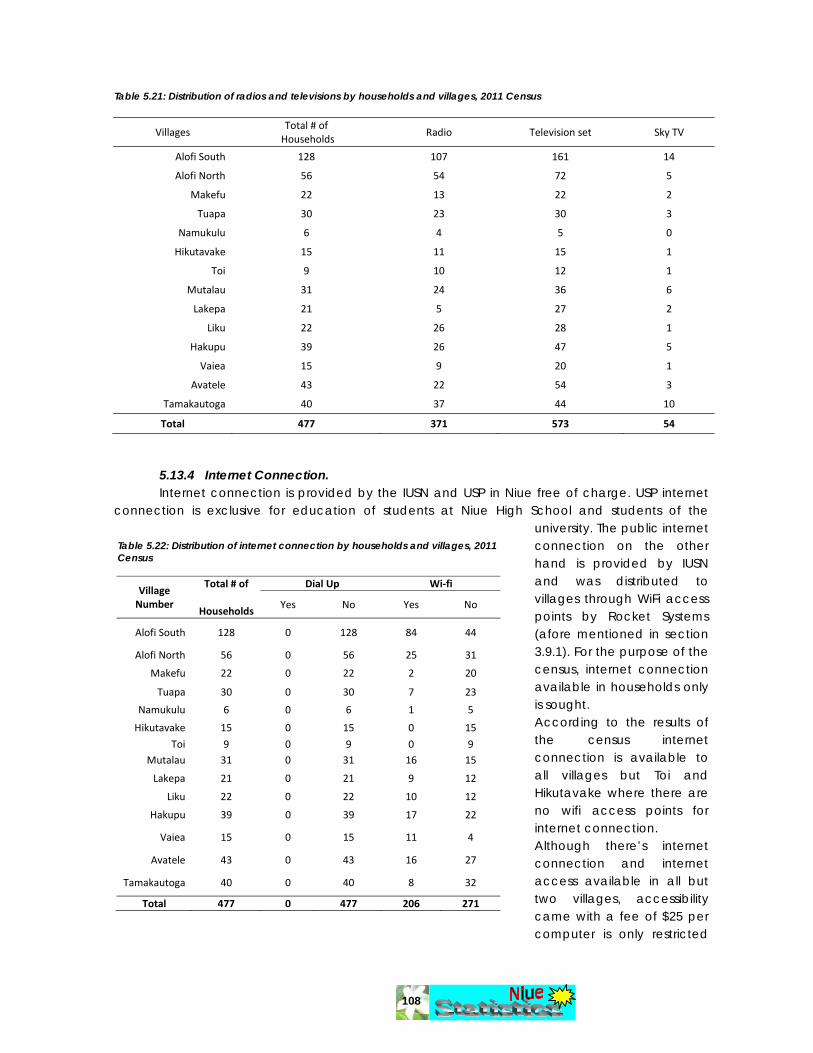
108
Table 5.21: Distribution of radios and televisions by households and villages, 2011 Census
Villages Total # of
Households Radio Television set Sky TV
Alofi South 128 107 161 14
Alofi North 56 54 72 5
Makefu 22 13 22 2
Tuapa 30 23 30 3
Namukulu 6 4 5 0
Hikutavake 15 11 15 1
Toi 9 10 12 1
Mutalau 31 24 36 6
Lakepa 21 5 27 2
Liku 22 26 28 1
Hakupu 39 26 47 5
Vaiea 15 9 20 1
Avatele 43 22 54 3
Tamakautoga 40 37 44 10
Total 477 371 573 54
5.13.4 Internet Connection. Internet connection is provided by the IUSN and USP in Niue free of charge. USP internet connection is exclusive for education of students at Niue High School and students of the
university. The public internet connection on the other hand is provided by IUSN and was distributed to villages through WiFi access points by Rocket Systems (afore mentioned in section 3.9.1). For the purpose of the census, internet connection available in households only is sought. According to the results of the census internet connection is available to all villages but Toi and Hikutavake where there are no wifi access points for internet connection. Although there’s internet connection and internet access available in all but two villages, accessibility came with a fee of $25 per computer is only restricted
Table 5.22: Distribution of internet connection by households and villages, 2011 Census
Village Number
Total # of
Households
Dial Up Wi‐fi
Yes No Yes No
Alofi South 128 0 128 84 44
Alofi North 56 0 56 25 31
Makefu 22 0 22 2 20
Tuapa 30 0 30 7 23
Namukulu 6 0 6 1 5
Hikutavake 15 0 15 0 15
Toi 9 0 9 0 9 Mutalau 31 0 31 16 15
Lakepa 21 0 21 9 12
Liku 22 0 22 10 12
Hakupu 39 0 39 17 22
Vaiea 15 0 15 11 4
Avatele 43 0 43 16 27
Tamakautoga 40 0 40 8 32
Total 477 0 477 206 271
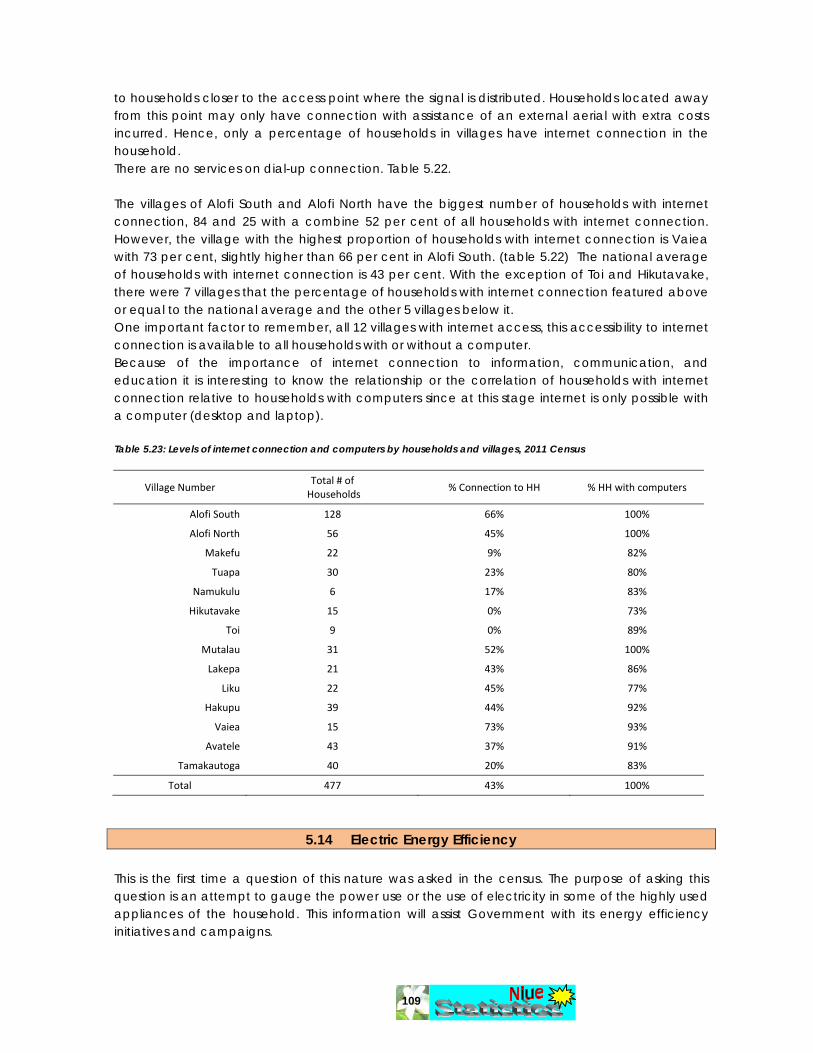
109
to households closer to the access point where the signal is distributed. Households located away from this point may only have connection with assistance of an external aerial with extra costs incurred. Hence, only a percentage of households in villages have internet connection in the household. There are no services on dial-up connection. Table 5.22. The villages of Alofi South and Alofi North have the biggest number of households with internet connection, 84 and 25 with a combine 52 per cent of all households with internet connection. However, the village with the highest proportion of households with internet connection is Vaiea with 73 per cent, slightly higher than 66 per cent in Alofi South. (table 5.22) The national average of households with internet connection is 43 per cent. With the exception of Toi and Hikutavake, there were 7 villages that the percentage of households with internet connection featured above or equal to the national average and the other 5 villages below it. One important factor to remember, all 12 villages with internet access, this accessibility to internet connection is available to all households with or without a computer. Because of the importance of internet connection to information, communication, and education it is interesting to know the relationship or the correlation of households with internet connection relative to households with computers since at this stage internet is only possible with a computer (desktop and laptop). Table 5.23: Levels of internet connection and computers by households and villages, 2011 Census
Village Number Total # of
Households % Connection to HH % HH with computers
Alofi South 128 66% 100%
Alofi North 56 45% 100%
Makefu 22 9% 82%
Tuapa 30 23% 80%
Namukulu 6 17% 83%
Hikutavake 15 0% 73%
Toi 9 0% 89%
Mutalau 31 52% 100%
Lakepa 21 43% 86%
Liku 22 45% 77%
Hakupu 39 44% 92%
Vaiea 15 73% 93%
Avatele 43 37% 91%
Tamakautoga 40 20% 83%
Total 477 43% 100%
5.14 Electric Energy Efficiency This is the first time a question of this nature was asked in the census. The purpose of asking this question is an attempt to gauge the power use or the use of electricity in some of the highly used appliances of the household. This information will assist Government with its energy efficiency initiatives and campaigns.

110
These appliances include: electric stove, automatic washing machine, iron, microwave, electric jug, and freezers (by various sizes – small, medium, and large). Generally speaking these appliances are very common in households and were frequently used. The census results showed that not all appliances of households (mentioned) are used as some households may have more than one of a kind. For example, of the 525 irons reported only 442 were used. Table 5.24: Levels of usage of common household appliances, 2011 Census
Appliance Stove Washing‐machine
Iron Microwave Electric Jug
Total Number 172 438 525 347 468
Number Used 166 371 442 307 412
Hours used/week 945 2,454 940 573 1,228
Hours used/day 135 351 134 82 175
Hours used/ day/machine
49 mins 56 mins 18 mins 16 mins 26 mins
The results clearly showed that other than the freezers and refrigerators that are required to be running all the time, the washing machine and the stove are the next highly used appliances in households, one runs for 56 minutes a day every day while the other for 49 minutes a day every day. The electric jug showed 26 minutes running time every day. Freezers are asked separate because of the various sizes available in different households. The small size freezer is up to 5.0 cubic feet, the medium size freezer up to 8 cubic feet and the large freezer is more than 8 cubic feet. Like the appliances above, it is not uncommon for householders to own more than one freezer and only one operates most of the time while the other one will be standing on standby.
5.15 Agricultural Tools and Equipment Agriculture tools and equipment was sought from households to determine the ability of households to produce agricultural products, firstly for food and secondly as a source of income or to supplement primary income. The census results showed that not all households own all identified agricultural tools and equipment or in other words different households owns different agricultural tools and equipment. However, for those who own tools and equipment the two most common ones are; 1. The bush knife or machete with 428 or 90 per cent of households owning 1,002 bush knives in total and; 2. Brush cutters with 341 or 71 per cent households owning 482 of them. The least common ones were the chainsaws with only 43 per cent or 204 of households owning one and the firearms with half of the household owning one. Table 5.25
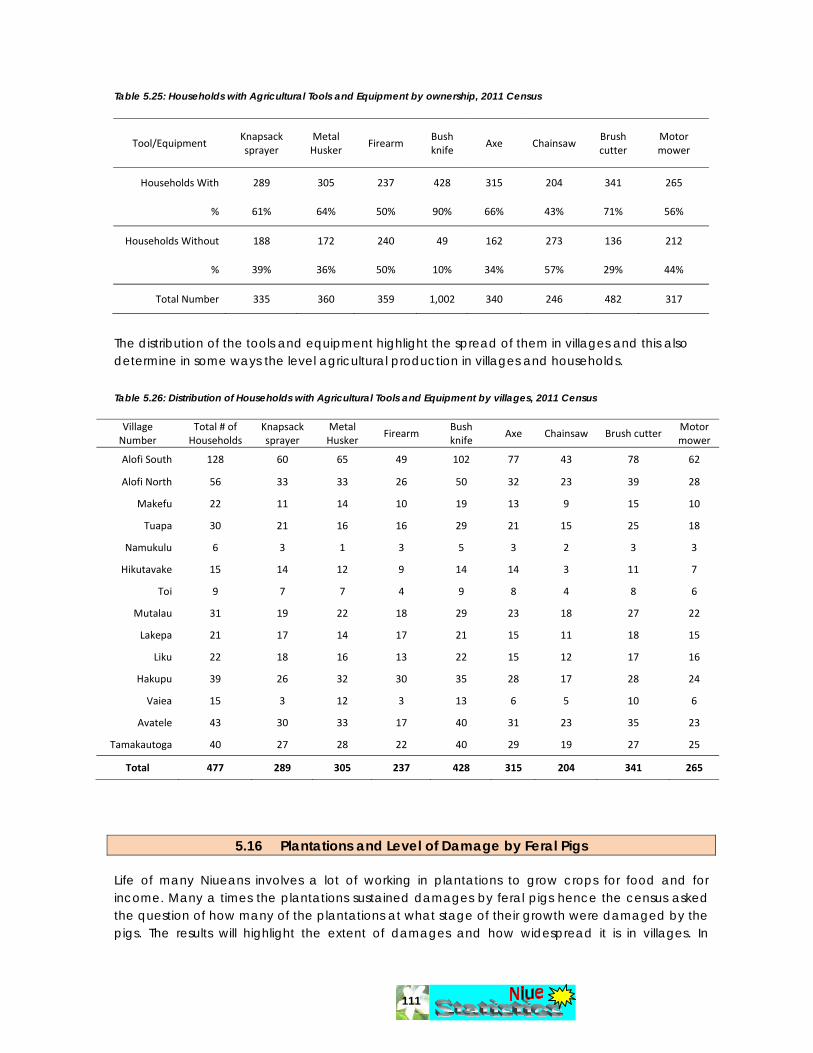
111
Table 5.25: Households with Agricultural Tools and Equipment by ownership, 2011 Census
Tool/Equipment Knapsack sprayer
Metal Husker
Firearm Bush knife
Axe Chainsaw Brush cutter
Motor mower
Households With 289 305 237 428 315 204 341 265
% 61% 64% 50% 90% 66% 43% 71% 56%
Households Without 188 172 240 49 162 273 136 212
% 39% 36% 50% 10% 34% 57% 29% 44%
Total Number 335 360 359 1,002 340 246 482 317
The distribution of the tools and equipment highlight the spread of them in villages and this also determine in some ways the level agricultural production in villages and households. Table 5.26: Distribution of Households with Agricultural Tools and Equipment by villages, 2011 Census Village Number
Total # of Households
Knapsack sprayer
Metal Husker
Firearm Bush knife
Axe Chainsaw Brush cutter Motor mower
Alofi South 128 60 65 49 102 77 43 78 62
Alofi North 56 33 33 26 50 32 23 39 28
Makefu 22 11 14 10 19 13 9 15 10
Tuapa 30 21 16 16 29 21 15 25 18
Namukulu 6 3 1 3 5 3 2 3 3
Hikutavake 15 14 12 9 14 14 3 11 7
Toi 9 7 7 4 9 8 4 8 6
Mutalau 31 19 22 18 29 23 18 27 22
Lakepa 21 17 14 17 21 15 11 18 15
Liku 22 18 16 13 22 15 12 17 16
Hakupu 39 26 32 30 35 28 17 28 24
Vaiea 15 3 12 3 13 6 5 10 6
Avatele 43 30 33 17 40 31 23 35 23
Tamakautoga 40 27 28 22 40 29 19 27 25
Total 477 289 305 237 428 315 204 341 265
5.16 Plantations and Level of Damage by Feral Pigs Life of many Niueans involves a lot of working in plantations to grow crops for food and for income. Many a times the plantations sustained damages by feral pigs hence the census asked the question of how many of the plantations at what stage of their growth were damaged by the pigs. The results will highlight the extent of damages and how widespread it is in villages. In
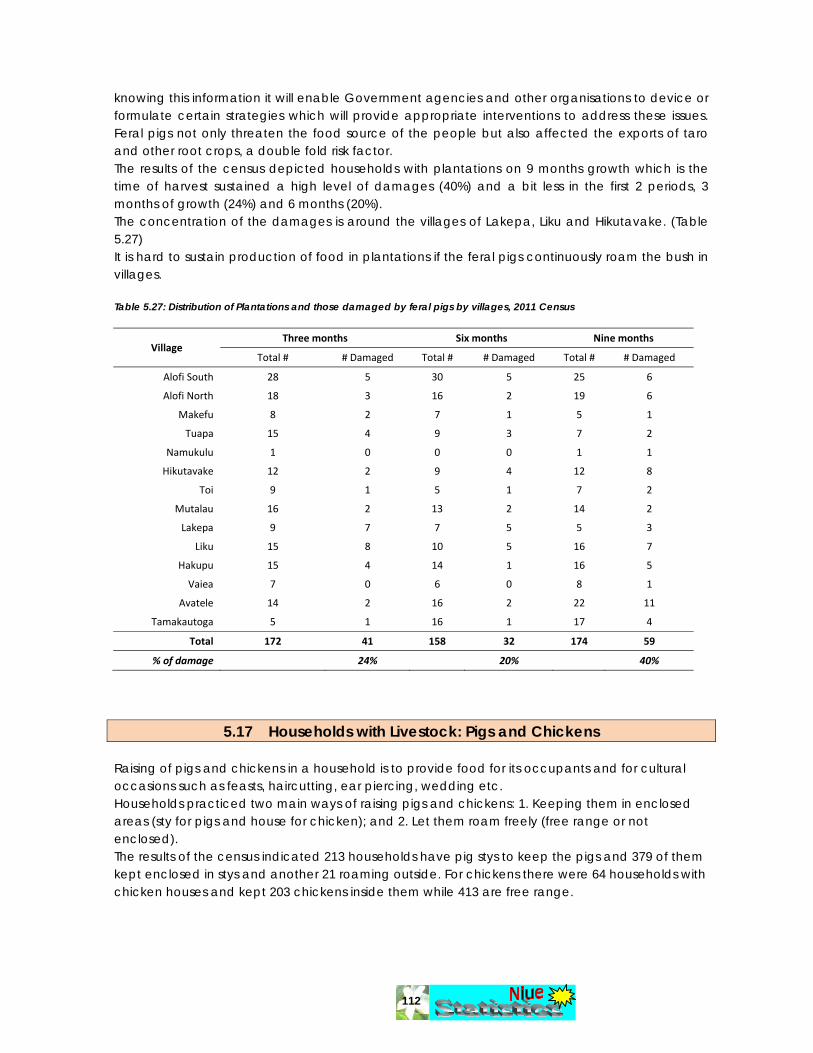
112
knowing this information it will enable Government agencies and other organisations to device or formulate certain strategies which will provide appropriate interventions to address these issues. Feral pigs not only threaten the food source of the people but also affected the exports of taro and other root crops, a double fold risk factor. The results of the census depicted households with plantations on 9 months growth which is the time of harvest sustained a high level of damages (40%) and a bit less in the first 2 periods, 3 months of growth (24%) and 6 months (20%). The concentration of the damages is around the villages of Lakepa, Liku and Hikutavake. (Table 5.27) It is hard to sustain production of food in plantations if the feral pigs continuously roam the bush in villages. Table 5.27: Distribution of Plantations and those damaged by feral pigs by villages, 2011 Census
Village Three months Six months Nine months
Total # # Damaged Total # # Damaged Total # # Damaged
Alofi South 28 5 30 5 25 6
Alofi North 18 3 16 2 19 6
Makefu 8 2 7 1 5 1
Tuapa 15 4 9 3 7 2
Namukulu 1 0 0 0 1 1
Hikutavake 12 2 9 4 12 8
Toi 9 1 5 1 7 2
Mutalau 16 2 13 2 14 2
Lakepa 9 7 7 5 5 3
Liku 15 8 10 5 16 7
Hakupu 15 4 14 1 16 5
Vaiea 7 0 6 0 8 1
Avatele 14 2 16 2 22 11
Tamakautoga 5 1 16 1 17 4
Total 172 41 158 32 174 59
% of damage 24% 20% 40%
5.17 Households with Livestock: Pigs and Chickens Raising of pigs and chickens in a household is to provide food for its occupants and for cultural occasions such as feasts, haircutting, ear piercing, wedding etc. Households practiced two main ways of raising pigs and chickens: 1. Keeping them in enclosed areas (sty for pigs and house for chicken); and 2. Let them roam freely (free range or not enclosed). The results of the census indicated 213 households have pig stys to keep the pigs and 379 of them kept enclosed in stys and another 21 roaming outside. For chickens there were 64 households with chicken houses and kept 203 chickens inside them while 413 are free range.

113
Table 5.28: Distribution of Households raising pigs and chickens by villages, 2011 Census.
Village Total HH HH with Pig stys
HH with pigs
enclosed
HH with pigs not enclosed
HH with Chicken House
HH with Housed Chickens
HH with Free range Chickens
Alofi South 128 38 70 ‐ 9 33 59 Alofi North 56 24 41 ‐ 5 15 53
Makefu 22 7 12 ‐ 2 6 14 Tuapa 30 12 29 ‐ 8 20 25
Namukulu 6 2 4 ‐ 0 0 9 Hikutavake 15 9 11 ‐ 3 15 11
Toi 9 6 8 ‐ 3 15 11 Mutalau 31 19 34 ‐ 6 10 25 Lakepa 21 12 19 ‐ 1 11 14
Liku 22 17 31 ‐ 10 20 39 Hakupu 39 17 31 ‐ 5 12 32 Vaiea 15 11 21 ‐ 3 7 21
Avatele 43 23 41 ‐ 7 17 58 Tamakautoga 40 16 27 ‐ 2 22 42
Total 477 213 379 21 64 203 413
114
CONCLUSION In conclusion, if anything about one’s nation, it is its people. Therefore it is very important for a nation to have a good account of its people and characteristics surrounding them as they are not only the fundamental part of a nation in making a nation a nation but also the crucial resource of the nation. There is no overemphasizing the fact that the availability of statistical information is imperative in evidence-based policy and decision making. On the same token, the information also provides the underlying basis to sound planning and policy evaluation of development strategies. The conducting this Population and Household Census of Niue 2011 has ensured the realisation of these facts for the benefit and betterment of the Government of Niue, the Niue Business community, the Civil Groups, and Development Partners in the deliverance of goods and services for the prosperity of the Niue people. It is equally important for various users of the report to realise the diverse nature of the 14 villages around Niue not only by location but in various aspects of the census findings. These include:
• The population composition, structure and processes, to describe and explain recent demographic developments;
• An overview on education, to describe and explain the level of education of the population;
• Snapshots on language and culture skills, to describe and explain the level of usage of Niuean language and some basic cultural skills;
• Snapshots on disabilities, tobacco and alcohol consumption, and non-communicable diseases, to describe and explain the widespread of occurrences or prevalence rates across the village populations and the total population of Niue;
• An overview of labour market activities, to describe and explain the developments and quality of life of residents in the village and in Niue;
• Some information of the level of income earn by the residents of Niue from their labour activities as this will explain the quality of life in the households;
• Some important household and housing characteristics, to explain and describe the developments and quality of life of residents;
• The availability of certain services to residents in households to ensure quality of life for them;
• The availability of vehicles in households to ensure mobility of residents to their places of work and other purposes; and
• The availability of agriculture equipment, fishing vessels, plantations and livestock to identify or determine food security of residents.
We are confident you will find statistics and statistical information in this report user friendly, as well as helpful in addressing the priority issues facing Niue.
“Niue ke monuina, Numela ke taki aki. Prosperous Niue, follow the numbers.”

115
PART II Appendix 1: List of Tables and Figures List of Tables Table 2.1: Total Population on census night, 2011 Census. Table 2.2: Total Residential Population on census night, 2011 Census. Table 2.3: Distribution of Total Population in households by sex and location, Census 2011. Table 2.4: Total Population change: 1997, 2001, 2006, and 2011 by villages, 2011 Census. Table 2.5: Distribution of Total Residential Population in households (including absentees) by
sex and location, 2011 Census. Table 2.6: Proportion of Total Residential Population who were absent on census night by
location, 2011 Census. Table 2.7: Distribution of Residential Population by Five Year Group and Sex, 2011 Census. Table 2.8. Percentage Distribution of Residential Population by Broad Age Group, Gender, Sex Ratio, Median Age and Dependency Ratio, 2011 Census. Table 2.9: Population Growth 1997 – 2011, 2011 Census. Table 2.10: Village Resident Population Annual Growth Rates: 2001 – 2011, 2011 Census. Table 2.11: Estimated age specific fertility rates (ASFR) and total fertility rate (TFR), 2006 – 2011, 2011 Census Table 2.12: Female Population 15 years and older by number of children ever born, 2011 Census. Table 2.13: Age specific fertility rates and total fertility rates calculated from births in the last 5
years before the census, 2011 Census. Table 2.14: Estimated Niuean Fertility based on Children ever born and registration data (2006-2011) (Trussell variant of Brass P/F Ratio Method, PFRATIO, US Census Bureau PAS program) Table 2.15: Estimated Niuean Fertility based on Children ever born and registration data (2006-2011) (Arriaga Method, ARFE-2, US Census Bureau PAS program) Table 2.16: Death registration data by age and sex, 2006 – 2011, 2011 Census. Table 2.17: Niue life expectancies at birth, 2006 – 2011, 2011 Census. Table 2.18: Population 4 years and older by place of residence in September 2010 Table 2.19: Population Overseas in September 2010, by reasons of coming to Niue, 2011
Census Table 2.20: Population Overseas in September 2010, by country/region of usual residence, 2011 Census. Table 2.21: Proportion of Population 4 years and older leaving in 12 months by village, 2011 Census. Table 2.22: Proportion of Population 4 years and older stating to leave Niue in 12 months after census by reasons of leaving, 2011 Census. Table 2.23: Resident population by usual residence and in another village in September 2010, 2011 Census. Table 2.24: Number of people who agree overseas people should be encouraged to live in Niue, for population aged 15 years and over, 2011 Census. Table 2.25: Nationality of overseas people preferred as new residents, for population aged 15 years and over, 2011 Census Table 3.1: Resident population by ethnicity and sex, 2011 Census.
116
Table 3.2: Per cent of resident population by religious denominations,1986-2011 Table 3.3: Distribution of residential population aged 15 years and over by age groups and marital status, 2011 Census. Table 3.4: Distribution of residential population aged 15 years and over by Age groups, Sex
and marital status, 2011 Census. Table 3.5: School Enrolments in School age groups by sex, 2011 Table 3.6: School attendance of the residential population aged 4 years by location, sex and levels of education, 2011 Census. Table 3.7: Highest level of educational qualifications 15 years and above by sex, 2011 Census Table 3.7a: Proportion of Highest level of educational qualifications by sex, 2011 Table 3.8: Highest level of educational qualifications, population 15 years and over, 2011 Census Table 3.9: Percentage Distribution of Population by Relationship to Head of Household, 2011 Census. Table 3.10: Proficiency in Vagahau of resident population aged 4 years and older, 2011 Census (N = 1,322) Table 3.11: Language spoken in each household, 2011 Census. Table 3.11a: Change of Language spoken in each household, 2006 - 2011 Table 3.12: Resident Population Age 4 and above who can weave a basket and husk a dry coconut by Age groups. Table 3.13: Nature of disability for residential population reporting a disability by sex, 2011 Census Table 3.14: NCDs of 15 years and over by age groups , 2011 Census Table 3.15: Household Participation in Sports and Exercise by villages, 2011 Census Table 3.16: Household Participation in Sports and Exercise by villages, 2011 Census Table 3.17: Smokers and Non-smokers of 15 years and over by age groups and sex, 2011 Census. Table 3.17a: Smokers and Non-smokers of 15 years and over by location, 2011 Census. Table 3.18: Drinkers and Non-drinkers of alcohol of 15 years and over by age groups and sex, 2011 Census. Table 3.18a: Alcohol Drinkers and Non drinkers of 15 years and over by location, 2011 Census. Table 3.19: Internet use of 4 years and above by age groups and sex, 2011 Census Table 3.20: Place of internet use by 4 years and above, 2011 Census. Table 3.21: Purpose of internet use by 4 years and above, 2011 Census Table 3.22: Total Television viewers and Radio listeners by 4 years and above in Age groups, 2011 Census Table 3.23: Television viewers by 4 years and above in Age groups, 2011 Census Table 3.24: Proportion of Television viewers by location or villages, 2011 Census Table 3.25: Favourite Programs of Television viewers by Types and sex, 2011 Census Table 3.26: Radio Listeners by 4 years and above in Age groups, 2011 Census Table 3.27: Favourite Programs of Radio Listeners, 2011 Census Table 4.1: Niue Labour market activity for 15 years and over, 2011 Census Table 4.2: Niue Employed Labour force by Age Groups, 2011 Census Table 4.3: Niue Employed Labour force by Occupation Groups (ISCO88), 2011 Census

117
Table 4.4: Niue Employed Labour force by Occupation Groups 2001 - 2011 Census Table 4.5: Niue Employed Labour force by Industry Groups (ISIC Rev4), 2011 Census Table 4.6: Annual Gross Income levels by Sex, 2011 Census Table 4.7: Annual Gross Income levels by Age Group, 2011 Census Table 4.8: Main mode of transport to and from work by villages, 2011 Census Table 5.1: Total number of houses by status and location, 2011 Census Table 5.2. Average household size by Villages: 2001 – 2011, 2011 Census Table 5.3: Percentage Distribution of Household Size, Niue 1997 – 2011 Table 5.4. Distribution of Dwelling types by Villages, 2011 Census Table 5.5: Type of roofing material by villages, 2011 Census Table 5.6: Distribution of Households and Total number of Rooms, 2011 Census Table 5.7: Distribution of Households and Total number of Bedrooms, 2011 Census Table 5.8: Renovations to Households in 5 years by villages, 2011 Census Table 5.9: New Households to be built in 5 years by villages, 2011 Census Table 5.10: Distribution of titled land of household by villages, 2011 Census. Table 5.11: Household Amenities, 2011 Census. Table 5.12: Changes to means of Cooking and Hot Water: 1997 - 2011 Table 5.13. Distribution of Household By Fishing Vessels Table 5.14: Type of Vehicles and Fuel types, 2011 Census. Table 5.15: Type of Vehicles by location, 2011 Census. Table 5.16 : Total number of Kitchen Appliances, 2011 Census Table 5.17: Total number of Other Household Appliances, 2011 Census Table 5.18: Total number of Leisure Appliances, 2011 Census Table 5.19: Distribution of Telephones by household and villages, 2011 Census Table 5.20: Distribution of computers by households and villages, 2011 Census Table 5.21: Distribution of radios and televisions by households and villages, 2011 Census Table 5.22: Distribution of internet connection by households and villages, 2011 Census Table 5.23: Levels of internet connection and computers by households and villages, 2011 Census Table 5.24: Levels of usage of common household appliances, 2011 Census Table 5.25: Households with Agricultural Tools and Equipment by ownership, 2011 Census Table 5.26: Distribution of Households with Agricultural Tools and Equipment by villages, 2011 Census Table 5.27: Distribution of Plantations and those damaged by feral pigs by villages, 2011 Census Table 5.28: Distribution of Households raising pigs and chickens by villages, 2011 Census. List of Figures Fig 1. Distribution of Total Population by Sex Fig 2. Distribution of Residential Population by Sex Fig 2a. Total Population of Niue: 1900 - 2011 Fig 3. Distribution of the Total Population by Villages Fig 4. The population Pyramid of Niue: Population by Age and sex Fig 5. The population Pyramid of Niue: Per cent of each sex Fig 6. The population Pyramid of Niue: Per cent of Total Population Fig 7. Comparing three different estimates of fertility for the period 2002-2006 with estimates for 1997-2002, and 1991-1997
118
Fig 8. Population increase by immigration. Fig 9. Resident population by ethnicity 1986-2011 Fig 10. Resident population by religious denomination Fig 11: Percentage Resident population with Educational Qualification by Sex in Age Groups Fig 12. Vagahau Niue Fig 13. Speak, Read, Write and Understand the Vagahau. Fig 14. Number of households with a umu-place Fig 15. Population with NCDs Fig 16. Proportion and trends of smokers: 2001 - 2011 Fig 17. Proportion and trends of drinkers: 2001 - 2011 Fig 18. Age pyramid of employed labour force by sex Fig19. Distribution of total workforce. Fig 20. Labour force: 1997 - 2011 Fig 21. Distribution of Annual Gross income: 2001 - 2011 Fig 22. Movement of households relative to Population: 2001 - 2011 Fig 23. Household sizes: 1997 - 2011 Fig 24. Types of houses Fig 25. Tenure of living quarters or households Fig 26. Main means of cooking Fig 27. Main means of hot water Fig 28. Three main means of hot water: 1997 - 2011 Fig 29. Three main means of cooking: 1997 - 2011
Appendix 2: Key concepts and definitions (as compiled and used by Niue Statistics Office during the 2011 census) Area Definitions Enumeration Area: This is a unit which may form part of a village or may consist of a whole village, depending on the number of inhabitants or the geographical layout of a village. A total of 24 enumeration areas were used with an average size of about 26 households. Village: A village may consist of one enumeration area or be made up of several enumeration areas (see reasons given above). The traditional unit of a village and its pre-defined boundaries always remain the same and has never changed. Niue: The terms relate solely to geographic Niue. And include persons enumerated on board vessels anchored in port on census night. Population Definitions Relationship to Head of Household: This refers to the relationship of the occupants to the head of the household. In a de facto marital arrangement, relationships are treated in the same way as legal marriages.
119
Place of Birth: The mother’s village of residence at the time of birth, regardless of whether the birth occurred in the Lord Liverpool Hospital, at home or elsewhere. Descent or Ethnic Origin: Refers to the blood mixture of races within a person, and is defined by adding one half of the mother’s racial origin to one half of the father’s racial origin. Half or more of one origin is the general criterion for inclusion in a racial group. Total Population: The basis of total population statistics is the de facto population present at the place of enumeration on census night. Visitors from overseas in Niue on census night are included in the count. Resident Population: This refers to everyone who is resident of Niue at the time of the census disregarding their ethnicity. Niuean population: Comprises all persons who specified themselves as having at least half or more than half of the Niuean blood stock; in cases where there is an equivalent fraction of different racial origins, the person’s preference race is used. Home Village: Refers only to persons of Niuean descent and commonly defines a person’s village of upbringing. Where a person’s birthplace is other than Niue, the originating village of the parents is used. Where the parents originate from different villages, the village where the most time has been spent is chosen. The father’s origin usually outweighs the mother’s origin in difficult cases. Religion: The religious denomination a person identifies with. This is the only question in the census where people have the statutory right not to answer. This does not show how many religious denominations a person follows because it is also possible to participate in more than one denomination. Marital Status Refers to a person’s marital status. Married – Legally married. Divorced is when legally divorced by the Court. De facto refers to a couple living together but are not legally married. Currently attending an educational institution: Ask if a person is still attending school or not. Level of education attending: Refers to all who are still attending primary, secondary and tertiary education. It does not include part time tertiary students who work full time. Educational Attainment: Defined as the highest level of education acquired in the New Zealand school system during the person’s entire lifespan, irrespective of whether or not he or she is currently attending school. Where it is not possible to determine the New Zealand equivalent, a broad category is used. Qualification Attained: The highest qualification gained at/or since leaving school, including completed and conferred certificates, degrees or diplomas obtained regardless of the nature of the qualification (i.e. educational, vocational or personal interest). A partially completed qualification was not recorded as attained.
120
First language as a child and still understands: Refers to the language a person learnt as a child and can still understand. Speaking using the Niuean Aims to find out how many people can speak Niuean. Understanding the Niuean language Aims to find out how many people can understand the Niuean language. Read and write in Niuean Aims to determine the population that is able to read and write using the Niuean language. Willingness to learn the Niuean language Refers to those who answered No to the questions on the ability to understand, read and write using the Niuean language. Residence 12 months prior census night Refers to where the respondent was permanently living 12 months prior. All persons temporarily overseas such as students, Government officials, or on holidays were excluded. Likely place residence in 12 months time Refers to a person’s expectation of where their future permanent residence will be. Main Activity Refers to the person’s own description of his or her main activity, during the week preceding the census, for persons aged 15 and over. Labour force Persons employed and unemployed; excludes those not seeking employment, housewives and students Labour force participation rate The number of persons in the labour force divided by participation rate the corresponding total number of persons (usually those 15 years and older) Paid Labour Force A person was included in the paid labour force if he or she said they worked for pay or profit or in a family business the week before the census. A person working in agriculture and fishing for sale. A person working by making handicraft for sale. Unpaid Labour Force A person working in agriculture and fishing for their own consumption. A person undertaking unpaid family or community work. Unemployed These are people not in the paid or unpaid labour force, and who either looked for work or were available to work in the week prior to the census. These are persons not in the above categories that are they did not work, were not looking for work and were not available to work in the week before the census. Not in the labour force Those in the following categories: Housework / Home duties; Students in fulltime education; Retired / Pensioners; Disabled persons; persons not interested in working

121
Employed This refers to whether the person is working for the Government, in the private sector or is self-employed. Employment Status Refers to sectors in which a person is employed, such as in government (public sector), private sector, self employed, non-government organizations. Industry The type of activity undertaken by the organisation, enterprise, business or unit of economic activity or production within which a person is employed. The industry classification used is based on the United Nations International Standard Industrial Classification (ISIC) Rev. 3. Occupation The principal job, trade, profession or type of work in which a person is employed full-time or part time for monetary gain, or in subsistence activities for sale or consumption. The occupation is classified based on the International Labour Organisation (ILO) International Standard Classification for Occupation 1988. Annual Gross Income Refers to how much the person’s salary/wage is for a 12 month period. Also includes an estimated amount of how much the person gets for selling their produce, fish or handicraft for the same period. Smoking Refers to the person’s smoking habits: never smokes at all, heavy smoker (smokes regularly every day), and casual smoker (smokes only on certain occasions). Drinking Refers to drinking habits: never drinks at all, heavy drinker (drinks regularly every day), and casual drinker (drinks only on certain occasions). A can refers to a can of beer with contents of 340 ml; a glass refers to a standard glass of mixed alcohol like whisky and Coke. Given Birth Asks whether the woman has given birth or not in their lifetime. Number of children born alive who are still living. Refers to the number of natural children born alive who are still living. Number of children born alive who have died Refers to the number of natural children born alive, but who are now deceased; adopted and fostered children are counted by their natural mothers. Household Definitions Household A unit consisting of one or more people who have a common arrangement for providing themselves with food, i.e. preparing meals and eating together. A household may consist of one person, but usually comprises a number of people who are often, but not always, related to each other. It is also possible to have households temporarily without occupants, if the occupants are away overseas.

122
Family unit A family is defined as a husband and wife with or without unmarried children. A married couple staying with their daughter and her husband on census night would constitute a two family household. Private household Those dwellings intended for habitation either by a single person, or a small group of individuals such as a family, who normally (though not always) form a durable social and economic unit, co-operating to provide themselves with the necessities of living. Non-private households or establishments Communal institutions intended for use by large groups of individuals or several families, usually on a semi temporary basis, bound together by a common purpose or similar interests, and sharing the same facilities (including in many cases communal dormitories and recreation areas). This category includes hotels, motels, prisons, hospitals, etc. Tenure of House Refers to the nature of occupancy of a private dwelling. Land Tenure Refers to whether the land the dwelling is built on is land titled to him or anyone else. It does not matter who it is titled to but as long as it has been titled legally in court. Plans on renovating or building a house in the next 5 years Refers to anyone living in the household who are planning to either renovate an existing house or build a new house. Languages spoken in the household Refers only to the main language used in the household irrespective of the households ethnicity. Number of pigs the household owns Refers to the number of pigs a household own in total including those that are situated in the bush. Number of pigpens a household owns Refers to the number of pigpens a household owns including those situated in the bush. Number of plantations a household has and the number ruined by feral pigs Refers to the number of plantations a household had or have in the last 12 months and those ruined by feral pigs. Number of fishing vessels The number of vessels owned by private households which are available for use and in useable order on census night. Number of vehicles Refers to the number of vehicles the household owns and operates and what type of fuel used. Ownership of domestic appliances Refers to the ownership of household items that are in working order, by each private household. Household members overseas Refers to the members of the household temporarily absent overseas, which includes those on training, business or on holiday.

123
Dwelling Definitions Dwelling Defined as living quarters (e.g. a room or a set of rooms) intended for habitation by a household. Thus, a dwelling may be a single building (e.g. a house); or it may consist of several buildings (a main building with a separate cooking or sleeping house, for instance). There may be several dwellings in a building (e.g. a block of flats). A dwelling may be a building not erected for the purpose of habitation (e.g. warehouse or community hall). It may consist of more than one household, in which case there would be separate arrangements for cooking and eating. Type of dwelling Refers to the different categories of the occupied private dwellings based structure (permanent or temporary), which are used wholly or partly for human habitation by one or more households. The categories include house, assembly unit (fale fuakau), flat, kitset house and others, including those not intended for habitation, but occupied by a household at the time of the census. For dwellings consisting of more than one structure, the main structure is taken as the main dwelling. Number of rooms Refers to the number of rooms in the dwelling, and includes bedrooms, sitting rooms and kitchens, but does not include pantries, laundries, bathrooms, toilets, passageways, or open verandas or porches not wholly enclosed. Amenities of dwelling Defines the habitability status of the dwelling with regard to the provision of sanitation, electricity and sewage disposal. Source of water supply Refers to all the possible sources of water supply for the household. Main means of cooking Refers to the main method of cooking most often used by a household; this means that out of all the methods of cooking used by the household, the one selected is used nearly every day. Main means of hot water Refers to the source of hot water most often used by the household. Demographic terms Age -dependency ratio The ratio of persons in the ages defined as dependent (under 15 and over 60 years) to persons in the ages defined as economically productive (15 - 59 years) Age - sex composition Distribution of population by age and sex Age-Specific Fertility Rates (ASFRs) Relates the number of births to women of a particular age-group, in a specific calendar year, to the mid-year population of women in that same age-group Average household size Total population living in private households divided by total number of private households
124
Balancing equation Population growth = Births Deaths + net migration Birth cohorts A group of people born in the same reference period Child mortality Mortality of children between 1 and 4 years of age Child mortality rate Total number of deaths of children aged 1. 4 during a year x, divided by the mid-year population of children aged 1.4 Child-bearing age (for women) Ages 15 - 49 (the reproductive age-span of women) Children Population Population under 15 years of age. Crude Birth Rate (CBR) The total number of live births per 1,000 population in a given year Crude Death Rate (CDR) The total number of deaths in a given year per 1,000 population Direction of migration Destination of migrants Economically active Persons 15 years and older who were employed or population looking for work; also referred to as the labour force. Educational attainment Proportion of the population 15 or 25 years and over by age-groups and level of education Elderly persons Persons aged 60 years and over Emigrants Persons who move out of a country for the purpose of establishing a new residence Extended-family household Household consisting of couples living with their children and others related by blood or through marriage Family A group of two or more persons related by birth, marriage or adoption and living together Fecundity The biological/physiological ability to reproduce Fertility Actual reproductive performance of a population; the number of live births occurring in a population
125
Household A single person living alone or a group voluntarily living together, having common housekeeping arrangements for supplying basic living needs, such as principal meals; the group may consist of related or unrelated persons Immigrants Persons who move into a country for the purpose of establishing a new residence Infant mortality Mortality of children under one year Infant Mortality Rate Total number of deaths of children under one year per (IMR) 1,000 live births in a year In-migrants Persons who move into a different area of a country for the purpose of establishing a new residence Internal migration The movement of people within a country for the purpose of establishing a new residence International migration The movement of people between countries for the purpose of establishing a new residence Life expectancy at birth (E (o)) The average number of years a new-born child would live if current mortality trends were to continue Marital status Married status of a person: includes not-married (single), currently married, divorced/separated, de facto, widowed Median age The age that divides a population into two numerically equal groups; that is, half the people are younger than this age, and half are older Migrant A person who moves for the purpose of establishing a new residence Migration Movement of people across a specified boundary for the purpose of establishing a new residence Mortality Deaths as a component of population change Natural increase Population increase that is the result of births and deaths; growth occurs when the number of births in a given time period (e.g. a calendar year) exceeds the number of deaths; negative growth, or population decline, occurs when the number of deaths exceeds the number of births Net migration rate The net effect of immigration and emigration on a country’s population, expressed as increase/decrease per 1,000 population in a given year
126
Nuclear family A couple and their unmarried children residing together Out-migrants Persons who move out of an area within a country for the purpose of establishing a new residence in a different area of the country Population census The total count of a population usually taken at 5 or 10 year intervals. Population density Number of persons per square mile or square kilometre of land area Population dynamics Development of population through time Population momentum Continued population growth even after birth rates have fallen due to a large number of women of childbearing age because of past high fertility Population policies Measures devised by governments to influence population size, growth or distribution Population processes Vital events or migratory movements: fertility, mortality and migration (including urbanisation) Population projections Scenarios of what future populations may look like under given assumptions Population structure Refers to population size, geographic distribution, age, sex structure and socio-economic characteristics Rate of natural increase Rate at which population grows (increase/decrease) during a given year, as the result of a surplus/deficit of births over deaths; expressed as a percentage of the base population Rate of population Rate at which population grows (increase/decrease) growth during a given year, as the result of natural increase plus net migration; expressed as a percentage of the base population School-age population Depends on the education systems of various countries, but usually ages 6.16 School enrolment Proportion of population, by age-groups or single years of age, currently enrolled in school Sex ratio Number of men per 100 women. Sex ratios over 100 indicate that there are more males than females, and sex ratios under 100 indicate more females than males Socio-economic characteristics of population Ethnicity, marital status, religious denomination, economic activity and educational attainment of population

127
Total Fertility Rate (TFR) The average number of children a woman would give birth to, during her lifetime, if she were to pass through her childbearing years conforming to the Age-Specific Fertility Rates of a given year Vital events Births, deaths, marriages and divorces Vital processes Population processes: fertility, mortality and migration (including urbanisation) Vital statistics Information on vital events Volume of migration Number of migrants Working-age population Normally defined as population aged 15 - 59 (or 15 - 64)
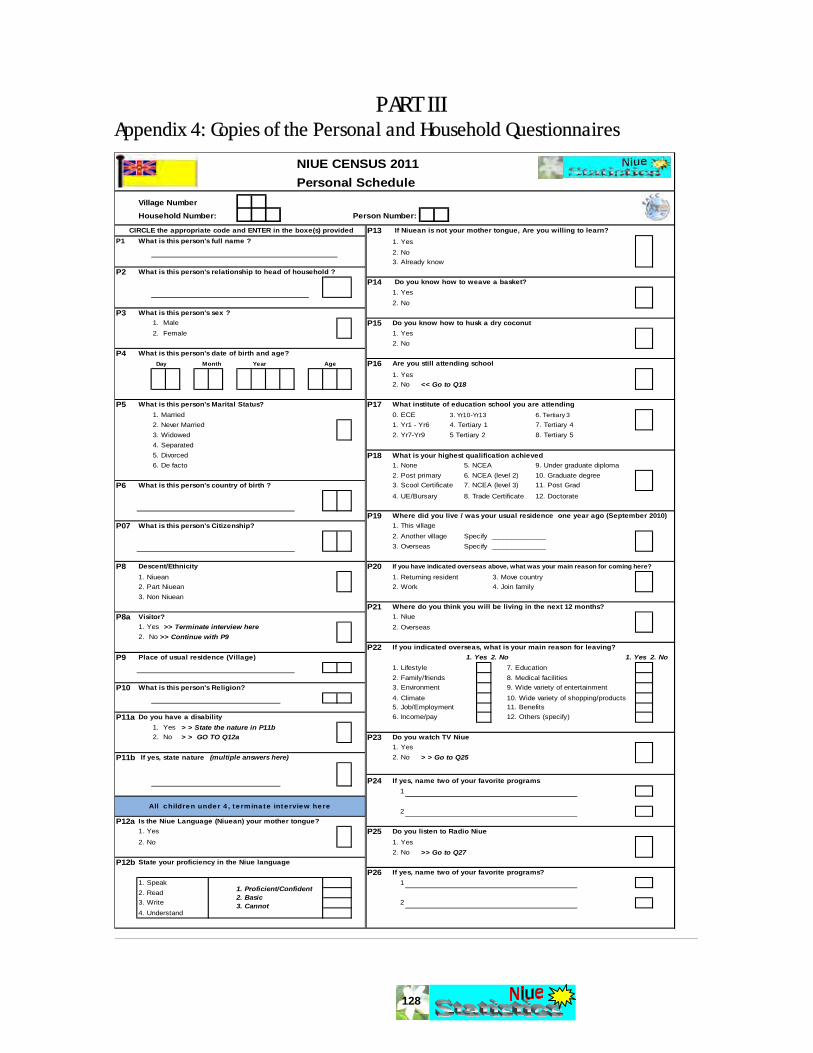
128
PART III Appendix 4: Copies of the Personal and Household Questionnaires
NIUE CENSUS 2011Personal Schedule
Village Number
Household Number: Person Number:
CIRCLE the appropriate code and ENTER in the boxe(s) provided P13 If Niuean is not your mother tongue, Are you willing to learn?P1 What is this person's full name ? 1. Yes
2. No3. Already know
P2 What is this person's relationship to head of household ?P14 Do you know how to weave a basket?
1. Yes2. No
P3 What is this person's sex ?1. Male P15 Do you know how to husk a dry coconut2. Female 1. Yes
2. NoP4 What is this person's date of birth and age?
Day Month Year Age P16 Are you still attending school
1. Yes2. No << Go to Q18
P5 What is this person's Marital Status? P17 What institute of education school you are attending1. Married 0. ECE 3. Yr10-Yr13 6. Tertiary 32. Never Married 1. Yr1 - Yr6 4. Tertiary 1 7. Tertiary 43. Widowed 2. Yr7-Yr9 5 Tertiary 2 8. Tertiary 54. Separated5. Divorced P18 What is your highest qualification achieved6. De facto 1. None 5. NCEA 9. Under graduate diploma
2. Post primary 6. NCEA (level 2) 10. Graduate degreeP6 What is this person's country of birth ? 3. Scool Certificate 7. NCEA (level 3) 11. Post Grad
4. UE/Bursary 8. Trade Certificate 12. Doctorate
P19 Where did you live / was your usual residence one year ago (September 2010)P07 What is this person's Citizenship? 1. This village
2. Another village Specify ______________3. Overseas Specify ______________
P8 Descent/Ethnicity P20 If you have indicated overseas above, what was your main reason for coming here?
1. Niuean 1. Returning resident 3. Move country2. Part Niuean 2. Work 4. Join family3. Non Niuean
P21 Where do you think you will be living in the next 12 months?P8a Visitor? 1. Niue
1. Yes >> Terminate interview here 2. Overseas2. No >> Continue with P9
P22 If you indicated overseas, what is your main reason for leaving?P9 Place of usual residence (Village) 1. Yes 2. No 1. Yes 2. No
1. Lifestyle 7. Education2. Family/friends 8. Medical facilities
P10 What is this person's Religion? 3. Environment 9. Wide variety of entertainment4. Climate 10. Wide variety of shopping/products5. Job/Employment 11. Benefits
P11a Do you have a disability 6. Income/pay 12. Others (specify)1. Yes > > State the nature in P11b2. No > > GO TO Q12a P23 Do you watch TV Niue
1. YesP11b If yes, state nature (multiple answers here) 2. No > > Go to Q25
P24 If yes, name two of your favorite programs1
2P12a Is the Niue Language (Niuean) your mother tongue?
1. Yes P25 Do you listen to Radio Niue2. No 1. Yes
2. No >> Go to Q27P12b State your proficiency in the Niue language
P26 If yes, name two of your favorite programs?1. Speak 12. Read3. Write 24. Understand
All children under 4, terminate interview here
1. Proficient/Confident 2. Basic 3. Cannot

129
P27 Do you use the internet? P37What is your annual gross income?1. Yes 1. $1 -$ 4,999 7. $30,000 - $34,9992. No >> Go to Q30 2. $5,000 - $9,999 8. $35,000 - $39,999
3. $10,000 - $14,9999 9. $40,000 - $44,999P28 Where do you use internet (multiple answers) 4. $15,000 - $19,999 10. $45,000 - $49,999
1.Home 1. Yes 2. No 5. $20,000 - $24,999 11. $50,000 +2. Work 1. Yes 2. No 6. $25,000 - $29,999 12. None3. Place of Education 1. Yes 2. No4. Another home 1. Yes 2. No P38What is your main mode of transport to work?5. Community internet access 1. Yes 2. No 1. Own car/van/truck 3. Motorbike6. Commercial internet acces 1. Yes 2. No 2. Share car/van/truck 4. Bicycle/Walk7. Other locations 1. Yes 2. No `8. Any place via phone 1. Yes 2. No P39How many hours per week do you spend with these activities?9. Any place via other access 1. Yes 2. No 1. Fishing
2. PlantationP29 What you used the internet for? (multiple answers) 3. Handicrafts
1. Getting informations about good and services 1. Yes 2. No2. Getting informations related to health 1. Yes 2. No P40How much money do you earn per week in selling the following produce:3. Getting informations from govt organisations 1. Yes 2. No 1. Fishing4. Interaction with general govt org 1. Yes 2. No 2. Plantation5. Sending or receiving email 1. Yes 2. No 3. Handicrafts6. Telephone over internet (VOIP) 1. Yes 2. No7. Posting information or instant messageing 1. Yes 2. No P41Do you smoke cigarettes?8. Purchasing or ordering goods 1. Yes 2. No 1. Daily 3. Not at all9. Internet banking 1. Yes 2. No 2. Occasionally 4. Don't know / Refuse to answer10. Education or learning 1. Yes 2. No11. Playing or downloading games 1. Yes 2. No P42Do you consume alcohol?12. Downloading movies, images 1. Yes 2. No 1. Daily 3. Not at all13. Donwloading software 1. Yes 2. No 2. Occasionally 4. Don't know / Refuse to answer14. Reading or downloading online newspaper etc 1. Yes 2. No15. Others 1. Yes 2. No P43Do you have this disease / sickness?
1. Diabetes 1. Yes 2. No2. Gout 1. Yes 2. No3. Asthma 1. Yes 2. No
P30 What was your main activity last week? 4. High blood Pressure 1. Yes 2. No1. Employer2. Emplyee working for salary in private sector or Government P44Do you agree that we should increase our population by allowing/enticing3. Self employed, producing goods or services for sale people from overseas to come and live in Niue?4. Self employed, producing goods for own and/or family consumption 1. Yes5. Unpaid worker in (family) business/plantation 2. No >> Go to P46 for all female aged 15 and over, others finish here6. Voluntary work 3. Don't know >> Go to P46 for all female aged 15 and over, others finish here7. Student8. Home Duties >> Go to P39 P45What kind of people do you prefer?9. Retired 1. Niueans 4. Asians 7. Any/No preference10. Did not work (none of the above) >> Go to P33 2. Other Pacific Is 5. Americans
3. European (NZ/Aust) 6. OthersP31 What is your main occupation?
P46Have you ever given birth to a child?P32 What industry do you work in? 1. Yes
2. NoP47Total number of children born alive and are living………
Males Females TotalP33 Did you actively look for paid work? (a)
1. Yes >> Go to P352. No >> Go to P34 (b)
P34 Why didn't you look for work? (c ) Overseas
1. Did not want to work2. Believe no (paid) work available3. Discouraged P48Total number of children born alive but later died4. Weather/No trasport Males Females Total5. Disabled6. Other
P49Total number of children ever born aliveMales Females Total
P35 Were you available to work if a job had been available?1. Yes2. No P50What is the date of birth and sex of the last child born alive?
(including a child that may have died later)P36 How many hours did you work last week? Day Month Year Sex
REMEMBER TO CHECK YOUR QUESTIONNAIRE BEFORE LEAVING THE HOUSE
FOR ALL PERSONS AGED 15 YEARS AND OVER
FOR ALL FEMALES AGED 15 YEARS AND OVER
F=2
Answer and Go to P39
In this household
Somewhere else in Niue
M=1
If P30, P31, P32 either 1,2,3 then
Go to P36

130
NIUE CENSUS 2011Housing and Dwelling Schedule
Village Number: H2. Males
Household Number: H3. Females
H1. Name of household head H4. Total Persons H5. Family Units
H6 Record all persons who are temporarily overseas (Include only those absent for 12 months and less)
Sex
1
2
3
4
5
6
7
8
9
10
H7 Type of dwelling H12 Amenities of dwelling1. Hurricane 1. Toilet Long Drop 1. Yes 2. No
2. Hurricane with extension 2. Toilet Water Seal 1. Yes 2. No
3. Modern house 3. Toilet Flush 1. Yes 2. No
4. Fale puga 4. Sewage Natural Hole 1. Yes 2. No5. Others (inclduing toursit accomodation, prison, hospital, etc) 5. Sewage Concrete Bottomless 1. Yes 2. No
6. Sewage Concrete complete 1. Yes 2. No
H7a Type of roofing: 1. Steel 2. Asbestos 3. Both 7. Hand Basin 1. Yes 2. No
8. Washing Tub 1. Yes 2. No
H8 Number of rooms in the living quarter 9. Bathtub 1. Yes 2. No
1. Bedroom 10. Shower 1. Yes 2. No
2. Kitchen 11. Kitchen sink 1. Yes 2. No
3. Bathroom 12. Food safe 1. Yes 2. No
4. Laundry 13. Food cupboard 1. Yes 2. No
5. Garage 14. Electricity Public supply 1. Yes 2. No
6. Sitting room 15. Electricity Own generation 1. Yes 2. No
7. Dining
8. Toilet
9. Linen H13 Main means of cooking10. Others 1.Eelectricty
2. GasH9 Do you think that you or anyone in the household will be renovating or 3. Wood
building a new house in the next 5 years? 4. Charcoal1. Renovate 1. Yes 2. No 5. Kerosene2. New 1. Yes 2. No 6. Others
H10 Tenure of living quarters1. Own outright H14 Main means of hot water2. Rent 1. Electricity'3. Lease 2. Gas4. Free with job 3. Wood5. Bying on mortgage 4. Solar Heater
5. OthersH11 Is the land this house built on titled? 6. None
1. Yes2. No
3. Don't know
Relationship to head of household
______/_______/_____________
______/_______/_____________
This Census is conducted under the legal authority of the Niue Statistics Act 2009
WARNING: Divulging of any information collected from the census and mutilation of defacement of the schedule is prohibited according to section (12) and (13) of the Niue Statistics Act 2009
Name Length of absenceReasons of
absenceDate of Birth
Write the appropriate answer(s) in the box(es) provided
______/_______/_____________
______/_______/_____________
______/_______/_____________
______/_______/_____________
______/_______/_____________
______/_______/_____________
______/_______/_____________
______/_______/_____________
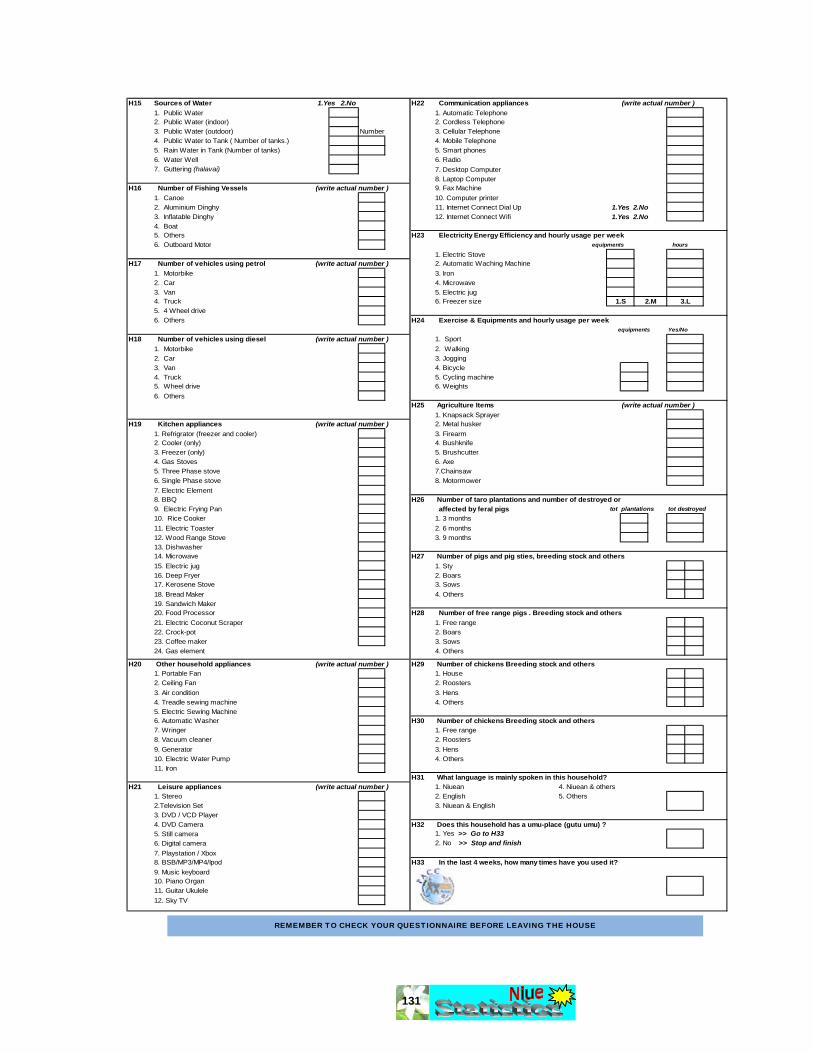
131
H15 Sources of Water 1.Yes 2.No H22 Communication appliances (write actual number )1. Public Water 1. Automatic Telephone2. Public Water (indoor) 2. Cordless Telephone3. Public Water (outdoor) Number 3. Cellular Telephone4. Public Water to Tank ( Number of tanks.) 4. Mobile Telephone5. Rain Water in Tank (Number of tanks) 5. Smart phones6. Water Well 6. Radio7. Guttering (halavai) 7. Desktop Computer
8. Laptop ComputerH16 Number of Fishing Vessels (write actual number ) 9. Fax Machine
1. Canoe 10. Computer printer2. Aluminium Dinghy 11. Internet Connect Dial Up 1.Yes 2.No3. Inflatable Dinghy 12. Internet Connect Wifi 1.Yes 2.No4. Boat5. Others H23 Electricity Energy Efficiency and hourly usage per week6. Outboard Motor equipments hours
1. Electric StoveH17 Number of vehicles using petrol (write actual number ) 2. Automatic Waching Machine
1. Motorbike 3. Iron2. Car 4. Microwave3. Van 5. Electric jug4. Truck 6. Freezer size5. 4 Wheel drive6. Others H24 Exercise & Equipments and hourly usage per week
equipments Yes/No
H18 Number of vehicles using diesel (write actual number ) 1. Sport1. Motorbike 2. Walking2. Car 3. Jogging3. Van 4. Bicycle4. Truck 5. Cycling machine5. Wheel drive 6. Weights6. Others
H25 Agriculture Items (write actual number )1. Knapsack Sprayer
H19 Kitchen appliances (write actual number ) 2. Metal husker1. Refrigrator (freezer and cooler) 3. Firearm2. Cooler (only) 4. Bushknife3. Freezer (only) 5. Brushcutter4. Gas Stoves 6. Axe5. Three Phase stove 7.Chainsaw6. Single Phase stove 8. Motormower7. Electric Element8. BBQ H26 Number of taro plantations and number of destroyed or9. Electric Frying Pan affected by feral pigs tot plantations tot destroyed10. Rice Cooker 1. 3 months11. Electric Toaster 2. 6 months12. Wood Range Stove 3. 9 months13. Dishwasher14. Microwave H27 Number of pigs and pig sties, breeding stock and others15. Electric jug 1. Sty16. Deep Fryer 2. Boars17. Kerosene Stove 3. Sows18. Bread Maker 4. Others19. Sandwich Maker20. Food Processor H28 Number of free range pigs . Breeding stock and others21. Electric Coconut Scraper 1. Free range22. Crock-pot 2. Boars23. Coffee maker 3. Sows24. Gas element 4. Others
H20 Other household appliances (write actual number ) H29 Number of chickens Breeding stock and others1. Portable Fan 1. House2. Ceiling Fan 2. Roosters3. Air condition 3. Hens4. Treadle sewing machine 4. Others5. Electric Sewing Machine6. Automatic Washer H30 Number of chickens Breeding stock and others7. Wringer 1. Free range8. Vacuum cleaner 2. Roosters9. Generator 3. Hens10. Electric Water Pump 4. Others11. Iron
H31 What language is mainly spoken in this household?H21 Leisure appliances (write actual number ) 1. Niuean 4. Niuean & others
1. Stereo 2. English 5. Others2.Television Set 3. Niuean & English3. DVD / VCD Player4. DVD Camera H32 Does this household has a umu-place (gutu umu) ?5. Still camera 1. Yes >> Go to H336. Digital camera 2. No >> Stop and finish7. Playstation / Xbox8. BSB/MP3/MP4/Ipod H33 In the last 4 weeks, how many times have you used it?9. Music keyboard10. Piano Organ11. Guitar Ukulele12. Sky TV
3.L1.S 2.M
REMEMBER TO CHECK YOUR QUESTIONNAIRE BEFORE LEAVING THE HOUSE
132
NNiiuuee 22001111 CCeennssuuss ooff PPooppuullaattiioonn aanndd HHoouusseehhoollddss
Enumerator’s Manual of Instructions
&
Field Booklet
133
PART ONE 1. Legislation The Census is taken under the statutory authority and provisions of the Niue Statistics Act 2009, No. 301. You will be carrying a copy of the Act while enumerating so you and the respondent can identify each others role in the census;
• The responsibility of the enumerator to collect and record the data • The onus of the respondent to answer the questions, and • Identify the punishments for failing to oblige.
2. Confidentiality All information collected for the Census is CONFIDENTIAL. Therefore, you are not in any circumstances allowed to disclose any information to any other persons, any Government Department, Police or the Taxation Office, even upon request without prior knowledge of the Government Statistician. It is an offence under the provisions of the Niue Statistics Act 2009 to release or reveal any personal information collected under the Census or to use the information for any other purpose other than for statistical purposes ONLY. 3. Appointments You have been appointed as Census Enumerator for the purpose of taking the population and household census of Niue 2011 in accordance with Article 3 Part(3), (4) and (5) of the Act. In accepting this appointment you are under Article 5 and Article 12 of the Act duly required to carry out your duties as Census Enumerator. You will be issued a Certificate of Appointment and an Identification card of which you should take with you as proof of your identity and role. 4. Census Moment The Census moment or sometimes referred to as a “reference point in time” is 12 midnight that connects Saturday, 10 September with Sunday 11 September 2011. The Census is the count of the populations as at 12 midnight of that night. 5. Gaining Cooperation You are chosen to be the enumerator for this area because you are familiar with people and the area. There has been a wide coverage of this exercise in the media therefore the people of Niue are aware and are expecting you. Your first aim should be to gain the cooperation of the person you are interviewing. If a person is unwilling or you know that they are giving you false answers, try and find out the reason for this behaviour and try and to resolve it. If their reasons for their reluctance in giving information are personal, sensitive or they think that it may be used against them, it is your duty to assure them that everything written on their schedules are confidential under the provisions of the Statistics Act Article 12 (2) & (3). Assure them that you are under oath, meaning that you cannot disclose any information to anyone else.

134
6. Enumeration Area Your area or village number and the matching enumeration area number of which you will be enumerating is one of the ones below. The classification of Area/Village Number and Enumeration Area Number: Village Name Village/Area No. Enumeration Area No
Alofi South 50 15, 16, 17, 18 Alofi North 51 19, 20 Makefu 52 01 Tuapa 53 02 Namukulu 54 03 Hikutavake 55 04 Toi 56 05 Mutalau 57 06 Lakepa 58 07 Liku 59 08 Hakupu 60 09, 10 Vaiea 61 11 Avatele 62 12, 13 Tamakautoga 63 14
Maps A map of your area is included in your census kit. Use it to guide you in your enumeration work. The map must be returned with ALL the schedules. 7. Difficult Cases If the respondents remains difficult or you are convinced that they are not going to or have no intentions of cooperating, you are to report the matter to the Supervisor immediately by phone or inform him/her when he/she comes to visit. 8. Respondents Rights You are to remember that the law does provide additional privacy for persons who are unwilling to give personal details on an open Population schedule. If this is the case, allow them to fill out their own questionnaire. Give them the schedule and tell them to put it in the envelope, which is provided. Make sure that you remind them politely that they are required to complete all questions correctly and properly. If there are incomplete questions then the Supervisor or the Government Statistician will return with the schedules. Note Article 23, Article 24 and Article 25 of the Act and bring it to the attention of the respondent. Hand over the envelope to the respondent with the information below and asked him/her to put all papers inside when finished. The supervisor will pick it up.
1. Name 2. Enumeration Area Number 3. Village 4. Household Schedule Number
Note: Supervisors please DO NOT OPEN the envelope.
135
9. Definitions Household/Dwelling: Refers to a house where:
1. A single person living alone and responsible for housekeeping arrangements for supplying basic living needs, such as principal meals.
2. A group voluntarily living together under one roof, having common housekeeping arrangements for supplying basic living needs, such as principal meals.
3. A group voluntarily living in more than 1 house but having common housekeeping arrangements for supplying basic living needs, such as principal meals.
4. The group may consist of related or unrelated persons. The following serves as examples of special cases you may encounter:
Old people who sleep in the house or in a assembly unit or any type of building separate from the main house, but share the cooking facilities and eat together; belong to the same household.
A visitor, border or lodger who sleeps in the house or in any type of building separate from the house belongs to the household. If a house or flat is shared by two or more family groups, each of which makes their own arrangements for cooking and eating, such groups should be regarded as constituting separate households. On the other hand if “everyone” in two or more family groups share the kitchen and house and eat together, they are to be regarded as members of one family.
Head of Household/Dwelling: Refers to the Head of the house and family whom others are related to. Note: In some occasions there maybe more than 1 family unit in the household, please establish who really the head of the household as oppose to head of family units.
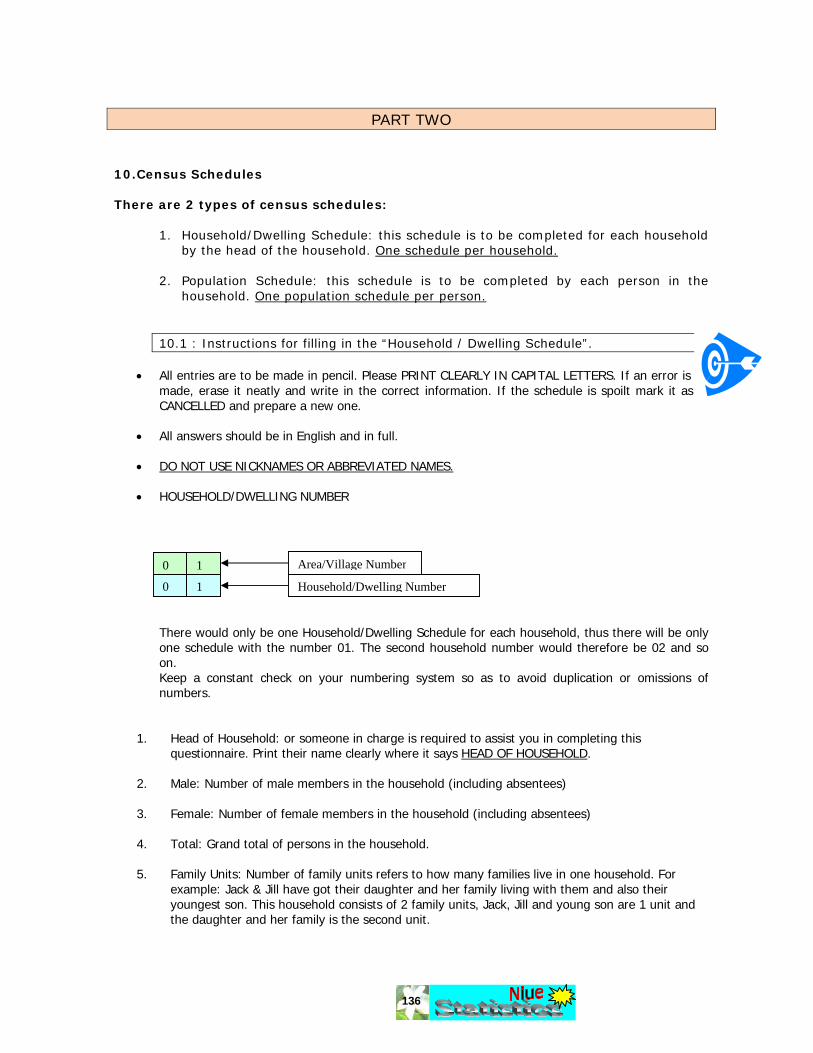
136
PART TWO
10. Census Schedules There are 2 types of census schedules:
1. Household/Dwelling Schedule: this schedule is to be completed for each household by the head of the household. One schedule per household.
2. Population Schedule: this schedule is to be completed by each person in the
household. One population schedule per person.
10.1 : Instructions for filling in the “Household / Dwelling Schedule”.
• All entries are to be made in pencil. Please PRINT CLEARLY IN CAPITAL LETTERS. If an error is made, erase it neatly and write in the correct information. If the schedule is spoilt mark it as CANCELLED and prepare a new one.
• All answers should be in English and in full.
• DO NOT USE NICKNAMES OR ABBREVIATED NAMES.
• HOUSEHOLD/DWELLING NUMBER
There would only be one Household/Dwelling Schedule for each household, thus there will be only one schedule with the number 01. The second household number would therefore be 02 and so on. Keep a constant check on your numbering system so as to avoid duplication or omissions of numbers.
1. Head of Household: or someone in charge is required to assist you in completing this questionnaire. Print their name clearly where it says HEAD OF HOUSEHOLD.
2. Male: Number of male members in the household (including absentees)
3. Female: Number of female members in the household (including absentees)
4. Total: Grand total of persons in the household.
5. Family Units: Number of family units refers to how many families live in one household. For example: Jack & Jill have got their daughter and her family living with them and also their youngest son. This household consists of 2 family units, Jack, Jill and young son are 1 unit and the daughter and her family is the second unit.
0 1
0 1
Area/Village Number
Household/Dwelling Number
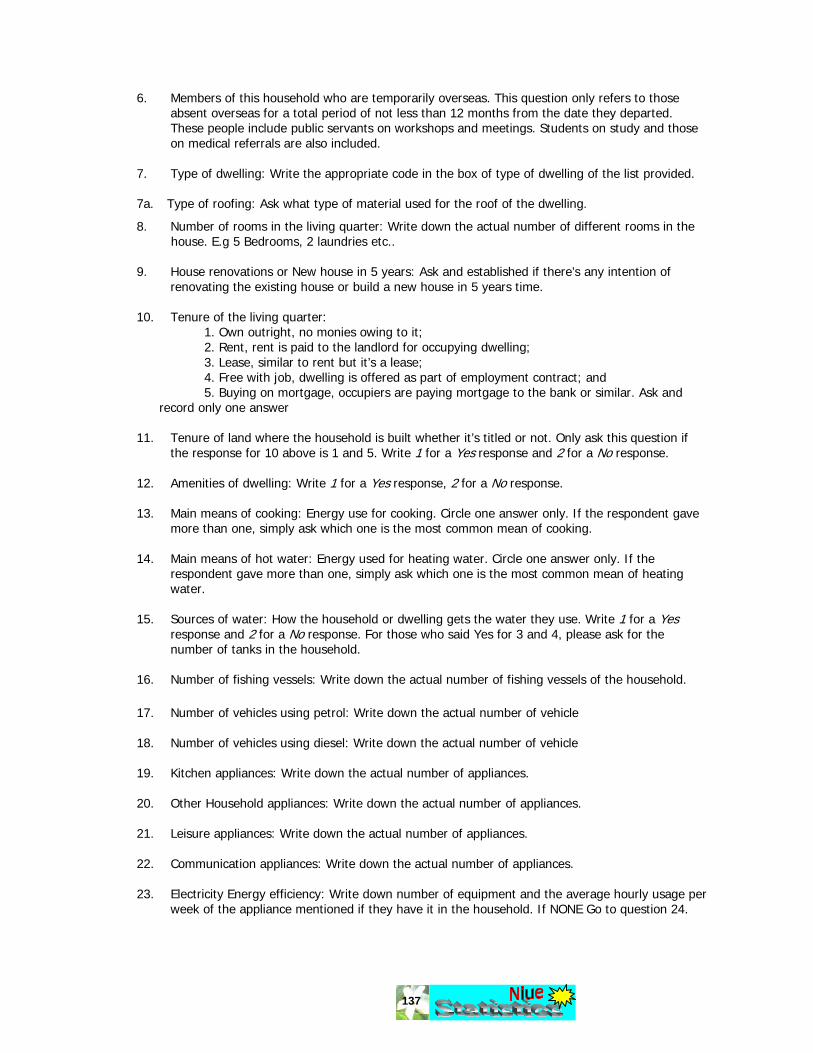
137
6. Members of this household who are temporarily overseas. This question only refers to those absent overseas for a total period of not less than 12 months from the date they departed. These people include public servants on workshops and meetings. Students on study and those on medical referrals are also included.
7. Type of dwelling: Write the appropriate code in the box of type of dwelling of the list provided.
7a. Type of roofing: Ask what type of material used for the roof of the dwelling.
8. Number of rooms in the living quarter: Write down the actual number of different rooms in the house. E.g 5 Bedrooms, 2 laundries etc..
9. House renovations or New house in 5 years: Ask and established if there’s any intention of renovating the existing house or build a new house in 5 years time.
10. Tenure of the living quarter: 1. Own outright, no monies owing to it; 2. Rent, rent is paid to the landlord for occupying dwelling; 3. Lease, similar to rent but it’s a lease; 4. Free with job, dwelling is offered as part of employment contract; and 5. Buying on mortgage, occupiers are paying mortgage to the bank or similar. Ask and
record only one answer
11. Tenure of land where the household is built whether it’s titled or not. Only ask this question if the response for 10 above is 1 and 5. Write 1 for a Yes response and 2 for a No response.
12. Amenities of dwelling: Write 1 for a Yes response, 2 for a No response.
13. Main means of cooking: Energy use for cooking. Circle one answer only. If the respondent gave more than one, simply ask which one is the most common mean of cooking.
14. Main means of hot water: Energy used for heating water. Circle one answer only. If the respondent gave more than one, simply ask which one is the most common mean of heating water.
15. Sources of water: How the household or dwelling gets the water they use. Write 1 for a Yes response and 2 for a No response. For those who said Yes for 3 and 4, please ask for the number of tanks in the household.
16. Number of fishing vessels: Write down the actual number of fishing vessels of the household.
17. Number of vehicles using petrol: Write down the actual number of vehicle
18. Number of vehicles using diesel: Write down the actual number of vehicle
19. Kitchen appliances: Write down the actual number of appliances.
20. Other Household appliances: Write down the actual number of appliances.
21. Leisure appliances: Write down the actual number of appliances.
22. Communication appliances: Write down the actual number of appliances.
23. Electricity Energy efficiency: Write down number of equipment and the average hourly usage per week of the appliance mentioned if they have it in the household. If NONE Go to question 24.
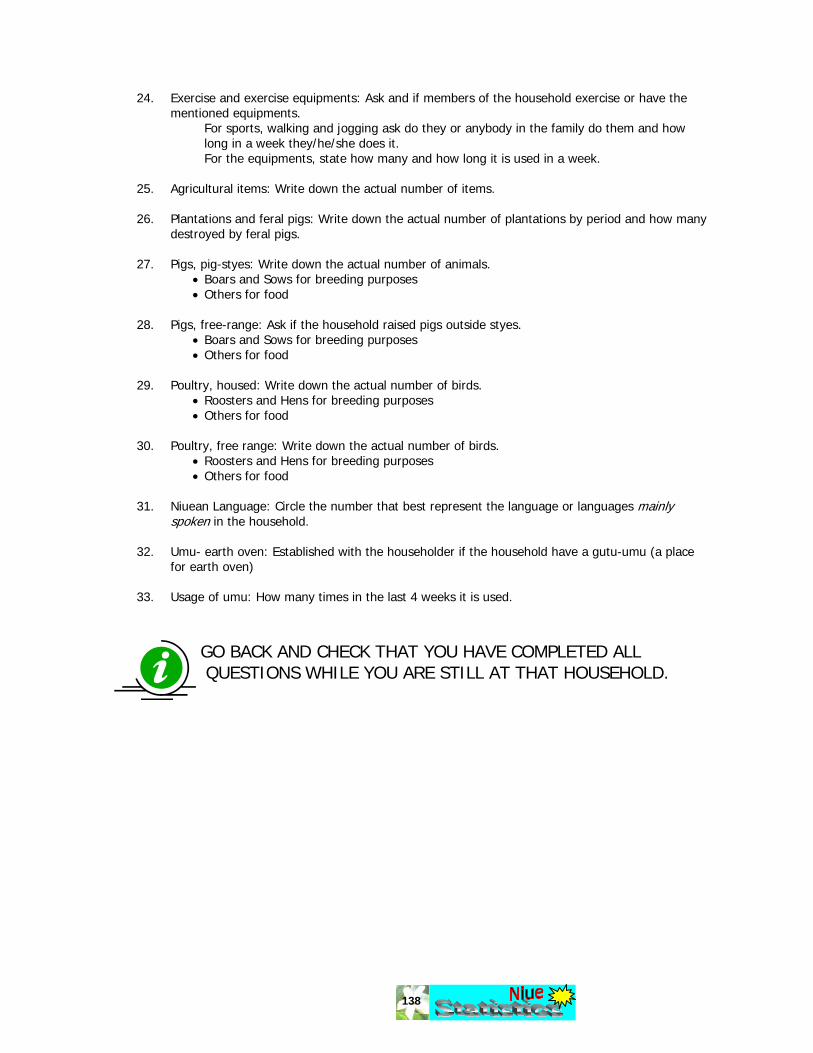
138
24. Exercise and exercise equipments: Ask and if members of the household exercise or have the mentioned equipments.
For sports, walking and jogging ask do they or anybody in the family do them and how long in a week they/he/she does it. For the equipments, state how many and how long it is used in a week.
25. Agricultural items: Write down the actual number of items.
26. Plantations and feral pigs: Write down the actual number of plantations by period and how many destroyed by feral pigs.
27. Pigs, pig-styes: Write down the actual number of animals. • Boars and Sows for breeding purposes • Others for food
28. Pigs, free-range: Ask if the household raised pigs outside styes.
• Boars and Sows for breeding purposes • Others for food
29. Poultry, housed: Write down the actual number of birds.
• Roosters and Hens for breeding purposes • Others for food
30. Poultry, free range: Write down the actual number of birds.
• Roosters and Hens for breeding purposes • Others for food
31. Niuean Language: Circle the number that best represent the language or languages mainly
spoken in the household.
32. Umu- earth oven: Established with the householder if the household have a gutu-umu (a place for earth oven)
33. Usage of umu: How many times in the last 4 weeks it is used.
GO BACK AND CHECK THAT YOU HAVE COMPLETED ALL QUESTIONS WHILE YOU ARE STILL AT THAT HOUSEHOLD.

139
10.2 INSTRUCTIONS FOR FILLING IN “THE POPULATION SCHEDULE”
All persons in the household are required to complete a Population Schedule. Person Number The numbers must be put in the last two boxes of the 6 boxes located at the top right hand corner of the questionnaire labelled Person No. For example: Person numbers should be in series as follow:
• Head of household or person in charge - 010101 • Spouse - 010102 • Unmarried sons and daughters- 010103 • Adopted children - 010104 • Married sons and daughters - etc • Grandchildren
1. Surname, Given Names Again, remember to write down the person’s real name not nicknames or initials. Also, ask for the spelling of the person’s name. 2. Relationship to Head of Household 1 Husband/Spouse 5 Niece 9 Grandchild 2 Wife/Spouse 6 Nephew 10 In laws 3 Son 7 Uncle 11 Not related 4 Daughter 8 Aunty Q3. Sex: Write 1 if the respondent is male and 2 if female. Q4. Date of Birth: Written as Day-Month-Year. The importance of a person’s date of birth is relevant to provide accurate data for health and population studies. Check to see you have NOT written today’s date. Q5. Marital Status: Marital Status of respondents:
• M Married legally married • NM Never Married has never been married • W Widowed spouse is deceased • S Separated still married but living separately from spouse • D* Divorced legally divorced • DF De facto living with partner but not legally married
* Make sure that divorced couples are legally separated by court order. Q6. Country of birth: Ask and write down the country where the respondent was born and the appropriate country code in the box (Table 2 of the Appendices).
0 1
0 1
0 5Area/Village number
Household Number
Person Number

140
Q7. Country of citizenship or permanent residency: Determines to ascertain person’s immigration status on Niue. Respondents who were granted permanent residency are regarded as Niuean residents despite the passport they hold and country of birth. Q8. Descent/Ethnicity:
• 1 – Niuean: Country of birth and citizenship is Niue and both parents are Niuean origin; • 2 – Part Niuean: One parent is Niuean and the other of another nationality; • 3 – Non-Niuean: A respondent not of any Niuean origin.
Q8a. Visitor: Ask if the respondent is a visitor. If YES terminate interview, IF NO continue. Q9. Home village: TO BE ANSWERED ONLY BY PERSONS BORN IN NIUE. A person’s home village is the village they lived during their childhood. If lived in more than one; the mother’s village of origin or where he/she prefers. For all others including visitors and foreigners write N/A. Q10 Religion: Use the following abbreviations to indicate religious convictions and affiliations. 1 EN Ekalesia Kerisiano Niue 2 RC Roman Catholic 3 LDS Latter Day Saints 4 Pr Presbyterian 5 JW Jehovah’s Witness 6 SDA Seventh Day Adventist 7 M Methodist 8 CE Church of England 9 B Baptists 10 O Other (specify) 99 No NOTE: This question is optional and a person has the right to refuse to answer. If a person refuses to answer this question write “OBJECT”. If the person says that he or she supports no particular religion write “NONE”. Q11. Disability: Ask the respondent if he or she has any disability. PERSONS 4 YEARS AND OVER ARE RQUIRED TO CONTINUE TO THE NEXT QUESTION. Q12. Vagahau Niue - a) Speech: Is the Niue language your mother tounge? b) Proficiency in the Niue language ( 1 – Proficient/Confident; 2 – Basic, 3 – Cannot) in:
i. Speech ii. Read iii. Write iv. Understand
c) Written: How well can you write in the vagahau Niue? d) Use: How often you write in the vagahau Niue? Q13. Vagahau Niue - Respondent who does not speak and write the vagahau Niue and willing to learn. Q14. Culture: Ask if the respondent know how to weave a basket out of coconut leaves(kato-tapola) Q15. Culture: Ask if the respondent know how to husk a dry coconut (fua niu pakupaku)

141
Q16. School attendance: Established if the respondent at the age of 4 upwards are at school and the older ones did go to school once. If they say YES ask Q17 if NO ask Q18 Q17. Education Institution: Ask the respondent of what education institute or school she/he is attending at the time of survey.
• If respondent is in ECE go to Q19 • If respondent is in Yr1 – Yr6 Primary school go to Q19 • If respondent is in Yr7 – Yr9 High School go to Q18 • If respondent is in Yr10 – Yr13 High School ask Q18 • If respondent is in a Tertiary institute level 4,5,and 6 ask Q18
Q18. Highest level of education attained: Obtain from the respondent their highest level of education, whether it be primary, secondary or tertiary ONLY if the respondent is 15 years old or currently in Year 11 and above. This question attempts to determine the most recent level (highest) of qualification the person has attained. Those who acquired a school certificate but later received a MA degree should state MA. Use the common abbreviations such as M.A, B.Com, U.E, etc. If a respondent has more than one qualification select the one that is considered of the highest level and if there is no difference of level, select the qualification that took the most time to obtain. CHECK that the reported qualification is compatible with the answer in Q 18. It is clear that a degree of law can only be reported by someone who attended University. Q19. Place of resident in September 2010: Ask the respondent where was he/she in September 2010 (last year); in this village, in another village , or overseas. Q20. Reasons of coming to Niue: Ask only if the respondent have said he/she was overseas in September 2010 and currently in Niue. Q21. Intended place of residence next year: Ask the respondent where would he/she be in 2012, in Niue or overseas. Q22. Why leave Niue: If the respondent said he/she will be overseas, ask what is the main reason of leaving Niue. Q23 & Q24.Television Niue: Ask if the respondent watch Television Niue. If Yes ask to name his/her favourite program. If No go to Q25 and Q26. Q25 & Q26. Niue Radio Sunshine: Ask if the respondent listen to Niue Radio Sunshine. If Yes ask to name his/her favourite program. If No stop the interview if the respondent is under 15 years of age. Q27. Internet: Ask the respondent if he or she uses the internet. If ‘Yes’ got to Q28 and Q29. If No, go to Q30 Q28. Location of internet use: Ask the respondent of where he/she used the internet., This is a multi-response question so identify and explain to the respondent the certain places where internet is available.
• Home • Work • Place of education • Another person’s home • Community Internet Access Facility • Commercial Internet Access facility

142
• Other locations • Any place via mobile phone • Any place via other mobile access devices
Q29. Purpose of internet use: Ask the respondent of what he or she used the internet for.
• Getting information about goods and services • Getting information related to health • Getting information from government organisations • Interact with government organisations • Sending and receiving mail • Telephoning over the internet/VoiP • Posting information or instant messaging • Purchasing or ordering goods or services • Internet banking • Education or learning activities • Playing or downloading video games or computer games • Downloading movies, images, music, watching TV or video, or listening to radio or music. • Downloading software • Reading or downloading online newspaper or magazines, electronic books • Other activities
ONLY PERSONS 15 YEARS AND OVER TO COMPLETE THE NEXT PART Q30. Main activity last week: Ask the respondent what was his/her main activity last week and follow the appropriate route. Please note: If the respondent said he/she was not working because of certain reasons such as being ill or on leave with or without pay but used to work, ask what was his/her main activity.
1. Working full time for wage or salary Persons who worked most of last week in a wage job, which should be considered as working full time. Note that those who were sick, on maternity leave or on holiday last week but are normally working for a financial reward should be included in this group.
Note that those who were sick, on maternity leave or on holiday last week but are normally working for a financial reward should be included in this group.
2. Working part time (including casual) Person who worked for less than 25 hours last week or working temporarily should be considered as working on casual basis.
Note that those who were sick, on maternity leave or on holiday last week but are normally working for a financial reward should be included in this group.
3. Working in agriculture, fishing, handicraft making mainly sale Person who worked most of last week at the plantation or fishing or doing such activities as “tuki ugako” for sale. 4. Working mainly to produce for own use/household consumption A person who spent most of last week at; the plantation, the sea or doing activities related to the growing, gathering and catching own food for the households consumption should be included in this group. 5. Domestic Duties not working for wages
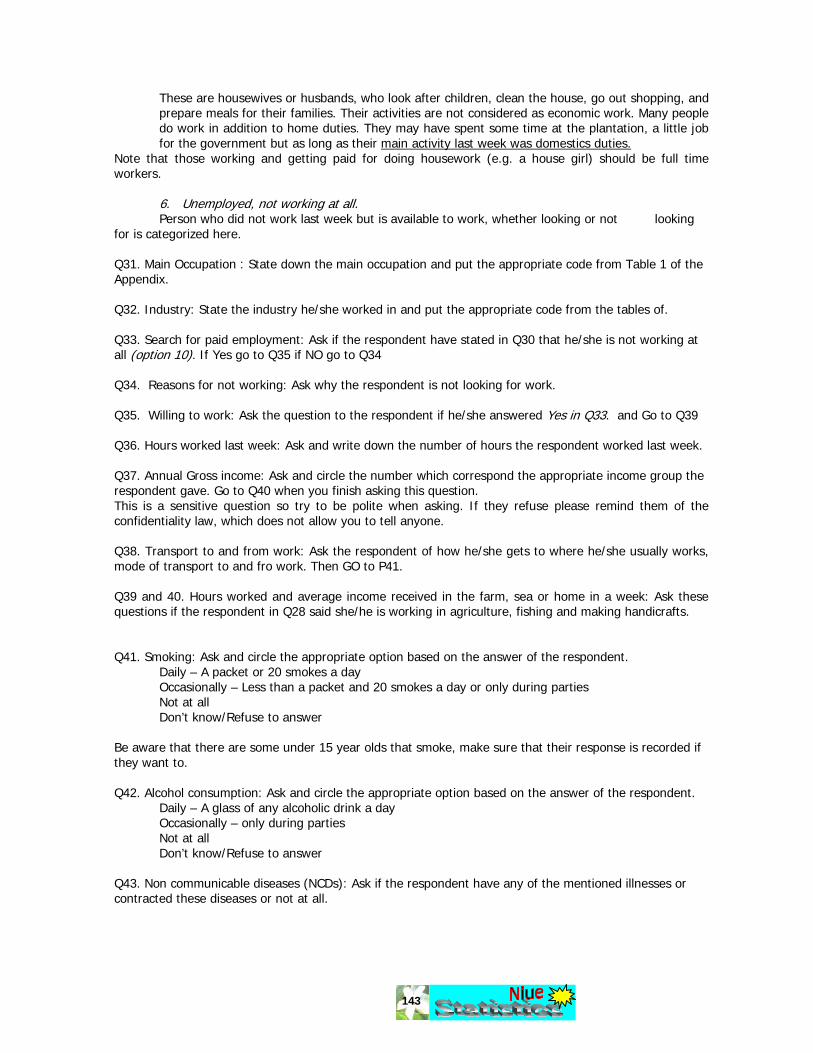
143
These are housewives or husbands, who look after children, clean the house, go out shopping, and prepare meals for their families. Their activities are not considered as economic work. Many people do work in addition to home duties. They may have spent some time at the plantation, a little job for the government but as long as their main activity last week was domestics duties.
Note that those working and getting paid for doing housework (e.g. a house girl) should be full time workers.
6. Unemployed, not working at all. Person who did not work last week but is available to work, whether looking or not looking
for is categorized here. Q31. Main Occupation : State down the main occupation and put the appropriate code from Table 1 of the Appendix. Q32. Industry: State the industry he/she worked in and put the appropriate code from the tables of. Q33. Search for paid employment: Ask if the respondent have stated in Q30 that he/she is not working at all (option 10). If Yes go to Q35 if NO go to Q34 Q34. Reasons for not working: Ask why the respondent is not looking for work. Q35. Willing to work: Ask the question to the respondent if he/she answered Yes in Q33. and Go to Q39 Q36. Hours worked last week: Ask and write down the number of hours the respondent worked last week. Q37. Annual Gross income: Ask and circle the number which correspond the appropriate income group the respondent gave. Go to Q40 when you finish asking this question. This is a sensitive question so try to be polite when asking. If they refuse please remind them of the confidentiality law, which does not allow you to tell anyone. Q38. Transport to and from work: Ask the respondent of how he/she gets to where he/she usually works, mode of transport to and fro work. Then GO to P41. Q39 and 40. Hours worked and average income received in the farm, sea or home in a week: Ask these questions if the respondent in Q28 said she/he is working in agriculture, fishing and making handicrafts. Q41. Smoking: Ask and circle the appropriate option based on the answer of the respondent. Daily – A packet or 20 smokes a day Occasionally – Less than a packet and 20 smokes a day or only during parties
Not at all Don’t know/Refuse to answer
Be aware that there are some under 15 year olds that smoke, make sure that their response is recorded if they want to. Q42. Alcohol consumption: Ask and circle the appropriate option based on the answer of the respondent. Daily – A glass of any alcoholic drink a day Occasionally – only during parties
Not at all Don’t know/Refuse to answer
Q43. Non communicable diseases (NCDs): Ask if the respondent have any of the mentioned illnesses or contracted these diseases or not at all.

144
Q44 & Q45. Population development: Ask if the respondent agree that we should increase our population for economic development thus allowing people from overseas to come and live in Niue and what kind of people preferred to come.
This part is for all female persons 15 years and over
Q46. Ask if the female respondent have given birth to a child. If Yes go to Q47 – Q50 Q47. Number of children still living: Only include children that are born to that person. Adopted children, foster children, step children are not counted. If this person has children adopted out by another person, the birth mother must include these children. Q48. Number of children alive at birth now deceased: Be courteous when this question is asked. This is the number of children born to this person that are now deceased. Q49. Number of children ever born alive: Be courteous when this question is asked. This is the number of children born to this person who died at birth. Q50. Date of birth of last child born alive: If mother has forgotten the date, ask her of any historical event that may have occurred at the time and then estimate the year. Refer to historical calendar at the back for assistance.
AT THE END OF THE INTERVIEW At completion of the interview, you must check to ensure that everybody in the household has been enumerated. The household & dwelling schedules for each household are to be bound together with the population schedules for each household. IMPORTANT: In case that you need to record further details to assist the Census Office in editing the forms, you can do so, by writing your comments somewhere closer to question or person’s response.
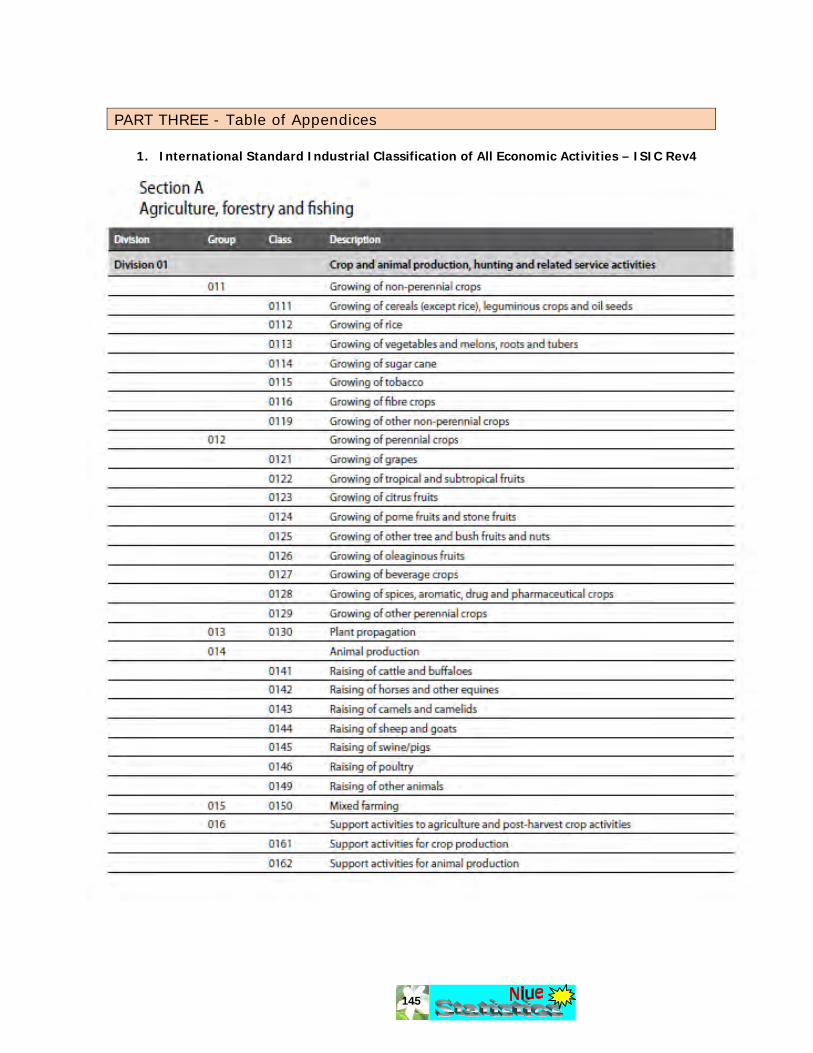
145
PART THREE - Table of Appendices
1. International Standard Industrial Classification of All Economic Activities – ISIC Rev4

146
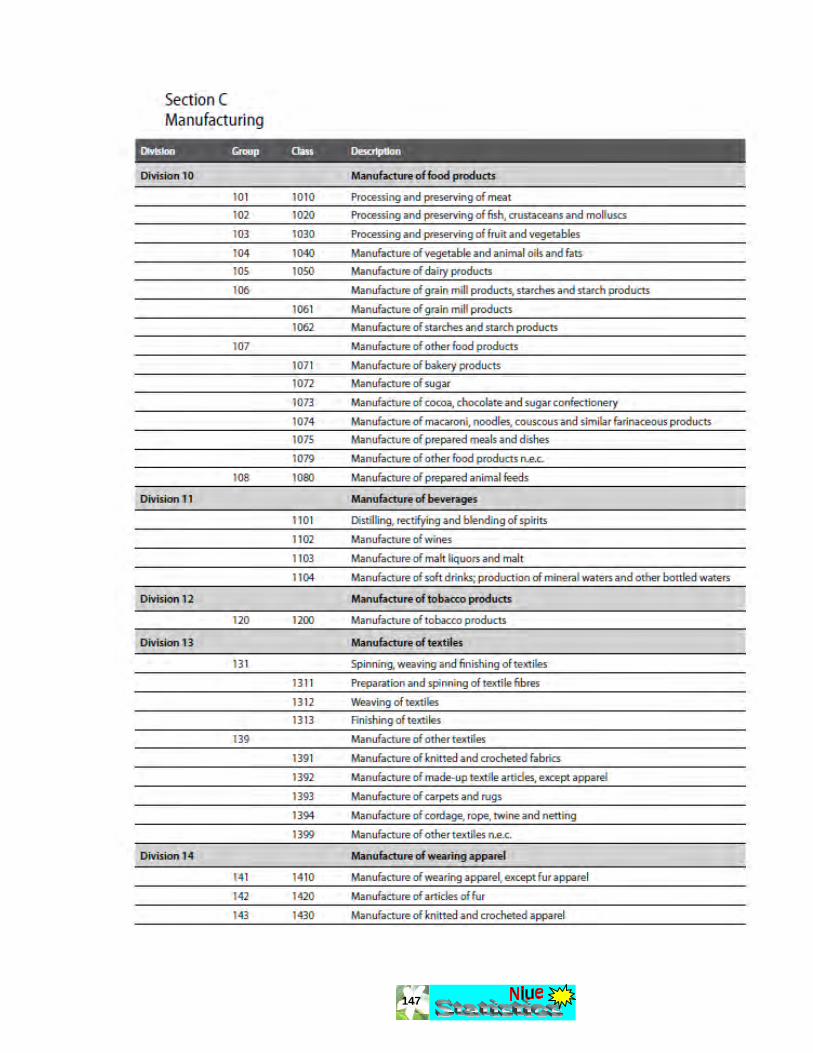
147
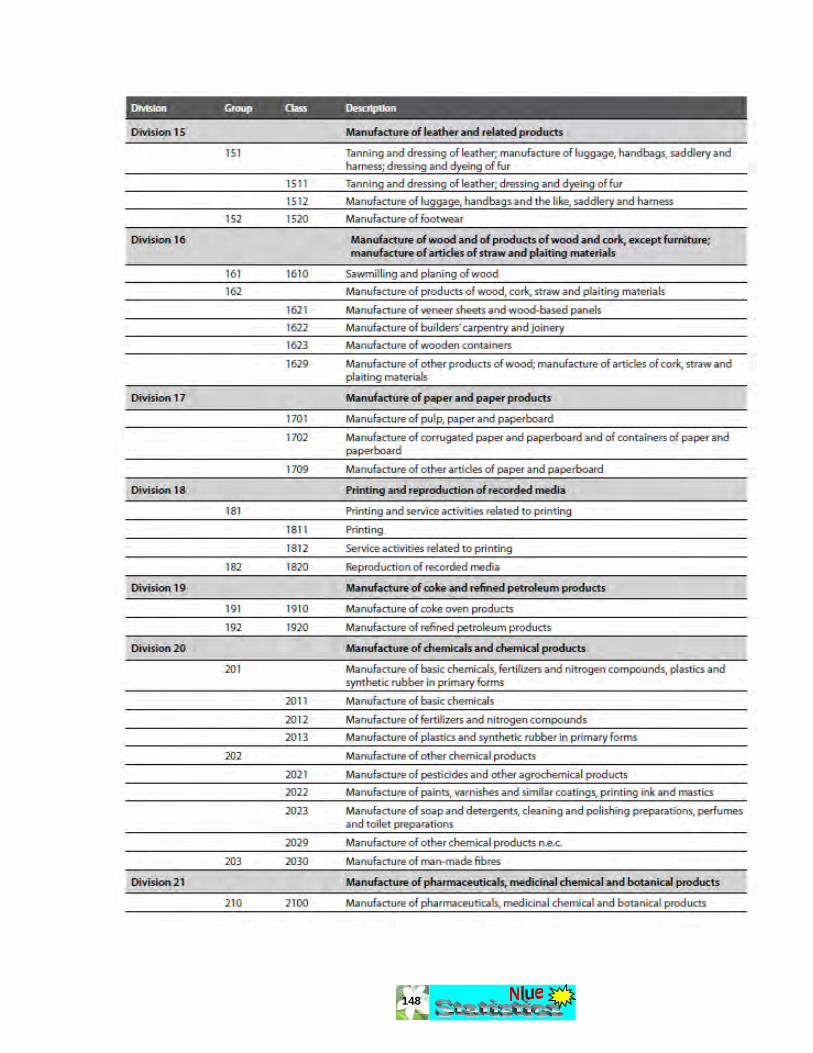
148
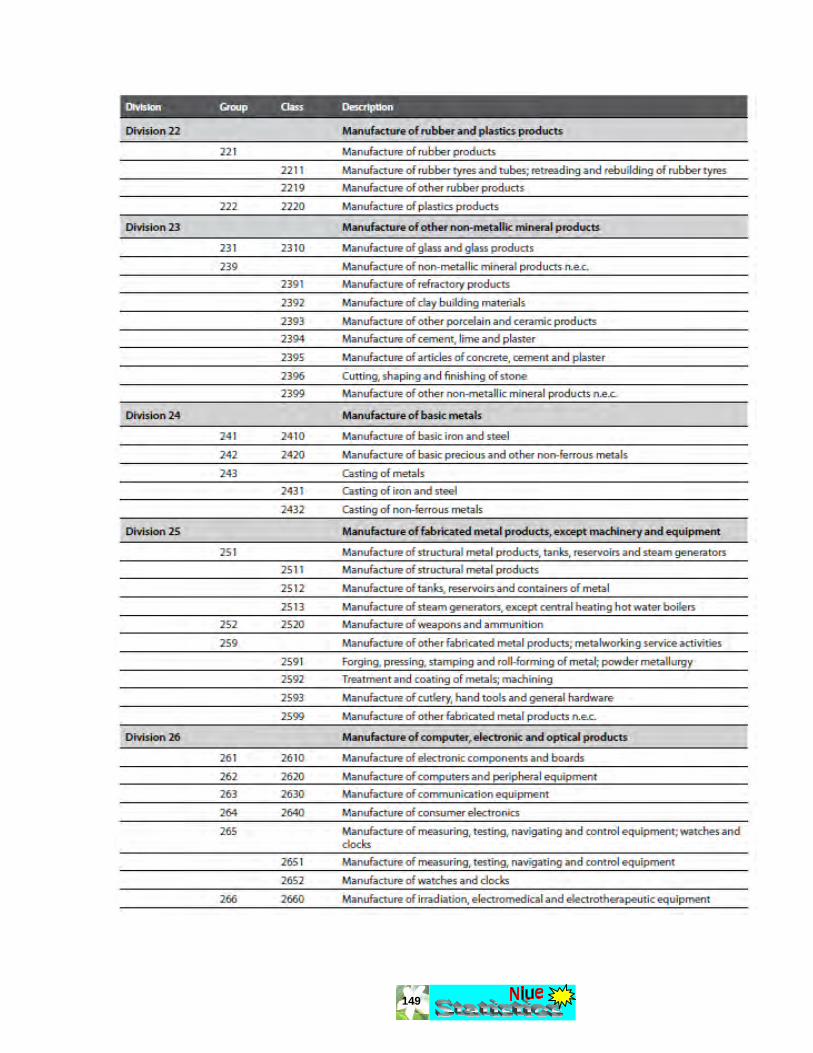
149

150
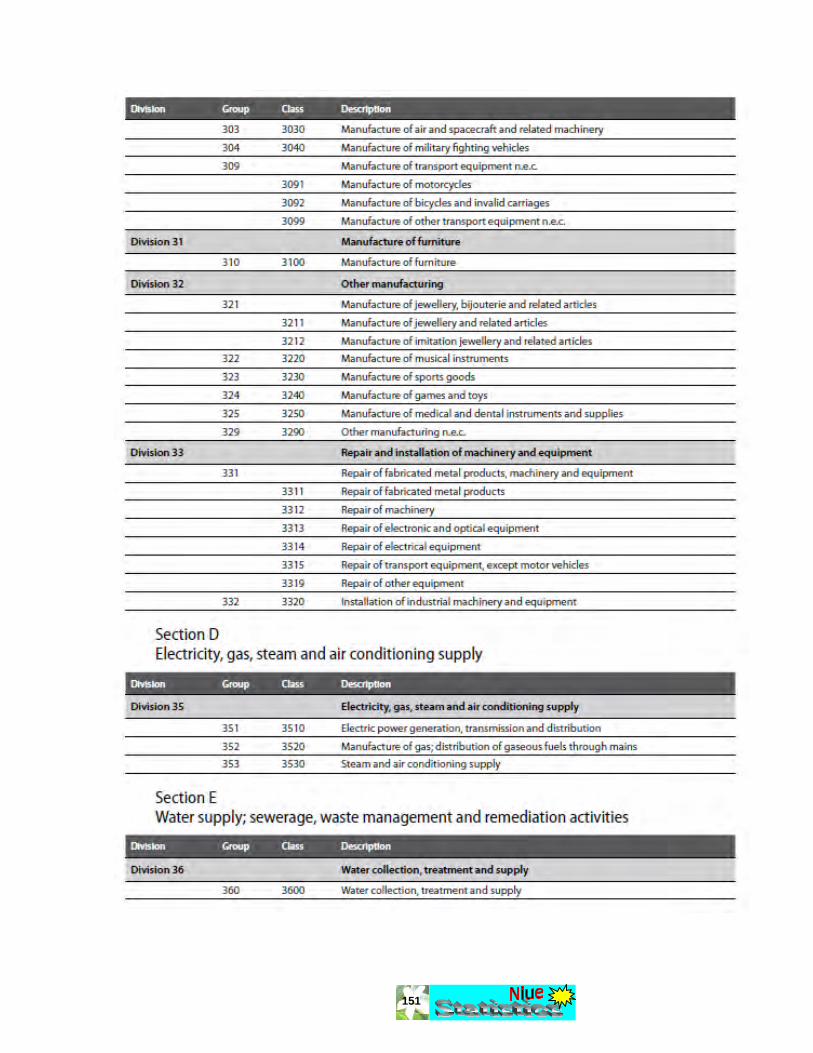
151

152
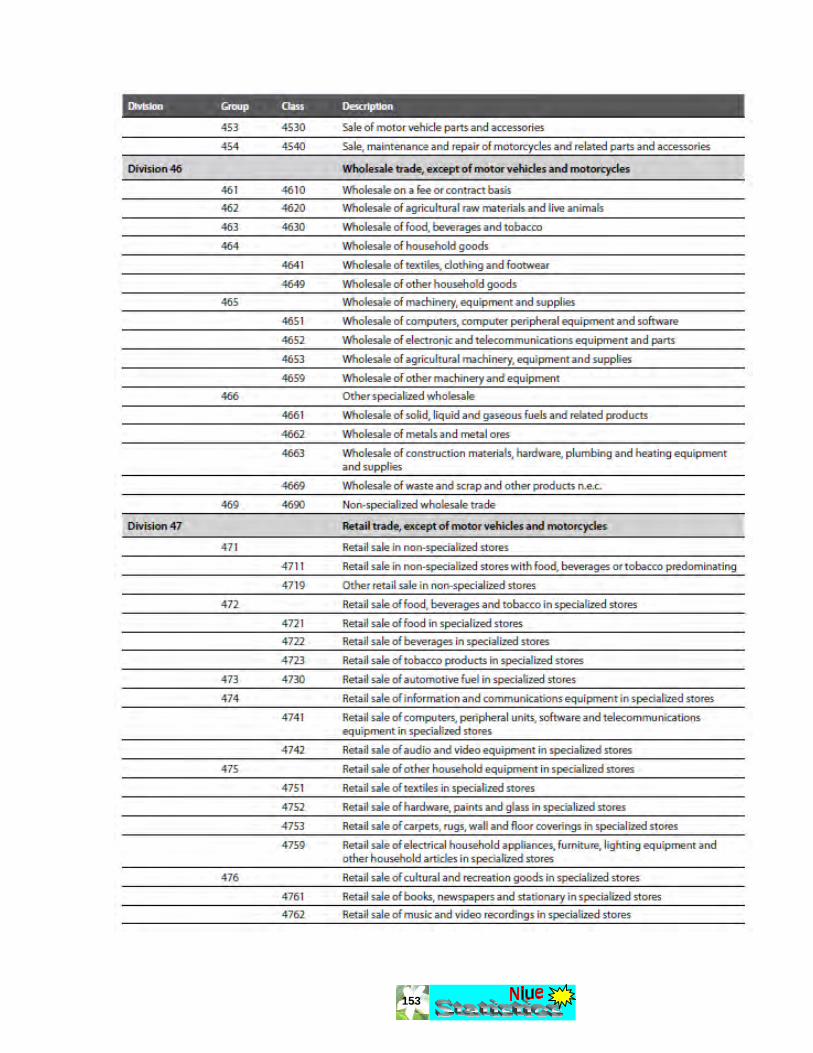
153
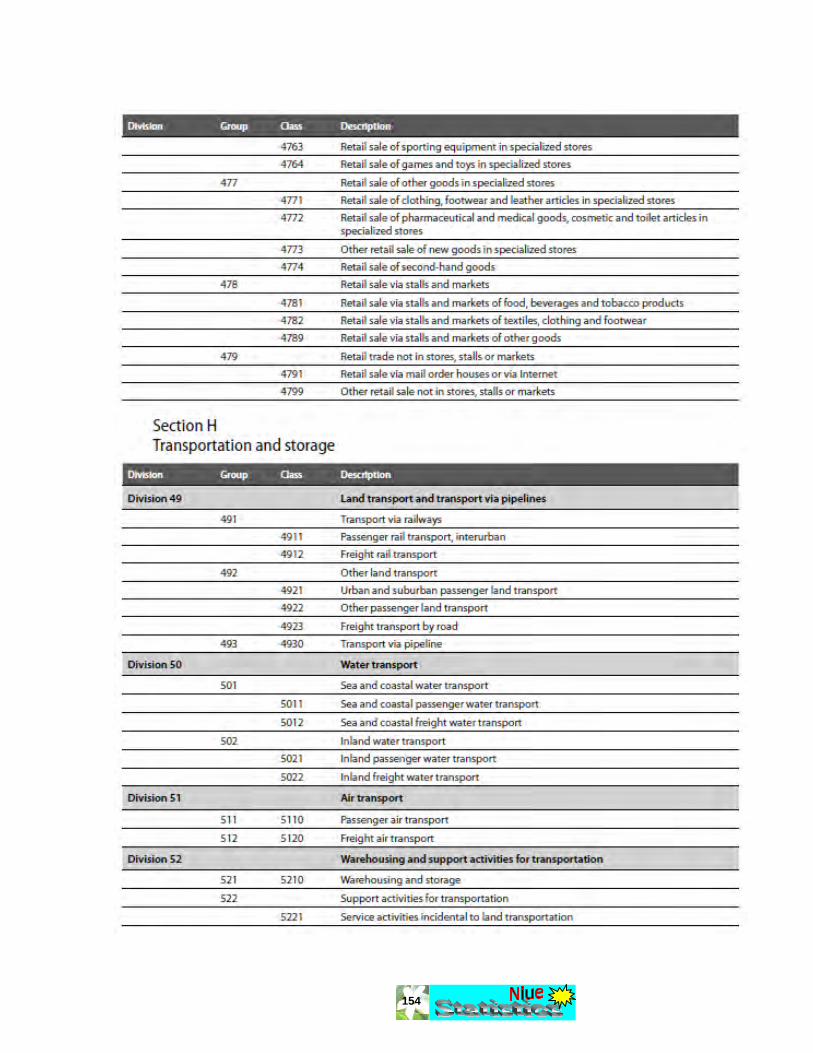
154
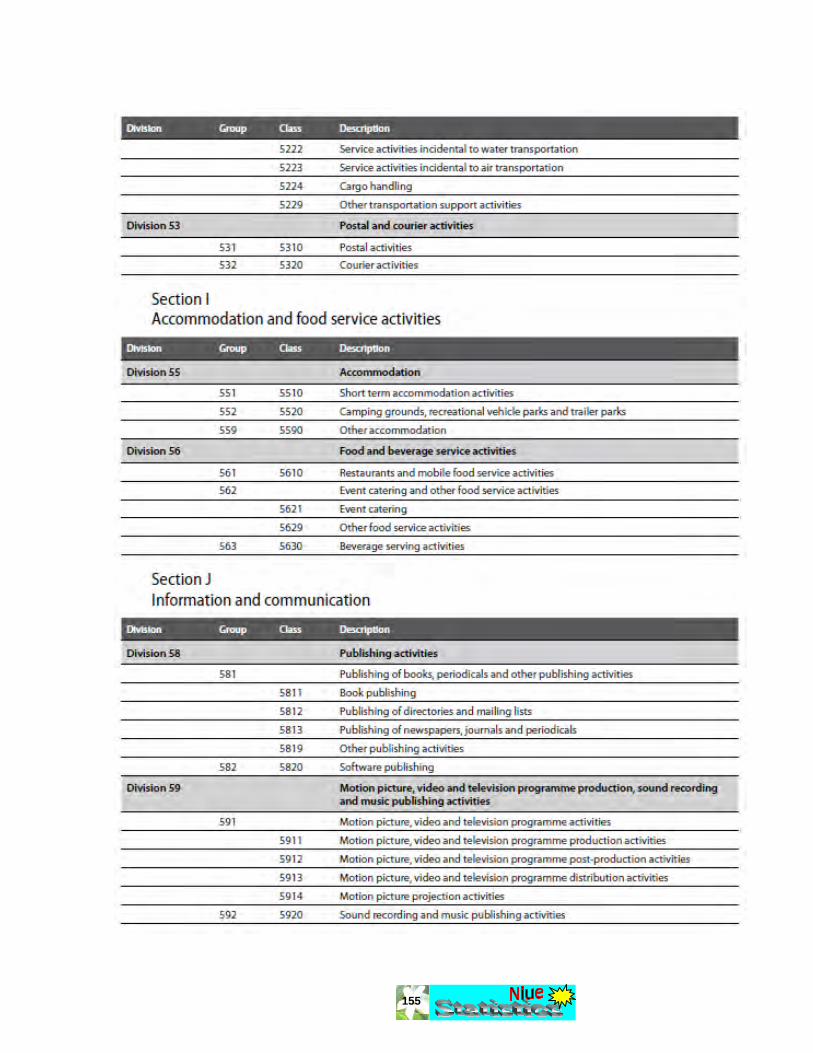
155

156

157
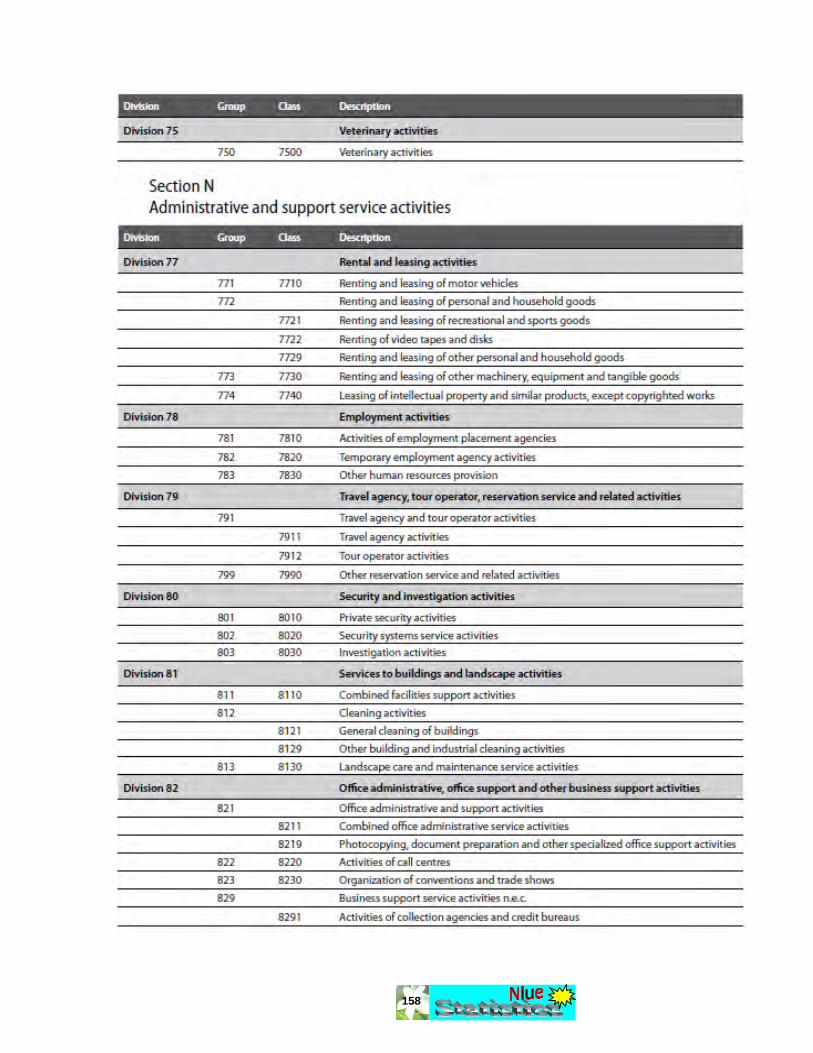
158

159

160
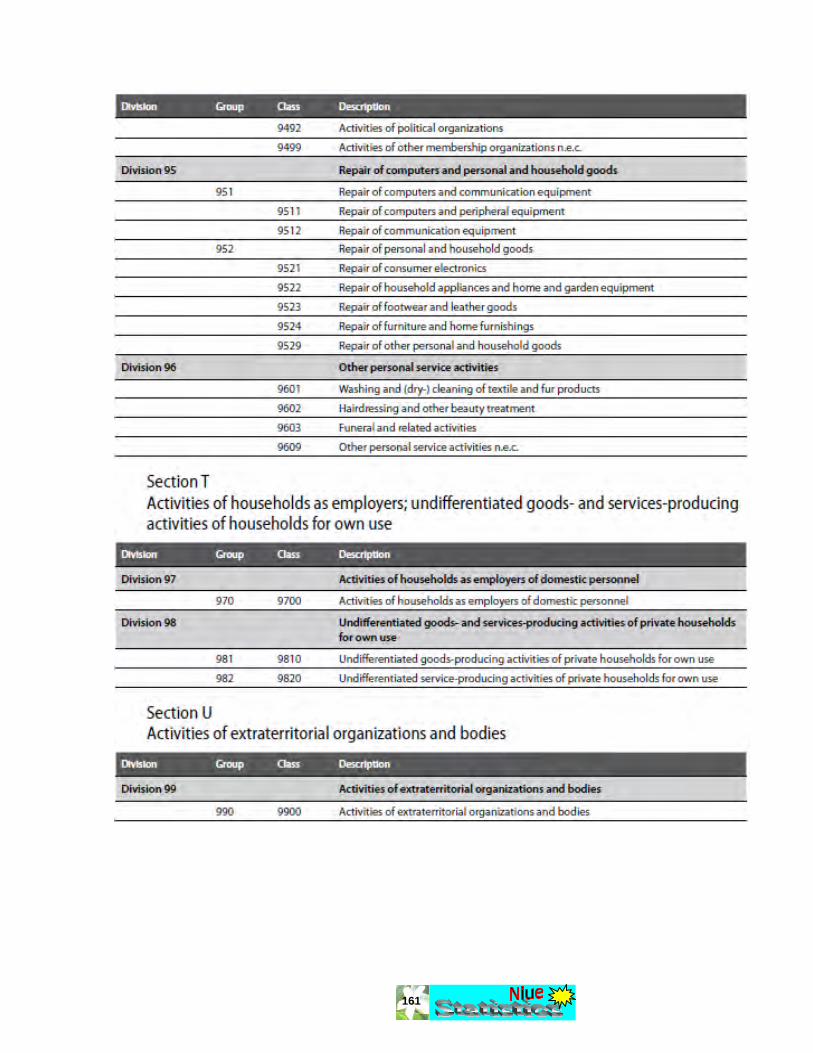
161
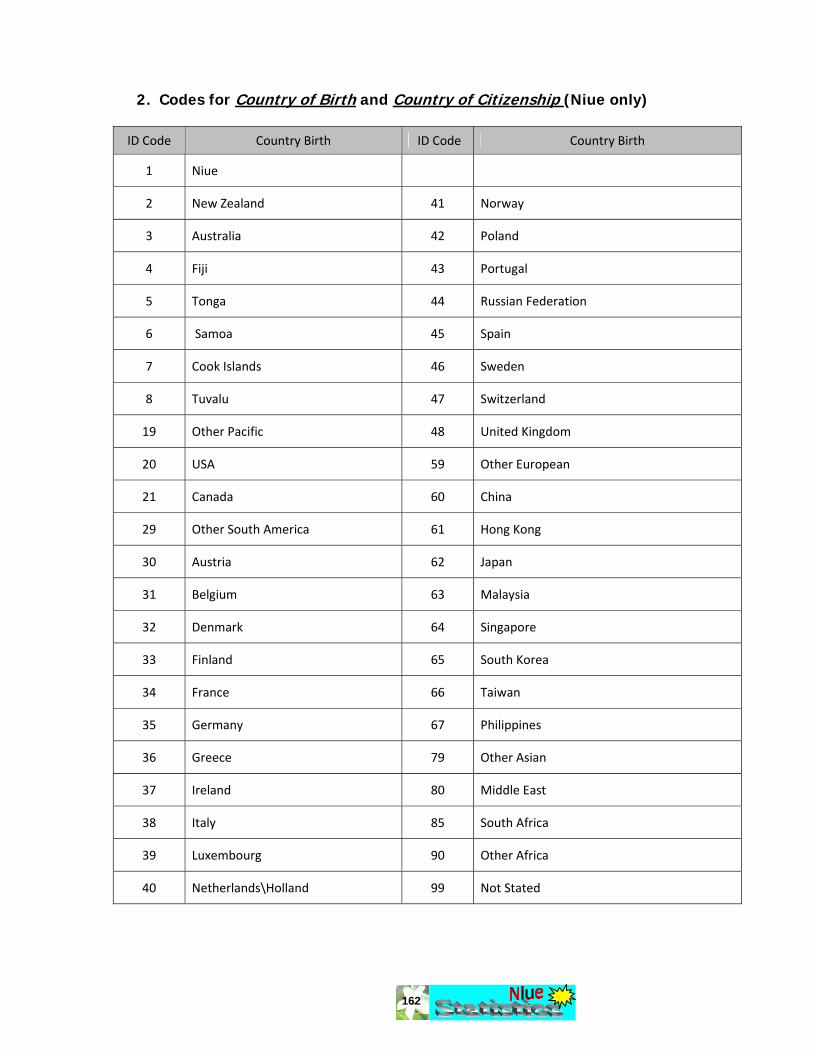
162
2. Codes for Country of Birth and Country of Citizenship (Niue only) ID Code Country Birth ID Code Country Birth
1 Niue
2 New Zealand 41 Norway
3 Australia 42 Poland
4 Fiji 43 Portugal
5 Tonga 44 Russian Federation
6 Samoa 45 Spain
7 Cook Islands 46 Sweden
8 Tuvalu 47 Switzerland
19 Other Pacific 48 United Kingdom
20 USA 59 Other European
21 Canada 60 China
29 Other South America 61 Hong Kong
30 Austria 62 Japan
31 Belgium 63 Malaysia
32 Denmark 64 Singapore
33 Finland 65 South Korea
34 France 66 Taiwan
35 Germany 67 Philippines
36 Greece 79 Other Asian
37 Ireland 80 Middle East
38 Italy 85 South Africa
39 Luxembourg 90 Other Africa
40 Netherlands\Holland 99 Not Stated

163
3. ISCO 88 – International Standard of Classification of Occupations
MAJOR GROUP 1: LEGISLATORS, SENIOR OFFICIALS AND MANAGERS 11 LEGISLATORS AND SENIOR OFFICIALS
111 LEGISLATORS
1110 Legislators
112 SENIOR GOVERNMENT OFFICIALS
1120 Senior government officials
113 TRADITIONAL CHIEFS AND HEADS OF VILLAGES
1130 Traditional chiefs and heads of villages
114 SENIOR OFFICIALS OF SPECIAL‐INTEREST ORGANISATIONS
1141 Senior officials of political‐party organisations
1142 Senior officials of employers', workers' and other economic‐interest organisations
1143 Senior officials of humanitarian and other special‐interest organisations 12 CORPORATE MANAGERS (This group is intended to include persons who ‐ as directors, chief executives or department managers ‐ manage enterprises or organisations, or departments, requiring a total of three or more managers.)
121 DIRECTORS AND CHIEF EXECUTIVES
1210 Directors and chief executives
122 PRODUCTION AND OPERATIONS DEPARTMENT MANAGERS
1221 Production and operations department managers in agriculture, hunting, forestry and fishing
1222 Production and operations department managers in manufacturing
1223 Production and operations department managers in construction
1224 Production and operations department managers in wholesale and retail trade
1225 Production and operations department managers in restaurants and hotels
1226 Production and operations department managers in transport, storage and communications
1227 Production and operations department managers in business services
1228 Production and operations department managers in personal care, cleaning and related services
1229 Production and operations department managers not elsewhere classified
123 OTHER DEPARTMENT MANAGERS
1231 Finance and administration department managers
1232 Personnel and industrial relations department managers
1233 Sales and marketing department managers

164
1234 Advertising and public relations department managers
1235 Supply and distribution department managers
1236 Computing services department managers
1237 Research and development department managers
1239 Other department managers not elsewhere classified 13 GENERAL MANAGERS (This group is intended to include persons who manage enterprises, or in some cases organisations, on their own behalf, or on behalf of the proprietor, with some non‐managerial help and the assistance of no more than one other manager who should also be classified in this sub‐ major group as, in most cases, the tasks will be broader than those of a specialised manager in a larger enterprise or organisation. Non‐managerial staff should be classified according to their specific tasks.
131 GENERAL MANAGERS
1311 General managers in agriculture, hunting, forestry/ and fishing
1312 General managers in manufacturing
1313 General managers in construction
1314 General managers in wholesale and retail trade
1315 General managers of restaurants and hotels
1316 General managers in transport, storage and communications
1317 General managers of business services
1318 General managers in personal care, cleaning and related services
1319 General managers not elsewhere classified
MAJOR GROUP 2 : PROFESSIONALS 21 PHYSICAL, MATHEMATICAL AND ENGINEERING SCIENCE PROFESSIONALS
211 PHYSICISTS, CHEMISTS AND RELATED PROFESSIONALS
2111 Physicists and astronomers
2112 Meteorologists
2113 Chemists
2114 Geologists and geophysicists
212 MATHEMATICIANS, STATISTICIANS AND RELATED PROFESSIONALS
2121 Mathematicians and related professionals
2122 Statisticians
213 COMPUTING PROFESSIONALS
2131 Computer systems designers and analysts
2132 Computer programmers
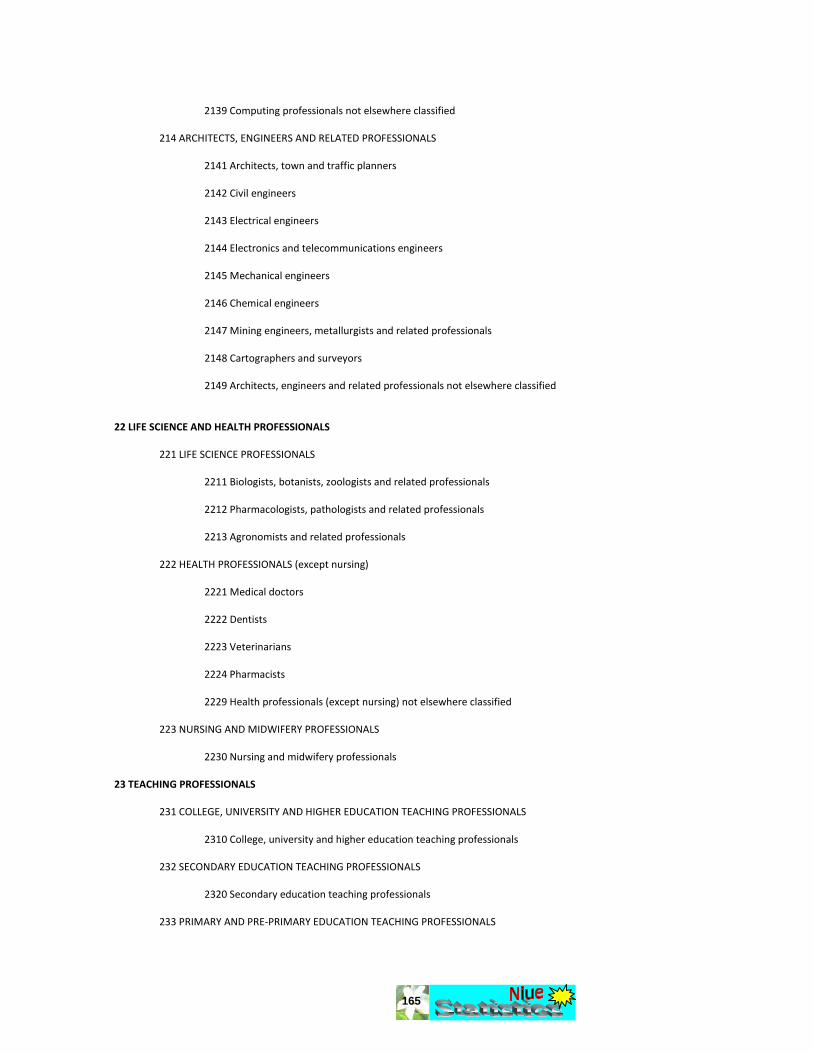
165
2139 Computing professionals not elsewhere classified
214 ARCHITECTS, ENGINEERS AND RELATED PROFESSIONALS
2141 Architects, town and traffic planners
2142 Civil engineers
2143 Electrical engineers
2144 Electronics and telecommunications engineers
2145 Mechanical engineers
2146 Chemical engineers
2147 Mining engineers, metallurgists and related professionals
2148 Cartographers and surveyors
2149 Architects, engineers and related professionals not elsewhere classified
22 LIFE SCIENCE AND HEALTH PROFESSIONALS
221 LIFE SCIENCE PROFESSIONALS
2211 Biologists, botanists, zoologists and related professionals
2212 Pharmacologists, pathologists and related professionals
2213 Agronomists and related professionals
222 HEALTH PROFESSIONALS (except nursing)
2221 Medical doctors
2222 Dentists
2223 Veterinarians
2224 Pharmacists
2229 Health professionals (except nursing) not elsewhere classified
223 NURSING AND MIDWIFERY PROFESSIONALS
2230 Nursing and midwifery professionals 23 TEACHING PROFESSIONALS
231 COLLEGE, UNIVERSITY AND HIGHER EDUCATION TEACHING PROFESSIONALS
2310 College, university and higher education teaching professionals
232 SECONDARY EDUCATION TEACHING PROFESSIONALS
2320 Secondary education teaching professionals
233 PRIMARY AND PRE‐PRIMARY EDUCATION TEACHING PROFESSIONALS

166
2331 Primary education teaching professionals
2332 Pre‐primary education teaching professionals
234 SPECIAL EDUCATION TEACHING PROFESSIONALS
2340 Special education teaching professionals
235 OTHER TEACHING PROFESSIONALS
2351 Education methods specialists
2352 School inspectors
2359 Other teaching professionals not elsewhere classified 24 OTHER PROFESSIONALS
241 BUSINESS PROFESSIONALS
2411 Accountants
2412 Personnel and careers professionals
2419 Business professionals not elsewhere classified
242 LEGAL PROFESSIONALS
2421 Lawyers
2422 Judges
2429 Legal professionals not elsewhere classified
243 ARCHIVISTS, LIBRARIANS AND RELATED INFORMATION PROFESSIONALS
2431 Archivists and curators
2432 Librarians and related information professionals
244 SOCIAL SCIENCE AND RELATED PROFESSIONALS
2441 Economists
2442 Sociologists, anthropologists and related professionals
2443 Philosophers, historians and political scientists
2444 Philologists, translators and interpreters
2445 Psychologists
2446 Social work professionals
245 WRITERS AND CREATIVE OR PERFORMING ARTISTS
2451 Authors, journalists and other writers
2452 Sculptors, painters and related artists
2453 Composers, musicians and singers
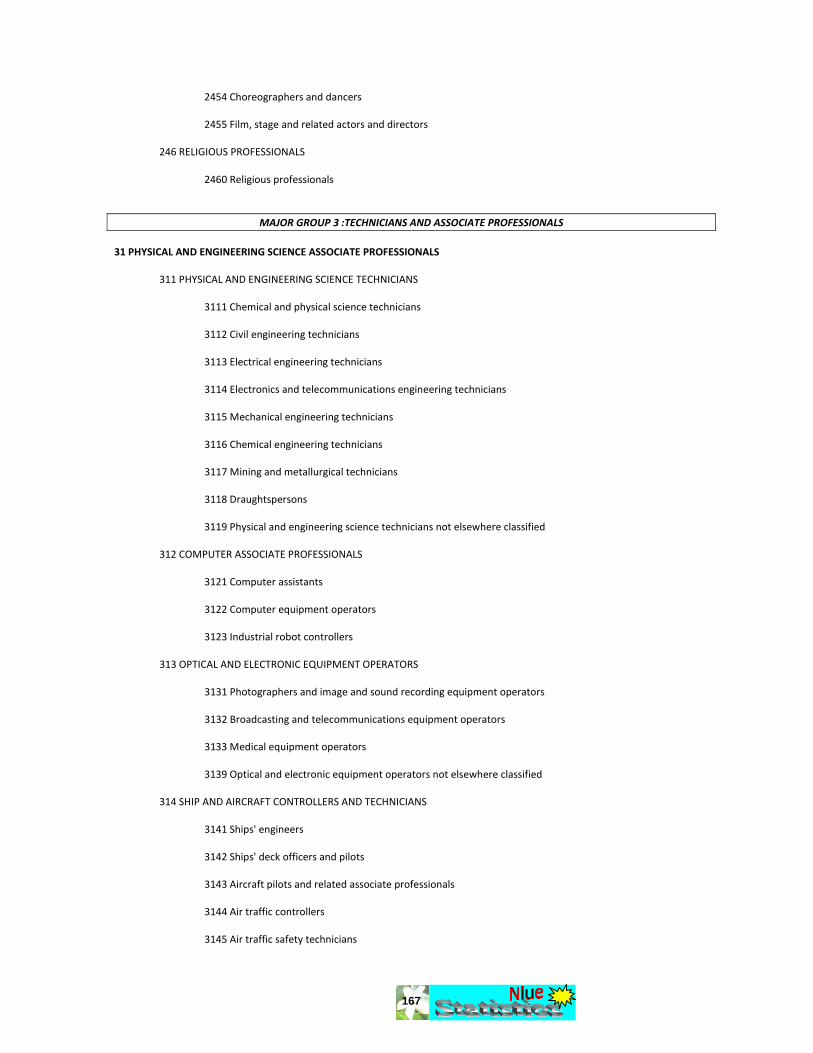
167
2454 Choreographers and dancers
2455 Film, stage and related actors and directors 246 RELIGIOUS PROFESSIONALS
2460 Religious professionals
MAJOR GROUP 3 :TECHNICIANS AND ASSOCIATE PROFESSIONALS 31 PHYSICAL AND ENGINEERING SCIENCE ASSOCIATE PROFESSIONALS
311 PHYSICAL AND ENGINEERING SCIENCE TECHNICIANS
3111 Chemical and physical science technicians
3112 Civil engineering technicians
3113 Electrical engineering technicians
3114 Electronics and telecommunications engineering technicians
3115 Mechanical engineering technicians
3116 Chemical engineering technicians
3117 Mining and metallurgical technicians
3118 Draughtspersons
3119 Physical and engineering science technicians not elsewhere classified
312 COMPUTER ASSOCIATE PROFESSIONALS
3121 Computer assistants
3122 Computer equipment operators
3123 Industrial robot controllers
313 OPTICAL AND ELECTRONIC EQUIPMENT OPERATORS
3131 Photographers and image and sound recording equipment operators
3132 Broadcasting and telecommunications equipment operators
3133 Medical equipment operators
3139 Optical and electronic equipment operators not elsewhere classified
314 SHIP AND AIRCRAFT CONTROLLERS AND TECHNICIANS
3141 Ships' engineers
3142 Ships' deck officers and pilots
3143 Aircraft pilots and related associate professionals
3144 Air traffic controllers
3145 Air traffic safety technicians
168
315 SAFETY AND QUALITY INSPECTORS
3151 Building and fire inspectors
3152 Safety, health and quality inspectors
32 LIFE SCIENCE AND HEALTH ASSOCIATE PROFESSIONALS
321 LIFE SCIENCE TECHNICIANS AND RELATED ASSOCIATE PROFESSIONALS
3211 Life science technicians
3212 Agronomy and forestry technicians
3213 Farming and forestry advisers
322 MODERN HEALTH ASSOCIATE PROFESSIONALS (except nursing)
3221 Medical assistants
3222 Sanitarians
3223 Dieticians and nutritionists
3224 Optometrists and opticians
3225 Dental assistants
3226 Physiotherapists and related associate professionals
3227 Veterinary assistants
3228 Pharmaceutical assistants
3229 Modern health associate professionals (except nursing) not elsewhere classified
323 NURSING AND MIDWIFERY ASSOCIATE PROFESSIONALS
3231 Nursing associate professionals
3232 Midwifery associate professionals
324 TRADITIONAL MEDICINE PRACTITIONERS AND FAITH HEALERS
3241 Traditional medicine practitioners
3242 Faith healers 33 TEACHING ASSOCIATE PROFESSIONALS
331 PRIMARY EDUCATION TEACHING ASSOCIATE PROFESSIONALS
3310 Primary education teaching associate professionals
332 PRE‐PRIMARY EDUCATION TEACHING ASSOCIATE PROFESSIONALS
3320 Pre‐primary education teaching associate professionals
333 SPECIAL EDUCATION TEACHING ASSOCIATE PROFESSIONALS
3330 Special education teaching associate professionals

169
334 OTHER TEACHING ASSOCIATE PROFESSIONALS
3340 Other teaching associate professionals
34 OTHER ASSOCIATE PROFESSIONALS
341 FINANCE AND SALES ASSOCIATE PROFESSIONALS
3411 Securities and finance dealers and brokers
3412 Insurance representatives
3413 Estate agents
3414 Travel consultants and organisers
3415 Technical and commercial sales representatives
3416 Buyers
3417 Appraisers, valuers and auctioneers
3419 Finance and sales associate professionals not elsewhere classified
342 BUSINESS SERVICES AGENTS AND TRADE BROKERS
3421 Trade brokers
3422 Clearing and forwarding agents
3423 Employment agents and labour contractors
3429 Business services agents and trade brokers not elsewhere classified
343 ADMINISTRATIVE ASSOCIATE PROFESSIONALS
3431 Administrative secretaries and related associate professionals
3432 Legal and related business associate professionals
3433 Bookkeepers
3434 Statistical, mathematical and related associate professionals
3439 Administrative associate professionals not elsewhere classified
344 CUSTOMS, TAX AND RELATED GOVERNMENT ASSOCIATE PROFESSIONALS
3441 Customs and border inspectors
3442 Government tax and excise officials
3443 Government social benefits officials
3444 Government licensing officials
3449 Customs, tax and related government associate professionals not elsewhere classified
345 POLICE INSPECTORS AND DETECTIVES

170
3450 Police inspectors and detectives
346 SOCIAL WORK ASSOCIATE PROFESSIONALS
3460 Social work associate professionals
347 ARTISTIC, ENTERTAINMENT AND SPORTS ASSOCIATE PROFESSIONALS
3471 Decorators and commercial designers
3472 Radio, television and other announcers
3473 Street, night‐club and related musicians, singers and dancers
3474 Clowns, magicians, acrobats and related associate professionals
3475 Athletes, sportspersons and related associate professionals
348 RELIGIOUS ASSOCIATE PROFESSIONALS
3480 Religious associate professionals
MAJOR GROUP 4 : CLERKS
41 OFFICE CLERKS
411 SECRETARIES AND KEYBOARD‐OPERATING CLERKS
4111 Stenographers and typists
4112 Word‐processor and related operators
4113 Data entry operators
4114 Calculating‐machine operators
4115 Secretaries
412 NUMERICAL CLERKS
4121 Accounting and bookkeeping clerks
4122 Statistical and finance clerks
413 MATERIAL‐RECORDING AND TRANSPORT CLERKS
4131 Stock clerks
4132 Production clerks
4133 Transport clerks
414 LIBRARY, MAIL AND RELATED CLERKS
4141 Library and filing clerks
4142 Mail carriers and sorting clerks
4143 Coding, proof‐reading and related clerks
4144 Scribes and related workers
171
419 OTHER OFFICE CLERKS
4190 Other office clerks
42 CUSTOMER SERVICES CLERKS
421 CASHIERS, TELLERS AND RELATED CLERKS
4211 Cashiers and ticket clerks
4212 Tellers and other counter clerks
4213 Bookmakers and croupiers
4214 Pawnbrokers and money‐lenders
4215 Debt‐collectors and related workers
422 CLIENT INFORMATION CLERKS
4221 Travel agency and related clerks
4222 Receptionists and information clerks
4223 Telephone switchboard operators
MAJOR GROUP 5 : SERVICE WORKERS AND SHOP AND MARKET SALES WORKERS 51 PERSONAL AND PROTECTIVE SERVICES WORKERS
511 TRAVEL ATTENDANTS AND RELATED WORKERS
5111 Travel attendants and travel stewards
5112 Transport conductors
5113 Travel guides
512 HOUSEKEEPING AND RESTAURANT SERVICES WORKERS
5121 Housekeepers and related workers
5122 Cooks
5123 Waiters, waitresses and bartenders
513 PERSONAL CARE AND RELATED WORKERS
5131 Child‐care workers
5132 Institution‐based personal care workers
5133 Home‐based personal care workers
5139 Personal care and related workers not elsewhere classified
514 OTHER PERSONAL SERVICES WORKERS
5141 Hairdressers, barbers, beauticians and related workers
172
5142 Companions and valets
5143 Undertakers and embalmers
5149 Other personal services workers not elsewhere classified
515 ASTROLOGERS, FORTUNE‐TELLERS AND RELATED WORKERS
5151 Astrologers and related workers
5152 Fortune‐tellers, palmists and related workers
516 PROTECTIVE SERVICES WORKERS
5161 Fire‐fighters
5162 Police officers
5163 Prison guards
5169 Protective services workers not elsewhere classified 52 MODELS, SALESPERSONS AND DEMONSTRATORS
521 FASHION AND OTHER MODELS
5210 Fashion and other models
522 SHOP SALESPERSONS AND DEMONSTRATORS
5220 Shop salespersons and demonstrators
523 STALL AND MARKET SALESPERSONS
5230 Stall and market salespersons
MAJOR GROUP 6 : SKILLED AGRICULTURAL AND FISHERY WORKERS 61 MARKET‐ORIENTED SKILLED AGRICULTURAL AND FISHERY WORKERS
611 MARKET GARDENERS AND CROP GROWERS
6111 Field crop and vegetable growers
6112 Tree and shrub crop growers
6113 Gardeners, horticultural and nursery growers
6114 Mixed‐crop growers
612 MARKET‐ORIENTED ANIMAL PRODUCERS AND RELATED WORKERS
6121 Dairy and livestock producers
6122 Poultry producers
6123 Apiarists and sericulturists
6124 Mixed‐animal producers

173
6129 Market‐oriented animal producers and related workers not elsewhere classified
613 MARKET‐ORIENTED CROP AND ANIMAL PRODUCERS
6130 Market‐oriented crop and animal producers
614 FORESTRY AND RELATED WORKERS
6141 Forestry workers and loggers
6142 Charcoal burners and related workers
615 FISHERY WORKERS, HUNTERS AND TRAPPERS
6151 Aquatic‐life cultivation workers
6152 Inland and coastal waters fishery workers
6153 Deep‐sea fishery workers
6154 Hunters and trappers 62 SUBSISTENCE AGRICULTURAL AND FISHERY WORKERS
621 SUBSISTENCE AGRICULTURAL AND FISHERY WORKERS
6210 Subsistence agricultural and fishery workers
MAJOR GROUP 7 : CRAFT AND RELATED TRADES WORKERS 71 EXTRACTION AND BUILDING TRADES WORKERS
711 MINERS, SHOTFIRERS, STONE CUTTERS AND CARVERS
7111 Miners and quarry workers
7112 Shotfirers and blasters
7113 Stone splitters, cutters and carvers
712 BUILDING FRAME AND RELATED TRADES WORKERS
7121 Builders, traditional materials
7122 Bricklayers and stonemasons
7123 Concrete placers, concrete finishers and related workers
7124 Carpenters and joiners
7129 Building frame and related trades workers not elsewhere classified
713 BUILDING FINISHERS AND RELATED TRADES WORKERS
7131 Roofers
7132 Floor layers and tile setters
7133 Plasterers
7134 Insulation workers
174
7135 Glaziers
7136 Plumbers and pipe fitters
7137 Building and related electricians
714 PAINTERS, BUILDING STRUCTURE CLEANERS AND RELATED TRADES WORKERS
7141 Painters and related workers
7142 Varnishers and related painters
7143 Building structure cleaners
72 METAL, MACHINERY AND RELATED TRADES WORKERS
721 METAL MOULDERS, WELDERS, SHEET‐METAL WORKERS, STRUCTURAL‐ METAL PREPARERS, AND RELATED TRADES WORKERS
7211 Metal moulders and coremakers
7212 Welders and flamecutters
7213 Sheet metal workers
7214 Structural‐metal preparers and erectors
7215 Riggers and cable splicers
7216 Underwater workers
722 BLACKSMITHS, TOOL‐MAKERS AND RELATED TRADES WORKERS
7221 Blacksmiths, hammer‐smiths and forging‐press workers
7222 Tool‐makers and related workers
7223 Machine‐tool setters and setter‐operators
7224 Metal wheel‐grinders, polishers and tool sharpeners
723 MACHINERY MECHANICS AND FITTERS
7231 Motor vehicle mechanics and fitters
7232 Aircraft engine mechanics and fitters
7233 Agricultural‐ or industrial‐machinery mechanics and fitters
724 ELECTRICAL AND ELECTRONIC EQUIPMENT MECHANICS AND FITTERS
7241 Electrical mechanics and fitters
7242 Electronics fitters
7243 Electronics mechanics and servicers
7244 Telegraph and telephone installers and servicers
7245 Electrical line installers, repairers and cable jointers
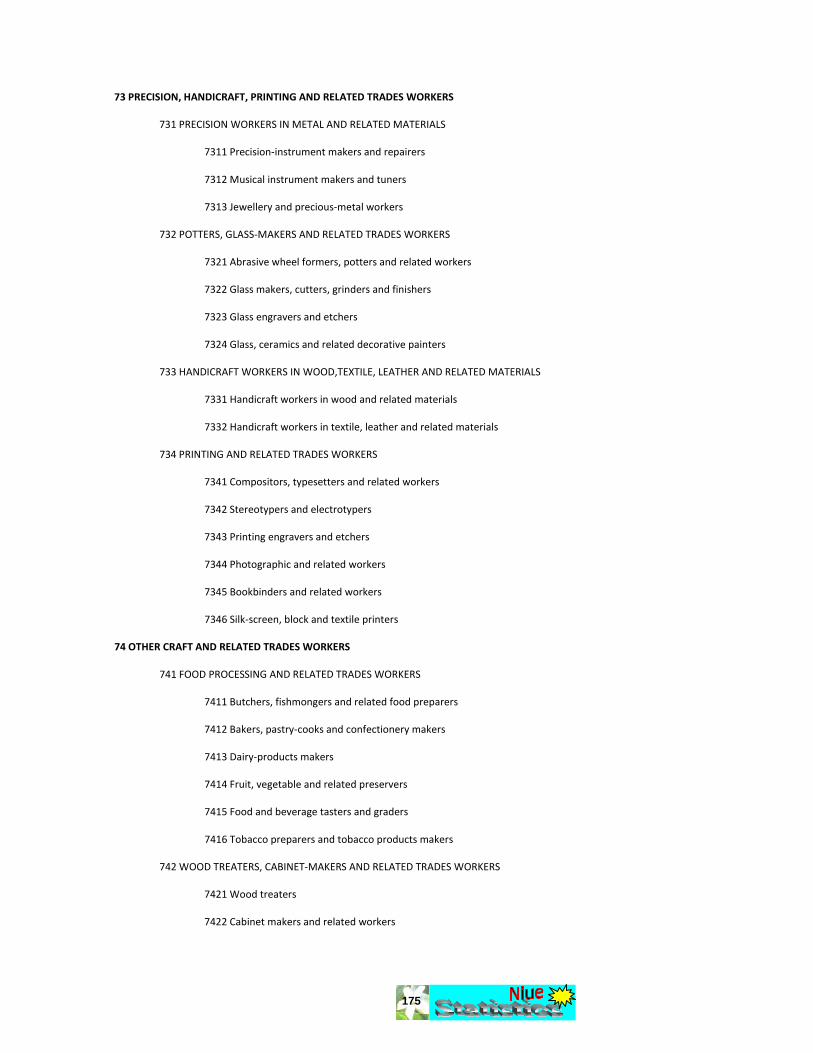
175
73 PRECISION, HANDICRAFT, PRINTING AND RELATED TRADES WORKERS
731 PRECISION WORKERS IN METAL AND RELATED MATERIALS
7311 Precision‐instrument makers and repairers
7312 Musical instrument makers and tuners
7313 Jewellery and precious‐metal workers
732 POTTERS, GLASS‐MAKERS AND RELATED TRADES WORKERS
7321 Abrasive wheel formers, potters and related workers
7322 Glass makers, cutters, grinders and finishers
7323 Glass engravers and etchers
7324 Glass, ceramics and related decorative painters
733 HANDICRAFT WORKERS IN WOOD,TEXTILE, LEATHER AND RELATED MATERIALS
7331 Handicraft workers in wood and related materials
7332 Handicraft workers in textile, leather and related materials
734 PRINTING AND RELATED TRADES WORKERS
7341 Compositors, typesetters and related workers
7342 Stereotypers and electrotypers
7343 Printing engravers and etchers
7344 Photographic and related workers
7345 Bookbinders and related workers
7346 Silk‐screen, block and textile printers 74 OTHER CRAFT AND RELATED TRADES WORKERS
741 FOOD PROCESSING AND RELATED TRADES WORKERS
7411 Butchers, fishmongers and related food preparers
7412 Bakers, pastry‐cooks and confectionery makers
7413 Dairy‐products makers
7414 Fruit, vegetable and related preservers
7415 Food and beverage tasters and graders
7416 Tobacco preparers and tobacco products makers
742 WOOD TREATERS, CABINET‐MAKERS AND RELATED TRADES WORKERS
7421 Wood treaters
7422 Cabinet makers and related workers

176
7423 Woodworking machine setters and setter‐operators
7424 Basketry weavers, brush makers and related workers
743 TEXTILE, GARMENT AND RELATED TRADES WORKERS
7431 Fibre preparers
7432 Weavers, knitters and related workers
7433 Tailors, dressmakers and hatters
7434 Furriers and related workers
7435 Textile, leather and related pattern‐makers and cutters
7436 Sewers, embroiderers and related workers
7437 Upholsterers and related workers
744 PELT, LEATHER AND SHOEMAKING TRADES WORKERS
7441 Pelt dressers, tanners and fellmongers
7442 Shoe‐makers and related workers
MAJOR GROUP 8 : PLANT AND MACHINE OPERATORS AND ASSEMBLERS 81 STATIONARY‐PLANT AND RELATED OPERATORS
811 MINING‐ AND MINERAL‐PROCESSING‐PLANT OPERATORS
8111 Mining‐plant operators
8112 Mineral‐ore‐ and stone‐processing‐plant operators
8113 Well drillers and borers and related workers
812 METAL‐PROCESSING‐PLANT OPERATORS
8121 Ore and metal furnace operators
8122 Metal melters, casters and rolling‐mill operators
8123 Metal‐heat‐treating‐plant operators
8124 Metal drawers and extruders
813 GLASS, CERAMICS AND RELATED PLANT OPERATORS
8131 Glass and ceramics kiln and related machine operators
8139 Glass, ceramics and related plant operators not elsewhere classified
814 WOOD‐PROCESSING‐ AND PAPERMAKING‐PLANT OPERATORS
8141 Wood‐processing‐plant operators
8142 Paper‐pulp plant operators
8143 Papermaking‐plant operators

177
815 CHEMICAL‐PROCESSING‐PLANT OPERATORS
8151 Crushing‐, grinding‐ and chemical‐mixing‐machinery operators
8152 Chemical‐heat‐treating‐plant operators
8153 Chemical‐filtering‐ and separating‐equipment operators
8154 Chemical‐still and reactor operators (except petroleum and natural gas)
8155 Petroleum‐ and natural‐gas‐refining‐plant operators
8159 Chemical‐processing‐plant operators not elsewhere classified
816 POWER‐PRODUCTION AND RELATED PLANT OPERATORS
8161 Power‐production plant operators
8162 Steam‐engine and boiler operators
8163 Incinerator, water‐treatment and related plant operators
817 AUTOMATED‐ASSEMBLY‐LINE AND INDUSTRIAL‐ROBOT OPERATORS
8171 Automated‐assembly‐line operators
8172 Industrial‐robot operators
82 MACHINE OPERATORS AND ASSEMBLERS
821 METAL‐ AND MINERAL‐PRODUCTS MACHINE OPERATORS
8211 Machine‐tool operators
8212 Cement and other mineral products machine operators
822 CHEMICAL‐PRODUCTS MACHINE OPERATORS
8221 Pharmaceutical‐ and toiletry‐products machine operators
8222 Ammunition‐ and explosive‐products machine operators
8223 Metal finishing‐, plating‐ and coating‐machine operators
8224 Photographic‐products machine operators
8229 Chemical‐products machine operators not elsewhere classified
823 RUBBER‐ AND PLASTIC‐PRODUCTS MACHINE OPERATORS
8231 Rubber‐products machine operators
8232 Plastic‐products machine operators
824 WOOD‐PRODUCTS MACHINE OPERATORS
8240 Wood‐products machine operators
825 PRINTING‐, BINDING‐ AND PAPER‐PRODUCTS MACHINE OPERATORS
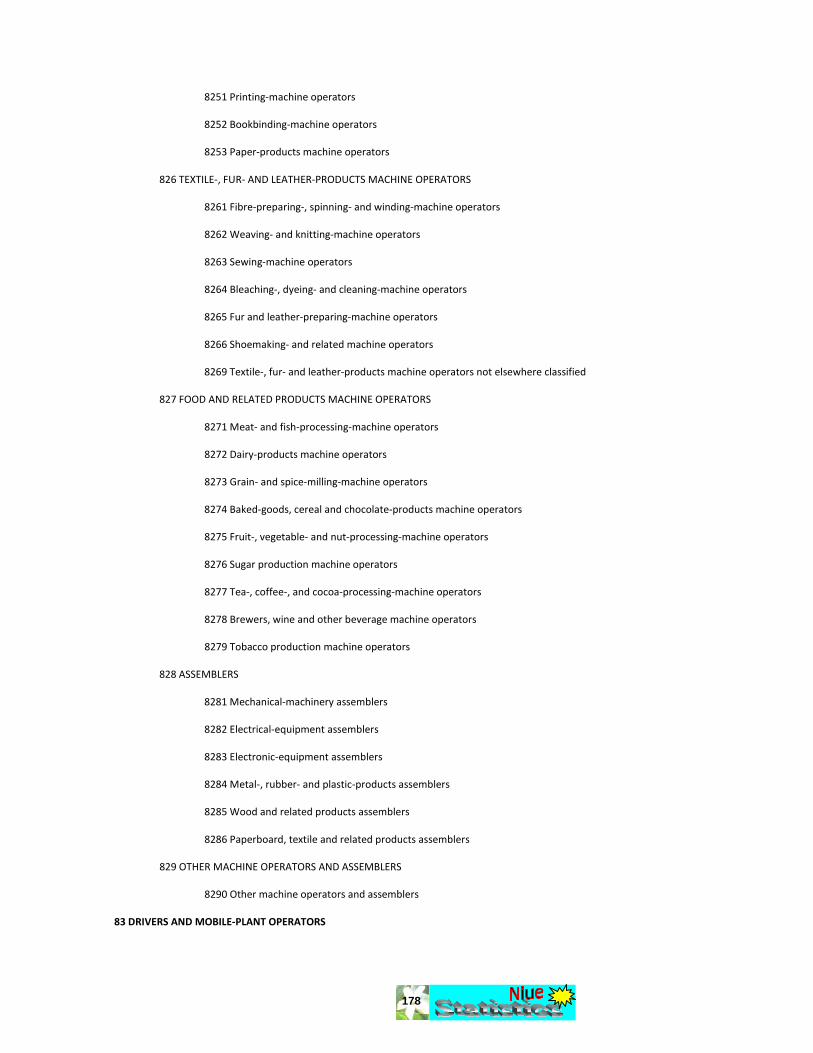
178
8251 Printing‐machine operators
8252 Bookbinding‐machine operators
8253 Paper‐products machine operators
826 TEXTILE‐, FUR‐ AND LEATHER‐PRODUCTS MACHINE OPERATORS
8261 Fibre‐preparing‐, spinning‐ and winding‐machine operators
8262 Weaving‐ and knitting‐machine operators
8263 Sewing‐machine operators
8264 Bleaching‐, dyeing‐ and cleaning‐machine operators
8265 Fur and leather‐preparing‐machine operators
8266 Shoemaking‐ and related machine operators
8269 Textile‐, fur‐ and leather‐products machine operators not elsewhere classified
827 FOOD AND RELATED PRODUCTS MACHINE OPERATORS
8271 Meat‐ and fish‐processing‐machine operators
8272 Dairy‐products machine operators
8273 Grain‐ and spice‐milling‐machine operators
8274 Baked‐goods, cereal and chocolate‐products machine operators
8275 Fruit‐, vegetable‐ and nut‐processing‐machine operators
8276 Sugar production machine operators
8277 Tea‐, coffee‐, and cocoa‐processing‐machine operators
8278 Brewers, wine and other beverage machine operators
8279 Tobacco production machine operators
828 ASSEMBLERS
8281 Mechanical‐machinery assemblers
8282 Electrical‐equipment assemblers
8283 Electronic‐equipment assemblers
8284 Metal‐, rubber‐ and plastic‐products assemblers
8285 Wood and related products assemblers
8286 Paperboard, textile and related products assemblers
829 OTHER MACHINE OPERATORS AND ASSEMBLERS
8290 Other machine operators and assemblers 83 DRIVERS AND MOBILE‐PLANT OPERATORS

179
831 LOCOMOTIVE‐ENGINE DRIVERS AND RELATED WORKERS
8311 Locomotive‐engine drivers
8312 Railway brakers, signallers and shunters
832 MOTOR‐VEHICLE DRIVERS
8321 Motor‐cycle drivers
8322 Car, taxi and van drivers
8323 Bus and tram drivers
8324 Heavy‐truck and lorry drivers
833 AGRICULTURAL AND OTHER MOBILE‐PLANT OPERATORS
8331 Motorised farm and forestry plant operators
8332 Earth‐moving‐ and related plant operators
8333 Crane, hoist and related plant operators
8334 Lifting‐truck operators
834 SHIPS' DECK CREWS AND RELATED WORKERS
8340 Ships' deck crews and related workers
MAJOR GROUP 9 : ELEMENTARY OCCUPATIONS 91 SALES AND SERVICES ELEMENTARY OCCUPATIONS
911 STREET VENDORS AND RELATED WORKERS
9111 Street food vendors
9112 Street vendors, non‐food products
9113 Door‐to‐door and telephone salespersons
912 SHOE CLEANING AND OTHER STREET SERVICES ELEMENTARY OCCUPATIONS
9120 Shoe cleaning and other street services elementary occupations
913 DOMESTIC AND RELATED HELPERS, CLEANERS AND LAUNDERERS
9131 Domestic helpers and cleaners
9132 Helpers and cleaners in offices, hotels and other establishments
9133 Hand‐launderers and pressers
914 BUILDING CARETAKERS, WINDOW AND RELATED CLEANERS
9141 Building caretakers
9142 Vehicle, window and related cleaners
915 MESSENGERS, PORTERS, DOORKEEPERS AND RELATED WORKERS
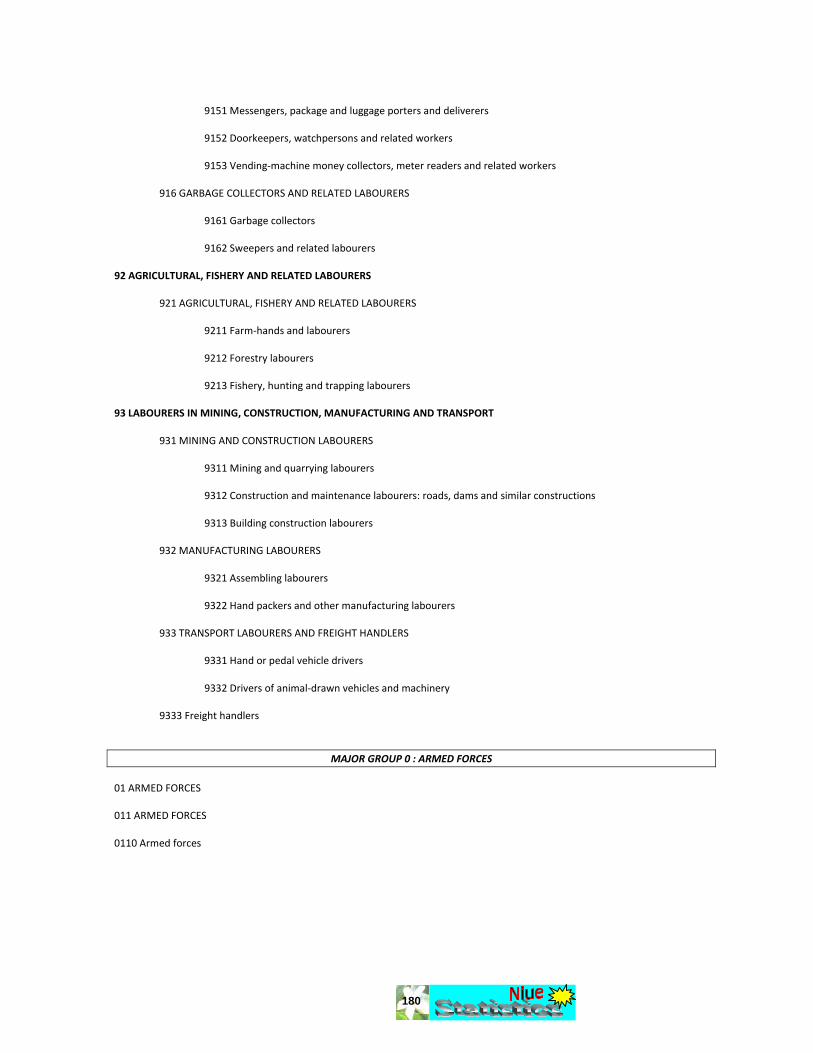
180
9151 Messengers, package and luggage porters and deliverers
9152 Doorkeepers, watchpersons and related workers
9153 Vending‐machine money collectors, meter readers and related workers
916 GARBAGE COLLECTORS AND RELATED LABOURERS
9161 Garbage collectors
9162 Sweepers and related labourers
92 AGRICULTURAL, FISHERY AND RELATED LABOURERS
921 AGRICULTURAL, FISHERY AND RELATED LABOURERS
9211 Farm‐hands and labourers
9212 Forestry labourers
9213 Fishery, hunting and trapping labourers 93 LABOURERS IN MINING, CONSTRUCTION, MANUFACTURING AND TRANSPORT
931 MINING AND CONSTRUCTION LABOURERS
9311 Mining and quarrying labourers
9312 Construction and maintenance labourers: roads, dams and similar constructions
9313 Building construction labourers
932 MANUFACTURING LABOURERS
9321 Assembling labourers
9322 Hand packers and other manufacturing labourers
933 TRANSPORT LABOURERS AND FREIGHT HANDLERS
9331 Hand or pedal vehicle drivers
9332 Drivers of animal‐drawn vehicles and machinery
9333 Freight handlers
MAJOR GROUP 0 : ARMED FORCES 01 ARMED FORCES 011 ARMED FORCES 0110 Armed forces

181
4. LEVEL OF EDUCATION: UNESCO CLASSIFICATION AND NIUE EQUIVALENT
UNESCO Name of Level Code NIUE Equivalent
Pre-primary Education 0 ECE
Primary education First stage of basic education 1 Yr1 – Yr6
Lower secondary education Second stage of basic education 2 Yr7 – Yr9
(Upper) secondary education 3 Yr10 – Yr13 NCEA L1 – L3
Post-secondary non tertiary education 4 NCEA L4
Under-Graduated Certificate and Diploma
First stage of tertiary education (not leading directly to an advanced research qualification)
5 Graduated Degree
Second stage of tertiary education (leading to an advanced research qualification)
6 Post-graduated Degree

182
1. Census Kit
Description of items in kit Quantity
Household/Dwelling Questionnaires
Population Schedules
Confidential Envelopes
Pencils
Rubber
Pencil Sharpener
Signed Declaration Form
Please check your kit. If it is on your list but not in your kit or if it is not enough ASK FOR IT! Enumerator Signature: ______________________________

183
1. Field Day Work
You must go around your area, note the location of every house, prepare your map and decide on your route. Note houses are occupied and unoccupied. You are required to prepare a preliminary list of households. There is a page for this exercise, you will have to do the following:
- allocate a house number, in series, regardless of occupancy, to each dwelling (empty dwellings to be indicated by a letter E.)
- enter the name of the Household Head for occupied dwellings.
- enter the total number of occupants for each occupied dwellings
- note remarks if necessary
Field Day Work
House
Number Household Number
on Map Name Of Head of Household Estimated No. of persons in H/hold Remarks
01 01 Mr QUARTZ 3
02 02 Mrs CASIO 2
03 E Empty 0
04 03 Miss SEIKO 4 Family live in 2 houses 05 03 Miss SEIKO -
06 E Empty 0
2. Enumeration before Population Census Night At 5.00pm, Saturday 10 September 2011, you will do the actual population enumeration. Begin by writing the names of every member of the household, possibly according to seniority in the provided page. At this stage you should also be completing the Household/Dwelling Schedule for that household. You can also start completing the population schedules.
Enumeration before Population Census Night
H/Hold No. Person Name Male Female Person No. Remarks
01 SAMUEL QUARTZ M 01
SAMMIE QUARTZ F 02
STEVEN QUARTZ M 03
02 JUGGIE CASIO M 01
CUTIE CASIO F 02
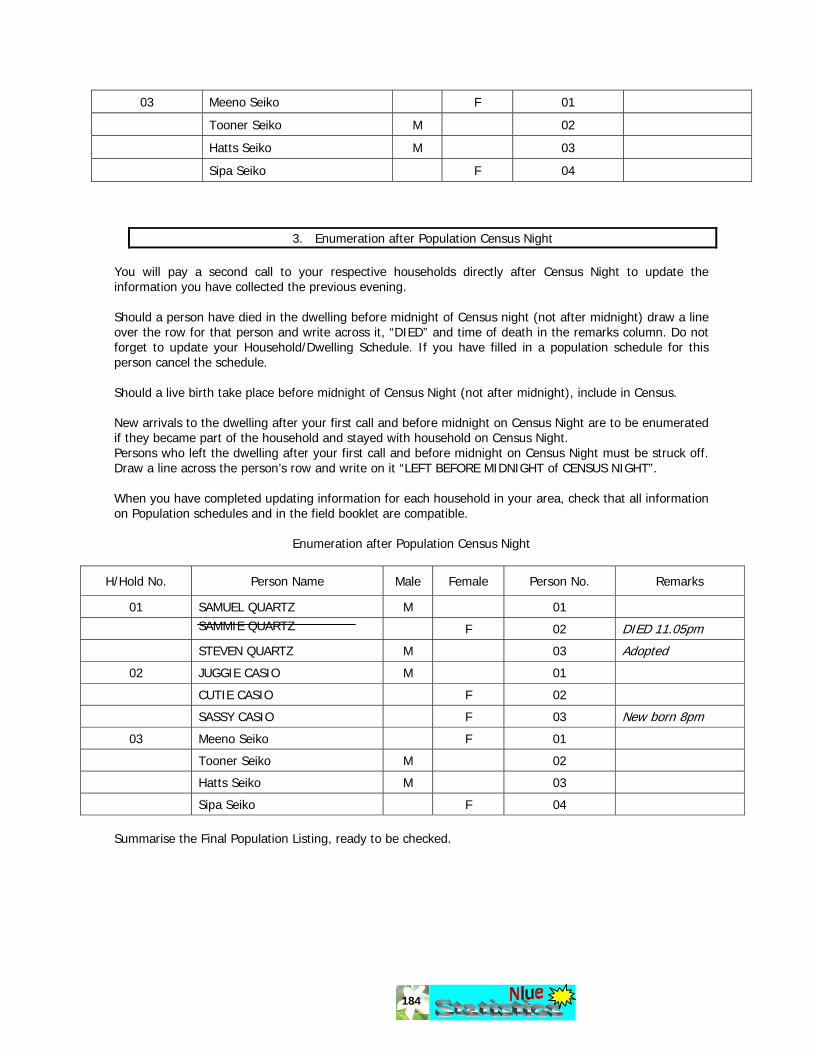
184
03 Meeno Seiko F 01
Tooner Seiko M 02
Hatts Seiko M 03
Sipa Seiko F 04
3. Enumeration after Population Census Night You will pay a second call to your respective households directly after Census Night to update the information you have collected the previous evening. Should a person have died in the dwelling before midnight of Census night (not after midnight) draw a line over the row for that person and write across it, “DIED” and time of death in the remarks column. Do not forget to update your Household/Dwelling Schedule. If you have filled in a population schedule for this person cancel the schedule. Should a live birth take place before midnight of Census Night (not after midnight), include in Census. New arrivals to the dwelling after your first call and before midnight on Census Night are to be enumerated if they became part of the household and stayed with household on Census Night. Persons who left the dwelling after your first call and before midnight on Census Night must be struck off. Draw a line across the person’s row and write on it “LEFT BEFORE MIDNIGHT of CENSUS NIGHT”. When you have completed updating information for each household in your area, check that all information on Population schedules and in the field booklet are compatible.
Enumeration after Population Census Night
H/Hold No. Person Name Male Female Person No. Remarks
01 SAMUEL QUARTZ M 01
SAMMIE QUARTZ F 02 DIED 11.05pm
STEVEN QUARTZ M 03 Adopted
02 JUGGIE CASIO M 01
CUTIE CASIO F 02
SASSY CASIO F 03 New born 8pm
03 Meeno Seiko F 01
Tooner Seiko M 02
Hatts Seiko M 03
Sipa Seiko F 04 Summarise the Final Population Listing, ready to be checked.
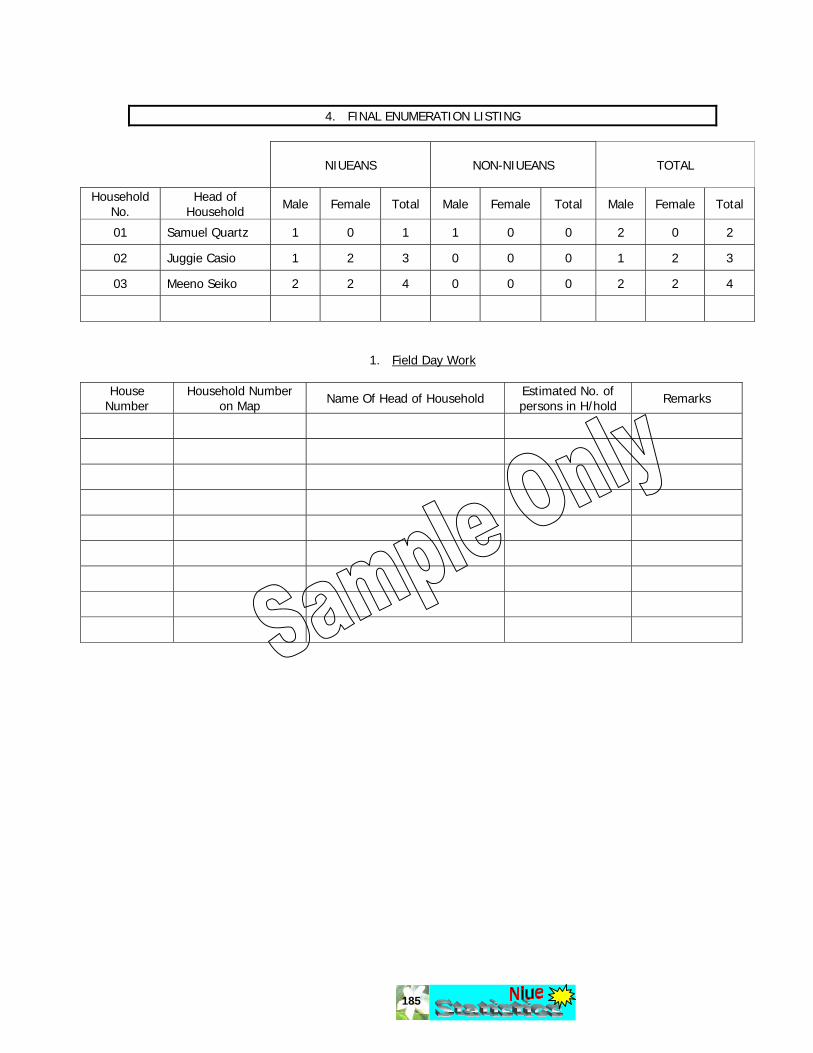
185
4. FINAL ENUMERATION LISTING
NIUEANS NON-NIUEANS TOTAL
Household No.
Head of Household Male Female Total Male Female Total Male Female Total
01 Samuel Quartz 1 0 1 1 0 0 2 0 2
02 Juggie Casio 1 2 3 0 0 0 1 2 3
03 Meeno Seiko 2 2 4 0 0 0 2 2 4
1. Field Day Work
House Number
Household Number on Map Name Of Head of Household Estimated No. of
persons in H/hold Remarks

186
1. ENUMERATION BEFORE POPULATION CENSUS NIGHT
H/Hold No. Person Name Male Female Person No. Remarks
2. ENUMERATION AFTER POPULATION CENSUS NIGHT
H/Hold No. Person Name Male Female Person No. Remarks
187
FINAL ENUMERATION LISTING
NIUEANS NON-NIUEANS TOTAL
Household No.
Head of Household Male Female Total Male Female Total Male Female Total
3. ENUMERATION AFTER POPULATION CENSUS NIGHT
H/Hold No. Person Name Male Female Person No. Remarks
188
4. FINAL ENUMERATION LISTING
NIUEANS NON-NIUEANS TOTAL
Household No.
Head of Household Male Female Total Male Female Total Male Female Total
2. SUMMARY SHEETS and STATEMENTS
CENSUS MATERIALS
Item Issued Completed Cancelled Unused Returned
Household Schedules
Population Schedules
Confidential Envelopes
SUMMARY OF PERSONS
Person recorded in Final Listing Male Female Total
Persons Recorded in Population
Schedules Male Female Total
Niuean
Non-Niueans
Total

189
3. STATEMENT OF ENUMERATORS
I hereby certify I have carefully checked the completeness of the Schedules and the data contained in the above summary table, and that they are true and correct. I am satisfied that all persons living in my census area at midnight on Census Night, 10 September 2011, have all been accounted for.
Signed: Dated this September 2011
Thank you for taking your time in doing this job thoroughly. It is crucial that you check your completed questionnaires.