National Population & Housing Census 2002 - IHSN Survey ...
160
National Population & Housing Census 2002 HBHB HBHBHB HBHBHBHBH BHBHBHBHBHB Published by Management & Information Systems Division P.O. Box 206, Victoria, Mahe, SEYCHELLES Price: R 200
-
Upload
khangminh22 -
Category
Documents
-
view
0 -
download
0
Transcript of National Population & Housing Census 2002 - IHSN Survey ...

National Population & Housing Census 2002
� �
��� HBHB ����� HBHBHB
�������� HBHBHBHBH ����������
BHBHBHBHBHB
Published by Management & Information Systems Division P.O. Box 206, Victoria, Mahe, SEYCHELLES
Price: R 200

Statistics & Database Administration Section Management & Information Systems Division October 2004
Preface
The conventional interval for conducting Population censuses is ten years for
most developing countries. This time consuming and costly exercise requires a
relatively large task force and considerable resources. The Seychelles
experience has shown that the whole operation from planning to results
dissemination can last beyond 2 years, in the light of limited human resources
coupled with other financial constraints.
While the 1997 mini-census was streamlined to collect data only on selected
variables, the 2002 round covered all the usual topics of enquiry plus some
additional items included at the request of various organisations. The timing of this
census was in accordance with the SADC member states’ agreement that each
member would conduct either a census or major demographic survey between
2000 and 2003. Other recent censuses previously conducted were in 1997 and
1994.
This report summarises the data collected for Seychelles as a whole with very
few tables having information broken down by district. Other detailed tables at
regional and district levels will be made available separately. A booklet
containing thematic maps of various topics on both population and housing will
also be published in the same series.
The first part of this report describes the geography of this country and the history
of census taking. The results of the census are presented in the second part and
detailed statistical tables are presented in the Appendices in Part 3.

I
Contents
Page
Part 1 History and Introduction…………………..…………………………………. 1
Chapter 1……………………………………………..……………………………….... 1
1.0 Geography and History…………..…………………………….……. 1
1.1 Location……………………………………………………………….… 1
1.2 Topography……………………………………………………….……. 1
1.3 The main islands………………………………………………………. 1
1.4 The outer islands………………………………………………………. 2
1.5 Climate………………………………………………………………….. 2
1.6 History…………………………………………………………………… 2
1.6.1 The first settlers………………………………………………….. 2
1.6.2 History of census taking………………………………………… 3
1.6.3 Revision of district boundaries………………………………… 4
1.6.4 The creation of the National Population Database………….. 4
Chapter 2…………………………………………………………………………….…. 6
2.0 2002 Census……………………………………………………………………. 6
2.1 Introduction ……………………………………………………………………... 6
2.2 Mapping………………………………………………………………………….. 6
2.3 Questionnaire…………………………………………….……………………... 7
2.3.1 Identifiers………………………………….……………………… 8
2.3.2 Demographic characteristics…………….……………………… 8
2.3.3 Employment and education…………….………………………. 8
2.3.4 Housing, agriculture and fishing 8
2.4 Publicity…………………………………………..……….…………………….. 9
2.5 The pilot test…………………………………..…………….…………………... 9
2.6 Recruitment and training of census officers…………………..……………... 10
Chapter 3……………………………………………………………………………….. 12
3.0 Organisation of the main census..………………………………………….. 12
3.1 Task allocation…………………………………………………………………… 12
3.2 The census week…………………………………………………..……….…… 13
3.3 Staff identification………………………………………………………………… 13
3.4 Coverage…………………………………………………………………………. 13
3.5 Data quality……….……….……….……….……….……….……….………… 14
3.6 Coding and data entry…….……….……….……….……….……….………… 14
3.7 Costing…….……….……….……….……….……….……….……….………… 16

II
Page
Part 2 Results………………………………………………………………………….. 17
Chapter 4……………………………………………………………………….…….… 17
4.0 Demographic and social characteristics………………………………….. 17
4.1 Population size and composition……………………………………….……… 17
4.1.1 Population size …………………………………………………. 17
4.1.2 Sex and age composition………………………………………. 17
4.2 Population distribution.……….……….……….……….……….………. ……. 21
4.3 Other demographic attributes…………………………………………….……. 28
4.3.1 Nationality…….……….……….……….……….……….………. 28
4.3.2 Religion…….……….……….……….……….…………….……. 29
4.3.3 Fertility…….……….……….……….……….……….…….……. 31
4.3.4 Marital status…….……….……….……….……….…………….. 32
Chapter 5……………………………………………………………………….……… 34
5.0 Socio-Economic characteristics…………………………………………… 34
5.1 Labour force and economic status………………………………………………… 35
5.2 Age dependency……………………………………………………………………… 36
5.3 Labour force participation …………………………………………………………… 36
5.4 Employment status…………………………………………………………………. 37
5.5 Job seekers…………………………………………………………………….……… 38
5.6 Literacy…………………………………………………………………….…………… 39
5.7 Education………………………………………………………………….…………… 40
5.8 Occupation……………………………………………………………….…………… 42
5.9 Industry ……………………………………………………………….……………… 43
Chapter 6………………………………………………………………………………….… 46
6.0 Housing and household facilities………………………………………………. 46
6.1 Household characteristics…………………………………………………………… 47
6.1.1 Type of dwelling……………………………………………………… 47
6.1.2 Construction of dwellings…………………………………………… 48
6.1.3 Household size………………………………………………………. 49
6.1.4 Age of dwellings…………………………………………………….. 50
6.1.5 State of repair……………………………………………………….. 51
6.1.6 Tenure……………………………………………………………….. 52
6.1.7 Water supply and sanitation……………………………………….. 53
6.1.8 Lighting and main cooking fuel…………………………………….. 55
6.1.9 Other domestic facilities…………………………………………….. 55

III
Page
Chapter 7……………………………………………………………………………………. 56
7.0 Information, communication and transport……………………………………. 56
8.0 Informal economic activities……………………………………………………… 59
8.1 Agriculture……………………………………………………………………………. 59
8.2 Fishing………………………………………………………………………………… 60
8.3 Other economic activities…………………………………………………………… 61
Part 3 Appendices……………………………………………………………………………….. 62
Appendix 1 Census Proclamation……………………………………………..………… 62
Appendix 2 Census Sticker (logo)…………………………………………….…..… 64
Appendix 3 Census Questionnaire…………………………………………….………… 65
Appendix 5 Statistical tables………………………………………………………………
67

IV
List of Tables
Page
Table 3.1 Staff distribution by Enumeration Zone…………………………………….. 12
Table 3.2 Breakdown of costs incurred for the 2002 Census………………………. 16
Table 4.1 Population counts from censuses 1971 – 2002 and growth rates………. 17
Table 4.2 Population by selected broad age groups, 2002 Census………………… 18
Table 4.3 Population distribution and density by district, 2002 Census……………. 22
Table 4.4 Population by Nationality status 1987, 1994 and 2002 (percentage)…… 28
Table 4.5 Non-Seychellois population by main nationalities 2002 Census………….. 29
Table 4.6 Seychelles Population by Religious Belief, 1994 and 2002 Census……. 30
Table 4.7 Female population by number of children ever born, 2002 Census……. 32
Table 4.8 Population aged 15 years and over by marital status, 1994 and 2002….. 33
Table 5.1 Population aged 12 years or more by economic status, 2002 census….. 34
Table 5.2 Composition of the labour force, 1994 and 2002 Census………………… 35
Table 5.3 Age dependency – 1977 – 2002……………………………………………. 36
Table 5.4 Labour participation rates by sex, 1994 and 2002………………………… 36
Table 5.5 Working population by condition of employment and sex, 2002………… 37
Table 5.6 Job seekers by age group and sex, 2002 Census (% within Sex)……….. 38
Table 5.7 Number of job seekers by length of time seeking work……………………. 39
Table 5.8 Literacy rates for persons 15 years or more, 2002 Census………………. 40
Table 5.9 Population aged 12 years or more by educational attainment ………… 41
Table 5.10 Population aged 12 years or more by educational attainment and sex,
2002 Census (% distribution within sex)………………………………………………
42
Table 5.11 Working population by broad occupational groups, 2002 Census……… 43
Table 5.12 Working population by broad occupational groups, 2002 Census……… 43
Table 5.13a Working population by industry and sex, 2002 Census………………… 44
Table 5.13b Working population by industry and sex, 2002 Census………………… 45
Table 6.1 Housing distribution by region, 1994, 1997 and 2002 Censuses……….. 47
Table 6.2 Households by type of dwelling unit, 2002 Census………………………… 48
Table 6.3 Number of housing units by type and construction of dwelling, 2002
Census……………………………………………………………………………………..
48
Table 6.4 Household size 1977 - 2002 …………………………………………………. 49
Table 6.5 Households by size and sex of head, 2002 Census……………………….. 50
Table 6.6 Domestic dwelling units by age of building, 2002 Census………………… 51
V
Page
Table 6.7 Dwellings by condition of repair, 2002 Census……………………………... 51
Table 6.8 Households by dwelling tenure, 1994-2002………………………………… 52
Table 6.9 Households by type of water supply, 1994 and 2002……………………… 52
Table 6.10 Methods of domestic waste disposal by region, 2002 Census………….. 54
Table 6.11 Energy for lighting and cooking, 2002 Census……………………………. 55
Table 7.1 Access to Information services, 1987- 2002………………………………… 56
Table 7.2 Access to Communication and entertainment, 1994 - 2002 ……………… 56
Table 7.3 Ownership of transport, 1987- 2002…………………………………………. 57
Table 7.4 Households by the languages most commonly spoken, 2002 Census …. 58
Table 8.1 Farming activities by households, 2002 Census…………………………… 59
Table 8.2 Livestock count for all households, 2002 Census………………………….. 60
Table 8.3 Households by main purpose of fishing and ownership of boat and
fishing gear, 2002 Census………………………………………………………………..
61
Table 8.4 Households engaged in cottage industry activities………………………… 61
List of Charts
Page
Chart 4.1 Seychelles Median Age, 1977 – 2002………………………………………. 19
Charts 4.2a to 4.2d Population Pyramids, 1977, 1987, 1994 and 2002…………….. 20
Chart 4.3 Changes in religious affiliation between 1994 and 2002………………….. 31
Chart 4.4 Population aged 15 years and over of selected marital status by age
group, 2002 Census………………………………………………………………………
33
Chart 5.1a Labour participation, 1994…………………………………………………… 37
Chart 5.1b Labour participation, 2002…………………………………………………… 37
Chart 5.2 Job seekers and unemployment rate, 1977 - 2002………………………… 38
Chart 5.3 Literacy rates for population aged 15 years or more by sex, 2002
Census………………………………………………………………………………………
40
Chart 6.1 Households and rate of growth, 1971 – 2002. ……………………………... 46
Chart 6.2 Trends in construction material for housing, 1971 - 2002…………………. 49
Chart 6.3 Water supply and sanitation, 1994 and 2002 Censuses…………………... 53
Chart 6.4 Means of domestic waste disposals by households, 2002………………… 54

VI
BASIC DATA
Census Date 26th August 2002 Total land Area 455.0 km2
Mahe Group 152.5 km2
Praslin Group 39.8 km2
La Digue Group 14.6 km2
Other Islands 248.1 km2
Population Density 179 per km2
Number of Islands 115
Granitic Islands 42 Coralline Islands 73
Population 81755 Mahe Group 71456 (87.4%) Praslin Group 7103 ( 8.7%) La Digue Group 2104 ( 2.6%) Other Islands 1092 ( 1.3%) Population Greater Victoria (1) 24994 (30.6%) Fertility The average number of children born in the lifetime of a woman is 2.0 Mortality Infant mortality rates per 1000 live births:
Males: 19.4 Females: 15.8
Both sexes: 17.6 Population Growth
Crude birth rate: 18.3 per 1000 Crude death rate: 8.0 per 1000 Rate of natural increase: 10 per 1000 Population growth rate per annum (%): Males: -2.06 Females: +1.05
Age Dependency Ratio 50% (2002 census figures) Child:Woman Ratio 279 per 1000 women
(1) Those living in the central districts which include: English River, Mt Buxton, St Louis, Bel Air, Mt Fleuri,
Roche Caiman, Les Mamelles and Plaisance
VII
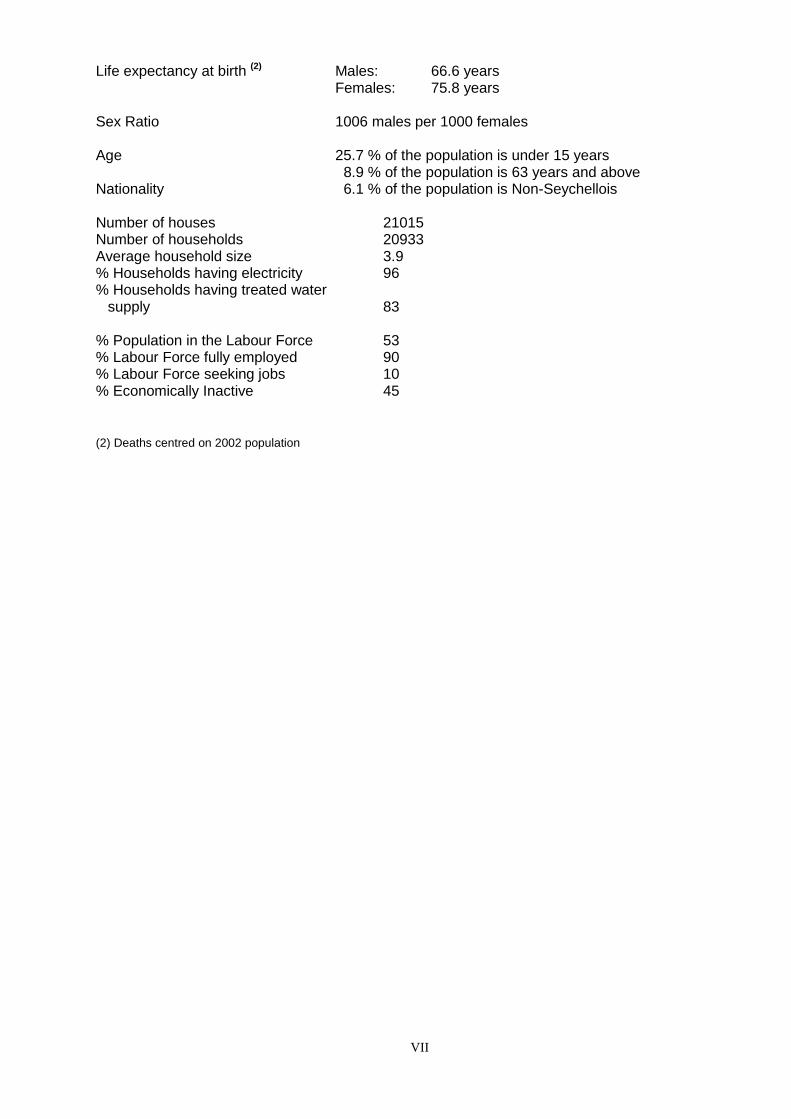
Life expectancy at birth (2) Males: 66.6 years Females: 75.8 years Sex Ratio 1006 males per 1000 females Age 25.7 % of the population is under 15 years 8.9 % of the population is 63 years and above Nationality 6.1 % of the population is Non-Seychellois Number of houses 21015 Number of households 20933 Average household size 3.9 % Households having electricity 96 % Households having treated water
supply 83
% Population in the Labour Force 53 % Labour Force fully employed 90 % Labour Force seeking jobs 10 % Economically Inactive 45
(2) Deaths centred on 2002 population

Part 1
Chapter 1
1.0 Geography and History 1.1 Location
The Seychelles islands consist of some 115 islands spread over 1,000,000 square kilometres of sea
in the middle of the Western Indian Ocean. Forty-two granitic islands account for 245 square
kilometres of the total area of 455 square kilometres. Of these, the largest and most populated is
Mahé. The rest of the islands are coralline and cover an area of 210 square kilometres.
1.2 Topography
The granitic islands that form the main group are spread around Mahé (the most developed in
Seychelles) and all lie within a 56 kilometre radius. The islands are of rugged formation and great
scenic beauty and mostly mountainous leaving very little flat land. Mahé lies between 4 and 5
degrees South of the Equator, and between 55 and 56 degrees East of Greenwich. It is about 27
kilometres long and up to 11 kilometres wide. A range of mountain runs down the whole length, most
of which is over 300 metres high, rising to the peak of Morne Seychellois at 905 metres.
1.3 The main islands
Mahé is about 1600 kilometres northwest of Mauritius and 925 kilometres north east of Mombassa.
The capital is Victoria and the small town boasts an excellent harbour sheltered by a small group of
islands offshore. The international airport of the republic spreads across 3 kilometres on the East
Coast of Mahé and it is capable of handling the largest passenger aircraft.
Praslin and La Digue are two other islands of major importance in terms of size and permanent
population. These two islands are about 8 kilometres apart and lie about 40 kilometres northeast of
Mahé. Silhouette Island is slightly larger than La Digue but sparsely populated because of its
mountainous terrain.

1.4 The other islands
The sprawl of over 70 coralline islands formed on submerged mountain peaks, provide flatter
topography. Some of these can support basic coconut and agricultural activities, while others are
mere sand cays that are almost entirely covered at high tide. The exception amongst the coralline
islands is Aldabra, the land area of which is almost the same as that of Mahé. Aldabra has a most
interesting fauna and flora and forms part of the prestigious Natural World Heritage Sites. The island
mainly consists of ragged coral stretches, ranging from 1 to 8 kilometres in width, enclosing a very
extensive lagoon. About a dozen of the coralline islands have a resident population. Labour is
recruited from Mahé on a contract basis when required.
1.5 Climate
The shade temperature varies little throughout the year, the hottest months being March and April (31
degrees Celsius) and the coolest being July and August (25 degrees Celsius). The Southeast Trade
winds blow steadily from May to September and this period is the most pleasant time of the year.
From November to April, the wind is mainly from the northwest but is usually very light and the
atmosphere very humid. The rainfall varies considerably from island to island and from month to
month. December and January are usually the wettest months while June and July, the driest. Much
of the rainfall during the wet season comes from torrential downpours that usually last only a few
hours before the clouds give way to blue skies. The islands attract very high rainfall of over 2000
millimetres per annum. However, some of the coralline islands have only a few millimetres of rain
each year. Over the more recent years, the weather patterns have been subject to environmental
phenomena (such as El Nino and El Nina), which have now and then altered the timing of the rainy
and drought seasons.
1.6 History
1.6.1 The first settlers
There is some evidence to suggest that the Seychelles islands were known and visited as long ago as
the 8th and 9th centuries. More recently in the 15th and 16th centuries pirates occasionally inhabited
them, but it was only in 1771 that the first settlers coming from Mauritius established themselves on St
Anne Island with their slaves, a total of 28 persons.

1.6.2 History of census taking
At the start of the French Revolution in 1789, the population of Seychelles numbered 591 persons.
The first census in Seychelles was carried out in 1791 but there are few records of the results in the
country. In 1803 another census was carried out. The details of each settler family and slaves were
recorded as well as details of animals and crops. The population had reached 2,121 by then, of
which 1,820 were slaves. There were 755 pigs, 281 cattle and 6,248 chickens and the main crops
were coffee, cotton and cloves. The population continued to increase as more settlers arrived, and
another census appears to have taken place in 1830. The final population at that time was recorded
at 8,500 people. From 1830 to 1840, the population of Seychelles fell sharply to 4,360. A number of
reasons have been put forward for this decrease, the most plausible being that when the British
abolished slavery in 1834 many of the settlers left with their slaves. In 1851 another census was
carried out. This time the principal islands were divided into sections and every house was visited.
For the other islands however, information had to be obtained from persons owning property on them.
The population was recorded as 6,841 rising to 7,580 at the next census in 1861.
Censuses continued to be carried out during the first year of each decade, the rhythm being broken
by the Second World War when the 1941 census was postponed until 1947. A new Census Act was
drawn up in 1959 for the purpose of the 1960 census. Few maps were available then. With the
exception of those in Victoria, the census districts and houses had no means of identification. At this
time the Roman Catholic bishop lent maps of Mahé, Praslin and La Digue, sub-divided into parishes.
These parishes were of a convenient size for census districts and were used. The 1960 census was
done and the population was 41,425 of which 81% lived on Mahé. Details on housing, occupation,
literacy, religion and nationality were recorded as well as the usual demographic data. A team of 201
enumerators and supervisors were employed, and these comprised mainly of students and teachers.
This census was supplemented by an agricultural census shortly afterwards.
Another census was conducted in May 1971 combining questions on population, employment,
housing and agriculture. The data thus collected were processed by computer for the first time. The
Roman Catholic parishes were again used as census districts. The results showed 1,500 persons
less than had been anticipated. The Census Commissioner at the time put the difference down to
errors in the migration figures over the intervening 11 years as the most likely cause but it is now
thought that a number of households in certain areas were not covered.
A change of government took place on the 5th June 1977. Mr France Albert Rene became president
and formed a new government. The change in government in June caused some delay in the final

preparation of the census to be held in that year. The results of the census reported a population of
61,900 persons.
1.6.3 Revision of district boundaries
A decision was taken to create new district electoral boundaries in 1980/1981. The census office with
limited resources conducted a census update exercise with the objective of obtaining social and
demographic data of individuals on a district basis. The results were mainly affected by double
counting persons migrating to another district and also under counting. As a result, a 6% under
enumeration was reported. The census update of 1981/1982 estimated that 63,245 persons or 98% of
the population were distributed amongst the three main islands. The estimated total number of
households was 13,107 for the three main islands.
1.6.4 The creation of the National Population Database
A population and housing census was conducted in August 1987 with the aim of catering for the
changes in the district boundaries and the creation of the National Population Database (NPD).
Following that, another census was conducted in 1994, the aim of which was to obtain reliable
population figures for the revision of the electoral district boundaries as stipulated in the constitution.
Secondly, the data would be used to validate the NPD. Thirdly, the census would provide the primary
source of basic population data for administrative and other aspects of economic and social planning,
and fourthly it would make available a base for current statistics and a statistical frame for sampling
surveys, studies, and research. For the first time, a thorough and detailed mapping exercise was
conducted. The exercise subdivided the country into over 400 enumeration areas for better
management control in the census enumeration. These maps would later serve as invaluable field
tools for subsequent censuses and surveys.
In 1997, the need to revise the electoral district boundaries and update the electoral lists necessitated
an urgent population count. The emphasis for an early census was that the exercise would also
serve as ground preparatory work for the forthcoming elections that would take place in 1998. The
establishment of new housing estates in different parts of the country had spurred considerable
internal migration and it was felt that the electoral lists should be amended to reflect such changes.
The exercise however took a narrower dimension compared to the usual census taking, in that data
were collected for only a selection of the usual census variables.

All persons were listed according to household membership during the 1994 Census including their
demographic characteristics but omitting the socio-economic details, which were recorded during field
enumeration.

Chapter 2
2.0 2002 Census 2.1 Introduction
In line with the general agreement within the Southern African Development Community (SADC)
member countries, each state would conduct either a population census or major demographic survey
during the period 2000-2003. Seychelles had planned to carry out its population census in 2003. The
activities were earmarked as follows; a comprehensive mapping exercise would be carried out during
the course of 2002 to i) update the existing sub-district maps to take into account new housing
estates, ii) split enumeration areas that had expanded, into manageable workloads and iii) make
available hard copy sets of maps complete with name listings, in preparation for enumeration that
would take place in 2003. However, the dates for the census were brought forward to August 2002.
This imposed considerable constraints in terms of time for effective preparations. Furthermore, the
fact that important resources such as accommodation, transport, a plotter and other accessories for
the exercise were yet to be procured, bringing forward the census dates necessitated shortening both
the time allocated for as well as the extent of some of the preparatory activities. Eventually the
preparation year became itself the census year.
2.2 Mapping
The Geographical Information Systems (GIS) technology currently available allows the mapping of
demographic and other attributes onto geographical features in great detail. The possibilities are
extensive and various informative thematic maps can be produced. Furthermore, the Census Office
had plans to build a housing geo-database (a database containing geographical data) prior to the
2002 census. From the database, area maps would be produced with useful details for ease of
enumeration.
The inadequacy of the maps prepared during the 1994 census was highlighted during the execution
of the mini census in 1997. In many areas the name listings did not correspond to the house
numbering. This posed difficulties in the field for the enumerators, thus it was anticipated that the
maps would be edited and updated.
Furthermore, most EA’s had expanded into unmanageable workloads due to the increase in new
housing estates and it was imperative that a new mapping exercise was needed for the next
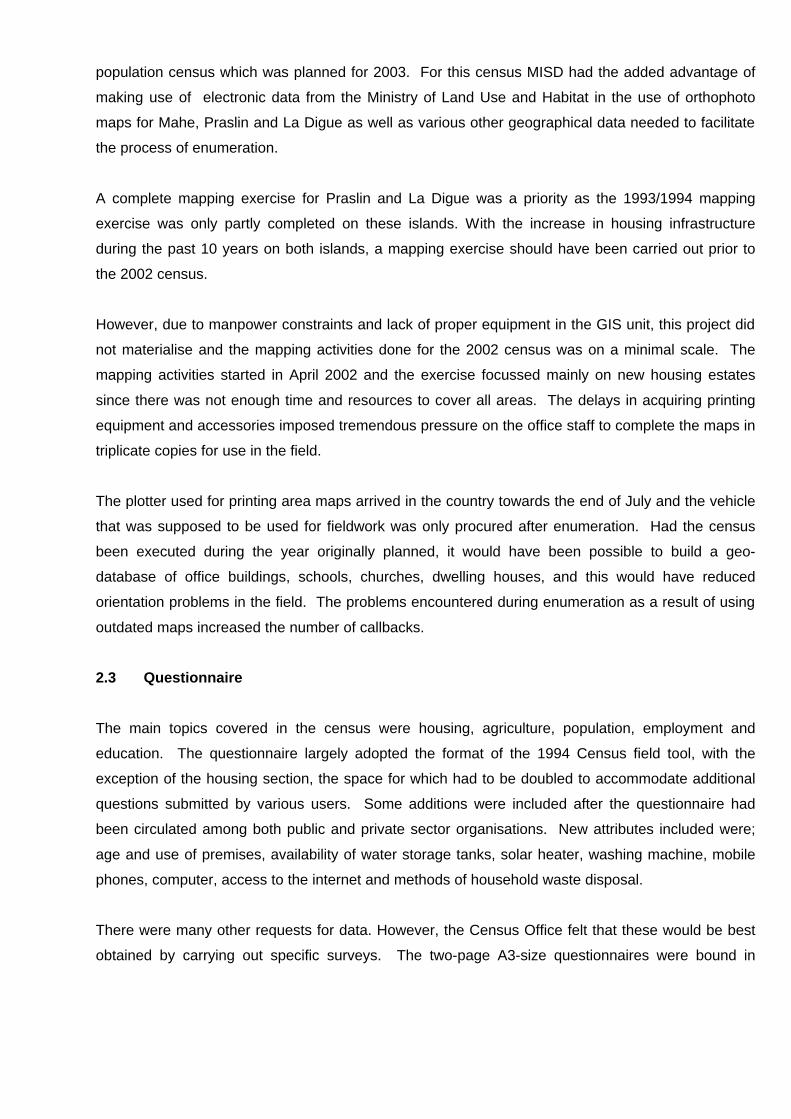
population census which was planned for 2003. For this census MISD had the added advantage of
making use of electronic data from the Ministry of Land Use and Habitat in the use of orthophoto
maps for Mahe, Praslin and La Digue as well as various other geographical data needed to facilitate
the process of enumeration.
A complete mapping exercise for Praslin and La Digue was a priority as the 1993/1994 mapping
exercise was only partly completed on these islands. With the increase in housing infrastructure
during the past 10 years on both islands, a mapping exercise should have been carried out prior to
the 2002 census.
However, due to manpower constraints and lack of proper equipment in the GIS unit, this project did
not materialise and the mapping activities done for the 2002 census was on a minimal scale. The
mapping activities started in April 2002 and the exercise focussed mainly on new housing estates
since there was not enough time and resources to cover all areas. The delays in acquiring printing
equipment and accessories imposed tremendous pressure on the office staff to complete the maps in
triplicate copies for use in the field.
The plotter used for printing area maps arrived in the country towards the end of July and the vehicle
that was supposed to be used for fieldwork was only procured after enumeration. Had the census
been executed during the year originally planned, it would have been possible to build a geo-
database of office buildings, schools, churches, dwelling houses, and this would have reduced
orientation problems in the field. The problems encountered during enumeration as a result of using
outdated maps increased the number of callbacks.
2.3 Questionnaire
The main topics covered in the census were housing, agriculture, population, employment and
education. The questionnaire largely adopted the format of the 1994 Census field tool, with the
exception of the housing section, the space for which had to be doubled to accommodate additional
questions submitted by various users. Some additions were included after the questionnaire had
been circulated among both public and private sector organisations. New attributes included were;
age and use of premises, availability of water storage tanks, solar heater, washing machine, mobile
phones, computer, access to the internet and methods of household waste disposal.
There were many other requests for data. However, the Census Office felt that these would be best
obtained by carrying out specific surveys. The two-page A3-size questionnaires were bound in

batches of 25 sets per booklet with a hard back cover for ease of use in the field. A copy of the
questionnaire is available in the appendices.
2.3.1 Identifiers
Basic questions on area location, the enumeration area number, house/map number, form number
and name of the head of household provided unique reference data for each household so that the
national sampling frame could be updated for future surveys. It was intended that the enumerators
would update the maps during enumeration to include new dwellings that were either completed after
the mapping exercise or could not be included during the exercise because of time constraint.
2.3.2 Demographic characteristics
The main demographic data for each member of household could be obtained from their national
identity cards. Those included names, date of birth, sex, and national identity number, NIN (as
registered on the NPD). Other information sought was whether the member of the household was
present, absent, visiting or abroad at the time of the census, his/her relationship to the head of
household, nationality, marital status and religion. For females aged 15 years or more, two questions
on fertility were asked. Those were the number of children ever born alive and details of any children
born during the 12 months preceding the census.
2.3.3 Employment and Education
Socio-economic characteristics were enquired of persons aged 12 years and above. Details on
literacy, educational attainment, employment status, occupation and place of work were asked of
every eligible respondent.
2.3.4 Housing, Agriculture and Fishing
As mentioned earlier, the census form was extended to meet the additional data requirements. The
first section on housing characteristics focussed on details about the type and use of dwelling, type of
construction, age and repair condition of the building, tenure, size and amenities or other equipment
as well as durable goods available or accessible to the households. The second section addressed
questions related to economic activities carried out in the household including backyard agricultural
activities, fishing and home-based manufacturing.

2.4 Publicity
Various publicity tools were designed with the aim of stimulating the interest of the public and
encouraging their co-operation. A poster was designed depicting symbols of the types of information
to be collected for the housing and population census. Posters printed in A3 format indicated the
dates set for enumeration. These were posted in selected public places such as at bus shelters, and
on notice boards in schools, health centres and ministries. A theme song was also composed and
sung by a local artist. This was aired on the radio and in the form of a video clip on the National
Television, weeks prior to Census enumeration. The national and other local papers also carried
educational and informative articles on the exercise to sensitise the public on the importance of
responding cooperatively and helping to make the exercise a success. By the time the census
started, the public was already aware of what was expected of them. Hence, it can be said that the
publicity campaign was effective.
2.5 The Pilot Test
The importance of testing the questionnaire, methodology and operations of a census or survey
cannot be over-emphasised. Some problems can usually be foreseen prior to enumeration, while
others can only be taken into account after trial runs and field experience. The pilot exercise was
carried out over a weekend in Port Glaud, one of the western districts on Mahe. The reason for the
selected location was manifold. Praslin region had first been suggested as the testing area. However,
due to cost and time-constraints, this option had to be dropped. Secondly, the Census Office had
been loaned working and boarding quarters at the Cap Ternay Youth Village, which being located in
the Port Glaud District, made it logistically convenient to operate from there without increasing the
cost of staff deployment. Furthermore, Port Glaud District commands a vast spread across the west
side of Mahe and has both mountainous and flat areas, sparsely and densely populated
neighbourhoods. Thus the geographical terrain of the area provided enough variation to test the
physical aspect of the exercise. Ten sub-districts were selected out of seventeen for the exercise. By
the second day, around 90 to 95 percent of the enumeration had been completed.
The pilot exercise was scheduled to be carried out over two days. Officers worked in pairs to
enumerate all households in the designated areas within the two days allocated. From the exercise, it
was observed that it would be best to have one enumerator per EA since most areas contained over
60 households. In addition to reviewing the allocation of EAs, the need for reliable transport
assistance was emphasised. Other minor amendments were also made to the questionnaire and the
field tools were finalised for the main exercise. The Pilot test thus served to highlight areas of
weakness that needed strengthening or reviewing.
It took an average of 15 to 20 minutes to enumerate a household, whereas the interview time for
institutions (collective worker’s residence, orphanages, homes etc.) could go beyond an hour. The
wide range of publicity given for the census facilitated the response considerably. Most households
needed very little explanation regarding the purpose of the exercise as they were already aware of
this.
The staff requirements were identified as follows. A total of 447 EAs were delineated in 25 districts.
Two supervisors would be allocated to each district and an additional one would be responsible for
the enumeration of institutions, which would be enumerated separately, giving a total of 51
supervisors. Furthermore, each supervisor (on Mahe, Praslin and La Digue) would assist with the
enumeration by completing one EA each. Hence if each field assistant were to be assigned an EA, a
total of about 397 assistants had to be recruited. However, due to budgetary constraints, it was not
possible to recruit the specified number of assistants and this number was cut to about a half. To
compensate for this cut in recruitment, the duration of time allowed for enumeration would be
increased from 3 to 5 days.
Given that an EA consisted of about 60 households, an assistant would thus have to enumerate
around 20 or more households per day on average. Interviewer fatigue seemed imminent, and this
arrangement would be impractical especially where houses were far apart involving greater walking
distances. Based on this, the final compromise proceeded as follows; field assistants would be
assigned 2 EAs each, and one additional assistant would be recruited per district to help out where
the workload was heavier. The number of field staff eventually recruited was 8 Zone supervisors, 51
field supervisors and 232 field assistants.
2.6 Recruitment and Training of Census Officers
As has traditionally been the case, the Census Office aimed to recruit teachers and post-secondary
students (who would normally be on holiday during that time) for the enumeration exercise. However,
with the changes in the polytechnic academic calendar, the semester break no longer coincides with
normal school holidays; hence the students were not available for recruitment. As a result, more
teachers were recruited as well as other personnel from other public sector organisations.
Training was done in three phases. First about 20 members of staff of the Census Office were trained
during a two-day workshop at Cap-Ternay Village between the 22nd and 23rd of July 2002. The first
day was dedicated to detailed explanation of the different sections of the questionnaire, concepts and
definitions. On the second day, participants followed model interviews and engaged in role-plays
among themselves after which a discussion was held to review common problems and iron out any

misconceptions. This first training session was conducted mainly in preparation for the pilot test,
which was to take place the following weekend (27th –28th) July 2002.
The second phase involved training of the field supervisors who were mostly schoolteachers and
other government officers. To accommodate the different work schedules of participants, they were
split in two groups of about 25 supervisors and the 2-day training sessions were held on different
dates for each group. In the third training phase, responsibility was given to the supervisors to guide
the field assistants through the field tools for data collection, with the Zone supervisors in attendance
to clarify or emphasise important issues. The supervisors were encouraged to give a lot of
importance to role-plays as a means of assessing the interviewing capabilities of the field assistants.
These sessions were held for two days.
The Census office experienced certain problems in the organisation of the training sessions. Some
venues for training sessions were confirmed late and recruitment in certain areas was not completed
till the day before the training was due. The Census Office had also sought assistance from certain
ministries to identify competent personnel to work as field supervisors. Unfortunately, towards the
end of July 2002, the office had still not received a list of potential candidates to participate in the
exercise. This hindered the planning committee in its efforts to plan a workable training schedule in
the short period of time left before the actual census. The last minute rush that followed did not make
it possible for the recruited applicants to be carefully screened for competency (especially for the field
assistants). As a result, the performance of some of the personnel recruited was not up to the
standard required.

Chapter 3
3.0 Organisation of the main census
3.1 Task allocation
The enumeration covered all the districts on Mahe, Praslin and La Digue as well as the inner and
outer islands. The country was divided into 8 zones comprising of 3 or four districts each. Table 3.1
below presents details of the work zones and sub-areas. Officers from the Census Office (MISD)
assumed the roles of Zone Supervisors and they were each responsible for between 6 to 8
supervisors, and between 25 to 40 field assistants. The supervisor’s job entailed enumerator training,
public relation maintenance, progress reporting, fieldwork supervision, maintaining summary sheets,
equipment control and liaising on a daily basis with the Zone supervisors.
Table 3.1: Staff distribution by Enumeration Zone, 2002 Census
Zone Districts Number
of EAs Number of
supervisors Number of field assistants
Planned Actual North Belombre
Beau Vallon Glacis Anse Etoile
22 23 19 24
2 2 2 2
10 11 9
11
11 12 11 12
Victoria 1 English River Mont Buxton St Louis Bel Air
16 15 17 17
2 2 2 2
7 7 8 8
8 8 9 9
Victoria 2 Mont Fleuri Plaisance Roche Caiman Les Mamelles
15 19 16 17
2 2 2 2
7 9 7 8
9 9 8 9
East Cascade Pointe Larue Anse Aux Pins Au Cap
18 12 22 20
2 2 2 2
8 5
10 9
10 9
11 10
South Anse Royale Takamaka Baie Lazare
19 18 19
2 2 2
9 8 9
11 9
10 West Anse Boileau
Grand Anse Port Glaud
14 14 24
2 2 2
6 6
11
11 7 7
Praslin / La Digue Grand Anse Baie Ste Anne La Digue
17 18 12
2 2 2
8 8 5
8 8 6
Outer islands / Institutions
All outer Islands All Institutions
1
Total 447 51 204 232

3.2 The census week
The main enumeration began on Thursday 26th August 2002 on Mahé, Praslin and La Digue and it
was to be done within five days. Some census officers from the office were sent to some of the other
islands by plane a few days before the main census in order to enumerate households there. For
most of the outer islands managed by the Island Development Company, questionnaires were sent
through their headquarters for their respective managers to complete the details of workers.
Institutions were enumerated simultaneously with households during the main census week. After the
designated five days, some areas still had a considerable number of households to be covered, so
the field teams were given an extra day to complete these areas. Intense publicity over the media
continued throughout the enumeration period, which was very effective in raising public awareness.
After enumeration, each household was labelled with a ‘Census Completed’ self-adhesive sticker
carrying the numerical identifiers as referenced in their respective questionnaires (i.e EA, Form and
House numbers).
3.3 Staff Identification
All census officers were issued with a numbered Identity card appointing him/her as a census officer
as delegated by the Census Proclamation Order of 1977. These cards were to be carried at all times
and produced at the introduction of interviews and upon request by respondents.
3.4 Coverage
Post enumeration checks by use of auxiliary sources indicated that there were some persons who
had not been counted in the main census. These are estimated to be around 2000. Although some
of those not enumerated could be complete households that for some reason were not visited, it is
likely that most individuals missed were those who were not present at their households at the time of
enumeration and their families failed to include them. It was felt that in some areas, the workload was
too heavy to be completed in the time given. Possible reasons for this undercount can be explained
by the fact that some of the recruited staff were not working conscientiously, and others not owning up
that they had not been able to complete the task allocated.
There was a considerable number of callbacks and office staff had to work beyond normal working
hours and during weekends to complete partly filled in questionnaires or enumerate those households
that were missed out. Callbacks were organised to try and complete enumeration for those missed
out altogether. The supervisors had already listed some of them after the main enumeration; while
others were only discovered as staff endeavoured to follow up on the callback lists handed in.
Among the callbacks, there were also individuals and households that had originally refused to

cooperate during the main census. Most of these cooperated when they were visited for a second
time. However, some thirty or so individuals still failed to provide information and hindered the
completion of the exercise.
After the main census enumeration, apart from the organisation of callbacks, the Census Office also
makes provisions for persons not enumerated to contact the office and make arrangements for
interviews. Unfortunately, not all individuals or households not visited make use of this opportunity.
Considering the number of refusals, it is felt that some individuals deliberately try to avoid being
enumerated and do not cooperate to make the exercise complete.
3.5 Data quality
All forms were returned to the respective zone supervisors at the end of the census week. In certain
areas, supervisory checks were not entirely satisfactory. Some of the questions for which data are
almost always unsatisfactorily collected are those relating to economic activities, i.e. for individuals
seeking work, where the last occupation and industry were not recorded. Another area of concern is
the fertility data. In some instances, the questions on fertility were missed out altogether.
Thorough checking of questionnaires by the supervisor should have enabled timely identification of
items of non-response. It would seem that part of the problem was again the workload of supervisory
staff, notwithstanding the fact that there could have been too much reliance on post-enumeration
queries and editing. It is fair to say that cost cutting at enumeration stage resulted in additional post
enumeration costs in terms of data editing and cleaning. A lot of queries to complete personal details
also had to be done by phone. Four rounds of callbacks that lasted up to April 2003 were done during
which over 900 households and more than 3000 persons were re-enumerated.
A post–enumeration survey was envisaged as part of the quality assurance check. However, the
limited resources especially in terms of manpower, presented a major hindrance to the practicality of
the exercise.
3.6 Coding and Data Entry
Data processing was carried out in two different stages. Most of the coding was undertaken at Cap
Ternay Youth Village, where the Census Office was loaned working space to allow some 20 persons
to work at a time. Meals were provided on site and assistance was obtained from officers from the
Department of Environmental Health to help with the coding which involved allocating selected codes
to nationality, occupation, industry, district of residence in the previous census and also circle
selected answers for housing data to facilitate data entry. All data capture was carried out at the
Census Office and recruited staff from various ministries assisted with the data entry after their normal

working hours. The bulk of the data had been entered by the end of February 2003, and printouts of
the data were available in the first week of March 2003. Due to several constraints in terms of
logistics, the whole printing exercise took three months to be completed. Manual checking of the
printed data against the questionnaires started in March 2003 and took around four months to be
completed, whereas computer editing (corrections) started in July 2003 and ended in April 2004. This
stage should also have been completed much earlier, but problems with equipment, coupled with the
lack of human resources did not make this possible. It is to be noted that the staff who worked on the
data processing were themselves also involved in other routine jobs of the office and at certain times
during the month, the data processing had to be stalled to allow for other work to be covered. This
arrangement in itself did not help to speed up data analysis and subsequently hindered the availability
of timely results.

3.7 Costing
The budget allocated for the census is presented in Table 3.2 below. Financial and technical
assistance from external organisations had not been sought early enough, hence the 2002 Census
was fully funded by the Seychelles Government and the budget managed by the Census
Commissioner.
Table 3.2 Breakdown of costs incurred for the 2002 Census
Description Cost (Rupees)
Staff remuneration
Zone/Field Supervisors 111,100.00
Enumerators 262,699.00
Coders 16,700.00
Data entry operators 63,038.00
Drivers 6,600.00
Call-backs 51,200.00
Data editing 121,238.00
Printing
Publicity (posters & stickers) 9,400.00
Field Manual binding 1,575.00
Questionnaires 26,337.50
Report (Census main results) 35,000.00
Atlas (Thematic maps) 26,000.00
Other equipment
Plotter 64,576.03
Accessories (ink cartridges, stationery etc.) 18,186.25
Clip boards 500.00
Vehicle 267,903.33
Fuel (Mahe) 31,100.00
Other transport costs 40,037.50
Telephone 35,461.01
Meals and accommodation 31,934.80
Total Costs 1,220,586.42

Part 2 Results
Chapter 4
4.0 Demographic and social characteristics 4.1 Population size and composition 4.1.1 Population size
The population was enumerated on a de jure basis defined here to include all resident population
living in Seychelles for a period of at least 3 months. The 2002 Census enumerated a total of 81,755
persons. However, it is estimated that the census may have undercounted the population by about
2.4%. The differential count from the population estimates at mid-year 2002 (end of June) is 934.
Taking into account the number of births that occurred during July and August 2002 (274), this brings
the differential down to 660 persons. Granted the undercount, it is concluded that the census count is
closer to the true population count than the mid-year estimate. It is not unusual that some persons are
missed out during the population census. Previous censuses have undercounted the population by
varying degrees ranging between 1 to 5 percent. However, with better cooperation from certain
members of the public, a lot of the omissions could have been avoided. Reasons for the undercount
are as explained in Chapter 3 (see “Coverage” at paragraph 3.4). Table 4.1 presents a population
count series from censuses conducted between 1971 and 2002. Annual inter-censal growth rates are
also given in the ultimate column.
Table 4.1 Population counts from censuses 1971 – 2002 and growth rates, Census year Female
(%) Male (%)
Total Population
Annual Growth rates (%)
1971 50.2 49.8 54, 695 .. 1977 49.6 50.4 61, 898 2.08 1987 50.3 49.7 68, 598 1.03 1994 50.1 49.9 74, 331 1.15 1997 50.5 49.5 75, 876 0.69 2002 49.8 50.2 81, 755 1.50
4.1.2 Sex and age composition
Of the 81,755 persons, 41, 004 (50.2%) were males and 40, 751 (49.8%) were females, which gives
us a slightly higher male population than that of female or a sex ratio of 101 males per 100 females.

With the exception of the 1977 census, all population counts since 1971 have recorded a higher
female proportion than that of male (see Table 4.1).
With regards to age composition, there were 6,378 children aged less than 5 years and they make up
7.8% of the population. One out of every 5 persons (or 20%) of the total population was aged less
than 12 years. The cut off point of 12 years is of interest here because it is usually adopted to qualify
an individual as being eligible to answer socio-economic questions. On the other hand, if one adopts
the international standard definition for child population, those aged between 0 and 14 years
represent 25% or one quarter of the population. The elderly population (using 63 years as the cut-off
point) accounts for around 9% of the population. Again this cut-off point is of interest because the
population in this age group are eligible for social security benefit. However, adopting the
international definition for the elderly, the population aged 65 years or more amount to 6,326 persons
or about 7.7% of the population (see Table 4.2). The remaining 67% of the population fall in the
working ages (15-64 years by standard definition).
Table 4.2 Population by selected broad age groups, 2002 Census Age group (years) Population % of total Under 12 16, 699 20.4 Under 15 21, 022 25.7 Working ages (15-64) 54, 494 66.7 Elderly (63 or more) 7, 156 8.9 Elderly (65 or more) 6, 326 7.7
The median age of the population was about 28 years in 2002 as compared to 26 years in 1997 and
23 years in 1987. Although still in the intermediate category, our population continues to age steadily
and is fast approaching what would be termed an ‘old’ population whereby the median age exceeds
30 years (see Chart 4.1).

Chart 4.1 Seychelles Median Age, 1977 - 2002
15
17
19
21
23
25
27
29
1977 1987 1994 1997 2002
Census year
Yea
rs
For a more detailed view of the changing population structure, the reader is referred to Charts 4.2a to
Chart 4.2d. The population pyramids depict clearly the narrowing base at younger ages with the
general structure slowly approaching that of a developed country.

4.2 Population distribution
4.2.1 Distribution and density
Seychelles has a total land area of 455.4 km2. With the current population of 81,755 persons, this
gives an overall density of about 180 persons per square kilometre. However, over half the land area
is accounted for by outer islands which are mostly uninhabited. In order to obtain a more realistic
picture of the population distribution, it is useful to look at the population by district. However, one
should bear in mind that there are wide areas within administrative boundaries that include reserve
areas, such as national and marine parks, and also undeveloped reclaimed land and industrial sites.
Disregarding this factor would grossly underestimate the actual density of certain areas. Table 4.3
presents the population distribution by district. For the reasons mentioned above, two sets of density
estimates have been provided. One set provides estimates of the population density based on the
total land area and the ultimate column gives estimates after taking into account the uninhabited
areas. The differences are very high in areas like Cascade, Mont Fleuri, Pointe Larue and Roche
Caiman.
Population density maps are also provided on pages 23 – 27, and these give a better picture of the
distribution of the population. The maps depict population density separately for regions Central,
East, West, North and Praslin/La Digue.

Table 4.3 Population distribution and density by district, 2002 Census
District Population % of total
Total Area
(km2)
Nominal Density
(km2)
(1)
Inhabited Area (km2)
Real Density
(km2) Anse Aux Pins 3564 4.4 2.5 1426 1.8 1980 Anse Boileau 4036 4.9 12.0 336 8.0 505 Au Cap 3215 3.9 8.3 387 4.7 684 Anse Etoile 4394 5.4 6.0 732 3.2 1373 Anse Royale 3687 4.5 7.1 519 7.1 519 Bel Air 2919 3.6 4.4 663 2.6 1123 Baie Lazare 2984 3.6 12.1 247 11.0 271 Belombre 3622 4.4 9.4 385 3.6 1006 Baie Ste Anne 3736 4.6 25.5 147 19.2 195 Beau Vallon 3816 4.7 4.5 848 3.5 1090 Cascade 3448 4.2 10.2 338 2.0 1724 English River 3612 4.4 1.2 3010 1.2 3010 Glacis 3592 4.4 6.8 528 4.2 855 Grand Anse Mahe 2594 3.2 15.7 165 8.2 316 Grand Anse Praslin 3367 4.1 16.2 208 7.5 449 La Digue 2104 2.6 14.7 143 4.4 478 Les Mamelles 2391 2.9 1.7 1406 1.5 1594 Mont Buxton 3110 3.8 1.2 2592 1.2 2592 Mont Fleuri 3598 4.4 5.7 631 1.4 2570 Other Islands 1092 1.3 240.1 5 - - Plaisance 3414 4.2 3.4 1004 1.6 2134 Port Glaud 2184 2.7 26.7 82 5.4 404 Pointe Larue 2717 3.3 3.5 776 1.4 1941 Roche Caiman 2673 3.3 1.1 2430 0.4 6683 St Louis 3277 4.0 1.4 2341 1.4 2341 Takamaka 2609 3.2 14.2 184 9.1 287 Total 81755 100.0 455.4 180 115.6 707
Note: (1) Excludes national parks, marine park islands and large parts of reclaimed non-residential areas. The district with the highest population is Anse Etoile (in North Mahe) with 4,395 persons, followed by
Anse Boileau (in West Mahe) with 4,036 persons. These are also the only two districts whose
population exceed 4,000. On the other hand, the least populated district is La Digue (Island) with
2,104 persons followed by Port Glaud (in West Mahe) with 2,184 persons. With regards to population
density however, we have a completely different set of districts at the extremes. Using the ‘real’
density, Roche Caiman (on the East Coast of Mahe) is at the high extreme with 6,683 persons/km2,
followed by English River (in town) with over 3,000 persons/km2. Baie Ste. Anne inhabitants (on
Praslin Island) enjoy the most sparsely populated area with only 195 persons/km2 followed by Baie
Lazare (in Southwest Mahe) with a density of 271 persons/km2 (see Table 4.3).

4.3 Other Demographic attributes 4.3.1 Nationality Table 4.4 Population by Nationality status 1987, 1994 and 2002 (percentage)
Nationality status
1987
1994 2002 Seychellois by birth 95.2 94.1 90.3 Seychellois by descent 2.0 2.3 2.4 Seychellois by registration 0.7 0.7 1.1 Non-Seychellois 2.1 2.4 6.1 Nationality not reported 0.0 0.5 0.0 Total (%) 100.0 100.0 100.0 Number of persons 68598 74331 81755
Table 4.4 shows a decline in the proportion of Seychellois by birth and a significant increase in that of
naturalised Seychellois and non-Seychellois over the last decade and a half. The proportion
represented by the Seychellois-born residents has decreased from 95.2% in 1987 to 94.1% in 1994 to
90.3% in 2002. In other words, one in every 10 current residents is not Seychellois-born. The actual
number of non-Seychellois recorded was 4,974. Table 4.5 provides a breakdown of non-Seychellois
by main Nationalities.
There are more than 1,500 Indian nationals living in Seychelles and they represent almost one third of
the total expatriates. The second largest non-Seychellois resident group is from Madagascar (401)
followed by Mauritians (389), Thai (358) and Sri Lankans (357), each representing between 7 to 8
percent of the expatriates living in Seychelles (see Table 4.5).

Table 4.5 Non-Seychellois population by main nationalities 2002 Census Nationality (Country of) Population % India 1547 31.1 Madagascar 401 8.1 Mauritius 389 7.8 Thailand 358 7.2 Sri Lanka 357 7.2 Philippines 304 6.1 South Africa 280 5.6 Kenya 253 5.1 Indonesia 173 3.5 United Kingdom 133 2.7 France 118 2.4 Other Europe 207 4.2 Other Africa 193 3.9 Other Asia 108 2.2 Latin America & The Caribbean 76 1.5 Australia 44 0.9 North America 24 0.5 Middle East 9 0.2 Total 4974 100.0
4.3.2 Religion
Christianity continues to be the dominating faith in the Seychelles. However, the last decade has
seen significant changes in terms of inter-denomination shifts. The majority of Seychellois are Roman
Catholics representing 82.3% of the population (see Table 4.6). Anglicans account for 6.4% and
other Christian denominations grouped together represent 4.5% of the population giving a total
representation of over 90% for all Christians. Non-Christians account for 5.3% of the total population
and those include Hindu, Islamic Faith, Bahai and atheists.

Table 4.6 Seychelles Population by Religious Belief, 1994 and 2002 Census
Religion 2002 1994
Change in relative
importance (%) (%) (%)
Roman Catholic 67280 82.3 64349 86.6 -4.3
Anglican 5220 6.4 5072 6.8 -0.4
Other Christians 2291 2.8 946 1.3 1.5
Seventh Day Adventist 907 1.1 584 0.8 0.3
Jehovah Witness 508 0.6 306 0.4 0.2
Hindu 1700 2.1 953 1.3 0.8
Islamic Faith 866 1.1 506 0.7 0.4
Atheists 511 0.6 338 0.5 0.2
Bahai 392 0.5 338 0.5 0.0
Other Non-Christians 820 1.0 244 0.3 0.7 Not reported 1260 1.5 695 0.9 Total 81755 100.0 74331 100.0 Total Christians 76206 93.2 71257 95.9 -2.7
Total Non-Christians 4289 5.2 2379 3.2 2.0 A closer look at the inter-denomination changes suggests a decline in the relative representation of
Roman Catholics and Anglicans. The proportion of these two most important denominations have
decreased by 4.3% and 0.4% respectively, whereas the Seventh Day Adventist (SDA) and Jehovah
Witness have increased by 0.3% and 0.2% respectively in their proportional representation. It is
interesting to note that data from the previous two censuses (1994 and 1987) showed decreases of
2% and 0.2% for the Roman Catholics and Anglicans respectively. Another significant phenomenon
worth of note is the representation of ‘Other Christians’ (excluding SDA and Jehovah Witness). The
absolute number of Other Christians has more than doubled between 1994 and 2002 (see Table 4.6).
Official auxiliary information indicates that over the last few years, there has been a surge of new
Christian denominations forming in Seychelles. Secondary data confirms that there are at least 20
other Christian denominations besides the ones listed above. Chart 4.3 gives a graphical
presentation of the changes within all the major religious groups. (The category ‘non-reported’ has
been omitted).

Chart 4.3 Changes in religious affiliation between 1994 and 2002
-5.5 -4.5 -3.5 -2.5 -1.5 -0.5 0.5 1.5
Roman Catholic
Anglican
Seventh Day Adventist
Jehovah Witness
Other Christians
Hindu
Islamic Faith
Bahai
Other Non-Christians
Atheists
% change from 1994
4.3.3 Fertility
Fertility is one area where Seychelles usually has relatively good quality data compared to other
African developing countries. This is primarily due to a solid mechanism in the vital registration
system. However, fertility data collected during censuses have been found to be less accurate than
those obtained through administrative processes especially data sought through parity questions
relating to teenage females. Fertility questions are usually addressed to females aged 15 years or
more. However, since there are young mothers aged less than 15 years; data for this group are also
included.
Comparison with secondary data suggests that there has been a tendency among interviewers to
omit the fertility questions which were placed at the ultimate columns on the questionnaire, at least for
young female teenagers. For this reason, data on number of children for females aged less than 15
have not been captured as can be seen in Table 4.7. There were at least 8 babies born to young
mothers less than 15 years who gave birth during 2001 and 2002, none of which is reflected in the
data presented below. Hence the category with parity level ‘0’ for females aged less than 15 years
actually includes a number of ‘not reported’ cases. Although there are relatively few young mothers
aged less than 15 years, data for this age group is very useful in providing some indication of the
minimum level of teenage-pregnancy and for gauging effects of family planning education programs
or such similar indicators.

Females aged 15 years or more account for about 75% of total females. According to the data,
11,189 females or 37% of this group have never borne any children. Although the census does not
contain data to prove otherwise, this figure seems a little too high given that over 65% of these
women are above 20 years. In other words, it is unlikely that one third of the female population aged
more than 20 years have not borne any children. It would be wise therefore to be cautious about
making serious fertility assumptions based on the census data alone. It would be recommendable to
review the format of the questionnaire (specifically with regards to the fertility questions) in an effort to
induce more awareness in the collection of such data during future censuses. A review of
experiences from past censuses has revealed a serious weakness in this particular area. It might
even be worth addressing fertility questions on a separate page in future censuses so that it becomes
more obvious to the interviewers.
Table 4.7 Female population by number of children ever born, 2002 Census
Age group
No. of children ever born
Less than 15
years
15 years or
more
% of 15 years
or more Age not
reported Total % of total
0 10310 11189 37 16 21515 53 1 – 2 9710 32 1 9711 24 3 – 4 5471 18 1 5472 13 5 – 6 2144 7 0 2144 5 7 or more 1909 6 0 1909 5 Total 10310 30423 100 18 40751 100
4.3.4 Marital Status
Table 4.8 presents a comparison of marital status by sex for persons aged 15 years or more. 42.6%
of this age group were single (never married) and 26.8% were legally married while 21.3% of them
were living in common law relationship (cohabiting). Compared to 1994, the highest decline in the
relative proportions can be observed among individuals who are married (-2.2%). Most of the other
categories have recorded slight increases. Among the same population segment (aged 15 years and
over), around 93% fall in the category single, married or cohabiting.

Table 4.8 Population aged 15 years and over by marital status, 1994 and 2002
1994 2002 1994* 2002 Marital status
Male Female Male Female Both sexes %
% % % % % % change Single 45.2 40.3 44.3 41.0 42.8 42.6 -0.2 Married 28.7 29.3 26.5 27.0 29.0 26.8 -2.2 Cohabiting 20.9 20.9 21.3 21.2 20.9 21.3 +0.4 Separated 1.0 1.5 1.3 1.8 1.2 1.6 +0.4 Divorced 1.2 1.7 1.2 1.9 1.4 1.6 +0.2 Widowed 1.0 5.2 1.1 5.5 3.1 3.3 +0.2 Not reported 2.0 1.1 4.4 1.5 1.6 2.9 +1.3 Total 100.0 100.0 100.0 100.0 100.0 100.0
* Figures for ‘both sexes’ have been adjusted for errors reported in 1994
For a closer look at the age pattern of the population in these three categories of marital status,
reference is made to Chart 4.4 below. The family formation patterns observed in 1994 have not
altered in 2002. Between the ages 20 to 40 years, a higher proportion of the population live in
common-law unions than observed at older ages. Of the population aged 40 years or more, over half
are married compared to 16% and 33% among age groups 20 to 30 and 30 to 40 years respectively.
Nevertheless, a significant 30% of individuals in the older ages are cohabiting.
Chart 4.4 Population aged 15 years and over of selected marital status by age group, 2002 Census
Age g
roup (
years
)
15 < 20
20 < 30
30 < 40
40 plus
Percent
1009080706050403020100
Marital status
Cohabiting
Married
Single
30
44
37
51
33
16
19
23
47
93

Chapter 5 5.0 Socio-Economic characteristics
Questions relating to socio-economic status were enquired of the population aged 12 years or more.
These addressed the subjects of educational attainment and literacy, work status, occupation and
industry. Originally this 12-year old cut-off point was set to try and measure child-labour. The first
four data columns of Table 5.1 present information for all persons for whom such information was
sought. However, 90% of the population between 12 and 14 years are students so the economic
analyses will focus on the population aged 15 years or more. Table 5.1 gives a breakdown of the
population eligible to answer socio economic questions.
Table 5.1 Population aged 12 years or more by economic status, 2002 census
Work status Population aged 12 years or more
Population aged 15 years or more
No. of persons
%
Female
Male
No. of persons
%
Employee (Government) 12437 19.1 7824 4613 12091 19.9 Employee (Parastatal) 5680 8.7 2280 3400 5930 9.8 Employee (Private) 15666 24.1 6883 8783 15694 25.8 Employer 441 0.7 131 310 441 0.7 Self-Employed 4843 7.4 793 4050 4843 8.0 Unpaid family worker 607 0.9 466 141 594 1.0 Part-time job seeker 1145 1.8 558 587 1142 1.9 Unemployed job seeker 3166 4.9 1619 1547 3159 5.2 Student 8473 13.0 4347 4126 4589 7.6 Other Inactive 11652 17.9 7236 4416 11563 19.0 Not reported 946 1.5 429 517 674 1.1 Total 1 65056 100.0 32566 32490 60720 100.0 Total employees 33783 51.9 16987 16796 33715 55.5 Working population 40819 62.7 18935 21884 40735 67.1 Total job seekers2 4311 6.7 2177 2134 4301 7.1 Total economically active 43985 67.6 20983 23948 43894 72.3 Inactive population 20125 30.9 11583 8542 16152 26.6
1 Includes 13 persons whose ages were not reported 2 Includes partial jobseekers

5.1 Labour force and economic status
The ‘Labour Force’ includes all persons from age 15 onwards who are either employed or
unemployed (seeking work). Employed persons include those persons who were engaged in the
supply of labour for any number of hours for payment in cash or in kind, plus unpaid family workers.
Unemployed persons are defined as individuals who were not working but were actively seeking work.
Of the 60,720 persons aged 15 years or more, 43,894 or 72% were in the labour force (See Table
5.1). The inactive population aged 15 years or more include full-time students, pensioners and other
individuals who are neither employed nor seeking work (e.g. the disabled, housewives etc.) This
group accounted for 26.6% of the population aged 15 years or more while the working population
make up 67% of the same age group. A comparison of the labour force composition for the last two
complete censuses is presented in Table 5.2. Over a period of 8 years, the labour force increased by
one and a quarter times its size. The unemployment rate decreased from 10.1% in 1994 to 7.2% in
2002. Note however, that there are a number of individuals for whom economic status has not been
reported, hence it is likely that the number of unemployed persons is slightly higher than what is
estimated here.
Table 5.2 Composition of the labour force, 1994 and 2002 Census Economic Group 1994 2002 % % Labour force 34871 100.0 43894 100.0 Employed 1 31329 89.8 40735 92.8 Under-employed 1074 3.1 1142 2.6 Unemployed 3542 10.1 3159 7.2
1 Including partially employed
5.2 Age dependency Over a period of 25 years, the child dependency ratio has decreased steadily from 74 children per
100 population of working age in 1977 to 39 in 2002, whereas the elderly dependency ratio has been
constant at 12 per hundred population of the working age group. This is yet another indication
towards an ageing population.

Table 5.3 Age dependency – 1977 - 2002 Population Census years 1977 1987 1994 2002 Aged 0-14 24540 23069 22667 21022 Aged 15-64 33250 40559 46204 1 54452 Aged 65 or more 3983 4884 5396 6281 Child dependency ratio (%) 74 57 49 39 Elderly dependency ratio (%) 12 12 12 12
1 Age not reported Included (58 cases)
5.3 Labour force participation Table 5.4 presents labour participation rates for both males and females for the 1994 and 2002
censuses. It can be observed that male participation is consistently higher than that of females
throughout all age groups. The total participation rate in 2002 was 77.2% for males and 67.4% for
females.
Table 5.4 Labour participation rates by sex, 1994 and 2002 Male Female Total Age group
1994
2002
1994
2002
1994
2002
15 < 20 32.3 40.5 30.4 32.0 31.4 36.3 20 < 25 88.9 89.8 82.6 84.5 85.8 87.2 25 < 30 93.7 93.5 87.1 88.8 90.3 91.2 30 < 35 93.8 94.6 85.4 89.7 89.6 92.2 35 < 40 94.0 93.4 82.6 89.9 88.7 91.7 40 < 45 92.2 92.6 78.8 87.4 86.2 90.1 45 < 50 90.7 91.0 73.6 84.1 82.8 87.8 50 < 55 86.1 86.3 64.6 78.2 75.2 82.6 55 < 60 76.0 79.7 52.4 66.2 63.4 73.0 60 < 65 52.6 51.5 30.3 40.3 40.7 45.3 65 + 6.1 9.4 3.3 3.0 4.9 5.5 Total 68.1 77.2 56.1 67.4 62.1 72.3
In general, the overall participation rates have increased from 62.1% in 1994 to 72.3% in 2002.
Although in 2002, male participation rates are still higher than those of their female counterparts, the
gender gap has narrowed as can be observed in Charts 5.1a and 5.1b.

Chart 5.1a Labour participation, 1994 Chart 5.1b Labour participation, 2002
5.4 Employment status (hours worked) Employed persons were asked to specify their condition of employment, i.e. whether they were full-
time, part time or casual workers. Full-time workers included individuals who worked for 5 hours or
more per day on a regular basis, whereas part-timers worked for less than 5 hours per day on a
regular basis. Any other workers were categorised as casual workers. Table 5.5 presents a
distribution of the working population by their condition of employment. The left side of the table
compares employment condition within each gender, whereas the right side looks at the sex
composition of each category of working condition. The percentage distribution within sex is quite
similar for male and female workers, with the majority of workers employed on a full time basis.
However, within each type of condition, there is a large proportional disparity between the sexes.
Male participation is dominant among casual workers (82%) and full time workers (53%), whereas
female workers account for the larger share of part-time workers (60%).
Table 5.5 Working population by condition of employment and sex, 2002 Employment condition
% within sex % within employment condition
Male Female Both sexes
Male Female Both sexes
Casual 4.5 1.2 2.9 81.7 18.3 100.0 Part time 3.4 5.8 4.5 40.0 60.0 100.0 Full time 84.8 86.2 85.4 53.2 46.8 100.0 Not reported 7.4 6.8 7.1 55.5 44.5 100.0 Total 100.0 100.0 100.0
Labour force participation rates by sex and age group - 1994
0.0
20.0
40.0
60.0
80.0
100.0
15 <
20
20 <
25
25 <
30
30 <
35
35 <
40
40 <
45
45 <
50
50 <
55
55 <
60
60 <
65
65 +
Per
cent
age
Male Female
Labour force participation rates by sex and age group - 2002
0.0
20.0
40.0
60.0
80.0
100.0
15 <
20
20 <
25
25 <
30
30 <
35
35 <
40
40 <
45
45 <
50
50 <
55
55 <
60
60 <
65
65 +
Per
cent
age
Male Female

5.5 Job seekers There were 4301 persons who were reported to be actively seeking work at the time of the census.
Of these, 2,173 or about half were females. One jobseeker out of four was partially employed
(engaged in an economic activity for less than 5 hours per day on a regular basis). The age
distribution of job seekers is about the same for males and females, but over 60% are aged less than
30 (see Table 5.6).
Table 5.6 Job seekers by age group and sex, 2002 Census (% within Sex ) Age group Sex Total
Unemployed Under-
employed Female Male % Number % Under 20 22.2 23.4 22.8 721 13.7 20<30 40.4 36.9 38.7 1222 29.6 30<40 20.3 18.8 19.6 619 26.5 40<50 11.5 14.4 14.4 407 16.1 50<60 4.5 5.4 4.9 156 10.9 60 or more 1.1 1.1 1.1 34 3.2 Total 100.0 100.0 100.0 100.0 Number
1615
1544
3159
1142
Between 1977 and 2002, the unemployment rate has fluctuated between 7% to over 15%. An
analysis of census data series for the last 25 years indicates 2002 to have the lowest unemployment
rate at 7.2%, and 1987 to have had the highest at 15.3%.
Chart 5.2 Job seekers and unemployment rate, 1977 - 2002
0
500
1000
1500
2000
2500
3000
3500
4000
4500
5000
1977 1987 1994 2002
Census year
No.
of j
ob s
eeke
rs
0.0
2.0
4.0
6.0
8.0
10.0
12.0
14.0
16.0
18.0
Une
mpl
oym
ent r
ate
(%)
Job Seekers Unemployment rate

Half of the unemployed population have been seeking work for less than 3 months, and
about 10% have sought work for more than two years (Table 5.7). Looking at the figures
cumulatively, it can be observed that more than three quarters of the unemployed individuals
have been seeking work for no more than one year. Among the cases for whom the length of
time seeking work labelled as ‘not reported’, more than half have reported a length of time of
over 4 years. These individuals have been assumed to be ‘passive job seekers’ and have
been separated from the active job seekers. A further question on ‘last job occupied’ was
asked of the unemployed job seekers. However, since there was no response for half of
those individuals, it has not been deemed worthwhile to analyse the responses.
Table 5.7 Number of job seekers by length of time seeking work Time seeking work
Total job seekers %
Totally unemployed %
0 < 3 months 2429 56.5 1568 49.6 3 < 6 months 389 9.0 348 11.0 6 < 9 months 464 10.8 409 12.9 9 < 12 months 83 1.9 74 2.3 1 year 360 8.4 313 9.9 2 years 226 5.3 198 6.3 Over 2 years 146 3.4 117 3.7 Not reported 204 4.7 132 4.2 Total 4301 100.0 3159 100.0 5.6 Literacy
An individual was defined as literate if he or she could read or write a complete sentence in any
language. Of the population aged 15 years and above, 91% were reported to be literate. The total
literacy rate within sex is almost the same for males and females (90.1% and 91.9% respectively).
However, the difference in literacy rate between the two sexes increases as one moves to higher age
groups indicating higher rates for females than those for males (see Table 5.8) and with literacy rates
also lowering for both sexes. The sex differential pattern can be clearly observed in Chart 5.3

Table 5.8 Literacy rates for persons 15 years or more, 2002 Census Age group
Both sexes (%) Female(%) Male(%)
Sex differentials
15 < 20 98.3 98.9 97.7 1.2 20 < 25 98.1 99.1 97.2 1.9 25 < 30 97.7 98.6 96.8 1.8 30 < 35 97.6 98.5 96.8 1.7 35 < 40 95.8 97.5 94.0 3.5 40 < 45 93.2 95.8 90.9 4.9 45 < 50 90.0 92.1 88.1 4.0 50 < 55 84.2 86.8 81.9 4.9 55 < 60 79.0 81.9 76.1 5.8 60 < 65 73.2 77.4 68.1 9.3 65 + 66.0 67.6 63.5 4.1 Total 91.0 91.9 90.1 1.8
Chart 5.3 Literacy rates for population aged 15 years or more by sex, 2002 Census
60.0
70.0
80.0
90.0
100.0
15 <
20
20 <
25
25 <
30
30 <
35
35 <
40
40 <
45
45 <
50
50 <
55
55 <
60
60 <
65
65 +
Age group
Lite
racy
rat
es
Female Male
5.7 Education Persons eligible to answer questions about educational attainment were those who were at least 12
years old at the time of the census. There were 65,056 persons aged 12 years or more. Table 5.9
presents this section of the population by the highest educational level attained. If one looks at the
cumulative percentage from the highest education level, it can be observed that at least 60% of the
relevant group have obtained a minimum of 3 years of secondary education. However, less than one
quarter of the same population have gone up to and beyond polytechnic. On the other hand, 4% of
the eligible population reported to have had no schooling at all.

Table 5.9 Population aged 12 years or more by educational attainment, 2002 Census Educational attainment
No. of
persons %
1 Cumulative %
No schooling 2651 4.1 95.5 Primary 11321 17.4 91.4 Other (e.g. adult learning etc.) 330 0.5 74.0 Secondary 1-2 years 8838 13.6 73.5 Secondary 3 years 6214 9.6 59.9 Secondary 4 years 4564 7 50.3 National Youth Service/Secondary 5 years 11029 17 43.3 Vocational 2177 3.3 26.3 Polytechnic 1-2 years, Teacher Training College 7782 12 23.0 Polytechnic 3-4 years, Form 6 3430 5.3 11.0 Pre-University 1522 2.3 5.7 University (Bachelor) 1490 2.3 3.4 University (MA, MBA, PHD) 742 1.1 1.1 Not reported 2966 4.6 Total 65056 100 Note 1: Cumulated from highest to lowest level

Comparing the education level of males to females, Table 5.10 shows a more or less equal
attainment for the two sexes at least up to polytechnic level. Beyond this level, there is a clear
indication of males dominating the higher educational achievements. Combining the two groups who
have reached university level, it can be reported that females represent only 37% of university
graduates indicating a gender imbalance at higher levels of education.
Table 5.10 Population aged 12 years or more by educational attainment and sex, 2002 Census (% distribution within sex)
Educational attainment % Female Male Total Number No schooling 50.2 49.8 100.0 2651 Primary 52.8 47.2 100.0 11321 Other (e.g. adult learning etc.) 51.5 48.5 100.0 330
Secondary 1-2 years 51.7 48.3 100.0 8838 Secondary 3 years 52.2 47.8 100.0 6214 Secondary 4 years 49.6 50.4 100.0 4564 National Youth Service/Secondary 5 years 51.9 48.1 100.0 11029 Vocational 41.0 59.0 100.0 2177
Polytechnic 1-2 years, Teacher Training College 50.9 49.1 100.0 7782 Polytechnic 3-4 years, Form 6 51.7 48.3 100.0 3430 Pre-University 48.7 51.3 100.0 1522 University (Bachelor) 38.0 62.0 100.0 1490 University (MA, MBA, PHD) 34.8 65.2 100.0 742 Not reported 37.0 63.0 100.0 2966 Total 50.1 49.9 100.0 65056 5.8 Occupation
The overall representation of gender within the working population is relatively balanced. However,
comparison of distribution across the main occupational sectors shows different patterns for male and
female workers. Table 5.11 indicates that among female workers, the most important groups (in
terms of proportional representation) are protective and service workers (25%), elementary workers
(24%) and professionals and associate professionals (21%) whereas among the male counterparts,
the dominant groups in order of magnitude are extraction, building, trade and craft workers (22%)
followed by elementary workers (17%) and the professionals & associates (15%) who make up the
third most important group. Looking at all workers together, it is observed that one worker out of five
(20%) is a labourer, but only one in twenty (5%) are market oriented agriculture and fishery workers.

Table 5.11 Working population by broad occupational groups, 2002 Census
Occupation group Female % Male % Total % Legislators, Senior officials & Managers 680 3.6 1283 5.9 1963 4.8 Professional & Associate professionals 4032 21.3 3333 15.3 7365 18.1 Clerks 2509 13.3 609 2.8 3118 7.7 Protective & Service workers 4699 24.9 2573 11.8 7272 17.9 Market oriented Agriculture & Fishery workers 451 2.4 1766 8.1 2217 5.4 Extraction, Building, Trade & Craft workers 699 3.7 4721 21.6 5420 13.3 Machine operators and Drivers 196 1.0 2439 11.2 2635 6.5 Elementary workers and Labourers 4592 24.3 3641 16.7 8233 20.2 Others 1036 5.5 1476 6.8 2512 6.2 18894 100.0 21841 100.0 40735 100.0 A comparison between figures reported for this Census and those of the 1994 Census shows that the
distribution of workers among occupational groups is quite similar (Table 5.12). Expatriate workers
accounted for 12.5% of legislators and senior officials with about the same proportion working as
labourers. However, the highest proportion of non-Seychellois workers can be found among
extraction, building, trade and craft workers.
Table 5.12 Working population by broad occupational groups, 2002 Census
Occupation group % of Total % Non-
Seychellois
% with post-
secondary education
1994 2002 2002 2002 Legislators, Senior officials & Managers 5.1 4.8 12.5 49.8Professional & Associate professionals 17.7 18.1 9.3 62.1Clerks 8.3 7.7 2.3 44.8Protective & Service workers 16.0 17.9 3.2 17.8Market oriented Agriculture & Fishery workers 5.6 5.4 10.1 15.4Extraction, Building, Trade & Craft workers 14.2 13.3 17.8 21.9Machine operators and Drivers 5.7 6.5 10.7 19.7Elementary workers and Labourers 20.5 20.2 12.7 8.8Others1 6.9 6.2 7.7 30.5 Total 100.0 100.0 9.7 28.9Note 1: Others include not reported cases The last column of Table 5.12 indicates the proportion of workers within each occupational group that
have attained the level of education of post secondary and beyond. The distribution is as expected
with higher proportions observed among the working groups in professional, legislative and
management positions. In contrast, less than one in ten individuals in elementary occupations
attained post secondary education.

5.9 Industry Community and other services remains the single most important industrial sector (see Table 5.13a).
This sector absorbs over 38% of the working population and the second largest sector is that of trade
(17.4%). A comparison of the distribution of workers within the sex category shows that the
predominance of the services sector is more pronounced among female workers (48.8%) than among
their male counterparts (29.3%). On the other hand, significantly higher proportions of men than
women are engaged in the agriculture, forestry and fishery areas and also in the construction and
quarrying sector.
Table 5.13a Working population by industry and sex, 2002 Census Industry Female % Male % Total %
Agriculture, Forestry and Fishing 646 3.4 2270 10.4 2916 7.2 Manufacturing 2329 12.3 1953 8.9 4282 10.5 Electricity, Gas and Water 133 0.7 776 3.6 909 2.2 Construction & quarrying 129 0.7 2676 12.3 2805 6.9 Wholesale and Retail Trade 3805 20.1 3280 15.0 7085 17.4
Transport, Storage and Communication 1090 5.8 2711 12.4 3801 9.3
Finance, Insurance, Real estate and Business services 751 4.0 537 2.5 1288 3.2
Community, Social and Personal Services 9227 48.8 6402 29.3 15629 38.4 Not reported 784 4.1 1236 5.7 2020 5.0 Total 18894 100.0 21841 100.0 40735 100.0 An analysis of the distribution within each industrial sector depicts more clearly the areas in which
each gender predominates. Community and other services, finance and business services, trade and
manufacturing are female dominated areas of work, whereas agriculture and fishing, public utilities,
construction, transport and communication are male dominated sectors (see Table 5.13b).

Table 5.13b Working population by industry and sex, 2002 Census
Industry Female
(%) Male
(%) Total
(%) Total Agriculture, Forestry and Fishing 22.2 77.8 100.0 2916 Manufacturing 54.4 45.6 100.0 4282 Electricity, Gas and Water 14.6 85.4 100.0 909 Construction and quarry 4.6 95.4 100.0 2805 Wholesale and Retail Trade 53.7 46.3 100.0 7085 Transport, Storage and Communication 28.7 71.3 100.0 3801 Finance, Insurance, Real estate and Business services 58.3 41.7 100.0 1288 Community, Social and Personal Services 59.0 41.0 100.0 15629 Not reported 38.8 61.2 100.0 2020 Total 46.4 53.6 100.0 40735

Chapter 6 6.0 Housing and household facilities
The distribution of domestic dwellings and access to various amenities is useful in assessing the
standard of living of the population. In the following chapter, an analysis of the current housing
situation and the related household characteristics are presented. The number of households has
grown steadily at an average rate of 1.8% annually between 1971 and 2002. In the space of three
decades, the actual number of households has increased from about 11000 in 1971 to almost twice
this number in 2002. Chart 6.1 shows the growth in household formation from 1971 to 2002.
Chart 6.1 Households and rate of growth, 1971 – 2002.
0
5000
10000
15000
20000
25000
1971 1977 1987 1994 2002 Average
Census year
No.
hou
seho
lds
0
0.5
1
1.5
2
2.5
3
No. households Inter-censal Growth rate
The total number of households (groups sharing the same cooking pot) enumerated in 2002 was
20,933, whereas the number of occupied dwelling units (houses) was 20,270. Worthy of note here is
the fact that certain housing units accommodate more than one household. With the additional 745
vacant houses enumerated, the total housing stock stands at 21,015. Out of the 20,933 households,
19,717 or 94% were living in single family dwelling units while the remaining 1,216 (6%) lived in multi-
family units, that is the latter group lived under the same roof and shared certain facilities, but cooked
their meals separately. Table 6.1 provides a distribution of households by region for the last three
censuses with the percentage increases for the last two.

Figures at district level are not comparable because of the changes in the number of districts and
certain boundaries between 1994 and 1997. However, the magnitude of the proportional changes
within the regions (Table 6.1) is indicative of household growth rates and provides some indication of
the impact of housing developments.
Table 6.1 Housing distribution by region, 1994, 1997 and 2002 Censuses
Region 1994 1997 % change over 1994 2002
% change over 1997
Central 5569 5815 4.4 6302 8.4 East/South 4067 4197 3.2 4948 17.9 West 2330 2447 5.0 2917 19.2 North 3147 3357 6.7 3975 18.4 Praslin/La Digue 1880 1966 4.6 2404 22.3 Other Islands 114 96 -15.8 387 303.1
6.1 Household characteristics 6.1.1 Type of dwelling For the 2002 census, data on type of dwellings were collected in slightly greater detail than in the
previous censuses. The additional breakdown within the category of conventional dwelling types has
permitted an insight into the extent to which multiple or clustered housing units are slowly gaining
importance in making more efficient use of scarce land for housing development. While the majority
of households (81%) are housed in single unit dwellings, over 16% of households dwell in multiple
units which include flats and semi-detached houses (see Table 6.2). Multi-purpose type which
account for some 2% of all households refer to dwellings that are used for both domestic and
commercial purposes. These may either be single or multiple units, although it is now common to find
blocks with the top floor used for accommodation and ground floor for commercial purposes. It is also
noted that there were 8 households who had no fixed dwelling. These households that added up to a
total of 16 individuals who reported not to have a home were mostly 1-person ‘households’, but a few
of them included more than one person. Meanwhile, institutional populations make up less than 1
percent of all households.
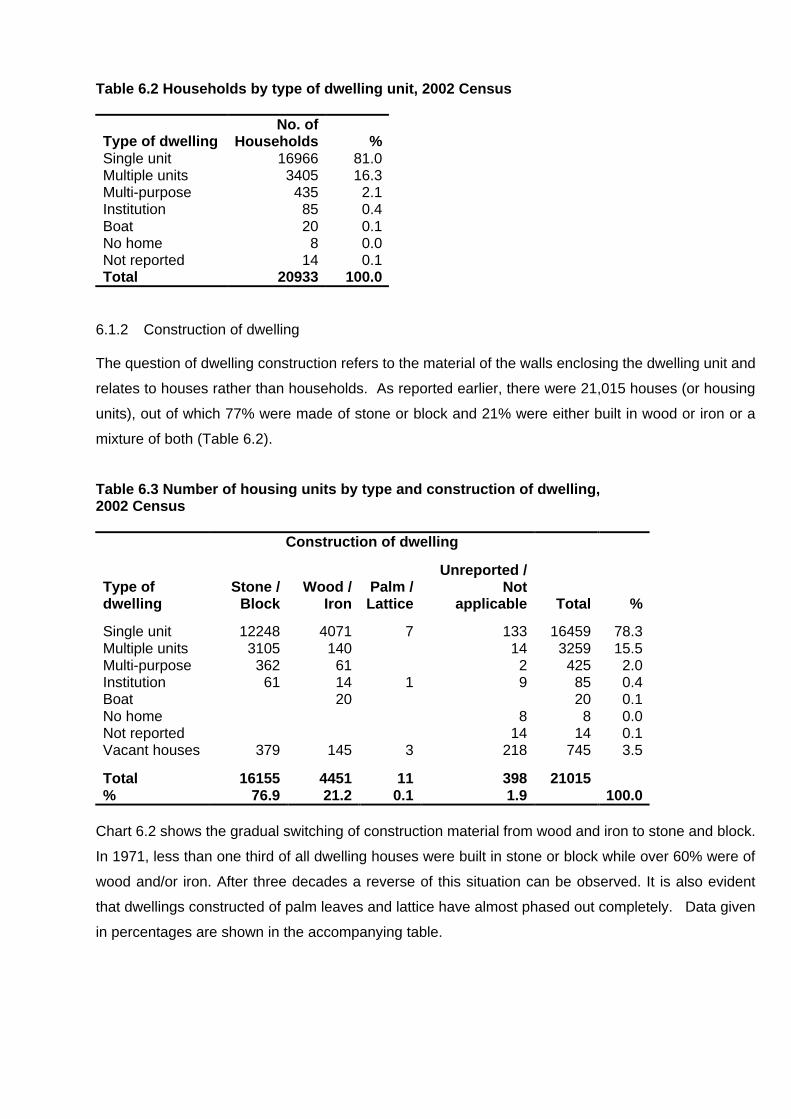
Table 6.2 Households by type of dwelling unit, 2002 Census
Type of dwelling No. of
Households % Single unit 16966 81.0 Multiple units 3405 16.3 Multi-purpose 435 2.1 Institution 85 0.4 Boat 20 0.1 No home 8 0.0 Not reported 14 0.1 Total 20933 100.0
6.1.2 Construction of dwelling The question of dwelling construction refers to the material of the walls enclosing the dwelling unit and
relates to houses rather than households. As reported earlier, there were 21,015 houses (or housing
units), out of which 77% were made of stone or block and 21% were either built in wood or iron or a
mixture of both (Table 6.2).
Table 6.3 Number of housing units by type and construction of dwelling, 2002 Census Construction of dwelling
Type of dwelling
Stone / Block
Wood / Iron
Palm / Lattice
Unreported / Not
applicable Total % Single unit 12248 4071 7 133 16459 78.3 Multiple units 3105 140 14 3259 15.5 Multi-purpose 362 61 2 425 2.0 Institution 61 14 1 9 85 0.4 Boat 20 20 0.1 No home 8 8 0.0 Not reported 14 14 0.1 Vacant houses 379 145 3 218 745 3.5 Total 16155 4451 11 398 21015 % 76.9 21.2 0.1 1.9 100.0
Chart 6.2 shows the gradual switching of construction material from wood and iron to stone and block.
In 1971, less than one third of all dwelling houses were built in stone or block while over 60% were of
wood and/or iron. After three decades a reverse of this situation can be observed. It is also evident
that dwellings constructed of palm leaves and lattice have almost phased out completely. Data given
in percentages are shown in the accompanying table.
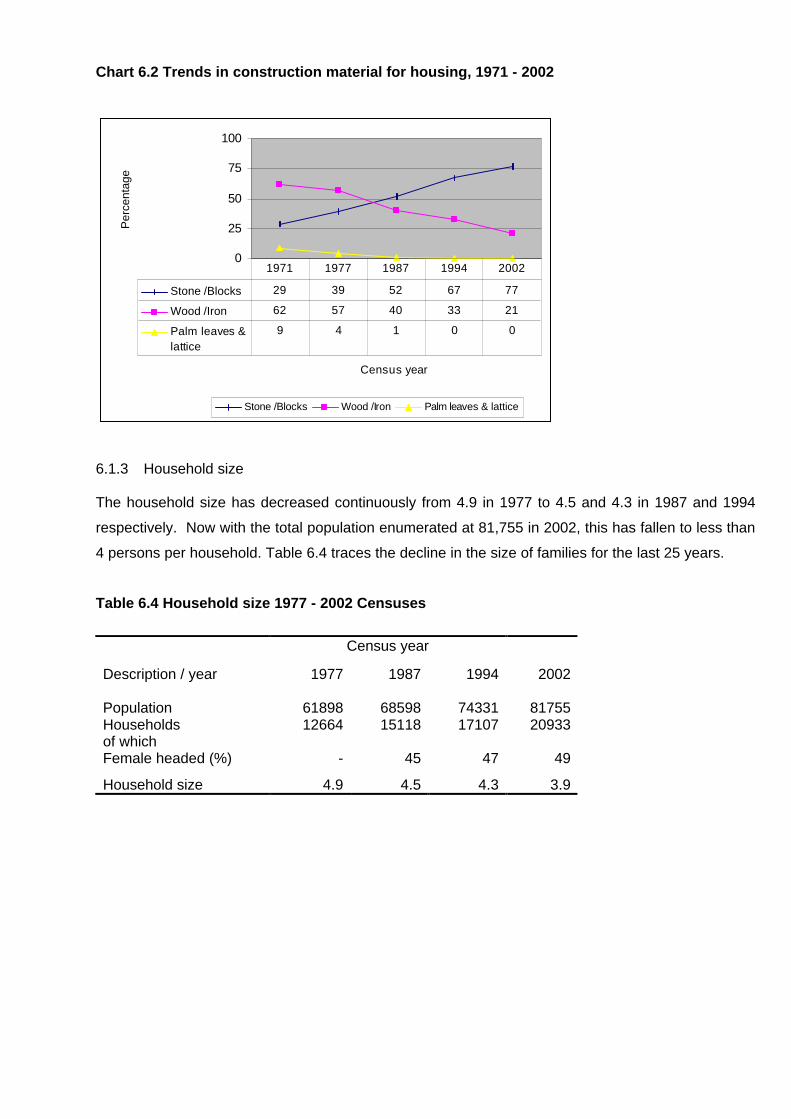
Chart 6.2 Trends in construction material for housing, 1971 - 2002
0
25
50
75
100
Census year
Per
cent
age
Stone /Blocks Wood /Iron Palm leaves & lattice
Stone /Blocks 29 39 52 67 77
Wood /Iron 62 57 40 33 21
Palm leaves &lattice
9 4 1 0 0
1971 1977 1987 1994 2002
6.1.3 Household size The household size has decreased continuously from 4.9 in 1977 to 4.5 and 4.3 in 1987 and 1994
respectively. Now with the total population enumerated at 81,755 in 2002, this has fallen to less than
4 persons per household. Table 6.4 traces the decline in the size of families for the last 25 years.
Table 6.4 Household size 1977 - 2002 Censuses
Census year Description / year 1977 1987 1994 2002 Population 61898 68598 74331 81755 Households 12664 15118 17107 20933 of which Female headed (%)
-
45
47
49
Household size 4.9 4.5 4.3 3.9

Along with the declining household size, there is a steady increase in female-headed households.
However, this does not necessarily conclude that there is a relationship between the sex of the head
of the household and the size of the household. While there is a considerable proportion of single
parent households (headed mostly by women), a number of households may have declared as head
of household the male or female spouse subject to who was responding to the census officer. There
were yet others who could not decide who to report as head since both spouses have equal
responsibilities. These last remarks notwithstanding, it would be of interest to look at family size in
relation to the sex of the head of household.
Table 6.5 Households by size and sex of head, 2002 Census
Household size %
Female %
Male Total No. of
households* % of
households 1 person 32.7 67.3 100.0 2980 14.3 2 persons 51.6 48.4 100.0 3257 15.7 3 persons 51.5 48.5 100.0 4004 19.2 4 persons 48.0 52.0 100.0 4121 19.8 5 persons 50.5 49.5 100.0 2913 14.0 6 persons 54.9 45.1 100.0 1570 7.5 7 or more persons 60.8 39.2 100.0 1961.0 9.4 All households* 49.1 50.9 100.0 20806 100.0
Note: * Dwellings based in Institutions and boats account for 1% of all households and are excluded Interestingly, Table 6.5 suggests a predominance of female-headed households among families of all
sizes except for the 4-person category. The 1-person households are male-dominated on a ratio 2:1
i.e. there are twice as many males living alone than there are females. The first category of
household size somewhat influences the gender balance among heads of households. Given that
there is no gender option among the 1-person households, if this category were omitted, the overall
proportion of female-headed households comes up to 52%.
6.1.4 Age of dwellings For the first time in census taking in Seychelles, an attempt has been made to capture data on the
age of the buildings that house dwellings. The age of building was split into 5-year intervals to allow
for better recollection on the part of the respondents. The analysis of this question will be restricted to
domestic dwelling units (i.e. excluding institutions and boats) and those account for 96% of all houses.
A number of respondents did not know the age of their dwelling unit. This is expected especially
where the inhabitants of the dwelling were either not the owners or the first tenants. Since it is the
first time to collect such data in the census, there are no comparative figures. However, it can be
observed from Table 6.6, that 23% of all dwelling houses were completed between 1997 and 2002
(i.e. aged between 1 to 5 years) and another 17% were built between 1991 and 1996 (6 to 10 years).

The cumulative figures indicate that half of all dwelling units are not more than 15 years old. Still,
more than one quarter of all dwellings are over 20 years. The ‘Not applicable’ category refers to
inhabited housing units that are still under construction. The proportion of dwellings made in stone or
blocks by age of dwelling shows that most of the iron or wooden buildings tend to be among the older
ones, and 4 out of 5 dwellings (80%) under construction are made of stone or blocks.
Table 6.6 Domestic dwelling units by age of building, 2002 Census
Age of building (years)
No. of Housing
units
% Cum.%
% in stone/
block
1-5 4635 23 23.0 84.6 6-10 3428 17 40.0 82.4 11-15 2300 11.4 51.5 80.0 16-20 2243 11.1 62.6 78.0 Over 20 5649 28.1 90.6 71.1 Not known 1529 7.6 75.3 Not applicable 37 0.2 9.4 81.1
Not reported 317 1.6 58.0 Total 20138 100 100.0
6.1.5 State of repair
The condition of the buildings as assessed by the interviewers were categorised as either good
(completely watertight and solidly built), poor (unsound, probably leaking and needing major repairs in
the immediate future) or fair (anything in-between good and poor). Based on these ratings, Table 6.7
provides a distribution of housing units by their condition of repair. Of the occupied houses, almost
75% were reported to be in good condition and 19% were rated fair while 5% were rated unsound.
Among the vacant houses, less than 40% were rated ‘good’, however, the level of non-reporting for
this item was high so the data may not be reflecting an accurate picture insofar as vacant houses are
concerned.
Table 6.7 Dwellings by condition of repair, 2002 Census
State of repair
Occupied houses %
Vacant houses % Population
Good 15008 74.0 270 36.2 58987 Fair 3850 19.0 107 14.4 16375 Poor 1020 5.0 92 12.3 3427 Not reported 392 1.9 276 37.0 *2966 Total 20270 100.0 745 100.0 81755
* includes 56 ‘not applicable’ cases

6.1.6 Tenure
Information on tenure status of dwellings reveals that 66% of households own their dwellings, while
24% rent their accommodation (Table 6.8). Comparison with 1994 data shows a decline in the
proportional representation of owner-occupied houses. This may be accounted for by the increases
observed in the proportion of households in rented and rent-free accommodation.
Table 6.8 Households by dwelling tenure, 1994 and 2002 Censuses
Households % % difference Tenure 2002 1994 2002 1994 Owner occupied 13889 11868 66.3 69.4 -3.1 Rented from government 3518 2462 16.8 14.4 2.4 Rented privately 1441 1154 6.9 6.7 0.2 Rented from private employer 115 266 0.5 1.6 -1.1 Rent free 1545 977 7.4 5.7 1.7 Not reported 425 380 2.0 2.2 -0.2 Total 20933 17107 100.0 100.0
6.1.7 Water supply and sanitation In 2002, around 87% of households reported having access to treated water, and 11% obtained
untreated water. The supply in both categories includes water from the Public Utilities Corporation
(PUC) and from private sources such as rivers and wells. Comparative figures from 1994 indicate a
slight increase in the proportion of households that have access to treated water. Although Table 6.9
shows a significant increase in the proportion of households without treated water, it is likely that a
good proportion of these households had been in the not ‘reported category’ in 1994 (i.e. water
source type was not known). A more detailed breakdown of water sources is provided in the relevant
section of the appendices.
Table 6.9 Households by type of water supply, 1994 and 2002 Censuses Water supply Households % 2002 1994 2002 1994 Treated 18166 14253 86.8 83.3 Untreated 2385 655 11.4 3.8 Unknown 382 2199 1.8 12.9 Total 20933 17107 100.0 100.0

Water storage is one of the new variables for which data was collected in the 2002 census.
Households were asked whether they had a water storage tank (with fitted pipe). This information is
presented with other water and sanitation questions in Chart 6.3. (Note that data on water storage
was not collected in 1994)
Chart 6.3 Water supply and sanitation, 1994 and 2002 Censuses
0 20 40 60 80 100
%
Treated water
Water storage
Flush toilet
2002 1994
Another new item included on the census questionnaire for the first time in the census was methods
of domestic waste disposal. Here disposal options enquired about were use of public bins,
burying/burning, dumping site and composting. These methods are not mutually exclusive and some
households do not restrict themselves to only one means of waste disposal. The findings for this
question are presented in Chart 6.4 and Table 6.10 below. The most common means of waste
disposal is that of public bins. Overall, 86.3% of households make use of public bins. The second
most common method among households is burying or burning (22.3%). The data collected also
revealed that only 8% of households do composting and 3.5% dispose their domestic waste in a
dumping site.

Chart 6.4 Means of domestic waste disposal by households, 2002 Census
86.3
22.4
3.58.0
0.0
20.0
40.0
60.0
80.0
100.0%
hou
seho
lds
Public bin Buried/burnt Dumping site Composting
Looking at the data on a regional level (in Table 6.10), some variations can be observed among the
various areas in the methods being used. For instance, the public bins are more commonly used in
the central and northern regions of Mahe and least used on Praslin and other islands, whereas
burning or burying as well as composting waste is more popular in the western region of Mahe and
least adopted in the town areas for obvious reasons. Dumping waste is the least common method of
all, and was reported to be more practiced on Praslin and other islands than on Mahe.
Table 6.10 Methods of domestic waste disposal by region, 2002 Census
Public
bin
Buried
/burnt
Compos
-ting
Dumping
site
Number of
Households
Region
Central (Mahe) 92.1 10.1 4.4 1.7 6302
East/South (Mahe) 80.5 28.9 7.7 4.8 4948
West (Mahe) 85.2 35.8 15.6 4.1 2917
North (Mahe) 91.3 20.1 8.0 1.7 3975
Praslin/ La Digue &
Other Islands
77.2 28.1 9.1 7.1 2791

6.1.8 Lighting and main cooking fuel
The question on energy supply was two-fold. Households were asked to specify the energy used for
lighting and that used for cooking. In 2002, 96% of households were using electricity for lighting
compared to 90% in 1994 whereas only 7.4% were using electricity for cooking compared to 17% in
1994. The most common fuel for cooking is liquid petroleum gas (LPG). 87% of households now use
gas to cook compared to 13% in 1994 and 1.9% in 1987. In 2002, only 2.1% of all households are
still using kerosene as cooking fuel compared to 61.3% in 1994 and 63.8% in 1987. A third question
relating to energy supply relates to solar heating in households. Only 1,771 or 8.5% of households
reported to have a solar heating system.
Table 6.11 Energy for lighting and cooking, 2002 Census
Energy source for lighting Households % Electricity 20118 96.1 Candles 430 2.1 Paraffin lamps 69 0.3 Other 16 0.1 Not reported 300 1.4 Total 20933 100 Energy source for cooking Households % Electricity 1556 7.4 Gas 18211 87.0 Kerosene 432 2.1 Wood 192 0.9 Charcoal 22 0.1 No cooking 197 0.9 Not reported 323 1.5 Total 20933 100
6.1.9 Other domestic facilities Since the mid 90’s the washing machine has emerged as a facility that is gaining importance in the
household. Besides refrigeration facilities (fridge/freezers), it was deemed useful to include this asset
as one of the indicators used to measure the standard of living. The results revealed that about 88%
of households were either equipped with a fridge or freezer or both, and 43% had a washing machine.
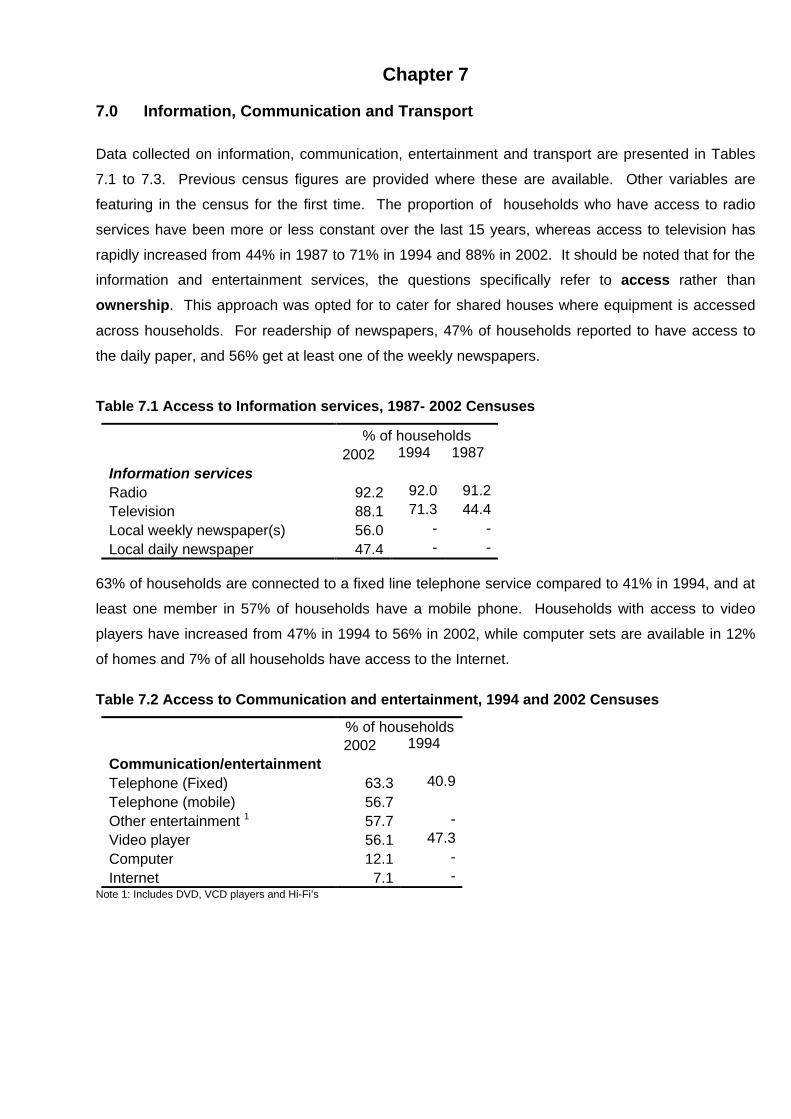
Chapter 7 7.0 Information, Communication and Transport
Data collected on information, communication, entertainment and transport are presented in Tables
7.1 to 7.3. Previous census figures are provided where these are available. Other variables are
featuring in the census for the first time. The proportion of households who have access to radio
services have been more or less constant over the last 15 years, whereas access to television has
rapidly increased from 44% in 1987 to 71% in 1994 and 88% in 2002. It should be noted that for the
information and entertainment services, the questions specifically refer to access rather than
ownership. This approach was opted for to cater for shared houses where equipment is accessed
across households. For readership of newspapers, 47% of households reported to have access to
the daily paper, and 56% get at least one of the weekly newspapers.
Table 7.1 Access to Information services, 1987- 2002 Censuses
% of households 2002 1994 1987 Information services Radio 92.2 92.0 91.2 Television 88.1 71.3 44.4 Local weekly newspaper(s) 56.0 - - Local daily newspaper 47.4 - -
63% of households are connected to a fixed line telephone service compared to 41% in 1994, and at
least one member in 57% of households have a mobile phone. Households with access to video
players have increased from 47% in 1994 to 56% in 2002, while computer sets are available in 12%
of homes and 7% of all households have access to the Internet.
Table 7.2 Access to Communication and entertainment, 1994 and 2002 Censuses
% of households 2002 1994 Communication/entertainment Telephone (Fixed) 63.3 40.9 Telephone (mobile) 56.7 Other entertainment 1 57.7 - Video player 56.1 47.3 Computer 12.1 - Internet 7.1 -
Note 1: Includes DVD, VCD players and Hi-Fi’s

One out of every four households owned a motorised vehicle in 2002 (taking into account all
motorised transport). Comparing figures for the last three major censuses indicates that the
ownership of transport by households has been increasing very slowly. 5.6% of households had
bicycles and less than 2% owned boats either for business or pleasure.
Table 7.3 Ownership of transport, 1987- 2002 Censuses
% of households 2002 1994 1987 Ownership of transport Car 1 20.6 21.4 16.2 Motorcycle 0.6 - - Boat (business) 1.6 - - Boat (pleasure) 2.0 - - Bicycle 5.6 - - Other transport 2 4.0 - -
Notes 1: 1987 and 1994 included all types of motorised land transport 2: Includes pick-up trucks, vans and other heavy transport

7.1 Spoken Languages
Each household was asked to specify the three main languages used at home in order of the most
commonly used. Table 7.4 presents the distribution of households by the importance of each spoken
language. It can be observed that the majority of households (92%) speak Creole as a first language,
and about 5% of households use English as their first language while French is the most spoken
language for less than 1% of all households.
Table 7.4 Households by the languages most commonly spoken, 2002 Census
First language spoken
No. of households %
Second language spoken
No. of households %
Third language spoken
No. of households %
Creole 19221 91.8 English 4577 21.9 French 1782 8.5 English 1022 4.9 Creole 564 2.7 English 177 0.8 French 169 0.8 French 300 1.4 Creole 139 0.7 Tamil 112 0.5 Other 241 1.2 Other 107 0.5 Other 359 1.7 None 15251 72.9 None 18728 89.5 Not reported 50 0.2 Total 20933 100.0 Total 20933 100.0 Total 20933 100.0
On the other hand, English is more commonly spoken as a second language than Creole but the
latter still more common than French as the second language used in the home. It is also noted that
almost three quarters of households speak only one language at home. As a third language, French
takes the lead ahead of Creole and English. 1782 or 8.5% of households speak French as a third
language. Details of other languages spoken are presented in the appendices

Chapter 8 8.0 Informal economic activities 8.1 Agriculture The last comprehensive agricultural survey that was carried out was in 1978. Two other attempts to
obtain up-to-date information in this area were in 1986 and 1998. Both exercises were unsuccessful
and incomplete. Basic agricultural information collected during the population and housing census is
not, on its own, sufficient to serve as a basis for making policies that will drive the agricultural sector.
However, the data collected do provide a glimpse into the less formal and small scale agricultural
activities carried out by households and provides an insight into the extent of subsistence agriculture.
Furthermore, the list of farming households complements and updates the sampling frame for more
specialised and intensive agricultural surveys and censuses.
In the 2002 census, households were asked to specify whether they had carried out any cultivation or
livestock rearing in the 12 months preceding the census. 4,685 households or 22.4% of all
households had engaged in cultivation, and 3,630 or 17.3% had reared livestock.
Out of the households that had done some farming, 539 or 11.5% grew crops mainly for sale, 607
(13%) sold the surplus and 36 (0.8%) cultivated for their own consumption.
Furthermore, 1321 of these households or 28.2% sold their produce. Of those who sold, 71.2% sold
vegetables, 48.1% sold fruits and 50.6% sold root crops (the categories are not mutually exclusive).
These figures are also presented in Table 8.1.
Table 8.1 Farming activities by households, 2002 Census
Number of households that: Households % Engaged in farming 4685 22.4 of which: cultivated mainly for sale 539 11.5 sold surplus 607 13.0 only for own consumption 36 0.8 Households who sold produce 1321 28.2 of which: vegetables 940 71.2 fruits 636 48.1 root crops 669 50.6
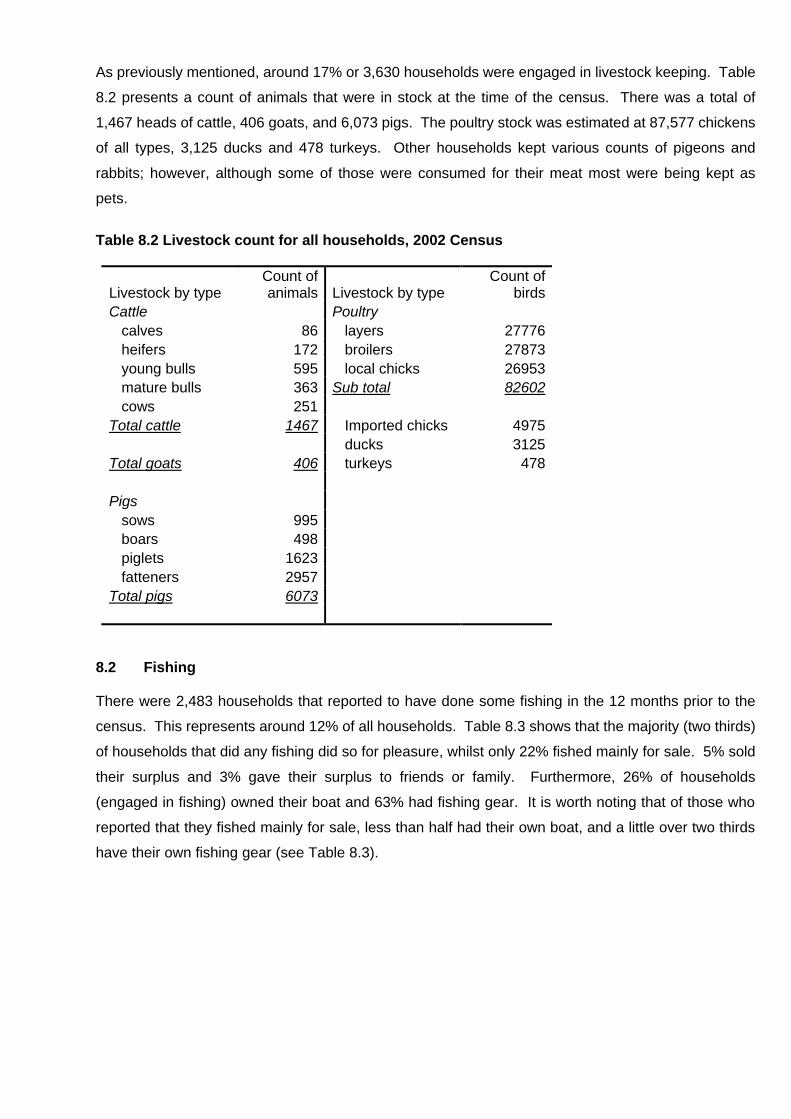
As previously mentioned, around 17% or 3,630 households were engaged in livestock keeping. Table
8.2 presents a count of animals that were in stock at the time of the census. There was a total of
1,467 heads of cattle, 406 goats, and 6,073 pigs. The poultry stock was estimated at 87,577 chickens
of all types, 3,125 ducks and 478 turkeys. Other households kept various counts of pigeons and
rabbits; however, although some of those were consumed for their meat most were being kept as
pets.
Table 8.2 Livestock count for all households, 2002 Census
Livestock by type Count of animals Livestock by type
Count of birds
Cattle Poultry calves 86 layers 27776 heifers 172 broilers 27873 young bulls 595 local chicks 26953 mature bulls 363 Sub total 82602 cows 251 Total cattle 1467 Imported chicks 4975 ducks 3125 Total goats 406 turkeys 478 Pigs sows 995 boars 498 piglets 1623 fatteners 2957 Total pigs 6073
8.2 Fishing There were 2,483 households that reported to have done some fishing in the 12 months prior to the
census. This represents around 12% of all households. Table 8.3 shows that the majority (two thirds)
of households that did any fishing did so for pleasure, whilst only 22% fished mainly for sale. 5% sold
their surplus and 3% gave their surplus to friends or family. Furthermore, 26% of households
(engaged in fishing) owned their boat and 63% had fishing gear. It is worth noting that of those who
reported that they fished mainly for sale, less than half had their own boat, and a little over two thirds
have their own fishing gear (see Table 8.3).

Table 8.3 Households by main purpose of fishing and ownership of boat and fishing gear, 2002 Census
Main purpose of fishing
No. households
% of total
% who
own a boat
% who own gear
Mainly for sale 538 21.7 44.8 68.8 Sale of surplus 130 5.2 48.5 67.7 Surplus given away 71 2.9 16.9 70.4 For pleasure 1647 66.3 19.5 61.8 Own consumption 10 0.4 0.0 70.0 Not reported 87 3.5 16.1 31.0 Total 2483 100.0 26.2 62.8
8.3 Other economic activities An attempt was made to capture data on the number of households engaged in cottage industry
activities. The data have not been collected in any great detail, but households were asked if any
member had engaged in making or selling handicraft or any other economic activities in the home
apart from their main jobs. The answers were recorded separately for handicraft making/selling but
the two categories are not mutually exclusive. Only 358 or 1.7% of households reported to have been
involved in handicraft making and/or selling. Other activities mentioned by households that engaged
in the same included manufacturing of food and non-food items, and also various services, offered as
an aside from their normal work. These are summarised in Table 8.4 below. ‘Other services’ include
among others hair cutting, consultancy, grass cutting, child minding, photography and small
trading businesses.
Table 8.4 Households engaged in cottage industry activities, 2002 Census
Type of economic activity Number of
households % of all
households Handicraft making & selling 358 1.7 Manufacturing (food & drinks) 116 0.6 Manufacturing (handiwork and other art) 129 0.6 Maintenance work (electrical, mechanical or other) 9 0.0 Other services 202 1.0


IDENTIFICATION
DISTRICT HNO (From Map) FORM NUMBERREPUBLIC OF SEYCHELLES
EA FAMILY NO POPULATION AND HOUSING CENSUS, 2002
LOCATION
PART 1: HOUSEHOLD MEMBERS
(NOTE: For persons with no NIN, write Mother's Maiden Name and Surname at the back)
ALL USUAL RESIDENTS POPULATION 12 YRS AND ABOVE (BORN BEFORE AUG 1990) FEMALES 15+ (BORN BEFORE AUG 1987)
A B C D E F G H I J K L M N O P Q R S T U
PER
SON
NU
MB
ER
P A V O
NATIONAL IDENTITY NUMBER PRESENT SURNAME MAIDEN SURNAME OTHER NAMES SEX DATE OF
BIRTH NATIONALITY
REL
ATI
ON
SHIP
TO
H
EAD
REL
IGIO
N
MA
RIT
AL
STA
TUS DISTRICT OF
RESIDENCE AT LAST
CENSUS (AUG 1997) (Ask of
persons born before August 1997)
LITE
RA
CY
(Y o
r N)
EDU
CA
TIO
N
WO
RK
STA
TUS
OCCUPATION (TYPE OF WORK)
INDUSTRY (PLACE OF WORK)
MO
NTH
S W
AN
TIN
G
WO
RK
(ST
6 &
7)
EMPL
OYM
ENT
STA
TUS
(C ,
P , F
)
NU
MB
ER O
F C
HIL
DR
EN B
OR
N
ALI
VE
DA
TE O
F LA
ST
LIVE
BIR
TH (I
N T
HE
LAST
12
MO
NTH
S)
PER
SON
NU
MB
ER
1 - - - - / /
A / / 1
2 - - - - / / / / 2
3 - - - - / / / / 3
4 - - - - / / / / 4
5 - - - - / / / / 5
6 - - - - / / / / 6
7 - - - - / / / / 7
8 - - - - / / / / 8
9 - - - - / / / / 9
10 - - - - / / / / 10
11 - - - - / / / / 11
12 - - - - / / / / 12
SUMMARY: NO. AGED UNDER 15 (Born After August 1987) NO. AGED OVER 15 (Born Before August 1987) TOTAL
A PAVO I RELATIONSHIP TO HEAD OF HOUSEHOLD J RELIGION K MARITAL STATUS N EDUCATION O WORK STATUS S EMPLOYMENT STATUS
P = PRESENT A = HEAD P = PARENT 0 = ROMAN CATHOLIC 5 = BAHAI 1 = SINGLE 0 =NO SCHOOLING 7 = POLY 1 - 2, TTC 0 = EMPLOYEE - GOVERNMENT 6 = PARTIALLY EMPLOYED JOB SEEKER F = FULL TIMEA = ABSENT W = WIFE SPOUSE B = BROTHER / SISTER / IN LAW 1 = ANGLICAN 6 = HINDU 2 = MARRIED 1 =P1 TO P6 8 = POLY 3 - 4, FORM 6 1 = EMPLOYEE - PARASTATAL 7 = UNEMPLOYED JOB SEEKER P = PART TIME
V = VISITOR H = HUSBAND SPOUSE G= GRANDCHILD 2 = SEVENTH DAY ADVENTIST7 = MUSLIM 3 = LIVING TOGETHER 2 =F1,F2 /P7,P8/ S1,S2 9 = PRE-UNIVERSITY 2 = EMPLOYEE - PRIVATE 8 = STUDENT C = CASUAL
0 = OVERSEAS D = DAUGHTER / IN LAW O = OTHER RELATIVE 3 = JEHOVAH'S WITNESS 8 = OTHER NON CHRISTIANS 4 = SEPARATED 3 =FORM3 / P9 OR S3 10 = UNIVERSITY (Bachelor) 3 = EMPLOYER 9 = OTHER (RETIRED, ETC)
S = SON / IN LAW N = NO RELATION 4 = OTHER CHRISTIANS 9 = NONE 5 = DIVORCED 4 =FORM4 / S4 11 = UNIVERSITY (MSc / MBA / PhD4 = SELF EMPLOYED 6 = WIDOWED 5 =NYS ; FORM 5 12 = OTHER 5 = UNPAID FAMILY WORKER
6 =VOCATIONAL
MAIN LANGUAGE USED IN HOME (List in order of importance) OFFICIAL USE
INTERVIEWER NO. STATISTICIAN'S INITIALS
DATE CODER'S INITIALS
SUPERVISOR'S INITIALS KB OPERATOR'S INITIALS
OF
/ / 2002
1
2
3
CONFIDENTIAL

IDENTIFICATION
DISTRICT HNO (From Map)FORM NO:
EA LOCATION
PART 2 HOUSING CHARACTERISTICS - (To be completed for each household)
Note: For shared houses, record HU2; HU3; HU4 and HU6 only for family No. 1
HU1 TYPE OF DWELLING HU7 WATER SUPPLY HU12 OWNERSHIP OF CAPITAL GOODS HE2 AGRICULTURAL DATA (Livestock)
(a) Vacant TREATED UNTREATED UNKNOWN Does this household possess any of the following Has the household reared any livestock or
MAINS SUPPLY poultry in the last twelve months
(b) Wholly Residential PRIVATE (River, well) (i) Transport
YES NO YES
(i) Building used wholly as one housing unit Car NO If NO, go to HE3(ii) Building containing more than one housing unit HU8 DOMESTIC WATER TANK / RESERVOIR (With pipe fittings) Motorcycle
(block of flats, semi-detached houses, etc..) Bicycle If YES, state present stock
Available Boat (business)
(c) Partly Residential Not available Boat (pleasure)
(iii) Building used partly for residential and partly Other (specify) LIVESTOCK No POULTRY No for other purposes (e.g., shop dwelling) HU9 TOILET FACILITY Calves Layers
(ii) Other facilities Heifers Broilers
(d) Institutions Flush toilet connected YES NO Young Bulls Local
(iv) (e.g., convent, infirmary, hospital, barrack, hotel) - to sewerage system Washing Machine Mature Bulls TOTAL
- to septic tank Fridge/Freezer Cows Chicks
(e) Boat Pit latrine TOTAL CATTLE Ducks
None HU13 WASTE DISPOSAL Sows Turkeys
(f) Other (no home) How does this household dispose of domestic waste Boars Others
Tick all that apply PigletsHU10 SOURCE OF ENERGY Fatteners
Public Bin TOTAL PIGS
HU2 CONSTRUCTION (1) FOR LIGHTING Buried / Burnt Goats
Dumping site
STONE / BLOCK Electricity Composting
WOOD / IRON Candles PALM / LATTICE Paraffin Lamps HOUSEHOLD ECONOMIC ACTIVITIES
Other, specify
HU3 AGE OF BUILDING HE1 AGRICULTURAL DATA (Crops)
(2) FOR COOKING HE3 FISHING
1 - 5 YEARS (1997-2001) (i) Have you or any members of your household done any farming
6 - 10 YEARS (1992 - 1996) Electricity in the last twelve months (i) Have you or any members of the household done any
11 - 15 YEARS (1987 - 1991) Gas fishing in the last twelve months
16 - 20 YEARS (1982 - 1989) Paraffin YES
OVER 20 YEARS (BEFORE 1982) Wood NO If NO, go to HE2 YES
NOT KNOWN Charcoal NO If NO, go to (ii)
NOT APPLICABLE (Boats, homeless) No cooking
NOT COMPLETED BUT INHABITED Other, specify (ii) Have you sold any agricultural produce in the last twelve months If YES, was it
HU4 STATE OF REPAIR (3) SOLAR HEATER YES YES NO
Available NO If NO, go to HE2 Mainly for sale
GOOD Not available Sale of surplus FAIR Surplus given away
POOR HU11 INFORMATION AND COMMUNICATION SERVICES For pleasure
If YES, specify (ii) Does this household wholly or partly own
HU5 TENURE Does this houseshold have access to any of the following within this dwelling
YES NO YES NO
OWNER OCCUPIED YES NO Vegetables Fishing boat
RENTED FROM GOVERNMENT Radio Fruit Fishing gear
RENTED PRIVATELY TV Root crops RENTED FROM PRIVATE EMPLOYER VCR, VCD, DVD HE4 OTHER ECONOMIC ACTIVITY
PROVIDED FREE BY EMPLOYER Other equipment eg. Hi-fi RENT FREE Telephone (fixed) (iii) Were crops grown (tick one) Is any member of this household engaged in the production,
Telephone (mobile) mainly for sale, of any of the following HU6 SIZE OF LIVING QUARTERS Computer YES NO
Connection to internet Mainly for sale YES NONUMBER OF ROOMS Newspaper (daily) Sale of surplus Making / selling handicrafts(excluding bathroom, halls, corridors, veranda, toilet, store) Newspaper (weekly) Other, (specify)
C O N F I D E N T I A L

List of tables in the Appendices
Page
P1.1: Seychelles Population By District And Sex, 2002 Census………………………………………………….. 69
P1.2 AA: Anse Aux Pins Population By Enumeration Area And Sex, 2002 Census……………………………. 70
P1.2 AB: Anse Boileau Population By Enumeration Area And Sex, 2002 Census……………………………... 71
P1.2 AC: Au Cap Population By Enumeration Area And Sex, 2002 Census……………………………………. 72
P1.2 AE: Anse Etoile Population By Enumeration Area And Sex, 2002 Census……………………………….. 73
P1.2 AR: Anse Royale Population By Enumeration Area And Sex, 2002 Census……………………………… 74
P1.2 BA: Bel Air Population By Enumeration Area And Sex, 2002 Census……………………………………... 75
P1.2 BL: Baie Lazare Population By Enumeration Area And Sex, 2002 Census……………………………….. 76
P1.2 BO: Belombre Population By Enumeration Area And Sex, 2002 Census…………………………………. 77
P1.2 BS: Baie Ste. Anne Population By Enumeration Area And Sex, 2002 Census…………………………… 78
P1.2 BV: Beau Vallon Population By Enumeration Area And Sex, 2002 Census………………………………. 79
P1.2 CA: Cascade Population By Enumeration Area And Sex, 2002 Census………………………………….. 80
P1.2 ER: English River Population By Enumeration Area And Sex, 2002 Census……………………………... 82
P1.2 GL: Glacis Population By Enumeration Area And Sex, 2002 Census……………………………………… 82
P1.2 GM: Grand Anse Mahe Population By Enumeration Area And Sex, 2002 Census..……………………... 83
P1.2 GP: Grand Anse Praslin Population By Enumeration Area And Sex, 2002 Census……………………… 84
P1.2 LD: La Digue Population By Enumeration Area And Sex, 2002 Census…………………………………... 84
P1.2 LM: Les Mamelles Population By Enumeration Area And Sex, 2002 Census…………………………….. 85
P1.2 MB: Mont Buxton Population By Enumeration Area And Sex, 2002 Census……………………………… 86
P1.2 MF: Mont Fleuri Population By Enumeration Area And Sex, 2002 Census……………………………….. 87
P1.2 OS: Population On Outer Islands By Enumeration Area And Sex, 2002 Census………………………… 88
P1.2 PA: Plaisance Population By Enumeration Area And Sex, 2002 Census…………………………………. 89
P1.2 PG: Port Glaud Population By Enumeration Area And Sex, 2002 Census……………………………….. 90
P1.2 PL: Pointe Larue Population By Enumeration Area And Sex, 2002 Census……………………………… 91
P1.2 RC: Roche Caiman Population By Enumeration Area And Sex, 2002 Census…………………………… 92
P1.2 SL: St Louis Population By Enumeration Area And Sex, 2002 Census……………………………………. 93
P1.2 TA: Takamaka Population By Enumeration Area And Sex, 2002 Census………………………………… 94
P1.3a: Seychelles Population by Age And Sex, 2002 Census……………………………………………………. 95
P1.3b: Total Population By Age Group And Sex, 2002 Census…………………………………………………... 96
P1.4: Native-born Seychellois By Place Of Registration, Age Group And Sex, 2002 Census………………... 97
P1.5: Population Aged 5 Years Or More By Current District And Place Of Residence At The Last Census (1997) ………………...………………...………………...………………...………………...………………............. 100
P2.1: Household Population By Relationship To Head Of Household By Marital Status And Sex, 2002 Census………………...………………...………………...………………...………………...………………............. 102
P2.2: Household and Institutional Population By Age Group And Sex, 2002 Census………………................ 103
P2.3: Head Of Household And Other Members by Relationship, Age Group And Sex, 2002 Census……….. 104
P2.4 Population In Households And Institutions By Household Size, 2002 Census………………................... 107
P2.5: Population In Households By Household Size And Number Of Children Less Than 15 Years, 2002 Census………………...………………...………………...………………...………………...………………............. 108
P2.6: Population In Households By Household Size, Broad Age Group And Sex, 2002 Census 109
P3.1: Population By Marital Status, Age Group And Sex, 2002 Census………………...………………............ 110
P3.2: Population By Religious Belief, Age Group And Sex, 2002 Census………………...………………......... 112
P3.3a: Population By First Spoken Language, Age Group And Sex, 2002 Census………………................... 115
P3.3b: Population By Second Spoken Language, Age Group And Sex, 2002 Census……………….............. 116
P3.3c: Population By Third Spoken Language, Age Group And Sex, 2002 Census……………….................. 117
P3.4: Population By Nationality, Age Group And Sex, 2002 Census………………...………………................. 118

Page
P4.1: Female Population Aged 15 Years Or More By Age Group and Number of Children Born Alive, 2002 Census………………...………………...………………...………………...………………...………………............ 125
P5.1: Population Aged 12 Years Or More Not attending School By Age Group, Educational Attainment And Sex, 2002 Census………………...………………...………………...………………...……………….................... 126 P5.2: Student Population Aged 12 to 29 Years By Age Group, Educational Attainment And Sex, 2002 Census………………...………………...………………...………………...………………...………………............. 129
P5.3: Student Population Aged 12 to 29 years, By Educational Attainment, Sex and Age, 2002 Census…... 131
P5.4: Population Aged 12 years or more By Literacy Status, Sex And Age Group, 2002 Census……………. 134
P6.1: Population Aged 15 Years Or More By Work Status, Age Group And Marital Status, 2002 Census….. 135
P6.2: Working Population By Occupation, Age Group And Sex, 2002 Census………………...………………. 139
P6.3: Working Population By Industry, Age Group And Sex, 2002 Census………………...………………...... 145
P6.4: Economically Active Population By Educational Attainment, Age Group And Sex, 2002 Census……... 147
P6.5: Economically Active Population By Educational Attainment, Industry And Sex, 2002 Census………… 149
P6.6: Inactive Population By Functional Group, Age Group And Sex, 2002 Census………………...………… 151
P6.7: Head Of Household By Work Status, Age Group And Sex, 2002 Census………………...……………… 152
P6.8: Population In Households By Work Status And Household Size, 2002 Census………………............... 153 P6.9: Population By Household Size And Number Of Members Below And Above 15 Years, 2002 Census………………...………………...………………...………………...………………...……………….... 159
H7.1: Households In Occupied Houses By Type Of Dwelling, 2002 Census………………...……………….... 155
H7.2: Households And Houses By District, 2002 Census………………...………………...………………......... 155
H7.3: Households By Type Of Dwelling, Sex And Age Group Of Head Of Household, 2002 Census……….. 156
H7.4: Households By Type Of Dwelling, Sex And Work Status Of Head Of Household, 2002 Census……… 158
H7.5: Homeless Households By Sex And Age Group Of Head Of Household………………...……………….. 159
H7.6: Vacant Houses By Construction Material Of Dwelling, 2002 Census………………...………………...... 159
H7.7: Occupied Houses By Age Of Dwelling And Construction Material Of Building, 2002 Census…………. 160
H7.8: Households By Type Of Water Supply And Type Of Toilet Facilities, 2002 Census………………........ 160
H7.9a: Households By Type Of Dwelling And Method Of Waste Disposal, 2002 Census………………......... 161
H7.9b: Households By Type Of Dwelling And Method Of Waste Disposal, 2002 Census…………………….. 161
H7.9c: Households By Type Of Dwelling And Method Of Waste Disposal, 2002 Census……………………... 162
H7.9d: Households By Type Of Dwelling And Method Of Waste Disposal, 2002 Census…………………….. 162
H7.10: Households By Type Of Energy Used For Lighting, 2002 Census………………...………………......... 163
H7.11: Households By Type Of Energy Used For Cooking, 2002 Census………………................................. 163
H7.12: Households By Tenure And State Of Repair Of Dwelling, 2002 Census………………........................ 164
H7.13: Households By Tenure And Type Of Toilet Facility, Water Supply And Availability Of Water Storage Tank, 2002 Census………………...………………...………………...………………...………………................... 165
H7.14: Availability Of, And Access To Durable Goods And Other Facilities In Households, 2002 Census………………...………………...………………...………………...………………...……………….... 166

Table P1.1: Seychelles Population By District And Sex, 2002 Census
District Female Male Total
Anse Aux Pins 1822 1742 3564
Anse Boileau 2069 1967 4036
Au Cap 1624 1591 3215
Anse Etoile 2325 2069 4394
Anse Royale 1851 1836 3687
Bel Air 1360 1559 2919
Baie Lazare 1523 1461 2984
Belombre 1891 1731 3622
Baie Ste Anne 1810 1926 3736
Beau Vallon 1914 1902 3816
Cascade 1780 1668 3448
English River 1911 1701 3612
Glacis 1775 1817 3592
Grand Anse Mahe 1328 1266 2594
Grand Anse Praslin 1548 1819 3367
La Digue 1070 1034 2104
Les Mamelles 1205 1186 2391
Mont Buxton 1522 1588 3110
Mont Fleuri 1566 2032 3598
Other Islands 216 876 1092
Plaisance 1778 1636 3414
Port Glaud 1091 1093 2184
Pte Larue 1343 1374 2717
Roche Caiman 1421 1252 2673
St Louis 1671 1606 3277
Takamaka 1337 1272 2609
Total 40751 41004 81755
Source: MISD

Table P1.2 AR: Anse Royale Population By Enumeration Area And Sex, 2002 Census
Enumeration Area Female Male Total
Bougainville 112 117 229
Anse Baleine 91 82 173
Sweet Escott 121 132 253
L'enfoncement 99 106 205
Les Canelles 1 70 55 125
Les Canelles 2 85 98 183
Les Canelles 3 116 115 231
Les Canelles 4 175 172 347
Mont Plaisir, Les Canelles 88 98 186
Mont Plaisir Upper, Les Canelles 89 63 152
Anse Royale, Mont Plaisir 92 95 187
Anse Royale 115 110 225
Mont Plaisir Lower 197 203 400
Mont Plaisir 1 116 117 233
Mont Plaisir 2 103 92 195
Mont Plaisir Upper 61 67 128
Pte Au Sel AR 1 80 68 148
Anse Royale / Fairy- Land 41 46 87
Total 1851 1836 3687
Source: MISD
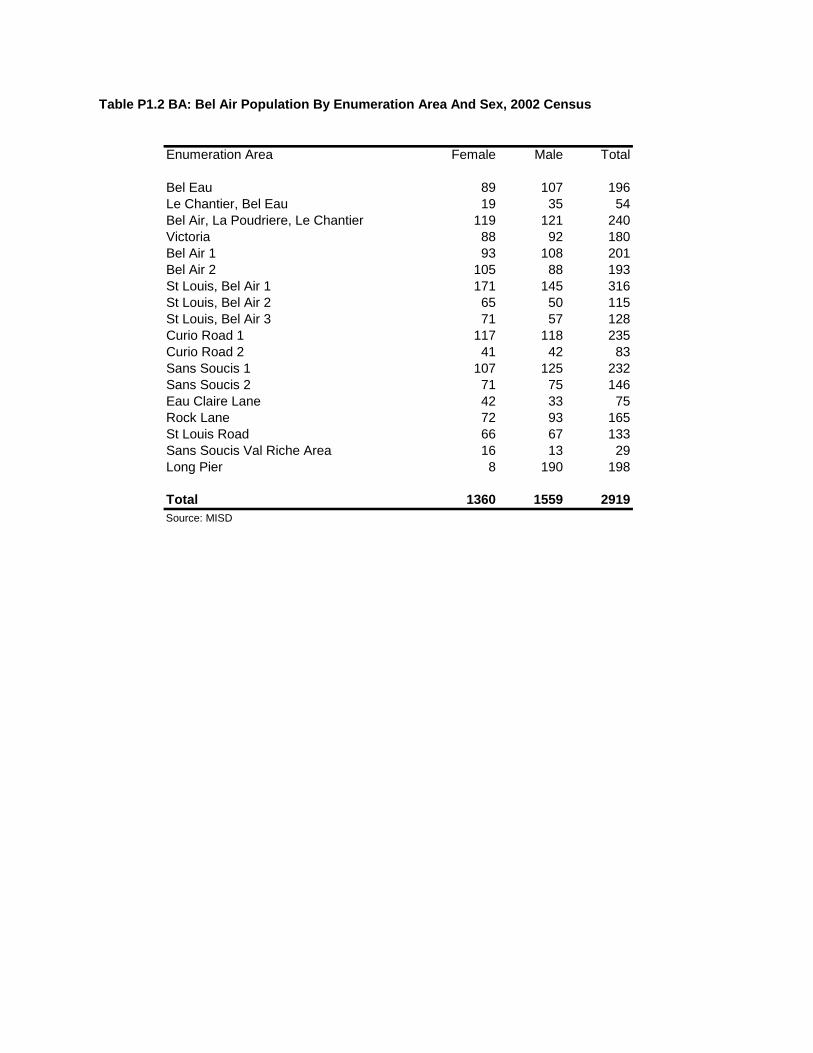
Table P1.2 BA: Bel Air Population By Enumeration Area And Sex, 2002 Census
Enumeration Area Female Male Total
Bel Eau 89 107 196
Le Chantier, Bel Eau 19 35 54
Bel Air, La Poudriere, Le Chantier 119 121 240
Victoria 88 92 180
Bel Air 1 93 108 201
Bel Air 2 105 88 193
St Louis, Bel Air 1 171 145 316
St Louis, Bel Air 2 65 50 115
St Louis, Bel Air 3 71 57 128
Curio Road 1 117 118 235
Curio Road 2 41 42 83
Sans Soucis 1 107 125 232
Sans Soucis 2 71 75 146
Eau Claire Lane 42 33 75
Rock Lane 72 93 165
St Louis Road 66 67 133
Sans Soucis Val Riche Area 16 13 29
Long Pier 8 190 198
Total 1360 1559 2919
Source: MISD

Table P1.2 BS: Baie Ste. Anne Population By Enumeration Area And Sex, 2002 Census
Enumeration Area Female Male Total
Hogani Bar From Jetty 42 43 85
Anse Marie- Louise 113 126 239
Hogani Bar Top 107 121 228
Joseph Road Baie Ste Anne Central 139 122 261
Baie Ste Anne Central 1 78 74 152
Fond Boffay Right Baie Ste Anne Central 111 114 225
Fond Boffay Left 58 55 113
Baie Ste Anne Central 2 124 167 291
Cap Samy, Marie-Jeanne 122 103 225
Marie-Jeanne Estate 103 94 197
Petit Anse La Blague 49 51 100
Grand Anse La Blague 140 167 307
Cote Dor 1 40 41 81
Cote Dor 2 94 107 201
Cote Dor, Mare Citronelle 170 181 351
Salazie Estate 152 184 336
Anse Possesion, Pasquaire Estate 85 97 182
Upper Anse Boudin, Anse Lazio, Zimbabwe 83 79 162
Total 1810 1926 3736
Source: MISD

Table P1.2 BV: Beau Vallon Population By Enumeration Area And Sex, 2002 Census
Enumeration Area Female Male Total
Sorento, Mare Anglaise 47 40 87
Mare Anglaise 1 57 48 105
Labatie-Jean Gill Area 60 66 126
Mare Anglaise 2 87 84 171
Mare Anglaise 3 111 98 209
Mare Anglaise 4 52 74 126
Beau Vallon 1 31 29 60
Beau Vallon 2 76 87 163
Beau Vallon Central 1 198 180 378
Beau Vallon Central 2 99 110 209
Beau Vallon Pascal Village 100 90 190
Pascal Village 1 94 92 186
Pascal Village 2 136 125 261
Pascal Village 3 137 153 290
Roche Bois Cable And Wireless Area 81 69 150
Beau Vallon 3 40 44 84
Le Niol Lower 1 72 81 153
Beau Vallon , Le Niol 129 126 255
Le Niol Lower 2 57 59 116
Gala Road 89 74 163
Beau Vallon,Mare Anglaise Upper 78 78 156
Labatie,Mont Signal 52 46 98
Labatie-Jean Gill Area 31 49 80
Total 1914 1902 3816
Source: MISD

Table P1.2 CA: Cascade Population By Enumeration Area And Sex, 2002 Census
Enumeration Area Female Male Total
Petit Paris 1 80 87 167
Anse Dejeuner 169 189 358
Talbot 1 93 82 175
Talbot 2 70 66 136
Cascade 1 89 112 201
Petit Paris, Providence 110 113 223
Brillant, Petit Paris 152 146 298
Petit Paris 2 52 50 102
Petit Paris 3 55 51 106
Cascade, Petit Paris 118 116 234
Cascade River Side 141 151 292
Cascade 2 71 79 150
Cascade 3 81 64 145
Cascade 4 98 102 200
Cascade (Village St. Andre) 72 74 146
Petit Paris 4 74 62 136
Providence Industrial Estate 255 124 379
Total 1780 1668 3448
Source: MISD

Table P1.2 ER: English River Population By Enumeration Area And Sex, 2002 Census
Enumeration Area Female Male Total
Mont Buxton, La Rosiere 94 76 170
La Rosiere, Mont Buxton 95 96 191
English River, Mont Buxton 125 125 250
Castor Road 111 135 246
English River 334 140 474
Thompson Lane 52 74 126
Union Vale 96 80 176
Majoie, Union Vale 79 138 217
Majoie 1 140 136 276
Majoie 2 152 136 288
Lower Majoie 100 96 196
Quincy Village 116 127 243
Union Vale Estate 1 119 125 244
Union Vale (Ex Prison Area) 69 48 117
Union Vale Estate 2 119 94 213
Village Tresor 110 75 185
Total 1911 1701 3612
Source: MISD

Table P1.2 GL: Glacis Population By Enumeration Area And Sex, 2002 Census
Enumeration Area Female Male Total
Machabee 1 97 111 208
Machabee 2 73 102 175
Carana, Machabee 85 87 172
Fond Des Liane, Machabee, L'ilot 104 109 213
Upper L'ilot 1 98 87 185
Upper L'ilot 2 104 111 215
L'ilot 79 95 174
Glacis, Vista Do Mar Estate 75 70 145
Vista Do Mar Estate 139 138 277
La Gogue 76 86 162
Glacis 1 128 123 251
Glacis 1 69 70 139
Malenga, Sorento 65 73 138
North East Point 1 87 98 185
North East Point 2 131 108 239
North East Point Top 21 28 49
North East Point 3 128 105 233
North East Point 4 41 41 82
Glacis Dan Raket 80 70 150
North East Point Flats 95 105 200
Total 1775 1817 3592
Source: MISD

Table P1.2 GM: Grand Anse Mahe Population By Enumeration Area And Sex, 2002 Census
Enumeration Area Female Male Total
Church Area 106 111 217
Upper Cemetery Area 95 94 189
Upper La Misere School Area 73 77 150
Souvenir 136 119 255
Helvetia 73 89 162
Barbarons (Dauban Estate) 121 114 235
Grand Anse Estate Area 134 134 268
Grand Anse Village 164 142 306
Flats Or School Area 126 107 233
Petit Barbarons 89 76 165
Ma Josephine 63 53 116
Barbarons Estate (Part 1) 71 79 150
Barbarons Estate (Part 2) 77 71 148
Total 1328 1266 2594
Source: MISD
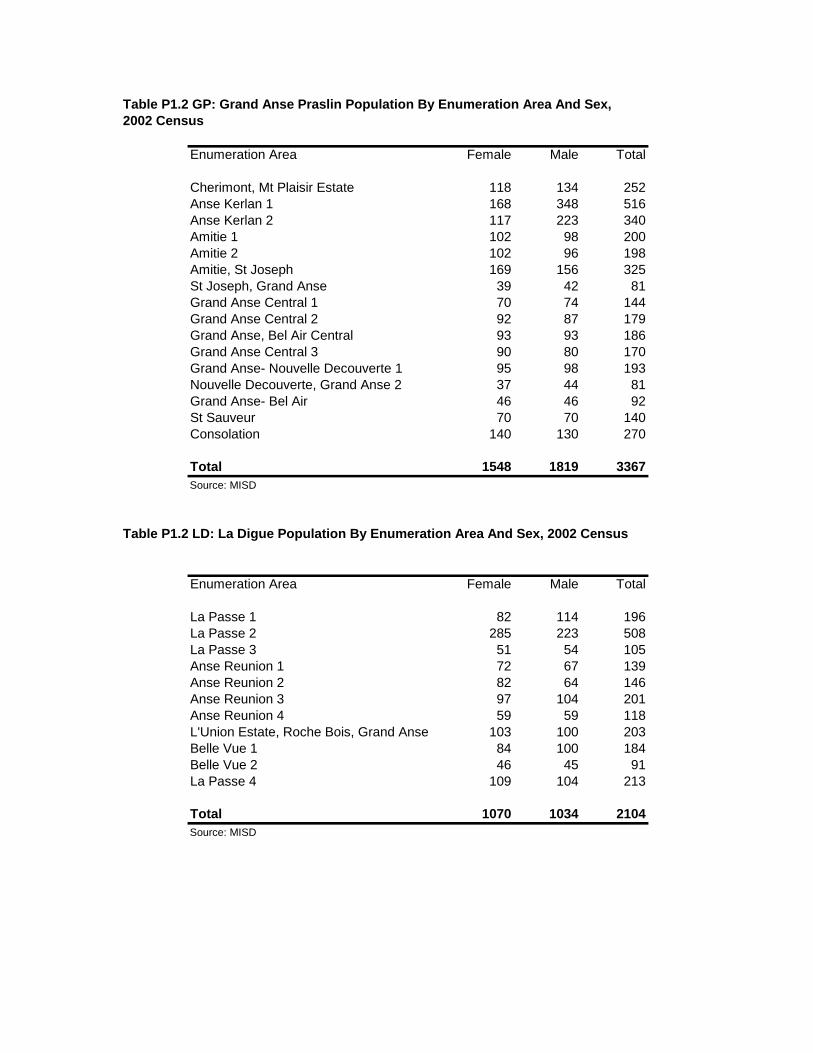
Table P1.2 GP: Grand Anse Praslin Population By Enumeration Area And Sex,
2002 Census
Enumeration Area Female Male Total
Cherimont, Mt Plaisir Estate 118 134 252
Anse Kerlan 1 168 348 516
Anse Kerlan 2 117 223 340
Amitie 1 102 98 200
Amitie 2 102 96 198
Amitie, St Joseph 169 156 325
St Joseph, Grand Anse 39 42 81
Grand Anse Central 1 70 74 144
Grand Anse Central 2 92 87 179
Grand Anse, Bel Air Central 93 93 186
Grand Anse Central 3 90 80 170
Grand Anse- Nouvelle Decouverte 1 95 98 193
Nouvelle Decouverte, Grand Anse 2 37 44 81
Grand Anse- Bel Air 46 46 92
St Sauveur 70 70 140
Consolation 140 130 270
Total 1548 1819 3367
Source: MISD
Table P1.2 LD: La Digue Population By Enumeration Area And Sex, 2002 Census
Enumeration Area Female Male Total
La Passe 1 82 114 196
La Passe 2 285 223 508
La Passe 3 51 54 105
Anse Reunion 1 72 67 139
Anse Reunion 2 82 64 146
Anse Reunion 3 97 104 201
Anse Reunion 4 59 59 118
L'Union Estate, Roche Bois, Grand Anse 103 100 203
Belle Vue 1 84 100 184
Belle Vue 2 46 45 91
La Passe 4 109 104 213
Total 1070 1034 2104
Source: MISD
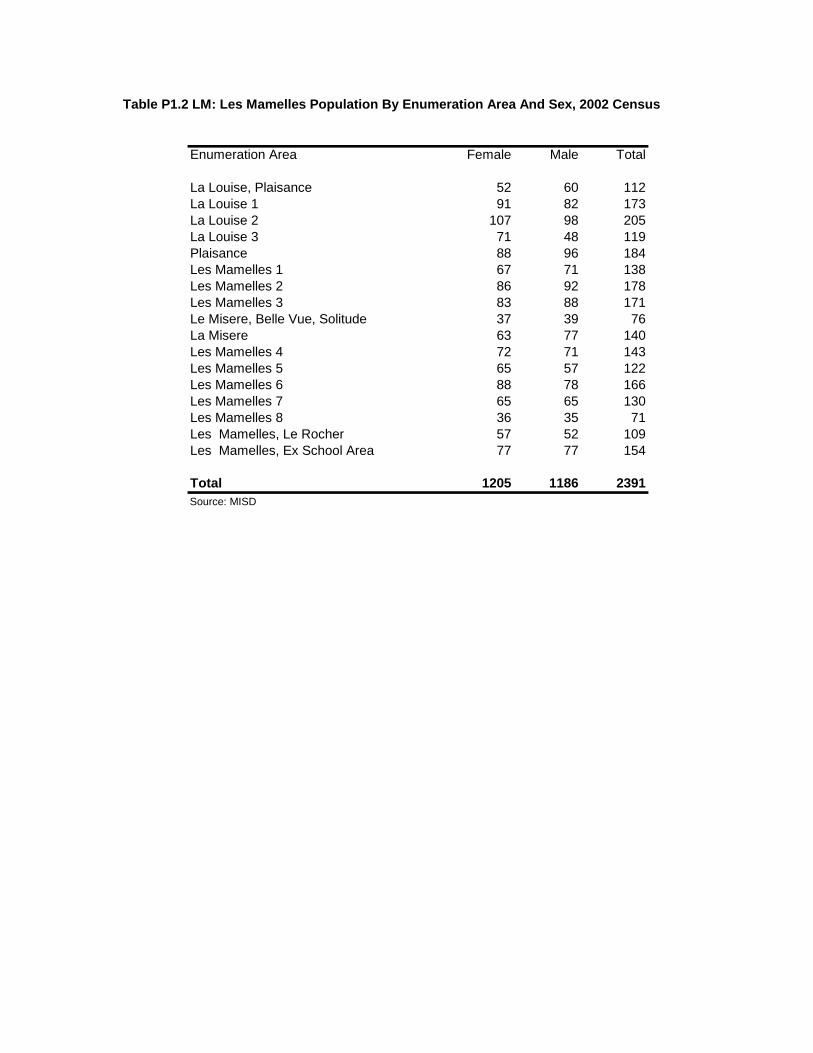
Table P1.2 LM: Les Mamelles Population By Enumeration Area And Sex, 2002 Census
Enumeration Area Female Male Total
La Louise, Plaisance 52 60 112
La Louise 1 91 82 173
La Louise 2 107 98 205
La Louise 3 71 48 119
Plaisance 88 96 184
Les Mamelles 1 67 71 138
Les Mamelles 2 86 92 178
Les Mamelles 3 83 88 171
Le Misere, Belle Vue, Solitude 37 39 76
La Misere 63 77 140
Les Mamelles 4 72 71 143
Les Mamelles 5 65 57 122
Les Mamelles 6 88 78 166
Les Mamelles 7 65 65 130
Les Mamelles 8 36 35 71
Les Mamelles, Le Rocher 57 52 109
Les Mamelles, Ex School Area 77 77 154
Total 1205 1186 2391
Source: MISD

Table P1.2 MB: Mont Buxton Population By Enumeration Area And Sex, 2002 Census
Enumeration Area Female Male Total
Creve Coeur, Upper Roche Bois 82 87 169
Lower Roche Bois, Belonie 115 154 269
Belonie, Moosa River 87 109 196
Hangard Street 93 94 187
Buton Lane, La Rosiere 70 62 132
Lower Mont Buxton 81 93 174
Mont Buxton 1 82 92 174
Mont Buxton Belonie 109 108 217
Mont Buxton 2 81 98 179
Mont Buxton Greenwich 1 93 115 208
Greenwich Estate 87 71 158
Mont Buxton Greenwich 2 107 97 204
Upper Greenwich 126 112 238
Dan Lenn 1 106 103 209
Dan Lenn 2 203 193 396
Total 1522 1588 3110
Source: MISD

Table P1.2 MF: Mont Fleuri Population By Enumeration Area And Sex, 2002 Census
Enumeration Area Female Male Total
Mont Fleuri, Rochon 131 133 264
Upper Rochon, Lower Rochon 71 85 156
Foret Noire 1 158 143 301
Foret Noire 2 81 75 156
Foret Noire 3 103 105 208
Foret Noire 4 105 114 219
Foret Noire, Beaufond Lane 113 106 219
Corgat Estate 1 86 81 167
Corgat Estate 2 57 115 172
Corgat Estate 3 158 136 294
Corgat Estate 4 69 74 143
Foret Noire 5 118 127 245
Mont Fleuri, Hermitage 133 542 675
Hermitage 138 123 261
Upper Hermitage, Mont Fleuri, Sans Soucis 45 41 86
New Port 32 32
Total 1566 2032 3598
Source: MISD

Table P1.2 OS: Population On Outer Islands By Enumeration Area And Sex, 2002 Census
Enumeration Area Female Male Total
Silhouette 63 73 136
North 23 125 148
Fregate 3 205 208
Alphonse 26 56 82
Assumption 1 6 7
Bird 18 19 37
Coetivy 39 213 252
Darros 9 76 85
Denis 22 56 78
Marie-Louise 1 4 5
Platte 1 2 3
Poivre 2 3 5
Providence 1 5 6
Remire 2 4 6
Farquhar 2 13 15
Desroches 3 16 19
Total 216 876 1092
Source: MISD
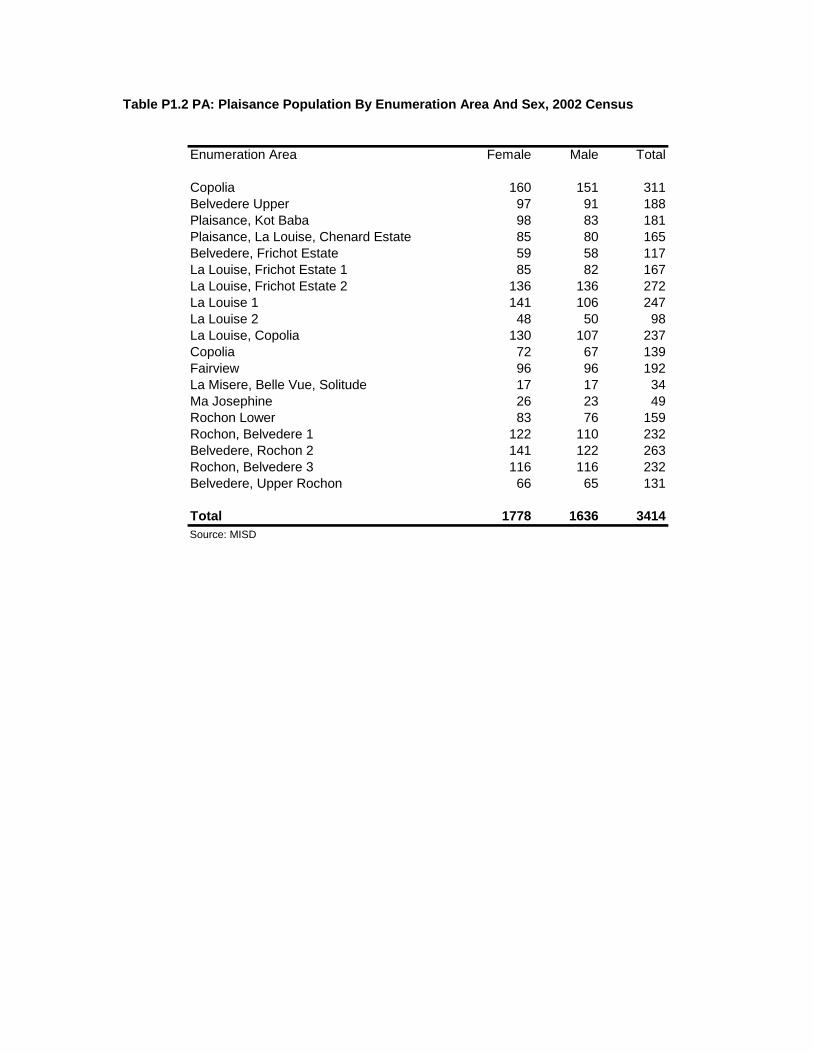
Table P1.2 PA: Plaisance Population By Enumeration Area And Sex, 2002 Census
Enumeration Area Female Male Total
Copolia 160 151 311
Belvedere Upper 97 91 188
Plaisance, Kot Baba 98 83 181
Plaisance, La Louise, Chenard Estate 85 80 165
Belvedere, Frichot Estate 59 58 117
La Louise, Frichot Estate 1 85 82 167
La Louise, Frichot Estate 2 136 136 272
La Louise 1 141 106 247
La Louise 2 48 50 98
La Louise, Copolia 130 107 237
Copolia 72 67 139
Fairview 96 96 192
La Misere, Belle Vue, Solitude 17 17 34
Ma Josephine 26 23 49
Rochon Lower 83 76 159
Rochon, Belvedere 1 122 110 232
Belvedere, Rochon 2 141 122 263
Rochon, Belvedere 3 116 116 232
Belvedere, Upper Rochon 66 65 131
Total 1778 1636 3414
Source: MISD

Table P1.2 PG: Port Glaud Population By Enumeration Area And Sex, 2002 Census
Enumeration Area Female Male Total
Des Arpents 94 105 199
Community Centre Area 72 65 137
Foret Noire Area 64 52 116
Forestry Area 79 73 152
Upper Morne Blanc 80 84 164
S.O.S Area 112 116 228
Port Launay Ex-NYS 30 33 63
Port Launay 93 83 176
Belle Vue Area 112 129 241
Beoliere Flats (Dans Limon) 58 65 123
Upper Beoliere Area 93 80 173
Lower Beoliere Area 43 44 87
Port Launay 93 92 185
Port Launay Flats 68 72 140
Total 1091 1093 2184
Source: MISD
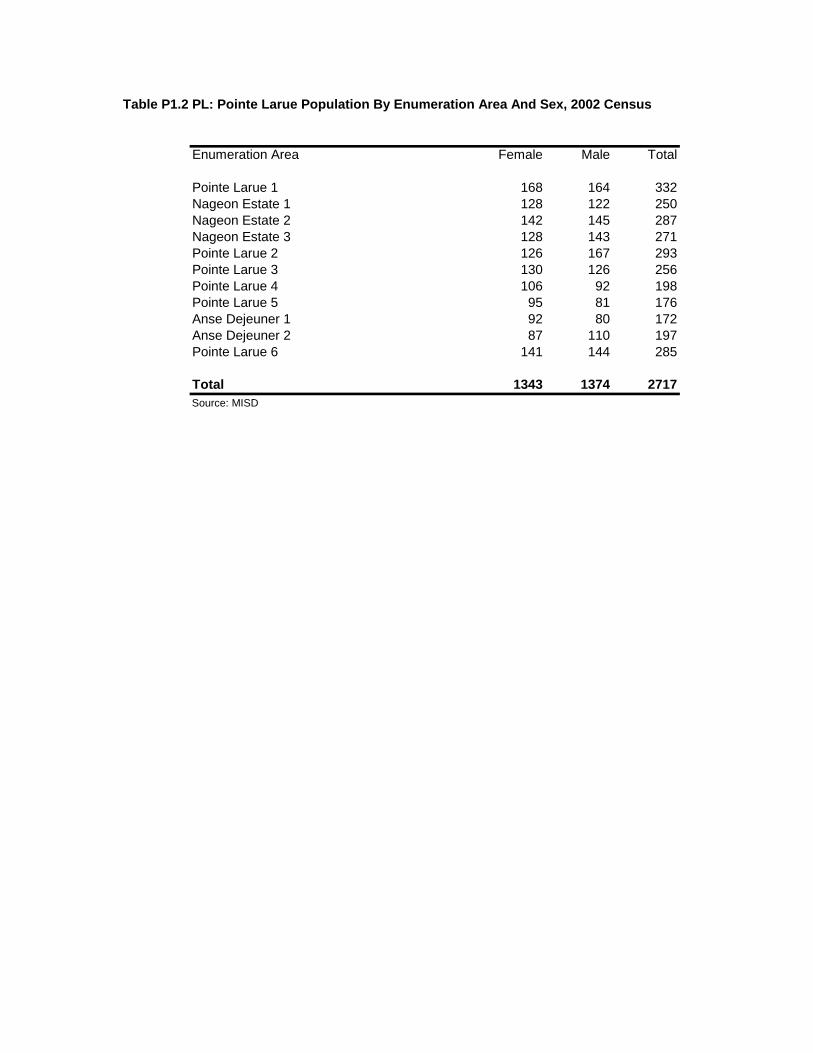
Table P1.2 PL: Pointe Larue Population By Enumeration Area And Sex, 2002 Census
Enumeration Area Female Male Total
Pointe Larue 1 168 164 332
Nageon Estate 1 128 122 250
Nageon Estate 2 142 145 287
Nageon Estate 3 128 143 271
Pointe Larue 2 126 167 293
Pointe Larue 3 130 126 256
Pointe Larue 4 106 92 198
Pointe Larue 5 95 81 176
Anse Dejeuner 1 92 80 172
Anse Dejeuner 2 87 110 197
Pointe Larue 6 141 144 285
Total 1343 1374 2717
Source: MISD

Table P1.2 RC: Roche Caiman Population By Enumeration Area And Sex, 2002 Census
Enumeration Area Female Male Total
Lower Plaisance 110 153 263
Plaisance 48 47 95
Les Mamelles Lower 1 1 3 4
Les Mamelles Lower 2 9 14 23
Les Mamelles, Le Rocher 28 27 55
Palmist Avenue 126 92 218
Harmony Street 115 106 221
La Rue Vavangue 127 115 242
Avenue Patatran 140 98 238
Avenue Des Lauriers 139 95 234
Rue Des Cedres 136 120 256
Guy Sinon Road/Aldabra Avenue (Part 1) 143 96 239
Guy Sinon Road/Aldabra Avenue (Part 2) 78 69 147
Guy Sinon Road/Aldabra Avenue (Part 3) 59 80 139
Guy Sinon Road/Aldabra Avenue (Part 4) 154 130 284
Roche Caiman Industrial Estate, AIRTEL &
Luxury Flats 8 7 15
Total 1421 1252 2673
Source: MISD
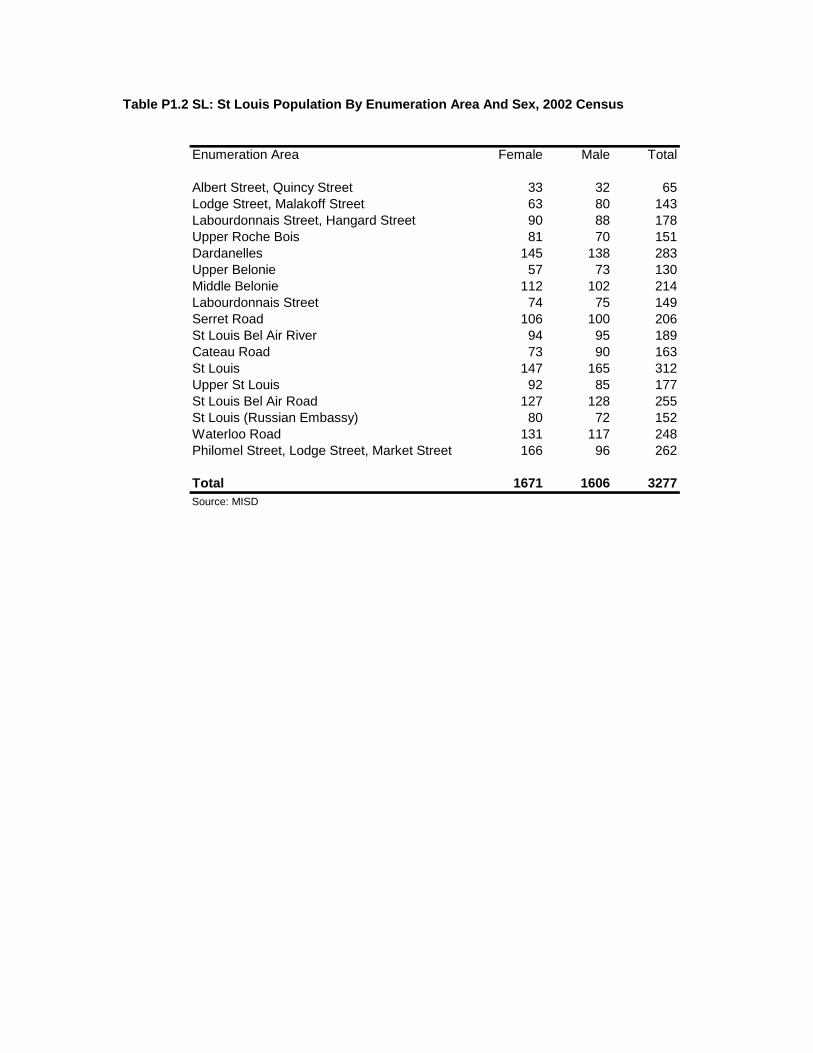
Table P1.2 SL: St Louis Population By Enumeration Area And Sex, 2002 Census
Enumeration Area Female Male Total
Albert Street, Quincy Street 33 32 65
Lodge Street, Malakoff Street 63 80 143
Labourdonnais Street, Hangard Street 90 88 178
Upper Roche Bois 81 70 151
Dardanelles 145 138 283
Upper Belonie 57 73 130
Middle Belonie 112 102 214
Labourdonnais Street 74 75 149
Serret Road 106 100 206
St Louis Bel Air River 94 95 189
Cateau Road 73 90 163
St Louis 147 165 312
Upper St Louis 92 85 177
St Louis Bel Air Road 127 128 255
St Louis (Russian Embassy) 80 72 152
Waterloo Road 131 117 248
Philomel Street, Lodge Street, Market Street 166 96 262
Total 1671 1606 3277
Source: MISD

Table P1.2 TA: Takamaka Population By Enumeration Area And Sex, 2002 Census
Enumeration Area Female Male Total
Anse Forban,Anse Marie Louise Area 17 17 34
Quatre Borne,Intendance Area 62 67 129
Intendance Road Area 41 40 81
Intendance Lower 64 46 110
Quatre Borne, Takamaka Lower 102 69 171
Takamaka Beach Way 66 68 134
Anse Forban 91 104 195
Quatre Borne 1 145 140 285
Quatre Borne 2 99 87 186
Upper Quatre Borne 70 81 151
Quatre Borne 111 103 214
Cemetery, Calorifer Area 1 194 168 362
Cemetery, Calorifer Area 2 113 123 236
Dan Pen-Pen, Takamaka Beach Way 15 17 32
Cap Macon, Bougainville 53 46 99
Bougainville 94 96 190
Total 1337 1272 2609
Source: MISD

P.1.3a: Seychelles Population by Age And Sex, 2002 Census
Age (years) Female Male Total Age (years) Female Male Total
<1 632 646 1278 52 301 316 617
1 662 646 1308 53 316 318 634
2 696 644 1340 54 243 293 536
3 582 688 1270 55 245 259 504
4 587 590 1177 56 246 274 520
5 661 748 1409 57 222 215 437
6 710 757 1467 58 237 214 451
7 706 750 1456 59 213 227 440
8 747 778 1525 60 235 212 447
9 747 765 1512 61 229 205 434
10 684 722 1406 62 246 195 441
11 771 780 1551 63 236 188 424
12 706 740 1446 64 244 162 406
13 697 721 1418 65 251 175 426
14 722 737 1459 66 204 183 387
15 720 732 1452 67 243 174 417
16 748 798 1546 68 238 162 400
17 757 735 1492 69 213 160 373
18 713 737 1450 70 228 152 380
19 592 711 1303 71 195 161 356
20 675 718 1393 72 188 153 341
21 706 762 1468 73 197 148 345
22 746 758 1504 74 171 98 269
23 711 816 1527 75 162 107 269
24 691 738 1429 76 148 107 255
25 724 689 1413 77 158 102 260
26 673 709 1382 78 138 73 211
27 746 808 1554 79 116 78 194
28 728 746 1474 80 127 83 210
29 664 720 1384 81 115 59 174
30 764 758 1522 82 80 44 124
31 701 719 1420 83 94 48 142
32 688 760 1448 84 77 32 109
33 753 815 1568 85 91 28 119
34 671 728 1399 86 79 30 109
35 781 725 1506 87 51 26 77
36 751 706 1457 88 48 16 64
37 686 677 1363 89 46 11 57
38 720 713 1433 90 40 11 51
39 710 673 1383 91 27 7 34
40 635 676 1311 92 21 6 27
41 622 670 1292 93 30 4 34
42 600 648 1248 94 15 1 16
43 541 648 1189 95 11 11
44 535 610 1145 96 11 1 12
45 518 581 1099 97 7 1 8
46 450 503 953 98 8 1 9
47 398 455 853 99 2 2
48 341 414 755 100 1 1 2
49 343 354 697 101 3 2 5
50 291 368 659 104 1 1 2
51 282 350 632 Not reported 18 40 58
Total 40751 41004 81755
Source: MISD
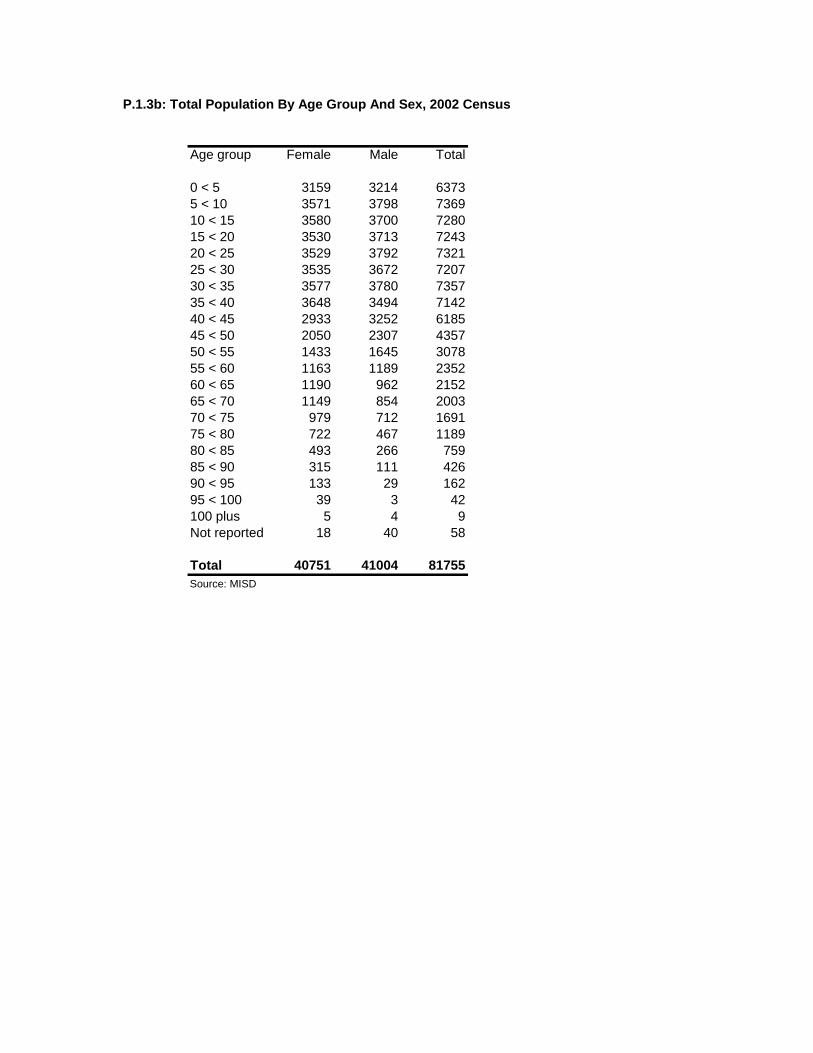
P.1.3b: Total Population By Age Group And Sex, 2002 Census
Age group Female Male Total
0 < 5 3159 3214 6373
5 < 10 3571 3798 7369
10 < 15 3580 3700 7280
15 < 20 3530 3713 7243
20 < 25 3529 3792 7321
25 < 30 3535 3672 7207
30 < 35 3577 3780 7357
35 < 40 3648 3494 7142
40 < 45 2933 3252 6185
45 < 50 2050 2307 4357
50 < 55 1433 1645 3078
55 < 60 1163 1189 2352
60 < 65 1190 962 2152
65 < 70 1149 854 2003
70 < 75 979 712 1691
75 < 80 722 467 1189
80 < 85 493 266 759
85 < 90 315 111 426
90 < 95 133 29 162
95 < 100 39 3 42
100 plus 5 4 9
Not reported 18 40 58
Total 40751 41004 81755
Source: MISD

P1.4: Native-born Seychellois By Place Of Registration, Age Group And Sex, 2002 Census
Place of registration
Age group Victoria
Anse
Royale Praslin La Digue Total
Female 0 < 5 2941 35 48 12 3036
5 < 10 3250 90 78 13 3431
10 < 15 3173 120 104 29 3426
15 < 20 3067 150 132 47 3396
20 < 25 2798 246 144 33 3221
25 < 30 2389 415 226 70 3100
30 < 35 2128 580 242 121 3071
35 < 40 2124 596 282 154 3156
40 < 45 1729 460 246 123 2558
45 < 50 1228 322 182 87 1819
50 < 55 837 264 138 68 1307
55 < 60 671 240 103 53 1067
60 < 65 679 278 103 65 1125
65 < 70 661 255 109 72 1097
70 < 75 569 208 107 66 950
75 < 80 412 152 98 34 696
80 < 85 275 117 59 30 481
85 < 90 177 72 37 24 310
90 < 95 74 31 17 9 131
95 < 100 20 8 8 3 39
100 plus 3 2 5
Not reported 4 2 6
Total 29209 4643 2463 1113 37428
Source: MISD
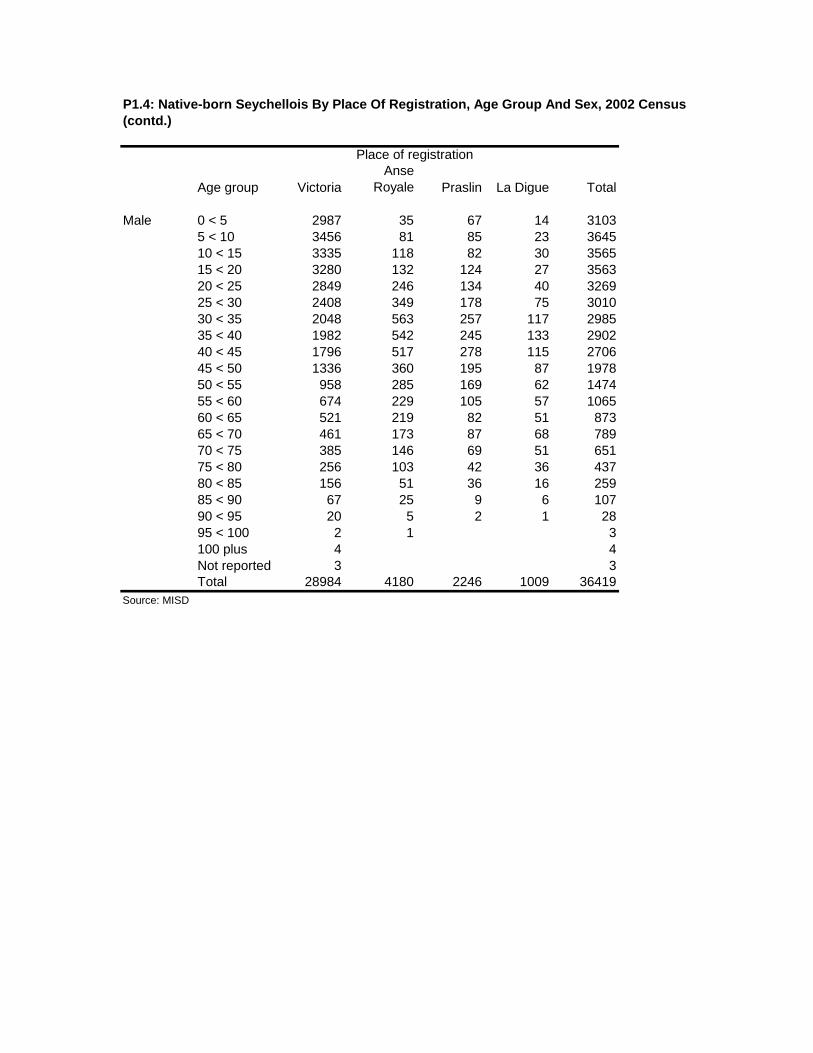
P1.4: Native-born Seychellois By Place Of Registration, Age Group And Sex, 2002 Census
(contd.)
Place of registration
Age group Victoria
Anse
Royale Praslin La Digue Total
Male 0 < 5 2987 35 67 14 3103
5 < 10 3456 81 85 23 3645
10 < 15 3335 118 82 30 3565
15 < 20 3280 132 124 27 3563
20 < 25 2849 246 134 40 3269
25 < 30 2408 349 178 75 3010
30 < 35 2048 563 257 117 2985
35 < 40 1982 542 245 133 2902
40 < 45 1796 517 278 115 2706
45 < 50 1336 360 195 87 1978
50 < 55 958 285 169 62 1474
55 < 60 674 229 105 57 1065
60 < 65 521 219 82 51 873
65 < 70 461 173 87 68 789
70 < 75 385 146 69 51 651
75 < 80 256 103 42 36 437
80 < 85 156 51 36 16 259
85 < 90 67 25 9 6 107
90 < 95 20 5 2 1 28
95 < 100 2 1 3
100 plus 4 4
Not reported 3 3
Total 28984 4180 2246 1009 36419
Source: MISD

P1.4: Native-born Seychellois By Place Of Registration, Age Group And Sex, 2002 Census
(contd.)
Place of registration
Age group Victoria
Anse
Royale Praslin La Digue Total
Both sexes 0 < 5 5928 70 115 26 6139
5 < 10 6706 171 163 36 7076
10 < 15 6508 238 186 59 6991
15 < 20 6347 282 256 74 6959
20 < 25 5647 492 278 73 6490
25 < 30 4797 764 404 145 6110
30 < 35 4176 1143 499 238 6056
35 < 40 4106 1138 527 287 6058
40 < 45 3525 977 524 238 5264
45 < 50 2564 682 377 174 3797
50 < 55 1795 549 307 130 2781
55 < 60 1345 469 208 110 2132
60 < 65 1200 497 185 116 1998
65 < 70 1122 428 196 140 1886
70 < 75 954 354 176 117 1601
75 < 80 668 255 140 70 1133
80 < 85 431 168 95 46 740
85 < 90 244 97 46 30 417
90 < 95 94 36 19 10 159
95 < 100 22 9 8 3 42
100 plus 7 2 9
Not reported 7 2 9
Total 58193 8823 4709 2122 73847
Source: MISD

P1.5: Population Aged 5 Years Or More By Current District And Place Of Residence At The Last Census (1997)
District of residence at last census District of residence at last census
District
Anse Aux
Pins
Anse
Boileau Au Cap
Anse
Etoile
Anse
Royale Bel Air
Baie
Lazare Belombre
Baie Ste
Anne
Beau
Vallon Cascade
English
River Glacis
Grand
Anse
Mahe
Anse Aux Pins 2939 14 12 13 21 11 13 3 6 12 15 5 7 10
Anse Boileau 9 3483 1 4 11 16 1 1 5 6 7 10
Au Cap 428 38 1788 15 83 14 24 21 7 23 42 9 13 16
Anse Etoile 23 13 3 3175 10 33 3 16 4 18 22 39 63 2
Anse Royale 37 10 6 25 2945 6 26 5 34 4 8 7 7 7
Bel Air 8 5 4 19 6 2101 13 2 2 20 8 16 9 5
Baie Lazare 12 30 1 3 20 1 2484 3 22 4 1 5 3
Belombre 14 7 12 16 11 24 1 2436 3 115 14 14 26 4
Baie Ste Anne 15 16 3 4 21 19 7 10 2982 13 6 11 8 5
Beau Vallon 19 13 34 21 26 3 15 7 2828 22 15 25 8
Cascade 40 5 3 10 36 4 8 5 10 11 2451 18 8 8
English River 12 13 1 35 18 41 12 13 4 22 15 2407 32 14
Glacis 16 2 6 43 4 30 4 11 1 38 19 24 2774 9
Grand Anse
Mahe 17 34 1 5 14 7 16 8 7 6 16 10 8 2001
Grand Anse
Praslin 9 10 7 15 25 10 5 7 50 20 3 14 7 5
La Digue 2 1 6 2 4 2 8 3 5 4 1
Les Mamelles 10 10 8 3 19 11 2 11 6 8 9 11 2 4
Mont Buxton 2 2 11 9 11 3 5 4 12 9 33 5 4
Mont Fleuri 20 20 1 25 22 26 6 7 10 7 14 14 7 13
Other Islands 17 20 3 14 22 9 14 12 7 21 28 13 12 13
Plaisance 11 23 1 11 27 12 4 15 7 13 25 15 9 17
Port Glaud 4 23 1 7 19 7 6 1 4 12 10 4 10 27
Pointe Larue 22 6 11 22 18 8 4 4 2 5 18 6 6 7
Roche Caiman 13 16 2 23 11 9 12 7 4 18 14 26 9 12
St Louis 12 8 2 11 5 13 19 1 19 14 12 15 4
Takamaka 14 12 4 52 1 8 1 4 5 3 4
Total 3725 3833 1877 3548 3456 2436 2694 2641 3166 3284 2800 2739 3071 2213
Source: MISD

P1.5: Population Aged 5 Years Or More By Current District And Place Of Residence At The Last Census (1997) contd.
District of residence at last census
District
Grand
Anse
Praslin
La Digue
& Inner
Islands
Les
Mamelles
Mont
Buxton
Mont
Fleuri
Other
Islands Overseas Plaisance
Port
Glaud
Pointe
Larue
Roche
Caiman St Louis Takamaka
Not
reported Total
Anse Aux Pins 3 1 4 12 23 1 38 26 5 28 1 15 4 39 3281
Anse Boileau 10 1 1 1 5 4 15 3 5 6 1 1 4 81 3692
Au Cap 11 11 10 28 58 3 93 16 4 87 6 18 28 50 2944
Anse Etoile 4 7 31 55 58 15 274 31 11 12 9 61 3 73 4068
Anse Royale 37 14 9 9 13 2 63 8 7 10 6 12 27 39 3383
Bel Air 9 2 3 27 20 7 309 21 1 4 10 39 1 30 2701
Baie Lazare 2 3 2 3 3 45 6 5 3 2 17 39 2719
Belombre 3 2 16 26 25 3 399 20 7 11 42 13 78 3342
Baie Ste Anne 46 15 3 8 9 3 95 12 12 8 4 5 3 75 3418
Beau Vallon 5 2 14 61 24 6 149 25 2 5 6 128 2 47 3512
Cascade 8 3 5 8 25 4 407 19 3 32 6 17 7 21 3182
English River 11 11 15 86 64 4 298 28 4 27 3 96 13 23 3322
Glacis 6 7 9 27 39 8 106 28 9 9 41 3 29 3302
Grand Anse
Mahe 1 13 14 29 1 40 30 37 10 3 15 6 9 2358
Grand Anse
Praslin 2334 4 5 5 10 25 14 7 11 4 17 4 473 3100
La Digue 7 1771 8 6 8 5 49 3 2 3 12 4 23 1939
Les Mamelles 1 1 1879 13 12 3 54 63 7 5 20 17 5 20 2214
Mont Buxton 4 2 11 2472 6 6 60 14 3 5 5 104 2 86 2890
Mont Fleuri 5 15 12 12 2436 42 200 35 4 12 9 29 4 370 3377
Other Islands 5 5 6 11 8 183 352 17 6 23 6 11 6 210 1054
Plaisance 4 6 28 14 33 5 55 2719 6 13 5 21 7 49 3155
Port Glaud 7 4 11 7 7 41 22 1694 7 13 10 20 1978
Pte Larue 13 6 7 2 13 8 39 14 2 2212 3 7 5 12 2482
Roche Caiman 4 3 251 22 31 1 73 67 3 8 1722 38 7 42 2448
St Louis 1 4 4 44 25 5 221 11 7 13 6 2529 3 53 3061
Takamaka 1 1 1 5 1 23 2 4 8 12 2227 9 2402
Total 2542 1900 2356 2973 2989 323 3523 3254 1857 2572 1835 3302 2415 2000 75324
Source: MISD

P2.1: Household Population By Relationship To Head Of Household By Marital Status And Sex, 2002 Census
Marital status
Relationship to head of
household Single Married Cohabiting Separated Divorced Widowed Not reported Total
Female Head 3356 2333 2424 414 414 1229 60 10230
Brother/Sister/In-Law 320 44 66 8 4 18 11 471
Daughter/In-Law 12901 628 919 86 76 26 690 15326
Grandchild 2960 25 45 4 3 1 257 3295
Non-relative 461 44 135 6 5 29 21 701
Other relative 918 79 106 12 22 94 77 1308
Parent 227 119 21 23 17 238 13 658
Wife 4619 2748 10 13 9 7399
Not reported 85 13 17 1 3 33 152
Female household population 21228 7904 6481 563 555 1638 1171 39540
Female Institutional population 716 345 9 1 43 22 75 1211
Male Head 2104 5017 2785 224 203 236 47 10616
Brother/Sister/In-Law 750 60 73 24 19 8 27 961
Grandchild 3127 11 25 2 6 254 3425
Husband 1601 2372 21 15 17 4026
Non-relative 911 194 175 18 15 10 39 1362
Other relative 1112 92 120 18 15 14 77 1448
Parent 71 59 11 15 6 52 6 220
Son/In-Law 14518 541 887 59 62 8 776 16851
Not reported 85 12 13 59 169
Male household population 22678 7587 6461 381 341 328 1302 39078
Male Institutional population 557 454 13 9 29 3 861 1926
Both sexes Head 5460 7350 5209 638 617 1465 108 20847
Brother/Sister/In-Law 1070 104 139 32 23 26 38 1432
Daughter/In-Law 12901 628 919 86 76 26 690 15326
Grandchild 6087 36 70 6 9 1 511 6720
Husband 1601 2372 21 15 17 4026
Non-relative 1372 238 310 24 20 39 60 2063
Other relative 2030 171 226 30 37 108 154 2756
Parent 298 178 32 38 23 290 19 878
Son/In-Law 14518 541 887 59 62 8 776 16851
Wife 4619 2748 10 13 9 7399
Not reported 170 25 30 1 3 352 581
Total household population 43906 15491 12942 944 896 1966 2473 78618
Total Institutional population 1273 799 22 10 72 25 936 3137
Total population 45179 16290 12964 954 968 1991 3409 81755
Source: MISD

P2.2: Household and Institutional Population By Age Group And Sex, 2002 Census
Household population Institutional population
Age group Female Male Total Female Male Total
Total
population
0 < 5 3145 3204 6349 14 10 24 6373
5 < 10 3555 3772 7327 16 26 42 7369
10 < 15 3554 3669 7223 26 31 57 7280
15 < 20 3490 3664 7154 40 49 89 7243
20 < 25 3341 3418 6759 188 374 562 7321
25 < 30 3302 3265 6567 233 407 640 7207
30 < 35 3353 3446 6799 224 334 558 7357
35 < 40 3480 3272 6752 168 222 390 7142
40 < 45 2838 3038 5876 95 214 309 6185
45 < 50 1999 2228 4227 51 79 130 4357
50 < 55 1420 1618 3038 13 27 40 3078
55 < 60 1154 1174 2328 9 15 24 2352
60 < 65 1184 942 2126 6 20 26 2152
65 < 70 1131 830 1961 18 24 42 2003
70 < 75 965 694 1659 14 18 32 1691
75 < 80 706 438 1144 16 29 45 1189
80 < 85 472 253 725 21 13 34 759
85 < 90 288 107 395 27 4 31 426
90 < 95 119 27 146 14 2 16 162
95 < 100 33 2 35 6 1 7 42
100 plus 4 4 8 1 1 9
Not reported 7 13 20 11 27 38 58
Total 39540 39078 78618 1211 1926 3137 81755
Source: MISD

P2.3: Head Of Household And Other Members by Relationship, Age Group And Sex, 2002 Census
Relationship to head of household
Age group Head
Brother
/Sister/ In-
Law
Daughter/
In-Law Grandchild
Non-
relative
Other
relative Parent Wife
Not
reported Total
Female 0 < 5 5 1797 1116 56 155 27 3156
5 < 10 6 2456 866 67 158 17 3570
10 < 15 10 2753 578 84 139 14 3578
15 < 20 47 32 2682 391 112 185 57 24 3530
20 < 25 257 82 2087 211 284 152 418 38 3529
25 < 30 630 69 1483 71 295 109 848 30 3535
30 < 35 1089 57 952 38 271 51 1115 10 3583
35 < 40 1424 71 606 16 198 39 1 1279 14 3648
40 < 45 1358 29 263 2 113 26 3 1130 9 2933
45 < 50 1057 14 124 2 68 11 12 755 7 2050
50 < 55 780 19 50 27 10 18 524 5 1433
55 < 60 661 9 26 9 17 21 413 7 1163
60 < 65 734 17 25 19 15 65 312 3 1190
65 < 70 750 17 15 25 30 89 220 3 1149
70 < 75 593 12 4 1 26 37 121 180 5 979
75 < 80 421 12 10 2 31 38 105 99 4 722
80 < 85 263 8 5 3 34 46 97 35 2 493
85 < 90 127 3 2 35 55 75 17 1 315
90 < 95 46 1 18 28 39 1 133
95 < 100 11 9 7 11 1 39
100 plus 3 2 5
Not reported 1 3 9 3 2 18
Total 10252 472 15344 3297 1790 1308 659 7405 224 40751

P2.3: Head Of Household And Other Members by Relationship, Age Group And Sex, 2002 Census (contd.)
Relationship to head of household
Age group Head
Brother
/Sister/ In-
Law Grandchild Husband
Non-
relative
Other
relative Parent
Son/ In-
Law
Not
reported Total
Male 0 < 5 3 1100 57 169 1854 28 3211
5 < 10 4 905 72 154 2636 22 3793
10 < 15 14 594 83 151 2836 19 3697
15 < 20 54 49 422 8 116 168 2856 40 3713
20 < 25 309 99 229 108 308 176 2300 263 3792
25 < 30 697 122 116 349 427 123 1652 186 3672
30 < 35 1230 121 30 609 408 117 1104 165 3784
35 < 40 1557 124 19 656 263 65 723 87 3494
40 < 45 1681 113 5 626 214 60 1 444 108 3252
45 < 50 1383 83 4 434 100 55 2 224 29 2314
50 < 55 1030 58 320 57 35 6 131 8 1645
55 < 60 764 42 1 248 43 23 7 56 5 1189
60 < 65 583 41 194 59 30 25 26 4 962
65 < 70 507 38 2 176 45 36 36 13 1 854
70 < 75 409 30 162 37 32 41 1 712
75 < 80 241 12 81 51 26 55 1 467
80 < 85 162 4 34 23 17 25 1 266
85 < 90 58 3 1 14 9 10 15 1 111
90 < 95 11 1 8 3 3 3 29
95 < 100 1 1 1 3
100 plus 1 3 4
Not reported 4 1 1 14 3 17 40
Total 10681 962 3428 4028 2390 1451 220 16861 983 41004

P2.3: Head Of Household And Other Members by Relationship, Age Group And Sex, 2002 Census (contd.)
Relationship to head of household
Age group Head
Brother
/Sister/ In-
Law
Daughter/
In-Law Grandchild Husband
Non-
relative
Other
relative Parent
Son/ In-
Law Wife
Not
reported Total
Both sexes 0 < 5 8 1797 2216 113 324 1854 55 6367
5 < 10 10 2456 1771 139 312 2636 39 7363
10 < 15 24 2753 1172 167 290 2836 33 7275
15 < 20 101 81 2682 813 8 228 353 2856 57 64 7243
20 < 25 566 181 2087 440 108 592 328 2300 418 301 7321
25 < 30 1327 191 1483 187 349 722 232 1652 848 216 7207
30 < 35 2319 178 952 68 609 679 168 1104 1115 175 7367
35 < 40 2981 195 606 35 656 461 104 1 723 1279 101 7142
40 < 45 3039 142 263 7 626 327 86 4 444 1130 117 6185
45 < 50 2440 97 124 6 434 168 66 14 224 755 36 4364
50 < 55 1810 77 50 320 84 45 24 131 524 13 3078
55 < 60 1425 51 26 1 248 52 40 28 56 413 12 2352
60 < 65 1317 58 25 194 78 45 90 26 312 7 2152
65 < 70 1257 55 15 2 176 70 66 125 13 220 4 2003
70 < 75 1002 42 4 1 162 63 69 162 1 180 5 1691
75 < 80 662 24 10 2 81 82 64 160 99 5 1189
80 < 85 425 12 5 3 34 57 63 122 1 35 2 759
85 < 90 185 6 2 1 14 44 65 90 1 17 1 426
90 < 95 57 1 1 8 21 31 42 1 162
95 < 100 12 10 7 12 1 42
100 plus 3 1 5 9
Not reported 5 1 3 1 23 3 3 19 58
Total 20933 1434 15344 6725 4028 4180 2759 879 16861 7405 1207 81755
Source: MISD

P2.4 Population In Households And Institutions By Household Size, 2002 Census
Household
size
Household
population
Institutional
population
Total
population
Total
households
1 2994 24 3018 3018
2 6522 8 6530 3265
3 12021 6 12027 4009
4 16484 12 16496 4124
5 14575 40 14615 2923
6 9420 12 9432 1572
7 5929 5929 847
8 3648 8 3656 457
9 2610 2610 290
10 1590 20 1610 161
11 1012 55 1067 97
12 780 12 792 66
13 299 299 23
14 238 28 266 19
15 150 15 165 11
16 128 128 8
17 68 34 102 6
18 36 36 2
19 19 19 1
20 60 60 3
21 42 42 84 4
22 22 22 1
23 23 23 1
24 48 48 2
27 27 27 1
29 29 29 1
32 32 32 1
35 35 35 1
41 41 41 1
42 42 42 1
44 44 44 1
52 52 52 1
69 69 69 1
79 79 79 1
95 95 95 1
99 99 99 1
103 103 103 1
107 107 107 1
137 137 137 1
138 138 138 1
155 155 155 1
186 186 186 1
208 208 208 1
229 229 229 1
246 246 246 1
261 261 261 1
307 307 307 1
Total 78618 3137 81755 20933
Source: MISD

P2.5: Population In Households By Household Size And Number Of Children
Less Than 15 Years, 2002 Census
Household
size
Persons 15
years or
more
Children
less than
15 years
Age not
reported Total
1 3016 2 3018
2 6072 454 4 6530
3 9295 2728 4 12027
4 11541 4950 5 16496
5 9967 4645 3 14615
6 6461 2971 9432
7 4103 1825 1 5929
8 2517 1139 3656
9 1785 824 1 2610
10 1121 489 1610
11 710 357 1067
12 575 216 1 792
13 199 100 299
14 183 83 266
15 111 54 165
16 81 47 128
17 71 31 102
18 36 36
19 19 19
20 34 26 60
21 52 32 84
22 22 22
23 21 2 23
24 33 15 48
27 27 27
29 29 29
32 32 32
35 7 28 35
41 41 41
42 37 5 42
44 36 8 44
52 52 52
69 64 5 69
79 79 79
95 95 95
99 99 99
103 103 103
107 105 1 1 107
137 137 137
138 138 138
155 154 1 155
186 186 186
208 198 10 208
229 229 229
246 246 246
261 261 261
307 295 12 307
Total 60675 21022 58 81755
Source: MISD

P2.6: Population In Households By Household Size, Broad Age Group And Sex, 2002 Census
Total population Female population Male population
Age group (years) Age group (years) Age group (years)
Others 60 or more Total Others 60 or more Total Others 60 or more Total
Household size
1 1941 1077 3018 415 567 982 1526 510 2036
2 4877 1653 6530 2392 1010 3402 2485 643 3128
3 10833 1194 12027 5456 767 6223 5377 427 5804
4 15450 1046 16496 7718 658 8376 7732 388 8120
5 13613 1002 14615 6798 611 7409 6815 391 7206
6 8640 792 9432 4350 483 4833 4290 309 4599
7 5421 508 5929 2704 283 2987 2717 225 2942
8 3316 340 3656 1675 200 1875 1641 140 1781
9 2361 249 2610 1170 134 1304 1191 115 1306
10 1467 143 1610 751 84 835 716 59 775
11 979 88 1067 483 52 535 496 36 532
12 727 65 792 299 36 335 428 29 457
13 281 18 299 131 7 138 150 11 161
14 250 16 266 117 10 127 133 6 139
15 152 13 165 69 8 77 83 5 88
16 121 7 128 68 6 74 53 1 54
17 92 10 102 41 5 46 51 5 56
18 36 36 1 1 35 35
19 19 19 19 19
20 52 8 60 25 6 31 27 2 29
21 79 5 84 35 3 38 44 2 46
22 22 22 22 22
23 23 23 1 1 22 22
24 46 2 48 17 1 18 29 1 30
27 27 27 27 27
29 29 29 6 6 23 23
32 32 32 32 32
35 35 35 30 30 5 5
41 5 36 41 5 36 41
42 33 9 42 17 3 20 16 6 22
44 21 23 44 7 11 18 14 12 26
52 52 52 2 2 50 50
69 69 69 10 10 59 59
79 79 79 79 79
95 95 95 95 95
99 99 99 99 99
103 102 1 103 74 74 28 1 29
107 107 107 1 1 106 106
137 137 137 20 20 117 117
138 12 126 138 44 44 12 82 94
155 155 155 4 4 151 151
186 186 186 186 186
208 207 1 208 3 3 204 1 205
229 229 229 157 157 72 72
246 246 246 246 246
261 261 261 261 261
307 306 1 307 64 64 242 1 243
Total 73322 8433 81755 35726 5025 40751 37596 3408 41004Source: MISD
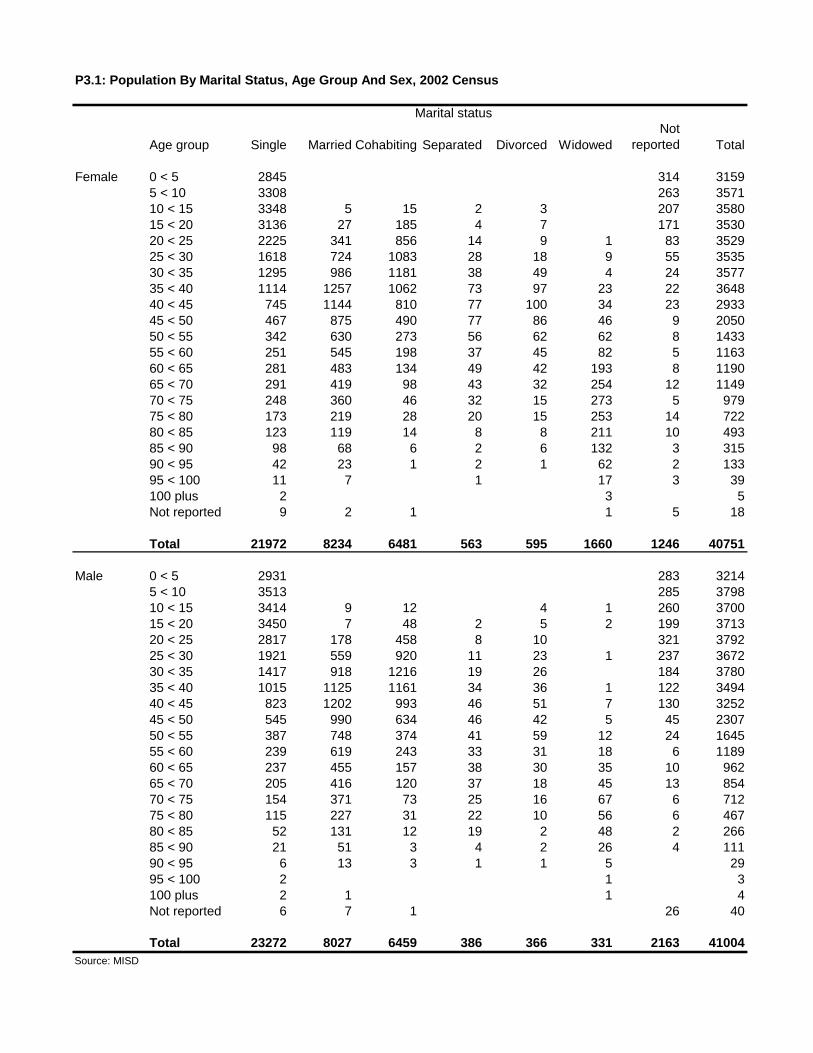
P3.1: Population By Marital Status, Age Group And Sex, 2002 Census
Marital status
Age group Single Married Cohabiting Separated Divorced Widowed
Not
reported Total
Female 0 < 5 2845 314 3159
5 < 10 3308 263 3571
10 < 15 3348 5 15 2 3 207 3580
15 < 20 3136 27 185 4 7 171 3530
20 < 25 2225 341 856 14 9 1 83 3529
25 < 30 1618 724 1083 28 18 9 55 3535
30 < 35 1295 986 1181 38 49 4 24 3577
35 < 40 1114 1257 1062 73 97 23 22 3648
40 < 45 745 1144 810 77 100 34 23 2933
45 < 50 467 875 490 77 86 46 9 2050
50 < 55 342 630 273 56 62 62 8 1433
55 < 60 251 545 198 37 45 82 5 1163
60 < 65 281 483 134 49 42 193 8 1190
65 < 70 291 419 98 43 32 254 12 1149
70 < 75 248 360 46 32 15 273 5 979
75 < 80 173 219 28 20 15 253 14 722
80 < 85 123 119 14 8 8 211 10 493
85 < 90 98 68 6 2 6 132 3 315
90 < 95 42 23 1 2 1 62 2 133
95 < 100 11 7 1 17 3 39
100 plus 2 3 5
Not reported 9 2 1 1 5 18
Total 21972 8234 6481 563 595 1660 1246 40751
Male 0 < 5 2931 283 3214
5 < 10 3513 285 3798
10 < 15 3414 9 12 4 1 260 3700
15 < 20 3450 7 48 2 5 2 199 3713
20 < 25 2817 178 458 8 10 321 3792
25 < 30 1921 559 920 11 23 1 237 3672
30 < 35 1417 918 1216 19 26 184 3780
35 < 40 1015 1125 1161 34 36 1 122 3494
40 < 45 823 1202 993 46 51 7 130 3252
45 < 50 545 990 634 46 42 5 45 2307
50 < 55 387 748 374 41 59 12 24 1645
55 < 60 239 619 243 33 31 18 6 1189
60 < 65 237 455 157 38 30 35 10 962
65 < 70 205 416 120 37 18 45 13 854
70 < 75 154 371 73 25 16 67 6 712
75 < 80 115 227 31 22 10 56 6 467
80 < 85 52 131 12 19 2 48 2 266
85 < 90 21 51 3 4 2 26 4 111
90 < 95 6 13 3 1 1 5 29
95 < 100 2 1 3
100 plus 2 1 1 4
Not reported 6 7 1 26 40
Total 23272 8027 6459 386 366 331 2163 41004
Source: MISD
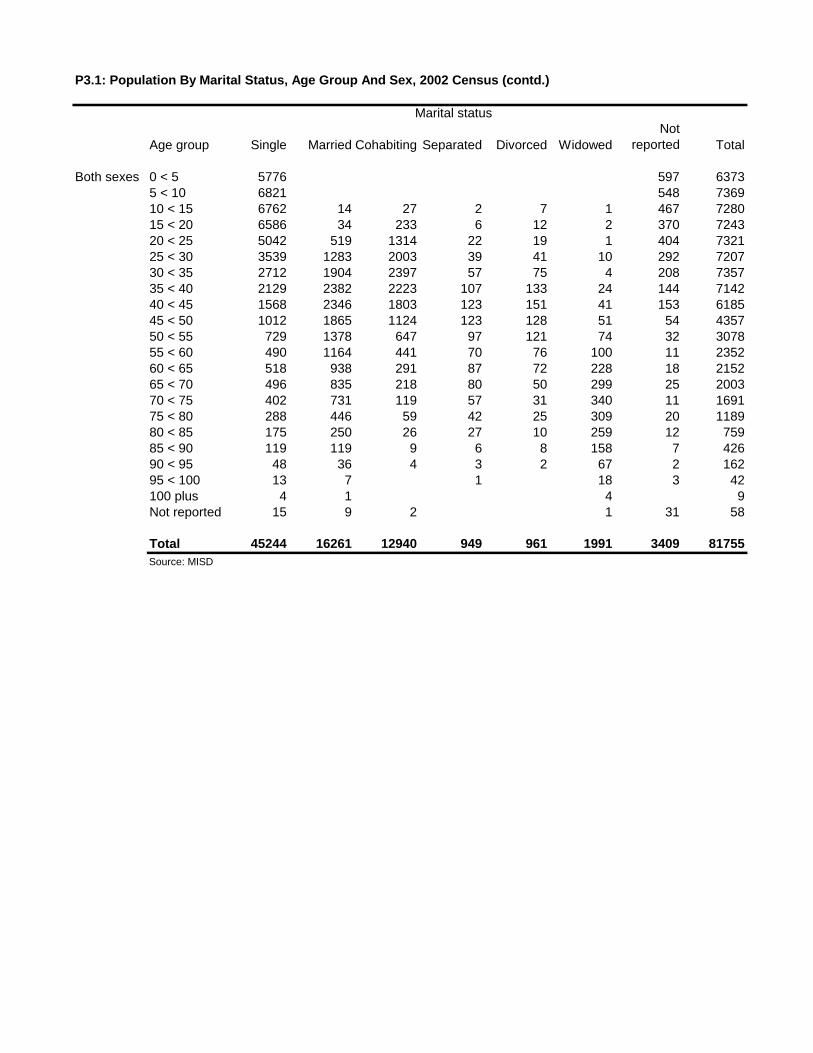
P3.1: Population By Marital Status, Age Group And Sex, 2002 Census (contd.)
Marital status
Age group Single Married Cohabiting Separated Divorced Widowed
Not
reported Total
Both sexes 0 < 5 5776 597 6373
5 < 10 6821 548 7369
10 < 15 6762 14 27 2 7 1 467 7280
15 < 20 6586 34 233 6 12 2 370 7243
20 < 25 5042 519 1314 22 19 1 404 7321
25 < 30 3539 1283 2003 39 41 10 292 7207
30 < 35 2712 1904 2397 57 75 4 208 7357
35 < 40 2129 2382 2223 107 133 24 144 7142
40 < 45 1568 2346 1803 123 151 41 153 6185
45 < 50 1012 1865 1124 123 128 51 54 4357
50 < 55 729 1378 647 97 121 74 32 3078
55 < 60 490 1164 441 70 76 100 11 2352
60 < 65 518 938 291 87 72 228 18 2152
65 < 70 496 835 218 80 50 299 25 2003
70 < 75 402 731 119 57 31 340 11 1691
75 < 80 288 446 59 42 25 309 20 1189
80 < 85 175 250 26 27 10 259 12 759
85 < 90 119 119 9 6 8 158 7 426
90 < 95 48 36 4 3 2 67 2 162
95 < 100 13 7 1 18 3 42
100 plus 4 1 4 9
Not reported 15 9 2 1 31 58
Total 45244 16261 12940 949 961 1991 3409 81755
Source: MISD

P3.2: Population By Religious Belief, Age Group And Sex, 2002 Census
Religion
Age group
Roman
Catholic Anglican
Seventh
Day
Adventist
Jehova
Witness
Other
Christian Bahai Hindu Muslim
Other non-
Christian
No
religion
Not
reported Total
Female 0 < 5 2622 183 39 22 97 18 50 42 17 30 39 3159
5 < 10 3046 200 39 21 119 14 39 39 17 21 16 3571
10 < 15 3107 232 35 23 76 17 22 24 13 16 15 3580
15 < 20 3004 216 42 33 106 25 16 39 18 15 16 3530
20 < 25 2850 250 56 30 127 15 35 54 54 19 39 3529
25 < 30 2860 253 43 20 129 17 65 48 59 19 22 3535
30 < 35 2927 228 35 28 119 19 60 40 88 18 15 3577
35 < 40 2964 227 43 39 117 20 60 30 109 25 14 3648
40 < 45 2423 214 32 30 93 19 48 22 28 9 15 2933
45 < 50 1708 146 28 12 69 12 28 17 11 13 6 2050
50 < 55 1224 97 24 6 30 6 16 7 14 5 4 1433
55 < 60 984 83 16 7 39 4 6 4 8 10 2 1163
60 < 65 1034 85 17 10 23 6 7 3 4 1 1190
65 < 70 1005 88 10 8 24 2 4 2 5 1 1149
70 < 75 864 69 11 4 18 4 3 5 1 979
75 < 80 637 52 10 1 10 3 3 1 5 722
80 < 85 449 32 3 6 1 2 493
85 < 90 273 31 2 2 2 2 2 1 315
90 < 95 118 12 1 2 133
95 < 100 36 3 39
100 plus 5 5
Not reported 14 3 1 18
Total 34154 2701 486 296 1206 198 467 377 448 207 211 40751
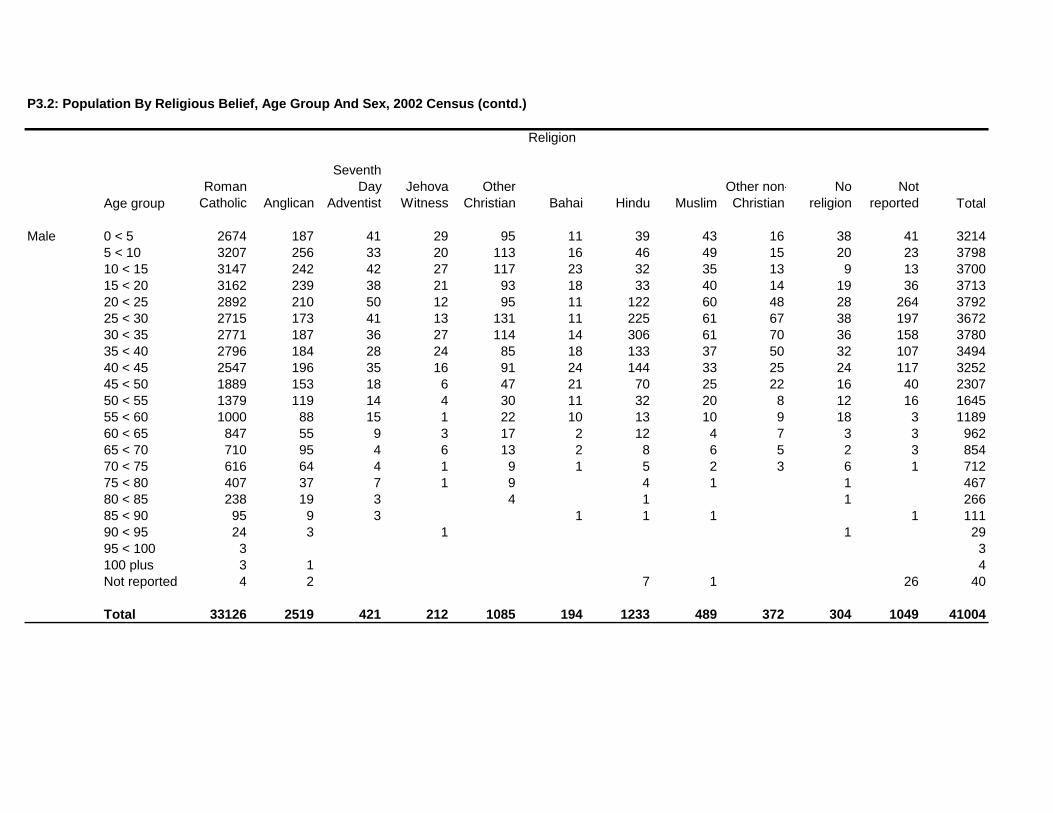
P3.2: Population By Religious Belief, Age Group And Sex, 2002 Census (contd.)
Religion
Age group
Roman
Catholic Anglican
Seventh
Day
Adventist
Jehova
Witness
Other
Christian Bahai Hindu Muslim
Other non-
Christian
No
religion
Not
reported Total
Male 0 < 5 2674 187 41 29 95 11 39 43 16 38 41 3214
5 < 10 3207 256 33 20 113 16 46 49 15 20 23 3798
10 < 15 3147 242 42 27 117 23 32 35 13 9 13 3700
15 < 20 3162 239 38 21 93 18 33 40 14 19 36 3713
20 < 25 2892 210 50 12 95 11 122 60 48 28 264 3792
25 < 30 2715 173 41 13 131 11 225 61 67 38 197 3672
30 < 35 2771 187 36 27 114 14 306 61 70 36 158 3780
35 < 40 2796 184 28 24 85 18 133 37 50 32 107 3494
40 < 45 2547 196 35 16 91 24 144 33 25 24 117 3252
45 < 50 1889 153 18 6 47 21 70 25 22 16 40 2307
50 < 55 1379 119 14 4 30 11 32 20 8 12 16 1645
55 < 60 1000 88 15 1 22 10 13 10 9 18 3 1189
60 < 65 847 55 9 3 17 2 12 4 7 3 3 962
65 < 70 710 95 4 6 13 2 8 6 5 2 3 854
70 < 75 616 64 4 1 9 1 5 2 3 6 1 712
75 < 80 407 37 7 1 9 4 1 1 467
80 < 85 238 19 3 4 1 1 266
85 < 90 95 9 3 1 1 1 1 111
90 < 95 24 3 1 1 29
95 < 100 3 3
100 plus 3 1 4
Not reported 4 2 7 1 26 40
Total 33126 2519 421 212 1085 194 1233 489 372 304 1049 41004

P3.2: Population By Religios Belief, Age Group And Sex, 2002 Census (contd.)
Religion
Age group
Roman
Catholic Anglican
Seventh
Day
Adventist
Jehova
Witness
Other
Christian Bahai Hindu Muslim
Other non-
Christian
No
religion
Not
reported Total
Both sexes 0 < 5 5296 370 80 51 192 29 89 85 33 68 80 6373
5 < 10 6253 456 72 41 232 30 85 88 32 41 39 7369
10 < 15 6254 474 77 50 193 40 54 59 26 25 28 7280
15 < 20 6166 455 80 54 199 43 49 79 32 34 52 7243
20 < 25 5742 460 106 42 222 26 157 114 102 47 303 7321
25 < 30 5575 426 84 33 260 28 290 109 126 57 219 7207
30 < 35 5698 415 71 55 233 33 366 101 158 54 173 7357
35 < 40 5760 411 71 63 202 38 193 67 159 57 121 7142
40 < 45 4970 410 67 46 184 43 192 55 53 33 132 6185
45 < 50 3597 299 46 18 116 33 98 42 33 29 46 4357
50 < 55 2603 216 38 10 60 17 48 27 22 17 20 3078
55 < 60 1984 171 31 8 61 14 19 14 17 28 5 2352
60 < 65 1881 140 26 13 40 8 19 7 11 4 3 2152
65 < 70 1715 183 14 14 37 4 12 8 5 7 4 2003
70 < 75 1480 133 15 5 27 5 8 2 8 7 1 1691
75 < 80 1044 89 17 2 19 7 4 1 1 5 1189
80 < 85 687 51 6 10 1 1 2 1 759
85 < 90 368 40 5 2 2 1 3 3 2 426
90 < 95 142 15 1 1 2 1 162
95 < 100 39 3 42
100 plus 8 1 9
Not reported 18 2 10 1 27 58
Total 67280 5220 907 508 2291 392 1700 866 820 511 1260 81755
Source: MISD
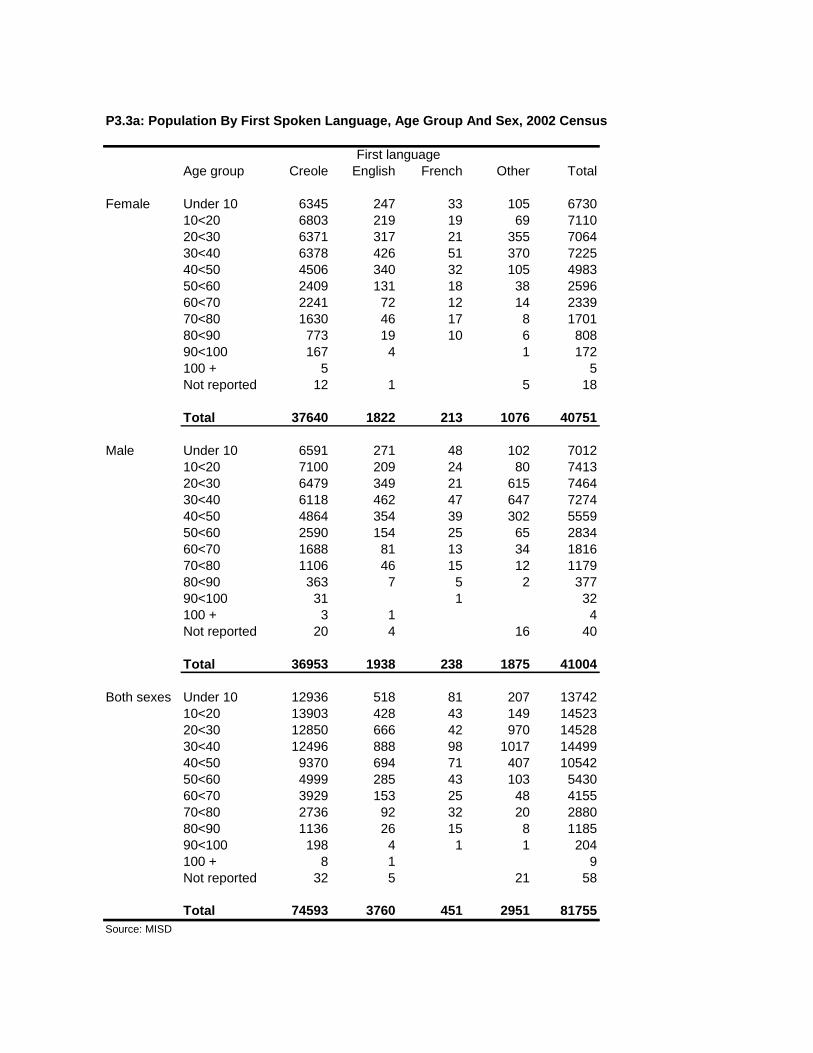
P3.3a: Population By First Spoken Language, Age Group And Sex, 2002 Census
First language
Age group Creole English French Other Total
Female Under 10 6345 247 33 105 6730
10<20 6803 219 19 69 7110
20<30 6371 317 21 355 7064
30<40 6378 426 51 370 7225
40<50 4506 340 32 105 4983
50<60 2409 131 18 38 2596
60<70 2241 72 12 14 2339
70<80 1630 46 17 8 1701
80<90 773 19 10 6 808
90<100 167 4 1 172
100 + 5 5
Not reported 12 1 5 18
Total 37640 1822 213 1076 40751
Male Under 10 6591 271 48 102 7012
10<20 7100 209 24 80 7413
20<30 6479 349 21 615 7464
30<40 6118 462 47 647 7274
40<50 4864 354 39 302 5559
50<60 2590 154 25 65 2834
60<70 1688 81 13 34 1816
70<80 1106 46 15 12 1179
80<90 363 7 5 2 377
90<100 31 1 32
100 + 3 1 4
Not reported 20 4 16 40
Total 36953 1938 238 1875 41004
Both sexes Under 10 12936 518 81 207 13742
10<20 13903 428 43 149 14523
20<30 12850 666 42 970 14528
30<40 12496 888 98 1017 14499
40<50 9370 694 71 407 10542
50<60 4999 285 43 103 5430
60<70 3929 153 25 48 4155
70<80 2736 92 32 20 2880
80<90 1136 26 15 8 1185
90<100 198 4 1 1 204
100 + 8 1 9
Not reported 32 5 21 58
Total 74593 3760 451 2951 81755
Source: MISD

P3.3b: Population By Second Spoken Language, Age Group And Sex, 2002 Census
Second language
Age group Creole English French Other Total
Female Under 10 144 1714 57 4815 6730
10<20 145 1734 70 5161 7110
20<30 193 1696 170 5005 7064
30<40 203 2024 140 4858 7225
40<50 155 1127 84 3617 4983
50<60 74 546 39 1937 2596
60<70 51 455 43 1790 2339
70<80 22 303 53 1323 1701
80<90 10 122 21 655 808
90<100 3 24 7 138 172
100 + 5 5
None 4 14 18
Total 1000 9749 684 29318 40751
Male Under 10 166 1659 66 5121 7012
10<20 144 1705 85 5479 7413
20<30 159 1690 57 5558 7464
30<40 196 1700 66 5312 7274
40<50 183 1278 65 4033 5559
50<60 82 582 56 2114 2834
60<70 48 309 36 1423 1816
70<80 33 219 26 901 1179
80<90 5 56 10 306 377
90<100 3 29 32
100 + 1 3 4
None 2 12 26 40
Total 1019 9213 467 30305 41004
Both sexes Under 10 310 3373 123 9936 13742
10<20 289 3439 155 10640 14523
20<30 352 3386 227 10563 14528
30<40 399 3724 206 10170 14499
40<50 338 2405 149 7650 10542
50<60 156 1128 95 4051 5430
60<70 99 764 79 3213 4155
70<80 55 522 79 2224 2880
80<90 15 178 31 961 1185
90<100 3 27 7 167 204
100 + 1 8 9
None 2 16 40 58
Total 2019 18962 1151 59623 81755
Source: MISD

P3.3c: Population By Third Spoken Language, Age Group And Sex, 2002 Census
Third language
Age group Creole English French Other Total
Female Under 10 44 38 605 6043 6730
10<20 24 36 686 6364 7110
20<30 140 32 683 6209 7064
30<40 91 66 701 6367 7225
40<50 46 35 450 4452 4983
50<60 19 20 230 2327 2596
60<70 14 25 210 2090 2339
70<80 19 20 139 1523 1701
80<90 7 5 55 741 808
90<100 1 4 14 153 172
100 + 5 5
None 1 17 18
Total 406 281 3773 36291 40751
Male Under 10 27 50 573 6362 7012
10<20 27 52 673 6661 7413
20<30 33 50 573 6808 7464
30<40 41 52 581 6600 7274
40<50 37 52 477 4993 5559
50<60 24 27 254 2529 2834
60<70 13 25 147 1631 1816
70<80 9 15 110 1045 1179
80<90 3 4 25 345 377
90<100 2 30 32
100 + 4 4
None 40 40
Total 214 327 3415 37048 41004
Both sexes Under 10 71 88 1178 12405 13742
10<20 51 88 1359 13025 14523
20<30 173 82 1256 13017 14528
30<40 132 118 1282 12967 14499
40<50 83 87 927 9445 10542
50<60 43 47 484 4856 5430
60<70 27 50 357 3721 4155
70<80 28 35 249 2568 2880
80<90 10 9 80 1086 1185
90<100 1 4 16 183 204
100 + 9 9
None 1 57 58
Total 620 608 7188 73339 81755
Source: MISD

P3.4: Population By Nationality, Age Group And Sex, 2002 Census
Broad Age group (years)
Female population
Nationality (Country) Under 15 15 - 64
65 or
more
Not
reported Total
Angola 2 2
Argentina 2 1 3
Austria 1 2 3
Australia 5 20 25
Azerbaijan 1 1
Bangladesh 1 9 10
Belgium 3 9 1 13
Canada 1 1
Congo 2 2 4
Switzerland 2 1 3
Cote D'ivoire 2 2
Cameroon 1 1
China 1 52 53
Cuba 1 14 15
Germany 2 19 3 24
Denmark 1 2 3
Algeria 1 1
Spain 2 2
France 18 51 2 71
Gabon 1 1
United Kingdom 10 55 17 82
Ghana 1 1
Guinea 1 5 6
Guinea-Bissau 1 1
Croatia 1 1 2
Haiti 3 3
Indonesia 167 1 168
Ireland 2 2
Israel 5 5
India 61 1177 3 8 1249
British Indian Ocean
Territory 2 2
Italy 1 13 4 18
Jamaica 1 1
Kenya 17 69 1 87
Saint Kitts And Nevis 8 14 22
Kuwait 1 1
Lebanon 1 1
Sri Lanka 18 225 2 1 246
Morocco 1 1
Madagascar 6 45 51
Mali 1 1
Mauritania 1 1
Mauritius 8 236 2 9 255Malawi 30 30

Broad Age group (years)
Female population
Nationality (Country) Under 15 15 - 64
65 or
more
Not
reported Total
Malaysia 2 2
Mozambique 2 2
Nigeria 2 18 20
Netherlands 1 1
Norway 1 1
Not Reported 22 3 25
New Zealand 3 3
Oman 1 1
Philippines 5 95 100
Pakistan 1 2 3
Poland 1 1
Portugal 1 1
Romania 1 1
Russian Federation 4 4
Rwanda 3 3
Sweden 2 4 1 7
Singapore 1 1
Slovakia (Slovak
Republic) 1 3 4
Sierra Leone 1 1
Swaziland 2 2 4
Thailand 2 83 85
Taiwan, Province Of
China 13 13
Tanzania, United
Republic Of 10 12 22
Uganda 1 1
United States 8 1 9
Venezuela 1 1
Seychellois 10482 25038 2405 7 37932
Born In Seychelles
(Registration Status
unknown) 28 1 1 30
Mayotte 1 1
Yugoslavia 3 3
South Africa 9 214 1 10 234
Zambia 1 8 9
Zimbabwe 1 4 5
Total 10712 27806 2446 40 41004
Source: MISD

P3.4: Population By Nationality, Age Group And Sex, 2002 Census (contd.)
Broad Age group
Male population
Nationality (Country) Under 15 15 - 64
65 or
more
Not
reported Total
Argentina 1 2 3
American Samoa 2 2
Austria 2 4 6
Australia 4 10 14
Azerbaijan 2 2
Bangladesh 1 3 4
Belgium 2 1 3
Canada 2 2
Central African Republic 1 1
Congo 1 1
Switzerland 7 1 8
Cote D'ivoire 3 3
China 2 8 10
Cuba 10 10
Czech Republic 2 2
Germany 19 1 20
Denmark 4 18 22
Spain 3 3 6
France 12 34 1 47
Gabon 3 3
United Kingdom 13 36 1 1 51
Guinea 1 6 7
Croatia 2 2
Hungary 1 1
Indonesia 5 5
Ireland 2 4 4 10
India 47 240 7 4 298
British Indian Ocean
Territory 1 1 2
Italy 1 9 10
Kenya 20 145 1 166
Cambodia 1 1
Comoros 1 1
Saint Kitts And Nevis 1 2 3
Sri Lanka 24 86 1 111
Lesotho 1 1
Morocco 1 1
Madagascar 6 344 350
Mongolia 1 1
Macau 1 1
Mauritius 9 123 2 134
Maldives 1 1Malaysia 3 3

Broad Age group
Male population
Nationality (Country) Under 15 15 - 64
65 or
more
Not
reported Total
Nigeria 5 6 11
Netherlands 1 1
Not Reported 5 5
New Zealand 2 2
Oman 1 1
Philippines 1 203 204
Pakistan 1 5 6
Reunion 1 1 2
Russian Federation 4 1 5
Sweden 4 4
Slovakia (Slovak
Republic) 1 3 4
Sierra Leone 2 2
Swaziland 1 1 2
Thailand 1 272 273
Trinidad And Tobago 1 1
Tanzania, United
Republic Of 12 9 21
Ukraine 1 1 2
Uganda 4 4
United States 3 9 12
Uzbekistan 1 1
Wallis And Futuna
Islands 11 1 12
Seychellois 10087 24851 3810 11 38759
Born In Seychelles
(Registration Status
unknown) 28 1 1 30
Yugoslavia 4 4
South Africa 7 38 1 46
Zambia 1 3 4
Zimbabwe 1 3 4
Total 10310 26588 3835 18 40751
Source: MISD

P3.4: Population By Nationality, Age Group And Sex, 2002 Census
Broad Age group (years)
Both sexes
Nationality (Country) Under 15 15 - 64
65 or
more
Not
reported Total
Angola 2 2
Argentina 3 3 6
American Samoa 2 2
Austria 3 6 9
Australia 9 30 39
Azerbaijan 3 3
Bangladesh 2 12 14
Belgium 3 11 2 16
Canada 3 3
Central African Republic 1 1
Congo 2 3 5
Switzerland 9 2 11
Cote D'ivoire 5 5
Cameroon 1 1
China 3 60 63
Cuba 1 24 25
Czech Republic 2 2
Germany 2 38 4 44
Denmark 5 20 25
Algeria 1 1
Spain 3 5 8
France 30 85 3 118
Gabon 3 1 4
United Kingdom 23 91 18 1 133
Ghana 1 1
Guinea 2 11 13
Guinea-Bissau 1 1
Croatia 1 3 4
Haiti 3 3
Hungary 1 1
Indonesia 172 1 173
Ireland 2 6 4 12
Israel 5 5
India 108 1417 10 12 1547
British Indian Ocean
Territory 1 3 4
Italy 2 22 4 28
Jamaica 1 1
Kenya 37 214 2 253
Cambodia 1 1
Comoros 1 1
Saint Kitts And Nevis 9 16 25
Kuwait 1 1Lebanon 1 1
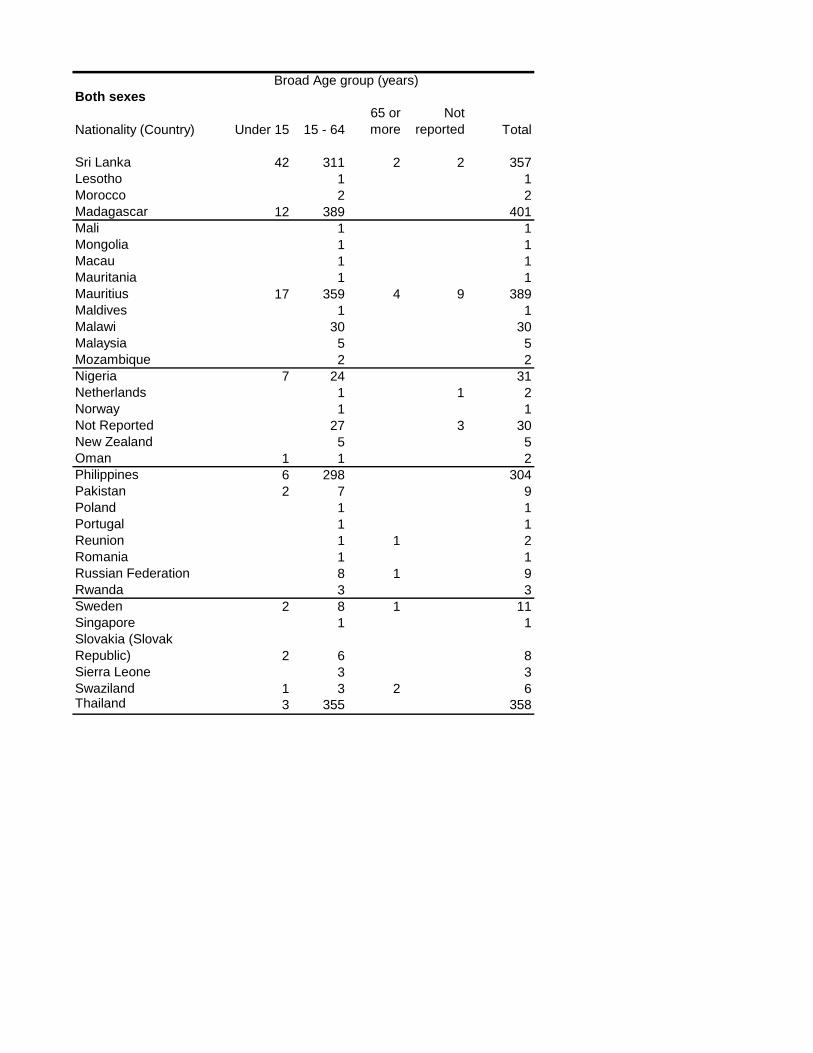
Broad Age group (years)
Both sexes
Nationality (Country) Under 15 15 - 64
65 or
more
Not
reported Total
Sri Lanka 42 311 2 2 357
Lesotho 1 1
Morocco 2 2
Madagascar 12 389 401
Mali 1 1
Mongolia 1 1
Macau 1 1
Mauritania 1 1
Mauritius 17 359 4 9 389
Maldives 1 1
Malawi 30 30
Malaysia 5 5
Mozambique 2 2
Nigeria 7 24 31
Netherlands 1 1 2
Norway 1 1
Not Reported 27 3 30
New Zealand 5 5
Oman 1 1 2
Philippines 6 298 304
Pakistan 2 7 9
Poland 1 1
Portugal 1 1
Reunion 1 1 2
Romania 1 1
Russian Federation 8 1 9
Rwanda 3 3
Sweden 2 8 1 11
Singapore 1 1
Slovakia (Slovak
Republic) 2 6 8
Sierra Leone 3 3
Swaziland 1 3 2 6Thailand 3 355 358

Broad Age group (years)
Both sexes
Nationality (Country) Under 15 15 - 64
65 or
more
Not
reported Total
Trinidad And Tobago 1 1
Taiwan, Province Of
China 13 13
Tanzania, United
Republic Of 22 21 43
Ukraine 1 1 2
Uganda 5 5
United States 3 17 1 21
Uzbekistan 1 1
Venezuela 1 1
Wallis And Futuna
Islands 11 1 12
Seychellois 20569 49889 6215 18 76691
Born In Seychelles
(Registration Status
unknown) 56 2 1 1 60
Mayotte 1 1
Yugoslavia 7 7
South Africa 16 252 2 10 280
Zambia 2 11 13
Zimbabwe 2 7 9
Total 21022 54394 6281 58 81755
Source: MISD

Table P4.1: Female Population Aged 15 Years Or More By Age Group and Number of Children Born Alive, 2002 Census
Number of children born alive
Age
group 0 1 2 3 4 5 6 7 8 9 10 11 12 13 14 15 -18
Not
reported Total
15 < 20 3283 225 17 5 3530
20 < 25 2265 970 240 46 6 2 3529
25 < 30 1369 1168 708 218 55 12 4 1 3535
30 < 35 877 918 1012 495 197 60 14 3 1 3577
35 < 40 637 607 1026 821 363 135 36 18 2 2 1 3648
40 < 45 425 313 638 724 475 217 92 28 15 6 2933
45 < 50 287 190 369 399 375 219 124 47 28 5 5 1 1 2050
50 < 55 237 119 243 233 200 152 98 90 31 17 5 5 3 1433
55 < 60 188 87 138 137 122 137 110 102 65 29 28 7 4 5 3 1 1163
60 < 65 261 71 91 94 94 118 123 82 90 71 45 29 8 7 3 3 1190
65 < 70 306 65 68 72 81 85 96 84 82 63 58 37 33 11 6 2 1149
70 < 75 322 77 65 50 40 61 76 64 57 49 47 31 16 12 5 7 979
75 < 80 265 50 54 38 37 39 42 42 43 34 28 15 16 4 8 7 722
80 < 85 210 56 35 24 29 27 28 19 15 11 14 6 9 5 4 1 493
85 < 90 161 35 28 19 12 13 11 6 6 9 4 3 7 1 315
90 < 95 74 13 11 5 4 3 6 3 5 4 3 2 133
95 < 100 20 3 3 3 2 1 1 3 1 1 1 39
100 plus 2 1 1 1 5
Total 11189 4968 4746 3383 2088 1283 859 594 438 302 240 134 101 45 29 23 1 30423
Source: MISD

Table P5.1: Population Aged 12 Years Or More Not attending School By Age Group, Educational Attainment And Sex, 2002 Census
Age group
Educational attainment 12 < 15 15 < 20 20 < 25 25 < 30 30 < 35 35 < 40 40 < 45 45 < 50 50 < 55 55 < 60 60 < 65 65 + Total
Female No Schooling 9 10 10 16 28 32 47 64 83 106 146 757 1308
Primary 8 10 46 75 122 308 462 504 560 583 733 2376 5787
Other eg. Adult learning etc. 3 13 11 18 16 22 13 15 6 9 21 147
Secondary 1-2 years 37 34 141 146 161 627 877 594 256 112 91 285 3361
Secondary 3 years 16 69 109 206 434 655 470 208 133 143 62 88 2593
Secondary 4 years 271 416 199 74 144 197 156 66 26 15 26 1590
National Youth service/
Secondary 5 years 1 477 1019 1328 1248 576 246 81 46 32 26 47 5127
Vocational 1 146 233 71 58 98 63 38 27 12 10 9 766
Polytechnic 1-2 years, TTC 245 728 790 754 555 192 102 61 30 12 24 3493
Polytechnic 3-4 years, form 6 2 16 361 367 333 248 65 43 23 21 6 17 1502
Pre-University 1 5 67 94 112 113 76 77 53 23 20 24 665
University (Bachelor) 32 93 104 93 67 55 37 23 11 13 528
University (MSc,MBA,PhD) 4 29 49 67 36 32 15 12 5 2 251
Not reported 12 30 64 54 39 73 89 70 47 28 34 110 650
Total 87 1316 3243 3479 3534 3605 2909 2037 1422 1157 1180 3799 27768

Table P5.1: Population Aged 12 Years Or More Not attending School By Age Group, Educational Attainment And Sex, 2002 Census (contd.)
Age group
Educational attainment 12 < 15 15 < 20 20 < 25 25 < 30 30 < 35 35 < 40 40 < 45 45 < 50 50 < 55 55 < 60 60 < 65 65 + Total
Male No Schooling 8 13 17 35 18 48 72 117 127 130 157 559 1301
Primary 7 25 70 70 124 385 712 615 651 602 554 1325 5140
Other eg. Adult learning etc. 1 4 14 13 10 23 19 19 5 12 4 18 142
Secondary 1-2 years 45 83 100 97 105 476 830 672 301 102 55 141 3007
Secondary 3 years 17 148 159 201 345 417 422 216 172 123 44 64 2328
Secondary 4 years 462 464 239 105 120 103 59 36 17 13 54 1672
National Youth service/
Secondary 5 years 367 1014 1143 1245 565 194 81 47 28 17 33 4734
Vocational 1 155 276 135 96 193 180 53 19 9 5 12 1134
Polytechnic 1-2 years, TTC 328 879 820 774 437 104 44 21 7 7 15 3436
Polytechnic 3-4 years, form 6 1 15 302 407 399 202 57 46 16 17 5 17 1484
Pre-University 1 6 58 107 138 112 86 72 47 35 17 46 725
University (Bachelor) 28 129 151 184 154 93 61 33 29 31 893
University (MSc,MBA,PhD) 1 6 46 63 107 91 63 47 22 13 20 479
Not reported 9 41 191 181 155 178 200 139 77 40 31 87 1329
Total 90 1648 3578 3623 3728 3447 3224 2289 1627 1177 951 2422 27804

Table P5.1: Population Aged 12 Years Or More Not attending School By Age Group, Educational Attainment And Sex, 2002 Census (contd.)
Age group
Educational attainment 12 < 15 15 < 20 20 < 25 25 < 30 30 < 35 35 < 40 40 < 45 45 < 50 50 < 55 55 < 60 60 < 65 65 + Total
Both
sexes No Schooling 17 23 27 51 46 80 119 181 210 236 303 1316 2609
Primary 15 35 116 145 246 693 1174 1119 1211 1185 1287 3701 10927
University (Bachelor) 1 7 27 24 28 39 41 32 20 18 13 39 289
University (MSc,MBA,PhD) 82 117 241 243 266 1103 1707 1266 557 214 146 426 6368
Other eg. Adult learning etc. 33 217 268 407 779 1072 892 424 305 266 106 152 4921
Secondary 1-2 years 0 733 880 438 179 264 300 215 102 43 28 80 3262
Secondary 3 years 1 844 2033 2471 2493 1141 440 162 93 60 43 80 9861
Secondary 4 years 2 301 509 206 154 291 243 91 46 21 15 21 1900
National Youth Service/
Secondary 5 years 573 1607 1610 1528 992 296 146 82 37 19 39 6929
Vocational 3 31 663 774 732 450 122 89 39 38 11 34 2986
Polytechnic 1-2 years, TTC 2 11 125 201 250 225 162 149 100 58 37 70 1390
Polytechnic 3-4 years, Form 6 60 222 255 277 221 148 98 56 40 44 1421
Pre-University 1 10 75 112 174 127 95 62 34 18 22 730
Not reported 21 71 255 235 194 251 289 209 124 68 65 197 1979
Total 177 2964 6821 7102 7262 7052 6133 4326 3049 2334 2131 6221 55572
Source: MISD

Table P5.2: Student Population Aged 12 to 29 Years By Age Group, Educational Attainment
And Sex, 2002 Census
Age group
Educational attainment 10 < 15 15 < 20 20 < 25 25 < 30 Total
Female No Schooling 2 2 4
Primary 137 23 3 2 165
University (Bachelor) 24 6 30
University (MSc,MBA,PhD) 2 1 3
other eg. Adult learning etc. 5 13 2 1 21
Secondary 1-2 years 1137 33 1 1171
Secondary 3 years 480 143 5 1 629
Secondary 4 years 28 622 2 652
National Youth Service/
Secondary 5 years 531 5 536
Vocational 3 105 11 119
Polytechnic 1-2 years, TTC 405 37 5 447
Polytechnic 3-4 years, Form 6 105 115 4 224
Pre-University 23 33 3 59
Not reported 114 115 9 2 240
Total 1906 2120 249 25 4300
Male No Schooling 3 3 2 8
Primary 163 17 2 182
University (Bachelor) 1 13 5 19
University (MSc,MBA,PhD) 1 1 1 3
other eg. Adult learning etc. 6 10 1 17
Secondary 1-2 years 1180 38 3 1221
Secondary 3 years 453 167 1 621
Secondary 4 years 24 557 5 586
National Youth Service/
Secondary 5 years 513 4 1 518
Vocational 1 129 9 1 140
Polytechnic 1-2 years, TTC 321 21 2 344
Polytechnic 3-4 years, Form 6 70 67 5 142
Pre-University 14 24 1 39
Not reported 143 117 5 265
Total 1973 1958 157 17 4105

Table P5.2: Student Population Aged 12 to 29 Years By Age Group, Educational Attainment
And Sex, 2002 Census (contd.)
Age group
Educational attainment 10 < 15 15 < 20 20 < 25 25 < 30 Total
Both sexes No Schooling 5 5 2 12
Primary 300 40 5 2 331
Other eg. Adult learning etc. 1 37 11 38
Secondary 1-2 years 1 3 2 2367
Secondary 3 years 11 23 3 1 1238
Secondary 4 years 2317 71 4 1243
National Youth Service/
Secondary 5 years 933 310 5 2 1068
Vocational 52 1179 7 259
Polytechnic 1-2 years, TTC 1044 9 1 799
Polytechnic 3-4 years, Form 6 4 234 20 1 387
Pre-University 726 58 7 103
University (Bachelor) 175 182 9 49
University (MSc,MBA,PhD) 37 57 4 6
Not reported 257 232 14 2 505
Total 3879 4078 406 42 8405
Source: MISD

Table P5.3: Student Population Aged 12 to 29 years, By Educational Attainment, Sex and Age, 2002 Census
Female Age
Educational attainment 12 13 14 15 16 17 18 19 20 21 22 23 24 25 26 27 28 29 Total
No Schooling 1 1 1 1 4
Primary 106 27 4 5 3 10 5 1 1 1 1 1 165
University (Bachelor) 5 5 6 7 1 1 2 2 1 30
University (MSc,MBA,PhD) 1 1 1 3
Other eg. Adult learning etc. 3 1 1 3 3 3 3 1 1 1 1 21
Secondary 1-2 years 446 535 156 15 11 1 3 3 1 1171
Secondary 3 years 9 34 437 120 18 3 1 1 2 1 1 1 1 629
Secondary 4 years 4 24 448 145 23 4 2 2 652
National Youth service/
Secondary 5 years 21 367 123 12 8 1 4 536
Vocational 1 1 1 6 59 28 12 6 2 2 1 119
Polytechnic 1-2 years, TTC 11 199 140 55 21 12 2 1 1 3 2 447
Polytechnic 3-4 years, form 6 5 19 32 49 69 26 11 5 4 3 1 224
Pre-University 6 8 9 10 12 6 2 3 1 2 59
Not reported 41 36 37 35 38 19 11 12 4 1 1 2 1 1 1 240
Total 611 635 660 647 608 466 247 152 120 67 30 21 11 6 11 3 2 3 4300
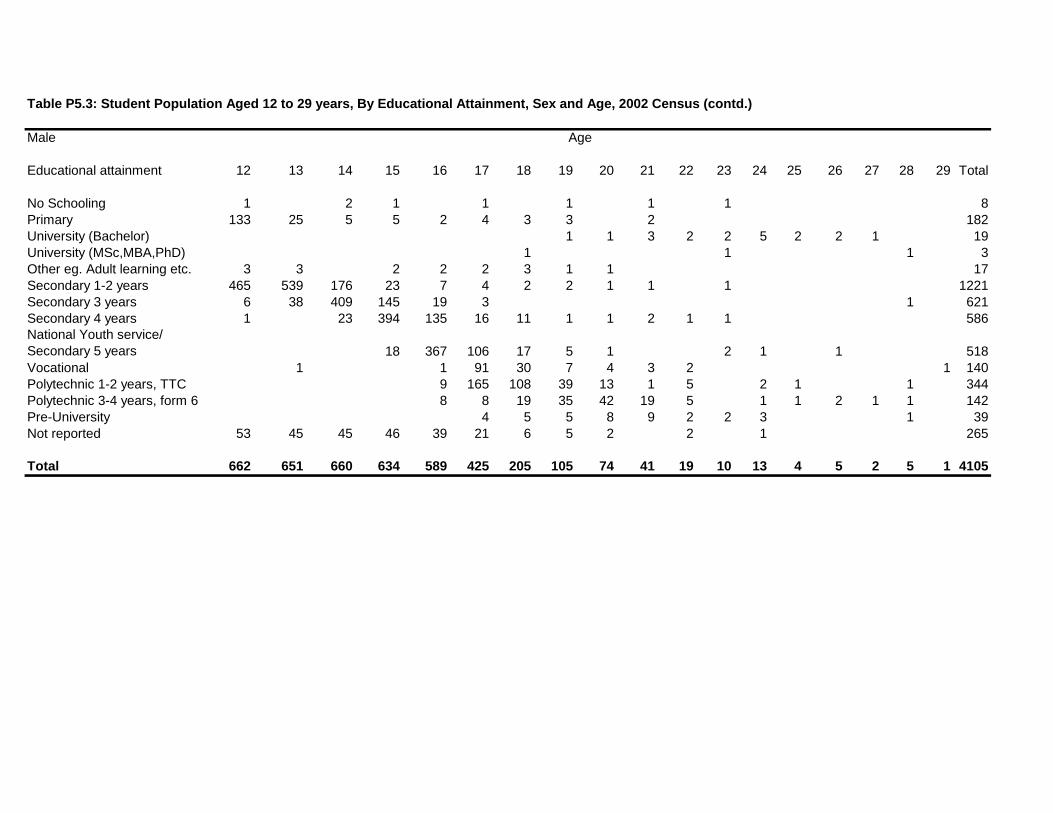
Table P5.3: Student Population Aged 12 to 29 years, By Educational Attainment, Sex and Age, 2002 Census (contd.)
Male Age
Educational attainment 12 13 14 15 16 17 18 19 20 21 22 23 24 25 26 27 28 29 Total
No Schooling 1 2 1 1 1 1 1 8
Primary 133 25 5 5 2 4 3 3 2 182
University (Bachelor) 1 1 3 2 2 5 2 2 1 19
University (MSc,MBA,PhD) 1 1 1 3
Other eg. Adult learning etc. 3 3 2 2 2 3 1 1 17
Secondary 1-2 years 465 539 176 23 7 4 2 2 1 1 1 1221
Secondary 3 years 6 38 409 145 19 3 1 621
Secondary 4 years 1 23 394 135 16 11 1 1 2 1 1 586
National Youth service/
Secondary 5 years 18 367 106 17 5 1 2 1 1 518
Vocational 1 1 91 30 7 4 3 2 1 140
Polytechnic 1-2 years, TTC 9 165 108 39 13 1 5 2 1 1 344
Polytechnic 3-4 years, form 6 8 8 19 35 42 19 5 1 1 2 1 1 142
Pre-University 4 5 5 8 9 2 2 3 1 39
Not reported 53 45 45 46 39 21 6 5 2 2 1 265
Total 662 651 660 634 589 425 205 105 74 41 19 10 13 4 5 2 5 1 4105

Table P5.3: Student Population Aged 12 to 29 years, By Educational Attainment, Sex and Age, 2002 Census (contd.)
Both sexes Age
Educational attainment 12 13 14 15 16 17 18 19 20 21 22 23 24 25 26 27 28 29 Total
No Schooling 2 1 2 1 1 2 1 1 1 12
Primary 239 52 9 10 5 14 8 3 1 3 1 1 1 347
University (Bachelor) 1 6 8 8 9 6 3 4 3 1 49
University (MSc,MBA,PhD) 1 1 2 2 6
Other eg. Adult learning etc. 6 4 1 5 5 5 6 2 1 1 1 1 38
Secondary 1-2 years 911 1074 332 38 18 5 5 5 2 1 1 2392
Secondary 3 years 15 72 846 265 37 6 1 1 2 1 1 1 1 1 1250
Secondary 4 years 5 47 842 280 39 15 3 1 4 1 1 1238
National Youth service/
Secondary 5 years 39 734 229 29 13 2 4 2 1 1 1054
Vocational 1 2 1 7 150 58 19 10 5 4 1 1 259
Polytechnic 1-2 years, TTC 20 364 248 94 34 13 7 1 3 4 1 2 791
Polytechnic 3-4 years, form 6 13 27 51 84 111 45 16 5 5 1 5 2 1 366
Pre-University 10 13 14 18 21 8 4 6 1 2 1 98
Not reported 94 81 82 81 77 40 17 17 6 1 3 2 2 1 1 505
Total 1273 1286 1320 1281 1197 891 452 257 194 108 49 31 24 10 16 5 7 4 8405
Source: MISD

Table P5.4: Population Aged 12 years or more By Literacy Status,
Sex and Age Group, 2002 Census
Literacy status
Age group Not reported No Yes Total
Female 10 < 15 62 23 2040 2125
15 < 20 16 22 3492 3530
20 < 25 10 22 3497 3529
25 < 30 13 38 3484 3535
30 < 35 10 43 3524 3577
35 < 40 8 84 3556 3648
40 < 45 10 113 2810 2933
45 < 50 8 154 1888 2050
50 < 55 7 182 1244 1433
55 < 60 5 205 953 1163
60 < 65 6 263 921 1190
65 + 24 1215 2596 3835
Total 179 2364 30005 32548
Male 10 < 15 56 27 2115 2198
15 < 20 44 42 3627 3713
20 < 25 59 49 3684 3792
25 < 30 69 47 3556 3672
30 < 35 65 55 3660 3780
35 < 40 63 146 3285 3494
40 < 45 51 244 2957 3252
45 < 50 22 252 2033 2307
50 < 55 21 277 1347 1645
55 < 60 7 277 905 1189
60 < 65 9 298 655 962
65 + 19 875 1552 2446
Total 485 2589 29376 32450
Both sexes 10 < 15 118 50 4155 4323
15 < 20 60 64 7119 7243
20 < 25 69 71 7181 7321
25 < 30 82 85 7040 7207
30 < 35 75 98 7184 7357
35 < 40 71 230 6841 7142
40 < 45 61 357 5767 6185
45 < 50 30 406 3921 4357
50 < 55 28 459 2591 3078
55 < 60 12 482 1858 2352
60 < 65 15 561 1576 2152
65 + 43 2090 4148 6281
Total 664 4953 59381 64998
Source: MISD
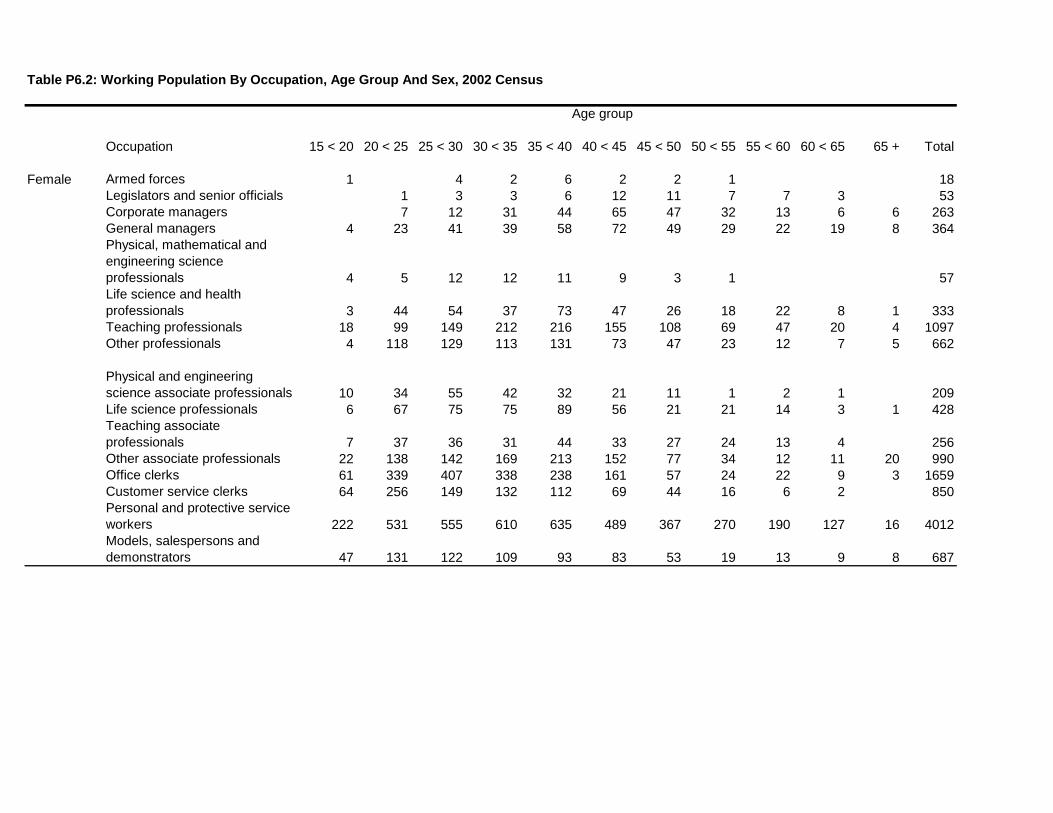
Table P6.2: Working Population By Occupation, Age Group And Sex, 2002 Census
Age group
Occupation 15 < 20 20 < 25 25 < 30 30 < 35 35 < 40 40 < 45 45 < 50 50 < 55 55 < 60 60 < 65 65 + Total
Female Armed forces 1 4 2 6 2 2 1 18
Legislators and senior officials 1 3 3 6 12 11 7 7 3 53
Corporate managers 7 12 31 44 65 47 32 13 6 6 263
General managers 4 23 41 39 58 72 49 29 22 19 8 364
Physical, mathematical and
engineering science
professionals 4 5 12 12 11 9 3 1 57
Life science and health
professionals 3 44 54 37 73 47 26 18 22 8 1 333
Teaching professionals 18 99 149 212 216 155 108 69 47 20 4 1097
Other professionals 4 118 129 113 131 73 47 23 12 7 5 662
Physical and engineering
science associate professionals 10 34 55 42 32 21 11 1 2 1 209
Life science professionals 6 67 75 75 89 56 21 21 14 3 1 428
Teaching associate
professionals 7 37 36 31 44 33 27 24 13 4 256
Other associate professionals 22 138 142 169 213 152 77 34 12 11 20 990
Office clerks 61 339 407 338 238 161 57 24 22 9 3 1659
Customer service clerks 64 256 149 132 112 69 44 16 6 2 850
Personal and protective service
workers 222 531 555 610 635 489 367 270 190 127 16 4012
Models, salespersons and
demonstrators 47 131 122 109 93 83 53 19 13 9 8 687

Table P6.2: Working Population By Occupation, Age Group And Sex, 2002 Census (contd.)
Age group
Occupation 15 < 20 20 < 25 25 < 30 30 < 35 35 < 40 40 < 45 45 < 50 50 < 55 55 < 60 60 < 65 65 + Total
Female
Market-oriented skilled
agricultural and fishery workers 17 69 83 52 68 54 29 31 25 11 2 441
Subsistence agricultural and
fishery workers 1 1 4 1 1 1 1 10
Extraction and building trades
workers 2 9 4 2 5 1 2 2 1 28
Metal, machinery and related
trades workers 3 4 2 1 1 1 1 13
Precision, handicraft, printing
and related trades workers 8 12 18 9 12 10 5 3 4 6 1 88
Other craft and related workers 59 66 55 79 101 84 52 38 19 16 1 570
Stationary-plant and related
operators 1 4 6 9 3 1 1 25
Machine operators and
assemblers 2 16 27 21 20 21 11 7 3 3 131
Drivers and mobile-plant
operators 4 5 5 10 11 5 40
Sales and service elementary
occupations 90 236 315 426 477 448 372 272 206 154 12 3008
Agricultural, fishery and related
labourers 14 47 68 78 90 60 55 20 25 6 1 464
Labourers in mining,
construction, manufacturing &
transport 24 187 246 233 210 114 54 35 13 4 1120
Not reported 78 98 104 145 146 149 111 75 53 33 26 1018
Total 769 2582 2884 3017 3145 2453 1648 1075 743 463 115 18894

Table P6.2: Working Population By Occupation, Age Group And Sex, 2002 Census (contd.)
Age group
Occupation 15 < 20 20 < 25 25 < 30 30 < 35 35 < 40 40 < 45 45 < 50 50 < 55 55 < 60 60 < 65 65 + Total
Male Armed forces 16 42 40 31 35 37 19 10 5 2 237
Legislators and senior officials 2 6 7 14 22 15 11 7 6 4 94
Corporate managers 1 17 48 60 99 119 81 44 47 12 26 554
General managers 8 28 55 85 95 119 92 67 39 31 16 635
Physical, mathematical and
engineering science
professionals 8 51 66 58 63 53 33 14 9 3 6 364
Life science and health
professionals 15 28 26 37 13 19 9 6 2 1 156
Teaching professionals 7 39 55 99 77 55 26 20 14 5 1 398
Other professionals 4 50 71 80 92 59 61 33 17 13 12 492
Physical and engineering
science associate professionals 28 174 169 172 157 91 67 26 19 10 1 914
Life science professionals 5 39 39 30 32 18 7 3 6 3 2 184
Teaching associate
professionals 2 15 10 12 16 11 4 4 1 2 77
Other associate professionals 5 78 116 117 133 120 75 54 34 9 7 748
Office clerks 20 67 88 72 68 53 43 27 20 7 3 468
Customer service clerks 13 34 30 27 14 16 4 1 2 141
Personal and protective service
workers 128 361 345 358 287 293 197 125 114 46 23 2277

Table P6.2: Working Population By Occupation, Age Group And Sex, 2002 Census (contd.)
Age group
Occupation 15 < 20 20 < 25 25 < 30 30 < 35 35 < 40 40 < 45 45 < 50 50 < 55 55 < 60 60 < 65 65 + Total
Male
Models, salespersons and
demonstrators 26 64 52 43 37 23 16 13 10 7 5 296
Market-oriented skilled
agricultural and fishery workers 121 222 253 253 234 217 165 124 91 55 20 1755
Subsistence agricultural and
fishery workers 4 1 4 2 11
Extraction and building trades
workers 155 497 471 486 410 444 271 210 95 64 20 3123
Metal, machinery and related
trades workers 96 205 177 175 150 147 96 45 22 23 6 1142
Precision, handicraft, printing
and related trades workers 7 11 15 23 13 16 7 2 5 1 3 103
Other craft and related workers 29 55 44 40 46 52 34 25 12 13 3 353
Stationary-plant and related
operators 12 28 31 25 23 16 19 7 5 166
Machine operators and
assemblers 24 75 41 57 37 45 26 15 4 7 3 334
Drivers and mobile-plant
operators 23 143 269 388 308 288 221 175 86 26 12 1939
Sales and service elementary
occupations 161 281 255 229 227 192 164 137 123 67 19 1855
Agricultural, fishery and related
labourers 28 56 52 61 62 48 44 42 22 8 2 425
Labourers in mining,
construction, manufacturing &
transport 93 228 237 218 196 153 97 55 50 32 2 1361
Not reported 120 154 170 185 163 155 111 75 49 30 27 1239
Total 1140 3035 3234 3421 3127 2875 2014 1373 912 482 228 21841

Table P6.2: Working Population By Occupation, Age Group And Sex, 2002 Census (contd.)
Age group
Occupation 15 < 20 20 < 25 25 < 30 30 < 35 35 < 40 40 < 45 45 < 50 50 < 55 55 < 60 60 < 65 65 + Total
Both sexes Armed forces 17 42 44 33 41 39 21 11 5 2 255
Legislators and senior officials 3 9 10 20 34 26 18 14 9 4 147
Corporate managers 1 24 60 91 143 184 128 76 60 18 32 817
General managers 12 51 96 124 153 191 141 96 61 50 24 999
Physical, mathematical and
engineering science
professionals 12 56 78 70 74 62 36 15 9 3 6 421
Life science and health
professionals 3 59 82 63 110 60 45 27 28 10 2 489
Teaching professionals 25 138 204 311 293 210 134 89 61 25 5 1495
Other professionals 8 168 200 193 223 132 108 56 29 20 17 1154
Physical and engineering
science associate professionals 38 208 224 214 189 112 78 27 21 11 1 1123
Life science professionals 11 106 114 105 121 74 28 24 20 6 3 612
Teaching associate
professionals 9 52 46 43 60 44 31 28 14 4 2 333
Other associate professionals 27 216 258 286 346 272 152 88 46 20 27 1738
Office clerks 81 406 495 410 306 214 100 51 42 16 6 2127
Customer service clerks 77 290 179 159 126 85 48 17 6 2 2 991
Personal and protective service
workers 350 892 900 968 922 782 564 395 304 173 39 6289

Table P6.2: Working Population By Occupation, Age Group And Sex, 2002 Census (contd.)
Age group
Occupation 15 < 20 20 < 25 25 < 30 30 < 35 35 < 40 40 < 45 45 < 50 50 < 55 55 < 60 60 < 65 65 + Total
Both sexes
Models, salespersons and
demonstrators 73 195 174 152 130 106 69 32 23 16 13 983
Market-oriented skilled
agricultural and fishery workers 138 291 336 305 302 271 194 155 116 66 22 2196
Subsistence agricultural and
fishery workers 1 5 5 5 3 1 1 21
Extraction and building trades
workers 157 506 475 488 415 445 273 212 95 65 20 3151
Metal, machinery and related
trades workers 96 208 181 177 151 148 97 46 22 23 6 1155
Precision, handicraft, printing
and related trades workers 15 23 33 32 25 26 12 5 9 7 4 191
Other craft and related workers 88 121 99 119 147 136 86 63 31 29 4 923
Stationary-plant and related
operators 13 32 37 34 26 16 20 8 5 191
Machine operators and
assemblers 26 91 68 78 57 66 37 22 7 10 3 465
Drivers and mobile-plant
operators 23 147 274 393 318 299 226 175 86 26 12 1979
Sales and service elementary
occupations 251 517 570 655 704 640 536 409 329 221 31 4863
Agricultural, fishery and related
labourers 42 103 120 139 152 108 99 62 47 14 3 889
Labourers in mining,
construction, manufacturing &
transport 117 415 483 451 406 267 151 90 63 36 2 2481
Not reported 198 252 274 330 309 304 222 150 102 63 53 2257
Total 1909 5617 6118 6438 6272 5328 3662 2448 1655 945 343 40735
Source: MISD

Table P6.3: Working Population By Industry, Age Group And Sex, 2002 Census
Age group
15 < 20 20 < 25 25 < 30 30 < 35 35 < 40 40 < 45 45 < 50 50 < 55 55 < 60 60 < 65 65 + Total
Industry
Female Agriculture, Forestry and Fishing 25 57 93 92 113 89 69 42 38 24 4 646
Quarrying 2 1 3 2 1 2 1 12
Manufacturing 82 340 447 442 418 288 166 79 41 24 2 2329
Electricity, Gas and Water 6 23 22 20 21 16 14 7 4 133
Construction 4 14 20 18 21 16 11 5 4 4 117
Wholesale and Retail Trade 278 666 571 600 569 460 301 175 101 64 20 3805
Transport, Storage and
Communication 29 201 184 177 183 141 94 52 13 15 1 1090
Finance, Insurance, Real estate
and Business services 24 137 118 125 141 95 57 31 13 8 2 751
Community, Social and
Personal Services 244 1066 1338 1437 1578 1252 862 624 478 289 59 9227
Not reported 77 76 90 103 99 95 72 59 51 35 27 784
Total 769 2582 2884 3017 3145 2453 1648 1075 743 463 115 18894
Male Agriculture, Forestry and Fishing 93 239 313 440 321 276 229 156 120 65 18 2270
Quarrying 3 1 6 6 4 10 4 3 1 2 40
Manufacturing 111 256 320 318 303 247 170 114 64 39 11 1953
Electricity, Gas and Water 42 149 108 97 97 105 81 48 30 18 1 776
Construction 118 435 430 439 339 360 220 156 71 44 24 2636
Wholesale and Retail Trade 285 641 528 447 385 404 234 137 91 70 58 3280
Transport, Storage and
Communication 64 322 437 465 443 356 282 182 100 43 17 2711
Finance, Insurance, Real estate
and Business services 12 81 82 75 68 82 47 44 28 9 9 537
Community, Social and
Personal Services 287 757 854 949 1022 880 628 444 360 161 60 6402
Not reported 125 154 156 185 145 155 119 89 47 33 28 1236
Total 1140 3035 3234 3421 3127 2875 2014 1373 912 482 228 21841

Table P6.3: Working Population By Industry, Age Group And Sex, 2002 Census (contd.)
Age group
15 < 20 20 < 25 25 < 30 30 < 35 35 < 40 40 < 45 45 < 50 50 < 55 55 < 60 60 < 65 65 + Total
Industry
Both
sexes Agriculture, Forestry and Fishing 118 296 406 532 434 365 298 198 158 89 22 2916
Quarrying 3 3 7 9 6 11 6 4 1 2 52
Manufacturing 193 596 767 760 721 535 336 193 105 63 13 4282
Electricity, Gas and Water 48 172 130 117 118 121 95 55 34 18 1 909
Construction 122 449 450 457 360 376 231 161 75 48 24 2753
Wholesale and Retail Trade 563 1307 1099 1047 954 864 535 312 192 134 78 7085
Transport, Storage and
Communication 93 523 621 642 626 497 376 234 113 58 18 3801
Finance, Insurance, Real estate
and Business services 36 218 200 200 209 177 104 75 41 17 11 1288
Community, Social and
Personal Services 531 1823 2192 2386 2600 2132 1490 1068 838 450 119 15629
Not reported 202 230 246 288 244 250 191 148 98 68 55 2020
Total 1909 5617 6118 6438 6272 5328 3662 2448 1655 945 343 40735
Source: MISD

Table P6.4: Economically Active Population By Educational Attainment, Age Group And Sex, 2002 Census
Age group
Under 20 20 < 30 30 < 40 40 < 50 50 < 60 60 + Total
Educational attainment
Female No schooling 1 9 26 88 120 58 302
Primary 7 94 373 821 832 326 2453
Other (e.g adult learning etc.) 1 16 27 33 16 7 100
Secondary 1-2 years 29 264 716 1273 264 54 2600
Secondary 3 years 60 268 963 578 203 43 2115
Secondary 4 years 222 533 200 315 64 12 1346
National Youth
Service/Secondary 5 years 415 2139 1691 295 62 21 4623
Vocational 137 285 145 89 35 5 696
Polytechnic 1-2 years, Teacher
Training College 220 1442 1241 262 72 10 3247
Polytechnic 3-4 years, Form 6 11 703 538 92 33 4 1381
Pre-University 4 142 200 136 64 13 559
University (Bachelor) 107 167 104 49 16 443
University (MA, MBA, PHD) 22 105 61 21 4 213
Not reported 21 95 98 139 56 22 431
Total 1128 6119 6490 4286 1891 595 20509
Male No schooling 3 27 39 137 197 80 483
Primary 18 121 459 1219 1034 351 3202
Other (e.g adult learning etc.) 1 18 28 37 10 7 101
Secondary 1-2 years 77 176 536 1379 351 46 2565
Secondary 3 years 135 332 718 600 258 51 2094
Secondary 4 years 420 658 219 152 41 18 1508
National Youth
Service/Secondary 5 years 336 2051 1734 267 68 20 4476
Vocational 149 402 279 227 28 5 1090
Polytechnic 1-2 years, Teacher
Training College 308 1648 1176 143 25 10 3310
Polytechnic 3-4 years, Form 6 14 691 589 97 29 9 1429
Pre-University 6 154 246 153 75 21 655
University (Bachelor) 152 330 237 91 38 848
University (MA, MBA, PHD) 1 49 170 148 63 20 451
Not reported 34 359 316 315 98 51 1173
Total 1502 6838 6839 5111 2368 727 23385

Table P6.4: Economically Active Population By Educational Attainment, Age Group And Sex, 2002 Census (contd.)
Age group
Under 20 20 < 30 30 < 40 40 < 50 50 < 60 60 + Total
Both
sexes Educational attainment
No schooling 4 36 65 225 317 138 785
Primary 25 215 832 2040 1866 677 5655
Other (e.g adult learning etc.) 2 34 55 70 26 14 201
Secondary 1-2 years 106 440 1252 2652 615 100 5165
Secondary 3 years 195 600 1681 1178 461 94 4209
Secondary 4 years 642 1191 419 467 105 30 2854
National Youth
Service/Secondary 5 years 751 4190 3425 562 130 41 9099
Vocational 286 687 424 316 63 10 1786
Polytechnic 1-2 years, Teacher
Training College 528 3090 2417 405 97 20 6557
Polytechnic 3-4 years, Form 6 25 1394 1127 189 62 13 2810
Pre-University 10 296 446 289 139 34 1214
University (Bachelor) 259 497 341 140 54 1291
University (MA, MBA, PHD) 1 71 275 209 84 24 664
Not reported 55 454 414 454 154 73 1604
Total 2630 12957 13329 9397 4259 1322 43894
Source: MISD

Table P6.5: Economically Active Population By Educational Attainment, Industry And Sex, 2002 Census
Educational attainment
No
schooling Primary
Secondary
1-5 yrs. Vocational Polytechnic
Pre-
University University
Not
reported Total
Industry
Female
Agriculture, Forestry and
Fishing 37 147 316 17 97 7 13 12 646
Quarrying 3 6 2 1 12
Manufacturing 24 387 1442 54 344 16 30 32 2329
Electricity, Gas and Water 1 11 70 7 39 2 2 1 133
Construction 1 17 56 2 26 3 4 8 117
Wholesale and Retail Trade 27 389 2194 204 745 46 48 152 3805
Transport, Storage and
Communication 7 79 402 37 455 43 37 30 1090
Finance, Insurance, Real
estate and Business services 5 32 256 25 347 36 41 9 751
Community, Social and
Personal Services 169 1262 4520 225 2117 363 419 152 9227
Not reported 18 119 416 24 132 20 35 20 784
Total 289 2446 9678 595 4304 537 629 416 18894
Male
Agriculture, Forestry and
Fishing 95 448 1143 68 332 42 84 58 2270
Quarrying 6 21 2 6 4 1 40
Manufacturing 26 300 951 114 407 41 75 39 1953
Electricity, Gas and Water 14 134 339 48 187 6 28 20 776
Construction 50 413 1097 163 393 52 39 429 2636
Wholesale and Retail Trade 41 318 1488 177 644 105 176 331 3280
Transport, Storage and
Communication 32 338 1259 114 679 99 124 66 2711
Finance, Insurance, Real
estate and Business services 1 38 181 16 154 33 104 10 537
Community, Social and
Personal Services 174 946 2635 261 1399 238 587 161 6401
Not reported 31 204 647 44 204 25 44 38 1237
Total 464 3145 9761 1007 4405 641 1265 1153 21841

Table P6.5: Economically Active Population By Educational Attainment, Industry And Sex, 2002 Census (contd.)
Educational attainment
No
schooling Primary
Secondary
1-5 yrs. Vocational Polytechnic
Pre-
University University
Not
reported Total
Industry
Both
sexes
Agriculture, Forestry and
Fishing 132 595 1459 85 429 49 97 70 2916
Quarrying 0 9 27 2 8 1 4 1 52
Manufacturing 50 687 2393 168 751 57 105 71 4282
Electricity, Gas and Water 15 145 409 55 226 8 30 21 909
Construction 51 430 1153 165 419 55 43 437 2753
Wholesale and Retail Trade 68 707 3682 381 1389 151 224 483 7085
Transport, Storage and
Communication 39 417 1661 151 1134 142 161 96 3801
Finance, Insurance, Real
estate and Business services 6 70 437 41 501 69 145 19 1288
Community, Social and
Personal Services 343 2208 7155 486 3516 601 1006 313 15628
Not reported 49 323 1063 68 336 45 79 58 2021
Total 753 5591 19439 1602 8709 1178 1894 1569 40735
Source: MISD

Table P6.6: Inactive Population By Functional Group, Age Group And Sex, 2002 Census
Functional group
Age group Students Other inactive Total
Female Under 10 6730 6730
10<20 4026 1689 5715
20<30 274 603 877
30<40 30 649 679
40<50 8 660 668
50<60 1 690 691
60<70 1785 1785
70<80 1651 1651
80<90 790 790
90<100 169 169
100 + 5 5
Not reported 10 10
Total 4339 15431 19770
Male Under 10 7012 7012
10<20 3931 1694 5625
20<30 174 363 537
30<40 13 336 349
40<50 2 402 404
50<60 3 442 445
60<70 1194 1194
70<80 1094 1094
80<90 366 366
90<100 32 32
100 + 4 4
Not reported 1 1
Total 4123 12940 17063
Both sexes Under 10 13742 13742
10<20 7957 3383 11340
20<30 448 966 1414
30<40 43 985 1028
40<50 10 1062 1072
50<60 4 1132 1136
60<70 2979 2979
70<80 2745 2745
80<90 1156 1156
90<100 201 201
100 + 9 9
Not reported 11 11
Total 8462 28371 36833
Source: MISD

Table P6.7: Head Of Household By Work Status, Age Group And Sex, 2002 Census
Age group
10<20 20<30 30<40 40<50 50<60 60 +
Not
reported Total
Work status
Female Employee (Government) 8 341 1114 968 566 179 1 3177
Employee (Parastatal) 1 104 319 237 116 33 810
Employee (Private) 9 254 638 702 273 88 1964
Employer 5 17 17 7 4 50
Self-Employed 1 20 81 112 65 35 314
Unpaid family worker 10 15 24 29 21 99
Part-time job seeker 1 26 56 47 42 18 190
Unemployed job seeker 5 57 110 98 41 8 319
Student 17 7 10 3 2 39
Other Inactive 4 56 139 199 296 2544 3238
Not reported 1 7 14 8 6 16 52
Total 47 887 2513 2415 1441 2948 1 10252
Male Employee (Government) 3 211 697 729 448 87 2175
Employee (Parastatal) 5 194 442 388 182 43 1254
Employee (Private) 11 364 835 822 393 142 3 2570
Employer 10 44 96 45 26 221
Self-Employed 1 150 597 769 440 163 1 2121
Unpaid family worker 2 1 3 6 4 16
Part-time job seeker 2 17 35 31 32 4 121
Unemployed job seeker 1 35 65 90 47 9 247
Student 29 4 4 1 38
Other Inactive 2 15 54 117 192 1479 1859
Not reported 1 4 13 17 9 15 59
Total 55 1006 2787 3063 1794 1972 4 10681
Both sexes Employee (Government) 11 552 1811 1697 1014 266 1 5352
Employee (Parastatal) 6 298 761 625 298 76 2064
Employee (Private) 20 618 1473 1524 666 230 3 4534
Employer 15 61 113 52 30 271
Self-Employed 2 170 678 881 505 198 1 2435
Unpaid family worker 12 16 27 35 25 115
Part-time job seeker 3 43 91 78 74 22 311
Unemployed job seeker 6 92 175 188 88 17 566
Student 46 11 14 4 2 77
Other Inactive 6 71 193 316 488 4023 5097
Not reported 2 11 27 25 15 31 111
Total 102 1893 5300 5478 3235 4920 5 20933
Source: MISD

Table P6.8: Population In Households By Work Status And Household Size, 2002 Census
Household size
1 2 3 4 5 6 7 - 10 11 - 15 16 - 20 21 + Total
Work status
Employee (Government) 455 1204 2143 2702 2237 1408 1912 329 38 9 12437
Employee (Parastatal) 304 573 919 1145 944 599 859 287 17 33 5680
Employee (Private) 631 1261 2243 2666 2338 1428 2258 435 112 2294 15666
Employer 27 36 99 103 83 39 48 3 1 2 441
Self-Employed 335 508 871 1069 766 462 717 106 8 1 4843
Unpaid family worker 2 50 109 151 107 64 101 18 1 4 607
Part-time job seeker 52 99 158 208 194 137 250 40 3 4 1145
Unemployed job seeker 81 244 460 597 558 417 663 124 17 5 3166
Student 35 258 943 1965 2085 1317 1547 237 23 58 8468
Other Inactive 1074 2236 3971 5707 5092 3430 5303 979 124 449 28365
Not reported 22 61 111 183 211 131 147 31 1 39 937
Total population 3018 6530 12027 16496 14615 9432 13805 2589 345 2898 81755
Total households 3018 3265 4009 4124 2923 1572 1755 216 20 31 20933

Table P6.9: Population By Household Size And Number
Of Members Below And Above 15 Years, 2002 Census
Age group
Under 15
15 years
or more Not reported Total
Household
size
1 3016 2 3018
2 454 6072 4 6530
3 2728 9295 4 12027
4 4950 11541 5 16496
5 4645 9967 3 14615
6 2971 6461 9432
7 - 10 4277 9526 2 13805
11 - 15 810 1778 1 2589
16 - 20 104 241 345
21 + 83 2778 37 2898
Total 21022 60675 58 81755
Source: MISD

Table H7.1: Households In Occupied Houses By Type Of Dwelling, 2002 Census
Type of dwelling
No. of
houses %
No. of
households %
Single unit 16459 81.2 16950 81.0
Multiple units 3259 16.1 3399 16.2
Multi-purpose 425 2.1 432 2.1
Institution 85 0.4 86 0.4
Boat 20 0.1 20 0.1
No home 8 0.0 18 0.1
Not reported 14 0.1 28 0.1
Total 20270 100.0 20933 100.0
Source: MISD
Table H7.2: Households And Houses By District, 2002 Census
District
No. of
houses %
No. of
households %
Anse Aux Pins 889 4.4 918 4.4
Anse Boileau 907 4.5 930 4.4
Au Cap 885 4.4 902 4.3
Anse Etoile 1070 5.3 1101 5.3
Anse Royale 944 4.7 1009 4.8
Bel Air 727 3.6 750 3.6
Baie Lazare 670 3.3 723 3.5
Belombre 906 4.5 923 4.4
Baie Ste Anne 964 4.8 999 4.8
Beau Vallon 1001 4.9 1018 4.9
Cascade 782 3.9 805 3.8
English River 846 4.2 876 4.2
Glacis 914 4.5 933 4.5
Grand Anse Mahe 662 3.3 680 3.2
Grand Anse Praslin 779 3.8 800 3.8
La Digue & Inner
Islands 604 3.0 605 2.9
Les Mamelles 633 3.1 643 3.1
Mont Buxton 770 3.8 810 3.9
Mont Fleuri 839 4.1 865 4.1
Other Islands 384 1.9 387 1.8
Plaisance 841 4.1 887 4.2
Port Glaud 566 2.8 584 2.8
Pte Larue 640 3.2 669 3.2
Roche Caiman 641 3.2 665 3.2
St Louis 789 3.9 806 3.9
Takamaka 617 3.0 645 3.1
Total 20270 100.0 20933 100
Source: MISD

Table H7.3: Households By Type of Dwelling, Sex And Age Group Of Head Of Household 2002 Census
Type of dwelling
Single unit
Multiple
units
Multi-
purpose Institution Boat No home
Not
reported Total
Age group
Female 15 < 20 27 19 1 47
20 < 25 165 75 12 3 2 257
25 < 30 399 220 6 1 1 3 630
30 < 35 736 335 11 3 1 2 1 1089
35 < 40 1021 378 19 3 2 1 1424
40 < 45 1083 256 16 2 1 1358
45 < 50 876 164 15 1 1 1057
50 < 55 670 98 10 1 1 780
55 < 60 579 69 12 1 661
60 < 65 655 67 10 2 734
65 < 70 657 84 6 2 1 750
70 < 75 523 58 12 593
75 < 80 356 58 5 1 1 421
80 < 85 238 22 3 263
85 < 90 112 12 2 1 127
90 < 95 42 4 46
95 < 100 9 1 1 11
100 plus 2 1 3
Not reported 1 1
Total 8150 1921 140 22 1 8 10 10252
Male 15 < 20 22 31 1 54
20 < 25 220 78 5 4 1 1 309
25 < 30 470 190 27 7 1 1 1 697
30 < 35 892 266 43 12 11 1 5 1230
35 < 40 1244 265 36 7 1 4 1557
40 < 45 1403 208 49 10 6 2 3 1681
45 < 50 1197 137 36 11 2 1383
50 < 55 901 95 27 4 1 1 1 1030
55 < 60 687 57 18 1 1 764
60 < 65 519 40 19 3 1 1 583
65 < 70 455 38 12 1 1 507
70 < 75 366 33 8 2 409
75 < 80 214 21 5 1 241
80 < 85 147 13 2 162
85 < 90 50 5 3 58
90 < 95 11 11
95 < 100 1 1
100 plus
Not reported 1 1 1 1 4
Total 8800 1478 292 64 19 10 18 10681
Source: MISD

Table H7.3: Households By Type of Dwelling, Sex And Age Group Of Head Of Household 2002 Census
Type of dwelling
Single unit
Multiple
units
Multi-
purpose Institution Boat No home
Not
reported Total
Age group
Both
sexes 15 < 20 49 50 1 1 101
20 < 25 385 153 17 7 1 3 566
25 < 30 869 410 33 8 1 2 4 1327
30 < 35 1628 601 54 15 12 3 6 2319
35 < 40 2265 643 55 10 3 5 2981
40 < 45 2486 464 65 12 6 3 3 3039
45 < 50 2073 301 51 12 1 2 2440
50 < 55 1571 193 37 5 1 2 1 1810
55 < 60 1266 126 30 2 1 1425
60 < 65 1174 107 29 5 1 1 1317
65 < 70 1112 122 18 3 1 1 1257
70 < 75 889 91 20 2 1002
75 < 80 570 79 10 2 1 662
80 < 85 385 35 5 425
85 < 90 162 17 5 1 185
90 < 95 53 4 57
95 < 100 10 1 1 12
100 plus 2 1 3
Not reported 1 2 1 1 5
Total 16950 3399 432 86 20 18 28 20933
Source: MISD
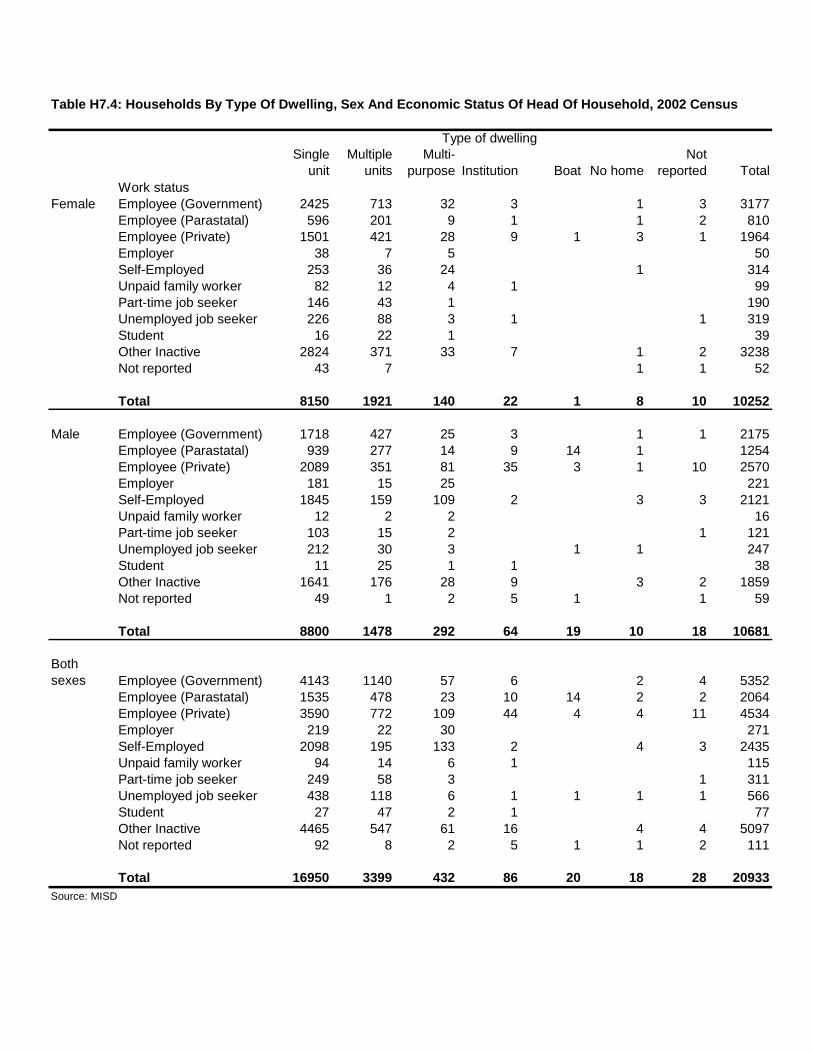
Table H7.4: Households By Type Of Dwelling, Sex And Economic Status Of Head Of Household, 2002 Census
Type of dwelling
Single
unit
Multiple
units
Multi-
purpose Institution Boat No home
Not
reported Total
Work status
Female Employee (Government) 2425 713 32 3 1 3 3177
Employee (Parastatal) 596 201 9 1 1 2 810
Employee (Private) 1501 421 28 9 1 3 1 1964
Employer 38 7 5 50
Self-Employed 253 36 24 1 314
Unpaid family worker 82 12 4 1 99
Part-time job seeker 146 43 1 190
Unemployed job seeker 226 88 3 1 1 319
Student 16 22 1 39
Other Inactive 2824 371 33 7 1 2 3238
Not reported 43 7 1 1 52
Total 8150 1921 140 22 1 8 10 10252
Male Employee (Government) 1718 427 25 3 1 1 2175
Employee (Parastatal) 939 277 14 9 14 1 1254
Employee (Private) 2089 351 81 35 3 1 10 2570
Employer 181 15 25 221
Self-Employed 1845 159 109 2 3 3 2121
Unpaid family worker 12 2 2 16
Part-time job seeker 103 15 2 1 121
Unemployed job seeker 212 30 3 1 1 247
Student 11 25 1 1 38
Other Inactive 1641 176 28 9 3 2 1859
Not reported 49 1 2 5 1 1 59
Total 8800 1478 292 64 19 10 18 10681
Both
sexes Employee (Government) 4143 1140 57 6 2 4 5352
Employee (Parastatal) 1535 478 23 10 14 2 2 2064
Employee (Private) 3590 772 109 44 4 4 11 4534
Employer 219 22 30 271
Self-Employed 2098 195 133 2 4 3 2435
Unpaid family worker 94 14 6 1 115
Part-time job seeker 249 58 3 1 311
Unemployed job seeker 438 118 6 1 1 1 1 566
Student 27 47 2 1 77
Other Inactive 4465 547 61 16 4 4 5097
Not reported 92 8 2 5 1 1 2 111
Total 16950 3399 432 86 20 18 28 20933
Source: MISD

Table H7.5: Homeless Households By Sex And
Age Group Of Head Of Household, 2002 Census
Sex of Head of
household
Female Male Total
Age group
20 < 25 1 1
25 < 30 1 1 2
30 < 35 2 1 3
35 < 40 2 1 3
40 < 45 1 2 3
45 < 50 1 1
50 < 55 1 1 2
55 < 60 1 1
60 < 65 1 1
65 < 70 1 1
Total 8 10 18
Source: MISD
Table H7.6: Vacant Houses By Construction
Material of Dwelling, 2002 Census
No.
Houses %
Stone / Block 379 50.9
Wood / Iron 145 19.5
Palm / Lattice 3 0.4
Not reported 218 29.3
Total 745 100
Source: MISD
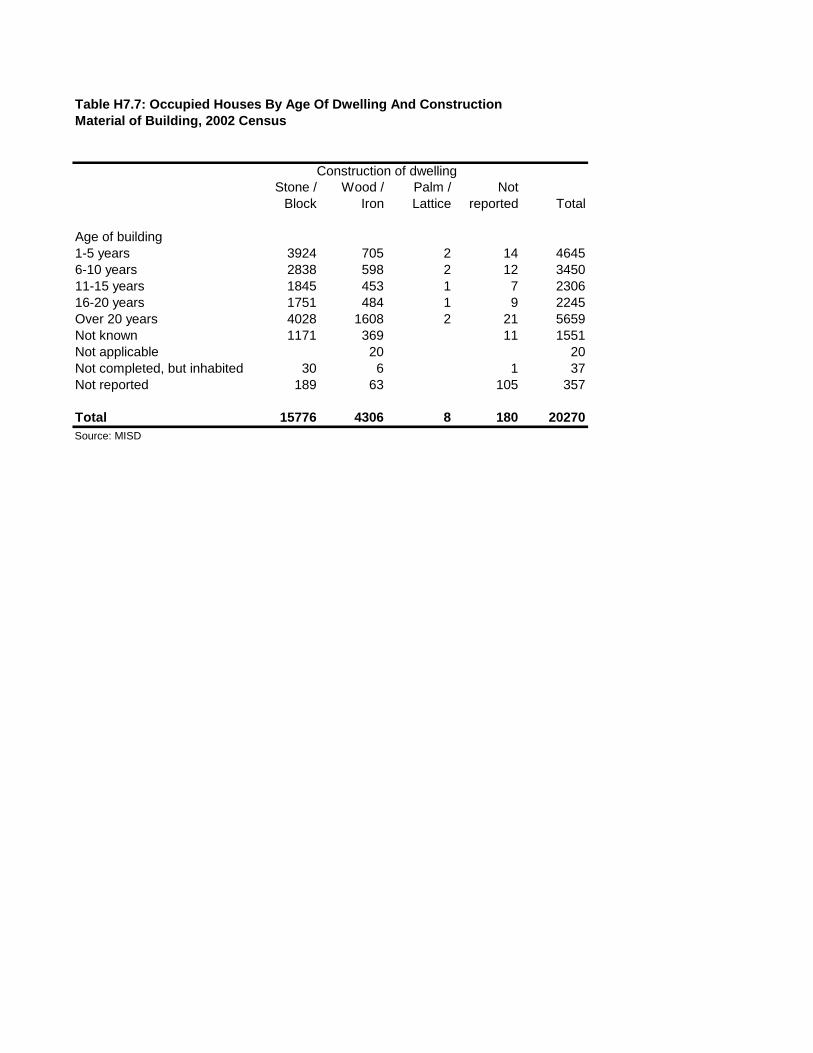
Table H7.7: Occupied Houses By Age Of Dwelling And Construction
Material of Building, 2002 Census
Construction of dwelling
Stone /
Block
Wood /
Iron
Palm /
Lattice
Not
reported Total
Age of building
1-5 years 3924 705 2 14 4645
6-10 years 2838 598 2 12 3450
11-15 years 1845 453 1 7 2306
16-20 years 1751 484 1 9 2245
Over 20 years 4028 1608 2 21 5659
Not known 1171 369 11 1551
Not applicable 20 20
Not completed, but inhabited 30 6 1 37
Not reported 189 63 105 357
Total 15776 4306 8 180 20270
Source: MISD

Table H7.8: Households By Type Of Water Supply And Type Of Toilet Facilities, 2002 Census
Toilet facility
Flush (to
sewerage
system)
Flush (to
septic
tank) Pit latrine None Other
Not
reported Total
Type of water supply
Mains supply (treated) 1516 15859 342 134 4 77 17932
Mains supply (untreated) 11 539 98 18 2 668
Mains supply (unknown) 9 8 6 23
Private supply (treated) 1 214 9 6 4 234
Private supply (untreated) 15 1358 276 60 8 1717
Private supply (unknown) 7 2 4 13
None 1 11 8 9 2 31
Other 1 1 2
Not reported 1 16 8 15 1 272 313
Total 1545 18013 751 253 5 366 20933
Source: MISD

Table H7.9a: Households By Type Of Dwelling And Method Of Waste Disposal, 2002 Census
Waste disposal (Public bin)
No Yes
Not
reported Total
Type of dwelling
Single unit 2267 14443 240 16950
Multiple units 223 3169 7 3399
Multi-purpose 73 358 1 432
Institution 4 68 14 86
Boat 1 17 2 20
No home 18 18
Not reported 28 28
Total 2568 18055 310 20933
Source: MISD
Table H7.9b: Households By Type Of Dwelling And Method Of Waste Disposal, 2002 Census
Waste disposal (Buried/burnt)
No Yes
Not
reported Total
Type of dwelling
Single unit 12196 4392 362 16950
Multiple units 3121 246 32 3399
Multi-purpose 381 46 5 432
Institution 48 8 30 86
Boat 18 2 20
No home 18 18
Not reported 28 28
Total 15764 4692 477 20933
Source: MISD

Table H7.9c: Households By Type Of Dwelling And Method Of Waste Disposal, 2002 Census
Waste disposal (Dumping site)
No Yes
Not
reported Total
Type of dwelling
Single unit 15933 592 425 16950
Multiple units 3277 89 33 3399
Multi-purpose 378 48 6 432
Institution 52 2 32 86
Boat 17 1 2 20
No home 18 18
Not reported 28 28
Total 19657 732 544 20933
Source: MISD
Table H7.9d: Households By Type Of Dwelling And Method Of Waste Disposal, 2002 Census
Waste disposal (composting)
No Yes
Not
reported Total
Type of dwelling
Single unit 15016 1532 402 16950
Multiple units 3239 128 32 3399
Multi-purpose 403 23 6 432
Institution 51 2 33 86
Boat 18 2 20
No home 18 18
Not reported 28 28
Total 18727 1685 521 20933
Source: MISD

Table H7.10: Households By Type Of Energy Used For Lighting, 2002 Census
Energy source for lighting
Electricity Candles
Paraffin
lamps Other
Not
reported Total
Type of dwelling
Single unit 16237 403 64 14 232 16950
Multiple units 3366 20 2 1 10 3399
Multi-purpose 422 6 1 3 432
Institution 74 1 3 8 86
Boat 19 1 20
No home 18 18
Not reported 28 28
Total 20118 430 69 16 300 20933
Source: MISD
Table H7.11: Households By Type Of Energy Used For Cooking, 2002 Census
Energy source for cooking
Electricity Gas Kerosene Wood Charcoal
No
cooking Other
Not
reported Total
Type of dwelling
Single unit 1176 14799 376 178 22 122 25 252 16950
Multiple units 346 2955 50 6 29 13 3399
Multi-purpose 26 380 5 5 9 3 4 432
Institution 8 58 1 3 7 2 7 86
Boat 19 1 20
No home 18 18
Not reported 28 28
Total 1556 18211 432 192 22 167 30 323 20933
Source: MISD

Table H7.12: Households By Tenure And Condition Of Repair Of Dweiiling, 2002 Census
State of repair
Good Fair Poor
Not
applicable
Not
reported Total
Tenure
Owner occupied 10209 2845 633 202 13889
Rented from government 2949 448 108 13 3518
Rented privately 1009 301 88 43 1441
Rented from private employer 99 10 4 2 115
Provided free by employer 536 130 35 13 714
Rent free 380 252 165 34 831
Not reported 104 46 23 20 232 425
Total 15286 4032 1056 20 539 20933
Source: MISD

Table H7.13: Households By Tenure And Type Of Toilet Facilities, Water Supply And Availability
Of Water Storage Tank, 2002 Census
Tenure
Owner
occupied
Rented
from
government
Rented
privately
Rented
from
private
employer
Provided
free by
employer Rent free
Not
reported Total
Toilet facility
Flush (to sewerage
system) 576 743 139 8 37 27 15 1545
Flush (to septic tank) 12506 2731 1220 105 633 662 156 18013
Pit latrine 539 18 53 1 35 89 16 751
None 193 3 10 4 42 1 253
Other 5 5
Not reported 70 23 19 1 5 11 237 366
Total 13889 3518 1441 115 714 831 425 20933
Type of water supply
Mains supply (treated) 11840 3381 1336 108 454 661 152 17932
Mains supply (untreated) 448 43 28 5 87 47 10 668
Mains supply (unknown) 16 1 5 1 23
Private supply (treated) 71 4 16 131 9 3 234
Private supply
(untreated) 1425 84 52 1 37 91 27 1717
Private supply
(unknown) 8 1 3 1 13
None 21 3 6 1 31
Other 2 2
Not reported 58 2 8 1 5 9 230 313
Total 13889 3518 1441 115 714 831 425 20933
Own water storage
tank
None available 8619 1124 881 73 442 570 123 11832
Not reported 66 5 14 4 7 227 323
Available 5204 2389 546 42 268 254 75 8778
Total 13889 3518 1441 115 714 831 425 20933
Source: MISD

Table H7.14: Availability Of, And Acess to Durable Goods
And Other Facilities In Households, 2002 Census
No. of
households %
Access to:
Radio 19298 92.2
Television 18445 88.1
Fixed telephone line 13246 63.3
Other entertainment equipment 12071 57.7
Cellular phone 11869 56.7
Video player 11737 56.1
Local Weekly newspaper 11717 56.0
Local Daily newspaper 9914 47.4
Computer 2523 12.1
Internet connection 1489 7.1
Ownership of:
Car 4307 20.6
Bicycle 1180 5.6
Boat for pleasure 423 2.0
Boat for business 331 1.6
Motorcycle 132 0.6
Refrigerator / Freezer 18470 88.2
Washing machine 8982 42.9
Solar heating 1771 8.5
Source: MISD