General Population Tables and Primary Census Abstract, Part ...
Upload
khangminh22Category
view
3download
0
SI AY BIN AQ
NFP
Households and Living Conditions
June 2010Central Statistical Office
POPULATION AND HOUSING CENSUS
Volume 6
2007
The Kingdom of Swaziland
Central Statistical OfficeP.O. Box 456
MbabaneTel: (+268) 404 2151/4 or 404 6260/1
Fax: (+268) 404 3300Email: [email protected] P
rintp
ak (
404-1
01
8
PO
PU
LA
TIO
N A
ND
HO
US
ING
CE
NS
US
Vo
lum
e 6

Central Statistical Office1
Preface
The Thematic Report of Households and Living Conditions is one publication in a series of reports that have been produced from the 2007 Population and Housing Census results. The Census results are presented at national, regional , Tinkhundla and urban/ rural level.
On behalf of Government, the Central Statistical Office (CSO) would like to express its sincere gratitude to all organizations and individuals who have made contributions towards the success of the Census. Special thanks go to the authors who have contributed in the thematic analysis of the various reports; Amos Zwane, Thembi Vilane, Thembinkosi Shabalala, Nombulelo Dlamini, Emma Bicego, Sabelo Simelane, Rachel Masuku, Nelisiwe Sikhosana, Marjorie Mavuso and Zodwa Dlamini-Mthethwa.
We thank the United Nations Population Fund (UNFPA) for its continued financial and technical support in all stages of the Census.
Our sincere appreciation goes to the Enumerators and Supervisors who worked tirelessly during the main Census enumeration. We are also grateful to the Data processing staff; Muzi Dube, Choice Ginindza and Qhawe Tfwala who produced the tables needed by the different authors.
Last but not least, we would like to acknowledge the support and cooperation of the general public, especially during the enumeration period.
Finally, I wish to thank everyone that contributed directly or indirectly, but not mentioned above, to the success of the census and in the publication of this report. The statistical data obtained from the 2007 census is massive and rich allowing for extensive use and application. As such, what is contained in the report is not the whole but only a very small portion. I urge all of the census data users to feel free and request C.S.O. for any data not found in this publication but was collected in the Census.
Amos M. ZwaneDirector of StatisticsCentral Statistical Office

Central Statistical Office2
Table of contentsTable of contents ............................................................................................................ 2List of Tables .................................................................................................................. 4
1 Introduction ...................................................................................................... 91.1 Relevance of data for household characteristics and living conditions ............. 91.2 Census data as a source of data on household characteristics and housing conditions ............................................................... 81.3 Definitions and other methodological issues ...................................................... 81.4 Brief review of contents of the report ................................................................ 8
2 Household characteristics ................................................................................ 82.1 Household size ................................................................................................... 92.2 Household composition – population by sex and relationship to head .............. 10
3 Characteristics of heads of households........................................................... 183.1 Head of households by age and sex ................................................................... 183.2 Head of households by level of school/literacy programme attended ............... 213.3 Average household size ...................................................................................... 243.4 Head of households by sex and activity status ................................................... 243.5 Head of households by sex and employment status ........................................... 283.6 Head of households by sex and industrial status ................................................ 31
4 Housing unit characteristics ............................................................................ 364.1 Acquisition of housing units .............................................................................. 364.2 Tenure of housing units ...................................................................................... 394.3 Quality of housing units ..................................................................................... 424.3.1 Main material of the roof ................................................................................... 424.3.2 Main material of the wall ................................................................................... 454.3.3 Main material of the floor ................................................................................... 49
5 Capacity of housing .......................................................................................... 525.1 Number of rooms ............................................................................................... 525.2 Number of rooms for sleeping ........................................................................... 535.3 Number of occupants ......................................................................................... 55
6 Water for drinking ........................................................................................... 576.1 Main source of water for drinking ...................................................................... 576.2 Travel time to source of drinking water ............................................................. 616.3 Households with access to safe drinking water .................................................. 636.3.1 Safe water sources .............................................................................................. 636.3.2 Unsafe waters sources ........................................................................................ 63

Central Statistical Office3
7 Toilet facility used by households .................................................................... 647.1 Main type of toilet facility .................................................................................. 647.1.1 Safe toilet facility ............................................................................................... 667.1.2 Unsafe toilet facility ........................................................................................... 67
8 Source of energy ............................................................................................... 698.1 Main source of energy for lighting ..................................................................... 698.2 Main sources of energy for cooking ................................................................... 72
9 Assets of households ......................................................................................... 769.1 Distribution of households by ownership of assets ............................................ 76
10 Agriculture ........................................................................................................ 8010.1 Distribution of households by crops grown/harvested ....................................... 8010.2 Distribution of households by type of livestock/poultry raised ......................... 8110.3 Distribution of households by type of fruits grown/picked ................................ 8310.4 Distribution of households involved in fish farming .......................................... 85
11 Conclusion Recommendations for the next census ....................................... 85
Central Statistical Office4
List of Tables
Table 1 : Distribution of households and household distribution by household size for total country ..................................................................12Table 2: Distribution of households and household distribution by household size for urban and rural areas .....................................................12Table 3: Distribution of households and household distribution by household size for Hhohho and Manzini region .........................................13Table 4: Distribution of households and household distribution by household size for Shiselweni and Lubombo region ...................................14Table 5: Distribution of household population by sex and relationship to head of household, Swaziland, 2007 Census ......................15Table 6: Urban distribution of household population by sex and relationship to head of household, Swaziland, 2007 Census .......................16Table 7: Rural distribution of household population by sex and relationship to head of household, Swaziland, 2007 Census ......................16Table 8: Distribution of households by area and sex of the head of household, Swaziland, 2007 Census .......................................................17Table 9: Distribution of households by age and sex of head of household for total country .........................................................................18Table 10: Distribution of households by age and sex of head of household for urban and rural areas ...........................................................19Table 11: Distribution of households by age and sex of head of household for Hhohho, Manzini, Shiselweni and Lubombo regions .........20Table 12: Distribution of heads of households by sex and by level of school/literacy programme attended for total country .................................21Table 13: Distribution of heads of households by sex and by level of school/literacy programme attended for urban and rural areas ...............22Table 14: Distribution of heads of households by sex and by level of school/literacy
programme attended for Hhohho, Manzini, and Shiselweni and Lubombo regions ..................................................................................23Table 15: Average number of persons per household, Swaziland, 2007 Census ........24Table 16: Distribution of heads of households by sex and by activity status for total country .................................................................................25Table 17: Distribution of heads of households by sex and by activity status for urban and rural areas ...................................................................26Table 18: Distribution of heads of households by sex and by activity status for Hhohho, Manzini, Shiselweni and Lubombo regions ..................27Table 19: Distribution of heads of households by sex and employment status for total country .................................................................................28Table 20: Distribution of heads of households by sex and employment status for urban and rural areas ....................................................................29Table 21: Distribution of heads of households by sex and employment status for Hhohho and Manzini regions .......................................................30Table 22: Distribution of heads of households by sex and employment status for Shiselweni and Lubombo regions ...............................................31

Central Statistical Office5
Table 23: Distribution of heads of households by sex and industrial status for total country .................................................................................32Table 24: Distribution of heads of households by sex and industrial status for urban and rural areas ...................................................................33Table 25: Distribution of heads of households by sex and industrial status for Hhohho and Manzini regions .......................................................34Table 26: Distribution of heads of households by sex and industrial status for Shiselweni and Lubombo regions ................................................35Table 27: Distribution of housing units by type of acquisition of the plot and by sex of head of household for total country ...............................36Table 28: Distribution of housing units by type of acquisition of the plot and by sex of head of household for urban and rural areas ............37Table 29: Distribution of housing units by type of acquisition of the plot and by sex of head of household for Hhohho, Manzini, Shiselweni and Lubombo regions ................................................................38Table 30: Distribution of housing units by tenure and by sex of head of household for total country .............................................................39Table 31: Distribution of housing units by tenure and by sex of head of household for urban and rural areas ................................................40Table 32: Distribution of housing units by tenure and by sex of head of household for Hhohho, Manzini, Shiselweni and Lubombo regions ..................................................................................41Table 33: Distribution of housing units by type of the main material of the roof and by sex of head of household for total country ....................42Table 34: Distribution of housing units by type of the main material of the roof and by sex of head of household for urban and rural areas ....................................................................................................43Table 35: Distribution of housing units by type of the main material of the roof and by sex of head of household for Hhohho, Manzini, Shiselweni and Lubombo regions ................................................44Table 36: Distribution of housing units by type of the main material of the wall and by sex of head of household for total country ......45Table 37: Distribution of housing units by type of the main material of the wall and by sex of head of household for urban and rural areas ..........46Table 38: Distribution of housing units by type of the main material of the wall and by sex of head of household for Hhohho and Manzini regions ....47Table 39: Distribution of housing units by type of the main material of the wall and by sex of head of household for Shiselweni and Lubombo regions .....48Table 40: Distribution of housing units by type of the main material of the floor and by sex of head of household for total country ........................49Table 41: Distribution of housing units by type of the main material of the floor and by sex of head of household for urban and rural areas .....50Table 42: Distribution of housing units by type of the main material of the floor and
by sex of head of household for Hhohho and Manzini regions ...................51Table 43: Distribution of housing units by number of rooms for total country, rural
and urban areas ............................................................................................52

Central Statistical Office6
Table 44: Distribution of housing units by number of rooms for Hhohho, Manzini, Shiselweni and Lubombo regions ................................................53Table 45: Distribution of housing units by number of rooms used for sleeping for total country, urban and rural areas .........................................53Table 46: Distribution of housing units by number of rooms used for sleeping for Hhohho, Manzini, Shiselweni and Lubombo regions ............54Table 47: Distribution of housing units by number of occupants for total country,
urban and rural areas ....................................................................................55Table 48: Distribution of housing units by number of occupants for Hhohho, Manzini, Shiselweni and Lubombo regions ................................................56Table 49: Distribution of households by main source of water for drinking and by sex of head of household for total country ......................................57Table 50: Distribution of households by main source of water for drinking and by sex of head of household for urban and rural areas ........................58Table 51: Distribution of households by main source of water for drinking and by sex of head of household for Hhohho and Manzini areas ...............59Table 52: Distribution of households by main source of water for drinking and by sex of head of household for Shiselweni and Lubombo areas ........60Table 53: Distribution of households by travel time to main source of water and by
sex of head of household for total country, urban and rural areas ...............61Table 54: Distribution of households by travel time to main source of water and by sex of head of household for Hhohho, Manzini, Shiselweni and Manzini regions ..................................................................61Table 55: Distribution of households by access to safe drinking water and by sex of
head of household for total country, urban, rural and regions .....................62Table 56: Distribution of households by access to not safe drinking water and by sex
of head of household for total country, rural and urban, regions .................63Table 57: Distribution of households by main type of toilet facility and by sex of head of household for total country, urban and rural areas ...............65Table 58: Distribution of households by main type of toilet facility and by sex of head
of household Hhohho, Manzini, Shiselweni and Lubombo rural areas .......66Table 59: Distribution of households by use of safe toilet facility and by sex of head of household for total country, urban, rural and regions ..........67Table 60: Distribution of households by use of not safe toilet facility and by sex of
head of household for total country, urban, rural and regions .....................68Table 61: Distribution of households by main source of energy for lighting and by sex
of head of household for total country .........................................................69Table 62: Distribution of households by main source of energy for lighting and by sex
of head of household for urban and rural areas ...........................................70Table 63: Distribution of households by main source of energy for lighting and by sex
of head of household for Hhohho and Manzini areas ..................................71Table 64: Distribution of households by main source of energy for lighting and by sex
of head of household for Shiselweni and Lubombo areas ...........................72Table 65: Distribution of households by main source of energy for cooking and by sex
of head of household for total ......................................................................73Table 66: Distribution of households by main source of energy for cooking and by sex
of head of household for urban and rural areas ...........................................73
Central Statistical Office7
Table 67: Distribution of households by main source of energy for cooking and by sex of head of household for Hhohho and Manzini regions ..............................74
Table 68: Distribution of households by main source of energy for cooking and by sex of head of household for Shiselweni and Lubombo regions .......................75
Table 69: Percentage distribution of households by ownership of assets and by sex of head of household for total country .............................................................76
Table 70: Percentage distribution of households by ownership of assets and by sex of head of household for urban and rural areas ................................................77
Table 71: Percentage distribution of households by ownership of assets and by sex of head of household for total country, Hhohho, Manzini regions ..................78
Table 72: Percentage distribution of households by ownership of assets and by sex of head of household for Shiselweni and Lubombo regions ............................79
Table 73: Percentage distribution of households by type crop grown/harvested and by sex of head of household for total country, urban and rural areas ...............80
Table 74: Percentage distribution of households by type crop grown/harvested and by sex of head of household for total country, Hhohho, Manzini, Shiselweni and Lubombo administrative regions ..........................................................81
Table 75: Percentage distribution of households by type livestock/poultry raised and by sex of head of household for total country, urban and rural, regions .....82
Table 76: Percentage distribution of households by type fruits grown/picked and by sex of head of household for total country, urban and rural areas ...............83
Table 77: Percentage distribution of households by type fruits grown/picked and by sex of head of household for total country, Hhohho, Manzini, Shiselweni and Lubombo administrative regions ..........................................................84
Table 78: Percent distribution of households involved in fish farming and by sex of head of household for country, urban, rural and regions .............................85
Central Statistical Office8
1. Introduction
1.1 Relevance of data for household characteristics and living conditions
Government recognizes the pivotal role of housing in the welfare of the population. Hence, her policy in the housing sector emphasizes the improvement in the sanitary conditions under which people live as well as provision of services such as access to roads, water and electricity.
It is the household that constitutes the unit of demand for both housing and services and it is household income that goes towards paying for the house and for services. The Government rec-ognizes the role of the family as the basic unit for reproduction and socialization and the right of individuals of eligible age to marry and form families.
The Household Composition indicator provides insight into the likely family structure of the residents of a given household (e.g. single person vs. married couple). Housing is a key influence on population distribution and density within localities. Changes in housing densities are at the centre of much discussion of the future of the cities
1.2 Census data as a source of data on household characteristics and housing conditions
The major sources of population data and information in Swaziland are population censuses and household surveys. A population census is a primary source of basic benchmark statistics to plan for and implement economic and social development in the country. It is strong and distinct, which arise from the completeness of coverage and the details it provides about the population in local areas and sub-groups, which no other data source meets.
Census data is presented and analyzed in terms of households as basic units of production and reproduction and for a variety of geographical units ranging from the country as a whole to in-dividual small localities. It further allows for international comparability of basic development indicators.
Specifically the contribution of the 2007 Census data to the study will provide a distinct basis for the analysis of composition, typology and living conditions of Households in Swaziland. Each of these basic measures of these households’ characteristics requires complete data to calculate which the census provides.
1.3 Definitionsandothermethodologicalissues In this section the concepts and classifications used in the 2007 Population and Housing Census are defined. In addition these concepts and classifications were based on regional and interna-tional recommendations with adaptations to suite local conditions. • Household: A household refers to a person or group of persons who may be related (family) or unrelated or both who live together and share meals (eat from the same pot), sharing of meals being the paramount criteria found in a household. Three major types of households were distinguished in the census namely;
1. Regular household: defined as a household whose members were found sharing housing units and their living quarters and meals during the census period.
8 Choice Ginindza
Central Statistical Office9
2. Collective household: referred to a large group of people who live together sharing common facilities such as kitchen, toilet, lounge, and dormitories. In such situations the residents may not have independent quarters that qualified as a housing unit as their living quarters during the census period.
3. Homeless: refers to any other household, not classifiable in either of the above, it is a residual, which in this case may accommodate the category of ‘homeless’ etc.
• Average Household Size: By knowing the number of people who live in households and the number of households, we can calculate the average size of households.
• Headofhousehold: The person of either sex who was looked upon by the other mem bers of the household as their leader or main decision maker.
• Typeofhousingunits: refers to a separate and independent living premises occupied by the household.
• Tenure: status of tenure indicates whether the dwelling unit was owner occupied or rented.
1.4 Brief review of contents of the report
The main focus of this report is to discuss households and their living conditions including household typology in Swaziland, using 2007 Population and Housing data to answer a series of issues. The discussions in this report are restricted only to Regular Households.
Section 1 focuses on the introduction issues of general relevance of the topic. The relevance of the topic uses in different institutions in Swaziland is discussed. The contribution of the 2007 Swaziland census data provided Central Statistical Office (CSO) and its potential usage is elaborated.
Section 2 focuses on the Household characteristics, Household size, and Household composition. The report uses primary data collected from individuals and households in Swaziland.
Section 3 explores the analysis of the topic theme according to the 2007 Census Data, to describe Characteristics of heads of households.
Section 4 uses a simple analysis of Housing unit characteristics in Swaziland. This addresses the sources of Acquisition of housing unit, Tenure of housing unit and Quality of housing unit.
In Section 5 the emphasis is on exploratory analysis of Capacity of housing. The relevance of the differential selected are investigated. Summary of key results of the analysis of differentials are presented in this section.
Section 6 attempts to do special analysis on access to Water for drinking. The analysis of the dis-tribution of main source of drinking water, travel time to the source and safe or not safe sources is investigated.
In Section 7 the emphasis is on analysis of Toilet facility used by households’ differentials. The relevance of the differential selected are investigated.

Central Statistical Office10
In Section 8 the emphasis is on Source of energy analysis of differentials. The relevance of the differential selected are investigated, to add to the initial earlier findings. Summary of key results of the analysis of differentials are presented in this section.
Section 9 attempts to do special analysis of Assets of household’s ownership. The analysis of the differential investigated.
Section 10 the emphasis is on analysis of Agricultural activities used by household’s differentials. The relevance of the differential selected are investigated, to add to the initial earlier findings. Summary of key results of the analysis of differentials are presented in this section.
Section 11 discusses conclusion recommendations for the next census

Central Statistical Office11
2. Household characteristics.
The following characteristics of regular households will be discussed in the section, the distribu-tion of households and population in those households, households’ composition and relationship to head of household. The census separates members of regular (private) households from people in institutions such as hospitals or hotels.
2.1 Household size
Table1 shows that in 2007 the total count of regular households enumerated was 212 195 with a resident total population of 1 005 206 people. From the data the household ranges from 1 to 20 members in a household. In Swaziland for every 50 households there are 9 households with 1 person. Similarly, for every 50 people 21 of them reside in a household of 8 or more members.
Table 1 : Distribution of households by household size for total country
Total CountryHousehold size Number of
households% Number of
People%
Total 212195 100 1005206 100 1 37461 18 37151 42 27942 13 55264 53 24314 11 72012 74 23999 11 94756 95 21826 10 107580 116 19032 9 112332 117 15187 7 104139 108+ 42434 20 421972 42
For urban and rural areas Table 2 indicates that in 2007 the total count of regular households enumerated was 48 576 with a resident total population of 155 190 people for urban. In addition for rural areas 850 016 people were resident in 163 619 households. In urban areas as the number of household members increases the number of households reduced. This phenomenon is the opposite in rural areas.
In urban areas for every 100 households there are 29 households with one person. Similarly, for every five people one of them resides in a household of eight or more members. For rural areas for every 50 households there are seven households with 1 household member. The most highlight for rural areas is that for every 25 households there are six households with 8 or more members. Like wise for every 50 people, 23 of them reside in a household of 8 or more members.

Central Statistical Office12
Table 2: Distribution of households by household size for urban and rural areas Household size Urban
Rural
Number of households
% Number of People
% Number of households
% Number of People
%
Total 48576 100 155190 100 163619 100 850016 100 1 14207 29 14055 9 23254 14 23096 32 9384 19 18464 12 18558 11 36800 43 6777 14 19875 13 17537 11 52137 64 5804 12 22608 15 18195 11 72148 85 4216 9 20320 13 17610 11 87260 106 2980 6 16968 11 16052 10 95364 117 1923 4 12397 8 13264 8 91742 118+ 3282 7 30503 20 39153 24 391469 46
Table 3 reveals that for the regions, the total count of regular households enumerated was 60 725 with a resident total population of 279 307 people for Hhohho. In addition for Manzini areas 313 963 people were resident in 72108 households.
In the Hhohho region for every 50 households there are nine households with one person. Simi-larly, for every 100 people there are 39 of them who reside in a household of eight or more mem-bers. For Manzini for every five households there is one household with one household member and for every 100 people there are 39 of them who reside in an eight or more household size.

Central Statistical Office13
Table 3: Distribution of households by household size for Hhohho and Manzini region Household size
Hhohho ManziniNumber of households
% Number of
People
% Number of households
% Number of
People
%
Total 60725 100 279307 100 72108 100 313963 100 1 11053 18 10965 4 14663 20 14530 52 7988 13 15800 6 11329 16 22392 73 7284 12 21588 8 8756 12 25869 84 7207 12 28476 10 8051 11 31672 105 6362 10 31370 11 6850 10 33585 116 5477 9 32334 12 5720 8 33522 117 4237 7 29043 10 4533 6 30800 108+ 11120 18 109731 39 12203 17 121593 39
Table 4 shows that the total count of regular households enumerated was 37 066 with a resident total population of 205 498 people for Shiselweni. In addition for Lubombo areas 42 296 people are resident in 206 438 households.
In the Shiselweni region for every 25 households there are three households with one person. Similarly, for every 100 people there are 49 of them who reside in a household of eight or more members. For Lubombo for every 100 households there are 17 households with one household member and for every 100 people there are 43 of them who reside in an eight or more household size.

Central Statistical Office14
Table 4: Distribution of households and household population by household size for Shiselweni and Lubombo region Household size
Shiselweni Lubombo
Number of households
% Number of People
% Number of households
% Number of
People
%
Total 37066 100 205498 100 42296 100 206438 100 1 4453 12 4416 2 7292 17 7240 42 3653 10 7232 4 4972 12 9840 53 3598 10 10683 5 4676 11 13872 74 3984 11 15788 8 4757 11 18820 95 4062 11 20125 10 4552 11 22500 116 3890 10 23118 11 3945 9 23358 117 3246 9 22463 11 3171 7 21833 118+ 10178 27 101673 49 8934 21 88975 43
Central Statistical Office15
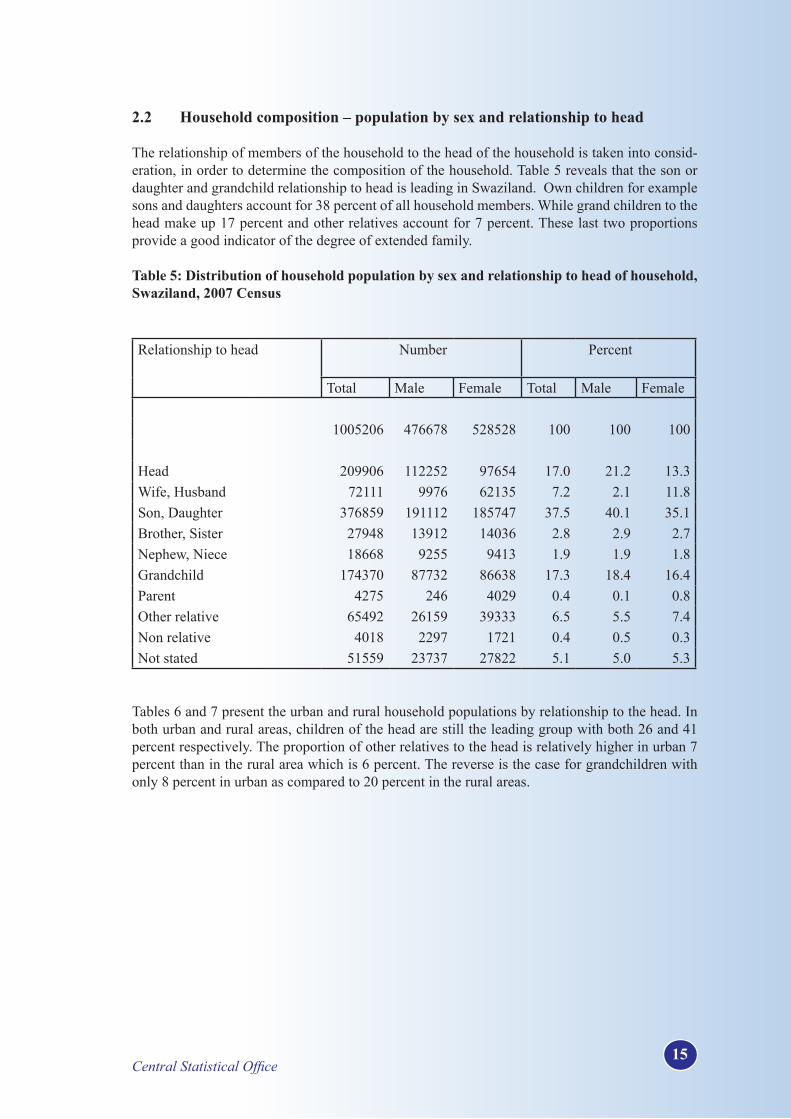
2.2 Household composition – population by sex and relationship to head
The relationship of members of the household to the head of the household is taken into consid-eration, in order to determine the composition of the household. Table 5 reveals that the son or daughter and grandchild relationship to head is leading in Swaziland. Own children for example sons and daughters account for 38 percent of all household members. While grand children to the head make up 17 percent and other relatives account for 7 percent. These last two proportions provide a good indicator of the degree of extended family.
Table 5: Distribution of household population by sex and relationship to head of household, Swaziland, 2007 Census
Relationship to head Number
Percent
Total Male Female Total Male Female 1005206 476678 528528 100 100 100 Head 209906 112252 97654 17.0 21.2 13.3Wife, Husband 72111 9976 62135 7.2 2.1 11.8Son, Daughter 376859 191112 185747 37.5 40.1 35.1Brother, Sister 27948 13912 14036 2.8 2.9 2.7Nephew, Niece 18668 9255 9413 1.9 1.9 1.8Grandchild 174370 87732 86638 17.3 18.4 16.4Parent 4275 246 4029 0.4 0.1 0.8Other relative 65492 26159 39333 6.5 5.5 7.4Non relative 4018 2297 1721 0.4 0.5 0.3Not stated 51559 23737 27822 5.1 5.0 5.3
Tables 6 and 7 present the urban and rural household populations by relationship to the head. In both urban and rural areas, children of the head are still the leading group with both 26 and 41 percent respectively. The proportion of other relatives to the head is relatively higher in urban 7 percent than in the rural area which is 6 percent. The reverse is the case for grandchildren with only 8 percent in urban as compared to 20 percent in the rural areas.

Central Statistical Office16
Table 6: Urban distribution of household population by sex and relationship to head of household, Swaziland, 2007 Census
Relationship to head
Number
Percent
Total Male Female Total Male Female 219147 104125 115022 100 100 100 Head 60128 35386 24741 27.4 34.0 21.5Wife, Husband 19571 3871 15700 8.9 3.7 13.6Son, Daughter 56650 27584 29066 25.9 26.5 25.3Brother, Sister 11216 5143 6073 5.1 4.9 5.3Nephew, Niece 9483 4255 5228 4.3 4.1 4.5Grandchild 17409 8160 9249 7.9 7.8 8.0Parent 6237 2650 3587 2.8 2.5 3.1Other relative 15402 6201 9201 7.0 6.0 8.0Non relative 7293 3358 3935 3.3 3.2 3.4Not stated 15760 7516 8244 7.2 7.2 7.2
Table 7: Rural distribution of household population by sex and relationship to head of household, Swaziland, 2007 Census
Relationship to head
Number PercentTotal Male Female Total Male Female
Total 786059 369500 416559 100 100 100 Head 150996 76310 74687 19.2 20.7 17.9Wife, Husband 53151 5827 47323 6.8 1.6 11.4Son, Daughter 320820 163250 157569 40.8 44.2 37.8Brother, Sister 17343 8491 8851 2.2 2.3 2.1Nephew, Niece 9796 4722 5073 1.2 1.3 1.2Grandchild 157572 79294 78277 20.0 21.5 18.8Parent 2071 730 1341 0.3 0.2 0.3Other relative 50701 19680 31020 6.4 5.3 7.4Non relative 3759 1574 2185 0.5 0.4 0.5Not stated 19853 9621 10232 2.5 2.6 2.5

Central Statistical Office17
Table 8 shows the distribution of households by area and by the sex of the head of the household. It can be seen that, for the country as a whole, there are slightly more male- headed households at 53 percent than female-headed ones which contribute 47 percent. The proportion of male-headed households is relatively higher in urban than rural areas, at 62 percent and 51 percent respectively.
The sex of household head varies significantly between the regions. Hhohho, Manzini, Lubombo regions are the only regions where the proportions of the female household heads is than 47 per-cent or less. For Shiselweni, the proportion of female-headed households is about 53 percent or more.
Table 8: Distribution of households by area and sex of the head of household, Swaziland, 2007 Census
Area Number Percent
Total Male Female Male Female Swaziland 212195 113397 98798 53.4 46.6 Urban 48576 30264 18312 62.3 37.7Rural 163619 83133 80486 50.8 49.2 Hhohho 60725 33751 26974 55.6 44.4Manzini 72108 38606 33502 53.5 46.5Shiselweni 37066 17523 19543 47.3 52.7Lubombo 42296 23517 18779 55.6 44.4

Central Statistical Office18
3. Characteristics of heads of households
3.1 Head of households by age and sex
Table 8 shows the distribution of households by broad age groups, area and by the sex of the head of the household. It can be seen that, for the country as a whole, that the highest of household headship happens in the age group 30 – 34 regardless of sex, which 34 percent of the total house-holds . There are slightly more male- headed households at 36 percent than female-headed ones which contribute 32 percent. However, in the age bracket of 60 years or more, there are more female-headed households at 20 percent compared to 15 percent of male – headed households.
Table 9: Distribution of households by age group and sex of head of household for total country Age Group Number Percent
Total Male Female Total Male Female Swaziland 212195 113397 98798 100 100 100 10 - 14 3041 1714 1327 1.4 1.5 1.315 - 29 50422 27155 23267 23.8 23.9 23.630 - 44 72581 40561 32020 34.2 35.8 32.445 - 59 48514 26673 21841 22.9 23.5 22.160 + 37382 17159 20223 17.6 15.1 20.5Not stated 255 135 120 0.1 0.1 0.1
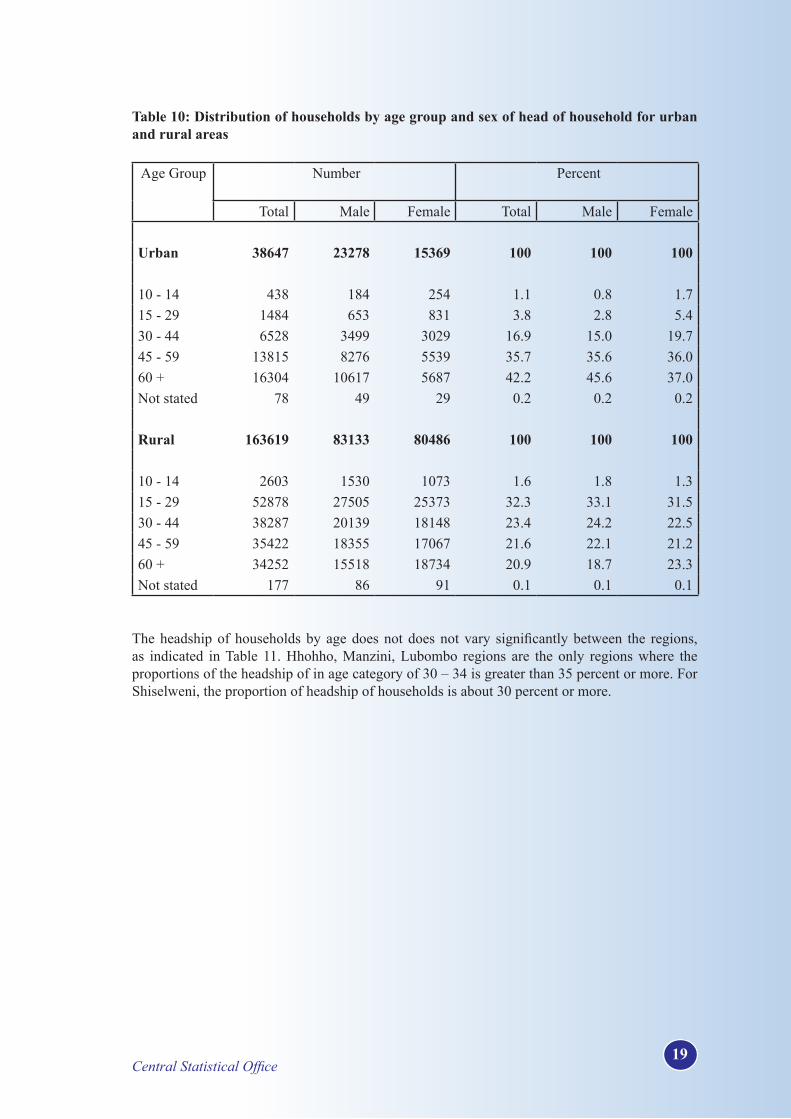
The proportion of household headship is relatively higher in urban than rural areas for age brackets 45 – 59 and 60 and more years, respectively. The percentage distribution is 36 and 42 percent for urban, compared to 22 and 21 percent for rural areas. However, in the age groups bracket of 30 – 44 this pattern is the opposite the headship percentage is 17 percent for the urban and 23 percent for the rural areas.
Central Statistical Office19
Table 10: Distribution of households by age group and sex of head of household for urban and rural areas Age Group Number
Percent
Total Male Female Total Male Female
Urban 38647 23278 15369 100 100 100 10 - 14 438 184 254 1.1 0.8 1.715 - 29 1484 653 831 3.8 2.8 5.430 - 44 6528 3499 3029 16.9 15.0 19.745 - 59 13815 8276 5539 35.7 35.6 36.060 + 16304 10617 5687 42.2 45.6 37.0Not stated 78 49 29 0.2 0.2 0.2 Rural 163619 83133 80486 100 100 100 10 - 14 2603 1530 1073 1.6 1.8 1.315 - 29 52878 27505 25373 32.3 33.1 31.530 - 44 38287 20139 18148 23.4 24.2 22.545 - 59 35422 18355 17067 21.6 22.1 21.260 + 34252 15518 18734 20.9 18.7 23.3Not stated 177 86 91 0.1 0.1 0.1
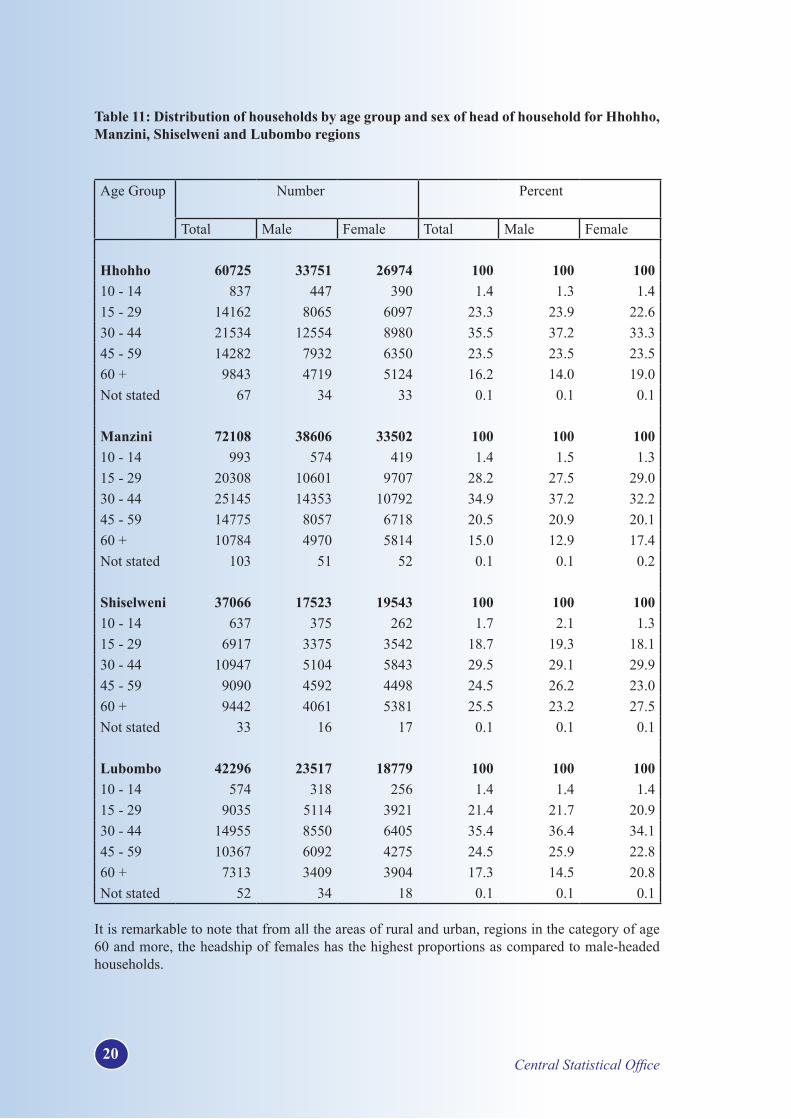
The headship of households by age does not does not vary significantly between the regions, as indicated in Table 11. Hhohho, Manzini, Lubombo regions are the only regions where the proportions of the headship of in age category of 30 – 34 is greater than 35 percent or more. For Shiselweni, the proportion of headship of households is about 30 percent or more.
Central Statistical Office20
Table 11: Distribution of households by age group and sex of head of household for Hhohho, Manzini, Shiselweni and Lubombo regions
Age Group Number Percent
Total Male Female Total Male Female
Hhohho 60725 33751 26974 100 100 10010 - 14 837 447 390 1.4 1.3 1.415 - 29 14162 8065 6097 23.3 23.9 22.630 - 44 21534 12554 8980 35.5 37.2 33.345 - 59 14282 7932 6350 23.5 23.5 23.560 + 9843 4719 5124 16.2 14.0 19.0Not stated 67 34 33 0.1 0.1 0.1 Manzini 72108 38606 33502 100 100 10010 - 14 993 574 419 1.4 1.5 1.315 - 29 20308 10601 9707 28.2 27.5 29.030 - 44 25145 14353 10792 34.9 37.2 32.245 - 59 14775 8057 6718 20.5 20.9 20.160 + 10784 4970 5814 15.0 12.9 17.4Not stated 103 51 52 0.1 0.1 0.2 Shiselweni 37066 17523 19543 100 100 10010 - 14 637 375 262 1.7 2.1 1.315 - 29 6917 3375 3542 18.7 19.3 18.130 - 44 10947 5104 5843 29.5 29.1 29.945 - 59 9090 4592 4498 24.5 26.2 23.060 + 9442 4061 5381 25.5 23.2 27.5Not stated 33 16 17 0.1 0.1 0.1 Lubombo 42296 23517 18779 100 100 10010 - 14 574 318 256 1.4 1.4 1.415 - 29 9035 5114 3921 21.4 21.7 20.930 - 44 14955 8550 6405 35.4 36.4 34.145 - 59 10367 6092 4275 24.5 25.9 22.860 + 7313 3409 3904 17.3 14.5 20.8Not stated 52 34 18 0.1 0.1 0.1
It is remarkable to note that from all the areas of rural and urban, regions in the category of age 60 and more, the headship of females has the highest proportions as compared to male-headed households.

Central Statistical Office21
3.2 Head of households by level of school/literacy programme attended
The Swaziland Population and Housing Census asked all persons, aged six years and over, about school attendance and highest level of education attained. Educational attainment question was put to people who are presently attending or have left school, college or university.
This question seeks to find out the highest level of school or literacy program that the person at-tended and how many years of schooling did he/she complete at that level. The level of school can be preschool, lower primary, secondary or high school, college or university. The literacy program could be ‘Sebenta’.
About a third, which is 32 percent of heads of households have attained higher primary of educa-tion. In addition, 43 percent of represents heads of households with secondary and high school education. There is a small proportion of about 5 percent of heads of households has university education.
Table 12: Distribution of heads of households by sex and by education level for total country
Education Level Percent Percent
Total Male Female Total Male Female Swaziland 160651 88344 72307 100 100 100 Preschool 9945 5330 4615 6.2 6.0 6.4Literacy Program 3418 1622 1796 2.1 1.8 2.5Lower Primary 7241 3719 3522 4.5 4.2 4.9Standards 51738 26380 25358 32.2 29.9 35.1Secondary, High school
69541 39169 30372 43.3 44.3 42.0
College 11290 6975 4315 7.0 7.9 6.0University 7478 5149 2329 4.7 5.8 3.2
There is a clear variation between proportions of household heads of urban and rural areas for heads with secondary and high school education as indicated in Table 13. For urban for every 25 households heads, 12 of them have secondary or high school education. Whereas, in rural areas for every 50 household heads, 21 of the house heads have secondary or high school education.
However, for heads with higher primary education the scenario is different. For every five house-hold heads in urban, one has higher primary education. Whereas in rural areas for every 100 household heads, 37 have higher primary education.

Central Statistical Office22
Table 13: Distribution of heads of households by sex and by education level for urban and rural areas
Education Level Number Percent
Total Male Female Total Male Female Urban 41980 26490 15490 100 100 100 Preschool 2246 1395 851 5.4 5.3 5.5Literacy Program 443 272 171 1.1 1.0 1.1Lower Primary 951 579 372 2.3 2.2 2.4Standards 8425 5068 3357 20.1 19.1 21.7Secondary, High school
20261 12856 7405 48.3 48.5 47.8
College 5525 3497 2028 13.2 13.2 13.1University 4129 2823 1306 9.8 10.7 8.4 Rural 118671 61854 56817 100 100 100 Preschool 7699 3935 3764 6.5 6.4 6.6Literacy Program 2975 1350 1625 2.5 2.2 2.9Lower Primary 6290 3140 3150 5.3 5.1 5.5Standards 43313 21312 22001 36.5 34.5 38.7Secondary, High school
49280 26313 22967 41.5 42.5 40.4
College 5765 3478 2287 4.9 5.6 4.0University 3349 2326 1023 2.8 3.8 1.8
Table 14 reveals that across the four regions there are no clear variations between the household heads with secondary or high school education. The proportions are 44 and 47 percent for Hhohho and Manzini respectively. In addition, it is equal for both Shiselweni and Lubombo 39 percent.

Central Statistical Office23
Table 14: Distribution of heads of households by sex and by education level for Hhohho, Manzini, and Shiselweni and Lubombo regions Education Level Number Percent
Total Male Female Total Male FemaleHhohho 46823 26989 19834 100 100 100Preschool 2989 1769 1220 6.4 6.6 6.2Literacy Program 998 495 503 2.1 1.8 2.5Lower Primary 1652 876 776 3.5 3.2 3.9Standards 13444 7159 6285 28.7 26.5 31.7Secondary, High school 20722 12169 8553 44.3 45.1 43.1College 4102 2517 1585 8.8 9.3 8.0University 2916 2004 912 6.2 7.4 4.6 Manzini 58439 31974 26465 100.0 100.0 100.0
Preschool 3742 1984 1758 6.4 6.2 6.6Literacy Program 823 360 463 1.4 1.1 1.7Lower Primary 2141 1085 1056 3.7 3.4 4.0Standards 16984 8513 8471 29.1 26.6 32.0Secondary, High school 27453 15317 12136 47.0 47.9 45.9College 4192 2599 1593 7.2 8.1 6.0University 3104 2116 988 5.3 6.6 3.7 Shiselweni 26770 12695 14075 100 100 100Preschool 1734 807 927 6.5 6.4 6.6Literacy Program 557 269 288 2.1 2.1 2.0Lower Primary 1756 810 946 6.6 6.4 6.7Standards 10509 4743 5766 39.3 37.4 41.0Secondary, High school 10352 4954 5398 38.7 39.0 38.4College 1274 724 550 4.8 5.7 3.9University 588 388 200 2.2 3.1 1.4 Lubombo 28619 16686 11933 100 100 100Preschool 1480 770 710 5.2 4.6 5.9Literacy Program 1040 498 542 3.6 3.0 4.5Lower Primary 1692 948 744 5.9 5.7 6.2Standards 10801 5965 4836 37.7 35.7 40.5Secondary, High school 11014 6729 4285 38.5 40.3 35.9College 1722 1135 587 6.0 6.8 4.9University 870 641 229 3.0 3.8 1.9

Central Statistical Office24
3.3 Average household size
On the average, there are 5 persons per household in Swaziland. The average household sizes are presented by in table 15. The table reveals that, in Swaziland, as a whole, households are made up of 5 members. There exist clear differences between urban and rural areas, where the average household size for the urban is about 3 members and about 5 members for rural.
Similarly, there are relatively significant differences between regions, except Hhohho and Lubombo which have 5 members per household respectively. The Manzini region has the smallest, 4 members and Shiselweni has the highest 6 members per household.
Table 15: Average number of persons per household, Swaziland, 2007 Census
Area Average number of persons per household
Swaziland 4.7
Urban 3.2Rural 5.2
RegionsHhohho 4.6Manzini 4.4Shiselweni 5.5Lubombo 4.9
3.4 Head of households by sex and activity status
According the Census activity/work status refers to the status in employment of an economically active individual, that is those who have been classified as working or have worked in the last 7 days (21 to 27 April 2007).
From Table 16 it can be observed that the largest group of household’s heads are engaged in the private sector and constitute 26 percent of all household heads. There are significant differences between males and females with 34 percent and 26 percent respectively. The second largest group of households are engaged in the Public service and self employment. There are more female heads in self employment 19 percent, compared to 15 percent male heads.

Central Statistical Office25
Table 16: Distribution of heads of households by sex and by activity status for total country Activity status Number Percent
Total Male Female Total Male Female Swaziland 113132 72233 40899 100 100 100 Employer 5483 3690 1793 4.8 5.1 4.4Self employed 18294 10530 7764 16.2 14.6 19.0Public service 18969 12751 6218 16.8 17.7 15.2Private sector 35252 24604 10648 31.2 34.1 26.0Family farm, business
3752 2223 1529 3.3 3.1 3.7
Other 10650 5871 4779 9.4 8.1 11.7Not stated 20732 12564 8168 18.3 17.4 20.0
From Table 17, it can be observed that there are significant differences between rural and areas for household heads in the private sector, 38 percent for urban compared to 28 percent in rural areas. In this group, for urban areas 41 percent are male heads and 32 percent constitute female heads. In the rural areas, 30 percent are male heads compared to 23 percent of female heads.
About 12 percent of urban household heads are in the self employed category, compared to 19 percent of rural household heads. For rural areas there are more female heads in the self employed category than male heads, which 23 percent and 16 percent respectively.

Central Statistical Office26
Table 17: Distribution of heads of households by sex and by activity status for urban and rural areas Activity status Number Percent
Total Male Female Total Male Female Urban 39569 26356 13213 100 100 100 Employer 1651 1137 514 4.2 4.3 3.9Self employed 4623 3157 1466 11.7 12.0 11.1Public service 7792 5106 2686 19.7 19.4 20.3Private sector 14941 10681 4260 37.8 40.5 32.2Family farm, business 817 454 363 2.1 1.7 2.7Other 3404 1679 1725 8.6 6.4 13.1Not stated 6341 4142 2199 16.0 15.7 16.6 Rural 73563 45877 27686 100 100 100 Employer 3832 2553 1279 5.2 5.6 4.6Self employed 13671 7373 6298 18.6 16.1 22.7Public service 11177 7645 3532 15.2 16.7 12.8Private sector 20311 13923 6388 27.6 30.3 23.1Family farm, business 2935 1769 1166 4.0 3.9 4.2Other 7246 4192 3054 9.9 9.1 11.0Not stated 14391 8422 5969 19.6 18.4 21.6
In the regions female heads of households slightly out number males heads in the self employed category, as Table 18 indicates. However, in both Private and Public sectors male heads of house-holds dominate.

Central Statistical Office27
Table 18: Distribution of heads of households by sex and by activity status for Hhohho, Manzini, Shiselweni and Lubombo regions
Activity status Number PercentTotal Male Female Total Male Female
Hhohho 34940 22715 12225 100 100 100Employer 1837 1300 537 5.3 5.7 4.4Self employed 6262 3795 2467 17.9 16.7 20.2Public service 6609 4334 2275 18.9 19.1 18.6Private sector 9825 7135 2690 28.1 31.4 22.0Family farm, business
1067 575 492 3.1 2.5 4.0
Other 3404 1862 1542 9.7 8.2 12.6Not stated 5936 3714 2222 17.0 16.4 18.2 Manzini 42711 26140 16571 100.0 100.0 100.0Employer 2585 1584 1001 6.1 6.1 6.0Self employed 7192 4253 2939 16.8 16.3 17.7Public service 6998 4799 2199 16.4 18.4 13.3Private sector 11506 7281 4225 26.9 27.9 25.5Family farm, business
1262 762 500 3.0 2.9 3.0
Other 4367 2306 2061 10.2 8.8 12.4Not stated 8801 5155 3646 20.6 19.7 22.0 Shiselweni 13941 8274 5667 100 100 100Employer 371 274 97 2.7 3.3 1.7Self employed 2293 1202 1091 16.4 14.5 19.3Public service 2653 1733 920 19.0 20.9 16.2Private sector 4412 2665 1747 31.6 32.2 30.8Family farm, business
548 340 208 3.9 4.1 3.7
Other 1221 708 513 8.8 8.6 9.1Not stated 2443 1352 1091 17.5 16.3 19.3 Lubombo 21540 15104 6436 100 100 100Employer 690 532 158 3.2 3.5 2.5Self employed 2547 1280 1267 11.8 8.5 19.7Public service 2709 1885 824 12.6 12.5 12.8Private sector 9509 7523 1986 44.1 49.8 30.9Family farm, business
875 546 329 4.1 3.6 5.1
Other 1658 995 663 7.7 6.6 10.3Not stated 3552 2343 1209 16.5 15.5 18.8

Central Statistical Office28
3.5 Head of households by sex and employment status
Employment/Occupation status refers to the kind of work the person does or the kind of work he/she did, when she was working for the first time. This question is to enquire specifically about the nature of the job he/she was doing most of the time in the last 7 days that is 21 to 27 April 2007.
Table 19 shows that the largest occupational group is elementary occupations, which include labourers and other unskilled occupations, and constitute 23 percent of all employed household heads. There are no major differences between males and females heads. The second largest occupational group by size for household heads is Services Workers, who make up 17 percent. Female heads slightly outnumber male heads in this category, 18 and 16 percent respectively.
For urban and rural, as well as regions the pattern follows that observed at national level. There are no significant variations between and within regions, as indicated by Tables 20, 21 and 22 correspondingly.
Table 19: Distribution of heads of households by sex and employment status for total country Employment status Number Percent
Total Male Female Total Male Female Total 114490 73066 41424 100.0 100.0 100.0 Legislators 3998 3274 724 3.5 4.5 1.7Professionals 9752 5428 4324 8.5 7.4 10.4Technicians 3625 2520 1105 3.2 3.4 2.7Clerks 5160 2325 2835 4.5 3.2 6.8Service workers 19225 11588 7637 16.8 15.9 18.4Skilled Agricultural & fishery workers
5932 4067 1865 5.2 5.6 4.5
Craft& related trades workers
17422 13464 3958 15.2 18.4 9.6
Plant &Machine operators & Assemblers
13653 9328 4325 11.9 12.8 10.4
Elementary occupations 26540 15249 11291 23.2 20.9 27.3Not stated 9183 5823 3360 8.0 8.0 8.1

Central Statistical Office29
Table 20: Distribution of heads of households by sex and employment status for urban and rural areas Employment status
Urban Rural Number
Total Percent Number
TotalPercent
Total Male Female Total Male Female Total 39840 100.0 100.0 100.0 74650 100.0 100.0 100.0 Legislators 2179 5.5 6.7 2.9 1819 2.4 3.2 1.2Professionals 4253 10.7 9.2 13.6 5499 7.4 6.4 9.0Technicians 1552 3.9 4.1 3.6 2073 2.8 3.1 2.2Clerks 2671 6.7 4.2 11.6 2489 3.3 2.6 4.6Service workers
7706 19.3 18.5 21.1 11519 15.4 14.4 17.2
Skilled Agricultural & fishery workers
1116 2.8 3.4 1.7 4816 6.5 6.8 5.8
Craft& related trades workers
5302 13.3 17.2 5.5 12120 16.2 19.1 11.5
Plant &Machine operators & Assemblers
3899 9.8 12.1 5.2 9754 13.1 13.2 12.9
Elementary occupations
8856 22.2 18.4 29.8 17684 23.7 22.3 26.1
Not stated 2306 5.8 6.2 5.1 6877 9.2 9.0 9.6

Central Statistical Office30
Table 21: Distribution of heads of households by sex and employment status for Hhohho and Manzini regions
Employment status
Hhohho
Manzini
TotalNumber
Percent TotalNumber
PercentTotal Male Female Total Male Female
Total 35262 100.0 100.0 100.0 43382 100.0 100.0 100.0 Legislators 1364 3.9 4.8 2.1 1616 3.7 4.8 2.0Professionals 3425 9.7 8.6 11.9 3638 8.4 7.7 9.5Technicians 1168 3.3 3.5 3.0 1317 3.0 3.4 2.4Clerks 2175 6.2 4.1 10.1 1833 4.2 3.0 6.1Service workers 6375 18.1 16.9 20.2 7880 18.2 18.3 17.9Skilled Agricul-tural & fishery workers
1681 4.8 5.2 4.0 1738 4.0 4.5 3.2
Craft& related trades workers
5568 15.8 20.0 8.0 7461 17.2 20.9 11.4
Plant &Machine operators &Assemblers
2701 7.7 10.7 1.9 6779 15.6 14.0 18.2
Elementary occupations
8345 23.7 19.3 31.8 7810 18.0 15.1 22.5
Not stated 2460 7.0 6.9 7.1 3310 7.6 8.2 6.7

Central Statistical Office31
Table 22: Distribution of heads of households by sex and employment status for Shiselweni and Lubombo regions Employment status
Shiselweni
Lubombo
TotalNumber
Percent
Total
Number
Percent
Total Male Female Total Male Female Total 14126 100.0 100.0 100.0 21720 100.0 100.0 100.0 Legislators 215 1.5 2.1 0.7 803 3.7 4.7 1.4Professionals 1297 9.2 8.3 10.5 1392 6.4 4.8 10.2Technicians 543 3.8 4.1 3.5 597 2.7 3.1 2.0Clerks 392 2.8 2.1 3.7 760 3.5 2.7 5.4Service workers 1947 13.8 13.3 14.5 3023 13.9 11.4 19.9Skilled Agricul-tural & fishery workers
1204 8.5 8.9 8.0 1309 6.0 6.1 5.8
Craft& related trades workers
1864 13.2 15.1 10.5 2529 11.6 13.7 6.8
Plant &Machine operators & Assemblers
1882 13.3 12.1 15.0 2291 10.5 14.1 2.3
Elementary occupations
3298 23.3 24.7 21.3 7087 32.6 31.1 36.2
Not stated 1484 10.5 9.3 12.3 1929 8.9 8.4 10.0
3.6 Head of households by sex and industrial status
The industry identifies the type of product, service, or activity produced or provided by the individual (and work mates if applicable) at the place where he/she works. In the Census industry refers to the product or services or main functions or activities of the ‘Work Place’.
The distribution of employed household heads by industry is presented in Table 23.The Manufacturing, Agriculture, and Wholesale and retail trade employ about a total of about 40 percent household heads. About 16 percent of female-head of households are in the wholesale and retail trade, compared to 9 percent of male-head of households.
The industrial sector of Agriculture, Construction, Public Administration, and Transport is heavily Male-heads dominated.

Central Statistical Office32
Table 23: Distribution of heads of households by sex and industrial status for total country Industrial status Number
Percent
Total Male Female Total Male Female Total 114442 73041 41401 100.0 100.0 100.0 Agriculture 14883 10763 4120 13.0 14.7 10.0Mining & quarrying
2365 2186 179 2.1 3.0 0.4
Manufacturing 17920 9690 8230 15.7 13.3 19.9Electricity 1705 1586 119 1.5 2.2 0.3Construction 7501 7230 271 6.6 9.9 0.7Wholesale & retail trade
13323 6600 6723 11.6 9.0 16.2
Hotels & restaurants
2172 838 1334 1.9 1.1 3.2
Transport 6542 6048 494 5.7 8.3 1.2Financial 3096 2592 504 2.7 3.5 1.2Real estate 4933 3176 1757 4.3 4.3 4.2Public Admin 9327 7520 1807 8.1 10.3 4.4Education 6514 3210 3304 5.7 4.4 8.0Social work without accommodation
2415 1027 1388 2.1 1.4 3.4
Community, Social
6163 4008 2155 5.4 5.5 5.2
Private households
7679 1964 5715 6.7 2.7 13.8
Extra - Territorial
44 33 11 0.0 0.0 0.0
Not stated 7860 4570 3290 6.9 6.3 7.9 In urban and rural, as well as in all the regions the pattern follows that observed at national level. There are no significant variations between and within regions, as indicated by Tables 24, 25 and 26 respectively.

Central Statistical Office33
Table 24: Distribution of heads of households by sex and industrial status for urban and rural areas Industrial status
Urban Rural
NumberTotal
Percent NumberTotal
PercentTotal Male Female Total Male Female
Total 39817 100.0 100.0 100.0 74625 100.0 100.0 100.0 Agriculture 4385 11.0 13.5 6.0 10498 14.1 15.4 11.8Mining & quarrying
170 0.4 0.5 0.2 2195 2.9 4.4 0.5
Manufacturing 5443 13.7 14.5 11.9 12477 16.7 12.5 23.6Electricity 828 2.1 2.8 0.6 877 1.2 1.8 0.2Construction 2250 5.7 8.2 0.6 5251 7.0 10.9 0.7Wholesale & retail trade
4461 11.2 10.1 13.3 8862 11.9 8.4 17.6
Hotels & restaurants
828 2.1 1.1 4.0 1344 1.8 1.2 2.9
Transport 2175 5.5 7.4 1.6 4367 5.9 8.8 1.0Financial 1461 3.7 4.3 2.5 1635 2.2 3.1 0.6Real estate 2398 6.0 5.6 6.9 2535 3.4 3.6 3.0Public Admin 4421 11.1 12.8 7.7 4906 6.6 8.9 2.8Education 2029 5.1 3.8 7.6 4485 6.0 4.7 8.1Social work without accommodation
1111 2.8 1.7 5.0 1304 1.7 1.2 2.6
Community, Social
2613 6.6 6.3 7.1 3550 4.8 5.0 4.3
Private households
3189 8.0 2.1 19.7 4490 6.0 3.0 11.0
Extra - Territorial
17 0.0 0.0 0.0 27 0.0 0.0 0.0
Not stated 2038 5.1 5.0 5.3 5822 7.8 7.0 9.2

Central Statistical Office34
Table 25: Distribution of heads of households by sex and industrial status for Hhohho and Manzini regions Industrial status
Hhohho Manzini
NumberTotal
Percent NumberTotal
PercentTotal Male Female Total Male Female
Total 35238 100.0 100.0 100.0 43392 100.0 100.0 100.0 Agriculture 4256 12.1 13.6 9.2 3544 8.2 9.5 6.0Mining & quarrying
500 1.4 2.0 0.3 390 0.9 1.3 0.3
Manufacturing 3245 9.2 9.1 9.3 8583 19.8 13.9 29.1Electricity 600 1.7 2.4 0.4 743 1.7 2.6 0.3Construction 2865 8.1 12.1 0.7 2839 6.5 10.2 0.7Wholesale & retail trade
4109 11.7 9.3 16.1 5930 13.7 11.7 16.8
Hotels & restaurants
980 2.8 2.0 4.3 766 1.8 1.0 2.9
Transport 2039 5.8 8.1 1.5 2631 6.1 9.2 1.1Financial 1292 3.7 4.6 1.9 1009 2.3 3.1 1.1Real estate 1931 5.5 5.2 5.9 2294 5.3 5.7 4.6Public Admin 3468 9.8 11.8 6.2 3841 8.9 11.9 4.1Education 1903 5.4 4.1 7.7 2502 5.8 4.7 7.4Social work without accommodation
778 2.2 1.4 3.8 846 1.9 1.4 2.8
Community, Social
2121 6.0 5.9 6.3 2478 5.7 6.0 5.3
Private households
3041 8.6 2.7 19.6 2546 5.9 2.3 11.4
Extra - Territorial 10 0.0 0.0 0.0 20 0.0 0.1 0.0Not stated 2100 6.0 5.6 6.7 2430 5.6 5.3 6.1

Central Statistical Office35
Table 26: Distribution of heads of households by sex and industrial status for Shiselweni and Lubombo regions Industrial status
Shiselweni Lubombo
NumberTotal
Percent
NumberTotal
Percent
Total Male Female Total Male Female Total 14114 100.0 100.0 100.0 21698 100.0 100.0 100.0 Agriculture 2159 15.3 16.9 13.0 4924 22.7 24.3 18.9Mining & quarrying
682 4.8 7.7 0.6 793 3.7 4.8 1.0
Manufacturing 2317 16.4 11.6 23.5 3775 17.4 19.4 12.8Electricity 109 0.8 1.2 0.2 253 1.2 1.6 0.2Construction 636 4.5 7.4 0.3 1161 5.4 7.3 0.7Wholesale & retail trade
1557 11.0 7.5 16.2 1727 8.0 4.9 15.1
Hotels & restaurants
169 1.2 0.6 2.0 257 1.2 0.4 3.0
Transport 662 4.7 7.2 1.0 1210 5.6 7.5 1.1Financial 261 1.8 2.8 0.5 534 2.5 3.1 1.0Real estate 226 1.6 1.6 1.6 482 2.2 2.1 2.4Public Admin 932 6.6 9.1 2.9 1086 5.0 5.9 2.9Education 1167 8.3 6.7 10.5 942 4.3 2.9 7.7Social work withoutaccommodation
329 2.3 1.8 3.2 462 2.1 1.3 4.1
Community, Social
711 5.0 5.7 4.1 853 3.9 3.9 4.0
Private households
801 5.7 3.6 8.7 1291 5.9 2.8 13.5
Extra - Territorial
10 0.1 0.1 0.0 4 0.0 0.0 0.0
Not stated 1386 9.8 8.5 11.8 1944 9.0 7.8 11.7
Central Statistical Office36
4. Housing unit characteristics
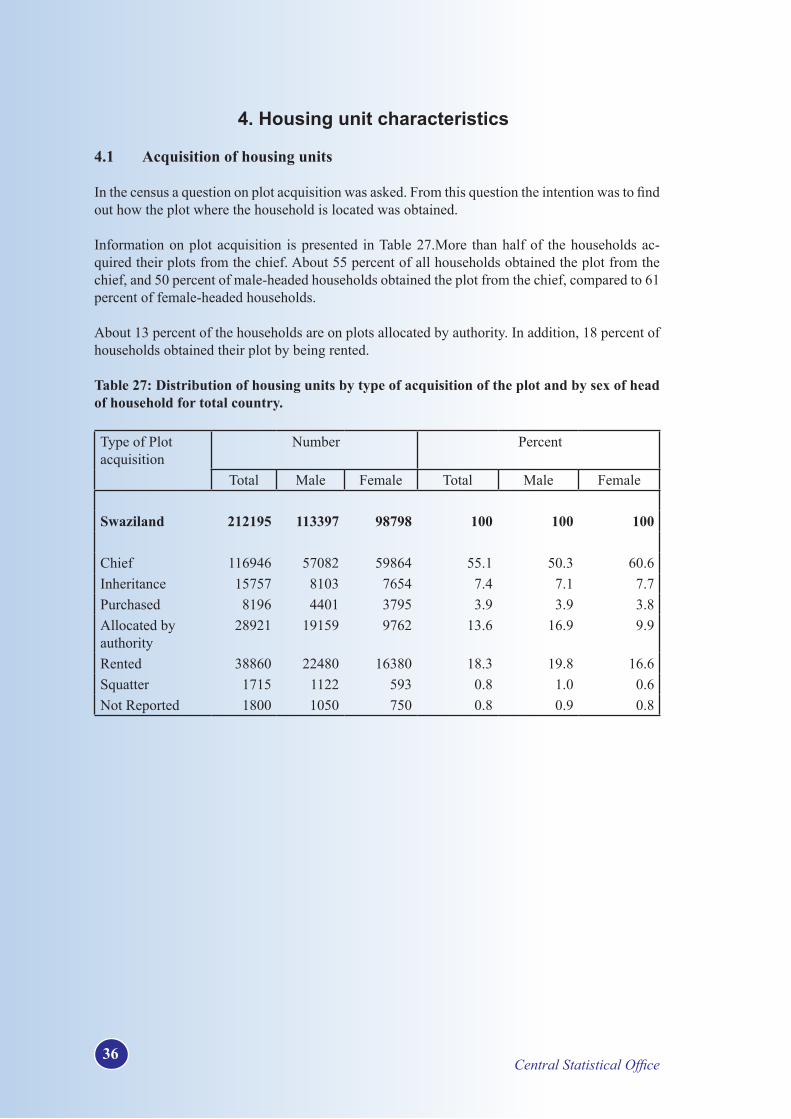
4.1 Acquisition of housing units
In the census a question on plot acquisition was asked. From this question the intention was to find out how the plot where the household is located was obtained.
Information on plot acquisition is presented in Table 27.More than half of the households ac-quired their plots from the chief. About 55 percent of all households obtained the plot from the chief, and 50 percent of male-headed households obtained the plot from the chief, compared to 61 percent of female-headed households.
About 13 percent of the households are on plots allocated by authority. In addition, 18 percent of households obtained their plot by being rented.
Table 27: Distribution of housing units by type of acquisition of the plot and by sex of head of household for total country.
Type of Plot acquisition
Number
Percent
Total Male Female Total Male Female Swaziland 212195 113397 98798 100 100 100 Chief 116946 57082 59864 55.1 50.3 60.6Inheritance 15757 8103 7654 7.4 7.1 7.7Purchased 8196 4401 3795 3.9 3.9 3.8Allocated by authority
28921 19159 9762 13.6 16.9 9.9
Rented 38860 22480 16380 18.3 19.8 16.6Squatter 1715 1122 593 0.8 1.0 0.6Not Reported 1800 1050 750 0.8 0.9 0.8

Central Statistical Office37
The reverse is true in urban and rural areas as shown in Table 28. In urban areas 10 percent of the households acquired their plot from the chief, whereby, about 9 percent were male-headed house-holds compared to 11 percent headed by females. For the urban areas 69 percent of households acquired their plot from the chief, with a distribution of 66 percent being male headed households and 72 percent female headed households.
About 12 percent of all households in rural areas rented their plot, compared to 40 percent in ur-ban areas. For, purchased plot acquisition its dominant in urban areas where 11 percent of house-holds purchased, compared to 2 percent in rural areas.
Table 28: Distribution of housing units by type of acquisition of the plot and by sex of head of household for urban and rural areas
Type of Plot acquisition
Number Percent
Total Male Female Total Male Female Urban 48576 30264 18312 100 100 100 Chief 4658 2579 2079 9.6 8.5 11.4Inheritance 1605 930 675 3.3 3.1 3.7Purchased 5254 2710 2544 10.8 9.0 13.9Allocated by authority
16463 11553 4910 33.9 38.2 26.8
Rented 19243 11668 7575 39.6 38.6 41.4Squatter 823 508 315 1.7 1.7 1.7Not Reported 530 316 214 1.1 1.0 1.2 Rural 163619 83133 80486 100 100 100 Chief 112288 54503 57785 68.6 65.6 71.8Inheritance 14152 7173 6979 8.6 8.6 8.7Purchased 2942 1691 1251 1.8 2.0 1.6Allocated by authority
12458 7606 4852 7.6 9.1 6.0
Rented 19617 10812 8805 12.0 13.0 10.9Squatter 892 614 278 0.5 0.7 0.3Not Reported 1270 734 536 0.8 0.9 0.7
Table 29 reveals that in all the four regions, more than half of the households acquired their plots from the Chief. The distribution for Hhohho, Manzini, Shiselweni and Lubombo are 55, 50, 67 and 54 percent respectively. In Hhohho and Lubombo a bigger proportion of the plots are allo-cated by authority, compared to Manzini and Shiselweni.
A major highlight in Table 29 is that in all the regions female-headed households are dominating when compared to male-headed households, for households that acquired plots from the Chief. The percentage distribution, stands at 60, 54, 70 and 63 for Hhohho, Manzini, Shiselweni and Lubombo correspondingly.

Central Statistical Office38
Table 29: Distribution of housing units by type of acquisition of the plot and by sex of head of household for Hhohho, Manzini, Shiselweni and Lubombo regions.
Type of Plot acquisition
Number Percent Total Male Female Total Male Female
Hhohho 60725 33751 26974 100 100 100Chief 33285 17085 16200 54.8 50.6 60.1Inheritance 4010 2247 1763 6.6 6.7 6.5Purchased 2875 1508 1367 4.7 4.5 5.1Allocated by authority
7523 4921 2602 12.4 14.6 9.6
Rented 12122 7432 4690 20.0 22.0 17.4Squatter 400 262 138 0.7 0.8 0.5Not Reported 510 296 214 0.8 0.9 0.8 Manzini 72108 38606 33502 100.0 100.0 100.0Chief 36022 17865 18157 50.0 46.3 54.2Inheritance 2886 1547 1339 4.0 4.0 4.0Purchased 3582 1991 1591 5.0 5.2 4.7Allocated by authority
7125 4497 2628 9.9 11.6 7.8
Rented 21003 11795 9208 29.1 30.6 27.5Squatter 813 535 278 1.1 1.4 0.8Not Reported 677 376 301 0.9 1.0 0.9 Shiselweni 37066 17523 19543 100 100 100Chief 24736 11115 13621 66.7 63.4 69.7Inheritance 4648 2289 2359 12.5 13.1 12.1Purchased 1163 597 566 3.1 3.4 2.9Allocated by authority
2905 1576 1329 7.8 9.0 6.8
Rented 3161 1678 1483 8.5 9.6 7.6Squatter 198 134 64 0.5 0.8 0.3Not Reported 255 134 121 0.7 0.8 0.6 Lubombo 42296 23517 18779 100 100 100Chief 22903 11017 11886 54.1 46.8 63.3Inheritance 4213 2020 2193 10.0 8.6 11.7Purchased 576 305 271 1.4 1.3 1.4Allocated by authority
11368 8165 3203 26.9 34.7 17.1
Rented 2574 1575 999 6.1 6.7 5.3Squatter 304 191 113 0.7 0.8 0.6Not Reported 358 244 114 0.8 1.0 0.6

Central Statistical Office39
4.2 Tenure of housing units
For a given the household a question was asked to find out its tenure status. The tenure indicates whether the dwelling unit was owner occupied or rented.
Table presents information on tenure of the households. Most of the housing units in the country are occupied by owners, about 69 percent. The majority are female- headed households, with a contribution of 75 percent compared to 64 percent of male-headed households. This trend is more common in rural areas than in urban areas, 82 and 27 percent, respectively.
Housing units occupied by renting is found in urban areas, about 40 percent compared to 12 per-cent in rural areas. About 10 percent of the households live in housing units provided by authority.
Table 30: Distribution of housing units by tenure and by sex of head of household for total country
Tenure Number PercentTotal Male Female Total Male Female
Swaziland 212195 113397 98798 100 100 100 Owner 146492 72554 73938 69.0 64.0 74.8Rented 39009 22574 16435 18.4 19.9 16.6Allocated by authority
22833 15854 6979 10.8 14.0 7.1
Other 2175 1404 771 1.0 1.2 0.8Not Reported 1686 1011 675 0.8 0.9 0.7

Central Statistical Office40
Table 31: Distribution of housing units by tenure and by sex of head of household for urban and rural areas
Tenure Number Percent
Total Male Female Total Male Female Urban 48576 30264 18312 100 100 100 Owner 13050 7078 5972 26.9 23.4 32.6Rented 19332 11723 7609 39.8 38.7 41.6Allocated by authority
14608 10484 4124 30.1 34.6 22.5
Other 1013 618 395 2.1 2.0 2.2Not Reported 573 361 212 1.2 1.2 1.2 Rural 163619 83133 80486 100 100 100 Owner 133442 65476 67966 81.6 78.8 84.4Rented 19677 10851 8826 12.0 13.1 11.0Allocated by authority
8225 5370 2855 5.0 6.5 3.5
Other 1162 786 376 0.7 0.9 0.5Not Reported 1113 650 463 0.7 0.8 0.6
Central Statistical Office41
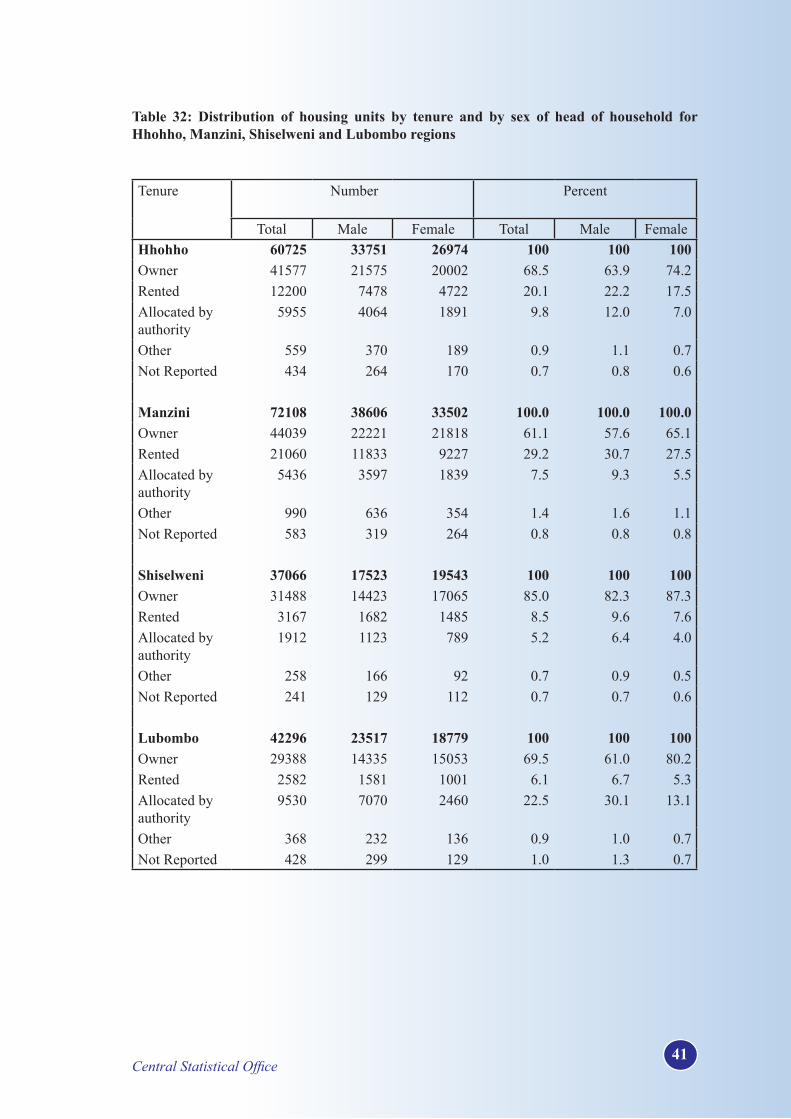
Table 32: Distribution of housing units by tenure and by sex of head of household for Hhohho, Manzini, Shiselweni and Lubombo regions
Tenure Number
Percent
Total Male Female Total Male FemaleHhohho 60725 33751 26974 100 100 100Owner 41577 21575 20002 68.5 63.9 74.2Rented 12200 7478 4722 20.1 22.2 17.5Allocated by authority
5955 4064 1891 9.8 12.0 7.0
Other 559 370 189 0.9 1.1 0.7Not Reported 434 264 170 0.7 0.8 0.6 Manzini 72108 38606 33502 100.0 100.0 100.0Owner 44039 22221 21818 61.1 57.6 65.1Rented 21060 11833 9227 29.2 30.7 27.5Allocated by authority
5436 3597 1839 7.5 9.3 5.5
Other 990 636 354 1.4 1.6 1.1Not Reported 583 319 264 0.8 0.8 0.8 Shiselweni 37066 17523 19543 100 100 100Owner 31488 14423 17065 85.0 82.3 87.3Rented 3167 1682 1485 8.5 9.6 7.6Allocated by authority
1912 1123 789 5.2 6.4 4.0
Other 258 166 92 0.7 0.9 0.5Not Reported 241 129 112 0.7 0.7 0.6 Lubombo 42296 23517 18779 100 100 100Owner 29388 14335 15053 69.5 61.0 80.2Rented 2582 1581 1001 6.1 6.7 5.3Allocated by authority
9530 7070 2460 22.5 30.1 13.1
Other 368 232 136 0.9 1.0 0.7Not Reported 428 299 129 1.0 1.3 0.7

Central Statistical Office42
4.3 Quality of housing units
The quality of housing is often used as a measure of the standard of living of a country and one of the most leading indicators of development. Better housing conditions are essential for human survivorship. Following food and clothing, the International Labour Organization (ILO) classifies housing as a basic need. Therefore, the absence of any of these three basic needs poses a danger to human life.
Information on the main materials used for construction of roofs, walls and floors are given in Tables 33 to 42.
4.3.1 Main material of the roof
Given the household structure, a question from the census was asked to establish the main material of the roof. If the housing structures were roofed with more than one type of material the most dominant one was recorded.
It can be seen from Table 33 that the most commonly used material for roofing in the country are corrugated iron sheets where more than half of the households reside in housing units with such roof. This proportion is even higher in rural areas than in urban areas. Households that live in housing units that whose main roofing material is thatch/grass constitute 13 percent of all households in the country. This percentage is far more in rural areas, about 13 percent than in urban which is about one percent, as shown in Table 34.
Table 34 reveals that at regional level, housing units with corrugated iron sheets are predominant in all the four regions. Manzini has the highest proportion of 87 percent, compared to the lowest Lubombo with 57 percent. Housing units whose roofs are constructed from thatched grass are most commonly found in Lubombo and Shiselweni.
In the Lubombo region, 13 out of 100 housing units have roofs covered by with asbestos sheets.
Table 33: Distribution of housing units by type of the main material of the roof and by sex of head of household for total country
Main roof material Number Percent
Total Male Female Total Male Female Swaziland 212195 113397 98798 100 100 100 Grass 27974 12984 14990 13.2 11.5 15.2Corrugated Iron 163630 87440 76190 77.1 77.1 77.1Asbestos 6620 4900 1720 3.1 4.3 1.7Tiles, slate, concrete 9147 5444 3703 4.3 4.8 3.7Traditional hut 1419 718 701 0.7 0.6 0.7Other 248 158 90 0.1 0.1 0.1Not Reported 3157 1753 1404 1.5 1.5 1.4

Central Statistical Office43
Table 34: Distribution of housing units by type of the main material of the roof and by sex of head of household for urban and rural areas Main roof material
Number
Percent
Total Male Female Total Male Female Urban 48576 30264 18312 100 100 100 Grass 400 215 185 0.8 0.7 1.0Corrugated Iron 35634 21697 13937 73.4 71.7 76.1Asbestos 6145 4506 1639 12.7 14.9 9.0Tiles, slate, concrete
5335 3196 2139 11.0 10.6 11.7
Traditional hut 171 110 61 0.4 0.4 0.3Other 76 44 32 0.2 0.1 0.2Not Reported 815 496 319 1.7 1.6 1.7 Rural 163619 83133 80486 100 100 100 Grass 27574 12769 14805 16.9 15.4 18.4Corrugated Iron 127996 65743 62253 78.2 79.1 77.3Asbestos 475 394 81 0.3 0.5 0.1Tiles, slate, concrete
3812 2248 1564 2.3 2.7 1.9
Traditional hut 1248 608 640 0.8 0.7 0.8Other 172 114 58 0.1 0.1 0.1Not Reported 2342 1257 1085 1.4 1.5 1.3

Central Statistical Office44
Table 35: Distribution of housing units by type of the main material of the roof and by sex of head of household for Hhohho, Manzini, Shiselweni and Lubombo regions Main roof material Number Percent
Total Male Female Total Male Female
Hhohho 60725 33751 26974 100 100 100Grass 5872 2814 3058 9.7 8.3 11.3Corrugated Iron 49615 27915 21700 81.7 82.7 80.4Asbestos 553 337 216 0.9 1.0 0.8Tiles, slate, concrete 3409 1961 1448 5.6 5.8 5.4Traditional hut 338 182 156 0.6 0.5 0.6Other 94 58 36 0.2 0.2 0.1Not Reported 844 484 360 1.4 1.4 1.3
Manzini 72108 38606 33502 100 100 100Grass 4182 1910 2272 5.8 4.9 6.8Corrugated Iron 62642 33590 29052 86.9 87.0 86.7Asbestos 369 262 107 0.5 0.7 0.3Tiles, slate, concrete 3334 1975 1359 4.6 5.1 4.1Traditional hut 384 216 168 0.5 0.6 0.5Other 57 37 20 0.1 0.1 0.1Not Reported 1140 616 524 1.6 1.6 1.6
Shiselweni 37066 17523 19543 100 100 100Grass 8192 3685 4507 22.1 21.0 23.1Corrugated Iron 27086 12903 14183 73.1 73.6 72.6Asbestos 32 18 14 0.1 0.1 0.1Tiles, slate, concrete 913 514 399 2.5 2.9 2.0Traditional hut 296 130 166 0.8 0.7 0.8Other 48 32 16 0.1 0.2 0.1Not Reported 499 241 258 1.3 1.4 1.3
Lubombo 42296 23517 18779 100 100 100Grass 9728 4575 5153 23.0 19.5 27.4Corrugated Iron 24287 13032 11255 57.4 55.4 59.9Asbestos 5666 4283 1383 13.4 18.2 7.4Tiles, slate, concrete 1491 994 497 3.5 4.2 2.6Traditional hut 401 190 211 0.9 0.8 1.1Other 49 31 18 0.1 0.1 0.1Not Reported 674 412 262 1.6 1.8 1.4

Central Statistical Office45
4.3.2 Main material of the wall
In a similar manner, under wall material the main material of the wall was recorded. If the housing structures have walls made of different material, the most dominant was recorded.
With respect to materials used for the construction of walls, cement bricks/blocks, mud and poles, as well as mud blocks predominate in the country. Close to 63 percent of households live in dwellings with walls made of cement bricks/blocks, while 23 percent reside in dwellings with walls made of mud and poles and about 7 percent reside in dwellings made of mud blocks.
In urban areas, cement blocks/bricks constitute 69 percent and mud and poles contribute 16 percent. On the other hand in rural areas cement blocks/bricks constitute 61 percent and mud and poles contribute 25 percent.
Walls constructed from cement blocks/bricks mostly common in the Manzini and Lubombo re-gions. Dwellings with walls constructed from mud and poles are mostly common in Hhohho and Shiselweni, 27 and 37 percent respectively.
Table 36: Distribution of housing units by type of the main material of the wall and by sex of head of household for total country
Main wall material
Number
Percent
Total Male Female Total Male Female Total 212195 113397 98798 100.0 100.0 100.0 Mud and poles 49002 24616 24386 23.1 21.7 24.7Stone 6679 3219 3460 3.1 2.8 3.5Grass 205 86 119 0.1 0.1 0.1Wood 1317 795 522 0.6 0.7 0.5Cement bricks, blocks
133892 72820 61072 63.1 64.2 61.8
Corrugated Iron
2844 1779 1065 1.3 1.6 1.1
Mud Blocks 14172 7848 6324 6.7 6.9 6.4Traditional hut 1571 775 796 0.7 0.7 0.8Not Reported 2513 1459 1054 1.2 1.3 1.1

Central Statistical Office46
Table 37: Distribution of housing units by type of the main material of the wall and by sex of head of household for urban and rural areas
Main wallmaterial
Number
Percent
Total Male Female Total Male Female Urban 48576 30264 18312 100.0 100.0 100.0 Mud and poles 7829 4616 3213 16.1 15.3 17.5Stone 348 190 158 0.7 0.6 0.9Grass 25 10 15 0.1 0.0 0.1Wood 486 318 168 1.0 1.1 0.9Cement bricks, blocks
33477 20974 12503 68.9 69.3 68.3
Corrugated Iron 729 518 211 1.5 1.7 1.2Mud Blocks 4825 3110 1715 9.9 10.3 9.4Traditional hut 171 110 61 0.4 0.4 0.3Not Reported 686 418 268 1.4 1.4 1.5 Rural 163619 83133 80486 100.0 100.0 100.0 Mud and poles 41173 20000 21173 25.2 24.1 26.3Stone 6331 3029 3302 3.9 3.6 4.1Grass 180 76 104 0.1 0.1 0.1Wood 831 477 354 0.5 0.6 0.4Cement bricks, blocks
100415 51846 48569 61.4 62.4 60.3
Corrugated Iron 2115 1261 854 1.3 1.5 1.1Mud Blocks 9347 4738 4609 5.7 5.7 5.7Traditional hut 1400 665 735 0.9 0.8 0.9Not Reported 1827 1041 786 1.1 1.3 1.0

Central Statistical Office47
Table 38: Distribution of housing units by type of the main material of the wall and by sex of head of household for Hhohho and Manzini regions Main wallmaterial
Number
Percent
Total Male Female Total Male Female Hhohho 60725 33751 26974 100.0 100.0 100.0 Mud and poles 16180 8937 7243 26.6 26.5 26.9Stone 429 214 215 0.7 0.6 0.8Grass 52 25 27 0.1 0.1 0.1Wood 554 367 187 0.9 1.1 0.7Cement bricks, blocks
34343 18710 15633 56.6 55.4 58.0
Corrugated Iron 721 460 261 1.2 1.4 1.0Mud Blocks 7459 4470 2989 12.3 13.2 11.1Traditional hut 344 185 159 0.6 0.5 0.6Not Reported 643 383 260 1.1 1.1 1.0 Manzini 72108 38606 33502 100.0 100.0 100.0 Mud and poles 8839 4389 4450 12.3 11.4 13.3Stone 630 352 278 0.9 0.9 0.8Grass 22 12 10 0.0 0.0 0.0Wood 386 232 154 0.5 0.6 0.5Cement bricks, blocks
54510 29489 25021 75.6 76.4 74.7
Corrugated Iron 1301 823 478 1.8 2.1 1.4Mud Blocks 5122 2591 2531 7.1 6.7 7.6Traditional hut 400 219 181 0.6 0.6 0.5Not Reported 898 499 399 1.2 1.3 1.2

Central Statistical Office48
Table 39: Distribution of housing units by type of the main material of the wall and by sex of head of household for Shiselweni and Lubombo regions Main wallmaterial
Number
Percent
Total Male Female Total Male Female Shiselweni 37066 17523 19543 100.0 100.0 100.0 Mud and poles 13714 6383 7331 37.0 36.4 37.5Stone 2064 929 1135 5.6 5.3 5.8Grass 49 12 37 0.1 0.1 0.2Wood 188 86 102 0.5 0.5 0.5Cement bricks, blocks
18884 9030 9854 50.9 51.5 50.4
Corrugated Iron 349 195 154 0.9 1.1 0.8Mud Blocks 1117 550 567 3.0 3.1 2.9Traditional hut 323 142 181 0.9 0.8 0.9Not Reported 378 196 182 1.0 1.1 0.9 Lubombo 42296 23517 18779 100.0 100.0 100.0 Mud and poles 10269 4907 5362 24.3 20.9 28.6Stone 3556 1724 1832 8.4 7.3 9.8Grass 82 37 45 0.2 0.2 0.2Wood 189 110 79 0.4 0.5 0.4Cement bricks, blocks
26155 15591 10564 61.8 66.3 56.3
Corrugated Iron 473 301 172 1.1 1.3 0.9Mud Blocks 474 237 237 1.1 1.0 1.3Traditional hut 504 229 275 1.2 1.0 1.5Not Reported 594 381 213 1.4 1.6 1.1
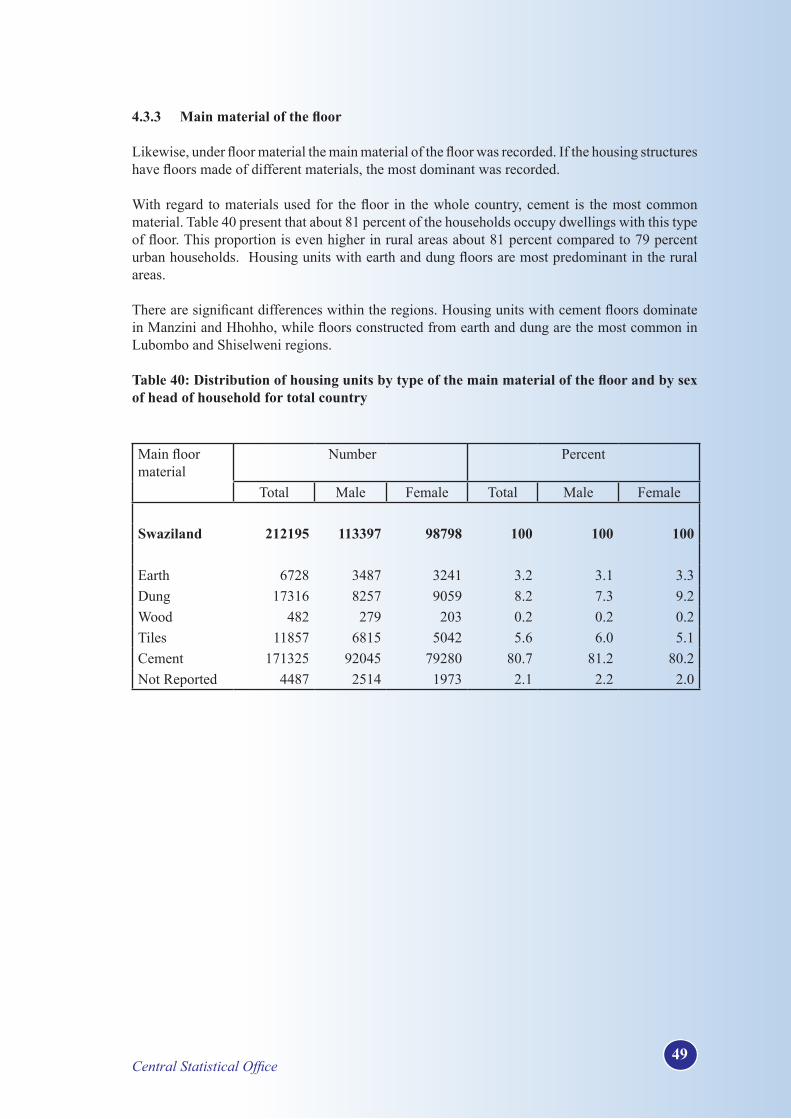
Central Statistical Office49
4.3.3 Mainmaterialofthefloor
Likewise, under floor material the main material of the floor was recorded. If the housing structures have floors made of different materials, the most dominant was recorded.
With regard to materials used for the floor in the whole country, cement is the most common material. Table 40 present that about 81 percent of the households occupy dwellings with this type of floor. This proportion is even higher in rural areas about 81 percent compared to 79 percent urban households. Housing units with earth and dung floors are most predominant in the rural areas.
There are significant differences within the regions. Housing units with cement floors dominate in Manzini and Hhohho, while floors constructed from earth and dung are the most common in Lubombo and Shiselweni regions.
Table40:Distributionofhousingunitsbytypeofthemainmaterialofthefloorandbysexof head of household for total country Main floor material
Number Percent
Total Male Female Total Male Female Swaziland 212195 113397 98798 100 100 100 Earth 6728 3487 3241 3.2 3.1 3.3Dung 17316 8257 9059 8.2 7.3 9.2Wood 482 279 203 0.2 0.2 0.2Tiles 11857 6815 5042 5.6 6.0 5.1Cement 171325 92045 79280 80.7 81.2 80.2Not Reported 4487 2514 1973 2.1 2.2 2.0

Central Statistical Office50
Table41:Distributionofhousingunitsbytypeofthemainmaterialofthefloorandbysexof head of household for urban and rural areas
Main floor material
Number Percent
Total Male Female Total Male Female Urban 48576 30264 18312 100 100 100 Earth 628 360 268 1.3 1.2 1.5Dung 233 123 110 0.5 0.4 0.6Wood 293 164 129 0.6 0.5 0.7Tiles 8125 4672 3453 16.7 15.4 18.9Cement 38248 24264 13984 78.7 80.2 76.4Not Reported 1049 681 368 2.2 2.3 2.0 Rural 163619 83133 80486 100 100 100 Earth 6100 3127 2973 3.7 3.8 3.7Dung 17083 8134 8949 10.4 9.8 11.1Wood 189 115 74 0.1 0.1 0.1Tiles 3732 2143 1589 2.3 2.6 2.0Cement 133077 67781 65296 81.3 81.5 81.1Not Reported 3438 1833 1605 2.1 2.2 2.0

Central Statistical Office51
Table42:Distributionofhousingunitsbytypeofthemainmaterialofthefloorandbysexof head of household for Hhohho and Manzini regions
Main floor material
Number
Percent
Total Male Female Total Male Female
Hhohho 60725 33751 26974 100 100 100Earth 1795 1032 763 3.0 3.1 2.8Dung 4595 2285 2310 7.6 6.8 8.6Wood 224 123 101 0.4 0.4 0.4Tiles 5185 2908 2277 8.5 8.6 8.4Cement 47728 26685 21043 78.6 79.1 78.0Not Reported 1198 718 480 2.0 2.1 1.8 Manzini 72108 38606 33502 100.0 100.0 100.0Earth 1445 775 670 2.0 2.0 2.0Dung 2864 1333 1531 4.0 3.5 4.6Wood 118 79 39 0.2 0.2 0.1Tiles 4507 2553 1954 6.3 6.6 5.8Cement 61651 33009 28642 85.5 85.5 85.5Not Reported 1523 857 666 2.1 2.2 2.0 Shiselweni 37066 17523 19543 100 100 100Earth 1484 701 783 4.0 4.0 4.0Dung 4758 2212 2546 12.8 12.6 13.0Wood 97 48 49 0.3 0.3 0.3Tiles 795 443 352 2.1 2.5 1.8Cement 29149 13746 15403 78.6 78.4 78.8Not Reported 783 373 410 2.1 2.1 2.1 Lubombo 42296 23517 18779 100 100 100Earth 2004 979 1025 4.7 4.2 5.5Dung 5099 2427 2672 12.1 10.3 14.2Wood 43 29 14 0.1 0.1 0.1Tiles 1370 911 459 3.2 3.9 2.4Cement 32797 18605 14192 77.5 79.1 75.6Not Reported 983 566 417 2.3 2.4 2.2

Central Statistical Office52
5. Capacity of housing
5.1 Number of rooms
According to the census a room was defined as a space in a housing unit or other living quarters enclosed by the walls reaching from the floor to the ceiling or roof covering or at least to the height of two meters, of a size large enough to hold a bed for an adult, that is at least 4 square meters. The total number of rooms includes bedrooms, dining rooms, studies, habitable attics, servant’s rooms, kitchens, rooms used for business purposes as long as they meet the criteria of walls and floor space. Passageways, verandas, lobbies, bathrooms, toilets, garages and storerooms as rooms were not included even if they meet the above criteria.
Table 43: Distribution of housing units by number of rooms for total country, rural and urban areas Number rooms Country Urban Rural
Number of housing
units
% Number of housing
units
% Number of housing
units
%
Total 212195 100 48576 100 163619 100 1 50846 24.0 17298 35.6 33548 20.52 29529 13.9 5643 11.6 23886 14.63 28867 13.6 5286 10.9 23581 14.44 34390 16.2 9743 20.1 24647 15.15 23684 11.2 5005 10.3 18679 11.46 15657 7.4 2680 5.5 12977 7.97 9539 4.5 1187 2.4 8352 5.18 6324 3.0 579 1.2 5745 3.59 3940 1.9 278 0.6 3662 2.210+ 7099 3.3 415 0.9 6684 4.1Not reported 2320 1.1 462 1.0 1858 1.1

Central Statistical Office53
Table 44: Distribution of housing units by number of rooms for Hhohho, Manzini, Shisel-weni and Lubombo regions
Number rooms
Hhohho Manzini Shiselweni Lubombo
Number of housing
units
% Number of housing
units
% Number of housing
units
% Number of hous-ing units
%
Total 60725 100 72108 100 37066 100 42296 100 1 14359 23.6 24270 33.7 5098 13.8 7119 16.82 9029 14.9 9142 12.7 4794 12.9 6564 15.53 8356 13.8 7801 10.8 5419 14.6 7291 17.24 9681 15.9 9957 13.8 6118 16.5 8634 20.45 6793 11.2 6951 9.6 4871 13.1 5069 12.06 4786 7.9 4713 6.5 3544 9.6 2614 6.27 2750 4.5 2812 3.9 2210 6.0 1767 4.28 1691 2.8 1928 2.7 1624 4.4 1081 2.69 1043 1.7 1261 1.7 1057 2.9 579 1.410+ 1696 2.8 2442 3.4 1875 5.1 1086 2.6Not reported 541 0.9 831 1.2 456 1.2 492 1.2
5.2 Number of rooms for sleeping
Of the number of rooms mentioned above, a question was asked to find out how many are used for sleeping.
Table 45: Distribution of housing units by number of rooms used for sleeping for total country, urban and rural areas Number of rooms used for sleeping
Country Urban RuralNumber of
housing units% Number of
housing units% Number of
housing units%
Total 212195 100 48576 100 163619 100 1 82691 39.0 24103 49.6 58588 35.82 57559 27.1 13495 27.8 44064 26.93 37394 17.6 7646 15.7 29748 18.24 16885 8.0 1876 3.9 15009 9.25 7665 3.6 558 1.1 7107 4.36+ 8276 3.9 484 1.0 7792 4.8Not reported 1725 0.8 414 0.9 1311 0.8

Central Statistical Office54
Table 46: Distribution of housing units by number of rooms used for sleeping for Hhohho, Manzini, Shiselweni and Lubombo regions Number of rooms used for sleeping
Hhohho Manzini Shiselweni
Lubombo
Number of housing units
% Number of housing
units
% Number of housing
units
% Number of housing
units
%
Total 60725 100 72108 100 37066 100 42296 100 1 23721 39.1 34078 47.3 11020 29.7 13872 32.82 16417 27.0 17022 23.6 10331 27.9 13789 32.63 11097 18.3 11039 15.3 7508 20.3 7750 18.34 4844 8.0 4735 6.6 3926 10.6 3380 8.05 2106 3.5 2138 3.0 1905 5.1 1516 3.66+ 2103 3.5 2492 3.5 2069 5.6 1612 3.8Not re-ported
437 0.7 604 0.8 307 0.8 377 0.9

Central Statistical Office55
5.3 Number of occupants
A question in the census asked how many persons usually sleep in the housing units.
Table 47: Distribution of housing units by number of occupants for total country, urban and rural areas Number of Occupants
Country Urban RuralNumber of
housing units% Number of
housing units% Number of
housing units%
Total 212195 100 48576 100 163619 100 1 45842 21.6 17465 36.0 28377 17.32 32052 15.1 9738 20.0 22314 13.63 27332 12.9 6630 13.6 20702 12.74 25062 11.8 5338 11.0 19724 12.15 21206 10.0 3515 7.2 17691 10.86 16743 7.9 2209 4.5 14534 8.97 12401 5.8 1276 2.6 11125 6.88 8996 4.2 674 1.4 8322 5.19 6546 3.1 432 0.9 6114 3.710 5372 2.5 332 0.7 5040 3.111 2422 1.1 137 0.3 2285 1.412 1748 0.8 82 0.2 1666 1.013 1197 0.6 42 0.1 1155 0.714 772 0.4 24 0.0 748 0.515+ 1663 0.8 79 0.2 1584 1.0Not reported 2841 1.3 603 1.2 2238 1.4

Central Statistical Office56
Table 48: Distribution of housing units by number of occupants for Hhohho, Manzini, Shiselweni and Lubombo regions
Number of Occupants
Hhohho Manzini Shiselweni
Lubombo
Number of housing
units
% Number of housing
units
% Number of housing
units
% Number of hous-ing units
%
Total 60725 100 72108 100 37066 100 42296 100 1 13172 21.7 18270 25.3 5411 14.6 8989 21.32 9147 15.1 12437 17.2 4544 12.3 5924 14.03 8130 13.4 9438 13.1 4409 11.9 5355 12.74 7524 12.4 8120 11.3 4383 11.8 5035 11.95 6239 10.3 6437 8.9 4173 11.3 4357 10.36 4749 7.8 4896 6.8 3619 9.8 3479 8.27 3420 5.6 3519 4.9 2848 7.7 2614 6.28 2483 4.1 2532 3.5 2088 5.6 1893 4.59 1740 2.9 1804 2.5 1673 4.5 1329 3.110 1389 2.3 1446 2.0 1396 3.8 1141 2.711 633 1.0 688 1.0 604 1.6 497 1.212 456 0.8 510 0.7 439 1.2 343 0.813 319 0.5 317 0.4 289 0.8 272 0.614 174 0.3 235 0.3 214 0.6 149 0.415+ 400 0.7 481 0.7 439 1.2 343 0.8Not reported 750 1.2 978 1.4 537 1.4 576 1.4

Central Statistical Office57
6. Water for drinking
As much as it important to analyse and discuss the quality of houses, it is similarly essential to deliberate on the household amenities that make living in these houses happy. A house that has been built with quality material on wall, roof and floor needs to be provided with some basic amenities that will enhance further the quality of life of the household.
Inadequate sanitation and lack of safe water for drinking and cooking, create conducive environment for the spread of infectious and parasitic diseases, and are therefore a public concern.
6.1 Main source of water for drinking
An essential element of life is water, not only to human beings, but to all living organisms. Therefore, a question was asked in the census about the main source of drinking water for the members of the household.
Table 49: Distribution of households by main source of water for drinking and by sex of head of household for total country Main water source Number
Percent
Total Male Female Total Male Female
Total 212195 113397 98798 100.0 100.0 100.0 Piped into housing
30869 19154 11715 14.5 16.9 11.9
Piped into yard, plot
53552 30478 23074 25.2 26.9 23.4
Community stand pipe
27275 13713 13562 12.9 12.1 13.7
Unprotected well 22484 10956 11528 10.6 9.7 11.7Protected well 6473 3188 3285 3.1 2.8 3.3Borehole 11982 5785 6197 5.6 5.1 6.3Spring (protected) 10098 4990 5108 4.8 4.4 5.2River, canal 3214 1695 1519 1.5 1.5 1.5Rain water 33403 16306 17097 15.7 14.4 17.3Tanker truck 1527 830 697 0.7 0.7 0.7Bottled water 3746 2148 1598 1.8 1.9 1.6Not Reported 7572 4154 3418 3.6 3.7 3.5

Central Statistical Office58
Table 50: Distribution of households by main source of water for drinking and by sex of head of household for urban and rural areas
Main water source Number Percent
Total Male Female Total Male Female Urban 48576 30264 18312 100.0 100.0 100.0 Piped into housing 23018 14445 8573 47.4 47.7 46.8Piped into yard, plot
14500 9098 5402 29.9 30.1 29.5
Community stand pipe
4288 2510 1778 8.8 8.3 9.7
Unprotected well 1757 1085 672 3.6 3.6 3.7Protected well 331 209 122 0.7 0.7 0.7Borehole 413 245 168 0.9 0.8 0.9Spring (protected) 641 418 223 1.3 1.4 1.2River, canal 508 346 162 1.0 1.1 0.9Rain water 941 563 378 1.9 1.9 2.1Tanker truck 69 43 26 0.1 0.1 0.1Bottled water 304 194 110 0.6 0.6 0.6Not Reported 1806 1108 698 3.7 3.7 3.8 Rural 163619 83133 80486 100.0 100.0 100.0 Piped into housing 7851 4709 3142 4.8 5.7 3.9Piped into yard, plot
39052 21380 17672 23.9 25.7 22.0
Community stand pipe
22987 11203 11784 14.0 13.5 14.6
Unprotected well 20727 9871 10856 12.7 11.9 13.5Protected well 6142 2979 3163 3.8 3.6 3.9Borehole 11569 5540 6029 7.1 6.7 7.5Spring (protected) 9457 4572 4885 5.8 5.5 6.1River, canal 2706 1349 1357 1.7 1.6 1.7Rain water 32462 15743 16719 19.8 18.9 20.8Tanker truck 1458 787 671 0.9 0.9 0.8Bottled water 3442 1954 1488 2.1 2.4 1.8Not Reported 5766 3046 2720 3.5 3.7 3.4

Central Statistical Office59
Table 51: Distribution of households by main source of water for drinking and by sex of head of household for Hhohho and Manzini areas Main water source
Number
Percent
Total Male Female Total Male Female Hhohho 60725 33751 26974 100.0 100.0 100.0 Piped into housing 9809 5578 4231 16.2 16.5 15.7Piped into yard, plot
17778 10653 7125 29.3 31.6 26.4
Community stand pipe
8448 4538 3910 13.9 13.4 14.5
Unprotected well 5794 3087 2707 9.5 9.1 10.0Protected well 1777 905 872 2.9 2.7 3.2Borehole 2192 986 1206 3.6 2.9 4.5Spring (protected) 2660 1417 1243 4.4 4.2 4.6River, canal 1067 619 448 1.8 1.8 1.7Rain water 7596 3857 3739 12.5 11.4 13.9Tanker truck 355 207 148 0.6 0.6 0.5Bottled water 914 528 386 1.5 1.6 1.4Not Reported 2335 1376 959 3.8 4.1 3.6 Manzini 72108 38606 33502 100.0 100.0 100.0 Piped into housing 10441 6243 4198 14.5 16.2 12.5Piped into yard, plot
25198 13898 11300 34.9 36.0 33.7
Community stand pipe
8987 4496 4491 12.5 11.6 13.4
Unprotected well 5311 2548 2763 7.4 6.6 8.2Protected well 1432 723 709 2.0 1.9 2.1Borehole 3098 1658 1440 4.3 4.3 4.3Spring (protected) 2949 1470 1479 4.1 3.8 4.4River, canal 912 492 420 1.3 1.3 1.3Rain water 9144 4543 4601 12.7 11.8 13.7Tanker truck 421 228 193 0.6 0.6 0.6Bottled water 1458 838 620 2.0 2.2 1.9Not Reported 2757 1469 1288 3.8 3.8 3.8

Central Statistical Office60
Table 52: Distribution of households by main source of water for drinking and by sex of head of household for Shiselweni and Lubombo areas
Main water source Number
Percent
Total Male Female Total Male Female Shiselweni 37066 17523 19543 100.0 100.0 100.0 Piped into housing 1978 1151 827 5.3 6.6 4.2Piped into yard, plot 5113 2580 2533 13.8 14.7 13.0Community stand pipe 5017 2289 2728 13.5 13.1 14.0Unprotected well 5751 2590 3161 15.5 14.8 16.2Protected well 1502 698 804 4.1 4.0 4.1Borehole 2502 1185 1317 6.8 6.8 6.7Spring (protected) 3170 1452 1718 8.6 8.3 8.8River, canal 886 405 481 2.4 2.3 2.5Rain water 9324 4269 5055 25.2 24.4 25.9Tanker truck 290 137 153 0.8 0.8 0.8Bottled water 490 259 231 1.3 1.5 1.2Not Reported 1043 508 535 2.8 2.9 2.7 Lubombo 42296 23517 18779 100.0 100.0 100.0 Piped into housing 8641 6182 2459 20.4 26.3 13.1Piped into yard, plot 5463 3347 2116 12.9 14.2 11.3Community stand pipe 4823 2390 2433 11.4 10.2 13.0Unprotected well 5628 2731 2897 13.3 11.6 15.4Protected well 1762 862 900 4.2 3.7 4.8Borehole 4190 1956 2234 9.9 8.3 11.9Spring (protected) 1319 651 668 3.1 2.8 3.6River, canal 349 179 170 0.8 0.8 0.9Rain water 7339 3637 3702 17.4 15.5 19.7Tanker truck 461 258 203 1.1 1.1 1.1Bottled water 884 523 361 2.1 2.2 1.9Not Reported 1437 801 636 3.4 3.4 3.4

Central Statistical Office61
6.2 Travel time to source of drinking water
From the census a question was asked about the time it takes to walk to and from the water source, where household members fetch water for domestic use.
Table 53: Distribution of households by travel time to main source of water and by sex of head of household for total country, urban and rural areas Time to water source Number
Percent
Total Male Female Total Male Female Swaziland 212195 113397 98798 100 100 100 Less than 30 min 67471 34093 33378 31.8 30.1 33.8
30 min to less than 1 hr 26611 12534 14077 12.5 11.1 14.2One hr to less than 1.5 hrs
12377 5845 6532 5.8 5.2 6.6
1.5 hrs to less than 2 hrs 3815 1804 2011 1.8 1.6 2.0Two hrs or more 4715 2231 2484 2.2 2.0 2.5Not Reported 97206 56890 40316 45.8 50.2 40.8 Urban 48576 30264 18312 100 100 100 Less than 30 min 628 360 268 1.3 1.2 1.530 min to less than 1 hr 233 123 110 0.5 0.4 0.6One hr to less than 1.5 hrs
293 164 129 0.6 0.5 0.7
1.5 hrs to less than 2 hrs 8125 4672 3453 16.7 15.4 18.9Two hrs or more 38248 24264 13984 78.7 80.2 76.4Not Reported 1049 681 368 2.2 2.3 2.0 Rural 163619 83133 80486 100 100 100 Less than 30 min 6100 3127 2973 3.7 3.8 3.730 min to less than 1 hr 17083 8134 8949 10.4 9.8 11.1One hr to less than 1.5 hrs
189 115 74 0.1 0.1 0.1
1.5 hrs to less than 2 hrs 3732 2143 1589 2.3 2.6 2.0Two hrs or more 133077 67781 65296 81.3 81.5 81.1Not Reported 3438 1833 1605 2.1 2.2 2.0

Central Statistical Office62
Table 54: Distribution of households by travel time to main source of water and by sex of head of household for Hhohho, Manzini, Shiselweni and Manzini regions Time to water source Number Percent
Total Male Female Total Male FemaleHhohho 60725 33751 26974 100 100 100Less than 30 min 1795 1032 763 3.0 3.1 2.830 min to less than 1 hr 4595 2285 2310 7.6 6.8 8.6One hr to less than 1.5 hrs
224 123 101 0.4 0.4 0.4
1.5 hrs to less than 2 hrs 5185 2908 2277 8.5 8.6 8.4Two hrs or more 47728 26685 21043 78.6 79.1 78.0Not Reported 1198 718 480 2.0 2.1 1.8 Manzini 72108 38606 33502 100.0 100.0 100.0Less than 30 min 1445 775 670 2.0 2.0 2.030 min to less than 1 hr 2864 1333 1531 4.0 3.5 4.6One hr to less than 1.5 hrs
118 79 39 0.2 0.2 0.1
1.5 hrs to less than 2 hrs 4507 2553 1954 6.3 6.6 5.8Two hrs or more 61651 33009 28642 85.5 85.5 85.5Not Reported 1523 857 666 2.1 2.2 2.0 Shiselweni 37066 17523 19543 100 100 100Less than 30 min 1484 701 783 4.0 4.0 4.030 min to less than 1 hr 4758 2212 2546 12.8 12.6 13.0One hr to less than 1.5 hrs
97 48 49 0.3 0.3 0.3
1.5 hrs to less than 2 hrs 795 443 352 2.1 2.5 1.8Two hrs or more 29149 13746 15403 78.6 78.4 78.8Not Reported 783 373 410 2.1 2.1 2.1 Lubombo 42296 23517 18779 100 100 100Less than 30 min 2004 979 1025 4.7 4.2 5.530 min to less than 1 hr 5099 2427 2672 12.1 10.3 14.2One hr to less than 1.5 hrs
43 29 14 0.1 0.1 0.1
1.5 hrs to less than 2 hrs 1370 911 459 3.2 3.9 2.4Two hrs or more 32797 18605 14192 77.5 79.1 75.6Not Reported 983 566 417 2.3 2.4 2.2

Central Statistical Office63
6.3 Households with access to safe drinking water
6.3.1 Safe water sources
Table 55: Distribution of households by access to safe drinking water and by sex of head of household for total country, urban, rural and regions Area Percent Number
Total Male Female Male Female Swaziland 170925 92574 78351 54.2 45.8 Urban 44105 27473 16632 62.3 37.7Rural 126820 65101 61719 51.3 48.7 Hhohho 49397 27557 21840 55.8 44.2Manzini 61275 33146 28129 54.1 45.9Shiselweni 27594 13185 14409 47.8 52.2Lubombo 32659 18686 13973 57.2 42.8
6.3.2 Unsafe waters sources
Table 56: Distribution of households by access to not safe drinking water and by sex of head of household for total country, rural and urban, regions
Area Number
Percent
Total Male Female Male Female Swaziland 34797 17635 17162 50.7 49.3 Urban 4140 2582 1558 62.4 37.6Rural 30657 15053 15604 49.1 50.9 Hhohho 9551 5289 4262 55.4 44.6Manzini 9401 4737 4664 50.4 49.6Shiselweni 7970 3640 4330 45.7 54.3Lubombo 7875 3969 3906 50.4 49.6

Central Statistical Office64
7. Toilet facility used by households
The census asked questions about the type of toilet or means of excreta disposal used in the house-holds. The information is presented in Tables 57 to 60.
7.1 Main type of toilet facility
Table 57 and 58 presents the percent distribution of households by type of toilet facility. About 16 percent of households in Swaziland have no toilet facility. Instead, they utilize the bush and other unknown type. Only 13 percent of the households in the country use flush toilet facility.
There are notable differences between urban and rural areas. Over 45 percent of the households in urban areas use flush toilet while the corresponding rural percentage is less than 4 percent. Over 19 percent of the rural households use the bush as against 2 percent in the urban areas.
In the Shiselweni and Lubombo region about 20 and 30 percent of households respectively, have no access to a toilet facility.

Central Statistical Office65
Table 57: Distribution of households by main type of toilet facility and by sex of head of household for total country, urban and rural areas Type of toilet Number
Percent
Total Male Female Total Male Female Swaziland 212195 113397 98798 100 100 100 Flush toilet 28035 17553 10482 13.2 15.5 10.6Pit_VIP 38191 19968 18223 18.0 17.6 18.4Pit ordinary 97816 50627 47189 46.1 44.6 47.8Bush 32764 15581 17183 15.4 13.7 17.4Other 1557 770 787 0.7 0.7 0.8Not Reported 13832 8898 4934 6.5 7.8 5.0 Urban 48576 30264 18312 100 100 100 Flush toilet 22043 13861 8182 45.4 45.8 44.7Pit_VIP 3433 2108 1325 7.1 7.0 7.2Pit ordinary 15620 9328 6292 32.2 30.8 34.4Bush 886 490 396 1.8 1.6 2.2Other 187 118 69 0.4 0.4 0.4Not Reported 6407 4359 2048 13.2 14.4 11.2 Rural 163619 83133 80486 100 100 100 Flush toilet 5992 3692 2300 3.7 4.4 2.9Pit_VIP 34758 17860 16898 21.2 21.5 21.0Pit ordinary 82196 41299 40897 50.2 49.7 50.8Bush 31878 15091 16787 19.5 18.2 20.9Other 1370 652 718 0.8 0.8 0.9Not Reported 7425 4539 2886 4.5 5.5 3.6

Central Statistical Office66
Table 58: Distribution of households by main type of toilet facility and by sex of head of household Hhohho, Manzini, Shiselweni and Lubombo rural areas Type of toilet Number
Percent
Total Male Female Total Male FemaleHhohho 60725 33751 26974 100 100 100Flush toilet 8738 4984 3754 14.4 14.8 13.9Pit_VIP 11879 6273 5606 19.6 18.6 20.8Pit ordinary 27562 15477 12085 45.4 45.9 44.8Bush 7590 3736 3854 12.5 11.1 14.3Other 519 302 217 0.9 0.9 0.8Not Reported 4437 2979 1458 7.3 8.8 5.4 Manzini 72108 38606 33502 100.0 100.0 100.0Flush toilet 9406 5675 3731 13.0 14.7 11.1Pit_VIP 15222 8070 7152 21.1 20.9 21.3Pit ordinary 36164 18782 17382 50.2 48.7 51.9Bush 5497 2632 2865 7.6 6.8 8.6Other 337 142 195 0.5 0.4 0.6Not Reported 5482 3305 2177 7.6 8.6 6.5 Shiselweni 37066 17523 19543 100 100 100Flush toilet 1699 998 701 4.6 5.7 3.6Pit_VIP 5601 2690 2911 15.1 15.4 14.9Pit ordinary 21191 9821 11370 57.2 56.0 58.2Bush 7002 3176 3826 18.9 18.1 19.6Other 403 175 228 1.1 1.0 1.2Not Reported 1170 663 507 3.2 3.8 2.6 Lubombo 42296 23517 18779 100 100 100Flush toilet 8192 5896 2296 19.4 25.1 12.2Pit_VIP 5489 2935 2554 13.0 12.5 13.6Pit ordinary 12899 6547 6352 30.5 27.8 33.8Bush 12675 6037 6638 30.0 25.7 35.3Other 298 151 147 0.7 0.6 0.8Not Reported 2743 1951 792 6.5 8.3 4.2
7.1.1 Safe toilet facility
To consider if the toilet facility was safe the following classification was considered during analysis. The flush and Pit_VIP toilet facilities were combined into one category safe toilet facility. The safeness in this context is hygienic.
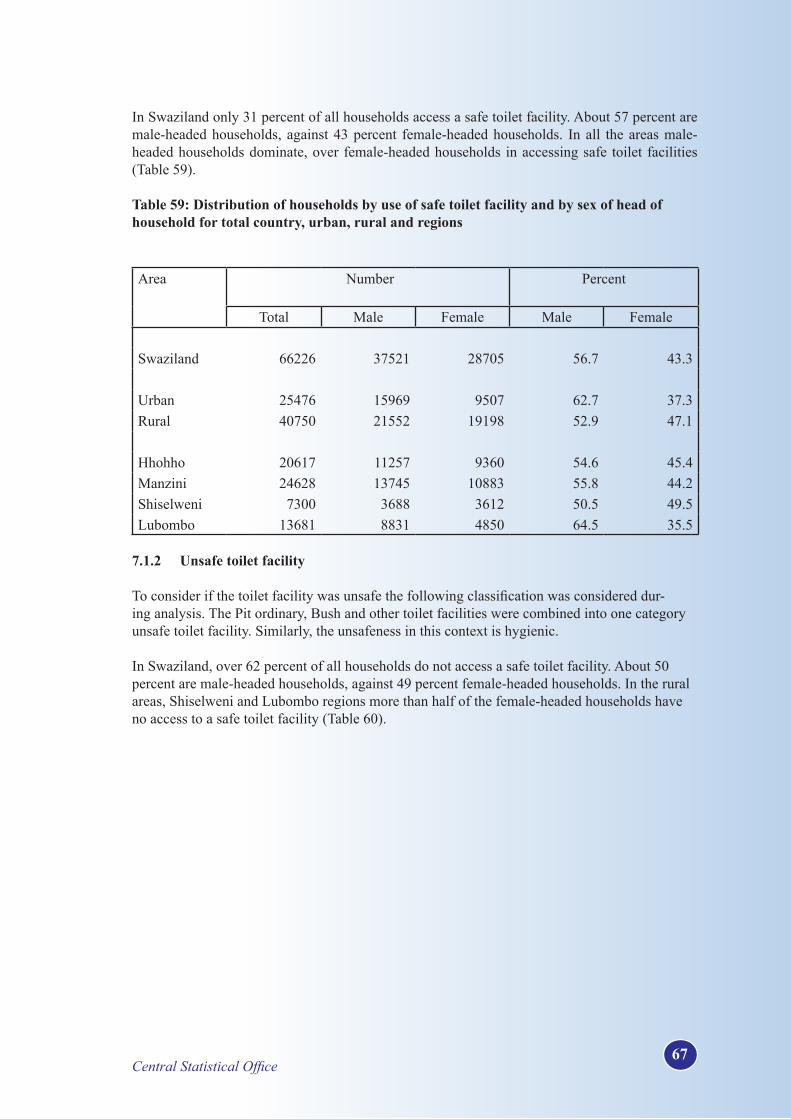
Central Statistical Office67
In Swaziland only 31 percent of all households access a safe toilet facility. About 57 percent are male-headed households, against 43 percent female-headed households. In all the areas male- headed households dominate, over female-headed households in accessing safe toilet facilities (Table 59).
Table 59: Distribution of households by use of safe toilet facility and by sex of head of household for total country, urban, rural and regions
Area Number
Percent
Total Male Female Male Female Swaziland 66226 37521 28705 56.7 43.3 Urban 25476 15969 9507 62.7 37.3Rural 40750 21552 19198 52.9 47.1 Hhohho 20617 11257 9360 54.6 45.4Manzini 24628 13745 10883 55.8 44.2Shiselweni 7300 3688 3612 50.5 49.5Lubombo 13681 8831 4850 64.5 35.5
7.1.2 Unsafe toilet facility
To consider if the toilet facility was unsafe the following classification was considered dur-ing analysis. The Pit ordinary, Bush and other toilet facilities were combined into one category unsafe toilet facility. Similarly, the unsafeness in this context is hygienic.
In Swaziland, over 62 percent of all households do not access a safe toilet facility. About 50 percent are male-headed households, against 49 percent female-headed households. In the rural areas, Shiselweni and Lubombo regions more than half of the female-headed households have no access to a safe toilet facility (Table 60).
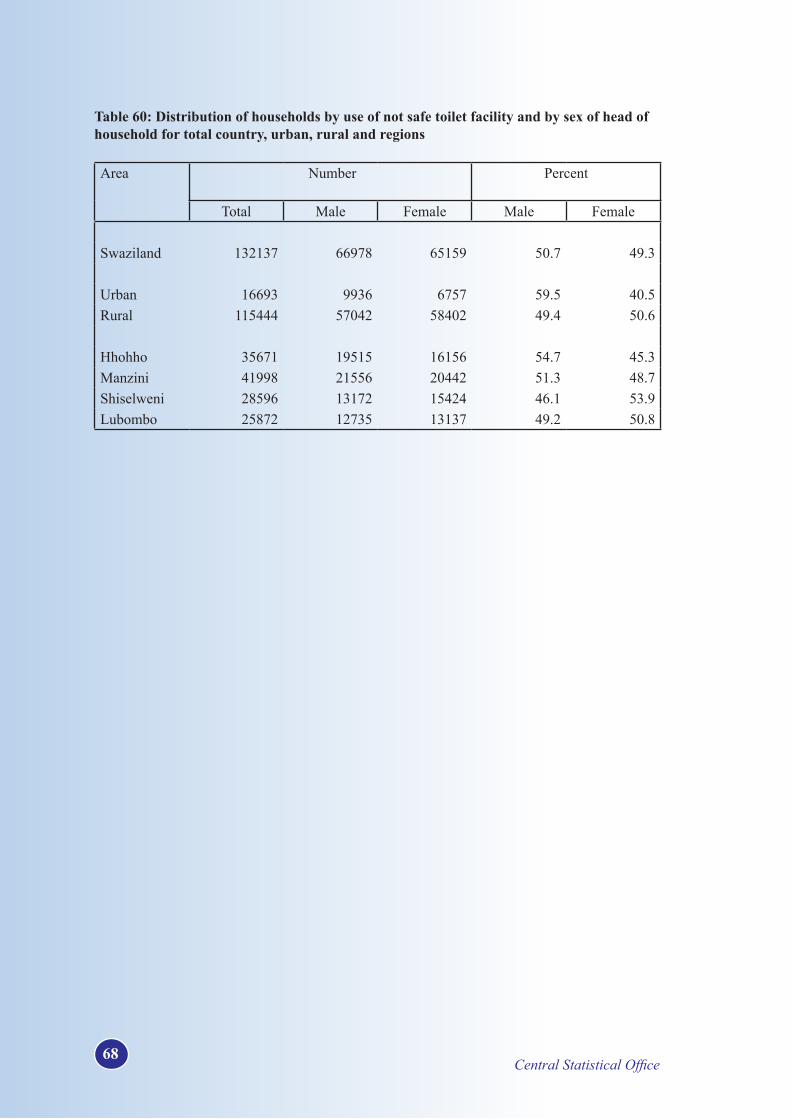
Central Statistical Office68
Table 60: Distribution of households by use of not safe toilet facility and by sex of head of household for total country, urban, rural and regions Area Number Percent
Total Male Female Male Female Swaziland 132137 66978 65159 50.7 49.3 Urban 16693 9936 6757 59.5 40.5Rural 115444 57042 58402 49.4 50.6 Hhohho 35671 19515 16156 54.7 45.3Manzini 41998 21556 20442 51.3 48.7Shiselweni 28596 13172 15424 46.1 53.9Lubombo 25872 12735 13137 49.2 50.8

Central Statistical Office69
8. Source of energy
Tables 61 to 68 present the percentage distribution of households by sources of energy for lighting and cooking.
8.1 Main source of energy for lighting
Questions about the main source of energy the household uses mainly for lighting was asked. Table 61 reveals that that main source of energy used for lighting, both electricity and the candle are the most common in the country as a whole. About 17 out of 20 households utilize these two sources. Paraffin is also a common source to some extent, as about 12 percent of households na-tionally use it for lighting.
On the hand, two thirds of the households in the urban areas use electricity as against less than 27 percent in the rural areas. Most rural areas rely on candles and paraffin, about 58 and 14 percent correspondingly (Table 62).
With regard to the regions most of the households use electricity for lighting in Manzini and Hhohho, while Shiselweni and Lubombo regions rely on candle and paraffin for the same purpose (Table 63 and 64).
Table 61: Distribution of households by main source of energy for lighting and by sex of head of household for total country
Main Lighting energy
Number
Percent
Total Male Female Total Male Female Total 212195 113397 98798 100.0 100.0 100.0 Electricity 74872 43780 31092 35.3 38.6 31.5Paraffin 26600 13598 13002 12.5 12.0 13.2Gas 1085 575 510 0.5 0.5 0.5Candle 106308 53525 52783 50.1 47.2 53.4Wood 638 304 334 0.3 0.3 0.3Solar 427 278 149 0.2 0.2 0.2Other 219 135 84 0.1 0.1 0.1Not Reported 2046 1202 844 1.0 1.1 0.9

Central Statistical Office70
Table 62: Distribution of households by main source of energy for lighting and by sex of head of household for urban and rural areas
Main Lighting energy
Number
Percent
Total Male Female Total Male Female Urban 48576 30264 18312 100.0 100.0 100.0 Electricity 31583 19720 11863 65.0 65.2 64.8Paraffin 4342 2600 1742 8.9 8.6 9.5Gas 239 144 95 0.5 0.5 0.5Candle 11712 7355 4357 24.1 24.3 23.8Wood 30 18 12 0.1 0.1 0.1Solar 55 36 19 0.1 0.1 0.1Other 42 24 18 0.1 0.1 0.1Not Reported 573 367 206 1.2 1.2 1.1 Rural 163619 83133 80486 100.0 100.0 100.0 Electricity 43289 24060 19229 26.5 28.9 23.9Paraffin 22258 10998 11260 13.6 13.2 14.0Gas 846 431 415 0.5 0.5 0.5Candle 94596 46170 48426 57.8 55.5 60.2Wood 608 286 322 0.4 0.3 0.4Solar 372 242 130 0.2 0.3 0.2Other 177 111 66 0.1 0.1 0.1Not Reported 1473 835 638 0.9 1.0 0.8

Central Statistical Office71
Table 63: Distribution of households by main source of energy for lighting and by sex of head of household for Hhohho and Manzini areas Main Lighting energy
Number
Percent
Total Male Female Total Male Female Hhohho 60725 33751 26974 100.0 100.0 100.0 Electricity 23520 13431 10089 38.7 39.8 37.4Paraffin 10596 5755 4841 17.4 17.1 17.9Gas 313 175 138 0.5 0.5 0.5Candle 25426 13858 11568 41.9 41.1 42.9Wood 114 60 54 0.2 0.2 0.2Solar 166 125 41 0.3 0.4 0.2Other 56 36 20 0.1 0.1 0.1Not Reported 534 311 223 0.9 0.9 0.8 Manzini 72108 38606 33502 100.0 100.0 100.0 Electricity 30639 17619 13020 42.5 45.6 38.9Paraffin 8537 4289 4248 11.8 11.1 12.7Gas 361 182 179 0.5 0.5 0.5Candle 31499 15901 15598 43.7 41.2 46.6Wood 129 67 62 0.2 0.2 0.2Solar 157 100 57 0.2 0.3 0.2Other 62 38 24 0.1 0.1 0.1Not Reported 724 410 314 1.0 1.1 0.9

Central Statistical Office72
Table 64: Distribution of households by main source of energy for lighting and by sex of head of household for Shiselweni and Lubombo areas
Main Lighting energy
Number Percent
Total Male Female Total Male Female Shiselweni 37066 17523 19543 100.0 100.0 100.0 Electricity 7177 3813 3364 19.4 21.8 17.2Paraffin 2687 1293 1394 7.2 7.4 7.1Gas 245 125 120 0.7 0.7 0.6Candle 26316 11980 14336 71.0 68.4 73.4Wood 210 93 117 0.6 0.5 0.6Solar 47 25 22 0.1 0.1 0.1Other 72 42 30 0.2 0.2 0.2Not Reported 312 152 160 0.8 0.9 0.8 Lubombo 42296 23517 18779 100.0 100.0 100.0 Electricity 13536 8917 4619 32.0 37.9 24.6Paraffin 4780 2261 2519 11.3 9.6 13.4Gas 166 93 73 0.4 0.4 0.4Candle 23067 11786 11281 54.5 50.1 60.1Wood 185 84 101 0.4 0.4 0.5Solar 57 28 29 0.1 0.1 0.2Other 29 19 10 0.1 0.1 0.1Not Reported 476 329 147 1.1 1.4 0.8
8.2 Main sources of energy for cooking
Questions about the main source of energy the household uses mainly for cooking was asked. It is possible that that a household may use more than one source of energy at any one time, but it is the one that is most often used that was recorded.
Table 65 indicates that half of the total households in Swaziland rely on wood for cooking. This proportion is even higher in rural areas, about 13 out of 20 households than in urban areas 9 out of 100 households (Table 66). More than 23 out 50 households in urban areas rely on electricity for cooking.
Close to half of the households in Hhohho and Manzini regions use electricity for cooking. Most of the households in the rest of the regions use mainly wood for cooking purposes (Table 67 and 68).
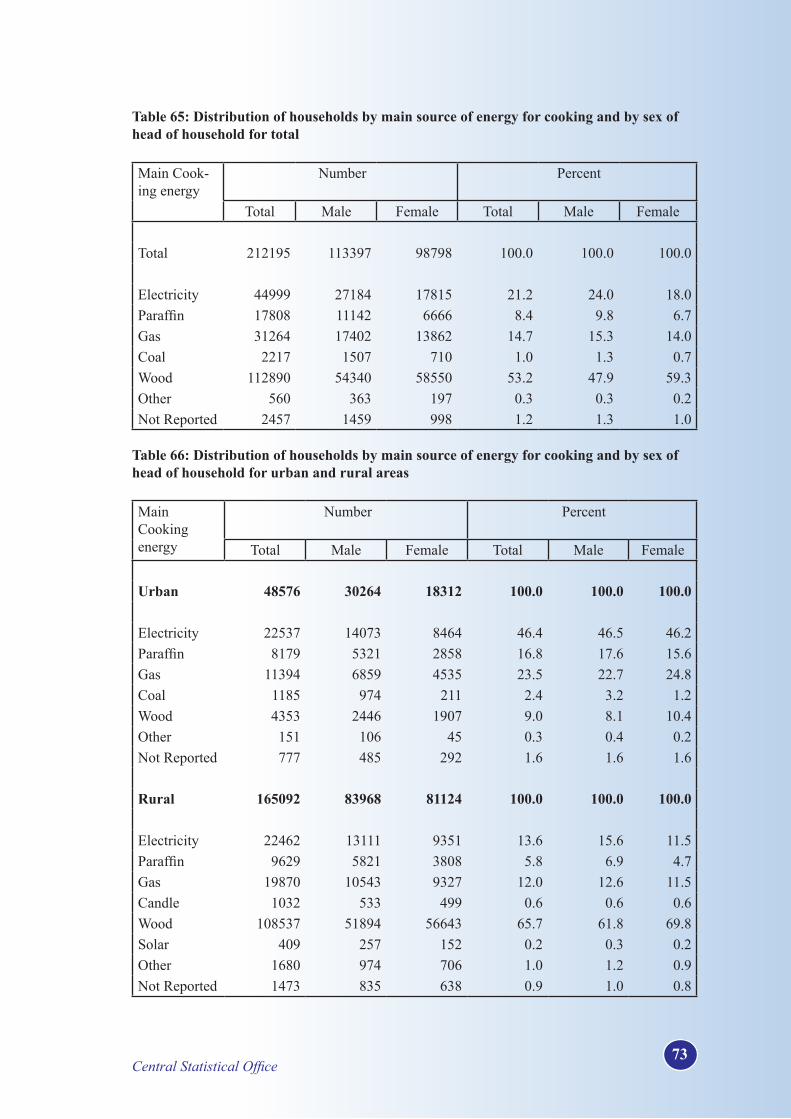
Central Statistical Office73
Table 65: Distribution of households by main source of energy for cooking and by sex of head of household for total Main Cook-ing energy
Number Percent
Total Male Female Total Male Female Total 212195 113397 98798 100.0 100.0 100.0 Electricity 44999 27184 17815 21.2 24.0 18.0Paraffin 17808 11142 6666 8.4 9.8 6.7Gas 31264 17402 13862 14.7 15.3 14.0Coal 2217 1507 710 1.0 1.3 0.7Wood 112890 54340 58550 53.2 47.9 59.3Other 560 363 197 0.3 0.3 0.2Not Reported 2457 1459 998 1.2 1.3 1.0
Table 66: Distribution of households by main source of energy for cooking and by sex of head of household for urban and rural areas Main Cooking energy
Number Percent
Total Male Female Total Male Female Urban 48576 30264 18312 100.0 100.0 100.0 Electricity 22537 14073 8464 46.4 46.5 46.2Paraffin 8179 5321 2858 16.8 17.6 15.6Gas 11394 6859 4535 23.5 22.7 24.8Coal 1185 974 211 2.4 3.2 1.2Wood 4353 2446 1907 9.0 8.1 10.4Other 151 106 45 0.3 0.4 0.2Not Reported 777 485 292 1.6 1.6 1.6 Rural 165092 83968 81124 100.0 100.0 100.0 Electricity 22462 13111 9351 13.6 15.6 11.5Paraffin 9629 5821 3808 5.8 6.9 4.7Gas 19870 10543 9327 12.0 12.6 11.5Candle 1032 533 499 0.6 0.6 0.6Wood 108537 51894 56643 65.7 61.8 69.8Solar 409 257 152 0.2 0.3 0.2Other 1680 974 706 1.0 1.2 0.9Not Reported 1473 835 638 0.9 1.0 0.8

Central Statistical Office74
Table 67: Distribution of households by main source of energy for cooking and by sex of head of household for Hhohho and Manzini regions Main Cooking energy
Number Percent
Total Male Female Total Male Female Hhohho 60725 33751 26974 100.0 100.0 100.0 Electricity 14602 8689 5913 24.0 25.7 21.9Paraffin 6733 4465 2268 11.1 13.2 8.4Gas 8471 4921 3550 13.9 14.6 13.2Coal 352 204 148 0.6 0.6 0.5Wood 29819 15017 14802 49.1 44.5 54.9Other 144 98 46 0.2 0.3 0.2Not Reported 604 357 247 1.0 1.1 0.9 Manzini 72108 38606 33502 100.0 100.0 100.0 Electricity 20619 12108 8511 28.6 31.4 25.4Paraffin 7862 4717 3145 10.9 12.2 9.4Gas 14352 7436 6916 19.9 19.3 20.6Coal 383 183 200 0.5 0.5 0.6Wood 27680 13431 14249 38.4 34.8 42.5Other 175 120 55 0.2 0.3 0.2Not Reported 1037 611 426 1.4 1.6 1.3

Central Statistical Office75
Table 68: Distribution of households by main source of energy for cooking and by sex of head of household for Shiselweni and Lubombo regions
Main Cooking energy
Number
Percent
Total Male Female Total Male Female Shiselweni 37066 17523 19543 100.0 100.0 100.0 Electricity 3092 1794 1298 8.3 10.2 6.6Paraffin 1906 1055 851 5.1 6.0 4.4Gas 2786 1400 1386 7.5 8.0 7.1Coal 218 106 112 0.6 0.6 0.6Wood 28585 12920 15665 77.1 73.7 80.2Other 161 90 71 0.4 0.5 0.4Not Reported 318 158 160 0.9 0.9 0.8 Lubombo 42296 23517 18779 100.0 100.0 100.0 Electricity 6686 4593 2093 15.8 19.5 11.1Paraffin 1307 905 402 3.1 3.8 2.1Gas 5655 3645 2010 13.4 15.5 10.7Coal 1264 1014 250 3.0 4.3 1.3Wood 26806 12972 13834 63.4 55.2 73.7Other 80 55 25 0.2 0.2 0.1Not Reported 498 333 165 1.2 1.4 0.9

Central Statistical Office76
9. Assets of households
9.1 Distribution of households by ownership of assets
During the census it asked to find out if the households have some assets in functioning condition, and the members of the household have access to these assets. If the asset was in good working condition it was recorded and if an asset was present but no longer functioning was not recorded.
Table 69: Percentage distribution of households by ownership of assets and by sex of head of household for total country
Type of Asset Number Percent
Total Male Female Male Female Swaziland Radio 162998 89642 73356 55.0 45.0Television 75057 43103 31954 57.4 42.6Refrigerator/Freezer
70570 39209 31361 55.6 44.4
Stove/Hot plate 93564 52229 41335 55.8 44.2Bicycle 17685 10748 6937 60.8 39.2Motorcycle 2369 1529 840 64.5 35.5Car 28119 17770 10349 63.2 36.8Van/Bakkie/Truck
14697 9709 4988 66.1 33.9
Tractor 5585 3536 2049 63.3 36.7Computer 10309 6510 3799 63.1 36.9Telephone 20782 11284 9498 54.3 45.7Cellular phone 128292 70849 57443 55.2 44.8Internet Access 6269 3771 2498 60.2 39.8
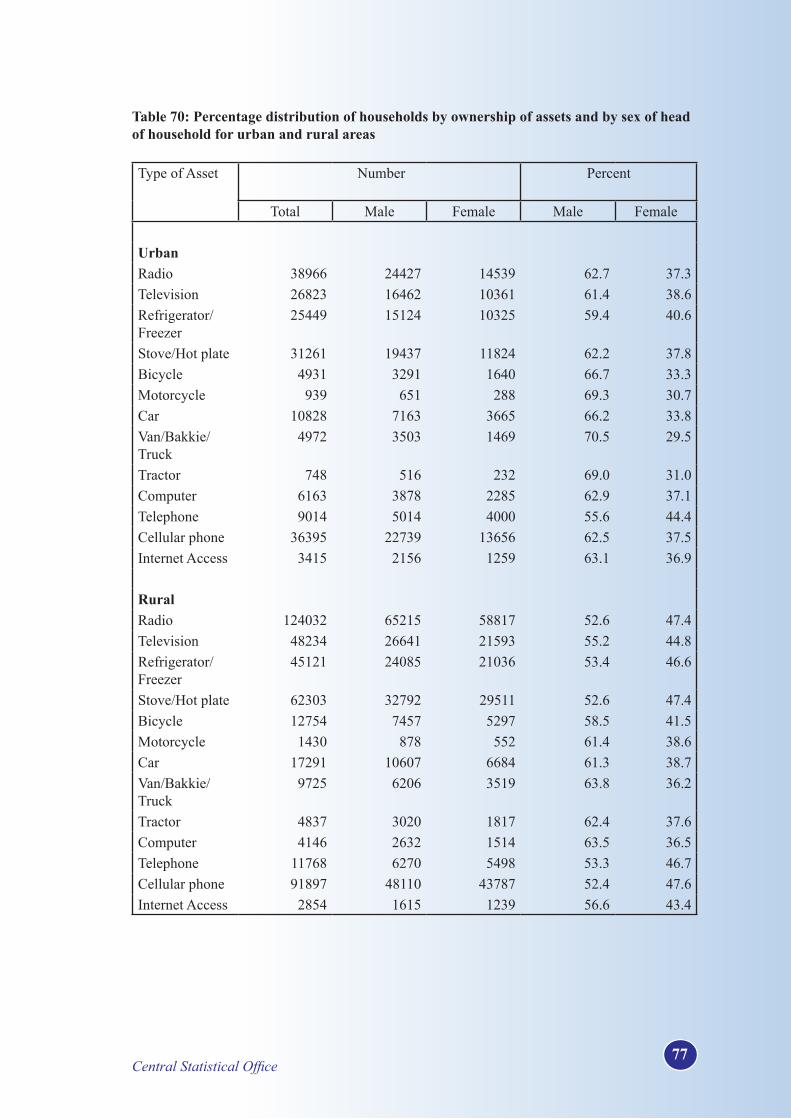
Central Statistical Office77
Table 70: Percentage distribution of households by ownership of assets and by sex of head of household for urban and rural areas Type of Asset Number Percent
Total Male Female Male Female Urban Radio 38966 24427 14539 62.7 37.3Television 26823 16462 10361 61.4 38.6Refrigerator/Freezer
25449 15124 10325 59.4 40.6
Stove/Hot plate 31261 19437 11824 62.2 37.8Bicycle 4931 3291 1640 66.7 33.3Motorcycle 939 651 288 69.3 30.7Car 10828 7163 3665 66.2 33.8Van/Bakkie/Truck
4972 3503 1469 70.5 29.5
Tractor 748 516 232 69.0 31.0Computer 6163 3878 2285 62.9 37.1Telephone 9014 5014 4000 55.6 44.4Cellular phone 36395 22739 13656 62.5 37.5Internet Access 3415 2156 1259 63.1 36.9 Rural Radio 124032 65215 58817 52.6 47.4Television 48234 26641 21593 55.2 44.8Refrigerator/Freezer
45121 24085 21036 53.4 46.6
Stove/Hot plate 62303 32792 29511 52.6 47.4Bicycle 12754 7457 5297 58.5 41.5Motorcycle 1430 878 552 61.4 38.6Car 17291 10607 6684 61.3 38.7Van/Bakkie/Truck
9725 6206 3519 63.8 36.2
Tractor 4837 3020 1817 62.4 37.6Computer 4146 2632 1514 63.5 36.5Telephone 11768 6270 5498 53.3 46.7Cellular phone 91897 48110 43787 52.4 47.6Internet Access 2854 1615 1239 56.6 43.4
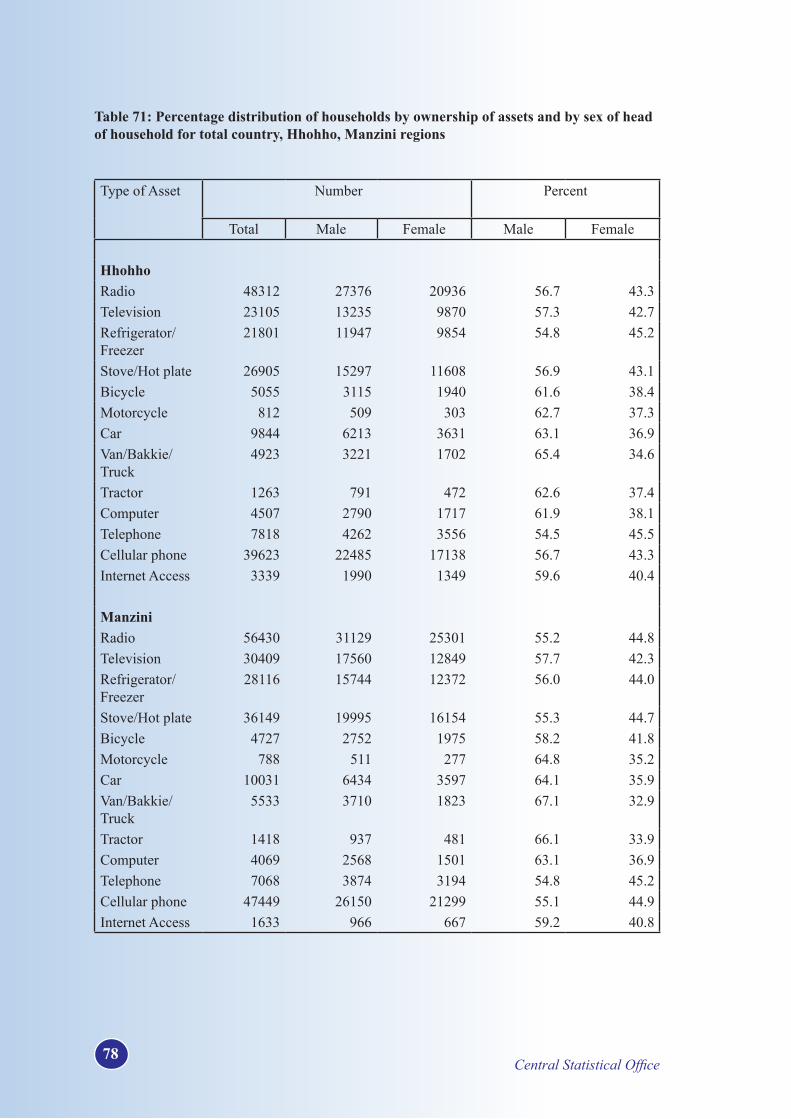
Central Statistical Office78
Table 71: Percentage distribution of households by ownership of assets and by sex of head of household for total country, Hhohho, Manzini regions
Type of Asset Number
Percent
Total Male Female Male Female Hhohho Radio 48312 27376 20936 56.7 43.3Television 23105 13235 9870 57.3 42.7Refrigerator/Freezer
21801 11947 9854 54.8 45.2
Stove/Hot plate 26905 15297 11608 56.9 43.1Bicycle 5055 3115 1940 61.6 38.4Motorcycle 812 509 303 62.7 37.3Car 9844 6213 3631 63.1 36.9Van/Bakkie/Truck
4923 3221 1702 65.4 34.6
Tractor 1263 791 472 62.6 37.4Computer 4507 2790 1717 61.9 38.1Telephone 7818 4262 3556 54.5 45.5Cellular phone 39623 22485 17138 56.7 43.3Internet Access 3339 1990 1349 59.6 40.4 Manzini Radio 56430 31129 25301 55.2 44.8Television 30409 17560 12849 57.7 42.3Refrigerator/Freezer
28116 15744 12372 56.0 44.0
Stove/Hot plate 36149 19995 16154 55.3 44.7Bicycle 4727 2752 1975 58.2 41.8Motorcycle 788 511 277 64.8 35.2Car 10031 6434 3597 64.1 35.9Van/Bakkie/Truck
5533 3710 1823 67.1 32.9
Tractor 1418 937 481 66.1 33.9Computer 4069 2568 1501 63.1 36.9Telephone 7068 3874 3194 54.8 45.2Cellular phone 47449 26150 21299 55.1 44.9Internet Access 1633 966 667 59.2 40.8
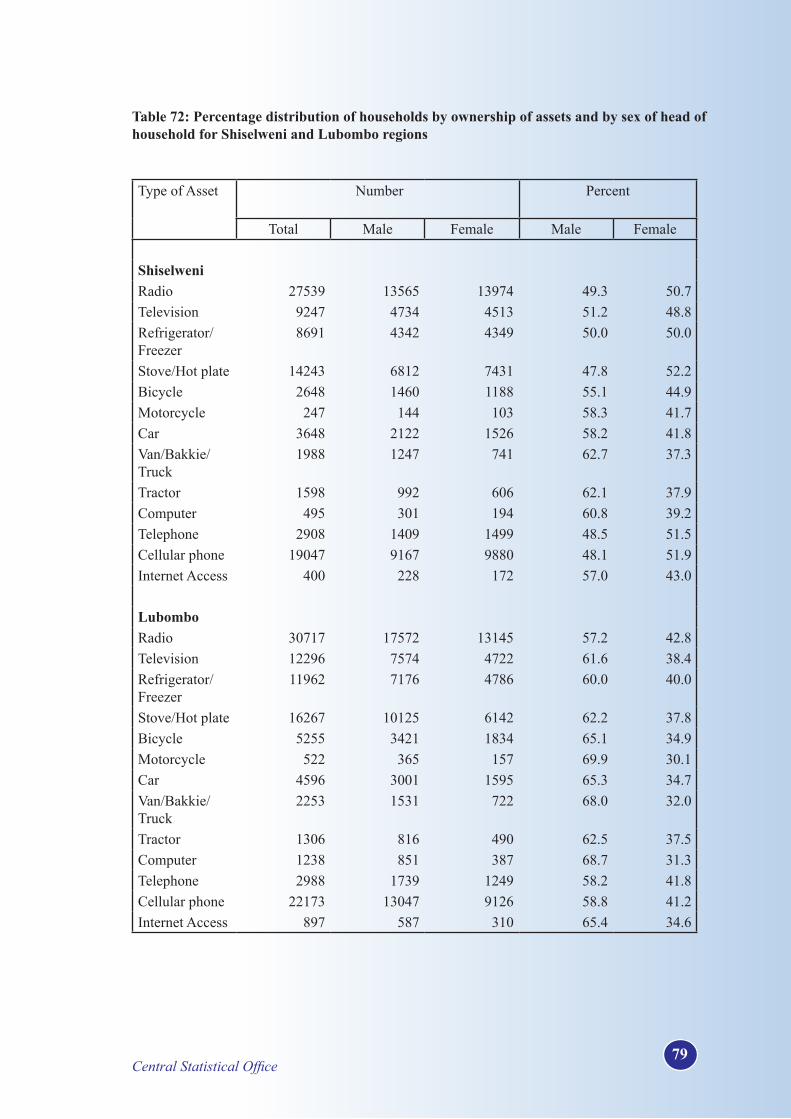
Central Statistical Office79
Table 72: Percentage distribution of households by ownership of assets and by sex of head of household for Shiselweni and Lubombo regions
Type of Asset Number Percent
Total Male Female Male Female Shiselweni Radio 27539 13565 13974 49.3 50.7Television 9247 4734 4513 51.2 48.8Refrigerator/Freezer
8691 4342 4349 50.0 50.0
Stove/Hot plate 14243 6812 7431 47.8 52.2Bicycle 2648 1460 1188 55.1 44.9Motorcycle 247 144 103 58.3 41.7Car 3648 2122 1526 58.2 41.8Van/Bakkie/Truck
1988 1247 741 62.7 37.3
Tractor 1598 992 606 62.1 37.9Computer 495 301 194 60.8 39.2Telephone 2908 1409 1499 48.5 51.5Cellular phone 19047 9167 9880 48.1 51.9Internet Access 400 228 172 57.0 43.0 Lubombo Radio 30717 17572 13145 57.2 42.8Television 12296 7574 4722 61.6 38.4Refrigerator/Freezer
11962 7176 4786 60.0 40.0
Stove/Hot plate 16267 10125 6142 62.2 37.8Bicycle 5255 3421 1834 65.1 34.9Motorcycle 522 365 157 69.9 30.1Car 4596 3001 1595 65.3 34.7Van/Bakkie/Truck
2253 1531 722 68.0 32.0
Tractor 1306 816 490 62.5 37.5Computer 1238 851 387 68.7 31.3Telephone 2988 1739 1249 58.2 41.8Cellular phone 22173 13047 9126 58.8 41.2Internet Access 897 587 310 65.4 34.6

Central Statistical Office80
10. Agriculture
10.1 Distribution of households by crops grown/harvested
To find out if the household grow crops a question was asked during the census. Whether, the crop was grown or not by the household was indicated. The crops were recorded regardless of the purpose they are grown for, domestic use or commercial purpose.
Table 73: Percentage distribution of households by type crop grown/harvested and by sex of head of household for total country, urban and rural areas Type of crop Number Percent
Total Male Female Total Male Female Swaziland 209184 111318 97866 100 100 100 Maize 103249 52701 50548 49.4 47.3 51.7Sweet Potatoes 28818 15409 13409 13.8 13.8 13.7Cotton 2114 1257 857 1.0 1.1 0.9Vegetables 35670 20949 14721 17.1 18.8 15.0Beans 16969 9601 7368 8.1 8.6 7.5Groundnuts 22364 11401 10963 10.7 10.2 11.2 Urban 33911 22686 11225 100 100 100 Maize 12501 8360 4141 36.9 36.9 36.9Sweet Potatoes 3746 2517 1229 11.0 11.1 10.9Cotton 285 190 95 0.8 0.8 0.8Vegetables 11728 7819 3909 34.6 34.5 34.8Beans 3554 2382 1172 10.5 10.5 10.4Groundnuts 2097 1418 679 6.2 6.3 6.0 Rural 175273 88632 86641 100 100 100 Maize 90748 44341 46407 51.8 50.0 53.6Sweet Potatoes 25072 12892 12180 14.3 14.5 14.1Cotton 1829 1067 762 1.0 1.2 0.9Vegetables 23942 13130 10812 13.7 14.8 12.5Beans 13415 7219 6196 7.7 8.1 7.2Groundnuts 20267 9983 10284 11.6 11.3 11.9

Central Statistical Office81
Table 74: Percentage distribution of households by type crop grown/harvested and by sex of head of household for total country, Hhohho, Manzini, Shiselweni and Lubombo administrative regions
Type of crop Number Percent
Total Male Female Total Male FemaleHhohho 60725 33751 26974 100 100 100Maize 8738 4984 3754 14.4 14.8 13.9Sweet Potatoes 11879 6273 5606 19.6 18.6 20.8Cotton 27562 15477 12085 45.4 45.9 44.8Vegetables 7590 3736 3854 12.5 11.1 14.3Beans 519 302 217 0.9 0.9 0.8Groundnuts 4437 2979 1458 7.3 8.8 5.4 Manzini 72108 38606 33502 100.0 100.0 100.0Maize 9406 5675 3731 13.0 14.7 11.1Sweet Potatoes 15222 8070 7152 21.1 20.9 21.3Cotton 36164 18782 17382 50.2 48.7 51.9Vegetables 5497 2632 2865 7.6 6.8 8.6Beans 337 142 195 0.5 0.4 0.6Groundnuts 5482 3305 2177 7.6 8.6 6.5 Shiselweni 37066 17523 19543 100 100 100Maize 1699 998 701 4.6 5.7 3.6Sweet Potatoes 5601 2690 2911 15.1 15.4 14.9Cotton 21191 9821 11370 57.2 56.0 58.2Vegetables 7002 3176 3826 18.9 18.1 19.6Beans 403 175 228 1.1 1.0 1.2Groundnuts 1170 663 507 3.2 3.8 2.6 Lubombo 42296 23517 18779 100 100 100Maize 8192 5896 2296 19.4 25.1 12.2Sweet Potatoes 5489 2935 2554 13.0 12.5 13.6Cotton 12899 6547 6352 30.5 27.8 33.8Vegetables 12675 6037 6638 30.0 25.7 35.3Beans 298 151 147 0.7 0.6 0.8Groundnuts 2743 1951 792 6.5 8.3 4.2
10.2 Distribution of households by type of livestock/poultry raised
Similarly, to find out if the household raised livestock/poultry a question was asked during the census. Whether, the livestock/poultry was raised or not by the household was indicated. The livestock/poultry were recorded regardless of the purpose they are raised for, domestic use or commercial purpose.

Central Statistical Office82
Table 75: Percentage distribution of households by type livestock/poultry raised and by sex of head of household for total country, urban and rural, regions Type of Livestock/Poultry
Number PercentTotal Male Female Total Male Female
Swaziland 83571 47216 36355 100 100 100Cattle 28818 15409 13409 34.5 32.6 36.9Goats 2114 1257 857 2.5 2.7 2.4Donkeys 35670 20949 14721 42.7 44.4 40.5Poultry 16969 9601 7368 20.3 20.3 20.3Urban 19313 12908 6405 100 100 100Cattle 3746 2517 1229 19.4 19.5 19.2Goats 285 190 95 1.5 1.5 1.5Donkeys 11728 7819 3909 60.7 60.6 61.0Poultry 3554 2382 1172 18.4 18.5 18.3Rural 64258 34308 29950 100 100 100Cattle 25072 12892 12180 39.0 37.6 40.7Goats 1829 1067 762 2.8 3.1 2.5Donkeys 23942 13130 10812 37.3 38.3 36.1Poultry 13415 7219 6196 20.9 21.0 20.7Hhohho 47550 25788 21762 100 100 100Cattle 11879 6273 5606 25.0 24.3 25.8Goats 27562 15477 12085 58.0 60.0 55.5Donkeys 7590 3736 3854 16.0 14.5 17.7Poultry 519 302 217 1.1 1.2 1.0Manzini 57220 29626 27594 100.0 100.0 100.0Cattle 15222 8070 7152 26.6 27.2 25.9Goats 36164 18782 17382 63.2 63.4 63.0Donkeys 5497 2632 2865 9.6 8.9 10.4Poultry 337 142 195 0.6 0.5 0.7Shiselweni 34197 15862 18335 100 100 100Cattle 5601 2690 2911 16.4 17.0 15.9Goats 21191 9821 11370 62.0 61.9 62.0Donkeys 7002 3176 3826 20.5 20.0 20.9Poultry 403 175 228 1.2 1.1 1.2Lubombo 31361 15670 15691 100 100 100Cattle 5489 2935 2554 17.5 18.7 16.3Goats 12899 6547 6352 41.1 41.8 40.5Donkeys 12675 6037 6638 40.4 38.5 42.3Poultry 298 151 147 1.0 1.0 0.9

Central Statistical Office83
10.3 Distribution of households by type of fruits grown/picked
To find out if the household grow fruits a question was asked during the census. Whether, the fruits were grown or not by the household were indicated. The fruits were recorded regardless of the purpose they are grown for, domestic use or commercial purpose.
Table 76: Percentage distribution of households by type fruits grown/picked and by sex of head of household for total country, urban and rural areas
Type of fruits
Number Percent
Total Male Female Total Male Female Swaziland 210668 114942 95726 100 100 100 Banana 46000 25472 20528 21.8 22.2 21.4Oranges 19280 10862 8418 9.2 9.4 8.8Mangoes 44276 24363 19913 21.0 21.2 20.8Peaches 48201 25421 22780 22.9 22.1 23.8Avocado 52911 28824 24087 25.1 25.1 25.2 Urban 40274 25664 14610 100 100 100 Banana 8830 5648 3182 21.9 22.0 21.8Oranges 3522 2216 1306 8.7 8.6 8.9Mangoes 9150 6055 3095 22.7 23.6 21.2Peaches 6422 4069 2353 15.9 15.9 16.1Avocado 12350 7676 4674 30.7 29.9 32.0 Rural 170394 89278 81116 100 100 100 Banana 37170 19824 17346 21.8 22.2 21.4Oranges 15758 8646 7112 9.2 9.7 8.8Mangoes 35126 18308 16818 20.6 20.5 20.7Peaches 41779 21352 20427 24.5 23.9 25.2Avocado 40561 21148 19413 23.8 23.7 23.9

Central Statistical Office84
Table 77: Percentage distribution of households by type fruits grown/picked and by sex of head of household for total country, Hhohho, Manzini, Shiselweni and Lubombo administrative regions
Type of fruits
Number Percent
Total Male Female Total Male FemaleHhohho 73548 41258 32290 100 100 100Banana 17035 9563 7472 23.2 23.2 23.1Oranges 5621 3288 2333 7.6 8.0 7.2Mangoes 13899 7547 6352 18.9 18.3 19.7Peaches 15189 8593 6596 20.7 20.8 20.4Avocado 21804 12267 9537 29.6 29.7 29.5 Manzini 62548 33695 28853 100.0 100.0 100.0Banana 13517 7389 6128 21.6 21.9 21.2Oranges 5644 3178 2466 9.0 9.4 8.5Mangoes 14133 7606 6527 22.6 22.6 22.6Peaches 14372 7526 6846 23.0 22.3 23.7Avocado 14882 7996 6886 23.8 23.7 23.9 Shiselweni 39166 19455 19711 100 100 100Banana 7994 4051 3943 20.4 20.8 20.0Oranges 3789 2019 1770 9.7 10.4 9.0Mangoes 4474 2275 2199 11.4 11.7 11.2Peaches 12929 6171 6758 33.0 31.7 34.3Avocado 9980 4939 5041 25.5 25.4 25.6 Lubombo 35406 20534 14872 100 100 100Banana 7454 4469 2985 21.1 21.8 20.1Oranges 4226 2377 1849 11.9 11.6 12.4Mangoes 11770 6935 4835 33.2 33.8 32.5Peaches 5711 3131 2580 16.1 15.2 17.3Avocado 6245 3622 2623 17.6 17.6 17.6

Central Statistical Office85
10.4 Distributionofhouseholdsinvolvedinfishfarming
Households were asked if they were doing agricultural activity including fish farming. The fish farming activity was recorded regardless of the purpose they are practiced for, domestic use or commercial purpose.
Table78:Percentdistributionofhouseholdsinvolvedinfishfarmingandbysexofheadofhousehold for country, urban, rural and regions Area Number Percent
Total Male Female Male Female Swaziland 4390 2362 2028 53.8 46.2 Urban 985 640 345 65.0 35.0Rural 3405 1722 1683 50.6 49.4 Hhohho 1423 829 594 58.3 41.7Manzini 1097 598 499 54.5 45.5Shiselweni 1177 526 651 44.7 55.3Lubombo 693 409 284 59.0 41.0
11. Conclusion Recommendations for the next census
The following are recommendations for the next census to be likely in 2017, if the decennial period will be observed.
The question on what is the source of drinking water for the household should have included the component of cooking. Therefore, recommend that in the next census should be asked, “What is the main source of drinking and cooking for members of the household?”.
There was no question asking about main source of energy for heating in the households. A very important question on garbage and refuse disposal was not asked, to find out how households were disposing their garbage.
Distances of households to the nearest essential services like hospitals, schools was not asked in 2007, yet in the previous censuses were asked.
In the agriculture module quantities and volumes must asked in the next census to add a value on the yes, categories.

Central Statistical Office86
Copyright © 2022 FDOKUMEN