2020 population and housing census of mongolia
298
NATIONAL REPORT 2020 POPULATION AND HOUSING CENSUS OF MONGOLIA NATIONAL STATISTICS OFFICE OF MONGOLIA
-
Upload
khangminh22 -
Category
Documents
-
view
2 -
download
0
Transcript of 2020 population and housing census of mongolia

NATIONAL REPORT2020 POPULATION AND HOUSING
CENSUS OF MONGOLIA
NATIONAL STATISTICS OFFICE OF MONGOLIA

EDITORIAL TEAMONE. REVIEWED BYAriunzaya Ayush
Master of Sociology, History and Political Science, Master of Business AdministrationChairperson of the NSO, Deputy Chairman of the State Commission on Population and Housing Census
Bayanchimeg ChilkhaasurenStatistician-Economist, Master of EconomicsVice Chairperson of the NSO
Amarbal AvirmedEconomist-Demographer, PhD in DemographicsDirector of the Population and social statistics department, Secretary of the State Commission on Population and Housing Census
TWO. PREPARED BYBolor-Erdene Tumurbaatar
Economist-DemographerDirector, Population and Housing Census Bureau, NSO
Uyanga Turbat Economist-DemographerSenior Statistician, Population and Housing Census Bureau, NSO
Tserendulam IchinnorovEconomist-StatisticianStatistician, Population and Housing Census Bureau, NSO
Uujinge OchirbalEconomist-DemographerStatistician, Population and Housing Census Bureau, NSO
Ariunsaikhan Tugsbat EconomistStatistician, Population and Housing Census Bureau, NSO
Batkhishig RyenchindorjEconomistStatistician, Population and Housing Census Bureau, NSO
Munkhjargal BurenjargalProgrammerOfficer, Population and Housing Census Bureau, NSO
Ariunzaya BatchuluunBusiness and economic managementOfficer, Population and Housing Census Bureau, NSO
Misheel MashbatAccountantOfficer, Population and Housing Census Bureau, NSO
Erdenemunkh TsenkherborProgram engineerSenior referent, Information technology department, NSO
Lkhagvatseren DulmaaComputer software and Hardware engineerReferent, Information technology department, NSO
Jargal GanbaatarComputer and Program engineerReferent, Information technology department, NSO

2020 POPULATION AND HOUSING CENSUS OF MONGOLIA NATIONAL REPORT
3
CONTENTS
EDITORIAL TEAM ............................................................................................. 2LIST OF TABLES .............................................................................................. 4LIST OF FIGURES ............................................................................................. 8FOREWORD ................................................................................................... 11MESSAGE FROM THE PRESIDENT OF MONGOLIA ........................................ 13MESSAGE FROM THE SPEAKER OF THE PARLIAMENT OF MONGOLIA ........ 15FOREWORD BY THE PRIME MINISTER OF MONGOLIA AND .......................... 17CHAIR OF STATE COMMISSION ON POPULATION AND HOUSING CENSUS .. 17OVERALL RESULT SUMMARY ........................................................................ 19
CHAPTER ONECOMPOSITION AND HIGHLIGHTS ................................................................29
CHAPTER TWONUMBER OF POPULATIONS, GROWTH, AGE AND SEX STRUCTURE ........39
CHAPTER THREECITIZENSHIP, ETHNICITY AND RELIGION ...................................................49
CHAPTER FOURPOPULATION DISTRIBUTION AND SETTLEMENT AND URBANIZATION ...65
CHAPTER FIVEINTERNAL MIGRATION .................................................................................75
CHAPTER SIXEDUCATION AND LITERACY .........................................................................91
CHAPTER SEVENHOUSEHOLD AND MARITAL STATUS .........................................................103
CHAPTER EIGHTPERSONS WITH DISABILITY AND TYPES OF DISABILTY ........................ 1115
CHAPTER NINEMOBILE PHONE AND INTERNET USERS ..................................................127
CHAPTER TENEMPLOYMENT .............................................................................................133
CHAPTER ELEVENMONGOLIAN CITIZENS RESIDING ABROAD ..............................................151
CHAPTER TWELVEHOUSEHOLD HOUSING CONDITION AND TYPES .....................................163
APPENDIX ................................................................................................... 181

2020 POPULATION AND HOUSING CENSUS OF MONGOLIA NATIONAL REPORT
4
LIST OF TABLESTABLE 2.1 POPULATION OF MONGOLIA, BY CENSUS YEARS .......................................................... 41TABLE 2.2. POPULATION VITAL STATISTICS INDICATOR, 2010-2020 ................................................ 42TABLE 2.3. POPULATION GROWTH IN AIMAGS AND THE CAPITAL, BY PERCENTAGE, 1989-2000,
2000-2010, 2010-2020 ....................................................................................................... 43TABLE 2.4. POPULATION BY AGE GROUPS, BY SEX, AND SEX RATIO, 2010, 2020 ........................... 44TABLE 2.5. POPULATION IN AIMAGS AND THE CAPITAL, BY SEX, AND SEX RATIO, 2010, 2020 .... 46TABLE 2.6. URBAN AND RURAL POPULATION, BY SEX, AND SEX RATIO, 2010, 2020 ..................... 46TABLE 2.7. SOME KEY INDICATORS OF POPULATION AGE STRUCTURE, 1989, 2000, 2010, 2020 .. 47TABLE 3.1. RESIDENT POPULATION IN MONGOLIA BY AIMAGS AND THE CAPITAL, BY SEX, AND
SEX RATIO, 2010, 2020 ....................................................................................................... 51TABLE 3.2. POPULATION AND ETHNIC GROUPS, BY PERCENTAGE, 2010, 2020 ............................ 52TABLE 3.3. ETHNICITY BY AGE GROUPS AND PERCENTAGE, 2020 .................................................. 53TABLE 3.4. PERCENTAGE DISTRIBUTION OF POPULATION AGED 10 AND ABOVE, BY ETHNICITY
AND EDUCATION LEVEL, 2020 .......................................................................................... 56TABLE 3.5. PERCENTAGE DITRIBUTION POPULATION AGED 15 AND ABOVE, BY ETHNICITY AND
EMPLOYMENT STATUS, 2020 ............................................................................................ 57TABLE 3.5.1 PERCENTAGE DISTRIBUTION OF POPULATION AGED 15 AND ABOVE, BY ETHNICITY
AND EMPLOYMENT STATUS, 2020 /CONTINUED/ ........................................................... 58TABLE 3.6. PERCENTAGE DISTRIBUTION OF FOREIGN CITIZENSS RESIDING IN MONGOLIA, BY
COUNTRY, 2010, 2020 ........................................................................................................ 59TABLE 3.7. PERCENTAGE DISTRIBUTION OF FOREIGN CITIZENS RESIDING IN MONGOLIA, BY
AIMAGS AND THE CAPITAL CITY, 2010, 2020 ................................................................... 59TABLE 3.8. PERCENTAGE DISTRIBUTION OF MONGOLIAN RESIDING POPULATION AND FOREIGN
CITIZENS, BY AGE AND GENDER STRUCTURE, 2010, 2020 ............................................ 60TABLE 3.9. PERCENTAGE DISTRIBUTION OF POPULATION AGED 15 AND ABOVE, BY RELIGIOUS
STATUS AND SEX, 2010, 2020 ........................................................................................... 61TABLE 3.10. PERCENTAGE DISTRIBUTION OF RELIGIOUS POPULATION AGED 15 AND ABOVE, BY
RELIGIONS AND SEX, 2010, 2020 ..................................................................................... 62TABLE 3.11. PERCENTAGE DISTRIBUTION OF RELIGIOUS POPULATION AGED 15 AND ABOVE, BY
AGE GROUPS AND RELIGIONS, 2020 ............................................................................... 62TABLE 3.12. PERCENTAGE DISTRIBUTION OF RELIGIOUS POPULATION AGED 15 AND ABOVE, BY
RELIGIONS AND AGE GROUPS, 2020 ............................................................................... 62TABLE 3.13. PERCENTAGE DISTRIBUTION OF POPULATION AGED 15 AND ABOVE, BY RELIGIOUS
STATUS, ETHNICITY AND RELIGIONS, 2020 .................................................................... 63TABLE 4.1. POPULATION DISTRIBUTION AND GROWTH BY REGIONS, 2000, 2010, 2020 ............... 68TABLE 4.2. POPULATION DISTRIBUTION AND GROWTH BY AIMAGS AND THE CAPITAL, 2000, 2010,
2020 .................................................................................................................................... 68TABLE 4.3. POPULATION DISTRIBUTION, BY REGIONS, URBAN AND RURAL AREAS, 2010, 2020 . 69TABLE 4.4. PERCENTAGE DISTRIBUTION OF POPULATION BY AIMAG, THE CAPITAL, URBAN AND
RURAL AREAS, 2010, 2020 ................................................................................................ 70TABLE 4.5. PERCENTAGE DISTRIBUTION OF POPULATION DENSITY BY REGION, 2010, 2020 ....... 71TABLE 4.6. PERCENTAGE DISTRIBUTION OF POPULATION NUMBER AND DENSITY BY AIMAG
AND CAPITAL, 2010, 2020 .................................................................................................. 72TABLE 4.7. PERCENTAGE DISTRIBUTION POPULATION NUMBER, GROWTH BY AIMAG, THE
CAPITAL, 2010, 2020 .......................................................................................................... 73

2020 POPULATION AND HOUSING CENSUS OF MONGOLIA NATIONAL REPORT
5
TABLE 5.1. PERCENTAGE OF MIGRATION SINCE BIRTH, BY REGION OF BIRTH, 2010, 2020 .......... 80TABLE 5.2. PERCENTAGE OF MIGRANTS SINCE BIRTH BY THE PLACE OF BIRTH AND THE
RESIDENCE AT THE TIME OF THE CENSUS, 2020 .......................................................... 81TABLE 5.3. NUMBER OF MIGRANTS FIVE-YEARS AGO BY PERMANENTLY RESIDING REGIONS,
2010, 2020 .......................................................................................................................... 81TABLE 5.4. POPULATION AGED 5 AND ABOVE, BY PERMANENTLY RESIDING REGION AT THE TIME
OF CENSUS, 2010, 2020 .................................................................................................... 82TABLE 5.5. PERCENTAGE OF POPULATION AGED 5 AND ABOVE, BY REGION AT THE TIME OF
CENSUS, 2010, 2020 ........................................................................................................ 83TABLE 5.6. NUMBER OF MIGRANTS IN THE PAST YEAR, BY REGION OF PERMANENT RESIDENCE,
2010, 2020 .......................................................................................................................... 84TABLE 5.7. NUMBER OF POPULATION, BY REGION OF PERMANENT RESIDENCE AT THE TIME OF
CENSUS AND A YEAR AGO, 2010, 2020 ........................................................................... 84TABLE 5.8. PERCENTAGE DISTRIBUTION OF POPULATION, BY REGION OF PERMANENT
RESIDENCE AT THE TIME OF THE CENSUS AND A YEAR AGO, 2010, 2020 ................... 85TABLE 5.9. PERCENTAGE DISTRIBUTION OF MIGRANTS IN THE PAST YEAR, BY AGE GROUPS
AND SEX, 2010, 2020 ......................................................................................................... 87TABLE 5.10. PERCENTAGE DISTRIBUTION OF REGIONS AT THE TIME OF BIRTH AND THE CENSUS,
2020 .................................................................................................................................... 88TABLE 5.11. PERCENTAGE DISTRIBUTION OF POPULATION AGED 1 AND ABOVE, BY REGION OF
PERMANENT RESIDENCE A YEAR AGO AND AT THE TIME OF CENSUS, 2010, 2020 ... 89TABLE 5.12. PERCENTAGE DISTRIBUTION OF POPULATION AGED 5 AND ABOVE, BY REGION OF
PERMANENT RESIDENCE AT THE TIME OF CENSUS, 2010, 2020 ................................ 89TABLE 6.1. EDUCATION LEVEL PERCENTAGE OF POPULATION AGED 10 AND ABOVE, BY SEX
2010, 2020 .......................................................................................................................... 94TABLE 6.2. PERCENTAGE DISTRIBUTION OF EDUCATION LEVEL OF POPULATION AGED 10 AND
ABOVE, BY URBAN AND RURAL AREAS, 2010, 2020 ....................................................... 94TABLE 6.3. PERCENTAGE DISTRIBUTION OF EDUCATION LEVEL OF POPULATION AGED 10 AND
ABOVE, BY AGE GROUPS, 2010, 2020 ............................................................................... 95TABLE 6.4. PERCENTAGE DISTRIBUTION OF POPULATION AGED 15 AND ABOVE, BY LITERACY IN
URBAN AND RURAL AREAS, 2010, 2020 .......................................................................... 97TABLE 6.5. PERCENTAGE DISTRIBUTION OF SCHOOL ATTENDACE FOR POPULATION AGED 6-29,
BY AGE AND SEX, 2010, 2020 ........................................................................................... 99TABLE 6.6. PERCENTAGE DISTRIBUTION OF SCHOOL ATTENDANCE FOR POPULATION AGED
6-29, BY URBAN AND RURAL AREAS AND SEX, 2010, 2020 ........................................ 100TABLE 6.7. PERCENTAGE DISTRIBUTION OF PRE-SCHOOL ATTENDANCE, BY AGE AND AREAS,
2020 .................................................................................................................................. 101TABLE 7.1. PERCENTAGE DISTRIBUTION OF POPULATION ENUMERATED IN HOUSEHOLDS AND
NON-HOUSEHOLD HOUSELHOLD UNITS, 2010, 2020 ................................................. 105TABLE 7.2. PERCENTAGE DISTRIBUTION OF POPULATION IN HOUSEHOLDS AND NON-
HOUSEHOLD UNITS, BY AIMAGS AND CAPITAL CITY, 2020 ......................................... 106TABLE 7.3. PERCENTAGE DISTRIBUTION OF HOUSEHOLD NUMBERS, BY URBAN AND RURAL
AREAS, 2010, 2020 ........................................................................................................... 106TABLE 7.4. HOUSEHOLD NUMBERS AND TYPES BY AREAS AND PERCENTAGE, 2010, 2020 ..... 107TABLE 7.5. PERCENTAGE DISTRIBUTION OF HOUSEHOLD NUMBER AND HOUSEHOLD SIZE, BY
AREAS, 2010, 2020 ........................................................................................................... 108TABLE 7.6. PERCENTAGE DISTRIBUTION OF HOUSEHOLD SIZE, BY AIMAGS AND THE CAPITAL,
2020 ................................................................................................................................. 109

2020 POPULATION AND HOUSING CENSUS OF MONGOLIA NATIONAL REPORT
6
TABLE 7.7. PERCENTAGE DISTRIBUTION OF HOUSEHOLD NUMBERS, BY SEX OF THE HEADS, BY AREAS, 2010, 2020 .......................................................................................................... 110
TABLE 7.8. NUMBER OF POPULATION AGED 15 AND ABOVE, BY MARITAL STATUS AND PERCENTAGE, 2000, 2010, 2020 .................................................................................... 110
TABLE 7.9. MARITAL STATUS OF POPULATION AGED 15 AND ABOVE, BY SEX AND PERCENTAGE, 2010, 2020 ........................................................................................................................ 111
TABLE 7.10. MARITAL STATUS OF POPULATION AGED 15 AND ABOVE, BY AGE GROUP, SEX, AND PERCENTAGE, 2010, 2020 ............................................................................................... 112
TABLE 7.11. MARITAL STATUS OF POPULATION AGED 15 AND ABOVE, BY AGE GROUP, SEX, AND PERCENTAGE, 2010, 2020 ............................................................................................... 113
TABLE 8.1. NUMBER OF PERSONS WITH DISABILITY, BY AGE GROUPS AND PERCENTAGE, 2010, 2020 ................................................................................................................................. 117
TABLE 8.2. NUMBER OF PERSONS WITH DISABILITY, BY AIMAGS AND CAPITAL, PERCENTAGE, 2010, 2020 ........................................................................................................................ 118
TABLE 8.3. NUMBER AND PERCENTAGE DISTRIBUTION OF PERSONS WITH DISABILITIES, BY URBAN AND RURAL AREAS, AIMAGS AND CAPITAL, 2010, 2020 ................................ 120
TABLE 8.4. TYPES OF FUNCTIONAL DIFFICULTIES AND PERCENTAGE DISTRIBUTION OF POPULATION AGED 15 AND ABOVE, BY AGE GROUP, 2020 ........................................ 122
TABLE 8.5. FUNCTIONAL DIFFICULTIES TYPES AND PERCENTAGE DISTRIBUTION OF POPULATION AGED 18 AND ABOVE, BY AGE GROUP, 2020 ......................................... 122
TABLE 8.6. FUNCTIONAL DIFFICULTY TYPES AND PERCENTAGE DISTRIBUTION OF PEOPLE AGED 18 AND ABOVE, BY AIMAGS AND CAPITAL, 2020 .......................................................... 124
TABLE 8.7. EDUCATION LEVEL AND PERCENTAGE DISTRIBUTION OF PEOPLE AGED 18 AND ABOVE, BY MULTIPLE FORMS OF FUNCTIONAL DIFFICULTY TYPES, 2020 ................ 125
TABLE 8.8. EMPLOYMENT STATUS AND PERCENTAGE DISTRIBUTION OF PEOPLE AGED 18 AND ABOV, EMPLOYMENT TYPES FUNCTIONAL DIFFICULTY TYPES, 2020 ........................ 126
TABLE 9.1. POPULATION USING CELLULAR PHONES BY AGE GROUP, , PERCENTAGE, 2010, 2020 .................................................................................................................................. 130
TABLE 10.1 LABOR FORCE PARTICIPATION LEVEL, BY URBAN AND RURAL AREAS, 2020 ........... 136TABLE 10.2 PERCENTAGE DISTRIBUTION OF POPULATION AGED 15 AND ABOVE BY EMPLOYMENT
STATUS, AGE GROUP, SEX, OCCUPATION RATE, 2020 ................................................... 138TABLE 10.3. PERCENTAGE DISTRIBUTION OF EMPLOYED POPULATION BY SEX, 2010, 2020 ........ 139TABLE 10.4. PERCENTAGE DISTRIBUTION OF EMPLOYED POPULATION AGED 15 AND ABOVE BY
SEX, URBAN AND RURAL AREAS, 2020 ........................................................................ 139TABLE 10.5. EMPLOYED POPULATION AGED 15 AND ABOVE, BY AGE GROUP, SEX, 2010, 2020 /by
thousand people/ ............................................................................................................. 139TABLE 10.6. PERCANTAGE DISTRIBUTION OF POPULATION AGED 15 AND ABOVE, OCCUPATIONAL
CLASSIFICATION, AND SEX, 2020 .................................................................................. 140TABLE 10.7. PERCANTAGE DISTRIBUTION OF POPULATION AGED 15 AND ABOVE, BY
OCCUPATIONAL CLASSIFICATION AND SEX, 2020 ....................................................... 140TABLE 10.8. PERCENTAGE DISTRIBUTION OF EMPLOYED POPULATION AGED 15 AND ABOVE,
ECONOMIC ACTIVITY ...................................................................................................... 141TABLE 10.9. PERCENTAGE DISTRIBUTION OF POPULATION AGED 15 AND OLDER, ECONOMIC
ACTIVITY SECTOR, 2020 ................................................................................................... 142TABLE 10.10. PERCENTAGE DISTRIBUTION POPULATION AGED 15 AND ABOVE BY ECONOMIC
ACTIVITY SECTOR, URBAN AND RURAL AREAS, 2020 .................................................. 143TABLE 10.11. PERCENTAGE DISTRIBUTION OF EMPLOYED POPULATION BY EMPLOYMENT STATUS
AND SEX, 2010, 2020 ....................................................................................................... 145

2020 POPULATION AND HOUSING CENSUS OF MONGOLIA NATIONAL REPORT
7
TABLE 10.12. UNEMPLOYED POPULATION, UNEMPLOYMENT RATE By sex, URBAN AND RURAL AREAS, 2010, 2020 ........................................................................................................... 146
TABLE 10.13. POPULATION OUTSIDE THE LABOR FORCE AGED 15 AND ABOVE, BY REASONS FOR UNEMPLOYMENT, SEX, /thousand people/, 2010, 2020 ................................................. 147
TABLE 10.14. POPULATION AGED 15 AND ABOVE OUTSIDE LABORFORCE BY AGE GROUP, UNEMPLOYMENT REASON, 2020 .................................................................................. 148
TABLE 11.1 NUMBER OF MONGOLIAN CITIZENS RESIDING ABROAD BY AGE GROUP AND SEX, 2010, 2020 ........................................................................................................................ 154
TABLE 11.2 MONGOLIAN CITIZENS RESIDING ABROAD, BY AIMAG AND THE CAPITAL CITY OF PERMANENT RESIDENCE, PERCENTAGE, 2020 ........................................................... 156
TABLE 11.3. PERCENTAGE DISTRIBUTION OF MONGOLIAN CITIZENS RESIDING ABROAD BY AIMAG AND THE CAPITAL CITY OF PERMANENT RESIDENCE AND CURRENT RESIDENTIAL REGIONS, 2010, 2020 ....................................................................................................... 156
TABLE 11.4 NUMBER OF CITIZENS RESIDING ABROAD BY COUNTRY OF RESIDENCE, DURATION, AND PERCENTAGE, 2020 ............................................................................................... 158
TABLE 11.5 NUMBER OF CITIZENS LIVING ABROAD BY COUNTRY OF RESIDENCE, RESIDENCE PURPOSE, PERCENTAGE, 2020 ...................................................................................... 158
TABLE 11.6. MONGOLIAN CITIZENS RESIDING ABROAD BY RESIDENCE PURPOSE AT TIME OF THE CENSUS AND PERCENTAGE, 2020 ................................................................................ 159
TABLE 11.7. PERCENTAGE DISTRIBUTION OF AGE GROUPS BY RESIDENCE PURPOSES AT THE TIME OF THE CENSUS, 2020 .......................................................................................... 160
TABLE 12.1. NUMBER OF DWELLING AND HOUSEHOLDS, BY DWELLING TYPES, URBAN AND RURAL AREAS, 2020 ....................................................................................................... 167
TABLE 12.2. NUMBER OF HOUSEHOLDS, BY DWELLING TYPES, 2010, 2020 .................................. 168TABLE 12.3. PERCENTAGE DISTRIBUTION OF DWELLING TYPES, BY LOCATION, 2010, 2020 ........ 168TABLE 12.4. PERCENTAGE DITRIBUTION OF HOUSEHOLDS, BY HOUSEHOLD NUMBER, TYPES OF
OWNERSHIP, 2010, 2020 ................................................................................................. 169TABLE 12.5. PERCENTAGE DISTRIBUTION OF HOUSEHOLD NUMBER, TYPES OF HOUSING
OWNERSHIP AND RURAL AND URBAN AREAS, 2010, 2020 ........................................ 169TABLE 12.6. PERCENTAGE DITRIBUTION OF HOUSEHOLD NUMBER, BY DWELLING TYPES,
ENERGY SOURCE, AND URBAN AND RURAL AREAS, 2020 ......................................... 170TABLE 12.7. NUMBER OF HOUSEHOLD MEMBERS IN GER AND GER WALLS BY PERCENTAGE
2010, 2020 ........................................................................................................................ 171TABLE 12.8. SOME INDICATORS FOR GER LIVING CONDITIONS, BY URBAN AND RURAL AREAS
AND PERCENTAGE, 2010, 2020 ...................................................................................... 172TABLE 12.9 NUMBER OF HOUSES, BASE WALL MATERIALS, WALL POLISHING MATERIALS, BY
DWELLING TYPES, PERCENTAGE, 2019 ........................................................................ 175TABLE 12.10. ROOFING MATERIALS, BY PERCENTAGE , 2019 ............................................................ 176TABLE 12.11. PERCENTAGE DISTRIBUTION AND NUMBER OF HOUSEHOLDS LIVING IN HOUSES BY
FAMILY MEMBERS AND SIZE OF LIVING AREA, 2010, 2020 .......................................... 177TABLE 12.12. NUMBER OF HOUSEHOLDS, MEMBERS LIVING IN THE HOUSE, NUMBER OF ROOMS,
PERCENTAGE, 2010, 2020 ............................................................................................... 177TABLE 12.13. HOUSEHOLD HEATING TYPES BY URBAN AND RURAL AREAS, PERCENTAGE 2010,
2020 .................................................................................................................................. 178TABLE 12.14. TYPES OF WATER SUPPLY FOR HOUSEHOLD LIVING IN HOUSE, BY URBAN AND
RURAL AREAS, 2010, 2020 .............................................................................................. 178TABLE 12.15. PERCENTAGE DISTRIBUTION OF SOME INDICATORS OF HOUSEHOLD CONDITIONS,
BY URBAN AND RURAL AREAS, 2010, 2020 .................................................................. 179

2020 POPULATION AND HOUSING CENSUS OF MONGOLIA NATIONAL REPORT
8
LIST OF FIGURES
FIGURE 1.1. STRUCTURE FOR MANAGEMENT AND ORGANIZATION OF THE POPULATION AND HOUSING CENSUS 2020 .................................................................................................. 37
FIGURE 2.1. POPULATION OF MONGOLIA, 2020 ................................................................................. 41
FIGURE 2.2. AVERAGE ANNUAL GROWTH RATE BETWEEN CENSUSES 1918-2020, BY PERCENTAGE ................................................................................................................... 42
FIGURE 2.3. POPULATION AGE STRUCTURE, BY PERCENTAGE, 1989, 2000, 2010, 2020 ................. 44
FIGURE 2.4. POPULATION -PYRAMID, 2010, 2020 ............................................................................... 45
FIGURE 3.1. POPULATION BY CITIZENSHIP, 2020 ............................................................................... 51
FIGURE 3.2. POPULATION BY ETHNICITIES, BY PERCENTAGE, 2020 ............................................... 54
FIGURE 3.3. DISTRIBUTION OF THE KAZAKHS, BY AIMAGS AND THE CAPITAL, 2020 .................... 54
FIGURE 3.4. DISTRIBUTION OF THE DURVUDS, BY AIMAGS AND THE CAPITAL, 2020 .................... 54
FIGURE 3.5. DISTRIBUTION OF BAYADS, BY AIMAGS AND THE CAPITAL, 2020 ............................... 55
FIGURE 3.6. DISTRIBUTION OF BURIADS, BY AIMAGS AND THE CAPITAL, 2020 ............................ 55
FIGURE 3.7. PERCENTAGE DISTRIBUTION OF POPULATION BY ETHNICITY IN URBAN AND RURAL, 2020 ................................................................................................................................... 55
FIGURE 3.8. PERCENTAGE DISTRIBUTION OF FOREIGN CITIZENS AGED 6 AND ABOVE, BY EDUCATION LEVEL, 2010, 2020 ....................................................................................... 60
FIGURE 3.9. PERCENTAGE DISTRIBUTION OF FOREIGN CITIZENSHIP, BY ECONOMIC ACTIVITIES, 2010, 2020 ......................................................................................................................... 61
FIGURE 4.1. POPULATION DISTRIBUTION BY SOUM, 2020 ............................................................... 67
FIGURE 4.2. POPULATION DENSITY BY AIMAG AND THE CAPITAL CITY, 2020 .................................. 71
FIGURE 4.3. INTERNAL MIGRATION TO ULAANBAATAR BY REGIONS (MIGRATION IN AND OUT- FLOW BY THOUS. PEOPLE) 2010, 2020 ........................................................................... 73
FIGURE 5.1. MIGRATION SINCE BIRTH, 2020 ..................................................................................... 78
FIGURE 5.2. INTERNAL MIGRATION IN THE PAST FIVE YEARS, 2020 ................................................ 78
FIGURE 5.3. INTERNAL MIGRATION IN THE PAST YEAR, 2020 .......................................................... 79
FIGURE 5.4. PERCENTAGE DISTRIBUTION OF INTER-AIMAG/CAPITAL CITY MIGRANTS, 2010, 2020 ................................................................................................................................... 79
FIGURE 5.5. PERCENTAGE DISTRIBUTION OF INTER-REGION MIGRANTS, 2010, 2020................... 79
FIGURE 5.6 NET MIGRATION RATE BY REGION, 2010, 2020 ............................................................. 86
FIGURE 5.7 MIGRANTS IN THE PAST YEAR, BY AGE GROUPS AND SEX, 2010, 2020 ....................... 87
FIGURE 6.1. AGE AND GENDER PYRAMID FOR POPULATION WITH HIGHER EDUCATION, 2010, 2020 ................................................................................................................................... 96

2020 POPULATION AND HOUSING CENSUS OF MONGOLIA NATIONAL REPORT
9
FIGURE 6.2. NUMBER OF POPULATION AGED 6 AND ABOVE, BY LITERACY*, 2020 ........................ 97
FIGURE 6.3. PERCENTAGE DISTRIBUTION OF ILLITERATE POPULATION AGED 15 AND ABOVE, BY AGE GROUP, 2010, 2020 .................................................................................................... 98
FIGURE 6.4. SEX RATIO OF SCHOOL ATTENDEES, BY AGE GROUPS 2010, 2020 ............................ 101
FIGURE 7.1. POPULATION ENUMERATED IN HOUSEHOLD AND NON-HOUSELHOLD UNITS, 2020 ................................................................................................................................. 105
FIGURE 7.2. HOUSEHOLD NUMBERS BY TYPES, 2020 .................................................................... 107
FIGURE 7.3. MEDIAN AGE AT FIRST MARRIAGE, BY YEARS, 2000, 2010, 2020 ............................... 111
FIGURE 7.3. PERCENTAGE DISTRIBUTION OF DIVORCED POPULATION, BY AGE GROUP AND SEX, 2010, 2020 ....................................................................................................................... 113
FIGURE 8.1. PERCENTAGE DISTRIBUTION OF PERSONS WITH DISABILITY, BY AGE GROUPS AND SEX, 2010, 2020 ............................................................................................................... 118
FIGURE 8.2. NUMBER AND PERCENTAGE DISTRIBUTION OF PERSONS WITH DISABLED, BY AIMAGS AND THE CAPITAL, 2010, 2020 ....................................................................... 119
FIGURE 8.3. NUMBER AND PERCENTAGE DISTRIBUTION OF PERSONS WITH DISABILITY, BY TYPES OF DISABILITY AND SEX, 2010, 2020 ................................................................ 121
FIGURE 8.4. NUMBER OF PERSONS WITH DISABILITY, BY TYPES OF DISABILITY, 2010, 2020 ..... 121
FIGURE 8.5. PERCENTAGE DISTRIBUTION OF PERSONS WITH FUNCTIONAL DIFFICULTIES AGED 18 AND ABOVE, BY MULTIPLE FORMS OF DIFFICULTY AND SEX, 2020 ..................... 123
FIGURE 8.6. PERCENTAGE OF PERSONS WITHOUT DIFFICULTIES AMONG RESIDENT POPULATION AGED 18 ABOVE, BY SEX, 2020 .............................................................. 123
FIGURE 9.1 PERCENTAGE OF MOBILE PHONE USERS AGED 6 AND ABOVE, BY AIMAGS AND CAPITAL, 2010, 2020 ....................................................................................................... 129
FIGURE 9.2. PERCENTAGE OF CELLULAR PHONE USERS IN THE POPULATION AGED 6 AND ABOVE, BY URBAN AND RURAL AREAS, 2010, 2020 .................................................... 130
FIGURE 9.3. CELLULAR PHONE USE OF WORKING POPULATION, PERCENTAGE, 2020 ............... 131
FIGURE 9.4. PERCENTAGE OF INTERNET USERS IN THE POPULATION AGED 6 AND ABOVE, BY AIMAG AND CAPITAL, 2010, 2020 .................................................................................. 131
FIGURE 9.5. PERCENTAGE OF INTERNET USERS IN THE POPULATION AGED 6 AND ABOVE, BY URBAN AND RURAL AREAS, 2010, 2020 ....................................................................... 132
FIGURE 9.6. INTERNET USERS IN POPULATION AGED 6 AND ABOVE BY AGE AND GENDER PYRAMID, 2010, 2020 ...................................................................................................... 132
FIGURE 10.1. STRUCTURE OF ECONOMIC ACTIVITY OF THE POPULATION AGED 15 AND ABOVE, 2020 ................................................................................................................................. 135
FIGURE 10.2. LABOR FORCE PARTICIPATION LEVEL BY POPULATION AGED 15 AND ABOVE, 2020.....136
FIGURE 10.3. LABOR FORCE PARTICIPATION LEVEL, BY PERCENTAGE, AIMAG AND CAPITAL, 2020 ................................................................................................................................. 137

2020 POPULATION AND HOUSING CENSUS OF MONGOLIA NATIONAL REPORT
10
FIGURE 10.4. LABOR PARTICIPATION LEVEL, BY PERCENTAGE, AGE GROUP, SEX, 2020 ............... 137
FIGURE 10.5. EMPLOYMENT STATUS BY PERCENTAGE, 2020 ........................................................... 138
FIGURE 10.6. COMPARISON OF OLD AND NEW EMPLOYMENT STATUS ........................................... 144
FIGURE 10.7. UNEMPLOYMENT RATE BY AIMAG, THE CAPITAL CITY, 2020 ..................................... 146
FIGURE 10.8. UNEMPLOYMENT RATE, BY AGE GROUP, SEX, 2020 .................................................... 147
FIGURE 10.9. POPULATION DISTRIBUTION OF AGE GROUP 15-24 NOT IN EMPLOYMENT AND EDUCATION BY PERCENTAGE AND SEX, 2020 ............................................................. 149
FIGURE 10.10. POPULATION DISTRIBUTION OF AGE GROUP 15-24 NOT IN EMPLOYMENT AND EDUCATION BY EDUCATIONAL LEVEL, PERCENTAGE AND SEX, 2020 ...................... 149
FIGURE 11.1. THE AGE AND GENDER PYRAMID OF CITIZENS RESIDING ABROAD, 2010, 2020 ..... 154
FIGURE 11.2. NUMBER AND SEX RATIO OF CITIZENS RESIDING ABROAD, 2010, 2020, / thousand people / ............................................................................................................................ 155
FIGURE 11.3. MONGOLIAN CITIZENS ABROAD, BY AIMAG AND THE CAPITAL CITY OF PERMANENT RESIDENCE, 2020 ........................................................................................................... 155
FIGURE 11.4. FIGURE 11.4. NUMBER OF MONGOLIAN CITIZENS RESIDING ABROAD, BY COUNTRY, 2020 ................................................................................................................................. 157
FIGURE 11.5. MONGOLIAN CITIZENS RESIDING ABROAD BY RESIDENCE PURPOSE AT THE TIME OF THE CENSUS AND PERCENTAGE, 2010, 2020 ....................................................... 160
FIGURE 11.6. MONGOLIAN CITIZENS RESIDING ABROAD BY AGE GROUPS, RESIDENCE PURPOSE AT THE TIME OF THE CENSUS AND PERCENTAGE, 2010, 2020 ................................. 161
FIGURE 12.1. TOTAL DWELLINGS AND NUMBER AND TYPES OF PERMANENTLY OCCUPIED DWELLINGS, 2020 .......................................................................................................... 166
FIGURE 12.2. NUMBER OF PERMANENTLY OCCUPIED DWELLINGS, BY AIMAGS AND THE CAPITAL, 2019 ................................................................................................................................. 167
FIGURE 12.3. NUMBER OF HOUSEHOLDS, BY DWELLING TYPES, 2020 .......................................... 167
FIGURE 12.4. ROOF, RAFTER AND FLOOR MATERIAL OF GER, BY PERCENTAGE, 2019 ................. 171
FIGURE 12.5. WATER SUPPLY HOUSEHOLD LIVING IN GER BY PERCENTAGE, 2020 ....................... 173
FIGURE 12.6. PERCENTAGE DISTRIBUTION OF HOUSES, BY COMMISIONED YEARS, 2019 ........... 174
FIGURE 12.7. PERCENTAGE DISTRIBUTION OF BASIC AND COVERING MATERIALS OF BUILDING FLOOR, 2019 ................................................................................................................... 176
FIGURE 12.8. PERCENTAGE DISTRIBUTION OF HOUSEHOLDS LIVING IN HOUSE, BY SOLID WASTE DISPOSAL, 2020 ............................................................................................................. 180
FIGURE 12.9. PERCENTAGE DISTRIBUTION OF HOUSEHOLDS LIVING IN HOUSE, 2020 ................. 180

2020 POPULATION AND HOUSING CENSUS OF MONGOLIA NATIONAL REPORT
11
FOREWORD
In 2020, Mongolia presented a Population and Housing Census report to you upon undertaking it 11th time in its history.
Making the nation’s population census data available is one of the pivotal commitments of the United Nations member states.
The Government of Mongolia fulfilled this commitment and successfully undertaken the Population and Housing Census in 2020 in line with the Law on Population and Housing Census of Mongolia and the Principles and Recommendations for Population and Housing Census, Revision 3, adopted by the United Nations Statistical Commission.
The Population and Housing Census in 2020, within the framework of Housing census was undertaken which has not been conducted since 1969.
A State Commission on Population and Housing Census, led by the Prime Minister of Mongolia, was established by the Parliament Resolution 77 in 2017. In the past two and a half years, the State Commission on Population and Housing Census, the National Statistics Office, the Census Commission at all administrative units and the Adhoc census bureaus successfully fulfilled their commitments by undertaking this unified national effort and making the census report available and accessible.
The Government of Mongolia, for the first time, fully funded the operational cost of this census devising a combined method of the registration and traditional enumeration, under the motto “The state is dear to people which the state treasures”, from the state budget. Each and every step of the census used the cutting-edge technologies and geographical information system, in particular using tablets for the data collection for the housing census, while ensuring alignment between different databases that managed by the public organizations.
The Population and Housing Census is a comprehensive undertaking from capturing a total population of a country in a preidentified time period along with housing data and other baselines for making the demographic and socio-economic analysis to making the result available to the public.
The Parliament Resolution 77, 2017 set the date for commencing the Population and Housing Census at midnight of January 8-9th, 2020 at 12.00 am.
The Chair of the Population and Housing Census Commission, the Prime Minister of Mongolia, disseminated the total enumerated population of Mongolia, 3 296 866, to the public on June 9, 2020.
The Mongolian population was 647.5 thousand in the first census in the 20th century and 1918, whereas it increased five times as of today.
This report contains 12 chapters and annexes covering the key indicators of the census. The chapter 1 includes the highlights and management aspects of the census. The chapters 2-4 contain the key indicators such as the population, growth, age, and sex structure, citizenship, ethnicity and religion, and population distribution, settlement and urbanization. The internal migration, education and literacy, household and marital status, mobile phone and internet users, employment status and Mongolian citizens residing abroad are compiled in the separate chapters respectively. Compilation of the functional

2020 POPULATION AND HOUSING CENSUS OF MONGOLIA NATIONAL REPORT
12
disability and the housing census were made based on the new methodology and illustrated in the new chapters respectively.
This report ensures comparability of the census data with the previous census indicators and entails some new key indicators at the soum and bag levels.
On the basis of this census data, a midterm population census will be undertaken by aimags and the capital, and population projection (from 2020 to 2050) will be carried out and disseminated to the public at the national, aimags and the capital level and by age, sex and others.
The census report will be made readily available and widely accessible both in print and electronic versions by taking advantage of the cutting-edge technologies.
CHAIRPERSON OF NATIONAL STATISTICS OFFICE DEPUTY CHAIR OF STATE COMMISSION ARIUNZAYA ON POPULATION AND HOUSING CENSUS AYUSH

2020 POPULATION AND HOUSING CENSUS OF MONGOLIA NATIONAL REPORT
13
Dear Colleagues at National Statistics Office,
Dear fellow citizens of Mongolia,
Mongolia successfully undertook its 11th Population and Housing Census.
I am honored to congratulate to the 19 thousand staff and public servants who intangibly contributed to the Population Housing Census 2020 and Housing Census 2019 respectively.
The census shows that the Mongolian population reached 3 296 966, an average growth rate of 2.2 percent, in 2010-2020. The population growth is one of the policy priorities for our sovereignty, and this priority will stay the same in the decades to come.
The history of the modern census is relatively shallow, however the ancient historical records exhibit that Mongolians enumerated its citizens in ways of registering belongings and assets, levying tax, and enumerating warriors for the safeguarding the sovereignty.
This census not only captured the total population of Mongolia, population age and sex structure, population growth, internal migration, education and employment status but a very detailed analysis of the housing by their type, capacity, structure and infrastructure.
In other words, You and me, we all have the readily made available up-to-date data that is crucial for assessing and evaluating the ongoing development policy and programs and for identifying areas that need improvements for more effective service and program delivery. Therefore, I call for an action for a use of the 2020 Population and Housing Census data as an evidence-based approach for any decision, planning exercises and/or public policy initiatives at the national level.
May each and every citizen of Mongolia benefit from the development policy and program outcomes.
June 12, 2020Government House
Ulaanbaatar
MESSAGE FROM THE PRESIDENT OF MONGOLIA


2020 POPULATION AND HOUSING CENSUS OF MONGOLIA NATIONAL REPORT
15
Dear Members of Parliament,
Dear fellow citizens of Mongolia,
The 11th Population and Housing Census 2020 was undertaken in line with the Law on Statistics of Mongolia and the Law on Population and Housing Census.
The date for undertaking of the Population and Housing Census 2020 was commenced at midnight of January 8-9th, 2020 at 00 /zero zero/ am and the census activities were commenced on January 9th of 2020, at 8 am as set forth by the Parliament Resolution 77, of December 8, 2017.
The data collection was completed over a period of a week, January 9-15, by 10 pm as stipulated by the Law on Population and Housing Census.
This census enabled the accurate analysis of the demography, the evaluation of the level of socio-economic development, and provided the up-to-date data for identifying the future development prospects of the country. The census data is comparable and met the requirements of the international community and serves the needs of policymakers at all the levels of Government, NGOs, manufactures, businesses researchers and academics.
I urge you to use the Population and Housing Census data for as it is an efficient tool for any effort for the development of the nation.
I am grateful to each and every citizen who actively engaged and collaborated in the census undertaking by letting the Enumerators in to their homes without any hurdles and providing them with the accurate data on household members and housing conditions.
I, therefore, acknowledge the National Statistics Office for its leadership for this major and critical undertaking by providing the Ministries, the Governors of aimag and Capital City, the Census Commission at all administrative levels, staff of the Adhoc census bureaus, Enumerators and Supervisors with the high-quality methodological guidance and management.
Furthermore, I would like to congratulate and wish success to each and every staff and public servants for their successful engagement in the Population and Housing Census.
MESSAGE FROM THE SPEAKER OF THE PARLIAMENT OF MONGOLIA
Government House, UlaanbaatarJune 9, 2020
ZANDANSHATARGOMBOJAV


2020 POPULATION AND HOUSING CENSUS OF MONGOLIA NATIONAL REPORT
17
It is my pleasure to extend my greetings to all Mongolians residing and working in our beautiful homeland and Mongolians residing in all parts of the world.
As recommended by the United Nations, over 200 countries, including 52 Asian countries, are undertaking a Population Census around 2020, and as of June 1, 2020, 46.0 percent of the world's 7.8 billion population have been officially counted.
Mongolia has successfully organized the 11th Population and Housing Census under the motto “The state is dear to people which the state treasures” and presents the census results hereby.
As of January 9, 2020, the population of Mongolia reached 3 296 866.
The integrated report of the Population and Housing Census 2020 and other reports for detailed research and analysis will be made available to the public in both print and electronically.
Pursuant to the Parliament Resolution 77, 2017 on “Establishment of a State Commission on Population and Housing Census” and the Resolution 2, 2018 on “Appointment of aimags and the Capital City Census Commissions”, the Government members and Governors of all level of the Government attached a great significance to the census and ensured delivery of the related legal mandates.
The Population and Housing Census data plays a pivotal role in any Government policy and planning initiatives. In particular, it serves as indispensable evidence and data source for identifying the economic activity and the employment status of the population over a specific period of time and for developing policy and programs for increasing employment and reducing unemployment and poverty followed by a pertinent decision-making and evaluation of effectiveness of the policy and programs.
It is noteworthy that the support and active participation of citizens and the public have been remarkable and the key success factor for the census undertaking.
I would like to acknowledge and express our gratitude to all media outlets, mobile operators and companies that have contributed to the public relations component of the census for disseminating the purpose and significance of the census to the public, which resulted in the effective undertaking of the Population and Housing Census.
On behalf of the State Commission on Population and Housing Census, our deepest appreciation goes to the National Statistics Office and its affiliate organizations, which played a key role in providing the stakeholders with the unified management, methodology and instructions throughout the country, for a high-quality organization and management of the census and processing of the data in a short period of time.
THE PRIME MINISTER OF MONGOLIA,CHAIR OF THE STATE COMMISSION ON KHURELSUKHPOPULATION AND HOUSING CENSUS UKHNAA
FOREWORD BY THE PRIME MINISTER OF MONGOLIA ANDCHAIR OF STATE COMMISSION ON POPULATION AND
HOUSING CENSUS


OVERALL RESULT SUMMARY
HOUSEHOLDS
SETTLEMENT AND MIGRATION
SHARE OF MIGRATION BETWEEN AIMAG AND THE
CAPITAL
536 309Nuclear
19 975Composite²
Single person
137 826
28.3%Other
5.7%Multiple
for population aged 10 and over
²People who share their residence with unrelated individuals
by percentage
22.5% 20.2%
12.0%8.2%
3.1%
203 317Extended family¹
Total Households
897 427
EDUCATION LEVEL DISABILITY
INTERNET USEPOPULATION SETTLEMENT, by soums
Urban populationRural population in Ulaanbaatar
of which:
INTERNET USE OF POPULATION AGED
6 AND ABOVE
Yes64.7%
frequently 38.0% 26.7%
No 35.3%
when necessary
in last year
in last 5 year
Since birth
2.8%5.5%
23.4%
4.9
13.717.1
29.2
3.9 4.7
26.5N
o ed
ucat
ion
Prim
ary
Basic
Hig
her
Hig
h sc
hool
Spec
ial s
econ
dary
Literacy rate of the population aged 15 and over
Literate 98..7% Illiterate 1..3%¹Two or more interrelated families living as one household
32% 68% 46%
Border of aimags
Border of soums
Population
Scale 1:9 000 000
Voc
atio
nal a
nd te
chni
cal
up to

2020 POPULATION AND HOUSING CENSUS OF MONGOLIA NATIONAL REPORT
20
OVERALL RESULT OF 2020 POPULATION
AND HOUSING CENSUS
3311..55% 6644..44% 44..11%
83.8% 3.8% 2.6%
2.0% 1.4% 6.4%
POPULATION
3 296 866HOUSING AND HOUSEHOLD
60.9%
546 979household
342 409household
8 039household
38.2% 0.9%
Ulaanbaatar2020
MONGOLIAN CENSUS COMMISSION
200 000 150 000 100 000 50 000 50 000 100 000 150 000 200 0000-4
5-9
10-14
15-19
20-24
25-29
30-34
35-39
40-44
45-49
50-54
55-59
60-64
65-69
70+770 868 dwelling
Total household 897 427
other dwelling
Khalkh Kazakh Durvud
Bayd Buriad other
ETHNICITY
4499..11% 5500..99%population pyramid
age
aged 15 or less aged 15-64 aged 65 and more
HOUSEHOLDS
SETTLEMENT AND MIGRATION
SHARE OF MIGRATION BETWEEN AIMAG AND THE
CAPITAL
536 309Nuclear
19 975Composite²
Single person
137 826
28.3%Other
5.7%Multiple
for population aged 10 and over
²People who share their residence with unrelated individuals
by percentage
22.5% 20.2%
12.0%8.2%
3.1%
203 317Extended family¹
Total Households
897 427
EDUCATION LEVEL DISABILITY
INTERNET USEPOPULATION SETTLEMENT, by soums
Urban populationRural population in Ulaanbaatar
of which:
INTERNET USE OF POPULATION AGED
6 AND ABOVE
Yes64.7%
frequently 38.0% 26.7%
No 35.3%
when necessary
in last year
in last 5 year
Since birth
2.8%5.5%
23.4%
4.9
13.717.1
29.2
3.9 4.7
26.5
No
educ
atio
n
Prim
ary
Basic
Hig
her
Hig
h sc
hool
Spec
ial s
econ
dary
Literacy rate of the population aged 15 and over
Literate 98..7% Illiterate 1..3%¹Two or more interrelated families living as one household
32% 68% 46%
Border of aimags
Border of soums
Population
Scale 1:9 000 000
Voc
atio
nal a
nd te
chni
cal
up to

21
OVERALL RESULT SUMMARY
POPULATION, GROWTH, AGE AND SEX STRUCTUREAccording to the Population and Housing Census 2020, the population of Mongolia reached
3 296 866. As of 2020, the population has grown five times since 1918 and by 2.2 percent on annual average since 2010. In all aimags and the capital city, the average annual population growth between the censuses was increased from the previous census.
The current census indicates some changes in the age structure of the population compared to 2010, and the increased share of population aged 0-9 years in the total population is caused from the increased birth rate since 2011. However, the low share of age group 15-29 in the population is caused from the decreased birth rate started in the early 1990s to 2006.
The sex ratio was steadily declining from 100.4 in 1979 to 98.1 in 2010 and 96.6 in 2020, and indicating a higher proportion of women in the total population. In the past 3 decades, the median age of the population raised almost by 10 years, 18.8 to 27.9, because of a decrease in birth and an increase in life expectancy.
The demographic dependency was 55.3 in 2020, which was decreased by 29.6 percentage points from 1989 and increased by 10.3 percentage points from 2010. The country’s socio-economic development can be positively impacted by delivery of a long-term policy and programs while taking advantage of the prominent proportion of working age population or the demographic window, especially by creating more employment opportunities.
CITIZENSHIP, ETHNICITY AND RELIGIONKhalkh ethnic group accounts for 83.8 percent of the population, which is an increase of 1.4 percentage
points from the previous census. The percentage of Kazakh ethnic group in the total population is 3.8 percent, second only to the Khalkhs. The proportion of Durvud, Bayad, and Buriad ethnic groups have been declining since 2010. In terms of the location, the Khalkh ethnic group is prevalent in all aimags and the capital city. Bayan-Ulgii (0.9 percent), Uvs (13.6 percent) and Khovd (28.1 percent) have the lowest percentage of Khalkh ethnic group in the total population of the aimags respectively. In contrast, in Bayankhongor, Gobi-Altai, Dundgovi, Zavkhan and Uvurkhangai aimags, more than 99 percent of the aimag population are Khalkhs.
The number of foreign nationals residing in Mongolia for 6 months or more increased by 37.4 percent or 6 098 people from 2010 to 22 418. The number of stateless persons has decreased from 71 to 37 since 2010. Residents of the People's Republic of China (PRC) and the Russian Federation (Russia) account for 53.3 percent of all foreign nationals residing in the country. Compared to the Population and Housing Census 2010, the proportion of Chinese nationals permanently residing in Mongolia decreased by 11.3 percentage points and the Russian nationals by 3.4 percentage points, whereas the proportion of US nationals increased by 6.6 percentage points.
Comparing foreign nationals permanently residing in Mongolia to the previous census, the proportion of population aged 0-14 increased by 9.9 percentage points and population aged 55 and over by 5.0 percentage points respectively. Approximately 70 percent of foreign nationals residing in Mongolia are those aged 25 and over or of working age. Therefore, 57.4 percent have higher education and predominantly engaged in other service activities, wholesale and retail trade, car and motorcycle maintenance, and education.
According to the recent census, 59.4 percent of the population aged 15 and over are religious, and 40.6 percent are atheists. Out of the total religious population, 87.1 percent is Buddhist. While a large

22
2020 POPULATION AND HOUSING CENSUS OF MONGOLIA NATIONAL REPORT
number of the population is Buddhist, disaggregating by the age group, the majority of youth aged 15-19 are Christians and Muslims. While an act of faith in religion and act of atheism vary by the ethnicity, 84.7 percent of Kazakhs practice religion, of which 81.9 percent are Muslims.
POPULATION DISTRIBUTION AND SETTLEMENT AND URBANIZATIONBy the region, 45.9 percent of the population live in Ulaanbaatar, 18.7 percent in the Khangai region,
15.8 percent in the Central region, 12.6 percent in the Western region, and 7.0 percent in the Eastern region.
Migration inflow to urban areas, which began in early 1990s, has been continuing for the past 30 years. As of 2020, 67.8 percent or 2 168.2 thousand people live in urban areas. The Western region is relatively densely populated, however, urbanization of the region is not intensively progressed. The urbanization in the Central region remains the highest following Ulaanbaatar.
The level of urbanization of aimags varies considerably. The development progress of social sectors in aimag centers, such as education, health, employment, trade and services, has outpaced the development of rural areas. It attracted migration inflow and increased the share of urban population in the aimag population.
Internal migration has had a significant impact on population density changes in aimags and the capital city. The population density of Ulaanbaatar increased by 66 people in 2020 since 2010, by 21 people in Orkhon aimag and by four people in Darkhan-Uul aimag, which are related to the internal migration.
The availability of infrastructure, the access to quality education and health services, especially a reliable employment and source of income in central and urban areas are the key factors attracting more and more people and intensifying the urbanization processes.
The major proportion of the urban population, 67.6 percent, lives in Ulaanbaatar alone. As a result of migration inflow, the share of capital city population in the total population increased by 3.4 percentage points in 2020, which is the highest increase compared to 2010. This is followed by the city of Erdenet and Darkhan. This makes 8.4 percent up of the city's population. Dornod, Dornogovi, Khuvsgul, Bayan-Ulgii and Selenge aimags have a relatively higher share of urban population than other aimags. In all other aimags, the share of urban population is very small, ranging from 0.5 to 1.5 percent.
INTERNAL MIGRATIONA total of 45.9 percent of the population is residing in Ulaanbaatar, 20.3 percent in aimag centers,
1.6 percent in villages, 10.5 percent in soum centers, and 21.7 percent in rural areas.
According to the census, the lifetime migrants between aimags and the capital city after their birth accounts for 23.4 percent of the total resident population, which is 9.7 percentage points decrease compared to the previous census 2010, 8.2 percentage points decrease from the past five-years and 1.5 percentage points decrease from the past one-year. However, an inter-regional lifetime migrant decreased by 8.8 percentage points compared to the previous Census 2010, 7.3 percentage points from the past five years, and 1.2 points from the past one-year respectively.
The aimags and the capital city are connected by a paved road. The Governor of the Capital City and the Mayor of Ulaanbaatar restricted the migration inflow from rural areas to Ulaanbaatar in 2017-2020, which has reduced the intensity of migration to the urban and settlement areas. In addition, absence of calamities such as droughts and dzuds in the livestock husbandry sector since the census 2010 may have reduced migration inflows. Analyzing from the internal migration pattern since birth, the migration

23
OVERALL RESULT SUMMARY
inflow stays relatively dominant in the pattern.
According to the census, 76.3 percent of people engaged in the capital city migration were the population coming back to Ulaanbaatar, which saw 1.3 percentage points increase compared to the previous census. However, the regional migration situation shows that the central region stays a dominant in terms of migration inflow.
The general pattern of internal migration which was compared to the previous past five-years seems similar to that of the internal lifetime migration. Migration outflow from the Western region is the highest followed by the Khangai region. The other regions didn’t experience many migration outflow.
Analyzing the recent two censuses data, the internal migration has declined since 2010. However, in all regions, the percentage of permanent residents were increased in the regions where they were counted and resided five years ago. Because of the relatively high flow from the Central region to Ulaanbaatar, there is a phased flow of “Other regions - Central regions - Ulaanbaatar”.
EDUCATION AND LITERACYA total of 98.7 percent of the population aged 15 and above is literate and increased by 0.4 percentage
point from the previous census. Mongolia's literacy rate remains high compared to the world average.
The share of educated population aged 10 and above reached 95.1, which marks 2.6 percentage points increase from the previous census. In terms of sex differences, it increased by 2.7 percentage points for the male and 2.3 percentage points for the female respectively. The proportion of the non-educated population reached 4.9, which shows a positive change of 2.6 percentage points decrease from the previous census.
As education level of the urban and rural population varies, the gap widens as the level rises. For example, the percentage of population with the upper secondary and higher education is 9.4-20.1 percentage points higher in urban areas than in rural areas, while the percentage of population with primary and lower secondary is 11.2-17.8 percentage points higher than in rural areas.
Nationwide, the share of the population with the higher education is 26.5 percent, while the share of population with technical and vocational education is 8.6 percent. This shows that there are relatively few people with technical and vocational education compared to those who have the higher education. A total of 84.1 percent of children aged 2–5 are engaged in preschool educational activities, increased by 24.0 percentage points since 2010. Disaggregating by the location, 83.6 percent of children aged 2-5 in rural areas were engaged in the same activities, which was increased by 38.0 percentage points from the previous census.
An enrollment to the school has been consistently increased compared to the previous censuses. According to the 2020 census, 72.6 percent of the population aged 6-29 are enrolled in educational institutions, which is an increase of 14.5 percentage points compared to 2010. In particular, 98.0 percent of children aged 6-17 are attending the secondary school. Analyzing the enrollment to school by sex, it is at the same level for the 6-14 age group compared to 2010, but for male aged 15 and over, or after completing the secondary education, their enrollment rate lowers than their female counterparts.
School enrollment among the population aged 25-29 reached 17.9 percent, which is the highest an increase of 12.3 percentage points since 2010.
HOUSEHOLD AND MARITAL STATUSAccording to the 2020 Population and Housing Census, 897.4 thousand households were counted.

24
2020 POPULATION AND HOUSING CENSUS OF MONGOLIA NATIONAL REPORT
This shows an increase of 183.6 thousand or 25.7 percent from the previous census, of which urban households increased by 126.8 thousand or 26.4 percent and the rural households increased by or 56.8 thousand or 24.2 percent respectively.
In terms of household structure, 59.8 percent are nuclear households (families), 22.7 percent are extended3 households , 15.4 percent are single person households, and 2.2 percent are composite4 households. Since the previous census, the nuclear households increased by 91.3 thousand or 20.5 percent, the extended households by 25.4 thousand or 14.3 percent, the single person households by 61.9 thousand or 81.6 percent, and composite households by 5.1 thousand or 34.2 percent respectively. The number of extended households in urban areas increased 3.9 times compared to rural areas. The average number of family members in a household is 3.6, which was the same as the national average in 2010. In particular, the households with 1-2 members increased by 60.4 thousand or 48.7 percent in urban areas and by 31.0 thousand or 46.5 percent in rural areas compared to the previous census. The share of female-headed households in the total number of households reached 28.5, which shows an increase of 7.0 percentage points compared to the 2010 census, 8.6 percentage points in urban areas and 3.7 percentage points in rural areas respectively.
In terms of the marital status of population aged 15 and above, 31.5 percent are never married, 60.6 percent are not registered and registered, 2.4 percent are divorced or separated, and 5.5 percent are widowed. Compared to the previous census, the number of never married populations increased by 82.8 thousand or 13.9 percent, not registered and registered population by 157.5 thousand or 13.7 percent and widows by 13.4 thousand or 12.8 percent respectively. The number of divorced and separated population decreased by 7.5 thousand or 12.7 percent.
The singulate mean age at marriage is 27.7, which is increased by 2 years during 2010 and 2020. The age difference between men and female for the first marriage has been more or less one to two years in the past 20 years.
1 A mixed household is a situation in which several interrelated families form joint household.2 Mixed households are cares where relatives and non-relatives form a household.
NUMBER OF PERSONS WITH DISABILITY AND TYPES OF DISABILITYNationwide, there are 106.4 thousand persons with disabilities, which is 3.3 percent of the total
resident population. The 58.9 thousand or 55.4 percent of total persons with disabilities are male and 47.4 thousand or 44.6 percent are female.
According to the recent census, there are 50.6 thousand people with congenital disabilities, compared to the previous census, which was 37.7 percent increases. The number of people with acquired disabilities is 55.7 thousand, which is decreased by 21.8 percent from the previous census.
While 45.0 percent of the male with disabilities are congenital and 55.0 percent have acquired disabilities, 50.8 percent of the female with disabilities are congenital and 49.2 percent have acquired disabilities. Considering the high number of congenital disability cases, there is a pressing need to identify the root causes of it in an holistic way by analyzing the different perspectives such as hereditary disorders, obstetric and childbirth complications, harmful effects and/or air pollution.
Comparing the type of disability with the previous census, persons with mobility and physical impairment decreased by 23.3 percent to 24.0 thousand, the number of people with visual impairment decreased by 23.3 percent to 12.8 thousand, the number of people with hearing impairment decreased by 31.2 percent to 8.7 thousand, and the number of people with mental disabilities increased by 3.0 percent to 21.5 thousand.

25
OVERALL RESULT SUMMARY
A total of 12.9 percent of the population with functional disability is youth aged 18-34, 46.9 percent are those 35-64 years old, and 40.2 percent are those 65 years old and above. Of which 28.7 percent have a difficulty in walking, 18.9 percent have visual impairments and the lowest are those with communication difficulties. Comparing the level of functional disability at aimags and the capital city level, Khuvsgul, Uvurkhangai and Tuv aimags have the highest percent, while Govisumber, Dundgovi and Umnugovi aimags have the lowest percent.
Of the total persons with functional disabilities, 15.5 percent have non-education, and 84.5 percent have some level of education. By disaggregating the level of education, 25.0 percent have secondary education, and 14.7 percent have basic education, and 10.7 percent have primary education.
According to the census, 31.2 percent of the total number of persons with functional disabilities are registered as employed, and further disaggregating by employment type, 47.3 percent of them are employed by household enterprises, 23.9 percent are full-time employees, and 13.0 percent are paid employees.
It is essential to recognize the contribution of persons with disabilities to the development of the country, to recognize their particularity and special needs in relation to socio-economic factors, and to create the reliable source of information to improve their living conditions and livelihoods.
CELLULAR PHONE AND INTERNET USERS A rapid development of information and communications technology triggers a widespread use of
cellular phones and the Internet among the population on a daily basis.
A total of 87.8 percent of the population aged 6 and above use cellular phones, while 64.7 percent are internet users. Comparing these indicators with the previous census, the number of cellular phone users increased by 13.8 percentage points and the number of Internet users increased by 34.1 percentage points respectively.
A total of 58.7 percent of the population uses the internet on a regular basis, and 41.3 percent use when necessary.
A total of 72.4 percent of the urban population and 49.3 percent of the rural population use the internet.
EMPLOYMENT STATUS A total of 59.7 percent of the total working age population aged 15 and above are in the labor
force, which was increased by 3.3 percentage points since 2010. However, the population outside the labor force (40.3 percent) decreased by 3.3 percentage points. Overall, the labor force participation rate increased since the previous census, especially female's labor force participation reached 54.6 percent which is 4.5 percentage points increase from the same period.
The male’s labor force participation rate remains higher than that of female. In terms of location, the labor force participation of both male and female is higher in rural areas than urban areas. In particular, the male’s labor force participation rate in rural areas is 69.1 percent, which is 5.8 percentage points higher than urban areas.
Whilst 53.8 percent of the population aged 15 and above are employed in urban areas, it is 60.6 percent in rural areas, which is due to the fact that the majority of the rural population is engaged in livestock husbandry. In particular, the men’s employment in rural areas is 66.5 which is 11.8 percentage points higher than that of men’s employment in urban areas. It is translated by the fact that the majority

26
2020 POPULATION AND HOUSING CENSUS OF MONGOLIA NATIONAL REPORT
of men in rural areas is engaged in livestock husbandry.
The share of employed in the total working age population is 53.8 which was increased by 6.0 percentage points compared to the previous census, whereas the share of the persons outside the labor force decreased by 3.3 percentage points to 40.3, and the unemployed accounts for 5.9 percent. There is a positive indicator that 16.7 percent of the population aged 60 and above are employed, which showed an increase of 8.3 percentage points from the previous census.
There has been a significant change in the employment pattern of population in 2020 since the last census. In 2010, paid employees were accounted for 56.2 percent of the total employed population, whereas it was increased by 10.7 percentage points to 66.9 percent in 2020. The share of employers decreased by 1.9 percentage points to 0.6 compared to the previous census, and the share of self-employed decreased by 1.1 percentage points to 26.6 respectively. Although the increase in the share of paid employee has some positive factors such as ensuring occupational safety, access to social welfare and exercising the full right to employment, the decline in the share of self-employed and employers might indicate that production and services are suffering from growth.
The national unemployment rate reached 9.9 percent in 2020, which saw 5.4 percentage points decrease from the previous census. The unemployment rate is 13.2 in urban areas and 3.7 in rural areas. This is mainly caused by the fact that there has been substantial amount of migration inflows in urban areas, at the same time there is fewer employment opportunities for those recently migrated from rural areas to urban areas.
Nationwide, the total population outside the labor force is 5.2 percent (873.8 thousand) increase from the previous census, including 11.3 percent (3.7 thousand) increase in number of persons unwilling to work and 8.9 percent (327.7 thousand) increase in school attendance. However, shares of persons with disability, those working from home and those who cannot find a suitable job decreased by 14.7-18.3 percent.
One of the indicators of the Sustainable Development Goals, the proportion of unemployed and out-of-school youth aged 15-24 is 12.2 percent. In particular, the percentage of unemployed and uneducated female aged 15-24 is 0.3 percentage points higher than the national level.
MONGOLIAN CITIZENS RESIDING ABROADAccording to the Population and Housing Census 2020, a total of 122.3 thousand citizens living
abroad were counted, which was increased by 14.2 percent from the Population and Housing Census 2010. At the time of the Census, it has been identified that 25.1 percent of citizens living abroad for the settlement purpose first pursued study and 19.8 percent of citizens who are self-employed first pursued study in their respective countries. A total of 58.8 percent of those living abroad are in the Asia-Pacific region and 23.9 percent are in the Europe.
Analyzing the population living abroad for 6 or more years by the regions, the regions have the same trend, except in the Western region, of 53.1-69.9 percent are in the Asia-Pacific region and 21.3-25.7 percent in Europe. However, 9 out of 10 people from the Western region live in the Asia-Pacific region. 21 percent of residents of Ulaanbaatar are residing in America, which is the largest among others.
A total of 122.3 thousand citizens residing abroad, of which 34.2 percent left the country for study purpose, 32.0 percent for employment (20.6 percent for self-employed, 10.4 percent for contractual employment, 1.0 percent for business/official mission), 12.6 percent for family reasons, 11.7 percent for permanent residence and the remaining 9.5 percent for other purposes.

27
CHAPTER 1COMPOSITION AND HIGHLIGHTS OF POPULATION AND HOUSING CENSUS 2020
HOUSEHOLD HOUSING CONDITION AND TYPESA total of 677.6 thousand dwellings suitable for living were registered in Mongolia in 2019, of which
44.9 percent were gers and 55.1 percent were houses. 74.2 percent of the total gers were main gers and 25.8 percent were extra ones. Whereas, 78.3 percent of the total houses were the main houses (74.2 percent are permanent houses) and 21.7 percent were seasonal ones.
A total of the 442.7 thousand permanently occupied dwellings are classified further by its type, 51.0 percent were ger, 46.0 percent were confortable private houses, 1.7 percent were apartment, 0.9 percent were detached house, and 0.4 percent were public accomodations. There are 335 587 dwellings in 7 444 apartments.
Of the total 897.4 thousand households in our country, 38.2 percent lives in gers, 60.9 percent in houses, and 0.9 percent in other types of dwellings. Compared to the previous census, the share of households living in houses increased by 7.3 percentage points, while the share of households living in gers decreased by 7.0 percentage points.
There is a substantial difference in dwelling types for population living in urban and rural areas. In urban areas, 74.5 percent of all households live in houses and 24.7 percent in gers. This is mainly associated with the widespread housing policies and programs are in place in big cities in the recent years.
According to the census, there are 4.7 thousand households nationwide without electricity, which is a significant improvement of 4.9 times decrease from the previous census. 93.5 percent of households without electricity lives in gers, of which 76.8 percent lives in rural areas.
Overall, living space has been increased. It can be seen from the fact that 24.4 percent of households living in houses live in 21-40 square meter spaces, 15.6 percentage points decrease from the previous census, and 67.1 percent of households living in houses of more than 40 square meters increased 2.1 times from the previous census.
The share of households living in houses connected to thecentral heating system increased by 5.9 percentage points to 57.5 percent in urban areas and by 5.0 percentage points to 12.2 percent in rural areas. This is associated with a sharp increase in the number of households living in houses.
While 49.7 percent of households living in houses have toilets connected to the central system, 47.4 percent have the pit latrines. Compared to the previous census, 46.4 percent of all households living in houses have bathtub and showers, which saw an increase of 5.8 percentage points. A total of 85.3 percent of households living in houses have their waste disposed through service organizations, which was increased by 8.2 percentage points compared to the previous census. In 2010, 5.0 percent of households living in buildings did not have a solid waste disposal point however it was dropped to 2.5 percent in 2020.


COMPOSITION AND HIGHLIGHTS OF POPULATION AND HOUSING CENSUS 2020
1CHAPTER


31
CHAPTER 1COMPOSITION AND HIGHLIGHTS OF POPULATION AND HOUSING CENSUS 2020
HIGHLIGHTS OF POPULATION AND HOUSING CENSUS 2020 The Population and Housing Census 2020 was undertaken in compliance with the principles set
forth in Article 5 of the Law on Population and Housing Census of Mongolia using technological advances extensively at each stage of the census in combination with the methods specified in clauses 4.1.1 and 4.1.2 of the law. While a long-form questionnaire (traditional method) was used for 10 percent of the total households, 90 percent of the collected data was obtained using a short-form questionnaire, based on the Population and Household database, and public organizations database.
Since the establishment of the statistical organization in Mongolia in 1924, the Population censuses were undertaken in 1935, 1944, 1956, and 1963. In 1969, a census to enumerate housings of the state and cooperatives, was undertaken. In every 10 years since 1969, the Population and Housing census has been undertaken in 1979, 1989, 2000, 2010, and 2020 in line with the common international methodology. The Housing census was undertaken separately in 2019.
The Housing census fully captured all residential buildings and structures and built a detailed address-based housing database including housing design, use, capacity, and access to infrastructure. In other words, the census was unique in ways that it provides a comprehensive source of information that met the needs of governmental and non-governmental organizations, manufacturers, businesses, academia and researchers and ensures its comparability at the international level.

32
2020 POPULATION AND HOUSING CENSUS OF MONGOLIA NATIONAL REPORT
RESOLUTION ON MOMENT OF CENSUS THE PARLIAMENT OF MONGOLIA

33
CHAPTER 1COMPOSITION AND HIGHLIGHTS OF POPULATION AND HOUSING CENSUS 2020
RESOLUTION ON ESTABLISHMENT OF THE STATE REGISTRATION COMMISSION OF THE PARLIAMENT OF MONGOLIA

34
2020 POPULATION AND HOUSING CENSUS OF MONGOLIA NATIONAL REPORT
RESOLUTION OF THE POPULATION AND HOUSING CENSUS COMMISSION OF MONGOLIA ON ANNOUNCING THE RESULTS OF THE 2020 NATIONAL POPULATION AND HOUSING CENSUS

35
CHAPTER 1COMPOSITION AND HIGHLIGHTS OF POPULATION AND HOUSING CENSUS 2020
COMPOSITION OF THE STATE CENSUS COMMISSION
CHAIRMAN
SECRETARY
DEPUTY CHAIRPERSON
MEMBERS
KHURELSUKH UKHNAA Prime Minister of Mongolia
TSERENBAT N. Minister of Nature, Environment and
Tourism
ENKH-AMGALAN B.Minister of Road and
Transport Development
ULAAN Ch.Minister of Food,
Agriculture and Light Industry
AMARBAL A.Director of Population and Social
Statistics Department
BADELKHAN KH. Minister of Construction and Urban Development
HURELBAATAR Ch.Minister of Finance
DAVAASUREN Ts.Minister of Energy
ENKHBOLD N.Minister of Defense
SUMYABAZAR D.Minister of Mining and
Heavy Industry
SARANGEREL D.Minister of Health
BAATARBILEG Yo.Minister of Education,
Culture, Science and Sports
CHINZORIG S.Minister of Labor and
Social Protection
AMARSAIKHAN S.Mayor of Ulaanbaatar, Governor of the Capital City,
Head of Capital City Census Commission
TSOGTBAATAR D.Minister of Foreign
Affairs
NYAMDORJ Ts.Minister of Justice and
Internal Affairs
ARIUNZAYA A.Chairperson of National Statistical Office
OYUN-ERDENE L. Cheif Cabinet Secretary of Government of
Mongolia

36
2020 POPULATION AND HOUSING CENSUS OF MONGOLIA NATIONAL REPORT
CHAIRMAN OF THE COMMISSION
AMARSAIKHAN S.Mayor of Ulaanbaatar,
Governor of the Capital City, Head of Capital City
Census Commission
RENTSENDORJ V.Mayor of Govi-Altai
Aimag
BAT-ERDENE O.Mayor of Dundgovi
Aimag
ERDENEBAATAR J.Mayor of Sukhbaatar
Aimag
MUNKHNASAN Ts.Mayor of Arkhangai
Aimag
BATSUURI G.Mayor of Govisumber
Aimag
BATSAIKHAN D.Mayor of Zavkhan
Aimag
ORGIL SH.Mayor of Selenge
Aimag
GYLYMKHAN A.Mayor of Bayan-Ulgii
Aimag
NASANBAT S.Mayor of Darkhan-Uul
Aimag
BATLUT D.Mayor of Orkhon
Aimag
BATJARGAL O.Mayor of Tuv Aimag
BATJARGAL G.Mayor of Bayankhongor
Aimag
ENKHTUVSHIN T.Mayor of Dornogovi
Aimag
GANBOLD G.Mayor of Uvurkhangai
Aimag
BATSAIKHAN D.Mayor of Uvs Aimag
BATZORIG Z.Mayor of Bulgan Aimag
BADAMSUREN M.Mayor of Dornod
Aimag
NARANBAATAR N.Mayor of Umnugovi
Aimag
DUGERJAV B.Mayor of Khovd Aimag
GANBOLD L.Mayor of Khuvsgul Aimag
GANBYAMBA N.Mayor of Khentii aimag

37
CHAPTER 1COMPOSITION AND HIGHLIGHTS OF POPULATION AND HOUSING CENSUS 2020
FIGURE 1.1. STRUCTURE FOR MANAGEMENT AND ORGANIZATION OF THE POPULATION AND HOUSING CENSUS 2020
ЗУРАГ 1.1. ХҮН АМ, ОРОН СУУЦНЫ 2020 ОНЫ ЭЭЛЖИТ ТООЛЛОГЫН УДИРДЛАГА, ЗОХИОН БАЙГУУЛАЛТЫН БҮТЭЦ
STATE CENSUS COMMISSION
NATONAL STATISTICAL OFFICE
Capital City Census Commission:
Governor of the Capital City
Capital City AD-HOC bureau Head of the Statistics Department of Ulaanbaatar
Aimags Census Commissions:
Governor of Aimags
Aimags AD-HOC Bureau
Head of Statistical department
Commission of Ministers
AD-HOC Bureau of Ministers
Census commissions of District Head of the district statistics department
Commissions of Soum
Governor of Soum
AD-HOC Bureau of district
Head of statistical department
AD-HOC bureau of Soum
Deputy governor of Soum
AD-HOC of Khoroo
Governor of Khoroo
AD-HOC of Bag
Governor of Bag
SUPERVISOR
ENUMERATOR
SUPERVISOR
ENUMERATOR


NUMBER OF POPULATIONS, GROWTH, AGE AND SEX
STRUCTURE
647 500 738 200 759 061 845 4811 017 158
1 197 595
1 595 006
2 043 954
2 373 493
2 754 685
3 296 866
0.1
0.8
0.3
0.9
2.62.8 2.9
2.5
1.4 1.5
2.2
0.00
0.50
1.00
1.50
2.00
2.50
3.00
3.50
4.00
4.50
5.00
0
500000
1000000
1500000
2000000
2500000
3000000
3500000
1979 1989 2000 2010 2020 1963 1969 1918 1935 1944 1956
2CHAPTER


41
CHAPTER 2NUMBER OF POPULATIONS, GROWTH, AGE AND SEX STRUCTURE
POPULATION AND SEX RATIOAccording to the Population and Housing Census 2020, Mongolian population reached 3 296 866,
increased 5 times since 1918, and is representing an average growth of 2.2 percent every year since 2010. A total resident population is 3 197 020, and the number of people residing abroad for more than 6 months is 122 301. While foreign nationals residing in Mongolia for more than 6 months is 22 418, stateless people counted as 37 (Figure 2.1).
FIGURE 2.1. POPULATION OF MONGOLIA, 2020
33 229966 886666 33 119977 002200
122 301 3 174 565
22 418 37
33 229966 886666 33 119977 002200
122 301 3 174 565
22 418 37
33 229966 886666 33 119977 002200
122 301 3 174 565
22 418 37
33 229966 886666 33 119977 002200
122 301 3 174 565
22 418 37
33 229966 886666 33 119977 002200
122 301 3 174 565
22 418 3733 229966 886666 33 119977 002200
122 301 3 174 565
22 418 37
33 229966 886666 33 119977 002200
122 301 3 174 565
22 418 37
TOTAL POPULATION
3 296 866
PEOPLE LIVING ABROAD MORE
THAN 6 MONTHS 122 301
MONGOLIAN CITIZENS RESIDING
IN MONGOLIA 3 174 565
FOREIGN NATIONALS RESIDING IN
MONGOLIA MORE THAN 6 MONTHS
22 418
STATELESS PERSONS
PESIDING IN MONGOLIA MORE THAHS 6 MONTS
37
RESIDENT POPULATION
3 197 020
The 2020 Population and Housing Census shows the total population of Mongolian citizens as 3 296.9 thousand, a growth by 542.2 thousand in the last 10 years. While 50.9 percent is female, 49.1 percent of the population is male. The sex ratio is at the level of 96.6 males per 100 females, down by 1.5 percentage points from the previous census (Table 2.1). The ratio has been constantly decreasing from 100.4 in 1979, and 98.1 in 2010 to 96.6 in 2020 and that shows there are more females in population.
TABLE 2.1 POPULATION OF MONGOLIA, BY CENSUS YEARS
Census yearsPopulation (thous.person)
Sex ratioTotal Male Female
1918 647.5 330.2 317.3 104.11935 738.2 370.8 367.4 100.91944 759.1 371.3 387.8 95.71956 845.5 420.3 425.2 98.81963 1 017.1 508.0 509.1 99.81969 1 197.6 597.4 600.2 99.51979 1 595.0 798.9 796.1 100.41989 2 044.0 1 020.7 1 023.3 99.72000 2 373.5 1 178.0 1 195.5 98.52010 2 754.7 1 363.9 1 390.8 98.12020 3 296.9 1 619.6 1 677.3 96.6

42
2020 POPULATION AND HOUSING CENSUS OF MONGOLIA NATIONAL REPORT
POPULATION GROWTHChanges in population is determined by a net/natural growth (differences between birth and death)
and a mechanical increase (migration). The population growth between censuses significantly depends on the political, social, and demographic development. There was an increase of 329.5 thousand of people, average annual growth by 1.4 percent between 1989-2000, 381.2 thousand of people, by average annual growth by 1.5 percent between 2000-2010, and 2.2 percent of average annual growth increased by 542.2 thousand from 2010 to 2020. The birth rate which showed decline since the yearly 1990s. Birth rate has increased since 2006, reached its peak in 2014, amounted 82 839 new births. The average growth of the population increased from 1.4 to 2.2 between the censuses, affected by higher percent of people in their reproductive ages between 2000 and 2010. The higher percentage is directly connected to the higher birth rates during 1970 to 1990.
FIGURE 2.2. AVERAGE ANNUAL GROWTH RATE BETWEEN CENSUSES 1918-2020, BY PERCENTAGE
0.8
0.3
0.9
2.62.8 2.9
2.5
1.4 1.5
2.2
1918-1935 1935-1944 1944-1956 1956-1963 1963-1969 1969-1979 1979-1989 1989-2000 2000-2010 2010-2020
TABLE 2.2. POPULATION VITAL STATISTICS INDICATOR, 2010-2020
YearCrude rate
Birth Death Population vital2010 23.1 6.7 16.42011 25.1 6.9 18.22012 26.0 6.3 19.72013 27.5 5.9 21.62014 28.0 5.6 22.42015 27.1 5.8 21.32016 25.9 5.8 20.12017 23.9 5.5 18.42018 24.5 5.6 18.92020 24.4 5.6 18.7
Because of a higher birth rate, aimags and the capital city population increased by 0.9-3.9 percent in the past 10 years and varies greatly from each other since 1989. From 2000 to 2010, populations of the capital and 5 aimags increased, while it declined in other aimags (Table 2.3). As well, the average annual growth in Ulaanbaatar, Orkhon and Umnugovi was higher than the national average, associated with migration to the capital and urban areas.
As of 2020 census, the average annual growth in Dundgovi, Dornogovi, Sukhbaatar, Bayan-Ulgii, Govisumber and Ulaanbaatar was higher than the national average growth by 0.2-1.7 percentage point.

43
CHAPTER 2NUMBER OF POPULATIONS, GROWTH, AGE AND SEX STRUCTURE
TABLE 2.3. POPULATION GROWTH IN AIMAGS AND THE CAPITAL, BY PERCENTAGE, 1989-2000, 2000-2010, 2010-2020
Aimags and the Capital2000/1989 2010/2000 2020/2010 Average annual growth %
(%) (%) (%) 1989-2000 2000-2010 2010-2020TOTAL 116.1 116.1 119.7 1.4 1.5 2.2Arkhangai 114.9 87.1 112.3 1.3 -1.2 1.4Bayan-Ulgii 100.2 96.7 123.3 0.0 -0.3 2.6Bayankhongor 113.7 89.7 116.5 1.2 -0.9 1.8Bulgan 119.0 86.9 115.7 1.6 -1.2 1.7Govi-Altai 101.4 84.2 107.8 0.1 -1.4 0.9Dornogovi 88.6 115.9 121.2 -1.1 1.4 2.4Dornod 93.0 92.3 118.0 -0.7 -0.7 2.0Dundgovi 104.5 75.4 121.3 0.4 -2.2 2.4Zavkhan 101.7 72.8 111.2 0.2 -2.5 1.2Uvurkhangai 115.4 90.9 115.2 1.3 -0.8 1.7Umnugovi 110.4 130.9 112.8 0.9 2.8 1.4Sukhbaatar 110.5 91.4 123.1 0.9 -0.8 2.6Selenge 114.9 97.6 112.8 1.3 -0.2 1.4Tuv 99.2 85.8 110.7 -0.1 -1.3 1.2Uvs 107.2 81.4 113.5 0.6 -1.7 1.5Khovd 113.4 88.5 116.7 1.2 -1.0 1.9Khuvsgul 116.9 96.5 117.5 1.4 -0.3 1.9Khentii 96.1 92.8 118.5 -0.4 -0.7 2.1Darkhan-Uul 97.1 113.6 113.1 -0.3 1.2 1.5Orkhon 127.4 126.8 118.7 2.2 2.4 2.1Govisumber - 108.3 135.4 - 0.8 3.9Ulaanbaatar 138.6 163.1 124.2 3.0 5.7 2.7
AGE AND AGE STRUCTUREThe age structure of population is of significance in tracking demographic trajectory, evaluating
the current process, and identifying the future trends. It is a useful tool to develop short-and-long term social and economic programs considering trends in age and gender structure changes of the population.
The age structure of population evolves due to the rates of birth and deaths. The percentages of youth, adults, and older people in the total population affect the socio-economic development of the country. On the other hand, trends in the rates of birth, death and migration patterns depend on the age structures. For instance, if the working age population tends to increase, it is necessary to adjust workplaces to the ones in demand based on the characteristics of male and female working age population.

44
2020 POPULATION AND HOUSING CENSUS OF MONGOLIA NATIONAL REPORT
FIGURE 2.3. POPULATION AGE STRUCTURE, BY PERCENTAGE, 1989, 2000, 2010, 2020
Percentage of children aged 0-14 in total population increased by 4.2 percentage point, showing growth in birth rate (Figure 2.3). 65 and older aged population increased by 0.6 percentage points from 2000.
TABLE 2.4. POPULATION BY AGE GROUPS, BY SEX, AND SEX RATIO, 2010, 2020
Age group2010 2020 Sex ratio*
Total Male Female Total Male Female 2010 2020TOTAL 100.0 100.0 100.0 100.0 100.0 100.0 98.1 96.60-4 10.6 10.9 10.4 11.7 12.2 11.2 103.2 105.55-9 8.0 8.2 7.7 11.3 11.8 10.8 103.8 104.710-14 8.7 8.9 8.5 8.5 8.8 8.2 102.8 104.215-19 9.7 9.9 9.5 6.8 7.0 6.5 102.4 103.520-24 11.3 11.5 11.2 7.3 7.5 7.1 101.7 101.925-29 9.8 9.9 9.7 8.4 8.6 8.2 100.4 100.930-34 8.7 8.8 8.6 9.3 9.4 9.1 99.6 99.235-39 7.8 7.8 7.8 7.6 7.6 7.6 97.7 97.340-44 6.8 6.7 6.9 6.8 6.7 6.9 95.9 94.545-49 5.9 5.8 6.0 6.0 5.8 6.2 94.4 91.350-54 4.5 4.3 4.7 5.0 4.7 5.3 90.1 86.055-59 2.7 2.5 2.8 4.3 4.0 4.7 86.2 81.960-64 1.8 1.6 2.0 2.9 2.6 3.3 80.7 75.765-69 1.4 1.3 1.5 1.7 1.4 1.9 82.2 69.470+ 2.3 1.9 2.7 2.4 1.9 3.0 66.8 60.7
Explanation:* the number of males per 100 females
Age group of 0-9 in the total population reached 23.0 in 2020 from 18.6 percentage in 2010, growing by 4.4 percentage points. Due to low birth rate between 1990 and 2006, age group of 15-29 years old declined by 8.3 percentage points to 30.8 in 2010 and 22.5 in 2020.
The sex ratio at birth averages 105, the same level as the other countries in the world. Because of the male death rate, the sex ratio has been differing as the age group goes up, according to the last 2 censuses.
The population pyramid is a graphical illustration that shows distribution of age and sex structures of population.

45
CHAPTER 2NUMBER OF POPULATIONS, GROWTH, AGE AND SEX STRUCTURE
In the below population pyramid, the gradually broadening shape in the middle of pyramid represents the number of people who are entering into labor force is increasing. The pyramid shape changes from the age under 30 because of the migration. Narrowing at the age group of 15-24 in 2020 means that there was decline in the birth rate since 1990, but the broader base of pyramid at the age of 0-9 indicates there has been increase in the birth rate in the recent years.
FIGURE 2.4. POPULATION -PYRAMID, 2010, 2020
200 000 100 000 0 100 000 200 000
0-45-9
10-1415-1920-2425-2930-3435-3940-4445-4950-5455-5960-6465-69
70+
200 000 100 000 0 100 000 200 000
Male Female Male Female2010 2020
Higher birth rate in the past 10 years brought an accelerated the percentage of children aged 0-17 from 27.3 to 31.5 percent, which increased necessity of preschool educational organizations. Furthermore, it is certain that it will increase the number of secondary schools, technical and vocational training institutes, university and colleges, and work places.
The sex ratio of Orkhon aimag and Ulaanbaatar population is lower than national average by 0.2-3.8 percentage points, Darkhan-Uul aimag is as the same level as the national level, and 0.1-8.7 percentage points greater than the national average in other aimags.

46
2020 POPULATION AND HOUSING CENSUS OF MONGOLIA NATIONAL REPORT
TABLE 2.5. POPULATION IN AIMAGS AND THE CAPITAL, BY SEX, AND SEX RATIO, 2010, 2020
Aimags and the Capital
2010 2020 Sex ratioTotal Male Female Total Male Female 2010 2020
TOTAL 2 754 685 1 363 923 1 390 762 3 296 866 1 619 573 1 677 293 98.1 96.6Arkhangai 84 584 42 219 42 365 94 994 47 641 47 353 99.7 100.6Bayan-Ulgii 88 056 44 127 43 929 108 530 54 196 54 334 100.5 99.7Bayankhongor 76 085 38 237 37 848 88 672 43 603 45 069 101.0 96.7Bulgan 53 655 27 623 26 032 62 089 31 494 30 595 106.1 102.9Govi-Altai 53 590 26 830 26 760 57 748 28 775 28 973 100.3 99.3Dornogovi 58 612 29 537 29 075 71 014 35 527 35 487 101.6 100.1Dornod 69 552 35 134 34 418 82 054 40 971 41 083 102.1 99.7Dundgovi 38 821 19 727 19 094 47 104 23 669 23 435 103.3 101.0Zavkhan 65 481 32 916 32 565 72 823 36 353 36 470 101.1 99.7Uvurkhangai 101 314 50 879 50 435 116 732 58 157 58 575 100.9 99.3Umnugovi 61 314 35 137 26 177 69 187 34 653 34 534 134.2 100.3Sukhbaatar 51 334 26 165 25 169 63 182 31 732 31 450 104.0 100.9Selenge 97 584 49 625 47 959 110 110 55 857 54 253 103.5 103.0Tuv 85 166 44 394 40 772 94 250 48 332 45 918 108.9 105.3Uvs 73 328 37 049 36 279 83 223 41 788 41 435 102.1 100.9Khovd 76 870 38 366 38 504 89 712 44 833 44 879 99.6 99.9Khuvsgul 114 926 57 193 57 733 135 095 66 977 68 118 99.1 98.3Khentii 65 811 33 633 32 178 77 957 39 378 38 579 104.5 102.1Darkhan-Uul 94 625 46 491 48 134 107 018 52 578 54 440 96.6 96.6Orkhon 90 700 44 488 46 212 107 634 52 838 54 796 96.3 96.4Govisumber 13 240 6 816 6 424 17 928 9 027 8 901 106.1 101.4Ulaanbaatar 1 240 037 597 337 642 700 1 539 810 741 194 798 616 92.9 92.8
The sex ratio differs in the urban and rural areas, and more females live in the city, while more males in the country.
TABLE 2.6. URBAN AND RURAL POPULATION, BY SEX, AND SEX RATIO, 2010, 2020
Urban, rural2010 2010
Male Female Sex ratio Male Female Sex ratioState average 1 313 968 1 333 577 98.1 1 619 573 1 677 293 96.6Urban 915 799 975 953 94.0 1 091 283 1 167 698 93.5Rural 448 124 414 809 108.0 528 290 509 595 103.7
Median age is the age that divides a population into two numerically equally sized groups. In other words, the median age is 27.9 which means that a half of the population is aged under 27.9 and the other half is aged above it in 2020. The median age has increased by 10 years in the past 30 years, which is related to decline in the birth rate and increase in life expectancy (Table 2.7).
A demographic indicator of economic significance that better depicts the population age structure change is the dependency ratio. The dependency ratio is the number of children and elderly per 100 working age population. The high dependency ratio in 1989 was due to the rising birth rate. In 2020, the ratio went down to 55.3, by 29.6 percentage points from 1989, but increased by 10.3 percentage points from 2010.

47
CHAPTER 2NUMBER OF POPULATIONS, GROWTH, AGE AND SEX STRUCTURE
TABLE 2.7.SOME KEY INDICATORS OF POPULATION AGE STRUCTURE, 1989, 2000, 2010, 2020
Indicators 1989 2000 2010 2020Median age /by year/ 18.8 21.6 25.8 27.9Dependency ratio 84.9 64.6 45.0 55.3Of which:
Children 77.4 58.9 39.6 48.9 Elderly 7.5 5.7 5.4 6.4
Ageing index 9.7 9.7 13.6 13.1


CITIZENSHIP, ETHNICITY AND RELIGION
3CHAPTER


51
CHAPTER 3CITIZENSHIP, ETHNICITY AND RELIGION
CITIZENSHIP
3 Mongolian citizens, foreign nationals and stateless persons who are residing in Mongolian territory more than 6 months or 183 days
The total population residing in Mongolian territory consists of 99.3 percent of Mongolian citizens, 0.7 percent of foreign nationals and 37 people who are stateless.
FIGURE 3.1. POPULATION BY CITIZENSHIP, 2020
Population residing in Mongolia
3 197 020
Mongolian citizens residing in Mongolia
3 174 565
Foreign citizens
22 418
Stateless persons
37
The number of people residing in Mongolian territory3 has reached 3 197.0 thousand. The sex ratio (males per 100 females) shows 0.2-1.0 percentage points increase in Ulaanbaatar, Orkhon, Khovd and Arkhangai aimags between 2010-2020, while 0.5-30.6 percentage points drop in other aimags, but no change in Darkhan-Uul aimag (Table 3.1).
TABLE 3.1. RESIDENT POPULATION IN MONGOLIA BY AIMAGS AND THE CAPITAL, BY SEX, AND SEX RATIO, 2010, 2020Aimags and the Capital
2010 2020 Sex ratioTotal Male Female Total Male Female 2010 2020
TOTAL 2 647 545 1 313 968 1 333 577 3 197 020 1 576 930 1 620 090 98.5 97.3Arkhangai 84 078 41 943 42 135 94 324 47 272 47 052 99.5 100.5Bayan-Ulgii 85 232 42 655 42 577 103 908 51 855 52 053 100.2 99.6Bayankhongor 75 690 38 023 37 667 88 008 43 215 44 793 100.9 96.5Bulgan 53 065 27 325 25 740 61 344 31 146 30 198 106.2 103.1Gobi-Altai 53 223 26 602 26 621 57 479 28 649 28 830 99.9 99.4Dornogobi 57 930 29 230 28 700 69 859 35 046 34 813 101.8 100.7Dornod 68 873 34 796 34 077 82 020 41 322 40 698 102.1 101.5Dundgobi 38 543 19 578 18 965 46 698 23 478 23 220 103.2 101.1Zavkhan 64 924 32 544 32 380 72 307 36 032 36 275 100.5 99.3Uvurkhangai 100 444 50 333 50 111 115 737 57 599 58 138 100.4 99.1Umnugobi 60 855 34 884 25 971 69 858 35 568 34 290 134.3 103.7Sukhbaatar 51 091 26 059 25 032 62 884 31 603 31 281 104.1 101.0Selenge 95 804 48 756 47 048 107 755 54 706 53 049 103.6 103.1Tuv 83 838 43 751 40 087 92 409 47 447 44 962 109.1 105.5Uvs 72 906 36 829 36 077 82 941 41 625 41 316 102.1 100.7Khovd 76 252 38 006 38 246 88 078 44 017 44 061 99.4 99.9Khuvsgul 114 331 56 899 57 432 134 318 66 604 67 714 99.1 98.4Khentii 65 335 33 399 31 936 77 320 39 085 38 235 104.6 102.2Darkhan-Uul 90 642 44 556 46 086 102 171 50 234 51 937 96.7 96.7Orkhon 87 118 42 813 44 305 104 032 51 176 52 856 96.6 96.8Gobisumber 13 081 6 740 6 341 17 445 8 796 8 649 106.3 101.7Ulaanbaatar 1 154 290 558 247 596 043 1 466 125 710 455 755 670 93.7 94.0

52
2020 POPULATION AND HOUSING CENSUS OF MONGOLIA NATIONAL REPORT
ETHNICITYThe last census enables a widespread and extensively study of population ethnicity. In the census
results, ethnic groups which has population less than 100 persons was categorized as “other”. Khalkh ethnic group makes 83.8 percent of Mongolian population, increased by 1.4 percentage points from the previous census, and followed by Kazakhs, 3.8 percent. The percentage of Durvuds, Bayads, and Buriads declined from 2010.
TABLE 3.2. POPULATION AND ETHNIC GROUPS, BY PERCENTAGE, 2010, 2020
Ethnicity2010* 2020*
Number of person Percentage Number of person PercentageMONGOLIAN CITIZEN TOTAL 2 631 117 100.0 3 174 565 100.0Khalkh 2 168 141 82.4 2 659 985 83.8Kazakh 101 526 3.9 120 999 3.8Durvud 72 403 2.8 83 719 2.6Bayad 56 573 2.2 63 775 2.0Buriad 45087 1.7 43 661 1.4Zakhchin 32 845 1.2 37 407 1.2Dariganga 27 412 1.0 36 419 1.1Uriankhai 26 654 1.0 29 021 0.9Darkhad 21 558 0.8 24 549 0.8Uuld 15 520 0.6 14 666 0.5Khotgoid 15 460 0.6 8 583 0.3Torguud 14 176 0.5 15 596 0.5Khoton 11 304 0.4 12 057 0.4Myangad 6 592 0.3 8 125 0.2Tuva 5 169 0.2 2 354 0.1Barga 2 989 0.1 2 832 0.1Uzemchin 2 577 0.1 2 308 0.1Eljigen 1 340 0.1 1 034 0.0Sartuul 1 286 0.0 2 023 0.1Khamnigan 537 0.0 384 0.0Tsaatan (Dukha) 282 0.0 208 0.0Uzbek (Chantuu) 260 0.0 202 0.0Kharchin 152 0.0 154 0.0Tsakhar 132 0.0 - -Khoshuud - - 382 0.0Other 601 0.0 143 0.0Other nationals (Mongolian citizen who are foreign) 541 0.0 3 979 0.1
Explanation: *Mongolian citizens living abroad not included
Children aged 0-14 take up more than 60 percent among Khotgoid, Tuva, Tsaatan (Dukha), and Khoshuuds, is associated with high birth rates. More than 25 percent of Buriad, Dariganga, Uzemchin, Sartuul, Khamnigan, and Kharchin people who are above 45 years old shows the population of these groups are aging.

53
CHAPTER 3CITIZENSHIP, ETHNICITY AND RELIGION
TABLE 3.3. ETHNICITY BY AGE GROUPS AND PERCENTAGE, 2020
Ethnicity TotalAge group
0-14 15-24 25-34 35-44 45-54 55+MONGOLIAN CITIZENS 100.0 32.2 13.8 17.1 14.2 11.0 11.7Khalkh 100.0 32.4 13.6 17.1 14.3 11.0 11.6Kazak 100.0 35.9 17.1 16.7 12.2 9.1 9.0Durvud 100.0 29.8 14.5 17.8 14.1 11.9 11.9Buriad 100.0 29.6 14.4 17.7 13.9 11.7 12.7Bayad 100.0 27.4 11.8 17.4 14.4 12.0 17.0Dariganga 100.0 29.8 15.7 17.5 14.0 10.6 12.4Uriankhai 100.0 22.9 12.1 19.5 16.6 13.2 15.7Zakhchin 100.0 29.1 14.6 17.7 13.8 11.7 13.1Darkhad 100.0 30.4 15.7 18.3 13.2 11.1 11.3Torguud 100.0 30.3 14.0 16.1 14.0 11.9 13.7Uuld 100.0 71.5 13.4 4.5 3.8 3.3 3.5Khoton 100.0 28.6 12.9 17.9 14.7 11.3 14.6Myangad 100.0 39.9 17.4 14.9 10.3 9.1 8.4Barga 100.0 28.7 18.4 16.0 15.5 10.7 10.7Uzemchin 100.0 65.6 13.4 7.1 4.7 4.3 4.9Kharchin 100.0 29.3 8.5 23.9 13.8 10.3 14.2Tsakhar 100.0 27.4 11.8 20.2 11.8 12.2 16.6Khotgoid 100.0 31.5 16.9 12.9 14.8 13.1 10.8Eljigen 100.0 19.8 14.1 18.0 18.2 13.8 16.1Tsaatan (Dukha) 100.0 18.7 17.7 18.8 14.6 13.0 17.2Sartuul 100.0 75.0 14.4 1.5 1.9 4.3 2.9Tuva 100.0 25.7 17.3 21.3 15.4 8.4 11.9Khorchin 100.0 46.8 13.6 3.9 7.8 7.8 20.1Uzbek (Chantuu) 100.0 71.5 14.6 3.7 3.9 3.4 2.9Other 100.0 23.1 9.1 14.0 17.4 14.7 21.7Other nationals (Mongolian citizen who are foreign) 100.0 20.2 16.1 21.7 15.2 12.4 14.4
Khalkhs are living in every aimags and the city. In Bayankhongor, Govi-Altai, Dundgovi, Zavkhan, and Uvurkhangai aimags, more than 99 percent of the populations is Khalkhs, but takes up only 0.9 percent in Bayan-Ulgii, 13.6 percent in Uvs, and 28.1 percent in Khovd. Khovd is a home to many ethnicities which consists of Khalkh (28.1 percent), Zakhchin (25.3 percent), Kazakh (11.2 percent), Uriankhai (8.3 percent), Torguud (7.4 percent), Durvud (6.5 percent), Uuld (6.1 percent), and Myangad (5.3 percent). In terms of regions, percentages of population living in the western part of Mongolia are Khalkh (41.0), Kazakh (25.8), Durvud (10.4), Bayad (7.1), and Zakhchin (5.6). While 77.7 percent of the total Kazakhs is living in Bayal-Ulgii, 41.8 percent of the Durvuds, 44.3 percent of the Bayads, 47.9 percent of the Khotons, and 86.7 percent of the Eljigens are residing Uvs aimag.
In Khangai region, the Khalkhs constitute 91.8 percent of the population, the Darkhads 3.5 percent, and the Khotgoids 1.3 percent. 91.6 percent of the population in the Central region is the Khalkhs,Darkhads 81.2 percents residing in Khuvsgul, 1.9 percent is the Bayads, and 1.8 percent is the Durvuds. The Khalkhs take up 73.8 percent of the people in the eastern region, the Darigangas take 12.1 percent, and the Buriads constitutes 10.2 percent. 67.2 percent of the Darigangas, and 7.0 percent of the Uzemchins are living in Sukhbaatar aimag. The Bargas and the Uzemchins in Dornod aimag where they mostly live, make up 2.3 and 2.1 percent of the population, and they represent 67.3 and 73.7 percent of their ethnic groups. /See the Appendix B Table 3.6/

54
2020 POPULATION AND HOUSING CENSUS OF MONGOLIA NATIONAL REPORT
The Khalkhs, the Kazakhs, the Durvuds, the Bayads, and the Buriads are the ethnic groups that make up higher percentages in the total population.
FIGURE 3.2. POPULATION BY ETHNICITIES, BY PERCENTAGE, 2020 KHALKH83.8%
KAZAKH3.8%
DURVUD2.6%
BAYAD2.0%
BURIAD1.4%
FIGURE 3.3. DISTRIBUTION OF THE KAZAKHS, BY AIMAGS AND THE CAPITAL, 2020
The Kazakhs mostly live in Bayan-Ulgii, Khovd, Selenge, Tuv, Khentii aimags and Ulaanbaatar.
FIGURE 3.4. DISTRIBUTION OF THE DURVUDS, BY AIMAGS AND THE CAPITAL, 2020
The Durvuds sparsely reside in every aimag, and constitutes 41.8 percent of the population in Uvs, and 34.3 percent in Ulaanbaatar.

55
CHAPTER 3CITIZENSHIP, ETHNICITY AND RELIGION
FIGURE 3.5. DISTRIBUTION OF BAYADS, BY AIMAGS AND THE CAPITAL, 2020
44.3 percent of Bayads live in Uvs aimag, 33.9 percent in Ulaanbaatar, and Bayads also live in Orkhon, Bulgan, Selenge, Tuv, and Darkhan-Uul aimags.
FIGURE 3.6. DISTRIBUTION OF BURIADS, BY AIMAGS AND THE CAPITAL, 2020
38.7 percent of Buriad live in Dornod, 37.5 percent in Ulaanbaatar and 12.6 percent in Khentii aimag. The Buriads also settled in the northern provinces of Mongolia, such as Khuvsgul, Selenge, Orkhon, Darkhan-Uul, Khentii, and Dornod.
The following figure shows that population belonging to the Darkhad, Tuva, Khotgoid, Uzbek (Chantuu), Hamnigan, Eljigen, Khoshuud, and Tsaatan (Dukha) ethnic groups live mainly in the rural areas.
FIGURE 3.7. PERCENTAGE DISTRIBUTION OF POPULATION BY ETHNICITY IN URBAN AND RURAL, 2020
55.268.8
10.110.512.6
18.824.827.127.228.1
42.048.148.350.851.652.152.2
55.456.1
60.460.5
63.565.5
70.875.1
79.2
44.831.2
89.989.587.4
81.275.272.972.871.9
58.051.951.749.248.447.947.8
44.643.9
39.639.5
36.534.5
29.224.9
20.8
0 20 40 60 80 100
Other nations (Mongolian citizens)Other ethnics
Tsaatan (Dukha)Hoshuud
EljigenKhamnigan
Uzbek (Chantuu)Khotgoid
TuvaDarkhad
KazakhBarga
UzemchinKhoton
DarigangaUriankhaiZakhchinTorguud
BuriadMyangad
BayadDurvud
UuldKhalkhSartuul
Kharchin
Urban Rural

56
2020 POPULATION AND HOUSING CENSUS OF MONGOLIA NATIONAL REPORT
TABLE 3.4. PERCENTAGE DISTRIBUTION OF POPULATION AGED 10 AND ABOVE, BY ETHNICITY AND EDUCATION LEVEL, 2020
EthnicityPopulation aged 10 or
above
Educational levelNon-
educatedHigher Specialized secondary
Technical and
vocational
Upper secondary
Lower secondary Primary
MONGOLIAN CITIZENS-TOTAL 100.0 26.5 4.7 3.9 29.2 17.1 13.7 4.9
Khalkh 100.0 27.1 4.7 3.8 29.8 16.6 13.2 4.8
Kazakh 100.0 21.2 3.2 4.2 22.3 21.7 20.4 7.0
Durvud 100.0 24.7 4.7 4.6 28.6 18.3 13.9 5.2
Bayad 100.0 26.9 4.6 3.9 27.0 17.7 14.7 5.2
Buriad 100.0 28.1 5.8 4.0 29.5 18.2 10.6 3.8
Zakhchin 100.0 24.5 4.8 3.6 29.5 18.6 13.9 5.1
Dariganga 100.0 24.7 6.1 6.4 24.6 20.7 12.9 4.6
Uriankhai 100.0 19.9 4.1 4.3 29.6 21.1 15.7 5.3
Darkhad 100.0 14.3 2.5 2.4 24.5 22.8 25.3 8.2
Uuld 100.0 32.0 5.5 3.5 27.8 14.7 12.3 4.2
Khotgoid 100.0 7.9 2.0 2.2 12.0 20.0 38.8 17.1
Torguud 100.0 28.9 6.3 3.9 29.9 14.9 12.0 4.1
Khoton 100.0 12.9 2.7 7.5 21.2 23.8 23.2 8.7
Myangad 100.0 23.4 4.8 4.5 29.9 20.1 12.3 5.0
Tuva 100.0 11.5 2.9 7.2 15.8 22.2 30.1 10.3
Barga 100.0 20.8 5.7 6.4 26.6 21.8 13.1 5.6
Uzemchin 100.0 18.7 4.3 7.0 25.1 24.2 15.6 5.1
Eljigen 100.0 19.6 3.8 6.5 25.7 18.8 15.5 10.1
Sartuul 100.0 24.2 5.8 5.4 30.2 17.1 12.7 4.6
Khamnigan 100.0 12.9 2.6 3.7 28.0 27.7 20.3 4.8
Tsaatan (Dukha) 100.0 4.9 2.0 0.0 17.6 19.6 30.4 25.5
Uzbek (Chantuu) 100.0 14.3 1.7 2.3 27.4 21.7 22.3 10.3
Kharchin 100.0 27.8 3.5 2.6 19.1 15.7 20.9 10.4
Hoshuud 100.0 3.9 3.0 2.0 13.3 23.6 39.4 14.8
Other 100.0 31.8 5.3 2.3 28.8 15.2 12.1 4.5Other nationals (Mongolian citizens)
100.0 17.8 3.3 4.2 27.0 20.6 20.1 7.0
According to the table, education level of the Bayads, the Khalkhs, the Kharchins, the Buriads, the Torguuds, and the Uulds is 0.4-5.5 percentage points higher than the nation’s average, but the other ethnics are 1.8-22.6 percentage points lower than it.

57
CHAPTER 3CITIZENSHIP, ETHNICITY AND RELIGION
TABLE 3.5. PERCENTAGE DITRIBUTION POPULATION AGED 15 AND ABOVE, BY ETHNICITY AND EMPLOYMENT STATUS, 2020
Ethnicity Employed population
Permanent employees
Fixed-term employees
Short-term and casual employees
Paid apprentices, trainees and
interns
Dependent contractors
MONGOLIAN CITIZENS-TOTAL 100.0 60.3 5.3 1.0 0.0 0.5
Khalkh 100.0 61.5 5.5 1.0 0.0 0.5
Kazakh 100.0 49.3 2.7 0.9 0.0 0.2
Durvud 100.0 57.9 5.4 0.8 0.0 0.5
Bayad 100.0 53.8 4.9 0.6 0.0 0.4
Buriad 100.0 60.5 6.0 1.0 0.0 0.5
Zakhchin 100.0 57.6 4.5 0.8 0.0 0.3
Dariganga 100.0 52.5 3.9 0.4 0.0 0.4
Uriankhai 100.0 53.6 4.0 1.1 0.0 0.4
Darkhad 100.0 33.2 2.7 0.6 0.0 0.3
Uuld 100.0 62.6 5.5 0.7 0.0 0.5
Khotgoid 100.0 34.5 4.4 0.5 0.0 0.1
Torguud 100.0 66.4 5.4 0.8 0.0 0.4
Khoton 100.0 39.7 4.0 0.8 0.0 0.5
Myangad 100.0 57.5 5.4 0.7 0.0 0.5
Tuva 100.0 42.9 6.5 0.7 0.0 0.5
Barga 100.0 54.1 4.5 1.1 0.1 0.5
Uzemchin 100.0 58.9 3.6 0.7 0.0 1.1
Eljigen 100.0 33.6 4.0 0.0 0.0 0.0
Sartuul 100.0 60.3 6.3 1.2 0.0 0.5
Khamnigan 100.0 39.6 2.8 0.0 0.0 0.0
Tsaatan (Dukha) 100.0 28.6 0.0 7.1 0.0 0.0
Uzbek (Chantuu) 100.0 33.3 4.2 1.4 0.0 0.0
Kharchin 100.0 71.4 14.3 0.0 0.0 0.0
Hoshuud 100.0 22.0 6.0 2.0 0.0 0.0
Other 100.0 55.8 1.9 0.0 0.0 1.9Other nationals (Mongolian citizens) 100.0 46.6 4.1 0.5 0.0 0.4

58
2020 POPULATION AND HOUSING CENSUS OF MONGOLIA NATIONAL REPORT
TABLE 3.5.1 PERCENTAGE DISTRIBUTION OF POPULATION AGED 15 AND ABOVE, BY ETHNICITY AND EMPLOYMENT STATUS, 2020 /CONTINUED/
Ethnicity Employers in corporations
Employer in household market
enterprises
Owner-operators of corporations
without employees
Own-account workers in
household market enterprises
without employees
Contributing family
workers
MONGOLIAN CITIZENS- TOTAL 0.4 0.2 0.3 26.1 5.9
Khalkh 0.5 0.2 0.3 25.2 5.3Kazakh 0.2 0.1 0.2 33.6 12.8Durvud 0.3 0.2 0.2 27.9 6.8Bayad 0.4 0.2 0.2 31.7 7.8Buriad 0.4 0.2 0.3 27.5 3.6Zakhchin 0.2 0.1 0.6 30.1 5.8Dariganga 0.3 0.2 0.2 27.9 14.2Uriankhai 0.2 0.2 0.3 32.0 8.2Darkhad 0.1 0.1 0.1 40.2 22.7Uuld 0.5 0.1 0.2 22.2 7.7Khotgoid 0.2 0.2 0.0 38.2 21.9Torguud 0.4 0.2 0.2 20.6 5.6Khoton 0.1 0.1 0.2 43.2 11.4Myangad 0.2 0.2 0.3 30.2 5.0Tuva 0.0 0.0 0.0 38.3 11.1Barga 0.4 0.1 0.4 30.9 7.9Uzemchin 0.3 0.4 0.1 29.4 5.5Eljigen 0.2 0.0 0.0 43.6 18.6Sartuul 0.2 0.4 0.0 27.8 3.3Khamnigan 0.0 0.7 0.7 54.8 1.4Tsaatan (Dukha) 0.0 0.0 0.0 50.0 14.3Uzbek (Chantuu) 1.4 1.4 0.0 54.2 4.1Kharchin 0.0 0.0 0.0 14.3 0.0Hoshuud 0.0 0.0 2.0 56.0 12.0Other 0.0 0.0 0.0 34.6 5.8Other nationals (Mongolian citizens) 0.5 0.1 0.1 42.0 5.7
According to the table, paid employment (full-time, temporary, casual workers, apprentices and contractors) among the Khoshuuds, the Tsaatsans (Dukha), the Darkhads, the Eljigens, the Uzbek (Chantuu), and the Khotgoids is 40 percent lower than the total population, but the family business and unpaid family production and service are relatively higher. Majority of the above-mentioned ethnics are employed in the agricultural sector, associated with the places they live, the rural areas. /see the Table 3.7, Appendix B/
FOREIGN CITIZENSForeign citizens residing in Mongolia for 6 months and more, are 22 418, increased by 37.4 percent
or 6 098 from 2010. But the stateless persons decreased by 71 to 37 persons from 2010. Foreign citizens from the People’s Republic of China and the Russian Federation take up 53.3 percent of the total foreign citizens. Compared with the Population and Housing Census 2010, permanent residents from the People’s Republic of China went down by 11.3 percent, residents from the Russian Federation by 3.4 percent, but people from the United States of America increased by 6.6 percentage points.

59
CHAPTER 3CITIZENSHIP, ETHNICITY AND RELIGION
TABLE 3.6. PERCENTAGE DISTRIBUTION OF FOREIGN CITIZENSS RESIDING IN MONGOLIA, BY COUNTRY, 2010, 2020
Country 2010 2020TOTAL 100.0 100.0The People’s Republic of China 53.0 41.7The Russian Federation 15.0 11.6The Republic of Korea 10.0 9.9The United States of America 4.0 10.6Other 18.0 26.2
A total of 77.9 percent of the foreign citizens is residing in the capital city, while 5.6 percent in Umnugovi, 3.5 percent in Dornod, 2.8 percent in Bayan-Ulgii, and 2.3 percent is residing in Orkhon aimag. Percentage of the foreign citizens in Ulaanbaatar is went up by 21.2 percentage points, and 2.4 percentage points in Bayan-Ulgii. But in Umnugovi, it decreased by 18.4 percentage points, and the sex ratio is relatively balanced, 134.3 in 2010 and 103.7 in 2020. Compared with other aimags, increasing number of people residing in Umnugovi, Dornod, and Bayan-Ulgii is probably associated with the fact they border the People’s Republic of China and the Republic of Kazakhstan (Table 3.7).
TABLE 3.7. PERCENTAGE DISTRIBUTION OF FOREIGN CITIZENS RESIDING IN MONGOLIA, BY AIMAGS AND THE CAPITAL CITY, 2010, 2020
Aimags and the Capital2010 2020
The number of population Percentage The number of
population Percentage
TOTAL 16 320 100.0 22 418 100.0Arkhangai 21 0.1 70 0.3Bayan-Ulgii 71 0.4 627 2.8Bayankhongor 43 0.3 15 0.1Bulgan 42 0.3 47 0.2Gobi-Altai 8 0.0 67 0.3Dornogobi 319 1.9 221 1.0Dornod 284 1.7 792 3.5Dundgobi 28 0.2 23 0.1Zavkhan 45 0.3 31 0.1Uvurkhangai 21 0.1 18 0.1Umnugobi 3 913 24.0 1 265 5.6Sukhbaatar 156 1.0 92 0.4Selenge 323 2.0 197 0.9Tuv 183 1.1 126 0.6Uvs 32 0.2 183 0.8Khovd 191 1.2 121 0.5Khuvsgul 41 0.2 155 0.7Khentii 240 1.5 81 0.4Darkhan-Uul 255 1.6 293 1.3Orkhon 807 4.9 509 2.3Gobisumber 43 0.3 29 0.1Ulaanbaatar 9 254 56.7 17 456 77.9

60
2020 POPULATION AND HOUSING CENSUS OF MONGOLIA NATIONAL REPORT
TABLE 3.8. PERCENTAGE DISTRIBUTION OF MONGOLIAN RESIDING POPULATION AND FOREIGN CITIZENS, BY AGE AND GENDER STRUCTURE, 2010, 2020
4 Activities of member organizations, repair and maintenance of computers, household and personal goods, and various other personal services
Age group
2010 2020Sex ratio
Age structure
of resident population
Foreign citizens Age structure
of resident population
Foreign citizens
Total Male Female Total Male Female 2010 2020
TOTAL 100.0 100.0 100.0 100.0 100.0 100.0 100.0 100.0 284.3 165.90-14 28.0 7.9 5.6 14.4 32.1 17.8 14.5 23.2 110.1 103.815-24 20.8 12.3 10.5 17.3 13.8 12.4 9.0 18.2 173.1 81.625-34 17.8 21.8 22.4 20.3 17.1 16.5 16.3 16.8 313.5 161.435-44 14.4 28.3 31.8 18.5 14.2 19.6 21.9 15.7 487.9 231.745-54 10.6 20.0 21.2 16.6 11.1 19.0 22.6 13.1 362.8 285.455+ 8.4 9.7 8.5 12.9 11.7 14.7 15.7 13.0 188.7 200.5
Foreign citizens with higher education take up 57.4 percent, increased by 21.3 percentage points from 2010, while foreign nationals with upper secondary and lower education decreased by 23.9 percentage points
FIGURE 3.8. PERCENTAGE DISTRIBUTION OF FOREIGN CITIZENS AGED 6 AND ABOVE, BY EDUCATION LEVEL, 2010, 2020
3.6
5.9
17.4
26.9
4.1
5.9
36.1
5.4
3.8
3.9
18.6
3.9
7
57.4
Non-educated
Primary
Lower secondary
Upper secondary
Techical and vocational
Specialized secondary
Higher
2020 2010
According to the distribution, 74.9 percent of the foreign citizens are employed in the field of maintenance and other service4, and whole and retail sales, car and motorcycle repair and maintenance service, 2.8 percent are in education, and 12.2 percent are working in mining exploration sector.

61
CHAPTER 3CITIZENSHIP, ETHNICITY AND RELIGION
Comparing with the previous census, there is a 10.9 percentage points increase in the field of whole and retail sales, car and motorcycle repair and maintenance service (Figure 3.9).
FIGURE 3.9. PERCENTAGE DISTRIBUTION OF FOREIGN CITIZENSHIP, BY ECONOMIC ACTIVITIES, 2010, 2020
16.8
8.3
1.3
9.5
32.5
24.9
6.7
3.8
1.1
2
2.8
3.2
12.2
17.6
57.3
Other service activities
Wholesale and retail trade, repair ofmotor vehicles and motorcycles
Mining and quarrying
Construction
Education
Activities of extraterritorialorganizations and bodies
Manufacturing
Other
2020 2010
RELIGIONThe Section 1, Article 3 of Mongolian Law on the Relationship between Church and State articulates
that “One has his/her freedom to have or choose any religious belief and faith”. In the Population and Housing Census 2010, questions of “Do you follow any religion? If so, what religion do you follow?” were asked for the first time, and the same questions were asked in this census from 10 percent sample of the population aged 15 and over. By disaggregating by sex, female are 5.2 percentage points higher religious than the male.
TABLE 3.9. PERCENTAGE DISTRIBUTION OF POPULATION AGED 15 AND ABOVE, BY RELIGIOUS STATUS AND SEX, 2010, 2020
Religious status2010 2020
Total Male Female Total Male FemaleTOTAL 100.0 100.0 100.0 100.0 100.0 100.0Non-religoius 38.6 42.9 34.4 40.6 43.3 38.1Religious 61.4 57.1 65.6 59.4 56.7 61.9
This census estimates reveal that 87.1 percent of the religious population are Buddhist. Compared with the Population and Housing Census 2010, percentage of the Christians and Shamanis among total population has been decreased, probably because of the growth of other religions.

62
2020 POPULATION AND HOUSING CENSUS OF MONGOLIA NATIONAL REPORT
TABLE 3.10. PERCENTAGE DISTRIBUTION OF RELIGIOUS POPULATION AGED 15 AND ABOVE, BY RELIGIONS AND SEX, 2010, 2020
Religion2010 2020
Total Male Female Total Male FemaleTOTAL 100.0 100.0 100.0 100.0 100.0 100.0 Buddhist 86.2 86.5 86.1 87.1 87.0 87.1 Christians 3.5 2.8 4.1 2.2 1.7 2.6 Muslim 4.9 5.4 4.6 5.4 6.0 5.0 Shaman 4.7 4.7 4.7 4.2 4.2 4.3 Other 0.7 0.6 0.5 1.1 1.1 1.0
By disaggregating the religious population by age group, people tend to follow the Buddhist when they get older, and vice versa for the Shaman.
TABLE 3.11. PERCENTAGE DISTRIBUTION OF RELIGIOUS POPULATION AGED 15 AND ABOVE, BY AGE GROUPS AND RELIGIONS, 2020
Age group Religious Buddist Christias Muslim Shaman OtherTOTAL 100.0 87.1 2.2 5.4 4.2 1.115-19 100.0 81.4 3.2 9.2 4.9 1.320-29 100.0 83.4 2.1 7.8 5.5 1.230-39 100.0 86.3 2.2 5.1 5.1 1.340-49 100.0 88.4 2.0 4.6 4.0 1.050-59 100.0 89.3 2.3 4.1 3.5 0.860-69 100.0 91.1 2.1 3.5 2.6 0.770+ 100.0 91.8 2.1 3.7 1.7 0.7
Among the Kazakhs, Uzbek (Chantuu), and the Khoshuuds, non-religious population takes up to 16 percent and it is less than the other ethnics. 81.9 percent of the Kazakhs and 88.9 percent of the Uzbeks (Chantuu) are Islams, while 89.3 percent of the Khoshuuds are Buddhists, and 95 percent of the total Islams in Mongolia are Kazakhs. It is significantly different from the other ethnics that the Shaman has spread among 10.0 percent of the Buriads, 13.8 percent of the Darkhads, 27.0 percent of the Tuvas, 11.8 percent of the Khamnigans, and 60.5 percent of the Tsaatans.
TABLE 3.12. PERCENTAGE DISTRIBUTION OF RELIGIOUS POPULATION AGED 15 AND ABOVE, BY RELIGIONS AND AGE GROUPS, 2020
Age group Religious Buddist Christias Muslim Shaman OtherTOTAL 100.0 100.0 100.0 100.0 100.0 100.015-19 7.9 7.4 11.5 13.4 9.3 9.920-29 17.7 17.0 16.9 25.5 22.9 19.530-39 22.5 22.4 21.9 21.4 27.3 27.540-49 20.7 21.0 18.6 17.6 19.2 19.950-59 16.6 17.0 17.1 12.5 13.5 13.460-69 9.4 9.8 9.1 6.1 5.7 6.470+ 5.2 5.4 4.9 3.5 2.1 3.4

63
CHAPTER 3CITIZENSHIP, ETHNICITY AND RELIGION
TABLE 3.13. PERCENTAGE DISTRIBUTION OF POPULATION AGED 15 AND ABOVE, BY RELIGIOUS STATUS, ETHNICITY AND RELIGIONS, 2020
Ethnicity groupPopulation
aged 15 and above -Total
Non- religoius Religoius
Religoius
Total Buddhist Christians Muslim Shaman Other
TOTAL 100.0 40.6 59.4 100.0 87.1 2.2 5.4 4.2 1.1MONGOLIAN CITIZENS-TOTAL 100.0 40.5 59.5 100.0 87.1 2.2 5.4 4.2 1.1
Khalkh 100.0 41.3 58.7 100.0 92.7 2.3 0.1 4.0 0.9Kazakh 100.0 15.3 84.7 100.0 1.3 0.3 96.7 0.1 1.6Durvud 100.0 42.3 57.7 100.0 92.8 2.0 0.2 2.9 2.1Bayad 100.0 40.7 59.3 100.0 93.3 1.5 0.2 2.9 2.1Buriad 100.0 49.2 50.8 100.0 74.5 3.5 0.1 19.8 2.1Zakhchin 100.0 46.0 54.0 100.0 93.2 3.1 0.1 2.3 1.3Dariganga 100.0 34.5 65.5 100.0 96.6 0.8 - 2.1 0.5Uriankhai 100.0 41.3 58.7 100.0 89.9 2.9 0.5 3.9 2.8Darkhad 100.0 61.2 38.8 100.0 62.2 1.5 - 35.6 0.7Uuld 100.0 40.0 60.0 100.0 91.2 2.6 - 5.4 0.8Khotgoid 100.0 26.7 73.3 100.0 96.3 0.6 - 3.0 0.1Torguud 100.0 36.8 63.2 100.0 92.8 2.4 0.6 3.2 1.0Khoton 100.0 36.7 63.3 100.0 40.9 4.7 42.5 1.7 10.2Myangad 100.0 47.8 52.2 100.0 93.1 1.1 - 2.9 2.9Tuva 100.0 48.8 51.2 100.0 44.6 1.2 - 52.6 1.6Barga 100.0 58.6 41.4 100.0 94.7 1.3 - 2.7 1.3Uzemchin 100.0 51.2 48.8 100.0 98.1 - - 1.0 0.9Eljigen 100.0 40.7 59.3 100.0 87.7 - - 12.0 0.3Sartuul 100.0 31.0 69.0 100.0 78.7 2.5 8.8 7.5 2.5Khamnigan 100.0 29.4 70.6 100.0 83.3 - - 16.7 -Tsaatan (Dukha) 100.0 31.6 68.4 100.0 11.5 - - 88.5 -Uzbek (Chantuu) 100.0 11.1 88.9 100.0 - - 100.0 - -Kharchin 100.0 50.0 50.0 100.0 100.0 - - - -Hoshuud 100.0 10.7 89.3 100.0 100.0 - - - -Other 100.0 32.4 67.6 100.0 78.3 - 13.0 8.7 -Other nations (Mongolian citizens)
100.0 87.5 12.5 100.0 50.0 - 50.0 - -
Foreign 100.0 46.2 53.8 100.0 44.4 30.2 11.1 1.6 12.7


POPULATION DISTRIBUTION AND SETTLEMENT AND
URBANIZATION
4CHAPTER


67
CHAPTER 4POPULATION DISTRIBUTION AND SETTLEMENT AND URBANIZATION
POPULATION DISTRIBUTION AND SETTLEMENT
5 Regional Economic Development Concept” approved by the State Great Khural in 2003 Name of cities and aimags of regions:
• Western region: Bayan-Ulgii, Govi-Altai, Zavkhan, Uvs, Khovd;• Khangai region: Arkhangai, Bayankhongor, Bulgan, Orkhon, Uvurkhangai, Khuvsgul;• Central region: Govisumber, Darkhan-Uul, Dornogovi, Dundgovi, Umnugovi, Selenge, Tuv;• Eastern region: Dornod, Sukhbaatar, Khentii;• Ulaanbaatar region: Capital city, its districts and satellite cities in the region adjacent to the capital city
Population settlement in aimag and the capital city, population density and development levels vary because of the different territorial size of the aimags and the capital, several geographical regions, uneven distribution of natural resources across the country, as well as distinctive climate in the different geographical regions. Disaggregating the population settlement by urban, rural areas and regions serve as a basis for analyzing the social and economic development of the territories in depth and developing policies that is tailored to specific needs and characteristics of regions and local areas.
A slight change in the general pattern of population settlement has been observed from the previous census. A migration flow of thousands of people from west to central region, the capital city caused the region to have sparse population (Figure 4.1).
FIGURE 4.1. POPULATION DISTRIBUTION BY SOUM, 2020
Disaggregating the population settlement by the regions5, 45.9 percent of the total population reside in Ulaanbaatar, while 18.7 percent in Khangai region, 15.8 percent in Central, 12.6 percent in Western, and 7.0 percent live in Eastern region (Table 4.1). Migration inflow to urban areas, which began in early 1990s, has been continuing for the past 30 years. According to the census in 2000, 3 out of 10 people out of the total population used to live in the capital city, but it increased to 4 people in 2010 and 2020 respectively.

68
2020 POPULATION AND HOUSING CENSUS OF MONGOLIA NATIONAL REPORT
TABLE 4.1. POPULATION DISTRIBUTION AND GROWTH BY REGIONS, 2000, 2010, 2020
Regionthous.person 2010/
2000%2020/2010%
Percentage2000 2010 2020 2000 2010 2020
TOTAL 2 373.5 2 647.5 3 197.0 11.5 20.8 100.0 100.0 100.0Western 421.6 352.5 404.7 -16.4 14.8 17.8 13.3 12.6Khangai 545.7 514.7 597.8 -5.7 16.1 23.0 19.4 18.7Central 443.7 440.7 506.2 -0.7 14.9 18.7 16.6 15.8Eastern 202.5 185.3 222.2 -8.5 19.9 8.5 7.0 7.0
Ulaanbaatar 760.1 1 154.3 1 466.1 51.9 27.0 32.0 43.6 45.9
TABLE 4.2. POPULATION DISTRIBUTION AND GROWTH BY AIMAGS AND THE CAPITAL, 2000, 2010, 2020
Aimags and the Capital
Population/thous.person/ 2010/2000%
2020/2010%
Percentage2000 2010 2020 2000 2010 2020
TOTAL 2 373.5 2 647.5 3 197.0 11.5 20.8 100.0 100.0 100.0Arkhangai 97.1 84.1 94.3 -13.4 12.1 4.1 3.2 2.9Bayan-Ulgii 91.1 85.2 103.9 -6.4 21.9 3.8 3.2 3.2Bayankhongor 84.8 75.7 88.0 -10.7 16.2 3.6 2.9 2.7Bulgan 61.8 53.1 61.3 -14.0 15.4 2.6 2.0 1.9Govi-Altai 63.7 53.2 57.6 -16.4 8.3 2.7 2.0 1.8Dornogovi 50.6 57.9 70.0 14.5 20.9 2.1 2.2 2.2Dornod 75.4 68.9 82.0 -8.6 19.0 3.2 2.6 2.6Dundgovi 51.5 38.6 46.7 -25.1 21.0 2.2 1.5 1.5Zavkhan 90.0 64.9 72.3 -27.9 11.4 3.8 2.5 2.3Uvurkhangai 111.4 100.4 115.7 -9.9 15.2 4.7 3.8 3.6Umnugovi 46.9 60.9 69.9 30.0 14.8 2.0 2.3 2.2Sukhbaatar 56.2 51.1 62.9 -9.0 23.1 2.4 1.9 2.0Selenge 100.0 95.8 107.7 -4.2 12.4 4.2 3.6 3.4Tuv 99.3 83.8 92.4 -15.6 10.3 4.2 3.2 2.9Uvs 90.0 72.9 82.9 -19.0 13.7 3.8 2.8 2.6Khovd 86.8 76.3 88.1 -12.1 15.5 3.7 2.9 2.8Khuvsgul 119.1 114.3 134.3 -4.0 17.5 5.0 4.3 4.2Khentii 70.9 65.3 77.3 -8.0 18.4 3.0 2.5 2.4Darkhan-Uul 83.3 90.6 102.2 8.8 12.8 3.5 3.4 3.2Orkhon 71.5 87.1 104.0 21.8 19.4 3.0 3.3 3.2Govisumber 12.2 13.1 17.4 7.1 32.8 0.5 0.5 0.5Ulaanbaatar 760.1 1 154.3 1 466.1 51.9 27.0 32.0 43.6 45.9
Population in Ulaanbaatar takes up 45.9 percent of the total residents in Mongolia, while 0.5-4.2 percent belong to the other aimags (Table 4.2). However, population in aimags have risen between the last 2 censuses, such as 32.8 percent in Govisumber, which is the highest and followed by 27.0 percent in Ulaanbaatar (Table 4.2).
For the last 3 decades, urbanization has been expanding rapidly in Mongolia, caused by infrastructure, education and health services in the urban areas where 2 168.2 thousand of people reside. But the difference of urbanization levels in the regions can be observed from the Table 4.3.

69
CHAPTER 4POPULATION DISTRIBUTION AND SETTLEMENT AND URBANIZATION
TABLE 4.3. POPULATION DISTRIBUTION, BY REGIONS, URBAN AND RURAL AREAS, 2010, 2020
Region Number ofCities and villages
Urban RuralPopulation
(thous.person) Percentage Population (thous.person) Percentage
2010TOTAL 39 1 798.1 67.9 849.4 32.1Western 8 122.3 34.7 230.1 65.3Khangai 10 225.1 43.8 289.6 56.2Central 11 211.4 48.0 229.2 52.0Eastern 9 84.9 45.8 100.4 54.2Ulaanbaatar 1 1 154.3 100.0 - -
2020TOTAL 41 2 168.2 67.8 1 028.8 32.2Western 8 135.3 33.4 269.4 66.6Khangai 9 245.2 41.0 352.6 59.0Central 15 229.3 45.3 276.9 54.7Eastern 8 92.3 41.5 129.9 58.5Ulaanbaatar 1 1 466.1 100.0 - -
Although the western region is densely populated, there is not much progressive urbanization is happening. The central region has the highest level of urbanization after Ulaanbaatar. For instance, population in Darkhan-Uul, Orkhon and Umnugovi aimags tend to rise in numbers due to accelerated growth of industries and services and better infrastructure such as the railway in Darkan-uul and Orkhon, and the mining sector development in Umnugovi in the past decade. The industrial complex in Dornogovi aimags may have been triggering the population to increase in the aimag.
Urbanization level in aimags is different from one another. Education and health care, workplaces, trade and services in aimag centers attract people from the rural areas, and cause the population to rise. Aimags connected to the railroad network, such as Govisumber, Dornogovi, Darkhan-Uul and Orkhon have population which represent more than 50 percent of the population (Table 4.4).
Rural population of the quite densely populated aimags such as Arkhangai, Bulgan, Zavkhan, Sukhbaatar, and Tuv, takes up more than 70 percent. The factors such as beautiful nature and congenial weather may have led to this fact.

70
2020 POPULATION AND HOUSING CENSUS OF MONGOLIA NATIONAL REPORT
TABLE 4.4. PERCENTAGE DISTRIBUTION OF POPULATION BY AIMAG, THE CAPITAL, URBAN AND RURAL AREAS, 2010, 2020
Aimags and the Capital
2010 2020Urban Rural Urban Rural
thous.person Percentage thous.
person Percentage thous.person Percentage thous.
person Percentage
TOTAL 1 798.1 67.9 849.4 32.1 2 168.2 67.8 1 028.8 32.2Arkhangai 20.6 24.5 63.5 75.5 20.6 21.9 73.8 78.1Bayan-Ulgii 30.7 36.0 54.6 64.0 38.9 37.5 65.0 62.5Bayankhongor 29.8 39.4 45.9 60.6 31.7 36.1 56.3 63.9Bulgan 14.1 26.6 38.9 73.4 15.5 25.3 45.8 74.7Govi-Altai 18.0 33.7 35.3 66.3 18.7 32.5 38.9 67.5Dornogovi 33.9 58.6 24.0 41.4 44.7 64.0 25.3 36.0Dornod 38.6 56.1 30.3 43.9 46.2 56.4 35.8 43.6Dundgovi 13.7 35.5 24.9 64.5 12.4 26.6 34.3 73.4Zavkhan 17.5 26.9 47.4 73.1 16.2 22.4 56.1 77.6Uvurkhangai 38.0 37.9 62.4 62.1 32.9 28.4 82.8 71.6Umnugovi 18.8 30.9 42.1 69.1 26.4 37.7 43.5 62.3Sukhbaatar 16.2 31.6 34.9 68.4 18.5 29.5 44.3 70.5Selenge 47.0 49.1 48.8 50.9 37.2 34.5 70.5 65.5Tuv 13.3 15.9 70.5 84.1 16.7 18.0 75.7 82.0Uvs 27.2 37.3 45.7 62.7 30.7 37.0 52.2 63.0Khovd 29.0 38.1 47.2 61.9 30.9 34.9 57.2 65.1Khuvsgul 38.4 33.6 75.9 66.4 44.3 32.9 90.0 67.1Khentii 30.1 46.0 35.2 54.0 27.5 35.6 49.8 64.4Darkhan-Uul 75.0 82.7 15.7 17.3 81.5 79.8 20.7 20.2Orkhon 84.2 96.6 2.9 3.4 100.2 96.3 3.8 3.7Govisumber 9.7 74.5 3.3 25.5 10.4 59.8 7.0 40.2Ulaanbaatar 1 154.3 100.0 - - 1 466.1 100.0 - -
POPULATION DENSITYPolitics, culture, history, administration, weather, and geography are the main contributing factors
to population distribution and settlement and density. In the past decade, internal migration is the key driving force for the population density in aimags and cities.
Although Mongolia has been one of the sparsely populated countries in the world, the population density has reached to 2.0 people per square kilometer in 2020, increased by 0.3 percentage points from the previous census. .

71
CHAPTER 4POPULATION DISTRIBUTION AND SETTLEMENT AND URBANIZATION
TABLE 4.5. PERCENTAGE DISTRIBUTION OF POPULATION DENSITY BY REGION, 2010, 2020
RegionTerritory
2010 2020Population
Persons per sq.km
Population Persons
per sq.km thous.km2 Percentage thous.
person Percentage thous.person Percentage
TOTAL 1 564.1 100.0 2 647.5 100.0 1.7 3 197.0 100.0 2.0Western 415.3 26.6 352.5 13.3 0.8 404.7 12.6 1.0Khangai 384.3 24.6 514.7 19.4 1.3 597.8 18.7 1.6Central 473.6 30.3 440.7 16.6 0.9 506.2 15.8 1.1Eastern 286.2 18.3 185.3 7.0 0.6 222.2 7.0 0.8Ulaanbaatar 4.7 0.3 1 154.3 43.6 245.6 1 466.1 45.9 311.9
Population density varies in the regions. The density in Ulaanbaatar population still remain the highest and is increasing. In 2000, there were 162 people per square kilometer, but it grew to 246 people in 2010, and 312 in 2020. Comparing the Khangai region with the previous census, the density has increased by 0.3 percentage points, while density in the Central, Western and Eastern region went up by 0.2 percentage points.
In 2020, 45.9 percent of the total population is residing in Ulaanbaatar which covers only 0.3 percent of Mongolian territory, and this trend is likely to rise in the future. Population density in the other regions is relatively less, but differs from each other, compared with Ulaanbaatar. Khangai and Central regions where weather is pleasant, are densely populated than Western and Eastern regions. For instance, there are 1.6 people per square kilometer in Khangai region, twice as many as in Eastern. It represents an internal migration to urban areas.
FIGURE 4.2. POPULATION DENSITY BY AIMAG AND THE CAPITAL CITY, 2020
Following the most densely populated city, Ulaanbaatar, Orkhon (130 people per sq.km) and Darkhan-Uul (31 people per sq.km) are densely populated than other aimags. The least populated

72
2020 POPULATION AND HOUSING CENSUS OF MONGOLIA NATIONAL REPORT
aimags, such as Govi-Altai, Umnugovi, Dornogovi, Dundgovi, Dornod, Bayankhongor, Sukhbaatar, and Zavkhan, show density percentage between 0.4 and 0.9.
In relation to the population density and population growth, Umnugovi stays at the same level, but there has been growth in the other aimags, compared to the census held in 2010. Urbanization is being intensified in Selenge and Govisumber aimags where the railway networks are connected.
TABLE 4.6. PERCENTAGE DISTRIBUTION OF POPULATION NUMBER AND DENSITY BY AIMAG AND CAPITAL, 2010, 2020
Aimags and the Capital
2010 2020thous.person Percentage per/km2 thous.
person Percentage per/km2
TOTAL 2 647.5 100.0 1.7 3 197.0 100.0 2.0Arkhangai 84.1 3.2 1.5 94.3 2.9 1.7Bayan-Ulgii 85.2 3.2 1.9 103.9 3.2 2.3Bayankhongor 75.7 2.9 0.7 88.0 2.7 0.8Bulgan 53.1 2.0 1.1 61.3 1.9 1.3Gobi-Altai 53.2 2.0 0.4 57.6 1.8 0.4Dornogobi 57.9 2.2 0.5 70.0 2.2 0.6Dornod 68.9 2.6 0.6 82.0 2.6 0.7Dundgobi 38.6 1.5 0.5 46.7 1.5 0.6Zavkhan 64.9 2.5 0.8 72.3 2.3 0.9Uvurkhangai 100.4 3.8 1.6 115.7 3.6 1.8Umnugobi 60.9 2.3 0.4 69.9 2.2 0.4Sukhbaatar 51.1 1.9 0.6 62.9 2.0 0.8Selenge 95.8 3.6 2.3 107.7 3.4 2.6Tuv 83.8 3.2 1.1 92.4 2.9 1.2Uvs 72.9 2.8 1.0 82.9 2.6 1.2Khovd 76.3 2.9 1.0 88.1 2.8 1.2Khuvsgul 114.3 4.3 1.1 134.3 4.2 1.3Khentii 65.3 2.5 0.8 77.3 2.4 1.0Darkhan-Uul 90.6 3.4 27.5 102.2 3.2 31.0Orkhon 87.1 3.3 108.9 104.0 3.2 130.0Gobisumber 13.1 0.5 2.4 17.4 0.5 3.2Ulaanbaatar 1 154.3 43.6 245.6 1 466.1 45.9 311.9
URBANIZATIONIn industrialized developed nations, industrialization process in the city triggers internal migration
towards urban areas. In less industrialized developing nations, industrialization on a less scale could lead to increased migration to central and urban areas. In other words, growing population in urban areas does not represent the development. For Mongolia, it is doubtful for the current urbanization is caused from the industrialization although the urbanization has been intensified year by year.
The past 20 years of population growth has seen a similar growth pattern that of 1969 and 2000. By 2020, two third of the total population is residing in urban areas. Majority of the population growth in urban areas is caused from the internal migration. Quality of education, health care and other essential services is better in the capital city and aimag centers than rural areas, as well as opportunities for manufacturing, trade and services and employment.

73
CHAPTER 4POPULATION DISTRIBUTION AND SETTLEMENT AND URBANIZATION
FIGURE 4.3. INTERNAL MIGRATION TO ULAANBAATAR BY REGIONS (MIGRATION IN AND OUT- FLOW BY THOUS. PEOPLE) 2010, 2020
Population growth in Ulaanbaatar is relatively higher than the population of other aimags, increased by 311.8 thousand from the previous census, which represents 67.6 percent of the total urban population in 2020.
TABLE 4.7. PERCENTAGE DISTRIBUTION POPULATION NUMBER, GROWTH BY AIMAG, THE CAPITAL, 2010, 2020
Aimags and the CpitalPopulation in capital
Growth percentPercentage
2010 2020 2010 2020TOTAL 1 798 147 2 168 253 120.6 100.0 100.0Western region 122 334 135 327 110.6 6.8 6.2Bayan-Ulgii 30 663 38 950 127.0 1.7 1.8Govi-Altai 17 962 18 706 104.1 1.0 0.9Zavkhan 17 485 16 232 92.8 1.0 0.7Uvs 27 178 30 662 112.8 1.5 1.4Khovd 29 046 30 777 106.0 1.6 1.4Khangai region 225 221 245 163 108.9 12.5 11.3Arkhangai 20 619 20 648 100.1 1.1 1.0Bayankhongor 29 829 31 731 106.4 1.7 1.5Bulgan 14 116 15 522 110.0 0.8 0.7Orkhon 84 187 100 183 119.0 4.7 4.6Uvurkhangai 38 027 32 891 86.5 2.1 1.5Khuvsgul 38 443 44 188 114.9 2.1 2.0Central region 211 451 229 331 108.5 11.8 10.6Govisumber 9 742 10 427 107.0 0.5 0.5Darkhan-Uul 74 985 81 517 108.7 4.2 3.7Dornogovi 33 932 44 714 131.8 1.9 2.1Dundgovi 13 664 12 412 90.8 0.8 0.6Umnugovi 18 781 26 367 140.4 1.0 1.2Selenge 47 008 37 217 79.2 2.6 1.7Tuv 13 339 16 677 125.0 0.7 0.8Eastern region 84 851 92 307 108.8 4.7 4.3Dornod 38 615 46 221 119.7 2.1 2.1Sukhbaatar 16 150 18 561 114.9 0.9 0.9Khentii 30 086 27 525 91.5 1.7 1.3Ulaanbaatar 1 154 290 1 466 125 127.0 64.2 67.6

74
2020 POPULATION AND HOUSING CENSUS OF MONGOLIA NATIONAL REPORT
Urbanization in Khangai region shows the highest percentage (11.3), excluding the level of Ulaanbaatar (Table 4.7).
It is peculiar that the percentage is higher in Western and Eastern regions from where migration outflow is high, than the Central region which experiences higher migration in-flow. On one hand, it shows a fact that people tend to migrate from “rural areas of the regions” to “rural areas of Central region”, in order to work in an agricultural sector. On the other hand, there are migration out-flows in the Western, Khangai, and Eastern regions, as well as migration from “rural to urban areas” within their regions and aimags. This migration can be determined by the aimag level survey.
Disaggregating the urbanization by aimag and capital city, Orkhon is the second to Ulaanbaatar with 96.3 percent. The fact that 3.7 percent of Orkhon’s population live in rural areas, enables the consideration of the aimag as a city. After Orkhon, Darkhan-Uul is listed with 79.8 percent, and Dornogovi with 64.0 percent. The places where 6 out of 10 people live in the urban areas, are Govisumber (59.8%) and Dornod (56.4%). It continues with aimags where urbanization percentage reaches between 32-37, such as Govi-Altai, Khuvsgul, Selenge, Khovd, Khentii, Bayankhongor, Uvs, Bayan-Ulgii, and Umnugovi.
Sukhbaatar, Uvurkhangai, Dundgovi, Bulgan, Zavkhan, Arkhangai, and Tuv aimags have relatively low percentage of urbanization, between 18.0 and 29.5. Although Tuv aimag receives a huge number of migrants, 82.0 percent of the migrants live in the rural areas of the aimag. This is because migrant herders tend to be close to the market, and the sector of livestock husbandry is densely sprawled across the Central region. Therefore, the Central region has become the transit place for migration from Western region to Ulaanbaatar (Table 4.4).
Urbanization level in all aimags except for Bayan-Ulgii, Dornogovi, Dornod, Umnugovi and Tuv, has decreased. Compared to the other aimags, Umnugovi was 6.8 percentage points growth in the urbanization level, which is resulted from the mining boom and Dornogovi was 5.4 percentage points, where the industrial complex has been built.
Apart from urbanization level, a data which indicates urbanization and centralization is the percentage distribution of population from urban areas of aimag and the capital city in the total population who live in urban areas. The Majority(67.6%) of the urban population reside only in Ulaanbaatar, which is the highest increase of 3.4 percentage points from 2010. Erdenet and Darkhan cities take up 8.4 percent of the urban population. The percentage is higher for Dornogovi, Dornod, Khuvsgul, Bayan-Ulgii and Selenge than other aimags. For the other aimags, 0.5-1.5 percent represents their population.
Apart from Ulaanbaatar, the aimag population distribution in the total population increased by 0.2 percentage points each for Dornogovi and Umnugovi, and by 0.1 percentage point in Tuv and Bayan-Ulgii aimags. There is no change in Govisumber, Dornod and Sukhbaatar, but decrease in other aimags. Aimags with high migration out-flow have higher urbanization, whereas places receive a high level of migration in-flow experiences a lower urbanization. It may be associated with the economic growth. The migration flows prior to 1990 had planned direction and aim, but since then, it has been occurring naturally.

Ulaanb
aatar
Orkhon
Foreign
Gobisumber
Arkhangai
Bayan-Ulgii
Bayank
hong
or
Bulgan
Gobi-Altai
Dornogobi
Dornod
Dundgobi
Zavkha
n
Uvukhangai
Umnugobi
Sukhbaatar
Selenge
Tuv
Uvs
KhovdKhuvsgul
Khentii
Darkhan-U
ul
INTERNAL MIGRATION
5CHAPTER


77
CHAPTER 5INTERNAL MIGRATION
INTERNAL MIGRATIONMigration is the key factor contributing to changes of administrative unit and population. For the
past 30 years, both internal and external migration have been intensified and there have been huge changes in population number and structure at the aimag, the capital, and the regional level. Since the transition to the market economy, people were moving from rural areas to urban areas for the education opportunity. According to the Article 16, Section 18 of the Constitution of Mongolia, it declares that “The citizens of Mongolia shall be guaranteed the privilege to enjoy the right to freedom of movement within the country and freedom to choose the place of one’s residence, right to travel or reside abroad, and to return to home country”, as such it creates enabling legislative environment for citizens to take part in the migration voluntarily.
Migration is taken into account in terms of certain time period and territory. A person who has lived in an administrative unit (aimag, the capital city) or a foreign country other than his/her permanent residence for more than 6 months is considered to have participated in migration.
In the census, migration pattern is analyzed using the below timeline:
• Residing in a place other than the place of birth;• Place where a person is residing 5 years ago; • Place where a person is residing one year ago.
Migration since birth is analyzed based on the 10 percent of the sample, while migration data of the past one and five years is based on Population and Household database.
Migrants are captured based on the latest migrated timeline regardless of number of migrations were made. When defining the characteristics of the migrant, the first method was to identify where the migrant was born (Figure 5.1).
“Residence since birth” means a person who has lived in a place where he/she was born and has never migrated to other places.
“Migrant since birth” means a person who is residing in a place other than he/she was born and a person who moved back to the place he/she was born at the time of the census. Migration since birth was determined as the place where a person was moved into. Despite how many times the person moved until January of 2020 since birth, the last place he/she residing was considered.
The main aim of the migration since birth is to show how many percent of resident population is native to the aimag or the capital city.
When identifying the migration flow and the time, every migrant residing in aimag or the capital city, was asked about their duration of the residence and the last place where he/she was residing.

78
2020 POPULATION AND HOUSING CENSUS OF MONGOLIA NATIONAL REPORT
FIGURE 5.1. MIGRATION SINCE BIRTH, 2020
In your permanent residence, have you lived since you were born or have you moved in ?
Since birth2 448 917
Moved in748 103
From other Aimags and the Capital
739 126
From abroad8 977
Based on the UN`s and the international standards for measuring a migration pattern by timeline, we started to identify the place where person used to live 5 years ago, since Population and Housing Census in 2000.
The second method to capture migration is to use certain time. In other words, it asks questions about the place where you permanently lived 5 years ago and at the time of the census regardless of how many times you moved prior to and post 2015. This estimate was made from the data in which population aged 5 and over was involved.
FIGURE 5.2. INTERNAL MIGRATION IN THE PAST FIVE YEARS, 2020
Where were you permanently resided by January, 2015?
Same as this place2 657 998
Different place155 763
Different Aimags and Capital
140 647
From abroad15 116
Duration of permanent residence is the third method to identify migration. In the census, every person was asked the duration of the current residence, and the place of previous permanent residence.
One of the important tools to measure migration is the administrative units. Migration within aimag or the capital city was not included in the migration indicators, but migration between aimags and the cities.

79
CHAPTER 5INTERNAL MIGRATION
FIGURE 5.3. INTERNAL MIGRATION IN THE PAST YEAR, 2020
Moved in748 103
Last 1 year87 955
Before that660 148
According to the Population and Housing Census 2020, inter-aimag/capital city migration since birth takes up 23.4 percent of the total residents, decreased by 9.7 percentage points from the previous census, by 8.2 in the past 5 years and by 1.5 in past year respectively.
FIGURE 5.4. PERCENTAGE DISTRIBUTION OF INTER-AIMAG/CAPITAL CITY MIGRANTS, 2010, 2020
33.1
13.7
4.3
23.4
5.5
2.8
Since birth
Last 5 year
Last 1 year2020 2010
Since the Census 2010, inter-region migrants since birth decreased by 8.8 percent, ‘past five years’ by 7.3 percent, and ‘past one year’ decreased by 1.2 percent.
FIGURE 5.5. PERCENTAGE DISTRIBUTION OF INTER-REGION MIGRANTS, 2010, 2020
29.7
12.2
3.8
20.9
4.9
2.6
Since birth
Last 5 year
Last 1 year
2020
2010
In order to simplify the migration analysis, only inter-regional migration is put in this report. Inter-aimag/capital city migration was integrated into the regions for compilation of the regional migration pattern. Therefore, inter-regional migration flow would be fewer than that of inter-aimags migration at the regional level.

80
2020 POPULATION AND HOUSING CENSUS OF MONGOLIA NATIONAL REPORT
MIGRATION SINCE BIRTHThe general patterns of migration since birth shows that migration flow towards Ulaanbaatar stayed
dominant than other regions. According to the census, 76.3 percent of the migrants in the capital are the people who moved in from another place, and the figure increased by 1.3 percentage points since 2010. The inter-regional migration pattern shows, the Central region stayed dominant in experiencing migration inflows from other regions.
Transportation network connection of Ulaanbaatar with other regions through railroads and paved roads and Oyu-Tolgoi and Tavan Tolgoi mining projects in Umnugovi, are the main development catalyst for urban areas in the Central region. For these reasons, 14.4 percent of the migrants headed toward the Central region, which is considered higher compared to other regions.
Migrants in the Central and Khangai region are mostly from Western and Eastern region, while migrants in Ulaanbaatar are from the Central and Khangai region, which makes the two regions the transit place for the migration.
In 2020, 33.0 percent of the total migration outflow is from the Western region, but the region experienced only 0.9 percent of the migration inflow. Since only 10.5 percent of the migrants are from the Eastern region, the migration has small impact on the population growth of the sparsely populated region.
TABLE 5.1. PERCENTAGE OF MIGRATION SINCE BIRTH, BY REGION OF BIRTH, 2010, 2020
Region of birth PercentageMigration since birth
Non-migrated Migration inflow Migration outflow2010
TOTAL 100.0 100.0 100.0 100.0Western 22.5 18.5 1.0 31.8Khangai 25.7 25.1 6.4 27.5Central 18.2 16.9 15.9 21.2Eastern 9.7 9.2 1.7 10.9Ulaanbaatar 23.1 30.3 75.0 5.9Abroad* 0.8 - - 2.7
2020TOTAL 100.0 100.0 100.0 100.0Western 19.2 15.5 0.9 33.0Khangai 23.1 21.8 6.7 28.2Central 17.8 16.9 14.4 21.2Eastern 9.3 9.0 1.7 10.5Ulaanbaatar 30.3 36.8 76.3 5.8Abroad* 0.3 - - 1.3
Explanation: *Foreign nationals, Mongolian citizens born abroad
According to the census, a region with the highest percentage of ‘permanent residence since birth’ is the Western (98.6), increased by 0.7 percentage points since 2010, followed by the Eastern region (95.2), increased by 2.4 percentage points, the Khangai region (92.5), increased by 2.3 percentage points, the Central region (81.6), increased by 10.1 percentage points, and Ulaanbaatar (64.6), increased by 15.7 percentage points (Table 5.2).

81
CHAPTER 5INTERNAL MIGRATION
TABLE 5.2. PERCENTAGE OF MIGRANTS SINCE BIRTH BY THE PLACE OF BIRTH AND THE RESIDENCE AT THE TIME OF THE CENSUS, 2020
Region of birth TotalRegion of permanent residence at the time of census MIGRATION
OUTFLOWWestern Khangai Central Eastern UlaanbaatarTOTAL 100.0 100.0 100.0 100.0 100.0 100.0 -Western 19.2 98.6 3.9 7.1 1.1 11.0 33.0Khangai 23.2 0.4 92.5 5.7 0.8 10.8 28.2Central 17.8 0.3 1.5 81.6 1.2 8.9 21.2Eastern 9.3 0.1 0.3 1.5 95.2 4.2 10.5Ulaanbaatar 30.3 0.6 1.7 4.0 1.7 64.6 5.8Abroad* 0.2 0.0 0.1 0.1 0.0 0.5 1.3MIGRATION IN-FLOW - 0.9 6.7 14.4 1.7 76.3 100.0
Explanation: *Foreign nationals, and Mongolian citizens born abroad
MIGRATION COMPARED TO 5 YEARS AGO Since the ‘migration in the past 5 years’ provides up-to-date information compared to the migration
since birth, it was estimated by the permanent place of residence as of January 2015.
A similarity has been captured between the migration in the past 5 years and the migration since birth with the following three dimensions (Table 5.3):
1. Ulaanbaatar2. Central region3. Khangai region
The migration outflow has been occurred in all the regions, except Uaanbaatar. The regions with the highest net migration outflows are the Khangai and Western regions (-8 279, -6 843). In the past 5 years, population in Ulaanbaatar has reached 1 256.4 thousand, risen by 29.4 thousand, due to the migration in-flows and it represents 44.7 percent of the population aged 5 and over.
TABLE 5.3. NUMBER OF MIGRANTS FIVE-YEARS AGO BY PERMANENTLY RESIDING REGIONS, 2010, 2020
Region Population Migration status 5 years ago
Net migration (+/-)Non-migrants Migration in
flowMigration
outflow2010
TOTAL 2 321 148 2 038 750 282 398 282 398 -Western 348 358 292 011 11 121 56 347 -45 226Khangai 493 075 425 698 23 723 67 377 -43 654Central 391 445 332 898 53 822 58 547 -4 725Eastern 182 152 153 452 8 275 28 700 -20 425Ulaanbaatar 884 407 834 691 185 457 49 716 135 741Abroad* 21 711 - - 21 711 -21 711
2020TOTAL 2 813 761 2 675 743 138 018 138 018 -Western 361 775 346 400 8 892 15 375 -6 483Khangai 537 850 510 538 19 033 27 312 -8 279Central 447 260 419 342 28 124 27 918 206Eastern 195 383 186 564 9 082 8 819 263Ulaanbaatar 1 256 377 1 212 899 72 887 43 478 29 409Abroad* 15 116 - - 15 116 -15 116
Explanation: * Foreign nationals and Mongolian citizens born abroad

82
2020 POPULATION AND HOUSING CENSUS OF MONGOLIA NATIONAL REPORT
The migration since their birth, the biggest flow towards Ulaanbaatar, has been from the Western region, whereas, in the past 5 years, Khangai and Central regions has become highest among the regions. 21.3 thousand people moved from Khangai region to Ulaanbaatar, decreased two times compared to the census 2010. The least flow belongs to the Eastern region from where only 107 people moved to the Western region.
TABLE 5.4. POPULATION AGED 5 AND ABOVE, BY PERMANENTLY RESIDING REGION AT THE TIME OF CENSUS, 2010, 2020
A region permanent residence 5 years ago
Population aged 5 and
above
Region of permanent residence at time of censusMIGRATION OUTFLOWWestern Khangai Central Eastern Ulaanbaatar
2010TOTAL 2 321 148 303 132 449 421 386 720 161 727 1 020 148 -Western 348 358 292 011 5 355 11 204 379 39 409 56 347Khangai 493 075 1 430 425 698 9 642 441 55 864 67 377Central 391 445 1 117 4 382 332 898 1 439 51 609 58 547Eastern 182 152 120 431 3 409 153 452 24 740 28 700Ulaanbaatar 884 407 7 721 12 572 24 038 5 385 834 691 49 716Foreign* 21 711 733 983 5 529 631 13 835 21 711MIGRATION IN-FLOW - 11 121 23 723 53 822 8 275 185 457 282 398
2020TOTAL 2 813 761 355 292 529 571 447 466 195 646 1 285 786 -Western 361 775 346 400 1 199 2 464 312 11 400 15 375Khangai 537 850 923 510 538 4 530 582 21 277 27 312Central 447 260 979 2 974 419 342 1 494 22 471 27 918Eastern 195 383 107 445 1 611 186 564 6 656 8 819Ulaanbaatar 1 256 377 6 084 13 816 17 594 5 984 1 212 899 43 478Foreign* 15 116 799 599 1 925 710 11 083 15 116MIGRATION IN-FLOW - 8 892 19 033 28 124 9 082 72 887 138 018
Explanation: * Foreign nationals and Mongolian citizens born abroad
It is highlighted previously that internal migration has decreased in 2020 compared to the census in 2010. But, percentage of people who has been permanently residing in a place where they were enumerated during the last census, has increased. Seeing from the migration flow pattern towards Ulaanbaatar from the Central region, there has been a phased flow through which migration passes “Other regions-Central region-Ulaanbaatar”.
For instance, percentage of population aged 5 and over, who has been the permanent resident of region where they were living 5 years ago, reached 94.3 in Ulaanbaatar, increased from 81.8 percent in 2010. For the other regions, 93.7-97.5 percent of the population has been permanently residing in the same place since January 2015 (Table 5.5).

83
CHAPTER 5INTERNAL MIGRATION
TABLE 5.5. PERCENTAGE OF POPULATION AGED 5 AND ABOVE, BY REGION AT THE TIME OF CENSUS, 2010, 2020
A region of permanent Residence 5 years ago Total
Region of permanent residence at the time of censusWestern Khangai Central Eastern Ulaanbaatar
2010 TOTAL 100.0 100.0 100.0 100.0 100.0 100.0Western 15.0 96.3 1.2 2.9 0.2 3.9Khangai 21.2 0.5 94.7 2.5 0.3 5.5Central 16.9 0.4 1.0 86.1 0.9 5.1Eastern 7.8 0.0 0.1 0.9 94.9 2.4Ulaanbaatar 38.1 2.5 2.8 6.2 3.3 81.8Abroad* 0.9 0.2 0.2 1.4 0.4 1.4
2020 TOTAL 100.0 100.0 100.0 100.0 100.0 100.0Western 12.9 97.5 0.2 0.6 0.1 0.9Khangai 19.1 0.3 96.4 1.0 0.3 1.7Central 15.9 0.3 0.6 93.7 0.8 1.7Eastern 6.9 0.0 0.1 0.4 95.3 0.5Ulaanbaatar 44.7 1.7 2.6 3.9 3.1 94.3Abroad* 0.5 0.2 0.1 0.4 0.4 0.9
Explanation: *Foreign nationals and Mongolian citizens born abroad
There is still migration outflow from the Western region. The percentage of migration outflow from Khangai region to Ulaanbaatar has replaced the Western region. Because, the migrants from Khangai region migrate either to the Central region and/ or Ulaanbaatar, while migrants from Western region migrate to Khangai, Central region and/or Ulaanbaatar.
RECENT (PAST ONE YEAR) MIGRATIONAccording to the Population and Housing Census 2020, the past year's migration flows by region
had two main directions, similar to the results of the previous censuses of 2000 and 2010 (Table 5.6).
1. Ulaanbaatar 2. Central region
The migration flow towards Ulaanbaatar has remained still in the past year. In 2010, the biggest migration flow into Ulaanbaatar was from the Khangai region. And the estimate has expanded by the Central region by the census in 2020. Within a year prior to the census, 80.5 thousand of people migrated internally, of which 68.7 percent to Ulaanbaatar, and 13.4 percent to the Central region.

84
2020 POPULATION AND HOUSING CENSUS OF MONGOLIA NATIONAL REPORT
TABLE 5.6. NUMBER OF MIGRANTS IN THE PAST YEAR, BY REGION OF PERMANENT RESIDENCE, 2010, 2020v
Region of permanent residence
PopulationMigration status in the past year
Net migration (+/-)Non-migrants Migration inflow Migration
outflow2010
TOTAL 2 647 545 2 546 378 101 167 101 167 -Western 365 998 347 989 4 548 18 009 -13 461Khangai 530 152 506 142 8 584 24 010 -15 426Central 435 318 417 104 23 589 18 214 5 375Eastern 191 418 182 146 3153 9 272 -6 119Ulaanbaatar 1 113 649 1 092 997 61 293 20 652 40 641Abroad* 11 010 - - 11 010 -11 010
2020TOTAL 3 123 431 3 042 920 80 511 80 511 -Western 400 987 391 396 3 316 9 591 -6 275Khangai 594 318 576 652 7 800 17 666 -9 866Central 502 161 483 716 10 830 18 445 -7 615Eastern 219 214 213 776 3 269 5 438 -2 169Ulaanbaatar 1 391 312 1 377 380 55 296 13 932 41 364Abroad* 15 439 - - 15 439 -15 439
Explanation: *Foreign nationals and Mongolian citizens born abroad
16.1 thousand and 15.3 thousand of people migrated into Ulaanbaatar from the Central and Khangai regions respectively in the past one year. Migration flow from the Eastern to the Western region was the lowest. In terms of migration outflow, 9.6 thousand of people migrated from the Western region, 13.9 thousand from Ulaanbaatar, 17.7 thousand from the Khangai, and 18.4 thousand from the Central region in 2019.
TABLE 5.7. NUMBER OF POPULATION, BY REGION OF PERMANENT RESIDENCE AT THE TIME OF CENSUS AND A YEAR AGO, 2010, 2020 Region of permanent residence
PopulationRegion of permanent residence at time of census MIGRATION
OUTFLOWWestern Khangai Central Eastern Ulaanbaatar2010
TOTAL 2 647 545 352 537 514 726 440 693 185 299 1 154 290 -Western 365 998 347 989 1 632 3 083 130 13 164 18 009Khangai 530 152 570 506 142 4 137 178 19 125 24 010Central 435 318 409 1 551 417 104 488 15 766 18 214Eastern 191 418 61 158 1 227 182 146 7 826 9 272Ulaanbaatar 1 113 649 3 077 4 838 10 746 1 991 1 092 997 20 652MIGRATION IN-FLOW - 4 548 8 584 23 589 3 153 61 293 101 167
2020TOTAL 3 123 431** 394 712 584 452 494 546 217 045 1 432 676 -Western 400 987 391 396 597 932 116 7 946 9 591Khangai 594 318 297 576 652 1 837 216 15 316 17 666Central 502 161 336 1 526 483 716 463 16 120 18 445Eastern 219 214 50 272 658 213 776 4 458 5 438Ulaanbaatar 1 391 312 1 827 4 817 5 509 1 779 1 377 380 13 932Abroad* 15 439 806 588 1 894 695 11 456 15 439MIGRATION IN-FLOW - 3 316 7 800 10 830 3 269 55 296 80 511
Explanation: *Foreign nationals and Mongolian citizens born abroad
**Number of people aged 1 and over, residing in Mongolia

85
CHAPTER 5INTERNAL MIGRATION
Due to the internal migration in the past year, population of Ulaanbaatar has risen by 55.3 thousand. As well, percentage of population aged 1 and over, living in Ulaanbaatar, has reached 45.9 percent, increased from 44.6 percent and by 1.3 percentage point, while estimates from Western, Khangai, and Central region show 0.2-0.3 percentage point decrease. The percentage remains at the same level in the Eastern region.
TABLE 5.8. PERCENTAGE DISTRIBUTION OF POPULATION, BY REGION OF PERMANENT RESIDENCE AT THE TIME OF THE CENSUS AND A YEAR AGO, 2010, 2020Region of permanent residence a year ago
TotalRegion of permanent residence at the time of census
Western Khangai Central Eastern Ulaanbaatar
2010TOTAL 100.0 100.0 100.0 100.0 100.0 100.0Western 13.8 98.7 0.3 0.7 0.1 1.1Khangai 20.0 0.2 98.3 0.9 0.1 1.7Central 16.4 0.1 0.3 94.6 0.3 1.4Eastern 7.2 0.0 0.0 0.3 98.3 0.7Ulaanbaatar 42.1 0.9 0.9 2.4 1.1 94.7Abroad 0.4 0.1 0.1 1.0 0.2 0.5
2020TOTAL 100.0 100.0 100.0 100.0 100.0 100.0Western 12.8 99.1 0.1 0.2 0.1 0.6Khangai 19.0 0.1 98.7 0.4 0.1 1.1Central 16.1 0.1 0.3 97.8 0.2 1.1Eastern 7.0 0.0 0.0 0.1 98.5 0.3Ulaanbaatar 44.6 0.5 0.8 1.1 0.8 96.1Abroad 0.5 0.2 0.1 0.4 0.3 0.8
Explanation: *Foreign nationals and Mongolian citizens born abroad
Compared with the census 2010, the percentage of population living in the same region of permanent residence since last year, the percentage of migration since birth, and the percentage of migration in the past five years, have gone up by 1.4 percentage points in Ulaanbaatar, 0.2-3.2 percentage points in the other regions respectively (Table 5.8).
Since there are migration flows from the Central and Khangai regions to Ulaanbaatar, and from the Western and the Eastern to Central and Khangai regions, the Central and Khangai regions have become the places not only “sending places”, but “receiving places” where migrants pass through to Ulaanbaatar, the final destination.
A net migration rate, comparing migration flow in the past year with population in region, has decreased from 2010. The net migration rate in Ulaanbaatar indicates positive, and the estimates has gone down by 6.8 per mille, showing migration inflows are higher than the migration outflow. A negative rate in other regions means there are more migration outflows than the migration inflows, which led the percentages to drop by 22.1 in the Eastern, by 21.2 in the Western, and by 12.5 per mille in the Khangai region respectively. It is intriguing for the Central region that the percentage turned from 12.3 into -15.2.

86
2020 POPULATION AND HOUSING CENSUS OF MONGOLIA NATIONAL REPORT
FIGURE 5.6 NET MIGRATION RATE BY REGION, 2010, 2020
-36.8-29.1
12.3
-32.0
36.5
-15.6 -16.6 -15.2-9.9
29.7
Western Khangai Central Eastern Ulaanbaatar
2010 2020
AGE AND GENDER STRUCTURE OF MIGRANTSIn addition to analyzing the migration pattern in terms of timeline and location, analyzing the
migrants’ socio-economic characteristics, such as age, sex, educational level, marital status, economic activity, income level, as well as housing conditions has far more significance. Although the census covers a limited scope of data and indicators, there is an opportunity for detailed analysis with different perspectives as it serves as the comprehensive data source for further sample surveys.
Among the migrants in the past year, there are 5.4 thousand more males than females, which indicates that males dominate in the migration. In particular, males of between 20-54 age groups migrated. More migration among older males could be explained by the fact that males reach the destination by themselves, then bring their families afterwards. Young people aged 20-34 years represent the highest percentage of migrants (38.5). It is related to the fact that students were enumerated where they were at the time of the census.

87
CHAPTER 5INTERNAL MIGRATION
TABLE 5.9. PERCENTAGE DISTRIBUTION OF MIGRANTS IN THE PAST YEAR, BY AGE GROUPS AND SEX, 2010, 2020
Age group
2010 2020Male Female Male Female
Population Percentage Population Percentage Population Percentage Population Percentage
TOTAL 60 953 100.0 53 069 100.0 46 679 100.0 41 276 100.00-4 4 776 7.8 4 613 8.7 4 782 10.2 4 547 11.05-9 2 384 3.9 2 354 4.4 4 254 9.1 4 149 10.110-14 2 370 3.9 2 236 4.2 2 462 5.3 2 430 5.915-19 10 645 17.5 12 253 23.1 2 354 5.0 2 465 6.020-24 13 239 21.7 12 483 23.5 5 066 10.8 6 496 15.725-29 6 988 11.5 5 262 9.9 6 663 14.3 6 231 15.130-34 5 307 8.7 3 375 6.4 5 546 11.9 3 885 9.435-39 4 441 7.3 2 568 4.8 3 808 8.2 2 406 5.840-44 3 841 6.3 2 014 3.8 3 070 6.6 1 849 4.545 + 6 962 11.4 5 911 11.1 8 674 18.6 6 818 16.5
Migrants take up only 2.8 percent of the total population, and percentage of males (1.5) is slightly higher that females (1.3). For females, women from age groups of 20-29 take up 30.8 percent of the total females, and it is mainly because of enrollment to the educational institutions. On the other side, migration of children under the age of 15, or elders aged 60 and over, shows the fact that there has been migration of families, since children and elders move with their parents or care-takers (Figure 5.7).
FIGURE 5.7 MIGRANTS IN THE PAST YEAR, BY AGE GROUPS AND SEX, 2010, 2020
0-4 5-9 10-14 15-19 20-24 25-29 30-34 35-39 40-45 45-49 50-54 55-59 60-64 65-69 70+
2020 2010
MALE
2020 2010
FEMALE
Compared with the total population, youth aged 20-34, are migrating on a wide scale with the aim of achieving higher level of education, or obtaining a degree. For youth from the age group of 20-24, education is not only primary reason for them to migrate, but chances to find employment at their destination.

88
2020 POPULATION AND HOUSING CENSUS OF MONGOLIA NATIONAL REPORT
REGION OF PERMANENT RESIDENCEPeople who are living in the place they were born at the time of the census, take up 96.1 percent in
Ulaanbaatar (Table 5.1). It has increased by 3.8 percentage points since 2010. The region with the lowest percentage is the Western region (64.0). It has risen by 9.6 percentage points in the Central, by 9.4 in the Eastern, and by 6.3 in the Khangai region.
2.2 percent of the people born in Ulaanbaatar, but lived at other place at the time of the census, was in Central region, 1.1 percent was in Khangai, 0.4 percent in Eastern, and 0.2 percent was in Western region. It indicates that people who were born in Ulaanbaatar tend not to migrate to somewhere.
TABLE 5.10. PERCENTAGE DISTRIBUTION OF REGIONS AT THE TIME OF BIRTH AND THE CENSUS, 2020
Region of birth TotalPlace of residence at the time of census
Western Khangai Central Eastern Ulaanbaatar2010
TOTAL 100.0 13.3 19.4 16.6 7.0 43.6Western 100.0 57.9 4.2 8.1 0.4 29.4Khangai 100.0 0.3 68.2 5.2 0.3 26.0Central 100.0 0.3 2.1 65.4 0.7 31.5Eastern 100.0 0.1 0.8 3.6 67.0 28.5Ulaanbaatar 100.0 0.5 2.0 4.4 0.7 92.3Abroad* 100.0 2.5 5.3 24.6 4.2 63.5
2020TOTAL 100.0 12.4 18.7 16.4 7.4 45.1Western 100.0 64.0 3.7 6.1 0.4 25.8Khangai 100.0 0.2 74.5 4.0 0.3 21.0Central 100.0 0.2 1.6 75.0 0.5 22.7Eastern 100.0 0.1 0.7 2.5 76.4 20.3Ulaanbaatar 100.0 0.2 1.1 2.2 0.4 96.1Abroad* 100.0 1.2 4.3 8.3 0.7 85.5
Explanation: *Foreign nationals, and Mongolian citizens born abroad
99.0 percent of population in Ulaanbaatar is residing in the same place they were a year ago, and the percentage is grown by 1.0 percentage points (Table 5.11). In other words, only 0.9 percent of the population has migrated to Ulaanbaatar. The western region has the percentage of 97.7 and the Eastern has 97.6.

89
CHAPTER 5INTERNAL MIGRATION
TABLE 5.11. PERCENTAGE DISTRIBUTION OF POPULATION AGED 1 AND ABOVE, BY REGION OF PERMANENT RESIDENCE A YEAR AGO AND AT THE TIME OF CENSUS, 2010, 2020
Region of permanent residence a year ago
TotalRegion of permanent residence at the time of census
Western Khangai Central Eastern Ulaanbaatar
2010TOTAL 100.0 13.3 19.4 16.6 7.0 43.6Western 100.0 95.1 0.4 0.8 - 3.6Khangai 100.0 0.1 95.5 0.8 - 3.6Central 100.0 0.1 0.4 95.8 0.1 3.6Eastern 100.0 0.0 0.1 0.6 95.2 4.1Ulaanbaatar 100.0 0.3 0.4 1.0 0.2 98.1Abroad* 100.0 3.9 3.7 39.9 3.3 49.2
2020TOTAL 100.0 12.6 18.7 15.8 7.0 45.9Western 100.0 97.7 0.1 0.2 0.0 2.0Khangai 100.0 0.0 97.0 0.3 0.0 2.7Central 100.0 0.1 0.3 96.3 0.1 3.2Eastern 100.0 0.0 0.1 0.3 97.6 2.0Ulaanbaatar 100.0 0.1 0.3 0.4 0.1 99.0Abroad* 100.0 5.2 3.8 12.3 4.5 74.2
Explanation: * Foreign nationals and Mongolian citizens born abroad
According to the table below, 96.5 percent of the population aged 5 and over, used to live in Ulaanbaatar 5 years ago, where 45.9 percent of the total population reside in. There is an increase of 2.1 percentage points since 2010. But, in terms of region, there is a growth of 12.0 percentage points in the Western, 11.3 in the Eastern, 8.8 in the Central, and 8.6 in the Khangai region respectively.
TABLE 5.12. PERCENTAGE DISTRIBUTION OF POPULATION AGED 5 AND ABOVE, BY REGION OF PERMANENT RESIDENCE AT THE TIME OF CENSUS, 2010, 2020
Region of permanent residence 5 years ago Total
Region of permanent residence at time of census
Western Khangai Central Eastern Ulaanbaatar2010
TOTAL 100.0 13.1 19.4 16.7 7.0 44.0Western 100.0 83.8 1.5 3.2 0.1 11.3Khangai 100.0 0.3 86.3 2.0 0.1 11.3Central 100.0 0.3 1.1 85.0 0.4 13.2Eastern 100.0 0.1 0.2 1.9 84.2 13.6Ulaanbaatar 100.0 0.9 1.4 2.7 0.6 94.4Abroad* 100.0 3.4 4.5 25.5 2.9 63.7
2020TOTAL 100.0 12.6 18.8 15.9 7.0 45.7Western 100.0 95.8 0.3 0.7 0.1 3.1Khangai 100.0 0.2 94.9 0.8 0.1 4.0Central 100.0 0.2 0.7 93.8 0.3 5.0Eastern 100.0 0.1 0.2 0.8 95.5 3.4Ulaanbaatar 100.0 0.5 1.1 1.4 0.5 96.5Abroad* 100.0 5.3 4.0 12.7 4.7 73.3
Explanation: *Foreign nationals and Mongolian citizens born abroad


EDUCATION AND LITERACY
4.9
17.1
29.2
3.9 4.7
26.5
A
C
D
E F
H
A
B
C
D
E
F
H
Non-educated
Primary
Secondary
High
Technical and vocational
Specialized secondary
Higher education
6CHAPTER


93
CHAPTER 6EDUCATION AND LITERACY
EDUCATION AND LITERACY Identifying education level of the population is an important tool for developing policy and planning
documents on the key demographic indicators such as labor force, migration, administrative and housing.
Education and literacy, one of the demographic indicators, present human development process
Census questionnaire, methodology, manual and the results are developed corresponding to the Article 10 of Law Mongolia on Education, “The content of educational activity is to deliver the objectives of education tailored to students’ age, physical and mental ability, talent and interest, personal and social needs, national heritage as well as technological advances”.
In the questionnaire of Population and Housing Census 2010, educational level was asked to all the population aged 6 and above, but were asked to the population aged 5 and above in this census. As well, Bachelor’s and diploma degree were considered as one in the 2010 census, but considered separately in this census.
According to the Article 7 of the “Law on Primary and Secondary Education”, it states that “6 years of schooling is primary education, 9 years of schooling is basic education, and 12 years of schooling is secondary education”, and it is stated in the Law on Higher Education, “the required attainment for obtaining a diploma or higher education is no less than 90 credit hours; including previously attended credit hours, a bachelor degree is no less than 120 credit hours, a master degree is no less than 150 credit hours, and a doctor’s degree is no less than 210 credit hours”.
The Population and Housing Census 2020 has been conducted on the basis of combination of registration and traditional approaches. Literacy data is collected through face to face approaches from randomly chosen sampled household. Thus, the data on literacy in the 2020 census will be compared by percentage with the 2010 census.
Education level of the population is identified at the age of 10 and above in compliance with the United Nations recommendations and the common international standards.
EDUCATION LEVELMongolian education system has undergone through the reform and started reaching the level
of developed nations. Compared with the previous census, educational indicators have grown up, and percentage of non-educated people among population aged 10 and above has decreased by this census.
Percentage of educated population aged 10 and above has increased to 95.1, showed a growth of 2.6 percentage points. Disaggregating by sex, 2.7 percentage point increase belongs to males, while 2.3 percentage points to females. There has been a positive indicator that percentage of non-educated population reached 4.9 percent, dropped by 2.6 percentage points since the previous census.
Further disaggregating by the education level, percentage of population with primary, basic, secondary, and specialized secondary education decreased by 0.8-2.8 percentage points, but population with technical and vocational and higher education increased, compared with the previous census.
26.5 percent of the population aged 10 and above has higher education, and, disaggregating by sex, 21.7 percentage of the males and 31.1 percent of the females have higher education. In the past decade, the country saw 8.2 percentage points increase among the population with higher education, which is a significant progress to Explanation.

94
2020 POPULATION AND HOUSING CENSUS OF MONGOLIA NATIONAL REPORT
TABLE 6.1. EDUCATION LEVEL PERCENTAGE OF POPULATION AGED 10 AND ABOVE, BY SEX 2010, 2020
Education level2010 2020
Total Male Female Total Male FemaleTOTAL 100.0 100.0 100.0 100.0 100.0 100.0Non-educated 7.5 8.0 6.9 4.9 5.3 4.6Educated 92.5 92.0 93.1 95.1 94.7 95.4Primary 15.8 16.6 15.0 13.7 14.6 12.8Lower secondary 17.9 20.3 15.6 17.1 19.2 15.1Upper Secondary 32.0 32.2 31.9 29.2 30.8 27.7Technical and vocational 2.8 3.1 2.6 3.9 4.3 3.4Specialized secondary 5.7 4.6 6.9 4.7 4.1 5.3Higher 18.3 15.4 21.2 26.5 21.7 31.1
A huge difference has been observed between male and female population with education. Percentage of females with higher education which was 5.8 percentage points higher than males, has gone up to 9.4 percentage points in 2020.
Non-educated population aged 10 and above takes up 4.9 percent of the total population, decreased by 2.6 percentage points, and, in particular, non-educated male population dropped by 2.7 percentage points.
As the society progresses, population`s needs, demands and opportunities and access to the education have been changing in shapes. Analyzing from the previous census result, population tend to have a lower level of education as ages compared to the youth.
Education level of the population differs in urban and rural areas.
TABLE 6.2. PERCENTAGE DISTRIBUTION OF EDUCATION LEVEL OF POPULATION AGED 10 AND ABOVE, BY URBAN AND RURAL AREAS, 2010, 2020
Education levelUrban Rural
Total Male Female Total Male Female2010
TOTAL 100.0 100.0 100.0 100.0 100.0 100.0Non-educated 4.9 5.2 4.6 13.1 13.7 12.5Educated 95.1 94.8 95.4 86.9 86.3 87.5Primary 10.8 11.1 10.6 26.6 27.6 25.5Lower secondary 14.3 16.5 12.2 26.0 27.9 23.9Upper secondary 37.6 38.8 36.5 19.6 18.6 20.6Technical and vocational 2.5 2.8 2.2 3.5 3.5 3.5Specialized secondary 6.5 5.3 7.5 4.2 3.0 5.4Higher or above 23.4 20.2 26.4 7.0 5.6 8.6
2020TOTAL 100.0 100.0 100.0 100.0 100.0 100.0Non-educated 4.3 4.7 4.0 6.2 6.6 5.9Educated 95.7 95.3 96.0 93.8 93.4 94.1Primary 10.0 10.6 9.6 21.2 22.4 20.0Lower secondary 11.2 12.7 9.9 29.0 31.7 26.2Upper secondary 32.3 35.2 29.7 22.9 22.2 23.6Technical and vocational 3.6 4.0 3.1 4.5 4.8 4.1Specialized secondary 5.5 4.8 6.0 3.2 2.7 3.6Higher or above 33.1 28.0 37.7 13.0 9.6 16.6

95
CHAPTER 6EDUCATION AND LITERACY
More the education level increases, a gap widens among the population in urban and rural areas. For instance, percentage of urban population with secondary and higher education is greater than that of people in rural areas by 9.4-20.1 percentage points, but for the primary and basic education level, the percentage is 11.2-17.8 lower than that of a rural’s.
A gap between non-educated population in urban and rural areas was 8.2 percentage points from 2000 to 2010, but it decreased by 6.3 to 1.9 percentage points in 2020.
In terms of education level in Ulaanbaatar, percentage of population with technical and vocational, and higher education has increased since 2010, but in rural areas, percentage has decreased for the population with primary and basic education.
TABLE 6.3. PERCENTAGE DISTRIBUTION OF EDUCATION LEVEL OF POPULATION AGED 10 AND ABOVE, BY AGE GROUPS, 2010, 2020
Age group Total Non-
educated
EDUCATION LEVEL
Primary Lower secondary
Upper secondary
Technical and vocational
Specialized secondary Higher
2010TOTAL 100.0 7.5 15.8 17.9 32.0 2.8 5.7 18.310-14 100.0 33.0 59.8 7.2 - - - -15-19 100.0 3.4 12.8 41.0 39.4 1.8 1.0 0.620-24 100.0 4.0 5.7 9.7 51.3 2.8 2.7 23.825-29 100.0 6.1 10.2 13.0 31.1 1.5 2.2 36.130-34 100.0 3.7 10.1 19.6 34.9 1.5 3.0 27.335-39 100.0 2.1 4.0 20.3 40.3 4.4 7.4 21.540-44 100.0 2.5 4.5 18.2 39.4 5.9 11.7 17.945-49 100.0 3.1 6.5 18.3 33.9 5.6 12.7 19.850-54 100.0 3.1 11.2 19.7 27.1 5.0 13.9 20.055-59 100.0 3.7 16.8 17.2 23.8 4.1 15.1 19.460+ 100.0 11.7 30.6 11.5 15.7 2.2 11.0 17.2
2020TOTAL 100.0 4.9 13.7 17.1 29.2 3.9 4.7 26.510-14 100.0 28.5 70.8 0.7 - - - -15-19 100.0 2.0 5.4 61.3 27.9 1.8 0.9 0.720-24 100.0 1.7 3.3 12.2 49.9 4.9 2.6 25.425-29 100.0 1.6 3.2 8.5 29.4 5.4 3.1 48.830-34 100.0 1.9 5.2 9.4 29.5 3.2 2.7 48.135-39 100.0 2.6 8.1 14.8 30.9 2.6 2.6 38.440-44 100.0 1.7 6.3 20.3 35.6 3.0 3.6 29.545-49 100.0 1.4 3.6 18.4 38.4 5.9 7.4 24.950-54 100.0 1.6 4.3 17.7 36.7 7.1 10.5 22.155-59 100.0 1.8 6.5 17.8 32.0 6.8 11.8 23.360+ 100.0 2.9 18.0 16.2 22.5 4.7 12.7 23.0
Disaggregating the education level by age, majority and/or 64.3 percent of the population aged 10 and above has earned secondary or higher education, increased by 5.5 percentage points since 2010 (Table 6.3).
The age group of 25-44 has the highest percent of population with higher education, increased by 11.6-20.8 percentage points. In the age group 15-44, the number of populations with secondary or lower

96
2020 POPULATION AND HOUSING CENSUS OF MONGOLIA NATIONAL REPORT
level education has decreased, while there is a certain amount of growth in population with secondary or Higher education level, which is the common scenario for all the age groups compared to the previous census. This is caused from the fact that pre-school education and school attendance has increased among total population. In 2010, percentage of non-educated population among the population aged 60 and above was higher, but it has been changed, and percentage of population with primary education has decreased, and population with basic and Higher education level has increased.
Generally, education level of the labor force aged 20-40 is higher, which is a positive indicator to Explanation. However, low percentage of population with vocational education is leading to a skills shortage in the manufacturing and service sector.
FIGURE 6.1. AGE AND GENDER PYRAMID FOR POPULATION WITH HIGHER EDUCATION, 2010, 2020
0 5 10 15 20 25
20202010
FEMALE0510152025
20-24
25-29
30-34
35-39
40-44
45-49
50-54
55-59
60+
20202010
MALE
In 2010 the majority of higher education level has been females and since male higher education level has been trending upwards, and approaching same level of females (Figure 6.1). Compared with the census in 2010, percentage of female population with Higher education in the age group of 30 and above, has increased, but unfortunately decreased for the males.

97
CHAPTER 6EDUCATION AND LITERACY
LITERACY
6 http://data.uis.unesco.org/index.aspx?queryid=166
The United Nations recommendations on literacy has been applied to the conduct of the Population and Housing census 2020 similar to the previous censuses. In the census, questions about literacy was asked from people with no educational background, and a person who can read and write simple sentences in any languages was considered as literate.
FIGURE 6.2. NUMBER OF POPULATION AGED 6 AND ABOVE, BY LITERACY*, 2020
Population aged 6 and above2 711 881
Educated2 305 946
Non-educated405 935
Literate345 045
Illiterate60 890
Explanation: *not included foreign nationals and stateless persons in Mongolia.
Although questions related to the literacy were asked from population aged 5 and above, the literacy level was defined by the age group of 15 and above for ensuring the comparability of the census data at the international level6 (Table 6.4).
TABLE 6.4. PERCENTAGE DISTRIBUTION OF POPULATION AGED 15 AND ABOVE, BY LITERACY IN URBAN AND RURAL AREAS, 2010, 2020
Literacy2010 2020
Total Urban Rural Total Urban RuralTOTAL 100.0 100.0 100.0 100.0 100.0 100.0Literate 98.3 99.1 96.3 98.7 99.3 97.6Illiterate 1.7 0.9 3.7 1.3 0.7 2.4
Education level of Mongolian population aged 15 and above has reached to 98.7 percent, increased by 0.4 percentage points since 2010, which is higher than the global average . But there is a gap between urban and rural areas. Illiterate urban population is 0.7 percent including people with mental disability, whereas it is 2.4 percent with a difference of 1.7 percentage points.

98
2020 POPULATION AND HOUSING CENSUS OF MONGOLIA NATIONAL REPORT
FIGURE 6.3. PERCENTAGE DISTRIBUTION OF ILLITERATE POPULATION AGED 15 AND ABOVE, BY AGE GROUP,
2010, 2020
In 2020, percentage of illiterate population aged from 15 to 19 is 0.6, dropped by 1.0 percentage points. In terms of location, 0.6 percent of urban and 1.7 percent of rural people are illiterate, which depicts that an attention should be drawn to the education of rural population (Table 6.3, Appendix B). Percentage of illiterate population shows decrease in all the age groups, compared with the census in 2010
SCHOOL ATTENDANCEThe population aged 2-39 have been asked about the school and kindergarten attendance.
According to the UN recommendations, school attendance was supposed to be defined between the age of 5 and 29. Since the school age is 6 in accordance with the new educational system, the school attendance was considered between the age of 6 and 29.
There has been a constant increase in the school attendance between censuses. In 2020, 72.6 percent of the population aged between 6-29 has attended the school, which displays 14.5 percentage points growth since 2010. The estimate reveals that 98.0 percent of the children between the age of 6 and 17 is attending the school (Table 6.5).

99
CHAPTER 6EDUCATION AND LITERACY
TABLE 6.5. PERCENTAGE DISTRIBUTION OF SCHOOL ATTENDACE FOR POPULATION AGED 6-29, BY AGE AND SEX, 2010, 2020
AgeAttending school Out of school
Total Male Female Total Male Female2010
6-29 58.1 55.7 60.6 41.9 44.3 39.46 93.6 93.0 94.3 6.4 7.0 5.77 97.9 97.7 98.1 2.1 2.3 1.98 98.4 98.3 98.6 1.6 1.7 1.49 98.5 98.3 98.6 1.5 1.7 1.46-9 97.1 96.8 97.4 2.9 3.2 2.610 98.2 97.9 98.5 1.8 2.1 1.511 97.6 97.1 98.1 2.4 2.9 1.912 96.7 95.8 97.7 3.3 4.2 2.313 95.8 94.6 97.0 4.2 5.4 3.014 94.7 92.8 96.7 5.3 7.2 3.310-14 96.6 95.6 97.6 3.4 4.4 2.415 93.0 90.5 95.6 7.0 9.5 4.416 89.5 85.5 93.6 10.5 14.5 6.417 84.0 79.0 89.2 16.0 21.0 10.86-17 94.8 93.3 96.3 5.2 6.7 3.718 72.5 65.2 80.0 27.5 34.8 20.019 61.0 52.2 69.9 39.0 47.8 30.120-24 29.8 25.8 33.8 70.2 74.2 66.225-29 5.6 4.7 6.5 94.4 95.3 93.5
20206-29 72.6 71.5 73.8 27.4 28.5 26.26 93.3 93.0 93.6 6.7 7.0 6.47 97.3 96.9 97.7 2.7 3.1 2.38 98.9 98.9 98.9 1.1 1.1 1.19 98.8 98.7 98.9 1.2 1.3 1.16-9 96.9 96.7 97.1 3.1 3.3 2.910 99.4 99.4 99.4 0.6 0.6 0.611 99.4 99.3 99.5 0.6 0.7 0.512 99.4 99.3 99.5 0.6 0.7 0.513 99.3 99.2 99.5 0.7 0.8 0.514 99.2 99.0 99.4 0.8 1.0 0.610-14 99.4 99.3 99.4 0.6 0.7 0.615 98.3 97.6 99.0 1.7 2.4 1.016 97.4 96.3 98.6 2.6 3.7 1.417 96.3 94.8 97.8 3.7 5.2 2.26-17 98.0 97.6 98.3 2.0 2.4 1.718 87.1 82.9 91.3 12.9 17.1 8.719 80.5 73.9 87.3 19.5 26.1 12.720-24 53.4 50.2 56.7 46.6 49.8 43.325-29 17.9 17.0 18.9 82.1 83.0 81.1

100
2020 POPULATION AND HOUSING CENSUS OF MONGOLIA NATIONAL REPORT
Disaggregating by sex, the school attendance of population aged 6 and 14 is at the same level as it was in 2010, but percentage of male attendance aged 15 and above, has been decreased after completing the basic level of education
The highest growth of 12.3 percentage points since 2010, attributes to population aged 25-29, displayed 17.9 percent.
Disaggregating by location, urban and rural, the school attendance is higher in the rural areas for the population up to 14 years old, but higher for the population up to 15 and above in the urban areas. The trend continues as the population ages, and by the age of 25-29, the urban population school attendance is 7.4 percentage points higher than that of rural.
TABLE 6.6. PERCENTAGE DISTRIBUTION OF SCHOOL ATTENDANCE FOR POPULATION AGED 6 -29, BY URBAN AND RURAL AREAS AND SEX, 2010, 2020
AgeUrban Rural
Total Male Female Total Male Female2010
6-29 60.1 58.4 61.8 53.8 50.2 57.86 96.1 95.8 96.5 89.6 88.5 90.77 98.4 98.3 98.5 97.0 96.7 97.48 98.7 98.6 98.7 98.0 97.8 98.39 98.7 98.6 98.9 98.0 97.8 98.26-9 98.0 97.8 98.2 95.7 95.3 96.210-14 71.7 97.1 98.0 95.1 93.4 96.915-17 93.0 91.1 94.8 80.7 73.5 88.715 95.8 94.7 96.9 88.2 83.5 93.116 93.5 91.7 95.4 81.2 73.4 89.817 89.6 86.9 92.2 68.8 59.5 79.96-17 96.4 95.6 97.2 92.0 89.3 94.818 81.4 76.8 85.7 35.4 27.7 47.819 71.7 64.9 77.9 17.4 13.1 24.520-24 37.3 33.5 40.9 6.2 5.1 7.625-29 7.2 6.1 8.3 2.0 1.8 2.2
20206-29 73.7 73.8 73.6 70.6 67.4 74.16 93.0 92.8 93.2 94.0 93.4 94.57 97.6 97.3 97.9 96.7 96.0 97.38 98.7 98.7 98.7 99.2 99.5 99.29 98.5 98.4 98.6 99.4 99.3 99.46-9 96.8 96.6 96.9 97.2 96.9 97.510-14 99.3 99.3 99.3 99.4 99.2 99.615-17 98.3 97.9 98.6 95.8 93.5 98.315 98.8 98.5 99.0 97.5 96.0 99.016 98.4 97.9 98.9 95.9 93.6 98.317 97.7 97.3 98.1 94.1 90.9 97.56-17 98.0 97.9 98.2 97.8 97.1 98.518 89.6 87.2 92.0 83.2 76.3 90.219 84.1 79.6 88.7 75.0 65.6 85.120-24 56.7 55.5 57.9 48.3 42.4 54.925-29 20.2 19.7 20.7 12.8 11.4 14.4
For all the age groups, percentage of females attending school is higher than males in both urban and rural areas.

101
CHAPTER 6EDUCATION AND LITERACY
FIGURE 6.4. SEX RATIO OF SCHOOL ATTENDEES, BY AGE GROUPS 2010, 2020
103.0 100.789.0
77.8 72.4
104.1 103.997.0
89.5 90.3
6-9 10-14 15-19 20-24 25-292010 2020
Compared with the census 2010, sex ratio of all the school attendees grows in all the age groups, which also shows higher attendance of males. In the age groups 6-14, the sex ratio is 104.1, same as the total population structure, but the ratio is declined when the age groups escalates in numbers.
84.1 percent of the population aged 2-5, is attending the preschool, increased by 24.0 percentage points since 2010. By location, there is a positive indicator that 83.6 percent of the rural population aged 2-5 is attending the preschool.
TABLE 6.7. PERCENTAGE DISTRIBUTION OF PRE-SCHOOL ATTENDANCE, BY AGE AND AREAS, 2020
Age2010 2020
Total Urban Rural Total Urban RuralTOTAL 60.1 68.2 45.6 84.1 84.3 83.62 44.5 51.6 31.5 65.2 65.5 64.43 59.2 68.4 42.1 85.0 85.1 84.84 67.5 76.9 51.2 90.9 90.9 91.05 75.5 83.0 62.7 94.0 93.9 94.1


HOUSEHOLD AND MARITAL STATUS
40000 30000 20000 10000 0 10000 20000 30000 40000
15
20
30
40
50
60
70
80
90+
БэлэвсэнЦуцалсанТусгаарласан
Гэрлэсэн батлуулаагүйГэрлэсэн батлуулсанОгт гэрлээгүйSingle/never married
Registered marriedNot registered married
Separated/Legally marriedDevorced/Not remarriedmarriedWidowed
7CHAPTER


105
CHAPTER 7HOUSEHOLD AND MARITAL STATUS
HOUSEHOLD NUMBERS AND STRUCTURES“A household consists of one or more people who live in the same dwelling, share their budget and
have their basic needs met together. Household members can be related by blood or not. There is a concept difference between a household and a family. One or more families may live in one household”. This is the common concept that has been used in the previous censuses and internationally.
Basically, population are classified as enumerated in household and non-household units. Persons with no relationship residing in the same housing unit is considered as Non-household unit, and this type of household usually consists of soldiers, prisoners, students, and workers who are residing in a dormitory, hospital, nursing home, hotel room, as well as attic, and sewage tunnels.
FIGURE 7.1. POPULATION ENUMERATED IN HOUSEHOLD AND NON-HOUSELHOLD UNITS, 2020
Resident Populataion3 197 020
Persons in households3 123 487
Non-household persons73 533
During the census 2020, 3 123 487(97.7%) of the resident population in Mongolia is enumerated 897.4 thousand households, and 73 533(2.3%) of the population is enumerated in non-household units (Figure 7.1).
TABLE 7.1. PERCENTAGE DISTRIBUTION OF POPULATION ENUMERATED IN HOUSEHOLDS AND NON-HOUSEHOLD UNITS, 2010, 2020
2010 2020 2020/2010%thous.person. Percentage thous.person. Percentage
TOTAL 2 647.5 100.0 3 197.0 100.0 120.8 Person in households 2 553.8 96.5 3 123.5 97.3 122.3 Person in Non-households 93.7 3.5 73.5 2.3 78.4
Compared with the previous census, persons in households increased by 569.7 thousand or 22.3 percent (annual growth of 2.3 percent), while persons in non-households decreased by 20.2 thousand or 21.6 percent (annual reduction of 2.4 percent).

106
2020 POPULATION AND HOUSING CENSUS OF MONGOLIA NATIONAL REPORT
TABLE 7.2. PERCENTAGE DISTRIBUTION OF POPULATION IN HOUSEHOLDS AND NON-HOUSEHOLD UNITS, BY AIMAGS AND CAPITAL CITY, 2020
Aimags and the CapitalHousehold
Total Percent Persons on households Percent Non-Household
persons Persent
TOTAL 3 197 020 100.0 3 123 487 97.7 73 533 2.3Arkhangai 94 324 100.0 93 278 98.9 1 046 1.1Bayan-Ulgii 103 908 100.0 102 696 98.8 1 212 1.2Bayankhongor 88 008 100.0 87 019 98.9 989 1.1Bulgan 61 344 100.0 60 541 98.7 803 1.3Govi-Altai 57 479 100.0 56 612 98.5 867 1.5Dornogovi 69 859 100.0 67 752 97.0 2 107 3.0Dornod 82 020 100.0 79 705 97.2 2 315 2.8Dundgovi 46 698 100.0 45 994 98.5 704 1.5Zavkhan 72 307 100.0 71 293 98.6 1 014 1.4Uvurkhangai 115 737 100.0 114 003 98.5 1 734 1.5Umnugovi 69 858 100.0 65 973 94.4 3 885 5.6Sukhbaatar 62 884 100.0 62 105 98.8 779 1.2Selenge 107 755 100.0 105 535 97.9 2 220 2.1Tuv 92 409 100.0 89 117 96.4 3 292 3.6Uvs 82 941 100.0 82 286 99.2 655 0.8Khovd 88 078 100.0 87 113 98.9 965 1.1Khuvsgul 134 318 100.0 132 137 98.4 2 181 1.6Khentii 77 320 100.0 75 796 98.0 1 524 2.0Darkhan-Uul 102 171 100.0 99 888 97.8 2 283 2.2Orkhon 104 032 100.0 101 699 97.8 2 333 2.2Gobisumber 17 445 100.0 16 860 96.6 585 3.4Ulaanbaatar 1 466 125 100.0 1 426 085 97.3 40 040 2.7
National average percent of the persons in non-household units is 2.3, but the rates in Ulaanbaatar, Dornod, Dornogovi, Govisumber, Tuv, and Umnugovi are higher than the national average by 0.4-3.3 percentage points.
TABLE 7.3. PERCENTAGE DISTRIBUTION OF HOUSEHOLD NUMBERS, BY URBAN AND RURAL AREAS, 2010, 2020
2010 20202020/
2010%thous.households. Percentage thous.
households. Percentage
TOTAL 713.8 100.0 897.4 100.0 125.7Urban 479.5 67.2 606.3 67.6 126.5Rural 234.3 32.8 291.1 32.4 124.2
In census 2020, 897.4 thousand households have been enumerated, increased by 183.6 thousand or 25.7 percent (by 2.9 percent annually). Households in urban areas went up by 126.8 thousand or 26.4 percent (by 2.9 percent annually), and in rural areas, went up by 56.8 thousand or 24.3 percent (by 2.7 percent annually). The number of total households has increased 2.1 times since 1989, including 2.6 times of growth in urban and 1.5 times of growth in rural areas.
In census 2020, 67.6 percent of the total 897.4 thousand households is residing in urban and 32.4 percent is residing in rural areas. The households in urban area increased by 0.4 percentage points.

107
CHAPTER 7HOUSEHOLD AND MARITAL STATUS
HOUSEHOLD TYPES
7 A mixed household is a situation in which several interrelated families form joint household.8 Mixed households are cases where relatives and non-relatives form a household.
According to the UN methodology, the household type is determined by the relationship of household members to the head of the household. It serves as a main source of information for development of mid and long-term demographic, social and economic policies of the country. There are 4 categories of households.
FIGURE 7.2. HOUSEHOLD NUMBERS BY TYPES, 2020
Total Households
897 427
Single person137 826
Nuclear536 309
Extended203 317
Composite19 975
In terms of the structure, 59.8 percent of the total households is nuclear households, increased by 91.3 thousand; 22.7 percent of the total households is extended7 households, increased by 25.4 thousand; 15.4 percent of the total households is single-person households, increased by 61.9 thousand and 2.2 percent of the total households is Non-household households8, increased by 5.1 thousand( 34.2 percent) (Figure 7.2).
In other words, 6 out of 10 households are the nuclear families where parents live with their children. Since it reflects our tradition and culture, the percentage of the extended family where core families live with their parents, sibling, and/or with relatives, is higher in Mongolia.
TABLE 7.4. HOUSEHOLD NUMBERS AND TYPES BY AREAS AND PERCENTAGE, 2010, 2020
Household type
Total Urban Ruralthous.
households Percentage thous.households Percentage thous.
households Percentage
2010TOTAL 713.8 100.0 479.5 100.0 234.3 100.0Single-person 75.9 10.6 47.2 9.9 28.7 12.2Nuclear 445.0 62.4 275.6 57.5 169.4 72.3Extended 177.9 24.9 145.2 30.3 32.7 13.9Composite 14.9 2.1 11.4 2.4 3.5 1.5
2020TOTAL 897.4 100.0 606.3 100.0 291.1 100.0Single-person 137.8 15.4 86.1 14.2 51.7 17.7Nuclear 536.3 59.8 340.0 56.1 196.3 67.4Extended 203.3 22.6 161.4 26.6 41.9 14.4Composite 20.0 2.2 18.8 3.1 1.2 0.5

108
2020 POPULATION AND HOUSING CENSUS OF MONGOLIA NATIONAL REPORT
The number of extended families shows 0.5 percentage point of increase since there are 161.4 thousand families in urban and 41.9 thousand (3.9%) in rural areas. It is probably related to the fact that migrants from the rural areas live with their relatives in urban areas where accessibility and availability of own housing are limited. And the migration may lead the number of single-person households to increase by 81.6 percent in urban areas (Table 7.4).
TABLE 7.5. PERCENTAGE DISTRIBUTION OF HOUSEHOLD NUMBER AND HOUSEHOLD SIZE, BY AREAS, 2010, 2020
Number of members
Total Urban Ruralthous.
households Percentage thous.households Percentage thous.
households Percentage
2010TOTAL 713.8 100.0 479.5 100.0 234.3 100.01-2 190.6 26.7 124.0 25.9 66.6 28.43-4 337.6 47.3 229.7 47.9 107.9 46.15-6 154.0 21.6 102.3 21.3 51.7 22.17+ 31.6 4.4 23.6 4.9 8.0 3.4
2020TOTAL 897.4 100.0 606.3 100.0 291.1 100.01-2 282.0 31.4 184.5 30.4 97.5 33.53-4 340.6 38.0 235.5 38.9 105.1 36.15-6 215.8 24.0 141.5 23.3 74.3 25.57+ 59.0 6.6 44.8 7.4 14.2 4.9
Although the household size differs from each other in urban and rural areas, the percentage of households with average size of 3-4 members is 69.1 in urban and 30.9 in rural areas
There is a huge change in the percentage of households with 1-2 persons. Compared with the census in 2010, the percentage has increased by 48.7 or 60.4 thousand in urban, and by 46.5 or 31.0 thousand in rural areas. The main factor could be the fact that people migrated from rural areas for education and employment opportunities, were enumerated as households. The number of families with members of 7 and above in urban areas, is 3.1 times higher than that of rural.

109
CHAPTER 7HOUSEHOLD AND MARITAL STATUS
TABLE 7.6. PERCENTAGE DISTRIBUTION OF HOUSEHOLD SIZE, BY AIMAGS AND THE CAPITAL, 2020
Aimags and the Capital Total
Number of member Average number of members
1-2 3-4 5-6 7+ 2010 2020TOTAL 100.0 31.4 38.0 24.0 6.6 3.6 3.6Arkhangai 100.0 33.3 36.9 26.0 3.8 3.3 3.5Bayan-Ulgii 100.0 16.9 34.3 35.7 13.1 4.4 4.3Bayankhongor 100.0 34.0 38.1 24.1 3.8 3.4 3.4Bulgan 100.0 38.3 34.9 23.1 3.7 3.3 3.3Govi-Altai 100.0 30.1 40.5 26.0 3.4 3.5 3.6Dornogovi 100.0 34.5 38.7 21.8 5.0 3.3 3.5Dornod 100.0 35.8 36.0 22.6 5.6 3.5 3.5Dundgovi 100.0 38.7 36.3 21.5 3.5 3.4 3.3Zavkhan 100.0 32.6 38.7 25.1 3.6 3.4 3.5Uvurkhangai 100.0 33.0 37.9 25.1 4.0 3.5 3.5Umnugovi 100.0 39.7 38.1 19.7 2.5 3.3 3.3Sukhbaatar 100.0 29.6 42.2 25.0 3.2 3.5 3.5Selenge 100.0 29.6 37.5 25.5 7.4 3.5 3.7Tuv 100.0 38.2 34.0 22.9 4.9 3.3 3.4Uvs 100.0 26.3 37.4 29.9 6.4 3.8 3.8Khovd 100.0 25.3 35.0 31.7 8.0 3.9 3.9Khuvsgul 100.0 31.5 40.3 24.1 4.1 3.4 3.5Khentii 100.0 40.9 34.5 20.9 3.7 3.3 3.2Darkhan-Uul 100.0 30.2 39.4 23.7 6.7 3.5 3.5Orkhon 100.0 26.0 43.8 24.5 5.7 3.5 3.7Govisumber 100.0 33.5 37.5 24.1 4.9 3.3 3.5Ulaanbaatar 100.0 30.7 38.2 22.9 8.2 3.7 3.6
The average household size is 3.6 persons in 2020, at the same level as in 2010. There is a 0.1-0.2 percent of growth in Tuv, Govi-Altai, Govisumber, Zavkhan, Dornogovi, Selenge, Arkhangai, and Orkhon aimags, but a 0.1 percent of drop in Bayan-Ulgii, Dundgovi, Khentii aimags and Ulaanbaatar, while no difference in Bayankhongor, Bulban, Khuvsgul, Dornod, Uvurkhangai, Umnugovi, Sukhbaatar, Uvs, Khovd, and Darkhan-Uul (Table 7.6).
The average household size is highest in Bayan-Ulgii and is larger by almost one person than the national average. Khovd aimag is the second largest higher than the national average. The proportion of households with 7 or more persons in Bayan-Ulgii is two times higher than the national average and it is related to the specific characteristics of the ethnic group. The percentage of households with 7 or more person is relatively high in Ulaanbaatar, which is associated with the internal migration.

110
2020 POPULATION AND HOUSING CENSUS OF MONGOLIA NATIONAL REPORT
There have been different patterns by disaggregating household head by gender and areas.
TABLE 7.7. PERCENTAGE DISTRIBUTION OF HOUSEHOLD NUMBERS, BY SEX OF THE HEADS, BY AREAS, 2010, 2020
GenderTotal Urban Rural
thous.households Percentage thous.
households Percentage thous.households Percentage
2010TOTAL 713.8 100.0 479.5 100.0 234.3 100.0Male headed 560.2 78.5 364.3 76.0 196.0 83.6Female headed 153.6 21.5 115.2 24.0 38.3 16.4
2020TOTAL 897.4 100.0 606.3 100.0 291.1 100.0Male headed 641.5 71.5 408.9 67.4 232.5 79.9Female headed 255.9 28.5 197.4 32.6 58.6 20.1
The proportion of female headed households has increased by 7.0 percentage points, by 8.6 percentage points in urban and 3.7 percentage points in rural areas respectively.
MARITAL STATUSThe factor that has a direct effect on population birth and growth rate is marital status. Since
marriage is a social phenomenon which closely associated with national tradition and culture, the basic pattern of marriage has remained relatively intact between the census years.
TABLE 7.8. NUMBER OF POPULATION AGED 15 AND ABOVE, BY MARITAL STATUS AND PERCENTAGE, 2000, 2010, 2020
Marital status2000 2010 2020
thous.person Percentage thous.
person Percentage thous.person Percentage
TOTAL 1 524.4 100.0 1 906.0 100.0 2 152.1 100.0
Sinlge 505.1 33.1 596.1 31.3 678.9 31.5
Married* 880.4 57.8 1 146.2 60.1 1 303.7 60.6
Divorced** 41.5 2.7 59.0 3.1 51.5 2.4
Widowed 97.4 6.4 104.6 5.5 118.0 5.5
Explanation: *includes those living together.
**includes those divorced or separated.
The percentage of people who are divorced or separated has dropped by 0.7 percentage point since 2010.

111
CHAPTER 7HOUSEHOLD AND MARITAL STATUS
TABLE 7.9. MARITAL STATUS OF POPULATION AGED 15 AND ABOVE, BY SEX AND PERCENTAGE, 2010, 2020
Marital statusTotal Male Female
thous.person Percentage thous.
person Percentage thous.person Percentage
2010
TOTAL 1 906.0 100.0 937.3 100.0 968.7 100.0
Single 596.1 31.3 322.5 34.4 273.6 28.2
Married* 1 146.2 60.1 568.9 60.7 577.3 59.6
Divorced** 59.0 3.1 25.2 2.7 33.8 3.5
Widowed 104.6 5.5 20.7 2.2 84.0 8.7
2020
TOTAL 2 152.1 100.0 1 039.6 100.0 1 112.5 100.0
Single 678.9 31.5 366.4 35.2 312.5 28.1
Married* 1 303.7 60.6 633.9 61.0 669.8 60.2
Divorced** 51.5 2.4 20.3 2.0 31.2 2.8
Widowed 118.0 5.5 18.9 1.8 99.0 8.9
Explanation: *includes those living together.
**includes those divorced or separated.
In terms of marital status among the population aged 15 and above, 31.5 percent of them are never married before; 60.6 percent of them is married or living together; and 2.4 percent of them are divorced or separated and 5.5 percent are widowed The number of single people has risen by 82.8 thousand or 13.9 percent; the number of married or living together people has grown by 157.7 thousand or 13.7 percent, and the number of widowed people has increased by 13.4 thousand or 12.8 percent. But the number of divorced or separated people has decreased by 7.5 thousand or 12.7 percent.
The median age at first marriage is an indicator which shows at what age both men and women get married.
FIGURE 7.3. MEDIAN AGE AT FIRST MARRIAGE, BY YEARS, 2000, 2010, 2020
25.7
26.228.6
2000
20102020
23.7
24.226.7
200020102020

112
2020 POPULATION AND HOUSING CENSUS OF MONGOLIA NATIONAL REPORT
The average age at first marriage increases as the education level of the population increases and the society and economy development fosters. The same development trajectory can be observed in the developed nations. The marriage age for both men and women has increased by three years in the past 20 years. From 2000 to 2010, it was increased by one year, but increased by 2 years between 2010 and 2020. In the last two decades, difference between the marriage age for men and women has been 1-2. It has been observed that there is going to be no change in such a short time, although it is embodied in the culture and traditions of the country.
Compared to the previous census, the percentage of youth aged 15-34 who never married, has increased by 10 percentage points, leading to increased median age for the first marriage. The percentage of people who never married, has been increased as the age group advances compared to 2010.
TABLE 7.10. MARITAL STATUS OF POPULATION AGED 15 AND ABOVE, BY AGE GROUP, SEX, AND PERCENTAGE, 2010, 2020
Age group Total
MaleTotal
Female
Single Married* Divorced** Widowed Single Married* Divorced** Widowed
2010TOTAL 100.0 100.0 100.0 100.0 100.0 100.0 100.0 100.0 100.0 100.015-24 29.7 72.8 7.5 2.7 0.1 28.1 75.3 11.1 4.1 0.225-34 25.2 18.8 29.8 21.6 2.0 24.2 15.5 31.4 23.8 2.535-44 20.2 5.6 28.1 36.8 7.7 19.9 5.2 27.4 35.8 9.645-54 14.5 2.0 20.7 28.4 19.7 15.0 2.6 19.1 27.6 22.555-64 5.9 0.5 8.4 7.7 21.0 6.8 0.8 7.2 6.8 23.965+ 4.6 0.3 5.4 2.8 49.7 6.1 0.6 3.8 2.2 41.2
2020TOTAL 100.0 100.0 100.0 100.0 100.0 100.0 100.0 100.0 100.0 100.015-24 21.4 57.2 2.0 0.4 0.0 19.5 61.5 3.7 0.7 0.025-34 26.1 29.6 25.3 10.1 1.3 24.4 25.3 27.9 12.5 1.335-44 21.4 8.2 29.4 27.4 5.2 20.5 7.1 28.6 27.3 5.545-54 16.0 3.5 22.6 35.8 14.6 16.5 3.6 21.7 34.2 16.355-64 10.0 1.2 14.2 21.3 29.2 11.7 1.8 13.1 21.0 31.365+ 5.1 0.3 6.5 5.0 49.7 7.4 0.7 5.0 4.3 45.6
Explanation: *includes those living together.
**includes those divorced or separated.
The percentage of age group of 45-64 among the divorced or separated has risen for both sexes, in particular, it has increased by around 14 percentage points in the age group of 55-64.

113
CHAPTER 7HOUSEHOLD AND MARITAL STATUS
TABLE 7.11. MARITAL STATUS OF POPULATION AGED 15 AND ABOVE, BY AGE GROUP, SEX, AND PERCENTAGE, 2010, 2020
Age group Total
MaleTotal
Female
Single Married* Divorced** Widowed Single Married* Divorced** Widowed
2010TOTAL 100.0 34.4 60.7 2.7 2.2 100.0 28.2 59.6 3.5 8.715-24 100.0 84.4 15.3 0.2 0.0 100.0 75.7 23.7 0.5 0.125-34 100.0 25.7 71.8 2.3 0.2 100.0 18.1 77.6 3.4 0.935-44 100.0 9.6 84.7 4.9 0.8 100.0 7.4 82.1 6.3 4.245-54 100.0 4.7 87.1 5.3 3.0 100.0 4.9 75.7 6.4 13.055-64 100.0 2.8 85.9 3.5 7.8 100.0 3.3 62.8 3.5 30.465+ 100.0 2.5 71.9 1.6 24.0 100.0 2.9 37.2 1.2 58.6
2020TOTAL 100.0 35.2 61.0 2.0 1.8 100.0 28.1 60.2 2.8 8.915-24 100.0 94.3 5.7 0.0 0.0 100.0 88.5 11.4 0.1 0.025-34 100.0 40.0 59.1 0.8 0.1 100.0 29.1 69.0 1.4 0.535-44 100.0 13.5 83.6 2.5 0.4 100.0 9.7 84.2 3.7 2.445-54 100.0 7.8 86.1 4.4 1.7 100.0 6.2 79.2 5.8 8.855-64 100.0 4.3 86.3 4.1 5.3 100.0 4.3 67.0 5.0 23.765+ 100.0 2.1 78.1 1.9 17.9 100.0 2.7 40.7 1.6 55.0
Explanation: *includes those living together
**includes those divorced or separated..
The percentage of divorced women is significantly higher than men in the all age groups (Table 7.11). Especially, percentage of widow is 37.1 percentage points higher than widower in the age group 65 and above. This could be explained by the fact that in this age group, mortality rate among male population is higher.
FIGURE 7.3. PERCENTAGE DISTRIBUTION OF DIVORCED POPULATION, BY AGE GROUP AND SEX, 2010, 2020
2010 female2010 male 2020 female2020 male15-24 1.3 -0.7 0.2 -0.125-34 8 -5.4 3.9 -2.135-44 12.1 -9.3 8.5 -5.645-54 9.3 -7.2 10.7 -7.355-64 2.3 -1.9 6.6 -4.365+ 0.7 -0.7 1.3 -1.0
15 10 5 0 5 10 15
15-24
25-34
35-44
45-54
55-64
65+
2020 male 2020 female 2010 male 2010 female
The number of divorced people was high in the age of 35-44 in 2010, but it is higher in the age group of 45-54 in 2020.


PERSONS WITH DISABILITY AND TYPES OF DISABILTY
НАЙМДУГААР БҮЛЭГ.
34.0%
12.0%
22.5%
20.2%
8.2%
3.1%
8CHAPTER


117
CHAPTER 8PERSONS WITH DISABILITY AND TYPES OF DISABILTY
A detailed and accurate data on persons with disabilities is essential for ensuring compliance of the Mongolian Law on “Social Protection of Persons with Disabilities”, delivering the “National Program for the Rights, Participation and Development of Persons with Disabilities”, achieving the UN’s “Sustainable Development Goals 2030,” and the Incheon strategy of 2021-2022 “Making the Rights of Persons with Disabilities Real” in the Asia-Pacific Region to create more inclusive, comfortable and human rights-based society for persons with disabilities. Therefore, the UN Census Principles recommends to include disability as a key indicator.
Data produced by the Population and Housing Census 2020 on people with disabilities will have a crucial role to play for assessing development policies, plans and programs, developing further policies and programs, assessing wide-ranging social needs of people with disabilities, and increasing their participation in all sectors.
Depending on the mode of enumeration of the Population and Housing Census 2020, the data on people with disabilities were compiled based on the Population and Household Database and databases of the General Department of Labor and Welfare under the Ministry of Labor and Social Welfare and the Ministry of Health.
DISABILITYAt the national level, the number of people with disabilities decreased by 1.6 percent from the
previous census to 106.4 thousand in 2020, accounting for 3.3 percent of the resident population.
TABLE 8.1. NUMBER OF PERSONS WITH DISABILITY, BY AGE GROUPS AND PERCENTAGE, 2010, 2020
Age group2010 2020
Person Percentage Person PercentageTOTAL 108 071 100.0 106 363 100.00-4 1 957 1.8 1 548 1.45-9 3 068 2.8 3 298 3.110-14 4 436 4.1 3 274 3.115-19 6 390 5.9 3 205 3.020-24 7 933 7.3 4 685 4.425-29 8 833 8.2 6 517 6.130-34 8 988 8.3 8 299 7.835-39 10 250 9.5 10 114 9.540-44 11 596 10.7 11 122 10.545-49 13 551 12.5 13 248 12.550-54 11 788 10.9 15 192 14.355-59 6 756 6.3 13 665 12.860-64 3 223 3.0 6 603 6.265-69 2 690 2.5 2 422 2.370+ 6 612 6.2 3 171 3.0
6.1 percent of all persons with disabilities are adolescents aged 10-19 and 10.5 percent are 20-29 years old, which is 3.9 percentage points and 5.0 percentage points less than the previous census respectively. People aged 35-59 make up 59.6 percent (63.3 thousand) of the total population with disabilities. Of these, 50-54 year olds increased by 14.3 percent from 2010 by 3.4 percentage points, and 55-59 year olds increased by 6.5 percentage points to 12.8 percent, which is the highest increase.

118
2020 POPULATION AND HOUSING CENSUS OF MONGOLIA NATIONAL REPORT
FIGURE 8.1. PERCENTAGE DISTRIBUTION OF PERSONS WITH DISABILITY, BY AGE GROUPS AND SEX, 2010, 2020
2010 2020 2010 2020Эрэгтэй Эрэгтэй Эмэгтэй Эмэгтэй
0-14 8.7 7.8 0-14 8.8 7.415-44 50.4 41.3 15-44 49.5 41.345-64 34.0 46.2 45-64 31.0 45.365+ 6.9 4.7 65+ 10.7 6.0
8 7.5 8 7.5
8.8
49.531.0
10.7
7.4
41.3
45.3
6.022002200
220011008.7
50.434.0
6.9
7.8
41.3
46.2
4.722002200
22001100
According to the 2020 census, 58.9 thousand (55.4 percent) of all people with disabilities are men and 47.4 thousand (44.6 percent) are women. 41.3 percent of men with disabilities are aged 15-44, 46.2 percent are aged 45-64, and the remaining percentage is children aged 0-14 and aged 65 and above. Compared to 2010, the proportion of men with disabilities aged 15-44 decreased by 9.1 percentage points, while the proportion of 45-64-year-olds increased by 12.2 percentage points. However, 41.3 percent of the total number of women with disabilities were aged 15-44 and 45.3 percent were aged 45-64. Compared to 2010, the proportion of women with disabilities aged 15-44 decreased by 8.2 percentage points, while the proportion of women aged 65 and above increased by 4.7 percentage points but proportion of women aged 45-64 increased 14.3 percentage points.
This shows that a high proportion of persons with disabilities aged 45-64 are of either gender. (Figure 8.1). However, the number of women with disabilities aged 65 and above is 1.8 times higher than the number of men due to the fact that women live longer than men
TABLE 8.2. NUMBER OF PERSONS WITH DISABILITY, BY AIMAGS AND CAPITAL, PERCENTAGE, 2010, 2020
Aimags and the Capital
2010 2020 2020/2010%Person Percentage Person Percentage
TOTAL 108 071 100.0 106 363 100.0 98.4Arkhangai 3 720 3.4 3 430 3.2 92.2Bayan-Ulgii 3 856 3.6 4 245 4.0 110.1Bayankhongor 3 696 3.4 3 590 3.4 97.1Bulgan 2 318 2.1 2 098 2.0 90.5Govi-Altai 2 528 2.3 2 904 2.7 114.9Dornogovi 2 560 2.4 2 654 2.5 103.7Dornod 4 082 3.8 4 019 3.8 98.5Dundgovi 1 881 1.7 1 858 1.7 98.8Zavkhan 2 939 2.7 3 650 3.4 124.2Uvurkhangai 4 604 4.3 3 972 3.7 86.3Umnugovi 2 183 2.0 2 026 1.9 92.8Sukhbaatar 3 057 2.8 2 672 2.5 87.4Selenge 4 711 4.4 4 416 4.2 93.7Tuv 3 825 3.5 3 216 3.0 84.1Uvs 3 358 3.1 4 470 4.2 133.1Khovd 2 896 2.7 2 564 2.4 88.5Khuvsgul 6 553 6.1 5 826 5.5 88.9Khentii 4 136 3.8 3 004 2.8 72.6Darkhan-Uul 3 738 3.5 4 131 3.9 110.5Orkhon 3 516 3.3 4 226 4.0 120.2Govisumber 510 0.5 707 0.7 138.6Ulaanbaatar 37 404 34.6 36 685 34.5 98.1

119
CHAPTER 8PERSONS WITH DISABILITY AND TYPES OF DISABILTY
Khuvsgul, Uvs, Selenge, Bayan-Ulgii, Orkhon and Darkhan-Uul have the largest number of people with disabilities, while Govisumber, Dundgovi and Umnugovi aimags have the fewest.
Compared to 2010, the number of people with disabilities has the highest increase in Govisumber, Uvs and Zavkhan, while the highest decrease has occurred in Khentii, Tuv and Uvurkhangai aimags.
Although 34.5 percent (36.7 thousand) of people with disabilities live in Ulaanbaatar, the growth rate is almost the same as in 2010 or increased by 0.1 percentage points. The increase was highest in Uvs (1.1 percentage points), Orkhon (0.7 percentage points) and Zavkhan (0.7 percentage points) aimags respectively.
FIGURE 8.2. NUMBER AND PERCENTAGE DISTRIBUTION OF PERSONS WITH DISABLED, BY AIMAGS AND THE CAPITAL, 2010, 2020
Compared to the previous census, the percentage of persons with disabilities in the total population of the aimags increased by 0.1-0.8 percentage points in Orkhon, Govisumber, Gobi-Altai, Zavkhan and Uvs, but decreased in other aimags and Ulaanbaatar. The largest declines were in Khentii (2.4 percentage points), Sukhbaatar (1.8 percentage points) and Khuvsgul (1.4 percentage points) aimags.

120
2020 POPULATION AND HOUSING CENSUS OF MONGOLIA NATIONAL REPORT
TABLE 8.3. NUMBER AND PERCENTAGE DISTRIBUTION OF PERSONS WITH DISABILITIES, BY URBAN AND RURAL AREAS, AIMAGS AND CAPITAL, 2010, 2020
Aimags and the Capital
2010 2020Urban Rural Urban Rural
Person Percentage Person Percentage Person Percentage Person Percentage
TOTAL 67 069 62.1 41 002 37.9 65 060 61.2 41 303 38.8Arkhangai 914 24.6 2 806 75.4 693 20.2 2 737 79.8Bayan-Ulgii 1 222 31.7 2 634 68.3 1 358 32.0 2 887 68.0Bayankhongor 1 584 42.9 2 112 57.1 1 255 35.0 2 335 65.0Bulgan 591 25.5 1 727 74.5 625 29.8 1 473 70.2Govi-Altai 864 34.2 1 664 65.8 1 004 34.6 1 900 65.4Dornogovi 1 309 51.1 1 251 48.9 1 511 56.9 1 143 43.1Dornod 2 309 56.6 1 773 43.4 2 192 54.5 1 827 45.5Dundgovi 640 34.0 1 241 66.0 543 29.2 1 315 70.8Zavkhan 696 23.7 2 243 76.3 680 18.6 2 970 81.4Uvurkhangai 1 851 40.2 2 753 59.8 1 149 28.9 2 823 71.1Umnugovi 782 35.8 1 401 64.2 904 44.6 1 122 55.4Sukhbaatar 1 033 33.8 2 024 66.2 828 31.0 1 844 69.0Selenge 2 244 47.6 2 467 52.4 1 804 40.9 2 612 59.1Tuv 606 151.8 3 219 84.2 631 19.6 2 585 80.4Uvs 1 302 38.8 2 056 61.2 1 749 39.1 2 721 60.9Khovd 1 095 37.8 1 801 62.2 1 014 39.5 1 550 60.5Khuvsgul 2 148 32.8 4 405 67.2 1 756 30.1 4 070 69.9Khentii 1 991 48.1 2 145 51.9 1 169 38.9 1 835 61.1Darkhan-Uul 2 708 72.4 1 030 27.6 3 074 74.4 1 057 25.6Orkhon 3 393 96.5 123 3.5 4 024 95.2 202 4.8Govisumber 383 75.1 127 24.9 412 58.3 295 41.7Ulaanbaatar 37 404 100.0 - - 36 685 100.0 - -
61.2 percent (65.1 thousand) of people with disabilities live in urban areas and 38.8 percent (41.3 thousand) live in rural areas, but this varies from aimag to aimag.
The number of people with disabilities in Ulaanbaatar, Orkhon and Darkhan-Uul aimags have not included in overall number of people with disabilities in urban and rural areas.
People with disabilities living in urban areas of Dornogovi, Dornod and Govisumber outnumber People with disabilities living in rural areas, while people with disabilities in Khuvsgul, Zavkhan and Arkhangai mostly live in rural areas. Compared to the previous census, the number of People with disabilities decreased in capitals of Khentii by 41.3 percent, Uvurkhangai by 37.9 percent, Arkhangai by 24.1 percent and increased in rural areas of Govisumber by 132.3 percent, Orkhon by 64.2 percent and Zavkhan by 32.4 percent respectively.

121
CHAPTER 8PERSONS WITH DISABILITY AND TYPES OF DISABILTY
FIGURE 8.3. NUMBER AND PERCENTAGE DISTRIBUTION OF PERSONS WITH DISABILITY, BY TYPES OF DISABILITY AND SEX, 2010, 2020
31.2
37.5
34.0
45.0
50.8
47.6
ЭРЭГТЭЙ
ЭМЭГТЭЙ
БҮГД
20202010
ТӨРӨЛХИЙН
68.8
62.5
66.0
55.0
49.2
52.4
20202010
ОЛДМОЛCongenital Acquired
Total
Female
Male
According to the census, out of 106.4 thousand people with disabilities, 50.6 thousand (47.6 percent) have congenital disabilities, an increase of 37.7 percent from the previous census. The number of people with acquired disabilities was 55.7 thousand (52.4 percent) which has decreased by 21.8 percent from the previous census.
45.0 percent (26.5 thousand) of men with disabilities are congenital and 55.0 percent (32.4 thousand) are acquired, while 50.8 percent (24.1 thousand) of women with disabilities are congenital and 49.2 percent (23.3 thousand) are acquired. (FIGURE 8.3). Analyzing the above, in 2020, 5 out of 10 women with disabilities were acquired, which is a decrease of 1 person compared to the previous census, and a decrease of 2 people to 5 for men.
FIGURE 8.4. NUMBER OF PERSONS WITH DISABILITY, BY TYPES OF DISABILITY, 2010, 2020
In terms of type of disability, 20.2 percent of the population has a mental disability, 22.5 percent has a physical disability, and 33.9 percent has a disability of other types (including combined and other disabilities) which is the highest in overall number. 3.1 percent of the people with disabilities are visually impaired which is the lowest in the type of disability.
Compared to the previous census, the number of persons with physical disabilities decreased by 23.3 percent, the population with visual impairments decreased by 23.3 percent, the population with hearing impairments decreased by 31.2 percent, and the population with mental disabilities increased by 3.0 percent.

122
2020 POPULATION AND HOUSING CENSUS OF MONGOLIA NATIONAL REPORT
FUNCTIONAL ABILITYThe Population and Housing Census 2020 devised a short set of questionnaire for operational skills
identified by the United Nations Group in Washington. A short set of questionnaires identifies difficulties in six sets of functional ability areas such as sight, hearing, walking, self-care, communication, and memory /ability of memorizing/.
The difficulties are calculated for the population aged 18 and above according to the recommendations of the Washington Group's short set of questionnaires. In this case, if questionnaire participant has answered at least one of the six functional ability is answered as “very difficult” or “unable to do at all”, then it is considered as functional difficulties.
12.9 percent of the population with functional difficulties are youth aged 18-34, 46.9 percent are 35-64 years old, and 40.2 percent are 65 years old and older. 28.7 percent of them has difficulty in walking, 18.9 percent in difficulty in vision and the least (10.1 percent) in difficulty in communication.
TABLE 8.4. TYPES OF FUNCTIONAL DIFFICULTIES AND PERCENTAGE DISTRIBUTION OF POPULATION AGED 15 AND ABOVE, BY AGE GROUP, 2020
Age group Total
Type of difficultyVision Hearing Mobility Cognition Selfcare Communication
TOTAL 100.0 18.9 15.9 28.7 12.9 13.5 10.118-19 100.0 19.0 13.1 14.9 17.5 14.2 21.320-24 100.0 17.4 13.1 15.9 21.8 13.0 18.825-29 100.0 20.2 11.9 16.9 19.8 12.2 19.030-34 100.0 18.2 16.2 20.3 17.0 11.7 16.635-39 100.0 20.1 17.4 21.4 16.4 10.8 13.940-44 100.0 19.3 18.9 22.9 16.1 9.5 13.345-49 100.0 22.7 16.3 26.5 13.1 10.1 11.350-54 100.0 22.4 16.7 28.8 12.8 9.4 9.955-59 100.0 20.6 15.0 32.7 11.2 12.3 8.260-64 100.0 17.4 15.1 36.7 10.5 13.3 7.065-69 100.0 18.5 13.9 38.3 10.7 13.2 5.470+ 100.0 16.9 16.6 30.1 11.0 17.5 7.9
TABLE 8.5. FUNCTIONAL DIFFICULTIES TYPES AND PERCENTAGE DISTRIBUTION OF POPULATION AGED 18 AND ABOVE, BY AGE GROUP, 2020
Age group Total
Type of difficulty
Vision Hearing Mobility Cognition Selfcare Communication
TOTAL 100.0 100.0 100.0 100.0 100.0 100.0 100.018-19 1.3 1.3 1.0 0.7 1.7 1.3 2.620-24 3.1 2.9 2.6 1.7 5.2 3.0 5.825-29 3.6 3.8 2.7 2.1 5.5 3.4 6.830-34 4.9 4.7 4.9 3.4 6.4 4.2 8.035-39 5.6 6.0 6.1 4.2 7.1 4.5 7.840-44 6.2 6.3 7.3 4.9 7.7 4.4 8.145-49 7.9 9.4 8.1 7.3 8.0 5.9 8.850-54 8.5 10.1 8.9 8.6 8.5 5.9 8.455-59 9.6 10.5 9.1 11.0 8.4 8.8 7.960-64 9.1 8.4 8.6 11.7 7.4 9.0 6.365-69 7.9 7.8 6.9 10.6 6.6 7.8 4.270+ 32.3 28.8 33.8 33.8 27.5 41.8 25.3

123
CHAPTER 8PERSONS WITH DISABILITY AND TYPES OF DISABILTY
Difficulties in visual, communication, memorizing/memory are the most common in age group 18-34, and visual and walking difficulties are most common in population aged 35 and above.
Disaggregating by age, difficulty rate is higher in the population aged 45 and above than in other age groups.
FIGURE 8.5. PERCENTAGE DISTRIBUTION OF PERSONS WITH FUNCTIONAL DIFFICULTIES AGED 18 AND ABOVE, BY MULTIPLE FORMS OF DIFFICULTY AND SEX, 2020
0
2
4
6
8
10
12
14
18-19 20-24 25-29 30-34 35-39 40-44 45-49 50-54 55-59 60-64 65-69 70+
3 4 5 6
For youth aged 18-34 and elders aged 65 and above, the multiple forms of difficulty is higher, while for middle-aged persons it is relatively low.
FIGURE 8.6. PERCENTAGE OF PERSONS WITHOUT DIFFICULTIES AMONG RESIDENT POPULATION AGED 18 ABOVE, BY SEX, 2020
16.5
24.0
28.6
31.2
34.9
38.9
42.0
43.8
45.0
46.4
47.1
47.3
23.0
35.1
38.0
41.7
42.4
44.9
47.5
48.5
49.4
48.9
48.6
48.7
70+
65-69
60-64
55-59
50-54
45-49
40-44
35-39
30-34
25-29
20-24
18-19
ЭрэгтэйЭмэгтэйFemaleMale

124
2020 POPULATION AND HOUSING CENSUS OF MONGOLIA NATIONAL REPORT
Analyzing the previous figure, difficulty of functional ability of the population aged 55 and above increases with as they age. Women in all age groups have a higher proportion of the population without functional difficulty than men in all age groups. This may be due to the fact that women are more meticulous in self-care routine and their health.
TABLE 8.6. FUNCTIONAL DIFFICULTY TYPES AND PERCENTAGE DISTRIBUTION OF PEOPLE AGED 18 AND ABOVE, BY AIMAGS AND CAPITAL, 2020
Aimags and the Capital Total
Type of difficulty
Vision Hearing Mobility Cognition Selfcare Communication
TOTAL 100.0 100.0 100.0 100.0 100.0 100.0 100.0Arkhangai 3.4 2.8 3.1 3.3 4.1 3.8 3.7
Bayan-Ulgii 3.2 3.5 3.0 3.5 3.2 3.4 2.4
Bayankhongor 3.3 3.7 3.3 3.3 3.7 2.8 2.8
Bulgan 2.4 2.1 2.6 2.5 2.5 2.4 2.7
Govi-Altai 2.3 2.3 2.8 2.2 2.3 2.3 2.1
Dornogovi 3.0 2.5 2.6 3.5 2.8 2.7 2.7
Dornod 2.3 2.9 2.5 2.0 2.5 1.8 2.0
Dundgovi 1.7 1.6 1.2 2.0 2.1 1.4 1.7
Zavkhan 2.2 2.3 2.2 2.1 2.4 2.3 1.9
Uvurkhangai 4.6 4.8 4.9 4.5 4.4 4.4 4.1
Umnugovi 1.8 1.8 1.9 2.0 1.5 2.0 1.7
Sukhbaatar 2.8 3.3 2.5 2.8 2.3 2.9 3.0
Selenge 2.6 2.1 2.3 2.6 3.1 3.0 3.4
Tuv 3.8 4.2 3.6 3.9 3.9 3.5 3.3
Uvs 2.9 2.7 2.8 2.8 2.9 2.2 3.3
Khovd 3.2 2.8 3.0 3.1 3.4 3.6 3.1
Khuvsgul 4.7 4.9 4.7 4.5 4.6 5.0 5.2
Khentii 3.1 4.0 3.1 3.0 3.0 2.5 2.7
Darkhan-Uul 3.8 4.0 4.1 3.7 3.7 3.5 3.7
Orkhon 2.7 2.4 2.9 2.6 2.6 3.3 2.7
Govisumber 0.7 0.8 0.8 0.7 0.6 0.7 0.8
Ulaanbaatar 39.5 38.5 40.1 39.4 38.4 40.5 41.0
When comparing the difficulty level of functional difficulty by aimag and capital city, Khuvsgul, Uvurkhangai and Tuv have the highest percentage, while Govisumber, Dundgovi and Umnugovi have the lowest percentage excluding capital city Ulaanbaatar.
Although the proportion of people with ability difficulties in Ulaanbaatar is high, it is small compared to the share of the population with a certain ability difficulty.

125
CHAPTER 8PERSONS WITH DISABILITY AND TYPES OF DISABILTY
EDUCATION
TABLE 8.7. EDUCATION LEVEL AND PERCENTAGE DISTRIBUTION OF PEOPLE AGED 18 AND ABOVE, BY MULTIPLE FORMS OF FUNCTIONAL DIFFICULTY TYPES, 2020
Education level TotalMultiple forms of functional difficulties
1 2 3 4 5 6
TOTAL 100.0 100.0 100.0 100.0 100.0 100.0 100.0Non-Educated 15.5 10.5 18.3 28.5 31.0 24.8 27.0Primary 10.7 9.0 11.8 12.9 13.8 20.9 22.3Lower Secondary 14.7 15.9 14.2 10.5 12.4 11.2 10.9Upper Secondary 25.0 27.5 23.9 20.2 18.6 13.8 14.5Technical and vocational 9.4 10.7 8.3 6.8 7.0 4.5 6.2Specialized secondary 10.5 10.9 10.4 10.0 7.6 10.6 9.0Diploma 3.0 2.7 3.6 2.9 3.4 4.5 3.5Bachelor 10.2 11.7 8.5 7.6 5.3 8.7 6.6Master 0.8 1.0 0.7 0.3 0.7 1.0 -Doctoral 0.2 0.1 0.3 0.3 0.2 - -
15.5 percent of the total people with functional difficulties have no education and 84.5 percent have some level of education. In terms of the level of education of people with functional difficulties , 25.0 percent have completed secondary education, 14.7 percent have basic education, and 10.7 percent have primary education which is the highest percentage. In terms of multiple forms of difficulties, primary education accounts for a high percentage of people with five or six difficulties.

126
2020 POPULATION AND HOUSING CENSUS OF MONGOLIA NATIONAL REPORT
EMPLOYMENT
TABLE 8.8. EMPLOYMENT STATUS AND PERCENTAGE DISTRIBUTION OF PEOPLE AGED 18 AND ABOV, EMPLOYMENT TYPES FUNCTIONAL DIFFICULTY TYPES, 2020
TotalMultiple forms of functional difficulties
1 2 3 4 5 6
TOTAL 100.0 100.0 100.0 100.0 100.0 100.0 100.0Employed 31.2 39.4 24.9 14.2 9.5 6.8 7.0Unemployed 68.8 60.6 75.1 85.8 90.5 93.2 93.0
Employment status TOTAL 100.0 100.0 100.0 100.0 100.0 100.0 100.0Permanent paid worker 23.9 26.4 16.1 14.9 16.1 9.5 27.8Temporary paid worker 13.0 13.5 13.0 10.4 3.6 4.8 - Casual paid worker 1.3 1.4 1.1 - - - -Paid apprentice, intern 0.1 0.1 - - - - -Sub-Constructor 0.3 0.3 0.2 - - - -Business entity employer 0.2 0.2 0.2 0.7 - - -Market-oriented household business employer 0.4 0.4 0.2 - - - -Business entity owner with no paid worker 0.5 0.6 0.6 - - - -Market-oriented household business employer with no paid worker 47.3 44.8 55.9 51.9 57.1 71.4 50.0
Contributing family member 13.0 12.3 12.7 22.1 23.2 14.3 22.2
According to the census, 31.2 percent of people with difficulties are registered as employed and 47.3 percent of people are self-employed, 23.9 percent are full-time employees, 13.0 percent are temporary employees.
In the face of any duplication of difficulties, the majority of household businesses operate. However, there are very few entrepreneurs and employers, apprentices and interns. This suggests that the greater the duplication of operational difficulties, the less likely that people will be able to work and, conversely, the more likely they will be to engage in household business activities and contribution services.

MOBILE PHONE AND INTERNET USERS
Internet users throughout the world
9CHAPTER


129
CHAPTER 9MOBILE PHONE AND INTERNET USERS
NUMBER AND STRUCTURE OF MOBILE PHONE AND INTERNET USERSMobile phones and the internet have become widely used by the population on a daily basis because
of the rapid development of information and communications technology.
The Population and Housing Census 2020 was conducted using combination of registration and traditional methods, and data on mobile and Internet use were obtained from family members of the sample who are 6 year-olds and above. The data on mobile and internet usage of the census 2020 is compared with the census 2010.
Mobile phone users 87.8 percent of the population aged 6 and above use the mobile phones and this is an increase of
13.8 percentage points from the previous census. The share of mobile phone users in the population of aimags and the capital city aged 6 and above is higher than the national average in Ulaanbaatar, Orkhon, Darkhan-Uul and Umnugovi. In Bayan-Ulgii aimag, the use of mobile phones is the lowest at 76.3 percent. Even during the previous census, the use of mobile phones in Bayan-Ulgii was low too. (Figure 9.1).
FIGURE 9.1 PERCENTAGE OF MOBILE PHONE USERS AGED 6 AND ABOVE, BY AIMAGS AND CAPITAL, 2010, 2020
88.9 percent of female population aged 6 and above and 86.5 percent of male use cellular phones. The proportion of female using mobile phones is 2.4 percentage points higher than that of male, while the proportion of male in the age group of 70 and above is 1.9 percentage points higher than that of female (Table 9.1).

130
2020 POPULATION AND HOUSING CENSUS OF MONGOLIA NATIONAL REPORT
TABLE 9.1. POPULATION USING CELLULAR PHONES BY AGE GROUP, , PERCENTAGE, 2010, 2020
Age group2010 2020
Total Male Female Total Male FemaleTOTAL 74.0 72.2 75.9 87.8 86.5 88.96-9 22.6 20.7 24.6 37.2 35.4 39.110-14 51.5 47.2 55.9 74.7 73.3 76.215-19 81.6 77.2 86.1 96.6 95.9 97.220-24 88.0 85.9 90.3 98.1 97.7 98.525-29 85.9 85.3 86.5 98.2 97.9 98.530-34 85.1 84.4 85.8 98.3 98.0 98.535-39 84.4 83.3 85.5 97.7 97.2 98.240-44 81.8 80.1 83.4 97.5 96.9 98.045-49 79.8 77.6 81.9 97.0 96.2 97.750-54 77.7 75.6 79.5 96.3 95.0 97.455-59 75.5 73.8 77.0 95.8 94.4 96.960-64 73.5 73.3 73.7 95.2 93.9 96.365-69 65.4 66.4 64.6 94.0 92.7 95.070+ 46.0 50.7 42.8 81.8 83.0 81.1
90.2 percent of the urban population and 82.9 percent of the rural population are mobile phone users. According to the census 2010, the use of mobile phones by the population was 28.6 points higher in urban areas than in rural areas, but in 2020 the gap decreased to 7.3 points. This is due to the rapid growth of information and communications technology. In other words, the modern information and communications technologies have been widely introduced to the both rural and urban areas in a relatively short period of time, reducing the gap between settlements (Figure 9.2).
FIGURE 9.2. PERCENTAGE OF CELLULAR PHONE USERS IN THE POPULATION AGED 6 AND ABOVE, BY URBAN AND RURAL AREAS, 2010, 2020
87.8
90.2
82.9
74.0
83.1
54.5
12.2
9.8
17.1
26.0
16.9
45.5
Total
Urban
Rural
Total
Urban
Rural
2020
2010
Users Non-Users
97.9 percent of the employed population use cellular phones. In terms of employment status, 97.8 percent of employers, 99.6 percent of full-time employees, and 100 percent of interns use cellular phones. Looking at the cellular phone use of the working population by sex, it can be seen from Figure 9.3 that female use it more than male.

131
CHAPTER 9MOBILE PHONE AND INTERNET USERS
FIGURE 9.3. CELLULAR PHONE USE OF WORKING POPULATION, PERCENTAGE, 2020
9911..22
9944..66
9977..44
9999..66
9999..66
9977..77
110000..00
9977..44
9988..22
9999..44
9944..00
9966..66
9977..77
9999..22
110000..00
9988..00
110000..00
9999..33
9999..44
9999..77
CCoonnttrriibbuuttiinngg ffaammiillyy wwoorrkkeerrss
OOwwnn--aaccccoouunntt wwoorrkkeerrss iinn hhoouusseehhoolldd mmaarrkkeett eenntteerrpprriisseesswwiitthhoouutt eemmppllooyyeeeess
OOwwnneerr--ooppeerraattoorrss ooff ccoorrppoorraattiioonnss wwiitthhoouutt eemmppllooyyeeeess
EEmmppllooyyeerr iinn hhoouusseehhoolldd mmaarrkkeett eenntteerrpprriisseess
EEmmppllooyyeerr iinn ccoorrppoorraattiioonnss
DDeeppeennddeenntt ccoonnttrraaccttoorr
PPaaiidd aapppprreennttiicceess,, ttrraaiinneeeess aanndd iinntteerrnnss
SShhoorrtt--tteerrmm aanndd ccaassuuaall EEmmppllooyyeeeess
FFiixxeedd--tteerrmm eemmppllooyyeeeess
PPeerrmmaanneenntt eemmppllooyyeeeessFFeemmaallee
MMaallee
INTERNET USERS Connecting to the Internet via a landline or cellular network is defined as using the Internet, and
Internet users are classified as regular users and occasional users who uses it where necessary
64.7 percent of the population aged 6 and above use the Internet, an increase of 34.1 percentage points from the previous census. 58.7 percent of the population uses the Internet regularly.
41.3 percent of Internet users use the Internet when needed by visiting Internet cafes or using friends’ and other people’s internet landlines, which is 6 percentage points lower than in 2010.
FIGURE 9.4. PERCENTAGE OF INTERNET USERS IN THE POPULATION AGED 6 AND ABOVE, BY AIMAG AND CAPITAL, 2010, 2020

132
2020 POPULATION AND HOUSING CENSUS OF MONGOLIA NATIONAL REPORT
The highest percentage of Internet users aged 6 and above lives in Ulaanbaatar, Darkhan-Uul and Orkhon aimags and it is twice as high as those use and live in Arkhangai, Uvurkhangai and Uvs aimags. (Figure 9.4).
FIGURE 9.5. PERCENTAGE OF INTERNET USERS IN THE POPULATION AGED 6 AND ABOVE, BY URBAN AND RURAL AREAS, 2010, 2020
64.7
72.4
49.3
30.6
41.7
6.8
35.3
27.6
50.7
69.4
58.3
93.2
Total
Urban
Rural
Total
Urban
Rural
2020
2010
Users Non-Users
72.4 percent of the urban population and 49.3 percent of the rural population use the Internet. Compared to the census 2010, internet usage in rural areas increased by 42.5 percentage points and in urban areas by 30.7 percentage points.
By sex, 66.6 percent of female and 62.7 percent of male population aged aged 6 and above are the Internet users. By age group, there are more male than female in the age groups of 6-9 years, 70 years and above, and more female in other age groups (Figure 9.6).
FIGURE 9.6. INTERNET USERS IN POPULATION AGED 6 AND ABOVE BY AGE AND GENDER PYRAMID, 2010, 2020
0.0 20.0 40.0 60.0 80.0 100.0
20202010
Female
0.020.040.060.080.0100.0
6-910-1415-1920-2425-2930-3435-3940-4445-4950-5455-5960-6465-6970+
20202010
Male

EMPLOYMENT
10CHAPTER


135
CHAPTER 10EMPLOYMENT
There are a number of reasons for compiling key economic indicators in the population and housing census. Data on economic activity of the population is crucial in determining a country's economic structure, employment patterns, participation in the labor market, and employment scale. It is of significance to measure key employment indicators from the census and link them with indicators of individual and household conditions for evaluating the socio- economic situation of the country and determining future prospects and trends in the employment.
Compiling the key economic indicators at the level of the smallest administrative units through the population and housing census has the advantage over other types of employment surveys. The definition of the economic indicators that are put in the census questionnaire is based on the United Nations “Principles and Recommendations for the Population and Housing Census 2020-III”.
The Population and Housing Census 2020 was conducted using combination of registration and traditional methods, and data on employment were collected from the population aged 15 and above from the sampled households.
Indicators for economically active population of the traditional questionnaire of Population and Housing Census 2020 were measured based to the methodology approved by the 19th International Conference of Labor Statisticians. According to the traditional census questionnaire, people who were employed at the time of the census, who were employed for at least one day in the week prior to the census, and who were not employed at that time but was generally employed were all considered to be “employed” respectively. In the registration-based data processing, the Population and Household Database was linked to the Social Insurance Payers' Database of the General Authority for Social Insurance under the Ministry of Labor and Social Welfare and the Database of Foreign Nationals and Stateless People of the Mongolia Immigration Agency.
FIGURE 10.1. STRUCTURE OF ECONOMIC ACTIVITY OF THE POPULATION AGED 15 AND ABOVE, 2020

136
2020 POPULATION AND HOUSING CENSUS OF MONGOLIA NATIONAL REPORT
EMPLOYMENT STATUSPopulation of working age of 15 and above is classified as both labor force and population outside of
labor force. The labor force includes the employed population and the unemployed. This data will serve as baseline data for development of the country's socio- economic policies, especially labor force policy.
According to the traditional census, the current census captured population with permanent and seasonal jobs and not employed at the time of the census as the employed population and all those registered in the database of social insurance payers and the database of foreigner nationals and stateless persons as ‘employed’. The economically inactive population includes those who are not in the labor market, as well as those who were unemployed due to lack of suitable work.
FIGURE 10.2. LABOR FORCE PARTICIPATION LEVEL BY POPULATION AGED 15 AND ABOVE, 2020
59.7 40.3
Ажиллах хүч Ажиллах хүчнээс гадуурх хүн амLabor force Population outside of labor force
59.7 percent of the total population aged 15 and above is in the labor force and this is an increase of 3.3 percentage points from 2010 (Figure 10.2).
There are significant differences in the level of labor force participation by location and gender. This indicator is 4.8 percentage points higher than in rural areas, which is the unique characteristic of labor force of the country. According to the census, the majority of herder population aged 15 and over in rural areas have contributed to the high level of rural labor force participation. The participation rate of the rural labor force decreased by 3.1 percentage points compared to the 2010 census. In terms of gender, the participation of both men and women in the labor force is higher in rural areas than in urban areas.
In particular, the participation of the male labor force in rural areas is 69.1 percent, which is 5.8 percentage points higher than in urban areas (Table 10.1).
TABLE 10.1 LABOR FORCE PARTICIPATION LEVEL, BY URBAN AND RURAL AREAS, 2020
Total Urban RuralTotal Male Female Total Male Female Total Male Female
Labor force 59.7 65.3 54.6 58.2 63.3 53.6 63.0 69.1 56.6Population outside labor force
40.3 34.7 45.4 41.8 36.7 46.4 37.0 30.9 43.4
The level of labor force participation in aimags is higher compared to the national level. In particular, Bayankhongor has the highest or 67.7 percent, Umnugovi has 65.7 percent, Dundgovi has 65.6 percent, Arkhangai has 65.4 percent, Gobi-Altai has 65.3 percent, Sukhbaatar has 65.2 percent, and Bayan-Ulgii has the lowest with 48.7 percent (Figure 10.3).

137
CHAPTER 10EMPLOYMENT
FIGURE 10.3. LABOR FORCE PARTICIPATION LEVEL, BY PERCENTAGE, AIMAG AND CAPITAL, 2020
Labor force participation rate, %Up to 50.050.0-54.9
55.0-59.9
60.0-64.965.0 and above
Map with a scale of 1:9 000 000
The increase in the labor force participation rate compared to the previous census is caused from the increase in the labor force participation rate in all age groups of 25 and above, especially among female population. (Figure 10.4).
FIGURE 10.4. LABOR PARTICIPATION LEVEL, BY PERCENTAGE, AGE GROUP, SEX, 2020
0.0
20.0
40.0
60.0
80.0
100.0
15-19 20-24 25-29 30-34 35-39 40-44 45-49 50-54 55-59 60+
Эрэгтэй ЭмэгтэйMale Female
There are significant differences in the age groups of the labor force. The level of male labor force is higher than female in all age groups. Women of age group 20-34 is 9.0-13.3 percentage points higher, which is due to the fact that there are more women studying the universities and colleges of that age group. The labor force participation is highest among the age group 25-44, with 81.8-84.2 percent for men and 72.1-78.5 percent for women. Especially in the 40-49 age group, the gender gap in labor force participation is the smallest, indicating the highest economically active population in this age group. However, the sharp decline in women's economic activity at the age of 55 and above is caused from retirement at the age of 55 (Table 10.2)

138
2020 POPULATION AND HOUSING CENSUS OF MONGOLIA NATIONAL REPORT
TABLE 10.2 PERCENTAGE DISTRIBUTION OF POPULATION AGED 15 AND ABOVE BY EMPLOYMENT STATUS, AGE GROUP, SEX, OCCUPATION RATE, 2020
Age group
Labor force Population outside labor force
Total Male Female Total Male Femalethous. person % thous.
person % thous. person % thous.
person % thous. person % thous.
person %
TOTAL 1296.8 59.7 686.2 65.3 610.6 54.6 873.8 40.3 365.4 34.7 508.4 45.415-19 16.6 7.7 12.2 11.0 4.5 4.2 200.2 92.3 98.0 89.0 102.2 95.820-24 100.0 44.4 57.8 51.0 42.2 37.7 125.4 55.6 55.5 49.0 69.9 62.325-29 189.5 73.1 101.9 78.3 87.6 67.9 69.7 26.9 28.2 21.7 41.5 32.130-34 230.6 80.4 121.9 84.9 108.8 75.9 56.2 19.6 21.6 15.1 34.6 24.135-39 194.1 80.9 101.3 84.6 92.8 77.2 45.7 19.1 18.4 15.4 27.3 22.840-44 175.9 81.7 88.8 83.7 87.1 79.8 39.3 18.3 17.4 16.3 22.0 20.245-49 154.8 80.8 75.9 81.5 78.9 80.1 36.8 19.2 17.3 18.5 19.6 19.950-54 121.1 74.5 59.1 77.5 62.0 71.9 41.4 25.5 17.1 22.5 24.2 28.155-59 75.4 53.4 43.6 67.8 31.8 41.3 65.8 46.6 20.7 32.2 45.2 58.760+ 38.8 25.2 23.8 25.0 15.0 10.9 193.3 83.3 71.3 75.0 122.0 89.1
Explanation: *Percentage of the age group to the population
LABOR FORCEAs Explanationd above, a person who had been employed for at least one hour in a week prior to the
census, and who was looking for a job was included in the labor force. Because we define employment in a short period of time, we use the term labor force based on UN recommendations.
According to the census, the enumerator considered participants ‘employed’ if that person did not terminate his/her employment contract with the business entity or organization. In other words, if the census participant was not employed in the week prior to the census, his or her employment was determined in accordance with the revised employment methodology in order to accurately determine his or her employment.
The census questionnaire identified the main reasons for not being employed, as well as whether there had been any attempts to seek paid employment (running a business) in the last 30 days. Job seekers were those who were unemployed in the week before the census, and those who were registered or unregistered by the Department of Labor and Welfare and were actively looking for job were identified as unemployed.
FIGURE 10.5. EMPLOYMENT STATUS BY PERCENTAGE, 2020
40.3
53.8
5.9
Ажиллах хүчнээс гадуурх хүн ам
Ажил эрхлэгчид
Ажилгүйчүүд
Population outside of labor force
Employed
Unemployed

139
CHAPTER 10EMPLOYMENT
The share of the unemployed people in the population aged 15 and above has decreased by 2.7 percentage points over the past 10 years to 5.9 percent. Although the unemployment rate has declined, the next sub-chapter describes how the unemployment rate has been changed.
EMPLOYED POPULATIONThis section provides occupational areas of all employed population, the main activities and
mandates of organizations and employment status.
TABLE 10.3. PERCENTAGE DISTRIBUTION OF EMPLOYED POPULATION BY SEX, 2010, 2020
Gender2010 2020
2020/2010%thous. person percent* thous. person percent*
TOTAL 911.7 47.8 1 167.9 53.8 128.1Male 495.1 52.8 617.4 58.7 124.7Female 416.6 43.0 550.5 49.2 132.1
Explanation: Percentage of population aged 15 and above
The employed population has increased by 28.1 percent since 2010. In terms of gender, the percentage of women is higher than that of men. However, the classification by location differs significantly (Table 10.4).
TABLE 10.4. PERCENTAGE DISTRIBUTION OF EMPLOYED POPULATION AGED 15 AND ABOVE BY SEX, URBAN AND RURAL AREAS, 2020
GenderTotal Urban Rural
thous. person percent* thous.
person percent* thous. person percent*
TOTAL 1 167.9 53.8 740.0 50.5 427.9 60.6Male 617.4 58.7 378.6 54.7 238.8 66.5Female 550.5 49.2 361.4 46.8 189.1 54.6
Explanation: Percentage of population aged 15 and older
Nationwide, 53.8 percent of the population aged 15 and above are employed, compared to 60.6 percent in rural areas, which is 10.1 percentage points higher than in urban areas. The rural population is declining from year to year and they are mainly engaged in livestock husbandry, which makes the share of employed people higher in rural than urban areas. In rural area, women's employment is 7.8 percentage points higher than urban employment percentage, while men's employment is 11.8 percentage points higher. Although the gap has narrowed since the 2010 census, the city's employment rate shows that thousands of people seeking employment in urban areas are still unable to find employment (Table 10.4).
TABLE 10.5. EMPLOYED POPULATION AGED 15 AND ABOVE, BY AGE GROUP, SEX, 2010, 2020 /by thousand people/
Age group2010 2020
2020/2010%Total Male Female Total Male Female
TOTAL 911.7 495.1 416.6 1 167.9 617.4 550.5 128.115-19 25.6 18.7 6.9 15.9 11.7 4.2 62.020-24 122.9 72.7 50.2 93.7 54.4 39.3 76.325-34 300.6 163.8 136.7 379.4 201.9 177.6 126.235-44 255.9 129.1 126.8 330.8 168.4 162.4 129.345-54 169.1 85.4 83.7 245.2 119.4 125.8 145.055-59 25.0 16.9 8.1 65.0 38.5 26.5 259.960+ 12.6 8.5 4.1 38.0 23.2 14.8 301.3

140
2020 POPULATION AND HOUSING CENSUS OF MONGOLIA NATIONAL REPORT
An interesting analysis can be made from the table above. The number of employed population aged 15-24 decreased from 2010, while the number of population aged 45-59 increased sharply, which may be related to the increase in youth school enrollment from the previous census. Also, for population aged 45-59, this group may not be interested in changing jobs and may be interested in a stable employment.
TABLE 10.6. PERCANTAGE DISTRIBUTION OF POPULATION AGED 15 AND ABOVE, OCCUPATIONAL CLASSIFICATION, AND SEX, 2020
OccupationThous.person Percentage
Total Male Female Total Male FemaleTOTAL 1 167.9 617.4 550.5 100.0 100.0 100.0Manager 117.6 59.8 57.8 10.1 9.7 10.5Specialist 231.7 83.2 148.5 19.8 13.5 27.0Technician and associate professional 49.5 25.0 24.5 4.2 4.0 4.5Clerical and support staff 42.8 13.6 29.2 3.7 2.2 5.3Trade and service staff 139.7 50.1 89.6 12.0 8.1 16.3Skilled agricultural, forestry and fishing workers 279.6 165.8 113.8 23.9 26.8 20.7Manufacturing, construction, handicrafts, other related trades/service 89.5 62.9 26.6 7.7 10.2 4.8
Machinery and equipment operators and assemblers 94.5 85.7 8.8 8.1 13.9 1.6Common professionals 100.5 52.3 48.2 8.6 8.5 8.7Armed force professionals 22.6 19.1 3.5 1.9 3.1 0.6
TABLE 10.7. PERCANTAGE DISTRIBUTION OF POPULATION AGED 15 AND ABOVE, BY OCCUPATIONAL CLASSIFICATION AND SEX, 2020
OccupationThous.person Percentage
Total Male Female Total Male FemaleTOTAL 1167.9 617.4 550.5 100.0 52.9 47.1Manager 117.6 59.8 57.8 100.0 50.8 49.2Specialist 231.7 83.2 148.5 100.0 35.9 64.1Technician and associate professional 49.5 25.0 24.5 100.0 50.4 49.6Clerical and support staff 42.8 13.6 29.2 100.0 31.8 68.2Trade and service staff 139.7 50.1 89.6 100.0 35.9 64.1Skilled agricultural, forestry and fishing workers 279.6 165.8 113.8 100.0 59.3 40.7
Manufacturing, construction, handicrafts, other related trades/service workers 89.5 62.9 26.6 100.0 70.3 29.7
Machinery and equipment operators and assemblers 94.5 85.7 8.8 100.0 90.7 9.3
Common professionals 100.5 52.3 48.2 100.0 52.1 47.9Armed force professionals 22.6 19.1 3.5 100.0 84.6 15.4
epending on the occupational classification of the population, there is a gender difference in each category. The occupations of Manager, Technician and associate professional, and common professionals have the smallest gender differences. Men make up more than 70 percent of machinery, equipment operators, assemblers, armed forces and manufacturing, construction, handicrafts, and related trades/services. However, 6 out of 10 people working as Specialist, Clerical and support staff and Trade and service are women.
98.6 percent of the employed population has some level of education, 98.3 percent of men and 99.0 percent of women have education. 30.9 percent of employed men have Higher education and 48.5 percent of women have Higher education, indicating that women predominate among those with Higher

141
CHAPTER 10EMPLOYMENT
education. According to the previous census, the education of female employed population was higher than that of men, but women were less represented at the managerial level, while in 2020 the share of women Managers increased by 6.1 percentage points compared to the previous census. However, men working as Technicians and and associate professionals have an increase of 12.3 percentage points from the previous census indicates that the gender gap is narrowing in this type of occupational area (Table 10.7).
The census identified main activities and mandates of organizations at which the employed population work. The classification of economic activity sectors is divided into organizations that fall under all types of property and non-profit organizations, governmental organizations, civil society organizations and religious organizations that serve the public, as well as private businesses. This classification is used for various purposes, such as GDP estimates and labor force surveys.
TABLE 10.8. PERCENTAGE DISTRIBUTION OF EMPLOYED POPULATION AGED 15 AND ABOVE, ECONOMIC ACTIVITY
Industrial classification of economic activities
Thous.person PercentageTotal Male Female Total Male Female
TOTAL 1 167.9 617.4 550.5 100.0 100.0 100.0Agriculture, Hunting and Forestry 286.3 169.1 117.2 24.5 27.4 21.3Mining and quarrying 51.3 41.0 10.3 4.4 6.6 1.9Manufacturing 90.5 45.8 44.7 7.7 7.4 8.1Electricity, gas and water supply 16.6 12.1 4.5 1.4 2.0 0.8Water supply, sewerage, waste management and remediation activities 7.9 4.4 3.4 0.7 0.7 0.6
Construction 68.1 51.8 16.3 5.8 8.4 3.0Wholesale and retail trade; repair of motor vehicles and motorcycles 142.2 68 74.2 12.2 11.0 13.5
Transportation and storage 58.1 45.4 12.7 5.0 7.4 2.3Accommodation and food service activities 27.1 7.9 19.3 2.3 1.3 3.5Information and communication 17.7 9.4 8.3 1.5 1.5 1.5Financial and insurance activities 31.0 11.0 20.0 2.7 1.8 3.6Real estate activities 4.5 2.2 2.4 0.4 0.4 0.4Professional, scientific and technical activities 22.8 11.3 11.5 2.0 1.8 2.1
Administrative and support service activities 24.7 15.4 9.3 2.1 2.5 1.7
Public administration and defense; compulsory social security 94.2 57.2 37.0 8.1 9.3 6.7
Education 115.1 27.1 88.0 9.9 4.4 16.0Human health and social work activities 50.7 9.4 41.2 4.3 1.5 7.5Arts, entertainment and recreation 10.5 5.2 5.3 0.9 0.8 0.9Other service activities 44.9 21.7 23.2 3.8 3.5 4.2Activities of households as employers; undifferentiated goods- and services-producing activities of households for own use
2.1 1.2 1.0 0.2 0.2 0.2
Activities of extraterritorial organizations and bodies 1.8 0.8 0.9 0.1 0.1 0.2
24.5 percent of the population works in agriculture, hunting, forestry and fishing, which is the highest among other sectors. The gender distribution of the employed population varies significantly depending on the specifics of the economic sector. For instance, more than 73 percent of workers in

142
2020 POPULATION AND HOUSING CENSUS OF MONGOLIA NATIONAL REPORT
mining, quarrying, transportation, warehousing, construction, electricity, gas, steam, and ventilation are men, while more than 71 percent of health, social welfare, education, hotels, housing, and public utilities workers are women (Table 10.9).
TABLE 10.9. PERCENTAGE DISTRIBUTION OF POPULATION AGED 15 AND OLDER, ECONOMIC ACTIVITY SECTOR, 2020
Industrial classification of economic activities
Thous.person PercentageTotal Male Female Total Male Female
TOTAL 1 167.9 617.4 550.5 100.0 52.9 47.1Agriculture, Hunting and Forestry 286.3 169.1 117.2 100.0 59.1 40.9Mining and quarrying 51.3 41.0 10.3 100.0 80.0 20.0Manufacturing 90.5 45.8 44.7 100.0 50.6 49.4Electricity, gas and water supply 16.6 12.1 4.5 100.0 73.0 27.0Water supply, sewerage, waste management and remediation activities 7.9 4.4 3.4 100.0 56.3 43.7
Construction 68.1 51.8 16.3 100.0 76.0 24.0Wholesale and retail trade; repair of motor vehicles and motorcycles 142.2 68 74.2 100.0 47.8 52.2
Transportation and storage 58.1 45.4 12.7 100.0 78.2 21.8Accommodation and food service activities 27.1 7.9 19.3 100.0 29.0 71.0Information and communication 17.7 9.4 8.3 100.0 53.1 46.9Financial and insurance activities 31.0 11.0 20.0 100.0 35.5 64.5Real estate activities 4.5 2.2 2.4 100.0 47.6 52.4Professional, scientific and technical activities 22.8 11.3 11.5 100.0 49.7 50.3
Administrative and support service activities 24.7 15.4 9.3 100.0 62.4 37.6Public administration and defense; compulsory social security 94.2 57.2 37.0 100.0 60.7 39.3
Education 115.1 27.1 88.0 100.0 23.6 76.4Human health and social work activities 50.7 9.4 41.2 100.0 18.6 81.4Arts, entertainment and recreation 10.5 5.2 5.3 100.0 49.3 50.7Other service activities 44.9 21.7 23.2 100.0 48.4 51.6Activities of households as employers; undifferentiated goods- and services-producing activities of households for own use
2.1 1.2 1.0 100.0 54.8 45.2
Activities of extraterritorial organizations and bodies 1.8 0.8 0.9 100.0 46.1 53.9
In terms of urban and rural economic activity, the urban population has a high share of workers in the wholesale and retail trade, motorcycle repair and maintenance, education, manufacturing, public administration, defense, and compulsory social security. However, the sector is relatively evenly distributed, not overly concentrated in the same sector as rural areas. In other words, 60.3 percent of those employed in agriculture, forestry, fishing, and hunting are rural workers, followed by education, public administration, defense, and compulsory social security shows the processing industry in rural areas is underdeveloped. (Table 10.10).

143
CHAPTER 10EMPLOYMENT
TABLE 10.10. PERCENTAGE DISTRIBUTION POPULATION AGED 15 AND ABOVE BY ECONOMIC ACTIVITY SECTOR, URBAN AND RURAL AREAS, 2020
Industrial classification of economic activitiesUrban Rural
thous.person Percentage thous.
person Percentage
TOTAL 740.0 100.0 427.9 100.0Agriculture, Hunting and Forestry 28.3 3.8 258.0 60.3Mining and quarrying 37.7 5.1 13.6 3.2Manufacturing 73.6 9.9 16.9 4.0Electricity, gas and water supply 13.7 1.8 2.9 0.7Water supply, sewerage, waste management and remediation activities 6.8 0.9 1.0 0.2
Construction 59.0 8.0 9.1 2.1Wholesale and retail trade; repair of motor vehicles and motorcycles 123.0 16.6 19.1 4.5
Transportation and storage 50.0 6.8 8.1 1.9Accommodation and food service activities 22.7 3.1 4.5 1.0Information and communication 15.9 2.2 1.8 0.4Financial and insurance activities 25.9 3.5 5.1 1.2Real estate activities 4.2 0.6 0.3 0.1Professional, scientific and technical activities 19.1 2.6 3.7 0.9Administrative and support service activities 21.4 2.9 3.3 0.8Public administration and defense; compulsory social security 69.8 9.4 24.3 5.7
Education 80.3 10.9 34.8 8.1Human health and social work activities 38.9 5.3 11.7 2.7Arts, entertainment and recreation 7.7 1.0 2.7 0.6Other service activities 38.6 5.2 6.3 1.5Activities of households as employers; undifferentiated goods- and services-producing activities of households for own use
1.7 0.2 0.4 0.1
Activities of extraterritorial organizations and bodies 1.6 0.2 0.2 0.0
The next important indicator used in labor force and employment survey is employment status. This indicator is essential because it determines the roles of the census participants and the duties and responsibilities at the organization, the contract signed, authority, power and accountability within the position.
The 19th International Conference of Labor Statisticians reaffirmed the employment status, and the revised employment status was used in the Population and Housing Census2020. The two different employment statuses in the 2010 and 2020 censuses were used and compared as follows. These include:

144
2020 POPULATION AND HOUSING CENSUS OF MONGOLIA NATIONAL REPORT
FIGURE 10.6. COMPARISON OF OLD AND NEW EMPLOYMENT STATUS
Employees
Permanent employees - 1
Fixed-term employees – 2
Short-term and casual employees– 3
Paid apprentices, trainees and interns- 4
Ажил олгогчEmployersEmployer in corporations -6
Employer in household market enterprises- 7
Self-Employed
Owner-operators of corporations without employees- 8Own-account workers in household market enterprises without employees- 9
Dependent contractor- 5
Members of cooperatives Owner-operators of corporations without employees- - 8
Farm and agriculture
Employer in household market enterprises- - 7
Own-account workers in household market enterprises without employees- - 9Contributing family workers – 10
Contributing family members without any payment Contributing family workers – 10
OLD STATUS NEW STATUS

145
CHAPTER 10EMPLOYMENT
TABLE 10.11. PERCENTAGE DISTRIBUTION OF EMPLOYED POPULATION BY EMPLOYMENT STATUS AND SEX, 2010, 2020
Total Male Female
2010TOTAL 100.0 100.0 100.0Paid worker 56.2 53.6 59.3Employer 2.5 3.1 1.8Self-employed 27.7 37.7 15.9Partnership or cooperative member 0.2 0.2 0.2Unpaid worker in household production and services 12.9 4.9 22.5Other 0.5 0.5 0.3
2020TOTAL 100.0 100.0 100.0Permanent paid worker 59.6 55.3 64.4Temporary paid worker 6.4 7.0 5.9Casual paid worker 0.9 1.2 0.6Paid apprentice, intern 0.0 0.0 0.0Sub-Constructor 0.5 0.7 0.2Business entity employer 0.4 0.5 0.3Market-oriented household business employer 0.2 0.2 0.2Business entity owner with no paid worker 0.3 0.3 0.3Market-oriented household business employer with no paid worker 25.8 32.3 18.5Contributing family member 5.9 2.5 9.6
The population employment status has been changed significantly over the past 10 years. In 2020, paid worker accounts for 66.9 percent of the total employed population, an increase of 10.7 percentage points from 2010. The share of employers decreased by 1.9 percentage points to 0.6 compared to the previous census, and the share of self-employed decreased by 1.1 percentage points to 26.6. An increase in the share of paid workers is contributing to the increased occupational health and safety, social welfare, and full access to employment, but a decrease in the proportion of self-employed and employers may indicate that production and services industry is not being scaled up (Table 10.11).
THE UNEMPLOYMENTThe number of unemployed population nationwide in 2020 was 128.9 thousand, which is a decrease
of 21.5 percent from 2010. During this period, the Mongolian labor force expanded by 256.3 thousand people. Unemployment in 2020 decreased by 5.4 percentage points from 2010, including 3.3 percentage points in urban areas and 9.3 percentage points in rural areas. Unemployment rate is higher among men due to the fact that the number of unemployed men is higher than that of women. This is mainly caused from the fact that men have a lower level of education than women.

146
2020 POPULATION AND HOUSING CENSUS OF MONGOLIA NATIONAL REPORT
TABLE 10.12. UNEMPLOYED POPULATION, UNEMPLOYMENT RATE By sex, URBAN AND RURAL AREAS, 2010, 2020
GenderTotal Urban Rural
Thous.person Unemployment rate Thous.person Unemployment rate Thous.person Unemployment
rate2010
TOTAL 164.1 15.3 114.6 16.5 49.5 13.0Male 95.0 16.1 65.9 17.7 29.1 13.4Female 69.1 14.2 48.7 15.0 20.4 12.6
2020TOTAL 128.9 9.9 112.4 13.2 16.4 3.7Male 68.7 10.0 59.5 13.6 9.2 3.7Female 60.1 9.8 52.9 12.8 7.2 3.7
In general, the unemployment rate is higher in urban areas and low in rural areas. This is caused, on the one hand, from high level of migration in-flow to the urban areas, on the other hand, to the lack of employment opportunities for those who migrated
Comparing the unemployment rate by aimags and the capital city, the highest unemployment rate is in Dornod aimag at 20.8 percent, Bayan-Ulgii aimag at 15.2 percent, and Ulaanbaatar at 14.5 percent, which is 4.6-10.9 percentage points higher than the national average. In Tuv aimag, the unemployment rate is the lowest at 2.6 percent.
FIGURE 10.7. UNEMPLOYMENT RATE BY AIMAG, THE CAPITAL CITY, 2020
Map with a scale of 1:9 000 000
Unemployment rate, %
1.0-4.9
5.0-9.9
10.0-14.9
15.0-19.9
20.0 and above
Among the unemployed population nationwide, there are 63.0 thousand youth aged 30-44, which is 49.1 percent of the total unemployed population. In other words, unemployment is highest among population aged 30-44. The unemployment rate for women aged 15-24 is higher than men because high number of women in this age group prefers to study at this age. Therefore, the reason for unemployment rate is higher in age group 55 and over is due to the fact that they retire at the age of 55. The male population aged 30s and above are more susceptible to unemployment.

147
CHAPTER 10EMPLOYMENT
FIGURE 10.8. UNEMPLOYMENT RATE, BY AGE GROUP, SEX, 2020
0.0
5.0
10.0
15.0
20.0
15-19 20-24 25-29 30-34 35-39 40-44 45-49 50-54 55-59 60+
Эрэгтэй Эмэгтэй
Over the past 10 years, the unemployment rate has dropped by 5.4 percentage points nationwide. By age group, it decreased by 19.1 percentage points between the ages of 15 and 24. This is caused from an increase in school enrollment of this age group by 13.4-24.7 percentage points compared to the previous census. However, the increase in the unemployment rate for those aged 45 and over may be due to the fact that employers set age limits for new positions, as well as insufficient conducive policies and programs are in place to support the employment of this age group.
POPULATION OUTSIDE LABOR FORCE Unemployed population aged 15 and above were asked for reasons why they were not working. The
unemployed population includes the full-time students aged 15 and above at all levels of educational institution, the working age people with disabilities who lost their abilities permanently and partially, family members taking care of children, the elderly and the sick, and population unable to work because of the nature of their family members` work. The classification of not finding a suitable job includes “those who want to work, are ready to work, have not been actively looking for a job in the week before the census because lost confidence in finding a suitable job or do not know where to look for a suitable job”.
TABLE 10.13. POPULATION OUTSIDE THE LABOR FORCE AGED 15 AND ABOVE, BY REASONS FOR UNEMPLOYMENT, SEX, /thousand people/, 2010, 2020
Reasons for unemployment
2010 2020 2020/ 2010%Total Male Female Total Male Female
TOTAL 830.3 347.1 483.2 873.8 365.4 508.4 105.2Student 300.5 136.7 163.8 327.2 151.8 175.5 108.9Retired 191.9 65.7 126.2 236.4 75.6 160.9 123.2Disabled 55.9 31.3 24.6 45.7 25.4 20.2 81.7Engagement in household duties 108.4 12.1 96.3 92.5 10.9 81.6 85.3
Unable to find suitable job 121.6 71.9 49.7 103.7 62.3 41.4 85.3
Unwilling to work 3.3 2.3 1.0 3.7 2.6 1.1 111.3Others 48.7 27.1 21.6 64.6 36.8 27.9 132.7
FemaleMale

148
2020 POPULATION AND HOUSING CENSUS OF MONGOLIA NATIONAL REPORT
Six out of 10 people outside the labor force are women. At the national level, the total population outside the labor force was 873.8 thousand which was an increase of 5.2 percent from the previous census, including an increase of 11.3 percent in the population unwilling to work and 8.9 percent in school attendance. However, the percentage of population who are unable to work, have engagement in household in duties and or who cannot find a suitable job decreased by 14.7-18.3 percent. In particular, the number of women unemployed due to engagement in household duties has decreased by 15.3 percent ever since 2010. Although the number of housewives decreased from the previous census, engagement in household duties remains the main reason for women not to be in the laborforce (Table 10.13).
TABLE 10.14. POPULATION AGED 15 AND ABOVE OUTSIDE LABORFORCE BY AGE GROUP, UNEMPLOYMENT REASON, 2020
Age groupTotal/thous.
person/
Population outside labor force /Thous./
Student Retired DisableddEngagement in household
duties
Can’t find suitable job
Unwilling to work Others
TOTAL 873.8 315.6 236.4 46.3 96.2 107.8 3.8 67.815-19 200.2 191.1 - 0.9 1.9 2.6 0.1 3.620-24 125.4 94.0 - 2.1 8.7 12.4 0.3 7.925-34 125.9 27.5 - 7.4 36.7 33.8 0.9 19.635-44 85.0 2.6 0.7 10.8 27.3 26.0 1.0 16.645-54 78.2 0.3 9.1 14.7 15.9 23.4 1.0 13.855-59 65.8 0.1 41.6 7.1 4.4 7.8 0.3 4.560+ 193.3 0.1 185.1 3.2 1.2 1.8 0.1 1.8
There are 3.8 thousand people who are not interested in working, of which 1.9 thousand or 51.8 percent are aged 25-44, and 1.0 thousand or 27.4 percent are aged 45-54, which are critical challenges to be addressed.
98.0 percent of those who could not find a suitable job have a certain level of education, of which 19.0 percent have a Higher education, 4.6 percent have specialized secondary education and 6.0 percent have technical and vocational education. 98.5 percent of population engaged in household commitments have a certain level of education, of which 29.0 percent have Higher education, 4.8 percent have specialized secondary education, and 4.3 percent have technical and vocational education. 95.4 percent of all people who are not interested in working have a certain level of education, of which 11.5 percent have Higher education, 3.8 percent have specialized secondary education, and 3.5 percent have technical and vocational education.
40.3 percent of the population aged 15 and above are outside the labor force. If we add the number of unemployed to this figure, 46.2 percent of the total population or one in two people are unemployed. In addition, it is working doing detailed analysis for the reasons why 11.5-29.0 percent of population who cannot find suitable jobs, or have household commitments and are not interested in working have the Higher education.
YOUTH AGED 15-24 NOT IN EMPLOYMENT AND EDUCATIONUnemployed and out-of-school youth aged 15-24 represent the percentage of the population in that
age group. The indicator identifies youth who are out of the education system, who are not trained, or who are not working, and shows that youths’ access to the labor market than the youth unemployment rate. The proportion of youth aged 15-24 who are unemployed or out of school is one of the criteria for

149
CHAPTER 10EMPLOYMENT
achieving Sustainable Development Goal 8 (Promoting Sustained, inclusive and economic growth, and full productive employment, and decent work for all).
In Mongolia, 13.8 percent of the total population and 20.4 percent of the working age population are youth aged 15-24. This is an opportunity where a demographic window is opened with young age structure for leveraging the sufficient labor available and a conducive demographic environment to socio-economic development of the country.
FIGURE 10.9. POPULATION DISTRIBUTION OF AGE GROUP 15-24 NOT IN EMPLOYMENT AND EDUCATION BY PERCENTAGE AND SEX, 2020
12.5
11.9
12.2
Эмэгтэй
Эрэгтэй
БүгдTotal
Male
Female
12.2 percent of the population aged 15-24 are unemployed and out of school. This means that 1 in 8 working age youth is unemployed and not engaged in the education. In particular, the percentage of women aged 15-24 who are unemployed and out of school is 12.5, or 0.3 percentage points higher than the national average. In other words, it is crucial to pay more attention to the conducive demographic environment and availability of the working age population which are are currently not fully utilized.
FIGURE 10.10. POPULATION DISTRIBUTION OF AGE GROUP 15-24 NOT IN EMPLOYMENT AND EDUCATION BY EDUCATIONAL LEVEL, PERCENTAGE AND SEX, 2020
0.0
5.0
10.0
15.0
20.0
25.0
30.0
35.0
40.0
Non-educated Primary Lowersecondary
Uppersecondary
Technical andvocational
Specializedsecondary
Higher
94.7 percent of unemployed and out-of-school youth aged 15-24 have a certain level of education, of which 24.1 percent have higher education and 11.4 percent have technical and vocational and specialized secondary education. In particular, 32.8 percent of unemployed and out-of-school women and 15.2 percent of men of this age group have completed higher education.
Male Female Total


MONGOLIAN CITIZENS RESIDING ABROAD
11CHAPTER


153
CHAPTER 11MONGOLIAN CITIZENS RESIDING ABROAD
NUMBER OF MONGOLIAN CITIZENS RESIDING ABROAD FOR 6 MONTHS OR MOREMongolia's transition to a market economy has led to an increase in the population outflow to
other nations. The article of constitution of Mongolia: “The citizens of Mongolia shall be guaranteed the privilege to enjoy the right to freedom of movement within the country and freedom to choose the place of one’s residence, right to travel or reside abroad, and to return to home country”, forms a legal basis for citizens to travel, study, work and return to the country at any time.
The Law on the National Population and Housing Census articulates collection of reliable data on citizens living, working, or studing abroad for six months or more.
The number of citizens traveling abroad is constantly increasing due to many reasons, such as education, employment, livehood support, running a business, getting health care, and getting married. In order to address the lack of registration and official data, the Ministry of Foreign Affairs and the National Statistics Office jointly developed and introduced a registration form and an electronic system www.citizen.gov.mn for Mongolian citizens residing abroad in the third quarter of 2018. However, data on Mongolian citizens living abroad for this census was compiled from by aligning the databases of the General Agency for Border Protection (GASP) and the General State Registration Agency (GASR) and the integrated database on population and household along with data collected through the household census questionnaires because of some logistical arrangements in application of this system such as communications aspect to citizens, activating registration, and ensuring stable use of the system. The census data collection was carried out by asking family members of citizens residing abroad in Mongolia and, on the other hand, citizens living abroad took part in the census online using ) voluntarily.
During the data processing, the data of citizens living abroad for 6 months or more was analyzed carefully by aligning it with the line organizations database. In particular, approximately 30,000 citizens became citizens of other nations, of which 29,000 became citizens of the Republic of Kazakhstan.
NUMBER, AGE AND GENDER STRUCTURE OF MONGOLIAN CITIZENS LIVING ABROAD
According to the results of the Population and Housing Census 2020, there were 122,301 citizens residing abroad which was an increase of 14.2 percent from 2010. Looking at the age structure of citizens residing abroad, the population aged 0-14 is 12.7 percent, those aged 15-44 are 72.3 percent, those aged 45-64 are 14.4 percent, and the population aged 65 and over is 0.6 percent. In other words, 9 out of 10 citizens residing abroad for a long time are of the working age population (Table 11.1)

154
2020 POPULATION AND HOUSING CENSUS OF MONGOLIA NATIONAL REPORT
TABLE 11.1 NUMBER OF MONGOLIAN CITIZENS RESIDING ABROAD BY AGE GROUP AND SEX, 2010, 2020
Age group
2010 20202010-2020%Total Male Female Sex ratio Total Male Female Sex ratio
TOTAL 107 140 49 955 57 185 87.4 122 301 56 655 65 646 86.3 114.20-4 4 598 2 309 2 289 100.9 3 509 1 781 1 728 103.1 76.35-9 3 171 1 595 1 576 101.0 6 272 3 216 3 056 105.2 197.810-14 3 535 1 771 1 764 100.2 5 755 3 003 2 752 109.1 162.815-19 9 176 4 420 4 756 93.0 7 262 3 782 3 480 108.7 79.120-24 20 400 10 164 10 236 99.3 16 060 8 484 7 576 112.0 78.725-29 20 739 10 161 10 578 96.1 19 954 10 155 9 799 103.6 96.230-34 16 855 7 500 9 355 80.1 19 820 9 507 10 313 92.2 117.635-39 13 343 5 797 7 546 76.8 14 176 6 102 8 074 75.6 106.240-44 7 930 3 380 4 550 74.3 11 083 4 221 6 862 61.5 139.845-49 4 168 1 628 2 540 64.1 8 798 3 112 5 686 54.7 2.1*50-54 1 883 742 1 141 65.1 5 140 1 769 3 371 52.5 2.7*55-59 709 269 440 61.1 2 647 902 1 745 51.7 3.7*60-64 304 117 187 62.6 1 080 365 715 51.0 3.6*65-69 162 54 108 50.0 396 149 247 60.3 2.4*70+ 167 48 119 48.1 349 107 242 44.2 2.1*
Explanation: * Times more
The age and gender pyramid of the citizens residing abroad shows that the majority of the citizens residing abroad are of working age (Figure 11.1). Compared to the 2010 age structure, the number of children aged 0-14 has almost doubled due to the fact that the family has been residing abroad for a long time for study or self-employment.
FIGURE 11.1. THE AGE AND GENDER PYRAMID OF CITIZENS RESIDING ABROAD, 2010, 2020
0 4000 8000 12000
20202010
ЭМЭГТЭЙ
04000800012000
0-45-910-1415-1920-2425-2930-3435-3940-4445-4950-5455-5960-6465-6970+
20202010
ЭРЭГТЭЙMale Female

155
CHAPTER 11MONGOLIAN CITIZENS RESIDING ABROAD
The sex ratio or a man per 100 women ratio stands at 86.3 percent (46.3 percent men and 53.7 percent women), indicates that the number of women living abroad is higher than the number of men however it is a decrease of 1.1 percentage points compared to 2010. The sex ratio declined with as the age group increases, and has been declined significantly from the age of 35. The majority of citizens aged 0-29 are men, while the working age group and the elderly are mostly women.
FIGURE 11.2. NUMBER AND SEX RATIO OF CITIZENS RESIDING ABROAD, 2010, 2020, / thousand people /
127.6
79.9
107.1
71.0
44.4
99.6
75.2
90.7
97.383.2 80.1 82.5
55.6
85.1
98.9
0.0
5.0
10.0
15.0
20.0
25.0
30.0
35.0
40.0
45.0
Korea USA Japan Kazakhstan Czech Australia China Germany France Russia
Sex
ratio
Num
ber o
f citi
zens
resi
ding
abr
oad
2010 2020 2010 2020
However, the sex ratio of citizens residing abroad varies from country to country. In particular, in the Republic of Korea, which has the largest Mongolian citizens, the sex ratio was 127.6 in 2010, 99.6 in 2020, and from 96.2 to 98.9 in the Russian Federation, from 79.9 to 90.7 in Japan in 2010 and in 2020 respectively. (Figure 11.2).
FIGURE 11.3. MONGOLIAN CITIZENS ABROAD, BY AIMAG AND THE CAPITAL CITY OF PERMANENT RESIDENCE, 2020
74.5 percent of citizens went abroad are from Ulaanbaatar, 4.3 percent from Bayan-Ulgii, 4.2 percent from Darkhan-Uul, and 3.4 percent from Orkhon aimag (Figure 11.3).

156
2020 POPULATION AND HOUSING CENSUS OF MONGOLIA NATIONAL REPORT
TABLE 11.2 MONGOLIAN CITIZENS RESIDING ABROAD, BY AIMAG AND THE CAPITAL CITY OF PERMANENT RESIDENCE, PERCENTAGE, 2020
Aimags and the Capital2010 2020
2020/2010%Numbers Percentage Numbers Percentage
TOTAL 107 140 100.0 122 301 100.0 114.2Arkhangai 505 0.5 740 0.6 146.5Bayan-Ulgii 2 824 2.6 5 250 4.3 185.9Bayankhongor 395 0.4 679 0.6 171.9Bulgan 588 0.6 792 0.6 134.7Govi-Altai 368 0.3 336 0.3 91.3Dornogovi 682 0.6 1 376 1.1 2.0*Dornod 679 0.6 826 0.7 121.6Dundgovi 277 0.3 429 0.4 154.9Zavkhan 557 0.5 547 0.4 98.2Uvurkhangai 870 0.8 1 013 0.8 116.4Umnugovi 459 0.4 594 0.5 129.4Sukhbaatar 243 0.2 390 0.3 160.5Selenge 1 780 1.7 2 553 2.1 143.4Tuv 1 330 1.2 1 968 1.6 148.0Uvs 422 0.4 465 0.4 110.2Khovd 617 0.6 1 758 1.4 2.8*Khuvsgul 593 0.6 933 0.8 157.3Khentii 476 0.5 718 0.6 150.8Darkhan-Uul 3 978 3.7 5 141 4.2 129.2Orkhon 3 581 3.3 4 113 3.4 114.9Govisumber 158 0.2 512 0.4 3.2*Ulaanbaatar 85 758 80.0 91 168 74.5 106.3
Explanation: * Times more
Compared to the 2010 census, 3.2 times more citizens left Govisumber, 2.8 times more citizens left Khovd, and approximately twice as many citizens left Bayan-Ulgii and Dornogovi to reside abroad (Table 11.2).
However, the number of residents permanently residing abroad from Zavkhan and Govi-Altai decreased compared to the previous census.
TABLE 11.3. PERCENTAGE DISTRIBUTION OF MONGOLIAN CITIZENS RESIDING ABROAD BY AIMAG AND THE CAPITAL CITY OF PERMANENT RESIDENCE AND CURRENT RESIDENTIAL REGIONS, 2010, 2020
Region
2010 2020
Total America Asia,Pacific Europe Africa Total America Asia,
Pacific Europe Africa
TOTAL 100.0 18.4 49.0 31.3 1.3 100.0 17.0 58.8 23.9 0.3Ulaanbaatar 100.0 20.8 46.3 31.6 1.3 100.0 21.0 53.1 25.7 0.2Eastern 100.0 7.9 54.8 35.6 1.7 100.0 5.7 68.6 25.4 0.3Central 100.0 10.0 51.4 37.1 1.5 100.0 6.9 68.1 24.7 0.3Khangai 100.0 11.1 55.9 31.9 1.1 100.0 8.2 69.9 21.3 0.6Western 100.0 4.6 81.3 13.2 0.9 100.0 2.0 92.8 4.9 0.3

157
CHAPTER 11MONGOLIAN CITIZENS RESIDING ABROAD
Overall 58.8 percent lived in the Asia-Pacific region and 23.9 percent in the Europe of those counted abroad. In terms of Mongolia's regions, the trend is the same in all regions except the Western region. 92.8 percent of the population from the Western region lives in the Asia-Pacific region.
Compared to the 2010 census, the number of people living abroad increased by 9.8 percentage points in the Asia-Pacific region, decreased by 7.4 percentage points in the Europe, 1.3 percentage points in the Americas and 1 percentage point in Africa (Table 11.3).
The highest number of Mongolian citizens residing is in the Republic of Korea (39982), the United States (19170), Japan (8772), Kazakhstan (7218), the Czech Republic (5997), Australia (5538), and China (5146) respectively. (Figure. 11.4).
FIGURE 11.4. FIGURE 11.4. NUMBER OF MONGOLIAN CITIZENS RESIDING ABROAD, BY COUNTRY, 2020
More than 30 years have passed since Mongolians have begun to travel freely abroad. In terms of timeline of citizens`s stay abroad, 28.4 percent live up to 1 year, the majority or 41.7 percent live abroad for 2-5 years, 16.9 percent live for 6 years or more, and the remaining 13.0 percent live for 11 years or more. Among those living abroad for 11 years or more, it is higher in the European countries such as the United Kingdom, Ireland, Poland, Hungary and Germany. Most citizens in Russia, China, Japan and South Korea stay these destinations for up to a year. Approximately 50 percent of citizens living in India, Turkey, and Australia live for 2-5 years, and about 30 percent of citizens living in Kazakhstan, France, and Canada live for 6-10 years (Table 11.4).

158
2020 POPULATION AND HOUSING CENSUS OF MONGOLIA NATIONAL REPORT
TABLE 11.4 NUMBER OF CITIZENS RESIDING ABROAD BY COUNTRY OF RESIDENCE, DURATION, AND PERCENTAGE, 2020
Country of residence Number TotalResided duration
0-1 year 2-5 year 6-10 year Above 11 yearTOTAL 122 301 100.0 28.4 41.7 16.9 13.0South Korea 39 982 100.0 33.7 44.9 12.8 8.6USA 19 170 100.0 17.0 40.9 21.5 20.6Japan 8 772 100.0 38.9 41.3 10.7 9.1Kazakhstan 7 218 100.0 26.3 32.3 31.3 10.1Czech 5 997 100.0 24.1 40.5 16.3 19.1Australia 5 538 100.0 33.4 46.0 13.1 7.5China 5 146 100.0 42.1 42.3 9.6 6.0Germany 3 972 100.0 19.8 39.6 19.3 21.3Sweden 3 951 100.0 22.7 41.7 23.3 12.3France 3 102 100.0 14.6 35.8 29.5 20.1Russia 2 814 100.0 41.3 41.7 9.9 7.1Turkey 2 716 100.0 33.4 47.0 13.9 5.7Austria 1 676 100.0 20.3 41.8 21.7 16.2Switzerland 1 469 100.0 22.9 37.1 22.7 17.3England 1 466 100.0 10.9 34.5 23.2 31.4Hungary 1 341 100.0 30.9 32.7 14.9 21.5Canada 1 283 100.0 17.1 37.6 27.9 17.4India 744 100.0 31.5 52.1 9.7 6.7Poland 654 100.0 18.2 41.1 17.1 23.6Ireland 643 100.0 25.8 36.5 13.1 24.6Other 4 647 100.0 22.9 37.2 20.9 19.0
In this census, we used the traditional method for collecting data from 10 percent of the total households and asked the purpose of first trip abroad from the citizens residing abroad and the purpose of the residency at the moment of the census. According to this result, the majority of citizens living abroad or 46.7 percent went abroad to study for the first time.
At the time of the census, 25.1 percent of those planning to move abroad were going to study for the first time. At the time of the census, 19.8 percent of the self-employed went abroad to study. This shows that the majority of people who go abroad for study, work or other purposes tend to settle in the country (Table 11.5).
TABLE 11.5 NUMBER OF CITIZENS LIVING ABROAD BY COUNTRY OF RESIDENCE, RESIDENCE PURPOSE, PERCENTAGE, 2020
Country of Current Residence
Purpose of residency a moment of census
Total Education/Study Settlement Contractual
employment
Business/ Official
mission
Regular employment
Familyreason Other
TOTAL 100.0 100.0 100.0 100.0 100.0 100.0 100.0 100.0Education/Study 46.7 95.1 25.1 6.1 15.2 19.8 9.2 21.0Residence 7.2 0.5 51.4 0.7 2.8 1.4 2.0 3.2Employment contract 14.2 1.0 5.6 92.6 2.3 4.2 2.2 10.9
Business trip 2.3 0.1 1.0 0.1 76.5 0.6 0.4 1.7Self-Employment 15.2 0.8 7.2 0.2 1.8 71.0 3.2 10.2Family purpose 11.9 2.1 7.0 0.3 1.4 1.9 82.0 1.4Other 2.5 0.4 2.7 0.0 0.0 1.1 1.0 51.6

159
CHAPTER 11MONGOLIAN CITIZENS RESIDING ABROAD
According to the census, 34.2 percent of the total population is studying, 32.0 percent is self-employed (20.6 percent is self-employed, 10.4 percent is working under an employment contract, 1.0 percent is on a mission), 12.6 percent is living for family reasons, and 11.7 percent is settling and the remaining 9.5 percent left the country for other purposes. (Table 11.6).
According to the country of residence, India, Russia, China, Japan, Australia, Germany and Ireland have the largest number of students (35.1 percent of the total number of students), and Kazakhstan, Poland, the United Kingdom and the United States have the largest number of permanent or temporary residing citizens (54.8 percent of the total number of residing purpose), the largest number of people going to Korea, the Czech Republic and Hungary for employment (71.3 percent of total employment), the largest number of people going to Korea, the Czech Republic, Sweden, Turkey, Switzerland and Poland for self-employment (62.2 percent of all self-employed) (Table 11.6).
TABLE 11.6. MONGOLIAN CITIZENS RESIDING ABROAD BY RESIDENCE PURPOSE AT TIME OF THE CENSUS AND PERCENTAGE, 2020
Country of residence Number Percent Study Residence Employment
contractForeign mission
Self-employment
Familyreason Others
TOTAL 122 301 100.0 34.2 11.7 10.4 1.0 20.6 12.6 9.5South Korea 39 982 100.0 27.7 4.6 19.4 0.6 29.7 8.1 9.9USA 19 170 100.0 37.0 17.2 3.6 0.8 15.4 15.0 11.0Japan 8 772 100.0 49.1 8.1 8.6 1.5 13.8 11.7 7.2Kazakhstan 7 218 100.0 21.5 40.2 2.8 0.2 9.8 17.9 7.6Czech 5 997 100.0 19.6 10.7 19.8 1.0 25.1 15.9 7.9Australia 5 538 100.0 42.5 11.6 3.3 0.6 13.8 14.4 13.8China 5 146 100.0 62.0 5.5 4.7 1.2 11.5 8.9 6.2Germany 3 972 100.0 41.6 15.4 4.0 0.7 14.2 14.8 9.3Sweden 3 951 100.0 24.0 15.2 7.6 0.9 24.7 20.8 6.8France 3 102 100.0 27.2 14.9 4.4 0.8 18.5 22.5 11.7Russia 2 814 100.0 63.4 7.1 2.7 1.8 9.4 10.2 5.4Turkey 2 716 100.0 32.3 6.9 10.7 0.9 31.8 10.4 7.0Austria 1 676 100.0 36.4 11.8 4.7 0.6 17.8 16.3 12.4Switzerland 1 469 100.0 31.3 14.0 5.7 1.9 21.9 14.9 10.3England 1 466 100.0 33.1 19.2 2.9 0.5 15.1 18.1 11.1Hungary 1 341 100.0 33.9 10.8 15.1 1.2 19.6 11.8 7.6Canada 1 283 100.0 35.1 16.5 4.4 1.8 14.4 16.2 11.6India 744 100.0 82.5 2.8 1.4 0.8 3.6 6.9 2.0Poland 654 100.0 29.5 20.3 6.1 2.3 20.7 13.0 8.1Ireland 643 100.0 40.3 14.8 3.0 0.9 16.9 15.7 8.4Other 4 647 100.0 30.9 14.5 6.3 5.4 16.4 15.3 11.2

160
2020 POPULATION AND HOUSING CENSUS OF MONGOLIA NATIONAL REPORT
FIGURE 11.5. MONGOLIAN CITIZENS RESIDING ABROAD BY RESIDENCE PURPOSE AT THE TIME OF THE CENSUS AND PERCENTAGE, 2010, 2020
Percentage34%
Study12%
Residence10%
Employment contract
1%
Foreign mission21%
Self-employment13%
Family reason9%
School37.0%
Contractual Employment
19.1%Regular Employment
19.6%Business/
Official mission2.6%
Health0.7%
Other21.0%
Compared to the 2010 census, the percentage of people working abroad decreased by 8.7 percentage points, the percentage of people working for study purposes decreased by 2.8 percentage points, and the percentage of people working on business trips decreased by 1.6 percentage points (Figure 11.5).
TABLE 11.7. PERCENTAGE DISTRIBUTION OF AGE GROUPS BY RESIDENCE PURPOSES AT THE TIME OF THE CENSUS, 2020
Agegroup Total
Residency purpose at the time of census
Study Settlement Employmentcontract Mission Self-
Employment Family reason Others
TOTAL 100.0 100.0 100.0 100.0 100.0 100.0 100.0 100.00-4 2.9 0.7 2.9 - - - 15.8 3.05-9 5.1 2.8 5.1 - - - 25.3 4.010-14 4.7 3.9 4.9 - - - 18.2 5.415-19 5.9 11.0 3.8 1.3 0.4 0.9 7.7 4.820-24 13.1 27.2 4.4 8.4 11.4 5.7 2.8 8.425-29 16.3 24.1 8.8 18.5 31.2 15.2 4.3 11.930-34 16.2 16.7 11.8 22.0 20.6 21.3 6.1 15.235-39 11.6 8.8 10.4 15.8 10.5 18.1 5.2 13.140-44 9.1 2.8 12.9 15.6 10.6 15.5 4.8 11.445-49 7.2 1.2 12.8 12.3 7.3 12.3 3.6 9.850-54 4.2 0.5 10.9 4.0 3.9 6.9 2.3 6.155-59 2.2 0.2 6.2 1.5 3.1 2.9 1.7 3.960-64 0.9 0.1 2.8 0.5 0.8 0.9 1.0 1.865-69 0.3 - 1.1 0.0 0.2 0.2 0.6 0.770+ 0.3 - 1.2 0.1 0.0 0.1 0.6 0.5

161
CHAPTER 11MONGOLIAN CITIZENS RESIDING ABROAD
In terms of age group, 79.0 percent of those residing abroad for study are aged 15-34. 52.8 percent of the self-employed are aged 35-54.
FIGURE 11.6. MONGOLIAN CITIZENS RESIDING ABROAD BY AGE GROUPS, RESIDENCE PURPOSE AT THE TIME OF THE CENSUS AND PERCENTAGE, 2010, 2020
20.0
11.9
58.8
9.3
52.4
6.510.2
1.2
17.2
5.17.4
14.117.2 15.5
1.0
33.9
6.2
11.9
2.4
36.1
6.0
1.1
23.1
13.617.8
Суралцах Суурьших Хөдөлмөрийн гэрээгээр ажиллах
Албан томилолтоор
ажиллах
Хувиараа хөдөлмөрлөх
Гэр бүлийн шалтгаанаар оршин суух
Бусад
0-14 15-34 35-54 55+
Study Setllement Employment contract contract
Foreign misison
Self-Employment
Family reason
Others
At the time of the census, 33.9 percent of the population aged 35-54 were self-employed and 52.4 percent were studying. However, the majority of the population under the age of 15 or 58.8 percent live abroad for family reasons, and 36.1 percent of the population aged 55 and above reside for the settlement purpose.


HOUSEHOLD HOUSING CONDITION AND TYPES
12CHAPTER


165
CHAPTER 12HOUSEHOLD HOUSING CONDITION AND TYPES
Housing is the primary necessity of human life and a basic need for healthy, comfortable and safe living. Every country designs a housing policy and a comfortable living environment for population.
Mongolian population and housing census used a number of different methods to measure indicators for housing and infrastructure accessibility. The first ever census on the state buildings and cooperatives was conducted in year of 1969. However, the 2000 and 2010 population and housing censuses did not include census of the housing stock particularly, but captured all type of housing suitable for living, ownership and ownership type, and the infrastructure availability.
This time, the population and housing census 2020 collected data on housing types and conditions, and the Dwelling census was conducted nationwide in 2019 aimed at collecting data on the type of housing and its conditions, as well as information on all types of housing suitable for living, its ageing, wall and roofing materials, and infrastructure.
Seasonal dwellings regardless of the settlement areas were pre-registered, and data on the main dwellings suitable for living was collected through the census, which included the following housing types:
1. All types of ger2. Detached house3. Comfortable private house4. Apartment building5. Public accommodation
In addition, all dwellings included in the Population and Housing Census were captured to determine whether they are occupied permenantly by residents, if so detailed data was collected on the aging of the dwellings, walls, floors, roofing materials, and infrastructure.
However, data on the housing conditions of households in the Population and Housing Census 2020 was collected from the both population and household database and traditional data collection method. The household was first asked about their housing type, and then the living conditions of the housing were determined. At the time of the census, household housings were generally classified as gers, houses, or other dwellings (non-residential) for the living.
One of the highlights of the combined use of Population and Housing Census data is that more than one household can live in a single dwelling, which may exceed the number of dwellings. Therefore, building blocks used for service, rented or vacant for a certain reason are excluded from the total the number of blocks and/or households in the apartment building because the data on the apartment buildings were collected from the Housing and Public Utilities Authority and Association of Apartment/House owners. The number of building blocks in the apartment building may differ from the number of households living in the apartment building.

166
2020 POPULATION AND HOUSING CENSUS OF MONGOLIA NATIONAL REPORT
HOUSING TYPES According to the housing census, there were 304,361 gers (44.9 percent) and 373,259 houses and
buildings (55.1 percent) out of a total of 677,620 dwellings, of which 74.2 percent were main gers and 25.8 percent were extra gers. 78.3 percent of the house and buildings are main dwelling (74.2 percent of which are permanent dwellings) and 21.7 percent are summer houses.
The census was conducted by collecting detailed data on the number of dwellings in which people live permanently. However, details of housing, such as unoccupied houses, extra gers, and summer houses, were not collected. Therefore, this chapter presents the detailed results of 770,868 dwellings, including 442,725 permanent gers, houses and buildings, and blocks within apartment buildings.
FIGURE 12.1. TOTAL DWELLINGS AND NUMBER AND TYPES OF PERMANENTLY OCCUPIED DWELLINGS, 2020
FFIIGGUURREE 1122..11.. TTOOTTAALL DDWWEELLLLIINNGGSS AANNDD NNUUMMBBEERR AANNDD TTYYPPEESS OOFF PPEERRMMAANNEENNTTLLYY OOCCCCUUPPIIEEDD DDWWEELLLLIINNGGSS,,22002200
Population aged 15 and over
FFIIGGUURREE1122..33.. NNUUMMBBEERR OOFF HHOOUUSSEEHHOOLLDDSS,, BBYY DDWWEELLLLIINNGG TTYYPPEESS,, 22002200
Total dwellings suitable for living
677 620
Ger
225 884
Extra ger
78 477
Permanently occupied dwelling
442 725
House
292 255
Summer houses
81 004
Ger
225 884 House
216 841
Apartment building
7 444
Blocks
335 587
Comfortable
private house
4 257
Detached
house
203 556
Public
accommodation
1 584
In houses546 979
In other dwellings
8 039
In gers342 409
Households897 427
In terms of permanently occupied dwelling, 51.0 percent are gers, 46.0 percent are detached houses, 1.7 percent are apartment buildings, and 0.9 percent are comfortable private houses and 0.4 percent are public accommodations. There are 335,587 housing unit in 7,444 apartment building.
Nationwide, 32.0 percent of permanent dwellings were located in Ulaanbaatar, 25.0 percent in the Khangai region, 18.1 percent in the Central region, 15.5 percent in the Western region, and 9.4 percent in the Eastern region. Uvurkhangai (5.3 percent), Khuvsgul (5.2 percent), Arkhangai (4.4 percent) and Selenge (4.0 percent) have the highest rates with the total number of population living in permanent dwellings.

167
CHAPTER 12HOUSEHOLD HOUSING CONDITION AND TYPES
FIGURE 12.2. NUMBER OF PERMANENTLY OCCUPIED DWELLINGS, BY AIMAGS AND THE CAPITAL, 2019
Map with a scale of 1:9 000 000
Number of permanently occupied dwellingsUp to 5,0005,001-10,00010,001-20,00020,001-50,000100,000 and above
In the coming sections, the housing census data on gers and houses/buildings permanently occupied by population is interpreted by aligning it with data pm housing conditions of all households counted in the Population and Housing Census. The data about the house and the traditional dwelling of the Mongolians - ger - are considered separately.
FIGURE 12.3. NUMBER OF HOUSEHOLDS, BY DWELLING TYPES, 2020
FFIIGGUURREE 1122..11.. TTOOTTAALL DDWWEELLLLIINNGGSS AANNDD NNUUMMBBEERR AANNDD TTYYPPEESS OOFF PPEERRMMAANNEENNTTLLYY OOCCCCUUPPIIEEDD DDWWEELLLLIINNGGSS,,22002200
Population aged 15 and over
FFIIGGUURREE1122..33.. NNUUMMBBEERR OOFF HHOOUUSSEEHHOOLLDDSS,, BBYY DDWWEELLLLIINNGG TTYYPPEESS,, 22002200
Total dwellings suitable for living
677 620
Ger
225 884
Extra ger
78 477
Permanently occupied dwelling
442 725
House
292 255
Summer houses
81 004
Ger
225 884House
216 841
Apartment building
7 444
Blocks
335 587
Comfortable
private house
4 257
Detached
house
203 556
Public
accommodation
1 584
In houses 546 979
In other dwellings
8 039
In gers 342 409
Households 897 427
According to the Population and Housing Census, 38.2 percent of all households live in traditional gers, 60.9 percent in houses, and 0.9 percent in other types of dwellings. The share of households living in gers decreased by 7.0 percentage points compared to the previous census, while the share of households living in houses increased by 7.3 percentage points.
TABLE 12.1. NUMBER OF DWELLING AND HOUSEHOLDS, BY DWELLING TYPES, URBAN AND RURAL AREAS, 2020
Permanently occupied dwelling Number of householdsTotal Urban Rural Total Urban Rural
TOTAL 770.9 562.6 208.3 897.4 606.3 291.1Ger 225.9 98.6 127.3 342.4 149.9 192.5Houses 545.0 464.0 81.0 547.0 451.6 95.3Other dwelling - - - 8.0 4.8 3.3
* Housing units inside the apartment buildings.
A total of 897.4 thousand households live in 770.9 thousand dwellings in Mongolia. The ratio of the number of households living to the number of permanent dwellings is similar in urban areas, while the ratio of households in rural areas is higher. This shows that many families live together in the same dwelling in the the rural areas.

168
2020 POPULATION AND HOUSING CENSUS OF MONGOLIA NATIONAL REPORT
The dwelling types for households in urban and rural areas are quite different. In urban areas, 74.5 percent of all households live in houses and 24.7 percent in gers. Compared to the previous census, the share of households living in gers decreased by 8.0 percentage points, while the share of households living in houses increased by 8.6 percentage points. This is due to the increase in housing policies and programs in large cities in the recent years. 66.1 percent of rural households live in gers, a decrease of 4.8 percentage points from the previous census, while a percentage of households living in houses increased by 4.2 percentage points. In general, the difference in the proportion of households living in gers and houses in urban and rural areas tends to decrease between the censuses, and the housing gap between households tends to narrow. The increase in the number of households living in houses in urban and rural areas indicates that the number of people living in comfortable private houses has increased, as well as the number of people building their own houses, thus the housing policy has had some effect.
The number of households living in apartment buildings is 29.4 percent of the total households, which is, increased by 8.1 percentage points since 2010 or increased by 112.0 thousand in the last 10 years. In addition, the share of households living in detached houses increased by 0.5 percentage points compared to 2010, and the percentage of households living in comfortale houses increased by 0.2 percentage points, indicating that the citizens prefer to live in their own built houses.
TABLE 12.2. NUMBER OF HOUSEHOLDS, BY DWELLING TYPES, 2010, 2020
Dwelling type2010 2020
thous. households Percentage thous.
households Percentage
TOTAL 713.8 100.0 897.4 100.0Ger 322.8 45.2 342.4 38.2House 382.8 53.6 547.0 60.9
Apartment buildings 152.3 21.3 264.3 29.4Comfortable private house 3.8 0.5 6.5 0.7Detached house 209.9 29.4 267.9 29.9Public accommodation 16.7 2.3 8.3 0.9
Other dwelling 0.1 1.1 8.0 0.9
In terms of households in ger area, 58.6 percent of soum-level households and 20.1 percent of rural households live in houses. This is a significant increase of 5.2-11.7 percentage points from 2010, which is indicates an increase in rural households, especially soum center households.
TABLE 12.3. PERCENTAGE DISTRIBUTION OF DWELLING TYPES, BY LOCATION, 2010, 2020
Housing types TotalLocation
Capital Aimags center Village Soum
center Rural
2010TOTAL 100.0 100.0 100.0 100.0 100.0 100.0Ger 45.2 28.9 39.4 36.7 52.0 84.7House 53.6 69.7 59.1 62.3 46.9 14.9Other dwelling 1.2 1.4 1.5 1.0 1.1 0.4
2020TOTAL 100.0 100.0 100.0 100.0 100.0 100.0Ger 38.2 22.2 29.9 32.3 39.6 79.1House 60.9 77.3 68.8 65.9 58.6 20.1Other dwelling 0.9 0.5 1.3 1.8 1.8 0.8

169
CHAPTER 12HOUSEHOLD HOUSING CONDITION AND TYPES
HOUSEHOLD HOUSING OWNERSHIPHousehold housing ownership is classified into three levels: private housing, business entities, and
state-owned.
TABLE 12.4. PERCENTAGE DITRIBUTION OF HOUSEHOLDS, BY HOUSEHOLD NUMBER, TYPES OF OWNERSHIP, 2010, 2020
Housing typesTotal Types of ownership
thous. households Percentage Private Business entities State-owned
2010TOTAL 713.8 100.0 96.2 2.2 1.6Ger 322.8 100.0 99.2 0.4 0.4House 382.8 100.0 94.7 2.9 2.5Other dwelling 8.2 100.0 48.6 39.8 11.6
2020TOTAL 897.4 100.0 98.5 0.8 0.7Ger 342.4 100.0 99.1 0.8 0.1House 547 100.0 98.3 0.7 1.0Other dwelling 8.0 100.0 95.8 1.9 2.3
98.5 percent of all households live in private housing and 1.5 percent in business entities and state-owned housing. Compared to 2010, the percentage of households living in their own private housing increased by 2.3 percentage points. Almost all households living in gers live in privately owned gers. However, 1.0 percent of households living in houses live in state-owned apartments, which is a decrease of 1.5 percentage points compared to the previous census
TABLE 12.5. PERCENTAGE DISTRIBUTION OF HOUSEHOLD NUMBER, TYPES OF HOUSING OWNERSHIP AND RURAL AND URBAN AREAS, 2010, 2020
Types of housing ownership
Total Urban Ruralthous.
households Percentage thous. households Percentage thous.
households Percentage
2010TOTAL 713.8 100.0 479.5 100.0 234.3 100.0Own 619.0 86.7 401.1 83.7 217.9 93.1Rental housing 45.0 6.3 40.9 8.5 4.1 1.7Non-rental housing 43.5 6.1 33.0 6.9 10.6 4.5Other 6.3 0.9 4.5 0.9 1.7 0.7
2020TOTAL 897.4 100.0 606.3 100.0 291.1 100.0Own 822.6 91.6 547.0 90.2 275.6 94.7Rental housing 32.8 3.7 28.3 4.7 4.5 1.6Non-rental housing 39.5 4.4 28.9 4.8 10.6 3.6Other 2.5 0.3 2.1 0.3 0.4 0.1
Household ownership is an indicator of what percentage of households and the population owns their own housing. Looking at the ownership of housing, a number of issues become clear. Nationwide, 8.4 percent or 74.8 thousand households do not have their own housing. Of these, 59.3 thousand are urban households. In rural areas, this indicator is relatively low, mainly due to the fact that it is possible to meet the housing needs by building new gers and houses.

170
2020 POPULATION AND HOUSING CENSUS OF MONGOLIA NATIONAL REPORT
HOUSEHOLD ELECTRECITY SUPPLY According to the Population and Housing Census 2020, 99.5 percent of all households, 98.7 percent
of households living in gers, and 99.9 percent of households living in houses are connected to the electricity transmission line. 88.9 percent of households connected to renewable energy live in gers, and 97.1 percent of them live in rural areas.
TABLE 12.6. PERCENTAGE DITRIBUTION OF HOUSEHOLD NUMBER, BY DWELLING TYPES, ENERGY SOURCE, AND URBAN AND RURAL AREAS, 2020
ELECTRICITY TYPETotal Urban Rural
thous. households Percentage thous.
households Percentage thous. households Percentage
TOTAL 889.4 100.0 601.5 100.0 287.9 100.0Centralized system 725.5 81.6 594.5 98.8 131.0 45.5Diesel station 0.5 0.1 0.2 0.0 0.3 0.1Renewable energy 151.2 17.0 4.6 0.8 146.6 50.9Power generator 7.6 0.8 1.0 0.2 6.6 2.3No electricity 4.7 0.5 1.3 0.2 3.4 1.2
GER 342.4 100.0 149.9 100.0 192.5 100.0Centralized system 196.7 57.4 144.1 96.2 52.6 27.3Diesel station 0.2 0.1 0.0 0.0 0.2 0.1Renewable energy 134.4 39.2 3.9 2.6 130.5 67.8Power generator 6.8 2.0 0.8 0.5 6.0 3.1No electricity 4.4 1.3 1.0 0.7 3.4 1.7
HOUSE 547.0 100.0 451.6 100.0 95.4 100.0Centralized system 528.8 96.7 450.4 99.7 78.4 82.3Diesel station 0.3 0.0 0.2 0.0 0.1 0.1Renewable energy 16.8 3.1 0.7 0.2 16.1 16.9Power generator 0.8 0.1 0.2 0.0 0.6 0.6No electricity 0.3 0.1 0.3 0.1 0.0 0.1
Nationwide, 4.7 thousand households are without electricity. This is 4.9 times less than in the previous census. 93.5 percent of all households without electricity live in gers, and 76.8 percent of them live in rural areas
GER HOUSING AND GER LIVING CONDITIONSIn Mongolia, 342.4 thousand households are living in 225.8 thousand traditional gers, which is 38.2
percent of the total number of households which indicates a decrease of 7.0 percentage points since 2010.
The housing census captured the roof, rafters, and floor materials of the ger housings in which people live. 91.3 percent of permanent gers have double rafters in winter and 8.7 percent have single rafters. Nationwide, 53.8 percent of gers have no floor, 38.1 percent have wooden floors, 6.1 percent have cement floors, and 2.0 percent have other types of flooring.

171
CHAPTER 12HOUSEHOLD HOUSING CONDITION AND TYPES
FIGURE 12.4. ROOF, RAFTER AND FLOOR MATERIAL OF GER, BY PERCENTAGE, 2019
38.1
6.1
2.0
53.8
Wooden Concrete Other No-Flooring
8.7
91.3
Single Double
8.7
91.3
8.7
91.3
According to the census, 68.7 percent of all households living in gers live in 5-walled gers and 11.3 percent in 6-walled gers. However, it is important to Explanation that ger sizes vary from region to region, depending on the number of wall heads and the size of the joints, depending on the province, local and ethnic group traditions.
69.3-69.9 percent of households living in five-walled gers are households with more than 3 members, which shows that five-walled gers are the most common type of housing in the country.
TABLE 12.7. NUMBER OF HOUSEHOLD MEMBERS IN GER AND GER WALLS BY PERCENTAGE 2010, 2020
Number of members
Total Below 5 5 6 Above 6thous.
households % thous.households % thous.
households % thous.households % thous.
households %
2010TOTAL 322.8 100.0 82.0 25.4 181.7 56.3 50.8 15.7 8.3 2.61-2 88.0 100.0 31.3 35.6 44.8 51.0 10.5 11.9 1.4 1.53-4 150.4 100.0 35.2 23.4 87.8 58.4 23.7 15.7 3.7 2.55-6 71.6 100.0 13.3 18.5 41.6 58.2 14.1 19.6 2.6 3.77+ 12.8 100.0 2.3 17.5 7.4 58.0 2.6 20.5 0.5 4.0
2020TOTAL 342.4 100.0 60.9 17.8 235.2 68.7 38.5 11.3 7.8 2.21-2 118.4 100.0 27.6 23.3 79.1 66.8 9.9 8.3 1.8 1.63-4 124.4 100.0 20.0 16.1 87.0 69.9 14.3 11.5 3.1 2.55-6 81.7 100.0 11.2 13.6 56.6 69.3 11.6 14.2 2.3 2.97+ 17.9 100.0 2.2 12.1 12.5 69.8 2.7 15.2 0.5 2.9
The household was asked about the living conditions of the ger, such as toilets, solid waste, waste and sewage disposal, and the results are compiled as below.

172
2020 POPULATION AND HOUSING CENSUS OF MONGOLIA NATIONAL REPORT
Conditions2010 2020
Total Urban Rural Total Urban RuralLATRINE TYPE 100.0 100.0 100.0 100.0 100.0 100.0
Improved pit latrine - - - 1.5 2.2 0.9Pit latrine - - - 77.4 96.8 62.3Bio latrine - - - 0.1 0.2 0.1No designated area 25.8 4.7 45.7 21.0 0.8 36.8
LATRINE 100.0 100.0 100.0 100.0 100.0 100.0Shared use 58.7 61.3 54.3 30.3 33.1 27.3No sharing 41.3 38.7 45.7 69.7 66.9 72.7
SOLID WASTE DISPOSAL 100.0 100.0 100.0 100.0 100.0 100.0By service organization 43.0 80.1 7.9 45.5 90.5 10.4Approved point 21.9 10.0 33.2 15.4 5.3 23.2Burning - - - 3.3 0.2 5.7Burying - - - 0.4 0.1 0.6No designated area 35.1 9.9 58.9 35.5 4.0 60.1
WASTE DISPOSAL 100.0 100.0 100.0 100.0 100.0 100.0Borehole 56.5 81.7 32.6 53.7 85.2 29.2Open area 43.5 18.3 67.4 46.3 14.8 70.8
Households without a fixed toilet account for 21.0 percent of the total households, a decrease of 4.8 percentage points compared to the previous census. This figure is 36.8 percent in rural areas. Households without fixed waste disposal sites account for 4.0 percent of all households in the city and 14.8 percent of households with open dumpsites, which is a decrease compared to the previous census, but it has a negative environmental impact for urban residents. A further technical study is needed for a right action to address this issue.
Compared to 2010, the percentage of households living in rural areas without a fixed solid waste disposal site increased by 1.2 percentage points, and the percentage of households with open waste disposal increased by 3.4 percentage points. Therefore, there is a need to pay more attention to soil pollution and hygiene and sanitation of urban and rural areas, and more targeted policies and programs should be designed for tackling this issue in the areas.
A safe drinking water sources include centralized systems, water distribution point connected and unconnected to the central network, protected wells, springs, streams, and bottled water, while unprotected wells, springs, streams, portable water, and improved surface water such as rivers, lakes, etc. not included in the source.
63.5 percent of ger households have access to safe drinking water. However, 36.5 percent use substandard drinking water, of which 19.8 percent use open water sources and 13.4 percent use unprotected hand wells.
TABLE 12.8. SOME INDICATORS FOR GER LIVING CONDITIONS, BY URBAN AND RURAL AREAS AND PERCENTAGE, 2010, 2020

173
CHAPTER 12HOUSEHOLD HOUSING CONDITION AND TYPES
FIGURE 12.5. WATER SUPPLY HOUSEHOLD LIVING IN GER BY PERCENTAGE, 2020
5555..55%%
1199..88%%
1133..66%%
44..44%%22..88%%
22..77%% 00..33%% 00..88%%Protected wells
Open water source(river, lakes, ponds)
Unprotected wells
Public water distribution point connected to thecentral networkPublic water distribution point not connected tothe central networkUnprotected springs, streams
Protected springs and streams
Other sources
NUMBER OF HOUSES, HOUSING CONDITIONS OF HOUSEHOLDSThe Housing Census and the Population and Housing Census included the following buildings in
the house category, and see Appendix B for the “Definitions Used in the Census” section:
1. Apartment building1.1.housing units inside an apartment building
2. Detached house3. Comfortable private house4. Public accomodation
In Mongolia, there are in 545.0 thousand Dwellings includes housing units of apartments in 216.8 thousand houses and apartments counted.
A detailed data on the design and operation of these buildings has been collected and the results are compiled as follows.

174
2020 POPULATION AND HOUSING CENSUS OF MONGOLIA NATIONAL REPORT
FIGURE 12.6. PERCENTAGE DISTRIBUTION OF HOUSES, BY COMMISIONED YEARS, 2019
0.3 3.4
6.3
9.9
13.3
5.9
17.9
42.4
0.6
Public apartment
0.20.9 1.1
1.7
5.8
12.7
30.3
44.5
2.8Detached house
before 1950 1950- 1960-
1970- 1980- 1990-
2000- 2009- Not clear
0.0 0.3 0.5 0.6 1.55.0
26.2
62.5
3.4 Independent house
1.8
9.0
9.3
9.1
18.0
5.8
18.2
26.3
2.5Public house
0.3 3.4
6.3
9.9
13.3
5.9
17.9
42.4
0.6
Public apartment
0.20.9 1.1
1.7
5.8
12.7
30.3
44.5
2.8Detached house
before 1950 1950- 1960-
1970- 1980- 1990-
2000- 2009- Not clear
0.0 0.3 0.5 0.6 1.55.0
26.2
62.5
3.4 Independent house
1.8
9.0
9.3
9.1
18.0
5.8
18.2
26.3
2.5Public house
44.7 percent of the total number of houses were commissioned in 2009-2019, 29.7 percent in 2000-2009, and 12.2 percent in 1990-1999, 6.1 percent in 1980-1989, 2.0 percent in 1970-1979, and 2.6 percent prior to 1969 respectively. By type of house, 29.5 percent of apartment buildings were commissioned during the years of major construction period, 1960-1989, and 60.3 percent were commissioned in the last 20 years. 43.0 percent of detached houses were commissioned in 1990-2009 and 44.5 percent in 2009-2019. However, 88.7 percent of comfortable private apartments have been commissioned in the last 20 years, of which 62.5 percent have been commissioned in the last 10 years. Also, the answer that they do not know the year of commissioning of a comfortable private house (3.4 percent) is higher than other apartments, which means that there are many cases of buying and renting apartments.

175
CHAPTER 12HOUSEHOLD HOUSING CONDITION AND TYPES
TABLE 12.9 NUMBER OF HOUSES, BASE WALL MATERIALS, WALL POLISHING MATERIALS, BY DWELLING TYPES, PERCENTAGE, 2019
Total Apartment building Detached house Comfortable
privatePublic
accomodationthous.
housing % thous. housing % thous.
housing % thous. housing % thous.
housing %
BASIC WALL MATERIAL 216.8 100.0 7.4 100.0 203.6 100.0 4.3 100.0 1.6 100.0
Cast reinforced 5.2 2.4 1.9 24.9 3.0 1.5 0.2 5.9 0.1 4.1Prefabricated reinforced concrete
1.9 0.9 1.3 17.8 0.5 0.2 0.1 2.0 0.0 0.9
Block 45.5 21.0 0.8 10.9 43.5 21.4 0.8 19.2 0.4 22.7Brick 27.8 12.8 2.3 30.6 23.8 11.7 1.3 31.7 0.4 25.4Wood 127.1 58.6 - - 125.2 61.5 1.3 29.4 0.6 38.2Sandwich plate 1.1 0.5 - - 0.8 0.4 0.2 5.8 0.0 2.1Mixed 4.3 2.0 0.7 9.6 3.3 1.6 0.2 4.4 0.1 3.3Others 4.0 1.8 0.5 6.2 3.5 1.7 0.1 1.6 0.1 3.3
WALL POLISHING, EXTERIOR FACADES
216.8 100.0 7.4 100.0 203.6 100.0 4.3 100.0 1.6 100.0
Cement plastering 65.7 30.3 3.8 50.9 60.0 29.5 1.2 29.0 0.7 41.9
Wood 22.7 10.5 - - 22.4 11 0.3 6.0 0.1 8.1Metal plate 4.3 2.0 0.1 0.7 3.9 1.9 0.3 6.7 0.0 1.1Plastic plate 2.3 1.1 0.0 0.5 1.9 1.0 0.3 7.6 0.0 0.6Stone plate 0.7 0.3 0.3 3.9 0.4 0.2 0.1 1.3 0.0 0.1Brick 71.1 32.8 1.3 17.9 67.8 33.3 1.4 34 0.5 28.9Yellow clay 17.3 8.0 0.4 4.9 16.7 8.2 0.1 1.4 0.2 10.9Tile 0.5 0.2 0.2 2.1 0.3 0.1 0.0 0.3 0.0 0.2Other 10.9 5.0 0.9 12.1 9.5 4.7 0.5 10.7 0.1 4.9Non 21.4 9.8 0.5 7.0 20.7 10.1 0.1 3.0 0.1 3.3
Blocks, bricks and wood account for the majority of 92.4 percent of the main building wall materials, while cement plaster and bricks accounted for 63.1 percent of the wall cladding and exterior facade materials. By type of housing, 30.6 percent of the main wall materials of public apartment buildings are bricks, 24.9 percent are cast reinforced concrete, 17.8 percent are precast reinforced concrete, and 50.9 percent of the wall cladding is cement plaster. 61.5 percent of the main wall material of the detached house is wood, 33.3 percent of the finishing material is brick and 29.5 percent is cement plaster.

176
2020 POPULATION AND HOUSING CENSUS OF MONGOLIA NATIONAL REPORT
FIGURE 12.7. PERCENTAGE DISTRIBUTION OF BASIC AND COVERING MATERIALS OF BUILDING FLOOR, 2019
3.410.7
24.5
0.8
55.6
0.6
4.4
Wooden Wooden parquetParquet /laminate/ TilesLinoleum No flooring
36.5
57.9
5.6
Wooden Concrete/cement Other
57.9 percent of apartments have concrete / cement floors, 36.5 percent have wooden floors, and 5.6 percent have other types of floors. 55.6 percent used linoleum, 24.5 percent compressed parquet, 10.7 percent wood, 8.6 percent wood, tiles and other materials for flooring. However, 0.6 percent of apartments have no floor covering.
TABLE 12.10. ROOFING MATERIALS, BY PERCENTAGE , 2019
Roof material Total Detached house, comfortable house ApartmentTOTAL 100.0 100.0 100.0Iron 81.5 83.8 23.1Clay 5.3 5.4 2.7Cipher 4.8 4.8 5.9Soft roofing 0.3 0.2 2.0Black paper 6.3 4.2 60.2Others 1.8 1.6 6.1
Metal (83.8 percent) was used for roofing of non-apartment buildings, while construction black paper (60.2 percent) was used for roofing of apartment buildings.
HOUSING CONDITIONS FOR HOUSEHOLD LIVING IN THE HOUSEIn Mongolia, 547.0 thousand households counted in 545.0 thousand dwellings, including 216.8
thousand blocks of apartment building. The number of households living in houses increased by 7.3 percentage points compared to the previous census.

177
CHAPTER 12HOUSEHOLD HOUSING CONDITION AND TYPES
TABLE 12.11. PERCENTAGE DISTRIBUTION AND NUMBER OF HOUSEHOLDS LIVING IN HOUSES BY FAMILY MEMBERS AND SIZE OF LIVING AREA, 2010, 2020
Number of members
TotalHouse size (square meter)
Until 20 21-40 Over 40thous.
households Percentage thous.households Percentage thous.
households Percentage thous.households Percentage
2010TOTAL 378.2 100.0 50.4 13.3 151.3 40.0 176.5 46.71-2 95.0 100.0 19.1 20.1 39.7 41.8 36.2 38.13-4 180.6 100.0 22.7 12.5 72.6 40.2 85.3 47.35-6 82.8 100.0 7.2 8.7 31.4 37.9 44.2 53.47+ 19.8 100.0 1.5 7.5 7.4 37.6 10.9 54.9
2020TOTAL 546.6 100.0 46.4 8.5 133.1 24.4 367.1 67.11-2 160.6 100.0 16.5 10.2 42.8 26.6 101.3 63.13-4 213.2 100.0 17.3 8.1 50.9 23.9 145.0 68.05-6 132.2 100.0 9.8 7.4 29.9 22.6 92.6 70.07+ 40.6 100.0 2.8 7.1 9.6 23.6 28.2 69.4
24.4 percent of households living in houses live in dwellings of 21-40 square meters, which is 15.6 percentage points less than in the previous census. However, the share of households living in houses with more than 40 square meters has reached 67.1 percent, an increase of 2.1 times from the previous census, which can be considered as an improvement in housing capacity. One indication of this is that 69.4 percent of households with 7 or more members live in dwellings of more than 40 square meters. Comparing the number of rooms and the number of households, it is clear that the housing capacity has increased.
TABLE 12.12. NUMBER OF HOUSEHOLDS, MEMBERS LIVING IN THE HOUSE, NUMBER OF ROOMS, PERCENTAGE, 2010, 2020
Number of family members Total
Number of rooms1 2 3 4 5-7 8+
2010TOTAL 100.0 33.6 39.5 18.9 5.5 2.1 0.41-2 100.0 43.5 37.0 14.5 3.5 1.2 0.33-4 100.0 32.8 40.8 18.9 5.2 1.9 0.45-6 100.0 26.5 40.0 22.4 7.5 3.0 0.67+ 100.0 23.5 38.4 24.9 8.5 3.9 0.8
2020TOTAL 100.0 28.6 43.5 20.4 5.3 1.9 0.21-2 100.0 37.6 41.3 15.8 3.8 1.3 0.13-4 100.0 28.6 45.7 19.2 4.6 1.7 0.25-6 100.0 24.0 42.8 23.8 6.8 2.4 0.37+ 100.0 23.4 40.9 25.1 7.2 2.9 0.4
According to the census, 72.1 percent of all households living in houses live in 1-2-room dwellings, which is a decrease of 1.0 percentage points from 2010. Compared to the previous census, 74.3 percent of households with 3-4 members live in 1-2 room dwellings, and 64.3 percent of households with 7 or more members live in 1-2 room dwellings, increased by 2.4 percentage points compared to the census period.

178
2020 POPULATION AND HOUSING CENSUS OF MONGOLIA NATIONAL REPORT
HOUSING UTILITIES INFRASTRUCTURE AVAILABILTY The tables below summarize the results for the household utilities infrastructure, such as heating,
water supply, baths, and showers.
49.6 percent of all households living in houses are connected to the central heating system, which is an increase of 5.7 percentage points compared to the previous census. The share of households living in houses with the central heating increased by 5.9 percentage points in urban areas and 5.0 percentage points in rural areas, respectively, due to a sharp increase in the number of households living in apartment buildings.
TABLE 12.13. HOUSEHOLD HEATING TYPES BY URBAN AND RURAL AREAS, PERCENTAGE 2010, 2020
Heating type2010 2020
Total Urban Rural Total Urban RuralTOTAL 100.0 100.0 100.0 100.0 100.0 100.0Centralized system 43.9 51.6 7.2 49.6 57.5 12.2Low pressure furnace 5.3 5.6 3.6 7.1 7.3 6.2Electric heater 0.6 0.7 0.5 2.0 2.3 0.6Normal stove heating 50.2 42.1 88.7 41.3 32.9 81.0Geothermal heating - - - 0.0 0.0 0.0Combustible gas - - - 0.0 0.0 0.0
The share of households living in houses with hot and cold water is 45.9 percent, which is an increase of 7.3 percentage points compared to the previous census. This figure is 53.8 percent in urban areas and 8.6 percent in rural areas. 49.4 percent or 270.4 thousand households living in houses use portable water, including 187.3 thousand households in the city. The percentage of households living in houses and using portable water decreased by 7.4 percentage points from the previous census, including 7.5 percentage points in urban areas and 6.6 percentage points in rural areas.
TABLE 12.14. TYPES OF WATER SUPPLY FOR HOUSEHOLD LIVING IN HOUSE, BY URBAN AND RURAL AREAS, 2010, 2020
Water supply2010 2020
Total Urban Rural Total Urban RuralTOTAL 100.0 100.0 100.0 100.0 100.0 100.0Centralized water supply 42.8 50.6 5.9 49.1 57.1 10.8
Hot and cold water 38.4 45.8 3.5 45.2 53.0 8.1Only cold water 4.4 4.8 2.4 3.9 4.1 2.8
Independent system 0.4 0.4 0.3 1.5 1.4 2.0How and cold water 0.2 0.2 0.1 0.7 0.8 0.5Only cold water 0.2 0.2 0.2 0.8 0.6 1.4
Portable 56.8 49.0 93.8 49.4 41.5 87.2
One of the main indicators of living conditions of house is a bath and a shower. This indicator serves a base for identifying the hygiene and sanitary conditions of the population and accessibility of hygine and sanitation facilities, and for developing such policies and programs.
According to the Population and Housing Census 2010, the question for baths and showers was divided into three categories: with baths and showers, public use of baths and shower, without baths and showers, while the census 2020 categorized them into two categories: with baths and showers or without baths and showers and it was asked to clarify if the baths and showers are for public use.

179
CHAPTER 12HOUSEHOLD HOUSING CONDITION AND TYPES
TABLE 12.15. PERCENTAGE DISTRIBUTION OF SOME INDICATORS OF HOUSEHOLD CONDITIONS, BY URBAN AND RURAL AREAS, 2010, 2020
2010 2020Total Urban Rural Total Urban Rural
LATRINE TYPES 100.0 100.0 100.0 100.0 100.0 100.0Centralized system - - - 49.7 58.0 10.5Borehole disposal latrine - - - 1.1 1.1 1Borehole disposal pit latrine - - - 0.5 0.3 1.1Improved pit latrine - - - 0.6 0.5 1.2Simple pit latrine - - - 47.4 39.9 83.1Bio latrine - - - 0.1 0.1 0.1No designated area - - - 0.6 0.1 3.1
TOILETRY 100.0 100.0 100.0 100.0 100.0 100.0Shared usage 31.0 30.5 33.3 13.6 12.7 17.5Non sharing 66.9 69.0 57.0 86.4 87.3 82.5No designated area 2.1 0.5 9.7
BATHTUBS and SHOWERS* 100.0 100.0 100.0 100.0 100.0 100.0With bathtub and shower 40.6 47.8 6.6 46.4 54.7 11.8
Permanently installed 40 47.1 6.0 45.4 53.7 10.7Portable 0.6 0.7 0.6 1.0 1.0 1.1
Public usage 2.2 2.5 0.5 6.5 6.4 7.7Without bathtub and shower 57.2 49.7 92.9 53.6 45.3 88.2
The Population and Housing Census 2010 did not ask for the type of household toilet, so it is not possible to compare the indicators with the census 2020. 49.7 percent of households living in houses have latrines connected to the central system, and 47.4 percent use pit latrines. In urban areas, 58.0 percent have access to centralized latrines, while in rural areas, 83.1 percent use pit latrines. However, 0.6 percent of all households do not have a toilet, which is 1.5 percentage points less than in 2010, but there are 3.3 thousand households without a toilet, which increases the risk of running soil pollution and the spread of infectious diseases.
Compared to the previous census, 46.4 percent of all households living in houses have bathtubss and showers, an increase of 5.8 percentage points. This indicator increased by 6.9 percentage points in urban areas and 5.2 percentage points in rural areas. Households living in houses with permanent bathtubs and showers account for 45.4 percent of all households living in houses, while in rural areas this figure is 10.7 percent, which is insufficient. The share of households without bathtubs and showers is 53.6 percent nationwide and 88.2 percent in rural areas.

180
2020 POPULATION AND HOUSING CENSUS OF MONGOLIA NATIONAL REPORT
FIGURE 12.8. PERCENTAGE DISTRIBUTION OF HOUSEHOLDS LIVING IN HOUSE, BY SOLID WASTE DISPOSAL, 2020
85.3
11.7
0.5 0.12.5
Collected by authorizedcollectors
Dispose in a local authorizeddump area
Burning
Buried
No special site
Separating household solid waste, disposing of it in the designated, disposing of wastewater through a unified drain network, and treating it at a treatment plant have a significant impact on population health, the environment, and soil pollution level. In particular, these indicators provide clear answers to many issues, such as recycling solid waste in large, densely populated centers and settlements, and raising public awareness about waste disposal. 85.3 percent of households living in houses dispose of their waste through service organizations, which is an increase of 8.2 percentage points compared to the previous census. In 2010, 5 percent of households living in houses did not have a solid waste disposal site, but by 2020 it did dropped to 2.5 percent..
FIGURE 12.9. PERCENTAGE DISTRIBUTION OF HOUSEHOLDS LIVING IN HOUSE, 2020
48.5
1.0
46.3
4.2
Central sewage disposalsystemIndividual sewage disposalsystemDosposed into borehole
None
48.5 percent of households living in houses dispose of their liquid waste through a centralized system, 1.0 percent through an independent system, 46.3 percent through boreholes, and the remaining 4.2 percent through open dumping. The high percentage of boreholes is due to the fact that the majority of households live in detached house

APPENDIX


183
APPENDIX
APPENDIX A
HISTORY OF MONGOLIAN POPULATION CENSUS
9 ‘Demographic history of Mongolia’ B. Erdenesuren, Ts. Badrakh. Ulaanbaatar, 2013
Traditionally, nations used to undertake censuses for the purposes of recruiting citizens for armed force and collecting tax in the past.
Ancient historical records documented that Mongolians used to conduct censuses to enumerate their population in the thirteenth century, but there is no clear proof shows how much territory the census covered in that time, or how many people were counted in which years.
According to the Central Archives of History, population and livestock census was conducted in Akhai Gunii Khoshuu (administrative unit), Tusheet khan aimag (present Baruunburen soum, Selenge aimag), in 1789, followed by a census which covered ten Khoshuus of Tusheet Khan aimag in 1854. Between 1789 and 1919, Mongolia conducted around 80 censuses to enumerate population and livestocks.
During the censuses, population and livestock were counted, simultaneously. Such specific censuses were carried out until.9
Around the world, nations have been regularly conducting the current population censuses around 200 years ago with a common plan and compiling and disseminating the result officially.
There were no regular population censuses until twentieth century in Mongolia. The Bogd Khanate of Mongolia first conducted its population census in 1918. The next censuses were conducted in 1935, 1944, 1956, 1963, 1969, 1979, 1989, 2000, 2010, and by-census in 2015 respectively. For the last 4 censuses, housing census was conducted in conjunction with the population census. In 1947 and 1950, census-like exercises were undertaken for collection of data on population.
The population census in 1956, conducted by the Statistics Division of State Planning Commission, used improved methodology and planning.
An independent public administrative organization with the mandate of statistics was formed in 1960 and began conducting the population and housing censuses since1963.
Since then, the National Statistical Office have been using the modern technologies for data processing and compilation and ensured compliance of questionnaires, plans, guidelines and methodologies with the international standards and methodologies.
The censuses in 1969, 1979, and 1989 followed the methodological guidelines developed by the Commission for Mutual Economic Assistance, which were aligned with the UN recommendations.
The Population and Housing Census in 2000 was unique in its own way because it was the first census in the period of transition from a centrally planned economy to market economy. There was an urgent need to change its enumeration methodology, definition, and socio-economic indicators.
The 2000 census was based on the United Nations ‘Principles and Recommendations for Conducting Census’ and the 2010 census used its updated version, and thus, ensured compliance of the census methodology with the international standards and methodology. Since there was no experience in conducting the by-census in 2015, it was conducted in accordance with the recommendations. The registration-based census result was disseminated by aligning the “Population and Housing data” with other databases of the public administrative organizations. Therefore, Mongolian citizens residing

184
2020 POPULATION AND HOUSING CENSUS OF MONGOLIA NATIONAL REPORT
abroad for 6 and over months, was enumerated via internet based on the international experience of aligning geographical information system with the by-census result.
LEGAL BASIS FOR POPULATION AND HOUSING CENSUS 2020 AND ITS MANAGEMENT AND ORGANIZATION
Forming a solid legal basis for the population census is a core guarantee to conduct the census. All the censuses carried out prior to 2010 were governed by the Government resolutions.
The Population and Housing Census 2010, 2020, the by-census 2015 and the housing census 2019 were carried out in accordance with the Law on Population and Housing Census, passed on Jan 3, 2008. The law ensured both legal and economic guarantee for conducting census, and stipulated relationships and accountabilities of multi-stakeholders involved in the census such as the census timeline, methodology, organization in charge of conduct of the census, and roles of administrative units, public organizations and individuals.
The list of legislative acts governing the Population and Housing Census 2020:
Mongolian laws:• “Law on Statistics”, paragraph 1, Article 7;• “Law on Population and Housing Census”;• “Law on Infringement”;
Resolutions of The State Great Khural:• “Setting date for census”, № 76, December 8, 2017;• “Establishment of State Commission”, № 77 December 8, 2017;
Resolutions of State Commission of Population and Housing Census:• “Operating Procedure for State Commission for Population and Housing Census”, February 22,
2018;• “Approval of plans”, № 1, February 22, 2018;• “Appointing Commission Members from aimag and capital city”, № 2, February 22, 2018;• “Rolling out Pilot Census on Housing Census in conjunction with the Population and Housing
Census 2020”, № 3, October 17, 2018;• “Master Planning of the Population and Housing Census 2020”, № 4, October 17, 2018;• “Appointing secretary of State Commission”, № B/20, February 7, 2018;• “Facilitating preparation steps for the Population and Housing Census 2020”, № 06, November
28, 2019;• “Approving Budget for the Population and Housing Census 2020”, № 07, November 28, 2019;• “Dissemination of the Population and Housing Census results”, № 01, June 12, 2020.
Decree of Chairperson of the National Statistics Office of Mongolia:• “Establishing Working Groups”, № 05, December 19, 2018;• “Rolling out Pilot Population and Housing census”, № A/150, December 25, 2018;• “Providing Census Commissions and Ad-hoc Bureaus of aimag, capital city with holistic
management and guidelines”, № A/36, March 20, 2019;• “Approving Revised Forms and Guidelines for Population and Household Registration”, № A/44,
March 28, 2019;• “Approving Questionnaire and Handbook for Housing Census”, № A/81, May 31, 2019.
Forms approved by above mentioned decree:• Questionnaires on housing (БОСТ-1-1)

185
APPENDIX
• Questionnaires on Ger (БОСТ-1-2)• Questionnaires on apartment building (БОСТ-2)• Preliminary registration form (БОСТ-3)• Progress report form (БОСТ-4)• Handbook for housing census
• “Approving codes and classification of territorial units for statistical purposes”, № A/104, July10, 2019;
• “Approval of renewed names and codes for bag and khoroo”, № A/117, August 14, 2019;
• “Approval of codes and classifications of Higher education programs for statistical purposes”,№ A/118, August 14, 2019;
• “Approving questionnaire, handbook, and guideline for the Population and Housing Census2020”, № A/151, October 11, 2019.
Forms and guidelines approved by above mentioned decree:• The Population and Housing Census 2020 questionnaire (ХАОСТ-1)• Additional questionnaire on population (ХАОСТ-1а, 1б)• Additional questionnaire on citizens residing abroad for 6 months and more (ХАОСТ-
1в)• Progress report on Population and Housing census (ХАОСТ-2)• Preliminary result of Population and Housing census (ХАОСТ-3)• Handover form for completed questionnaires of Population and Housing census
(ХАОСТ-4)• Population and Housing census 2020-Questionnaire on quality control and assurance
(ХАОСТ-11)Additional questionnaire on quality control and assurance (ХАОСТ-11а)• Guidelines and handbooks on questionnaire and compilation forms of the Population
and Housing Census 2020.
CENSUS PLANNINGThe census serves as one of the major sources for the statistical data.
A particularity of conducting the Population and Housing census is ensuring contribution and wide engagement of all stakeholders from the smallest administrative unit to the Ministries and the public under neat management and organization.
The Population and Housing Census 2020 fully met the requirements such as forming a management team for the preparation of the census and developing and delivering a comprehensive plan. .
The United Nations has recommended its member states to conduct the Population and Housing Census at least once between 2015 and 2024. Hence, it was obligation for Mongolia to conduct the census.
The Population and Housing Census 2020 was conducted in alignment with the national legistations governing the census and the Revision 3, “Principles and Recommendations for Population and Housing Censuses” adopted by the UN Statistics Divison. Therefore, in conjunction with the Population and Housing Census 2020, the housing census was conducted in 2019 aimed at addressing the pressng data needs at the national level by using the newly compiled address data.
The master plan for application of methodology to the census, its management and organization,

186
2020 POPULATION AND HOUSING CENSUS OF MONGOLIA NATIONAL REPORT
stages, and administration budget, which was approved by the State Commission of the Population and Housing Census on October 17, 2018 was used.
An action plan with 73 articles and sections, was approved by the first meeting of State Commission on Population and Housing Census on February 22, 2018 and ensured its compliance for the conduct of the census.
The Population and Housing Census 2020 undergone through the following stages:
I. Preparation stageII. ТEnumeration stageIII. Monitoring and Evaluation stageIV. Data processing stageV. Analysis analysisVI. Dissemination stage
The preparation stage entailed a delivery of various planned activities, such as mapping of censusterritories, development of, printing and dissemination of communications materials, questionnaires and guidelines, rolling out a pilot census, delivering training sessions, assessing the feasibility of equipment and computer software and improving and updating them.
THE MANAGEMENT AND ORGANIZATION OF CENSUSAccording to the “Law on Population and Housing Census”, the management and organization of
the Census 2020 was managed by the State Commission, the National Statistics Office, aimag, capital city, soum, and district, the census commissions established at the Ministries, the ad-hoc bureaus at the local administrations and Ministries, enumerators, and supervisors.
THE STATE COMMISSION OF CENSUSThe State Commission was formed with the following stakeholders by № 77 resolution of the State
Great Khural on December 8, 2017 as stipulated in the Paragraph 2, Article 13 of “Law on Population and Housing Census”. The stakeholders include:
КChair of Commission:Prime Minister of Mongolia
Deputy Chairs of Commission:Chairperson of National Statistics OfficeChief of Cabinet Secretariat of the Government of Mongolia
Members:Minister of Environment and TourismMinister of Construction and Urban DevelopmentMinister of DefenseMinister of Education, Culture, Science and SportMinister of Foreign AffairsMinister of Road and Transport DevelopmentMinister of FinanceMinister of Mining and Heavy IndustryMinister of Labor and Social WelfareMinister of Justice and Internal AffairsMinister of Food, Agriculture, and Light Industry

187
APPENDIX
Minister of EnergyMinister of HealthGovernor of the Capital City and Mayor of Ulaanbaatar
Secretary:Head of Population and Social Statistics Department, National Statistics Office of Mongolia
A full-time employee who met the requirements articulated in the Article 13.4 of “Law on Population and Housing Census”, was appointed as the Secretary of the State Commission, by the resolution Б/20 of State Commission on February 7, 2018. .
The mandates of the State Commission::
• To prepare and organize the census, supervise compilation of results, and provide a holisticguidance;
• Ensure alignment of activities between Ministries and Agencies and provide a coherentmanagement for the census;
• Budget the conduct of census for approval of the state budget;• Exercise powers stated in the Paragraph 5, Article 13 of “Law on Population and Housing
Census”
NATIONAL STATISTICS OFFICE The National Statistics Office conducted the census with the following main mandates:
• To provide a holistic management and coordination of the census nationwide;;• To provide professional and methodological advice and assistance to the State Commission and
its members;• To develop and discuss draft decisions of the State Commission;• To provide preparation for the meeting of the State Commission, keep minutes of the meeting
and publish and report its’ decisions;• To approve methodological instructions and guidelines for census questionnaires, compliance
of census legislations; to publish and distribute questionnaires and related communicationsmaterials;
• To compile the census results and submit to the State Commission;• To process and make an analysis of the census data and to disseminate the census results to
the public• To deliver required training and public relations activities;• Other mandates articulated by the relevant legislations and specified by the State Commission
CENSUS COMMISSION AT THE LOCAL LEVELPursuant to the “Law on State Population and Housing Census”, the State Census Commission
established the Census Commissions at the local and capital city levels according to the Resolution No.02 of February 22, 2018 on “Appointment of Aimag and Capital City Census Commission”.
The Census Commissions of the the aimag, capital city, soum and district were established by the decision of the local administration based on the relevant decisions of the State Commission stating “The State Census Commission shall determine the composition of aimag and capital city census commissions, the aimag and capital city census commissions shall determine the composition of soum and district census commissions.”
In accordance with the recommendations of the higher-level Census Commission, an ad-hoc bureau was established to conduct the Population and Housing Census, and the obligations set forth in

188
2020 POPULATION AND HOUSING CENSUS OF MONGOLIA NATIONAL REPORT
Article 13.7 of the Law on the State Population and Housing Census were fulfilled.
The Census Commission at all levels were accountable for conducting the census within their respective administrative units, providing the necessary funds, human resources, venues, vehicles and fuel, training the census staff, ensuring the participation rate for the census, and compiling and submitting the compiled results to the National Statistical Office.
AD-HOC BUREAU AT THE LOCAL LEVELThe ad-hoc bureau for the census was led by the head of the statistical department/divisions at the
aimag and capital city levels, and the Deputy Governor at the soum and district level with representations of support staff of the statistics and registration departments/divisions and Govenor`s Office. The ad-hoc bureaus consisted of a total of 3-6 people (new hires and the statistical office/department/division employees) for performing the following duties and responsibilities under the direction of the Census Commission:
• To assist and collaborate in mapping of the primary administrative unit;• To ensure preparation and co-organize training sessions at the local level;• To promote the importance of the census to every household and citizen;• To update, verify, and prepare the local population and household data one month prior to the
census; and• Count each household and citizen without any gap, overlap or duplication, to compile a summary
daily activities and submit it to the State Commission on a daily basis.
The local ad-hoc bureaus for the Population and Housing Census 2020 were established within the mandates and structures of the statistical departments/divisions of the respective aimag, capital city, soum and district. One employee is working under an one-year contract from January 1, 2020 to January 1, 2021 during the census at the ad-hoc bureau.
ENUMERATOR, SUPERVISORSoum and district Census Commissions and the ad-hoc bureaus selected persons who met the
following general requirements as enumerators and supervisors:
• Ability to work full time;• Attainment of qualification above secondary education;• Ability to write neat and legible;• A strong communication skills;• A strong team work;• Experience in working for population and livestock censuses, other surveys, elections, and
community outreach.
In addition to the above requirements, requirements of attending the training sessions, living and working in the soums until the tablet is handed over to the soum Census Commission at the end of the enumeration stage for the housing census enumerators.
PILOT CENSUS AND REVISION OF QUESTIONNAIRE FORMA pilot census was rolled out to pilot the management and organization of the census and
questionnaire form for the Population and Housing Census2020. For the purpose of piloting the methods, principles, systems and tools for data collection of the Housing Census 2019 at the primary administrative level and identifying and addressing the potential challenges around the census, the

189
APPENDIX
enumeration was made by the tablets in Erdenebulgan soum, Ikhtamir soum of Arkhangai aimag andn 6th, 9th and 19th khoroo of Chingeltei district in June 2018 respectively.
ТIn the pilot census, depending on the different climatic zones of our country, the settlement of the population, and the internal migration patterns, the areas were selected for their likelihood of posing any challenges to the the regular census. The pilot census included the most populated parts of the capital city which are the 1st, 2nd, 3rd and 10th sections of the 6th khoroo of Songinokhairkhan district, 4th, 13th, 14th and 16th sections of the 15th khoroo of Khan-Uul district, and the 5th, 9th, 19th section of the 5th khoroo of Bayanzurkh district at the urban level, 1st and 7th bag of Kherlen soum and 5th bag of Sergelen soum of Dornod aimag at the rural level. The same timeline of the regular census, which is non shifting night timeline , applies to the pilot population and housing census in 2020. This means that children born after the timeline are not counted, but people who died after the timeline are counted.
The data collection for the pilot Housing Census was conducted from October to November 2018, and the Pilot Population and Housing Census data collection was carried out from January 10 to 16, 2019. The pilot Population and Housing census counted 25,402 people, while the pilot housing census counted 3,018 apartments. The Pilot Population and Housing Census 2020 devised the traditional data collection methods. In other words, all households in the selected unit were counted in the pilot census. The aim was to pilot the traditional method for the regular censuses, and to verify the data of the counted households in accordance with the Population and Household Database and the Housing Census Database to assess the database completeness, data filling and quality of the databases.
However, for the Pilot Housing Census, the Collector for ArcGIS software was used to classify the dwellings depicted in the “Address Map” into four main categories: apartment buildings, other types of dwellings, summer houses and non-residential buildings. A preliminary registration was made by adding new dwellings and gers that are not depicted in the Address map, and the total number of dwellings to be counted by the pilot housing census was calculated.
The Collector for ArcGIS software had many advantages, such as classifying points and polygons (angular shapes) depending on the type of dwelling, determining the location of the dwelling at the spatial level, and monitoring the census process online at the spatial level. However, Collector for ArcGIS is not a survey software, so it was difficult to process the questionnaire. For this reason, Survey123 for ArcGIS software, which is compatible with the Collector for ArcGIS software, were used to process the data. This software includes all the features required for questionnaire correlation, transitions, criteria, classification, and coding or data collection.
The above-mentioned pilots enabled the finalization the regular census questionnaire, development and printing of instruction for completing the questionnaires and guidelines for Census Commission and ad-hoc bureau staff, supervisors and enumerators, and provision of other necessary preparations. The pilots informed issues to be addressed in terms of budget, planning, questionnaires and consolidation form indicators for the regular census, and the guidelines for completing the questionnaire.
GEOGRAPHICAL INFORMATION SYSTEM AND MAPIn 2019, Mongolia conducted the first ever Housing Census (HC) and used cutting-edge technology
for the first time. The ArcGIS for Collector and Survey123 for ArcGIS software and particular area address maps were installed on 200 tablets which were used in the census, and the census was conducted according to the regional routes of Western Region, Khangai Region, Central Region, Eastern Region, and the city of Ulaanbaatar. The Population and Housing Census 2020 differs from other censuses conducted based on the HC address map.

190
2020 POPULATION AND HOUSING CENSUS OF MONGOLIA NATIONAL REPORT
ENUMERATOR MAP
A combination of survey software, Collector for ArcGIS and Survey123 and ArcGIS, offered by the international geographic information system software supplier ESRI were used for collecting data for the housing census. The Collector for ArcGIS software had many advantages, such as classifying points and polygons (angular shapes) depending on the type of dwelling, determining the location of the dwelling at the spatial level, and monitoring the census process online at the spatial level. Therefore it enabled the enumerator to add a permanently occupied dwelling data manually which is not depicted on the address map but has a permanent resident while collecting data
The map created as a result of the pre-registration is connected to the census questionnaire and distributed to each enumerator on a portable census tablet. The enumerator collected the census information offline and transferred the collected information to the central server via the Internet by visiting the ad-hoc bureau at the specified time, and reported the census progress from time to time.
In addition, ArcGIS Online software, online monitoring software, was developed for monitoring the census progress online. This enabled monitoring of the progress both at the special level and in a table format.
Application of a package geographical information software to the data collection created an enabling environment for disseminating the census result to the public more clearer and user-friendly way, enabled opportunity to develop various thematic special maps and applications
The maps play a pivotal role in conducting census at the high level with excellent quality and bring the following benefits:
1. It simplifies the coordination of census activities by planning the activities based on the specialdata of administrative unit for the staff working on the ground.
2. It plays a crucial role for ensuring a full coverage of all households by aligning the identified andassigned dwellings along with a plan for count with the census area boundaries.
3. A systematic and phased geospacial information framework enables an opportunity to us thethematic special maps and increases number and types of products deriven from the censusresults.
The ESRI and Monmap, an official distributor of ESRI of Mongolia enabled an opportunity to use the aforemention software in every stages of the census.
One of the particularity of the Housing Census is that the data collection was not started simultenanously at the national level but collected data on all building and dwellings suitable for living from the western region to the eastern one by using revised maps developed by the Administration of Land Affairs, Geodesy and Cartography according to the revised methodology for an addressing system. The Collector for ArcGIS and Survey123 and ArcGIS software and the cutting-edge technology tablet were used for the data collection. However, data on apartment buildings were collected from the Housing and Public Utilities Authority and the Association of Apartment/House Owners.

191
APPENDIX
APPENDIX B
SOME CONCEPTS AND DEFINITIONS USED IN THE 2020 POPULATION AND HOUSING CENSUS
№ Concepts Definitions
CENSUS
1 Population and housingcensus
Total process of collecting, compiling, evaluating, analyzing and publishing or otherwise disseminating demographic, economic and social data pertaining of all persons in a country or ill a well delimited part of a country, within the time which is specified in this law;
2 Moment of census Shall be 00. 00 hour on the date of commencement of the time of the Census:
3 Counting time From 09:00 am on January 9, 2020 to 10:00 pm on January 15, 2020;
4 Census units Means a individual, households, dwellings, and buildings containing dwellings;HOUSEHOLD, POPULATION
5 Household
The household is the group of people who live together in one house, with a joint budget, jointly provide the food and other basic needs. Members of the household should be family or relatives;there can be some membersin the household with no relationto the other members.
6 Main household
Despite of the type of the housing unit, the“Main household” is the household who owns the housing unit based on a certificate to own, or a rental contract, or it is the household who has lived longest in the housing unitif the owner is someone else.
7 Sharing household The sharing household is the household who is living together with the main household in one housing unit..
8 Household head
The household head will be determined by the members of the household. The household head is a family member, who usually reside in the household, is above 16 years old, the main contributor to the household income, plays a significant role in decision making of the household.
9 Household members
The household members are one person or a group of people who are relatives or family members who live together in one housing unit, with a joint budget, and jointly provide food and other basic needs.However, relatives and other people who are not members of the household can live in this household during the census date.
10 Nuclear household The household which consists of an entirely single-family nucleus or married-couple family or father or mother with child (ren) or without child (ren).
11 Extended household
The household which consists of: a. a single-family nucleus and other persons related to the nucleusb. two or more family nuclei related to each other without any other personsc. two or more family nuclei related to each other plus other persons related toat least one of the nucleid. two or more persons related to each other, none of whom constitute a familynucleus.
12 Mixed household
The household which consists of:a. a single family nucleus plus other persons, some of whom are related to thenucleus and some of whom are notb. a single family nucleus plus other persons, none of whom is related to thenucleusc. two or more family nuclei related to each other plus other persons, some ofwhom are related to at least one of the nuclei and some of whom are not related to any of the nucleid. two or more family nuclei related to each other plus other persons, none ofwhom is related to any of the nucleie. two or more family nuclei not related to each other, with or without any otherpersonsf. two or more persons related to each other but none of whom constitute afamily nucleus, plus other unrelated persons g. non-related persons only.

192
2020 POPULATION AND HOUSING CENSUS OF MONGOLIA NATIONAL REPORT
№ Concepts Definitions
13 De jure population Mongolian citizens, foreign nationals and stateless persons who are residing in Mongolian territory more than 6 months or 183 days
14 De facto population At the time of the census, the total population residing in the area (regardless of whether they live permanently or temporarily).
DISABILITY AND TYPE
15 Disabled personA disabled person is a person who has lost his/her ability to participate in social relations permanently or for more than 12 months due to physical, psychological, mental, or sensory difficulty.
16 Congenital disabilityThe limited ability to participate in social relationships due to a physical,psychological,mental, or sensory difficulty caused by a genetic disorder, or pregnancy and delivery complications.
17 Acquired disabilityThe limited ability to participate in social relationships because of physical, psychological,mental, or sensory disorder due to domestic or factory accidents, diseases and or vocational diseases.
18 Seeing Loss of vision or limited ability to see due to an eye problem, disorder and or diseases.
19 Speaking Complete loss or limited ability to speak due to a speaking organs’ disorder and or diseases.
20 Hearing Complete loss or limited ability to hear due to a hearing, or speaking organs’ disorder and or diseases.
21 Moving Complete loss or limited ability to perform daily normal actions due to inability to move acertain part of the body.
22 Mental disorder
Mental disorder is displayed by the changes in thinking, feeling, and understanding and in behaviour.Due to these changes, one’s ability to participate in social relations could be limited due to the external(intellectual disability developed between ages of 0-3 years caused by aftermath of delivery complications) and internal(changes in chromosomes, hormonal changes in the body) factors.
23 Combined If a person has more than one type of disability, it is considered a combined disability.
24 Other Loss or limited ability to perform daily activities due to any illness or disease other than the above.
FUNCTIONING DIFFICULTY AND TYPE25 No difficulty There are no problems with any action, no problems with the senses
26 Some difficulty Participates in daily activities with the support or assistance of others;
27 A lot of difficulty
60-90 percent of the process is done with the help of tools and others. (Always leans on someone while walking, gives additional explanations when understanding something, performs simple household chores with the support of others)
28 Cannot do the activity at all Performing any action, the health problem affects the ability to act 100% and it is not possible to perform any action on one's own.
29 SeeingThe purpose of the questions on seeing are to identify persons who have vision difficulties or problems seeing even when wearing glasses or contact lenses. When using your glasses or contact lenses, do you have difficulty seeing?
30 Hearing
The purpose of these questions is to identify persons who have some hearing limitation or problems of any kind with their hearing, even when using a hearing aid. Included are problems hearing in a noisy or quiet environment; problems distinguishing sounds from different sources; and problems hearing in one or both ears. When using your hearing aid(s), do you have difficulty hearing?

193
APPENDIX
№ Concepts Definitions
31 Mobility
The purpose of this item is to identify persons who have some limitation or problems of any kind getting around on foot. Walking refers to the use of the lower limbs (legs) in such a way as to propel oneself over the ground to get from one point to another. The capacity to walk should be without assistance of any device (wheelchair, crutches, walker, etc.) or human. If such assistance is needed, the person has difficulties walking. Difficulties walking can include those resulting from impairments in balance, endurance, or other non-musculoskeletal systems, including problems walking up or down steps.
32 Cognition
Remembering refers to the use of memory to recall incidents or events. It means the individual can bring to mind or think again about something that has taken place in the past. Also included are problems remembering what someone just said, or becoming confused or frightened about most things.
33 Self-care The purpose of this item is to identify persons who have problems taking care of themselves independently.
34 Communication
The purpose of this item is to identify persons who have problems with talking, listening, or understanding speech such that it contributes to difficulty in making themselves understood to others or understanding others. Communicating refers to a person exchanging information or ideas with other people through the use of language. Included are problems making oneself understood, or problems understanding other people when they speak, to try to communicate in other ways.
RESIDENCE
35 Usual resident A person who has lived in the administrative unit for more than 6 months (183 days) as of the census date.
36 Temporarily absent A person who has been temporarily absent from the administrative unit of usual residence for less than 6 months (183 days) as of the census date.
37 Temporarily presentA person who is present in the administrative unit of enumeration that is other than the administrative unit of his/ her usual residence for less than 6 months (183 days) as of the census date.
EDUCATION
38 No education
A person who did not complete 3rd grade (during 1975-1996), or 4th grade (until 1975, or during 1997-2004), or 5th grade (after 2005) of secondary school. Also, children who are currently attending in 1-5th grade of secondary school in 2020 or those who dropped out of school will be considered as having no education.
39 Primary education
A person who graduated 3rd grade (during 1975-1996), 4th grade (until1975, or during 1997-2004), 5th grade (after 2005) of secondary school. Also, the person who participated and graduated from an informal and distance learning programme.
40 Incomplete secondary or basic education
A person who graduated 7th grade (until 1975), 8th grade (during 1975-2004), and 9th grade (2005 and after) of the secondary school in day, evening, external programme and participated and graduated the basic education programme and has got a certificate of basic education.
41 Complete secondary or high school education
A person who graduated 10th grade (up to 2006), 11th grade (2006 and after) of the secondary school in a day, evening and external programme, and participated and graduated informal education programme and has got a certificate.
42 Technical and vocational education
A person who graduated from a Vocational Training Centre (formerly a technical and vocational school) and has got a vocational certificate.
43 Vocational middle education A person who graduated from a vocational college abroad and locally (formerly a technical) or same level schools and has got a certificate or diploma.

194
2020 POPULATION AND HOUSING CENSUS OF MONGOLIA NATIONAL REPORT
№ Concepts Definitions
44 Higher education
A person who graduated from an international or national university, institute or college in day or evening classes or correspondence courses and has got a diploma of bachelor, master or doctoral level or same level document to certify the educational level. Diploma courses for higher education shall be at least 90 sets of hours, including bachelor's courses 120 hours, master's courses 150 hours and doctoral courses 210 hours, including the previous level. Also, the person who graduated a 3 year programme from the Teachers University before 1964, the person who graduated the Political Party Institute before 1966, the person who graduated a two year course at the Institute of Political Party, or those who graduated from the Evening Institute for Marxism-Leninism and the Labor Institute for the East will belong to this classification.
45 LiterateA person who is able to read, understand and write a simple and short sentence about daily life in any language (not depending on the types of the script) and this ability is kept after a certain period of time
46 IlliterateA person who is not able to read, understand and write a simple and short sentence about daily life in any language (not depending the types of the script) and the ability is lost after a certain period of time.
FAMILY STATUS47 Never married A person who is above the age 15 and never got married.
48 Not registered marriedA person who is living with his/ her partner (regardless of the duration), but not registered with the civil registration agency and has not got an official marriage certificate.
49 Registered married A person who has registered the marriage in the civil registration agency and has got a marriage certificate.
50 Separated/ Legally marriedA person who has separated but not legally divorced and not living with someone else regardless of the duration. However, it is not considered that people living separately are separated due to official work.
51 Divorced A person who is legally divorced and has not married again and is not living with someone else regardless of the duration.
52 Widowed The person who has not married again or living with someone else after the death of a wife/husband regardless of the duration.
EMPLOYMENT
53 Employed A person who has a permanent job or the person who had at least one day’s paid job during the week before the census date.Those on annual, sick, or maternal leave will be considered employed.
54 UnemployedA person who is actively looking for a job during the week prior to the census date despite of the unemployment registration with the labor and welfare service department..
55 Potential labor force
Potential labor force, refers to persons not in employment who express an interest in this form of work but for whom existing conditions limit their active job search and/or their availability. Potential labor force includes the following persons: а. Persons seeking employment but currently unavailable, and attempted to seek employment but currently not ready (unavailable jobseekers); b. Persons are not seeking employment but intent to be employed and are currently available to be employed (available potential jobseekers).
56 Working age populationWorking age population is defined as those aged 15 years and above. Working age population is categorized into labor force and persons outside of the labor force.
57 Labor force Labor force refers to the current supply of the labor for the production of goods and services in exchange for pay or profit.

195
APPENDIX
№ Concepts Definitions
58 Persons outside the labor force
Persons outside the labor force are those of working age who were neither in employment nor in unemployment in the short reference period with reasons of either in education or retired or elder or disabled, or discouraged for seeking employment. Extended labor force is defined as the sum of the labor force and plus the potential labor force.
59 Permanent employees
Employees who are guaranteed a minimum number of hours of work and are employed on an ongoing or indefinite basis. There is no specified date or event on which the employment will be terminated other than any age or time for retirement that may apply in the economic unit concerned. They can be full-time or part-time workers, in formal or informal jobs. The group includes recently appointed employees with jobs that are subject to an initial trial period but are expected to continue indefinitely.
60 Fixed-term employeesEmployees with a specified number of hours of work who are employed on a time-limited basis for a period of three months or more. They can be full-time or part-time workers, and in formal or informal jobs.
61 Short-term and casual employees
Short-term and casual employees are employees with short-term employment arrangements and/or without a guaranteed minimum number of hours of work per pay period.
62 Paid apprentices, trainees and interns are employees
Paid apprentices, trainees and interns are employees who perform any activity to produce goods or provide services for others, in order to acquire workplace experience or skills in a trade or profession and receive payment in return for work performed.
63 Dependent contractors
Dependent contractors are those workers who have contractual arrangements of a commercial nature (but not a contract of employment) to provide goods or services for or through another economic unit. They are not employees of that economic unit, but are dependent on that unit for organization and execution of the work, income, or for access to the market. They are workers employed for profit, who are dependent on another entity that exercises control over their productive activities and directly benefits from the work performed by them.
64 Employer in corporations
Employers are those who hold self-employment jobs, for profits and engage one or more person to work for them as ‘employee’, on continuous basis. Here, employed persons ‘not at work’ are included, but partners and family helpers are not regarded as employee. Employers are categorized into ‘employers in corporations’, i.e. directors and managers of enterprises and ‘employers in household market enterprises’.
65 Employers in household market enterprises
Employers in household market enterprises are workers who, alone or with one or more partners, operate an unincorporated market enterprise for profit, and who, employ one or more persons (including temporarily absent employees but excluding themselves, their partners and contributing family workers) to work in that enterprise as an employee on a regular basis. ‘On a regular basis’ included employed persons ‘not at work’ but exclude partner employers and family helpers.
66Owner-operators of corporations without employees
Owner-operators of corporations without employees are workers who hold a job in an incorporated enterprise (such as a limited liability corporation or limited partnership), does not engage anyone other than partners, family members and themselves in their business activities.
67Own-account workers in household market enterprises without employees
Own-account workers in household market enterprises without employees are workers who operate an unincorporated market enterprise for profit, alone or with one or more partners or contributing family workers, and do not employ any persons to work in the enterprise as an employee.

196
2020 POPULATION AND HOUSING CENSUS OF MONGOLIA NATIONAL REPORT
№ Concepts Definitions
68 Contributing family workers
Contributing family workers assist a family member or household member in a market-oriented enterprise operated by the family or household member, or in a job in which the assisted family or household member is an employee or dependent contractor. They do not receive regular payments, such as a wage or salary, in return for the work performed, but may benefit in kind or receive irregular payments in cash as a result of the outputs of their work through family or intra-household transfers, derived from the profits of the enterprise or from the income of the other person. They do not make the most important decisions affecting the enterprise or have responsibility for it.
NATIONAL STANDARD CLASSIFICATIONOF OCCUPATIONS AND ITS DEFINITIONS
69 Managers
A manager is an officer who has responsibility to plan, manage, coordinate, monitor and evaluate, develop the policies and guidelines and monitor the implementation. For instance, all levels of heads, directors, law makers of the government agencies, private companies, NGOs and supervisors, all levels of governors, managers etc.
70 Professionals
A person who performs tasks such as increasing the knowledge base, utilization of scientific and cultural theories and concepts and able to teach these subjects and trained at high professional levels. For instance, an officer in charge of scientific and engineering issues, doctors, nurses, teachers, researchers, business and administrative officers ,programmers, religious officers, singer, and actor etc.
71 Technicians and associate professionals
A person who performs technical tasks such as assisting in research related to science and engineering and utilization of results in practice. They will work on monitoring and managing engineering related work and processes of the mining, production, construction and other sectors. For instance, technician of physics and engineering, investigators of the mining, factory and construction sector, quality assurance controller, technician of live world study, other related assistance, controller and technician of an airplane etc.
72 Clerical support workers
A person who performs tasks such as making Explanations on information related to certain issues, compiling, saving documents, making estimations, making restorations, money transactions, organizing trips, receiving comments, making requests, making appointments and arranging meetings etc. Computer operator, service assistance, registration assistant, office assistance and etc.
73 Service and sales workers
A person who has the responsibility to run a protection or trade related businesses such as managing tourism and household related work, running a food service, providing care for someone or protecting someone from illegal actions and danger of fire, running a small business to sell goods at the market or small shops etc. For instance, private service providers, sales officers, caretakers, body guards or security officers and etc.
74 Skilled agricultural, forestry and fishery workers
An person who performs tasks such as planting seeds, looking after woods, preparing food for animals, or collecting wild fruits and herbs, feeding and protecting animals, or producing animal related products, fishing for family food consumption. For instance, agricultural, forestry and fishery workers with market orientation, farmers, fishermen, hunters and collectors.
75 Production, construction, craft and related trades workers
Persons who construct, maintain and repair buildings and other structures. Those who form metal, erect, maintain and repair heavy metal structures, engage in machine-tool setting as well as in fitting, maintaining and repairing machinery, including engines, vehicles, electrical and electronic equipment, or make and repair precision instruments, musical instruments, various articles such as jewellery, precious metal ware, ceramics, porcelain ware and glassware, as well as handicrafts made of wood or textile, leather or related materials, or they perform printing or book-binding tasks. Metal, machinery, mechanics related workers, handicraft, printing operators, electronic and cyber technician, food processors, wood treaters, textile and garment producers and etc.

197
APPENDIX
№ Concepts Definitions
76 Plant and machine operators, and assemblers
Plant and machine operators and assemblers operate and monitor industrial and agricultural machinery and equipment on the spot or by remote control, drive and operate trains, motor vehicles and mobile machinery and equipment, or assemble products from component parts according to strict specifications and procedures. For instance, technicians, drivers, and operators of machinery and equipments.
77 Elementary occupations
Elementary occupations consist of simple and routine tasks which mainly require the use of hand-held tools and often some physical effort For instance, cleaners, assistants for agriculture, forest, fishing, mining, construction, production, transportation and food production related work or street trade and service related works.
78 Armed forces
Members of the armed forces are those personnel who are currently serving in the Mongolian Armed Forces, including auxiliary services, whether on a voluntary or compulsory basis, and who are not free to accept civilian employment. An armed force officer can perform various tasks as it is in civilian employment. Mid-level officers, senior officers and high level officers belong to this category.
DEFINITIONS OF STANDARD INDUSTRIAL CLASIFICATIONS OF ALL ECONOMIC ACTIVITIES
79 Agriculture, forestry, fishing and hunting
Exploitation of vegetal and animal natural resources, comprising theactivities of growing of crops, raising and breeding of animals, harvesting of timber and other plants, animals or animal products from a farm or their natural habitats.
80 Mining and quarrying
The mining activities related to the extraction of minerals occurring naturally as solids (coal and ores), liquids (petroleum) or gases (natural gas). Extraction can be achieved by different methods such asunder ground or surface mining, well operation, seabed mining etc.
81 Manufacturing
This section includes the physical or chemical transformation of materials, substances, or components into new products, although this cannot be used as the single universal criterion for defining manufacturing. The materials, substances, or components transformed are raw materials that are products of agriculture, forestry, fishing, mining or quarrying as well as products of other manufacturing activities. Substantial alteration, renovation or reconstruction of goods is generally considered to be manufacturing.
82 Electricity, gas, steam and ventilation
This section includes the activity of providing electric power, natural gas, steam, hot water and the like through a permanent infrastructure (network) of lines, mains and pipes. The dimension of the network is not decisive; also included are the distribution of electricity, gas, steam, hot water and the like in industrial parks or residential buildings.
83
Water supply; sewerage, waste management andremediation activities
This section includes activities related to the management (including collection, treatment and disposal) of various forms of waste, such as solid or non-solid industrial or household waste, as well as contaminated sites. The output of the waste or sewage treatment process can either be disposed of or become an input into other production processes. Activities of water supply are also grouped in this section, since they are often carried out in connection with, or by units also engaged in, the treatment of sewage.
84 Construction
This section includes general construction and specialized construction activities for buildings and civil engineering works. It includes new work, repair, additions and alterations, the erection of prefabricated buildings or structures on the site and also construction of a temporary nature.
85
Wholesale and retail trade; repair of motor vehicles andmotorcycles
This section includes wholesale and retail sale (i.e. sale without transformation) of any type of goods and the rendering of services incidental to the sale of these goods. Wholesaling and retailing are the final steps in the distribution of goods. Goods bought and sold are also referred to as merchandise.
86 Transportation and storage
This section includes the provision of passenger or freight transport, whether scheduled or not, by rail, pipeline, road, water or air and associated activities such as terminal and parking facilities, cargo handling, storage etc. Included in this section is the renting of transport equipment with driver or operator. Also included are postal and courier activities.

198
2020 POPULATION AND HOUSING CENSUS OF MONGOLIA NATIONAL REPORT
№ Concepts Definitions
87 Accommodation and food service activities
This section includes the provision of short-stay accommodation for visitors and other travellers and the provision of complete meals and drinks fit for immediate consumption. The amount and type of supplementary services provided within this section can vary widely.
88 Information and communication
This section includes the production and distribution of information and cultural products, the provision of the means to transmit or distribute these products, as well as data or communications, information technology activities and the processing of data and other information service activities.
89 Finance and insurance activities
This section includes financial service activities, including insurance, reinsurance and pension funding activities and activities to support financial services. This section also includes the activities of holding assets, such as activities of holding companies and the activities of trusts, funds and similar financial entities.
90 Real estate activities
This section includes acting as lessors, agents and/or brokers in one or more of the following: selling or buying real estate, renting real estate, providing other real estate services such as appraising real estate or acting as real estate escrow agents. Activities in this section may be carried out on own or leased property and may be done on a fee or contract basis. Also included is the building of structures, combined with maintaining ownership or leasing of such structures. This section includes real estate property managers.
91 Professional, scientific and technical activities
This section includes specialized professional, scientific and technical activities. These activities require a high degree of training, and make specialized knowledge and skills available to users.
92 Administrative and support service activities
This section includes a variety of activities that support general business operations.
93
Public administration and defence; compulsorysocial security
This section includes activities of a governmental nature, normally carried out by the public administration. This includes the enactment and judicial interpretation of laws and their pursuant regulation, as well as the administration of programmes based on them, legislative activities, taxation, national defence, public order and safety, immigration services, foreign affairs and the administration of government programmes. This section also includes compulsory social security activities.
94 Education
This section includes education at any level or for any profession, oral or written as well as by radio and television or other means of communication. It includes education by the different institutions in the regular school system at its different levels as well as adult education, literacy programmes etc. Also included are military schools and academies, prison schools etc. at their respective levels. The section includes public as well as private education.
95 Human health and social work activities
This section includes the provision of health and social work activities. Activities include a wide range of activities, starting from health care provided by trained medical professionals in hospitals and other facilities, over residential care activities that still involve a degree of health care activities to social work activities without any involvement of health care professionals.
96 Arts, entertainment and recreation
This section includes a wide range of activities to meet varied cultural, entertainment and recreational interests of the general public, including live performances, operation of museum sites, gambling, sports and recreation activities.
97 Other service activitiesThis section includes the activities of membership organizations, the repair of computers and personal and household goods and a variety of personal service activities not covered elsewhere in the classification.
98
Activities of households as employers; undifferentiatedgoods- and services-producing activities of householdsfor own use
This section includes activities of households as employers of domestic personnel such as maids, cooks, waiters, valets, butlers, laundresses, gardeners, gatekeepers, stable-lads, chauffeurs, caretakers, governesses, babysitters, tutors, secretaries etc.; This division includes the undifferentiated subsistence goods-producing and services producing activities of households.

199
APPENDIX
№ Concepts Definitions
99 Activities of extraterritorial organizations and bodies
This section includes activities of international organizations such as the United Nations and the specialized agencies of the United Nations system, regional bodies etc., the International Monetary Fund, the World Bank, the World Customs Organization, the Organization for Economic Co-operation and Development, the Organization of Petroleum Exporting Countries, the European Communities, the European Free Trade Association etc. This class also includes activities of diplomatic and consular missions when being determined by the country of their location rather than by the country they represent
HOUSING
100 BuildingA building is any independent free-standing structure comprising one or morerooms or other spaces, covered by a roof and usually enclosed within external walls or dividing walls that extend from the foundations to the roof.
101 Apartment
This isahousing unit inside a building which is fully or partially dedicated for human housing and used as living quarter during the census date. Apartment is built for people to live in and it contains housing units with one or moreseparate rooms for each household. Apartment is fully equipped with necessary infrastructure for convenient living.
102 Comfortable private house
Intended for single-household, connected to a centralized utility system or connected to an utility system, independent of heating, ventilation, water supply, sewerage, power supply and communication lines, with a built-in toilet (water pump).Non-public accommodations include that rooms not located above the other households room, entrances, auxiliary room, attic, basement, and basement. Have a living room (bedroom and living room), kitchen, bathroom or shower, toilet, storage, closet and attic or no attic.
103 Detached houseThisis ahousing unitwith one or moreseparate rooms and often located in ger districts and has partial or no infrastructure (kitchen, bath, shower, heating system, water supply, and toilet inside the house).
104 DormitoryThe dormitory usually has a shared kitchen, a toilet, a shower and a meeting room. Dormitories for employees of business entities and organizations, students of all levels of schools and other similar dormitories.
105 Other
This includes dwellings that were not originally built for human habitation or that have been remodeled for human habitation. Other dwellings shall be considered as in a school, factory, office or part of a room (intended for the location of a business entity or organization) where households and people are living, non-permanent, temporary shelters and unsuitable for human habitation. For example, caravans, barns, sheds, warehouses, shops, kiosks, roofs, basements, entrances, heating wells (trenches), forests, mountains, caves, etc., are considered to be other dwellings if households and people living there.
106 Other public accommodation Communal housing such as rest homes, sanatoriums, hospitals, and carecentres, prisons, and army dormitory.
107 Number of rooms The number of rooms includes bedrooms, dining rooms and studies.
108 Floor space(square meters)
The floor space of a housing unit is the total floor space insquaremeters where people live including guest rooms, bedrooms, children’s rooms, studies,dining room and others including kitchen, toilet, hall, built-in cupboards, storage rooms and etc.

200
2020 POPULATION AND HOUSING CENSUS OF MONGOLIA NATIONAL REPORT
POPULATION AND HOUSING CENSUS OF MONGOLIA QUESTNAIRE-2020 /HAOST-1/
1. WHAT TYPE OF LIVING QUANTER DOES YOUR HOUSEHOLD OCCUPY?Ger ..............................................................................................................1 House/ Building ....................................................................................2 Non-residential accomodation .......................................................3 Other..........................................................................................................4
TO BE ASKED FROM HOUSEHOLDS LIVING IN HOUSE/ BUILDING.2. WHAT IS THE TYPE OF YOUR HOUSE/ BUILDING?
Apartment/ Condominium ..............................................................1Comfortable private house ..............................................................2 Detached house ....................................................................................3Student’s dormitory ............................................................................4Staff dormitory ......................................................................................5Other public dwelling .........................................................................6
3. HOW MANY ROOMS ARE THERE IN THIS DWELLING?
Number of rooms ................................................................
4. WHAT IS THE SIZE OF THE TOTAL FLOOR SPACE?
Square meters ..............................................................
5. DO YOU HAVE A KITCHEN IN THIS DWELLING?Yes ...............................................................................................................1No................................................................................................................2
6. IS YOUR KITCHEN/ COOKING AREA SHARED WITH OTHERS?Not shared ...............................................................................................1Shared .......................................................................................................2
7. DO YOU HAVE A BATH / SHOWER IN THIS DWELLING? Yes ...............................................................................................................1No................................................................................................................2
8. WHAT IS THE TYPE OF THIS BATH / SHOWER? Fixed ...........................................................................................................1Assembled/ Portable ..........................................................................2
9. DO YOU SHARE THIS BATH / SHOWER WITH OTHERS?? Yes ...............................................................................................................1No................................................................................................................2
TO BE ASKED FROM HOUSEHOLDS LIVING IN GERS.
10. HOW MANY GERS DOES HOUSEHOLD HAVE?
Number of GERs ...........................................................................
11. HOW MANY WALLS DOES YOUR MAIN GER HAVE?
Number of walls ...................................................................
TO BE ASKED FROM ALL HOUSEHOLDS.
12. IS YOUR WATER SUPPLY SYSTEM INSIDE OF YOUR DWELLING? Yes ...............................................................................................................1No................................................................................................................2
13. WHAT IS THE TYPE OF WATER SOURCE OF YOUR DWELLING? Centralized system ...............................................................................1Individual system..................................................................................2
14. IS THERE COLD AND HOT WATER? Cold and hot water ..............................................................................1Only cold water .....................................................................................2
15. WHERE IS DRINKING WATER SOURCE LOCATED? In own dwelling ....................................................................................1In own yard .............................................................................................2Elsewhere.................................................................................................3
16. WHAT IS THE TYPE OF DRINKING WATER SOURCES IN YOUR OWN DWELLING?
Centralized system ...............................................................................1Individual system..................................................................................2
17. WHAT IS THE TYPE OF DRINKING WATER SOURCES OUTSIDE OF YOUR DWELLING?
Protected dug well ...............................................................................1Water kiosk connected to central network 2Water kiosk not connected to central network ........................3Protected dug well ...............................................................................4Protected springs .................................................................................5Unprotected tube well .......................................................................6Unprotected dug well ........................................................................7Unprotected springs ...........................................................................8Tanker-truck ............................................................................................9Cart with small tank/drum ............................................................. 10Bottled water ....................................................................................... 11 Rainwater .............................................................................................. 12Surface water (rivers, lake, ponds) .............................................. 13Others ..................................................................................................... 14
18. WHAT IS THE DISTANCE BETWEEN YOUR HOUSEHOLD AND WATER SOURCE?
Meters ......................................................
IV.HOUSING QUISTIONNAIRE
Data collected by Date
Enumerator name: Signature:
Supervisor name: Signature:
19. WHAT IS THE MAIN SOURCE OF ELECTRICITY OF THIS DWELLING?Central power system ............................................................................... 1Diesel station ................................................................................................ 2Renewable electricity generator .......................................................... 3Power generator ......................................................................................... 4No electricity ................................................................................................ 5
20. WHAT IS THE MAIN SOURCE OF HEATING OF THIS DWELLING?Central heating system ............................................................................ 1Steam boiler ................................................................................................. 2Electric heater .............................................................................................. 3Geothermal heating .................................................................................. 4Combustible gas ......................................................................................... 5Low pressure furnace ................................................................................ 6Fire stove ........................................................................................................ 7
21. WHAT IS THE MAIN TYPE OF FUEL USED FOR COOKING?Electricity ....................................................................................................... 1Liquefied petroleum gas ......................................................................... 2Wood ............................................................................................................... 3Coal .................................................................................................................. 4Improved fuel ............................................................................................... 5Animal dung ................................................................................................. 6Other................................................................................................................ 7
22. IS THERE TOILET FACILITY? Yes ..................................................................................................................... 1No toilet available ...................................................................................... 2
23. IS THERE TOILET FACILITY IN YOUR DWELLING? Yes ..................................................................................................................... 1No...................................................................................................................... 2
24. WHAT IS THE TYPE OF TOILET FACILITY OF YOUR DWELLING?Connected to central sewage disposal system .............................. 1Individual sewage disposal system ..................................................... 2Septik tank..................................................................................................... 3Other................................................................................................................ 4
25. WHAT IS THE TYPE OF TOILET FACILITY OUTSIDE OF YOUR DWELLING?Pit latrine with slab .................................................................................... 1Improved pit latrine with slab ............................................................... 2Compost toilet ............................................................................................. 3Septik tank..................................................................................................... 4Open pit ......................................................................................................... 5
26. DO YOU SHARE YOUR TOILET FACILITY WITH OTHERS? Yes ..................................................................................................................... 1No...................................................................................................................... 2
27. HOW IS YOUR HOUSEHOLDS WASTE WATER DISPOSED?Central sewage disposal system .......................................................... 1Individual sewage disposal system ..................................................... 2Disposed into borehole ........................................................................... 3Pit latrine ........................................................................................................ 4None ................................................................................................................ 5
28. DO YOUR SEPARATE YOUR SOLID WASTE BEFORE DISPOSAL?Yes ..................................................................................................................... 1No...................................................................................................................... 2
29. HOW DO YOU DISPOSE OFF YOUR SOLID WASTE?Collection of waste collecting service: Regular ................................................................................................. 1 Irregular ................................................................................................ 2Disposed to special site ........................................................................... 3Burning ........................................................................................................... 4Buried .............................................................................................................. 5Dumped /no special site/ ........................................................................ 6
30. WHAT IS THE TYPE OF OWNERSHIP FOR THIS DWELLING?Individuals ..................................................................................................... 1Private enterprise ....................................................................................... 2Government organization`s ................................................................... 3
31. WHAT IS TYPE OF TENURE OF THIS DWELLING?Owner occupied ......................................................................................... 1Rental .............................................................................................................. 2Occupied free of rent ................................................................................ 3Other................................................................................................................ 4
32. IS YOUR DWELLING COVERED IN RENTAL HOUSING PROGRAM?Yes ..................................................................................................................... 1No...................................................................................................................... 2
33. IN WHAT KIND OF RENTAL HOUSING PROGRAM IS YOUR DWELLING IS COVERED?
Government ................................................................................................. 1Local ................................................................................................................. 2Private enterprise ....................................................................................... 3Other................................................................................................................ 4
Respondent name: Signature:
Phone number : _____________________________________________________
Data entry Date
Name of coder: Signature:
Name of typer: Signature:
Surname, Given name, Register ID
Relationship to head of the
household
SexMale - 1
Female - 2Age Residing country
Purpose Dura-tion of
residence in abroad (in years)
Initial Resid-ing
А Б 1 2 3 4 5 6 7
1 1 2
2 1 2
3 1 2
4 1 2
5 1 2
6 1 2
Purposes: Education/ Study - 1, Settle - 2, Contractual employment - 3, International organization/Diplomatic mission - 4, Regular employment -5, Family - 6, Other -7 Will section II continue? Yes - 1 Continue with Form HAOST-1c. No – 2
SECTION II. PERSONS RESIDING ABROAD FOR OVER 6 MONTHS
1
2020 POPULATION AND HOUSING CENSUS OF MONGOLIA
Approved by the Order No.A/151 of the Chairperson of the National Statistical Office of Mongolia in 11th October 2019. HAOST-1
All responses in this questionnaire form are kept in secret in accordance with No. 4 of Act 5 of Mongolian legislation on “Confidentiality of Pri-vate Information”, and No. 18.3 of Law on Popula-tion and Housing Census of Mongolia.
Street/ road name and number:
Area, buildiing, town name:
Building number:
Yard number: Door number:
SECTION I. ADDRESS
А9. Main household 1 Sharing household 2 Non-household 3
А10. Number of persons enumerated
А11. Number of additional sheets
А12. Are there any family members of this household who reside abroad for work or study for over six months? If yes, please state the number. Yes (Ask section II) .......................................1
Number of persons abroad No (Proceed to population questionnaire) .........2
АА. Household ID:
А1. Census Committee Number
А2. Aimag/ Capital city name and code
А3. Soum/ District name and code
А4. Bag/ Khoroo name and code
А5. Enumerator number
А6. Questionnaire form number А7. Village name and code
А8. Locality : /Capital-1, Aimag center-2, Village-3, Soum center-4, Countryside - 5/
А12
А10
А12
А15
FINISH
FINISH
FINISH
А7
А12
А17
А19
А26
А27
А25

201
APPENDIX
1. WHAT TYPE OF LIVING QUANTER DOES YOUR HOUSEHOLD OCCUPY?Ger ..............................................................................................................1 House/ Building ....................................................................................2 Non-residential accomodation .......................................................3 Other..........................................................................................................4
TO BE ASKED FROM HOUSEHOLDS LIVING IN HOUSE/ BUILDING.2. WHAT IS THE TYPE OF YOUR HOUSE/ BUILDING?
Apartment/ Condominium ..............................................................1Comfortable private house ..............................................................2 Detached house ....................................................................................3Student’s dormitory ............................................................................4Staff dormitory ......................................................................................5Other public dwelling .........................................................................6
3. HOW MANY ROOMS ARE THERE IN THIS DWELLING?
Number of rooms ................................................................
4. WHAT IS THE SIZE OF THE TOTAL FLOOR SPACE?
Square meters ..............................................................
5. DO YOU HAVE A KITCHEN IN THIS DWELLING?Yes ...............................................................................................................1No................................................................................................................2
6. IS YOUR KITCHEN/ COOKING AREA SHARED WITH OTHERS?Not shared ...............................................................................................1Shared .......................................................................................................2
7. DO YOU HAVE A BATH / SHOWER IN THIS DWELLING? Yes ...............................................................................................................1No................................................................................................................2
8. WHAT IS THE TYPE OF THIS BATH / SHOWER? Fixed ...........................................................................................................1Assembled/ Portable ..........................................................................2
9. DO YOU SHARE THIS BATH / SHOWER WITH OTHERS?? Yes ...............................................................................................................1No................................................................................................................2
TO BE ASKED FROM HOUSEHOLDS LIVING IN GERS.
10. HOW MANY GERS DOES HOUSEHOLD HAVE?
Number of GERs ...........................................................................
11. HOW MANY WALLS DOES YOUR MAIN GER HAVE?
Number of walls ...................................................................
TO BE ASKED FROM ALL HOUSEHOLDS.
12. IS YOUR WATER SUPPLY SYSTEM INSIDE OF YOUR DWELLING? Yes ...............................................................................................................1No................................................................................................................2
13. WHAT IS THE TYPE OF WATER SOURCE OF YOUR DWELLING? Centralized system ...............................................................................1Individual system..................................................................................2
14. IS THERE COLD AND HOT WATER? Cold and hot water ..............................................................................1Only cold water .....................................................................................2
15. WHERE IS DRINKING WATER SOURCE LOCATED? In own dwelling ....................................................................................1In own yard .............................................................................................2Elsewhere.................................................................................................3
16. WHAT IS THE TYPE OF DRINKING WATER SOURCES IN YOUR OWN DWELLING?
Centralized system ...............................................................................1Individual system..................................................................................2
17. WHAT IS THE TYPE OF DRINKING WATER SOURCES OUTSIDE OF YOUR DWELLING?
Protected dug well ...............................................................................1Water kiosk connected to central network 2Water kiosk not connected to central network ........................3Protected dug well ...............................................................................4Protected springs .................................................................................5Unprotected tube well .......................................................................6Unprotected dug well ........................................................................7Unprotected springs ...........................................................................8Tanker-truck ............................................................................................9Cart with small tank/drum ............................................................. 10Bottled water ....................................................................................... 11 Rainwater .............................................................................................. 12Surface water (rivers, lake, ponds) .............................................. 13Others ..................................................................................................... 14
18. WHAT IS THE DISTANCE BETWEEN YOUR HOUSEHOLD AND WATER SOURCE?
Meters ......................................................
IV.HOUSING QUISTIONNAIRE
Data collected by Date
Enumerator name: Signature:
Supervisor name: Signature:
19. WHAT IS THE MAIN SOURCE OF ELECTRICITY OF THIS DWELLING?Central power system ............................................................................... 1Diesel station ................................................................................................ 2Renewable electricity generator .......................................................... 3Power generator ......................................................................................... 4No electricity ................................................................................................ 5
20. WHAT IS THE MAIN SOURCE OF HEATING OF THIS DWELLING?Central heating system ............................................................................ 1Steam boiler ................................................................................................. 2Electric heater .............................................................................................. 3Geothermal heating .................................................................................. 4Combustible gas ......................................................................................... 5Low pressure furnace ................................................................................ 6Fire stove ........................................................................................................ 7
21. WHAT IS THE MAIN TYPE OF FUEL USED FOR COOKING?Electricity ....................................................................................................... 1Liquefied petroleum gas ......................................................................... 2Wood ............................................................................................................... 3Coal .................................................................................................................. 4Improved fuel ............................................................................................... 5Animal dung ................................................................................................. 6Other................................................................................................................ 7
22. IS THERE TOILET FACILITY? Yes ..................................................................................................................... 1No toilet available ...................................................................................... 2
23. IS THERE TOILET FACILITY IN YOUR DWELLING? Yes ..................................................................................................................... 1No...................................................................................................................... 2
24. WHAT IS THE TYPE OF TOILET FACILITY OF YOUR DWELLING?Connected to central sewage disposal system .............................. 1Individual sewage disposal system ..................................................... 2Septik tank..................................................................................................... 3Other................................................................................................................ 4
25. WHAT IS THE TYPE OF TOILET FACILITY OUTSIDE OF YOUR DWELLING?Pit latrine with slab .................................................................................... 1Improved pit latrine with slab ............................................................... 2Compost toilet ............................................................................................. 3Septik tank..................................................................................................... 4Open pit ......................................................................................................... 5
26. DO YOU SHARE YOUR TOILET FACILITY WITH OTHERS? Yes ..................................................................................................................... 1No...................................................................................................................... 2
27. HOW IS YOUR HOUSEHOLDS WASTE WATER DISPOSED?Central sewage disposal system .......................................................... 1Individual sewage disposal system ..................................................... 2Disposed into borehole ........................................................................... 3Pit latrine ........................................................................................................ 4None ................................................................................................................ 5
28. DO YOUR SEPARATE YOUR SOLID WASTE BEFORE DISPOSAL?Yes ..................................................................................................................... 1No...................................................................................................................... 2
29. HOW DO YOU DISPOSE OFF YOUR SOLID WASTE?Collection of waste collecting service: Regular ................................................................................................. 1 Irregular ................................................................................................ 2Disposed to special site ........................................................................... 3Burning ........................................................................................................... 4Buried .............................................................................................................. 5Dumped /no special site/ ........................................................................ 6
30. WHAT IS THE TYPE OF OWNERSHIP FOR THIS DWELLING?Individuals ..................................................................................................... 1Private enterprise ....................................................................................... 2Government organization`s ................................................................... 3
31. WHAT IS TYPE OF TENURE OF THIS DWELLING?Owner occupied ......................................................................................... 1Rental .............................................................................................................. 2Occupied free of rent ................................................................................ 3Other................................................................................................................ 4
32. IS YOUR DWELLING COVERED IN RENTAL HOUSING PROGRAM?Yes ..................................................................................................................... 1No...................................................................................................................... 2
33. IN WHAT KIND OF RENTAL HOUSING PROGRAM IS YOUR DWELLING IS COVERED?
Government ................................................................................................. 1Local ................................................................................................................. 2Private enterprise ....................................................................................... 3Other................................................................................................................ 4
Respondent name: Signature:
Phone number : _____________________________________________________
Data entry Date
Name of coder: Signature:
Name of typer: Signature:
Surname, Given name, Register ID
Relationship to head of the
household
SexMale - 1
Female - 2Age Residing country
Purpose Dura-tion of
residence in abroad (in years)
Initial Resid-ing
А Б 1 2 3 4 5 6 7
1 1 2
2 1 2
3 1 2
4 1 2
5 1 2
6 1 2
Purposes: Education/ Study - 1, Settle - 2, Contractual employment - 3, International organization/Diplomatic mission - 4, Regular employment -5, Family - 6, Other -7 Will section II continue? Yes - 1 Continue with Form HAOST-1c. No – 2
SECTION II. PERSONS RESIDING ABROAD FOR OVER 6 MONTHS
1
2020 POPULATION AND HOUSING CENSUS OF MONGOLIA
Approved by the Order No.A/151 of the Chairperson of the National Statistical Office of Mongolia in 11th October 2019. HAOST-1
All responses in this questionnaire form are kept in secret in accordance with No. 4 of Act 5 of Mongolian legislation on “Confidentiality of Pri-vate Information”, and No. 18.3 of Law on Popula-tion and Housing Census of Mongolia.
Street/ road name and number:
Area, buildiing, town name:
Building number:
Yard number: Door number:
SECTION I. ADDRESS
А9. Main household 1 Sharing household 2 Non-household 3
А10. Number of persons enumerated
А11. Number of additional sheets
А12. Are there any family members of this household who reside abroad for work or study for over six months? If yes, please state the number. Yes (Ask section II) .......................................1
Number of persons abroad No (Proceed to population questionnaire) .........2
АА. Household ID:
А1. Census Committee Number
А2. Aimag/ Capital city name and code
А3. Soum/ District name and code
А4. Bag/ Khoroo name and code
А5. Enumerator number
А6. Questionnaire form number А7. Village name and code
А8. Locality : /Capital-1, Aimag center-2, Village-3, Soum center-4, Countryside - 5/
А12
А10
А12
А15
FINISH
FINISH
FINISH
А7
А12
А17
А19
А26
А27
А25

202
2020 POPULATION AND HOUSING CENSUS OF MONGOLIA NATIONAL REPORT
Register ID:
Family name:
Surname:
Given name:
TO BE ASKED FROM ALL AGES.
1.ARE YOU THE HEAD OF THE HOUSEHOLD?Head of household ................................................ 01Non relative ............................................................... 11
2.WHAT IS YOUR GENDER? Male ................................................................................1Female ............................................................................2
3.WHAT IS YOUR DATE OF BIRTH?
Year: Month: Day:
4. HOW OLD ARE YOU?
5.WHAT IS YOUR CITIZENSHIP?Mongolian .................................................................. 01 Foreign (specify country)
_____________________________Non-citizenship ....................................................... 99
6.WHAT IS YOUR ETHNICITY?Khalkh ............................................................................1
Other (specify) _______________
7.WHAT IS YOUR RESIDENCY STATUS? Permanent residence ..............................................1Temporarily absence ................................................2Temporarily residence .............................................3
8.PLACE OF USUAL RESIDENCE FOR TEMPO-RARY PRESENT OR PLACE OF CURRENT RESI-DENCE FOR TEMPORARY ABSENT PERSONS?
Aimag/ capital city (foreign country) name:
____________________________Soum/ District (City) name:
____________________________
9.ARE YOU LIVING IN YOUR PERMANENT RESIDEN-CY SINCE YOUR BIRTH OR HAVE YOU MOVED IN?
Since birth ...................................................................1Returned back after usually residing in different place ........................................................2Moved in from different place .............................3
10.WHAT IS YOUR PLACE OF BIRTH? locality:
______________________
11.WHAT WAS YOUR PREVIOUS RESIDENCE AND WHEN DID YOU MOVED IN YOUR CURRENT RESIDENCE?
locality:
________________________
Year:
12.WHAT WAS YOUR PERMANENT RESIDEN-CY IN JANUARY, 2015? (To be asked from age 5 and over)
Aimag/ Capital city (Foreign country) name and locality:
________________________
13.ARE YOU CURRENTLY ATTENDING SCHOOL (INCLUDING PRESCHOOL OR KINDERGARDEN)?
(to be asked from ages 2-39) Yes ....................................................................................1No.....................................................................................2
14. HAVE YOU EVER ATTENDED SCHOOL OR ANY EARLY CHILDHOOD EDUCATION PROGRAMME?
(to be asked from ages 2-39) Yes ...............................................................1 Class:No.........................................................2
Register ID:
Family name:
Surname:
Given name:
TO BE ASKED FROM ALL AGES.
1.WHAT IS YOUR RELATIONSHIP WITH HOUSEHOLD HEAD?Son/ daughter .......................................................... 03Father/ mother ........................................................ 04Siblings ....................................................................... 05Father/mother in law ............................................ 06Son/daughter in law .............................................. 07Grandparent ............................................................. 08Grandchild ................................................................. 09Other relative ........................................................... 10Non relative ............................................................... 11
2.WHAT IS YOUR GENDER? Male ................................................................................1Female ............................................................................2
3.WHAT IS YOUR DATE OF BIRTH?
Year: Month: Day:
4. HOW OLD ARE YOU?
5.WHAT IS YOUR CITIZENSHIP?Mongolian .................................................................. 01 Foreign (specify country)_____________________________Non-citizenship ....................................................... 99
6.WHAT IS YOUR ETHNICITY?Khalkh ............................................................................1
Other (specify) _______________
7.WHAT IS YOUR RESIDENCY STATUS? Permanent residence ..............................................1Temporarily absence ................................................2Temporarily residence .............................................3
8.PLACE OF USUAL RESIDENCE FOR TEMPORARY PRESENT OR PLACE OF CURRENT RESIDENCE FOR TEMPORARY ABSENT PERSONS?
Aimag/ capital city (foreign country) name:
____________________________Soum/ District (City) name:
____________________________
9.ARE YOU LIVING IN YOUR PERMANENT RESIDEN-CY SINCE YOUR BIRTH OR HAVE YOU MOVED IN?
Since birth ...................................................................1Returned back after usually residing in different place ........................................................2Moved in from different place .............................3
10.WHAT IS YOUR PLACE OF BIRTH? locality:
______________________
11.WHAT WAS YOUR PREVIOUS RESIDENCE AND WHEN DID YOU MOVED IN YOUR CURRENT RESIDENCE?
locality:
________________________
Year:
12.WHAT WAS YOUR PERMANENT RESIDEN-CY IN JANUARY, 2015?(To be asked from age 5 and over)
Aimag/ Capital city (Foreign country) name and locality:
________________________
13.ARE YOU CURRENTLY ATTENDING SCHOOL (INCLUDING PRESCHOOL OR KINDERGARDEN)?
(to be asked from ages 2-39) Yes ....................................................................................1No.....................................................................................2
14. HAVE YOU EVER ATTENDED SCHOOL OR ANY EARLY CHILDHOOD EDUCATION PROGRAMME?
(to be asked from ages 2-39) Yes ...............................................................1 Class:No.........................................................2
SECTION III. INDIVIDUAL QUESTIONNAIRE SECTION III. INDIVIDUAL QUESTIONNAIRE
2 7
PERSON № 0 1 PERSON № 0 6TO BE ASKED FROM AGES 15 AND OVER.
28.WHAT IS YOUR CURRENT MARITAL STATUS?Single (Never married) .......................................... 1Married : Registered ............................................... 2
Living together ................................. 3Separated, but legally married........................... 4Divorced and not remarried ............................... 5Widowed and not remarried .............................. 6
29.DO YOU HAVE A RELIGION?No religion ................................................................... 1Buddhism ..................................................................... 2Christianity ................................................................... 3Islam .............................................................................. 4Shamanism .................................................................. 5Other ............................................................................. 6
30.WHAT IS YOUR PROFESSIONS?
______________________________
______________________________
______________________________
31.HAVE YOU BEEN EARNING AT LEAST 1 HOUR OF PAID EMPLOYMENT FOR THE LAST 7 DAYS?
Yes .................................................................................. 1No................................................................................... 2
32.DO YOU ENGAGED PAID WORK/BUSINESS ACTIVITIES?(Parental leave, seasonal work, shift work, on paid leave and study leave will be considered as paid work)
Yes .................................................................................. 1No................................................................................... 2
33.WHAT WAS THE MAIN ECONOMIC ACTIVITY OF YOUR BUSINESS OR ORGANIZATION AT WORK?
_________________________
34.WHAT WAS YOUR OCCUPATION?
_________________________
35.WHAT IS YOUR EMPLOYMENT STATUS?Employee:
Permanent employees .......................................... 1Fixed-term employees ........................................... 2Short-term and casual employees ................... 3Paid apprentices, trainees and interns ..................... 4Dependent contractors ........................................ 5
Employers:Corporations .............................................................. 6Household market enterprises .................................... 7
Without employees:Operators of corporations ................................... 8Account workers in household market enterprises ........................................................ 9
Contributing family workers .................................10
36. IN LAST 30 DAYS, DID YOU TRY TO FIND A JOB OR ENGAGED IN ANY TYPE OF BUSI-NESS ACTIVITY?
Yes .................................................................................. 1No................................................................................... 2
37.WHY DO YOU NOT TRY TO FIND A JOB OR ENGAGED IN ANY TYPE OF BUSINESS ACTIV-ITY?
Studying in school .................................................. 1Pensioner .................................................................... 2Disability of labor..................................................... 3Discouraged to findi a job/ expecting there is not any job for me ................................... 4No proper skills or experience ........................... 5Engage in housework ............................................ 6Others ........................................................................... 7
38.IF YOU GOT OPPORTUNITY TO WORK OR ENGAGE IN BUSINESS ACTIVITY IN LAST WEEK, WERE YOU ABLE TO WORK?
Yes .................................................................................. 1No................................................................................... 2
TO BE ASKED FROM AGES 15 AND OVER.
28.WHAT IS YOUR CURRENT MARITAL STATUS?Single (Never married) .......................................... 1Married : Registered ............................................... 2
Living together ................................. 3Separated, but legally married........................... 4Divorced and not remarried ............................... 5Widowed and not remarried .............................. 6
29.DO YOU HAVE A RELIGION?No religion ................................................................... 1Buddhism ..................................................................... 2Christianity ................................................................... 3Islam .............................................................................. 4Shamanism .................................................................. 5Other ............................................................................. 6
30.WHAT IS YOUR PROFESSIONS?
______________________________
______________________________
______________________________
31.HAVE YOU BEEN EARNING AT LEAST 1 HOUR OF PAID EMPLOYMENT FOR THE LAST 7 DAYS?
Yes .................................................................................. 1No................................................................................... 2
32.DO YOU ENGAGED PAID WORK/BUSINESS ACTIVITIES?(Parental leave, seasonal work, shift work, on paid leave and study leave will be considered as paid work)
Yes .................................................................................. 1No................................................................................... 2
33.WHAT WAS THE MAIN ECONOMIC ACTIVITY OF YOUR BUSINESS OR ORGANIZATION AT WORK?
_________________________
34.WHAT WAS YOUR OCCUPATION?
_________________________
35.WHAT IS YOUR EMPLOYMENT STATUS?Employee:
Permanent employees .......................................... 1Fixed-term employees ........................................... 2Short-term and casual employees ................... 3Paid apprentices, trainees and interns ..................... 4Dependent contractors ........................................ 5
Employers:Corporations .............................................................. 6Household market enterprises .................................... 7
Without employees:Operators of corporations ................................... 8Account workers in household market enterprises ........................................................ 9
Contributing family workers .................................10
36. IN LAST 30 DAYS, DID YOU TRY TO FIND A JOB OR ENGAGED IN ANY TYPE OF BUSI-NESS ACTIVITY?
Yes .................................................................................. 1No................................................................................... 2
37.WHY DO YOU NOT TRY TO FIND A JOB OR ENGAGED IN ANY TYPE OF BUSINESS ACTIV-ITY?
Studying in school .................................................. 1Pensioner .................................................................... 2Disability of labor..................................................... 3Discouraged to findi a job/ expecting there is not any job for me ................................... 4No proper skills or experience ........................... 5Engage in housework ............................................ 6Others ........................................................................... 7
38.IF YOU GOT OPPORTUNITY TO WORK OR ENGAGE IN BUSINESS ACTIVITY IN LAST WEEK, WERE YOU ABLE TO WORK?
Yes .................................................................................. 1No................................................................................... 2
TO BE ASKED FROM AGE 5 AND OVER.
15.WHAT IS THE HIGHEST LEVEL OF YOUR EDUCATION COMPLETED?
No education ............................................................01Primary education ..................................................02Lower secondary education ..............................03Upper secondary education ..............................04Technical education ..............................................05Specialized secondary ..........................................06Diploma ......................................................................07Bachelor`s or equivalent level ...........................08Master`s or equivalent level ...............................09Doctoral or equivalent level ...............................10
16.CAN YOU READ AND WRITE A SIMPLE SENTENCE?
Yes .................................................................................. 1No................................................................................... 2
17.CAN YOU DO A SIMPLE ADDITION AND SUBTRACTION?
Yes .................................................................................. 1No................................................................................... 2
18.DO YOU USE MOBILE PHONE? Yes .................................................................................. 1No................................................................................... 2
19.DO YOU USE INTERNET? Yes: always ...................................................................1
when necessary.............................................2No....................................................................................3
20. DO YOU HAVE DIFFICULTY SEEING, EVEN IF WEARING GLASSES?
No difficulty ................................................................1 Some difficulty ..........................................................2 A lot of difficulty ........................................................3 Cannot do at all .........................................................4
21.DO YOU HAVE DIFFICULTY HEARING, EVEN IF USING A HEARING AID?
No difficulty ................................................................1 Some difficulty ..........................................................2 A lot of difficulty ........................................................3 Cannot do at all .........................................................4
22.DO YOU HAVE DIFFICULTY WALKING OR CLIMBING STEP?
No difficulty ................................................................1 Some difficulty ..........................................................2 A lot of difficulty ........................................................3 Cannot do at all .........................................................4
23.DO YOU HAVE DIFFICULTY REMEMBER-ING OR CONCENTRATING?
No difficulty ................................................................1 Some difficulty ..........................................................2 A lot of difficulty ........................................................3 Cannot do at all .........................................................4
24.DO YOU HAVE DIFFICULTY WITH SELF-CARE SUCH AS WASHING ALL OVER OR DRESSING?
No difficulty ................................................................1 Some difficulty ..........................................................2 A lot of difficulty ........................................................3 Cannot do at all .........................................................4
25. USING YOUR OWN LANGUAGE, DO YOU HAVE DIFFICULTY COMMUNICATING, FOR EXAMPLE UNDERSTANDING OR BEING UN-DERSTOOD?
No difficulty ................................................................1 Some difficulty ..........................................................2 A lot of difficulty ........................................................3 Cannot do at all .........................................................4
26. DO YOU HAVE DISABILITY REGISTERED AT HEALTH AND SOCIAL WELFARE AUTHORITY?
Yes .................................................................................. 1No................................................................................... 2
27. IS YOUR DISABILITY CONGENITAL DISOR-DER OR ACQUIRED DISABILITY?
Congenital disorder ................................................ 1Acquired ...................................................................... 2
А7
А7
А9
А9
А13
А13
А15 А15
А33 А33
А36 А36
А38 А38
А28 А28
Finish population questionnaire Finish population questionnaire
А18 А18
А16 А16
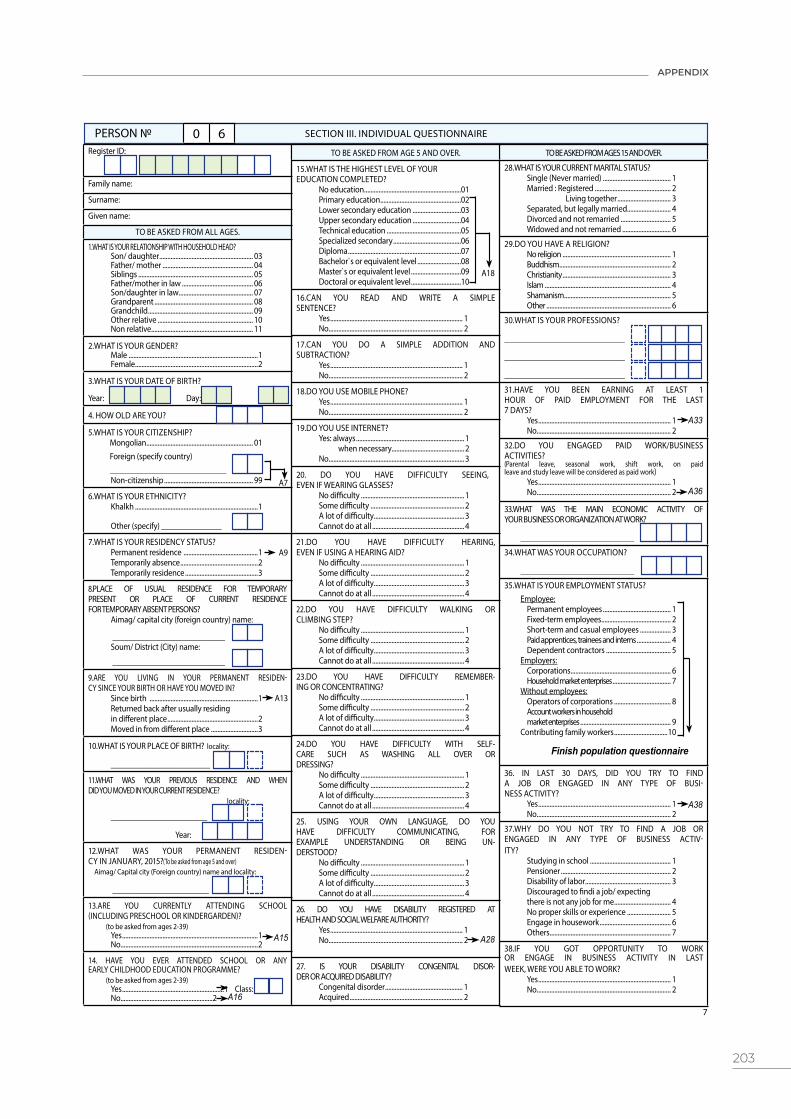
203
APPENDIX
Register ID:
Family name:
Surname:
Given name:
TO BE ASKED FROM ALL AGES.
1.ARE YOU THE HEAD OF THE HOUSEHOLD?Head of household ................................................ 01Non relative ............................................................... 11
2.WHAT IS YOUR GENDER? Male ................................................................................1Female ............................................................................2
3.WHAT IS YOUR DATE OF BIRTH?
Year: Month: Day:
4. HOW OLD ARE YOU?
5.WHAT IS YOUR CITIZENSHIP?Mongolian .................................................................. 01 Foreign (specify country)
_____________________________Non-citizenship ....................................................... 99
6.WHAT IS YOUR ETHNICITY?Khalkh ............................................................................1
Other (specify) _______________
7.WHAT IS YOUR RESIDENCY STATUS? Permanent residence ..............................................1Temporarily absence ................................................2Temporarily residence .............................................3
8.PLACE OF USUAL RESIDENCE FOR TEMPO-RARY PRESENT OR PLACE OF CURRENT RESI-DENCE FOR TEMPORARY ABSENT PERSONS?
Aimag/ capital city (foreign country) name:
____________________________Soum/ District (City) name:
____________________________
9.ARE YOU LIVING IN YOUR PERMANENT RESIDEN-CY SINCE YOUR BIRTH OR HAVE YOU MOVED IN?
Since birth ...................................................................1Returned back after usually residing in different place ........................................................2Moved in from different place .............................3
10.WHAT IS YOUR PLACE OF BIRTH? locality:
______________________
11.WHAT WAS YOUR PREVIOUS RESIDENCE AND WHEN DID YOU MOVED IN YOUR CURRENT RESIDENCE?
locality:
________________________
Year:
12.WHAT WAS YOUR PERMANENT RESIDEN-CY IN JANUARY, 2015? (To be asked from age 5 and over)
Aimag/ Capital city (Foreign country) name and locality:
________________________
13.ARE YOU CURRENTLY ATTENDING SCHOOL (INCLUDING PRESCHOOL OR KINDERGARDEN)?
(to be asked from ages 2-39) Yes ....................................................................................1No.....................................................................................2
14. HAVE YOU EVER ATTENDED SCHOOL OR ANY EARLY CHILDHOOD EDUCATION PROGRAMME?
(to be asked from ages 2-39) Yes ...............................................................1 Class:No.........................................................2
Register ID:
Family name:
Surname:
Given name:
TO BE ASKED FROM ALL AGES.
1.WHAT IS YOUR RELATIONSHIP WITH HOUSEHOLD HEAD?Son/ daughter .......................................................... 03Father/ mother ........................................................ 04Siblings ....................................................................... 05Father/mother in law ............................................ 06Son/daughter in law .............................................. 07Grandparent ............................................................. 08Grandchild ................................................................. 09Other relative ........................................................... 10Non relative ............................................................... 11
2.WHAT IS YOUR GENDER? Male ................................................................................1Female ............................................................................2
3.WHAT IS YOUR DATE OF BIRTH?
Year: Month: Day:
4. HOW OLD ARE YOU?
5.WHAT IS YOUR CITIZENSHIP?Mongolian .................................................................. 01 Foreign (specify country)_____________________________Non-citizenship ....................................................... 99
6.WHAT IS YOUR ETHNICITY?Khalkh ............................................................................1
Other (specify) _______________
7.WHAT IS YOUR RESIDENCY STATUS? Permanent residence ..............................................1Temporarily absence ................................................2Temporarily residence .............................................3
8.PLACE OF USUAL RESIDENCE FOR TEMPORARY PRESENT OR PLACE OF CURRENT RESIDENCE FOR TEMPORARY ABSENT PERSONS?
Aimag/ capital city (foreign country) name:
____________________________Soum/ District (City) name:
____________________________
9.ARE YOU LIVING IN YOUR PERMANENT RESIDEN-CY SINCE YOUR BIRTH OR HAVE YOU MOVED IN?
Since birth ...................................................................1Returned back after usually residing in different place ........................................................2Moved in from different place .............................3
10.WHAT IS YOUR PLACE OF BIRTH? locality:
______________________
11.WHAT WAS YOUR PREVIOUS RESIDENCE AND WHEN DID YOU MOVED IN YOUR CURRENT RESIDENCE?
locality:
________________________
Year:
12.WHAT WAS YOUR PERMANENT RESIDEN-CY IN JANUARY, 2015?(To be asked from age 5 and over)
Aimag/ Capital city (Foreign country) name and locality:
________________________
13.ARE YOU CURRENTLY ATTENDING SCHOOL (INCLUDING PRESCHOOL OR KINDERGARDEN)?
(to be asked from ages 2-39) Yes ....................................................................................1No.....................................................................................2
14. HAVE YOU EVER ATTENDED SCHOOL OR ANY EARLY CHILDHOOD EDUCATION PROGRAMME?
(to be asked from ages 2-39) Yes ...............................................................1 Class:No.........................................................2
SECTION III. INDIVIDUAL QUESTIONNAIRE SECTION III. INDIVIDUAL QUESTIONNAIRE
2 7
PERSON № 0 1 PERSON № 0 6TO BE ASKED FROM AGES 15 AND OVER.
28.WHAT IS YOUR CURRENT MARITAL STATUS?Single (Never married) .......................................... 1Married : Registered ............................................... 2
Living together ................................. 3Separated, but legally married........................... 4Divorced and not remarried ............................... 5Widowed and not remarried .............................. 6
29.DO YOU HAVE A RELIGION?No religion ................................................................... 1Buddhism ..................................................................... 2Christianity ................................................................... 3Islam .............................................................................. 4Shamanism .................................................................. 5Other ............................................................................. 6
30.WHAT IS YOUR PROFESSIONS?
______________________________
______________________________
______________________________
31.HAVE YOU BEEN EARNING AT LEAST 1 HOUR OF PAID EMPLOYMENT FOR THE LAST 7 DAYS?
Yes .................................................................................. 1No................................................................................... 2
32.DO YOU ENGAGED PAID WORK/BUSINESS ACTIVITIES?(Parental leave, seasonal work, shift work, on paid leave and study leave will be considered as paid work)
Yes .................................................................................. 1No................................................................................... 2
33.WHAT WAS THE MAIN ECONOMIC ACTIVITY OF YOUR BUSINESS OR ORGANIZATION AT WORK?
_________________________
34.WHAT WAS YOUR OCCUPATION?
_________________________
35.WHAT IS YOUR EMPLOYMENT STATUS?Employee:
Permanent employees .......................................... 1Fixed-term employees ........................................... 2Short-term and casual employees ................... 3Paid apprentices, trainees and interns ..................... 4Dependent contractors ........................................ 5
Employers:Corporations .............................................................. 6Household market enterprises .................................... 7
Without employees:Operators of corporations ................................... 8Account workers in household market enterprises ........................................................ 9
Contributing family workers .................................10
36. IN LAST 30 DAYS, DID YOU TRY TO FIND A JOB OR ENGAGED IN ANY TYPE OF BUSI-NESS ACTIVITY?
Yes .................................................................................. 1No................................................................................... 2
37.WHY DO YOU NOT TRY TO FIND A JOB OR ENGAGED IN ANY TYPE OF BUSINESS ACTIV-ITY?
Studying in school .................................................. 1Pensioner .................................................................... 2Disability of labor..................................................... 3Discouraged to findi a job/ expecting there is not any job for me ................................... 4No proper skills or experience ........................... 5Engage in housework ............................................ 6Others ........................................................................... 7
38.IF YOU GOT OPPORTUNITY TO WORK OR ENGAGE IN BUSINESS ACTIVITY IN LAST WEEK, WERE YOU ABLE TO WORK?
Yes .................................................................................. 1No................................................................................... 2
TO BE ASKED FROM AGES 15 AND OVER.
28.WHAT IS YOUR CURRENT MARITAL STATUS?Single (Never married) .......................................... 1Married : Registered ............................................... 2
Living together ................................. 3Separated, but legally married........................... 4Divorced and not remarried ............................... 5Widowed and not remarried .............................. 6
29.DO YOU HAVE A RELIGION?No religion ................................................................... 1Buddhism ..................................................................... 2Christianity ................................................................... 3Islam .............................................................................. 4Shamanism .................................................................. 5Other ............................................................................. 6
30.WHAT IS YOUR PROFESSIONS?
______________________________
______________________________
______________________________
31.HAVE YOU BEEN EARNING AT LEAST 1 HOUR OF PAID EMPLOYMENT FOR THE LAST 7 DAYS?
Yes .................................................................................. 1No................................................................................... 2
32.DO YOU ENGAGED PAID WORK/BUSINESS ACTIVITIES?(Parental leave, seasonal work, shift work, on paid leave and study leave will be considered as paid work)
Yes .................................................................................. 1No................................................................................... 2
33.WHAT WAS THE MAIN ECONOMIC ACTIVITY OF YOUR BUSINESS OR ORGANIZATION AT WORK?
_________________________
34.WHAT WAS YOUR OCCUPATION?
_________________________
35.WHAT IS YOUR EMPLOYMENT STATUS?Employee:
Permanent employees .......................................... 1Fixed-term employees ........................................... 2Short-term and casual employees ................... 3Paid apprentices, trainees and interns ..................... 4Dependent contractors ........................................ 5
Employers:Corporations .............................................................. 6Household market enterprises .................................... 7
Without employees:Operators of corporations ................................... 8Account workers in household market enterprises ........................................................ 9
Contributing family workers .................................10
36. IN LAST 30 DAYS, DID YOU TRY TO FIND A JOB OR ENGAGED IN ANY TYPE OF BUSI-NESS ACTIVITY?
Yes .................................................................................. 1No................................................................................... 2
37.WHY DO YOU NOT TRY TO FIND A JOB OR ENGAGED IN ANY TYPE OF BUSINESS ACTIV-ITY?
Studying in school .................................................. 1Pensioner .................................................................... 2Disability of labor..................................................... 3Discouraged to findi a job/ expecting there is not any job for me ................................... 4No proper skills or experience ........................... 5Engage in housework ............................................ 6Others ........................................................................... 7
38.IF YOU GOT OPPORTUNITY TO WORK OR ENGAGE IN BUSINESS ACTIVITY IN LAST WEEK, WERE YOU ABLE TO WORK?
Yes .................................................................................. 1No................................................................................... 2
TO BE ASKED FROM AGE 5 AND OVER.
15.WHAT IS THE HIGHEST LEVEL OF YOUR EDUCATION COMPLETED?
No education ............................................................01Primary education ..................................................02Lower secondary education ..............................03Upper secondary education ..............................04Technical education ..............................................05Specialized secondary ..........................................06Diploma ......................................................................07Bachelor`s or equivalent level ...........................08Master`s or equivalent level ...............................09Doctoral or equivalent level ...............................10
16.CAN YOU READ AND WRITE A SIMPLE SENTENCE?
Yes .................................................................................. 1No................................................................................... 2
17.CAN YOU DO A SIMPLE ADDITION AND SUBTRACTION?
Yes .................................................................................. 1No................................................................................... 2
18.DO YOU USE MOBILE PHONE? Yes .................................................................................. 1No................................................................................... 2
19.DO YOU USE INTERNET? Yes: always ...................................................................1
when necessary.............................................2No....................................................................................3
20. DO YOU HAVE DIFFICULTY SEEING, EVEN IF WEARING GLASSES?
No difficulty ................................................................1 Some difficulty ..........................................................2 A lot of difficulty ........................................................3 Cannot do at all .........................................................4
21.DO YOU HAVE DIFFICULTY HEARING, EVEN IF USING A HEARING AID?
No difficulty ................................................................1 Some difficulty ..........................................................2 A lot of difficulty ........................................................3 Cannot do at all .........................................................4
22.DO YOU HAVE DIFFICULTY WALKING OR CLIMBING STEP?
No difficulty ................................................................1 Some difficulty ..........................................................2 A lot of difficulty ........................................................3 Cannot do at all .........................................................4
23.DO YOU HAVE DIFFICULTY REMEMBER-ING OR CONCENTRATING?
No difficulty ................................................................1 Some difficulty ..........................................................2 A lot of difficulty ........................................................3 Cannot do at all .........................................................4
24.DO YOU HAVE DIFFICULTY WITH SELF-CARE SUCH AS WASHING ALL OVER OR DRESSING?
No difficulty ................................................................1 Some difficulty ..........................................................2 A lot of difficulty ........................................................3 Cannot do at all .........................................................4
25. USING YOUR OWN LANGUAGE, DO YOU HAVE DIFFICULTY COMMUNICATING, FOR EXAMPLE UNDERSTANDING OR BEING UN-DERSTOOD?
No difficulty ................................................................1 Some difficulty ..........................................................2 A lot of difficulty ........................................................3 Cannot do at all .........................................................4
26. DO YOU HAVE DISABILITY REGISTERED AT HEALTH AND SOCIAL WELFARE AUTHORITY?
Yes .................................................................................. 1No................................................................................... 2
27. IS YOUR DISABILITY CONGENITAL DISOR-DER OR ACQUIRED DISABILITY?
Congenital disorder ................................................ 1Acquired ...................................................................... 2
TO BE ASKED FROM AGE 5 AND OVER.
15.WHAT IS THE HIGHEST LEVEL OF YOUR EDUCATION COMPLETED?
No education ............................................................01Primary education ..................................................02Lower secondary education ..............................03Upper secondary education ..............................04Technical education ..............................................05Specialized secondary ..........................................06Diploma ......................................................................07Bachelor`s or equivalent level ...........................08Master`s or equivalent level ...............................09Doctoral or equivalent level ...............................10
16.CAN YOU READ AND WRITE A SIMPLE SENTENCE?
Yes .................................................................................. 1No................................................................................... 2
17.CAN YOU DO A SIMPLE ADDITION AND SUBTRACTION?
Yes .................................................................................. 1No................................................................................... 2
18.DO YOU USE MOBILE PHONE? Yes .................................................................................. 1No................................................................................... 2
19.DO YOU USE INTERNET? Yes: always ...................................................................1
when necessary.............................................2No....................................................................................3
20. DO YOU HAVE DIFFICULTY SEEING, EVEN IF WEARING GLASSES?
No difficulty ................................................................1 Some difficulty ..........................................................2 A lot of difficulty ........................................................3 Cannot do at all .........................................................4
21.DO YOU HAVE DIFFICULTY HEARING, EVEN IF USING A HEARING AID?
No difficulty ................................................................1 Some difficulty ..........................................................2 A lot of difficulty ........................................................3 Cannot do at all .........................................................4
22.DO YOU HAVE DIFFICULTY WALKING OR CLIMBING STEP?
No difficulty ................................................................1 Some difficulty ..........................................................2 A lot of difficulty ........................................................3 Cannot do at all .........................................................4
23.DO YOU HAVE DIFFICULTY REMEMBER-ING OR CONCENTRATING?
No difficulty ................................................................1 Some difficulty ..........................................................2 A lot of difficulty ........................................................3 Cannot do at all .........................................................4
24.DO YOU HAVE DIFFICULTY WITH SELF-CARE SUCH AS WASHING ALL OVER OR DRESSING?
No difficulty ................................................................1 Some difficulty ..........................................................2 A lot of difficulty ........................................................3 Cannot do at all .........................................................4
25. USING YOUR OWN LANGUAGE, DO YOU HAVE DIFFICULTY COMMUNICATING, FOR EXAMPLE UNDERSTANDING OR BEING UN-DERSTOOD?
No difficulty ................................................................1 Some difficulty ..........................................................2 A lot of difficulty ........................................................3 Cannot do at all .........................................................4
26. DO YOU HAVE DISABILITY REGISTERED AT HEALTH AND SOCIAL WELFARE AUTHORITY?
Yes .................................................................................. 1No................................................................................... 2
27. IS YOUR DISABILITY CONGENITAL DISOR-DER OR ACQUIRED DISABILITY?
Congenital disorder ................................................ 1Acquired ...................................................................... 2
А7
А7
А9
А9
А13
А13
А15 А15
А33 А33
А36 А36
А38 А38
А28 А28
Finish population questionnaire Finish population questionnaire
А18 А18
А16 А16

204
2020 POPULATION AND HOUSING CENSUS OF MONGOLIA NATIONAL REPORT
INVENTORY OF HOUSES AND APARTMENT-2019 /BOST1-1/
Approved by the Order No.A/81 of the Chairperson of the National Statistical Office of Mongolia in 31th May 2019.
1. What is the type of your house?Detached house ..................................................... 1Comfortable private house ..................................... 2Public accommodation ........................................... 3Non-residential dwelling .......................................... 4
2. Does anyone live in the house all the time?Yes ...........................................................................1No ............................................................................2
3. What is the reason of people doesn't live house all the time?Summer house ........................................................1To be demolish .........................................................2Other ........................................................................9
4. In what year was the house commissioned?
5. How many floors is the house?/Number of floors above the basement/
6. How many rooms does the house have?1 room.....................1 6 rooms......................62 rooms...................2 7 rooms......................73 rooms...................3 8 rooms......................84 rooms...................4 9 or more5 rooms...................5 rooms.........................9
7. Does the house have a kitchen / dwelling?Yes ...........................................................................1No ............................................................................2
8. Does the house have a bath or shower?Yes ...........................................................................1No ............................................................................2
9. What is the size of the total floor space?10. What is the main material of the house wall?
Cast reinforced ........................................................1Prefabricated reinforced concrete ............................2Block ........................................................................3Brick .........................................................................4Wood ........................................................................5Sandwich plate ........................................................6Mixed .......................................................................7Other ........................................................................9
BOST - 1-1
11. What is the material of the walls and exterior of the house?
Cement plaster ........................................................1Wood ........................................................................2Metal plate ...............................................................3Plastic plate ............................................................4Stone plate ...............................................................5Brick .........................................................................6Yellow clay ...............................................................7Tiles .........................................................................8Other ........................................................................9Non ........................................................................10
12. What is the main material of the house floor?Wood .......................................................................1Concrete / cement .................................................2Other .......................................................................9
13. What is the floor covering material of the house?Wood .......................................................................1Wooden parquet .....................................................2Parquet / laminate / .................................................3Tiles ........................................................................4Linoleum .................................................................5Non .........................................................................6Other .......................................................................9
14. What is the roofing material of a house?Iron ..........................................................................1Clay .........................................................................2Cipher .....................................................................3Soft roof ..................................................................4Black paper .............................................................5Other .......................................................................9
15. Does the house lose heat?Yes ...........................................................................1No .............................................................................2
16. Where does the house lose heat?Roof .......................................................................AWall .........................................................................BWindow .................................................................. CFloor ....................................................................... DDoor ........................................................................ENot know .................................................................F
Square meters.
All responses in this questionnaire form are kept in secret in accordance with No. 4 of Act 5 of Mongolian legislation on Confidentiality of Private Information and No. 18.3 of Law of Population and Housing Census of Mongolia.
INVENTORY OF HOUSES AND APARTMENTS - 2019 HOUSING QUESTIONNAIRE
Question 4
Question 17
Finish questionnaire
SECTION I. ADDRESSА1.CensusCommittee Number
А3.Soum, District
А2.Aimag, Capital city
А4.Bag, Khoroo
А8.Yard number
А7.Building number
А5.Street/ road name and number
А6.Area,building, town name
А12.Time and minutes to start the questionnaire
А11.Questionnaire form number
А10.Enumerator number
А9.Door number
II. QUESTIONNAIRE
Finish questionnaire

205
APPENDIX
27. Is there toilet facility?Yes ...........................................................................1No toilet available ....................................................2
28. Is there toilet facility in your dwelling?Yes ...........................................................................1No ............................................................................2
29. What is the type of toilet facility of your dwelling?Connected to central sewage disposal system .......1Individual sewage disposal system ..........................2Septik tank ...............................................................3Other ........................................................................9
30. What is the type of toilet facility outside of your dwelling?Pit latrine with slab ...................................................1Improved pit latrine with slab ...................................2Compost toilet ..........................................................3Septik tank ...............................................................4Open pit ...................................................................5
31. What is the type of residential sewer?Central sewage disposal system ............................1Individual sewage disposal system ..........................2Disposed into borehole ............................................3None ........................................................................4
32. What is the type of solid waste disposal in the apartment?Collection of waste collecting service in regular intervals ...................................................................1Collection of waste collecting service in irregular intervals ...................................................................2Disposed to special site ...........................................3Burning ....................................................................4Buried ......................................................................5Dumped ...................................................................6
33. What is the type of ownership for this dwelling?Individuals ................................................................1Private enterprise .....................................................2Government organization's ......................................3
34. Does your house/apartemt have a garage?Yes ...........................................................................1
Number of cars to be placed No .............................................................................2
35. Does the house have an outdoor area?Yes ...........................................................................1No ............................................................................2
36. Total area of exterior landscaping: Hence: Tree planted area:
Lawn area:
37. What is the market value of the house?
38. What is your contact phone number?
17. What is the type of water source of your dwelling?Centralized system ..................................................1Individual system .....................................................2Portable ...................................................................3
18. Does the apartment have hot and cold water?Cold and hot water ..................................................1Only cold water ........................................................2
19. Is your water supply system inside of your dwelling?Yes ...........................................................................1No ............................................................................2
20. Where is drinking water source located?In own dwelling ........................................................1In own yard ..............................................................2Elsewhere ................................................................3
21. What is the type of drinking water sources in your own dwelling?
Centralized system .................................................1Individual system ....................................................2
22. What is the type of drinking water sources outside of your dwelling?
Protected dug well ..................................................1Water kiosk connected to central network ..............2Water kiosk not connected to central network ........3Proctected dug well ................................................4Protected springs ....................................................5Unprotected tube well .............................................6Unprotected dug well ..............................................7Unprotected springs ................................................8Tanker-truck ............................................................9Cart with small tank/drum .......................................10Bottled water ......................................................... 11Rainwater ..............................................................12Surface water (rivers, lake, ponds) .......................13Other .....................................................................99
23. What is the distance between your household and water source?
Within 200 meters ...................................................1200-500 meters ........................................................2500-1000 meters ......................................................3Over 1000 meters ....................................................4
24. What is the main source of electricity of this dwelling?Central power system ..............................................1Diesel station ............................................................2Renewable energy ...................................................3Small-sized generator ..............................................4No electricity .............................................................5
25. What is the main source of heating of this dwelling?Central heating system ...........................................1Steam boiler ...........................................................2Electric heater.........................................................3Underground heat...................................................4Flammable gas .......................................................5
Low pressure stove ................................................6Fire stove ................................................................7
26. What is the main type of fuel used for house heating?Wood ....................................................................... 1Coal ........................................................................ 2Improved fuel .......................................................... 3Animal dung ............................................................ 4Other ....................................................................... 5
million tugrug.
Year Month DayQuestionnaire
finished date:
Time, minutes:
....................................................................................................................
Question 20
Question 22
Question 24
Question 27
Question 31
Question 30
Question 37
Square meters.
Square meters.
Square meters.
Question 31

206
2020 POPULATION AND HOUSING CENSUS OF MONGOLIA NATIONAL REPORT
INVENTORY OF HOUSES AND APARTMENT-2019 /BOST1-2/
Approved by the Order No.A/81 of the Chairperson of the National Statistical Office of Mongolia in 31th May 2019.
All responses in this questionnaire form are kept in secret in accordance with No. 4 of Act 5 of Mongolian legislation on Confidentiality of Private Information and No. 18.3 of Law of Population and Housing Census of Mongolia.
1. Does anyone live in the ger all the time?Yes ...........................................................................1No ............................................................................2
2. What is the reason of people doesn't live ger all the time?Dual ger ...................................................................1Other ........................................................................9
3. How many walls does the ger have?4 walls.................1 8 walls..................4 5 walls.................2 10 walls................5 6 walls.................3
4. What is the type of floor does ger have?None floor ...............................................................1Wood .......................................................................2Concrete .................................................................3Other .......................................................................9
5. Are the roofs and rafters single or double in the cold season?
Single .......................................................................1Double .....................................................................2
6. Does the ger lose heat?Yes ...........................................................................1No .............................................................................2
7. Where does the ger lose heat?Roof ......................................................................... AТуурга ..................................................................... BDoor ........................................................................ CFloor ........................................................................ DNot know ................................................................. E
8. Where is drinking water source located?In own yard ..............................................................1Elsewhere ................................................................2
9. What is the type of drinking water sources outside of your dwelling?
Protected dug well ..................................................1Water kiosk connected to central network ..............2Water kiosk not connected to central network ........3Proctected dug well ................................................4Protected springs ....................................................5Unprotected tube well .............................................6Unprotected dug well ..............................................7Unprotected springs ................................................8Tanker-truck ............................................................9
BOST - 1-2
Cart with small tank/drum .......................................10Bottled water ......................................................... 11Rainwater ..............................................................12Surface water (rivers, lake, ponds) .......................13Other .....................................................................99
10. What is the distance between your household and water source?
Within 200 meters ....................................................1200-500 meters ........................................................2500-1000 meters ......................................................3Over 1000 meters ....................................................4
11. What is the main source of electricity of this dwelling?Central power system ..............................................1Diesel station ............................................................2Renewable energy ...................................................3Small-sized generator ..............................................4No electricity .............................................................5
12. What is the main source of heating of this dwelling?Electric heater.........................................................1Fire stove ................................................................2
13. What is the main type of fuel used for ger heating?Wood ....................................................................... 1Coal ........................................................................ 2Improved fuel .......................................................... 3Animal dung ............................................................ 4Other ....................................................................... 9
14. Is there toilet facility?Yes ...........................................................................1No toilet available ....................................................2
15. What is the type of toilet facility of your ger?Pit latrine with slab ...................................................1Improved pit latrine with slab ...................................2Compost toilet ..........................................................3Septik tank ...............................................................4Open pit ...................................................................5
16. What is the type of residential sewer?Disposed into borehole ............................................1None ........................................................................2
17. What is the type of solid waste disposal in the ger?Collection of waste collecting service in regular intervals ...................................................................1Collection of waste collecting service in irregular intervals ...................................................................2Disposed to special site ...........................................3Burning ....................................................................4Buried ......................................................................5Dumped ...................................................................6
Finish questionnaire
INVENTORY OF HOUSES AND APARTMENTS - 2019 GER QUESTIONNAIRE
II. QUESTIONNAIRE
Question 3
Question 14
Question 16
Question 8
SECTION I. ADDRESSА1.CensusCommittee Number
А3.Soum, District
А2.Aimag, Capital city
А4.Bag, Khoroo
А8.Yard number
А5.Street/ road name and number
А6.Area,building, town name
А12.Time and minutes to start the questionnaire
А11.Questionnaire form number
А10.Enumerator number
А9.Door number

207
APPENDIX
21. What is the market value of the ger?
22. What is your contact phone number?
18. What is the type of ownership?Individuals ................................................................1Private enterprise .....................................................2
19. Does the ger have an outdoor area?Yes ...........................................................................1No ............................................................................2
20. Total area of exterior landscaping: Hence: Tree planted area:
Lawn area:
....................................................................................................................Question 21
million tugrug.
Year Month DayQuestionnaire
finished date:
Time, minutes:
Square meters.
Square meters.
Square meters.

208
2020 POPULATION AND HOUSING CENSUS OF MONGOLIA NATIONAL REPORT
INVENTORY OF HOUSES AND APARTMENT-2019 /BOST2/
1. Does anyone live in the apartment all the time?Yes ...........................................................................1No ............................................................................2
2. What is the reason of people doesn't live apartment all the time?Demolition ................................................................1Other ........................................................................2
3. In what year was the apartment commissioned?
4. How many floors is the apartment?
5. Is there a place for trade and services on the ground and ground floors of the building?
Yes, the design has not changed .............................1Yes, redesigned and perforated ..............................2No ............................................................................3
6. How many apartment does in the house ?
7. What is the main material of the apartment wall?Cast reinforced ........................................................1Prefabricated reinforced concrete ...........................2Block .......................................................................3Brick .........................................................................4Mixed .......................................................................5Other ........................................................................9
8. What is the material of the walls and exterior of the apartment?
Cement plaster .......................................................1Metal plate ..............................................................2Plastic plate ............................................................3Stone plate ..............................................................4Brick ........................................................................5Yellow clay ..............................................................6Tile ..........................................................................7Non .........................................................................8Other .......................................................................9
9. What is the roofing material of an apartment?Iron ..........................................................................AClay .........................................................................BCipher .................................................................... CSoft roof ................................................................. DBlack paper .............................................................EOther .......................................................................F
Approved by the Order No.A/81 of the Chairperson of the National Statistical Office of Mongolia in 31th May 2019. BOST - 2
All responses in this questionnaire form are kept in secret in accordance with No. 4 of Act 5 of Mongolian legislation on Confidentiality of Private Information and No. 18.3 of Law of Population and Housing Census of Mongolia.
INVENTORY OF HOUSES AND APARTMENTS - 2019 APARTMENT QUESTIONNAIRE
II. QUESTIONNAIRE
Finish questionnaire
Question 3
SECTION I. ADDRESSА1.CensusCommittee Number
А3.Soum, District
А2.Aimag, Capital city
А4.Bag, Khoroo
А7.Building number
А5.Street/ road name and number
А6.Area,building, town name
А12.Time and minutes to start the questionnaire
А11.Questionnaire form number
А10.Enumerator number
10. What is the type of water source of your dwelling?Centralized system ..................................................1Individual system .....................................................2Portable ...................................................................3
11. Does the house have hot and cold water?Cold and hot water ..................................................1Only cold water .......................................................2
12. What is the main source of electricity of this dwelling?Central power system .............................................1Diesel station ..........................................................2Renewable energy ..................................................3
13. What is the main source of heating of this dwelling?Central heating system ...........................................1Electric heater .........................................................2Steam boiler ............................................................3Low pressure stove .................................................4
14. What is the type of toilet in this dwelling?Connected to central sewage disposal system .......1Other ........................................................................9
15. What is the type of residential sewer?Central sewage disposal system ............................1Individual sewage disposal system ..........................2Other ........................................................................3
16. Does the collection of waste collecting service in regular intervals?
Yes ...........................................................................1No ............................................................................2
17. Does the house have a ramp for wheelchair users?Dedicated ramp .......................................................1Non-dedicated ramps ..............................................2Non ..........................................................................3
18. Does the house have an elevator?Yes ...........................................................................1No ............................................................................2
19. Does the house have a fire alarm system?Yes ...........................................................................1No ............................................................................2
Question 12

209
APPENDIX
24. Total area of exterior landscaping:
Hence:Kids playground: Tree planted area:
Lawn area:
25. What is the market value of 1m2 of the house?
26. What is your contact phone number?
20. How many parking spaces are there outside the apartment?
21. How many parking spaces are there in the apartment?
22. Does the apartment have an outdoor area?Yes ...........................................................................1No ............................................................................2
23. Is there a children's playground outside the apartment? Yes ...........................................................................1No .............................................................................2
....................................................................................................................
Question 25thousand tugrug
.
Year Month DayQuestionnaire
finished date:
Time, minutes:
Square meters.
Square meters.
Square meters.
Square meters.

210
2020 POPULATION AND HOUSING CENSUS OF MONGOLIA NATIONAL REPORT
APPENDIX В
TABLE 1.1. NUMBER OF RESIDENT POPULATION OF MONGOLIA, BY AGE GROUP, AIMAGS AND THE CAPITAL, 2020
Aimags and the Capital Total
Age group0-4 5-9 10-14 15-19 20-24 25-29 30-34
TOTAL 3 197 020 383 259 368 314 274 874 216 767 225 385 259 199 286 850Arkhangai 94 324 10 774 10 352 8 279 7 526 8 106 7 461 7 064Bayan-Ulgii 103 908 14 145 12 201 10 381 9 785 8 670 9 156 7 978Bayankhongor 88 008 10 534 10 075 7 760 6 815 7 456 7 398 7 299Bulgan 61 344 6 536 6 364 5 217 4 402 4 756 4 492 4 283Govi-Altai 57 479 6 204 6 039 5 338 4 883 4 840 4 233 4 339Dornogovi 69 859 8 038 7 982 6 345 5 027 4 969 5 763 6 457Dornod 82 020 10 050 9 378 7 089 5 454 5 690 6 700 7 150Dundgovi 46 698 5 500 4 526 4 111 3 645 3 872 3 491 3 491Zavkhan 72 307 7 860 7 540 6 905 5 705 6 072 5 325 4 923Uvurkhangai 115 737 13 274 12 477 10 426 9 220 9 859 8 966 9 024Umnugovi 69 858 8 642 7 902 5 718 4 866 5 250 6 038 6 951Sukhbaatar 62 884 7 590 7 044 5 143 4 485 4 765 5 191 5 187Selenge 107 755 11 889 11 529 9 366 7 915 7 994 8 252 8 570Tuv 92 409 10 584 10 164 7 914 6 416 6 533 6 829 6 994Uvs 82 941 10 174 9 569 8 305 7 301 7 445 6 654 5 813Khovd 88 078 11 038 10 371 8 324 7 477 8 212 7 096 6 414Khuvsgul 134 318 15 046 15 144 12 315 10 257 10 602 10 911 10 730Khentii 77 320 8 938 8 370 6 890 6 046 5 945 6 093 5 795Darkhan-Uul 102 171 11 850 11 402 8 748 6 555 7 151 8 337 8 562Orkhon 104 032 12 028 11 476 8 550 6 470 7 001 8 784 9 498Govisumber 17 445 2 226 2 183 1 594 1 186 1 296 1 448 1 512Ulaanbaatar 1 466 125 180 339 176 226 120 156 85 331 88 901 120 581 148 816
Continued table 1.1
Aimags and the Capital
Age group35-39 40-44 45-49 50-54 55-59 60-64 65-69 70+
TOTAL 239 794 215 218 191 657 162 440 141 166 96 226 55 343 80 528Arkhangai 6 395 6 391 5 836 5 053 4 105 2 792 1 759 2 431Bayan-Ulgii 6 637 5 912 5 298 4 295 3 525 2 427 1 383 2 115Bayankhongor 6 275 5 797 5 072 4 269 3 583 2 216 1 305 2 154Bulgan 4 207 4 415 4 172 3 847 3 215 2 305 1 372 1 761Govi-Altai 4 183 4 089 3 759 3 136 2 463 1 655 843 1 475Dornogovi 5 492 4 799 4 106 3 402 2 902 2 021 1 129 1 427Dornod 6 141 5 485 4 835 4 100 3 816 2 788 1 494 1 850Dundgovi 3 368 3 165 2 802 2 443 2 210 1 595 908 1 571Zavkhan 5 178 5 201 4 783 4 080 3 274 2 179 1 171 2 111Uvurkhangai 8 131 7 779 7 113 5 997 4 960 3 238 2 040 3 233Umnugovi 5 601 4 486 3 977 3 299 2 811 1 683 926 1 708Sukhbaatar 4 859 4 503 3 778 3 172 2 667 1 995 1 115 1 390Selenge 7 683 7 304 7 024 6 298 5 507 3 715 2 108 2 601Tuv 6 615 6 304 5 827 5 202 4 758 3 486 2 002 2 781Uvs 5 332 4 942 4 696 4 295 3 422 2 096 1 117 1 780Khovd 5 553 5 436 4 945 4 143 3 480 2 317 1 275 1 997Khuvsgul 9 065 9 029 8 416 7 193 6 200 3 954 2 199 3 257Khentii 5 581 5 302 4 608 4 044 3 658 2 600 1 508 1 942Darkhan-Uul 7 351 6 980 6 328 5 793 4 969 3 386 1 962 2 797Orkhon 7 547 6 673 6 575 6 233 5 638 3 282 1 725 2 552Govisumber 1 229 1 108 1 002 850 710 449 254 398Ulaanbaatar 117 371 100 118 86 705 71 296 63 293 44 047 25 748 37 197

211
APPENDIX
TABLE 1.2 NUMBER OF MALE RESIDENT POPULATION OF MONGOLIA, BY AGE GROUP, AIMAGS AND THE CAPITAL, 2020
Aimags and the Capital Total
Age group0-4 5-9 10-14 15-19 20-24 25-29 30-34
TOTAL 1 576 930 196 803 188 352 140 208 110 141 113 271 130 143 143 491Arkhangai 47 272 5 569 5 239 4 156 3 850 4 179 3 921 3 656Bayan-Ulgii 51 855 7 286 6 162 5 188 4 950 4 367 4 593 4 070Bayankhongor 43 215 5 250 5 161 3 964 3 336 3 806 3 810 3 681Bulgan 31 146 3 397 3 255 2 652 2 305 2 448 2 390 2 250Govi-Altai 28 649 3 219 3 122 2 764 2 521 2 462 2 156 2 199Dornogovi 35 046 4 151 4 152 3 231 2 500 2 484 2 969 3 340Dornod 41 322 5 113 4 787 3 609 2 824 2 868 3 540 3 750Dundgovi 23 478 2 842 2 351 2 109 1 885 1 998 1 818 1 794Zavkhan 36 032 4 092 3 876 3 490 2 929 3 178 2 788 2 457Uvurkhangai 57 599 6 812 6 306 5 389 4 698 5 156 4 638 4 565Umnugovi 35 568 4 467 4 062 2 871 2 476 2 700 3 140 3 651Sukhbaatar 31 603 3 846 3 623 2 628 2 322 2 470 2 705 2 653Selenge 54 706 6 066 5 929 4 757 4 024 4 189 4 489 4 585Tuv 47 447 5 389 5 167 4 148 3 279 3 474 3 734 3 758Uvs 41 625 5 264 4 947 4 204 3 706 3 844 3 494 2 971Khovd 44 017 5 656 5 329 4 268 3 760 4 166 3 670 3 294Khuvsgul 66 604 7 741 7 809 6 239 5 148 5 329 5 592 5 388Khentii 39 085 4 553 4 294 3 491 3 117 3 160 3 255 2 992Darkhan-Uul 50 234 6 173 5 784 4 498 3 310 3 533 4 313 4 391Orkhon 51 176 6 224 5 808 4 418 3 271 3 505 4 444 4 821Govisumber 8 796 1 129 1 146 835 587 692 763 783Ulaanbaatar 710 455 92 564 90 043 61 299 43 343 43 263 57 921 72 442
Continued table 1.2
Aimags and the Capital
Age group35-39 40-44 45-49 50-54 55-59 60-64 65-69 70+
TOTAL 119 621 106 169 93 162 76 257 64 238 41 768 22 808 30 498Arkhangai 3 273 3 186 2 909 2 428 1 952 1 260 747 947Bayan-Ulgii 3 316 2 982 2 543 2 103 1 634 1 138 608 915Bayankhongor 3 051 2 868 2 426 2 052 1 641 906 507 756Bulgan 2 165 2 319 2 123 1 924 1 517 1 070 619 712Govi-Altai 2 109 2 009 1 902 1 523 1 128 725 328 482Dornogovi 2 923 2 426 2 045 1 596 1 360 893 484 492Dornod 3 251 2 844 2 447 1 985 1 779 1 221 606 698Dundgovi 1 712 1 586 1 382 1 242 1 054 694 385 626Zavkhan 2 572 2 533 2 363 1 992 1 551 992 447 772Uvurkhangai 4 100 3 844 3 469 2 808 2 310 1 401 863 1 240Umnugovi 2 939 2 339 2 099 1 628 1 387 802 375 632Sukhbaatar 2 477 2 364 1 951 1 538 1 252 883 463 428Selenge 4 032 3 828 3 520 2 981 2 637 1 686 960 1 023Tuv 3 585 3 351 2 998 2 563 2 309 1 624 938 1 130Uvs 2 720 2 456 2 297 2 017 1 658 962 461 624Khovd 2 824 2 704 2 408 1 958 1 649 1 035 548 748Khuvsgul 4 489 4 514 4 161 3 509 2 878 1 721 873 1 213Khentii 2 891 2 703 2 243 1 982 1 754 1 251 661 738Darkhan-Uul 3 637 3 406 3 029 2 699 2 161 1 408 824 1 068Orkhon 3 682 3 314 3 122 2 842 2 519 1 509 730 967Govisumber 640 531 495 389 346 200 101 159Ulaanbaatar 57 233 48 062 41 230 32 498 27 762 18 387 10 280 14 128

212
2020 POPULATION AND HOUSING CENSUS OF MONGOLIA NATIONAL REPORT
TABLES 1.3 NUMBER OF FEMALE RESIDENT POPULATION OF MONGOLIA, BY AGE GROUP, AIMAGS AND THE CAPITAL, 2020
Aimags and the Capital Total
Age group0-4 5-9 10-14 15-19 20-24 25-29 30-34
TOTAL 1 620 090 186 456 179 962 134 666 106 626 112 114 129 056 143 359Arkhangai 47 052 5 205 5 113 4 123 3 676 3 927 3 540 3 408Bayan-Ulgii 52 053 6 859 6 039 5 193 4 835 4 303 4 563 3 908Bayankhongor 44 793 5 284 4 914 3 796 3 479 3 650 3 588 3 618Bulgan 30 198 3 139 3 109 2 565 2 097 2 308 2 102 2 033Govi-Altai 28 830 2 985 2 917 2 574 2 362 2 378 2 077 2 140Dornogovi 34 813 3 887 3 830 3 114 2 527 2 485 2 794 3 117Dornod 40 698 4 937 4 591 3 480 2 630 2 822 3 160 3 400Dundgovi 23 220 2 658 2 175 2 002 1 760 1 874 1 673 1 697Zavkhan 36 275 3 768 3 664 3 415 2 776 2 894 2 537 2 466Uvurkhangai 58 138 6 462 6 171 5 037 4 522 4 703 4 328 4 459Umnugovi 34 290 4 175 3 840 2 847 2 390 2 550 2 898 3 300Sukhbaatar 31 281 3 744 3 421 2 515 2 163 2 295 2 486 2 534Selenge 53 049 5 823 5 600 4 609 3 891 3 805 3 763 3 985Tuv 44 962 5 195 4 997 3 766 3 137 3 059 3 095 3 236Uvs 41 316 4 910 4 622 4 101 3 595 3 601 3 160 2 842Khovd 44 061 5 382 5 042 4 056 3 717 4 046 3 426 3 120Khuvsgul 67 714 7 305 7 335 6 076 5 109 5 273 5 319 5 342Khentii 38 235 4 385 4 076 3 399 2 929 2 785 2 838 2 803Darkhan-Uul 51 937 5 677 5 618 4 250 3 245 3 618 4 024 4 171Orkhon 52 856 5 804 5 668 4 132 3 199 3 496 4 340 4 677Govisumber 8 649 1 097 1 037 759 599 604 685 729Ulaanbaatar 755 670 87 775 86 183 58 857 41 988 45 638 62 660 76 374
Continued table 1.3
Aimags and the Capital
Age group35-39 40-44 45-49 50-54 55-59 60-64 65-69 70+
TOTAL 120 173 109 049 98 495 86 183 76 928 54 458 32 535 50 030Arkhangai 3 122 3 205 2 927 2 625 2 153 1 532 1 012 1 484Bayan-Ulgii 3 321 2 930 2 755 2 192 1 891 1 289 775 1 200Bayankhongor 3 224 2 929 2 646 2 217 1 942 1 310 798 1 398Bulgan 2 042 2 096 2 049 1 923 1 698 1 235 753 1 049Govi-Altai 2 074 2 080 1 857 1 613 1 335 930 515 993Dornogovi 2 569 2 373 2 061 1 806 1 542 1 128 645 935Dornod 2 890 2 641 2 388 2 115 2 037 1 567 888 1 152Dundgovi 1 656 1 579 1 420 1 201 1 156 901 523 945Zavkhan 2 606 2 668 2 420 2 088 1 723 1 187 724 1 339Uvurkhangai 4 031 3 935 3 644 3 189 2 650 1 837 1 177 1 993Umnugovi 2 662 2 147 1 878 1 671 1 424 881 551 1 076Sukhbaatar 2 382 2 139 1 827 1 634 1 415 1 112 652 962Selenge 3 651 3 476 3 504 3 317 2 870 2 029 1 148 1 578Tuv 3 030 2 953 2 829 2 639 2 449 1 862 1 064 1 651Uvs 2 612 2 486 2 399 2 278 1 764 1 134 656 1 156Khovd 2 729 2 732 2 537 2 185 1 831 1 282 727 1 249Khuvsgul 4 576 4 515 4 255 3 684 3 322 2 233 1 326 2 044Khentii 2 690 2 599 2 365 2 062 1 904 1 349 847 1 204Darkhan-Uul 3 714 3 574 3 299 3 094 2 808 1 978 1 138 1 729Orkhon 3 865 3 359 3 453 3 391 3 119 1 773 995 1 585Govisumber 589 577 507 461 364 249 153 239Ulaanbaatar 60 138 52 056 45 475 38 798 35 531 25 660 15 468 23 069

213
APPENDIX
TABLES 1.4. NUMBER OF RESIDENT POPULATION OF MONGOLIA, BY AGE GROUP, AIMAGS AND THE CAPITAL, 2020 URBAN-TOTAL
Aimags and the Capital Total
Age group0-4 5-9 10-14 15-19 20-24 25-29 30-34
TOTAL 2 168 253 265 009 257 324 180 973 132 943 138 445 179 341 210 249Arkhangai 20 648 2 422 2 312 1 731 1 443 1 513 1 656 1 755Bayan-Ulgii 38 950 5 291 4 419 3 500 3 258 2 921 3 752 3 423Bayankhongor 31 731 3 999 3 889 2 731 2 089 2 274 2 785 2 866Bulgan 15 522 1 641 1 589 1 237 1 025 1 140 1 203 1 194Govi-Altai 18 706 2 079 2 016 1 605 1 396 1 436 1 444 1 599Dornogovi 44 714 5 418 5 475 4 138 3 090 3 000 3 677 4 394Dornod 46 221 5 789 5 636 4 083 2 998 3 085 3 750 4 136Dundgovi 12 412 1 577 1 433 1 057 810 892 1 036 1 113Zavkhan 16 232 1 770 1 799 1 490 1 128 1 163 1 254 1 201Uvurkhangai 32 891 3 894 3 935 2 940 2 294 2 501 2 721 2 852Umnugovi 26 367 3 484 3 176 2 245 1 681 1 790 2 331 2 665Sukhbaatar 18 561 2 523 2 318 1 517 1 061 1 069 1 564 1 763Selenge 37 217 4 088 4 023 3 193 2 673 2 549 2 812 3 025Tuv 16 677 2 002 1 927 1 324 1 030 1 003 1 315 1 399Uvs 30 662 3 821 3 577 2 809 2 325 2 436 2 771 2 389Khovd 30 777 4 046 3 655 2 603 2 261 2 611 2 769 2 566Khuvsgul 44 188 4 953 5 059 3 922 2 927 3 212 3 595 3 780Khentii 27 525 3 254 3 107 2 519 2 104 1 994 2 322 2 051Darkhan-Uul 81 517 9 605 9 353 6 963 5 114 5 487 6 667 7 066Orkhon 100 183 11 685 11 107 8 255 6 197 6 690 8 452 9 271Govisumber 10 427 1 329 1 293 955 708 778 884 925Ulaanbaatar 1 466 125 180 339 176 226 120 156 85 331 88 901 120 581 148 816
Continued table 1.4
Aimags and the Capital
Age group35-39 40-44 45-49 50-54 55-59 60-64 65-69 70+
TOTAL 166 818 144 638 127 877 108 707 96 411 65 959 38 233 55 326Arkhangai 1 368 1 247 1 189 1 208 1 011 709 446 638Bayan-Ulgii 2 541 2 217 2 124 1 743 1 483 1 009 530 739Bayankhongor 2 217 1 935 1 706 1 472 1 432 867 553 916Bulgan 1 000 973 1 010 989 916 646 404 555Govi-Altai 1 357 1 240 1 145 1 098 941 581 301 468Dornogovi 3 595 2 967 2 499 2 066 1 776 1 186 659 774Dornod 3 296 2 937 2 536 2 222 2 119 1 606 878 1 150Dundgovi 798 657 624 670 616 456 255 418Zavkhan 1 130 1 057 1 078 972 868 535 276 511Uvurkhangai 2 317 2 125 1 860 1 663 1 393 832 587 977Umnugovi 1 973 1 516 1 334 1 266 1 083 697 405 721Sukhbaatar 1 364 1 191 964 858 796 673 409 491Selenge 2 613 2 531 2 495 2 149 1 902 1 371 808 985Tuv 1 177 1 063 959 962 854 678 386 598Uvs 1 972 1 770 1 650 1 691 1 431 860 438 722Khovd 1 876 1 802 1 738 1 555 1 309 826 439 721Khuvsgul 2 968 2 919 2 840 2 485 2 188 1 388 808 1 144Khentii 1 925 1 771 1 565 1 373 1 292 937 585 726Darkhan-Uul 5 949 5 540 4 962 4 502 3 888 2 662 1 545 2 214Orkhon 7 291 6 435 6 302 5 938 5 388 3 120 1 626 2 426Govisumber 720 627 592 529 432 273 147 235Ulaanbaatar 117 371 100 118 86 705 71 296 63 293 44 047 25 748 37 197

214
2020 POPULATION AND HOUSING CENSUS OF MONGOLIA NATIONAL REPORT
TABLES 1.5. NUMBER OF RESIDENT POPULATION OF MONGOLIA, BY AGE GROUP, AIMAGS AND THE CAPITAL, 2020 URBAN-MALE
Aimags and the Capital Total
Age group0-4 5-9 10-14 15-19 20-24 25-29 30-34
TOTAL 1 052 223 135 918 131 530 92 304 67 351 67 677 86 919 102 808Arkhangai 9 975 1 236 1 160 806 755 768 806 865Bayan-Ulgii 19 135 2 742 2 247 1 740 1 658 1 435 1 808 1 719Bayankhongor 15 082 1 985 2 034 1 412 1 005 1 053 1 326 1 387Bulgan 7 577 828 783 631 525 565 606 608Govi-Altai 9 121 1 101 1 045 841 710 713 690 781Dornogovi 21 999 2 804 2 846 2 129 1 545 1 424 1 790 2 172Dornod 22 278 2 937 2 906 2 074 1 549 1 484 1 859 1 997Dundgovi 5 831 801 742 544 412 403 458 532Zavkhan 7 780 931 902 726 557 607 626 575Uvurkhangai 15 723 2 015 1 957 1 513 1 143 1 243 1 279 1 319Umnugovi 12 531 1 723 1 616 1 130 850 884 1 070 1 246Sukhbaatar 8 959 1 247 1 202 766 563 499 736 853Selenge 18 642 2 090 2 101 1 613 1 375 1 311 1 464 1 570Tuv 8 125 998 987 683 520 525 670 692Uvs 15 206 1 991 1 858 1 444 1 135 1 254 1 415 1 198Khovd 15 037 2 060 1 851 1 343 1 119 1 279 1 390 1 270Khuvsgul 21 366 2 526 2 622 1 976 1 475 1 565 1 692 1 861Khentii 13 432 1 636 1 630 1 277 1 090 1 022 1 176 999Darkhan-Uul 39 627 5 000 4 703 3 583 2 560 2 643 3 405 3 563Orkhon 49 148 6 036 5 619 4 262 3 114 3 320 4 264 4 685Govisumber 5 194 667 676 512 348 417 468 474Ulaanbaatar 710 455 92 564 90 043 61 299 43 343 43 263 57 921 72 442
Continued table 1.5
Aimags and the Capital
Age group35-39 40-44 45-49 50-54 55-59 60-64 65-69 70+
TOTAL 81 213 69 654 60 627 49 491 42 463 27 929 15 439 20 900Arkhangai 663 608 550 576 436 303 194 249Bayan-Ulgii 1 224 1 104 959 840 656 462 250 291Bayankhongor 1 024 945 755 667 604 350 207 328Bulgan 487 501 505 465 404 286 159 224Govi-Altai 653 581 551 472 431 278 118 156Dornogovi 1 806 1 454 1 210 925 822 505 291 276Dornod 1 597 1 384 1 149 969 916 692 342 423Dundgovi 359 293 272 290 272 188 103 162Zavkhan 523 468 498 432 379 265 97 194Uvurkhangai 1 109 1 002 852 750 612 353 224 352Umnugovi 924 701 609 528 485 335 159 271Sukhbaatar 653 605 485 387 353 281 167 162Selenge 1 369 1 307 1 231 1 008 877 589 357 380Tuv 573 527 453 426 390 287 165 229Uvs 986 867 785 780 675 382 179 257Khovd 934 866 809 696 599 362 190 269Khuvsgul 1 377 1 431 1 349 1 178 966 585 319 444Khentii 916 835 731 603 589 416 252 260Darkhan-Uul 2 873 2 661 2 356 2 071 1 651 1 074 641 843Orkhon 3 553 3 174 2 990 2 701 2 393 1 437 682 918Govisumber 377 278 298 229 191 112 63 84Ulaanbaatar 57 233 48 062 41 230 32 498 27 762 18 387 10 280 14 128

215
APPENDIX
TABLES 1.6. NUMBER OF RESIDENT POPULATION OF MONGOLIA, BY AGE GROUP, AIMAGS AND THE CAPITAL, 2020 URBAN-FEMALE
Aimags and the Capital Total
Age group0-4 5-9 10-14 15-19 20-24 25-29 30-34
TOTAL 1 116 030 129 091 125 794 88 669 65 592 70 768 92 422 107 441Arkhangai 10 673 1 186 1 152 925 688 745 850 890Bayan-Ulgii 19 815 2 549 2 172 1 760 1 600 1 486 1 944 1 704Bayankhongor 16 649 2 014 1 855 1 319 1 084 1 221 1 459 1 479Bulgan 7 945 813 806 606 500 575 597 586Govi-Altai 9 585 978 971 764 686 723 754 818Dornogovi 22 715 2 614 2 629 2 009 1 545 1 576 1 887 2 222Dornod 23 943 2 852 2 730 2 009 1 449 1 601 1 891 2 139Dundgovi 6 581 776 691 513 398 489 578 581Zavkhan 8 452 839 897 764 571 556 628 626Uvurkhangai 17 168 1 879 1 978 1 427 1 151 1 258 1 442 1 533Umnugovi 13 836 1 761 1 560 1 115 831 906 1 261 1 419Sukhbaatar 9 602 1 276 1 116 751 498 570 828 910Selenge 18 575 1 998 1 922 1 580 1 298 1 238 1 348 1 455Tuv 8 552 1 004 940 641 510 478 645 707Uvs 15 456 1 830 1 719 1 365 1 190 1 182 1 356 1 191Khovd 15 740 1 986 1 804 1 260 1 142 1 332 1 379 1 296Khuvsgul 22 822 2 427 2 437 1 946 1 452 1 647 1 903 1 919Khentii 14 093 1 618 1 477 1 242 1 014 972 1 146 1 052Darkhan-Uul 41 890 4 605 4 650 3 380 2 554 2 844 3 262 3 503Orkhon 51 035 5 649 5 488 3 993 3 083 3 370 4 188 4 586Govisumber 5 233 662 617 443 360 361 416 451Ulaanbaatar 755 670 87 775 86 183 58 857 41 988 45 638 62 660 76 374
Continued table 1.6
Aimags and the Capital
Age group35-39 40-44 45-49 50-54 55-59 60-64 65-69 70+
TOTAL 85 605 74 984 67 250 59 216 53 948 38 030 22 794 34 426Arkhangai 705 639 639 632 575 406 252 389Bayan-Ulgii 1 317 1 113 1 165 903 827 547 280 448Bayankhongor 1 193 990 951 805 828 517 346 588Bulgan 513 472 505 524 512 360 245 331Govi-Altai 704 659 594 626 510 303 183 312Dornogovi 1 789 1 513 1 289 1 141 954 681 368 498Dornod 1 699 1 553 1 387 1 253 1 203 914 536 727Dundgovi 439 364 352 380 344 268 152 256Zavkhan 607 589 580 540 489 270 179 317Uvurkhangai 1 208 1 123 1 008 913 781 479 363 625Umnugovi 1 049 815 725 738 598 362 246 450Sukhbaatar 711 586 479 471 443 392 242 329Selenge 1 244 1 224 1 264 1 141 1 025 782 451 605Tuv 604 536 506 536 464 391 221 369Uvs 986 903 865 911 756 478 259 465Khovd 942 936 929 859 710 464 249 452Khuvsgul 1 591 1 488 1 491 1 307 1 222 803 489 700Khentii 1 009 936 834 770 703 521 333 466Darkhan-Uul 3 076 2 879 2 606 2 431 2 237 1 588 904 1 371Orkhon 3 738 3 261 3 312 3 237 2 995 1 683 944 1 508Govisumber 343 349 294 300 241 161 84 151Ulaanbaatar 60 138 52 056 45 475 38 798 35 531 25 660 15 468 23 069

216
2020 POPULATION AND HOUSING CENSUS OF MONGOLIA NATIONAL REPORT
TABLES 1.7. NUMBER OF RESIDENT POPULATION OF MONGOLIA, BY AGE GROUP, AIMAGS AND THE CAPITAL, 2020 RURAL-TOTAL
Aimags and the Capital Total
Age group0-4 5-9 10-14 15-19 20-24 25-29 30-34
TOTAL 1 028 767 118 250 110 990 93 901 83 824 86 940 79 858 76 601Arkhangai 73 676 8 352 8 040 6 548 6 083 6 593 5 805 5 309Bayan-Ulgii 64 958 8 854 7 782 6 881 6 527 5 749 5 404 4 555Bayankhongor 56 277 6 535 6 186 5 029 4 726 5 182 4 613 4 433Bulgan 45 822 4 895 4 775 3 980 3 377 3 616 3 289 3 089Govi-Altai 38 773 4 125 4 023 3 733 3 487 3 404 2 789 2 740Dornogovi 25 145 2 620 2 507 2 207 1 937 1 969 2 086 2 063Dornod 35 799 4 261 3 742 3 006 2 456 2 605 2 950 3 014Dundgovi 34 286 3 923 3 093 3 054 2 835 2 980 2 455 2 378Zavkhan 56 075 6 090 5 741 5 415 4 577 4 909 4 071 3 722Uvurkhangai 82 846 9 380 8 542 7 486 6 926 7 358 6 245 6 172Umnugovi 43 491 5 158 4 726 3 473 3 185 3 460 3 707 4 286Sukhbaatar 44 323 5 067 4 726 3 626 3 424 3 696 3 627 3 424Selenge 70 538 7 801 7 506 6 173 5 242 5 445 5 440 5 545Tuv 75 732 8 582 8 237 6 590 5 386 5 530 5 514 5 595Uvs 52 279 6 353 5 992 5 496 4 976 5 009 3 883 3 424Khovd 57 301 6 992 6 716 5 721 5 216 5 601 4 327 3 848Khuvsgul 90 130 10 093 10 085 8 393 7 330 7 390 7 316 6 950Khentii 49 795 5 684 5 263 4 371 3 942 3 951 3 771 3 744Darkhan-Uul 20 654 2 245 2 049 1 785 1 441 1 664 1 670 1 496Orkhon 3 849 343 369 295 273 311 332 227Govisumber 7 018 897 890 639 478 518 564 587
Continued table 1.7
Aimags and the Capital
Age group35-39 40-44 45-49 50-54 55-59 60-64 65-69 70+
TOTAL 72 976 70 580 63 780 53 733 44 755 30 267 17 110 25 202Arkhangai 5 027 5 144 4 647 3 845 3 094 2 083 1 313 1 793Bayan-Ulgii 4 096 3 695 3 174 2 552 2 042 1 418 853 1 376Bayankhongor 4 058 3 862 3 366 2 797 2 151 1 349 752 1 238Bulgan 3 207 3 442 3 162 2 858 2 299 1 659 968 1 206Govi-Altai 2 826 2 849 2 614 2 038 1 522 1 074 542 1 007Dornogovi 1 897 1 832 1 607 1 336 1 126 835 470 653Dornod 2 845 2 548 2 299 1 878 1 697 1 182 616 700Dundgovi 2 570 2 508 2 178 1 773 1 594 1 139 653 1 153Zavkhan 4 048 4 144 3 705 3 108 2 406 1 644 895 1 600Uvurkhangai 5 814 5 654 5 253 4 334 3 567 2 406 1 453 2 256Umnugovi 3 628 2 970 2 643 2 033 1 728 986 521 987Sukhbaatar 3 495 3 312 2 814 2 314 1 871 1 322 706 899Selenge 5 070 4 773 4 529 4 149 3 605 2 344 1 300 1 616Tuv 5 438 5 241 4 868 4 240 3 904 2 808 1 616 2 183Uvs 3 360 3 172 3 046 2 604 1 991 1 236 679 1 058Khovd 3 677 3 634 3 207 2 588 2 171 1 491 836 1 276Khuvsgul 6 097 6 110 5 576 4 708 4 012 2 566 1 391 2 113Khentii 3 656 3 531 3 043 2 671 2 366 1 663 923 1 216Darkhan-Uul 1 402 1 440 1 366 1 291 1 081 724 417 583Orkhon 256 238 273 295 250 162 99 126Govisumber 509 481 410 321 278 176 107 163

217
APPENDIX
TABLES 1.8. NUMBER OF RESIDENT POPULATION OF MONGOLIA, BY AGE GROUP, AIMAGS AND THE CAPITAL, 2020 RURAL-MALE
Aimags and the Capital Total
Age group0-4 5-9 10-14 15-19 20-24 25-29 30-34
TOTAL 524 707 60 885 56 822 47 904 42 790 45 594 43 224 40 683Arkhangai 37 297 4 333 4 079 3 350 3 095 3 411 3 115 2 791Bayan-Ulgii 32 720 4 544 3 915 3 448 3 292 2 932 2 785 2 351Bayankhongor 28 133 3 265 3 127 2 552 2 331 2 753 2 484 2 294Bulgan 23 569 2 569 2 472 2 021 1 780 1 883 1 784 1 642Govi-Altai 19 528 2 118 2 077 1 923 1 811 1 749 1 466 1 418Dornogovi 13 047 1 347 1 306 1 102 955 1 060 1 179 1 168Dornod 19 044 2 176 1 881 1 535 1 275 1 384 1 681 1 753Dundgovi 17 647 2 041 1 609 1 565 1 473 1 595 1 360 1 262Zavkhan 28 252 3 161 2 974 2 764 2 372 2 571 2 162 1 882Uvurkhangai 41 876 4 797 4 349 3 876 3 555 3 913 3 359 3 246Umnugovi 23 037 2 744 2 446 1 741 1 626 1 816 2 070 2 405Sukhbaatar 22 644 2 599 2 421 1 862 1 759 1 971 1 969 1 800Selenge 36 064 3 976 3 828 3 144 2 649 2 878 3 025 3 015Tuv 39 322 4 391 4 180 3 465 2 759 2 949 3 064 3 066Uvs 26 419 3 273 3 089 2 760 2 571 2 590 2 079 1 773Khovd 28 980 3 596 3 478 2 925 2 641 2 887 2 280 2 024Khuvsgul 45 238 5 215 5 187 4 263 3 673 3 764 3 900 3 527Khentii 25 653 2 917 2 664 2 214 2 027 2 138 2 079 1 993Darkhan-Uul 10 607 1 173 1 081 915 750 890 908 828Orkhon 2 028 188 189 156 157 185 180 136Govisumber 3 602 462 470 323 239 275 295 309
Continued table 1.8
Aimags and the Capital
Age group35-39 40-44 45-49 50-54 55-59 60-64 65-69 70+
TOTAL 38 408 36 515 32 535 26 766 21 775 13 839 7 369 9 598Arkhangai 2 610 2 578 2 359 1 852 1 516 957 553 698Bayan-Ulgii 2 092 1 878 1 584 1 263 978 676 358 624Bayankhongor 2 027 1 923 1 671 1 385 1 037 556 300 428Bulgan 1 678 1 818 1 618 1 459 1 113 784 460 488Govi-Altai 1 456 1 428 1 351 1 051 697 447 210 326Dornogovi 1 117 972 835 671 538 388 193 216Dornod 1 654 1 460 1 298 1 016 863 529 264 275Dundgovi 1 353 1 293 1 110 952 782 506 282 464Zavkhan 2 049 2 065 1 865 1 560 1 172 727 350 578Uvurkhangai 2 991 2 842 2 617 2 058 1 698 1 048 639 888Umnugovi 2 015 1 638 1 490 1 100 902 467 216 361Sukhbaatar 1 824 1 759 1 466 1 151 899 602 296 266Selenge 2 663 2 521 2 289 1 973 1 760 1 097 603 643Tuv 3 012 2 824 2 545 2 137 1 919 1 337 773 901Uvs 1 734 1 589 1 512 1 237 983 580 282 367Khovd 1 890 1 838 1 599 1 262 1 050 673 358 479Khuvsgul 3 112 3 083 2 812 2 331 1 912 1 136 554 769Khentii 1 975 1 868 1 512 1 379 1 165 835 409 478Darkhan-Uul 764 745 673 628 510 334 183 225Orkhon 129 140 132 141 126 72 48 49Govisumber 263 253 197 160 155 88 38 75

218
2020 POPULATION AND HOUSING CENSUS OF MONGOLIA NATIONAL REPORT
TABLES 1.9. NUMBER OF RESIDENT POPULATION OF MONGOLIA, BY AGE GROUP, AIMAGS AND THE CAPITAL, 2020 RURAL-FEMALE
Aimags and the Capital Total
Age group0-4 5-9 10-14 15-19 20-24 25-29 30-34
TOTAL 504 060 57 365 54 168 45 997 41 034 41 346 36 634 35 918Arkhangai 36 379 4 019 3 961 3 198 2 988 3 182 2 690 2 518Bayan-Ulgii 32 238 4 310 3 867 3 433 3 235 2 817 2 619 2 204Bayankhongor 28 144 3 270 3 059 2 477 2 395 2 429 2 129 2 139Bulgan 22 253 2 326 2 303 1 959 1 597 1 733 1 505 1 447Govi-Altai 19 245 2 007 1 946 1 810 1 676 1 655 1 323 1 322Dornogovi 12 098 1 273 1 201 1 105 982 909 907 895Dornod 16 755 2 085 1 861 1 471 1 181 1 221 1 269 1 261Dundgovi 16 639 1 882 1 484 1 489 1 362 1 385 1 095 1 116Zavkhan 27 823 2 929 2 767 2 651 2 205 2 338 1 909 1 840Uvurkhangai 40 970 4 583 4 193 3 610 3 371 3 445 2 886 2 926Umnugovi 20 454 2 414 2 280 1 732 1 559 1 644 1 637 1 881Sukhbaatar 21 679 2 468 2 305 1 764 1 665 1 725 1 658 1 624Selenge 34 474 3 825 3 678 3 029 2 593 2 567 2 415 2 530Tuv 36 410 4 191 4 057 3 125 2 627 2 581 2 450 2 529Uvs 25 860 3 080 2 903 2 736 2 405 2 419 1 804 1 651Khovd 28 321 3 396 3 238 2 796 2 575 2 714 2 047 1 824Khuvsgul 44 892 4 878 4 898 4 130 3 657 3 626 3 416 3 423Khentii 24 142 2 767 2 599 2 157 1 915 1 813 1 692 1 751Darkhan-Uul 10 047 1 072 968 870 691 774 762 668Orkhon 1 821 155 180 139 116 126 152 91Govisumber 3 416 435 420 316 239 243 269 278
Continued table 1.9
Aimags and the Capital
Age group35-39 40-44 45-49 50-54 55-59 60-64 65-69 70+
TOTAL 34 568 34 065 31 245 26 967 22 980 16 428 9 741 15 604Arkhangai 2 417 2 566 2 288 1 993 1 578 1 126 760 1 095Bayan-Ulgii 2 004 1 817 1 590 1 289 1 064 742 495 752Bayankhongor 2 031 1 939 1 695 1 412 1 114 793 452 810Bulgan 1 529 1 624 1 544 1 399 1 186 875 508 718Govi-Altai 1 370 1 421 1 263 987 825 627 332 681Dornogovi 780 860 772 665 588 447 277 437Dornod 1 191 1 088 1 001 862 834 653 352 425Dundgovi 1 217 1 215 1 068 821 812 633 371 689Zavkhan 1 999 2 079 1 840 1 548 1 234 917 545 1 022Uvurkhangai 2 823 2 812 2 636 2 276 1 869 1 358 814 1 368Umnugovi 1 613 1 332 1 153 933 826 519 305 626Sukhbaatar 1 671 1 553 1 348 1 163 972 720 410 633Selenge 2 407 2 252 2 240 2 176 1 845 1 247 697 973Tuv 2 426 2 417 2 323 2 103 1 985 1 471 843 1 282Uvs 1 626 1 583 1 534 1 367 1 008 656 397 691Khovd 1 787 1 796 1 608 1 326 1 121 818 478 797Khuvsgul 2 985 3 027 2 764 2 377 2 100 1 430 837 1 344Khentii 1 681 1 663 1 531 1 292 1 201 828 514 738Darkhan-Uul 638 695 693 663 571 390 234 358Orkhon 127 98 141 154 124 90 51 77Govisumber 246 228 213 161 123 88 69 88

219
APPENDIX
TABLES 2.1. PERCENTAGE DISTRIBUTION OF RESIDENT POPULATION OF MONGOLIA, BY AGE GROUP, AIMAGS AND THE CAPITAL, 2020
Aimags and the Capital Total
Age group0-4 5-9 10-14 15-19 20-24 25-29 30-34
TOTAL 100.0 12.0 11.5 8.6 6.8 7.0 8.1 9.0Arkhangai 100.0 11.4 11.0 8.8 8.0 8.6 7.9 7.5Bayan-Ulgii 100.0 13.6 11.7 10.0 9.4 8.3 8.8 7.7Bayankhongor 100.0 12.0 11.4 8.8 7.7 8.5 8.4 8.3Bulgan 100.0 10.7 10.4 8.5 7.2 7.8 7.3 7.0Govi-Altai 100.0 10.8 10.5 9.3 8.5 8.4 7.4 7.5Dornogovi 100.0 11.5 11.4 9.1 7.2 7.1 8.2 9.2Dornod 100.0 12.3 11.4 8.6 6.6 6.9 8.2 8.7Dundgovi 100.0 11.8 9.7 8.8 7.8 8.3 7.5 7.5Zavkhan 100.0 10.9 10.4 9.5 7.9 8.4 7.4 6.8Uvurkhangai 100.0 11.5 10.8 9.0 8.0 8.5 7.7 7.8Umnugovi 100.0 12.4 11.3 8.2 7.0 7.5 8.6 10.0Sukhbaatar 100.0 12.1 11.2 8.2 7.1 7.6 8.3 8.2Selenge 100.0 11.0 10.7 8.7 7.3 7.4 7.7 8.0Tuv 100.0 11.5 11.0 8.6 6.9 7.1 7.4 7.6Uvs 100.0 12.3 11.5 10.0 8.8 9.0 8.0 7.0Khovd 100.0 12.5 11.8 9.5 8.5 9.3 8.1 7.3Khuvsgul 100.0 11.2 11.3 9.2 7.6 7.9 8.1 8.0Khentii 100.0 11.6 10.8 8.9 7.8 7.7 7.9 7.5Darkhan-Uul 100.0 11.6 11.2 8.6 6.4 7.0 8.2 8.4Orkhon 100.0 11.6 11.0 8.2 6.2 6.7 8.4 9.1Govisumber 100.0 12.8 12.5 9.1 6.8 7.4 8.3 8.7Ulaanbaatar 100.0 12.3 12.0 8.2 5.8 6.1 8.2 10.2
Continued table 2.1
Aimags and the Capital
Age group35-39 40-44 45-49 50-54 55-59 60-64 65-69 70+
TOTAL 7.5 6.7 6.0 5.1 4.4 3.0 1.7 2.5Arkhangai 6.8 6.8 6.2 5.4 4.4 3.0 1.9 2.6Bayan-Ulgii 6.4 5.7 5.1 4.1 3.4 2.3 1.3 2.0Bayankhongor 7.1 6.6 5.8 4.9 4.1 2.5 1.5 2.4Bulgan 6.9 7.2 6.8 6.3 5.2 3.8 2.2 2.9Govi-Altai 7.3 7.1 6.5 5.5 4.3 2.9 1.5 2.6Dornogovi 7.9 6.9 5.9 4.9 4.2 2.9 1.6 2.0Dornod 7.5 6.7 5.9 5.0 4.7 3.4 1.8 2.3Dundgovi 7.2 6.8 6.0 5.2 4.7 3.4 1.9 3.4Zavkhan 7.2 7.2 6.6 5.6 4.5 3.0 1.6 2.9Uvurkhangai 7.0 6.7 6.1 5.2 4.3 2.8 1.8 2.8Umnugovi 8.0 6.4 5.7 4.7 4.0 2.4 1.3 2.4Sukhbaatar 7.7 7.2 6.0 5.0 4.2 3.2 1.8 2.2Selenge 7.1 6.8 6.5 5.8 5.1 3.4 2.0 2.4Tuv 7.2 6.8 6.3 5.6 5.1 3.8 2.2 3.0Uvs 6.4 6.0 5.7 5.2 4.1 2.5 1.3 2.1Khovd 6.3 6.2 5.6 4.7 4.0 2.6 1.4 2.3Khuvsgul 6.7 6.7 6.3 5.4 4.6 2.9 1.6 2.4Khentii 7.2 6.9 6.0 5.2 4.7 3.4 2.0 2.5Darkhan-Uul 7.2 6.8 6.2 5.7 4.9 3.3 1.9 2.7Orkhon 7.3 6.4 6.3 6.0 5.4 3.2 1.7 2.5Govisumber 7.0 6.4 5.7 4.9 4.1 2.6 1.5 2.3Ulaanbaatar 8.0 6.8 5.9 4.9 4.3 3.0 1.8 2.5

220
2020 POPULATION AND HOUSING CENSUS OF MONGOLIA NATIONAL REPORT
TABLES 3.1. NUMBER OF POPULATION AGED 15 AND ABOVE, BY MARITAL STATUS, AGE GROUP, 2020
Age group Total Single/Never
MarriedRegistered
marriedNot registered
married
Separeted/ Legally
married
Divorced/ not remarried Widowed
TOTAL 2 152 109 678 901 1 110 170 193 581 24 857 26 650 117 95015-17 126 981 126 789 5 187 - - -18-19 88 835 87 507 459 856 9 - 420-24 223 544 187 390 19 324 16 508 198 81 4325-29 257 438 121 506 90 788 43 098 1 033 626 38730-34 284 908 65 911 171 490 42 060 2 153 2 153 1 14135-39 237 508 31 760 171 896 25 550 2 837 3 250 2 21540-44 213 108 20 355 160 201 20 381 3 787 4 215 4 16945-49 189 324 14 771 141 084 17 294 4 279 4 752 7 14450-54 160 507 9 561 117 542 12 694 4 279 4 643 11 78855-59 139 752 6 781 100 032 8 232 3 446 3 779 17 48260-64 95 353 3 285 65 605 3 844 1 706 1 944 18 96965-69 54 883 1 566 34 458 1 584 655 722 15 89870+ 79 968 1 719 37 286 1 293 475 485 38 710
TABLES 3.2. NUMBER OF MALE POPULATION AGED 15 AND ABOVE, BY MARITAL STATUS, AGE GROUP, 2020
Age group Total Single/Never
MarriedRegistered
marriedNot registered
married
Separeted/ Legally
married
Divorced/ not remarried Widowed
TOTAL 1 039 588 366 417 542 325 91 607 9 978 10 317 18 94415-17 64 736 64 676 2 58 - - -18-19 44 946 44 648 104 192 2 - -20-24 112 474 100 130 6 471 5 784 61 22 625-29 129 129 69 990 39 168 19 360 340 203 6830-34 142 218 38 481 80 761 21 283 757 755 18135-39 118 036 18 455 84 177 12 721 1 092 1 242 34940-44 104 683 11 496 79 537 9 794 1 519 1 702 63545-49 91 433 8 169 70 069 8 428 1 764 1 989 1 01450-54 74 827 4 836 58 504 6 220 1 757 1 759 1 75155-59 63 207 3 122 50 487 4 159 1 446 1 440 2 55360-64 41 171 1 312 33 458 2 000 712 722 2 96765-69 22 496 573 18 122 850 303 264 2 38470+ 30 232 529 21 465 758 225 219 7 036

221
APPENDIX
TABLES 3.3. NUMBER OF FEMALE POPULATION AGED 15 AND ABOVE, BY MARITAL STATUS, AGE GROUP, 2020
Age group Total Single/Never
MarriedRegistered
marriedNot registered
married
Separeted/ Legally
married
Divorced/ not remarried Widowed
TOTAL 1 112 521 312 484 567 845 101 974 14 879 16 333 99 00615-17 62 245 62 113 3 129 - - -18-19 43 889 42 859 355 664 7 - 420-24 111 070 87 260 12 853 10 724 137 59 3725-29 128 309 51 516 51 620 23 738 693 423 31930-34 142 690 27 430 90 729 20 777 1 396 1 398 96035-39 119 472 13 305 87 719 12 829 1 745 2 008 1 86640-44 108 425 8 859 80 664 10 587 2 268 2 513 3 53445-49 97 891 6 602 71 015 8 866 2 515 2 763 6 13050-54 85 680 4 725 59 038 6 474 2 522 2 884 10 03755-59 76 545 3 659 49 545 4 073 2 000 2 339 14 92960-64 54 182 1 973 32 147 1 844 994 1 222 16 00265-69 32 387 993 16 336 734 352 458 13 51470+ 49 736 1 190 15 821 535 250 266 31 674
TABLES 3.4. NUMBER OF URBAN POPULATION AGED 15 AND ABOVE, BY MARITAL STATUS, AGE GROUP, 2020
Age group Total Single/Never
MarriedRegistered
marriedNot registered
married
Separeted/ Legally married
Divorced/ not remarried Widowed
TOTAL 1 449 537 449 344 726 950 154 679 19 348 19 900 79 31615-17 78 403 78 288 2 113 - - -
18-19 53 619 52 861 204 544 8 - 220-24 136 696 115 991 8 921 11 560 152 47 2525-29 177 793 87 396 55 327 33 654 773 412 23130-34 208 683 51 511 118 094 35 150 1 655 1 539 73435-39 164 956 23 823 114 270 20 959 2 164 2 318 1 42240-44 142 998 14 654 102 948 16 618 2 975 3 108 2 69545-49 126 131 10 572 89 881 14 144 3 365 3 558 4 61150-54 107 210 6 478 75 972 10 101 3 347 3 525 7 78755-59 95 262 4 291 66 842 6 528 2 722 2 944 11 93560-64 65 183 1 885 44 411 3 058 1 344 1 515 12 97065-69 37 810 856 23 759 1 238 490 578 10 88970+ 54 793 738 26 319 1 012 353 356 26 015

222
2020 POPULATION AND HOUSING CENSUS OF MONGOLIA NATIONAL REPORT
TABLES 3.5. NUMBER OF RURAL POPULATION AGED 15 AND ABOVE, BY MARITAL STATUS, AGE GROUP, 2020
Age group Total Single/Never
MarriedRegistered
marriedNot registered
married
Separeted/ Legally
married
Divorced/ not remarried Widowed
TOTAL 702 572 229 557 383 220 38 902 5 509 6 750 38 63415-17 48 578 48 501 3 74 - - -18-19 35 216 34 646 255 312 1 - 220-24 86 848 71 399 10 403 4 948 46 34 1825-29 79 645 34 110 35 461 9 444 260 214 15630-34 76 225 14 400 53 396 6 910 498 614 40735-39 72 552 7 937 57 626 4 591 673 932 79340-44 70 110 5 701 57 253 3 763 812 1 107 1 47445-49 63 193 4 199 51 203 3 150 914 1 194 2 53350-54 53 297 3 083 41 570 2 593 932 1 118 4 00155-59 44 490 2 490 33 190 1 704 724 835 5 54760-64 30 170 1 400 21 194 786 362 429 5 99965-69 17 073 710 10 699 346 165 144 5 00970+ 25 175 981 10 967 281 122 129 12 695
TABLES 3.6. PERCENTAGE DISTRIBUTION OF POPULATION, BY ETHNICITY, AND AIMAGS AND THE CAPITAL, REGION, 2020
Aimags and the Capital, Region
Mongolian citizens-Total Khalkh Kazak Durvud Buriad Bayad Dariganga Uriankhai Zakhchin
TOTAL 100.0 83.8 3.8 2.6 1.4 2.0 1.1 0.9 1.2Arkhangai 100.0 97.1 0.1 0.2 0.1 0.1 0.0 0.0 0.0Bayan-Ulgii 100.0 0.9 91.0 0.9 0.0 0.1 0.0 5.6 0.0Bayankhongor 100.0 99.7 0.1 0.1 0.0 0.1 0.0 0.0 0.0Bulgan 100.0 95.1 0.1 0.7 0.9 1.6 0.0 0.2 0.1Govi-Altai 100.0 99.3 0.1 0.1 0.0 0.1 0.0 0.1 0.2Dornogovi 100.0 96.5 0.2 0.5 0.3 0.2 1.4 0.3 0.2Dornod 100.0 70.3 0.1 0.6 20.8 0.2 2.1 0.1 0.2Dundgovi 100.0 99.6 0.0 0.1 0.1 0.1 0.1 0.0 0.0Zavkhan 100.0 99.2 0.0 0.2 0.0 0.1 0.0 0.1 0.1Uvurkhangai 100.0 99.6 0.1 0.1 0.0 0.1 0.0 0.0 0.0Umnugovi 100.0 98.7 0.1 0.2 0.2 0.2 0.1 0.1 0.1Sukhbaatar 100.0 59.6 0.0 0.2 0.3 0.3 39.0 0.1 0.1Selenge 100.0 85.6 0.9 2.9 0.7 3.4 0.1 1.7 0.9Tuv 100.0 93.9 1.0 1.2 0.5 1.4 0.1 0.4 0.3Uvs 100.0 13.6 0.2 42.3 0.1 34.2 0.0 0.2 0.1Khovd 100.0 28.1 11.2 6.5 0.2 0.4 0.0 8.3 25.3Khuvsgul 100.0 76.0 0.0 0.1 0.6 0.1 0.0 2.3 0.1Khentii 100.0 89.1 0.7 0.5 7.1 0.3 0.7 1.1 0.1Darkhan-Uul 100.0 83.4 2.5 4.0 0.7 4.1 0.1 0.9 1.5Orkhon 100.0 89.9 0.7 2.2 0.6 1.8 0.1 0.9 0.6Govisumber 100.0 95.3 0.5 1.2 0.3 1.5 0.4 0.1 0.2Ulaanbaatar 100.0 91.2 0.7 2.0 1.1 1.5 0.6 0.5 0.8TOTAL 100.0 83.8 3.8 2.6 1.4 2.0 1.1 0.9 1.2Western region 100.0 41.0 25.8 10.4 0.1 7.1 0.0 3.3 5.6Khangai region 100.0 91.8 0.2 0.5 0.3 0.5 0.0 0.7 0.1Central region 100.0 91.6 1.0 1.8 0.5 1.9 0.3 0.7 0.6Eastern region 100.0 73.8 0.3 0.5 10.2 0.3 12.1 0.5 0.1Ulaanbaatar 100.0 91.2 0.7 2.0 1.1 1.5 0.6 0.5 0.8

223
APPENDIX
TABLES 3.6. a PERCENTAGE DISTRIBUTION OF POPULATION, BY ETHNICITY, AND AIMAGS AND THE CAPITAL, REGION, 2020
Aimags and the Capital
Mongolian citizens-Total Khalkh Kazak Durvud Buriad Bayad Dariganga Uriankhai Zakhchin
TOTAL 100.0 100.0 100.0 100.0 100.0 100.0 100.0 100.0 100.0Arkhangai 3.0 3.4 0.0 0.2 0.1 0.1 0.0 0.1 0.1Bayan-Ulgii 3.2 0.0 77.7 1.1 0.1 0.1 0.0 20.0 0.1Bayankhongor 2.8 3.3 0.0 0.1 0.1 0.1 0.0 0.0 0.1Bulgan 1.9 2.2 0.0 0.5 1.2 1.6 0.1 0.3 0.1Govi-Altai 1.8 2.2 0.0 0.1 0.0 0.1 0.0 0.1 0.2Dornogovi 2.2 2.5 0.1 0.4 0.5 0.2 2.6 0.6 0.3Dornod 2.6 2.2 0.1 0.6 38.7 0.3 4.8 0.3 0.5Dundgovi 1.5 1.8 0.0 0.1 0.1 0.1 0.1 0.0 0.0Zavkhan 2.3 2.7 0.0 0.1 0.0 0.1 0.0 0.1 0.1Uvurkhangai 3.6 4.3 0.0 0.1 0.1 0.1 0.1 0.1 0.1Umnugovi 2.2 2.5 0.1 0.2 0.3 0.2 0.2 0.3 0.2Sukhbaatar 2.0 1.4 0.0 0.1 0.4 0.2 67.2 0.2 0.1Selenge 3.4 3.5 0.8 3.7 1.7 5.7 0.3 6.3 2.6Tuv 2.9 3.3 0.8 1.3 1.1 2.0 0.2 1.1 0.7Uvs 2.6 0.4 0.1 41.8 0.1 44.3 0.0 0.5 0.2Khovd 2.8 0.9 8.1 6.8 0.3 0.5 0.0 25.2 59.4Khuvsgul 4.2 3.8 0.1 0.2 1.9 0.2 0.1 10.8 0.2Khentii 2.4 2.6 0.5 0.5 12.6 0.4 1.4 2.9 0.2Darkhan-Uul 3.2 3.2 2.2 4.8 1.7 6.5 0.3 3.4 4.0Orkhon 3.3 3.5 0.6 2.8 1.4 2.9 0.3 3.2 1.5Govisumber 0.5 0.6 0.1 0.2 0.1 0.4 0.2 0.1 0.1Ulaanbaatar 45.6 49.7 8.7 34.3 37.5 33.9 22.1 24.4 29.3
Continued table 3.6
Aimags and the Capital, Region Darkhad Torguud Uuld Khoton Myangad Barga Uzemchin Kharchin Khotgoid
TOTAL 0.8 0.5 0.5 0.4 0.2 0.1 0.1 0.0 0.3Arkhangai 0.0 0.1 2.3 0.0 0.0 0.0 0.0 0.0 0.0Bayan-Ulgii 0.0 0.0 0.0 0.0 0.0 0.0 0.0 0.0 0.0Bayankhongor 0.0 0.0 0.0 0.0 0.0 0.0 0.0 0.0 0.0Bulgan 0.5 0.1 0.1 0.5 0.1 0.0 0.0 0.0 0.0Govi-Altai 0.0 0.1 0.0 0.0 0.0 0.0 0.0 0.0 0.0Dornogovi 0.1 0.1 0.1 0.1 0.0 0.0 0.0 0.0 0.0Dornod 0.3 0.1 0.1 0.1 0.1 2.3 2.1 0.0 0.0Dundgovi 0.0 0.0 0.0 0.0 0.0 0.0 0.0 0.0 0.0Zavkhan 0.0 0.1 0.1 0.0 0.0 0.0 0.0 0.0 0.1Uvurkhangai 0.0 0.0 0.1 0.0 0.0 0.0 0.0 0.0 0.0Umnugovi 0.1 0.1 0.1 0.0 0.0 0.0 0.0 0.0 0.0Sukhbaatar 0.1 0.0 0.0 0.0 0.0 0.0 0.3 0.0 0.0Selenge 0.3 0.5 0.2 1.7 0.2 0.0 0.0 0.0 0.0Tuv 0.1 0.1 0.2 0.1 0.0 0.0 0.0 0.0 0.0Uvs 0.0 0.3 0.1 7.0 0.5 0.1 0.0 0.0 0.0Khovd 0.0 7.4 6.1 0.0 5.3 0.0 0.0 0.0 0.0Khuvsgul 14.9 0.1 0.0 0.0 0.0 0.0 0.0 0.0 5.5Khentii 0.0 0.1 0.1 0.0 0.0 0.1 0.0 0.0 0.0Darkhan-Uul 0.2 0.8 0.3 0.5 0.2 0.0 0.0 0.0 0.1Orkhon 0.6 0.2 0.2 1.6 0.2 0.1 0.0 0.0 0.1Govisumber 0.1 0.1 0.1 0.1 0.1 0.0 0.0 0.0 0.0Ulaanbaatar 0.2 0.5 0.4 0.1 0.1 0.0 0.0 0.0 0.1TOTAL 0.8 0.5 0.5 0.4 0.2 0.1 0.1 0.0 0.3Western region 0.0 1.7 1.4 1.4 1.2 0.0 0.0 0.0 0.0Khangai region 3.5 0.1 0.5 0.3 0.1 0.0 0.0 0.0 1.3Central region 0.1 0.3 0.1 0.5 0.1 0.0 0.0 0.0 0.0Eastern region 0.1 0.1 0.0 0.0 0.1 0.9 0.9 0.0 0.0Ulaanbaatar 0.2 0.5 0.4 0.1 0.1 0.0 0.0 0.0 0.1

224
2020 POPULATION AND HOUSING CENSUS OF MONGOLIA NATIONAL REPORT
Continued table 3.6 a
Aimags and the Capital Darkhad Torguud Uuld Khoton Myangad Barga Uzemchin Kharchin Khotgoid
TOTAL 100.0 100.0 100.0 100.0 100.0 100.0 100.0 100.0 100.0Arkhangai 0.1 0.3 14.9 0.1 0.1 0.0 0.3 2.6 0.1Bayan-Ulgii 0.0 0.2 0.2 0.0 0.2 0.0 0.1 0.7 0.1Bayankhongor 0.1 0.1 0.2 0.1 0.1 0.0 0.0 0.7 0.0Bulgan 1.2 0.2 0.6 2.4 0.4 0.4 0.1 0.0 0.2Govi-Altai 0.0 0.2 0.2 0.0 0.1 0.0 0.0 0.7 0.0Dornogovi 0.2 0.4 0.5 0.3 0.3 0.5 0.3 0.7 0.2Dornod 0.8 0.7 0.3 0.4 1.1 67.3 73.7 7.8 0.0Dundgovi 0.0 0.0 0.1 0.0 0.0 0.0 0.0 0.7 0.0Zavkhan 0.1 0.2 0.3 0.1 0.1 0.1 0.0 0.7 1.0Uvurkhangai 0.1 0.2 0.5 0.1 0.2 0.1 0.1 0.0 0.1Umnugovi 0.2 0.3 0.2 0.2 0.2 0.1 0.3 0.0 0.1Sukhbaatar 0.4 0.1 0.1 0.1 0.2 1.0 7.0 0.0 0.0Selenge 1.5 3.4 1.4 15.0 2.2 1.2 0.4 6.5 0.6Tuv 0.5 0.6 1.1 0.5 0.3 0.6 0.4 4.5 0.3Uvs 0.1 1.5 0.4 47.9 4.8 3.3 0.1 0.6 0.1Khovd 0.1 41.7 36.3 0.4 56.8 0.2 0.1 1.3 0.2Khuvsgul 81.2 0.3 0.1 0.2 0.3 0.0 0.1 5.8 85.4Khentii 0.1 0.3 0.2 0.1 0.3 1.2 0.6 1.9 0.1Darkhan-Uul 0.8 4.9 2.1 4.6 2.0 0.9 0.3 5.8 0.9Orkhon 2.6 1.1 1.6 14.1 2.6 1.5 0.7 0.0 1.3Govisumber 0.1 0.2 0.1 0.1 0.1 0.3 0.0 1.9 0.1Ulaanbaatar 9.8 43.1 38.6 13.3 27.6 21.3 15.4 57.1 9.2

225
APPENDIX
Continued table 3.6
Aimags and the Capital, Region
Eljigen Tsaatan (Dukha) Sartuul Tuva Uzbek
(Chantuu) Khamnigan Khoshuud Other
Other ethnic groups /
Mongolian citizen/
TOTAL 0.0 0.0 0.1 0.1 0.0 0.0 0.0 0.0 0.1Arkhangai 0.0 0.0 0.0 0.0 0.0 0.0 0.0 0.0 0.0Bayan-Ulgii 0.0 0.0 0.0 0.8 0.0 0.0 0.0 0.0 0.7Bayankhongor 0.0 0.0 0.0 0.0 0.0 0.0 0.0 0.0 0.0Bulgan 0.0 0.0 0.0 0.0 0.0 0.0 0.0 0.0 0.0Govi-Altai 0.0 0.0 0.0 0.0 0.0 0.0 0.0 0.0 0.0Dornogovi 0.0 0.0 0.0 0.0 0.0 0.0 0.0 0.0 0.0Dornod 0.0 0.0 0.1 0.0 0.0 0.3 0.0 0.0 0.1Dundgovi 0.0 0.0 0.0 0.0 0.0 0.0 0.0 0.0 0.0Zavkhan 0.0 0.0 0.0 0.0 0.0 0.0 0.0 0.0 0.0Uvurkhangai 0.0 0.0 0.0 0.0 0.0 0.0 0.0 0.0 0.0Umnugovi 0.0 0.0 0.0 0.0 0.0 0.0 0.0 0.0 0.0Sukhbaatar 0.0 0.0 0.0 0.0 0.0 0.0 0.0 0.0 0.0Selenge 0.0 0.0 0.1 0.4 0.0 0.0 0.0 0.0 0.4Tuv 0.0 0.0 0.2 0.2 0.0 0.0 0.0 0.0 0.3Uvs 1.1 0.0 0.2 0.0 0.0 0.0 0.0 0.0 0.0Khovd 0.0 0.0 0.0 0.3 0.1 0.0 0.4 0.0 0.4Khuvsgul 0.0 0.2 0.0 0.0 0.0 0.0 0.0 0.0 0.1Khentii 0.0 0.0 0.0 0.0 0.0 0.1 0.0 0.0 0.0Darkhan-Uul 0.0 0.0 0.1 0.2 0.0 0.0 0.0 0.0 0.4Orkhon 0.0 0.0 0.0 0.1 0.0 0.0 0.0 0.0 0.1Govisumber 0.0 0.0 0.0 0.0 0.0 0.0 0.0 0.0 0.0Ulaanbaatar 0.0 0.0 0.1 0.0 0.0 0.0 0.0 0.0 0.1TOTAL 0.0 0.0 0.1 0.1 0.0 0.0 0.0 0.0 0.1Western region 0.2 0.0 0.1 0.3 0.0 0.0 0.1 0.0 0.3Khangai region 0.0 0.0 0.0 0.0 0.0 0.0 0.0 0.0 0.1Central region 0.0 0.0 0.1 0.2 0.0 0.0 0.0 0.0 0.2Eastern region 0.0 0.0 0.0 0.0 0.0 0.1 0.0 0.0 0.0Ulaanbaatar 0.0 0.0 0.1 0.0 0.0 0.0 0.0 0.0 0.1

226
2020 POPULATION AND HOUSING CENSUS OF MONGOLIA NATIONAL REPORT
Continued table 3.6 a
Aimags and the Capital Eljigen Tsaatan
(Dukha) Sartuul Tuva Uzbek (Chantuu) Khamnigan Khoshuud Other
Other ethnic groups /
Mongolian citizen/
TOTAL 100.0 100.0 100.0 100.0 100.0 100.0 100.0 100.0 100.0Arkhangai 0.0 0.0 0.3 0.0 0.0 0.3 1.3 0.0 0.0Bayan-Ulgii 0.0 0.0 0.7 33.7 2.5 0.3 0.0 2.8 16.9Bayankhongor 0.0 0.0 0.1 0.0 0.0 0.0 0.0 0.0 0.2Bulgan 0.0 1.0 1.3 0.0 0.5 0.3 0.0 0.7 0.5Govi-Altai 0.1 0.0 0.1 0.0 0.0 0.0 0.3 0.0 0.1Dornogovi 0.1 0.0 0.3 0.3 0.0 0.3 0.0 2.8 0.6Dornod 0.0 0.0 3.2 0.2 0.0 65.6 0.0 7.7 0.8Dundgovi 0.0 0.0 0.1 0.0 0.0 0.0 0.0 0.0 0.1Zavkhan 0.0 0.0 0.8 0.0 0.0 0.0 0.0 2.1 0.1Uvurkhangai 0.1 0.0 0.3 0.0 0.0 0.0 0.0 0.7 0.2Umnugovi 0.0 0.0 0.4 0.1 0.0 0.0 0.0 0.0 0.4Sukhbaatar 0.0 0.0 0.0 0.0 0.0 0.0 0.0 2.1 0.9Selenge 0.7 1.0 4.0 18.8 1.5 0.5 1.8 9.1 10.9Tuv 0.6 0.0 6.8 9.2 0.0 0.2 0.3 2.8 6.0Uvs 86.7 1.4 8.4 0.3 0.0 0.0 0.0 4.9 0.7Khovd 0.3 0.0 2.0 12.5 74.7 0.5 87.7 0.0 8.6Khuvsgul 1.6 90.8 2.7 1.6 0.0 0.0 0.0 4.9 3.5Khentii 0.1 0.0 1.4 0.4 0.0 19.8 0.0 0.7 0.4Darkhan-Uul 0.3 0.0 4.0 10.3 3.0 0.0 0.0 5.6 9.1Orkhon 0.5 0.0 2.3 2.2 1.5 0.8 0.0 2.1 3.4Govisumber 0.0 0.0 0.1 0.1 0.0 0.0 0.0 0.0 0.1Ulaanbaatar 8.9 5.8 60.7 10.3 16.3 11.4 8.6 51.0 36.5

227
APPENDIX
TABLES 3.7. PERCENTAGE DISTRIBUTION OF POPULATION, BY ETHNICITY AND INDUSTRIAL CLASSIFICATION OF ECONOMIC ACTIVITIES, 2020
Ethnic group Employed population
INDUSTRIAL CLASSIFICATION OF ECONOMIC ACTIVITIES
Agri
cultu
re, F
ores
try
and
Fish
ing
Min
ing
and
quar
ryin
g
Man
ufac
turi
ng
Elec
tric
ity, g
as, s
team
an
d ai
r con
ditio
ning
su
pply
Wat
er s
uppl
y; s
ewer
age,
w
aste
man
agem
ent a
nd
rem
edia
tion
activ
ities
Cons
truc
tion
Who
lesa
le a
nd re
tail
trad
e; re
pair
of m
otor
ve
hicl
es a
nd m
otor
cycl
es
MONGOLIAN CITIZENS-TOTAL 100.0 24.8 4.3 7.8 1.4 0.7 5.9 12.1
Khalkh 100.0 23.0 4.5 8.1 1.4 0.7 6.1 12.6Kazak 100.0 41.9 2.3 4.4 1.3 0.4 2.6 7.0Durvud 100.0 27.9 3.0 8.0 1.7 0.6 6.1 11.2Bayad 100.0 32.7 2.8 8.2 1.4 0.4 5.6 10.7Buriad 100.0 25.2 6.0 7.3 1.6 0.5 5.2 10.8Zakhchin 100.0 29.6 3.5 6.4 1.5 0.7 5.2 10.1Dariganga 100.0 36.7 3.1 4.6 1.0 1.1 3.4 9.0Uriankhai 100.0 35.3 3.1 6.9 1.4 0.6 4.1 8.2Darkhad 100.0 58.5 1.7 3.9 0.5 0.4 2.4 5.4Uuld 100.0 23.8 2.4 6.8 1.7 0.8 6.7 10.8Khotgoid 100.0 52.3 2.6 4.4 1.8 0.4 3.0 7.6Torguud 100.0 20.1 3.0 6.8 1.5 1.0 4.6 12.4Khoton 100.0 49.9 2.1 6.3 1.1 0.6 5.4 7.6Myangad 100.0 28.6 3.2 7.2 1.5 0.6 6.2 10.3Tuva 100.0 43.8 5.3 9.0 0.5 0.2 4.1 7.3Barga 100.0 33.7 3.7 7.9 1.2 0.3 4.8 8.4Uzemchin 100.0 33.3 6.2 4.9 1.8 0.8 4.5 9.5Eljigen 100.0 61.0 0.6 4.4 1.0 0.2 0.8 5.0Sartuul 100.0 21.0 3.3 7.1 1.2 0.7 8.7 13.1Khamnigan 100.0 50.0 2.1 6.9 0.7 0.0 6.9 8.3Tsaatan (Dukha) 100.0 57.1 0.0 7.1 7.1 0.0 0.0 0.0Uzbek (Chantuu) 100.0 55.6 0.0 4.2 1.4 0.0 5.6 5.6Kharchin 100.0 10.7 3.6 3.6 0.0 3.6 10.7 10.7Khoshuud 100.0 62.0 2.0 2.0 0.0 0.0 6.0 6.0Other 100.0 30.8 3.8 19.2 0.0 0.0 11.5 9.6Other ethnic groups /Mongolian citizen/
100.0 43.0 4.2 6.9 0.4 0.4 4.5 8.4

228
2020 POPULATION AND HOUSING CENSUS OF MONGOLIA NATIONAL REPORT
Continued table 3.7
Ethnic group
INDUSTRIAL CLASSIFICATION OF ECONOMIC ACTIVITIES
Tran
spor
tatio
n an
d st
orag
e
Acco
mm
odat
ion
and
food
ser
vice
ac
tiviti
es
Info
rmat
ion
and
com
mun
icat
ion
Fina
ncia
l and
in
sura
nce
activ
ities
Real
est
ate
activ
ities
Prof
essi
onal
, sc
ient
ific
and
tech
nica
l act
iviti
es
Adm
inis
trat
ive
and
supp
ort s
ervi
ce
activ
ities
MONGOLIAN CITIZENS-TOTAL 5.0 2.3 1.5 2.7 0.4 2.0 2.1
Khalkh 5.3 2.5 1.6 2.8 0.4 2.0 2.3Kazak 2.0 0.8 0.9 1.8 0.1 1.4 1.2Durvud 4.0 1.7 1.1 2.5 0.3 1.7 1.7Bayad 3.6 1.5 1.2 2.3 0.3 1.7 1.6Buriad 3.6 2.2 1.4 2.7 0.3 2.4 1.9Zakhchin 4.9 1.6 1.0 2.0 0.4 1.8 1.8Dariganga 3.8 1.8 1.3 2.2 0.2 1.7 1.4Uriankhai 3.2 1.7 0.8 1.7 0.3 1.5 1.4Darkhad 2.2 0.9 0.5 1.1 0.1 1.0 1.1Uuld 4.3 2.0 1.5 3.0 0.3 2.0 1.8Khotgoid 2.8 2.0 0.7 1.3 0.4 1.1 0.7Torguud 5.4 2.1 1.0 3.0 0.5 1.8 2.1Khoton 2.2 1.4 0.5 0.6 0.1 0.9 0.7Myangad 3.8 2.0 1.0 2.1 0.2 1.7 1.6Tuva 3.1 1.2 0.5 1.0 0.0 0.5 0.7Barga 2.0 2.1 1.0 2.2 0.2 1.4 1.2Uzemchin 1.4 1.8 1.2 3.5 0.1 1.7 1.4Eljigen 0.8 1.3 0.8 1.5 0.0 1.0 0.2Sartuul 7.5 3.1 1.6 3.8 0.1 1.5 2.6Khamnigan 1.4 1.4 2.1 2.1 0.7 0.0 0.7Tsaatan (Dukha) 0.0 0.0 0.0 7.1 0.0 0.0 7.1Uzbek (Chantuu) 0.0 2.8 0.0 0.0 0.0 0.0 0.0Kharchin 7.1 3.6 3.6 3.6 0.0 0.0 0.0Khoshuud 2.0 2.0 0.0 0.0 0.0 0.0 4.0Other 3.8 1.9 0.0 1.9 0.0 3.8 0.0Other ethnic groups /Mongolian citizen/ 2.3 1.8 0.6 1.3 0.3 2.0 1.1

229
APPENDIX
Continued table 3.7
Ethnic group
INDUSTRIAL CLASSIFICATION OF ECONOMIC ACTIVITIES
Publ
ic a
dmin
istr
atio
n an
d de
fenc
e; c
ompu
lsor
y so
cial
se
curi
ty
Educ
atio
n
Hum
an h
ealth
and
soc
ial
wor
k ac
tiviti
es
Arts
, ent
erta
inm
ent a
nd
recr
eatio
n
Othe
r ser
vice
act
iviti
es
Activ
ities
of h
ouse
hold
as
empl
oyer
s; u
ndiff
eren
tiate
d go
ods-
and
serv
ices
-pr
oduc
ing
activ
ities
of
hous
ehol
ds fo
r ow
n us
e
Activ
ities
of e
xtra
terr
itori
al
orga
niza
tions
and
bod
ies
MONGOLIAN CITIZENS-TOTAL 8.2 9.9 4.4 0.9 3.2 0.2 0.1
Khalkh 8.0 9.6 4.3 0.9 3.3 0.2 0.1Kazak 8.1 15.6 5.3 0.7 1.9 0.0 0.1Durvud 8.6 11.1 4.6 0.8 3.0 0.1 0.1Bayad 8.0 10.0 4.2 0.7 2.9 0.1 0.1Buriad 9.0 10.7 4.8 1.0 3.1 0.1 0.1Zakhchin 10.0 11.1 4.7 0.8 2.5 0.1 0.1Dariganga 10.4 10.1 5.0 0.9 2.2 0.2 0.1Uriankhai 10.4 11.7 4.0 1.1 2.4 0.2 0.0Darkhad 6.4 8.4 2.8 0.9 1.7 0.1 0.0Uuld 9.6 12.4 5.9 0.9 2.9 0.1 0.2Khotgoid 5.0 7.3 2.9 0.5 3.0 0.0 0.0Torguud 13.4 11.5 5.5 0.9 3.3 0.1 0.2Khoton 6.0 8.9 3.5 0.5 1.6 0.0 0.0Myangad 8.5 12.5 4.5 1.0 3.3 0.2 0.1Tuva 6.8 13.8 1.5 0.2 0.5 0.0 0.0Barga 7.9 11.2 5.8 0.8 3.8 0.2 0.2Uzemchin 10.0 10.5 3.7 1.2 2.4 0.1 0.0Eljigen 6.7 7.7 4.0 0.6 2.3 0.0 0.0Sartuul 6.3 9.1 4.7 1.1 3.1 0.2 0.1Khamnigan 5.6 7.6 0.7 0.0 2.8 0.0 0.0Tsaatan (Dukha) 14.3 0.0 0.0 0.0 0.0 0.0 0.0Uzbek (Chantuu) 6.9 5.6 8.3 0.0 2.8 0.0 1.4Kharchin 17.9 17.9 0.0 0.0 3.6 0.0 0.0Khoshuud 8.0 4.0 2.0 0.0 0.0 0.0 0.0Other 3.8 7.7 1.9 0.0 0.0 0.0 0.0Other ethnic groups /Mongolian citizen/ 7.3 9.6 3.0 0.7 2.0 0.2 0.1

230
2020 POPULATION AND HOUSING CENSUS OF MONGOLIA NATIONAL REPORT
TABLES 4.1. NUMBER OF RESIDENT POPULATION, BY CITIZENSHIP, ETHNICITY, AND SEX, 2020
Ethnic group Total Male FemaleTOTAL 3 197 020 1 576 930 1 620 090Total Mongolian citizens-Total 3 174 565 1 562 918 1 611 647 Khalkh 2 659 985 1 308 163 1 351 822 Kazakh 120 999 60 462 60 537 Durvud 83 719 41 435 42 284 Buriad 43 661 21 101 22 560 Bayad 63 775 31 950 31 825 Dariganga 36 419 17 980 18 439 Uriankhai 29 021 14 165 14 856 Zakhchin 37 407 18 557 18 850 Darkhad 24 549 11 940 12 609 Torguud 15 596 7 545 8 051 Uuld 14 666 7 300 7 366 Khoton 12 057 5 965 6 092 Myangad 8 125 3 955 4 170 Barga 2 832 1 384 1 448 Uzemchin 2 308 1 157 1 151 Kharchin 154 83 71 Tsakhar 11 8 3 Khotgoid 8 583 4 435 4 148 Eljigen 1 034 519 515 Tsaatan (Dukha) 208 102 106 Sartuul 2 023 977 1 046 Tuva 2 354 1 198 1 156 Khorchin 39 19 20 Uzbek (Chantuu) 202 121 81 Khalimag 16 9 7 Tumed 32 19 13 Sunud 14 9 5 Khamnigan 384 206 178 Khoshuud 382 210 172 Tuved 1 1 0 Balba 14 6 8 Other 16 10 6 Other foreign /Mongolian citizen/ 3 979 1 927 2 052Foreign citizen 22 418 13 986 8 432No Citizenship 37 26 11

231
APPENDIX
TABLES 4.2. NUMBER OF RESIDENT POPULATION, BY CITIZENSHIP, ETHNICITY AND SEX, 2020
URBAN
Ethnic group Total Male FemaleTOTAL 2 168 253 1 052 223 1 116 030Total Mongolian citizens-Total 2 148 980 1 041 012 1 107 968 Khalkh 1 882 620 912 106 970 514 Kazakh 50 819 25 041 25 778 Durvud 53 155 26 006 27 149 Buriad 24 482 11 362 13 120 Bayad 38 607 18 930 19 677 Dariganga 18 781 8 979 9 802 Uriankhai 15 126 7 215 7 911 Zakhchin 19 514 9 504 10 010 Darkhad 6 892 3 154 3 738 Torguud 8 641 4 066 4 575 Uuld 9 609 4 615 4 994 Khoton 6 127 2 952 3 175 Myangad 4 906 2 381 2 525 Barga 1 361 629 732 Uzemchin 1 114 509 605 Kharchin 122 66 56 Tsakhar 5 2 3 Khotgoid 2 330 1 185 1 145 Eljigen 130 60 70 Tsaatan (Dukha) 21 15 6 Sartuul 1 519 714 805 Tuva 640 324 316 Khorchin 36 18 18 Uzbek (Chantuu) 50 25 25 Khalimag 11 6 5 Tumed 28 15 13 Sunud 8 4 4 Khamnigan 72 37 35 Khoshuud 40 25 15 Tuved 1 1 0 Balba 7 4 3 Other 11 6 5 Other foreign /Mongolian citizen/ 2 195 1 056 1 139Foreign citizen 19 241 11 189 8 052No Citizenship 32 22 10

232
2020 POPULATION AND HOUSING CENSUS OF MONGOLIA NATIONAL REPORT
TABLES 4.3. NUMBER OF RESIDENT POPULATION, BY CITIZENSHIP, ETHNICITY, AND SEX, 2020
RURAL
Ethnic group Total Male FemaleTOTAL 1 028 767 524 707 504 060Total Mongolian citizens-Total 1 025 585 521 906 503 679 Khalkh 777 365 396 057 381 308 Kazakh 70 180 35 421 34 759 Durvud 30 564 15 429 15 135 Buriad 19 179 9 739 9 440 Bayad 25 168 13 020 12 148 Dariganga 17 638 9 001 8 637 Uriankhai 13 895 6 950 6 945 Zakhchin 17 893 9 053 8 840 Darkhad 17 657 8 786 8 871 Torguud 6 955 3 479 3 476 Uuld 5 057 2 685 2 372 Khoton 5 930 3 013 2 917 Myangad 3 219 1 574 1 645 Barga 1 471 755 716 Uzemchin 1 194 648 546 Kharchin 32 17 15 Tsakhar 6 6 0 Khotgoid 6 253 3 250 3 003 Eljigen 904 459 445 Tsaatan (Dukha) 187 87 100 Sartuul 504 263 241 Tuva 1 714 874 840 Khorchin 3 1 2 Uzbek (Chantuu) 152 96 56 Khalimag 5 3 2 Tumed 4 4 0 Sunud 6 5 1 Khamnigan 312 169 143 Khoshuud 342 185 157 Balba 7 2 5 Mongolian citizen other 5 4 1 Other foreign /Mongolian citizen/ 1 784 871 913Foreign citizen 3 177 2 797 380No Citizenship 5 4 1

233
APPENDIX
TABLE 5.1. LIFETIME MIGRATION OF POPULATION, BY AIMAGS AND THE CAPITAL, AND SEX, 2020
Aimags and the Capital
Total population NonmigrantsTotal Male Female Total Male Female
TOTAL 100.0 100.0 100.0 100.0 100.0 100.0Arkhangai 4.5 4.4 4.6 3.7 3.6 3.6Bayan-Ulgii 3.5 3.6 3.4 4.1 4.2 4.1Bayankhongor 4.0 4.0 4.1 3.6 3.6 3.7Bulgan 2.7 2.6 2.6 2.2 2.2 2.1Govi-Altai 3.2 3.1 3.3 2.3 2.3 2.4Dornogovi 2.3 2.2 2.3 2.3 2.2 2.3Dornod 3.4 3.4 3.5 3.4 3.4 3.4Dundgovi 2.4 2.3 2.4 2.0 2.0 2.0Zavkhan 4.2 4.2 4.3 2.9 2.9 2.9Uvurkhangai 4.9 4.9 4.9 4.5 4.5 4.5Umnugobi 2.5 2.4 2.5 2.7 2.6 2.8Sukhbaatar 2.6 2.6 2.6 2.4 2.5 2.4Selenge 3.5 3.6 3.5 3.1 3.2 3.0Tuv 4.2 4.2 4.2 3.3 3.3 3.2Uvs 4.3 4.3 4.2 3.1 3.2 3.1Khovd 4.0 3.9 3.9 3.3 3.4 3.3Khuvsgul 5.3 5.3 5.4 5.3 5.3 5.4Khentii 3.2 3.2 3.3 3.1 3.1 3.1Darkhan-Uul 2.5 2.6 2.5 2.4 2.4 2.3Ulaanbaatar 1.8 1.8 1.8 1.8 1.9 1.8Orkhon 0.4 0.4 0.4 0.5 0.4 0.4Gobisumber 30.3 30.7 30.0 38.0 37.8 38.2Foreign* 0.3 0.3 0.3 - - -
Continued table 5.1
Aimags and the Capital
Inmigrants Outmigrants
Total Male Female Total Male FemaleTOTAL 100.0 100.0 100.0 100.0 100.0 100.0Arkhangai 0.6 0.5 0.7 7.5 7.4 7.6Bayan-Ulgii 0.2 0.2 0.2 1.5 1.5 1.6Bayankhongor 0.3 0.3 0.3 5.4 5.4 5.4Bulgan 1.1 1.2 1.1 4.0 4.0 4.1Govi-Altai 0.2 0.2 0.3 6.1 6.2 6.1Dornogovi 1.9 2.1 1.8 2.2 2.2 2.2Dornod 0.8 0.8 0.8 3.5 3.4 3.6Dundgovi 0.3 0.3 0.3 3.6 3.7 3.6Zavkhan 0.4 0.3 0.4 8.7 8.9 8.5Uvurkhangai 0.6 0.6 0.7 6.3 6.2 6.3Umnugobi 1.0 1.1 0.9 1.6 1.5 1.6Sukhbaatar 0.4 0.4 0.4 3.2 3.2 3.2Selenge 3.9 4.0 3.9 4.9 4.8 4.9Tuv 2.9 3.0 2.9 7.3 7.2 7.4Uvs 0.2 0.2 0.2 8.0 8.3 7.8Khovd 0.4 0.3 0.4 5.7 5.8 5.7Khuvsgul 0.5 0.5 0.4 5.2 5.0 5.3Khentii 1.4 1.4 1.4 3.8 3.7 3.8Darkhan-Uul 5.8 5.6 5.8 3.0 3.0 3.0Ulaanbaatar 7.6 7.8 7.5 1.7 1.6 1.7Orkhon 1.2 1.2 1.1 0.5 0.5 0.5Gobisumber 68.3 68.0 68.5 5.1 5.2 5.0Foreign* - - - 1.2 1.3 1.1
Explanation: *Foreign citizens and Mongolians born abroad

234
2020 POPULATION AND HOUSING CENSUS OF MONGOLIA NATIONAL REPORT
TABLE 5.2. NUMBER OF POPULATION, BY PLACE OF BIRTH AND PLACE OF USUAL RESIDENCE AT THE TIME OF THE CENSUS, BY AIMAGS AND THE CAPITAL, 2020
Birth place Total Arkhangai Bayan-Ulgii Bayanhongor Bulgan Govi-Altai Dornogovi
TOTAL 100.0 100.0 100.0 100.0 100.0 100.0 100.0Arkhangai 4.5 95.0 - 0.1 1.2 0.0 0.5Bayan-Ulgii 3.5 - 98.7 0.0 0.1 0.0 0.1Bayankhongor 4.0 0.6 0.0 97.7 0.3 0.7 0.8Bulgan 2.6 0.3 0.0 0.0 86.1 - 0.4Govi-Altai 3.2 0.1 0.0 0.3 0.3 97.4 0.5Dornogovi 2.3 0.0 0.0 0.1 0.1 0.0 79.5Dornod 3.5 0.1 - 0.0 0.1 0.0 1.1Dundgovi 2.4 0.0 - 0.1 0.2 0.0 1.6Zavkhan 4.2 0.4 0.0 0.1 1.3 0.3 0.4Uvurkhangai 4.9 0.5 - 0.2 2.8 0.2 1.0Umnugobi 2.5 0.0 - 0.1 0.1 0.0 0.8Sukhbaatar 2.6 0.0 0.0 0.0 0.1 - 2.4Selenge 3.5 0.2 0.1 0.0 0.5 0.2 0.9Tuv 4.2 0.2 0.0 0.1 0.3 0.0 1.0Uvs 4.3 0.2 0.1 0.1 2.2 0.1 0.5Khovd 4.0 0.1 0.4 0.1 0.1 0.4 0.5Khuvsgul 5.3 0.5 0.0 0.1 1.6 - 0.7Khentii 3.2 0.1 0.0 0.0 0.1 - 1.1Darkhan-Uul 2.5 0.3 0.1 0.2 0.2 0.0 0.5Ulaanbaatar 1.8 0.2 0.1 0.0 1.2 0.0 0.3Orkhon 0.4 0.0 - - 0.0 - 0.7Gobisumber 30.3 1.2 0.4 0.7 1.1 0.7 4.6Foreign* 0.3 0.0 0.1 0.0 0.0 - 0.1
Continued table 5.2
Birth place Dornod Dundgovi Zavkhan Uvurkhangai Umnugovi Sukhbaatar Selenge Tuv
TOTAL 100.0 100.0 100.0 100.0 100.0 100.0 100.0 100.0Arkhangai 0.2 0.2 0.2 0.8 0.3 0.0 2.1 1.5Bayan-Ulgii 0.0 - 0.0 0.0 - 0.0 1.6 0.4Bayankhongor 0.0 0.1 0.1 0.5 0.5 0.1 1.3 1.3Bulgan 0.1 0.2 0.0 0.2 0.2 0.0 0.9 0.4Govi-Altai 0.1 0.1 0.6 0.2 0.1 0.0 1.4 1.7Dornogovi 0.2 0.3 0.0 0.2 0.8 0.3 0.4 0.4Dornod 93.5 0.1 0.1 0.1 0.3 1.5 0.3 0.2Dundgovi 0.1 95.8 0.0 0.2 1.6 0.1 0.4 1.2Zavkhan 0.2 0.1 96.4 0.1 0.5 0.0 1.8 2.1Uvurkhangai 0.2 0.3 0.1 95.8 0.8 0.1 0.9 1.4Umnugobi 0.0 0.4 - 0.2 90.0 0.1 0.1 0.1Sukhbaatar 2.4 0.1 - 0.0 0.2 95.0 0.1 0.2Selenge 0.2 0.1 0.1 0.1 0.7 0.2 72.3 1.0Tuv 0.2 0.4 0.1 0.1 0.3 0.3 1.4 78.7Uvs 0.2 0.2 0.4 0.1 0.2 0.2 4.0 1.9Khovd 0.0 - 0.1 0.0 0.2 0.1 1.9 0.7Khuvsgul 0.1 0.1 0.4 0.1 0.6 0.1 2.2 0.8Khentii 0.7 0.1 0.0 0.1 0.2 0.6 0.3 0.4Darkhan-Uul 0.1 0.1 0.1 0.2 0.3 0.1 2.1 0.4Ulaanbaatar 0.0 0.0 0.3 0.0 0.1 0.0 0.4 0.2Orkhon 0.0 0.2 - 0.0 0.3 0.0 0.0 0.1Gobisumber 1.5 1.0 1.0 1.0 1.7 1.2 4.0 4.8Foreign* 0.0 0.1 0.0 0.0 0.1 0.0 0.1 0.1

235
APPENDIX
Continued table 5.2
Birth place Uvs Khovd Khuvsgul Khentii Darkhan-Uul Orkhon Govisumber Ulaanbaatar
TOTAL 100.0 100.0 100.0 100.0 100.0 100.0 100.0 100.0Arkhangai 0.0 0.2 0.3 0.2 2.3 5.2 0.4 2.9Bayan-Ulgii 0.3 0.8 0.0 0.8 1.4 1.2 0.0 0.4Bayankhongor 0.0 0.0 0.1 0.2 2.4 1.5 2.0 2.1Bulgan 0.0 0.0 0.1 0.1 1.2 11.1 0.3 1.0Govi-Altai 0.1 0.4 0.0 0.2 2.7 2.6 1.0 2.4Dornogovi - 0.0 0.0 0.9 0.6 0.5 8.3 0.7Dornod 0.0 0.1 0.1 1.0 0.5 0.5 0.5 1.5Dundgovi 0.0 0.0 0.0 0.2 0.4 0.3 12.7 1.3Zavkhan 0.2 0.0 0.4 0.2 3.4 7.8 0.9 3.2Uvurkhangai 0.0 0.0 0.0 0.3 1.3 1.6 1.1 2.6Umnugobi 0.0 0.0 0.0 0.1 0.4 0.2 2.1 0.6Sukhbaatar 0.0 - 0.0 3.6 0.4 0.2 1.1 1.1Selenge 0.0 0.1 0.2 0.2 6.4 2.1 1.2 1.6Tuv 0.1 0.0 0.1 0.4 1.6 0.9 2.2 3.3Uvs 98.1 0.6 0.1 0.6 5.3 4.6 1.6 2.7Khovd 0.3 96.9 0.1 0.2 3.1 1.4 0.2 2.3Khuvsgul 0.0 0.1 97.3 0.4 2.0 6.6 1.0 1.6Khentii - - 0.1 87.7 0.5 0.4 1.7 1.6Darkhan-Uul 0.2 0.1 0.2 0.1 57.5 1.2 0.8 1.2Ulaanbaatar 0.1 0.2 0.1 0.1 0.7 44.1 0.2 0.6Orkhon - - 0.0 0.0 0.2 0.0 54.1 0.2Gobisumber 0.6 0.5 0.8 2.5 5.4 5.7 6.5 64.6Foreign* 0.0 0.0 0.0 0.0 0.3 0.3 0.1 0.5
Explanation: *Foreign citizens and Mongolians born abroad
TABLE 5.3. NUMBER OF POPULATION AGED 5 AND ABOVE BY MIGRATION STATUS, AIMAGS AND CAPITAL, AND SEX, 2020
Aimags and the Capital
Total population NonmigrantsTotal Male Female Total Male Female
TOTAL 2 813 761 1 380 127 1 433 634 2 657 998 1 302 261 1 355 737Arkhangai 85 846 42 761 43 085 80 151 40 146 40 005Bayan-Ulgii 89 793 44 621 45 172 88 343 43 923 44 420Bayankhongor 78 729 38 686 40 043 74 874 36 779 38 095Bulgan 55 885 28 267 27 618 51 196 25 963 25 233Govi-Altai 52 927 26 210 26 717 49 512 24 612 24 900Dornogovi 60 517 30 092 30 425 56 295 27 970 28 325Dornod 71 710 35 895 35 815 68 053 34 071 33 982Dundgovi 41 456 20 756 20 700 38 770 19 439 19 331Zavkhan 65 724 32 575 33 149 61 861 30 651 31 210Uvurkhangai 104 764 51 909 52 855 98 517 48 872 49 645Umnugobi 57 826 28 810 29 016 55 270 27 439 27 831Sukhbaatar 55 456 27 879 27 577 53 011 26 672 26 339Selenge 97 911 49 400 48 511 89 162 45 173 43 989Tuv 83 028 42 503 40 525 74 739 38 308 36 431Uvs 75 648 37 797 37 851 70 734 35 425 35 309Khovd 77 683 38 638 39 045 74 378 37 104 37 274Khuvsgul 120 666 59 595 61 071 115 603 57 199 58 404Khentii 68 217 34 323 33 894 64 080 32 303 31 777Darkhan-Uul 91 435 44 721 46 714 83 171 40 667 42 504Ulaanbaatar 91 960 44 892 47 068 83 976 41 141 42 835Orkhon 15 087 7 530 7 557 13 403 6 668 6 735Gobisumber 1 256 377 602 700 653 677 1 212 899 581 736 631 163Foreign* 15 116 9 567 5 549 - - -

236
2020 POPULATION AND HOUSING CENSUS OF MONGOLIA NATIONAL REPORT
Continued table 5.3
Aimags and the Capital
Inmigrants Outmigrants Net migration
Total Male Female Total Male Female Total Male FemaleTOTAL 155 763 77 866 77 897 155 763 77 866 77 897 - - -Arkhangai 3 399 1 557 1 842 5 695 2 615 3 080 - 2 296 - 1 058 - 1 238Bayan-Ulgii 1 420 646 774 1 450 698 752 - 30 - 52 22Bayankhongor 2 600 1 186 1 414 3 855 1 907 1 948 - 1 255 - 721 - 534Bulgan 3 612 1 786 1 826 4 689 2 304 2 385 - 1 077 - 518 - 559Govi-Altai 1 763 818 945 3 415 1 598 1 817 - 1 652 - 780 - 872Dornogovi 5 526 2 925 2 601 4 222 2 122 2 100 1 304 803 501Dornod 3 917 2 138 1 779 3 657 1 824 1 833 260 314 - 54Dundgovi 2 428 1 197 1 231 2 686 1 317 1 369 - 258 - 120 - 138Zavkhan 2 586 1 289 1 297 3 863 1 924 1 939 - 1 277 - 635 - 642Uvurkhangai 3 946 1 915 2 031 6 247 3 037 3 210 - 2 301 - 1 122 - 1 179Umnugobi 5 946 3 662 2 284 2 556 1 371 1 185 3 390 2 291 1 099Sukhbaatar 2 283 1 085 1 198 2 445 1 207 1 238 - 162 - 122 - 40Selenge 6 704 3 467 3 237 8 749 4 227 4 522 - 2 045 - 760 - 1 285Tuv 7 086 3 750 3 336 8 289 4 195 4 094 - 1 203 - 445 - 758Uvs 2 033 936 1 097 4 914 2 372 2 542 - 2 881 - 1 436 - 1 445Khovd 2 662 1 257 1 405 3 305 1 534 1 771 - 643 - 277 - 366Khuvsgul 3 669 1 664 2 005 5 063 2 396 2 667 - 1 394 - 732 - 662Khentii 4 302 2 229 2 073 4 137 2 020 2 117 165 209 - 44Darkhan-Uul 7 150 3 394 3 756 8 264 4 054 4 210 - 1 114 - 660 - 454Ulaanbaatar 8 028 3 811 4 217 7 984 3 751 4 233 44 60 - 16Orkhon 1 816 999 817 1 684 862 822 132 137 - 5Gobisumber 72 887 36 155 36 732 43 478 20 964 22 514 29 409 15 191 14 218Foreign* - - - 15 116 9 567 5 549 - 15 116 - 9 567 - 5 549
Explanation: *Foreign citizens and Mongolians born abroad
TABLE 5.4. NUMBER OF POPULATION, BY PAST-YEAR MIGRATION STATUS, AIMAGS AND THE CAPITAL, AND SEX, 2020
Aimags and the Capital
Total population NonmigrantsTotal Male Female Total Male Female
TOTAL 3 123 431 1 539 225 1 584 206 3 035 476 1 492 546 1 542 930Arkhangai 94 608 47 337 47 271 90 920 45 528 45 392Bayan-Ulgii 101 010 50 440 50 570 100 212 50 026 50 186Bayankhongor 87 666 43 078 44 588 85 093 41 788 43 305Bulgan 61 562 31 186 30 376 58 650 29 701 28 949Govi-Altai 57 633 28 645 28 988 55 537 27 632 27 905Dornogovi 68 402 34 198 34 204 66 135 33 009 33 126Dornod 80 608 40 403 40 205 78 348 39 222 39 126Dundgovi 46 421 23 337 23 084 44 823 22 508 22 315Zavkhan 72 529 36 066 36 463 70 081 34 863 35 218Uvurkhangai 115 945 57 555 58 390 111 834 55 508 56 326Umnugobi 67 129 33 710 33 419 65 232 32 583 32 649Sukhbaatar 61 921 31 168 30 753 60 664 30 490 30 174Selenge 107 226 54 214 53 012 102 561 51 844 50 717Tuv 94 025 48 158 45 867 88 037 45 037 43 000Uvs 82 828 41 542 41 286 80 025 40 153 39 872Khovd 86 987 43 391 43 596 84 898 42 378 42 520Khuvsgul 132 969 65 924 67 045 129 876 64 369 65 507Khentii 76 685 38 702 37 983 74 225 37 441 36 784Darkhan-Uul 101 790 49 959 51 831 97 418 47 752 49 666Ulaanbaatar 101 568 49 829 51 739 97 272 47 749 49 523Orkhon 17 168 8 591 8 577 16 255 8 108 8 147Gobisumber 1 391 312 672 023 719 289 1 377 380 664 857 712 523Foreign* 15 439 9 769 5 670 - - -

237
APPENDIX
Continued table 5.4
Aimags and the Capital
Inmigrants Outmigrants Net migrationTotal Male Female Total Male Female Total Male Female
TOTAL 87 955 46 679 41 276 87 955 46 679 41 276 - - -Arkhangai 1 370 646 724 3 688 1 809 1 879 - 2 318 - 1 163 - 1 155Bayan-Ulgii 796 363 433 798 414 384 - 2 - 51 49Bayankhongor 716 327 389 2 573 1 290 1 283 - 1 857 - 963 - 894Bulgan 1 453 790 663 2 912 1 485 1 427 - 1 459 - 695 - 764Govi-Altai 628 307 321 2 096 1 013 1 083 - 1 468 - 706 - 762Dornogovi 2 216 1 264 952 2 267 1 189 1 078 - 51 75 - 126Dornod 1 736 1 115 621 2 260 1 181 1 079 - 524 - 66 - 458Dundgovi 763 392 371 1 598 829 769 - 835 - 437 - 398Zavkhan 671 356 315 2 448 1 203 1 245 - 1 777 - 847 - 930Uvurkhangai 1 333 760 573 4 111 2 047 2 064 - 2 778 - 1 287 - 1 491Umnugobi 2 824 2 025 799 1 897 1 127 770 927 898 29Sukhbaatar 717 365 352 1 257 678 579 - 540 - 313 - 227Selenge 2 744 1 596 1 148 4 665 2 370 2 295 - 1 921 - 774 - 1 147Tuv 2 369 1 416 953 5 988 3 121 2 867 - 3 619 - 1 705 - 1 914Uvs 899 433 466 2 803 1 389 1 414 - 1 904 - 956 - 948Khovd 965 496 469 2 089 1 013 1 076 - 1 124 - 517 - 607Khuvsgul 1 527 743 784 3 093 1 555 1 538 - 1 566 - 812 - 754Khentii 1 355 765 590 2 460 1 261 1 199 - 1 105 - 496 - 609Darkhan-Uul 2 403 1 262 1 141 4 372 2 207 2 165 - 1 969 - 945 - 1 024Ulaanbaatar 4 408 2 232 2 176 4 296 2 080 2 216 112 152 - 40Orkhon 766 477 289 913 483 430 - 147 - 6 - 141Gobisumber 55 296 28 549 26 747 13 932 7 166 6 766 41 364 21 383 19 981Foreign* - - - 15 439 9 769 5 670 - 15 439 - 9 769 - 5 670
Explanation: *Foreign citizens and Mongolians born abroad

238
2020 POPULATION AND HOUSING CENSUS OF MONGOLIA NATIONAL REPORT
TABLE 5.5. PERCENTAGE OF RESIDENT POPULATION, INMIGRANTS BY RESIDENCE YEAR, AIMAGS AND THE CAPITAL, AND SEX, 2020
TOTAL Place of residence at the time of the census
Total population
Place of birth and residence
Inmigrants by residence year
Inmigrants <1 1-3 4 5-6 7-9 10-12
13-15
16-19 20+
TOTAL 100.0 76.6 23.4 0.5 1.4 0.5 1.5 2.2 2.2 2.3 4.0 8.8Arkhangai 100.0 95.0 5.0 0.2 0.9 0.3 0.4 0.6 0.6 0.4 0.4 1.2Bayan-Ulgii 100.0 98.6 1.4 0.0 0.2 0.0 0.2 0.1 0.1 0.1 0.1 0.6Bayankhongor 100.0 97.7 2.3 0.2 0.4 0.1 0.3 0.2 0.3 0.2 0.2 0.4Bulgan 100.0 86.1 13.9 0.3 1.3 0.5 2.2 1.2 1.4 0.9 1.4 4.7Govi-Altai 100.0 97.4 2.6 0.1 0.8 0.1 0.3 0.3 0.2 0.3 0.1 0.4Dornogovi 100.0 79.4 20.6 1.0 2.8 0.8 2.1 2.5 2.3 1.8 2.3 5.0Dornod 100.0 93.5 6.5 0.2 0.9 0.3 0.5 0.5 0.7 0.3 0.4 2.7Dundgovi 100.0 95.8 4.2 0.3 0.8 0.2 0.6 0.4 0.2 0.3 0.3 1.1Zavkhan 100.0 96.4 3.6 0.1 0.8 0.2 0.4 0.5 0.3 0.3 0.3 0.7Uvurkhangai 100.0 95.8 4.2 0.2 0.6 0.2 0.5 0.5 0.3 0.3 0.5 1.1Umnugobi 100.0 90.1 9.9 0.6 3.0 0.4 1.4 1.9 1.0 0.4 0.3 0.9Sukhbaatar 100.0 95.0 5.0 0.1 1.0 0.4 0.7 0.9 0.4 0.4 0.2 0.9Selenge 100.0 72.3 27.7 0.4 1.6 0.6 1.3 2.1 3.3 2.0 2.8 13.6Tuv 100.0 78.6 21.4 0.8 2.2 0.7 1.9 1.9 2.9 1.2 2.4 7.4Uvs 100.0 98.1 1.9 0.2 0.2 0.1 0.3 0.2 0.2 0.3 0.1 0.3Khovd 100.0 96.9 3.1 0.1 0.5 0.2 0.2 0.4 0.4 0.3 0.2 0.8Khuvsgul 100.0 97.3 2.7 0.1 0.4 0.1 0.3 0.2 0.3 0.3 0.3 0.7Khentii 100.0 87.8 12.2 0.3 1.5 0.5 1.0 1.0 1.0 0.9 1.0 5.0Darkhan-Uul 100.0 57.5 42.5 1.2 2.7 0.8 1.7 3.3 3.9 3.7 6.2 19.0Orkhon 100.0 44.1 55.9 1.5 3.9 1.2 2.9 4.3 4.6 4.4 7.9 25.2Gobisumber 100.0 54.1 45.9 1.6 4.5 2.1 3.9 5.6 4.5 2.9 4.3 16.5Ulaanbaatar 100.0 64.6 35.4 0.6 1.5 0.6 2.1 3.4 3.2 3.8 7.1 13.1

239
APPENDIX
Continued table 5.5 MALE
Place of residence at the time of the census
Total population
Place of birth and residence
Inmigrants by residence year
Inmigrants <1 1-3 4 5-6 7-9 10-12
13-15
16-19 20+
TOTAL 100.0 78.2 21.8 0.5 1.4 0.4 1.4 2.1 2.1 2.1 3.8 8.0Arkhangai 100.0 95.8 4.2 0.2 0.7 0.2 0.4 0.5 0.5 0.4 0.4 0.9Bayan-Ulgii 100.0 98.9 1.1 0.0 0.1 0.0 0.1 0.1 0.1 0.0 0.1 0.6Bayankhongor 100.0 97.7 2.3 0.2 0.5 0.1 0.2 0.2 0.3 0.2 0.2 0.4Bulgan 100.0 86.7 13.3 0.2 1.1 0.4 2.1 1.4 1.4 1.0 1.5 4.2Govi-Altai 100.0 98.2 1.8 0.1 0.6 - 0.3 0.2 0.2 0.2 0.1 0.1Dornogovi 100.0 79.3 20.7 1.0 2.9 0.6 2.1 2.6 2.6 1.7 2.4 4.8Dornod 100.0 93.8 6.2 0.2 0.9 0.2 0.4 0.6 0.7 0.4 0.4 2.4Dundgovi 100.0 95.8 4.2 0.4 0.9 0.2 0.4 0.4 0.1 0.3 0.3 1.2Zavkhan 100.0 97.3 2.7 0.1 0.8 0.1 0.3 0.3 0.2 0.3 0.2 0.4Uvurkhangai 100.0 96.4 3.6 0.1 0.6 0.1 0.5 0.4 0.4 0.3 0.3 0.9Umnugobi 100.0 89.8 10.2 0.6 3.1 0.4 1.5 2.0 0.9 0.4 0.4 0.9Sukhbaatar 100.0 95.5 4.5 0.1 0.7 0.4 0.7 0.9 0.3 0.3 0.2 0.9Selenge 100.0 74.5 25.5 0.5 1.4 0.5 1.0 1.9 3.1 1.7 2.9 12.5Tuv 100.0 80.2 19.8 0.7 2.0 0.7 1.8 1.9 2.8 1.0 2.3 6.6Uvs 100.0 98.4 1.6 0.3 0.1 0.0 0.3 0.2 0.2 0.2 0.1 0.2Khovd 100.0 97.4 2.6 0.0 0.4 0.2 0.2 0.4 0.4 0.2 0.1 0.7Khuvsgul 100.0 97.2 2.8 0.1 0.5 0.1 0.3 0.4 0.3 0.2 0.3 0.6Khentii 100.0 88.8 11.3 0.3 1.3 0.4 1.0 1.1 0.8 0.9 1.2 4.3Darkhan-Uul 100.0 60.7 39.3 1.1 2.7 0.7 1.6 3.0 3.4 3.5 5.9 17.4Orkhon 100.0 46.4 53.6 1.5 3.8 0.9 2.6 3.9 5.0 4.3 7.5 24.1Gobisumber 100.0 56.0 44.0 1.8 4.9 1.8 4.1 5.1 3.6 2.6 4.9 15.2Ulaanbaatar 100.0 66.6 33.4 0.6 1.5 0.6 1.9 3.3 3.1 3.6 6.8 12.0

240
2020 POPULATION AND HOUSING CENSUS OF MONGOLIA NATIONAL REPORT
Continued table 5.5 FEMALE
Place of residence at the time of the census
Total population
Place of birth and residence
Inmigrants by residence year
Inmigrants <1 1-3 4 5-6 7-9 10-12
13-15
16-19 20+
TOTAL 100.0 75.2 24.8 0.5 1.5 0.6 1.6 2.3 2.3 2.4 4.2 9.4Arkhangai 100.0 94.1 5.9 0.3 1.0 0.4 0.4 0.7 0.7 0.4 0.4 1.6Bayan-Ulgii 100.0 98.3 1.7 0.0 0.2 0.1 0.3 0.2 0.1 0.0 0.1 0.7Bayankhongor 100.0 97.7 2.3 0.1 0.4 0.2 0.3 0.2 0.3 0.2 0.2 0.4Bulgan 100.0 85.5 14.5 0.3 1.4 0.5 2.3 1.1 1.4 0.9 1.4 5.2Govi-Altai 100.0 96.6 3.4 0.1 0.9 0.2 0.2 0.5 0.3 0.4 0.2 0.6Dornogovi 100.0 79.5 20.5 1.0 2.7 0.9 2.1 2.4 2.0 1.9 2.3 5.2Dornod 100.0 93.2 6.8 0.2 0.9 0.4 0.6 0.3 0.7 0.3 0.4 3.0Dundgovi 100.0 95.9 4.1 0.3 0.7 0.2 0.7 0.3 0.3 0.3 0.2 1.1Zavkhan 100.0 95.6 4.4 0.2 0.8 0.2 0.5 0.7 0.4 0.4 0.3 0.9Uvurkhangai 100.0 95.2 4.8 0.2 0.6 0.2 0.5 0.5 0.3 0.4 0.6 1.5Umnugobi 100.0 90.3 9.7 0.6 2.7 0.4 1.4 1.8 1.2 0.4 0.3 0.9Sukhbaatar 100.0 94.4 5.6 0.2 1.2 0.4 0.7 0.9 0.5 0.5 0.3 0.9Selenge 100.0 70.2 29.8 0.3 1.8 0.7 1.6 2.4 3.5 2.2 2.7 14.6Tuv 100.0 76.9 23.1 0.8 2.4 0.8 2.0 1.9 2.9 1.4 2.5 8.4Uvs 100.0 97.8 2.2 0.2 0.3 0.1 0.3 0.3 0.3 0.2 0.2 0.3Khovd 100.0 96.3 3.7 0.1 0.5 0.2 0.3 0.5 0.4 0.4 0.4 0.9Khuvsgul 100.0 97.4 2.6 0.1 0.3 0.1 0.3 0.3 0.2 0.3 0.3 0.7Khentii 100.0 86.9 13.1 0.2 1.6 0.5 1.0 1.0 1.1 0.9 1.1 5.7Darkhan-Uul 100.0 54.6 45.4 1.1 2.8 0.9 1.8 3.5 4.3 3.9 6.4 20.7Orkhon 100.0 41.9 58.1 1.4 3.9 1.5 3.2 4.5 4.6 4.5 8.2 26.3Gobisumber 100.0 52.3 47.7 1.5 4.2 2.4 3.8 6.1 5.3 3.2 3.8 17.4Ulaanbaatar 100.0 62.8 37.2 0.6 1.5 0.7 2.2 3.5 3.3 3.9 7.3 14.2
TABLE 5.6. PERCENTAGE OF RESIDENT POPULATION, INMIGRANTS BY RESIDENCE YEAR, AGE GROUP AND SEX, 2020
TOTAL
TotalOf which: by age group
0-4 5-9 10-14 15-19 20-24 25-29 30-34 35-39 40-44 45-49TOTAL 100.0 100.0 100.0 100.0 100.0 100.0 100.0 100.0 100.0 100.0 100.0 Lifetime 76.6 97.8 94.7 91.9 86.7 77.8 69.2 65.7 66.5 66.2 66.5Inmigrants 23.4 2.2 5.3 8.1 13.3 22.2 30.8 34.3 33.5 33.8 33.5Of which: by residence year<1 0.5 0.6 0.4 0.3 0.7 1.2 0.9 0.6 0.4 0.3 0.3 1-3 1.4 1.4 1.3 1.0 1.1 2.8 3.4 1.9 1.3 1.1 0.8 4 0.5 0.2 0.6 0.4 0.4 0.9 1.5 0.8 0.5 0.4 0.3 5-6 1.5 - 1.7 1.2 1.0 2.1 3.7 2.8 1.8 1.4 1.1 7-9 2.2 - 1.3 2.4 1.9 2.0 5.2 5.0 3.0 2.5 1.9 10-12 2.2 - - 2.3 2.4 2.1 3.8 5.6 3.8 2.6 2.3 13-15 2.3 - - 0.5 3.0 2.6 2.4 5.5 4.5 3.6 2.9 16-19 4.0 - - - 2.8 5.8 4.7 5.7 9.3 8.2 6.7 20+ 8.8 - - - - 2.7 5.2 6.4 8.9 13.7 17.2

241
APPENDIX
Continued table 5.6
Of which: by age group50-54 55-59 60-64 65-69 70-74 75-79 80-84 85-89 90-94 95-99 100+
TOTAL 100.0 100.0 100.0 100.0 100.0 100.0 100.0 100.0 100.0 100.0 100.0 Lifetime 65.2 61.6 58.1 53.3 45.7 46.1 47.8 47.3 42.8 48.2 33.3Inmigrants 34.8 38.4 41.9 46.7 54.3 53.9 52.2 52.7 57.2 51.8 66.7Of which: by residence year<1 0.2 0.3 0.2 0.3 0.3 0.3 0.4 0.3 1.4 - - 1-3 0.8 0.7 0.8 0.7 0.5 0.8 0.6 0.8 0.9 - - 4 0.3 0.2 0.3 0.2 0.4 0.1 0.5 0.8 0.9 - - 5-6 1.0 0.8 1.1 1.1 0.9 1.0 0.6 1.3 1.4 1.8 - 7-9 1.7 1.3 1.4 1.9 1.9 1.5 1.7 2.1 2.3 - - 10-12 2.0 1.7 1.7 1.9 1.9 1.8 2.0 1.8 0.5 - - 13-15 2.5 2.3 2.6 2.5 2.7 2.1 1.9 1.6 3.3 3.6 - 16-19 5.8 5.4 5.1 5.1 5.3 5.9 5.8 4.6 4.7 8.9 - 20+ 20.5 25.7 28.7 33.0 40.4 40.4 38.7 39.4 41.8 37.5 66.7
Continued table 5.6 MALE
TotalOf which: by age group
0-4 5-9 10-14 15-19 20-24 25-29 30-34 35-39 40-44 45-49TOTAL 100.0 100.0 100.0 100.0 100.0 100.0 100.0 100.0 100.0 100.0 100.0 Lifetime 78.2 97.8 94.8 91.7 87.5 79.1 71.8 67.3 68.2 67.3 67.2Inmigrants 21.8 2.2 5.2 8.3 12.5 20.9 28.2 32.7 31.8 32.7 32.8Of which: by residence year<1 0.5 0.6 0.3 0.3 0.5 1.0 1.0 0.5 0.4 0.4 0.4 1-3 1.4 1.4 1.3 0.9 1.0 2.4 2.8 2.1 1.4 1.2 0.9 4 0.4 0.1 0.6 0.4 0.3 0.7 1.1 0.6 0.4 0.4 0.2 5-6 1.4 - 1.7 1.2 0.9 1.8 2.8 2.6 1.9 1.4 1.0 7-9 2.1 - 1.3 2.6 1.8 1.8 4.5 4.6 3.0 2.6 2.0 10-12 2.1 - - 2.4 2.2 2.1 3.4 5.2 3.7 2.6 2.2 13-15 2.1 - - 0.5 3.0 2.6 2.4 5.0 4.2 3.6 2.9 16-19 3.8 - - - 2.8 5.7 4.9 5.7 8.5 7.9 6.7 20+ 8.0 - - - - 2.8 5.3 6.4 8.3 12.6 16.5

242
2020 POPULATION AND HOUSING CENSUS OF MONGOLIA NATIONAL REPORT
Continued table 5.6 Of which: by age group
50-54 55-59 60-64 65-69 70-74 75-79 80-84 85-89 90-94 95-99 100+TOTAL 100.0 100.0 100.0 100.0 100.0 100.0 100.0 100.0 100.0 100.0 100.0 Lifetime 66.1 62.6 58.7 53.9 45.5 46.1 44.7 52.5 32.8 23.1 -Inmigrants 33.9 37.4 41.3 46.1 54.5 53.9 55.3 47.5 67.2 76.9 100.0Of which: by residence year<1 0.2 0.3 0.3 0.4 0.5 0.2 0.3 - 3.5 - - 1-3 0.9 0.6 0.9 0.6 0.4 0.5 0.7 0.4 1.7 - - 4 0.4 0.2 0.3 0.2 0.4 0.2 0.5 - - - - 5-6 1.0 0.7 1.0 1.1 0.8 0.8 0.5 1.2 3.4 7.7 - 7-9 1.6 1.3 1.2 1.6 1.9 1.8 1.5 2.1 3.4 - - 10-12 2.2 1.7 1.6 1.8 1.8 1.7 1.7 1.7 - - - 13-15 2.4 2.4 2.4 2.8 2.6 2.2 1.8 0.8 1.7 - - 16-19 5.8 5.5 4.8 5.4 4.6 5.7 5.8 2.9 6.9 15.4 - 20+ 19.4 24.7 28.8 32.2 41.5 40.8 42.5 38.4 46.6 53.8 100.0
Continued table 5.6 FEMALE
TotalOf which: by age group
0-4 5-9 10-14 15-19 20-24 25-29 30-34 35-39 40-44 45-49TOTAL 100.0 100.0 100.0 100.0 100.0 100.0 100.0 100.0 100.0 100.0 100.0 Lifetime 75.2 97.8 94.6 92.0 85.9 76.6 66.7 64.2 65.0 65.2 66.0Inmigrants 24.8 2.2 5.4 8.0 14.1 23.4 33.3 35.8 35.0 34.8 34.0Of which: by residence year<1 0.4 0.6 0.3 0.3 0.8 1.5 0.9 0.5 0.4 0.3 0.3 1-3 1.5 1.4 1.3 1.0 1.3 3.3 3.9 1.9 1.2 0.9 0.6 4 0.6 0.2 0.7 0.4 0.4 1.1 1.9 1.0 0.5 0.4 0.3 5-6 1.6 - 1.8 1.2 1.1 2.4 4.6 3.0 1.8 1.3 1.1 7-9 2.3 - 1.3 2.3 2.0 2.2 5.9 5.4 3.0 2.5 1.8 10-12 2.3 - - 2.1 2.6 2.0 4.2 6.0 3.9 2.7 2.4 13-15 2.4 - - 0.7 3.1 2.5 2.4 6.0 4.8 3.6 2.9 16-19 4.2 - - - 2.8 5.8 4.5 5.7 10.0 8.4 6.8 20+ 9.5 - - - - 2.6 5.0 6.3 9.4 14.7 17.8

243
APPENDIX
Continued table 5.6 Of which: by age group
50-54 55-59 60-64 65-69 70-74 75-79 80-84 85-89 90-94 95-99 100+TOTAL 100.0 100.0 100.0 100.0 100.0 100.0 100.0 100.0 100.0 100.0 100.0 Lifetime 64.4 60.8 57.6 52.9 45.9 46.1 50.1 44.9 46.5 55.8 37.5Inmigrants 35.6 39.2 42.4 47.1 54.1 53.9 49.9 55.1 53.5 44.2 62.5Of which: by residence year<1 0.2 0.3 0.2 0.3 0.3 0.4 0.4 0.4 0.7 - - 1-3 0.6 0.8 0.8 0.8 0.7 0.9 0.6 0.9 0.7 - - 4 0.3 0.3 0.3 0.2 0.3 0.1 0.5 1.1 1.3 - - 5-6 1.0 0.9 1.2 0.9 1.0 1.1 0.6 1.3 0.6 - - 7-9 1.8 1.2 1.5 2.1 1.7 1.3 1.8 2.1 1.9 - - 10-12 1.9 1.7 1.7 1.9 1.9 1.8 2.2 1.9 0.6 - - 13-15 2.5 2.1 2.8 2.4 2.8 2.2 2.0 2.1 3.8 4.6 - 16-19 5.9 5.3 5.3 4.9 5.8 6.0 5.8 5.4 3.8 7.0 - 20+ 21.4 26.6 28.6 33.6 39.6 40.1 36.0 39.9 40.1 32.6 62.5
TABLE 6.1. NUMBER OF POPULATION AGED 6 AND ABOVE, BY EDUCATIONAL LEVEL AND AIMAGS AND THE CAPITAL, 2020
Aimags and the Capital Total
Education Level
Non
-edu
cate
d
Prim
ary
Low
er
seco
ndar
y
Uppe
r se
cond
ary
Tech
nica
l and
vo
catio
nal
Spec
ializ
ed
seco
ndar
y
Dipl
oma
Bach
elor
Mas
ter
Doct
oral
TOTAL 2 711 881 405 935 332 826 414 060 708 410 93 625 113 985 27 863 560 088 51 656 3 433Arkhangai 81 278 11 921 15 314 20 106 18 305 2 551 2 247 327 9 850 646 11Bayan-Ulgii 86 510 14 868 16 565 17 005 16 982 3 151 2 350 449 14 402 730 8Bayankhongor 75 334 11 587 11 809 20 407 16 615 2 821 2 040 309 9 006 731 9Bulgan 53 320 7 167 7 672 13 673 13 190 1 696 1 807 238 7 526 344 7Govi-Altai 50 016 7 342 8 457 11 234 11 021 2 155 1 592 179 7 281 744 11Dornogovi 59 908 8 998 7 937 11 187 13 870 3 141 3 214 419 10 416 714 12Dornod 69 189 10 599 8 797 14 682 17 630 3 106 3 327 313 10 033 695 7Dundgovi 40 173 5 658 8 038 10 395 6 858 1 927 1 530 146 5 281 337 3Zavkhan 62 793 10 167 10 658 13 136 13 880 2 546 1 937 235 9 376 849 9Uvurkhangai 99 750 14 824 22 042 24 465 19 684 3 286 2 420 281 11 984 757 7Umnugobi 58 218 9 018 8 262 12 150 13 043 2 516 2 201 219 10 146 659 4Sukhbaatar 53 658 8 895 9 932 13 123 9 475 3 325 2 098 251 6 131 423 5Selenge 93 183 12 668 10 053 18 118 28 016 5 255 4 496 431 13 490 648 8Tuv 79 499 11 158 10 760 19 696 18 711 4 224 3 202 545 10 367 828 8Uvs 70 562 12 093 13 041 14 642 14 335 3 352 2 032 242 10 090 727 8Khovd 74 784 12 407 11 385 15 219 17 013 2 313 3 092 317 11 961 1 028 49Khuvsgul 115 878 19 113 23 138 23 722 29 109 2 532 3 202 434 13 691 927 10Khentii 66 482 10 260 10 211 16 109 15 915 2 381 2 089 178 8 741 591 7Darkhan-Uul 87 528 12 053 8 339 10 746 25 294 4 446 5 102 347 19 520 1 620 61Orkhon 89 058 12 313 8 189 9 325 28 116 3 625 4 583 516 20 469 1 865 57Gobisumber 14 696 2 270 1 810 2 313 3 706 702 901 132 2 663 198 1Ulaanbaatar 1 230 064 180 556 100417 102 607 357 642 32 574 58 523 21 355 337 664 35 595 3 131

244
2020 POPULATION AND HOUSING CENSUS OF MONGOLIA NATIONAL REPORT
TABLE 6.2. NUMBER OF POPULATION AGED 6 AND ABOVE, BY EDUCATIONAL LEVEL AND AGE GROUP, SEX, AND URBAN-RURAL, 2020
Age group Total
Education Level
Non
-edu
cate
d
Prim
ary
Low
er
seco
ndar
y
Uppe
r se
cond
ary
Tech
nica
l and
vo
catio
nal
Spec
ializ
ed
seco
ndar
y
Dipl
oma
Bach
elor
Mas
ter
Doct
oral
TOTAL 2 711 881 405 935 332 826 414 060 708 410 93 625 113 985 27 863 560 088 51 656 3 4336-9 286 228 285 909 319 - - - - - - - -10-14 273 544 77 903 193 626 2 015 - - - - - - -15-19 215 816 4 429 11 620 132 346 60 132 3 944 1 895 190 1 260 - -20-24 223 544 3 880 7 428 27 326 111 443 10 941 5 784 1 256 54 144 1 342 -25-29 257 438 4 074 8 382 21 788 75 704 13 878 7 921 1 358 116 680 7 615 3830-34 284 908 5 393 14 811 26 744 84 037 9 179 7 815 1 866 122 705 12 129 22935-39 237 508 6 286 19 266 35 255 73 306 6 121 6 076 1 723 79 414 9 667 39440-44 213 108 3 642 13 309 43 314 75 852 6 489 7 712 1 980 52 651 7 666 49345-49 189 324 2 635 6 755 34 853 72 621 11 179 14 105 2 732 38 789 5 188 46750-54 160 507 2 625 6 822 28 445 58 868 11 444 16 871 3 396 28 407 3 240 38955-59 139 752 2 574 9 021 24 804 44 692 9 525 16 531 3 932 25 829 2 449 39560-64 95 353 1 625 9 850 17 978 25 392 5 657 12 640 3 422 17 147 1 303 33965-69 54 883 1 107 8 518 8 973 12 632 2 644 7 850 2 278 9 992 602 28770+ 79 968 3 853 23 099 10 219 13 731 2 624 8 785 3 730 13 070 455 402
Continued table 6.2 MALE
Age group Total
Education Level
Non
- ed
ucat
ed
Prim
ary
Low
er
seco
ndar
y
Uppe
r se
cond
ary
Tech
nica
l an
d vo
catio
nal
Spec
ializ
ed
seco
ndar
y
Dipl
oma
Bach
elor
Mas
ter
Doct
oral
TOTAL 1 325 373 208 944 172 651 226 408 362 505 50 835 48 236 10 986 225 464 17 660 1 6846-9 146 275 146 107 168 - - - - - - - -10-14 139 510 40 086 98 372 1 052 - - - - - - -15-19 109 682 2 716 7 065 67 444 27 829 2 508 1 455 99 566 - -20-24 112 474 2 364 4 940 17 372 55 330 6 626 3 788 549 21 052 453 -25-29 129 129 2 535 5 856 14 029 42 826 8 130 4 736 599 47 896 2 504 1830-34 142 218 3 315 9 692 16 265 47 237 5 247 4 424 782 51 117 4 045 9435-39 118 036 3 731 12 249 19 704 39 682 3 431 3 124 698 31 821 3 422 17440-44 104 683 2 155 8 617 23 934 39 832 3 382 3 442 739 19 889 2 503 19045-49 91 433 1 450 4 108 20 246 36 859 5 649 5 898 950 14 475 1 605 19350-54 74 827 1 330 3 770 16 041 28 630 5 507 6 416 1 159 10 795 1 033 14655-59 63 207 1 218 4 371 13 281 21 445 4 896 5 566 1 440 9 922 909 15960-64 41 171 695 4 060 8 751 12 040 2 893 3 953 1 275 6 745 570 18965-69 22 496 383 2 913 4 155 5 517 1 341 2 469 888 4 317 327 18670+ 30 232 859 6 470 4 134 5 278 1 225 2 965 1 808 6 869 289 335

245
APPENDIX
Continued table 6.2 FEMALE
Age group Total
Education Level
Non
-edu
cate
d
Prim
ary
Low
er
seco
ndar
y
Uppe
r se
cond
ary
Tech
nica
l and
vo
catio
nal
Spec
ializ
ed
seco
ndar
y
Dipl
oma
Bach
elor
Mas
ter
Doct
oral
TOTAL 1 386 508 196 991 160 175 187 652 345 905 42 790 65 749 16 877 334 624 33 996 1 7496-9 139 953 139 802 151 - - - - - - - -10-14 134 034 37 817 95 254 963 - - - - - - -15-19 106 134 1 713 4 555 64 902 32 303 1 436 440 91 694 - -20-24 111 070 1 516 2 488 9 954 56 113 4 315 1 996 707 33 092 889 -25-29 128 309 1 539 2 526 7 759 32 878 5 748 3 185 759 68 784 5 111 2030-34 142 690 2 078 5 119 10 479 36 800 3 932 3 391 1 084 71 588 8 084 13535-39 119 472 2 555 7 017 15 551 33 624 2 690 2 952 1 025 47 593 6 245 22040-44 108 425 1 487 4 692 19 380 36 020 3 107 4 270 1 241 32 762 5 163 30345-49 97 891 1 185 2 647 14 607 35 762 5 530 8 207 1 782 24 314 3 583 27450-54 85 680 1 295 3 052 12 404 30 238 5 937 10 455 2 237 17 612 2 207 24355-59 76 545 1 356 4 650 11 523 23 247 4 629 10 965 2 492 15 907 1 540 23660-64 54 182 930 5 790 9 227 13 352 2 764 8 687 2 147 10 402 733 15065-69 32 387 724 5 605 4 818 7 115 1 303 5 381 1 390 5 675 275 10170+ 49 736 2 994 16 629 6 085 8 453 1 399 5 820 1 922 6 201 166 67
Continued table 6.2 URBAN
Age group Total
Education Level
Non
-ed
ucat
ed
Prim
ary
Low
er
seco
ndar
y
Uppe
r se
cond
ary
Tech
nica
l and
vo
catio
nal
Spec
ializ
ed
seco
ndar
y
Dipl
oma
Bach
elor
Mas
ter
Doct
oral
TOTAL 1 828 431 269 232 163 951 182 941 526 289 57 965 88 906 24 156 465 432 46 183 3 3766-9 199 204 198 939 265 - - - - - - - - 10-14 179 690 52 953 125 300 1 437 - - - - - - - 15-19 132 022 2 735 6 423 79 584 39 359 2 092 1 185 60 584 - - 20-24 136 696 1 806 2 624 11 653 72 990 5 447 3 830 665 36 717 964 - 25-29 177 793 1 519 1 671 7 683 54 655 7 799 5 885 1 051 91 048 6 447 35 30-34 208 683 1 905 2 695 9 582 65 370 6 080 6 405 1 623 103 891 10 910 222 35-39 164 956 2 113 3 436 11 070 58 252 4 426 5 173 1 544 69 853 8 700 389 40-44 142 998 1 344 2 259 12 955 58 991 4 568 6 550 1 783 47 110 6 948 490 45-49 126 131 1 102 1 383 10 679 53 375 6 906 11 160 2 300 34 044 4 721 461 50-54 107 210 991 1 571 9 821 44 132 7 053 12 960 2 889 24 456 2 954 383 55-59 95 262 1 017 2 056 9 813 35 294 6 020 12 666 3 483 22 235 2 289 389 60-64 65 183 654 2 411 7 740 21 022 3 782 9 810 3 146 15 052 1 232 334 65-69 37 810 445 2 413 4 508 10 746 1 828 6 153 2 094 8 765 580 278 70+ 54 793 1 709 9 444 6 416 12 103 1 964 7 129 3 518 11 677 438 395

246
2020 POPULATION AND HOUSING CENSUS OF MONGOLIA NATIONAL REPORT
Continued table 6.2 RURAL
Age group Total
Education Level
Non
-ed
ucat
ed
Prim
ary
Low
er
sec
onda
ry
Uppe
r s
econ
dary
Tech
nica
l an
d vo
catio
nal
Spec
ializ
ed
seco
ndar
y
Dipl
oma
Bach
elor
Mas
ter
Doct
oral
TOTAL 883 450 136 703 168 875 231 119 182 121 35 660 25 079 3 707 94 656 5 473 576-9 87 024 86 970 54 - - - - - - - - 10-14 93 854 24 950 68 326 578 - - - - - - - 15-19 83 794 1 694 5 197 52 762 20 773 1 852 710 130 676 - - 20-24 86 848 2 074 4 804 15 673 38 453 5 494 1 954 591 17 427 378 - 25-29 79 645 2 555 6 711 14 105 21 049 6 079 2 036 307 25 632 1 168 3 30-34 76 225 3 488 12 116 17 162 18 667 3 099 1 410 243 18 814 1 219 7 35-39 72 552 4 173 15 830 24 185 15 054 1 695 903 179 9 561 967 5 40-44 70 110 2 298 11 050 30 359 16 861 1 921 1 162 197 5 541 718 3 45-49 63 193 1 533 5 372 24 174 19 246 4 273 2 945 432 4 745 467 6 50-54 53 297 1 634 5 251 18 624 14 736 4 391 3 911 507 3 951 286 6 55-59 44 490 1 557 6 965 14 991 9 398 3 505 3 865 449 3 594 160 6 60-64 30 170 971 7 439 10 238 4 370 1 875 2 830 276 2 095 71 5 65-69 17 073 662 6 105 4 465 1 886 816 1 697 184 1 227 22 9 70+ 25 175 2 144 13 655 3 803 1 628 660 1 656 212 1 393 17 7
TABLE 6.3. NUMBER OF POPULATION AGED 6 AND ABOVE, BY LITERACY STATUS AND AGE GROUPS, SEX, 2020
Age group Total Literate Illiterate
Urban RuralTotal Literate Illiterate Total Literate Illiterate
TOTAL 2 711 881 2 662 972 48 909 1 828 431 1 803 510 24 921 883 450 859 462 23 988 6-9 286 228 265 882 20 346 199 204 185 320 13 884 87 024 80 562 6 46210-14 273 544 271 996 1 548 179 690 178 751 939 93 854 93 245 60915-19 215 816 214 510 1 306 132 022 131 429 593 83 794 83 081 71320-24 223 544 221 466 2 078 136 696 135 991 705 86 848 85 475 1 37325-29 257 438 254 017 3 421 177 793 176 520 1 273 79 645 77 497 2 14830-34 284 908 280 734 4 174 208 683 207 069 1 614 76 225 73 665 2 56035-39 237 508 233 150 4 358 164 956 163 338 1 618 72 552 69 812 2 74040-44 213 108 210 514 2 594 142 998 142 154 844 70 110 68 360 1 75045-49 189 324 187 385 1 939 126 131 125 315 816 63 193 62 070 1 12350-54 160 507 158 674 1 833 107 210 106 619 591 53 297 52 055 1 24255-59 139 752 137 860 1 892 95 262 94 531 731 44 490 43 329 1 16160-64 95 353 94 493 860 65 183 64 804 379 30 170 29 688 48265-69 54 883 54 363 520 37 810 37 634 176 17 073 16 729 34470+ 79 968 77 930 2 038 54 793 54 036 757 25 175 23 894 1 281

247
APPENDIX
Continued table 6.3 MALE
Age group Total Literate Illiterate
Urban RuralTotal Literate Illiterate Total Literate Illiterate
TOTAL 1 325 373 1 299 092 26 281 876 630 863 798 12 832 448 743 435 403 13 3406-9 146 275 135 697 10 578 101 768 94 689 7 079 44 507 41 036 3 47110-14 139 510 138 684 826 91 630 91 131 499 47 880 47 556 32415-19 109 682 108 818 864 66 907 66 531 376 42 775 42 284 49120-24 112 474 111 228 1 246 66 927 66 508 419 45 547 44 700 84725-29 129 129 127 087 2 042 86 070 85 278 792 43 059 41 814 1 24530-34 142 218 139 618 2 600 101 881 100 932 949 40 337 38 742 1 59535-39 118 036 115 358 2 678 80 022 79 122 900 38 014 36 259 1 75540-44 104 683 103 089 1 594 68 607 68 119 488 36 076 34 979 1 09745-49 91 433 90 283 1 150 59 447 59 025 422 31 986 31 272 71450-54 74 827 73 832 995 48 462 48 129 333 26 365 25 727 63855-59 63 207 62 245 962 41 685 41 329 356 21 522 20 925 59760-64 41 171 40 849 322 27 420 27 285 135 13 751 13 560 19165-69 22 496 22 352 144 15 156 15 125 31 7 340 7 218 12270+ 30 232 29 952 280 20 648 20 595 53 9 584 9 331 253
Continued table 6.3 FEMALE
Age group Total Literate Illiterate
Urban RuralTotal Literate Illiterate Total Literate Illiterate
TOTAL 1 386 508 1 363 506 23 002 951 801 939 660 12 141 434 707 423 910 10 7976-9 139 953 130 157 9 796 97 436 90 631 6 805 42 517 39 527 2 99010-14 134 034 133 306 728 88 060 87 619 441 45 974 45 690 28415-19 106 134 105 692 442 65 115 64 894 221 41 019 40 795 22420-24 111 070 110 258 812 69 769 69 480 289 41 301 40 768 53325-29 128 309 126 867 1 442 91 723 91 237 486 36 586 35 675 91130-34 142 690 140 948 1 742 106 802 106 127 675 35 888 34 894 99435-39 119 472 117 697 1 775 84 934 84 209 725 34 538 33 521 1 01740-44 108 425 107 364 1 061 74 391 74 031 360 34 034 33 361 67345-49 97 891 97 055 836 66 684 66 289 395 31 207 30 785 42250-54 85 680 84 789 891 58 748 58 487 261 26 932 26 327 60555-59 76 545 75 607 938 53 577 53 201 376 22 968 22 404 56460-64 54 182 53 652 530 37 763 37 519 244 16 419 16 127 29265-69 32 387 32 037 350 22 654 22 509 145 9 733 9 510 22370+ 49 736 48 077 1 659 34 145 33 427 718 15 591 14 526 1 065

248
2020 POPULATION AND HOUSING CENSUS OF MONGOLIA NATIONAL REPORT
TABLE 6.4. NUMBER OF POPULATION AGED 6 AND ABOVE, BY LITERACY STATUS, AIMAGS AND THE CAPITAL, 2020
Aimags and the Capital Total Literate Illiterate
TOTAL 2 711 881 2 662 493 49 388Arkhangai 81 278 79 470 1 808Bayan-Ulgii 86 510 84 215 2 295Bayankhongor 75 334 73 562 1 772Bulgan 53 320 52 452 868Govi-Altai 50 016 48 965 1 051Dornogovi 59 908 58 457 1 451Dornod 69 189 67 584 1 605Dundgovi 40 173 39 206 967Zavkhan 62 793 61 083 1 710Uvurkhangai 99 750 96 893 2 857Umnugobi 58 218 57 439 779Sukhbaatar 53 658 51 498 2 160Selenge 93 183 91 558 1 625Tuv 79 499 77 835 1 664Uvs 70 562 68 426 2 136Khovd 74 784 72 953 1 831Khuvsgul 115 878 113 018 2 860Khentii 66 482 64 243 2 239Darkhan-Uul 87 528 86 505 1 023Orkhon 89 058 88 199 859Gobisumber 14 696 14 428 268Ulaanbaatar 1 230 064 1 214 631 15 433

249
APPENDIX
TABLE 6.5. NUMBER OF POPULATION AGED 6-29, BY SCHOOL ATTENDANCE, AND AGE GROUP, URBAN-RURAL, 2020
Age group
Total Studying Non-StudyingTotal Male Female Total Male Female Total Male Female
6-29 1 256 570 637 070 619 500 912 698 455 757 456 941 343 872 181 313 162 5596-9 286 228 146 275 139 953 277 376 141 470 135 906 8 852 4 805 4 0476 78 970 40 512 38 458 73 659 37 678 35 981 5 311 2 834 2 4777 73 745 37 511 36 234 71 761 36 361 35 400 1 984 1 150 8348 69 984 35 868 34 116 69 193 35 459 33 734 791 409 3829 63 529 32 384 31 145 62 763 31 972 30 791 766 412 35410-14 273 544 139 510 134 034 271 770 138 493 133 277 1 774 1 017 75710 67 251 34 229 33 022 66 822 34 009 32 813 429 220 20911 61 994 31 752 30 242 61 620 31 540 30 080 374 212 16212 54 938 27 923 27 015 54 607 27 738 26 869 331 185 14613 45 977 23 481 22 496 45 676 23 303 22 373 301 178 12314 43 384 22 125 21 259 43 045 21 903 21 142 339 222 11715-19 215 816 109 682 106 134 197 971 97 486 100 485 17 845 12 196 5 64915 42 246 21 470 20 776 41 521 20 947 20 574 725 523 20216 42 081 21 541 20 540 40 994 20 734 20 260 1 087 807 28017 42 654 21 725 20 929 41 077 20 598 20 479 1 577 1 127 45018 43 757 22 048 21 709 38 094 18 281 19 813 5 663 3 767 1 89619 45 078 22 898 22 180 36 285 16 926 19 359 8 793 5 972 2 82120-24 223 544 112 474 111 070 119 441 56 416 63 025 104 103 56 058 48 04520 44 781 22 754 22 027 34 093 15 704 18 389 10 688 7 050 3 63821 43 896 22 145 21 751 30 848 14 159 16 689 13 048 7 986 5 06222 43 180 21 643 21 537 23 440 11 154 12 286 19 740 10 489 9 25123 45 005 22 577 22 428 17 212 8 515 8 697 27 793 14 062 13 73124 46 682 23 355 23 327 13 848 6 884 6 964 32 834 16 471 16 36325-29 257 438 129 129 128 309 46 140 21 892 24 248 211 298 107 237 104 06125 47 296 23 909 23 387 11 558 5 676 5 882 35 738 18 233 17 50526 43 412 21 731 21 681 9 230 4 436 4 794 34 182 17 295 16 88727 51 591 25 974 25 617 9 158 4 353 4 805 42 433 21 621 20 81228 56 434 28 128 28 306 8 496 3 949 4 547 47 938 24 179 23 75929 58 705 29 387 29 318 7 698 3 478 4 220 51 007 25 909 25 098

250
2020 POPULATION AND HOUSING CENSUS OF MONGOLIA NATIONAL REPORT
Continued table 6.5 URBAN
Age group
Total Studying Non-StudyingTotal Male Female Total Male Female Total Male Female
6-29 825 405 413 302 412 103 608 301 305 030 303 271 217 104 108 272 108 8326-9 199 204 101 768 97 436 192 785 98 347 94 438 6 419 3 421 2 9986 55 684 28 530 27 154 51 781 26 486 25 295 3 903 2 044 1 8597 51 922 26 360 25 562 50 669 25 651 25 018 1 253 709 5448 48 409 24 792 23 617 47 787 24 467 23 320 622 325 2979 43 189 22 086 21 103 42 548 21 743 20 805 641 343 29810-14 179 690 91 630 88 060 178 463 90 983 87 480 1 227 647 58010 45 278 22 933 22 345 44 946 22 772 22 174 332 161 17111 40 840 20 933 19 907 40 573 20 790 19 783 267 143 12412 36 627 18 621 18 006 36 393 18 499 17 894 234 122 11213 29 409 15 020 14 389 29 218 14 924 14 294 191 96 9514 27 536 14 123 13 413 27 333 13 998 13 335 203 125 7815-19 132 022 66 907 65 115 123 596 61 585 62 011 8 426 5 322 3 10415 26 198 13 322 12 876 25 875 13 125 12 750 323 197 12616 26 077 13 375 12 702 25 647 13 091 12 556 430 284 14617 26 128 13 272 12 856 25 525 12 916 12 609 603 356 24718 26 488 13 328 13 160 23 728 11 624 12 104 2 760 1 704 1 05619 27 131 13 610 13 521 22 821 10 829 11 992 4 310 2 781 1 52920-24 136 696 66 927 69 769 77 491 37 126 40 365 59 205 29 801 29 40420 27 119 13 564 13 555 21 770 10 209 11 561 5 349 3 355 1 99421 26 113 12 881 13 232 19 444 9 067 10 377 6 669 3 814 2 85522 26 352 12 750 13 602 15 100 7 276 7 824 11 252 5 474 5 77823 27 476 13 346 14 130 11 431 5 719 5 712 16 045 7 627 8 41824 29 636 14 386 15 250 9 746 4 855 4 891 19 890 9 531 10 35925-29 177 793 86 070 91 723 35 966 16 989 18 977 141 827 69 081 72 74625 30 273 14 701 15 572 8 294 4 031 4 263 21 979 10 670 11 30926 28 757 13 868 14 889 6 935 3 331 3 604 21 822 10 537 11 28527 35 720 17 293 18 427 7 331 3 460 3 871 28 389 13 833 14 55628 40 227 19 389 20 838 6 999 3 244 3 755 33 228 16 145 17 08329 42 816 20 819 21 997 6 407 2 923 3 484 36 409 17 896 18 513

251
APPENDIX
Continued table 6.5 RURAL
Age group
Total Studying Non-StudyingTotal Male Female Total Male Female Total Male Female
6-29 431 165 223 768 207 397 304 397 150 727 153 670 126 768 73 041 53 7276-9 87 024 44 507 42 517 84 591 43 123 41 468 2 433 1 384 1 0496 23 286 11 982 11 304 21 878 11 192 10 686 1 408 790 6187 21 823 11 151 10 672 21 092 10 710 10 382 731 441 2908 21 575 11 076 10 499 21 406 10 992 10 414 169 84 859 20 340 10 298 10 042 20 215 10 229 9 986 125 69 5610-14 93 854 47 880 45 974 93 307 47 510 45 797 547 370 17710 21 973 11 296 10 677 21 876 11 237 10 639 97 59 3811 21 154 10 819 10 335 21 047 10 750 10 297 107 69 3812 18 311 9 302 9 009 18 214 9 239 8 975 97 63 3413 16 568 8 461 8 107 16 458 8 379 8 079 110 82 2814 15 848 8 002 7 846 15 712 7 905 7 807 136 97 3915-19 83 794 42 775 41 019 74 375 35 901 38 474 9 419 6 874 2 54515 16 048 8 148 7 900 15 646 7 822 7 824 402 326 7616 16 004 8 166 7 838 15 347 7 643 7 704 657 523 13417 16 526 8 453 8 073 15 552 7 682 7 870 974 771 20318 17 269 8 720 8 549 14 366 6 657 7 709 2 903 2 063 84019 17 947 9 288 8 659 13 464 6 097 7 367 4 483 3 191 1 29220-24 86 848 45 547 41 301 41 950 19 290 22 660 44 898 26 257 18 64120 17 662 9 190 8 472 12 323 5 495 6 828 5 339 3 695 1 64421 17 783 9 264 8 519 11 404 5 092 6 312 6 379 4 172 2 20722 16 828 8 893 7 935 8 340 3 878 4 462 8 488 5 015 3 47323 17 529 9 231 8 298 5 781 2 796 2 985 11 748 6 435 5 31324 17 046 8 969 8 077 4 102 2 029 2 073 12 944 6 940 6 00425-29 79 645 43 059 36 586 10 174 4 903 5 271 69 471 38 156 31 31525 17 023 9 208 7 815 3 264 1 645 1 619 13 759 7 563 6 19626 14 655 7 863 6 792 2 295 1 105 1 190 12 360 6 758 5 60227 15 871 8 681 7 190 1 827 893 934 14 044 7 788 6 25628 16 207 8 739 7 468 1 497 705 792 14 710 8 034 6 67629 15 889 8 568 7 321 1 291 555 736 14 598 8 013 6 585

252
2020 POPULATION AND HOUSING CENSUS OF MONGOLIA NATIONAL REPORT
TABLE 6.6. NUMBER OF POPULATION AGED 6-15, BY SCHOOL ATTENDANCE AND SEX, AIMAGS AND THE CAPITAL, 2020
Aimags and the Capital
TotalSchool attendance
Studying Non-StudyingTotal Male Female Total Male Female Total Male Female
TOTAL 602 018 307 255 294 763 590 667 300 910 289 757 11 351 6 345 5 006Arkhangai 17 755 8 951 8 804 17 613 8 859 8 754 142 92 50Bayan-Ulgii 21 791 10 958 10 833 20 429 10 216 10 213 1 362 742 620Bayankhongor 17 075 8 690 8 385 16 920 8 579 8 341 155 111 44Bulgan 10 903 5 586 5 317 10 768 5 505 5 263 135 81 54Govi-Altai 11 100 5 681 5 419 10 990 5 601 5 389 110 80 30Dornogovi 13 642 6 963 6 679 13 536 6 893 6 643 106 70 36Dornod 15 656 7 973 7 683 15 583 7 928 7 655 73 45 28Dundgovi 8 278 4 255 4 023 8 218 4 215 4 003 60 40 20Zavkhan 13 879 7 099 6 780 13 757 7 021 6 736 122 78 44Uvurkhangai 22 049 11 265 10 784 21 756 11 072 10 684 293 193 100Umnugobi 12 866 6 548 6 318 12 757 6 483 6 274 109 65 44Sukhbaatar 11 516 5 936 5 580 11 431 5 865 5 566 85 71 14Selenge 19 906 10 168 9 738 19 740 10 067 9 673 166 101 65Tuv 17 104 8 774 8 330 16 962 8 683 8 279 142 91 51Uvs 17 251 8 784 8 467 17 030 8 635 8 395 221 149 72Khovd 18 031 9 269 8 762 17 711 9 101 8 610 320 168 152Khuvsgul 26 186 13 357 12 829 25 772 13 089 12 683 414 268 146Khentii 14 504 7 377 7 127 14 357 7 286 7 071 147 91 56Darkhan-Uul 18 809 9 573 9 236 18 673 9 503 9 170 136 70 66Orkhon 18 803 9 581 9 222 18 709 9 520 9 189 94 61 33Gobisumber 3 530 1 847 1 683 3 509 1 833 1 676 21 14 7Ulaanbaatar 271 384 138 620 132 764 264 446 134 956 129 490 6 938 3 664 3 274
TABLE 7.1. NUMBER OF POPULATION AGED 15 AND ABOVE, BY MARITAL STATUS, AGE GROUPS AND SEX, 2020
Age group Total
Marital statusSingle/
Never Married
Registered married
Not registered married
Separated/ Legally
married
Divorced/ not
remarriedWidowed
TOTAL 2 152 109 678 901 1 110 170 193 581 24 857 26 650 117 95015-17 126 981 126 789 5 187 - - -18-19 88 835 87 507 459 856 9 - 420-24 223 544 187 390 19 324 16 508 198 81 4325-29 257 438 121 506 90 788 43 098 1 033 626 38730-34 284 908 65 911 171 490 42 060 2 153 2 153 1 14135-39 237 508 31 760 171 896 25 550 2 837 3 250 2 21540-44 213 108 20 355 160 201 20 381 3 787 4 215 4 16945-49 189 324 14 771 141 084 17 294 4 279 4 752 7 14450-54 160 507 9 561 117 542 12 694 4 279 4 643 11 78855-59 139 752 6 781 100 032 8 232 3 446 3 779 17 48260-64 95 353 3 285 65 605 3 844 1 706 1 944 18 96965-69 54 883 1 566 34 458 1 584 655 722 15 89870, + 79 968 1 719 37 286 1 293 475 485 38 710

253
APPENDIX
Continued table 7.1 MALE
Age group Total
Marital statusSingle/
Never Married
Registered married
Not registered married
Separated/ Legally
married
Divorced/ not
remarriedWidowed
TOTAL 1 039 588 366 417 542 325 91 607 9 978 10 317 18 94415-17 64 736 64 676 2 58 - - - 18-19 44 946 44 648 104 192 2 - - 20-24 112 474 100 130 6 471 5 784 61 22 6 25-29 129 129 69 990 39 168 19 360 340 203 68 30-34 142 218 38 481 80 761 21 283 757 755 181 35-39 118 036 18 455 84 177 12 721 1 092 1 242 349 40-44 104 683 11 496 79 537 9 794 1 519 1 702 635 45-49 91 433 8 169 70 069 8 428 1 764 1 989 1 014 50-54 74 827 4 836 58 504 6 220 1 757 1 759 1 751 55-59 63 207 3 122 50 487 4 159 1 446 1 440 2 553 60-64 41 171 1 312 33 458 2 000 712 722 2 967 65-69 22 496 573 18 122 850 303 264 2 384 70, + 30 232 529 21 465 758 225 219 7 036
Continued table 7.1 FEMALE
Age group Total
Marital statusSingle/
Never Married
Registered married
Not registered
married
Separated/ Legally married
Divorced/ not remarried Widowed
TOTAL 1 112 521 312 484 567 845 101 974 14 879 16 333 99 00615-17 62 245 62 113 3 129 - - - 18-19 43 889 42 859 355 664 7 - 4 20-24 111 070 87 260 12 853 10 724 137 59 37 25-29 128 309 51 516 51 620 23 738 693 423 319 30-34 142 690 27 430 90 729 20 777 1 396 1 398 960 35-39 119 472 13 305 87 719 12 829 1 745 2 008 1 866 40-44 108 425 8 859 80 664 10 587 2 268 2 513 3 534 45-49 97 891 6 602 71 015 8 866 2 515 2 763 6 130 50-54 85 680 4 725 59 038 6 474 2 522 2 884 10 037 55-59 76 545 3 659 49 545 4 073 2 000 2 339 14 929 60-64 54 182 1 973 32 147 1 844 994 1 222 16 002 65-69 32 387 993 16 336 734 352 458 13 514 70, + 49 736 1 190 15 821 535 250 266 31 674

254
2020 POPULATION AND HOUSING CENSUS OF MONGOLIA NATIONAL REPORT
TABLE 7.2. NUMBER OF POPULATION AGED 15 AND ABOVE, BY MARITAL STATUS, AGE GROUPS AND URBAN-RURAL, 2020 URBAN
Age group Total
Marital status
Single/Never Married
Registered married
Not registered married
Separated/ Legally
married
Divorced/ not remarried Widowed
TOTAL 1 449 537 449 344 726 950 154 679 19 348 19 900 79 31615-17 78 403 78 288 2 113 - - -18-19 53 619 52 861 204 544 8 - 220-24 136 696 115 991 8 921 11 560 152 47 2525-29 177 793 87 396 55 327 33 654 773 412 23130-34 208 683 51 511 118 094 35 150 1 655 1 539 73435-39 164 956 23 823 114 270 20 959 2 164 2 318 1 42240-44 142 998 14 654 102 948 16 618 2 975 3 108 2 69545-49 126 131 10 572 89 881 14 144 3 365 3 558 4 61150-54 107 210 6 478 75 972 10 101 3 347 3 525 7 78755-59 95 262 4 291 66 842 6 528 2 722 2 944 11 93560-64 65 183 1 885 44 411 3 058 1 344 1 515 12 97065-69 37 810 856 23 759 1 238 490 578 10 88970, + 54 793 738 26 319 1 012 353 356 26 015
Continued table 7.2 RURAL
Age group Total
Marital status
Single/Never Married
Registered married
Not registered
married
Separated/ Legally married
Divorced/ not
remarriedWidowed
TOTAL 702 572 229 557 383 220 38 902 5 509 6 750 38 634 15-17 48 578 48 501 3 74 - - - 18-19 35 216 34 646 255 312 1 - 2 20-24 86 848 71 399 10 403 4 948 46 34 18 25-29 79 645 34 110 35 461 9 444 260 214 156 30-34 76 225 14 400 53 396 6 910 498 614 407 35-39 72 552 7 937 57 626 4 591 673 932 793 40-44 70 110 5 701 57 253 3 763 812 1 107 1 474 45-49 63 193 4 199 51 203 3 150 914 1 194 2 533 50-54 53 297 3 083 41 570 2 593 932 1 118 4 001 55-59 44 490 2 490 33 190 1 704 724 835 5 547 60-64 30 170 1 400 21 194 786 362 429 5 999 65-69 17 073 710 10 699 346 165 144 5 009 70,+ 25 175 981 10 967 281 122 129 12 695

255
APPENDIX
TABLE 7.3. NUMBER OF RESIDENT POPULATION OF MONGOLIA, BY NUMBER OF SIZE AND TYPE OF THE HOUSEHOLD, 2020
Household size TotalType of Household
One-person Nuclear Extended CompositeTOTAL 3 123 487 130 342 1 953 195 941 189 98 7611 130 342 130 342 - - -2 275 903 - 226 621 45 538 3 7443 448 997 - 359 813 82 079 7 1054 710 238 - 564 003 134 963 11 2725 669 378 - 464 230 189 845 15 3036 449 220 - 252 260 180 906 16 0547 207 720 - 61 264 133 074 13 3828 106 882 - 19 260 77 204 10 4189 54 924 - 4 281 43 744 6 89910 30 884 - 1 051 24 593 5 24011 17 187 - 338 13 464 3 38512 9 424 - 60 7 267 2 09713 5 165 - - 3 706 1 45914 3 110 - 14 2 236 86015 1 608 - - 1 144 46416+ 2 505 - - 1 426 1 079
Continued table 7.3 URBAN
Household size TotalType of Household
One-person Nuclear Extended CompositeTOTAL 2 113 538 79 443 1 191 492 748 938 93 6651 79 443 79 443 - - -2 185 291 - 149 216 32 674 3 4013 308 539 - 238 066 63 926 6 5474 482 494 - 366 119 105 979 10 3965 439 858 - 275 515 150 059 14 2846 283 354 - 125 716 142 499 15 1397 144 625 - 26 872 104 996 12 7578 80 450 - 7 611 62 778 10 0619 45 775 - 1 735 37 285 6 75510 27 039 - 419 21 498 5 12211 15 880 - 187 12 363 3 33012 8 795 - 36 6 698 2 06113 4 898 - - 3 466 1 43214 3 054 - - 2 194 86015 1 590 - - 1 129 46116+ 2 453 - - 1 394 1 059

256
2020 POPULATION AND HOUSING CENSUS OF MONGOLIA NATIONAL REPORT
Continued table 7.3 RURAL
Household size TotalType of Household
One-person Nuclear Extended CompositeTOTAL 1 009 949 50 899 761 703 192 251 5 0961 50 899 50 899 - - -2 90 612 - 77 405 12 864 3433 140 458 - 121 747 18 153 5584 227 744 - 197 884 28 984 8765 229 520 - 188 715 39 786 1 0196 165 866 - 126 544 38 407 9157 63 095 - 34 392 28 078 6258 26 432 - 11 649 14 426 3579 9 149 - 2 546 6 459 14410 3 845 - 632 3 095 11811 1 307 - 151 1 101 5512 629 - 24 569 3613 267 - - 240 2714 56 - 14 42 015 18 - - 15 316 52 - - 32 20
TABLE 8.1. NUMBER OF POPULATION WITH DISABILITY, TYPE AND FORMS OF DISABILITY, AIMAGS AND THE CAPITAL, 2020
Aimags and the Capital Total
CongenitalVisual Speeching Hearing Physical Mental Other Combined
TOTAL 50 622 6 627 2 882 5 351 10 643 14 744 7 567 2 808Arkhangai 1 902 274 139 241 473 524 150 101Bayan-Ulgii 2 257 242 127 161 738 455 399 135Bayankhongor 1 924 252 85 195 447 656 213 76Bulgan 1 183 217 56 127 279 342 122 40Gov-Altai 1 149 132 67 134 232 304 187 93Dornogovi 987 104 64 101 222 342 118 36Dornod 1 647 188 86 171 289 690 183 40Dundgovi 945 106 50 86 179 352 127 45Zavkhan 1 767 204 103 182 408 517 305 48Uvurkhangai 1 956 241 141 210 479 564 242 79Umnugovi 957 130 33 112 204 286 161 31Sukhbaatar 1 010 149 72 125 157 343 126 38Selenge 2 039 298 153 172 399 724 246 47Tuv 1 753 216 96 169 370 682 169 51Uvs 1 804 276 145 140 352 510 250 131Khovd 1 291 168 130 132 289 338 164 70Khuvsgul 3 187 476 148 371 704 852 371 265Khentii 1 607 256 90 143 338 526 196 58Darkhan-Uul 1 442 159 75 176 276 451 274 31Orkhon 1 251 122 59 143 262 372 166 127Govisumber 268 30 9 48 60 80 29 12Ulaanbaatar 18 296 2 387 954 2 012 3 486 4 834 3 369 1 254

257
APPENDIX
Continued table 8.1 Aimags and the Capital Total Acquired
Visual Speeching Hearing Physical Mental Other CombinedTOTAL 55 741 6 135 426 3 345 13 331 6 773 22 495 3 236Arkhangai 1 528 179 14 83 509 219 392 132Bayan-Ulgii 1 988 115 13 54 350 171 1 095 190Bayankhongor 1 666 221 8 71 459 196 575 136Bulgan 915 130 10 62 281 107 276 49Gov-Altai 1 755 195 18 100 361 165 815 101Dornogovi 1 667 227 16 111 525 159 544 85Dornod 2 372 326 9 213 494 338 901 91Dundgovi 913 105 7 50 272 107 333 39Zavkhan 1 883 119 14 121 480 281 767 101Uvurkhangai 2 016 286 15 130 488 231 779 87Umnugovi 1 069 124 9 65 320 125 391 35Sukhbaatar 1 662 261 14 119 459 163 577 69Selenge 2 377 214 26 107 580 283 1 085 82Tuv 1 463 202 14 78 406 207 471 85Uvs 2 666 426 10 116 507 248 1 150 209Khovd 1 273 134 11 74 309 147 519 79Khuvsgul 2 639 315 24 177 664 281 971 207Khentii 1 397 172 8 102 384 147 528 56Darkhan-Uul 2 689 225 11 132 407 280 1 583 51Orkhon 2 975 292 14 217 808 394 1 027 223Govisumber 439 66 6 38 102 42 162 23Ulaanbaatar 18 389 1 801 155 1 125 4 166 2 482 7 554 1 106
TABLE 8.2. NUMBER OF POPULATION WITH DISABILITY, BY AGE GROUPS AND AIMAGS AND THE CAPITAL, 2020
Aimags and the Capital Total
Age group0-4 5-9 10-14 15-19 20-24 25-29 30-34
TOTAL 106 363 1 548 3 298 3 274 3 205 4 685 6 517 8 299Arkhangai 3 430 35 75 101 113 180 211 266Bayan-Ulgii 4 245 35 105 127 147 219 293 318Bayankhongor 3 590 49 103 81 125 224 231 277Bulgan 2 098 21 51 63 78 80 124 164Gov-Altai 2 904 30 65 82 105 154 145 213Dornogovi 2 654 41 91 89 88 123 158 222Dornod 4 019 54 101 110 98 176 287 380Dundgovi 1 858 25 61 72 53 69 119 169Zavkhan 3 650 30 79 74 89 175 229 252Uvurkhangai 3 972 88 113 146 162 218 261 296Umnugovi 2 026 46 89 76 74 116 135 178Sukhbaatar 2 672 47 76 66 55 132 165 198Selenge 4 416 41 87 105 139 211 262 333Tuv 3 216 41 85 89 85 130 199 283Uvs 4 470 41 111 145 159 255 306 337Khovd 2 564 36 88 87 110 177 173 210Khuvsgul 5 826 85 167 163 182 267 381 454Khentii 3 004 53 86 107 95 142 216 220Darkhan-Uul 4 131 66 122 132 99 175 226 256Orkhon 4 226 52 129 116 104 142 231 292Govisumber 707 8 27 13 23 29 44 49Ulaanbaatar 36 685 624 1 387 1 230 1 022 1 291 2 121 2 932

258
2020 POPULATION AND HOUSING CENSUS OF MONGOLIA NATIONAL REPORT
Continued table 8.2
Aimags and the Capital
Age group35-39 40-44 45-49 50-54 55-59 60-64 65-69 70+
TOTAL 10 114 11 122 13 248 15 192 13 665 6 603 2 422 3 171Arkhangai 331 392 436 452 406 213 104 115Bayan-Ulgii 419 474 636 573 458 229 83 129Bayankhongor 402 427 437 506 422 148 47 111Bulgan 171 183 246 296 262 187 71 101Gov-Altai 274 315 434 486 352 127 40 82Dornogovi 241 287 301 357 299 163 76 118Dornod 502 468 590 640 459 99 29 26Dundgovi 174 209 239 239 223 115 39 52Zavkhan 402 493 510 619 416 197 39 46Uvurkhangai 440 443 504 506 483 165 45 102Umnugovi 187 193 207 238 235 103 54 95Sukhbaatar 265 301 329 384 329 163 72 90Selenge 417 455 585 718 618 268 83 94Tuv 313 327 387 431 435 227 96 88Uvs 426 503 577 686 522 191 70 141Khovd 208 297 296 310 274 156 61 81Khuvsgul 497 563 696 811 731 395 170 264Khentii 293 271 329 399 368 234 89 102Darkhan-Uul 345 400 496 643 608 328 109 126Orkhon 313 421 534 680 658 280 97 177Govisumber 64 61 90 103 99 47 16 34Ulaanbaatar 3 430 3 639 4 389 5 115 5 008 2 568 932 997
TABLE 8.3. NUMBER OF POPULATION WITH DISABILITY, BY TYPE OF DISABILITY, AND AGE GROUPS, 2020
Age group Total
Type of disabilityVisual Speeching Hearing Physical Mental Other Combined
TOTAL 106 363 12 762 3 308 8 696 23 974 21 517 30 062 6 0440-4 1 548 104 53 62 318 201 636 1745-9 3 298 368 182 149 722 529 1 018 33010-14 3 274 407 242 149 758 686 769 26315-19 3 205 427 231 215 683 809 606 23420-24 4 685 546 249 357 946 1 430 895 26225-29 6 517 768 252 534 1 400 2 079 1 178 30630-34 8 299 1 019 351 757 1 825 2 258 1 700 38935-39 10 114 1 296 342 917 2 306 2 598 2 183 47240-44 11 122 1 359 333 963 2 433 2 516 2 993 52545-49 13 248 1 529 384 1 163 2 752 2 546 4 084 79050-54 15 192 1 556 268 1 327 3 153 2 626 5 408 85455-59 13 665 1 390 201 1 166 3 017 1 994 5 093 80460-64 6 603 782 113 541 1 761 827 2 253 32665-69 2 422 380 46 165 823 273 632 10370+ 3 171 831 61 231 1 077 145 614 212

259
APPENDIX
Continued table 8.3 MALE
Age group Total
Type of disabilityVisual Speeching Hearing Physical Mental Other Combined
TOTAL 58 947 7 767 1 871 4 617 13 963 11 028 16 206 3 4950-4 875 61 35 35 159 118 361 1065-9 1 880 193 113 83 355 327 590 21910-14 1 858 231 158 92 397 404 423 15315-19 1 822 255 134 125 385 450 330 14320-24 2 690 344 148 195 525 812 504 16225-29 3 755 482 151 323 836 1 154 632 17730-34 4 675 631 187 430 1 130 1 199 895 20335-39 5 539 751 186 473 1 389 1 345 1 135 26040-44 5 865 813 178 456 1 479 1 221 1 437 28145-49 6 797 953 211 526 1 644 1 176 1 905 38250-54 7 821 993 141 606 1 838 1 188 2 599 45655-59 8 271 962 113 687 1 893 955 3 111 55060-64 4 337 535 62 363 1 084 469 1 588 23665-69 1 458 220 22 102 457 156 434 6770+ 1 304 343 32 121 392 54 262 100
Continued table 8.3 FEMALE
Age group Total
Type of disabilityVisual Speeching Hearing Physical Mental Other Combined
TOTAL 47 416 4 995 1 437 4 079 10 011 10 489 13 856 2 5490-4 673 43 18 27 159 83 275 685-9 1 418 175 69 66 367 202 428 11110-14 1 416 176 84 57 361 282 346 11015-19 1 383 172 97 90 298 359 276 9120-24 1 995 202 101 162 421 618 391 10025-29 2 762 286 101 211 564 925 546 12930-34 3 624 388 164 327 695 1 059 805 18635-39 4 575 545 156 444 917 1 253 1 048 21240-44 5 257 546 155 507 954 1 295 1 556 24445-49 6 451 576 173 637 1 108 1 370 2 179 40850-54 7 371 563 127 721 1 315 1 438 2 809 39855-59 5 394 428 88 479 1 124 1 039 1 982 25460-64 2 266 247 51 178 677 358 665 9065-69 964 160 24 63 366 117 198 3670+ 1 867 488 29 110 685 91 352 112

260
2020 POPULATION AND HOUSING CENSUS OF MONGOLIA NATIONAL REPORT
TABLE 8.4. NUMBER OF POPULATION WITH DISABILITY AGED SIX AND ABOVE, BY AIMAG AND THE CAPITAL AND EDUCATIONAL LEVEL, 2020
Aimags and the Capital Total
Educational levelNon
educated Primary Lower secondary
Upper secondary
Technical and vocational
Specialized secondary Diploma Bachelor Master Doctor
TOTAL 104 200 16 815 14 142 21 634 30 335 4 253 5 465 947 10 004 569 36Arkhangai 3 387 695 790 879 646 114 103 8 144 8 -Bayan-Ulgii 4 189 559 918 1 040 1 063 192 102 20 281 13 1Bayankhongor 3 519 656 591 1 073 736 127 110 9 208 8 1Bulgan 2 066 385 374 596 421 62 81 6 136 5 -Govi-Altai 2 864 488 488 758 667 120 109 4 213 16 1Dornogovi 2 599 494 365 678 584 126 128 16 198 8 2Dornod 3 949 630 533 1 104 1 062 140 184 11 267 18 -Dundgovi 1 821 468 382 453 260 62 71 5 116 4 -Zavkhan 3 609 680 614 1 022 822 150 96 6 203 16 -Uvurkhangai 3 864 827 897 1 049 655 109 97 7 213 10 -Umnugovi 1 961 462 331 499 366 66 75 8 150 4 -Sukhbaatar 2 606 640 542 653 370 147 109 6 136 3 -Selenge 4 356 531 506 1 210 1 337 248 237 17 260 10 -Tuv 3 159 608 542 897 607 180 137 15 167 6 -Uvs 4 410 891 796 1 028 923 228 170 12 335 27 -Khovd 2 512 555 435 561 564 83 112 1 183 18 -Khuvsgul 5 717 1 206 1 324 1 372 1 236 111 197 17 244 10 -Khentii 2 935 660 533 763 624 81 106 5 159 4 -Darkhan-Uul 4 041 499 307 699 1 451 232 322 15 489 27 -Orkhon 4 152 549 335 638 1 619 209 290 28 458 24 2Govisumber 696 103 93 151 186 37 42 6 74 4 -Ulaanbaatar 35 788 4 229 2 446 4 511 14 136 1 429 2 587 725 5 370 326 29
TABLE 8.5. NUMBER OF POPULATION WITH DISABILITY AGED 15 AND ABOVE, BY MARITAL STATUS AND AIMAGS AND THE CAPITAL, 2020
Aimags and the Capital Total
Marital statusSingle/
Never Married
Registered married
Not registered married
Separeted/ Legally
married
Divorced/ not remarried Widowed
TOTAL 98 243 30 993 48 990 7 142 2 050 2 214 6 854Arkhangai 3 219 1 073 1 688 89 27 46 296Bayan-Ulgii 3 978 814 2 817 16 7 43 281Bayankhongor 3 357 1 241 1 644 168 36 71 197Bulgan 1 963 675 982 90 25 41 150Govi-Altai 2 727 859 1 595 66 17 37 153Dornogovi 2 433 798 1 050 268 73 62 182Dornod 3 754 1 352 1 710 345 104 91 152Dundgovi 1 700 610 797 113 44 50 86Zavkhan 3 467 1 031 2 073 117 21 45 180Uvurkhangai 3 625 1 336 1 790 179 51 60 209Umnugovi 1 815 660 666 277 61 34 117Sukhbaatar 2 483 827 1 255 113 31 42 215Selenge 4 183 1 290 2 085 342 131 94 241Tuv 3 001 1 033 1 382 236 100 67 183Uvs 4 173 1 127 2 536 62 34 43 371Khovd 2 353 864 1 267 19 12 40 151Khuvsgul 5 411 1 882 2 737 147 81 140 424Khentii 2 758 968 1 202 257 75 82 174Darkhan-Uul 3 811 1 005 1 987 279 103 133 304Orkhon 3 929 977 1 961 358 95 136 402Govisumber 659 186 310 75 30 14 44Ulaanbaatar 33 444 10 385 15 456 3 526 892 843 2 342

261
APPENDIX
TABLE 8.6. NUMBER OF POPULATION WITH DISABILITY AGED 15 AND ABOVE, BY EMPLOYMENT STATUS, AND AIMAGS AND THE CAPITAL, 2020
Aimags and the Capital Total
Employment status
Empl
oyed
Unem
ploy
ed
Perm
anen
t em
ploy
ees
Fixe
d-te
rm e
mpl
oyee
s
Shor
t ter
m a
nd c
asua
l em
ploy
ees
Paid
app
rent
ices
, tr
aine
es a
nd in
tern
s
Depe
nden
t co
ntra
ctor
s
Corp
orat
ions
Hous
ehol
d m
arke
t en
terp
rise
s
Oper
ator
s of
co
rpor
atio
ns
Acco
unt w
orke
rs in
ho
useh
old
mar
ket
ente
rpri
ses
Cont
ribu
ting
fam
ily
wor
kers
TOTAL 98 243 31 092 67 151 7 591 5 733 245 9 57 62 66 83 14 393 2 853
Arkhangai 3 219 1 436 1 783 135 89 1 - 1 1 1 1 907 300Bayan-Ulgii 3 978 1 178 2 800 130 87 2 1 1 2 - 5 620 330Bayankhongor 3 357 1 661 1 696 177 103 3 - 1 1 4 9 1 100 263Bulgan 1 963 807 1 156 123 79 4 1 - 1 - 3 518 78Govi-Altai 2 727 1 426 1 301 162 189 4 2 1 1 1 5 795 266Dornogovi 2 433 888 1 545 174 184 2 - 1 - 2 1 455 69Dornod 3 754 1 282 2 472 331 256 9 - 6 4 3 5 591 77Dundgovi 1 700 775 925 117 63 2 - 2 2 2 1 565 21Zavkhan 3 467 1 622 1 845 198 163 4 - - 1 4 3 1 056 193Uvurkhangai 3 625 1 749 1 876 175 152 18 1 2 2 4 8 1 267 120Umnugovi 1 815 726 1 089 172 90 3 - 1 - - 1 419 40Sukhbaatar 2 483 918 1 565 125 88 3 - 1 3 2 1 524 171Selenge 4 183 1 132 3 051 348 174 7 1 4 4 6 2 544 42Tuv 3 001 1 148 1 853 201 115 8 - 3 1 1 3 760 56Uvs 4 173 1 811 2 362 257 265 3 - 4 2 2 3 1 038 237Khovd 2 353 753 1 600 184 74 5 - - 1 - 2 423 64Khuvsgul 5 411 1 944 3 467 230 129 9 1 - 2 2 4 1 198 369Khentii 2 758 793 1 965 129 128 6 - 6 3 1 2 465 53Darkhan-Uul 3 811 832 2 979 306 268 2 - 1 5 4 4 229 13Orkhon 3 929 776 3 153 253 319 15 1 1 5 2 5 152 23Govisumber 659 219 440 63 87 2 - - - 1 - 63 3Ulaanbaatar 33 444 7 216 26 228 3 601 2 631 133 1 21 21 24 15 704 65

262
2020 POPULATION AND HOUSING CENSUS OF MONGOLIA NATIONAL REPORT
TABLE 8.7. NUMBER OF POPULATION WITH FUNCTIONAL DIFFICULTY AGED 18 AND ABOVE, BY DIFFICULTY TYPE AND AGE GROUP, 2020
Age group
Number of population Total
Type of difficultySeeing Hearing Walking Cognition Selfcare Communication
TOTAL 197 942 100.0 18.9 15.9 28.7 12.9 13.5 10.118-19 2 484 100.0 19.0 13.1 14.9 17.5 14.2 21.320-24 6 172 100.0 17.4 13.1 15.9 21.8 13.0 18.825-29 7 118 100.0 20.2 11.9 16.9 19.8 12.2 19.030-34 9 629 100.0 18.2 16.2 20.3 17.0 11.7 16.635-39 11 094 100.0 20.1 17.4 21.4 16.4 10.8 13.940-44 12 224 100.0 19.3 18.9 22.9 16.1 9.5 13.345-49 15 579 100.0 22.7 16.3 26.5 13.1 10.1 11.350-54 16 886 100.0 22.4 16.7 28.8 12.8 9.4 9.955-59 19 082 100.0 20.6 15.0 32.7 11.2 12.3 8.260-64 18 072 100.0 17.4 15.1 36.7 10.5 13.3 7.065-69 15 728 100.0 18.5 13.9 38.3 10.7 13.2 5.470+ 63 874 100.0 16.9 16.6 30.1 11.0 17.5 7.9
TABLE 9.1. NUMBER OF POPULATION AGED 6 AND ABOVE, BY CELLULAR PHONE USAGE, AND SEX, 2010, 2020
Age group
Total population Percentage of cellular phone users2010 2020 2010 2020
Total Male Female Total Male Female Total Male Female Total Male FemaleTOTAL 2 315 698 1 145 286 1 170 412 2 732 942 1 338 652 1 394 290 74.0 72.2 75.9 87.8 86.5 88.96-9 172 864 87 951 84 913 287 495 146 877 140 618 22.6 20.7 24.6 37.2 35.4 39.110-14 236 865 120 064 116 801 274 874 140 208 134 666 51.5 47.2 55.9 74.7 73.3 76.215-19 257 645 130 560 127 085 216 767 110 141 106 626 81.6 77.2 86.1 96.6 95.9 97.220-24 292 183 147 472 144 711 225 385 113 271 112 114 88.0 85.9 90.3 98.1 97.7 98.525-29 247 983 124 490 123 493 259 199 130 143 129 056 85.9 85.3 86.5 98.2 97.9 98.530-34 222 522 111 976 110 546 286 850 143 491 143 359 85.1 84.4 85.8 98.3 98.0 98.535-39 202 383 100 819 101 564 239 794 119 621 120 173 84.4 83.3 85.5 97.7 97.2 98.240-44 179 267 88 273 90 994 215 218 106 169 109 049 81.8 80.1 83.4 97.5 96.9 98.045-49 158 756 77 475 81 281 191 657 93 162 98 495 79.8 77.6 81.9 97.0 96.2 97.750-54 122 082 58 009 64 073 162 440 76 257 86 183 77.7 75.6 79.5 96.3 95.0 97.455-59 71 989 33 384 38 605 141 166 64 238 76 928 75.5 73.8 77.0 95.8 94.4 96.960-64 49 453 22 106 27 347 96 226 41 768 54 458 73.5 73.3 73.7 95.2 93.9 96.365-69 38 232 17 262 20 970 55 343 22 808 32 535 65.4 66.4 64.6 94.0 92.7 95.070+ 63 474 25 445 38 029 80 528 30 498 50 030 46.0 50.7 42.8 81.8 83.0 81.1

263
APPENDIX
TABLE 9.2. NUMBER OF POPULATION AGED 6 AND ABOVE, BY INTERNET USAGE, AND SEX, 2010, 2020
Age group
Total population Percentage of internet users2010 2020 2010 2020
Total Male Female Total Male Female Total Male Female Total Male FemaleTOTAL 2 315 698 1 145 286 1 170 412 2 732 942 1 338 652 1 394 290 30.6 28.4 32.8 64.7 62.7 66.66-9 172 864 87 951 84 913 287 495 146 877 140 618 7.7 8.0 7.3 20.4 20.6 20.210-14 236 865 120 064 116 801 274 874 140 208 134 666 25.5 25.3 25.6 57.8 56.8 58.815-19 257 645 130 560 127 085 216 767 110 141 106 626 53.4 49.8 57.1 90.1 88.3 91.820-24 292 183 147 472 144 711 225 385 113 271 112 114 53.0 48.4 57.7 91.3 89.8 92.825-29 247 983 124 490 123 493 259 199 130 143 129 056 38.8 35.1 42.6 88.2 86.6 89.730-34 222 522 111 976 110 546 286 850 143 491 143 359 30.0 26.3 33.9 85.9 84.2 87.535-39 202 383 100 819 101 564 239 794 119 621 120 173 26.9 23.1 30.7 78.0 75.2 80.740-44 179 267 88 273 90 994 215 218 106 169 109 049 23.7 20.5 26.9 71.3 67.2 75.145-49 158 756 77 475 81 281 191 657 93 162 98 495 22.8 19.8 25.6 66.4 61.2 71.050-54 122 082 58 009 64 073 162 440 76 257 86 183 20.0 18.0 21.9 57.6 51.6 62.755-59 71 989 33 384 38 605 141 166 64 238 76 928 16.1 16.4 15.9 51.2 45.2 56.160-64 49 453 22 106 27 347 96 226 41 768 54 458 12.5 14.4 11.0 41.6 37.8 44.765-69 38 232 17 262 20 970 55 343 22 808 32 535 8.0 9.8 6.5 33.7 33.3 34.070+ 63 474 25 445 38 029 80 528 30 498 50 030 3.2 4.2 2.6 18.4 20.4 17.0
TABLE 9.3. NUMBER OF EMPLOYED POPULATION AGED 15 AND ABOVE OF CELLULAR PHONE USAGE, BY EMPLOYMENT STATUS AND SEX, 2020
Employment statusTotal work force Percentage of cellular phone
users Percentage of cellular phone non-
usersTotal Male Female Total Male Female Total Male Female
TOTAL 1 167 921 617 419 550 502 97.9 97.4 98.4 2.1 2.6 1.6 Permanent employees 695 534 341 236 354 298 99.6 99.4 99.7 0.4 0.6 0.3
Fixed-term employees 75 243 43 108 32 135 98.8 98.2 99.4 1.2 1.8 0.6
Short-term and casual employees 11 073 7 642 3 431 98.0 97.4 99.3 2.0 2.6 0.7
Paid apprentices, trainees and interns 362 202 160 100.0 100.0 100.0 - - -
Dependent contractor 5 337 4 168 1 169 97.8 97.7 98.0 2.2 2.3 2.0 Employer in corporations 4 879 3 197 1 682 99.7 99.6 100.0 0.3 0.4 -
Employer in household market enterprises
2 370 1 325 1 045 99.4 99.6 99.2 0.6 0.4 0.8
Owner-operators of corporations without employees
3 609 1 796 1 813 97.6 97.4 97.7 2.4 2.6 2.3
Own-account workers in household market enterprises without employees
300 912 199 100 101 812 95.3 94.6 96.6 4.7 5.4 3.4
Contributing family workers 68 602 15 645 52 957 93.3 91.2 94.0 6.7 8.8 6.0

264
2020 POPULATION AND HOUSING CENSUS OF MONGOLIA NATIONAL REPORT
TABLE 9.4. NUMBER OF EMPLOYED POPULATION AGED 15 AND ABOVE OF INTERNET USAGE, BY EMPLOYMENT STATUS AND SEX, 2020
Employment statusTotal work force Percentage of internet
users Percentage of internet non-
usersTotal Male Female Total Male Female Total Male Female
TOTAL 1 167 921 617 419 550 502 75.3 72.3 78.5 24.7 27.7 21.5 Permanent employees 695 534 341 236 354 298 90.1 87.9 92.1 9.9 12.1 7.9
Fixed-term employees 75 243 43 108 32 135 80.4 77.7 83.6 19.6 22.3 16.4
Short-term and casual Employees 11 073 7 642 3 431 78.1 75.7 82.9 21.9 24.3 17.1
Paid apprentices, trainees and interns 362 202 160 85.1 85.7 84.4 14.9 14.3 15.6
Dependent contractor 5 337 4 168 1 169 83.0 81.0 88.4 17.0 19.0 11.6
Employer in corporations 4 879 3 197 1 682 93.1 93.2 92.9 6.9 6.8 7.1
Employer in household market enterprises
2 370 1 325 1 045 84.4 85.6 83.1 15.6 14.4 16.9
Owner-operators of corporations without employees
3 609 1 796 1 813 79.6 80.1 79.1 20.4 19.9 20.9
Own-account workers in household market enterprises without employees
300 912 199 100 101 812 51.1 47.0 58.6 48.9 53.0 41.4
Contributing family workers 68 602 15 645 52 957 43.5 58.8 38.5 56.5 41.2 61.5
TABLE 9.5. NUMBER OF UNEMPLOYED POPULATION AGED 15 AND ABOVE OF CELLULAR PHONE USAGE, BY REASON OF UNEMPLOYMENT AND SEX, 2020
Reason for unemployed
Percentage of cellular phone users Percentage of cellular phone non-usersTotal Male Female Total Male Female
TOTAL 94.3 93.2 95.0 6.1 7.3 5.2In school 97.8 97.5 98.1 2.2 2.6 1.9In pension 91.7 90.8 92.2 9.0 10.1 8.5Disabled 75.0 74.8 75.1 33.4 33.6 33.2Home maker 98.1 94.0 98.5 1.9 6.4 1.5Couldn't find an approriate job 95.5 94.2 97.2 4.7 6.2 2.9
Registered and searching for job 96.8 95.6 97.8 3.3 4.6 2.2
Searching for job without register 96.9 95.2 98.3 3.2 5.1 1.7
Not interested in working 84.8 82.4 90.8 17.9 21.4 10.2
Other 95.8 94.8 96.9 4.3 5.5 3.2

265
APPENDIX
TABLE 9.6. NUMBER OF UNEMPLOYED POPULATION AGED 15 AND ABOVE OF INTERNET USAGE, BY REASON OF UNEMPLOYMENT, AND SEX, 2020
Reason for unemployedPercentage of internet users Percentage of internet non-users
Total Male Female Total Male FemaleTOTAL 97.9 97.4 98.4 2.1 2.6 1.6In school 99.6 99.4 99.7 0.4 0.6 0.3In pension 98.8 98.2 99.4 1.2 1.8 0.6Disabled 98.0 97.4 99.3 2.0 2.6 0.7Home maker 100.0 100.0 100.0 0.0 0.0 0.0Couldn't find an approriate job 97.8 97.7 98.0 2.2 2.3 2.0
Registered and searching for job 99.7 99.6 100.0 0.3 0.4 0.0
Searching for job without register 99.4 99.6 99.2 0.6 0.4 0.8
Not interested in working 97.6 97.4 97.7 2.4 2.6 2.3Other 95.3 94.6 96.6 4.7 5.4 3.4
TABLE 9.7. NUMBER OF POPULATION AGED 6 AND ABOVE, BY CELLULAR PHONE USAGE, AND EDUCATIONAL LEVEL, 2020
Education level
Population aged 6 and above Percentage of cellular phone users
Percentage of cellular phone non-users
Total Male Female Total Male Female Total Male FemaleTOTAL 2 711 881 1 325 373 1 386 508 87.8 86.5 88.9 12.2 13.5 11.1Non-Educated 405 935 208 944 196 991 45.9 45.3 46.5 54.1 54.7 53.5Primary 332 826 172 651 160 175 80.1 79.5 80.7 19.9 20.5 19.3Lower Secondary 414 060 226 408 187 652 94.3 93.8 95.0 5.7 6.2 5.0
Upper Secondary 708 410 362 505 345 905 98.0 97.7 98.3 2.0 2.3 1.7
Technical and vocational 93 625 50 835 42 790 98.0 97.6 98.4 2.0 2.4 1.6
Specialized secondary 113 985 48 236 65 749 98.2 97.9 98.4 1.8 2.1 1.6
Diploma 27 863 10 986 16 877 98.2 97.6 98.6 1.8 2.4 1.4Bachelor 560 088 225 464 334 624 99.6 99.4 99.7 0.4 0.6 0.3Master 51 656 17 660 33 996 99.8 99.7 99.8 0.2 0.3 0.2Doctoral 3 433 1 684 1 749 99.1 98.3 100.0 0.9 1.7 0.0

266
2020 POPULATION AND HOUSING CENSUS OF MONGOLIA NATIONAL REPORT
TABLE 9.8. NUMBER OF POPULATION AGED 6 AND ABOVE, BY INTERNET USAGE, AND EDUCATIONAL LEVEL, 2020
Education levelPopulation aged 6 and above Percentage of internet
usersPercentage of internet non-
usersTotal Male Female Total Male Female Total Male Female
TOTAL 2 711 881 1 325 373 1 386 508 64.7 62.7 66.6 54.5 59.5 50.2Non-Educated 405 935 208 944 196 991 23.0 23.7 22.3 333.9 321.8 347.6Primary 332 826 172 651 160 175 52.0 52.2 51.8 92.3 91.7 92.9Lower Secondary 414 060 226 408 187 652 55.8 54.7 57.0 79.3 82.7 75.5Upper Secondary 708 410 362 505 345 905 71.1 71.3 70.9 40.6 40.2 41.0Technical and vocational 93 625 50 835 42 790 67.3 67.4 67.2 48.6 48.4 48.8
Specialized secondary 113 985 48 236 65 749 68.4 70.4 66.9 46.2 41.9 49.6
Diploma 27 863 10 986 16 877 70.6 66.7 73.0 41.7 49.8 37.0Bachelor 560 088 225 464 334 624 93.6 92.8 94.1 6.9 7.8 6.3Master 51 656 17 660 33 996 97.8 96.7 98.5 2.2 3.4 1.5Doctoral 3 433 1 684 1 749 95.5 92.4 98.5 4.7 8.2 1.5
TABLE 10.1. ECONOMIC ACTIVITIES OF THE POPULATION AGED 15 AND ABOVE, BY AGE GROUPS, AND SEX, 2020
TOTAL
Age groups
Popu
latio
n ag
ed 1
5 an
d ab
ove
Labor force Outside the labor force
Tota
l
Empl
oyed
Unem
ploy
ed
Tota
l
Stud
ent
Retir
ed
Disa
bled
Enga
gmen
t in
hous
ehol
d du
ties
Suita
ble
wor
k no
t fo
und
Unw
illin
g to
wor
k
Othe
r
TOTAL 2 170 573 1 296 781 1 167 921 128 860 873 792 327 237 236 442 45 658 92 492 103 680 3 672 64 611
15-19 216 767 16 616 15 868 748 200 151 193 155 - 705 1 563 1 960 101 2 667
20-24 225 385 100 007 93 712 6 295 125 378 98 070 - 1 990 7 585 10 750 230 6 753
25-29 259 199 189 519 172 869 16 650 69 680 24 910 - 3 113 15 803 16 777 382 8 695
30-34 286 850 230 631 206 557 24 074 56 219 7 139 - 4 118 19 091 15 411 504 9 956
35-39 239 794 194 078 173 712 20 366 45 716 3 066 - 5 068 15 666 13 003 495 8 418
40-44 215 218 175 891 157 103 18 788 39 327 428 660 5 661 11 262 12 772 536 8 008
45-49 191 657 154 824 137 828 16 996 36 833 201 1 772 6 719 8 189 12 074 570 7 308
50-54 162 440 121 087 107 344 13 743 41 353 97 7 288 7 975 7 682 11 333 464 6 514
55-59 141 166 75 350 64 970 10 380 65 816 66 41 663 7 096 4 407 7 768 294 4 522
60-64 96 226 24 296 23 606 690 71 930 44 65 350 2 478 1 012 1 624 79 1 343
65-69 55 343 8 331 8 221 110 47 012 28 45 816 544 176 176 10 262
70+ 80 528 6 151 6 131 20 74 377 33 73 893 191 56 32 7 165

267
APPENDIX
Continued table 10.1 MALE
Age groups
Popu
latio
n ag
ed
15 a
nd a
bove
Labor force Outside the labor force
Tota
l
Empl
oyed
Unem
ploy
ed
Tota
l
Stud
ent
Retir
ed
Disa
bled
Enga
gem
ent
in h
ouse
hold
du
ties
Unab
le to
fin
d su
itabl
e jo
b
Unw
illin
g to
w
ork
Othe
r
TOTAL 1 051 567 686 163 617 419 68 744 365 404 151 765 75 586 25 449 10 928 62 303 2 612 36 76115-19 110 141 12 158 11 691 467 97 983 93 840 - 405 617 1 271 75 1 77520-24 113 271 57 779 54 393 3 386 55 492 42 930 - 1 119 1 061 6 346 142 3 89425-29 130 143 101 939 93 189 8 750 28 204 10 624 - 1 702 1 316 9 560 261 4 74130-34 143 491 121 867 108 674 13 193 21 624 2 783 - 2 295 1 473 9 111 356 5 60635-39 119 621 101 251 90 028 11 223 18 370 1 200 - 2 740 1 309 7 940 361 4 82040-44 106 169 88 816 78 374 10 442 17 353 174 445 2 946 1 138 7 720 382 4 54845-49 93 162 75 881 66 968 8 913 17 281 98 1 097 3 455 1 131 7 054 420 4 02650-54 76 257 59 112 52 421 6 691 17 145 48 1 983 4 030 1 173 6 250 318 3 34355-59 64 238 43 579 38 500 5 079 20 659 28 6 364 4 449 1 198 5 559 225 2 83660-64 41 768 14 885 14 387 498 26 883 17 22 323 1 808 410 1 339 64 92265-69 22 808 5 144 5 056 88 17 664 11 16 874 394 82 136 6 16170+ 30 498 3 752 3 738 14 26 746 12 26 500 106 20 17 2 89
Continued table 10.1 FEMALE
Age groups
Popu
latio
n ag
ed
15 a
nd a
bove
Labor force Outside the labor force
Tota
l
Empl
oyed
Unem
ploy
ed
Tota
l
Stud
ent
retir
ed
Disa
bled
enga
gem
ent
in h
ouse
hold
du
ties
Unab
le to
find
su
itabl
e jo
b
Unw
illin
g to
w
ork
Othe
r
TOTAL 1 119 006 610 618 550 502 60 116 508 388 175 472 160 856 20 209 81 564 41 377 1 060 27 85015-19 106 626 4 458 4 177 281 102 168 99 315 - 300 946 689 26 89220-24 112 114 42 228 39 319 2 909 69 886 55 140 - 871 6 524 4 404 88 2 85925-29 129 056 87 580 79 680 7 900 41 476 14 286 - 1 411 14 487 7 217 121 3 95430-34 143 359 108 764 97 883 10 881 34 595 4 356 - 1 823 17 618 6 300 148 4 35035-39 120 173 92 827 83 684 9 143 27 346 1 866 - 2 328 14 357 5 063 134 3 59840-44 109 049 87 075 78 729 8 346 21 974 254 215 2 715 10 124 5 052 154 3 46045-49 98 495 78 943 70 860 8 083 19 552 103 675 3 264 7 058 5 020 150 3 28250-54 86 183 61 975 54 923 7 052 24 208 49 5 305 3 945 6 509 5 083 146 3 17155-59 76 928 31 771 26 470 5 301 45 157 38 35 299 2 647 3 209 2 209 69 1 68660-64 54 458 9 411 9 219 192 45 047 27 43 027 670 602 285 15 42165-69 32 535 3 187 3 165 22 29 348 17 28 942 150 94 40 4 10170+ 50 030 2 399 2 393 6 47 631 21 47 393 85 36 15 5 76

268
2020 POPULATION AND HOUSING CENSUS OF MONGOLIA NATIONAL REPORT
TABLE 10.2. ECONOMIC ACTIVITIES OF THE POPULATION AGED 15 AND ABOVE, BY AGE GROUPS AND URBAN RURAL, 2020
URBAN
Age groups
Population aged 15
and above
Labor force Outside the labor force
Tota
l
Empl
oyed
Unem
ploy
ed
Tota
l
Stud
ent
Retir
ed
Disa
bled
Enga
gem
ent
in h
ouse
hold
du
ties
Unab
le to
fin
d s
uita
ble
job
Unw
illin
g to
w
ork
Othe
r
TOTAL 1 464 947 852 436 740 007 112 429 612 511 216 177 171 450 33 634 71 626 70 727 2 342 46 55515-19 132 943 7 893 7 460 433 125 050 121 250 - 360 948 1 081 46 1 36520-24 138 445 57 830 53 741 4 089 80 615 64 636 - 1 190 4 931 5 948 111 3 79925-29 179 341 128 094 114 728 13 366 51 247 20 021 - 2 067 12 236 10 746 225 5 95230-34 210 249 166 183 144 855 21 328 44 066 6 558 - 2 970 15 766 10 795 329 7 64835-39 166 818 131 812 113 576 18 236 35 006 2 877 - 3 747 12 634 9 101 325 6 32240-44 144 638 115 095 98 125 16 970 29 543 404 507 4 259 8 885 9 103 354 6 03145-49 127 877 100 190 84 882 15 308 27 687 188 1 320 5 097 6 268 8 778 394 5 64250-54 108 707 78 321 65 905 12 416 30 386 92 4 894 6 113 5 850 8 126 308 5 00355-59 96 411 48 134 38 471 9 663 48 277 61 30 146 5 426 3 249 5 687 199 3 50960-64 65 959 12 441 11 932 509 53 518 37 48 627 1 885 707 1 199 45 1 01865-69 38 233 3 919 3 827 92 34 314 23 33 439 411 122 138 5 17670+ 55 326 2 524 2 505 19 52 802 30 52 517 109 30 25 1 90
Continued table 10.2 RURAL
Age groups
Population aged 15
and above
Labor force Outside the labor force
Tota
l
Empl
oyed
Unem
ploy
ed
Tota
l
Stud
ent
Retir
ed
Disa
bled
Enga
gem
ent
in h
ouse
hold
du
ties
Unab
le to
find
su
itabl
e jo
b
Unw
illin
g to
w
ork
Othe
rTOTAL 705 626 444 345 427 914 16 431 261 281 111 060 64 992 12 024 20 866 32 953 1 330 18 05615-19 83 824 8 723 8 408 315 75 101 71 905 - 345 615 879 55 1 30220-24 86 940 42 177 39 971 2 206 44 763 33 434 - 800 2 654 4 802 119 2 95425-29 79 858 61 425 58 141 3 284 18 433 4 889 - 1 046 3 567 6 031 157 2 74330-34 76 601 64 448 61 702 2 746 12 153 581 - 1 148 3 325 4 616 175 2 30835-39 72 976 62 266 60 136 2 130 10 710 189 - 1 321 3 032 3 902 170 2 09640-44 70 580 60 796 58 978 1 818 9 784 24 153 1 402 2 377 3 669 182 1 97745-49 63 780 54 634 52 946 1 688 9 146 13 452 1 622 1 921 3 296 176 1 66650-54 53 733 42 766 41 439 1 327 10 967 5 2 394 1 862 1 832 3 207 156 1 51155-59 44 755 27 216 26 499 717 17 539 5 11 517 1 670 1 158 2 081 95 1 01360-64 30 267 11 855 11 674 181 18 412 7 16 723 593 305 425 34 32565-69 17 110 4 412 4 394 18 12 698 5 12 377 133 54 38 5 8670+ 25 202 3 627 3 626 1 21 575 3 21 376 82 26 7 6 75

269
APPENDIX
TABLE 10.3. ECONOMIC ACTIVITIES OF THE POPULATION AGED 15 AND ABOVE, BY AIMAGS AND THE CAPITAL, 2020
TOTAL
Aimags and the Capital
Popu
latio
n ag
ed 1
5 an
d ab
ove
Labor force Outside the labor force
Tota
l
Empl
oyed
Unem
ploy
ed
Tota
l
Stud
ent
Retir
ed
Disa
bled
Enga
gem
ent
in h
ouse
hold
du
ties
Unab
le to
find
su
itabl
e jo
b
Unw
illin
g to
w
ork
Othe
r
TOTAL 2 170 573 1 296 781 1 167 921 128 860 873 792 327 237 236 442 45 658 92 492 103 680 3 672 64 611
Arkhangai 64 919 42 464 40 657 1 807 22 455 10 583 6 113 1 116 1 199 2 778 65 601Bayan-Ulgii 67 181 32 748 27 779 4 969 34 433 15 939 6 075 1 435 2 981 5 378 137 2 488Bayankhongor 59 639 40 362 37 946 2 416 19 277 8 072 5 298 1 004 1 324 2 521 59 999Bulgan 43 227 27 182 25 823 1 359 16 045 6 614 4 423 617 1 211 1 848 52 1 280Gobi-Altai 39 898 26 046 24 864 1 182 13 852 6 352 3 465 658 751 1 759 42 825Dornogobi 47 494 30 212 29 158 1 054 17 282 6 306 4 605 1 011 1 428 2 265 91 1 576Dornod 55 503 35 508 28 116 7 392 19 995 7 086 6 874 1 775 1 287 2 072 54 847Dundgobi 32 561 21 364 20 470 894 11 197 4 595 3 457 607 566 1 240 59 673Zavkhan 50 002 29 938 28 220 1 718 20 064 8 601 5 456 1 057 1 124 2 554 88 1 184Uvurkhangai 79 560 51 303 49 708 1 595 28 257 11 755 7 753 1 188 1 821 3 639 100 2 001Umnugobi 47 596 31 294 30 024 1 270 16 302 6 510 3 641 602 1 927 1 522 107 1 993Sukhbaatar 43 107 28 091 26 286 1 805 15 016 4 930 4 808 1 138 1 301 2 208 81 550Selenge 74 971 40 425 38 341 2 084 34 546 11 411 8 902 1 918 3 840 4 828 162 3 485Tuv 63 747 38 509 37 496 1 013 25 238 8 440 7 756 1 126 2 611 3 042 174 2 089Uvs 54 893 31 827 30 485 1 342 23 066 10 041 5 074 1 177 1 141 4 183 57 1 393Khovd 58 345 32 559 30 503 2 056 25 786 11 504 5 775 1 041 1 985 3 273 109 2 099Khuvsgul 91 813 55 096 52 212 2 884 36 717 14 496 9 163 2 112 3 182 5 497 171 2 096Khentii 53 122 28 859 27 557 1 302 24 263 8 592 5 549 1 142 2 156 4 510 194 2 120Darkhan-Uul 70 171 39 582 36 548 3 034 30 589 10 401 9 392 2 053 3 437 4 223 52 1 031Orkhon 71 978 39 301 37 356 1 945 32 677 9 247 9 905 2 346 3 931 5 719 124 1 405Gobisumber 11 442 6 952 6 411 541 4 490 1 570 1 262 235 353 510 23 537
Ulaanbaatar 989 404 587 159 501 961 85 198 402 245 144 192 111 696 20 300 52 936 38 111 1 671 33
339

270
2020 POPULATION AND HOUSING CENSUS OF MONGOLIA NATIONAL REPORT
Continued table 10.3 MALE
Aimags and the Capital
Popu
latio
n ag
ed
15 a
nd a
bove
Labor force Outside the labor force
Tota
l
Empl
oyed
Unem
ploy
ed
Tota
l
Stud
ent
Retir
ed
Disa
bled
Enga
gem
ent
in h
ouse
hold
du
ties
Unab
le to
fin
d s
uita
ble
job
Unw
illin
g to
w
ork
Othe
r
TOTAL 1 051 567 686 163 617 419 68 744 365 404 151 765 75 586 25 449 10 928 62 303 2 612 36 761
Arkhangai 32 308 22 708 21 632 1 076 9 600 4 820 1 823 604 278 1 659 42 374 Bayan-Ulgii 33 219 17 918 15 465 2 453 15 301 7 630 2 152 687 517 2 958 85 1 272 Bayankhongor 28 840 21 100 19 895 1 205 7 740 3 416 1 482 542 248 1 425 39 588 Bulgan 21 842 14 849 14 098 751 6 993 3 091 1 387 342 233 1 133 47 760 Gobi-Altai 19 544 13 664 13 080 584 5 880 2 965 935 342 110 1 018 25 485 Dornogobi 23 512 16 434 15 900 534 7 078 2 775 1 395 605 68 1 249 68 918 Dornod 27 813 19 369 15 772 3 597 8 444 3 206 2 140 1 000 270 1 268 38 522 Dundgobi 16 176 11 402 10 879 523 4 774 2 066 1 050 321 79 783 45 430 Zavkhan 24 574 16 187 15 311 876 8 387 4 114 1 521 535 138 1 382 49 648 Uvurkhangai 39 092 27 485 26 634 851 11 607 5 264 2 264 644 193 1 994 74 1 174 Umnugobi 24 168 17 489 16 753 736 6 679 2 981 1 083 336 213 918 70 1 078 Sukhbaatar 21 506 15 416 14 423 993 6 090 2 096 1 415 674 139 1 337 67 362 Selenge 37 954 22 859 21 616 1 243 15 095 5 299 3 025 1 075 540 2 976 123 2 057 Tuv 32 743 21 676 21 091 585 11 067 3 906 2 564 637 475 1 992 136 1 357 Uvs 27 210 17 113 16 420 693 10 097 4 588 1 458 606 169 2 427 35 814 Khovd 28 764 17 870 16 819 1 051 10 894 5 321 1 718 578 193 1 845 81 1 158 Khuvsgul 44 815 29 384 27 923 1 461 15 431 6 530 2 701 1 112 535 3 206 129 1 218 Khentii 26 747 15 909 15 171 738 10 838 4 005 1 791 652 368 2 609 140 1 273 Darkhan-Uul 33 779 21 415 19 798 1 617 12 364 4 769 3 069 1 164 424 2 294 36 608 Orkhon 34 726 21 061 19 937 1 124 13 665 4 347 3 491 1 268 179 3 487 82 811 Gobisumber 5 686 3 697 3 383 314 1 989 731 419 139 21 325 20 334
Ulaanbaatar 466 549 301 158 255 419 45 739 165 391 67 845 36 703 11 586 5 538 24 018 1 181 18 520
Continued table 10.3 FEMALE
Aimags and the Capital
Popu
latio
n ag
ed
15 a
nd a
bove
Labor force Outside the labor force
Tota
l
Empl
oyed
Unem
ploy
ed
Tota
l
Stud
ent
Retir
ed
Disa
bled
Enga
gem
ent
in h
ouse
hold
du
ties
Unab
le to
fin
d s
uita
ble
job
Unw
illin
g to
w
ork
Othe
r
TOTAL 1 119 006 610 618 550 502 60 116 508 388 175 472 160 856 20 209 81 564 41 377 1 060 27 850Arkhangai 32 611 19 756 19 025 731 12 855 5 763 4 290 512 921 1 119 23 227Bayan-Ulgii 33 962 14 830 12 314 2 516 19 132 8 309 3 923 748 2 464 2 420 52 1 216Bayankhongor 30 799 19 262 18 051 1 211 11 537 4 656 3 816 462 1 076 1 096 20 411Bulgan 21 385 12 333 11 725 608 9 052 3 523 3 036 275 978 715 5 520Gobi-Altai 20 354 12 382 11 784 598 7 972 3 387 2 530 316 641 741 17 340Dornogobi 23 982 13 778 13 258 520 10 204 3 531 3 210 406 1 360 1 016 23 658Dornod 27 690 16 139 12 344 3 795 11 551 3 880 4 734 775 1 017 804 16 325Dundgobi 16 385 9 962 9 591 371 6 423 2 529 2 407 286 487 457 14 243Zavkhan 25 428 13 751 12 909 842 11 677 4 487 3 935 522 986 1 172 39 536Uvurkhangai 40 468 23 818 23 074 744 16 650 6 491 5 489 544 1 628 1 645 26 827Umnugobi 23 428 13 805 13 271 534 9 623 3 529 2 558 266 1 714 604 37 915Sukhbaatar 21 601 12 675 11 863 812 8 926 2 834 3 393 464 1 162 871 14 188Selenge 37 017 17 566 16 725 841 19 451 6 112 5 877 843 3 300 1 852 39 1 428Tuv 31 004 16 833 16 405 428 14 171 4 534 5 192 489 2 136 1 050 38 732Uvs 27 683 14 714 14 065 649 12 969 5 453 3 616 571 972 1 756 22 579Khovd 29 581 14 689 13 684 1 005 14 892 6 183 4 057 463 1 792 1 428 28 941Khuvsgul 46 998 25 712 24 289 1 423 21 286 7 966 6 462 1 000 2 647 2 291 42 878Khentii 26 375 12 950 12 386 564 13 425 4 587 3 758 490 1 788 1 901 54 847Darkhan-Uul 36 392 18 167 16 750 1 417 18 225 5 632 6 323 889 3 013 1 929 16 423Orkhon 37 252 18 240 17 419 821 19 012 4 900 6 414 1 078 3 752 2 232 42 594Gobisumber 5 756 3 255 3 028 227 2 501 839 843 96 332 185 3 203Ulaanbaatar 522 855 286 001 246 542 39 459 236 854 76 347 74 993 8 714 47 398 14 093 490 14 819

271
APPENDIX
TABLE 10.4. EMPLOYED POPULATION AGED 15 AND ABOVE, BY OCCUPATIONAL CLASSIFICATION, URBAN, RURAL AND SEX, 2020
Occupational classification
Total Urban RuralTotal Male Female Total Male Female Total Male Female
TOTAL 1 167 921 617 419 550 502 740 007 378 581 361 426 427 914 238 838 189 076Managers 117 610 59 790 57 820 100 521 50 556 49 965 17 089 9 234 7 855Professionals 231 682 83 166 148 516 188 230 69 121 119 109 43 452 14 045 29 407Technicians and associate professionals
49 472 24 952 24 520 40 061 20 338 19 723 9 411 4 614 4 797
Clerical support workers 42 814 13 630 29 184 34 588 10 790 23 798 8 226 2 840 5 386
Service and sales workers 139 715 50 140 89 575 114 315 42 380 71 935 25 400 7 760 17 640
Skilled agricultural, forestry and fishery workers
279 610 165 779 113 831 22 217 13 988 8 229 257 393 151 791 105 602
Craft and related trades workers 89 475 62 888 26 587 73 149 52 257 20 892 16 326 10 631 5 695
Plant and machine operators, and assemblers
94 471 85 656 8 815 74 788 67 568 7 220 19 683 18 088 1 595
Elementary occupations 100 522 52 340 48 182 76 279 38 627 37 652 24 243 13 713 10 530
Armed forces occupations 22 550 19 078 3 472 15 859 12 956 2 903 6 691 6 122 569

272
2020 POPULATION AND HOUSING CENSUS OF MONGOLIA NATIONAL REPORT
TABLE 10.5. EMPLOYED POPULATION AGED 15 AND ABOVE, BY INDUSTRIAL CLASSIFICATION OF ECONOMIC ACTIVITIES, URBAN, RURAL AND SEX, 2020
Industrial classification of economic activities
Total Urban RuralTotal Male Female Total Male Female Total Male Female
TOTAL 1 167 921 617 419 550 502 740 007 378 581 361 426 427 914 238 838 189 076Agriculture, Hunting and Forestry 286 286 169 130 117 156 28 331 17 304 11 027 257
955 151 826 106 129
Mining and quarrying 51 262 41 007 10 255 37 668 29 725 7 943 13 594 11 282 2 312Manufacturing 90 483 45 807 44 676 73 571 37 233 36 338 16 912 8 574 8 338Electricity, gas and water supply 16 564 12 088 4 476 13 658 9 736 3 922 2 906 2 352 554
"Water supply, sewerage, waste management and remediation activities"
7 863 4 425 3 438 6 821 3 730 3 091 1 042 695 347
Construction 68 100 51 751 16 349 58 958 44 221 14 737 9 142 7 530 1 612"Wholesale and retail trade; repair of motor vehicles and motorcycles"
142 180 67 986 74 194 123 037 58 451 64 586 19 143 9 535 9 608
Transportation and storage 58 072 45 413 12 659 49 973 38 678 11 295 8 099 6 735 1 364Accommodation and food service activities 27 129 7 871 19 258 22 674 6 771 15 903 4 455 1 100 3 355
Information and communication 17 745 9 425 8 320 15 907 8 358 7 549 1 838 1 067 771
Financial and insurance activities 30 980 10 995 19 985 25 921 9 516 16 405 5 059 1 479 3 580
Real estate activities 4 534 2 156 2 378 4 210 1 982 2 228 324 174 150Professional, scientific and technical activities 22 794 11 328 11 466 19 131 9 418 9 713 3 663 1 910 1 753
Administrative and support service activities 24 730 15 433 9 297 21 407 13 240 8 167 3 323 2 193 1 130
Public administration and defense; compulsory social security
94 164 57 160 37 004 69 824 40 756 29 068 24 340 16 404 7 936
Education 115 116 27 117 87 999 80 329 18 865 61 464 34 787 8 252 26 535Human health and social work activities 50 657 9 445 41 212 38 947 7 070 31 877 11 710 2 375 9 335
Arts, entertainment and recreation 10 453 5 156 5 297 7 725 3 770 3 955 2 728 1 386 1 342
Other service activities 44 909 21 741 23 168 38 613 18 024 20 589 6 296 3 717 2 579
Activities of households as employers; undifferentiated goods- and services-producing activities of households for own use
2 149 1 178 971 1 703 998 705 446 180 266
Activities of extraterritorial organizations and bodies 1 751 807 944 1 599 735 864 152 72 80

273
APPENDIX
TABLE 10.6. EMPLOYED POPULATION AGED 15 AND ABOVE, BY EMPLOYMENT STATUS, AGE GROUPS AND SEX, 2020
TOTAL
Age groups Total
Employment status
Perm
anen
t em
ploy
ees
Fixe
d-te
rm e
mpl
oyee
s
Shor
t-te
rm a
nd c
asua
l em
ploy
ees
Paid
app
rent
ices
, tra
inee
s an
d in
tern
s
Depe
nden
t con
trac
tors
Empl
oyer
s in
cor
pora
tions
Empl
oyer
in h
ouse
hold
m
arke
t ent
erpr
ises
Owne
r-op
erat
ors
of
corp
orat
ions
with
out
empl
oyee
s
Own-
acco
unt w
orke
rs
in h
ouse
hold
mar
ket
ente
rpri
ses
with
out
empl
oyee
s
Cont
ribu
ting
fam
ily
wor
kers
TOTAL 1 167 921 695 534 75 243 11 073 362 5 337 4 879 2 370 3 609 300 912 68 60215-19 15 868 8 742 2 395 202 39 55 10 23 21 1 445 2 93620-24 93 712 68 927 3 880 918 111 489 65 83 170 11 002 8 06725-29 172 869 126 801 6 260 1 515 72 1 001 290 262 418 27 124 9 12630-34 206 557 142 867 8 906 1 967 44 1 202 669 368 591 40 416 9 52735-39 173 712 103 726 8 105 1 783 38 815 767 401 519 47 431 10 12740-44 157 103 85 686 7 761 1 599 19 619 767 392 541 49 879 9 84045-49 137 828 72 714 8 073 1 388 19 600 828 342 520 45 617 7 72750-54 107 344 54 783 8 198 989 10 356 685 234 419 36 052 5 61855-59 64 970 25 773 10 625 533 7 153 514 163 233 23 603 3 36660-64 23 606 4 331 6 671 133 1 34 196 63 112 10 654 1 41165-69 8 221 763 2 642 31 - 10 67 26 41 4 133 50870+ 6 131 421 1 727 15 2 3 21 13 24 3 556 349
Continued table 10.6 MALE
Age groups Total
Employment status
Perm
anen
t em
ploy
ees
Fixe
d-te
rm e
mpl
oyee
s
Shor
t-te
rm a
nd c
asua
l em
ploy
ees
Paid
app
rent
ices
, tra
inee
s an
d in
tern
s
Depe
nden
t con
trac
tors
Empl
oyer
s in
cor
pora
tions
Empl
oyer
in h
ouse
hold
m
arke
t ent
erpr
ises
Owne
r-op
erat
ors
of
corp
orat
ions
with
out
empl
oyee
s
Own-
acco
unt w
orke
rs
in h
ouse
hold
mar
ket
ente
rpri
ses
with
out
empl
oyee
s
Cont
ribu
ting
fam
ily
wor
kers
TOTAL 617 419 341 236 43 108 7 642 202 4 168 3 197 1 325 1 796 199 100 15 64515-19 11 691 5 770 2 212 136 26 43 7 16 19 1 146 2 31620-24 54 393 37 490 2 658 663 65 414 42 53 103 8 191 4 71425-29 93 189 64 160 3 903 1 090 42 820 187 161 235 19 601 2 99030-34 108 674 70 195 5 578 1 453 18 983 454 202 285 27 919 1 58735-39 90 028 49 139 5 080 1 236 19 636 542 231 264 31 793 1 08840-44 78 374 38 277 4 572 1 088 8 470 510 221 250 32 078 90045-49 66 968 31 228 4 673 880 10 427 532 182 266 28 048 72250-54 52 421 24 348 4 163 609 7 225 412 118 171 21 796 57255-59 38 500 16 864 4 107 382 6 121 338 86 111 16 078 40760-64 14 387 3 024 3 439 78 - 21 119 39 55 7 451 16165-69 5 056 447 1 592 15 - 7 41 9 23 2 838 8470+ 3 738 294 1 131 12 1 1 13 7 14 2 161 104

274
2020 POPULATION AND HOUSING CENSUS OF MONGOLIA NATIONAL REPORT
Continued table 10.6 FEMALE
Age groups Total
Employment status
Perm
anen
t em
ploy
ees
Fixe
d-te
rm e
mpl
oyee
s
Shor
t-te
rm a
nd c
asua
l em
ploy
ees
Paid
app
rent
ices
, tr
aine
es a
nd in
tern
s
Depe
nden
t con
trac
tors
Empl
oyer
s in
co
rpor
atio
ns
Empl
oyer
in h
ouse
hold
m
arke
t ent
erpr
ises
Owne
r-op
erat
ors
of
corp
orat
ions
with
out
empl
oyee
s
Own-
acco
unt w
orke
rs
in h
ouse
hold
mar
ket
ente
rpri
ses
with
out
empl
oyee
s
Cont
ribu
ting
fam
ily
wor
kers
TOTAL 550 502 354 298 32 135 3 431 160 1 169 1 682 1 045 1 813 101 812 52 95715-19 4 177 2 972 183 66 13 12 3 7 2 299 62020-24 39 319 31 437 1 222 255 46 75 23 30 67 2 811 3 35325-29 79 680 62 641 2 357 425 30 181 103 101 183 7 523 6 13630-34 97 883 72 672 3 328 514 26 219 215 166 306 12 497 7 94035-39 83 684 54 587 3 025 547 19 179 225 170 255 15 638 9 03940-44 78 729 47 409 3 189 511 11 149 257 171 291 17 801 8 94045-49 70 860 41 486 3 400 508 9 173 296 160 254 17 569 7 00550-54 54 923 30 435 4 035 380 3 131 273 116 248 14 256 5 04655-59 26 470 8 909 6 518 151 1 32 176 77 122 7 525 2 95960-64 9 219 1 307 3 232 55 1 13 77 24 57 3 203 1 25065-69 3 165 316 1 050 16 - 3 26 17 18 1 295 42470+ 2 393 127 596 3 1 2 8 6 10 1 395 245
TABLE 10.7. EMPLOYED POPULATION AGED 15 AND ABOVE, BY EMPLOYMENT STATUS, AGE GROUPS AND URBAN RURAL, 2020
URBAN
Age groups Total
Employment status
Perm
anen
t em
ploy
ees
Fixe
d-te
rm e
mpl
oyee
s
Shor
t-te
rm a
nd c
asua
l em
ploy
ees
Paid
app
rent
ices
, tra
inee
s an
d in
tern
s
Depe
nden
t con
trac
tors
Empl
oyer
s in
cor
pora
tions
Empl
oyer
in h
ouse
hold
m
arke
t ent
erpr
ises
Owne
r-op
erat
ors
of
corp
orat
ions
with
out
empl
oyee
s
Own-
acco
unt w
orke
rs
in h
ouse
hold
mar
ket
ente
rpri
ses
with
out
empl
oyee
s
Cont
ribu
ting
fam
ily
wor
kers
TOTAL 740 007 555 216 62 513 9 508 234 4 178 4 316 1 867 2 300 92 612 7 26315-19 7 460 5 742 1 065 166 15 36 8 11 6 255 15620-24 53 741 47 147 2 705 721 66 318 54 48 79 2 095 50825-29 114 728 98 727 5 150 1 264 48 728 233 200 257 7 215 90630-34 144 855 118 481 7 608 1 705 30 961 613 296 377 13 699 1 08535-39 113 576 86 799 6 981 1 575 28 682 703 321 367 15 031 1 08940-44 98 125 70 929 6 575 1 395 17 500 679 336 359 16 243 1 09245-49 84 882 58 358 6 680 1 219 16 490 735 276 371 15 722 1 01550-54 65 905 43 633 6 698 854 8 297 606 196 272 12 536 80555-59 38 471 20 753 9 040 457 4 130 450 123 133 6 991 39060-64 11 932 3 598 5 936 116 1 28 155 42 54 1 855 14765-69 3 827 679 2 426 27 - 5 61 14 21 548 4670+ 2 505 370 1 649 9 1 3 19 4 4 422 24

275
APPENDIX
Continued table 10.7 RURAL
Age groups Total
Employment status
Perm
anen
t em
ploy
ees
Fixe
d-te
rm e
mpl
oyee
s
Shor
t-te
rm a
nd c
asua
l em
ploy
ees
Paid
app
rent
ices
, tra
inee
s an
d in
tern
s
Depe
nden
t con
trac
tors
Empl
oyer
s in
cor
pora
tions
Empl
oyer
in h
ouse
hold
m
arke
t ent
erpr
ises
Owne
r-op
erat
ors
of
corp
orat
ions
with
out
empl
oyee
s
Own-
acco
unt w
orke
rs
in h
ouse
hold
mar
ket
ente
rpri
ses
with
out
empl
oyee
s
Cont
ribu
ting
fam
ily w
orke
rs
TOTAL 427 914 140 318 12 730 1 565 128 1 159 563 503 1 309 208 300 61 33915-19 8 408 3 000 1 330 36 24 19 2 12 15 1 190 2 78020-24 39 971 21 780 1 175 197 45 171 11 35 91 8 907 7 55925-29 58 141 28 074 1 110 251 24 273 57 62 161 19 909 8 22030-34 61 702 24 386 1 298 262 14 241 56 72 214 26 717 8 44235-39 60 136 16 927 1 124 208 10 133 64 80 152 32 400 9 03840-44 58 978 14 757 1 186 204 2 119 88 56 182 33 636 8 74845-49 52 946 14 356 1 393 169 3 110 93 66 149 29 895 6 71250-54 41 439 11 150 1 500 135 2 59 79 38 147 23 516 4 81355-59 26 499 5 020 1 585 76 3 23 64 40 100 16 612 2 97660-64 11 674 733 735 17 - 6 41 21 58 8 799 1 26465-69 4 394 84 216 4 - 5 6 12 20 3 585 46270+ 3 626 51 78 6 1 - 2 9 20 3 134 325
TABLE 10.8. EMPLOYED POPULATION AGED 15 AND ABOVE, BY EDUCATIONAL LEVEL, AIMAGS AND THE CAPITAL, AND SEX, 2020
TOTAL
Aimags and the Capital Total
Educational level
Non
-edu
cate
d
Prim
ary
Low
er
seco
ndar
y
Uppe
r se
cond
ary
Tech
nica
l and
vo
catio
nal
Spec
ializ
ed
seco
ndar
y
Dipl
oma
Bach
elor
Mas
ter
Doct
oral
TOTAL 1 154 205 16 311 69 692 171 914 328 566 56 974 58 288 14 421 391 159 44 127 2 753Arkhangai 40 641 824 6 173 12 115 10 107 1 805 1 303 179 7 530 598 7Bayan-Ulgii 27 530 897 4 430 4 993 5 662 1 448 1 052 234 8 201 608 5Bayankhongor 37 936 745 3 479 13 111 9 413 1 919 1 223 198 7 145 698 5Bulgan 25 790 349 2 117 7 556 7 554 1 108 1 030 147 5 616 310 3Gobi-Altai 24 797 598 2 691 6 553 5 970 1 542 1 021 121 5 589 704 8Dornogobi 28 946 434 1 728 5 459 7 778 2 267 2 031 226 8 352 664 7Dornod 27 337 440 1 392 5 410 7 952 1 834 1 782 181 7 699 641 6Dundgobi 20 448 482 3 220 6 304 3 655 1 338 921 79 4 134 312 3Zavkhan 28 194 1 265 3 127 6 408 6 717 1 641 1 087 147 7 009 786 7Uvurkhangai 49 693 1 300 9 239 14 329 10 716 2 295 1 449 177 9 489 694 5Umnugobi 28 771 534 2 492 6 729 7 398 1 873 1 346 122 7 689 585 3Sukhbaatar 26 200 1 139 3 735 7 531 5 033 2 154 1 091 172 4 944 398 3Selenge 38 173 298 1 125 6 695 13 407 3 188 2 409 246 10 223 578 4Tuv 37 385 437 2 537 10 459 10 460 2 778 1 818 326 7 819 747 4Uvs 30 364 1 088 4 612 6 788 6 444 2 059 1 082 151 7 469 664 7Khovd 30 423 929 2 405 6 756 7 906 1 337 1 653 172 8 293 926 46Khuvsgul 52 114 1 748 8 481 11 936 14 978 1 638 1 872 275 10 328 850 8Khentii 27 488 666 2 368 7 131 7 475 1 502 1 093 123 6 585 539 6Darkhan-Uul 36 336 218 452 2 820 11 813 2 596 2 575 193 14 144 1 472 53Orkhon 36 956 189 433 2 205 13 259 2 033 2 130 260 14 758 1 645 44Gobisumber 6 387 50 223 876 1 813 496 550 79 2 118 181 1Ulaanbaatar 492 296 1 681 3 233 19 750 153 056 18 123 27 770 10 613 226 025 29 527 2 518

276
2020 POPULATION AND HOUSING CENSUS OF MONGOLIA NATIONAL REPORT
Continued table 10.8 MALE
Aimags and the Capital Total
Educational level
Non
-ed
ucat
ed
Prim
ary
Low
er
seco
ndar
y
Uppe
r se
cond
ary
Tech
nica
l and
vo
catio
nal
Spec
ializ
ed
seco
ndar
y
Dipl
oma
Bach
elor
Mas
ter
Doct
oral
TOTAL 607 721 10 628 46 092 107 474 192 324 33 754 29 828 6 031 165 089 15 183 1 318Arkhangai 21 625 538 3 894 7 146 5 528 999 557 57 2 748 155 3Bayan-Ulgii 15 347 547 2 701 3 078 3 462 915 628 88 3 703 223 2Bayankhongor 19 890 471 2 165 7 848 5 091 921 514 60 2 627 192 1Bulgan 14 069 230 1 481 4 774 4 192 647 475 41 2 149 79 1Gobi-Altai 13 016 359 1 747 3 914 3 293 868 442 44 2 160 186 3Dornogobi 15 700 296 1 198 3 539 4 670 1 368 1 162 77 3 181 206 3Dornod 15 013 321 1 060 3 657 4 579 1 134 927 64 3 085 181 5Dundgobi 10 864 322 2 195 3 774 1 878 717 376 24 1 498 77 3Zavkhan 15 291 843 2 087 4 034 3 842 932 519 51 2 771 209 3Uvurkhangai 26 628 814 5 938 8 359 5 694 1 268 651 59 3 671 173 1Umnugobi 15 541 335 1 603 4 167 4 311 1 089 693 36 3 116 190 1Sukhbaatar 14 346 713 2 565 4 581 2 718 1 183 515 73 1 850 146 2Selenge 21 497 201 798 4 692 8 141 2 133 1 249 70 4 047 164 2Tuv 21 004 312 1 828 6 964 5 974 1 710 856 138 3 029 192 1Uvs 16 327 710 3 015 3 999 3 571 1 146 518 52 3 090 224 2Khovd 16 764 613 1 555 4 193 4 903 800 891 71 3 448 265 25Khuvsgul 27 853 1 078 5 435 7 001 8 240 896 848 88 4 066 196 5Khentii 15 117 485 1 751 4 604 4 194 848 543 45 2 483 160 4Darkhan-Uul 19 666 147 345 2 002 7 414 1 689 1 541 69 6 028 408 23Orkhon 19 710 132 304 1 486 8 247 1 221 1 145 93 6 454 604 24Gobisumber 3 361 46 164 536 1 062 303 331 36 827 56 -Ulaanbaatar 249 092 1 115 2 263 13 126 91 320 10 967 14 447 4 695 99 058 10 897 1 204
Continued table 10.8 FEMALE
Aimags and the Capital Total
Educational level
Non
-ed
ucat
ed
Prim
ary
Low
er
seco
ndar
y
Uppe
r se
cond
ary
Tech
nica
l and
vo
catio
nal
Spec
ializ
ed
seco
ndar
y
Dipl
oma
Bach
elor
Mas
ter
Doct
oral
TOTAL 546 484 5 683 23 600 64 440 136 242 23 220 28 460 8 390 226 070 28 944 1 435Arkhangai 19 016 286 2 279 4 969 4 579 806 746 122 4 782 443 4Bayan-Ulgii 12 183 350 1 729 1 915 2 200 533 424 146 4 498 385 3Bayankhongor 18 046 274 1 314 5 263 4 322 998 709 138 4 518 506 4Bulgan 11 721 119 636 2 782 3 362 461 555 106 3 467 231 2Gobi-Altai 11 781 239 944 2 639 2 677 674 579 77 3 429 518 5Dornogobi 13 246 138 530 1 920 3 108 899 869 149 5 171 458 4Dornod 12 324 119 332 1 753 3 373 700 855 117 4 614 460 1Dundgobi 9 584 160 1 025 2 530 1 777 621 545 55 2 636 235 -Zavkhan 12 903 422 1 040 2 374 2 875 709 568 96 4 238 577 4Uvurkhangai 23 065 486 3 301 5 970 5 022 1 027 798 118 5 818 521 4Umnugobi 13 230 199 889 2 562 3 087 784 653 86 4 573 395 2Sukhbaatar 11 854 426 1 170 2 950 2 315 971 576 99 3 094 252 1Selenge 16 676 97 327 2 003 5 266 1 055 1 160 176 6 176 414 2Tuv 16 381 125 709 3 495 4 486 1 068 962 188 4 790 555 3Uvs 14 037 378 1 597 2 789 2 873 913 564 99 4 379 440 5Khovd 13 659 316 850 2 563 3 003 537 762 101 4 845 661 21Khuvsgul 24 261 670 3 046 4 935 6 738 742 1 024 187 6 262 654 3Khentii 12 371 181 617 2 527 3 281 654 550 78 4 102 379 2Darkhan-Uul 16 670 71 107 818 4 399 907 1 034 124 8 116 1 064 30Orkhon 17 246 57 129 719 5 012 812 985 167 8 304 1 041 20Gobisumber 3 026 4 59 340 751 193 219 43 1 291 125 1Ulaanbaatar 243 204 566 970 6 624 61 736 7 156 13 323 5 918 126 967 18 630 1 314

277
APPENDIX
TABLE 10.9. UNEMPLOYED POPULATION AGED 15 AND ABOVE, BY EDUCATIONAL LEVEL, AIMAGS AND THE CAPITAL, AND SEX, 2020
TOTAL
Aimags and the Capital Total
Educational level
Non
-ed
ucat
ed
Prim
ary
Low
er
seco
ndar
y
Uppe
r se
cond
ary
Tech
nica
l and
vo
catio
nal
Spec
ializ
ed
seco
ndar
y
Dipl
oma
Bach
elor
Mas
ter
Doct
oral
TOTAL 128 851 1 235 3 522 15 649 56 605 5 346 5 959 282 38 605 1 598 50Arkhangai 1 807 26 179 477 601 115 47 5 351 6 -Bayan-Ulgii 4 969 74 376 725 1 853 417 265 19 1 219 21 -Bayankhongor 2 416 49 165 647 1 027 138 85 5 295 4 1Bulgan 1 359 21 86 444 517 75 51 3 160 2 -Gobi-Altai 1 182 15 54 248 492 76 41 5 247 4 -Dornogobi 1 054 23 46 301 369 92 56 - 159 8 -Dornod 7 392 160 439 2 023 3 181 447 300 8 806 28 -Dundgobi 894 27 89 289 213 95 56 1 120 4 -Zavkhan 1 718 33 78 413 682 123 62 6 317 4 -Uvurkhangai 1 595 31 215 474 523 101 43 3 201 4 -Umnugobi 1 270 24 73 292 488 93 62 1 227 10 -Sukhbaatar 1 805 97 215 500 500 205 84 2 196 6 -Selenge 2 084 15 59 505 1 009 135 88 9 259 5 -Tuv 1 013 15 34 282 388 116 25 6 143 4 -Uvs 1 341 53 75 259 421 165 43 5 317 3 -Khovd 2 056 35 121 351 809 116 95 5 506 18 -Khuvsgul 2 884 107 255 633 1 278 104 73 9 417 8 -Khentii 1 302 36 91 394 488 86 32 - 171 4 -Darkhan-Uul 3 034 22 72 536 1 521 194 117 2 552 18 -Orkhon 1 945 22 38 190 903 140 71 3 557 21 -Gobisumber 541 9 38 124 235 26 34 4 69 2 -Ulaanbaatar 85 190 341 724 5 542 39 107 2 287 4 229 181 31 316 1 414 49
Continued table 10.9 MALE
Aimags and the Capital Total
Educational level
Non
-ed
ucat
ed
Prim
ary
Low
er
seco
ndar
y
Uppe
r se
cond
ary
Tech
nica
l and
vo
catio
nal
Spec
ializ
ed
seco
ndar
y
Dipl
oma
Bach
elor
Mas
ter
Doct
oral
TOTAL 68 740 786 2 306 9 770 32 272 3 028 2 898 133 16 914 611 22Arkhangai 1 076 13 127 315 365 68 27 1 158 2 -Bayan-Ulgii 2 453 40 210 375 966 244 121 4 483 10 -Bayankhongor 1 205 29 87 369 503 57 42 4 111 2 1Bulgan 751 15 59 258 277 43 25 - 73 1 -Gobi-Altai 584 8 34 142 259 28 13 3 97 - -Dornogobi 534 19 31 178 179 42 28 - 55 2 -Dornod 3 597 110 281 1 130 1 469 216 140 1 243 7 -Dundgobi 523 20 62 181 122 58 32 1 47 - -Zavkhan 876 25 51 227 371 63 24 3 112 - -Uvurkhangai 851 19 126 285 260 63 20 - 77 1 -Umnugobi 736 14 43 193 308 53 27 1 92 5 -Sukhbaatar 993 59 161 314 249 105 41 2 60 2 -Selenge 1 243 12 44 345 595 77 45 5 118 2 -Tuv 585 10 23 187 212 64 16 3 68 2 -Uvs 693 37 42 149 236 80 24 - 122 3 -Khovd 1 051 19 70 193 469 67 55 1 172 5 -Khuvsgul 1 461 55 167 354 629 55 38 5 154 4 -Khentii 738 16 63 265 257 53 20 - 64 - -Darkhan-Uul 1 617 14 48 337 843 120 61 1 192 1 -Orkhon 1 124 13 25 135 592 89 37 1 227 5 -Gobisumber 314 3 24 81 141 13 22 - 30 - -Ulaanbaatar 45 735 236 528 3 757 22 970 1 370 2 040 97 14 159 557 21

278
2020 POPULATION AND HOUSING CENSUS OF MONGOLIA NATIONAL REPORT
Continued table 10.9 FEMALE
Aimags and the Capital Total
Educational level
Non
-ed
ucat
ed
Prim
ary
Low
er
seco
ndar
y
Uppe
r se
cond
ary
Tech
nica
l and
vo
catio
nal
Spec
ializ
ed
seco
ndar
y
Dipl
oma
Bach
elor
Mas
ter
Doct
oral
TOTAL 60 111 449 1 216 5 879 24 333 2 318 3 061 149 21 691 987 22Arkhangai 731 13 52 162 236 47 20 4 193 4 -Bayan-Ulgii 2 516 34 166 350 887 173 144 15 736 11 -Bayankhongor 1 211 20 78 278 524 81 43 1 184 2 1Bulgan 608 6 27 186 240 32 26 3 87 1 -Gobi-Altai 598 7 20 106 233 48 28 2 150 4 -Dornogobi 520 4 15 123 190 50 28 - 104 6 -Dornod 3 795 50 158 893 1 712 231 160 7 563 21 -Dundgobi 371 7 27 108 91 37 24 - 73 4 -Zavkhan 842 8 27 186 311 60 38 3 205 4 -Uvurkhangai 744 12 89 189 263 38 23 3 124 3 -Umnugobi 534 10 30 99 180 40 35 - 135 5 -Sukhbaatar 812 38 54 186 251 100 43 - 136 4 -Selenge 841 3 15 160 414 58 43 4 141 3 -Tuv 428 5 11 95 176 52 9 3 75 2 -Uvs 648 16 33 110 185 85 19 5 195 - -Khovd 1 005 16 51 158 340 49 40 4 334 13 -Khuvsgul 1 423 52 88 279 649 49 35 4 263 4 -Khentii 564 20 28 129 231 33 12 - 107 4 -Darkhan-Uul 1 417 8 24 199 678 74 56 1 360 17 -Orkhon 821 9 13 55 311 51 34 2 330 16 -Gobisumber 227 6 14 43 94 13 12 4 39 2 -Ulaanbaatar 39 455 105 196 1 785 16 137 917 2 189 84 17 157 857 21
TABLE 11.1. NUMBER OF MONGOLIAN CITIZENS LIVING ABROAD, BY COUNTRY OF CURRENT RESIDENCE, AIMAGS AND THE CAPITAL OF RESIDENCE IN MONGOLIA, 2020 TOTAL
Aimags and the Capital of Residence in Mongolia
Total
Country presently residing
South Korea USA Japan Kazakhstan Czech Australia China Germany Sweden France
TOTAL 122 301 39 982 19 170 8 772 7 218 5 997 5 538 5 146 3 972 3 951 3 102 Arkhangai 740 385 26 58 - 18 32 26 9 45 15 Bayan-Ulgii 5 250 15 44 12 4 982 1 7 11 - - 1 Bayankhongor 679 271 18 65 3 38 34 60 21 14 3 Bulgan 792 457 46 60 1 44 8 20 16 42 7 Govi-Altai 336 147 21 31 - 15 10 35 9 17 2 Dornogovi 1 376 671 56 73 3 54 62 211 17 31 44 Dornod 826 361 49 50 1 73 27 64 20 21 12 Dundgovi 429 158 18 51 - 42 20 28 9 35 3 Zavkhan 547 220 38 51 - 16 25 27 10 10 1 Uvurkhangai 1 013 449 36 129 1 81 13 87 21 16 7 Umnugovi 594 246 32 38 1 33 67 51 14 16 5 Sukhbaatar 390 111 19 39 - 48 13 64 17 18 3 Selenge 2 553 1 186 145 115 23 161 162 76 63 133 43 Tuv 1 968 874 123 206 20 99 30 117 32 112 35 Uvs 465 162 26 57 1 7 25 29 6 18 2 Khovd 1 758 277 30 76 1 119 8 56 49 15 27 3 Khuvsgul 933 444 38 98 2 44 30 88 26 13 8 Khentii 718 400 34 40 3 30 17 60 10 28 4 Darkhan-Uul 5 141 2 338 427 231 281 298 152 133 141 184 207 Orkhon 4 113 1 630 496 254 11 266 236 190 90 126 78 Govisumber 512 272 27 23 2 23 26 28 19 18 17 Ulaanbaatar 91 168 28 908 17 421 7 015 764 4 598 4 486 3 692 3 407 3 027 2 602

279
APPENDIX
Continued table 11.1 TOTAL
Aimags and the Capital of Residence in Mongolia
Country presently residing
Russia Turkey Austria Switzerland England Hungary Canada India Poland Ireland
TOTAL 2 814 2 716 1 676 1 469 1 466 1 341 1 283 744 654 643 Arkhangai 12 18 8 5 - 8 - 43 7 - Bayan-Ulgii 52 82 - - 7 - 1 - 3 - Bayankhongor 21 19 8 3 6 2 1 62 9 3 Bulgan 10 45 2 10 5 2 - 2 1 - Govi-Altai 23 10 3 - - - - 7 - - Dornogovi 23 26 17 25 8 1 4 6 1 1 Dornod 95 18 1 2 - 6 - 6 - - Dundgovi 6 16 2 4 2 8 - 9 2 2 Zavkhan 41 12 1 6 2 3 1 67 - 1 Uvurkhangai 38 33 5 6 3 11 1 37 1 1 Umnugovi 11 22 8 13 1 1 - 8 - 4 Sukhbaatar 23 9 3 1 6 - 2 8 - - Selenge 185 89 44 28 22 11 2 8 5 11 Tuv 46 96 24 19 29 8 3 30 6 4 Uvs 50 22 7 3 1 1 - 32 - 2 Khovd 17 32 3 - 3 - 1 19 1 - Khuvsgul 28 30 9 9 3 8 - 23 6 - Khentii 25 12 14 4 3 4 - 4 3 - Darkhan-Uul 91 161 106 58 34 69 13 12 27 17 Orkhon 180 231 46 72 18 38 15 22 17 10 Govisumber 6 16 8 8 5 5 1 3 - 1 Ulaanbaatar 1 831 1 717 1 357 1 193 1 308 1 155 1 238 336 565 586
Continued table 11.1 TOTAL
Aimags and the Capital of Residence in Mongolia
Country presently residing
Belgium Italy Spain Netherlands Singapore Sudan Vietnam Thailand South Sudan Other
TOTAL 610 296 293 192 178 100 92 84 83 2 719 Arkhangai 3 - - - 2 1 - 2 1 16 Bayan-Ulgii - - - - - - - - - 32 Bayankhongor 4 - - - - 4 - 1 - 9 Bulgan 7 1 - - - 2 - 1 1 2 Govi-Altai - - - - 2 1 - - 1 2 Dornogovi 8 3 6 - 1 4 - 2 3 15 Dornod 1 - - 2 2 1 - 1 - 13 Dundgovi 5 - - - 1 - - - 1 7 Zavkhan 2 - 5 - - 2 1 - 1 4 Uvurkhangai 3 4 - - 2 9 - - 2 17 Umnugovi 4 - 3 - - 1 - - - 15 Sukhbaatar - - - - 1 2 - 1 1 1 Selenge 12 1 2 2 1 7 - 1 1 14 Tuv 9 2 1 3 2 5 1 2 1 29 Uvs - - - 3 - 2 1 2 1 5 Khovd - - - - - 10 - - 3 9 Khuvsgul 1 - 1 1 1 8 1 - 3 10 Khentii - 2 3 - - - - 1 - 17 Darkhan-Uul 35 13 29 14 9 1 - 1 1 58 Orkhon 16 8 11 3 6 5 - 2 5 31 Govisumber 3 - - - - - - 1 - - Ulaanbaatar 497 262 232 164 148 35 88 66 57 2 413

280
2020 POPULATION AND HOUSING CENSUS OF MONGOLIA NATIONAL REPORT
Continued table 11.1 MALE
Aimags and the Capital of Residence in Mongolia
Total
Country presently residing
South Korea USA Japan Kazakhstan Czech Australia China Germany Sweden France
TOTAL 56 655 19 953 8 227 4 173 3 560 2 724 2 463 2 326 1 419 1 752 1 426 Arkhangai 397 210 11 30 - 11 14 13 3 25 7 Bayan-Ulgii 2 629 10 23 9 2 481 - 3 7 - - - Bayankhongor 395 150 8 39 2 19 17 36 7 6 2 Bulgan 381 227 17 35 - 20 4 7 4 19 6 Govi-Altai 190 82 9 25 - 9 5 17 3 11 - Dornogovi 685 367 19 41 1 25 28 92 5 12 22 Dornod 413 183 24 22 1 43 12 30 5 9 9 Dundgovi 206 73 8 26 - 24 9 15 2 13 2 Zavkhan 342 131 21 31 - 7 10 12 3 3 1 Uvurkhangai 566 253 15 69 1 43 8 45 6 9 6 Umnugovi 303 138 14 20 - 12 34 26 3 4 3 Sukhbaatar 210 58 8 25 - 28 7 33 5 9 1 Selenge 1 285 655 61 57 9 72 73 32 24 61 20 Tuv 981 462 52 111 5 41 14 63 11 42 23 Uvs 275 90 12 32 1 5 14 15 1 13 1 Khovd 897 159 12 37 543 4 24 25 4 19 - Khuvsgul 470 219 15 54 1 23 18 36 8 7 5 Khentii 351 206 16 17 1 16 8 31 4 12 - Darkhan-Uul 2 523 1 235 180 120 147 133 76 79 43 86 99 Orkhon 1 944 817 223 144 8 117 111 90 27 50 45 Govisumber 256 142 11 12 1 10 12 14 7 7 8 Ulaanbaatar 40 956 14 086 7 468 3 217 358 2 062 1 962 1 608 1 244 1 335 1 166
Continued table 11.1 MALE
Aimags and the Capital of Residence in Mongolia
Country presently residing
Russia Turkey Austria Switzerland England Hungaria Canada India Poland Ireland
TOTAL 1 399 1 185 670 490 557 594 598 604 295 271 Arkhangai 3 8 3 - - 4 - 43 3 - Bayan-Ulgii 24 50 - - 3 - - - 2 - Bayankhongor 13 6 4 2 5 1 - 61 6 - Bulgan 6 24 - - 2 2 - 2 - - Govi-Altai 15 3 - - - - - 7 - - Dornogovi 15 13 4 9 3 1 1 6 - 1 Dornod 44 10 1 1 - 2 - 6 - - Dundgovi 4 7 - 1 1 3 - 9 2 1 Zavkhan 30 8 - 2 1 2 1 67 - 1 Uvurkhangai 21 17 1 1 1 8 1 36 - - Umnugovi 9 11 3 1 - 1 - 7 - 2 Sukhbaatar 15 4 - - 4 - 2 8 - - Selenge 100 37 15 6 11 7 1 8 2 7 Tuv 20 36 7 4 19 5 3 28 3 2 Uvs 29 16 3 1 1 - - 32 - 1 Khovd 13 18 1 - 2 - - 19 1 - Khuvsgul 16 11 3 2 2 3 - 23 4 - Khentii 9 4 4 1 1 2 - 4 2 - Darkhan-Uul 45 67 43 21 13 27 2 10 14 8 Orkhon 78 95 15 21 5 19 6 21 10 6 Govisumber 3 9 5 4 2 4 1 2 - 1 Ulaanbaatar 887 731 558 413 481 503 580 205 246 241

281
APPENDIX
Continued table 11.1 MALE
Aimags and the Capital of Residence in Mongolia
Country presently residing
Belgium Italy Spain Netherlands Singapore Sudan Vietnam Thailand South Sudan Other
TOTAL 265 105 113 79 63 94 33 36 50 1 131 Arkhangai - - - - - 1 - 1 1 6 Bayan-Ulgii - - - - - - - - - 17 Bayankhongor 1 - - - - 4 - - - 6 Bulgan 2 1 - - - 2 - - 1 - Govi-Altai - - - - 1 1 - - 1 1 Dornogovi 3 - 2 - - 4 - 1 3 7 Dornod - - - 1 1 1 - 1 - 7 Dundgovi 1 - - - 1 - - - 1 3 Zavkhan - - 3 - - 2 1 - 1 4 Uvurkhangai 1 2 - - - 9 - - 2 11 Umnugovi 2 - 2 - - 1 - - - 10 Sukhbaatar - - - - - 1 - - 1 1 Selenge 6 1 2 - - 7 - - 1 10 Tuv 4 - 1 - 1 5 - - 1 18 Uvs - - - 1 - 2 1 - 1 3 Khovd - - - - - 10 - - 3 3 Khuvsgul 1 - - 1 - 8 1 - 3 6 Khentii - 2 1 - - - - 1 - 9 Darkhan-Uul 15 5 10 8 3 1 - - 1 32 Orkhon 5 1 4 1 2 5 - 1 3 14 Govisumber 1 - - - - - - - - - Ulaanbaatar 223 93 88 67 54 30 30 31 26 963
Continued table 11.1 FEMALE
Aimags and the Capital of Residence in Mongolia
Total
Country presently residing
South Korea USA Japan Kazakhstan Czech Australia China Germany Sweden France
TOTAL 65 646 20 029 10 943 4 599 3 658 3 273 3 075 2 820 2 553 2 199 1 676 Arkhangai 343 175 15 28 - 7 18 13 6 20 8 Bayan-Ulgii 2 621 5 21 3 2 501 1 4 4 - - 1 Bayankhongor 284 121 10 26 1 19 17 24 14 8 1 Bulgan 411 230 29 25 1 24 4 13 12 23 1 Govi-Altai 146 65 12 6 - 6 5 18 6 6 2 Dornogovi 691 304 37 32 2 29 34 119 12 19 22 Dornod 413 178 25 28 - 30 15 34 15 12 3 Dundgovi 223 85 10 25 - 18 11 13 7 22 1 Zavkhan 205 89 17 20 - 9 15 15 7 7 - Uvurkhangai 447 196 21 60 - 38 5 42 15 7 1 Umnugovi 291 108 18 18 1 21 33 25 11 12 2 Sukhbaatar 180 53 11 14 - 20 6 31 12 9 2 Selenge 1 268 531 84 58 14 89 89 44 39 72 23 Tuv 987 412 71 95 15 58 16 54 21 70 12 Uvs 190 72 14 25 - 2 11 14 5 5 1 Khovd 861 118 18 39 576 4 32 24 11 8 3 Khuvsgul 463 225 23 44 1 21 12 52 18 6 3 Khentii 367 194 18 23 2 14 9 29 6 16 4 Darkhan-Uul 2 618 1 103 247 111 134 165 76 54 98 98 108 Orkhon 2 169 813 273 110 3 149 125 100 63 76 33 Govisumber 256 130 16 11 1 13 14 14 12 11 9 Ulaanbaatar 50 212 14 822 9 953 3 798 406 2 536 2 524 2 084 2 163 1 692 1 436

282
2020 POPULATION AND HOUSING CENSUS OF MONGOLIA NATIONAL REPORT
Continued table 11.1 FEMALE
Aimags and the Capital of Residence in Mongolia
Country presently residing
Russia Turkey Austria Switzerland England Hungaria Canada India Poland Ireland
TOTAL 1 415 1 531 1 006 979 909 747 685 140 359 372 Arkhangai 9 10 5 5 - 4 - - 4 - Bayan-Ulgii 28 32 - - 4 - 1 - 1 - Bayankhongor 8 13 4 1 1 1 1 1 3 3 Bulgan 4 21 2 10 3 - - - 1 - Govi-Altai 8 7 3 - - - - - - - Dornogovi 8 13 13 16 5 - 3 - 1 - Dornod 51 8 - 1 - 4 - - - - Dundgovi 2 9 2 3 1 5 - - - 1 Zavkhan 11 4 1 4 1 1 - - - - Uvurkhangai 17 16 4 5 2 3 - 1 1 1 Umnugovi 2 11 5 12 1 - - 1 - 2 Sukhbaatar 8 5 3 1 2 - - - - - Selenge 85 52 29 22 11 4 1 - 3 4 Tuv 26 60 17 15 10 3 - 2 3 2 Uvs 21 6 4 2 - 1 - - - 1 Khovd 4 14 2 - 1 - 1 - - - Khuvsgul 12 19 6 7 1 5 - - 2 - Khentii 16 8 10 3 2 2 - - 1 - Darkhan-Uul 46 94 63 37 21 42 11 2 13 9 Orkhon 102 136 31 51 13 19 9 1 7 4 Govisumber 3 7 3 4 3 1 - 1 - - Ulaanbaatar 944 986 799 780 827 652 658 131 319 345
Continued table 11.1 FEMALE
Aimags and the Capital of Residence in Mongolia
Country presently residing
Belgium Italy Spain Netherlands Singapore Sudan Vietnam Thailand South Sudan Other
TOTAL 345 191 180 113 115 6 59 48 33 1 588 Arkhangai 3 - - - 2 - - 1 - 10 Bayan-Ulgii - - - - - - - - - 15 Bayankhongor 3 - - - - - - 1 - 3 Bulgan 5 - - - - - - 1 - 2 Govi-Altai - - - - 1 - - - - 1 Dornogovi 5 3 4 - 1 - - 1 - 8 Dornod 1 - - 1 1 - - - - 6 Dundgovi 4 - - - - - - - - 4 Zavkhan 2 - 2 - - - - - - - Uvurkhangai 2 2 - - 2 - - - - 6 Umnugovi 2 - 1 - - - - - - 5 Sukhbaatar - - - - 1 1 - 1 - - Selenge 6 - - 2 1 - - 1 - 4 Tuv 5 2 - 3 1 - 1 2 - 11 Uvs - - - 2 - - - 2 - 2 Khovd - - - - - - - - - 6 Khuvsgul - - 1 - 1 - - - - 4 Khentii - - 2 - - - - - - 8 Darkhan-Uul 20 8 19 6 6 - - 1 - 26 Orkhon 11 7 7 2 4 - - 1 2 17 Govisumber 2 - - - - - - 1 - - Ulaanbaatar 274 169 144 97 94 5 58 35 31 1 450

283
APPENDIX
TABLE 11.2. NUMBER OF MONGOLIAN CITIZENS LIVING ABROAD, BY DURATION OF RESIDENCE IN ABROAD AND COUNTRY OF CURRENT RESIDENCE, 2020
TOTAL
Duration of Residence in abroad
TotalCountry presently residing
South Korea USA Japan Kazakhstan Czech Australia China Germany Sweden France
TOTAL 122 301 39 982 19 170 8 772 7 218 5 997 5 538 5 146 3 972 3 951 3 102Less than 1 year 16 185 6 128 1 539 1 501 1 020 603 811 1 221 390 361 220
1 year 18 563 7 341 1 715 1 909 876 841 1 038 948 397 535 2332 year 15 801 6 301 1 750 1 415 661 745 876 758 396 456 2503 year 13 367 4 886 2 059 865 544 640 622 528 413 385 2694 year 13 646 4 539 2 253 897 744 634 667 609 444 462 3065 year 8 143 2 221 1 773 443 383 408 381 281 319 345 2866 year 4 863 1 389 886 239 361 248 170 133 186 193 1997 year 3 862 1 019 767 166 370 163 125 92 182 156 1638 year 3 613 814 660 157 536 163 136 77 125 210 1679 year 4 329 868 907 167 772 190 154 62 151 196 21210 year 4 068 1 038 900 212 218 214 142 128 124 165 17511 year 3 287 900 616 163 252 245 86 83 114 121 13112 year 3 062 965 557 151 110 288 102 77 78 98 10313 year 2 053 479 543 101 86 145 55 54 82 72 8214 year 1 592 336 381 101 92 105 46 30 67 52 5015 year 1 038 157 299 51 38 56 22 15 69 32 6016 years and above 4 829 601 1 565 234 155 309 105 50 435 112 196
Continued table 11.2 TOTAL
Duration of Residence in abroad
Country presently residing
Russia Turkey Austria Switzerland England Hungary Canada India Poland Ireland
TOTAL 2 814 2 716 1 676 1 469 1 466 1 341 1 283 744 654 643Less than 1 year 661 380 157 144 63 197 104 67 50 761 year 502 528 184 192 97 217 115 167 69 902 year 394 471 199 139 98 143 112 92 68 533 year 316 335 149 131 161 119 117 188 62 794 year 301 307 213 171 135 93 143 86 88 745 year 162 164 139 104 111 84 111 22 51 296 year 92 120 80 90 76 56 84 19 29 127 year 43 79 100 56 59 36 50 13 18 188 year 35 57 58 50 52 30 60 12 16 179 year 39 66 51 64 88 48 79 8 28 1210 year 68 54 75 73 65 30 85 20 21 2511 year 42 56 52 54 65 37 50 14 12 2012 year 35 28 53 57 104 27 37 9 10 1313 year 13 25 28 36 35 28 26 7 17 2514 year 21 13 26 23 33 26 37 8 18 3615 year 21 7 35 15 36 16 14 3 5 2116 years and above 69 26 77 70 188 154 59 9 92 43

284
2020 POPULATION AND HOUSING CENSUS OF MONGOLIA NATIONAL REPORT
Continued table 11.2 TOTAL
Duration of Residence in abroad
Country presently residing
Belgium Italy Spain Netherlands Singapore Sudan Vietnam Thailand South Sudan Other
TOTAL 610 296 293 192 178 100 92 84 83 2 719Less than 1 year 54 27 28 24 15 43 17 21 26 2371 year 63 50 16 16 22 47 16 14 32 2932 year 58 33 20 20 24 6 14 16 4 2293 year 50 34 43 26 31 1 10 6 5 2934 year 51 35 56 17 26 2 10 5 4 2745 year 54 17 26 7 14 - 5 5 4 1946 year 22 14 13 7 6 - 4 2 4 1297 year 35 9 9 7 4 - 2 1 - 1208 year 32 14 10 3 8 - 3 3 1 1079 year 33 8 8 9 5 - 1 - - 10310 year 18 13 13 7 3 - 4 2 2 17411 year 23 7 5 9 2 - 2 2 - 12412 year 8 5 15 5 4 - 2 3 1 11713 year 11 9 7 3 4 - - 2 - 7814 year 15 2 4 2 3 1 1 - - 6315 year 12 4 - 10 1 - - - - 3916 years and above 71 15 20 20 6 - 1 2 - 145
Continued table 11.2 MALE
Duration of Residence in abroad
TotalCountry presently residing
South Korea USA Japan Kazakhstan Czech Australia China Germany Sweden France
TOTAL 56 655 19 953 8 227 4 173 3 560 2 724 2 463 2 326 1 419 1 752 1 426Less than 1 year 8 209 3 295 761 776 455 303 368 585 166 171 102
1 year 9 365 3 864 762 957 449 423 507 457 162 256 1292 year 7 664 3 171 741 704 333 378 421 376 147 234 1183 year 6 492 2 560 943 442 261 288 265 223 162 177 1184 year 6 122 2 157 969 406 368 263 293 264 151 192 1365 year 3 536 1 025 765 177 191 190 146 107 124 135 1456 year 2 172 664 366 108 181 113 71 62 67 86 917 year 1 634 470 314 73 174 64 55 32 65 64 768 year 1 563 360 276 66 271 67 58 37 43 102 659 year 1 885 389 374 76 386 86 61 28 60 78 9210 year 1 694 486 354 77 112 84 58 52 37 72 7611 year 1 346 397 235 61 133 117 34 24 27 49 5812 year 1 293 452 209 56 64 125 48 25 30 40 4813 year 861 239 216 48 40 58 20 20 25 25 3514 year 660 142 168 47 41 51 14 13 23 19 2815 year 422 67 124 14 22 20 8 6 23 12 3216 years and above 1 737 215 650 85 79 94 36 15 107 40 77

285
APPENDIX
Continued table 11.2 MALE
Duration of Residence in abroad
Country presently residingRussia Turkey Austria Switzerland England Hungary Canada India Poland Ireland
TOTAL 1 399 1 185 670 490 557 594 598 604 295 271Less than 1 year 372 178 73 57 27 98 48 49 25 321 year 255 233 86 77 44 115 57 138 37 422 year 178 209 85 68 41 71 54 74 29 303 year 156 167 72 39 64 62 60 167 32 294 year 135 122 101 65 62 41 58 67 40 365 year 76 73 43 40 41 40 45 16 19 136 year 49 42 32 27 33 27 37 16 11 17 year 22 34 38 13 16 11 23 10 8 68 year 17 23 17 14 20 10 30 7 7 49 year 20 22 18 16 37 18 38 5 10 510 year 29 18 27 10 20 16 43 17 8 1311 year 19 23 17 20 20 10 23 10 7 912 year 17 11 18 15 35 16 20 5 9 613 year 5 11 7 8 10 8 17 5 8 1514 year 9 7 6 5 13 7 15 7 8 1115 year 10 4 13 3 10 7 7 3 4 716 years and above 30 8 17 13 64 37 23 8 33 12
Continued table 11.2 MALE
Duration of Residence in abroad
Country presently residing
Belgium Italy Spain Netherlands Singapore Sudan Vietnam Thailand South Sudan Other
TOTAL 265 105 113 79 63 94 33 36 50 1 131Less than 1 year 25 12 11 15 5 41 6 9 15 1291 year 29 23 10 6 15 44 9 4 23 1522 year 26 15 11 9 11 5 3 9 3 1103 year 28 13 18 15 9 1 7 1 1 1124 year 21 11 16 6 9 2 2 2 3 1245 year 23 4 9 3 5 - 1 4 - 766 year 11 4 7 2 3 - 1 1 2 577 year 14 2 5 3 1 - 1 - - 408 year 16 6 3 - 2 - - 1 - 419 year 17 4 3 4 1 - - - - 3710 year 5 2 5 3 - - 1 1 2 6611 year 6 2 1 3 - - 1 - - 4012 year 3 1 6 1 1 - 1 2 1 2813 year 3 3 3 1 - - - 1 - 3014 year 2 - 1 - - - - - - 2215 year 6 1 - 5 - - - - - 1416 years and above 30 2 4 3 1 - - 1 - 53

286
2020 POPULATION AND HOUSING CENSUS OF MONGOLIA NATIONAL REPORT
Continued table 11.2 FEMALE
Duration of Residence in abroad
TotalCountry presently residing
South Korea USA Japan Kazakhstan Czech Australia China Germany Sweden France
TOTAL 65 646 20 029 10 943 4 599 3 658 3 273 3 075 2 820 2 553 2 199 1 676Less than 1 year 7 976 2 833 778 725 565 300 443 636 224 190 118
1 year 9 198 3 477 953 952 427 418 531 491 235 279 1042 year 8 137 3 130 1 009 711 328 367 455 382 249 222 1323 year 6 875 2 326 1 116 423 283 352 357 305 251 208 1514 year 7 524 2 382 1 284 491 376 371 374 345 293 270 1705 year 4 607 1 196 1 008 266 192 218 235 174 195 210 1416 year 2 691 725 520 131 180 135 99 71 119 107 1087 year 2 228 549 453 93 196 99 70 60 117 92 878 year 2 050 454 384 91 265 96 78 40 82 108 1029 year 2 444 479 533 91 386 104 93 34 91 118 12010 year 2 374 552 546 135 106 130 84 76 87 93 9911 year 1 941 503 381 102 119 128 52 59 87 72 7312 year 1 769 513 348 95 46 163 54 52 48 58 5513 year 1 192 240 327 53 46 87 35 34 57 47 4714 year 932 194 213 54 51 54 32 17 44 33 2215 year 616 90 175 37 16 36 14 9 46 20 2816 years and above 3 092 386 915 149 76 215 69 35 328 72 119
Continued table 11.2 FEMALE
Duration of Residence in abroad
Country presently residing
Russia Turkey Austria Switzerland England Hungary Canada India Poland Ireland
TOTAL 1 415 1 531 1 006 979 909 747 685 140 359 372
Less than 1 year 289 202 84 87 36 99 56 18 25 441 year 247 295 98 115 53 102 58 29 32 482 year 216 262 114 71 57 72 58 18 39 233 year 160 168 77 92 97 57 57 21 30 504 year 166 185 112 106 73 52 85 19 48 385 year 86 91 96 64 70 44 66 6 32 166 year 43 78 48 63 43 29 47 3 18 117 year 21 45 62 43 43 25 27 3 10 128 year 18 34 41 36 32 20 30 5 9 139 year 19 44 33 48 51 30 41 3 18 710 year 39 36 48 63 45 14 42 3 13 1211 year 23 33 35 34 45 27 27 4 5 1112 year 18 17 35 42 69 11 17 4 1 713 year 8 14 21 28 25 20 9 2 9 1014 year 12 6 20 18 20 19 22 1 10 2515 year 11 3 22 12 26 9 7 - 1 1416 years and above 39 18 60 57 124 117 36 1 59 31

287
APPENDIX
Continued table 11.2 FEMALE
Duration of Residence in abroad
Country presently residing
Belgium Italy Spain Netherlands Singapore Sudan Vietnam Thailand South Sudan Other
TOTAL 345 191 180 113 115 6 59 48 33 1 588Less than 1 year 29 15 17 9 10 2 11 12 11 1081 year 34 27 6 10 7 3 7 10 9 1412 year 32 18 9 11 13 1 11 7 1 1193 year 22 21 25 11 22 - 3 5 4 1814 year 30 24 40 11 17 - 8 3 1 1505 year 31 13 17 4 9 - 4 1 4 1186 year 11 10 6 5 3 - 3 1 2 727 year 21 7 4 4 3 - 1 1 - 808 year 16 8 7 3 6 - 3 2 1 669 year 16 4 5 5 4 - 1 - - 6610 year 13 11 8 4 3 - 3 1 - 10811 year 17 5 4 6 2 - 1 2 - 8412 year 5 4 9 4 3 - 1 1 - 8913 year 8 6 4 2 4 - - 1 - 4814 year 13 2 3 2 3 - 1 - - 4115 year 6 3 - 5 1 - - - - 2516 years and above 41 13 16 17 5 - 1 1 - 92
TABLE 11.3. NUMBER OF MONGOLIAN CITIZENS LIVING ABROAD, BY COUNTRY OF CURRENT RESIDENCE AND PURPOSE, 2020
Country of Current Residence
Total
Purpose of visit
Education/Study Settlement Contractual
employment
Business/ Official
mission
Regular employment
Family reason Other
TOTAL 122 301 41 819 14 344 12 774 1 199 25 187 15 410 11 568South Korea 39 982 11 082 1 844 7 739 225 11 880 3 253 3 959USA 19 170 7 098 3 294 684 150 2 957 2 879 2 108Japan 8 772 4 304 709 752 133 1 212 1 026 636Kazakhstan 7 218 1 552 2 900 199 16 707 1 292 552Czech 5 997 1 176 643 1 187 57 1 506 956 472Australia 5 538 2 354 644 182 32 767 796 763China 5 146 3 188 284 242 63 591 458 320Germany 3 972 1 652 613 159 29 563 587 369Sweden 3 951 949 599 299 36 978 821 269France 3 102 844 461 137 24 575 697 364Russia 2 814 1 783 201 75 50 266 287 152Turkey 2 716 877 188 291 24 863 284 189Austria 1 676 610 197 79 10 299 274 207Switzerland 1 469 460 206 84 27 322 219 151England 1 466 485 282 43 7 221 265 163Hungary 1 341 455 145 202 16 263 158 102Canada 1 283 450 211 57 23 185 208 149India 744 614 21 10 6 27 51 15Poland 654 193 133 40 15 135 85 53Ireland 643 259 95 19 6 109 101 54Belgium 610 161 113 31 6 139 128 32Italy 296 148 38 18 3 30 50 9Spain 293 84 42 24 4 56 65 18Netherlands 192 55 32 3 3 53 37 9Singapore 178 72 10 10 1 41 28 16Sudan 100 2 - 15 79 - - 4Vietnam 92 44 8 4 2 7 19 8Thailand 84 43 9 2 2 6 5 17South Sudan 83 29 1 3 35 6 6 3Other 2 719 796 421 184 115 423 375 405

288
2020 POPULATION AND HOUSING CENSUS OF MONGOLIA NATIONAL REPORT
Continued table 11.3 MALE
Country of Current Residence
Total
Purpose of visit
Education/Study Settlement Contractual
employment
Business/ Official
mission
Regular employment
Family reason Other
TOTAL 56 655 19 358 5 691 7 314 737 11 509 7 044 5 002South Korea 19 953 5 100 658 4 989 127 5 855 1 459 1 765USA 8 227 3 151 1 276 295 74 1 265 1 293 873Japan 4 173 2 110 266 417 84 558 457 281Kazakhstan 3 560 713 1 434 112 12 384 634 271Czech 2 724 563 260 536 30 676 440 219Australia 2 463 1 045 236 88 18 377 372 327China 2 326 1 464 88 124 36 248 188 178Germany 1 419 614 198 50 17 170 261 109Sweden 1 752 443 239 138 23 417 380 112France 1 426 412 180 63 16 266 334 155Russia 1 399 921 84 36 31 121 135 71Turkey 1 185 437 66 135 12 335 123 77Austria 670 253 64 26 9 111 125 82Switzerland 490 187 70 22 15 71 83 42England 557 181 94 20 1 69 133 59Hungary 594 221 44 90 11 114 71 43Canada 598 206 82 16 12 98 110 74India 604 540 7 5 4 9 31 8Poland 295 88 52 16 8 67 42 22Ireland 271 92 36 10 3 48 51 31Belgium 265 79 43 13 4 47 65 14Italy 105 62 10 3 2 11 17 -Spain 113 28 14 9 3 19 30 10Netherlands 79 23 10 2 3 19 18 4Singapore 63 32 3 5 - 9 7 7Sudan 94 2 - 15 73 - - 4Vietnam 33 16 2 1 1 3 8 2Thailand 36 14 2 2 1 2 3 12South Sudan 50 10 - 3 32 1 1 3Other 1 131 351 173 73 75 139 173 147

289
APPENDIX
Continued table 11.3 FEMALE
Country of Current Residence
TotalPurPose of visit
Education/Study Settlement Contractual
employmentBusiness/
Official missionRegular
employmentFamily reason Other
TOTAL 65 646 22 461 8 653 5 460 462 13 678 8 366 6 566South Korea 20 029 5 982 1 186 2 750 98 6 025 1 794 2 194USA 10 943 3 947 2 018 389 76 1 692 1 586 1 235Japan 4 599 2 194 443 335 49 654 569 355Kazakhstan 3 658 839 1 466 87 4 323 658 281Czech 3 273 613 383 651 27 830 516 253Australia 3 075 1 309 408 94 14 390 424 436China 2 820 1 724 196 118 27 343 270 142Germany 2 553 1 038 415 109 12 393 326 260Sweden 2 199 506 360 161 13 561 441 157France 1 676 432 281 74 8 309 363 209Russia 1 415 862 117 39 19 145 152 81Turkey 1 531 440 122 156 12 528 161 112Austria 1 006 357 133 53 1 188 149 125Switzerland 979 273 136 62 12 251 136 109England 909 304 188 23 6 152 132 104Hungary 747 234 101 112 5 149 87 59Canada 685 244 129 41 11 87 98 75India 140 74 14 5 2 18 20 7Poland 359 105 81 24 7 68 43 31Ireland 372 167 59 9 3 61 50 23Belgium 345 82 70 18 2 92 63 18Italy 191 86 28 15 1 19 33 9Spain 180 56 28 15 1 37 35 8Netherlands 113 32 22 1 - 34 19 5Singapore 115 40 7 5 1 32 21 9Sudan 6 - - - 6 - - -Vietnam 59 28 6 3 1 4 11 6Thailand 48 29 7 - 1 4 2 5South Sudan 33 19 1 - 3 5 5 -Other 1 588 445 248 111 40 284 202 258

290
2020 POPULATION AND HOUSING CENSUS OF MONGOLIA NATIONAL REPORT
TABLE 12.1. DWELLINGS, BY AIMAGS AND THE CAPITAL, 2019
Aimags and the Capital Total Type of dwellingsGer Extra Ger House Seasonal house
TOTAL 677 620 225 884 78 477 292 255 81 004Arkhangai 30 053 12 846 5 311 9 327 2 569Bayan-Ulgii 17 525 327 42 16 598 558Bayankhongor 27 044 14 065 7 227 4 789 963Bulgan 19 226 5 593 660 10 348 2 625Gobi-Altai 12 973 8 260 2 074 2 412 227Dornogobi 14 909 5 805 2 488 5 965 651Dornod 17 714 5 044 1 320 9 256 2 094Dundgobi 13 598 8 166 2 056 2 711 665Zavkhan 20 331 8 520 2 882 7 819 1 110Uvurkhangai 33 144 16 891 4 824 9 333 2 096Umnugobi 19 106 10 354 4 701 3 879 172Sukhbaatar 18 508 9 959 1 839 5 779 931Selenge 25 064 4 216 1 399 17 344 2 105Tuv 29 720 9 762 4 743 10 973 4 242Uvs 20 564 12 124 2 710 4 387 1 343Khovd 19 105 10 197 3 174 5 263 471Khuvsgul 46 736 8 573 3 603 24 842 9 718Khentii 25 134 9 992 2 658 8 551 3 933Darkhan-Uul 15 145 1 954 1 539 9 991 1 661Orkhon 22 246 3 827 803 14 297 3 319Gobisumber 2 815 1 370 419 976 50Ulaanbaatar 226 960 58 039 22 005 107 415 39 501
TABLE 12.2. PERMANENTLY OCCUPIED DWELLINGS, BY AIMAGS AND THE CAPITAL, 2019
Aimags and the Capital Pe
rman
ently
oc
cupi
ed
dwel
lings Ge
r
Apar
tmen
t
Hous
ing
units
in
side
apa
rtm
ents
Deta
ched
hou
se
Com
fort
able
pr
ivat
e ho
use
Publ
ic
acco
mm
odat
ion
Tota
l hou
sing
un
its p
erm
anen
tly
occu
pied
*
TOTAL 442 725 225 884 7 444 335 587 203 556 4 257 1 584 770 868Arkhangai 19 395 12 846 56 1 487 6 479 9 5 20 826Bayan-Ulgii 15 204 327 64 1 379 14 559 198 56 16 519Bayankhongor 17 464 14 065 146 2 697 3 151 83 19 20 015Bulgan 12 699 5 593 53 833 6 994 42 17 13 479Gobi-Altai 10 303 8 260 359 2 343 1 624 38 22 12 287Dornogobi 10 461 5 805 311 8 686 4 155 147 43 18 836Dornod 12 162 5 044 229 6 846 6 577 293 19 18 779Dundgobi 10 194 8 166 85 1 112 1 734 170 39 11 221Zavkhan 14 083 8 520 67 1 070 5 356 101 39 15 086Uvurkhangai 23 672 16 891 95 2 294 6 447 196 43 25 871Umnugobi 13 479 10 354 95 2 605 2 772 209 49 15 989Sukhbaatar 14 704 9 959 133 2 159 4 090 472 50 16 730Selenge 17 673 4 216 280 5 920 12 829 304 44 23 313Tuv 17 480 9 762 199 3 356 7 082 333 104 20 637Uvs 15 076 12 124 105 2 092 2 815 25 7 17 063Khovd 14 188 10 197 175 3 659 3 765 31 20 17 672Khuvsgul 23 178 8 573 83 1 916 14 429 66 27 25 011Khentii 14 659 9 992 144 3 777 4 428 67 28 18 292Darkhan-Uul 8 646 1 954 425 15 547 5 959 245 63 23 768Orkhon 14 147 3 827 205 13 149 9 774 324 17 27 091Gobisumber 2 168 1 370 58 2 439 710 26 4 4 549Ulaanbaatar 141 690 58 039 4 077 250 221 77 827 878 869 387 834
Explanation:*Included housing units inside apartments

291
APPENDIX
TABLE 12.3. THE NUMBER OF HOUSE, BY TYPE OF HOUSE, AND A YEAR OF CONSTRUCTION, 2019
A year of construction Total
Type of houses
Apartment Detached house
Comfortable private house
Public accommodation
TOTAL 216 841 7 444 203 556 4 257 1 584Before 1950 361 22 310 29Year 1950-1959 2 307 251 1 900 13 143Year 1960-1969 2 850 470 2 211 22 147Year 1970-1979 4 414 734 3 511 25 144Year 1980-1989 13 128 993 11 786 64 285Year 1990-1999 26 511 441 25 765 214 91Year 2000-2009 64 414 1 330 61 681 1 114 289Year 2009-2019 96 929 3 160 90 693 2 660 416Don't know 5 927 43 5 699 145 40
TABLE 12.4. THE NUMBER OF HOUSES, BY A YEAR OF CONSTRUCTION, AIMAGS AND THE CAPITAL, 2019
Aimags and the Capital
A year of construction
Total Before 1950
Year 1950-1959
Year 1960-1969
Year 1970-1979
Year 1980-1989
Year 1990-1999
Year 2000-2009
Year 2009-2019
Don't know
TOTAL 216 841 361 2 307 2 850 4 414 13 128 26 511 64 414 96 929 5 927 Arkhangai 6 549 5 17 78 131 705 1 127 1 799 2 683 4 Bayan-Ulgii 14 877 1 4 34 116 365 1 123 4 089 9 145 - Bayankhongor 3 399 - 10 55 55 198 352 673 2 055 1 Bulgan 7 106 8 11 70 257 859 1 698 1 501 2 517 185 Gobi-Altai 2 043 10 14 87 123 281 269 469 790 -Dornogobi 4 656 106 520 77 181 378 648 1 064 1 657 25 Dornod 7 118 20 39 101 316 460 973 1 594 2 821 794 Dundgobi 2 028 - 4 24 44 224 271 422 1 015 24 Zavkhan 5 563 - 9 318 144 304 716 1 201 2 871 -Uvurkhangai 6 781 1 10 41 49 110 475 2 125 3 919 51 Umnugobi 3 125 - 6 58 58 256 259 459 2 017 12 Sukhbaatar 4 745 1 20 25 158 352 556 746 2 785 102 Selenge 13 457 75 540 287 423 1 667 2 411 3 145 3 967 942 Tuv 7 718 9 90 260 173 692 1 282 1 880 3 324 8 Uvs 2 952 1 10 29 28 193 510 772 1 409 -Khovd 3 991 2 14 53 74 214 586 1 074 1 974 - Khuvsgul 14 605 10 58 172 187 466 1 547 4 683 7 424 58 Khentii 4 667 10 60 59 181 385 693 1 141 2 084 54 Darkhan-Uul 6 692 13 24 178 151 619 890 1 769 2 120 928 Gobisumber 798 3 200 27 81 59 108 144 148 28 Orkhon 10 320 - - 9 213 394 1 052 3 322 4 585 745 Ulaanbaatar 83 651 86 647 808 1 271 3 947 8 965 30 342 35 619 1 966

292
2020 POPULATION AND HOUSING CENSUS OF MONGOLIA NATIONAL REPORT
TABLE 12.5.THE NUMBER OF DWELLINGS*, BY THE MAIN AND COVERING MATERIALS OF FLOOR AND TYPE OF DWELLINGS, 2019
TotalType of dwellings
Ger Detached house
Comfortable private house
Public accommodation
Main materials of floor
TOTAL 435 281 225 884 203 556 4 257 1 584No floor 121 499 121 499 - - -Wood 162 560 86 056 75 121 583 800Concrete/ Cement 134 988 13 830 116 868 3 532 758
Other 16 234 4 499 11 567 142 26
Covering materials of floor
TOTA: 209 397 - 203 556 4 257 1 584Wood 7 031 - 6 791 54 186Wood parquet 22 373 - 21 464 828 81Parquet /laminate/ 51 295 - 48 217 2 827 251
Tiles 1 766 - 1 657 40 69Linoleum 116 493 - 115 172 412 909None 1 172 - 1 161 - 11Other 9 267 - 9 094 96 77
TABLE 12.6. NUMBER OF GERS, BY MAIN MATERIALS OF FLOOR, AIMAGS AND THE CAPITAL, 2019
Aimags and the Capital Total
Main materials of floorNo floor Wood Concrete/Cement Other
TOTAL 225 884 121 499 86 056 13 830 4 499Arkhangai 12 846 5 772 6 840 143 91Bayan-Ulgii 327 238 54 9 26Bayankhongor 14 065 11 147 2 191 708 19Bulgan 5 593 4 585 290 90 628Gobi-Altai 8 260 5 224 2 587 383 66Dornogobi 5 805 3 942 1 064 411 388Dornod 5 044 3 201 1 656 140 47Dundgobi 8 166 5 370 2 180 603 13Zavkhan 8 520 6 063 1 951 219 287Uvurkhangai 16 891 8 676 7 648 531 36Umnugobi 10 354 5 813 3 543 903 95Sukhbaatar 9 959 5 851 3 795 285 28Selenge 4 216 3 092 554 176 394Tuv 9 762 7 375 1 697 467 223Uvs 12 124 6 278 4 798 169 879Khovd 10 197 7 452 1 812 495 438Khuvsgul 8 573 5 340 3 065 15 153Khentii 9 992 4 896 4 728 320 48Darkhan-Uul 1 954 1 116 575 248 15Orkhon 3 827 2 183 900 604 140Gobisumber 1 370 867 400 99 4Ulaanbaatar 58 039 17 018 33 728 6 812 481

293
APPENDIX
TABLE 12.7. THE NUMBER OF HOUSES*, BY USEFUL FLOOR SPACE, ROOMS, TYPE OF DWELLINGS, 2019
TotalType of dwellings
Detached house Comfortable private house
Public accommodation
Useful floor space
TOTAL 209 397 203 556 4 257 1 584Up to 21 8 362 8 261 11 9021-30 24 197 24 042 89 6631-40 32 543 32 370 122 5141-50 41 426 41 051 348 2751-60 29 874 29 627 207 4061-70 22 795 22 280 452 6371-80 18 547 18 037 442 6881-90 6 441 6 192 215 3491-100 7 606 7 217 306 83101+ 16 548 13 549 2 013 986Don't know 1 058 930 52 76
Rooms
TOTAL 209 397 203 556 4 257 1 5841 room 76 964 76 754 116 942 rooms 79 061 78 206 786 693 rooms 33 796 32 460 1 224 1124 rooms 11 921 10 720 915 2865 rooms 3 800 3 148 600 526 rooms 1 733 1 300 342 917 rooms 524 396 90 388 rooms 543 282 81 1809 rooms and above 1 055 290 103 662
TABLE 12.8. THE NUMBER OF GERS, BY GER WALLS, MARKET PRICE, 2019
Market price of ger TotalNumber of ger walls
4 5 6 8 10TOTAL 225 884 44 293 148 960 26 972 5 509 150Up to 1 million 15 306 7 072 7 429 707 89 91.1-2 million 81 272 19 980 54 571 6 178 519 242.1-3 million 62 737 9 021 44 474 8 415 804 233.1-4 million 21 261 2 331 13 795 4 308 817 104.1-6 million 22 944 1 505 14 382 5 142 1 888 276.1-8 million 3 678 276 2 022 729 634 179.1 million and above 9 376 1 781 5 896 983 682 34Don't know 9 310 2 327 6 391 510 76 6

294
2020 POPULATION AND HOUSING CENSUS OF MONGOLIA NATIONAL REPORT
TABLE 12.9.THE NUMBER OF HOUSES*, BY TYPE OF DWELLINGS, MARKET PRICE, 2019
Type of dwellings
Market price of houses
Total Up to 1 million
2-3 million
4-10 million
11-20 million
21-30 million
31-40 million
41-50 million
51 million
and above
Don't know
TOTAL 209 397 341 1 826 26 933 52 852 42 198 20 009 13 349 25 556 26 333Detached house 203 556 333 1 783 26 824 52 727 41 919 19 566 12 903 22 128 25 373Comfortable private house 4 257 4 31 32 53 162 368 391 2 710 506
Public accommodation 1 584 4 12 77 72 117 75 55 718 454
TABLE 12.10.THE NUMBER OF APARTMENTS, BY A YEAR OF CONSTRUCTION, MARTKET PRICE OF 1 SQUARE METER, 2019
Apartment market price
A year of construction
Бүгд Before 1950
Year 1950-1959
Year 1960-1969
Year 1970-1979
Year 1980-1989
Year 1990-1999
Year 2000-2009
Year 2009-2019
Don't know
TOTAL 7 444 22 251 470 734 993 441 1 330 3 160 43Up to 1 million 2 811 16 167 292 450 474 256 437 691 28
1.1-2 million 3 519 5 49 114 254 460 144 674 1 816 32.1-3 million 755 - 18 48 22 26 29 148 464 -3.1-4 million 123 - 4 5 1 1 2 21 87 24.1-5 million 32 - - 1 1 1 1 14 14 -5.1 million and above 110 - 13 - 1 6 2 32 54 2
Don't know 94 1 - 10 5 25 7 4 34 8

295
APPENDIX
TABLE 12.11.THE NUMBER OF HOUSEHOLDS, BY TYPE OF DWELLINGS, AIMAGS AND THE CAPITAL, 2020
Aimags and the Capital Total Ger House Other dwellingTOTAL 897 427 342 409 546 979 8 039Arkhangai 27 055 19 067 7 761 227Bayan-Ulgii 24 327 740 23 258 329Bayankhongor 25 570 20 016 5 375 179Bulgan 18 481 9 279 8 770 432Gobi-Altai 16 075 12 895 3 064 116Dornogobi 20 115 8 273 11 583 259Dornod 23 378 8 035 14 748 595Dundgobi 14 212 11 091 3 026 95Zavkhan 20 713 13 571 6 880 262Uvurkhangai 33 062 22 816 9 998 248Umnugobi 21 106 15 506 5 396 204Sukhbaatar 17 725 11 395 6 275 55Selenge 29 004 6 580 22 034 390Tuv 27 043 16 114 10 618 311Uvs 21 646 17 190 4 313 143Khovd 22 513 15 636 6 279 598Khuvsgul 37 914 17 962 19 334 618Khentii 23 906 14 909 8 696 301Darkhan-Uul 28 797 3 775 24 794 228Orkhon 28 386 4 447 23 812 127Gobisumber 4 979 1 863 3 021 95Ulaanbaatar 411 420 91 249 317 944 2 227
TABLE 12.12. THE NUMBER OF HOUSEHOLDS, BY TYPE OF HOUSES, AIMAGS AND THE CAPITAL, 2020
Aimags and the Capital Total Apartment
buildingComfortable
private houseDetached
housePublic
accommodationTOTAL 546 979 264 316 6 440 267 923 8 300Arkhangai 7 761 884 34 6 755 88Bayan-Ulgii 23 258 469 292 22 444 53Bayankhongor 5 375 1 947 50 3 341 37Bulgan 8 770 532 33 8 097 108Gobi-Altai 3 064 1 257 79 1 561 167Dornogobi 11 583 5 614 207 5 220 542Dornod 14 748 5 163 106 8 689 790Dundgobi 3 026 906 187 1 755 178Zavkhan 6 880 786 102 5 887 105Uvurkhangai 9 998 1 678 157 8 056 107Umnugobi 5 396 1 890 267 2 967 272Sukhbaatar 6 275 1 718 508 3 866 183Selenge 22 034 4 456 523 16 779 276Tuv 10 618 1 632 313 8 163 510Uvs 4 313 1 347 85 2 842 39Khovd 6 279 1 823 80 4 248 128Khuvsgul 19 334 983 135 18 040 176Khentii 8 696 2 731 81 5 558 326Darkhan-Uul 24 794 15 005 408 9 051 330Orkhon 23 812 12 070 426 11 135 181Gobisumber 3 021 2 088 41 810 82Ulaanbaatar 317 944 199 337 2 326 112 659 3 622

296
2020 POPULATION AND HOUSING CENSUS OF MONGOLIA NATIONAL REPORT
TABLE 12.13.THE NUMBER OF HOUSEHOLDS LIVE IN GERS, BY HOUSING CONDITIONS, URBAN AND RURAL, 2020
Total Urban Rural
DRINKING WATER SOURCE
TOTAL 342 409 149 873 192 536Protected deep well 187 025 124 822 62 203Drinking water distribution kiosk connected with central water supply system
15 224 14 130 1 094
Drinking water distribution kiosk not connected with central water
9 677 9 037 640
Protected dug well 3 201 417 2 784Protected springs 874 51 823Unprotected deep well 785 97 688Unprotected dug well 46 050 98 45 952Unprotected springs 9 167 358 8 809Tanker-truck 1 295 708 587Cart with small tank/drum 378 32 346Bottled water 61 38 23Rainwater 758 758Surface water 67 847 63 67 784Other 67 22 45
ELECTIRICITY SOURCE
TOTAL 342 409 149 873 192 536Central power system 196 667 144 150 52 517Diesel generating plants 212 34 178Renewable energy system 134 371 3 851 130 520Power generators 6 775 822 5 953No electricity 4 384 1 016 3 368
HEATING SOURCETOTAL 342 409 149 873 192 536Electric heater 1 407 1 150 257Fire stove 341 002 148 723 192 279
TOILET TYPE
TOTAL 342 409 149 873 192 536Improved pit latrine with slab 4 987 3 328 1 659Regular pit latrine with slab 264 909 145 031 119 878Bio-latrine 458 331 127Open pit 72 055 1 183 70 872
DISPOSE OF HOUSEHOLD SOLID WASTE
TOTAL 342 409 149 873 192 536Collected by authorized collectors 155 644 135 626 20 018
Dispose in a local authorized dump area 52 561 7 893 44 668
Burning 11 205 306 10 899Buried 1 320 79 1 241No special site 121 679 5 969 115 710
SEWAGE DISPOSAL SYSTEM TYPE
TOTAL 342 409 149 873 192 536Disposed into borehole 183 873 127 747 56 126None 158 536 22 126 136 410
OWNERSHIP TYPE
TOTAL 342 409 149 873 192 536Individuals 339 246 149 256 189 990Privately enterprise 2 883 466 2 417Government organization's 280 151 129
TENURE TYPE
TOTAL 342 409 149 873 192 536Owner occupied 324 955 137 571 187 384Rental 5 853 4 763 1 090Occupied free of rent 10 925 6 970 3 955Other 676 569 107

297
APPENDIX
TABLE 12.14.THE NUMBER OF HOUSES, BY TYPE OF HOUSES, HOUSING CONDITIONS, 2020
Total
Type of houses
Apartment building
Comfortable private house
Detached house
Public accommodation
WATER SUPPLY
TOTAL 546 979 264 316 6 440 267 923 8 300Centralized water supply with hot and cold water
247 258 238 704 3 770 3 015 1 769
Individual water system with hot and cold water
3 929 1 205 599 1 989 136
Carrying portable water from outside 270 417 9 657 4 255 606 5 150
Centralized water supply with only cold water
21 263 14 229 1 771 4 160 1 103
Individual water system with only cold water
4 112 521 296 3 153 142
DRINKING WATER INSIDE SOURCE
TOTAL 262 758 252 954 3 616 5 239 949Centralized water supply 261 238 252 933 3 282 4 145 878
Individual water system 1 520 21 334 1 094 71
DRINKING WATER OUTSIDE SOURCE
TOTAL 284 221 11 362 2 824 262 684 7 351Protected deep well 163 413 48 2 109 155 592 5 664Drinking water distribution kiosk connected with central water supply system
38 709 - 512 37 199 998
Drinking water distribution kiosk not connected with central water
26 393 - 78 25 969 346
Protected dug well 17 959 - 97 17 762 100Protected springs 574 2 - 566 6Unprotected deep well 1 967 - 5 1 954 8Unprotected dug well 2 001 - 5 1 919 77Unprotected springs 631 - - 628 3Tanker-truck 8 700 - 11 8 594 95Cart with small tank/drum 851 - - 844 7
Bottled water 11 454 11 309 2 141 2Rainwater 24 - - 24 -Surface water 11 097 - 4 11 070 23Other 448 3 1 422 22
ELECTRICITY SOURCE
TOTAL 546 979 264 316 6 440 267 923 8 300Central power system 528 806 264 296 6 438 249 979 8 093Diesel generating plants 238 15 - 212 11
Renewable energy system 16 842 3 2 16 642 195
Power generators 790 2 - 788 - No electricity 303 - - 302 1

298
2020 POPULATION AND HOUSING CENSUS OF MONGOLIA NATIONAL REPORT
HEATING SOURCE
TOTAL 546 979 264 316 6 440 267 923 8 300Central heating system 271 592 255 575 5 295 7 167 3 555
Furnace 38 758 8 456 727 28 673 902Electric heaters 10 809 244 404 9 865 296Fire stove 225 728 41 11 222 130 3 546Geothermal energy 41 - 2 38 1Combustible gas 51 - 1 50 -
TOILET TYPE
TOTAL 546 979 264 316 6 440 267 923 8 300Flushing toilet connected to central sewage
271 870 254 748 5 080 9 019 3 023
Flushing toilet flow into septic tank 5 859 70 1 269 4 329 191
Flushing toilet flow into pit latrine with slab
2 537 1 58 2 350 128
Improved pit latrine with slab 3 439 1 9 3 277 152
Regular pit latrine with slab 259 360 9 495 18 245 120 4 727
Bio-latrine 591 1 6 547 37Open pit 3 323 - - 3 281 42
DISPOSE OF HOUSEHOLD SOLID WASTE
TOTAL 546 979 264 316 6 440 267 923 8 300Collected by authorized collectors 466 545 255 107 5 703 199 628 6 107
Dispose in a local authorized dump area 63 968 9 204 735 52 057 1 972
Burning 2 581 3 2 2 569 7Buried 343 - - 334 9No special site 13 542 2 - 13 335 205
SEWAGE DISPOSAL SYSTEM TYPE
TOTAL 546 979 264 316 6 440 267 923 8 300Central sewage disposal system 265 344 252 814 5 271 4 441 2 818
Individual sewage disposal system 5 635 484 1 166 3 786 199
Disposed into borehole 252 958 11 012 3 237 759 4 184None 23 042 6 - 21 937 1 099
OWNERSHIP TYPE
TOTAL 546 979 264 316 6 440 267 923 8 300Individuals 537 568 260 022 6 332 265 010 6 204Privately enterprise 3 855 1 418 63 1 726 648Government organization's 5 556 2 876 45 1 187 1 448
TENURE TYPE
TOTAL 546 979 264 316 6 440 267 923 8 300Owner occupied 491 128 237 258 5 861 243 842 4 167Rental 26 514 16 035 238 7 871 2 370Occupied free of rent 27 574 10 130 326 15 473 1 645Other 1 763 893 15 737 118