Ukrainian Canadians and the 1981 Canada Census
132
SAMPi£ COfijf RET. TO Research Report No. 22 UKRAINIAN CANADIANS AND THE 1981 CANADA CENSUS: A STATISTICAL COMPENDIUM William Darcovich, editor Paul Yuzyk, associate editor Boris Myhal and Zenon Yankowsky, contributors Canadian Institute of Ukrainian Studies University of Alberta Edmonton 1988
-
Upload
khangminh22 -
Category
Documents
-
view
0 -
download
0
Transcript of Ukrainian Canadians and the 1981 Canada Census
SAMPi£ COfijf
RET. TOResearch Report No. 22
UKRAINIAN CANADIANS AND THE 1981 CANADA CENSUS:A STATISTICAL COMPENDIUM
William Darcovich, editor
Paul Yuzyk, associate editor
Boris Myhal and Zenon Yankowsky, contributors
Canadian Institute of Ukrainian Studies
University of Alberta
Edmonton 1988

Canadian Institute of Ukrainian Studies
University of Alberta
Occasional Research Reports
The Institute publishes research reports periodically. Copies may be ordered from the
Canadian Institute of Ukrainian Studies, 352 Athabasca Hall, University of Alberta,
Edmonton, Alberta, T6G 2E8.
The name of the publication series and the substantive material in each issue (unless
otherwise noted) are copyrighted by the Canadian Institute of Ukrainian Studies.

Occasional Research Reports
UKRAINIAN CANADIANS AND THE 1981 CANADA CENSUS
(A Supplement to the Statistical Compendiumon Ukrainians in Canada, 1891-1976)
William Darcovich, editor
Paul Yuzyk, associate editor
Boris Myhal and Zenon Yankowsky, contributors
Research Report No. 22— 1988
Canadian Institute of Ukrainian Studies
University of Alberta
Edmonton, Alberta
Digitized by the Internet Archive
in 2016
https://archive.org/details/ukrainiancanadia22darc
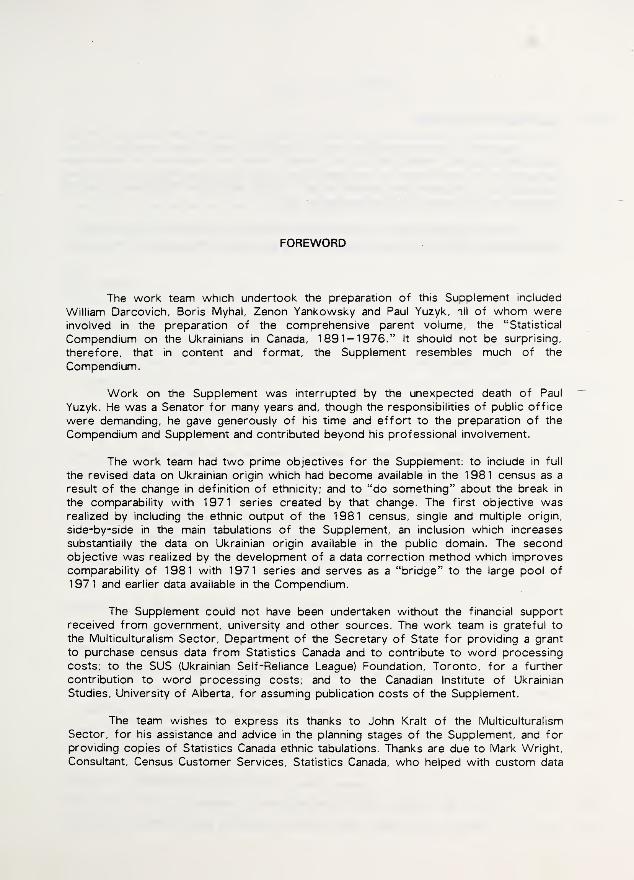
FOREWORD
The work team which undertook the preparation of this Supplement included
William Darcovich, Boris Myhak Zenon Yankowsky and Paul Yuzyk, nil of whom wereinvolved in the preparation of the comprehensive parent volume, the “Statistical
Compendium on the Ukrainians in Canada, 1891-1976.” It should not be surprising,
therefore, that in content and format, the Supplement resembles much of the
Compendium.
Work on the Supplement was interrupted by the unexpected death of Paul
Yuzyk. He was a Senator for many years and, though the responsibilities of public office
were demanding, he gave generously of his time and effort to the preparation of the
Compendium and Supplement and contributed beyond his professional involvement.
The work team had two prime objectives for the Supplement: to include in full
the revised data on Ukrainian origin which had become available in the 1 98 1 census as a
result of the change in definition of ethnicity; and to “do something” about the break in
the comparability with 1971 series created by that change. The first objective wasrealized by including the ethnic output of the 1981 census, single and multiple origin,
side-by-side in the main tabulations of the Supplement, an inclusion which increases
substantially the data on Ukrainian origin available in the public domain. The secondobjective was realized by the development of a data correction method which improvescomparability of 1981 with 1971 series and serves as a “bridge” to the large pool of
1 97 1 and earlier data available in the Compendium.
The Supplement could not have been undertaken without the financial support
received from government, university and other sources. The work team is grateful to
the Multiculturalism Sector, Department of the Secretary of State for providing a grant
to purchase census data from Statistics Canada and to contribute to word processing
costs; to the SUS (Ukrainian Self-Reliance League) Foundation, Toronto, for a further
contribution to word processing costs; and to the Canadian Institute of Ukrainian
Studies, University of Alberta, for assuming publication costs of the Supplement.
The team wishes to express its thanks to John Kralt of the Multiculturalism
Sector, for his assistance and advice in the planning stages of the Supplement, and for
providing copies of Statistics Canada ethnic tabulations. Thanks are due to Mark Wright,
Consultant, Census Customer Services, Statistics Canada, who helped with custom data

IV
specification and retrieval.
Members of the professional staff of Statistics Canada were consulted on sev-
eral data problems. Thanks are due to Pamela White for comments on intercensus
comparability of ethnic statistics; to Brenda Clarke for help in resolving some farm data
problems; to J. Norland for advice on data for common-law relationships, and to
George Mori for advice on school attendance data.
Tamara Kandyba typed the manuscript on word processor. The work team is
appreciative of her contribution in presenting a large body of data compactly and clearly.
W.D.January 1987
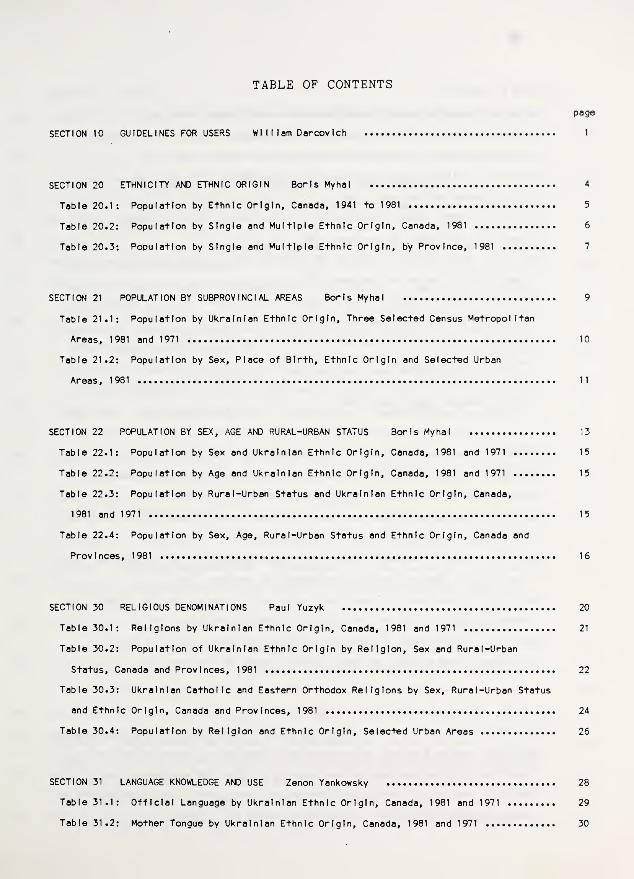
TABLE OF CONTENTS
page
SECTION 10 GUIDELINES FOR USERS W1 1 1 lam Darcov Ich 1
SECTION 20 ETHNICITY AND ETHNIC ORIGIN Boris Myhal 4
Table 20.1: Population by Ethnic Origin, Canada, 1941 to 1981 5
Table 20.2: Population by Single and Multiple Ethnic Origin, Canada, 1981 6
Table 20.3: Population by Single and Multiple Ethnic Origin, by Province, 1981 7
SECTION 21 POPULATION BY SUBPROVINCIAL AREAS Boris Myhal 9
Table 21.1: Population by Ukrainian Ethnic Origin, Three Selected Census Metropolitan
Areas, 1981 and 1971 10
Table 21.2: Population by Sex, Place of Birth, Ethnic Origin and Selected Urban
Areas, 1981 11
SECTION 22 POPULATION BY SEX, AGE AND RURAL-URBAN STATUS Boris Myhal 13
Table 22.1: Population by Sex and Ukrainian Ethnic Origin, Canada, 1981 and 1971 15
Table 22.2: Population by Age and Ukrainian Ethnic Origin, Canada, 1981 and 1971 15
Table 22.3: Population by Rural-Urban Status and Ukrainian Ethnic Origin, Canada,
1981 and 1971 15
Table 22.4: Population by Sex, Age, Rural-Urban Status and Ethnic Origin, Canada and
Provinces, 1981 16
SECTION 30 RELIGIOUS DENOMINATIONS Paul Yuzyk 20
Table 30.1: Religions by Ukrainian Ethnic Origin, Canada, 1981 and 1971 21
Table 30.2: Population of Ukrainian Ethnic Origin by Religion, Sex and Rural-Urban
Status, Canada and Provinces, 1981 22
Table 30.3: Ukrainian Catholic and Eastern Orthodox Religions by Sex, Rural-Urban Status
and Ethnic Origin, Canada and Provinces, 1981 24
Table 30.4: Population by Religion and Ethnic Origin, Selected Urban Areas 26
SECTION 31 LANGUAGE KNOWLEDGE AND USE Zenon Yankowsky 28
Table 31.1: Official Language by Ukrainian Ethnic Origin, Canada, 1981 and 1971 29
Table 31.2: Mother Tongue by Ukrainian Ethnic Origin, Canada, 1981 and 1971 30

SECTION 31 (cont'd)
Table 31.3: Home Larguage by Ukrainian Ethnic Origin, Canada, 1981 and 1971 30
Table 31.4: Ukrainian Mother Tongue and Home Language, AM Ethnic Origins by Sex,
Rural -Urban Status and Place of Birth, Canada and Provinces, 1981 30
Table 31.5: Official Languages by Sex, Rural-Urban Status, Place of Birth and Ethnic
Origin, Canada and ProvI nces, 1981 31
Table 31.6: Mother Tongue, Population of Ukrainian Origin, by Sex, Rural-Urban Status and
Place of Birth, Canada and Provinces, 1981 33
Table 31.7: Home Language, Population of Ukrainian Origin, by Sex, Rural-Urban Status and
Place of Birth, Canada and Provinces, 1981 34
Table 31.8: Ukrainian Mother Tongue, Population of Ukrainian Origin, by Age, Sex and
Rural -Urban Status, Canada and Provinces, 1981 35
Table 31.9: Ukrainian Home Language, Population of Ukrainian Origin, by Age, Sex and
Rural-Urban Status, Canada and Provinces, 1981 36
Table 31.10: Population by Ukrainian Mother Tongue, Ukrainian Home Language and Ethnic
Origin, Selected Urban Areas, 1981 37
SECTION 32 EDUCATION AND TRAINING WI I Mam Darcovich 39
Table 32.1: Population 15 Years and Over, by School Attendance and Ukrainian Ethnic
Origin, Canada, 1981 and 1971 41
Table 32.2: Population 15 Years and Over, by Highest Level of Schooling and Ukrainian
Ethnic Origin, Canada, 1981 and 1971 41
Table 32.3: School Attendance, Population 15 Years and Over, by Sex, Rural-Urban Status,
Place of Birth, Age and Ethnic Origin, Canada and Provinces, 1981 42
Table 32.4: Highest Level of Schooling, Population 15 Years and Over Not Attending and
Attending School, by Age and Ethnic Origin, Canada and Provinces, 1981 44
Table 32.5: Highest Level of Schooling, Population 15 Years and Over by School
Attendance, Place of Birth and Ethnic Origin, Canada and Provinces, 1981 47
SECTION 33 POLITICAL PARTICIPATION Paul Yuzyk 51
Table 33.1: Codes for Party Affiliation and Symbols for Characteristics of Candidates ... 52
Table 33.2: Federal Elections and By-E lections; Votes Cast In Constituencies With at
Least One Ukrainian Candidate In Elections Held In 1979, 1980 and 1984 53
Table 33.3: Provincial Elections and By-E lections; Votes Cast In Constituencies With at
Least One Ukrainian Candidate In Elections Held from 1977 to 1985 56

SECTION 33 (cont’d)
Table 33.4: Fringe-Party Candidates of Ukrainian Ethnic Origin, Federal and Provincial
Elections, 1977 to 1985 60
SECTION 40 LABOUR FORCE BY OCCUPATION AND INDUSTRY Zenon Yankowsky 61
Table 40.1: Labour Force Population 15 Years and Over by Occupation and Ukrainian Ethnic
Origin, Canada, 1981 and 1971 63
Table 40.2: Labour Force Population 15 Years and Over by Industries and Ukrainian Ethnic
Origin, Canada 1981 and 1971 63
Table 40.3: Participation In the Labour Force by Ethnic Origin and Industrial Sector,
Canada, 1981 and 1971 63
Table 40.4: Labour Force Population 15 Years and Over by Occupation, Sex and Ethnic
Origin, Canada and Provinces, 1981 64
Table 40.5: Labour Force Population 15 Years and Over, Selected Professional and
Technical Occupations, by Sex and Ettmic Origin, Canada, 1981 67-
Table 40.6: Labour Force Population 15 Years and Over, Selected Professional and
Technical Occupations, by Ethnic Origin, Canada and Provinces, 1981 68
Table 40.7: Labour Force Population 15 Years and Over, Selected Occupations, by Sex and
Ethnic Origin, Canada, 1981 71
Table 40.8: Labour Force Population 15 Years and Over by Industries and Ethnic Origin,
Canada and Provinces, 1981 72
SECTION 41 FARMS AND FARM OPERATORS Boris My ha I 74
Table 41.1: Selected Farm Statistics by Ethnic Origin of Farm Operator, Canada and
Provinces, 1981 76
Table 41.2: Average Income From AM Sources by Ethnic Origin and Highest Level of
Schooling of Farm Operator, 1981 (Number of Operators Reporting) 78
Table 41.3: Average Income of Farm Operators by Source, Highest Level of Schooling and
Ethnic Origin, Canada and Prairie Provinces, 1981 ($ per Operator) 79
SECTION 42 INCOME SOURCES AND LEVELS WI 1 1 lam Darcovich 80
Table 42.1: Average Income, Population 15 Years and Over by Ethnic Origin and Source of
Income, Canada, 1981 and 1971 ($ per Person) 81
Table 42.2: Average Income, Population 15 Years and Over by Source of Income,
Rural-Urban Status and Ethnic Origin, Canada and Provinces, 1981 ($ per Person) 82
SECTION 42 (cont'd)
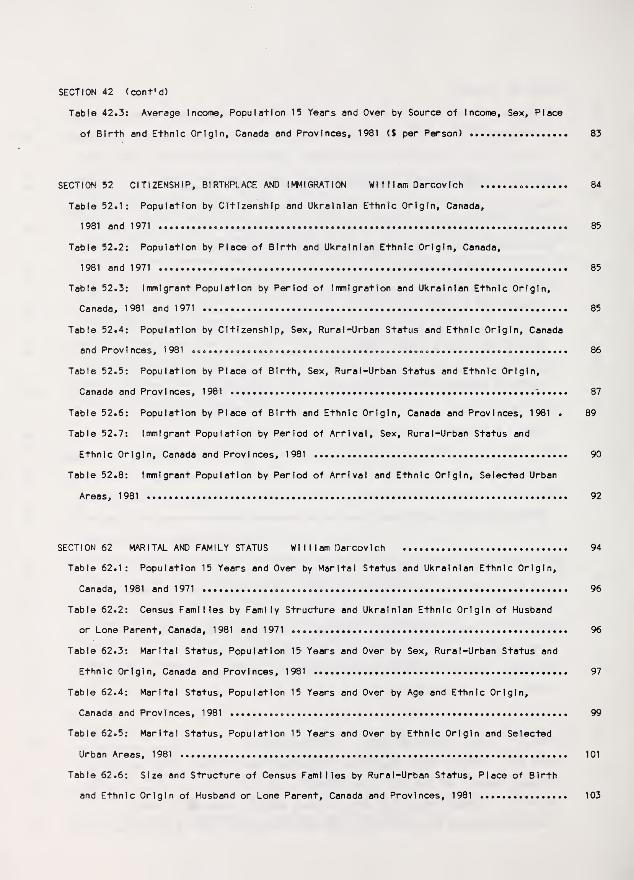
Table 42.3: Average Income, Population 15 Years and Over by Source of Income, Sex, Place
of Birth and Ethnic Origin, Canada and Provinces, 1981 ($ per Person) 83
SECTION 52 CITIZENSHIP, BIRTHPLACE AND IMMIGRATION WII I lam Darcovich 84
Table 52.1: Population by Citizenship and Ukrainian Ethnic Origin, Canada,
1981 and 1971 85
Table 52.2: Population by Place of Birth and Ukrainian Ethnic Origin, Canada,
1981 and 1971 85
Table 52.3: Immigrant Population by Period of Immigration and Ukrainian Ethnic Origin,
Canada, 1981 and 1971 85
Table 52.4; Population by Citizenship, Sex, Rural-Urban Status and Ethnic Origin, Canada
and Provinces, 1981 86
Table 52.5: Population by Place of Birth, Sex, Rural -Urban Status and Ethnic Origin,
Canada and Provinces, 1981 87
Table 52.6: Population by Place of Birth and Ethnic Origin, Canada and Provinces, 1981 . 89
Table 52.7: Immigrant Population by Period of Arrival, Sex, Rural-Urban Status and
Ethnic Origin, Canada and Provinces, 1981 90
Table 52.8: Immigrant Population by Period of Arrival and Ethnic Origin, Selected Urban
Areas, 1981 92
SECTION 62 MARITAL AND FAMILY STATUS WI 1 1 lam Darcovich 94
Table 62.1: Population 15 Years and Over by Marital Status and Ukrainian Ethnic Origin,
Canada, 1981 and 1971 96
Table 62.2: Census Families by Family Structure and Ukrainian Ethnic Origin of Husband
or Lone Parent, Canada, 1981 and 1971 96
Table 62.3: Marital Status, Population 15 Years and Over by Sex, Rural-Urban Status and
Ethnic Origin, Canada and Provinces, 1981 97
Table 62.4; Marital Status, Population 15 Years and Over by Age and Ethnic Origin,
Canada and Provinces, 1981 99
Table 62.5: Marital Status, Population 15 Years and Over by Ethnic Origin and Selected
Urban Areas, 1981 101
Table 62.6: Size and Structure of Census Families by Rural-Urban Status, Place of Birth
and Ethnic Origin of Husband or Lone Parent, Canada and Provinces, 1981 103

SECTION 62 (cont'd)
Table 62.7: Census Families by Family Structure, Place of Birth and Ethnic Origin of
Husband or Lone Parent, Selected Urban Areas, 1981 105
Table 62.8: Husband-Wife Families, Ethnic Origin of Husband by Ethnic Origin of Wife,
Canada and Provinces, 1981 107
Table 62.9: Husband-Wife Families, Ethnic Origin of Wife by Ethnic Origin of Husband,
Canada and Provinces, 1981 and 1971 108
TECHNICAL APPENDIX A CORRECTION TO 1 981 UKRAINI AN ORIGIN DATA Wl I 1 1 am Darcov ich 109
Table A.1 : Male and Female Ancestors and Ethnic Origin Responses, Canada, 1981 and
1971 Censuses 109
Table A. 2: Ukrainian Ethnic Origin Series and Ancestral Composition Categories, Canada,
1981 and 1971 Censuses 110
Table A. 3: I ntermarr l age of Ukrainian Husbands and Wives in Husband-Wife Families,
Canada, 1981 to 1951 Censuses 111
Table A. 4: Derivation of Corrected Series, Ukrainian Population, Canada, 1981 112
APPENDIX 1 ADDITIONAL 1981 ETHNIC DATA 114
BIBLIOGRAPHY 115

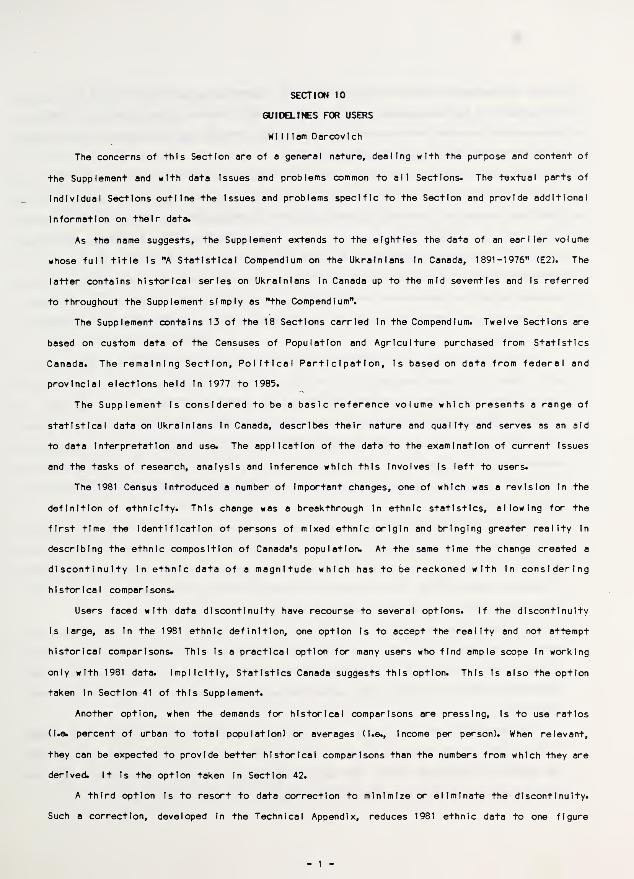
SECTION 10
GUIDELINES FOR USERS
William Darcovlch
The concerns of this Section are of a general nature, dealing with the purpose and content of
the Supplement and with data Issues and problems common to all Sections. The textual parts of
Individual Sections outline the Issues and problems specific to the Section and provide additional
Information on their data.
As the name suggests, the Supplement extends to the eighties the data of an earlier volume
whose full title Is "A Statistical Compendium on the Ukrainians In Canada, 1891-1976" (E2). The
latter contains historical series on Ukrainians In Canada up to the mid seventies and Is referred
to throughout the Supplement simply as "the Compendium".
The Supplement contains 13 of the 18 Sections carried In the Compendium. Twelve Sections are
based on custom data of the Censuses of Population and Agriculture purchased from Statistics
Canada. The remaining Section, Political Participation, Is based on data from federal and
provincial elections held In 1977 to 1985.
The Supplement Is considered to be a basic reference volume which presents a range of
statistical data on Ukrainians In Canada, describes their nature and quality and serves as an aid
to data Interpretation and use. The application of the data to the examination of current Issues
and the tasks of research, analysis and Inference which this Involves Is left to users.
The 1981 Census Introduced a number of important changes, one of which was a revision In the
definition of ethnicity. This change was a breakthrough In ethnic statistics, allowing for the
first time the Identification of persons of mixed ethnic origin and bringing greater reality in
describing the ethnic composition of Canada's population. At the same time the change created a
discontinuity In ethnic data of a magnitude which has to be reckoned with 1n considering
historical comparisons.
Users faced with data discontinuity have recourse to several options. If the discontinuity
is large, as in the 1981 ethnic definition, one option Is to accept the reality and not attempt
historical comparisons. This is a practical option for many users who find ample scope In working
only with 1981 data. Implicitly, Statistics Canada suggests this option. This Is also the option
taken In Section 41 of this Supplement.
Another option, when the demands for historical comparisons are pressing. Is to use ratios
(I.e. percent of urban to total population) or averages (I.e., Income per person). When relevant,
they can be expected to provide better historical comparisons than the numbers from which they are
derived. It Is the option taken In Section 42.
A third option Is to resort to data correction to minimize or eliminate the discontinuity.
Such a correction, developed In the Technical Appendix, reduces 1981 ethnic data to one figure
- 1 -
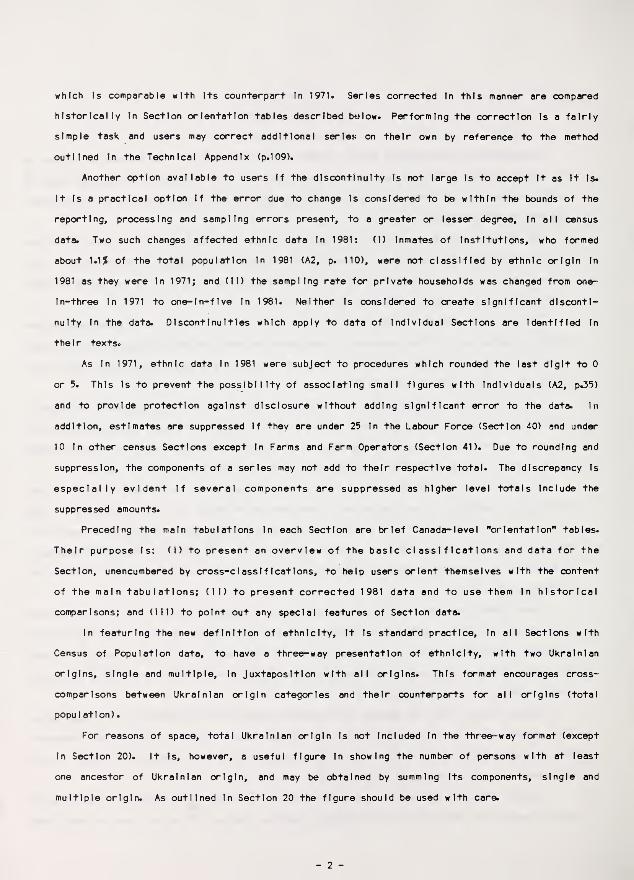
which Is comparable with Its counterpart In 1971. Series corrected In this manner are compared
historically In Section orientation tables described below. Performing the correction Is a fairly
simple task and users may correct additional series on their own by reference to the method
outlined In the Technical Appendix (p.109).
Another option available to users If the discontinuity Is not large Is to accept It as It Is.
It is a practical option if the error due to change is considered to be within the bounds of the
reporting, processing and sampling errors present, to a greater or lesser degree. In all census
data. Two such changes affected ethnic data In 1981: (I) Inmates of Institutions, who formed
about 1.1S of the total population in 1981 (A2, p. 110), were not classified by ethnic origin In
1981 as they were In 1971; and (II) the sampling rate for private households was changed from one-
In-three in 1971 to one-ln-five in 1981. Neither Is considered to create significant disconti-
nuity in the data. Discontinuities which apply to data of individual Sections are Identified in
the I r texts.
As in 1971, ethnic data In 1981 were subject to procedures which rounded the last digit to 0
or 5. This Is to prevent the possibility of associating small figures with Individuals (A2, p.35)
and to provide protection against disclosure without adding significant error to the data. In
addition, estimates are suppressed If they are under 25 In the Labour Force (Section 40) and under
10 in other census Sections except In Farms and Farm Operators (Section 41). Due to rounding and
suppression, the components of a series may not add to their respective total. The discrepancy Is
especially evident If several components are suppressed as higher level totals Include the
suppressed amounts.
Preceding the main tabulations In each Section are brief Canada-level "orientation" tables.
Their purpose Is: (I) to present an overview of the basic classifications and data for the
Section, unencumbered by cross-classifications, to help users orient themselves with the content
of the main tabulations; (II) to present corrected 1981 data and to use them in historical
comparisons; and (III) to point out any special features of Section data.
In featuring the new definition of ethnicity. It Is standard practice. In all Sections with
Census of Population data, to have a three-way presentation of ethnicity, with two Ukrainian
origins, single and multiple. In Juxtaposition with all origins. This format encourages cross-
comparisons between Ukrainian origin categories and their counterparts for all origins (total
popu I at ion)
.
For reasons of space, total Ukrainian origin Is not Included In the three-way format (except
in Section 20). It Is, however, a useful figure In showing the number of persons with at least
one ancestor of Ukrainian origin, and may be obtained by summing Its components, single and
multiple origin. As outlined In Section 20 the figure should be used with care.
- 2 -
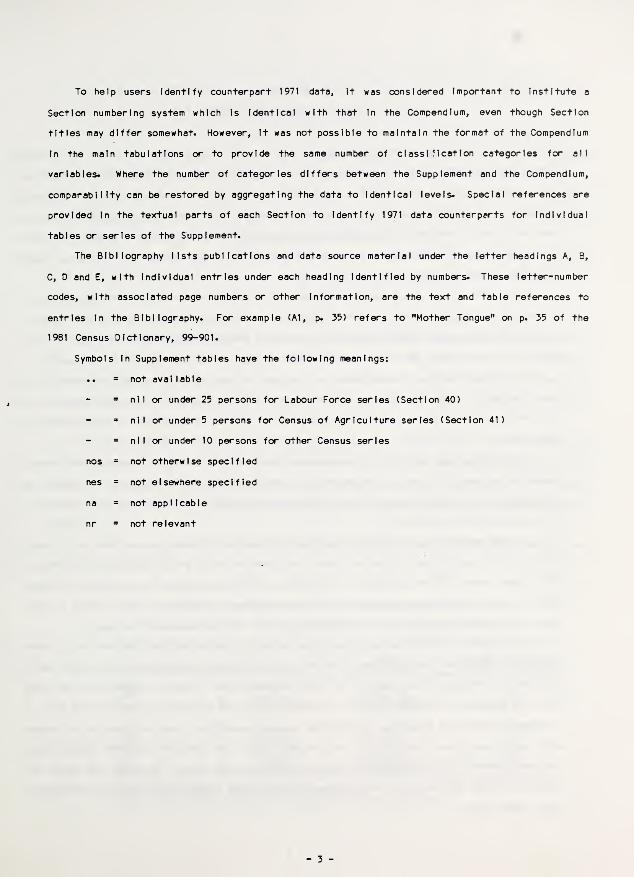
To help users Identify counterpart 1971 data. It was considered Important to Institute a
Section numbering system which Is Identical with that In the Compendium, even though Section
titles may differ somewhat. However, It was not possible to maintain The format of the Compendium
In the main tabulations or to provide the same number of classification categories for all
variables. Where the number of categories differs between the Supplement and the Compendium,
comparability can be restored by aggregating the data to Identical levels. Special references are
provided In the textual parts of each Section to Identify 1971 data counterparts for Individual
tables or series of the Supplement.
The Bibliography lists publications and data source material under the letter headings A, B,
C, D and E, with Individual entries under each heading Identified by numbers. These letter-number
codes, with associated page numbers or other Information, are the text and table references to
entries In the Bibliography. For example (A1, p. 35) refers to "Mother Tongue" on p. 35 of the
1981 Census Dictionary, 99-901.
Symbols In Supplement tables have the following meanings:
• • = not aval lable
- s nil or under 25 persons for Labour Force series (Section 40)
- = nl 1 or under 5 persons for 1Densus of Agriculture series (Section
- = nil or under 10 persons for other Census series
nos S not otherwise specified
nes = not elsewhere specified
na = not appi I cable
nr s not relevant
- 3 -

SECTION 20
ETWICITY AM) ETWIC ORIGIN
Boris Myhal
The classification of the population by ethnic origin has a long history In the Canadian
Census and has been documented for the population In general (E5, pp^O-9) and for the Ukrainians
as an Individual ethnic group (E2, pp.6-7, 12-25). A growing dissatisfaction with existing
procedures led Statistics Canada to the study and testing of alferratl ves (E5, pp.24-40) and to a
new definition In the 1981 Census with a significantly different approach to ethnic classifica-
tion. The change continued the process of adaptation to the needs of the times but also created
important problems In data comparability.
In the 1971 census questionnaire (A13) the ethnic question was stated as: "To what ethnic or
cultural group did you or your ancestor (on the male side) belong on coming to this continent?"
In the 1981 census questionnaire (A2, p.179), the ethnic question was stated as: "To which
ethnic or cultural group did you or your ancestors belong on first coming to this continent?"
The main difference between the two Is that the 1981 definition is no longer confined to the
male side but is widened by the possibility of using female ancestry. The "roots" nature of the
1971 definition Is retained and made more precise for 1981 as it reads "on 'first* coming to this
continent".
Widening the basis of ethnicity to male and female ancestors allowed respondents to Identify
themselves as belonging to one (single) or two or more (multiple) ethnic groups. Maintaining the
roots nature of the definition continued to provide respondents with an objective criterion for
the Identification of ethnicity.
The 1981 definition provided two figures, single and multiple origin, for each ethnic group,
while the 1971 definition provided only one. The question which arises immediately Is to which
1981 figure should 1971 be compared. As Indicated by Statistics Canada, for a number of European
ethnic groups Including the Ukrainians, a direct comparison of 1971 with either single or total
(single and multiple) origin would be inaccurate (A2, p. 110) and should not be made.
To facilitate 1971-1981 comparisons, a correction to 1981 series was developed by a method
outlined In the Technical Appendix (Table A4, p. 112) which is considered to make 1981 series
conceptually comparable with 1971. The resulting corrected figure of 642,300 for the total
Ukrainian population In Canada in 1981 is compared with 1971 and earlier years In Table 20.1. It
is noteworthy that the proportion of Ukrainian to total population, when all data are in compar-
able terms, was stable from 1941 to 1981 at about 2.7$. This stability over the 40-year period
Indicates that the Ukrainian and total population grew at equal rates. Table 20.1 also shows that
Ukrainian single and multiple origins form 2.4$ and 12.2$ respectively of their corresponding
total populations.
4

Users may make additional corrections on their own to provincial series for Ukrainian origin,
according to the method outlined In the Technical Appendix (p. 109).
Table 20.2 provides an overview of Canada's ethnic composition which comprises over 90 ethnic
groups and aggregations. The large Increase In number of groups over 1971 Is due to Increased
Immigration from countries In Southeast Asia and the Indian Subcontinent and the more precise
specification of ethnic origins in formerly aggregated or residual categories such as I ndo-
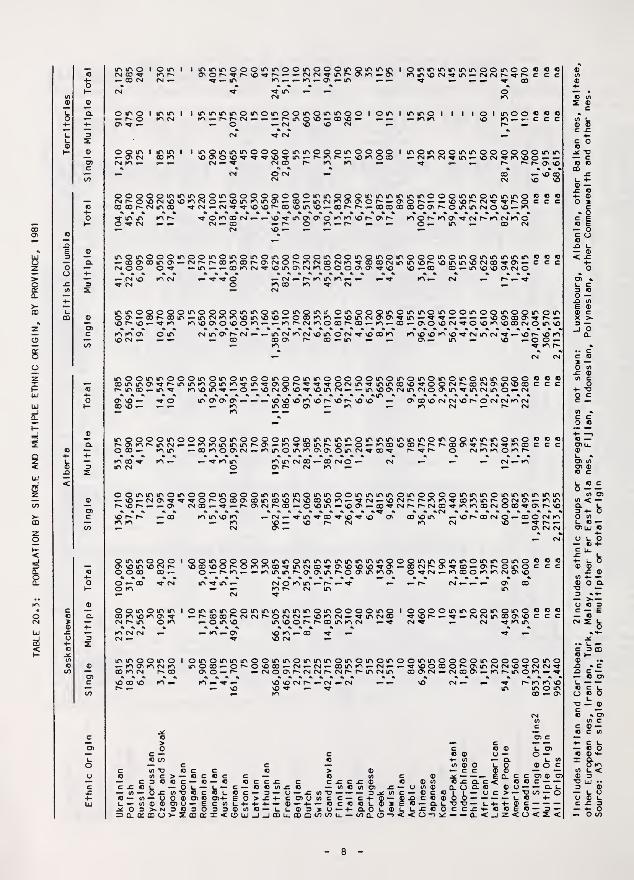
Paklstanl, Spanish, Other Asiatic, Other European, etc. (A1, pp.109-12). Table 20.3 Is a
consolidated version of the above overview for the Provinces.
On the next-to-the- I ast line in Tables 20.2 and 20.3, the figure for multiple origin Is shown
In the single origin column; this is a presentational device to indicate that the sum of all
single and multiple origins is equal to the total population.
Proper care must be exercised in using data In Tables 20.2 and 20.3. Multiple and total
origins cannot be compared between groups due to duplication of respondents. For example, a
person of Italian and German origin would be Included twice In the multiple origin data, once as
Italian and once as German. For this reason It is meaningless to compute totals for the multiple
and total origin columns, as Indicated by the "na" (not applicable) symbols In the bottom lines of
the tables.
The tables are best utilized when each ethnic group is considered apart from the others and
Its categories are cross-compared, single, multiple and total origin with each other or with all
origins. For Ukrainians the three origins may be cross-compared with counterpart data In other
Sections of the Supplement. It Is, however possible to compare single origins between ethnic
groups.
The 1971 counterparts of the data In Tables 20.2 and 20.3 are In the Compendium (E2, pp.
26-40).
TABLE 20.1; POPULATION BY ETHNIC ORIGIN, CANADA 1941 to 1981,
Ukrainian Origin; S=slngle, M=multlple, T=total, C=corrected total
Year Ukralnllan OriginTotal
Popu 1 at IonPercent Ukrainianto Total Population
1981 T 754,980 24,083,495 3.11981 S 529,615 22,244,880 2.41981 M 225,365 1,838,615 12.3
1981 cl 642,300 24,083,495 2.71971 T 580,660 21 ,568,310 2.71961 T 473,337 18,238,247 2.61951 T 395,043 14,009,429 2.81941 T 305,929 11,506,655 2.7
^Comparable to 1971, see Technical Appendix.Source; for 1981 Table 20.2; for 1941 to 1971 E2, pp. 26-27.
5
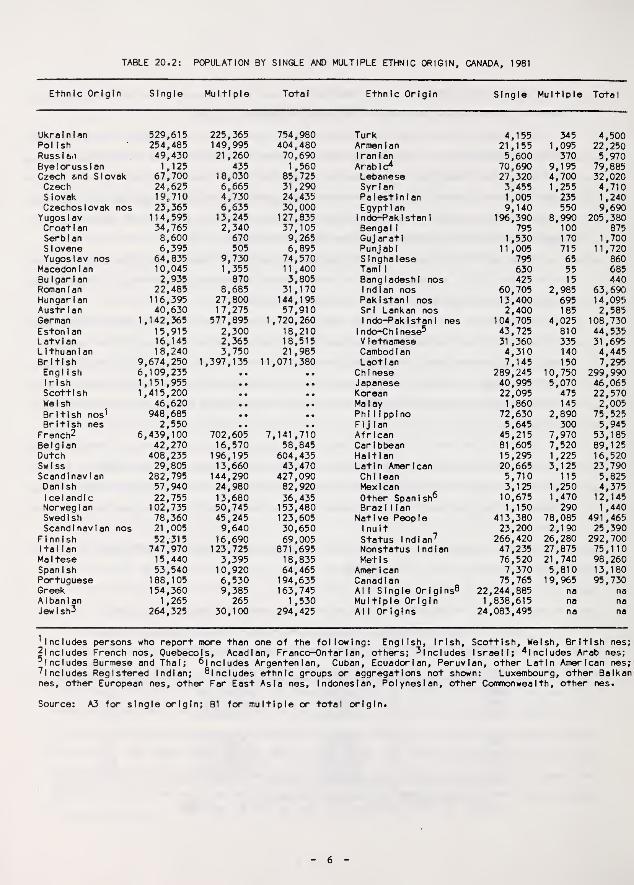
TABLE 20.2; POPULATION BY SINGLE AND MULTIPLE ETHNIC ORIGIN, CANADA, 1981
Ethnic Origin Single Multiple Total Ethnic Origin Single Multiple Total
Ukrainian 529,615 225,365 754,980 Turk 4,155 345 4,500Polish 254,485 149,995 404,480 Armen 1 an 21,155 1,095 22,250Russian 49,430 21,260 70,690 1 ran 1 an 5,600 370 5,970Byelorussian 1,125 435 1,560 Arabic^ 70,690 9,195 79,885Czech and Slovak 67,700 18,030 85,725 Lebanese 27,320 4,700 32,020Czech 24,625 6,665 31,290 Syrian 3,455 1,255 4,710Slovak 19,710 4,730 24,435 Palestinian 1,005 235 1 ,240Czechoslovak nos 23,365 6,635 30,000 Egyptian 9,140 550 9,690Yugoslav 114,595 13,245 127,835 1 ndo^aklstan I 196,390 8,990 205,380Croat 1 an 34,765 2,340 37,105 Bengal 1 795 100 875Serbian 8,600 670 9,265 Guj aratl 1,530 170 1 ,700S 1 ovene 6,395 505 6,895 PunJ abl 11,005 715 11,720Yugoslav nos 64,835 9,730 74,570 Singhalese 795 65 860
Macedon 1 an 10,045 1,355 11,400 TamI 1 630 55 685Bulgarian 2,935 870 3,805 Bangladeshi nos 425 15 440Romanian 22,485 8,685 31,170 Indian nos 60,705 2,985 63,690Hungarian 116,395 27,800 144,195 Pak 1 Stan I nos 13,400 695 14,095Austrian 40,630 17,275 57,910 Sri Lankan nos 2,400 185 2,585German 1,142,365 577,895 1,720,260 1 ndo-PakIstanI nes 104,705 4,025 108,730Eston 1 an 15,915 2,300 18,210 1 ndo-Ch 1 nese^ 43,725 810 44,535Latvian 16,145 2,365 18,515 Vietnamese 31 ,360 335 31 ,695Lithuanian 18,240 3,750 21,985 Cambod I an 4,310 140 4,445British 9,674,250 1,397,135 11,071,380 Laotian 7,145 150 7,295Engl Ish 6,109,235 • • • • Chinese 289,245 10,750 299,990Irish 1,151,955 • • • • Japanese 40,995 5,070 46,065Scottish 1,415,200 • • • • Korean 22,095 475 22,570Welsh 46,620 • • • • Malay 1,860 145 2,005British nos^ 948,685 • • • • Philippine 72,630 2,890 75,525British nes 2,550 • • • • FIj Ian 5,645 300 5,945
French^ 6,439,100 702,605 7,141 ,710 African 45,215 7,970 53,185Belgian 42,270 16,570 58,845 Caribbean 81,605 7,520 89,125Dutch 408,235 196,195 604,435 Haitian 15,295 1,225 16,520Sw 1 ss 29,805 13,660 43,470 Latin American 20,665 3,125 23,790Scandinavian 282,795 144,290 427,090 Chi lean 5,710 115 5,825Danish 57,940 24,980 82,920 Mexican 3,125 1 ,250 4,3751 cel and Ic 22,755 13,680 36,435 Other Spanish^ 10,675 1 ,470 12,145Norweg 1 an 102,735 50,745 153,480 Brazi 1 Ian 1,150 290 1 ,440Swedish 78,360 45,245 123,605 Native People 413,380 78,085 491 ,465Scandinavian nos 21 ,005 9,640 30,650 1 nult 23,200 2,190 25,390
Finnish 52,315 16,690 69,005 Status Indian^ 266,420 26,280 292,700Italian 747,970 123,725 871,695 Nonstatus Indian 47,235 27,875 75,110Ma 1 tese 15,440 3,395 18,835 Metis 76,520 21,740 98,260Spanish 53,540 10,920 64,465 Amer 1 can 7,370 5,810 13,180Portuguese 188,105 6,530 194,635 Canadian 75,765 19,965 95,730Greek 154,360 9,385 163,745 Al 1 Single Origins^ 22,244,885 na naAlbanian 1,265 265 1 ,530 Multiple Origin 1,838,615 na naJewish^ 264,325 30,100 294,425 All Origins 24,083,495 na na
^Includes persons who report more than one of the following: English, Irish, Scottish, Welsh, British nes;
^Includes French nos, Ouebecols, Acadian, Franco-Ontar Ian, others; ^Includes Israeli; ^Includes Arab nes;^Includes Burmese and Thai; ^includes Argentenlan, Cuban, Ecuadorian, Peruvian, other Latin American nes;^Includes Registered Indian; 8 Includes ethnic groups or aggregations not shown; Luxembourg, other Balkannes, other European nes, other Far East Asia nes, Indonesian, Polynesian, other Commonwealth, other nes.
Source; A3 for single origin; B1 for multiple or total origin.
6

TABLE
20.3;
POPULATION
BY
SINGLE
AND
MULTIPLE
ETHNIC
ORIGIN,
BY
PROVINCE,
1981
m o o o io o00 ^ O P' O'CM O' VO lO
I if\oOif'Oir>OOOOir>Oir>if'QOir>tr'mir'ir>(rvomir>if'iriOOOOir'0 occr'CMOO'CMK^CN^OlTi — —
(N CM tf\ CM
ir» 'T ovO<NCMCOK>K^^^.-OOOmCM
‘oo CM VO
(MOO.-'<S-'V'>fl-ir>.- — OOK^CN c c c(N^irvvOK'OO'Or^CMOOCN
ir» CM CM ^
o ir> o IT- o o I o irv
avCTiCDCMcyiO —cm^ KV OO VO — —K>
Oir'Otnir'omir'if'OOOif'OOinirvo l oioirv i Qinoirvoinoo ccc•^K^OOirvK^CMOOvOOOf^r'(OOvK^OODirv CM— — OvCNO'vOI^irvO'O'CCC— t-»-CMCMK^^^O''^lf''VCM.-K' CM^CM CM K^lTv K>K>lfV
— .-CM K'OOCMO' — CM — vO —VO CM —
m »Tv >rv ir\ o QO' ^ vO O' O'r- ^ r*» irv —
I oootrvoooirvif'irvirvirMf'irvOOOOtrvoomir'Oif'irvOvoovom'O-ooooPMO^irv vor-voor^tooDiTv
O' - — — — irviTvOvO^ODOD- OvO^00K>O'o >o o irv CM _OOfO'OOOvOOCMO'
1000101^0010CM '.r K> vO ^ O
to fo r*
vO CM — to— o —O' — o
lotojoioiooiroiotooiooooioiooioioooooooiotojooioioooooooolotOr^OCMOOP'OCMOtOO'r'OOD^CMCM — vOtOOO'^CMtOOOtOCMOOfOOOr' — ^P^tOrrvOOD —
C OlO'^flOtOODCM^tOCNtOOCM.-CM.-tOlOOtOvO^^aD'^r.-tOtOOOvO^ — ^OvOCMCMOlO —O toio^ .-lO — CM — CM.- — tOtO'^-lOtO^O'P^VOtOOO'CMQvOOtOCMOO^P^tOvOO'OOtOOO
000 .- ^oo— .-r'CM — — — — .-'OCMp^.-vo^vocMtoO''<r — tocM — — O' — toov- — cm>4 ^ vo — ovcM ir> — — —
oooooioiooooiovoioioioioioiooioooooioioooioooiooioiooioooio^tOO'O'OCMO'tO^O^OOO'^f^CMCMO^OOvOOtO’VtCMCMlOvOCMO'OOOCNCMCMtO — Or*lOOvOvOCMtOf^CMlO — — CMVOtO^ — tOMTVOOviOCMO — 'O^OOOOvOOO'OOCM'^CM^C7''VCMOOCM
r^— toiovor^ — — CMr^ovOr^iovoOfO^iO'V'CM— oocM —
CM vo to
— 00 vO — vo
lOlOlOIOtOlOlOOOOlOOOlOOQiOOlOlOtOOOlOOlOlOOOOlOOOlOlOOlOOOOOlOO0>^— CMCM^OO'P^'fl-'^OvOfOp^OO — CMlOtOO — OOOlOOOvO'O’iraOOOO' — VCMCMVO — VO(M-«f\0OvOvr^vOO — O'OO — — — t000r~0000'0'— P^to^to— 00'^vOOOvOvOOOO'00<MtOOOOOr*'OOvOvOCM
toooov — coovoto-to p*- lo — r- —
to
— CMP^CMP^— — OlOP^iOOilO— OvOiOOvOtOtOCMtOO“ ‘ “ CM — — — O' — tOOv— OO lO — O'\0 — to 00 CM CM 00 to
to — — — CM ^00 CM lO 00 to
r-' p" iTi
00ir>00if'if'000000000if'u^ifv0ir'if'if'»f'00000ir>m000if'if'0if'0ir' o«j orr^CM^tOOP^vOlOtO— tn^OOOP^OOtOOCMOP^'TOO'P^CO cccto — ^(3'OCMtOO''^r^CM^OtOvOvOOvOOOO^vOO'OtO — OOvO — CMiTi^- tOOOOOO' —
O' — 00 — mo tocM — ooo'
to — CM 00 — p^ to 00 CM m vo —O — Im CM
O m o O m m i
vo CM OO to o 00CM 00 m
omooommoooomooommmoooom^^ — omp^cM^OfOCM — — p^p^ — CMOv^rcM^— Or^toor^Ovoootop«-oo^ (OCMCMav^m^t^oooooooomooomooommoootoONtocM^- p^otop^r'.m^^ — O
'9-^vo — — — ^ocMm— or^toor^OvDootop-co^. • .«««.« ..... .CM— m ooo — 'S-— CM .- — — — ^ —— CJV O' —
ommomooomomomommommmmomooooooomoomooomomomo^m^O''^vo — 00omP^p^^p»^oor'vomcMCM^tovOP^CMvooo'a-voo'0'mcMvocM — mm^— mr>vor^O 00^ top-i^cMP^r^ — r^tovO'TOtocM — p^<^tO'*»'^toO'CMtoP^ — — ^omoor^to— ovo. .CM .« .... .................. ... .JTV . . . . .
^m^p' vO CM— p*0'— — CM ^ ^ CM vOCM — to
omm I mmmmomomomoommommmoomomoomoommommmmo^tooo O'mmtoto — O'mm — — ovtor*-- cMCMOOaO'»s-p~p~'^^'^<3'OOCMtop'mr^O'0'Ovoov-^vo O'VO — totop'CMCMtotomoocMvoocMvop^m'^tom vom — — mocoocMtocMCM
mooO' P^ CMO CM
I omooommmmommmmommmoomooommooomomoommmmtovocMCMOom^too — t^^O'vo — mO'OP^O'O — vocoso- tocMmtoo'O'O' —to— — ^to— — — OOCM^vO^OOCMOOP»tOtOtO mto to o P» O'
om I momoomomooomoomoommmmooomooomooommoomomvOP* vo — CMooooo — OOO' — p'^to — m — too'^ooooofop^ — o — omo^ — oop''3‘— to-^r— CM vom CMOO'XJ- — CM — cMr^mooO'm^’^oooo — o— ocm — — cmoooo — m — toooto —. . .......... ........
to CM ocMO'm^— cMfO's-to to— m^cMvop'-v^CT'm— ^p.K' —m to o — CM
o>o
c —o cn
V) T3(A C3 «3
C £ <0 U— «fl — O £«J — V) — U— (A O O^ O 3 >> tsi
3 CL (T CD O
C<0 c
> — «3 Cto C — C— O L —«A -D to CO ® 05 <D05 O — E3 0 3 0>- Z CD QC
O C C —— O O C C £ CL— C— OCtAjCOOL O C — 3 — U — J10)4- E0>^4-CC?)0C <A L 4- 4- 4-3 3 ® (A to —X<OLU_>_JCOtj_COOCOCOli_
> ®<J (A
C f C £ ®— (A ® (A O)O — — — 3
Cc ®u —— a.
® O
L. O)
^1_ VA
® O C
CO CL O '
c c O) ® O)ccc — —O — — Q. LT3 CO — O
_ C 4-— L4-4-®C_ COCC£H-CCEC— 3 —CL<_J2<0<2<
CA
®i-g
=
C £ Q. C <cciL—<-> = >c ® 0 O —Q.UT3T3 — L4-4-
7
continued
TABLE
20.3:
POPULATION
BY
SINGLE
AND
MULTIPLE
ETHNIC
ORIGIN,
BY
PROVINCE,
1981
OCS CO
OO CM
o oj- OON ««r
o in I
KN(N
inmmoooininoomoooinoininin I oininminminoON o n- 'T vO ^ CM CM ^ m ON tn ON K> in no cm in — cm
"q- in KN KN ON in« « « « «— — lo ^
ininminoinoinooinoininoom.-r«-r^<N.-^<>-p^inONO — oono —O (M NO NO CM
inQinininoooominoooinooooNOONONO'^^^vO'^m.-r'fnr^.-NomooD
CM CM CD tn m
I oininminminooinoo o oinmNOCM'^in— CMCMf^^f^ c c^ 00
m o o o <0 om c c c
inoinooinmooooooinin.-CMincM^m— NOCM^fnioo*- —^ r*»n>r^ONNO00 VO 00CM NO NO
ooooomminooinooooQOOOinmoCMr'ONOCMNONOKNCMo^'OintnmO'.-oo.- * *
00 00 CM in 00 ^ cm cm ^ no no oo no in
inmooominininininoooininoininino cincMfnoNONOr*'>-ONOr'— »”NONor^CM^'<«'r*o cNO»-oon»p^«-oocDooooooNr*-oinincMONOw-m
^omoocM.-.-NO^inONONOtnmNOf^ONn-CM.-0O — n- o KN.-r^ ^
cnI NO ^ —
inOinooomooinoinoinoinQOOOinooinoinoinoooinoinoin.-ooONOOinON-i-CMr*r^oomcor^ONCMOP^mcMoocMfn^oooocMininNor'NOininNO(M(MOO o in — — OO fo CM ^ NO in ON CM m o o o ON ON ^ NO no»-oo oo.-inNO
- - - - - - ... - ^ ^
in in in m in00 On —NO ON CM o
m CM — ^ oo
ininoooooinooooininoinomoinifoinoooinoininoinooinooinooinoin~~ — incMmKNNOinNONO'^oooKNtn— vomcMONON ' *
NO On O NO O KN
m KN ONNO CM
CMincM^.-NOf^vo»nNO o o —^ m r»
inooinmoooinoinoinooinooininoooooinoinoinoinoinoininoooooininON^r^inmiooinm^in^ONOr~^'^'^ocMin^ininooNO^OOCMr>'00(NONinNOOor»inoD.-in^ KNNomMC.-o.--NOCMONNO'^NOincM— .-inNOONCMinc'ioONin^mcMino — cm««« *« «.««««««««««««*» »if\ « «»««*«««««««onno— •VO inONONON.-.-.-NONONOKNNor^'On-NONO »— ONOONOcMCMNor^ocMCMtncMOO in OO m KN CM CM
i o o o o inOn m r» m *•5inoooooinooooinOinininininoininininininoinooinminoino
^csis— ^fnfnininmr-CJN>i~fnvoDinr~NO — o«— KNooNOQOr^f^r~ooONvr«-cMVKNooN m — 00 rn o CMM m in o m KN ON ON o in CM V OO V r^vt'^ o cm cn tn o m f"
« «D « «b^ ^ V KN in KN Ifi CM 00 ^ OO CM o -- CM CM KNo ON CM m —
O O in in inNO CM O'NO
oinoooinoooininminoininooininininoinooooinininoininininvvvon-oooONflOinooNOCMNOOONom.-vcM.-NOCMr^f^fnKNvcDfninr^O<NON —ON cMoo—'V — r^ONCMC^oo.-ONOin— NOON.-oovcMr'*r*«'CMOOVKNmoocMOoovON
in infn in
NO
CM vinvoovNOVNONO n- CM
.-NOf^OOCMO — oooCM NO V
CJN
CM KN1—
CM CM
CM
oinmQoo • ooinoogooininpminininininininoooin^oinino^inoino 5 5 5OVCM»-moOOK>KNCMONNO
oomoinin 1 oininmooininininininoinooooino 1 OOOO00 tn NO KN ON V 00 00 CM CM o CM CM NO kn CM V in CM 00 VNor*.-cMc^in om .-oinvo inNOOr»p^ooinKNCM .-v cmvKN CM CM KN ON NO KN 00 V •-CM V NO CM
ininoomoino *J ® <0
^^CMCMinOOONNO c c cCM V m in
in in o o in o i
KN O' KN CM tn00 m CM 00
O>o
c —C CO
oinoinininooininoinininoinoinoinooinmoinOoo.-on'ONOoo — cM.-cM.-ooinm.-CM.-.-VNOOooONO — .-CMOONr^CMCMr^CMr^r^incMin oooncm.-cmoo
NO NO CM CMNO V Vtn
CM
ooinoooooinor^ONinCMCMNOVCMCMVON.-tnr~inoKN.-v— V r~ m in NO
in momOO ON
c co c c o>— ccoc c —OC— O— 10 «3CC^— C— tOClrt
IflIOOC ID1_«JC— 3 —O ® on <0 C3M- E O > £ 4-OIO— E cini_4--»-4- —O3033®(n«3— 1.
® ®4- inin ® o— C -
o ®o ——
> Q.
c cg
L. O)o —® o
CL C C ON ® D5oj:o.c< o«jc — —0.00.0 ®(J — — Q.U
in "oin c
C 3 O
in — oin ® ®o:£Do:^zmcr±<ouj_j_jmiZ£DQooc^u. — co(L.o*^<<0”»^—-Ql<-jz<o<z<
> ®o in
c c jc c x: ®® — inoinoN _
jz imo— — — 3^m c — ®c « i i — oc > — tjco — oCJNUincc— CM-®— ®X)co®00 — — — — i-O 4-— 4-— O CO Cl_ ®X E O— Q.l_-D-0 — l_4-4-®C" 3»0— 4-Q.Ol-®l-l-.COOCCX'l-OOEO— 3 —
in u® ®
s°-O— c
o oCD
JC
biJC o•t:
®o X
c• oc iO E
*c ooXi l_
<5
cJ> •t. c3 Oo —X in
E ®
O) inO) ®o c
i- o co — —
in cnin < —
O mi_ o —ONLlI oo u o-0 4-c u.
I- b
T3 —3 »4-— >.—0 0 3c — E— oCM z; u
JiC•• 1- —C 3 00
s *-® •«jQ « CX C —— O O)
bbh
JO
• O)
c in
® N*-
Q.O mu <3
_ ^ o— O lO
8
SECTION 21
POPULATION BY SUBPROVINCIAL AREAS
Boris Myhal
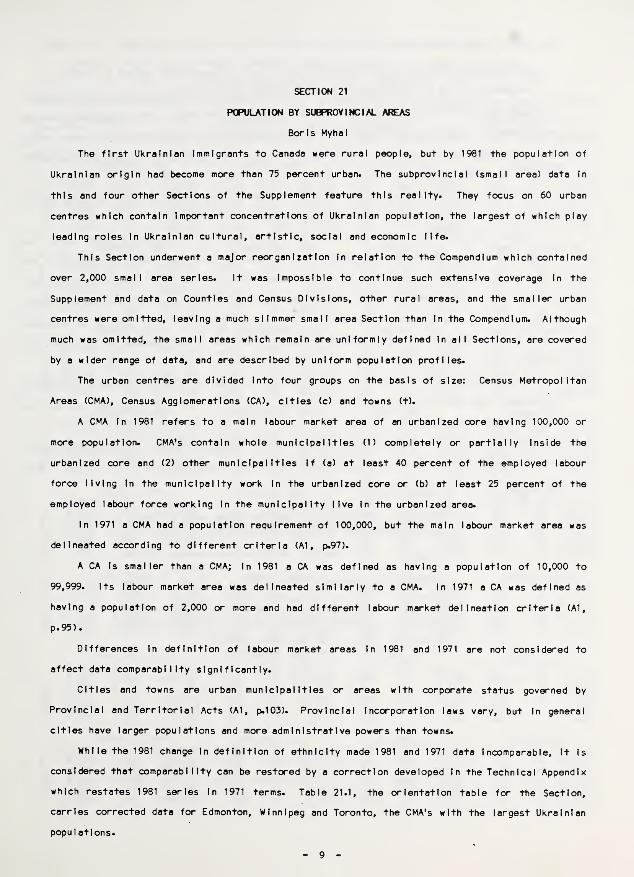
The first Ukrainian Immigrants to Canada were rural people, but by 1981 the population of
Ukrainian origin had become more than 75 percent urban* The subprovlnclal (small area) data In
this and four other Sections of the Supplement feature this reality. They focus on 60 urban
centres which contain Important concentrations of Ukrainian population, the largest of which play
leading roles In Ukrainian cultural, artistic, social and economic life.
This Section underwent a major reorganization In relation to the Compendium which contained
over 2,000 small area series. It was Impossible to continue such extensive coverage In the
Supplement and data on Counties and Census Divisions, other rural areas, and the smaller urban
centres were omitted, leaving a much slimmer small area Section than In the (kDmpendlum. Although
much was omitted, the small areas which remain are uniformly defined In all Sections, are covered
by a wider range of data, and are described by uniform population profiles.
The urban centres are divided Into four groups on the basis of size; Census Metropolitan
Areas (CMA), Census Agglomerations (CA), cities (c) and towns (t).
A CMA In 1981 refers to a main labour market area of an urbanized core having 100,000 or
more population. CMA's contain whole municipalities (1) completely or partially Inside the
urbanized core and (2) other municipalities If (a) at least 40 percent of the employed labour
force living In the municipality work In the urbanized core or (b) at least 25 percent of the
employed labour force working In the municipality live In the urbanized area.
In 1971 a CMA had a population requirement of 100,000, but the main labour market area was
delineated according to different criteria (A1, p.97).
A CA Is smaller than a CMA; In 1981 a CA was defined as having a population of 10,000 to
99,999. Its labour market area was delineated similarly to a CMA. In 1971 a CA was defined as
having a population of 2,000 or more and had different labour market delineation criteria (A1,
p.95).
Differences In definition of labour market areas In 1981 and 1971 are not considered to
affect data comparability significantly.
Cities and towns are urban municipalities or areas with corporate status governed by
Provincial and Territorial Acts (Al, p.103). Provincial I ncorporatlon laws vary, but In general
cities have larger populations and more administrative powers than towns.
While the 1981 change In definition of ethnicity made 1981 and 1971 data Incomparable, It Is
considered that comparability can be restored by a correction developed In the Technical Appendix
which restates 1981 series In 1971 terms. Table 21.1, the orientation table for the Section,
carries corrected data for Edmonton, Winnipeg and Toronto, the CMA's with the largest Ukrainian
populations.
9

According to the corrected series, the three CMA's show an Increase In population. Edmonton
Increased from 62,655 In 1971 to 73,840 In 1981 to become the largest CMA, replacing Winnipeg,
the largest In 1971. The population of Toronto Increased slightly, to 61,220 In 1981; but on the
basis of single origin ethnicity Its Ukrainian population would be shown to decline from 60,755
In 1971 to 50,705 In 1981.
Users may make additional corrections on their own to other urban area series, according to
the method outlined In the Technical Appendix (p.109).
Table 21.2 classifies total population of each urban area by sex and place of birth. The
latter, In turn Is classified Into three groups; those who were born and still reside In the
province of birth (CR), those born In other province than that In which they reside (CO), and
Immigrants (0). These data are useful In showing the Interprovincial migration of Canadlan-born
persons to urban areas, exclusive of wlthln-provlnce migration from farms, rural areas and other
urban areas. The 1971 data counterparts for Table 21.2 are In the Compendium (E2, pp.66-119,
629-30).
The Compendium carried the 1971 populations for counties and census Divisions (E2, pp.60-5).
Counterpart 1981 data are available In a research report by Kordan (E3, pp.28-35) and are not
repeated In this Section.
Small area data on religion, language, period of Immigration, marital status and family
status are provided In other Sections of the Supplement; Tables 30*4 (p.26), 31.10 (p.37), 52.8
(p.92), 62.5 (p.101) and 62.7 (p.105) respectively.
TABLE 21.1: POPULATION BY UKRAINIAN ETHNIC ORIGIN, THREESELECTED CENSUS ^€TR0P0LITAN AREAS, 1981 and 1971
CensusMetropol Itan
Area
1981 1971
Single Multiple TotalCorrected^
Total Total
Edmonton 63,120 21,445 84,565 73,840 62,655Winnipeg 58,970 20,380 79,350 69,160 64,305Toronto 50,705 21,025 71,730 61 ,220 60,755
^Comparable to 1971; see Technical Appendix.Source: for 1981, Table 21.2; for 1971, E2, p.66.

TABLE 21.2: POPULATION BY SEX, PLACE OF BIRTH, ETHNIC ORIGIN AND SELECTED URBAN AREAS, 1981
Status: T“both sexes, M=male, F»female, CR=born In Canada, province of residence,CO«born In Canada, other province, O=born outside Canada, CMA= census metropolitan area,
CA=census agglomeration, c«clty, t»town
Sta-tus
Ukrainian
Al 1
Origins
Ukrainian
Al 1
Origins
Ukrainian
Al 1
Origins
Ukrainian
Al 1
OriginsSin-gle
Mul-tiple
Sin-gle
Mul-tiple
Sin-gle
Mul-tiple
Sin-gle
Mul-tiple
EDMONTON, CMA REGINA. CMA LONDON. CMA VERNON. CAT 63,120 21,445 650,895 9,820 4,635 162,390 3,100 1,925 280,055 2,450 995 41,520M 31 ,280 10,545 329,650 4,705 2,215 79,335 1,465 880 135,460 1,200 570 20,510F 31,845 10,900 321 ,245 5,115 2,415 83,050 1,640 1,045 144,605 1,245 425 21,010CR 47,845 17,285 239,270 7,915 3,925 120,365 1,530 1,570 197,270 645 600 19,230CO 9,395 3,870 182,585 1,335 635 24,610 655 280 26,130 1,390 335 15,3350 5,880 295 129,040 570 75 17,410 915 75 56,660 415 35 6,955
WINNIPEG, CMA THUNDER BAY , CMA KITCHENER, CMA PRINCE GEORGE, CAT 58,970 20,380 578,625 9,435 4,670 119,720 3,035 1,750 285,145 2,045 1,390 67,305M 27,875 10,360 280,065 4,685 2,380 60,010 1,565 790 140,810 1,075 710 34,385F 31 ,095 10,015 298,555 4,750 2,295 59,710 1,470 960 144,330 975 685 32,920CR 45,565 17,775 380,100 6,205 4,245 84,540 1,830 1,520 195,990 730 875 34,560CO 5,930 2,110 86,390 1,910 345 14,835 535 155 26,040 1,195 470 23,0850 7,475 490 112,135 1,335 80 20,345 670 75 63,110 125 50 9,655
TORONTO, CMA ST. GATHER INESi, CMA HALIFAX, CMA SAULT STE. MARIE, CAT 50,705 21,025 2,975,495 9,395 4,140 301,565 625 845 275,745 1,900 1,475 86,390M 24,575 10,230 1,457,175 4,625 2,050 147,820 315 430 135,085 1 ,030 795 43,070F 26,130 10,795 1,518,320 4,770 2,090 153,745 315 410 140,665 865 685 43,320CR 22,600 17,075 1,551 ,445 5,330 3,765 204,215 210 445 199,840 1,365 1,390 68,005CO 10,655 2,630 291,415 1,850 270 30,870 370 360 55,730 225 65 5,3300 17,450 1,320 1,132,640 2,215 100 66,480 45 35 20,175 305 25 13,055
VANCOUVER , CMA OTTAWA-HULL , CMA YORKTON, c BRANDON, cT 29,285 18,335 1,250,610 4,700 3,770 711,915 4,710 755 14,980 2,245 970 34,995M 14,155 8,845 615,315 2,360 2,040 347,015 2,270 400 7,250 1 ,075 490 16,775F 15,130 9,490 635,295 2,340 1 ,725 364,905 2,445 355 7,730 1,170 475 18,245CR 8,965 11,860 535,140 2,060 2,450 447,570 4,045 710 11,825 1,820 805 25,610CO 17,200 5,810 343,465 , 1,745 1,150 162,590 350 30 1,825 260 150 5,8200 3,115 670 372,005 895 170 101 ,760 315 15 1,325 170 15 3,570
CALGARY, CMA WINDSOR, CMA PRINCE ALBERT. CA LETHBRIDGE » cT 18,045 10,965 587,020 5,195 2,900 243,640 3,795 1,555 37,190 1,820 1,145 53,405M 8,630 5,620 299,200 2,545 1,465 1 1 9, 1 05 1,960 670 18,215 925 580 26,090F 9,420 5,345 287,825 2,650 1,445 124,540 1,830 880 18,970 905 565 27,315CR 8,420 6,695 236,765 2,855 2,555 175,610 3,145 1,310 29,840 995 910 30,090CO 8,175 4,060 224,730 1,165 150 15,710 280 210 4,625 490 215 12,9800 1,450 210 125,525 1,175 195 52,320 365 30 2,730 340 15 10,330
SASKATOON , CMA OSHAWA, CMA KELOWNA, CA BRANTFORD , CAT 14,590 5,235 152,265 4,265 2,105 152,685 3,465 1,475 76,720 1,760 910 86,985M 7,115 2,675 73,575 2,120 965 75,815 1,660 655 37,545 905 405 42,380F 7,475 2,560 78,695 2,145 1,140 76,865 1,805 825 39,175 855 505 44,605CR 11,840 4,255 108,875 2,495 1,860 107,250 385 700 27,065 1,065 835 64,215CO 1,485 865 25,605 675 180 15,570 2,580 710 35,090 330 35 7,0400 1,265 115 17,785 1,095 65 29,865 495 70 14,570 365 35 15,735
HAMILTON, CMA VICTORIA, CMA DAUPHIN, t VEGREVILLE. tT 11,620 5,620 537,645 3,075 2,860 229,495 3,190 350 8,615 2,315 175 5,085M 5,820 2,660 264,845 1,490 1,375 109,550 1,435 185 4,030 1 ,080 105 2,460F 5,805 2,955 272,800 1,585 1 ,480 119,945 1,750 165 4,580 1,230 70 2,620CR 5,750 4,955 348,750 850 1,665 96,600 2,705 340 6,755 1,915 175 3,665CO 2,435 445 48,445 1,965 1,120 78,490 220 10 1,110 130 - 8250 3,435 220 140,455 260 70 54,405 260 - 755 265 - 600
MONTREAL, CMA SUDBURY. 'CMA KAMLOOPS. CA RED DEER » cT 13,005 3,530 2,798,040 3,395 1,645 148,690 1,975 1,515 63,975 1,525 825 44,350M 6,600 1,830 1,359,820 1,665 830 74,135 1,075 830 31 ,870 795 425 22,085F 6,410 1,700 1,438,220 1,730 810 74,555 895 680 32,105 730 405 22,275CR 6,695 2,785 2,219,345 1,905 1,530 116,120 615 895 32,300 775 605 23,060CO 1,215 440 125,830 725 75 16,530 1,235 585 22,320 690 205 16,0650 5,095 310 452,865 760 40 16,045 125 25 9,345 55 20 5,230
continued

TABLE 21.2: POPULATION BY SEX, PLACE OF BIRTH, ETHNIC ORIGIN AND SELECTED URBAN AREAS, 1981
Status: T=both sexes, M=male, F=female, CR=born In Canada, province of residence,CO=born In Canada, other province, O=born outside Canada, CMA= census metropolitan area,
CA=census agglomeration, c=clty, t=town
Ukrainian Ukrainian Ukrainian UkrainianSta»tus
Sin-gle
Mul-tiple
At 1
OriginsSln-gle
Mul-tiple
At 1
OriginsSin-gle
Mul-tiple
Al 1
OriginsSin-gle
Mul-tiple
Al 1
Origins
MOOSE JAW , CA PORTAGE LA PRAIRIE, CA ST. PAUL,,t MELVILLE » c
T 1,790 515 34,785 1 ,320 385 19,555 1 ,070 185 4,705 685 125 4,930M 840 290 16,920 585 215 9,640 570 105 2,415 310 70 2,440F 950 220 17,870 735 165 9,915 495 80 2,290 370 60 2,490CR 1,255 425 24,080 970 320 14,550 860 160 3,275 600 125 3,940CO 255 85 6,920 190 65 3,415 65 25 860 45 - 4650 280 - 3,785 160 - 1,585 140 - 565 35 - 525
NORTH BATTLEFORD. CA KENORA. CA KINGSTON,,CA THE PAS. t
T 1 ,600 665 18,245 1,210 470 15,380 515 655 111,815 565 210 6,185M 730 395 8,855 625 235 7,740 275 305 55,100 75 120 3,105F 865 275 9,385 585 235 7,640 250 345 56,715 290 90 3,080CR 1,275 600 14,265 675 405 10,325 250 450 80,875 390 185 4,070CO 105 50 2,150 335 60 3,515 175 185 14,275 140 25 1 ,5500 225 15 1 ,825 200 -
1 ,545 90 20 16,660 40 - 560
GRANDE PRAIRIE, c SARNIA. CA GUELPH, CA KAMSACK. tT 1,220 850 23,965 930 640 83,310 590 525 77,395 700 50 2,515M 560 410 12,365 445 305 41 ,615 305 265 37,865 330 20 1,220F 655 445 11,605 485 335 41 ,695 285 265 39,530 365 30 1,295CR 850 635 13,515 515 515 60,895 340 420 54,530 560 50 2,000CO 285 215 7,940 245 105 7,970 110 80 6,525 55 - 315
0 85 - 2,510 165 20 14,440 140 20 16,340 80 - 195
MEDICINE HAT, CA THOMPSON,,CA Tl^f4INS,
.c SMOKY LAKE, t
T 960 850 49,075 965 515 14,310 680 370 45,760 695 20 1 ,000M 495 450 24,595 555 295 7,555 360 180 23,135 340 - 490
F 460 400 24,480 410 220 6,760 315 195 22,630 350 15 515CR 445 570 26,085 625 445 7,745 435 310 34,435 550 20 730
CO 450 265 17,280 335 70 4,950 105 35 6,890 - - 75
0 70 15 5,710 - - 1,615 135 25 4,435 140 - 205
SELKIRK. t SYDNEY^,,CA FORT FRANCES, t NORTH BAY, CA
T 1,255 530 9,460 820 650 121 ,685 815 210 8,685 295 385 56,435M 660 265 4,690 385 330 59,895 450 110 4,215 135 175 27,825F 600 260 4,775 435 325 61 ,790 365 95 4,470 165 210 28,610CR 1 ,050 495 7,380 635 550 108,265 490 195 6,180 140 315 45,090CO 90 35 1,150 100 75 10,075 280 - 1,480 115 60 6,9950 115 - 930 85 25 3,350 40 15 1,030 45 - 4,345
NANAIMO. 1CA CHILLIWACK, CA PENTICTON, c WYNYARD, tT 1,005 735 57,285 805 520 41,095 760 260 22,900 605 35 2,110M 465 345 28,600 410 225 20,265 375 120 11,025 275 20 970F 545 390 28,685 400 300 20,830 385 140 11,880 330 15 1,135CR 325 465 29,695 245 275 17,530 130 150 8,945 485 40 1 ,640
CO 595 265 17,315 435 185 15,085 525 105 9,480 40 - 2300 85 - 10,280 130 65 8,485 105 - 4,480 75 - 245
CANORA, t FLIN FLON,,CA PORT ALBERNI, CA ITUNA, t
T 1,575 135 2,610 885 380 9,820 565 445 32,445 635 - 815M 760 60 1 ,235 425 180 5,095 260 215 16,780 280 - 365F 820 75 1,370 455 205 4,730 300 230 15,660 355 - 450CR 1,320 130 2,135 520 260 5,555 200 350 19,465 485 - 615CO 110 - 225 315 120 3,455 290 90 7,820 - - 40
0 150 - 250 50 - 815 80 - 5,160 145 - 160
Whe full name Is St. Cather I nes-N I agara CMA; ^Total of Sydney CA and Sydney Mines CA.Source: Cl 8, Cl 9.
SECTION 22
POPULATION BY SEX, AGE AND RURAL-URBAN STATUS
Boris Myhal
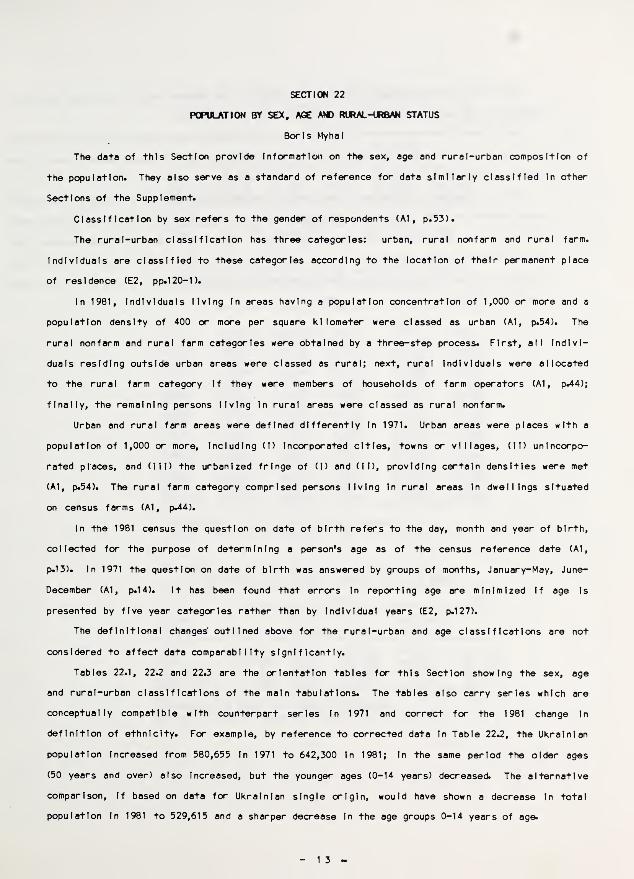
The data of this Section provide Information on the sex, age and rural-urban composition of
the population. They also serve as a standard of reference for data similarly classified In other
Sections of the Supplement.
Classification by sex refers to the gender of respondents (A1 , p.53).
The rural-urban classification has three categories: urban, rural nonfarm and rural farm.
Individuals are classified to these categories according to the location of their permanent place
of residence (E2, pp.120-1).
In 1981, Individuals living In areas having a population concentration of 1,000 or more and a
population density of 400 or more per square kilometer were classed as urban (A1, p.54). The
rural nonfarm and rural farm categories were obtained by a three-step process. First, all Indivi-
duals residing outside urban areas were classed as rural; next, rural Individuals were allocated
to the rural farm category If they were members of households of farm operators (A1, pv44);
finally, the remaining persons living In rural areas were classed as rural non farm.
Urban and rural farm areas were defined differently In 1971. Urban areas were places with a
population of 1,000 or more. Including (I) Incorporated cities, towns or villages, (II) unincorpo-
rated places, and (III) the urbanized fringe of (I) and (II), providing certain densities were met
(A1, p.54). The rural farm category comprised persons living In rural areas In dwellings situated
on census farms (A1, p.44).
In the 1981 census the question on date of birth refers to the day, month and year of birth,
collected for the purpose of determining a person’s age as of the census reference date (A1,
p.13). In 1971 the question on date of birth was answered by groups of months, January-May, June-
December (Al, p.14). It has been found that errors In reporting age are minimized If age Is
presented by five year categories rather than by Individual years (E2, p.127).
The definitional changes' outlined above for the rural -urban and age classifications are not
considered to affect data comparability significantly.
Tables 22.1, 22.2 and 22.3 are the orientation tables for this Section showing the sex, age
and rural-urban classifications of the main tabulations. The tables also carry series which are
conceptually compatible with counterpart series In 1971 and correct for the 1981 change In
definition of ethnicity. For example, by reference to corrected data In Table 22.2, the Ukrainian
population Increased from 580,655 In 1971 to 642,300 In 1981; In the same period the older ages
(50 years and over) also Increased, but the younger ages (0-14 years) decreased. The alternative
comparison. If based on data for Ukrainian single origin, would have shown a decrease In total
population In 1981 to 529,615 and a sharper decrease In the age groups 0-14 years of age.

Users may make additional corrections on their own to provincial and other series by
reference to the method outlined In "he Technical Appendix (p«109).
Table 22.4 Is the main table In the Section, cross-classifying data on Ukrainian origin and
all origins by province, sex, rural-urban status and age. The 1971 counterparts are In the
Compendium (E2, pp.1 33-162).
The sex, age and rural -urban classifications are applied. In total or In part, to various
subpopulatlons In other Sections of the Supplement, that Is: persons 15 years of age and over,
farm operators, persons with Ukrainian mother tongue, persons with Ukrainian home language, the
Immigrant population, and others. The classifications of this Section apply to the total
population and serve as a standard of reference and a comparison base for counterpart data In the
other Sections.

TABLE 22.1: POPULATION BY SEX AND UKRAINIAN ETHNICORIGIN, CANADA, 1981 and 1971
1981 1971
Sex Single Multiple TotalCorrected^
Total Total
TotalMaleFemale
529,615265,210264,405
225,365112,935112,430
754,980378,145376,835
642,300321 ,680320,620
580,655295,720284,935
^Comparable to 1971; see TechnicalSource: for 1981, Table 22.4; for
Appendix.1971, E2, p. 133.
TABLE 22.2: POPULATION BYORIGIN, CANADA,
AGE AND 1
1981 andUKRAINIAN ETHNIC1971
Age
1981 1971
Single Multiple TotalCorrected^
Total Tota 1
Total 529,615 225,365 754,980 642,300 580,6550-4 19,010 37,165 56,175 37,590 39,9505-9 22,185 32,330 54,515 38,350 50,91010-14 28,900 30,355 59,255 44,080 54,70015-19 38,755 30,750 69,505 54,130 53,26520-24 47,245 26,410 73,655 60,450 45,74525-29 47,235 22,795 70,030 58,635 37,82530-34 42,595 16,205 58,800 50,695 32,65535-39 35,410 9,740 45,150 40,280 34,53540-44 30,955 5,725 36,680 33,815 37,60545-49 33,390 3,765 37,155 35,270 45,59550-54 35,990 3,050 39,040 37,515 36,56055-59 42,300 2,365 44,665 43,480 31,48060-64 33,160 1,830 34,990 34,075 24,84065 plus 72,465 2,870 75,335 73,900 54,990
Comparable to 1971; see Technical Appendix.Source: for 1981, Table 22.4; for 1971, E2, pp. 133-5.
TABLE 22.3: POPULATION BY RURAL-URBAN STATUS ANDUKRAINIAN ETHNIC ORIGIN, CANADA, 1981 and 1971
Rural-UrbanStatus
1981 1971
Single Multiple TotalCorrected^
Total Tota 1
Total 529,615 225,365 754,980 642,300 580,655Urban 403,205 179,340 582,545 492,875 435,325Rural Nonfarm 79,205 34,090 113,295 96,250 69,495Rural Farm 47,195 11,930 59,125 53,160 75,840
^Comparable to 1971; see Technical Appendix.Source: for 1981, Table 22.4; for 1971, E2, pp. 133-6.

TABLE 22.4; POPULATION BY SEX, AGE, RURAL-URBAN STATUS AND ETHNIC ORIGIN, CANADA AND PROVINCES, 1981
Status: T=both sexes, M=male, F=female, U=urban, f=rural farm, N=rural nonfarm
Canadal Atlantic Provinces Quebec Ontario
Ukrainian Ukrainian Ukrainian Ukrainian
Sta-tus
Sin-gle
Mul-tiple
Al 1
OriginsSin-gle
Mul-tiple
Al 1
Or I g 1 nsSin-gle
Mul-tiple
Al 1
OriginsSin-gle
Mul-tiple
Al 1
Origins
T 529,615 225,365 24,083,495 2,845 3,090TOTAL
2.214,145 14,640 4 ,255 6,369,065 133,995 69,040 8,534,260M 265,210 112,935 11,958,360 1,470 1 ,560 1,103,410 7,510 2 ,165 3,142,010 66,540 34,200 4,210,645F 264,405 112,430 12,125,140 1,375 1,535 1,110,730 7,125 2 ,095 3,227,060 67,455 34,835 4,323,620U 403,205 179,340 18,215,440 1,965 2,205 1,182,350 13,780 3,910 4,931 ,530 118,220 59,015 6,968,570f 47,195 11,930 1,046,265 60 40 46,975 95 35 186,335 2,405 1,335 282,715N 79,205 34,090 4,821,795 820 835 984,815 760 315 1,251,200 13,370 8,685 1,282,975
T 19,010 37,165 1,783,110 150 5550-4 YEARS172,300 385 595 472,820 3,565 10,735 593,095
M 9,615 18,720 914,315 65 235 87,915 205 255 242,925 1 ,745 5,280 303,720F 9,395 18,450 868,795 85 320 84,380 180 340 229,895 1,815 5,450 289,380U 13,505 28,395 1,274,630 115 370 85,900 350 510 337,560 3,025 8,970 472,070f 2,075 1,925 74,585 - - 2,820 - - 13,100 55 145 17,990N 3,430 6,840 433,895 35 180 83,580 30 80 122,160 481/ 1,620 103,040
T 22,185 32,330 1,775,060 135 3905-9 YEARS
191,200 305 435 440,840 4,150 9,520 616,680M 11,470 16,710 910,815 100 200 98,265 175 225 226,085 2,150 4,950 316,940F 10,720 15,620 864,245 35 185 92,935 135 210 214,750 1,995 4,570 299,745U 15,225 24,585 1,263,820 65 265 94,715 295 380 322,230 3,500 7,825 486,700f 2,925 2,035 87,645 - - 3,555 - - 14,330 125 205 22,015N 4,030 5,705 423,595 75 115 92,925 15 55 104,280 530 1,490 107,970
T 28,900 30,355 1 ,916,040 160 44010-14 YEARS205,895 385 500 479,585 5,285 9,105 674,765
M 14,985 15,300 981 ,630 100 205 105,655 220 295 245,555 2,695 4,600 345,690F 13,915 15,060 934,410 60 235 100,235 165 210 234,035 2,590 4,505 329,070U 19,570 23,270 1,369,055 100 300 103,280 360 465 356,405 4,455 7,600 530,535f 4,375 2,200 113,560 - - 4,915 - - 20,770 130 260 29,620N 4,945 4,890 433,425 60 130 97,690 15 35 102,410 700 1,240 114,610
T 38,755 30,750 2,303,580 215 39015-19 YEARS232,665 780 560 616,830 7,885 9,360 804,875
M 19,510 15,255 1,175,100 105 210 118,915 415 280 314,385 4,030 4,660 411,020F 19,245 15,500 1,128,480 115 180 113,750 365 275 302,440 3,850 4,700 393,860U 28,530 24,525 1,699,550 160 320 123,045 735 535 467,090 6,875 8,000 643,170f 5,045 2,090 137,305 - - 6,380 - - 28,565 215 275 37,460N 5,185 4,135 466,725 55 60 103,245 35 20 121,175 790 1,085 124,245
T 47,245 26,410 2,334,420 270 32520-24 YEARS204,280 1,190 585 640,960 11,080 8,135 786,815
M 23,125 13,085 1,166,870 140 195 101,250 590 300 320,175 5,440 3,890 390,270F 24,125 13,325 1,167,550 135 130 103,030 600 290 320,790 5,640 4,240 396,540U 39,375 22,815 1,865,000 190 255 119,190 1,140 570 513,820 10,005 7,315 669,010f 2,400 795 77,355 - - 3,750 - - 18,265 170 120 22,335N 5,480 2,800 392,065 80 65 81,340 50 15 108,880 900 695 95,470
T 47,235 22,795 2,166,170 310 33025-29 YEARS188,480 1,120 460 584,915 12,565 7,175 731,245
M 23,990 11,405 1,078,385 145 140 92,755 570 225 291 ,455 6,325 3,520 356,955F 23,245 11,390 1,087,775 165 190 95,725 555 230 293,460 6,240 3,660 374,295U 38,535 18,955 1,687,590 230 255 104,640 1,080 425 452,465 11,070 6,380 614,475f 2,360 675 59,855 - 15 2,265 - - 11,380 145 55 14,535N 6,340 3,160 418,730 75 65 81,575 40 30 121,075 1,350 740 102,235
T 42,595 16,205 2,033,805 360 25530-34 YEARS179.875 1.085 355 546,255 11,210 5,345 719,495
M 22,090 8,090 1,015,835 155 135 90,325 595 195 272,050 5,760 2,610 355,225F 20,510 8,115 1,017,975 205 120 89,550 490 160 274,200 5,450 2,730 364,270U 33,105 13,170 1 ,550,700 240 195 94,185 1,005 300 417,440 9,755 4,510 593,345f 2,890 620 65,515 - - 3,115 - - 10,910 165 65 16,635N 6,610 2,415 417,595 110 55 82,580 80 50 117,905 1,285 770 109,515
continued
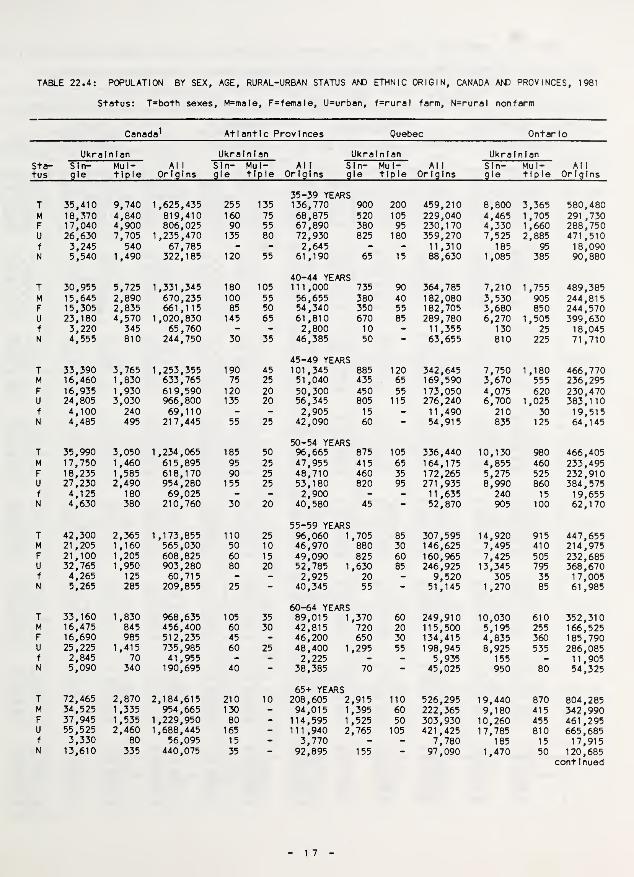
TABLE 22.4: POPULATION BY SEX, AGE, RURAL-URBAN STATUS AND ETHNIC ORIGIN, CANADA AM) PROVINCES, 1981
Status: T=both sexes, M=male, F=-female, U=urban, f=rural farm, N=rural nonfarm
Canada^ Atlantic Provinces Quebec Ontario
Ukrainian Ukrain I an Ukrain I an
Sta-tus
Sin-gle
Mul-tiple
Al 1
OriginsSin-gle
Mul-tiple
Al 1
OriginsSin-gle
Mul-tiple
35-39 YEARST 35,410 9,740 1,625,435 255 135 136,770 900 200M 18,370 4,840 819,410 160 75 68,875 520 105F 17,040 4,900 806,025 90 55 67,890 380 95U 26,630 7,705 1,235,470 135 80 72,930 825 180f 3,245 540 67,785 - - 2,645 - -
N 5,540 1,490 322,185 120 55 61,190 65 15
40-44 YEARST 30,955 5,725 1,331,345 180 105 111,000 735 90M 15,645 2,890 670,235 100 55 56,655 380 40F 15,305 2,835 661,115 85 50 54,340 350 55U 23,180 4,570 1,020,830 145 65 61,810 670 85
f 3,220 345 65,760 - - 2,800 10 -
N 4,555 810 244,750 30 35 46,385 50 -
45-49 YEARST 33,390 3,765 1,253,355 190 45 101,345 885 120M 16,460 1 ,830 633,765 75 25 51,040 435 65
F 16,935 1,930 619,590 120 20 50,300 450 55U 24,805 3,030 966,800 135 20 56,345 805 115
f 4,100 240 69,110 - - 2,905 15 -
N 4,485 495 217,445 55 25 42,090 60 -
50-54 YEARST 35,990 3,050 1,234,065 185 50 96,665 875 105
M 17,750 1 ,460 615,895 95 25 47,955 415 65F 18,235 1,585 618,170 90 25 48,710 460 35U 27,230 2,490 954,280 155 25 53,180 820 95f 4,125 180 69,025 - - 2,900 - -
N 4,630 380 210,760 30 20 40,580 45 -
55-59 YEARST 42,300 2,365 1,173,855 110 25 96,060 1 ,705 85M 21 ,205 1,160 565,030 50 10 46,970 880 30F 21,100 1 ,205 608,825 60 15 49,090 825 60U 32,765 1 ,950 903,280 80 20 52,785 1,630 85f 4,265 125 60,715 - - 2,925 20 -
N 5,265 285 209,855 25 - 40,345 55 -
60-64 YEARST 33,160 1 ,830 968,635 105 35 89,015 1,370 60M 16,475 845 456,400 60 30 42,815 720 20F 16,690 985 512,235 45 - 46,200 650 30U 25,225 1 ,415 735,985 60 25 48,400 1,295 55f 2,845 70 41,955 - - 2,225 - -
N 5,090 340 190,695 40 - 38,385 70 -
65+ YEARST 72,465 2,870 2,184,615 210 10 208,605 2,915 110M 34,525 1 ,335 954,665 130 - 94,015 1,395 60F 37,945 1,535 1,229,950 80 - 114,595 1,525 50U 55,525 2,460 1,688,445 165 - 111,940 2,765 105f 3,330 80 56,095 15 - 3,770 - -
N 13,610 335 440,075 35 - 92,895 155 -
UkrainianAll Sin- Mul- All
Origins gle tiple Origins
459,210 8,800 3,365 580,480229,040 4,465 1 ,705 291 ,730230,170 4,330 1,660 288,750359,270 7,525 2,885 471 ,51011 ,310 185 95 18,09088,630 1 ,085 385 90,880
364,785 7,210 1,755 489,385182,080 3,530 905 244,815182,705 3,680 850 244,570289,780 6,270 1,505 399,63011,355 130 25 18,04563,655 810 225 71,710
342,645 7,750 1,180 466,770169,590 3,670 555 236,295173,050 4,075 620 230,470276,240 6,700 1 ,025 383,11011,490 210 30 19,51554,915 835 125 64,145
336,440 10,130 980 466,405164,175 4,855 460 233,495172,265 5,275 525 232,910271,935 8,990 860 384,57511,635 240 15 19,65552,870 905 100 62,170
307,595 14,920 915 447,655146,625 7,495 410 214,975160,965 7,425 505 232,685246,925 13,345 795 368,670
9,520 305 35 17,00551,145 1,270 85 61,985
249,910 10,030 610 352,310115,500 5,195 255 166,525134,415 4,835 360 185,790198,945 8,925 535 286,085
5,935 155 - 11,90545,025 950 80 54,325
526,295 19,440 870 804,285222,365 9,180 415 342,990303,930 10,260 455 461 ,295421,425 17,785 810 665,685
7,780 185 15 17,91597,090 1,470 50 120,685
continued

TABLE 22.4: POPULATION BY SEX, AGE, RURAL-URBAN STATUS AND ETHNIC ORIGIN, CANADA AND PROVINCES, 1981
Status: T=both sexes, M=male, F=fefnale, U=urban, f=rural farm, N=rural nonfarm
Manitoba Saskatchewan A I berta British Columbia
Ukrainian Ukrainian Ukrainian UkrainianSta-tus
Sin-gle
Mul-tiple
Al 1
OriginsSin-gle
Mul- Alltlple Origins
Sin-gle
Mul-tiple
Al 1
OriginsSin-gle
Mul- Alltlple Origins
T 99,795 30,490 1,013,705 76,810 23,280TOTAL
956,440 136,710 53,075 2,213,650 63,610 41,215 2,713,615M 48,875 15,730 501,270 38,810 11,870 480,970 69,385 26,535 1,132,045 32,005 20,430 1,352,040F 50,925 14,765 512,435 38,000 11 ,410 475,475 67,325 26,535 1,081,605 31,600 20,785 1,361,575U 71,130 24,040 718,340 47,035 15,775 553,575 100,310 41,745 1,710,275 49,815 31 ,930 2,114,210f 11,150 1,910 95,880 15,700 3,645 182,155 16,595 4,305 192,355 1,195 645 59,835N 17,515 4,540 199,485 14,075 3,865 220,710 19,800 7,025 311,025 12,595 8,640 539,565
T 3,850 4,740 76,705 3,300 4,4350-4 YEARS
81,420 5,995 9,605 187,990 1,720 6,315 191,155M 1 ,880 2,485 39,355 1,655 2,360 41,760 3,035 4,820 96,685 1,005 3,205 98,065F 1,970 2,250 37,350 1 ,640 2,075 39,660 2,960 4,785 91 ,300 710 3,110 93,090U 2,600 3,520 50,620 1,965 2,875 44,375 4,180 7,435 140,785 1,235 4,565 139,710f 500 325 7,535 695 675 14,935 800 690 14,405 35 75 3,810N 755 890 18,555 640 885 22,115 1,015 1,480 32,790 445 1 ,680 47,630
T 4,620 4,630 79,040 4,010 3,5905-9 YEARS
77,365 6,660 8,045 173,980 2,240 5,570 188,920M 2,300 2,430 40,625 2,200 1,825 39,430 3,295 4,100 89,200 1,220 2,905 96,665F 2,320 2,220 38,415 1,815 1 ,760 37,940 3,365 3,940 84,780 1,025 2,665 92,255U 2,860 3,515 50,870 2,320 2,260 41 ,030 4,560 6,125 126,785 1,585 4,085 138,185f 735 320 8,895 1,010 670 16,580 1 ,015 675 17,430 40 170 4,835N 1,025 800 19,275 685 660 19,755 1,075 1,240 29,760 615 1,315 45,905
T 5,590 4,255 82,015 5,365 3,35510-14
79,610YEARS
8,670 7,255 179,065 3,375 5,345 207,805M 2,940 2,205 41,780 2,740 1,730 40,965 4,540 3,700 91,800 1,725 2,515 106,390F 2,655 2,045 40,235 2,625 1,625 38,650 4,135 3,555 87,270 1,655 2,830 101 ,410U 3,385 3,260 52,510 2,995 2,185 41,705 5,810 5,230 127,945 2,400 4,145 153,450f 1,100 300 10,465 1 ,560 630 19,215 1 ,475 890 21,830 110 115 6,740N 1,100 690 19,040 810 540 18,695 1 ,385 1,140 29,290 865 1,085 47,615
T 7,155 4,375 95,570 6,430 3,35015-19
94,755YEARS
11,950 7,170 213,370 4,235 5,460 238,310M 3,485 2,280 48,335 3,215 1,615 48,070 6,010 3,445 108,995 2,220 2,725 121,625F 3,680 2,095 47,235 3,210 1,735 46,685 5,940 3,725 104,370 2,020 2,735 116,685U 5,045 3,470 64,860 3,910 2,255 54,230 8,535 5,550 160,720 3,180 4,325 182,850f 1,040 330 11,450 1 ,640 595 21,515 2,015 790 24,180 120 95 7,760N 1,070 575 19,255 880 505 19,010 1,400 830 28,475 935 1,040 47,700
T 8,275 3,230 93,695 6,500 2,57520-24
88,445YEARS
14,085 6,730 262,950 5,705 4,750 250,205M 4,000 1 ,600 46,845 3,215 1,335 44,545 6,855 3,345 136,235 2,840 2,375 124,010F 4,275 1,630 46,845 3,280 1,240 43,905 7,230 3,390 126,720 2,865 2,370 126,195U 6,740 2,805 72,265 4,850 1,980 60,010 11,815 5,915 222,895 4,515 3,920 203,725f 610 125 6,540 755 245 11,045 805 260 11,760 50 35 3,650N 920 300 14,880 890 350 17,395 1,465 555 28,295 1,145 795 42,825
T 8,180 2,655 85,445 5,430 1 ,86525-29
80,300YEARS
13,000 5,575 239,975 6,470 4,625 248,315M 4,010 1 ,420 42,290 2,840 950 40,650 6,815 2,860 126,760 3,210 2,240 123,815F 4,175 1,240 43,155 2,590 920 39,650 6,185 2,710 113,215 3,255 2,390 124,495U 6,315 2,200 64,595 3,730 1,330 50,975 10,765 4,620 199,825 5,225 3,665 195,965f 665 120 6,075 795 205 11,885 685 260 10,710 55 30 3,000N 1,210 335 14,780 900 335 17,440 1,545 690 29,440 1,180 935 49,345
T 7,575 2,120 79,060 4,990 1,26530-34
67,690YEARS
11,595 3,210 194,855 5,635 3,565 239,805M 3,970 1,160 39,505 2,610 645 34,695 6,070 1,605 100,220 2,850 1,695 120,210F 3,600 960 39,555 2,385 625 32,995 5,525 1,610 94,640 2,780 1,875 119,595U 5,600 1,765 58,620 3,270 905 41,210 8,865 2,605 156,400 4,250 2,815 185,390f 695 90 6,125 890 190 12,000 1,020 225 12,865 115 35 3,870N 1,280 265 14,315 830 170 14,480 1,710 375 25,595 1,265 715 50,550
continued
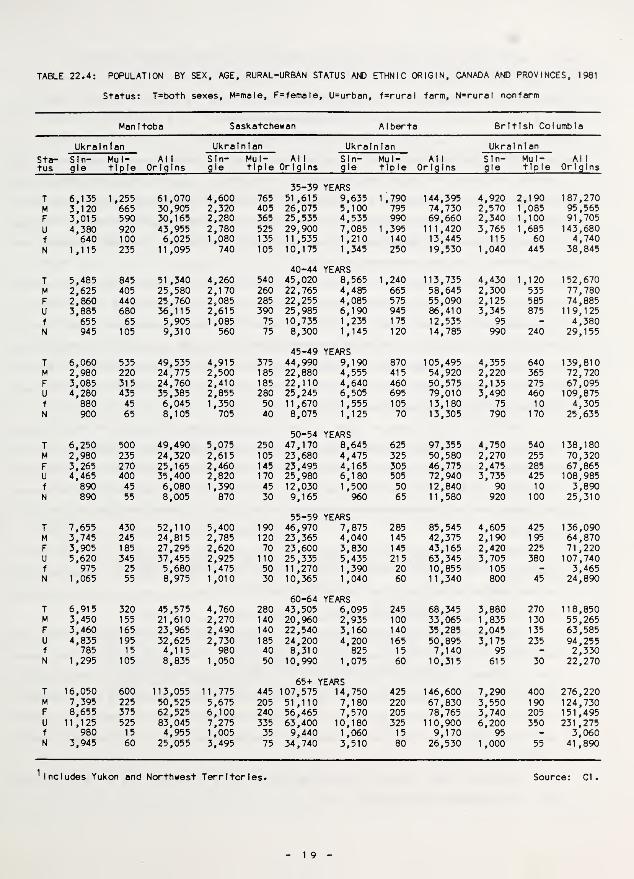
TABLE 22.4: POPULATION BY SEX, AGE, RURAL-URBAN STATUS AND ETHNIC ORIGIN, CANADA AND PROVINCES, 1981
Status: T=both sexes, M=male, F=female, U=urban, f=rural farm, N=rural nonfarm
Manitoba Saskatchewan Alberta British Columbia
Ukrainian Ukrainian Ukrainian Ukrainian
Sta-tus
Sin-gle
Mul-tiple
Al 1
OriginsSin-gle
Mul- Alltlple Origins
Sin-gle
Mul-tlp le
Al 1
OriginsSin-gle
Mul-tiple
Al 1
Origins
T 6,135 1,255 61,070 4,600 76535-39
51,615YEARS
9,635 1,790 144,395 4,920 2,190 187,270M 3,120 665 30,905 2,320 405 26,075 5,100 795 74,730 2,570 1,085 95,565F 3,015 590 30,165 2,280 365 25,535 4,535 990 69,660 2,340 1,100 91,705
U 4,380 920 43,955 2,780 525 29,900 7,085 1 ,395 111,420 3,765 1 ,685 143,680f 640 100 6,025 1 ,080 135 11,535 1,210 140 13,445 115 60 4,740N 1,115 235 11,095 740 105 10,175 1,345 250 19,530 1,040 445 38,845
T 5,485 845 51 ,340 4,260 54040-44
45,020YEARS
8,565 1,240 113,735 4,430 1 ,120 152,670M 2,625 405 25,580 2,170 260 22,765 4,485 665 58,645 2,300 535 77,780F 2,860 440 25,760 2,085 285 22,255 4,085 575 55,090 2,125 585 74,885U 3,885 680 36,115 2,615 390 25,985 6,190 945 86,410 3,345 875 119,125f 655 65 5,905 1,085 75 10,735 1,235 175 12,535 95 - 4,380N 945 105 9,310 560 75 8,300 1,145 120 14,785 990 240 29,155
T 6,060 535 49,535 4,915 375
45-4944,990
YEARS9,190 870 105,495 4,355 640 139,810
M 2,980 220 24,775 2,500 185 22,880 4,555 415 54,920 2,220 365 72,720F 3,085 315 24,760 2,410 185 22,110 4,640 460 50,575 2,135 275 67,095U 4,280 435 35,385 2,855 280 25,245 6,505 695 79,010 3,490 460 109,875f 880 45 6,045 1,350 50 11,670 1,555 105 13,180 75 10 4,305N 900 65 8,105 705 40 8,075 1,125 70 13,305 790 170 25,635
T 6,250 500 49,490 5,075 25050-54
47,170YEARS
8,645 625 97,355 4,750 540 138,180M 2,980 235 24,320 2,615 105 23,680 4,475 325 50,580 2,270 255 70,320F 3,265 270 25,165 2,460 145 23,495 4,165 305 46,775 2,475 285 67,865U 4,465 400 35,400 2,820 170 25,980 6,180 505 72,940 3,735 425 108,985f 890 45 6,080 1,390 45 12,030 1,500 50 12,840 90 10 3,890N 890 55 8,005 870 30 9,165 960 65 11,580 920 100 25,310
T 7,655 430 52,110 5,400 19055-59
46,970YEARS
7,875 285 85,545 4,605 425 136,090M 3,745 245 24,815 2,785 120 23,365 4,040 145 42,375 2,190 195 64,870F 3,905 185 27,295 2,620 70 23,600 3,830 145 43,165 2,420 225 71,220U 5,620 345 37,455 2,925 110 25,335 5,435 215 63,345 3,705 380 107,740f 975 25 5,680 1,475 50 11,270 1 ,390 20 10,855 105 - 3,465N 1,065 55 8,975 1,010 30 10,365 1,040 60 11,340 800 45 24,890
T 6,915 320 45,575 4,760 28060-64
43,505YEARS
6,095 245 68,345 3,880 270 118,850M 3,450 155 21 ,610 2,270 140 20,960 2,935 100 33,065 1,835 130 55,265F 3,460 165 23,965 2,490 140 22,540 3,160 140 35,285 2,045 135 63,585U 4,835 195 32,625 2,730 185 24,200 4,200 165 50,895 3,175 235 94,255f 785 15 4,115 980 40 8,310 825 15 7,140 95 - 2,330N 1,295 105 8,835 1,050 50 10,990 1,075 60 10,315 615 30 22,270
T 16,050 600 113,055 11,775 44565+ YEARS
107,575 14,750 425 146,600 7,290 400 276,220M 7,395 225 50,525 5,675 205 51 ,110 7,180 220 67,830 3,550 190 124,730F 8,655 375 62,525 6,100 240 56,465 7,570 205 78,765 3,740 205 151,495U 11 ,125 525 83,045 7,275 335 63,400 10,180 325 110,900 6,200 350 231 ,275f 980 15 4,955 1,005 35 9,440 1 ,060 15 9,170 95 - 3,060N 3,945 60 25,055 3,495 75 34,740 3,510 80 26,530 1,000 55 41,890
^Includes Yukon and Northwest Territories. Source: Cl
.
SECTION 30
RELIGIOUS DONOMINATIONS
Paul Yuzyk
Data on religious denominations (religions) by ethnic origin have been available since 1931,
making them one of the longer continuous series In the Census. Names of religions varied over the
period, but the two traditionally Ukrainian denominations were standardized In the Compendium as
Greek Catholic and Greek Orthodox. Following the practice In 1981 census publications, the names
In the Supplement have been changed to "Ukrainian Catholic" and "Eastern Orthodox"; together they
are referred to as the Eastern-rite religions.
In the 1981 Census, religion refers to specific religions, groups or bodies, denominations,
sects, cults or religious communities reported by respondents In answer to the question "What Is
your religion?" For Infants and young children the religion to be reported was the one In which
they were being brought up. It should be emphasized that the census Information on religion does
not reflect actual membership, the degree of affiliation or extent of commitment to a given
religious group (Al, p.43). As the 1971 question on religion was very similar, (A9, p.29) there
Is no significant data discrepancy with 1981.
Table 30.1, the orientation table for the Section, provides an overview of the religious
classifications In the main tabulations and contains corrected 1981 data for comparison with 1971.
The table contains two additional categories, "other religions" and "other origins". Reading down
the stub of the table, the data are classified by Ukrainian Catholic, Eastern Orthodox and "other
religions"; the last contains the Roman Catholic, United Church and other religions as detailed In
Table 30.2.
Read I ng across the columns of Table 30.1 , religious data are classified by the. ethnic
headings for 1981 single, multiple and total origin; the corrected 1981 and counterpart 1971
series; and "other origins". The last Includes non-Ukral nl an origins such as Greek, Yugoslavian,
British, Polish and others as detailed In Table 30.3.
The corrected series, adjusted for the major change In definition of ethnicity In 1981, are
considered to be conceptually comparable with those for 1971. Their comparison (Table 30.1) shows
that the number of persons of Ukrainian origin In 1981 decreased significantly In the Ukrainian
Catholic and Eastern Orthodox religions, and conversely, that they Increased very significantly In
"other religions". To make provincial and other comparisons with 1971, users may correct
additional 1981 data on their own by reference to the method outlined In the Technical Appendix
(p.l09).
The data In Tables 30.1 and 30.3 may be used to update historical data In Tables 30.1 and
30.2 In the Compendium (E2, pp.172, 175).

Table 30.2 classifies Ukrainians by province, religion, sex and rural-urban status. Its main
features, referring to data for Canada, are that over half (51$) of Ukrainian single origin and a
very high majority (91$) of multiple origin are affiliated with non-Eastern-r Ite religions. It
should be noted that a high proportion of Ukrainians, particularly those of multiple origin,
reported affiliation with the Roman Catholic, United Church and Anglican religions; and that the
Jehovah’s Witnesses religion and the "no religion" category reported large proportional Increases
In 1981 over 1971.
As a note of caution. It should be Indicated that a census publication (A7, p.A-9) which
shows a total of 361,560 persons In the Eastern Orthodox religion, also shows that only 7,200 are
Ukrainian Orthodox. The latter Is an Incompletely derived figure and has no relation to the
98,695 single and 6,535 multiple origin Ukrainians of the Eastern Orthodox religion In Table 30.3.
Table 30.3, shows the Eastern-rite religions by province, ethnic origin, sex and rural-urban
status. The main feature, referring only to the data for Canada, Is the very different magnitudes
of the ethnic origins affiliated with each Eastern rite religion. Ukrainians of single origin are
dominant (83.5$) In the Ukrainian Catholic religion, followed by Ukrainians of multiple origin
(6.7$). Farther down the line are the British (3.9$) and Polish (1.6$) single origins. In the
numerically much larger Eastern Orthodox religion, the most Important single origins are the Greek
(40.1$), Ukrainian (27.3$), Yugoslav (6.6$), British (3.6$), Romanian (2.3$) and Russian (2.1$);
Ukrainian multiple origin forms 1.8$.
Table 30.4 shows religions by ethnic origin for the same 60 urban areas as In Section 21
(p.9). It conforms to the format of Table 30.1 In that It has the "other religions" and "other
or I g I ns" categor I es.
The 1971 counterparts of the data In Tables 30.2, 30.3 and 30.4 are In the Compendium (E2,
pp.177-182, 191-210 and 183-190, respectively).
TABLE 30.1; RELIGIONS BY UKRAINIAN ETHNIC ORIGIN, CANADA, 1981 AND 1971
1981 1971 1981
Religion Single Multiple TotalCorrected^
Total TotalOther
Origins
Ukrainian Cathol Ic
Eastern OrthodoxOther Rel
Ig Ions
All RelIg Ions
159,09598,690
271,825529,610
12,7406,535
206,085225,360
171,835105,225477,910754,970
165,465101 ,955374,870642,290
186,460116,700277,500580,660
18,750256,340
nrnr
^Comparable to 1971; see Technical Appendix.Source: for 1981, Tables 30.2, 30.3; for 1971, E2, p.1 77.
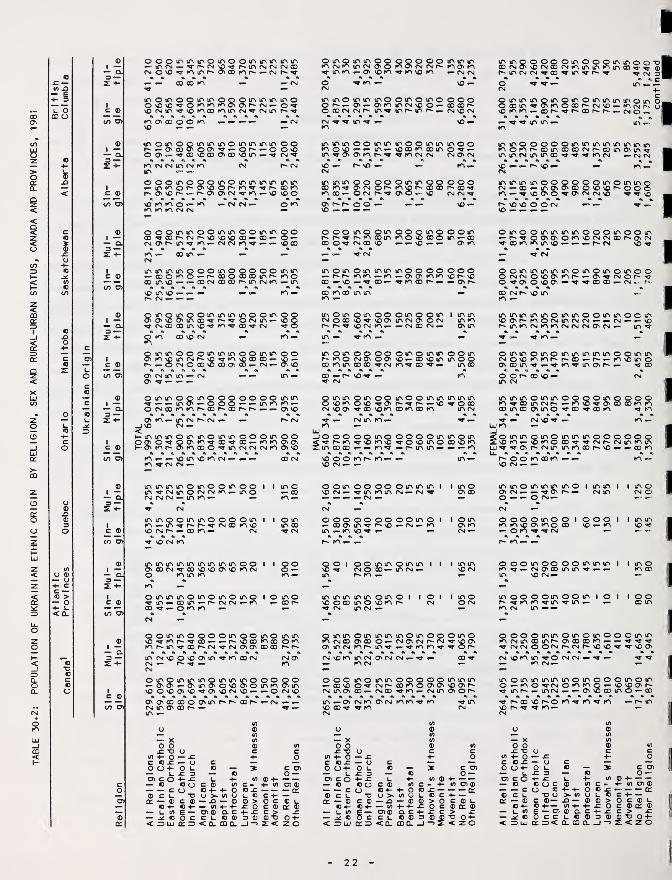
TABLE
30.2:
POPULATION
OF
UKRAINIAN
ETHNIC
ORIGIN
BY
RELIGION,
SEX
AND
RURAL-URBAN
STATUS,
CANADA
AND
PROVINCES,
1981
u oCD O
y 0)<— o
c
<0.
I—
— Q.3 —
C ©to O)
I—
— CM3
©I—
— a
c ^to o>
I—
— d3 —2 -H
©I—_ Q,
3Si
c ©to 0)1
000»r\mm0m00sr\mirvirvir\CM o 'O ir» r»
^ — OD 00
00 K> r*« — <N r* ^iriK>^0'v0K>^»ov0
)©fNm'^vOK>ootoir>(N-.rfMmO) 00 o O ^
iT'inominmoomomooooor^^O).-ONromfMvoo.-oooDr^ooOfMcsr* if)^ if>r')nr'^rM)OtN
triOiriOOic^>c^ir>oit^ir»iriiriOOr>«»-.o^oo^oo^^— or^.-o 0)0OON«— 'VOOvOOOOOOvOlO^^CM'VK> tN CM m fMID
1^ CM
©oomoooiooifMnirMoiotfN*nto©C“0)'OOi^K^'.»^r»QOro- - *-r*“avo)CM^t<^»-)0)00O) )0 c~
VO»^K^O«-K) lO to CM CM
CM CM »- o K\
ir- mm oo inio moo mm mooK^oso<^.— ifN—)OOOf^ooir>o^ —tf> ^ O 0\ )<\ ^ CM CM CMO^CM
to f^to^ k^<f^CM
irtiTMftoooooiftiooooooooKt^O)CMOf^toop^ooaof^oo''«’K^OD»-OCMr.»*«fO)0»-VO CMCM^«««««« ca ««O' C- c* o oto —
ir'mir>«noooinoooooif\«r>.-OOOPOOo-r'OOOOOOOjC'f^KtOooici'O.-^oocMOOOOr^incMto.-ir'
vO ITi VO —r. CM
^
w- t^
^CMODODlOvO^K^^
omif'oooif'ioirioojovr'ooOf'^'OVOCMI^'O^f^'OODOO-- \0 —
*
r»«-.0<NCOOvOODOvOD— CM— OVVO
— ID'
0ifvir>0Qic»0000000 lOifv— lOO—OOO— «— lOfOKVo CM OO to r**
O'to—irvcMC'CM —VO CM —
O — — ifv tc00 p*- — — O' VO
CM
t— mmiT'Oir'ifvOinir'OOOir'OOgo O^PC^t^•^ 00'^ X— p^tn oc^tOr^O'IOXO'^lf'CMCMCMK'O'VO
00 (N
mioif'iT'Oif'OOmoo I I vncirv^CMlTiOCMCMK'— vnoCM CM CM — IfV KV
— 00
1010001010000010 I I Oloto—iO.s-r^r^’q-CMXfOvo loxVOCMC^ — ®tO— CM <«-CM
vO CM to
lOlOlOlOlOlOlOlOlOOOO'XCM'^XVOVOO'VOIOCMO to lO to
o oo —
to —oloioiooiooiooloo^lO— XIO— C'CMCM— tom ^ — o to to —CM —
o o lo lo oVO ^ to ^to lo ^ X
ooovoooiooioioX— — C'VOXtO® otoC'CM.a-CMO'O'Xxr^C'
lO CM X O XCM — r» ^CM
O' X to X CM CM O'to
O lO O lO X— O' O' — O'XOXCT'X^O'XCMX— — O CMXO'O'XXOO'xr^C'Xc-— CM — —CMlOC^XC'— ^ —X —
o ox: “o y
w +- O — -cc o j: — yO o 4- o y— y ^ 3X c o 4- -c— C «J o— —CO© c y Xq: — © c ©C4-0+-— ytrtE —— ^ o O c< X UJ X o
c ©« 4-y >— X— to
O) ©<0.
to C » M-M- O <0 j= —to y y o cM-— © © > O c4- 4- J= O c ©a. c M- X c >© © 3 © ©Xmo j 2:
<
to X ©
I I" « IX O ^ CM X XCM
<^toxr>*— — O'r^
looxoiooooxoox iioiocMox'O'trxO'xcMO'OCM lotoC* P>- ^ X CM to— — CM X CM — O'
X
to O to o^ “OO CMX to X XX
ooooiooxxooxO' oo X — XXX xooX.«-<NX^X'«-— XX
- C* X ^
8 XX 0X00 XOOXX XXXxxox’.roc'^p''—x^oxCM xo X Xto X to X to X CM
«<r — CM X X
ooxoooooxxxi ixoXCM— ^XXXCM— CM^ oxCM —000000000X0 I— oox^r^x— CM—
X
X — X XO XO' X
r>» X— —
8 ^ I O O X X O X X I
XXXXXOXOI Ixoxxoxxc*^ CM X CM —O I I xoCM O CM
oxxoxxxxoxoooxoXCMXOXO— CMOCMf^CM^XOoxcMxr^x^— 'vxx^^op^
ooo xoxxooo— XX O'^ CMf^ xxoCMXOX— CMX^X —X XO' O'O c-
X— O CMX OCM xx*vX X Tf X
C O)
o£to 4-c ©o o — ©
XoX yo — x:x: — y4- o yy £ 3O 4- 4T y 4-
© O c © to cC o © 4- 4- O ©y X y >> to y y© c © —X — © ©M- ©M-— tnM- 4-Xto E— X© Q.C+-©Occy ©©3uj cc=> < 0. mo I
© c> oO c
X ©
04-20
22 -
XXQOOOOXOOOXXOO"0xcmOxcmxcmxxxxxx^^ oO- X CN CM rr x ^ ^ ^ CM 3
® « c'X — —
OXXXOXOXOXXXXOX OOXX.9-OXOXP-CMX — XfMf^ oXXX ~X X r»
— ^ ^ X X —X
XXOOOOOXXXXXXXXXOXC-XXXXCMf^XXOXTfX X CM X X X ^ ^ X CM — CM CM
— P^ x^XXXXOOOOOOXOXXOCM— X — xooxoxxr^oooX— ««fXOO^OCMCMX ^^x
I
Ioooxxooxxooxxoo oooxooxooqxooox ox^xc'CMC'Xxxx— X— o— p^p-.^c'xxxxo'oxox — X —CM O P^ X X — CM CM X ^ — — X X XO^CMXX X— — ox ^
X oX X
O X XQ O OX X X
oooX CM CM— r* CM
X o o XX O' CMX ^CM I
O XCM CM^ O
XXX0X00X00 X 00CM o—
. CM ^CM P^ X X
IX XO'X X
xxoX O CMCM X X
X XX CMCM CM
o o XCM — —CM O CM
X O O XCM — — X— X ^
X XO XCD X
X Xr- ODX
XXX— —x o c-
O O X XX X X o— CO
X XCOX 00
o X XX CM P^0 X 0o o— X.4 CD
— CM X ^
is X XX —oX XCD .»X X
xooV CM P^00 P^ X
o o o oCM X X X— — 00 X
X oox — —
X XX X O I XX I— .f O C' — CM XO CM— I
CM — —000 x00 1000 1 I XXXXOXOOO X — X X''fOX^'q-CM — — —
r- X — — I
oooX ^ —Xxoo ooxCM 0)00 X X ^X CM—
xoo^ XX CM
O ox O O XX ^X ^ X —X —
—
oooX CM X^ CM CM
O XX 0X000 XP^ O' OD 00O OCM P^ CM C-
X o oX — —X X ^
O X X.!p ^ ^<«r X O'
X O Xo — X^ XXXX X O XO .«-CM o X X— XCM — — O'
oooo — XX 00 XX O XX O' p^0-00
^ p^ 00X 1^ ^CM
— Xo od -D4- O© JZ
0 0 4- © —— ©
y— JZ
o y£ 34- J=© o C © to
o 0 4-4-0D y to y
C ©— X — ©© H <0 4-4-
S— Oi © Q. Cecu©©
m Z5< £L m Q.
<0 ©C - 4-© X —y © c© > oX o C
(0 O) ©— — cr
c © y© m ©
X> o 4-<20
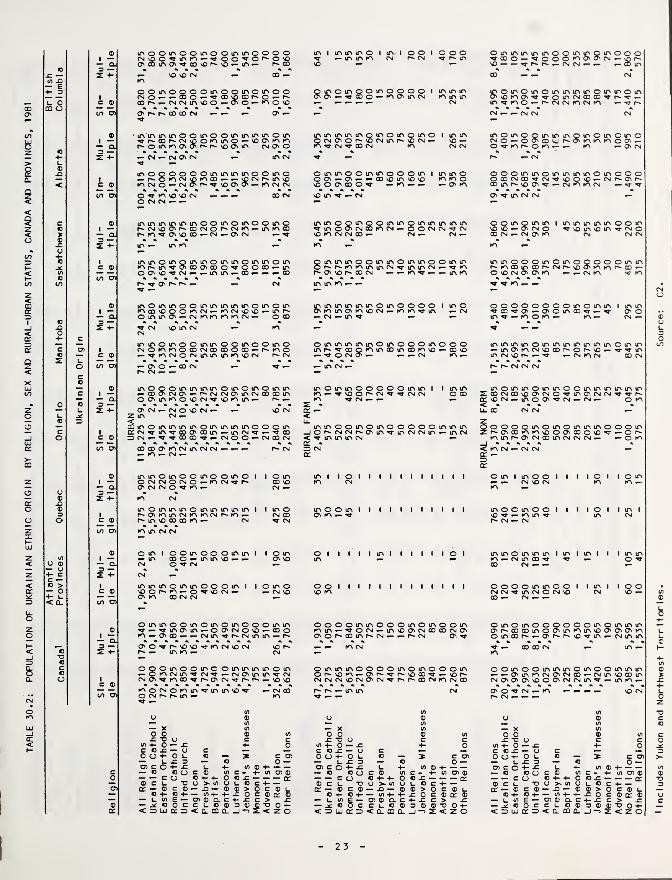
TABLE
30.2;
POPULATION
OF
UKRAINIAN
ETHNIC
ORIGIN
BY
RELIGION,
SEX
AND
RURAL-URBAN
STATUS,
CANADA
AND
PROVINCES,
1981
® inoOtnoOir»oOir>moo O O m 1 m m m o 1 m 1 O O 1 o O o O m m m m m O o m m o O O1 CN^o^irvK^*-^
O5(oinO'^0D'Or^O O O O vO ^ — m m K CN P^ CN P- m •V oo o — ^ o O o K CN VD P*
CD ma. vo — m — P^ 00 vo — — vo — — V p. p. (N CN — — —(0 3 4k 4k
£ 4- _ \0 VO (N 00 — 00 CNvt ^ to
+ 3 ooinoooomoomom o o 90 95 10 moo m o O o O 1 m m m m o m o m o m m m m o m m o m1 (NO — «-00O^TT 00 VO OD P- O — p^ •»T oo o — K (TV m CN K m m O' vO K O' ^ ^ o m CN 00 00 p^ N- —
u o C ® oor^.-.(N<N»f>voo — O' o — m O vo — — — (N m ^ K o — p^ (N CN K CN K — N- p.m o
to O) ov CD 00 <N — O' — CN — — CN CN CNN-
® ' mm m m o o m o o m m m m o m m m m m m oO vom o m o m o 1 m m mom O o mo o oo
m m 06 m O m o m o1 ^r'00p^(N\oommo — voov KV m <5 (N <TVm CN
CN m p*» vo CN — vo CN o — Vt.'- K K K o (Tv —a p^ommovof^r^ vo O' m CN O' o ^ oo CN K CN CN O ^ K P^ O K r— K (TV (N
<0 34- Z 4- — <N — <N O' <N m CN —
—
p. — CNt. < —
moooooommmmoo m o o m m o o m m o o s m 1 m m O o o o m m o m m m m O m o O O1 — P»Ot^<N»OK'(X5mcNo — CNO>r*^
— — vo (N m vo O CTv — Cv — — oo vo m vo K K O O 00 CN oo ^ CN vo vo CN p. (Tv P.< ® vo O' O' — m CN CN vo o c^ 00 o ^ — K — c^ K oo m p- vo (Tv ^ CN K CN — ^ N-
% .to O) o .9- m VO 'O <N — CO CN vo m N’ — CN (Tv N- m CN CN —
O CN (N — — —*
C ® mmmmmmoo m o m o o m o m m o O m oO' CN 00
o m m o m m m m m O m mO CN o 1 m m m m m o o mo 1 r»(Nvoovr^oo(NO <N m — m m CO m o K CN o O CN CN CN vo m vo m CN o
a. p^m'^ovvoco— (N — (TV (N — '(T vO KV CN CN oo — CN — CN — 00 CN — CN CTv K CN CN (N
u
3ZL 4- m — mm — KV K
15 1 mmomommomf^m-N-ooDOvoD
m m o m m o m Q m mO P* P^moo m m O m m o o m m m m o O O m O m o 8 o o o m m
c ® O ^ O O CO — m K K m m CN m m CN K P- K 00 m 00 p^ CN p- vo K K p' CD —U) — oovvo^cN — — m m — 00 — — CO P^ (Tv vo p. oo CN .
—
— K N- — — m K O vo CN CTv (TV K — CN K 'e' Kn to CT % «k ik
to f" "cr oT r* — CN m m KV ^ K w— — •
^ —C2
® mOmmoommmoDvooomcN — m m m om (N vo vom o m irv m m
O' Kv m m m m o m o o O O 1 m O o o o o o o O o m O m m 1 m m1 iTi (TV K vo CN — K K ^ m CN ^ 00 •«T CTV — O' o m oo «T O' O
Q. ommov — (Nmm KV m CN — O 00 — CN — m — — m — K O K K — CN — ®<D 3 «k . . o
Z 4- ^ (N VO m (N m «— ^ 1-
o (N 34- c o0mm mmomoomm(NOmmooDCNCD o o m o o m o o m m m m m o m O o o m o o O m m m mom m m m m m m o m m toC o» 1 00 O 00 — p. m o m p^ oo o m
CN O' — m 00 m 00 K vo 00 vO — m (Tv K CN vO 00 p» o p. vo N- ^ mc •a* C ® — ^mcNOfNmm m m vo (N CN — ^ o — — CN K m CN vo p. — ^ — CN K CN m CN:e t. A 4k
O to O) — O' O — <0 CM N- — — m CN P^ P^ CN CN CN
cCN — —
® mooommmm— ODOvCNOv — P^CNo m o m o m m m O m moo o o O m m 1 1 m m mom mom m o o m m m m m m
c 1 (N O' m (N 00 CO m K — ^ vo O P- CN ^ •V CN CN o oo 2 00 CN CO vo O' CN o rr m CTV CN CN •N- P-•IM O. OOvmmovocM^ vo m m — p^ — K ^ CN — — vo CN — m o (Tv Psl (N — O K
0 Q 3 % it
t. 21 4- OVCM — CNOvOCN — vo CN li. OO CN CNi. 2 m (N(0 =3 ^mommmmom U. z4- m m m o o O m lf> O O m o m o o o o o m m m i o o o O m o m m m m o o o mC 1 £rcN^m'*TCD<3'oom
0(N — ^^QDOD'^ — — m CN ^ ^ 00 _J O P^ CN CN P^ O' m ^ m CN CN m m CN P^ CTv 00 K K vo o oo O vo V— O P-o c ® (N o o — CN 00 CN < •^ m m m (N K m p^ CTV CN CD m CN (N (N — O K
4k A « CX _Jto U) ooooovm(Nm(NCN ^ ^ CN 2 CN < K CN — CN CN— m — <N — (X cx2
(X
® mmomoomo O m o 1 1 o m m 1 1 O 1 1 1 1 1 1 1 1 1 1 1 o m 1 moo 1 1 1 1 o 1 1 o m0(N(N0CN0—
m
CN ^ r- oo vo K CN CN VO P4 K K —o. (Tv (N <N o ^ m — CN — K
u 3d> r 4- m (N
® mommmomm m m m 1 1 m o moo m 1 1 1 1 1 1 1 1 1 1 1 moo m O o 1 1 1 1 O 1 1 m 1
3 1 r'OvmmcNK'KvcN p- m — CN 00 ov K — vo ^ — K m V m Pslo c ® m VO 00 00 m — CN ^ CN P' CN — CN
to O) m m (N <N
(/)
® o m 1 o o m o o O m m 1 1 o m O 1 1 II 1 m 1 1 1 1 1 1 CD 1 m m o m m m 1 m 1 m 1 1 1 m m1 — m 00 o — m m vo — — c^ vo m K — CN m 00 ^ Tj- —— O '>9-
o ® “ Q. (N O ^ (N —
—
CD CN — —o 3
4- c 2! 4- (N —Cc > 1 mmmommoo o m 1 1 O m o O O 1 1 1 1 1 1 1 1 1 1 1 1 1 o o o o m m o O 1 1 m 1 1 O O •— 0 c ® voor^m.-0'«*‘vo CN — CN vo vo K (N (N ^ m CN o CN vo CN vo — W5+- L. O' m 00 (N (N 00 — CN — — ®< Q. to O)
L04-ommoomom^ — ^movm—
o
o m o o o m m o o o o m m o o o m o m o O m o m o moo o O O o m o m m m® CJv CN o vo 00 o K m — ^ O CN — m vo (TV CN 00 00 CN CTv O' 00 00 m o CTV m K m vo (TV CTv (Tv K 1-
1•— m — ovoo — — (Nm ^ p- CN m m — p. O' o 00 m p" CN — —— P^ CN (TV o m 00 P- — CTV p. p. VO m «— CN m m L.a. «k «k ®
«— 3 — O'o^r'VOvo^mcNvocN vo K CN ^ — 00 00 CN ^ m — KC 2 4- — m Kv — CN K•DC
4-lA
c OQOmoomc O m m m m o m o m m moo o o m o m o o O m o o m o o m m m O m o C m m m ®— OK'(Nm^(N'<9- — CN O' m m ^ CN O P- vO K — O' P^ N- p- vo 00 VO p. — — (Tv m K CN (Tv CN 00 CN m vO 00 m XO 1 (NO'^moo^p»0'(N»9-r^p» — VO VO CN CN CN vO CN <TV CN <«3- p^ 00 CN K CN oo CN O' O' (Tv vO O O' CN CN m ^ m K — 3c ® ........ 4-— — mocNomm^m m vo ^ «
—
CN OO p' p- — m m CN O' O ^ CN — K W— vo Psl 1_to o (N p. m —^ — KV ^ — — p. CN — 0z
(A (A (A 3o ® o ® O ® C
V) (A (A o— X vt — X «A — X (A
o o£ T3 U® (A O 0 ® (A ® (A cc C ^ *D o C C (J C C o
«n 4- 0 — £ 4- O «A 4- O — JC 4- 0 lA 4- O — ^ 4- OC o £ — u c C O JC — o C C C ^ — o c 30 0 4- 01- O — * C O) 0 0 4- O 1- o — :k c *05 0 0 4- 0 L o — C CT5 >-— U 4= 3 — o o — — 1- 4= 3 o O — L .C 3 o O —CJ5 C o 4- £ l_ 4- tf) ® 4- 05 C O 4- 4= L 4- (A ® 4- 05 C O 4- ^ L 4- (A ® 4- «A
c — O c o c ® W C - 4- (A *05 ® — O ® o c ® (A c - 4- <A (T5 ffi — O O O C ® (A c 4- (A 05 ® ®O — —CO 04-4- 0 O 4= — — — (X — — c o « 4- 4- O o ^ — — •mm £X — — c O C 4- 4- O o 3 — (X 3
® C l_ TO (J >. </) U l_ O C 4- ® c u D (J >. V5 O L O C 4- ® C l- T3 U >- (A U (- O C 4- 305 tr — ® c ® — X5 — ® ® > 0 C ® L. cx — ® C ® — Xi — ® ® > 0 C 0) (X — ® C ® — 3 ® ® > 0 C ® L•— 0 4- 0 4 W4- 4- .C O c ® (X ® C 4- 0 4 «A 4- 4- £ O c ® cr ® O 4- C 4 (A 4- 4- 3 0 c ® £X ® (J— — 05®CLC4-4=C > 4= — 1. «A E — 05 ® a c 4- JC c > £ — l_ to E — 05 ® ca. c 4- 3 c > 3 C® — -xoocci_o ® 3 ® C ”D 0 4- — c O C c L O ® 3 ® ® T5 O 4- — o O C C L o ® 3 ® 0 4-cr <=)LJQ:2<£L£DQ l“>2 <20 < =5 UJ CX =3 < CL CD CL -J 2 < Z O < 3 UJ CX 3 < £L CD O. _l —
)
2 < z o *-
- 23 -
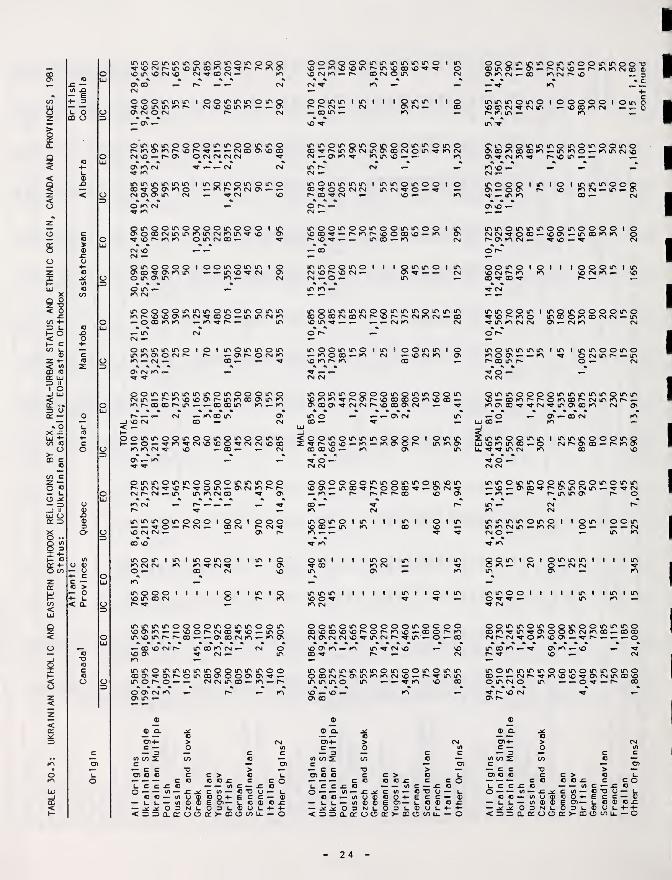
TABLE
30.3:
UKRAINIAN
CATHOLIC
AND
EASTERN
ORTHODOX
RELIGIONS
BY
SEX,
RURAL-URBAN
STATUS
AND
ETHNIC
ORIGIN,
CANADA
AND
PROVINCES,
1981
Status;
UC=Ukralnlan
Catholic;
EO=Eastern
Orthodox
Atlantic
British
Canada^
Provinces
Quebec
Ontario
Manitoba
Saskatchewan
Alberta
Columbia
Origin
mioOir\ir\ir»OinOir\omoOQ^vorMi^mvOiriooroo^r^r>»K^^VOITIVOCNVO CN^ODCM—0\ 00CM
o o o m in m i ooirinmoirvo^VOlTvtTvfOP** CMvOvomr^.—ON CM O Csl CM
oicNinmoooommoo mmo— — (NOOONvOODCMNO.-r-ON OCNCNCMCM ""T
inioiTNifNifNtfN I mQiooioomo00 ^ ^ ro p ^ lo CM ON —
—
CM P ON tfN
O CM
inooiTNOOoomooo^.OOOCMlfNlTNKNlfNCMKMfN^vO^nOC^IOKN OlfNCMOO.-8
CM pCM —piTiOOOO I OOifNOiTiin I pONOO^ONKNJO .-.-ifNp^CM O'O ITk On IfN KN CM
O lOto CM
ifNOOoOtfNtfNirNOtTNOtfNOir'ir'KNr>»vOvOONtOCM^OOO*-(r'lfNCMKN.-OOOKNKN — KN^r"— IfN
O IfN ITN m tfN O I
IfN to C7N o CMto CM
I tfN O IfN tfN O tfN•«- O' r* O CM KN00 — 'O-
OOlfNlfNtfNlfNlfNlfNOlfNOOOlfNO(Min.-l^tONONOONr'tfNtOOOO'tfNfOKN P- 00 00 r- IfN
cvT
OO CO IfN
‘to OO IfN*
OOlfNlfNOOlfNPOlfNOlfNOOlfNlfNt— — O.--3-IO^fMVOVCO'^fMCMN£>a0
to to CM ^ NO .- 00 .- CM
CM r** CM VfN IfN to CM 00
IfNlfNtfNOlfNOOO I OO I— ^ o r- CM 00 CMNO CM CM .- .—
IfNOm I IfN I IfNOlfNO I
IfN o O O I I
NO IfN OO CMr- ^
IfNlfNlfNIfNOOOOIfNOlfNjfNOOlfN
.- 00 NO CM P~NO (ON
to
IfNlfNOlfNlfNlfNlfNlfNOplfNlfNlfNOOODO''q’ONP^OlfNOOOOOO'0'W' ->1 w * » ^ k* N 'w' W ' W ' ^ifNOP^o — CMCMifNOO.-to.-r'
O O' CM toO' IfN
l_ c c° C«.— I_ l-
(D —
(0— J= ^tfl u gIf) <D O3 N 1>
c: o o
c >to ID £— — Irt cC If) — ID
C O EE C7)— i_
O 3 I- ®a >- CD o
— £ «3T3 O —C C —C ® ID
O l_
CO Ll. —
OOOOOOlfNIfNlfNIfNlfNlfNO I IfN
NO.-tONONOlf'P^lfNNOOONO^'^ ONOCMtO.-P» 00 CM o IfN CM
CM ^ to
O O IfN IfN I IfN I
P*- CM — CM.- 00 IfN
I I P IfN IfN IO CMto
IfNIfNOlfNpifNOlfNOOlfNlfNOlfNOOO’^rr^IfNONCMlfNONOOfMOIfN'lttOfMCM .- P to ^
IfN © IfN IfN IfN IfNOO O O CM CMP^ 00 ^ CM
IfN IfN O IfN O O I
IfN CM ^ O ^NO
IfNOOlfNOOlfNOOlfNIfNOO I IfN
NOoo^«-r>top^NOOOONO.-io PNO •M’ — — IfN 00 — to CM
IfN IfN O O IfN OCM NO P^ NO CM .—CM »- O .-
p IfN IfNp
IfN O O IfN— to O CONO to P- to
IfNOlIfNSOOlfNIfNIO.-to CM .-NOCMtO P
00 .-
IfN O IfN IfN
^ to to ^P 00 P ^OPOOlfNOlfNIfNOOlfNP NOCM CM r~ NO 00 P CMp>Pr^NOOooootONOOo.-
— P CM
O O IfN o^ P' NO VO00 CD NO —
o o oP IfNto .-
OOlfNlfNOlfNIfNOlfNNOlfNOD^p.*OOOD^^PfM^P> P*- P~ P» CD NO P
O IfN I I^ CDIfN
I I IfN o I IfN I I I I IfN
to CM .- ^p to
IfN IfN IfN I I I
NO O ^to CM
I I I IfN I I O I IfN
potnoiTNPPppoifNpcpo
IfNOlfNlfNlfNIfNIfNOirNOOlfNOlfNIfN©ODCMP'PlfNfOtOCMNO.-P^^lf'lf'IfN IfN IfN O >CN ^^VKN NO CD'V to
NO .- NOP 00
® Cl
u c c £ to
o — — Irt — £ ^c«j— inuffitDO"*-— i-l_— i/)®OE P—O 3 N U O 3 L.
c >ID O— — irt c — x:
>toc c
cID *D O —E c C —l_ C ® CD“ o
<=>roQ.£r:oocc:>-cDc:>cou. — ©
- 24
OPOifNIfNIfNOlfN IfNOOlfNIf'OO'^OOlfNP — Pw-p.-fMNO — P^tOtOCMOO ®PtOCM— CD tOCMP*NO .,-.3
IfNIfNIfNPlfN© 1 ©POPO I ©IfN O.— pQDtOCM .-.0=0
^N CD toP .fl- CM to ^IfNIfNIfNOlfNOlfNOOlfN©OOtO.-lfNtOO.-IOlfNCMNOP IfN
N p
O IfNPOpilfNIOIlfNIfNIfNPO©p<— ©p p- p to CM IfN P
p p <_
IfNIfNPlfNIfNIfNOOlfNOO©©CMCM^OP'.-PP.-IfNPfOtOp.-PtOCM.- ^p^^
©OlfNOIOI I IPPOlfNIlfNP CM to .- P
IfN IfN O © IfN I IfN^ P P^ to O IfN^ IfN to CM CM PIfN O O © O IfN o© to ® CM CM .- IfN
CM to CM
IfNOlfNIfNlfMfN I IfN I IfNIfNOOlXNOtoop — .-to ocMifNr^.-ifNP* ® IfN P* o .- CM
8 lfNlfNOOOOlfNlfN|fNlfN|fN©lfN|fN— ®tOr^P'OfO®P>CMIfNtOP''->tOPP.Q-'^CMTrifNPPtO CM p
u. ^ ^ m CM
IfNIfNPlfNIfNOOlfNPOOlfNOlfNIfN.-p.— pfflrrr^PifNCMifN^^^cM_tO.- P»lfNlfNP p> o
IfNIfNIfNIfNpIfNpl lOlfNIOClfNIfNtOCMlfN—-fOCM o.— —.-CMCM O — IfN to
8 0lflCIPlfN|fNlfNl I I
to — CM O .- CM CMIfN © _
IfN IfN © O IO 'T ^ —^ CM
CMP^CM^PtOPP
— — O ^ — P*
P4-C —— 3
in If) S — p
u c c .co — — irt
ID €3 —— U l_ —— ^ JC O< =3 =) D_
C Q QC —— -C ^ CIfl U ® (D
V) ® ® E3 N l_ Oa: o o cr
c —C T5E c
eCJ
u.C o
x: «3
u — I-c — ®® o £
m o cf) L-
I
I
I
I

if'if'cr'OiTtooooiTto O Om o O m m 1 m 1 m 1 m o 1 1 1 1 o o m m m m 1 o m m m o o 1 1 mOfOK^VOCM^— •«TX' m CM CM o — — m — m — m tn tn o tn m CM ® ® ^ — m CM
oo o r^^incMCN 0^r^0»- — m — vO tn — m CM — CMO' <3 Ul « « « « » « *
£ r* *- — — CM CM —(A 3 rs
Ecn +" 3 if\ m m o Q lOv 1 mooo o o m O m m 1 1 1 1 1 1 till 1 1 1 O m Q m 1 1 1 1 1 m 1 1 1 1 mUJ r^OvocNKSco ^-irvi^m m — — m — O' m vo O' tn <7)
o *U 0 o O' CD CM CO CM ® ^ —z CD O 3 A A
> O'
§a. if'cncnmoif'vf'iriOir'ir' m mo O o m m m 1 , m 1 O O 1 1 1 m m o o o o 1 o o m o o m 1 1 m
®ooO'^oir'K>oir'i^iri ® ® ® vO — — O' r- O' CM O CM ® CM — CM ® in — ® ^ ^Q (0 o ooif'irc'O o O' — cr> •— CM O' O' CM — m CM P^ m — CM CM m — •
2 UJ « • « • m<
® ss- , — CM m r- m o<Q
SiiTiOOirNOin 1 inocnif' o m m m m m o m 1 o , o 1 o m 1 o 1 m m o m m 1 1 1 o o o m 1 o 1 m ®
< < CD ® r» CM VO ® ^ tn ro — m— O' r- O' m o m CM ^ m CM ® CM ® o — — — ® ® — CM uz o ® CM O K> ^ o »- m o o — CM m m M- — — — u< 3 • • » « 3o ® CM »- \o m m ^ o
CM CM Vi
z*c ir'ir'ir'iT'cr>oir>cr'000 O m 1 o m m o m o m 1 o m o o 1 1 1 o o o m m m m 1 o 1 m m o m 1 o
o c r^'^®®0'CMCMO't^CM^ CM m o r- r- o n* •
—
A- m M- O CM p*- M- ® — ® *a- o — — CM A— inX o ®®^^^ oo — »n«— M- ® vO CM •
—
CM CM O' CM — CM —q; ® UJs JC O' — — ^ tn tn in
oo +*
o OOtf'Omcr'l lOOO m m 1 o o m m o 1 o 1 1 1 m o 1 1 1 m m m o o 1 1 1 1 1 m m m 1 1 oz j£. ^ ® CM CM — 1^ O' CM — O' — p- m m ® lO \o in m 'O p- o —I V) o ® O CM ® O' O' m — CM in ® CM — CMt— c 3 « A «
CO ^ — 'O m m M-X
S-8< 0 Qoovnoooinoocf' o m m o m o m o • o « o 1 m m m o 1 m m o o o m 1 o m o o m 1 1 1 m£ OK'r-vocr* — oor'cr'® ^ tncM O' m ^ m tn CM r-* — — CM — O' ^ ® m ^ O' — ® CM CMCO c o ^K'cnCMK^ O— ^ITv *T ^ o — CM ® —=> l- JO UJ»- o 0 in O CM CM CM m CM< 4-1- c cCO l_ c omoinoin i m i oo m m o m m m o o 1 1 1 o 1 m 1 1 1 1 m O m m o 1 m 1 m 1 o )n m o 1 o
® 10 inO®®CM'«9- CM oco 'S- 'O — O' O' r- ^ vO tn O' VO — m p- m «
—
— CM CM CM in ® CDz z: o ® ^ m ® m — CM — •^ CM — V
—
m CM ^ CM m —< «fl 3 UCD (0 ^ CJ' CM — vO m ® P-- oIT LU m CM3 II ®1 O-1 UJ mmooinoooooo m m m o o o o m m o m o m o m i 1 1 m m o O m m m o o m m m 1 1 1 o a.< inmo'®^ — CM'^oi^n- r- ® ^ r- ® CM •^ — CM CM ® tn ® — ^ ® ® GO ® vo m in ® m CM <9-
tr .« o o^inr^tnmmO'O^^ to- tn m m CM CM — cc ® — — VO — vo in ® 4-3 u 0 UJ 21 < A A£r — OC^— CM 0'CM®m ® on u m — 3
u Z CO — P» — CM < z E• 0 83 < — u QX -c 4- m Z •o
UJ +- C oroooininvnoininoin rn mo o _j m m m 1 1 o 1 1 toil 1 1 o m m o o 1 o 1 m m m O 1 o 1 m cCO eo O 3 — M-®— CM®CM'^'«rvom — o ® r«- < m r- — CM CM CM _J ^ ® CM CM m 0\ oO o *9-— o»^ m — in — d: VO m < CM m CM CM
>- 3 3 q: A A ®CD C in ® CM — on 3 in CM
n on O)c
CO cz — oinininoooininmo o m m O m o 1 1 1 1 o m till 1 1 m O O 1 o o 1 m 1 o o 1 1 m 1 o mo «j ^K'CMCMinr'®p^^n*o CM ® o O' — CM CM CM ^ — — — ^ — m m— u o ^®CM— ^ CMCMCMr-- tn ® 1^ — — CM L.
O u UJ A A A A A A A A ®— 3 $ CM CM — ^ ^ ^_l II 3 M- 4-UJ U ® 0Z 3 3 inminoininoo i mm 1 m o m m o 1 1 1 1 1 1 till 1 1 1 m o m o 1 1 1 1 • m 1 1 m I o
o- CM CM C^ — ® CM — m — ^ CM o m in m ^ — — CM mX o o cyv CM — r- m CM CM ®o •• 3 3o ® m 3~U
H « cn o m 1 1 m 1 m o 1 m 1 1 O 1 o 1 1 1 1 1 1 1 1 1 1 1 1 1 1 1 o o C 1 o 1 m m o m 1 1 1 o cDC O ® — O' tn ® ^ CM CM ^ — CM CTv
O CO o VC p«. ^ m m CM•1- c o A A
z c UJ CM —q: to > •
UJ — O m m o o 1 1 1 1 1 o 1 1 O 1 m O O I 1 1 1 1 1 1 1 1 1 1 1 I m o m 1 1 1 1 1 1 O 1 1 m 1 1 m>— 1- ® O ® CM O' CM tn VOCM- ®CO < D. o m m<UJ
3b
Q oommmmommmm moo o m o o o m m m o o o o m o o m m m o m o o m o m o o m m m mz CMmM- — 0'f^fnmvo®m r- o CM omm'a-CMmr- — tn CM p- CMO'®CJ' — p^ — p^ ^ ^ 'a Pa 00 <7) u< o vDm-O' — mr'VCor-'OO CM o to o ® CM CM m CM m m )0 m — O' ® in o CM ® — — uUJ AAAAA AAAAA ®o o CM CM ^ CM ® (N vO CM — — CM O' ^ — 'a- 'a- — CM — 1-— T3 CM r~ <I9- CM — CM —
] O m — +•o C m
c mooommooommomo o m o o o 1 o 1 o m m m m m 1 o m m m o m o 1 m m m O O m 1 O ®t- o fnocMr^mp'voo'^or' tn VO tn m CM ® m CM r~' m — tn o — M- M- CM — P- — CM ^ in vo in m ® CM X< o m<7' — o — O' — CMn*m — o — o O CM O 'a- p" — CM CM O' m ® o — CMo 3 A A A A A % 4-
in o o CM m in O r- — m o — Uz ^ CM — CM — CM CM o< — — zz •D— ® ® c< oon IP CL ® Q. ® CLX — — O o o c3 0)4- > CM 0)4- > CM 0)4- > CM oC — O m c — o in c — o m
c — 3 — c c — 3 c c — 3 c c 3• • in ® z Vi o — in cn S Vi o — tn Vi ^ Vi o Xro O) c O) c O) c o>— c c ® > — c c o > — c c o > mO t. O) «3 C C C > o u C7) O O c c > o 1. 0)0 0 c c > o u ®K> o — — — CO oo^ c c o •— — •— c o o ox: c C o c o o o ^ c c o •oi_cc£C — — inc — 4= O 1. c c o o — in c — £ o i_ c c x: o — —me x: o 3UJ O — — in— c in — to •o O — u O — — in £ c in — o "D o — u O — — m — ^ c m — o 3 o l_-J oo— cnu®i0O4-E c c — ® o o — in u $ o O 4- E c c — ® c o — in y ® O o 4- E c c ® "uCD — uu— <n®®E O)— i_ o ® o £ — u l_ — in ® ® E O)— l_ o ® O jC — i_ u — in ® ® E CD— o ® o c< — J^^03N1_03U® O l_ 4- 4- — ^ ^ O 3 N u O 3 l_ ® O l_ 4- 4- — J)£ O 3 N U 0 3 ® u u 4- 4-J- <330.®OC5®>-mO ® u — o <33Q.®00® >- ® o ® u — o <33D.o:oo®>-mo Vi u o —
2 5
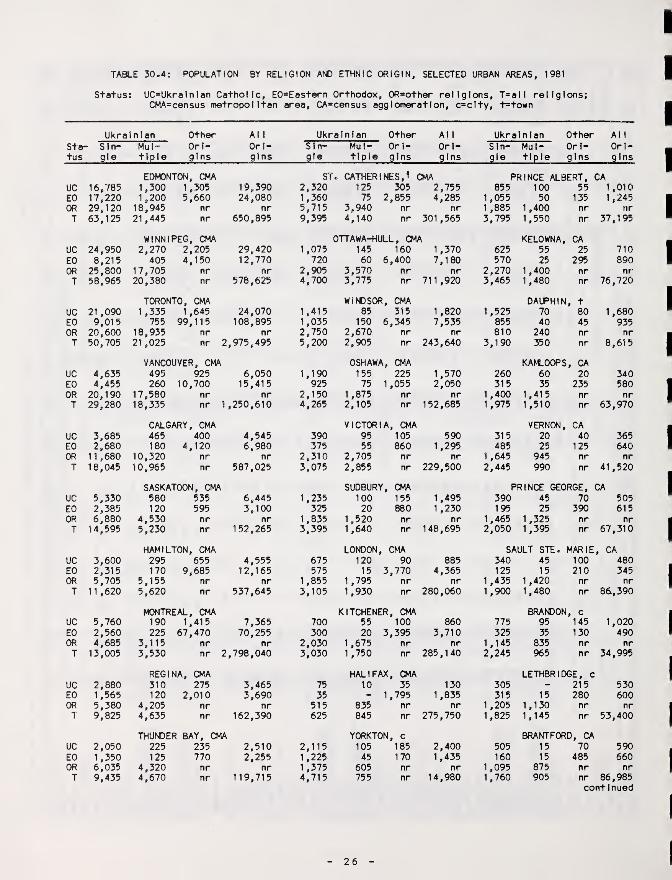
TABLE 30.4: POPULATION BY RELIGION AND ETHNIC ORIGIN, SELECTED URBAN AREAS, 1981
Status: UC=UkraInlan Catholic, EO=Eastern Orthodox, 0R=other religions, T=all religions;CMA=census metropolitan area, CA=census agglomeration, c=clty, t=town
Ukrainian Other Al 1 Ukrainian Other Al 1 Ukrainian Other Al 1
Sta- Sin- Mul- Or I- on- Sin- Mul- Ori- Ori- Sin- Mul- Ori- Ori-tus gle t^ple gins gins gle tiple gins gins gle tiple gins gins
EDMONTON, CMA ST. CATHERINES,^ CMA PRINCE ALBERT. <CAUC 16,785 1,300 1,305 19,390 2,320 125 305 2,755 855 100 55 1,010EO 17,220 1,200 5,660 24,080 1,360 75 2 ,855 4,285 1,055 50 135 1,245OR 29,120 18,945 nr nr 5,715 3,940 nr nr 1 ,885 1,400 nr nr
T 63,125 21,445 nr 650,895 9,395 4,140 nr 301,565 3,795 1,550 nr 37,195
WINNIPEG, CMA OTTAWA-HULL, CMA KELOWNA, CAUC 24,950 2,270 2,205 29,420 1,075 145 160 1,370 625 55 25 710EO 8,215 405 4,150 12,770 720 60 6,400 7,180 570 25 295 890OR 25,800 17,705 nr nr 2,905 3,570 nr nr 2,270 1,400 nr nrT 58,965 20,380 nr 578,625 4,700 3,775 nr 71 1 ,920 3,465 1,480 nr 76,720
TORONTO, CMA WINDSOR, CMA DAUPHIN » +UC 21 ,090 1,335 1 ,645 24,070 1,415 85 315 1 ,820 1,525 70 80 1,680EO 9,015 755 99,115 108,895 1,035 150 6 ,345 7,535 855 40 45 935OR 20,600 18,935 nr nr 2,750 2,670 nr nr 810 240 nr nrT 50,705 21,025 nr 2 ,975,495 5,200 2,905 nr 243,640 3,190 350 nr 8,615
VANCOUVER, CMA OSHAWA, CMA KAICOOPSi, CAUC 4,635 495 925 6,050 1,190 155 225 1,570 260 60 20 340EO 4,455 260 10,700 15,415 925 75 1 ,055 2,050 315 35 235 580OR 20,190 17,580 nr nr 2,150 1,875 nr nr 1,400 1,415 nr nrT 29,280 18,335 nr 1 ,250,610 4,265 2,105 nr 152,685 1,975 1,510 nr 63,970
CALGARY, CMA VICTORIA, CMA VERNON, CA
UC 3,685 465 400 4,545 390 95 105 590 315 20 40 365EO 2,680 180 4,120 6,980 375 55 860 1,295 485 25 125 640OR 1
1,680 10,320 nr nr 2,310 2,705 nr nr 1,645 945 nr nr
T 18,045 10,965 nr 587,025 3,075 2,855 nr 229,500 2,445 990 nr 41,520
SASKATOON, CMA SUDBURY, CMA PRINCE GEORGE, (CA
UC 5,330 580 535 6,445 1,235 100 155 1,495 390 45 70 505EO 2,385 120 595 3,100 325 20 880 1,230 195 25 390 615OR 6,880 4,530 nr nr 1,835 1,520 nr nr 1,465 1,325 nr nrT 14,595 5,230 nr 152,265 3,395 1 ,640 nr 148,695 2,050 1,395 nr 67,310
HAMILTON, CMA LONDON, CMA SAULT STF. MARIE , CAUC 3,600 295 655 4,555 675 120 90 885 340 45 100 480EO 2,315 170 9,685 12,165 575 15 3 ,770 4,365 125 15 210 345OR 5,705 5,155 nr nr 1 ,855 1,795 nr nr 1,435 1,420 nr nrT 11,620 5,620 nr 537,645 3,105 1,930 nr 280,060 1,900 1,480 nr 86,390
MONTREAL. CMA KITCHENER , CMA BRANDON1, cUC 5,760 190 1,415 7,365 700 55 100 860 775 95 145 1,020EO 2,560 225 67,470 70,255 300 20 3 ,395 3,710 325 35 130 490OR 4,685 3,115 nr nr 2,030 1,675 nr nr 1,145 835 nr nrT 13,005 3,530 nr 2 ,798,040 3,030 1 ,750 nr 285,140 2,245 965 nr 34,995
REGINA, CMA HALIFAX , CMA LETHBRIDGE, c
UC 2,880 310 275 3,465 75 10 35 130 305 - 215 530EO 1 ,565 120 2,010 3,690 35 - 1 ,795 1,835 315 15 280 600OR 5,380 4,205 nr nr 515 835 nr nr 1 ,205 1,130 nr nrT 9,825 4,635 nr 162,390 625 845 nr 275,750 1,825 1,145 nr 53,400
THUNDER BAY, CMA YORKTON , c BRANTFORD, CAUC 2,050 225 235 2,510 2,115 105 185 2,400 505 15 70 590EO 1,350 125 770 2,255 1 ,225 45 170 1,435 160 15 485 660OR 6,035 4,320 nr nr 1,375 605 nr nr 1,095 875 nr nrT 9,435 4,670 nr 119,715 4,715 755 nr 14,980 1,760 905 nr 86,985
continued
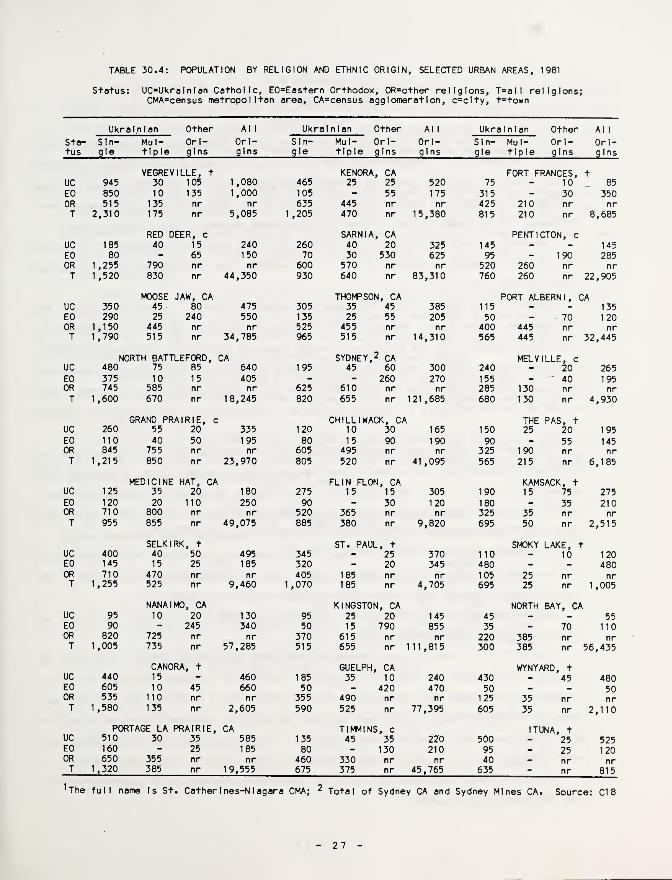
TABLE 30.4: POPULATION BY RELIGION AND ETHNIC ORIGIN, SELECTED URBAN AREAS, 1981
Status: UC=UkralnIan Catholic, EO=Eastern Orthodox, 0R=other religions, T=all religions;CMA=census metropolitan area, CA=census agglomeration, c=clty, t=town
Ukrainian Other Al 1 Ukrainian Other Al 1 Ukrainian Other Al 1
Sta- Sin- Mul- Orl- Orl- Sin- Mul- Ori- Ori- Sin- Mul- Ori- Ori-tus gle tip le gins gins gle tiple gins gins gle tiple gins gins
VEGREVILLE, t KENORA CA FORT FRANCES. tUC 945 30 105 1,080 465 25 25 520 75 - 10 85
EO 850 10 135 1,000 105 - 55 175 315 - 30 350OR 515 135 nr nr 635 445 nr nr 425 210 nr nrT 2,310 175 nr 5,085 1 ,205 470 nr 15,380 815 210 nr 8,685
RED DEER, c SARNIA,, CA PENTICTON, c
UC 185 40 15 240 260 40 20 325 145 - - 145EO 80 - 65 150 70 30 530 625 95 - 190 285OR 1,255 790 nr nr 600 570 nr nr 520 260 nr nrT 1,520 830 nr 44,350 930 640 nr 83,310 760 260 nr 22,905
MOOSE JAW, CA THONPSON, CA PORT ALBERNI. CAUC 350 45 80 475 305 35 45 385 115 - - 135EO 290 25 240 550 135 25 55 205 50 - 70 120OR 1,150 445 nr nr 525 455 nr nr 400 445 nr nrT 1,790 515 nr 34,785 965 515 nr 14,310 565 445 nr 32,445
NORTH BATTLEFORD, CA SYDNEY, 2 CA MELVILLE, cUC 480 75 85 640 195 45 60 300 240 - 20 265EO 375 10 15 405 - - 260 270 155 - - 40 195OR 745 585 nr nr 625 610 nr nr 285 130 nr nrT 1,600 670 nr 18,245 820 655 nr 121 ,685 680 130 nr 4,930
GRAND PRAIRIE, c CHILLIWACK. CA THE PAS, tUC 260 55 20 335 120 10 30 165 150 25 20 195EO 110 40 50 195 80 15 90 190 90 - 55 145OR 845 755 nr nr 605 495 nr nr 325 190 nr nrT 1,215 850 nr 23,970 805 520 nr 41,095 565 215 nr 6,185
MEDICINE HAT, CA FLIN FLON. CA KAMSACK. tUC 125 35 20 180 275 15 15 305 190 15 75 275EO 120 20 110 250 90 - 30 120 180 - 35 210OR 710 800 nr nr 520 365 nr nr 325 35 nr nrT 955 855 nr 49,075 885 380 nr 9,820 695 50 nr 2,515
SELKIRK, t ST. PAUL, t SMOKY LAKE, tUC 400 40 50 495 345 - 25 370 110 - 10 120EO 145 15 25 185 320 - 20 345 480 - - 480OR 710 470 nr nr 405 185 nr nr 105 25 nr nrT 1,255 525 nr 9,460 1,070 185 nr 4,705 695 25 nr 1,005
NANAIMO, CA KINGSTON, CA NORTH BAY, CAUC 95 10 20 130 95 25 20 145 45 - _ 55EO 90 - 245 340 50 15 790 855 35 - 70 110OR 820 725 nr nr 370 615 nr nr 220 385 nr nrT 1,005 735 nr 57,285 515 655 nr 111,815 300 385 nr 56,435
CANORA, t GUELPH , CA WYNYARD. tUC 440 15 - 460 185 35 10 240 430 - 45 480EO 605 10 45 660 50 - 420 470 50 _ _ 50OR 535 110 nr nr 355 490 nr nr 125 35 nr nrT 1,580 135 nr 2,605 590 525 nr 77,395 605 35 nr 2,110
PORTAGE LA PRAIRIE, CA TIMMINS, c ITUNA. tUC 510 30 35 585 135 45 35 220 500 - 25 525EO 160 - 25 185 80 - 130 210 95 - 25 120OR 650 355 nr nr 460 330 nr nr 40 - nr nrT 1,320 385 nr 19,555 675 375 nr 45,765 635 - nr 815
^The full name Is St. CatherInes-NIagara CMA; ^ Total of Sydney CA and Sydney Mines CA. Source: C18

SECTION 31
UWGUAGE KNOWLEDGE AM) USE
Zenon Yankowsky
This S^tlon provides data on official languages, mother tongue and home language. Data on
official languages fulfill requirements under the Official Languages Act for accurate population
counts on English and French spoken as a mother tongue (A2, p.10). Data on mother tongue and home
language help to meet the concerns of ethnic groups which, faced with a declining use of their
languages, look to these data for Information on the extent of their linguistic assimilation.
Knowledge of official language refers to the ability to conduct a conversation In either of
the official languages of Canada (A1, p.38). The reference has remained practically unchanged
from 1971 (A9, p.24).
Mother tongue refers to the first language learned as a child. In the 1981 Census, the
question was: "What Is the language you first learned In childhood and still understand?" (A2,
p.176) which conforms with the definition of mother tongue In the Official Languages Act, 1968-69.
In the 1971 Census question, the reference was to the "language first spoken and still understood"
(A13, p.2). The 1981 definition Is less restrictive In classifying Individuals to mother tongue
as the ability to understand a language requires less language skills than the ability to speak
It.
The question on home language In the 1981 Census Is: "What language do you yourself speak at
home now?" followed by an Instruction "If more than one language, which language do you speak most
often?" (A2, p.179). In 1971 the question was "What language do you most often speak at home
now?" (A13, p.10). Including the Instruction, the 1981 question can be Interpreted much the same
as In 1971. Home language Is the new name for the 1971 "language most often spoken at home".
For Infants who had not learned to speak, the official and home language to be reported was
the one most commonly spoken at home, (A1, pp.17, 38) For mother tongue, the language to be
reported Is the first one the Infants are or will be learning (A1, pp.35).
None of the definitional changes noted above are considered to have a significant effect on
data comparability between 1981 and 1971.
Tables 31.1, 31.2 and 31.3, the orientation tables for the Section, give an overview of the
language classifications In the main tabulations and provide corrected 1981 data which are
considered to be conceptually comparable with 1971. Comparison of corrected 1981 with 1971 data
shows an Increased number of Ukrainians who know the official languages, specified as English
only, French only, and English and French (Table 31.1); a decreased number who know Ukrainian as a
mother tongue (Table 31.2); and a decreased number who speak Ukrainian at home (Table 31.3).
Users may correct additional 1981 series on their own by reference to the method outlined In
the Technical Appendix (p.109).
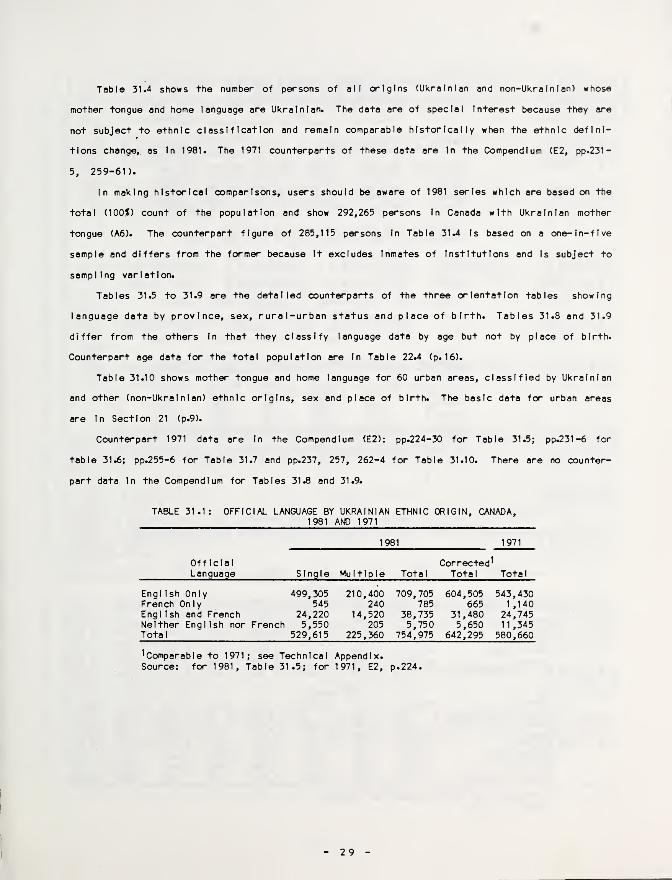
Table 31.4 shows the number of persons of all origins (Ukrainian and non-UkraIn Ian) whose
mother tongue and home language are Ukrainian. The data are of special Interest because they are
not subject to ethnic classification and remain comparable historically when the ethnic defini-
tions change,, as In 1981. The 1971 counterparts of these data are In the O^mpendlum (E2, Pp.231-
5, 259-61).
In making historical comparisons, users should be aware of 1981 series which are based on the
total (lOOj) count of the population and show 292,265 persons In Canada with Ukrainian mother
tongue (A6). The counterpart figure of 285,115 persons In Table 31.4 Is based on a one-ln-five
sample and differs from the former because It excludes Inmates of Institutions and Is subject to
sampling var I at I on.
Tables 31.5 to 31.9 are the detailed counterparts of the three orientation tables showing
language data by province, sex, rural-urban status and place of birth. Tables 31.8 and 31.9
differ from the others In that they classify language data by age but not by place of birth.
Counterpart age data for the total population are In Table 22.4 (p. 16).
Table 31.10 shows mother tongue and home language for 60 urban areas, classified by Ukrainian
and other (non-Ukralnlan) ethnic origins, sex and place of birth. The basic data for urban areas
are In Section 21 (p.9).
Counterpart 1971 data are In the Compendium (E2): pp.224-30 for Table 31.5; pp.231-6 for
table 31.6; pp.255-6 for Table 31.7 and pp.237, 257, 262-4 for Table 31.10. There are no counter-
part data In the Compendium for Tables 31.8 and 31.9.
TABLE 31.1; OFFICIAL LANGUAGE BY UKRAINIAN ETHNIC ORIGIN, CANADA,1981 AND 1971
OfficialLanguage
1981 1971
Single Multiple TotalCorrected^
Total Total
Engl Ish Only 499,305 210,400 709,705 604,505 543,430French Only 545 240 785 665 1 ,140Engl Ish and French 24,220 14,520 38,735 31,480 24,745Neither English nor French 5,550 205 5,750 5,650 11,345Total 529,615 225,360 754,975 642,295 580,660
^Comparable to 1971; see Technical Appendix.Source; for 1981, Table 31.5; for 1971, E2, p.224.

TABLE 31.2: MOTHER TONGUE BY UKRAINIAN ETHNICORIGIN, CANADA, 1981 AND 1971
MotherTongue
1981 1971
Single Multiple TotalCorrected^
Total Total
Ukrainian 254,690 10,335 265,025 259,860 283,660Engl Ish 267,900 209,475 477,375 372,635 281,665French 1,480 1,530 3,010 2,245 3,270Other 5,545 4,025 9,570 7,560 12,065Total 529,615 225,360 754,975 642,295 580,660
^Comparable to 1971; see Technical Appendix.Source: for 1981, Table 31.6;;
for 1971, E2, p. 231.
TABLE 31. 3: HOME LANGUAGE BY UKRAINIAN ETHNIC ORIGIN,CANADA, 1981 AND 1971
HomeLanguage
1981 1971
Single Multiple Tota 1
Corrected^Total
1
Tota 1
Ukrainian 86,330 2,165 88,495 87,410 132,535Engl Ish 439,415 220,975 660,390 549,905 441,940French 1,995 1,050 3,040 2,520 2,705Other 1,875 1,175 3,050 2,460 3,475Total 529,615 225,360 754,975 642,295 580,660
Ccsrnparable to 1971; see Technical Appendix.Source: for 1981, Table 31.7; for 1971, E2, p.255.
TABLE 31.4; UKRAINIAN MOTHER TONGUE AND HOME LANGUAGE, ALL ETHNIC ORIGINS BY SEX,RURAL-URBAN STATUS AND PLACE OF BIRTH, CANADA AND PROVINCES, 1981
Area Tota 1 Male Female Urban FarmNon-farm
Place of Birth
OutsideCanada Canada
Canada^ 285,115MOTHER TONGUE
140.025 145.095 213,755 29,535 41 ,825 207,765 77,355Atlantic Provinces 855 435 420 615 30 210 690 155Quebec 10,575 5,250 5,330 10,010 80 485 4,995 5,580Ontario 78,955 38,300 40,650 71,230 1,430 6,295 43,600 35,355Manitoba 56,865 27,455 29,410 38,705 7,315 10,850 46,105 10,765Saskatchewan 44,175 22,035 22,135 25,035 10,135 9,005 37,245 6,925A 1 berta 66,680 33,555 33,130 46,115 10,100 10,475 53,925 12,755British Columbia 28,585 12,745 13,845 21,705 455 4,430 20,825 5,760
Canada^ 94,565HOME
44,255LANGUAGE50,305 71,135 8,950 14,475 44,925 49,640
Atlantic Provinces 140 65 75 80 25 40 85 55Quebec 5,815 2,810 3,000 5,585 35 195 1,725 4,085Ontario 32,855 15,595 17,265 30,490 550 1,820 9,645 23,210Manitoba 19,315 8,780 10,530 12,015 2,870 4,430 11,715 7,600Saskatchewan 14,320 6,675 7,635 7,620 4,675 2,940 9,620 4,700A 1 berta 17,320 8,005 9,310 11,300 2,450 3,570 9,685 7,630British Columbia 4,770 2,300 2,470 4,020 60 685 2,425 2,345
^Includes Yukon and Northwest Territories.Source; C4, C6.
30
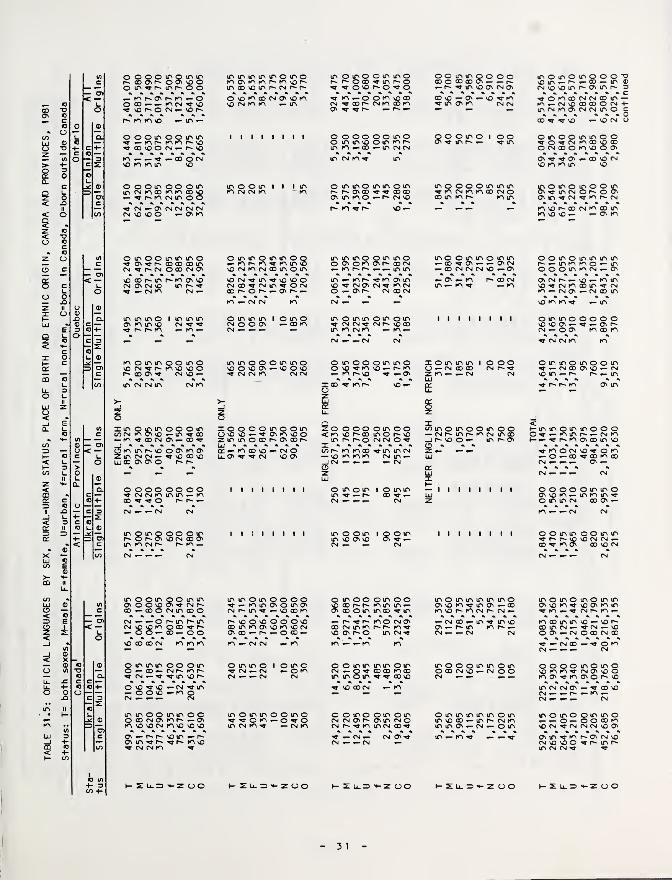
>oL.
CL
c<0
O I—
c— O)
_l ®< X— ® O ®O V) •DC a
U. -c C cU. 4- oO O o
Xi "c 3• •
m II «• »- L.
JO ®m O(A CA
UJ 3 C_l 4- •—m ® to< 4-K- to
C (A
4-CO
® 200O »n
^ O'kT\o*
o o^ »-^ 00
o ir»
K> r>\o o
irv ir>
vO Oo o
^ 'O\0 r*
if> if\r»» vor* vO
lO — ^ ^ 00
O Oir> <N
o mlO 00
oo(N ir>
o ir>
ooo o
o inootfMOtno«f o\ Tj- 00 CD 00 m<N'^r»r4O00CNON^ooDp^lr^^^K^o^voCM O' CN vo m f"^ ^ <N K> C4 »-
in m m o i in m mO' m in \o CN ^^ n- K> ^ m •-
roommooinovO (N'«rr^tnv0'00
00 O' ^ (N \o —in CM CM in CM m
xinV) CM— m TT
d tnz inuioc
m \o o O' tn O'CM (N — XT so 00 \oO' O' o p^ n-
oooooooo^ (MCMmmin — tn00 ^ ^ o p^ p- —
min m CM p^ p^ »n
CM
ininmintnoinoK'O'K'K'r-K'vOn-inoO'Oinp^CMt~»r^
O'Of^oocMO'vomvo CM m m ^ in
I I I I I I I I
m o o in I I I mtn CM CM K> -in
OininOinmOQ»-mn«m^K'in'0vocMKvcMOOinoinvOCM^in^d-vOvOOCMOD'^tfCMin^OCMOCP^OP^^-OiP^*-
o in m in i o in O^ o o O' »- 00 m
ininooominovOO'OO'— vOOvO^ CM CM m CM CM
looooinooinCOvOvO — ^OvinvOOzinmooop^CT'CDp'-IjJ ««•>«*«*cjc*-moO'D«-CMOu. O' ^ ^ (N vO O'
I I I I I I I
00 o CM in oo o
I I I I I
ininoinoooo^--mmO'OinO'CMP^inrf^VOOOK'
in oinooinmor» r^Ooo^inp'O^^O'OP^O'TO•^r tn»-oomvocoCM'^tOOP^CMK'OOK'O' ^ ^ I*" ^ »-
o oooooinoo ininvooinmn-m m^Q0»-incMCMin CM in
O ininominomP>* P* 0' 00^^00 00O' intno— r'CM'O
00 O 00 oo '
^p^^in'OO'CMO'
inooooininm^mcMininoocMooo in m p^ mm
\0^ •- ^ ^
^ m 1^ p^ —
.
m»-mr^^K' 0'mvO^CMO'CM^mCMO — O' 1^ CM 00 CM
m ommomom^ (MCM^ CMI^VOOOm m cMin ^
mo ommo mm^-OO^Ov*-*- O'CM^-OOfMCNCM'O^O'
I I I I I I I I
momomoooTOiom»— p~»-oo»— m ®CMvO'Omp'O'mr' 3^omoocMCMOom —in^<NvOCOOOOCM 4-mcMmovCMCMmo c««««OO'^'^'O — VOCMU
omoommoo^O^CMinOOvOODocMoootn'OOO'
momomoomO'^mcMOP^oO'Oim^CM^mi^cM
oomommmmf^^mmmo — ^O o o m m (N
c^cMp^•-\o— mmvo^CMmoom^cMm — CMOv— CMoom
ommooooovO'OO'^^^O'P^CM ^ o O' m 00 m^ CM CM m m
O m o O o m m o X o m m m i1 o oo o m m o m o O mo vo ^ m vo »- p- m O — CM 00 00 CM P^ ^ — CM 00 (O' vo — CM^ m p~ vo ^xoo ^ mi^o
^Oivo^*
2 m ^ CMlO
E
CM vo m ^ p^
^ p'
m
n- •r- mO' m
< mmo o o o m o ovO P^ CD mo P» vOP- P^ O CM CM O ^m m oo ^ m m CMm m m <n m •-
o m o in I o m mm ^ — p^ 00 ^(N CM
^ CM
o moo oinoovoooi^p^mmm*-O' 00 o m moo^rm
CM»- — or^mf^mcMvo'omooO'^p'^oo— oo»-oovo oo 00 CM m m m
o mmm oo o mo — oo—CMp'-mp'^CM — ^'^tmvon'ovo^vo— CMrj-m»- o ovo «-m oCM ^ ^ — CM
mmoommocooocMO'mp>-^ 0'
l^vOOvDOOOvOoommovvomvocMOVOO — P^*-O0D«—m »- CM (N *- m
mvovocMmvovovomommoomo«9-'vom»-o^om CM m ^ ^ CM m
«- p* r*' vo m »- p^in ^ p' Mf r» m voCM CM m rr
OO
^p^^p^mocMOvoocMmmr^p^m^vo O' o m CM ^
oommmmomCM^O^oDoomoommom^^cDvo^ vo oocM ^ m
comoomomCMCMO'P^O'mCMOcMp^^mmcMOOMj-
U.O >»-z oo
comomoomoo— CMp^ mi^mcM moo_jp*voo»- mp'O'
— I I I I I I I I
I I I I I I I I
mommmmmo0"om'^mO'«-oomvof^mcMn-CM»-•-cMOO — mMi- mvoO' »- p^ m m n' ^CM — — CM CM
mooommomooocMvo»-CM oo
ommmmmommvooo»-mp^ cMmm m O' «—CM ^ o mm »- m ^ ^ ^
l—mmommooo0 ^«-mmp'»-CMm-—^p'mo'ODmvo^mocMvo^om^o — OD^OOmODCM — ^ — c^ ^CM ^ CM
ooooommo0''Om—mmm^o m m CM 00 O' —
oomm oomm^P-P^VOVOCNCM^oo m O' 00 vo CM
CM ^ ^ CM
m o m O mOmmovvom^voovmm^m^^CMp>-m*-mcomm vo»— vor^oomcM^^cM^voOOv^CMOODCMOD
oooomomovomm^cMOvvoomo'^mo'OP''0mcMCMO'— ^oDvoCM — — «- m ^CM ^ CM
moino oinino^^o*-oooomVOCM^CMCMCMVOO'O'm^m n- O' CM voCMvo'OO^p'mp'm CM CM TT ^
O O
- 3 1
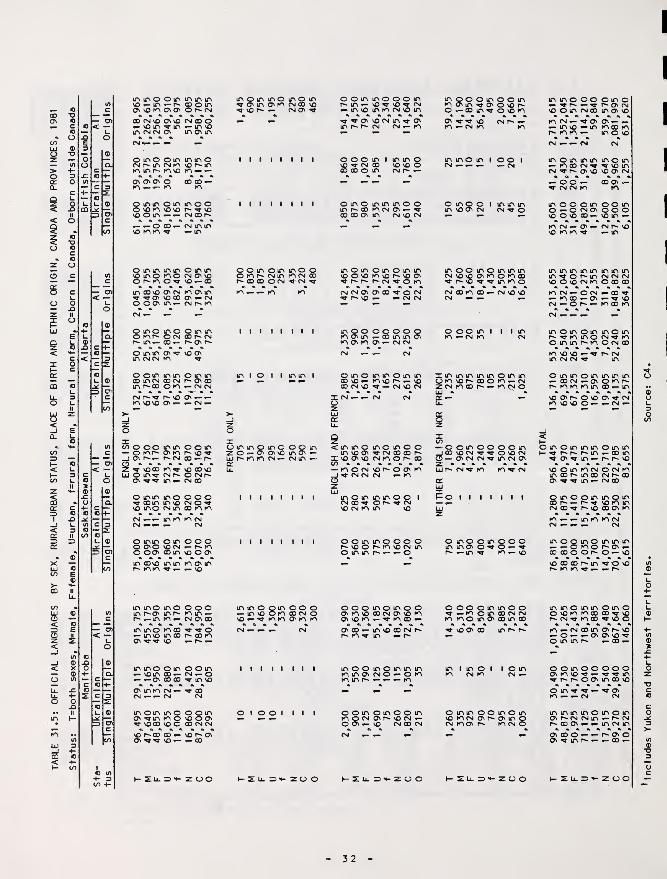
— O)< —1-o
cl-
-3^ f—
m in o O in in m m\o»-in— ooom0''0K>0i0N or«<NoorsiiooMOCMooo^vom^in »-inioin (N CM oi in O' in« « a « «
o in o o in m in oCMr*>incMK> 'Or^mminr^tnio m®-*—
o m in o in in o oO'OmvO'or^'^'Ovo O in CN 03 r-
—- — o oo»- CMininvO mm «T — in
OinininmOininlOinO K'O fMO"0or-fn0'9-'0 — 00
inoO'OO'CMfno'in^ Tj- On vO 00 Oi^PM©©O' in^ CNi^m
©in© in© ©mm©mr-©fM®r»CMr^m«“ ® — r~ONc^
m ©
m
</}©©©mm©©m~ Q O'
m
P^CN
Z'v©© ©©©LLi©m^ (Np~ ©CNr^© m »- CM ©
©mm m© ©©©^©mm© CM©^©m©CMm ©mm
©©© ©m ©©©
m m©mp^ »-mm m©^ m©©
mm©— ©m*— ^©
m ©mm —m*©*m ©©
© m© —© ©
©©m ^© ®
© m^ ©m ©
m ©m© ^m^ ©©© p^©© ^^
m ©m ©© ©© m© ©CM CM
m©mm©m©m^©m©mcM©©•'»• © n* <— CM © -^
I I I I I I I I
i I I I I I
©©m©mm©©©mp»cMmmcM©p**©©©CM<«rCM'^r
I I I I I I I I
m I © I I m m I
mm©m©©©m©^© ©© m© —
I I I I I I I I
mmo©moo©*-m©©m©CM©©»-^ mm ©mmCM — ^ — CM
I I I I I I t I
© I © © I II I
l-2li.©H-200
©©mm©©©mp^m»-©^©^cM»-m© mmcM©m
© © © m I mm©© «a- CM © © © ©© © © m CM r- »-
©m© m m m © omp^© mcM©*-^© ® © m CM © CM
momomomm©©©m©p-©©^p^p^ i^CM^©mCM CM © © © •TJ O CM
P» © •- — CM CM
m © m © ^ CM CM
I m © m m © m mI © •— m © »— ©I CM © MJ- CM © CM
X CMO
<mm© m©m©©m©©^CM©©p^X©©© CMm©p^©
m © m m m © © l
CM © «« © n« ^ CM© CM m m ©
©©m m©©©©n»©© p^m©CMm©mm ^ o
©©©m©m©©
©«—©m^©©m«k
© ^ ^ © CM »-
©mo© I m m mm © © CM CM 0
moomommm
xm mmmm©mmom©r^©©m^CMzcMm©p**^mcM©
©©m©©©©m
Xlij
I© I I I I I I
© m © © m ©m m © © '9' ©p^ •- m ^ m
©©©©mm©©^^m©m©CMCMmm©m©©m©
mm©©© ©m©»-^P^*-^ P^©CM©©mcM© m©©mcM<-^© oi*-*-^m©^mm©mn- m m — mo©CM ^ CM CM*
m©mmm mom^-mocM^'e-omCM^r^©© ©©CM
m©©©m ©©m©— ©CM©©©©— ©©©©^©m'j-
mmmmmmmmm^rop^m cmcmcm©©©CMm ©©©mcM^ocM— ©^— m©—©— 'e©CM^or^— m©m
m©m©m momc»^mm©CM^m©mmc^mocM©
©mm©m mmm^©CM*-©©mp^p>«-mmmm ©«—
m
— © © P' o © © ^m ©©©»-— CM
Omommm ©mm»-”^p'r'p^m*-©m^©^m»-i^r^©©ommcMOCMmmop^mocMp*©© ^ ^ m ^ CM ©
CM©'^r^©©©m
moomommm^^©m©i^© —©©©©p^© — ©
mmomm om©©©mm© ©^©r*>CM^m©^©©'T © © © m p^ p~
moomommmmm©CM©^©mm m p^ m
oomomoom
o o
O mm oomom©mcM©p«>©m©CM m © p^ m CM ©
X H- 2 o ©
m«-CM©m©p«-©^o*— •— ©©©'!•© m m p' >— © —
oomooooo©m©Mj-^^^mTrp«i^©©m©©
mmmmomom©i^CMCMm^-r^cMp^©©»-«-mcMm
- 32 -

TABLE
31.6:
MOTHER
TONGUE,
POPULATION
OF
UKRAINIAN
ORIGIN,
BY
SEX,
RURAL-URBAN
STATUS
AND
PLACE
OF
BIRTH,
CANADA
AND
PROVINCES,
1981
Status:
M=male,
F=fema1e,
U=urban,
f=rural
farm,
N=rural
nonfarm,
C=born
In
Canada,
O=born
outside
Canada
i- m»r\ir\»f\0000 in in o in oto o to m 65 60 75 oomoooom m o m o 1 mom
c ® .-t^oooNir>r»\ovo»n fM <N kS
m®®CMr^®CNfo vO — ^ to 03 C^£ to CM — CN CM m CN CM ^ m CN to ^ .-to-oi -Ho
£ O m O m o o o 1
O r* — — o O 1 O O 1 1 O 1 o o o m m m o i m m m Q 1o m O'rn m 1
o ® o to CN to to VO ^ CM oo CN m -o — O'3 c CM CN
o. C7) oC 1.
•»- 0 li.-3 lOioOiTiintoiriiri
O' — cor«(OoocNvoO O in O O o o o momoomom in m o o in o o o
2 L in in o to ^ ® ® p^ CMmP»^P~.-OCN ®0®'^'N- ^ m ovO^(NOn>00^«N in o m vo to in to ®Of^toO'miom CN ® ® to ®C £ C — «k «k *C -t- UJ— r*. ^ ^ ^ ^ o ^ to to O' m ^ O' to ® O' O' O' O' o ® ®
0 C4 <N CN (N ^ ^ CN ^ CN CN to ^ to — to toc <c 1 omOir\inmioio
oo^^o\.-r^iocN— 0»-if><NroO'<N
in o in Q in2 \0 — m O' m O in inCN in o ommmomoo — m o o o 1 moo
O' CM lO1. c ^®mO'N-0'®® m m CM ^ \oS CM m o— c < to vo ® CM CN CM ^OtO®CMtOCN.-=} ® n o • « . .
m <N
^
o% * % % 3 • • &
i_— •- < CM e- ^ CN
3 K p cr oZ I-< ® I
U <ooooiriinooS v£>fOror^ooo.-ir»V o o o o o o in in _jmmmooomm ® o o m o m momCO in ffi ^ O m O' <c>'Tmo®'^.-® — CM O CN ^ P^ o p^ m£ r- ro m ^ fo < in CN CN to to ® ^ ^ r~* ^ ^ ^ K ® ^ ^ ® — to ^
c 4“ CO
*0)O
1- £ lO 1 O O 1 1 O >Tv o 1 in o 1 1 O 1 O O O m o m o 1
to vO O' — CN too m m m 1 1 m o
o ® o vD vO lO ^ (N CN CN CM to to ® m —3 c
o O) ®c u.
o> o Li.
c 1- oootoooino in o in o in o in o oomoomoo O m m m m o m mCO L. 1 x: fOoo^\Dt^O'r»io
«NO'^o^^r'\OiriCM 3 ^ CM ® CN in p~ -.-tor*® — — ®m ® vO to o ^ P- o
® C31 «n p^ O' CM in CJ' ^ CM Ol^CNtOtOtO.-® ® N- CN to P^ ® ® ®c JZ c —
lU — ffi ^ ^ iTN ^ \o ® p* ^ VO in \o vo ® p' ® p^ o m O' O CJ' o ® ®c
^ CN cs to N- to — CN to to to m p" m CN to to
*c 1 moooiTiOooP^^CNIO IT\ VD »— vO
OinOinOOOin momommmo m o Q O OtO — iO(X3.-
m m o1. c CN'»p^incN^'Oin P^^tO^^.-tO^ Tf o ^— c inn>p^^ooto.“ O.-m.-CMtO'^CN O — O' P^ ^ ® — ®3 <0 Q
U — OrrvON-vOON — On 0'0'0'CN0'®tOi0 O'OO'^O'O'®^ to — ® to ®%*•3 in <N CN to TT lO CN to m to CN ^ -w
L. mmOOinmooCNioONO^mp^CNO
in o 1 m 1 1 o o O Q m o 1 mom® 'O •— vo CM m m o O O m mom® ^ to CM CN — p" m ® CN vo m
c x: OO^OCN<N^'TVO CM CN p- O' m — ® ®O) O CM to CN — —uo x: ooinoinooin o in 1 o 1 1 O 1 o o o m 1 moo o m m o 1 O m m
® o to.-.-^^r^vO'O CN CM CN O O' N- ® CN p» to P^ ^ p^ too 3 c in r«* 03 to ^ ® CN to m m .3- _ CN fO to
O) ®Q. C i. ^ ^ ^
0 u.K«— ininoininmino inoininooom mmommoom o o o m m O m o3 U p«'to^ininvoO'3^V0®\0®0\0'^ oo O' O' to in — CNp»mmcM^ocN ^ ^ O O' O' m ® m
O' ^ ^ ® ® .-mm® CN o o ® CN 1^ to« « * « «
C •+T c — o^inm\oo.-info CM CN CN to — CM to 'e CM CM ^ ® CM —o 0 LU — o o o »o to o ® to to mc
CN — CN
*io , mooininoinolOincFmvommin
® in in o o 1 O in 1 O o m m 1 toom <w O' ® m m o O m o o m1. c LU ^ to CM CN ^ p^ CN m m m P* ^ toJC — c tovovoor^^m^ o CN CM — p^ CM m ^ CM O p.“
3 <0 c zl_ — o -w in ® oc CN CN CN>3 < g O O
$ 0. LUmfc zinooininooin o o in in o 1 moo LU o o o m 1 1 o o I— m m m o m o o oS <•^lno^.“^3lno^ — Mf CM to CN CN 3 m O' ® ^ mo Z O' CN ® to CJ'£ Oin\ooointo\o.-to OCN —= CN CM O CN o — o — m ®4- « « « . . . %
C O in CN CN CN to < CN — CN
o>•— £ oininooininin
CD^IO.-tOtOvO — < in o 1 in 1 m m 1 mommoomo O m m m i o o oto ® p.u ® o CN CN CN ooi — tocMmoo m o ^ CNo 3 c ^ r* to CN CM O' ^ ^ ® ® — CM CM
O) ®® c u
0 li.C7> »-c Qininmooinm mmir\Oinoir»iTN o o m o 1 o m m m o O m m m m m
!rQOO\cDmtO'Win r^r^ONCNK\c^^tf> ® m o m o <— to ® ® ® p~
CN vo ® ® O ^— p.
CO 1 x: ^^^lO.-tO'^^ O O O' 'S- \o o O CN ® P^ to ® CN mo®£ O) «/)
c c — r^NO.-'OO.-to^ CM .- CN ^ CN to to O 0<T> — ^® to CN m ® —o b UJ — lO to to O CN Mf \0 mc
£ CN CN CN
*io 1 Oininoininoin^030tOiniOvD inoinoinmoo0®^CNCNinvD^ oommooom oommmomo1. c CNOO^'^P^.-^® ^ CN ^ CM o — ® ®— c VO^CNOlOOmcE p- to to m m ^ VO f" O' ^ ^ O' CMp'mtotovcto®3 c o
i> — ^inO'.-ior'inm O' ^ ^ ® ^ ^ -- V ® ^ ^ m O' —JlC inCNCNO\CNI003\0 p^ to to ® to to3 CN
Sta- tus H-2li.3H-zOO »- s: li. 3 M- zoo l-2Li-3H-zCJO T M F U f N C 0
33 -
^Includes
Yukon
and
Northwest
Territories.
Source

I
00 o m m o 1 1 in o o m in in i o m in m m m © i 08 © © © © I © © ©Ov o •- m in o VO 00 fn ^ VO (M in CM m p- ® m m ® O' — ^ r** ®
c4-
* O) oCO —
1o £ o o o in 1 1 o 1 ( 1 1 « 1 1 1 1 o m © © 1
ov in m p^m © 1 m © m m l © m i 1z o U ^ — m ^ «(*• — <7v m m CM m cm m i0 o c
> <3 ®o Q. 3rr o ' O u.Q. X 4-
, co O ominoininoo ©ooinoinoo
cM-^rooinOr^vOvoOmommm©© mmmmmmmm 1
§c 3 -J 1 f ^^^^ovincM^
00'9‘'»S’VOI^'«’'<^’'=^— r^tn® — © ® CMO ® P»
m®OP^^®'«’^ 1c SL o>w ovc^ — inmc^vocM CM — CM CM ®CM®®®mp^ — 1< o c — « Ck fli» « 8) A ^ « Ck « Pc. g UJ — O' m ^ tn ^ ov «M ^ ^ Ifk K> tn CM CM ® ® ® — o o o — ® © —< c o «N — — CM <N {Nj ^ ^ {VJ m CM CM ^ m ^ CM CM m mn X << c
z< +- c1
cininmoinmoor^ — vOOv — r^mm in in © in o in o in
zc*’0'®ininvo — vom © © © ©^ m 0^ ® © m ©© ® VO
cDmm©© 1 ©m©ScMmp^o cMOvm1o 3 L. — c ^ CM <N CM — m — < CM — — CM ^ — CM CM — m X — — 1
o X<0 oJ_— 3
UJ < d 1
X c JiC o X ou X 1- ooc z
-< X
1CD II u ^inoinoinooo ^ in in in in i ©mo j © m © © m< m m — CM — m © m — ©©©©m©©m 1o ® cojn ® ^ p^ ® — ^ © l-'3-©Mf®mCM®® 1U. CM — — — — — CM — — CM CM
1O«r
c 4-o g
UJ X cr>
o «3< C L. £ o o in o 1 1 in o 1 1 1 1 1 1 1 1 © m m m 1® m CM m m m 1 1 1 1 1 1 1 1 1 1
e!o o 03 o VO CM »9- in <N m CM ® 1o o c 1« <3 ® 1c
O)3O)
1.u.< c c
c <3 ooooinmoo ©©©mm©©© © © m m m © © © mooomommCO 1- CO fn — csiinmsocM — on”mK'vo©r^<N
®®0'0'Or^CMK' m CM — m CM m — CM — ©p'X o O'l^csio'in^tnvo ® © ® ® m m m CMOvm— — ©'t® 1(- X c c — 1< II «3 i UJ — — o — O'oomooK' K'CM©0'CM© — CM ©CM®ov'«-®mm O'O'O'®— CMmm
1o 0 00 ^ ^ m *- r- ® m m m — — ® C'l ® m ® — m CM CM — m 1CO c Xz E <3 1 oomooinmin m©m©©mo©
mm©0'fnK'"<- — mmmm©m©© m©©m©mm©l- L. c r»'^moooo — CM'^ ® O' r- O' m — CM in10 — c inoinoinooor^ ©©©0'r^m®CM IP) ^ ^ CM p*“ ® © cyv ^ m © © © j
ir <- X (0 (0 oX c u — r^cDOvocM^Ovo m®r^®CMm®'<’ m ® © CM tn ® ® ^ — CM m CM CM1 o_i c X< ®X oX <3 uac 1- 3
3 0U u inminooininin 1 1 1 1 1 1 1 1 ©mm© 1© -«» m © 1 m m ©©©©©©mm
©O'O' — CMmcMmX II ® n»vDOmcMCMCM'«s- m \£>
LU Z c £ •” m vo o — m vo m CM CM m CM mCO 4- fib
« 03 o>“ ECD 1.
10 o £ oooooooo 1 1 1 1 1 1 1 1 m m m m m © m © m © m m 1 i © ©O' CTv © ® ® CM
1H- 03 o intncM — K3— r»co m •^ © p^ — P*> Ov ®Z 03 O) c o in in O' —O' ® m m m m10 ® t
o o Cl. 3 t-l- C71 UcX 3 •¥ Co U n inoinininminin m©©m©©m© m m © m m mm© ©©m©©mm©m — — m©p^mr^II 3 _j r^vo — CM — mmov ©^movmmmTp©mm— ® O' — © CM ® Mf CM in © ©z X 1 JC OvOvOCDvOinr^ — ^ p»- ® — CM CM CM mm©®mmcMCM< S O) tf»
« c E c — oooin — tnmin V- — (M CM ^ — m m p^m'^p'— ®mcMz c (0 O UJ “ tv — — r*- — Kv — ® m m m ®c X CM — — — CM
cu 1 UJ3 K3 c minmoininoo C3 S 1 1 1 1 1 1 1 m m m m i 1 © © m©m©mm©cX II L. — c VOC^ODODVOCMOOX z o Tf m o vO ^ m — CMP^CM^©'^X «3 C — aocMincMm^vo p- m ^ © •«s- m c
u. X u. — 3*- 1/3
o o ®0) X < cr o ©z
o (3
E§z
CL
o CDUJ 1
1- C Je <inininminoOin — 1 1 1 1 1 1 1 1 X © m © m 1 1 m m Kmmm©©mm© >_< ® or^r-ovvoo- 000 K ©^ ^ © m — CM zm©©m— O'Ov© u_J II JZ 00. oooin — CMm^ Z O ® ^ ^ p* p^ u
u. C 4- < ®o>
o — — — 1-
0. 0) •— < 4-JZ inooooinoo O m 1 1 1 © m 1 © m © © m ©mm © m m m i m m m 1/3
«3 o 0> o Ovo^ — ^^OO in CM CM CM VO ® ® m® O' ^p^ m CM p^ © vo ^ CM m m ®
UJ E cn c o — 00 f~> CM vo m — mmo II o «3 ® « « * % ©< 3 — — — «— — — 4-X O) oi u. Uo c c 0z • • «— o inOininOinoin ©m©©m©m© m © m © m m © m
CM O' O'mm©mmm©© z< V) CO _J — voin^ — in—
o
CM©<NO'inovmn* ® © ® CM m^ o> m © ©©© — Ovm-
©
3 1 JZ ^lor^ioor^r^i*^ ^ m ® p^ m — ^ — CM m^c^c^®mm® X+- c 03 W c«3 n 1 c — OCMvo^OinOO (M ^ ^ ^ CM f^mmp*- ® — CM— ©®— — O'CM o+” 0 UJ — focM — tnenvoocM ©mm® — ® —
o CO c X ^ CM CM m ^ cX o
O 1 JCc oooooinoo m © © m © 1 m © m © © m m m © m ©©mmmmmmomi''— O'O'm'^
3— c tncM- oinootn O' ^ ® ® CM ^ m ^ © m ® CMm ® — vo 1^ n- >-r" X O <0 ^nlnoocMOOO^n — m p^ ©©0'^^©0'©
1/3• u — « • • «vOOininoocM— in m CM CM m — m © ^ m ® — ® — ®X 00 ^ VO — ^ ^ m — — CM CM X
3UJ
a! ^3 «AOc
< 4- 3 KXU-XM-ZOO I-XU.XH-200 K X U. X M- z o © KXU.XM-ZO©H CO 4-
34

TABLE 31.8: UKRAINIAN MOTHER TONGUE, POPULATION OF UKRAINIAN ORIGIN, BY AGE,SEX AND RURAL-URBAN STATUS, CANADA AND PROVINCES, 1981
Status; T=both sexes, M-male, F=fetnale, U=urban, f=rural farm, N=rural nonfarm
Age - Ukrainian Single Origin Age - Ukrainian Multiple OriginSta-tus 0-4 5-9 10-14 15-19 20-34 35-49 50-64 65+ Tota 1 0-14 15-34 35-49 50-64 65+ Total
T 1,815 2,460 4,185 6,830 33,290 54,020CANADA^
87,365 64,720 254,690 680 2,340 2 ,580 3,035 1 ,695 10,330M 885 1,290 2,075 3,560 16,815 26,775 43,390 30,620 125,410 380 1,080 1 ,185 1,270 730 4,645F 930 1,170 2,115 3,270 16,485 27,250 43,975 34,100 129,280 300 1,260 1 ,395 1 ,765 965 5,690U 1,375 1,665 2,715 4,625 26,515 38,930 65,980 49,190 191 ,000 505 1,805 1 ,890 2,400 1,475 8,085f 270 540 1,010 1,500 2,880 7,630 9,745 3,065 26,635 90 180 275 185 40 765N 170 255 465 700 3,890 7,465 11,640 12,470 37,060 85 355 410 460 170 1 ,480
T . . 10 120 210ATLANTIC PROVINCES
195 145 700 10 20 45
M - - - - 60 90 95 95 355 - - - - - 15
F - - - - 60 125 100 50 345 - - - 15 - 30U - - 15 95 150 145 115 525 - - - 15 - 25f - - - - - - 10 15 25 - - - - - -
N - - - - 20 65 40 20 150 - - - - - 20
T 105 125' 135 300 1,500 1 ,485QUEBEC
3,160 2,615 9,425 30 55 30 90 40 250M 50 70 70 165 750 725 1,580 1,265 4,680 25 10 30 30 20 135F 50 50 65 135 750 755 1,585 1,350 4,745 - 30 - 60 15 115U 105 125 125 280 1,470 1,350 3,015 2,480 8,940 30 50 30 90 40 245f - - - - - 35 25 70 - - - - - -
N - - 10 15 25 95 125 130 405 - - - - - -
T 710 815 1,300 1 ,795 10,490 11,615ONTARIO
27,320 17,190 71 ,240 250 550 525 930 520 2,775M 360 415 650 960 5,160 5,410 13,710 8,050 34,720 110 275 220 370 255 1,225F 350 400 650 840 5,330 6,205 13,610 9,135 36,515 140 285 305 565 265 1,550U 640 705 1,195 1,665 9,585 10,165 24,610 15,760 64,320 225 475 435 815 490 2,445f - - 20 50 170 285 585 175 1,305 - 10 20 20 - 60N 65 110 85 80 735 1,165 2,120 1,255 5,615 15 60 70 100 25 270
T 315 495 935 1,390 5,785 10,430MANITOBA
16,815 14,570 50,740 65 565 485 670 380 2,180M 130 220 500 680 2,925 5,145 8,110 6,740 24,450 55 270 245 335 130 1,045F 180 275 435 715 2,860 5,290 8,700 7,830 26,285 10 295 240 335 255 1,135U 205 290 465 775 4,060 7,025 11,765 9,945 34,540 30 425 330 460 345 1,595f 70 140 355 370 835 1,650 2,260 975 6,590 30 55 75 55 - 215N 35 60 120 250 890 1,755 2,785 3,715 9,615 - 90 85 155 35 375
T 225 375 780 1,285 4,355 8,700SASKATCHEWAN
12,800 11,005 39,520 85 315 375 340 250 1,360M 100 240 355 690 2,315 4,375 6,400 5,270 19,745 35 160 175 145 85 610F 130 130 420 595 2,040 4,330 6,395 5,735 19,775 30 150 205 195 160 755U 85 150 315 520 2,790 4,830 6,960 6,795 22,455 40 195 245 220 185 890f 105 195 340 570 885 2,635 3,355 935 9,020 25 55 75 65 25 255N 30 25 125 195 675 1,235 2,485 3,270 8,045 - 50 55 55 40 220
T 395 555 855 1,785 8,790 15,750ALBERTA
18,175 13,365 59,670 175 620 805 540 300 2,435M 205 290 410 895 4,510 8,140 9,215 6,475 30,140 90 235 360 230 145 1 ,080F 190 265 445 890 4,285 7,615 8,955 6,890 29,535 70 360 445 305 155 1,355U 270 315 465 1,155 6,760 10,850 12,265 9,065 41 ,140 125 470 575 390 230 1 ,805f 95 195 285 490 945 2,920 3,325 960 9,210 15 60 105 45 10 240N 30 40 100 145 1 ,095 1,980 2,590 3,340 9,320 15 95 120 100 60 395
T 70 90 175 255 2,165 5,670BRITISH COLUMBIA8,795 5,825 23,035 45 230 335 445 200 1,250
M 40 50 80 160 1,045 2,790 4,210 2,730 11,105 30 95 145 150 85 515F 20 40 90 90 1,115 2,885 4,585 3,090 .11,930 - 120 195 295 115 740U 65 70 135 225 1,690 4,440 7,135 5,015 18,780 30 180 260 400 185 1,060f - - - - 40 110 180 75 415 - _ _ _ - _
N - 15 30 20 435 1,125 1,480 735 3,845 10 40 80 40 10 195
^ Includes Yukon and Northwest Territories. Source: C5.
35

TABLE 31.9: UKRAINIAN HOME LANGUAGE, POPULATION OF UKRAINIAN ORIGIN, BY AGE, SEX, AND RURAL-URBAN STATUS,CANADA AND PROVINCES, 1981
Status: T=both sexes, M=male, F=fefnale, U=urban, f=rural farm, N=rural nonfarm
Age - Ukrainian Single Origin Age - Ukrainian Multiple OriginSta-tus 0-4 5-9 00-14 15-19 20-34 35-49 50-64 65+ Total 0-14 15-34 35-49 50-64 65+ Total
CANADA^T 1,135 1,025 1,565 2,495 7,470 8,155 27,275 37,205 86,330 215 405 290 615 640 2,165M 600 570 745 1,330 4,025 3,450 12,870 16,920 40,520 110 180 75 225 290 880F 535 450 820 1,165 3,445 4,705 14,400 20,280 45,815 100 225 220 390 350 1,290U 940 850 1,195 1,915 6,345 5,650 20,690 27,710 65,290 145 290 205 415 530 1,580f 90 100 265 385 670 1,550 3,280 1.715 8.050 50 55 60 65 30 265N 105 75 105 200 465 960 3,305 7,775 12,995
ATLANTIC PROVINCES
55 30 135 85 320
T - - - - 15 - 25 45 95 - - - - -
M - - - - - - - 15 40 - - - - -
F - - - - - - 15 25 60 - - - - -
U - - - - - - 10 40 65 - - - - -
f - - - - - - - - 25 - - - - -
N
QUEBECT 70 50 70 265 685 490 1.765 1 ,955 5,350 - 15 - 40 20 100M 45 35 35 135 370 240 845 890 2,600 - - - - - 45F 25 15 40 135 310 245 915 1 ,060 2,750 - - 35 15 50U 70 50 70 245 670 465 1,720 1,870 5,160 - - - 40 20 95f - - - - 10 - - 25 - - - - -
N 15 15 35 85
ONTARIO
160
T 605 520 800 1,165 3,715 2,565 10,755 10,485 30,600 95 145 75 200 215 735
M 305 265 385 570 1,995 950 5,310 4,845 14,630 20 60 25 85 105 310F 295 255 410 595 1,720 1,615 5,445 5,640 15,975 55 95 45 no 115 425U 545 485 760 1,095 3,530 2,350 9,915 9,725 28,415 80 145 60 165 215 670f - “ 25 55 40 265 95 495 - - - 20 - 20
N 55 35 35 35 130 170 570 660
MANITOBA
1 ,695 15 45
T 185 170 300 435 1,170 1,820 5,420 8,065 17,570 20 55 60 135 200 480
M 95 95 140 240 635 765 2,600 3,470 8,040 20 25 15 55 80 215F 85 75 160 195 535 1,060 2,820 4,600 9,530 “ 10 40 85 115 265U 120 110 150 230 770 1 ,030 3,500 5,070 10,980 - 25 30 75 155 290f 45 40 120 135 285 495 910 550 2,580 20 25 25 15 15 110N 15 20 20 70 120 300 1,010 2,445 4,015
SASKATCHEWAN
45 25 75
T 50 90 155 275 520 1,390 3,800 6,670 13,050 - 30 45 85 90 275M 25 50 50 185 315 630 1,695 3,100 6,050 - 20 - 25 50 95F 25 45 110 95 205 760 2,105 3,670 7,000 - 15 40 65 45 180
U 20 65 70 85 290 580 1,740 4,140 6,990 - 20 30 40 55 155f 15 30 65 130 175 575 1,230 505 2,730 - - - 20 - 55N 15 20 60 50 235 835 2,125
ALBERTA
3,335 25 25 65
T 175 150 190 130 1,120 1 ,515 4,265 7,845 15,565 35 125 100 100 80 445M 80 95 95 175 595 655 1,880 3,620 7,195 20 30 25 30 30 155F 95 55 90 135 520 860 2,385 4,225 8,370 80 70 75 45 295
U 125 110 115 215 860 950 2,735 5,080 10,195 20 60 70 45 50 270f 30 30 75 80 145 425 835 530 2,150 - 20 25 10 - 75
N 15 110 140 695 2,230 3,215
BRITISH COLUMBIA
25 45 25 100
T 55 40 45 45 235 365 1,245 2,040 4,070 15 20 50 35 125
M 45 30 30 30 105 210 535 980 1,960 - 20 20 55F 10 - 15 10 130 155 715 1,060 2,110 - 15 25 15 70U 60 25 25 35 205 275 1,060 1 ,785 3,465 -> - 10 40 35 105
f - - - - - 15 25 40 - - - - -
N - 15 25 - 35 95 160 235 570 - - - 10 - 20
^Includes Yukon and Northwest Territories. Source; C7.
36

TABLE 31.10: POPULATION BY UKRAINIAN MOTHER TONGUE,UKRAINIAN HOME LANGUAGE AND ETHNIC ORIGIN, SELECTED URBAN AREAS, 1981
Status: T=both sexes, M=Ukralnlan mother tongue, H=Ukralnlan home language,C=born In Canada, 0=born outside Canada
Ukrainian Other Ukrainian Other Ukrainian Other Ukral n 1 an Other
Sta- Sin- Mul- Ori- Sin- Mul- Ori- Sin- Mul- Ori- Sin- Mul- Ori-tus gl^ tiple gins gle tiple gins gle tiple gins gle tiple gins
EDMONTON, CMA REGINA, CMA LONDON, CMA VERNON, CAMT 27,970 1,185 1,930 3,615 180 225 1,535 50 120 1,180 25 130MC 22,665 1 ,140 1,385 3,125 165 175 705 25 45 875 20 95
MO 5,300 45 540 490 15 55 830 15 80 300 - 40HT 7,070 165 430 625 15 45 700 - 40 325 - 40HC 3,665 160 165 360 10 40 145 - - 160 - 30HO 3,415 - 265 265 - - 560 - 35 165 - 15
WINNIPEG, CMA THUNDER BAY, CMA KITCHENER, CMA PRINCE GEORGE. CAMT 27,990 1,330 2,060 4,170 185 345 1,375 35 80 695 40 95
MC 21,220 1,155 1,450 2,930 155 215 825 25 10 590 45 85
MO 6,770 175 610 1,235 25 135 530 - 70 100 - -
HT 8,685 240 575 1,260 55 80 430 - 10 85 - 20HC 3,995 115 155 405 30 - 120 - - 45 - 15
HO 4,690 125 425 850 20 75 310 - 10 40 - -
TORONTO. CMA ST. CATHERINES^ , CMA HALIFAX , CMA SAULT STE. MARIE . CAMT 31,415 880 1,855 4,870 220 385 125 20 30 735 30 75
MC 15,510 585 720 2,780 160 175 100 20 25 475 30 50MO 15,905 295 1,130 2,090 55 215 25 - - 260 - 20HT 16,215 325 660 1 ,940 60 90 - - - 185 - 20HC 4,560 160 125 595 35 15 - - - 55 - -
HO 11,655 170 535 1,340 30 80 - - - 130 - 15
VANCOUVER, CMA OTTAWA-HULL, CMA YORKTON, c BRANDON, c
MT 11,200 655 995 2,075 130 135 2,465 100 115 975 85 80MC 8,655 570 615 1,350 95 80 2,170 90 115 815 85 60MO 2,540 80 380 725 35 55 295 10 - 160 - 20HT 2,125 65 230 630 30 50 900 35 30 210 20 -
HC 1,010 45 85 260 20 15 630 25 20 140 20 -
HO 1,120 20 145 370 10 35 270 - - 70 - -
CALGARY, CMA WINDSOR, CMA PR 1 NCE ALBERT, CA LETHBRIDGE , cMT 5,875 340 590 2,590 215 300 1,985 75 130 760 60 65MC 4,735 320 410 1,595 140 125 1,640 60 100 455 40 35MO 1,140 20 175 995 75 175 345 15 30 305 20 30HT 1,010 50 160 940 30 65 570 - 40 270 - 20HC 490 35 95 285 20 - 355 - 20 70 - -
HO 520 15 70 650 - 55 220 - 20 200 - 20
SASKATOON,,CMA OSHAWA, CMA KELOWNA, CA BRANTFORD. CA
MT 6,825 290 550 2,340 95 130 1,755 70 115 815 25 65MC 5,690 270 475 1,350 75 50 1,335 60 60 480 25 15
MO 1 ,135 20 70 995 20 85 415 15 55 335 - 45HT 2,045 50 110 1,025 20 45 495 - 25 300 - 20HC 1,260 30 70 310 15 - 235 - 10 90 - -
HO 780 20 40 715 - 45 260 - 15 210 - 20
HAMILTON, CMA VICTORIA, CMA DAUPHIN, t VEGREVILLE. tMT 6,575 285 430 1,110 60 125 2,215 55 145 1,540 30 95MC 3,415 210 150 900 60 70 1 ,960 55 130 1,280 30 75MO 3,155 80 285 205 - 60 255 - 10 260 - 20HT 2,815 70 175 75 10 15 1,100 - 60 740 10 60HC 780 30 25 15 10 - 880 - 45 520 10 30HO 2,040 35 145 60 - - 215 - 10 220 - 30
MONTREAL, CMA SUDBURY, CMA KAMLOOPS, CA RED DEER, cMT 8,625 235 760 1,840 70 125 710 40 45 295 35 -
MC 4,035 175 280 1,105 70 90 615 40 15 260 20 -
MO 4,585 65 480 735 - 35 95 - 35 30 15 -
HT 5,075 95 285 805 35 20 55 - 10 - - -
HC 1,515 50 45 280 35 - 45 - - - - -
HO 3,560 40 235 525 - 20 - - - - - -
continued

TABLE 31.10; POPULATION BY UKRAINIAN MOTHER TONGUE,UKRAINIAN HOME LANGUAGE AND ETHNIC ORIGIN, SELECTED URBAN AREAS, 1981
Status: T=both sexes, M=UkraIn1an mother tongue, H=Ukrafnlan home language,C=born In Canada, O=born outside Canada
Sta-tus
Ukrainian otherOri-gins
Ukrainian OtIler
-I-Ins
Ukrainian OtherOri-gins
Ukrainian OtherOri-gins
Sin-gle
Mul-tiple
Sin-gle
Mul- Ortiple g
Sin-gle
Mul-tiple
Sin-gle
Mul-tiple
MOOSE JAW, CA PORTAGE: LA PRAIRIE, CA ST. PAUL. c MEL VI LLE, cMT 730 55 70 670 25 35 595 10 40 345
MC 470 55 55 515 25 25 460 10 30 305 - -
MO 255 - 15 155 - 15 135 - 15 35 - -
HT 195 10 - 180 - - 170 - 30 115 - -
HC 30 10 - 85 - - 65 - - 80 - -
HO 165 - - 95 - - 105 - 30 35 - -
NORTH BATTLEFORD, CA KENORA, CA KINGSTON. CA THE PAS, tMT 940 55 125 545 25 70 200 15 15 255 - 15MC 720 40 75 360 25 40 125 10 10 215 - -
MO 215 15 50 180 - 30 75 - - 40 - 15
HT 315 15 45 245 - 25 50 - 80 - 20HC 185 - 15 120 - ~ 20 - 55 -
HO 125 10 30 125 - 15 30 - - 25 - 20
GRANDE PRAIRIE, c SARNIA, CA GUELPH, CA KAMSACK, tMT 395 10 30 390 - 60 205 - 40 450 15 55MC 320 10 25 265 - 30 100 - - 375 10 55
MO 75 - - 125 - 30 105 - 30 80 »
HT 60 - - 140 - 10 80 - 10 235 - 15
HC 35 - - 60 - - 20 - 15 155 - 20HO 20 - - 75 - 10 65 - - 80 - -
MEDI CINE. HAT, CA THONPSON, CA TIMMINS, c SMOKY LAKE. tMT 275 - 30 280 25 - 355 30 40 485 - "=
MC 230 - 30 270 20 - 235 10 20 345MO 45 - - - - 120 15 20 135 •
HT 25 - - 25 - - 90 - - 295 15
HC 20 - 20 - - 20 - ” 180 -
HO - - - - - - 70 - - 120 - 10
SELK 1 RK , t SYDNEY2 . CA FORT FRANCES , t NORTH BAY. CAMT 530 25 20 285 - 15 375 35 110 - -
MC 415 25 20 200 - 15 335 - 15 80 -
MO 115 - 85 - - 40 - 15 35 “ -
HT 110 - - 60 - 15 110 - 10 40 _ -
HC 55 - - 25 - 10 80 - - - - -
HO 60 - - 30 - - 25 - 10 35 - -
NANAIMO. CA CHILLIWACK , CA PENTICTON. c WYNYARD, tMT 310 10 45 305 35 35 295 - 30 390 - -
MC 245 10 35 210 25 15 215 30 315 - -
MO 60 - 15 95 - 20 75 - - 75 - -
HT 45 - - 60 _ 30 75 - - 175 - -
HC 25 - - 25 - 15 25 - - 115 - _
HO 15 - - 40 - 20 50 - - 60 - -
CANORA, t FLIN FLON, CA PORT ALBERNI
,
CA ITUNA, tMT 1,020 20 95 380 > 50 210 - 45 510 - 40MC 865 20 80 340 - 45 155 - 35 365 - 35
MO 150 - 15 45 • - 55 - - 145 - -
HT 595 10 55 70 - - 30 - - 300 - 15
HC 445 10 35 50 - _ - - 165 - -
HO 155 - 25 25 - - 25 - - 135 - -
Vull name Is St. Cather I nes-N I agara CMA; Qf Sydney CA and Sydney Mines CA.Source: Cl 9.
38

SECTION 32
EDUCATION AND TRAINING
William Darcovich
This Section comprises data on school attendance and highest level of schooling. In addition
to the major change In the definition of ethnicity, two non-ethnic changes affected the historical
comparability of these data In 1981. One was the reduced population coverage, from 5 years of age
and over In 1971 to 15 years and over In 1981; the other was the changed nature of 1981 data on
vocational training and the resulting revisions required In the classification for the highest
level of schooling.
Deletion of the 5-14 age groups from 1971 education data can restore comparability lost due
to the change In age coverage; comparability of data for the highest level of schooling can be
maintained In those parts of the classification not affected by vocational training; and compar-
ability of ethnic data can be maintained by the method outlined In the Technical Appendix (p.109).
School attendance In 1981 refers to either full-time or part-time (day or evening attendance)
at a school, college or university at any level, between September 1980 and June 3, 1981.
Students taking 75? of the normal course load In the grade or year of registration are considered
to be full-time; students In courses of six weeks or less taken during the day are considered as
attending school part-time. Courses taken for leisure or recreation are not Included In school
attendance data (Al, p.45).
The highest level of schooling In 1981 refers to the highest grade or year of elementary or
secondary school attended or the highest year of university or post-secondary training completed
(Al, p.48). The highest level of schooling classification for the purposes of this Section Is
presented In Table 32.2. It Is hierarchical In nature as Its categories, with minor exceptions,
are ranked In progressively higher levels of educational attainment. The nature of most
categories Is evident from their names, but for the categories below, additional Information Is
provided (Al, p.47).
In "grades 11-13 with certificate", a high school graduation certification Is one which Is
classifiable as junior or senior matriculation, general or technical-commercial.
A "trades certificate or diploma" Is obtained through apprenticeship (Journeyman’s training).
Although training requirements do not stipulate a high school certificate. In fact Individuals
with and without such certificate are Included In the classification. This make dubious the exact
ranking of the category In the hierarchy.
"Post-secondary non-unlverslty" training Includes persons with a high school diploma or
certificate and a non-unlverslty certificate or diploma from a community college, CEGEP, Institute
of technology or other non-degree granting educational Institution.

Tables 32.1 and 32.2, the orientation tables for the Section, provide an overview of the
school attendance and highest level of schooling classifications; the tables also provide the
corrected series which are conceptually comparable with 1971 and can be used to correct for the
1981 change In definition of ethnicity.
In Table 32.1, the corrected series show 51,760 fulHtlme school attenders of Ukrainian
origin In 1981, a decrease of 2.4 percentage points from 53,270 In 1971 If each figure Is
expressed as a percent of Its population 15 years and over. There was a similar decrease (1.6
percentage points) In full-time school attendance for the total population which Is attributed. In
part, to the decline In the birth rate beginning In the late fifties. The effect was to reduce
school attendance In the 15-19 years age group, particularly In the compulsory school attendance
ages of 15 and 16 years (A5, Charts 2, 8, 9). Ukrainians are considered to have experienced
similar demographic changes, so that the above analysis would also explain the decrease In their
school attendance.
In comparison of school attendance data. It should be kept In mind that the 1981 definition
of "not attending school full-time" (Table 32.1) Is comparable with the 1971 definition In the
Compendium of "not attending school"
In Table 32.2 the highest level of schooling classification Is comparable with 1971 only In
the lowest and highest categories. With reference to the corrected series, there was a marked
decline In 1981, compared to 1971, In the number of persons with no schooling and with grades 1 to
8; conversely, there was a marked Increase In the number of persons with some university education
and with a university degree.
Users may make additional corrections to 1981 series on their own according to methods
outlined In the Technical Appendix (p.109), allowing historical comparisons for provincial and
other series.
Table 32.3 shows school attendance by province, sex, rural-urban status, place of birth and
age. Table 32.4 shows the highest level of schooling by province and age. Table 32.5 shows
school attendance by highest level of schooling, province and place of birth.
Counterpart 1971 data for the main tabulations are In the Compendium (E2); pp.283-6 for Table
32.3; pp.309-11 for Table 32.4; some of the data on pp.317-24 for Table 32.5.

TABLE 32.1: POPULATION 15 YEARS AND OVER, BY SCHOOL ATTENDANCE ANDUKRAINIAN ETHNIC ORIGIN, CANADA, 1981 AND 1971
' SchoolAttendance
1981 1971
SingleMul-tiple Total
Corrected^Tota 1 Tota 1
Attending Full-time 37,160 29,200 66,360 51,760 53,720Attending Part-time 24,025 11,055 35,080 29,555 •
.
Not Attending 398,335 85,255 483,590 440,965 • •
Population 15 years and over 459,520 125,510 585,030 522,275 435,100Not Attending Full-time‘S 422,360 96,310 518,670 470,515 381,380
^Comparable to 1971; see Technical Appendix; ^Includes "attending part-time" and "not attending".Source: for 1981, Table 32.3; for 1971, E2, pp. 283-6.
TABLE 32.2: POPULATION 15 YEARS AND OVER, BY HIGHEST LEVEL OF SCHOOLING ANDUKRAINIAN ETHNIC ORIGIN, CANADA, 1981 AND 1971
Highest Levelof School Ing
1981 1971
SingleMul-tiple Total
Corrected^Tota 1 Total
No School Ing^ 14,065 465 14,530 14,295 21,005Grades 1-8 105,795 6,745 112,540 109,165 150,105Grades 9-10 67,845 19,365 87,210 77,525 • •
Grades 11-13, No certificate 62,490 22,475 84,965 73,730 • •
Grades 11-13, Certificate 45,185 17,720 62,905 54,045 • •
Trades Cert 1 f I cate^ 13,000 2,645 15,645 14,320 • •
Post-secondary Non-unIversIty 80,695 27,490 108,185 94,440 • •
Some university 35,515 15,010 50,525 43,020 24,960Bachelor's Degree 25,565 10,255 35,820 30,695 •
.
University Certificate^ 4,080 1 ,575 5,655 4,870 ,
,
Master's Degree 4,275 1,390 5,665 4,970 .
.
Earned Doctorate - 1,010 375 1 ,385 1 ,200 ,
,
University Degree^ 34,930 13,595 48,525 41,735 17,000Population 15 years and over 459,525 125,510 585,035 522,280 435,100
^Comparable to 1971; see Techn I ca I -Appendix; ^Includes kl ndergarten; ^Includesdiploma; ^Above Bache lor' s level; ^Includes four categories Immediately above.Source: for 1981, Table 32.5; for 1971, E2, pp.309-11.

TABLE
32
.3:
SCHOOL
ATTENDANCE,
POPULATION
15
YEARS
AND
OVER,
BY
SEX,
RURAL-URBAN
STATUS,
PLACE
OF
BIRTH,
AGE
AND
ETHNIC
ORIGIN,
CANADA
AND
PROVINCES,
1981
5
— O)< —
iTimooirtmmoiriinifvom(»-P^f^O'«NO^K^O(NOD^OK>K^ror^O'iO»“'VOOO.“<M 0NK>f**Ov0 ^fNK> 0'v0•.S’ v£) r^ '.r •«— CD p" v£) <N m
injntfsoomifHOOOmoVOK^CM —
ooiofv!ir>'9-oor^oO'COr'K>(Nin\ooopo.-^aD
g inir>omomOQOmor»o*^oD»nooD^r^^r^K^OfOrOP-tMOtoovo^voKT.-tN.-^OOtO ^ "
o iT» in cy> >- r- m ^^2
ooominoominoinonj — .-Q-<«-r^inr'<F-p^ooin
K^inr*infMina'i>nmoD\oinQ QQ CTi ^ i/^ <NJ
W^nT kC
d'ttl — ON'0 <N.—\o ^ ^ r~
inoooinmooininminin.-inrMC'JOOinf'* — Omr**osoovo ^m«N
ominininmoomtnino^mfnONr^.-m^Ov»na3^
^ r- p^ - - -
^ m »n o
»— in r 1 uu r-»
VO rsj <N VO O in
VO in
oz in— OvO CD
inooinooininmoo^inoovooD.“VOoovoavO'O'o.-p^.-p^ininovoI'^OO'O'p'fnrvivocNmfn00 — ^m.-Kvvor»vOf^oo
vofn — mmV VO p^
mmoocmmomomomo'vo'vvomvoovmoo**-'^ovovovm m p^ f — Ov p^
ooomommoommovO'«trMOvCDODODP'^vOmOcon- — p^cD — csimcsioovo —— mvovoovmooKNKVfNvodvoomaommfnfM<NOv — CMmmoovovoocM — n-vOKvvo
m p' p^ — mcMKv — vovo
mcmomooooomomcMmcMoomvoomvom —CNOCMm. OOODOO^^VOOVCN
00 m m
momomoommmomKvomr'p^ovovn-vo — c>jmKVOV^OD — CM — — VVO'^OOoop'O^KvommcM^oocMavOvooinvocNp^ — mm —m — CM m m — cm
O' ^ ^— CM111 +m c m mH-SU.ZS'P-ZOO — CMCM^
omomoommmmmoooocMOvp^mmvo— p^mp*CM O' CM vo '^o — CMt^mvo^ ^ CM m m — CM
mmmommommmoooov — — mp^ — mm —00 vo — m ^ vo — CM o m CM
mooommooooomo — ovt^vovomm — mcMCMov p- — CM mP^ — CMCMO'^
vO — — m —
©omoomomoooo— p^mocMoomp'CMvop^m— vD^'^p*‘Ovp^mmcMmp^^ ov vo m00 m ^ MpCM — — CM
V ov ^ m ^ o mV Mp m — m 00 mCM —
oooo I omomoom00 m m p^ — vo CM CM ov m
—
CM — — CM CM —
ujoooo I mmomoom~ OvvOCMP** —S m o m o— ov m O'
QoomoooommommOmp-oD^mvomcMOCM'^QDX^O'^©OOvOO'«'VOCM«q' —o » •> « <=>
to — m m *«p
m CM CM m m 00 m <vp o o vo
oommiooi immt— m vo 00
omoomommotnmm— vom^ — vomr'CMmoop^vomo — — mmovo — ooov
lOiTi — — mcMmmcMooo^f^ — vccMCMmmcMvoommommov — oocM cMvo-
mmmmomoomooomvoO'O'MpcM — ^ovo — oco — oo^CMmr^mocJ'mmm m O' — o CM vc
mooommommmooCMmr^^ — vo^oomvcoocMOOO — OvOCCM- 00— vOCMOv
^ — CM oCM — — CM
CM CM — — Mp ^CM —
O' ^ ^— CM ^111 +m o m mZUlZH-ZOO— CMCM-^P
mmomoomoommm’oOOOvOv^vOOO- P^OvO' — 00 ®^ ^ ^ mf¥ w . rsj
» I ^ w ' wrOOHVO^KirS8^3^mOvvOCMvomocMmr^ov —— CM 00 r** m o 00 m vo p^ vooo^mvo — vo — m»- c
O
mmooomomoooomcMmomovoovoomoo^O — OVP-CM — P*>CM — CMm-
o m oo = <3v • PM
ooomoommoommCMvOvOCMmMpp>*^OOvO — vop^ — mvocMoo — mvop>“ — —
mmmoommmmomoovvommp^omvooomooovovoom — cMOvp^oocMmooop^ — mcMmovooovoooocMOOOOOP'-CMOv^mO — ^ —m m CM m ^ —
mom I ommomm i
r^— — vo— — — vo
LjmmmmmmommomoZCMVOvOvO — ^CMOvOOO^m
k
^ o
O'
mommmmommommMpovm'«+m'VOvp^CMOVOP^'^VOCM — CM'<'M-vO00
QvO^mP^QP^ — — CM©O'— p^o mm —
iijOmmo I ommmmm i— VOOOCMP*-®^(— "o- CM — m m CM
momm l ommmoo loo^n-— p^r^ — vomp^CM — — CM CM —
omomooomomomCMOvCMOVOO^mvOCMCMCM^oocMmO'^mor^p^'9-cM^oooovp^miMot^mcT'Op^m^O'OvocM'ep — mom— — ovo — movCMm^ —
omommooommmoOCMOOP'^OOvO^OvCT'CMO'CMO — OvO'+mOCMP'O
omomoommmoomvoo'p^ovm’fl'^ — mp-om— mp^ooocMO — — Oimm
I
I
4 2
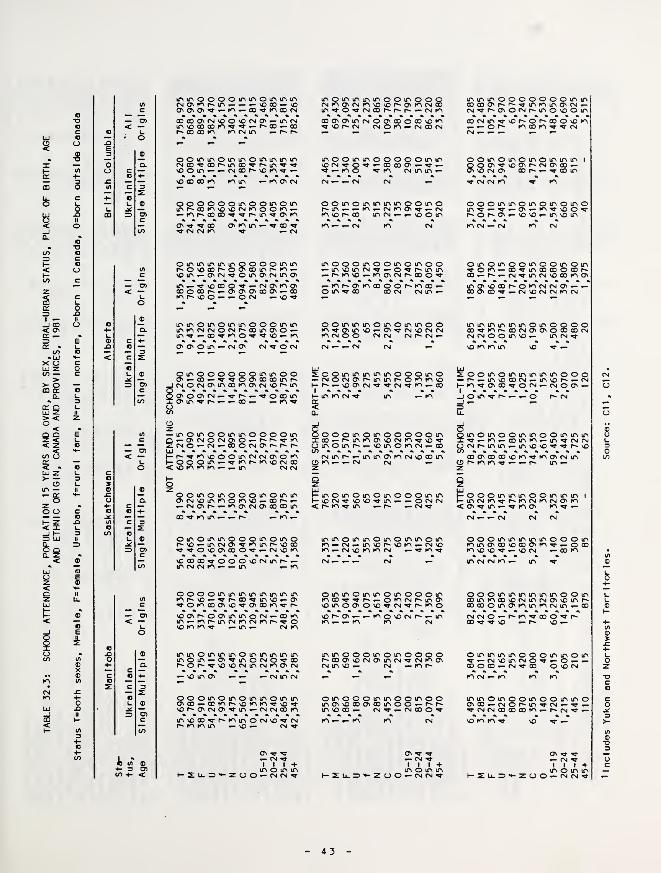
TABLE
32.3:
SCHOOL
ATTENDANCE,
POPULATION
15
YEARS
AND
OVER,
BY
SEX,
RURAL-URBAN
STATUS,
PLACE
OF
BIRTH,
AGE
AND
ETHNIC
ORIGIN,
CANADA
AND
PROVINCES,
1981
-8
— cn< —uo
iL (A o+ 3 05
iriiriOOOOmiriOmiriinrMO^K>r.lr^.-»-.-vooo.-^oa'0505^»-K> — OO^rOOD(N00 0005fN500VO(N05«— lOCNiri\OODOOK^^'».-f^OD.-OC3
00 00 lo K\ <N m r>
ooininoiniriomioiomCMOO^cop^ir»oO'«*-p^if\^^vOOin^.-fNoor^vOK^'».-VO 00 00 K> K> ir« •- 05 CM
ooooooinooiTiominr^OOK5v050CMK500K5.—.-ior^oooo^^r'iri^O\K5
\0m.-0'CM^o»rv05CMir»05
r^v0O»-«-O<N .-vo^
miriO»r\omir>OOOir5ioir>K^cMCMOCMr^ooinC750 —lf>'^.-00'^K5O^^'O.-rO05 05 o ir» — CM 05
inoooooommoo
omoomiooooo05CMO<N050.-i^r«-^O»-CM.-00OCMO5r^r^^K5vOOOlf5CMCM050OOlf5.-^K5(^K5\OrMK5 K5 K5 ir\ CM
00ir50if5000tr50tf5ir5O5(M5Olf5K5OK5VC5.-00r~'.-.-cM05»^.-K50'rM050oaDir>
OO ^ K5 ir» ^ K>
0tf50m«r>000tr50ir50r^50»-iriCM05'^K5if5r^5oao^^05005000^.- CM 50 K5
5Coooo^oo050CMir5r'^mCMCMK5.-.-lf5 .-K5
0000«riintf5lf55f5ir>5f5lf5tor-NO — ^r^oo^if550.-05'»OK500O5V0'»O500K5«a-r«^
50 05r^O05if5tf>ocM.-m«— K5t^lf5CMK5CMK5r'50 K5 K5 ^ tr\ ^
CD rr\
^ oCM K5
miT'OtoioiriOmmiTiioiomom — <^^lr^ocMO^QOf^or*'^50 50CMm<MK505(N
mommmmoomoooCMK^C^CMK^5OvOr~O5K^CMC0m^O'«-CMOOr-r**r>' — CMm00 05 05mcMO05 00 O005om^50r^cM cMom — CMOOCM
moommooooomm— 00 00 05
oomommmmoomor^m — — m — cMmo5^ — CMK55or^oo mcM — — 500m« • « « « .
CMm — — (N
mooomoomomoo— m50m<N^ — 0^r*~mm— r»K550 — mo5(Nr»ooo^— K>r^05K5oooor«*moo —O m ^ oo 00 CM CM m
—
oommmomommoomxr05m 50 — 05 '^cm50cm(nK5(MOO CMCM CMr-CM —
— CMh-
ommmmmooomoOCMC^r^mmr>omK^50— vo05(M^^CM*^m — 00
»— m K5 CM ^
X 00 _ _omomr* — 50mOK5CM —• CO .mCOCM
Kmomomomooommh-50CM^50 50'<fm — — OCNCM<r-m'^m — — cm'^
mmommomommomm — (N — m50r^50K> — CM50m — CM 50 K5 K5 CM ^ ^ K5 ^CM — — — CN —
ommommomooommoo'^j-^p^ — omcNp^mOs5omo05050^cN^p«'moN0r~05 — — mo50CMP^ — mm — — m K5 CM
mmooomomoooor^00O55OCMO5mcM^cNmO5CMm50— CM — K5r~-
50m05 — — — CMmcN — — —
ooomomommomm05 00 — 00K5p^5omm^5O^50P'CJ5CM<j5^m — CMCNOom
05 Tf ^— CMl I I -fm o m mO O — CM CM TP
05 ^ ^— CM '9•
l I I +m o m mKZL.XH-200 — CMCM-«S-
mmmooooooomm05p~p'*9-mmm0'CM —
oocMm^50r'Of^ooovoK5— — moom^'vcM
pompmompmmm
i
ooommomomomom«a- — ^ — C35 — m^500'S-r^0p~05 — 50 50- m5om
omomoomoomom^om — oO^mooooooor'00 — p^ — CM^mcM5O0DmO5
CM CM m CM
mmmmmmomoooo00^mp^00CM05 05OQ0Q0CMCMCMOOm50— mcM^
i^oomommmmmooo— p» — m5O0OCM — m50r^ — CMH- m^05 00 ^0CM — CM005 —I
_j o m ^ — — o p^ CM
momoommoommm^ — K5 — comm- m'^cNCMCMp»mm — m50 50^^p~50
p-ooommmoommm i
I— mcNm^r*mcMK5 CM 05 m<05^m — ^K505 K5^ —
ooommmmmooomK5m05C0500005K5^ — oooK5 50 50 — 50 CM -comm CM CM m —
ooommmmmmoomoommco50CMmcM05 50mr~'ooooom05mmK5CMm — 00
CM CM o — m00 ^ 50 — 00 o V p^
50 —
ommmmooommom^ — CN50mcMO'V — o — —OOOOO — CM^OD 050CMK5 CM — m
mmomoomoommo05 00- CMOr^m^q-CN — '«^ —^CMCMOOOOOOK^— t^CM^—* . * « « « •
50 m m ^ 50 ^ —
05 ^ 'S-— CM TTI I t +m o m mO O — CM CM Mf
4 3
1
Includes
Yukon
and
Northwest
Territories.
Source;
Cl
1,Cl
2
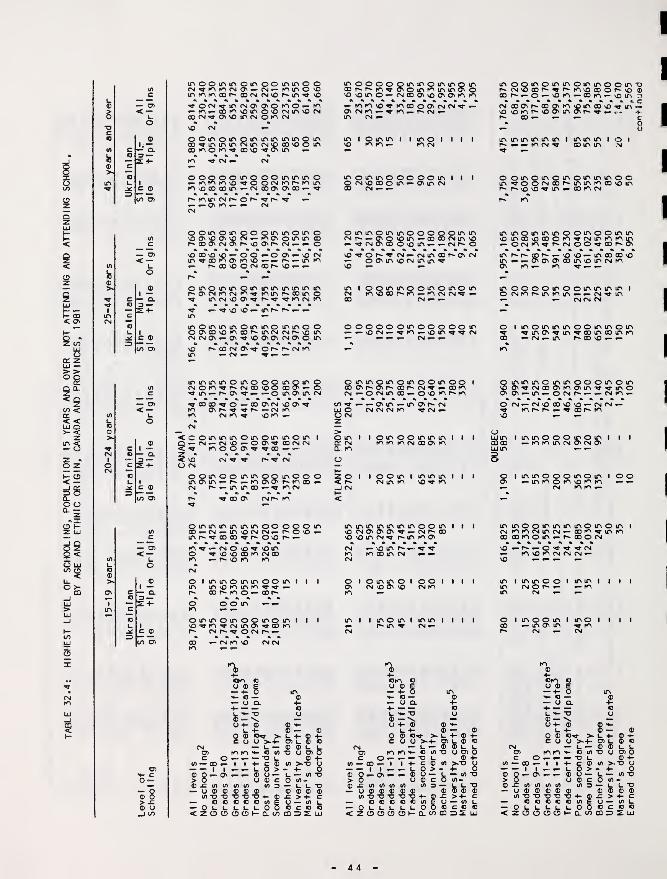
TABLE
32.4;
HIGHEST
LEVEL
OF
SCHOOLING,
POPULATION
15
YEARS
AND
OVER
NOT
ATTENDING
AND
ATTENDING
SCHOOL
BY
AGE
AND
ETHNIC
ORIGIN,
CANADA
AND
PROVINCES,
1981
— Oi< —u.o
— O)< —l_
o
moommomoommoo<N-.TK^fOCSa\— CN.-KMnO'OmtoK^aot^oOfMCMvor^m^vO«««« »
.-K>.-ooK>voir> 0'0 fvmvocMOOfV^O'NOlOtSOK^fNsiT ^oomoir>omirur>irMr»omQO^mmmrsiirvrMOCovooio00 o QO xo
ir>ooooomir\o»nif\oir»oDr^r^K^^o^ou^K^lf^^r\^ovovomo— <N 0DO>\OONOVK>K^^KM*^v0^f^C0O0^rslCM^.-OvCMK^.-^K^.-r'CV.-IC\ CM
mioinini imoi i i i
VO K> »- K> CM
momir»oooooif\ i
0(N^ooom.-o\ir»fM
oir\ooomir>omo oinmoinmoooooiom0'vpcM.-tooNo»r»inoo cMr».-aNQvoir>»-oDOD(NmvocM^p*‘VOO\r^cM.-^o »-^(MONOOo^Oin.-.— CMp^o
o o invO O' vor* 00 ON
NOODVOVD — 00.-0 ON.-VO CMin^oo»no'»nNO.-.— r^.-inKi
r'OONOOCMOor-vO^.-
OinoininOinininmmintnr^ONCMfncNfO'^KMnr>'OOmQ^ tnfMvooN^f^^^fncMfn
\0 \0 in r*
inOininm oinino mmo OoONOOvotnoor^mcMCNr^vOincMCMO'.-ON’^voo'ONCMONOin
m in in o moO KN r» CM 00m r» O' ^I o mom o
oo^o<— oooNCM vooN^0'r^^'«a'r*— CMin
CM m ^ \OKN
CM
*< c
z «< NOO CM
O O O' ^ ^ 00
omoommoomoooONm — (^.-mONOP^moD.-p^»-mmoo—'^ mcM
> « « « & « «oo O' CMt*« m
NO^or*^ CM^CMmoor-ONCM^ oONmNOCMmm^\o
oooooomooooom.-.-NOCM.-^mj^Nom^^ CM
cr? ^liJ oO CM
O ma CMa. m
5 o<_J CM
OCMmoo.-O'Omr^m
tn m CM 00 c^ m
I I o o m I m m m I i
CM m m vo ^ m
m oomommommoom'or'CMvOoop^'^i^KNvoooor^vO ®oof^'.-O.-'Orn— 00 fn«-vom 3CM ooc^p-*oooNK^omoDvO’«m«=»\ONOmp^vOONmONr^^.-.^=-p- oo
c
o omomomommmo©m ^oocMOOf^mmmooNomn* p^ONO^m.-oofncM
m mommmoomoommm n*r**oop^'^'0 '0 .-mfl00ovoin ^^ONONONOOmvomcMmO' K> m ^ ^ ^
I mommmoommom^mON^m^oomoomm.— CM^m p^oono.— —
O mmmommooomomo ON'^cMooONmo'm'=«f'M-moO' ON^-m^OCMP^.— .-CMKN —O CM.-CMOCO'O'O — cmcm.-
mp^i^.-'M-oDr^mVO —
Lum immooomom i
moo — K'fnmcMO'CMO'
o immooomom I ooO' »— mmomyomm^ CM m m
(/>
O'
Tm
§-mmmmmooooo m m m m m m0> C3V
m m o O m 1 r 1 m m o o m m m mom o m 1
V) CM m vO CM CM O VD58
CM CJV ^ ^ fvi r- 00 CM m m CM m CM 00 m ^ m mc m ^oooo^p^ovor^.- vo m CM ^ p^ m m O' 00 00 m o m — p^ oo O CM
«k— O) m <i— CM o vo ^ VO m CM vO m p- ^ St vo p^ o' SP 4 St CM< — o ^ vo NO 00 tn CM CO m m 00 m CM — — V- m vo m CM CM CM —
KN VO m m CM voo
CM
® O 1 mmommoom
i
1 1 o 1 O m m O 1 O o 1 1 1 1 m 1 m m o o 1 m m 1 1 1 1
1 — m mvommm^'^.- CTN CM vo O' vo CM m m CM o p- — — m— a. p^ oo p^ m o — 00 p^ m m CM — —3 —s o o o mm
ommomoomom
i
1 1 m 1 1 m o m 1 m m 1 1 1 1 o 1 m o o m 1 m o 1 1 1 1
1 vO'^m^cMmO'-^oom r- m CM — oo m ov m St mc ® 1
^ CM P^ ^ O CM P^ CM n- CM CM
to O) 00 CM K> VO CMCMm
a 1m©
•4- 4- 4-
CKN n ©m © ©m ©U ® E o ® R y © E— 4-0 m 4" O in — 4- O mH- «J — ® © — © H- c ©— U Q. 4- u a. 4- — y Q. 4-
4- — — O 4- «v © 4- — MV ©« <«- T3 O **- -D y US- -o y5 \ _ S ® —O 4- ® ® H- o 4- © © y 4- © s-
t. 4- © — ® L, 4- © — © u 4“ © ©O ® <0^ >. l_ 4- $ 4- o © ©^ >- l_ 4- © 4- 0 © ©'S- >. U 4- © 4-
C O O >-4“ O) U ® Q c y y >-4- O) U © © c y y >-4- 05 U © ©CM — L. — ® ® L. 1. CM — y — © © U U CM U — © ©a> mm *- c tf) -D u oi 0 Ol1 m m H- o in "o y o) o CJ) mm c in "D y 05 0c O — — — -O u ® 4* c o — .-—•DU © 4- c o _ •D U © 4-
irt — 00 — 1 1 4- C ® Ifl >--0 y in MV 00 — 1 1 4“ c © in >-0 y in oo T T 4- c © in >.-D yOi 1 1 — — 1_ 0 > - 4- 0 —
1 — u 0 > - 4- O — —1 1 U 0 > - 4- O
H- C "® Q ^ON— — ® U— l_ — 1/) •O © 0 C?N — © y— u — in “D © Q O' © y — u in "o0 — > O o ® c o in > 0 y © c o in» > 0 y ©CO in
® -C U> W U) 1/) </) 3 — l_ t. •D © 4= in t/t in m in 3 — t *- © in in in m in 3 — u u -o— Q — U ® ® ® ® ® ® ® ® ® u © © © © © © © © © y © © © © © © © © ©® 0 y)T3 T3 ‘DT5
'04- ffiJT >-4- c in T3 "D T5 D -D 4- © 4: > 4- C in -D -D •o -D -D 4- © £ > 4- C> x: QIOCCIDVIE U — in t. a © © o © in E y — in u — © o o o © in E y MV in u® O — o L.t-l_l.l-OOeDc a O i- l. u u u O O © c © © o u u u u u 0 0 © C © ©_J t/5 <zcDOOot-cLtom=) 2; LU < 2 0 0 0 O 1— 0. cn m o:e uj < zoo o O 1
- CL to m =5 ^ UJ
44

TABLE
32.4:
HIGHEST
LEVEL
OF
SCH(X)LING,
POPULATION
15
YEARS
AND
OVER
NOT
ATTENDING
AND
ATTENDING
SCHOOL
BY
AGE
AND
ETHNIC
ORIGIN,
CANADA
AND
PROVINCES,
1981
o'©
I—
Tj- tT ITi »- <N I to CN 00 O —r-ooa».-oD— CM oir>'^<j\voo— CM.-m rofOCMCM.-^.-
S OOOOOio iTi ir> irv m O iTi
tor''^r«-o — r^r«-&>CMK>CM
m m Q o tTi m o o in o in in lOlOfO^OD^Oin ^oo^o^oo^oCM\OtOfMtO.-VO OOVO^CM^»-CM^toin oDin^CM r*CM.-\0 CM
inoooinmoinooininin
O' OCMtOCMVOOiininOOCMCMo— »-inio.-to
inooooininmininoi l
CD in.-n»inaoO'OtO'OCMto o> ^ CM to »“
inoooooooinmooin
oininininomoooinmo'o•-r'0'0<NoO'CMC^oOlnoDCM ©CMlDvOvOCMinvOfO— .-otor^ 3
8 OiiOOir^tooDCM to.-
oinoomooinoin i
•^\Oto^O'or~tor^m
oooomoomminoooCMoONooinin— r^oD.-^O'toO'^vor^O'f^oD^.-p^
in o in oomo in o o o in inOOOn.fOOsO ooinop^oO'S-lOCMiOincMinoo tomcM^oc^or^ocMr-incM to^totovotoCM— tO.-in-'tfO' to^\D^\o»-in CMtOCMtO \OCMCM
CM
intnoininomoininoinototor-r-m^in votnmcMCMCM\0 ^sfNOr^^oocMininm —. ... ...— — CM ^ CM CM
• 00 CM ^ OXCM CMOr-O'tOCM
oooooQininoinooo— ODCMODCNO'in'paoioin^ oO'lnvOOOfMO'CM^ — CMOvOtO. ........... .lO— dm — inr-so — invO^ —n- CM to ^ CM lOtOCMCM
- oooomino ofO00r^vO'O0'Or''O— CMvo^iO^r'OOcocM—
o m o m m0000
1 — o m m —
o oinoinoooinminin ooovOoocM^r^to^cMm^cNOOto O'®- or^vOvOCMiOfO
— tomto lOCMCM
mmmoomoommom oCMvor^mm- QCMm'^ — vor^'OCMtOf^O'toO'n'^cM^to®
tOCMvOCMmCMOCMCMtO^ CMtOtOCM lOtOCMCM
I oooomoomommCMC'- m^ior^^mmtoCMtOvOtO— CMvOrn
mmooooomommm o®®0'mp^®CMotor»m®'^CM r^O' — r^miOfO® — —Os _ CM to —
— cn<—
i.
o©
I—
mom o o m in oomooo— — ®®tOCM^ CMiOO- «-tO®vOCM®vommto^cM — —lOCMOffitOCM'T tOOtOmCM® CM® — ®— gCMm
p lommmmmomoo ip^m'vO' p^— ®p^ —m O' m "'T 'D
^®
ommmomm moomo— tOpOiCMtO— ®®'3-CM— P^to— CM — — Os —
— CM to CM
m oommmmmmmmmOipto- — mr'*<pton'CMCMptoto— ^p^m'TO — ^ —
imoommooooi
i
O <N
.ooooommomoomn>tor'0'mcM^O'^®CM —CM — n>r^n> — ®iom
mmoommoomom
i
®top^^®r^®CMmp*^cMn>mmmo®om —^ — pto^
X mO •K CM
in mso
immopPmmoi
i
0'd®CMfO^O'tO— ^ ^ ® ^ CM
pmpppmpoomto® — ®r*O'® 0'm —— p^ ^ ^ <7' to
I—— Q.
3—2-»-
mppmmpm mppmpP^— ®P®P^CM ®r*CM — CM®CMtOO'— — ® ^^CM
PO'CMto^ r-mP to 1^ P^ ^ ^ CM® CM CM —
to — — to t^ m to. ...
O' to to —
pmPmmPm mmm®— r'^to®tocMm —rr\ — i/N tr\ »r\ ^— in ® m
CM CM
P mppmppmmmr~»p^^to®0'fomcMmm— O'O'P'd-m — ®
m m m P m p p i
p^ m ^ o — O' O'— ® m m — CM
p immpmmmmp® ®®0'P®®0 —— CM ^ m ® to mCM CM
pmpppmmmpm
i
m — mr'pto— to^cMp^cM^O'®r>»tocM —
p I m p m o I m m I im — to O' m O' mto — — ^ .9- — CM
to CM to to •
CM CM
5**3)
o—
© 8© o_l®
L. H- T3©—U-
w
l_ 4-
Q © toCOO >»-«- 05 l_ ©— l_ — © © UtOtO'»-©«J"D(JC3)O — — — "D 1. ©I I 4- c © in >."o— — t O > - 4-— — © o — i_— in
u © c omininm ins — uu— o©©©~~ ---
CM05C
in — ® —— I I
Os58© x:
in'O-D'OTO-04- > -f-— oioocoinEU— in— OUl_l_l_UOOCCO<20ooc»(-£L®mx2;
©(J4- ©
L. 4-O © >* l-c cj y >» 4- cj) i_ © o
CM — l_— ©©Ul_CT toto’^ocn'oocsoC p— — — -OU ©4“
in — ® — I i4-c©in >^*D oI I— — U0>-4- O
© O'-O'— — ©o— 1- — in"o> o o © c O in-©fintninin ms——
* y©©©©© ©©©©in-0‘0-D-OT34- >4- C— oooocinfy — ini_— oyuyyyooocoo<xopooK£L®mx2:iu
y **- T3© —
\
y 4- ©
o <Bc y yto top — —
cT?
I — — y oC7S — —© g-o'-- © y
© x: m in in in m— y © © © © ©in -o •© ® “D "O 4-— o o o o o in— oyyyyyo<200001-0.
C75 y© ©•o yin >»- 4-
8 m© 8J= >y —o cffl
© oy yC7) O
4- Cm yC OX uj
4 5

TABLE
32.4;
HIGHEST
LEVEL
OF
SCHOOLING,
POPULATION
15
YEARS
AND
OVER
NOT
ATTENDING
AND
ATTENDING
SCHOOL
BY
AGE
AND
ETHNIC
ORIGIN,
CANADA
AND
PROVINCES,
1981
CO O)
— O)<—L.
o
I—
C — Q.C 3 —
o
10
>-
O'
— O)< —uo
> sz® o_l CO
K^ot'^tor^CMOO'^ooif'fNr^OkCV00 O* CO*O* <»•*OO*O <N*Oo-foaovocNCNsovrsicNin
minoininooooooom^0'K>^«»roD'^fnO'inO'r^OinoO'OOOoomomfn..-CN.-'00400 00^.- —
O'fnmvo^^moro.-r^fninCMtNOOfM^'rom^csiOMnto2 ior^O'r*CMOf^oo
in I o o o o o Oin o mo incvO'^m.-m'OO'vocMm00 tv so m Kwn om <NCM
g moomoOQomoom(Nm'a-K>{vn»or^.-OOsO00 00 00 00(V.-tVO'.-SOvO»“
tv — V >o m (Vm m
omON
tvVOtv
< oI- mcn r-LU «£C SO
oooooooomoooinp^tvvtvfv tv^ sor^oo-^^^On^vO^ sovosovotv
00 in tv(V V ^ f~*
mmmomommom s
.-mmi'^o'ostvsoso.-V ^ — o o so
ommmmmommo
i
.-m.-^(v<v.-r*'r^'V.-.-n«OtvONr»0
ooooommomom 8
r^fvtv^oomKNtvONr^»”KNrs!mnjr^Trn»osm
V so mor*» so m
I m m o o m OO I 8
ON so — m in o om m m v" m
O lOmmomomm KN.-m'^m*-^O' mr^^ov^oso
cm to
u ® i— 4- 0 mH- o — ®— U Q. 4-4-— — aIgr:® if04- ® ® H-
l_ 4- ® —O ® <0^ > l_ 4- ®COO >-4- O) U ©
C4 «— l_ — ® ® UO) mmH-o</»‘Doa)c o.-— — "Ol. ®
1 — 00—1 I 4- c ® <n >^*o"—I I— — i_o>-4-_ov— — ® o— w — to
o ®V) U) *fl Irt
5 8® j=— o ® ® ® ® ®
to T3 to -D t: -O
w — «O to-
® b ®^ >4-ceocowtfiEo — <0— 0l-l_l-L.t_00OCO<20000*-Q.tO CDOZ
ommmommomooooso— tv tVOOvO so- 00—0 —— 00*^ r- — — tnKNvrooON r-
o 00-^0 mmp^ — sbION cv — so mm mmON ^o <Vv^ rx —
00 ^ ^omooQommoop»mo— otVNONOooootv <<f '^ rv — — —
tv —ON ^ tv — —I
moomoooomooom— ONsooN —On osmt-m ocom ooooo mo'^mmo oi
m^ mr-so mON — o m
m
^ OOOO tVM— CO—
—
mo mmo omoommo— tvmONONONONOooo— sotv CD V m cv cv ostvtvtv
Ommommooommomsomoo^OsosommOs mr- coo oomtvm
oomommooomoom;- 0— r-osom— — r^oor^tvN^sofv (V tv O' oV vfcvmcv
:S r^oTtv*ON* mm o o•!G tv^^ so ^
—
oom mo mmom"VOO 00— (V- — tvvo — — m 00 tv
— soo mooo mommooomo on-oo
imooommo^ ommotvom^ tv o r** 00 V tv
miomomomoi i
Jo fvso — mmsooN<*g — V m \o tv —
tvoic
trt —
fer04-
O ®C O
00I I
Os® g JL ^
®l_ 4- © 4-O) O © O© © U O•0 0 0)0
© 4-
8b* — Irt -o
lA-
l-g
W 3 — l_ l_
— O< Z
t3C ®L. L.o o
•o too o1. l-oo
t0 4-® lA
O O(-CL
t3©£ >4- C
O — tn i_® c ® oCO o:e uj
</)
©a:m
>4- ©crt —
b ©2O
t3 OC X3O
©c >O O^ ^ •
3 < —^m -tn •-
-g?’ ..
3 — ©— C OO — l-
C o 3— I- o— 4- in
46

TABLE
32.5;
HIGHEST
LEVEL
OF
SCHOOLING,
POPULATION
15
YEARS
AND
OVER
BY
SCHOOL
ATTENDANCE
PLACE
OF
BIRTH
AND
ETHNIC
ORIGIN,
CANADA
AND
PROVINCES,
1981
oc Z4-
— O)< —
L.o
I—
«3 — Qj3
- Q.3 —Z +•
iT> ir>
oToT
ir> o in o oCM o ^CO m m \o n*
o oj — rvi ^VO in m ^ <NO O O' 00 (N
in invo
in p^
^ inO' CNCM in
§sVO
IQ8VO P^
8§OO in o O inCO O KV ov00 m ^
in o^ <N
o m(N CM^ vO
o oCM CMCM <r
o oP" vO— 00
in mvo ^in —
o ooo
00 m
ininooininoooomoinCMO«-“ 00'r^vOinP^CMCMO'CMoDvoovomminoDocMCMP^voinO^O'CMrnOK^Ovor-^CMp^ov(Nor^fn.-\OCMm^in.-ov CM vo *n 00 <M O' tn CM
ininininooooomoin i
CMKv0O'» oo^oo.-mr'inoop"* vO'9'fn
•^inp^r'.-p'-'vcMCMinOCMCM.-
oinoininoinmoininoinOinvovoo*— ooinocMKvinr-r'zr^O'^vooov.-oo*'S’inov^fnQ^O'voO'O'^p^vDn-pnO'^mZ^CMOOCNOOm^OOCMP^.-.-ujvo CM.-
O I opinminooinoino)— aoovfnn-inmoovom«<T^IP" (M CM PO CM »-
»
g ininpoooinooinminmKvo.-r'vooDOD.-m^mm'^mcM jncMCM
g CM ^ 00
w O' (N (Co O' pnvo CM ^
88vo in
crTm CM00 tn
o in in I^ vO ^ '
in ^ p^ I
in Oo tnmCM
CM »n-V vo
in oK> CMm ovo O'*vovo '«•
O' ^o
O OiO OIm 00.
o**
^ I
o• CM inCM in
. CM
in inin p^CM in
O*^*
8
o o in m o in o— p^ r~- vO O KV CMvoin ^ in mp^ ^
00 1^ m ^
CM
o in in o in ooo pn ^ CM opn p^ vo m 00 p^
m pn vo pn o —O CM ^ ^
ovpn O' ^ ^ ^CM O in P^ CM
CMO pn m
mo o o oo mo«- ^ vo vo pnp^cM pn CM ^pn ^
vo CM CM
Ovo m ^ oin^p^vo vo
omoommmmmomoo(NoocMoocM.-moomp^.-.-oo^mvoP^OOop'^O'pnovmcM
mooooo oo omommpnvOvocMmp^ovfn^^^.-.-^CM pncMCN
Omomom mommmomO'-'fpnvom— m.-.-CMP^pnp^^p^p^ovvopocmp^ op^^.-
ooomomommmmoO^ovomvopnvo^mmp^0'vop^pnvo»-»-.-0'0'o.-
X •
o 8X —
uj mH mK c^
O'.-^'^m^O'^p^oocMcMP^vopncn^^oom —
Pn CM CM
I momooommomvovor^pn moo coo cm.-
(M
mmmmmmoommooom.-OCMvo^ (MC^ p..*mp<'vooooocM.-.-r'Oomovom'^.-pn.-CMO'O'CMO'-Opnp.'^oovoov^p^r^p** 00 ^ ^p^ pnc^mpncMPncMP^omovOvr^.—tr> rn CM — CM cm
mommoomommomomp^ooop^CMvor~CMCMmpntncM^CMOvooopnoooo.— ovpn
O imooommmmmom'DCM vocMvDP^p^ovpnpnoovovo®vO co^op^^mr^pnovovos«o vO vO VO CM pn «q- ^ —CM .-(M.^.-^ 0DvO— «- .4-— c
oo
m I mooommmomm 1o .-cMCM^vopnp^Ov^.-00 <N ^ CMP^vO—
—
I oommomomomoOf^vOCMmco^vo^vopn.-.-pnoo.-moopncMCM
o I moommmmmminm^ O' m O' p^»- 00 — 00 p^
^ 00 o O' m
o I I
00CM
O I m I omooomoo •m CM CM^.-O'OCT'ODCDov ^ KV ^
mUJ m I mooooommomo
p^^O'O'voo^Opn.— pnpnoot^p^r'OvO^pn'fl-.-
»— »- — CM CM m ^ vo CM P^
o I I I I m I
I o o m o I I
pn m pn
oto m Im
f— o I mooooomoomo1— ^ ^CMpno'pnocMCMinO'.-<vo 's-mp^mp'-CM.— mr^CMp-'
vo pnpn.-O'CMpnr^CMvocMpnp^ CM ^ vo o pn vo CM m CM pnO ^ KV CM --
moomommmoommCMP^OVOCMP^CMOvOCMpnt^ocMOCMP^pncM
m m m m 0 m 0 m m m 0 m 0 m m m 0 88 mm m 0 OO m m 1 m 0 0 m m mom 0 0 m1 CM vo O' -«»• O^CDOO^^vOCO^^ in vo CM in o»o m 00 VO VO O' CM m 0 m m —
vO O' voCM CD ^ — m vo
c m 0 CD ^ 0 vo m m 0 CM 0 in 0 00 CM CM O' *-CM vo m — CM 00 0 m 00 CM CM p^ vo% ^
to O) O' -<» m p^ CM in pn 0 m m ^ ^ 00 ^ 00 *- O' CMP^ m^c^ m m CD m mm »- 0 vo vo ^ 00 in CM tTv *- 0 m m in .-vO CM CMin
1 1 m®
+- 4- 4-cm c om 0 om cu 0 E 0 ® E u ® E•“ 4- 0 m — 4- 0 1n — 4- 0 mVl- CD ® H- to ® <- c — ®— <J 0. 4- — 0 Q. 4- — 0 Q. 4-
•— c 4-— — 0KJ)
\s'*~•0 0 fc**"
TO y U «- TO 0»- c ®— "M 9mm ® — 'm0 04- ® ® H- 04- ® 04- ® $U 4- ® — ® U 4- ® ® U 4- ® ®•— 0 0 ® 0^ l_ 4- ® 4- 0 ® 0^ >- u 4- ® 4- 0 ® >* U 4- ® 4-0 0 c u 0 >-4- C31 U ® to c 0 0 >- 4- 05
!k ® 0 COO >«4- 05 t ® 0> CM U — ® ® U u CM — U — ® ® u u CM u — ® ® u u0 u O) mpn ».» c in TO 0 C7) 0 05 mm >*- 0 in *0 U CO) 0 05 m m H- 0 in T3 0 10) 0_J to c 0 T3 U ® 4- c 0 — TO L ® 4- c 0 TO U ® 4-
V)— 00 1 1 4- c ® in >.T5 0 m — 00 TT 4- C ® in >«T0 y in 00 TT ^ c ® in >-•0 01 1 U 0 >- 4- 0 — 1 T t 0 > - 4- 0 1 T 0 > • 4-
® 5 — c^ ® u — u — in •0 ® Q — O' ® 0 — u — in TO ® Q O' ZZI ^ 0 — u — in> 0 0 ® c 0 in* > 0 0 ® c 0 m- > 0 0 ® c 0 in*0>£ in in in in in 3 — u u TO ® x: m in in m in 3 — u u D ® X m in m in in 3 — u u TJ— 0 ® ® ® ® ® ® ® ® ® 0 ® ® ® ® ® ® ® ® ® V ® ® ® ® ®
T3 -D -O® ® ® ®
in -D T3 T3 T? TO 4-®£> 4- C in TO "o TJTJ T? 4- ffi X. >4- C in •0 TO 4- ® £ > 4- cn « to (0 «J <n 6 u — in u to to to to ® in E 0 — in u n a 0 C ® in E 0 — in u— 0 u u u u U 0 0 ® c c to *> 0 u u u u u 0 0 C c to to *- 0 u u U U U 0 0 ® c c 0<Z OCD 00 1
- CL to ffi UJ < ZOO 00 t-Q_ to CD 02; UJ < z 0 0 OO »- 0. to CD 0 2 UJ
47
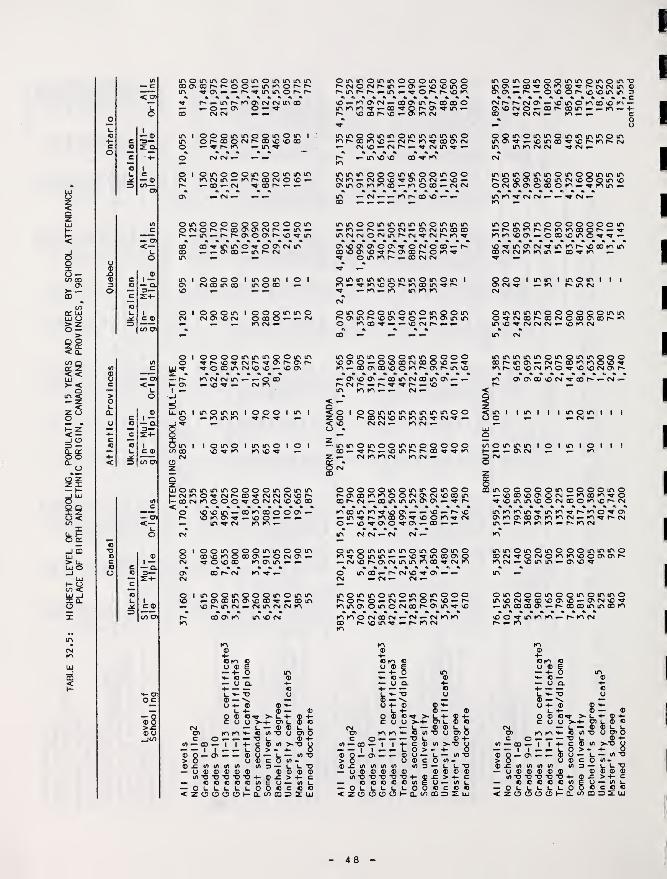
TABLE
32.5:
HIGHEST
LEVEL
OF
SCHOOLING,
POPULATION
15
YEARS
AND
OVER
BY
SCHOOL
ATTENDANCE
PLACE
OF
BIRTH
AND
ETHNIC
ORIGIN,
CANADA
AND
PROVINCES,
1981
< 0)f
uo
I
— Q.3—SH-
— O)<—
o
® 8>x;® o_jtn
m » CM (N ir> 00
in I oooininoomoin i
in o 00 o CM r> 00 \o 00o .-in'»
CM CM ^
o I oinoooinooinminCM rnfsiin»-mr^cDCN!O'0»-
oo ^ 00 r-
oooin loooininoCM CR vO CM O 00 O ^ CNm CM «r-
— mcMCMm<— .-ooo0> VO
Oirii lomoimmoioitn 00
om VO
QLuoinininmooooinoinm_ mmmir\v-jvw>v_5'—'irvvjinCMmO*«tCMP^00^CMCMCMvOn«ODCMK^OOO^OCMCMVOVOCDo vo'oif'.-oomooooov^ in ON VO o —m ^ CM tn m
ft
CM
8 I ooirvoooininooinVOK>OOOOV— ~^ O VO 00 ‘ “
o I inooinoooinoinmvo ^ovoDinovvoco^ft-ooinft- VO m CM ft- CM in CM CM m
00 own in VO CM
cm c
M- C— U Q.
ifo M- ® ® H-
l- -4- ® —0 ® l_ M-COO >-4- C7) U
CM — i_ — ® ®O) mm^-cvn-DoC 0 .-ft- — "OU ®-+-
Irt — OOft-l |M-C®lfl>*'DOI Ift-.-l- 0 >- 4- O
® O — ON.-ft- ® o — U — WT5>0 0®cOift»®£in(/)iA</) i/i 3 —i_i_‘D— o®®®®® ®®®®
lrtTJ-DT3 T3 TJ 4- ®£ >-- C— c«n®®(/)Eo— <ni_— 0 L.UL.OI- 00 I0 COC<zoooo»-a.tocD32:Lij
® c1- L.tj) o® -4-
>*•0
OiniTioifNinooomooor^cMOCMr^in.-ov'ft-vovoinoi^inr~r^.-inft-^Of^p^vOtnvo.-mo'CMft-ooovinp^cooooinmm«^ft-00'a-or'Ov^inft-c* VO 00 Cft VO ^ ON tn CM
moinomoQininoiTvomON.-oD'^ONinoo^r^cMCMONONft-r^.-O'Oor^vo'omCMf^r^cMON.— voinomoovoONvOCMO.-ODP^OOm.-.ft-fn00 1TCMCM.- K\.-ft-
m "Om ®m 3
ipifNOmmoinininiciomiOv^.-voir\oo^vor^mr*»cMI m m CM CM ^ CM
QOininooinoo in in in cOvo^ovincMft-vo.- P- o p 0KlOOft-KNOQOft-CMCM o CM o oON o 00 o tn
ininooinininininoinmin^m.-r«*.-OCMft-ONCMinooooincMCMOCMinr^cM^CMC'in^
in o in Im CO m ^ r-^ m ft- m m m m
omoooinoinoinpoinn»ovinn'VOON'^o»“4novinino m 00 ^00 ft^
vO CM ft- ft-
oininoooininooooOnO — OvOOOCMOOOvO.-^“ ONp**invom ft- 00 ON CD vo o
ft-OvvoONft-cDincMooinONft-ft-r- CM p-- ft- fft TT ^ r- ft- vom m m ft- ft- cm --
< ft-
<o I ooinininminininoo20 r^oocMvoinmin'^CM^<vo CMCMft- mcMft-O ft
— ininoinoominoooooOOft-^C-ft-VOinP-P'-OO'^'^KN2^ CM tnm CM m CM ft”
oooooinoininoinoop'*ovoomKvoocMONCMvoooinoor^CMft-ooinininONONft-^r^
KNcomfn^voovft-ft-'Oft-n'VOft-in^p^mooON^voo»n-vcMOft-vO^ONO^ONft-OOft-ft-
CM CM ft- CM CM ft-
oinoininininoinoomom^oininft-ft-vo^mooONO— cMvop'-ONCMininPHoo^cMin
inaD<^p**CMvc^ONft-ft-ft- CM ft- CM
inoinmoinoinoinooop*‘OP^Oft-CMft-mop^vo.-p^fninOvoinocMOOP^ONin^vo»nmocM00CMft-CM.-CMKMnCO p«- \o in ft- p^ tn CM
K>
otn o
M- C —— O Q.
® —
\
O 4- ®o Sd "o <COO
— - ®
O m KN H-c Oft-.- —
W — 00 — I I— — I I ^ ^ L.
® Q — ON ft- — ®>0 O® ^ l/l lA 1/1 <A— O ® ® ® ® ®
Irt T5 TJ -D "D "D— cone®— O O O O l_ ^_< 20 OO O K
•D Oin >
® ci- L.Ol o
b w
"^8in T>
m 3 — L.
1;;!o o0. in
® ®£ >o —c cCD =>
- 48 -
n-ONmr«p.«mKNooop^ — ^mmvooNft-ooovomo^^ —
poo^ CM ftt
CM
oininininooooooininOftS-CMODC-ODCMOODOvOOC-min VO ^ CM CM CM
in CM
tninininoinoinmooor^incyv — CMr»QDKNmovO'«d-r»vovocMmo^vovocMOvp«'ONONOOVOCM^OOP-
c/5 o in in in i^ ^ ON CM3 CM
O I in I o I I
8OQinoooooinooooinoft-v0CDv0OvQCM.-K500KN.S-O•^voininvoocMODOKNvoc-CMinKNKNin^inKN^P-KNO^ONONKlONOOO'KNKNCM.-KN'.S-p'-CMinft-C-KNKlKlft-r-KNCM
minoinoino ooinmmoCDCM^OCMOKNKNvOOCJNONI^KNCM.-voininft-ONvo^
oinoooinoomoinmoinvOCM^ODvOONvOft-OvCMvO'S-.-inoDOOON.-n«oooDininooKN
CMO)c
in —
brO M-
UO ®c o
58
o00 ft-
I I
ft- <7V
KN KN
T T
o® ® L U
M- c in "D 0 0)0— T3 U ® 4-4- c ® m >."D oL. O > ft 4- O® o — L. — in "Oo ® c o in-- u o 3
— o< 2
•O -DO ®1- Oo o
m 3 — V® ® ® ® ®0 4- ® £ >4- Co in E o .— in i_
i_ O O o c o oI- 0. 1/5 CD O Z UJ
I
I
I
I

cr trt
Ui UJ> oo z
li</?^
UJ <<
in o
K UJCO oUJ <o uX
I—— Q.
3 —r •»-
— Q.3z;
oj
2^
to O)
O)«*- co —
®8> x:0> O_i to
in in inm ^vo o
in vo mm CM in^ CM
m om K\GO GO
oToTCM tnmm
o ininocoCM inin vo(N
g o inin oo c^
moavm m
mm o oo o^CD O ^m^ o ocM vo
m— ^ ON m VONO CM <N ^CM^CM —
mm O om mGO— — rf r*^CM m CMCM
m m QVO — oCM — vo
m^a-
m o^ CMvOvO
OOGO mCM CM
o oCM CMGOO
oo m oo mmcM r«* r*m GO
CM m^
mmmoo moooooomCMmOOGOOv GOCMOO — ooovvoom— P'mGOCMmmmmCMp-mmov ^ CD mcoomo mP^ — OVVOVO GO'^ GO^CM— CMvo »- CM CM — m— —
o m m mr* m CM m— ov m
omooomm Ommr'mGOOO'S'r^O' m o»o m CMCM
— m m m vom cm
o Q m m^ vO — GOO' O' r* r«-
m m omooo ovom'^comcMr^ —oo cMOimovov CM
O O O m^ m GO^ — O' mom mmomo m^GO mo o mo GO— O' — GOO vooo m
ooO mmcN
O o o mCM ^ mm O' vO O'
o m om o omO ^ r-m Tf —m ^ GO <3' CM CM
f— ^CMGOOOO GO^CMPvo --f—ooomoo om mommmz^voc^(NGO om CMO'mr*»(M'^O'O'moommvOGomomGO
>— mmoom mmomooomt^vop^r^oo— mooocMO— CMGO mGomor^CMm—vo ^K^m— m—
—
om ou « §— •HO m«- c— o— O Q. •-•I — o
O ® Ot -H ® —
g® O^ >• U "H ®O U O) l_ ®
CM — U— ® ® Uo) mm'*-oifl*aoo)c o— — — "OU ®
lA — OO— I l-HC®® >»T>-I 1 ^—
® Q— cjv- — ® y — i_ — «>0 u ® c o o)-®£l/)V)l/l</> l/> 3 — Ul-— u®®®®® ®®®in-O'D'D-D-O-H®^ >-H— OOOOOMEO — in— Ol-UU UUOOO CO<ZOOO O»-Q-t0 CD=)X
moomm oo mmmomoCMom^G0 m^p^m''9-v£)m —ovvCoomo- m^r^oooGOvommm— — vocMmvoovOmcM^vop* cMvop^mc?' — CMr- CM CM CM CM m—
oommomoomomoo- - -1 05 r-
oomoomoomoomomiNp^CMmoo®'0 P« 0'OG0‘ *iO'm^r*'CMm— — m m CM mi
OP'r^m— O'm —
m o — vo —
'
o* ^ CM m mCM m 00 CM
m— —
CM O' p* o vo o P^
68to
e> 8
m o o o^ — CD m^ r*- m CM
o m m m00 ® ^ O'
O' o
moommmomP^^mvO'«9-^CMGOvo— o'omooo'^
omommommCM'^fflO'O^OCMO CM p~ p» m
Q m ^ ^zUI}“ ® o o m m
CM vo CM ^m o —mooomooomoOCMvOvOvOCMP**O' m vo ^ — — CM
CM®ovp-m— p*mcM
oommmmommommmmomO'vocMTt^r*> 0'^mO'•fpovmcMO cj'^CMf^oo'mo'
mommmoooooooomp'VOO'^ ^O p'Ovomo'CMp^ mom^mcMOoocM— — — CM — CM
mmmmo moomommmOvm — p^CMCM^voo— ^ovmvoo'O'Ovmmop^p-mvom-
H- O —— U Q.
CMO)
o ® o^ l_ •*- Ocoo >*4- O) l_ ®m m o ift 'oo — — — "O u® — I I -H C ® Ifl
I I — — u o >
O O)®
>-*D
_ immmommoommO'Dm mmp'OOvO'O^p'p^m®OvOOvCMOmvO- ®CM^ 3• cm vo O' ^ m vo — vo CM m —
— mm— -4-c
8mmmommoomm
i
— ®o— cM'^rm'V^’^rCM CM O m CM
o I ooomooommmp^» movocMOOP-p^vo®m — mcM— mom
I mommoommmmomO'®p-®CMvo®®o®vovp~o^i^p-® 0'om— mp^®CM®f^m— CMm — —
I lomomoomoo®®(MH-^p'0^m— (N O' m
m I momoommoomoCM VO®P-CM— mCM— CMCMmP^ — ^ ^ CM CM O' O' — —m CM
ZO 11 o o m m o o o o o m—® ® P~ vo CM P'O' VO ^ CM vO
^® 0'mp-»-m m m CM m m1 «(“CM — CM CM o ® ^^m0- o 1 1 1 m m I m m o m iJO ^ ® ® ® CM —
T~ l-o ® —— — I I— — O — —
58"°'— ?8®£IAIAtf)(A «ft3— l_U"0 ®£— O®®®®® ®®®® — *'
«*0 -D-0 -D-0 *H ox: >-H C— oooooinfo— irtu— OUl.L.l_UOOOCOO<zooooi-Q.®m=) 2 uj
I omoomommmoVOmOO®'9-OCN(M'«T^— — — p* vo m
oommomommom— ONp*— m p-o®cmoop~vo®m®^m^cMO' —« « * » « » «— CM CM ^ O' m —
o I ooooomooom
i
® — m — ^ CM — ® O' m CMCM — — ^ CM —
o lommoomommo
i
m mcM®vo®^®mmmm — CM CM — oom —
om o
<4- O —— y Q.
y -t- ®L. H-
O ® O^c y y >-
CM — uo> Kv m oc o — — — X)
® — ® — I I "H c— — u OI I — — u o^ O' — — ® yy ®£ I/I (A i/> in u)
y ® ® ® ® ®irt-D®®®®-*-
o o o o o mO u u u u u OZ O O O O K CL
O) L® ®o yifl
• -H
8 </>—1_
® ®£ >y —o cm=>
®S oU 1-
o -o
•H Cin uo oz; UI
- 49 -
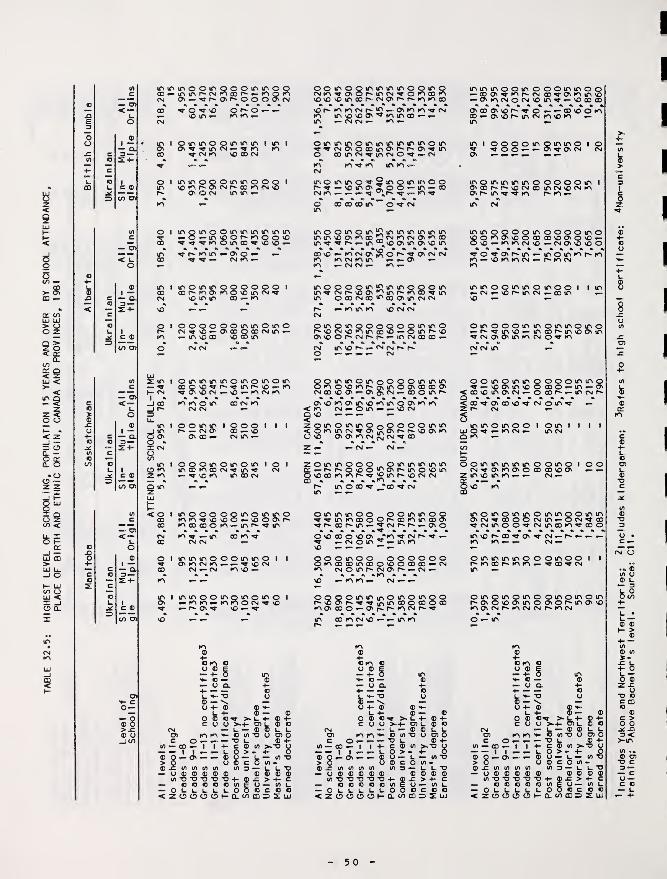
TABLE
32
.5:
HIGHEST
LEVEL
OF
SCHOOLING,
POPULATION
15
YEARS
AND
OVER
BY
SCHOOL
ATTENDANCE
PLACE
OF
BIRTH
AND
ETHNIC
ORIGIN,
CANADA
AND
PROVINCES,
1981
— Q.3
minmoomQooiriinoo00 —CN O' — ^r^ONr^ooo^csi
^ o vo o r* o —
—
vO lf\ — K\ —
tnmoooifxinooo i
NOi^p^cRcMr*oDtn<N\oO' © CM tf>»n —
o f moir'OOminif'if'iT'mS —O— lOvOOr^fOOOVO
^'»^K>Olf' 0D^vO\O —
ir» I m o m m® CDt^KsOsCM \o m ir»« a «
VO — —
O I o o o o(N ^ vo —— ir> VO ©
I a_l ®_i r*©u.
inI in
8 ^a
I oinmintnomoinoinQ00 '0 ^f~»'^inr~v0 — m•m-^nocm — vo — tncNtn
< oCDCD
K> to o mCM CM
ffi CM cn
looinmioooi I I— CM O' ® — \0O' ® — CM in —
in I oooinoinom i om in®fn®(M^in^ cmm — vvoK> in®CMin — —
— inr'^in
iinmmoooininoi l
O'fncMm — — ^lOCMCM — CM m VO —
VO — —
CMtn^O'Or*in<M«»om®fnvo®®in®f^cMO'p^r«fnm®®p^(ntncMr-i2 — 0'fnfn<*rcMm in®®o\“tnin® — —in — CM CM — K> —
inininooinoooinmooI cjv ,«• tn ^ ~ O' tn in ®— ® ® ®
Otnininoinmininininoin^«^cMO' 0 ®inO'^r>“ 0'^in© ® in CM ^ in CM © — CMa a a a a a am »n ^
CM
moininO'^Smoinmo©r^ar — voinoifa©© — in — ®a a a a a,^ a a a© ®®®in ©<^CM
" ® CT' at tn pa CM ®— 0'tncM©cM®in^^a»wwaaaaaaaaaaaa«0'® 0'®r«a '^0 — — ®®OK>®— 0'®paincMtn®m —in —
motnininino ooooinov®pa.|a.vocM® incM®cMtnO' fa. min CM
in©©in©in“'ininininmininin® 0'in®J5 cMfncMC?'fn®in ^ ^ fa. — in © in O' ® in
®*®*— fncMOv^iSo oTcmcmm Kv CM m in — — O' —m — CM (M — m —
in©o©©miJ>inin©©©ininatcMpa® 0''i^inpaK'®'fl-inm © ® CM ® ® O' in m CM
©©©inoo©oin©O'®©®®®©©® —
CM
© inpa ®©®CMo
— K\ in ® CM CM
©in©©OQv_«wa>uiwcM®K'inffi'® — ©inpa®© ra CM pa pa
in ® pa
O © in in ©— © in pa ®m CM ® ® —
inin©©inin©ino©i iin— CM — ®pairvCM— ®in —® — —
oinoooininoininoino— pa<vm®— in®rairvvo©in^CM©©in»ncM o^mCM CM fa. pa
CM
8 ©ininoino©o©inininK' 0 ®K'pa©in©©®®©CM®®© — ©OvCM — ®©inpaaaaaaa^'^a aaaai®K'©in®K'in©©K'K'j
CM — ©in- — ®CM
iinommOoOoooininiK'incM'V© 5<©(^r^®©m) ©©mcM^cM^®a a a a a a. ^ ^ CM —
zoinino©© ^©mininmincr — par»o®oino'fa.tfvovoin0 ®®fnK'f~*^ 5 inpa®cMCM
_ o o in in c o_ ©i^®fnm®©f^m— ^CMPapa — ©o
O ® ® © ® © *fn at CM pa ^ —^ — CMOin^ — intn
8 © o in o o ©©©o©©tn®®in®©®©®® — CMtn cMOinraCM©pa — CM —® ^iokT— cm —
—
OQQOininio©inomoopa®©pa'M‘^irvin®c®o®K\©®© — ©papatnCMpa^in ©fncM®— — intn
©inoinin©o©©inino— ®©in®o®o — m — ©oat<®®in©CM— ©®|a. — inCMfa
< ®*
inIxl ©Oto
o ©CM2 in
g®m
ininininino©in© iat©fn©o®®®©® in tn — — CM —o o
in©in©ininOinin©©inin©CM^®©© CMin — OCM^®atCMin©©'^CMin®K'at®0
oinininin©©Oin©oram®paK'tn — ^®atcMin —
©inoinoino o m o in o inpa©o®©ino©Opain©®m©CMpaK>CMCM pafnCM
K> fn® ® ®4- 4- 4-«3 in «3 OK> re o fnU ® E y ® E y ®- 4-0 in 4- 0 in — 4-a- C — ® H- O ® >- re— O Q. 4- a- y Q. 4- — y4- — a- re 4- C 4. _
© l_ a- T3 u L H- T3 y y H-M- C ® — \ ® .a. ® —0— O 4- ® ® a- y 4- ® ® H- y 4-
L 4- ® — ® 1- 4" ® — ® y— Q 0 ® Car >. 1- 4- $ 4- o ® c.^ > y 4- ® 4- 0 ®® 0 C U O >.4- © L. ® re c y y > 4- © y ® O c y> JC CM — L — ® ® (- 1- CM — ® ® y y CM® (J © rv fn a- re in -O y © o © m »n a- re in ® y © o © tn »n
c © — — — -o t- ® 4- c © — — -o y ® 4- c © — —in — ® — 1 1 4- C ® in >® in — ® — 1 T 4- C ® in >TJ y in — ® — 1 1
® g—ovZ —® £ in </) lA in— u ® ® ® ®
in ® ® -o ®— coon<20000
u ® c
T5 -t-
«3 in
u oh- CL '
b in
®.c >o —10 cm ®
in -o
"L "D
— _ I I a- — L. O® Q — © — — ® U>0 U ®® .c in in in in in— o ® ® ® ® ®
in T3 *D -D -O ®— C <3 O <3 ® in— OLLLLLO< 20000 I-CL
in TO
"L "D
x: >o —® cm =>
— — I I a- — l_
® o — © — — ®> o o® f in in in in— o ® ® ® ® ®
in -D *o ® ® ®
>.+• ©i_ ® ol_ — ® ® L Uc in ® y © O•o i_ ® 4-c ® in >a"o oO >- +- Oo — i_ — in "o® c o in -in 3 — l. L. TD
® ® ® ®4- ® .C > ^- Cin £ u— in i_
O O «3 c o o< 2 oooo»-a.®ffi© 2:
50
Mncludos
Yukon
and
Northwest
Territories;
^ip^judes
kindergarten;
^Refers
to
high
school
certificate:
^Non-unlversIty
training;
5
Above
Bachelor’
s
level.
Source:
Cl
1.

SECTION 33
POLITICAL PARTICIPATION
Paul Yuzyk
This Section provides electoral results for constituencies In which candidates of Ukrainian
origin ran for office In federal and provincial elections held from 1977 to 1985. It extends
counterpart data In the Compendium for elections held from 1904 to 1975 (E2, pp.337-73).
The procedures for Identifying Ukrainian candidates were similar to those In the Compendium.
Federal and provincial election results were examined and candidates known to be Ukrainian and
those with Ukrainian-sounding surnames were selected. This list was subjected to an Intensive
review to check doubtful surnames, screen out non-Ukralnlan candidates and to add Ukrainian
candidates omitted from the Initial list. The review Involved checking different sources of
Information on the ethnicity of candidates: news Items In the Ukrainian press; the Dictionary of
Ukrainian Surnames (El); biographies In the Par I lamentary Guide (E7) which often contain ethnic
Information on winning candidates; and Individuals knowledgeable on the ethnic background of
candidates. In determining ethnicity, candidates were considered to be Ukrainian If one parent was
of Ukrainian origin.
The Identification process Is nevertheless approximate and may be the source of two kinds of
errors: Ukrainian candidates may not be Identified when In fact they ran for office and conver-
sely, non-Ukralnlan candidates may be Identified as Ukrainian. Both types of errors are no doubt
present In the tabulations of this Section, but It Is considered that for the very large majority
of candidates Ukrainian ethnicity Is Identified correctly.
Presentation of electoral results In the Supplement differs from that In the Compendium by
the separation of constituencies Into two categories: those In which at least one Ukrainian
candidate Is affiliated with a main political party; and those In which Ukrainian candidates are
affiliated only with a fringe party (Table 33.1). Fringe-party candidates have several character-
istics which distinguish them from main-party candidates, for example: It Is easier for them to
become candidates as generally there Is no party nominating convention; they are usually near or
at the bottom of the list In terms of votes cast and tend to repeat candidacies over several
successive elections; and many of them create the Impression of not being serious about the number
of votes they receive and that they are running for reasons other than winning.
Table 33.1 shows the codes which Identify party affiliation of candidates and the symbols
which. If attached to surnames, provide additional Information about the candidates. The use of
the symbols (*, », and #) to the left of the surname Is described In Table 33.1. The two-asterisk
symbol placed to the right of the surname Indicates that the candidate's ethnicity has been
established by reference to biographies In the Parliamentary Guide, or falling that from general
knowledge that the candidate was of Ukrainian origin. The foregoing symbol serves In fact to

distinguish candidates known to be of Ukrainian origin with considerable certainty from those
known with less certainty.
Table 33.2 shows all candidates In federal constituencies In which at least one candidate of
Ukrainian origin Is affiliated with a main political party. The data are for general elections
held In 1979, 1980 and 1984 and show votes cast, occupation, and party affiliation for each
candidate. Table 33.3 shows similar data, except for omission of candidates' occupation, for
constituencies In provincial general elections and by-elections held from 1977 to 1985.
Table 33.4 shows Ukrainian fringe-party candidates who ran for office In federal and
provincial constituencies. The last column of the table gives (1) the number of candidates In
each constituency and (II) the ranking of Ukrainian candidates In terms of votes cast.
TABLE 33.1; CODES FOR PARTY AFFILIATION AND SYMBOLS FOR OIARACTER I ST I C$ OF CANDIDATES
AFFILIATION
Main Parties Fringe Parties
ARM - Alberta Rural MunicipalitiesCRW - Confederation of Regions Western PartyI NO - Independent (some)LIB - Liberal
- Manitoba ProgressiveNDP - New Democratic Party0 - OtherPC - Progressive ConservativeSC - Social Credit (Alta., B.C.)WCC - Western Canada Concept(-) - Affiliation or occupation not stated
CM - Communist PartyCW - Commonwea I thGP - Green PartyIND - Independent (some)LBT - Libertarian
- Marx I st-Len I n I st0 - OtherRH - RhinocerousSC - Social Credit (outside Alta., B.C.)(-) - Affiliation or occupation not stated
SYMBOLS
To the left of surname Initial* - female candidate= - father of Ukrainian origin# - mother of Ukrainian origin
To the right of the surname** - ethnicity of candidate confirmed

TABLE 33.2: FEDERAL ELECTIONS AND BY-ELECTIONS; VOTES CAST IN CONSTITUENCIES WITW AT LEAST ONE UKRAINIANCANDIDATE IN ELECTIONS HELD IN 1979, 1980 AND 1984
General Election (31st) MACKENZIE, SASK.May 22, 1979; Clarke Ministry #S. KORCH INSKI** (PC) Farmer 13,050
PC-136; LIB-114; NDP-26; SC-6; T-282 D. Schmelchel (NDP) Manager, PubI Ic Rel atlons 10,370Source: F8, 1979 K. Geddes (LIB) Farmer 3,421
J. DASHCHUK (SC) Businessman 384
ELGIN, ONT.J. Wise (PC), Firmer 21,181 SASKATOON WEST, SASK.
J. TOKAR (LIB) Director of Education 9,273 R. HNATYSHYN** (PC) Lawyer 20,174M. Weltzel (NDP) Accountant 4,293 R. Parker (NDP) Broadcaster-Businessman 15,094
C. Williams (LIB) Professor 6,837ONTARIO, ONTARIO B. Loran (IND) Teacher 1,293
S. Fennell (PC) Insurance Executive 22,583 D. Cranfleld (SC) Property Manager 221
=N. CAFIK** (LIB) Member of Parliament 15,730 S. Dennis (ML) Postal Worker 76
G. RIson (NDP) Teacher 11,510R. Posma (LBT) Purchasing 160 THE BATTLEFORDS-MEADOW LAKE, SASK.D. Carrel 1 (M.) Hospital Worker 72 T. Ny lander (PC) Farmer 11,003
E. NESDOLY** (NDP) Teacher 10,327WATERLOO, ONT. C. Me Isaac (LIB) Veterinarian 7,318
W. McLean (PC) Pastor 23,837 J. Stalwick (IND) Farmer 353
F. Epp (LIB) Administrator 18,172M. MAKARCHUK** (NDP) Lawyer 9,375 YORKTON-MELVILLE, SASK.B. Posma (LBT) Engineer 241 L. Ny Strom (NDP) Teacher 16,677B. Erdman (ML) Motorman 125 J. Miller (PC) Farmer 11,381
P. KOTYK (LIB) Lawyer 5,501
ETOBICOKE, LAKESHORE, ONT. B. Hudye (IND) Farmer 1 ,566K. Robinson (LIB) Lawyer 15,791
=A. KOLYN (PC) Businessman 15,044 ATHABASCA, ALTA.T. Meagher (NDP) Secretary Treasurer 14,265 P. YEWCHUK (PC)** Medical Doctor 15,978S. Gold (LBT) Computer-Specialist 349 C. Knight (LIB) Senior Buyer 7,843T. Morris (CM) Editor 169 R. Godbout (NDP) Student/Truck Driver 2,770D. Waldman (ML) Typesetter 72 C. Eberhart (SC) Heavy Equipment Serviceman 645
PARKDALE-HIGH PARK, ONT. CALGARY CENTRE, ALTA.J. Flls (LIB) Principal 15,281 H. ANDRE** (PC) Member of Parliament 22,124Y. SHYM<0** (PC) High School Teacher 15,207 F. Wright (LIB) Manager 10,555D. Little (NDP) Teacher 9,539 B. HARASYMIW (NDP) Professor 4,095V. Miller (LBT) Editor 250 T. Erhart (SC) Carpenter 522K. McCuaIg (OD Reporter 168 C. Swann (CM) Pipe Fitter 75A. SIksna (-) Computer Operator 61 J. Northrup (M_) Factory Worker 66C. Nugent (ML) Telephone Operator 52
CALGARY, EAST, ALTA.DAUPHIN, MAN. J. KUSHNER** (PC) Retired Security Officer 28,320
G. Ritchie (PC) Physician 12,239 #A. LUDWIG (LIB) Lawyer 11,019L. LEWYCKY** (NDP) Professor 11,770 B. PASHAK (NDP) College Instructor 5,172R. KLIMCHUK (LIB) Merchant 4,311 G. Barber (IND) Business (Manager) 1,080
T. Hammond (SC) Businessman 805ST. BONIFACE, MAN. B. Potter (CM) Chemical Plant Operator 65
R. Bockstael (LIB) Businessman 19,752 P. Ask In (ML) Operator 54J. Hare (PC) Agriculturist 16,987G. WICHENKO (NDP) Engineer 11,455 EDMONTON EAST, ALTA.M. GItterman (ML) Student 60 =B. YURKO** (PC) Chemical Engineer 18,699R. Maley (-) Retired 56 J. Paschen (LIB) Electrical Contractor 9,253
L. FogwIII (NDP) Hospital Worker 5,154SELKIRK- INTERLAKE, MAN. K. Carlou (CM) Journalist 168
T. Sargeant (NDP) Office Manager 14,225 P. Morton (M_) Hospital Worker 84P. MASNIUK** (PC) Politician 13,569B. Shead (LIB) Employment Manager 5,522 EDMONTON NORTH, ALTA.
#S. PAPROSKI** (PC) Member of Parliament 24,618WINNIPEG-ASSINIBOINE, MAN. J. YANICX (LIB) Accounts Manager 10,259
D. McKenzie (PC) Supervisor, Communications 28,192 J. Miller (NDP) Instructor 5,673D. Matas (LIB) Lawyer 13,668 D. Nelson (ML) Oil Worker 122M. MELNYK (NDP) Claims Examiner 7,949P. Stevens (SC) Manufacturer 150 EDMONTON-STRATHCONA, ALTA.A. Segal (ML) Institutional Worker 72 D. Kllgour (PC) Lawyer 26,430
J. KINISKY (LIB) Businessman, Farmer 12,471WINNIPEG NORTH, MAN. R. Davidson (NDP) Food Consultant 5,352
D. Orllkow (NDP) Labour Educator 22,417 J. HIM (CM) Steelworker 120A. Steen (PC) Office Manager 11,749 C. Arnold (ML) Hospital Worker 73W. HLADY (LIB) Anthropologist 8,002W. Ross (CM) Secretary 242 VEGREVILLE, ALTA.B. Ostrow (ML) Medical Worker 141 D. MazankowskI (PC) Businessman 26,448
G. WITIUK (LIB) Farmer 3,848J. Kenney (NDP) Teacher 3,191B. TuomI (CM) Secretary 264
continued- 53 -

TABLE 33.2: FEDERAL ELECTIONS AND BY-ELECTIONS; VOTES CAST IN CONSTITUENCIES WITH AT LEAST ONE UKRAINIANCANDIDATE IN ELECTIONS HELD IN 1979, 1980 AND 1984
General Election (32nd) CALGARY EAST, ALTA.Feb. 15, 1980; Trudeau Ministry J. KUSHNER** (PC) Member of Parliament 23,073LIB-147; PC-103; NDP-32; T-202 #A. LUDWIG** (LIB) Lawyer 11,662
Source: F8, 1980 Be PASHAK (NDP) College Instructor 4,490Je Young, Professional Businessman 3,271
ETOBICOKE-LAKESHORE, ONT. P. Pazdor (RH) (^mputer Consultant 638K. Robinson (Llg) Lawyer 17,903 J. Othen (SC) Welder 422
=A. K(DLYN (PC) Small Businessman 13,209 B. Potter (CM) Chemical Plant Operator 58T. Meagher (NDP) Secretary-Treasurer 12,405 P. Ask In (ML) Telephone Operator 55S. KImIsh (LBT) Reinsurance Underwriter 2470. Waldman (ML) Office Worker 88
=^Be
EDMONTON EAST, ALTA.YURKO** (PC) Professional Engineer 14,840
PARKDALE-HIGH PARK, ONT. Ge Lorente (LIB) Businessman 7,606J. Fils (LIB) Member of Parliament 17,213 Je Evans (NDP) Instructor 4,763A. WITER** (PC) Management Consultant 12,116 Jo TYMCHYSHYN (SC) Businessman 187D. Little (NDP) Teacher 8,094 K. Carlou (CM) Journalist 84W. SZCZESNY (CM) Journalist 160 P. Morton (ML) Hospital Worker 57S. Yamada (LBT) Secretary 146c® Nugent (M_) Telephone Operator 55
#S.EDMONTON NORTH, ALTA.PAPROSKI** (PC) Member of Parliament 21,442
DAUPHIN, MAN. A. Yates (LIB) Counsellor 9,696L. LEWYCKY** (NDP) Executive Assistant 12,960 J. Younle (NDP) Teacher 5,1070. HESCHUK (PC) Dentist 11,116 Do Nelson (M_) Transportation Worker 112R. Hale (LIB) Farmer 4,849
VEGREVILLE, ALTA.WINNIPEG-ASSINIBOINE, MAN. D. MazankowskI (PC) Businessman 25,682
Do McKenzie (PC) Communications Supervisor 22,160 *F. RACHANSKY (LIB) Free-Lance Writer 4,373D. Matas (LIB) Lawyer 15,424 H. Mandelbaum (NDP) Consultant 3,172M. MELNYK (NDP) Claims Examiner 7,304 A. GORDEY (SC) Retired Teacher 575P« Penner (IND) Farmer 201 Co HOHOL (RH) Unemployed 359R. Kantorovlh (ML) Technician 45 Be TuomI (CM) Secretary 17
WINNIPEG NORTH, MAN.D. Orllkow (NDP) Labour Educator 18,561 General Election (33rd)W. HLADY (LIB) Anthropo loa 1 st 9,517 Sept. 4, 1984; Mulroney MinistryR. KONIUK (PC) Self-employed 8,313 PC-211; LIB-40; NDP-30; IND-1; T-282Wc Ross (CM) Secretary 195 Source: F8, 1984B. Ostrow (ML) Physician 149
BURLINGTON, ONT.CARIBOO-CHILCOTIN, B.C. 6. Kempling (PC) Businessman 37,577
L. Greenaway (PC) Veterinarian 12,355 W. MULKEWICH (NDP) Municipal Councillor 11,687H. Olaussen (NDP) Steam Engineer 10,292 F. Schwenger (LIB) Professional Engineer 11,406Le OZERO (LIB) Administrator 7,577H. RIarh (ML) Steelworker 92
E.
OSHAWA, ONT.Broadbent (NDP) Professor 25,092
MACKENZIE, SASK. A. SOSNA (PC) Lawyer 23,028#S. KORCH INSKI (PC) Farmer 10,794 T. Kelly (LIB) Lawyer 10,719L. Bracken (NDP) Farmer 10,435 Ro Posma (LBT) General Motors Worker 335K. (5eddes (LIB) Farmer 4,548 L. Bolkoff (CW) Teacher 74L c Mattson (CM) Teacher 165 R. RAK (CM) Paint Repair 72
REGINA WEST, SASK. WELLAND, ONT.L. Benjamin (NDP) Manager 17,353 A. Pletz (PC) Dairyman 18,418S. BOZAK (PC) Businessman 13,374 G. Parent (LIB) Educator 14,481F. Favel (LIB) Project Coordinator 10,190 R. DOBRUCKI (NDP) Constituency Assistant 10,508D. Lamport (-) Crisis Worker 151 A. Rlvett ((3P) Technologist 284K. C^orklll (ML) Truck Driver 55 J. MacLennan (CM) Political Organizer 145
SASKATOON WEST, SASK. PARKDALE-HIGH PARK, ONT.R. HNATYSHYN** (PC) Minister of the Crown 17,636 A. WITER** (PC) Management Consultant 15,879R. Parker (NDP) Businessman 14,852 J. FI Is (LIB) Member of Parliament 14,419c® Williams (LIB) Professor 8,116 J o Friesen (NDP) Actor/Wr Iter/Teacher 8,232S. Dennis (M.) Postal Worker 97 Do Heinrich (GP) Executive 592
W. 01 In (LBT) Salesman 223CALGARY CENTRE, ALTA. A. Larsen (CM) Editor 130
H. ANDRE** (PC) Chemical Engineer 18,610G. Ho Lem (LIB) Businessman 9,698 YORK-SCARBOROUGH, ONT.D. Jones (NDP) Associate Professor 2,994 W. McCrossan (PC) Actuary 48,809W. SAMOIL (RH) Student 766 J. Rowlands (LIB) Alderman 35,869T. Erhart (SC) Carpenter 257 *Y. BONDARCHUK (NDP) Editorial Supervisor 13,260C. Swann (CM) Sprinkler Fitter 58 G. Dance (LBT) Layout Artist 1,067J. Northrup (ML) Packing House Worker 43 A. McBride (IND) Ordained Minister 704
D. Cauchon (IND) Buyer 666continued
54

TABLE 33.2: FEDERAL ELECTIONS AND BYELECTIONS; VOTES CAST IN CONSTITUENCIES WITH AT LEAST ONE UKRAINIANCANDIDATE IN ELECTIONS HELD IN 1979; 1980 AND 1984
YORK SOUTH-WESTON, ONT.J. Nunziata (LIB) Barrister, Solicitor 14,217S. KRASH INSKY (NDP) Lawyer 11,679C. Testa (PC) Architect 10,789M. LUCZKIW, (-) Teacher 526M. PETR I W (LBT) Engineer 281
M. Phillips (CM )^ Journal Ist-Photographer 174
DAUPHIN-SWAN RIVER, MAN.
B. White (PC) (-) 11,973L. LEWYCKY** (NDP) Sociology Professor 10,219D. Cowling (LIB) Farmer 4,352D. Switzer (CRW) Welder 1,589
PROVENCHER, MAN.J. Epp (PC) Teacher 20,077R. BUZAHORA (NDP) Principal 6,941W. Rempel (LIB) School Principal 4,859R. Bowers (CRW) Bookkeeper 2,347D. Ives (LBT) Accountant 232
WINNIPEG NORTH, MAN.D. Orllkow (NDP) Member of Parliament 18,209L. FEDORKIW (PC) Teacher 12,705C. Lorenc (LIB) Lawyer 10,421P. Fletcher (CM) Party Leader 283W. HAWRYLUK (IND) Accountant 243E. DOLSKI (IND) Consultant-Economics 180
WINNIPEG-ST. JAMES, MAN.G. Mlnaker (PC) Professional Engineer 12,523L. Donner (NDP) Social Worker 9,843D. RYBACK (LIB) Homemaker 6,007F. Debrechen (CRW) Market Analyst 830J. Talarico (LBT) Self-employed 164R. Pugh (CM) Welder 86
MOOSE JAW, SASK.W. Gottsellg (PC) Farmer 15,803G. KINDRACHUK (NDP) Trainman 13,338L. Hart (LIB) Farmer 4,762B. Boechler (CRW) Contractor 446
PRINCE ALBERT, SASK.S. Hovdebo (NDP) Educator 13,359G. DOBROWOLSKY (PC) Businessman 13,062J. Harradence (LIB) Lawyer 10,886T. PANAS (CRW) Clerk 262
REGINA WEST, SASK.L. Benjamin (NDP) (-) 23,865D. Stephens (PC) Businessman 16,066S. MAZURAK (LIB) Director of Sports 10,405S. La Rose (RH) Student 313F. King (CRW) Decorator 247K. Carlou (CM) Publisher’s Representative 75
SASKATOON WEST, SASK.R. HNATYSHYN** (PC) Lawyer 26,012R. Fisher (NDP) Holstman 18,910M. Darling (LIB) Project Manager 6,355G. Adllman (RH) Retired 495D. Goodine ((DRW) Farmer 337K. Morvick (GP) Civic Employee 150R. Bonsor (IND) Labourer 109
YORKTON-MELVILLE, SASK.L. Nystrom (NDP) Teacher 18,116K. WASYLYSEN (PC) Lawyer 11,800A. Del low (LIB) Lawyer 4,996B. KRUCZKO (CRW) Farmer 400
CALGARY CENTRE, ALTA.H. ANDRE** (PC) Member of Parliament 24,924K. Gainer (LIB) Lawyer 5,955S. Keeley (NDP) Business Agent 5,138G. Staples (GP) Teacher 761
J. Ferguson (CRW) Retired Teacher 604J. Kyriakakis (LBT) Playwright 180
CALGARY EAST, ALTA.A. KINDY** (PC) Physician 36,825R. Sykes (LIB) Chartered Accountant 14,749B. PASHAK (NDP) College Instructor 8,558D. WERESCHUK (IND) Carpenter Foreman 993N. GalenzoskI (CRW) Housewife 658J. Othen (SC) Retired 343W. Kol linger (LBT) Draftsman 324B. Potter (CDM) Chemical Plant Operator 122
CROWFOOT, ALTA.A. Malone (PC) Farmer 26,291L. Creasy (NDP) Businesswoman 3,153V. MacNaughton (LIB) Homemaker 2,483J. DOMANSKI (CRWP) Retired Farmer 1,559A. Robinson (SC) Retired 294
EDMONTON EAST, ALTA.B. LESICK** (PC) Pharmacist 16,119M. Stan ley-Venne (NDP) Director, Training 7,668A. lafolla (LIB) Businessman 6,002
=B. YURKO** (IND) Professional Engineer 2,857C. Major ((DRW) Businessman 241
R. Silvester (GP) Writer 233D. Wallis (CM) Party Leader 128
EDMONTON NORTH, ALTA.#S. PAPROSKI (PC) Business Manager 29,074G. Stevenson (NDP) Professor 12,305D. Stewart (LIB) Accountant 8,311D. Draginda (CRW) General Contractor 520F. Cerm Inara (SC) Maintenance Mechanic 345N. Rankin ((DM) Computer Programmer 194
EDMONTON WEST, ALTA.M. Dor In (PC) Chartered Accountant 25,764M. MacDonald (LIB) Lawyer 9,673M. MOROZ (NDP) Case Worker 7,339K. Richardson ((DRW) Businessman 697
C. YANDA (GP) Student 326
LETHBRIDGE-FOOTHILLS, ALTA.B. Thacker (PC) Lawyer 31,316C. Credico (NDP) Union Representative 6,822S. Ward (LIB) Teacher 5,315S. PINCHAK (-) Businessman 2,145R. Start (SC) Salesman 456C. BARANOSKY (CRW) Professional Engineer 426
VEGREVILLE, ALTA.D. MazankowskI (PC) Businessman 32,480G. OLEKSIUK (NDP) Executive Assistant 3,793E. Forcler (LIB) Teacher 2,775L. Schlamp ((DRW) 01 1 f lel d Transportation 537S. KOSTIUK (SC) Clock Repairing 372B. Bruso (RH) Public Accountant/Pastor 347T. Firth (CM) Secretary 194

TABLE 33.3; PROVINCIAL ELECTIONS AND BY-ELECTIONS; VOTES CAST IN CONSTITUENCIESWITH AT LEAST ONE UKRAINIAN CANDIDATE IN ELECTIONS HELD FROM 1977 TO 1985
MANITOBAElection Oct. 11, 1977
31 st Legisl atureLyon Ministry
PC-33; NDP-23; LIB-1; T-57Source F7, 1978
ASSINIBOIAN. Price (PC) 7,863Sc PATRICK (LIB) 4,271M. NELNYK (NDP) 2,106
BURROWSB. HANUSCHAK** (NDP) 4,103K. ALYLUIA (PC) 1,688A. Percheson (LIB) 490
DAUPH 1
N
J. Galbraith (PC) 4,590P. BURTNIAK** (NDP) 4,330
EMERSONA. Driedger (PC) 3,125S. DEREWIANCHUK** (NDP) 2,153G. Catelller (LIB) 309
GLADSTONEJ. Ferguson (PC) 4,635W. WERBISKI (NOP) 2,151S. Lachter (LIB) 662
I NKSTERS. Green (NDP) 5,175B. Jones (PC) 2,711B. KRAWCHUK (LIB) 934
LAC DU BONNETS. USKIW** (NDP) 5,037J. Vaags (PC) 3,795R. Dyne (LIB) 515
POINT DOUGLASD. Mat InowskI (NDP) 3,116
*M. DIDENKO (PC) 915D. Marks (LIB) 769H. Dyck (CM) 62P. Stevens (SC) 59
RAD ISSONA. Kovnats (PC) 4,535H. SHAFRANSKY** (NDP) 3,757E. Reese (LIB) 1,394
ROBL 1
N
W. McKenzie (PC) 3,291K. MIKOLAYENKO(NDP) 2,351J. ANDRONYK (LIB) 410
ST. GEORGE#B. URUSKI** (NDP) 3,103A. Rohl (PC) 2,568D. Gelsler (LIB) 369
ST. JOHNSS. Chernlack (NDP) 3,845J. Borger (PC) 1,892M. TRACZ (LIB) 733D. Plowman (Ofl) 81
SELKIRKH. Pawley (NOP) 5,519T. Denton (PC) 4,452E. MOTKALUK (LIB) 573
SWAN RIVERD. Gourlay (PC) 3,909L. HARAPIAK (NDP) 3,179
TRANSCONAW. PARAS I UK** (NDP) 6,474T. Leonard (PC) 4,749D« Dennison (LIB) 767
MANITOBAElection Nov. 17, 1981
32nd LegislaturePawley Ministry
NDP-33; PC-23; IND-1; T-57Source: F7, 1982
ASSINIBOIAR. Nordman (PC) 4,006M. MELNYK (NOP) 2,822P. Moss (LIB) 817F. Huck (MP) 378
BURROWSC. Santos (NDP) 4,890M. Shore (PC) 1,384B. HANUSCHAK** (MP) 728W. Anderson (LIB) 617P. Fletcher (CM) 144
DAUPHIN#J. PLOHMAN (NDP) 4,680J. Galbraith (PC) 4,044B. Hawkins (LIB) 1,049
ELLICEB. Corrin (NDP) 4,233G. Scott (PC) 1,712R. Cantlveros(LIB) 782A. KLYM (NP) 222B. Monaco (IND) 56
EMERSONA. Driedger (PC) 4,376P. Dupuis (NDP) 4,020S. ZARETSKI (LIB) 308J. Thiessen (NP) 116
GIMLIJ. BUCKLASCHUK** (NDP) 4,825K. Cosens (PC) 3,995A. Chambers (LIB) 276P. BAZAN (NP) 127
INKSTERD. Scott (NDP) 6,283B. Dueck (PC) 1,561S. Green (1^) 783M. TRACZ (LIB) 364
I NTERLAKE#B. URUSKI** (NDP) 4,599C. Dueck (PC) 2,181B. Lundale (LIB) 372L. Jaeb (Lib) 509
KILDONANM. Dolln (NDP) 6,794K. GALANCHUK (PC) 4,478A. Berkowits (LIB) 755D. Tokarz (MP) 300
S.LAC DU BONNETUSKIW** (NDP) 4,682
B. Trainer (PC) 2,809
H.LAKESIDEEnns (PC) 5,055
L. MOLDOWAN (NDP) 2,630B. Ridgeway (LIB) 592He McCaw (M») 107
M.LOGANHemphill (NDP) 3,759
S. JUBA** (IND) 700A. LeClaIre (PC) 659A# Potvin (^f’) 103
D.RIELDodick (NDP) 4,362
D. era Ik (PC) 4,120J. KARASEV ICH (LIB) 1,087K. Kotls (^f») 98
P.RIVER EASTEyier (NDP) 5,949
H. Plercy (PC) 5,903*S. WOLECHUK (LIB) 259L c Ulrich (MP) 177
D.ST. JOHNSMai InowskI (NDP) 4,004
D. CIL INSKY (PC) 1,785H. KOZLOWSKI (LIB) 674B. Bel Ian (MP) 446C. Ross (CM) 117
H.SELKIRKPawley (NDP) 5,626
E. KINASCHUK (PC) 3,020M. Hof ford (MP) 131
E.SEVEN OAKSKOSTYRA** (NDP) 6,127
A. Christie (PC) 2,179W. GLOWACKI (LIB) 486M. Golden (MP) 367
D.
SWAN RIVERGourlay (PC) 3,884
L. HARAPIAK (NDP) 3,615G. Simpson (^P) 138
H.THE PASHARAPIAK** (NDP) 4,236
P. PIELAK (PC) 1,303
W.
TRANSCONAPARAS 1 UK** (NDP) 6,013
J. LOPUCK (PC) 2,269A* SMACZYLO (NP) 120
SaskatchewanElection Oct. 18, 1978
19th LegislatureBlackney Ministry
NDP-44; PC-15; 0-2; T-61
A.
Source: F7, 1979
CANORAMatsalla (NDP) 4,258
E. TESLIA (PC) 2,647J. Matsalla (LIB) 730
56continued
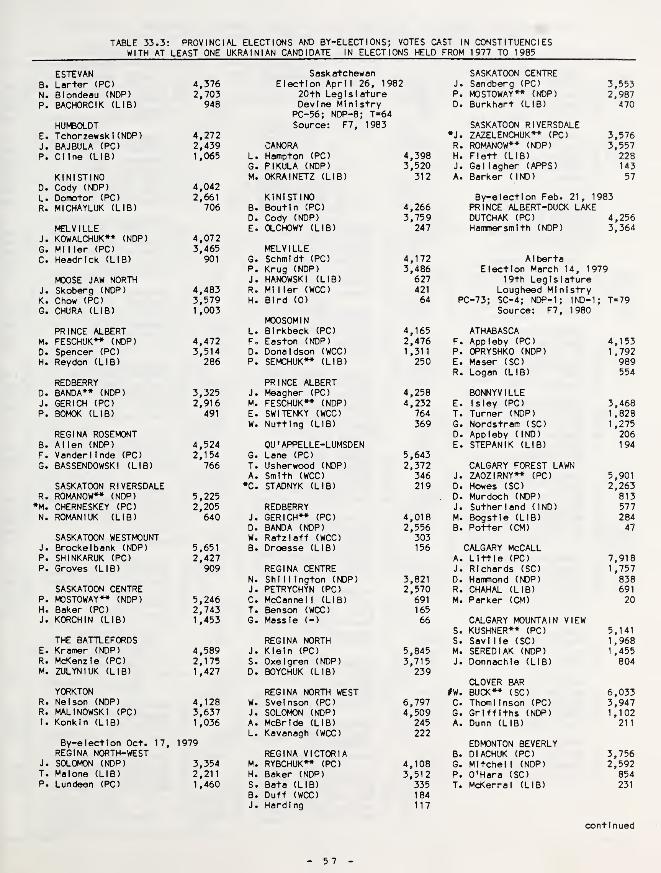
TABLE 33.3: PROVINCIAL ELECTIONS AND BY-ELECTIONS; VOTES CAST IN CONSTITUENCIESWITH AT LEAST ONE UKRAINIAN CANDIDATE IN ELECTIONS HELD FROM 1977 TO 1985
ESTEVANB. Larter (PC) 4,376N. Blondeau (NDP) 2,703P. BACHORCIK (LIB) 948
HUMBOLDTE. Tchorzewsk I (NDP) 4,272J. BAJBULA (PC) 2,439P. Cline (LIB) 1,065
KINISTINOD. Cody (NDP) 4,042L. Domotor (PC) 2,661R. MICHAYLUK (LIB) 706
MELVILLEJ. KOWALCHUK** (NDP) 4,072G. Miller (PC) 3,465C. Headrick (LIB) 901
MOOSE JAW NORTHJ. Skoberg (NDP) 4,483K. Chow (PC) 3,579G. CHURA (LIB) 1,003
PRINCE ALBERTM. FESCHUK** (NDP) 4,472D. Spencer (PC) 3,514H. Reydon (LIB) 286
REDBERRYD. BANDA** (NDP) 3,325J. GERICH (PC) 2,916P. BOMOK (LIB) 491
REGINA ROSEMONTB. Allen (NDP) 4,524F. Vanderllnde (PC) 2,154G. BASSENDOWSKI (LIB) 766
SASKATOON RIVERSDALER. ROMANOW** (NDP) 5,225
*M. CHERNESKEY (PC) 2,205N. ROMAN I UK (LIB) 640
SASKATOON WESTMOUNTJ. Brockelbank (NDP) 5,651P. SHINKARUK (PC) 2,427P. Groves (LIB) 909
SASKATOON CENTREP. MOSTOWAY** (NDP) 5,246H. Baker (PC) 2,743J. KORCHIN (LIB) 1,453
THE BATTLEFORDSE. Kramer (NDP) 4,589R. McKenzie (PC) 2,175M. ZULYNIUK (LIB) 1,427
YORKTONR. Nelson (NDP) 4,128R. MALINOWSKI (PC) 3,637I. Konkin (LIB) 1,036
By-elect I on Oct. 17, 1979REGINA NORTH-WEST
J. SOLOMON (NDP) 3,354T. Malone (LIB) 2,211P. Lundeen (PC) 1,460
Sask atchewanElection Apr 1 1 26, 1982
20th LegislatureDevine Mini stry
PC-56; NDP-8; T=64Source: F7, 1983
CANORAL. Hampton (PC) 4,398G. PIKULA (NDP) 3,520M. OKRAINETZ (LIB) 312
KINISTINOB. Boutin (PC) 4,266D. Cody (NDP) 3,759E. OLCHOWY (LIB) 247
MELVILLEG. Schmidt (PC) 4,172P. Krug (NDP) 3,486J. HANOWSKI (LIB) 627R. MI 1 ler (WCC) 421
H. Bird (0) 64
MOOSOMINL. BIrkbeck (PC) 4,165F. Easton (NDP) 2,476D. Donaldson (WCC) 1,311P. SEMCHUK** (LIB) 250
PRINCE ALBERTJ. Meagher (PC) 4,258M. FESCHUK** (NDP) 4,232E. SWITENKY (WCC) 764W. Nutting (LIB) 369
OU’APPELLE-LUMSDENG. Lane (PC) 5,643T. Usherwood (NDP) 2,372A. Smith (WCC) 346
*C. STADNYK (LIB) 219
REDBERRYJ. GERICH** (PC) 4,018D. BANDA (NDP) 2,556W. Ratzlaff (WCC) 303B. Droesse (LIB) 156
REGINA CENTREN. Shi 1 1 Ington (NDP) 3,821J. PETRYCHYN (PC) 2,570C. McCannell (LIB) 691T. Benson (W(X) 165G. Massle (-) 66
REGINA NORTHJ. Klein (PC) 5,845S. Oxelgren (NDP) 3,715D. BOYCHUK (LIB) 239
REGINA NORTH WESTW. Svelnson (PC) 6,797J. SOLOMON (NDP) 4,509A. McBride (LIB) 245L. Kavanagh (W(X) 222
REGINA VICTORIAM. RYBCHUK** (PC) 4,108H. Baker (NDP) 3,512S. Bata (LIB) 335B. Duff (WCC) 184J. Harding 117
J.
SASKATOON CENTRESandberg (PC) 3,553
P. MOSTOWAY** (NDP) 2,987D. Burkhart (LIB) 470
*J.SASKATOON RIVERSDALEZAZELENCHUK** (PC) 3,576
R. ROMANOW** (NDP) 3,557H. Flett (LIB) 228J. Gallagher (APPS) 143A* Barker (IND) 57
By-electlon Feb. 21, 1983PRINCE ALBERT-DUCK LAKEDUTCHAK (PC) 4,256Hammersmith (NDP) 3,364
A 1 bertaElection March 14, 1979
19th LegislatureLougheed Ministry
PC-73; SC-4; NDP-1; IND-1; T=79
F.
Source: F7, 1980
ATHABASCAAppleby (PC) 4,153
P. OPRYSHKO (NDP) 1 ,792E. Maser (SC) 989R. Logan (LIB) 554
E.
BONNYVILLEIsley (PC) 3,468
T. Turner (NDP) 1 ,828G. Nordstram (SC) 1,275D. Appleby (IND) 206E. STEPANIK (LIB) 194
J.
CALGARY FOREST LAWNZAOZIRNY** (PC) 5,901
D. Howes (SC) 2,263D. Murdoch (NDP) 813J. Sutherland (IND) 577M. Bogstle (LIB) 284B. Potter (CM) 47
CALGARY McCALLA. Little (PC) 7,918J. Richards (SC) 1,757D. Hammond (NDP) 838R. CHAHAL (LIB) 691
M. Parker (CM) 20
S.
CALGARY MOUNTAIN VIEWKUSHNER** (PC) 5,141
S. Savl 1 le (SC) 1,968M. SEREDIAK (NDP) 1 ,455J. Donnachle (LIB) 804
#W.CLOVER BARBUCK** (SC) 6,033
C. Thomllnson (PC) 3,947G. Griffiths (NDP) 1,102A. Dunn (LIB) 211
B.
EDMONTON BEVERLYDIACHUK (PC) 3,756
G. Mitchell (NDP) 2,592P. O'Hara (SC) 854T. McKerral (LIB) 231
continued

TABLE 33.3: PROVINCIAL ELECTIONS AND BY-ELECT I ONSj VOTES CAST IN CONSTITUENCIESWITH AT LEAST ONE UKRAINIAN CANDIDATE IN ELECTIONS HELD FROM 1977 TO 1985
EDMONTON CALDER By-elect Ion Nov. 21, 1979 EDMONTON BEVERLYTe Chambers (PC) 5,205 BARRHEAD B. DIACHUK** (PC) 6,887B. KOBLUK (NDP) 2,180 KOWALSKI (PC) 4,257 W. GERELUK (NDP) 5,637Dc Service (SC) 982 Taylor (LIB) 2,102 D. Dombro (WCC) 819R. Guthrie (LIB) 535 Bouyea (SC) 1,067 S. KOSTIUK (SC) 268
Corbett (NDP) 716EDMONTON GLENGARRY EDMONTON KINGSWAY
R. Cook (PC) 4,309 #C. PAPROSK 1 (PC) 4,283Do Stewart (NDP) 1,489 A 1 berta A® McEachern (NDP) 3,735Vo NAKONECHNY (SC) 1,277 Election Nov. 2, 1982 Me By 1 ngton (IND) 1,401
R. Hayter (LIB) 719 20th Legislature C. Long (WCC) 662Lougheed Ministry Be Broad (LIB) 314
EDMONTON GOLD BAR PC-75; NDP-2; IND-2; T-•79 G. KLIMIUK (SC) 194A. Hlebert (PC) 6,044 • Source: F7, 1983Ko Wright (NDP) 2,343 EDMONTON MILLWOODSA. CETINSKI (SC) 1,397 BARRHEAD M. Pahl (PC) 10,149L. Switzer (LIB) 1,002 K. KOWALSKI (PC) 4,999 G. Gl beau It (NDP) 5,146
N. Taylor (LIB) 3,330 D. Fletcher (WCC) 1,888EDMONTON KINGSWAY J. Mitchell (WCC) 633 W. Mohabir (LIB) 568
#K. PAPROSK!** (PC) 4,387 He Wharton (NDP) 478 T. JUBA (SC) 335A. McEachern (NDP) 2,563 S. Bassani (SC) 240Mo Hatters ly (SC) 975 E. Charman (ARM) 39 EDMONTON STRATHCONAD. Richardson (LIB) 684 J. KOZIAK** (PC) 7,141E. Keehn (IND) 51 CALGARY BUFFALO G. Wright (NOP) 6,637
B. Lee (PC) 7,594 Re Coombes (WCC) 740EDMONTON MEADOWLARK To SIndl Inger(ARM) 2,650 M. Scambler (ARM) 271
Go Amerongen (PC) 7,075 B. PASCAK (NDP) 1,209 J. HI 1 1 (CM) 65Jo Bell (NDP) 2,098 *A. BOZAK (WCC) 729R. Forsythe (SC) 1,237 REDWATER ANDREWR. CHARKO (LIB) 904 CALGARY FOREST LAWN G. TOPOLNISKY** (PC) 4,438Co RIngrose (IND) 448 J. ZAOZIRNY** (PC) 9,605 S. LESKIW (NDP) 2,507
K. Richmond (NDP) 1,479 R. PULL 1 SHY (WCC) 1,121EDMONTON NORWOOD H. Braeutlgam(WCC) 1,245 M. SENYCH (IND) 467
Co CHICHAK** (PC) 3,950 J. Galry (LIB) 309 L. McCal lum (LIB) 157R. Martin (NDP) 3,194 E. Ayers (SC) 294M. Ekelund (SC) 703 B. Potter (CM) 56 ST. PAULWo Coombs (LIB) 486 J. DROBOT** (PC) 4,267Kc Carlou (CM) 45 CALGARY GLENMORE L. Dubois (NDP) 2,869
He Planche (PC) 13,832 1. Bourne (WCC) 444EDMONTON STRATHCONA B. McClung (WCC) 1,863
Jo KOZIAK** (PC) 5,464 G. YANCHULA (NDP) 1,532 VEGREVILLEGo Wright (NDP) 4,808 B. Rust (ARM) 528 J. BAT 1 UK** (PC) 4,557Eo Charman (SC) 927 B. SARAF INCHAN (NDP) 2,433Go Walton (LIB) 739 CALGARY Mcknight L. YASINSKI (WCC) 706Go Ball (IND) 155 Eo Musgreave (PC) 12,130 R. Robert (SC) 489Jo Hill (CM) 52 Eo Nesbitt (NDP) 2,461 Be Bernard (IND) 190
J. JASIENCZYK (WCC) 1,351REDWATER-ANDREW J. Gleason (LIB) 621 WHI TECOURT
Go TOPOLNISKY** (PC) 3,945 J. GLOWACKI (SC) 366 P. TRYNCHY** (PC) 4,635So LESKIW (NDP) 2,870 A. Lee (WCC) 2,276E. Hannig (SC) 547 CALGARY MOUNTAIN VIEW Re Davies (NDP) 1,220R. PISESKY (LIB) 148 B. ZIP** (PC) 7,179 Ge Richardson (SC) 674
P. Elder (NDP) 3,369 J. Powers (LIB) 158ST. PAUL S. Keeling (WCC) 771
C. Anderson (PC) 3,173 D. Ablonczy (IND) 705 OntarioL. Dubois (NDP) 2,854 J. Joynt (LIB) 418 Election June 9, 1977
J. Hull (SC) 582 31 st Legislature0. BOYKO (LIB) 219 CALGARY NORTH WEST Davis Ministry
S. Embury (PC) 12,189 PC-58; LIB-33; NDP-33; 0=1; T=125VEGREVILLE W. KOSTIUK (WCC) 1,758 Source: F7, 1978
J. BAT 1 UK** (PC) 3,835 F. Johnson (NDP) 1,748H. BABCHUK (NDP) 2,490 A. McClure (SC) 404 BRANTFORDR. Robert (SC) 1,210 M. MAKARCHUK** (NDP) 13,376A. VI net (LIB) 269 CARDSTON Pe Gl 1 1 les (PC) 9,081
J. Thompson (PC) 3,746 A. Zabell (LIB) 6,130WH 1 TECOURT S. PINCHAK (WCC) 2,300
P. TRYNCHY** (PC) 3,834 L. Howard (NDP) 245 CARLETONK. Forscutt (NDP) 1,442 Se Handleman (PC) 14,847G. Richardson (SC) 1 ,214 CLOVER BAR E. Consigl lo(LIB) 10,241
#W. BUCK** (I^D) 6,173 *Je WASYLYCIA-LEIS (NDP) 6,837S. Berg (PC) 5,426S. Jorstad (WCC) 1,774D. Morris (NDP) 1,670
5 8
continued

TABLE 33.3: PROVINCIAL GOVERNMENT ELECTIONS AND BY-ELECTIONS; VOTES CAST IN CONSTITUENCIESWITH AT LEAST ONE UKRAINIAN CANDIDATE IN ELECTIONS HELD FROM 1977 TO 1985
CHATHAM-KENT CHATHAM-KENT LAKESHORED. McKeough (PC) 10,769 A. Watson (PC) 9,471 R. Grier (NDP) 11,539R. FRANKO (NDP) 6,482 R. FRANKO (NDP) 6,508 F. Sgarlata (LIB) 9,502D. Gall (LIB) 5,919 D. Want (LIB) 6,466 =A. KOLYN** (PC) 7,886
HURON-BRUCE LAKE NIPIGON YORK WESTM. Gaunt (LIB) 17,356 J. Stokes (NDP) 7,846 N. LELUK** (PC) 14,595N. MacGregor (PC) 7,523 J. PAZIUK (PC) 1,828 L. Bralthwalte (LIB) 13,880
D. ZYLUK (NDP) 1,754 J. LENTOWICZ (LIB) 1,714 P. Jones (NDP) 6,930B. Dunk (LBT) 1,099
LAKE NIPIGON OSHAWAJ. Stokes (NDP) 7,747 M. Breaugh (hCP) 10,307A# Charr (PC) 2,417 B. BOYCHYN (PC) 7,836 British ColumbiaJ # LENTOWICZ (LIB) 1,397 1 • Wal lace (LIB) 3,311 Election May 5, 1983
33rd LegislatureNIAGARA FALLS HIGH PARK-SWANSEA W. Bennett Ministry
V. Kerrlo (LIB) 13,280 Y. SHYNKO** (PC) 11,473 SC-35; MDP-22; T-57G. Ungaro (PC) 9,352 E. Zlemba (NDP) 8,793 Source F7, 1984P. SOBOL (NDP) 7,952 P. SImonells (LIB) 3,635
B. Cumming (LBT) 507 DELTAHIGH PARK-SWANSEA W. Davidson (SC) 21 ,496
E. Zlemba (NDP) 10,409 LAKESHORE K. Moser (NDP) 13,300B. BOYTCHUK (PC) 9,630 =A. KOLYN** (PC) 10,607 D. Hoyt (PC) 1,117T. Ives (LIB) 4,897 D. Sullivan (NDP) 9,375 K. BUHAY (LIB) 464R. McKay (LBT) 360 B. Whelton (LIB) 5,738 M. Coggan (WCC) 450C. Negre (CM) 177 G. Flowers (CM) 376
DEWDNEYLAKESHORE YORK WEST A. Pel ton (SC) 15,820
P. Law lor (NDP) 13,252 N. LELUK** (PC) 18,501 *S. WEREMCHUK (NDP) 15,269=A. KOLYN** (PC) 7,957 M. Eagen (LIB) 10,228 w. Altwasser (IND) 566C. Welnshelmer(LIB) 4,781 P. Durning (NDP) 2,865 R. Moore (LIB) 410G. Flowers (CM) 643 D. Douloff (IND) 538
RICHMONDPARKDALE J. Nielsen (SC) 26,261
J. Dukszta (NDP) 7,574 Ontar 1o H. Steves (NDP) 18,575S. MAMAK (LIB) 5,134 Election May 2, 1985 S. NAZARUK (PC) 1,751L. Monaco (PC) 4,116 33rd Legislature R. Ernes (LIB) 897G. Blythe (CM) 343 Peterson Ministry
LIB-48; NDP-25; PC-52; T--125 SOUTH PEACE RIVERYORK WEST Source: F7, 1986 D. Phi 1 1 Ips (SC) 6,540
N. LELUK** (PC) 16,538 G. MIchlel (NDP) 3,368P. Farrow (LIB) 10,450 BURLINGTON SOUTH W. LITWIN (LIB) 2571. Barrett (NDP) 8,510 S. Jackson (PC) 16,479R. Vaughan (LBT) 260 D. Redfearn (LIB) 11,822 VANCOUVER-POINT GREY
W. MULKEWICH( NDP) 10,820 P. McGeer (SC) 22,970G. Gardom (SC) 22,550
By-elect I on Oct. 19, 1978 CHATHAM-KENT M. MARCHAK (NDP) 16,612CHATHAM-KENT M. Bossy (LIB) 10,340 H. Thomas (NDP) 15,849Watson (PC) 9,296 A. Watson (PC) 9,206 A. Warnke (LIB) 2,048Gamble (LIB) 8,588 R. RANKO (NDP) 5,535 L. Auer (LIB) 1,675FRANKO (NDP) 7,449 L. MacLean (PC) 1 , 573
HAMILTON-MOUNTAIN A. Carr (GP) 1,549B. Charlton (NDP) 13,871
Ontario S. ONESCHUK (PC) 9,729Election March 19, 1981 D. Agostino (LIB) 7,757
32nd LegislatureDavis Ministry OSHAWA
PC*-70; LIB-33; NDP-21 ;0-1
; T=125 M. Breaugh (NDP) 12,686Source; F7, 1982 B. BOYCHYN (PC) 7,528
J. Neal (LIB) 5,034ALGOMA-MANITOULIN
J. Lane (PC) 7,160 BELLWOODSE. Masslcotte(LIB) 2,986 R. McClellan (NDP) 8,088P. BOYCHUK (NDP) 2,336 W. BARDYN (LIB) 6,655
B. de Sao Jose (PC) 1,964BRANTFORD R. Rodgers (-) 324
P. Gillies (PC) 12,847M. MAKARCHUK** (NDP) 9,588 HIGH PARK-SWANSEAH. German (LIB) 5,896 Y. SHYM<0** (PC) 9,960
E. Zlemba (NDP) 9,630CARLETON J. RUDNICKI (LIB) 5,578
B. Mitchell (PC) 17,846 B. Cumming (LBT) 498H. Dalgeler (LIB) 8,621 R. SZAJKOWSKI (-) 244N. WASYLYCIA-LEIS (NDP) 5,446 A. Scorer (GP) 209
DYNOWSK
1
383

TABLE 33.4: FRINGE-PARTY CANDIDATES OF UKRAINIAN ETHNIC ORIGIN, FEDERAL AND PROVINCIAL ELECTIONS1977 TO 1985
YearVotes cast
Numberof
Cand!”=
Constituency of Name, Pol Itical Can- Winner datesElec-tion
Affiliation, Occupation d I date andRank
FEDERAL ELECTIONS
Sarnla-Lambton Ont. 1984- Fred Kahenek (IND), Unemployed 51 24,066 5 (5)
Hal ton Ont. 1984 Chris Kowalchuk (GP) (-) 1 ,494 38,076 4 (4)
Water loo Ont. 1984 Layne E. Kulcheckl (LBT), Sales Manager 525 31,898 4 (4)
L I nco 1 n Ont. 1984 *Anne Stasluk (IND), Unemployed 121 26,318 7 (6)
Sudbury Ont. 1984 Phil Moon Popovich (RH), Disc Jockey 241 18,012 5 (4)
Timmins - Chapleau Ont. 1984 Peter Nastasluk Bruce (-), Therapist 127 11,944 4 (4)
Etobicoke - Lakeshore Ont. 1984 Peter Boychuk (CM), Journalist 216 19,902 5 (5)
Surrey - White Rocki B.C. 1984 Peter Zullnlak (RH), Umpire 481 39,544 6 (4)
Calgary South Alta. 1984 Bill Bohdan (CW), Engineer 136 55,590 6 (6)
Mississauga North Ont. 1980 Bill Shpikula (NL), Steelworker 74 30,000 5 (5)
Niagara Falls Ont. 1980 David Wlwcharyk (ML), Furnaceman 61 15,871 5 (5)
Oshawa Ont. 1980 Russel Rak (CM), Auto Paint Repairman 81 26,761 6 (5)
Oshawa Ont. 1980 Steve RutchInskI (M_), Steelworker 29 26,761 6 (6)
St. Catherines Ont. 1980 *VIcky Wlwcharyk (ML), Health Care Aid 35 18,622 6 (6)
Wei 1 and Ont. 1980 John Sever Insky (CM), Shipper 95 18,112 5 (4)
Broadv I ew-Greenwood Ont. 1980 Walter Belej (LBT), Architectural Designer 352 12,953 9 (4)
Game 1 1
n
Que. 1980 Polack Eugene Antonyszyn (RH), Mechanic 1 ,640 29,332 9 (4)
Saint-Jacques Que. 1980 Marc KrushelnyskI (LBT), Superintendent 137 17,757 10 (6)
VaudreuI
1
Que. 1980 * Irena Bubniuk (LBT), Musician, Teacher 479 39,159 6 (5)
Portage - Marquette Man. 1980 Doug MIchaelchuk (f^). Industry Worker 174 16,219 4 (4)
Selkirk - Inter lake Man. 1980 Ken Kalturnick (ML), Railway Worker 97 15,055 4 (4)
Mission - Port Moody B.C. 1980 Michael Sulyma (SC), Retired 358 23,224 5 (4)
Vancouver Quadra B.C. 1980 Allen Soroka (M_), Librarian 50 20,993 8 (7)
Calgary North Alta. 1980 Bill Kaltyrnyk (ML), Industry Worker 46 26,201 6 (6)
Guelph Onto 1979 Joe Barabas (IND), Lathe Machinist 190 18,149 7 (4)
Haldimand - Norfolk Ont. 1979 WI 1 1 lam Triska (SC), Electrical Contractor 309 22,655 4 (4)
Mississauga North Ont. 1979 Bill Shpikula (ML), Steel Worker 64 30,531 5 (5)
Niagara Falls Ont. 1979 David Wlwcharyk (ML), Furnaceman 135 16,916 4 (4)
Oshawa Ont. 1979 Rus Rak (CM), Spray Painter 80 29,090 6 (4)
St. Catherines Ont. 1979 *VIctorIa Wlwcharyk (^L), Greenhouse Worker 40 23,444 6 (6)
Wei 1 and Ont. 1979 John Sever Insky ((^M), Shipper 83 16,025 6 (5)
Etobicoke Centre Ont. 1979 Nick Hrynchyshyn (Ol), Journalist 112 23,141 7 (4)
Broadview Greenwood Ont. 1979 W. Belej (LBT), Architectural Designer 474 13,187 7 (4)
Spadina Ont. 1979 Mike GIdora (CM), Editor 158 12,542 7 (5)
Lachine Que. 1979 James E. Bobyn (LBT), Engineer 85 29,846 8 (6)
Rosemont Que. 1979 Andre KIshka (-), Engineer 167 28,116 9 (7)
Winnipeg - Fort Garry Man. 1979 Douglas MIchalchuk (ML), Labourer 90 18,822 6 (5)
Richmond South Delta B.C. 1979 Allen H. Soroka (ML), Law Librarian 45 30,262 5 (5)
Prince George2 B.C. 1979 William W. Kordyban (IND), Lumberman 1
PROVINCIAL ELECTIONS
,531 13,330 4 (4)
Oakvl 1 le Ont. 1985 Chris Kowalchuk (GP) 2 ,008 14,265 4 (4)
York South Ont. 1982 Myron A. Petr I w (LBT) (By-elect I on) 234 11,212 5 (4)
Saskatoon South Sask. 1982 Carol Stadnyk (IND) 118 4,611 5 (4)
Yorkton Sask. 1982 Ted Yashcheshen (WCC) 194 5,487 5 (5)
Calgary Egmont Alta. 1982 Victor Lenko (ARM) 156 10,330 5 (5)
Edmonton Norwood Alta. 1982 George J.P. Wowk (IND) 207 4,855 5 (4)
Edmonton Whitemud Alta. 1982 Joe Trenchy (IND) 283 10,703 6 (5)
Vancouver South B.C. 1979 Allen Harvey Soroka (-) 81 19,741 9 (9)
Calgary North HI 1
1
Alta. 1979 John J. Jaslenczyk (IND) 71 6,760 5 (5)
River Heights Man. 1979 Hawryluk (WDP) (By-election) 19 3,473 4 (4)
Elgin Ont. 1977 WI 1 1 lam Triska (-) 172 12,655 4 (4)
Oshawa Ont. 1977 Russel Rak (CM) 199 12,226 4 (4)
RIverdale Ont. 1977 Walter Belej (LBT) 196 9,639 6 (5)
1 Includes North Delta; 2|ncludes Bulkley Valley.Source: F8 for Federal, F7 for Provincial candidates.
60

SECTION 40
LABOUR FORCE BY OCCUPATION AMD IMDUSTRY
Zenon Yonkowsky
The data In this Section refer to the working-age population 15 years of age and over,
excluding Inmates, classified by occupation and Industry.
The working-age population Is divided Into two broad categories; (I) persons In the labour
force and (II) the remainder of the population, or persons not In the labour force. The labour
force Is defined as persons who. In the week prior to census enumeration, were either employed or
unemployed. Persons not In the labour force are those who In the reference week were students,
homemakers, retired workers, persons not looking for work and persons with a long-term Illness or
disability (A1, pp. 28-31 ).
The participation rate expresses the labour force as a percent of the total working-age
population (A1, p.39).
Occupation refers to the kind of work persons In the labour force were doing In the reference
week as Indicated by the nature of their work and the most Important duties of their jobs (A1
,
p.37). The classification of occupations Is based on the 1971 Canadian Dictionary and
Classification of Occupations (A12, pp.1-16).
Industry refers to the general nature of the business where persons worked, as Indicated by
the name of their employer and the kind of business. Industry or service engaged In by the
establishment (A1, p.27). The classification of Industries Is based on the 1970 Standard
Industrial Classification (A4, p.A-1).
In the classification of occupations In this Section, the 1971 concept of the labour force Is
applied, providing 1981 data which are more comparable with 1971. However, In the classification
of Industries the 1981 concept of the labour force Is applied. The two concepts differ slightly
and give 1981 labour force counts for total occupations of 12,267,075 for all origins and 306,140
for Ukrainian single origin (Table 40.4), with the corresponding labour force count by Industry
being 12,054,155 and 302,305 respectively (Table 40.8).
Tables 40.1 and 40.2, the orientation tables for the Section, provide an overview of the
occupation and Industry categories In the main tabulations. The tables also provide corrected
1981 series which are conceptually comparable with 1971 and adjust for the 1981 change In
definition of ethnicity. Comparison of the corrected series with 1971 shows Increases In the
Ukrainian labour force for all occupations and Industries, with the exception of decreases In the
farming and material handling occupations and the agricultural Industry.
Table 40.3, using corrected data for labour force by Industry, updates series 40.1-14 In the
Compendium (E2, p.389). Participation rates In 1981 were In general higher than In 1971 and rates
for Ukrainian origin were higher than for all origins In 1981 and In 1971. Table 40.3 also shows
the relative Importance, In terms of the latxDur force, of the agricultural and non-agr I cultural
sectors of the economy.
Users may make additional corrections to 1981 series on their own, according to the method
outlined In the Technical Appendix (p.109). This would allow them to make historical comparisons
for Individual occupations and Industries and to update additional participation rates (E2,
p«391).
Table 40.4 shows the major occupational categories of Table 40.1 cross-classified by sex and
province. Table 40.5 shows 60 selected professional and technical occupations by sex for Canada
and Table 40.6 shows a similar number and composition of occupations by province for the total
population. Table 40.7 shows a selection of occupations, covering most of the major occupational
categories In Table 40.4, which have been or still are of Interest to Ukrainians. A special
feature of tlie table Is a more detailed presentation of the administrative category.
Table 40.8 details the major Industry categories shown In Table 40.2 by sex and province.
The source of these data Is a special Statistics Canada tabulation available from the Ministry of
State for Mu Iticu Itural Ism (B1 ). As Indicated at the beginning of this Section, the Industry
classification Is based on a different definition of the labour force than for occupations.
The counterpart 1971 series for 1981 occupations and Industries are In the Compendium (E2);
pp.392-5 for Table 40.4j pp.407-19 for Tables 40.5, 40.6 and 40.7; and pp.420-6 for Table 40,8.
- 62 -
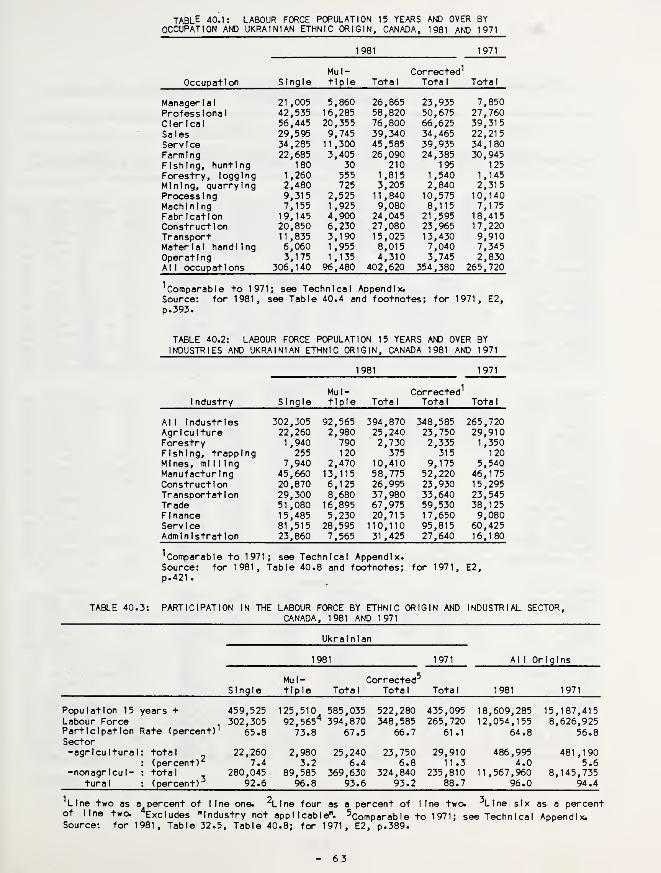
table 40.1: LABOUR FORCE POPULATION 15 YEARS AND OVER BYOCCUPATION AND UKRAINIAN ETHNIC ORIGIN, CANADA, 1981 AND 1971
Occupation
1981 1971
SingleMul-tiple Total
Corrected^Tota 1 Total
Managerial 21 ,005 5,860 26,865 23,935 7,850Professional 42,535 16,285 58,820 50,675 27,760Clerical 56,445 20,355 76,800 66,625 39,315Sales 29,595 9,745 39,340 34,465 22,215Service 34,285 11,300 45,585 39,935 34,180Farming 22,685 3,405 26,090 24,385 30,945Fishing, hunting 180 30 210 195 125
Forestry, logging 1,260 555 1,815 1,540 1,145Mining, quarrying 2,480 725 3,205 2,840 2,315Processing 9,315 2,525 11,840 10,575 10,140Machining 7,155 1,925 9,080 8,115 7,175Fabrication 19,145 4,900 24,045 21,595 18,415Construction 20,850 6,230 27,080 23,965 17,220Transport 11,835 3,190 15,025 13,430 9,910Material handling 6,060 1,955 8,015 7,040 7,345Operating 3,175 1,135 4,310 3,745 2,830All occupations 306,140 96,480 402,620 354,380 265,720
^Comparable to 1971; see Technical Appendix.Source: for 1981, see Table 40.4 and footnotes; for 1971, E2,p.393.
TABLE 40.2: LABOUR FORCE POPULATION 15 YEARS AND OVER BYINDUSTRIES AND UKRAINIAN ETHNIC ORIGIN, CANADA 1981 AND 1971
1 ndustry
1981 1971
SingleMul-tiple Total
Corrected^Tota 1 Total
All Industries 302,305 92,565 394,870 348,585 265,720Agriculture 22,260 2,980 25,240 23,750 29,910Forestry 1,940 790 2,730 2,335 1,350Fishing, trapping 255 120 375 315 120Mines, milling 7,940 2,470 10,410 9,175 5,540Manufacturing 45,660 13,115 58,775 52,220 46,175Construction 20,870 6,125 26,995 23,930 15,295Transportation 29,300 8,680 37,980 33,640 23,545Trade 51,080 16,895 67,975 59,530 38,125Finance 15,485 5,230 20,715 17,650 9,080Serv I ce 81,515 28,595 110,110 95,815 60,425Administration 23,860 7,565 31,425 27,640 16,180
^Comparable to 1971; see Technical Appendix.Source: for 1981, Table 40.8 and footnotes; for 1971, E2,p.421.
TABLE 40.3: PART I C I PAT I ON IN THE LABOUR FORCE BY ETHNIC ORIGIN AND INDUSTRIAL SECTOR,CANADA, 1981 AND 1971
Ukrainian
1981 1971 All Origins
SingleMul-tiple
Corrected^Total Total Tota 1 1981 1971
Population 15 years + 459,525 125,510^ 585,035 522,280 435,095 18,609,285 15,187,415Labour Force 302,305 92,565^^ 394,870 348,585 265,720 12,054,155 8,626,925Participation Rate (percent)' 65.8 73.8 67.5 66.7 61 .1 64.8 56.8Sector-agricultural : tota 1 22,260 2,980 25,240 23,750 29,910 486,995 481,190
: (percent)*^ 7.4 3.2 6.4 6.8 11.3 4.0 5.6-nonagr Icu 1
-: tota 1 280,045 89,585 369,630 324,840 235,810 11,567,960 8,145,735
tural : (percent)^ 92.6 96.8 93.6 93.2 88.7 96.0 94.4
^Llne two as a percent of line one. \lne four as a percent of line two. \lne six as a percentof line two. ^Excludes "Industry not applicable". ^ 971 . see Technical Appendix.Source: for 1981, Table 32.5, Table 40.8; for 1971, E2, p.389.
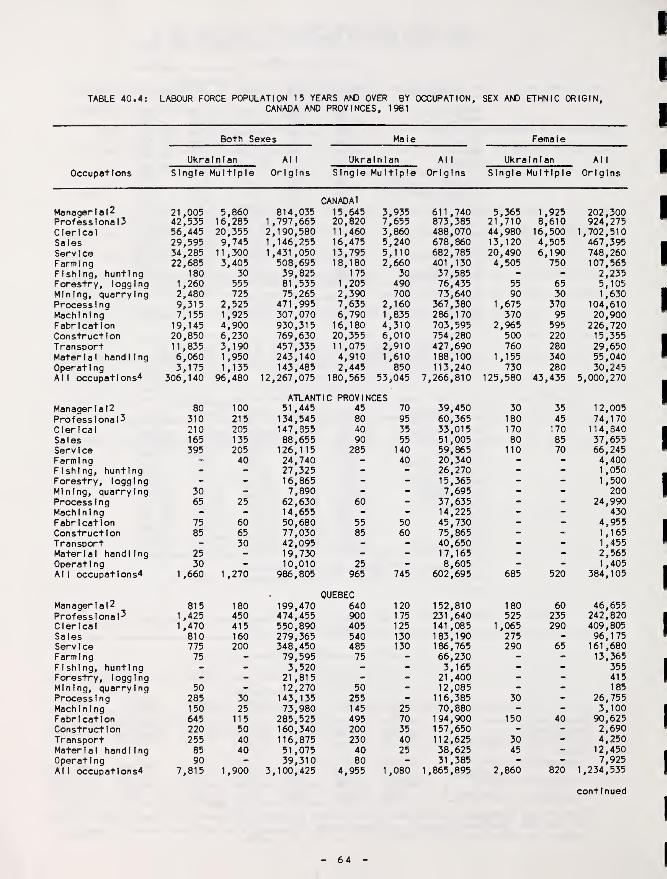
TABLE 40.4 j LABOUR FORCE POPULATION 15 YEARS AND OVER BY OCCUPATION, SEX AND ETHNIC ORIGINCANADA AND PROVINCES, 1981
Bo+h Sexes Male Female
Ukrainian All Ukrainian Al 1 Ukrainian Al 1
Occupations Single Multiple Origins Single Multiple Origins Single Multiple Origins
Manager 1 a |2
CANADAl
21.005 5.860 814,035 15,645 3,935 611,740 5,365 1,925 202,300Profess Iona 13 42,535 16,285 1,797,665 20,820 7,655 873,385 21,710 8,610 924,275Clerical 56,445 20,355 2,190,580 11,460 3,860 488,070 44,980 16,500 1,702,510Sales 29,595 9,745 1,146,255 16,475 5,240 678,860 13,120 4,505 467,395Serv 1 ce 34,285 11,300 1,431,050 13,795 5,110 682,785 20,490 6,190 748,260Farming 22,685 3,405 508,695 18,180 2,660 401,130 4,505 750 107,565Fishing, hunting 180 30 39,825 175 30 37,585 - - 2,235Forestry, logging 1,260 555 81,535 1,205 490 76,435 55 65 5,105Mining, quarrying 2,480 725 75,265 2,390 700 73,640 90 30 1,630Processing 9,315 2,525 471,995 7,635 2,160 367,380 1,675 370 104,610Machining 7,155 1,925 307,070 6,790 1,835 286,170 370 95 20,900Fabrication 19,145 4,900 930,315 16,180 4,310 703,595 2,965 595 226,720Construction 20,850 6,230 769,630 20,355 6,010 754,280 500 220 15,355Transport 11,835 3,190 457,335 11,075 2,910 427,690 760 280 29,650Material handling 6,060 1,950 243,140 4,910 1 ,610 188,100 1,155 340 55,040Operating 3,175 1,135 143,485 2,445 850 113,240 730 280 30,245All occupations^ 306,140 96,480 12,267,075 180,565 53,045
ATLANTIC PROVINCES
7,266,810 125,580 43,435 5,000,270
Manager la I2 80 100 51,445 45 70 39,450 30 35 12,005Professional 3 310 215 134,545 80 95 60,365 180 45 74,170Clerical 210 205 147,355 40 35 33,015 170 170 114,840Sales 165 135 88,655 90 55 51,005 80 85 37,655Serv 1 ce 395 205 126,115 285 140 59,865 110 70 66,245Farming 40 24,740 - 40 20,340 - - 4,400Fishing, hunting - - 27,325 - - 26,270 - -
1 ,050
Forestry, logging - - 16,865 - - 15,365 - -1 ,500
Mining, quarrying 30 - 7,890 - - 7,695 - - 200Processing 65 25 62,630 60 - 37,635 - - 24,990Machining - - 14,655 - - 14,225 - - 430Fabrication 75 60 50,680 55 50 45,730 - - 4,955Construction 85 65 77,030 85 60 75,865 - - 1,165Transport - 30 42,095 - - 40,650 - “ 1,455Material handling 25 - 19,730 - - 17,165 - - 2,565Operating 30 - 10,010 25 - 8,605 - -
1 ,405All occupatlons4 1 ,660 1,270 986,805 965
QUEBEC
745 602,695 685 520 384,105
Manager la |2 815 180 199,470 640 120 152,810 180 60 46,655Professional^ 1,425 450 474,455 900 175 231,640 525 235 242,820Clerical 1,470 415 550,890 405 125 141,085 1,065 290 409,805Sales 810 160 279,365 540 130 183,190 275 - 96,175Serv 1 ce 775 200 348,450 485 130 186,765 290 65 161 ,680Farming 75 - 79,595 75 - 66,230 - - 13,365Fishing, hunting - - 3,520 - - 3,165 - - 355Forestry, logging - - 21,815 - - 21,400 - - 415Mining, quarrying 50 - 12,270 50 - 12,085 - - 185
Processing 285 30 143,135 255 - 116,385 30 - 26,755Machining 150 25 73,980 145 25 70,880 - - 3,100Fabrication 645 115 285,525 495 70 194,900 150 40 90,625Construction 220 50 160,340 200 35 157,650 - - 2,690Transport 255 40 116,875 230 40 112,625 30 - 4,250Material handling 85 40 51,075 40 25 38,625 45 - 12,450Operating 90 - 39,310 80 - 31,385 - - 7,925All occupatlons4 7,815 1,900 3,100,425 4,955 1,080 1,865,895 2,860 820 1,234,535
continued
64

TABLE 40.4: LABOUR FORCE POPULATION 15 YEARS AND OVER BY OCCUPATION, SEX AND ETHNIC ORIGINCANADA AND PROVINCES, 1981
Both Sexes Male Female
Ukrainian Ukrainian Ukrainian
Occupation Single Multiple Origins Single Multiple Origins Single Multiple Origins
Manager I a 12 6,185 1,960 321 ,760ONTARIO4,540 1 ,340 237,945 1,645 625 83,815
Professional 3 12,845 5,515 670,550 6,815 2,690 334,175 6,015 2,815 336,370Clerical 15,510 6,785 865,415 3,680 1,320 196,285 11,830 5,465 669,130Sales 7,395 3,300 428,510 3,895 1,605 243,075 3,500 1,695 185,425
Serv I ce 9,275 3,540 517,025 4,120 1,685 248,195 5,150 1 ,860 268,835Farming 1,750 650 156,020 1,115 450 115,520 635 205 40,500Fishing, hunting - - 1,395 - - 1,230 - - 170Forestry, logging 185 115 12,515 170 80 11,005 - 40 1,515Mining, quarrying 425 115 18,770 405 110 18,415 - - 350Processing 3,260 950 163,625 2,730 795 128,190 530 155 35,430Machining 2,875 765 147,160 2,690 705 132,700 185 60 14,460Fabrication 6,835 1,730 390,625 5,505 1,445 288,945 1,330 285 101 ,690Construction 3,495 1,280 244,825 3,425 1,245 239,930 65 25 4,895Transport 2,485 945 151,955 2,315 825 139,335 165 115 12,620Material handling 2,045 610 102,570 1 ,600 540 73,875 445 65 28,695Operating 840 410 57,725 700 305 44,915 140 105 12,815AM occupations^ 80,520 30,830 4,548,410 46,790 1 6,465 2,629,935 33,730 14,365 1,918,480
Manager I a 12 3,255 695 32,010MANITOBA2,430 515 24,250 825 180 7,755
Professional^ 7,270 2,125 75,740 3,360 965 33,970 3,905 1,155 41,770Clerical 10,280 2,805 88,425 2,310 710 19,900 7,970 2,095 68,525Sales 5,405 1,230 46,995 2,820 735 27,250 2,585 495 19,745Service 6,545 1,570 63,545 2,450 740 27,470 4,095 830 36,075Farming 4,970 525 42,640 4,235 440 35,380 735 85 7,260Fishing, hunting 70 -
1 ,040 70 - 990 - - 45Forestry, logging 185 50 1,430 175 45 1,320 - - 110Mining, quarrying 300 65 3,085 295 60 2,980 - - 105Processing 1,460 390 13,035 1,145 335 10,410 315 55 2,620Machining 1 ,155 240 11,385 1,110 230 10,875 40 - 510Fabrication 3,825 755 37,635 3,035 660 28,005 790 90 9,635Construction 3,290 655 29,370 3,205 640 28,770 90 - 600Transport 2,355 520 20,130 2,245 480 18,910 115 45 1 ,220Material handling 1,030 205 8,360 800 140 6,505 225 65 1 ,850Operating 715 170 ‘ 5,760 525 115 4,335 190 50 1,430All occupations^ 55,330 12,875 510,885 32,140 7,320 299,525 23,190 5,555 211,365
Manager I a l2 2,195 385SASKATCHEWAN
26,920 1,670 320 20,730 530 65 6,190Professional 3 4,885 1,420 61 ,605 2,330 550 25,750 2,545 870 35,860Clerical 5,615 1,560 65,270 1,100 275 11,710 4,515 1,285 53,560Sales 3,675 795 41,410 2,110 470 25,175 1,565 320 16,235Serv I ce 4,500 1,170 53,125 1 ,450 465 20,495 3,050 705 32,630Farming 8,190 905 86,050 6,725 770 72,005 1,465 140 14,045Fishing, hunting - - 205 - - 180 - - -
Forestry, logging 95 35 1,225 100 35 1,140 - - 90Mining, quarrying 345 140 5,095 330 135 4,965 - - 130Processing 845 140 7,105 630 120 5,930 210 - 1,175Machining 610 85 5,845 580 85 5,650 35 _ 195Fabrication 1,710 340 20,295 1,525 315 18,045 185 - 2,245Construction 3,000 765 33,940 2,940 730 33,245 65 30 700Transport 1,460 255 15,835 1,375 230 14,615 85 30 1,225Material handling 595 195 6,460 510 170 5,660 85 30 800Operating 335 75 4,035 265 50 3,240 70 25 795Al 1 occupations^ 40,495 8,785 461 ,380 25,045 5,020 283,980 15,450 3,765 177,400
continued

TABLE 40.4: LABOUR FORCE POPULATION 15 YEARS AND OVER BY OCCUPATIONCANADA AND PROVINCESp 1981
SEX AND ETHNIC ORIGIN
Both Sexes Male Female
Ukrainian Al 1 Ukrainian Al 1 Ukrainian All
Occupation Single Multple Origins Single Multiple Origins Single Multiph3 Origins
Manager 1 a |2 6,185 1,450 91,670ALBERTA4,690 915 68,395 1,495 535 23,275
Professional^ 11,145 3,670 176,840 5,270 1,740 89,675 5,860 1,930 87,185Clerical 15,730 4,755 216,870 2,590 780 37,500 13,135 3,975 179,370Sales 7,980 2,365 119,010 4,710 1,285 68,825 3,275 1,075 50,190Service 7,820 2,260 133,305 2,890 985 57,050 4,930 1,270 76,255Farming 7,060 1,025 83,965 5,595 780 66,370 1,470 245 17,585Fishing, hunting - - 210 - - 200 - - -
Forestry, logging 165 25 3,115 150 - 2,885 " 235Mining, quarrying 1,020 285 18,870 1,000 270 18,550 - - 325Processing 1,710 300 23,420 1.410 275 19,365 300 - 4,055Machining 1,655 435 26,305 1,600 425 25,295 55 - 1,010Fabrication 3,745 950 60,870 3,380 875 53,785 370 70 7,080Construction 7,470 1,915 114,265 7,265 1,840 111,520 205 75 2,745Transport 3,695 705 51,005 3,435 650 46,020 260 55 4,985Material handling 1,200 360 18,950 995 295 15,680 210 70 3,275Operating 745 235 12,550 540 190 9,895 205 45 2,655All occupations^ 81,525 21,975 1,213,700 48,115 12,035 730,475 33,410 9,945 483,230
Managerial^ 2,200 1,060BRITISH COLUMBIA
87,800 1,565 645 66,080 640 420 21,710Professional 3 4,480 2,755 198,805 1,930 1,225 95,365 2,560 1,525 103,435Clerical 7,410 3,760 250,325 1.320 605 47,650 6,095 3,160 202,675Sales 4,115 1,745 140,525 2,290 945 79,370 1,825 800 61,150Serv l ce 4,870 2,315 184,920 2,055 945 80,870 2,810 1,370 104,050Farming 620 235 35,535 415 175 25,160 205 65 10,375Fishing, hunting 90 - 5,885 80 - 5,320 - - 560Forestry, logging 610 325 24,395 590 310 23,155 - - 1,235Mining, quarrying 290 115 8,130 275 110 7,840 - - 290Processing 1,675 680 58,660 1,390 585 49,170 290 95 9,490Machining 695 355 27,450 645 340 26,270 55 -
1 ,180Fabrication 2,265 940 82,980 2,145 870 72,710 120 70 10,275Construction 3,205 1,470 106,900 3,160 1,420 104,435 50 55 2,465Transport 1,530 675 57,655 1,425 645 53,920 105 30 3,735Material handling 1,070 510 35,375 925 405 30,035 145 100 5,340Operating 425 200 13,655 310 145 10,495 115 55 3,155AM occupations^ 37,910 18,485 1,412,490 22,065 10,175 834,765 15,845 8,315 577,725
^Includes Yukon and Northwest Territories; ^includes Am I n I strati ve occupations; ^IncludesTechnical occupations; ^Includes occupations not classified, not stated and not applicable.
Source: Cl 4
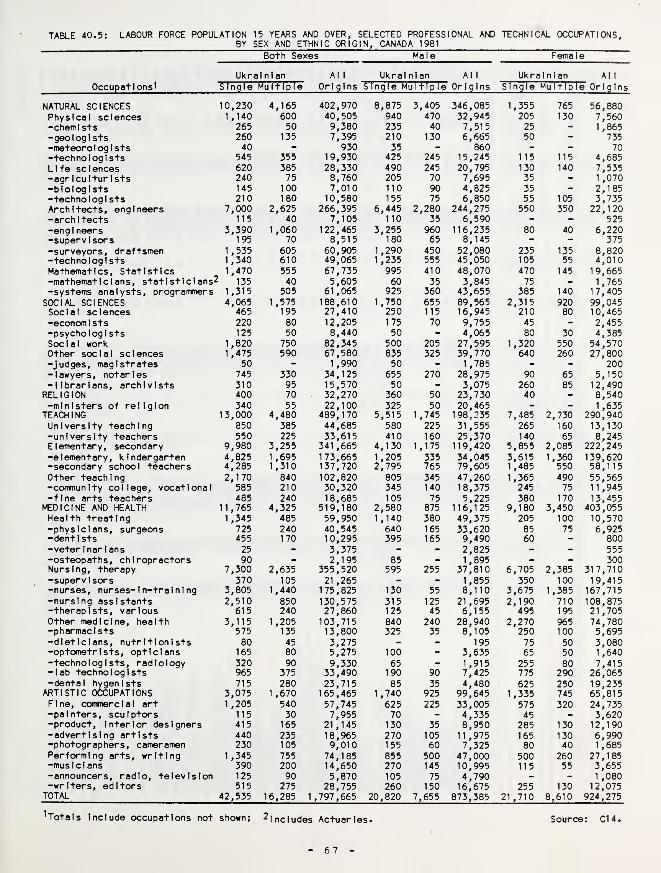
TABLE 40.5: LABOUR FORCE POPULATION 15 YEARS AND OVER, SELECTED PROFESSIONAL AND TECHNICAL XCUPATIONS,BY SEX AND ETHNIC ORIGIN, CANADA 1981
Occupations^
Both Sexes Male Fema 1le
Ukrainian Al 1
OriginsUkral
n
Ian Al 1
OriginsUkrainian Al 1
Single Multiple Single Mu Itlple Single Mu 1 tip 1le Origins
NATURAL SCIENCES 10,230 4,165 402,970 8,875 3,405 346,085 1 ,355 765 56,880Physical sciences 1,140 600 40,505 940 470 32,945 205 130 7,560-chemists 265 50 9,380 235 40 7,515 25 - 1,865-geologists 260 135 7,395 210 130 6,665 50 - 735-meteoro 1 og 1 sts 40 - 930 35 - 860 - - 70
-technologists 545 355 19,930 425 245 15,245 115 115 4,685Life sciences 620 385 28,330 490 245 20,795 130 140 7,535-agriculturists 240 75 8,760 205 70 7,695 35 -
1 ,070-biologists 145 100 7,010 110 90 4,825 35 - 2,185-technologists 210 180 10,580 155 75 6,850 55 105 3,735Architects, engineers 7,000 2,625 266,395 6,445 2,280 244,275 550 350 22,120-architects 115 40 7,105 110 35 6,590 - - 525
-engineers 3,390 1,060 122,465 3,255 960 116,235 80 40 6,220-supervisors 195 70 8,515 180 65 8,145 - - 375
-surveyors, draftsmen 1,535 605 60,905 1,290 450 52,080 235 135 8,820-technologists 1,340 610 49,065 1 ,235 555 45,050 105 55 4,010Mathematics, Statistics 1,470 555 67,735 995 410 48,070 470 145 19,665-mathematicians, statistician s^
! 135 40 5,605 60 35 3,845 75 -1 ,765
-systems analysts, programmers 1,315 505 61,065 925 360 43,655 385 140 17,405SOCIAL SCIENCES 4,065 1,575 188,610 1,750 655 89,565 2 ,315 920 99,045Social sciences 465 195 27,410 250 115 16,945 210 80 10,465-economists 220 80 12,205 175 70 9,755 45 - 2,455-psychologists 125 50 8,440 50 - 4,065 80 30 4,385Social work 1,820 750 82,345 500 205 27,595 1 ,320 550 54,570Other social sciences 1,475 590 67,580 835 325 39,770 640 260 27,800-judges, magistrates 50 - 1,990 50 - 1,785 - - 200-lawyers, notaries 745 330 34,125 655 270 28,975 90 65 5,150- 1 1 brar 1 ans, arch 1 v 1 sts 310 95 15,570 50 - 3,075 260 85 12,490RELIGION 400 70 32,270 360 50 23,730 40 - 8,540-ministers of religion 340 55 22,100 325 50 20,465 - -
1 ,635TEACHING 13,000 4,480 489,170 5,515 1,745 198,235 7 ,485 2 ,730 290,940University teaching 850 385 44,685 580 225 31 ,555 265 160 13,130-university teachers 550 225 33,615 410 160 25,370 140 65 8,245Elementary, secondary 9,980 3,255 341 ,665 4,130 1,175 119,420 5 ,855 2 ,085 222,245-elementary, kindergarten 4,825 1,695 173,665 1,205 335 34,045 3 ,615 1 ,360 139,620-secondary school teachers 4,285 1,310 137,720 2,795 765 79,605 1 ,485 550 58,115Other teaching 2,170 840 102,820 805 345 47,260 r,365 490 55,565-community college, vocational 585 210 30,320 345 140 18,375 245 75 11,945-fine arts teachers 485 240 18,685 105 75 5,225 380 170 13,455MEDICINE AND HEALTH 11,765 4,325 519,180 2,580 875 116,125 9 ,180 3 ,450 403,055Health treating 1,345 485 59,950 1,140 380 49,375 205 100 10,570-physicians, surgeons 725 240 40,545 640 165 33,620 85 75 6,925-dentists 455 170 10,295 395 165 9,490 60 - 800-veterinarians 25 - 3,375 - - 2,825 - - 555-osteopaths , chi ropractor
s
90 - 2,195 85 - 1,895 - - 300Nursing, therapy 7,300 2,635 355,520 595 255 37,810 6 ,705 2 ,385 317,710-supervisors 370 105 21 ,265 - - 1,855 350 100 19,415-nurses, nurses-ln-tralning 3,805 1,440 175,825 130 55 8,110 3 ,675 1 ,385 167,715-nursing assistants 2,510 850 130,575 315 125 21,695 2 ,190 710 108,875-therapists, various 615 240 27,860 125 45 6,155 495 195 21,705Other medicine, health 3,115 1,205 103,715 840 240 28,940 2 ,270 965 74,780-pharmacists 575 135 13,800 325 35 8,105 250 100 5,695-dieticians, nutritionists 80 45 3,275 - - 195 75 50 3,080-optometrists, opticians 165 80 5,275 100 - 3,635 65 50 1,640-technologists, radiology 320 90 9,330 65 - 1,915 255 80 7,415-lab technologists 965 375 33,490 190 90 7,425 775 290 26,065-dental hygenists 715 280 23,715 85 35 4,480 625 250 19,235ARTISTIC OCCUPATIONS 3,075 1,670 165,465 1,740 925 99,645 r»335 745 65,815Fine, commercial art 1,205 540 57,745 625 225 33,005 575 320 24,735-painters, sculptors 115 30 7,955 70 - 4,335 45 - 3,620-product. Interior designers 415 165 21,145 130 35 8,950 285 130 12,190-advertising artists 440 235 18,965 270 105 11,975 165 130 6,990-photographers, cameramen 230 105 9,010 155 60 7,325 80 40 1,685Performing arts, writing 1,345 755 74,185 855 500 47,000 500 260 27,185-musicians 390 200 14,650 270 145 10,995 115 55 3,655-announcers, radio, television 125 90 5,870 105 75 4,790 - -
1 ,080-writers, editors 515 275 28,755 260 150 16,675 255 130 12,075TOTAL 42,535 16,285 1 ,797,665 20,820 7,655 873,385 21,,710 8,,610 924,275
^Totals Include occupations not shown; 2| ncludes Actuaries. Source: Cl 4.

TABLE
40.6:
LABOUR
FORCE
POPULATION
15
YEARS
AND
OVER,
SELECTED
PROFESSIONAL
AND
TECHNICAL
OCCUPATIONS,
BY
ETHNIC
ORIGIN
CANADA
AND
PROVINCES,
1981
to O ift m o m in o o o o m in m o p p o X P o P o P o o P o O P P p O P P o o P O P QOt to to
o oc >.»• in 00 00 X CM ^ Ot CM p CM CM O X O X o X C7t P P P to to X CM <7t M- M-— •— — to r» M- O' in (N o CD Kt CM X to m p P X Ot r* p P p O P P K' CM P P X CM p to CM — P CM oOi
< in in r* CM CM CM p CM tn o CM CM ot p — p p 8 p p P Ot CM r*» CM o r*» p <?t CM CM .» n- CMu to O in CM CM P CM — CM F- r' •- CM to ^ P X CM — CMo o
•“
® 15 90 30 1 in in , 1 o in 1 in 1 in o 8 1 p o 1 o p p O 1 1 p p P O p P o 90 P O P o o Pc 1— X to p p — p p r- M- X — p CM X »— O' O' X r»
o — Q. X tn CM CM CM p — CM CM — KT — O P p P p — n*3—
c 314- o1. 1 p in in
C4 ^ Otin in o o in o in in in in o o P p p o o o p o pp 06 O §8 p POOX o o o o p p p p o oc ® ^ 00 m to 'S- ry o Kt m p CM p p X r*» MT X n- X to o to ^ X — — OtX — 'T tn Kt ^ P p CM — p p f*- p CM to CM ^ CM CM r-
CO O) <k
tn CM p CM p
to
c pooO 00 r"o o m o m in in in o in o p P o p O P p p P p p o o p P o p P O P o p O O O P p p
«» o m ot Ot in O to P^ CM X Kt o p P o p o P p p CM r- o n* CM P X P P p X ^ p XC7) o to ® CM to ro p- P^ O CM P Kt P o p p p P p p X — o p ^ O to to ^ P to X ^ to CM to<u CM 00 in tn vO CM Kt ^ CM Ot «— r» p X P CM r* r- X p p r* o Ot — o ^ P O p Ot to — CM r>-o ot in CM IF- k— V— p Ot ^ p p
—
c^
o*“
c®
1— X O 1 1 1 1 1 , 1 1 06 o 1 1 1 O 1 1 1 1 30 1 1 1 p 1 1 O p p , 1 toil 1 p
o — Q. UJ CM p p Ot to p CM to3— X
c"id
S4- ou
C ® o in 1 1 o 1 1 1 1 in 1 in 1 in p o , p O 1 1 1 o 1 1 1 1 1 O P P 60 90 50 o 1 P O P o 1 pX 00 in Kt OOP ’9- o (^ o p p P p P to ^ TTCO CT Kt CM CM
to
c CO O o in in o 8 oommoininm o POP O P o o o O O P P P P P o P P P P o O P o o P oUJ 00 r- Ot p^p^ooinx.-xo' p^ p ^ O (N X P p pO Ot
PXPPF- X P CM P O' to ^ to Ot CJt
U) o 00 CM ^ ^ O O' p Kt in in X X O p P X P P P p O CM X O' CM P O' O' CM to _ r- o O P to< zu CM CM «— CM P P Kt CM CM W— CM — p ^ _ P CM CM p — P CM f~» CM «- p ^ p V—o > CM — P — p
®XX
c 1— in 1 1 1 1 1 1 1 1 1 1 1 1 1 1 1 O 1 1 1 1 1 1 1 1 O 1 1 O 1 1 1 ! toil 1 o— CL o in p p to
c Z4^ H-zo <u _I
.E® t- in ! 1 1 1 1 « 1 1 1 1 1 1 1 1 1 1 1 p 1 1 ! « 1 1 1 1 1 o o 1 p p 1 1 1 toil J oX < tn CM CM P p
CO X
in oinoinoooooininminininin p p o o P o POPOOOOP PPPOOOPOOP P oc O 00 O' Kt Kt \D X O' o to ^ o to tn o 8 otj-'9XCMr>*n>or^x tOtOCMCMCMXXP^ O' CM— •— Ot in m tn O' tn f^omKt.-^inPor~ p P -IT CM p p — P CM F-PPPPP^XPP — OtpCMP
•
—
O)< —L.o
— Q.3«—S-t-
CScO
P'OvOr'CsIOOOO'r^m — OOt^<NOD<N^^^lf^CN<NO^•^K^.-K^^^<^IOCOO^O^OOlf^^ \0 rs| vOODfM.- OOvOK^.-K\(NOO^K^'<«rr^(OOt^.-.-irv^.-lf\
»noomir>if>ir>ooir>oooiriOu*»oifNtrvjr>oooooirvOif>oif\ir>inir>oooovnmoom\ooiot^tr>oor'OOD<N^vor^o.-m'^or^c?'ooir>mONioa>i^ir>oooocMma'.-^'*-^cNoo^p^fo.-\0 ^ K\ K\ ^ ^ \C O vOvOm iT\ir>.- ^IOCVICM»OK>OOfM<MK^^CN.-vO
CNi^rslCNinvDCN^<NO — lO O ^ CM r*to^K^oooir>ONoocM.-iri'k • « « « »
to O' ^ CM
«/t
o<rt oUJ co ®
c4-
«n </)
O «Crt — +
O V)
or (/) ®rs ^ u< 0. I
tf) — u+- O) cV) O ®
i_ (fl
3 4-4- «n
o oC </)
J=o ®
O ® 4-C 4- —
10 O <rt
I- (0 U®— o>
C L.
0)<—0 ^1 I
0 j: u® u I-
4“ l_ O1 < I
>O) Q. 1_C 3 3® V) (O
I I I
oin •—— «o oO) <J —0 — 4-— 4- «0
O 5 Ec E ®
>«tn— UJc oc zO LJ
>v» —® ^— oL. U« c
«0 uC7> 1. OC ® -D
^ OU O® ®
® 4- ®^ ® EI s: I f8
U toto —
-J
cn I
C7) i_
O OO
*
U K
I V>
o •c to
c• o
to —L. U® O>- 1.X ^c —
o <® UJ® X
I- 4
O I I
4-Cr>t0 l_ 4-to z u ® c— — ® > ®c X > — EX o — C ®E<C3 —
I UJ X I UJ
u >*O U4- Oc -o
O> to z4- <u® UJ
o to
® cl_ c to
o
y to o;£ — — c4- to 4- —— >* c to
Q ^ ® U® Q.T5 3X I I z
t
I
I
I
I
I
I
I
I
I
I
I
68
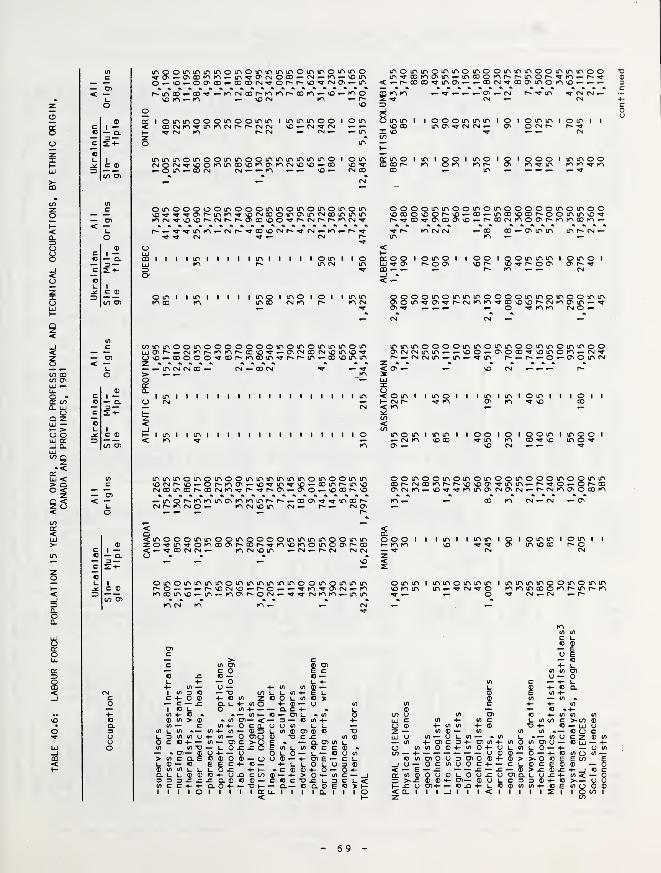
TABLE
40
.6:
LABOUR
FORCE
POPULATION
15
YEARS
AND
OVER,
SELECTED
PROFESSIONAL
AND
TECHNICAL
OCCUPATIONS,
BY
ETHNIC
ORIGIN
CANADA
AND
PROVINCES,
1981
mooirimmijnoir>oirNiriioif\OmiriOir»iriO— O^ODK^K^— ITi'.a-a'fSlOCD — — vOtPvo.-vO.-oo'co.-cDoo<N'^or~r^vO'^<NON.-ir> <f"* IfT GO* 00
*'IT to rsT OO to K> CO vO O CD
\0 to to \o (N to — S
r'-ODOO^lOO'— .-ODCN'TODONiriOtOvO.-.-.-
<DI—— CL
I ommoooioooiTiin i mioioooco<Nto^ir>torMO>f''<N<N vd.-cn'toj^ tNfO t^CM ^(N.-
o »n
^ IT>
iO
O m m I
VO COX VOCO
iriiniooioooiritfvooiriioirviriiriirvo<NOCN'J-\OOtOmOOvOKV<OvtOfNvOvO »-00
o ifv
VO 'TCM 00
(TV O I iTi I OlvnOlQIOOOliOifvOOto tor- ^ to ^ in to to ^ to
in — ^ ^ ^
— O)
< ro
oinoooooinoooininoinoinomoinvo^'T^O'o-into^vocMoooinO'incMooininintocM^vovor-CMr-t->Ov oovoO'S-O'CMr-r-tocM'^
ooooinmooinoinoooooinoinoo
r-'^TTinto — CNr-^covocNr-TTCM — to — r-'T
O^ . litniliiliniliiioinl
in
<h”p; o <^ (
CD — -
^^*
.-ovmm inr-CM.-
loinoi lOOiQOinminioinoir-oov voc- vD^r-oOv Ovr-'S-^ r-. K> CM
in I I in I I I I in o I in o I o I I in inin 00 CM to r- to cm
Ov 'T ^ ^ ^CM
Ovo — ooooO'VOOr^tooDin^p-r-in.-oovOinin— in CM CM CO »-
I I I in
CN
I in I I I I I I I I I « I I I I I o
inininooooininoinmooininoininooovcMcsimin.-.-voO'-ovooO'^vOinoio.-CM —t^.-CMCMin»-in.-^in ^ ^ ^p«'.-o*- 0'OincM
'j- *— T < OV
<Oini iinoi I iiniinioini»— CMC- 'TtO Ov to ^vO< to
mom I mm I looioioomimooi.-cMto vooo ^m to oo^vo mO'Tov VO CM ^ ^
mmmomomoommmmmmomoomm*.-or-•^oc^•— vO'Tm^vO'— oomt^mvo
VO 00 r- VO
oomoomomomoomooomoommoop-cMootoc'p-vovoov'^mm.-r'^O’-Of^ooovcMto.-vo^^tomavCMO'CM«-r-CMtoovoooto
— mor-totomovtotomr-r----ooov^^mooi^CMi-'tocMOo- lOCMvom CM.- r^—
<mooommOOmoooommmmQOmm20 '^m'3-otoooO'r-oDr^TtovotoomoO'r--oo<.-T0DCMCM— tOCNVOm — CM.-C'CM CMCMo • * — VO
omommmmommmmmmoomommmr-o.~.-.-r-vocMvo.-r-C.-.-^to^OcM.-totooomvo — m-.-ioovr*ocM — 'T'TCMtoto-.mm
to CM to CM
omm I mmommmvotom m.-^CM'^o
mmmmoomototomoootor-mTT PM CM —- r-
CMcO
V)
lA (_
W =
M- in
c b
a. L.3 3in cI I
in o+- —in TO
O. EQL. l_
>-in oic Oo —— Oo —— "O CO+• «J in 2o. L. -t- in oO in +- o.*— f- tj —» in o>— < — 3
in M- o c Q. o oin-t-in — ®oi_in-l- in — o 0)0 ®in — o) c >>o E •— i_O^JCOEinu H o 0 1-
|| 0^-0i_ O 4- k * c104- OjQ cto ® —^CLOC®— C«Q.0H T3|— — ClI I I I I o: u. I
C 4-O) L.— C
b£® ®4- >C -O— cI I
Ito »u
in 4-L. L.
® <0
x:Cl O)40 CI- —O) E
15I 0.
^ b0 o— c— bin c3 CE (0
1 I fi
m— +-<3 in
— Ein ®>-j:j= u0. I
in4-in
in —4- O)in o
8b0)4-I I
in4-in
i_ in
3 4-4- in
O)
4- O Q.
Oi_ in COO 4-
in in .c_ •— mO in O) uin i_ o —— O — 4-> >- O «5
l- ® c Ex: — ^ — ® >£ ®OjCUO)Q.I_U^®Ol_C33®4-4-i-®®ioin4-oI < I I I I I X
o »4-
O) in
O O c 4
L. OO)—0 401 I
O oc 2O LU
in oi"’
r8 8^Crt I
69

TABLE
40.6:
LABOUR
FORCE
POPULATION
15
YEARS
AND
OVER.
SELECTED
PROFESSIONAL
AND
TECHNICAL
OCCUPATIONS,
BY
ETHNIC
ORIGIN
CANADA
AND
PROVINCES,
1981
V)c in o o in in in o o
in m vo r~- v£5 vomm mmmmommmoomooo mm
CM 05mmooomoommm— oomcMOOCMomm — — O mS 05
m05 50(35 — p^GOmcomoOGOOmmC''^ o
05 in CM lO ^ m P« CM CM^ om'^^0550cMmMfooo — ^OO m50 <355005mm^cMooo— 50 p- p- 03< < ft ft ft ft ft ft ft QL. O ffl ^ CM CM CM^ ^ tn !^05 ^orocMOP^m — O CM o m^ MT CM mmr^io— CM — — p- — CM
iO in — — 50 4T CM —rs ©
(D ^ 1 25 95 55 1 in 70 50 mm o o m m o m m i m 1 o m mm ( 1 1 o m o o 1 1 m 1 m 1o oo m n* m — 1 o m Uc 1— o P^CM CM p* 50 m o p** m p^ oo m m m 50 m 3
o — Q. GO mm CM — 00 CM — CM CM p^ o3— X tC5c to CM
oL> 1 — 1 in o o 1 ino CM 05 in
oo 80 40 mo mmomoooo— CMP^^O'moO'vm o m o
1J- ^ mo ommcM moommomm i om m o OC ® in CM CMf^ 05 m 05 m ^CMoo05CMmm^ — mcMp^ 003 CM.- 00^ fo CM m — o m m m — m — CM Mg’
CO 05 - ft »
(A
c o o in in o oP» K> \0 05 ^r* in fn 50
in Q50 o>
in m mo omommmmo Q mO' <M
o m om mo momommmmmoo o m oo -a- r- com — mop^i^o^o — r- 00 00 or« \ommcMoocMC350ocMr'*'w<35— O) r» m <350 00 CM ’^m-^oocMm — — 00 50 CM O' oo m m 00'»*"9’O'O5mr>-Q000'^CM m — 00<L. r* 50 tn *- CM CM tn mtn o m — oocM— mmm — 05 — 50 00 mo mcMCM^ — — m — CM 50 IAo Mf m.- — ^ CM — — — p^ ©
< Uo ©
C 1— X 1 in in o 1 1 1 in oo m m moomommmm
i
m o mo m 1 mmoom imomo i 1 m o 3o — Q. UJ .-05 50 5om V CM cMmm^50‘^m5om f"- p^ ^ oo CM 05 50 m m mmmcM m p- 4=
3— CD 05 r'tn m ^ O' — m CM — CM m — — 50 yc U << mc lA
1 ©C ® in o in in in in in o m m o m omomoommoooo o m O 1 omoom 1 mommomo m o
=3 K5 r*. r» 50 00 00 *— m.- 50— 0nO55OO'Ot^cM — n* p*» 50 p» P^ 50 p»- — CM m — ^r m CM m — m 50 3to 05 ^ fn in p^m — m — GO m CM — \£\ 00 ^ — oo 11— — CMCMP--m — — CM ..la.
ft ft ft yfn CM— — CM c
(A cC o o m in in o in o o m o m mmmmmmommmoo o m mo oomomooooomom X
in 50 in r*« CM O' ^ mm50P'mmmoi^"«rGD5om^ m 50 mm mcMm— cM5om05mmoD — 50 2 o— 05 »n o 50 50 m K5 m CM 05-— 05m<J0050'CMCM05omoooo5 m<M^m0505mcMTrmcM50(Mmr^ 4:< « * • » ft lA1. z fncM CD mvo m CM o — — m p^ m — m ^ K> ^ ^ ft—
o < —
-
CM 50 4»0
®c
c 1— O 1 o in 1 1 1 1 o m o m m m m 1 1 o o 1 1 O 1 o o 1 m 1 1 1 m 1 O O t 1 1 1 1 1 1 1 o lA
c — Q. < fO CM m K> m f'' m CM mm 50 O m (Mm CM C3— »- CM— — m Q
c <4"
(D to O1 < ft
to 1 in o in in in o in o m mo o o m o m m o 8 m m m m o m m 1 oommm loooo i 1 o m 3p^ 50 50 ^ 05 00 GO 50 CM m ^ m p» p^ m o m m ^ 05 00 m^oocMO mmm^ 00 y
to 05 50 ^ 50 50 — m m ^ m — CM — 00 y* ft 0—
©43
o mo in o m in o o in oo ooommmOQO^CMP-P^O'OD'O
o m o o mm oo mmooomoommmmoo3"y
(A m p*> m m ^ m CM GO (35 GO m ^ CM m ^ m ^ m — mp-00CMO\0t^r'''V50m''a“ cC CM CM fn <1— 50 m o ^ o in r^m m50GD05 — cMmmo(30CM50 moo 50(M^ 50— P'-0(M50 50^^ mCM<35 p- —
OB05 m CM — »- o CM p- mm m CM — (S 05 50 — »Q- — — m CM CM m lA
< CM CM p-1. ©o
O<CD CmT
® O I o in o 1 1 1 in O 1 om o m 1 o o 1 1 t o m m o 1 o 1 1 1 m o m m 1 i i i m i 1 o m1— »- m tn 05 m 05 — CM ’'I- CM •V m — m r- p^ ^ p- m 50 m CM
c — Q. 50 m CM CM — 50 CM — — (A
o 3— ©Z-H CM
c z*5 4-
1 in o o o o in in o m mo moomomooom o m m oCM 50
oomoomm immmmm 1 m O1 50 50 CO ^ 50 ^ CM moi CMm 5or^ooommoom<Mmmo 00^ r^ooKN^ifN ^irv^ifNvO P^ U
=5 C ® ^ —
-
tn —
-
GO 00 m — CM — m r* 50 — m ^^ ^ ft— ^ CM U©
to 05 CM CM — P" »-
CJ)
4“IA
c ©>" c X
c (A (3) © <31 aClA C O E c 4-+- c "©
JC. © © — ulA (A O >- (A u 4“ O U 4- o© — lA u c 4* (A— y — 4- lA lA © — zN y > *05 0)U © (A Q 1 «A 3 © 43 (/5UUIA4-EU
c C IA<— _ c © T3 © U X © C 4- 0 © 4- ©lA Z©OUlA©X 43o © © f — JZ C C?) © f- C75 — C — aC ft U 4- «A O 4- © — y (A C— —
. (j © SL y 0 © -C -J u— y < C7) 31 © u 0 IA4-— — ftC4- . U ©
u u y u y © y ft lA 4- © • • —” (A ^~ © ^ O) U •» <A 0c lA (A © o © © © 0»— © UJ c (A © © lA > © lA O— < — 3 — © lA 4- 4- cC5. + «- ©4- lA C O © X — u lA — c (A 4* O C X (.j y (A u u O3 <A — o « o 4- — y 4- 4- • © (A U (A tA4" <A— ©OU lA© O)©©U a— O C lA >. . > jC O O lA •C U 3 lA lA y 4“ IA — O <310 S^
*0? C aC lA © 3O 05 l_ — C
0 O O • Cv> >-4- >«u >« y (A z © c 4” O C © 4-— lA— 07) C >-0 \
0 4=.C S S1
•> — ft (3) <A U >-o u 4“ u © UC4-4-<U©lA «A (A 43 — U : lA U (A © C C © •
X O lA — © — lA ©4“ © © — U 4- — 4- . (311— © y 4- — y QUO— u— © y lA <A
0 lA l_ l_ Z M- O <A U 4- C 43 4= C © UJ y lA O) > IA C ft E © © 0 ©— oy ©-4- (3)E — c u— ©CO lA Z U © C © c 3 z — — c u ® — © E E C 4- © — 4- u u 0 u y 3 © -Vt) © L. l_ — © > © E OUE© — 4-IA4- — © IA (A U U U 0 4= 4- K • C © © 4- O — 04- 3> © X .o o *c X > — E © y©Eco— >© (A ft U U © © ©4- yXCtO©— 4- > Om- (A C — _J —4A O jC © — — — <_) — c ©
—
©.c O ©jC © U 3 3 3 aC .C JOft© ©©— C ©C-DJCU 3 c u < yQ-OH _J E < C 3 — © (A4- yn-O ® X43 3 lA C C 4-4" ft O 4 43 1- — ft— © ft © E © X H c1 too 1 1 UJ 1 UJ X 1 UJ 1 1 O 1
1 ^ X 1 1 Z 1 1 1 1 o 1 1 1 1 1 X X 1 1 1 1 X 1 1 1 P —X 1- <
I
I
I
I
I
I
I
70 -
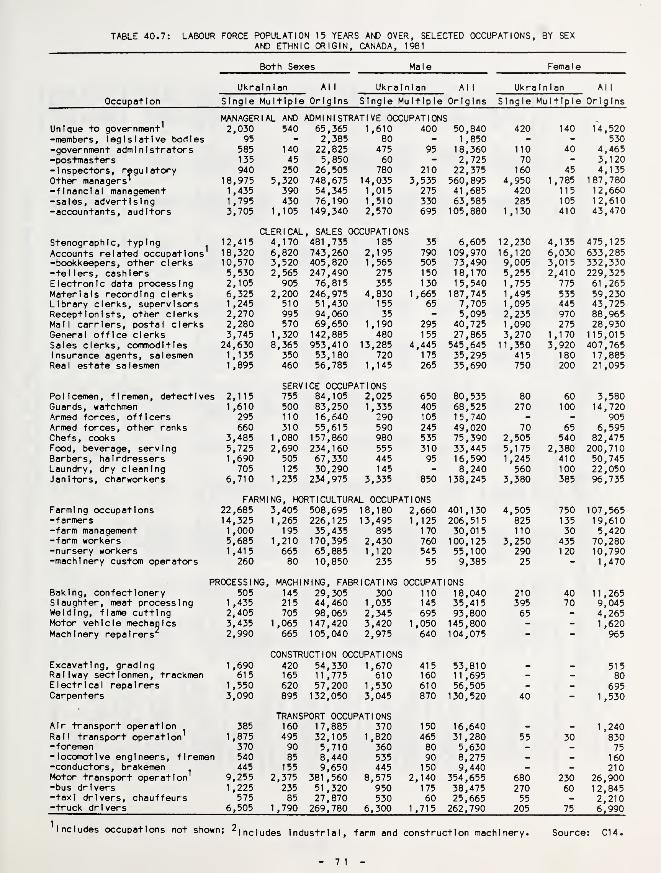
TABLE 40.7; LABOUR FORCE POPULATION 15 YEARS AND OVER, SELECTED XCUPATIONS, BY SEXAND ETHNIC ORIGIN, CANADA, 1981
Both Sexes Male Female
Ukrainian Al 1 Ukrainian Al 1 Ukrainian Al 1
Occupation Single Multiple Origins Single Multiple Origins Single Multiple Origins
Unique to government^MANAGERIAL AND2,030 540
ADMINISTRATIVE OCCUPATIONS65,365 1,610 400 50,840 420 140 14,520
-members , legislative bod I es 95 - 2,385 80 - 1,850 - - 530-government adm I n I strator
s
585 140 22,825 475 95 18,360 110 40 4,465-postmasters 135 45 5,850 60 - 2,725 70 - 3,120- I nspectors, regu 1 atoryOther managers'
940 250 26,505 780 210 22,375 160 45 4,13518,975 5,320 748,675 14,035 3,535 560,895 4,950 1,785 187,780
-financial management 1,435 390 54,345 1,015 275 41,685 420 115 12,660-sales, advertising 1,795 430 76,190 1,510 330 63,585 285 105 12,610-accountants, auditors 3,705 1,105 149,340 2,570 695 105,880 1,130 410 43,470
Stenograp h I c , typingAccounts related occupations^
12,415CLER 1 CAL
4,170, SALES OCCUPATIONS481 ,735 185 35 6,605 12,230 4,135 475,125
18,320 6,820 743,260 2,195 790 109,970 16,120 6,030 633,285-bookkeepers, other clerks 10,570 3,520 405,820 1,565 505 73,490 9,005 3,015 332,330-tellers, cashiers 5,530 2,565 247,490 275 150 18,170 5,255 2,410 229,325E 1 ectron I c data process I ng 2,105 905 76,815 355 130 15,540 1,755 775 61 ,265
Materials recording clerks 6,325 2,200 246,975 4,830 1,665 187,745 1,495 535 59,230Library clerks, supervisors 1,245 510 51,430 155 65 7,705 1 ,095 445 43,725Receptionists, other clerks 2,270 995 94,060 35 - 5,095 2,235 970 88,965Mall carriers, postal clerks 2,280 570 69,650 1,190 295 40,725 1 ,090 275 28,930General office clerks 3,745 1,320 142,885 480 155 27,865 3,270 1,170 115,015Sales clerks, commodities 24,630 8,365 953,410 13,285 4,445 545,645 11,350 3,920 407,765Insurance agents, salesmen 1,135 350 53,180 720 175 35,295 415 180 17,885Real estate salesmen 1,895 460 56,785 1,145 265 35,690 750 200 21 ,095
Policemen, firemen, detectives 2,115SERVICE OCCUPATIONS755 84,105 2,025 650 80,535 80 60 3,580
Guards, watchmen 1,610 500 83,250 1,335 405 68,525 270 100 14,720Armed forces, officers 295 110 16,640 290 105 15,740 - - 905Armed forces, other ranks 660 310 55,615 590 245 49,020 70 65 6,595Chefs, cooks 3,485 1 ,080 157,860 980 535 75,390 2,505 540 82,475Food, beverage, serving 5,725 2,690 234,160 555 310 33,445 5,175 2,380 200,710Barbers, hairdressers 1,690 505 67,330 445 95 16,590 1,245 410 50,745Laundry, dry cleaning 705 125 30,290 145 - 8,240 560 100 22,050Janitors, charworkers 6,710 1 ,235 234,975 3,335 850 138,245 3,380 385 96,735
Farming occupationsFARMING, HORTICULTURAL OCCUPATIONS
22,685 3,405 508,695 18,180 2,660 401,130 4,505 750 107,565-farmers 14,325 1,265 226,125 13,495 1,125 206,515 825 135 19,610-farm management 1,000 195 35,435 895 170 30,015 no 30 5,420-farm workers 5,685 1,210 170,395 2,430 760 100,125 3,250 435 70,280-nursery workers 1,415 665 65,885 1,120 545 55,100 290 120 10,790-machinery custom operators 260 80 10,850 235 55 9,385 25 - 1,470
PROCESSING, MACHINING, FABRICATINGBaking, confectionery 505 145 29,305 300
OCCUPATIONSno 18,040 210 40 11,265
Slaughter, meat processing 1 ,435 215 44,460 1,035 145 35,415 395 70 9,045Welding, flame cutting 2,405 705 98,065 2,345 695 93,800 65 - 4,265Motor vehicle mechanics 3,435 1,065 147,420 3,420 1 ,050 145,800 - -
1 ,620Machinery repairers'^ 2,990 665 105,040 2,975 640 104,075 - - 965
Excavating, grading 1,690CONSTRUCTION OCCUPATIONS
420 54,330 1.670 415 53,810 515Railway sectlonmen, trackmen 615 165 11,775 610 160 11,695 - - 80Electrical repairers 1,550 620 57,200 1,530 610 56,505 - - 695Carpenters 3,090 895 132,050 3,045 870 130,520 40 - 1,530
Air transport operationRail transport operation
385TRANSPORT OCCUPATIONS160 17,885 370 150 16,640 1,240
1,875 495 32,105 1,820 465 31 ,280 55 30 830-foremen 370 90 5,710 360 80 5,630 - - 75-locomotive engineers, firemen 540 85 8,440 535 90 8,275 - - 160-conductors, brakemenMotor transport operation^
445 155 9,650 445 150 9,440 - - 2109,255 2,375 381,560 8,575 2,140 354,655 680 230 26,900
-bus drivers 1,225 235 51,320 950 175 38,475 270 60 12,845-taxi drivers, chauffeurs 575 85 27,870 530 60 25,665 55 - 2,210-truck drivers 6,505 1,790 269,780 6,300 1 ,715 262,790 205 75 6,990
Includes occupations not shown; ^includes Industrial, farm and construction machinery. Source: C14.

TABLE
40.
8j
LABOUR
FORCE
POPULATION
15
YEARS
AND
OVER
BY
INDUSTRIES
AND
ETHNIC
ORIGIN
CANADA
AND
PROVINCES,
1981
— Q,3—ZH-
Oi<—
uo
CO cn
omojnif'inmtfMnoicoir>o<Mr^K>\ooDovor^^'^O 00 '»< m m ^ vo in — iri
Tj» ^ otNmr-fMCNro
too inO' 00 tn
*-
oTCM
Oininmmo oooinmmm—'Ovo^^cMinvoKMncMr*CM«Mr^r^^r»inooin'OvoinoocN^QO— •^ooin.-K'J^00 O' ^ m in CM to o o o O'in p^(NCM^.-in»-CM
oo moo m —to m cNr^00*^to CMr- -M-
00
ommmmmom'oOicMvomotoo — ©to.— oomooo^O' 3• « «««c
*«''9‘'^or«*0''V00‘—OCNCOtOtrir- — 4-lO" to r" c
oo OOoo comm so CM
mm ommmomcMm'vmsoCM—tO-^tOsOtO —
so — CMm — O' CM
15,825
25595 mm oom mmm
(M — tor-cM — r~> r"CMm — soso mm<N
VP — — CM to
13,470
22540 45
1,630
180 7552,725 1,130 5,780
950
Om omommmtor-ocM^omoomm'»''Otomoo— otosocM^CMm
16,185
920 250
ommomoofQ— ^mO'QCJ'to^OOD- p^mmm*^^• • • • • • (..w
m to .j- so — 00
m m m 1— p«. toto so
kT
125
4,730
3451,6306,335 2,715 4,030 2,235
CM
ooooommmoooo^r'0’vm.-r^.-n't*'t0oQOOOOCMtOtOOsOvOtO— •
.-OOmCM— ^•^CMP^O^CMmr»CM toio m M' GO m Q CMO vO'.-cm.^ — ocm
i I m o m m o m o00 m CM to to <Ti toto CMCM — m
oooommomOO'^O'O'M-OOCNO
CM CM to to
O in— toO'
^ — .-CM
I m o o m m o om ^ <N VO .-CM .- .- CM
om momomcMso sO mm .- m r- <N —
CM m to to o O' oo— O'.— moioocNr-CM ^ ^ m
I m o m o o00 .- m •M- to— to
I m m o o o o mO' CM O' 00 vo som (N —
CM .-
in O m m m m o m m oo o m o m o mo00 to
m m moo O O CM Lu o m o m mo o oo o m mc 1
- 00 CM — C7S m o to CM o -on- CM oo r- m to — to to P- so ^ to so p- m o — p- 00 to TPin —— ©CJS CMO so ^ oo m O' to ^ 00 cys 00 CM O' •f p- — CM to \£) 00 ^ — o O'- — so p> to m so m so© — O) SWu <— — CM 00 ^ r-oo so OOs m r^ O' 00 r- so CM so so CM SO O
SO SO O'to 00 CM m — — — «
—
Tp <ys — oo oc L, so CM — CM so oo m to so <7s 00 — — CM — O — O' T — so CM so to
O Os CM m m to>0 t^u © m 1 1 1 1 m m O m m o m O 1 1 1 1 O o m o 1 o — m 1 1 1 1 1 1 1 m mom0= 1 — o CM m -•q-to m — m O m CM o CM O' to ^ os p-
C — Q. CM CM •If CM p^ CMo © 3—
Z 4-4- cC o© © —
m o 1 1 oo o m o m m o m o 1 1 1 m o m m OO to O 1 1 1 1 o 1 1 o moo4- 1 CM to to CJS 00 00 m so P^ 00 n* so — to so p- 'f to to CM P-< 33 C © so — CM to — — — so — to
in C3)
op-
m m o m ss o o o m m s m m m m o m moo O m oo O O m o o m moo mooin so 00 o p- ^ r- •If so CM 00 P- m O' O' CM so — o CM
P-
lys p- p^ — O so o m 00 so Tp O'c Os P«. to 1^ — O CM CM ^ so CM CM 00 so so O' p“ 00 m CM m CM m CM — — m CM
•.3''OCMr'sOO'n*0'^'Or**QOmoooto— r^sosootor^oCM CM n> Os o so
moooommomommsOOOO'CMn-.-CNOOO'tOO'vOmo'f^'*—
—
— sooocNmmCMCM CM to so 00 so m 00 1
^O' .- .- CM
moomooooommo0 '0 'S-m'^vor~ooooo— sotOCMO'CMOS'OOOtOO'^mOOCNCM ^
in Q. O) c c© Q. c o) O O— © — c c— —L.© L.—— 04- +4-L. +- — U. — © ©in 3 — 3 4- 4- l_34->»«E 4-OL, ms04-o — i_o) 030 ©©inC 34-C •©l_Q. OO—— O in— (n**- 4-in © c — c— ©^ ©3 incTJ ©> —— u i_tn cc cb©clE— 0)0 — — © Ot- L. — ®T3
<<li.ij_ZZO»-h-u.tn<
m so — M- so —in so O' to oo^— to — so
^ m CM n* m(yitoto-sfr-so r- — CM to
m o m m m oO' O CM O' o soCM CM so o so
m m m o m— so oo CM r- «.«• — p.- so min so 00 —o
oCM
in m o o in inc^ Tp so o o om so (M
“§5^o o m m o •- so so CM -M- ^
(M r.- p." so
ooo— toon-CMm— 00 — mCJsCM— tOtOP^CMI^CDOfOoo— so CMOOtO— to
oooininominmooinn*0CsOCMsOsO— —O— CM —CMp^— v^r^m— soO'M'
— to CM 00 to oc to
ooooommmommoCM— oom^m — tocMsop^'^r^OOCM tOCMOsOtOpoODP"
34- >> ••D — 1_ OC 3 4- C— o in —— ®4Z— L. L. in— CD o —< < L- U-
C C3) O— C C ——— 04-— L, — ©— 3 4-4-E 4- O l_
0 3 0• ©1-0.
1/)H_ ^ (fl o c —©3inc-o©>cCCC©©CU^— © 0OI-— ©TJZZ OK-»-
m so m© ©—o o ^ — u t/t —
.— — p>- ^ O' — os— CM m
O) cCO) o— c c —
O 4-— u, — ©-3 4-4-E 4- O l_
0 3 0« © t_ Q.m 4- m
©L.m SO 4-
© © in
o o —> c — c
c T3 © > —ccc©©ci_E— © OL. 1- — ©TOZZOHh-U-iO<
I
I
I
I
I
I
72

TABLE
40.8s
LABOUR
FORCE
POPULATION
15
YEARS
AND
OVER
BY
INDUSTRIES
AND
ETHNIC
ORIGIN
CANADA
AND
PROVINCES,
1981
oooinoooooooin— K^O<N(N(N00ir»0'— — O'CNO'oom^OO'io — ^-o^r-
m m m o m m m o O m m o m o mom m m o o o(A •'T — CM 'T r* — CM P^ r* m vo •'T m — O' OO o m vo 'T •< MC vo m o ^ m cjv m ^ ON r** ^ iTN m m — 00 o — CM m Ov PM
. . . • «— O) CMO m m o — p. ^ CM O' OO vo — ^ — P4 CM O PM O 00 vo 00<~ 00 K> CMOOCM^t^.-0\ CM CM m CM vOCJv O' m CM vovo vo — «r m — ^ m mCM — CM ^ 00 m — CM
jO£3
o %
O o ooomo»omir>ooif»m.-K>.-r-oO'vo^r^»-oofO
(o ro 00 — — m CN
mm O m o m m o m o o m o m o 1 O m m m m m m ou 1
— OO) m vo mcM OO' ^ r- O' — m 00 m m ^ r*. p. — Mc Q- 00 ^ CM 00 CM mvo m CD vO ov m — m ^ p** p. m
JZ. o 3— . . «(A Z-H r* <N ^ — fO — trs ^ c^ —— — — m
— -
U irvininminoomomino mo m m o— 00 <Jvmo om o s§ O O O 1 o o o m o o O m
CQ 1 — ootoooK'too'O'tnO'o^lOO — 00 r*<N 00 00 O.-'OvO^m o vo p- m m CM CM CM p. r* m— CMM-
Z3 c d> O' vo p- ^ r** m m vo CM — — —
-
CM — •M m vo o%
(/) O) p- — ir> K> fO vO CN O CN ^CM cMm m — m — m — vo —(O — CM
Oif'Ommmif'inOOinm OO mom Q mOv CM
OO m OO o m m m o m o m o m m m(A P-lfMOOO^OOl^OOvQ'^P^
0'r'OCMO'OOOK>'S®r'-vOm— O' m vom CM o op. P^
O' vO O'mm •M" ^ m m 00 — 00 — — 00 o CM
C r* vo CTvm O'O CM — vO OO o M- M O 00 P«- vO. «— O) o> 04 TT voooooocMin'Ooo
O' 00 r- o (N o o vo fo 00mio s — m ^ CM ^ — m vo Ov vo vo m“ m o o ^ m
<— CM VO 00 — p. — CM m m — — CM — CM O' •M- o mL. r» 'p PM
<0
o
u a) looo 1 omif'if'Oif'Oto mo O 1 om ^ OO o m m o m m Qm vO1 1 o m o O m m m m
« 1— if'if'in oif'.-mr^ooroto^ O' to P*» — O' O »- <N oo
CM O' o m CM m o r* o — m vo m — GO m CMjQ C — Q. 00 VO O' moo m— m CM O' vo CM m ^ CM vO ov GO O' Oi
«] 3— . % % . .< Z+- — CM CM Ov — m
c*cl_ omo 1 00000(000 mo m 1 m m m So o
ovcM mo m m m m 1 o m m m o m m o
1 cNicvr^ o O' (o VO fo — ® 00 00 ^ OO CM — o m CM m 00 m GO r* m vo •M- PM mO' — 00 r*
m=5 C O vOOCN tor^ (N 00 ^ ^ K> vO r*^ — 'T — m vovo CO m 00 vo p«* o
. . %CO Oi or* Trvoaor>to^.— VO
00 — CMr*m m mr* m r* — p. m CM — — vo CM m m— m
(A ir> ir'OiT'if'OOif'irvoOif' m o o m m m m m m m o m o m O O O m m o o m o Qc — 00'Ot^'VK'r'p>*(N'^'»K> om 00 o vo
CM CM 00m M- m^'T p^ CM — m 00 m CD p. PM CM 00 vo CM
r'O'tf'CNOK'K'^vOlTiK^vO P»CM CJVVO mm 00 00 vO Lu O r* CM — m r* — o vo m— O)< — ^ vO •— K>00— vO'OO'^m o— .— .— — 00 00 ^ p. ^ _ — vO^ PM CO PM — C7V m
C _lir'QO »-CMK'K'r^— (NKV i Qor^ CM CM CM M- M- CM m — p"<0 o <•'»• — CM UJ —X H- Ll.
a> osz t—o iTi irv 1 if'irvirvtr'OOOif' OO m 1 m OO om o m m m o 1 1 m m m m m o m ou 1
— tOOv^ ^tf'0'0»-lf'(NO OOVO m — O-'t CM m — O voC3V m m •M- m m m 00 p. M- —
C — Q. •'TOO VO irv r- in K> VO r* 00 r* m m m moo — m — — vo CM p. ma «3 3—-X •“ 2+- 00 .-CM •M- m —(0
«} mom 1 mmmoooom OO o 1 m mo om o m o m o m 1 o o m o o m m mc O
CMr-^ r-oimcM-vvomm r* CM CM vo p. m CM m r* o o m m PsI — P4 PM O O' O' M* mZ3 O' — ooO'r'''Tr-moaD r^vo — r* CM m vo p. vo m CO — m — r* PM 00 C3V GO m o«« ««««««« * »
CO Oi O' CO CNCMtnvO— OCM 'T vO CM CM CMm m — m — CM votn CM
(A momoommmmoom•^m'^vOOOOO'— OlOCMvOO'tnmmoocM.-vocyvcMvoK'
om moo m m mom m o m m o o o o o O m m m mc O' o m m CM m vo mo ^ — m m *T vo m m 00 O CO o— •— mcyv m CM — OV vo vo vo CM m o m *T CM — CM m O' m O' m m— O) % % »< — .-CM — — voovo— vomcMtn •'T m — — vo OO m — O' CM P^ p. CD CM O' O' m Qm — ^
vOL. O 'T r-CMmODCM'^^ ovtn M- CM m CM o CMo m — CM CM
<0
® oomoomoomomm o m o 1 m m o o m o m m o m 1 1 1 m o m m m o OC 1— — OvmK'r''M-CMmr*tno'M- moo -M- ^ r* vo m p*- m M- vo o O' m CO M- vo P* O
•«- <0 — a. m'M- — vovo^CMf^r* — om — m — CM CM •M-^vO CM — M- CM O M CM m3— — « « • « « «k %c c 24- CM ^ ^ <M K> ^ r* ^V « m — PM
nu ooommoommomom— — O'tnK'oo^r.O'Otn
m o m m o m o moo o m m o m 1 m m m m m o o m3 c ® m •'T p. r* so OVO mTPO OO
O' O' — p^ m p. — p. M- P* vO PM m•”— VO OOCM r- CM r» m m o r-o — vo cjvm O' 00 O' r* m CM CM p. p* m —-CO O) . — ....... %
'T 'T r-'CMvoO'CM^m —^ ^CM m m •^ CM CM PM — M- — ov CMm —
•
m CM
o> O) OlI
cCM —m r* CM
c c—
m
r» CM m M 1
(A C3. O) c c (A Q. O) c c «A a.. Oi C c® Ol C CO) 0 O ® (0.C O) 0 0 ® a C O) 0 0
(A — to — c c — — o — c c «) — c c® l_® 0-1- 4- ” ® l_ — — o 4- 1- ® i. 0 4^
4-l_ 4-— l_— C O 4- L. 4- — c_— C n 4- t. 4- — u. C to1- <A 3 ^ 3 4- t. <A 3 3-f- 4- L. (A 3 — 3 4- +• l_+• 3
^
W 3 4- >* .*i 4- O i_ m vo 4- 3 4- >. . E4- Ub “bi.
4-<A O — l_0) 030 ®®<A C3 — L. Oi O 3 O ® ® (A T3 — l_ C311 U 3 (A3 C34-C .C»_Q. OO — C 3 4- C .. <0 U. a. o O — C 3 4- C . O L. a. o o _o — OlA — IA''-+-«A® C— C — O <A — V) H-+. CA ® C
CTJ C— C — U (A — lA't- 4- «A ® C — C
c — ®JC®3<AC"C3(0> — ® -c o 3 lA > — ® JZ ® 3 «A c -o (0 >— UL.lACCC(0(C3Cl.E — 1- L. «A C C C (0 <0 C L. e — 1- 1_ lA C C C <0 C C l_ E— 0)0 — — «3 Ol-l_— O'D — O) o — — <0 0 l_ l_ — ® XJ — O) o — — to O l_ 1. — ® XJ<<U.U.220KKU.<0< << U. U. 2 20 h-H- U. CO < <<ll.ll. 22 CJ 1- 1- u. CO <
73
Mncludes
Yukon
and
Northwest
Territories;
^Includes
"Industry
not
applicable"
except
In
multiple
origin;
^Includes
Quarries
and
Oil
Wells;
^Includes
Communication
and
Other
Utilities;
^Includes
Insurance
and
Real
Estate;
^Refers
to
Community,
Business
and
Personal
Service
Industries;
7pefers
to
Public
Administration
and
Defense.
Source:
A4
for
all
origins
and
Ukrainian
single
origin;
B1
for
multiple
Ukrainian
origin.
SECTION 41
F/W6 AND FARM OPERATORS
Boris My ha I
A computer linkage of the 1981 Censuses of Agriculture and Population enabled f»*m operator
c
to be classified on a one-ln-five sample basis to Ukrainian single or multiple origin* Because
the data on multiple origin did not provide complete coverage of Ukrainian farm operators, they
were excluded from this Section* The data Included were for single origin and were not comparable
with 1971; thus, there are no historical comparisons In this Section*
Table 41.1 provides selected data pertaining to farm operators and nature of farms.
Definitions (A8, pp* vl-xl) which are relevant to the table are given below.
In 1981 a census farm was Identified as a holding with agricultural sales of $250 or more per
year. The definition Is In line with actual practice In Identifying farm holdings In the
Agricultural Census and other surveys* Long standing practice In Statistics Canada has assumed
one operator per farm, serving to equate the number of operators with the number of farms* Thus
In the first line of Table 41.1 the figure of 19,955 Ukrainian farm operators Is the same as the
number of farms they operate. This figure also serves as a check total for classifications of
farms or farm operators elsewhere In the table. For example, the figure of 19,955 farm operators
Is also the total for "all farms by product type".
SummerfaMow Is land from which no crop was to be harvested In 1981, but which was to be
cultivated, worked or sprayed during the year for weed control and moisture conservation.
Other Improved land Includes areas In farmsteads, home gardens, lanes. Idle land and new
breaking. Other unimproved land Includes woodland or native pasture or hay I and not cultivated,
waste and rocky land, sloughs and marshes*
Farms are classified by tenure depending on whether the operator owns the land, rents from
others, or both.
Farms are classed by product type on the basis of the commodity or group of commodities which
form 51 percent or more of total sales. Sales refer to the year 1980.
Farm capital, comprising land, farm machinery, equipment and livestock. Is valued at market
pr I ces
.
Age of operator on last birthday Is reported In terms of five-year age groups between 15 to
69 years and by the age group 70 years and over.
Livestock and poultry are reported on holdings where they are located and not necessarily on
the holdings of their owners.
Off-farm work by operators Includes days of paid agricultural and non-agr Icu I tura I work In
the year previous to the census date*
Farm Income Is defined as self employment Income (gross receipts less operating expenses and
depreciation) received In 1980 from the operation of a farm on own account or In partnership (Al,
p. 22). Wages and salaries and other Incomes are defined In Section 42 (p.80).
Cross-compar Isons between farm operators of Ukrainian origin and all origins are possible at
the Provincial level. For example, the average size of farm for Ukrainian operators In
Saskatchewan was 713 acres; for operators of all origins It was 941 acres. However, care should
be taken In making cross-compar I sons at the Canada level. As most Ukrainian operators live In the
Prairie Provinces where land Is farmed extensively, cross-compar Isons based on a land measure
would tend to be In their favour.
Table 41.2 shows the Income of farm operators from all sources In the year 1980 by Income
class and highest level of schooling. For example, of the 10,420 Ukrainian farm operators with a
total Income of $12,000 or less, 5050 or 48t had an education of grade 8 or less. For all origins
the corresponding proportion Is 39$.
Table 41.3 shows average Income per farm operator by major sources of income and highest
level os schooling for Canada and the Prairie Provinces; the latter were combined to safeguard the
reliability of the Income data. In general, a positive relationship appears to exist between the
educational level of the farm operator and Income received from wages and salaries.
Cross-comparisons on a single origin and all origin basis can be considered between data of
this Section and counterpart data of other Sections, as follows: (I) number of farm operators
(Table 41.1) versus rural farm population (Table 22.4), number In farm occupations (Table 40.7)
and labour force In the agricultural Industry (Table 40.8); (II) number of farm operators (Table
41.1) versus rural farm and total population by comparable age groups (Table 22.4), (III) number
of farm operators (Table 41.2) versus all Individuals 15 years of age and over by comparable
categories for highest level of schooling (Table 32.5); (Iv) farm operators (Table 41.3) versus
rural farm and all Individuals 15 years of age and over by average Income and comparable Income
sources (Table 42.2).
In Tables 41.1 and 41.2, last digits pertaining to number of farm operators or number of
farms are randomly rounded to 0 or 5 to provide protection against disclosure without adding
significant error to the data (A2, p. 35). Randomly rounded components of a series may not add to
the total as the latter Is Itself randomly rounded. In Table 41.3 average Income Is obtained from
unrounded data and rounded to the nearest dollar.
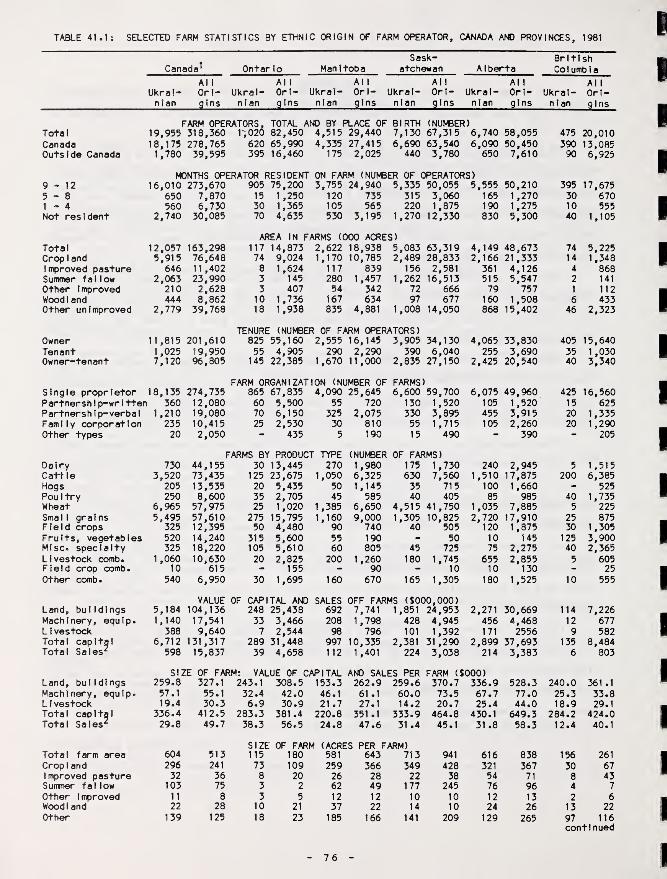
TABLE 4t.1: SELECTED FARM STATISTICS BY ETHNIC ORIGIN OF FARM OPERATOR, CANADA AND PROVINCES, 1981
Sask- BritishCanada^ Ontario Manitoba atchewan A I berta Co 1 umb I a
All All All All All AllUkral- Orl- Ukral- Orl- Ukral- Orl- Ukral- Orl- Ukral- Orl- Ukral- Orl-nlan gins nfan gins nian gins nian gins nian gins nian gins
TotalCanadaOutside Canada
FARM OPERATORS,19,955 318,360 r,02018,175 278,765 6201,780 39,595 395
TOTAL AND BY PLACE OF82,450 4,515 29,44065,990 4,335 27,41516,460 175 2,025
BIRTH (NUMBER)7,130 67,315 6,7406,690 63,540 6,090
440 3,780 650
58,055 475 20,01050,450 390 13,0857,610 90 6,925
MONTHS OPERATOR RESIDENT ON FARM (NUMBER OF OPERATORS)9-12 16,010 273,670 905 75,200 3,755 24,940 5,335 50,055 5,555 50,210 395 17,6755-8 650 7,870 15 1,250 120 735 315 3,060 165 1,270 30 6701 - 4 560 6,730 30 1,365 105 565 220 1,875 190 1,275 10 555Not resident 2,740 30,085 70 4,635 530 3,195 1,270 12,330 830 5,300 40 1,105
AREA IN FARMS (000 ACRES)Total 12,057 163,298 117 14,873 2,622 18,938 5,083 63,319 4,149 48,673 74 5,225Crop 1 and 5,915 76,648 74 9,024 1,170 10,785 2,489 28,833 2,166 21,333 14 1,348Improved pasture 646 11,402 8 1,624 117 839 156 2,581 361 4,126 4 868Summer fallow 2,063 23,990 3 145 280 1,457 1,262 16,513 515 5,547 2 141
Other Improved 210 2,628 3 407 54 342 72 666 79 757 1 112Woodland 444 8,862 10 1,736 167 634 97 677 160 1,508 6 433Other unimproved 2,779 39,768 18 1,938 835 4,881 1,008 14,050 868 15,402 46 2,323
TENURE (NUMBER! OF FARM OPERATORS)Owner 11,815 201,610 825 55,160 2,555 16,145 3,905 34,130 4,065 33,830 405 15,640Tenant 1,025 19,950 55 4,905 290 2,290 390 6,040 255 3,690 35 1 ,030Owner-tenant 7,120 96,805 145 22,385 1,670 11,000 2,835 27,150 2,425 20,540 40 3,340
FARM ORGANIZATION (NUMBER OF FARMS)Single proprietor 18,135 274,735 865 67,835 4,090 25,645 6,600 59,700 6,075 49,960 425 16,560Partnersh
1p-wr 1 tten 360 12,080 60 5,500 55 720 130 1,520 105 1 ,520 15 625
PartnershIp-verba 1 1,210 19,080 70 6,150 325 2,075 330 3,895 455 3,915 20 1,335
Family corpor at I on 235 10,415 25 2,530 30 810 55 1 ,715 105 2,260 20 1,290Other types 20 2,050 - 435 5 190 15 490 - 390 - 205
FARMS BY’ PRODUCT TYPE (NUMBER OF FARMS)Dairy 730 44,155 30 13,445 270 1,980 175 1,730 240 2,945 5 1,515Cattle 3,520 73,435 125 23,675 1,050 6,325 630 7,560 1 ,510 17,875 200 6,385Hogs 205 13,535 20 5,435 50 1,145 35 715 100 1 ,660 - 525Pou 1 try 250 8,600 35 2,705 45 585 40 405 85 985 40 1,735Wheat 6,965 57,975 25 1,020 1,385 6,650 4,515 41,750 1,035 7,885 5 225Small grains 5,495 57,610 275 15,795 1,160 9,000 1,305 10,825 2,720 17,910 25 875Field crops 325 12,395 50 4,480 90 740 40 505 120 1,875 30 1,305Fruits, vegetables 520 14,240 315 5,600 55 190 - 50 10 145 125 3,900Ml sc. specialty 325 18,220 105 5,610 60 805 45 725 75 2,275 40 2,365Livestock comb. 1,060 10,630 20 2,825 200 1,260 180 1,745 655 2,855 5 605Field crop comb. 10 615 - 155 - 90 - 10 10 130 - 25Other comb. 540 6,950 30 1,695 160 670 165 1,305 180 1,525 10 555
VALUE OF CAPITAL AND SALES OFF FARMS ($000,000)Land, buildings 5,184 104,136 248 25,438 692 7,741 1,851 24,953 2,271 30,669 114 7,226Machinery, equip. 1,140 17,541 33 3,466 208 1,798 428 4,945 456 4,468 12 677L I vestock 388 9,640 7 2,544 98 796 101 1,392 171 2556 9 582Total capital 6,712 131,317 289 31,448 997 10,335 2,381 31,290 2,899 37,693 135 8,484Total Sales^ 598 15,837 39 4,658 112 1,401 224 3,038 214 3,383 6 803
SIZE OF FARM: VALUE OF CAPITAL AND SALES PER FARM (SOOO)Land, buildings 259.8 327.1 243.1 308.5 153.3 262.9 259.6 370.7 336.9 528.3 240.0 361 .1
Machinery, equip. 57.1 55.1 32.4 42.0 46.1 61.1 60.0 73.5 67.7 77.0 25.3 33.8L I vestock 19.4 30.3 6.9 30.9 21.7 27.1 14.2 20.7 25.4 44.0 18.9 29.1Total capital 336.4 412.5 283.3 381.4 220.8 351 .1 333.9 464.8 430.1 649.3 284.2 424.0Total Sales^ 29.8 49.7 38.3 56.5 24.8 47.6 31.4 45.1 31.8 58.3 12.4 40.1
SIZE: OF FARM (ACRES PER FARM)Total farm area 604 513 115 180 581 643 713 941 616 838 156 261
Crop 1 and 296 241 73 109 259 366 349 428 321 367 30 671 mproved pasture 32 36 8 20 26 28 22 38 54 71 8 43Summer fal low 103 75 3 2 62 49 177 245 76 96 4 7
Other I mproved 11 8 3 5 12 12 10 10 12 13 2 6Woodland 22 28 10 21 37 22 14 10 24 26 13 22Other 139 125 18 23 185 166 141 209 129 265 97 116
continued
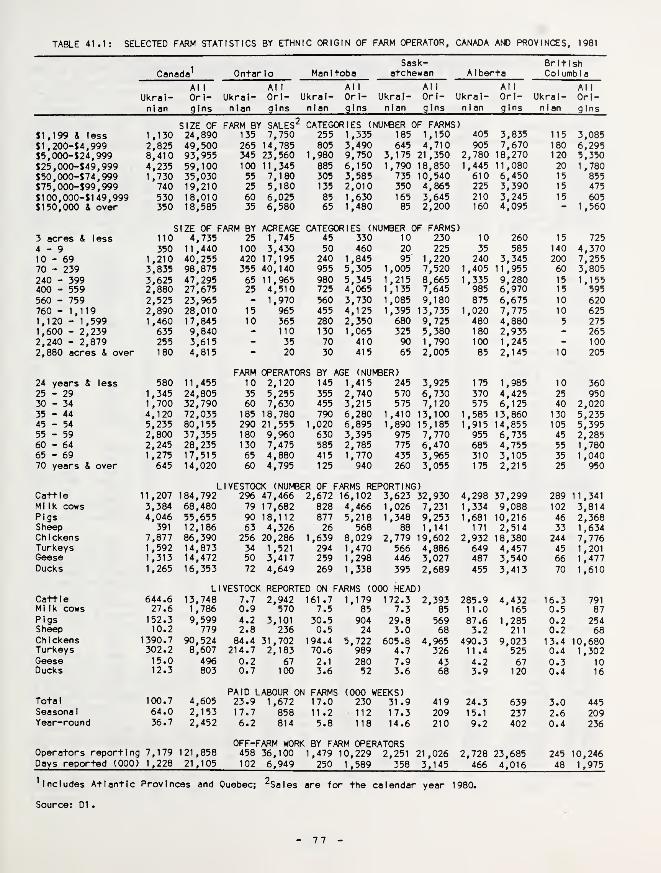
TABLE 41.1: SELECTED FARM STATISTICS BY ETHNIC ORIGIN OF FARM OPERATOR, CANADA AND PROVINCES, 1981
Sask- BritishCanada' Ontario Manitoba atehewan A I berta Columbia
Ukrai-Al 1
Ori- Ukrai-Al 1
Ori- Ukrai-Al 1
Ori- Ukrai-Al 1
Ori- Ukrai-Al 1
Ori- Ukrai-Al 1
Ori-nian gins nian gins nian gins nian gins nian gins nian gins
$1,199 & less 1,130SIZE OF24,890
FARM BY SALES^135 7,750
CATEGORIES (NUNBER OF FARMS)255 1,335 185 1,150 405 3,835 115 3,085
$1,200-54,999 2,825 49,500 265 14,785 805 3,490 645 4,710 905 7,670 180 6,295$5,000-524,999 8,410 93,955 345 23,560 1,980 9,750 3,175 21,350 2,780 18,270 120 5,350$25,000-549,999 4,235 59,100 100 11,345 885 6,150 1,790 18,850 1,445 11,080 20 1,780$50,000-574,999 1,730 35,030 55 7,180 305 3,585 735 10,540 610 6,450 15 855575,000-599,999 740 19,210 25 5,180 135 2,010 350 4,865 225 3,390 15 475
$100,000-5149,999 530 18,010 60 6,025 85 1,630 165 3,645 210 3,245 15 6055150,000 & over 350 18,585 35 6,580 65 1,480 85 2,200 160 4,095 -
1 ,560
3 acres & lessSIZE OF FARM BY
110 4,735 25ACREAGE1,745
CATEGORIES (NUMBER OF FARMS)45 330 10 230 10 260 15 725
4-9 350 11,440 100 3,430 50 460 20 225 35 585 140 4,37010 - 69 1,210 40,255 420 17,195 240 1,845 95 1,220 240 3,345 200 7,25570 - 239 3,835 98,875 355 40,140 955 5,305 1,005 7,520 1,405 11,955 60 3,805240 - 399 3,625 47.295 65 11.965 980 5,345 1,215 8,665 1,335 9,280 15 1,155400 - 559 2,880 27,675 25 4,510 725 4,065 1,135 7,645 985 6,970 15 595
560 - 759 2,525 23,965 - 1,970 560 3,730 1,085 9,180 875 6,675 10 620760 - 1,119 2,890 28,010 15 965 455 4,125 1,395 13,735 1,020 7,775 10 6251,120 - 1,599 1,460 17,845 10 365 280 2,350 680 9,725 480 4,880 5 2751,600 - 2,239 635 9,840 - 110 130 1,065 325 5,380 180 2,935 - 2652,240 - 2,879 255 3,615 - 35 70 410 90 1,790 100 1,245 - 100
2,880 acres & over 180 4,815 - 20 30 415 65 2,005 85 2,145 10 205
24 years 2r less 580 11,455FARM
10OPERATORS BY AGE (NUMBER)2,120 145 1,415 245 3,925 175 1,985 10 360
25 - 29 1,345 24,805 35 5,255 355 2,740 570 6,730 370 4,425 25 95030 - 34 1,700 32,790 60 7,630 455 3,215 575 7,120 575 6,125 40 2,02035 - 44 4,120 72,035 185 18,780 790 6,280 1 ,410 13,100 1,585 13,860 130 5,23545 - 54 5,235 80,155 290 21 ,555 1,020 6,895 1,890 15,185 1,915 14,855 105 5,39555 - 59 2,800 37,355 180 9,960 630 3,395 975 7,770 955 6,735 45 2,28560 - 64 2,245 28,235 130 7,475 585 2,785 775 6,470 685 4,755 55 1,78065 - 69 1,275 17,515 65 4,880 415 1,770 435 3,965 310 3,105 35 1 ,04070 years & over 645 14,020 60 4,795 125 940 260 3,055 175 2,215 25 950
Cattle 11,207LIVESTOCK (NUI^ER OF FARMS REPORTING)
184,792 296 47,466 2,672 16,102 3,623 32,930 4,298 37,299 289 11,341MI Ik cows 3,384 68,480 79 17,682 828 4,466 1,026 7,231 1,334 9,088 102 3,814Pigs 4,046 55,655 90 18,112 877 5,218 1,348 9,253 1,681 10,216 46 2,368Sheep 391 12,186 63 4,326 26 568 88 1,141 171 2,514 33 1,634Chickens 7,877 86,390 256 20,286 1,639 8,029 2,779 19,602 2,932 18,380 244 7,776Turkeys 1,592 14,873 34 1,521 294 1,470 566 4,886 649 4,457 45 1,201Geese 1,313 14,472 50 3,417 259 1,298 446 3,027 487 3,540 66 1,477Ducks 1,265 16,353 72 4,649 269 1,338 395 2,689 455 3,413 70 1,610
Cattle 644.6LIVESTOCK REPORTED ON FARMS (000 HEAD)
13,748 7.7 2.942 161.7 1.179 172.3 2.393 285.9 4,432 16.3 791MI Ik cows 27.6 1,786 0.9 570 7.5 85 7.3 85 11.0 165 0.5 87Pigs 152.3 9,599 4.2 3,101 30.5 904 29.8 569 87.6 1,285 0.2 254Sheep 10.2 779 2.8 236 0.5 24 3.0 68 3.2 21
1
0.2 68Chickens 1390.7 90,524 84.4 31,702 194.4 5,722 605.8 4,965 490.3 9,023 13.4 10,680Turkeys 302.2 8,607 214.7 2,183 70.6 989 4.7 326 11.4 525 0.4 1 ,302Geese 15.0 496 0.2 67 2.1 280 7.9 43 4.2 67 0.3 10Ducks 12.3 803 0.7 100 3.6 52 3.6 68 3.9 120 0.4 16
Total 100.7 4,605PAID LABOUR ON23.9 1,672
1 FARMS17.0
(000 WEEKS)230 31 .9 419 24.3 639 3.0 445
Seasonal 64.0 2,153 17.7 858 11.2 112 17.3 209 15.1 237 2.6 209Year-round 36.7 2,452 6.2 814 5.8 118 14.6 210 9.2 402 0.4 236
Operators reporting 7,179 121,858OFF-FARM WORK458 36,100
. BY FARM OPERATORS1,479 10,229 2,251 21,026 2,728 23,685 245 10,246
Days reported (000) 1,228 21,105 102 6,949 250 1,589 358 3,145 466 4,016 48 1,975
includes Atlantic Provinces and Quebec; ^Sales are for the calendar year 1980.
7 7
Source: D1
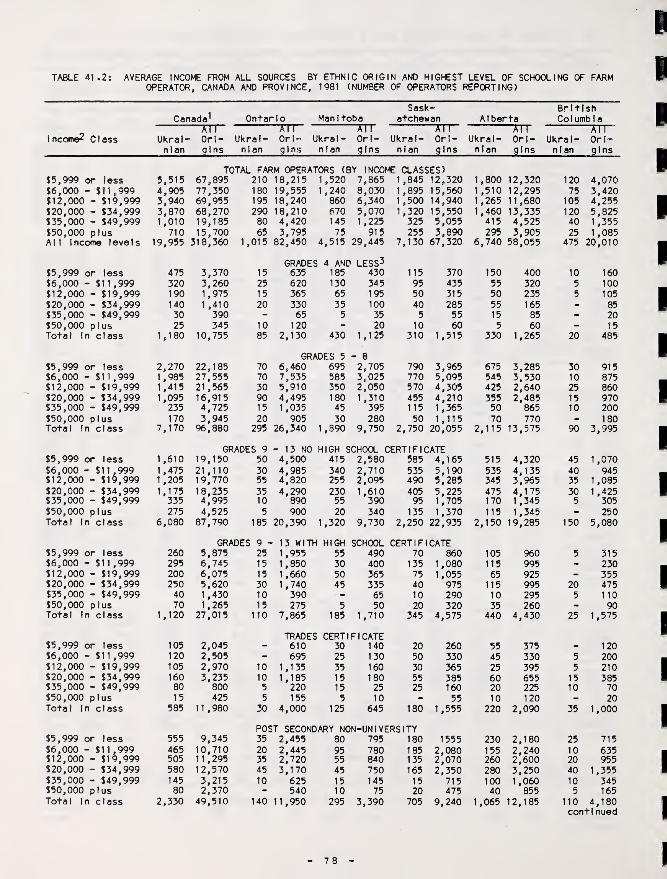
TABLE 41.2: AVERAGE INCONE FROM ALL SOURCES BY ETHNIC ORIGIN AND HIGHEST LEVEL OF SCHOOLING OF FARMOPERATOR, CANADA AND PROVINCE, 1981 (NUMBER OF OPERATORS REPORTING)
Sask" BritishCanada^ Ontario Manitoba atchewan A 1 berta Columbia
Income^ Class
——jrrrUkral- Orl-nlan gins
Ukrai-nian
-TvrOrl" Ukral-glns nian
Ori-gins
Ukrai-nian
"TrrOri-gins
Ukrai-nian
Al 1
Ori-gins
Ukrai-nian
Al 1
Ori-gins
$5,999 or less 5,515TOTAL FARM OPERATORS (BY INCOME CLASSES)
67,895 210 18,215 1,520 7,865 1,845 12,320 1,800 12,320 120 4,070$6,000 - $11,999 4,905 77,350 180 19,555 1,240 8,030 1,895 15,560 1,510 12,295 75 3,420$12,000 - $19,999 3,940 69,955 195 18,240 860 6,340 1,500 14,940 1,265 11,680 105 4,255$20,000 - $34,999 3,870 68,270 290 18,210 670 5,070 1,320 15,550 1,460 13,335 120 5,825$35,000 - $49,999 1,010 19,185 80 4,420 145 1,225 325 5,055 415 4,525 40 1,355$50,000 plus 710 15,700 65 3,795 75 915 255 3,890 295 3,905 25 1,085All Income levels 19,955 318,360 1,015 82,450 4,515 29,445 7,130 67,320 6,740 58,055 475 20,010
$5,999 or less 475 3,370 15GRADES635
1 4 AND LESS^185 430 115 370 150 400 10 160
$6,000 - $11,999 320 3,260 25 620 130 345 95 435 55 320 5 100$12,000 - $19,999 190 1,975 15 365 65 195 50 315 50 235 5 105
$20,000 - $34,999 140 1 ,410 20 330 35 100 40 285 55 165 - 85$35,000 » $49,999 30 390 - 65 5 35 5 55 15 85 - 20$50,000 plus 25 345 10 120 - 20 10 60 5 60 - 15Total In class 1,180 10,755 85 2,130 430 1,125 310 1,515 330 1,265 20 485
$5,999 or less 2,270 22,185 70GRADES 5
6,460 695- 8
2,705 790 3,965 675 3,285 30 915$6,000 - $11,999 1,985 27,555 70 7,535 585 3,025 770 5,095 545 3,530 10 875$12,000 - $19,999 1,415 21,565 30 5,910 350 2,050 570 4,305 425 2,640 25 860$20,000 - $34,999 1,095 16,915 90 4,495 180 1 ,310 455 4,210 355 2,485 15 970$35,000 - $49,999 235 4,725 15 1,035 45 395 115 1,365 50 865 10 200$50,000 plus 170 3,945 20 905 30 280 50 1,115 70 770 - 180Total In class 7,170 96,880 295 26,340 1,890 9,750 2,750 20,055 2,115 13,575 90 3,995
$5,999 or less 1,610GRADES 9
19,150 50
- 13 NO4,500
HIGH SCHOa CERTIFICATE415 2,580 585 4,165 515 4,320 45 1,070
$6,000 - $11,999 1,475 21,110 30 4,985 340 2,710 535 5,190 535 4,135 40 945$12,000 - $19,999 1,205 19,770 55 4,820 255 2,095 490 5,285 345 3,965 35 1,085$20,000 - $34,999 1,175 18,235 35 4,290 230 1,610 405 5,225 475 4,175 30 1,425$35,000 - $49,999 335 4,995 10 890 55 390 95 1,705 170 1 ,345 5 305
$50,000 plus 275 4,525 5 900 20 340 135 1,370 115 1,345 - 250Total In class 6,080 87,790 185 20,390 1,320 9,730 2,250 22,935 2,150 19,285 150 5,080
$5,999 or less 260GRADES 9 -
5,875 25
• 13 WITH1,955
HIGH55
SCHOOL490
CERTIFICATE70 860 105 960 5 315
$6,000 - $11,999 295 6,745 15 1,850 30 400 135 1,080 115 995 - 230$12,000 - $19,999 200 6,075 15 1,660 50 365 75 1,055 65 925 - 355$20,000 « $34,999 250 5,620 30 1 ,740 45 335 40 975 115 995 20 475$35,000 - $49,999 40 1,430 10 390 65 10 290 10 295 5 1 10
$50,000 plus 70 1,265 15 275 5 50 20 320 35 260 - 90Total In class 1,120 27,015 110 7,865 185 1,710 345 4,575 440 4,430 25 1,575
$5,999 or less 105 2,045TRADES610
CERTIFICATE30 140 20 260 55 375 120
$6,000 - $11,999 120 2,505 - 695 25 130 50 330 45 330 5 200$12,000 - $19,999 105 2,970 10 1,135 35 160 30 365 25 395 5 210$20,000 - $34,999 160 3,235 10 1,185 15 180 55 385 60 655 15 385$35,000 - $49,999 80 800 5 220 15 25 25 160 20 225 10 70$50,000 plus 15 425 5 155 5 10 - 55 10 120 - 20Total In class 585 11 ,980 30 4,000 125 645 180 1,555 220 2,090 35 1,000
$5,999 or less 555 9,345POST SECONDARY NON-UNIVERSITY35 2,455 80 795 180 1555 230 2,180 25 715
$6,000 - $11,999$12,000 - $19,999
465 10,710 20 2,445 95 780 185 2,080 155 2,240 10 635505 1 1 ,295 35 2,720 55 840 135 2,070 260 2,600 20 955
$20,000 - $34,999 580 12,570 45 3,170 45 750 165 2,350 280 3,250 40 1,355$35,000 - $49,999 145 3,215 10 625 15 145 15 715 100 1,060 10 345$50,000 plus 80 2,370 - 540 10 75 20 475 40 855 5 165Total In class 2,330 49,510 140 11,950 295 3,390 705 9,240 1,065 12,185 no 4,180
continued
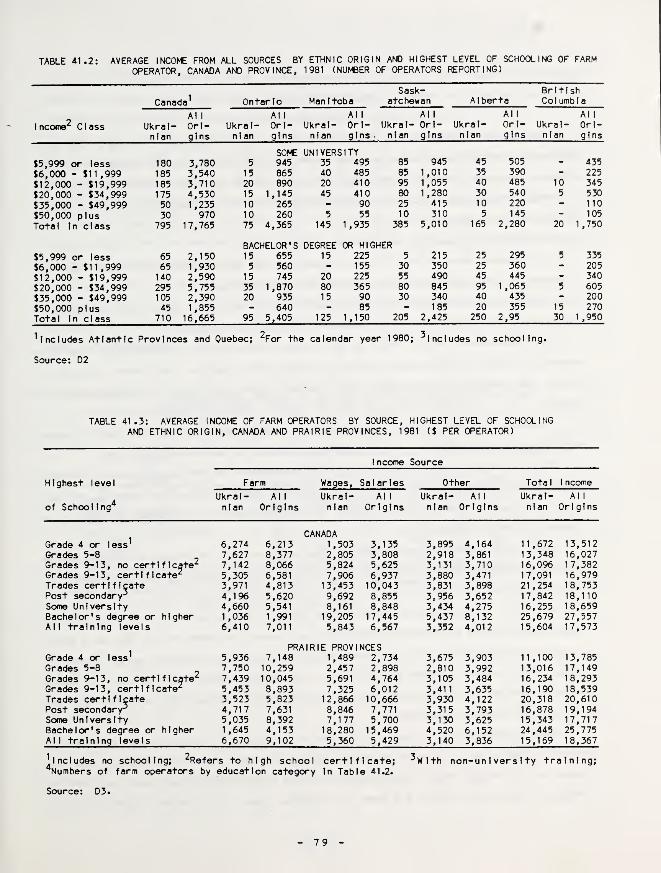
TABLE 41.2: AVERAGE INCOME FROM ALL SOURCES BY ETHNIC ORIGIN AND HIGHEST LEVEL OF SCHOaiNG OF FARM
OPERATOR, CANADA AND PROVINCE, 1981 (NUNBER OF OPERATORS REPORTING)
Canada^ Ontario ManitobaSask-
atchewan AlbertaBritishCol umbla
91 ncome”* C 1 ass Ukrai-
nian
Al 1
Ori-gins
Ukrai-nian
Al 1
Ori-gins
Ukrai-nian
Al 1
Ori-gins
Ukrai-nian
Al 1
Ori-gins
Ukrai-nian
Al 1
Ori-gins
Ukral-n I an
Al 1
Ori-gins
SOME UNIVERSITY$5,999 or less 180 3,780 5 945 35 495 85 945 45 505 - 435
$6,000 - $11,999 185 3,540 15 865 40 485 85 1,010 35 390 - 225
$12,000 - $19,999 185 3,710 20 890 20 410 95 1,055 40 485 10 345
$20,000 - $34,999 175 4,530 15 1,145 45 410 80 1,280 30 540 5 530
$35,000 - $49,999 50 1,235 10 265 - 90 25 415 10 220 - no$50,000 plus 30 970 10 260 5 55 10 310 5 145 - 105
Total In class 795 17,765 75 4,365
BACHELOR’S
145
DEGREE
1,935 385
OR HIGHER
5,010 165 2,280 20 1 ,750
$5,999 or less 65 2,150 15 655 15 225 5 215 25 295 5 335
$6,000 - $11,999 65 1,930 5 560 - 155 30 350 25 360 - 205
$12,000 - $19,999 140 2,590 15 745 20 225 55 490 45 445 - 340
$20,000 - $34,999 295 5,755 35 1,870 80 365 80 845 95 1 ,065 5 605
$35,000 - $49,999 105 2,390 20 935 15 90 30 340 40 435 - 200
$50,000 plus 45 1,855 - 640 - 85 - 185 20 355 15 270
Total In class 710 16,665 95 5,405 125 1 ,150 205 2,425 250 2,95 30 1 ,950
^Includes Atlantic Provinces and Quebec;
Source: D2
^For the calendar year 1980; ^Includes no school Ing.
TABLE 41.3: AVERAGE INCOME OF FARM OPERATORS BY SOURCE, HIGHEST LEVEL OF SCHOaiNGAND ETHNIC ORIGIN, CANADA AND PRAIRIE PROVINCES, 1981 ($ PER OPERATOR)
1 ncome Source
Highest level Farm Wages, Salaries Other Tota 1 1 ncome
of School Ing^Ukral- All
nian OriginsUkrai-nian
Al 1
OriginsUkral- All
nIan OriginsUkrai-nian
Al 1
Origins
CANADAGrade 4 or less^ 6,274 6,213
inun
1,503 3,135 3,895 4,164 11,672 13,512Grades 5-8 7,627 8,377 2,805 3,808 2,918 3,861 13,348 16,027Grades 9-13, no certificate^ 7,142 8,066 5,824 5,625 3,131 3,710 16,096 17,382Grades 9-13, certificate^ 5,305 6,581 7,906 6,937 3,880 3,471 17,091 16,979Trades certificate 3,971 4,813 13,453 10,043 3,831 3,898 21,254 18,753Post secondary’ 4,196 5,620 9,692 8,855 3,956 3,652 17,842 18,1 10
Some University 4,660 5,541 8,161 8,848 3,434 4,275 16,255 18,659Bachelor's degree or higher 1 ,036 1,991 19,205 17,445 5,437 8,132 25,679 27,557All training levels 6,410 7,011 5,843 6,567 3,352 4,012 15,604 17,573
Grade 4 or less^
PRAIRI E PROVINCES5,936 7,148 1,489 2,734 3,675 3,903 11,100 13,785
Grades 5-8 7,750 10,259 2,457 2,898 2,810 3,992 13,016 17,149Grades 9-13, no certificate^ 7,439 10,045 5,691 4,764 3,105 3,484 16,234 18,293Grades 9-13, certificate^ 5,453 8,893 7,325 6,012 3,411 3,635 16,190 18,539Trades certificate 3,523 5,823 12,866 10,666 3,930 4,122 20,318 20,610Post secondary^ 4,717 7,631 8,846 7,771 3,315 3,793 16,878 19,194Some University 5,035 8,392 7,177 5,700 3,130 3,625 15,343 17,717Bachelor's degree or higher 1 ,645 4,153 18,280 15,469 4,520 6,152 24,445 25,775Al 1 training levels 6,670 9,102 5,360 5,429 3,140 3,836 15,169 18,367
^Includes no schooling; ^Refers to high school certificate; ^Wlth non-un I vers I ty training;^Numbers of farm operators by education category In Table 41.2.
- 7 9
Source: D3
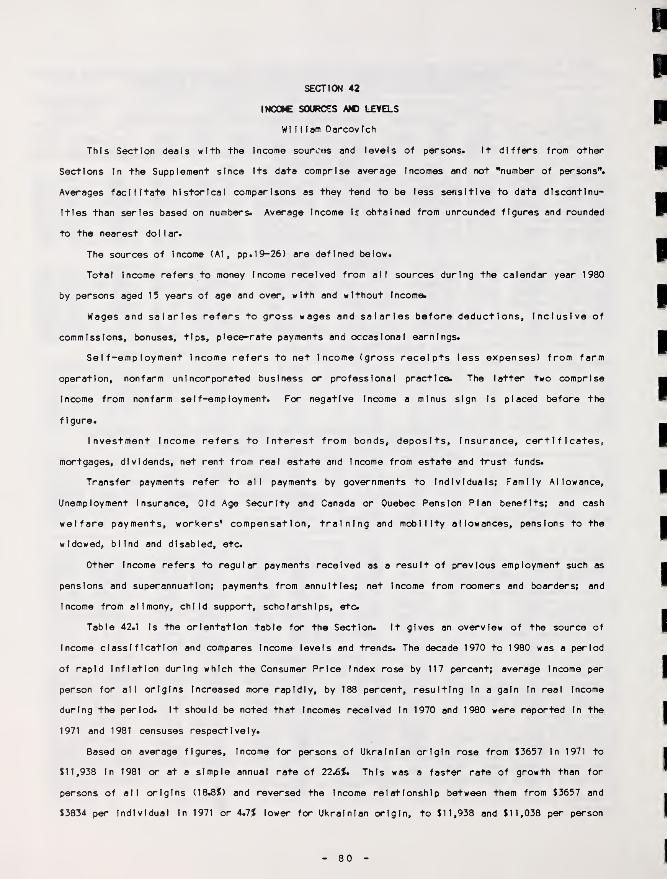
SECTION 42
INCOME SOURCES AND LEVELS
William Darcovlch
This Section deals with the Income sources and levels of persons. It differs from other
Sections In the Supplement since Its data comprise average Incomes and not "number of persons".
Averages facilitate historical comparisons as they tend to be less sensitive to data discontinu-
ities than series based on numbers. Average Income Is obtained from unrounded figures and rounded
to the nearest do 1 1 ar.
The sources of Income (A1 , pp. 19-26) are defined below.
Total Income refers to money Income received from all sources during the calendar year 1980
by persons aged 15 years of age and over, with and without Income.
Wages and salaries refers to gross wages and salaries before deductions. Inclusive of
commissions, bonuses, tips, piece-rate payments and occasional earnings.
Self-employment Income refers to net Income (gross receipts less expenses) from farm
operation, nonfarm unincorporated business or professional practice. The latter two comprise
Income from nonfarm self-employment. For negative Income a minus sign Is placed before the
figure.
Investment Income refers to Interest from bonds, deposits. Insurance, certificates,
mortgages, dividends, net rent from real estate and Income from estate and trust funds.
Transfer payments refer to all payments by governments to Individuals; Family Allowance,
Unemployment Insurance, Old Age Security and Canada or Quebec Pension Plan benefits; and cash
welfare payments, workers' compensation, training and mobility allowances, pensions to the
widowed, blind and disabled, etc.
Other Income refers to regular payments received as a result of previous employment such as
pensions and superannuation; payments from annuities; net Income from roomers and boarders; and
Income from alimony, child support, scholarships, etc.
Table 42.1 Is the orientation table for the Section. It gives an overview of the source of
Income classification and compares Income levels and trends. The decade 1970 to 1980 was a period
of rapid Inflation during which the Consumer Price Index rose by 117 percent; average Income per
person for all origins Increased more rapidly, by 188 percent, resulting In a gain In real Income
during the period. It should be noted that Incomes received In 1970 and 1980 were reported In the
1971 and 1981 censuses respectively.
Based on average figures. Income for persons of Ukrainian origin rose from $3657 In 1971 to
$11,938 In 1981 or at a simple annual rate of 22.6$. This was a faster rate of growth than for
persons of all origins (18.8$) and reversed the Income relationship between them from $3657 and
$3834 per Individual In 1971 or 4.7$ lower for Ukrainian origin, to $11,938 and $11,038 per person
80 -
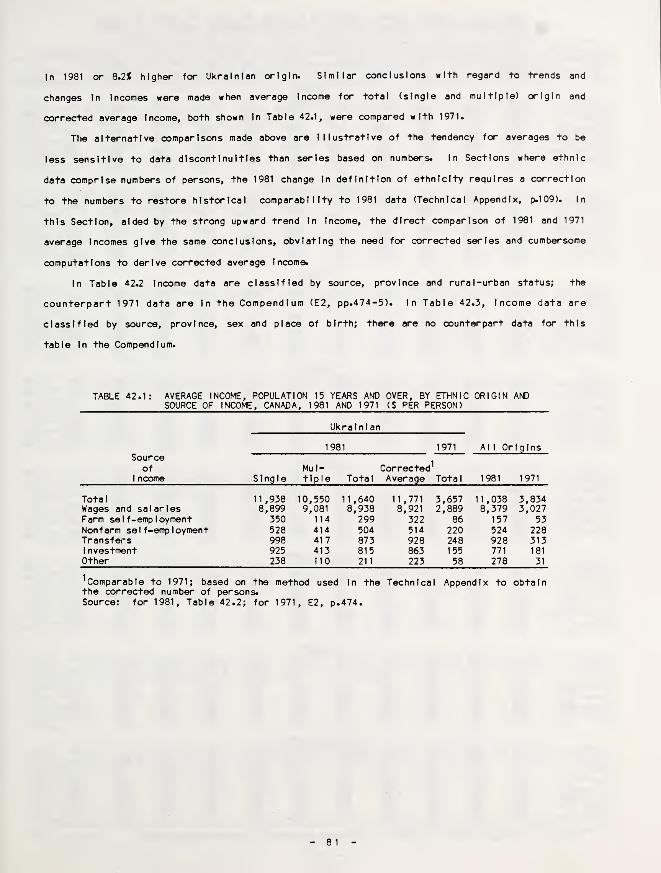
In 1981 or 8.21 higher for Ukrainian origin. Similar conclusions with regard to trends and
changes In Incomes were made when average Income for total (single and multiple) origin and
corrected average Income, both shown In Table 42.1, were compared with 1971.
The alternative comparisons made above are Illustrative of the tendency for averages to be
less sensitive to data discontinuities than series based on numbers. In Sections where ethnic
data comprise numbers of persons, the 1981 change In definition of ethnicity requires a correction
to the numbers to restore historical comparability to 1981 data (Technical Appendix, p.109). In
this Section, aided by the strong upward trend In Income, the direct comparison of 1981 and 1971
average Incomes give the same conclusions, obviating the need for corrected series and cumbersome
computations to derive corrected average Income.
In Table 42.2 Income data are classified by source, province and rural -urban status; the
counterpart 1971 data are In the Compendium (E2, pp.474-5). In Table 42.3, Income data are
classified by source, province, sex and place of birth; there are no counterpart data for this
table In the Compendium.
TABLE 42.1: AVERAGE INCOME, POPULATION 15 YEARS AND OVER, BY ETHNIC ORIGIN AM)SOURCE OF INCOME, CANADA, 1981 AND 1971 ($ PER PERSON)
Sourceof
1 ncome
Ukrain I an
1981 1971 All Origins
SingleMul-tiple
CorrectedTotal Average
1
Tota 1 1981 1971
Tota 1 11,938 10,550 11,640 11,771 3,657 11,038 3,834Wages and salaries 8,899 9,081 8,938 8,921 2,889 8,379 3,027Farm self-employment 350 114 299 322 86 157 53Non farm se 1 f-emp 1 oymen
t
528 414 504 514 220 524 228Transfers 998 417 873 928 248 928 3131 nvestment 925 413 815 863 155 771 181
Other 238 no 211 223 58 278 31
^Comparable to 1971; based on the method used In the Technical Appendix to obtainthe corrected number of persons.Source: for 1981, Table 42.2; for 1971, E2, p.474.

TABLE 42.2; AVERAGE INCOME, POPULATION 15 YEARS AND OVER BY SOURCE OF INCOME,RURAL-URBAN STATUS AND ETHNIC ORIGIN, CANADA AND PROVINCES, 1981 ($ PER PERSON)
All Individuals Urban Rural Farm Rural Nonfarm
Income Ukrainian AM Ukrainian All Ukrainian All Ukrainian AllSource Single Multiple Origins TTngle Multiple Origins Single Multiple' Origins Single Multiple Origins
Total 11,938 10,550 11,038 12,540 10,792CANADAi11,556 8,696 7,130 8,950 10,580 10,233 9,397
Wages2 8,899 9,081 8,379 9,744 9,407 8,990 3,499 4,319 4,022 7,468 8,712 6,855FarnP 350 114 157 60 23 21 3,283 1,749 2,910 226 112 108Non farm3 528 414 524 502 410 526 563 227 470 647 508 529Transfers 998 417 928 991 416 897 590 291 574 1,271 468 1,1341 nvestment 925 413 771 976 420 819 694 504 859 786 338 559Other 238 110 278 266 116 303 68 41 115 182 95 211
Total 11,529 9,209 8,532 12,331ATLANTIC PROVINCES9,388 9,391 7,254 4,416 7,078 9,848 9,073 7,519
Wages2 9,440 8,106 6,268 10,067 8,308 7,133 2,519 3,781 3,895 8,452 7,858 5,293Farm^ 34 3 38 •- - 5 1,682 71 1,305 -27 6 17Nonfartip 387 442 372 461 454 380 - 305 304 229 416 365Transfers 857 370 1,234 880 383 1,090 1,052 - 918 778 362 1,4331 nvestment 605 161 380 700 136 483 2,000 259 518 234 228 243Other 206 127 240 223 107 300 - - 137 182 203 168
Total 11,583 9,830 10,122 11,694QUEBEC
9,590 10,571 8,227 14,523 7,398 9,998 13,016 8,620Wages2 8,484 8,442 7,754 8,604 8,370 8,232 3,928 13,171 3,454 6,881 8,617 6,368Farm3 6 9 80 4 - 11 371 760 2,343 -11 - 37Nonfarm3 526 361 525 500 202 529 1,205 204 381 905 3,229 529Transfers 1,220 508 1,030 1 ,217 477 992 71 356 733 1 ,409 1,094 1,2381 nvestment 1,089 389 533 1,111 412 588 2,652 33 409 494 76 321
Other 259 121 199 257 130 220 - - 78 320 - 128
ONTARIOTotal 12,521 10,333 11,561 12,577 10,429 11,862 12,194 7,802 9,217 12,068 9,981 10,365Wages2 9,543 8,904 8,848 9,646 9,017 9,206 7,090 5,719 4,802 9,030 8,538 7,700FarnP 47 26 87 5 2 7 1,968 900 2,143 84 72 83Non farnP 555 439 522 536 421 520 759 258 475 690 609 543Transfers 1,027 432 852 1 ,038 440 845 684 285 585 986 395 949I nvestment 1,049 413 925 1,045 428 941 1 ,462 531 1,070 1,013 267 800Other 300 118 328 306 121 342 230 109 142 265 100 289
MANITOBATotal 10,075 9,425 10,164 10,780 9,738 10,971 7,210 5,693 7,302 8,801 9,116 8,355Wages2 7,258 8,109 7,396 8,301 8,508 8,399 2,729 3,237 2,761 5,548 7,763 5,669Farm3 366 105 323 31 23 31 2,963 1,366 2,962 228 60 200NonfarrtP 342 265 431 298 247 440 263 355 281 576 340 466Transfers 1,080 450 917 1 ,039 441 903 677 408 494 1,499 521 1,1791 nvestment 799 392 804 845 403 851 522 282 731 771 372 654Other 230 105 294 266 116 348 57 45 72 179 61 188
SASKATCHEWANTotal 10,218 9,324 10,651 11,288 9,903 11 ,469 8,377 7,392 9,811 8,574 8,384 9,160Wages2 6,574 7,401 6,676 8,362 8,327 8,465 2,422 3,330 2,613 4,945 6,816 5,248FarnP 1 ,122 637 1,333 310 188 258 4,296 3,176 5,339 519 392 911Non farm3 477 332 503 459 341 522 413 272 368 603 344 564Transfers 1 ,077 457 919 1,086 482 926 545 229 462 1,603 553 1,2731 nvestment 782 409 957 830 449 969 652 377 934 757 250 945Other 186 88 262 241 116 329 49 8 95 146 28 219
ALBERTATotal 13,171 11,288 12,885 14, ,124 11,771 13,432 9,287 6,801 9,989 11,324 10,695 11,432Wages2 10,120 9,983 10,191 11,404 10,581 11,073 4,225 4,382 4,543 8,178 9,276 8,476FarnP 430 142 352 65 17 50 2,980 1,372 3,251 266 251 331NonfarnP 663 380 590 625 443 557 783 37 670 766 149 734Transfer 844 295 660 804 278 646 546 273 456 1,293 431 8731 nvestment 924 408 854 1,007 371 851 690 709 948 677 481 813Other 190 80 237 219 81 255 63 28 120 145 107 205
BRITISH1 COLUMBIATotal 12,992 11,576 12,461 13,167 11,643 12,712 10,675 10,630 10,763 12,477 11,358 11,591Wages2 10,147 936 9,472 10,270 10,007 9,686 6,474 818 6,644 9,978 9,706 8,883FarnP 34 -7 45 21 -3 17 692 -110 1,302 27 -16 22NonfarnP 541 552 638 507 510 622 1 ,694 807 828 574 716 686Transfers 1 ,002 490 919 1,032 489 932 787 415 577 899 495 9001 nvestment 999 463 1,021 1,045 491 1,071 905 552 1,224 815 339 788Other 269 143 367 293 149 385 124 148 187 183 118 312
1 Includes Yukon and Northwest Territories; 2|ncludes salaries; ^p^om self-employment; Source; CIO.
82
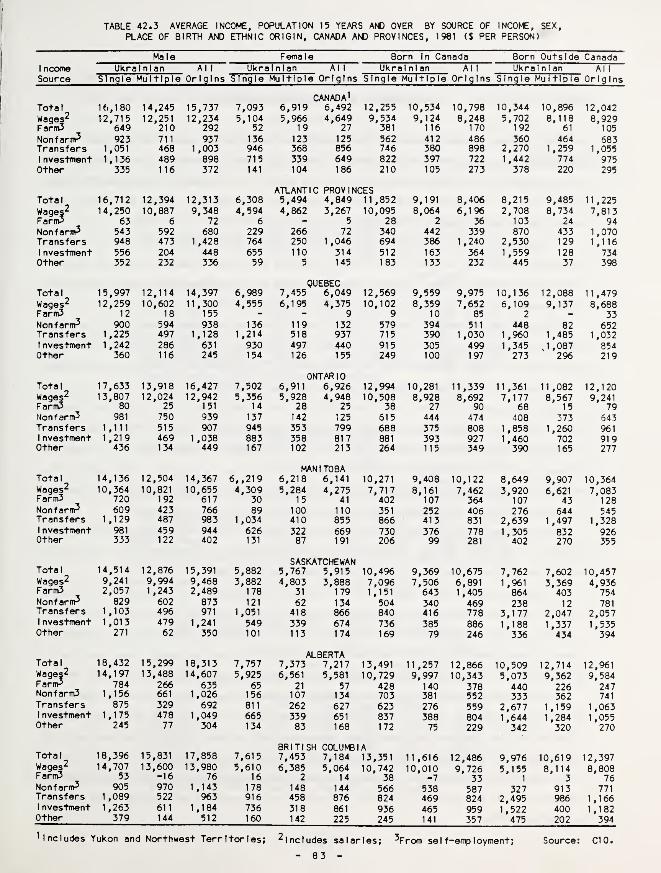
TABLE 42.3 AVERAGE INCOME, POPULATION 15 YEARS AND OVER BY SOURCE OF INCOME, SEX
PLACE OF BIRTH AND ETHNIC ORIGIN, CANADA AND PROVINCES, 1981 ($ PER PERSON)
Male Female Born In Canada Born Outside Canada1 ncome Ukrainian Al 1 Ukrainian Al 1 Ukral n 1 an Al 1 Ukral n I an Al 1
Source Single Multiple Origins Single Multiple Origins Single Multiple Origins Single Multiple Origins
Total ie.,180 14,245 15,737 7,093Canada!
6,919 6,492 12,255 10,534 10,798 10,344 10,896 12,042Waqes^ T2,715 12,251 12,234 5,104 5,966 4,649 9,534 9,124 8,248 5,702 8,118 8,929Farm3 649 210 292 52 19 27 381 116 170 192 61 105
Non farm^ 923 711 937 136 123 125 562 412 486 360 464 683Transfers 1,051 468 1,003 946 368 856 746 380 898 2,270 1,259 1 ,0551 nvestment 1,136 489 898 715 339 649 822 397 722 1,442 774 975Other 335 116 372 141 104 186 210 105 273 378 220 295
Total 16,712 12,394 12,313 6,308ATLANTIC5,494
PROV 1 NCES4,849 11,852 9,191 8,406 8,215 9,485 11,225
Wages^FarirP
14,250 10,887 9,348 4,594 4,862 3,267 10,095 8,064 6,196 2,708 8,734 7,81363 6 72 6 - 5 28 2 36 103 24 94
Nonfarm^ 543 592 680 229 266 72 340 442 339 870 433 1,070Transfers 948 473 1 ,428 764 250 1,046 694 386 1,240 2,530 129 1,1161 nvestment 556 204 448 655 110 314 512 163 364 1,559 128 734Other 352 232 336 59 5 145 183 133 232 445 37 398
Total 15,997 12,114 14,397 6,989QUEBEC
7,455 6,049 12,569 9,559 9,975 10,136 12,088 11,479Wages^ 12,259 10,602 11,300 4,555 6,195 4,375 10,102 8,359 7,652 6,109 9,137 8,688Farm3 12 18 155 - - 9 9 10 85 2 - 33Nonfarm^ 900 594 938 136 119 132 579 394 511 448 82 652Transfers 1,225 497 1,128 1 ,214 518 937 715 390 1,030 1,960 1,485 1,0321 nvestment 1,242 286 631 930 497 440 915 305 499 1,345 J ,087 854Other 360 116 245 154 126 155 249 100 197 273 296 219
Total 17,633 13,918 16,427 7,502ONTARIO
6,911 6,926 12,994 10,281 11,339 11,361 11,082 12,120Wages^ 13,807 12,024 12,942 5,356 5,928 4,948 10,508 8,928 8,692 7,177 8,567 9,241Farm3 80 25 151 14 28 25 38 27 90 68 15 79Non far 981 750 939 137 142 125 615 444 474 408 373 643Transfers 1,111 515 907 945 353 799 688 375 808 1 ,858 1,260 9611 nvestment 1,219 469 1,038 883 358 817 881 393 927 1 ,460 702 919Other 436 134 449 167 102 213 264 115 349 390 165 277
Total 14,136 12,504 14,367 6,, 219MANITOBA
6,218 6,141 10,271 9,408 10,122 8,649 9,907 10,364Wages^ 10,364 10,821 10,655 4,309 5,284 4,275 7,717 8,161 7,462 3,920 6,621 7,083Farm3 720 192 617 30 15 41 402 107 364 107 43 128Nonfarm^ 609 423 766 89 100 110 351 252 406 276 644 545Transfers 1,129 487 983 1,034 410 855 866 413 831 2,639 1 ,497 1,3281 nvestment 981 459 944 626 322 669 730 376 778 1,305 832 926Other 333 122 402 131 87 191 206 99 281 402 270 355
Total 14,514 12,876 15,391 5,882SASKATCHEWAN
5,767 5,915 10,496 9,369 10,675 7,762 7,602 10,457Wages^ 9,241 9,994 9,468 3,882 4,803 3,888 7,096 7,506 6,891 1 ,961 3,369 4,936Farm3 2,057 1,243 2,489 178 31 179 1,151 643 1,405 864 403 754Nonfarm^ 829 602 873 121 62 134 504 340 469 238 12 781Transfers 1 ,103 496 971 1,051 418 866 840 416 778 3,177 2,047 2,0571 nvestment 1,013 479 1,241 549 339 674 736 385 886 1,188 1,337 1,535Other 271 62 350 101 113 174 169 79 246 336 434 394
Total 18,432 15,299 18,313 7,757ALBERTA
7,373 7,217 13,491 11,257 12,866 10,509 12,714 12,961Wage|2FarnP
14,197 13,488 14,607 5,925 6,561 5,581 10,729 9,997 10,343 5,073 9,362 9,584784 266 635 65 21 57 428 140 378 440 226 247
Non farm3 1,156 661 1,026 156 107 134 703 381 552 333 362 741Transfers 875 329 692 811 262 627 623 276 559 2,677 1,159 1 ,0631 nvestment 1,175 478 1,049 665 339 651 837 388 804 1,644 1,284 1 ,055Other 245 77 304 134 83 168 172 75 229 342 320 270
Total 18,396 15,831 17,858 7,615BRITISH7,453
COLU^B 1
A
7,184 13,351 11,616 12,486 9,976 10,619 12,397Wages'^ 14,707 13,600 13,980 5,610 6,385 5,064 10,742 10,010 9,726 5,155 8,114 8,808Farm3 53 -16 76 16 2 14 38 -7 33 1 3 76Nonfarm^ 905 970 1,143 178 148 144 566 538 587 327 913 771Transfers 1,089 522 963 916 458 876 824 469 824 2,495 986 1,1661 nvestment 1,263 611 1,184 736 318 861 936 465 959 1,522 400 1,182Other 379 144 512 160 142 225 245 141 357 475 202 394
1 Includes Yukon and Northwest Territories; ^includes salaries; ^From self-employment; Source: CIO.
- 83 -
SECTION 52
CITIZENSHIP, BIRTTFLACE AM) IMMIGRATION
William DarcovIch
This Section provides data on citizenship, place of birth and period of Immigration. In the
Compendium (E2, p.556) period of Immigration Is shown separately In Section 51; In the Supplement
It Is Included with citizenship and place of birth since It Is considered advantageous to group
related data In one Section. The orientation tables for the Section, (Tables 52.1, 52.2, 52.3)
reflect the tripartite nature of the data.
Citizenship refers to the legal citizenship status of the Individual (A1, pp.10-1). Three
citizenship categories are Identified: Canadian citizen by birth, Canadian citizen by natural-
ization and citizen of "other country" (Table 52.1). The sum of the last two series, comprising
76,660 persons. Is defined as the Ukrainian single origin Immigrant population In 1981.
Place of birth refers to the specific province If born In Canada or to the specific country,
according to boundaries at census date. If born outside Canada (A1, pp.40-1). Table 52.2 shows
persons born In Canada subclassified Into those residing In the province of birth, and those born
In a different province who have migrated to the province of residenceb
Table 52.2 shows also that there are 76,925 persons of Ukrainian single origin born outside
Canada which Is slightly higher than the Immigrant population of 76,660 In Table 52.1. The
difference arises because some persons born outside Canada are considered, for purposes of
citizenship In 1981, to be Canad I an-born. Table 52.1 provides a slightly more restrictive
definition of the Immigrant population than Table 52.2 (A1, p.40), but due to the small difference
In numbers. It Is not considered to be of significance In historical comparisons.
Period of Immigration refers to the grouping of years In which the Immigrant population (as
defined In Table 52.1) arrived In Canada (A1, p.40). Numbers of Immigrants by six periods of
arrival and the total Immigrant population are shown In Table 52.3.
In the main tabulations. Tables 52.4 and 52.5 detail citizenship and place of birth data by
province, sex and rural urban status. Table 52.6 details the data In Table 52.5 by giving the
province of birth of those specified as born In "other province" and the Individual country of
birth of those specified as born "outside Canada". Tables 52.7 and 52.8 detail data by period of
Immigration, the former by province, sex and rural urban-status and the latter by 60 urban areas.
The orientation tables also provide corrected 1981 data, allowing historical comparisons with
1971. For example, the data In Table 52.2 can be utilized In the analysis of Interprovlnclal
migration for the Canadian-born population. If persons born In "other province" are considered as
Immigrants to the province of present residence. In 1971, of the total population born In Canada,
21.4$ lived In a province other than that In which they were born and In 1981 this proportion
Increased to 24.2$. The data In Table 52.6 can aid In the analysis by showing the migrants'
province of birth.
84

Users wishing to undertake provincial or other historical comparisons may make corrections to
additional 1981 data on their own by reference to the method outlined In the Technical Appendix
(p.109).
Counterpart 1971 data for the main tabulations are In the Compendium (E2): pp.591-4 for Table
52.4; pp.600-20 for Tables 52.5 and 52.6; pp.561, and 567-9 for Tables 52.7; and pp.574-5 for
Table 52.8.
TABLE 52.1: POPULATION BY CITIZENSHIP AlO UKRAINIAN ETHNIC ORIGIN,CANADA, 1981 AND 1971
1981 1971
Citizenship SingleMul-tiple Tota 1
Corrected^Total Total
Canada 524,520 223,570 748,090 636,305 573,505- by birth 452,945 219,215 672,160 562,555 474,250- by naturalization 71,570 4,355 75,925 73,750 99,255
Other country 5,090 1,790 6,880 5,985 7,150All countries 529,610 225,360 754,970 642,290 580,655Immigrant Population 76,660 6,145 82,805 79,730 106,405
^Comparable to 1971;Source: for 1981,
see Technical Appendix.Table 52.4; for 1971, E2, p.591.
TABLE 52.2: POPULATION BY PLACE OF BIRTH AND UKRAINIAN ETHNIC ORIGIN,CANADA, 1981 AND 1971
Place ofBirth
1981 1971
SingleMul-tiple Total
Corrected^Total Total
Canada 452,685 218,760 671,445 562,065 474,250- province of residence 337,420 177,130 514,550 425,985 372,810- other province 115,260 41,630 156,890 136,075 101 ,440
Outside Canada 76,925 6,600 83,525 80,225 106,405All countries 529,610 225,360 754,970 642,970 580,655
^Comparable to 1971; see Technical Appendix.Source: for 1981, Table 52.5; for 1971, E2, p.600; A10, p.1.
TABLE 52.3: IMMIGRANT POPULATION BY PERIOD OF IMMIGRATIONAND UKRAINIAN ETHNIC ORIGIN, CANADA, 1981 AND 1971
Period ofImmigration
1981 1971
SingleMul-tiple Total
Corrected^Total Total
Al 1 Periods 76,665 6,150 82,815 79,740 106,4051961-81 6,675 2,730 9,405 8,040 5,12521971-81 2,900 1,580 4,480 3,690 -1961-70 3,770 1,145 4,915 4,340 5,12521951-60 14,610 1,465 16,075 15,340 17,5651 946-50 18,085 715 18,800 18,445 20,260Before 1946 37,300 1,240 38,540 37,920 63,455
^Comparable to 1971, see Technical Appendix; ^For 1961-71.Source: for 1981, Table 52.7; for 1971; E2, p.560.

TABLE
52.4:
POPULATION
BY
CITIZENSHIP,
SEX,
RURAL-URBAN
STATUS
AND
ETHNIC
ORIGIN,
CANADA
AND
PROVINCES,
1981
ID >HO
OiomoiTiinmotf) voaivocMootnaoiTt
O'^r-K^vo^'^ov
< —1-o
— O)< —
t-
o
irvinommmmor^o\»— <7\r'Omir>VOfM'O — K^fOCNir*
moinmooQOIOCM.“.-K^OCN^
moifioomom<N{N^irkaocN'^ooK>.-0'OK^aoir»io
COCNOKMnfi^Oin»<«i 3
OOr*<NCslO\<NfMo m ^ fn^o^'^ 00'05<N GO \0 -i- VO O CM VO 00^ ^ irv lo
vovoaococviocMoof<^^p^^<N.-VOO\VO n
aiooaDCMootfxo"^
O — VO — —
oooirvoifvirvifvO'. vO O IX^ ^ Ov <7v
.-VO — CM ^O (TV O trv IT» O O1^ vo CM vo irv CM —
ro .-CM
OinirvOmoiniTv^KMO'^r.^CMCOOv lO CN
OinoirvQOioirvaor»^ooocF' “
(TV —
QifvifvifvOOOirv^cMO\ — ioirv>^.-O K> vO iTv
vfv I m iTv O iTi iTv O00 ITV — ^ iTv C*^ ^ ^ — K\ CM
irvOvx^vTvinirimoirv—“OvOK^oooiTivO CM CM fO CM CM
m I iTv m if\ iTt o oc«. r» CM o CM— m CM vo
O I I o irt iTv o icvm vo vo m vo —
=
CM
CM .- CM --
irvOifHOirvirvirviTv tfvifvOOOOOOoocMomop-ON^vo^'^'i'O'irvp.-^
moiOQOifvoifvirviOQChcM — oop^
ootrviTvoooicv
^oiCMvoo^-^r*avoor'OQOP>»r^votrvOOOV^'vfl^OCM .«”0—"OV^^OCM
vo‘^i^ifNO\p**ai(?iKvvoovvor»K> 0'm^ r— r. fO vO vc\ in (Tv
inirvioifv^.— eoirvCM^cor^OvaoooinO .-CM .- —
^ ^ kmo — .- vo — ^ .-
o ©c*’ mirv o
o min 03m —
in inm —® 1^oinoinoinmop^mo®©.-.-cMOin — ®©®^CM 8 0 o in m in in inO © 0\ ffl © .— ov
inmO'^'Oin'^^oooooooo©®CMKV'^®P>‘CM® — ®^ov®mm
• CM in in ® om — — CM CM
ooooininmm® KVCM \0
in
o oCM CMin ®
in o®CM m
in oov
ov Oooinmoinminr>=®CM®®®mmn.’^fninmoor*.
inomininmoin^®CMOv®ov^inc»pnov — ini^ovfo
minoominooKvm-"inoov — o®ovoyo®r'r>.'.9‘
CM — p"in®®ov —® ® m ® KiCM m —
— KV ® o ® ©— — ovCM — in ® —
inininoininoor»KV®P^KV®® —CMOKVfnmKV®®omoinoinininooKi — p^®in — o®m'^ocM®Kvin
o in o m in o m '
o o ® © m ®^ m © CM CM m Kv
inmooointninm®in®^c»p.»p.-ov — — — © — P*.©
oooinooinoCMP^ — ^inoo^®vO®^mOv'^CM
m KV KV — KV ®<\o Kv m — CM •
h- • •O CM —
©r^OOCMCM^OOCM®®mKV — (NKV — ® — CM
Ovininp>*®CMCMr>^CMKvmcM®'«!for.“2 KV m CM CM KV
< • •m CM —oeL
inmooooinmin'^inoo.j'KVinm CM — ^ CM in ®
oooinininmo©'M’^O^OOvCMCM ^ ^ fsj ^ CM KV
in o in m in oO m — Kv in— O CM — CM K>
ooooinooin— ov®m^p^ CM ov m ^ in
<cr in I3 ®cc —
oinooinoininP-OVCM — ®o®®in — — ®r^CMp.*in
in o in in o in in— o © ov — — P^® Ov p- o —inOinminininm®OCM — P^-^OP^® — ^®ocM®m
oooinomoo®^©®incMinoCM— ®oovov®®
ininOOOininin8 — ^ ® — Kv r* m
in ^ p>. o —CM ® ^ KV ® CM CM in in m in CM s
— oin o in o in in— p^ ® o ® inov in ^ ® .i- o
inooooinoooovoc*^ — p^®®p^ovKv®p.»Mrov
inminininooininCMCMOV^® — c*KVCMO — ®®oo
ininmininininop^oinin — r^<o^
Kv c~ o m O' ®ooooooino— OV^OVCMCMO®CMCMpn®OCMinCM
o oCM —
® ® © KV CM ®^ ® in ®® m ® ® ® oocM®fn — op-'Cm
00®CM'^^OV©ovp^C'inr^CMinKV® O' Kv m ^ gp*’ ® ®— O ov CM -.f ^• « « •o — CM m
— ov — mo®^ ® ^ O' p^ MfCM — —
in — —
in in— ®CM Ov
moo— ^ ®® «a- ov2S8 o O' m m Kv ®^'^OV^'^CM — —
oommomomcMmp^CM^o^p^— — mmmm — ov
mommooompx-Mpm- ®m^Kv® CM ® ® CM ®ov CM KV ® Ov CM CM o
<0 CM CM m ^
mmmoomooMfCMCMC*®OOVCMOv® — p^mcM — m
oooomoom®®Kvovmm®^OKV®KV®®®P^mmmoomom®®ov® — mmc*®CM^mmmmp.»
mmoommoom — cM^m®®om®mov®®o®mooommomm®P*“P«*CM®CM
p^ ® O' '.f o8® — ^®KVmCM® — O ^ m —
J3E
C 3O _» Oo oo c— — O ® W —
04” O — 04- 4- in®C®l_ 4-Ol_ —00®0 — J^® 4-‘ c in ® —
04- 3 C 00 — l_o<o-oz®<®
— ®O C 3
o —CL X Ou ^
— — O ® O O 4=04- U — 04” 4” in®C®l_ 4“Ol_ —O O® O — ^ ® 4-c — ® 4- c in® —04- 3 C 00 — 1.o<ooz®<®
—, JQ> EO C 3l_ « —Ql » O
® ou o ®— — o ® o o ®04” o — 04” 4- in®C®l_ 4-Ol.—00®0 — ^® 4-c— ® 4-cin® —
04- 3 C 00 — l_o<o-02:®<®
®E
C 3o —X. 8
u o ®— — o ® o o ®04” O — 04- 4- in®C®l_ 4”Ol_ —O O® O — ® 4”c — ® 4” c in® —04- 3 C 00 — Lo < 0-0 z ® < m
o ®u o— — o ® o04- 0 — 04- 4-in®C®l„ 4-OL.—O O® O— ^ ® 4”c — ® 4” c in® —04- 3 C 00 — l_CJ<OOZ®<CQ
I
I
I
I
I
I
I
I
I
I
I
I
I
I
I
II
II
I
86

cn< —
— CD< —
L.O
c Of-c
C (_<0 3
C >JO X>
— Cf)
<Lo
Oinmp ITS o omOir»rOO' ONOlfNK^K^O0"0»^<No\ ^ r^r>4 (NCM 00'«*'
ON ^ ^ (N
o o I o o I oo(N CN fO KNOOCN
<»f »-
OOOO tf'O ifNtfNON VO O' O' — VOCN(N'^00 00'^*— nOIO«»«« «• ••cnknknonooo cNinCNP^^^ ON^ O—P»ON<NCN*-CN KMfN
ooirNifNOmoor~ ^ o «j- — m onoooooKNNomooom
OlfNlfMfN IfMTN IfNOCNO^o mo CN^r*aor^cN ^o r^m
ifNiniTimoo mm— ONCNVO OON:mr^vor» om mm
^cn-n:cN NO noou_mZCN —
:o o I m m m moIm ^ m r*—
oomomoooON^omcNO m—(N ^ ^ vo O CD
oo CN — — CN
O' vo r* o m CN O'vomcNm GOO r^m^0'CN»-^CNCN'^
^oom'^T ^00 0"«t
m 00 ^ m Nooo
mmooomooCNNOmNO mo r^O^ m O O NO
— NO CN r>-—
^ — O ^ cj o0 4- o—TJ C ® l_ 4- O l_00 ^ 0 —^ ® 4-C — ® 4- C tf) ^0 4- 3 c O O —o < oo SCO <cn
— CT)
< —uo
< —1.
o
o mooommo"oNOCNmmNomcNCN ®•— nOOC^OnOCOnO 3. .c^ mmmvom^^ —
NO oocNCN^ooNom4-00 m o ^ m NO c
o o O m o o m
m oommommCN CNmONCNCNr>-0ONCNmcNmNOm^
m mmmommom^^ — moocNCJNm m ^ m no 00 O'
NO*omoor-CNcD —^m^ONOr*«^aoCN oomoooooooo CN m NO — (N
S m o o o om o vo ^ m m NOr-ONCOOCDONCNONOo'cNmvOCJNCNCNON— NO CN CN m mCN
mmooomoooo CN^or^<?NmoNO NO — r-cN^— — m
>C5
O'*
I—
m
NO
o m— mP- CN
r- ONm m— CN
m oCN NOo r*
o o— OnVO r-
O m1^— o
'kC r«rm CNNO oo
o mo P-CN C3N
m o00 —CN NO
o om CNo o
m m— ON00 <o
m OCJN om CN
m — — ON or-
o momommmP'»O00O'V0N00 —CNOOODP'-OO'VOON« ««««««&
p«» cNmmt—mmTpON ONO'vcN^ONm— ONNONOf^r- — CN« • * « • «
r- — m m — —
o oomomoom mmo^mcNr-— ON — mvoON^CN
o oooommoCN -^o- '^p^mo^ mmcNCN — mmr- — p-ONONmc—ON
u a jc^ — o .o u o 4=04- 0 — 04- 4“ «nOCOU 4-CI.—(0 C 43 (0 — JC ® 4-C— ® 4-C tfl^ —C 4- 3 COD— l-0<OOSCC5<CQ
- 87 -

I
— O)< —
1.o
oomommooo m VO VO fo
«- o ^ o o vo— ^ VO ON r* ^ 00ov <N ov ^
mirvOOOiTvirvor*00CMK>f<^vO'«S'^ro CM tfv fo ^ ^ ifv
tn ^
ifv o irvirv o irurv
CM 00 in KV VO KV
QirvirvirvoiTiOintO\O^vO'4'^<-00CMvOOlfvr‘K^'9-VO
r>*<Mr*r^OO»r>o•<«'vor- —OooocM^'i-OvO
oirvOirvirvoirvmmr^^r^O'OCTV'xj-irv'^ovvOK^r'Ooo
ov«-»-cMir> — voovo ^ ^ (N ^
oooirvoirvomvOCNvO —-
fOONfOvofOcovocor*
irv^^ooKVirvCMOoCM ^ VO CMCM
OOOOOuTvirvirvvo^irvooirvOvcMic^irvK^ovf>‘»-oo —^o»-<3vr~cMoocoavr~- — »— vovof^o
Oifviri»rvir>oooO — CMlTvOvOOOvO'9’ifvK^vovO'^r^r^
O ifv vfv ifv Op*“ CM Ov vo irv
vO — vO vO ov
CM CM IfV r*» CMm Ov vo ov VOIfv C3V KV
CO VO CMoKV vO VO
o o in o oin VO •- CM Ov— CTv vO O
O m m^ ^ 00CM KV o
o in o o inin CM KV ^ oOv vO 00 VO KV
o in in^ CD OKV ^ CJV
u
«J —» o® o
Q JZO jQ u c x;C-HU— 0-H-Hin
T3C®l_-H«0l_ —(0 <0 — ^ ®-*-C— ®4-CWXl —o<OOXtn<a3
inQOOinoinoCMOOOVr>'KVKVOOvOOOOOvvOinO»-CM
ooQininoininoor~oO^Ovin'»^inCMOvvoor-ininvo vOr»OCMOvO — VO
Oininooinminin^^ooo®r»voCM ov CM in CM o
vOCMOCMinKVOOOin ^ vo KV
- - ^r- ^ CM
OCMvOOvvOOOvOinKvmovKVCMin — KVM- ^ 00 — KV in
^r^-^KV^OOCMCMincMCMin — ^KVooKV '
m —
oinooininmocMininin»-ooovvoCM ^ ^ KV ^ KV VO
KV —
oinoooininmKV“ * ‘
VO
in CM
sCM ^
ooinooinoin— coin — ov?**• CM — ^
oinmoomininin»-KVCMvO^ — KVvO«— vO*— ^^OOO
o o in o o in inVO in Q CM
CM KV in »- in oin I o o m o m oKV ^ ^ P" KVCM VO P^ — —
OOinminoom— in—^ovQO'^oOO CM KV VO »“ ov
CM r* in KV VO CM CM »- *- CM
oooinininoo^mP^^Q'^CM*-^QOOCTvO'^^KV
inoinininintnmmoO'^CM^CMKvm*-KVooininop^m vOCMKVmOV»-CMCM
inommoinoo^voKvp^ocMinoinooov'^cMvooocM
ov p^VO VO— o
QvOCMKV —^ KV KV OCM ^ ^ OV O
mov^ov — inKvooOOCMKVCMCJVCTVOVP-— in^Kvm
KV'^ — ovoinvovo r^vovoovincMODP^vOincMCMOOOP^m^<7vCM»-»-CMCM^
»- o — CM KV
OOininmOino^aO'VOO^KV^CMCM'itOVKV«»a-CM^»-
oininooinoo— cMinp>*oovoooop-^-tfVKVin-^ooo
inininmoooinP*-KVKV*-00KV^KVvO CM 00 vO CM vO
OV_^KV^^vOOO KV ^ ^ CM CM00 ^ KV vO 00
omooomoovDvOO'^'Oin*—r^CM^KV^inKvr*«vO — ^Oin^»-ooCM in ^ KV vo CMCM
ommoinoomKVOOOOP^r^ — ovKvoomooinooop^
moinoinoinovoininr^r^KVvoCMO r*' vO O' M" O
inmoooinooOvvOinvOCMOvvOOvKVP*-inOOKVvOvO
^ o ^ in ^ — vO CM P>» —
o in o in in o inp^ OO — KV in m»- 00 ov OO VO CM ov
o o m m mvO'T^o*— r^Oin
o o Vo in ^CM —
ZOCMCMOvOKV^KV^ ^CM^U.
u. oCMCM
o in in in o in O— CM O Ov CM KV KVin ov in in o O'
oomininoooCMP^'VCMCMKVO"^vOP^vO'OP^CM'^P**
cc o ! omoinmoZ3«— *-r^^KV0DOva: ov ^ CM CM —
_!OOinooinoo<oinoinp^ — Kvvo0;^<N^a0KVin*“r>*>
I«— *“ in vo »— VO CM CM O O • CM
ooooinoinmooincMP^cMCTvinvoCMinoor^mvoov'^ Qoov^r^ovovov —
inoooininotnvO«-— OOOVVOOOCM^ ^ VO P^ 00 VO
oooinoinooKVvOinCMOOCJvOOOVKV-^CM^KVr^-^
in in KV CM ov
inoininooomO0D00KVC3v^p»lfvVOVO—OOOO—-KV
ooQininomin^VOOCMVOCMCMOOCMKVOVP^^O — KV
oooinminoinp*>von-CMOvKVinKV»-OKVin^»-p>‘00
ininoooininmr^OOCMvOOD'^— O'OOKVin'^OODODvO
^ooovo^r^ovcMTfOKV^vOvOOOCMvOOOOOOKVKVinvO
KVKVOOP-'O'OV*-^ KV p- P~- o CM KVO CM KV ^ ^ 00 ov
KVCM0O0O'^CM'«J-CMov^p^KvoovomKV00 CM ^ ^
Ovp^ — 'Oin'^^OOOOOVCMVOP^*— O'OVOV^O — — CNCM
oooooooo<3vr-»cMooin«-»-Ovovovin^oop^*—
^
oinoinminooovin»-^p^'O00'^OKVOvp-P^CMvO —
inininooinininvOKvcM^r'Ovin'*#'P- — P" KV 0« M-
CM OV <3V O' O'cMin^-voocMP-^vo
p» ^ KV in in
oinooininminoo«— p'-r'-KVvOino^r'VOinovooKVKV
inoininininomvoovinop^^r-ovovo O VO o vO
ooinooinminO^'^^OOvOCDCJ'
KV ^ ov o 00 ovKV KV KV
^CM O' •- in KV
^ Ov ^ ^
minoinoooovOOOKVCMOr-^^^^OOVOOOOCM
Q JZ
°-§ ^« -*- o — _ .
•O C ® U -4- ® _C O jQ «J — ^ ®c — ® -f- c in ^C -H 3 C C «J
«3 £1.
in
0<002c/><CQ
o n _^ — 0^0o +- o — o->-•o C ® U -H «10 O— ^ ®-Hc — ®-»-cin^ —®-4-3C®«J— l»
O < OO Z W < CO
u ox— o X U O X0 -
4- O-H-H inT0C®l_4-Ot_ —O «0J3 O — ^ ®-t-c — ®-f- c tnx —0-4-3C00 — l_0 <OOZtO <£0
— Xo *= J(t 5 o
® oo ox— 0 X 00
l_ +- o t. —0 0X0 — ^®-f-c — ®-t- c tnx —0-4-3C00— UO<OO2:t0<CD
I
88

ir\Oomoir>mooiriLnir\ § m m m oo to 3 too m o mmininomomm p o o o m m o
ov m p^ CM o ® M' s OOPvOOr'O'OO — CM-- — ® in CM 3 mto ^ P-
— — ovX'VMTMrm ft— ® CMM CM — mm'^^oinmin 3 Ov CM P^ p- to 3 — — OVOOVCMIOOCMO — m 3
ft ft ft ft ft ft ft ft
^sOr-tfiCNK^^r'-CN CO CM m to 3 to 3CM — OV ^ OV 3 m to MT m — <7V to CM
®*3 — m to CM 3 3 OV m to o V-€MB O) O 3 r- O to CM < — m o o CM p- m m ® — to ® 3 2 lO< m \0 CM m — — o — P- CM CM CM — — o — 3
L.o GO m vOft ft— CM s3 CM — ft
CM
O omOQir>moif>m^O00''5»n0^r**m o in m o m o o o
CM r- ffl ® moo® Ov ® m o m m o o m m m m m m 1 1 o m s m o m® 3 o o o — t^ ® m CM to ® p- o CM CM ov to m
ovoo — 'om^ir\ o ^ m to CM 3 m OV CM CM 3 o — — to — — — — — 'T CM CMQ. X ft
Ci
— CM 00 — CM 40 — 3 ^ to to CM ovO +• VO m — ^ CM to
t—C 3 o mz loomoooirvom
OvOiTvO — — — r~-rOo in m o m m o o o o m m o o m m o mo o m to p- o m m o 88 m o o m m O m
c o to n* o to m ® m CM Ov m to o ov 3 CM ® CM o CM ooo 1- ® Ovvrv® — ^CMOvvO r- CM to to to — P- 3 n- CM 3 to CM o ^ ® to — — m — — CM — •M-
« % « « « « % % ft ft ft ft ft ft %3 o> lO CM ov to OV CM 00 o — CM — m to ov CM to ov CM P^ CM CM 3
C to — vO OV CM to 3 — — — mCO CO
070 135 595 290 825 100 880 365 920
moo o o o m moo o m m o o o m o m m m o m o o m m m mz — m — O 3 «f — mm m CM ® ov ov p- 3 CM m <3v
8 ov CM o CM(A — CM m ^ 3 CM m P^ Mt — ov 3 3 3 CM Ov P» ® o m ® 3 CM to ® to ® ®
ft ft ft
o OvvOvOvOOv^tOin to to OV VO ^ to VO CM o ov m toovmm 30 P-— p- Ov ov ® p- ^p- m ® -'T ov CM to P-- CM to 3 •M-
£O) VO to o — — ^ P- CM 3 ^ — ... CM ® “S' 3 3
< to — vO ® to m CM — — — ® — to(_ % ft ft %
1o vO ITV m
<CM —
® ffl irvirviTvOicvoQO i
»r> — r-votrvr-io®o m o I 1 1 m 1 75 95 70 H- m o o m Q o Q
P- 3 CM ov 3 — lOm m m o o o o m m s m m O< LU OV CO CM X to to CM ^ — CM to ® 'T
9 o. B CM — ro — CO to X O ® ^ ov P- ^ to CM CM CM — — CM — ®C ffi ft ft ft ft ft ft ft
z c 4- to to to — O to CM CM CM< in ^ mo c 3 ®z u% eo ooinooooo 1
'^•ifvr-cMirvirvovoo o o o m o m o moo O m in o in in o O o 28 o 8 m o o m m
z t- ® — m p^ •M- ^ m m ® CM to — '9-toP-ton> — 3 CM o M- p^vo — to ^ If* ifv — m o — CM to m pft — m Ov m o m CM — o pft — (TV m CM •'T to m • •
CD 3 C3 % ®c r- OV to m 3 CM p^ CM n- to
to CJV — 3 to CM oOf CM — 4.
o 40 3
o oto
irvirMOoirvmoifvo m o m m o o m m o m mto to 3 o m m m o m o m § m m o o m m o m m o mz ^vOfOCM^irvr-QCM— CMlO^tOvOOVOOirv
— vo o m o p- r-- CM O Ov P^ CM ® p- •M- O 8 3 m o mtfl m m CD to CM ^ P- to ov CM ^ rf 3 ov m to- m P-. 00 to ov ® m ov m p- 3C 40 % « ft ft ft ft ft ft ft ft
UJ — •— ^vovO'^vOMrmcM o in pft 3 — to 3 CM ® m — ov 3 p- CM P^ 3 m ®* 3* toO) s — r- to ov
CM OV* ft
to CM CM CM ® m — CM ^ CM P-- CM ®§ <
u5 ov P^ ®
< o > CM — CM 3o XX X X® X Qifvoirvifvoioo 1
^OOlOVOCMCft — tom 1 1 1 1 1 O 1 m m o o o o m m o m m
XCMCMmCMtOftTo m o m O 1 1 m o o o m oX m to pft ^ t-» CM to ftT o CM CM O to m
CL o o — — ^ — OV OV < CM to ® ov CM m Ov toX Co 4- to — CM to to <3V — CM< CM — CMc 3 < 40
“n:e
mifvoirvirvoirio l m o o 1 1 O O 1 m m o o in o in m O in o o ss o o m m m o o o oL. ® < ^tfVP-OVOV^CM^ CM Cft — to — — CM — r- ® fft- to 3 ® 'S’ m •M" ® CM p" m p- to ® CM< CO ^ — CM — to vo CM ® •«r — o ® — 3 P-- 3 CM 3
X 3 O) ft ft ft ft
c CM — CM 3 — to 'S' o to 3*P- 3 p-
ffi
40
irvirvOiTvOOOooOV — •^CMOOvovirvto
m o o o in o in in moo o m o m o m o o m o o o o o m o m in o Oto CO m 3 to — — — m3 O O m — 'T m o m (M m '3' p- — CM in O to 3Z </) •^lO — ®P^CM®r-CM to vO OVt03tOCMOVOO — P- ^ ov ov O — CM to 3 3 to ftT ® 3 CM ® ® m oo c— •— toovov — r-®'^'»TO vo CO CO — Mr ® ^ CM Mf tOOVCN®P-3C^tO P- 'T to CM ov* Ov* CM 3
»- — O) ® — o®CJvr-r^Oirv — CM ^ CM ^ to OV ® — Ov 3 — — ^ CM ^ 3 — CM 3< < •— O'virvcMOCMOtfv CM — — ® to o ® O P^ ® in
_l u ft ®3 o ^ — — — — vOvOCM o CM toa. CM CM 4.o < oX <
moirvooiTvinoirv ffl 4-® o m3 vo
o o o o m m m m o o omooommm o O m m 1 o m m m m o m —vox^r-voox^p- OV P^ P-^ CM o— ® 3 3 rr o
P- CM 3(- ov CM — ^ rr — CM 3 ^ o m to O I"- p- ® m 4.
• c Q. z tovop^^r^vovfv — pft r- n- o — •'T to ^ O 3 — — ® — 3 4.C < ftftftftftftftft ft ft ft ft z ®• o 4- o loovr-ovvoifvinio CO — — 3 i o ^ 3 ^ ov* 1—
CM CM CM ^ CM to vo to CM CMm c 3 CM CM +•in
iij o irvomirvotfvirvoo m m m m in in in o in m m mmmoomoo m o o m o o m O o o m m ®L. ® — CMOicv^ior-vo — CO to to p- — ® p- to 3 CM Ovmp- — ^ — P-® P-- p^ m m to ® o m CM XJ£. ” vooxcMvocMvoirvirv vo OV P^ 3 m m to CM — Ov P- to ov CM CM CM — CM "T a\ ov CM 'T CM m 3< 3 o> ft ft 4-
c ovtomirv^ov — CM CM — CO to — CM to 3 Ov 3 ov CM OV m CM O UCM CM — O — Pft — in MT p- ov 1
^ ® 040 in — z
in in in X<A ® ® ® c
_ ® o oft® o 4. in ® c 4.
«n — c 4- ® — 4- c0 3 — « E C O U 3 > o E C o oo e > — 5 in 3 3 ® £ 0 0 in 3 XO 3 C o 3 ® o o — 3 C u 6 ® o c 3
o —- c l_ « O 0>4- O C X— c X m 10 0)4- o c >•9^,9 J 0- ® > c a a -CO X ® > c o
® 4- 3 CD ® — O — 4- c O 4-0 ® o 4- 4. o inu l. 4- ^ 5 ^ is — ^ to ® 4. SZ 10 o 4_ in ®a — 4.30030 — O <3 in « >- 3^3 — 3 C <J 3 O o O in c >. 3 ®
ffi — VA4-4- 0 — 04-4- 3 0 — c 3 m IA4-4- O — 04- 4- o o — o c •o 4- X 3a. X— U04-4.0C —4-®J^— 030U 3 C c 3 «_ 5 ® ® o — — l_ O 4- l_ ® c •D c c 3 i_ a ® ® o
2 tt: O 4- E l- 4- in 4- ® ^ — O 3 4. (0 O' 10 10 o 4- E 4- 4- m 73— — 3WC4-®— l_ C 40 £ ® in i_ — — — 4- — — 3 in C 4- ® 4. C 40 — f ® in i_ 4- c— l_ — OOC34-® « 40 0 0 N 3 ® c C — 3 — 4. — 10 O C 3 4- ® C 40 O 0 N 3 ® C C 3<x<® 2:oo<»- O 3 X X O < CD 3 3 < O <®<®zoo< h- O X X X O < O X X < O —
89

I—
C ®to O)
Xc ©to Oi
to •to
«uj_l o< 2> •-
q; o
o <
1,
®3 Cl
C ©to O)
S5 :
ifN m o o o if>
_ ON ^ Ki ONvo o vn ID ov ON vo ^ 00 m »- 00
IfN ITN o o<N r* r>* QO O <N ^
IfN ON NO CN C«J KN ON^ ON (N ^ csiO O IfN ITN t'N ^ CN
CM ^
in O — Onoo tn 00 ONOn in CM
00 m CM CM ONCM NO NO c* CMo in CM *-
ON CM CM CM ^CM KN r* CM O00 O •» — CM
in in in o o "o00 CM in ©00 CM CM ON ^ 3« tt> « ©I c
CN ^ifN m in ^ CM«- c
Oy
m in o in oCM NO ON Onm ^ ^ —
in o o in ooo ON m ON inm in KN ^ CM Mf o C* KN ^
in in in o oON m ^ m
in in in m in m oCMo-mNom^ —CM NO — m t- ^
o in in in inm ON m VO m^ in — ^ ON
in o o o inr- CM o CO c*O O CM VO —
in o o o oC' vo m mCM Kl NO fC ON
in m o o inm CM ^ CMNO »- CM CM
00 — in NO MT« « tt • «
CM m 00 o ONtn ^
in in in o o^CMf^c^'a-KN CM in in ON
o in o o o in inm ^ ^ ^ rn ^^ CM ^ 00 O CM
o in o o oCM ON 00 o ino m ON ^ o
o o in o mKN m CM ^— NO o 00 NO
in in o m oOn 00 ON NO in^ Ki VO VO
in o in in oOnOnOnONo—ON ^ ^ ^ ^
o KN o in o^ NO CM r* o^ m ^ Ki vo
CM KN C* m KlCM »- VO ^ Kl CM inm KN
^
KN CO oo CM KNNO in vo •— CMCM —
KN 00 KN CM 00ON ON CM CM ^
CM —
o o in oo in —
o o in in in o inOn in CM ON
in ^ CM mo o in o ooo — in CM o00 CM ON 00 ON
m o O in oKl KN O O QNO CM 00 r** O'
o in o o oNO m c» CMCM NO C«
in m o o in— CM O KN NOCM —
— — CM ^ ^ ^
_jOininoooin3KN*-^P^0Din0O0.— mKN»-KN — o
in o m o inU! CM KN o CM NO_i NO vo o CM
LlI in in in o in_i o 00 r«* Kl ^< in r> p^ ^ 00
I ^
o o in m oON m 00 vO OnCM O — CM
u. o O in o O2 in O CD P^ ONO »- m p' KN
1- Q_ •5J- •"S' VO 00 oo P^ 2 O CM P^ KN Lu kn »- vo in O' QC KN © O' in O < CM ^ CO4, 4,2, 6.
o 00 CM ^ ^ ^ CM u. "sr CM © in CM ^ QC _J CM
©1— »— in o m o m in 1 o in o o 1 ©mill O O 1 1 1
©cr
in in 1 1
<cr
1 © in O 1 in t— Q. O o 00 in CM ^ p^ ^ ^ ^ ^ KN NO in »— •— Q; KN
m o m o in in o^ ^ CM ^ in —CM ^
KN ON CM NO KN CM P^^ r* in CM in in in00 o «- ON ON CM in
o o o in in in oin Kl oo ^ vo ^
p-* m ^ CM
NO CM ^ »-
10515 70 o o 1 in o
*- KN KN ^ © © 1 in inin CM CM © © 1 1 1 1 in in 1 © ©
in — CM ^
1,897,555 1,025,490
498,300 122,720 251,040
1,945,785 1,053,905
455,525 130,180 306,170
3,409,260 1,913,255
827,445 213,205 455,360
in © in © min p^ © p^ CM© © "tP KN Kl
CM © © © ©00 CM CM ^
in in m in inP^ © CM CM
© CM © Kl in
CM © © © CMin KN © KN ©KN ^
3,115 1,335
790 400 600
in o in in oCM ON P~© KN NO Kl vo
KN *-
in m m in inCM CM © P"CM KN CM in ©in CM «- —
in © in © ©in ^ MT KN ^CM —
© in in in inp*. © © CM© CM ^ ^ —
in in o o o in oNO o r- 00 ovO NO O' P^ NO O KN
o m o in oin *- oo 00 r*^ o — KN in
o in in o oCM NO KN ON KNin vo ^ vo
in m in o oin CM CM vovO O KN vo vo
in in o o oKN P^ O vO OCM — KN •<«" KN
O O O O OOO P^ P^ O ^P» O' O Kn
ON KN 00 O P^
1. ^ ^ O O O© 00 00 p^ NO in ©0. I I I I I y^ ^ ^ ^ vo o— a\ ^ O' ©< ^ — ^ ^ m
u •“ o o© 00 vo in ©0. I I I t-
«-» •- vO O-voin^>-— O' O' ON ©< ^ CD
u ^ o o© 00 vo in ©0. I I I u^ ^ vo O“'Oin^'«“
ON ON ON ©< ^ ^ ^ CD
l- »- O O© 00 vo in ©0. I I I u^ vo O
in ^ H-ON O' ©— CD
1- •- o o© 00 NO m ©
I > k^ ^ vo O-NOin'^H-— O' O' O' ©
1- «- o o ^© 00 NO in ©0. I I I y^ ^ NO O— vo in •<S- 'p;— O' O' O' ©< ^ ^ — CD
I
90

TABLE
52.7;
IMMIGRANT
POPULATION
BY
PERIOD
OF
ARRIVAL,
SEX,
RURAL-URBAN
STATUS
AND
ETHNIC
ORIGIN,
CANADA
AND
PROVINCES,
1901
l/l o o ifi o o lo m^ Ki <N in r»in in in ovO CM in Kl
o o in in o in m in Q O O00 00
m o m m o m m m m mc m O 00 vO Kl CN 'O Kl vO O' lO 8 Kl oo P vo— in r* m m o\ m m O ^ CN vO P~ in CN vo r* oo Kl o CN m m p* o p. vO ^ P •
—
CMto *0) Ik *
< O' m vo n* oo ^ OI 00 P>* oo 00 (3i O OI CN tOKl OO
— Kl Kl vo N- S CM vO vO2 z C4cso\m’»rio.- o vO m to vO CN in (N Kl O' —
•
CM •—E3
o \o m ^ ^ m — Kl in CN *—
0 o lo o o o o min m m m ^ OI vo
o m m op5 oo OO vO
in o o o m o in in in m m O 1 1 1 m o O O 1
o c 1 00 p» in Kl r* in Kl oo p>» m <^ — lO CN10 jQ. vo ^ m <N m CM vO Kl O' m
3I/I c z *—
+• a1. 1 in in in o in o If! O in in in o in o o in in
(31 (31O in o m in o m m m m m m m o m
CD o c 4) 00 vO OI <N CM vO CM CM CM 00 (N Kl O CM (31 CO vo 00 p» P CM CM O' (O' CM K N-o lO m m 00 Oi lO CN m in m 00 00 Kl Kl Kl P^ O ''T vo P* O —- oo •
—
—
•
mto o> •
\0 K> CM in Kl
I/I in o o in o o o o o m m o in in m m m in m o o in o m m o m m m c m oc \0 ^ CM CM K> OI p>* o o — in (31 ^ o Kl — Kl ^ vo o <31 p ^ CM m lO Kl vo m CM— CM in m in o m OI vo vo in Kl p^ (31 vo Kl o O' »o P* O' 00 VO Kl oo o m CM oCl % «
< m 00 lO p^ •—lO OI CM vo n* CM vo
(31 O CM vO in in o ^8 vO p“ (D m ^ Kl w- vO vo* CM (Nu OO C3I K\ p^ O' Kl Kl vo — ^ Kl
10o m.- — Kl
+-o in in m Q m in o
p~ o *- OI — o ino o o oCN o p~
O m m in o o in m in in o m m 1 O 1 o o m o m<5 c m O P' N- "«r o — OI P* CN vO ,
—
o ^ r— CM CMo — Q. r^'^rcM.-.-.-.- ^ CM — Kl CN vo Kl *— —
< "c
*io
z
L.
JC 1 o m in o in in in o in in o in in m o in m in m o in o O o o o o m m o o O3 c 0 CM o ^ OI m 00 m CM (31 o O 00 o Kl 1^ in Kl CN vO N- Kl P vo oo CM Kl o m m— m OI ^ o m m ^ vo CM CM ^ in 00 CM 00 o oo in O' «— 00to O)
CM CN 00 vO — in C3i — in CM —2o z
I/I zc <inmOinOinin o m o in m in in in m m o inO CM
mom a: o O m(N CM
m m u. m m m LTV o_l«»tNr'in^vO — in — vo ^ m UJ OI oo 2 Kl CN < Kl m 2 O 00 (3i (O' K— C31 rsoocMinion- — 1^ UJ CN (31 CD OI in _i in m 00 (N < O CN m CD 'a- Li_ (31 (31 (D VO m O (31 O Kl vo P< < CQ 2
c u OCNiovocjioino i o (N in — (31* Z CM Kl Kl cr 00 (N 00 Kl Kl _J VO P Kl ,
—
CM10 o 0. 00 CM — ^ UJ N" CM => in CN CN < _JX u. QC <
1
JO <inininooino60 55 30 o s in o ^8 o m m O
o: m 1 1 1 m (T=0 o 1 m 1 m
o c — a. h-»OOiO^^.-P^ p^ in Kl CM «
—
«
—
(T m w— K4- o 3 O CM —c •— Z -i- i-
c
«} Qto L.
1 o o o in in o o o o o in in O o in o in in m m m m o O m O o O m 1 o o=3 C 0 in OO CM CM CM vo OI CM oo vo in in o ^ in vo oo 00 vo Kl p- — tT 00 P N- CM
•— — \o CM CM in lO — .-CM vo (N OI —
-
— ^ Kl p vo voto oi
lO in CM Kl* CM Kl *“
I/I O in in in in o o in in o o o § m o00 O'o o o o mom o O m o m o m o O m
c CMCM.-OOIC3I.- CM Kl O .- 00 00 Kl CM Kl m Kl vo vO P p m Kl Kl P (N*“ CM — O C^ (31 vo C3I P^ — 00 in —- CM o o Kl CM ^ vO o 00 O' (31 O -VJ- z o (TVo>< — ^ 00 CM VO — lO OI CM ^ in vO in Kl vo O in CM ^ O' C3I CN ml- 'i- lO ^ CM CM m vo m — r* Kl — CM CM VO (N CMo
o 01— o in o in o o o o o in m in in in o 1 in in o O O Om Kl C3I
o m 1 1 m m m 1 m mo C — C3. o vo in in m m ^ P>» Oi ^ OI c^ C3i vo Kl OI CM Kl P Kl CM-t- O 3 CN N- —Z 4-c Ccz; o
L.1 o o o in in o om VO VO OI Ki vo 00
o o in o o o in o in oOImom m o o o m m o o m m3 C O CM •.T lOo m O CM vo CM C3I p ^ —
-
vo vo 00 Kl vO oo•“ ^ p~ m m CM 00 in c^ ^ m oo vo N" vO 00 Kl N- Kto OI
O — VO in (N in Kl 00
I/I vO in lO in VO «/) vo (A vO lA vO
CN § s;•oo a o
o O'T3o
N-OI
TT<31
T30
r:r: o o o W — o o u o o u ^ o o U o o U o o0) 00 00 p' vo in ® ® 00 vo in ® 0 00 vO in ® ® 00 vo m ®
1 1 u® 00 vo
1 1
m1
® ® 00 vo m ®t- 0. 1 1 1 1 1 c 0. 1 1 1 0. 1 1 1 u 0. 1 0. U 0. 1 1 1 uo *r
•“*r 0 vO 0 vo 0 vo O vO 0 vo 0
0. -vop'voin^M-—• Oi OI Oi Oi OI ®-voin'VH-— OI OI O' ® n vo in
C3V (3V><r H-O' ® = 8 m H-
Oi Oi ®~ vo m
O' OITrOI 5
m(3v (O' ®c CD < CD < — CD < (D < — — — CD
9 1
'Includes
Yukon
and
Northwest
Territories;
^Period
of
Immigration
Is
for
first
five
months
of
the
year
In
1981
Source:
C9.
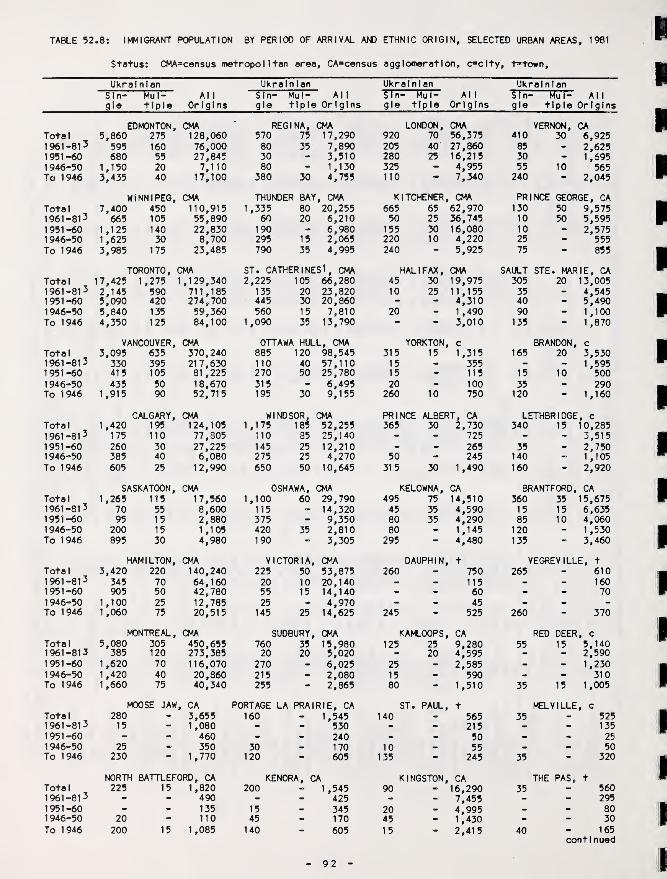
TABLE 52.8: IMMIGRANT POPULATION BY PERIOD OP ARRIVAL AND ETHNIC ORIGIN, SELECTED URBAN AREAS, 1981
Status: CMA=census metropolitan area, CA»census agglomeration, c*clty, t»town.
Ukrainian Ukrainian Ukrainian UkrainianSin- Mu I- All Sin- Mul- All Sin- Mu I- AM Sin- Mu I- Allgte tiple Origins gle tiple Origins gle tiple Origins gle tiple Origins
EDMONTON. CMA REGINA, CMA LONDON, CMA VERNON, CATotal 5,860 275 128,060 570 75 17,290 920 70 56,375 410 30 6,9251961 -01
5
595 160 76,000 80 35 7,890 205 40 27,860 85 - 2,6251951-60 680 55 27,845 30 - 3,510 280 25 16,215 30 - 1,6951 946-50 1,150 20 7,110 80 - 1,130 325 - 4,955 55 10 565To 1946 3,435 40 17,100 380 30 4,755 110 - 7,340 240 - 2,045
WINNIPEG. CMA THUNDER BAY’, CMA KITCHENER , CMA PRIINCE GEORGE, CATotal 7,400 450 110,915 1,335 80 20,255 665 65 62,970 130 50 9,5751961-813 665 105 55,890 60 20 6,210 50 25 36,745 10 50 5,5951951-60 1,125 140 22,830 190 - 6,980 155 30 16,080 10 - 2,5751946-50 1,625 30 8,700 295 15 2,065 220 10 4,220 25 - 555
To 1946 3,985 175 23,405 790 35 4,995 240 - 5,925 75 - 855
TORONTO, CMA ST. GATHER INESl, CMA HALIFAX, CMA SAULT STE. MARIE. CATotal 17,425 1,275 1,129,340 2,225 105 66,280 45 30 19,975 305 20 13,0051961-813 2,145 590 711,185 135 20 23,820 10 25 11,155 35 - 4,5451951-60 5,090 420 274,700 445 30 20,860 - - 4,310 40 - 5,4901946-50 5,840 135 59,360 560 15 7,810 20 - 1,490 90 - 1,100To 1946 4,350 125 84,100 1,090 35 13,790 - - 3,010 135 - 1,870
VANCOUVER, CMA OTTAWA HULL, CMA YORKTON , c BRANDON, cTotal 3,095 635 370,240 885 120 98,545 315 15 1,315 165 20 3,5301961-813 330 395 217,630 110 40 57,110 15 - 355 - - 1,5951951-60 415 105 81,225 270 50 25,780 15 - 115 15 10 5001 946-50 435 50 18,670 315 - 6,495 20 - 100 35 - 290To 1946 1,915 90 52,715 195 30 9,155 260 10 750 120 - 1,160
CALGARY, CMA WINDSOR, CMA PRINCE ALBERT. CA LETHBRIDGE » cTotal 1,420 195 124,105 1,175 185 52,255 365 30 2,730 340 15 10,2851961 -81
3
175 110 77,805 no 35 25,140 - - 725 - - 3,5151951-60 260 30 27,225 145 25 12,210 - . 265 35 - 2,7501 946-50 305 40 6,080 275 25 4,270 50 - 245 140 - 1,105To 1946 605 25 12,990 650 50 10,645 315 30 1,490 160 2,920
SASKATOON, CMA OSHAWA, CMA KELOWNA, CA BRANTFORD, CATotal 1,265 115 17,560 1,100 60 29,790 495 75 14,510 360 35 15,6751961-813 70 55 8,600 115 - 14,320 45 35 4,590 15 15 6,6351951-60 95 15 2,880 375 - 9,350 80 35 4,290 85 10 4,0601946-50 200 15 1 ,105 420 35 2,810 80 - 1,145 120 - 1,530To 1946 895 30 4,980 190 - 3,305 295 - 4,480 135 - 3,460
HAMILTON, CMA VICTORIA. CMA DAUPHIN , t VEGREVILLE, t
Total 3,420 220 140,240 225 50 53,875 260 - 750 265 - 6101961-813 345 70 64,160 20 10 20,140 - - 115 - - 1601951-60 905 50 42,700 55 15 14,140 - - 60 - - 701 946-50 1,100 25 12,785 25 - 4,970 - - 45 - - -
To 1946 1,060 75 20,515 145 25 14,625 245 - 525 260 - 370
MONTREAL, CMA SUDBURY, CMA KAMLOOPS , CA RED DEER » cTotal 5,080 305 450,655 760 35 15,980 125 25 9,280 55 15 5,1401961-813 385 120 273,385 20 20 5,020 - 20 4,595 - 2,5901951-60 1,620 70 116,070 270 6,025 25 - 2,585 - - 1,2301946-50 1,420 40 20,860 215 - 2,080 15 590 - - 310To 1946 1,660 75 40,340 255 - 2,865 80 - 1,510 35 15 1,005
MOOSE JAW, CA PORTAGE LA PRAIRIE, CA ST. PAUL, t MELVILLE, cTotal 280 - 3,655 160 - 1,545 140 565 35 - 5251961-813 15 - 1,080 - 530 - 215 - - 1351951-60 - - 460 - 240 - 50 - - 251 946-50 25 - 350 30 170 10 55 .. - 50To 1946 230 - 1,770 120 605 135 245 35 - 320
NORTH BATTLEFORD, CA KENORA, CA KINGSTON, CA THE PAS, tTotal 225 15 1,820 200 - 1,545 90 - 16,290 35 5601961-813 - - 490 - 425 - - 7,455 - 2951951-60 - - 135 15 345 20 - 4,995 _ 801 946-50 20 - 110 45 170 45 - 1,430 - 30
To 1946 200 15 1,085 140 605 15 - 2,415 40 165continued
92

TABLE 52^: IMMIGRANT POPULATION BY PERIOD OF ARRIVAL AND ETHNIC ORIGIN, SELECTED URBAN AREAS, 1981
Status: CMA=census metropolitan area, CA=census agglomeration, c*clty, t=town.
Ukrainian Ukrainian Ukrainian Ukrainian
Sin- Mul- Allgle tlple Origins
Sin- Mul- Allgle tlple Origins
Sin-gle
Mul-tiple
Al 1
OriginsSingle
- Mul- Alltlple Origins
TotalGRAND PRAIRIE, c80 - 2.450 165
SARNIA, CA15 14,370
GUELPH,140 25
CA16,185 80
KAMSACK, t200
1961-813 - - 1,275 - - 7,310 20 - 7,820 - - 30
1951-60 . . 430 45 - 3,960 70 - 5,165 - - 15
1946-50 10 - 160 45 - 1,195 15 - 1,170 - - 20
To 1946 60 - 585 80 - 1,905 40 - 2,025 70 - 135
MEDICINE HAT. CA THOMPSON, CA TINWINS, c SMOKY LAKE , t
Total 65 15 5,680 - - 1,600 140 25 4,410 140 - 2001961-813 - 15 1,725 - - 1,150 - -
1 ,075 - - 40
1951-60 - - 1.485 - 345 30 - 1,455 15 - 25
1 946-50 25 - 485 - 70 25 - 365 - - -
To 1946 40 - 1,985 - 40 80 15 1,515 115 - 135
Total 115SELKIRK . t
935 90SYDNEY, 2 CA
20 3,660FORT FRANCES, t
45 10 1,025NORTH BAY
50, CA4,195
1961 -81
3
- - 345 - 20 1,270 - 10 245 - -1 ,425
1951-60 . - 280 • 530 - - 230 - -1 ,430
1946-50 10 - 95 - 305 - - 85 15 - 480
To 1946 95 - 220 85 - 1,560 40 - 465 15 - 860
TotalNANAIMO,
80CA10,195
CHILLIWACK, CA130 45 8,170
PENTICTON110
1 , c4,485 75
WYNYARD, t245
1961 -81
3
10 - 4,380 - 15 2,550 10 -1 ,320 - - 65
1951-60 - - 2,660 35 15 2,495 - - 1,170 - - -
1946-50 15 - - 795 10 810 - - 295 - - -
To 1946 50 - 2,375 75 10 2,325 85 - 1,700 75 - 175
Total 155CANORA, t
255FLIN FLON, CA
50 - 815PORT80
ALBERNI, CA- 5,130 140
ITUNA, t165
1961 -81
3
- - 10 - 280 - - 2,030 10 - 101951-60 - - 20 - 85 10 - 1,955 - - -
1 946-50 25 - 30 15 90 45 - 390 - - -
To 1946 125 - 195 30 360 10 - 755 130 - 150
^The full name Is St. Catherlnes-Nlagara CMA; Qf Sydney CA and Sydney Mines CA. Vor firstfive months of the year In 1981. Source: C21.
93
SECTION 62
MARITAL AM) FAMILY STATUS
William Darcovich
In this section marital data refer to the conjugal status of the population, or the number of
single, married, common-law, widowed, separated and divorced persons; family data refer to the
classification of families by type (structure), size, and ethnic Intermarriage of spouses. These
data are useful In determining the extent of ethnic group Integration with Canadian marital and
fam 11 y II festy I es.
Marital status applies to persons 15 years of age and over. Its six categories are defined
as follows (A1, p.33):
- single refers to persons who never married and to persons whose marriage was annuled.
- married refers to persons whose spouse Is living unless the couple Is separated or divorced.
- common- 1 aw refers to any case of a couple living together In this type of union (A2, p.168).
- widowed refers to persons who have lost their spouse through death and have not remarried.
- separated refers to persons who have separated due to desertion, marriage breakdown or
because they no longer want to live together, but have not obtained a divorce.
- divorced refers to persons who have obtained a legal divorce and have not remarried.
In 1971 the definition of marital status categories (Table 62.1) was similar to 1981 except
that the common- 1 aw relationship was Included with the married (A9, p.25).
There was a tendency In the past for respondents to report single, married or widowed Instead
of the common-law, divorced, or separated conditions (E2, p.728), and the further tendency In
census publications to group socially sensitive conditions with other categories. For example,
the divorced were Included with the widowed, and the separated were Included In some censuses with
the married and In others with the widowed and divorced. In 1971 the separated, widowed and
divorced were shown separately only In special tabulations (E2, pp.729, 748-9). With the Increas-
ing public acceptance of these conditions, and their likely more accurate reporting In 1981, the
six marital conditions are shown separately In this Section.
According to the census family concept of Statistics Canada (A1, p.59), a family refers to a
husband and wife with or without children or to a lone parent of either sex with one or more
children. Common-law relationships are Included with husband-wife families. For purposes of this
Section, the husband Is the head In husband-wife families.
Children are defined as sons or daughters (Including adopted or step children) who have never
married, regardless of age and are living In the same dwelling as their parents (A1, p.61).
Family size refers to total family members, parent(s) and children, living at home.
The same concept of the census family was also used In the 1971 census. There are very
little family data In the Compendium.
94 -

Tables 62.1 and 62.2, the orientation tables of this Section, provide an overview of the
marital and family classifications; they also show corrected 1981 series which may be compared
with 1971. The marital data In Table 62.1 Is cross-classified by province, sex and rural-urban
status In Table 62.3; by province and age In Table 62»4; and by 60 urban areas In Table 62.5.
Tables 62.6 and 62.7 are based on the classification of families shown In Table 62.2 except
that male and female lone parent families are combined, due to the small number of the former.
Into the category lone parent families. Families are cross-classified In Table 62.6 by province,
family size, family structure, and place of birth and rural-urban status of family head; and In
Table 62.7 by 60 urban areas, family structure and place of birth of family head.
In Table 62.8, husbands In husband-wife families are classified by ethnic origin, province
and ethnic origin of wife; conversely In Table 62.9, wives In husband-wife families are classified
by ethnic origin, province and ethnic origin of husband. The tables are useful In showing the
rates of Intermarriage of Ukrainian husbands and wives In 1981 and 1971. Counterpart data for
1961 and 1951 are In the Compendium (E2, pp.780-1).
Historical comparisons In Table 62.1 and 62.2 are based on corrected 1981 data which are
conceptually comparable with ethnic data In 1971. There cannot be a category-by-category matching
with 1971 series as common-law relationships and male and female lone parent families were not
available as separate categories In 1971. In Table 62.1, In comparing marital components with the
counterpart population 15 years of age and over, the proportion of divorced persons of Ukrainian
origin Increased sharply from 1.6$ (100 x 7100/435,100) In 1971 to 2.9^ (100 x 15,185/522,275) In
1981; In Table 62.2 the proportion of lone parent to total families Increased from 8.9$ In 1971 to
10.4$ In 1981.
Users may make additional corrections to 1981 data on their own by reference to the method
outlined In the Technical Appendix (p.109), allowing historical comparison of provincial and other
series.
Counterpart 1971 data for the main tabulations are In the Compendium (E2): pp.737-42, 748-9
for Table 62.3; pp.750-61 for Table 62.4; pp.743-9 for Table 62.5; p.778 for Table 62.6. There
are no counterpart 1971 data In the Compendium for Table 62.7.
- 95
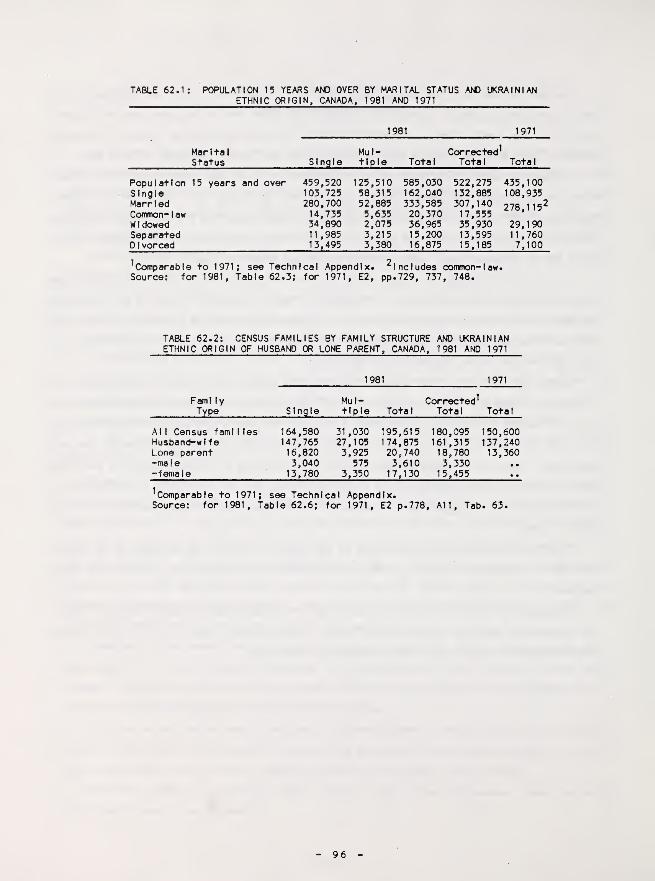
TABLE 62. t: POPULATION 15 YEARS AND OVER BY MARITAL STATUS AfC UKRAINIANETHNIC ORIGIN, CANADA, 1981 AND 1971
Mar I ta
1
Status
1981 1971
SingleMul-tiple Total
Corrected^Total Total
Population 15 years and over 459,520 125,510 585,030 522,275 435,100Single 103,725 58,315 162,040 132,885 108,935Married 280,700 52,885 333,585 307,140 278,1 15^Common- 1 aw 14,735 5,635 20,370 17,555W I dowed 34,890 2,075 36,965 35,930 29,190Separated 11,985 3,215 15,200 13,595 11,760D I vorced 13,495 3,380 16,875 1 5 , 1 85 7,100
1 5Comparable to 1971; see Technical Appendix. Includes common- 1 aw.Source: for 1981, Table 62.3; for 1971, E2, pp.729, 737, 748.
TABLE 62.2: CENSUS FAMILIES BY FAMILY STRUCTURE AND UKRAINIANETHNIC ORIGIN OF HUSBAND OR LONE PARENT, CANADA, 1981 AND 1971
FamI lyType
1981 1971
SingleMul-tiple Total
Corrected^Total Tota 1
A1 1 Census fami 1 les 164,580 31 ,030 195,615 180,095 150,600Husband-w 1 f
e
147,765 27,105 174,875 161,315 137,240Lone parent 16,820 3,925 20,740 18,780 13,360-male 3,040 575 3,610 3,330 •
.
-female 13,780 3,350 17,130 15,455 ..
^Comparable to 1971; see Technical Appendix.Source: for 1981, Table 62.6; for 1971, E2 p.778. All, Tab. 63.
96
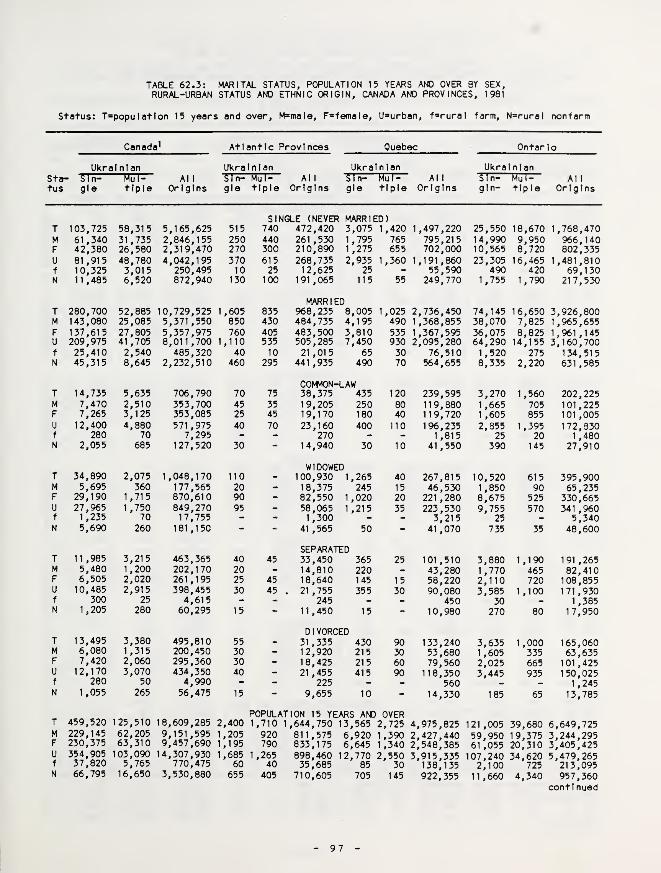
TABLE 62.3: MARITAL STATUS, POPULATION 15 YEARS AND OVER BY SEX,RURAL-URBAN STATUS AND ETHNIC ORIGIN, CANADA AND PROVINCES, 1981
Status: T=populatlon 15 years and over, M=male, F=female, U»urban, f=rural farm, N»rural nonfarm
Canada^ Atlantic Provinces Quebec Ontario
Ukrainian Ukrainian Ukrainian UkrainianSta- Sin- Mul- Al 1 Sin- Mul- All Sin- Mul- Al 1 Sln- Mul- Al 1
tus gle tiple Origins gle tiple Origins gle tiple Origins gln- tiple Origins
SINGLE (NEVER MARRIED)T 103,725 58,315 5,165,625 515 740 472,420 3,075 1,420 1,497,220 25,550 18,670 1,768,470M 61,340 31,735 2,846,155 250 440 261 ,530 1,795 765 795,215 14,990 9,950 966,140F 42,300 26,580 2,319,470 270 300 210,890 1,275 655 702,000 10,565 8,720 802,335U 81,915 48,780 4,042,195 370 615 268,735 2,935 1,360 1,191,860 23,305 16,465 1,481,810f 10,325 3,015 250,495 10 25 12,625 25 - 55,590 490 420 69,130N 11,485 6,520 872,940 130 100 191,065 115 55 249,770 1,755 1,790 217,530
MARRIEDT 280,700 52,885 10,729,525 1,605 835 968,235 8,005 1,025 2,736,450 74,145 16,650 3,926,800M 143,080 25,085 5,371,550 850 430 484,735 4,195 490 1,368,855 38,070 7,825 1,965,655F 137,615 27,805 5,357,975 760 405 483,500 3,810 535 1,367,595 36,075 8,825 1,961 ,145U 209,975 41,705 8,011,700 1,110 535 505,285 7,450 930 2,095,280 64,290 14,155 3,160,700f 25,410 2,540 485,320 40 10 21,015 65 30 76,510 1,520 275 134,515N 45,315 8,645 2,232,510 460 295 441,935 490 70 564,655 8,335 2,220 631 ,585
C0^t^N-LAWT 14,735 5,635 706,790 70 75 38,375 435 120 239,595 3,270 1,560 202,225M 7,470 2,510 353,700 45 35 19,205 250 80 119,880 1,665 705 101,225F 7,265 3,125 353,085 25 45 19,170 180 40 119,720 1,605 855 101 ,005U 12,400 4,380 571,975 40 70 23,160 400 no 196,235 2,855 1,395 172,830f 280 70 7,295 - - 270 - - 1,815 25 20 1,480N 2,055 685 127,520 30 - 14,940 30 10 41,550 390 145 27,910
WIDOWEDT 34,890 2,075 1,048,170 110 - 100,930 1,265 40 267,815 10,520 615 395,900M 5,695 360 177,565 20 - 18,375 245 15 46,530 1,850 90 65,235F 29,190 1,715 870,610 90 - 82,550 1,020 20 221,280 8,675 525 330,665U 27,965 1,750 849,270 95 - 58,065 1,215 35 223,530 9,755 570 341 ,960f 1 ,235 70 17,755 - - 1,300 - - 3,215 25 - 5,340N 5,690 260 181,150 - - 41,565 50 - 41,070 735 35 48,600
SEPARATEDT 11,985 3,215 463,365 40 45 33,450 365 25 101 ,510 3,880 1 ,190 191 ,265M 5,480 1,200 202,170 20 - 14,810 220 - 43,280 1,770 465 82,410F 6,505 2,020 261,195 25 45 18,640 145 15 58,220 2,110 720 108,855U 10,485 2,915 398,455 30 45 . 21,755 355 30 90,080 3,585 1,100 171,930f 300 25 4,615 - - 245 - - 450 30 - 1,385N 1,205 280 60,295 15 - 11,450 15 ” 10,980 270 80 17,950
D 1 VORCEDT 13,495 3,380 495,810 55 - 31,335 430 90 133,240 3,635 1,000 165,060M 6,080 1,315 200,450 30 - 12,920 215 30 53,680 1,605 335 63,635F 7,420 2,060 295,360 30 - 10,425 215 60 79,560 2,025 665 101,425U 12,170 3,070 434,350 40 - 21,455 415 90 118,350 3,445 935 150,025f 280 50 4,990 - - 225 - - 560 1,245N 1,055 265 56,475 15 - 9,655 10 - 14,330 185 65 13,785
POPULATION 15 YEARS AND1 OVERT 459,520 125,510 18,609,285 2,400 1,710 1,644,750 13,565 2,725 4,975,825 121 ,005 39,680 6,649,725M 229,145 62,205 9,151,595 1,205 920 811,575 6,920 1,390 2,427,440 59,950 19,375 3,244,295F 230,375 63,310 9,457,690 1,195 790 833,175 6,645 1 ,340 2,548,385 61 ,055 20,310 3,405,425U 354,905 103,090 14,307,930 1,685 1,265 898,460 12,770 2,550 3,915,335 107,240 34,620 5,479,265f 37,820 5,765 770,475 60 40 35,685 85 30 138,135 2,100 725 213,095N 66,795 16,650 3,530,880 655 405 710,605 705 145 922,355 11,660 4,340 957,360
contI nued

TABLE 62.3s MARITAL STATUS, POPULATION 15 YEARS AND OVER, BY SEX,
RURAL-URBAN STATUS AND ETHNIC ORIGIN, CANADA AND PROVINCES, 1981
Status: T=populatlon 15 years and over, M=male, F=female, U*urban, f=rural farm,N=rural nonfarm
Manitoba Saskatchewan A i berta British Columb 1 a
Ukrainian Ukrainian Ukrainian Ukrainian
Sta- Sln-tus gle
Mul- Alltiple Origins
Sin-gle
Mul-tiple
Al 1
OriginsSin-gle
Mul-tiple
Al 1
OriginsSln-gln-
Mul-tiple
Al 1
Origins
T 19,950 7,975 211,100 14,830SINaE (NEVER MARRIED)
5,585 191,835 28,110 13,005 470,050 11,405 10,740 539,270M 11,690 4,445 116,795 9,035 3,035 111,640 16,485 7,160 279,505 6,965 5,835 306,300F 8,265 3,525 94,305 5,805 2,550 80,190 11,625 5,845 190,545 4,440 4,905 232,970U 14,695 6,630 154,415 9,405 4,025 117,255 21,645 10,665 378,790 9,325 8,875 441,130f 2,575 480 21,485 3,260 840 37,505 3,775 1,115 41,365 190 135 12,800N 2,680 860 35,190 2,170 720 37,075 2,690 1,225 49,890 1,895 1,730 85,340
T 51,740 7,085 452,870 40,360 5,100MARRIED
434,405 70,225 12,050 962,530 34,060 9,915 1,224,330M 25,910 3,445 226,610 20,605 2,500 217,825 35,925 5,580 482,765 17,235 4,725 613,060F 25,835 3,645 226,255 19,760 2,605 216,575 34,300 6,470 479,770 16,820 5,190 611,265U 36,390 5,495 319,115 23,990 3,450 245,790 50,185 9,470 730,450 26,130 7,495 941,525f 5,670 440 44,740 8,565 760 88,705 8,835 895 91,130 710 130 28,700N 9,680 1,150 89,015 7,805 890 99,910 11,200 1,685 140,950 7,215 2,285 254,105
T 2,300 600 23,670 1,365 390COMMON-LAW
19,145 4,215 1,415 78,865 2,980 1,415 101,130M 1.155 290 11,860 700 175 9,525 2,170 610 39,540 1,430 590 50,580F 1,145 315 11,810 665 215 9,620 2,045 810 39,300 1,550 825 50,555U 1 ,965 550 18,925 1,075 315 13,535 3,650 1,290 68,245 2,330 1,115 76,550f 45 - 450 70 20 1,035 110 10 1 ,285 25 - 960N 285 40 4,290 220 60 4,580 445 120 9,340 625 290 23,620
T 7,680 430 50,755 5,235 325WIDOWED
44,700 6,700 345 68,990 3,350 315 117,670M 1,175 60 8,200 755 65 7,330 1,115 65 11,370 540 60 20,025F 6,505 365 42,555 4,480 265 37,370 5,580 280 57,615 2,815 260 97,645U 5,635 355 39,345 3,435 240 28,535 4,840 290 55,365 2,965 255 101,875f 410 30 1,580 380 20 2,635 390 15 2,760 25 - 920N 1,640 40 9,830 1,425 65 13,535 1 ,470 45 10,860 365 65 14,875
T 2,140 405 19,500 1,200 270SEPARATED
14,425 2,280 505 35,905 2,055 765 66,150M 1 ,010 195 8,640 530 80 6,475 1 ,025 150 16,400 880 275 29,540F 1,130 210 10,865 660 185 7,950 1,255 355 19,510 1,170 490 36, ,610U 1,860 375 16,670 930 235 10,715 1 ,985 455 31,375 1,725 670 55,130f 70 - 365 90 - 785 75 - 850 25 - 535N 205 35 2,465 175 25 2,925 220 40 3,685 305 90 10,490
T 1,925 375 18,050 1,145 230DIVORCED
13,525 3,855 850 56,285 2,420 820 77,180M 825 175 7,405 600 100 6,005 1,795 360 24,785 1,010 315 31,405F 1,105 200 10,645 550 130 7,520 2,060 490 31,500 1,415 505 45,775U 1,735 340 15,860 925 195 10,640 3,450 785 50,545 2,125 720 66,650f 50 - 370 80 25 765 110 10 1,285 35 - 545N 140 35 1,825 140 15 2,125 290 50 4,455 260 95 9,990
T 85,740 16,875 775,940 64,135POPULATION 15
11,905 718.035YEARS AND OVER115.385 28.170 1 ,672,620 56,265 23,975 2,125,735
M 41,760 8,610 379,505 32,220 5,960 358,805 58,520 13,915 854,360 28,060 11,800 1,050,915F 43,980 8,260 396,435 31 ,915 5,950 359,230 56,865 14,255 818,260 28,210 12,175 1,074,815U 62,290 13,740 564,335 39,755 8,455 426,465 85,760 22,955 1 ,314,755 44,590 19,135 1,682,870f 8,820 970 68,990 12,440 1,665 131,430 13,305 2,050 138,685 1,010 285 44,450N 14,630 2,160 142,615 11,935 1,780 160,145 16,320 3,165 219,180 10,670 4,560 398,415
1 1ncludes Yukon and Northwest Territories.Source: Cl 3.
98
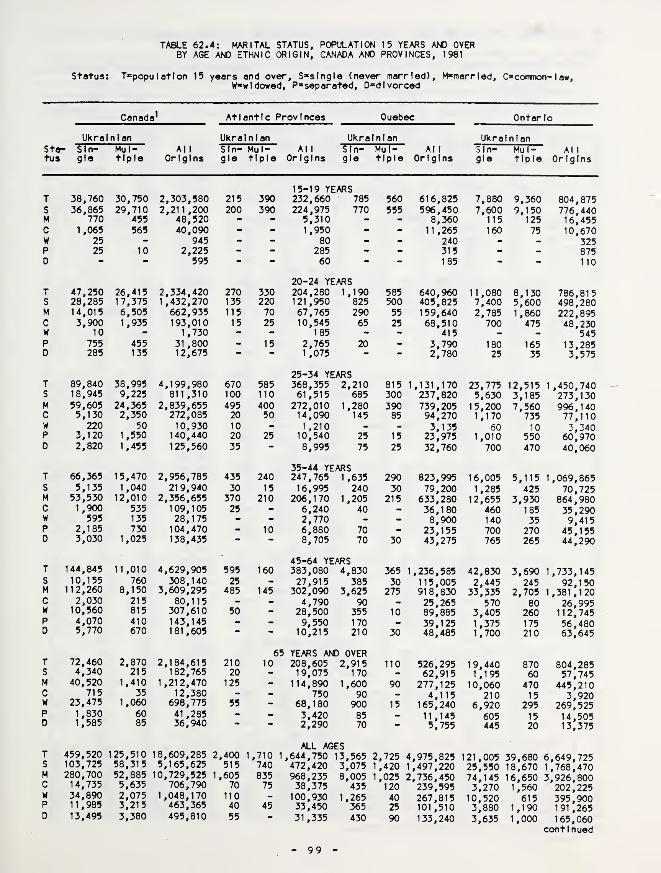
TABLE 62.4: MARITAL STATUS, POPULATION 15 YEARS AND OVERBY AGE AND ETHNIC ORIGIN, CANADA AND PROVINCES, 1981
Status: T*populatIon 15 years and over, S“slngle (never married), M«marrled, Ocoiwnon- 1 aw,W»w1dowed, P’separated, 0=dlvorced
Canada^ Atlantic Provinces Quebec Ontario
Ukrainian Ukrainian Ukrainian Ukral n I anSta- Sln-tus gle
Mul-tiple
Al 1
OriginsSin-gle
Mul-tiple
AI
1
OriginsSin-gle
Mul-tiple
Al 1
Origins3 1 n—gle
Mul-tiple
Al I
Origins
T 38,760 30,750 2,303,580 215 39015-19 YEARS232,660 785 560 616,825 7,880 9,360 804,875
S 36,865 29,710 2,211,200 200 390 224,975 770 555 596,450 7,600 9,150 776,440M 770 455 48,520 - - 5,310 - - 8,360 115 125 16,455C 1,065 565 40,090 - - 1,950 - - 11,265 160 75 10,670W 25 - 945 - - 80 - - 240 - - 325P 25 10 2,225 - - 285 - - 315 - - 875D - - 595 - - 60 - - 185 - - 110
T 47,250 26,415 2,334,420 270 33020-24 YEARS204.280 1.190 585 640,960 11,080 8,130 786,815
S 28,285 17,375 1,432,270 135 220 121,950 825 500 405,825 7,400 5,600 498,280M 14,015 6,505 662,935 115 70 67,765 290 55 159,640 2,785 1 ,860 222,895C 3,900 1,935 193,010 15 25 10,545 65 25 68,510 700 475 48,230W 10 - 1,730 - - 185 - - 415 - 545P 755 455 31.800 - 15 2,765 20 - 3,790 180 165 13,285D 285 135 12,675 — —
1 ,075 - - 2,780 25 35 3,575
T 89,840 38,995 4,199,980 670 58525-34 YEARS368,355 2,210 815 1 , 1 31 , 1 70 23,775 12,515 1 ,450,740
S 18,945 9,225 811 ,310 100 110 61,515 685 300 237,820 5,630 3,185 273,130M 59,605 24,365 2,839,655 495 400 272,010 1,280 390 739,205 15,200 7,560 996,140C 5,130 2,350 272,085 20 50 14,090 145 85 94,270 1,170 735 77,110W 220 50 10,930 10 - 1,210 . . 3,135 60 10 3,340P 3,120 1,550 140,440 20 25 10,540 25 15 23,975 1,010 550 60,970D 2,820 1,455 125,560 35 - 8,995 75 25 32,760 700 470 40,060
T 66,365 15,470 2,956,785 435 24035-44 YEARS247,765 1,635 290 823,995 16,005 5,115 1,069,865
S 5,135 1,040 219,940 30 15 16,995 240 30 79,200 1,285 425 70,725M 53,530 12,010 2,356,655 370 210 206,170 1,205 215 633,280 12,655 3,930 864,980C 1,900 535 109,105 25 - 6,240 40 36,180 460 185 35,290W 595 135 28,175 - - 2,770 - - 8,900 140 35 9,415P 2,185 730 104,470 - 10 6,880 70 - 23,155 700 270 45,155D 3,030 1,025 138,435 - - 8,705 70 30 43,275 765 265 44,290
T 144,845 11,010 4,629,905 595 16045-64 YEARS383,080 4,830 365 1 ,236,585 42,830 3,690 1,733,145
S 10,155 760 308,140 25 - 27,915 385 30 115,005 2,445 245 92,150M 112,260 8,150 3,609,295 485 145 302,090 3,625 275 918,830 33,335 2,705 1,381,120C 2,030 215 80,115 - - 4,790 90 • 25,265 570 80 26,995w 10,560 815 307,610 50 - 28,500 355 10 89,885 3,405 260 112,745p 4,070 410 143,145 - - 9,550 170 - 39,125 1,375 175 56,480D 5,770 670 181,605 — - 10,215 210 30 48,485 1,700 210 63,645
T 72,460 2,870 2,184,615 21065
10YEARS AND OVER208.605 2.915 110 526,295 19,440 870 804,285
S 4,340 215 182,765 20 - 19,075 170 - 62,915 1,195 60 57,745M 40,520 1,410 1,212,470 125 - 114,890 1,600 90 277,125 10,060 470 445,210C 715 35 12,380 - - 750 90 4,115 210 15 3,920W 23,475 1,060 698,775 55 - 68,180 900 15 165,240 6,920 295 269,525P 1,830 60 41,285 - - 3,420 85 11,145 605 15 14,505D 1,585 85 36,940 — — 2,290 70 - 5,755 445 20 13,375
T 459,520 125,510 18,609,285 2,400 1,710 1
ALL AGES,644,750 13,565 2,725 4 ,975,825 121,005 39,680 6,649,725
S 103,725 58,315 5,165,625 515 740 472,420 3,075 1,420 1 ,497,220 25,550 18,670 1,768,470M 280,700 52,885 10,729,525 1,605 835 968,235 8,005 1,025 2 ,736,450 74,145 16,650 3,926,800C 14,735 5,635 706,790 70 75 38,375 435 120 239,595 3,270 1,560 202,225W 34,890 2,075 1,048,170 110 - 100,930 1,265 40 267,815 10,520 615 395 , 900P 11,985 3,215 463,365 40 45 33,450 365 25 101 ,510 3,880 1,190 191,265D 13,495 3,380 495,810 55 - 31,335 430 90 133,240 3,635 1,000 165,060I , wou
continued
99
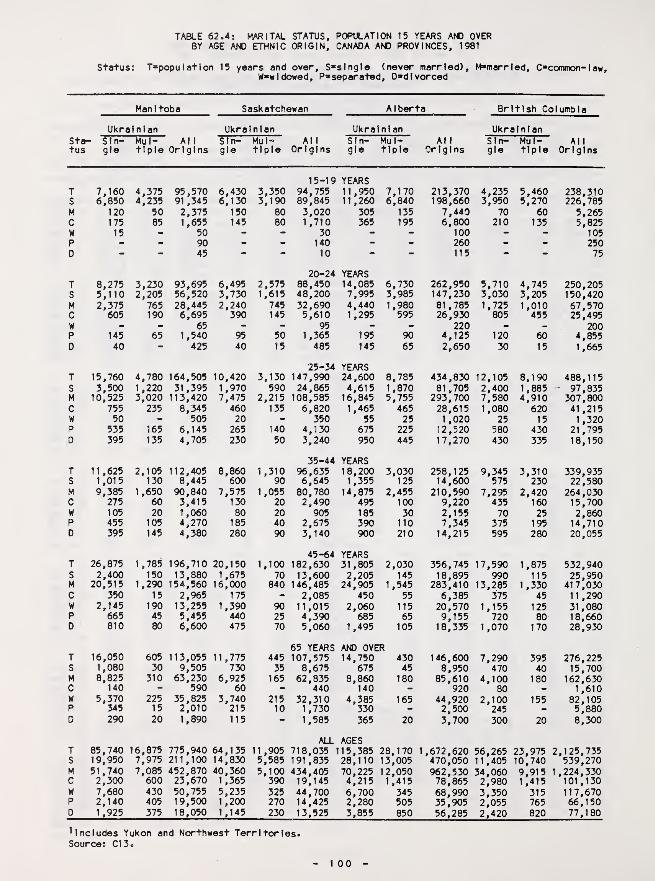
TABLE 62.4: MARITAL STATUS, POPULATION 15 YEARS AND OVERBY AGE AND ETHNIC ORIGIN, CANADA AND PROVINCES, 1981
Status: T=populatlon 15 years and over, S*s!ngle (never married), M»marrled, C»common-law,W»wldowed, P»separated, D»dIvorced
Man 1 toba Saskatchewan A 1 berta British Columbia
Ukrainian Ukrainian Ukrainian UkrainianSta-tus
Sin-gle
Mul- Alltiple Origins
Sin- Mul- Allgle tiple Origins
Sin- Mul- Allgle tiple Origins
Sin- Mul-gle tiple
Al 1
Origins
15-19 YEARST 7,160 4,375 95,570 6,430 3,350 94,755 11,950 7,170 213,370 4,235 5,460 238,310S 6,850 4,235 91 ,345 6,130 3,190 89,845 11,260 6,840 198,660 3,950 5,270 226,785M 120 50 2,375 150 80 3,020 305 135 7,440 70 60 5,265C 175 85 1,655 145 80 1,710 365 195 6,800 210 135 5,825W 15 - 50 - - 30 - - 100 - - 105P - - 90 - - 140 - - 260 - - 250D - - 45 - - 10 - - 115 - - 75
20-24 YEARST 8,275 3,230 93,695 6,495 2,575 88,450 14,085 6,730 262,950 5,710 4,745 250,205S 5,110 2,205 56,520 3,730 1,615 48,200 7,995 3,985 147,230 3,030 3,205 150,420M 2,375 765 28,445 2,240 745 32,690 4,440 1,980 81,785 1,725 1,010 67,570C 605 190 6,695 390 145 5,610 1,295 595 26,930 805 455 25,495W - - 65 - - 95 - - 220 - - 200P 145 65 1,540 95 50 1,365 195 90 4,125 120 60 4,855D 40 - 425 40 15 485 145 65 2,650 30 15 1,665
25-34 YEARST 15,760 4,780 164,505 10,420 3,130 147,990 24,600 8,785 434,830 12,105 8,190 488,115S 3,500 1,220 31,395 1,970 590 24,865 4,615 1,870 81,705 2,400 1,885 - 97,835M 10,525 3,020 113,420 7,475 2,215 108,585 16,845 5,755 293,700 7,580 4,910 307,800C 755 235 8,345 460 135 6,820 1,465 465 28,615 1,080 620 41 ,215W 50 - 505 20 - 350 55 25 1,020 25 15 1,320P 535 165 6,145 265 140 4,130 675 225 12,520 580 430 21,795D 395 135 4,705 230 50 3,240 950 445 17,270 430 335 18,150
35-44 YEARST 11,625 2,105 112,405 8,860 1,310 96,635 18,200 3,030 258,125 9,345 3,310 339,935S 1,015 130 8,445 600 90 6,645 1,355 125 14,600 575 230 22,580M 9,385 1,650 90,840 7,575 1,055 80,780 14,875 2,455 210,590 7,295 2,420 264,030C 275 60 3,415 130 20 2,490 495 100 9,220 435 160 15,700W 105 20 1,060 80 20 905 185 30 2,155 70 25 2,860P 455 105 4,270 185 40 2,675 390 110 7,345 375 195 14,710D 395 145 4,380 280 90 3,140 900 210 14,215 595 280 20,055
45-64 YEARST 26,875 1,785 196,710 20,150 1,100 182,630 31,805 2,030 356,745 17,590 1,875 532,940S 2,400 150 13,880 1,675 70 13,600 2,205 145 18,895 990 115 25,950M 20,515 1,290 154,560 16,000 840 146,485 24,905 1,545 283,410 13,285 1,330 417,030C 350 15 2,965 175 - 2,085 450 55 6,385 375 45 11,290W 2,145 190 13,255 1,390 90 11,015 2,060 115 20,570 1,155 125 31,080P 665 45 5,455 440 25 4,390 685 65 9,155 720 80 18,660D 810 80 6,600 475 70 5,060 1,495 105 18,335 1,070 170 28,930
65 YEARS AND OVERT 16,050 605 113,055 11,775 445 107,575 14,750 430 146,600 7,290 395 276,225S 1,080 30 9,505 730 35 8,675 675 45 8,950 470 40 15,700M 8,825 310 63,230 6,925 165 62,835 8,860 180 85,610 4,100 180 162,630C 140 - 590 60 - 440 140 - 920 80 - 1,610W 5,370 225 35,825 3,740 215 32,310 4,385 165 44,920 2,100 155 82,105P 345 15 2,010 215 10 1,730 330 - 2,500 245 - 5,880D 290 20 1,890 115 - 1,585 365 20 3,700 300 20 8,300
ALL AGEST 85,740 16,875 775,940 64,135 11,905 718,035 1115,385 28,170 1,672,620 56,265 23,975 2,125,735S 19,950 7,975 211,100 14,830 5,585 191,835 28,110 13,005 470,050 11,405 10,740 539,270M 51,740 7,085 452,870 40,360 5,100 434,405 70,225 12,050 962,530 34,060 9,915 1,224,330C 2,300 600 23,670 1,365 390 19,145 4,215 1,415 78,865 2,980 1,415 101,130w 7,680 430 50,755 5,235 325 44,700 6,700 345 68,990 3,350 315 117,670p 2,140 405 19,500 1,200 270 14,425 2,280 505 35,905 2,055 765 66,150D 1,925 375 18,050 1,145 230 13,525 3,855 850 56,285 2,420 820 77,180
includes Yukon and Northwest Territories.Source: Cl 3.
1 00 -

TABLE 62.5: MARITAL STATUS, POPULATION 15 YEARS AND OVER BY ETHNIC ORIGIN AND SELECTED URBAN AREAS, 1981
Status: T*populatIon 15 years and over, S=slngle (never married), M=marrled, C=common law, W=wldowed,P'separated, D=dlvorced, CMA=census metropolitan area, CA=census agglomeration, c=clty, t=town
Ukrainian Ukrainian Ukrainian Ukra In I an
Sta Sin- Mul- All Sin- Mul- All Sin- Mul- All Sin- Mul- Alltus gle tiple Origins gle tiple Origins gle tiple Origins gle tiple Origins
EDMONTON. CMA REGINA, CMA LONDON, CMA VERNON. CAT 53,950 11,265 504,175 7,975 2,470 123,675 2,805 1,110 220,710 2,175 615 31 .850S 14,245 5,670 151,710 2,025 1,260 35,550 655 505 59,550 430 290 7,110M 30,955 4,500 .273,730 4,740 930 69,910 1,620 470 126,325 1,340 265 19,420C 2,140 685 26,405 325 75 4,530 105 35 8,205 65 20 1,485W 3,240 185 21 ,060 500 60 6,640 180 15 12,580 210 - 1,765P 1,280 205 12,220 190 85 3,525 125 45 7,750 65 15 905D 2,085 380 19,045 200 55 3,520 120 35 6,290 70 25 1,165
WINNIPEG, CMA THUNDER BAY , CMA KITCHENER, CMA PRINCE GEORGE. CAT 51,710 11,880 456,835 8,430 2,535 93,445 2,735 980 217,665 1 ,700 680 48,415S 12,470 5,830 128,575 1,620 1,270 25,260 585 375 55,355 375 265 12,780M 29,985 4,665 254,850 5,265 1,025 53,410 1,695 480 132,950 1,030 310 27,830C 1,595 460 15,465 295 85 3,475 60 15 6,725 100 50 3,260W 4,590 315 30,515 775 40 6,135 225 20 11,460 115 10 1,315P 1,535 330 13,845 240 60 2,795 105 45 6,270 45 30 1,615D 1,535 285 13,580 240 55 2,365 70 30 4,915 45 15 1,615
TORONTO, CMA ST. CATHERINES,! CMA HALIFAX, CMA SAULT STE. MARIE, CAT 46,340 13,340 2,360,605 8,465 2,235 236,605 495 480 213,870 1 ,670 920 65,910S 11,290 6,830 673,165 1,605 1,045 58,190 105 195 64,410 300 485 18,050M 26,350 4,835 1,340,680 5,430 930 142,710 345 245 117,795 1 ,045 360 39,030C 1,295 575 72,275 155 85 6,440 - 15 8,250 45 40 1,630W 4,130 180 132,290 785 55 16,130 - - 10,980 170 - 3,770P 1,575 460 73,770 295 65 7,245 10 20 5,200 30 20 1,590D 1,695 465 68,430 195 55 5,890 30 - 7,245 75 - 1,840
VANCOUVER, CMA OTTAWA-HULL, CMA YORKTON, c BRANDON, cT 26,540 11,570 1,009,305 4,210 2,315 561,180 3,915 405 11,720 2,000 575 27,385S 5,890 5,515 277,515 925 1,160 168,090 885 160 2,945 415 220 7,185M 14,870 4,295 552,990 2,575 900 307,520 2,420 205 7,085 1 ,215 300 15,700C 1,500 630 42,135 145 105 22,355 65 - 270 70 25 920w 1,875 175 61,440 305 15 29,060 390 20 950 200 - 1,920p 1,015 465 33,395 105 70 18,290 100 - 220 55 15 810D 1,380 485 41,830 155 65 15,865 65 10 245 50 - 850
CALGARY, CMA WINDSOR, CMA PRINCE ALBERT. CA LETHBRIDGE , cT 15,525 6,530 460,360 4,680 1,640 188,150 3,200 620 27,215 1 ,660 640 41 ,625S 4,050 3,160 139,340 1 ,000 715 49,260 635 245 7,390 265 250 10,695M 8,920 2,610 247,740 2,630 765 109,620 2,090 305 15,910 1 ,155 310 24,505C 805 370 24,545 100 15 4,320 50 25 835 45 30 1,305W 550 55 16,915 615 50 13,550 305 20 1,705 115 - 2,465P 350 115 11,485 145 30 5,510 60 ~ 780 40 - 945D 850 215 20,335 185 65 5,895 50 15 595 40 35 1,710
SASKATOON, CMA OSHAWA, CMA KELOWNA. CA BRANTFORD
.
CAT 12,555 3,030 118,150 3,745 1,195 115,285 3,200 785 61,155 1 ,510 470 67,085S 3,440 1,535 36,040 725 510 27,480 510 335 13,295 310 230 15,730M 7,140 1,130 64,505 2,350 560 71,365 2,205 390 38,545 960 205 40,785C 335 140 4,550 95 75 4,525 105 30 2,230 40 20 2,035w 880 80 6,430 335 10 5,475 205 10 3,540 105 - 4,705p 365 105 3,275 135 30 3,690 75 - 1,535 50 15 2,175D 395 45 3,360 110 10 2,750 90 15 2,010 40 -
1 ,655
HAMILTON, CMA VICTORIA,,CMA DAUPHIN.
,t VEGREVILLE , t
T 10,645 3,075 422,780 2,835 1,810 189,750 2,840 175 7,045 2,030 85 4,005S 2,195 1,385 108,255 565 860 46,375 510 80 1,530 340 70 860M 6,695 1,345 253,725 1,595 680 106,670 1,765 60 4,290 1,315 20 2,530C 195 100 11,320 180 130 8,070 70 15 155 30 - 105W 970 65 25,770 160 15 14,275 370 . 790 250 - 325P 325 135 12,370 140 55 6,095 95 - 180 35 _ 100D 260 40 11,345 205 80 8,260 25 15 105 60 - 90
MONTREAL, CMA SUDBURY, CMA KAMLO(DPS. CA RED DEER, cT 12,045 2,325 2,237,550 3,125 860 111,610 1,730 845 48,200 1 ,270 475 33,920S 2,770 1,280 669,250 600 385 30,250 390 370 12,550 370 190 9,730M 7,000 805 1,182,935 1,970 400 66,660 955 395 27,945 710 200 18.435C 380 100 120,280 75 20 3,445 110 35 2,490 65 25 2,205
continued
1 0 1
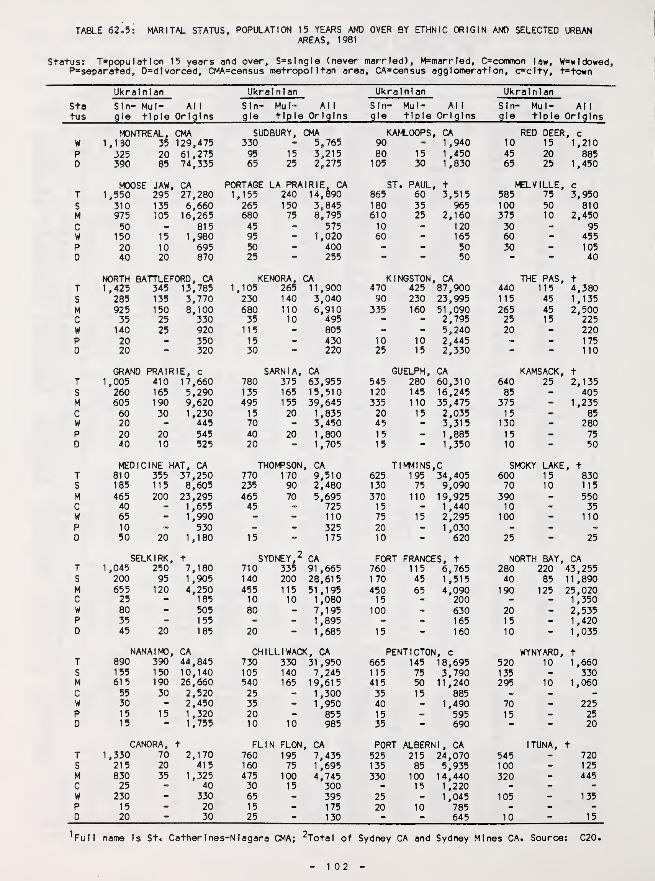
TABLE 62^5: MARITAL STATUS, POPULATION 15 YEARS AND OVER BY ETHNIC ORIGIN AND SELECTED URBANAREAS, 1981
Status? T»populatIon 15 years and over, S=s Ingle (never married), M=marrled, C=common law, W=wldowed,P=separated, D=dlvorced, CMA=census metropolitan area, CA=census agglomeration, c=clty, t=town
Ukrainian Ukrainian Ukrainian Ukrainian
Sta Sin- Mul- A! 1 Sin- Mul- Al 1 S I n- Mul- Al 1 Sin- Mul- Al 1
tus gie tiple Origins gle tiple( Origins gle tiple Origins gle tiple Origins
r^NTREAL. CMA SUDBURY, CMA KAI>L00PS,,CA RED DEER . c
W 1,130 35 129,475 330 - 5,765 90 - 1,940 10 15 1,210P 325 20 61,275 95 15 3,215 80 15 1,450 45 20 885D 390 85 74,335 65 25 2,275 105 30 1,830 65 25 1,450
MOOSE JAW. CA PORTAGE LA PRAIRIE, CA ST,. PAUL,, t MELVILLE. c
T 1,550 295 27,280 1,155 240 14,890 865 60 3,515 585 75 3,950S 310 135 6,660 265 150 3,845 180 35 965 100 50 810M 975 105 16,265 680 75 8,795 610 25 2,160 375 10 2,450C 50 - 815 45 - 575 10 - 120 30 - 95W 150 15 1,980 95 - 1,020 60 - 165 60 - 455P 20 10 695 50 - 400 - - 50 30 - 105D 40 20 870 25 - 255 - - 50 - - 40
NORTH BATTLEFORD, CA KENORA, CA KINGSTON,,CA THE PAS, t
T 1,425 345 13,785 1,105 265 11,900 470 425 87,900 440 115 4,380S 285 135 3,770 230 140 3,040 90 230 23,995 115 45 1,135M 925 150 8,100 680 110 6,910 335 160 51,090 265 45 2,500C 35 25 330 35 10 495 - - 2,795 25 15 225w 140 25 920 115 - 805 - 5,240 20 - 220p 20 - 350 15 - 430 10 10 2,445 - > 175D 20 - 320 30 - 220 25 15 2,330 - - 110
GRAND PRAIR IE, c SARNIA, CA GUELPH, CA KAMSACK, tT 1,005 410 17,660 780 375 63,955 545 280 60,310 640 25 2,135S 260 165 5,290 135 165 15,510 120 145 16,245 85 - 405M 605 190 9,620 495 155 39,645 335 110 35,475 375 - 1,235C 60 30 1,230 15 20 1,835 20 15 2,035 15 - 85W 20 - 445 70 - 3,450 45 - 3,315 130 - 280P 20 20 545 40 20 1 ,800 15 -
1 ,885 15 - 75D 40 10 525 20 - 1,705 15 - 1,350 10 - 50
MEDICINE HAT, CA THOMPSON , CA TIMMINS,,C SMOKY LAKE , tT 810 355 37,250 770 170 9,510 625 195 34,405 600 15 830S 185 115 8,605 235 90 2,480 130 75 9,090 70 10 115
M 465 200 23,295 465 70 5,695 370 110 19,925 390 - 550C 40 - 1,655 45 - 725 15 -
1 ,440 10 - 35w 65 - 1,990 - - 110 75 15 2,295 100 - 110p 10 530 - - 325 20 - 1,030 - - «
D 50 20 1,180 15 ” 175 10 - 620 25 - 25
SELKIRK, t SYDNEY,
2
CA FORT FRANCES, t NORTH BAY. CAT 1,045 250 7,180 710 335 91 ,665 760 115 6,765 280 220 43,255S 200 95 1,905 140 200 28,615 170 45 1,515 40 85 11 ,890M 655 120 4,250 455 115 51,195 450 65 4,090 190 125 25,020C 25 - 185 10 10 1,080 15 - 200 - - 1,350W 80 « 505 80 - 7,195 100 - 630 20 - 2,535P 35 - 155 - - 1,895 - - 165 15 - 1,420D 45 20 185 20 - 1,685 15 - 160 10 - 1,035
NANAIMO, CA CHILLIWACK, CA PENTICTON1, c WYNYARD, tT 890 390 44,845 730 330 31,950 665 145 18,695 520 10 1 ,660S 155 150 10,140 105 140 7,245 115 75 3,790 135 - 330M 615 190 26,660 540 165 19,615 415 50 11,240 295 10 1,060C 55 30 2,520 25 - 1,300 35 15 885 - -
W 30 - 2,450 35 - 1,950 40 - 1,490 70 - 225P 15 15 1 ,320 20 - 855 15 - 595 15 - 25D 15 — 1,755 10 10 985 35 - 690 - - 20
CANORA, t FL IN FLON , CA PORT ALBERNI, CA ITUNA, tT 1,330 70 2,170 760 195 7,435 525 215 24,070 545 - 720S 215 20 415 160 75 1 ,695 135 85 5,935 100 - 125
M 830 35 1,325 475 100 4,745 330 100 14,440 320 - 445C 25 - 40 30 15 300 - 15 1,220 - - -
W 230 - 330 65 - 395 25 - 1,045 105 - 135P 15 - 20 15 - 175 20 10 785 - - -
D 20 ” 30 25 - 130 - - 645 10 - 15
Vull name Is St« Cather Ines-Nlagara CMA; ^Total of Sydney CA and Sydney Mines CA. Source: C20.
1 02
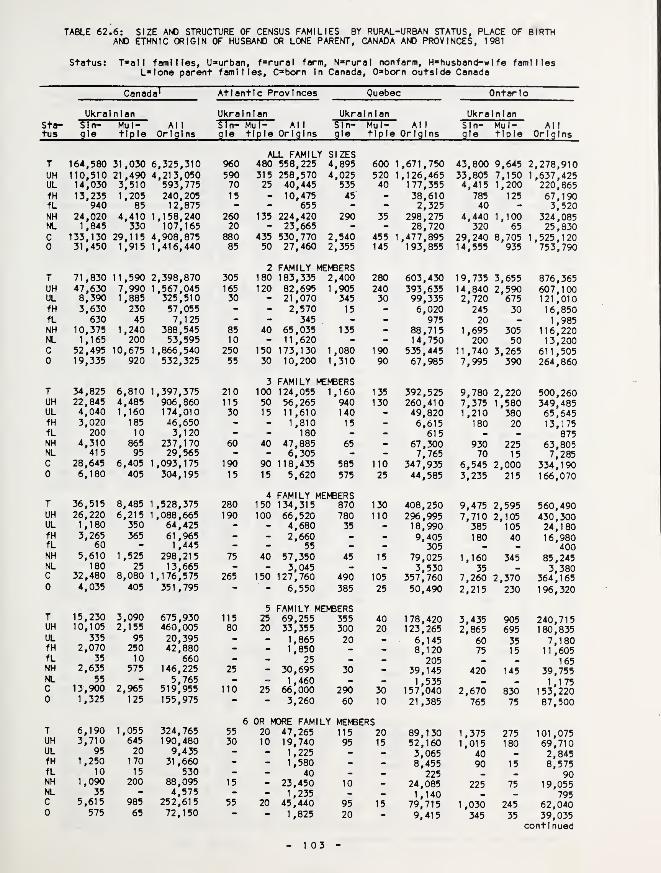
TABLE 62.6: SIZE AND STRUCTURE OF CENSUS FAMILIES BY RURAL-URBAN STATUS, PLACE OF BIRTHAND ETHNIC ORIGIN OF HUSBAND OR LONE PARENT, CANADA AND PROVINCES, 1981
Status: T*all families, U»urban, f*rural farm, N»rural nonfarm, H*husband-wl fe familiesL*lone parent families, C=born In Canada, O»born outside Canada
Canada^ Atlantic Provlnc^ Quebec Ontario
Ukrainian Ukrainian Ukrainian UkrainianSta-tus
Sin-gle
Mul-tiple
Al 1
Originssin-gle
Mul-tiple
Al 1
OriginsSin-gle
Mul- Alltiple Origins
Sin-gle
Mu 1-
tlp leAl 1
Origins
ALL FAMILY SIZEST 164,580 31,030 6,325,310 960 480 558,225 4,895 600 1,671,750 43,800 9,645 2,278,910UH 110,510 21,490 4,213,050 590 315 258,570 4,025 520 1,126,465 33,805 7,150 1,637,425UL 14,030 3,510 593,775 70 25 40,445 535 40 177,355 4,415 1,200 220,865fH 13,235 1 ,205 240,205 15 - 10,475 45“ - 38,610 785 125 67,190fL 940 85 12,875 - - 655 - - 2,325 40 - 3,520NH 24,020 4,410 1,158,240 260 135 224,420 290 35 298,275 4,440 1,100 324,085NL 1,845 330 107,165 20 - 23,665 - - 28,720 320 65 25,830C 133,130 29,115 4,908,875 880 435 530,770 2,540 455 1,477,895 29,240 8,705 1 ,525,1200 31,450 1,915 1,416,440 85 50 27,460 2,355 145 193,855 14,555 935 753,790
2 FAMILY ME^eERST 71,830 11,590 2,398,870 305 180 183,335 2,400 280 603,430 19,735 3,655 876,365UH 47,630 7,990 1,567,045 165 120 82,695 1,905 240 393,635 14,840 2,590 607,100UL 8,390 1,885 325,510 30 - 21,070 345 30 99,335 2,720 675 121,010fH 3,630 230 57,055 - - 2,570 15 - 6,020 245 30 16,850fL 630 45 7,125 - - 345 - - 975 20 - 1,985NH 10,375 1,240 388,545 85 40 65,035 135 - 88,715 1,695 305 116,220NL 1,165 200 53,595 10 - 11,620 - - 14,750 200 50 13,200C 52,495 10,675 1,866,540 250 150 173,130 1,080 190 535,445 11,740 3,265 611,5050 19,335 920 532,325 55 30 10,200 1,310 90 67,985 7,995 390 264,860
3 FAMILY -MEMBERST 34,825 6,810 1,397,375 210 100 124,055 1,160 135 392,525 9,780 2,220 500,260UH 22,845 4,485 906,860 115 50 56,265 940 130 260,410 7,375 1 ,580 349,485UL 4,040 1,160 174,010 30 15 11,610 140 - 49,820 1,210 380 65,645fH 3,020 185 46,650 - - 1,810 15 - 6,615 180 20 13,175fL 200 10 3,120 - - 180 - - 615 - - 875NH 4,310 865 237,170 60 40 47,885 65 - 67,300 930 225 63,805NL 415 95 29,565 - - 6,305 - - 7,765 70 15 7,285C 28,645 6,405 1,093,175 190 90 118,435 585 110 347,935 6,545 2,000 334,1900 6,180 405 304,195 15 15 5,620 575 25 44,585 3,235 215 166,070
4 FAMILY MENBERST 36,515 8,485 1,528,375 280 150 134,315 870 130 408,250 9,475 2,595 560,490UH 26,220 6,215 1,088,665 190 100 66,520 780 110 296,995 7,710 2,105 430,300UL 1,180 350 64,425 - - 4,680 35 - 18,990 385 105 24,180fH 3,265 365 61,965 - - 2,660 - - 9,405 180 40 16,980fL 60 - 1,445 - - 55 - - 305 400NH 5,610 1,525 298,215 75 40 57,350 45 15 79,025 1,160 345 85,245NL 180 25 13,665 - - 3,045 - - 3,530 35 _ 3,380C 32,480 8,080 1,176,575 265 150 127,760 490 105 357,760 7,260 2,370 364,1650 4,035 405 351,795 - - 6,550 385 25 50,490 2,215 230 196,320
5 FAMILY MENBERST 15,230 3,090 675,930 115 25 69,255 355 40 178,420 3,435 905 240,715UH 10,105 2,155 460,005 80 20 33,355 300 20 123,265 2,865 695 180,835UL 335 95 20,395 - - 1,865 20 - 6,145 60 35 7,180fH 2,070 250 42,880 - - 1,850 - - 8,120 75 15 11,605fL 35 10 660 - • 25 - _ 205 165NH 2,635 575 146,225 25 - 30,695 30 - 39,145 420 145 39,755NL 55 - 5,765 - 1,460 . .
1 ,535 *1 ,175
C 13,900 2,965 519,955 110 25 66,000 290 30 157,040 2,670 830 153,2200 1,325 125 155,975 - - 3,260 60 10 21,385 765 75 87,500
6 OR MORE FAMILY MENBERST 6,190 1,055 324,765 55 20 47,265 115 20 89,130 1,375 275 101,075UH 3,710 645 190,480 30 10 19,740 95 15 52,160 1,015 180 69,710UL 95 20 9,435 - - 1,225 - • 3,065 40 2,845fH 1,250 170 31,660 - - 1,580 - - 8,455 90 15 8,575fL 10 15 530 - - 40 _ _ 225 90NH 1,090 200 88,095 15 - 23,450 10 _ 24,085 225 75 19,055NL 35 - 4,575 - - 1,235 - _ 1,140 _ 795C 5,615 985 252,615 55 20 45,440 95 15 79,715 1,030 245 62,0400 575 65 72,150 - - 1,825 20 - 9,415 345 35 39,035
continued
1 03
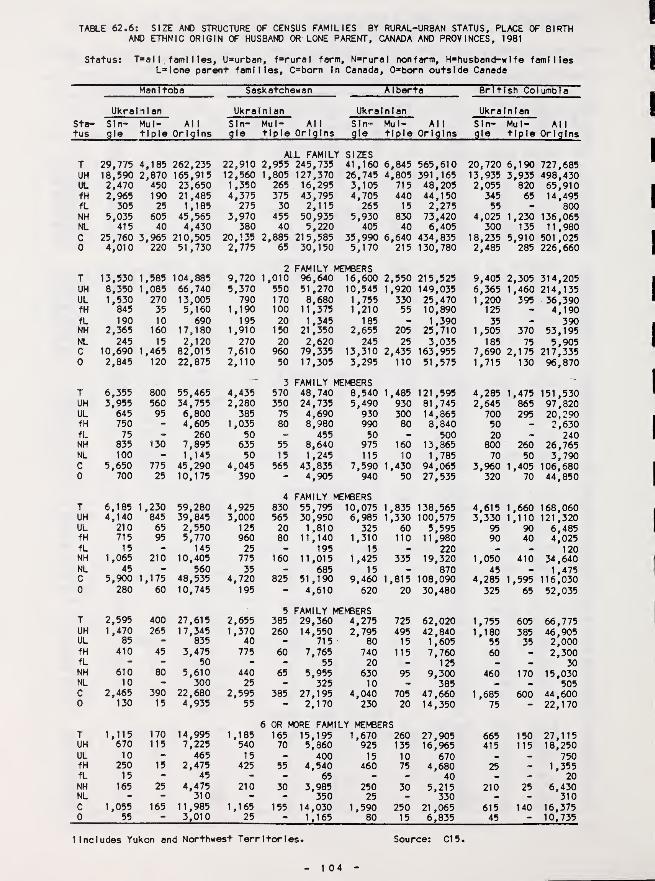
TABLE 62.6: SIZE AND STRUCTURE OF CENSUS FAMILIES BY RURAL-URBAN STATUS, PLACE OF BIRTHAND ETHNIC ORIGIN OF HUSBAND OR LONE PARENT, CANADA AND PROVINCES, 1981
Status: T»al I families, U=urban, f»rural farm, N»rural nonfarm, H»husband-wlfo familiesL»lone parent families, C=born In Canada, O»born outside Canada
Manitoba Saskatchewan A I berta British Columbi"
Ukrainian Ukrainian Ukrainian Ukrain I an
Sta-tus
Sin-gle
Mul- Alltiple Origins
Sin-gle
Mul- Alltiple Origins
Sin-gle
Mul- Alltiple Origins
Sin-gle
Mul- Alltiple Origins
ALL FAMILY SIZEST 29,775 4,185 262,235 22,910 2,955 245,735 41,160 6,845 565,610 20,720 6,190 727,685UH 18,590 2,870 165,915 12,560 1,805 127,370 26,745 4,805 391,165 13,935 3,935 498,430UL 2,470 450 23,650 1,350 265__ 16,295 3,105 715 48,205 2,055 820 65,910fH 2,965 190 21 ,485 4,375 375 43,795 4,705 440 44,150 345 65 14,495fL 305 25 1,185 275 30 2,115 265 15 2,275 55 - 800NH 5,035 605 45,565 3,970 455 50,935 5,930 830 73,420 4,025 1,230 136,065NL 415 40 4,430 380 40 5,220 405 40 6,405 300 135 11,980C 25,760 3,965 210,505 20,135 2,885 215,585 35,990 6,640 434,835 18,235 5,910 501,0250 4,010 220 51,730 2,775 65 30,150 5,170 215 130,780 2,485 285 226,660
2 FAMILY MEMBERST 13,530 1,585 104,885 9,720 1,010 96,640 16,600 2,550 215,525 9,405 2,305 314,205UH 8,350 1,085 66,740 5,370 550 51,270 10,545 1,920 149,035 6,365 1,460 214,135UL 1,530 270 13,005 790 170 8,680 1,755 330 25,470 1,200 395 36,390fH 845 35 5,160 1,190 100 11,375 1,210 55 10,890 125 - 4,190fL 190 10 690 195 20 1,345 185 . 1,390 35 390NH 2,365 160 17,180 1,910 150 21 ,350 2,655 205 25,710 1,505 370 53,195NL 245 15 2,120 270 20 2,620 245 25 3,035 185 75 5,905C 10,690 1,465 82,015 7,610 960 79,335 13,310 2,435 163,955 7,690 2,175 217,3350 2,845 120 22,875 2,110 50 17,305 3,295 110 51,575 1,715 130 96,870
—3 FAMILY MEMBERS
T 6,355 800 55,465 4,435 570 48,740 8,540 1,485 121,595 4,285 1,475 151,530UH 3,955 560 34,755 2,280 350 24,735 5,490 930 81,745 2,645 865 97,820UL 645 95 6,800 385 75 4,690 930 300 14,865 700 295 20,290fH 750 - 4,605 1,035 80 8,980 990 80 8,840 50 - 2,630fL 75 260 50 455 50 - 500 20 240NH 835 130 7,895 635 55 8,640 975 160 13,865 800 260 26,765NL 100 - 1,145 50 15 1,245 115 10 1,785 70 50 3,790C 5,650 775 45,290 4,045 565 43,835 7,590 1,430 94,065 3,960 1,405 106,6800 700 25 10,175 390 - 4,905 940 50 27,535 320 70 44,850
4 FAMILY MEMBERST 6,185 1,230 59,280 4,925 830 55,795 10,075 1,835 138,565 4,615 1,660 168,060UH 4,140 845 39,845 3,000 565 30,950 6,985 1,330 100,575 3,330 1,110 121,320UL 210 65 2,550 125 20 1,810 325 60 5,595 95 90 6,485fH 715 95 5,770 960 80 11,140 1,310 110 11,980 90 40 4,025fL 15 - 145 25 - 195 15 . 220 . _ 120NH 1,065 210 10,405 775 160 11,015 1,425 335 19,320 1,050 410 34,640NL 45 - 560 35 - 685 15 - 870 45 . 1,475C 5,900 1,175 48,535 4,720 825 51,190 9,460 1,815 108,090 4,285 1,595 116,0300 280 60 10,745 195 - 4,610 620 20 30,480 325 65 52,035
5 FAMILY MENBERST 2,595 400 27,615 2,655 385 29,360 4,275 725 62,020 1,755 605 66,775UH 1,470 265 17,345 1,370 260 14,550 2,795 495 42,840 1,180 385 46,905UL 85 - 835 40 - 715 80 15 1,605 55 35 2,000fH 410 45 3,475 775 60 7,765 740 115 7,760 60 - 2,300fL - - 50 - - 55 20 - 125 - - 30NH 610 80 5,610 440 65 5,955 630 95 9,300 460 170 15,030NL 10 - 300 25 - 325 10 - 385 - • 505C 2,465 390 22,680 2,595 385 27,195 4,040 705 47,660 1,685 600 44,6000 130 15 4,935 55 - 2,170 230 20 14,350 75 - 22,170
6 OR MORE FAMILY MEMBERST 1,115 170 14,995 1,185 165 15,195 1,670 260 27,905 665 150 27,115UH 670 115 7,225 540 70 5,860 925 135 16,965 415 115 18,250UL 10 - 465 15 - 400 15 10 670 . 750fH 250 15 2,475 425 55 4,540 460 75 4,680 25 1,355fL 15 - 45 - - 65 - - 40 - 20NH 165 25 4,475 210 30 3,985 250 30 5,215 210 25 6,430NL - - 310 - - 350 25 - 330 - - 310C 1,055 165 11,985 1,165 155 14,030 1,590 250 21,065 615 140 16,3750 55 - 3,010 25 - 1,165 80 15 6,835 45 - 10,735
1 1ncludes Yukon and Northwest Territories. Source: Cl 5.
1 04

TABLE 62.7: CENSUS FAMILIES BY FAMILY STRUCTURE,PLACE OF BIRTH AND ETHNIC ORIGIN OF HUSBAND OR LONE PARENT, SELECTED URBAN AREAS, 1981
Status: T*all families, H*husband-wlfe families, L*lone parent families,C=born In Canada, O=born outside Canada, CMA»census metropolitan area,
CA»census agglomeration, c»clty, t=town
Ukrainian
All
Origins
Ukrainian
AllOrigins
Ukrainian Ukrainian
Al 1
OriginsSin-gle
Mul-tiple
Sin-gle
Mul-tiple
Sin-gle
Mul- Alltiple Origins
Sin-gle
Mul-tiple
EDMONTON, CMA REGINA, CMA LONDON, CMA VERNON, CAT 18,570 2,630 166,440 2,760 515 41,780 890 265 75,155 865 190 11,600H 16,470 2,325 147,040 2,465 430 36,710 800 220 66,290 725 165 10,275L 2,100 305 19,400 300 90 5,065 90 45 8,870 140 20 1,325C 16,220 2,555 120,365 2,540 510 35,455 540 250 53,700 690 190 9,0050 2,345 75 46,075 220 10 6,325 355 15 21,460 175 - 2,600
WINNIPEG, CMA THUNDER BAY,,CMA KITCHENER, CMA PRINCE GEORGE. CA
T 17,450 2,860 152,195 3,015 555 31 ,665 1,095 255 76,845 700 180 17,420H 15,355 2,470 132,760 2,710 500 27,935 950 195 68,880 565 160 15,290L 2,095 395 19,435 300 60 3,735 145 65 7,960 135 25 2,135C 1 4,580 2,685 112,320 2,540 530 23,725 800 230 53,205 660 180 13,8350 2,870 180 39,880 475 25 7,945 290 30 23,640 35 - 3,590
TORONTO. CMA ST. CATHERINES.^ CMA HALIFAX, CMA SAULT ST. MARIE. CAT 15,855 2,980 785,390 3,170 605 83,160 190 140 70,835 660 210 22,765H 13,830 2,565 692,835 2,865 495 73,640 185 120 61 ,675 555 205 20,060L 2,025 420 92,550 305 115 9,520 - 10 9,160 100 - 2,705C 8,780 2,595 374,775 2,255 560 56,665 170 115 63,705 580 200 17,3900 7,080 380 410,615 920 45 26,490 15 20 7,130 80 15 5,375
VANCOUVER, CMA OTTAWA-HULL, CMA YORKTON, c BRANDON > cT 9,195 2,755 329,820 1,490 600 185,400 1,355 100 4,030 695 165 9,395H 7,990 2,230 291,350 1,390 535 161,240 1,225 90 3,625 645 155 8,125L 1,200 520 38,470 100 65 24,155 125 - 400 55 10 1,265C 7,990 2,590 200,385 1,150 545 149,785 1,230 95 3,585 655 165 8,1600 1,205 165 129,435 340 55 35,610 125 - 440 45 - 1,230
CALGARY, CMA WINDSOR, CMA PRINCE ALBERT, CA LETHBRIDGE, cT 5,265 1,605 149,910 1,640 395 64,345 1,260 160 9,420 655 195 14,325H 4,730 1,415 133,210 1,365 345 55,980 1,130 145 8,205 615 170 12,695L 535 185 16,695 275 45 8,365 130 15 1,215 45 30 1,635C 4,670 1,575 106,425 1,200 325 45,165 1,125 150 8,435 530 190 10,5100 595 25 43,480 440 60 19,185 135 - 980 130 - 3,815
SASKATOON, CMA OSHAWA, CMA KELOWNA, CA BRANTFORD , CAT 4,260 690- 38,765 1,400 335 41,800 1,170 175 22,150 575 135 23,905H 3,800 600 33,960 1,250 285 37,485 1,080 145 20,030 540 105 21,105L 460 85 4,805 150 50 4,310 90 25 2,115 40 25 2,795C 3,770 675 32,630 885 320 29,705 935 160 16,170 420 115 18,0000 490 20 6,135 520 10 12,090 235 15 5,975 155 20 5,905
HAMILTON, CMA VICTORIA, CMA DAUPHIN. t VEGREVILLE. tT 3,965 735 146,880 1,040 425 63,365 1,000 25 2,430 760 10 1,405H 3,520 630 130,860 855 355 56,250 910 15 2,185 705 10 1,285L 445 105 16,015 185 70 7,120 90 15 240 55 115C 2,425 650 92,115 945 405 44,005 905 30 2,145 645 10 1,1600 1,540 85 54,760 95 25 19,360 95 - 280 115 - 245
MONTREAL, CMA SUDBURY, CMA KAMLOOPS , CA RED DEER,» c
T 4,270 500 742,325 1,125 210 39,110 670 265 17,035 455 100 11,460H 3,785 465 640,060 990 180 34,460 555 245 14,930 400 65 10,145L 490 40 102,265 140 30 4,650 110 20 2,100 55 30 1,315C 2,130 360 573,495 820 205 32,485 600 260 13,445 435 95 9,5950 2,145 140 168,825 310 - 6,620 65 - 3,590 20 1,860
continued
1 05

TABLE 62.7: CENSUS FAMILIES BY FAMILY STRUCTURE,PLACE OF BIRTH AND ETHNIC ORIGIN OF HUSBAND OR LONE PARENT, SELECTED URBAN AREAS, 1981
Status: T=all families, H=husband-wl fe families, L=lone parent families,C=born In Canada, O=born outside Canada, CMA=census metropolitan area,
CA»census agglomeration, c=clty, t»town
Ukrainian Ukrainian Ukrainian Ukrainian
Sin- Mul- Allgle tiple Origins
Sin-gle
Mul- AMtiple Origins
Sln-
9 I®
Mul- Alltiple Origins
Sin-
gle
• Mul- Alltiple Origins
MOOSE JAW, CA PORTAGE LA PRAIRIE, CA ST. PAUL, t MELVILLE, cT 500 80 9,395 375 40 5,000 335 - 1,240 220 10 1 ,355H 480 55 8,345 325 40 4,470 320 - 1,120 205 10 1,250L 25 20 1,045 50 - 530 20 - 120 15 - 105C 400 80 8,175 310 40 4,475 285 - 1,000 205 10 1,1950 100 -
1 ,215 65 - 525 55 - 240 15 - 160
NORTH BATTLEFORD, CA KENORA, CA KINGSTON, CA THE PAS, tT 495 95 4,710 425 55 4,100 215 70 29,685 155 30 1,550H 455 85 4,130 395 55 3,645 185 55 26,280 125 25 1,330L 40 - 580 30 - 455 30 20 3,405 25 - 220C 385 85 3,990 340 50 3,560 170 70 23,445 130 30 1,3300 no - 720 85 - 540 45 - 6,240 25 - 220
GRANDE PRAIRIE, c SARNIA, CA GUELPH, CA KAMSACK, tT 310 135 5,990 260 80 22,755 170 80 20,670 230 10 755H 280 100 5,325 240 70 20,440 160 65 18,415 215 - 660L 30 40 665 20 - 2,315 - 20 2,250 20 100C 290 140 5,105 215 75 17,225 125 75 14,345 210 15 6900 15 885 50 - 5,535 45 - 6,325 25 - 65
MEDICINE HAT, CA THOMPSON , CA Tl MMINS, c SMOKY LAKE , tT 315 115 13,320 255 35 3,485 270 50 11,880 195 - 285H 260 95 12,250 240 35 3,145 230 50 10,500 190 « 280L 50 20 1,070 10 345 45 -
1 ,375 - - -
C 285 120 11,110 250 30 2,885 200 40 10,065 130 - 1900 30 “ 2,205 - - 605 75 - 1,815 65 - 90
SELKIRK, t SYDNEY,
2
CA FORT FRANCIS, t NORTH BAY , CAT 430 50 2,530 285 65 30,085 260 45 2,400 105 65 14,790H 375 45 2,170 235 65 25,620 245 40 2,110 90 60 12,915L 55 360 50 - 4,470 20 - 290 « -
1 ,865C 395 55 2,190 240 60 28,900 250 45 2,060 90 65 13,1750 30 - 335 40 - 1,185 - - 345 15 -
1 ,610
NANAIMO, CA CHILLIWACK. CA PENTICTON1, c WYNYARD, tT 280 105 16,085 325 70 11,440 235 35 6,645 170 585H 265 95 14,330 310 55 10,245 215 25 5,960 145 510L 15 - 1,755 15 10 1 ,200 15 10 680 25 - 80C 265 105 12,290 250 60 8,180 180 30 4,925 130 4900 20 - 3,795 75 - 3,260 55 - 1,715 45 - 105
CANORA, t FLIN1 FLON , CA PORT ALBERNI. CA ITUNA, tT 475 25 720 290 40 2,720 180 55 8,570 190 - 255H 440 25 670 240 35 2,495 155 50 7,695 155 - 215L 40 - 55 40 - 225 25 - 880 40 - 40C 405 25 610 260 40 2,390 150 55 6,465 115 - 1750 70 - 110 25 - 330 35 - 2,110 80 - 80
^The full name Is St. Cather I nes-N I agara CMA; ^Total of Sydney CA and Sydney Mines CA.Source: C23.

TABLE 62.8: HUSBAND-WIFE FAMILIES, ETHNIC ORIGIN OF HUSBANDBY ETHNIC ORIGIN OF WIFE, CANADA AND PROVINCES, 1981 AND 1971
US=Ukralnlan single origin, UM=Ukralnlan multiple origin, AO=AII Origins, UO=Ukralnlan origin
Ethnic Origin of Wife
Year
HusbandsrmncOrigin Total'
Ukrainian“^
17;=
—
wiT=-gle tlple
Po-1 Ish
Rus-sian
Bri-tish
Ger-man
Scan-dina-vian French
Other
Origins
1981 US 147,765 62,580 2,725 6,290CANADA^
670 40,975 10,155 2,910 6,925 14,5351981 UM 27,105 2,210 2,600 575 85 10,000 1,470 590 1,275 8,3151981 AO 5,611,495 142,525 30,460 69,365 12,760 2,319,635 305,070 74,890 1 ,512,080 1,144,715
1971 UO 137,240 74,050 7,915 • • 29,525 8,230 2,960 5,930 8,6301971 AO 4,605,485 135,990 71,235 .. 2,095,075 303,730 87,520 1 ,243,255 668,680
1981 US 870 65ATLANTIC PROVINCES
50 - 545 45 65 901981 UM 445 - - - 290 - - 20 1201981 AO 493,465 755 430 870 85 357,215 10,875 1,355 83,520 38,355
1971 UO 700 115 35 . . 400 25 10 65 251971 AO 409,810 715 850 . • 311,045 11,895 1,875 67,930 15,475
1981 US 4,360 2,050 25 135QUEBEC
20 685 95 990 3601981 UM 560 40 30 - - 145 - - 140 1951981 AO 1 ,463,345 3,925 560 4,940 685 114,295 8,975 1,070 1 ,179,060 149,840
1971 UO 5,210 2,770 255 • • 760 115 15 900 3901971 AO 1,222,175 4,680 5,370 • • 136,635 12,420 1,895 947,020 114,150
1981 US 39,025 14,995 545 1,515
ONTARIO155 13,220 1,565 190 1,955 4,895
1981 UM 8,370 355 570 220 15 3,810 295 45 465 2,5851981 AO 2,028,695 36,885 9,530 33,800 2,575 1 ,091,690 103,500 11,220 166,545 572,940
1971 UO 39,105 19,275 1 ,930 • • 10,530 1,870 350 1,875 3,2851971 AO 1,718,575 37,795 32,510 .. 1 ,023,095 112,665 14,195 157,950 340,385
1981 US 26,590 13,775 655 1,765MANITOBA
60 5,280 1,630 455 1,180 1,7851981 UM 3,670 625 560 95 -
1 ,000 265 90 145 8951981 AO 232,970 26,575 3,915 7,770 770 90,370 26,755 6,490 18,300 52,025
1971 UO 26,645 16,680 2,230 • • 4,040 1,335 495 860 9951971 AO 213,490 26,940 9,595 • • 90,890 27,260 8,045 17,340 33,415
1981 US 20,910 10,565 330SASKATCHEWAN
985 190 4,020 2,195 575 535 1,5051981 UM 2,625 360 305 75 20 725 220 60 60 8001981 AO 222,105 19,985 2,770 4,780 1 ,620 89,475 41,590 11,365 12,040 38,490
1971 UO 20,265 12,475 1,270 e • 2,925 1 ,635 560 465 9301971 AO 198,230 19,845 6,110 • • 83,205 40,490 13,480 11,550 23,550
1981 US 37,380 16,555 845 1 ,400ALBERTA
120 9,400 3,125 1,040 1,425 3,4851981 UM 6,075 600 710 120 15 1 ,835 435 185 275 1,8951981 AO 508,730 35,960 7,225 10,285 1,890 216,700 61,010 20,295 27,835 117,520
1971 UO 31 ,080 17,830 1,630 5,795 2,055 900 1,115 1,7551971 AO 348,805 31,085 9,685 •• 162,255 52,370 22,010 19,900 51,500
1981 US 18,305 4,500 310BRITISH COLUf^lA450 125 7.690 1,470 645 755 2,360
1981 UM 5,235 225 400 50 25 2,145 250 200 170 1,7701981 AO 648,995 18,130 5,885 6,845 5,095 345,285 51,715 22,760 24,100 169,190
1971 UO 13,985 4,835 555 • • 4,985 1,155 615 615 1,2301971 AO 484,950 14,685 7,005 • e 284,535 45,985 25,625 20,935 86,190
Wotal husbands or total husband-wife families; ^Includes Yukon and Northwest Territories.Source: For 1981, Cl 7; for 1971, A9, Tab. 63.
1 07

TABLE 62.9: HUSBAND-WIFE FAMILIES, ETHNIC ORIGIN OF WIFEBY ETHNIC ORIGIN OF HUSBAND, CANADA AfC PROVINCES, 1981 AND 1971
US=UkraInlan single origin, UM=Ukralnlan multiple origin, AO=AI I Origins, UO=*Ukra I n I an origin
Ethnic Origin of Husband
Year
WIrfTih'lc"
Origin
ves
Total
^
Ukrainianb I
n- Mu 1-
gle tiplePo-lish
Rus-sian
Bri-tish
Ger-man
Scan-dina-vian French
OtherOrigins
1981 US 142,530 62,575 2,205 6,590CANADA^
810 36,775 9,235 3,440 6,070 14,8201981 UM 30,460 2,730 2,605 625 125 11,720 2,050 540 1,235 8,8401981 AO 5 ,611,495 147,765 27,110 73,785 13,390 2 ,286,495 319,440 84,050 1,484,260 1,175,200
1971 UO 135,990 74,050 8,710 e • 28,485 7,355 3,190 4,635 9,5801971 AO 4 ,605,485 137,240 75,115 .. 2,059,865 315,570 92,790 1,217,875 707,025
1981 US 755 65ATLANTIC PROVINCES
10 - 465 30 10 65 100
1981 UM 430 - - - - 265 25 - 15 1151981 AO 493,460 865 450 945 75 354,670 13,305 1,810 82,235 39,100
1971 UO 715 115 25 440 35 5 60 401971 AO 409,810 700 945 • • 308,735 13,340 2,310 66,495 17,315
1981 US 3,925 2,050 40 155QUEBEC
40 545 60 20 615 4051981 UM 560 25 30 30 185 - - 90 1851981 AO 1 ,463,345 4,360 560 5,920 830 115,890 10,255 1,275 1,159,215 165,040
1971 UO 4,680 2,770 150 • • 675 105 20 570 3901971 AO 1 ,222,175 5,210 5,945 • • 139,925 13,580 2,155 930,720 1,246,456
1981 US 36,885 14,995 360 1,290ONTARIO
145 11,485 1,330 320 1,745 5,2201981 UM 9,530 540 575 215 - 4,390 400 40 465 2,9001981 AO 2 ,028,695 39,025 8,370 35,515 2,320 1 ,072,580 107,800 12,600 161,335 589,155
1971 UO 37,795 19,275 2,030 • « 9,630 1,320 350 1 ,375 3,8101971 AO 1 ,718,575 39,105 34,535 • • 999,845 116,740 15,090 153,060 360,200
1981 US 26,580 13,775 625 1,970MAN 1 TOBA
110 5,005 1,650 590 970 1 ,8801981 UM 3,910 655 560 105 25 1,230 240 125 135 8451981 AO 232,970 26,585 3,665 8,165 835 89,770 27,520 7,245 17,335 51,840
1971 UO 26,940 16,680 2,590 • • 3,975 1,385 515 760 1,0301971 AO 213,490 26,645 10,160 • • 89,625 27,875 8,075 16,595 34,520
1981 US 19,980 10,565 360SASKATCHEWAN
1.205 165 3.425 1,970 575 505 1,2051981 UM 2,770 330 305 75 45 765 390 40 80 7351981 AO 222,100 20,910 2,625 5,445 1,800 85,850 43,305 12,065 11,765 38,345
1971 UO 19,845 12,475 1,465 • • 2,525 1,470 570 375 9751971 AO 198,230 20,265 6,365 • • 80,255 42,045 13,950 10,905 24,455
1981 US 35,960 16,555 595 1,470ALBERTA
145 8,380 2,775 1,135 1,380 3,5301981 UM 7,230 845 715 130 - 2,285 645 175 305 2,1251981 AO 508,725 37,380 6,075 10,745 1,975 222,155 62,400 22,855 27,240 117,900
1971 UO 31 ,085 17,830 1,905 • • 5,680 1,910 975 900 1 ,8801971 AO 348,805 31,080 10,280 • • 158,225 53,715 23,205 18,860 53,435
1981 US 18,130 4,500 220BRITISH COLUMBIA495 200 7,370 1,390 780 760 2,415
1981 UM 5,890 31 0 400 65 30 2,550 345 155 145 1 ,8751981 AO 648,995 18,310 5,235 6,940 5,515 340,615 54,160 25,850 24,395 167,980
1971 UO 14,685 4,835 530 • • 5,480 1,105 745 575 1,4201971 AO 484,950 13,985 6,795 e • 279,665 47,635 27,560 20,585 88,725
^ Total wives or total husband-wife families: ^Includes Yukon and Northwest Territories.Sourcei: For 1981, Cl 7 ; for 1971, A9, Tab. 63
•
1 0 8
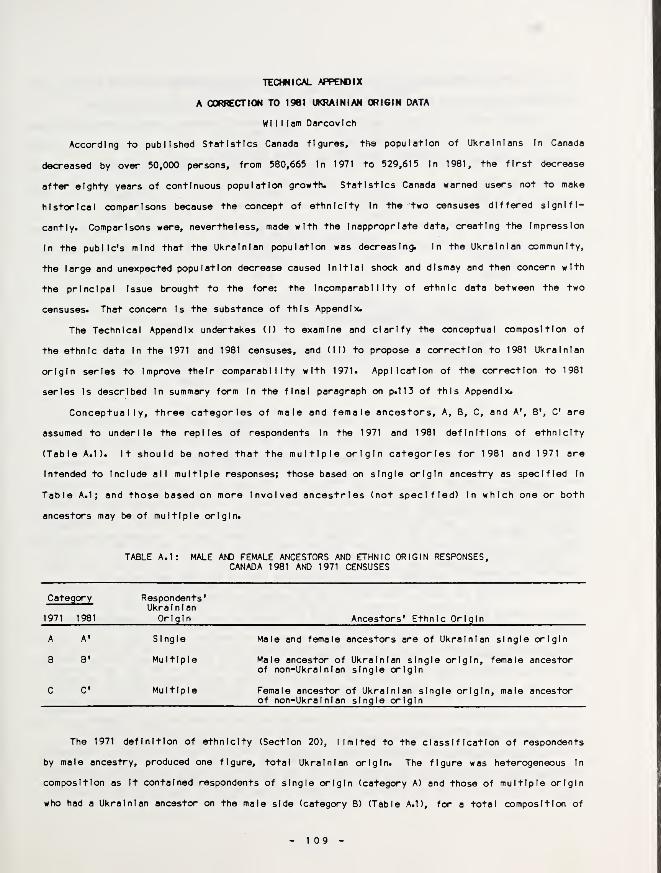
TECHNICAL APPEfOIX
A CORRECTION TO 1981 UKRAINIAN ORIGIN DATA
William Darcovlch
According to published Statistics Canada figures, tte population of Ukrainians In Canada
decreased by over 50,000 persons, from 580,665 In 1971 to 529,615 In 1981, the first decrease
after eighty years of continuous population growth* Statistics Canada warned users not to make
historical comparisons because the concept of ethnicity In the two censuses differed signifi-
cantly. Comparisons were, nevertheless, made with the Inappropriate data, creating the Impression
In the public's mind that the Ukrainian population was decreasing. In the Ukrainian community,
the large and unexpected population decrease caused Initial shock and dismay and then concern with
the principal Issue brought to the fore: the IncomparabI I Ity of ethnic data between the two
censuses* That concern Is the substance of this Appendix*
The Technical Appendix undertakes (I) to examine and clarify the conceptual composition of
the ethnic data In the 1971 and 1981 censuses, and (11) to propose a correction to 1981 Ukrainian
origin series to Improve their comparability with 1971. Application of the correction to 1981
series Is described In summary form In the final paragraph on p.113 of this Appendix.
Conceptually, three categories of male and female ancestors. A, B, C, and A', B', C are
assumed to underlie the replies of respondents In the 1971 and 1981 definitions of ethnicity
(Table A.l )* It should be noted that the multiple origin categories for 1981 and 1971 are
Intended to Include all multiple responses; those based on single origin ancestry as specified In
Table A.l; and those based on more Involved ancestries (not specified) In which one or both
ancestors may be of multiple origin.
TABLE A.l: MALE AMD FEMALE ANCESTORS AND ETHNIC (DR I GIN RESPONSES,CANADA 1981 AND 1971 CENSUSES
Category
1971 1981
Respondents'UkrainianOrigin Ancestors' Ethnic Origin
A A' Single Male and female ancestors are of Ukrainian single origin
B B' Multiple Male ancestor of Ukrainian single origin, female ancestorof non-Ukralnlan single origin
C C* Multiple Female ancestor of Ukrainian single origin, male ancestorof non-Ukralnlan single origin
The 1971 definition of ethnicity (Section 20), limited to the classification of respondents
by male ancestry, produced one figure, total Ukrainian origin. The figure was heterogeneous In
composition as It contained respondents of single origin (category A) and those of multiple origin
who had a Ukrainian ancestor on the male side (category B) (Table A.1), for a total composition of
1 0 9
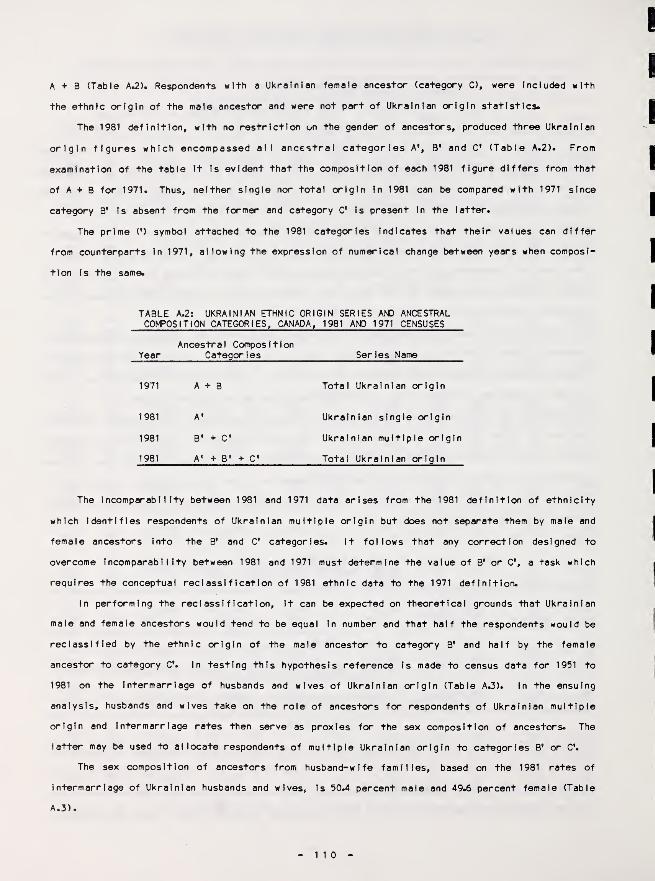
A + B (Table A.2). Respondents with a Ukrainian female ancestor (category C), were Included with
the ethnic origin of the male ancestor and were not part of Ukrainian origin statistics.
The 1981 definition, with no restriction on the gender of ancestors, produced three Ukrainian
origin figures which encompassed all ancestral categories A', B* and C* (Table A.2). From
examination of the table It Is evident that the composition of each 1981 figure differs from that
of A + B for 1971. Thus, neither single nor total origin In 1981 can be compared with 1971 since
category B* Is absent from the former and category C* Is present In the latter.
The prime (') symbol attached to the 1981 categories Indicates that their values can differ
from counterparts In 1971, allowing the expression of numerical change between years when composi-
tion Is the same.
TABLE A.2: UKRAINIAN ETHNIC ORIGIN SERIES AND ANCESTRALCOVPOSITION CATEGORIES, CANADA, 1981 AND 1971 CENSUSES
YearAncestral Composition
Categor I es Series Name
1971 A + B Total Ukrainian origin
1981 A' Ukrainian single origin
1981 B' + C Ukrainian multiple origin
1981 A* + B» + C’ Total Ukrainian origin
The IncomparabI I Ity between 1981 and 1971 data arises from the 1981 definition of ethnicity
which Identifies respondents of Ukrainian multiple origin but does not separate them by male and
female ancestors Into the B' and C* categories. It follows that any correction designed to
overcome IncomparabI I Ity between 1981 and 1971 must determine the value of B* or C’, a task which
requires the conceptual reclassification of 1981 ethnic data to the 1971 definition.
In performing the reclassification. It can be expected on theoretical grounds that Ukrainian
male and female ancestors would tend to be equal In number and that half the respondents would be
reclassified by the ethnic origin of the male ancestor to category B' and half by the female
ancestor to category C. In testing this hypothesis reference Is made to census data for 1951 to
1981 on the Intermarriage of husbands and wives of Ukrainian origin (Table A.3). In the ensuing
analysis, husbands and wives take on the role of ancestors for respondents of Ukrainian multiple
origin and Intermarr lage rates then serve as proxies for the sex composition of ancestors. The
latter may be used to allocate respondents of multiple Ukrainian origin to categories B' or C.
The sex composition of ancestors from husband-wife families, based on the 1981 rates of
Intermarr lage of Ukrainian husbands and wives. Is 50.4 percent male and 49.6 percent female (Table
A.3).
1 1 0

TABLE A.3: INTERMARRIAGE OF UKRAINIAN HUSBANDS AND WIVES IN HUSBAND-WIFEFAMILIES, CANADA, 1981 TO 1951 CENSUSES
Husbands ofUkrainian origin^who married non-Ukralnlan wives
W 1 ves ofUkrainian origin'who married non-Ukralnlan husbands Tota 1
1981
Number 112,295 110,405 222,700
Rate ($) 50.4 49.6 100.0
1951 to 1971 ( Inclusive)
Number 125,336 130,965 256,301
Rate ($) 48.9 51 .1 100.0
1951 to 1981 ( Inclusive)
Number 237,631 241 ,370 479,001
Rate ($) 49.6 50.4 100.0
^Classified according to the ethnic definition In each census year.Source: for 1981, Tables 62.8, 62.9; for 1971, A9, Tab. 63; for 1961 and1951, E2, pp. 780-1
Estimating the 1981 sex composition of ancestors outside husband-wife families Is more
Involved. I ntermarr lage In husband-wife families Is ultimately the source of all ancestors,
deceased or living, for respondents of Ukrainian multiple origin. Couples Intermarried In a
historical period appear as Intermarried In the 1981 census If they are still together. When
marriages end because of death, separation or divorce, former spouses may become deceased
ancestors or reappear In the Census In male or female lone parent families or as non-family
persons. These changes In status would leave the sex composition of ancestors the same as when
they were Intermarr led. On this basis the 1981 proxy for the sex composition of ancestors In
categories outside husband-wife families. Including deceased ancestors. Is the historic rate of
Intermarriage for 1951 to 1971, or 48.9$ males and 51.1$ females. (Table A.3).
The estimate of the 1981 sex composition of all ancestors Is obtained by combining ancestors
for husband-wife families with those outside such families, or by considering the average rate of
Intermarr lage for the period 1951 to 1981. The resulting estimate of the sex composition for all
ancestors Is 49.6$ males and 50.4$ females (Table A.3) or within one percentage point of sex
equal Ity.
The data In Table A.3 do not cover several matters relevant to the sex composition of
ancestors: comparable census data on the Intermarriage of husbands and wives before 1951 are not
available; the data In Table A.3 for 1951 to 1971 are classified for ethnicity by male ancestry
only and do not encompass, as do the data for 1981, all husbands and wives of multiple Ukrainian
- Ill

origin; there are no data before 1951 on Intermarr lages contracted outside of Canada; and there Is
some double counting In the derivation of the sox composition ratios-
Three sets of data^none entirely suited to deal with the problems above, were examined; (a)
Intermarriage of brides and bridegrooms In the Greek Catholic and Greek Orthodox denominations for
marriages contracted In Canada In 1921 to 1941 (E2, pp.696-9), which serve as proxies for the
domestic Intermarriage of Ukrainian husbands and wives; (b) the Intermarr lage In 1981 of Ukrainian
husbands and wives of multiple origin; and (c) the Intermarriage of Ukrainian husbands and wives
born outside Canada (Cl 6, C17)-
The first set of data suggests a slightly upward adjustment to the 1951 to 1981 female ratio
In Table A.3, raising It to 50.5J from 50-4^; each of the latter two data sets Indicated that more
husbands than wives Intermarried, suggesting a downward adjustment to the ratio of female
ancestors, but of unknown amount. For double counting, there Is very little Information to go on
and the direction and amount of the needed adjustment Is an open Issue.
Having regard to the near equality of the sex composition ratios In Table A.3, the margin of
uncertainty which still remains In the analysis, and the practical measures of facilitating
understanding and greater use of the ratios. It was decided not to depart from the original
assumption of equality, 50.0$ male and 50.0$ female ancestors. At 50.0$ (or 0.5) they become the
correction ratios for partitioning the 1981 Ukrainian multiple origin series Into the B' and C*
categories.
Applying the 0.5 ratio above to the 1981 Ukrainian multiple origin series of 225,365 (Table
A.4), and adding the result to the Ukrainian single origin series of 529,615 produces the
corrected 1981 figure of 642,300 for the total Ukrainian population of Canada. The latter has the
composition A* + B* and Is comparable with the 1971 total Ukrainian population of 580,660 which
has the composition A + B.
TABLE A. 4: DERIVATION OF CORRECTED SERIES, UKRAINIAN POPULATION,CANADA, 1981
Year Name Category Number
1971 Total Ukrainian origin A + B 580,660
1981 Ukrainian single origin A» 529,615
1981 Ukrainian multiple origin B' + C* 225,365
1981 Ukrainian multiple origin x (0.5) B* 112,685
1981 Corrected total Ukrainian origin A' + B* 642,300
The correction has several useful features; It reduces two estimates of Ukrainian origin In
1981 to one, which Is numerically comparable to the estimate for 1971; It may be applied to all
Ukrainian multiple origin series, but would be less reliable for estimates based on a small number
- 112 -
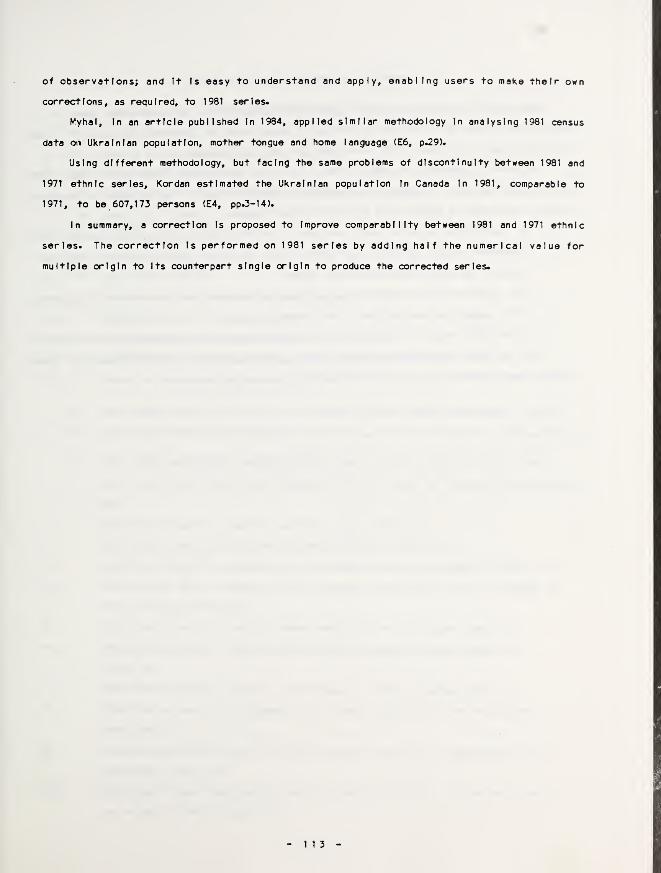
of observations; and It Is easy to understand and apply, enabling users to make their own
corrections, as required, to 1981 series*
Myhal, In an article published In 1984, applied similar methodology In analysing 1981 census
data on Ukrainian population, mother tongue and home language (E6, p.29).
Using different methodology, but facing the same problems of discontinuity between 1981 and
1971 ethnic series, Kordan estimated the Ukrainian population In Canada In 1981, comparable to
1971, to be 607,173 persons (E4, pp.3-14).
In summary, a correction Is proposed to Improve comparability between 1981 and 1971 ethnic
series. The correction Is performed on 1981 series by adding half the numerical value for
multiple origin to Its counterpart single origin to produce the corrected series*
1 1 3
APPENDIX 1 ADDITIONAL 1981 ETHNIC DATA
I
I
Census data on Ukrainian single, multiple and total origin and counterpart data for all
origins were deposited In the Public Archives of Canada under the reference, TDarcovIch (William)
and Yuzyk (Paul): Additional 1981 Census Data for the 1981 Supplement*"
The material deposited Includes all the Items listed under the B, C and D letter codes In the
Bibliography (pp*115-6)* In general the material contains more detail than Is shown In Supplement
tables* The following material may be of particular Interest:
- B: part of the material under this code Is on Ukrainian multiple origin classified Into
component groups; Ukrainian and British only, Ukrainian and French only, Ukrainian -
Polish - German - Russian, and other groups*
- C8: place of birth Is detailed by sex, rural-urban status and 20 provinces and countries.
- Cl 4: occupations are detailed by 595 categories.
- Cl to C23: each of the 23 entries Includes data for Yukon and the Northwest Territories.
Data for some non-Ukralnlan origins, Polish, German, Russian, Yugoslav, Romanian, Czech,
Slovak, Jewish, and other groups are Included with the material In code B.
1 1 4
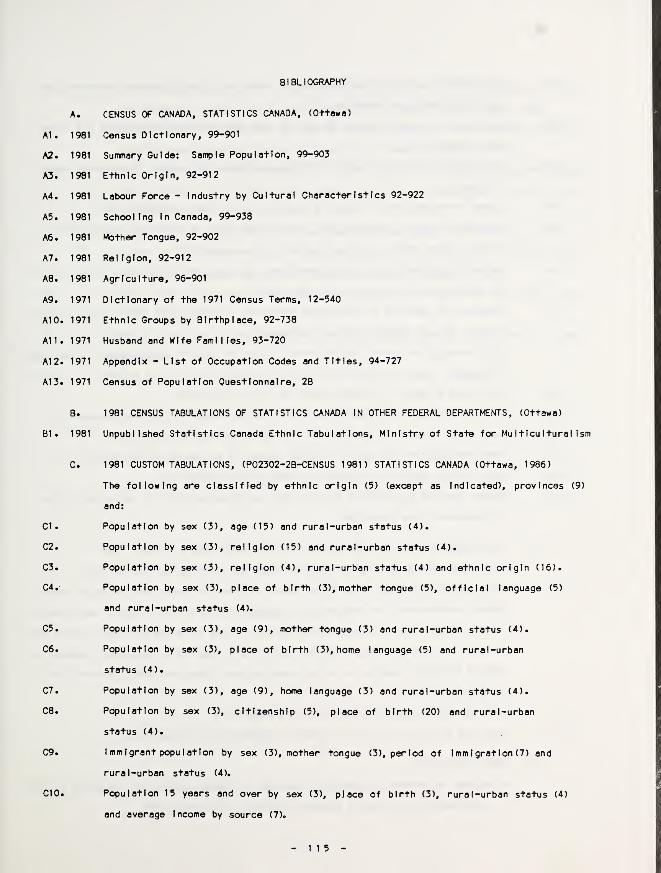
BIBLIOGRAPHY
A1.
A2.
A3.
A4.
A5.
A6.
A7.
A8.
A9.
A10.
All.
A12.
A13.
B1.
Cl.
C2.
C3.
C4.
C5.
C6.
C7.
C8.
C9.
CIO.
A. CENSUS OF CANADA, STATISTICS CANADA, (Ottawa)
1981 Census Dictionary, 99-901
1981 Summary Guide: Sample Population, 99-903
1981 Ethnic Origin, 92-912
1981 Labour Force - Industry by Cultural Character I st I cs 92-922
1981 Schooling In Canada, 99-938
1981 Mother Tongue, 92-902
1981 Religion, 92-912
1981 Agriculture, 96-901
1971 Dictionary of the 1971 Census Terms, 12-540
1971 Ethnic Groups by Birthplace, 92-738
1971 Husband and Wife Families, 93-720
1971 Appendix - List of Occupation Codes and Titles, 94-727
1971 Census of Population Questionnaire, 2B
B. 1981 CENSUS TABULATIONS OF STATISTICS CANADA IN OTHER FEDERAL DEPARTMENTS, (Ottawa)
1981 Unpublished Statistics Canada Ethnic Tabulations, Ministry of State for Mu I ticu I tural Ism
C. 1981 CUSTOM TABULATIONS, (P02302-2B-CENSUS 1981) STATISTICS CANADA (Ottawa, 1986)
The following are classified by ethnic origin (5) (except as Indicated), provinces (9)
and:
Population by sex (3), age (15) and rural-urban status (4).
Population by sex (3), religion (15) and rural-urban status (4).
Population by sex (3), religion (4), rural-urban status (4) and ethnic origin (16).
Population by sex (3), place of birth (3), mother tongue (5), official language (5)
and rural-urban status (4).
Population by sex (3), age (9), mother tongue (3) and rural-urban status (4).
Population by sex (3), place of birth (3), home language (5) and rural-urban
status (4).
Population by sex (3), age (9), home language (3) and rural-urban status (4).
Population by sex (3), citizenship (5), place of birth (20) and rural-urban
status (4).
I mm I grant population by sex (3), mother tongue (3), period of I mm I gratlon (7) and
rural -urban status (4).
Population 15 years and over by sex (3), place of birth (3), rural-urban status (4)
and average Income by source (7).
115 -
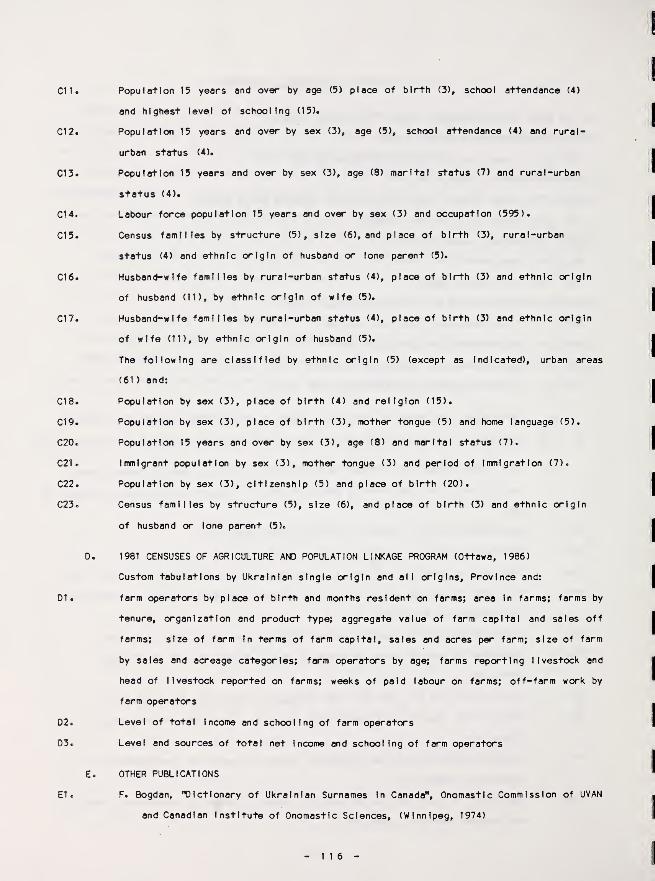
C11.
Cl 2.
C13.
C14.
CIS.
C16.
C17.
C18.
C19.
C20«
C21.
C22.
C23.
01 .
02 .
03.
E.
El .
Population 15 years and over by ago (5) place of birth (3), school attendance (4)
and highest level of schooling (15).
Population 15 years and over by sox (3), age (5), school attendance (4) and rural-
urban status (4).
Population 15 years and over by sox (3), ago (8) marital status (7) and rural-urban
status (4).
Labour force population 15 years and over by sex (3) and occupation (595).
Census families by structure (5), size (6), and place of birth (3), rural-urban
status (4) and ethnic origin of husband or lone parent (5).
Husband-wife families by rural-urban status (4), place of birth (3) and ethnic origin
of husband (11), by ethnic origin of wife (5).
Husband-wife families by rural-urban status (4), place of birth (3) and ethnic origin
of wife (11), by ethnic origin of husband (5).
The following are classified by ethnic origin (5) (except as Indicated), urban areas
(61) and:
Population by sex (3), place of birth (4) and religion (15).
Population by sex (3), place of birth (3), mother tongue (5) and home language (5).
Population 15 years and over by sex (3), age (8) and marital status (7).
Immigrant population by sex (3), mother tongue (3) and period of Immigration (7).
Population by sex (3), citizenship (5) and place of birth (20).
Census families by structure (5), size (6), and place of birth (3) and ethnic origin
of husband or lone parent (5).
1981 CENSUSES OF AGRICULTURE AND POPULATION LINKAGE PROGRAM (Ottawa, 1986)
Custom tabulations by Ukrainian single origin and all origins. Province and:
farm operators by place of birth and months resident on farms; area In farms; farms by
tenure, organization and product type; aggregate value of farm capital and sales off
farms; size of farm In terms of farm capital, sales and acres per farm; size of farm
by sales and acreage categories; farm operators by age; farms reporting livestock and
head of livestock reported on farms; weeks of paid labour on farms; off-farm work by
farm operators
Level of total Income and schooling of farm operators
Level and sources of total net Income and schooling of farm operators
OTHER PUBLICATIONS
F. Bogdan, ’Dictionary of Ukrainian Surnames In Canada", Onomastic Commission of UVAN
and Canadian Institute of Onomastic Sciences, (Winnipeg, 1974)
- 116

William Darcovlch, Editor, Paul Yuzyk, Associate Editor, "Statistical Compendium on the
Ukrainians In Canada, 1891-1976", University of Ottawa Press, (Ottawa, 1980)
Bohdan S. Kordan, "Ukrainians and the 1981 Canada Census: A Data Handbook" Canadian
Institute of Ukrainian Studies, University of Alberta, (Edmonton, 1985)
Bohdan S. Kordan, with the assistance of Rita F. Chow* "Ukrainians and the 1981 Canada
Census Ethnic-Origin Question", Journal of Ukrainian Studies* Vol. 10, No* 2,
(Toronto, 1985)
John M* Kralt, "Ethnic Origin In the Canadian Censuses, 1871-1981" pp* 18-49 In
Changing Realities: Social Trends Among Ukrainian Canadians, edited by W.R*
Petryshyn, Canadian Institute of Ukrainian Studies, (Edmonton, 1980)*
B* Myhal, The 1981 Census of Population of Canada (4)" In Now I DnI, Vol* XXXV, March
1 984, (Toronto)
Pierre G* Normandln, Editor, The Par 1 1 amentary Guide", Various Years, 1977 to 1985,
(Ottawa)
*
"Report of the Chief Electoral Officer", 1979, 1980 and 1984, (Ottawa).