ANNUAL -VIII 1981 - IRC
242
t ^ A N N U A L -VIII 1981 INDIAN ASSOCIATION FOR WATER POLLUTION CONTROL
-
Upload
khangminh22 -
Category
Documents
-
view
2 -
download
0
Transcript of ANNUAL -VIII 1981 - IRC

t ^
ANNUAL -VIII 1981
INDIAN ASSOCIATION FOR WATER POLLUTION CONTROL

! J O B I N W O N lt,llLROU
NECDOUMC
EAAT' I
* Division Instruments S. A. OEDEX, FRANCE. $
* • *
? A NEW LEADER J
$ in the field of ICP. *
$ More than 180 instruments In the World : USA, JAPAN $ £ CHINA, USSR, EUROPE, MIDDLEEAST, SOUTH AMERICA, $ * AFRICA, INDIA, etc. *
& 4 ' The most complete range, the most advanced systems on A * the market today. The equipment you need i s in the JOBIN T * YVON line. * ¥ * $ The best optics in the world. Unequalled p e r f o r m a n c e s . . . . $ * Do not hesitate to contact our laboratories. -J| * *
If you can find, on the world market, an universal, high * performing instrument, it should be the JY 48 PE t JY j
^ 38 VHR : *
% - unequalled optics, using a Master holographic grating * ¥ 2550 g/mm.. $
? - Spectral range in the first order 1200-4000A. $ * - dispersion in the first order 3.95 A/mm. in X $ - the 2nd 1.98 A/mm. * ¥ - 86 PMT positions. $ T - JY 38 VHR monochromator. $ ^ - ICP and spark stand usable with the polychromator, ICP T
usable also as computerized sequential instrument. 5 ^ - large range of accessories (dismountable torch with argon & ^ sheath, ultrasonic nebulizer.) ^ * *
| Representatives in India | | MATERIALS RESEARCH INSTRUMENTS, | % 63, Bajaj Bhavan, •.* $ Nariman Point, t f BOMBAY-400 021. Tel. 23 20 44 $
*
*
* ^ ^ ^ ^ * f r ^ ^ ^ ^ ^ ^ ^ ^ & ^ 4 ^ W ^ ^ ^ ^ 4 & ^ ^ ^ < ^ - 4 * " * t 4 & 4 f r * f r +

I A W P C TECHNICAL ANNUAL
i
511 U
-VIII
LIBRARY International Btference Centrt for Community Water Supply
!SVi -y^\
INDIAN ASSOCIATION FOR WATER POLLUTION CONTROL
JAWAHARLAL NEHRU MARG,
NAGPUR - 440 020
1 9 8 1

PUBLISHER Prof. V. RAMAN, Scientist, NEERI & Secretary, IAWPC, Nagpur-440 020.
EDITOR Prof. V. RAMAN.
Jt. EDITOR
COVER DESIGN
PRODUCTION
PRINTED AT
Dr. P.V.R.C. PANICKER, Scientist, NEERI, Treasurer, IAWPC, NAGPUR-440 020.
Dr, P.V.R.C. PANICKER.
Dr. P.V.R.C. PANICKER.
Mahima Printing Press, NAGPUR-440 010.
* This volume is published on the responsibility of Indian Association for Water Pollution Control (IAWPC). However, the Association is not responsible for the views expressed by the authors, or for the correctness of the literaturecited by them.
* The mention of specific companies or of certain manufacturers' products does not imply that they are endorsed or recommended by IAWPC, in preference to others of a similar nature which are not mentioned.
* Reproduction from this volume with due acknowledgement is permitted.
i I I I i j i I i i.
I I1
i i

I A W P C
MEMBERS OF THE EXECUTIVE COMMITTEE, 1981
PRESIDENT Shri S. T. Khare, 502, Lovedale Juhu Tara Rd., BOMBAY-400049.
VICE-PRESIDENT Shri B. V. Rotkar, Chief Engr. (Urban), Maharashtra Water Supply and Sewerage Board, BOMBAY-400 032.
FEDERATION DIRECTOR Shri T. R. Krishna Rao, Hindustan Dorr-Oliver Ltd. Andheri (East) BOMBAY-400 090.
SECRETARY Prof. V. Raman, Scientist, NEERI, NAGPUR-440 020.
TREASURER Dr. P. V. R. C. Panicker, Scientist, NEERI NAGPUR-440 020.
IMMEDIATE PAST PRESIDENT
Prof. N. Majumder, 48/60, Swiss Park CALCUTTA-700 033.
Contd.
i i i

MEMBERS 1. Dr. B. B. Sundaresan, NEERI, NAGPUR-440 020.
2. Shri C. E. S. Rao, Hindustan Construction Co. Ltd. Ballard Estate BOMBAY-400 038.
3. Shri P. K. Chatterjce, CMDA, CALCUTTA-700 017.
4. Shri D. B. Bhatt, 52, Himatlal Park No. 2 Near Azad Society
. AHMEDABAD-380 015.
5. Dr. A. V. S. Prabhakar Rao, Dept. of Civil Engg. I. I. T., KANPUR-208 016.
6. Shri A. Raman, NEERI Zonal Laboratory .Inside Chandrawal Water Works-II DELHI-110 054.
7. Shri M Parabrahmam, •Dept. of Environment NEW DELHI-110 029.

Foreword
k it
i i i
P
i i
It is a reality to-day that 1,500,000,000 people are forced to drink filthy Contaminated Water. Particularly women and children have to walk intolerable distances d«lpftii^ccj|^<rei»feWMMltM^ people die each day di® to p/^x^jsdkd. djfqm&t j & % « ? " ^ ^ E ^ f ^ S ^ yater in sufficient quantlies sh^ulabeiaiiiailaTlWo'^lf^edple Tftrrfreatf weoreahe ; a condition of life i|self. I
As* aajeJEert towords this goal IAWPC is sfcnjy*«g to disseminate practical k(fowl4d|e in the field of Water Pollution Control, through this TECHNICAL ANNUAL-8th in the series.
The papers presented in this volume have come from a broad spectrum of professional and scientific organizations, and the topics include theorcy, design, case studies, research findings, critical reviews, practical aspects of implementation of water pollution control measures etc. Hope, This document will be of immense value to those concerned with water quality management.
This volume could be brought out with the kind co-operation and financial support from our learried mertibers and generous advertisers. IAWPC is grateful to them. ;
Nagpur, 28-12-1981
V. Raman.
I

DISEASE HALVED In tha Third World, constructing drinking watar and tawaga lyitami could halva tha incidanca of ditaaiai lika typhoid, dysantry, cholara and ichiitoiomiatii.
Courtery : U. N. Env. Programme
VI
C O N T E N T S
1. Abstracts
2. Conservation of energy and Environmental Pollution Control. V. Raman and B. B. Sundaresan.
3- Implementation of Pollution Control Laws : Facts and Fallacies. S. G. Kale.
4. Trace elements of Surface Waters In Uttar Pradesh. B. K. Handa, Adarsh Kumar and D. K. Goel.
5. Agra Water Quality. Chandra Prakash and D. C. Rawat
6. A Simple Water and Plankton Sampler. C. S. Sharma and Bharat B. Gupta-
7. Effect of ionic concentration of vegetable tanning effluent on Anaerobic filter. S. N. Chattopadhya and H. C. Arora.
8. Treatment of Waste pickle liquor from a tube mill. S. R. Alagarsamy, G. Vijayaraghavan, and M. Gandhirajan
9. Adsorption of zinc from Aqueous Solutions by flyash. P. V. S. S. Prabhu, M. S. Narayana Swamy and T. S. S. Narasa Raju.
10. Determination of Alpha values for some wastewaters. S. N. Kaul, A. C. Manuel and V. Raman.
11. Additional Surfaces in Reactor on Nitrogen and Phosphorus Removal from sewage. H. R. Nagalingacharya and T. M. Ambeer Ahmed.
12. Activated sludge treatment of liquid Wastes—A review. Desh Deepak.
13. Sewage treatment Plant at Jaipur. P. S. Rajvanshi and S. K. Mishra,
vii

14. Effect of Temperature on Oxygen Transfer. S. B. Kute and S. M. Dhabadgaonkar
15. Rotating Biological Contactor. A. N. Khan and V. Raman.
16. Role of aquatic plants in Water Pollution Control. S. B. Chaphckar and G. N. Mhatre.
17. Recycling of Refinery effluents for Agriculture. R. P. Mishra, L. N. Sharma, R. C Dixit and A. Raman.
18. Paper Mills Effluent for Sugarcane irrigation. •M. R. Reddy, Jivendra and S. C. Jain.
19. Effects of organophospborus insecticides on Fish and Fish-food organisms. S. K. Konar and T. K. Ghosh.
20. Soil suspensions and their Coagulation. V. P. Thergaonkar, O. B. Thakre. P. K. Tarafdar. R. A. Thakre, and Ramtekke, D. S.
Short Technical Communication.
21. Detection of Trace elements in Kali Nadi Water in Mcerut. V. P. Kudesia and C. B. Sharma.
22. IAWPC LIFE MEMBERS.
23. Our Advertisers.
via

iyppn
ion-exchange capability?
Tou$:\ , 1. Having «team of the most
experienced and resuiforiented •» professiofials in the field pf Water Treatment ind lo'rfefwan^e / Technology. '
S. Having a technlcaTtpllaboratiori of lonac Cheu\i6aK#iripany, a Division of Sywoft Corporation, USA. one of the most experienced makers of ion exchangers in the world.
v 3. Having a technical collaboration of Permutit Company, USA, one of the most experienced water treatment engineering companies in the world.
4. Having a task oriented RAD Division (Resin & Engineering) with Sophisticated lab and test facilities.
5. Having a comprehensive range of fugged and reliable ion exchange resins including macroporous cation and anion exchangers and a total range of water treating equipment
c. Having detailed site investigations, water analysis, pilot plant and scheme selection studies and in-depth technical recommendations,
7. Having detailed project engineering and design capabilities including selective procurement supported by modern management aids. Also a professional site management service
8. Having the back-up of captive engineering and highly sophisticated fabrication facilities of THERMAX.
o Having an all India service network-customer oriented and fully geared to tackle and solve field problems.
10 Having a high technology oriented Applied Ion Exchange and Diversification Division.
To you: ( 1 . A total and comprehensive water «.
treatme.qt ajid jon exchange service \ from one source—from site surveys; *
Sa f f l^K^^^e 'cMic lTserv ice . 3. Acfwp^^t^*j,aiisirfg\5ystems,Reverse
Osmoss equipment and effluent treatment plants incorporating latest International technology in these fields.
4. Continuous improvement in technologies. to maximise life, efficiency and economy of the total water treatment system.
5. Water Treatment Systems and Ion Exchange Resins to suit all your requirements.
6. Free technical service, without obligation, to ensure that your water treatment system is the best.
7. An efficient water treatment system at optimised capital and operating costs. with delivery as per schedule and speedy, trouble-free installation and commissioning.
8. Unbeatable quality and unquestionable standards.
An 'on-tap-service geared to respond swiftly to your needs anytime, anywhere.
10. A tremendous benefit to Indian Industry by exploiting the versatile nature of ion exchange technology end finding wider and newer applications in process industries and Pollution Control
TULSI-theNoJinTotalWaterTreatmentand Ion Exchange capability*
Tulsi Fine Chemical Industries (Pvt) Ltd. ,1916/7, Shlvajlnagar, Ferguson College Roed.PUNE 411 004.
- * Auoelau Company. THUMAX Private limited. Rediffuiion/TC/IOTSaR
IX

Abstracts V. RAMAN, and B. B. SUNDARESAN Conservation of Energy and Environmental Pollution Control IAWPC.TECH ANNUAL, VIII; 1-5, 1981.
ABSTRACT
In choosing environmental engineering systems, energy resources, fuel, chemicals and costs need be considered. It is pertinent to ask whether the impact of environmental control' activities on energy and resources will be required for meeting the shortages that- exist. Energy, fuel and resoufce economics have changed drastically now and it may be necessary to assess the consequences orr energy and resources arising out of environ- • mental protection activities and Standards Setting.
Examples have been provided to illustrate how best energy and resources could be conserved from practical point of view.
KALE, S. G. Implemntation of Pollution Control Laws : Fact and Fallacies. IAWPC TECH ANNUAL, V m , 6-10,1981.
ABSTRACT
The Central and State Boards for the Prevention and Control of Water Pollution implement the water pollution act by issuing consent letters to industries^-wTicrein eertain conditions are stipulated common to all the industries. Some of these" conditions, such as segregation of drain lines, limiting values for COD, classification of bio-degradable effluent, mode of prescribing standards for the treated effluent and need for a new parameter in place of 5D20°C BOD; are discussed here. On these
conditions the author expresses his views which are in contradiction with the present practices followed by Central & State Boards. The author wishes that some study group should discuss the points raised in this paper and should give recommendations to authorities. This will help in saving an uncalled for investment on pollution control projects.
x

-4= ^
A RICHARDSON & CRUDDAS (1972) LTD.
(A Govt, of India undertaking)
A HOUSE OF TECHNOLOGICAL AND ENGINEERING SKILLS
FOR CONSULTANCY AND EXECUTION OF TURNKEY PROJECTS IN
• ENVIRONMENTAL ENGINEERING • STRUCTURAL • MECHAWCA! & ELECTRICAL AND • REFRIGERATION
L
Effluent Treatment Plant at Hindustan Machine Tools Ltd., Bangalore.
.|?&Cr> is now equipped wi th a fullftedged analytical, research and development laboratory in
Environmental Engineering.
<^R&C^> Manufacturers of
• India Mark II Deepwell Handpumps • Package water Treatment Plants • Combination Coolers, Ice Makers,
Milk Chilling Units, Ice Candy Plants, Deep Freezer, Ice Cream Freezers, Cold Storage Plants, Etc.
^ < ^ t e £ > RICHARDSON & CRUDDAS (1972) LTD. f ^ f " ^ RAJAJI SALAI, MADRAS-600001. 1858 HEAD OFFICE : Byculla Iron Works, Bombay-440 008
zr ELEGANT
XI

HANDA, B. K., ADARSH KUMAR and D. K. GOEL Trace Elements of surface waters in Uttar Pradesh IAWPC TECH. ANNUAL-VIII 11-17 (1981)
ABSTRACT
Studies reported here indicate that the Gomati river water at Lucknow was polluted with respect to copper and zinc (and perhaps also from rubidium and cesium and the same appears to be the case for the Ramganga river water at Moradabad. "I he Sai river water at Rai Bareilly and Bani appears to be polluted with respect to molybdenum, while the water from the right bank of the Ganga river at Kanpur (Old Bridge site) is enriched with respect to iron and manganese as compared to the water from the left bank, while the latter has much higher zinc content as compared to the former. Similary the Yamuna river water* at Jahanabad (Fatehpur) has high value of 55 micrograms/1 of lithium. These facts do indicate the utility of trace element studies to evaluate pollution status of the surface waters, particulary because some of them are quite toxic to the aquatic biota.
CHANDRA PRAKASH AND D. C. RAWAT
Agra Water Qulity
IWAPC TECH. ANNUAL VII, 18-22, 1981.
ABSTRACT
Agra, draws its raw water from the river Jamuna. Water samples from Poiya Ghat were collected and examined throughout the year 1978 to determine the seasonal variations in physico-chemical and bacteriological qualities. The present situation .within the city is too far from satisfactory with regard to water quality and quantity requirements. It has total 40 mgd capacity water treatment plants and one sewage pumping station as against 1.5 million population (including floating). It is necessary to evolve a water and wastewater . management scheme which will progressively meet the requirements of the present as well as future population and industries of corporation area.
XI1

F Bh«^lB»kj»t^«l»^Bh^BI>^l^*t^»kjttShSjtq^»l%^fl^ tgh^»iyi^^^^
«S
cTdf Specialised Services in
COMPLETE WATER SUPPLY &
SEWERAGE SCHEMES WASTE WATER SOLID WASTES IRRIGATION.
INVESTIGATION FEASIBILITY STUDIES DESIGN CONSULTANCY-CONSTRUCTION MANAGEMENT
Contact
Shah Technical Consultants Pvt. Ltd
Consulting Engineers
406, Raheja Centre
Plot No. 214, Nariman Point
Bombay-400021
Phones: 220018/226081
Cable : SHATEC
Telex; 011-6027
f
9
?
MADRAS OFFICE
Phone : 444832 Telex : 041-7726
fci«'my»*H0J»,M<5«^»B8«,M(SJ*,mSj« ""HSJ* *iliyoiB)v^tQ*^RQM^VN^<VQV«4(yw^(|jj}V?iQr«<g)*^g<r^igiQ
Xlll

SHARMA, C. S. and GUPTA, B. B.
A Simple Water and Plankton Sampler,
IAWPC TECH ANNUAL, VIH, 23-25, 1981
ABSTRACT
For hydrobiological and limnological studies, a simple indigenous water sampler of light weight has been designed. This sampler can record the sampling depth, the water temperature and the colour of water at different depths at the same time.
CHATTOPADHYA, S. N. AND ARORA, H. C.
Effect of Ionic Concentration of Vegetable Tanning Effluent on Anaerobic Filter
IAWPC TECH. ANNUAL, Vffl, 26-32, 1981.
ABSTRACT
Excessive ionic load in a wastewater impairs the efficiency of an anaerobic treatment system. The objective of this study therefore was to assess whether the ionic concentration with special reference to chlorides, available in live tannery wastes adversely affects the anaerobic contact filter process. Ionic loadings in terms of chlorides ranging between 3200-5000 mg/1 are available in live waste and were tried. Total estimated ionic concentrations corresponding to aforegiven chloride loadings were recorded to be 6500-11500 mg/1. Batch feed system was adopted keeping the retention time as 1 day.
Even at the highest loading in terms of chlorides i. e. 5000 mg/1, average percent removals in terms of COD, BOD and Tannin respectively were recorded as 94.6, 95.0 and 86.1. The percent removals are comparable to those tried earlier by eliminating soak liquor from the feed. It can therefore be concluded that the efficiency of the anaerobic contact filter is not impaired at least upto a chlorides concentration of 5000 mg/1, the corresponding Total Estimated Ionic Concentration ( T E I C ) being 115000 mg/1.
xiv

-*- « " Mh iHfi Mtti HW fiifc IMi rttft flifi W i flit Mil flfl *if *ift HT J JM "If MM l i t ilrf i l i l Mtf iTIf ififi iM* Mfc Jifc J i * JMrt Jtfi iti V T W ^ T ^ l ^ ' » V W W ' W W W *R' W WV 9fcp Ml" WW" Wk* T W» W W 1W Ml !^* * V W Dfc1 WV WW JH1 TftT W1V W V
i $ $ GramtPARBILD Phones : 0-26346; R-23404, 32153, 22987 $
| Parwan i B u i l d e r s | | E n g i n e e r s And C o n t r a c t o r s J ^ Q-8, Laxmi Nagar, Nagpur - 440 022 $
* $ | Specialists in Design and Construction of R. C. C- Structures, O. H. and $ % Underground Tanks, Slab Drains, R. C. C. Aqueducts Etc. $
$ *
| D. K. Navagire & Co. f $ Consultants, Engineers & Contractors for Water Treatment $ $ Plants, Water Retaining Structures * * % % Park View, Dhantoli, NAGPUR - 440 012 $ $ $ | Telephone : Office - 26327, Res. - 32675, 33713 $ * * * | ^ If/f/j //ie -fles/ Compliments from : T
f * | Kerala Chemicals & Proteins Limited f
i A Joint Ventnre of : £
i Kerala State Industrial Development Corporation Ltd. i $ Nitta Gelatine Co. Ltd., Japan $ $ Mitsubishi Corporation, Japan * * ? * ! I Regd. Office - Factory - » I XXXV/385 A3, Durbar Hall Road, Kathikudam. P. O., f I Ernakulam, Post Box No. 1760 Via. Koratty, X * Cochin-682 016 Trichur District £ $ Telephone : 37805, 37904 & 35269 Telephone: 613 & 623 * $ Telex : 0885-536 (Chalakudy) % $ Grams : KEMIGEL, Ernakulam. %
i %
XV

ALAGARSAMY S. R, VIJAYARAGHAVAN G, and GANDHIRAJAN. M. Treatment of Waste Pickle Liquor From A Tube Mill
IAWPC TECH. ANNUAL VIII, 33-45, 1981.
ABSTRACT
One of the major operations in metal product industry is the descaling/.pickling wherein a huge quantity of acid is employed everyday. Consequently, the industry discharges spent acid in the form of waste pickle liquor and also acidic rinse waters. As the waste water resulting from such operations is hyghly acidic and contains high dissolved salts, the disposal of such acidic wastes warrant a detailed consideration of local conditions and possible recovery system.
A case study undertaken for the treatment, recovery and disposal of pickle liquor for a tube mill with finished products of cold rolled mild steel and welded'tubes and electrical resistant weldable tubes is presented.
PRABHU, P. V. S. S„ NARAYANA SWAMY., M. S., and NARASA RAJU, T. S. B.
Adsorption of Zinc From Aqueous Solutions by Fly-Ash
IAWPC TECH. ANNUAL, VUI, 4&-52,1981
ABSTRACT:
Batch studies for the removal of zinc by adsorption on Flyash were made. Experimental rusults obtained could be. explained by Freundlich adsorption isotherm very well. The study included the effect of concentration of solute (zinc), concentration of flyash and pH, on the percentage removal of zinc. In the pH range 3-4, maximum percentage removal of (89%) was obtained. The probable processes involved in the adsorption kinetics of this system are also- discussed.
xvi

Enviro control associate n Im/hjkfm. tmiml ,
OFFERS CONSULTANCY & TURNKEY PROJECT SERVICE FQR
INDUSTRIAL WASTE WATER TREATMENT WATEa 'TREATMi^T . . A | l^® i L^T l 0^^AAQWiJTGRJWG & CONTROL. SE$|pRAGE SYST€#T FEASIBILITY & PROJECT REPORTS
• LABORATORY & PILOT PLANT STUDIES
AMAR—ASHISH' 2ND FLOOR. NEAR L.I.C. BUILDING] OPP MUNICIPAL CORPORATION. SURAT. GRAM ENVIROCON, PHONE : 3 1 4 8 0 .
(SQutAQntaOiwaQhtdtfl SUVIDHAADS 81
*!a^» * * ^ t****- *****- «i8h>. »f »^»ig | rt» tr**^ » * ^ »n»- iBtri tff^s***^ »^~- »ro
DRAIN BRAIN JFr>om
ENVIRONMENT PROTECTION ASSOCIATES (Engineers & Contractors)
22, 3rd Avenue, Besant Nagar, Madras - 600 090
T. No. - 4 1 3 6 7 0 Grams : ECOSYSTEM
YES ! We are one of the few around who have put their brains in tackling the problems emanating from your drains, viz. effluents. Before there is
further drain on your brain in solving pollution problems call in the experts at the above address, for turnkey projects and assistance
in the treatment of water, sewage and industrial effluents.
^a*ag«>'UQr ,aQr*!(g*">qge^^v*iiQr*^**^e'W^arvB** ,^*^^r^9*
xvu

KAUL, S. N., MANUEL, A. C. and RAMAN, V., Determinatioo of Alpha values for some Waste Water IAWPC TECH. ANNUAL, VEL 53-59, 1981
ABSTRACT:
Waste contaminants have marked effect on. the Oxygen transfer rate as they tend to influence both the liquid film coefficient, KL and the specific area (A/V). Most of the alpha values available in literature are concerned with the bubble aeration system. In the present investigation alpha values for some .waters have been reported using a model surface aerator for designing an appropriate aeration system.
NAGALINGACHARYA and AMEER AHMED, T. M., Additional surfaces in reactor and Nitrogen and Phosphorus Removal from sewage. IAWPC TECH. ANNUAL, Vm 60-68, 1981
ABSTRACT:
The problem of eutrophication observed in natural water sources such as streams, lakes, ponds and reservoirs is mainly due to the addition of nutrients in the natural body of water, which can be well mitigated by controlling the introduction of nutrients into the natural bodies. The reduction of nutrients in the conventional methods of treatment seldom goes beyond 40 percent. Therefore, various modified methods have been devised to treat the nutrients such as nitrogen and phosphorus, by various reasea-rch workers. In view of economizing the treatment process, reactors with additional surfaces were used in the experimental work, which was found better in performance than the aeration tank in activated sludge extended aeration process, with reference to parameters such as BOD, S. S., Total solids, etc.
xviii

mm»^.iBw..iB>w.nh^iB^.E»w. .t»^.H>^ . E W .m^. T»>- .m^ »m^i nif^ .i^w. ttah^.i
J A T U L
offers
j ft Direct Difes
J ft Acid Dtjes
ft 1:1 Metal Complex Dqes
ft 1:2 Metal Complex Dijes
g Most Suitable for dyeing of
j ^ various Leathers at reasonable prices
A l s o
For Requirements Contact :-
THE ATUL PRODUCTS LIMITED P. O. ATUL 396020 DIST : VALSAD,
GUJARAT
r
r
w
r i J ATUL SODIUM THIOSULPHATE (HYPO) f
£ In Crystal & Powder for tanning. j
j r
r
XIX

DESH DEEPAK Activated Slduge Treatment of Liquid Wastes—a review. . IAWPCTECH. ANNUAL, VIII, 69-82, 1981
ABSTRACT:
Being a heterogeneous microbiological system, activated sludge process is a very complicated system and its characteristics vary widely with the design and operational conditions. Biopoly-mer formed by the bacteria under unfavourable conditions serves as binding material for microorganisms to form floes. This biopoly mer (slime) helps in the removal of suspended as well as dissolved particles from the waste. The size and shape of the bacterial cell also depend on the availability of oxygen and nutrients. Under short supply of oxygen and nutrients cells become filamentous. In practice, in 'activated sludge process both spheroid and filamentous structures are found. Both interparticle and intraparti-cle mass transfer resistances influence the Oa and substrate supply rate to the cells in floe.
There is no significant difference in sludge yield between air and oxygen supply systems.
RAJVANSHI, P. S. & MISHRA, S. K.
Sewage Treatment Plant at Jaipur. IAWPC TECH. ANNUAL, VIII, 83-87, 1981,
ABSTRACT
The paper discusses salient features of the Activated sludge plant at Jaipur, India. This plant has been in operation from 1979, and consists of primary and secondary treatments including aerobic digesters for the stabilisation of sludge. While achieving a BOD removal of 95 to 97.5 percent, the income generated from the sludge and effluent can meet the entire expenditure on the plant, and can have savings too, by efficient operation and maintenance.
xx

| QUALITY OR QUANTITY ? f jj[ We say, both i $ The largest pharmaceutical industry in India,believes in,both quality and q u a n t i t y |l Best medicines to combat diseases are produced in large quantities adhering t o £ $ the pharmacopial standards. % sji At Hyderabad , over 30 basic drugs and fifty formulat ions a re pGod.<u£9d.#t<ery $ * year and made available to the common man. * * That is why I D P L is now for millions a healing hand *
! IDP L * Indian Drugs & Pharmaceuticals Ljjnked
Hyderabad-500 037
*
3j| WITH BEST COMPLIMENTS OF : ESTD. J019 jf
| HUKUMCHAND JUTE MILL^ LimTEf) J * Regd. Office : 15. INDIA EXCHANGE PLA^^ALCUTTA-7|!Jp| . | * Telegram : 'HUKUMILLS' Calcutta Telephone: 22-3jjjf^^a»f) £ | Telex : HUK.UM 021-2771 CHEMICAL ] j j§ra i lp : $ $ JUTE MILLS DIVISION Manufactuop'of: $ 3| Manufacturers & Exporters of CAUSTIC SODA L ^ M Rayon Grade) * * QUALITY HESSIAN, SACKING, CARPET LIQUID CHLORINE * 1 BACKLVG CLOTH, TWINE COTTON HYDROCHLORIC A8S8T& 1 T BAGGING JUTE YARN JUTE FELT ETC. HYPOCHLORITE ? X ***• •*** 2 | MILLS AT « NAIHATI, P.O. HAZINAGAR PLANT AT : AMLAI ? $ Dist. 24 PARGANAS P. O. AMLAr PAPER MrLLS $ ^ (West Bengal) DIST. SHAHDOL (M. P.) $ *§» fr" ^Ifr 4 f r ^ 1 ^ ^Wfr I f r ^( f r ^ 1 ^ ^ I f r ^( f r ^ I f r fll^ ^ I f r 7 ^ ^ I f r V W ^ i ^ ^ i ^ ^ ( f r ^ f r ^ f r 4 l f r ^ I f r T l f r ^W* I f r *W^ ^ f r ^ ^ ^ l f r ^ l f r * ^
| Determind Efforts of Gwalior Rayons | To Combat Pollution Hazards | The Company, fully conscious of the gravity of pollution JS hazards, has always taken an enlightened view of the problem. f Environmental pollution has been minimized with a wide range to of effective measures. Effluent waste-load has been reduced by ® adopting improved chemical recovery techniques. Effluent is | | ® diligently treated in a well-equipped treatment plant to meet the 0) ® prescribed standards. Gaseous pollutants are discharged in great $ H dilution only through tall stacks at high velocity to ensure wide ^ i dispersion. Extensive tree plantat ion and horticultural activi- ffl © ties in and around the industrial complex impart a lush green ® q appearance to the topography. AH these measures for conser- {$ <| vat ion of natural resources and pollut ion aba t emen t provide a &) © fitting answer to the much propagated pollution hazards of the & ® Rayon Industry. §| © Ceaseless Endeavour Against Pollution & g The Gwalior Rayon Silk Mfg. (WVG) Co. Ltd. g m ( Staple Fibre Div is ion) & v P .O. Birlagram, Nagda (M. P.) g § Telegram : G R A S I M Telephone : 38 & 88 | <g;e©S@©©©©©©©©Si©©©e©©@©©®©e@3©@©©©©S©§©S©S9©@©©3@@©©©®@©S>
XXI

KUTE, S. B. and DHABADGAONKAR. S. M.
Effect of Temperature on Oxygen Transfer
IAWPC TECH. ANNUAL, VIII, 88-93, 1981
ABSTRACT :
An attempt has been made to study the variation of overall oxygen transfer coefficient in relation to the temperature in an aeration system. The present study coveres the range of temperature from 25°C to 33°C. It was found that the temperature characteristic for surface aeration system in the study worked out to 1.024.
KHAN, A. N. and RAMAN, V. Rotating Biological Contactor for the Treatment of Wastewater in India. IAWPC TECH, ANNUAL, VIII, 94-107, 1981
ABSTRACT :
A.laboratory unit and a Pilot Plant of Rotating Biological Contactor were operated in NEERI, Nagpur, India to investigate their performance for the Treatment of domestic wasewater.
Laboratory studies using 20 cm diameter discs made up of Asbestos cement sheets and pilot plant studies using 40 PVC discs of 1 m diameter with clear spacing of 2.5 cm between them, and revolving at 5 RPM gave encouraging results. The pilot plant studies were conducted at a flow rate of 0.5 m3/hr, duration of sewage flow 10-12 hrs/day, detention period in the disc cham-.ber 1.25 hrs and. in final settling tank 1 hr.
It was found that 83-93 percent BOD reduction could be achieved at a BOD loading of 6-15 g/m2/day for a settled sewage influent BOD5 of 130-150 mg/1 under laboratory conditions and 77-91 percent reduction in BOD of the final effluent could be achieved at a loading of 20-28 g BOD/ma of disc area/day for a raw sewage influent BOD5 of 250-300 mg/1 for the pilot plant under the field conditions.
xxu

t • Check suspended solids fast—with
Whatman filters—for Water Pollution Monitoring. KVhatman glass microfibre filters bring speed and
consistency to water pollution monitoring. Their high flow rate gives a fast evaluation of suspended
tolids. /lade from 100% borosilicate glass, Whatman glass
microfibre filters use no binders in their manufacture.
they can be relied on for high chemical purity and c
i i i i
consistency.
Five grades are available, each with a valuable combination of flow rate and particle retention. Whatman grade GF/C is the standard filter in water pollution monitoring in many countries of the world. The latest publication 818 WPM, from Whatman distributors or direct,gives the technical background, up-to-date techniques and standard literature references. Get your copy now.
• •
iAA Whatman i D Please send literature on
'Water Pollution Monitoring with Whatman Products'
Whatman Ltd., Indian Liaison Office 101. Mi t ta l Chambers. 228.Nariman Pbint. Bombay-400021
i i i • Name I J Organisation.
J Addresi i I — , U
Jit le

CHAPHEKAR, S. B. and MHATRE, G. N. Role of Aquatic Plants in Water Pollution Control. IAWPC TECH ANNUAL VTJI, 108-115, 1981.
ABSTRACT :
This paper discusses the role of a few aquatic plants to avoid environmental hazards. Though biological devices have their limitations, they are quite reliable in detecting, monitoring and scavenging the environmental pollutants. Some of the commonly used wastewater aquatic weed management methods are described and discussed.
M1SHRA, R. P.. SHARMA, L. N. DIXIT, R. C , and RAMAN, A. Recycling of Refinery Effluents for agriculture IAWPC TECH. ANNUAL VEU, 116-128, 1981.
ABSTRACT:
Irrigation of crops with composite refinery effluent can be attempted provided adequate care is taken for the treatment of the waste to a level considered safe for soil and crops. In this paper the authors have presented and reviewed the available data regarding (i) the characteristics of refinery effluents, (ii) range of pollutants in treated effluents, (iii) irrigation water quality criteria, (iv) treatment and segragetion of the effluents and (v) evaluation of composite refinery wastes for continuous irrigation. The advantages and limitations of recycling refinery effluents have been discussed. It is considered that with adequate treatment and precautions, treated refinery effluents can be used for the irrigation of crops near inland refineries for the final disposal to prevent pollution of surface waters. Continuous monitoring of soils and ground water will ensure proper renovation of effluent and to prevent the development of undesirable soil conditions.
xxiv
©
©
©
0) 0)
© 0) 0) ^ ©
8 iUitli £tst Compliments from : { 0) 0) 0) & © 0)
| STRAW PRODUCTS LIMITED | 8 (J. K. Paper Mills) $ 0) (0)
g JAYKAYPURPIN 765 017 g
0) ©
''Manufacturers of quality papers and paper Boards" 92
8 * S * g Telephone : RAD 50 Telegram : JEKEPAPER g g RAD 70 RAYAGADA g » © © ©
W/7W BEST COMPLIMENTS FROM : g
© Pulp and Paper Research Institute © (a) * • 0)
g JAYKAYPUR-765017, ORISSA g ol PAPRI-dedicated to the Services of Pulp-Paper and g g Allied Industries for : g 8 - SELF RELIANCE 2 ® - BETTER PRODUCTIVITY © g - NEW RAW METERIALS, CHEMICALS AND ADDITIVES g 0) - PROCESS INNOVATIONS © g - EFFICIENCY AND COST REDUCTION g ®» - WASTE UTILIZATION © g - TESTING, ANALYSIS AND QUALITY CONTROL OF g @ PULP -PAPER AND RELATED PRODUCTS © & - VIABILITY REPORTS FOR SMALL SCALE PULP AND g 5 PAPER PLANTS-GENERAL CONSULTANCY 9 © - LIBRARY & DOCUMENTATION SERVICES g g ALSO-PAPRI-Liquor Fire Boiler (PATENTED) g
g The Institute is well epuipped with modern testing/Research g © equipments. © © The staff is qualified and experienced 1$ 0) Recognized by some Universi t ies as a C e n t r e for P h . D . degree g g PAPRI offers expert personalized service from conception g 6 to completion. & © For particulars-contact Secretary. 0) (£©@©©©©©©©©©g©©©©S©S©©©©@©©©©©©©©©S©©@©©©©©©©©©©@©©©©e©g)
XXV

REDDY M. R., JIVENDRA and JAIN, S. C. Paper Mills Effluent for sugarcane irrigation IAWPC TECH. ANNUAL VHI, 129-146, 1981
ABSTRACT:
Exhaustive experiments on full four crops of sugarcane carried out for 8 years, separately with fresh water and effluent from an integrated Pulp and Paper Mill adopting sulphate process and high internal controls, indicate that the effluent can successfully be used for irrigation of sugarcane, especially on acidic coarse textured sandy/sandy loamy soils as available in Rayagada Region (Orissa) with about 20% increase in sugarcane yield without affecting the quality of cane or the soil. Besides, about 1500 acres rain fed land of Rayagada region, can get uninterrupted irrigation. This, besides the financial gains, offers an alternative to grow high yield variety of cane instead of low yield one resistant to draught conditions presently grown.
KONAR, S. K. and GHOSH, T. K.
Effects of Organophosphorus Insecticides on Fish and Fish Food Organisms. IAWPC TECH. ANNUAL, VIH, 147-160,^1981.
ABSTRACT
The effects of three insecticides, malathion metasystox. and ambithion on the fish Tilapia mossambica, plankton Cyclops viridis and worm Branehiura sowerbyi were determined.
Planktons were the most susceptible and worms were the most resistant to the insecticides. The feeding rates of fish were significantly reduced at IT, 2T and 3T of malathion and IT, 2T, 3T, and 4T of matasystox and ambithion. The growth of the fish was reduced at IT and 3T of malathion, at IT, 2T and 3T of metasystox, and at 2T, 5T and 6T of ambithion. The condition factors were reduced at 3T of malathion and metasystox. The maturity indices were not influenced. The fecundity offish was reduced at IT and2T of malathion and 6T of ambithion. The breeding behavior of exposed fish was normal. The insecticides did not influence dissolved oxygen, total alkalinity, free carbon-dioxide, turbidity and pH of water. Malathion at 3T reduced the copepods by 9-13%, and gastropods by 18%. Chironomids and aquatic weeds were greatly increased. The half-life of ambithion for biological activity was 29 h. The rats fed with fish-flesh contaminated by metasystox lost 8% of the body weight.
XXVI

wo water 01 treatment jobs are alike. And we're one of the few people around who realize it.
And, we're one of the even fewer who can do something about it.
Because we can do the whole job.
The process engineering. Supplying & erecting And see that you get the
service it takes to make it work right.
That's how we've gotten so far ahead in this business. By figuring out and building better ways ourselves to make water and waste treatment work better.
For big business. Military Establishments. Big cities. Small business. And little towns.
CUJ Clear Water Limited D-68, East of Kailash New Delhi-110065. Ph.: 681618, 681554
*i:^m&p
OBAWT
£Si^3
xxvii

THERGAONKAR, V. P. THAKRE, 0. B. TARAFDAR, P. K., THAKRE, R. A., and RAMTEKE, D. S. Soil Suspensions and their Coagulation. IAWPC TECH. ANNUAL, VDI161—167, 1981.
ABSTRACT:
Fly ash and six soil samples were suspended in tap water and their analysis, and Cation Exchange Capacity (C. E. C.) determinations were done. Soils could be categorised in four groups on the basis of their C. E. C. viz., (i) with 0 or negligible C. E. C. (Flyash) (ii) C. E. C. less than 10 rrreq/100 g soiT (iii) C. E. C. between 10 and 200 meq/10O soil and (ivj C. E. C. between . 20 and 100 meq/100 g soil. Soil suspensions were coagulated with alum at 5 pH ranges including highly acidic, original soil suspension pH and highly alkaline pH. Jar tests were used to plot coagulation curves.
It was found that optimum dose required to get a residual turbidity of 50 NTU increases with ihe C. E. C. of soils, for all the pH values studied. The experiments indicate correlation between C. E. C. and pH of suspension and the alum requirement.
JOIN IAWPC
AS
LIFE MEMBER
0)
0) 0) 0)
0) 0)
I 0) 0)
Individuals Institutions
Rs. 200/- Rs. 1500/-
9) &
XXV1U

IAWPC TECH. ANNUAL, V H I 1-5, (1981).
Conservation of Energy and Environmental Pollution Control V. RAMAN* AND B. B. SUNDARESAN*
Introduction
In choosing systems for environmental pollution control, environment, energy, fuel, chemicals and cost need be considered. All over the world including India, drastic change m outlook is discernible as regards energy economics. In developing energy resowrGas- and manufacturing products like chemicals, careful evaluation of environmental impacts is taken into consideration. It is pertinent to ask whether the impact on energy and material resources arising out of environmental control activities have been considered.
A dichotomy of actions is bound to exist. Conservation of energy and materials will be required in meeting the shortage that exists.
The general approach should be to :
i ) adopt technology that saves ene rgy and chemicals, and reduced environmental pollution.
ii) obtain additional impact information on the generic technologies that may have adverse environmental effects :
iii) develop environmentally compatible and economically viable alternatives to potentially inappropriate technology.
iv) encourage recycling and recovery of wastes :
v ) consider flexibility in regulatory system and standards of discharge of wastes into ambient environment without substantially affecting the environment.
Energy and fuel economfcs have changed drastically now, and it may be necessary to assess the coAse'qft&neeS of energy and resources arising out of environmental pro<eet*on activities. An inherent conflict seetas to exist apparently between environmental control and conservation of energy and resources. It should be possible and desirable to develop methodologies which are compatible rather than conflicting.
Effluent Standards
Flexible regulatory standards without causing environmental degradation, suitable to local conditions can bring down the extent of treatment. The unit cost of removing the last few per cent of pollution will be higher than that of the first. Realistic and subtle relaxation in effluent standards can bring down the extent of treatment which can save on energy and chemicals.
Seasonal standards for effluent could be considered, e. g. one stringent during low-flow period of receiving waters and the other less stringent during high-flow period ( monsoon flow period ). Telescoping adjustment of chemicals and
National Environmental Engineering Research Institute, Nagpur, India.
1

2 RAMAN AND SUNDARESAN
capacity of treatment during low-flow and high-flow periods of receiving waters would lead to saving in O & M cost, thereby reducing energy and chemical consumption in waste-water treatment.
Possibilities exist of treating the waste-water to a particular limit of pollution concentration ( less stringent, i. e. higher than the desired effluent standards ) and then diluting with fresh water or relatively unpolluted waste-water from other sources to bring the effluent to the desired limit. This would reduce the cost of energy and resources (fuel, chemi cals and materials ) for the waste-water treatment and disposal systems, as well as reduce the quantum of sludge produced. Reduced sludge production would lead to less energy for dewatering and drying, and lower fuel costs for transportation of sludge for disposal.
Treatment of waste-waters from phosphoric acid plant and NPK fertiliser granulation unit, for the removal of fluorides and phosphates to bring down to the desired standards, results in high annual consumption of chemicals and energy as well as resulting in large quantities of sludge being produced. Flexibility of effluent standards for the pollutants during low and high flow period of receiving waters, and/or dilution of the moderately treated effluent with relatively unpolluted waste-water from other sources are possible approaches to save on energy and resources in waste-water treatment and disposal. The quantum of sludge production is reduced to some extent and reflected to less utilisation of energy for pumping, dewatering and transportation.
Savings in energy and resources would be possible in the treatment of waste-waters from fertiliser manufacture, by relaxation of urea and phosphate
present in the waste-waters, The presence of phosphates and nitrates in waters may result in eutrophication of receiving waters, but the exact limits of concentration when such phenomenon occurs would depend on the characteristics and the hydraulic regime of receiving waters. A set of standards has to be fixed based on the experience in India and abroad for the regulatory agencies to act upon for protecting the water environment, and should not be bypassed.
Generic Technology Change
Industry has become involved in planning new processes and practices to save energy and resources. These measures may result in increasing or lessening of environmental problems.
In chlor-alkali plant, diaphragm cells are being considered to replace mercury cells, to eliminate environmental pollution due to discharge of mercury. While the caustic produced by the mercury cell does not require further concentration before being sold to customers, the caustic from diaphragm cell must be passed through evaporators, which involves additional energy consumption, improved membrane cells may obviate this disadvantage.
In phosphoric acid manufacture, bye-product sulphuric acid could be used, resulting in environmental benefits arising from the increased use of sulphur wastes. Recovery of fluorides from the waste products is another possibility. Digesting of phosphate with hydrochloric acid can be considered, by which a concentrated calcium chloride stream is created for which there is no possible recovery method.
In the manufacture of titanium-dioxide, by adopting the chloride route

CONSERVATION OF ENERGY 3
(using hydrochloric acid), it is possible to reduce the quantum of environmental pollution (with less production of sludge), to reuse spent hydrochloric acid and to treat the waste-water at reduced energy and cost level. The chloride route is favoured from air pollution considerations.
In the manufacture of urea, for the absorption and separation of carbon-dioxide, use of catalyst like 'vetrococke' solution (arsenious trioxide) is favoured from the point of view of excellent corrosion inhibition and economic energy The environmental impact arising out of the presence of significant concentration of arsenic in waste-waters due to leakages and overflow need be considered. This aspect has led to change in the process technology, adopting relatively less toxic or non-toxic processes like Benfi-eld, Pot-bicarbo etc. The alternate processes cited may not have adverse environmental effects, but result in less efficient corrosion inhibition and more energy consumption. Compared with the risk involved in discharge of arsenic bearing waste-waters to inland or estuarine waters, the extra cost in going in for the alternate processes is favoured.
In waste-water treatment plant in refineries, petrochemicals, and sewage treatment, a polishing or maturation pond of 2 to 5 days capacity as an additional treatment facility (the last in the treatment flow sheet) can act as a further polishing unit, buffer against surge flows, and ensure enffluent of desired standards. This additional facility may involve extra unit cost, extra material cost and extra pumping cost. But, it may be noted that the stored water in the pond containing treated effluent can always be used as a potential reserve for fire fighting purposes within the campus. This aspect will definitely be an unquantifiable benefit which will obviate the extra cost
involved in the additional unit. The final effluent can be profitably used for the development of green belt around the industry.
In the case of domestic sewage, the treatment is an expensive and energy consuming process, especially when mechanical surface aerators or diffused aeration is resorted to. Sludge treatment and disposal will be required. Environmentally compatible system to satisfy effluent standards, and recycling and reuse system to get benefit and need for the extra energy requirements are being considered. The utilisation of gas produced from digestion of sludge and the utilisation ©f well treated sewage for agriculture, indus trial cooling etc. are the benefits. Such systems can justify waste-water control system, satisfy the regulatory standards and derive quantifiable and unquantifiable benefit for the investment involved.
Similar environmentally campatible economically viable systems can be considered for wastewaters emanating from several other industries like paper and pulp, steel mill, milk dairy, fertiliser e tc
These concepts are also applicable in air pollution control. In copper smelting operation, the sulphurdioxide in smelter after cleaning, can be used in the manufacture of sulphuric acid. In chlor-alkali plants, air pollution cause, by clorine is mitigated by converting to HC1, by combination with hydrogen gas produced and scrubbing.
To avoid environmental pollution problems arising out of fossil fuel fired furnaces, many industries (e. g. glass and steel) are investigating electric furnaces which are easier to control. The environmental benefit is obtained at an incremental cost, due to the increased cost of of the new utility. In coal fired furnacess additional control facilities are to be

4 RAMAN AND SUNDARESAN
introduced to control, air and solid waste emissions.
Several industries are investigating fluidised beds as more efficient mass transfer and process units, both for the process and in treating wastewaters. Such systems provide opportunities to use less energy.
Industrial Solid Wastes and Regulations :
Chemical manufacturing units in India will soon be facing problems of proper and hygienic disposal of solid wastes produced from industrial operations. In USA.rules and byelaws formulated by EPA govern the siting of disposal site, regulate the method of storage and transport of toxic chemicals and precautions to be followed for the handling and disposal of such wastes. Similar regulations are bound to come in India in near future, for preventing the pollution of ground water and surface water by leaching from toxic chemical dumps, and also to prevent explosion and undesirable odours. Such regulations will obviously increase the transportation and other ancilliary costs (increased use of energy) for the industry. Episodes have occurred in USA (i. e. near Niagra Falls) when the chemical dumps dumped year ago have started leaching and polluting ground water with toxic chemicals. Similar situations exist in petrochemical unit, fertiliser manufactures, thermal power plants etc. like disposal of spent catalysts, byeproduct gypsum and fly-ash from power station; and same can be profitably reused to limited extent. The prob-blem of disposal of such solid waste necessitates suitable statutory regulations and proper control techniques, to reduce secondary environmental pollution.
Energy Consumption in Environmental Control Units
The waste-water pollution potential
of selected industries viz. sugar, distillery, cotton textiles, pulp and paper, petroleum refineries, is approximately estimated for the period 1978-79 to be about 14,000 million p. e. (population, equivalent). Taking into account other industries, small, medium and large scale, it may work out to 20,000 million p. e. approximately. The annual energy consumption for conventional biological oxidation (by coke activated sludge) alone would be about 300 million KWH (without considering the energy consumed for pumping, dewatering of sludge, operation of plant, materials and sludge transportation).
The total quantity of suspended particulate matter from various industries like cement, fertiliser (PandN), refineries, pulp and paper, steel, sulphuric acid, soda ash, aluminium, copper, thermal power plant etc. would be around 9 million tonnes per year, and including other industries, it could be about 12 million tonnes/year (which constitutes 70 to 80 per cent of the total air pollutant emissions). The approximate energy for part removal of SPM by bag filter, cyclone or ESP may be about (including energy consumption due to operation of of exhaust fans, blowers etc.) 41,5,000 million KWH.
There is scope to economise on energy and resources in environmental protection systems by proper choice, design and development of pollution control devices.
Summary and Conclusions
Conflict appears to exist between the measures adopted for environmental pollution control, and conservation of energy and resources of an industry. This conflict is not real but apparent only, if a realistic approach to environmental

CONSERVATION OF ENERGY 5
control regulations and initial environmental impact assessment are cosidered. Regulations governing effluent standards, sites for disposal of solid toxic waste, and handling and transportation of solid toxic wastes etc. will have an unfavourable effect on the consumption of energy and resources, for an industry. Research and development are not lagging in the development of new generic technologies (process) and environtally compatible and economically remunerative environmental control systems. In the systems for treatment and removal of pollutants in water and air, there is scope for new techniques, and modifications of existing units to conse
rve energy and resources. Typical examples (with reference to actual situations in India) are cited, where the conflicts could be resolved. Care should be taken to avoid serious environmental problems while energy problems are solved. There is scope for conservation of energy and resources with reference to environmental pollution control, at process treatment and disposal stages.
Acknowledgements
This Paper was presented at the National Convention of Indian Institution of Plant Engineers, held at Cochin during Dec. 1980.

IAVVPC TECH. ANNUAL, VIII 6-10, (1981).
Implementation Control Laws : Fallacies S. G. KALE*
Introduction
As a practising Environmental Engi neer, the author is closely associated with the interpretation and the implementation of various pollution control laws and regulations. While doing so, he had an opportunity to discuss the various technical aspects of these regulations with the Government Officers, Consulting Engineers and Plant Engineers. As a result, it was felt that there were certain aspects of these regulations common to all industries which need to be reviewed and discussed. In this paper, following five important points are discussed :
1. Segregation of drain lines
2. Limiting values for C.O.D.
3. Classification of Biodegradable Effllucnt.
4. Mode of prescribing standards for the treated effluent,
5. Need for a new parameter in place of 5D 20°C B.O D.
1. Segregation of drain lines :
Industries are generally asked to segregate drain lines. It is expected that the industrial effluent, domestic effluent and the storm water shall be collected
* Executive (Pollution Control) Technical Di
of Pollution Facts and
separately. One can appreciate the segregation of storm water from industrial and domestic effluent. In the absence of this, the effluent treatment plant will cease to function during monsoon period. However, segregation of domestic effluent from industrial effluent appears to be uncalled for; particularly where the industrial effluent is treated with the domestic effluent. In fact, where the combined effluent treatment is practised, the domestic effluent, apart from dumping of mass loadings to some extent on aeration tanks, serves as a main source of nitrogen and phosphorus. This enhances the biological activities. In view of this, the mixing of domestic effluent with the industrial effluent is always advantageous where the combined biological treatment is carried out.
The argument pro-segregation is that the quantitative measurments separately for domestic and the industrial effluent are possible, which is one of the pre-requisite in designing the biological units. However, the biological units can be designed directly for the combined effluent after monitoring the combined effluent for B.O.D. Separate measure ments are not required. The variations in the proportions of the domestic and industrial effluent are bound t o be reflected in B. O. D. values for which the biological units can be designed.
sion Ciba-Gcigy of India Limited, Bombay.
6

POLLUTION CONTROL LAWS 7
Out of 8 lakhs of Rupees Sanctioned for Pollution Control, 6 lakhs are spent on separating the waste streams and balance on mixing them again. The additional credit request is for the construction of effluent treatment plant, sir /
By segregating the domestic effluent and mixing it again with the industrial effluent, we do not achieve any purpose' It not only delays the whole project, but considerable amount of the project cost in terms of money and man-power is diverted for this purpose. Segregation becomes still more difficult where the plants are located far away from each other. In view of this, it is suggested to review this condition. The implementing authorities can achieve their purpose by suitably prescribing the combined effluent quality and quantity.
2. Limiting values for C. O. D :
Various IS codes as well as the authorities, recommend the limiting values for Chemical Oxygen Demand or C. O. D. Generally, the value specified is 250 mg/1. It is now a common experi
ence that with the improved methods of biodegradation, though it is possible to reduce B. O. D., values of C. O. D. may not be reduced to the desired level. With the inception of the various complex processes and chemicals in the manufacturing units it has almost become impo ssible to pinpoint in many cases, the root cause of C O . D. The ultimate high values of C. O. D. may be due to the additive effect of many complex substances present in the waste which are oxidisable with potassium dichromate. Where the biological treatment is operating with the desired efficiency level and where it is not possible to pinpoint the exact cause of high C.O.D. values of the raw waste or the treated effluent, the only alternative is to subject the treated effluent to bio-assay test for fish toxicity If it is proved that the effluent is nontoxic and the B.O.D. is within the limit then the authorities should consider this effluent as acceptable.
3. Classification of Biodegradable Effluent:
An Act called 'The Water ( Prevention and Control of Pollution) Cess Act, 1977' is enacted on 7th December, 1977 to 'provide for the levy and collection of a cess on water consumed by persons carrying on certain industries and by local authorities, with a view to augment the resources of the Central Board and the State Boards for the Prevention and Control of Water Pollution constituted under the Water (Prevention and Control of Pollution ) Act, 1974', As per Section 3 (and Schedule II) of the said Act, the cess shall be payable by- (a) every person carrying on any specified industry, and (b) every local authority and shall be calculated on the basis of the water consumed by such persons or local authority, as the case may be.for any of the purpose' as specified. Under

g KALE
the various purposes specified, the processing water, whereby water gets polluted and the pollutants are easily biodegradable and the processing water whereby water gets polluted and the pollutants are not easily biodegradable and are not toxic are charged at different rates, latter being charged at higher rate.
One of the criteria used to classify the water as 'non-biodegradable' is the ratio of C. O. D. to B. O. D. of the untreated effluent. In some cases, the effluent is classified as 'not easily biodegradable' since the C. O. D. to B. O. D. ratio is greater than 2.0. This does not sound logical since the C. O. D. to B. O. D. ratio in case of sewage on many occasions exceed this value. Nevertheless, sewage cannot be classified as 'not easily biodegradable'.
It is, therefore, suggested that the classification for the 'biodegradable effluents' and 'not easily biodegradable effluents' shall be based on the percentage of the biodegradation achieved through the biological treatment and the ratio of raw waste COD to BOD. Perhaps 80 to 90 percent removal of the B. O. D, in the bio-reactors and the COD to BOD ratio as 3.50 can be taken as criteria for the classification of effluent as biodegradable.
4. Mode of prescribing standards for the treated effluent:
At present, standards (except for dissolved oxygen) are prescribed in the letter of consent as a specific value for a particular parameter not to be exceeded on any occasion. This means, if it is specified that B. O. D. shall be less than 100 mg/1, oh no occasion the treated effluent shall have B. O. D. value greater than 100 mg/1.
No, No. The factory building is to the left of it. What you see are the holding tanks for our effluent treatment plant !
The present standards to not take into account the number of samples, frequency of sampling or the statistical processing of the treated effluent sample analysis results. For example, out of ten values of B. O. D., three may exceed limiting value but the average value may be within the limit. It is quite likely on the other hand, that the average may be within the limit but ninety percentile value may not be within limit. It is the experience of the author that the plants designed on the basis of average value, 90 percentile value and the maximum value differ significantly both in sizes and investments. Considering the method of prescribing the present limiting values, one has no option but to accept the maximum value out of the set as a basis for the design. However, this calls for heavy investment, more power and larger area. , This is particularly so in the case of biological units. Secondly, if the frequency of occuring the maximum value of the designed value is very

POLLUTION CONTROL LAWS 9
less, the investment made in the plant and the connected load is not fully utilised. The scarce resources cannot be wasted like this in a developing country like ours. The performance of the biological units are found to be varying within certain range depending upon the slug discharges occuring in the production plants. One of the popular answer to supress the effect of these slug discharges is to have Equalisation or Ho-mogcnisation . basins. However, the basins designed on the basis of 'mass diagram' are found to be too targe to construct. As such, one has to accept the lower equalisation capac'ltie's which consequently leads to fluctuating B.O.D. load on the aeration tanks. This in turn gives the treated effluent of varying quality. In view of this, it is necessary to prescribe the number of samples to be analysed and the method of statistical processing of the results such as average value or ninety percentile value etc. This procedure will not only avoid the extra unused capacities of the effluent treatment facilities, but will also serve as an unified basis for the effluent treatment plant design.
5. Need for the new parameter in place of 5 D 200C B. O. D.
B. O. D. 5 D 20°C is the most widely used parameter to determine the oxygen requirements as well as the efficiency of the treatment. It suffers from many limitations such as long period of time required, pre-treatment in case of toxic wastes and non-utilisation of the total soluble organic matter. The British Royal Commission of sewage Disposal used the temperature of 20°C since the mean summer temperature of river water was found to be 18.3°C, very near to 20°C. Secondly, it was observed that all the rivers in England take less than 5 days to meet the sea. Hence it was deci
ded to use 20°C as an incubation temperature and 5 days as an incubation period, However, these conditions do not exist in the tropical countries like ours. As such, the use of 5D 20°C B. O. D. will not give a clear picture of what is going to happen due to discharge of the waste.
It is a pressing need to develop the new test. Various other tests such as Total Organic Carbon (T.O.C.), Total Oxygen Demand (T.O.D.), Theoretical Oxygen Demand (Th. O.D.) are being introduced now. Efforts are also being made to correlate the valgus, measures. In view of this, it is l^^aght necessary to devise the new test which can represent the local condition*. One of the advantages cited for 5D2P°C.B.O.D. test is the uniformity while comparing various results and tests. However, same can be done by using van't—Hoff—Arrhenius relationship and deriving the reaction constant 'K' for that particular waste when needed.
Summary and conclusions :
Five important points common to all the industries in implementing pollution control laws are discussed solely on technical grounds and it is concluded as follows :
1. Segregation of drain lines:
The segregation of domestic effluent from the industrial effluent as well as the measurement of the individual stream may not be insisted upon in those cases where the combined effluent treatment is carried out.
2. Limiting values for C.O.D. :
The authorities should not consider C.O.D. as a paramater to be controlled where the B.O.D. values are within the limit and the effluent is non-toxic.

10 KALE
3. Classification of Biodegradable Effluent:
The effluent should not be classified as non-biodegradable if COD to BOD ratio is more than 2.0. The classification shall be based on the predetermined degree of the biodegradation achieved and the ratio of COD to BOD as 3.5. The water cess shall be charged accordingly.
4. Mode of prescribing standards for the treated effluent:
It is necessary to precribe the acceptable statistical method of data processing for the treated effluent. This will not only avoid the extra unused capacities of the effluent treatment facilities, but will also serve as an unified basis for the effluent treatment plant design.
5. Need for the new paramater in place of 5D20°C B.O.D :
The B.O.D. test ( 5D20°C ) does not represent the local conditions as it was originally designed by British Royal Commission of Sewage Disposal. The new parameter in place of B, O, D. is required to be coined.
The author is aware of the fact that the above mentioned recommendations
are not the only answers for these problems. He neither poses to have ready made answer to these problems nor is this within the scope of the paper. The purpose of presenting this paper is to initiate discussions on these .points among the experts, Government authorities and practising engineers. The recommendations of such a group, if accepted by authorities, can help in saving an uncalled for investment on pollution control projects.
Acknowledgements :
The author is thankful to CIBA-GEIGY OF INDIA LIMITED, for allowing him to publish this paper. Profuse thanks are due to Shri B. V. Rotkar, the the former Member Secretary, Maharashtra Prevention of Water Pollution Board, for various discussions which have helped in crystalizing these thoughts. Thanks are also due to Shri P. P. Ramchandran who prepared the cartoons exactly as per the concepts.
( A Paper expressing these views was presented in the "AH India Symposium on Effluent Treatment" organised by Indian Centre for Training & Development at Bombay, on May 8, 1980. The revised version of the paper is presented here).

IAWPC TECH. ANNUAL, VHI 11-17, (1981).
Trace Elements of Surface Waters in Uttar Pradesh B. K. HANDA, ADARSH KUMAR AND D. K. GOEL
Introduction
Much of the sewage from cities, towns and even villages finds its way into the streams. So long as the pollutant volume is small relative to the receiving waters, self purification processes will tend to take care of this pollution. However, with increase in population and increase in use of water, in many cases the sewage volume relative to that of the receiving waters cannot be ignored, particularly during the pre-monsoon months when the natural flow of rivers is relatively small. Further with increase in industrial activity, the discharge of waste industrial effluents into streams has also become a matter of grave concern. Most of the studies on pollution of surface waters relate primarily to the becterial or organic pollutants 1, 3, 5, 7, i3? and not much work seenis to have been done to study the trace element pollution of natural surface waters.
The study of trace elements in surface waters, however, is very important as some of these elements (e. g. Cu, Zn, Ag) are extremely toxic to the aquatic biota. Further some of these trace elements tend to bioconcentrate in the food chain and can ultimately be harmful to man (e. g. lead, mercury). However the study of trace elements is some what complicated by the fact that 'suspended matter' and even bottom sediments in streams can be effective scavengers for
many trace elements and these may not be present in solution form for long. Nevertheless a study of the trace eelme-nts can be of considerable help in pin pointing the source of pollution and also about the 'pollution status' of the natural water bodies. In the present paper a brief discussion on the trace element content of surface waters from Uttar Pradesh is given.
Experimental
Water sample, two and half litres, collected from the stream was acidified by addition of HN03 (reagent grade) to pH 1.5 The acidified water samples were concentrated 10 times on a hot plate at low heat and were analysed for Ag, Cu, Zn, Co, Mo, Cd, Sr, Li, Rb and Cs, using Perkin Elmer model 306-Atomic Absorption Spectrophotometer, with deuterium background corrector. In a few cases iron and manganese determinations were also carried out using Atomic Absorption Spectrophotometer °. 10.
Results and discussion
The chemical analysis results are tabulated in Table 1. The data are given in micrograms/1.
There are two main sources of trace elements in natural waters ; (i) natural and (ii) man-made. The natural sources include interalia the weathering products of rocks and minerals with
11

HANDA ET AL
. • * • * . . ^ CM I - > I I I I I I I I - " I I I I I I I | 1 I I | | t I I | « | |
I o o o - ; l I I l I I I I I " I I I I I I l
' ' l ' l l I ' I l $ i t
CO CO CO CM c m t
(N CD N en - - CM • - _ : S } ^ 2 2 - 2 J ( £ > ^ T ' ? o . o ^ „ _ c o c o ^
N N N „ j N CM - • —
8 8 2 2 a s g 8 S s 8 S S 2 2 S 8 ? 9 a o -m o o o = 2 c o ^ f J i n i O c o i o M
•s -s-s-s-g-g-s-s-s-s-H-s-s-g-s-s-s-g-g-s-g-g-g-g-g-a-g-soagg,^
o N N io - CM ""> — " > ( o m , f ) e < i ^ . i r ) i n i o ^ _ , 2 <N CM —
M-«r"s>r-^^?^-^^>^M?
'i* CO *T3 -**-*- - ^ -1- * * ^- * ' * • .' ." • • -' • * < * • * > * • ! i ^ 5 ' * ! 3 ' ^ 0 i ^ ' , ^ ' ^ i ' * * cM^o m e o o N n e o o ^ i n a f l m + d j i i O i n . - - •$• CT; O
^ — — CM CM
2 "5
bo •O
T3 0
6i
c 3
•O
- ~ JS <-!
u
.2 § • a * < «
a c 3
KM**
M « 03
to
' 'C
J f OS
s * CQ (J
= •?. .e
l l t l -o -a c c o _
II si
» B f f l U l f f l 0 0 0 0 > J i 4 J S
3 5 a a c 5 •SI 'J?'J? to «3
« rt rt PJ rt c« rt S 60 60 00 60 60 60 3
(4 c 3
«J c 3
<3 c 2
13 c 3
(3 C 3
O J r! I I 3 1 § I I § § § § ^ -3 ^ 1 « S |-I-E> M- I I S | - - I -g

TRACE ELEMENT POLLUTION 13
which the water comes into contact during its history. The man-made resources include i) discharge of trace elements into the atmosphere by burning of fossil fuels/industrial activity and their subsequent washing down by rain either directiy into the stream channels or as runoff from lands; ii) direct discharge of industrial waste effluents containing these trace elements into the stream waters; iii) direct discharge of sewage wastes into the surface waters and iv) pollution of ground water due to anthropogenic activities, which may ultimately find its way into the surface waters.
However, as lias already been stated above, the suspended matter as well as bottom sediments tend to remove trace elements from aqueous solution and an such the trace element determined from filtered samples may represent only a fraction of the total element actually present in a certain specified volume of surface water. In the present case, although filtration of the sample, prior to acidification was not resorted to most of the samples were quite clear and the data represent approximately the elements in aqueous solution, except in the case of Ganga river water at Kanpur.
The examination of data shows that concentration of most trace elements is quite small. In most of the samples silver could not be detected and the same was found to be true for molyb
denum and cadmium. However, in a few cases anomalous values were encountered, viz,, 42 micrograms/1 of Ag in the Ganga river water at Ballia; 28 and 50 micrograms/I of Mo in the Sai river water at Rai Bareilly and Bani. Copper and zinc content in surface waters was generally below 10 micrograms/I and 20 micrograms/1 respectively but here too anomalous values were obtained. Same was the case of lithium, rubidium and cesium.
Significance of trace elements for aquatic life :
Table 2 gives the guidelines laid down for the occurrence of some trace elements in surface waters to protect aquatic life. l a , 16
SILVER :
Silver tends to bio-accumulate in the food chain. Algae and Daphnia magna are reported to have absorbed silver from water, the concentration factor being 96 and 26 respectively x5. Fish (fathead minnow) also concentrates silver from water but not to the same extent as Daphnia Sp. The concentration of silver (as AgNo3) causing the onset of inhibition of cell multiplication (toxicity threashold) for the blue green algae Microcystis aeruginosa and the green algae Scendesmus quadricauda were 0.7 and 9.5 microgram Ag/1 respectively. Fresh water bacteria are sensitive to silver; community numbers are
Table 2 : Guidelines for the protection of fresh water aquatic life
Concentrations in micrograms/1
Paramatcr Limit Paramater Limit
Iron Zinc Copper Silver
300 30 5
0.1
Nickel Cadmium Lead Cobalt
25 3
30

14 HANDA ET AL
not affected but heterotrophic activity Is affected by 0.1 and 0. 01 microgram/1 of Ag2. In view of these characteristics of silver, it has been daid lown that levels of silver in fresh water should not exceed 0.1 microgram/1 15.
The data given in Table 1 show clearly that in a number cases the silver content of surface waters was below the limits of detection, ie., less than 0.1 microgram/1 and as such these waters were quite safe from the viewpoint of this paramater. In a few cases values ranging from 1-2 micrograms/1 of A g + also were encountered, which may perhaps be attributed to natural factors, although, a limit of 0.2 microgram/1 of A g t + in surface waters from non-industrial areas has been suggested4. However, the high values of 9, 10 and 42 micrograms/1 of A g + , in the case of Gomati, Yamuna and Ganga river waters respectively, (Table 1), are more likely to be attributed to pollution due to anthropogenic activities.
COPPER
Toxicity of copper to aquatic organisms varies with the chemical speciation of copperas well as a number of physical and chemical characteristics of the water, such as its temperature, hardness and turbidity. l a For the protection of aquatic fresh water species maximum acceptable concentration of 5 micrograms/1 of Cu+ + in water has been prosposed8
The data show that around two-third of the water samples analysed have copper content either below or equal to this limit, while 15% of the water analysed had copper content above 5 micrograms/1, but below 10 micrograms/1. In a few samples, the copper content exceeded 10 micrograms/1, the highest value being 105 micrograms/1
in the Gomati river water. In natural waters cupric oxide or hydroxide carbonate minerals of copper would limit the solubility of copper in the pH range from 7.0-8.0, to 64 to 6.4 micrograms/1 it is obvious that this high value of copper is definkcly to be attributed to pollution of the Gomati river water.
ZINC
Zinc tends to be bio-accumulated; the concentration factors for Cladophora glomerata from Lake Ontario were 2900 and 100014. Zinc is acutely and chronically toxic to aquatic organisms particularly fish. The zinc toxicity is, however, dependent upon a number of factors like hardness, temperature, dissolved oxygen content and presence of copper and cadmium in natural waters. Copper and cadmium, for example, enhance the toxicity of zinc, while increasing hardness decreases the toxicity. Zinc toxicity also increases with increasing temperature and decreasing dissolved oxygen content.
The Great Lakes Water Quality Board8 recommeded level for the Great Lakes as 30 micrograms Zn/1. However, as has already been pointed out in hard waters somewhat higher concentrations of zinc can be tolerated, as would be the case with the river waters in Uttar Pradesh.
The study of the zinc content of stream waters from Uttar Pradesh (Table 1) showed that in about 90% of the water samples the zinc content was found to be below 30 micrograms/1, and only in a few cases it exceeded 30 micrograms/1. These values for zinc are apparently due to pollution from anthropogenic sources.
COBALT
Little information is available on

TRACE ELEMENT POLLUTION
Table - 3 C a d m i u m l imits , in micrograms/1 , for aquatic organisms.
15
Parameter Water characteristics Limits (micrograms/1) USEPA 1972 USEPA 1976
Cadmium Soft water for salmonids Hard woter - do-Soft water for others Hard water -do-
0.4 3.0 4.0
30.0
0.4 1.2 4.0
12.0
the toxicity of cobalt to aquatic biota. However, examination of cobalt content of surface waters from Uttar Pradesh (table 1) showed that in 50% of the surface waters the cobalt content was below the limits of detection (i. e. less than 0.1 microgram/1), while in 90% of the water samples its concentration was below 5 micrograms/1. In only 4 samples the cobalt content exceeded 5 micrograms/1, but the highest value was below 14 micrograms/1. Since concentrations of this element are still low, it is not possible to comment on the pollution status of the river waters.
MOLYBDENUM
In most of the water samples, molybdenum was below the limit of detection, i. e. less than 0.1 microgram/ I. However, in three instances the molybdenum content was found high, the highest value being 50 micrograms/1 (Sai river to Bani), which is attributed to anthropogenic sources.
CADMIUM
Cadmium has been shown to be extremely toxic to aquatic organisms11
However, there is great, variability regarding toxicity of cadmium to various organisms. Amongst the fish species, for example, the salmonids are the most sensitive. Dissolved oxygen, hardness, temperature and chelating capacity of
water affect cadmium toxicity. At lower levels of dissolved oxygen or at higher temperature, the toxicity of cadmium generally tends to be enhanced, whereas at higher hardness values the toxicity effect is reduced, probably due to calcium which is considered to have an antagonistic effect on cadmium-Chelation also helps to reduce cadmium toxicity. The U. S. E. P. A . " lowered the limits of cadmium in fresh waters for aquatic organisms as in Table-3.
The data given in Table 1 show that in most of the samples the cadmium content was below the limits of detection, i. e. it was less than 0.1 microgram/ 1. In only 6 samples (18% of the total), cadmium could be detected, the highest concentration being only 4 micrograms/1. Since the river waters in Uttar Pradesh are moderataly hard, it is obvious that they are quite suitable for other organisms but for salmonids, the cadmium content in a few river waters is somewhat high. Nevertheless, since the cadmium content is still low, it may be stated that the pollution of the river water from this element is not significant as yet.
IRON
When sufficient iron is added to water in the form of salts, it may be precipitated from water upon contact with air and produce adverse

16 HANDA ET AL
effects on aquatic organisms. A criterion level of 0.300 mg/1 of total iron has been proposed for the protection of aquatic environment 8
Although only a few samples were analysed for this element, it appears that the iron content of Ganga and Sai river waters is on the high side. The most interesting fact is that the Ganga water on the right bank-where sewage effluent can be seen entering the river has a much higher iron content than that of the left bank (LHS), indicating that the effluent entering the river is enriched with iron.
MANGANESE : No limits have been placed on the manganese content of fresh waters for aquatic life but levels below 20 micrograms/1 have been recommended for the protection of marine aquatic life. The study of manganese content in surface waters was carried out in only a few samples. The data show that maganese content was below this limit. However, the interesting fact remains that the manganese content of Ganga river water from the right bank (RHS) was over three times that of water from left bank (LHS), clearly indicating that some Mn is entering the river near the right bank.
Strontium, Lithium, Rubidium and Casium:
There is little information on the toxic effects of these elements (assuming strontium and cesium to be non-radioactive) on the aquatic biota. However, a value of 55 micro grams/1 was found to occur in the Yamuna river water at Jahanabad (Fatehpur). Anomalous values for rubidium seem to occur in the river waters of Yamuna (Mathura), Ghaghaara (Bahraich), Gomti (Lucknow), and Ram-ganga (Moradabad), where Rb content was found above 20 micrograms/1.
Cesium concentrations were also considered high in Kuwana (Basti), Yamuna (Rampur Mandi, Dehradun), and Ram-ganga (Moradabad).
Conclusions
The data indicate that the Gomati river water is polluted at Lucknow, with respect to at least copper, zinc and perhaps from rubidium and cesium. Similarly the Sai river seems to be polluted with respect to molybdenum. Interesting contrast in iron, zinc and manganese content of the Ganga river waters between the right and the left banks is also observed at Kanpur (Old Bride site).
Acknowledgements
While some samples were collected by the authors themselves, others were collected by the Hydrogeologist working in C.G.W, B..N.R. to whom the authors are deeply indebted. They are also thankful to the Director, N. R. for forwarding the paper for publication.
REFERENCES
1. Agrawal, D. K. , Gaur, S. D , Tiwari, I . C , Narayanaswami, N . and Marwah, S. M., Physico-chemical characteristics of Ganges Water at Varanasi. Ind. J. £/ivi-ron. Hlth. 18, 201-206 (1970;.
2. Albright, L. J . , Wentworth, J . W. and Wilson, E. M. , Technique for measuring metallic salt effects upon the indigenous heterotrophic microflora of a natural water. Water Res. G., 1589-1596 (1972).
3. Bharati, A., Saxcna, R. P. and Pandey, G. N. Physiological imbalances due to hexavalcnt chromium in fresh water algae. Ind. J. Environ. Hlth. 2 1 , 2 3 4 -243(1979).
4. Boyle, R. W. The geochemistry of silver and its deposits. Geol. Surv. Can. Bull. No. 160. Department of Energy, Mines and Resources, Ottawa, Canada.
TRACE ELEMENT POLLUTION 17
5. Dakshini, K. M. M. and Soni, J. K. Water quality of sewage drains entering Yamuna in Delhi. Ind. J. Environ Hlth. 21, 354-360 (1979).
6. Davies, P. H. The need to establish heavy metal standards on the basis of dissolved metals. Chap. 5 Workshop on Toxicity to Biota of metal forms in natural waters-International Joint Commission Great Lakes Research Advisory Board, 93-126 (1976).
7. Govindan, V. S. and Sundaresan, B. B., Seasonal succession of algal flora in polluted region of Adyar river. Ind. J. Environ. Hlth. 21, 131-142 (1979).
8. Great Lake's Wuter Quality Board, Great Lakes Water Quality, 1975. Appendix A Annual Report of the Water Quality Objectives sub-committee. Fourth Annual Report, (1976).
9. Handa, B. K., Method of collection and analysis of water samples and interpretation of water analysis data. Tech. Manual No. 1 CGWB, Min. of Agr. and Irrig.363pp. (1974).
10. Handa, B .K. , Modern Methods of Water Analysis. Technical Report No. 3, C. G.
W. B.. Min. of Agr, and Irrigation. 404 pp. (1976).
11. Handa, B. K., Water Quality Criteria for irrigation, municipal, industrial etc. purposes. Technical Manual No. 4. C.G. W. B., Min. of Agr. and Irrigation, 176 pp(1977).
12. McNeely, R. N., Neimanis, V. P. and Dwyer, L,, A guide to water quality parameters. Inland Waters Directorate, Canada, 89 pp. (1979).
13. Prasad, B. N. and Saxena, M. Ecological study of blue-green algae in river Gomati. Ind. J. Environ. Hlth. 22, 151-168 (1980).
14. Taylor, M. C. and Demayo, A., Zinc. Inland Waters Directorate, Canada, 52 pp(1980).
15. Taylor, M. C , Demayo, A. and Reeder, S., Silver, Inland Waters Directorate, Canada, 14 pp (1980).
16. U. S. E. P. A. Water Quality Criteria 1972, Environmental Protection Agency. Washington, D. C. Pub. EPA-R3-73-33.
17. U S. E. P. A „ Quality criteria for water. Environmental Protection Agency, Washington, D. G. Pub. EPA-440/9-76-023.

IAWPC TECH. ANNUAL, V H I 18-22, (1981).
Agra Water Quality CHANDRA PRAKASH* AND D. C. RAWAT**
Introduction
During the past many years the water quality in Agra was reported to have deteriorated considerably all round the year, more acute circumstances in summer. The public used to complain about bad taste and odour of water, situation becoming serious with the frequent occurrence of algae and worms in tap water. Agra corporation area is proposed to be developed in future in the pattern of metropolitan requirements. There major corridors of development have been identified in peripheral direction. Among the various infrastruc-tural facilities to be planned and provided for a city, water .and wastewater management constitutes an important fied.
The management and recommendation should be best suited for local conditions, its compatibility with the environmental and the future pollutional threat from Mathura Oil Refinery which will come into operation during 1982. The adoptability of such a scheme be studied in detail with respect to cost and its impact on the local environment. The planning approach in this context should be towards conserving water as much as possible for the essential uses. Such a system should maintain the environment of the region in equilibrium by adopting the process of recycling. This appears to be not only economical but also environmentally acceptable solution
in places wherever adequate land is available around the urban centres.
Materials and Methods
Water samples were collected monthly from Poiya Ghat in clean two litre bottles. They were analysed for physical (Limnological Methods)1, and chemical characteristics as in Standerd Methods3.
Samples for bacteriological analysis were collected in 250 ml sterilised glass bottles. The presumptive and confirmatory tests for coliforms were done by using lactose broth and brilliant green lactose bile broth respectively, whereas the presumptive and confirmatory tests for faecal streptococci were done by using azide dextrose broth and ethyl violet azide broth, respectively.
Results and Discussion
The physico-chemical and biological studies show positively the high organic pollution of the river Jamuna at Agra3,*. The physico-chemical and tacterioiogical data collected during the period of this study are give in table-1.
(a) Physical Characteristics
The temperatnre varied between 28.1 to 36.5°C in summer, between 21.3 to 24.6°C in winter, and 25.6 to 28.0°C in rainy season. In summer, the increase in temperature affects indirectly by incre-
* CSIR Research Fellow ** Professor, Environmental Studies, Dept. of Zoology, Agra College, Agra, India.
18

AGRA WATER QUALITY 19
asing toxicity and intensifying deoxyge-nation, produced by the biological oxidation of organic matter. The bacterial action is accelerated leading to more oxygen consumption and consequent D. O. depletion. Rain fall, which can dilute and wash the wastes away in rivers, occurs only for about three months. For the rest of the year, river trickles thin and is degraded with wastes.
Among the physical factors, water flow is of great consequence, which has got a direct relationship with water quality and quanitity. The flow varied between 11.51 cu.m/sec. (summer) to 2973.80 cu. m/see (rainy season) while the turbidity measured between 28 to 4000 units.
(b) Chemical characteristics
The pH of the river water was alkaline and ranged from 7.4 to 8.0 in summer, and 7.5 to 7.8 in winter and 7.1 to 7.5 in rainy season. Total solids were high in rainy and summer seasons. The values ranged from 736 to 1786 mg/1 in summer, 617 to 1029 mg/1 in winter and 1640 to 3074 mg/1 in rainy season. Values of total hardness and alkalinity recorded were 430 and 210 mg/1 in summer, 120.4 and 102 mg/1 in rains and 188 and 150 mg/1 in winter respectively. Observations of chloride and sulphate concentrations show the extent of pollution to which the river is subjected. The minimum and maximum monthly values of chlorides and sulphates were 365 to 250.9 mg/1 and 24.4 to 237 mg/1 respectively.
The oxygen and carbondioxide are reciprocal and directly influence the ecology of the water stock. During summer (April, May & June), the C 0 3 is absent, while oxygen is at higher values (6.1 to 6.6 mg/1), due to increase in the photo-
synthetic activity of phytoplankton. The silicate contents show the concentration of 38 mg/1 with a peak in June.
It is evident from the table that BOD and COD values were very high in summer. The BOD values ranged from 252 to 527 mg/1 in summer and from 59.7 to 188 mg/1 in winter. The BOD was considerably lower in the rainy season (13.4 to 36.4 mg/1). The ratio of COD and BOD values were more than 2 which indicate organic pollution. The nitrogen ranged from 8.1 to 13.6 mg/1 in summer, 27 to 2.38 mg/1 in monsoon and 4.6 to 6.2 mg/1 in winter. The phosphate ranged from 3.3 to 5.8 mg/1, 1.67 to 2.3 mg/1 in summer and winter seasons respectively; while from 0.23 to 1.43 mg/1 in rainy season.
(c) Bacteriological characteristics
For 100 ml the minimum and maximum values of MPN count of coli-forms recorded during this study were 13x103 and 14x106 while for faecal streptococci the values ranged between 6.74x10² and 14x10* respectively.
The International Standards5 for raw water used for public supply show that if, processes like flocculation, sedimentation, filtration, and disinfection are followed, the average MPN of conform should be less than 5000 per 100 ml. and should not exceed on more than 20 per cent of the occasions Only 25 per cent samples showed coliform MPN less than 20,000 per 100 ml at Agra. The physico-chemical and bacteriological characteristics support this and clearly indicate that Jamuna water is highy polluted.
Management
The proposed management scheme

20 PRAKASH AND RAWAT
s
•0
•a JS u • u
i I
i l 22
,2
o
CM
26.7
21.9
<o CM
25.6
13.4
o ©
0.0
46.5
3
m o ID
213.
77
8 8 =
8 o © CO
eo o CO
CO
CM
o CO CM
in r CM
7.4
CN
lO CM C>
r*; c> CM
79.6
"
CO
CI CM
to
r m 00 CM
58.6
4
o>
o 5
CM tO
1 0 M co cs
CO CM CO tC r-, r^ ,—, ^ 5 2 ™ CM 2 cq « ^ f g g £
i i n _ .• • ~
lO * O CM CM • » N O -
r _ „ _ eo
• * — CO C M
j io in * * M J , 1 n O J N - io -
IO o o CO CO CM CM
R; K -* CM in •—• co o •*t" i n
O CM —.
CM O .. _ CO • _ ^ C) o «
^ I N * * ^ J ^
O CM
^ r S ^ <o § — * • O o CM —
« $ r * CM — r^ ^ \c> <?!L?s
P e p p o o - N r CM . t o N ° * « N ic in — — io w
I a a
I «
1 ! ft
|£'
o
8 o
o —• o —
oq o — CO —' ^ ! O CO CO CO l O
» - eo g S S rr CM co CM in ci
o o
8 co" c ^ c o ^ r ^ i n — _ — S ^ - i , • * , J CM O CO O V- "~. • * _ O ^
- SI
• ^ CO - " — — < ( O CO O l CO CO — CM
«*• ^ m «5 • CO CO <£>
•^ r- CM — — o o CM o m r co "1
£ £ 8 8 8 " 2 8 S ~ « S 1 tO ~ *-• .* _ »« ^ •* tfl ca t ^
••a •n co r^ •*• ~ =2 CM CM CM O CO 8
5 ex
CO CM CM CO • CO l£> ^J" ^
*^ r^ — —• —« CM
to co O r^ ^« ^* "-• CO l O CM O*) CM
o s lg CO
CO
,6,
s £ « *
o R t; ja ja
05 £ S h 3 G ^5
; c • -
"SI J? « :
— ~s fth E-» H O
i a
| o
!ij Hiliie§iiti

AGRA WATER QUALITY 21
cr LU •— <
£ UJ or z>
FUT (Z
LU
<
cr CD <
z LU
I ^5 LU u CO
CD iT Q
2 LU CD <
Z < < 2
•=i
Is
I
e
o
o •J z o < z UJ I o
n
1 O
l C
l
1 s 1 1 i
• — ? • 5 ?
•
? L
J i f i;
• H s§ • « , i : • E = • o -li
if HI
*?
8S
If IS II s?
r -
N * r a
z> Sa
|3U
,&. tr—i j °*i
1 s
i=i
n o o o u.
o-*
^ K
& u

22 PARKASH AND RAWAT
taking ecological and recycling concepts, if adopted would meet the total requirements of potability, industries, irrigation, recreation and laundries. The river Jamuna draws the impounded polluted raw water from Keetham lake, 22 km upstream from the Agra water works intake, in scarcity days. This lake water should be taken only after primary treatment to minimize its high algal load and foul odour, in consequence to check the choking of water treatment filters, as occurs frequently in Agra water works-A barrage at Jamuna-Karon confluence is proposed (12 km down stream from the water works ) to meet all the present as well as future water requirements, on augmentation from 40 mgd to 75 mgd (Fig- 1).
The present 160 million litres of wastewater per day in Agra, will increase in quantity when the water supply is augmented. The parallel underground sewerage system should converge at Nunihai and Taj Ganj to collect the wastewater from east and west halves of the city. The collected wastewater could be treated in open stabilization ponds 6, 7.
The effluent could be effectively utilised for aqua culture and agriculture, The treated effluent could also be used for industrial processes. First grade compost and biogas could also be obtained if managed properly, Green belts can be effectively created for betterment of total environment.
Recommendations
The following recommendatinos are suggested in connection with the water requirements :
1. During summer, the river water is highly polluted by domestie and industrial wastes and cattle. These conditions
are further accentuated by a very low water flow and profuse algal bloom. This can be improved by maintaining at least 800 cusec flow in the river releasing more water through upstream.
2. The upstream (15 km stretch) of river Jamuna at Agra should be adequately protected against pollution by checking the discharge of sullage, specially during summer.
3. The wateworks should be provided with sufficient qualified staff (the quality control wing) for better operation and performances of the treatment units.
Acknowledgement
The first author is grateful to C. S. I. R., New Delhi for the award of a Junior Research Fellowship.
REFERENCES
1. Welch, Paul S., "Limnological Methods" , Published by Mc Graw-Hill Book Company, Inc. , 1948.
2. "Standard Methods for the Examination of,water and wastewater", 14th Edn., APHA-AWWA-WPCF, New York (1975)-
3. Prakash, C , "Limnological Study of River Jamuna with reference to pollu, t ion." Ph. D. Thesis, Agra University. Agra, India, 1980.
4. Prakash, C , Rawat, D. C. and Grover, P . P . , "Ecological Study of the River Jamuna" . 1AWPC Tech. Ann. 5, 32-45, 1978;
5. Wld. Hlth. Org. Geneva, ' ' International Standards for Drinking Water" , 3rd Edn. , 1971.
6. Prakash, C., Prakash, P. and Rawat, D . C. "Environmental Pollution dynamics". IAWPC Tech. Ann. 6 & 7, 140-148, 1980.
7. Wld. Hlth. Org. Reg. Publ. South-East Asia.New Delhi, Ser. No. 4, 1977. "Com-1 munity Water Supply and Excreta Disposa in South-East Asia."
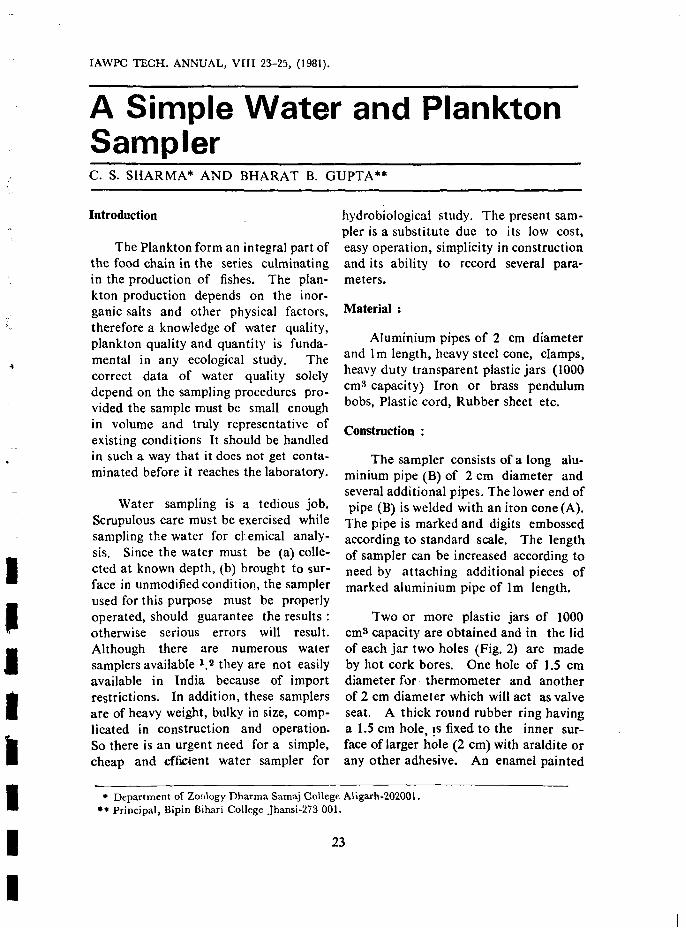
IAWPC TECH. ANNUAL, V H I 23-25, (1981).
A Simple Water and Plankton Sampler C. S. SHARMA* AND BHARAT B. GUPTA**
Introduction
The Plankton form an integral part of the food chain in the series culminating in the production of fishes. The plankton production depends on the inorganic salts and other physical factors, therefore a knowledge of water quality, plankton quality and quantity is fundamental in any ecological study. The correct data of water quality solely depend on the sampling procedures provided the sample must be small enough in volume and truly representative of existing conditions It should be handled in such a way that it does not get contaminated before it reaches the laboratory.
Water sampling is a tedious job. Scrupulous care must be exercised while sampling the water for chemical analysis. Since the water must be (a) collected at known depth, (b) brought to surface in unmodified condition, the sampler used for this purpose must be properly operated, should guarantee the results : otherwise serious errors will result. Although there are numerous water samplers available 1 .2 they are not easily available in India because of import restrictions. In addition, these samplers are of heavy weight, bulky in size, complicated in construction and operation. So there is an urgent need for a simple, cheap and efficient water sampler for
hydrobiological study. The present sampler is a substitute due to its low cost, easy operation, simplicity in construction and its ability to record several parameters.
Material :
Aluminium pipes of 2 cm diameter and lm length, heavy steel cone, clamps, heavy duty transparent plastic jars (1000 cm3 capacity) Iron or brass pendulum bobs, Plastic cord, Rubber sheet etc.
Construction :
The sampler consists of a long aluminium pipe (B) of 2 cm diameter and several additional pipes. The lower end of pipe (B) is welded with an iron cone (A).
The pipe is marked and digits embossed according to standard scale. The length of sampler can be increased according to need by attaching additional pieces of marked aluminium pipe of lm length.
Two or more plastic jars of 1000 cm3 capacity are obtained and in the lid of each jar two holes (Fig. 2) are made by hot cork bores. One hole of 1.5 cm diameter for thermometer and another of 2 cm diameter which will act as valve seat. A thick round rubber ring having a 1.5 cm hole, is fixed to the inner surface of larger hole (2 cm) with araldite or any other adhesive. An enamel painted
* Department of Zoology Dharma Samaj College Aligarh-202001. ** Principal, Bipin Bihari College Jhansi-273 001.
23
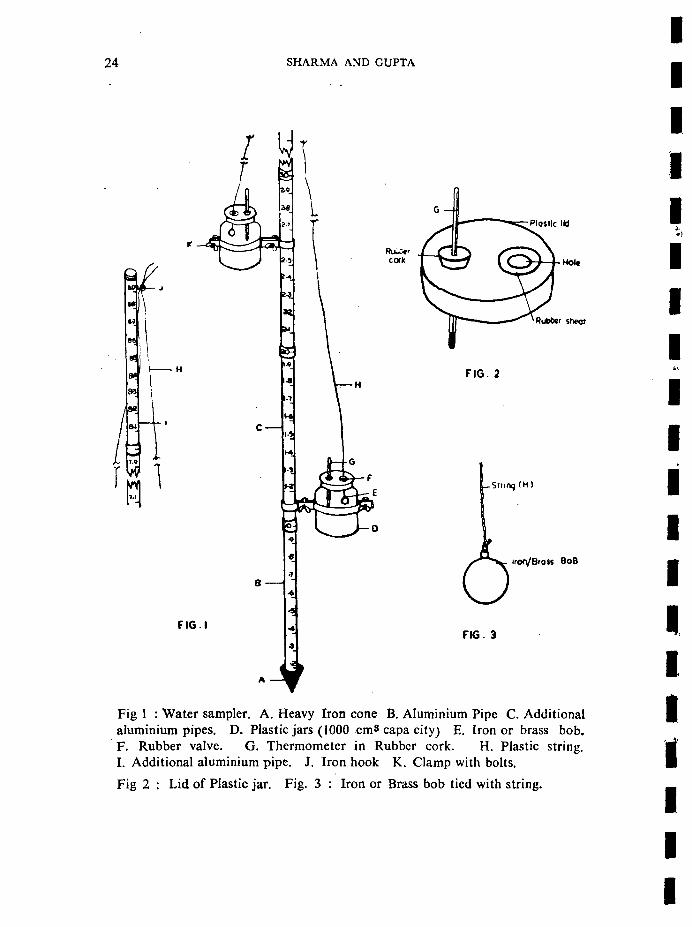
24 SHARMA AND GUPTA
FIG I
4
Plastic Ik)
Hoi*
Rubter sheet
FIG. 2
SlnnqtH)
iron/BroK 8oB
FIG. 3
Fig 1 : Water sampler. A. Heavy Iron cone B. Aluminium Pipe C. Additional aluminium pipes. D. Plastic jars (1000 cm3 capa city) E. Iron or brass bob. F. Rubber valve. G. Thermometer in Rubber cork. H. Plastic string. I. Additional aluminium pipe. J. Iron hook K. Clamp with bolts.
Fig 2 : Lid of Plastic jar. Fig. 3 : Iron or Brass bob tied with string.

PLANKTON SAMPLER 25
iron/brass bob (Pendulum bob,E) of 3 cm diameter is hung by a strong plastic string in such a way that the bob remains inside the jar while the plastic string comes out from the larger hole. A mercury thermometer is inserted in the cork and fitted into the smaller hole of the lid. Vaseline is applied around the thermometer to make the apparatus air tight. The plastic jars are now clamped on the aluminium pipe B or C at desired mark.
The string of all the jars are tied to a hook (J) in the upper most aluminium pipe in such a way that the hole of plastic jars are perfectly closed.
Operation:
The operation of this sampler is easy. The additional pipes are first screwed to the main pipe accoding to need making it sure that the cone will reach the bottom of the water body. The jars are clamped at the mark of predetermined depth at which the water is to be collected. The pipes are then lowered in the water keeping it straight in one hand and tying the string of all the jars to the hook (J) by pulling upward so that the bob may fit properly in larger hole, making it water tigt. When the cone A has reached the bottom of the water body the string H be loosened By loosening the string H the round metal bob (E) will go down with its own weight allowing the water and plankton enter in platic jars at desired depth. The emergence of air bubbles indicates filling of the jars, when no more air bubbles come to surface, the string is again pulled up and tied with the hook (J) so that the water from any other depth could not enter and contaminate it. The mark upto which the pipe dips into the water, indicate the total depth of the water body. The apparatus is lifted out slowly from the water and the mark
at which the clamps are tightened, be noted. The different depth at which the water has been collected can be obtained by deducting the aforesaid readings from the total depth of the water body.
The water temperature at different depths is read from the mercury thermometer fitted in each jar just after pulling of the sampler from the water without any change, as the thermometer bulb remains dipped in the collected water. The water colour can be noted by comparing the jar water with that of standard colour plates. Thereafter the jar can be seperated from the pipes by loosening the clamps and the water collected in jars is used for further investigation.
Merits of the sampler :
1. The construction is easy and cost is very low.
2. The sampler is of light weight and easily be transported.
3. It can record temperature of water at different depths, the depth of the pond/water body and water colour at different depths at the same time.
Acknowledgement:
The authors are thankful to the authorities of Dharma Samaj college, Aligarh for providing necessary facilities and to Council of Scientific & Industrial Research, New Delhi for financial assistance.
References :
/ . "Standard Methods for the Examination of Water and waste water". AWWA, WPCF, APHA, (1976)
2. P. S. Welch. "Limnological Methods" McGraw Hill Book Go. Inc. New York ( 1948).

IAWPC TECH. ANNUAL, VHI 26-32, (1981).
Effect of Ionic Concentration of Vegetable Tanning Effluent on Anaerobic Filter __ S. N. CHATTOPADHYA* AND H. C ARORA*
Introduction
Current practice in India for the treatment of vegetable tannning effluents is by anaerobic lagooning followed by one or two stage aerobic treatment. Under this practice it is recommended that the soak liquor rich in ionic concentration specially the chlorides, should be isolated and solar dried. There are swo reasons for this recommendation viz., i) ionic concentration beyond specific levels is reported x to exert toxicity in the anaerobic system thereby impairing its efficiency, ii) the permissible concentration of total dissolved solids (TDS) prescribed by ISI 2 that can be let onto land is 2100 mg/1 whereas the vegetable tanning effluent has a TDS value in the range of 10,000 to 15.000 mg/1, which is much above the allowable limit. Whereas simple dilution could be the remedy for the second aspect, first aspect deserves ascertaining by laboratory studies.
Anaerobic Contact Filter Process has been confirmed to be a process of great promise for the treatment of vegetable tanning effluents 3.* with several advantages over the conventional lagooning. The objective of this study was to assess the adverse effect if any, of high ionic concenttation in situ in the effluent on the efficiency of Anaerobic Contact Filter Process.
Material and Methods
Common sea salt (predominantly sodium chloride) is used for preserving raw hides which before processing are soaked in fresh water to remove the salt and this forms soak liquor. Since chlorides are predominant in this liquor, they have been taken as a guiding parameter for varying loadings on the filter. Desired concentrations of chlorides in the feed were arrived at by appropriately diluting the soak liquor and mixing it with the final mixed waste from the remaining units. Ions other than chloride viz., S04"~9,Ca+ , Mg+a, Na+ and K were estimated in relation to the chlorides made available in the feed which was prepared in the laboratory by volumetrically proportionating live wastes collected from different units of the tannery. Five sets with different Chloride concentration viz., 3200 mg/1 (I), 3500 mg/1 (II), 4000 mg/1 (III), 4500 mg/1 (IV) and 5000 mg/1 (V) were tried. This is the range in which chlorides are available in live final mixed tannery effluents.
To study the efficiency of the system at different chloride concentrations, COD, BOD and tannin were estimated both in the feed and the treated effluent coming out from the filter, keeping the
* NEERI Kanpur Zonal Laboratory, Kanpur 208002
26

VEGETABLE TANNING EFFLUENT 27
fe(t> TANk
BASi
NLTtR CCLOMN -OUTLET
FtLTEen TtoN
FALSE
SoTrom
Fig. 1 - Laboratory Experimental Unit of Anaerobic Contact Filter.
retention time as one day. Batch feeding was adopted for loading the filter.
The same filter as used in earlier studies (3, 4) was taken up for this study also, as it was already in a ripe condition, (Fig. 1). Basic data of the experimental filter is reproduced in Table 1 for ready reference.
Results and discussions
Results recorded at different chloride loadings with associated ionic concentrations have been presented in Table 2. It would be observed from the Table that for each chloride loading, at least four sets of data were collected. Arithmetic averages of these sets of data have been presented in Fig. 2 where the percent removals of COD, BOD and tannin have been plotted against the Total Estimated Ionic Concentrations (TEIC) corresponding to the five different 'Chloride loadings' (I, II, III, IV, V). Arithmetic averages of Various ions corresponding to five different 'chloride loadings' have been incorporated in Table-3.
From Fig. 2 it can be observed that at TEIC I, the respective COD, BOD and tannin removal are 92.8%, 94.5% and 87.50%. At TEIC II, there is a slight drop in the percent removals in all the aforesaid parameters (Table 4). At subsequent TEICs i. e. Ill, IV, and V the percent removals pick up again and reach a little higher level of removals than at TEIC I. It is not certain if the slight drop needs any explanation since the difference between TEIC I and II is marginal (Table-3). However, from the figure it is amply clear that at as high a TEIC as 11,514 (V), which could safely be considered as the highest available live final mixed waste from a vege-
TABLE 1
Height of the filter Inner diameter of the filter Volume of the filter (exclusive of top noneffective space, 150 mm) Volume of the filtration medium Volume of interspaces Size of filtration medium
Porosity of filtration medium
1850 mm 140 mm
25.61 14.81 10.81
40.0 mm (quartz stones)
0.419

28
TABLE 2
CHATTOPADHYA AND ARORA
PERFORMANCE OF THE FILTER AT DIFFERENT LOADINGS IN
S. Different Ionic Concentration
No cr
S E T - I
1. 3200
2. 3200
3. 3200
4. 3200
5. 3200
S E T - I I
1. 3500
2. 3500
3 . 3500
4 . 3500
5. 350O
6. 3500
7. 3500
S E T - I I I
1. 4000
2. 4000
3. 4000
4. 4000
5. 400O
6. 4000
S E T - I V
I. 4500
2. 4500
3. 4500
4. 450O
S E T - V
1. 5000
2. 5000
3. 5000
4. 5000
5. 5000
6. 5000
S 0 4 Ca
_ _ 450 1402
500 1427
450 1362.7
420 1402.5
400 1282.5
500 1082
184 1402
190 1482.9
190 1482.9
200 1726
150 1920
200 1726
200 1726
200 1942
200 1942
200 1942
200 1902
260 1482
200 1489
--
500 1520
500 1520
600 1502
600 1502
580 1600
580 1600
in the Influent
++ Mg
_ 291.8
243.2
291.8
243 2
194.5
267.5
267.5
4-13.3
413.4
525
710
560
560
560
560
500
243.3
243.2
560
--
800
800
840
840
860 .
860
+ Ma
_ -
2000
2000
1800
625
600
2120
2000
2000
1620
1900
1920
1920
1860
1860
2000
1500
150
2120
- ' -
2500
2500
2500
3000
2600
2600
+ K
_ -
640
640
600
520
520
1800
1650
1650
800
500
750
750
800
800
800
750
750
800
--
1000
1000
1000
1000
900
900
PK Inf.
6.6
6.6
6.6
(i.6
6.8
6.6
6.3
6.3
6.3
6.4
6.5
6.5
6.3
6.4
6.3
6.3
6.4
6.6
6.4
6.2
6.7
6.3
6.3
6.3
6.4
6.2
6.3
6.2
Eff.
7.2
7.2
7.1
7.2
7.2
7.1
7.2
7.3
7.2
7.3
7.3
7.3
7.4
7.4
7.3
7.2
7.2
7.4
7.3
. 7.3
7.2
7.2
7.2
7.1
7.1
7.1
7.1
7.1
ALL VALUES EXCEPT pH ARE EXPRESSED AS mg/I

VEGETABLE TANNING EFFLUENT
TERMS OF CHLORIDES WITH RETENTION TIME OF 1 DAY
29
Inf. C. O. D.
Eff. % Red. Inf. B. O. D.
Eff. %Red Inf. Tannin
Eff. %ITed
18500
1537G
15312
13296
13296
15290
15955
14700
15092
15286
13912
13490
14528
13620
13176
13176
13356
13568
13728
11832
14520
14112
16128
16324
15552
16416
15155
15974
1520
1050
974
888
975
1107
975
2548
2842
2646
1786
1663
1634
1543
950
990
1105
392
500
979
720
1078
950
1060
950
734
737
655
91.7
93.1
93.6
93.3
92.6
92.7
93.89
82.7
81.1
82.6
87.16
87.67
88.7
88.67
92.74
92.49
91.73
93.43
96.36
91.7
93.75
92.3
94.11
93.51
93.89
95.53
95.14
95.9
10000
8930
11000
8500
10250
9150
10600
8500
8000
9000
6000
7770
7000
7750
7160
7500
6800
8000
5150
7800
8250
10000
10330
7700
8800
7530
10600
50
455
590
350
495
473
625
1100
966
1000
783
890
755
680
485
480
415
515
425 460
620
335
600
560
383 335
350
92.5
94.8
94.5
95.8
95.1
94.8
94.1
87.0
87.9
88.89
87.1
88.5
89.07
91.2
93.23
93.6
93.6
93.56
92.71
94.1
92.4
96.65
93.2
92.72
95.54
95.5
96.6
1200
1250
1250
1280
1280
1180
1000
1280
1150
1150
1150
1150
1400
1400
1280
1200
1150
1150
1150
1000
1000
1180
1400
1150
1250
1400
1280
1250
140
130
160
175
180
160
120
200
175
175
220
200
180
175
175
200
200
200
200
150
175
180
200
130
180
180
175 100
88.3
89.6
87.2
C6.3
85.9
86.4
88.0
84.4
84.8
84.7
80.87
82.61
87.1
87.5
86.33
83.3
82.61
82.61
82.61
85.0
82.5
84.75
85.71
88.69
85.6
84.72
86.33
85.6
Contd on Page-30

30 CHATTOPADHVA AND ARORA
TABLE-2 Contd form Page-29
Tc
Inf.
S R T -
22070
23296
1836B
16480
S E T -
30584
16296
13216
14376
15980
14720
12772'
S E T -
13752
15568
20608.
27668
14760.
23500
S F . T -
29264
23972
27300
S E T -
27076
17620
20440
25000-
18600
1G520
tal Solids
Eff.
I
II
I I I
- I V
- V
14268
16976
11132
13020,
10852
11240
9656
8188
9896
10012
11276
8340
6612
12524
20756
4336
11424
12024
14660
12464
2012O.
11672
14940
15120
13552
13464
Total Volatile Solids
Inf. Eff.
11904
10508
5900
8896
12252
8536
7496
7388
6232
6544
7248
6752
7220
9332
1096O
7668
6588
11720
7652
12500
14372
7420
10540.
16920
8540
10708
4908
5704
3988
5440
6480
4204
2816
4512
4452
3796,
5468
3164
3712
6208
6272
3758
6528
5884
5520
2524
10412
4540
6240
6740
5092
4664
Suspended Solids
Tnf.
1520
3352
1260
804
980
1224
1256
464
456
342
1100
1344
408
432
1352
1298
1040
1672
1972
1624
EI ia 1068
1640
680
668
320
Eff.
1212
2708
548
630
996
532
712
180
176
108
568
428
348
352
916
540
824
576
944
80
844
652
880
-640
264
Suspen Volatil
Inf.
1172
1760
660
496
456
888
816
216
174
208
864
1088
272
25C
636
988 .
412
1368
332
624
604
920
880
828
540
100
dcd e Solids
Eff.
340
544
392
412
304
240
456
140
112
48
204
332
140
36
916
540
212
396
132
24
536
560
540
-320
140

VEGETABLE TANNrNG EFFLUENT 31
•J
> o 1 Ml
c* K
a \ j
3 0.
90
M
70
«0
ft
f «
M
>•
£06 COD
_ ! _ • _ a -r#M»'«>
I t B IT - * f <- : •<? m la. 10k lit M Hi III IH 'Hi Tioo
TOTAL £STI"IATSO '0<V,. c*v<:Mrr«iir/0* (TElC) , rn^/L
Fig. 2 - Percent COD, BOD and Tannin Removals at different ionic Concentrations.
table tannery, the efficiency of the system is not impaired.
McGarty x has deseribed the effects of different cations on an anaerobic system as under :
Cation St imulatory Moderately Inhibitory
Strongly Inhibitory
Sodium Potassium Calcium Magnesium
100 - 200 mg/1 2 0 0 - 4 0 0 mg/1 100 - 200 mg/1 7 5 - 1 5 0 mg/1
3500 - 5500 mg/1 2500-4500 mg/1
2500 - 4500 mg/1 1000- 1500 mg/1
8000 - mgll 12000- mg/1 8000 - mg/1 3000 - mg/1
It can be seen from Table-3 and 4 any adverse effect on the system. This that as per McCarty's categorization, all the cations recorded in the present study fall between 'Stimulatory' and 'Moderately Inhibitory' and have not shown
should confirm McCarty's categorization.
IV. Acknowledgements
Authors are indebted to Dr. B. B.
TABLE-3 Arithmetic Average Values of Total Est imated Ionic Concentration ( TEIC ) and Different Ions At Different Chloride Loadings
I.
I I .
I I I .
IV.
V.
TEIC
7873
8094
.9178
9351
11514
c i -
3200
3500
4000
4500
5000
5 0 4 - 2
455
313
200
220
560
Ca+2
1398
1459
1863
1486
1540
Mg+Q
259
376
497
454
833
Na+-
1930
1436
1843
1913
2616
K+
626
995
775
783
966
TEIC — Total Estimated Ionic Concentration
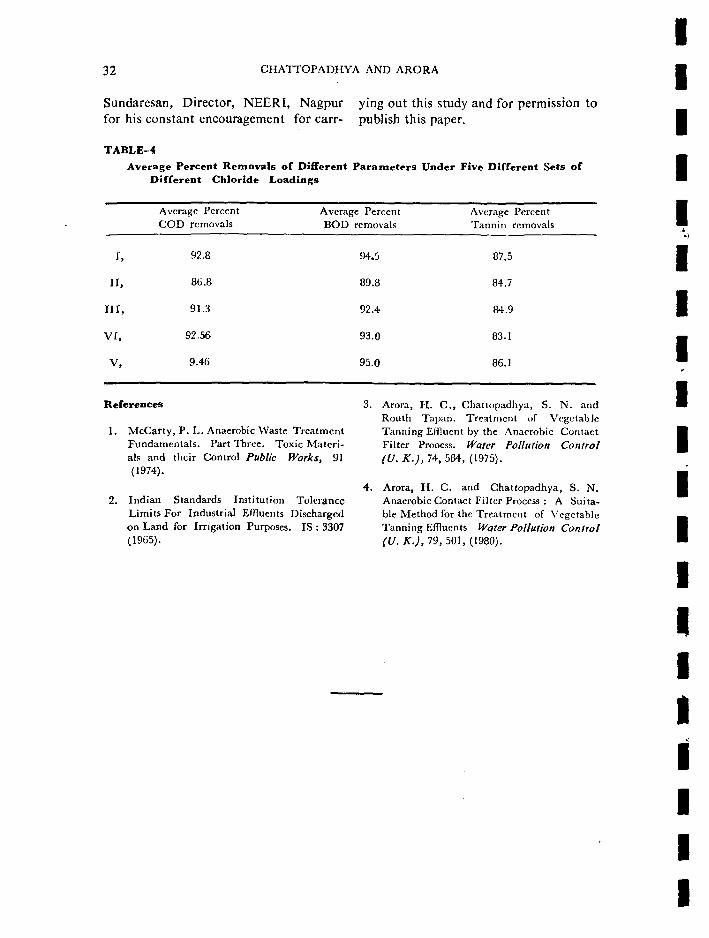
32 CHATTOPADHYA AND ARORA
Sundaresan, Director, NEERI, Nagpur ying out this study and for permission to for his constant encouragement for carr- publish this paper.
TABLE-4
Average Percent Removals of Different Parameters Under Five Different Sets of Different Chloride Loadings
r,
ir»
nr,
V I ,
V,
Average Percent COD removals
92.8
8G.8
91.3
92.56
9.46
Average Percent BOD removals
94.5
89.8
92.4
93.0
95.0
Average Percent Tannin removals
87.5
84.7
84.9
83.1
86.1
References
1. McCarty, P. L. Anaerobic Waste Treatment Fundamentals. Part Three. Toxic Materials and their Control Public Works, 91 (1974).
2. Indian Standards Institution Tolerance Limits For Industrial Effluents Discharged on Land for Irrigation Purposes. IS : 3307 (1965).
Arora, H . C , Chattopadhya, S. N. and Routh Tiipan. Treatment of Vegetable Tanning Effluent by the Anaerobic Contaet Filter Proocss. Water Pollution Control (U. K.), 74, 584, (1975).
Arora, H . C. and Chattopadhya, S. N. Anaerobic Contact Filter Process : A Suitable Method for the Treatment of Vegetable Tanning Effluents Water Pollution Control (U.K.), 79, 501, (1980).

IAWPC TECH. ANNUAL, Vr i l 33-45, (1981).
Treatment of Waste Pickle Liquor From A Tube Mill S. R. ALAGARSAMY*, G. VUAYARAGHAVAN** AND M. GANDHIRAJAN***
Introduction
As common to all metal product industry, mills processing to obtain cold rolled mild steel tubes, cold rolled welded tubes and electrical resistant weldable tubes also generate waste water from various operations. The waste water emanated from such mills is known to be highly acidic and contain high concentration of dissolved salts, besides suspended iron.
A case study involving treatment and disposal of waste pickle liquor generated from a tube mill is presented in this paper.
Manufacturing Process and Sources of Waste Water
The hot rolled flat mild steel strips are the basic product from which final components are obtained. In respect of water usage and chemicals employed in the manufacture and consequent generation of process waste water, the manufacturing process is confined to pickling operation in this particular instance.
In the pickling operation, mild steel strips are immersed in acid (Pickle liquor) to remove oxides and scales and rinsed thereafter in static water bath
(static swill) and finally in flowing water stream ( flowing swill). As strips are immersed in pickle liquor, oxides of iron and scales from the strips are removed and retained in the pickle liquor. Consequently pickle liquor gets contaminated with iron oxides and losses its strength. It is reported that the initial strengh of pickle liquor bath of about 85% drops down to as low as 1 to 15% after substantial use l The loss in acid strength of the pickle liquor is made up with addition of fresh acid as and when required. The bleed oft" from pickling bath is done thrice a day during 'acid make-up's. In spite of such make-ups the pickle liquor has to be ultimately discharged into drain as "spent acid" on account of its high content of iron which is unsuitable for optimum and economicnl pickling. The spent acid is therefore completely drained once a day.
Continuous dipping of pickled flats leads to build up of acidic and iron concentration in static water bath. As acid concentration builds up the static water bath is discharged. Generally, the discharge is once in a shift. Further, subsequent rinsing of rinsed strips/tubes in flowing swill also contribute acidic conditions in flowing swill water, which is discharged as such into the drain.
•Joint Manager (PH), ** Project Engineer, *** Chemist, Richardson & Cruddas (1972) Ltd., Madras.
33

34 ALAGARSAMY ET AL
nmt(9NCf4»noxni)
HCi MATH
,tr*iBt
Wt »ATH
ST*TIC itinum
I 4S -'U cnoo e*' >
franc et"tf
FLOWM 6UILL
t «<unr tm i
tLOnmO 4UHJ. CCONTIHUOUtl
Fig. 1 - Wastewater flow f r o m Pickl ing Shop
Thus the wastes emanating from of 198.35M3 / day out of which spent pickling operation consist of following acid constitutes only 2.75 per cent of the streams (fig. 1) total flow (Table I). While the waste
flow from static swill constitutes about 1. Spent acid of pickle liquor 5.50 per cent, the flowing swill waste 2. Static swill water, and forms the bulk with 91.75 per cent of 3. Flowing swill water. total flow.
Waste Flow Waste Characteristics
The quantum of the waste waetr As stated earlier, the main consti-discharged from the mill is of the order tuents of the waste water are hydrochlo-
TABLE-l
Source and Quality of Effluents f r o m the Tube Mill
S. No. Source Flow
gpd M 3 / day Remarks.
Pickle liquor (Batch)
Static swill (Batch)
1,200 5.45 800 gallons once in a day and 133.3 gallons during make up of pickling bath ( 3 times/day )
2,400 10.90 800 gallons 3 times a dav.
Flowing swill 40,000 182.00 Continuous flow at 7.58 M 3 /hr .

TUBE MILL WASTE TREATMENT
S. No.
1.
2.
3.
TABLE n
Variation in Effluent Characteristics.
Source of waste water
Pickle liquor
Static swill
Mowing swill
Hydrochloric Acid as HCl gram/litre
20-10 ( 2 - 4 % )
5 - 8 (0.5-0.8%)
0.07 (0.007%)
Iron as Fe grams/litre
120-150 ( 12-15%)
5.0 (0.5%)
0.2-0.4 (0.02-0.04%)
Table-IH. Pollutional Lead.
S. No. Source Quantity of effluent discharged M3/day
Pollutional Load
HCl Kg /day
Iron as Fe Kg/day.
1.
2.
3.
Pickle liquor
Static swill
Flowing swill
Total :
5.45
10.90
182.00
198.35
109.10-218.20
54.55-87.28
12.74
176.39-318.22
655.00-819.00
54.55-54.55
36.40-78.80
745.95-952.30
ric acid and iron. The acid and iron concentration of the various streams are shown in Table II.
Po/lutional Load :
As seen in Table II, the pickle liquor is highly pollutional with 2 to 4% ofacidand 12 to 15 percent of iron. The flowing swill water is less pollutional with 0.007 per cent of acid and 0.02 to 0.04 per cent of iron.
Although the pickle liquor volume is less, it is highly pollutional with high concentration of acid and iron. The total pollutional load is estimated and presented in Table IH. The total acid discharged in all the three streams amounts to as high as 318 Kg/day out
of which pickle liquor alone constitutes 218 Kg/day which is 68 per cent of total acid discharged. Likewise the pickle liquor is found to carry 819 Kg/day iron out of the total 952 Kg/day which is 86% of iron dicharged every day.
Existing Treatment :
The existing treatment plant at the mill is basically a neutralisation unit wherein spent acid and static swill wastes are combinedly neutralised by employing lime. Flowing swill water is separately neutralised with lime. The neutralised effluent of flowing swill water is let out into lakes while the neutralised pickle liquor and static swill waste is transported for sea discharge. The treatment diagram is shown in fig. 2.

36 ALAGARSAMY ET AL
UMS TO fZAM pttTOft € 4* 3 5 *r?/OAY
toon?
t90r*f
PUMP uOuse
JO
cjt*t n ea/c* pH TO n
'u>v*NC W u
*o.ooaipd
Fig. 2 - Exist ing Treatment at the Mil l
Treatment Performance :
The neutralised effluent of pickle liquor and static swill contains a high chloride concentration of 30,000 to 52,000 mg/1 and total dissolved salts of 55,000 to 80,000 mg/1 which are far in excess of prescribed discharge limits of I. S. for surface waters and irrigation. The pH of the neutralised effluent is found to be above 10. Hence even for marine disposal being practised at present the treated effluent requires additional treatment for pH correction. The neutralised flowing swill water contains chlorides as much as 530 to 1550 mg/1 and TDS of 1120 to 3355 mg/I.
Thus, the present mode of treatment leaves an effluent of exceedingly high pH and high concentration of chlorides and TDS. Severe handling and disposal problems are experienced due to enormous quantity of iron hydroxide sludge generated from the neutralisation of the wastes. The present mode of
waste disposal by Iagooning is found to create ground water pollution. In order to overcome the obove and to improve the system, a detailed investigation was carried out on the various aspects of neutralisation, including chemical requirements and sludge production, solar evaporation etc.
Investigational Work :
The objective of the investigation was to achieve an effective neutralisation of wastes by optimum dosage of chemicals, complete precipitation of iron, easy handling of settled sludge and to eliminate the ground water pollution. Thus, in order to arrive at the optimum chemical requirement for neutralisation and precipitation of iron and to determine settlabiiity and quantum of iron sludge produced, certain Ioboratory experiments were earried out.
The pickle liquor was diluted at various proportions and the treatment

TUBE MIXL WASTE TREATMENT 37
Fig. 3 - Lime treatment at pH 11 of Pickle Liquor at various dilutions.
Fig. 4 - L i m e aeration to P icke Liquor at various Dilat ions.
study was carried out using 10% Lime slurry of 90% CaO content. The settla-bility of sludge generated and characteristics of supernatent was studied. The results are shown in figures 3 and 4 and the summary of test results is presented in Table IV.
It was noted during the investigation that neutralisation of pickle liquor alone led to enormous formation of thick and dense precipitate which in turn reduced reactivity of lime and increase the quantum of unreacted lime in sludge. The settlability of the sludge was also found poor. On the other hand, neutralisation of diluted pickle liquor resulted in increased settlability of sludge. However, there was an increase in total volume of sludge and TDS per unit volume of
pickle liquor treated. Based on the above the optimum dilution of pickle liquor was obtained at 1:2 considering sludge production, settlability, and concentration of TDS in supernatant.
Lime Requirement :
The lime (90% pure) required for neutralisation of waste and precipitation of iron from pickle liquor and static swill was experimentally arrived at 1129 Kg/day, slightly higher than the theoretical value of 1048 kg/day.
In case of flowing swill 0.01% HC1 and 0.05% iron (Fe), 2ml of 10% lime slurry was found adequate for 1 litre of of waste to increase its pH to 11. Thus the total lime requirement worked out to 48 kg/day.
Table
Dilution ratio
Lime Dose (gms/lit)
Sludge volume (ml/lit)
T. D. S. mg/1
IV.
89
Neutralisation of Pickle
1:1
82
790
,500
1:2
52
750
77, 000
Liquor
1:3
38
680
74, 000
t o pH 11.
1:10
11
400
31,000

38 ALAGARSAMY ET AL
Fig. 5 - Iron removal by L i m e Addition (Pickle Liquor 1 : 2 dilation)
Iron Precipitation :
The study carried out on iron precipitation indicated that complete precipitation of iron could be achieved only at a pH of 11.0. The residual iron concentration in pickle liquor and static swill waste at various pH is shown in Table V and in figure 5.
As seen from Table V, the iron content of 32 gms/1 could be removed to a level of 3.7 gms/I at a pH of 7.0 and complete removal of iron could be achieved only at a pH of 11.0. Even though iron could be completely precipitated at pH 9.5, it was found difficult to control
and maintain the pH at 9.5 with lime addition. The pH suddenly raised from 8 to above 10 even with addition of a little lime.
Sludge Production :
As such pickle liquor and static swill water arc fairly free suspened parti-
i cles whereas flowing swill water contains traces of suspended matter, possibly due to the presence of ferric oxide. From experiments carried out on pickle liquor with dilution, it was found that neutralisation step (to raise pH to 7) alone generated sludge production to the extent of 40 to 79% V/V depending on the dilution. In case of flowing swill water, when pH was increased to 11 for precipitation of iron, sludge production was found 1% V/V.
The total volume of sludge produced from treatment of all the three effluents to a pH of 11 is theoretically calculated and shown in Table VI.
It is seen that the sludge to be handled every day is quite enormous and is of the order of 25M3/day with 6.0% solid concentration.
TABLE V Precipitation of Iron With Lime-Pickle Liquor
1:2 Dilution (Lime a s CaO 90% Pure)
S. No.
1.
2.
3.
4.
5.
PH
0.8
2.0
6.0
7.0
11.0
Lime
g
required m/1
—
—
33.4
44.4
52.2
Iron in tr
as Fe (gms/I) e treated waste
32
19
12.7
3.7
Nil
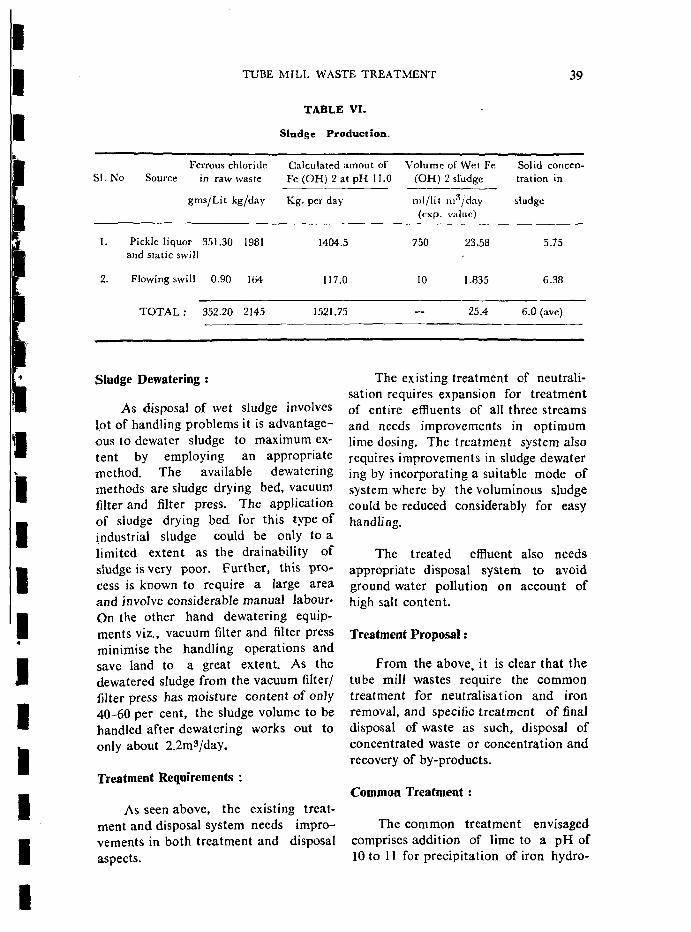
TUBE MiLL WASTE TREATMENT 39
TABLE VI.
Sludge Production.
Ferrous chloride Calculated ainout of Volume of Wet Fe Solid concen-SI .No Source in raw waste Fe (OH) 2 at pH 11.0 (OH) 2 sludge tration in
gms/Lit kg/day Kg. per day ml/lit rn /day sludge (cxp. value)
1. Pickle liquor 351.30 1981 1404.5 750 23.58 5.75 and static swill
2. Flowing swill 0.90 164 117.0 10 1.835 6.38
T O T A L : 352.20 2145 1521.75 - - 25.4 6.0 (ave)
Sludge Dewatering :
As disposal of wet sludge involves lot of handling problems it is advantageous to dewater sludge to maximum extent by employing an appropriate method. The available dewatering methods are sludge drying bed, vacuum filter and filter press. The application of sludge drying bed for this type of industrial sludge could be only to a limited extent as the drainability of sludge is very poor. Further, this process is known to require a large area and involve considerable manual labour* On the other hand dewatering equipments viz., vacuum filter and filter press minimise the handling operations and save land to a great extent. As the dewatered sludge from the vacuum filter/ filter press has moisture content of only 40-60 per cent, the sludge volume to be handled after dewatering works out to only about 2.2m3/day.
Treatment Requirements :
As seen above, the existing treatment and disposal system needs improvements in both treatment and disposal aspects.
The existing treatment of neutralisation requires expansion for treatment of entire effluents of all three streams and needs improvements in optimum lime dosing. The treatment system also requires improvements in sludge dewater ing by incorporating a suitable mode of system where by the voluminous sludge could be reduced considerably for easy handling.
The treated effluent also needs appropriate disposal system to avoid ground water pollution on account of high salt content.
Treatment Proposal:
From the above, it is clear that the tube mill wastes require the common treatment for neutralisation and iron removal, and specific treatment of final disposal of waste as such, disposal of concentrated waste or concentration and recovery of by-products.
Common Treatment :
The common treatment envisaged comprises addition of lime to a pH of 10 to 11 for precipitation of iron hydro-

40 ALAGARSAMY ET AL
xidc. Thus the wastes from all three sources amounting to 198,35 M3/day will . be pumped to a reaction tank to which lime will be added to increase the pH for neutralisation of acid and precipitation of iron. The reacted waste will then be subjected to settling for separation of precipitated iron hydroxide. By addition of lime the total volume of waste and lime liquor will increase by about 11 percent. The common treatment also includes dewatering system for the settled iron hydroxide sludge. The dewatering system could be either drying beds, vacuum filter or filter press.
The dewatered sludge could be removed and used as landfill.
Waste Disposal
As seen earlier, inspite of neutralisation the treated waste is unfit for discharge on account of high content of chloride, TDS and high pH. It therefore becomes nesessary to process further so that the neutralised effluent is made lit for discharge. Based on the local site condition and available methods the following alternatives were considered
1. Sea disposal,
2. Ion exchange, and
3. Evaporation & concentration for final disposal or recovery.
Sea Disposal
For sea disposal, the neutralised waste will have to be adjusted for pH and properly settled so that the effluent shall have suspended solids less than 100 mg/1. As stated earlier the total effluent for sea disposal is 214 m3/day and hence it is necessary to employ a fleet of tankers numbering 20 to 30 for transporta
tion of the effluent to sea which is about 30 kms away from the tube mill. The number of tankers could be reduced to 10-15 when repeated trips are made by each tanker twice.
Ion-Exchange :
The Ion Exchange technology is generally recommended for waters having total dissolved solids in the order of 1000 mg/1 or less. Although this method is technically feasible it is not economically viable for waters containing high concentration of TDS. However, in this particular case it i8
found that this method could not be employed on account of extremely low-resin specific load leading to channeling in the resin bed and consequent poor exchange capacity. Besides the prohibitive costs, there are associated problems like disposal of regenerant effluents of more than the original waste volume requiring enormous quantity of alkali for neutralisation. In spite of neutralisation the regenerant effluents cannot be disposed on account of its high concentration of TDS in the order of 4-5 percent.
Thus while attempting to process the tube mill effluents of 214 M 3 /day with approx. 1 percent TDS we are left with a much higher volume of regenerant effluents with 4-5 times the influent concentration. Thus, this method could not find its place in the alrernatives considered for cost study.
Evaporation and Concentration for Final Disposal or Recovery :
The neutralised effluent after pH adjustment could be concentrated by employing either solar evaporation or by means of mechanical evaporator for reducing the volume for sea discharge of

TUBE NULL WASTE TREATMENT 41
CMyS
Fig. 6 - Solar evaporation rate.
recovery of by-products. In order to assess the rate and extent of solar evapo ration field investigation was carried out by employing actual effluent. The raw waste was neutralised and settled prior to evaporation experiments. The results of evaporation experiments are graphically shown in tig. 6. The evaporation rate was observed to increase marginally in the beginning for three days and then drop down. The increased duration of evaporation beyond nine days did not contribute further evaporation presumably due to inherent hygroscopic nature of calcium chloride present. The concentrated volume after evaporation at the end of 9 days was found to be 8.24 percent of the initial effluent. These experiments indicated the possibility to reduce the volume to about 20m3 from an original total waste volume of 214m3/day.
As solar evaporation requires a large area to the extent of 36,000m2, the mechanical evaporation was considered as an alternative. Multiple effect evaporation is preferred as it economises energy consumption. Therefore, triple effect forced circulation evaporator operating under vacuum was considered. The steam rising from the third effect evaporator could be condensed in a barometric condenser and the condensate could be returned as boiler feed water.
By-Product Recovery :
As seen earlier, the raw waste from the mill contains ferrous chloride and hydrochloric acid. After neutralisation and precipitation of iron, the treated effluent contains mainly calcium chloride in liquid medium artd iron hydroxide and unreacted lime in the sludge form. When sludge is separated out by
" settling, the supernatant liquid medium has mainly calcium chloride. The calcium chloride obtainable from
the waste is estimated to be of the order of 2 tonnes/day in a volume of 214m3. Considering the potential use of calcium chloride it was considered worthwhile to concentrate and obtain the calcium chloride solution by mechanical evaporation and employ the same as brine solution in refrigeration.
Treatment Alternatives :
A schematic diagram showing various alternatives of treatment and disposal/recovery method is given in fig. 7.
Cost of Treatment
The area and cost of various treatment alternatives and concentration and evaporation of treated effluents and disposal of effluent/concentrated effluent are worked out. The area and cost of common treatment cemprising lime neutralisation, precipitation, settling and sludge dewatcring are tabulated in Table VII.
The common treatment involving lime neutralisation and lime treatment for precipitation of iron is etimated to cost Rs. 4,95,000/- to Rs. 9,02,000/-depending on the alternative of sludge dewatering system. It is seen that the cost of lime neutralisation and lime treatment alone accounts Rs. 3,72,000/-

42 ALAGARSAMY ET AL
£ fc

TUBE MrLL WASTE TREATMENT 43
TABLE VII
Area and Cost of Common Treatment.
I .
IT.
I I I .
1.
2.
3.
4.
Particulars
Area (M a )
Capital Cost (Rupees)
Operating Cost per annum (Rupees)
Chemicals
Power
Maintenance and Repair
Operational Personnel excluding unskilled workers
Common Treatment with sludge dewatering by means of
Drying Beds
1,350.00
5,42,000.00
5,83,200.00
17,250.00
7,850.00
50,400.00
6,58,700.00
Filter Press
1G2.00
4,95,000.00
5,83,200.00
22,300.00
8,300.00
50,400.00
6,64, 200.00
Vacuum filter.
170.00
9,02,000.00
5,83,200.00
38,900.00
16,400.00
50,000.00
6,88,900.00
Thus the variation of cost for the sludge dewatering method ranges from Rs. 1,23,000/- to Rs. 5,30,000/-. Out of the sludge dewatering methods considered, the filter press cost the minium with an estimated value of Rs. 1,23,000/-. It also requires less area as compared to the conventional sludge drying beds. Although the sludge drying bed is found to be the cheapest for operation and maintenance, the difference in cost is insignificant when compared to the filter press system. Further the sludge drying bed system requires a large area to the extent of 1200 m2 and is likely to cause problems of chokage and problems of sludge handling as the area is very large. Sludge dewatering by means of vacuum filters seems to cost almost four times that of the filter press. Thus the filter press system is found most economical in this case for dewatering of the sludge.
The designs and estimates worked out on the disposal of treated effluent into sea or use as byproduct indicate that sea disposal does not involve any capital investment except a marginal sum towards a reaction chamber for pH correction. However sea disposal would involve a huge sum of operating cost to the order of Rs. 46,80,000/-. On the other hand disposal of concentrated waste after evaporation would involve a capital investment of Rs. 27,00,000-/ to Rs. 31,00,000 and operating cost of Rs. 5,07,000/- to Rs. 59,11,000/- depending on the evaporation system adopted.
As seen in Table VIII the capital and operating costs are cheaper in the case of solar evaporation. However, solar evaporation will require about 36,000 M2 of land. Taking into account the cost towards land the capital cost of the

ALAGARSAMY ET AL.
TABLE VIII.
Cost of Sea Disposal and Brine Recovery.
Disposal of neutralised Disposal of neutralised Recovery of brine Particulars waste after pH corre- waste after concentration by after concentration
clion and without Solar Muliiple by two stage multi-concentration evaporation efFccievaporation pie effect evaporator
I Area M 2 — 36,000.00 250.00 350.00
II Capitaf Cost remove shace
(Rupees) — * 27,00,000.00 31,00,000.00 35,70,000.00
III Operating Cost per annum (Rupees)
1. Tanker hiring 46,80,000.00 4,68,000.00 4,68,000.00 charges
2. Power/Fuel oil — — 52,90,000.00 53,26,600.00
3. Repair ajid — 27,000.00 59,000.00 67,400.00 maintenance
4. Operating personnel — 12,000.00 94,000.00 94,000.00
Total Cost : 46,80,000.00 5,07,000.00 59,11,000.00 54,88,000.00
* Docs not include land cost lor solar evaporation.
solar evaporation system would be Rs. 35,00,000/-. Thus the solar evaporation system still works out to be cheaper as oompared to the multiple effect evaporator which requires huge quantity of fuel oil and hence involves high operating cost to the order of Rs. 59,11,000-/
The proposal of by-product recovery from the treated effluent would involve a capital investment of Rs. 35,70,000/- and an operating cost Rs, 55,880,00/- Considering the return from the sale of Calcium Chloride brine obtainable from the recovery the net operating cost is estimated to be as high as Rs. 42,64,000/-
Thus out of the various proposals of waste disposal/recovery, the waste disposal after concentration by solar evaporation is found to be most economical for this instance.
Summary
1. The waste water discharged by the tube mill from its pickling operation amounts to 198,35M3/day with a pollu-tional load of about 300- Kg/of HCl acid and 950 Kg of iron.
2. The waste water therefore requires treatment for neutralisation and removal of iron,

TUBE MTLL WASTE TREATMENT 45
3. In spite of neutralisation and lime treatment for iron removal, the treated effluent does not conform relevant IS standards for discharge into inland surface waters on account of high total dissolved salts and pH.
4. In the present case, various alternatives were considered which include sea disposal of the treated effluent with/ without concentration and reeovery of CaCl2 brine from the treated effluent.
5. The study reveals that, the filter press system was more economical as
compared to conventional sludge drying bed and vacuum filter for dewatering the iron sludge.
6. The detailed analysis of waste disposal of the treated effluent indicates that concentration of treated effluent by solar evaporation and sea disposal by tanker was economical as compared to the other alternatives.
Reference
1. KULKARNT, S. D. "Disposal of Waste Pickle liquor", r.A.W.P.C, 10th Anniversary Commemoration volume, 172 (1973).

IAWPC TECH. ANNUAL, VIIl 46-52, (198!)
Adsorption of Zinc From Aqueous Solutions by Flyash P. V. S. S. PRABHU*, M. S. NARAYANA SWAMY* AND T. S. S. NARASA RAJU*
Introduction
The natural bodies of waters arc polluted by different contaminants like organ ics, refractories, heavy metal ions etc., from domestic sewage, agricultural and industrial wastewater discharges. Waters containing significant concentrations of some of the metal ions are toxic to human beings, animals as well as aquatic organisms. Therefore efforts in different ways have been made to control water pollution, through suitable treatment measures.
Amongst the heavy metals zinc is chronically and acutely toxic to several aquatic organisms2. There are many opportunities for contamination of water by zinc, both from natural sources and from its industrial uses. Heavy metals are employed in several major industries4. In particular, zinc is released in the following industrial waste discharges: pulp, paper mills, paper board, building paper, board mills; organic chemicals, petrochemicals; alkalies, chlorine, inorganic chemicals; fertilizers; petroleum refining; basic steel works foundries; basic non-ferrous metal works, foundries.' and steam generation power plants etc.
Excessive ingestion of zinc may affect the human metabolism, through the changes brought about in the mineral
and the enzyme budget, especially of children and patients already suffering from irregular metabolism 20. Zinc has been reportedly toxic to plant growth when present in the range of 0.3 to 1.6 mg/1 for soybeans6; 0.5 mg/1 for subterranean clover1; and 0.5 mg/1 for maize and beans19.
In Tndia, the wastewater from Viscose Rayon factory 18 contained zinc in concentrations ranging from 171-216 mg/1. In Rajasthan, at Debary, zinc smelter release effluents3 contained, zinc in concentrations upto 160 mg/1.
The USPHS (United States Public Health Service) recommends that the concentration of zinc should not exceed 10mg/l both in surface waters and irrigation waters1. The derived working level for zinc in irrigation water be 2.0 mg/1 as recommended by the Australian water Resources Councils. Tolerance limit, for industrial effluents containing zinc, discharged into inland surface waters is 5.0 mg/1 as suggested by the Indian Standards Institution92.
It is a matter of concern that most of the toxic metals ( especially zinc ) could not be removed during the traditional processes used in water treatment for public water supplies, 7, 9, n , 15, x$ though by adsorption on activated car-
* Environmental Engineering Laboratory, Dcpt. of Civil Engg., Instt. of Technology, Banaras Hindu University, Varanasi-221005.
46

ADSORPTION OF ZINC 47
bon, a very low and unknown amount of zinc is removed. 2 1
In a study for the removal of heavy metal ions using fly ash, the cheapest and most unconventional adsorbent, obtained from thermal power stations as waste product, complete removal of metal ions from the aqueous solutions could be achieved. Further studies for optimal removal of metal ions, using fly ash as adsorbent was also recommended.1*
In this paper results of laboratory batch studies on the adsorption of zinc from aqueous solutions by flyash are reported, and the probable processes involved in the adsorption kinetics of this system are also discussed.
Experimental Aspects :
( i ) Characterization of fly-ash
The adsorbent flyash was obtained from the Obra Thermal Power Station, U. P. The principal ingredients of flyash are silica, alumina and iron oxides. Lime and carbon are present in minor proportions. The actual composition of the fly ash depends on the variety of coal used and the degree of burning,
Physically the fly ash is characterized by its fineness, large surface area per unit weight and wide particle size distribution. Just like activated carbon fly ash is also a porous substance.
The nature of silica surface and its adsorption behaviour as a function of pH would be of considerable interest, in view of the fact that the surface of silica may exhibit considerable affinity toward metal cations within the pH range of natural waters5. The alumina content present in fly ash could also be expected to play an important role in the removal of anions.10
(ii) The selection of Adsorbate
The selection of zinc as adsorbate was based on two factors. (1) Its presence in waste waters from mining, rayon and other industries in significant concentrations and its toxicity to plants and animals. (2) The avilability of suitable and easier techniques for the analysis.
Aqueous solution of zinc was prepared by dissolving definite, weighed amount of zinc metal (BDH- Analar sample) in concentrated HC1.
(Hi) Experimental Procedure
Batch type experiments were conducted in which, weighed quantities of fly ash were contacted with a prescribed volume of standard aqueous zinc solution in polythene bottles. These bottles were shaken thoroughly using an electric wrist-shakar, for a prescribed length of time, to attain equilibrium. The system was maintained at constant temperature. After the completion of shaking the reaction mixtures were filtered using Whatman No 42 filter papers. The filtrate containing residual concentration of zinc was analysed colourimetrically.
Zinc reacts with potassium ferrocya-nide to form the colloidal precipitate of zinc cyanide complex1 '. The concentration of zinc is evaluated by measuring the intensity of the complex using the linear read-out ultraviolet absorption spectrophotometer (CECIL, made in U-K.) operating at wave length of 650 nm.
Results and Discussion:
The experimental data obtained for the system of zinc adsorption on flyash could be discussed using the well known Freundlich adsorption isotherm
£f = K'Cl/n (D

48 PRABHU ET AL
100 0 / -
, 9 0 0 r -
•5 80.0|—/ Fl»o»h Dotoqt - 4 00g/100ml
Zn- Solution Concentration = 106 m o / I
Room Umptfalurt = 240 i0 .5*C
?00r-
to.olL-i—L J i_ I 1 I 1 J 1 L 0-0 . 2 0 4.0 6-0 8.0 10-0 12.0 14.0 16.0 1843 20.0 22.0
Tim* in Hours
Fig 1 - Dependence of Percentage Removal of Zinc on Time
which represent the relation between the amount of solute (zinc) adsorbed per unit weight of adsorbent ( flyash ) and the concentration of solute in aqueous solution. Here, (X/M) is the amount of solute adsorbed on unit weight of adsorbent in equilibrium with C, the concentration of solute in aqueous solution. K/ and n are known as "Freundlich parameters", which are to be determined from the data obtained. These parameters are the indicators of adsorption capacity and intensity respectively.
The batch tests were also used to evaluate the effect of solute concentration, flyash concentration and pH on the extent of sorption.
The dependence of percentage removal of zinc, on time is studied and shown in figure 1. The time taken for reaching the equilibrium is determined from the figure. It was observed that the vigour of shaking enhanced the rate of adsorption.
The equilibrium data, obtained at different pH values, for zinc uptake by flyash was tested to ascertain whether it could be adequately described by the
Freundlich isotherm equations. A plot of the data (Figure 2), at different pH values show that it fits Freundlich model very well. The Freundlich parameters were evaluated ( K/ and 1/n ) and values are shown in table 1.
The effect of pH on the percentage removal of zinc was also investigated.
•»io.,on oT Z*nc Solution
»100 mo/1
r ,m C . Hurt s I 4 4 t Q S * C
10 JO 50
EqMi. ( c ]
70 100
Fig, 2 - F r e u n d l i c h Isotherms at Different pH Values of the Zinc Solution

ADSORPTION OF ZTNC 49
Table-l.
pH of solution
2.0
2.5
3.8
6.5
K /
1.025
1.014
1.0099
1.007
1/n
0.0027
0.0012
0.0009
0.00056
The data plotted (Figure III) shows that the percentage removal of zinc increases with increasing pH, to a maximum value and then declines with further increase in pH. So it is evident from the figure that in the pH range 3 to 4 maximum removal of zinc occurs.
The fact, that the increase of solute concentration increases the adsorption intensity could also be explained by the figuie 4. This also refers to the validity of the Freundrich adsorption isotherms for this system.
The effect of the ftyash concentration on the removal of zinc from aqueous solution is shown in the figure V. The linear relationship illustrated in the figure was obtained by plotting the logarithm of the percentage removal of zinc versus, the logarithm of the flyash concentration. The equation for the fitted curve is similar to that given by earlier researches12, which is as follows :
log Xp = nlog Cf + log K, where XP = percentage removal of Zn
n = Constant Cf => flyash concentration, mg/1 K/ = Constant
The parameters 'n' and K/ are of definite importance on the characterization of the capacity of removal of zinc by flyash. The stope 'n' is dependent on the order of the change in zinc removal with changing flyash concentration,
KJO.0-
90.0
o ao.o
i TOO
» 600
500
Fly.sh Concntratlon « J 1 ° " m « ° 1 856 mg •
Room Ttmptraturt « 24.0 « 0.5•C
0.0 ?0 4.0
PK
6.0 6.0
Fig. 3 - Effect of pH on Percentage Removal of Zinc
Co (2)
Q x 100 Co
W 10 <0
Etbm. [c] 'O 100
Fig. 4 - Freundlich Isotherms at Different Concentrations of the Zinc Solution

50 PRABHU ET AL
*?"] o 100
40
K -
>— M a p * t 0 . 0 H 2 J
Aoom Umpvvatur* • 24. O t 0.3«C
pM o* th» Solution ; 4.0
Concentration ot Zinc a tot ittg/t
}
O i l
0 11
o,n
O i l
a '00 200 JOO 400 (00 I0OUO0 1100
Flyun Conctntr«.liontmg/1QOf'>
Fig. 5 - Adsorption of Zinc at Varying Flyash Concentration
while Ky is dependent on the extent of removal of zinc by the flyash. The figure explains that, with in the chosen flyash concentration range, the amount of zinc removal is not so significant as the concentration of flyash is increased,
The kinetics of adsorption by flyash and the factors controlling the adsor-ptive processes is further studied, which may be useful for an accurate judgement of the adsorptive capacity of flyash.
The figure 6, is obtained by plotting the fraction of zinc concentration remaining in solution at any time ' t \ i.e. (Ct/Co) versus t»». The linear dependence of (Ct/Co) on t°29, as demonstrated by the figure can be expressed by the relation12
Ct/Co = 1 - K, : t">
The type of adsorption observed in this experiment was not controlled solely by diffusion rates, since removal was a function of t0 '29 rather than t°-5. If interparticle diffusion were the rate determining step, the rate of adsorption would have varied with the square root of time produciug a value of 'm' equal to 0.519. An example of such a system is the adsorption of ABS (alkyl benzene sulfonate) by granular carbon23
' • I I • I 1 I 1
ao o.t to '5 !0 J ! io
Fig. 6 - The Kinetics of Adsorption Process
It can be anticipated that there are atleast two processes involved in the adsorption of zinc on flyash, neither of which is much slower than the other. One process is the transport of the solute from the solution through the particle solution intereface, into the pores of the particles. This process is the combination of hydrodynamic transport, which is dependent on the vigour of mixing and diffusional transport, which can occur through the adsorbent-solution interface and through the pores of the adsorbent particle ( intraparticle diffusion ).
The second process can be expected as adsorption of zinc on the available surface of flyash. This process may consist of the orientation at the particle solution interface, such as the formation of electrical double layer and other effects which are probably specific to the nature of the adsorbate and the adsorbent.
Summary and Conclusions :
The findings of this study, demonstrate that flyash, is a good adsorbent for the removal of zinc from aqueous solutions.

ADSORPTION OF ZINC 51
The removal of zinc proceeds rapidly on initial contact and then continues at increasingly slower rates.
The percentage removal of zinc, increases with increasing its concentration in the aqueous solution.
The pH of the solution plays an important role on the removal of zinc. There is a range of pH 3 to 4 at which maximum percentage removal is obtained
As the concentration of flyash is increasing, with in the chosen flyash concentration range, the prentage removal of zinc is affected very little.
Finally the rate controlling step in the adsorption of zinc on flyash is nnt solel> dependent on one process. This is probably a case, in which neither diffu-sional transport nor adsorption is rate determining exclusively.
Acknowledgements:
The authors wish to acknowledge the financial support of the University Grants Commission, New Delhi, which made this study possible. Also the authors wish to thank the Head, Department of Civil Engineering, Institute of Technology, Banars Hindu University, for providing necessary laboratory facilities.
References :
1. Alan J . Rubin ( E d . ) : Aqueous-Environmental chemistry of metals", p . 92 (1976).
2. Barry, T . Hart " A compilation of Australian Water Quality Criteria", Barry, T. Hart; Australian Water Resources Council, Canberra, Technical paper No. 7 (1974).
3. Bhandari, L. M. Characteristics of zinc smelting industrial waste and simultaneous removal of toxic elements and phosphates from it. Ind . J . Environ. Hlth. , 15 236,(1973)
4. Dean, J . G.; Bosqui, F. L.; Lanouette, V. H. : "Removing heavy metals from waste water. Environ. Sci. Tcchnol, 6, 518, (1972).
5. Dugger, D. L.; J . H. Stanton; B. M. Irby, B. L. McConnel, W. W. Cummings and R. W. Meatman. : " T h e Exchange of twenty metal ions with the weakly acidic silanol group of silica gel". J . Phys. Chcm., 68,759(1964).
6. Earley, E.B. : "Minor element studies with Soybeans, I Varietal reactions to concentrations of zinc in excess of the nutritional requirement". J . Agronomy. 35, 1012, (1943).
7. Forstner, TJ-; G. T. W., Wittmann (Eds.) : "Meta l pollution in the Aquatic environment". Spingcr-Verlag, New York, p . 331 (1979).
8. Friberg, L.; Piscator, M.; Nordberg, G. F. and Kjellstrom, T. : "Cadmium in the Environment". CRC, Cleveland (1974).
9. Funke, J . W. : "potential reuse on purified sewage". Water S-A. 1, 36, (1975).
10. Gangoli .N. and G. Thodos: "Phosphate adsorption studies". J . Water Pollut. Control Fed. 45. 842 (1973).
11. Jackson, S. and V. Brown : "Effect of toxic wastes on treatment processes and watercourses". Water Pollution Control (London) p. 292, (1970).
12. Mancy, K. H.; W. E. Gates; J . D. Eye and P. K . Deb. : "Adsorption kinetics of ABS (Alkyl benene sulfonate) on flyash". Proc-19th Ind. Waste Conf. Purdue Univ., Eng. Bull., Ext . ,Ser . 117, 146 (1965).
13. Milikan, C. R. : "Effect of different levels of zinc and phosphorus on the growth of subterranean clover. Australian J . of Agri. Res. 14 180(1963).
14. Narendra Gangoli, Markey David C. and Thodos George : "Removal of heavy metal ions from aqueous solutions with flyash". Proc. of the Natl. Conf. on Complete Watcrusc (2nd), Publ. by A. I. Ch. E., New York, NY, p. 270, (1975).

52 PRABHU ET AL
15. Nctzar, A and P. Wilkinson, : Removal of heavy metals from wastewater by adsorption
• on sand. Proc. 29th Ind. Waste Con:. Purdue Univ. Engg. Bull., Engg. Extn., Sor. 145, 841, (1974).
16. Nilsson, R. "Removal of metals by Chemical treatment of municipal waste water. Water Res. 5, 51,(1971).
17. Rodier J . ' 'Analysis of water" John-Wiley and Sons, Ine., New York, 820 (1975).
18. Sastry, C. A. and G. K. Khare : Studies on the recovery of zinc from viscose Rayon wastes. Indian J . of Environ. Health. 13, 199,(1971).
19. Scharrer, K. ajd J . Jung : The measurement of micronutrients in water culture experi
ments with maize and brocadbeans (in German) Land, Forsch. 10, 3, (1957).
20. Schroeder, H . A..A.P. Nason, I. H . Tipton, and J . J . Balassa: Essential Trace elements in Man. Zinc Relation to environmental cadminm J . Chronic Dis. 20, 179, (1967).
21. Sigworth, E.A. and S.P. Smith : Adsorption of inorganic compounds by activated carbon . ] . Amer. water wks. Assoc.,-64, 386, (1972).
22. Indian Standards Institution : " Tolerance Limits for Industrial effluents discharged into inland surface waters". IS : 2490 Part-I , 1974.
23. Water, J r . W.J . and J .C . Morris : Adsorption for removal of Biologically Resistant Materials from Waste Waters". Seminar on Advanced Waste Treatment Research, Cincinnati, Ohio (1962).

IAWPC TECH. ANNUAL, VIII 53-59, (1981).
Determination of Alpha Values for Some Wastewaters S. N. KAUL,* A. C. MANUEL* AND V. RAMAN*
Introduction ;
The supply of oxygen is basic to all aerobic biological treatment systems. The transfer of oxygen is dependent on the type of her&t'mg device and the system und.fr .consideration viz., plug flow or compt'&lefy mixed, the properties of wastewater under aeration and system configuration.
A large amount of information are available in the literature pertaining to bubble aeration with or without turbine agitation. Therefore, an attempt has been made to determine experimentally the effect of some contaminants viz. phenol, sewage, dairy waste and water containing ABS/LAS on alpha. Effect of sludge solid concentration on alpha has also been covered. These values of alpha can be used by the practising engineer for designing an aeration system under consideration.
Oxygen Transfer
The total quantity of oxygen transferred is related primarily to the sum of overall surface generated and the amount of waste water pumped by the surface aerator. The performance of surface aerator is related to aeration under standard condition by the following
relationship which incorporates alpha value1.
OC/ = OC (£*«>-€) ' oc
c. OC = KLa(20o)C,V
Where-
OC/, OC = Oxygenation capacity (kg/ hr) under field and standard conditions respectively.
Csw, C, = Dissolved oxygen saturation concentration (mg/1) for process and tapwater-20° respectively.
C = D.O concentration (mg/1) in the aeration basin.
oc = Ratio of mass transfer coefficients
V = Volume of the aeration basin (1).
T — Temperature, °C and
K .a (20) = Overall mass transfer coefficient (hr-1) at 20°C.
Alpha value is an important variable for the determination of oxygen transfer efficiency and is defined as follows :
Alphaf oc ) = P— r a l 1 m a s s transfer coefflcient-wastewatcr *• Overall mass transfer coefficient-tap water.
* Scientists, NEJERI, NAGPUR-20.
53

54 KAUI. ET AL
Therefore, the entire problem reduces to the determination of the mass transfer coefficients in both wastewater and tap water under identical conditions.
Materials and Methods :
Various concentrations of sewage, phenol, dairy waste and surface active agents were made with tap water. Dairy waste solution of various concentrations was made from amul baby milk powder. The plexiglass model aeration basin of 3' x 3' X 3' was used which was filled upto two diameter of cone of water or wastewater level. A radial bladed surface aerator (8" diameter) operating at optimum speed of 200 rpm and blades fully submerged was fixed in the centre of the aeration basin.
Experiments were also conducted using LAS and phenol in a 18"x I8"x42" aeration basin with a water height of two diameter of cone four inch diameter surface aerator with eight blades. Experiments with ABS were performed because in India it is still being used as surface active agent in detergents.
Studies were also conducted for alpha at various temperatures. These experimental runs were conducted at different periods of the year when the temperature of water was different (so as to avoid heating or cooling the water).
BOD, COD, sludge solid concentration, phenol concentration and S A A activities were determined as per the standard methods8. The aeration tank BOD/COD, and sludge solids were measured before and after the aeration and an average of the two values was used for experimental details.
Although the biological uptake rate or respiration rate was not required in
case of sewage, its value was used to check the respiration rate (r) obtained from graphical plot of dc/dt versus concentration. The respiration rate of sludge solids in endogenous growth phase was determined as follows.
The sludge solids were taken from the pasveer type oxidation ditch pilot plant. A well mixed portion of sludge solids of known concentration was taken
" in a large 2 litre flat bottom flask and aerated for some time to increase its DO content. Then, some portion of it was placed in a 500ml wide mouth bottle (5.08 cm dia) and was completely filled with above solution which was plugged with a stopper with a small DO probe (gold/silver electrode). The agitation of the sample was provided by a magnetic strirrer and the excess of solution was drained off from the rubber tubing which was closed by a pinch cock. The depletion of DO concentration with time was plotted. The slope of this plot yielded respiration rate (r).
The aeration basin was filled with water and later replaced with other waste water contaminants. The required quantity, slightly in excess of sodium sulphite with cobalt chloride as a catalyst was added to remove the initial DO content in the aeration basin. The surface aerator was started until the entire basin was completely devoid of DO and after that increase in DO concentration was recorded with time in all waste-waters including tap water.
Determination of Mass Transfer Coefficient and Alpha.
Under process conditions, the KL a in general will be different from its value with clean water. Noga] and Hurwitz» have distribed the following technique for evaluation since it is impracticable to determine the factors under plant condi-

ALPHA 55
tions. A model aerator is used in a small aeration basin. KL a under clean water condition is first determined. The water is then replaced with waste water and concentration of DO versus time plot is made in both cases.
The general equation- of oxygen transfer is given by -
dc = KL a ( C.-C ) - r.
rearranging the above equation the rate of change of oxygen becomes :
dc dt = ( KfaC, - r ) - KL aC.
If the straight line on the graphical plot is extrapolated to a C value of 7ero, the value of dc/dt thus obtained will be equal to (KL a Cs - r). From the knowledge of Cg of the waste water, the value of r can computed. The foregoing procedure is based on the assumption that uptake rate r, would not change appreciably during the period of the test. The respiration rate obtained from experiments checked reasonably well with this value. Steady state method was used to evaluate KL a with activated sludge solids of different concentrations.
KLa = r
For other waste waters or clean water which contained no micro-organisms, the basic oxygen transfer equation is modified with r = O.
dc dt = KLa ( C , - C )
» !6 S i H m m HMI . t l .HI
Fig. 1 - Saturation Deficit DO Versus T i m e
which on integration results in a linear mathematical form Y=Kx+C, i.e.
log (C,C) = KL at + constant.
Plotting log ( C, - C ) against time will yield a straight line, the slope of which gives, KL a.
Alpha is then, given by :
Alpha = KL a waste water
KL a tap water.
Results and Discussion
A typical plot of log ( Q - C) versus time is shown in figure 1 for phenol. ABS and dairy waste. The slope of the line can directly give KL a as follows :
KL a (hr-i) = 2.303 (log (CVC^ - log (C.-C)9 ) / ( t , - tx) where (t„ - tv) = time interval for build up of concentration
from Cx to C2 (min.)

56 KAUL ET AL
* 0
so
1 0
) 0
10
>«
«
IV V Yv
V" \ \ \ \ v s
i • *
* i
< • r~ 1
SEWAM
• >">nq/\ BOO
o >S . . 100 . 0 1 » .
* - -..
\ J • 0 ?S 1 ^ \ ^
^ ^
1 . " : — • o • i . I ) „*. IIMH.10 » >
Fig. 2 - Plot o f Concen t ra t ion of DO Ve r sus T i m e for V a r i o u s Sewage Gone.
The steepest line gave the highest value which was obviously obtained for water. As the concentration of contaminants changed, the value of KL a also changed accordingly.
The respiration rate of the microorganisms in sewage was found by plotting DO concentration with time (figure 2) As the sewage concentration was increased, the slope or respiration rate was found to increase. Is is normally advisable to have measurements of DO
l iw- ri>
Fig. 3 - Plot of Cone of DO Versus T i m e For MLSS
concentration. The respiration rate no longer observes the zero-order kinetics when the DO concentration is less than 1 ppm.
Figure 3 is a plot of DO concentration against time for sludge solids at various concentration. The slope of the line yields respiration rate. As the sludge solid concentration is increased, there is a slight increase in respiration rate. The sludge solids were in endogenous growth phase and nearly mineralised. The respiration rate for the endogenous growth phase is normally in range of 3.7-19.7 mg/l/hr4. The choice was primarily to avoid the system becoming unstable because the respiration rate remains practically constant and thus, the effect of sludge solids could be determined more easily. It appears from figure 4 that respiration rate was independent of oxygen concentration upto 1.0 mg/I. Beyond that value the respiration rate was function of DO concentration.
KL a values for sewage at various concentrations were found from figure 5. This is a plot of dc/dt versus C and the slope of this plot gave KL a. As the con-

ALPHA 57
dc Fig. 4 - Plot of -gj -Versus DO Cone For
Sewage
centration of (BOD) sewage was increased, the value of Ki a decreased. Since straight lines were obtained, the system is quite stable. If a straight line is not obtained then, r, is not constant and, therefore, respiration rate equation has to be modified as it may happen with high loadings or high respiration rate values (because there may be a possibility of DO concentration falling below 0.5 mg/1 at equilibrium and then r = f (t,c, micro-organism concentration media and system conditions).
Figure 5 is plot of concentration of contaminants (phenol, dairy waste and sewage) versus alpha. For phenol, the decrease of alpha with increase in its concentration is low compared to sewage and dairy wastes. The decrease in alpha value is linear between 500-1500 mg/1 of phenol concentration. The decrease in alpha value for dairy waste is quite irregular with increase in its concentration. The decrease in alpha with increase in sewage (BOD) concentration is nearly linear. However, the alpha values for
1600!
- -oo
i?00
I
£
<X
a z 600 z o
1.00
POO
WASTE WAT£ft
• PHENOL mg/\ • DAIRY WASTE- COO mg/1 o SEWAGE - BOD. . mq/<
Fig. 5 - Plot of Cone Versos Alpha For Various Wastewaters
sewage are greater than that of dairy waste upto lOOmg/l. Beyond that it appears the value for dairy waste water are slightly on higher side.
Sundaresan et al 5 found the value of alpha in their activated sludge treatment process (with MLSS varying in the range of 2,500-3.000 mg/1) by surface aerator for domestic sewage as 0.85 which corresponds to the sewage BOD between 25-75 mg/1 in the aeration system.
Figure 6 describes alpha value versus rotational speeds for ABS, LAS and phenol. Alpha value increases witri increase in rotational speed surface aerator. Downing 6 also predicted this fact in his paper on aeration by mechanical means. Initially the increase in alpha is high, then the rate of increase is mode rate and finally the rate of increase is again high with increase in rotational
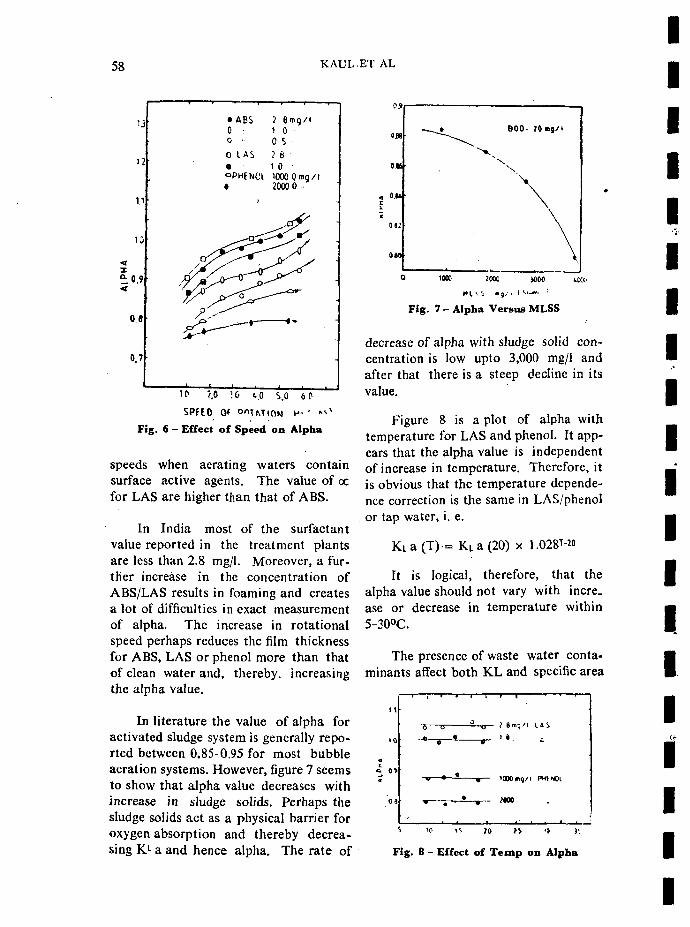
58 KAUL.ET AL
U
12
11
10
< I
<
0 8
M
• ABS ? 6 m g / l 0 • 1 0 o • O S '
o I A S ? 8 • a 1 0 oPHENCl 1000 Omq/1 • 2000 0 •
10 7,0 >0 t.0 s.O 6 0
SPEEO Of oiTATWN M_ ' " ^
Fig. 6 - Effect of Speed on Alpha
speeds when aerating waters contain surface active agents. The value of oc for LAS are higher than that of ABS.
In India most of the surfactant value reported in the treatment plants are less than 2.8 mg/1. Moreover, a further increase in the concentration of ABS/LAS results in foaming and creates a lot of difficulties in exact measurement of alpha. The increase in rotational speed perhaps reduces the film thickness for ABS, LAS or phenol more than that of clean water and, thereby, increasing the alpha value.
In literature the value of alpha for activated sludge system is generally reported between 0.85-0.95 for most bubble aeration systems. However, figure 7 seems to show that alpha value decreases with increase in sludge solids. Perhaps the sludge solids act as a physical barrier for oxygen absorption and thereby decreasing Ki a and hence alpha. The rate of
1000 2000 3000 t(XX.
Hl^. i «g / . H - " '
Fig. 7 - Alpha Versus MLSS
decrease of alpha with sludge solid concentration is low upto 3,000 mg/1 and after that there is a steep decline in its value.
Figure 8 is a plot of alpha with temperature for LAS and phenol. It appears that the alpha value is independent of increase in temperature. Therefore, it is obvious that the temperature dependence correction is the same in LAS/phenol or tap water, i. e.
KLa(T) = KLa(20) x 1.028™>
It is logical, therefore, that the alpha value should not vary with increase or decrease in temperature within 5-30°C.
The presence of waste water contaminants affect both KL and specific area
- i — ; — i — • — i — i — i — r
» * — = «— I000m()/i PH(N0I
S '0 i s JO JV
Fig. 8 - Effect of T e m p on Alpha

ALPHA 59
(A/V) and hence KL a. This effect was reflected by changing various concentrations of some of the substances used in the present experimentation.
Conclusion
From the foregoing discussion, it appears that alpha value varies because there is a change in one of the properties of the system (y— viscosity, o—surface tension and Dm - molecular difiusivity) or combination of them or there is some physical blockage for the oxygen transfer. Secondly, it is also advisable to find alpha value of the waste water for which aeration system is to be designed at the required effluent concentration. Alpha value may also depend on the systems configuration and flow regime.
Acknowledgement :
Authors wish to thank the Director, NEERI, Nagpur for his kind permission to publish this paper.
References
1. Gloyna, E. F. and Eckenfelder, W. W. [Eds] Advances in Water Quality Improvement Vol i n (19G8), Univ. of Texas, Austin (U. S. A.)
2. Standard Methods For the Examination of Water and Waste Water, 14th Edition (1976) APHA, AWWA and WPCF, Washington-DC (USA).
3. Nogaj and Hurwitz Proc. of 18th Ind . Waste Conference, April 30, May 1 and 2 (19G3), Purdue Univ. Lafayette, Indiana ( U . S . A . )
4. WPCF manual of Practice 5 Aeration in waste water treatment WPCF Washington ( U . S . A), 1976
5. Sundaresan B. B., College of Engg, Guin-dy, Madras CSIR-Report on Entrainmcnt Surface Aerator 1976, N Delhi (India)
6. Downing, A. L. Institution of Public Health Engrs J . (London) 59, p t -2 , 80, (April 1960).

I'AWPC TECH. ANNUAL, VI I I 60-68, (1981).
Additional Surfaces in Reactor on Nitrogen and Phosphorus Removal From Sewage H. R. NAGALINGACHARYA* AND T. M. AMBEER AHMED**
Intoduction
Water is one of the most important substances put to various uses in addition to domestic purposes. The used water finds its way into the surface or sub surface water resources, ultimately introducing varieties of pollutants causing degradation of water quality in the natural source. With the advancement of civilization, science & Technology, the level of concentration of pollutants introduced into the natural body of water has increased posing a water quality management problem. In order to maintain and preserve the quality of water in the natural sources, the concentration of pollutants in the waste water discharged into the streams and lakes should be reduced to such a level that can be taken care of by the natural phenomena by adapting suitable treatment method.
The concept of treatment of sewage in the early stages was limited to the reduction of the polluting parameters such as BOD, total solids, suspended solids, turbidity and removal of toxic substances. The parameters such as nitrogen and phosphorus products were not considered as the polluting para
meters as they were considered as essential nutrients necsssary for the metabolism of the biological fauna in the treatmenl processes. When the concentration of the nutrients increases beyond that required for the efficient bacterial cell metabolism, they pose problem of stream sanitation, necessitating the removal of nutrients from the waste-water.
Sources of Waste Contributing Nutrients
The domestic sewage (or sanitary sewage) is normally rich in nutrients, when discharged into natural water course, causing the over-fertilization of the stream. Other sources are, waste water from the industries like food processing and canning, gelatine manufacturing, slaughter houses, dairy and tanning. The petrochemical industries and fertilizers factories countribute wastes containing large percentages of nitrogen and phosphorus. The drainage or runoff from agricultural lands also contain large quantities of nitrogen and phosphorus. Because of the increased use of syndets and detergents for washing in laundries and domestics cleaning, the concentration of phosphates in wastewater has increased to a very great extent.
* Department of Civil Engineering, B . V . B. College of Engineering & Technology, Hubli. ** Faculty of Civil Engieccring, Viswcswarayya College of Engineering, Bangalore University,
Bangalore.
60

ADDITIONAL SURFACES IN REACTOR 61
As the removal of nitrogen and phosphorus, in the conventional methods of treatment, go only up to 40% 1,2 the residual nitrogen and phosphorus which are of considerable magnitude will be found in the effluents from the treatment plants.
Large concentrations of nitrogen and phosphorus compounds in wastewater discharged in to the streams cause eutrophication of natural sources of water 1,2.
Secondary effects of nitrates in water will be the health hazards in infants, developing the disease known as methenoglobinamia 3.
Nutrients Removal
In an attempt to control the problems of eutrophication advanced waste water treatment measures should be taken, to reduce the concentration of nitrogen and phosphorus to an acceptable level as the existing conventional methods of treatment are inadequate.
Physical treatment processes are of lesser importance in connection with the removal of nitrogen and phosphorus as much of these pollutants are found in dissolved condition.
Chemical treatment operations can be adopted to bring about the required degree of purification of the waste-water but they are expensive and can be adopted only under unavoidable circumstances.
In all these treatment methods large quantity of energy will be necessary to treat the sewage upto the acceptable level, either in the form of released chemical energy or applied external energy. These methods are generally regarded as high energy methods.
The transformation of the wastewater characteristics can be brought about under ambient conditions of temperature and pressure by the enzymatic reactions of bacterial mass, in the biological treatment processes.
Two types of biological treatment units are in common use, viz., aerobic units and anaerobic units. The aerobic biological units bring about the transformation much quicker than the anaerobic units.
In the aerobic system air is used to supply the required quantity of oxygen for the oxidation of the pollutants. The biomass may be either in the attached state as in the case of trickling filter, contact beds, Rotating Biological contractors (R. B. C.) etc, or in suspended state as in the case of activated sludge process and its various modifications. The units which are operated on the suspended bio-mass technique require large quantity of air to keep the biomass in suspension in addition to that required for oxidation of pollutants, more so when the nitrification is to be achieved in the treatment of waste water.
The performance of the activated sludge units is comparatively higher than that of the trickling filter. On the contrary the trickling filter is robust in operation and the air requirement is also less. With a view to combine the advantageous features of both the suspended and attached biomass techniques, various modifications have been developed by workers in the field.
Nitrogen removal by a modified activated sludge process has been suggested, which is a combination of activated sludge process and the trickling filter*. It has been stated that this process is efficient in nitrogen removal. S. R. T. and loading rates have profound effect

62 NAGALINGACHARYA AND AHMED
on nitrification in the treatment units. Extent of nitrification is directly related to the S. R. T.5,6. Longer S. R. T. will be required to achieve nitrification in the activated sludge units. Because of longer S, R. T. required for the nitrification two stage activated sludge process for nitrogen oxidation, has been recommended7.
In the attached biomass technique, various modifications have been develop-ped. Differenl kinds of contact media have been tried of which the broken stones, durable plastics and cement asbestos have been commonly adopted. In Hay's process8, preference has been given to vertically placed closely spaced cement asbestos sheets. It has also been stated that the additional surfaces provided in the form of asbestos sheets remove more nitrogen. This has given rise to the Development of R. B. C. The adaptability of R. B. C. to the waste water treatment has been studied by many workers9 ,1 0 ,1 1 . They have concluded that the system is as well adaptable for the treatment of nitrogen under suitable environmental conditions such as alkalinity and inorganic carbon.
Similar to Hay's process, the treatment of sewage has been studied by using a single aeration tank with surfaces, with reference to B.O.D., C O . D. p.H.> total solids and suspended solids. The results obtained were in favourof the reactor with additional surfaces.
The present investigations were taken up to study the effects of additional surfaces in the removal of nitrogen and phosphorus from sewage. The experimental work was carried out in the Environmenal Engineering laboratory of the Faculty of Civil Engineering, Bangalore University, Bangalore.
The experimental work was conducted in three phases, increasing the concentration of nitrogen and phosphorus upto40 mg/1 and 12 mg/1 respectively adopting the same organic loading, varying the ratios of BOD 5/TKN.
Materials and Methods:
Reators : The bench scale models of completely mixed continuous flow reactors, were fabricated using transparent acrylic sheet of 6 nun. thick, of 20 liters capacity. Two reactors were used in the experimental set up, one being the conventional activated sludge aeration tank used as a control and the other being the aeration tank with additional surface. Twenty five plates of cement asbestos sheets provided the additional surface area of 4050 sq/cm providing as area of 202.5 cm2 per unit volume of the reactor. The schematic diagram of experimental set up is shown in the figure 1.
Feed : The investigations were carried out using natural sewage collected from the Vrishabhavathi valley in the first phase and synthetic sewage in
TF
1 | Tc Ts
I 1 1 Ec \ ES
Sc Ss Esc | j , Ess
r -T f -T c -T s -
sc -
Influent J'c.cd tank Control tank Surfaces tank Settling tank for Ec
Ss -Ec -Es -Esc-E s s -
Scttling tank for Es Effluent from Tc Effluent from Ts Effluent from Tc Effluent from Ss
Fig. 1 - Schematic Diagram of Experimental Set-Up
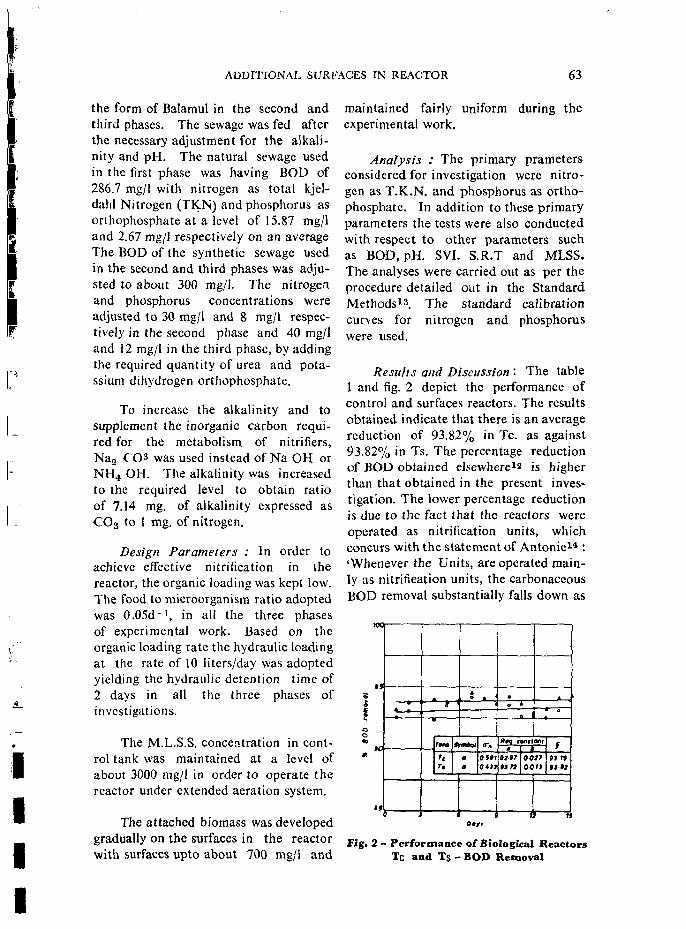
ADDITIONAL SURFACES IN REACTOR 63
the form of Balamul in the second and third phases. The sewage was fed after the necessary adjustment for the alkalinity and pH. The natural sewage used in the first phase was having BOD of 286.7 mg/1 with nitrogen as total kjel-dahl Nitrogen (TKN) and phosphorus as orthophosphate at a level of 15.87 mg/1 and 2.67 mg/1 respectively on an average The BOD of the synthetic sewage used in the second and third phases was adjusted to about 300 mg/1. The nitrogen and phosphorus concentrations were adjusted to 30 mg/1 and 8 mg/1 respectively in the second phase and 40 mg/1 and 12 mg/1 in the third phase, by adding the required quantity of urea and potassium dihydrogen orthophosphate.
To increase the alkalinity and to supplement the inorganic carbon required for the metabolism of nitrifiers, Na2 C03 was used instead of Na OH or NH 4 OH. The alkalinity was increased to the required level to obtain ratio of 7.14 mg. of alkalinity expressed as C 0 3 to 1 mg. of nitrogen.
Design Parameters : In order to achieve effective nitrification in the reactor, the organic loading was kept low. The food to microorganism ratio adopted was 0.05d"', in ali the three phases of experimental work. Based on the organic loading rate the hydraulic loading at the rate of 10 liters/day was adopted yielding the hydraulic detention time of 2 days in all the three phases of investigations.
The M.L.S.S. concentration in control tank was maintained at a level of about 3000 mg/1 in order to operate the reactor under extended aeration system.
The attached biomass was developed gradually on the surfaces in the reactor with surfaces upto about 700 mg/1 and
maintained fairly experimental work.
uniform during the
Analysis : The primary prameters considered for investigation were nitrogen as T.K.N, and phosphorus as orthophosphate. In addition to these primary parameters the tests were also conducted with respect to other parameters such as BOD, pH. SVI. S.R.T and MLSS. The analyses were carried out as per the procedure detailed out in the Standard Methods13. The standard calibration curves for nitrogen and phosphorus were used.
Results and Discussion : The table 1 and fig. 2 depict the performance of control and surfaces reactors. The results obtained indicate that there is an average reduction of 93.82% in Tc. as against 93.82% in Ts. The percentage reduction of BOD obtained elsewhere12 is higher than that obtained in the present investigation. The lower percentage reduction is due to the fact that the reactors were operated as nitrification units, which concurs with the statement of Antonie1* : 'Whenever the Units, are operated mainly as nitrification units, the carbonaceous BOD removal substantially falls down as
TOO
» 0
• 0
« to *
I f
11
4 — • —
0 J
• t •
—
raw r.
* .
trmbot
0
i
ff»
out
i
« 0 *
. * ,
' * ff#9 rwitronr
»7t?
nn
i 0O7> 0 0 < J
1
f
r~ » Oerf
fig. 2 - Performance of Biological Reactors Tc and Ts - BOD Removal

64 NAGALTNGACHARYA AND AHMED
Table 1 - Performance o f Biological Reactors BOD Removal
DAY X
1.
2.
3.
4.
5-
6.
7.
8.
9.
10.
11.
12.
13.
14.
15.
INFLUEN1
332
315
306
312
320
316
308
300
298
309
314
325
295
305
315
Tc Ts . (Effluent)
24
22
22
24
21
20
18
18
19
20
23
24
22
21
19
22
20
19
19
20
19
17
18
17
18
20
23
20
18
18
BOD
T c ( y l ) Tc(yz>
(Removal)
92.50
93.00
92.81
82.30
93.45
93.67
94.15
94.00
93.62
93.52
92.67
92.61
92.54
93.11
93.96
93.16
93.05
93.79
93.91
93.75
93.98
94.48
94.00
94.29
94.17
93.63
92.92
93.22
94.09
94.28
REG. EQN
X
CN(
o o +
CI csi en tt
•* >*
. 1 y
CO
o
o-n Tc
2
d
REG EQN
X CO
o o -•-
r^ CO
11
_3 y
ci cq CO
Ts
"O (M CO •*?
o
Regression Equation not lor extrapolation
the nitrificrs affect the metabolic activities of carbonaceous oxidizers.'
The table 2 and fig. 3 and 4 show the percentage reduction of TKN and
>00
1" !
* 4
9
r
• ,
1
«
fen*|5>«*oJ
u 0 4
<
CO.
0504 1011
t •
« £ _ ,
„ » -
— T ^
i o
R»1 rontrom
* It It
b 01M Oltt
1 i
i
• I 01 nit
I f
.
;
t
Fig. 3 - Performance of Biological Reactor - Nitrogen Remova l
Fig. 4 - Performance of Biological Reactor Influent & Effluent Concentrations

ADDITIONAL SURFACES IN REACTOR 65
Table. 2 : Performance of Biological Reactors Nitrogen Removal .
DAY X
1.
2.
3.
4.
5.
6.
7.
8.
9.
10.
11.
12.
13.
14.
15.
INFT.
41.20
41.25
40.96
40.23
40.16
40.75
40.64
40.82
41.55
41.05
40.58
40.75
41.00
41.20
40.50
NITROGEN
Esc.
4.08
4.17
3.17
3.82
3.65
3.78
3.62
3.56
3.52
3.55
3.45
3.50
3.65
3.48
3.45
Ess.
3.75
3.58
3.17
3.02
2.98
3.10
3.02
2.49
2.38
2-35
2.40
2.45
2.52
2.55
2.38
%REMOVAL
Tc ( y )
90.09
89.89
90.82
90.50
90.91
90.72
91.09
91.27
91.52
91.35
91.49
91.41
91.09
91.55
91.48
T s ( y )
90.89
91.32
92.26
92.49
92.58
92.39
92.57
93.96
94.27
94.27
94.08
93.98
93.85
93.81
94.12
REG
EOJM
X to CO
o +
CO
°l oi CO
11
>>
-1 y
o o CT1
o - n
Tc
to o m o
REG
EQN
X OS
+
CO CO
II CI
-2 y
CO CN
CO
< j - n
Ts
8
Regression equation not for extrapolation.
the concentration variations of the nitrogen influent and effluents from Tc and Ts. The results obtained indicate the average reduction of 93.13% in Ts. as against 91.11% in Tc.indicating better performance of Ts.
The table 3 and figure 5 and 6 reveal the precentage removal of phosphorus as othophosphate in the reactors T, and Tc. The results obtained in this investigation indicate an average reduction of 47.17% in T„ as against 51.92% in Tc
from which it can be inferred that the phosphorus removal efficiency of Te is higher than that of Ts. In the control
00
•0
to
<0
10
JO
i
»
rait*
u u
Sr-td
0 4
——'"•"I
1
•»
1
1 » I
1
#wf cwvroAf
• tut
6 »005 M M
m
\ t
t
tin 1717
i rf
Fig. 5 - Performance of Biological Reactor - Phosphorus Removal

g 6 NAGALrNGACHARYA AND AHMED
Table 3 Performance of Biological Reactors-Phosphorus Removal
DA
1.
2.
3.
4.
5.
6.
7.
8.
9.
10.
11.
12.
13.
14.
15.
Y INF.
12.15
12.17
12.23
12.14
12.31
12.42
12.34
12.1:8
12.10
11.95
11.85.
12.08
12.15
12.12
12.20
Regression
PHOSPHORUS.
ESc
6.76
6.69
6,28
6.84
6.32
6.28
5.89
5.79
5.20
5.25
5.23.
5.27
5.28
5.36
5.28
ecjuation no*
E s s
7.45
7.72
6.89
6.90
6.91
6.29
6.37
6.98
6.05
5.98
5,95
6.01
6.05
5.98
5.82
%REMOVAL.
T c ( y, ) T c (y2)
44.36 38.68
45.02 36.56
48.65 43.66
43.65 43.16
48.65 43.86
49.43 49.35
52.26 48.37
52.46 50.90
57.02 50.00
56.06 49.95
55.86 49.78
56.37 50.24
56.54 50.20
55.77 50.66
56.72 52.29
for extrapolation.
Reg
X
o ©
+ 00 oo en f
11 F-4-
Y»
T c
c- n
*n
Reg Yl
EQN
X oo ON ©
+ VO r -\ D _
ON r^
II
o~a
T
Fig. 6 - Phosphorus Removal Influent and Effluent Concentration
reactor which is operated as an extended aeration activated sludge Uuit, excess, slddge is produced. Phosphorus is taken up by the mirobial mass in the sludge. •When the excess sludge is wasted, the phosphorus content taken up by the cells will also be removed yielding better performance of Tr. Phosphorus removal is related tc-.quantity of sludge wasted..
The quantity of solids escaping from the Ts was negligible as such a lower percentage removal is observed in this experimental work. :
Figure 7 depicts the comparative performance of the control reactor and

ADDITIONAL SURFACES IN REACTOR 6 7
93 79 I 93 82
I i
9101,
93 12
I
5192
J?17
% BOD rtmovol % Nitrogtn rtmovQl * Photphoru$ rfmoval
Fig. 7 - Abstract of Results of Phase - III
surface reactor with referenoe to BOD, Nitrogen and phosphorus.
Summary and Conclusions :
1) pH in both the reactors was in the range of 8.0 to 8.5 which is the optimum range for effective nitrification.
2) The control reactor was operated as an extended aeration Unit with SRT of more than 20 days which is sufficiently greater than that required for effective nitrification. The 5 . V.I. was found to be between 50 to 100 indicating good settlcable characteristics.
3) Solids escaping from T8 were negligibly small in quantity with which it can be concluded that the secondary sedimentation tank can be dispensed with or even if to be provided the size will be small making the system more economical.
4) The results with respect to the BOD and nitrogen indicate that the performance of Tg is slightly better than that of the control reactor.
5) On the contrary the conventional extended aeration activated sludge Unit proved to be better with respect to phosphorus removal.
6) Though the same quantity of air was to be supplied to both the reactors Tc
and Ts. the D. O. level in the T, was more than that in Tc by an extent of 1.4 mg/1 on an average. This indicates that further economy could be achieved by minimizing the quantity of air supply in the case of T,.
REFERENCES
1. E. Gus Fruh, The overall picture of Eutrophieation' J.Wat. Pollut.Cont. Fed. 39, 9 1967
2. A. Srinivasalu 'Eutrophieation Trends in a Chain of Artificial Lakes in Madras 'Env. Health Oct. 1969
3. Water Supply 'Nitrate in Potable Waters and Methemoglobinamia 'Year book of A. P. H . A. New-York 1950.
4. Srinivasalu Balarkishna and W. W. Ecken-felder j r 'Ni t rogen removal by Modified Activated sludge Treatment Process'

68 NAGALFNGACHARYA AND AHMED
J.San. Engg. Division Proc A. S. C. E. Waste Water* 43rd Annual Conference April 1970. W. P. C. F . Boston Mass Oct, 1970.
5. A. L. Downing et al 'Nitrification in Activated Sludge process, / . Inst. Sew. Puri
fication Part 2 130, 1964.
6. Jenkins D. and Gavrison W. E. 'Control of Activated sludge by Mean Cell Residence T i m e / . Wat. Pollut. Com. Eed. 40,11, 1968
7. Wild etal 'Factors Affecting the Nitrification Kinetics' J. Wat. Pollut. Cont. Fed 43,9, 1971.
8. Karl Imhoff and Gordon M. Fair 'Sewage Treatment ' John Wiley and company 2nd Edition 1956.
9 . R . L. Antonie 'Application of Biodisc process to the Treatment of Domestic
10. R. L. Antonie et al 'Evaluation of R. D. S. Waste-water Treatment Plant ' / . Wat, Pollut. Cont. Fed. 46,3,1974.
11. Cecil Lue Hing et al'Biological Nitrification of Sludge Lagoon Supernatant by R. D. S ' / . Wat. Pollut. Cont. Fed 48, 1976.
12. T . M. Ameer Ahmed 'Ph. D. Thesis', unpublished, Bangalore University, Bangalore.
13. 'Standard Methods for examinaton of Water, and Wastewater 14th Edition APHA, AWWA, WPCF, USA.
14. R. L. Antonie 'Fixed Biological surfaces Waste Water Treatment" CRC prrss. 1978.

IAWPC TECH. ANNUAL, V H I G9-82, (1981).
Activated Sludge Treatment of Liquid Wastes-A Review DESH DEEPAK*
Introduction :
Liquid effluents from process industries and domestic waste water contain particulate and soluble organic mrterials suspended or dissolved in the carriage water. Most of the suspended particles are removed by gravity sedimentation or by physical sorption of particles on solid surfaces. Soluble organic substance in the conventional processes are removed by biological tretment process.1
Biological treatment can be accomplished in number of ways but the basic characteristic of the system is the use of mixed heterogeneous microbiological culture for the oxidation of pollutants. In most cases organic matters are converted to oxidized end products mostly carbon dioxide and new bacterial cell. The organic matter serves as both energy source and a source of carbon for cell synthesis under these circumstances.3
The types of configurations are very common in use in biological oxidation process ( i ) Film flow process and (ii) suspended culture process. Trickling filter is a typical example of the film flow process. In film flow process waste water is sprayed over a bed of support media (mainly, gravel, rocks, etc.) covered with biological slime and allowed to flow downward, through the bed in the form of liquid film. Inorganic and orga
nic substances from the liquid film are extracted by the microorganisms in the slime. Microorganisms are active in the film as well as in the slime and therefore reaction takes place both in the film and in the slime.
Suspended culture processes make use of flocculant microbiological cultures, i. e. culture in which large number of cells agglomerate together in floes. These floes are maintained in suspension either by diffused air or by mechanical agitation. Typical examples of suspended culture system are aerated lagoons, oxidation ponds, activated sludge and anaerobic digestion.
Activated sludge process is a well established and well practiced biological treatment process for the treatment of industrial and municipal waste. The efficiency of the process depends on various parameters including chemical composition of the waste, retention time, sludge concentration temperature etc.
This paper presents a review of the factors that influence the organic matter removal efficiency in an activated sludge process.
Microbiological Aspects :
From biological viewpoint, the activated sludge process may be considered as continuous flow enrichment culture of
1 Department of Chemical Engineering, University of Roorkce, ROORKEE.
69

70 DEEPAK
microorganism with predominant species being determined by the characteristics of input wastes and environmental conditions created through process design and operation. Although the process is .simple in concept, it is actually a very highly complex biological system with poorly understood behaviours with the size variations in the process input, there are usually a considerable temporal fluctuations in the species of micro-organisms predominating.3 The micro organisms upon whose activities the operation of biological waste treatment processes depend are bacteria, algae and protozoa. The bacteria important in aerobic treat ment are rod shaped facultative and mesophilic. They are excellent oxidizer of dead organic matter which grow extensively well in sewage*.
In mixed microbial populations or enrichment culture species predominance is influenced by composition and temperature of the, environment. Che-mosynthctic growth occurs at the expense of energy released by the flow of electrons from donors to acceptors
cell material oxidation
C 5 H75 n Oa enzymc5 n C 0 2 + n NH 3
+ 2 n H 2 0 - AH
The chemical formula of cell as shown above is C 5 H 7 N0 3 . When phos-
mediated by the viable organisms. A portion of this energy is captured by the organisms for conducting the work of synthesis and reproduction. The remaining scapes as heat. The extent to which microbial growth occurs is a function of energy released by the electron transfer ( a charateristic of the microbial species). Those organisms which can convert the energy most rapidly and can convert the enery most efficiently in a given environment will dominate since their growth rate will be highest5.
Stoicliiometry ami Chemical Composition of Cells
In biological oxidation process the organic matter is removed from waste water by reaction with enzymes associated with biologically active slimes or sludges suspended. In the presence of enzymes predominate by living organisms, a part of the organic matter removed is oxididized and a part is synthesized to cell material. In turn the cell meterial is oxidized to carbon dioxide and water. These three reactions are illustrated by following material balance0.
phorus is also present the formula becomes CG0HS7 0 2 3 N 1 2 P 7. Current policy is that elemental composition is relatively constant with respect to growth rate and a representative formula changes very little for different process operating conditions.
Organic matter oxidation :
CxHvO s + (X + - J - y ) 0 2 Cnj^X X CO a + Y H aO - A H
Cell material synthesis
n ( CsH.O, ) + n NH 3 + n. ( X + - J - -J- - 5 ) Oa
enzyme ( ^ H ? ^o^ )n + „ ( x _ 5 } ^
+ -J- ( y-4 ) HaO ± A H

ACTIVATED SLUDGE TREATMENT 71
Microbiological Growth Kinetics
Numerous studies have been conducted to correlate the performance of activated sludge system treating waste to various operating conditions. A large number of kinetic expressions and procedures have been proposed. The efficiency of waste water treatment depends on microbial growth and a knowledge of bacterial growth is essential in under standing water treatment.8
Bacterial growth can be mathematically described by two separate equations. Because bacteria increase in proportion to their mass present, growth is said to occur in exponential manner and may be described9 by
dy dF — s — p x = Y T j j — - b x ...... ( I )
dF KSX 6 _ ( 2 )
dt _ Ks + S
where dx dt = n c t growth rate of orga
nism per unit volume of reactor, mass/volume-time
M = specific growtli rate, time-1
X = microbiological mass concentration, mass/volume
Y = growth yield coefficient, mass/mass
dF dt = rate of microbial substrate uti
lization per unit volume b = organisms decay coefficient
K = maximum rate of substrate utilization per unit weight of the organism, time-1
S = Cone, of substrate surrounding the organism, mass/ volume
Ks= is the substrate concentration when
dF _ K dl 2— ' m a s s P e r U n ' 1 v o ' u r n e >
As bacteria also grow as a result of binary fission which can be mathematically expressed as
In - j ^ — = n In 2 ( 3 )
Providing that an increase in microbial mass is proportional to an increase in microbial number, eqn. (1) and (3) may be equated and expressed as.
p = n ln2
Experimentally, the specific growth rate has been shown to be a function of substrate concentration and to follow Monod's relation :
" - ^ ( 5 )
Where f*m% = maximum specific growth rate
Under batch culture growth conditions where the bacterial mass was allowed to grow at maximum specific growth rate („,,»). Monod showed that a stoichiometric portion of the substrate was converted to microbial mass and the remainder of the substrate was oxidized to organic and inorganic end products.
Filamentous Versus Zoogleal Growth
Both filamentous and zoogleal micro organisms are essential to the integrity of the macrostructure of activated sludge floe. Filamentous micro-organisms play an important role in determining the physical properties of activated sludge. Filaments form backbones on which zoogleal microorganisms attach and form a strong floe. An absence of nla-

72 DEEPAK
ment leads to the formation of pin point floe, a weak floe that show shears into small aggregates and particles that tend to contribute a secondary effluent turbidity. An over abundance of filaments extending from the floe surface into bulk solution produces a bridging network that prevent the close approach of floes, hindering the rate and extent of an agglomeration, settling and compaction.10
The out growth of filaments from activated sludge floe occurs when conditions within the floe interior allow for higher growth rate for filamentous microorganisms than the zoog'eal micro-organ-ims. One of the common limiting conditions related to filament outgrowth is in floe interia D, O. concentration. This varies with number of conditions including bulk D. O. concentration, floe size, diffusion of oxygen, and other substrate through the floe and bulk substrate concentration. It is evident that filament outgrowth occurs during the incident of higher organic loading in both air and oxygen supply system. Besides increased number and length of extended filaments attached to floes, there was also increase in the number and length of free floating filaments.
The extension of filament from ftocs causes the effective floe size to be increased. This necessitates ihe design of larger media to ensure that the depth filtration, rather than the surface filtration will occur. Over growth of filament effects both the zone settling velocity and sludge compaction. With filamentous bulking waste activated sludge will be more dilute and higher processing and disposal cost will occur.
Sezgin, et al1 0 have reported that at least for large compact floes, the concentration of oxygen and all other nutrients
must be much lower at the Centre than its surface. This leads to the suggestion that filamentous bulking is a consequence of conditions inside the floe especially the low dissolved oxygen there. However, this hypothesis is entangled in contradictions. Firstly, lacking both oxygen and substrate microorganism inside larger floes lead to auto fermentation, of bio mass and cell number. More over all bacteria in normal activated sludge are strictly aerobic, never fermentative-Secondly, under low dissolved oxygen concentrations floes tend to be elongated or stronger rather than spherical and compact.Thcse are exposed to low concentration of nutrients and carbon dioxide. Consequently, the kinetics and ecology of activated sludge are determined by conditions near the floe surfaces because that is where microbial reproduction actually occurs.
Chlorine and hydrogen per oxide have been the most common chemicals used to kill filamentous micro-organisms in the activated sludge process.11 Small chlorine dozes of 2 to 3 kg./100 kg. MLVSS day reduce the S V I from 180 — 200 ml/g to 45-80 ml/g without affecting nitration. The over due level was 5 to 7 kg/1000 kg/MLVSS day.
Material Balance
The organic matter removal rate in an activated sludge depends on the bio-mass present in the reactor. There are two factors which affect the biomass content in the reactor. Firstly, the growth rate of microbial population present in the reactor and secondly, the recycle of the sludge to the reactor.
For a completely mixed sludge process with cellular recycle as shown in the figure 1, "under steady state following

ACTIVATED SULDGE TREATMENT 73
Fig. 1 - Schematic Diagram of a Completely Mixed Activated Sludge Process
relations are obtained9.
e-1 = Y*s.-b c Ks+S
_ i M =
S l K,(l+bOc)
X = Y (S0 - SQ %
1 + b 0C 8
YQ (S0 - St ) 1 + b %
(6)
(7)
Fx = excess micro organism production rate, mass/time.
An additional useful expression is to relate observed yield Yot>t to the biological solids retention time. The equation is
(8) Yob> = (Q-W) X.+WX. Q ( S„ - Sx ) (H)
(9) alternatively the equation can be written
(10) Yo6J = (12) l-b0c
which can be conveniently written as
1 Y0(,g -4-0,
The food (substrate) to mass ratio
Where Q = influent flow rate, volume/time
S0 = influent substrate concentration, mass/volume
S), = effluent substrate concentration, mass/volume
V = reactor volume,
W «= flow rate of the underflow waste sludge, volume/time,
Xr = recycle and waste solids concentration mass/volume.
6e =biological solids retention time. b i n e d t 0 Produce the following
6 = mean hydraulic detention time 1 . . . F
(13)
-rr* or the process loading factor can be expressed as follows :
F M"
0_( S0 -_S! ) VX
(14)
based on incoming flow, time. 0,
Equations (9) and (14) cau be com-fol
Y i^T)~h (15)

74' DEEPAK
Either equation (11) or (9) can be conveniently used for the determination of system constant Y and b.
In the. case of plug flow reactor
Where A = reactor cross sectional area,
dF R = Reaction rate = gj-
X = distance along the reactor,
For ease in us.e in biological system design for an analytical solution of equation, Michaelis-Menten kinetic function can be simplified to zero order kinetics at high.substrate concentration (S > > Kg) and first order kinetics at low substrate concentration ^S < < K g ) l a .
Flocculation in Activated sludge
The efficiency of an activated sludge process invariably depends on the floe size and its composition. About 60% of the total mass of sludge in a conventional plant can be considered of biodegradable material both cells and entrapped material14. Essentially all cell materials are bio degradable13. In the case of fully aerated continuous culture of Aerobacter aerogenes at 37aC and at solid retention time of 10.4 days, the live, and growing cells were less than 40% of the total cells present in the system. The live portion of cell mass may substantially increase at 25°Ci5.
A characteristic of activated sludge is the selective manitenance of a slowly growing sludge mass containing large amounts of polymeric material associated with micro organisms in the form of slimes. A large fraction of the total floe volume is usually taken up by the micro organisms. This* slime is produced
by the micro organism under limited supply of nutrient and it serves as binding agent in the floe formation. It also provides protection from protozoan and bacterial predators, a medium for adsorption and entrapment of particulate matters from the waste water and a medium for exoenzyme activity and hydrolysis product transport.10 The exact chemical composition of this extra cellular bio polymer is not known due to extreme complexity, probably because many chemical processes are taking place simultaneously, such as recondensa-tion of hydrolysis'products in a portion of- bio polymer containing live cells, extra cellular condensation of simple compounds produced as metabolic end products, synthesis of capsular slime and release of compex molecules after cell lysis.17 Extra cellular biopolymer is an active flocculating agent for suspended mater including dispersed microorganisms.
The bacterialexopolymer acts as an anionic poly electrolyte and like any other polyelectrolyte there is an optimum doze of bib polymer for given turbidity and composition of suspension.18 Removal of suspended matter is thus seen as a basically physico-chemical process involving adsorption and entrapment on and in the bio polymer and subsequent settlement of large floe particles. Optimum flocculation can be effected by an activated sludge in the correct growth phase and a low level of turbulence is optimal. The more high density material entrapped in the fide, the better will be the settling properties.™
Mc Kinnery2*> studied the factors controlling flocculation which in turn govern . sedimentation. He found that well fed rapidly growing micro organisms tended to result in dispersed growth'. Floe forming tendencies appear only

ACTIVATED SLUDGE TREATMENT 75
OKPERSED CEll
• nt'otlon ' V j / i i t i i
copsule or slime loyet stagnant wate> laye
Fig. 2 - Diagrammatic Representation of Mass Transfer Resistances in Microbial Sys tems With Different Contacting Patterns.
when foods are limited and catabolism become a significant fraction of total respiration. Conventional activated sludge operations require good floccula-tion, therefore relatively low load ratio are employed. The mixing intensity of the aeration tank also affect floe size. The greater the mixing intensity or tur-bulance level, the small the floe size. In their studies Englande and Eckenfclder21
varied the over all velocity gradient from 40 to 900 s e c 1 by combinations of bubble gas flow and turbine mixes speed and reported decrease in floe size from 140 to 10 fi. However this range of turbulence had no significant effect on system performance.
Mass Transfer Aspects
Activated sludge process makes use ' of flocculent microbial cultures, i. e. cultures in which large number of cells agglomerate together in floes. These floes may be of 20 to 200 n in diameter where as a single microorganism is I to 5 M in diameter. The growth rate of microorganisms depends on the supply of the substrate to the individual microorganism where it is in the floe or in suspension as an individual identity.
The Monod expression though widely used to attain bioiogical growth kinetics in batch reactor, does not account for any mass transfer resistance external to the bacterial cells. In practice, in all biological waste treatment systems of interest, the organisms responsible for substrate removal do not exist in solution as dispersed cells. Typically they exist either as (i) biological floe particles suspended in a liquid medium where in the order of 1 million cells per floe are clumped together in a gelatinous matrix or (2) layers of microorganisms or biofilms attached to a fixed surface (Figure 2). Therefore for an actual waste treatment system the reaction rate is not related directly to the liquid phase substrate concentration but to the mass flux of the floe or film to the active organism within. When the solid surface consists of a wet permeable material such as biological slime, soluble materials may be transferred by molecular diffusion to the active site in the interior of permeable material. It is possible that these mass transfer steps may limit the overall rate of removal reaction.
The parameters which affect the

76 DEEPAK
transport of substrate or nutrient from bulk to the Centre of Cell mass of floe are discussed here.
Interphase liquid film Resistance
In diffused aeration, seven resistances oxygen transfer exist from bubble to the cell32. The liquid path resistance-have been conceptually viewed as stagnant liquid films, one around the gas bubble and one around the floe similar to the two film theory of Lewis and Whitman. Although recently Denck wertz93 has shown that stagnant films actually do not exist at the surfaces, the model is valid to add resistance in series.
For dispersed bacterial cells, the effect of the liquid film is neglible resulting in oxygen drops through the liquid film of about 0.0003 mg/1. For the large-sized floes, the effect of liquid film is less accurately defined. For a spherical floe particle suspended in an infinite liquid volume, exhibiting a uniform oxygen uptake, the relative oxygen or substrate drop, through the liquid film and floe particle has been shown to be a function of the relative diffusivities.
where Ce, Cs, C« = oxygen concentration in the bulk liquid, at the floe centre respectively, and D/,DC = diffusi-vity of floe and liquid respectively. With pure culture floes, the effective diffusivities were estimated to be only 8% of that in water V 4 - Due to the irregular nature of the floe particles, actual diffusivities through the floe material were not determined. More recent data on diffusivities through bio films indicate D/ to be closer to De indicating that liquid film resistance may be as important as the floe resistance to mass transfer.
The magnitude of the liquid film resistance to interphase transport can be estimated with the aid of the mass transfer correlation for flow past spheres, given by25
Nu = 2.0 + 0.6 (R)°.5 + Sco.33 ...(18)
where,
kd Nu = -r - = mass transfer Nusselt Df
number
k = mass transfer coefficient mass flux/
concentration driving force.
R = -=— = Reynolds number
V = kinematic viscosity of bulk liquid,
u = relative velocity between particle and fluid
Mass Transfer Resistance of Floe Particles
Intraparticle mass transfer resistances play in important role in the removal of substrate in activated sludge process. Yano, et al.20 have experimentally determined that the intraparticle resistance to oxygen transfer was rate limiting for suspended particle of Aspergillus niger. They estimated diffusivities of oxygen in the biomaterial ranged from 5 to 90% of the corresponding values of O a in water-
Many investigators have considered increased turbulance as a technique to reduce mass transfer effect on floe particles and increase the removal efficiency of activated sludge. The effect of turbulance on the mass transfer mechanisms for the liquid to the floe particle may be three fold (i) reduction of the liquid film resistance (ii) reduction of floe clump resistance and (iii) solubilization of a

I ft.
I L I
1 I I 1
1 I r
I I I I
ACTIVATED SLUDGE TREATMENT 77
portion of the floe providing additional nutrient for microbiological degradation. Since vigorous agitation may tend to disperse cell clumps, it is difficult to separate the effect of agitation on the clump matrix diffusional resistance from the agitational effect on any stagnant liquid film surrounding the particle. For suspended particles, the diffusional resistance afforded by any liquid .film will usually be minor by comparison with intraparticle diffusional resistance.
In order to determine the significance of the intraparticle diffusional resistance to glucose transfer, pure culture floes of Zoogloea ramigera were used, Baillod and Boyle1 estimated the rates at which these floes practically remove both glucose and oxygen from solution at low glucose concentrations (0 - 40 mg/J). After the floe particle size was reduced by blending the glucose and oxygen uptake rate were measured again. They concluded that any increase in glucose and oxygen uptake rates due to reduction in particle size would be indication of diffusional limitations.
The diffusional resistance or concentration drops through floe particle have typically been evaluated3* assuming a uniform uptake rate in the floe. For regular geometric shapes the oxygen concentration drops from the floe centre are as follows :
_A<ta_ Cg - C„ - B D/ (19)
where A = uniform oxygen uptake rates mg/cm2 -h
d = floe diameter or thickness, cm
B = constant depending on floe shape
Shape sphere cyclinder
B 24 16
Two faced flat plate One faced flat plate
8 2
Using the above model as the concentration at the floe suiface decreases at same concentration Cm will be equal to zero. This concentration describes the limiting substrate concentration, where further decrease will cause an inactive or in the case of oxygen, an anoxic core to develop in the floe centre, thus decreasing the over all reaction rate. The anoxic core model has been used to describe the mass transfer resistance of relatively large pure culture floe particles of Zaag/ea ramigera. The results of experiments on oxygen indicate that the limiting oxygen concentration for the zooglocal floes varied from 0.6 to 2.5 mg/1 depending upon the oxygen uptake rate, temperature and floe size. The normal diameter of the floe size, varied from 80 to 250 (i significantly larger than typical activated sludge. When the floe samples were blended to yield a mixture of dispersed cells and smaller floe particles, then diffusional resistance was markedly reduced resulting in limiting oxygen concentration of 0.1 to 0.4 mg/1. Figure 3 shows the effect of Oa uptake
r .- I C
Of '&01I . 0 * M * > * <>oet
<W1 "»»"
ti
/
/ ^ s ^
1
tn**i •
;u iu /
W i s ^
1 « « ^ , — "
10 u.
« . ; U0I6"« 'Ot# I f*g ' 3 T l
Fig. 3 - Effect of Oxygen Uptake Rate and Floe Size on Required D.O. Concentra
t ion For Zoogleal Floe (Mueller et al 24)

78 DEEPAK
rate and floe size on required dissolved oxygen concentration for zoogleal floe as analyzed by Mueller, et al24.
Baillod and Boyle1 using the same pure culture fioc of Zoogloea ramigera dctermied the limiting substrate concentration for glucose to range from 3 to 10 mg/1. Again relatively good agreement between observed and calculated values using anoxic core model was obtained. However the analysis was relatively insensitive to the model chosen since a first order kinetic model also effectively -fit data. Using equation (19), the relative glucose and oxygen gradient through floes can be estimated as.
(SJd9j*)i = b± P/» (20) ( C» - CB )0 A„ D/jt
where the subrcripts O and g refer to oxygen and glucose respectively. The ratio of different values will be the same
as that in the water. i,e. ^f° _ j 7
Baillod and Boyle1 measured the ratio of glucose to oxygen uptake rates to vary from 0.8 to 2.0 with a significant portion of glucose ( 71 to 80% ) synthesized into cellular material. Using these values with equation above the substrate gradient in the fioc was about 7 to 10 times greater than the oxygen gradient.
Concerning mas transfer to and with in film, eg. trickling filter, it can be deduced from the surface area to volume relationship of the bio-mass itself, that diffusion limitations on mass transfer are potentially greater in the case of fixed film than in the case of suspended particles. Kornegy and Andrew27 investigated the glucose uptake rate by the film growing on the surface of the continuous flow annular reactor when film thickness
was allowed to increase at fixed dilution rate. It was found that glucose uptake rate increased linearly with increasing film thickness until a thickness of 70/* was attained. Beyond this thickness oxygen and glucose uptake rates were independent of film thickness.
Effect of Temperature on Activated sludge Process :
Like other biological systems activated sludge treatment system also gets disturbed with change in temperature. Mostly facultative mesophilic bacteria are active during the degradation of organic wastes. Jaworski, et al.28 from an aerobic digestion study of a mixture of primary waste and activated sludge, concluded that an increase in digestion temperature from 15-35°C stimulated the suspended solids reduction rate. Woodley29 however, reported a decrease in the reduction of primary solids when the digestion temperature was increased from 35°C - 52°C. He also noted that sludge settcalibility was better after aerobic digestion at 35°C than what was after digestion at 52°C
Randall, et al.3° have studied the digestion kinetics of activated sludge at various temperatures ranging from 5 to 45°C. Their results are shown in Table 1. Data in table show that floe sizes were a function of reactor temperature. At 45"C after 15 days floe size decreases to 5/*, which is mainly due to thermal degradation of cell mass.
Oxygenated Versus Aerated Systems
With respect to high purity oxygen system, a relatively low turbulence system, lower sludge yields than parallel air aeration have been claimed. This effect has been stated as due to the higher oxygen concentration (5 to 10 mg/1) used

Mixed liquor property
ACTIVATED SLUDGE TREATMENT 79
TABLE 1 : Variation in Mixed Liquor Propertion with Digestion
Digestion Digestion temperature, in degrees centigrade time, in days 5 10 20 30 35 45
BOD, mg/1 0 3,320 1,560 1,480 3,450 1,390 1,200
5 2,980 1,750 1,510 1,520 1,390 625
10 2,650 1,500 1.480 1,290 1,315 625
15 2,320 1,450 1,160 1,200 910 615
Oxygen up-make milligram per litre per day per litre VSS
Mixed liquor suspended solids, mg/1
Mixed liquor volatile sus-peneded solids mg/1.
Floe diameter in microns.
0
2
5
7
10
15
0
5
10
15
0
5
10
15
0
. 5
10
15
0.0125
0.0134
0.0130
0.0145
0.0072
0
16,090
14,020
13,745
13,295
11,370
9.3C8
9,674
9,320
28
38
45
40
0.0073
0.0071
0.0068
0.0026
0.'1035
0
16,700
15,730
15,000
14,700
11,305
10,372
9,891
9,835
102
40
39
34
0.0160
0.0131
0.0133
0.0103
0.0097
0.0039
17,550
16,245
15,000
13,800
11,820
10,993
9,479
8,835
100
46
35
25
0.0758
0.0554
0.0265
0.0177
0.0104
0.0083
16,000
13,890
13,690
12,965
11,508
0,962
9,840
9,333
26
36
42
28
0.0441
0.0326
0.0195
0.0209
0.0168
0.0039
15,000
13,690
13,270
11,960
9,795
8,917
8,665
7,770
90
2G
15
24
0.0646
0.0217
0.0176
0.0201
0.0208
0.0029
15,200
13,110
13,080
13,080
9,960
8,425
8,405
8,240
90 .
27
38
5

80 DEEPAK
in these systems resulting in increased oxygen penetration in the floe and higher degradation rate. Humminick and Ball31 have found no difference in activated sludge yield and decay coefficient. Now in substrate removal kinetics for both air and oxygen bench scale units operated in similar modes.
Kilinsk32 also reported no significant difference between air and oxygen systems.
A recent study conducted by Sezgin et al1 0 suggested that to control bulking, minimum D O levels of 2.0 mg/1 with automation D. O. control will ensure equality of oxygen and air sludge setta-bility at substrate removal rate of 0.3 g BOD/g VSS day. Bulking was related to the filament quantity of the floe which was postulated to be affected by bulk D. O. concentration due to mass transfer limitations with in the floe.
Gaudy and Turner33 have reported that in the presence of high dissolved oxygen concentration and high aeration rate intensity the metabolic rate of activated sludge increased slightly. They stated that the attainment of high oxygen tension required an increased agitation, thus increasing shearing force on the flocculation population. This might have simply enhanced the opportunity for a greater number of cells to enter fully in the reaction.
Rickard and Gaudy3* reported lower net sludge yield and higher decay coefficients resulted with increased agitation (G values 300-1500 sec-1) in bench scale reactors. Reduced yields were due to the decreased carbohydrate release to solution. With respect to high purity oxygen system, a relatively low turbulence system, lower sludge yields than parallel air supply system have been
claimed. This effect has been stated as due to the higher oxygen concentration (5 to 10 mg/I) used in these system resulting in increased oxygen penetration in the floe and higher degradation rate.35 ,36
Yang37 concluded on the basis of his studies of biological kinetic constants operational performances, sludge composition and sludge volume index in the oxygenated and aerated systems are d»»erent in both.Because such differences existed in both aerated and oxygenatea systems, the development of design criteria should be considered differently.
REFERENCES
1. Baillod, C. R., and Boyle, W. C , " Mass Transfer Limitations in substrate Removal " J. Sanit Engg. Div. ASCE, 96, 52f> (1970).
2. Schroeder, E. D., " Water and Waste Water Trea tmen t" , McGraw Hill Book Co. New York (1977).
3. Chiu, S. Y., Fan, L. T. , Kao, T. C. and Erickson, I. C. " Kinetic Behaviour of Mixed Population Activated Sludge " . Biotech, and Bioengg., 14, 179, (J972).
4. Mara, D., " Sewage Treatment in Hot climates " English Language Book Society and John Wiley and Sons, Chichester (1978).
5. Characklis, W. G. and Gujar, W., " T e m perature Dependency of Microbiological Reactions " Prog. Wat. Tech. Suppl. I. i l l (1979>.
6. Weston, R. F. , and Eckenfelder, W. W . " Applications of Biological Treatment to Industrial Wastes (i) Kinetic and Equilibria of oxidative t rea tment" . Sewage Ind. Wastes 27, 802 (1955).
7. Shcrrard, J . H . , " Kinetics and Stoichio-roetry of completely Mixed Activated Sludge "J. Water Pollut. Control Fed., 49, 1968 (1977).
8. Heidman. J . A. " Pilot Plant Evaluation of Alternative Activated Sludge systems " Municipal Environmental Research Labora-

ACTIVATED SLUDGE TREATMENT 81
tory U. S. Environmental Protection Agency Cincinnati-Ohio, (August 1977).
9. Lawrence, A. W., and McCarty, P. L. " Unified Basis for Biological Treatment Design and Operation " , / . Sani. Engg. Div. ASCE96, SA3 757 (1970).
10. Sezgins, M. , Jenkins, D., and Parker, D. S. " A unified Theory of Filamentous Activated Sludge Bulking " , J. Water Pollut. Control Fed. SO, 362(1978).
11. Parker, D. S. "Development and Implementation of Biological Denitrification at Two Large Plants " , Conference on Nitrogen as water Pollutants Copenhagen Den mark (1976).
12. Mueller, J . A. " Kinetics of Biological Floes Prog. Wat. Tech. Suppl. I, 143 (1979).
13. Gaudy, A. F . , Jr . , Yang, P. Y., and Obayashi, A. W. " Studies on the total Oxidation of Activated Sludge with and without Hydrolytic Pretrcatment " , J. Water Pollut. Control Fed. 43, 40 (1971).
14. Upadhyay, A. K. and Eckcnfelder, W. W. Jr. , " Biodegradable Fractions as an Acti. vity Parameter of Activated Sludge " Water Research 9, 691, (1975).
15. Tempest D. W. Studies on the Growth of Aerobactor Aerogencs at low Dilution Rates in Chemistat." In Microbial Physiology and continuous culture, Edited by Powell. E. O. H . M. S. O. London, 243 (1967).
16. Adams, R. M., and Asano, T. "Removal of Mechanisms and Design suggestions for Activated Sludge" J. Water Pollut- Control Fed., 50, 1931 (1978).
17. Dewalle, F. B. and Chian, E. S. K. "Kinetics of Fermation of Humie Substances in Activated Sludge systems and Their Effects on Flocculation" Biotech and Bioengg., 16,739 (1974),
18. Busch, P. L., and Stumn, W., "Chemical Interactions in the Aggregation of Baeteria Bioflocculation in Waste Treatment" Environ. Science and Technol.,2, 49 (1968)
19. Bisogni, J . J . J r . , and Lawrence, A W . . , "Relationships between Biological Solids Retention Time and Settling Character-ristics of Activated Sludge' ' Water Research 5 753(1971).
20. McKinnery, R. E. Biological Flocculation In Biological Treatment of Sewage and Industrial Wastes Vol. I Rehinhold Publishing Co. (1958).
21. Englande, A. J . , and Eckenfelder, W. W. "Oxygen Concentrations and Turbulences as Parameters of Activated Sludge Scale U p " University of Texas, (1972).
22. Ba i ly . J .E . and Ollis. D. F. , "Biochemical Engineering Fundamentals" McGrawhitl Book co. New York (1977).
23. Danckwcrtz, P. V., "Todays Problems and Some Approaches to their solutions" Proc. of 20th Anniversary symposium on Mass Transfer and Diffusion, Chemical Engineering Department, University of Houstan, April 5,6, (1973).
24. "Muller . J . A., Boyle, W. C , and Light foot, E. M . , Oxygen Diffusion Through Biological Floes", Biotech, and Bioengg. 10, 331 (1968).
25. Bird, R. B., Stuwart, E. W., and Light foot, E. M. , "Transpor t Phenomena'* Johnwilcy and sons Inc. New York (1970)
26. Yano, T. , Kodama, T . , and Yamada, K. "Fundamentals studies on the Aerobie Fermentations Part VI I I Oxygen Transfer within Mold Pel let" Agricultural and Biological Chemistry 25, 580 (1961).
27. Kornegy, B. H. , and Andrews, J . H . "Kinetics of Fixed Film Biological Reactions" J. Water Pollut. Control Fed, 40 R 460 (1968).
28. Jaworski, N. , Lawton, G. W., and Rohlich, G. A., "Aerobic Sludge Digestion. Pape r
presented at conference on Biological Waste Treatment Manhatten college, Bronx, New York. (1968).
29. Woodley, R. A., " A Study of Aerobic Biochemical Oxidation of primary Sewage sludge at Mcsophilic and Thermophilic

82 DEEPAK
Temperatures. M. E. Thesis Purdue U n i - / . Water Pollut. Control Fed. 36, 767 versity, 1961. (1964)..
30. Ri'.ndall C. W., Richards, J . B., and King, P. H. , "Temperature effects on Aerobic Digestion Kinetics", J. of the Environmental Engg. Div. ASCEEE 5J 795, (1975).
31. Hamenick, M. J . , and Ball, J . E . "Kineties of Activated sludge Oxygenation" J. Water Pollut. Control Fed , 46, 733 (1974).
32. Kilinski, A ; " Comparison of Air and oxygen Activated sludge systems". Paper presented at 48th Water Pollution Control Federation, Miami Beach (1975).
33. Gaudy, A. F.; Jr. and Turner, B. G, "Effect of Air Flow Rate on Response of Activated sludge to Quantitative Shock Loading"
34. Rickard, M. D. and Gaudy, A. F. J r . Effect of Mixing Energy on sludge yield and cell composition". J. Water Pollut. Control Fed 40, R 129(1968).
35. Matson, S. V., Characklis, W. G., and Busch.P. VV. "Oxygen Supply Limitation in Full scale Biological Treatment System, 27th P I W C , 894 (1972).
36. Romagnoli, R. J . , "Dcwatering characteristics of Sludge from Industrial Oxygen Activated sludge system", 29th PIVVC (1974).
37. Yang, P. Y. "Biological Kinetic Behaviours and oxygenated systems", Biotech and Bio Engg.: 14, 1171 (1977).

IAWPC TECH. ANNUAL., V I I I 83-87, (1981).
Sewage Treatment Plant at Jaipur P. S. RAJVANSHI* S. K. MISHRA**
Jaipur with a population of 10 lakhs has got two major sewer out falls in the north and south of the city. The sewage treatment plant on the north side was commissioned in the year 1979. This is the first plant of its kind in the state and conceptual design consideration for waste water treatment incorporates several inovating features. One of these is that biological treatment has been used with aerobic digester attached with sludge thickener. This treatment unit has been in full operation for approximately two years and this paper describes the facilities being used and discusses some of the design and basic mechanisms involved.
The designed capacity is 3mgd with the total capacity for 6mgd. The lean hour flow is Imgd. Sewage receives primary treatment prior to biological treatment. After biological treatment the effluent is discharged to Jal Mahal with the excess activated sludge being thickened by gravity. The thickened sludge is digested and passed on to the drying beds for final disposal as manure. The design parameters have been appended as follows :-
Design Specification
Unit : 1. Inlet Chamber : - Out fall sewer 1200mm diameter with capacity of average D. W. F. 12 MGD.
Unit : 2 Screen Chamber : Two chambers of 6 MGD capacity. Velocity of Flow : Max.
0.76 mt/Scc. at peak flow. Screen size : Coarse screen 3 " opening Fine screen 3 /4" opening.
Unit : 3 Grit removal Plant : Capacity Ultimate DWF 6 MGD. Velocity of Flow 0.772 Mt/Sec.
Specific gravity of grit particles 2 . 3 Min.: size of grit settl ing: 0.2mm; settling t ime : 65 Seconds.
Grit channel: Four sub-channels of parabolic section 2.286 meter wide at top and 0.6m at bottom with depth of 0.85 meter.
Unit : 4 Aeration Tanks (42) Proposed inlet BOD-450 mg/lit Outlet BOD-lOm/lit (efF. 97.8% Detention time in the tank : 13:28 Hr. Proposed MLVSS conccntation :2520 Proposed MrSS concentration : 4200 Oxy. capacity 1.15 Kg./Kg. of BOD. oxy. transfer capacity of each of 5 aerators 1.3Kg/HP/Hr.
Capacity of aeration tank: 15.08 miiiion (358660 x 42) Proposed SVr : 50-100 Volume of surplus sludge 2250 Kg/day Proposed F/M ratio 0.1485 Proposed solid retention time 20-24 days. Proposed surface loading rate : 525 kg./ 1000 cum. Aeration tanks : 10.36x10.36x2. 47 Mt . Hopper bottom tanks ; 10.36x10.10.36-5.56x5.56) 1M
Aeration cones : 1.8mt. diameter high intensity cones, Reduction gear : Weather proof worm reduction gear heads from 960 rpm to 40 rpm. Motors : 12.5 H P .
Unit:-5 Final settling Tanks Surface overflow rate : 53750 lit/day/sqmt. Detention period 2 j Hr. T. capacity of tank : 5.675 million lit.
* Chief Engineer, PHED, Rajasthan. ** Chemist, PHED, Rajasthan.
83

84 RAJVANSHI AND M1SHRA
Sludge 400 mm dia working under hydrostatic condition.
Unit : 6 Return sludge Pump house Pumping capacity : 6 MGD with 2 MGD stand - b y .
Unit : 7 Sludge Thickener Capacity : 186140 lit. Size s RCC 6.1 circular tank with 3.96 meter depth with hopper bottom : In le t : 200 mm dia C. I. pipe Out le t : 200 mm dia C. I . pipe with valve.
U n i t : 8 Aerobic digestors : Detention time: 12 days. Oxy. capacity : 0.08 Kg. of Oxy per Kg. BOD removed.
Aeration tank: 10.97 x 10.77x2.47 M T Hopper bottom tank :
(10.97 x 10,97+ 5.56 x 5.56) x 1 m
U n i t : 9 Secondary sludge Pump House Pump capacity : 27.2 cum/Hr. Rising-main : 150 mm dia C I pipe.
U n i t : 10 Sludge drying beds Area: 4366 sqm. Drying time 10 days. 12 Nos. S. drying beds size : 22.87 x 17.62 meter.
Preliminary Treatment :
The sewage from half the city of Jaipur is let to this treatment plant by a 1200 mm dia. masonry sewer. The total quantity of sewage received by the treatment plant is about 3 mgd with a maximum flow in trie morning/evening. The removal of big and floating objects is done by screens of size 3" and 3/4°. The bar screen has been set with the bars sloping in the direction of the flow, and the angle with the horizontal is 60°. Bar screens are cleaned by hand. Alternatively the cleaning of screens is also done by substituting another set of screens of the same size.
Grit Removal plant :
Practically, a datention period of 1 minute and a velocity of about 1 fps. have been found to be most effective in removal of grit. Theoretically this unit
should eliminate inorganic material larger than about 0.2mm. This ramoval is effected by means of a small settlement tank from which the grit is removed by pump. The specific gravity of the grit material, though may vary, comes to 2.6. The four parabolic channel with a depth of 2.286 meter, top width 0.6 m and 0.85 m at bottom also play vital role in removing the grit from sewage. This unit is equipped with a mechanical device for removing the grit and washing. The unit makes use of small detention tank (grit collector and washer) where after being washed, the grit is discharged by a conveyor. The conveyed material is dumped into a trolly standing just below it for final disposal.
Aeration tanks
Sewage is led through channels to the surface aeration system.
The mechanical aeration system introduces oxygen into the liquid and the activated sludge is kept in suspension by an agitator rotating at or near the surface of the aeration tank. Aeration cone consists of an inverted rotating funnel shaped agitator equipped with vanes on its upper surface. Surmounting on masonry uptake tube, situated in the centre of each aeration pocket, circulation and aeration are produced by the aeration cones drawing liquid from the draught tube and spraying (spraying also damps down foaming which in some other processes has become a serious problem \ over the tank surface, entraining and dissolving oxygen in the process. In this manner the liquid in the tank is kept in motion. Sludge is prevented from settling and the agitation of the surface effects aeration.
Final Settling Tank :
From the aeration tank the sewage

SEWAGE TREATMENT 85
flows to a final circular settling tank whose storage capacity is 5675000 lit.
The detention time is 2.3 hours. Scraper has been provided to concentrate the sludge to hopper. Sludge is removed from the tank by pumping
Sludge Thickener :-
Twenty percent of the settled sludge is pumped to a gravitational thickener while about eighty percent of the same meets the sew&ge entering aeration tanks The Unit op^sate^.vgrjj miich like a. settling tank. The feed scjids entering in the middle are distributed radially and the sludge solids are collected as under flow. There are three zones in such a
thickener. Clear zone : Top liquid escaping over the weirs. Feed zone: uniform solid concentration to the point of sludge By thickening the volume of sludge going to the aerobic digester is reduced and the over flow is returned to the f.s.t. inlet.
The thickened Sludge is then passed on to the aerobic digester.
Aerobic digesters :
Waste biological sludge so produced is stabilised by simply reserving aeration in four aeration basins.
Performance of the plant
The characteristics of the raw sewage are given in Table-1.
Table-1 . Characteristics of Raw Sewage
Particulars Minimum Maximum
Colour
Odour
pH
Total Alkalinity(asCaCo3) m g / l
Chlorides (asCI) mg/l
Total scttlcable solids (30 mts) ml/1
Total solids mg/l
Total volatile solids mg/l
Total disolved solids mg/l
Total suspended solids mg/l
BOD5 mg/l
CODmg/1
D. O. mg/l
Brown—gray
Little
7.3
488
192
2
1270
390
910
340
250
680
0.1
Very seldom Offensive
3.2
716
336
10
2225
1015
1310
300
COO
1540
1.9

8 6 RAJVANSHI AND MrSHRA
Aerobic stabilization process has the advantage of a complete food chain and a very mixed and varied ecology including some anaerobic and facultative organisms.
This results. in a very non-fragile ecology and thus the aerobic stabilization process is less, susceptible to be upset than the other processes. These have been designed to eliminate all sludge disposal problems and to allow only inert solids to escape over the drying beds.
Drying Beds :
The removal of water from sludge in drying beds takes places in two steps. The water drains out of the sludge into the sand and accumulates in the drains. A considerable fraction of the water is drained by settling of the solid and general compaction followed by the formation of channels. Further dewater-ing occurs by evaporation. This is accomplished by 12 drying beds. They consist simply of shallow ponds with sand bottoms and tile drains, sludge is pumped to these beds at a depth of 6-12 inches and the time required for the sludge to dewater to a Iiftable consistency ranges from 10-15 days. The drying beds are rectangular in shape with low surrounding walls. The design specifications have
TABLE-II Purification
Min. Max.
BOD5 mg/1 250 600
Suspended Solids Mg/1 340 900
Percentage Reduction in BOD5 is of the order of
been laid by AVPCF 1959 as 1.75-2.5 square feet per capita, while British experience dictates bed area between 3.5 to 5.5 sq ft./capita. More adequately it is considered, to be 0.84 sqm of drying bed for every 7 persons of contributory population.
On the basis of the operating experience, the results confirm the design specifications. BOD5 removal is to the extent of 95 to 97.5% (table-2). The effluent is of excellent quality with minimum and maximum BOD5 of 7 and 15 respectively, though design requirement is 10 against the influent BOD5 of 450 mg/1. The maximum BOD5 is obviously due to overloading of the plant but substantial lower effluent BOD5 value is achieved. The final product, sewage sludge dried on the beds contains substances of considerable fartilizing value such as Nitrogen, Phosphroous, Potassium, Humus, and organic growth producing substances. As is known, it conditions the soil and helps to retain moisture, it can be used as true fertilizer, and as a compost too. (Table III). The cost evaluation so far made comes to about Rs. 80 per tonne, on the basis of the nutrients it possesses, but may be more if blended with other soil conditioners. Farm yard
efficiency of the plant :
Effluent Design jgS ° Min. Max. specification
T 15 20 20450 (influent & 10 for effluent)
15 30 30
i% to 97.5%

SEWAGE TREATMENT
TABLE-III Fertilizing Value of Sewage Sludge
87
Percent by
weight on dry basis
Total Nitrogen
Total Phossphorous
Total Potasium
SEWAGE SLUDGE
Desired value
3.0-4.3
2-4
0.1-0.6
Actual Values
3.5-4.0
1.5-2.5
0.3-0.6
FM Compost
0.5
0.2
0.5
1.2-1.5
1.0-1.2
1.4-1.6
manure and compost contain very less nitrogen and phosphorus in comparison to sewage sludge. Fortification with Phosphoric acid and ammonia may result in more economic returns.
Maintenance Cost :-
The expenses incurred annually for the maintenance of sewage treatment plant at Jaipur are as follows.
Electricity charges Rs. 4,80,000/-Labour, salary etc. Rs. 3,00,000/-Miscellaneous Rs. 60,000/-
Total 8,40,000/-
Revenue Return
Anually the production of sewage sludge is about 10,000 cum which at the rate of Rs. 80 per cum yields Rs. 8^00,000.
Effluent (2.9 mgd) passed on to Jal-mahal for onward use as irrigation
water, adds about Rs.95,000 per annum. In total the revenue return comes to be Rs. 8,95,000/-. The total maintenance costs Rs. 8,40,000/-per annum can be very well met within the revenue returned.
The economic use shall be furthered when the plant runs to its full capacity of 6 mgd. The revenue also will be doubled proportionately and accounts for a gross saving of Rs. 4,80,000 annully.
Conclusion :
The system to date has been capable of meeting a process effluent guarantee of 10 mg/1, BOD5. There was no evidence of filamentous growth and associated problems and no major system design problem could be noticed. It is revealed that the income generated from the sludge and effluent could meet the entire expenditure on the plant and have savings too, by efficient operation and maintenance.

IAWPC TECH. ANNUAL., VI I I 88-93, (1981).
Effect of Temperature on Oxygen Transfer S. B. KUTE* AND S. M. DHABADGAONKAR**
Introduction :
The process of aeration is influenced by, temperature. The effect of temperature on oxygen tranfer is usually described in terms of temperature characteristic 9 as in equation (1) given below :
K L a ,T) = K L . ,20)0 0 - 2 0 ) . . . (1)
where, KL» (T) = Overall oxygen transfer coefficient at temperature T°C
KL» (20) = Overall oxygen transfer coefficient at temperature 20°C
T = Temperature of system in degrees centigrade
6 = Temperature characteristic.
Temperature characteristic has been a subject of considerable research and has been found to vary from 1.016 to 1.037.1 The literature also reveals that practically no work has been carried out in India in this regard. Attempt has therefore been made to study the variation of overall oxygen transfer coefficient in relation to the temperature. This work has been reported in the present paper.
Materials and Methods :
Experimental Set up
The experimental set up used in this
study is shown in fig. 1. It consisted of M. S. aeration tank measuring 80 cm x 67.5 cm and 95 cm in depth. Inlet and outlet connections were provided to the tank so as to fill the tank with water and to facilitate its removal. The water level of 75 cm was kept constant throughout the study. The aerator used was plate type surface aerator as shown in fig. (2) It was fabricated by welding 2 blades to 12 cms dia and 3 mm thick plate. The size of blade was 2 cm x 2 cm. A 40 cms long and 16 mm dia mild steel rod was screwed vertically at the centre of the plate, The aerator was rotated with the help of 1 HP motor at a speed of 1425 r.p.m. The submergence of aerator was kept to 16 cm throughout the study.
Measurement of Oxygen Transfer Efficiency :
Though several procedures have been
Fig. 1 - Experimental Setup.
* Post Graduate student (P. H . E.). ** Lecturer in Public Hcalte Engineering, Visvesvaraya Regional College of Engineering,
Nagpur-440 011.
88

EFFECT OF TEMPERATURE 89
„ J IL«M » _ » » S>mm
.IS • mm 01* M \ ROO
Fig. 2 - Details of Aerator
followed to estimate the oxygen transfer coefficiente the non-steady state aeration procedure has been generally developed as a standard and hence the same was adopted. This test involves the chemical removal of dissolved oxygen by addition of sodium sulphite and cobalt chloride (catalyst). The increase in oxygen concentration was measured during aeration and oxygen transfer coefficient was calculated from equation (2). given below,
dc d t =K t a ( C . - C )
Where, dc ——~ = Rate of change of
dt dissolved oxygen concentration with time
C s = Saturation concentration of oxygen
CL = Dissolved oxygen concentration at any time t.
Procedure :
The detailed procedure adopted is discussed below.
i ) The tank was filled up to desired level and the water temperature was noted.
i i) The dissolved oxygen of the water was measured by winkler's modified method2 immediately.
iii) The dissolved oxygen of tank water was then removed by adding sodium sulphite powder and cobalt chloride. A concentration of 10 mg/1 Na^S03
and 1 mg/1 COCla per mg/1 dissolved oxygen was added.
iv) Thorough mixing of tank water was then carried out by starting aeration unit. Samples for D.O. were collected at selected time intervals i.e. at 0, 1 min, 3 min, 5 min, 10 min, 15 min, 20 min, 30 min, 45 min from starting. These samples were tested for dissolved oxygen content by winkler's method and D. O. of water at various time intervals was known.
v) A period of 45 minutes was observed to bring the D.O. level to more than 90% of the saturation value. Therefore after 45 minutes of aeration the aeration unit was stopped. The water temperature was again noted. The same procedure was repeated for various runs of observations.
Determination of D. O. Saturation '•
In the present study the D. O. saturation value ( C„) corresponding to a specific temperature was obtained from the tables directly.For temperatures above 30°C, the saturation value was obtained using the equation (3) as follows.*

KUTE AND DHABADGAONKAR
5 £
, ' BO
••* r*; io c f • ^ - ^ ^ ^
CO CO o CO CO CO
tO CO
m
r CD CO
s CO
r- r-. i — co 8 £ ?
t
— CO
CM O OS 1^
2 CO
o CO
3 CO
t i 0 N N O N « ^ C 0 i f > C 0 l D i " O - ' N a ) ^ t c v ' ? 5 C f l O - ; * ^ N O o - . t 0 f l , . f t l f l l f , • i o « o i t i o » « o i N ^ n * S q ! < ; o - oS — "~: co oj >o o> — ^ t P N a S o N co — * H O o l i d « « a - ' i n - ' in - . IO — to ~ lO — ' O ^ i o — . IO ~ tO — i^ — tO — ^ — tO-i
f J J i ^ S i o c j c - j t O r ^ c o o i n ^ S c S " S c o S l : , 1 ^ , S « - ' ' C c o c o : " ; • : " : u ' •": c-3 ' ^ . "I . . . \ . ^ co — ^) w c?i ^ co - - . •> — • " — io — uS — '° CM "> ~ l ° CM ""> CM >o CM' «"S CM u-j CM iri CM
C O t f t N N C p i n r t - t o c a - N o i S o i i ? , ? . ^
3 c
is a o E P
'•0 CO C> CO •ir CM
Sm o M O n n O " . CM CO CM CO CM m CO * CM •* CM CM •* CM
—' £ °~> r; r-~ r^ co ».o
CM
- - r^ r-* —» 0 . - . 1 °? to tO 1^ CO . . . . _t • * C M ' * C M ' ^ ' C M ^ c 4 ^ c s J ^ ; > ; - ^ C M m c O i n c M
!^2 I ""> CO io CM in CM
>o o —' CD CM 00
C O C O ^ C O C O C O * C O C O C O C O c o C O C O C O C O C O c o c o c O C O C O c O C O C O ^ ^ ( ^ ^
t o CO lO N * t^ CO CM io lO ff> O CO* • * CO •"»• CO x*
a . m t c n + CM ~ CM IO tO CM u-j i e M i n N ^ t v i ^ ^ L i ^ i n M i r i - ' i n - iOfJ + M i r ) C > i ' O i N ^ _ ' O e > j 1 I j - ; ^ J I o c (
co — ^ • t o c o - ^ . t o i ^ c o t o c n L Q O ' t — M O C O O S ^ ; S S 0 2 « S ' ' * 5 9 0 O — ' t o CMOCJCMCNr^cooco-^r^co—; © r to —; ~ — ci « cj o ^ * ^ oi q - coco ~ to ~* <o — io—• in © to' © to* — to © © — t c — - i n — i o " - * o — to in* r^ — t o o
co T}< co to i n CM 0> — CM -
t c c o o a i c M O O c o c o o — ? o a i i n c o o a ) c ^ c o c o f ^ C j O M , c ^ c M i n i ^ a ) O a i i n c o , » * - - o t O h . i ; o 5 n ^ c o N c o o c o c q n ^ r g ^ ^ q N C O ^ ^ t O n . N ^ c o c o ^ 3 « o i « O c f l f ; © t o © t o o < o o t o © i ^ C > t O © t d © f ^ © r ^ © t O © c ^ © ^ © r ^ © i ^ c o r ^ © r ^ o i ' ~ - 0 ' - » "
— , - , — , - , CM
' O o o
o
c 3
o S o S o 8 o S o « o 2 o : o S i o S o S o S o ; o : o S o § i o S o S o 5
dud u d y d <v d u d y d oc yd yd yd yd yd yd yd yd yd yd y I i I . ' . I I T i I I T i 1 I ] i i
Q u £ u Q u Q y Q u Q y Q u Q y Q y Q u Q y Q u Q U Q u Q y Q y Q y Q U
— — CO co td
© ~

EFFECT OF TEMPERATURE 91
Fig. 3 - Determination of Kla for Ron No. 1
C s = 14.652-4.1022x10⁻¹
(T) + 7.9910x10⁻³ (T)2
- 7.7774x10⁻³ (T)2 . . . (3)
The small discrepancy In the D. O. saturation value due to salinity and pressure was ignored.
Observasions, Results and Discussion :
Observations :
The observations for non-steady state method of determination of oxygenation capacity for water have been tabulated in Table-1.
Results :
Calculation o/"ATL» :
From the observations recorded in Table-1 graphs have been plotted between log (C» - CL ) on y-axis and time in minutes on x-axis. Straight lines were drawn by eye judgement. The typical graph and related calculations have been illustrated in Fig. 3 for Run No. 1
The values of KL , for other runs have been similarly calculated and tabu, latedin Table-1.
Tfnnpi*iii oifrr**«tr tT-tol't
Fig. 4 - Variation of Ku (t) c with temperature (base 10)
Calculation of 6 :
As seen before
KLa(T, =KLa(20) 0 ( T - 20 )
Taking logarithms on both sides.
log KLa (T) = log KLa (20) + log 6 < T " 20 >
This is comparable to a straight line equation of the form
Y = Y0 + mx
Where, Y0 = Intercept on y - axis m = Slope of line.
To find the value of 9 a plot (Fig.4) has been made between log KLa (T) on y - axis and (T-20) on x-axis. The line of best fit has been obtained by least square method, the parameters for which are tabulated in Table-2. The values of KLa have been converted to base 10 only for convenience. According to least square method the line of best fit is given by its slope and intercept as follows.

92 KUTE AND DHABADGAGNKAR
TABLE - 2 : Computation Table for Curve Fitting by Least Square Method.
Sr. No.
1
2
3
4
5
6
7
8
9
JO
11
J2
13
14
15-
16
17
18
Temp
O0G
33
31
31
32.9
30.7
32.1
32.1
30.7
31.1
32.7
31.8
30.2
25.4
26
26.2
25.2
25.7
26.1
K L a (t) (basce)
4.71
4.41
4.41
4.60
4.21
4.27
4.52
4.31
4.38
4.38
4.31
4.34
4.80
3.75
3.65
3.75
3.91
3.94
K L a (t) (base 10) Col 3/2.3
2.04
1.91
1.91
1.99
1.83
1.85
1.96
1.87
1.90
1 90
1.87
1.88
1.65
1.63
1.58
1.63
1.G9
1.71
t - 2 0
* i
13
11
11
12.9
10.7
12.1
12.1
10.7
11.1
12.7
11.8
10.2
5.4
6.0
6.2
5.2
5.7
• 6.1
173.9
J°8 K L a (t) (base 10)
Y i
0.3096
0.2810
0.2810
0.2988
0.2624
0.2671
0.2922
0.2718
0.2787
0.2787
0.2718
0.2741
0.2174
0.2121
0.1986
0.2121
0.2278
0.2329
4.6621
2 X i
169
121
121
166.41
114.49
146.41
146.41
114.49
123.21
161.29
139.24
104.04
29.16
36.00
38.44
27.04
32.49
37.21
1827.33
X. Y I I
4.02
3.09
3.09
3.85
2.80
3.23
3.53
2.90
3.09
3.53
3.20
2.79
1.17
1.27
1.23
1.10
1.26
1.42
46.56
N N N N N N N N € x<y< - ( n € y( € *i2 € y«- € Xj € x4y
m = slope = Y0 = Intercept = N N N N
N € Xi2-(€ x ( ) 2 N €Xi*- ( € x o * <=1 ! = 1 , <=1 <=1

EFFECT OF TEMPERATURE 9 3
Where, N = Number qf observations.
From Table-2 € x(=173.9, € x<3=1827.33
€ y =4.6621,
This line of best fit has Been shown in Fig. 4.
Discussion
( i ) For the surface aeration sys. tern used in this study, the temperature characteristic 0 works out to 1.024. The value of temperature characteristic 9 obtained in this study is very much in agreement with the value of 0 reported in literature. 3,*
( i i ) The present study covers the range of temperature from 25°C to 33°C. It will be desirable to evaluate the tempe rature characteristic 0 for temperature range lower than that considered in the present study.
(iii) It may however be necessary to evaluate the value of 6 using different aeration systems.
€ Xi y< = 46.56 and N = 18
putting these values in above equations, we have,
Summary :
The temperature characteristic for surface aeration system used in this study works out to 1.024.
References :
1. S. N. Kaul and V. Raman, <• Alpha-An Important Variable in Wastewater Aera
t ion" , 1AWPC Tech. Annual VI & VII p. 107 (1980).
2. Standard Methods for Examination of Water and Wastewater, Fourteenth Edition, APHA AWWA, WPCF.
3. Eckcnfelder, W. W. Jr . , "Aeration and Mass Transfer *', Ind. Wat. Pol. Control., McGraw-Hill Inc., p . 65.
4. Fair, G., Geyer, J . C. and Ocun, D. A., "Water and Wastewater Engineering", Vol. I I , John Wiley & Sons Inc., New York.
m = log 0 18x46.56- 173.9x4.6621 =0.0103
18x1827.33-(173.9)2
6 = 1.024. 1827.33x4.662 - 173.9x46.56
Y 0 = l o g i o KLa (20) = 18x1827.33
» 0.1592 (173.9)

IAWPC TECH. ANNUAL., VIII 94-107, (1981).
Rotating Biol< A. N. KHAN* AND V. RAMAN*
Introduction
There is a long felt need in India of providing satisfactory, low cost and simple sewage treatment facilities for isolated houses, institutions, hotels and small and medium sized communities.Such facilities should require occasional inspection and maintenance, flexibility in construction and operation, relatively unskilled supervision, maintenance and operation, and should occupy limited area. They should be capable of treating wide variation of flow and organic load producing effluent of desirable standards of purity with respect to BOD and suspended solids. The Rotating Biological Contactor (RBC) or Bio-disc system, a secondary biological treatment process, is claimed to have these advantages which appear to be suitable to Indian conditions.
The RBC or Bio-disc unit consists of a series of closely spaced circular discs mounted on a horizontal rotating shaft. The shaft along with the discs are fixed in a semi-circular cylindrical tank through which the wastewater flows, with the water level just below the shaft. While rotating at a low speed, the disc surface is alternately exposed to the atmosphere and wastewater. The disc serves as media for growth and adhesion of biological slime, device for bringing the slime and film of water in contact with air, and creating mildly turbulent mixing conditions within the tank contents. As the disc rotates, the biological slime on any
* Scientists, NEERI., NAGPUR-440020
Contactor
sector of the disc is alternately dipped into the wastewater, where the slime metabolises non-settleable and dissolved organic matter and aerated with each revolution of the disc. The settleable organic matter and the sloughed film due to excess growth from the disc, passes along with the effluent as suspensions which are removed in the subsequent stage in the secondary settling tank.
Review of Literature
The idea of RBC originated in USA in 1928, and it was referred to as 'Biological "Wheel' and in Germany as' Immersion Drip Filter'. Further developments in the process took place during the last two decades mainly in Germany and USA. Large number of plants are now in vogue in Europe and USA.2 Laboratory and pilot plant studies in understanding the kinetics and evolving design criteria are reported by many workers. 3 - 1 4
The first municipal wastewater treatment plant in Pewaukce, USA using RBC process constructed by Autotrol Corporation on full scale was in operation since 1971 to treat a flow of II79m»/ day (0.47 mgd); and the first large scale RBC treatment unit with a capacity of 20 mgd for upgrading the existing trea-ment unit is in operation in Philadelphia.
Based on the studies reported in USA, Europe and Thailand the general requirements for design and operation
94

ROTATING BIOLOGICAL CONTACTOR 95
are as follows : The rotational speed of the discis limited to 1 to 10 rpm and the clear spacing between the discs is kept at 2 to 5 cms with a gap of about 5 cms at the bottom. A detention time of 10 to 90 minutes, organic dies loading rate of 3 to 16gms m^/day, hydraulic loading rate of 0.04 to 0.11 m3/day/m3 of disc area, power consumption (depending on capacity) of 0.3 to 2.G kwh/kg BOD removed and power requirements of 0.4 to 1 watt/ma of disc area are the other relevent parameters, while the BOD removal efficiency ranges from 80 to 95% at wastewater temperatures of 10°C to 20°C.
Objective of Study
The RBC as a treatment device is not yet in use in India, eventhough it has great potential due to its compactness and simplicity of operation and favourable temperature conditions. As such, it is felt that the feasibility of its use in India should be investigated under laboratory and field conditions.The studies aimed to achieve the objectives of formulating relationship amongst the treatment efficiency, organic loading, hydraulic loading, rotational speed, power consumption, and evolve compact units for various treatment capacities.
Materials and Methods
Initially, laboratory model studies were carried out with synthetic sewage and settled domestic sewage, foiio-wed by studies on pilot plant treat-ng raw municipal sewage.
LABORATORY MODEL
The laboratory model set up of RBC as shown in Fig. 1 consisted of 20 cm diameter, 4 mm thick, asbestos cement discs (with perforations) with clear spacing of 2 cms. They were centrally mounted to a horizontal shaft rotated by a
! Mivf Mt-r
ig. 1 - Laboratory Unit of Rotating Biological Contactor
fractional horse power motor fitted with reduction gear and adjustable belt drive for varying the rotational speed (3.5 and 8 rpm). The discs along with shaft assembly mounted to a perspex tank (of cross section similar to Imhoff tank). About 40 per cent of the disc area was submerged in wastewater. The bottom portion of the tank acted as a settling chamber and was partitioned into small compartments to contain varying number of discs.
It was possible to feed separately each of the compartment and work independently of the others with separate inlet and outlet arrangements. Continuous feeding was accomplished by electrolytic pump connected to feed bottle cont. afning synthetic or raw settled sewage. Fig. 2 shows the set up of the laboratory model experiment. The sloughed material and the settled organic material were periodically removed from bottom storage chamber. The feed was varied for various hydraulic and organic loading rates. The influent and effluent samples

96 KHAN AND RAMAN
WVM 01L1
Fig. 2 - Horating Biological Contactor Showing Feeding Arrangement
were collected at particular time intervals regularly and analysed for the usual parameters like temperature, pH. BOD.COD. S.S. TDS, NH 3-N. The units were continuously dosed at loading rates varying from 6.2 to 42 gms of BOD per square meter of disc area per day. The synthetic sewage was prepared by dissolving a high protein cereal and milk powder in water to get a BOD5 of about 250 mg/1.
Later the experiments were repeated with settled domestic municipal sewage and the unit was operated at organic load rates ranging from 6.2 g/day/m5* to 31.0 g/day/m2 of disc area, at rotational speeds of 3.5 and 8 rpm.
Further studies were carried out using cylindrical semicircular chamber fitted with shaft and some/discs with separate settling compartment, the total capacity remaining the same as that of Imhoff type tank.
B. PILOT PLANT
(i) Large size composite RBC Settling Tank with A. C Sheets.
cum
The studies were carried out initially on a large size pilot plant of Imhoff tank type with the settling chamber below the reactor. The discs were made from 1.22m x 1.22m square pieces of absestos cement sheets (136 numbers) by chopping oft the corners to give octagonal shape with surface area of 1.226 square meters. They were mounted on a mild steel shaft rota
ted at 5 rpm by 5 H. P. motor fitted with reduction gear and chain drive. The settled domestic sewage was fed at the rate of 47.67 m3/day for a continuous period of 10 to 12 hours in a day. The studies had to be discontinued after 4 months operation due to some structural failure of the discs.
ii) Small size plant with PVC circular sheets.
Fig. 3 shows the details of the set up of the RBC where the secondary
I t M «» 01 OlK'40 t i l l ' . It k • 0 • •«» .0 M l . 01IC OUMtla.i* k-OlAC *Oi.ul>l ' 0 , 0 * - 1
r n o M f i , > • •
•ft«t(H ri« 04KS >1, Cm •MM WE • > I I * Oa .1 U i . t - B I H .OHIO V04.WMI 10 l t « p »
Fig. 3 - Rotating Biological Contactor Pilotplant with PVC Dises
settling chamber is a separate unit. The tank located in NEERJ compus, Nagpur, consisted of semicircular mild steel tank of 1.22 meter diameter and 1.52 m long. 40 plane discs made of PVC of 1 meter diameter were fixed centrally to a mild steel shaft of 3.7 cm diameter and they were spaced longitudinally at clear interval of 2.5 cms. The clearance from the bottom of the tank to the bottom edge of disc was kept at 7.5 cms. The shaft was rotated at 5 rpm by a 1.5 kw (2 H. P.) electric motor fitted with reduction gear and belt drive. The unit was fed by raw sewage tapped from a

ROTATING BIOLOGICAL CONTACTOR 97
•*•• • s i s / - • " ' " \ _ •
> m^ ._.4^k^- — •»-.»-•Otn. «,rH ^ * \ _ f.J — _-, • T C j r - . c . « i C ' • « . I ' l l l ' V I l , !
Fig. 4 - RBC Pilot Plant with Cover and with Modified Settling Tank
distribution chamber where raw municipal screened sewage was pumped. The effluent from the disc unit passed on to the rectangular settling tank (of mild steel) of size 1.22m x 0.91m x 0.508m depth with a liquid capacity of 0.5m3. The scttlable organic material and the 'humus' or sloghings from the film attached to the discs were removed in the settling tank. The feed to the system was for 8 to 12 hours continuously in a day, and the remaing hours of the day, the RBC was working without any feed. The flow measurements were carried out by V-notch attached to a separate chamber after the settling tank. Occassiona l^ , volumetrically also the flow was computed. The performance of RBC was observed under two conditions viz. open type and enclosed type covered by a mild steel perforated cover. Later, some modifications were made in the outlet for the settling tank by providing serrated weirs instead of 5 cms. diameter circular opening initially (Fig. 4).
The studies were carried out first with open reactor and secondary settling tank with a single pipe outlet and later the same units were modified with the reactor closed by a ventillated semicircular lid and the settling tank provided with serrated weir outlets (Fig. 4).
Observations and Discussion
A- Laboratory RBC Model Composite (Imhoff tank type) Reactor
i) Using Synthetic Sewage : In the Imhoff tank type reactor with
settling chamber below the disc chamber,
it took about 7 to 10 days for the optimum growth of biological film on the disc surfaces and steady state conditions. Table 1 shows the performance data of the reactor with reference to hydraulic load, temperature, COD, BOD and S. S. of the influent and effluent, and the biomass accumulation on the discs. The organic loading rates (in terms of BOD5) ranged from 6.2 to 42 gms/day/m2
of disc area (1.2 to 8.7 lbs/day/1000 square feet of disc area). The efficiencies varied from 55 to 88 percent removal with reference to BOD5 in the decreasing order or organic loadings. The BOD of the influent varied from 233 to 276 mg/1 while the S. S. of the influent was 196 mg/1. The S. S. in the effluent ranged between 18 to 25 mg/1.
ii ) Using Settled Domestic Sewage :
The same composite unit was later charged with settled domestic sewage for different loading rates working at three different rotating speeds namely 3 rpm, 5 rpm and 8 rpm. Different organic loadings were achieved by utilising different chambers having different numbers of discs and adjusting if necessary the hydraulic flow rate. It took about 5 to 7 days for the biological slime to grow and attain a steady state. Table 2 shows the average performance characteristics of the unit. The average wastewater tem perature was 28°C. It is seen from Table 2 that 90 per cent overall BOD5 removal could be obtained with organic loading rate of 10 g/m2 /day, when the unit was
operated at 5 rpm. The BOD5 of the final effluent after settling was always less than 23 mg/1 (8 to 23 mg/1) during the period of study, while the BOD5 of the influent to the reactor varied from 102 to 130 mg/1, for the three different speeds considered. The suspended solids present in the settled effluent varied from 8 to 15 mg/1.

98 KHAN AND RAMAN
TABLE 1 - Laboratory Study Data on the Performance of RBC Unit (Imhoff Tank Type, Composite) For the Treatment of Synthetic Sewage
Parameters Experiments No. @
1 !
6
0.39
0.0256
8.4
6.0
243
28 88.4
438
72
84.0
12.0
18
2
4
0.26
0.0385
6.0
10.6
276
33
87.8
466
60
86.3
12.0
25
3
1
0.06
0.166
1.9
42.4
276
124
54.6
466
195
58.0
23.0
25
No. of discs
Surface area ( m )
Hydraulic loading, m ' / m ' / d a y
Detention time (hrs.)
Organic loading, g /m 2 /day
Influent
BOD (rog/1) Effluent
% reduction
Influent
COD (mg/1) Effluent
% reduction
Effluent suspended solids, mg/1
Biomass, VSS g /m 2 of disc surface
@ For each experiment No. at least 10 observations were recorded and the average given.
* Disc speed - 3 RPM
Hydraulic flow for 24 hours in all the experiments was 10 liters.
Liquid temperature varied between 21-22 C.
Influent suspended solids 196 mg/1.
•0
o
« »0
o •
O FO o • 0
•0
i._ ^
" •
O " -© S t PM
0---0 S r »l»
3 «
Fig. 5 - Organic Loading Vs Percentage BOD Redact ion at 3.5 and 8 R P M
Fig. 5 & Tables 2 & 3 show the average overall performance of the disc system at the three speeds studied viz. 3,5 and 8 rpm. There was marginal increase in the efneiency of removal of BOD with increase in speed for the same organic loading rates.
iii) Laboratory RBC Unit with Semi-Circular reactor and Separate Settling Tank.
A Comparative study for a brief period was made regarding the perfor-

ROTATING BIOLOGICAL CONTACTOR 99
TABLE-2 Performance of the Laboratory RBC Unit (Imhoff Tank Type) Treating Settled Sewage
Disc RPM
**Expt. No.
Hydraulic
load
m3 /m2 /day
Organic
load
g/m2 /day
BOD5 ,mg/I
Influent
Effluent
"^reduction
COD mg/1
Influent
Effluent
%rcduction
p H
Influent
Effluent
Suspended
Sol ids ,mg/1
Influent
Effluent
%reduction
Biomass
VSS,g/ra2
1
0.051
G.64
130
10
92
290
48
83
7.3
7.7
91
II
88
19.02
3
2
0.099
11.7G
118
15
87
261
72
72
7.3
7.6
80
9
89
28.16
3
0.287
29.29
102
29
71
128
96
55
7.2
7.4
45
18
60
26.68
2
0.047
6.20
130
9
93
278
47
83
7.3
7.6
74
8
89
20.80
5
1
0.066
10.00
150
14
90
309
66
78
7.3
7.6
63
5
92
23.36
3
0.115
14.88
129
23
83
265
80
70
7.3
7.5
80
12
85
17.92
1
0.051
6.64
131
8
94
304
59
•80
7.3
7.6
8
1
8
16.00
8
2
0.099
12.20
122
8
93
269
64
76
7.1
7.5
76
8
89
23.00
3
0.288
31.00
108
22
79
234
90
61
7.2
7.5
51
15
70
18.00
** : Number of Discs 6,4,1, for item 1,2, and 3 in each column.

100 KHAN AND RAMAN
TABLE-3 Weight o f Biomass Developed on the Discs at Different Discs Speeds and Loads (Using Settled Domest ic Sewage Lab. Model
Disc Speed R P M
Organic Loading Rate, g/m2 /day
Biomass* VSS, g/m2 of disc area.
6.7
11.7
19.20
28.16
6.3
10.0
20.80
23.36
6.7
12.2
16 00
23.00
* A month after start of operation.
mance of semi-circular tank reactor with separate settling tank and composite ImhofT tank reactor using settled domestic sewage. It is seen from Table 4 that the efficiency of BOD5 removal of 83% could be obtained at an organic loading rate of 14.9 g/m2/day for the semi-circular unit, while for the composite ImhofT tank type, the efficiency of BOD5 removal was 76% under identical conditions. The removal of the S. S. in the former type was 83% while for the composite type, 76 per cent.
B. Pilot Plant Studies
i ) Pilot Plant with Asbestos Cement Sheets Using Settled Domestic Sewage
The pilot plant composite RBC reactor (with settling tank below ) was operated at a rotational speed of 5 rpm for feed rate of 47.67 m^/day of settled domestic sewage. While the RBC reactor was operating throughout the day, the sewage was fed only for 10 to 12 hours continuously during the day. An overall BOD5 reduction of 77 percent
was observed, while there was 50 percent removal of ammonia nitrogen and 30% removal of Phosphate ( Table 5 ). The studies had to be discontinued after three months of continuous operation due
to structural defects noticed in the disc assembly.
i i) Pilot Plant with PVC circular Discs Using Raw Domestic Sewage.
The raw domestic municipal sewage was fed by gravity to pilot RBC plant with PVC discs (Fig. 3 and 4) through a distribution chamber. The RBC was operated continuously throughout the day, while the flow of sewage was restricted to 8 to 10 hours during the day time, due to operational difficulties. For a period of 2 Years, the RBC reactor was operated by keeping it open to the atmosphere and at a constant speed of 5 rpm. The speed of 5 rpm was selected based on laboratory studies and with reference to reduced power consumption.
The PVC discs were initially found to be smooth and the biological film

RORATrNG BIOLOGICAL CONTACTOR 101
TABLE-4 Comparative Studies Using Settled Sewage With Imhoff Type and S e m i Circular Chambers With Separate Settling Tanfc. Average Valoes +
PARAMETERS EXPERIMENT NO.
1*
No. of Discs
Surface area, ml
Chamber (s) capacity (litres)
Hydraulic loading rate, m3 /m? /day
Detention time, (hrs.)
Organic Loading rate, g/mZ
B.O.D., mg/I
Influent
Effluent
%reduction
C.O.D. mg/I .
Influent
Effluent
%reduction
Effluent Suspended Solids mg/I.
Biomass, g/m*
2
0.13
2.05
0.115
3.3
14.9
130
31
76
307
87
71
15
62.8
2
0.13
2.18
0.1 IS
3.4
14.9
I3»
22
£3
307
70
76
10
76.8
* Imhoff type of Tank with Discs. ** Semicircular tank with Discs followed by a
semicircular settling tank.
(Vol. 0.950 + 1.230 = 2.180 litres)
4. Average value of 21 observations.
- Disc speed, 5 RPM - Average liquid temperature, 240C
- Total flow to the unit for 24 hours, 15 litres.
adhering to the disc surface was not appa rently 'thick'. After 3 months of operation with smooth discs, the disc surface was showered and coated with fine sand which was fixed to the discs by 'Wavin PVC Cement'. Table 6 gives the perfor
mance data of the pilot plant studies for varying conditions viz. open reactor tank with smooth PVC disc and roughened with coated sand and closed reactor tank with modifications to the outlet of settling tank. The hydraulic flow rate ranged from 4.54 to 5.77ms/day corresponding to an organic loading rate of 15.2 to 27.7 g/ma of disc area per day. The BOD5 of influent was almost consi-stant during the period of the day and as such samples were collected at a time 2 to 3 hours after the pumping of sewage started. The effective detention time

J02 KHAN AND RAMAN
TABLE : S - Data f rom RBC pilot plant s tudies for the treatment of sett led domest ic sewage using discs made up of asbestos cement Sheets.
Parameters Average Values and Range
Temperature °G
Total Flow (10-12 hrs/day), Hydraulic Load, m3 Organic Load, g/m? BO. D.mgll Influent
Effluent
% reduction CO.D.mlj Influent
Effluent
Reduction NH3-N, mgjl Influent
Effluent
% reduction FOK , mgil Influent
Effluent
% reduction
m3
I ml 1 day / d a y
(20 - 30)
47.67 0.143
16.1
114 (86-135)
26 (15-45)
77
280 (210-360)
54 (30-90)
80
17.0 (13.6-19.0)
8.5 (6.5-10.4)
50
11.5 (8.5-14.0)
8.5 (6.2-11.0)
30
* The table gives the average values of 25 observations during the operation of RBC from
. January, 1974 to April, 1974. * No. of Discs mounted on two.Shafts : 136 * Surface Area of each disc (on both sides) :
2.45 m2 * Total surfaccacra of 136 discs : 332.2 m?
for the stated ranges of flow in the RBC reactor tank was 1.6 to 1.26 hours, while for the secondary settling tank it was 1.1 to 0.9 hours. The influent BOD during the period of the studies varied from 218 mg/l to308 mg/1.
There was gradual reduction of efficiencies of removal of BOD6 and S.S. as the organic feed loading rate was
increased from 15 g/m^ of disc area/day to 28/ma of disc area/day. The overall BODs removal varied from 77 to 91 per cent and S. S. removal varied from 67 to 94 per cent in the decreasing order or organic loading rate. The removal of BOD5 in the reactor alone ranged from 68 to 89 per cent. Ammonia nitrogen to an extent of 50 to 60 per cent was removed in the system.
During the period of studies at various seasons of the year the temperature of sewage varied from 20°C to 35°C. The whole plant worked under natural field conditions without any control over temperature, organic strength etc. Only the hydraulic flow rate was regulated.
As can be seen from Tabic 5, the efficiency of removal of BOD5 in the reactor with smooth PVC discs was lower by about 15 to 18 percent compared to the reactor with sand coated PVC discs. Under similar conditions with sand coated PVC discs, the removal of BOD in RBC reactor which was open was higher by about 10 to 15 percent to that of reactor which was closed by ventilated lid. It was to some extent improved with respect to BOD and SS removal after modification of the outlet arrangements using serrated weirs. Settling tank with modified outlet arrangents was being used for the closed reactor, while earlier the same reactor without closed lid was operated along with single pipe outlet.
It may be noted that the sewage that was fed to the system, had only preliminary treatment of screening and grit removal and no primary settling. Perhaps, the performance efficiency of the system could be bettered by charging with primary settling sewage. Otherwise, by providing a second stage smaller reactor unit in series with the existing one, the efficiency could possibly be improved.

ROTATING BIOLOGICAL CONTACTOR 103
TABLE-6 : Data on the Performance of RBC Pilot Plant wi th PVC Discs, for Treatment of Raw Domestic Sewage.
(The tabic gives the average values of 10-12 observations)
PARAMETERS
RBC tank T e m p 0 C
pH of liquid in RBC tank
Total flow/day (3 day) m3 )
Hydraulic loading m3 / m2 / day
-12hrs /
rate,
Organic loading rate, gjirfl / day
BOD, mg/1
COD, mg/1
Suspended solids, mg/1
NH3 - N, mg/1
NO3 - N , mg/1
Bio-mass on Disc, g/mjj
Inf. El Ez
Inf. El E3
Inf. Ei E2
Inf. Ei
Ea
Inf. Ei
E 2
Jan . ' 76 to
April '76
1*
24-27
7.4-7.5
5.77
0.090
27.7
3.8 98(68)% 70(77%)
573 217(58%) 132(73%)
109 54(50%) 36(67%)
'
27.7
PERIOD OF OPERATION
Oct. '76 to
Feb. '77
2**
20-28
7.5-7.8
5.58
0.087
25.6
295 32(89%) 24(91%)
588 105(82%) 87(75%)
405 44(89%) 24(94%)
37 22(41%) 15(60%)
nil 1.0 1.3
34.7
F e b . ' 7 7 to
June '77
2**
26-31
7.6-7.7
4.49
0.070
22.3
319 74(77%) 55(83%)
551 127(77%) 90(84%)
355 38(89%)
26(93%)
38 30 26
nil 2.0 2.3
50.0
Aug. '78 to
May '79
4**
29-35
7.5-7.9
4.54
0.071
15.2
216 48(78%) 40(82%)
600 134(78%) 98(84%)
314 68(78%) 22(90%)
40 23(43%) 18(55%)
nil 1.2 1.3
78.3
June '79 to Aug. '79
5»**
29-34
7.6-7.9
4.99
0.078
20.7
255 86(66%) 45(82%)
662 199(70%) 75(88%)
466 152(58%) 54(90%)
32 16(50%) 16
nil 2.1 4.2
63.0
El : Effluent from RBC Contact tank E 2 : Final Fffluent after settling tank : (%) percentage Efficiency * : The RBC plant was operated with smooth PVC discs without cover, ** : The RBC plant was operated with sand coated PVC discs without cover. *** : The RBC plant was operated with sand coated PVC discs with ventillated cover and modified
settling tank

104 KHAN AND RAMAN
Organisms in The Slime
After the start up of the plant, about 7 to 10 days of continuous operation was required to build up an optimum growth of biological slime adhering to the disc and to reach a steady state condition producing an effluent of desired quality.
The microscopic examination of slime revealed mixed culture of Protozoans, Rotifers, Nematodes, Filamentous bacteria, Fungi and Algae, while particular species dominated under different conditions of working of the reactor. Identified organisms are shown below.
Algae
Oscilllatoria sp.
Spirulina sp-Phormidium sp. Chlamydomonas sp. Chlorella sp. Actinosphaeriutn sp.
Anacystis sp. Synedra sp. Denticula sp. Diatoma sp-Tab ell aria sp.
Nilzschia sp. Navicula sp. Fungi Fusarium sp.
FILAMENTOUS BACTERIA Sphaerotilus nutans
Protozoa Paramecium
can da turn Vorticella sp. Epistylis sp. Ameoba protetis Glaucoma sp. As pi disc a
costata Carchesium sp. Opercularia sp. Lionotus sp-Podophrya sp. Chilodonella
uncinata Colpoda sp. Euplotes sp. Rotifers Rotaria
rotatoria Lecane sp. Philodina sp.
Nematodes Rhabditis Larvae Doriolamus sp.
than that reported elsewhere, even-though the consumption will only be slightly less than that for conventional activated sludge process. The plant could very well
Laboratory studies with synthetic sewage showed abundance of filamentous bacteria, Sphaerotilus natans. When the pilot plant reactor was operated with raw sewage under ventilated cover, the biological organisms present in the slime adhering to the disc showed abundance of filamentous fungus, Fusarium sp. and a small proportion of algae. Under conditions of pilot plant reactor completely exposed to the atmosphere (without the ventilated cover) and operating with raw sewage, algae were also found in abundance in the slime.
The average concentration of bio mass present on the discs of the pilot plant varied from 35. to 78 g/ma of disc area. On an average, the total weight of the biomass adhering to the surfaces of 40 discs in the pilot plant, was estimated to be about 4 kgs ; while the total suspended solids present in the mixed liquor in the reactor was found 0.25 kg, which works out to about 6 percent in the discs. The total quantity of sludge accumulated in the settling tank for a fixed period was measured and worked out to about 0.4 gm per gm of BOD applied.
Loading and Power Requirements
From the results of the performance of the pilot plant, it is possible to obtain efficiencies of purification ranging from 82 to 90 percent for loading rates of 16 to20g /m 2 of sewage applied to the system.
Power consumption as measured by Wattmeter connected to the drive motor of 1.5 kw capacity, worked out to 1 to 1.25 kw/hr foi one kg. of BOD removed. It is to be noted that the power rating of the motor was much higher than that required, and as such, the power consumption seemed to be relatively higher

ROTATING BfOLOGrCAL CONTACTOR 105
operate with a 0.5 kw motor instead of 1.5 kw motor.
Cost Aspects (as in the year 1976)
The break up of the cost of different components of the pilot RBC fabricated at NEERI are as follows :
1. Geared Motor ... Rs. 5,890.00
2. 40 Nos. circular PVC disc of lmdia ... Rs. 4,680.00
3. Settling tank piping & fabrication ... Rs. 4,500.00
Rs. 15,070.00 Contingencies ... Rs. 930.00
Total Rs. 16,000.00
The cost of the system is equivalent to about 2000 US dollars, for treating a flow of 0.5 m3 / hour (110 gallons per hour) of raw sewage with BOD of 250 to 300 mg/I and working at an efficiency range of 82 to 90%.
Summary and Conclusion
l .The Rotating Biological Contactor (RBC) or Bio-disc due to its compact construction, simplicity of operation and favourable climatic conditions has great potential for use in the treatment of wastewaters in India. Accordingly, studies were conducted under laboratory and field conditions with the objective of its feasibility for use in India, and formulating relationship amongst the treatment efficiency, organic and hydraulic loadings, rotational speed and power consumption.
2. Performance studies were carried out in a laboratory Rotating Biological Contactor using synthetic and domestic sewage for nearly two years period, for
two types namely, composite Imhoff tank type reactor with settling tank below the reactor, and RBC reactor with separate settling tank.
3. Later, studies were carried out using raw degritted and screened municipal sewage, on the performance of RBC pilot plant with 40 PVC circular discs of one meter diameter followed by a rectangular settling tank. The performance characteristics were studied under two conditions viz. when the reactor was open, and when the reactor was enclosed by ventilated cover.
4. The operation of the pilot plant was carried out under field conditions, and there was no control as regards the strength of wastewater and temperature. The RBC was operating continuously, while the sewage flow was limited to 8 to 10 hours during the day time, feeding the reactor at a constant rate of 0.5 m3 / hour (variation ± 10 percent) under ambient conditions and temperatue of wastewaters varying from 20°C to 35°C.
5. Under the tropical climatic conditions prevailing at Nagpur, India, the RBC pilot plant achieved overall efficiencies of removal of 81 to 90 percent, for BOD5 at 20°C, and 90 to 91 percent for suspended solids at an organic loading rate of 16 to 20 g/m2 of disc area/ day and hydraulic loading rate of 0.07 to 0.08 m3/m2/day when the applied feed of raw screened and degritted domestic sewage has BOD concentration of 250 to 300 mg/1, suspended solids concentration of about 400 mg/1 and the temperature of sewage in the reactor varied from 20° C to 33° C for different seasons of the year. Other design parameters include the submergence of 45 percent for the discs, rotational speed of 3 to 5 rpm, effective detention time in the reactor of 1.5 hours.

106 KHAN AND RAMAN
6. Such a compact unit occupying an overall area of 41 /2 meter by 4 l / 3 meter can as well serve a population of 50 to 100 persons depending on the water consumption. A 0.5 K. W. motor with reduction gear and belt drive would suffice to rotate the discs.
7. The desludging from the settling tank need to be carried out only once in a week or two weeks. The quantity of sludge produced is estimated at 0.4 Kg per kg of BOD removed in the system.
8. There were no major mechanical troubles in the RBC Pilot Plant during its continuous operation for two years. The bearing had to be occasionally lubricated or replaced.
9. The cost of the PVC discs (in India) form nearly 35 to 40 percent of the Total cost of the RBC system. The cost can be reduced by using alternative cheap materials like split bamboo, aluminium sheet etc. for discs. By using PVC discs, the per capita capital cost works out to Rs. 160 for the unit serving 100 persons.
10. The power consumption varied from 1 to 1.2KWH/kg BOD removed, which could be brought down by using a lower horse power rating motor drive.
11. Further field studies on pilot plant scale should be continued with alternative material disc, feasibility of use of wind mills as drive mechanism for rotation of discs, increasing loading rates, addtional surfaces, methods to decrease power consumption, and using the RBC based on extended aeration principle for reduction of sludge volume and its easy disposal.
12. Open type of RBC gives higher efficiency for BOD removal than that for the enclosed type.
13. The RBC can be successfully operated with screened, degritted sewage avoiding primary settling tank and the problem of disposal of primary sludge. The efficiency can be improved by working the RBC in stages.
Acknowledgements
Grateful thanks are due to the Director, Dr. B. B. Sundaresan for his encouragement and interest. This paper was earlier presented in the First National Symposium/Workshop on Rotating Biological contactor Technology held at Pennsylvania sponsored by Universityof Pittsburg and USEPA during February, 1980.
REFERENCES
1. Borchardt, J . A. 'Biological waste Treatment Using Rotating Discs', Biological Waste Treatment edited by R. P. Canale, Inter-science Publishers, N. Y. (1971)
2. Antonie, R. L. Kluge, D. L. & Mielke, J . H . 'Evaluation of a rotating disc wastewater treatment plant' JWPCF, 46 3, Mareh 1974.
3. Antonie, R. L. Kochlcr, F. J . 'Application of Rotating disc process to Municipal waste Water Treatment' U. S. EPA, Project No. 17050 DAM/11/1971.
4. Antonie, R. L. 'Response of the Bio-disc process to fluctuating wastewater flows' 25th Purdue Univ. Conf. Mav 1970.
5. Torpey, W. N. ct al 'Rotating disc with biological growth prepare waste water for disposal or reuse', JWPCF, Nov. 1971.
6. Khan A . N . , Siddiqi R. H. , 'Treatment of Waste water by Biological Discs' Indian J . Environmental Health . 14 4,289-29»i, 1972.
7. Raman V. Khan A. N. , 'Sewage Treatment for small communities : Indian Association for Water Pollution Control, Technical Annual No. 4, 1977.

ROTATING BIOLOGICAL CONTACTOR 107
8. Technical Digest, National Environmental Engineering Research Institute, Nagpur, India No.60, April 1978.
9. Pcscod M. B. Nair J . V. 'Biological disc filtration for Tropical Waste Water Treatment', Water Research, 6 12, 1509-1523, Dec. 1972.
10. Prctorius, W. W. 'Rotating Disc unit-A waste Treatment system for small communities', Water Pollution Control, 72 (b), 1973.
11. Steels, T. H . 'Design basis for the rotating disc process*, Eff. Wat. Treat. J . 14 431, 1974.
12. Bruce A. M. , Merkens J . C. 'Developments in Sewage Treatment for small communities', Proc. Eighth P . H. E. Conf. Loughborough Univ. of Technology, January 1975. (Published in Aspects of Sewage Treatment Proceedings, edited by John Pickford)
13. Clark, J . H . Moseng I . M. , Asano T. 'Performance of a Rotating Biological Contactor under varying waste water flows', J W P CF, 5 50, 896 May 1978.
14. K I u g e D . L. K i p p R . J . 'Evaluation of the RBC process for Municipal Wastewater Treatment U . S. EPA-600/2-78-028, March 1978.

IAWPC TECH. ANNUAL, V l I I 108-115, (1981).
Role of Aquatic Plants in Water Pollution Control S. B. CHAPHEKAR* AND G. N. MHATRE*
The Problem
Problem of pollution as a cousequ-ence of increased industrialization is by now a well known phenomenon. Pollution and its consequent adverse effects on life and property has become a house hold topic. In case of pollutants in water, the problem is more serious as not only the industrial wastes but even discharge of domestic wastewater and sewage can also be major pollutants. A large amount of data is available that discusses the nature of pollutants in water, their sources and effects of life.
Types of water Pollutants
The contamination of a waterbody takes place due to the discharge of effluents from industries. It may also take place due to the dumping of domestic and agricultural wastes. Agrochemicals also reach water bodies through speepage from cultivated areas.
The water pollutants are often classified according to their mode of occurrence as follows,9
Mode of occurrence
Nature Example
I ) Physical
I I ) Chemical
i ) floating matter
ii ) suspended matter
iii) thermal
i ) organic
i i) inorganic;
foam, scum, wood and leaves.
silt, sand, gravel, metal pieces, cinders, rubber, wood chips, paper pulp, solid sewage material and animal carcasses.
waste heat
oils, dyes, synthetic detergents, chlorinated hydrocarbons, phenols, carboxylic acids, sugars and carbohydrates.
acids, alkalies, chlorine, metallic salts, nitrates, phosphates, hydrogen sulphide and radioactive isotopes.
* Environmental Sciences Laboratory, Department of Botany, The Institute of Science, Bombay-440 032
108

ROLE OF AOJUATfC PLANTS 109
III) Biological i) pathogenic
ii) algae
iii) aquatic weeds
Of the lot, chemical pollutants of industrisl origin are the most hazardous ones. A lot of literature on the sources, transport, fate and effects of each of the chemical pollutants mentioned above on life including their toxic effects, is available and hence wiil not be repeated here.
Various corrective measures can be applied before the toxicity of the water pollutants is felt on the natural ecosystems. Discussion here is confined to the possible corrective measures for the incidence of water pollution. Again, the corrective measures discussed here refer to the use of green plants for the purpose. It may also be added that most of the literature referred to here is from the Western countries. A lot of interest in the subject has been created by now and there are many centres where work is in progress in this area. Regional Research Laboratory, Jorhat; Jawaharlal Nehru University, Delhi; Indian Institute of Technology, Bombay; The institute of Science, Bombay are some of them.
Corrective Measures for Reducing Aquatic Pollution :
There are many engineering and chemical methods which have been widely used by industries and municipalities in the developed countries for treating
bateria, protozoa, fungi, parasitic worms that produce diseases, algae and viruses.
excess growth caused by eutro-phication, the decay of which causes depletion in oxygen content of water.
growth of which uses needed water.
the effluents and sewage, before they are released in water. Many of these methods though efficient, are very expensive. Due to the huge amount of capital investment required for the implementation of the known engineering and chemical methods of waste treatment as also due to the ignorance about the long term benefits of such measures and very often due to the lack of the sense of social responsibility, the wastes are usually dumped in water without any proper treatment. Such dumping of wastes in useful water may lead to unexpected consequences, sometimes obvious as the outbreaks of epidemics.
To avoid such environmental hazards, the biological organisms, especially plants can be of great help. Though biolo gical devices have their limitations and are not expected to replace the engineering measures completely, they are quite reliable in detecting, monitoring and efficient in scavenging the environmental pollutants.
Algae or phytoplanktons are the first plants to be affected due to water pollution. The presence or absence of specific phytoplankton can be a very good monitoring device for detecting the quality of waste e.g. the absence of some sensitive algal species in the polluted waters of Mula and Mutha rivers in Pune1. Acute sewage pollution of Mutha

HO CHAPHEKAR AND MHATRE
river in Pune was related with algal blooms.
Besides phytoplanktons, the terrestrial plants growing along the polluted waterways also get affected due to the quality of water and the substratum. Areas where the pollution stress is very acute may be completely bare of vegetation, or certain species only may be absent. Bareness or lack of sensitive species is an important indicator of pollution. It is found that the diversity of angiosperms was reduced at industrially polluted sites along Ulhas river at Kalyan, near Bombay5. In a study of Kalu river, near Kalyan, it was reported that the floristic diversity was severely affected at a polluted site-Ambivali, compared to that at a clean site upstre-am-Titwala7. At Ambivali the plant' community in the intertidal zone of the river was dominated by only two plant species : Pycreus macrostachyos and Cynodan dactylon- Pycreus formed almost a monoculture with highest importance value of 300. Heavy metals like Hg, Cu, Cd and Pb were present in high concentrations in the water and in the sediments of the river bank. The Pycreus plants and also absorbed and accmulated these heavy metals in high concentrations in the leaves and rhizomes. Reduction in diversity and the presence of a tolerant metal accumulator plant species like Pycreus, was related to the pollution of water, the pollutants coming from the industries situated at Ambivali.
Sensitive species which are absent from acutely polluted sites can be used for monitoring water pollution load. There are many instances, where sensitive algal species have been used to detect concentrations of particular pollutants like heavy metals9. On the other hand, the tolerant and accumulator species like Pycreus1 and algal spe
cies like Stigeoclonium and Schizo-meris* are good indicators of pollutants in water.
Waste Water Treatment Using Aquatic Weeds :
Researchers have discovered that some aquatic weeds can scavenge inorganic, and some organic compounds from water. The weeds absorb and incorporate the dissolved materials into their own body tissues. Plants also function as efficient filters. Effluents passed through a bed of plants is stripped of its pollutants and, ^when released into waterways, cause less environmental damage. The plant units clean so rapidly and effectively that they are now seriously considered for use as a "final polish" in sewage treatment. The clean water produced is, in most situations, suitable for re-use in irrigation and industry. Furthermore, the plants themselves can be harvested and used, thus providing additional benefit. The same technique can be used for treating animal manure and other farm wastes3,*,11.
For developing countries, such techniques can prove extremely imortant. Nitrates, ammonium compounds, phosphates and organic carbon discharged from sewage treatment facilities are the nutrients needed in agriculture. The first two are primary ingredients of fertilizers. Since fertilizer manufacture is energy intensive and thus increasingly expensive process, aquatic plants provide an indigenous alternative fertilizer, available within the rural regions. Soil conditioning capacity of these manures, would be an added advantage.
This fertilizer recovery method is simple to carry out; wastewater effluent is led to shallow ponds planted with aquatic weeds. The resultant growth can

ROLE OF AQUATIC PLANTS 111
be harvested regularly, each time leaving some plants to regrow a new crop, so that the water purification becomes a continual process. Alternatively the plants may be allowed to grow for an entire season and then harvested - perhaps even after draining the pond. This method is versatile and can be scaled for villages, farms, or small municipalities.
In addition, aquatic weeds can be used to partially strip traces of potentially harmful or odorous agents from drinking as well as waste waters, including cadmium, nickel, mercury, silver, cobalt, phenol and potential carcinogens 1 0 , 1 2 , 1 3 . The aquatic plants absorb and accumulate these elements, which may become, 4,000-20,000 times more concentrated in the plants than in the water through the process of biomagnification8.
An aquatic weed-water treatment system can be inexpensive to build and maintain. If properly located, gravity would deliver the wastewater, the plants would act as an agricultural crop utilizing solar energy and the nutrients from the wastewater. Virtually no energy costs would be incurred other than the planting and harvesting of the weeds. The harvested plants can be used to provide raw material for making processed animal feed, soil additives8, methane gas 8, 15 and other products.
Not all aquatic plants are equally adapted for growing on wastewaters Many of those that seem to grow best are common weeds, e. g. the common reed Phragmites communis, bulrush Scirpus lacuslris, water hyacinth Ekh-hornia crassipes, duckweeds (Lemna spp. and Spirodela spp,), forms of elodea (Elodea canadensis, etc), Hydrilla verticillata and Ceratophyllum de-mersum-
Some of the commonly used wastewater aquatic weed management methods are given below.
Water Hyacinth Method :
Several resarch groups in the United States have adapted this method for its usefulness in treating sewage. For example, water hyacinth is "farmed" on a 3.6 ha sewage legoon serving the city of Lunedale, Mississippi (population 2,500) by the National Space Technology Laboratories, NASA. The University of Florida and the Texas State Department of Health Resources also treat sewage with water hyacinth on an experimental basis. Warm weather in the sub-tropical regions is found to be conducive for hyacinth growth, as a result it can increase at a phenomenal rate of 15% surface area per day. At this rate 20-40 tons of wet water hyacinth can be harvested per hectare per day, removing the nitrogenous waste of over 2000 people and the phosphorus waste of over 800 people8.
Under ideal conditions water hyacinth can remove elements at the rate, given below :
Element
Nitrogen Phosphorus Potassium Calcium Magnesium Sodium
Amount recovered (kg/ha/day
22-44 8-17
22-44 11-22
2-4 18-34
Water hyacinth culture removes algae and fecal bacteria, greatly reduces suspended matter and removes odour-causing compounds. The resultant effluent is clear, odourless and contains practically no nitrogen ; some phosphorus remains because it is removed more slowly than nitrogen. Water hyacinth

112 ROLE OF AQUATrc PLANTS
and alligator weed used as secondary and tertiary filtration systems for domestic sewage, reduced the suspended solids, total kjeldahl nitrogen, total phosphorus, BOD5 and total organic carbon levels from 60% to 98% within a two week period.14
Emergent Plant Method :
This method has been developed and patented by the Max Planck institut of West Germany in which reeds and bulrushes are used to purify water. The untreated waste water first passes through a bed of gravel topped with sand in which common reed is planted. The reeds quickly grow to be 2-4 m tall and spread their roots through the gravel. Wastewater is spread over surface of the bed and soil particles are trapped on the sand as the water percolates downward. Dissolved organic and inorganic material is absorbed by the reeds or decomposed by the microorganisms in the gravel. For this process the oxygen required is available through the large air passages present in the entire plant body of the reeds. As a result the plants indirectly enhance the efficiency of the breakdown of organic material, by creating a route for rapid transport of oxygen to deep portions of the bed. The plants also help in reducing the accumulation of sludge on the surface of the bed by giving rise to new roots which aid in digesting the sludge and hence slow down the rate of sludge build-up on the surface of the bed.
The water then flows to the site of the second stage of the process, a gently sloping bed of gravel planted with the bulrush (Scirpus lacustris). As the water percolates across this living filter, the plant absorbs more organic materials and inorganic nutrients. As a result, colloidal substances in the water floccu
late and settle out. In the presence of the bulrush, bacterial and other pathogens in the sewage are significantly reduced.
A similar system developed in The Netherlands also uses long ditches, largely because of their suitability for mechanical maintenance. In this system, however, no gravel is used,the plants are rooted in the bottom soil. The water flowing through the pond is purified by microorganisms : the nutrients dissolved in the wastewater are absorbed by the plants and by the microorganisms. It is believed that the plants function mainly by providing attachment sites for the microorganisms that purify the sewage, rather than acting themselves as purifiers..
The water leaving these units is clear, neutral (about pH 7), and do not exert an oxygen demand on the receiving waters, though it may contain dissolved nitrogen and phosphorus. The reeds and bulrushes are harvested periodically. The fibre of these plants is valuable.
Submerged Plant Method :
Submerged aquatic weeds can extract nutrients from wastewater as the floating and the emergent ones, but these plants grow well only in oxygenated water and therefore can not be used to treat wastewaters where microbial decomposition can create anoxic conditions. Instead, they are best used after the organic wastes have been decomposed to soluble inorganic materials. At this stage pathogens, parasites and toxic substances have been removed and a variety of herbivorous aquatic animals are able to live. The grass carp Ctenopharyngodon idella val., various herbivorous fishes, the crayfish Orconectes spp., waterfowl etc. are examples. To these animals, the

CHAPHEKAR AND MHATRE 113
submerged weeds are a succulent food that they convert into meat more efficienctly than more fibrous plants like water hyacinth and reeds.
Due to their underwater growth, submerged weeds are difficult to harvest mechanically; herbivorous animals act as harvesters, but stocking rates have to be carefully balanced to avoid decimating the weeds and reducing their nutrient removing ability.
Two submerged Weed's of tropical and subtropical regions that grow in heavily fertilized water are HydrUla and Ceratophyllum demersum.
Duckweed Method :
Like the water hyacinth, duckweeds float on water and extract nutrients from it. Species of Wolffia, Letnna and Spirodela show promise for use in recovering nutrients from wastewater. They absorb nutrients through both the root and lower surface of the frond. An exponential growth rate enables a duckweed colony to absorb considerable quantities of minerals.
During the growing season in the southern United States, doubling times (in terms of biomass) for Spirodela oligorhiza range from 3 to 7 days. Calculations based on doubling time of 7 days, show that Spirodela oligorhiza growing on a 1 ha lagoon will remove the nitrogen, phosphorus and potassium of 207 dairy cows occupying a milking parlour for 4 hours per day and fed standard U. S. rations.
Doubling times of 5 days have been recorded for Lemna species grown on a wastewater lagoon in subtropical Louisiana. Monthly yields ranged from 1.7 to 6.7 tons per ha (dry weight) depending
on the nutrient avilability. Crude protein content was 40% on a dry weight basis.
In tropical climates, the doubling times of 3 days can be achieved. Under such conditions, a small farm pond> easily harvested manually, could provide sufficient forage for domestic animals.
Limitations :
It is important not to overlook the limitations in the techniques of employing plants for waste-water treatment. Some of them are -
1. The use of aquatic weeds for wastewater treatment is still experimen tal.
2- Except for the emergent plant method, the techniques require shallow ponds to grow for the weeds.
3. Lagooning wastewater is not universally accepted as safe for public health, however, if carefully managed, they are safe and perhaps more effective than conventional wastewater treatment for removing pathogenic bacteria, parasitic-worm eggs, protozoa cysts and eggs and heavy metals. On the other hand, if mismanaged, the lagoons can become the abode of many disease-producing organisms. They can seep and pollute groundwaters, and can fail to kill pathogenic bacteria.
4. In using such sewage treatment techniques, there is potential hazard from pathogens, toxic heavy metals and carcinogens. Care, quality control and public health safety measures must be enforced.

•114 ROLE OF AQUATrC PLANTS
5. The role of aquatic weeds is to remove inorganic nutrients from treated wastewaters, they should not be harvested and used if they have come in direct contact with raw sewage. If used where wastewater contains persistent pesticides, heavy metals or industrial wastes, the plants must be disposed off safely. In the NASA wastewater treatment project, water hyacinths containing such compounds are fermented to methane gas1*.
6. To achieve maximum recovery of nutrients like nitrogen and phosphorus, a balance should be maintained in the amounts in the wastewater and the absorption capacity of the vegetation during the residence time of water in the pond.
7. Slight turbulence in the water is necessary for a reasonable rate of nutrient removal. In stationary water, nutrients in the top layers are depleted and growth of plants slows down. Turbulence also improves the oxygen content and distribution, and facilitates growth of bacteria, zooplankton and other organisms that help break down organic wastes.
8. Care must be taken to avoid anaerobic conditions in the weed-filled treatment ponds. For example, a floating weed mat that completely covers a water surface reduces natural aeration of the water as well as the sun light needed for phyto-planktons and submerged hydrophytes that oxygenate the water. Depletion in dissolved
oxygen, reduced phytoplankton production and lower fish production have been reported due to 25% surface cover of water hyacinth in fertilized ponds at Auburn, Alabama0. By regularly harvesting the weeds and thus maintaining free water surface or by stocking the plants on 'final effluent'. from previous water treatment facilities, anaerobic conditions can be avoided.
1. Balakrishnan, M. S. and Gunale, V. R. (1978). Algae involved in air and water pollution in the Poona area pp. 62-73. In : Proceedings of the Seminar on Man and His Environment, (compiled by S. B. Cha-phekar) organised by the Institute of Science, Bombay, on October 6, 1976.
2. Blinn, D. W. Tompkins, T. and Zalcski, L . Mercury inhibition on primary productivity using large volume plastic chambers in situ. J.Phycol., 13 58-61 (1977)
3. , Boyd, C. E. Vascular Aquatic Plants for Mineral Nutrient Removal from polluted waters. Economic Botany, 24 : 95-103-(1970)
On Usefulness of these Techniques at Home :
Aquatic weed wastewater treatments could make excellent progress in developing countries. There is much yet to learn, and the concepts developed else where can be modified to fit local weeds and needs. The techniques need much ingenuity but do not require complicated technology, great expense or imported equipment. It may however, be useful to emphasize that the techniques are experimentation - intensive and before employing them in field, each individual factor involved in the operation, will ave to be verified individually as well as in combination with others, to ensure success.
References :

CHAPHEKAR AND MHATRE 115
4. Boyd, C. E. Accumulation of dry matter, nitrogen and phosphorus by cultivated water hyacinth. Economic Botany, 30 : 51-76. (1976)
5. Chaphekar, S. B., Divckar, D. P., Jayara-man, K., Jere, M. G., Khan, S. M. and Tipnis,.P..P. Effect of industrial pollution on the angiosperm flora along the Ulhas river at Kalyan, near Bombay. The Rotani' que 4 (2) : 85-92. (1973)
6. McVca, C. and Body, E. Effects of water hyacinth cover on water chemistry, phyto-p lankton and fish in ponds. / . Environ. qual.4(3) : 375-78. (1975)
7. Mhatre, G. N. , Chaphekar, S. B. Rao, Ramani, I. V., Patil, M.Tt. and Haldar, B. C. Effect of industrial pollution on the Kalu river ecosystem. Environ. Pollut-, (Series A) 23 (1) : 67-78 : (1980)
8. National Academy of Sciences (1976). aquatic weeds useful : Some perspectives for Developing Countries pp. 115-147-Report of an Ad hoc Panel of the Advisory Committee on Technolagy Innovation, Board of Science and Technology for International Development, Commission on International Relations, published by NAS, Washington, D. C.
9. Newsom, G. and Sherratt, G . J . Water Pollution. Published by Attrincham John Sherratt & Son Ltd., England. (1972)
10. Wolverton, B. C. Water hyacinths for removal of phenols from polluted waters. NASA Technical Memorandum T M - X -72722. pp. 1-16,(1975)
11. Wolverton, B. C , Barlow, R. M. and McDonald, R. C. Application of vascular aquatic plantsfor pollution removal, energy and food production in a biological system. NASA Technical Memorandum T M - X -62726. pp. 1-15, (1975)
12. Wolverton, B. C. and McDonald, R. C. Water hyacinths and alligator weeds for removal of lead and mercury from polluted waters. NASA Technical Memorandum TM-X-72723. pp. 1-12, (1975)
13. Wolverton, B. C. and McDonald, R. C. Water hyacinths and alligator weeds for removal of silver, cobalt and strontium from polluted waters. NASA Technical Memorandum TM-X-72727. pp. 1-12. (1975)
14. Wolverton, B. C. and Gordon, J . Water hyacinths and alligator weeds for final filtration of sewage NASA Technical Memorandum TM-X-72724. pp. 1-8, (1975)
15. Wolverton, B . C . , McDonald, R. C. and Gordon, J . Bio-conversion of water hyacinths into methane gas : Part 1. NASA Technical Memorandum TM-X-72725, pp . 1-13,(1975)

IAWPC TECH. ANNUAL., VIH 116-128, (1981).
Recycling of Refinery Effluents For Agriculture R. P. MISHRA,* L. N. SHARMA,* R. C. DIXIT* AND A. RAMAN*
Introduction
The discharge of sewage and industrial wastes, treated or untreated, to surface waters has exceeded the assimilative capacity of receiving streams at many places. The resulting pollution poses a threat to our water supplies. This threat has stimulated the quest for better treatment and disposal processes which will greatly reduce the pollutional load that our waste waters contribute to the surface water1. Reuse of treated effluents for crop production through irrigation qualifies as one such process. Land treatment of sewage and industrial effluents is now considered an acceptable engineering process for efficient waste water management. The benefits of land treatment system include (i) the reuse of effluent for crop production, (ii) renovation of waste water quality, (iii) Ground water recharge and sometimes (iv) utilisation of nutrients, resulting in the prevention of direct discharge of pollutants to water courses.
Unlike sewage effluents, the use of treated refinery waste waters is not a common practice. The main reason for its non-use is that most of the large oil refineries of the world are situated near the sea shore where the treated effluent could be directly discharged to the sea or estuaries without creating nuisance or damage. At other places the final efflue
nts are discharged in to water courses which are not of potential importance for use as community water supplies. At places where the refineries are situated inland and where the treated effluent has to be discharged into water courses meant for public water supply, the discharge becomes critical because more often than not, sufficient dilution may not be available during the lean flow season for further natural purification of the effluent. In such situations, the land treatment of refinery effluents can be considered provided adequate treatment is given to the effluent to the level considered safe for soils and crops.
Source and Composition of Refinery Effluents
There are many oil refineries in India engaged in refining both indigenous and imported crude. The refining operations include processes like crude desalting, fractional distillation, cracking, reforming, polymerization, alkylation, solvent extraction, dewaxing, hydrotrea-ting etc. In these processes, large volumes of water are used as process water, cooling water, for steam generation, in heat exchangers, refrigeration and air conditioning, boilers, condensers and for washing. On an average 20 to 70 litres of water is used for every litre of crude processed. In fact, the volume of water used in a refinery is second only to water used in the steel industry2.
* NEERI Zonal Laboratory, Delhi-110 054.
116

REFINERY EFFLUENTS 117
Oil refining is a very complex process and the wastes originate from several sources. Broadly speaking the wastes can be classified in to four categories viz, (1) oil free liquid wastes. (2) oily liquid wastes. (3) process liquid wastes and (4) sanitary wastes. The wastes are discharged from normal process operations (Production units), utility operations (boiler blow down and cooling water system), contaminated storm water runoff, Ballast water blow down (as applicable), and from tank farms. Together these form the combined or composite effluent. The effluent from the various streams could be acidic or alkaline, saline or non-saline, oily or oil free, phenolic or phenol free, sulphide free or with soluble sulphides, depending upon the operations. The four major waste streams in a refinery are (i) The spent caustic stream, (ii) the actual process wastes, (iii) the acidic waste streams and (iv) blow down from cooling towers, boilers and process steam generators. The major pollutants are free oil, emulsified oil, sulphides and mercaptans, phenoiics, organics (BOD & COD), suspended solids, acidity, alkalinity ammonia, chlorides, dissolved salts and toxic metals.3 A typical spent caustic stream includes wastes from benzene sulfonation scrubbing, ortho-phenyl phenol washing, alkylate washing and polymerization. The process wastes from production units include wastes from crude desalting, catalytic cracking, Nap-tha cracking and sour condensates from distillation and cracking. The acid waste streams include wastes from acid wash alkylation,acid wash phenol still bottoms, acid wash ortho-phenyl phenol and sulfite wash liquid ortho-phenyl phenol distillation4,5. The pollution potential of these streams are shown in table-1. The range of pollutants considered important in an untreated composite refinery effluent has been presented in table-2. A
scrutiny of table-1 and table-2. would show that the untreated refinery effluent as such cannot be used for irrigation and therefore must be treated to bring down the concentration of the pollutants to desired level. The addition of such effluents to soils modifies a whole series of chemical, physico-chemical and biological reactions, the consequences of which will be harmful to soils and crops6. The acceptability of treated refinery effluent will also depend mainly on the composition of the effluent, soils and crops. The utility operations contribute the maximum dilution water and m fact this helps in improving the final composition of the effluent. The characteristics of the effluents from cooling towers, boiler blow-down and Demineralisation plant are shown in table-3.
Composition of Treated Refinery Effluent
Generally the treatment processes in a refinery include API oil separation, tilted plate separation, filtration for oil removal, dissolved air flotation, stripping, neutralisation, coagulation, ilocculation, precipitation, equalisation, activated sludge, aerated lagoons, trickling filters, and carbon adsorption. The concentration of various pollutants gets substantially reduced in the final composite effluent because of (1) Physical, chemical and biological treatment and (2) considerable dilution of the wastes by water from the utility operations. The characteristics of composite treated refinery wastes are shown in table4.-7,8 It is seen that by and large, the treated refinery effluents meet the irrigation standards except with regard to certain constituents.
Irrigation Water Quality Criteria
The quality criteria for irrigation waters have been extensively reviewed

118 MiSHRA ET AL
«J cu
-5° | 1/3 ? S.O.
s •< H a H 09 H H i/>
•<<
u Z he W OS
H
W as H
(x O 09
u H en
H H O < OS < a u a (A
H O K D O w
i W • J aa <
11 iil
:<! = §
Iff
^T rt
2 5.5
i-£\- S
E *
6 .c
6
u
nzen
>- o c u
c L>
a. a
3 J5
sui C
tio
'ng
-C
was
]
so c
ub
bi
scr
o o <0
o o CO
o o o_
s
o o I —
o o
o o
o o o o CO 0!
o o o
o o r-~ ,-
o CM cn CM
s
a o
o o CO
a.
o
CM I
O
I —
2 12 o
o
o 2
o o o • * - "*".. o © to" r-T — — to
o o CO
— o 1 O o to
o o CO
^J
t d 1
o 1 o Tf
r-~ —.
S to S
60
s 00
E
O o CM
'•5 "3 Q Q •<3 £ O O < < « <J
3 £
•u
"o </) s o
U rt 2 <« n
Sal
0 CO
rt
z
rt X 0 . 3
C/3
.~
.£ C 3
CO
Q •o
'For

REFINERY EFFLUENTS 119
TABLE-2 : Characteristics of Composite Untreated Refinery Wastes (All parameters except pH arc expressed in mg/1)
Sr. No. Characteristics Values for* 12
American refineries
Range ol values** from ISI DOC : CDC
26 (6321) P-3
1.
2.
3.
4.
5.
6.
7.
8.
9.
10.
Free Oil
Emulsified Oil
Sulphides and mcrcapt
Phenolic compounds as
BOD, 20OC 9
Suspended Solids
Chromate (as Cr O . ) Zinc (as Zn) and — Phosphate (as PO~)
COD
Chlorides
pH
57
—
8.8
27
160
350
2000-3000
80-120
10-220
12-30
100-300
200-400
5-20
320
310
8.4
MC Kinney, R . E . 1967~
ISI DOC : CDC 26 (6321) 10
by many workers n , 1 2 & 13. Literature review indicates that important criteria considerations for irrigtion waters are salinity, sodicity, Boron, sulphates and chlorides. On the basis of available information irrigation waters have been broadly divided in to four categories (Table-5). Substances other than these have not been mentioned because earlier workers had confined themselves to work for comparatively pure waters. Utilisation of sewage and industrial wastes for irrigation gained increasing use and because of these reasons other parameters, not included in general water quality considerations, were seriously considered since these could harm the soil and crops. Work relating to the use of sewage and industrial effluents in agriculture has stimulated thoughts to
consider other parameters in terms of limiting concentration. The constituents of significance in this context are pH, BOD, COD, Sulphides, Oil & Grease, ammonia, phenol, suspended solids, phosphates and toxic heavy metals 1,«, 14 15 1G 17
* » ) • Suitability of Industrial Effluents for Irrigation Use
The important criteria to be considered for the use of treated refinery effluents in agriculture are salinity, sodicity, acidity, alkalinity, toxic metals, BOD, phenol, oil (free and emulsified) and sulphides.
The factors which are important to decide the suitability of a refinery effluent for crop irrigation in a region are:-

120 MISHRA ET AL
TABLE-3 : Characteristics of Effluents from Utility Operations
Data from American Refineries* Data from Indian Refineries**
Parameters Boiler blow down
Cooling Tower blowdown
Plant raw water supply
Cooling Tower
blowdown
Neutralised Demineraliscd Plan Effluent
1.
2.
3.
4.
5.
6.
7.
8.
9.
to.
11.
12.
13.
14.
15.
16.
1,7.
18.
p H
Total suspended solids
Volatile suspended solids
BOD520 C
COD
Oil & Grease-
Temp. C
Chromium*
Total dissolved solids
Total solids
Sodium as Na +
Susphates as SO..—
Percent sodium
Sodium adsorption ralio-
Chlorides as C I "
Calcium as Ca + +
Magnesium as Mg-+ +
Potassium as K +
11.6
40
24.9
60.9
201
14
174
0.8
4907
4947
-
-
-
-
-
-
-
_
7.3
34
26
33
141
7
27
12.2
7650
7684
7.9
Nil
8.5
Nil
7.2
150
32-35
364
364
72
9
46
2.3
61
54
23 •*•
3
1100
1100
200
370
57
4.4
160
138
13
6
7430
7480
1865
4000
78
24.5
550
212
138
18
* Data by Davis L. Ford 1976 ** Data by Kale et al , 1980
i. Chemical composition of the efflue- ii. Physical and chemical characteristics nts:- of the soil of the region :
Total dissolved solids, Sodium adsorption ratio, chlorides, sulphates, sulphites and sulphides, oil & grease, phenol, acidity, alkalinity,, boron and toxic heavy metals.
a. Physical : Infiltration rate, Texture, permeability, Water holding capacity,
b. Chemical : Exchangeable sodium percentage, Conductivity of satu-

REFINERY EFFUENTS 121
TABLE-4. Characteristics of Treated Composite Refinery Wastes
(All values except pH, Sodium percent and SAR expressed in mg/1)
SI. No. Characteristics Biological* Treatment 70 American refineries
Jndian* Refineries average data
Recently ** observed Indian Refinerv
1.
2.
3.
4.
5.
6.
7.
8.
9.
10.
11.
12.
13.
BOD5 20 ° c
COD
Oil
Suspended solids
Dissolved solids
Sulphides
P H
Ammonia (as N)
Phosphates (as P)
Alkalinity as CaCo3
Phonols as C6 H5 O H . .
Percent Sodium Na% . .
Sodium Adsorption Ratio
120
395
27
55
1750
23,
8
84
5
308
16
-
-
6-130
19-341
2-27
0-246
490-1720
0.1-0.3
6.8-9.1
0.6-43.0
0-5.8
190-390
0-1
-
-
22
47
1.5
10
590
Nil
7.6
0.6
0.3
230
0.9
59
4.5
*CPHEEO, New Dchlhi and NEERr Nagpur, 1975 ** Kale, C. K. eta!, 1981
ration extracts, Cation exchange capacity of Soil saturation extracts, organic matter, Cacium carbonate, concentration of soluble cations like C a + + , M g + + , Na+ andK + .
iii. Cropping pattern of the Zone :-Consumptive water requirement of the crops, salt tolerance behaviour of the crops.
iv. Climate & Geo-hydrology :-Rainfall (Arid, semi-arid or humid) -amount and distribution, Depth of Ground water table and its quality. Sub-soil drainage.
Evaluation of Refinery Effluents for Irrigation.
A study of the characteristics of the effluents originating from spent caustic wastes, acidic wastes, process wastes (Table - 1) and wastes from boiler blow-down, cooling water systems and process steam generation (table - 3) reveals that none of these streams could be used for irrigation directly because of the presence of high amounts of acids, alkalies, bio-degradable organic matter, excessive total salt concentrations, high sodium values and the presence of excessive amounts of free oil, phenol and sulphides. Even the untreated composite refinery
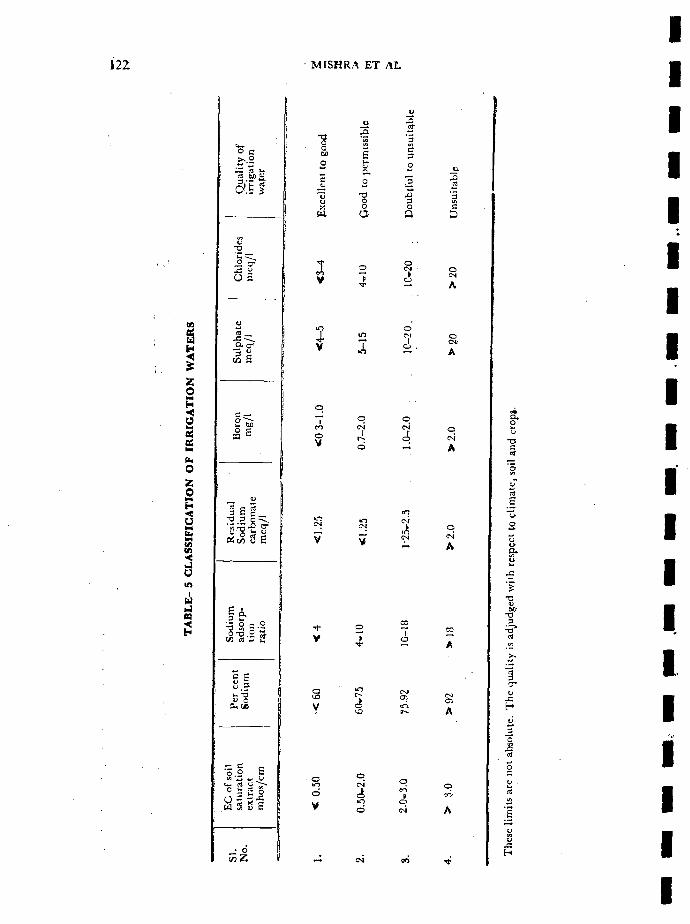
122 MISHRA ET AL
c a-
w. a
en V
o "7
J. v
o V
o
oil
EC
of
s.
c o
satu
rati
ex
trac
t
CO 2+
S
o .c E
V
o
O
o CM
A
o A

REFrNERY EFFLUENTS 123
TABLE- 6 Suggested Maximum Permissible Levels of Pollutants in Refinery Wastes Meant For Irrigation.
S. No. Problem Evaluating Parameters
Treated Refinery Effluent
Suitable for most crops in all soils
Suitable for selected
crops for some soils
Unsuitable for most
crops in most soil types
Salinity' EC of effluent u mhos/cm < 500 500-3000 > 3000
2.
3.
4.
5.
6.
7.
Alkali hazard
Sodium hazard
Spccificion toxicity
a.
b.
c.
Oil & Grease
Biodegradable organ ics
Phenol ics
Sodium adsorption ratio (SAR)
Percent sodium
Sodium(by SAR)
Boron
Chlorides
Sulphates
Hcxanc extractable matter
BOD5 2 0 C
As C 6 H 5 O H
< 5
< 60
< 3
mg/L < 6.5
mg/t < 200
mg/L < 480
mg/L < 10
mg/L < 100
mg/L < 10
5-10
60-75
3-8
0.5-2.0
200-400
480-750
10-100
100-500
10-50
> 10
> 75
> 8
> 2-10
> 400
> 750
> 100
> 500
> 50
effluent can not be considered safe for direct and continuous irrigation because the concentration of certain pollutants (Particularly high salt and sodium values) are high and may adversely affect the soils and crops in the long run. Adequate treatment must therefore be provided to bring down the concentrations of the pollutants to a level considered safe for continuous irrigation.
The major pollutants originating from various main processing units of a refinery have been shown in table-l,It will be useful to discuss the effect of these pollutants on soils and crops.
Salinity
Excess salt in irrigation water directly affects the plant growth 1S. The
wastes from spent caustic streams and acid wastes contains excessive amounts of salts after regeneration (TabIe-3). These streams contribute mainly to the increased salt content of the composite effluent. High salinity in the effluent used for irrigation will further increase the salinity of soil water due to evapotrans-piration and inadequate leaching, The problem becomes further aggravated If the soils of the region are already saline or if the ground water quality is brackish. When the salinity of the soil saturation extracts exceeds more than 500 u mhos/cm the yields of many sensitive crops are restricted (Table-5). Refinery effluents with EC of less than 500 u mhos/cm are idealy suited for irrigation of all crops in all soils (Table-6). If the EC of the composite effluent exceeds

124 MISHRA ET AL
1000 u mhos/em caution has to be applied for the selection of crops ami choice of soil types. If the EC of the effluent exceeds 2000 u mhos/cm care must be taken to grow only selected salt resistant crops in light textured soils with good sub-soil drainage to facilitate leaching and prevent soil salt accumulation. It is imperative therefore to isolate, seggre. gate the salty effluents to bring down the salinity of the effluent meant for irrigation-
Sodicity
Effluents having a ratio of Na to (Ca + Mg) higher than one have been suggested leading to sodium hazard of fine textured soils19. The distinguishing characteristics of such sodic/alkali soils are high content of exchangeble sodium and consequent decrease in the permeability of soils due to deflocculation of soil colloids. Such soils are hard and compact and not easily amenable to tilling. The alkali hazard of irrigation waters is measured mostly by two parameters, viz., Sodium adsorption ratio and percent sodium. The percent sodium is related to the nutritional hazard to plants while the SAR value is a better indicator of the exchangable sodium percentage and serves as a delicate index of potential sodium hazard of irrigation waters (table-5). The sodium hazard to soils is considered negligible if the SAR does not exceed 5, which implies that such an effluent can be used in all situations (Table-6). When the SAR of the effluent exceeds more than 10, it becomes necessary to use discretion in choosing soils of right texture and drainability. Likewise, if the per cent sodium value of the effluents remain within 60, it can be used for all crops without hesitation (Table-5). A sodium per cent value of the effluent exceeding 75 with SAR exceeding 10 is considered unsuitable for
all crops and soils. Liquid wastes orig^ nating from crude desalting, spent caustic streams and the DM plant effluent contain very high amounts of sodium ions (table-l & 3). When it mixes with the effluent from other streams, it increases the SAR and per cent sodium values of the composite effluents. Correspondingly, it decreases the quality of the effluent for irrigation. It naturally suggests therefore that it will be desirable to seggregate some of these streams and discharge the wastes separately (if found feasible) to improve the quality of the final effluent.
Acidity and alkalinity
Large quantities of acids and alkalies are used in refinery operations. The pH of the various caustic streams is very high because of the use of sodium hydroxide. Similarly, the pH of the acidic waste streams is very low because of the use of acids or generation of acidic wastes. Crude desalting and cracking processes (both catalytical and thermal) produce alkaline waste waters, whereas alkylation and polymerization processes contribute to the acidity of the wastes5. The spent caustic streams (Benzene sulphonation scrubbing and polymerisation units) also discharge highly alkaline waters (Tablc-1), the pH of which exceeds 12. The variation of the pH of the effluents is not a major problem since pH control could be managed by measures such as neutralisation, balancing, equalisation and dilution by large volumes of cooling waters. The p H o f t h e composite refinery effluent is generally maintained within 6.5 to 8.5 which does not affect the soils or crops.
Sulphates, Sulphites and Sulphides
Sulphates occur naturally in all waters. The refinery effluents contain

REFINERY EFFLUENTS 125
sulphur in all its forms i. e„ as sulphides, sulphites, thiosulphates and sulphates. Soluble sulphides are however dominant constituents of refipery effluents. Crude oil desalting, fractional distillation, cracking, alkylation and hydrotreating are the units which discharge large quantities of effluent containing sulphides. Since sulphides interfere with the refining process, these aje removed by caustic or diethaloamine scrubbing or appear as sour condensates water in these initial processing pggrations. Most of the soluble sul£j||jd«s are converted to H2S and removed either by steam stripping or chemical precipitation5. The composite refinery effluent contains about 10-220 mg/1 (tabIe-2) and the treated effluent rarely contains any sulphides. Since the concentration of sulphides in the final effluent is nil or so negligible, it is not likely to create any problem in the irrigation of crops.
The maximum permissible concentration of sulphates in irrigation waters is 20 meq/1 (960 mg/1) and the total sulphates concentration in the composite refinery effluent invariably remains much below this level. The effluent discharged from the DM plant may contain very high concentration of total sulphates (table-3). The discharge of the DM plant effluent is not very large, hence it may be possible to isolate this effluent stream to improve irrigation water quality. The reduction of sulphates and incompletely oxidised inorganic sulphur compounds to hydrogen sulphides is relatively unimportant in well aerated soils19.
Oxygen Demand
The oxygen demand of refinery effluent can be measured as IOD (Immediate oxygen demand), BOD (Biochemical Oxygen Demand) and COD (Chemical Oxygen Demand)3. Almost
without exception, the untreated refinery wastes exert a major oxygen due to the presence of soluble hydrocarbons and sulphides. Crude and product storage, crude oil desalting, catalytic cracking and dewaxing operations discharge effluents with very high COD. BOD is primarily exerted in effluents from crude oil desalting, catalytic cracking, dewaxing, drying and sweetening operations5. The BOD of the composite refinery effluent however rarely exceeds 250-300 mg/1 and COD 350-500 mg/I (table-2). The BOD and COD values of fuily treated composite refinery effluent is much less (table-4). The IOD of the final ef$S®at is negligible. Biological treatment of the effluent considerably reduces the oxygen demand values (BOD & COD) for land application systems. The BOD and COD values of treated composite refinery effluents do not exceed 25-30 mg/1 and 50-60 mg/1 respectively. Although, rigid values can not be formulated in terms of BOD or COD concentrations, it is generally agreed that a maximum permissible limiting concentration of 500 mg/1 in terms of BOD should form the upper limil2°.
Free and Emulsified Oil
Free oil is found in appreciable quantities in the effluent discharged from crude oil and product storage, fraction distillation, cracking, reforming, polymerisation, alkylation units and dewaxing operations. Emulsified oil appears in large quantities from crude oil desalting and fractional distillation units. Some untreated refinery effluents may contain free oil as high as 2000-3000 mg/1 (table-2), and emulsified oil from 80-120 mg/1. After the separation of the free oil by gravity separators and the removal of emulsified oil by air flotation and/or precipitation, these pollutants are reduced significantly. With the modern treat-

126 MISHRA ET AL
merit methods, the total oil concentration (hexane extractable matter) in the final composite effluent seldom exceeds 5-10 mg/1 (Table-4).
Review of available literature indicates that the amount of residual oil contributed by the final refinery effluent would not impair its utility for irrigation purpose. Hydrocarbons, particularly those of aromatic types which are highly toxic, have been extensively used as weedicides for the control of weeds in irrigation ditches. The practice has not caused any economically important damage to the standing crops. It has also been reported that the aromatic hydrocarbons even at a dosage of 300 mg/1 in irrigation waters did not damage or affect the yield of field crops". 1SI2» has suggested a limiting concentration of 10 mg/1 of oil for irrigation waters. But on the basis of data available it is suggested that this limit is very strict and could be relaxed to much higher levels (table-6) depending upon the soil conditions and climatic considerations. For continuous irrigation it is preferable to limit oil concentration to 10 mg/1 to rule out any possibility of long term adverse effects. Oil in excessive concentrations (500 mg/1) could prove harmful to soil microflora interfering with aeration of the root zone and photosynthetic activity -of algae by surface coating phenomenon. Murphy21 observed that surface of crude pelroleum on soils did not inhibit the germination of wheat seeds when applied at the rate of 500 gals/acre but when applied at the same rate germination was affected severely when the crude oil was mixed with upper 4 inches
• of the soil layer. Such extreme applica tion of oil loading is inconceivable even when the untreated refinery effluent is considered for irrigation and much less when treated effluent is used for crop irrigation.
Phenol
Phenol is a common constituent of the refinery wastes. It is produced in many refinery operations but the catalytic cracking and crude oil distillation sections contribute the maximum amounts4. The composite refinery effluent contains 10-30 mg/1 of phenol (tablc-2). Biological treatment like activated sludge, aerated lagoon and trickling filters reduce the phenol concentrations to very low limits. A well treated refinery should not contain more than 1-2 mg/I of phenol. Because phenol is present in such low concentrations and because it is bio-degradable, it will get easily decomposed by soil microorganisms in well aerated soils. It has been reported that phenol is not deleterious to soils or crops even at a concentration of 40-50 mg/1 in irrigation waters32.
Chlorides
Chlorides are harmful to crops when present in concentrations exceeding more than 20 meq/I (700 mg/I) in irrigation waters. The concentration of chlorides in treated composite refinery seldom exceeds 300 mg/I (tabIe-2), assuming that the level of chlorides in raw water supply is within reasonable limits. The chlorides in the effluent arc mainly contributed by crude desalting and alkylation operations5. The effluent from the demora l i sation unit also contains high chloride concentrations (tabIe-3). Chlorides, in any composite refinery waste, will not create problems for crop irrigation as these will be found well below the limit ing concentrations.
Metals
Occasionally, some of the heavy metals may be encountered in trace
-concentrations in the final refinery, efflu-

REFINERY EFFLUENTS 127
ent. Chromium, copper, lead and zinc are the elements that could be expected. Greater toxicity of these elements to plants, acts as a major barrier against toxicity to man and animals. Plants do not absorb Pb, As, Zn, B and Cr in quantities to pose hazards to people or animals consuming the plant produces. As far as food chain relations are concerned, the levels of metals found in refinery effluent should not cause any serious concern for reasons discussed. But a monitoring of their possible accumulation in soil is important from the view point of ground water pollution8.
Summary and Conolusions
This paper describes the characteristics and pollutional effects of treated refinery effluent meant for agricultural use. The water quality criteria for irrigation, as applicable to treated refinery effluent, have been discussed. On the basis of available data and literature review, the authors are of the opinion that segration of certain effluent streams toxic to plants or soils and subsequent treatment by physical, chemical and biological methods can produce a final effluent that will meet the required irrigation water quality standards. In arid regions of the country where the evapo-transpiration exceeds the annual rainfall and where adequate surface or ground water is not available, treated refinery effluent can be used for supplemental irrigation. Recycling of refinery effluent by land application will achieve many objectives such as renovation of effluent, utilisation of used water, and the prevention of pollution of surface water streams meant for community water supply.
REFERENCES
1. Wilson, C. W. and Beckett, F . E. Municipal Sewage Effluents for Irrigation. The Louisiana Tech. Alurnini Federation, USA, 19G81
2 Nemcrow, N . L. Theories and Practices of Industrial Waste Treatment. Addison-Weslty Publishing Co. Inc., Reading, Massachusetts, 1963.
3. American Petroleum Institute. 1st Fdn. Manual on Disposal of Refinery Wastes Vol. I Liquid Wastes. Washington, DC. 1969.
4. Ford, D. L. Ch. 8. Water Pollution Contro. in Petroleum Industry in Ed. Azad, H. S. Industrial Waste Management Handbook. Mc Graw Hill Book Company, New york 1976.
5. Jones, H . R. Pollution Control in the Petroleum Industry. Noyes Data Corporation, New Jersey, London., 1973.
6. Fcrgusan, H . Ch. 4. Acceptability of Waste Water Effluents by soils. Ed. Sanks, R. L. & Asano, T. in Land Treatment and Disposal of Municipal and Industrial Waste Water. Ann Arbor Science Publishers Inc. , Michigan 1976.
7. C . P . H . E. E. O. , New Delhi and N . E . E . R. L , Nagpur Course Manual on Industrial Waste Treatment 1975.
8. Kale, C. K., Mishra, R. P. and Sundaresan, B. B Utilisation of Petroleum Refinery Effluents for Crop Irrigation. Proceedings of the Seminar organised by Indian Oil Corporation at Haldia Oil Refinery, (W. B.) on 7th April 1980.
9. Mc Kinney, R. E. Biological treatment system for refinery wastes. Jour. Wat. Poll Control Fed. 39, 346 1967.
10. Indian Standards Institution, New Delhi. Proposed Draft Indian Standard Guide for treatment and disposal of effluents ol Petroleum refinery industry CDC 26 (6321) 1980.
11. Wilcox, L. V. Classification and use of irrigation waters. U . S. D. A. Circular No. 969 1959.
12. Richards, L. A. Diagnosis and improvement of saline and alkaline soils. U. S. D. A. Agricultural Handbook No. 60 1968.
13. Mc Kee, J . E. and Wolf, W. H . Water Quality Criteria. State Water Quality Board, California 1963.

128 MISHRA ET AL
14. Rhodes, J . D. and Bernstein. Chemical physical and biological properties of irrigation and soil water. Ed. Leonard L. Ciaccio In Water & Water Pollution Hand Book-Vol. I . , Marcel Dckker Inc. , New york, 1971-
15. Wilcox, V. Effects of industrial wastes on water for irrigation use. Am. Soc. Testing Mats. Tech. Publn. 273, 1959.
16. Frank; M. D ' l t r i . 1977. Waste Water Renovation and Reuse. Marcel Dekker Inc. New
York. •
17. U. S. D. A., U . S. Army and U. S. E. P. A. Process Design Manual for Land Treatment of Municipal Waste Waters 1977.
18. Paliwal, K. V. Irrigation with saline waters. Water Technology Centre, New Delhi IARI Monograph No. 2 1972.
19. Bear, F. F . Chemistry of the soil. 2nd Edn.
Oxford and IBH Publishing Company, New Delhi, 1976.
20. Indian Standards Institution, New Delhi, IS : 3307. Tolerance limits for industrial effluents discharged on land for irrigation purpose, 1977.
21. Murphy, H . F. 1929. Some effects of crude petroleum on nitrate production, seed germination and growth. Soil Science, 27 : 17, 1929.
22. Meinck, F. Stoff, H . and Kohlschitter, H . Industrial waste waters, (Industrie-Abwasser). 2nd Fd. Gustav Fischer Verlag. Stuttgart 536, 48 D. M . 1956.
23. Allaway, W . H . Food chain aspects of the use of organic residues. In Soils for Management of Organic Wastes and Waste Waters. SSSA, ASA, CSSA, Madison, Wisconsin, USA 1977.

IAWPC TECH. ANNUAL, VIII 129-146, (1981).
Paper Mills Effluent For Sugarcane Irrigation M. R. REDDY,* JIVENDRA,** AND S. C. JAIN***
Introduction
The industry today, faces the question ' How to dispose of the effluent ? ' The problem is still more acute for the Pulp & Paper Industry which consumes large quantity of water and in turn lets out high volume of effluent. The problem is to aggravate with the pace of industrialisation. Considering the industrial growth vis-a-vis the pollution of water resources, even the advanced countries have accepted it as unavoidable one and never tried to curb the industrial growth in spite of effective legislation and insistence of pollution control measures. If the effluent from the Pulp & Paper industry could successfully be used for irrigational purposes, besides economical and complete abatement of water pollution, which is not possible even with the best technology available, many lands, especially in a country like ours, which often depend upon God, can be successfully irrigated. Many paper mills located in proximity of rivers but without much resources for proper treatment of their effluents can possibly take advantage of the proposition.
Literature Review
by Industrial waste water has been tried
several workers for irrigation. The
waste water from cheese factory and Dairy have been found quite effective for several crops1, 2. Sulphite pulp mill waste water was observed to have no adverse effect on Sunflower seed germinations. Field studies with pulp mill waste for irrigation of crops like potatoes, corn, bean, cabbage, carrots and tomatoes etc, gave results comparable with that of irrigation with plain water Kraft pulp mill waste water has been utilised for a number of grasses,5. No adverse effect has been observed on the yield of crops like cotton, corn and grasses etc. by using waste water from pulp and paper mill 6 , 7. Encouraging results were also found in studies on irrigation of crops like paddy, wheat and groundnut with the waste water from pulp and paper mill8. Rajannan et al9 studied the germination of crop seeds of rice, black gram and tomato and indicated the possibility of irrigation of suitable crops by the kraft pulp and paper mill waste water.
However, no reference is available for irrigating sugarcane with pulp & paper mill waste water.
Background
Out of about 5000 acres of land in Rayagada (Orissa) cultivating sugarcane.
* Incharge, Water Services, Presently, a Consultant, Industrial Water & Wastes at Hyderabad. ** Manager (Control & Tech. Services)
*** Vice President (Works), J K Paper Mills (A Division of Straw Products Limited), Jaykaypur, Orissa.
129

130. REDDY ET AL
TABLE-1 Analysis of The Combined Effluent
Range
PH
Calcium-
Magnesiurrt
Posphorus.
Sodium
Potassium*
Boron
Tntal'Nitrogerr
Sodium
Carbonate alkalinity
Bicarbonate alkntinity
Sulphate as SO4
Total suspended solid*
Total dissolved solids-
BOD5
COD
iing/l
» »
*i
rt
>y
r>
j »
0 /
mg/1
> '
> i
>>
J *
> • >
7.0
80
20
»
140
6
6.1
0
20
C)
80
HO-
400
600
100
600
9.0
120
2 i
3.0
190
14
0.1S
3.0
31.0
10.0
120
120
fiOO
800
140
700
cotton and paddy etc. approximately 1,500 acres in close vicinity of the JK. Papar Mills grow sugarcane. As the cultivators depend on the rains only, they usually plant CO 997 or CO 881 or CO 12675 variety of sugarcane which is resistant to drought conditions but of low yield type.. The analysis of composite samples of the untreated effluent, of course, let out after exhaustive internal controls (table-1) indicates it to contain elements which are helpful to sugarcane growth if not high nutrients and it falls well within the tolerance limits prescribed by I. S. I. standard (table-2) No.
3307/1977 for effluents suitable for irrigation. Effluents moderately alkaline in nature, could safely be used directly for any crop on soils of loamy and sandy loamy texture and for salt tolerant crops on dry loamy and cfay soils whereas diluted effluent is suitable for all crops and soils. Any harmful effects of residual carbonate and boron are not known which are within limits otherwise. An irrigation water for sugarcane with sodium % below 50, Boron in between 0.3-1 ppm and Residual carbonate less than 1.25 mg/1 has been rated as excellent to good10. Even National Environmental

PAPER MILL EFFLUENT 131
TABLE- 2 I. S. I. Standard 3307-1977
for tolerance limits for effluents suitable for irrigation
pH 5.5-9.0
BOD5 mg/1 500
Total dissolved solids ,, 2100
Oil & grease ,, 10
Sulphate , , 1000
Boron ,, 2
Sodium % 60
Engineering Research Institute, Nagpur observed that the effluent after primary sedimentation can safely be used for sugarcane irrigation. Rayagada region having strong acidic, coarse textured and sandy loamy soil and sugarcane, a major cash crop in the area, being classified as salt tolerant crop, the authors initiated a study on the utilization of the untreated combined effluent from the integrated pulp and paper mill for the irrigation of sugarcane with respect to its effect on the soil and the crop.
Procedure
The experiments were carried out on about 2 acres of land in vicinity of JK Paper Mills for 8 years. Set-Ill was continued on the land on which earlier Set-I & II were carrid out. To have a systematic study, the active cooperation and assistance of Sugarcane Research Sub-station, Government of Orissa was taken. • In all, four sets of experiments, each consisting of plant crop, 1st and 2nd ratoons were conducted to study all aspects. The combined effluent from various sections of the pulp and paper
plants, without any physical or chemical treatment but after maximum possible internal controls to ensure least possible pollutants, was used for all the experiments. However, no solid waste was allowed to mix with it.
The fields were ploughed to a depth of 9" for 5-6 times to make the soil soft. The planting in the scheduled manner and harvesting after about a year were done at the same times to have a comparative study. In 1st and 4th set of experiments, sugarcane variety Co 997 and in 2nd and 3rd Co 419 were plaated. The former is the veriety rcsitant to drought conditions prevailing in the region and the latter, a high yield type provided adequate irrigation is available. Fertilizers used were Ammonium Sulphate, Super Phosphate and Muriate of Potash as sources for Nitrogen, Phosphorous and Potassium respectively. No irrigation cither with effluent or fresh water was given during monsoon period, i. e. July-October. All possible date especially the yield and quality of sugarcane and sugar were collected. The initial as well as final pH of the soil from the experimental fields were tested. Few soil samples were also tested in detail for their characteristics.
The data for experiments conducted with different levels of nutrients and irrigation intervals in Set-Ill and IV respectively were statistically analysed to interpret the results.
Set - 1 formed initial experiments irrigating with effluent only (flooded irrigation) without following any manuring or irrigation schedule. As it gave satisfactory growth, higher yield better quality of juice, when compared to the local fields irrigated with fresh water, a systematic study was planned.

132 REDDY ET AL
In Set II, two adjacent plots of equal area were irrigated separately with equal quantity of fresh water and effluent at intervals of 7 days keeping the manure levels of N, 73; P 2 0 5 , 75: K 3 0 , 45 (all in kgs per acre) identical in both the cases for the major crop. 1 st and 2nd ratoons were fertilized with N 36 kgs, P 2 0 5 27 kgs and KaO 23 kgs per acre.
Set III was a completely nutrient experiment designed statistically to study on the response variation with N. P. K. Irrigation was carried out identically with fresh water and effluent on 2 x 3 3
arrangement, i. e. 27 No. of sub-plots for each irrigation with three different levels of N. P. K. Fertility status of soil before taking up this experiment was : Carbon 0.25%, pH 4.65, Potassium 76 kgs and Phosphorus 9 kgs per acre respectively. The different nutrient levels were as under :
N 73 110 and 146 all in P 2O s 36, 55 73 kgs per K aO 23, 34, 45 acre.
Nitrogen was applied in 3 split doses whereas P and K at the time of planting only.. The quantity of irrigation given at 10 days interval between November-June was identical for all plots, i. e. 203 cms/ acre per crop excluding the rainfall being 140 cms per annum on average.
For 1st ratoon the dose of fertilizers was as under :
Table-3 : Set-I-Resnlts with effluent irrigat ion only.
N P 2 O 5
K aO
36 18 22
55 27 34
73 36 45
) ) )
all in kgs/ acre.
The cattle damage did affect data collection 1st ratoon crop. In the 2nd ratoon, identical doses of P 2 0 5 27 kgs, N 36 kgs and KaO 23 kgs per acre were given.
Cane yield Juice analysis Corrected brix Sucrose Pol CCS Purity pH of soil Initial Final
T/acre
0 /
O'
% %
1 32.0
21.4 J8.78 1.185
87.7
4.5 5.5
2 22.0
19.8 17.0 1.22
85.85
5.5 6.0
3 15.5
17.0 14.9
1.116 87.65
6.0 6.3
NB : 1,2 & 3 denotes plant, 1 st and 2nd ratoon crops respectively. Above figures are averpges of a number of readings.
Set-IV of experiments designed statistically were undertaken to study the effect of varying irrigation intervals and Nitrogen levels under the split plot design irrigation with the effluent only being the main plot treatment and levels of N being the sub-plot treatment. 36 plots each of 33' x 33' were divided for three levels of irrigation, i. e. 10, 15 and 20 days intervals. Each level of irrigation had 3 levels of Nitrogen, i. e, 36 kgs, 73 kgs and 110 kgs per acre. P 2 0 5 and K 9 0 were kept constant at 55 and 45 kgs per acre.
Observations and Results
Set-I : With flooded effluent irrigation, the yield was higher when compared to the local plant and 1st ratoon average yield of 22-24 and 17-20 tons/ acre (table 3; for well irrigated and rain-fed field respectively, in spite of the fact that no irrigation or manuring schedule was followed.
The quality of juice was also better when compared to the local corrected brix of 15/18 and purity % of 80/82. Soil pH increased from 4.5 to 6.3 after 3 years of irrigation, 1st year increase was higher but later reduced.

PAPER MILL EFFLUENT 133
TABLE-4 Set-II Results w i th effluent and fresh water irrigations.
Germination
Tillers per linear 30 cms.
Cane height
Girth
Cane yield
Juice analysis
Corrected brix
Sucrose
CCS
Purity
PH of soil
Initial
Final
/o
No.
cms
cms
T/acre
/o
/o
<y la
/a
IE
55.2
4.2
330
2.54
48.22
22.0
18.75
1.16
85.27
4.5
6.0
IF
45.5
4.5
338
2.26
41.36
21.2
18.3
1.16
86.32
4.5
5.5
2E
-
3.11
-
-
21.73
22.68
19.8
1.22
87.3
6.0
6.3
2F
-
3.53
-
-
12.27
22.42
20.0
1.26
89.3
5.5
5.5
3E
-
3.53
262
-
19.93
21.4
18.8
1.16
87.8
C.3
6.5
3F
-
3.2
237
-
17.8
20.6
18.0
1.18
87.3
5.5
5.7
- 1, 2 & 3 denotes plant, 1st and 2nd ratoon crops respectively. - E & F denotes irrigation with effluent and fresh water respectively. - Above figures are averages of a number of readings.
Set-II : The crops, in general, were practically the same in their characteristics except that germination percentage was higher with the effluent irrigation. The average yield with the effluent for plant - 1st ratoon crop was higher by about 30% when compared to that of fresh water (table-4). Quality of juice was well comparable. Soil pH increased from 4.5 to 6.5 after 3 years of effluent irrigation in comparison to 5.7 with the fresh water. 1st year increase was significant but later it was marginal.
Set-Ill : In general, effluent irrigation gave better results in respect of germination, cane height, girth, yield of cane, extraction and quality of the juice
in all the three crops (table-5a-5c). Quality of juice was observed to be better in 1st and 2nd ratoon crops when compared to the major crop in both the cases of effluent as well as fresh water irrigations. The average increase in yield of all the three crops and plant - 1st ratoon crops were about 15% and 18% respectively more in effluent irrigation than with fresh water.
The effluent irrigation had significant effect on cane height, girth, cane yield and corrected brix in the major crop but in 1st and 2nd ratoon crops there was no significant effect.
The different levels of fertilizers had no significant effect on any of the chara-

134 REDDY ET AL
TABLE - 5-a
SET- III PLANT CROP RESULTS W IT H DIFFERENT LEVELS OF FERTILIZERS
Fertilizer
Germination
% E F
Tillers/linear 30 cms
Nos.
E F
Cane height
cms
E F
Girth
cms
E F j
Cane yield
T/acre
E F
Levels of N
N»
N2
N 3
Levels of P
P»
P?
Pa
Levels of K
K,
K2
K 3
Average
F test (0.05)
49.37 46.08 3.41 3.46 353.3 345.6
51.32 45.74 3.55 3.57 352.4 349.7
43.99 48.11 3.67 3.58 361.0 338.8
51.37 48.23 3.64 3.58 352.2 348.8
46.40 45.21 3.55 3.53 350.7 336.4
40.91 46.49 3.64 3.49 363.8 348.5
47.72 50.59 3.63 3.74 346.6 347.4
50.86 43.69 - 3.54 3.32 359.5 340.4
46.10 45.66 3.46 3.54 360.6 346.0
48.23 46.64 3.54 3.54 355.6 344.6
Not. sig.
Std. error of Mean (SEm) NPK 2.04
E 283
Not sig.
0.096
0.124
Between I sig.
4.58
7.33
2.94 2.86 52.26 44.47
2.89 2.86 50.G3 46.34
2.98 2.86 51.11 43.02
2.92 2.85 51.28 45.09
2.94 2.89 50.43 45.96
2.93 2.83 52.28 42.79
2.9! 2.76 50.08 44.89
2.95 2.93 52.54 46.25
2.95 2.88 51.37 42.69
2.94 2.86 51.33 44.61
Between K Between I and between sig. I sig.
0.03
0.209
1.62
2.18
Note :-E and F denotes irrigation with effluent and fresh water respectively.
-Sig. and I stand for significant and irrigation respectively.
—Above figures are averages of a number of readings.

PAPER MILL. EFFLUENT 135
IRRIGATED WITH EFFLUENT AND FRESH WATER
Extraction of juice
Corrected brix
Purity
50.1 44.8 21.48 20.55 1.003 0.993 17.37 15.86 80.86 82.04
46.1 50.4 21.33 20.46 1.062 1.010 17.74 17.00 83.16 83.09
49.5 43.1 21.52 20.82 1.013 0.960 17.38 16.61 80.76 79.78
49.1 45.9 21.61 20.85 1.073 0.991 18.02 16.94 83.38 81.25
46.1 46.8 21.26 20.59 1.011 1.035 17.20 17.30 80.90 84.02
50.5 45.6 21.45 20.39 0.993 0.936 17.27 16.23 80.51 79.59
48.2 43.1
49.9 47.7
47.6 47.5
48.6 46.1
Interaction N X I sig.
21.75
21.46
21.11
21.44
20.94
20.40
20.49
20.61
Between Is ig .
1.116
0.954
1.008
1.026
Not sig
1.033
0.970
0.959
0.987
18.43
16.87
17.19
17.50
Not sig
17.39
16.58
16.50
16.82
84.73 83.04
78.60 81.27
81.43 80.53
81.62 81.61
Not. sig.
1.38 0.346 0.G43 0.55 1.52
1.41 0.420 0.053 0.69 1.88
Soil pH
E
Initial 4.5
Final 6.0 5.0

136 REDDY ET AL
TABLE-5-b x S-IU-IST
RESULTS W I T H DIFFERENT LEVELS OF FERTILIZERS
Levels of N
N i
N2
N 3
Levels of P
P»
Pa
*3
Levels of K
K l
K 9
K 3
Average
F teat (0.05>
• Std. error of Mean (SEm)
NPK
Effluent
1 Tiller per ! 30 c | Nos 1 E
3.73
3.46
3.26
3,93
3.06
3.46
3.60
3.18
3.67
3.48
Not sig.
0.239
0.367
linear ns
F
3.04
3.31
3.21
3.12
3.30
3.14
3.43
3.24
2.89
3.19
Cane height
cms E F
268.5
268.8
271.6
273.8
271.2
263.8
253.6
276.9
278.3
2C9.6
269.9
269.0
256.0
265.4
268.9
260.7
270.0
258.7
265.1
265.0
Not sig-.
8.40
13.09
Gir th
cms E
2.72
2.70
2.74
2.74
2.73
2.69
2.77
2.64
2.75
2.72
Not sig
0.046
0.082
F
2.66
2.70
2.77
2.70
2.64
2.79
2.69
2.68
2.76
2.71
Cane
T/A E
26.55
30.08
32.50
31.66
27.23
28.88
28.63
28.52
31.09
29.51
-
yield
ere F
24.52
23.30
23.38
25.38
24.24
21.58
26.62
24.06
20.52
23.73
Note :- E & F denotes irrigation with effluent and fresh water respectively.
— Sig. stands for significant.
— Above figures are averages of a number of readings.

PAPER MILL EFFLUENT 137
RATOON CROP
IRRIGATED WITH EFFLUENT AND FRESH WATER.
Extraction of juice
/o E F
Corrected Brix
% E F
CCS
0/
/o E F
Sucrose
/o E F
Purity
% E F
53.0 50.7 20.74 20.81 1.139 1.179 18.33 18.85 88.48 90.58
54.8 47.5 20.22 20.22 1.131 1.142 18.15 18.22 89.76 90.11
47.8 47.8 20.82 20.42 1.137 1.133 11.41 18.14 88.42 88.83
50.0 46.7 20.48 20.52 1.108 1.166 17.99 18.55 87.84 90.40
53.7 51.9 20.60 20.59 1.152 1.166 18.44 18.57 89.51 90.19
51.8 49.7 20.73 20.34 1.146 1.122 18.49 18.04 89.19 88.69
53.7
51.1
50.7
51.8
50.4
50.0
45.6
48.7
Interaction P x K sig
1.41
2.39
SoU pH
Initial Final
20.93 20.30
20.25 20.58
20.62 20.58
20.60 20.49
Not sig.
0.18
0.30
E 6.0 6.0
1.159
1.121
1.126
1.136
Not sig.
0.018
0.028
F 5.0 5.5
1.127
1.170
1.157
1.151
18.67
18.06
18.18
18.31
Not sig
0.243
0.379
18.08
18.70
18.43
18.40
89.20 89.06
89.19 90.86
88.17 89.55
88.88 89.80
Not sig.
0.587
0.879

138 REDDY ET AL
cteristics of the plant or juice in any of the crops except the effect of K. on girth in the major crop.
However, interactions have been significant as per details given below :
Major crop - N and irrigation interaction extraction of juice. Level Nx with effluent or N 2 with fresli water gave better results.
1st ratoon - P x K interaction was significant on juice extraction. P a x K2 and P3 x Kx interactions gave better juice extractions.
2nd ratoon - N x Irrigation interactions were significant in case of corrected brix, CCS and sucrose %. N 9 x effluent irrigation gave better results in these respects.
Statistical analysis of cane yield in 1st and 2nd ratoons could not be done as crop in some plots was partially damaged by cattle.
With regard to the soil in the first year pH increased at a higher rate with the use of effluent but later the incrcasae was marginal. After 3 years of experiments, the final pH rose to 6.6 from 4.5 in case of effluent irrigated plots in comparison to 6.0 of fresh water irrigated ones ( table 7 )•
Main effect of P & K levels were significant for organic carbon content. Interactions P x I, N x P, N x K and P x K were also significant on this chara cteristic. Except pH and available K aO. which increased significantly with effluent irrigation, there was no other significant effect of effluent.
Set-IV : Summarized results of the data statistically analysed as given in tables 6a-6c indicate that there has been in general, no significant effect of irrigation intervals either on the cane or juice characteristics in any of the crops. However, levels of N were found to have significant effect only on cane yield in major and 1st ratoon crops. In major crops, N 2 & N 3 levels being at par gave better results than Nx. In 1st ratoon crop, N 3 gave better results than Nx and Na> both being at par.
Levels of N had significant effect on cane height and utility of nutrients (ratio of cane to green tops weight) in 1st ratoon crop. N3 level gave much better results than Nx but slightly superior than N2 . None of the interactions were found significant. However, the following interactions were found to give better results.
Major crop - N3 x Ix on cane and sugar yields and utility of nutrients.
1st ratoon - N 3 x I2 on tillers, cane height, cane and sugar yield and utility of nutrients. NjX I2 and N 3 x I3 on sucrose and purity of cane juice.
2nd ratoon - N 2 x Ix on sucrose, and crop sugar yields. N 3 x Ij on
girth.
There was no significant effect of levels of Nitrogen or interval of irrigation on any of the characteristics of soil including pH (table 8). The salient feature has been that there was very little increase in pH of the soil even after 3 years (6a & 6c ) of irrigation with effluent in this set. The initial pH of 5.0/

PAPER MILL EFFLUENT 139
H <
«
Q Z < H Z w
j
2 « * £ o o •<
h a! U W «1 N
* 3 is
1/3 - J w > « > - l
H Z id «
W
W
pa
w
T3 OJ
>* a L»
4J
h
b
[4
i- c cu u
6 o CO
r~
CO
~ o CO
o to CO
o CO
CO
o
CO
<o cn o CO
CN
s
CO
o CO
o
CO
CO
o CO
< 0
o CO
en
o CO
7> o CO
^z
S
—• r ^ ~->
CO en
CO
CM
CO
cv CN
O
-*•
cn lO CO
CO
—'
CO CO CO
o CO
CO
CO
o o
3 CO
cn
m CO
to
—. r .
CM —
— co
814
o
854
756
o
CO
795
o
739
776
o 80
0
819
o
831
-- r^
—, CN —
o CO
§
3 — on —>
co
CM — —•
S ** «
sx
.2.°° « '—*
I—I /-*
o t ^ .
o
r*» in
CO
O
r- '-o
r -. O l O
C .
— !A
ax £z
z
o o
©
utnA
2£ W
o o
CI •+ • f
o
1
a.
cc.i
vcly
. w
ater
res
di
ngs.
t re
sp
fres
h of
rea
S ~° •
8 s a = c § oo u 3 • - 3 c
and
s he
ffl
of a
irri
gati
on
gati
on w
it
: av
erag
es
- 1
& s
ig.
deno
te
E&
F de
note
irr
i —
Abo
ve f
igur
es a
r
U,
U4
T,
o
o ID
a, "H
oil
w
nit
o
in to
ina
U.

140 REDDY ET AL
TABLE-6a. SET-IV PLANT CROP (MAJOR)
Characteristic
Germination
Tillers/linear- 30
Cane height
Girth
Cane yield^acre
CCS
Sucrose
Corrected brix
Purity
Sugar yield
cms
Ratio of cane weight to Green tops weight
Initial pH of soil
llJnit
/o
Nos.
cms
cms
T
/<>
/o
0 / •
/o
T
Nitrogen 1
N\
55.9
4.51
2G1.0
2.52
30.41
1.146
18.36
20.41
90.0
3.49
4.93
N2
55.8
4.29
2C6.3
2.56
34.04
1.119
17.99
20.08
89.6
3.83
5.60
•vei
N3
cycle
It
54.4 54.2
4.53 4.49
268.5 266.5
2.57 2.55
33:91 33.93
1.135 1.134
18.21 18.25
20.26 20.44
89.9 89.3
3.72 3.87
5.23 5.36
of irri
h
58.1
4.29
265.7
2.56
32.19
1.133
18.14
20.12
90.2
3.56
5.30
»ation
la
53.8
4.56
263.7
2.54
32.23
1.133
18.16
20.19
89.9
3.61
5.10
Avg.
55.4
4.45
265.3
2.55
32.79
1.133
18.19
j's. E. ,mcan
1.96
0.16
3.03
0.018
0.682
0.0271
0.369
20.25 0.343
89.8
3.68
5.25
0.807
0.12
0.279
5.0/5.3
F. test (0.05)
Not sig
- d o -
- d o -
-do
litwn. N sig
Not sig
- d o -
- d o -
- d o -
- d o -
- d o -
NB : Sig denotessignificant.
5.3 increased to 5.7/5,9 only. As on these plots, earlier set-I & set set-Ill were also carried out, the pH could be taken to rise from 4.5/4.8 to 5.7/5.9 in 6 years.
The detailed analysis of uncultivated, cultivated and after experiments with effluent for 3 years given in table 9 indicate no adverse effect on the soil characteristics due to effluent irrigation.
Discussion & Conclusion
The conclusions arrived along with their discussions wherever necessary, based on experiments on four sets of full crope each covering a period of three years and consisting of plant, 1st and 2nd ratoon crops using untreated efflueut
from an integrated pulp and paper mill adopting alkaline process of pulping for irrigation are given below :
a. The effluent from a pulp and paper mill with good internal controls containing moderate contaminants but appreciable quantity of soluble ogranics and elements like Calcium, Magnesium and Potassium etc. necessary for the plant growth and falling well within the limits of l.S.I. standard for effleunts suitable for irrigation can be advantageously xised for irrigation of sugarcane, salt, tolerant crop in nature, especially in tracts of acidic sandy or sandy loamy coarse textured soils.
b. The irrigation with effluent is

PAPER MILL EFFLUENT
TABLE-6-b : SET-IV- : 1ST RATOON CROP.
141
Characteristic
Tillars/lincar 30 cms
Cane height
Girth
Cane yield/acre
CCS
Sucrose
Corrected brix
Purity
Sugar yield/acre
Ratio of sugarcane weight to green tops wt.
Unit
Nos.
cms
»>
T
%
%
%
%
T
Ni
Ni
5.4
266.6
2.30
30.12
1.129
17.8
19.20
92.71
3.46
5.82
(rogen level
N2
6.2
276.2
2.21
34.13
1.090
17.37
19.24
90.14
3.76
5.85
N3
Irrigation cycle
h
6.2 5.1
279.6 272.2
2.28 2.27
34.36 32.51
1.110 1.078
17.59 17.27
19.31 19.11
91.09 90.37
3.88 3.60
5.93 5.70
h
6.8
276.8
2.24
33.69
1.138
17.84
19.44
91.77
3.84
5.90
13
5.8
273.4
2.28
32.41
1.112
Avg. S. E. mean
5.9 0.478
274.1 1.20
2.26 0.044
32.87 0.593
1.110 0.0283
17.65 17.59 0.374
19.2
9I.S£
3.66
5.50
19.25 0.258
91.38 0.847
3.70 0.068
5.70 0.153
F test (0.05)
Not sig.
Btwn. N sig.
Not sig.
Btwn. N sig.
Not sig.
Not sig.
- d o -
- d o -
Btwn. N sig.
- d o -
NB : Sig. denotes Significant.
superior than with fresh water in respect of yield of sugarcane and plant characteristics. The yield of sugarcane for plant 1st ratoon crops could be taken to be higher by a minimum of 18/20% in comparison to fresh water irrigations, though it goes to about 40% ( set-IV ) when compared to the local average yield. The quality of produce can be well compared with or rather considered better than that of fresh water. This is possibly because of (i) presence of soluble organic matter and elements necessary for plant growth in the effluent which is available to the plant directly, (ii) Calcium along with organic matter present in the efffuent in appreciabe quantity play an important role in formation of stable aggregates. The aggregates or grouping of soil particles in a manner to expose more air space between the particles help the plant to
grow with better root system12, (iii) organic matter constantly subjected to humification and mineralization, by a chain of reactions, help the plant growth and also makes the soil a store for moisture necessary for sugarcane especially in sandy soils.11 (iv) The increase in pH due to effluent irrigation on the acidic soil as sugarcane grows and yields well at pH 5.5-7.5, neutral pH preferred1*. At this pH, concentration of toxic ions in the soil decreases and more essential nutrients become available13.
c. The availability of effluent for irrigation especially on rain fed lands has one more aspect of better growth and yield. Sugarcane prefers high soil moisture and humidity for its vegetative growth particularly in hot climate, drought affects growth and maturity. 20% yield is believed to be increased by app-

142 REDDY ET AL
TABLE-6-c, SET-IV 2ND RATOON CROP.
Characteristic | Unit Nitrogen level I Irrigation cycle . , „ .„
6 I 5 7 | A y g _ g £ p t e s f
Cane height
Girth
Cane yield/acre
Sucrose
CCS
Corrected brix
Purity
Sugar yield/acre
Raiioof cane wt.to green tops wt.
Final pH of soil
g"-
M
T
/o
/o
0 /
/o
/o
T
_
! 'Nl N 2 N3 I II 12 13 ' 'mean (0.05)
Tiller/linear 30 cms Nos. 5.C2 5.75 5.54 5.82 5.44 5.66 5.64 0.337 Not sig.
279.2 275.2 278.8 274.2 277.6 281.4 277.7 2.30 - d o -
2.56 2.55 2.64 2.60 2.57 2.59 2.58 0.037 - d o -
27.90 28.27 27.39 27.96 27.37 28:23 27.85 1-06 - d o -
19.12 18.60 18.53 19.27 18.57 18.41 18.75 0.386 - d o -
1.188 1.151 1.133 1.197 1.135 1.140 1.157 0.027 - d o -
21.51 21.25 21.20 21.25 21.45 20.93 21.32 0.344 - d o -
88.89 87.53 87.41 90.C8 86.57 87.96 87.95 0.566 - d o -
3.31 3.26, 3.10 3.35 3.11 3.21 3.22 0.122 - d o -
4.66 4.75 4.57 4.62 4.64 4.73 4.66 0.162 - d o -
5.9 5.7 5.7 5.7 5.6 5.9 5.7
NB : Sig. denotes significant.
lying right irrigation at the right time14, even after 6 years of continuous irriga-Photosynthesis in sugarcane is greatly tion with effluent. In the first year, impaired due to inadequate supply of there is an appreciable increase in pH water, the rate of pre-monsoon irrigation but later it is low/marginal, being highest.
g. The general apprehension that d. No adverse effect on the crop in the effluent, alkaline in nuture, would
any respect. have damaging effect on the soil due to constant absorption of bases leading to
e. Sugarcane crop has responded a stage of Sodium poisoning does not maximum to Nitrogen. Intervals of irri- hold good especially in the strata of gation did not indicate any significant sandy or sandy loamy coarse textured effect, 10 days being lowest. soil because of leaching phenomenon
during rains, (in Rayagada region rain. f. There is no adverse effect on the fall about 120 cms/annum). This is subs-
soil characteristics. The absorption of tantiated by the fact that when these bases including Sodium and organics is plots were kept uncultivated for 2-3 insignificant. The initial pH of the soil • years, the pH went down to 5.2/5.4. of 4.5-5.0 did not go beyond 6-6.7 when Mahapatra12 opines that inorganic and compared with 5-6 with the fresh water organic material leaches from one layer

PAPER MILL EFFLUENT 143
o o
W
a
w
w
It-
w
12
a
,(*
«
a
c
p
81
S w
s
td
td
tO
id
•^
s j ^ h o«a tfaTS.S.sgifi
c 4J •
s -a Sis
M4
c
5 . 4; bo
to tO id
t o q id
( M t O
id
CD
q id
a o
.269
o
.322
o
.306
o
q <d
<d CO
<d
6.81
CM
cd
.267
o
.236
o
0.31
7
l O
o CO o CO
cd lO CM CO
cd CM
CM
o CM CT! (M
O
t O CO
to
to
o
.306
o
p.
0 0 i-i
0 0
CO
CO
CT>
CO
s l O
r-
CM
l O
CM
CO
r-
q CM
• *
CM
t o CM
CO
£ l O
to
4.T
cd
~*. cd
•n •1-CM
CO
CM
CO
CO
CM
en CO
< X
•9
at
<3
n 2
3 -a § *

144 REDDY ET AL
TABLE-8 : Set-IV : Soil Characteristics after 3 years with effluent irrigation only bat with different Nitrogen levels and irrigation cycles.
Soil characteristic Unit Nitrogen level
Ni N2 N3
Irrigation cycle
12 13 Avg. F test (0.05)
pH 5.9 5.7 5.7 5.8 5.6 5.9 5.7 Not sig.
Replaceable sodium Meq/100 0.67 0.61 0.74 0.67 0.68 0.67 0.67 gms
Tolal soluble sails x l0"6mhos / 157 153 180 167 153 170 163 (Conductivity cm
Total Replaceable Meq/100 2.23 2.30 2.33 2.23 2.27 2.37 2.29 basis gms
Organic carbon /a
- d o -
Soluble sodium Meq/100 0.22 0.22 0.22 0.22 0.24 0.20 0.22 - d o -gms
- d o -
0.496 0.495 0.530 0.500 0.531 0.489 0.507 - d o -
to another under good rainfall and tempe rature. Joffee" has also confirmed that Sodium and Calcium leaches out in higher quantity than any of the cations especially in tropical climate. Calcium and Sulphur in form of organic sulphides in combination with organics present in the effluent help the prevention of Sodium poisoning and depletion of Calcium ions in the soil11.
h. In case of the effluent having high pollutants arid or the nature of the soil being different from the one in the experiments, it could be probably still used for irrigation of sugarcane after its primary clarification or partial boilogical treatment.
Advantages
Though findings are of universal application, they are more significant to Rayagada and similar regions. JK Paper Mills with an annual capacity of 40,000 tonnes let out 6.5-7.0 MGD of effluent. Assuming 1.5-1.8 MG per acre per
annum necessary for adequate irrigation, about 1500 acres of land can be profusely irrigated. The cost will be much lower than incurred on drawing water from Nagavalli Lift Irrigation Society. Moreover, they are unable to cater to the demand. Presently, about 300 acres are only irrigated and that too scanty. Ideal charge being about 300 cms per acre/ annum, the irrigation is only to the tune of 125-150 cms by rains and three irrigations of 10-13 cms each.
In the region, average plant-lst ratoon yield/acre using the effluent can be safely taken as 30 tons against the local average yield of 22-24 and 17-20 tons for irrigated and rainfed fields respe ctively. Besides, presently low yield variety cane like CO 997, resistant to drought conditions, is grown due to scarcity of irrigation. Once the effluent is available, high yield variety like Co 419 expecting an yield of about 45-50 tons per acre can be grown.
Considerable increase in yield of

PAPER MILL EFFLUENT
Table-9 : Comparison of the Soli*
145
Total Nitrogen
Available Nitrogen
Total Phosphorus ( P 2 0 5 )
Available Phosphorus (P2o5)
Total Potash) (K aO)
Available Potash (KgO)
Soluble Sodium
Exchangable Sodium
Organic Carbon
Cationic exchanging eapacity
pH of 20% aqueous Solution
Unit
%
%
/o
/o
0/
/o
/o
Mcq/lOOgms
0/ to
/o
Meq/lOOgms
Virgin soil from uncultivated
lands in Rayagada
region
0.055-0.099
0.0008-0.0018
0.077-0.29
0.01-0.16
2.31-2.52
0.0-0.028
-
0.04-0.06
-
10.7-14.3
5-5.5
Cultivated lands in Rayagada region-manured and
irrigated
0.04-0.1
0.001-.OOI5
0.134-0.222
0.04-0.13
1.54-2.1
0-0.017
-
0-0.6
-
3.8-21.0
5.0-6.3
Virgin soil from expri-mental plots
0.04
0.001
0.117-0.131
0.018
2.1-2.5
0.011-0.027
0.2-0.22
Traees
0.25-0.34
1.8-2.2
4.5-5.0
Soil after 3 years of irrigation with
effluent & manuring
0.04
0.001
0.118-0.15
0.004-0.052
1.54-2.12
Traces-0.027
0.22-0.24
0.014-0.02
0.27-0.50
3.8-6.4
6.0-G.7
sugarcane and its better quality, in addition to adequate and cheaper irrigation for larger area of land will amply benefit the cane cultivators, sugar mills and State exchequer.
Besides, the paper mills can be helped in reducing appreciably the expenditure on treatment of the effluent when it is to be discharged to the river.
Acknowledgement
Authors are thankful to the management of M/s Straw Products Ltd. for providing the facilities to carry out the studies and also their kind permission to publish the paper. They are grateful to the then Dy. Director, Agriculture (sugarcane), Govt, of Orissa, Shri K. C.
Mishra for the active cooperation and assistance through Sugarcane Research Station, Rayagada.
CREDITS TO :
- Shri C. Ch. Panda, the then Sr. Research Assistant, Sugarcane Research Station, Rayagada for his valuable guidance, supervision and assistance.
- Shri A. D. L. Prasad, Manager, Jcypore Sugar Co., Rayagada for his constant interest in the utilization of effluent for irrigation and also making the services of his laboratory available.
- Shri K. C. Swami, Agricultural

146 REDDY ET AL
Assistant, J. K. Paper Mills, for his day-to-day assistance.
- Shri S. D. Sharma, Sr. Chemist (SQC), JK Paper Mills for the statistical analysis of the experimental data.
REFERENCES
1. MCkee, F. J . Dairy Waste Disposal by spray irrigation, Sew. lndust. Wastes, 29, 157 (1957).
2. Rohlich, G. ct al objectives and procedures for a study of spray irrigation of Dairy Wastes, Proceeding 12th lndust. Waste Con/. Purdue University, Ext. Scries 94,636 (1958).
5. Bishop, F. W. and Wilson, J. W. South land paper mill waste Treatment and Disposal ' ' , Sew & lndust. Wastes 26, 1485 (1954).
6. Anon. Mill waste grows low and high corn, Pulp & Paper 28, 36 (1954).
7. McCormich, L. L. Effects of Paper Mill Wastewater on cattle, crops and soil, M. S. Thesis, Louisiana state University (1959).
8. Khambatta, S. J . and Kctkar, C. M, Present scheme for treatment and utilisation of paper mill effluent on land for irrigation presented in the symposium on ' Problems connected with disposal of waste from various industries round about Poona ' Nov. 29-30 1969.
9. Rajannan, G. and Obliswamy, G. Effect of Paper factory effluent on soil and crop plants, Indian J. Environ. Hlth,2 120-130(1979).
10. Singh, Todi. Rating of irrigation water for Sugarcane, cited by Chem. Analysis of soil by Jackson. M. L., unpublished lecture.
11. .Toffee, J . S. The ABC of soils, Oxford Book Co. 46-50, 83-84, 170-174 (1965).
12. Mahapatra, S. ABC of Sugarcane, Directorate of Agriculture and Food production Orissa, (1978).
13. Van Nostrand's Scientific encyclopedia. Van Nostrand Reinhold Company, New York, 1222-23 (1976).
14. Motiwala, M. P, Water management of Sugarcane Singh K, Recent Advances in production techniques of sugarcane; Alam, M. Climate requirement for sugarcane - All unpublished lectures delivered at Institute of Sugarcane Resarch, Lucknow.
15. " Standard Methods for the examination of Water and Wastewater ," APHA, AWWA and WPCF, New York (1965).
Spulnik, J . B. ct al Effect of Waste sulphite liquor on soil properties and plant growth, Soil Science 49, 37, (1949).
Stephenson, R. E. and Bollen, W. B.. Field use of Sulphite Waste liquor in irrigation water, TAPPI 32, 422 (1949).

fAWPC TECH. ANNUAL., VIIT 147-160, (1981).
Effects of Organophosphorus Insecticides on Fish and Fish Food Organisms S. K. KONAR* AND T. K. GHOSH*
Introduction
Pesticides are widely used for controlling agricultural pests and vectors. Most of these pesticides drain into water generally during monsoon period. Many toxicants are known to reduce the survival, growth and reproduction of fish and other aquatic invertebrates l, 5 Although the pesticides are useful in crop protection and hence unavoidable in agriculture the interests of pisciculturists cannot be ignored. In this study we have extensively tested a hypothesis proposed by Konar0,7 to estimate the safe concentrations of the organophosphorus insecticides to protect fishes and other aquatic life.
Materials and Methods
Materials : The fish Tilapia mossa-mbica, the plankton Cyclops viridis and the worm Branchiura sowerbyi were used as test organisms. The organophosphorus insecticides used were malathion 50 EC (O, O-dimethyl phosphorodithio-ate of diethyl mercaptosuccinate) marketed by Macneill and Berry Ltd,, Calcutta, rnetasystox [ O, O-dimethyl- S-2 (ethyl-sulphinyl) -ethylthiophosphate ] of Bayer India Ltd., Bombay, and ambithion 500 E which is 1:1 mixture of malathion and accothion [O, O-dimethyl 0-(3-methyI
-4-nitrophenyl) phosphorothioate ] marketed by Cynamid India Ltd., Bombay.
Methods • Bioassays were conducted in the laboratory (27.4 ± I.2« C) generally after the methods of APHA et al. Fish were exposed for 96 h in 15-liter glass aquaria containing 10 liters of unchlorinated borehole water (pH 7.0; DO, 8 ppm; total alkalinity, 177 ppm as CaC03) . The acute toxicity tests on plankton and worm were performed in 350-ml glass beaker containing 300 ml of borehole unchlorinated water in the laboratory. The tests for plankton and worm were run respectively for 48 h and 96 h to determine LCO, LC5, LC50, LC95 and LC100 (concentrations at which none, 5, 50, 95% and all died within specified period). The LC5 ; LC50 and LC95 values were estimated from statistically fitted graphs9, - l a .
Three series of feeding tests were conducted. In the first series fish were exposed to insecticides and they were fed with unexposed live food. In the second series, the fish were exposed and they were given live food which were exposed to the same concentration of the toxicant for 24 h, and in the third series, the unexposed fish were fed witft exposed live food. Live earthworms (Pheretima posthwna) were cut into
Fisheries Laboratory, Dept. of Zoology, Kalyani University, Kalyani (VV. B.)
147

148 KONAR AND GHOSH
TABLE 1 - Schedules of various outdoor tests.
Schedules
Treatment
Feeding
Water renewal
Growth measurement
Water analysis
Plankton sampling
Aquatic flora and bottom organism sampling
0
Apuarium
0,1,2,3
nil
(feeding) Vat day of Exposure
0,15,30,45, 60,75
6 days a week
2« ,13,28,43, 58,73
0,30,60,90
0,10,20,30 40,50,60,70, 80,90
Tank
0,15,30,45, 60,75
6 days a week
Nil
0,120
0,15.30,45, 60, 75,90, 105,120
0,20,40,60, 80,100,120
120
"Day before exposure.
pieces and used as food. Various schedules are given in Table I.
Long-term tests on fish were conducted in 60-liter earthen vats containing 50 liters of water for 90 days and in cement tanks (108 x 150 x 584 cm) for 120 days containing 6474 liters of water. In each tank, finely minced soil was added to form 1-inch thick layer at the bottom; and this soil was treated with 1 kg of lime, 1 kg of cowdung and 500 g of mustard oil cake. Each earthen vat was stocked with 15 fish and each tank with 700 g of fish fry or fingerlings (ranging from 283 to 365 in number.)
Sublethal concentrations selected for these tests are shown in Table 2. For determining these sublethal levels two factors were estimated, called SAFE -1 (safe application factor equation-1) and SAFE-2. SAFE-1 was estimated by
dividing 96-h FCO offish by 96-h LCI 00 of fish, and SAFE-2 was determined by dividing 48-h LCO of cyclops by 48-h LCI00 of cyclops. Then SAR-1 (safe application rate-1) was estimated by multiplying SAFE-1 by 96-h LC50 of fish. This concentration was designed as 2T; 50% and 25% of SAR-1 were designated respectively as 3T and 4T. The LCO of a toxicant for fish was designated as IT. SAR-2 was estimated by multiplying SAFE-2 by 96-h LCO of fish (designated as 5T). SAR-3 was estimated by multiplying SAFE-2 by 96-h LC50 of fish and SAR-4 by multiplying SAFE-2 by 48-h LC50 of cyclops (designated respectively as 6T and 7T).
The length and weight and condition factor of fish13 were measured; fecundity, maturity index and egg diameters were determined; water characteristics were analysed8. Besides, length-

INSECTICIDES ON PISH 149
TABLE 2 - Sublethal concentrations of insecticides used in laboratory and outdoor tests. The concentrations arc expressed in terms of parts of active ingredient per million parts of water (ppm.)
Insectici' aVs
Designated as
IT 2T 3T 4T 5T 6T 7T
Malathion
Metasystox
Ambithion
0.400 0.312
2.000 1.850
0.500 0.420
0.156
0.925
0.210
0.078
0.462
0.105 0.200 0.280 0.100
weight relationships and relative condition factors (Kn) were estimated The tests on half-life or biological activity were made in outdoor vats (27.9 ± 0.84°C) containing 50 liters of water 14, 15. To determine the effects of contaminated fish-flesh on warm-blooded animals, were crushed the fish exposed to various toxicants to pulp and mixedl%. with commercial rat-food (marketd by Hindustan Lever Ltd., India) to form suitable pellets. These pellets were given to rats twice a day for 15 days. Simultaneously, control rats were reared which were given uncontaminated fish-flesh. Initial and final weights of rats were recorded. Observations on mortality and behavioural changes were made daily.
Results and Discussions :
Toxicity
Acute Toxicity : The results of the acute toxicity tests are shown in Table 3. The fish Tilapia mossambica was more susceptible to malathion than to ambithion and metasystox. Of the three organisms; the plankton Cyclops viridis was the most sensitive and the worm Br an-chiura sowerbyi the most resistant to the toxicants.
Reactions of Fish : Fish exposed to malathion and metasystox showed similar reactions. At 0.40 to 0.55 ppm of malathion and 2.5 to 5.0 ppm of metasystox, fish lost balance within 24 h. Fish sur
faced for 30-35 minutes and then settled at the bottom, occasionaly jumping up to the surface to gulp air. Fish exposed to 0.12 ppm or more ambithion exhibited darkening of body color and surfacing. Whitish thread-like fecai matters exuded from the vents of exposed fish. Fish became lethargic, and gradually lost equilibrium. Sometimes fish gyrated anticlockwise. Most fish recovered gradually within 4 days. At 0.90 ppm of ambithion, the ovaries bulged out through vent of fish and the fish died within 24 h.
Feeding behaviour Malathion at IT, 2T and 3T reduced the feeding rates of fish in scries 1 and 2 tests (P<0.001) (Fig. 1), and at 4T, the
E2T 037 E]*T
1 F 0 : i
f
%
2
SERIES
Fig. 1 - Effects of malathion on the feeding rates o f f i s h , Tilapia mossambica. In series 1 , exposed fish w e r e given unexposed live food; in series 2, exposed fish were given exposed l ive food, and in series 3, unexposed f ish were given exposed live food.

150 KONAR AND GHOSH
TABLE 3 - Toxicity of organophosphorus insecticides to f ish and fish food organisms . CL, confidence l i m i t s .
Insecticides
Malathion
Mctasysiox
Ambithion
Organisms
Tilapia mossambica
Cyclops . viridis
Branchiura sowerbyi
Tilapia mossambica
Cyclops viridis
Branchiura sowerbyi
Ttlapia mossambica
Cyclops viridis
Branchiura sowerbyi
LCO
0.40
0.32
2.00
2.00
0.07
2.00
0.50
0.J6
3.00
LC5
0.42
0.42
2.26
2.83
0.10
2.98
0.56
0.19
3.09
Lethal LC50
0.50
1.30
4.57
4.20
0.29
5.37
0.70
0.25
3.87
concentration 95%CL
0.43-0.58
1.07-1.58
3.78-5.52
3.76-4.70
0.28-0.30
4.42-6.52
0.42-1.08
0.22-0.28
3.62-4.13
(ppm) LC95
0.60
2.07
9.33
4.48
0.89
15.59
0.70
0.30
4.84
LCI 00
0.64
2.50
10.00
4.50
1.00
24.00
0.80
0.40
5.50
feeding rates were comparable to those of control. Metasystox and ambithion at IT, 2T, 3T and 4T reduced the feeding
I .110
80
2 O
Q 4 0
>0
• 0J< 0 - '
1 I of/; sit
of
0 ^ -
4 C 1 ? J
SERIES
Fig. 2 - Effects of metasystox on the feeding rates o f f i s h in three series of tests .
rates (P<0.001) in series 1 and 2 tests (Figs. 2 and 3); in series 3, the feeding rates were comparable to those of control. Survival '• In vats, 7% offish exposed to 3T of mala-
i Q O f I
El
°p of: °p o ;:
2 3 SERIES
Fig. 3 - Effects of ambith ion on the feeding rates of f i sh in three series of tests.

INSECTICIDES ON FrSH 151
J.I
I ' 2T 3T <T 5' X
" i
f t
IS IT
C O N C E N T R A T I O N
Fig. 4 - Effects of malathion on the growth o f f i s h .
thion died on 74th day; 3 and 17% offish died on 30th and 60ht day when exposed to IT and 2T of metasystox. At 2T of ambithion, 50% of fish died during 1-63 days; during this period all control fish survived. At 6T and 7T of ambithion respectively 40 and 2% of fish died during 16-85 days compared to 3% mortality in control. In tanks, at 2T of ambithion, 4% of fish died within 2 days; at
Si
52
•It
J 6
>.e
O.J
?«..
I 1
J J_
vAr
•
1 J_
• KG
1 1 i
m
1 1
11 1 -
, 1 1 C IT
8 S. 8.0 o
4 0
2.J
2 ' 3T 4T
U J L 68
S)
c IT CONCENTRATION
Fig. 5 - Effects of metasystox on the growth o f f i sh .
| T J 7 JT
C O N C E N T R A T I O N
Fig. 6 - Effects of ambi th ion (at IT to 4T) on the growth of fish.
6T, 63% of fish died during 47-78 days. No fish died in any control tank.
Growth
Growth rate : In vats, malathion at IT and 3T reduced fish growth by 14-17% and at 2T increased by 8% )Fig. 4). In tanks, malathion at 3T increased growth by 16%. In vats, metasystox at IT, 2T and 3T reduced growth by 18-37% (Fig. 5), and 2T by 37% (P<0.05). In tanks, metasystox at 3T reduced growth of fish by 15%. The growth offish at IT, 2T (fingerlings), 3T and 4T of ambithion in vats was comparable; the growth was reduced at 2T (fry) (P<0.001), 5T (P<0.001) and 6T (P<0.01); at 7T growth was normal (Fig. 6). The growth increased at 2T, 5T and 7T(P>0.05) (Fig. 7) and decreased at 6T (P <0.05) of ambithion in tanks (Fig. 8).
The gross food conversion ratio in the control tank was 4.08 compared to 3.16 and 5.60 in tanks exposed to malathion and metasystox both at 3T. The food conversion ratios were 3.26, 3.28, 6.95 and 3.51. respectively for fish in tanks exposed to 2T, 5T, 6T and 7T of ambithion compared to 3.03 to 3.62 for control fish.
Condition factor : In vat test with mala-

152 KONAR AND GHOSH
§ 00
\ * 10 5
I t "
C 71 ST CONCENTRATION
Fig. 7 - Effects of ambithion (at 2 T a n d 5T) on the growth of fish.
thion, the mean condition factor of control fish was 1.16. The condition factors offish exposed to IT, 2T, 3T and 4T of malathion were respectively 1.16, 1.23, 1.34 and 1.27. The fish exposed
c sr n CONCENTRATION
Fig. - 8 Effects of ambithion (at 6T and 7T) on the growth of f ish.
to IT, 2T, 3Tand 4T of metasystox in vats had condition factors of 1.30, 1.39, 1.19, and 1.41 respectively compared to
TABLE 4 - Influence of insecticides on length-weight regressions of f i sh reared in tanks.
Insecticide
Malathion
Metasystox
Ambithion
Concentration
Control
3T
Control
3T
Control
2T
5T
Con trol
6T
7T
N
102.
120
102
74
491
442
474
1005
226
1067
Regression
Y = 2.8438 X - 4.5482
Y = 2.8646 X - 4.5626
Y = 2.8438 X - 4.5482
Y = 3.1000 X - 5.0365
Y = 2.6534 X - 4.2025
Y = 2.7833 X - 4.4368
Y = 2.8941 X - 4.6106
Y = 2.9297 X - 4.6825
Y = 2.3120 X - 3.5098
Y = 2.6685 X - 4.1970

INSECTICIDES ON FISH 153
TABLE 5 - Influence of insecticides on the size frequency of fish, Tilapia mossam-bka- A 12-50 mm; B, 51—75 mm; C, 76-100 mm; D, 101-140 mm.
.Size groups (%) Insecticide Concentration \ g Q £j~
C
3T
C
3T
C
2T
5T
C
6T
7T
21 .
17 .
21
-
3
9
2
1
-
3
53
37
53
52
61
47
31
40
10
56
26
42
26
43
33
28
39
57
86
38
-
4
-
-
3
16
28
2
4
3
1.54 of control. The condition factor of fish exposed to 3T was nearly 23% less than that of unexposed fish (P> 0.05). In vat tests with ambithion, the mean condition factor for control fish was 1.47. The condition factors of fish at IT, 2T, 3T, 4T, 5T, 6T, and 7T of ambithion were respectively 1.42, 1.55, 1.58, 1.34, 1.51, 1.48 and 1.46.
In tanks, the condition factors offish exposed to 3T of malathion and of meta-systox were respectively 1.48 and 1.36 compared to 1.55 of control; obviously the condition factor of exposed fish was reduced (P<0. 10 for malathion and P<0.001 for metasyslox). The condition factors of fish at 2T, 5T, 6T and 7T of ambithion in tanks were respectively 1.44, 1.57, T53 and 1.58 compared to 1.45 of control.
Length-weight Relationship : The slopes of the regression equation were lower
for fish exposed to malathion (PO.001) and greater for fish exposed to metasys-tox (P<0.001) than the control fish (Table 4). The slopes of regression equations were greater for fish at 5T of ambithion (P <6.001). The slopes for fish at 2T, 6T and 7T of ambithion did not vary from those , of control (P> 0.05). Among fish exposed to malathion, the Kn's for size groups 56-60 mm were higher than those of control. The Kn's of fish exposed to 3T of metasys-tox slightly differed for size groups 68-73 mm from those of control fish. The Kn was very high for 20 mm size group of fish at 5T of ambithion; at 6T, Kn's for 55.0, 59.0 and 650 mm size groups were lower than those of control fish. For other size groups, Kn's were comparable to those of control.
Fish Size Group. Fish obtained from various tanks were sorted for different size groups (Table 5). Fish of 12-50 mm size group were more numerous in control (by 20%) than in tank exposed to malathion. Similarly, fish of 51-75 mm group were 30% more in the control than in exposed tank. Fish of-76-100 mm sizes were greater in number in the exposed tank than in the control. These variations were highly significant (P<0.001). In tanks treated with meta-systox, fish of 12-50 mm sizes were not present; fish of 76-100 mm sizes were 86% more numerous in the exposed tank than in the control ( P < 0 001). The fish of size group 101-140 mm were larger at 5T of ambithion (P<0.05); these were also larger at 2T (P<0.05); the fish of 12-50 size were larger in number at (7T P<0.05) The numbers of fish of other size groups in tanks exposed to ambithion were not different from those of control (P<0.05).
Reproduction
Maturity Indices. In vats, the maturity indices of fish (male and female) exposed

154 KONAR AND GHOSH
TABUS 6- Maturity indices of fish, Tilapia mossambica exposed to various concentrations of insecticides. Tests were made in earthen vats (V) or tanks (T).
Insecticides V/T Concentration Maturity index (%) + SE
Male Female
Malathion V
V
V
V
V
T
T
:Metasystt« y
V
V
V
V
T
T
AmbithioD Series 1
V
V
V
V
V
G
I T
2T
3T
4 T
G
3T
C
I T .
2T
3T
4 T
C
3T
C
I T
2T
3T
4 T
0.145
0.195
± 0.017
T 0.017
0.135 ± 0.017
0.195 ± 0.017
0.165 ± 0.017
0.073 ± 0.004
0.170 ± 0.009
0.110 ± 0.054
0.265 ± 0.054
0.265 ± 0.054
0.345
0.125
0.073
0.190
0.330
0.340
0.530
0.430
0.400
± 0.054
± 0.054
± 0.004
± 0.009
± 0.056
± 0.056
± 0.056
± 0.056
± 0.056
2.770 ± 1.241
2.085 ± 1.241
3.330 ± 12.41
4.750 ± 1.241
6.860 ± 1.241
0.500 ± 0.039
1.660 ± 0.105
2.140 ± 0.592
1.990 ± 0.592
1.460 ± 0.592
1.750 ± 0.592
1.050 ± 0.592
0.500 ± 0.039
1.070 ± 0-094
4.735 ± 0.610
4.765 ± 0.610
4.380 ± 0.610
4.045 4- 0.610
5.140 ± 0.610 ... Con td
to various levels of malathion and meta-systox did not vary widely from those of control (P<0.05) (Table 6). The maturity Index of male fish at 2T of ambi-thion was increased (P<0.05). At other levels the indices were not reduced. In
tanks, fish exposed to 3T of malathion and of metasystox exhibited higher maturity indices (P<0.001). The indices were not altered at various levels of ambithion in tanks (P<0.05).
Fecundity. In vats, fish exposed to IT

INSECTICIDES ON FISH
TABLE 6 Contd.
155
Insecticides V/T Concentration
Ambithion Series 2
V
V
V
T
T
T
Series 3
V
V
V
T
T
T
C
2T
5T
C
2T
5T
C
6T
7T
C
6T
7T
Maturity index (%) +. SE
Male Female
0.330 ± 0.045
0.270 - t 0.045
0.240 :fj 0.045
0.205 ± 0.047
0.232 ± 0.047
0.300 ± 0.047
0.085 ± 0.011
0.077 ± 0.011
0.380 ± 0.011
0.087^)- 0.067
0.380 -(- 0.067
0.480 ± 0.067
1.590 ± 0-352
1.840 ± 0.352
1.380 ±0.352
1.950 ± 0.428
2.140 ± 0.428
2.240 i 0.428
0.480 ± 0.058
0.410 ± 0.058
0.420 ± 0.058
2.810 ± 0.249
2.550 ± 0.249
2.910 4- 0.249
and 2T of malathion showed lower fecundities ( P <0.05 ) ( Table 7 ). Fish exposed to IT, 2T, 3T and 4T of meta-systox exhibited 13-76% higher fecundities; the fecundity of 4T fish was significantly higher (P "^.OS). The fecundities of fish at IT, 2T, 3T, 4T, 5T, 6T and 7T of ambithion in vats did not vary from those of control (P <0.05); the fecundity at 6T was lower from that of control (PO.Ol). In tanks fish exposed to 3T of malataion and metasystox exhibited higher fecundity (P <0.001). The fecundities of fish at 2T, 5T and 7T of ambithion in tank did not differ from those
of control (P> 0.05). The fecundity was higher at 6T (P <0.05).
Egg Size. Exposed fish showed variations in the frequency of occurrence of egg size groups. Malathion at various levels in vats exhibited similar egg size groups as in control (P> 0 05). The fish exposed to 2T of raetasystox had 98% more eggs of size group A (0.05-0.23 mm) than that in control. The eggs of size group B (0.24 - 0.46 mm) were lesser in number in fish exposed to 21 of metasystox, (P<0.05). The fish exposed to IT and 4T of metasystox, however, possessed

156 KONAR AND GHOSH
TABLE 7-Inflacnce of insecticide on the fecundity of fish, Titapia mossambica.
Concen tration
Scries I
e
»T
2T
3T
4T
Series 2
G
zr
5T
Scries 3i
C
6 T
7 T
Vat
539
462
48)
563
499
Malathion Tank
246
379
%
Insecticides
Metasystox Vat ' Tank
238 246
2 %
269
306 .546
420
Ambithion Vat tank
'
230
241
381
328
338
127
148
68
66
30
51
274
226
305
250
294
227
larger number of eggs of this size (P <0.05). The differences in the number of eggs of groups A, B, C (0.47-0.69 mm and D (0.70 - 2.27 mm) in fish at IT, 2T 3T, 4T (except for group B), 5T and 7T of ambithion were not significant (P> 0.05); at 4T, the eggs of group B were larger in number (P<0.05); the number of eggs of group A was larger (P <0.05) and that of eggs of group B lower (P<0.05) at 6T of ambithion; in these fishes the eggs of groups C and D were absent.
Fish ezposed to 3T of malathion in tanks showed variations in the occurrence of all egg size groups compared to control
(P^O.10 for groups B andD;P<0.001 for groups A and C). Fish exposed to 3T of metasystox had eggs of group A larger in number than in control (P<0.001): the number of eggs of group B was comparable to that of control; the eggs of groups C and D were lower in number (P<0.10 for C; P < 0 001 forD) . The differences in number of eggs in fish at 2T, 5T, 6T and 7T (except for eggs of group C in fish at 6T and 7T) of ambithion from that of control fish were not significant(P<0.05). The number of eggs of group C in fish at 6T and 7T were lower (P>0.05. '"•;'•
Breeding Behaviour and Spawning : Fish

INSECTICIDES ON FISH 157
r •SO
1 «
r i
70 (0 «0 )0 100 120
OAYS
[~1 gastropod Q chironomu*
R C I ' C
C0NCE'«''~<»''0><
Fig. 9 - Influence of metathlon on the fauna and flora of tanks
exposed to malathion, metasystox and ambithion (except fry of 2T, 5T, 6T and 7T) in vats and tanks exhibited normal breeding behaviuor, such as display of colors by males, chasing of females, fighting of one male with rival male and building of nests at the bottom.
Several exposed and control fish spawned during the test period. In control vats of malathion, 35 hatchlings were found. In vats exposed to IT, 2T, 3T and 4T malathion, respectively 28, 70, 67 and 80 hatchlings were found. In vats exposed to IT, 3T and 4T of metasystox, 6-12 hatchlings were found during 28-58days. In control and 2T vats, hatchlings were found. In vats at 1T, 2T, 3T and 4T of ambithion, respectively 56, 34, 85 aud 51 hatchlings were found; besides, 25 fry were found in 2T vats. In control, 127 hatchlings were found. All control and exposed fish in tanks spawned.
Aquatic Ecosystem
In vats and tanks, malathion, metasystox and ambithion did not alter DO, COa , alkalinity, turbidity, temperature, pH, odor and color of water. The ranges
of various water quality factors in test vessels were as follows : DO, 7-19 ppm: free C 0 2 , 0-18 ppm: alkalinity, 120-340 pprh: and pH, 6.2-7.5.
There was very little influence of 3T of malathion on copepod population: copepodes were 9-13% less in numbr in the exposed tank during 40-80 days (Fig. 9). Gastropod population in 3T tank was 18% less compared to control. In exposed tank the population of Chironomus larvae was 215% greater. The aquatic weeds Pistia stratiotes grew profusely in exposed >*awfcsv.£k»n' *H tke control tanks. ••."•«
In tanks exposed to 3T of metasystox, the copepodes were 19-46% less in number during 40-60 days compared te control (Fig. 10). The population of gastropods and Chironomus larvae were respectively 41% and 315% more in exposed tanks compared to control. The number of weeds in control and exposed tanks were comparable for 40 days: thereafter the number of weeds in the control tank gradually declined.
In ambithion treated tanks, copodes at 2T and 5T were generally lower than
HO
160
70 (0 60 60 100 <?0
Q Go* I'opod Q fn . 'ononvj l >0
•>n
<0
' 0
r -
JLll
1000 t
700 °
100 l_
n
Fig. 10 - Influence of metasystox on the fauna and flora of tanks.

158 KONAR AND GHOSH
3UU
100
>00
0 r~
i.
-•- • 'r'
•
>?0
,60
• ; o
so
>0
— f
•.
^r
-
•
«!
V
«
1
•. _ %y
M
• •» • ; . ••
>» ?9 l i SS 11 99 104 I I ! 0»irS
Fig. 11 - Influence of ambithion (at 2T and 5T) on the fauna and flora of tanks.
in control tanks. Copepodes at 6T were larger than in control tanks during 14-89 days; thereafter their population declined (Fig. 11). The gastropod population was much larger at 2T, 5T, 6T
•and 7T of ambithion; at 6T, the gastropod population was 137 limes larger than that of control tanks (Fig. 12).
•Chironomus larvae at 2T and 5T of ambithion were nearly 19 and 21% more compared to control. At 6T of ambithion, Chironomus larvae were higher than that of control tanks; at 7T they were smaller in number by 23% of that of control.
Half-life of Toxicant
The LCOs of aged solution of ambi thion were determined in outdoor vats using the fish Tilapia mosambica and deactivation indices were ". estimated. These indices were plotted against days for which solutions were aged.* The number of days corresponding to deactivation index of 2 was 1.2; that is, the half-life of biological activity of ambithion in outdoor vat was about 29 h.
Effects of Contaminated Fish-flesh on Rats
Flesh of fish exposed to 3T of malathion
>.i
i 5
> 0
0.0 V C IT V
< 9 i t
S t i l l * 16
Q o t i l ' O l M Q CMrtotmul
H
1500
1100
1100
1000 „
\ 1000 m
R.
100
100
e IT n e IT M CONCIMTNATION
Fig. 12 - Influence of ambithion (at 6T and 7T) on the fauna and flora of tanks.
and metasystox and 2T, 5T, 6T and 7T of ambithion (in each tank, fish received six exposures of any of these insecticides) were fed to rats. AH exposed rats showed normal behaviour and all were alive during test period. The rats fed with malathion contaminated fish-flesh gained 2% more weight than the control. Rats fed with metasystox contaminated fish-flesh lost8% of initial weight; the control rats gained weight by 2% of initial. The rats exposed to 2T, 5T, 8T and 7T of ambithion gained respectively 17, 24, 26 and 31% of initial weight compared to 29% gained by control rats. At the end of test, the gross pathology of all exposed rats were comparable to the controls.
Estimated Safe Levels
The estimated' levels of toxicants (2T, 3T, 4T, 5T, 6T and 7T) were drained into water six times within a period of 90-120 days at intervals of 15 days. In India, drainage of pesticides into water never occurs continuously. In fact, we have drained pesticides at more closer intervals than would be expected in nature.. The results show that estimated

INSECTICIDES ON FISH 159
safe application rates (SAR's) were safe for normal growth and reproduction of fish.
The use of sensitive biological material such as the plankton Cyclops viridis for estimating the safe disposal rate of toxicants appers to be prospective. The safe leves 5T, 6T and 7T were estimated in which the safety factors were calculated by using the lethal concentrations for the plankton. The 7T appears to be safe not only to food organisms but also to fry and fingerlings of fish. Thus by using the plankton Cyclops viridis in static bioassays, the long-term safe concentrations of toxicants can be derived. Our earlier observations also indicated that long-term safe level of toxicants may be derived from short-term static bioassays (8, », 16, ", l 8 , ™).
While estimating the safe concentration of a toxicant, the entire ecosystem should be considered (20, 21, 2 2 ) . Variety of environmental factors, multiplicity of chemicals and formulations may sometimes, interact to make the situation complicated23. For example l.Oppbof either DDT, toxaphene or parathion alone does not effect growth of oyster but a mixture of these levels of three insecticides reduced the growth24.
Estimated SAR is the concentration of a toxicant that develops in water. For pesticides, therefore, the actual amount to be sprayed on crops should be deter, mined by extrapolation of the estimated SAR giving consideration to the distance of potential water, the number of drainages, the nature and formulation of the pesticide, and the possible amount of pesticide that will be lost due to absorption and/or adsorption by the crop, soil particles and other agents during drainage18. Moreover, one must see whether this extrapolated dose of the
pesticide is really useful for pest control. There is thus urgent need for greater coordinated resarch among polltuion biologists and plant protection specialists.
Acknowledgemets
This research was partly funded by grant FG-ln-515 (A7-AE-10) with SKK as Principal Investigator.
REFERENCES
1. Johnson, D. W. " Pesticides and fishes - a review of selected literature. " . Trans-Amer. Fish. Soc. 97, 398 (1968).
2. McKim, J . M. Christensen, C. M, Tucker, J . H . Bcnoit, D. A. and Lewis M. J. " Effects of pollution on freshwater fish " . J * Water Pollut. Control Fed. 45, 1370 (1973).
3. McKim, J . M. , Christensen, G. M. Tucker, J . H. , Benoit, D. A. and Lewis, M. J . " F.ffects of Pollution- on freshwater fish " . J . Water Pollut. Control .Fed. 46, 1540 (1974).
4. McKim, J . M. , Bcnoit, D. A. Bicsinger-K. E., Brungs, VV. A: and Siefert, R. E-" Effects of Pollution on freshwater fish". J . Water Pollut. Control Fed. 47, 1711 (1975).
5. McKim, J . M., Anderson, R. L., Bcnoh, D. A., Spehar, R. L. and Stokes, C. N . " Effects of Pollution on freshwater fish". J . Water Pollut. Control Fed. 48, 1544 (1976).
6. Konar, S. K. " Toxicity of heptachlor to aquatic life " . J . Water Pollut. Control Fed. 42,299 (1970).
7. Konar, S. K. " Simple method for estimation of permissible field application rate of heptachlor " . Sci ane Cult. 37, 148 (1971).
8. American Public Health Association, American Water Works Association, and Water Pollution Control Federation. Standard methods for examination of water and waste water " . 13th ed., APHA, Inc., New York (1971).

160 KONAR AND GHOSH
9. Bliss, C. I . " T h e method of p rob i t " . Science. 79, 38 (1934).
10. Bliss, C. I . " Calculation of the dosage-mor. tality curve " . Ann. Appl.. Biol. 22,134 (1935).
11. Litchfield, J . T. Jr . , and Wilcoxon, F . " A simplified method for evaluating dose—effect experiments " . Jour. Pharm. Exp. Therap. 96, 99 (1949).
12. Fisher, R. A., and Yates, F . " Statistical tables for biological, agricultural and medical research " . Oliver and Boyd. London. 6th ed. (1963).
13. Lagler, K. F . " Freshwater fishery biology " 2nd ed. W M . C. Brown Co. Dubuque Iowa. (1956).
14. Marking, L . L. "Methods of estimating the half-life of biological activity of toxic chemicals in water " . Invest. In Fish Control. 46, 9 (1972).
15. Marking, L. L„ and Dawson, V . K. " The half-life of biological activity of antimycin determined by fish bioassay " . Trans. Amer Fish.Soc. 101 100(1972).
16. Ghosh, T . K. and Konar, S.. K. "Safe disposal of pesticides : A new mcteod of estimation tested on ambi th ion" . Proc. Nat. Acad. Sci., India 46B, 373 (1976).
17. Basak, P. K. , and Konar, S. K. " Pollution of Water by pesticides and protection of
fishes : parathion " . Proc. Nat. Acad. Sci,. India. 468,382(1976).
18. Basak, P. K., and Konar, S. K. "Estimation of safe concentrations of Insecticides : a new method tested on DDT and BHC" . J . Inland Fish. Soc. India 9,9 (1977a).
19. Basak, P. K., and Konar, S. K . " A New method for the determination of safe concentrations of insecticides to protect fishes". Indian J . Environ. Hith. 19, 283 (1977b).
20. Burdick, G. E. " Use of bioassays in determining levels of toxic wastes harmful to aquatic organisms " . In E. L. Copper, ed. A symposium on water quality criteria to protect aquatic life. Amer. Fish. S o c , Washington, D. C , 4, 7 (1967).
21. Konar, S. K. " Pesticides, aquatic ecosystems and man " . In Advance notes on symposia and discussion, Animals and env-iornment. 61st Sess. Sci. Cong. Nagpur, 2 , 15(1974).
22. Konar S. K. " Pesticides and aquatic ecosystems " . Indian Jour. Fish. 22, 80 (1975).
23. Cope, O. B. " Contamination of the freshwater ecosystems by pest ic ides" . J . Appl. Ecol. (Brit.). 3 , 33 (1966).
24. Lowe. J . I., Wilson, P. D. Rick, A. J . , and Wilson, J . , A. J . "Chron ic exposure of oysters to DDT, toxaphene and parathion". Proc. Nat Shell-fish. Assoc. 61, 71 (1971).

IAWPC TECH. ANNUAL., VIII 161-167, (1981).
Soil Suspensions and Their Coagulation THERGAONKAR V. P.* THAKRE O. B.**; TARAFDAR P. K.* THAKRE R. A.* RAMTEKE D. S.*
Introduction
Soil suspensions are predominant in natural turbidity of river waters. These are removed by coagulation and floccula-tion during water treatment. Coagulation is a chemical process and is closely related to stability and instability of colloid systems. Natural turbidity is presumed as colloidal system. The stability and instability of such a system can be explained by two approaches, viz the chemical theory and physical or double layer theory. The chemical theory is based on the assumption that colloids have definite chemical structural units and that there is a definite chemical interaction detween the coagulant and the suspended particulate matter. As a result insoluble complexes are formed which settle down as precipitates, eg. coagulation of fulvic acid by aluminium or iron salts, when fulvates settle down. In this mechanism inherent chemical composition of suspended matter is important.
The second theory emphasises the importance of electrical double layer around a colloid, effects of counter ion adsorption and the zeta potential reduction during destabilisation of colloidal systems. The electrical charges at the water-particle interface may originate due to dissociation of the ionizable groups of the
colloid itself or can be due to adsorption of low molecular weight ions on its surface. The availability of the ionizable groups is related to chemical composition and structure of the suspended matter.
It is, however, necessary to apply both the approaches in order to understand the colloid stability and instability. The chemical nature of the suspended matter is important, whatever mechanism is accepted.
Water works apply the coagulation/ flocculation phenomenon to clarify turbid waters. The turbibity is due to suspended soil which is brought into rivers/ lakes. The coagulant is generally alum The suspensions are generally the top soil layers of the adjoining fields through which the river flows. Chemical composition of suspended matter is likely to be different depending on the location of a particular waterworks. Soils have definite chemical and physical properties which can play some role during their coagulation.
It was decided to investigate as to how differgnt soils have (i) different chemical composition (ii) how do they flocculate at the same pH values by identical alum doses and (iii) to see if their behaviour during coagulation could
* Scientists, N. E. E. R. I., Nagpur. ** Head of Department of Chemistry, Institute of Science, Nagpur.
161

162 THERGAONKAR ET AL
TABLE-1. CHEMICAL ANALYSIS OF SOILS
S. No Soil Organic Total Ca + 2 Mg + 2 N a + K + SiO a + F e + 3 Al + 3 Phos- Tita- C.E.C. matter oxides phor- nium meq/
0/ O/ O/ O/ O/ Of 0 / u!> /O ' " "
/o /o /o /o /o /o /o o/ ems.
1. Fly ash — .24.25 3.2 0.48 — 5.0 58.1 0.81 — 0.625 — 0
2. Soil 1 5.1 17.52 1.53 0.42 0.152 10.5 76.9 0.805 0.10 0 .2987— 8.4
3. Soil 2 7.525 7.175 2.0 0.60 0.515 6.51 61.0 0.81 0.088 0.2785 — 17
4 . Soil 539 18.4 32.5 10 0.36 0.717 13.75 . 47.0 0.81 0.098 0.275 — 74 .
5: Soil 300 13 33.35 5-6 1.95 0.137 3.75 50.5. 0.73 0.0875 0.25 — 88
be explained on the basis of their chemical natures under laboratory conditions.
Experimental
1. Six soil samples and one fly ash sample were collected from National Bureau of Soil Survey in Nagpur and the Koradi Thermal Power Station respectively.
2. These were analysed as per AOAC1 for their chemical characters.
3. Their water extracts were analysed as per Standard Methode2. 20 gms/1 was used for water extract.
4. Soil samples were finely ground-500 g. were suspended in 20 1. tap water to conduct jar tests The suspensions were aerated for thorough mixing and allowed to settle for two hours. The supe rnatant was used for jar tests.
5. pH values 3, 5,and7of the suspension were obtained by addition of 0.1 N HC1 and pH 9.0 and 10.0 were obtained by addition of 0.1 N NaOH. No attempt was made to maintain pH values constant after addition of alum. Initial and final turbidities were measured by HACH turbidimeter.
6. No attempt was made to separate clay, silt from soils.
Results & Discussions
Mineral analysis of the soil samples (Table 1) shows that these soils can be categorised on the basis of their cation exchange capacities. The four groups are with C. E. C. (i) negligible (fly ash) (ii) less than 10(iii) between 10 and 20 and (iv) more than 20 meq/100 g. Soils with high CEC have shown more organic contents. Fly ash has been described as an amorphous mass without crystalline structure9. The di - and mono valent ions in fly ash should be presented as oxides at temperature of coal ignition. The mineral content of fly ash are not much different from that of the soils The CEC is negligible because of the absence of crystalline structure in fly ash and lack of organic matter. The metallic ions in fly ash are not replaceable by polyvalent cations. Interpretation of coagulation studies of above for groups of soils will be with respect to cation exchange capacity. Exchange capacities of clays and their surface areas are interrelated3, eg., montmorillonite clay has an exchange capacity of 100 meq/100 g and kaolinite clays have values between 3 to 15 meq/lOOg. The ratio of surface

SOIL SUSPENSIONS 163
TABLE-2 ANALYSIS OF WATER EXTRACT OF SOILS
Soil
Fly ash
Soil 1
Soil 2
Soil 539
Soil 300
CEC mg/l lOOg
0
8.4
17
74
83
PH
8.75
6.3
6.25
8.8
8.0
Turbidity Alkalinity NTU/1 mg/l
350
362.5
475
475
450
—
500
750
500
1000
Ca^-H mg/1
95
trace
trace
48.1
9.0
M g 2 + mg/l
35
4.86
6.8
12.1
4.86
Na + mg/l
5.5
22.5
38.75
130
25
mg/1
—
3.75
5.0
7.2
7.5
areas of montmorillonite to kaolinite is about 5.4. The soils studied in the present paper, can be kaolinite when CEC is up to 20 meq/100 g and montmorillonite with CEC 81 meq/100 g. Results of X-ray diffraction are awaited, when the predominant c/ay in every soil will be known. Coagulation has relevance to surface area of suspended particulate matter in water.
The results of jar tests conducted at various pH values can be grouped as follows : (1) pH less than 3.0 ; this pH is significant because aluminium is present as tripositive ions at this pH. Tri-positive ions can nutralize the zeta potential suspensions and also exchange replaceable di- and mono-valent cations, (ii) Original pH : The soils when suspended in tap water imparted different pH varying from 6.3 to 8.0. Addition of alum and subsequent coagulation at these pH values can be presumed to represent natural conditions, (iiii) pH 7.0 to 8.0. In this pH range the insoluble Al(OH3) and polymeric species will predominate, (iv) pH 8.0 to 9.0 : Aluminate ion AlO'i are likely to be present along with some insoluble Al(OH)3 and (v) pH 9.0 and ) 0.0 : where the aluminate ions predominate which have the negative charge, unlike the polymeric species
which 8.0*.
are present in pH range 7.0 to
»oo
tctc'm'
ALUM DOM
Fig. 1 - Fffect of CEC on alum requirement for a minimum residual turbidity at a
particular pH.
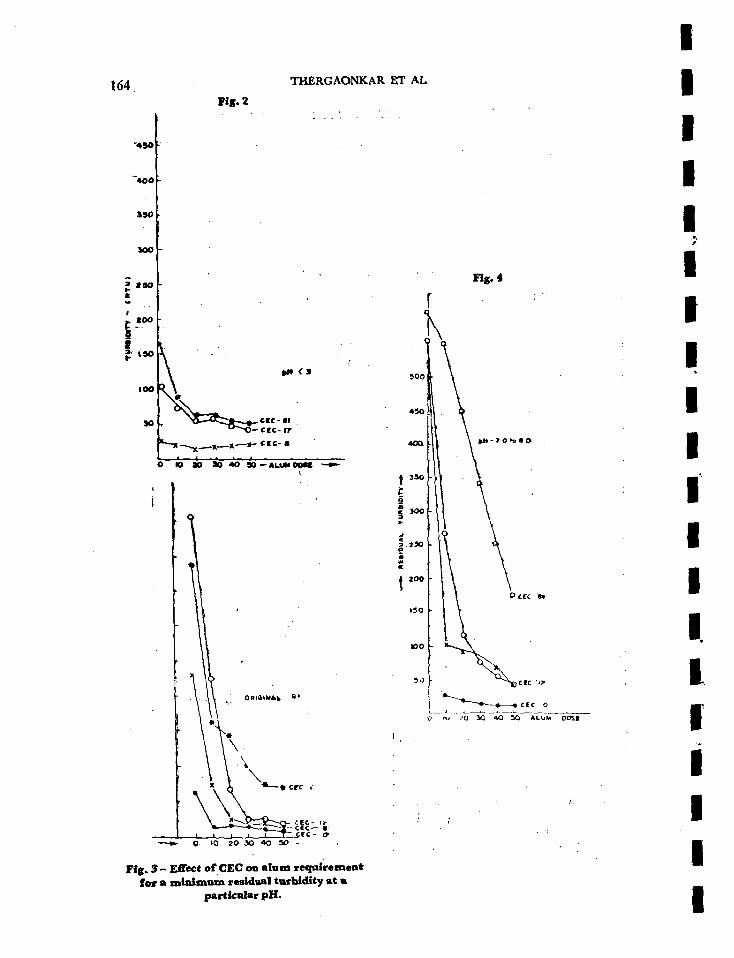
164 THERGAONKAR EX AL
Fig. 2
"490
• 0 0
SSO
Fig. *
| M - > 0 l t l O
0 10 20 JO 0O SO
Fig. ? - Effect of CEC on alum requirement for a minimum residual turbidity at a
particular pH.

SOIL SUSPENSIONS 165
Table-3 O p t i m u m a lum dose for residual turbidity 50 NTU
CEC
p H 3 . 0
Original
pH 7 to 8
pH 8 to 9
pH 9 to 10
0
—
3.0
not required
12.0
8.0
8.0
Not required
15
43.0
43.0
53.0
17
37
25
47
57
73
81
55
not possible
82.0
63.0
not possible
pH • BO *0 9 0
O 10 20 M «0 50 »LUM 00««
Fig. 5 - Effect of CEC on a l u m requirement for a m i n i m u m residual turbidity.
Using this data, Coagulation curves with residual turbidities Vs. alum dose are plotted in Fig. 1 to 5. Desired residual turbidity in settled water was arbitrarily fixed at 50 NTU and thus alum dose to achieve this residual turbidity is optimum. The extrapolated optimum dose at various pH and for different CEC are shown in Table 3.
Table 3 shows that the optimum alum dose required to get a residual turbidity of S6 MTU increases with the cation exchange capacity at all the pH values. It has been mentioned that the perikinetic demand of alum to reduce the particle charged increased linearly with the CEC of the suspension5. Pack-ham questioned this in absence of constant pH6. Subsequently, Kim, et al showed that CEC-alum relationship existed even at constant pH. The latter workers worked with pure bentonite and kaolinite clays. The present experiments with soil suspensions and not only clay show that alum consumption increases with increasing CEC. These conclusions are true for different soils within identical pH ranges.
Soils when coagulated at different pH have shown that they flocculate better in the acidic range upto CEC 8 meq/100 g of soil. Low CEC means total excbangable cations are low and which can be replaced by existing hydrogen ions. Besides, hydrogen ions are known to suppress the zeta potential and can be compared with the tripositive cations^. It is necesary to suppress the zeta potential which increases due to more exchangable sites on the clays in soils.
Aluminium ions are lost during the process and hence alum consumption

166 THERGAONKAR ET AL
increases. This values studied.
trend is seen at all pH
Fig. 6- to 9 show residua/ turbidities for all the soil suspensions at various pH values studied. Effect of 0, 20 and 40 mg/1 of alum arc shown in these figures. These curves show pH of best flocculation (minimnm residual turbidity). The results can be summarised as in TabIe-4.
Table 4 - EC and pH of m i n i m u m turbidity.
Alum dose mg/1 C. E. C. pH of minimum turbidity
0 0 0 0
20 ' 20
20 20 . 40 40 40
• 40
0.0 8.0
17.0
ai.o 0.0 8.0
17.0 81.0
0.0 8.0
17.0 81.0
8.2 8.4 8.4 3.0 7.9 7.4 8.2 5.5 8.0 8.4 8.4 5.5
ZOO
> 8 0
» 6 0
I O
> 2 0
IOO
0 0
eo
4 0
2 0
-
a
-< o
-•a -
Fig. 6 - Curves far best zone of Coagulation of Soil suspension having a CEC of
0. meq/100 g m of Soil ,
too
eo
Fig. 7 - Curves for best zone of coagulation of sol i suspension having CEC of
8 meq/100 g. of so i l
This table shows that soil suspensions with higher C. E. C. were better flocculated at lower pH values. This is in conformity with earlier findings by Kim, Ludwig and Bishop7
Summary
1. This work in dicates that the types of predominant clay in the soil suspension govern, the alum dose during coagulation.
The cation exchange capacity of soil appeared to cause an increase in alum consumption, Optimum alum dose required to get residual turbidity of 50 .NTU increased • with CEC of soils irrespective of pH values.
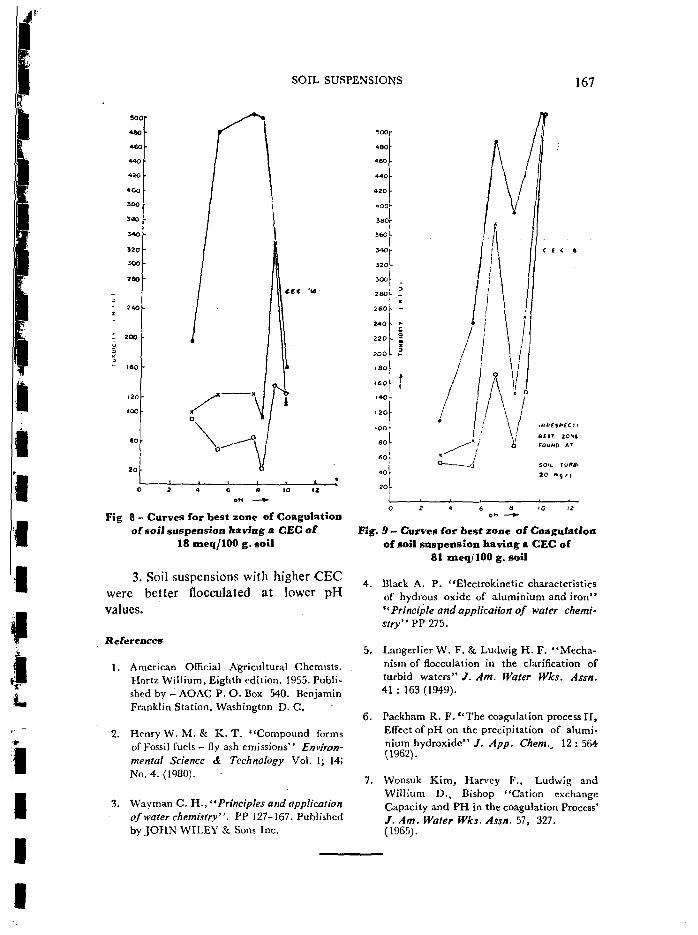
SOIL SUSPENSIONS 167
I
I
'sr
L
I I
300
**o
««o
440
42c
400
MO
sao
340
S20 •
JCO
Z»0
120
IO0
Fig 8 - Curves for best zone of Coagulation of so i l suspension having a CEC o f
18 meq/100 g. so i l
3. Soil suspensions with higher CEC were better flocculated at lower pH values.
References
1. American Official Agricultural Chemists. Hortz Willium, Eighth edition. 1955. Published by - AOAC P. O. Box 540. Benjamin Franklin Station. Washington D. C.
2. Henry W. M. & K. T. "Compound forms of Fossil fuels - fly ash emissions" Environmental Science & Technology Vol. 1; 14; No. 4. (1980).
3. Wayman C. H. , "Principles and application of water chemistry". PP 127-167. Published by JOHN WILEY & Sons Inc.
500r
460-
460 -
440 •
420 •
°°T 380r
l 560}-
320 J-
300U
260j- ,-
260 -
240
220
2O0
• 80
60|- \
140-
120
• 0 0 j-
SO
IRAESPECTI
6EST ZOM
FOUND AT
SOIL TURfll
Fig. 9 - Curves for best zone o f Coagulation of soil suspension having a CEC of
81 meq/100 g. soil
4. Black A. P. "Electrokinctic characteristics of hydrous oxide of aluminium and i ron" •'Principle and application of water chemistry' ' PP 275.
5. Langerlicr W. F. & Ludwig H. F . "Mechanism of flocculation in the clarification of turbid waters" J. Am. Water Wks. Assn. 41 : 163 (1949).
6. Packham R. F . " T h e coagulation process I I , Effect of pH on the precipitation of aluminium h y d r o x i d e " / . App. Chem. 12:564 (1962).
7. Wonsuk Kim, Harvey F., Ludwig and Willium D., Bishop "Cation exchange Capacity and PH in the coagulation Process' / . Am. Water Wks. Assn. 57, 327. (1965).

IAWPC TECH. ANNUAL, Viri , 168-170, (1981).
Short Technical Communication
Detection of Trace Elements in Kali Nadi Water in Meerut V. P. KUDESIA* AND C. B. SHARMA*
Abstract
Using Hilger and Watts 1.7 metre emission spectrograph and atomic absorption spectrophotometer trace elements Mn, Cr, V, Ti, Zn, Pb, Cu, Cd, As, Bi were determined in Kali Nadi water samples over a period of time at various sites. The study shows considerable sporadic pollution from waste industrial effluents, particularly with reference to vanadium and chromium.
Introduction
District Meerut has an area of 5561 Sq. km. In this district industrialization is going on at a very fast pace, that problem of air and water pollution has assumed serious proportions. The most well established industries in the region
. include Daurala Sugar works, Daurala Distillery, Modi Rubber Ltd., Diwan Rubber Industries, Electra, Light Carts, Saru Steel and Alloys, Mawana Sugar Works, and Modi Complex of Industries-
District Meerut is boardered by river Yamuna and Ganges on western and eastern sides respectively. In addition there are a number of lotic and lentic water resources such as Hindon river, Kali Nadi, Budhi Ganga, etc.
Water from these sources is used for drinking, irrigation, fish catch as well as for disposal of effluents from industries.
The river Kali Nadi has a large stretch of water of varying depths at different places. It originates near the village Barabas near Iqbalpur, District Saharan-pur. After passing through Deoband and Muzaffarnagar it enters into District Meerut. It flows at a distance of 9 km. from Meerut city. The water is clear upto the point it receives discharge of pombined effluents of Sugar, Distillery and Rubber industries.
Daurala Sugar Works is situated at about 13 km. from Meerut city. In the year 1978-79, this mill crushed 3,43 067.578 metric tonnes of sugarcane and produced 37,383.5 tonnes of cane sugar and 12,733 8 tonnes of mollases. The industry produces 6000000 litre of effluent per day which are discharged into a kachha effluent channel for their final dispoal into Kali Nadi.
Daurala Distillery, in the year 1978-79, processed 807,006 metric tonnes of mollases and. produced 185,10,000 litres of rectified spirit. From the distillery 350,000-400,000 litres/day of effluent is discharged into the effluent channel.
•Water Pollution Lab., D. N. (P. G.) College, Meerut-250002.
168

DETECTION OF TRACE ELEMENTS
TABLE-1 Trace elements of Kali Nadi river in Meerut.
169
Location
Pavli
Jalauli
Phulahry
P. A. C. Lines
Defence Colony
Near Medical College
Date of collection
18.7.79
18.8.79
18.9.79
17.10.79
5.2.80
6.7.79
6.9.79
6.11.79
6.7.79
6.9-79
6.11.79
6.7.79
6.9.79
6.11.79
6.7.79
6.9.79
6.11.79
6.7.79
6.9.79
6.11.79
Concentration expressed Pb
105
85
28
10
40
12
17
20
27
22
6
75
65
12
62
45
49
40
54
70
Cu
10
7
8
5
12
3
7
6
15
6
16
5
7
18
2
13
6
7
4
15
Zn
10
5
7
12
5
4
11
9
17
3
12
4
3
12
3
7
11
19
4
2
Cd
2
N.D.
N.D.
3
15
2
10
15
N.D.
11
19
N.D.
6
7
2
6
18
4
7
3
Cr
90
50
100
150
170
130
112
118
70
105
167
46
112
179
56
40
65
79
86
103
in micrograms/1 V
18
30
45
55
3
7
15
22
29
18
23
12
15
22
27
16
5
21
9
2
Bi
N.D.
2
N.D.
5
3
6
3
5
2
3
2
5
7
2
N.D.
6
7
18
4
3
itre Ti
10
4
2
N.D.
5
2
10
6
4
11
25
2
7
3
5
8
18
16
3
5
As
14
7
3
12
N.D.
3
2
N.D.
5
16
4
3
12
N.D.
4
7
13
2
5
18
Mn
300
250
200
170
56
116
156
82
270
142
178
152
162
86
95
117
166
85
11
113
Modi Rubber Ltd. is situated at Modipuram about 8 km. from Meerut. It produces 2400 tyres per day. In a single day 5000 to 6000 litres of effluent are released from this factory.
The effluent of Daurala Sugar Works, Daurala Distillery and Modi Rubber Ltd. are discharged into channel which
joins the river Kali Nadi between village Medpur and Datawali-Gesapur about 1.5 km. north east near the bridge on Kali Nadi on Garh road. The combined effluent has dark brown colour and has aromatic obnoxious smell.
This paper presents a study of the detection of some trace elements in the

170 KUDESIA AND SHARMA
effluents of above industries at the point where they meet with Kali Nadi river. This analysis will be of great help in connection with control of effluent pollution, in the study of fish fauna and on agricultural products.
Experimental
2\ litres of water samples were collected in polyethylene bottles from effluents from various points starting from village Pavli, Jalauli Phulahry, P. A. C. Lines, near Medical College and Defence Colony at almost one month interval and were analysed for various trace elements by Hilger and Watts 1.7 meter emission spectrophotometer (Perkin-Elmer model 306) as per standard procedure described in literature1,2.
Results and Discussion
The trace elements concentration of Kali Nadi water samples collected over a period of time at various sites are given in Table 1.
An examination of trace elements in the effluents shows that Cr, Mn, V, Zn and Cd are quite important. The migration of Cr, ions will depend upon the
form in which it is present in the effluent; the trivalent form will tend to get fixed in the soil while the hexavalent form will be much more mobile. Zn and Pb are likely to be retained by the soil. The fixation of Mn will depend on the pH and redox potential prevailing in the soil environment. Cd will also be retained by the soil and there is less possibility of migration. The data in Table 1 show that the concentration of trace elements.present in the industrial waste effluent will cause a heavy pollution in Kali Nadi river. Non-absorption ofCr will also affect fish fauna and agricultural products.
Acknowledgement—
The authors are thankful to the college authorities for providing laboratory facilities and also to U.G.C. (India) for providing senior research fellowship to one of the authors. (C. B. S).
References
1. Handa, B. K. , Modern Methods of Water Analysis, Technical Manual No. 3, Central Ground Water Board, Lucknow 1976
2. Kudcsia, V. P. , Water Pollution, Pragat Prakashan, Meerut 1980.

IAWPC LIFE MEMBERS
Shri
INSTITUTIONS
Name & Address No. Indian oil corporation ILM-1 Refineries Division Indian Oil Bhavan, Janapath NEW DELHI 110 001
Central Board for the Prevention ILM-2 and Control of Water Pollution Skylark Building 60, Nehru Place NEW DELHI 110 019
Hindustan Copper Ltd., ILM-3 Industry-House 10, Camac street CALCUTTA 700 017
The Hindustan Construction ILM-4 Dr. Co. Ltd., Construction House, Ballard Estate, Bornbay-400 038
Name & Address Indian Petrochemicals Corporation, P. O. PetrochemicaIs-391346 Dist. Baroda.
No. ILM-10
INDIVIDUALS
Ahlawat, V. S., Exe. Engineer PHED 53, Shri Rampura Colony, Civil LiruRS, JAIPUR-302006.
LM-170-
Ajmal, M., Chemistry Section, Z. H. Engg. College, A. M. U., ALIGARH-202001.
LM-115
Hindustan Dorr-Oliver Ltd., ILM-5 Dorr-Oliver House, Chakala, Andheri (East), Bombay-400 092
Geo. Miller & Co. Pvt. Ltd., ILM-6 91, Nehru Place, NewDelhi-110 019
Dept. of Solid Wastes ILM-7 Management of B. M. C , Shree Chhatrapati Shivaji Maharaj Market Building, M. R- Amdedkar Marg. Bombay-400 001
Indian Standards Institution, ILM-8 Manak Bhavan, 9, Bahadurshah Zafar Marg, New Delhi-110 002
Engrs. India Ltd., ILM-9 4, Sansad Marg, New Delhi-110 001
Shri
Shri
Altekar, R. A., LM-163. Executive Engineer, Maharashtra Water Supply & Sewerage Project, 4th Floor, Express Towers, BOMBAY-400021.
Amar, M, LM-68. Deputy Manager (Facilities) Semi conductor Complex Ltd; Phase VIII, S. A. S. Nagar, DIST. : ROPAR-160051 (PUN.)
LM-3. Shri Amritkar, S. R., 13, Jeevantara Hsg. Soc, Ramwadi, Naupada, THANA-400602.
Shri Annegiri P. R„ LM-207. Plot No. 7 Shanta niwas, Telang's Bungalow, 1st Floor, Yeshwant Nagar, Talegao, Dist. Poona.
171

Name & Address No. Name & Address No.
Prof. Ansari A. A., LN-41. Prof, of Civil Engg., Bhagalpur College of Engg., P. O. SABOUR-813210, DISTT : BHAGALPUR (BIHAR).
Shri Ansari, M. H., LM-237 I. T. R. C . LUCKNOW.
Shri Arora, J., LM-58. 8 A/D II, Extention, Gandhinagar, JAMMU (TAWI) J & K.
Shri Badrinath, S. D.. LM-216. Scientist, N. E, E. R. I.. NAGPUR-440020
Shri Baitha, L. L., LM-44. Asst. Engineer, P. H. University Sub. Divn^ Agam Kuan, PATNA-7 (BIHAR).
Shri Bategopal, R., LM-198. 19, Varadappa Naicker St., MADRAS-600024.
Dr. Balakrishnan, K. P., IM-209. " Sreerangam ",. Dewan's Road, COCH1N-16 (KERALA).
Shri Barthakur, K. C , LM-12. Executive Engineer-PHE Gauhati Divn. No. II, Gauhati-781021, ASSAM
Shri Baruah, K. C , LM-245. Executive Engineer, Board for Prev. & Control of Water Pollution, P. P. Road, Rehabari, GAUHATI-781008, ASSAM.
Dr. Basu, A. K., LM-144. NEERI Zonal Laboratory, 23, R. N. Mukherjee Road, CALCUTTA-700001.
Shri Bhagotra, V. K., 290, New Plots, JAMMU (TAWI)-l80005, J & K STATE.
LM-51.
Shri Bharatiya, A., LM-66. Dept. of Botany. M. M. College (P. G.\ MODINAGAR-201204 (U. P)
Dr . Bhargava, D. S., LM-42. Reader (Pollution Control), Dept. of Civil Engineering, University of Roorkee, ROORKEE-247672 (U. P.)
Shri Bhattacharya, D. N.. LM-20I. C/o Dr. N. P. Smha, Hinoo, RANCHl-8340002.
Shri Bhattacharya, S. K., LM-52. 64/1/22A, Khudiram Bose Sarani, CALCUTTA-700037.
Prof. Bhavanani, H. V. LM-5. B/3 Vikram Baug, Pratap Ganj„ VADODARA-390002.
Shri. Bheda, N. R. LM-177. 92, Mowbrays Road, MADRAS-600018.
Shri Bhide, W. D., LM-90. A-12/14, Govt. Officers Quarters, Haji Ali Park,. BOMBAY-400034.
Dr. Bhole, A. G.( LM-217. Prof, in Civil Engg., V. R. C. E. NAGPUR^440011.
172

Name & Address No. Name & Address No.
Dr. Bhoota, B. V., LM-32. "The Ratnarn", Little Gibbs Road, BOMBAY-400006.
Shri Bopardikar, S. M. LM-55. C/o Prof M. V. Bopardikar, 50, Vijayanagar Colony, POONA-411030
Shri Chabria, N. D., "Sadhana", 4th Floor, Flat No. 30, Nowroji Gamadia Road, BOMBAY-400026.
Shri Chandra, G. R., C/o Mr. M. D. Patel "Nayan" 1, Rama Krishna nagar, RAJKOT-360001.
Dr. Chaphekar, S. B. Dcptt. of Botany, Institute of Science, BOMBAY-400032.
LM-76-
LM-229.
LM-162.
LM-121. Shri. Chatterjee, N. K., M/S. Nagaland Pulp and Paper Company Ltd; P. O. PAPERNAGAR-798 623, DISTT : MOKOKCHUNG, NAGALAND.
Shri Chatterjee, S., LM-7. Consulting Chemical Engr., 17, Justice Dwarkanath Rd. CALCUTTA-700020.
Shri Chaturvedi, M. K., LM-152. Executive Engineer, Construction Division, U. P. Jal Nigam, SRINAGAR-246174 (GARWAL)
Dr. Chaudhuri, M., LM-9. Deptt. of Civil Engineering, Indian Instt. of Technology, KANPUR-16 (UP)
Prof. Chaudhuri," N., LM-38. Chairman, Central Board for the Prevention & Control of Water Pollution, 5th and 6th Floors, Skylark Building, 60, Nehru Place, NEWDELHI-110 019.
Shri Chaudhuri, N. P., LM-149. Neelam Plot No. 3, Behind Hospital of ' Dr. Dawabhakta, JALGAON-425001.
Shri Manpoong, C. T., LM-187. Executive Engineer, Rural Works Division, KHONSA-786630. DISTT : TIRAP (ARUNACHAL)
Shri Choudhury, A. N. D., LM-39. C/o. Foundation Engineers Bureau, Milanpur, Rehabari GAUHATI-781 008.
Shri Darji, R. B., LM-193. Chemical Engineer, Reliance Textiles, Block-119/9CH, Sector-22, GANDHINAGAR-382022.
Shri Das, N. K., LM-148. Chief Chemist, H. J. M. Ltd; Chemicals Divn. P. O. AMLAI PAPER MILLS-484117, DISTT: SHAHDOL. (M. P.)
173

Name & Address No. Name & Address No.
.Shri Datta, A. K., . LM-203. Asst. Prof; Civil Engineering, B. E. College, HOWRAH-711103.
Dr. De, A., LM-118. Reader, Dept. of Civil Engg., Jadavpur University, CALCUTTA-70OO32.
Prof. De, A. K , LM-104. Deptt. of Chemistry, Visva-Bharati, SANTINIKETAN-731231. (W. B.)
Shri Desai, V. D. LM-34. Dy. Municipal Commissioner (Retired), Sheetala Darshan, Flat No. 42,4th Floor, 375, Lady Jamshedji Road, Mahim, BOMBAY-400 016.
Dr. Desh Deepak, LM-159. Dept. of Chemical Engg., University of Roorkee, ROORKEE-247672 (U. P.)
Shri. Devendra Singh, LM-10. 5, Nanabhai Mansion, 5th, Floor, Sir P. M. Road, FORT. BOMBAY-400 001.
Dr. Dhabadgaonkar, S. M. LM-247. 37, V. R. C. E. Qrs., NAGPUR-440011.
Shri Dhoke, L. V., LM-171. Exe. Engineer PHED., Kasardih. F/2 Civil Lines DURG (M. P)
Dr. (Mrs.) Doctor, T. R., LM-234. Prof. & Head, Microbiology Dept., Sir M. V. College of Science, Old Nagardas Road, BOMBAY-400069.
Shri Dutt, S. S., LM-246. Asst. [n-Charge, Lab., H. J. M. Ltd. (Chem. Divn.) P. O. Amlai Paper Mills, DISTT : SHAHDOL (M. P.)
Shri Dutta, M., LM-117. 7/8, Raja Rajballaw Street, CALCUTTA-700003.
Shri Dwivedi, R. C , LM-57. 108, Chandralok, Aliganj, LUCKNOW-226006.
Shri Gad, V. M., LM-185. Apartment-S-11, '< PEMINO " , 1-B, Altamount Road, BOMBAY-400094.
Shri Gadkari, S. K., LM-46. N. E. E. R. I., NAGPUR-440020.
Prof. Gajendragadkar, S. K., LM-49. Victoria Jubilee Technical Institute, Matunga, BOMBAY-400019.
Shri Ganapathy, S., LM-78. . 6-4-423/1,
Prasanna Nilayam, Bholakpur. SECUNDERABAD (A. P.)
Dr. Gaonkar, S. A., LM-69. 6th Road, T. P. S. 5, Shreeji Kripa, Flat No. 10, Lilac Coop. Housing Society, Santa Cruz (E), BOMBAY-400055.
174

Name & Address No.
Shri Gawalpanchi, R. R., LM-H6. 42, W. High Court Road, Tilak Nagar, NAGPUR.
Shri George, K. P., LM--208. Asstt. Engineer, Kerala State Board for Prevention & Control of Water Pollution, Kowdiar, TRIVANDRUM-695003. (KERALA)
Dr. George, T. K., LM--174. Prof, in Civil Engineering, College of Engineering, TRIVAND RUM--695016 (KERALA).
Shri Ghosal, S. K.. LM--161. 113, J. N. Lahiri Road, Serampore, HOOGHLY (W. B.)
Dr. Ghosh, T. K., LM-221. Scientist, N. E. E. R. L, NAGPUR-440020.
Shri Gopalkrishnan, A. N., LM-244. P. H. Engineer, Richardson & Cruddas (1972) Ltd., Post Box No. 1276, MADRAS-500001.
Shri Gulati S. L., LM-63. Supdtg. Engineer (P. H), House No. 3384, Sector 27-D, CHANDIGARH (PUNJAB).
Shri Gupta, A. S., LM-243. Exec. Engr. & P. A. to Z. C. E. (H), U. P, Jal Nigam, 11, Mohini Road, DEHRADUN.
Name & Address No.
Shri Gupta, V. K., LM-133. C--193 Sector-C, Mahanagar, LUCKNOW-226006-
Shri Gurunadha Rao, B. V. S. LM-86. No. 10, 9th Avenue, Harington Road, Chetpet, MADRAS-600031.
Shri Gyan Sagar, LM--91. 5. E. (R & D), U. P. Jal Nigam, 6, Rana Pratap Marg, LUCKNOW-(U. P)
Shri Hanmantha Rao, S., LM-84. Chairman, Karnataka State Board for Prevention & Control of Water Pollution, 8th Floor, Utility Building, M. G. Road, BANGALORE-560001.
Shri Hans, D. K., LM-225. 232, Basant Niwas, Begum Bagh, MEERUT-25000I.
Shri Hanumanulu, V. LM-228. C/o Mrs. V. Aruna, In the House of ShriA. V. Rama Rao (Food corpn.) Maganti vari street. Ram chandra Rao Peta, ELURU-8534002.
Shri Jain, A. K., LM-97. J—191, Rajouri Garden, NEW DELHI-110027.
Dr. Jain, D. K., LM-214. 69, Azad Road, MEERUT-250002.
175

Name & Address No. Name & Address No.
Shri Jain, L. K., LM-22. 46, Bhandara Road, Itwari, NAGPURu440002. (M. S.)
Shri Jain, M., . LM-75. 1, Darya Gunj, Ansari Road, NEW DEL H[-110002.
Shri Jain, P. C , LM-74. Executive Engineer, P. H. E. D., Water Works, PALI-306401 (RAJ).
Dr. Jain, S. K., LM-224. Scientist, 173, Radio Colony, INDORE-452001.
Shri Jain, V. K., LM-62. 48, Saket Nagar, INDORE-452001.
Shri Jai Narain. LM-130. ] , Shivmandir Marg, Lajpatnagar II. NEW DEL HI-110024.
Shri Jalgaonkar, A. D., LM-98. Env. Engineering Divn,, Engineers India Ltd; 4, Sansad Marg, NEW DELHI-ii oooi..
Mrs. Joglekar, S. J-, LM-140. A-6 Customs & Excise Quarters, WADALA. BOMBAY -400031.
Shri Joshi, A. B., LM-25. B-29, Rajyog, Vazira Naka, Lokamanya Tilak Road, BorviJi (West), BOMBAY-400092.
Shri Joshi, D. S., LM-223. 1/4, Sewage Purification Works Senapati Bapat Marg, Dadar, BOMBAY-400028.
Shri Joshi, G. C , LM-220 "Saurabh" Bungalow, Mamta Park, Behind Navgujarat College, Ashram Road, AHMEDABAD-380014.
Shri Joshi, J. N., LM-218, E-3, 10 Blocks, Gulbai Tekra, AHMEDABAD-380015.
Miss. Joshi, N. S., LM-186. Scientist, N. E. E. R. I., NAGPUR-440020.
Shri Kadam, A. P., LM-233 'Kusum Kunj' Vithal Society Navapura BARODA-390001.
Shri Kale, S. G., LM-173 Block No. 6, Plot No. 10, Jagdusha Nagar,
• Ghatkopar(W), BOMBAY-400086.
Shri Kale, V. W., LM-141. C/o Klean Laboratories, 1340 Shivaji Nagar, PUNE-5 (M.S.)
Shri Kanal, K. D., LM-4. Q-9, Scientific Co-Op. Housing Society, Laxmi Nagar, NAGPUR-400 022.
Shri Kannan, V., LM-206. 48, 6th Cross, Annaiappa Block, Bonson Town, BANGALORE-560056.
176

Name & Address No. Name & Address No.
Shri Kansal, S. K., LM-87. Sewage Pumping Station, Khanjarpur Crossing, ROORKEE-247672.
Dr. Kantawala, D. C , LM-43. Env. Engg. Consultants, 96/97, Mittal Chambers, Narimaa Point, BOMBAY-44002I.
Shri Kapoor. A., LM-192. H-25, Green ParJc Extn., NEW DELHI-110016.
Dr. Kardile, J. M , Research Officer, Environmental Engineering Research Division, M. E. R. I., NASIK-4 (M. S.)
Shri Karnavat, D. K., "The Peak", C-114, SavitriPath, Mangal Marg, Bapunagar, JAIPUR-302004.
Dr. Kaul, S N., Scientist, N . E . E. R. I., NAGPUR-^40020.
LM-137.
LM-172.
LM-175.
LM-30. Shri Kerhalkar, M. B., Executive Engineer, P H. Engg. Division, Civil Lines R E W A-486001 (M. P.)
ShriKerof, Manohar LM-248. Env., Engineer, 134 C/MIG/Pocket-D, Block-A, Shalimar Bagh, DELHI-110033.
Prof. Khanna, P., LM-143. Department of Civil Engineering, Indian Institute of Technology, Powai, BOMBAY-400076.
Shri Khanna, P. K., LM-65. A-8, Parekh Mahal, Veer Nariman Road, BOMBAY-400020.
Dr. Khanolkar. V. D., LM-178. Parkhe Research Instt., KHOPOLI-410203 (M.S.)
Shri Khare, R. P., LM-168. Asstt. Engineer, Construction Division, SRINAGAR-GARHWAL-246174 (U.P.)
Shri Khare, S. T;.. LM-147. 502, Lovedale, Juhu Tara Road, BOMBAY-400iO-49.
ShriKirangc, V., LM-230. W-24. MrDC Area NAGPUR-440016
Shri Kohli, A. K., LM-8. Asstt. Professor, Civil Engineering Deptt., Pant College of Tech., G. B. Pant University of Agriculture Tech., PANTNAGAR DISTRICT NAINTAL (U.P)
Dr. Konar, S. K., LM-6. Fisheries Laboratory, Dept. of Zoology, Kalyani University, KALYANI P. 0.-741235, DISTT : NADIA, W. B.
Shri Krishnamurthy, T. LM-85. 170, Bharathy Street. PONDICHERY-605001.
Shri Krishna Rao, T. R., LM-48. Managing Director, Hindustan Dorr. Oliver Ltd; Dorr-Oliver House, Chakala, Andheri East, BOMBAY-400093.
177

Name & Address No. Name & Address No.
Shri Krishnasastry, K. R. LM-249 1-10-5, Ashoknagar, HYDERABAD-500020.
Prof. Krishnaswamy, G., LM-59. Dept. of Applied Mech. and Hydrology. Regional Engineering College, ROURKELA-8 (ORISSA).
Shri Krishnaswamy, K. S., Union Construction, 3, Block-3, Sorab Barucha Road, Colaba, BOMBAY-400005
Dr. Kudesia, V. P„ LM-158 C-30, Shastri Nagar, MEERUT (U. P)
Dr. (Mrs.) Lakshmi Shukla, LM-211 Assoc Professor in Geography, C/o Shilpi Handicrafts Centre, Ganesh Temple, Moti Doongari, JAIPUR-302004 (RAJ.)
Shri Lai. K., LM-33 Driplex Water Engg. Pvt. Ltd; 217, Hans Bhawan, Bahadur Shah Zaflfar marg, NEW DELHI-110002.
Shri Madhavan, M. N., LM-180 Block-1, Flat-2, Rajendranagar, PATNA-16.
Prof. Mahabal, B. L., LM-126 17, Chandravijay Housing Society. Lokmanya Tilak Road, Mulund (East), BOMBAY-400081.
Shri Mahendra, Pratap, LM-226 232, Basant Niwas, Begumbagh. MEERUT-250001.
Shri Mahulkar, R. C , LM-160 Kirloskar Consultants Ltd; 917/19A, Fergusson College Road, Shivaji Nagar, PUNE-411004.
Shri Majumder. G., LM-176 48/60, Swiss Park. CALCUTTA-700033.
LM-47
Dr. Manamohan Rao, N. LM-111 Sri Siddharth Instt. of Technology, Kunigal Road, Maralur, TUMKUR-572105.
Shri Mangayya, K., LM-77 Executive Engr., Port Qrs. Type V-17, Harbour Park Extn., VISAKHAPATNAM-530003.
Shri Manjan Rao, P., LM-157 Zonal Engineer, A. P. I. I. C. Industrial Corporation Ltd; VUAYAWADA-520007 (A. P).
Shri Mankad, U. C , LM-100 C/o Geo Miller & Co. P. Ltd; 6th Floor, Bhandari House, 91 Nehru Place, NEW DELHI-110019.
Dr. Marathe, V. B. LM-251 Officers Staff Qrs, 10, Civil Lines, NAGPUR.
Dr. Mehrotra, I., LM-200 71/8, D. S. Barrack University of Roorkee, ROORKEE-257672 (U.P)
LM-35 S h r i Maihotra, S. K., 48, A/B3 DDA Flats, Lawrence Road, DELHI-110035.
178

Name & Address No. Name & Address No.
Shri Mehta, A. D., LM-122 2/36, A, H. Wadia Baug, G. D. Ambedkar Marg, BOMBAY-500033.
Shri Mehta, H. N., LM-56 Chief Civil Engineer, Commercial & Industrial Combine Ltd; P. O. Box 835, TANGA (THE UNITED REPUBLIC OF TANZANIA) TANZANIA.
Shri Mirchandani, N. W. LM-195 B-32, Seema Apartments, Bullock Road, Band Stand, Bandra, BOMBAY-400053
Shri Misra, A. B., LM-109 Jt. Director, Env. & Ecology, 113, Jawahar Bhawan, LUCKNOW-(U.R)
Shri Mithal, R. K. LM-227 Executive Engineer, Temp. Project Division, U. P. Jal Nigam, 99/3 Dharampur Haridwar Rd., DEHRA DUN (U.P)
Prof. Modi, H. A., LM-155 Dept. of Microbiology, S. P. T. Arts & Science College P. O. GODHRA-489001 (GUJ)
Shri Mody, H. E., LM-205 392/66, Vijaynagar, Nawa Vadaj, AHMEDABAD-13.
Shri Mohapatra, S. K.. LM-181 Senior Manager Water Supply & Environment Control 2nd Floor, IPICOL House, Janpath, BHUBANESWAR-7.
Shri More, V. S. LM-82 Manager (Pollution Con.), Indian Oil Corp. Ltd; Refineries & Pipelines Divn., Indian Oil Bhavan, Janapath, NEW DELHI-110001.
Dr. Mowli, P. P., LM-94 Deptt. of Civil Engg. S. V. University College of Engineering, TIRUPATI-5J7502 (A.P.)
Shri Mukherjee, S. R., LM-16 FJat No. 6-6, Estate-B, V. I. P. Road, CALCUTTA-700054.
Shri Mundhra, S. D. LM-37 M/s. Geo. Miller Co. P. Ltd; Bhandari House, 91, Nehru Place, NEW-DELHI-110019.
Shri Munichamy, M., LM-219 Plot No. RB-5, Subbaraj Street, Gandhiji Road, TIRUNAGAR* MADURAl-625006.
Shri Nageswara Rao, Y , LM-125 Municipal Engineer, Nakkalagutta Water tank, Hanumkonda, WARANGAL, 506004(A.P.)
Shri Nanjappa, G., LM-2I3 50, Nanjappa Road Cross, Shantinagar, BANGALORE-560027.
Shri Nanjundappa, C. N., Exe. Engineer, Water Supply Divn. (S), Cauvery Bhavan, III floor, BANGALORE-56000!7.
LM-53
179

Name & Address No. Name & Address No.
Shri Nanjundaswamy, P. L., LM-199 Dr. Chief Engineer, Karnataka Urban Water Supply and Drainage Board, Utility Building, M. G. Road, BANGALORE-56000I. Shri
Shri Narayana, K. L., LM-194 Lecturer, Dept. of Civil Engg., Regional Engineering College, WARANGAL-506004.
Shri Narayanaswamy, M. S., LM-U4 Prof, in Civil Engg., Banaras Hindu University, VARANASI-221005.
Shri Natarajan, R., LM-20 Flat, 3, Kamala Sadan, 255, U. U. Bhat Road, Matunga BOMBAY-440O19.
Dr. Natarajan, R., LM-IJ t General Manager (R &D), M/s. Tulsi Fine Chemical Industries (P)Ltd. 1216/7, Shivaji Nagar Fergusson College Road, POONA-411 004.
Prof Nayak, U. M.. LM-93. Head, Deptt. of Engg. Chemistry, Birla Instt. of Technology, MESRA (RANCHI) BIHAR.
Shri.
Shri
Dr.
Shri
Shri
Dr. Oza,P. P. LM-72 Shri 4. Adinath Society, Dr. Vikram Sarabhai Road, AHMEDABAD-3800I5.
Pal, D-. LM-145. Bhanwar Bhavan. (Near Shiva Mandir), P. O. BARAUT. DISTT; MEERUT (U.P.)
Palanisamy, A., LM-150. Executive Engineer, TWAD Board, Central Designs Divn., 5-F, Vigneswar Bhavan, Vinayaga Nagar. MADURAI-625020.
Palondicar, V. P., LM-I96. 772. Vasant, Aquem Alto, MARGAO-GOA.
Pancholi, B. H. LM-23, 7, Annabefle, 81; S. V. Road, Santa Cruz West. BOMBAY-440 054.
Panicker, P.V.R.C.. LM-101 Scientist, N.E.E.R.I., NAGPUR-440 020.
Parabrahmam, M. LM-124. Principal Scientific Officer, Dept. of Environment, Technology Bhavan. New Mehrauli Road, NEW DELHI-110029.
Paramasivam, R., LM-50 Scientist, N.E.E.R.I., NAGPUR-440 020
Pareek, N. K., LM-71 33, New Power House Road, Sector-7, JODHPUR-342001.
180

Name & Address No. Name & Address No.
Shri Parekh. M. N., LM-24. Sikkim Distilleries Ltd; P. O. RANGPO (SIKKIM).
Shri Parikh, B. N., LM-64. C/o M/s. Parikh Construction Co., Post Box No. 5, 611, Shivaji Nagar, Miraj Road, SANGALI-416416.
Shri Parikh, Y. J., LM-112. Env. Engg. Consultants. 96-97 Mi ttal Chambers, Nariman Point, BOMBAY-400021.
Shri Parkash, A., LM-67. S. E. (Projects), Haryana State Agril. Marketing Board, House No. 12, Sector-27A. CHANDIGARH-160022.
Shri Parwani, A. U., LM-103. Parwani Builders, 127, Lax mi Nagar, NAGPUR-440022
Shri Patcl.S. C , LM-191. Dy. Engineer, P. H. San. Sub Divn. No. 1. Mani Mandir, MORVI-363641.
Shri Patel, T. M., LM-136. 57, Punam Nagar Society, Bhatar Road, SURAT (GUJARAT).
Shri Patel, V D., LM-89. C/o Dahyabhai B. Patel, Hathibhag Street, P. O. SOKHDA-391745, TALUKA & DIST ; BARODA
Shri Patil, S. K., LM-79. Executive Engineer, Env. Engg. Works Divn., Jupitor Building, Gokhale Road, THANE-400602.
Dr. Patwardhan, A. D.. LM-95. 7/132, Kanchanganga, Opp : Mahim, P. O.. Mahim, BOMBAY-400016.
Shri Paul D. R., LM-107. G-17, Rishikesh-I Evershine Nagar Near Orlum Church Off. Karve Road, Ma lad (West) BOMBAY
Dr. Peeran, S. F., LM-81 Triplicane High Road, 312, Big Mosque Compound, MADRAS-600005.
Shri Phadnis, V. G., LM-250 " Girija ", 5, Sitabag Colony, Opp. Water Treatment Plant, Sinhagad Road, PUNE-411030.
Dr. Pltchai, R., LM-36 Prof. Pub. Health Engg., College of Engg. Guindy, MADRAS-600025.
Shri Poddar, S. L., LM-102 2nd Floor, Room No. 116, 178, M. G. Road, CALCUTTA-700007
Shri Prabhakar, S., LM-134 Scientific Officer DEED (ETP) BARC, BOMBAY-400085.
181

Name & Address No. Name & Address No.
Dr. Prabhakara Rao, A. V. S„ LM-15 Professor, Deptt. of Civil Engineering, Indian Institute of Tech., I. I. T. Post Office, KANPUR-208016 (U. P).
Shri Prafullokumar, R. K., LM-119 Kaishamthong Ahanthem Leikai, IMPHAL-795001 (MANIPUR STATE).
Shri Prakash, J. J., LM-1 70, Lavelle Road, Bangalore-1.
Shri Prasad, S. C , LM-156 Dept. of Civil Engineering, M. N. R. Engineering College, ALLAHABAD-211004 (U. P)
Shri Pujara, K. H., LM-106 13, Ganga Jamuna Society, Shah Alam Tolnaka, AHMEDABAD-380022.
Shri Purnayya, D., LM-165 Executive Engineer (PH), H. No, 10-3-14/B/4/1/B, Humayun Nagar, HYDERABAD-500028.
Shri Raghu, V., LM-222 Dy. Adviser (PHE), C. P. H. E. E. O., Nirman Bhavan, NEW DELHI-110011.
Shri Rajani, A. K., LM-239 B-l/281, Janakpuri, NEW DELHI-110058.
Shri Rajeevan, M- N„ LM-236 " Novami ", Puthuppally Road, Medical College, TRIVANDRLIM-695011 CKERALA).
Shri Raj Kumar, LM-51 C-2/8, River Bank Colony, LUCKNOW, (U. P.)
Shri Raju, B. S. N., LM-240 Lecturer in Civil Engg. A. U. Engg. College, VISAKHAPATNAM-5300O3.
Shri Ramakrishna, B., LM-2. No. 10, 2nd Main Road, Gayatri Devi Park Extn., Malleswaram, BANGALORE-3.
Shri Raman, A., LM-70. NEERt Delhi Zonal Lab., Chandrawal Water Works-II, Alipore Road, DELHI-110054.
Prof. Raman, V., LM-11. Scientist, N. E. E, R. I., NAGPUR-440 020.
Shri Ramaprasad, G., LM-127. Reader in Civil Engg., S. V. University College of Engineering, TIRUPATI-517 502.
Shri Ranade, S. S., LM-183. Colour Chem, Ltd: Balkum Village, THANE-MAHARASHTRA.
Dr. Ranade, S. V. LM-29. Walchand College of Engg., Vishrambag, SANGLI-416 415(M. S.)
Shri Rangappa, N., LM-235. Executive Engg., Panchayat Raj, ANANTAPUR-515001 (A. P.)
182

Name & Addrecs No. Name & Address No.
Shri Rangwala. S. C , LM-212. 'Sada Mangal", 12, Gokul Park, Near Viswas Flats, Behind L. D. College of Engg., Ambawadi, AHMEDABAD-380015.
Shri Rao, C. E. S. LM-28 5, "SABARI" 11th Road, Chembur, BOMBAY-71. A S.
Shri Rao. S. N. LM-242. Dy. Analyst, Bihar State Water Pollution Control and Prevention Board. 7, Mangles Road, PATNA-800015. (Bihar)
Shri Rasal, D. R., LM-113. Regional Officer, Maharashtra Prevention of Water Pollution Board, Bharat Kunj, New Osmanpura, AUR ANG AB AD-431001.
Shri Rau, V. V. S., LM-184. Dy. Manager, Pollution Control), Heavy Engineering Corporation Ltd; E-261 Sector-2, RANCHI-834004.
Shri Rengaraj, K., LM-154. Asst. Prof, of Chemistry, College of Engineering, Guindy. MADRAS-600025.
Shri Roy, A. K., LM-26. Sanitary Engineer, World Health House, World Health Organization Ring Road, NEWDELH1-110 001.
Shri Sanchetee, H. C, LM-188. Kolari Mohalla, Navchokia, JODHPUR-342001 (Raj.)
Shri Sanghavi, K. A., LM-105. Subha Sadan, Dena Waii Thakurdlwar, J. S. Road, BOMBAY-400 002.
Shri Sanghavi, M. M., LM-12 E-21 Sarvodaya Nagar, Panjrapole Road, BOMBAY-400 004.
Shri Sangwan, B. S., LM-169. 1, Officers Colony, Ward No. 20, Opp : Model School, Church Road, ROHTAK (HARYANA).
Shri Satyanarayana, S., LM-129 Asstt. Project Engineer, B-227, Fertilizer City-505 210, DISTT: KARIMNAGAR (A.P)
Shri Savalappan, K. N., LM-88 4th Main Road, Thiruvanmiyur, MADRAS-600041
Shri Sen, K., LM-197 Executive Engineer (PHE), Blue-Angel Cottage, Lummawrie Hills, SHILLONG-793003, (MEGHALAYA)
183

Name & Address No. Name & Address No.
Shri Sengar, R.M.S., LM-128 Lecturer, Dept. of Botany, Agra College, AGRA-282 002.
Shri Sengup'ta, M., LM-210 Fiat No. 3, Block-H, Manicktola Housing Estate, VIP Road, CALCUTTA-700054.
Shri Seth. A.K., LM-110 Scientist and Head, NEERI Zonal Laboratory. B-25, Rajendra Marg, Bapunagar, JAIPUR-3O20O4
Shri Shah, M. M'., LM-190 Kirti Society, Varsodani Chawl, Sabarmati, AHMEDABAD-380015.
Shri Shah, M. S., LM-139 Meher House 4th Floor, 15, Cawasji Patel Street;. Fort, BOMBAY-40O001.
Shri Sharma, D. P., L M-167 44 A-B, Adharsh Nagar, LUCKNOW-226005
Dr: Shethna, Y. I. LM-40 Prof. & Head, Dept. of Life Sciences, Vidyanagar Campus, Santa Cruz (East), BOMBAY-400 098
Prof. Shivaji Rao, T., LMr23I Principal College of Engineering Andra University 5/33, Sripuram Quarters VISAKHAPA TNAM-530003
Shri Singh, C. B., LM-215 Mayaikoibi, P. O. IMPHAL-795001. (MANIPUR).
Shri Singh, L.N., LM-202 Construction Division, U. P.' Jal Nigam, Sri Nagar (GWL) DISTT : POUR.I GARWAL.
Dr. Singh, M.M., LM-21 376, Marhatal, JABALPUR-482002
Shri Singh Deo, D. N., LM-73 Additional Secretary, Housing & Urban Development Dept., Oris'sa Secretariat,
• BHUBANESWAR.
Shri Singhi P. K., 16, Babar Lane, NEW DELHI. 110001.
LM-17
LM-146 Dr. Sircar, P. K. Qr. No. E-20/6., P. O. INDIAN EXPLOSIVE 829112, GOMIA, DISTT :.GIRIDIH (BIHAR)
Dr. Sivasankar, B., Dept. of Chemistry, College of Engg. PAUT, MADRAS-600025.
Shri Sobti, B, S., 2485/A, Bengali Mohalla, AMALA CANTT (HARYANA)
LM-153
LM-189
LM-60 Dr. Subba Rao. B.. Walchand College of Engineering, SANGLI-.VISRAMBAGH 416415.
184

Name & Address No. Name & Address No.
Shri Subburamu, K., LM-99 Env. Engineering Deptt., Engineers India Ltd; 4, Sansad Marg, NEW DELHI-110001.
Shri Sudhalkar, V. S., LM-92 "Swayam Prakash, 22, Pratap Ganj BARODA-390002
Shri Sukumaran, P. K. LM-166 Plant Engineer (C), N.P.P.C. Ltd; PAPER NAGAR-P. O. 798623, MOKOKCHUNG DISTT, NAGALAND.
Dr. Sundaresan, B. B., LM-45 Director, N.E.ER.L, NAGPUR-440020.
Prof. Tamhankar, B. A., LM-135 Vishwa-Chandra, Vishwa Laxmi Housing Society, Opp : Kirloskar Kisan Kothrud POONA-411029.
Shri Tandale, S. V., LM-14 Sub Divisional Engineer, Env. Engg. Works Sub Division, PANDHARPUR-413304, DISTT: SOL APUR.
Dr. Tejam, B. M., LM-164 Director, Institute of Ecotechnics, India, D-2/301, Jumbo Darshan, Andheri (E), BOMBAY-400069.
Shri Tasgaonkar, S. K., LM-142 Chief Engineer, Maharashtra Water Supply and Sewerage Project, Express Towers, 4th Floor, Nariman Point, BOMBAY-400021.
Shri Tewari, R. N., LM-96 Env. Engineering Deptt., Engineers India Ltd. 4, Sansad Marg, NEW DELHt-110001.
Shri Thakur, U. C , LM-232 Lieutenant Colonel, Commanding Officer,
103, Engineering Regiment, C/o 99 APO.
Shri Thomas Mahew, LM-138 39, Uday Park, NEW DEL Hl-11G.G49.
Shri Thyaga Raj, V. E.. LM-108 17/C, 37A Cross, 8th Block, Jayanagar, BANGLORE-560041.
Shri Thayagaraja, B. N., LM-123 Project Engineer, Bangalore Water Supply & Sewerage Board, Cauvery Bhavan, Ilnd Floor, BANGALORE- 560009:
Shri Tripathi, P. N., LM-61 Assistant Professor of Civil Engineering, Bhagalpur College of Engg., P. O. SABOUR-813210 BHAGALPUR.
Dr. Trivedi, R. C , LM-132 Adviser (Pollution Control), C/o Industries Commissioner, C/3 M. S. Building Lai Darwaja, AHMEDABAD-1.
Shri Valaulicar, V. R., LM-31 1II-2, Junta House, PANAJI, GOA.
185

Name & Address No. Name & Address No.
Shri Vasani, J. S., LM-80 Manager (Technology), Hindustan Dorr Oliver Ltd; Chakala, Andheri (East), BOMBAY-^00093.
Shri Vashi, N. V., LM-120 "Amar Ashish". 2nd floor, Opp. Mun. Corporation, SURAT-395003
Shri Veerabhadrachari, S. K.( LM-38 Supdtg. Engg., No. 147, III Cross, I Block (East), Jayanagar, BANGALORE-560011.
Shri Venkataiah, R. P., LM-204 C/o Navega Engrs; Pvt. Ltd; 6-3-666/A, Opp. Instt. Med. Sciences, Panjagutta, HYDERABAD-5O00O4.
Shri Venkataraman, R., LM-151 22, 3rd Avenue, (3 B Customs Colony), Besant Nagar, MADRAS-600090.
Shri Venkatraman, S., LM-83 Sr. Engineer (Poll. Control), Indian Oil Corpn. Ltd; (R & P), Janapath, Indian Oil Bhavan, NEW DELHI-110001.
Prof. Venkata Rao, M. V., LM-J79 Civil Engineering Deptt., Andhra University, WALTAIR-530003.
Shri Vijayaraghavan, G., LM-241 Project Engineer, Richardson & Cruddas (1972) Ltd; 23, Rajaji Salai, MADRAS-600001.
Shri Wadia, P. S,. LM-27 9, Walchand Terraces, Tardeo, BOMBAY-400034.
Shri Warade, G. N., LM-182 Sub Regional Officer, Maharashtra Prevention of Water Pollution Board, Muzaffarabad Hall, First Floor, Proctor Road, Grant Road (East) BOMBAY-400007.
186

B©©S©©©§S§3SS§g3SaSS©S©®9§©©S©S©©©S@S@§S®6©©3S©S@@SSS©@ff l
0) 0;
& 0» 0)
with Desl Compliments J'xom :
Aqua Pura Corporation
Water Purification Specialists, Matrufatturers,
Engineers and Co tractors,
ON GOVERNMENT AND RAILWAY LIST
Ahmedabadi Pole, Post Box No. 907,
Supply and Installation of
IMPROVED CHLORINATOR
Corrosion Proof Plastic Type for G a s , Pa ten ted , with
* Reliable Performance * Simplicity of Design
* Unique Operat ing Principle. * Higher Quality Componen t s .
05 0)
& (Q 0) ® 0; (0)
&
& 0i & 0) & «, 0) <$ 0) 0) 0) 0)
0) 01
(9 0V
& &
8 0! & 0i ® 0) 0)
g KadwaSher i , 1170/11 , Shivaji Nagar, g 0) § 0) Baroda-390001 P O O N A - 4 1 1 0 0 5 0) 0) 0» (0) (* 0) TeIephoue-56301. <5 0' * (9 0) <§ © a '«V
0) ®
0) « 0) § 0)
<»
IS O U R SPECIALITY $
» @
XXIX

S©3®©@a3©©§©©©©©©©©@S©©©©©©S©9©@§©S3§©©©©9S@S©©@©@@©©®©$
P
VUilh Best Compliments from; :
Tata Consulting Engineers BOMBAY HOUSE HOMI MODY STREET BOMBAY 400023.
CONSULTANTS for
INDUSTRIAL. POWER and ENVIRONMENTAL ENGINEERING
8 &
V
(8
G>
0)
8
a*
WATER-CHEM LABORATORIES
MANUFACTURERS OF
CHLORINE TABLETS CHLORINE LIQUID
AND CHL0R0SC0PE
(Apparatus to estimate residual Chlorine in water <jj> Price Rs. 60/- each) jf
(As per NEERI Know How) © (9
Enquiries Solicited : jj|
ADDRESS : 11-6-652, RED HILLS g HYDERABAD-500 004 ft INDIA 1
XXX

.* v.* w . M » M f >f. «... »M MJ J*» . . * * " *»* y « if^i J*< ,*J* • j«>' T** Mf Mi M* i t f Mtt MM tit MA flifc M+ Mft IHI* JM+
* How Utah Power & Light Company saved 33 %
| while cutting pollution 95%*
| ENELCO* ABC* Automatic Backwash Filter reduces suspended solids f in cooling tower blow-down discharge from 100 mg /I to less than | £ 5 mg/l, while saving 33% on installation costs and up to 25% * on operating costs.
¥ Utah Power & Light Company's Carbon $ Station was faced with regulations sti-$ pulating that the maximum allowable $ suspended solids discharge level t© tke $ Price River could be no more than 20 $ mg/l. The Utility industry's first Kop-* pers / Environmental Elements ABW J Automatic Backwash Filter for this ? purpose was installed, and the results * were spectacular. Prior to installation, * discharge water into the river registered
If conventional presssure type filters adequate to do the job were used, the cost would have been 50% more than thai of the ABW filter in place. When compared to a conventional sand filter, the ABW filter costs much less to operate, too. It is never out of service during backwashing. Less than a foot of head is required, so no feed pumps are needed And the ABW requires a backwash source of only 420 1pm as
* TSS (total suspended solids) ranging compared to about 21,000 Iprr> for a * * from 35 to 110 mg/l but now the ABW conventional sand filter of the same $ * filter regularly produces an effluent of | less than 5 mg/l TSS.
J Capital investment savings were equally dramatic.
ENELCO ABW Automatic Backwash Filters have been in use in municipal and industrial applications worldwide for over 30 years.
ENELCO Thickeners and Clarifiers also are available in a wide range of sizes. ENELCO flue gas desulphurization thickeners feature the newly developed auto-raise/constant torque capability.
| ENELCO ABW FILTERS, THICKENERS, CLARIFIERS, CARBON FILTERS f ETC. ARE NOW MANUFACTURED IN INDIA BY
SRTMVAS ENYTRO SYSTEMS PVT. LTD. C1/39/13-16, GIDC Industrial Estate, Naroda, Ahmedabad 382 330.
* * *
* * *
ENELCO and ABW are trademarks of the Environmental Baltimore, MD 21203.
Elements Corporation,
*
*
*
*
*
*
xxxt

* !
| With Best Compliments from: | * ' ! * *
* !
I Madura Coats Limited * * J | Thread Group |
* - * .
| KORATTI 680 308. | * - ' • *
* !
^ , — _ — _ . £ * - • ' • * • FOR ANALYSIS OF • * * $ WATER, SEWAGE AND INDUSTRIAL WASTES •
$ • $ * FOR MAINTENANCE AND COMMISSIONING $ * * * OF * * * | EFFLUENTS TREATMENT PLANTS $
* I £ * FOR CONSULTANCY AND TURNKEY $ * PROJECT SERVICES. * * *
| Klean Laboratories I $ (Approved by M. P. W. P. Board) * * $ | 1340 SHIVAJI NAGAR Phones: | | OPP. PREMIER GARAGE 56913 PUNE | $ PUNE-411005. 293386 BOMBAY. $ * *
xxx.ii

Not only awareness but a down-to-earth approach and an action-oriented environmental control programme, no matter what the costs be, are GSFC's basic philosophy of development. Its treatment plant for removing phosphates and flourides from the phosphatic group's liquid effluents and the BOD reduction plant for the caprolactam waste are first of their kind in our country. And now the plans for recovering DAP dust and fluorides from waste gases are taking a concrete shape
The ammonia absorption system set up in 1967 and the DCDA system in 1974 are GSFC's major steps in prevention of air pollution Another landmark Monsanto s latest technology, today the last word in total prevention of sulphur dioxide air pollution will be incorporated in the Company's new Sulphuric Acid plant now under construction.
Whether it is Ion Exchange or Reverse Osmosis, Biological treatment like nitrification or denitrification, use of Algae for removal of nitrogen or air stripping for removal of ammonia, the GSFC scientists have been endlessly experimenting for a better environment. GSFC is also actively participating in the Baroda Effluent Channel Project being implemented at a substantial cost. Dedicated to innovation and research with a rational approach to pollution abatement. GSFC has always contributed to a cleaner and healthier environment so vital for the human life. Indeed the ICMA award to GSFC in 1976 is a testimony to its pioneering work in abatement of liquid and air pollution in the fertilizer and fibre industry.
i GSFC-where growth and environment go together. GUJARAT STATE FERTILIZERS COMPANY LIMITED
P.O. Fertilizernagar 391750 Dist. Vadodara
XXXI11

« I J WE OFFER COMPLETE TURN-KEY PLANTS FOR f
i EFFLUENT TREATMENT I
I OUR SPECIALITY |
J I 1 DISSOLVED AIR FLOATATION PROCESS |
WHICH GUARANTEES f
HIGH DEGREE OF PURIFICATION WITH f t BYE PRODUCTS RECOVERY *> f
FROM SLUDGE B
J
bi
I
J
J
Patel Brothers Services and Engineering Pvt. Ltd.
Elphinston Building, 6 Veer Nariman Road
FORT, BOMBAY-400 023.
Telex No : 011-2546 GPVL Telephone Nos : 251072
313295
Telegram : PATELBROS
IN COLLABORATION WITH
M/s. Aminodan Technologies Aps Ltd.
Denmark
xxvi

*i
I
FOR DEPENDABLE, TECHNICALLY SOUND AND ECONOMICAL
U. E. Offer expert consultancy services in :
ft
4} Answer to all your pollution problems, contact:
1 I | Universal Luvmi^kmuj Pvt. Ltd. | 1 32-33 Nehru Place, 3rd ftour 2 i New Delhi-110 01-9. 4 $ • £
« J ^ Gram : ENVIRO Phone: 682908. I
9
5 * Industrial Waste Treatment and Disposal. -£
* Sewerage and Sewage Treatment £
ft * Laboratory and Pilot Plant Studies for Wastewater $1
Characterization and Process Development. ft
i * Water Purification and Distribution
ft * Environmental Impact Investigations
± * Solid Wastes Management. ^
xxvii

J
J WE HAVE SO FAR ACTED AS CONSULTANTS FOR EFFLUENT f • TREATMENT FACILITIES TO VARIOUS CLIENTS IN : h
* CHEMICAL INDUSTRIES f * DAIRIES f * FERTILIZER COMPLEXES |, * PAPER AND PULP MILLS jf * PESTICIDES PLANTS f * PETROCHEMICALS INDUSTRIES |
| * PHARMACEUTICAL INDUSTRIES f * RAYON INDUSTRY § * RUBBER INDUSTRIES g, * TEXTILE MILLS f Environmental Engineering Consultants f
96-97 Mittal Chambers, Nariman Point, Bombay-400 021, India. B Phones : 235329, 232176 Telex': 011-6784 MEEC IN, I
• *-> INDUSTRIAL WATER AND WASTE TREATMENT . f * DOMESTIC WATER AND WASTE TREATMENT h * R. C. C. AND STRUCTURAL STILL DESIGN ¥
J * PROJECT MANAGEMENT * INVESTIGATION PLANNING VALUATION * AIR POLLUTION MONITORING
ALSO LABORATORY ANALYSIS OF WATER AND WASTE WATER LABORATORY STUDIES OF TREATABILITY OF INDUSTRIAL WASTEWATER. HYDROGRAPHrC STUDIES.
Makers of:
(1) Quality Papers Bank, Bond, Rag Ledger, Airmail, Bible Printing, Maplitho, Cheque paper, Black Pastel, Coloured Printing, Absorbant Base, Kraft etc.
(2) Quality Boards White Duplex, Triplex.-white & Coloured, Black-centered white Triplex, etc.
Consultancy given for Pulp and Paper Plants of 10 to 30 TPD capacity.
Manufacturers of Equipment and Components for Pulp and Paper Industry.
J The Sirpur Paper Mills Ltd., SIRPUR-KAGHAZNAGAR 504296 (A. P.)
E r^*U*""d*^Jj s^<iQrv(3*^5*1HB<,^lB«^B(,<^*^RVt^^v^iBrHtQ)r,a(g«^qgrvqgv^q)^RBVVB3
XXXVI

j r
There was a Time when
F E R T I L I S E R
was unknown to the
Indian farmer. ,-.
r
J The-H came 9
F A C T
the fist large-scale fertiliser C
producer in India on the banks
of Periyar in Kerala
from where the
j F E R T I L I S E R C U L T
J spread over to lead ¥
§ the country to prosperity. t
1 I J I
THE FERTILISERS AND CHEMICALS
I TRAVANCORE LIMITED i
r
j UDYOGAMANDAL - 683 501 - KERALA a
J f
y^ga^^ayr^B^y^jfli^^ii^^y^w^ii^^^^p^tqBg^yy^^t^BgM^p^jw im]»^mj<^ig]^^jy^t*4d*'<J*tB<
XXX VI1

5SS©©©§@S§©©s@©©S©©@§S©©©§©@SS©@©S©3®©©©©©©§©g©©©©©©g
(0 © 10) ©
©
©
With %st Qomj>(iments 6f
3SK
©
o (0)
© © © Harihar Poly fibers
Prop : THE GWALIOR RAYON SILK MFG (WVG) CO. LTD.)
Regd. Office : Birlagram Nagda MP
&
&
© (0
0)
©
8
©
© ©
©
Office :
••INDUSTRY HOUSE"
45 Fairfield Road GPOBoxNo. 5124 BANGALORE 560 001
Works :
KUMARAPATNAM
Pin 581 123 Dist. Dharwar Karnataka State.
0» <s» (5) 0) ' • ) )
(3) 0» 0) (J) <» «J> 9 <!»
(9 ® 0) 0)
01
(0)
Phone 73051 and 73052
G r a m : P O L Y F I B E R S
Telex 845 233 H P F I N
Phone Har ihar 271/274 ®
Grams : " P O L Y F I B E R S " f»
Telex : 844 221 H P F I N £
m § S S § § § @ ® @ @ g g g S 6 g § @ § g © @ § g g g g g g § @ § g S S g g S § @ g g © @ @ g g @ g g § @ g g f t
XXX

© §©©©©©©©©©§©©©©©©©©©©©©©.©§©©© ©©©©9©©©®©©©©§§©©©©;5©3©©3)
©
©
© (0
<0 © (0
© © © ©
© © © If) © © ©
©
© © ©
ANY PROBLEMS JN WATER POLLUTION ?
nut? Best People to contact are
Hydraulic & G^ieral
203, ARUN CHAMBERS,
J. DADAJI ROAD.
BOMBAY-400 034.
Tel. 376975, 898075, 898393
We undertake
Grams : HYLICGEN,
BOMBAY.
0) &
(ft & & &
0)
0)
0) 0) 0) 0)
8 © 0)
TURNKEY PROJECTS IN
WATFR & WASTE WATER TREATMENT,
LABORATORY ANALYSIS OF SAMPLES,
PREPARATION OF FEASIBILITY REPORTS
FOR INDUSTRIAL EFFLUENT TREATENT
& DISPOSAL.
&
<fe©@©9©©@©®&§S©@S@S33S@-§©9Sa9@ £SS©9S@S@3©®@©@©3§a@S'3@39©«& -
XXXI

Chatterpur village: The incidence of water-borne disease dropped significantly after the installation of Wavin pipes.
Proof unearthed!
17-year old Wavin water supply pipes found as smooth as if laid yesterday
¥n 1962, Wavin presented a complete pipeline system to Chatter
pur, a village near Delhi. The Central Institute of
Plastic Engineering and Tools, at Guindy, Madras, tested a specimen of the pipe, which was recently unearthed for the purpose.
The report certifies, "The pipe does not show any sign of erosion or corrosion... The test results clearly indicate that the. specimen has a very good time endurance."
How Wavin pipes are cheaper, better, faster to install
Wavin PVC pipes cost 20-40% ; less than conventional pipes. _
PVC is totally corrosion-resistant, does not get pitted. This reduces friction, because of which
Wavin pipes employ a bore smaller than in conventional pipes, ultimately resulting in a better rate of flow. More: PVC is extremely durable.
Wavin pipes are lightweight, easily transported and simple to fit. 6 men can lay 1 kilometre of Wavin pipes in a day. Compare this with the alternative: massive, heavy, unwieldy, conventional pipes.
An additional bonus! US tests have proved that the
manufactured PVC uses only . 20% of the precious energy spent to produce metal pipes. If India . were to change over entirely to PVC, imagine the amount of energy that would be made available to our power-starved country...and how it would
revolutionise agriculture and rural water supply.
International development and health organisations
specify PVC pipes for their projects
You now know why. If you want full details, write
today to:
The Sales Manager Wavin India Limited Ambattur Industrial Estate Madras-600058.
I Plastics for agriculture and rural development v * ^ « * ^ M.H> J
Sales Offices at Madras, Delhi, Bombay, Calcutta and Patiala. Factories at Madras. Ghaziabad & Nagpu'r.
XL

We are her silent sentinels,
keeping an unobtrusive watch over her welfare. She has not
heard of us; even when she grows up into healthy
womanhood, she will not realise that ours was
the hand behind her good health... we, at HCC
built Water Purification Plants which gave her
pure, potable, safe water. We also built Sewage
Purification Plants and Effluent Disposal Plants to
keep contamination and pollution away. And, we
shall continue to guard her forever!
Construction House Wglchand Hirachand Marg
Ballard Estate Bombay 400 038 Tel: 268091 Telex: 011-1780 WALB-IN
XLi

I Orient Paper Mills Limited I
» Manufacturers of Quality Printing-Writing Packing-Wrapping Papers & Paper Boards. Also manufacture superior quality 'ORMO' Brand Ammonia Paper *
The largest Paper manufacturers in India, ORIENT PAPER | MILLS can offer the best quality because the products are * manufactured by the most modern machines under expert * supervision. Rigid laboratory tests and quality control systems a ensure consistency of quality well known to printers. $
MILLS : BRAJRAJNAGAR (ORISSA), AMLAI (M. P.)
I Alembic Chemical Works Co., Ltd, f
* Baroda 390 003 f
4 Manufacturers of Antibiotics, Ethical *
jfc Pharmaceuticals and Home Products. &
* ^ ^ ^ < ^ ^ ^ 4 K ^ * f r ^ 4 & ^ ^ ^ ^ < ^ * ^ 4&4& 4 * ^ ^ 4 & ^ * g > ^ < « & 4* *» •*»<«*+
XLii

XLiii

t©©©©©©§©©©§§©§§©§§©§©§§§©§§§§§§3©©§©§§§ ©©©©3©©©©©©@©©©§) ©
©
© ©
FOR BE3T QUALITY OF
WRITING PRINTING AND WRAPPING PAPER
REMEMBER
A N D H R A P A P E R
0) ©
0) 0) 0)
©
©
Manufactured by :
The Andhra Pradesh Paper Hills Ltd.. RAJAMUNDRY-533 105
Telegram : PAPERMILL
TELEX : 0492-202
Telephone : 4380-4389
(10 lines)
(C) © © © © (0 ©
© ©
© © © © © © © © ©
© © © © © © ©• ©
I S PENMALT INDIA LIMITED Offers the most advanced solid bowl continuous
scroll discharge centrifuge SUPER-D-CANTER
Extensively used for, dewatering industrial and municipal effluent sludges.
Manufactured in India in technical collaboration with SHARPLES-STOKES DIVISION OF PENNWALT CORPORATION, USA
For more product details, write to PENNWALT INDIA LIMITED
M IDC Plot No. D-221, Trans Thana Creek
Thana Belapur Road, NEW BOMBAY : 400 613.
Tel. Nos. ; 8705,8706, 8709, 8778 & 8794. Telex : 011-2091 Gram : PENNWALT BOMBAY
0)
0) 0)
0> ©) 0)
8 0) 0) 0) 0) 0) 0) 0) 0> 0) 0) 0) 0) 0) 0) 0) 0; 0> 0) 0) 0) 0) 0)
8
0)
0> 0) 0) 0) 0) 0) 0)
XLiv

i
They are *imf*te;;bl5<>iS's«
€r»9*neers have &|e.ib :$k*$!$M;-Yj nvolved to r oJy'Srtg: .*0«H^IU^••:!, I-very problems 8*1 kitwSmd&Qf'ii i.vprpeess lnd«itrW :. ' ••; *t$r \ ^throughout todta, •' •.•• • ., j -:::.;.':
|>Consequently, H»ndu*^B:-^:^/> f- p©rr»OJiver has evolved :;Y ^ ?;J'equipment which Is easy ••:,. r- to operate and hIonly • • . I dependable. Standard K equipment that can handle your. j waste and ailbw yttu to continue | with.Vdu* nlaTn prediction. | ffyeuvBlsh, Hindustan ;: .";•'• ;. Do'mbl'lvar £nsi««er.S:-•. } ,V- • ;;• wlfl fee glad to-study •;::V • ;;;.
::"" I your specific problems;^!' * suggest remedies
DORR OUUER X S § * ^HINDUSTAN OdRB"OUVER.UlV»TH> i:,:"6CWt-0f.tV6R MOUSE, CKAKMA iMJDM*m (tAm'80M«A.Yv*9G*M;o /
XLv

9 «
Si
I
T E E P O L
A Multi-Purpose Liquid Detergent
* TEEPOL — cuts grease instantly
MARKETED BY
5 "
V THE ANSWER TO ALL
YOUR CLEANING PROBLEMS ft
ft ¥ ^ . 4
* TEEPOL — a world-class/ detergent formulation of Shell. •&
* TEEPOL — drives dirt out faster £
I 5 * TEEPOL — is concentrated - saves you money.
kj . ' f t 3? A little Teepol does a lot of cleaning. t
\ ft
\
NATIONAL ORGANIC CHEMICALS INDUSTRIES LTD. Mafatlal Centre, Nariman Point, Bombay - 400 021 ^
ft
XLvi

C H A R M I N A R A.C.Pressure Pipes Well-known for their: Leafe-proof Hydrotite Couplings Life-long durability Higher flow capacity
% Immune to encrustation, tubercu-' lation and bacterial corrosion. • Higher strength for hydrostatic
crush and flexural loads. • Easy to cut and lay and inexpen
sive to install. # Once installed needs no
maintenance. # Available in wide range of sizes
from 80mm to 600mm diameters and in classes 5, 10, 15, 20 and 25
Charminar AC. Pressure Pipes have been the natural choice of engineers for rural, urban and industrial water supply schemes.
AHYDERABAD ASBESTOS CEMENT PRODUCTS UMfTED Sanatnagar , Hyderabad - 500 018.
Always use Charminar A.C. Pressure Pipes w i th Hydrotite Couplings I
XLvii

Pf32iv&cshfe^r3hkkj»^h>^(£b>^@^
I uUith vest dsompdmcnts %cm :
I 4
1 INDIAN PETROCHEMICALS CORPORATION LIMITED
VADODARA
Manufacturers of
Low Density Polyethylene (Indothene)
Polypropylene (Koylene)
Polybutadiene Rubber (Cisamer)
Acrylic Fibre (Cashmilon)
Dimethyl Terephthalate (DMT)
Ortho & Mixed Xylenes
Paraxylene
Solvent CDC
Ethylene Glycol
Ethylene Oxide
Polyethylene Glycol
Hydrocyanic Acid
Acrylonitrile
Linear Alkyl Benzene
Polyalkyl Benzene
Heavy N-Paraffins
J Benzene and Carbon Black feedstock.
XLviii
ra

DETERGENTS FOR TOMORROW'S PEOPLE TODAl^
HINDUSTAN LEVER THE MAKERS OF RIN AND SURF
wrAmujHMMy
«9 With best compliments from : ®9
9 0) 0
<0 fO) (0 (0 (0 (0 (0 (0 (0 (0 (0 (©
Cyanides & Chemicals Company (Prop : Hindusthan Development Corporation Ltd.)
Manufacturers of : Sodium Cyanide Potassium Cyanide Complex Cyanides
For your requirements please contact:
(0 ® (0 (0
BOMBAY Ravindra Annexe (3rd Floor) 194 Dinshaw Wachha Road Backbay Reclamation BOMBAY 400021 Phone : 240740
(0
SURAT Relief Chambers Nanpura Main Road Nanpura SURAT 395 001
Phone : 35459
Telex : 0178-281
NEW DELHI Kanchenjunga (7th Floor) 18 Barakhamba Road NEW DELHI 110 001
Phone : 40001 (5 lines) Telex : 031-3249
CALCUTTA Mody Building 27 Sir RN Mukherjee Road CALCUTTA 700001
Phone: 23-0166 5 (lines) Telex : 021-3309
g©©©©@©©©©©©©©©@©©§©©S©©©9©©@©S©®©©@g©©®©©®gg©@@®g@g@@@|
XLiX

SUPRIYA DYE - GHEM £ A New/ Name in Pthe/ogen Blue f
r ^ Factory : Head Office : g
Supriya Dye-Chem Supriya Dye-Chem jp Plot No. 165/B-12, 48, Hill Road, | G. I. D. C , VAPI-39S 195 Bandra, Bombay-50 f
How In make one lakh rnpees
by saving only Rs. 135 a month Easy, two-step 20-year plan
Walk into a Central Bank branch today. You'd be walking around as a lakhpati 20 years later.
I Central Bank of India A Government of India Undertaking
The bank that moves out to people and places.
J JOIN IAWPC S
t
J For Advancement and Promotion of Knowledge and practical J know-how in Water Pollution Control.
i BENEFITS J I I * IAWPC Newsletter-Monthly | 4 * IAWPC TECHNICAL ANNUAL (OR Convention t 1 Volume) f 5 * Indian Journal of Environmental Health-Quarterly ip | * » TechnicalDigest of NEERI-Quarterly | J * NEERI Publications at Concessional Rates f
J * WPCF (U. S. A.) Publications at Concessional Rates in a
Indian Currency. t
J F 3 Please contact : 0 J Secretary, g
J Indian Association for Water Pollution Control. §
- Jawaharlal Nehru Marg, NEERI P. O., NAGPUR-440020 |
L

i
Our Adveritsers
f\. Tulsi Fine Chemical Industries Pvt. Ltd.
/ 2. Richardson & Cruddas(1972) Ltd.
3. Shah Technical Consultants Pvt. Ltd.
4. Parwani Builders
5. D. K. Navagire & Co.
6. Kerala Chemicals & Proteins Ltd.
7. Envirocontrol Associates
8. Environment Protection Associates
9. The Atul Products Limited
10. Indian Drugs & Pharmaceuticals Ltd.
11. Hukumchand Jute Mills Ltd.
12. The Gwalior Rayon Silk Mfg. (Wvg) Co. Ltd.
13. Whatman Ltd.
14. Straw Products Limited
15. Pulp and Paper Research Institute
16. Clear Water Limited
17. Aqua Pura Corporation
18. Tata Consulting Engineers
19. Water Chem Laboratories
20. Srinivas Enviro Systems Pvt. Ltd.
21. Madura Coats Ltd.
22. Klean Laboratories
23. Gujarat State Ferlitizers Co. Ltd.
24. Patel Bros. Services and Engg. Pvt. Ltd.
Li

25. Universal Enviroscience Pvt. Ltd.
26. Environmental Engg. Consultants
27. The Sirpur Paper Mills Ltd. .
28. The Fertilisers and Chemicals Travancore Ltd.
29. Harihar Polyfibres
30. Hydraulic and General Engineers. Ltd.
3-1. Wavin India Limited
32. The Hindustan Construction Co. Ltdl
33. Orient Paper Milts Ltd.
34. Alembic Chemical Works Co Ltd.
35. D. Ionic India Pvt. Ltd.
36. The Andhra Pradesh Paper mills Ltd.
37. Pennwalt India Ltd.
38. Hindustan Dorr Oliver Ltd.
39. National Organic Chemicals Industries Ltd.
40. Hyderabad Asbestos. Cement Products Ltd.
41. Indian Petrochemicals. Corporation Ltd.
42. Hindustan Lever Ltd.
43. Cyanides and Chemicals Company
44. Supriya Dye-Chem.
45. Central Bank of India
46. Materials Research Instruments.
47. Geo. Miller & Co. Pvt. Ltd.,
^'amount Pollution Control PvULtd.
... xx
... xxx
... xxx\
... xxxvii
... xxxviii
... xxxix
... xL
... xLi
... xLii
... xLii
... xLiii
... xLiv
... xLiv
... xLv
... xLvi
... xLvii
... xLviii
... xLix
... xLix
... L
... L
2nd Cover
3rd Cover
4th Cover
Lii

capital &
organic wastes the 'Carrousel'way.
The Carrousel' activated sludge treatment is today the most outstanding
process by which sewage and complex industrial wastes can he purified to a
tiigh degree at a much less capita) and operating costs
A unique design that combines advantages of plug-tlow and completely mixed
system. Prevents short-circuiting and provides buffering action
Highly power intensive mixing zone eight times that of conventional system
increases oxygen transfer efficiency. Only a minor fraction of power Input Is
consumed for creating linear flow however, the velocity is sufficient to
keep the activated sludge in suspension — the entire bio-mass is utilized for process
Higher flexibilities for adjustment oxygenation to optimum
Varying levels of oxygen from zero results in nitrification and fication-effects nftrogen removal, makes
alkalinity and oxygen released during denurification available
Sludge production Is less and well stabilized.
Sobhagya-GM* 456
itment of A 1 m levels. I p 4 n high to I { J 1 denitii- L J 1
Low Capital Cost: Requires no primary treatment and only fewer aerators. Land requirement i t less- Civil construe* tion is simple and economical. Capital cost reduced upto 40%. Low Operating Cost : Power requirement is lower by 30 to 50"%. Number of units are less—fewer operators to run and maintain. High Reliability : Insensitive to fluctuations in flow and strength. 98% BOD removal and 70% nitrogen removal can be achieved. No wonder then, more than 300 installa* tions the world over treat industrial and municipal wastes the Carousel' way. In India too Carrousel' plants are treating successfully sewage and industrial wastes for many municipalities and industries. The 'Carrousel' technology is available to you from Geo. Miller.
Geo.Miller & Co.Pvt.Ltd. Bhandari House. 6th Floor. 91. Nehru Place. New Delhi-110 01? Phone: 682522. Telex 031-481 Regd. Office : 7 Kiran Sh".~ Calcutta 700 001

I.