DRINKING WATER AND SCIENCE - IRC Wash
152
SHUBHRA CHAKRAVARTY DRINKING WATER AND SCIENCE (OA/7 Indian Experiment)
-
Upload
khangminh22 -
Category
Documents
-
view
0 -
download
0
Transcript of DRINKING WATER AND SCIENCE - IRC Wash

SHUBHRA CHAKRAVARTY
DRINKINGWATERANDSCIENCE(OA/7 Indian Experiment)

Water is an essential ingrediant for human liferecognised since the Vedic ages when theSupply of drinking water was classified as areligious act. In present days also, top priorityhas been assigned by Government of India inDrinking Water Supply, particularly in villages.This is a major component of the programmerelated to rural development. For furtheremphasis on this, a National TechnologyMission has been formed which will provide asource in almost all problem villages duringthe current plan period.
A large part of national resources are spentfor providing the basic infrastructure at thevillage level. However, due to non scientifichandling and lack of maintenance these areoften deteriorated and not in a position toprovide the desired services. The wide spreadknowledge of scientific practices among thecommon people and village level functionariesalso help in preventing such wastage. Thepresent publication will provide interestingreading in practical experience about adoptionof scientific methods and technologicalservices in solving the problems of people atthe most hardest state of social and economicliving.
In this Technical Approach the areas coveredby major programme of rural water supplyhave been taken up to describe the practicalexperience of the author enumerating the waysand means of application of technologicalsolutions and their outcome. Vital benefit suchas supply of clean potable water on a sustain-ed basis has been made possible in droughtprone areas. With the application of Science,it is possible to optimise the utilisation of bothground and surface water in a manner so asto make it available in desired time and spaceavoiding wastage and making it cost effectivein the long run. The quality of water is a veryimportant criteria for its appropriate end use.The scientific method for quality assessmentand necessary improvement in quality havebeen discussed in simple language for under-standing by persons not practising science.
This book is a must for all concerned withDrinking Water. The policy makers and thosein functional authority will find it inspiring for
(Continued on back flap)
Rs. 175

DRINKING WATERAND SCIENCE
(An Indian Experiment)
SHUBHRA CHAKRAVARTY
LIBRARY, INTONATION;,;.. Wi.iCENTRE f-C'? ;C.V,V!',:,:nv \V .
P.O. Co;; y:.:i...o, ; :DO9 A D Ti;.,Tei. (070) 81491 ! ext 141/M2
L 0 :
P1.Y
BATRA BOOK SERVICE

Batra Book Service1/5, Bhagat Singh LaneGole Market, New Delbi-1Tele : 310129, 350417
S. Chakravarty
First Edition 1990
Printed by :Lohia Composing Agencyat Sunil PrintersC.B -386, NarainaNew Delhi-II0028

In memory of my Mother
who is always remembered

Preface
Water has been considered to be a perennial bliss of mothernature. But repeatitive flood and drought make us to thinkabout the sensuality of this resource which can be more econo-mically and optimally utilised with application of scientificmethods like other critical resources.
A|l the people handling and using water should be fullyconcerned about its inherent nature and criteria involved withit. This is possible when all the dimensions of science is ex-plained in a simple language with an analytical approach. Thelosses due to water borne diseases which are predominent inour rural an semi urban sectors, can also be reduced to a greatextent with large scale awareness generation on the subject.The infrastructure created for water supply is often not used tothe fullest extent and the downtime adds on to avoidablewastage. A self sustaining System maintained by the local userswould provide an ideal solution in this situation.
In this collection of essays Titled "Drinking Water andScience An Indian Experiment", an attempt has been made toanalyse in one place all the related aspects of specific inputrequired for both quantitative and qualitative management forfor sustained supply of potable water to the people all over thecountry. The language is simple so as to make it readable forboth technical and non technical personnel, who may be inter-ested in knowing the state of art of Indian Water with specialemphasis on drinking water.
As has been highlighted by the National Mission on Drink-ing Water, the generation of Awareness and involvement of thepublic is the key to the successful outcome of the programmeundertaken by the Central and State Government. I have nodoubt that the publications of this nature will be of great helpin this regard.
SHUBHRA CHAKRAVARTY

Acknowledgement
I am deeply indebted to Director General, CSIR and to theCSIR laboratories whose achievement I have freely highlighted"in this book, to provide me the opportunity of work and acqu-intance in the related field. T must place in record the guidanceprovided by Dr. Ram K. Iyengar, Additional Director General,CSIR for the article titled Cost effective Technology for potablewater in villages and the assistance by Mrs. Rekha Sharma,Scientist for the articles viz. Mission Approach in AcceleratedDevelopment of weaker Section and Technology for Safe Drink-ing Water.
My secretary Mrs. Pratibtia has patiently typed all themodified versions of the manuscript,
Inspite of all, the production of this book would not havebeen possible without the support and enthusiasm of Mr. X C.Batra of Batra Book Service who is equal claimant of reader'sreaction. I expect all persons interested in water will find ituseful.

Contents
Preface v
Acknowledgement vi
1. Mission Approach in Accelerated Developmentof Weaker Section 1
2. Cost Effective Technology for Potable Water inVillages 30
3. Water Resources and Their Development in aTropical System 44
4. Integrated Approach for Ground Water Manage-ment in India 57
5. Nitrate in Ground Water 64
6. Surface Water Potential and its Utilisation inIndia 70
7. Mission Approach for Quality Management ofDrinking Water 82
8. Technology for Safe Drinking Water 97
9. Training of Professional Engineers for MultiDisciplinary Approach in Water Supply Manage-ment 123
10. Support Services from International Agencies 139
Bibliography 141
1
Mission Approach in AcceleratedDevelopment of Weaker Section*
In developing countries large amount of resource is spenttowards welfare and development of the weaker section ofpeople, who are not in a position to derive direct benefits fromthe economic activities of the country. In a situation of grow-ing resources gap, it is important to design the programme ofdevelopment in such a manner so as to reach the target groupof beneficiaries without lapses in between.
In India, a recent experiment involving application of Scienceand Technology to a number of Societal Missions in the fieldof Immunisation, Literacy, Drinking Water, Oil Seeds, DairyDevelopment etc. have been taken up for achieving the indivi-dual sector target without lagging in the implementation of theprogramme laid for Seventh Five Year Plan.
In the first few years' progress of the Societal Missions, aconsiderable operational changes have been experienced speci-ally due to the involvement of the workers and beneficiaries atthe grass root level. This paper deals in both qualitative andquantitative aspects of the various programme undertaken bythe Societal Missions, their success and particular reference tothe involvement of women.
The plan outlay in a developing country contains a greatdegree of deficit in budget which is mainly due to compartment-
* Reprinted from Yojona.

alisation of the input and output of individual sectors and alarge section of the population continuously remaining outsidethe range of economic planning, which makes an increasingdemand on health and welfare budget and subsidies, such as infood and fertilisers. In India, almost 60 per cent of the popula-tion comprising of women and backward classes, still have littleinvolvement and awareness about the overall progress of thecountry or the fellow citizen. The day-to-day drudgery includ-ing poverty, health and sanitation problem, drinking water,food and fodder and fuel are the foremost challenges of theirlife. Statistical relation has been drawn between illiteracy andhigher child and pregnancy death as well as number of childrenin a family and other such backwardness.
The 20 point programme of Govt. of India is the cuttingedge of the plan for poor and has been restructured in thelight of achievements and experience and the objectives in theSeventh Plan. The restructured programme renews the commit-ment to eradicating poverty, raising productivity, reducingincome irregularities removing social and economic desparitiesand improving the quality of life. This include :
Attack on rural poverty Justice to Scheduled Caste andTribes
Strategy to rainfed agricul- Equality for womenture
Better use of irrigation water New opportunities for youth
Bigger storage panels Housing for the people
Enforcement of land reforms Improvement of slums
Special programme for rural New strategy for forestrylabour clean drinking water
Health for all by 2000 AD Protection of the Environment
for the consumer.
Two child norm Energy for tne village
Expansion of Education A responsive Administration

The nation is spending increasing amount of resources inHealth and Family Welfare, Integrated Rural Development,Rural Water Supply etc. without achieving the total coverageof the population desired. In view of this diversity of situationa number of Societal Missions were formulated during the•current plan period, with time targetted objective based onresults attainable through application of Technology.
In words of National Leader, "High technology should be•applied in a simple manner to every day objects that are neededin our rural areas and the Technology Missions will stretchfrom laboratories to the people".
The Missions were launched to give a new focus to develop-ment in which we shift from directing people to empoweringpeople. The concept was to replicate our success stories from•other areas to meet basic needs. The Mission approach wasrequired to create a sense of urgency and to provide manage-ment focus, increase communication, organise information,improve centre state coordination and substantially improvethe participation of the people. However, in order to maintainthe working environment in the long run, a number of otherfacilities are required such as regeneration of existing institu-tions, administrative reforms, decentralised planning, openness•and accountability which should be inbuilt in the system. Thepresent Missions and their targets are described below :
Literacy Impart functional literacy to 80 millionilliterate persons in 15-35 age group by1995. 30 million by 1990 and another 40million by 1995.
DrinkingWater Supply 40 litres per capita per day in allareas for human and 30 litre per capitaper day in desert areas for cattle, by 1990.
Immunization Reduce mortality due to DiphtheriaPertussis, Tetanus, Poliomyelitis, Tuber-culosis, Measles among children, andpregnant women. Achieve self sufficiencyin vaccine production (BCG, DPT, TT).

4
Oil Seeds
Telecommunication
Dairy Development
Production of 16 to 18 million tonnes oilseeds per year by 1990. 26 million tonnes.seeds and 8 million tonnes oil by 2000.
To bring up the call completion rate 98per cent for local calls, 94 per cent forjunction calls and 80 per cent for STDcalls, reduce the fault rate to 10 per 100station both for telephones and telexes,increase the efficiency of normal trunkcall to 80 per cent by 1990. Improve the-Directory enquiry and billing services.
150,000 village cooperative in 275districts. Increase milk production to 700]akh metric tons and per capita availabi-lity to 196 gms per day. Productivity 640liter per cow and 1020 liter per buffalo*per annum by 1995.
The Baseline Scenario
The development strategy of VII plan aims at direct attackon problems of poverty, unemployment and regional imbalance.&Around the year 1985 the country had 360 million women, 110million SC and 60 million ST and 270 million below povertylevel i.e. with monthly income less than Rs. 150/-. These com-prise of the weaker section, to whom the welfare programmeof the country is directed. The outlay of Seventh Five YearPlan for public sector was about Rs. 1,80,000 crores out ofwhich Rs. 9000 crores was allocated for Rural Development,Rs. 29000 crores for social services and Rs. 3000 crores forSpecial Areas Programme.
The beneficiaries of the welfare programme comprise of 40-per cent SC/ST. In addition various special programmes forupliftment of the backward community were activated with out-lay of Rs. 280 crores in Central Sector and Rs. 12,000 crores inthe State Sector. A number of Scheduled Caste Development
Corporations were set up ID the states for implementing welfareprogramme including distribution of bank loan and allocationof surplus lands and creation of job opportunities etc. IntegratedTribal Development Projects were set up in addition toIRDP (Integrated Rural Development Programme), DroughtProne Area Programme, RLEGP (Rural Landless EmploymentProgrammes). This is further supported by SCP (Special Com-ponent Programme;, MNP (Minimum Need Programme) andTribal sub plan drawn at state level.
Under IRDP, 254 lakh families have so for been assistedwith total investment of Rs. 8413 crores, about 20 per cent ofthese are headed by women. In addition, a number of schemeswere taken up to benefit women in need. 3000 women weretrained and provided employment in training cum productioncentres. Primary education and vocational training were orga-nised by Voluntary Organisations for about 1,11,000 women,3589 units were assisted under socio-economic programme toprovide a coverage for 47011 women. A summary of the pro-gramme operated for benefit of weaker section is presented inTable 1, in Annexure I.
The Plan Achievement and Mission Approach
The Seventh Plan target was to bring 75 per cent of thecountry's population above the poverty line and provide 37 percent with literacy. The total plan outlay was at the level ofRs. 350,000 Crore including a deficit financing of Rs. 15,000Crore. In order to provide for the success of the plan imple-mentation the country needs substantial improvement and eco-nomy in use of resources. This is possible only through accele-rated development and use of domestic capabilities and totalinvolvement of people or beneficiaries.
As a close observer of progress of India, UNICEF hasobserved that a continuing gap exists in India's otherwise im-pressive profile of progress, which is a gap in developing thefull potential of basic human capability through increasinglyequal opportunity to all of its 800 million people. The inabilityof a large cross section of people to share the fruits of prospc

rity of the country arises mainly from illiteracy, dietary defici-encies, communicable diseases, unsafe drinking water andisolation caused by lack of communication. The approachtowards the rapid changing scene of the developmental map ofIndia is basically to link the available scientific solutions to theneeds of the Society by matching the managerial skill with thepolitical will. The Missions seek to achieve to build and facili-tate purposeful use of the vast servicing infrastructure into anopen and wholistic orientation for a given task.
Although the National Societal Missions which are popu-larly called the Technology Missions, cover widely diverse fieldsnamely drinking water, immunization, adult literacy, oilseeds,dairy development and telecommunications, they are identifi-able by common features namely mutual linkages pointing toan integrated strategy, district level planning and decentralisa-tion of authority and responsibility, active involvement of grassroot level organisations including NGO's, careful use of simpleand sophisticated technology and basic theme of motivationand mobilization of all the partners involved, including theplanners and benefactors. In words of one partner of the Tech-nology Missions, the technology missions are important manage-ment innovation in the Govt. whereby many agencies have beenable to come together and work in matrix type organisationswithout losing their individual autonomy and characterstic, Anew culture of cooperation and understanding each others pro-blems and to pool the resources towards the common objective-have helped in reduction of the implementation gap.
TECHNOLOGY MISSION HIGH LIGHTS
Oilseeds Mission
The Technology Mission on Oilseeds launched in May 1986,has the immediate objective of producing 160 to 180 lakh tonnesof oilseeds and between 40 to 50 lakh tonnes of edible oil by1990. In the short and medium term, the approach is to im-prove use of available technologies and experiment with high-yielding imported seeds. In the long term, the objective is to

develop indigenous seeds, improve their yields, decrease cropduration and increase oil content.
India imported IS lakhs tonnes of edible oil in 1987-88. In1988-89 the imports are expected to be of 8 lakh tonnes only.The production of oil seeds within the country during 2 yearsare given in Table II.
TABLE IIProduction of Oilseeds : 1987-88 and 1988-89
(Lakh tonnes)
Oilseeds
GroundnutRapeseed andmustardsoyabeanSesatnumsunflowersafflowerNiger seedLinseedCastor seed
1987-88(Officialestima-
tes)
56.733.79.8
5.66.14.51.83.71.8
1988-89(CMIEestima-
tes)
74.036.013.5
6.56.56.02.05.54.5
Change0/
/o
30.56.8
37.8
16.16.6
33.011.148.6
150.0
Total nine oil-seeds 123.7 154.5 24.9
The Mission has developed a new integrated policy on oil-seeds for accelerating the move towards self-reliance by boostingdomestic production of oilseeds through improved technologyincentive prices to farmers, with suitable subsidy if needed forholding price line within specified limits :
(a) Support to farmers with technology inputs to raise theoutput.
(b) Review of the prices of edible oils distributed throughthe public distribution system.

(c) Prescription of a price band for range of variation,
(d) Procurement of domestically produced oilseeds andedible oils by the designated authority namely NationalDairy Development Board for building a buffer stock.
(e) Constitution of empowered committee headed by theCabinet Secretary to supervise the implementation ofthe policy.
Telecommunication Mission
The first telephone line in India was opened in 1881 andtelegraph line in 1851. At the time of independence there wereonly 321 telephone exchanges and 82000 working connections.By 1987, this was increased to above 12000 exchanges and 40lakh'lines (35 lakh working connections). This covers 216 cities,3029 towns and 8877 villages including 44,248 public calloffices. There are 36000 long distance public telephone and tele-graph offices.
The Telecommunication Mission was established in 1986with the following broad objective :
— improve quality of service through staff commitment.
— selected use of new technology in net work upgradationand special inputs in selected areas of net work toachieve net work customers satisfaction.
— improvement in the delivery of telegrams within 12 hrs.from present level of 30 per cent to 99 per cent byreplacement of mechanical teleprinters with electronicones.
— Reduction in fault rate of telephones from present levelof 35 per cent to 20 per cent by replacing old telephoneinstrument drop wires, fault prone overhead lines andcables by introduction of computerised subscribers linetesting.

9
— 6,00,000 PCO by 2000 A.D.
— Provide Telex Facility on demand.
— Improve call success rate.
From 91 per cent to 99 per cent for local calls.
From 70 per cent to 98 per cent for junction calls.
From 20 per cent to 90 per cent for STD calls.
Through the induction of PCM Systems and opticalfibres in junction net work, induction of digital micro-wave and digital TAXS in addition to commissioning ofcomputerised trunk exchanges in big cities and by induc-tion of SFK system for manual trunk exchanges.
Drinking Water Mission
The Technology Mission on Drinking Water in Villages andRelated Water Management has the following objectives :
* Cover all problem villages by 1990.
* Supply of potable water at 40 litres per capita/day.
* Supply 70 litres per capita/day in desert areas.
* — 40 litres for human beings.
* — 30 litres for cattle.
* Evolve cost effective technology mix to achieve theseobjectives.
* Take conservation measures for sustained supply ofwater.
Of the 5.75 lakh villages in the country about 1.62 lakhproblem villages have been identified. A problem village hasbeen defined as :

10
* No source of water,
* Water source at more than
— 1.6 km distance
— 15 meters depth
— 100 meters elevation difference
* Biological contamination
* Chemical contamination
The Technology Mission on Drinking Water aims at a scien-tific study and evolving cost-effective solutions by mobilisingand pooling the resources of various agencies viz. Space, AtomicEnergy, CSIR, Central Ground Water Board (CGWB), etc.
Research and development has been carried out in vitallyimportant areas such as finding sources of water, treatment ofwater and identifying the water-related health hazards. Appli-cations of such findings have not percolated down to the ruralareas. It is being increasingly realised that integrated applica-tion of science and technology is necessary for solution to thewater-related problems in rural India, on a long term basis.
The strategy for accomplishment of the total coverageadopted by the Mission are as follows :
For visible results focus on submissions (country wide)Eradication of Guinea worm—9920 villages by 1989.
Control of Fluorosis—8700 villages by 1988.
Control of Brackishness—17,500 villages by 1990.
Removal of Excess Iron—2900 villages by 198S.
To focus on 50 Projects Areas (Mini Missions).
To evolve new cost effective S & T techniques.

11
* To replicate and simultaneously apply these techniquesfor the rest of problem villages.
• Integrated approach for water conservation.
Literacy Mission
Till Sixth plan, education was taken to be a social servicerather than an input in the development programme of thecountry. A change in emphasis started during sixth plan periodwherein human resource development has been considered to bepivotal in the social and economic development of the country,A new National Education Policy was approved by the Parlia-ment in May 1986, which envisages universalisation of primaryeducation and adult literacy by 1990.
According to the 1981 census, the literacy rate increasedfrom 16.67 per cent in 1951 to 36.23 per cent in 1981. Of thetotal 412 districts in the country, 343 had a literacy level belownational average, inclusive of the 193 districts where the femaleliteracy rate is below 20 per cent (1981).
Inspite of the apparent increase there is a significant increasein actual number of illiterate persons over this period. Theplan expenditure almost doubled from Rs. 2524 Crores in SixthPlan to Rs. 6383 Crore in the Seventh Plan. However, theliteracy rate among male is around 47 per ceat, among femaleis 25 per cent and 16 per cent among Scheduled Castes andTribes.
To accelerate the coverage of this gap, the literacy Missionwas created integrating few of the existing programme of stateand central level and strengthening them with suitable techno-logical input and services input of voluntary teachers from thepublic, teachers and students at large. The programmeincludes :
Participation of a million student volunteers apart fromNCC, National Service Scheme, Nehru Yuvafc Kendras, Bharat

12
Scouts and Guides. The student volunteers will be suppliedwith free Literacy kit—and 10000 youth activities will betrained.
Setting up of "Jana Shiksha Nilayam" at the rate of oneNilayam for four or five villages with a population of about5000, for continuing education has been taken up in addition tostrengthening the extension facilities at employers, trade union,universities, colleges and polytechniques.
Modernisation in teaching will be introduced through im-proved aids, such as new types slates, globes, maps, models,radios, cassettes slides, film strips, T.V. etc.
Adult Education Centres will be set up at village level undersupervision of Jana Shiksha Nilayam.
Techno pedagogic input in literacy will be provided in 40selected districts in the first place.
Shramik Vidya Peeth to be set up to provide literacy toworking class, upto Dec. 1988 they covered 90,797 beneficiariesin 1987-88.
300 voluntary agencies in 1987-88 and 1000 in 1989-90 willbe identified for imparting 3 weeks training each year to 50-75persons, in addition to universities, trade unions, Nehru YuvakKendras and social and labour research institutes
Village Education Committee and jathas or cultural caravanstudents, teachers and artists will tour places making peopleaware of the importance of literacy and there own rights.
Immunization Mission
In the middle of Seventh Plan, the general death rate isone per cent and life expectancy at birth is 55 years. The infantmortality is controlled at less than 10 per cent. In rural areasthere are 14,145 primary health centres and 98,987 subcentres.The 20 point programme lays special emphasis on improving

13
the health status of the people. According to the programme,it is proposed to promote family planning on a voluntary basisas a people's movement, substantially augment universalprimary health facilities and control leprosy, tuberculosis andblindness, accelerate programme of welfare for women andchildren and nutrition programme for pregnant women, nursingmothers and children in tribal, hilly and backward areas. Theemphasis is on preventive and promotive aspects.
Immunization is a low cost efficient technology for childsurvival and prevention of disabilities. The Expanded Pro-gramme on immunization was started in 1978 with the objectiveof reducing morbidity mortality and disabilities due toDiptberia, Hooping cough, Tetanus and Tuberculosis by makingfree vaccination services easily available to all eligible childrenand Expectant mothers. Polio and Typhoid vaccination wereincluded in the programme in 1979-80, Tetanus Toxide (SchoolChildren) in 1980-81, BCG was brought under the purview ofEPI in 1981-82 and Measles vaccine was initiated in 198S-86.
Universal Immunization Programme was started in thecountry in 1985-86 with the objective to immunise 85 per centof eligible infants against six preventable disease and to cover100 per cent pregnant women by 1990. The total number ofinfants was 822 lakh and women 925 lakh. In 1985-86, 30selected districts were taken up, 62 were added in 1986-87 and90 in 1987-88, 120 in 1988-89 and the remaining in 1989-90.
This programme was further strengthened by setting up ofImmunization Mission in 1986, which had specific programmefor vaccination for specified disease and indigenous productionof vaccines as well as their preservation by cold chain equip-ment and intensive health education and training for lastingimpact.
Progress level and outlook for future
In an attempt to quantify the outcome of the MissionApproach, achievements of previous plans vis-a-vis the currentprogramme have been summarised in Table III in Annexure 2.

14
However, it needs a very detailed survey to establish the factwhether an increasing number of the members of the targetgroup are feeling communicated or participated in the long run.But presently it is worthwhile to take a short term evaluationof the organised methodology for continued impetus andexpectations therefrom.
It may be worth while to mention that in the year 1987 thecountry faced a calamatious drought, but a positive growth rateof 3.6 per cent was maintained. Oilseeds production reached anew high along with record harvest of kharif crop and alsogood rabi crop and substantial reduction in oil import wasachieved as compared to the previous years by 50 per cent.1986-87 production was 11 million tonnes with 60 per centrainfall and that is 1987-88 with 25 million tonnes with 40 percent rainfall. The production is expected to reach 155 lakhtonnes in 1988-89. This is possible by demonstration ofimproved technology along with coordinated input of fertilizers,pesticides, seeds, irrigation facilities etc. as well as economicsupport prices for the farmer. Under the Mission Programme40 new varieties of groundnut, mustard and sunflower havebeen released with average yields thrice as high as that ofpresent breeds. New policy concensus has been derived forproduction, distribution, import and pricing to balance theinterest of farmers, consumers as well as the economy as awhole.
The Water Mission has already provided 65,000 problemvillages with at least one source of water, 32,000 water harvest-ing structures have been created and new sources have beenfound in 3,985 villages and hydrogeo-morphological maps havebeen completed for 25 States/U.T.s. The number of guinea-worm affected villages has been reduced from about 8,000 to3,111. A number of technology for improving water quality topotable level have been demonstrated in over 30 villages, whichincluded removal of dissolved salts, flourides iron etc.Elaborate steps have been taken to ensure testing of quality ofwater at sources including training of local persons. More than5,000 people have been trained at different levels, by variousnational institutions in order to make large number of func-
15
tionaries conversant with appropriate scientific activity. Stan-dardisation of existing technologies and equipments have beentaken up for making them cost effective and widely available tocommon people.
The Immunisation Mission looks forward to cover whole ofthe country by vaccination by the end of 7th Plan as well as totake necessery measures for production, preservation andtesting of vaccines indigenously in a large number of centresthrougheut the country. As such the backlog is expected to beCleared and modernised facilities be established for improvedhealth programme for the coming years. Indigenous productionof few vaccines and cold chain equipments will emerge as apart of the Mission activities.
In the field of telecommunication, rapid strides have beenmade both in rural and urban sectors. Eleven digital exchangesand 2,000 long distance public telephones have been installedin rural areas in 1987-88. 278 district headquarters have beenconnected by STD and 3,300 public telephones have beeninstalled in urban areas. 70 per cent telegrams are being deliver-ed within 12 hours and trunk call completion rates haveincreased from 70 per cent to 84 per cent. Other measures forimprovement in equipments and services are under implementa-tion.
In spreading of literacy, the contribution of student volun-teers and other voluntary agencies have been greatly increasedsince the commencement of the Literacy Mission. Improvedprototypes of black boards, slates, dustless chalks and lanternshave been developed and field tested.
The key lessons already derived from the Mission activitiesappear to be as follows :
(a) Mission concept should be used selectively and ongoing programmes should not be merely redesignatedas Technology Mission.

16
(b) Priority should be given to specific activities in specificregions, such as desalination of water in brackish waterzone and intervention of technology should be clearlyexplicit within its own limits.
(c) Concerned agencies and voluntary groups should beinvolved from the very beginning and all their resourcesbe pooled and integrated for common aims.
(d) The action points and policy should be dearly specifiedin written document for total understanding among allconcerned.
(e) Standardisation, Monitoring and Evaluation should betaken up as essential tasks rather than a subsidiarysystem. The ultimate and intermediate goals saould beset up for monitoring.
( / ) It is necessary to deemphasise hierarchy and emphasiseegalitarianism. Teamwork and integration will have tobe ensured to eliminate wastage and duplication indelivery of services.
(g) The target group should be made aware that theMissions are interested in eleminating their problems.So that they come forward to take over from the func-tional authorities the ownership and responsibility formaintenance and replication of the facilities created onassembled by the Mission.
(h) Lastly, the spirit should continue and transform thegeneral way of work in the long run.
The rural women who have accepted the role of secondfiddle in all walks of life, may now find their own role in nationbuilding after achieving the basic needs such as health, drinkingwater and literacy.

ANNEXURE 1
TABLE I
Socio-Ecoaomic Programme for Weaker Section
Name ofProgramme
Objective Outlay(Rs. Crore)
Target
1
Integrated RuralDevelopmentProgramme(IRDP).
Alleviation of Rural povertythrough creation of assets/financial assistance in theform of subsidy by theGovernment.
2,352 To reduce the population effectedby poverty below 20 per cent.The poverty line income isRs. 6,400 per year for rural areas.20 million people are expected tobe benefited under the pro-gramme. It is provided that 30per cent of assisted familiesshould be from SC/ST and 30per cent of the assisted should bewomen.
(Contd.)

Annexnre 1 {Contd.}
1
National RuralEmploymentProgramme(NREP).
Rural LandlessEmploymentGuarantee(RLEGP)Training of RuralYouta for Self-Employment(TRYSEM)
Creation of employment and 2,488also durable assets for eco-nomic growth and rise inincome at a steady rate in-cluding improvement innutrition and living standardof rural poor.To provide employment toatleast one member of everylandless bouse hold for 100mandays.To train youth women, 150SC/ST with productive, tech-nical and managerial skillswith which they can set uptheir own self-employedventures. Financial Assist-ance and infra-structuralassistance for productionand marketing of such goodsis provided.
1,455 million mandays are to begenerated.
1,013 million mandays are to begenerated.
The target group for rural youthis between 18-35 years drawnfrom the families having incomeless than Rs. 4,800. Atleast 33per cent SC/ST youth are beni-fitted.

Prooess-cum- ProductDevelopment Centres(PPDC).Development ofWomen andChildren inRural Areas(DWCRA).
Integrated ChildDevelopmentServices (ICDS).
Minimum needsProgramme (MNP).
PPDC will take up specialprogramme at a substantiallyincreased level.To provide support to enable 48women to generate incomegenerating activities throughchild care activities provid-ing health care, security andnursing of children at theNREP work sites,
To reduce childhood morta- 75lity, morbidity malnutritionby supplying health, educa-tion, nutrition as non-formaleducation to children below6 years of age and pregnantand nursing mothers of ruraland backward areas as slum.To develop human resources 10,000and infrastructure in villages in State Sectorthrough elementary educa- 1,464 in Cen-tion, Adult education, rural tral Sector
To assist the women of IRDPfamilies through financial grantof Rs. 15,000 to a group of 15to 20 women and train themthrough TRYSEM facilities andprovide with basic facilities forproduction and sale of theirproducts.Implement 1,738 IntegratedChild Development ServicesProject in most backward areascovering most of tribal placeswith more than 30 per cent STpopulation and urban slum.
To integrate the programmewith other Development pro-gramme and anti-poverty pro-gramme so as to create neces-
(Contd.)

Anaexur* 1 (Contd.)
health, rural water supply,rural electrification, ruralRoad, rural housing environ-mental improvment of urbanslums and nutrition,
sary linkages in the deliveryservices.
Education : 25 million childrenfor formal education and 25million children for non-formaleducation.Health : Establish 54,000 healthcentres.Water supply : cover allremaining problem village,39,000.Roads : To cover 20,487villages.Electrification : To cover mini-mum 65 per cent villages in allStates/UTs.Rural Housing : To cover 0.27

Special ComponentAssistancefor SC/ST.
(i) Tribal SubplanSocio-economicdevelopment oftiibal areas andfamilies.
(ii) Scheduled CasteDevelopmentCorporation
{iii) Integrated VribalDevelopmentproject.
(a) To arrange bank loanetc. for tribal familiesfor setting up smallscale industries.
(b) To distribute surplusland among SC/STfamilies.Development of primi-tive tribes in segregatedtribal areas.
930
173
million house-holds foi allo-cation of sites and 2.7 millionfamilies for construction.Environment: 9 millions slumdwellers to be provided withimproved living condition.Nutrition: Continued supportto 7 million eligible persons.
(Contd.) K>

ANNEXURE2TABLE III
Comparative Statement of Mission Progress/Achievement and Ongoing RuralDevelopment Programme
to
Programme
1
ARWSP
DrinkingWaterMission
1985-86
2
50,000villages250 lakh(population)
Coverage1986-87
3
500 lakh
1987-88
4
90903villages
800 lakh(Population) (Population)
90,000villages
1,05,000villages
1988-89
5
251 lakh(Population)
52,000villages
Use of New/ExistingTechnology
6
32,000 RainWater Har-vestingstructurescreated.Guineaworm
Remark
7
For first timeear-marking offunds for waterconservationunder DPAP.Ground Water
affected villages potential mapreduced from now available

8,000 odd to for 46 districts3,111. important for
source finding.100 Desalination 85 Waterplants to be set Quality testingup 1988-89. (7Mobile desali-nation plantssupplied tostates).
130-Defluorida-tion plantsbeing set up in1988-89.3,000-Iron Re-moval plantsbeing set up.
laboratoriesare to be setup at districtlevel.
200 Solarpumping Sys-tem in villages.
For first timequality stan-dards for tube-wells formul-ated and pres-cribed.Step-well con-version intosanitary wells.
(.Contd.)

Annexure 2 (Contd.)
1
Oil SeedProductionGroundnutSoyabeenRape-seed/MustardSunflowerSafflowerOilseedsMission
1,762.4852.8
38.43521.8
2,900 qtns1,535 qtns
35 qtns35 qtns40 qtns
110 lakhTonnes
123iakh 155 lakhTonnes Tonnes
New Technologyfor sunflowerprocessing demon-strated. 70 newvarieties forgroundnut, mus-tard and sunflowerreleased for firsttime with averageyield 3 timeshigher.Modern expeller

Adult Educa-tion Programme
LiteracyMission
6.3Mill
8.6Mill
9.1 10Mill Mill
(target)—80 Mil l -
prototypedemonstrated.5,000 expellersto be moder-nised.In-expensive ricebran stabiliserdemonstrated,Polypack oilpouches intro-duced.
Improved pro- Ex-service mentotypes of have beenblackboards, drawn intoslates, dustless Mission fromchalks and Ian- 25 Districts.terns havebeen developedand field tested.
(Contd.) to

Annexare 2 (Cotttd.) KJ
Ongoing Tele-communicationProgramme
44,000 (localcalls) 1,500Trunk Calls700 STD (Target)Cummulative
Mass mobilisa-tion of studentsvolunteers wasdone in summerof 1988, 6 lakhstudents toreach out to 10lakh illiterates.Action plan for1 lakh illiteratePrison inmatesfinalised.Nehru YuvakKendras involv-ed in 27Districts.

Telecommuni-cation Mission
Call SuccessSTDJunction "CallLocal Calls
207090
2,000 longdistancespublic tele-phones ins-talled in ruralpublic areas3,300 publictelephonesinstalled inurban areas.Public tele-phones to beprovided61,000 forlocal calls.
35,000 forTrunk Calls7,000 forSTD Calls
45 7072 8095 98
1! Rural 7 out of 10Exchanges telegramsinstalled now deliveredPrototypes within 12for reliable hours andpublic tele- efficiency ofphones are manual trunkson trial has increasedelectronic from 70 to 84key board per cent.to replacethe conven-tional MorseCode Systemfor transmit-ting telegramsis being usedfor trials.
{Contd.)

Annesnre 2 (Contd.) 00
Primary andCommunityHealth CentresImmunisationMission
1,829111
30Districts
1,747343
62Ditricts
32840
90Districts
PregnantWomen
3 Mill(Target)
12 Mill(Target)
IS Mill(Target)
3,151(Target)
312(Target)
120Districts
20 Mill(Target)
Plans for indi-genous produc-tion of polio,measles Vaccineby 1991 finali-sed.Indigenisationof cold chainequipmentinitiated.
Testing faci-lities to bepromoted.
40 Districts touse Indianmade equip-ment in 1988-89.11 Vaccinetesting Centreto becreatedby mid-89.

At presentonly 2 areavailable(Haffkine andPasteurs).Modernisationof above twostarted.
Children 2 Mill 8 Mill 12 Mill 15 Mill(Target) (Target) (Target) (Target)

Cost Effective Technology forPotable Water in Villages*
The benefit of Science & Technology have been concen-trated in the urban section, while the rural population havenot developed full conciousness of the impact S&T can have inhuman life. Scientists have carried out research and develop-ment in vitally important areas essential for human life suchas finding of sources of water, treatment of water to potablequality and identifying the water related health hazards.Application of such finding have been taken up in a sporadicmanner until recently. It is being increasingly realised thatintegrated application of Science & Technology is necessaryfor permanent solution of the water related problems in ruralIndia.
The Technology Mission for Drinking Water and relatedWater Management have taken up problems-wise approach inits action plan and has developed five sub-Missions for scienti-fic source finding, eradication of guinea worm, control offluororis, removal of excess iron and control of brackishness.A concerned scientific organisation has been nominated as thenodal agency for achieving the targets set in each of the sub-Missions.
Since water is closely linked with the people, the Missionenvisages complete involvement of people to carry it forwardafter the initial establishment and commissioning of the tech-nologies by the Government agencies. As such the awareness
* Presented in NMDW Seminar at CSMCRI, Bhavnagar.

31
generation and location specific cost effective solutions havebeen made an integral part of the Mission.
It has been experienced that as high as 40 per cent of theavailable capital remains dormant due to the high down-timeof equipments. Standardisation and proper maintenance cansolve 80 per cent to 90 per cent of this problem. This wouldinvolve proper application of existing norms as well as evolu-tion of better norms for maintenance, materials and designs.
It has to be borne in mind that the new S&T inputs are notaltogether alien to the water supply system in villages and thescientists in the laboratory as well as the water supply authori-ties in villages can both gain from each others experience infurthering their respective field of work. A continuous dialougecan establish the optimum norms of practices for continuousrunning of water supply schemes with routine check up andmaintenance, which will lead to minimisation of down time.
Scientific Approach of the Sub-Missionn
(0 Scientific Source Finding : As high as 68 per cent of theproblems of target villages are associated-with lack of adequatewater sources. This means non-availability of surface andground water sources within 1.6 km. distance and/or higherthan 15 meters depth, or 100 meters elevation difference. Tofind water resources use of satellite imageries, geophysicalresistivity sounding and geohydrological studies need to beundertaken for locations of possible water bearing zone oraquifers. This will be followed by drilling and installation ofhand pumps etc.
Figure 1 shows the programme of action required in thisregard. As per present practice, the success rate of completionof drilling is not more than 10 per cent the rate of completionof the location studies. This makes it more important to avoiddrilling failures by adopting scietific source finding methods fora particular location. This will also reduce the total cost sincethe cost of drilling is 8 to 10 times higher than that of sourcefinding studies.

32
ESTABLISH KEOLMKEME.NTS
SU/kWTITY/ SUAUTYPOMESTIC/INDU5TK1AL/AGRICULTUI»\LOCATION OF CENTRE. OF DEMWD
5TUDY OF POTENTIAL SOURCES
GEOLOGICAL MAPS/ MEMOIRSBOREHOLE LOSS/ SITE INVESTIGATION REPORTSAERIAL PHOT06RAPHS/TOPOSRAPWC MAPS
A5SES5MEMT OF POTENTIAL AQUIFER
DISTANCE FROM SOURCE TOr>EPTM TO WATER
TRANSMI<a9IVITY ANO 5TOR.ATIVITYAPPROXIMATE PERENNIAL YIELD
SELECTION OF MOST SUITABLESEISMICMAGNETICGRAVITY
HYDR0GEOL0SY AS EXPECTED?WATER OOALITY &ATISF
DRILL MORE OWSERVATIOM WELL5 AMD. A PRODUCTION
PUMP TE<3T PRODUCTION WELLPUMPiusTEST RESULTS:
TRAVieM\55IVITY AND STORATIVITY,YIELD OF W E L L ,
EFFECT OF ABSTRACTION OV1 OTHER WALLS.SURFACE WATER Boot es»-me EvwiROHMEiri
D6VEL0P MODELS OFTHE A«U1FEK
PRBDItrnOURESOURCE MANACEMEffIPEHTIFICATIOMDATA MAMtPUiATVOU
^ • A 5 g E g g Y'ELP OF A&UIFERl
SAFESOAR.O OF SUPPLY
TOTAL ABSTRACTIONMOM WOK U3ATCRSUAL1TY
Fig. 1. Stages ia the assessment, development and management of anaquifer (after Hamill and Bell. 1986).

33
(«7) Eradication of ftuorosis ; Fluoride in ground wateroccurs in a region bearing granite rock (Ca F»), Lime stoneetc. It is difficult to draw any definite relationship between therock types, the nature and origin of ground water and flouridedistribution in sub-terrainean waters. Presence of fluoride ioIndia has been initially detected through mottling of teeth anddeformation of bone structure. So far 13 States have beenreported to be effected by high flouride levels in ground waterin peninsular Indian region.
Solubility of fluoride in water depends on presence of otherelectrolytes and pH of water. Fluoride ion can be removedfrom water by suitable ion exchange resins or chemical preci-pitation and coagulation. NEERI has used various methodsnamely, anion exchange resins, cation exchange resins, sawdust carbon, Defluoron-1 and Defluoron-2, activated magnesiaetc. for removal of fluoride ions. The Nalgonda technique usescommercial calcined magnesite as the precipitating agent. Thetreated water flows by gravity through wiremcsh filter into acarbon-dioxide reaction chamber where excess alkalinity isremoved by carbon dioxide treatment. After detailed studiesincluding use of various reagents the Nalgonda technique wasdeveloped which involved adding in sequence an alkali,chlorine and aluminium sulphate followed by flocculation,sedimentation and filtration.
The solubility of Al F3 in presence of A1(OH)3 is guided bythe following relation,
Concentration of ( O H " ) = 6 9 1 g x l Q g x Concentration of (F~)
As such, when the water sample contains hydroxide andfluoride ions and alum solution is added to it, Al (OH3) willbe precipitated until the OH" ions are removed, in order toincrease the concentration of fluoride ions to the desired level.Henceforth aluminium fluoride will coprecipitate alongwithtrace of aluminium hydroxide, as long as the ratio of concen-tration is maintained in supernatant liquid. Experiments have

34
confirmed that the above concentration also help (F") removalwith the floe during flocculation and sedimentation. It was
THE FIGURE SHOWS THE VARIATIONOP Z WITH TE6T WATER ALKALINITYAf FLUORIDE. LEVELS BETWEENZO AViD 10 Ovnj F|L
2.00 400 GOO &00 IOOO
Fig. 2. Relationship between Test Water Alkalinity and the FluoridesRemoved by Unit Quantity of Alum.

35
also established that presence of poly phosphates, nitrates andorganic matter has no adverse effect on defluoridation.
The dosage requirement for lime and alum is calculated asper laboratory experiments conducted with raw water fromthe source. The typical results are presented in Figure 2.
The Nalgonda process for treatment of water for removalof fluoride, developed by NEERI, includes channel mixer,pebble bed flocculator, sedimentation tanks and sand filters.The entire system is gravity operated except the filling of over-head storage tank and delivery from treated water tank. Theuse of channel mixer for mixing lime and alum and pebblebed flocculator in place of conventional flocculator make thesystem less dependent on power supply fluctuations. The rawwater tank can be filled with minimum of 2 hours of powersupply. The design of the plant is available in 40, 80, 160 and380 cubic meter per day capacities. The running cost of suchplants reduce substantially with increase in design capacity,in the following order:
Capital Cost
Running Cost
> 0.33 (Bow rate) 0.36
2.9 X10* X (flow rate) -0.62
The sequence of operation is shown in Figure 3.
t ime Slurry Alum solution
RawWater
ToStar*
Flocculator Seal- mentation Filtration
Fig. 3. Flow diagram of Defluoridation Process

3«
(in) Removal of excess iron : The problem of excess iron inground water is usually associated with the presence of excessmanganese which occur in shale^ sand stone and other rocks.The minerals are dissolved by ground water containing carbon-dioxide in absence of oxygen. The insoluble oxides are reducedand transformed to soluble bicarbonates. The same reactionsalso occur in the lower portion of deep reservoirs that floodiron and manganese bearing soils and rocks.
The presence of iron and manganese in water is objection-able as they stain clothing and plumbing fixtures and detractfrom the appearance of water. The maximum permissible limitof iron in water is 1 ppm, and that of Manganese is 0.5 ppm.
For removal of these impurities, aeration method is exten-sively used. Ferrous bicarbonate is precipitated by aerationwhich causes removal of carbondioxide. The pH of water isalso required to be adjusted for facilitating precipitation ofiron. The following stages are involved in iron removal :
Aeration : Dissolution of oxygen in water containing dis-solved iron, helps in stripping of CO2 to oxidize ferrous ironto ferric state as shown in the following equations :
4Fei++O2+80H-+2H~2O=4Fe(OH)3
- ^jp- «K.(Fe»*). pO2. (OH")2
Increase in pH and dissolved oxygen results in acceleratediron removal. Iron is removed in the form of Fe (OH)j whichprecipitated.
Settling: Chemical addition followed by clarification isnecessary, if iron is accompanied by colour, turbidity andorganic matter. Alum with or without preehlorination is used.
Filtration : The precipitated iron hydroxide floes are remov-ed by sand filtration. The filtered water will meet the drinkingwater quality standards.
Oxidation : Stoichiometrically 0.14 mg oxygen is required

37
to oxidise 1 mg of iron. Oxidation can be accelerated by raisingth* pH and saturation by dissolved oxygen.
CO2 removal: It has been seen that 80 per CO2 removal isachieved, if a drop of water is exposed to air for 3-5 seconds.Removal of C0j reftults in formation of microflocs of Fe (OH),which settle in a settling tank or separated by floatation.Escaping microflocs are absorbed on the gravel in the Sand bedof the iron removal unit. Absorbed Fe (OH)j enhances filterefficiency.
Higher concentration of iron (more than 6 mg/1) results inheavy sludge which is removed by coagulation.
The flow diagram of an iron removal unit is given inFigure 4.
Aeration TankIran
^J RemovalUni
TrodcertwaterStorayeTanks
Fig. 4. Flow Diagram for Iron Removal Unit.
The number of trays and number and size of holes and thelayer of filtration bed comprising of sand and coal and gravel iscalculated on the basis of the capacity of source of the water.The cost of a 8 cubic meter per day plant is around Rs. 40,000to Rs. 50,000 which can be run by a 1 HP pump.
(iv) Control of Brackishness : The presence of total dissolvedsolids in excess of 1500 ppm in water and render the waternon-potable. About 12 states in India are affected by presenceof high dissolved solids in water and require control ofbrackishness and salinity for providing potable water.

38
The dissolved solids content in water is measured by-electrical conductivity methods. Dissolved solids can be remov-ed by Reverse Osmosis (RO) and Electro Dialysis (ED) processfor control of brackishness.
The RO process involves application of high pressure tocause solvent (water) to flow across the selective membranewhich does not allow dissolved solids to permeate. The rejec-tion of individual ions depend on the size of the ion and thecombination of other ions present in dissolved state. The majorparameter of RO process is the characteristic of the membraneand its configuration.
CSMCRI Bhavnagar has developed secondary and substi-tuted cellulose acetate membrane with cellulose acetate mixedesters. Poly acrylonitrile poly methyl methacrylate and acrylo-nitrile methacrylate copolymer etc., various other polymershave also been tried at bench scale level for development ofhigh salt rejection membrane.
The tubular configuration of RO plant has achieved 94-95per cent of salt rejection when operated at pressure of 600psig. Presently spiral configuration of RO module have beendeveloped which provided higher area/volume ratio, lowercapital and operating cost and better flexibility for replacementof membrane.
The RO process has been applied for desalination of waterand ten plants based on CSMCRI technology are operating inTamil Nadu, Rajasthan and Andhra Pradesh. Two plants havebeen gifted to Thailand.
The flow diagrams of RO plants are given in Figure 5. Theoperating features of RO plants are given as follows:
pH of feed water—9.4—5.1
Operating Voltage—Higher than 400 volts
Plant capacity—50,000 litres per day

WELL PUMP
>
* 1
WELL
D10TRI6UTIOH
I T
HlgH PRESSURE
PLUNGER PUMP
ACID SOLUTION SHMP 50LUT1OW
PRODLCT WATER STORAGE
TA.MK ,
0^0IAIR &L0O1ERS
.DECAR60NMOR;
R£VERSE.OSMQSiev|, MODULES
E f FLUE SIT
Fig. S. RO Plant Flow Diagram.

40
Operating Pressure—600 psig
Salt rejection—Higher than 80 per cent
Electrodialysis
Electrodialysis process for desalination of brackish waterinvolves separation of dissolved cations and anions by the useof ion exchange membranes. Ion exchange membranes are thinfilms which arc largely impervious to water but contain electri-cally charged groups set in a gel structure which allows theions of salts to pass through under the application of directelectric current. Anion exchange membrane contains electropositive groups which attracts, by coulombic interaction, suchnegatively charged ions as chlorides and sulphates and allowthem to pass through. The positive charged ions such as sodiumand calcium are prevented and are exclusively passed throughcation membranes in the reverse direction.
In an electrodialysis apparatus, the anion exchange andcation exchange membranes are arranged alternatively into anassembly of cells of about 1-2 mm thickness with suitablegaskets and spacers to create ion traps into which the ionisedsalts are made to migrate by applying an electric potentialthrough suitable electrodes at the ends. The cells are assembledinto stacks of 60 x 30 x 75 cm size which comprises as many as200 membranes.
The membranes are made out of interpolymers of polyethy-lene and vinyl monomers like styrene and divinyl benzene towhich cation exchange property is added by sulphonation andanion exchange property is added by chloromethylation follow-ed by amination.
In electrodialysis process the energy consumed is directlyproportional to the salinity hence it becomes uneconomicbeyond 5000 ppm of dissolved solids in feed water. Feed wateris first treated for removal of hardness by ion exchange and issplit into 2 streams and fed into alternate set of compartmentsin the stack. The electrode chambers are separately flushed

41
with the feed water. When direct current is passed through thisBait, the ions migrate towards the respective electrodes ofopposite charges but due to the presence of membrane thealternate chambers get depleted in salt content while theremaining chambers get concentrated. The process can operatecontinuously if the concentrated and dilute solutions are
Ou
94UMVTY OF WATEK TREATED BY MEMBRANEPROCESSES 1.0, REVERSEEIECTRODIAIYSIS E D . = 5 0 0 0 ppvi
10
PI Pi MS
^g A 5 5 T 8 5 10
DAILY WATER
Fig. 6. Comparison of Cost of Water Supplied by DisalinationTechniques with Water Pipelines.

continuously withdrawn from the respective chambers. Thesalinity of product water can be adjusted by flowrate andcurrent input.
Cost of product water by RO/ED plants vary from Rs. 4 toRs. 10 per 1000 litre. 7 ED plants have been installed inGujarat, Rajasthan, West Bengal and Diu. The comparison ofRO/ED plants with piped water supply are given in figure 6.
Cost effective solutions
The water supply units which can be run by human powerand has a life of 15-20 years with annual maintenance of 2 to3 per cent of the capital cost, can be cost effective. To this yardstick, the social cost of available mandays due to good healthmay be added wherever maintenance of units for water quality isconcerned. The water supply facilities which are installed withwelfare fund or interest-free grants from Govt. should not besubjected to interest charges for costing. The depreciationcharges also should not be calculated at more than those fornormal water works equipments. Basically the life of thetechnological plants can be extended to the same extent, byproper maintenance. As such the maximum depreciationcharges should not be more than 5 to 7 per cent of the capitalcost.
The evaluation of proformance of RO/ED plants have shownthat the cost component of depreciation charges are almost 50per cent of the total running cost while the direct cost includ-ing chemicals, power, and man-power is 30 to 40 per cent onthe basis of 8 hours running of plants. As such, it can be seenthat the continuous running of plants on 3 shift basis andstandardisation of depreciation charges can bring down thecost per cubic meter of treated water by 50 per cent of thepresent cost. For example, the cost of treated water for 10cubic meter per day (8 hours) plant including depreciation,chemical and power and man power and interest charges isRs. 38.47 per cubic meter while the cost of the treatment withonly membrane, chemical power and man power charges comes

43
to Rs. 13.9 per cubic meter. This plant has worked on anaverage for 2.5 hours only per day as compared to the rated8 hours per day. The common experience of reduction of shareof fixed cost by increasing the output should be adopted by theauthorities responsible for operation of such plants.
The reference Ito RO and ED plants have been made becausetheir capital cost is highest among all treatment plants forimprovement in water quality. The RO/ED plants can alsoeffect the removal of other ions such as fluoride and Nitratesto some extent. The treatment methods specific for removal offluoride and ion will also fall within the standard to be appliedfor RO/ED plants.
Better management practices normally applied to all processplants such as formulation of reliable data base, prescheduledroutine maintenance and improvement in design and materials,would also apply to these plants. However, these can be furtherimproved by innovative measures in the basic design, materialimprovement or operation and maintenance norms of suchunits. Reduction of time taken in installation, by developmentof standard modules, can also result in achieving costreduction.
Simultaneous action have been started towards achievingmultidimentional goals and the Technology Advisory Groupsare pursuing the possible measures in these directions. All theknown source of expertise are being brought within the net-work of the agencies involved with the Mission. It is expectedthat by the end of the first phase of the demonstrative mini-missions, a comprehensive data base will be generated whichwill optimise the activities in the consequent phases.

Water Resources and TheirDevelopment in a Tropical System
The principal water resources for human use are :
(0 Surface resources through rivers and stf«*«js. and
(«") ground water.
The current estimation of annual flow of all river systemsin India is of the order of 2,000,000 million cubic meter. Thecorrect and scientific assessment of all the ground water poten-tial of the country which is under progress over last 2 decades,is yet to be finalised.
The development of water resources in India is linked withnon-availability of water, quality assessement for potability,location, distribution and variation, climatic condition includ-ing rain-fall, nature of soil and terrain, cropping pattern etc.Dealing with all these diversified field for conjunctive use ofwater calls for a comprehensive integrated strategy for theconservation and development of water resources. The integra-ted policy for rational development for water resources needsdue attention to irrigation, drainage, navigation, flood control,hydro-electric power generation, supply and disposal of waterfor industrial and domestic use, reclaimation of land includingafforestation, control of pollution from point and non pointsources, pisciculture, animal husbandry, recreation, ground

45
water recharge etc. The water resources being limited, increas-ing competition between agriculture, industry and other users isenvisaged. Keeping this in view, the national policy of waterhas been worked out giving highest priority to safe drinkingwater, to which the irrigation water conies next.
Other policy measures under consideration include introduc-tion of legislative measure for systematic water management,setting of national agencies such as National Water Board forspecific tasks, reservation of water for drinking purposes in allirrigation projects, compulsory prescribed geophysical surveybefore drilling deep tube wells, banning of cultivation of waterintensive crops in water scarcity areas.
Role of Hydrology in Water Resources Developmentand Utilisation
Hydrology is the earth science which deals with availabilityof water resources and their variability in space and time.Hydrological investigation and analysis constitute basic require-ment in the effective utilization of water resources, their deve-lopments and coordination as well as mitigation of disasterscaused by extreme events like floods, droughts, etc. Thehydrological analysis is mainly related to the assessment ofwater yields, estimation of flood for design of structures andsuch other analysis as would be required for flood control, reser-voir operation and water resources managment. Besides basicand fundamental research in scientific hydrology, it, is necessaryto identify and develop appropriate technologies for dealingwith practical fields problems with typical environmental,physiographic and climatic conditions. Hydrology as an inter-disciplinary science has grown considerably after the launchingof International Hydrological Decade. Recent developments inthis field include use of mathematical and conceptual modelswith high speed digital computers, systems techniques, remotesensing and nuclear technique.
The important areas of study/research in the field ofHydrology are listed below :
1. Assessment of Water Resources

46
2. Floods
3. Design Flood including Design Storm
4. Surface Water Yield
5. Ground Water Yield
6. Inter Basin Transfer
7. Water Logging, Drainage and Salinity
8. Water Quality and Waste Disposal
9. Water Availability from Lakes (Natural and manmade)
10. Water Management including Erosion and sedimenta-tion
11. Drought and its causes and cure
12. Arid Zone Hydrology
13. Conjunctive use of Surface and Ground Water
14. Information System, Data Storage and Processing
15. Hydrological Investigation
16. Hydrology of Mountaineous areas.
17. Hydrological Problems of Forests and AgriculturalLands
IS. Man's Influence on Water Regime and Availability
19. Hydrological and Environmental Factors for WaterResources Projects
20. Integrated Planning of Surface Water Resources
21. Water Use Management

47
22. Water Availability Studies in Hard Rock Areas
23. Hydrology of Coastal Areas, Esturaries and Deltas
24. Hydrology of Islands.
25. Man Power Development
26. Water Laws
27. Nuclear Applications
28. Remote Sensing
29. Instrumentation
The Steps Involved in Water Management
A graphical correlation of components involved in totalwater management is shown in Fig. 1. The scientific methodsinvolved in ground water exploration are described below :
(i) Hydrological Exploration
The key for successful ground-water programme lies inobtaining essential information on Geology and Hydrology of aterrain. Knowledge of Hydrology is needed to determine thethe sources of supply and discharge of groundwater. Precipita-tion (ultimate supply source) may infiltrate to groundwaterdirectly or it may go as run off and stream flow which infiltratesin part. Excess water supplied to the land for irrigation pur-poses, could sink partly underground and contribute significant-ly to the ground water reservoir. Quantitative evaluation of allthese items are essential for a proper understanding of ground-water occurence and availability. The second essential item isprecise information on geological formation such as(i) sedimentation framework, («) structural framework,(///) thick-ness of various geological units acting as aquifers, and(JV) permeability and storage characters.

GEOLOGY RAIN FALL
1 1
INFILTRATION STORAGECAPACITY
QUANTITATIVE VARIATION OFGROUNDWATER OCCURRENCEIN SPACE AND TIME
1
1 NEED FOR EXPLORATION1 AND MANAGEMENT
HYDRAULICCONDUCTIVITY
HYDROGEOLOGICAL ANDGEOPHYSICAL EXPLORATION
ESTIMATION OFAQUIFER POTENTIAL
OPTIMAL EXPLOITATION!i I
REMEDIALMEASURES
Fig. 1

49
The hydrological and geological features when combinedtogether would lead towards understanding the hydrologicalsystem/or a unit. It could be a major unit (macro basin) or amicro unit (micro basin). Each of the basin or a sub-basinwould have surface hydrological boundaries and a sub-surfacesystem with certain degree of transmissivity and storage. Onemust analyse these boundaries and parameters as accurately aspossible before any system is subjected to development pro-grammes and management practices.
A rapid inexpensive reconnaissance survey over a regioncould be conducted in unexplored regions through quick fieldtraverses and by collecting all relevant geological and hydrolo-cal features. Interpretations of ERTS images combined withfield checks should become a part of these rapid studies.
All available hydrological data such as water levels springdischarges, yield characters of well structures and waterquality parameters when properly evaluated over a geologicalterrain would facilitate preparation of a preliminary hydrologi-cal map.
The above studies could further be intensified to map theterrain in detail and estimate the micro-level changes in theflow patterns, velocity potentials, yield characters and chemicalquality variations. These detailed studies could be taken upover a period to time — say one hydrological cycle or twohydrological cycles depending upon the logistics. Detailedhydrological and hydrochemical maps could consequently beprepared which could serue as potential tools for developmentof ground water either for drinking or irrigation. The abovestudies would in general help to evolve the following hydrologi-cal information.
(a) Primary and secondary porosity and permeabilitycharacteristic of the materials.
(b) Aquifer boundaries.
(c) Depth of water table and probable saturated thicknessof aquifers.

50
id) Relationship between topography, geology andhydrology.
(e) Identification of recharge and discharge areas ; relation-ships between surface and ground waters.
( / ) Estimates of productive areas for ground water develop-ment and design of well fields.
(g) Estimates of groud water quality ; fresh or saline.
(//') Hydrological Test Analysis-Yield CharactersEquipment-Interpretation Techniques
In a ground water system, if its flow properties and yieldcharacters are to be properly evaluated, a proper hydrologicaltesting design should be framed and short and long durationhydrological tests should be carried out depending uponthe details of the parameters we are looking for. Anumber of methods/techniques are available to evaluatethe hydrological parameters. One should be careful in adoptingright method of approach taking into consideration the wellstructural design and the ground water system. One should notuse methods available for a confined system to an vinconfinedsystem etc.
A mobile generator and necessary pumping equipment andand assemblies are used to test wells in both hard rocks andsedimentaries. The equipment could be moved from place toplace with the help of a jeep and tractor. Hydrological testsshould be carried out even in remote places where electricity isnot available. Ascertaining the yield characters is a must for anyground water development programme whether it is for drink-ing or irrigation. The above procedure when followed wouldyield the following information:
(a) Yield characterstics and potentials of a well.
(b) Efficiency of the well performance.

51
(c) Confirmation of the hydrological nature of the aquifer.
(d) Determination of the hydraulic properties of theaquifer system.
(e) Production of the effect(s) of present or future pumpingfrom the ground water system.
Simulation of Aquifer Parameter
The purpose of a simulation model is the following :
(a) To synthesize past hydrologic events.
(b) To predict furture hydrologic events and to evaluate,for designing purposes and computation of hydraulicevents occuring rarely in nature.
(c) To evaluate the effects of artificial charges imposed byman on the hydrologic regime.
(d) To provide a means of research for improving theunderstanding of hydrology including the run offprocess.
Aquifer parameters are obtained by pumping tests at severalpoints and are estimated for the areas in between. In practice,three types of models are used namely.
(a) Resistor-Capacitor model (R-C Model).
. (b) Digital models
(c) Hybrid models
(d) Analog model
With the help of analog models, the physical condition ofthe system can be measured at each point of the model but theparameters can be varied only in a limited manner. In case ofdigital and R-C models the aquifer has to be sub-divided intoa large number of sub-areas and the parameters can be varied

52
in wide range. But the response of the model is only availablein a sub-area.
A very rough view of prices of hydraulic modelling ispresented in Figure II.
Digital model
o* node-
Fig. II
It can be seen that for less than 1000-2000 node points thedigital model will be less expensive than the RC model. For ahigher number of node points the price of a digital model isis higher than the RC model.
The basic data on aquifer system is obtained by geophysicalinvestigation, This is to be combined with bore hole measure-ments in existing wells or some additional wells if necessaryand pumping tests for the evaluation of the aquifer parameters.As such the geonydrologists and the hydrologists who will buildup the simulation model, should plan together the first modelof the system. The surface data and Hydrological data togetherwill simplify the model. The first rough model may not simulatethe prototype in its most accurate form but the models' resultswill bring up questions to hydrologists who are to conductfurther field studies, with the result of which the model can berefined further.
Different simulation technique is best suited for specifictype of aquifers. If the aquifer system is very simple, analog

53
models as an electrolytic through or a conducting paper modelwill be sufficient. For more complex system, RC analog, digitalor hybrid models are more useful. The kind of simulationmodel which will be most suitable depends on the availabilityof man power and price of diverse techniques. If the aquiferparameters are changing with time, the application of techni-ques becomes more complicated and capital intensive.
Hydrochemistry of Ground Water
A major part of the ground water infiltrates through thesoil and therefore, it acquires the mineral composition andcharactcrstic of the soil. Many of the process involved inweathering of rocks which give rise to soil formation result indissolution of minerals by leaching by water. Decomposition oforganic water by micro organisms results in presence of solublebicarbonates in water.
The chemical composition of water in a basin can be usedto understand the flow and mixing patterns of Water ofdifferent origins. The geochemistry of confined and unconfinedaquifer and river water clearly distinguish between recharge,transition and discharge zones. In practical experience it hasbeen found that the radioistopic tracer studies and studies ofchemical characterstic are in conformity with each other, indetermining the specific hydraulic zones.
In order to ascertain accurate hydrochemical characterstic,it is necessary to adopt spot sampling and anlaysis by mobilelaboratory. It is also necessary to design and fabricate monitor-ing gadgets to continuously measure the level of contaminantsat identified locations.
Organisation and Programme in India
As many as sixty organisations are working in the fieldrelated to hydrological investigation inclusive of the inter-national hydrological programme sponsored by UNESCO.The: phase III of the programme which is under implementa-tion during the current years, cover the following :

54
1. Investigation of elements of the bydrological cycle anddetermination of water balances. ;
2. Methods for the investigation of surface and groundwater regimes and for the determination of hydrologicalparameters for water projects.
3. Interaction between climatic variability and change andhydrological processes.
4. Hydrology of particular regions and land areas.
5. Application of special technologies for the study ofwater resources.
6. Methods for assessing the charges in the hydrologicalregime due to man's influence.
7. Environmental impact studies of water projects.
8. Specific influence of man on the hydrological regime.
9. Methodologies for water resources assessment.
10. Methodologies for integrated planning and manage-ment of water resources.
11. Systems management for reduction of negative sideeffects of water resources development.
12. Development presentation of information forplanners and and decision makers concerning theimplications of modern water resources planning andmanagement approaches.
13. Promotion of education and training in the fields ofwater resources.
14. Preparation of guidance material to be used for theestablishment of training courses in hydrology andwater resources management, addressed to variouscategories of a personnel.

55
15. Improvement of teaching methods in hydrology andwater resources nabagenebt.
16. Comparative methodologies for public information andthe promotion of public participation in the properutilization, protection and conservation of waterresources.
17. Scientific information systems : to facilitate the flowand utilization of scientific and technical informationin the field of water resources.
18. Methods for the effective transfer of knowledge andtechnology related to water resoruces, and for theevaluation of their impacts in developing countires.
About eighty scientific organisations including Central. Stateand Universities educational bodies are engaged within thethe country in various tasks involved in the above programme.*
The Technology Mission for Drinking Water in Villagesand Related Water Management
During the tenure of 7th plan, period, about 1.5 lac villageshave been identified where new potable sources of water isrequired to be created, A Central Technology Advisory Grouphas been formed which shall attempt precise indentification ofdependable sources and prepare plans for development ofground water sources and disseminate ground water data to theuser agencies for follow up action; develop and suggest areasfor augmentation of the existing ground water resourcesthrough micro level ecological planning and make recommen-dations for conjunctive use of ground and surface waterresources.
At the state level there are source finding committees whichwill take care of the details of conservation, recharge, qualitymonitoring and exploration for water. Hydrogeomorphologicaland lineament maps on 1:250,000 scale have been prepared forabout six districts in the north and most of the southern part

56
of the country. Potential features around the villages withwater scarcity in selected districts have been plotted on the1:50,000 topographical maps. In order to cover the entirecounty under this activity, extensive man power developmentprogramme has been taken up by central agencies for place-ment of property qualified personnel at the state level forcollection and interpretation of satellite data and geohydrologi-cal data, and preparation of maps etc.
The Technology Mission has taken up 50 districts in thefirst place, for systematic demonstration of application ofscientific techniques in reduction of time and cost in creationof new potable water sources and their maintenance. CentralScientific agencies namely Central Groundwater Board,National Gaophysical Research Institute, Space ApplicationCentre, National Remote Sensing Agency will help the stateGovts. in providing adequate scientific input for source locationand development in these districts. About 25,000 villages arelikely to be covered under this demonstration programme.
The demonstration of technology in the 50 pilot districts isexpected to bring out various locations specific combinations.The examination of data on development of water source inthese districls could generate the pattern which should beadopted in similar locations for application of technology.
During last few months about 25 districts have been exten-sively covered by scientific source finding techniques and asmany as 1500 locations have been indicated, The drilling failurein these locations is significantly lower than those locationswhich are drilled without adequate scientific studies.

Integrated Approach for GroundWater Management in India
The requirement of drinking water for the present populationin India at the rate of 40 Ipcd is about 1.1 mil. hra.
The average annual rainfall is .about 400 mil. hm. whichprovides potential for 60-65 mil. hm. of surface water and25-40 mil. hm, of ground water. However, about 300 millionpeople remain affected by Jack of supply of potable water tillthe 7th Five Year Plan Period.
One of the main difficulties in making water available attime and place of need is the highly non-uniform spatio-temporal distribution of the various utilisable components ofthe hydrological cycle of rainfall, surface water and groundwater. The variation of rainfall throughout the country rangesfrom 10 cm to 1070 cm per year. The occurance of surfaceand ground water also has very wide spatio-temporal variationdue to diverse topological, hydrological, hydrometeorologicaland soil conditions. In such a situation the problem of drinkingwater cannot be solved on a permanent basis without resortingtp scientific management of this resource.
Programme of integrated Water Management in generalinvolves

58
(0 quantitative assessment of the utilizable components ofthe dynamic water system,
(//) quantification of interlinkages between these compo-nents,
(///) maximization of the utilizable water through propermanipulation of these interlinkages,
0'v) maintenance of desired quality of water for specificand uses.
A graphical presentation of suggested procedure for designand implementation of water supply scheme for sustainedsupply of potable water is given at page 59.
India experiences an average annual rain fall of about 1200mm which is significantly higher as compared to that in UnitedStates which is about 200 mm per year. The quantity ofprecipitation received every year is about 400 mham which isdistributed in 3 basic ways :
Evaporation loss — 70 mham
Surface run off — 115 mham
Percolation into soil — 215 mham
This creates annual renewable resources of ground water ofabout 40 mham.
The demand of water in India is mainly for irrigationwhich consists of more than 90 per cent of the total demand.Domestic and Industrial uses accounts for the remaining.Drinking water comprises very small part of the total consump-tion and is not more than 1-2 mham per year. However, thelatter involves specific quality requirement in order to provideappropriate health and welfare for the community. The totalwater consumption does not exceed 150 mham per year inour country, which can be met out of the renewable watersources, simultaneously maintaining the ground water sources.

r 1ictKTtncATiOK errtetLtis,tssrssucMT orZHSTlHi WJTIM ttSOVtCCS
QMASISiTtDH Htf H.tC*TiOh OfFtCtlHltsro* tXPL0HATtOS,tt*lttt£-SSIMC, *sscssucnr,wtitii ntttrue-NT aMUUStHlNTOr WiTtf KMUIKtS
touctTiKC socicrreu imncowirea roT{nrtu. cose tvtnoM-CtSUSCS £TC
JOUAHTITYOF WATER | QUALITY Of W*TEH|
I«PLO«»TION FOD U L t O H Or«HOUN0 WATER
•SSCSSUtNT BA G C T F
AUGMCNTATtOKor mTei iDC SCNIIC ES
t
CHEMICAL• KILTS'S
1
MCT£RK>IMICU.»>1»LTSIS
Fig. 1

60
Inspite of the above situation we are faced with severe watershortage in various parts of our country and are not in aposition to make available required quantity water at timesand places of need. This situation occurs mainly due to highregional variation in rain fall, from 100 mm in Rajasthandeserts to 11,000 mm at Cherapunji, also high non-uniformspatio temporal distribution of ground water, great diversityin topologi'cal, hydrological, hydrometeorological and soilcondition in various parts of the country. It is primarily becauseof these variations in availability of water, the related problemscannot be solved on a permanent basis without resorting toscientific management of the dynamic resource.
Suggested Steps in Scientific Water Management
The objective of water management is to increase theresidence time of water on land by efficient and cost effectivestorage during and places of abundance for being used attime of scarcity. Similar objective is also applicable for groundwater which is to be used as complement and supplement tothe water available on the surface.
The collection and study of existing regional data ontopography, geology, geomorphology would give the basicunderstanding about the watershed area. Hydrology, rain fall,evaporation rate, surface hydrology and potential of watersource will indicate the total resource available at time andplace. Use pattern and water collection status including therequirements of water for specific end uses and indicated shortfall, identifying the requirement of further action to be under-taken with respect to the exploitation of various sources, shouldbe verified as primary measure.
The exploration of ground water should be carried out afterstudying the land-sat imagery of the region, Ground checkand geological traversing data will indicate the location ofthe aquifer. The well inventory should be verified bygeo-electrical profiling and sounding along with geophysicallogging. Hydrological maps should be prepared after study of

61
the forgoing data, in order to indicate the possible location tobe tapped for adequate ground water resource.
Dug wells and bore wells are next to be drilled in the moreSuitable points identified by geoelectrical sounding and groundwater draft is assessed before installing the stand post or publicsupply points.
The ground water should be suitably supplemented by useof surface water in order to preserve the latter for more difficulttimes. Surface water can last longer provided adequate stepsare taken for control of evaporation and seepage. Moderntechnologies for evaporation/seepage control by use of poly-meric chemicals and films have been extensively used in othercountries. In addition, efficient water harvesting system shouldbe identified and installed for cost effective storage at the pointsof collection of rain water,
The quality of the ground and surface water which has beenmade available at particular place should be assessed for itsacceptability particularly for the purpose of drinking. Theparameters may be broadly underlined as under:
Physical : colour, turbidity, temperature, taste,odour.
Chemical : pH, conductivity, Alkalinity, hard-ness, chlorides sulphates, fluorides,nitrates, iron, manganese, CO].
Bactereological : MPN Test/rapid test
Biological : Guinea worm vector
After identification of water problems one has to assess theappropriate type of treatment technology to be adopted forthe particular source. In some cases Jhe source can beabandoned and there may not be need for treatment, as watermay be available from another nearby source of good quality.However, in many cases it has been experienced that concept

62
of treatment of water at the source points, may avoid needfor laying long drawn distribution lines and its maintenance.It may be possible to develop a method of involving thecommunity in installation and maintenance of the treatmentfacility installed for a community, by the community itself.This concept is propagating in various developing countries ata satisfactory rate.
In case of installation of treatment plant, it is necessary toadopt a suitable design which is specific for the location.The operation and maintenance and evaluation of the plantincluding its acceptance should always form an essential partof such plants. Efforts should be made for ensuring that thecommunity is involved from the begining for installation,operation, maintenance and evaluation particularly for asubject like water which has lasting effect on humanity andenvironment.
Guidelines for environmental impact assessment for use anddisposal of water should be derived and followed for preserva-tion of both surface and ground water. Disposal of highlypolluted water in surface or on the ground will change thenature of the regional water shed to an irrepairable extent.
Infrastructure Requirement
It is essential to have adequate infrastructural supports tofacilitate adoption of scientific management system for utilisa-tion and preservation of water resources. Trained man poweris one of the greatest constraint in furthering scientific practicesand adopting an integrated approach. It is necessary toorganise specially designed training programme to train a goodnumber of scientists/technicians in the integrated approach.These people can further replicate such training in their indi-vidual region. Engineers, Geologists, Geohydrologists can beselected for such training. Operational part of the system canfurther be taken up by science graduate and technicians in thefield.
It is necessary to install rain-gauging stations, stream-gaugingstations in strategic locations for assessment of surface water

63
flow over the years. Comprehensive multiparameter hydro-meterological stations should also be installed for collection ofhydrological information.
Adequate facility for drilling of exploratory bore wells forassessing the availability of ground water in various places inthe country should be provided. Present facilities are not ina position to cover more than 1000 such wells a year. Assess-ment of well potential is to be carried out simultaneously bypumping/recuperation test to estimate hydrological parametersof the aquifer.
In most of the places in the country the quality of water isnot tested in absence of appropriate facilities. Since thedrinking water is more linked with human health, it is necessaryto assess its quality by testing laboratories, which should beinstituted at the district level and state headquarters level andprovided with instruments which should give preliminary anddetailed information about water quality in order to indicatethe need for treatment of water.
Design and installation of the water treatment system shouldbe undertaken after assessing the most cost effective measuresalong with simultaneous operation and maintenance.
Intensive health education for public through all theestablished and other possible means should be developed inorder to maintain the awareness regarding appropriate use ofwater from individual water sources.
It is not possible to develop such huge infrastructure undersupervision of the Government alone. It is necessary that allorganisations engaged in development and utilisation of watershould do their own bit in regard to development of such asystem. It is more important that the system should be main-tained after it has been installed and provide necessary datafor monitoring of the quantity and quality of the water sources.A base has been prepared with the help of national and inter-national bodies concerned in development and use of water,which should be further widened for broad basing as well asfor micro level operation.

Nitrates in Ground Water
Origin of Nitrate
A newly emerging problem in the field of ground waterquality is in the form of excessive nitrates arising out ofincreased use of nitrogen fertilisers. The current consumptionof nitrogen fertilisers in the country is of the order of 10 mil.tons which is likely to increase to 15 mil. tons by the end ofthe century. This fortifies the global nitrogen cycle as indicatedbelow:
Ait-Nitrogen
PlantsUrea •" ~"Ammonia
Animals

65
The nitrate compouds present in soil helps the plants inthe synthesis of their substance. It is the nitrogen compoundwith highest stage of oxidation. It occurs due to minerali-sation of organic manure and subsequent bacterial nitrification,discharge also occurs during thunderstorm by means of electricNitrate in the atmosphere, which is the largest reservoir ofnitrogen.
Nitrate in ground water is usually derived from,
— Nitrate from the geochemical composition of groundwater
— Nitrate from thunderstorm
— Nitrate from manure
— Nitrate from the organic pool of the soil
— Nitrate from the infiltration of surface runoff.
Sodium nitrate and calcium nitrate are often found inminerals occuring in arid zones and are highly soluble in water.Ammonium is bound on the lattice of silicates in a non-exchangeable form and is released only if the rock gets decayed.The nitrogen compounds go into surface waters mainly throughthe introduction of the communal, agricultural and industrialwaste waters, through the rain water and through the washingaway of agriculturally used surface and built areas. Averagedistribution of contamination from each source may be repre-sented as under :
Commercial fertilisers 31 %
Manure 19%
Soil nitrogen 46%
Rains 4%
Presently the specified limit of nitrates in drinking water hasbeen set at 50 mg NO3 per litre.

<56
Effect of Nitrate
The nitrate itself has no effect on health. But nitrate getsreduced to nitrite, which has a definite toxic effect at theconcentration of 0.1 mg/1. The nitrite oxidises the red colour-ing matter (hemoglobin) of blood to methemoglobin, in whichcase the blood colouring matter is not in a position to transportoxygen. In case large rates of conversions are involved, innersuffocation may occur which can be recognised by the grey-Ijlue colouring of skin and mucous membrane. In case ofinfants the convertion of hemoglobin can occur at doublespeed, as such they are more susceptible to methemoglobinemia.Such cases were reported more frequently when the limitingnitrate concentration was laid as 90 mg/1.
Besides methemoglobinemia, which is characterised assecondary toxicity, there is possibility of tertiary toxicity dueto formation of nitrosamines. Nitrosamine occurs due to thereaction of nitrate with amines which are essential constituentof human food. Nitrosamines are reported to be very strongcancer producing agents.
The nitrates can be reduced to nitrite with the help ofbacteria
— in water distributing lines
— by means of reduction of bacteria in foodstuffs anddrinks
— in the stomach and small intestine
—- in dental cavities.
Measures For Reducing Nitrates
In India, in a recent survey, 1290 ground water samplesfrom 1 i states were found to be having nitrate content morethan 45 mg/lit. Most of them are also found to have highdissolved solids content. Necessary steps should be taken

67
to supply nitrate free water in these regions viz. Rajasthan,Gujarat, Tamil Nadu, Andhra Pradesh, Haryana, Karnataka,Lakhshadweep, Madhya Pradesh, Bihar, Maharastra, Orissaetc. Various methods adopted and suggested in other countriesare indicated below for information and perusal.
It has to be kept in view that the cost of such solutionvaries from one possibility to another depending on the place,hydrogeological conditions and agricultural conditions. Dilutionby mixing with nitrate free water is often recommended inthis regards, if possible. As nitrates are often associated withhigh TOS (total dissolved Solids), the standard technologiesapplied for. desalination viz reverse osmosis and electrodialysiscan also achieve the removal of nitrates, as is the case forfluorides and other undesirable salts.
The method of natural decomposition of nitrates by bacteriacan be sucessfully applied for removal of nitrates. The pre-requisite for the course of denitrification are the partly oxidisedconditions, optimum pH-value and temperature and sufficientsupply of reduction agent for the micro-organism. Dependingon the type of micro-organism used, either hydrogen (Auto-trophic becteria) or an organic carbon compound (heterotrophicbacteria) are added as reduction agent. For denitrificationwithin a short time, highly concentrated bacteria on a suitable•carrier is used. As an after treatment aeration for enrichingoxygen, active coal-filtration for the removing the residue sub-strate and disinfection of the nitrate-free water is carried out.
The advantage of this method is that only nitrate compounds*re converted to nitrogen gas, keeping the other properties ofwater unaltered. No separation nor pre-treatment are required.But for disadvantage, the carbonate hardness of water is in-creased and extensive checking for complete removal of nitrateis required.
For supply of water with reduced nitrate content for drink-ing purposes the following alternative measures can be-adopted : —

Source Development
* Procurement of water from other sources totally orpartially.
* New tapping of ground water with low-nitrate content byconstructing new wells in nitrate free zone, widening offlat wells or tapping of water from higher depth.
* Selective aquifer management with known nitrate profiles.
Hydro-Technical Methods
* Physico-chemical methods such as reverse osmosis, ion-exchange (pure anionexchange and partial desalting) elec-trodialysis.
* Biological methods including autotrophic denitrificationwith hydrogen and heterotrophic denitrification withorganic substrate.
* Subsoil denitrification.
* Elimination by high nitrate consuming vegetation,
The selection of any of these measures should depend onthe location of the concerned water works with respect to thevicinity of source of supply, existing piping system includinglong distance water supply, hydrogeological factors, conditionswithin catchment area.
However, for each individual hydrotechnicol method, addi-tional expeniture for pretreatment of raw water and the sub-sequent post treatment of the treated water and that for re-moval of waste water should be taken into consideration. It isnecessary to apply all these methods in such a way that theyconform to the standard concept of seepage/drainage removal.
In the biological method, installation of plant for posttreatment by aeration etc. can be avoided by allowing a suffi-

69
ciently long aerobic passage (canal) to be attached to thedenitrification platform. The capacity of subsoil for aerobic selfpurification may be used as a basis for design of this canal.The nitrate removal plants should be designed and laid in sucha manner that even during the peak operation the limitingvalues of nitrates, 50 mg/1, should never be exceeded.
The cost of treatment by these methods may vary betweenRs. 3 to Rs. 8 per cubic mtr, of treated water and is quite un-economic for small water works below 30 cubic mtrs. per hourcapacity, praticularly when the raw water is strongly loadedwith nitrate. As such, one must generally proceed on the basisof the assumption that treatment should be taken up as a lastresort. In many cases a combination of instantly implementedhydrological measures and a packet of agricultural measuresadopted to local condition would be most suitable way to solvethe problem of nitrate load. In this respect a close collaborationbetween the water supplyiag and the agricultural sectors with inthe affected catchment areas is necessary.

Surface Water Potential and ItsUtilisation in India
The World Waters
The global Water Resources are estimated at the rate of1.5xl09cu k.m. of which ocean waters are 98%, and theother surface waters including lakes, rivers, soil moistures andbiological waters are not more than 1% of the remaining 2%.The evaporation from ocean and other surface waters provideabout 110,000 cu k.m. water every year, but most of thisamount goes to the ocean leaving only 25 per cent for reple-nishing the land based water system. The polar ice caps andglaciers form a major source of fresh water. At present glacierscover 16.2 mil k.m.1 or about 11 per cent of land surface.99 per cent of the total glacial ice on earth, estimated to be 27mil. k.m.*, is concentrated in Antarctica and Greenland. Therest can be considered for supplementing the surface watersources through natural and artificial melting processes. Manyriver discharges are supplemented by seasonal melting ofglaciers, however, consolidated man made effort in this directionshould be supported by adequate environmental impactstudies.
Runoff is major factor affecting the water available onground. This is often associated with runout of the neigbhour-ing ground water components. The length of total shoreline isabout 370000 k.m. and the discharges of 304 major rivers inabout 661,960m3 per sec. The drainage area of these rivers is

71
about 61930 km2 x 10~J. These comprise of about 60 per centof total world runoff.
Precipitation supplements the land based water sytsemsincluding runoff as indicated below :
Precipitationexcess |
1111
1surfacerunoff
!
• 1
1I
1subsurfacepercolation
subsurunof
rfacef
Total precipitation1I 1
infiltration other abstraction1
\Deep
percolation
1ground waterrunoff withshort termtravel
11
ground waterrunoff
11
Total runoff
fground waterrunoff withlong termtravel
I
This can be summarised by the equation
P=R+E-J~As
P is precipitation
R is run off
E is evaporation
As is storage change which can be positive or negative
72
There is a sharp asymmetry in the quantitative distributionand dynamical significance among the elements of globalwater system. The basic features of the surface water systemsand those of the streamflow regime are specified by the climati-cal conditions. Under the given climatical conditions theamount and time variation of baseflow are controlled bygeohydrological characterstics. From the hydrological pointof view the present decade represent a transient period fromnatural regime into man controlled or influenced regime. Thiswill be achieved by extending water resources planning andoperation activity to more areas.
In particular the surface water reacts sensitively to all man-induced changes within drainage area. The subsurface campo-nent of river runoff formed by underground runoff of differenttypes from aquifers, drained by hydrographic network providesthe genetic and quantitative index of relation between surfacerunoff and under ground runoff. Subsurface flow representsone of the main components of the water cycle during theformation of water regime of river basins. Quantitative esti-mation of subsurface flow provides a quantitative coordinationof precipitation, river runoff and ground water to characterisethe relations between the main sources of ground water re-charge, and would help in estimating direct undergrounddischarge into seas and oceans. Estimation of basins byhydrologic-hydrogeological method for the preparation of riverrunoff hydrographs would also give an indication of theparameters of subsurface inflow into rivers from the permanentaquifers. This will develop methods for the forecast of seasonalvariation of discharge of river basins. Information on hydro-logy and physics of soils, hydrochemistry, hydrodynamics,geomorphology and other related seiences, are required forreliable estimation of the water resources at a given timeand space.
Surface Water In India
The Indian subcontinent has an unique geographic position.

73
In the north the Himalayas, snow capped ranges feed thegreat Himalayan risers, one fifth of their flow being snowmelt.To the South spread the tropical seas between 10° N and 10° Slatitudes which is the generation zone of tropical cumulusclouds. The rainfall during June-September from the South-West monsoon and November-February from the North Eastmonsoon comes to an average 105 cms.
India has fourteen major rivers, fortyfour medium riversand a great number of minor streams with a total annual runoffof 1645 thousand million cubic meter (TMC). The annualrainfall is estimated to be contributing about 3816 TMC. Thereare abaut 1500 glaciers in the Himalayan region with totalvolume of ice of the order of 1400 k.m. There are a few largenatural lakes like Dal and Wullar in Janamu and Kashmir,Kolleru in Andhra Pradesh, Chilka in Orissa, Pulikat in TamilNadu etc. The potential of these lakes have not yet beenscientifically studied. About 2.8 rn.k.m. of Indian territory isreported to be ground water worthy and 30 per cent of thetotal ground water is generally used for water supply network.
In India 90 per cent of the water required is used forirrigation, but only 50 per cent of the net sown area may bebrought under irrigation till the end of the century, by imple-menting the ultimate potential of major medium and minorsurface water and ground water based irrigation projects. Thiswill cover about 113 mha of agriculture area and about 60 percent of agriculture will continue to be rainfed.
The anticipated need of water for population of 900 milis estimated to be about 850 TMC. The surface water sourcesalone can provide 1440 mil acre feet, which is same as in USA.But in USA, its utilisation is five times of that in India. Thestorage capacity in India will not exceed 200 mil acre feet by2000 A.D. which will be affected by heavy silting by that time.Already one third of the country is drought prone and about40 mil ha land is affected by flood annually. An efficientsystem of water management alone can help id meeting the

74
agriculture target as well as avoid the natural calamities andassociated losses.
Some preliminary studies indicate, by making optimum useof water resources through construction of storages in the headreaches of the rivers and by interlinking the river systems aswelt as by effecting economics in water use on the existingirrigation systems, the ultimate irrigation potential in thecountry may be increased to 140-145 m.ha.
Presently the efficiency in water usage for irrigation i.e. theratio of water requirement of crop to the water delivered, isnot more than 30-40 per cent. It is hampered by the inappro-priate field channels, inadequate preparation of land and lackof consolidation of land holdings. Marginal and small farmersholding less than 2 ha land each have 70 per cent of their landsirrigated by small tanks and stored rain water.
Another major aspect to be considered for efficient watermanagement is development of waste lands. These are causeddue to factors such as water logging due to restriction of flowof water by the construction of roads, rail tracks, canals;obstruction of natural drainage by culverts and bridges; seepagefrom canal systems including water courses and field channels,deep percolation in canal irrigation areas, often as a result ofover irrigation and heavy rainfall and floods. Alkalinity andsalinity are caused due to lack of leaching and drainage in parti-cular areas.
It is desired therefore that construction of irrigation projectsare not undertaken in isolation without simultaneous com-mand area development and watershed management. Theseactivities along with engineering works should be brought undersame authority for Development of surface water resources.
Scientific Water Management
The economic effects of the way runoff moves through thewatershed are determined by the state of simultaneous watershedeconomic development. Flood Plain Development, the extent

75
of available uses for fresh water, and the number of participantsin agricultural activities translate the sequence of physical Howevents into a lime pattern of derived economic value. Structuresare used to alter the physical system and thereby the time andspace pattern of flows and storage within the watershed. If theresulting increase in derived economic value or system utilityexceeds the cost of structure, their installation is justified.
The interdependence of surface and ground waters in Indiamay be represented at page 76.
The river water supply being seasonal, thus need to bestored or supplemented by ground water to meet the multiplecropping demand and other deficit areas.
In designing the systems appropriate cropping pattern andwater losses criteria has to be taken into consideration alongwith the distribution and accessibility to farmers. The cost ofirrigation projects may be around Rs. 20000 per ha and theeconomic return can be improved by improving performancecapability and operating characterstics. Existing systems canbe modernised by changing the cross section of major canals,building parallel canals, canal lining, increasing control struc-tures changing design of gates, constructing a higher proportionof the distribution system to reach closer to the farmer,conjunctive use of groundwater and many other changes.Modernisation can yield quite high rates of return by over-coming constraints to reliable and efficient water distribution.
Conceptual Medal in Water Resources Planning
For the conceptual model of water resources planning, themajor dimensions to be kept in view are space, time, economicvalue, the three hydraulic dimensions of flow, chemical andbiological quality as well as political and public support. Theresources geometry operates with four basic interconnectedvectors, resources, demand, pollution and upgrading. The effectof unpredictable climatic (stochastic) factors on the resourcescan be derived from pattern of data available for the past.

PRECIPITATION
HELD I
ITUSEWEU
LL i L itReeFIELD * IRK1U1B
AREA
SURFACEKUWOFF
HOh.
peep
EVAPORATION
MET
GU6 fXTC

77
The basic operational policy of the resources geometry is tooptimise application of intervention vector upon the resourcesvectors so as to comply with the requirements of the demandvector and the systems target. The probabilistic nature of theresources can be overcome by supplementary provisions, in longterm planning, as man made water will prevail upon the naturalwater sources, at a specified cost. As such, the limitation im-posed by natural resources on the model, will be of economicnature (Richardian). When the proportion of costly man madefresh water to cheaper natural water become substantial, theeconomic efficiency of prevailing water applications will have tobe revaluated and the present uses of water for low value pro-duction will have to be reconsidered.
To put it in a more general form, the system space of plan-ning will have to be expanded from the limited contents of newwater and demand streams to include both introduction of newwater application techniques and reallocation of existing wateruses. For achieving such higher level system approach, the areaof analysis for long term planning has to include followingmanipulative patterns :
(a) Selection of management patterns for the natural waterresources and the over-all water resulting optimal wateryields and qualities.
(b) Technological intervention into natural water cycle thatwill within economic limits improve the yields and
quality of the natural water resources.
(c) Shifting of water allocations in keeping with anticipatedrising water costs.
(d) Adjusting and changing water utilisation technology, soas to adapt it to anticipated higher cost of man-madewater.
The unit of management of water supply system should be ahydroJogical basin rather than fargmented for individual com-munities within basin, as this will provide realistic basin data

78
on flow pattern, spell of dry season, maximum flood flow,average flow on a long term basis, as well as the extent ofurbanisation, industrialisation and number of housing unitsplanned for the region. This will also help in integration ofavailable manpower and better distribution of water betweenupstream and downstream users.
Upgrading of Resources
Upgrading of water resources in arid countries like Indiacomprise of six complexes :
(a) The water supply function conceived within the frame-work of the hydrological cycle.
(b) Possible modification of the hydrological cycle byhuman intervention.
(c) The composition of the resource base of productioncomplexes and services into which water enters as asubstantial input.
(d) Man made water.
(e) Resources pollution.
(f) Political and institutional implications.
Upgrading the quantity of water by applying measures re-lated to complexes a, b and d and improving its quality byapplying measures related to complex e will have to completewith measures related to modification of the resources base(complex c), while complex f (politico institutional) will usuallybe treated as a constraint. The optimum solution will select thelowest cost measures and modifications of the resources basethat will make it possible to maintain the desired and economi-cally justifiable scope of production of commodities andservices.
Various appropriate technologies have been developed anddemonstrated for augmentation of surface water both by

79
quantitative and qualitative measures which should be propa-gated through socio-political will for benefit of populationsuffering with scarcity. The important ones which have beenaccepted in general in India, are described below :
Seasonal water may be channelised from the slopes, espe-cially in hilly terrains with the help of mini chek dams in linedponds or closed tanks. Thin walled tanks consuming sub-stantially less cement can be constructed locally by laying ironwiremesh within the building material using special moulds andtechniques. A capacity range from 600 lit to 20000 lit has beenachieved by application of this technique. It is normallyrecomtnendable to build the storage facility for individual house-hold or small communities residing in far off places in desert-affected areas. When single pipeline supply has been arranged,ferrocement structures for storage can be gainfully utilised. Insome cases the rain water falling on the roof top of a house ischannelised to a storage tank to supplement the water require-ment of the family. The demand of water and number of rainydays including the magnitude of rainfall should be taken intoconsideration while designing the storage capacity.
Open tanks with shallow bottoms have been extensively usedfor harvesting rain water in the plains. These are prepared byraising side elevation by eight to ten feet. Use of imperviouslining of bricks covered by polyctbylene/PVC sheets help inlonger retention of water. Evaporation control with long chainether based composites layers spread over water surfaces hasbeen able to control upto 80 per cent loss by evaporation at anominal cost upto wind velocity of 40 miles per hour. With in-creasing cost of other opportunities, these techniques are ex-pected to become more widely accepted.
Another area of technical approach is to increase the effi-ciency of water use by crops. Water retention polymers havebeen used by cash crops, orchard and other crops with averageincrease of 30 to 80 per cent in yield. Large scale manufactureof these polymers have been taken up by indigenous industriesand widespread consumption practice is expected to follow.

80
Some of the more traditional methods adopted in rain waterharvesting, surface water proofing and runoff farming may notbe out of place to be mentioned here. Few tested surface im-pervious covers are soil bentonite, soil cement, mud pluster(mixture of soil, wheat husk and cow dung) use of oil emulsionwith soil and tank silt, mechanical stablilisation, sodium car-bonate spray and grass (lasirus sindicus) cover at 25 cms x 25cms spacing. Among these methods, oil emulsion has beenfound most effecitve in improving the runoff of the catchmentarea.
Higher crop yield have been found in farms of arid zoneslike Rajasthan by recycling the runoff, use of micro catchmentwith moisture barrier of bentonite clay and 40 cms furrow and60 cms ridge method of planting. It has been found thatfurrows are more effective in conserving moisture upto 30 cmdepth. Contourtrenching conserve moisture from 28 per cent to46 percent, contour bunds conserve from 29 per cent to 44 per-cent and contour furrowing 51 per cent to 109 per cent undervariable rainfall conditions. Many village households in aridNorth West India have successfully harvested rain water fromrooftop and collected in ground tanks. This is used for cattleas well as domestic uses other than cooking and drinking.
In use of surface water great deal vigilance is required to bepracticed with respect to its bacteriological nature. Presence ofturbidity and coliforms are essentially found in water flowing oraccumulated on the surface. In addition, there is presence ofdissolved salts, pesticides etc occuring on account of character-sties of the land and its use. Accordingly the available watermay be required to be treated chemically, physically or biologi-cally for making it suitable for the end use.
Biological upgradation is usually carried by application ofchlorine or other oxidizing agent in a suitable form, for removalof faecal coliform from drinking water. Chlorine tablet, slowsand filtration, pot chlorination are few among the methodsused for village water supply in India. Yet another biologicalwater-borne menace for human health predominent in half adozen states are guinea worm vector cyclops which are pro-

SI
pagated through human contact with water bodies. These arecontrolled by separation as well as use of pesticides. Superiormethods are under advanced stage of demonstration, whichincorporate use of plastic dispensors as well as nontoxic chemi-cals.
The physical upgradation is carried out by removal ofsuspended impurities and colloidal matters. For this purposetraditional coagulation and filtration techniques are still foundmost suitable. Mixing of various grades of water may be afuturistic approach in cases where such opportunities arepossible to be derived.
Chemical upgradation involves removal of undesirablechemical ingradients with the help of physicochemical actions.Membrane separation processes with the application of highperssure or electromotive forces are widely applicable for waterpretrearted for removal of biological and physical impurities.Polymeric membranes have been used for reduction of dissolvedsolids by reverse osmosis and electrodialysis methods. The costof such treatment is dependent upon the quality of input andoutput water, the nature of membrane and the rate of poweravailable. A large number of such plants have been installedthrough out the world including India. These processes arepossible to be used for desalinating sea water and highlybrackish water in the coastal region.
It is necessary for men to be fully conversant with thenature of water which is going to be consumed for various pur-poses, in order to take optimised steps for its supply. Thequality assessment is an essential step in this direction. Thereis a tendancy to take the available water for granted and acceptit by physical appearance and taste which often create healthand other hazards. Many water supply stations distribute theirwater without minimum basic tests for presence of bacteria orresidual chlorine. The toxic ingradients and dissolved im-purities are hardly estimated even at state headquarters level.
The government of India has taken up the training of man-power and establishment of analytical facilities at state anddistrict level in order to catalyse widespread common practicesfor water quality assessment.

Mission Approach for QualityManagement of Drinking Water
The problem of water supply has been traditionally linkedwith distance of source, both horizontal and vertical, and itsquantity in terms of per capita consumption requirement ofhuman and cattle population. However, after the enactment oflegislation regarding water pollution control, increasing attentionhas been given to the quality of water. The Decade Programmeon Drinking Water Supply and Sanitation has been instrumentalin on formulating specific schemes related to maintenance ofquality of potable water. The major contaminants in surface andground water sources, which have been established to be harmfulfor human health are bacteria, guineaworm and faecal choli-forms, excess dissolved solids in particular, fluoride and iron saltsapart from hardness metal/salts and turbidity. The quality ofground water although guided by the nature of rock strata, isalso affected by the drawal rate, seepage, use of fertilisers,pesticides etc.
The policy concept for disbursement of water gives highestpriority to the drinking water supply in the irrigation schemes.Nevertheless, the major sources of water such as great river likeGanga, are also not free from harmful pollutants.
Steps have been initiated to monitor the quality of water ofrivers such as Ganga and Yamuna on one haDd, and on theother hand to establish water treatment plants for removal or
S3
dissolved solids, fluoride, iron Guineaworm, faecal coliformetc.
In addition, the sources of pollutants are also being treatedto reduce the effluent BOD at less than 20 mg per litre andsuspended solids less than 20 mg per litre. These levels aremore stringtent than develop countries where BOD is permittedat 30 mg per litre and suspended solids at 50 mg per litre.
CUaming of River
The immediate reduction of pollution load (leading eventu-ally to tatal prevention) on the river and the establishment ofself sustaining treatment plant systems thus emerge as the twoobjectives of the Action Plan in the first phase. Accordingly,the following can be identified as the components of the ActionPlan.
Renovation (cleaning/desilting/repairing) of existing trunkssewers and outfalls to prevent the overflow of sewage intoriver.
Construction of interceptors to divert flow of sewage andother liquid wastes into river.
Renovation of existing sewage pumping stations and sewagetreatment plants and installation of new sewage treatment plantsto recover the maximum possible resources, specially energy,to operate the pumping and treatment plants and drive themaximum possible revenue to cover at least the operation andmaintenance cost of these plants.
Arrangements for bringing human and animal wastes fromlocations proximate to the sewage/sullage digesters for sanitarydisposal, production of energy and manure.
Providing sullage of sewage pumping stations at the outfallpoints of open drains, to divert the discharge from the riverinto the nearest sewers and treatment plants.
84
Alternative arrangements to prevent discharge of animal andhuman wastes from cattle sheds located on the river banks.
Low cost sanitation schemes in area adjoining the river toreduce or prevent the flow of human wastes into the river.
Biological conservation measures based on proven techniquesfor purification of streams.
Pilot projects to establish cost effective systems for diversionof wastes now flowing into the river, their treatment and resour-ces recovery.
Pilot projects to establish feasibility of technology appli-cations in the treatment of wastes and resources/energyrecovery.
Depending on feasibility, circumstances and availability offunds certain other components will need to be taken up inphases, such as the following :
Extending the existing sewerage systems in the towns tocover the unsewered areas.
Construction of large cattle sheds in the fringe of urbanareas to facilitate collection of animal and human waste at suit-able places and generating biogas (energy) and manurial matterat these points. This will also prevent the rainfall run-off fromthe urban area washing and bringing all the muck to the riverduring the rainy season and grossly polluting it. Keeping thecattle at such sheds instead of built up areas will also improvethe urban environment.
Prevention of throwing of dead bodies in river.
Regulation of the use of pesticides and insecticides for agri-culture in such a way that surface run-off from the cultivatedareas does not carry excessive quantities of these materials tothe rivers.
This includes treatment of sewage in 27 Class I cities and

85
23 Class II cities along the bank of the rivers. Tn addition^ 28sampling locations are situated along the course of the river formonitoring of the quality of water with respect to presence ofmetallic compound such as Iron, Arsenic, Chromium, Lead,Cadmium, Manganese, Copper, Nickel, Zinc and Mercury andpesticides commonly used in agriculture.
Utilisation of Sewage
Stoppage of discharge of sewage/sullage into the rivershould reduce the pollution level by almost 75 per cent. Fortu-nately, in most of the major urban settlements on the banks ofthe main rivers trunk-sewers have already been laid along theriverside to intercept the drains/sewers coming from the inha-bited areas. Most of the dry-weather discharge of sewage/sullage(which at times also contains liquid wastes of minor industrialunits) can be intercepted and carried by these sewers to suchdownstream plants where sewage can be pumped above theground level and applied on land for cultivation. But often thepumping plants installed for this purpose are not properly ope-rated and maintained, with the result that sewage overflowsfrom the sewers and finds its way to the river. The problemhas to be solved and it should be possible to do it in the follow-ing manner.
Sewage is a very rich source of energy (through the produc-tion of biogas) and manurial matter. Utilisation of this manu-rial matter can increase the crop yield substantially. On thebasis of Nitrogen, Phosphorous, and Potassium content (NPK),the per capita contribution of manurial matter can be takenas almost Rs. 3 per year. As regards energy, the per capita con-tribution of biogas (in terms of equivalent energy from keroseneoil) can be taken as Rs. 2 per year. The production of energyfrom sewage will also ensure a regular supply of power to runthe sewage pumping and treatment plants. In view of scarcityof power, the provision of energy atleast for operating the treat-ment plant by such recycling should be a critical consideration.In some cases some surplus power may still be available forother uses. Ways and means for an optimum use of this powercan be worked out after considering the local condition at eachplace.

86
As regards the best utilisation of the rich manorial compo-nents of sewage i.e. the disgested sluge and effluent produced bythe sewage treatment plants, it should be recognised that thesearc marketable products and the authorities should be able toarrange for their sale at reasonable rates on the basis of NPKcontents.
At present, raw sewage is generally allowed to be used byfarmers at very low prices that have no bearing on the manurialvalue sewage. The use of untreated sewage for irrigation is alsoinadvisable because its handling by the farmers and eating ofthe produce from these farms pose serious health hazards.
A noconventional sewage treatment plant, much cheaperand compact than the conventional plants, is quite feasible.Raw sewage is led to a settling process where solids are separat-ed from liquid. The solids go to disgester to produce methanegas and digested solid. The methane gas is fed to gas turbine togenerate electrical power for running the factory as well as tosell the surplus to other consumers. The digested solid is soldas manure. The liquid from the settling process goes to biologi-cal aerator where more solids are produced and separated to befed to digester. The liquid or water from the biological aeratoris clean enough to be used for acquaculture where algae andfishes are grown. Algae is harvested as poultry feed and fishesare marketed. The water from aquaculture flows out as irriga-tion water. Thus, each sewage treatment plant functions as aresource recycling unit producing energy, manure, poultry feed,fish and irrigant. Hence efficient marketing of these productsis also conceived as an integral part of resource recycling unit.A conceptual model based on the treatment plant developed bythe National Botanical Research Institute, Lucknow, is present-ed in Figure 1.
Quality of Drinking Water
The desired level of contaminants in drinking water is givenin Annexure I. In most water supply schemes, no analyticalfacility is included as an integral part so as to ascertain themonitoring of quality. As such, as a special consideration the

OHIIO5f>imHlNAHKIMASS. -
6Rlh0tN6ANDf LtU MU
115*1 1ANK
HUlVHOLII
Fig. 1. Integrated Sewage Utilisatiya System.

National laboratories took up the water quality assessment inabout 2000 villages. The report of the systematic assessmentalong with recommendations were handed over to the localauthorities for taking steps for installation of treatment plantsfor respective sources of water including ponds and streams,dug well bore well hand pump and piped water supply. In someinstances where the land is in general over-irrigated withregular use of chemical fertilisers the piped water was found tocontain more than the desired level of dissolved salts.
Simple technologies like air oxidation, chemical precipita-tion and selective membrane separation can be used for removalof harmful contaminants which are often found in water. Butmaintenance of such units in rural areas where simple hand-pump maintenance is also difficult to achieve, pose certainproblem.
Several National laboratories with expertise in water qualityassessment and technologies for rendering water potable, havebeen assigned to take up intensive training programme forregional functionaries, in order to enable them to continue theseactivities for sustained supply of potable water. Suitable packa-ges for training, manpower, laboratory set up, operating manualfor treatment plants are being developed and supplied to allthe regional authorities in charge of water supply systems.
In brief, it can be stated that a massive programme forcollation and dissemination of technology on a nation widebasis has been taken up. An indicative list of various techno-logies and equipments involved is given in Annexure II.
Integrated S & T Activities
A summary of Scientific and Technical activities are listedin Table I.
Potable water testing kits are being developed in order tofacilitate standardisation of baseline data on quality of nationwide sources of water, as well as for water quality monitoring.
Improvement in design of check dams and rain water har-vesting system and storages are being carried out for reducing

89
the loss of rain water. Use of chemicals for surface evapora-tion control is also under consideration for this purpose. Onthe other hand, for combating the drought situations, scientificground water exploration with compulsory geoelectric soundingis being adopted to minimise unsuccessful drilling of bore wells.Tubewell maintenance is being improved to bring down thefailure rates from 30-40 per cent to less than 10 per cent byapplication of improved material and design as well as bettersystems of maintenance.
TABLE I
Summary of S & T Activities for Water Mission
Activity
2.
3.
4.
5.
6.
Water SamplesAnalysedNew SourcesFoundAwarenessGenerated
TechnologyDemonstrationFinalised
R&D ProjectsIdentifiedPersonsTrained
1986-87
1253
434Seminars
2Camps
2CSMCRI-5NEERM5SERC-10
30
16
243
1987-88
1500
1000Seminars
3Camps
5CSMCRI-10NEERI-25SERC-15
50
16
500
CSMCRI—Central Salt and Marine ChemicalsResearch Institute, Bhavnagar.
NEERI—National Environmental EngineeringResearch Institute, Nagpur.
SERC—Structural Engineering Research Centre,Ghaziabad.

90
As long term measures for preserving the qualitative andquantitative nature of water sheds, related water managementactivities in representative areas have been taken up. Thisincludes study of well behaviour, aquifer modelling, successfulrecharge and also ingress measurement through chemical hydro-logy. The main theme of all these activities remain to be theestablishment of cost effectiveness in sustained supply of pota-ble water. Preservation of water quality through environmentalactivities including sanitation and drainage, cultivation of waterpurifying herbs for biological control of contaminants, soilpreservation through afforestation and other established methodwill continue to be adopted wherever applicable.
The human resource management and systems managementprogrammes have been set up both with short term and longterm targets. It is highly encouraging to watch that the func-tionaries beneficiaries as well as the NGO's, all have a greatdeal of interest in learning and adopting the scientific approachwithin the framework of their individual role related to water.For bridging the gaps in information and resources implementa-tion of projects are being carried out by the scientific andadministrative authorities in close coordination with each other.

ANNEXUREISubstances and characteristic affecting the acceptability of water for domestic use
Substancesof characteristics
1
Substances effect-ing the colour,TCUSubstances caus-ing odoursSubstances alter-ing the tasteTurbidity JTU
Dissolved soHds
pH range
Total hardness
Undesirable effectthat may heproduced
2
Discolouration
Odours
Taste
GastrointestinalirritationGastrointestinalirritationTaste, corrosion,scale formationTaste, scaleformation
Highestdesirablelevel3
5 units
Unobjectionable
Unobjectionable
5 units
500mg/l
7.0 to 8.5
300 mg CaCO3/l
Maximum permis-sible level
4
25 units
Unobjectionable
Unobjectionable
25 units
1500 mg/1
6.5 to 9.0
600 mg CaCo3/l
(Contd.)

Annexure I (Contd.)
1
Calcium
Magnesium
Copper
Iron
Taste, scaleformationTaste, scale forma-tion gastrointestinalirritation in presenceof sulphates
Astringent taste,discolouration,corrosion ofpipes fittingsutensils.Astringent taste,discolouration,
75 mg Ca/1
Not more than50 mg/1 ifthere are SO4
if there is lesssulphatemagnesium up-to 100 mg/Mgmay be allowedat the rate of10 mg
0.5 mg Cu/1
0.1 mg Fe/I
200 mg Ca/1
100 mg/1200 mg/1 sulphate
1.5 mg Cu/1
1.0 mg Fe/1

Chloride
Sulphates
Nitrate
FluoridePhenolic compounds
Manganese
turbidity, depo-sits growth ofiron bacteria inpipes.Taste, corrosionin hot watersystemGastrointestinalirritation whencombined withmanganese ofsodiumDanger of infan-tile methaemogfo-binaemia, if thewater is consumedby infantsFluorosisTaste particularly
Astringent taste,discolouration,turbidity, depositsin pipes
200 mg Cl/1
200 mg SO4/I
20 mg/NO3/l
LOmgF/10.0001 mgphenol/10.1 mg/Mn/I
LOmgC/L
400 mg SOJL
1.5 mg F/l0.002 mg Phenol/1
0.5 mg Mn/1

WHO guidelines values for health related organic contaminantsContaminants Guideline value
(mg/litre)
Aldrin and dieldrin 0.03Benzene 10Benzo (a) pyrene 0.01Chlordane (Total isomers) 0.3Chloroform 302, 4-D 100DDT (total isomers) 1I, 2-DichIoroethane 101, 1-Dichloroethane 0.3HeptacMor and heptachlor epoxide 0.1Hexachlorobenzene 0.01gamma-BHC (HCH lindane) 3Methoxychlor 30Pentachlorphenol 102, 4, 6-trichlorophenoI 10
The guideline values for these substances were computed from a conservative, hypoth etical, mathema-tical model that cannot be experimentally verified and therefore, should be interpreted differently.Uncertainties involved are considerable and a variation of about two orders of magnitude {i.e. from0.1 to 10 times the number) could exist.

95
ANNEXURE II
List of Technologies
Desalination by Reverse Osmosis
Desalination by Electrodialysis
Mobile Reverse Osmosis Plants
Solar Electrodialysis
Solar Stills—Domestic and Community Uses
Defluoridation by Nalgonda Technique
Muscle Powered Defluoridation Plants
Domestic Iron Removal Unit
Handpump Unit for Iron Removal
Potchlorinator
Chlorine Table t and Ampoules
Water Filter Candle
Slow Sand Filtration Unit
Package Water Treatment Plants
Deep Well Hand Pump
Shallow Well Hand Pump
Wind Mill
Water Testing Kits
Chloroscope
Aluminium Strip Turbidity Meter

96
PH Meter
Earth Resistivity Meter
Bore Hole Logger
Bacteriological Analysis Kit
Ferrocement Water Storage Tanks
Digital Turbity Meter
Refraction Seismic Timer
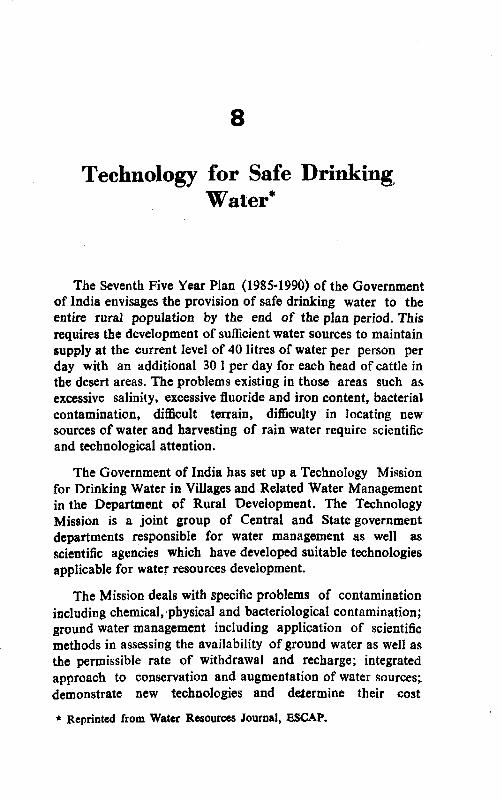
8
Technology for Safe DrinkingWater*
The Seventh Five Year Plan (1985-1990) of the Governmentof India envisages the provision of safe drinking water to theentire rural population by the end of the plan period. Thisrequires the development of sufficient water sources to maintainsupply at the current level of 40 litres of water per person perday with an additional 30 1 per day for each head of cattle inthe desert areas. The problems existing in those areas such as.excessive salinity, excessive fluoride and iron content, bacterialcontamination, difficult terrain, difficulty in locating newsources of water and harvesting of rain water require scientificand technological attention.
The Government of India has set up a Technology Missionfor Drinking Water in Villages and Related Water Managementin the Department of Rural Development. The TechnologyMission is a joint group of Central and State governmentdepartments responsible for water management as well asscientific agencies which have developed suitable technologiesapplicable for water resources development.
The Mission deals with specific problems of contaminationincluding chemical, physical and bacteriological contamination;ground water management including application of scientificmethods in assessing the availability of ground water as well asthe permissible rate of withdrawal and recharge; integratedapproach to conservation and augmentation of water sources;demonstrate new technologies and determine their cost
* Reprinted from Water Resources Journal, ESCAP.

98
effectiveness, and supervises the replication of those technolo-gies by the local authorities. The objectives of the Mission are:
—to provide safe water to 98,746 residual problem villagesby the end of 1990, the end of the International DrinkingWater Supply and Sanitation Decade. A problem villageis defined as a village with no source of water or a villagewith a water source of more than 1.6 kilometres away,15 meters depth, 100 meters elevation difference or withbiological or chemical contamination (guinea worm,cholera, typhoid, fluoride, brackishness, iron, etc);
—to supply 40 1 of water per person a day. This amount isincreased to 70 1 per day in the desert area —40 1 forman and 30 1 per bead of cattle;
—to evolve a cost effective technology mix to achieve theabove objectives within the specified Five-Year Planallocation; and
—to take conservation measures for a sustained watersupply.
The Council of Scientific and Industrial Research (CSIR),as the agency responsible for co-ordinating the scientific andtechnological inputs for various activities undertaken by theTechnology Mission has the following action plan (co-operatingagencies are indicated in parenthesis) :
1. To act as the nodal agency to control fluorosis and theremoval of excess iron (National EnvironmentalEngineering Research Institute—NEER1) and controlof brackishness (Central Salt and Marine ChemicalsResearch Institute—CSMCRI).
2. To provide training to the state government and volun-tary agencies' representatives in :
—geophsical exploration for ground water—(NationalGeophysical Research Institute^NGRI)

99
—water quality assessment (Industrial ToxicologyResearch Centre—ITRC/NEERI)
—operation of reverse osmosis and electrodialysisplant—(CSMCRI)
—defluoridation and iron removal—(NEERI)
—structures for rain water harvesting and storage—(Structural Engineering Research Centre—SERC,Ghaziabad).
3. To set up demonstration projects in selected minimissions in 55 districts with a view to evolve costeffective technology for sustained availability of water.The following aspects will be covered :
—scientific methods for source rinding;
—improvement of traditional methods for water collec-tion, storage and conservation;
—purification of water to potable quality;
—improvement of materials and designs of water supplysystems;
—Technology transfer for sustained supply of plant,machinery and spare parts; and
—research and development for innovative solutions.
CSIR technologies in water supply
An attempt has been made to use the various technologiesdeveloped by CSIR laboratories in the assessment of waterquality and water availability; treatment of water to free itfrom chemical, physical and bacteriological contaminants; andstorage and distribution of water. Drawings and designs alongwith a technology package have been developed for most of

100
the technologies many of which have also been manufacturedin India. Demonstration of the technologies for solving specificproblems have been carried out in mini missions in 55 districtsthroughout India. The list below provides in detail the techno-logies commissioned and tested by CSIR. For further informa-tion on each technology contact:
Water Mission Cell
Council of Scientific and Industrial ResearchAnusandhan Bhavvan, Ran* Marg,New Delhi-110001India
Technology transfer charges vary. However basis informa-tion is provided free.
Purification
1. Reverse osmosis (RO)—CSMCRI, Bhavnagar
(a) Community use
Service
Control of brackishness up to 6000 parts per million (ppm)of total dissolved solids (TDS).
Description
Brackish water is passed under a pressure of 400-600 poundsper square inch fpsi) through a spiral semi-permeable celluloseacetate membrane which is chemically coated. The membranerejects 85-90 per cent of dissolved salts. The output of waterranges from 300 to 400 litres/square meter (m2)/day. Plantswith capacity to produce upto 50,000 litres of water per daycost about Rs. 8 lakh each.
Operating data
Plant capacity — 10,000—50,000 litres/day ofproduct water

101
Plant cost — Rs. 18,000—Rs. 25,000 per 1000litres of product water dependingon installed capacity of plant andsalinity of feed water.
Cost of product — Rs. 6—Rs. 15 per 1000 litreswater depending on the capacity of the
plant and salinity of feed water.
Maintenance cost — 2 per cent of capital cost.
Power consumption — 5 kilowatt hour (Kwh) per 1000and cost litres.
(b) Mobile Unit
Service
Control of brackishness up to 6000 ppm of TDS in morethan one places.
Description
The small capacity plant fitted on passenger bus chassis canbe taken to problem villages for treating water on the spot.The unit costs about Rs. 4.5 lakh (1986), of which Rs. 3 lakhis the cost of the bus.
Operating data
Plant capacity : 10,000 litres/day.
Fuel required : Diesel oil
Manpower required : One driver and one helper
2. Electrodialysis (ED)—CSMCRI, Bhavnagar
Service
Control of brackishness up to 5000 ppm of TDS.

102
Description
Electrodialysis (ED) plant consists of stacks of cation andanion exchange membrane packed alternately between twoelectrodes. Brackish water is split into two streams and passedthrough the alternate chambers in the stack. On passing electriccurrent, the positive and negative ions travel towards oppositeelectrodes and thus the water become free from dissolved salts.Desalination process is continued by withdrawing salt freewater continuously from the system. Salinity of product wateris controlled by adjusting flow rate and current.
Operating data
Input Output
Capacity : 45,000 litres/day 30,000 litres/day
Total dissolved solids
solids: 5,000 ppm 1,000 ppm
Input voltage : 220 volts per pairof cell
Hardness: 200 ppm 40 ppm
Energy : One kwh for removing1 kilogram (kg) ofdissolved salts
Plant cost: Rs. 10,000—15,000 per 1,000 litres perday depending on installed capacity.
Cost of watertreatment: Rs. 3~Rs. 6 per 1,000 litres of product
water in salinity range of 3,000—5,000ppm TDS.
Maintenance cost: 2 per cent of capital cost of plant.

103
3. Solar stills—CSMCRI, Bhavnagar
(a) Community unit
Service
Removal of salinity (more than 10,000 ppm of TDS).
Description
Solar stills operate in batches. Stills are filled with rawwater to a depth of 10 centimetres (cms) with about 100 litresof water/m2 of evaporating area. When the level drops to 5 cm,brine is discharged and fresh raw water is fed. The averageoutput of still ranges from 2.0 to 3.0 litres/m2 of evaporatingarea per day. Solar stills are ideal for small and isolatedcommunities where water is saltish and power is scarce. Thetreated water is potable and can be used for analytical andbattery charging purposes. Construction materials for the solarstills are similar to those commonly used in building construc-tion.
Operating data
Input Output
Raw water with 10,000 ppm to Product water contains
35,000 ppm of TDS 40 ppm TDS
Feed temp, 20°—30°C. Temp of brine in still, 50°C.Pressure AtmosphericSource of energy : Solar
Plant cost: Rs. 1 lakh—Rs. 1.25 lakh per 1,000 litres ofproduct water
Product water cost : Rs. 15—Rs. 20 per 1,000 litres dependingon capacity.
(b) Household unit

104
Service
Removal of salinity, more than 10,000 ppm of TDS.
Technical features
Solar stills designed for household use provide output ofdesalinated water at the rate of about 2 to 3 l/m'/day. Invest-ment cost is about Rs. 120 per litre of product water.
4. Water Filter Candles—Central Glass and CeramicResearch Institute (CGCRI), Calcutta/Regional ResearchLaboratory (RRL), Jorhat.
(Household unit)
Service
Removal of Bacteriae.
Description
To remove suspended particles and bacteria from raw water,water is passed through filter candles fitted to domestic watercontainers, including earthen pitchers. One candle can meetdaily requirements of drinking water of an average family.A candle costs about Rs. 14. The life of a candle is about 2-3years.
Technical data
Input Output
pH : 6.5—8 6.5—8Conductivity : 1.6—3.75 1.6—3.75Turbidity : 0.64—2.74 Negligiblenephelometric turbidity unit
(NTU)
Bacteria coliform [Most Probable Number (MPN)]:Filtration rate 1—1.5 litres/hour

105
5. Low cost water filter. Central Food Technical Researchinstitute (CFTR1) Mysore.
Service
Removal of pesticides and contaminants.
Description
Raw water, contaminated with pesticides is passed throughfour clay pots of 20-40 litres capacity with perforated bottomand are placed one above the other on a wooden stand.
The second and third pot have an 8 cm thick adsorbentpack of specially processed carbon and an 8 cm thick layerof pure sand, respectively. Pure water free from pesticides andharmful microorganisms percolates though second and thirdpots and accumulates in the fourth container. Cost per litre oftreated water is about 0.3 paise. The above materials can treat400 litres of water.
6. Package water treatment plant—NEERI, Nagpur]
Service
Removes turbidity and other suspended impurities insurface waters.
Description
The package plants consists of simple innovative units forchemical coagulation sedimentation and filtration, all incorpo-rated in a compact system. By treatment of water in this plantit is possible to reduce turbidity from 4000 to 2 NTU. Thisprocess is particularly suitable for small communities. Theplant can be used for treating 3000—4000 litre/hour of water.
Specifications
Alum dosage — 7—200 milligrani (mg)/litrc

106
Power consumption — 1 kwh/1000 litres of treatedwater.
7. Water disinfection with chlorine tablets/ampoules—NEERI, Nagpur
(Household treatment)
Service
Removal of bacteria
Description
Safe water with a fixed range of chlorine, 2 mg/litre ofwater, can be obtained by disinfecting with chlorine tablets andampoules. The treated water is stirred and allowed to stand for30 minutes. A pack of 1000 tablets (2.5 gm each) cost Rs. 80;each tablet can disinfect about 250 litres of water. Tablets inother sizes are also available.
8. Double pot chlorination system for wells with 4000litres capacity—NEERI, Nagpur.
Service
Removal of bacteriae, virus and protozoa.
Description
It consists of two cylindrical pots—one inside the other. Theinner pot is fitted with a moist mixture of 1 kg of bleachingpowder, 2 kg of sand and is placed in the other. A hole of1 cm diameter is provided in the inner pot. A similar hole isto be made 3-4 cm above the bottom of the outer pot. Themouth of both the pots are tied with polythene sheets. Thechlorinator is left in a wire cage and lowered by rope in thewell below water surface for 2-3 weeks. The unit costs aboutRs. 30 (1986).

107
9. Single pot chlorinator system—NEERI, Nagpur(for wells of 9,000—13000 litres capacity)
Service
Removal of bacteriae, virus and'protozoa in drinking water.
Description
It censists of a plastic pot of 5-litre capacity with a coverfilled with gravel of 2,0—2.5 cm size to a height of 5 cm frombottom. A mixture of bleaching powder and coarse sand (I : 3by weight) is placed on the top of the gravel to about an equalheight. Two half centimetre diameter holes are made in thecover of the pot, which is placed in a wire-cage and hung atthe centre of the well to be disinfected. The position of pot isadjusted so that it remains submerged in water under a depthof about 1 metre. The chlorine from the bleaching powder inthe pot oozes out slowly and maintains a residual concentrationof about 0.5—0.2 mg per litre for 5 days (when the draw offrate of water from the well is about 1,2u0 litres per day).
Technical data
One pot costing about Rs. 40 (1986) is sufficient for a com-munity well (9,000—13000 litres capacity) where 900—1,300litres water are drawn per day. It gives adequate chlorinationfor 5—7 days. Residual chlorine in the water is negligible (0.5—0.2 mg/litre).
10. Slow sand filtration—NEERI, Nagpur(a) For small communities in rural areas
Service
Removal of impurities such as organic matter, diseasecarrying organisms and turbidity in surface water.
Description
Slow-sand filtration is most suitable for purifying polluted

108
surface waters for rural and small community water supplies.Surface water of turbidity level up to 20 NTU can be treatedby slow-sand fitters to produce a filtrate with turbidity of lessthan 1 NTU.
For 100 per cent safety, chlorination with bleaching powderis necessary. Treatment cost ranges from Re. 0.5—Re. 1 per1,000 litres of treated water. The process has several advan-tages :
— Improves simultaneously physical, chemical and bacte-riological quality of raw water.
- Provides a single-step treatment for surface waters oflow turbidity (20 NTU)
— Simple to construct, easy to operate and maintain.Hence it is manageable with local skill and resources.
— Operating cost is quite low, because it is based onlabour rather than energy or chemical inputs.
For surface waters of high turbidity a suitable pretreatmentstep such as an infiltration system, sedimentation tanks, hori-zontal flow roughing filtration etc. is necessary.
Raw water from the nearby river is drawn through aninfiltration gallery to reduce suspended impurities and thenfiltered through slow-sand filter to produce clean and safewater for drinking. The technology is most suited for popula-tions of up to 100,000. Its cost ranges from 50 paise to Re. 1.00per litre of water treated.
Operating data
Input Output
Capacity 57,000 litres/hour 57,000 litres/hour

109
Turb}dity-20NTU 1 NTU
Chemical oxygen demand—20 mg/ 3 mg/Jitrelitre
Dissolved solids—500 ppm 500 ppm
§b) Domestic Water Filter
Service
Removal of impurities in surface water.
Description
The unit consists of a 120-litre capacity steel or ferrocementdrum (40 cm diametre, 100 cm depth). It is filled with a layerof 0.7 mm—1.4 mm size coarse sand and 3 mm—6 mm sizegravel, each layer of 5 cm thick and overlaid by 40 cm of0.2 mm—0.3 mm size sand. The rate of filtration is slow andthe unit gives about 50 litres of purified water in 10-12 hours.
11. Defluoridation of Water—NEERI, Nagpur.
(a) Nalgonda technique(Community level)
Service
Removal of Fluoride
Description
The plant consists of flash mix unit, flocculator, settlingtank, rapid gravity sand filter and disinfection unit.
Alum, lime and bleaching powder in prescribed quantitiesarc added to water, followed by flocculation, sedimentation,and filtration. The defluoridated water is distributed throughpublic stand posts. The per capita cost of the plant to supply40 litres per head per day ranges from Rs. 40 for a population

noof 875 to Rs. 90 for a population of 1750 persons. The cost oftreatment varies from Rs. 1.3 to Rs. 1.6/1000 litres dependingupon the raw water quality.
Operating data
Input Output
Fluoride content 4 mg/litre 1 mg/litre
(b) Household techniques
Service
Removal of Fluoride
Description
Excess fluoride at household level can be removed byrepeating the Nalgonda process in a container of capacity20-50 litres wherein prescribed chemicals are added, stirred for10 minutes and allowed to settle for one hour.
Supernatant water is tapped for drinking purposes.
The cost of treatment depends only on cost of chemicalsused. For treating 1000 litres of water the cost is about 0,80paise.
11. Chloroscope — NEERI, Nagpur
Service
Estimation of residual chlorine in-drinking water.
Description
The instrument makes use of orthotoluidine dihydrochlo-ride reagent for development of colour with residual chlorinein water. The developed colour is visually matched with thestandard colour discs calibrated for residual chlorine level of0.1, 0 2, 0.5 and 1 mg/litre. Two glass sample tubes withmarking are placed at a specified level in the instrument and aglass dropper adding the reagent is also supplied.

I l l
12. Iron and manganese removal — NEERI, Nagpur"(a) Large unit of 400 litre/hour capacity
Service
Removal of iron and mgananese
Description
Iron (Fe) Manganese (Ma) in drinking water are identifiedby the reddish brown precipitate and metallic taste. Permissi-ble limits of Fe and Mn are 0.3 and 2.1 mg/litre respectively.NEERI's process for removal of soluble iron and maganeseinvolves aeration over a series of coke beds followed by sandfiltration. The process reduces the iron/manganese content inaffected water to a neglible and safe level. Fabrication cost ofplant without reinforced concrete cement/brick work isestimated at Rs. 50,000 (1986) for 400 litres/hour capacity.
Technical Data
Pump : Centrifugal multistage pump for a flow of 400litres/hour/head.
Aeration tank : 2x40 litres/hour aeration trays (three waterstorage tanks, capacity 1,600 litres each)
(b) Domestic Unit
Service
Removal of Iron and Manganese
Description
A domestic iron and manganese removal unit can be installed on wells with handpumps. A 200 litre/hour capacity unitwould cost about Rs.. 700 (1986).
Water Analysis
1. Water analysis kit

112
(a) Central Scientific Instrument Organization (CSIO),.Chandigarh.
Service
Assessment of chemical contaminants in water.
Description
The water analysis kit incorporates a pH meter, a dissolvedoxygen analyzer with an electronic thermometer and a conduc-tivity meter. All these units are designed in modular form toenable easy replacement of component parts and serviceability.In addition the kit has been designed to operate on availablebatteries so that it can be taken easily to the actual spotawhere measurements are to be carried out.
Specifications
— pH meterRangeAccuracyMillivolts
Temperature compensation
— dissolve oxygen analyserRangeAccuracy
Temperature compensation
— Conductivity bridgeRange
Accuracy
0-7; 7-14± 0.1 pH0 to 1000 mV, eitherpolarityManual 20° to 80°C
0.20 ppm oxygen+ 3% (with Winkler'smethod)Manual 0—50°C
IK, 10K 1000K and 1Mega ohms±2%
(b) Industrial Toxicology Research Centre, Lucknow
Service
Assessment of bacteriological contaminants in water.

113
Description
The water analysis kit consists of a small incubator forcarrying out bacteriological analysis and chlorometre used fordetermining chloride, nitrate and fluoride levels by standardmethods. The kit can run on generator or electricity mains..
A simple membrane filtration assembly comprising plexfglass filter holder with rubber washers held together bybutterfly screws, is attached to a syringe. The syringe filledwith the water to be tested is then slowly pushed through thefilter. The microbial content of test samples of water will bemeasured by MPN tests which is to be followed by colonycount of faecal and non faecal coliforms.
Specifications
Dimensions 20 X14 x 11 inches
Weights 20 kgs
Incubator 9 square inches
2. Turbidity meter-CSIO, Chandigarh
(a) Digital
Service
Determination of turbidity of drinking water.
Descripstion
The instrument incorporates, among other important circuitelements, a pre-amplifier, a linear amplifier, a precision AC/DCconverter and ADC digital display. The instrument is insensi-tive to any general white Jight background. A sensitive siliconphotodiode has been used of as a light sensor. The instrumentcan be used for estimating the efficiency of municipal watertreatment plants by measuring the turbidity of inflowing rawwater.

114
Specifications
The turbidity meter operates over a single range of 0 to1000 JTU (Jackson Turbidity Unit) with an accuracy of betterthan 2 per cent and a resolution of 1 JTU.
(b) Aluminium strip turbidity metre.
Service
Measurement of turbidity of surface water sources,
Description
A simple device called Aluminium Strip Turbidity Metre hasbeen designed and developed at CSIO to obtain approximatevalues of turbidity by simple visual inspection. The device actu-ally consists of an aluminium strip about 20 cms and has aplatinum needle attached with a screw to one end of the strip.A 1.5 metre non-wettable cloth tape is attached to the otherend of the strip which is immersed in water to a depth wherethe needle just disappearas visualJy. At this depth, the level ofwater on the tape is measured. This indicates the turbidity.The strip turbidity metre is a handy, inexpensive and extremelysimple device to measure the turbidity of water sources likerevers, canals, lakes, ponds, etc.
Supply and Water Storage
1. Ferrocement (FC) water storage tanks—StructuralEngineering Research Centre (SERC), Ghaziabad
Service
Storage of water
Description
Ferrocement is a highly versatile form of reinforced cementmortal, reinforced with closely packed layers of steel wire-meshes. It is possible to castferrocement elements with thick-ness as small as 10 mm Ferrocement possesses high resistance

115
to cracking and unlike steel structures has high corrosion re-sistance. It is an ideal material of constrution for water tanks.SERC Ghaziabad has developed two techniques for producingcylindrical ferrocement concrete tanks suitable for storingdrinking water. In the semi-mechanised process, ferrocementwalls are produced using a simple process equipment in whichthe steel wire-mesh layers are plastered with cement by hand instretched condition over a rotating mould. Tanks are assembledusing precast reinforced cement concrete base, ferrocement wall,roof and lid. In the second process, ferrocement segmental shellelements are cast in segments of a cylinder over masonary orwooden moulds. The cylindrical wall of the tanks are assembledusing these precast segments. Tanks from 200 to 20,000 litrecapacities can be constructed using the above two processes.Ferrocement tanks are lighter in weight than reinforced cementconcrete/masonary tanks and cost effective in comparison withplastic tank (33 per cent), steel tank (50 per cent) and rein-forced cement concrete (25 per cent). The casting skills can beeasily acquired by rural labourers and damage can be easilyrepaired at the site itself.
Specifications
Capacity 6000-2500 litres
Diameter 900-1200 mm
Thickness of wall 10 mm
Wire-mesh 240+1/2 for surfaces 3 mm wire ringfor top and bottom.
Plasticizing chemicals are added to mortar to make it im-pervious for water.
2. Rainwater harvesting system—SERC Ghaziabod
Service
Collection of drinking water.

116
Description
SERC, Ghaziabad has modified the traditional rain watercollection system for making it more safe and hygienic byintroducing the catchment, inflow and storage components. Aby pass system has been developed for removing wash out duringfirst rain. A filtering system has also been introduced alongwith strainers at various water entry points.
3. Windmill Samira—National Aeronautical Laboratory(NAL), Bangalore
Service
Lifting of water from shallow wells up to 7 metres depth.
Description
The windmill "SAMIRA" is designed to have a 7.5 metrerotor which comprises of 3 blades. The rotor drives a centri-fugal pump of 2 hp rating. It is superior in design due to rotarytransmission and nova! spoiler arrangement as against thefurling of the head used in conventional multivative designs.It costs about Rs. 25,000 and is at par with imported windmills at 2 hp rating in 25 km/hour wind speed.
Specifications
Starting wind speed 13 km/hour; peak output, 20,000 litres/hour in 25 km/hour winds.
4. Deep Well Hand Pump
Service
Pumping of ground water
Description
This pump can draw ground water from a depth of 30-40metres below ground level. It was primarily meant to segmentsafe drinking water facility in water scarce and drought strickenplaces. It is an improved design and adopted by UNICEF for

117
their water supply programme for the villages. The pumpincludes the following major components :
— pump head together with the handle and pump stand,
— riser main, the pipe that carries the water from thesource to the surface via cylinder valve assembly, and
— connecting rod which connects the piston in cylindervalve assembly to the handle.
Special features :
— elimination of costly non-ferrous parts,
— use of non-metallic parts to minimise corrosion,
— effort reducer incorporated for easy manual operation,and
— minimum cost of maintenance.
Sperifications
Depth
Overall height of the pump
Height from the ground level
Maximum stroke angle
Output
Spout (dia)
Leverage
Pump Head
Platform
50 m
1,457 mm
1,060 mm
40°
9-13 litres/minute
32 mm
1,070 mm
Fabricated
1.8 mm dia

118
Prospecting
1. D.C. Earth Resistivity Metre—NGRI, Hyderabad
Service
Data of earth resistivity and spontaneous polarisationpotential are needed in prospecting for water by the electricalmethod. Changes in electrical resistivity either in the verticalor lateral direction can be interpreted in terms of geology andmineralogy and natural earth potentials associated withsulphide mineralisation. This instrument is a combined resisti-vity and self-potential meter. It is useful for :
— locating probable aquifers
— determining depth to bed rock
— prospecting for conductive ore bodies e.g. metallicsulphides, graphite etc.
Working principle
The instrument incorporates rugged transistorised DCpotentiometer for voltage measurement across potential elec-trodes and an accurate current meter for measuring the DCexcitation current that is sent into the ground through currentelectrodes. From the knowledge of the electrodes separationand the voltage and current involved, it is possible to calculatethe value of apparent resistivity.
Specfiication
Potential 0—1.018 mV DC
Current transfer 10—2,000 A.D.C. in eightranges
Accuracy of measurement + 1%
Read Out Potential off two dials andcurrent off a meter
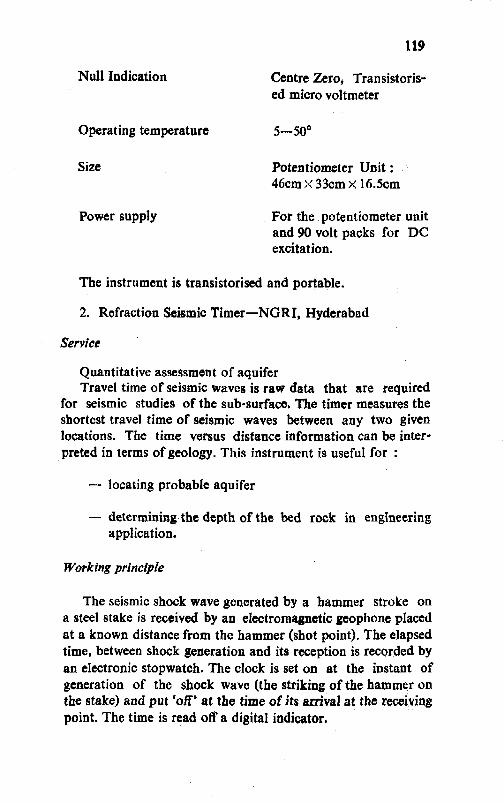
119
Null Indication Centre Zero, Transistoris-ed micro voltmeter
Operating temperature 5—50°
Size Potentiometer Unit:46cm x 33cm X 16.5cm
Power supply For the potentiometer unitand 90 volt packs for DCexcitation.
The instrument is transistorised and portable.
2. Refraction Seismic Timer—NGRI, Hyderabad
Service
Quantitative assessment of aquiferTravel time of seismic waves is raw data that are required
for seismic studies of the sub-surface. The timer measures theshortest travel time of seismic waves between any two givenlocations. The time versus distance information can be inter*preted in terms of geology. This instrument is useful for :
— locating probable aquifer
— determining the depth of the bed rock in engineeringapplication.
Working principle
The seismic shock wave generated by a hammer stroke ona steel stake is received by an electromagnetic geophone placedat a known distance from the hammer (shot point). The elapsedtime, between shock generation and its reception is recorded byan electronic stopwatch. The clock is set on at the instant ofgeneration of the shock wave (the striking of the hammer onthe stake) and put 'off' at the time of its arrival at the receivingpoint. The time is read off a digital indicator.

120
Specifications
Range of measurement
Accuracy of measurementRead out
999 milly/seconds withoutrecycling.
± 1 countDigital indication of athree digit count on asingle moving coil meter,obtained sequentially bypressing switches.
10-45°C
27.5cm X 28cm x 16cm
5.7 kg
Built in source of ] 2 voltsDC composed pack of 1.5volt flash light cells.
Electrodynamic geo-phone.Natural frequency : 4 HzSensitivity : 1 Volt cm/sec.Damping : Less thancritical.
The instrument is fully transistorised and portable.
3; Borehole Logger—NGRI, Hyderabad,
Service
Measurement of two electrical properties in the boreholapotential and resistivity can be used :
Operating temperature
Size
Weight
Power supply
Shock Sensor

121
— for stratiographic investigations in general and identi-fication/correlation of geological markers like faults,
— mineral prospecting,
— groundwater investigations.
Description
The system consists of a sonde (down hole electrodes)logging cable, winch, measuring sheave ground electrode, cablemotion sensing system depth indicator, strip chart recorder,square wave constant current generator and self potential andresistivity separation module. An inverter drives the chartrecorder and also supplies power to all other electronic circuits.The cable winch is capable of accommodating 1,000 feet (300metres) of four conductor cable.
The design differs from the conventional electrical loggingequipment. The recording chart paper drive is coupled to themotion of logging electrode electrically. A square wave constantcurrent is driven into the impedance between a surface referencepoint and the down hole electrode. The voltage across a secondreference point on the surface and the down hole electrode issampled a short while prior to every current switching. Thesamples are held separately during the positive and. negativehalf cycles. The sum of these held-values gives a voltage propor-tional to S.P. while the difference is a voltage proportional tothe resistance.
Specification
Integrated Circuits (ICS)
Digital(7 types)
Seven segment display Linear(35 types)

122
Transistors(9 types)
Diodes(3 types)
SCR's(3 types)
Proset Potentiometers(3 types)
Capacitors(14 types)

Training of Professional Engineersfor Multi Disciplinary Approachin Water Supply Management
The development and maintenance of water sourcesbeginwith the Satelite imagery for regional outlook, pin pointing ofsources by ground survey, assessment of aquifer to determinethe potential and nature of the sources, quality assessment,treatment, as well as the rational use pattern for avoidingpossibilities of imbalance or adverse environmental effects. AMission approach for solving the perennial problem of watershortage or lack of rational utilisation, include emphasis onproviding multi-disciplinary training and demonstration to theengineers concerned with various aspects of water supply. TheCouncil of Scientific and Industrial Research has organised fewsuch training programme over the last two years which havehelped in broadening the outlook of the water supply authori-ties, enabling them to look into the associated problems forexploitation of a particular source for a short-term objective.
The vastness of the problem cannot be handled by a singleorganisation and poses a need for multi-plier effect for dis-semination of knowledge through the persons trained at variouslevel.
Need of Training
Water occupies a very competitive position specially in anexpanding economy in a developing country like India. The

124
objective of water resources systems management is largelypolitical but can be described as a spectrum of goals :
To control or otherwise manage the fresh water resources ofthe cognizant geographic or political subdivision so as toprovide for protection against injurious consequences ofexcessess or deficiencies in quality.
To provide or maintain water in such places and times andin adequate quantity and quality for human or animal con-sumptions, wild life (including native plants), food produc-tion and processing, industrial production including energy,commerce and for the recreational, aesthetic and conserva-tion purposes.
Accomplish all these with a minimum cost of physical, eco-nomic and human resources.
It needs a multidisciplinary approach to keep in view all therelated aspects, when taking practical steps regarding waterresources management. The Water Resources Engineering isnot exclusively related to huge dams, reservoirs or long windingaquaducts as all water problems cannot or should not be solvedby such systems. Water Resources Planner should be in a posi-tion to give consideration to all the important alternativeswhich can be made available such as ground water development,weather modification, watershed management and water harvest-ing, desalination, waste water reclamation, economic alloca-tion or political allocation.
Economic analysis of water management system has toassign a special price on health recreational and other values.For industrial usage cost of water treatment in relation to theraw water quality can be easily calculated. Cost functions canbe developed to evaluate losses to a region by deterioration inits water quality with regard to industrial usage. The applica-tion of systems analysis methods can make it possible to takeinto account a large number of variables and determine theoptimum alternative.

125
These broad aspects need to be imbited in all training pro-gramme for Water Management.
Philosophy of Training
Since water is the forre-unner of development, all humanactivities pre-suppose the availability of sufficient and reliablesupplies of water of good quality. As such, training for waterdevelopment should be given a high priority rating in the allo-cations of national resources for development. This multidis-ciplinary dynamic subject matter include the following;
Both surface and ground water resources are to be deve-loped.
Investigations for the availability and location of watersources.
Assessment of water quantity and quality.
Planning and design of water treatment and supply projects.
Construction of water schemes.
Operation and maintenance of completed water supplyschemes.
The key technical skills involved are civil, electrical, mecha-nical, environmental and sanitary engineering. Scientific skillsare required in Chemistry, biology, hydrology, geology. Thesupport of general services in accounting, personnel and suppliesand the skills of economists, sociologists, demographers andsystems analysts are also required.
All these skills are required at various levels of specialisationi.e. professional, subprofessional, technician and craftsman. Itis important that skill levels be advanced on all fronts so thatprogress in one sphere is not negated by the liability of otherspheres to adapt their activities to changed conditions. Theneeds of organisations change as new technologies are applied.In this process, training must be a continuous activity lastingan entire career starting with induction, continue with on-the-

126
job instruction and should from time to time include specificallydesigned courses to meet increased responsibility for adaptationto new technologies,
A line about the cost of application of new technologiesmay be event to be mentioned here in relation to the accuredbenefit. Theoritically, this may be presented as in figure 1. The
100
111
10
10ID A.B=health states
a=expenditurexy=health level
attained
" Expenditure
Fig. 1. Hypothetical Relations between Village Health and Costs ofWater Supply Project.
actual per capita cost can be calculated and compared with percapita cost of health maintenance and productive man houravailability which are vital components in the development ofthe country.

127
Training Objectives and Staff Development for Drink-ing Water in Villages
The training objectives should reflect the basic establishedpolicy i.e. to provide the total rural population with potablewater. Such training should be geared towards learning theprinciples that will enhance the desired goal. The training ofengineers should satisfy the following broad objectives:
• At the end of the course, the trainees should be able toapply the principles related to water supply with theappropriate technology to suit a particular environment.
* They should be able to plan, manage and liaise with staffat the junior level and with the users for care and main-tenance of the water supply system.
The concept of applying principles learnt in one subject areato new situation implies that the subjects taught to technicalofficers should be broad in nature. The guidelines for appro-priate technology may be used as under :
The choice of technology should be one that would facilitatea significant improvement in the quantity of potable watersupply to villages.
The technology should be as low as possible in cost with-out jeopardizing the effectiveness of the improvementssought.
The technology should facilitate operation and maintenanceby users without demanding a high level of technical skill.
The technology should make as much use as possible oflocally available materials, there by decreasing reliance uponimported materials.
Where possible, the technology should encourage thegrowth of local manufacturing of necessary equipments andparts.
The technology should be compatible with local users,values, attitudes and preferences.

128
The technology should encourage and facilitate communityinvolvement and participation.
Suggested Curriculum for Various Levels of TrainingEngineer Level
Detection and maintenance of water sources. Water relateddiseases/water quality analysis. Social organisation and manage-ment economics and planning low cost sanitation methods asalternative to traditional sewage treatment. Updating of techno-logy through continuous research.
Total Water Management System.
Technician Level
Water hygiene and water borne diseasesPolitical Science.
General studies and management (for social, cultural andeconomic factors in the life of consumers).
Safety precautions during construction maintenance andoperation.
Technical Assistant Level (for individual area)
Drilling Drilling techniques, geological formations, admi-nistration.
Shallow Well siting, geological formations, well construc-wells tion, pump installation, community participation,
administration well hydraulic.
Pump Pump operations, full identification and repair,attendant preventive maintenance.
Gravity Fed Pumping, construction work, welding, water treat-schemes ment, community, organisation, hydraulics, map
reading, leveling tools.
Treatment Plumbing, mechanical work installation techniques,plants tools, welding and soldering.Electrician Installation of electric pumps, welding, plumbing,
tools, fault identification and repair.

129
Health aspects, simple water technology, commu-Qjficer nity development, extension a#d communication.
CSIR Training Programme Undertaken for WaterTechnology Mission
The Council of Scientific and Industrial Research has deve-loped specific expertise in various fields related to watermanagement. In 1986, CSIR entered into a Memorandum ofUnderstanding with Ministry of Agriculture for providing:.t»ining to the recommended personnel in CSIR technologies.A number of Training Programme organised by various nationallaboratories are listed in Table 1. These courses were based onthe experience of the laboratories in the respective fields andsubsequently enriched and modified with suggestions of theparticipants to make them more suitable for the field condi-tions. In general, each programme was formulated to demons-trate each technological method with introduction to the theore-tical principal involved.
Geophysical Exploration
Theory of geological formation and their magnetic proper-ties; instruments to be used for water exploration ; steps involv-ed in selection of region and in pin pointing the sources;practical demonstration of methods and instruments in locatingthe water sources by field survey.
Water Quality Assessment
Theory of water contaminants, their origin and effect onhealth is given t« ^participants to form the background. Theprinciple of analysis for each containments along with use ofequipment, reagents and procedure involved ; make and supp-lies of instruments and approximate cost; sampling procedureand instruction for storage and handling of samples; settingupend maintenance of modular laboratory for Water QualityAnalysis.
JRain Water H%rVe«tit>g
•Scope of harvesting of rain water as related to rain fall andother sources in the region ; Design and materials for appro-

130
priate structures ', Description properties and application offerrocement structures; selection of local material and construc-tion of F.C. Structures ; Development of local masons forcommercial services.
Treatment of Water (Desalination, DeBuoridation,Iron Removal)
Basic principle such as reaction, input/output conditions,critical considerations, cost and operational aspects were ex-plained briefly. The participants were helped to operate theseplants to note and handle each step themselves. Intensivequestion answer sessions and audiovisuals are provided in addi-tion to written course material to make the points reachhome.
The Effects of Training
There was an initial lukewarm response to the programmeand many States could not find appropriate persons to be nomi-nated for the training programmes which were designed for work-ing officials, with a duration of maximum 10 days (except thecourse on Geophysical exploration which has a duration of onemonth due to field survey and data interpretation being involv-ed). However, in successive programmes greater interest wasexpressed and in few cases the trained persons were engaged inimplementation of projects based on these technologies. How-ever, in a greater number of cases, trained persons were notutilised to cary out jobs based on the subject of training. ManyStates could not nominate participants due to lack of clarity onthe need of training for appropriate persons.
However, the programme helped on creating an interestawareness among all concerned about the need and ways forapplication of technology for various water supply system.Many States are forward with request for exclusive field demon-stration of selected technology in their premises which expedi-ted their activities in providing coverage to the problem areas.
The requirement of personnel to be trained in different

131
areas were sought from all States for the year 1988-89. A fewonly has responded so far, which are presented in Table 2.
This shows a large number of States still are indicisive withrespect to the training needs or have already got adequatelytrained personnel to perform the induction of new technologies.
For greater involvement, the central technical agencies areundertaking wider demonstration of technologies related tosource finding and development, quantity assessment and sett-ing up of treatment plants in association with the State Govern"meats on "doing together" basis.
An integrated approach for total water management includ-ing rense of water is being considered to be taken up in coope-ration with respective state authorities in selected states fordemonstrating the inter related aspects of management, controlana monitoring. This is essentially to carry out the integralaspects of the erstwhile training programme in the field along-with long term implication in sustained water supply. Theexperience and findings of the state authorities, backed by thescientific studies of the central agencies can bring out undisput-ed facts to specify the guidelines to bo adopted in supply andmaintenance of water for a region.

TABLE 1Techuology Mission on Safe Drinking Water in Villages Training Programme
by CSIR for 1986-87Course Title Organised
byOrganised
atDate Partici-
pantsStates/CV.A.)
to
1
Rain WaterHarvestingRain WaterHarvestingGeophysicalSurvey G.W.ExplorationGeophysicalSurvey G.W.ExplorationGeophysicalSurvey G.W.ExplorationDesalination,R.O.E.D.
SERC (G)
SERC (G)
NGRI (Hyd.)
NGRI (Hyd.)
NGRI (Hyd.)
SERC (G)
SERC (G)
NGRI (Hyd.)
NGRI (Hyd.)
NGRI (Hyd.)
Jan. 5, 87 (5 days) 16
Mar. 30, 87 (12 days) 14
Mar. 11, 87 (4 Weeks) 9
July 1, 87 (4 Weeks) 25
May-June, 88 (6 Weeks) 21
CSMCRI, Bhavnagar CSMCRI, Bhavnagar Mar. 17,87(1 Week) 19

DefluoridationQliy. AnlalysisWater and WasteWaterQlty. AnalysisWater and WasteWaterQlty. AnalysisWater and WasteWaterQlty. AnalysisWater and WasteWaterIron RemovalIron RemovalIron RemovalDefluoridation
DefluoridationDesalinationRO, EDDesalinationRO.ED
N EER I, Nagpu rITRC, Lucknpw
NEERI, Nagpur
NEERI, Nagpur
RRL {JT.)
NEERI, NagpurNEERI, NagpurNEERI, NagpurNEERI, Nagpur
NEERI, NagpurCSMCRI,BhavnagarCSMCRI,Bhavnagar
AMRELI.UujaratITRC, Lucknqw
NEERI, Nagpur
NEERI, Nagpur
RRL (JT.)
AgartalaGangtok, SikkimMirzapur, UPMehasana,GujaratPalakudoddi, APCSMCRI
CSMCRI
ApnUM,JB/U week)May 18, (10 Days)
June 9, 87 (16 Days)
July 6, 87 (5 Days)
Jan. 88
July 14, 87 (5 Days)Oct. 7, 87 (5 Days)Nov. 7, 87 (3 Days)Dec. 87 <4 Days)
Dec. 87 (2 Days)Oct. 12, 87 (5 Days)
Feb. 24, 88 (3 Days)
is40
40
35
9
45321822
797
6
(Contd.)

Table 1 (Contd.)
1
Rain Water
Rain WaterHarvestingRain WaterHarvestingQuality AnalysisWater and WasteWaterQuality AnalysisWater and WasteWaterQuality AnalysisWater and WasteWaterQuality AnalysisWater and WasteWaterQuality AnalysisWater and WasteWater
Total
2
SERC (G)
SERC (G)
SERC (G)
NEERI (Nagpur)
NEERI (Nagpur)
NEERI (Nagpur)
NEERI (Nagpur)
NEERI (Nagpur)
3
Manipur
SERC (G)
Bhopal
NEERI (Nagpur)
NEERI (Nagpur)
NEERI (Nagpur)
NEERI (Nagpur)
NEERI (Nagpur)
4
Nov. 9, 87 (22 Days)
Oct. 28, 87 (10 Days)
Jan. 11, 88 (6 Days)
Sept. 87 (2 Days)
Nov. 87 (5 Days)
Nov. 87 (2 Days)
Jan. 88 (2 Days)
March 88 (2 Days)
5
26
11
40
20
22
21
22
20
647

TABLE 2Exploration Assessment of Ground Water Resources
State
MaharashtraMeghalayaManipurGujaratMadhya PradeshKashmirWest BengalSikkimJammuLakshdeepTamilnadu
Total
No. ofDistricts
2908
19458
16461
18
154
No.of Hydro-geologistAvailable
26100
191000000
75
365
No.of Geo-PhysistsAvaila-
ble
900
130000000
22
No. ofTeamsPropos-ed/to beOrgani-
sed
928
49256
181700
125
Persons inService
2C003
20103
26000
50
322
PersonsReq.(Fresh)M.Sc./B.E.
022
1103
721700
98
Techni-cians Req.B.Sc./Dipin Engg.
302420
12542
1400
120 Lh

Water Quality Testing (WQT)
State
MaharashtraMeghalayaGujaratManipurMadhya PradeshKashmirWest BengalSikkimJammuLakashdeepTamil Nadu
Total
No. ofDistricts
290198
108
16460
20
120
ExistingLabs.for WQT
270310000005
37
IdentifiedProblemVillages
04727
142881749
03178
25243440
339810 •
963
53996
AdditionalLabs. Re-
quiredFuIIfledge
613008
181
696
58
Mobile
61381
14IS
12100
73
Qualifiedand
Trainedpersonsin WQT
00
20290
26000
24
81
Addi-tionalpersonsto beTrained
294
1721336490
566
912
350

Water Treatment
States
I
Maharashtra
MeghalayaGujarat
Madhya Pradesh
LakshadweepJamtnuSikkim
West Bengal
Kashmir
No. ofdistricts
2
0
07
00
64
16
8
No. of treat-ment plants
alreadyset up
3
0
2 Iron7 DES, IDEF
0
Q0
180 DISIN120 IR, 249DISIN
0
No. of treat-ment plantsto be setup
4
2RO
03 DEF, 13DES9RO9RO
30 DISIN1990 DISIN251 IR, 8 DES
0
No. ofpersonsalreadytrained
5
004 DEF, 3DES00
0036 IR, 2DES, 24DISIN
0
No. of persons tobe trained
6
4 DEF, 4 DES
10 Iron9 DEF, 26 DES
09 DES
30 DISIN440 DISIN118 IR, 3 DES, 58DISIN
0
(Contd.)

Table 2 (Contd.)00
1
Manipur
Tamil Nadu 3 DES RO,DES RO,DES ED
2 IR, 1 DEF, 8 IRON, 2 DEF,1 DES, 10 10 DISINDISIN
3 0
Total 52
DES=Desalination DISIN=Disinfection DEF=Deft Uoridation IR=Iron Removal

10
Support Services from InternationalAgencies
Among the international agencies, many of the constituentbodies of United Nations such as UNESCO, WHO, UNICEFhave extended great deal of assistance in Resource Survey,Research Training and Educational Programme and specificexploratory studies on assessment of the nature of resourcesand special problem areas. UNDP assistance have been provid-ed for creation of infrastructure for aquisition of hydrologtcaldata and study centres including National Institute of Hydro-logy. UNICEF spends about $70 m for water supply andsanitation annually for all countries.
World Meteorological Organisation and World Bank haveassisted in setting up of meteorological studies and irrigationprojects respectively. In addition, a number of policy papershave been prepared by such agencies for guiding the utilisationof water resources in India, with a satisfactory degree of opti-misation. Experts services have been made available by WHO,UNICEF, UNDP for providing alternative solutions forregional problems and setting up of information net work.
Apart from United Nations, a number of individualcountries have taken keen interest in development of the waterresources of India. Development agencies in Sewden, Denmark,FRG, UK and other European countries have participated inprojects of hydrological studies in difficult terrains and under-ground water flow characterstics. In addition, a large number

140
of ground water mining and distribution projects are alsosupported including supply of rigs. The total assistance wouldrun into thousands of crores of rupees in terms of capital.
The International Decade of Drinking Water Supply andsanitation has aroused great degree of awareness about propercare to be taken in consumption and maintenance of water. Asuitable emphasis on conversion of bad water into good watermay help in restoration of natural system wherever it hasbecome harmful for the local environment.

Bibliography
Approaches and Methodologies for Development of GroundWater Resources—Proceedings of Indo German Workshop(1975) National Ghophysical Research Institute, Hyderabad.
Water Purification : Trends in Membrane Technology—Waterand Waste Treatment CSMCRI, Bhavnager March, 1989
State of Art Report on Reverse Osmosis and ultrafiltration—Central Salt and Marine Chemicals, Research Institute,Bhavnager, December, 1988
Principles of Electrodialysis and the State of Art of theTechnology for Water Desalination, Central Salt andMarine Chemicals Research Institute, Bhavnager, December,1988
Silver Jubilee Commemoration Volume, National Environ-mental Engineering Research Institute, Nagpur, 1985
Seventh Five Year Plan, Govt. of IndiaSignificant Achievements—Council of Scientific & Industrial
Research, Rafi Marg, New Delhi, 1986-87Water Analysis Manual—Industrial Toxicology Research Centre,
Lucknow, 1987Water Shed Based Farming Systems in Hilly Regions—Singh,
J. Agric. Engg. 1986, 23 (4), 318-22Official Documents of the National Technology Mission, Govt.
of IndiaWenner Resistivity Data Interpretation a comparative study—
Sharma K. K. et. al. Bull. Pure. appl. Sci-Sec F 1985,4(1-2), 17-19
Theory and applications of nonlinear programming to waterresources system—Jain S.K., J. Instn of Engrs India-Pt Cl1987, 67(6), 330-4
Derivation of average unit hydrograph using smooth leastsquare technique—Singh B.D., J.Instn of Engrs, India-PtCl 1987, 67(6), 347-52

142
Brief appraisal of severe rainstorms of Madhya Pradesh regionfor the optimum development of its water resources—DharON, Mandal B.N., Mulye S.S. Indian J. Pur Riv. Vail. Dev.1987, 37(3-4), 81-93
Water Management in Drought Prone Areas—Chitle M.A.,Bhagirath 1986, 33(4), 161-8
Simple method of forecasting Water Treatment Plant Costs—Alagarsamy SR, Gopalakrishnan AN J. Indian Water WksAssn. 1987, 19(11), 1-7
Indian Science Congress (1989) presentationWork Shop Proceedings of National Drinking Water MissionGuidelines for Drinking Water Quality—World Health Organi-
sationAnnual Report 1988—UNICEFOur Common Future, World Commission on Environment and
Development—1987Law, Science and Development—Proceeding of Conference,
March 1985Push—Vol. I & II ; Transmission—Vol. I & IITreatment of Drinking water for Organic Containments-
Proceeding of Second National Conference, Canada 1986

(Continued on back flap)
their thinking process and related considera-tions. The voluntary agencies and othersengaged in supply of water will find it handyfor reference with respect to the problemswhich may be faced in their work. The .usersof water also can find at one place what theyshould get and how. Last but not the least, thescientists may also be inspired for achievingbetter solutions then those available today,
Shubra Chakravarty is Post Graduate Chemi-cal Engineer with varied experience in Transferof Technology and handled the wide range oflab to land programme in various sector ofIndustry. After Graduation and Post GraduateResearch in Chemical Engineering at JadapurUniversity. Calcutta. She started professionalcarrier as lecturer in M.S. University of Baroda,but soon joined Council of Scientific & Indus-trial Research at its headquarters in Delhi.She also worked in Department of Chemicalsand Department of Science and Technology,Government of India. She has over 40 publi-tions and presented technical papers innational and international symposium.
Since the last few years the emphasis of herwork has been on the Technology for thepeople in accordance with the National Policy.She has participated in and studied a numberof programme where Indegenous technologieshave been successfully demonstrated insolving the perennial problems of people atthe village level. The analysis and explanationof the methodologies will help the local bodiesand workers in selecting the appropriatecourse of action resulting in long impact onstate of society and economy.
The views expressed in this book entirelythose of the author and not necessarily thoseof the CSIR.

OTHER PUBLICATIONS
Use of Microprocessors in Information Analysisand Library Applications
Dr. S. Nagarajan 175
On Line Informations Processing throughMini & Micro Computers
Dr. S. Nagarajan & H.C. Jain 175
The Roster of Information Scientists in IndiaSociety for Information Science, New Delhi 250
Scientific Communications/Bibliometrics/Informetrics
Dr. I.N. Sengupta and Dr. S. Nagarajan 195
Fuel From Wastes and weedsP D Tyagi 175
BATRA BOOK SERVICE1/5, Bhagat Singh Lane, Gole Market
',4 New Delhi-110001 (India)Phone : 310129-350417