RID 7 6 - IRC Wash
251
, • •-**- R I D 7 6 INFORMAL COLLOQUIUM ON THE ANALYSIS OF ORGANIC MICROPOLLUTANTS IN WATER \ Organized by the National Institute for Water Supply in cooperation with the W.H.O. International Reference Centre for Community Water Supply at Damsigt Building, Nieuwe Havenstraat 6, Voorburg, The Netherlands.
-
Upload
khangminh22 -
Category
Documents
-
view
2 -
download
0
Transcript of RID 7 6 - IRC Wash
, • • - * * -
R I D 7 6
INFORMAL COLLOQUIUM ON THE ANALYSIS OF
ORGANIC MICROPOLLUTANTS IN WATER
\
Organized by the National Institute for Water Supply incooperation with the W.H.O. International Reference Centrefor Community Water Supply at Damsigt Building, NieuweHavenstraat 6, Voorburg, The Netherlands.
INFORMAL COLLOQUIUM ON THE ANALYSIS OF
ORGANIC MICROPOLLUTANTS IN WATER
Organized by the National Institute for Water Supply incooperation with the W.H.O. International Reference Centrefor Community Water Supply at Damsigt Building, NieuweHavenstraat 6, Voorburg, The Netherlands.
Wednesday, February the 18th 1976.
GC/MS analyses of organic compounds in domestic waste waterDr. A.W. Garrison, U.S. Environmental Protection Agency, Athens(presently consultant with I.R.C.).
Identification of the cause of odour nuisance in the neighbourhoodof an industrial waste water siteDrs. C.T.H. Morra, National Institute for Water Supply, Voorburg
Organic micropollutants in the rivers Rhine and MeuseDrs. W. van de Meent, K.I.W.A., Rijswijk
Considerations on precursors and formation of haloforms in waterDrs. J.J. Rook, Rotterdam Water Works, Rotterdam
Organic constituants of water, analysis by capillary gaschromatographyDr. W. Giger, EAWAG, Diibendorf, Switzerland
The analysis of volatile organic compounds at different steps ofdrinking water processesDr. L. Stieglitz, Nuclear Research Centre, Karlsruhe
Drinking water contamination in The Netherlands, Methods,preliminary results and future programsIr. B.C.J. Zoeteman, G.J. Piet, National Institute for Water Supply,Voorburg
Qualitative and quantitative methods for the analysis of organicsin surface waterDr. J. Freudenthal, National Institute for Public Health,Bilthoven, The Netherlands
Identification of organic compounds in drinking water fromthirteen U.S. citiesDr. A.W. Garrison, U.S. Environmental Protection Agency, Athens
GC-M3 Analysis of Organic
Compounds in Domestic Wastewaters
by
A. W. Garrison, J. D. Pope and F. R. Allen
U.S. Environmental Protection Agency
Environmental Research Laboratory
College Station Road
Athens, GA 30601

INTRODUCTION
In 1971 this laboratory began a program to identify
extractable, volatile organic compounds in domestic
wastewaters. Objectives were to develop analytical
techniques for such analyses, to identify compounds being
discharged into surface waters after secondary or advanced
treatment, and to provide specific compound data that will
help to determine waste treatment effectiveness. Knowledge
of the specific compounds discharged is needed to study
• health effects of pollutants, to help determine the sources
of compounds found in drinking water surveys!, and to
~establi~sh~~effluent guidelines. Finally, some parts of the
world are concerned about the possible need to renovate
domestic wastewater for human consumption2'3, and the
identification of hazardous compounds in such wastewaters is
imperative for safe renovation.
Most previous studies of raw and treated sewage have
been mainly non-specific characterizations of particulate
and soluble fractions*-?. Organics were assigned to groups
such as amino acids, carbohydrates, lipids, acids, proteins.
were identified, in the past few years, with the increasing
concern over trace organics in all types of water, and with
the availability of adequate analytical tools, more
investigators are identifying and quantifying specific
soluble organics in municipal effluents. Work in Israel8
resulted in the identification by combined gas
chromatography-mass spectrometry (GC-MS) of several fatty
acids and aliphatic and aromatic hydrocarbons. Considerable
work of this nature has been conducted in the United
Kingdom*/«; specific optical brighteners, amino acids,
carbohydrates, steroids, pesticides, and phthalates were
identified. Earlier work of a less comprehensive nature
resulted in the identification of volatile acids*o and
polycyclic aromatic hydrocarbons11.
More recently, Burlingt&a*** began to use high
resolution GC-MS to analyze mixtures of organics extracted
from treated municipal effluents, and has identified several
specific compounds. Dunlap1^ is using accumulator columns
for extraction and both electron impact and chemical
ionization GC-MS to identify organics contributed to ground
water by municipal solid wastes and septic tank effluents.
Glaze1* has identified more than 4 0 chlorinated compounds
produced during wastewater chlorination. In work closely
related to that reported here, Giger15, in Switzerland, is
using capillary column gas chromatography (GC) and GC-MS toi *
separate and identify compounds in municipal wastewaters;
several aliphatic and aromatic hydrocarbons, chlorinated
compounds, and alcohols have been identified.
It is generally agreed that the bulk of organic
material—over 7556 in most waters--is non-extractable, non-
volatile, and mostly non-gas chromatographable. Municipal
wastewaters are no exception6; but a group in the USA has
made significant progress in identifying these materials,
including those produced by chlorination, after separation
by high pressure liquid chromatography16-*8.
Since the principal objective of our research was to
identify extractable, volatile organics in representative
raw and treated domestic wastewaters, the EPA* s Advanced
Waste Treatment Research Laboratory (AWTRL) .at the Taft
Center in Cincinnati was selected as the main sample source.
Their pilot scale waste treatment plants have no industrial
input, and their operation is well controlled and
documented.
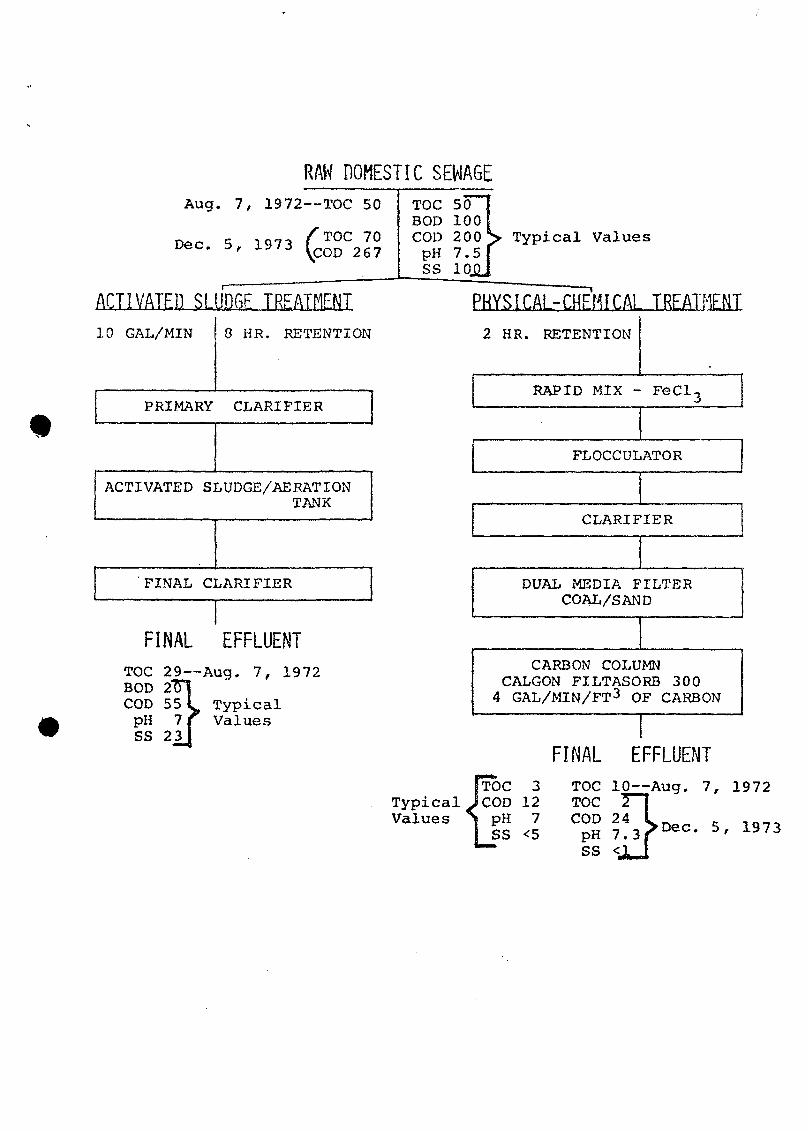
The activated sludge and physical-chemical pilot '
treatment plants take raw sewage from a common residential
line (Figure 1) . The activated sludge plant is a typical
*
biological treatment process depending upon bacterial action
for most of the organics removal; the physical-chemical
system relies mostly on removal of organics by carbon
adsorption. Values for total pollution parameters (Figure
1) are highly variable, especially those for the raw sewage,
mostly due to fluctuations in dilution of the organics by
relatively unpolluted water. Since the pilot plants are
enclosed within the AWTRL laboratory, the temperature varies
little from day to day, but the averages does range from
12°C in winter to 20°C in summer.
Later, samples from the Blue Plains sewage treatment
plant at Washington, D.C., were included in this project at
the request of the Blue Plains plant manager. The EPA has a
small research project at this plant where raw sewage is
lime-clarified. Samples were collected, chlorinated, and
extracted by Blue Plains personnel before being shipped to
ERL-Athens for analysis.
u
EXPERIMENTAL
Sampling
Fifteen to twenty liter samples of raw sewage,
activated sludge effluent, and physical-chemical effluent
were collected in August 1972 and December 1973. In August
1972, three grab samples were collected at intervals
corresponding to the retention time of each treatment
system. Samples were collected in glass containers,
adjusted to pH 4-5 with HCl as a preservative, and stored
for one to three days at 4°C before extraction.
In December 1973, composite samples were collected at
each sample point for 3.5 days while the glass sample
containers were in a refrigerator at 4°c. Portions of each
composite were transfered to polyethylene containers, frozen
and stored for about two weeks until extraction.
Extraction and Fractionation
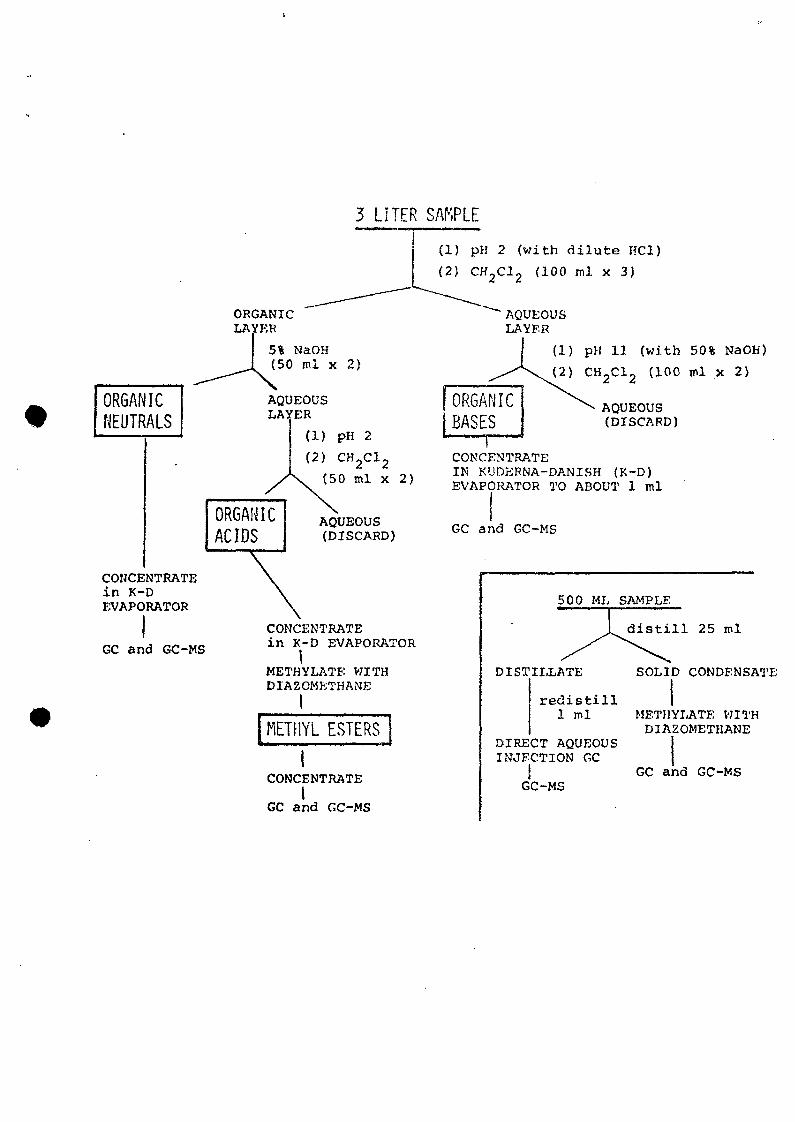
Samples were extracted manually in 3-liter batches
using a liquid/liquid extraction scheme designed to separate
sample components into acid, basic, and neutral fractions
(Figure 2). Pesticide grade methylene chloride was the
extractant. All water used for reagents (HCl and NaOH
solutions) was distilled and pre-extracted with methylene
chloride. Before final evaporation, sample extracts were
dried by passing through sodium sulfate that had been heated
in a muffle furnace at 600°C for 2 hrs. A gentle stream of
nitrogen was used for final evaporation of extracts to a
known volume of appropriate concentration for GC analyses.
Extracts were combined with those from other 3-1 batches and
stored in glass vials with teflon lined septa at 4°C. The
acid fractions were methylated with diazomethane in the
presence of methanol*9. A control was prepared for each
sample set by taking appropriate amounts of solvents and
reagents through the above extraction scheme.
One raw sewage sample was extracted into weak and
strong acid fractions in addition to the usual extraction
scheme. The first organic layer (Figure 2) was extracted
with 5% sodium bicarbonate to extract strong acids, then
with 5% sodium hydroxide for weak acids. Each extract was
acidified, re-extracted with methylene chloride, and
methylated (Figure 2). This fractionation was discontinued
because only two compounds, phenols of very low
concentration (<1 ppb) , were recovered in the weak acid
fraction.
Five hundred milliliter portions of some samples were
distilled (Figure 2) by directly heating, using a water-
cooled condenser. The first 25 ml of distillate was
collected and re-distilled to collect the first 1 ml.
During distillation of the raw sewage, several milligrams of
waxy white material collected in the condenser. This was
dissolved in methylene chloride, and methylated with
diazomethane.
Chlorination
#
Lime-clarified raw sewage from the EPA-DC Blue Plains
pilot plant in Washington, DC, was chlorinated and extracted
at that facility. Chlorination was by addition of a sodium
hypochlorite solution of such a pH that the final pH of the
sample at "breakpoint chlorination" was between 7 and 7.5.
The residual free chlorine in the sample was 3-5 mg/1. The
chlorinated sample was allowed to stand for about 30 minutes
before extraction. Extraction followed essentially the same
procedure used at ERL-Athens (Figure 2) . The extracts were
delivered to ERL-Athens for final concentration,
methylation, and analysis.
1

Ozonolysis
About 10 yl of the methylene chloride solution of the
raw sewage acid fraction, previously esterified with
diazomethane, was added with 2 ml of MeOH to the sample tube
of an apparatus constructed after the design of Beroza20.
After adjusting the oxygen flow to approximately 10 ml/min,
the cold bath was brought into place, and o»onation began.
At 2 min, the indicator solution detected excess ozone, but
the generation continued for another 30 3ec. After the
system was flushed with nitrogen, 0.5 ml of dimethyl sulfide
was added to the sample tube to reduce the ozonides. To
insure complete reaction, the sample tube was left in the
cold bath for 5 min, then placed in an ethanol/ice bath for
1 hr. Upon removal from this bath, the sample was shaken
for 5 min, and the volume adjusted for GC analysis by gentle
evaporation with a nitrogen stream.
Gas Chromatography
All extracts were analyzed by GC. Typical conditions
were:
GC: Varian 1400, Perkin Elmer 990 or Tracor MT220
Column: 6 ft x 1/8 in i.d. (1/4 in o.d.) glass
Packing: 3% SE-3 0 on 80/100 mesh Gas Chrom. Q.
Program: 50° for 2 min, then to 250c> at 5°/min.
Carrier gas: helium at 50 cc/min.
Sample size: 2 yl
Detector: flame ionization
Some extracts were analyzed on a 3% SP-2100 column using
similar GC conditions. This liquid phase is very similar to
SE-30, but has a higher temperature limit. However, SP-2100
appeared to cause more tailing of early eluting peaks.
Aqueous distillates were analyzed by direct injection
of 1 to 10 yl into a 10% FFAP GC column. (Temp, program:
150° for 2 man, then to 180° at 4°/min. Gas flow: 21
cc/min. Column: 6 ft x 1/4 in glass).
Other Instrumentation
A Finnigan 1015 mass spectrometer interfaced via a
Gohlke separator to a modified Varian 1400 GC was used for
GC-MS analysis**. A System Industries System 150 interfaced
the GC-MS to a Digital Equipment Corp. PDP8/e computer for
data acquisition, storage, and manipulation. Ionizing
voltage was 70 eV.
Some low resolution GC-MS work was done on a Varian MAT
CH5/DF system interfaced to a Varian 2740 GC via a Watson-
Biemann separator and to a Varian MAT SS-100 Data System.
This instrument was also used at a resolution of about 5000
for determination of possible empirical formulae of the
major mass spectral peaks of some unknown biodegradation
products in the activated sludge effluent.
The GC conditions for GC-MS analyses were similar to
those used for GC analyses described previously.
Chemical ionization mass spectrometry was performed on
selected extracts with a separate computerized Finnigan 1015
mass spectrometer interfaced to a Finnigan 9500 GC using
methane as a carrier/reactant gas.
Combination gas chromatograph-infrared spectroscopy
instrumentation was a computerized Digilab FTS-14D/IR
Fourier transform spectrophotometer equipped with the
Digilab GC/IR accessory and interfaced to a Perkin-Elmer 990
GC22. This instrument was used to confirm the presence of
the clofibrate metabolite in the acid fraction of the
activated sludge effluent collected in December 1973.
to

After tentative identification of pollutants by GC-MS,
a Perkin-Elmer PEP-1 Data System, interfaced to a Varian
14 00 GC operated under the conditions described above, was
used for computerized quantitation and retention time
measurements.
Identification of Compounds
Sample mass spectra stored on disks from the Finnigan
GC-MS runs were compared via acousticoupler connection with
standard spectra in the EPA-Battelle computer files at
Battelle (Columbus). Sample mass spectra were also compared
through a computer terminal and acousticoupler with standard
spectra in the NIH Mass Spectral Search System in Bethesda,i
Maryland. Later a combination of these two search systems
was used--the Mass Spectral Search System, handled by the
Cyphernetics Corp., Ann Arbor, Michigan, This system
contains about 4 0,000 reference mass spectra23.
These computer-based searches were supplemented by
manual searches of the Aldermaston Eight Peak Index of Mass
Spectra^4. Two publications were particularly helpful in
interpreting the mass spectra of long-chain acids", 26 r and
the clofibrate metabolite was first identified by matching
its spectrum in the Archives of Mass Spectral Data27.
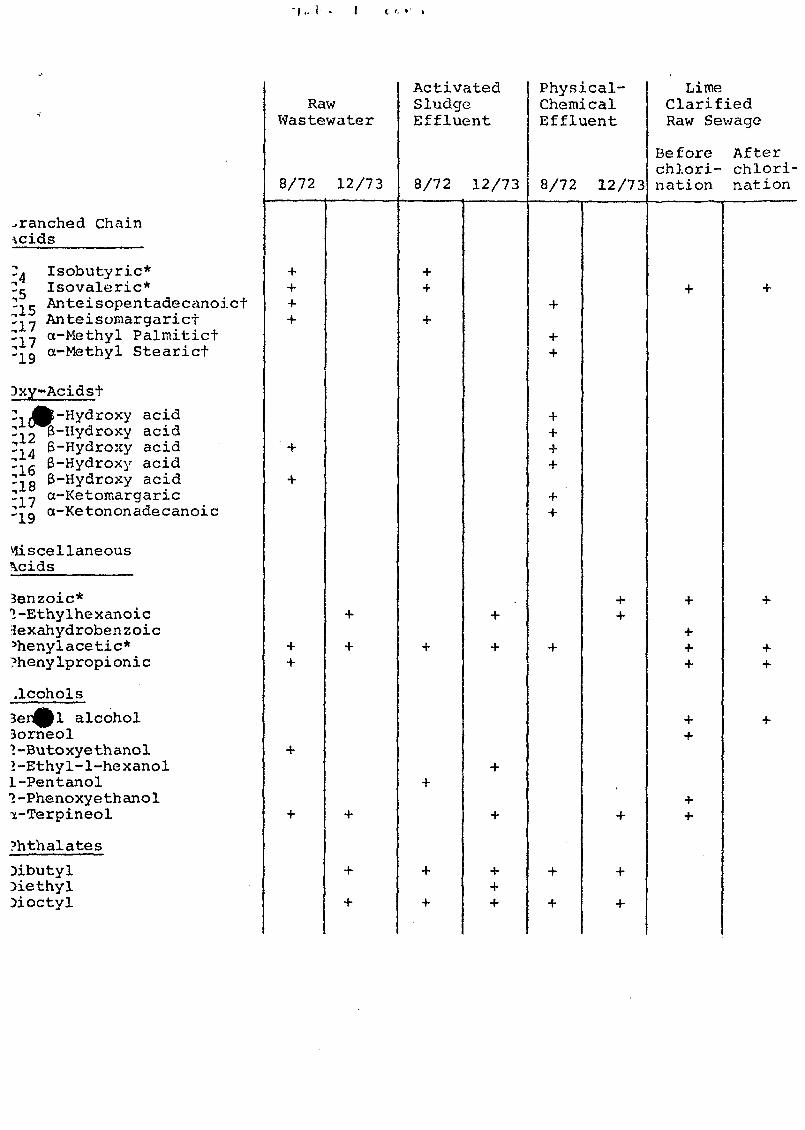
Many compound identifications were confirmed (Table 1)
by matching their GC retention times and mass spectra with
those of standards. Standards of most of the acids were
obtained in kit form from Applied Science Laboratories,
Inc., State College, PA, or Supelco' Inc. , Bellefonte, PA.
RESULTS AND DISCUSSION
Raw Sewage Components
Total Methylene Chloride Extractables
Figure 3 shows the FID/GC peaks observed in all
fractions of the methylene chloride extract of raw sewage
collected from the AWTRL in December 1973. The acid and
neutral fractions contained about the same amounts of gas
chromatographable organic compounds, but the basic fraction
contained much less. The methylated acid fraction produced
a chromatogram that was typical of this fraction in all
samples, even after treatment. Palmitic (C ) , stearic16
(C.o), and oleic (C- ) acids predominated; the even-numberedlo lo
straight chain acids and palmitoleic acid (Cr^) were at16
intermediate concentrations; and the odd-numbered straight
I • ? .
chain acids, branched chain acids, and miscellaneous acids
were at lower concentrations (see Figure 4-8 for other
compounds in acidic fractions).
Caffeine and nicotine produced the predominant peaks in
the basic fraction chromatograms; no other components have
yet been identified. Caffeine, ct-terpineol, and several
aliphatic and aromatic hydrocarbons were found in the
neutral fractions. Most neutral fractions also contained
cholesterol, coprostanol, phthalates, and several components
that appeared to be long-chain alcohols and/or unsaturated
hydrocarbons.
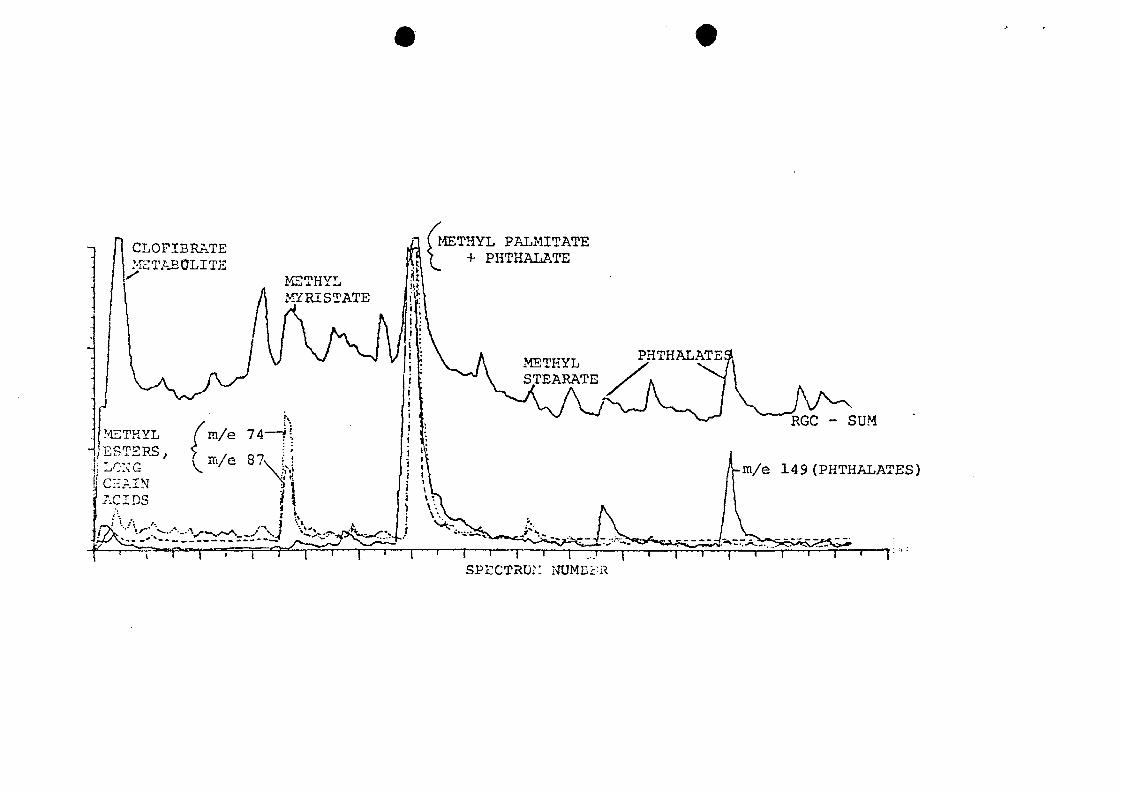
Raw Sewage Condensate
During distillation of the raw sewage sample of
December 1973 as a means of concentration for analysis of
volatile free acids, several milligrams of a waxy white
solid collected in the condenser. This material was
analyzed by GC-MS (Figure 9) after solution in methylene
chloride and methylation. Limited mass range searches of
the stored mass spectral data indicated the presence of
three phthalates (m/e 149) , and methyl palmitate and methyl
myristate (m/e 74 and 87) . The acid metabolite of the drug
clofibrate was the most abundant component.
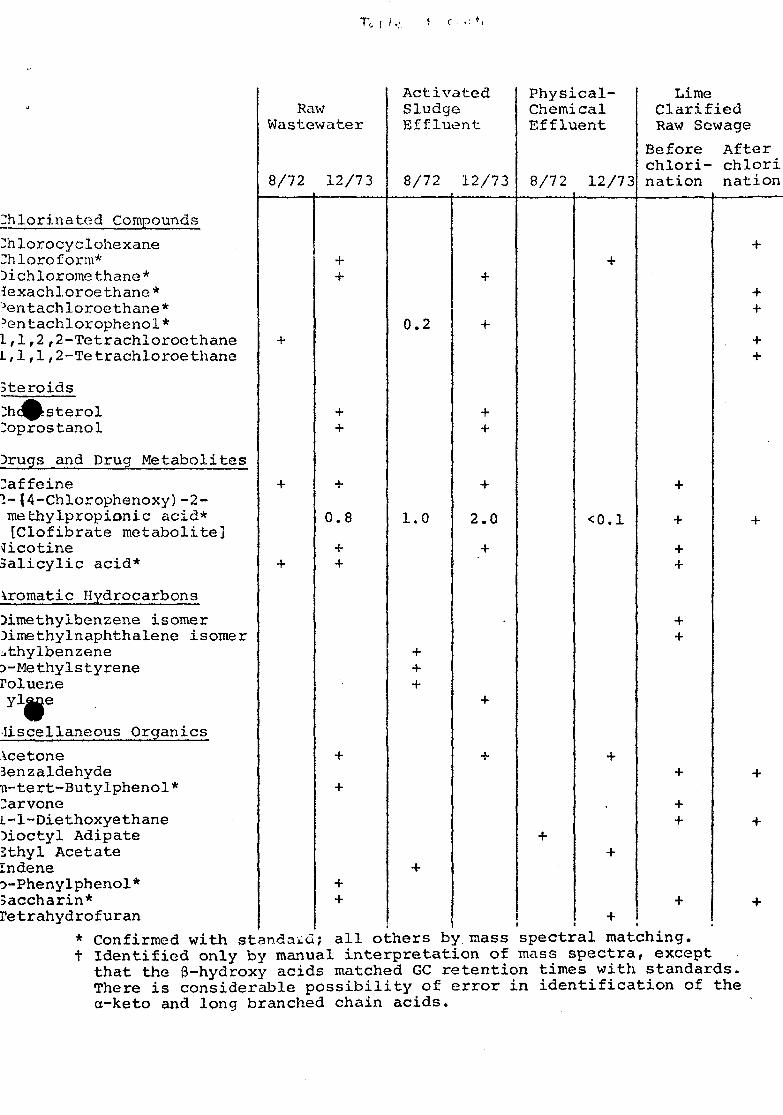
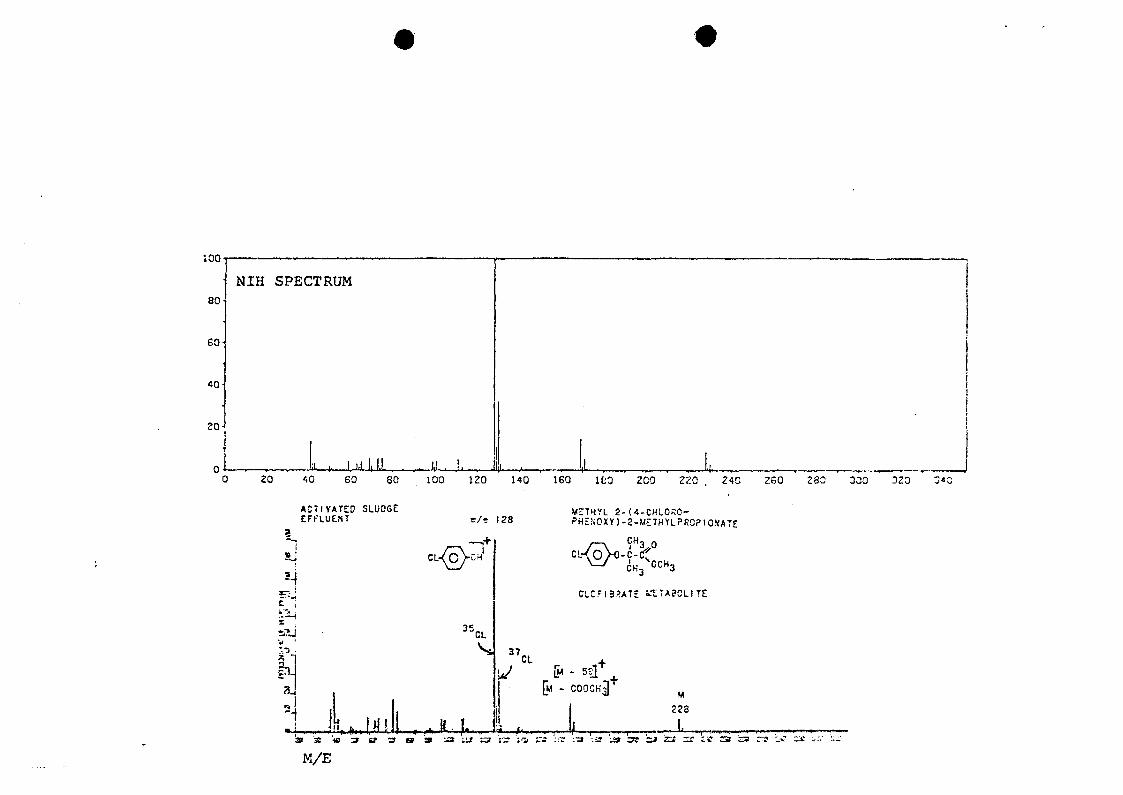
The main human metabolite of the drug clofibrate [ethyl
2-(4-chlorophonoxy)-2 -methylpropionate] has been shown to
be 2-(4-chlorophenoxy)-2-methylpropionic acid (Figure 10).
It is excreted in urine at 85% of the amount of the drug
ingested20. Clofibrate is used by many older people in
doses of 2 g/day to control atherosclerosis. It is not
manufactured in this country, but is dispensed here.
Although the parent drug was never found in sewage, the
metabolite was found in both August 1972 and December 1973
samples of the Cincinnati AWTRL pilot plant sewage, in
Athens, GA, municipal sewage, and in sewage from Washington,
DC, lime-clarified raw sewage (see Table 1 for
concentrations). The metabolite identification was verified
by comparison of mass spectra (Figure 10) and infrared
spectra (Figure 11) of a standard with those of the sample
component.
Effects of Physical Chemical and Activated Sludge Treatment
Treatment Effects on Acid Components
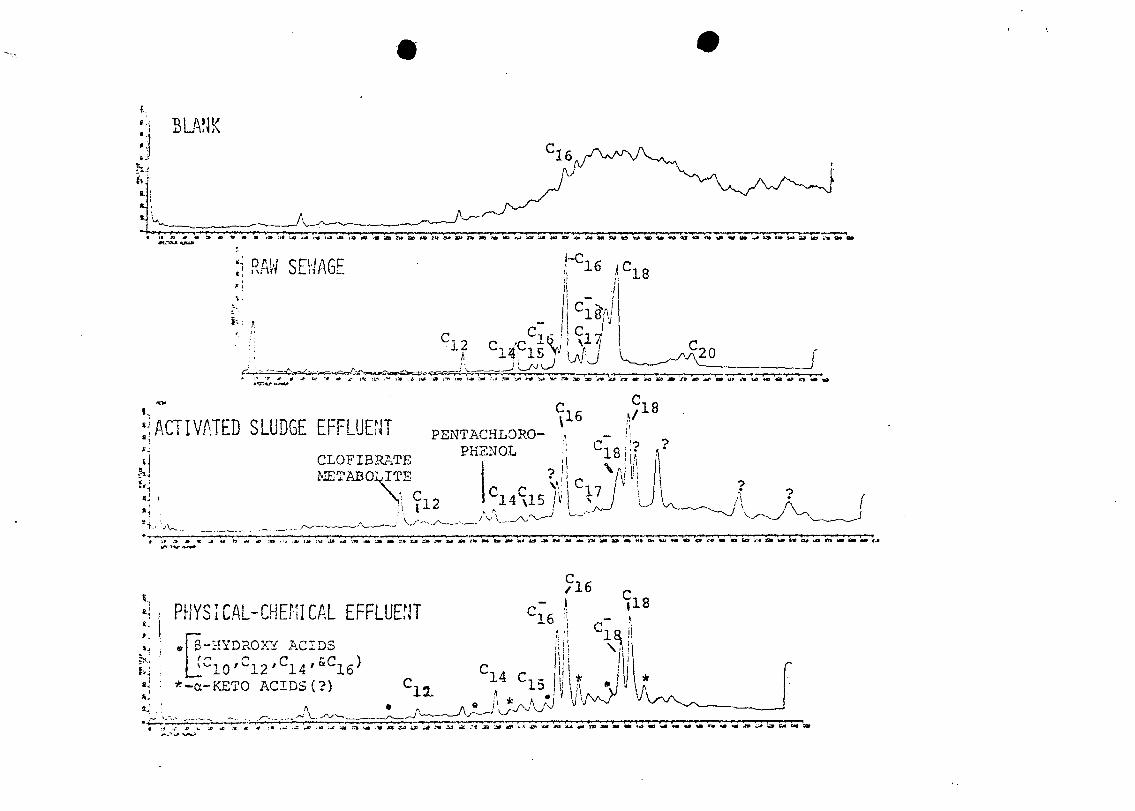
Comparison of chromatograms (Figure H) showed the
changes incurred during activated sludge and physical-
chemical treatment of the raw sewage collected in August

1972. These chromatograms were reconstructed by the
computer (RGC's) using the mass spectrometer as the
detector, and were normalized on the most intense peak.
Therefore, concentrations of the same components in
different chromatograms were not comparable; only relative
changes in components and concentrations were comparable.
Measured concentrations of some components (Table 1) showed
that there was a 3- to 5-fold decrease in concentration of
the main components (C. * » Sfi' S a r S'a * n r a w s e w a 9 e a f t e r
activated sludge treatment, and a 10- to 100-fold decrease
after physical-chemical treatment. These main components
were present in about the same relative concentrations after
treatment.
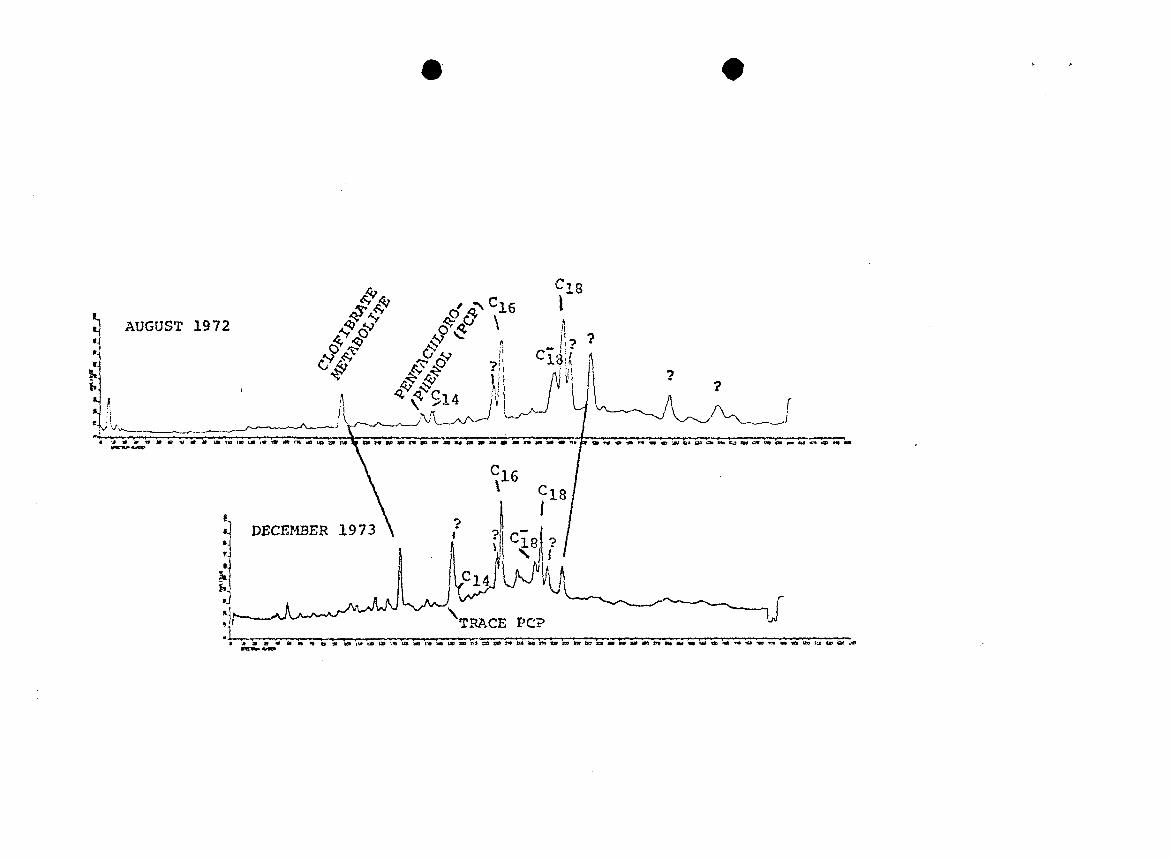
At least five new compounds with similar structures,
based on their mass spectra, are present after activated
sludge treatment (marked with a question mark in Figure H).
IR spectral evidence obtained on the GC-FTIR system,
indicated that one of the larger unknown peaks was a LAS
detergent biodegradation intermediate. This speculation
correlated well with the sample history and with literature
data on LAS degradation routes29. Although the low
resolution GC-MS gave an unidentifiable spectrum, it did
provide an apparent molecular weight. High resolution GC-
MS, provided several possible molecular formulae for this
parent ion, one of which matched that of the speculated
biodegradation product, p-hydroxy phenyldecanoic acid. A
possible formula for one of the fragment ions also matched
that of a logical fragment of the same compound. High
resolution GC-MS also provided tentative structural
information for two of the other possible biodegradation
products.
Pentachlorophenol and the clofibrate metabolite were
present only after activated sludge treatment. Their
absence in the raw sewage is unexplained, but they could
have been absorbed on activated sludge particulate matter
from earlier raw sewage influents and partially desorbed
during this sampling. (The clofibrate metabolite was found
in the raw sewage of the December 1973 series of samples,
but in relatively small concentration.) Since the drug
clofibrate was not found in the neutral fraction of the raw
or treated sewage, the acid metabolite probably was not
produced during activated sludge treatment.
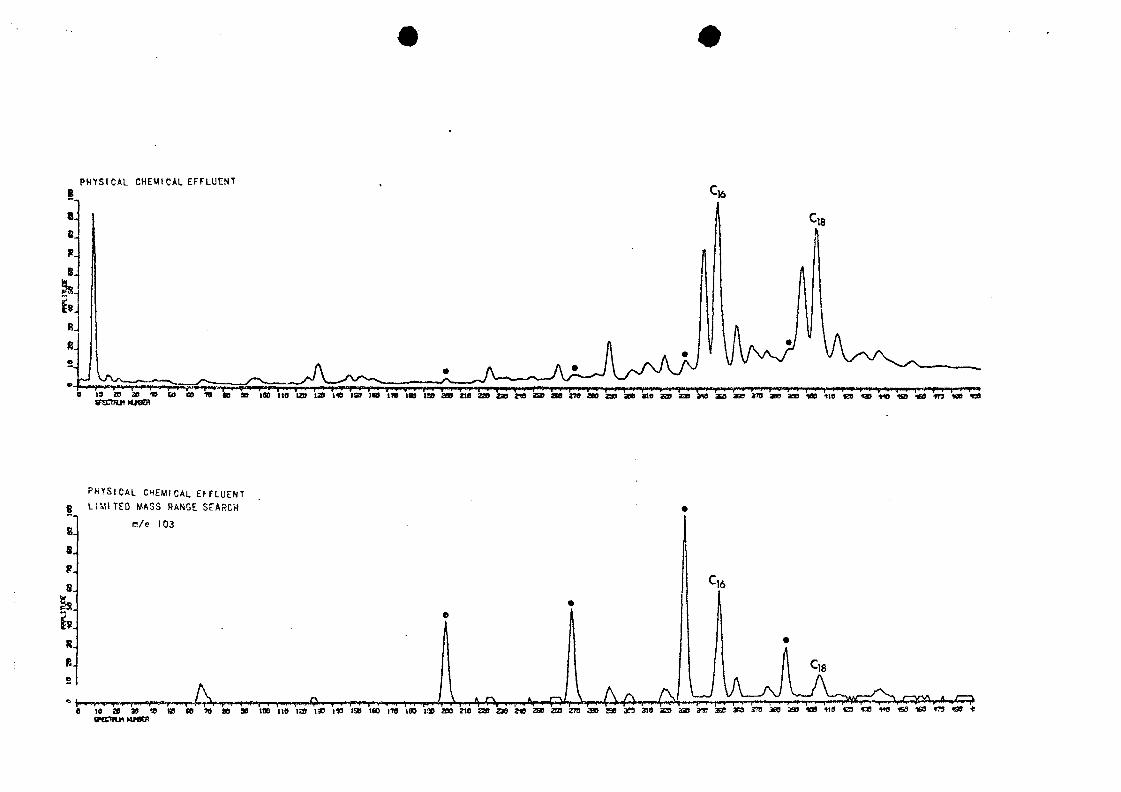
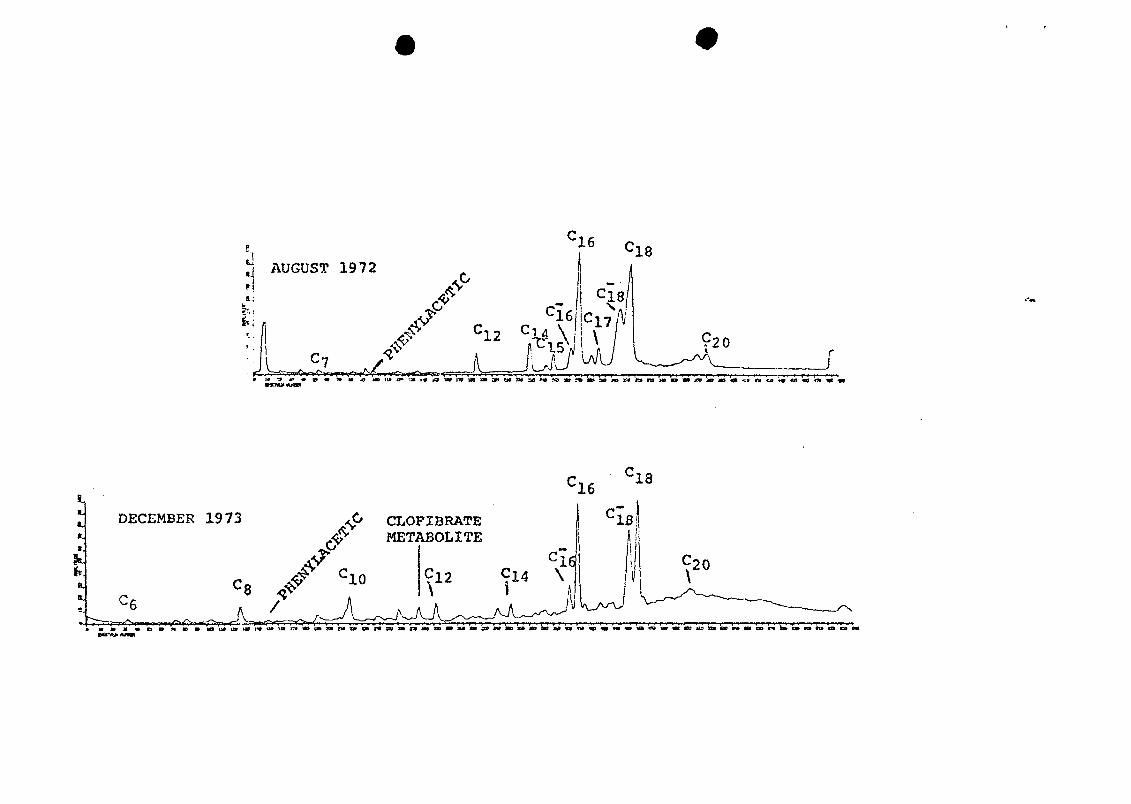
Palmitoleic acid (C-) was present in relatively more
abundance after physical-chemical treatment than in the raw
sewage. The main changes after this treatment, however, are
the formation of four $-hydroxy and three a-keto long-chain
acids (Figure 4). The identities of these compounds have
not been confirmed, but their mass spectra, especially those
of the g-hydroxy acids, are fairly distinctive. A limited
mass range search of the disc-stored mass spectral data for
m/e 103, which is distinctive for $-hydroxy acids, indicated
their presence (Figure 5); a homologous series was indicated
by the almost equal spacing of GC peaks (time of elution).
These oxygenated acids were apparently formed during
physical-chemical treatment, probably on the carbon column.
Biological activity has been shown to occur on columns of
activated carbon used for waste treatment30. In this case,
the occurrence of oxidation was surprising, because the
effluent smelled slightly of hydrogen sulfide, which
indicated anaerobic conditions.
There was little difference in composition of the raw
sewage acids in samples collected 16 months apart (Figure
6). Except for the two unsaturated acids, concentrations of
the main components were higher in the first sample than in
the second sample (Table 1). Palmitoleic acid (CL- ) , was
seven times more concentrated in the second sample, and the
clofibrate metabolite (about 0.8 yg/1) was found only in the
second sample.
Activated sludge treated effluents taken 16 months
apart were also similar in acid composition (Figure 7). The
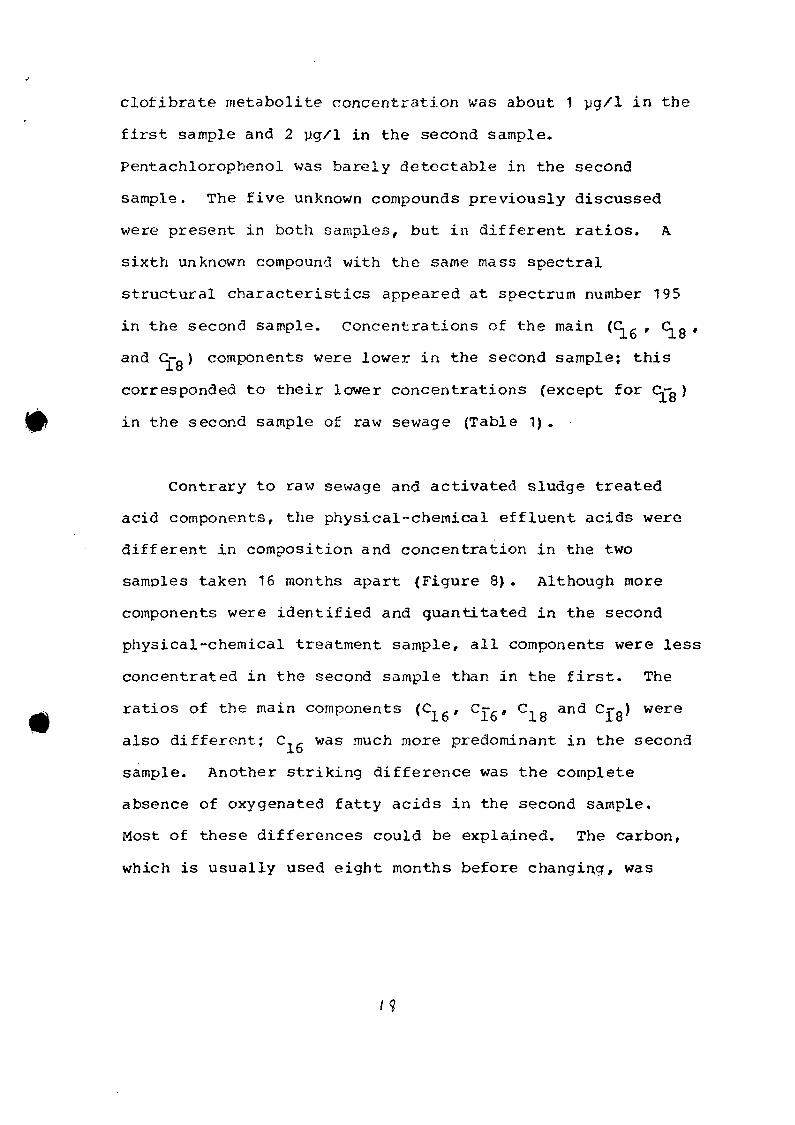
clofibrate metabolite concentration was about 1 pg/1 in the
first sample and 2 yg/1 in the second sample.
Pentachlorophenol was barely detectable in the second
sample. The five unknown compounds previously discussed
were present in both samples, but in different ratios. A
sixth unknown compound with the same mass spectral
structural characteristics appeared at spectrum number 195
in the second sample. Concentrations of the main (C. g , C g ,
and C.-_ ) components were lower in the second sample; this
corresponded to their lower concentrations (except for Cj~8 )
in the second sample of raw sewage (Table 1) .
Contrary to raw sewage and activated sludge treated
acid componentsr the physical-chemical effluent acids were
different in composition and concentration in the two
samples taken 16 months apart (Figure 8). Although more
components were identified and quantitated in the second
physical-chemical treatment sample, all components were less
concentrated in the second sample than in the first. The
ratios of the main components (Cn . , Cr-,, C, _ and Cr-O) wereX o io lo X o
also different; C.g was much more predominant in the second
sample. Another striking difference was the complete
absence of oxygenated fatty acids in the second sample.
Most of these differences could be explained. The carbon,
which is usually used eight months before changing, was
seven months old at the first sampling, but a different
batch of carbon had been used only one month before the
second sampling. The fresh carbon resulted in removal of
more organics, and apparently was not old enough to allow
establishment of bacterial colonies sufficient for
biological metabolism of fatty acids.
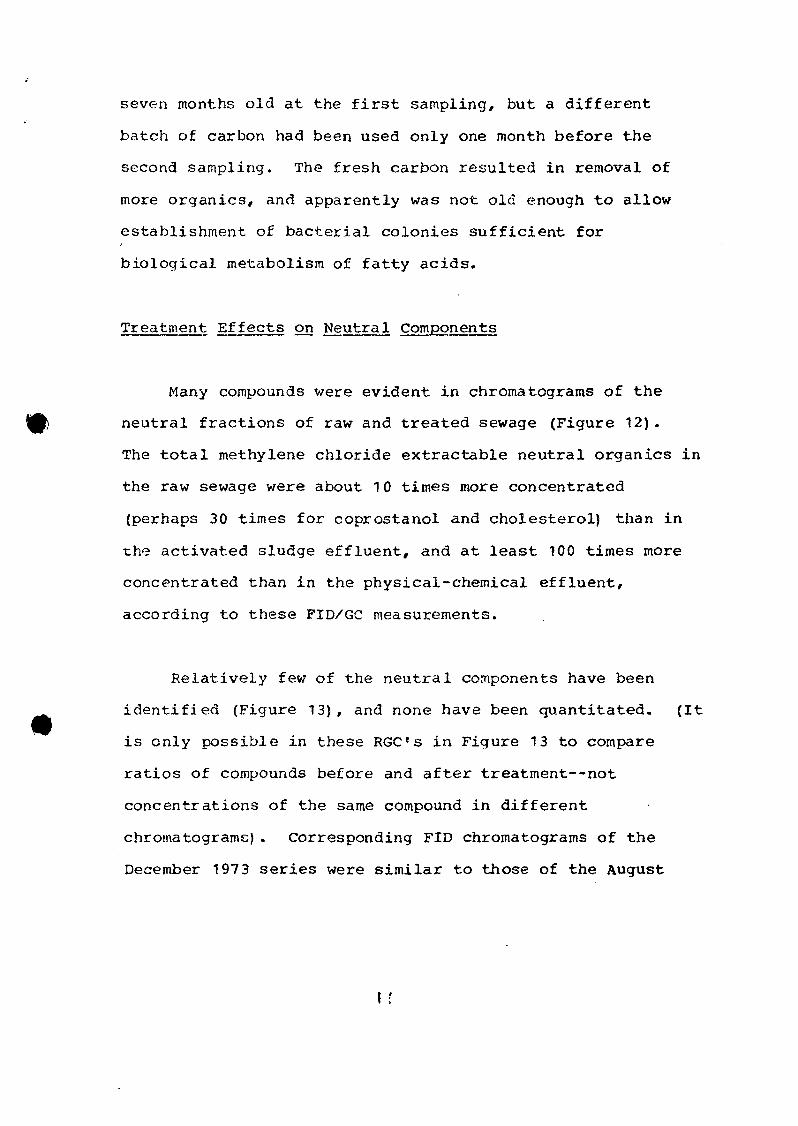
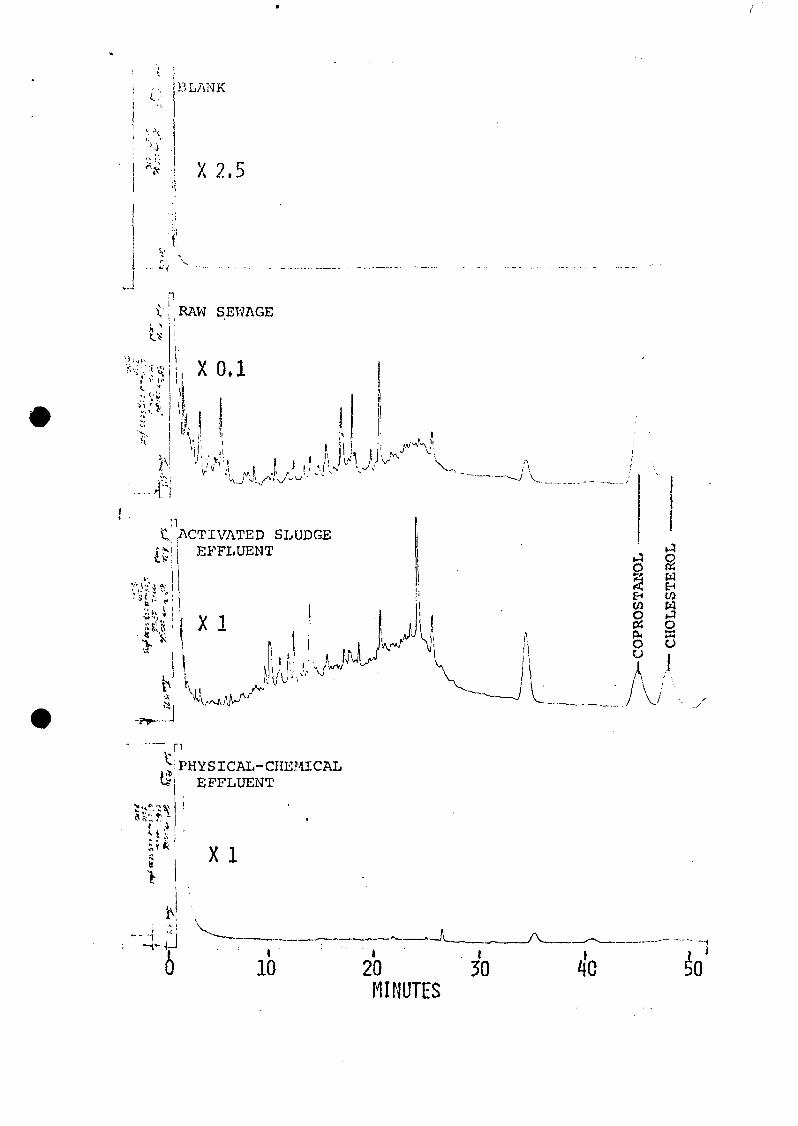
Treatment Effects on Neutral Components
Many compounds were evident in chromatograms of the
neutral fractions of raw and treated sewage (Figure 12).
The total methylene chloride extractable neutral organics in
the raw sewage were about 10 times more concentrated
(perhaps 30 times for coprostanol and cholesterol) than in
the activated sludge effluent, and at least 100 times more
concentrated than in the physical-chemical effluent,
according to these FID/GC measurements.
Relatively few of the neutral components have been
identified (Figure 13), and none have been quantitated. (It
is only possible in these RGC's in Figure 13 to compare
ratios of compounds before and after treatment--not
concentrations of the same compound in different
chromatograme). Corresponding FID chromatograms of the
December 1973 series were similar to those of the August
1972 series (Figure 12) in that almost no peaks showed up in
the blank and few were in the physical-chemical effluent
extract. The unsaturated or oxygenated hydrocarbons and oc-
terpineol are decreased in concentration relative to
caffeine, the large unknown (*), and dioctyl phthalate after
activated sludge treatment. Dibutyl phthalate predominates
after physical-chemical treatment, but is probably at a very
low concentration. These chromatograms were not programed
to a high enough temperature to see coprostanol and
cholesterol, which were observed in other chromatograms of
the same samples.
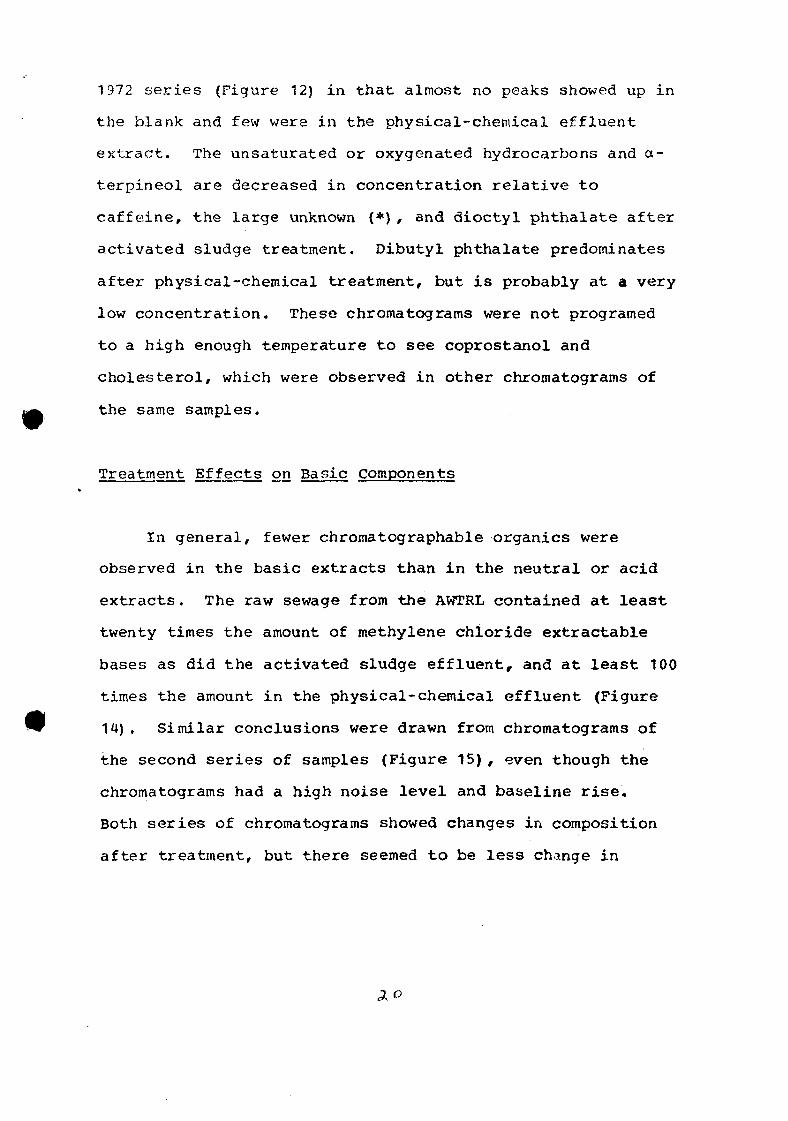
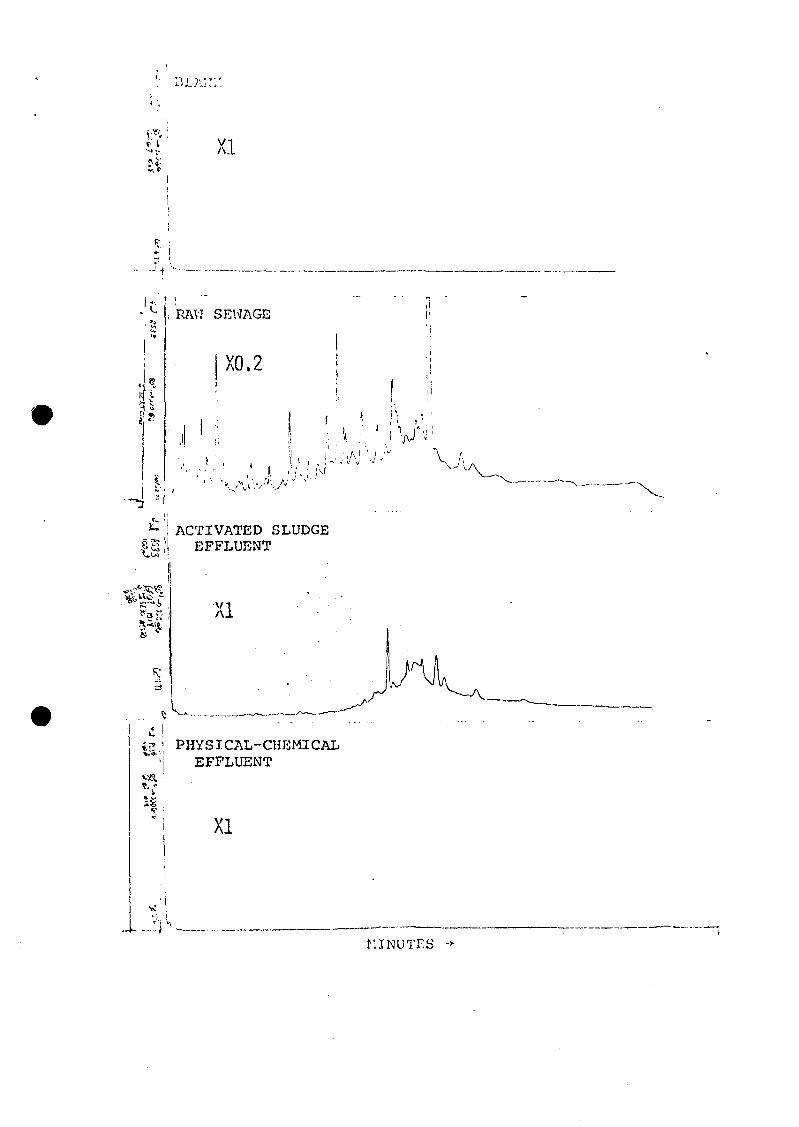
Treatment Effects on Basic components
In general, fewer chromatographable organics were
observed in the basic extracts than in the neutral or acid
extracts. The raw sewage from the AWTRL contained at least
twenty times the amount of methylene chloride extractable
bases as did the activated sludge effluent, and at least 100
times the amount in the physical-chemical effluent (Figure
14) . Similar conclusions were drawn from chromatograms of
the second series of samples (Figure 15), even though the
chromatograms had a high noise level and baseline rise.
Both series of chromatograms showed changes in composition
after treatment, but there seemed to be less change in
concentration of some components after activated sludge
treatment in December 1973.
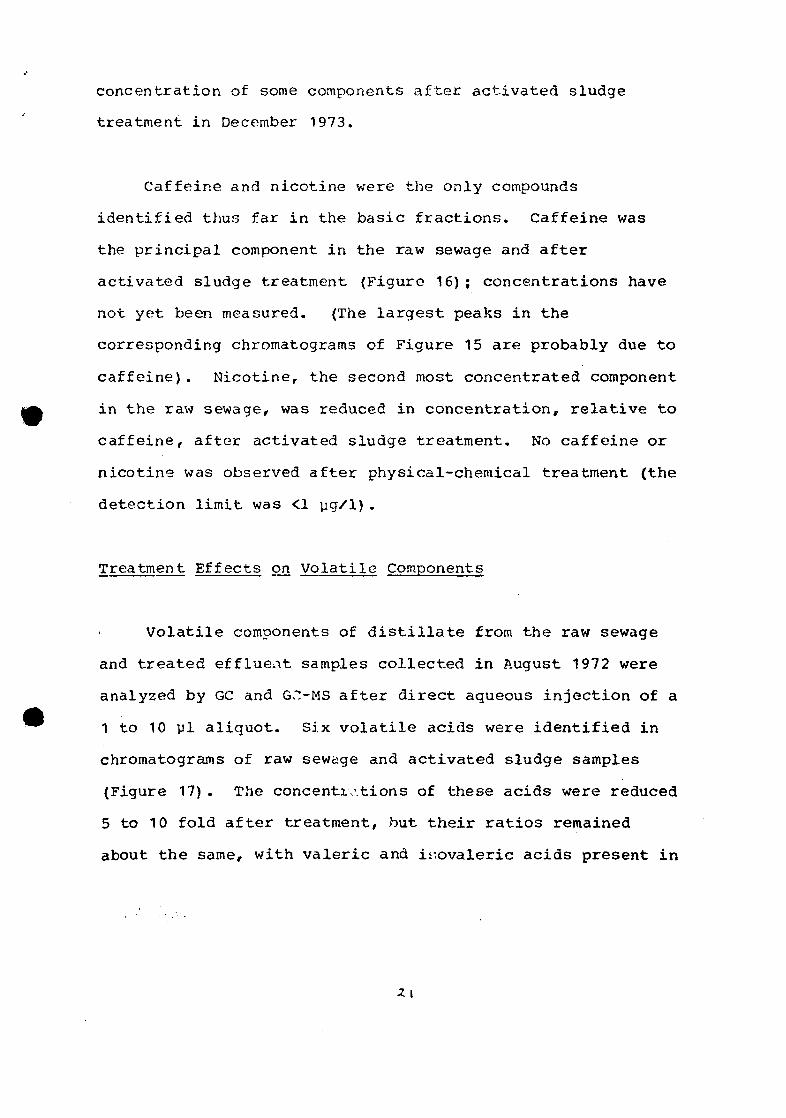
Caffeine and nicotine were the only compounds
identified thus far in the basic fractions. Caffeine was
the principal component in the raw sewage and after
activated sludge treatment {Figure 16); concentrations have
not yet been measured. (The largest peaks in the
corresponding chromatograms of Figure 15 are probably due to
caffeine). Nicotine, the second most concentrated component
in the raw sewage, was reduced in concentration, relative to
caffeine, after activated sludge treatment. No caffeine or
nicotine was observed after physical-chemical treatment (the
detection limit was <1 yg/1).
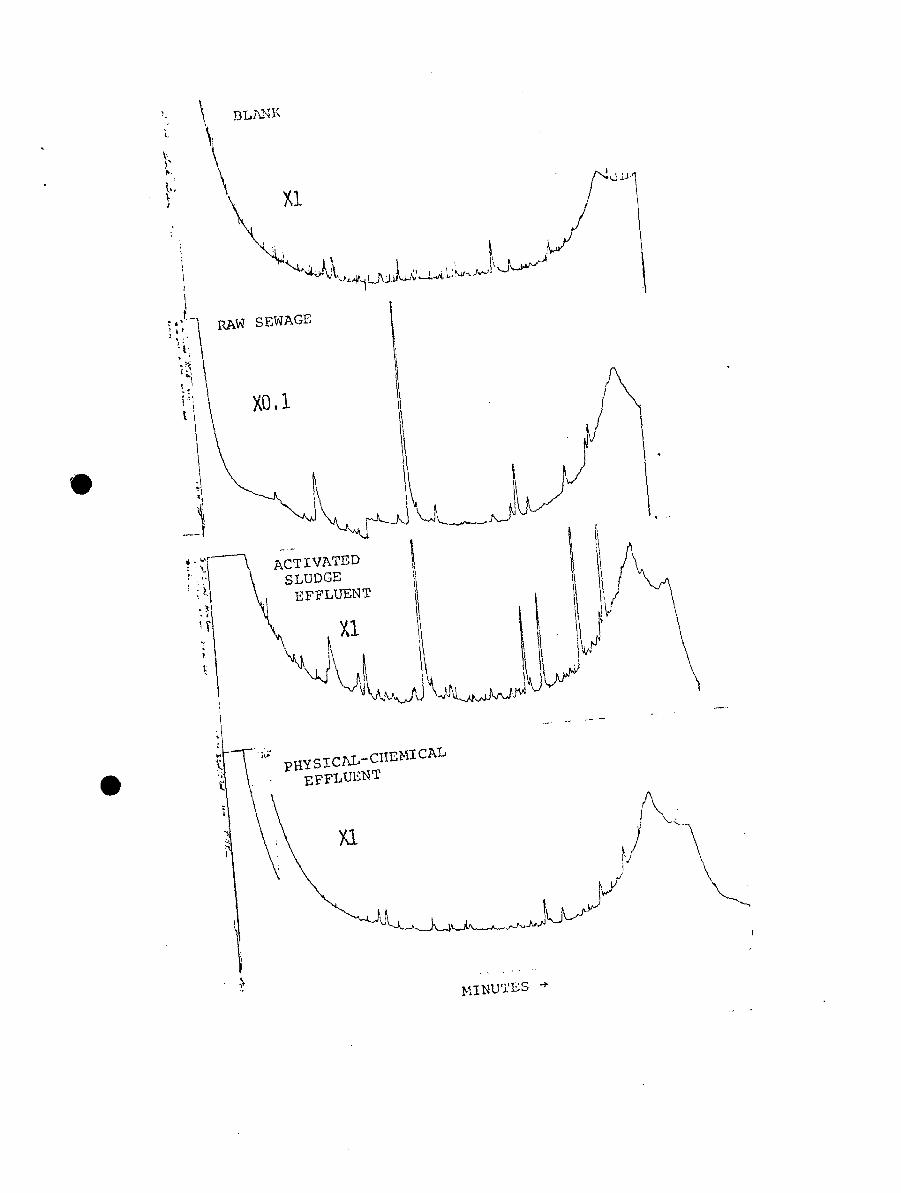
Treatment Effects on Volatile Components
Volatile components of distillate from the raw sewage
and treated effluent samples collected in August 1972 were
analyzed by GC and G."!-MS after direct aqueous injection of a
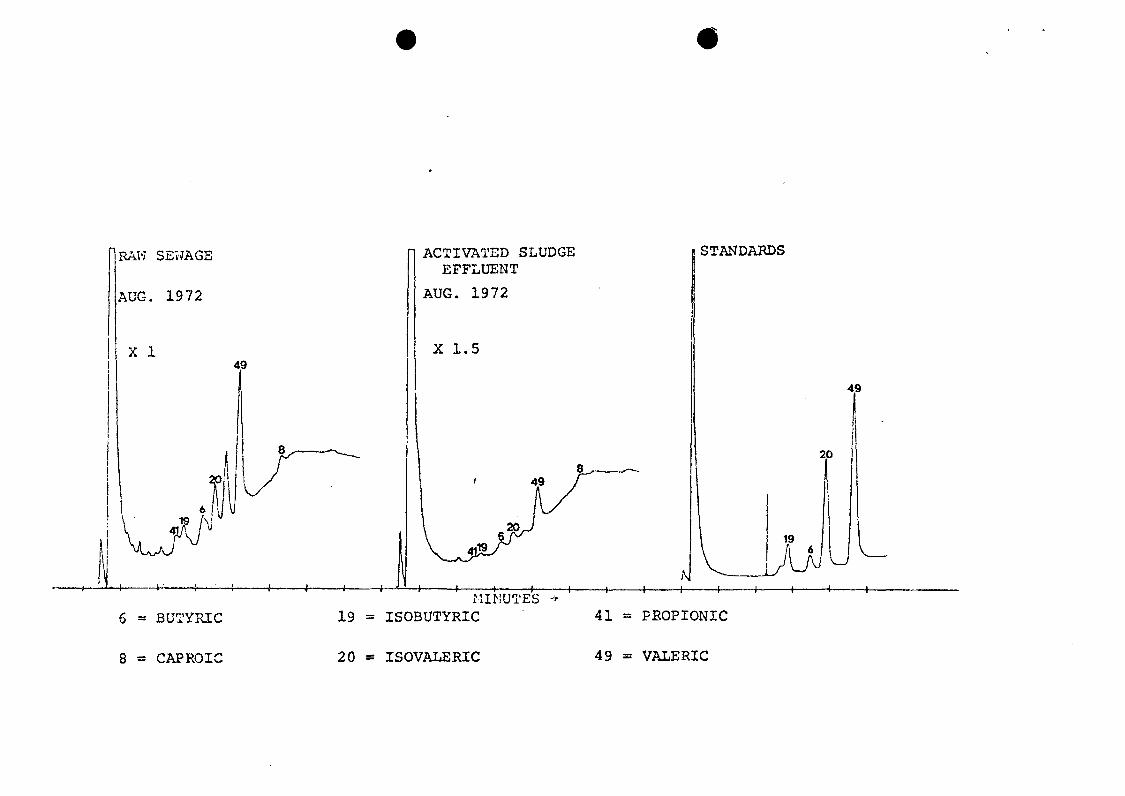
1 to 10 yl aliquot. Six volatile acids were identified in
chromatograms of raw sewage and activated sludge samples
(Figure 17). The concentrations of these acids were reduced
5 to 10 fold after treatment, but their ratios remained
about the same, with valeric and ir.ovaleric acids present in

most abundance. These compounds were verified by comparison
of GC retention times of sample components with those of
standards. GC-MS analysis of these free acids did not give
discernible peaks on the RGC.
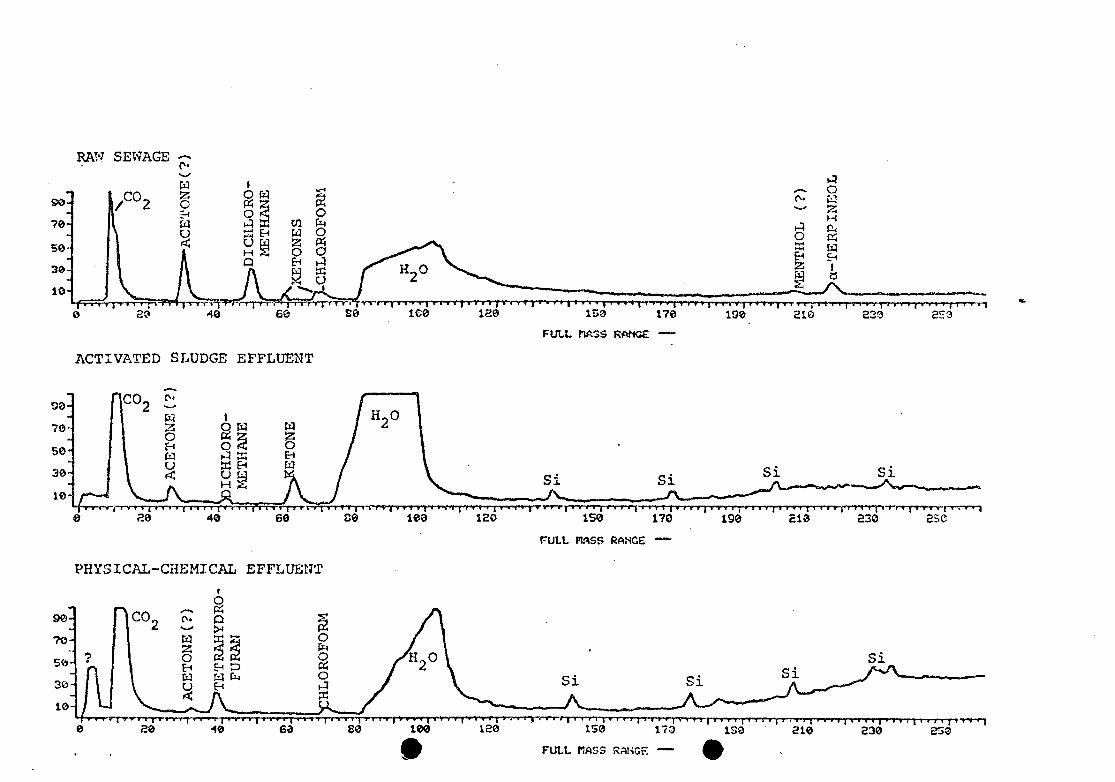
Other volatile components of the distillate from raw
sewage and treated effluent samples were identified by GC-MS
after direct aqueous injection and modification of the GC
temperature program (Figure 18).
Most components were neutral oxygenated or halogenated
materials, that were reduced in concentration or disappeared
after treatment. One ketone increased in relative
concentration after activated sludge treatment, and
tetrahydrofuran was observed only after physical-chemical
treatment.
Effects of Chlorination
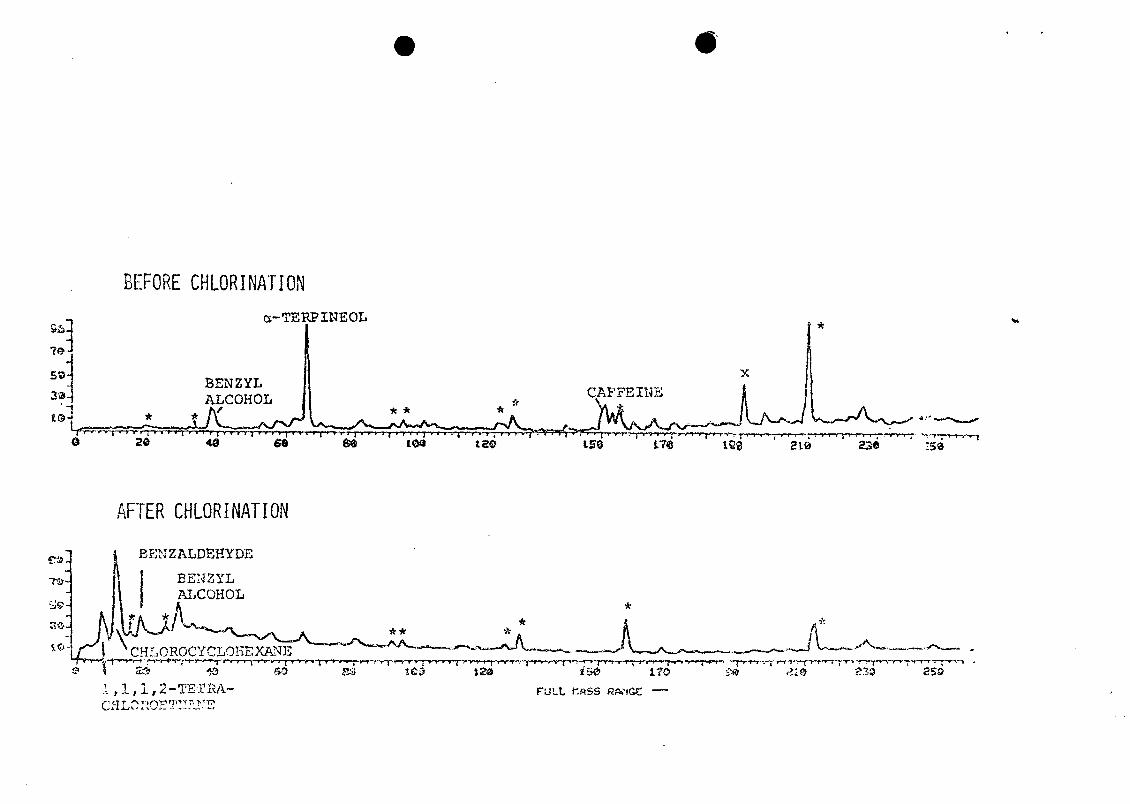
Chlorination effects were determined by analysis of
fractions before and after chlorination. Comparison of
chromatograms of the neutral fractions of lime-clarified
sewage from the Blue Plains waste treatment pilot plant
before and after chlorination showed that some components
Z-
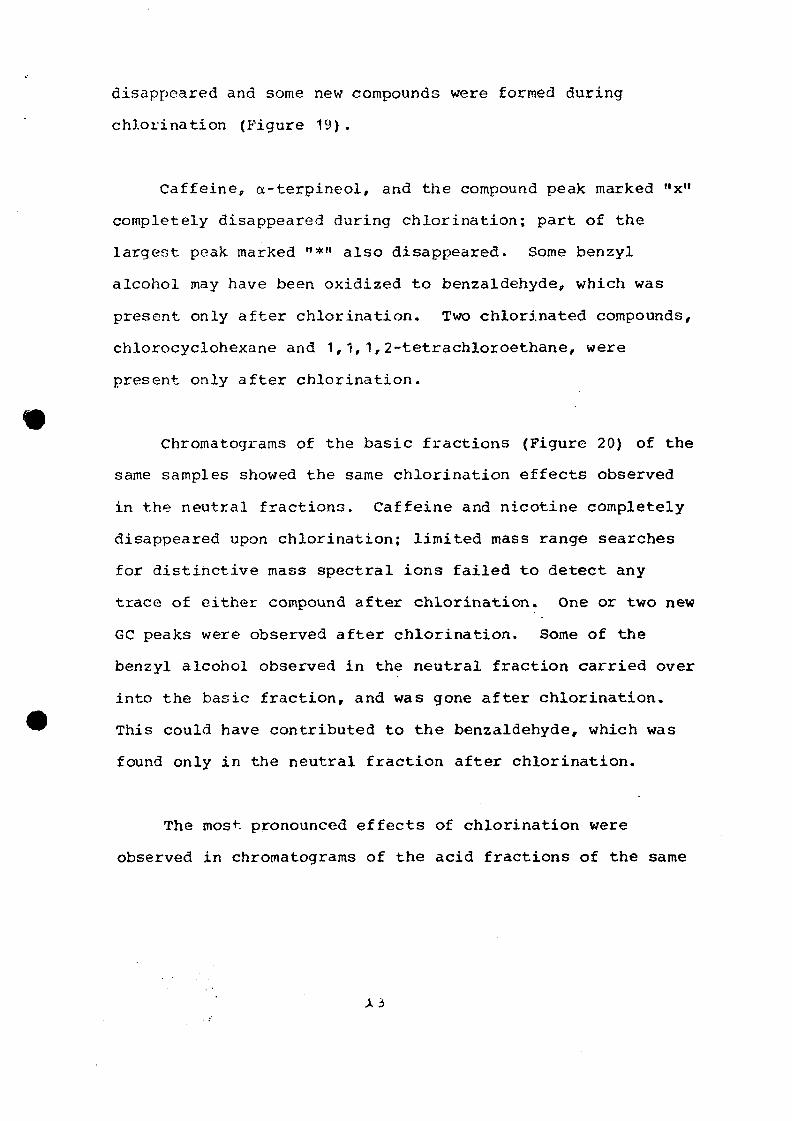
disappeared and some new compounds were formed during
chlorination (P'igure 19) .
Caffeine, a-terpineol, and the compound peak marked "x"
completely disappeared during chlorination; part of the
largest peak marked "*" also disappeared. Some benzyl
alcohol may have been oxidized to benzaldehyde, which was
present only after chlorination. Two chlorinated compounds,
chlorocyclohexane and 1,1,1,2-tetrachloroethane, were
present only after chlorination.
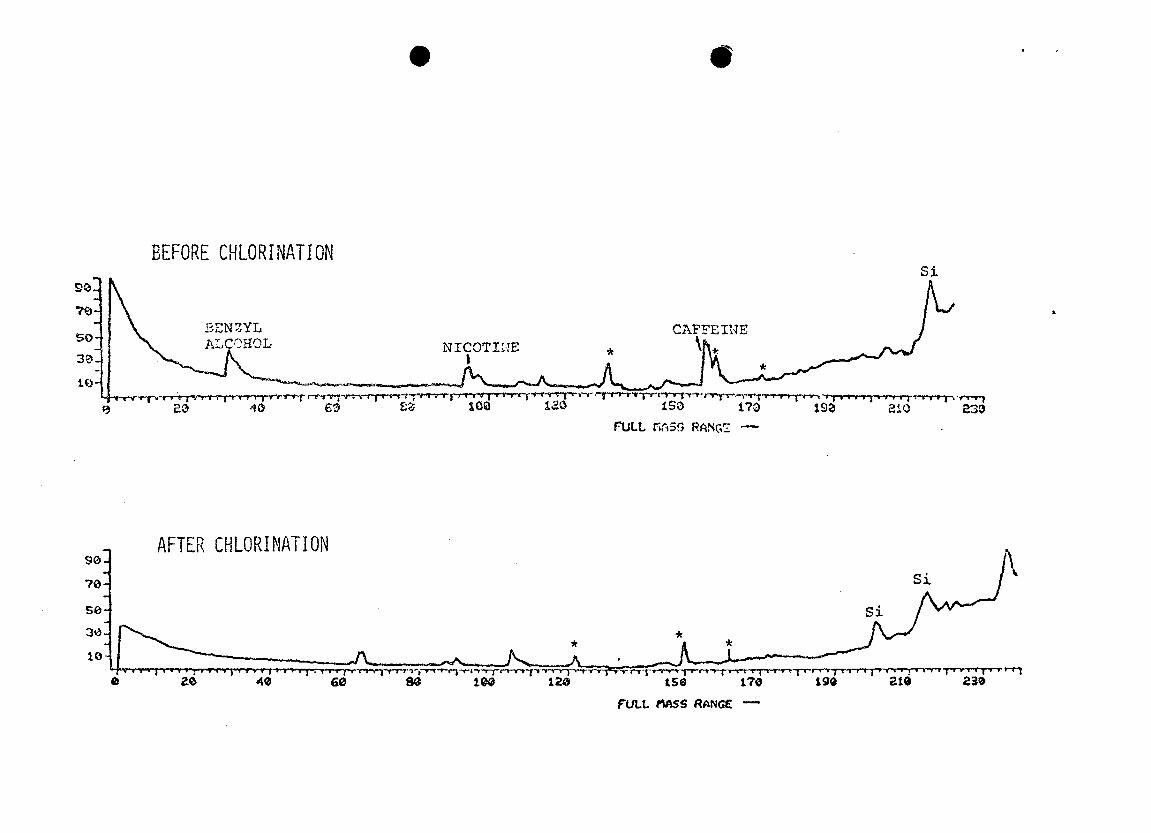
Chromatograms of the basic fractions (Figure 20) of the
same samples showed the same chlorination effects observed
in the neutral fractions. Caffeine and nicotine completely
disappeared upon chlorination; limited mass range searches
for distinctive mass spectral ions failed to detect any
trace of either compound after chlorination. One or two new
GC peaks were observed after chlorination. Some of the
benzyl alcohol observed in the neutral fraction carried over
into the basic fraction, and was gone after chlorination.
This could have contributed to the benzaldehyde, which was
found only in the neutral fraction after chlorination.
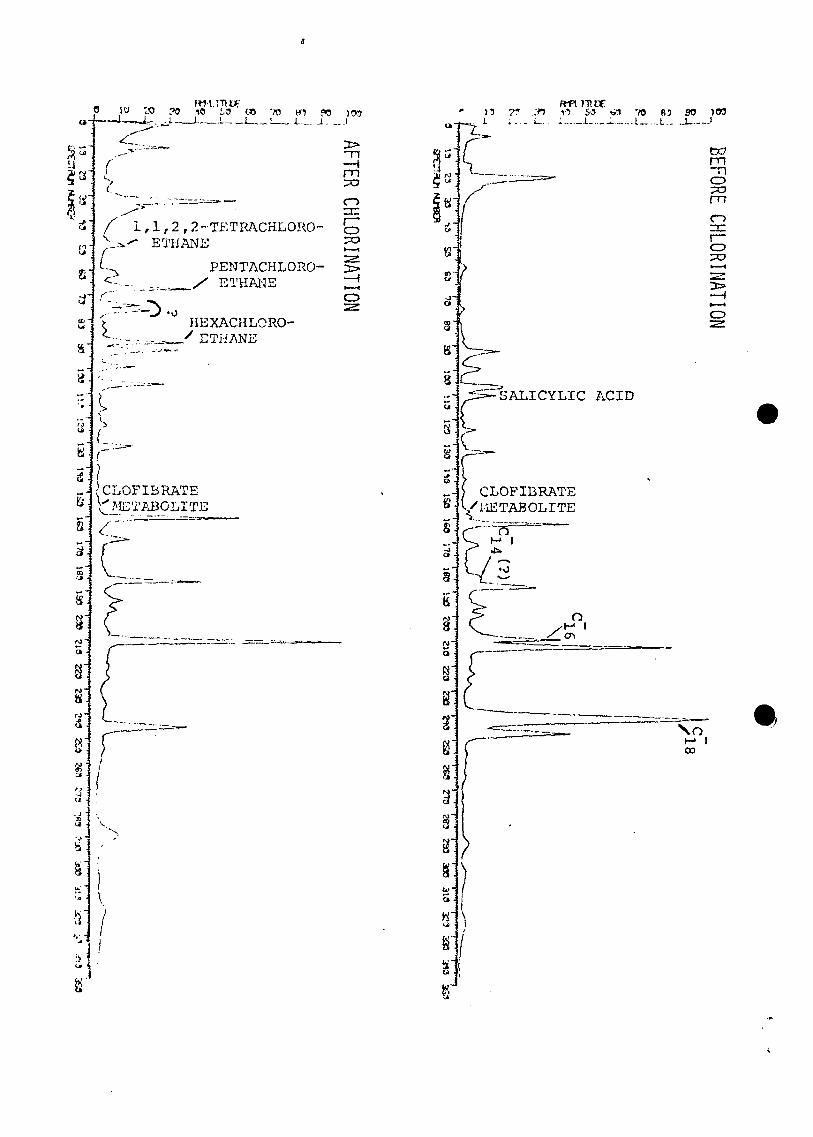
The most pronounced effects of chlorination were
observed in chromatograms of the acid fractions of the same
X 3
samples (Figure 21). Salicylic acid and all three mono-
unsaturated fatty acids completely disappeared. Traces of
the clofibrate metabolite were present in both
chromatograms. Several new compounds (1,1,2,2-
tetrachloroethane, pentachloroethane, hexachloroethane, and
at least five unknown compounds) apparently were formed
during chlorination. The presence of these neutral
chlorinated compounds in the acid fraction cannot be
explained at this time; they could be analytical artifacts,
but were not seen in any other extracts.
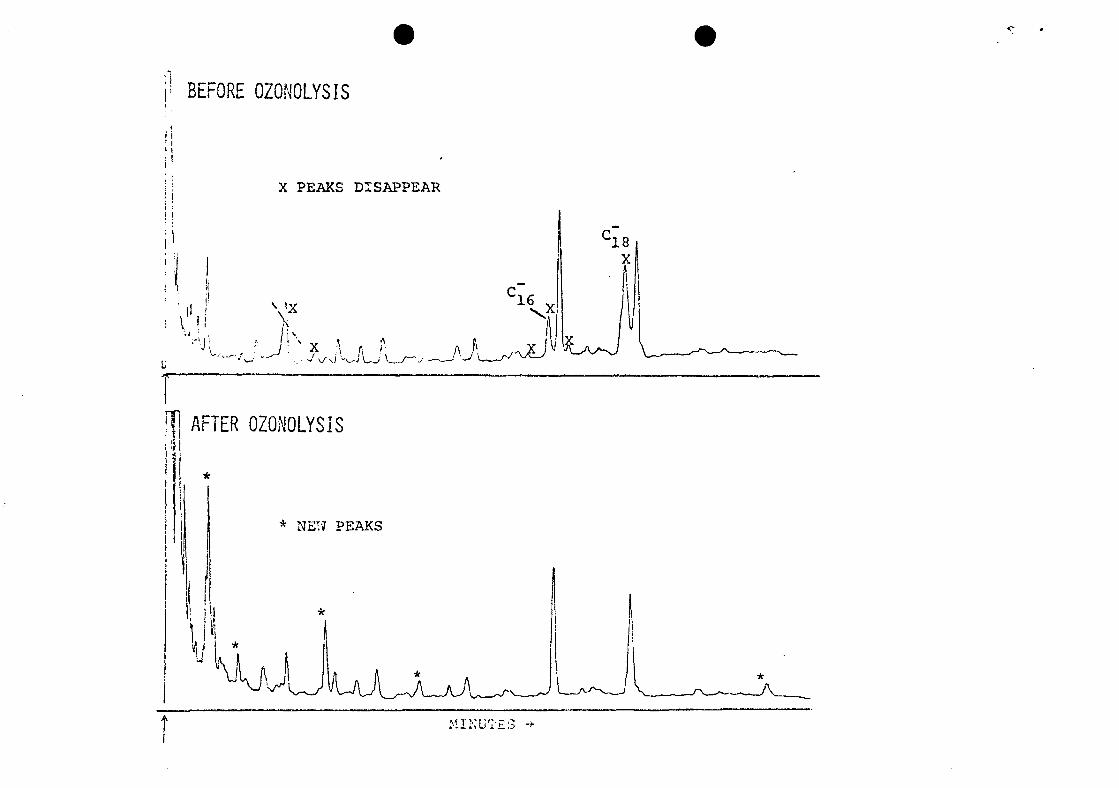
Effects of Ozonolysis
Ozonolysis of the AWTRL raw sewage (Figure 22) had some
of the same effects on acids as did chlorination of the Blue
Plains lime-clarified raw sewage. The mono-unsaturated Cr,
and C- acids and several minor components (probably
unsaturated) reacted completely. Several new peaks,
probably aldehyde reaction products, were formed. The
ozonolysis reaction was different from the chlorination
reaction in that the acids were methylated before reacting
with ozone, and the reaction occurred in methylene chloride
solution, not in the aqueous phase. This ozonolysis
techniquezo was devised as an analytical tool to detect or
confirm unsaturated compounds, and it proved useful for this

purpose. Although it was not designed to simulate waste
treatment by ozonation, similar reaction with the
unsaturated acids would be expected during such waste
treatment.
CONCLUSIONS AND REMAINING WORK
Eighty specific volatile organic compounds were
identified in raw and treated domestic wastewaters (Table
1), mostly by gas chromatography-mass spectrometry. A
series of five or more similar unknown acids of relatively
high concentration, were possibly detergent metabolites that
were formed during activated sludge treatment of raw sewage;
these need to be identified and quantitated. Only a few
neutral compounds were identified in raw and treated
domestic wastewaters; unsaturated and/or oxygenated
hydrocarbons and many completely unknown compounds present
in relatively high concentration have not been identified.
While the basic fractions were less complex, several
components remain unidentified.
Physical-chemical treatment, (carbon adsorption) was
more effective than activated sludge treatment in reducing
the concentration of specific volatile organic pollutants,
but even in physical-chemical effluents, obvious components
need to be identified and quantitated, especially in the
neutral fractions.
Brief analytical studies on sewage before and after
chlorination indicated important changes in some components.
These changes need to be better defined by identification
and quantification of compounds that react with chlorine and
products that are formed by chlorination.
Identification of compounds is not enough. Their
quantities must be measured before the significance of
changes occurring during treatment can be assessed.
Concentrations of only a few of the compounds identified in
this study have been measured (Table 1). After qualitative
and quantitative analysis of components in domestic
wastewaters, toxicological studies will be necessary to
determine the need for improved waste treatment methods.
These volatile, methylene chloride extractable
compounds constitute only a small fraction (certainly less
than 25%) of the total organic components of raw or treateu
domestic sewaqe. The next frontier in analysis of

wastewaters is identification and measurement of these non-
volatile components.

ACKNOWLEDGEMENTS
The authors appreciate the advice and cooperation of
personnel at the EPA's Advanced Waste Treatment Research
Laboratory, Cincinnati, Ohio. This research was not only
condoned, but supported and encouraged by Mr. Jesse Cohen
and Dr. Robert Bunch, of that laboratory. Dr. James
Westrick and Mr. Richard Dobbs gave valuable technical
advice and helped in obtaining samples. Mr. Thomas Pressley
of that Laboratory's Blue Plains (Washington, DC) pilot
plant suggested analysis of the chlorinated samples, and
collected, chlorinated and extracted these samples.
t
At ERL-A/hens, Mssrs. Mike Carter and Alfred Thruston
and Ms. Ann Alford performed the GC-MS analysis, which
consumed many man-months over a three year period. Dr. Leo
Azarraga performed the GC-IR analyses. Dr. James Ryan at
the EPA's pesticide analysis facility at Research Triangle
Park, NC, performed some of the high resolution GC-MS
analyses. Ms. Anne Elder did much of the drafting work.
XS

DISCLAIMER
Mention of commercial products, trade names, and
companies is for informational purposes only and does not
imply endorsement by the U.S. Environmental Protection
Agency or the Athens Environmental Research Laboratory.
REFERENCES
1. L. H. Keith, A. W. Garrison/ F. R. Allen, M. H. Carter,
T. L. Floyd, J. D. Pope and A. D. Thruston, Jr.,
"Identification of Organic Compounds in Drinking Water
from Thirteen U.S. Cities", presented at the Symposium
on Identification and Analysis of Organic Pollutants in
Water at the First Chemical Congress of the North
American Continent, Mexico City, Mexico, November 30-
December 5, 1975. (Chapter 22, this book).
2. H. J. Ongerth, D. P. Spath, J. Crook and A. E.
Greenberg, "Public Health Aspects of Organics in
Water", JAWWA 65, 495-498, 1973.
3. World Health Organization, International Reference
Centre for Community Water Supply, "Health Effects
Relating to Direct and Indirect Re-Use of Waste Water
for Human Consumption" Report of an International
Working Meeting, Amsterdam, The Netherlands, January
13-16, 1975, Technical Paper No. 7, September 1975.
4. R. L. Bunch, E. F. Barth and M. B. Ettinger, "Organic
Materials in Secondary Effluents", JWPCF, 33, 122-126,
1961.
5. J. V. Hunter and H- Heukelekian, "The Composition of
Domestic Sewage Fractions11, JWPCF, 37, 1142-1163, 1965.
6. H. A. Painter, "Organic Compounds in Solution in Sewage
Effluents", Chem. Ind., September, 818-822, 1973.
7. M. Rebhun and J. Manka, "Classification of Organics in
Secondary Effluents", Environ. Sci. Technol. 5_, 606-
609, 1971.
8. J. Manka, M« Rebhun, A. Mandelbaum and A. Bortinger,
"Characterization of Organics in Secondary Effluents",
Environ. Sci. Technol. 8,, 1017-1020, 1974.
9. H. A. Painter, Water Pollution Research Laboratory,
Stevenage, England, Private Communication, October
1973.
10. J. J. Murtaugh and R. L. Bunch, "Acidic Components of
Sewage Effluents and River Water", JWPCF 37, 410-415,
1965.

11. J. Reichert, H. Kunte, K. Engelhart and J. Borneff,
"Carcinogenic Substances Occurring in Water and Soil.
XXVII Further Studies on the Elimination from Waste
Water of Carcinogenic Polycyclic Aromatic
Hydrocarbons", J^ Zbl. Bakt. Hyg. I Abt. Orig^ B. 155,
18-40, 1971. Chem Abstr. 1971, 75:154806c.
12. A. L. Burlingame, E. S. Scott, J. W. de Leeuw, B. J.
Kimble and F. C. Walls, "The Molecular Nature and
Extreme Complexity of Trace Organic Constituents in
Southern California Municipal Wastewater Effluents,"
presented at the Symposium on Identification and
Analysis of Organic Pollutants in Water at the First
Chemical Congress of the North American Continent,
Mexico City, Mexico, November 30-December 5, 1975.
(Chapter 31, this book).
13. W. J. Dunlap, M. R. Scalf, and D. C. Shew, "Isolation
and Identification of Organic Contaminants in Ground
Water", presented at the Symposium on Identification
and Analysis of Organic Pollutants in Water at the
First Chemical Congress of the North American
Continent, Mexico City, Mexico November 3 0-December 5,
1975. (Chapter 27, this book).
14. W. H. Glaze, J. E. Henderson, IV, G. Smith and 0. D.
Sparkman, "Analysis of New Chlorinated Organic
Compounds in Municipal Wastewaters after Terminal
Chlorination," presented at the Symposium on
Identification ana ?inalysis of Organic Pollutants in
Water at the First, Chemical Congress of the North
American Continent, Mexico City, Mexico, November 30-
December 5, 1975. (Chapter 16, this book).
15. W. Giger, M. Reinhard, C. Schaffner and P. Zurcher,
"Analysis of Organic Constituents in Water by High
Resolution Gas Chromatography in Combination with
Specific Detection and Computer Assisted Mass
Spectrometry", presented at the Symposium on
Identification and Analysis of Organic Pollutants in
Water at the First Chemical Congress of the North
American Continent, Mexico City, Mexico, November 30-
December 5, 1975. (Chapter 26, this book).
16. W. W. Pitt, Jr., R. L. Jolley and S. Katz, "Separation
and Analysis of Refractory Pollutants in Water by High-
Resolution Liquid Chromatography", presented at the
Symposium on Identification and Analysis of Organic
Pollutants in Water at the First Chemical Congress of
the North American Continent, Mexico City, Mexico,
November 30-December 5, 1975. (Chapter 14, this book).
17. R. L. Jolley, G. Jones, Jr., and J. E. Thompson,
"Determination of Chlorination Effects on Organic
Constituents in Natural and Process Waters Using High-
Pressure Liquid Chromatography", presented at the
Symposium on Identification and Analysis of Organic
Pollutants in Water at the First Chemical Congress of
the North American Continent, Mexico City, Mexico,
November 30-December 5, 1975. (Chapter 15, this book).
18. W. W. Pitt, R. L. Jolley and S. Katz, "Automated
Analysis of Individual Refractory Organics in Polluted
Water", U. S. Environmental Protection Agency Res. Rep.
No. EPA 660/2-74-076, August 1974.
19. R. G. Webb, A. W. Garrison, L. H. Keith and J. M.
McGuire, "Current Practice in GC-MS Analysis of
Organics in Water", U. S. Environmental Protection
Agency Res. Rep. No. EPA-R2-73-277, August 1973.
20. M. Eeroza and B. Bierl, "Rapid Determination of Olefin
Position in Organic Compounds in Microgram Range by
Ozonolysis and Gas Chroma tography", Anal. Cherry, 39_,
1131-1135, 1967.
21. J. M. McGuire, A. L. Alford and M. H. Carter, "Organic
Pollutant Identification Utilizing Mass Spectrometry'1,
U. S. Environmental Protection Agency Res. Rep. No.
EPA-R2-73-234, July 1973.
22. L. V. Azarraga and A. C. McCall, "Infrared Fourier
Transform Spectrometry of Gas Chromatography
Effluents," U. S. Environmental Protection Agency Res.
Rep. No. EPA-660/2-73-034, January 1974.
23. S. R. Heller, J. M. McGuire and W. L. Budde, "Trace
Organics by GC-MS", Environ. Sci. Technol. 9, 210-213,
1975.
24. Mass Spectrometry Data Centre, Eight Peak Index of Mass
Spectra, 1st Ed., Atomic Weapons Research
Establishment, Aldermaston, Reading, England, 1493 p.,
1970.
25. R. Ryhage and E. Stenhagen, "Mass Spectrometry of Long-
Chain Esters, Chapt. 9", in Mass Spectrometry of Organic
Ions,F. McLafferty, Ed., Academic Press, New York and
London 1963.
26. C. M. Williams, A. H. Porter and M. Greer, "Mass
Spectrometry of Biologically Important Aromatic Acids"
University of Florida College of Medicine and Veterans
Administration Hospital, Gainesville, Florida. July
1969.
27. E. Stenhagen, S. Abrahamsson and F. W. McLafferty,
Eds., Archives of Mass Spectral Data, Vol. 3_, 193-38U,
Interscience Publishers, Div. John Wiley and Sons,
Inc., New York, N. Y., 1972.
28. J. D. Fitzgerald, "Mode of Action and Clinical Results
of Regelan" Wieru Klin. Wochenschar. 79, 716-720, 1967.
Chem. Abstr. 1967, 67;107356f.
29. A. J. Willetts and R. B. Cain, "Microbial Metabolism of
Alkylbenzene Sulphonates", J\ Biochern^ 129, 389-403,
1972.
30. D. F. Bishop, T. P. O'Farrell, A. F. Cassel and A. P.
Pinto, "Physical-Chemical Treatment of Raw Municipal

Wastewater" U.S. Environmantal Protection Agency Res.
Rep. No. EPA-670/2-73-070, September 1973.
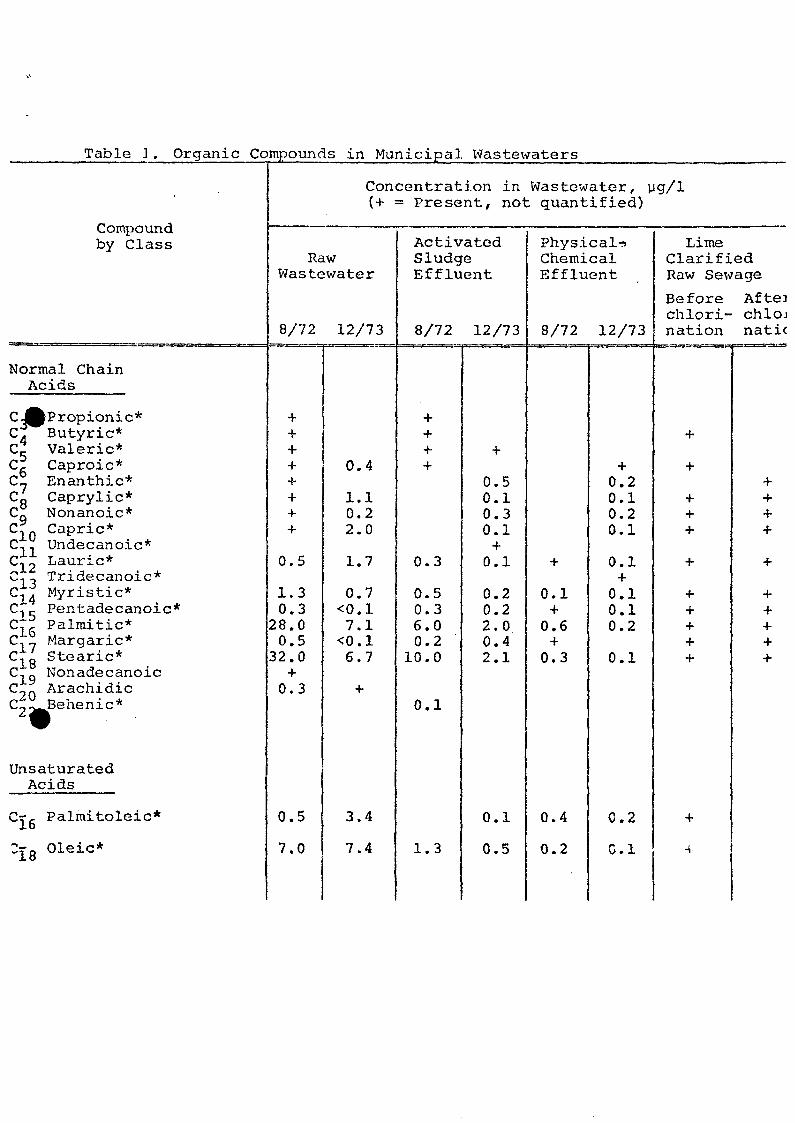
Table ] . Organic Compounds in Municipal Wastewaters
Compoundby Class
Normal ChainAcids
cJ^Propionic*C. Butyric*C5 Valeric*Cg Caproic*C ? Enanthic*Cg Caprylic*Cg Nonanoic*C^_ Capric*C,.. Undecanoic*C,2 Laurie*C, , Tridecanoic*C, . Myristic*C^r Pentadecanoic*C£6 Palmitic*C,7 Margaric*c(g Stearic*C,Q NonadecanoicC 2 Q ArachidicL ^*CI \\ O Tl T /^ >
UnsaturatedAcids
Cr, Palmitoleic*
3rg Oleic*
Concentration in(+ '
RawWastewater
8/72 12/73
x+
+
0.5
1.30.3
28.00.5
32.0+0.3
0.5
7.0
0.4
1.10.22.0
1.7
0.7<0.17.1
<0.16.7
+
3.4
7.4
Wastewater. yg/1= Present, not quantified)
ActivatedSludgeEffluent
8/72 12/73
+
0.3
0.50.36.00.2
10.0
0.1
1.3
+
0.50.10.30.1+0.1
0.20.22.00.42.1
0.1
0.5
Phys.icalr)ChemicalEffluent
8/72 12/73
+
0.1+0.6+0.3
0.4
0.2
+0.20.10.20.1
0.1+0.10.10.2
0.1
0.2
C.I
LimeClarifiedRaw Sewage
Before Afteschlori- chlojnation nati<
+
+
+
+
+
-4-
+
++
+4.4.4-4-
I.. 1 . I I '- » .
..ranched Chain
:4 Isobutyric*2r Isovaleric*2,5 Anteisopentadecanoict2,~ Anteisomargarict:,7 a-Methyl Palmitict
19 Stearict
3xy~Acidst
2, Jfe-Hydroxy acid:7^-Hydroxy acidZ^A 6-Hydroxy acid:|g 3-Hydroxy acid
182,~ ct-Ketomargaric2,g a-Ketononadecanoic
miscellaneous\cids
Benzoic*•J-Ethylhexanoiclexahydrobenzoic5henylacetic*?henylpropionic
alcohols
4^ alcoholSorneol?-Butoxyethanol>-Ethyl-l-hexanol1-Pentanol?-Phenoxyethanol3t-Terpineol
Phthalates
OibutylDie thy 1Dioctyl
RawWastewater
8/72 12/73
ActivatedSludgeEffluent
8/72 12/73
Physical-ChemicalEffluent
8/72 22/73
LimeClarifiedRaw Sewage
Before Afterchlori- chlori-nation nation
Chlorinated Compounds
-hlorocyclohexanechloroform*Dichloromethane*lexachloroethane*^entachloroethane*^entachlorophenol*1,1,2,2-TetrachloroethaneL,l ,1,2-Tetrachloroethane
Steroids
^oprostanol
3rugs and Drug Metabolites
Caffeine1-{4-Chlorophenoxy) -2-rae thylpropionic acid*[Clofibrate metabolite]
JicotineSalicylic acid*
\romatic Hydrocarbons
Dimethyibenzene isomerDimethylnaphthalene isomerjthylbenzene5-Methylstyreneroluene
RawWastewater
8/72 12/73
++
0.8
+
ActxvatedSludgeEffluent
8/72 12/73
0.2
1.0
+
+
+
2.0
•f
Physical-ChemicalEffluent
8/72 12/73
LimeClarifiedRaw Sewage
Before Afterchlori- chlorination nation
+
*
liscellaneous Organics
Acetone3enzaldehydeTV-tert-Butylphenol*ZarvoneL-1-Diethoxyethane5ioctyl AdipateSthyl AcetateIndeneD-Phenylphenol*Saccharin*retrahydrofuran
* Confirmed with standard; all others by mass spectral matching,t Identified only by manual interpretation of mass spectra, except
that the 0-hydroxy acids matched GC retention times with standards.There is considerable possibility of error in identification of thea-keto and long branched chain acids.

LIST OF FIGURES
Number
1. Flow diagrams of parallel sewage treatment pilotplants, with values for total pollutional para-meters, at EPA's Advanced Waste TreatmentResearch Laboratory, Cincinnati, Ohio. Sampleswere taken of the raw sewage and each finaleffluent.
2. Extraction/fractionation scheme for municipalwastewater samples. Inset shows distillationscheme to concentrate samples for direct aqueousinjection GC.
3. Typical methylene chloride extractables in rawdomestic sewage by FID/GC.
4. Changes in acid components with treatment, August1972. Computer-reconstructed gas chromatograms(RGC's) of methylated acid fractions, using themass spectrometer as the detector (plots ofamplitude vs. spectrum number). Time frames(spectrum numbers) are not equivalent—the rawsewage was run using a different GC program.(? = unknown compounds of similar structure.)
5. Physical-chemical effluent (as in Figure 4) withcorresponding limited mass range search for m/e103, indicative of long-chain &-hydroxy acids («).(C-,6 and C,g fatty acids are in such abundancethat their small m/e 103 peaks also give largesignals.)
6. RGC's of methylated acid fractions of two rawsewage samples collected at different times. GCtemperature programs were different, so time scales(spectrum numbers) are not equivalent.
7. RGC's of methylated acid fractions of two activatedsludge treated effluents collected at differenttimes. GC temperature programs were different, sotime scales (spectrum numbers) are not equivalent.(? = unknown compounds of similar structure.)
8. RGC's of methylated acid fractions of two physical-chemical treated effluents collected at differenttimes. GC temperature programs were different, sotime scales (spectrum numbers) are not equivalent.

FIGURES (Cont'd)
Number
9. Methylated solid condensate from distillationof raw sewage—RGC and limited mass range RGC'sfor m/e 74, 87, and 149 using the Varian CH-5GC-MS system (amplitude vs. spectrum number).
10. Mass spectra of the methyl ester of clofibratemetabolite. Standard (top) and the compoundextracted from activated sludge effluent (bottom).
11. GC-Fourier Transform IR spectra of the methylester of the clofibrate metabolite. Standard(top) and the compound extracted from activatedsludge effluent (bottom).
12. Changes in neutral components with treatment,August 1972. FID gas chroinatograms.
13. Changes in neutral components with treatment,December 1973. Computer-reconstructed gaschroinatograms, using the mass spectrometer asthe detector (plots of amplitude vs. spectrumnumber). The asterisk (*) designates the sameunknown compound in all extracts.HC = hydrocarbon.
14. Changes in basic components with treatment,August 1972. FID gas chromatograms.
15. Changes in basic components with treatment,December 1973. FID gas chromatograms.
16. Changes in basic components with treatment,December 1973. Computer-reconstructed gaschromatograms, using the chemical ionizationmass spectrometer as the detector (plots ofamplitude vs. spectrum number) .
17. Analysis of volatile acids by direct injectionof aqueous concentrates onto a 10% FFAP GCcolumn—FID detector.
18. RGC's of volatile neutrals, obtained by directinjection of aqueous concentrates into theGC-MS—10% FFAP column. (Si = silicon compoundsfrom column bleed.) Plots of spectrum number(full mass range) vs. % total ion current.

FIGURES (Cont'd)
I umber
19. Changes in neutral components in lime clarifiedraw sewage upon chlorination—RGC plots ofspectrum numbers (full mass range) vs. % totalion current. (* = matching peaks in the twoRGC's.)
20. Changes in bases in lime clarified raw sewageupon chlorination—RGC plots of spectrum number(full mass range) vs. % total ion current.(* = matching peaks in the two RGC's.)
21. Changes in acid compounds in lime clarified rawsewage upon chlorination—RGC's of methylatedextracts.
22. Changes in methylated acid extract of rawsewage upon ozonolysis. FID gas chromatograms.
RAW DOMESTIC SEWAGEAug. 7, 1972—TOC 50
Dec 5 1971 (T0C 7 0Dec. 5, 1973 ^ C Q D 2 6 ?
TOC 50BOD 100COD 200J> Typical ValuespH 7.5SS 10J
ACTIVATED SLUDGF TREATMENT10 GAL/MIN 8 HR. RETENTION
PRIMARY CLARIFIER
ACTIVATED SLUDGE/AERATIONTANK
FINAL CLARIFIER
FINAL EFFLUENTTOC 29—Aug. 7, 1972BOD 2T~COD 55 L TypicalpH 7 f ValuesSS 23
PHYSICAL-CHEMfCAL TREATMENT2 HR. RETENTION
RAPID MIX - FeCl-
FLOCCULATOR
CLARIFIER
DUAL MEDIA FILTERCOAL/SAND
CARBON COLUMNCALGON FILTASORB 3004 GAL/MIN/FT3 OF CARBON
Proc 3Typical JCOD 12Values S pH 7
LSS <5
FINAL EFFLUENTTOC lO^Aug. 7, 1972TOC
ss <
3 LITER SAMPLE(1) pH 2 (with dilute HC1)
(2) CH 2C1 2 (100 ml x 3)
ORGANICNEUTRALS
ORGANICLAYER
5% NaOH(50 ml x 2)
AQUEOUSLAYER
AQUEOUS(DISCARD)
CONCENTRATEin K-DEVAPORATOR
GC and GC-MS
CONCENTRATEin K-D EVAPORATOR
iMETHYLATE WITHDIAZOMETHANE
IMETHYL ESTERS
ICONCENTRATE
IGC and GC-MS
"AQUEOUSLAYER
(1) pH 11 (wi th 50% NaOH)
(2) CH-C1- (100 ml x 2)
AQUEOUS(DISCARD)
CONCENTRATE-IN KUDERNA-DANISH (K-D)EVAPORATOR TO ABOUT 1 ml
GC and GC-MS
500 ML
DISTILLATE
redistill1 ml
DIRECT AQUEOUSINJECTION GC
!GC-MS
SAMPLE
distill 25 ml
SOLID CONDENSA11
METHYLATE WITHDIAZOMETHANE
11GC and GC-MS

ACIDS (METHYLATED)XI
J l NEUTRALS
CAFFEINEHYDROCARBONS. \ 1
' ' xNl I / I ;
K. ,
SUNK
:| RAW SB/AGE
'<•••• ,
?,ACTIVATED SLUDGE EFFLUENT :i6 ris
CLOFIBRATEMETABOI ITE
\
PENTACHLORO-PH2N0L
H, W
C ,
•I. PHYSICAL-CHEMICAL EFFLUENT^ •: . B-HYDROXY ACIDS
K :i [iC10/C12/Ci4'&C16)
*\ \ *-a-KETO ACIDS (?)
.•-.. _/«A-.^^^v 9 US M JC # :» ,»J
PHYSICAL CHEMICAL EFFLUENT
PHYSICAL CHEMICAL EFFLUENT
8 LIMITED MASS RANGE SEARCH
m/e 103E.
8.
8.
u.
10 » 38 -
DECEMBER 1973
It.
8/5F^sT
'10
'16'18
CLOFIBRATEMETABOLITE
\
C16\
CIB!Ii
I J t*> S* fl«

AUGUST 1972
ETKYL'ACETATE (?)
•I• I : -
- H ,^^-^r~r-T'r-c~—-
'16•8-HYDROXY ACIDS
<C1O' C 1 2 ' C 1 4 & C16> C[^i
*a-KETO ACIDS ( ? ) 5 j;
'18
3S5 3W W 33T
'16
DECEMBER 1973
ETHYLACETATE
2~ETHYL
( METHYL PALMITATE[ft ( + PHTHALATECL0FI3RATE
METAEOLITEMETHYLMYRISTATE
PHTHALATEMETHYLSTEARATE
RGC - SUM
m/e 149(PHTHALATES)
SPECTRUi: IWMDir-R
80
60-
40-
20-
(V
NIH SPECTRUM
| | | .
!
. •L ii60 80 100 120 HO ieo JfeO 2C0 220 240 260 230 300 320 340
ACtlYATED SLUDGEEF>"LUENT ft 128
iact-jt ' i
V '--7 •u3-1
35CL
VrTHYL 2-(4-CHL0KC-PHiN0XY)-2-M£THYLPR0P!0,VATE
ci/oVo-c-dfCK- CCH,
CL +
[M - COOCK3I
•« 3 tr 31 . y.
vz: ;•» C»
M
223
^ - ^ • ^ ^ , • • , . • , , .a a a ^ ' :s a a rs -.* 3 -•:.
M/E
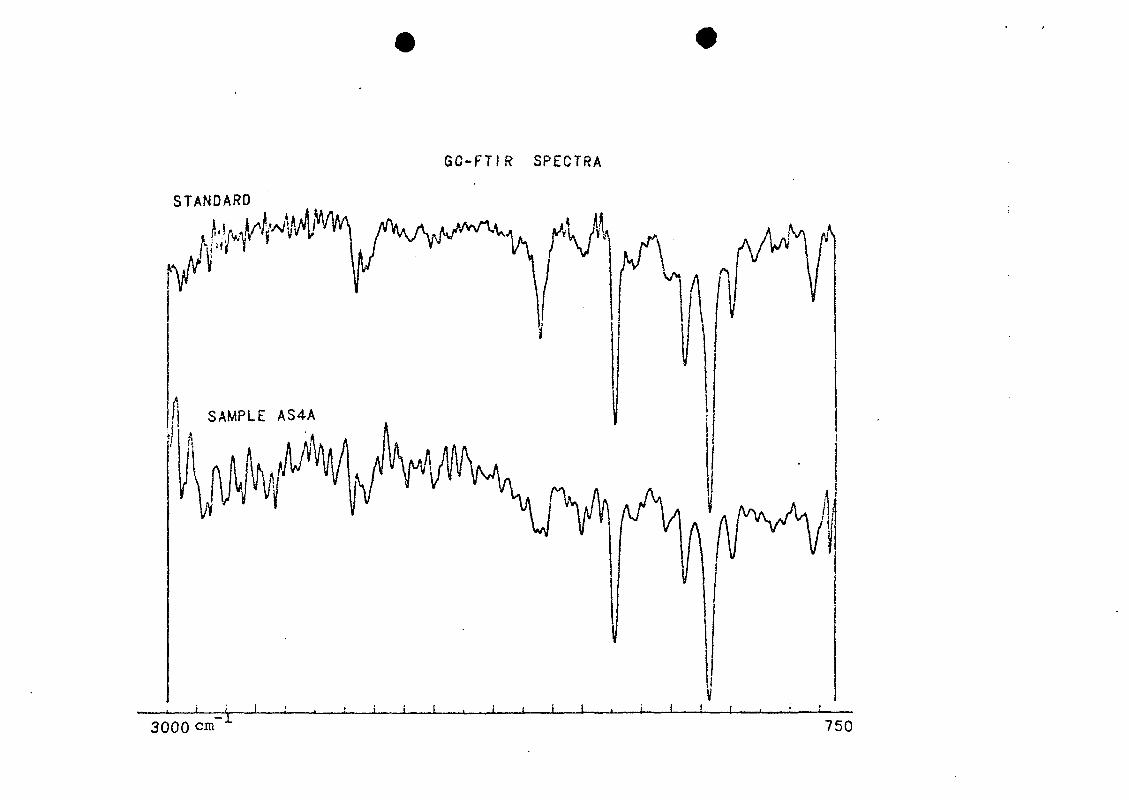
GC-FTIR SPECTRA
STANDARD
3000 cm 750
. •-'•; 33 L A N Kt..:
X 2.5I ':
V, RAW SEWAGE
'P- %X 0.1
nt. ACTIVATED SLUDGEj>'| EFFLUENT
5SIS i A 1
V ,
%w
(0 WO Pp; oo o
v •,
PHYSICAL-CHEMICALEFFLUENT
X 1
10 20MINUTES
30

i BLAi
iK
100 K 0 200— ^
250 300 35
PH.TH
0 400
T i l
~ — .
4 5 0
RAW SEWAGE UN SATURATED OR'OXYGENATED HC
CAFFEINE HCa-TERPINEOL
ft ALIPHATIC
T1J
DIOCTYL•PHTHALATE
:PHT1|AI^TE__,_,100 150 200 250 300 350 400 450
ACTIVATED SLUDGEEFFLUENT
UNSATURATED OROXYGENATED HC
XYLENECAFFEINE
2-ETHYL-1-HEXANOL
II
DIOCTYLPHTHALATE
\
100
DIBUTYLPHTHALATE
150 200 250 300 350 400 450
PHYSICAL-CHEMICALEFFLUENT
CYCLOOCTA-TETRAENE(?)
CAFFEINEDIETHYLX
DIBUTYLPHTHALATE
TRIMETHYLPYRIDINE (?)
ri
DIOCTYLPHTHALATE
rPHTHALATE
100 150 200 250 300 350SPECTRUM NUMBER
400 450
'; :i LA: :r.
siA.L
; RAV? SEWAGE
X0.2
'• i . : - • J: \ '• I s /
! ACTIVATED SLUDGEI EFFLUENT
A
;LPHYSICAL-CHEMICAL
EFFLUENT
S.XI
S
f i lNUTES ->•
ACTIVATEDSLUDGEEFFLUENT
PHYSICAL-CHEMICALEFFLUENT
MINUTES

K.
V.
P.
B.
RAW SEWAGE
0 10 iff 3^ -WStETHH fU«CP
NICOTINE\
CAFFEINE
MOTIVATED SLUDGEEFFLUENT
8.
CAFFEINE
e in ?o * « so so TO ee 38 ie» no tzs ias I-W iso ico ITS IWJ IM ar i n 220 ao
PHYSICAL-CHEMICALEFFLUENT
u 3 ii « a in it m » i» in ia |3( i-te iss iso n« leo iso
RAW SEWAGE
AUG. 1972
X 149
ACTIVATED SLUDGEEFFLUENT
AUG. 1972
X 1.5
STANDARDS
N
49
•+- 1 1
BUTYRIC 19 =MINUTES
ISOBUTYRIC 41 = PBOPIONIC
8 = CAPROIC 20 = ISOVALERIC 49 = VALERIC
RAW SEWAGE
FULL MASS RftftGE
ACTIVATED SLUDGE EFFLUENT
50-
30-
C"
PZrJ^i
Si
eerl-r ( I t l T ] I T r t | 1 » I
30 120- I • ' ' «•! ' • »
150 170r^ -ryf r* f ' n v p m yt TT r- 't'T't*f 'n
190 £10 £30
FULt RflSS RANGE
PHYSICAL-CHEMICAL EFFLUENT
S i
FULL P1ASS RANGE
?©-
50-
33-
&
BEFORE CHLORINATIONO-TERPINEOL
BENZYLALCOHOL
•y-r-fi
20 6©
* *
TTj-yy, i | r I • , |
&a ioa
CAFFEINE
/v^Vrv^170
T"^r
AFTER CHLORINATION
BENZALDEHYDE
CHLOROCYCLOKEXANEA"
250
BEFORE CHLORINATION
839
90-
70-
56-
30-
10-
AFTER CHLORINATION
*A. JLJ
180 120[-ft- r-i -f T t-T-TT-r-
17«
FULL MASS RANGE
S i
S i
< p'riT|Ti'i » )•
219
s
3 10 TO ?9 10 CO '«) to ?0J ! tL_-_.L J !
<C
mpa
^ ^ - I . .
/ 1,1,2,2-TETRACHLORO- 5ETHANE
;
JCLOFIBRATE\^AIE'
PENTACHLORO-_ / ETHA1-JE
HEXACHLORO-xETHANE
/
•
u
a'S
6"
5.
N
O -
s:
B:a:r
a:8:5 -
V> 50 «t 70 83 90:...._.l L._...l_....t- -J—-
m
parnr->rr:I—o
CD
'ALICYLIC ACID
( CLOFIBRATEi
:! nrr! BEFORE OZONOLYSIS
X PEAKS DISAPPEAR
V• l \
'16
AFTER OZONOLYSIS
MINUTES --
IDENTIFICATION OF THE CAUSE OF ODOUR NUISANCE IN THE
NEIGHBOURHOOD OF AN INDUSTRIAL WASTE WATER SITE
Drs. C. Morra,Drs. F. de Grunt,Ing. A. de Boer,Mr. G. Piet.
ABSTRACT
The odour nuisance caused by an effluent composed of several
industral effluents and domestic sewage was examined to indicate
(a) particular responsible polluter(s).
The effluent was examined by gaschromatography-mass spectromctry
and the results were compared with organoleptic observations.
Instrumental analysis as well as sensory evalution indicated both
the responsible polluter, by which is demonstrated that sensory
evaluation can be used as an usefull analytical tool.
1. INTRODUCTION:
The odour nuisance of a particular effluent could be caused by
three suspected polluters, factory X and Y and domestic sewage
from a city. The combined waste water is discharged into open
surface water, at location Z, where a rapid dilution can take
place. Factory X released about 100 times more waste water than
factory Y.
When the effluent discharge started the population started com-
plaining about odour nuisance;. The type of smell was described
as sewery-like, but more times complaints indicated an "indus-
trial" odour. Recreation on the open surface water became res-
tricted because of the odour nuisance.
7m investigation was started in 1974 and the combined waste water
at the location 2 was analyzed with G.C.-M.S. The polluter Y
probably caused the odour at that time. The polluter Y changed
its effluent treatment system but the local population kept com-
plaining about odour nuisance, the character of the odour seemed to
be somewhat different however.
In the summer of 1975 an orientation was made using sensory eva-
luation and instrumental analysis. Both methods indicated polluter
X as the responsible one at this moment, A final investigation to
establish the responsible polluter with ample evidence was started
at the end of 1975.
At the time sufficient data were available about the type of
components released by the individual polluters, while the
waste water system was better known too. It should be kept in
mind that chemical reactions of individual componentsoriginating
from different sources could give chemical reactionsleading to
the formation of odourous products.
- 2 -
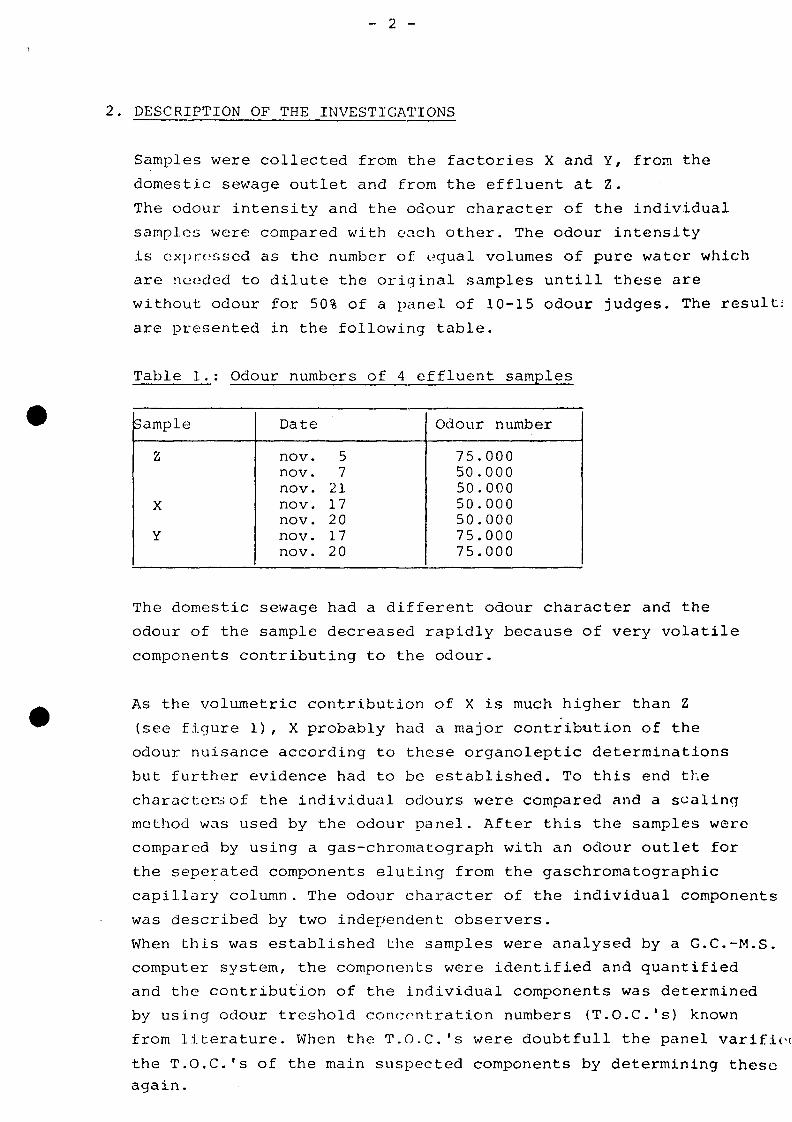
2. DESCRIPTION OF THE INVESTIGATIONS
Samples were collected from the factories X and Y, from the
domestic sewage outlet and from the effluent at Z.
The odour intensity and the odour character of the individual
samples were compared with each other. The odour intensity
is expressed as the number of equal volumes of pure water which
are needed to dilute the original samples untill these are
without odour for 50% of a panel of 10-15 odour judges. The result:
are presented in the following table.
Table 1.: Odour numbers of 4 effluent samples
Sample
Z
X
Y
Date
nov. 5nov. 7nov. 21nov. 17nov. 2 0nov. 17nov. 2 0
Odour number
75.00050.00050.00050.00050.00075.00075.000
The domestic sewage had a different odour character and the
odour of the sample decreased rapidly because of very volatile
components contributing to the odour.
As the volumetric contribution of X is much higher than Z
(see figure 1), X probably had a major contribution of the
odour nuisance according to these organoleptic determinations
but further evidence had to be established. To this end the
character..-; of the individual odours were compared and a scaling
method was used by the odour panel. After this the samples were
compared by using a gas-chromatograph with an odour outlet for
the seperated components eluting from the gaschromatographic
capillary column . The odour character of the individual components
was described by two independent observers.
When this was established the samples were analysed by a G.C.-M.S.
computer system, the components were identified and quantified
and the contribution of the individual components was determined
by using odour treshold concentration numbers (T.O.C.'s) known
from literature. When the T.O.C.'s were doubtfull the panel varificc
the T.O.C.'s of the main suspected components by determining these
again.
- 3 -
In this way a final report could be made indicating the respon-
sible polluter.
3. RESULTS OF THE ORGANOLEPTIC RESEARCH
The evaluation of the character of the sample odour was made
by comparing the effluent samples with each other and by
comparing each sample with calibration substances.
A list of the calibration substances with their individual
odour character and the results obtained with the scaling method
is presented in table. 2.
The calibration substances were chosen in accordance with the
odour of the samples.
0 = no resemblance
10 = full resemblance.
Some conlcusions can be drawn already
- There is an evident odour resemblance between X and Z.
- There is no evident odour resemblance between Y and Z.
- Ethyldisulfide is X more elevated at Z which suggests a certain
contribution of domestic sewage, the odour disappears rappidly
however, after 5-10 minutes the Z sample scores lower for
ethyldisulfide while 6 and 7 become more elevated.
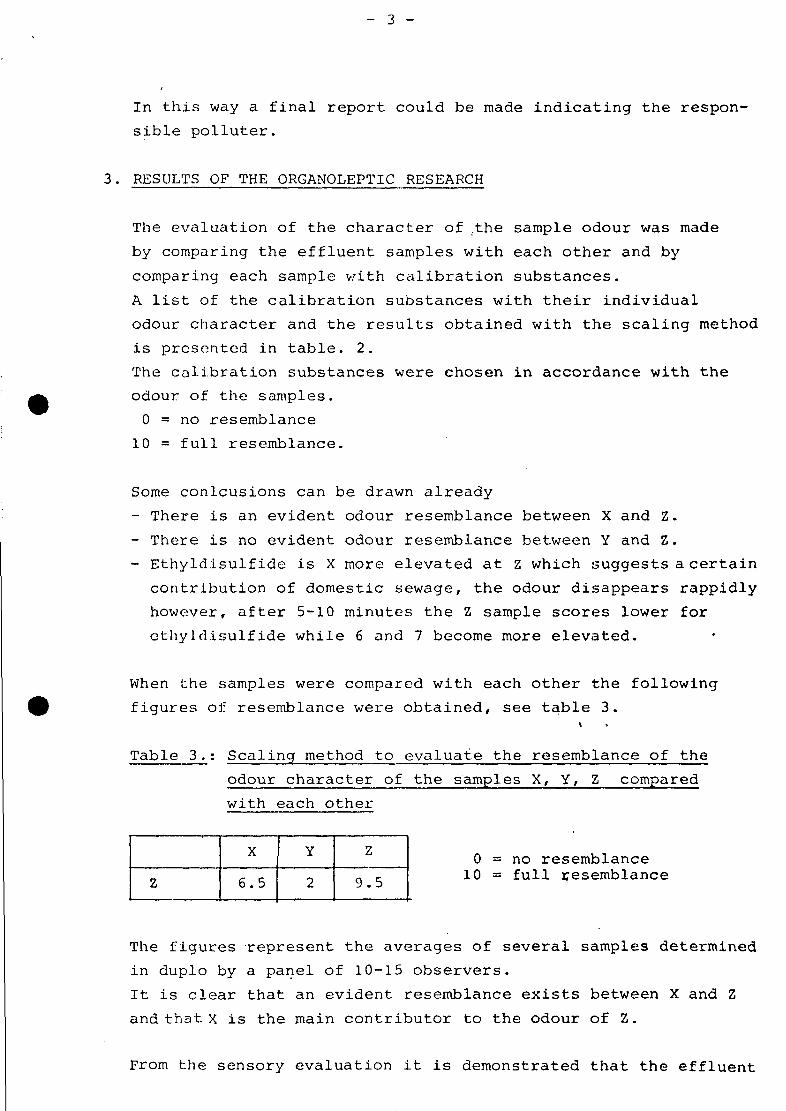
When the samples were compared with each other the following
figures of resemblance were obtained, see table 3.
Table 3.: Scaling method to evaluate the resemblance of the
odour character of the samples X, Y, Z compared
with each other
0 = no resemblance10 = full resemblance
The figures represent the averages of several samples determined
in duplo by a panel of 10-15 observers.
It is clear that an evident resemblance exists between X and Z
and thatx is the main contributor to the odour of Z.
From the sensory evaluation it is demonstrated that the effluent
zX
6 .5
Y
2
Z
9 . 5

- 4 -
at Z has a certain contribution of domestic sewage, but the
nuisance in the environment comes from an industrial effluent
namely X- The domestic effluent's odour character is not really
observed at location Z, but the "industrial" odour causes the
problems.
4. IDENTIFICATION AND ODOUR EVALUATION OF THE INDIVIDUAL COMPONENTS
OF THE SAMPLE
The samples were extracted with a cyclohexane-diethylether mixture
(1:1) of 1% (1:100). The extracts were concentrated by means of a
gentle pure nitrogen stream and a splitless injection of 1 ul was
made on a capillary column. The elute of the column was fed to
a flame-conization detector (10%) and the remaining was diluted
with nitrogen and fed to an outlet where a odour observer was
. stationed, (see figure 2). The odour intensive peaks were marked
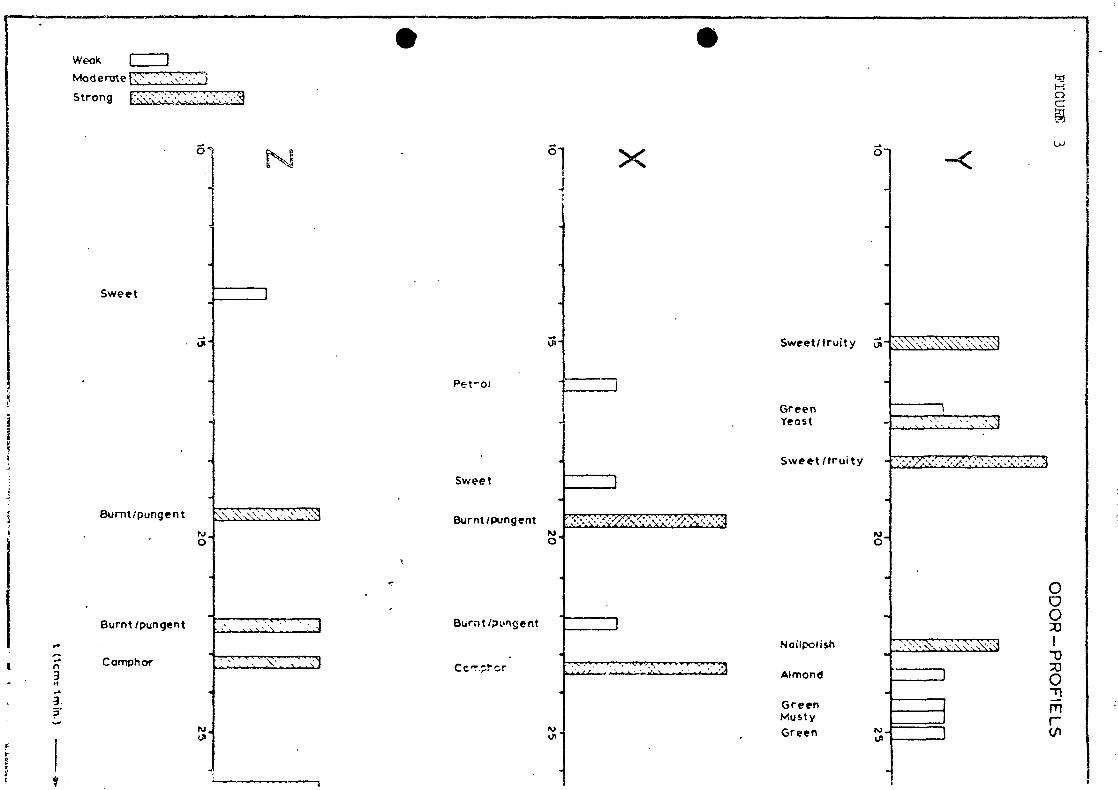
and the odour characterized (see figures 3 and 4). The odour
intensive peaks were particularly examined by G.C.-M.S. and a
list of peaks of interest was made with a description of the
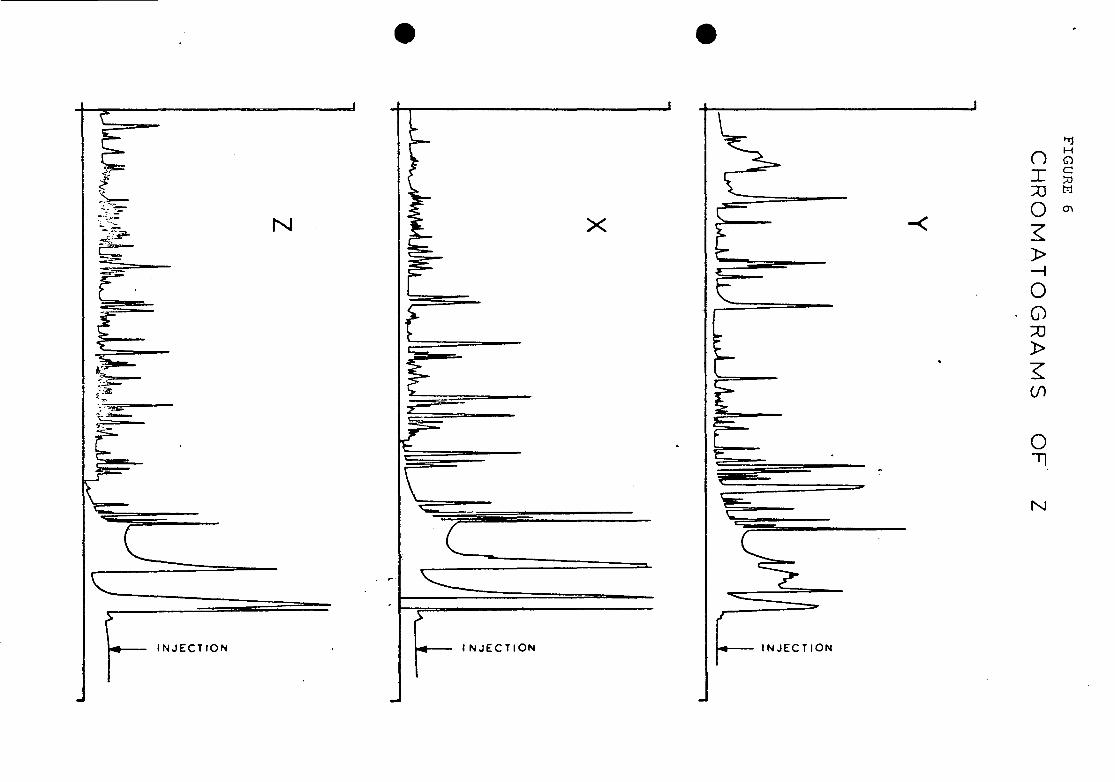
odour character (figure 6, 7 and 8). After this a so called
odourogram was set up where the concentration of a particular
component was plotted in its ratio to the threshold odour con-
centration (1 means that the concentration = the odour threshold
concentration as determined by a panel where 50? of the members
observe the odour and 50% does not observe it). A component in a
concentration ratio 1 will be noticed by 50% of a population
and contributes to the odour of the samples'(figure 9).
It is evident from the odourograms that X is the main contributor
to the odour nuisance caused by the effluent at Z. Particularly
naphtalene and the substituted naphtalens, besides indene,
indanes, ethylbenzene, dimethylstyrene and acenaphtene are causing
the odour nuisance at location Z.
5. INSTRUMENTAL ANALYSIS
A capillary column 50 m, OV, i.d. 0,32 mm was used for seperating
the substances. A Dupont 492 mass-spectrometer was used for makinq
the fragrnentograms (scan time = 1 sec.decade) and a Interdata
computer was used for the calculation and storage of the fragmento-
grams. Strongly polar components were not analyzed and organic
sulfur components were not registered with the analytical systems.
- 5 -
The odour character of the substances identified however, were in
accordance with the odour character of the samples of location Z
causing odour nuisance.
DISCUSSION
Sensory evaluation coupled with advanced instrumental analysis
is of great assistance in finding causes of odour nuisance.
The human nose, when used in a right way, so that the observations
are made in such a way that they are statistically reliable, is
still a very valuable instrument in finding polluters. The factory
X is evidently responsible for the odour nuisance as is proven
by different independent methods and measures have to be taken
to avoid this in the future. As oftentimes an expensive invest-
ment has to be made by polluters'to treat their effluent before
releasing these to open surface waters, clear evidence has to
be established to demonstrate the source of the pollution.
Instrumental analysis combined with sensory evaluation is a mighty,
tool to perform these difficult tasks.
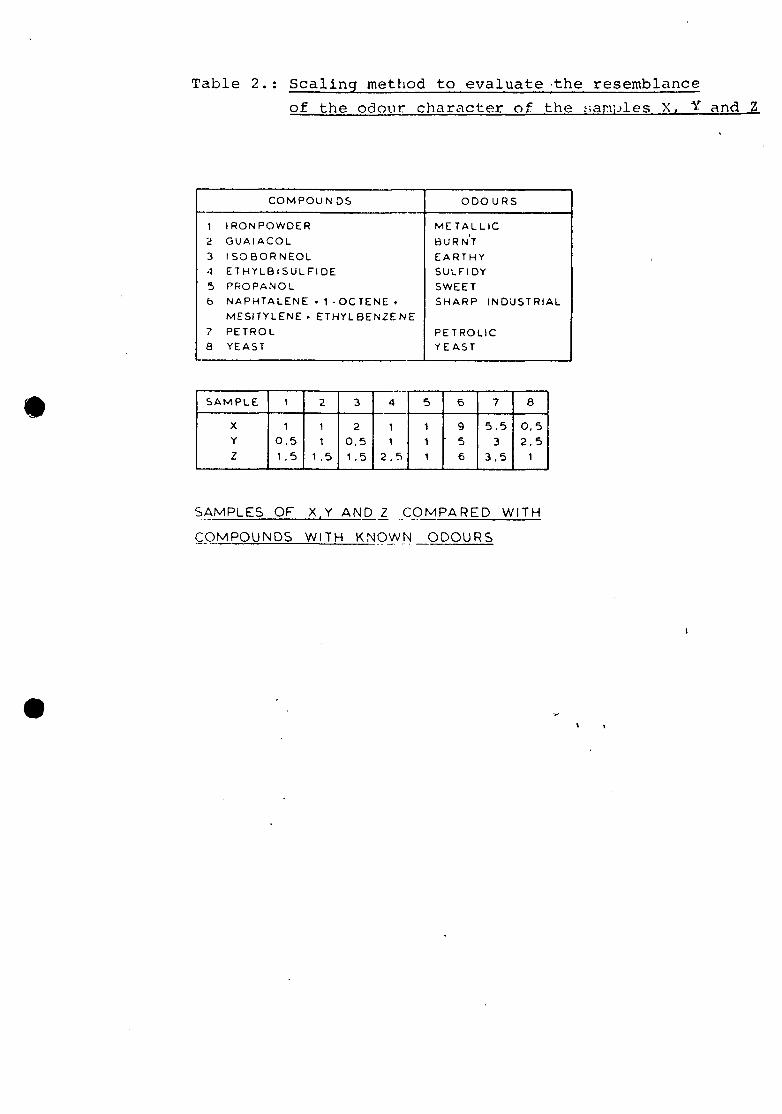
Table 2.: Scaling method to evaluate the resemblance
of the odour character of the samples X, Y and
1
2
3
A
5b
78
COMPOUNDS
IRONPOWDERGUAI ACOLI SOBORNEOLETHYLBISULFIDEPROPANOLNAPHTALENE•1-OCTENE•MESITYLENE. ETHYLBENZENEPETROLYEAST
ODO URS
METALLICBUR N'T
EARTHYSULFIDYSWEETSHARP INDUSTRIAL
PETROLICYEAST
SAMPLE
XY2
1
1
0,51,5
2
11
1 .5
3
20,51,5
4
11
2 , 5
5
1
1
1
6
9• 5
6
7
5,53
3,5
8
0,52,5
1
SAMPLES OF X.Y AND Z COMPARED WITH
COMPOUNDS WITH KNOWN ODOURS
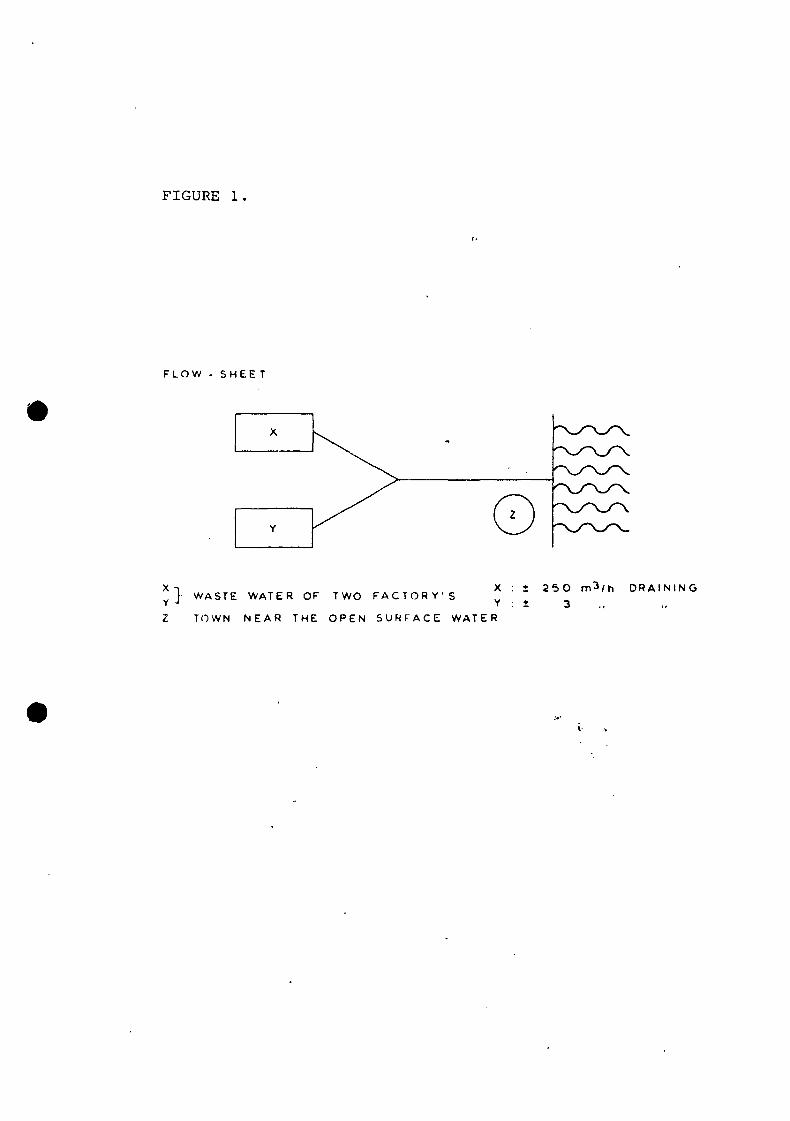
FIGURE 1 .
F L O W - S H E E T
} W A S T E W A T E R OF T W O F A C T O R Y ' SXY
T O W N N E A R T H E O P E N S U N F A C E W A T E R
2 5 0 m 3 / h D R A I N I N G
3
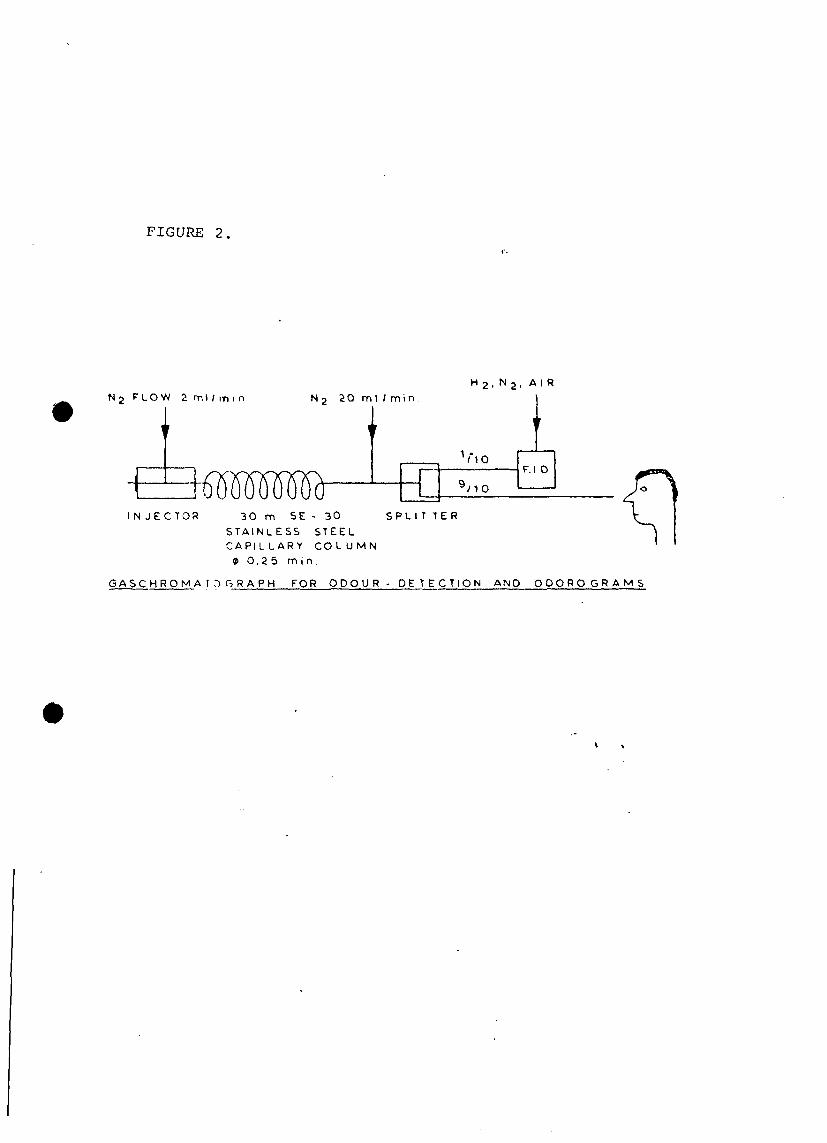
FIGURE 2 .
N j F L O W 2 m l / t n i nH 2 . N 2 , A I R
No 20 mI / mi n
mwm' M O
f / 1 O
F.I D
I N J E C T O R 3 0 m S E - 3 0 S P L I T T E R
S T A I N L E S S S T E E L
C A P I L L A R Y C O L U M N
<t> 0 , 2 5 m i n .
G A S C H R O M A I O G R A P H F O R O D O U R - D E T E C T I O N A N D O D O R O G R A M S

Petroi
Weckcorrpftor °
^;v,-W^v.;j
V.'eakcomplior [ • •
Petro!S tear ire
Plastic
Earthy/pungent
Puncsnt
01
Earthy/pungent
-
01
Eorty/Pungcnt
— ™ •>
•'. . . V . . . N \ \ >
Burnt/pine
Green-
PineU) -01
Mint
Spicy /burnt
Thinner
I
1
I
I
Sewery
8urnt
O o
PetrolPlastic
l-l
(Jt
i
\
j
i
Weak I I
M o d e r a t e K s \ . V ' v , >
Strong fc^A'SA;;-:-:
6'
Sweet
•
Burnt/pungent
o"
Burnt/pungent
- ? Camohor
;
t
3t
5
r
•
I
Pet-oi
-
Sweet
,> .fivs-. • \ i i'. .i i\1 Burnt/pungents-
r
VOi
•
(3or—'
Sweet/fruity jt-
1
GreenYeast
Sweet/fruity
I
o '
1Nailpolish
*+'f<{ •'*> ' • ' " • • • " A l m o n d
GreenMustyGreen J -J
-
. v\ fs-..': \ . \-^
0D
o33
• * * •. * N *^i \ s "'<."'.\.\S'»N>*\'vJyJ
I
O-nrnH
1

TRIMETHYL - NAPHTALENE(EARTHY PRICKLED )
DIMETHYL - NAPHTALENE(WEAK CAMPHORIC)
J2METHYL-NAPHTALENE
( C AMPHORIC )
JLO NAPHTALENE
( CAMPHOR IC )METHYL - INDENE
(UNPLEASANT BURNING)
AINDENE
(UNPLEASANT BURNING)
oao
ooZX3
oTl
O
M
'V
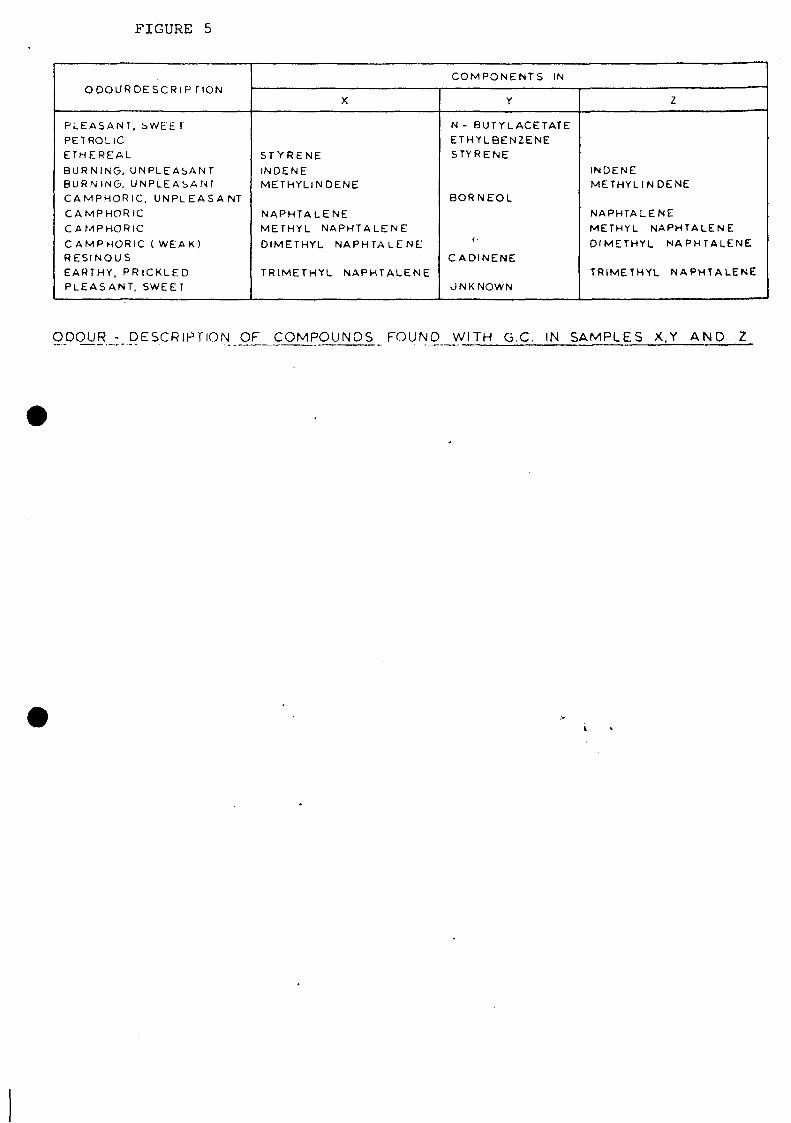
FIGURE 5
^^k f ^ ^ ^ • f ^ \ ^ * \ ^ * ^ ^ r*H * ^ _ f\ ^ * ^»« * .
ODOURDESCRlP TION
PLEASANT, bWEET
PETROLIC
ETHEREAL
BURNING, UNPLEASANTBURNING, UNPLEASANT
CAMPHORIC, UNPLEASANT
CAMPHORIC
CAMPHORIC
C AMPHORIC ( WEA K)RESINOUS
EAHTHY, PRICKLED
PLEASANT, SWEET
COMPONENTS IN
X
STYRENE
INDENE
METHYLINDENE
NAPHTALENE
METHYL NAPHTALENE
DIMETHYL NAPHTALENE
TRIMETHYL NAPHTALENE
Y
N - BUTYLACETATE
ETHYLBENZENE
STYRENE
BORNEOL
CADINENE
UNKNOWN
Z
INDENE
METHYLINDENE
NAPHTALENE
METHYL NAPHTALENE
DIMETHYL NAPHTALENE
TRIMETHYL NAPHTALENE
ODOUR - DESCRIPTION OF COMPOUNDS FOUND WITH G.C. IN SAMPLES X,Y A N D 2
N
INJECTION INJECTION
O o
O
o70
00
O

CHROMATOGRAM OF Z
HoaS3w
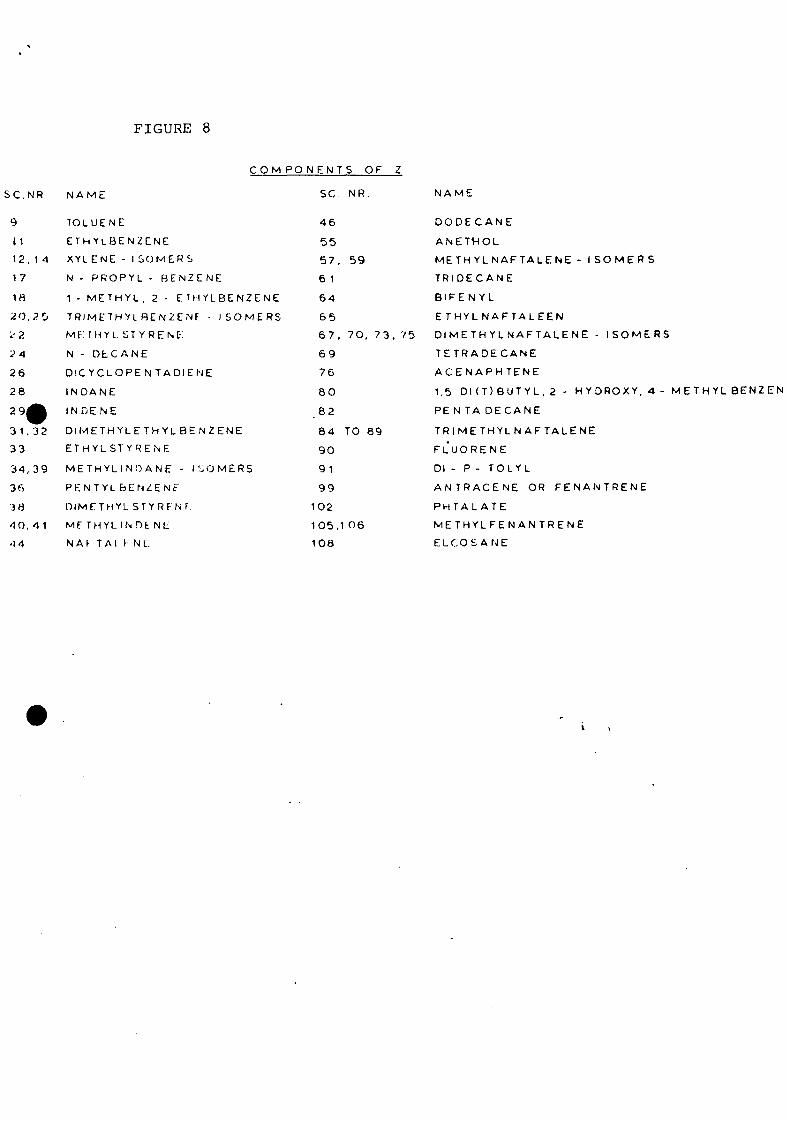
FIGURE 8
SC.NR N A M E
C O M P O N E N T S OF Z
SC NR.
9
11
1 2 . 1 4
17
1f l
20 .25
1-2
la,
2 6
2 8
2 9A
3 1 . 3 2
3 3
34,3 9
3 6
3 8
40, 41
•1-1
TOLUENE
E T H Y L B E N Z E N E
XYL ENE - 1 SOMEHS
N - PROPYL - BENZENE
1 - METHYL. 2 - ETHYLBENZENE
TRIMETHYLBEN2ENF • ISOMERS
M f: 1 H Y I. S T Y R E N E!
N - D t C A N E
D!C YCLOPEN TADIENE
INDANE
INDENE
DIMETHYLE THYL BENZENE
ETHYL STYRENE
METHYLINDANE - ISOMERS
PENTYL BENZENE
DIMETHYL STYRF.N F
Mf THYL IN Dfc N f
N A \ T A 1 KNt:
4 6
5 5
57
6 1
6 4
6 5
6 7
6 9
7 6
8 0
8 2
8 4
9 0
9 1
9 9
1 0 2
1 0 5
1 0 8
, 59
, 70 , 7
TO 89
,1 06
NAME
DODECANE
ANETVHOL
METH Y L N A F T A L E N E - I S O M E R S
TRIDECANE
BIFEN YL
E THYL NAF TALEEN
75 DIMETH YLNAFTALENE - I SOMERS
TETRADECANE
A C E N A P H TENE
1.5 D I ( T ) B U T Y L , 2 - H Y D R O X Y . 4 - METHYLBENZEN
PE N TA DECANE
TRIME THYL NAF TALENE
FLUORENE
Dl - P - TOLYL
ANTRACENE OR FENANTRENE
PHTALATE
METHYLFENANTRENE
ELCOS ANE
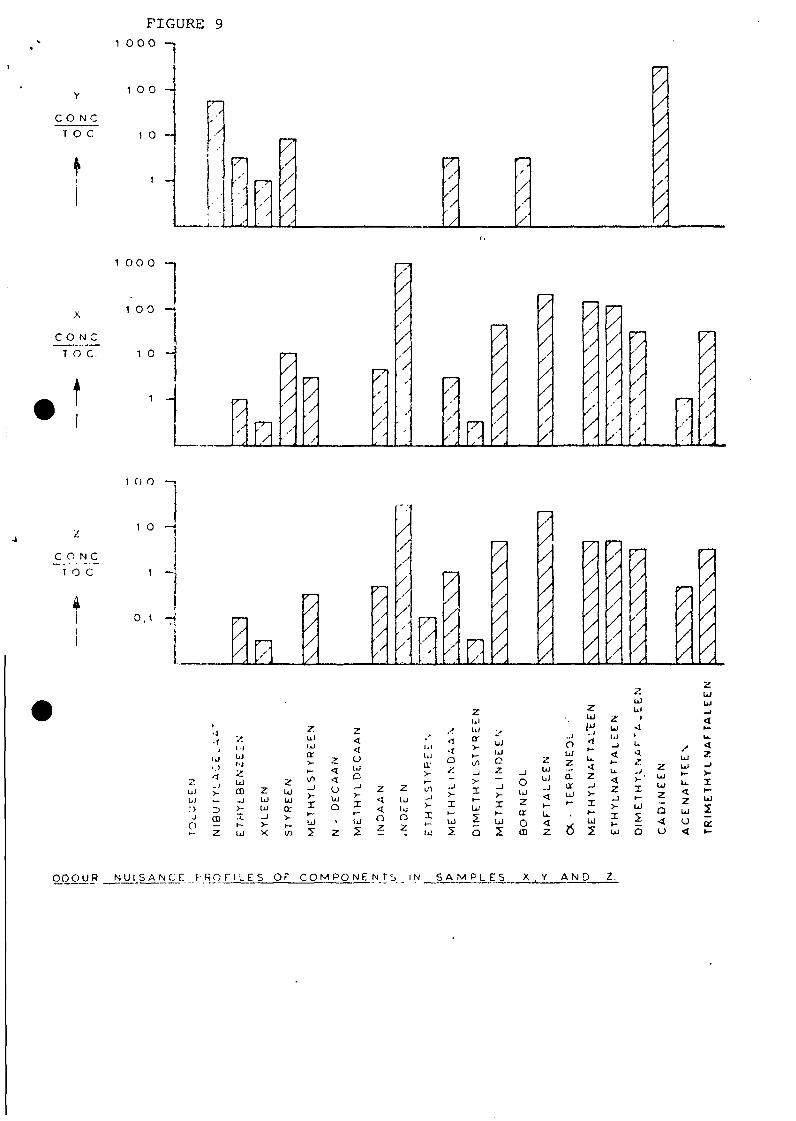
FIGURE 9i 0 0 0 - ,
Y
C O N C
T O C
1 0 0 -
t 0 -
x
CO NC
T O C.
100 0
I O O -<
1 0 -
1 -
_C_O N C
T O C
1 f) 0
1 0 - !
0 , 1
• I• 1
'6 »
XIIuit-i'Z.uiCD
X
zUlUl
>-X
2UJUl•t
ul
Ui
D
oUlQ
Id
O
III
UJ
IX
1/1
V
I
•IOy.—
i
ii—t, i
zuuiorV
_ j
V
II—
Ul
2
o2
LJ
oILJ
2(£
oCD
UJUl
JOu/ZaorUJ
ZUI
u
2
I•-Ul
I.I
<2
I
zului
I
Ul
ui2
UlUl.1<
uiUJ
z hfui £
O D O U R N U I S A N C E f - R O F I L E S O F C O M P O N E N T S I N S A M P L E S X . Y A N D 2 .
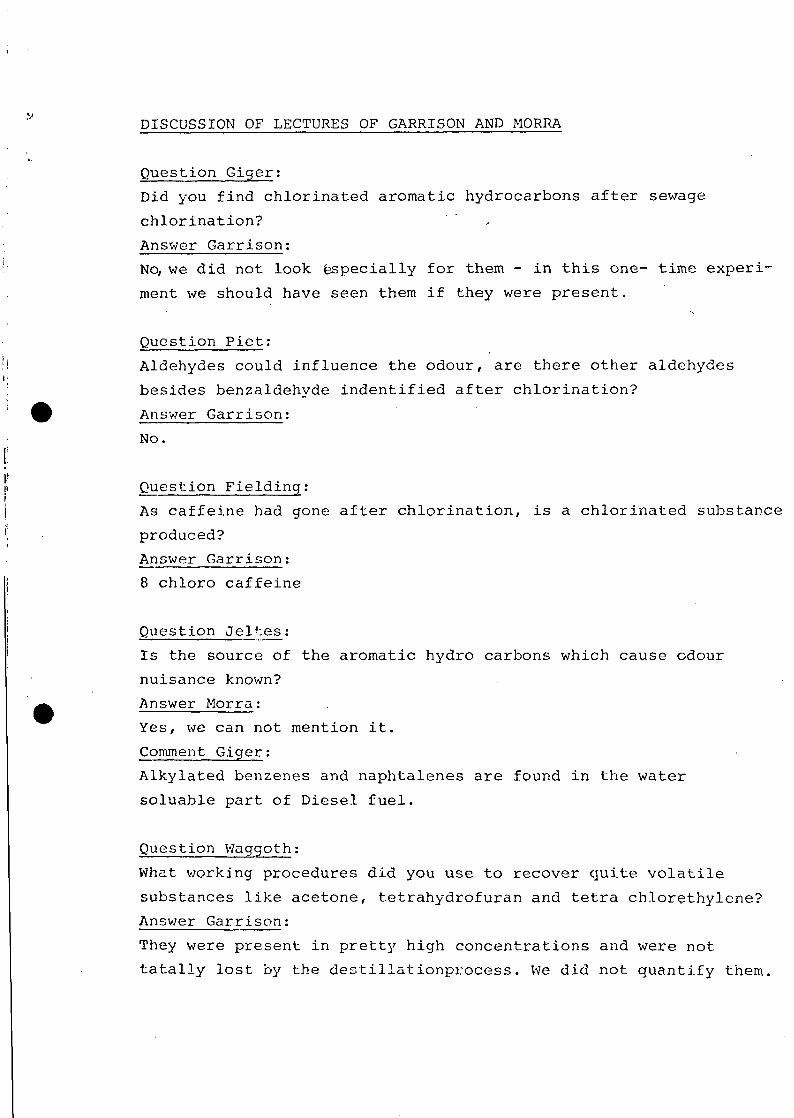
DISCUSSION OF LECTURES OF GARRISON AND MORRA
Question Giger:
Did you find chlorinated aromatic hydrocarbons after sewage
chlorination?
Answer Garrison:
No, we did not look ^specially for them - in this one- time experi-
ment we should have seen them if they were present.•s
Question Piet:
Aldehydes could influence the odour, are there other aldehydes
besides benzaldehyde indentified after chlorination?
Answer Garrison:
No.
Question Fielding:
As caffeine had gone after chlorination, is a chlorinated substance
produced?
Answer Garrison:
8 chloro caffeine
Question Jeltes:
Is the source of the aromatic hydro carbons which cause odour
nuisance known?
Answer Morra:
Yes, we can not mention it.
Comment Giger:
Alkylated benzenes and naphtalenes are found in the water
soluable part of Diesel fuel.
Question Waggoth:
What v.'orking procedures did you use to recover quite volatile
substances like acetone, tetrahydrofuran and tetra chlorethylene?
Answer Garrison:
They were present in pretty high concentrations and were not
tatally lost by the destillationprocess. We did not quantify them.

11
IJ
JJ
JJ
j
I
ORGANIC MICRO POLLUTANTS IN THE
RIVERS RHINE AND MEUSE
drs. U. van de Fleent
Text of the lecture held at the
Colloquium Analysis of Organic
Micro pollutants in Water on
10th February 1976 at the National
Institute for Drinkinguater supply
KEURINGSINSTITUUT UOOR WATERLEIDINGARTIKELEN KIWA l\l. V,
3
J
- 2 -
Organic Micro Pollutants in the Ri.uBr Rhine and M e u s e .
Ever since 1973 the rivors Rhine and Meuse have? been regularly tested by
KIWA for the presence of organic micropollutants. This investigation
(KIWA/RIblA project) is carried out in co-operation with those wator
companies forming the Rhine Committee of U/atercompanies in the Nether-
lands having the aim of gathering information about the nature and
eppearancG of organic compounds in surface water used for the public
water supply.
During 1975 the investigations were continued at which much attention
was paid to the identification of organic compounds and the nuantification
of certain interesting components. With the help of the following
classification a view will be given of a part of the results obtained
From the investigations carried out during 1975.
Sample Programme
Analytical Methods
View of identified Compounds
Organic Chlorine Compounds
Polynuclear Aromatic Hydrocarbons
Sfimnln Pronrnmmn.
Both the Rhino and the Meuse are important rivers in relation to the
public water oupply. In 1975 samples of 20 1 were weekly taken from
the Wnal at Oraksl and from the Mouse at Berg and at Heusden.
Fig. 1 shows the sampling spots. Thereupon the samples were transport-
ed to the KHJ!A/R IUJA laboratory at Dergambacht and put into work.
The mass-spectrornetrical identification of the individual components
was carried out in the KIWA laboratory at Rijswijk.
Analytical Methods.
The analytical procedure is schematically shown in fig. 2 and proceeds
as follows:
Tho 20 1 sample is exhaustively extracted with 2 1 petroleum ether (PE)
for 16 hours with the help of the so-called KIWA extractor.
Thi3 extraction procedure guarantees an almost complete recovery at a
great variety of compounds, like those occur in polluted surface water.
*) KIWA is granted the hospitability of this laboratory by the Dune
Water works of The Hague.
Ii
ii
liii
i
- 3 -
The petroleum ether extract is concentrated to 250 ml by means of
evaporation 25 ml of this is resorued for the determination of the
E0C1 content (the fraction of the organic chlorine compound extractable
from water by petroleum ether) faulty called T0C1 (Total Organic
Chlorine content).
This analysis is carried out by burning the.sample in an oxygen furnace
and by determining the chloride developed at that microcoulometrically.
The other part of the petroleum ether extract is washed with diluted
hydrochloric acid in order to isolate the basic organic compounds.
The diluted hydrochloric acid is then extracted with diethylcther
(DEE) after which a gaschrornatographic (GC) and/or gaschroma tographic-
mass-spQctrometric (GS-MS) determinations of the aromatic bases follow.
The petroleum ether washed with diluted hydrochloric acid is concentrated
to 5 ml by moans of evaporation and column-chromatographically separated
by means of a silicagel column in an aliphatic fraction, an aromatic
fraction and a fraction containing polar organic compounds (oxys) such
as alcohols, esters etc.
Except for the aliphatic fraction (oil) the occurring compounds are
determined gnschromatographically and/or gaschromatographically-rnass-
spoctrometrically.
According to tho procedure described there is a possibility to ioolato
a large number of compounds from water and afterwards to separate them
mutually, to identify them as well as to determine their quality.
Organic Microoollutants•
Tables I, II and III sum up all organic compounds found in the rivers
Rhine (Uaal) and Mouse and which were determined mass-spectrometriclly
during the period of 1972 to 1975 inclusive.
The compounds with a dotted line havo only been indicated in the Meuse.
It will striko the attentive reader that the table includes compounds
which do not belong under the heading of this table, (hexachlorocyclo
hexane, limonone). The indications "Aromatics", "Aromatic Bases" and
"Oxys" apply to most of the compounds occurring in the fraction in
nuestion. The fact that a matter might land in the "wrong" fraction
can be explained by its physical chemical properties. The tables suffice
with the name of the compound without mentioning which isomers were
indicated.
I
j
One or'more isomors have been found in the majority of tho eligible
compounds. This contoxt will not go into this with the exeption of
dichlorotolunne. Dichlorotolueno is present in both the aromat '
tho oxy-fraction. In the aromatic-fraction the dichlorotoluene from
2 to 5 occurs whereas in the oxy-fraction this is the oS, c^-dichloro-
toluene. The occurrence of phtalntes in the base and oxy-fraction can
bo oxplainod by an incomplete extraction when washing the petroleum-
ether with diluted hydrochloric acid. The occurrence of a number of
compounds (nitrotoluene, nitrobenzene, tetrachlorophenol) in the
aromatic as well as the oxy-fraction is caused by an incomplete separat-
ion on tho silicagel column. These compounds form the "transitional
phase" between the aromatic and the more polar oxy-fraction.
OrgnnJc Phi or inn Compounds.
During 1975 the analysis of organic chlorine compounds was appraoched
from two sides, namely by means of the determination of the total
organic chlorine content of the petroleum ether extract (see the
analysis scheme) and the sum of the chlorine content of individual
organic chlorine compounds from the different fractions.
Table IV shows a number of organic chlorine compounds indicated in
Ij/aol water. The contribution of the individual components to the total
organic chlorine contont calculated from the concentrations has been
tabulated as well as the microcoulomotrically determined EOC1 content.
Those results have been plotted in fig. 3 and shows that the EOC1 con-
tent of tho Waal generally fluctuated from 10 to 20 Lig/l.
The sum of the chlorine content of the components in the ttable
fluctuated from 2 to 5 Jjg/l with the exception of the first nuarter
of that year. The results of the Meune are shown in table V and fig. 4.
The organic chlorine contents of the fleuse are generally between 5
and 15 ug/l. The num of the chlorine contents of the individual components
is smaller than 1 and has not been plotted in the figure.
When comparing the.' results of the Waal with the ones of the Meuse it
is striking that tho occurrence of organic chlorine compounds differs
in both a auulitntivo and a quantitative respect. The contents of tho
Mouse are lownr, yet in spmo enseo remarkable values ere found.
From the analytical point of view, tho results show us that we are
JIj
Jj
j
3
j
- 5 -
not yet able to determine all individual parameters. Our research efforts
have to be directed to filling this lack of knowledge.
Polynuclear Aromatic Hydrocarbons.
The second group of organic compounds to be considered is formed by
the polynucleor aromatic hydrocarbons in so far as thay can be
determined by means of the applied gaschrom'atographical method.
The concentrations of phonanthrene, fluoranthene and pyrene found in
the Waal and Clause) in 1975 are given in tsbles V/I and VII. The sum
of thoaci contsnls ha3 been plotted in figures 5 and 6.
Thoao figures include the A1, A2 and A3 levolc of tho "Counsil
Directive (June 1975)" concerning the reauired auality of surface
water which is used for the preparation of drinking water in member
States' of the European Community. According to this directive the
concentration of polynucloar aromatic hydrocarbons in the Waal is
too high for drinking water purposes.
The more so as in the calculation described only three polynuclear
aromatic hydrocarbons are involved.
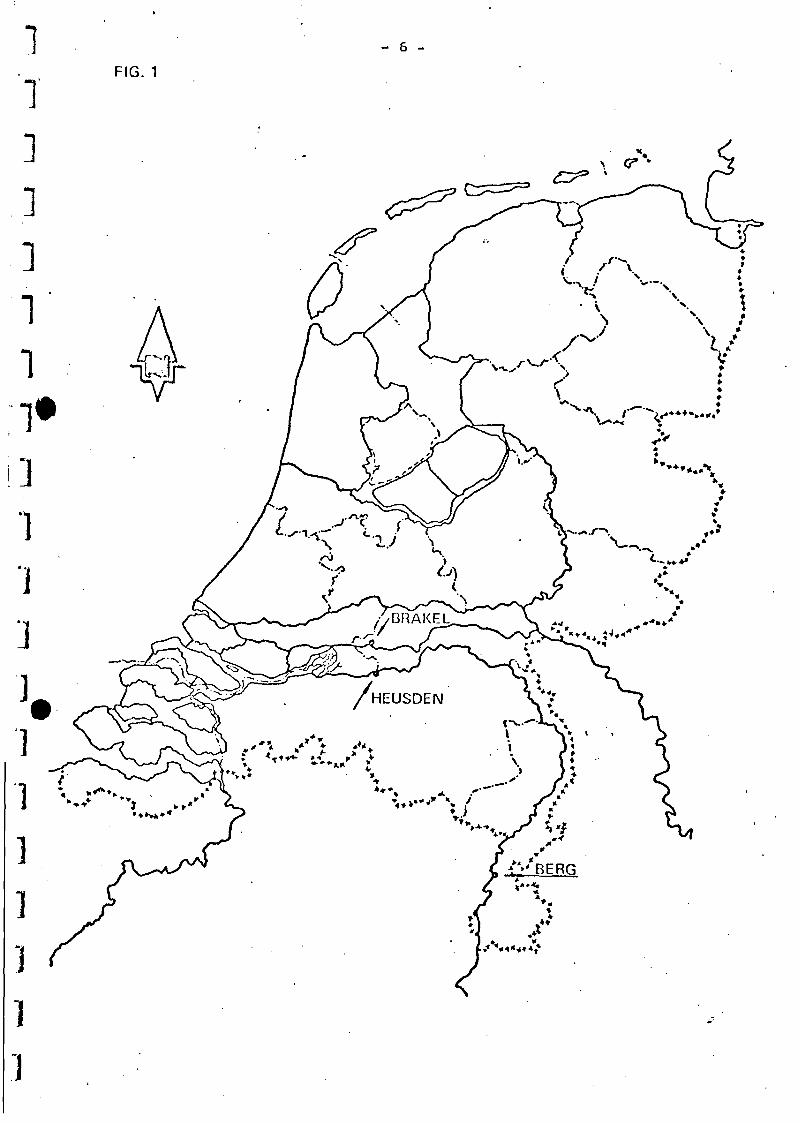
- 6 -
7FIG. 1
T1• ^ v-..
• v
. < • '
V
•t«»»
*»
>.*
" \ / •
»«»
•
l
J
L
s^ . ^
r^f
\ V V
.r3RAKEL'J/
r-
\."'
* \ .
»•«
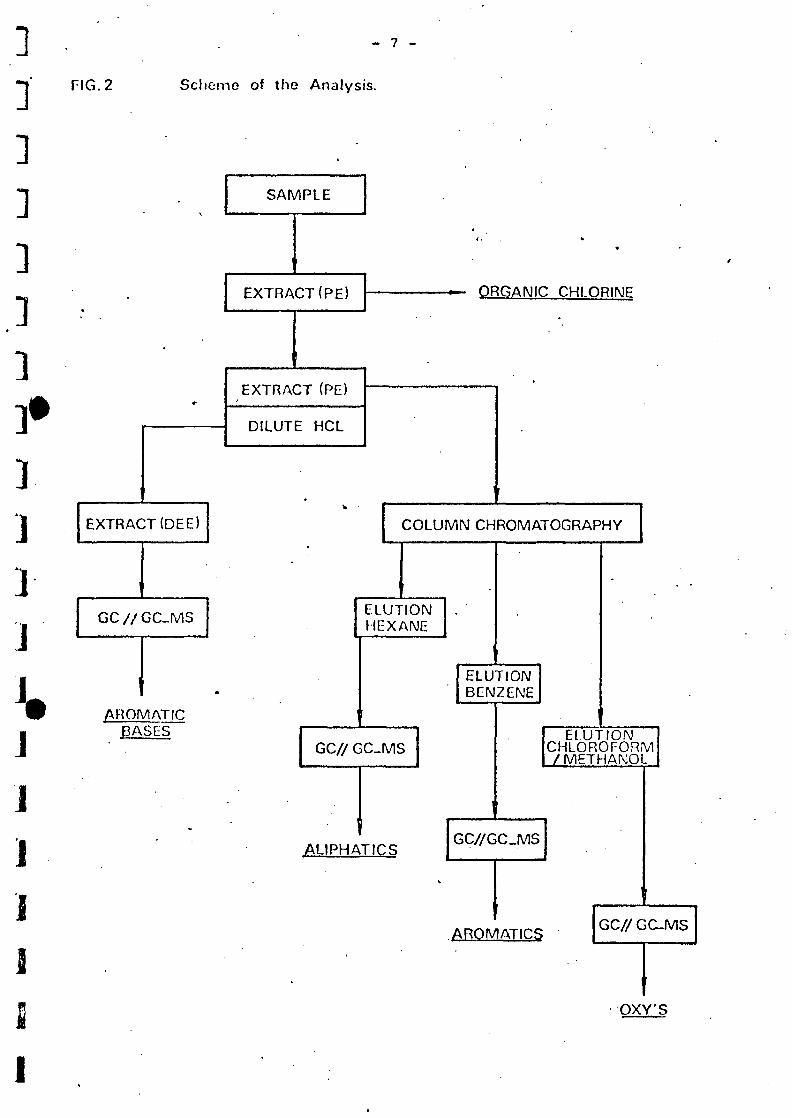
- 7 -
FIG. 2 Scheme of the Analysis.
3
111 *311j
j
iJI1
•SAMPLE
EXTRACT(PE)
EXTRACT (PE)
DILUTE HCL
*
— ORGANIC CHLORINF
EXTRACT(DEE) COLUMN CHROMATOGRAPHY
GC / / GC-MS
AROMATICBASES
ELUTIONHEXANE
GC// GC-MS
ALIPHA
•
ELUTIONBENZENE
TICS
-
ELUTIONCHLOROFORM/ METHANOL
GC//GC_MS
AROfV1ATICSGC// GC-MS
OXY'S
1

II1I1I]
f1I1J
- 8 -
1
j
TABLE I
Identified compounds, AROMATIC FRACTION, Waal and Fleusefrom 1972 to 1975 inclusive.
Alk(en)ylbenzenes.
ethylbenzene
propylbenzene
isopropylbenzene
C - benzene
C - benzene
C - benzeneD
C_- benzene
dime thylben zone
trimcthylben/'one
diethylbBnzeno
diisopropylbenzene
styrene
ethyl toluene
Chlorobnnzenes,
chlorobenzene
dichlorobenzcne
trichlorobcnzene
tetrachlorobenzene
chlorotolueno
dichlorotoluono
trichlorotoluene
Nitrobenzenes.
nitrobenzene
nitrotoluene
nitrobenztrifluoride
ni troxylene
Chloronitrobenzenes.
.chloronitrobenzene
dichloronitrobenzene
chloronitrotoluena
Phenols.
diter. butylcresol
trichlorocresol
totrachlorocresol
tetrachlorophenol
phenylphenol
DiphenyIs.
biphenyl
ditolyl
dichlorobiphenyl
trichlorobiphenyl
tetrachlorobiphenyl
Pi- and polynucloar aromatic hydrocnThnnr
naphtalane
methylnaphtalena
dimethylnaphtalene
trimethylnaphtalene
nitronaphtalene • •
acenaphtalene
methylacenaphtalene
fluorene
I
The underlines (----) compounds are found in the river Uaal only,
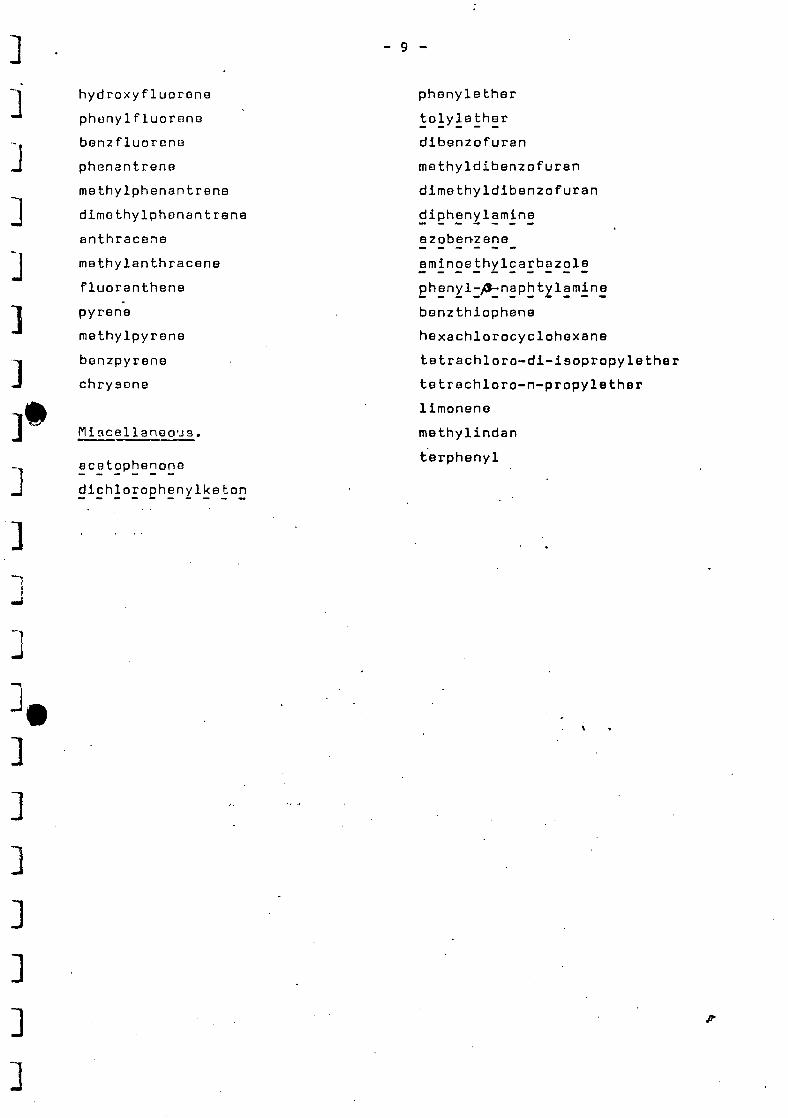
hydroxyfluorene
phony 1fluorane
benzfluoreno
phenantrene
methylphenantrene
dimothylphenantrene
anthracene
methylanthracene
f luoranthene
pyrene
methylpyrene
benzpyrene
chrysone
Miscellaneous.
acetophenono
dichlorophenylketon
phenylether
tolylether
dibenzofuran
methyldibenzofuran
dimethyldibenzofuran
diphenylamine
azobenzane
eminoethylcarbazole
phBnyl-/©-naphty lamina
benzthiophena
hexachlorocyclohexane
tetrachloro-di-isopropylether
tatrachloro-n-propylether
limoneno
methylindan
terphenyl
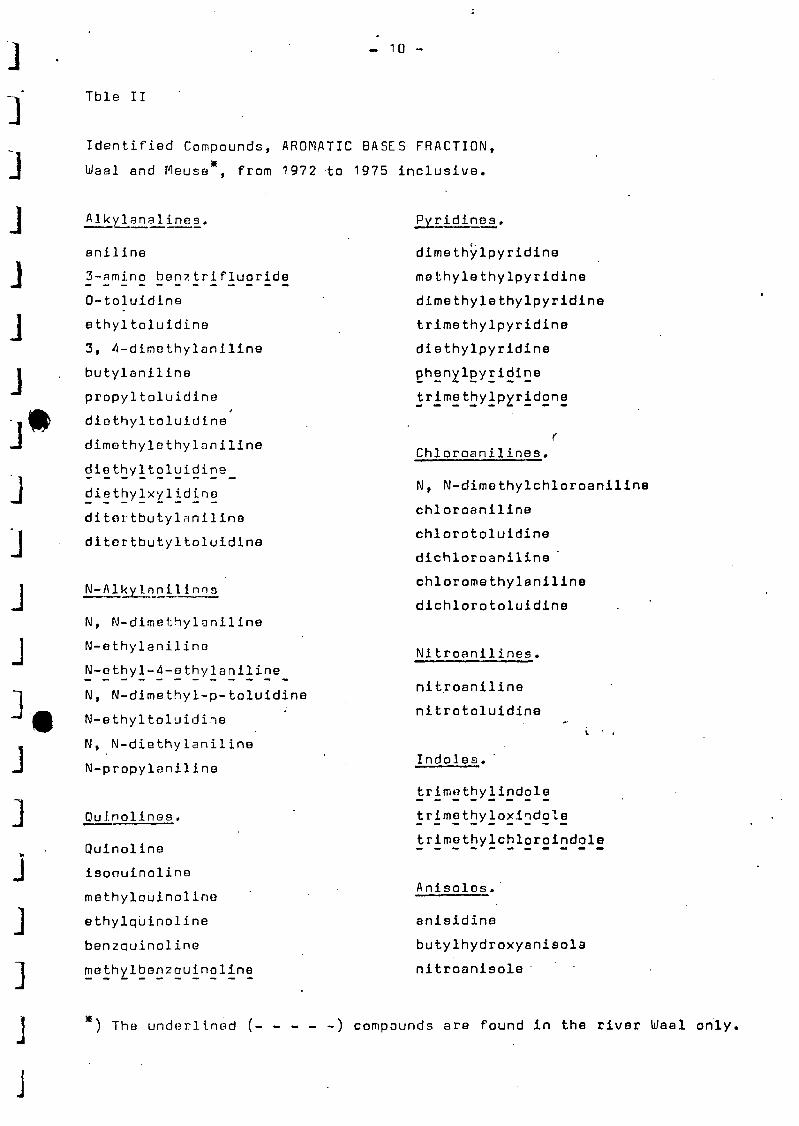
Tble II
Identified Compounds, AROMATIC BASES FRACTION,
Waal and fieuse from 1972 to 1975 inclusive.
J
Alkylanalines.
aniline
3-amino ben?trifluoride
0-toluidine
ethyltoluidine
3, 4-dimothylaniline
butylaniline
propyltoluidine
diethyltoluidine
dimethylethylaniline
diothyltoluidine
diethylxylidino
ditortbutylanilino
ditortbutyltoluidine
N-/\lky_lnni l i n n s
N, N-dimethylaniline
N-ethylanilino
N-ethyl-4-ethylaniline
N, N-dimethyl-p-toluidine
N-ethyltoluidine
N, N-diethylaniline
N-propylaniline
Quinolines.
Quinoline
isoauinoline
methylauinoline
ethylquinoline
benzauinoline
meth^lbenzauinoline
Pyridines.
dimethylpyridins
mothylethylpyridins
dimethylethylpyridine
trimethylpyridine
diethylpyridine
phenylpyridine
trimethylpyridone
Chloroanilines.
N, N-dimethylchloroaniline
chloroaniline
chlorotoluidine
dichloroaniline
chloromethylaniline
dichlorotoluidine
Nitroaniline9.
nit.roaniline
nitrotoluidine
Indoles«
trimothylindole
trimethyloxindole
trimethylchloroindole
Anisolos.
anisidine
butylhydroxyanisola
nitroanisole
J ) The undtarlinsd (-----) compounds are found in the river Waal only.

J - 1 1 -
j
Jj
J
Other N-compounds.
benzthiazole
octahydrophenazine
Organophosphates.
triethylphosphata
tributylphosphate
tri(chloroQthyl)phosphate
PhtalatB3 and adipates. •
dimethylphtalate
diisobutylphtalate
dibutylphtalate '
dioctylphtalate
dinonylphtalate
dioctyladipate
MiscB 11aneg_us .
ditert. butylhydroxybenzoic acid
phtalonitrile
phonylpropylether
phenylproponylether
j
Jj
j
j
j
j
J
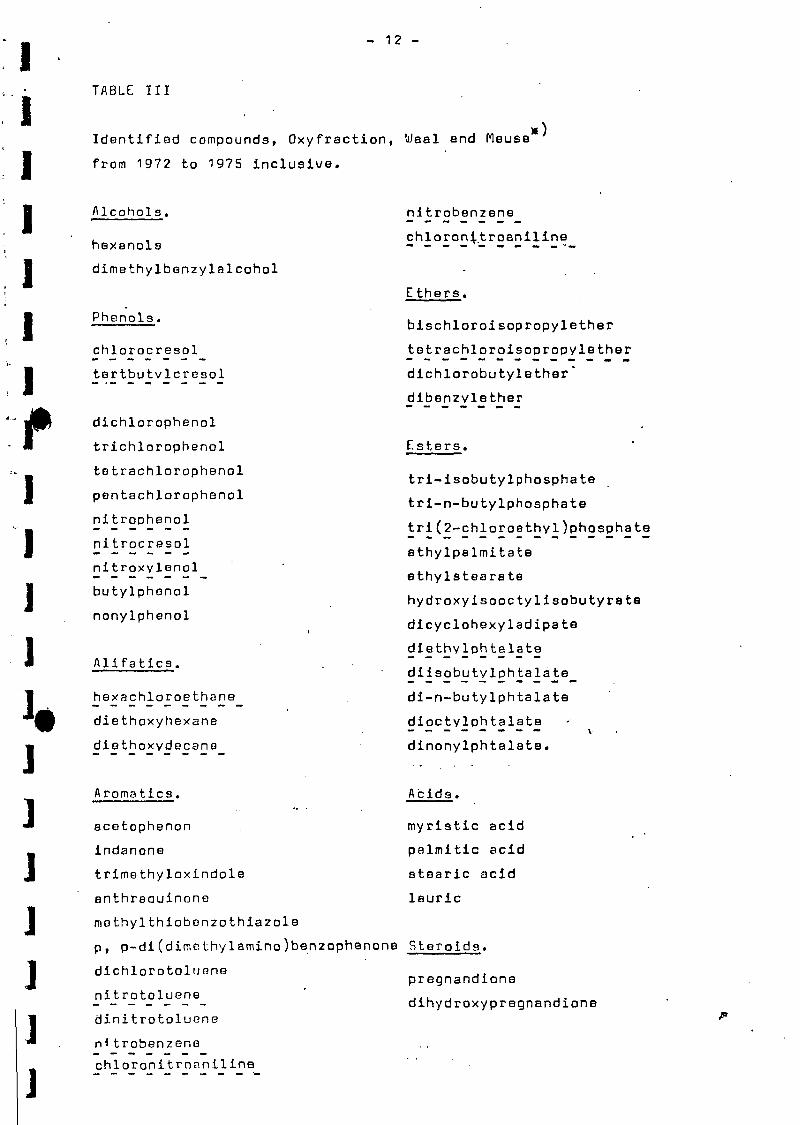
1- 12 -
TABLE III
II
Identified compounds, Oxyfraction, Waal and Reuse
from 1972 to 1975 inclusive.
I]
fII1J1 *J3j
JJJJ
Alcohols.
hexanols
dimethylbenzylalcohol
Phenols.
chlorocresol
tartbutvlcresol
dichlorophenol
trichlorophenol
totrachlorophenol
pentachlorophenol
nitroDhenol
nitrocresol
nitroxvlenol
butylphonol
nonylphenol
Alifatics.
hexachloroethane
diethoxyhexane
diethoxydecano
nitrobenzene
chloronj/troaniline
E thers.
bischloroisopropylether
totrachloroisoDropylether
dichlorobutylether"
dibenzylether
Esters,
tri-isobutylphosphate
tri-n-butylphosphate
tri(2-chloroethyl)phosphate
athylpalmitate
ethylstearate
hydroxyisooctylisobutyrate
dicyclohexyladipate
diethylphtalate
diisobutylphtalate
di-n-butylphtalate
dioctylphtalate_ _ _ _ _ _ _ _ v
dinonylphtalate.
Aroma tics. Acids,
acstophenon myristic acid
indanone palmitic acid
trimethyloxindole stearic acid
anthraauinono leuric
mothylthiobonzothiazole
p, p-di (dime)thylamino)benzophenone Steroids.
dichlorotoluene .,pregnandione
nitrotoluene ' ... . ..- - - - - - - dinydroxypregnandionedinitrotolucns
nitrobenzene
chloronitrnaniline

1 - 13 - (Table III)
11IIt
torpenes
isophorone
cyclohexylcyclohexanone
terbutylcyclohexanone
3',33
,1
1
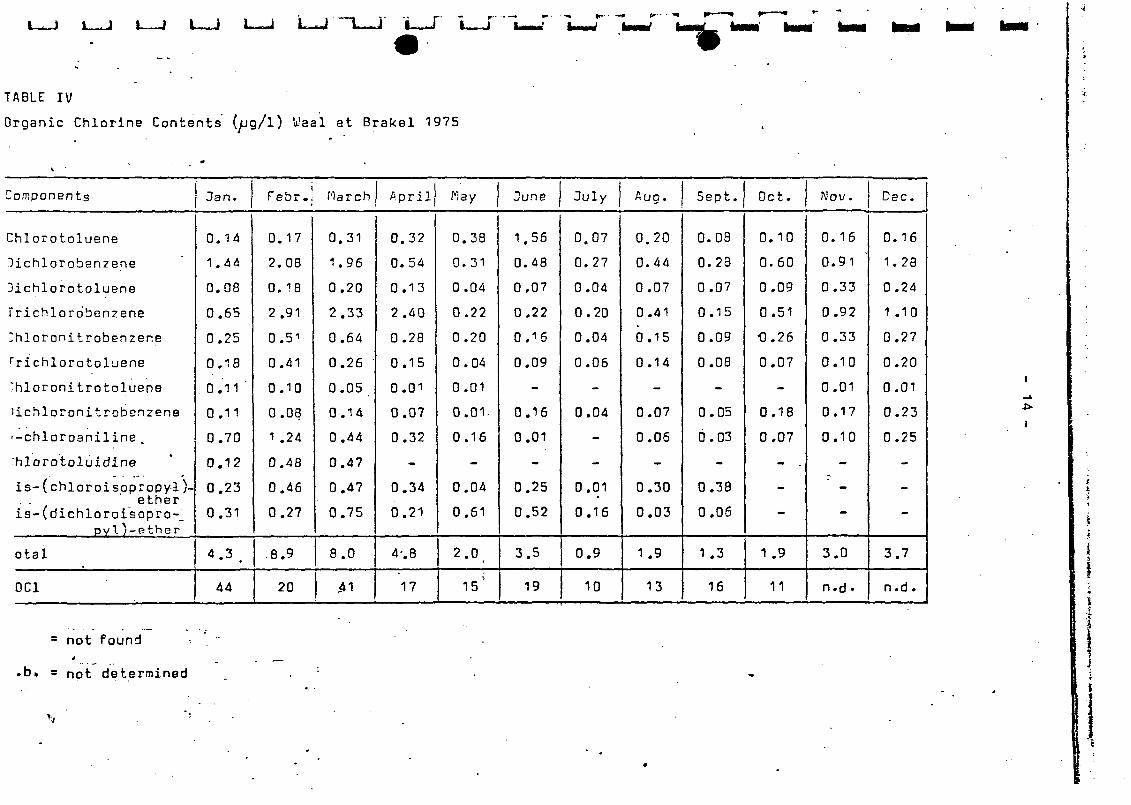
TABLE IV
Organic Chlorine Contents (yug/l) Uaal at Brakel 1975
Components
Chlorotoluene
Dichlorobenzene
!)i chlorotoluene
Trichlorobenzene
Ihloronitrobenzene
i'richlorotol'jene
'hloronitrotoluens
lichloronitrobenzene
•-chloroaniline.
hlorotoluidine
is-(chloroisppropyl)-
. . etheris-(dichloroisopro-_
DVl /-ethero t a l
0C1
J a n .
0.14
1.44
0.08
0.65
0.25
0.18
0.11"
0.11
0.70
0.12
0.23
0.31
4- 3 .
44
Febr.!
0.17
2.08
0.18
2.91
0.51
0.41
0.10
0.08
1 .24
0.48
0.46
0.27
8.9
20
March
0.31
1.96
0.20
2.33
0.64
0.26
0.05
0.14
0.44
0.47
0.47
0.75
8.0
.41
A p r i l
0 . 3 2
0 . 5 4
0 . 1 3
2 . 4 0
0 . 2 8
0 . 1 5
0 . 0 1
0 . 0 7
0 . 3 2
-
0 . 3 4
0 . 2 1
4 - . 8
17
Hay
0 . 3 8
0 . 3 1
0 . 0 4
0 . 2 2
0 . 2 0
0 . 0 4
0 . 0 1
0 . 0 1 .
0 . 1 6
-
0 . 0 4
0 . 6 1
2 . 0 ,
15'
June
1.56
0.48
0.07
0.22
0.16
0.09
-
0.16
0.01
-
0.25
0.52
3.5
19
July
0.07
0.27
0.04
0.20
0.04
0.06
-
0.04
-
-
0.01
0.16
0.9
10
Aug.
0.20
0.44
0.07
0.41
0.15
0.14
-
0.07
0.06
-
0.30
0.03
1.9
13
Sept.
0.08
0.23
0.07
0.15
0.09
0.08
-
0.05
0.03
-
0.38
0.06
1.3
16
Oct.
0.10
0.60
0.09
0.51
•0.26
0.07
-
0.18
0.07
-
-
-
1.9
11
Nov.
0.16
0.91
0.33
0.92
0.33
0.10
0.01
0.17
0.10
-
-
-
3.0
n.d •
Dec.
0.16
1.28
0.24
1 .10
0.27
0.20
0.01
0.23
0.25
-
-
-
3.7
n.d .
= not found
>b» = not determined
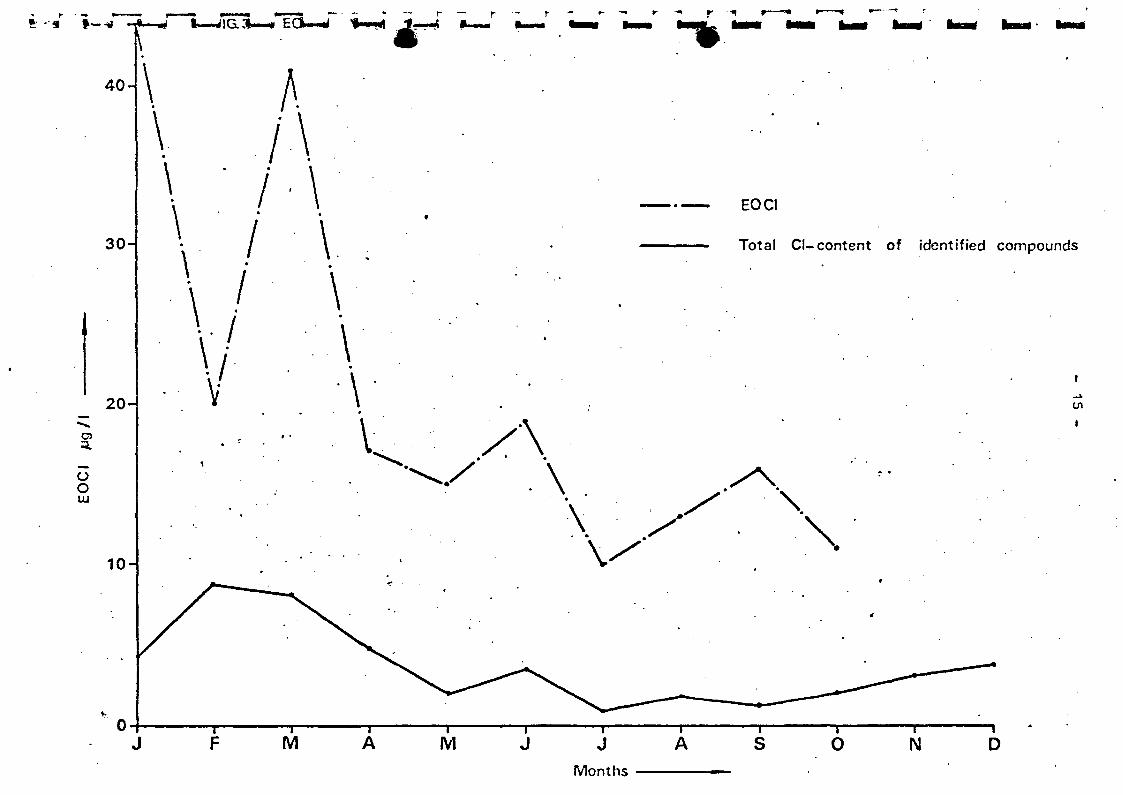
ftr - « f—-
4 0 -\
V\
3 0 -
2 0 -
oo
10-
i—WIG:*—» EO—J
A/ \
r — r •" r- - • - * r
\ / • \
VA
\
EOCI
Total Cl-content of identified compounds
enI
••
M M JMonths
o N
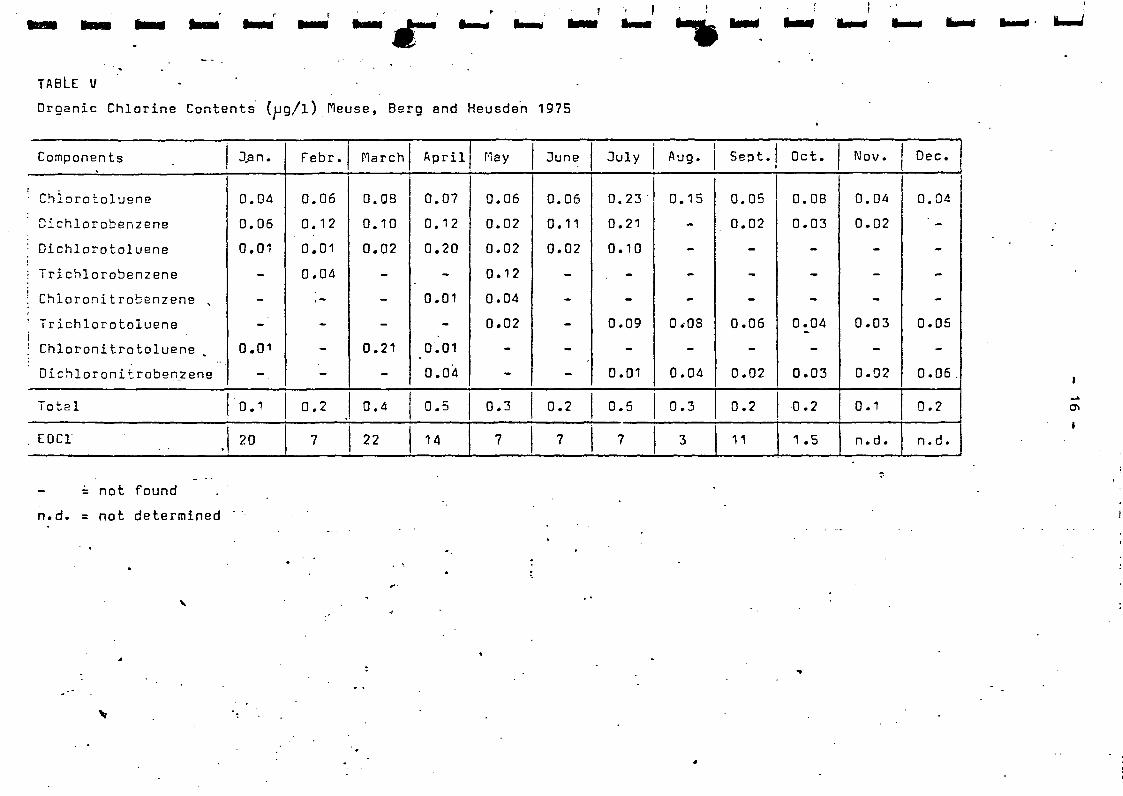
TABLE V -
Organic Chlorine Contents (ug/l) Fleuse, Berg and Heusden 1975
Components
Chiorotoluene
Cichlorobenzene
Dichlorotoluene
Trichlorobenzene
Chioronitrobenzene x
Trichlorotoluene
Chloronitrotoluene
Dichloronitrobenzene
Total
. EOC1
Jan.
0.
0.
0.
0
0
.04
06
.01
-
-
-'
.01
-
.1
20
Febr.
0
0
0
0
0
.06
.12
.01
.04
-
-
-
.2
7
March
0.
0.
0.
0
0
OS
10
.02
-
-
-
.21
-
.4
22
April
0.07
0.12
0.20
-
0.01
-
0.01
0.04
0.5
14
May
0.06
0.02
0.02
0.12
0.04
0.02
-
-
0.3
7
June
0
0
0
0
.06
.11
.02
-
-
-
-
-
.2
7
July
0.23
0.21
0.10
-
0.09
-
0.01
0.5
7
Aug.
0
0
0
0
.15
-
-
-
-
.08
-
.04
.3
3
Sept.
0.05
0.02
-
-
-
0.06
-
0.02
0.2
11
Oct.
0
0
0
0
0
1
.08
.03
-
-
-
.04
-
.03
.2
.5
Nov.
0.04
0.02
-
-
-
0.03
-
0.02
0.1
n. d.
Dec.
0.04
-
-
-
0.06
-
0.06 .
0.2
n.d.
= not found
n.d. = not determined
I

FIG. 4 EOCI Meuse Berg and Heusden 1975
20 -
OOHi
10-
A
\ / \\ / \V \• •—
M
>
J JMonths •
A/ Vx/ \
• \
A S 0J F M A IVl J J A S O N

TABLE VI ,
Polynuclear Aromatic Hydrocarbons (ug/l) Waal at Brakel 1975
Components
Phenanthrene
Fluoranthene
Pyrene '
Total
Jan.
0.60
0.83
0.53
1.96
Febr.
0.10
0.20
0.20
0.50
rarch
0.23
0.48
0.38
1.09
April
0.16
0.72
0.24
1.12
Hay
0.07
0.13
0.10
0.30
June
0.10
0.16
0.10
0.31
July
0.07
0.13
0.07
0.27
Auq.
0.10
0.20
0.18
-0.48
Sect.
0.20
0.15
0.36
Oct.
1.30
1.20
0.73
3.23
Nov.
0.13
0.25
0.23
0.61
Dec.
0.13
0.33
0.30
0.76
TABLE Mil
Polynuclear Aromatic Hydrocarbons (ug/l) Meuse, Berg and Heusden 1975
t_»CD
Components
Phenanthrene.
Fluoranthene
Pyrene
To'ta l
Jan.
0.15
0.33
0.25
0.73
Febr.
0.25
0.20
0.30
0.75
March
0.09
0.30
0.20
0.58
April
0.34
0.56
0.36
1'.26
May
0.13
0.13
0.26
June
0.10
0.14
0.24
July'
0.10
0.13
0.20
0.43
Aug.
0.08
0.15
0.15
0.38
Sept.
0.04
0.12
0.10
0.26
. Oct.
0.03
0.10
0.08
0.21
TJov. .
0.03
0.20
0.13
0.36
Dec.
0.17
0.43
0.33
0.93
- = not.found
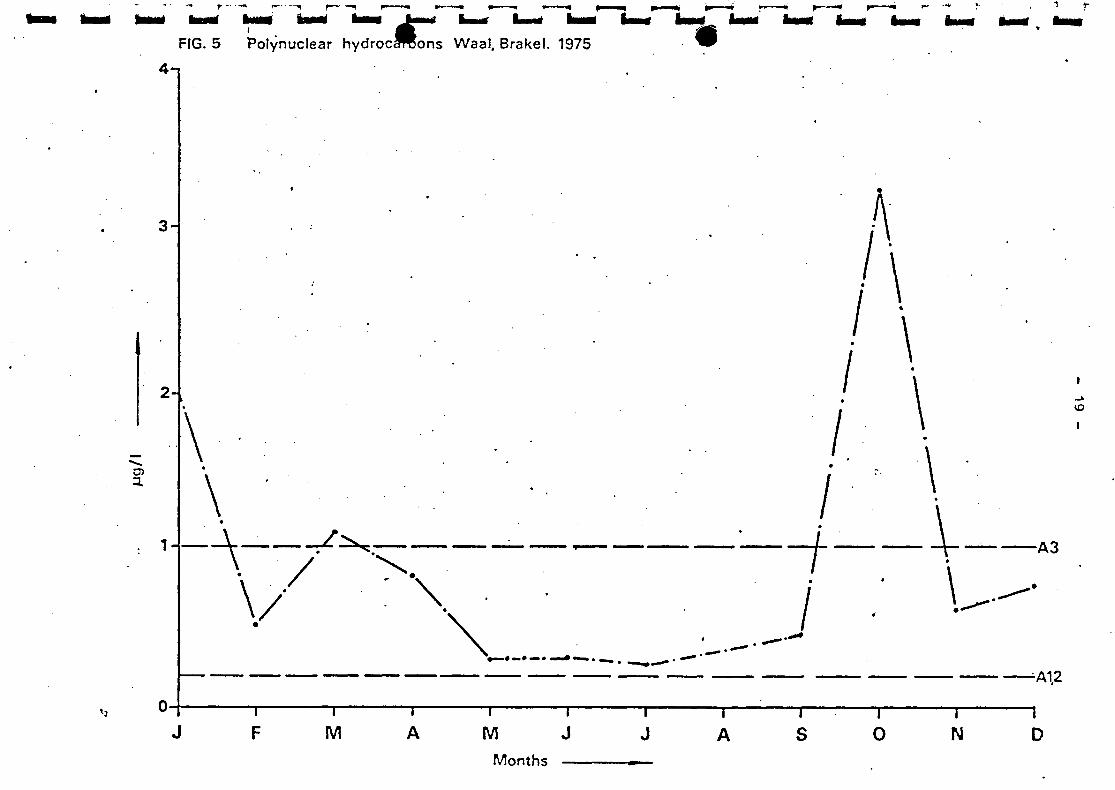
FIG. 5 Polynuclear hydrocaroons Waal, Brake!. 1975
4-7
w
3-
2 -
1 -
A/ >V \ I
-A3
-A1,2
1 1
M JMonths
i
Ji
Ai
Si
01
N
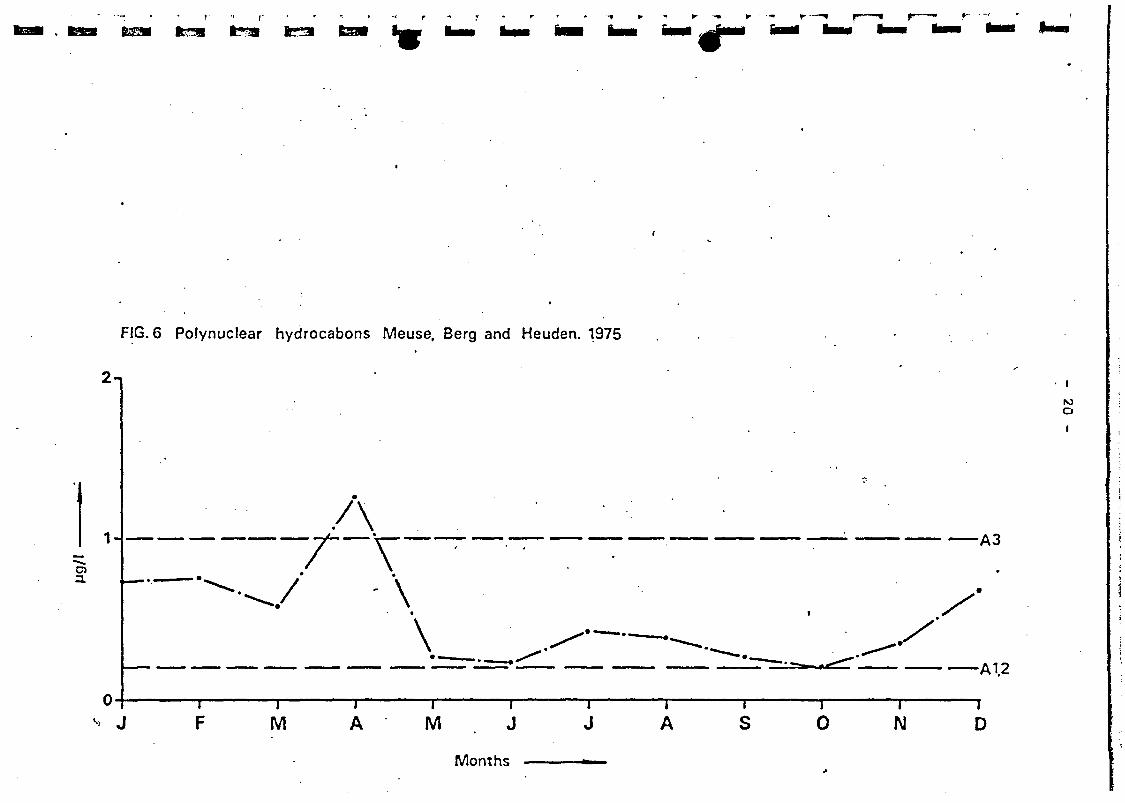
- « r- • • • *
FJG.6 Polynuclear hydrocabons Meuse, Berg and Heuden. 1975
2-1
1 -
o
A\\•
too
•A3
i
A Mi
Ji
Ai
S
- A 1.2
D
Months
1' CONSIDERATIONS ON PRECURSORS AND FORMATION OF HALOFORMS IN WATER
Drs. J.J. Rook,
Rotterdam Water Works, 1976.
In 1966 the analysis of volatile substances in the river Rhine
was started in the Rotterdam Water Works Laboratory.
At that time the aim of the research was to locate the origin of
bad odour and taste of the water. As the intake was situated at
the lowest end of the river Rhine, biodegradable matter was not
in the first place expected to impair taste and odour, but rather
persistant substances, especially chlorinated solvents, benzene,
derivatives and other bad smelling volatile compounds were supposed
to be responsible for this adverse effect. Consequently we looked
for a method which was specific for volatiles.
The analysis procedure was chosen in analogy with headspace analy-
sis as already known from the brewery industry, but an enlarged
bottle was necessary for water, see figure 1.
A 5 liter glass vessel was partly filled with 3.5 liter of water
sample which was equilibrated with 2 liter of nitrogen gas.
The head-space gas was passed over a gaschromatographic pre-
column, figure 2, cooled with dry ice. Magnesium-perchlorate was
used as a drying agent.
The system was calibrated for the recovery of haloforms. Overall
recovery was about 10% . For final analysis the pre-column was
connected to an analytical column and flash-heated as shown in
figure 3.
G.C. was performed on a 7 ft column, 1/4 inch, 10% TCP on
Chromosorb P; carrier gas N~, 4 0 ml/inin; temperature programmed
from 20 to 120 C. A typical headspace fingerprint of river Rhine
is given in figure 4.
The normal purification treatment consistingof breakpoint chlori-
nation, coagulation, sedimentation and rapid sand filtration did
not remove headspace volatiles significantly. Only in the very
volatile fraction the peaks of freons, butanes and pentanes
diminished by 40%. A puzzling observation was the appearance of
four new, large peaks which were clearly produced by chlorination,
as shown by comparing the chromatograms of riverwater and chlori-
nated water in figure 5.

The four new peaks were identified with haloforms. Particularly
chloroform was found in concentrations from 0,0 2 to 0,1 mg/liter.
Also traces of tetrachloromethane, trichloroethylene and some
aromatic hydrocarbons were detected.
Most of the volatile substances were reduced considerably by adding
powdered activated carbon during the purification process.
Test runs with pilot filters of granulated activated carbon
indicated that the small molecules of haloforms show a limited
adsorption, and particularly chloroform, show break-through already
after 4 to 5 days.
Analysis of the chlorine used for chlorination showed that chloro-
form was not an impurity of the chlorine. This meant that it was
formed during the chlorination step. The identification of the
other haloforms demonstrated the formation of CHCl-, Br, CHBr2Cl
and CHBr.,.
In the period of 1970-1973 the Rotterdam Water V7orks investigated
the role of precursors of the haloforms. In the first approach
we thought of the haloformreaction with acetone as precursor. It
is wellknown that methyl ketones such as acetone produce haloforms
after addition of halogenes.
O OIt V
CH3 - C - R + 3 HOX —=? CH3 - C - R + 3 H2O
followed by: 0
CX3 - C - R + H2O —•=? CHX3 + R - C - OH
The reaction rate is determined by pH. This is evident because
the rate-determining step is the formation of an "enol" from
the ketone.
0 Oii i< ,
CH, - C - R ^ CHO = C - R + H
In laboratory tests however, acetone reacted too slow to account
for the concentrations of CHC1_ produced (table 2). So a different
precursor had to be found.
As the majority of possible volatile precursors of chloroform are
removed in the storage reservoir of the Rotterdam Water Works
(storage 3-4 months) before the chemical treatment is applied, the
main precursors had to be a less volatile and non biodegradable
substance.

By changing the rawwater supply from water of the river Meuse
(TOC of about 3.5 mg/liter) which is much less contiminated with
industrial micropollutants than the river Rhine, the chloroform
formation did not decrease. This again supported the view that the
precursor did not originate from industrial wastes.
Various uncontaminated groundwater samples were treated with chlo-
rine to confirm the hypothesis that naturally colored substances
were the cause of chloroform and bromoform formation.
Most groundwater samples had only chloroform contamination after
chlorination. Bromoform was formed instead when 2-3 mg bromine
was added to the water sample.
The bromide concentration of the riverwater (resp. 0,4 mg/1 in the
Rhine and 0,14 mg/1 in the Meuse) decreased during chlorination
Table 1.; Decrease of bromide concentration by chlorination
Type of water Bromide concentration (mg/1)
Before chlorination After chlorination
Rhine (1972) 390 210136 57
The deficit in bromide ions after chlorination (0.18 ppm for
river Rhine water and 0,08 ppm for Meuse water) is important.
It means that more organic brominated compounds are formed than
the volatiles CHX . The author suggests that heavier degradation
products are formed. By the addition of chlorine, biomide-ions
are oxidized to bromine, which than forms HBrO (or a BrO ion),
which again brominates several organic substances, eg. phenols
are easily brominated.
Acetone can be rejected as precursor of chloroform in the water
purification because the yield of chloroform appeared to be only
0,1 % of acetone concentration 100 mg/1 acetone after 4 hours
chlorination at 10°C as given in table 2.
The attention was now focused on fulvic and humic substances.
Generally coloured water samples gave more chloroform production
than uncoloured samples. Grcundwaters, which were rich in fulvic
substances i.e. more coloured,produced more chloroform formation
than the less colored samples. When humic substances obtained by
infusion of peat wered added to pure water samples, chloroform
was formed. After addition of sodium bromide in an equivalent
concentration to surface water, all 4 haloforms were formed
namely chloroform, dichlorobromomethane, dibromochloromethaan,
and bromoform, figure 6.
Fuivic and humic substances are polycondensates of polyhydroxy-
benzene, and other aromatics, as illustrated in figures 7 and 8.
Resorcinol i.e. meta-dihydroxy benzene is a well known building
block, which gives chloroform by chlorination in high yields,
see table 2 and 3.
Conclusively a somewhat analogous mechanism in comparisson with
the ketone reaction is suggested for the behaviour of hydroxy-
aromatics. In the last case the formation of phenoxide-ions is to
be considered to induce chloroform formation by activating the
aromatic ring strongly in the ortho-positions.
The carbon atom between the OH groups in the meta-position seems
to be readily attacked.
Fuivic- and humic acids still contain some OH groups in the meta-
position, which act as active sites for chlorine to produce
haloforms. When the humic acid concentration in water is reduced
the chloroform formation decreases. Furthermore a competition
between chlorination and ozonisation was observed. Ozonisation
before chlorination lowered the chloroform production only when
the time lag between the two dosing points was shorter than some
minutes. This indicates that ozone and chlorine compete for the
active sites with different reaction rates.
The original research focussed on the cause of odour and
taste problems, has given valuable information about the cause
of haloform production. It must be noticed however that
chloroform in concentration,^ 100 yg/liter certainly contributes
to bad odour and taste of drinking water.
To avoid risks in water purification the organic content of the
raw water must be as low as possible. The W.H.O. as well as the
E.P.A. recommend a T.O.C. of 5 mg/liter and if possible 1 mg/liter
should be preferred when indirectly reused waste water is the
raw water source for the drinking water supply.

Table 1.
Haloforms from precursors, 100 ppra concentration,
1000 ppm Clp, reaction during 4 hr, at 10 C.
dimedone
1, 3-indandione
1t3-cyclohexanedione
1,3-cyclohexanediol
1f 2-cyclohexanedione
1,4-cyclohexanedione
resorcinol (meta)
hydroquinone (para)
catechol (ortho)
pyrogallol
phloroglucinol
phenol
acetone
ethanol
pH 7
90/
Gio
50'/
0.6/
0/
0.8/
40/
1.5/o
0.3'/
0/
0/
Qffo
0.2/
0/
pH 11
100/
45°/
70/
0 . G'fo
Qffo
10°/
90/
5/
5/
5/
1.5/
1/
6.5/

Table 2.
Yield of chloroform in mol. / (2 hr, 15°C).
pH7 pH 11
dimedon 100$ 100/
1,3-indandione 3/ 45/
hydroquinone 2/
quinone 1«I
resorcinol
phloroglucinol
phloroglueinolmonopentylether
orcinol ifo
2,6-dihydroxytoluene M° &f°
In the series of polyhydroxybenzenes the meta-dihydroxybenzenes
give high yields: e.g. resorcinol and the related orcinol.
Phloroglucinol with 3 OH-groups in meta-position was found
desintegrate mainly into 3 molecules of dichloroacetic acid.
When we tested the mono-pentylether of phloroglucinol the ability
for haloform formation was significantly enhanced, the monoether
had remained the character of resorcinol. As OR-substituents do
not differ much from OH-groups, both having -I +M effects, they
are activating o- and p- substitutions. This phenomenon must be
considered as blocking the formation of phenoxide ions. The
phenoxide ion combines +1 with +M effect; it activates strongly
on ortho and para places.
Sk

FIGURE 1Rook

Cooled
precolumn
drying agentKC1O,
FIGURE 2
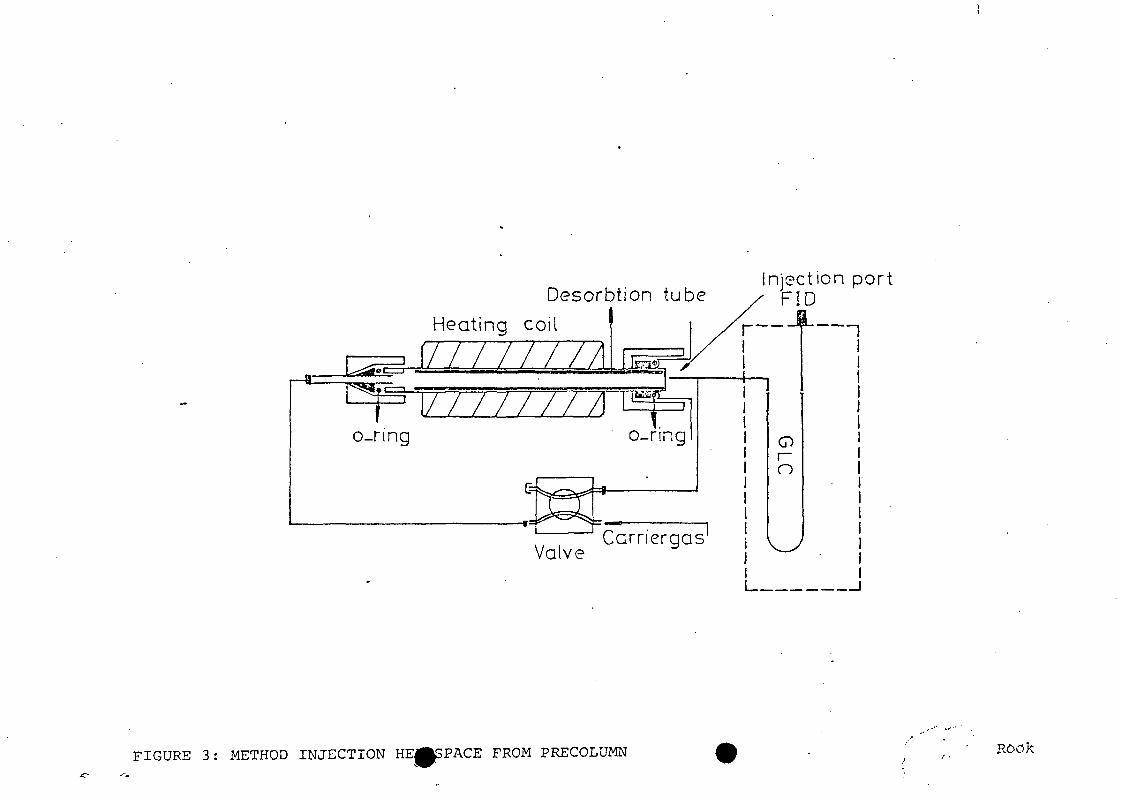
Desorbtion tubeHeating coil
[/ / / / / / /A
///////Ao_ring
'.=*
ValveCarnergas
Injection portFID
FIGURE 3: METHOD INJECTION HE^fSPACE FROM PRECOLUMN

Ii'
4.: Headspace Rhine at Ochtenkm. 906
Rook

i
— Chlorinated water -
lie. g •Hcjd\|i;Kvi'lironiutii|:rjins. Up|>ci— river water; lower — chlorinated water (peaks.1. It. i .ind (I .in.' luiloloi ins)
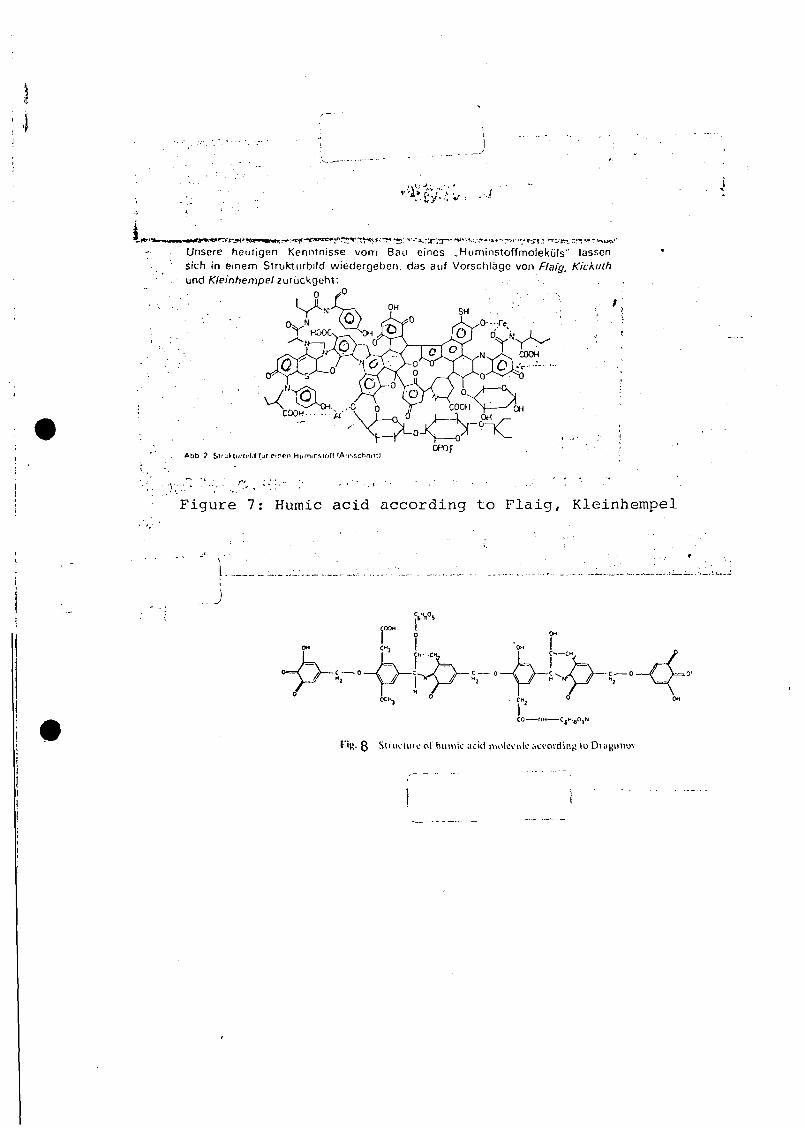
Unsere heutigen Kenntnisse vom Bau eines ..Huminstoffmolekuls' lasscnsich in einem Strukturbild wiedergeben. das auf Vorschlage von Flaig, Kickuthur\d Kleinhempel;
* 0
. OHOH _
\ ^-^^CH.. ..d b Y" coon > — ^
OPOfAbt) 2: Sir iXurtrM fuf einen HuminMoff 'A-isschnin).
Figure 7: Huraic acid according to Flaig, Kleinhempel
CO NH C6H lBOjN
I'*'U- 8 Structiiic ol' humic acid molecule according ^o Dra
DISCUSSION OF LECTURES OF v.d. MEENT AND ROOK
Question Garrison:
Did you try to correlate turbidity of the water with chloroform
production, Symons has found such a correlation?
Answer Rook:
Most water were groundwaters of very low turbidity, we found a
direct correlation with T.O.C. and also with colour, high turbiditie
correlated with higher amounts of humic substances adsorbed on
mineral suspended solids, this is my hypothesis.
Question Hutzinger:
Have model substances been used closer in molecular weight to
natural humic substances (e.g. commercial or prepared fulvic acids)
Answer Rook:
They all work.
Question Giger:
There is a big peak in the fluoranthene, phenanthrene pyrene
concentration in October, do you know where it comes from? Are
the PAH's adsorbed on solid matter or are they dissolved in the
water?
Answer v.d. Meent:
There is no proof where it comes from we have no proof that PAH's
are adsorbed on solid matter.
Comment Fielding:
We are convinced that the bulk of PAH's are associated with sus-
pended particulate matter as we have seen in flood conditions.
Comment Piet:
We found correlation between PAH's and particulate matter in
the Meuse when the flow suddenly increased.
Question Fielding:
What is the reason for monitoring the non-carcinogens instead
of the known carcinogens of the PAH's?
Answer v.d. Meent:
It is just a matter of analytical procedure.
Question Piet:
There is about 15% of the "Total extractable organic chlorine"
found back in individual components which were measured with G.L.C.

f.1,1
Is this due to the fact that much organic chlorine material is
non-volatile or is also a part of the very volatile components
lost?
Answer v.d. Meent:
Yes, both possibilities exist, another possibility is the
interference of bromide, or iodide in the microcoulometric chloride
determination.
Question Ott:
There are two marked big peaks for the organic chlorine compounds
in Januari and March in the Waal and in the Meuse. Is there any
explanation for this?
Answer v.d. Meent;
The sample frequency of once a v/eek could be responsible for that.
It is not tried to correlate concentrations with hydrological
behaviour.
Question Stieglitz;
We also found nitrobenzotrifluoride, do you know where it comes
from and what is the toxicity?
Answer v.d. Meent;
We have no further information about it.
Question v. Buuren; i
Is there an important part of the TOC1 remaining in the water
phase after petroleum-ether extraction and what happens with the
humic material?
Answer v.d. Meent;
Yes, referring to the work of Prof. Sontheimer I can say that
chlorinated lignines and humic material is not determined in the
procedure described. Adsorption on activated carbon can give higher
results.

The analysis of volatile organic compounds present and
formed during drinking water processing
Dr. L. Stieglitz, Institut fur Heifie Chemie,
Kernforschungszentrum Karlsruhe
W. Leger, Lehrstuhl fur Radiochemie der
Universitat Heidelberg
In the last two years, special emphasis was put on the
analysis of organic pollutants from water works. The
objectives of the work are
1) Identification of volatile pollutants by GC-MS in
water samples. The samples are taken at different
processing steps of selected water works of the river
Rhine.
2) Quantitative determination of the pollutants, in order
to estimate the efficiencies of the different processing
steps with regard to the individual compounds.
The work is part of a programme of the Engler-Bunte-
Institut, Technical University Karlsruhe.
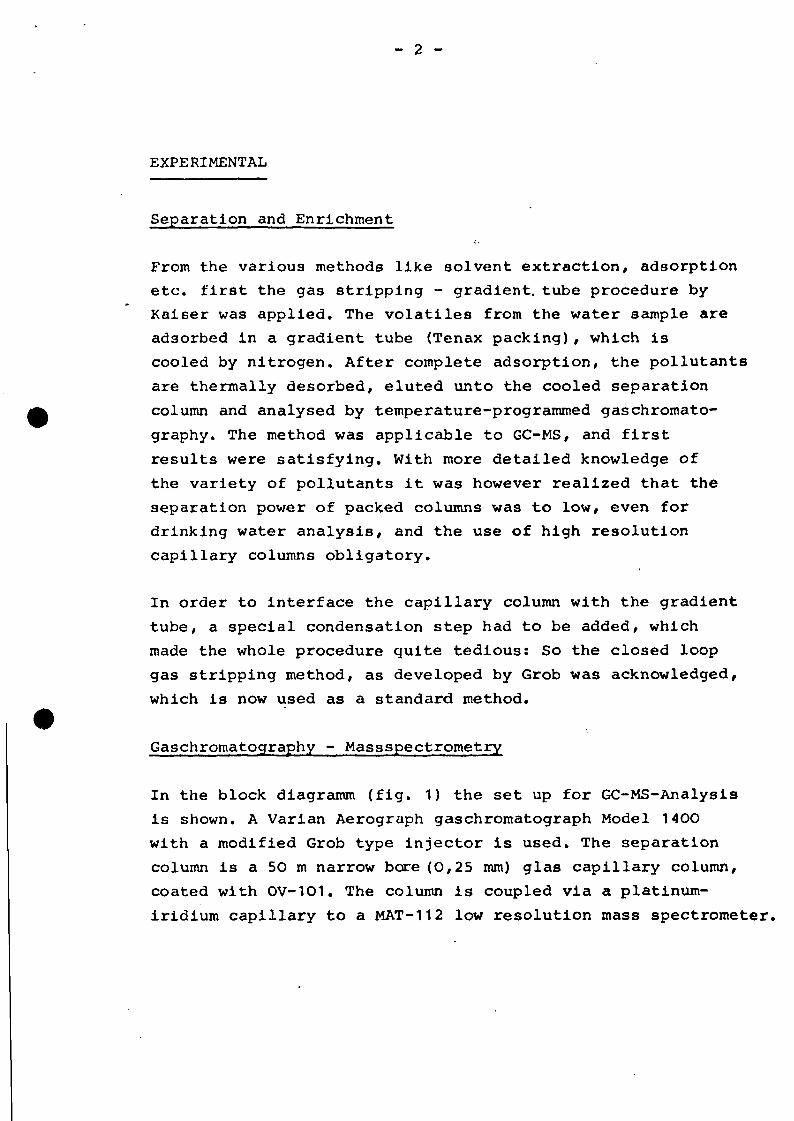
- 2 -
EXPERIMENTAL
Separation and Enrichment
From the various methods like solvent extraction, adsorption
etc. first the gas stripping - gradient, tube procedure by
Kaiser was applied. The volatiles from the water sample are
adsorbed in a gradient tube (Tenax packing), which is
cooled by nitrogen. After complete adsorption, the pollutants
are thermally desorbed, eluted unto the cooled separation
column and analysed by temperature-programmed gaschromato-
graphy. The method was applicable to GC-MS, and first
results were satisfying. With more detailed knowledge of
the variety of pollutants it was however realized that the
separation power of packed columns was to low, even for
drinking water analysis, and the use of high resolution
capillary columns obligatory.
In order to interface the capillary column with the gradient
tube, a special condensation step had to be added, which
made the whole procedure quite tedious: So the closed loop
gas stripping method, as developed by Grob was acknowledged,
which is now used as a standard method.
Gaschromatography - Massspectrometry
In the block diagramm (fig. 1) the set up for GOMS-Analysis
is shown. A Varian Aerograph gaschromatograph Model 1400
with a modified Grob type injector is used. The separation
column is a 50 m narrow bore (0,25 mm) glas capillary column,
coated with OV-101. The column is coupled via a platinum-
iridium capillary to a MAT-112 low resolution mass spectrometer.
- 3 -
The instrument is run at a cyclic scan, which is controlled
by the computer. The data are stored on magnetic tape and
processed afterwards. The signal of the total ion current
is fed to a recorder to have a visual control of the GC-
run. The GC-peak areas are calculated by an electronic
integrator and printed out.
Samples
Normally 2 1 samples of water are taken for the outgasing.
After 3 hours of gas stripping, the pollutants are extracted
with CS2.
For quantitative work two additional steps are addedi
a) addition of known amounts of internal standard
As internal standard we use chlorododecane, which is not
present as a pollutant, and which has a retention time
different from the compounds to be investigated. The ex-
traction is done in four steps. For the first two extrac-
tion steps a carbondisulfide is used with the standard added
in a concentration of 74 ng/yul. The next further extractions
are carried out with CS- without standard.
b) determination of response factors
As with the FID, the response of the mass spectrometer is
also different for the various compounds. In order to account
for these different responses calibration runs are made with
CS2~solutions containing known amounts of compounds such as
chlorobenzenes, and other prominent pollutants. The concen-
trations are in the ppm range. The response factors are
calculated refering to the response of the standard as unity.

- 4 -
In table 1 some of the response factors are listed.
Table 1 Response factors of pollutants for GC-MS-Analysia
cci cci
cci(ClC3Hg)2O
C6H6C,H,C1
0,75
1,55
1,45
0,9
0,49
0,69
0,71
0,73
0,79
O,6O
1,0
With these data the concentrations may be calculated as
comp,
WSTDASTD VOl« ' i cP d
(ng/1)
with WSTD
ASTD
Acpd
Vol.
fcpd
weight of standard added
peak area of standard
peak area of compound
volume of water sample
response factor of compound
With the standard weight in nano-grams and the sample volume
in liters the calculated concentration is in ng/1.
- 5 -
In this calculation the assumptions are made:
- that the stripping efficiency is 90 - 100 % and
deviations are within the error .limits of the method
- that no break-through or loss of the compounds from
the charcoal filter takes place.
RESULTS
The application of the procedure is discussed with samples
from a water work. At four strategic points samples were
drawn over a period of November 1975 to January 1976.
point A: sample from river water
point B: sample after bankfiltration
point C: sample raw water with chlorination
point D: sample drinking water prior to chlorination
and distribution
The samples were kept frozen until analysis.
Qualitative aspects
In fig. 2 to 3 the chromatograms of the four samples are
shown. More than ninety percent of the peaks could be
identified. The prominent compounds are listed in table 2.
The comparison of the gas chromatograms shows the effect
of bank filtration/ viz. the decrease of variety and
concentration of a substantial number of compounds. After
- 6 -
chlorination of the raw water additional peaks emerge,
as already earlier pointed out by Dr. Rook, which are
essentially dibromochlormethane and bromoform, but also
bromotoluene, dimethylbromobenzene. up to trimethylbromo-
benzene.
Quantitative aspects
With the quantitative determination of individual compounds,
the fate of pollutants on their way through the different
processing stages of the water work may be traced. In
fig. 4 the change of concentrations of aromatic halogen
compounds is illustrated. The following facts are obvious
- the concentration of chloroaromatics is decreased by
the bank filtration
- a slight increase may be seen through the chlorination
process
- bromotoluene (2 isomers), not present in the river water
and bank filtrate is formed at a concentration of
150 ng/1 in the chlorination step
- in the following purification processes of the water
work the concentrations are decreased to 70 ng/1 for
dichlorobenzenes, and below 10 ng/1 for all other
aromatic halogen compounds.
In fig. 5 the behaviour of selected aliphatic compounds
is shown. Noteworthy are the following relations:
- production of haloforms (CHBr2Cl, CHBr3) to concentrations
of 2 - 2,5 /ug/1 in the chlorination step (Rook-Effect1)
- 7 -
- also increase of tetrachloroethylen by a factor of 2
- the over-all purification efficiencies are around 70 %
for tetrachloroethylene and 30 . for trichlorethylene.
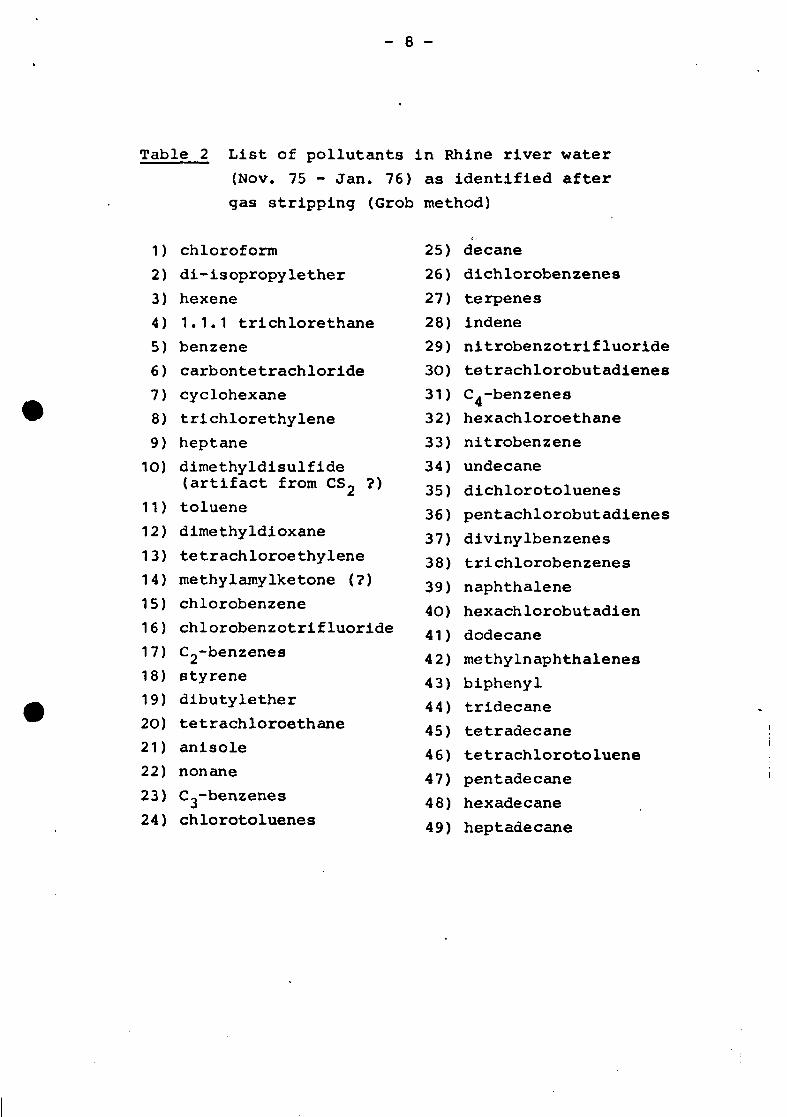
- 8 -
Table 2 List of pollutants in Rhine river water
(Nov. 75 - Jan. 76) as identified after
gas stripping (Grob method)
1) chloroform
2) di-isopropylether
3) hexene
4) 1.1.1 trichlorethane
5) benzene
6) carbontetrachloride
7) cyclohexane
8) trichlorethylene
9) heptane
10) dimethyldisulfide(artifact from CS 2 ?)
11) toluene
12) dimethyldioxane
13) tetrachloroethylene
14) methylamyIketone (?)
15) chlorobenzene
16) chlorobenzotrifluoride
17) C^-benzenes
18) styrene
19) dibutylether
20) tetrachloroethane
21) anisole
22) nonane
23) C3-benzenes
24) chlorotoluenes
25) decane
26) dichlorobenzenes
27) terpenes
28) indene
29) nitrobenzotrifluoride
30) tetrachlorobutadienes
31) C.-benzenes
32) hexachloroethane
33) nitrobenzene
34) undecane
35) dichlorotoluenes
36) pentachlorobutadienes
37) divinylbenzenes
38) trichlorobenzenes
39) naphthalene
40) hexachlorobutadien
41) dodecane
42) methylnaphthalenes
43) biphenyl
44) tridecane
45) tetradecane
46) tetrachlorotoluene
47) pentadecane
48) hexadecane
49) heptadecane

MS
HAT /nz,
-
um*.
US*
flq. 1 Block diagramm of GC-MS-conbination
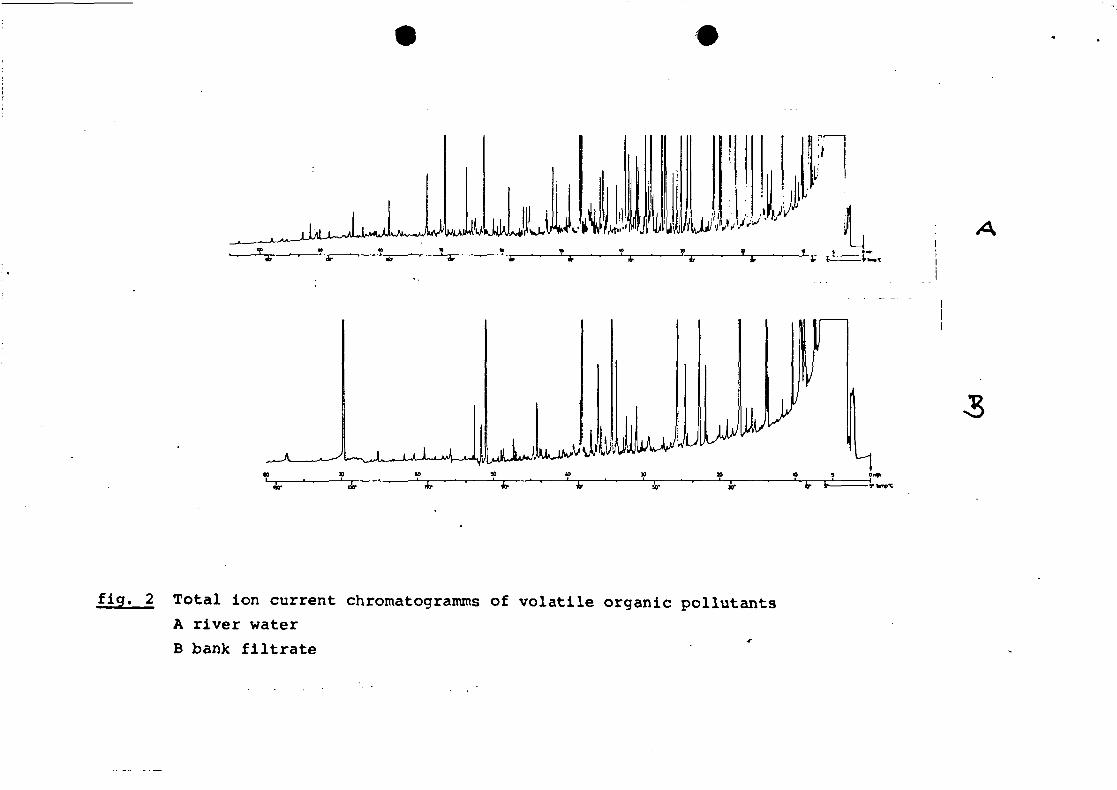
\J -Jjj Uli-A ill
-P*np*C
fig« 2 Total ion current chromatogramms of volatile organic pollutants
A river water
B bank filtrate
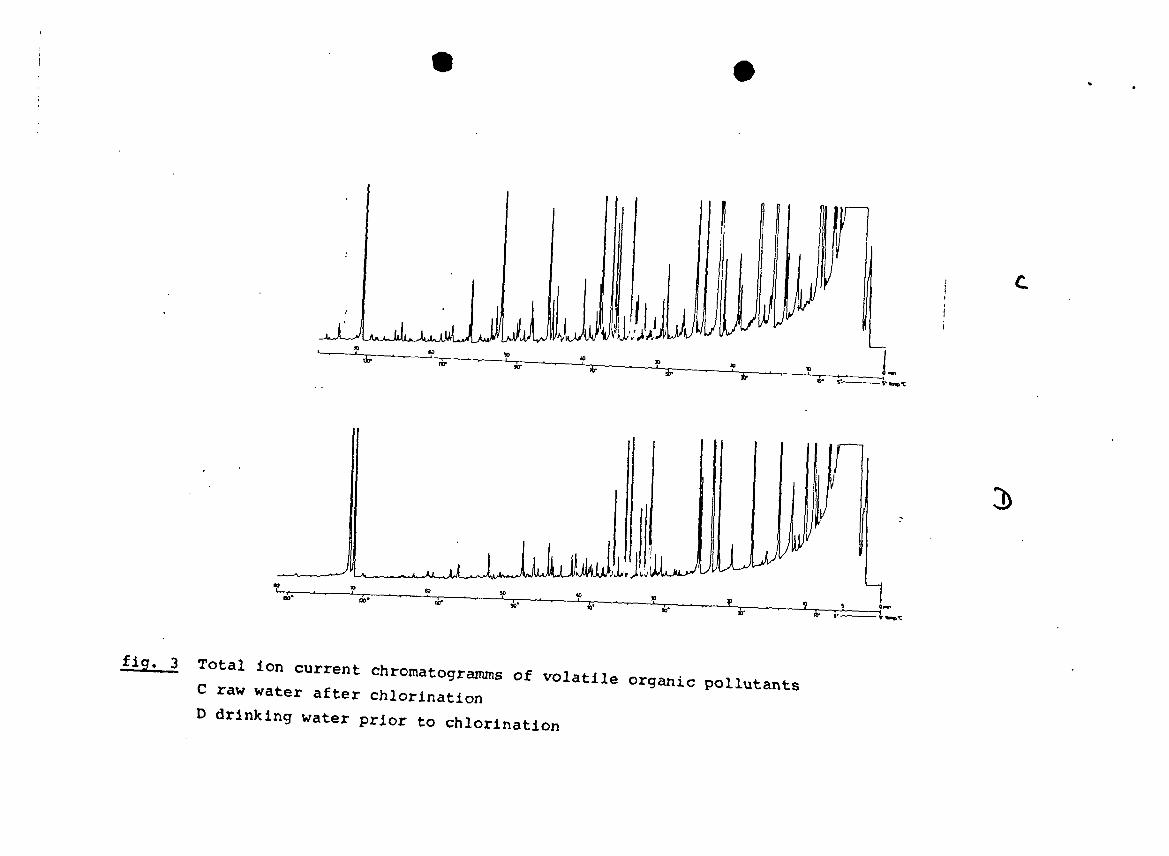
^_<__Ax^JUl^^Ai>"-~AdlWlJ^K/W^ JkiA
3>
fig. 3 Total ion current chromatogramms of volatile organic pollutants
C raw water after chlorination
D drinking water prior to chlorination

fig. 4 Behavior of aromatic halogen compounds in drinking
water processing
S
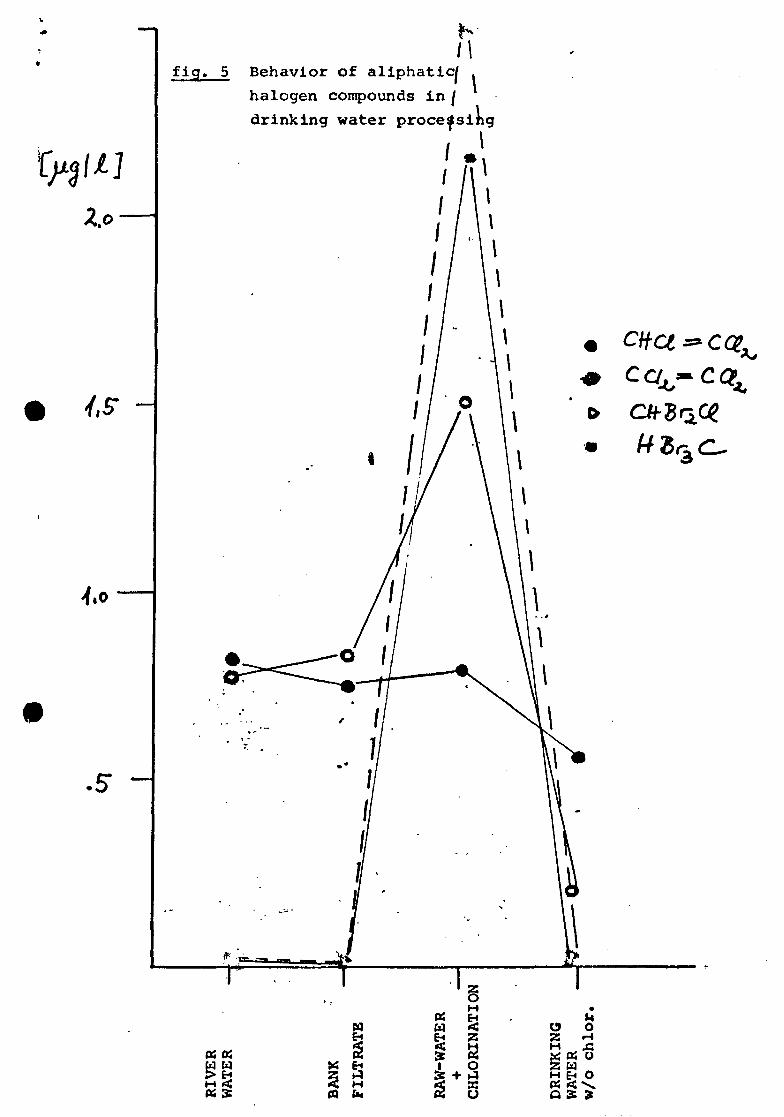
Z.o
Iff ~
Mfig. 5 Behavior of aliphatic| .
halogen compounds in /
drinking water processing
CJ I< M0) (N
w <
IJ2 o
O
22 wH t« O

nORGANIC CONSTITUENTS OF WATER - ANALYSIS BY CAPILLARYGAS CHKOMATOGRAPHY
by: Walter Giger,Swiss Federal Institute for Water Resources andWater Pollution Control (EAWAG)
INTRODUCTION
The impact of organic constituents on the aquatic environmentis of growing concern for ecological and hygienic reasons. Witha few exceptions routine assessments of water quality are basedon collective parameters like total organic carbon or biologicaloxygon demand. But, since most biochemical reactions show a verypronounced structural dependence, studies on chemical ecologynecessitate analyses for single constituents. Such investigationsare hindered by two intrinsic properties of organic water con-stituents. Firstly, the organic assemblages in environmentalsamples are of an extraordinarily high compositional complexity,and secondly, single components occur in trace quantities only.Therefore, very efficient enrichment, seperation, and detectiontechniques are needed.
The seperation efficiency of capillary gas chromatography byfar exceeds what presently is achievably by other methods. Thisanalytical technique thus offers the best possibility to carewith highly complex minimum of organic compounds. The limitationshowever, are given by the necessary limit volability and thermalstability of the components amenal to gas chromatography.
This paper reports an analyr.es of organic constituents in waterutilizing gas chromatograpliy with glass capillary columns.Detection and identifications arc achieved by flane ionizn Lion,electron capture or compul ir.i zed mass spectromotry. By cipplylmjtwo different enrichment procedures, namely closed loop (JMCOUSstripping and liquid-liquid extraction, a bread variety ofwater samples can be studied. Analyses of primary and secondaryeffluents and river water. The results are discussed with respectto both possible sources and to the fate of organics in watertreatment processes and in the aquatic ecosphere.
METHODS
Enrichment
Effluents of primary and secondary sewage treatment were filteredthrough a glass fritted funnel. The filtrates were then extractedby simple liquid-liquid partitioning into methylenechloride.The extracts were separated into three fractions by adsorptioncolumn chromatography on silica (1). The nonpolar constituentseluted with pentane and methylenechloride were analyzed by glasscapillary gas chromatography after evaporative concentration.The more polar constituents were eluted with methanol, evaporatedto dryness, and taken up in methylenechloride.
Volatile organic constitutents from river were enriched by aclosed-loop gaseous stripping/adsorption/elution-proceduredeveloped by Grob. The main advantage of this method is thehigh enrichment factor (1 : 106) which enables the detectionof traces in the ng/1 range. Since the gas chromatographicanalyses can be performed without prior evaporation, low boilingcomponents are quantitatively extracted as well.
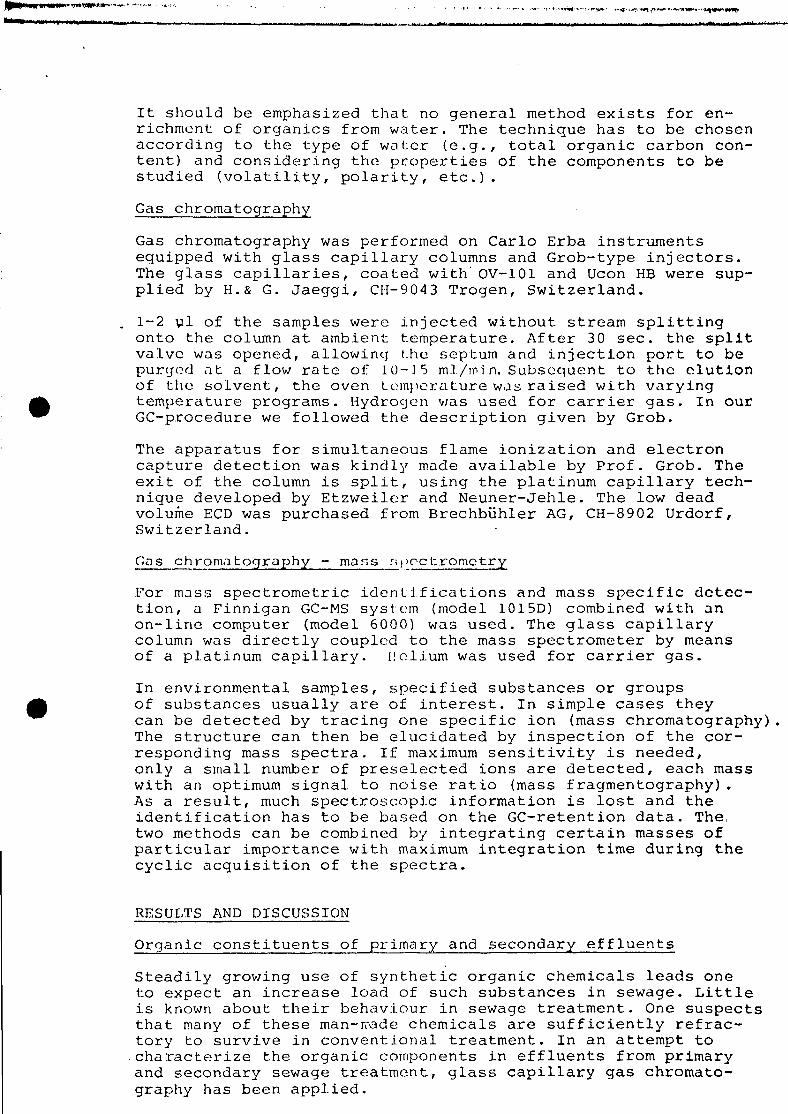
It should be emphasized that no general method exists for en-richment of organics from water. The technique has to be chosenaccording to the type of water (e.g., total organic carbon con-tent) and considering the properties of the components to bestudied (volatility, polarity, etc.).
Gas chromatography
Gas chromatography was performed on Carlo Erba instrumentsequipped with glass capillary columns and Grob-type injectors.The glass capillaries, coated with OV-101 and Ucon HB were sup-plied by H.& G. Jaeggi, CH-9043 Trogen, Switzerland.
1-2 ul of the samples were injected without stream splittingonto the column at ambient temperature. After 30 sec. the splitvalve was opened, allowing t.he septum and injection port to bepurged at a flow rate of 10-15 ml/mi n. Subsequent to the clutionof the solvent, the oven temperature was raised with varyingtemperature programs. Hydrogen was used for carrier gas. In ourGC-procedure we followed the description given by Grob.
The apparatus for simultaneous flame ionization and electroncapture detection was kindly made available by Prof. Grob. Theexit of the column is split, using the platinum capillary tech-nique developed by Etzweiler and Neuner-Jehle. The low deadvolume ECD was purchased from Brechbuhler AG, CH-8902 Urdorf,Switzerland.
Gas chromatography - mans r;>>octromctry
For mass spectrometric identifications and mass specific detec-tion, a Finnigan GC-MS system (model 1015D) combined with anon-line computer (model 6000) was used. The glass capillarycolumn was directly coupled to the mass spectrometer by meansof a platinum capillary. Helium was used for carrier gas.
In environmental samples, specified substances or groupsof substances usually are of interest. In simple cases theycan be detected by tracing one specific ion (mass chromatography)The structure can then be elucidated by inspection of the cor-responding mass spectra. If maximum sensitivity is needed,only a small number of preselected ions are detected, each masswith an optimum signal to noise ratio (mass fragmentography).As a result, much spectroscopic information is lost and theidentification has to be based on the GC-retention data. The,two methods can be combined by integrating certain masses ofparticular importance with maximum integration time during thecyclic acquisition of the spectra.
RESULTS AND DISCUSSION
Organic constituents of primary and secondary effluents
Steadily growing use of synthetic organic chemicals leads oneto expect an increase load of such substances in sewage. Littleis known about their behaviour in sewage treatment. One suspectsthat many of these man-roade chemicals are sufficiently refrac-tory to survive in conventional treatment. In an attempt tocharacterize the organic components in effluents from primaryand secondary sewage treatment, glass capillary gas chromato-graphy has been applied.

Table 1 lists mean values of TOC and of the various fractionweights. A noteworthy difference in elimination rates betweenTOC (73%) and the methylenechloride extractable material (83%) ,suggests a higher amount of nonextractable polymeric consti-tuents in the secondary effluent. The pentane and methylene-chloride eluates of the silica chromatography contain hydro-carbons predominantly of petroleum origin. The bulk of the ex-tractable material is eluted with methanol and consists ofmore polar compounds which are only partly amenable to gaschromatography.
Table 1.: Weight distribution of organic constituents in primaryand secondary effluents.
Primary Secondary Eliminationeffluent effluent ratemg/1 mg/1 %
Total organic carbon 19.3 11.1 72
Methylenechloride extractablePentane eluateMethylenechloride eluateMethanol eluate
1 2 . 00 .440 .36
1 0 . 3
2 . 00 . 0 50 . 0 61 .7
83898 384
Data represent the mean values of three 96-hour compositesamples. Total organic carbon was determined on a BeckmanTOC analyzer after filtration through a glass fritted funnel.Weights of the extractable matter and the three fractions weremeasured by a Cahn electrobalance. Small aliquots (20-50 ulof 1-2 ml) were transferred with a 100-ul-syringe to the alumi-num pan of the balance and weighed after air-drying.
In this report we focus on the two hydrocarbon fractions, aimingat a better understanding of the behaviour of petroleum con-stituents in activated sludge treatment.
The gas chromatograms of figure 1 characterize the aliphatichydrocarbons in primary and secondary effluents, respectively.Before activated sludge treatment, a mixture of saturates thatvery much resembles the alkane distribution in No. 2 fuel oilis found, n-alkanes are dominant with a maximum abundance in theC. , to C. .-range. The pattern of branched hydrocarbons is close-ly related to the fingerprints often found in petroleum-derivedhydrocarbon mixtures. In the secondary effluent, the distributioncurve is shifted to a higher boiling range with its maximum atn-hcptadecane. One possible explanation for this transformedion would be the easier microbial degradation of hydrocarbonswith shorter chain length.
However, the GC's reveal strong evidence that, at least in theC.4~C~n-range, allmost no biological degradation is taking place.It is a well established fact that branched and particularlyisoprencidal hydrocarbons are more slowly degraded than straightchain alkanes. The ratios of n-heptadecane to pristane andn-octadecane to phytane can therefore be used as measures forthe degree of microbiol degradation. As shown in figure lf theseratios are not changed by the activated sludge treatment.
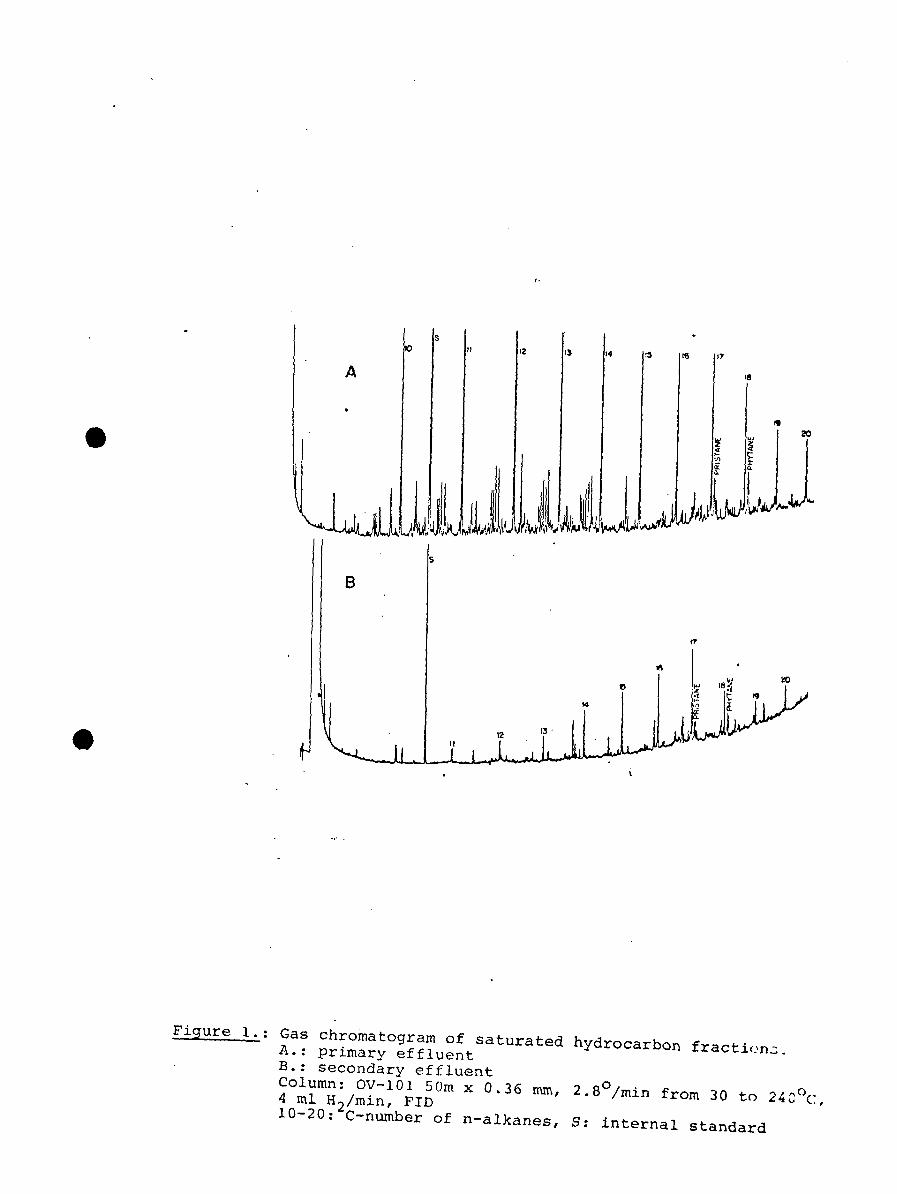
B
ii
y
Figure 1.: Gas chromatogram of saturated hydrocarbon fractions.A.: primary effluentB.: secondary effluentColumn: OV-101 50m x 0.36 mm, 2.8°/min from 30 to 24C°C,4 ml H2/min, FID10-20: C-number of n-alkanes, S: internal standard
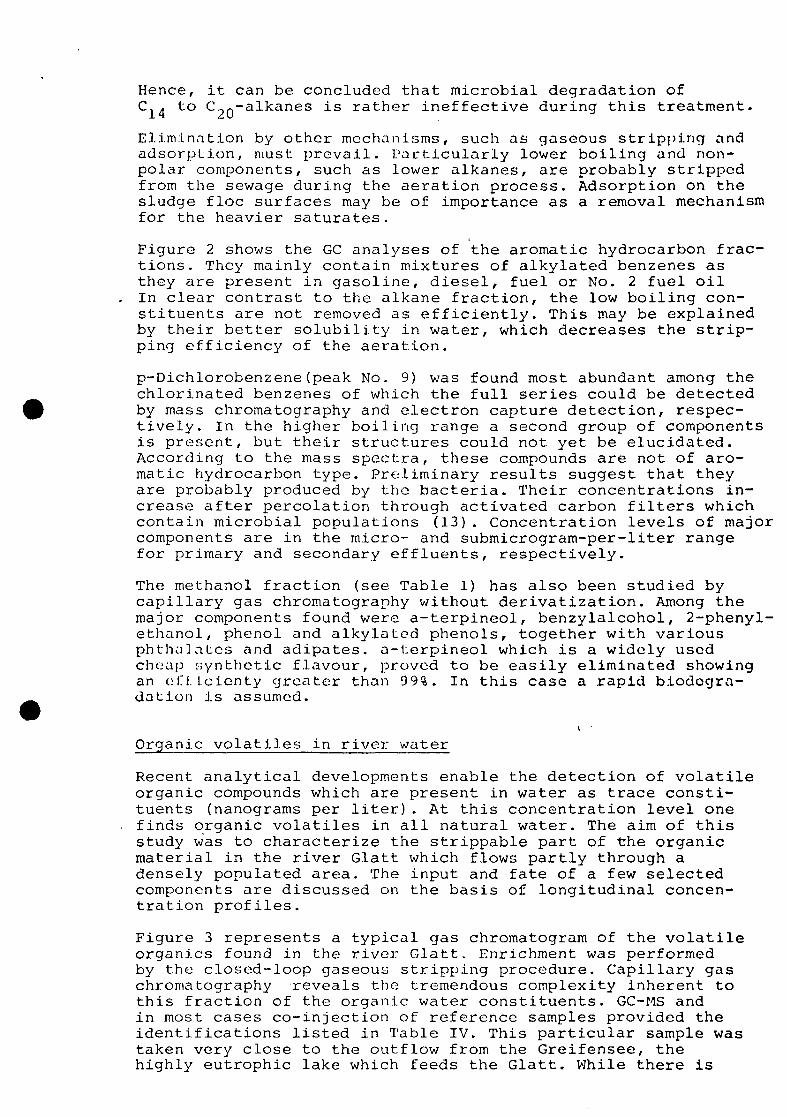
Hence, it can be concluded that microbial degradation ofC.^ to C?0-alkanes is rather ineffective during this treatment.
Elimination by other mechanisms, such as gaseous stripping andadsorption, must prevail. Particularly lower boiling and non-polar components, such as lower alkanes, are probably strippedfrom the sewage during the aeration process. Adsorption on thesludge floe surfaces may be of importance as a removal mechanismfor the heavier saturates.
Figure 2 shows the GC analyses of the aromatic hydrocarbon frac-tions. They mainly contain mixtures of alkylated benzenes asthey are present in gasoline, diesel, fuel or No. 2 fuel oilIn clear contrast to the alkane fraction, the low boiling con-stituents are not removed as efficiently. This may be explainedby their better solubility in water, which decreases the strip-ping efficiency of the aeration.
p-Dichlorobenzene(peak No. 9) was found most abundant among thechlorinated benzenes of which the full series could be detectedby mass chromatography and electron capture detection, respec-tively. In the higher boiling range a second group of componentsis present, but their structures could not yet be elucidated.According to the mass spectra, these compounds are not of aro-matic hydrocarbon type. Preliminary results suggest that theyare probably produced by the bacteria. Their concentrations in-crease after percolation through activated carbon filters whichcontain microbial populations (13). Concentration levels of majorcomponents are in the micro- and submicrogram-per-liter rangefor primary and secondary effluents, respectively.
The methanol fraction (see Table 1) has also been studied bycapillary gas chromatography without derivatization. Among themajor components found were a-terpineol, benzylalcohol, 2-phenyl-ethanol, phenol and alkylated phenols, together with variousphthulntcs and adipates. a-terpineol which is a widely usedcheap synthetic flavour, proved to be easily eliminated showingan oL'f. tcienty greater than 9 9%. In this case a rapid biodogra-dation Is assumed.
Organic volatiles in river water
Recent analytical developments enable the detection of volatileorganic compounds which are present in water as trace consti-tuents (nanograms per liter). At this concentration level onefinds organic volatiles in all natural water. The aim of thisstudy was to characterize the strippable part of the organicmaterial in the river Glatt which flows partly through adensely populated area. The input and fate of a few selectedcomponents are discussed on the basis of longitudinal concen-tration profiles.
Figure 3 represents a typical gas chromatogram of the volatileorganics found in the river Glatt. Enrichment was performedby the closed-loop gaseous stripping procedure. Capillary gaschromatography reveals the tremendous complexity inherent tothis fraction of the organic water constituents. GC-MS andin most cases co-injection of reference samples provided theidentifications listed in Table IV. This particular sample wastaken very close to the outflow from the Greifensee, thehighly eutrophic lake which feeds the Glatt. While there is

Figure 2.; Gas chromatogram of aromatic hydrocarbon fractions.A.: primary effluentB.: secondary effluentColumn: OV-101 50m x 0.36mm, 2.8°/min from 30 to 240°C,4 ml H /min, FID.1-22: identified constituents listed in Table II,S: internal standard.
Table II; Aromatic hydrocarbons identified in primary and secon-dary effluents
1. Toluene2. Ethylbenzene3. m-/p-Xylene4. o-Xylene5. l-Ethyl-4-methylbenzene/
l-Ethyl-3-methylbenzene6. 1.3.5-Trimethylbenzene7. l-Ethyl-2-methylbenzene9. 1.4-Dichlorobenzene
10. 1.2.3-Trimethylbenzene11. l-Isopropyl-4-methylbenzene
12. Indan13. 1.4-Diethylbenzene15. 1.3~Dimethyl-2-ethylbenzene/
1. 3-Dimethyl-4-ethylbenzene16. 1.2-Dimethyl~4-ethylbenzene17. 1.2.4.5-Tetramethylbenzene18. 1.2.3.5-Tetramethylbenzene19. Tetralin20. Naphtalene21. 2-Methylnaphthalene22. 1-Methylnaphtalene
Numbers refer to "Figure 2.

Figure 3.: Gas chromatogram of volatiles stripped from theriver Glatt.Column: Ucon HB, 50m x 0.32mm, 3°/min from 30 to 18O°C,2 ml H2/min, FIDSampling location close to the outflow from Greifensee.1-34: identified compounds listed in Table IIIS: internal standards
Table III: Compounds identified in river water.
l-Ethyl-3-methylbenzenel-Ethyl-4-methylbenzenel-Ethyl-2-methylbenzene1.3.5-Trimethylbenzene1.2.4-TrimethylbenzeneDiacetone alcohol1.2.3-Trimethylbenzene1.4-Dichlorobenzenen-NonanalC TT (-> V
1.2.3.4.5.6.7.8.9.
10.11.12.
25.26.27.28.29.30.31.32.33.34.
Benzene1.1-Diethyoxy-ethanecis-DichloroethyleneTrichloroethylene1.2-DichloropropaneTetrachloroethyleneTolueneEthylbenzene.p-Xylenem-Xyleneo-Xylene/chlorobenzenen-Propylbenzene
n-Pentadecanen-HexadecanePhistanen-HeptadecanePhytanen-OctadecaneTri-n-butylphosphaten-DibutylphtalateIso-Dibutylphthalaten-Eicosane
131415161718192021222324
•
nWehlinal
Numbers refer to Figure 3.

no discharge of sewage into the Glatt between the Greifenseeand the sample point, the Greifensee itself is subjected toa heavy sewage load. The mean residence time of water in thelake .is about one year.
The identified components can be divided into the followinggroups:A.: alkylated benzenes (No. 1,7-17,19)B.: low-molecular-weight chlorinated hydrocarbons (No. 3-6,11,20)C : aldehydes (No. 21,24)D.: aliphatic hydrocarbons (No. 25-30,34)E.: miscellaneous
Groups A and B are ubiquitous in the environment and have beenfound in natural and treated waters. These components are pre-sumably derived from human activity since they either occur infossil fuels or are widely used organic solvents. A homologousscries of n-aldohydes is considered to be of biogenic origin.This series extends from Cg-toC -aldehyde with its maximumat n-decanal. The aliphatic hydrocarbons appearing in theC 5-C2Q-range may be either indigenous or petroleum-derived.
To get a better insight into the sources of these materials andtheir fate in the river, quantitative determinations were per~formed along the Glatt. Londitudinal concentration profiles ofthree components are shown in Figure 4. n-Decanol remains con-stant from the Greifensee to the Rhine. This leads to the as-sumption that the main source for n-decanal is the Greifensee.No change occurs in the well aerated river either because noelimination takes place or due to additional diffuse inputs.The other two components (tetra-chloroethylene and 1.4 dichlo-robenzene) clearly demonstrate the influence of civilization.The water at station 1 contains significantly lower concentra-tions. The concentration profile for tetra-chloroethyleneforms a distinct peak at station 2, suggesting a dominant pointsource between stations 1 and 2. This could be explained bythe impact of the town of Diibendorf which is located aboveStation 2. Evaporation processes in the river are probablyresponsible for the concentration decrease after station 2.Dichlorobenzene, on the other hand, levels off after station2 which might be explained by additional inputs along theriver.
CONCLUSIONS
Capillary gas chromatography is a method of great potentialfor analyses of organic constituents, particularly in combinationwith appropriate enrichment and preseparation techniques. Com-plex mixtures of volatile organic components as contained inwater are unraveled by this highly efficient separation tech-nique. Specific detectors and directly coupled, computerizedmass spectrometry further enhance the yield of information.Mass chromatographic methods enable a convenient screening forcomponents of interest. It has to be stressed, however, thatgas chromatography is capable of analyzing only a minor fractionof the organic matter in water samples. Comparisons with TOCvalues in the case of primary and secondary effluents show thatonly approximately 5% of the organics are amenable to analysisby gas chromatography. A similar relation probably holds forother types of water. Derivatization and high pressure liquidchromatography should be applied to widen the scope of organicanalyses.
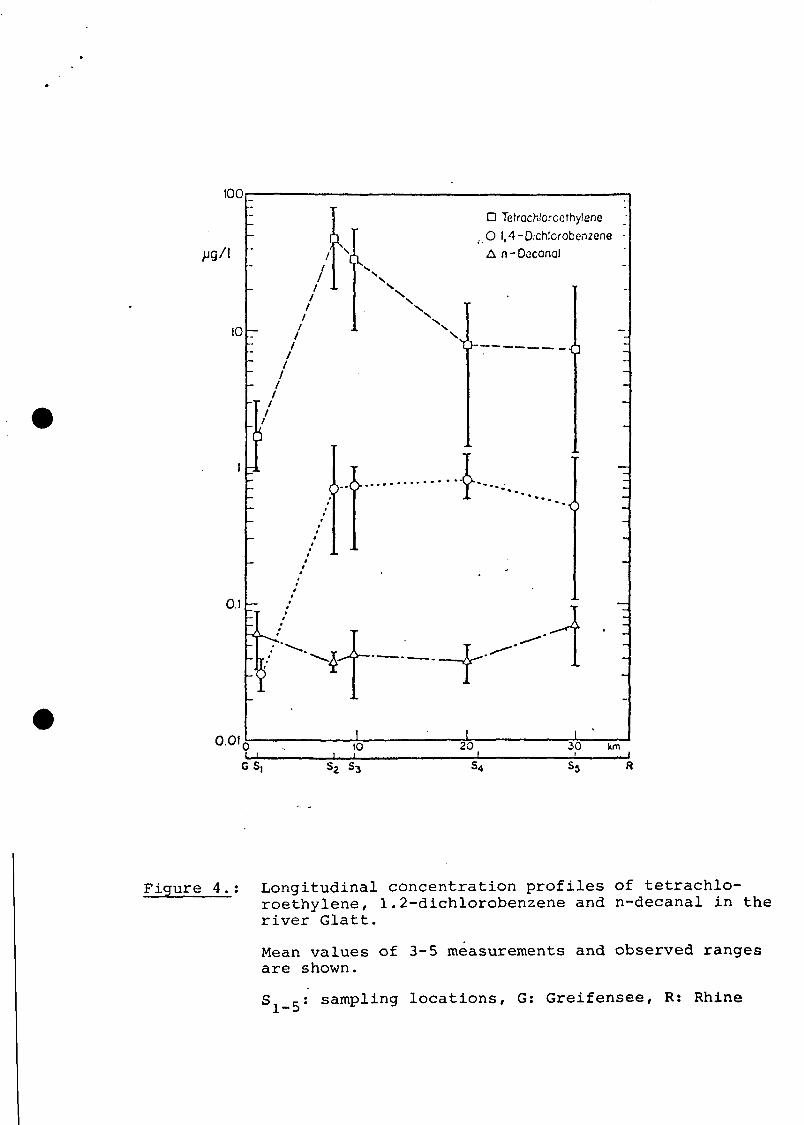
too
O.I
O.O10I I
D Tetrochlorccthylene
,.O 1,4-Dichlorobenzene
A n-Doconol
-0
• • • o
\r"
to 20 3 0 km
GS,
Figure 4.; Longitudinal concentration profiles of tetrachlo-roethylene, 1.2-dichlorobenzene and n-decanal in theriver Glatt.
Mean values of 3-5 measurements and observed rangesare shown.
S c-: sampling locations, G: Greifensee, R: Rhine1~3
For evaluating potential health hazards and ecological impactsof organic chemicals the direct interrelation between chemicalstructure and biological activity has to be considered. Con-sequently, it may be misleading to assess environmental qualityby analyses with methods not achieving full separation andidentification of specific compounds.
Complete resolution of organic constituents in environmentalsamples is extremely difficult, if not impossible. The betterour analytical methods, the more we recognize the complexityof the mixtures present. Two approaches promise to providevaluable information. Firstly one can concentrate on a few se-lected constituents which are either of high ecological rele-vance or represent particular classes of compounds; the path-ways and fates of these constituents would be investigatedquantitatively. Secondly, monitoring changes in distributionpatterns or fingerprints can describe qualitatively the beha-viour of groups of components. The latter approach would begreatly improved by the development of computer methods forsophisticated processing of GC-MS data.
We plan to follow along both these lines to get better insightinto the behaviour of organic constituents in water treatmentprocesses and in the aquatic ecosphere.
This presentation is part of a paper which was presented atthe Symposium on Identification and Analysis of OrganicPollutants in Waters, Mexico City, December, 1975.The full paper:"Analyses of organic constituents in water by high resolutiongas chromatography in combination with computer-assisted massspectrometry"by Walter Giger, Martin Reinhard, Christion Schaffner andFritz Ziircher will be published in"Identification and Analysis of Organic Pollutants in Water",L.H. Keith, Editor, Ann Arbor Science, 1976.
Colloquium on the analysis of organic rr.icropollutants in water
Voorburg, The Hague.
CONTAMINATION OF DRINKING WATER WITH ORGANICS IN THE NETHF.RLhuOS
by:
G.J. Piot.
and
B.C.J. Zooteman
18 februari 1976.
DRINKING WATER CONTAMINATION WITH ORGANICS IN THE NETHERLANDS
Methods
G.J. Piet and B.C.J. Zoeteman
1. INTRODUCTION
To evaluate the health effects and the contribution to odour
of volatile organic compounds in drinking water, that means gas-
chromatographable organics, the compounds have to be concentrated
in a form where they can be easily subjected to a gaschromatogra-
phic analysis for identification and quantification.
The complexity of the organic constituents in drinking water from
different sources is well known, so the analysis must be performed
wiLh high resolution gaschromatography, combined with a sensitive
and fast mass-spectrometer. That means too a fast computer to
sample the peaks of individual components or a mixture of organic
components.
Low detection limits must be reached to reduce the volume of the
water sample to be analyzed. It is almost impossible to transport
or pretrent big volumes of drinking water without introducing
contamination.
In general identification and quantification of the individual
component is limited to a concentration of about 10 ppt in water.
For instance, benz(a)pyrene, a very toxic substance can be allowed
to a concentration of about 10 ppt in drinking water, according to
W.H.O. recommandations (200 nanogram PAH's/liter). The same holds
for very odourans compounds in water. Practically all organic com-
pounds have a threshold odour concentration in water which is higher
than 10 ppt.
2. CONCENTRATION TECHNIQUES,
Concentration of the volatile organic compounds in water(up to 2 5
catoms) is performed in several ways.
2.1. Closed loop stripping technique with an inert gas (Grob method)
under standart conditions. Reproducibility of recovering and quan-
titative measurement of the organic compounds is achieved and con-
trolled by adding an internal standard of e.g. butylcyclohexane.
In the standard procedure 5 liters of water sample are used in the
stripped organic compounds are adsorbed on a very tin activated
charbonfilter, which is eluted with 20 microliters of CS~ or
methylene chloride. No evaporation of the solvent has to be applied
so no loss of very volatile components takes place.
The concentration step takes 15-20 minutes depending on the type
of drinkingwater, this can be extended to 16 hours to recover
high boiling or very polar compounds.
In general 20-90% of each organic component is recovered. A sample
of tapwater of The Hague and of Dordrecht is shown, the gaschroma-
togruphic analysis took place with a 50 meter, 0,35 mm i.d. glass
OV, capillary column.
The detection limit in capillary chromatography for most components
is 0.04 nanogram, so in most cases 80 ml of drinkingwater is
sufficient for detection, when the final concentrate of 20 ul CS2
is evaporated to 2 microliters. 8 ml of drinkingwater is sufficient
when each organic compound has a concentration of about 10 ppt.
Extracts can be stored for several days without losses.
2.2. Macroreticular XAD resins.
In this case adsorption of the organics on the resin takes place
in the water-phase, longer contact times are necessary because
of the fact that about 80 ml of diethylether has to be used for
the elution of the adsorbed compounds, bigger volumes of water have
to be treated.
When no evaporation of the final extract is performed 320 liters of
water have to be used for detection of the components with capillary
gaschromatography at a detection limit of 10 ppt. When the final
extract of 80 ml of diethylether is concentrated to a volume of 0,5
ml where allmost no loss of e.g. toluene takes place, this volume
to be concentrated can be reduced to 20 liters of drinkingwater
A glass column of 30 cm length and 1.5 cm i.d. is filled with resin.
Recovery efficiencies for most components are between 20-60%.
2.3. Extraction techniques are used mostly in "analysis for specific
compounds: PAH's, PCB's specific organo-chlorine compounds, oil"
are concentrated in this way.
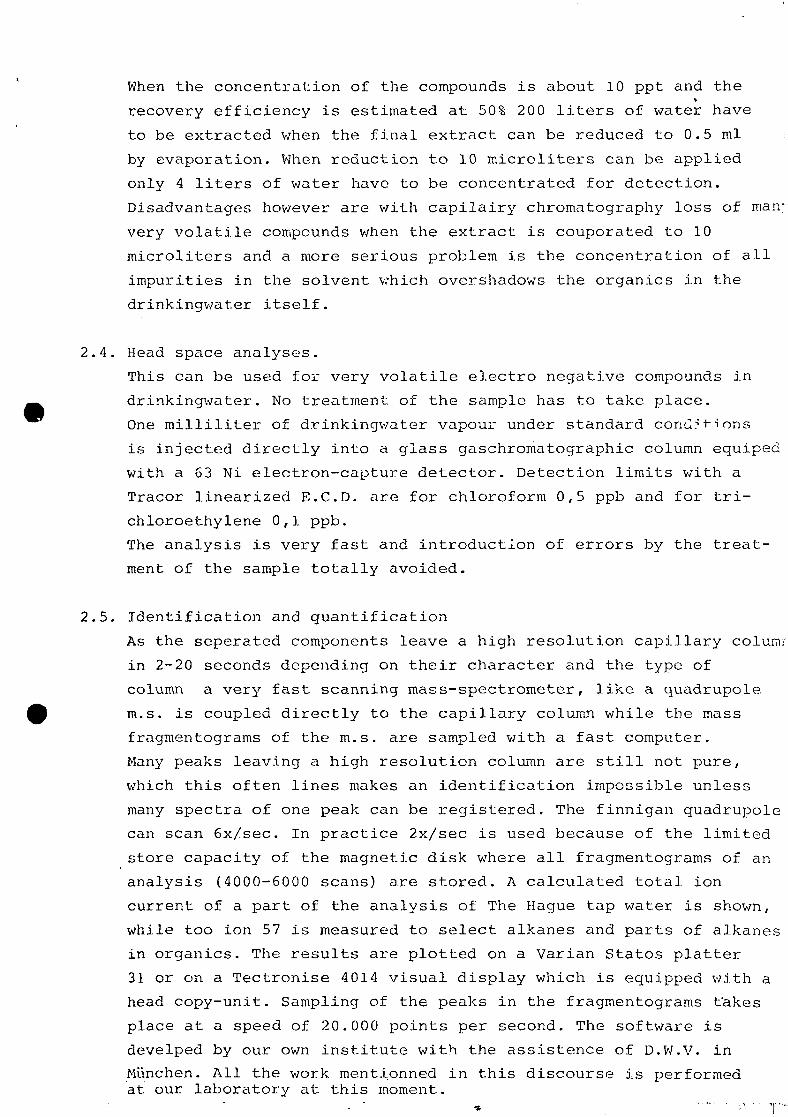
When the concentration of the compounds is about 10 ppt and the
recovery efficiency is estimated at 50% 200 liters of water have
to be extracted when the final extract can be reduced to 0.5 ml
by evaporation. When reduction to 10 microliters can be applied
only 4 liters of water have to be concentrated for detection.
Disadvantages however are with capilairy chromatography loss of man-
very volatile compounds when the extract is couporated to 10
microliters and a more serious problem is the concentration of all
impurities in the solvent which overshadows the organics in the
drinkingwater itself.
2.4. Head space analyses.
This can be used for very volatile electro negative compounds in
drinkingwater. No treatment of the sample has to take place.
One milliliter of drinkingwater vapour under standard cond? t-.i ons
is injected directly into a glass gaschromatographic column equiped
with a 63 Ni electron-capture detector. Detection limits with a
Tracor linearized E.C.D. are for chloroform 0,5 ppb and for tri-
chloroethylene 0,1 ppb.
The analysis is very fast and introduction of errors by the treat-
ment of the sample totally avoided.
2.5. Identification and quantification
As the seperated components leave a high resolution capillary column
in 2-20 seconds depending on their character and the type of
column a very fast scanning mass-spectrometer, like a quadrupole
m.s. is coupled directly to the capillary column while the mass
fragmentograms of the m.s. are sampled with a fast computer.
Many peaks leaving a high resolution column are still not pure,
which this often lines makes an identification impossible unless
many spectra of one peak can be registered. The finnigan quadrupole
can scan 6x/sec. In practice 2x/sec is used because of the limited
store capacity of the magnetic disk where all fragmentograms of an
analysis (4000-6000 scans) are stored. A calculated total ion
current of a part of the analysis of The Hague tap water is shown,
while too ion 57 is measured to select alkanes and parts of alkanes
in organics. The results are plotted on a Varian Statos platter
31 or on a Tectronise 4014 visual display which is equipped with a
head copy-unit. Sampling of the peaks in the fragmentograms fakes
place at a speed of 20.000 points per second. The software is
develped by our own institute with the assistence of D.W.V. in
Munchen. All the work mentionned in this discourse is performedat our laboratory at this moment.
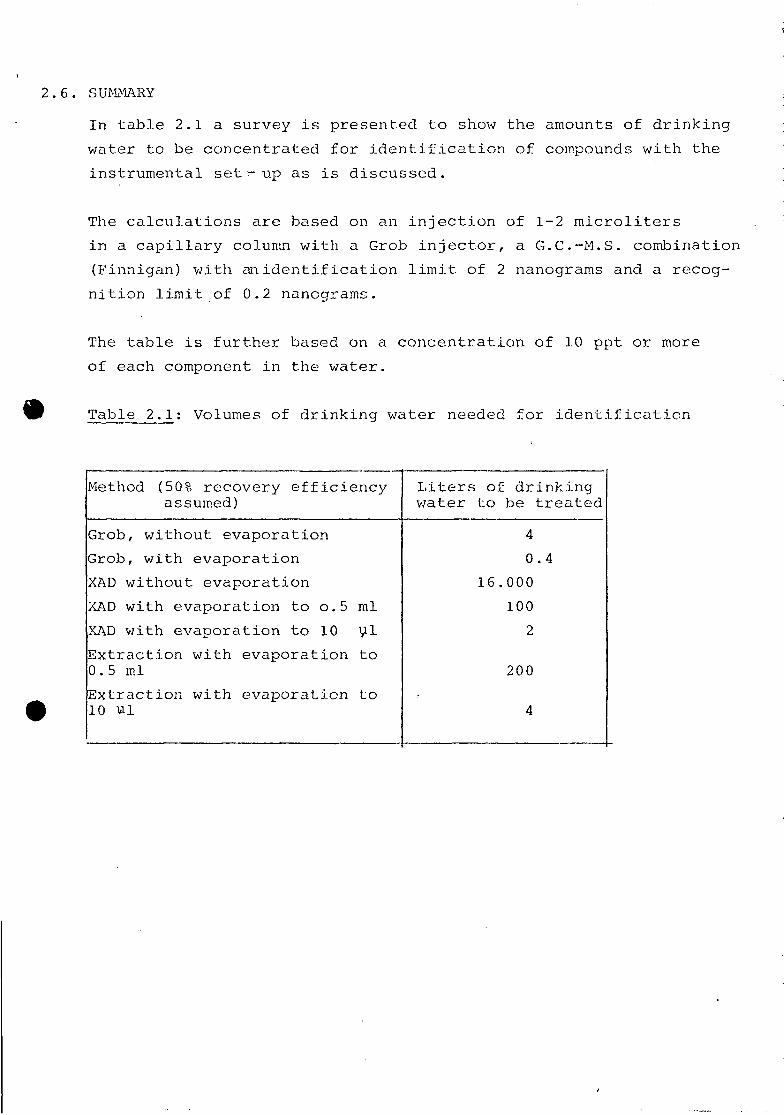
2.6. SUMMARY
In table 2.1 a survey is presented to show the amounts of drinking
water to be concentrated for identification of compounds with the
instrumental set-up as is discussed.
The calculations are based on an injection of 1-2 microliters
in a capillary column with a Grob injector, a G.C.-M.S. combination
(Finnigan) with an identification limit of 2 nanograms and a recog-
nition limit of 0.2 nancgrams.
The table is further based on a concentration of 10 ppt or more
of each component in the water.
Table 2.1; Volumes of drinking water needed for identification
Method (50% recovery efficiencyassumed)
Grob, without evaporation
Grob, with evaporation
XAD without evaporation
XAD with evaporation to o.5 ml
XAD with evaporation to 10 yl
Extraction with evaporation to0.5 ml
Extraction with evaporation to10 u.l
Liters of drinkingwater to be treated
4
0.4
16.000
100
2
200
4
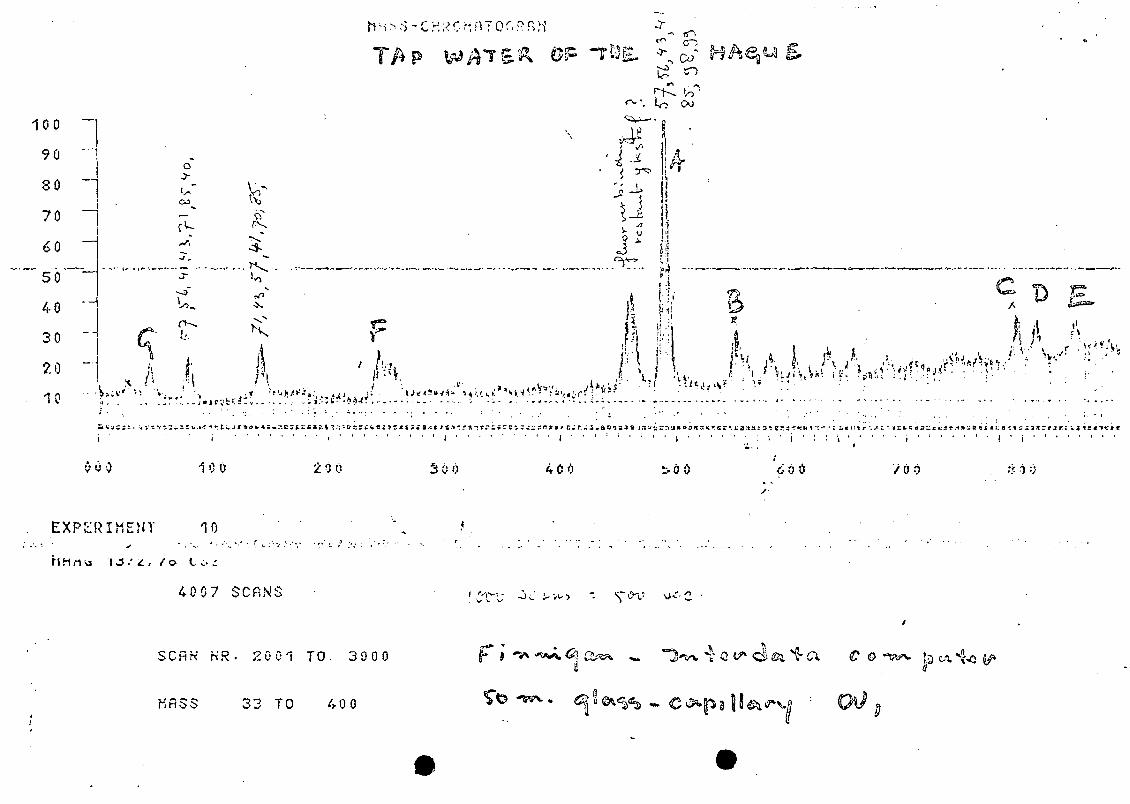
£fc 6P
100
90
80
70
60
"50~
40
30
2 0
10}\ A
;.ifvt::2
5« c y i 5 r. '^s'<»ti-»6£». •»•; ^
C* v 0 100 0 0
Uy7 I
J
L• oO 6 0 0 / o o
i • i ' '
M A»*
EXPERIMENT 10
40 0 7 SCfiNS
SCflH HR. 1 1 0 3000
KfiSS 33 TO 40 0

riHss-UHROMHTOGPRM J
P
30
90
30
70
SO
50
>0
—
—
—
—
...
10
0 0 y
I "Ji'k.
. t• -• \
. :l
; ) i " '* L 0. ij
3 0 0 600
i l
70 0 o 0
EXPtRIHEHT 10 .
H M A !i *! 3 / i. f 7 & C •> "
4 0 07 SCttNS
SCRH NR- 1 9 ? 1 TO 25>90
MflSS 57 TO 57
f
DRINKING WATER CONTAMINATION WITH ORGANICS IN THE NETHERT.ANDS
B.C.J. Zoeteman,
National Institute for Water Supply,The Netherlands
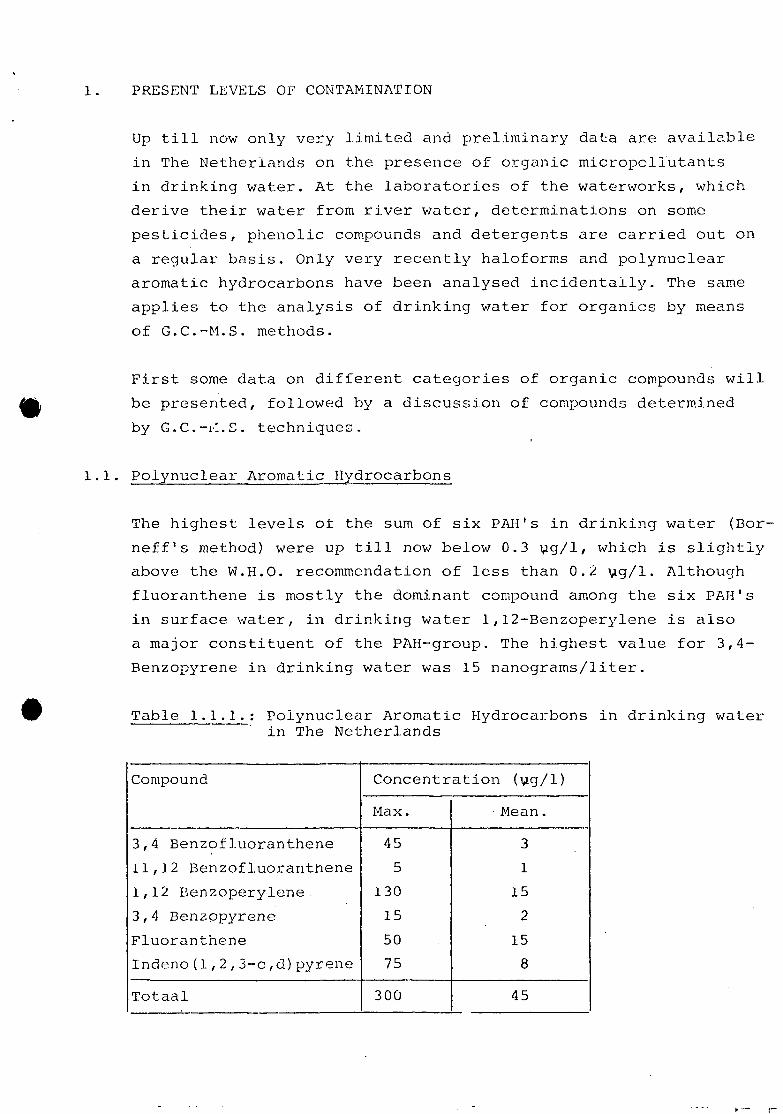
1. PRESENT LEVELS OF CONTAMINATION
Up till now only very limited and preliminary data are available
in The Netherlands on the presence of organic micropcliutants
in drinking water. At the laboratories of the waterworks, which
derive their water from river water, determinations on some
pesticides, phenolic compounds and detergents are carried out on
a regular basis. Only very recently haloforms and polynuclear
aromatic hydrocarbons have been analysed incidentally. The same
applies to the analysis of drinking water for organics by means
of G.C.-M.S. methods.
First some data on different categories of organic compounds will
be presented, followed by a discussion of compounds determined
by G.C.-i-l.S. techniques.
1.1. Poiynuclear Aromatic Hydrocarbons
The highest levels of the sum of six PAH's in drinking water (Bor-
neff's method) were up till now below 0.3 ug/1, which is slightly
above the W.H.O. recommendation of less than 0.2 ug/1. Although
fluoranthene is mostly the dominant compound among the six PAH's
in surface water, in drinking water 1,12-Benzoperylene is also
a major constituent of the PAH-group. The highest value for 3,4-
Benzopyrene in drinking water was 15 nanograms/liter.
Table 1.1.1.: Polynuclear Aromatic Hydrocarbons in drinking waterin The Netherlands
Compound
3,4 Benzofluoranthene
11,12 Benzofluoranthene
1,12 Benzoperylene
3,4 Benzppyrene
Fluoranthene
Indeno(l,2,3-c,d)pyrene
Totaal
Concentration (ug/1)
Max.
45
5
130
15
50
75
300
Mean.
3
1
15
2
15
8
45
- 2 -
The limited number of determinations can not be used to answer the
question if there exists a P.A.H. problem in tapwater due to
P.A.H. release by bitumibous pipe coatings.
On the other hand it is not likely that the riverwater contamina-
tion can lead to unacceptable high P.A.H. level- in conventionally
treated drinking v/ater.
1.2. Volatile halogenated compounds
Since the v/ork of Rook on haloforms was published in 197 4 the
class of volatile organics in drinking water has suddenly received
a great deal of attention. The main reason for this was the
relatively high concentration of the volatile compounds which
was in several cases closer to the p.p.m. level than to the
normally found p.p.b. level for organics in drinking water.
Furthermore the simple volatile substances can be rather toxic
due to their high reactivity. Some compounds are particularly
of interest because of their proven or possible mutagenic pro-
perties .
Examples are chloroform, tetra, vinylchloride, dibromoethane,
tri-chloroethylene as well as some halo-ethers like bis-chloro-
ethylether. All these compounds except vinylchloride, have been
detected at levels of 1 nanogram/liter or substantally higher
quantities in tapwater in The Netherlands. As the larger cities
in The Netherlands are located in the water short western part
of the country, they mainly depend on river water for their
water supply. The drinking water of a large part (25%) of the
Dutch population therefore has been treated with chlorine and
contains halogenated compounds.
The following maximum and average concentrations have been
found by our laboratory in tapwater of cities like Amsterdam,
The Hague, Rotterdam, Dordrecht and Zwolle.

Table 1.2.1: Volatile halogenated organics in Dutch tapwaters
Name
ChloroformDi-chiorobromomethane +
trichloroethyleneBroraoformDibromochloromethaneBromoethaneIodoethanel-chioro-2-bromoethaneDibromoethaneDichloroethaneDichloroetheneDichloropropaneTetrachlooretheneHexachlorobutadiene
ChlorobenzeneIodobenzeneChiorotolueneo-Dichlorobenzenem-Dichlorobenzenep-Dichlorobenzene
2,2 DichlorodiethyletherMonochlorodipropyletherBis (3-chloropropyl)etherBis(2-chioroisopropyl)ether
Concentration (ug/1)
Max.
100
252031
A'0.1«i0.10.11
^.0.1Z0.10.5
0.10.10.110.13
0.10.10.110
Mean
15
531
0.1
. N
12
108312222115
211325
21310
1.3. Organics determined by G.C./M.S. techniques
Lists with organic compounds which have been identified in drinking
water have been distributed the last 2 years on a frequent basis
among research laboratories. The most recent version of the
E.P.A. of January 1976 shows already about 300 different sub-
stances. Data on the present concentrations are still very limited.
Quantitative information is however essential for the evaluation
of health risks and organoleptic aspects related to the presence
of the considered compounds. Besides the earlier mentionned halo-
forms, dichlorobenzenes e.o., main contaminants The Netherlands
are compounds in drinking water derived from surface water with
concentrations above + 10 nanogram/liter like acetates and
naphtalenes as well as some benzenes and alcanes like trimethyl-
benzene and decane. Furthermore everywhere phtalates like

diethylphtalate and dibutylphtaiate are found in tapwater. General-
ly these compounds are not of interest from a toxicological
point of view. However the taste and odour of the water can be
influenced significantly. In this respect particularly dichloro-
benzenes and naphtalenes are of importance, as table 1.3.1
illustrates . . -- ••
Table 1.3.1: Some odour relevant tapwater contaminants in The
Netherlands.
Name
p-DichlorobenzeneGeosminNaphtaleneo-Chlorophenol1,3,5TrimethylbenzeneDimethylnaphtaleneChloroform2-MethylthiobenzthiazoleBis(2-chloroisopropyl)
etherMethylnaphtaleneIndene
Max.Detec-tedCone.vg/i
30.0610233
1001
100.50.1
Thresh.OdourCone.yg/1
0.30.0155232,5
1007.5
10051
iRatio !cone/Th.0.C
104211110.2
0.10.10.1

2. PLANNED STUDY OF ORGANIC MICROPOLLUTANTS IN TAPWATER OP 20 CITIES
IN THE NETHERLANDS
2.1. GENERAL ASPECTS
To improve the knowledge relating to the importance of the
present types and concentrations of organic compounds in tap-
water a study of tapwatex" in 20 Dutch cities is planned for 1976.
The cities have been selected in such a way that all the surface
water abstracting waterworks are included. Also those plants
are considered that use groundwater which can be partially con-
sidered as bakfiltered riverwater. Furthermore 7 controle cities
are included which use exclusively groundwater.
The aim of the investigation is not only to make an inventory
of the present concentrations of organic micropollutants in tap-
water, and particularly those with known mutagenic, carcinogenic
and teratogenic potential, but also to study a possible relation-
ship between the presence of organic pollutants and the perceived
taste and odour by the population. The philosophy behind this is
that a first sign for the consumer of water quality deterioration,
due to higher levels of organic pollutants, will be reflected in
the taste or smell of the tapwater. The smell may give him a
very sensitive and usefull warning for an unwanted break-through
of organic chemicals into the drinking water.
For the testing of the organoleptic properties of the water a
national panel of about 50 selected consumers will be used. It is
hoped that finally the presence of certain organic water contami-
nants can be related to a higher incidence of complaints about
the taste and smell of certain types of water. It is also anti-
cipated that the presence of certain organic pollutants can be
correlated with mortality rates due to different types of desease,
in the studied cities. Some more details of the planned study
on sampling, chemical analysis and organoleptic testing are
described in the following.
4.2. SAMPLING AND CHEMICAL-BIOLOGICAL MEASUREMENTS
The collection of a representative sample of the drinking water
of a city is a difficult exercise. Furthermore the prevention of
contamination of the sample with organic compounds from the
atmosphere has been found to be a very important aspect, as well
as losses of volatile compounds to the aim. In the national study
individual samples of 10 taps in each city will be collected for
the determination of haloform concentrations and for each city
a mixed sample of 200 liters will be collected by adding 20 liter
samples from 10 taps in a city into a stainless-steel container,
which is specially developed for this purpose. All sampling is
carried out by stainless-steel or teflon material under prevention
of direct contact between the sampled water and the atmosphere.
The mixed 200 liter sample will be used for organoleptic testing
by a panel, for analysis on haloforms, P.A.H.'s and other organic
compounds using as a concentration step the closed loop stripping
method developed by Grob as well as concentration by adsorption
on XAD-resin.
Both concentrates will further be analysed by a capillary G.C.-M.S.
technique (using a Finnigan quadrupole mass-spectrometer, coupled
with a W.D.V. computersystem).
Part of the XAD-concentrate, corresponding to a sample volume of
50 liters, will also be tested for mutagenic effects using a
simplified version of the Ames'test with mutated Salmonella
bacteria.
4.3. ORGANOLEPTIC TESTING
For the study of the influence of organic micropoilutants in drink-
water on the perceived taste and odour a panel will be selected
consisting of 2 citizens from each of the studied cities. The
panel as a whole will be formed on the basis of equal, numbers
of males and females, a representative age distribution between
18-65 years and a representative sensitivity of the taste and
smell organs. In relation to the latter the 50 panelmembers will
be selected from a total number of 150 persons after testing their
odour sensititvity for organic odorants in water.
The actual organoleptic testing of the water will take place in
Utrecht in co-operation with the Psychological Laboratory of the

University of Utrecht.Wether or not this study will proof a
relation between bad taste and smell of drinking water and insuf-
ficient treatment; of drinking water for certain organic micro-
pollutants, it is hoped that it will at least contribute to a
better quantitative knowledge of the level of tapwater conta-
mination with organic compounds in this country and it's signifi-
cance from a toxicological point of view.
Thank you very much.
DISCUSSION OF LECTURES OF GIGER, STIEGLITS, PIET, ZOETEMAN, . , ,
Question de Groot:
Is the possibility considered to install a capillary column ,
on which an injection of an extract is made, in an analytical
identification system to have that column used at an other
laboratory to facilitate the exchange of information?
Answer Piet;
This is not yet considered.
Question Fielding;
Is there an optimum temperature in the Grob recirculating gas-
stripping?
Answer Piet:
It is limited by the condensation that takes place in the system
and on the carbon filter. High boiling and more polar compounds
can be concentrated with the XAD adsorption. Different methods
of concentration will give the right picture when these are combined
Question Fielding:
Giger did filter the water before using it in the recirculating gas-
stripping procedure. Did you consider the less volatile components
in this procedure?
Answer Giger:
No. •• . • .
Question Rook:
Why is no drying agent, like magnesium perchlorate, introduced
in the stripping method to be able to work at more elevated
pressures?
Answer Piet:
In using the Kaiser Gradient tube we had to incorporate a drying
agent to get rid of the water condensed, but we found losses in
the organics comparing chromatograms with and without using a dry-
ing agent. In the nanogram level losses occur easily
Ansv/er Giger:
The Grob stripping method is developed for nanograms of volatile
components and for higher boiling components we have to use other
concentration techniques, probably XAD or even extraction proce-
dures .
{' Question Oskam:
"' The PAH content of drinking water in table 3.1.1
of Zoeteman is orders of magnitude higher than the levels in
Rhine and Meuse as found by v.d. Meent. Is this because of re-
lease from bituminous lining in the distribution system?
Answer Zoeteman:
No, we have to make a correction in the table it should be
nanograms/liter•
QUALITATIVE AND QUANTITATIVE METHODS FOR THE ANALYSIS OF
ORGANICS IN SURFACE WATER
Dr. J. Freudenthal
National Institute for Public HealthBilthoven, The Netherlands
Abstract
A new method for elemental analysis is described.
It is based on destruction of the molecules by an electrodeless
plasma and mass spectroinetric investigation afterwards.
"Chlorograms" obtained with this method are given for a
sewer sample and a sample of Rhine river water. The unknown compounds
are identified.
The frequency of occurrence and the concentration range
of the identified substances are checked in a system "mass spectral
library of surface waters". A description of this system is given.
Qualitative and quantitative methods for the analysis of organics in
surface water.
Element analysis.
Thousands of unknown compounds are present in the polluted
surface water of e.g. the Rhine river (at the ppt and higher level). There-
fore a choice is made for the identification of specific types of compounds.
The choice is the group of halogenated organic compounds. In order to locate
those compounds in the gas chromatogram, there is a need for a selective
detector parallel to the mass spectrometer (fig. 1). Just after the gas
chromatograph a splitter leads one fraction of the eluent into the selective
detector and the other fraction into the mass spectrometer. This procedure
is well known and several selective detectors are in use for this purpose.
For halogenated substances, the electron capture detector
has been used frequently. This is possibly mainly because its excellent
sensitivity and its simplicity in use. However, it responds not only to
halogenated compounds. Furthermore the response of the detector is not
proportional to the number of halogenes in the molecule. Therefore the
detector is not a quantitative detector for the amount of halogene atoms
in the molecules.
Other examples of selective detectors are the sulphur-phosphor
detector and the coulometrio detector.
Most of the detectors are only specific to one or more
elements. It would be interested to have a tunable selective detector.
Such a detector is the plasma emission detector. This type of detector
was investigated by us. The sensitivity of it was good for metals. But
for the elements Cl, Br, F, P, S, N and 0 the sensitivity was only in
the nanogram range. Moreover, the response of the detector is matrix
dependent; there is no linear response. Thus quantitative measurements
were not possible.
Starting from the idea of the plasma emission detector, we
developed a new type of detector: the plasma-mass spectrometer detector.
In this type of detector the molecules are being destroyed
in an electrodeless microwave plasma. In the plasma the molecules are
atomized and thereafter in a reaction they react with hydrogen. These
molecules are then detected in a mass spectrometer.
- 2 -

- 2 -
The advantages of the system are the following:
1) The system is inexpensive, because one needs the mass spectrometer
for the identification anyway.
2) There are no dead volumes between the GLC-capillary column and the
mass spectrometer.
3) The system is sensitive; for chlorine for example the sensitivity is
in the pieogra*n range.
4) The system is quantitative, because of the absence of matrix effects.
5) The plasma can still be used for a simultaneous optical investigation.
In figure 2 the chlorogram of the water of a sewer is given.
In table I the identified substances are given. Prom the chlorogram one
can see that also all chlorinated compounds in that part of the chromato-
gram were identified. From table I follows that there are also chlorinated-
bromir.ated compounds. Therefore a bromogram was taken and the brominatcd
compounds were identified (table II).
In figure 3 a part of the chlorogram of Rhine water is
given. From this enormous number of compounds only a fraction is con-
sidered at first. In figure 4 the very first part of figure 3 is given
(under other chromatographic conditions).
Results are given in table III.
The mass spectrometrical surface water library.
After the identification of an unknown compound in surface water, one
wants to know whether the compound is a common one and in what concentra-
tion range the compound usually occurs. To get the information one can
perform a lot of fragmentographic work on many samples. This is of course
a time consuming operation. To avoid this, an other system was developed:
"the mass spectral library of surface water".
On several places in the Netherlands (fig. 5) every 4 weeks
in 1974 a sample of surface water was taken. A methylene chloz^ide extract
was made from this 3 litre sample. These extracts were run over a GC-MS-
computer system. All the data were stored on the magnetic tape.
If one wants to know whether a certain compound occurs in
the surface water one simply asks the computer to generate the fragmento-
gram for the specific compound. If the compound is there, the fragmento-
gram will show a response.
- 3 -
- 3 -
The advantage of the system is, that it costs just computer-
time to know whether the compound is there or not and to make a semi-
quantitative measurement.
Data are only generated when there is a need for those data.
The limit of detection for our set-up of 197^ was 0.5 ppb. However, the
limit can be made lower, if necessary. The runs are made from fresh
extracts, deterioration of the data is impossible.
The system is further an historic representation. We observed
for example an- increase of pentachlcrophenol in the last two years in the
Rhine river water. A screening on hexachlorobutadiene for 197 - gave high
values (an exact quantification has still to be done).

Fig. 1 A selective detsctor is placed parallel to the mass spectrometer.
A splitter makes that a fraction of the eluent goes to the mass
spectrometer arid the other fraction to -the selective detector-
GLC
/
(
inter
face
selective
detector
M.S.

Fig. 2 A chlorogram of water of a sewer.
15*35"
2159"2M2"
m/e= 36 125*C iso C II R Hexaan-extr
R.I.V. Spectrometrie 6600

Fig. 3 A chlorogram of water of the Rhine River.
The gas chromatographic column was 30 m., and has an internal
diameter of 0.45 mm. The phase was OV-101.
15'35"c
5'55"
3'29"
m/e = 36 150 C iso E-21A5
R.I.V. Spectrometrie 6599
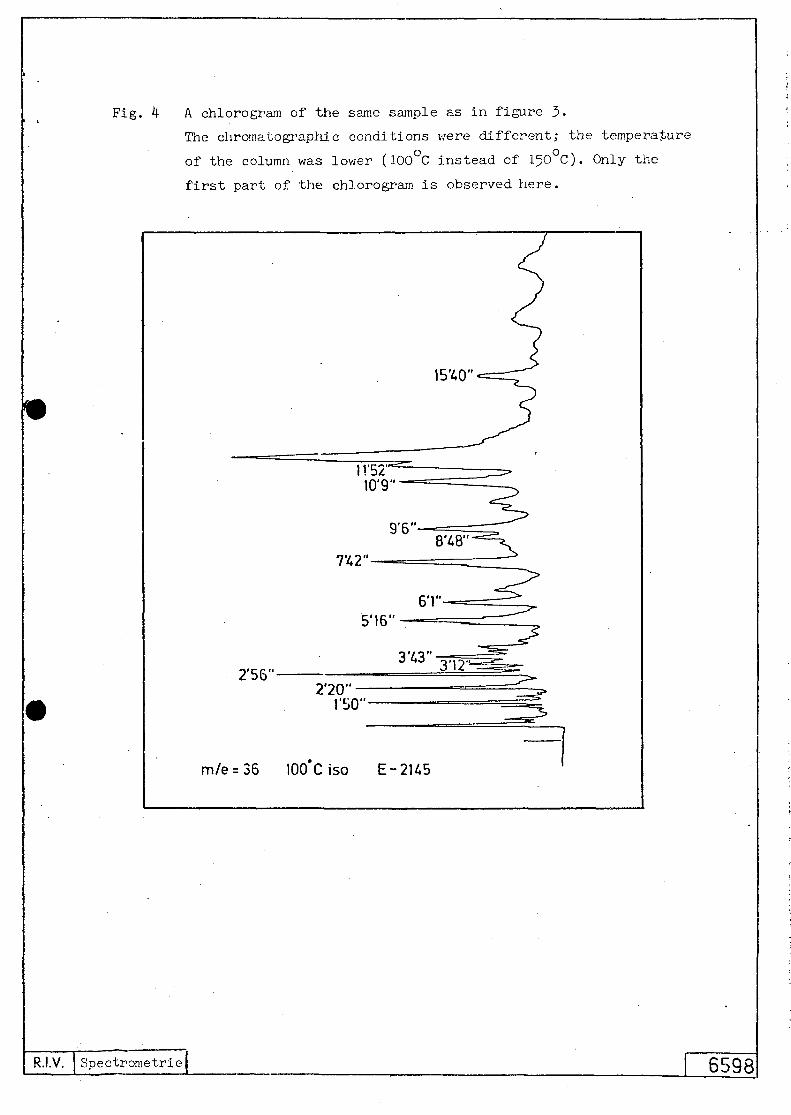
Fig. 4 A chlorogram of the same sample as in figure 3.
The chromatographic conditions were different; the temperature
of the column was lower (100°C instead of I50 C ) . Only the
first part of the chlorogram is observed here.
2'56'2*20"
7X2"
l'SO"
m/e = 36 100 C iso E -2U5
R.I.V. Spectrometriej 6598
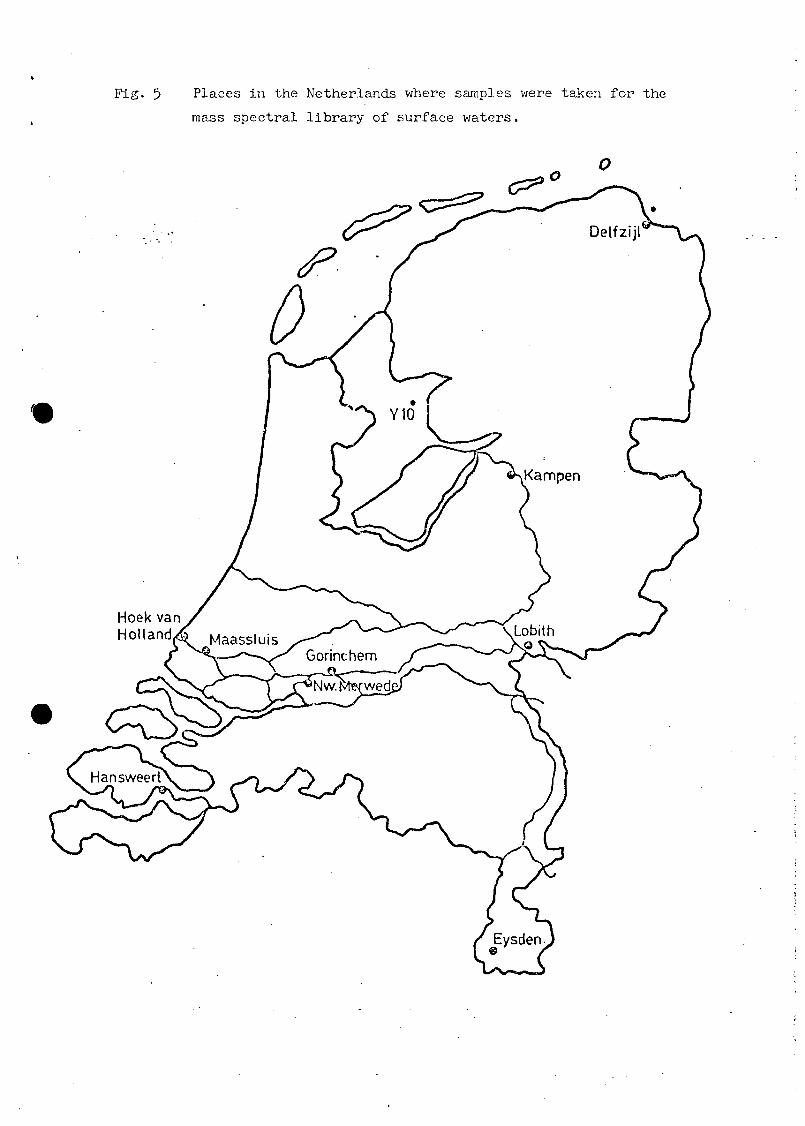
Fig. 5 Places in the Netherlands where samples were taken for the
mass spectral library of surface waters.
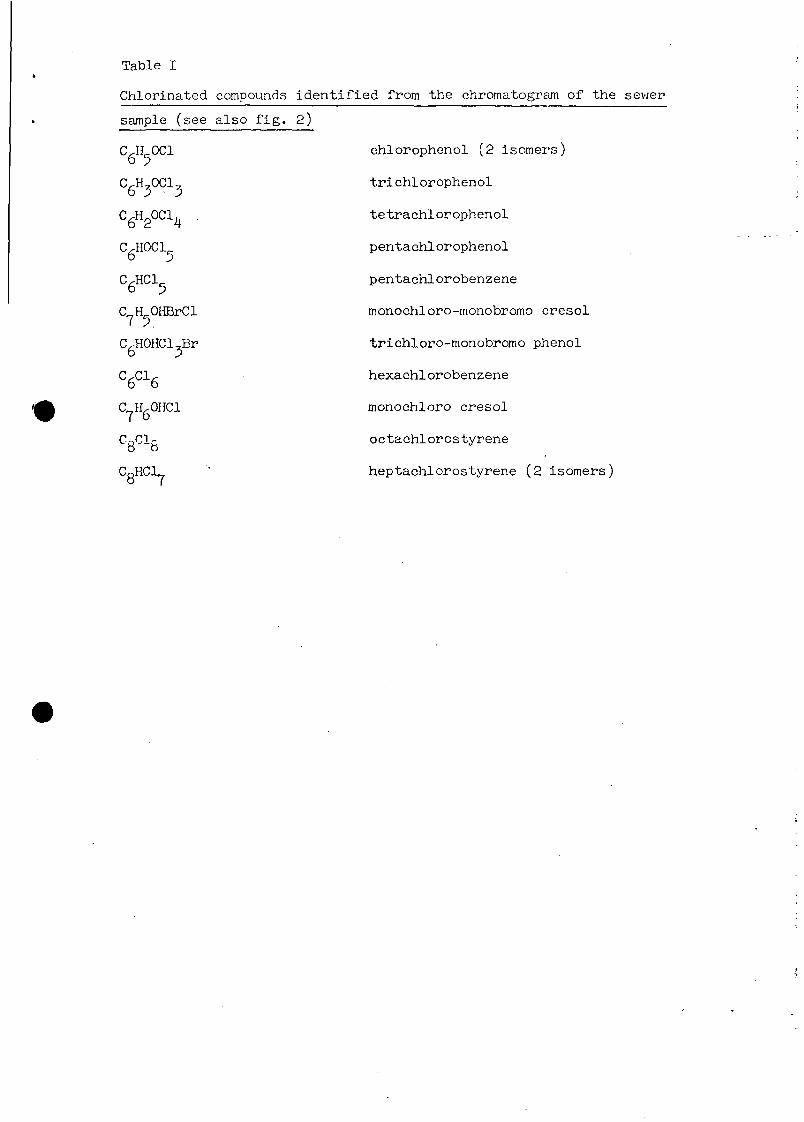
Table I
Chlorinated compounds identified from the chromatogram of the sewer
sample (see also fig. 2)
6 5
5
C^H.OHBrCl
CgHOHClJBr
C6C16
C
C 8 C 1 6
C 8 H C 1 7
chlorophenol (2 isomers)
tri chlorophenol
te trachlor ophenol
pentachlorophenol
pentachlorobenzene
monochloro-monobromo cresol
trichloro-monobromo phenol
hexachlorobenzene
monochloro cresol
octachlorostyrene
heptachlorostyrene (2 isomers)
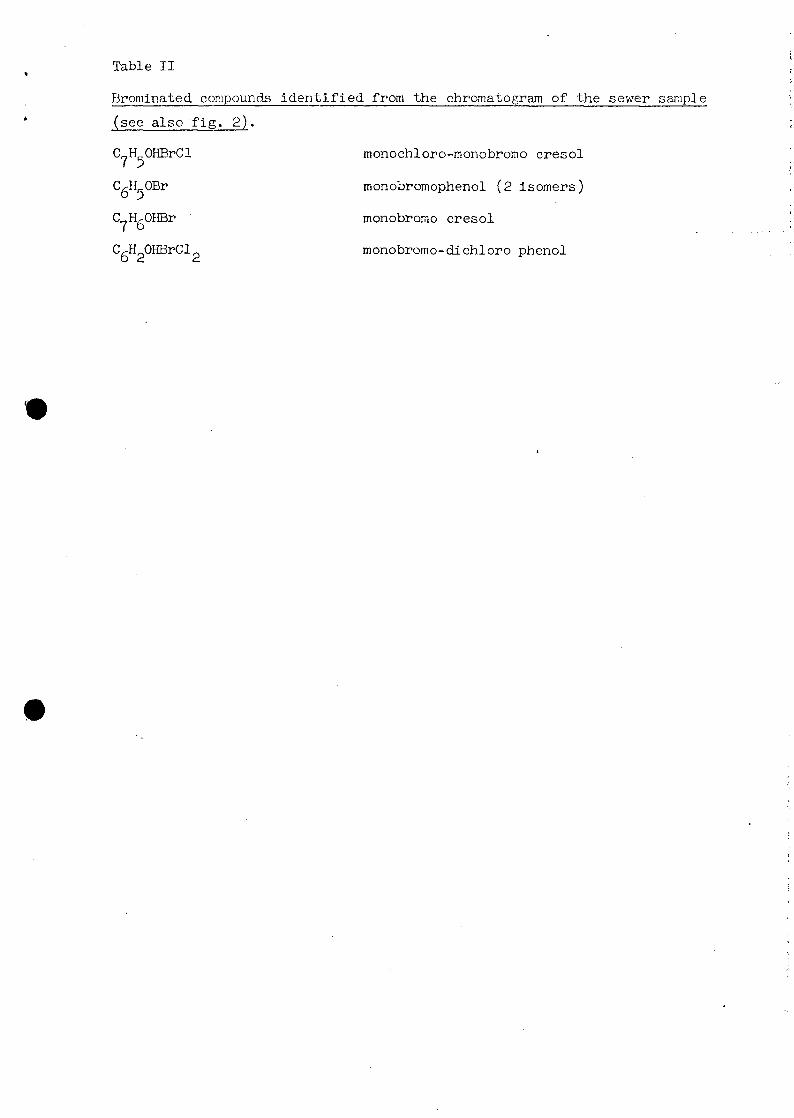
Table I I
Brominated compounds i d e n t i f i e d from the chromatogram of the sewer sample
(see also f i g . 2).
C H OHBrCl
CgH QBr
.OHBrCl _2 d.
monochloro-rnonobromo cresol
monobromophenol (2 isomers)
monobromo cresol
monobromo-dichloro phenol

Table III
Chlorinated compounds identified from the chromatogram of the Rhine River
(see also figures 3 and 4 ) .
C6H6NC1
C6 H5N C 12
C6H2C14
C,-H,OC1,D 3 3
C BLOC1,
C.Cl^H6 5
C.C1,6 6
C4 C 16
monochloro-aniline
tri chlorobenzene
dichloro-aniline
tetrachlorobenzene
tri chlorophenol
di chloro-toluldine
' trichlorocresol
pentachlorobenzene
hexa chlorobenz ene
pentachlorophenol
hexachlorobutadiene
matched within 1 ppm.
D: i r i k x i . q W-itir-r f r o : n ; i i i i . " ; - . .o ; i TJ.: . ; , C.i
by
L. K. Keith, A. W. Garrison, F. R. Allen, M. H. Carter,
T. L. Floyj, J. D. Pope, and A. D. Thruston, Jr.
U. S. Envi ron."ner.tal Protection Agency
Environmental Research Laboratory
College Station Rd.
Athens, GA 30 601
I li'i'.' \X/',\. .
The idea that it is desirable or necessary to
specifically identify the indxvidual organic compounds
present in drinking water is rather recent. The embryo of
this concept can be found in the records of a 1964
conference on pollution of interstate waterways of the Lower
Mississippi River and its tributaries, called by the U.S.
Secretary of Health, Education and Welfare. One of the
^J recommendations of that conference was to establish a
committee to direct and advise in the identification and
abatement of all sources of pollution affecting the Lower
Mississippi River. Sy 1967 consumer complaints of "oily11
and "chemical" flavors in the drinking water of New Orleans
and nearby communities were occurring with increasing
freguency. Fish caught below Baton Rouge, LA were no longer
saleable because of these same bad tastes. On March 23,
1967 Dr. Leslie L. Glasgow, Chairman of the Louisiana Stream
•Control Commission, wrote to the Commissioner of the U.S.
Federal Water Pollution Control Administration requesting
technical assistance in obtaining specific information on
the effects of the presence of organic chemicals on water
quality and aquatic life in the Mississippi and Calcasieu
A. Rivers. The first step was to identify the compounds
;;ri.- • .. in l':o ri.vors. Work v: •; boqun in 1969 and
culminated with a report1 in 1972 in which forty-six organic
compounds were listed as being present in the raw or treated
water supplies from three water plants (Carrollton plant of
New Orleans, Jefferson #2 at Marrero and the U.S. Public
Health Service Hospital at Carville). An additional forty-
four compounds not detected in the three water plants were
identified in wastewaters from ten industrial plants that
discharge into the Mississippi River just above New Orleans.
In July 1974, representatives of the State of Louisiana
and the City of New Orleans requested the Region VI
Environmental Protection Agency (EPA) administrator to
undertake an analytical survey of the organic chemicals
present in the finished water of three New Orleans area
water plants (Carrollton, Jefferson #1, and Jefferson ?,2) .
Samples were taken in August 1974, extracted by EPA's R. S.
Kerr Environmental Research Laboratory in Ada, OK, and analyzed
by the Water Supply Research Laboratory, Cincinnati, Ohio and
^ by the Analytical Chemistry Branch of the Athens, Georgia
Environmental Research Laboratory. On November 8, 1974, a
preliminary report2 was released by the U.S. EPA that listed
sixty-six organic chemicals identified in the finished water
of the three New Orleans area water plants with concentrations
that ranged in most cases from 0.01-5 ug/liter. The USAEC—Ames
Laboratory at Iowa State University added six more compounds
to the list, and through additional research at the Athens
/xioii j.i.ii ;•. J.J _•_::; li L:...j:.:tu1y a n o t h e r t. . .;::hy-^
!:poun;Io were idontified, raiding the total identifications
to ninety-four.
Simultaneously with the release of the New Orleans
preliminary report, the U.S. EPA announced plans for a
National Orqanics Reconnaissance Survey (NORS) of water
supplies of representative cities across the nation to
determine the identity, concentrations and potential effects
of chemicals in these drinking waters. Eighty cities were
selected for analysis of six halocarbons in their raw and
finished water supplies. Both raw and finished water were
studied in order to correlate the presence of the haloforms
with either the raw water source or the chlorination
treatment. Ten of these same cities were chosen as sites
for a more comprehensive survey of the organic content of
finished drinking waters. An interim report to Congress3,•
discusses the preliminary results of the eighty city survey
and five of the comprehensive analyses.
The Analytical Chemistry Branch of the Athens
Environmental Research Laboratory analyzed the three New
Orleans area carbon chloroform extracts (CCE's) in 1974 and
the ten-city CCE's of the 197 5 comprehensive National
Organics Reconnaissance Survey. The results of the analyses
from these thirteen water plant CCE's (Table 1) are the subject
of this paper.

TV.blc 1. Drinking Wauo:r Supply Source;
Source Character Water Plants
Miss. R. at Nov.- 1. Carrolltcn (City of NewOrleans)
2. Jefferson Parish #1(eaut b.-.nk)
3. Jefferson Parish *2 •-(west bank)
Uncontarair.-ited U~land Water 1. Seattle, V:A.2. Nev: York, :;. Y.
Ground Water2. Tuc^cn, A3
•s.\ COY.1. : i r . i . :\--.< ;; Agriculture _ T -.
Center; p.::. Ir.duc r r i a l 1. Cincinnati , CM
Contaminated b" 'lunicioal I'a:':•'- 1. Philadelphia, PA.2. Terre' cr.ne I-arish, LA.
SAMPLING
Detailed descriptions of the sampling procedures appear
elsewhere. 2'3 A variety of sampling procedures were used at
New Orleans because this was the first place studied and
because the best method of concentrating a wide variety of
organic compounds present in trace amounts in water was
not—and still is not—known.
At each New Orleans water plant, triplicate one liter *-
samples of finished water were extracted in separatory
funnels with two ml of tetralin. The extract was sealed in
septum vials at the plant site. If extraction of very
volatile components (e.g. chloroform, benzene) was ! •
quantitative, a 500 fold concentration factor would be achieved.
A small peak from chloroform was detected. In EPA
laboratories tetralin extraction has since been supplanted
by the Volatile Organics Analysis (VOA technique because
the latter is a superior method for concentrating trace amounts
of very volatile organics from water.
Volatile Organics Analysis, accomplished by purging the
water sample with helium, adsorbing the compounds on a small
column of Tenax or Chromosorb 10 3 and then thermally desorbing
them onto a gas chromatographic column, was carried out by the EPA's
r
Cincinnati Water Supply Research Laboratory and is covered
in a later chapter.
Adsorption of the compounds in the New Orleans water
supplies with XAD-2 resin was carried out by Mr. Gregor
Junk, USAEC-Ames, Iowa State University, Ames, Iowa
according to his established technique.5 The eluates from
these resin columns were analyzed at both the Athens and the
Ames laboratories. Thirty-six of the ninety-four compounds
identified were found in the resin eluates6 and six of these
were found only by Junk.
Three types of carbon adsorption units were used in the
New Orleans study bur only one--the CAM sampler—was used in
the 10-ci-y National Org-inics Reconnaissance Survey (NOf;S) .
The CAM sampler is a 3 inch diameter by 18 inch long glass
cylinder that contains about 3/4 lb of granular activated
carbon. In the New Orleans CAM samplers used for the "70
year" CCL's, the coarse carbon was used on each end of the
j^olumn as a filter and holder for the fine mesh carbon. Two
CAM samplers were always connected in series at each of the
sites. The second type of carbon adsorption unit used was
the Mega-sampler. It consisted of two large columns
connected in series; each column holds about 22 pounds of
carbon. The third type of unit used was the Mini-sampler, a

ii.r.all poly.1!:.,-I o:ilori.i.j tuLo that holu3 about 1 Oq (0.15 lbs)
of 14 x 40 mesh activated carbon.
The Meqa-sampler was only used at the Carrollton water
plant; 3 00,000 gal of water was passed through it over a 7
day period. The CAM samplers were used at all three New
Orleans water plants. A so-called "70-year" sample was
collected over a 7 day period (25,500 liters) and represents
the amount of water a person would theoretically drink in 70
years at the rate of 1 liter/day. The Mini-sampler was used*"
at the three New Orleans water plants; a 2 month equivalent
(60 liters) sample was collected over a 2 day period.
Sampling was much less extensive for the 10 cities in
the NOKS; 6000 liters of water were passed through two CAM
samplers in series over a 7 day period.
Appropriate blanks were prepared for every method of
sample concentration used, including separate
adsorbent/solvent blanks for each of the carbon and resin
extracts. These blanks were examined for interfering
background components by both gas chromatography (GC) and
gas chromatography-mass spectrometry (GC-MS).
carried to the Athens Environmental Research Laboratory in
teflon bottles.
The Mini-samples were dried and extracted at EPA's
Region VI Laboratory Facility in Houston, Texas. One half
of the;;e "2 month" CCS's were mailed to the Athens
Enviror.Mcntal Research Laboratory.
Upon receipt of each of these extracts they were
concentrated further in Kuderna-Danish and Micro-Snyder
column evaporators (Figures 1 and 2); the final volume was
adjusted with a gentle stream of nitrogen so that 1
microliter of the extract corresponded to 1 liter of water
passed through the carbon or XAD resin filter (e.g. the NORS
CCE's were concentrated to a volume of 6.0 ml since 6,000
liters of water was passed through the carbon filters). The
extracts from the respective carbon and resin blanks and
each of the solvent blanks were all concentrated to volumes
equivalent to their corresponding sample extracts. An
exception to this procedure was the Mini-samples. We
received half of the "2 month" extracts and these were each
concentrated to 0.3 ml so that 1 ul corresponded to 100
milliliters of water passed through the carbon filter.
Blank extract volumes were adjusted accordingly.
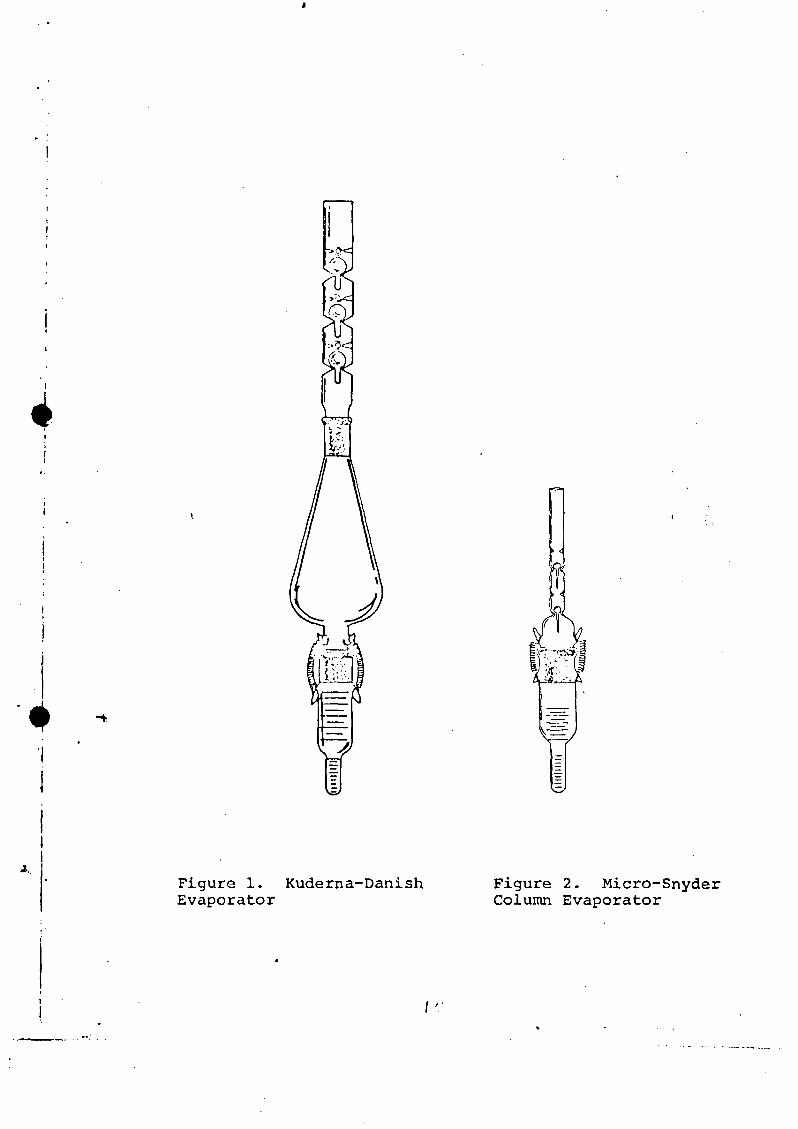
I
J
Figure 1. Kuderna-DanishEvaporator
Figure 2. Micro-SnyderColumn Evaporator

PRE-ANALYSIS FRACTIONATION
Organic analyses were performed using concentrated
extracts from carbon and XAD-2 resin adsorption columns.
Various attempts were made to fractionate the extracts to
improve subsequent GC peak separation--most of these were
unsuccessful. For example, TLC (silica gel : benzene) could
be used to separate the mega-sample into three distinct
fractions. However GC-MS of these separate fractions gave
no identifications that were not also made by direct GC-MS
of the original extract. The TLC separation had been
attempted because it is particularly recommended for
isolation of polynuclear aromatic hydrocarbons; in this case
it was wasted effort.
Aliquots of the mega-sample CCE, the Carrollton "70-
year" CCE, and their respective blanks were analyzed by the
EPA organochlorme pesticide method.7 This procedure
involves fractionation by column chromatography on florsil
with detection by electron capture GC. The presence of
dieldrin and endrin, as determined by this technique, was
confirmed by matching GC retention times with standards on
two other GC columns cf varying polarity. Further
confirmation, as well as detection of chlordene,
<l
a-chlordane, and pentachlorophenyl methyl ether, was obtained
by GC-MS analysis of the appropriate fractions. With the
exception of dieldrin, these compounds were present at
concentrations too low for GC-MS detection using the total
extracts. Dieldrin was detected in the total extracts only
after searching for characteristic peaks by limited mass
range mass spectral technigues. The Jefferson #1 and
Jefferson #2 "70 year" CCE's were successfully analyzed by
electron capture GC for the detection and measurement of
endrin without prior fractionation. **
Other attempts were made to improve GC peak separation
by various types of fractionatio.i. Steam distillation
neatly separated the mega-sample CCE into volatile
distillables and non-distillables, but did little to improve
actual peak separation without major adjustment of GC
conditions. Solubility extraction of the CCE into strongly
and weakly acidic, basic, and neutral fractions served only
to show that most of the compounds are neutral.
Fortunately, extract fractionation was not necessary for
qualitative or even quantitative analysis. Computer
controlled GC-MS analysis, with computer manipulation of
acquired data, allowed identification of compounds by direct
injection of CCE's.
I "2.
QUALITATIVE AND QUANTITATIVE METHODS
Instrumentation •
Gas chromatography of the New Orleans CCE's was
performed using a Varian 1100 GC with a flame ionization
detector (FID). A 10 ft x 1/8 in I.D. glass column was
packed with 3X SP-2100 on 80-100 mesh Supelcon AW/DMCS.
Helium was used as a carrier gas at 20 ml/min and the
temperature was programed from 40-280°C at 6°/min after an
initial 6 minute hold at 40°. Similar conditions were used ,
to obtain mass spectra on the Finnigan 1015 GC-MS system.
The "70 year" Carrollton CCE was rechromatographed on a
30 meter by 0.1 mm I.D. glass capillary column coated with
Supelco SP-2100. The column was prepared at the Athens
Environmental Research Laboratory. Replacement of the
Gohlke separator in the Finnigan 1015 GC-MS with a 9 inch
stainless steel capillary tube enabled direct connection of
the glass capillary column with the mass spectrometer.
Improved chromatographic separation (Figure 3) and enhanced
sensitivity of this arrangement led us to use the capillary
column with all the following CCE's from the 10-city
comprehensive NORS.
i .

PACKED COLUMN
CAPILLARY COLUMN
Figure 3. Comparison of a portion of the GC traces from theCarrollton "70 your" CCE using (Top) a conventionalpacked column and (Bottom) a glass capillary column.The stationary phase is SP-2100 in both examples.

Sample injection size was reduced from the 2.0 ul used
with the packed column to 0.1 ul on the capillary column; no
injection splitter was used with the latter.
Chromatographic conditions for GC-MS analyses using the
capillary column were modified and included multiple
temperature and carrier gas (helium) flow programing.
Injection was made with the GC oven door open, the column at
room temperature (about 30°C), and the pressure in the mass
spectrometer ion chamber at 1.5 x 10~s torr. The GC oven
- door was closed 5 minutes after injection and the
temperature was slowly increased to about 50°C over the next
6 minutes. At 11 minutes after injection the oven
temperature controller was set at 60°C. Two minutes later
temperature programming at 2°/min was started. Twenty-three
minutes after injection (80°C) the temperature program rate
was increased to 6°/min and carrier gas flow was increased
to produce a pressure of 2.8 x 10~5 torr in the ion chamber
(previously determined to correspond to a helium flow of 2
cc/min at room temperature). Thirty-three minutes after
w injection (130°C) the temperature program rate was increased
to 10°/min. The final temperature of 250°C was maintained
for 20 minutes.
Computer-controlled collection of mass spectral data
was begun immediately after sample injection. To prevent
/ • >
filament damage as solvent entered the MS, the ionization
current was shut off 2.5 minutes after injection and turned
on again 3.5 minutes after injection. Electron energy was
maintained at 70 eV and filament current at 100 ua. The
Finnigan 1015 mass spectrometer was connected by a System
Industries System 150 interface to the PDP-8/e computer. A
mass spectrum from m/e 41 to 350 was acquired approximately
every 2.5 seconds under control of the computer.
Chemical ionization mass spectrometry (CIMS) was
performed on selected components in the Carrollton "70 year"
CCE with a separate computerized Finnigan 1015 mass
spectrometer interfaced to a Finnigan 9500 GC using methane
as the caxrier/reactant gas. The same PDP-8/e computer was
used for data acquisition.
Some initial GC-MS work was done on a Varian MAT CH5/DF
system interfaced to a Varian 2740 GC via a dual Watson-
Bieman separator and to a Varian SS-100 Data System. This
instrument was later used in the New Orleans study for
determination of empirical formulae of the major fragments
in the mass spectra of alachlor and the alachlor chlorine
homolog and for confirmation of the atrazine empirical
formula.
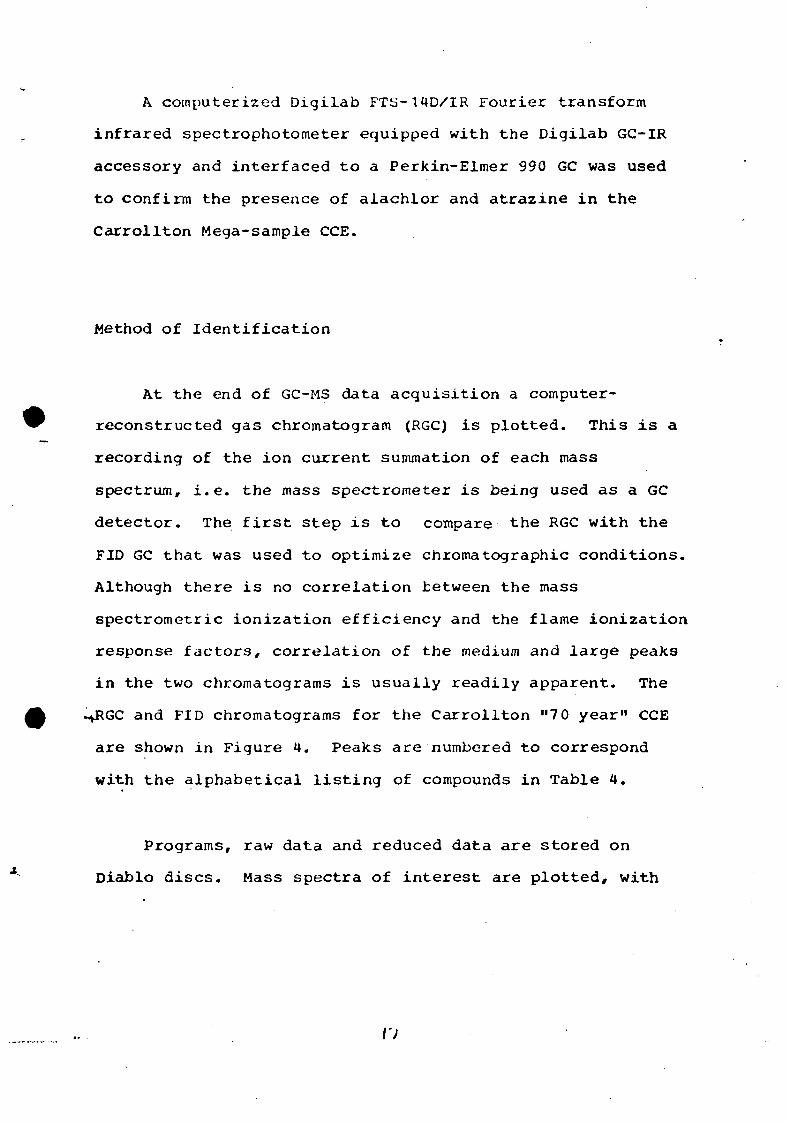
A computerized Digilab FTS-14D/IR Fourier transform
infrared spectrophotometer equipped with the Digilab GC-IR
accessory and interfaced to a Perkin-Elmer 990 GC was used
to confirm the presence of aiachlor and atrazine in the
Carrollton Mega-sample CCE.
Method of Identification
At the end of GC-MS data acquisition a computer-
reconstructed gas chromatogram (RGC) is plotted. This is a
recording of the ion current summation of each mass
spectrum, i.e. the mass spectrometer is being used as a GC
detector. The first step is to compare the RGC with the
FID GC that was used to optimize chromatographic conditions.
Although there is no correlation between the mass
spectrometric ionization efficiency and the flame ionization
response factors, correlation of the medium and large peaks
in the two chromatograms is usually readily apparent. The
-+RGC and FID chromatograms for the Carrollton "7 0 year" CCE
are shown in Figure 4. Peaks are numbered to correspond
with the alphabetical listing of compounds in Table 4.
Programs, raw data and reduced data are stored on
Diablo discs. Mass spectra of interest are plotted, with
n
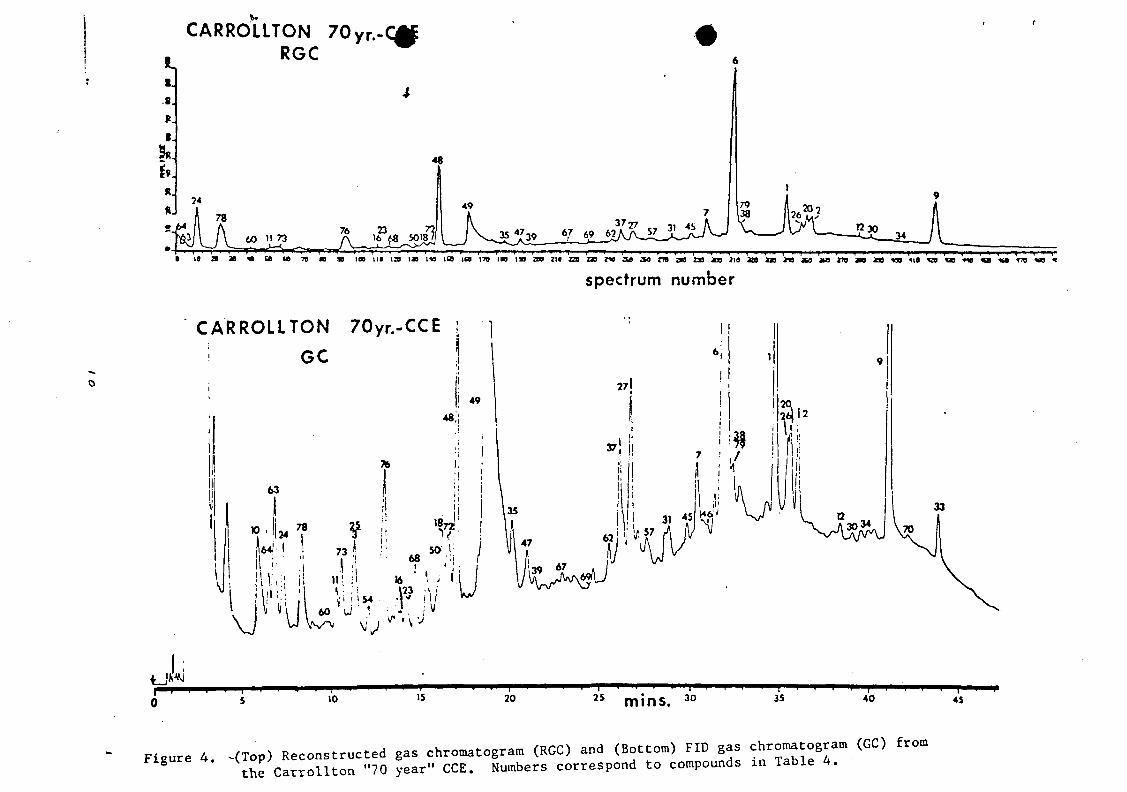
CARROLLTON 70 y r . -CMRGC
i.
8
6 16 £8 5018
48
m in m la a m si as n st ig n ao a xs ID xt
spectrum number
CARROLLTON 70yr.-CCE \ }
' GC !
10 IS 20 25 m ins . 30 40 4S
Figure 4 ^(ToP) Reconstructed gas chromatogram (RGC) and (Bottom) FID gas c h r o n o g r a m (GC) fromFigure 4 . ^ P ;
C a r r o l U o n ,,70 y e a r - . C C E . Numbers correspond to compounds in Table 4 .
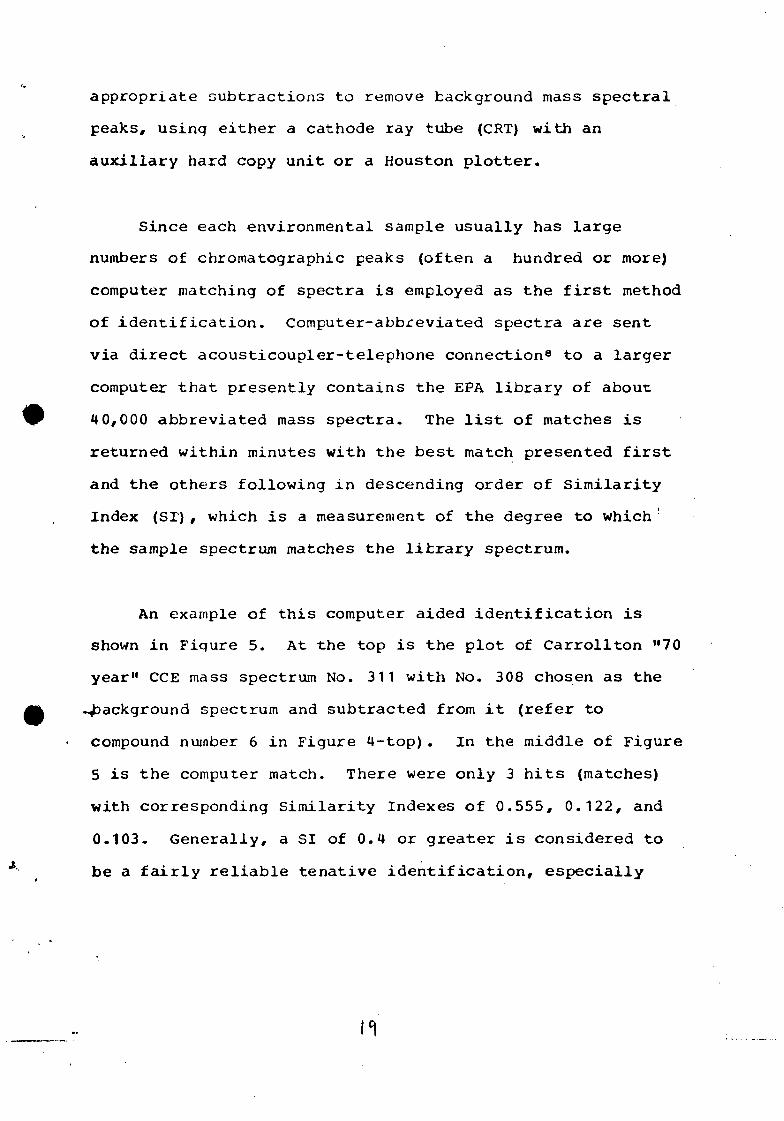
appropriate subtractions to remove background mass spectral
peaks, using either a cathode ray tube (CRT) with an
auxiliary hard copy unit or a Houston plotter.
Since each environmental sample usually has large
numbers of chromatographic peaks (often a hundred or more)
computer matching of spectra is employed as the first method
of identification. Computer-abbreviated spectra are sent
via direct acousticoupler-telephone connection8 to a larger
computer that presently contains the EPA library of about
4 0,000 abbreviated mass spectra. The list of matches is
returned within minutes with the best match presented first
and the others following in descending order of Similarity
Index (ST), which is a measurement of the degree to which
the sample spectrum matches the library spectrum.
An example of this computer aided identification is
shown in Fiqure 5. At the top is the plot of Carrollton "70
year" CCE mass spectrum No. 311 with No. 308 chosen as the
-background spectrum and subtracted from it (refer to
compound number 6 in Figure U-top). In the middle of Figure
5 is the computer match. There were only 3 hits (matches)
with corresponding Similarity Indexes of 0.555, 0.122, and
0.103. Generally, a SI of 0.4 or greater is considered to
be a fairly reliable tenative identification, especially
SAMPLE SPECTRUM
6 0 :
20- J i J ,
Carrollton
1,
70-yr
,,!!„
CCE,
AH
9/16/74
1 „!„
Spectrum
1 1. L
311-308
iL .• 1 •30 70 90 110 130 150 170 190 210
COMPUTER HATCHING
3 Hits Methyl 3-oxooctadecanoate 312 C19 H56 03 ,Atrazine iSEWL) File key-6524File key-8671 SI-0.122SI-0.555
l-Methyl-4-<1.2.3,4-tetrahydro-2-naphthyl)piperazine230C15H22N2File key-4842SI-0.103 Cost of search: 0.36
COMPUTER REFERENCE SPECTRUM
File key? 86712-Chloro-4-ethylamino-6-isopropylamino-6-triazine (Atrazine) (SEWU-T6N CN EnJ BMY CM2 FG- 215 C8 H14 Cl N5 BSR 0186m/e INT m/e INT m/e INT m/e INT m/e INT27 37 28 38 43 86 44 46 55 1358 100 68 41 69 29 79 3 87 593 13 94 10 104 10 105 6 122 8
130 3172 6201 2
132173202
101310
137174215
53
14
147175216
232
158 5200 33217 3 -
Figure 5. (Top) Mass spectrum of Carrollton "70 year" CCE, spectrum No. 311minus No. 308; (Middle) computer match of this data.— 3 h i t s ;
•(Bottom) print out of Atrazine's abbreviated spectral data thatcorresponds to the "best hi t" .
when, as in this instance, the next best match has a very
low SI. The tentatively identified compound is always
visually checked against a reference mass spectrum either
from the data bank (as shown at the bottom of Figures ), our
files, other compilations of spectra (such as the
Aldermaston Eight Peak Index of Mass Spectra9), or the
scientific literature. However, the tentative
identification is never considered confirmed until it has
been verified by comparison of two different physical
measurements of a standard (usually the GC-MS spectrum and
GC retention time) obtained on our instruments under similar
operating conditions. In this paper, compounds that have
been confirmed by this definition are marked with an
asterisk in tables where they are listed.
When there is no reasonaole computer match (or when it
has been determined that the sample compound does not
correspond to any of the computer matches) the
identification must be made by "manual spectral
interpretation. Often supplementary information from high
resolution gas chromatography-mass spectrometry (GC HRMS),
chemical ionization gas chromatography-mass spectrometry (GC
CIMS) or gas chromatography Fourier transform-infrared
spectroscopy (GC-IR) is necessary to make tentative
identifications from spectral interpretations. Examples of
2|
these identifications are discussed in a later section of
this chapter.
Searches for compounds by mass spectral fragments that
are specific, or at least indicative of them is a helpful
routine. Figure 6 shows a portion of the Carrollton "70
year" RGC and a limited mass RGC (LMRGC) based on m/e 277,
one of the fragments in a characteristic chlorine isotope
cluster in the mass spectrum of dieldrin. The dieldrin peak
in the RGC was so small that it could not be located until
it was enhanced by the limited mass search.
Methods of Quantitation
Two methods of quantitation were used. The New Orleans
samples were quantitated using GC peak areas and the NORS
samples were quantitated using RGC peak areas. Each has
advantages and disadvantages.
A Perkin-Elmer PEP-1 Data System, interfaced to a
Varian 140 0 GC operated under the conditions described
above, was used for computerized GC quantitation and
retention time measurements. Since atrazine was present in
all extracts of New Orleans samples, it was chosen as an
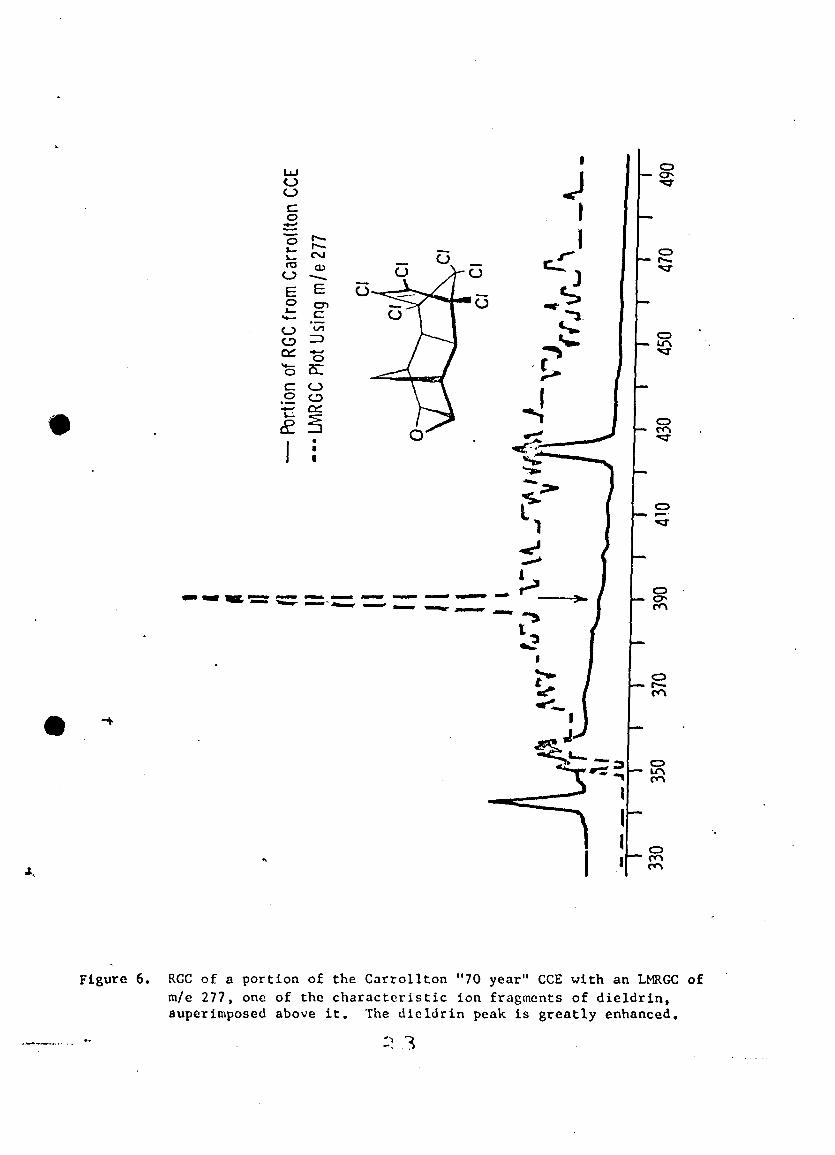
oco
"o
OEo
«*—
o
o
£
CVJ
"i"encl / l
"5a:oo
J
Figure 6. RGC of a portion of the Carrollton "70 year" CCE with an LMRGC ofm/e 277, one of the characteristic ion fragments of dieldrin,auperimposed above it. The dieldrin peak is greatly enhanced.
internal standard. A stock solution of 5 parts-pcr-thousand
of atrazine (99.7% pure) in chloroform was the internal
standard for quantitation of all identified pollutants for
which standards were obtained. Solutions of known amounts
of pure reference compounds were prepared and mixed with a
known amount of the atrazine reference stock solution.
Mixtures were designed so as to obtain good GC peak resolution.
The atrazine was assigned a flame response factor (RF) of 1.000
and, since its concentration was known, the computer system was
able to calculate the RF, as well as the relative retention
time (to atrazine), of each standard.
After tentative identification of pollutants by GC-MS, a
PEP-1 computer program was written for the GC-computer analysis
of each extract, allowing the computer to use the known flame
responses to calculate pollutant concentrations (Figure 7).
The concentrations of the concentrated extract are expressed in
g/liter which corresponds to yg/liter in the original water
samples since the concentration factor is 1 million times. In
some cases, the RF calculated for one standard was also used
for other compounds of the same chemical class. The relative
retention times, calculated for all pollutants and printed out
by the computer, were then manually compared with those of the
available standards. The blanks had to be dosed with atrazine
as an internal standard, since atrazine was absent from them.
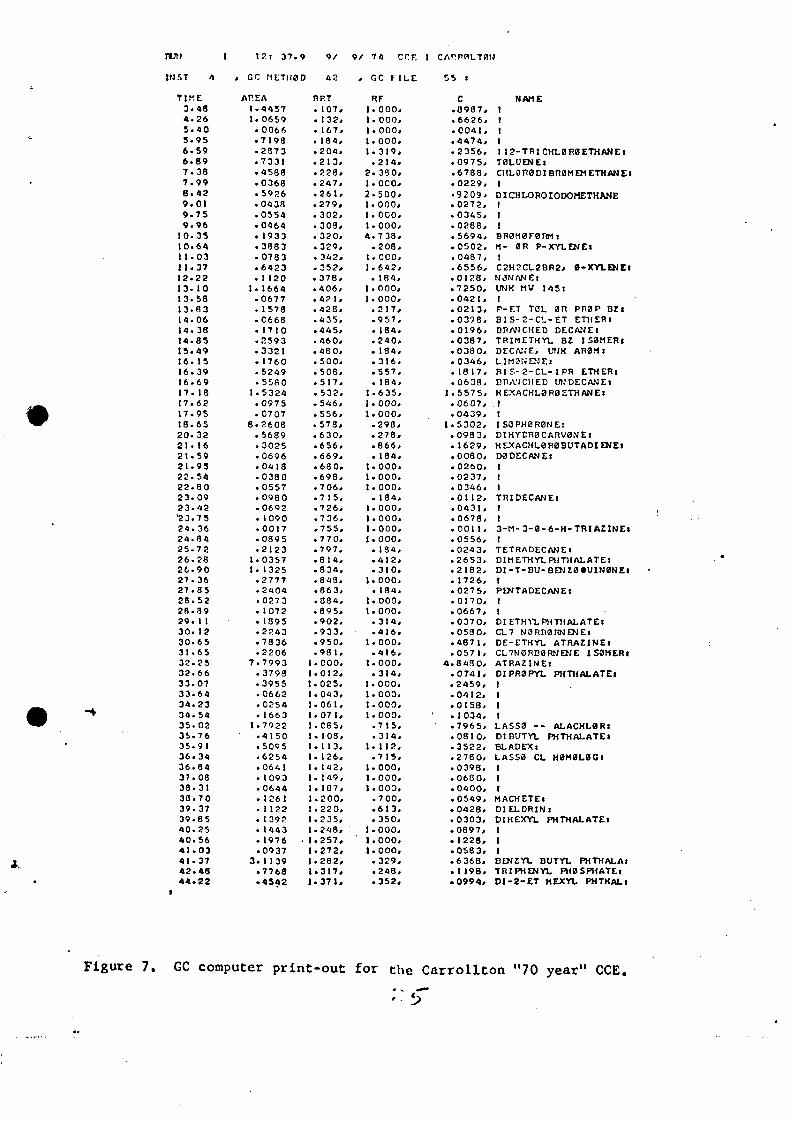
nni 12l 37.9 9/ 9/ 74 err. l
ST 4
TIME3-484.265.405.956.596.897 .387 . 9 98 . 4 29 .019 .759 .96
10. 3510.641 1.03I 1.3712.2213. 1013.5813-8314-0614. 3814.8515.4916. IS16.3916.6917. 1817.6217.9S18.6520.322 1 . 1 621 .5921.9522.5422-8023.0923 .4223.7524.3624.8425-7226 .2826 -9027 .3627 .852B.522R.8929. 1 130 . 1230 .6531 .6532.2532.6633.0733.6434.2334. 5435.0235 .7635.9136.3436.8437.0838.3130.7039-3739.8540.2540.5641.0341.3742.4844.22
, GC METHOD
A PEAU44571.0659
. 0066
.7198
.2873• 7331.4588.0368.5926.0438.0554.0464. 1933.3883.0783.6423. 1 120
1.1664.0677. 1578-C668.1710.2593.3321• 1760• 5249. 5580
1.5324.0975.0707
8.2608• S689• 3025.0696.0413.0380.0557. 0980• 0692. 1090• 0017• 0895• 2123
1.03571.1325
.2777
. 2404
.0273. 1072. 1895.2243.7836.2206
7.7993• 3798.3955.0662• 0254. 1663
1.7922• 4150.S095.6254.064 1. 1093.0644.1261. 1 122• 1392. 1443•1976 •• 0937
3.1139• 7768• 4S42
4 2
n p T. 107,. 132,. 167,. 184,.204 ,. 213 ,.228 ,. 2 4 7 ,. 2 6 1 , :. 2 7 9 ,. 302,. 303,
GC F ILE
RF1.000,1 . 000.1 .000,. 000.. 3 1 9 ,. 2 1 4 .
>. 390,. 0 0 0 ,
! . 5 O O ,. 0 0 0 ,. 000,. 0 0 0 ,
. 3 2 0 , 4 . 7 3 3 ,
. 3 2 9 ,
. 342,
. 3 5 2 ,
. 3 7 8 ,
. 4 0 6 ,
. 4 ? 1 ,
. 4 2 8 ,-435 ,. 445 ,. 4 6 0 ,. 4 8 0 ,. 5 0 0 ,. 506 ,. 5 1 7 ,. 5 3 2 ,. 5 4 6 ,. 556 ,. 578,. 6 3 0 ,-656 ,. 6 6 9 ,. 6 8 0 ,. 6 9 8 ,. 706 ,.7 15..726 ,. 736 ,. 755 ,. 7 7 0 ,.797 ..814 ,. 8 3 4 ,.843 ..863 ..884 ,. 8 9 5 ,. 9 0 2 ,. 9 3 3 ,.9 50.. 9 8 1 ,. 000 .. 012 ,. 025 ..043 .. 0 6 1 ..07 1,.065 .. 108..113 .. 126,. 142,. 149,. 107,
1.200,. 220 ,.235 ,. 248 ,. 2 5 7 ,. 2 7 2 ,. 2 8 2 ,
1.317,. 3 7 1 ,
. 2 0 8 ,1. OCO,. 6 4 2 ,. 184,. 000,. 0 0 0 ,. 2 1 7 ,. 9 5 7 ,. 184.. 2 4 0 ,. 184,. 3 1 6 .. 5 5 7 ,. 184,. 6 3 5 ,. 000,. 0 0 0 ,. 2 9 8 ,. 2 7 8 ,. 666 ,. 184,
t.OOO.. 0 0 0 .. 000.. 184.
1. 000,1.000.1.000.. 0 0 0 .. 184,. 4 1 2 ,. 3 1 0 .. 0 0 0 .. 184.
t.OOO.. 0 0 0 .. 3 1 4 ,. 4 1 6 ,. 000.. 4 1 6 .. 0 0 0 ..314 .. 000..000 .. 0 0 0 .. 0 0 0 ..7 15..314 .. 1 12,. 715 .. 000 .
1.000,.000 .. 7 0 0 ,. 6 1 3 .. 350 .. 000 ,
1.000.1.000.. 3 2 9 ,. 248 ,.352,
55 i
C.0987,.6626,. 0 0 4 1 ,.4474,.2356,.0975,.6788,.0229.•9209..0272,.0345,.0286,.S694,.0502..0487,.6556,.0128,.7250,. 0 4 2 1 ,.0213,.0396..0196,.0387,.0380,.0346,.1817,.0638,
1.5575,.0607,.0439,
1.5302,.0983,.1629,.0080,.0260..0237,.0346..0112.. 0431 ,.0678..001 1,.0556,.0243..2653,.2182,. 1726.• 027S,.0170..0667,.0370,.0580..4671 ,.057 1,
4.8480,.0741 ,.2459,.0412,.0158,. 1 034,.7965..0810,.3S22,.2780,.0398..0680,.0400,.0549,.0428,.0303,.0897,.1228,.0583,.6368,. 1 1 9 8 ,. 0 9 9 4 ,
NAME11|1
1I2-TR1CHL0R0ETHANE!T0LUENEICHL0n0DIBR0MEMETHANEl1
DICHLOROIODOMETHANE111BR0M0F0nMiM- BR P-XYLENEl1C2H2CL2BR2, 0-XYLENElNJNANElUNK MW 14511
r-F.T TOL an PR0P BZID1S-2-CL-ET ETllERiBRANCHED DECAMElTRIMETHYL BZ 1S0MERIDECATJE, UTJK AR0MILIM3NENEIBIS-2-CL-1PR ETHERiBn,Y!CHED IJTJDECANElHEXACHL0R0 ETHANE 111ISOPH0R0NE:DIHYDR0CARV0NEIHEXACHL0R0BUTADIENEID0DECANEJ
'RIDECANEi
3-M-3-0 -6 -H-TRIAZ1NEI1TETRADECANElDlMETHYLPHTHALATElDI-T-8U-8ENZ0«UIN0NEl1PENTADECANEl1101 ETHVL PHTHALATElCL7 N3RO0nNENElDE-ETHYL ATRAZINElCL7N0RB0RNENE ISOMERlATRAZlNEiDIPR0PYL PHTHALATEl1111LASS0 - - ALACHL0RIDIBUTYL PHTHALATElBLADEXlLASS3 CL H0M0L0GI1I1MACHETElDIELDRINiD1HEXYL PHTHALATEl1!1BENZYL BUTYL PHTHALAlTRIPHENYL PH0SPHATEID1-2-ET HEXYL PHTHALl
Figure 7. GC computer print-out for the Carrollton "70 year" CCE.

The advantage of the above method is that a standard is
not needed for every compound identified. FID response
factors for compounds with similar structures and functional
groups are usually similar enough that a model compound can
be used to determine response factors (e.g. once the
response factor of 0.181 was determined for tridecane
(Figure 7) it could be used for seven other normal and
branched alkanes in the sample). Disadvantages of the above
method are that careful correlation is required between the
RGC and the FID GC peaks (sometimes a difficult task with
10 minor components of complex mixtures) and a separate PEP-1
GC computer program must be generated for each sample.
A pair of System Industries GC-MS peak quantitation
routines called QNTATE and QNTSET were used for the ten NORS
samples. Data acquisition on standard compounds is made
under the same conditions as data acquisition of the
samples. A computer file containing information from the
standard runs is established using the System Industries
^^ jQNTSET program. The beginning, end and maximum of each peak
(using spectrum numbers from the RGC), the quantity (expressed
in nanograms) of the corresponding compound and its name are entered
into the QNTSET file. Next, the QNTATE program is called into
execution. The beginning, end and maximum spectrum numbers of
the sample peak is specified along with information pertaining
to the standard peak in the QNTSET file with which the
sample peak is to be compared. For each sample peak the
computer prints out the name of the compound and the amount
present (expressed in nanograms). Peak areas in both QNTSET
and QNTATE programs are computed with baseline subtracted.
The user specifies the spectral limits of the peak and the
computer then assumes that the baseline connects the first
spectrum before the starting value and the first spectrum
after the terminating value.
Advantages to the QNTSET/QNTATE method of quantitation
are ease and speed in setting up the standard files and
direct comparison of the raw data in the computerized sample
files with the same type of data in the standard files.
Comparison of peaks from an RGC with peaks from a FID gas
chromatogram is eliminated. Disadvantages are that
sensitivity, calibration stability and base line may vary
more over the time periods encountered between sample and
standard runs (often several days) than these same parameters
in a gas chromatograph. Also, the ionization efficiency of
compounds of similar structure or with similar functional
groups seems to vary more than the flame response factors
using a FID.
Both methods require that standards and samples be run
under identical conditions as far as possible. Best results
2i

are obtained when samples and standards are run immediately
after one another. In practice, of course, this is not
usually feasable since standard runs cannot be made until
the compounds in the sample are tentatively identified.
Presumably once the standard mixture is prepared and run the
sample could then be rerun. Since other factors in the
overall analytical scheme such as efficiency of adsorption
of the sample compounds onto the carbon and their desorption
by chloroform were possibly of greater magnitude than the
variation in quantitation conditions, this reanalysis was not
considered to be worthwhile. The concentrations of the
compounds reported are therefore only approximations and could
vary from their true values by as much as a factor of 2. Since
the adsorption, desorption and concentration steps are not
likely to be 100% efficient most of the concentration values
reported are probably lower than their true values.

RESULTS
Compound Identifications
Alachlor and its chlorine homolog
Alachlor (also known as Lasso and Lazo) is an
acetanilide derivative introduced by the Monsanto Company in
1967 as a pre-einergence herbicide for use with soybeans,
corn, cotton and peanuts. Its chemical name is 2-chloro-
21,6'-diethyl-N-(methoxymethyl) acetanilide (structure I).
It does not qive an easily discernible molecular ion by
electron impact mass speccrometry (EIMS), and its spectrum
was not in the computer data bank, which made its
identification difficult.
l.
The identification of this compound was particularly
desirable since the size of its GC peak indicated that it
was present in a relatively high concentration. Also, an
associated peak in the gas chromatogram had a similar mass
spectrum so one identification might lead to another.
Chemical ionization mass spectrometry (CIMS), however, gave
a characteristic molecular-ion-plus-one peak (m/e 270)
(Figure 8). High resolution mass spectrometry (HRMS),
obtained on the fly using the GC effluent, produced possible
empirical formulae of the important mass fragments,
'j^ including the molecular ion. These empirical formulae were
correlated with reasonable fragmentation modes of the parent
molecule, so that the most probable parent ion formula was
deduced (Figure 8). Since other herbicides had been
identified in the samples, a herbicide handbook10 was
searched for compounds having the appropriate molecular
formula and structural characteristics. Alachlor was the
only possibility. A standard of alachlor produced the same
low resolution mass spectrum and GC retention time,
^ ^confirming the identification.
The identity of alachlor was further confirmed by
Fourier transform gas chromatography-infrared spectroscopy
(see Figure 8), with a spectrum obtained on the fly from the
•*•• Carrollton mega-sample extract. This spectrum matched that
of the standard obtained in the same mode.
•vrt
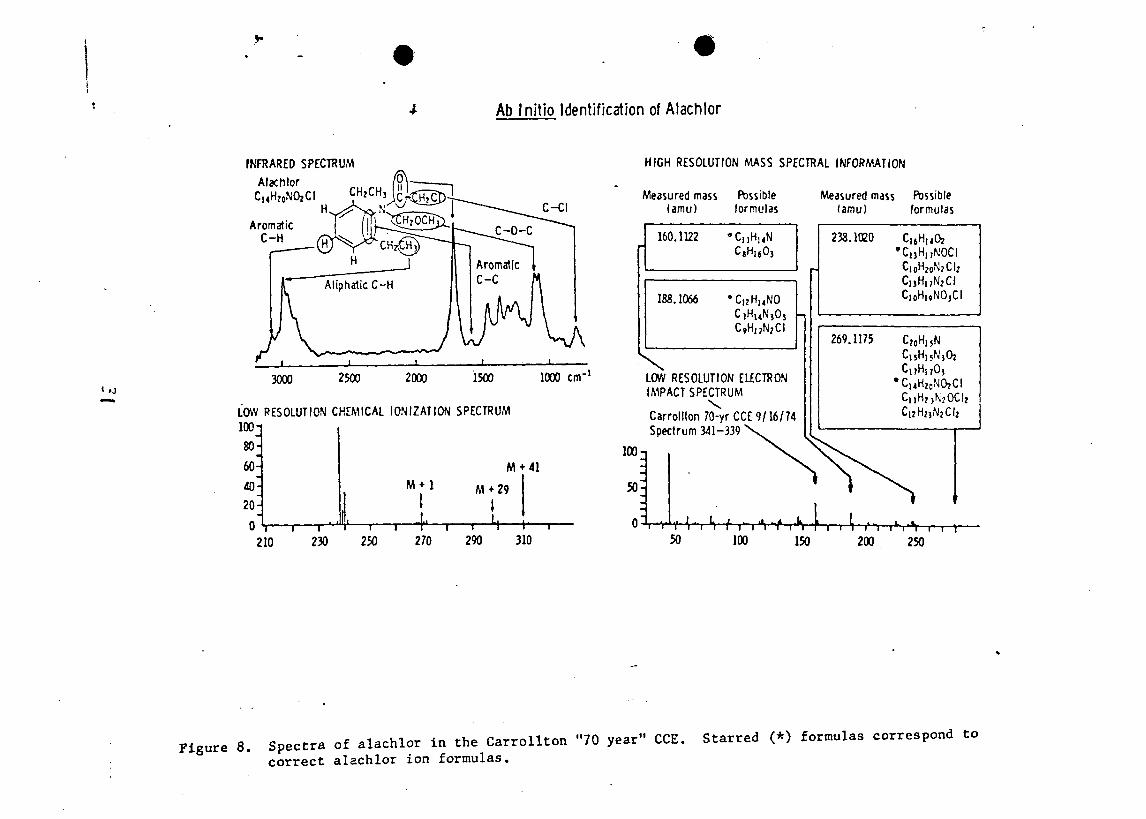
Ab Initio Identification of Alachlor
INFRARED SPECTRUM
Alachlor
AromaticC-H
C-CI
3000 2500 2000 1500 1000 cnr
LOW RESOLUTION CHEMICAL IONIZATION SPECTRUM100-1
60-
40-
20-
0 \210 230 250 270
M + 41
1 * * M + 29
» 1
290 310
HIGH RESOLUTION MASS SPECTRAL INFORMATION
Measured mass Possible(amu) formulas
Measured mass Possible(amu) formulas
160.1122C,H16O}
188.1066 •C,?H14NOC,HMN,O,C,H,,N,CJ
LOW RESOLUTION ELECTRONIMPACT SPECTRUM
\Carrollton 70-yr CCE 9/16/74Spectrum 341-339
238.1020 CuHuOj•C13H17NOCI
269.1175
lOO-i
50-
C|jH,,N7CICi0H,,NOjCI
CwH,T0,
50
Figure 8. Spectra of alachlor in the Carrollton "70 year" CCE. Starred (*) formulas correspond tocorrect alachlor ion formulas.
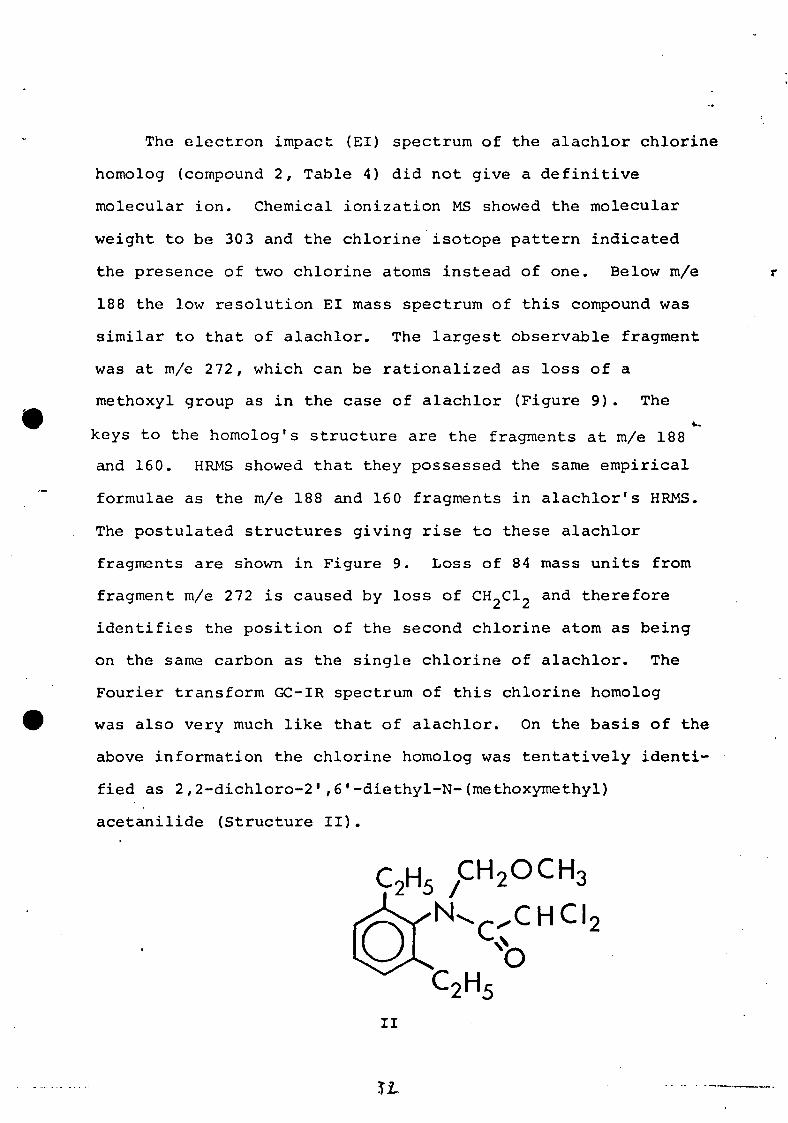
The electron impact (El) spectrum of the alachlor chlorine
homolog (compound 2, Table 4) did not give a definitive
molecular ion. Chemical ionization MS showed the molecular
weight to be 30 3 and the chlorine isotope pattern indicated
the presence of two chlorine atoms instead of one. Below m/e
188 the low resolution El mass spectrum of this compound was
similar to that of alachlor. The largest observable fragment
was at m/e 272, which can be rationalized as loss of a
methoxyl group as in the case of alachlor (Figure 9). The
keys to the homolog's structure are the fragments at m/e 188
and 160. HRMS showed that they possessed the same empirical
formulae as the m/e 188 and 16 0 fragments in alachlor1s HRMS.
The postulated structures giving rise to these alachlor
fragments are shown in Figure 9. Loss of 84 mass units from
fragment m/e 272 is caused by loss of CH2C12 and therefore
identifies the position of the second chlorine atom as being
on the same carbon as the single chlorine of alachlor. The
Fourier transform GC-IR spectrum of this chlorine homolog
was also very much like that of alachlor. On the basis of the
above information the chlorine homolog was tentatively identi-
fied as 2,2-dichloro-2',6'-diethyl-N-(methoxyroethyl)
acetanilide (Structure II).
CH2OCH3
11
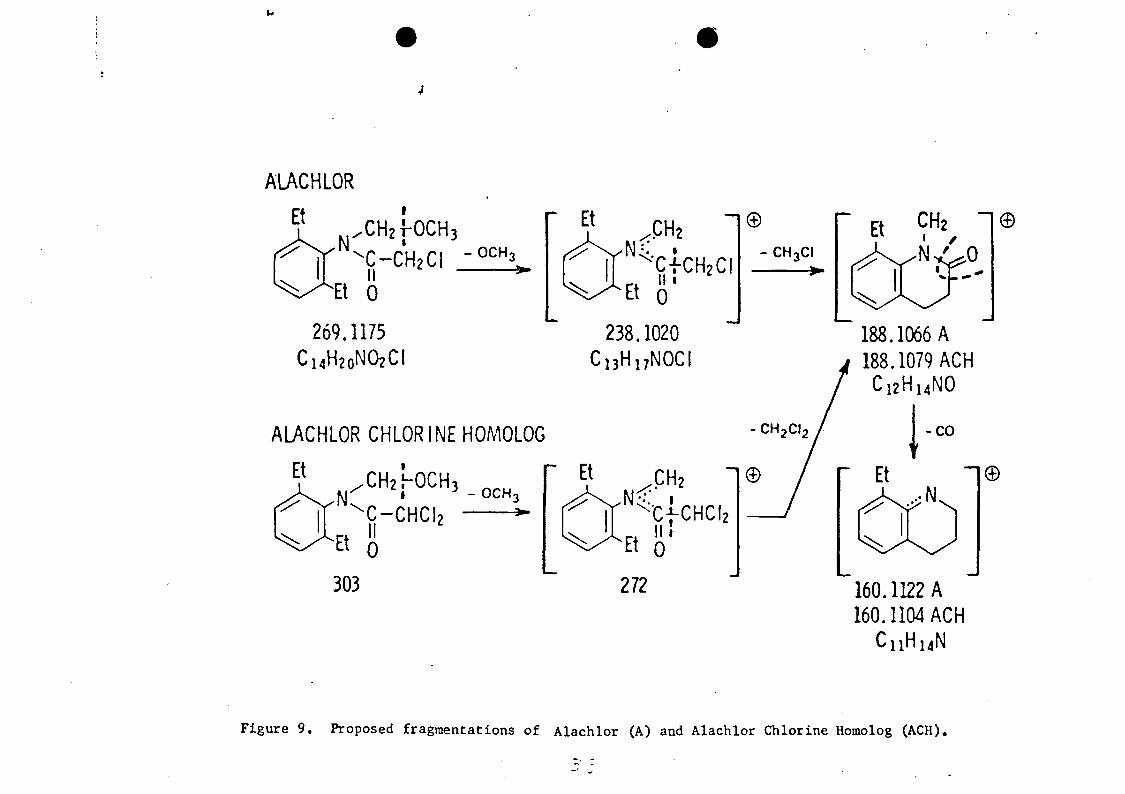
ALACHLOR
EtN:
CHzj-OCH;C-CH2CI " 0CH3
:
Et 0
269.1175C14H20NO2CI
ALACHLOR CHLORINE HOMOLOG
303
Et / C H 2
: CfCH 2 CI0
238.1020C13H17NOCI
- CH3C1
Et
188.1066 A188.1079 ACH
C12H14NO
I-co
160.1122 A160.1104 ACH
CnH 1 4 N
Figure 9. Proposed fragmentations of Alachlor (A) and Alachlor Chlorine Homolog (ACH).

In an attempt, to confirm the identification of the
alachlor homolog and to determine whether it could have been
produced during chlorination treatment of New Orleans
drinking water, solutions of 5 mg/1 alachlor in distilled
water were treated with up to 138 mg/1 of chlorine gas for
22 hours at room temperature. Two chlorinated compounds
were formed, the concentrations of which were dependent upon
the concentration of chlorine. The concentration of
alachlor diminished correspondingly. The spectra of these
compounds did not match that of the alachlor homolog found
in the New Orleans water; they appeared to correspond to one
and two chlorine additions to the aromatic ring of alachlor.
Therefore the homolog is probably not formed by chlorination
of alachlor in the New Orleans water supply; it could be a
by-product of alachlor manufacture.
Deethylatrazine
Deethylatrazine (desethylatrazine) was found in New
Orleans water only in samples collected by carbon
adsorption, not in resin adsorption samples. Dealkylation
appears to be the major mechanism involved in microbial
degradation of alkyl substituted chloro-s-triazines.l*
However, microbial degradation produces both deethyl- and
deisopropylatrazine. Similarly oxidative dealkylation by
J-V
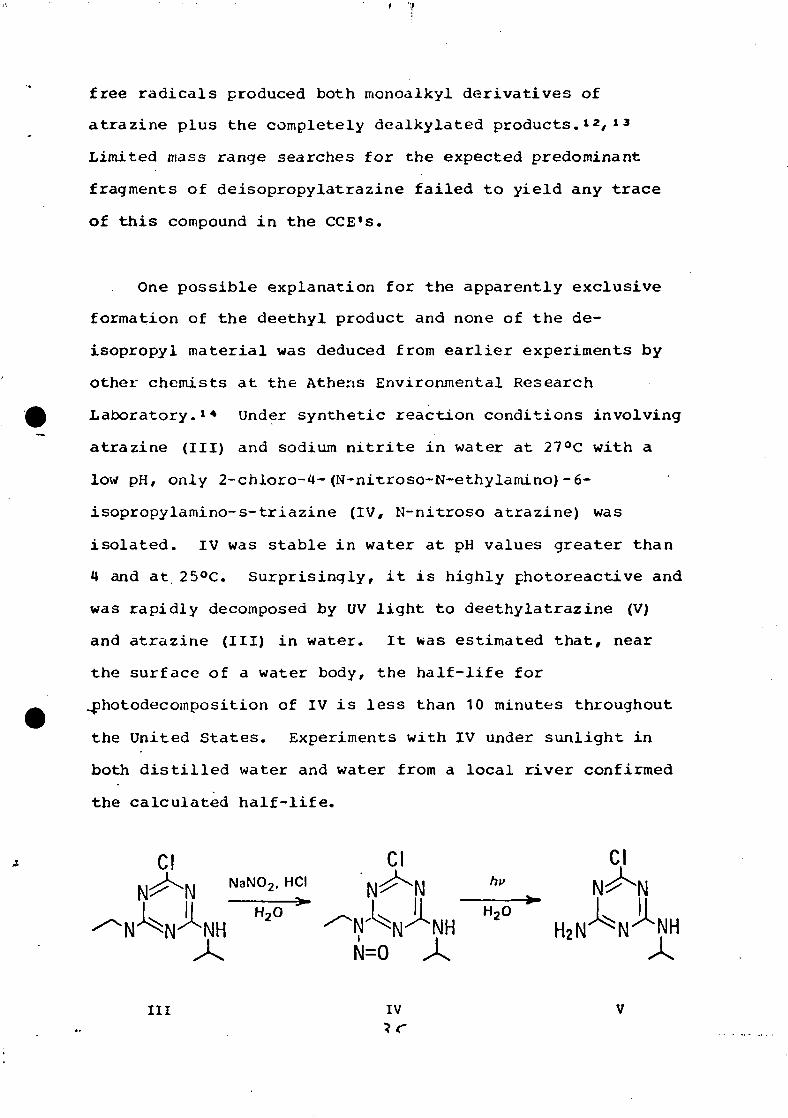
free radicals produced both monoalkyl derivatives of
atrazine plus the completely dealkylated products.*2/13
Limited mass range searches for the expected predominant
fragments of deisopropylatrazine failed to yield any trace
of this compound in the CCE's.
One possible explanation for the apparently exclusive
formation of the deethyl product and none of the de-
isopropyl material was deduced from earlier experiments by
other chemists at the Athens Environmental Research
Laboratory.14 Under synthetic reaction conditions involving
atrazine (III) and sodium nitrite in water at 27°C with a
low pH, only 2-chloro-4- (N-nitroso-N-ethylamino)-6-
isopropylamino-s-triazine (IV, N-nitroso atrazine) was
isolated. IV was stable in water at pH values greater than
4 and at 2 5°C. Surprisingly, it is highly photoreactive and
was rapidly decomposed by UV light to deethylatrazine (V)
and atrazine (III) in water. It was estimated that, near
the surface of a water body, the half-life for
^photodecomposition of IV is less than 10 minutes throughout
the United States. Experiments with IV under sunlight in
both distilled water and water from a local river confirmed
the calculated half-life.
Cl Cl Cl^ NaNO2.HCI N ^ S v N hu
[ I H2O > ^ L [I H2O »
NH ^ N ^ N ^ N H H 2 N NA N=O X X
III IV
Analysis for N-nitroso atrazine (IV) in the CCE samples
by GC was unsuccessful since a standard of IV decomposed
during gas chromatography under all conditions tried. Analysis
for IV using limited mass range plots from the GC-MS data of
the New Orleans CCE's was also unsuccessful. However, Fine
et al. reported the possible presence of IV in the New Orleans
CCE's on the basis of high performance liquid chromatography
(hplc) chromatograms of the CCE's using a new Thermal Energy
Analyzer (TEA) as a selective detector for N-nitroso compounds.15
A N-nitroso atrazine (IV) standard matched the retention time
of one of the twenty-four peaks in the hplc-TEA chromatograms
of the New Orleans CCE's. Its concentration was estimated
to be about 0.1 ug/1 in the drinking water. An extract of
water from the Mississippi River, although not concentrated as
much as the CCE's, showed many of the same peaks in its
hplc-TEA chromatogram including the one with the same
retention time as IV. At present these data are only tenative
and must remain so until the identity of each peak is
confirmed. Preliminary analysis of the New Orleans CCE's
by other chemists using liquid chromatography with a dual
wavelength ultra violet (UV) detection system showed no
detectable N-nitrosoatrazine (IV) down to the lower limit of
0.1 ug/1. It is possible that this is not contradictory to
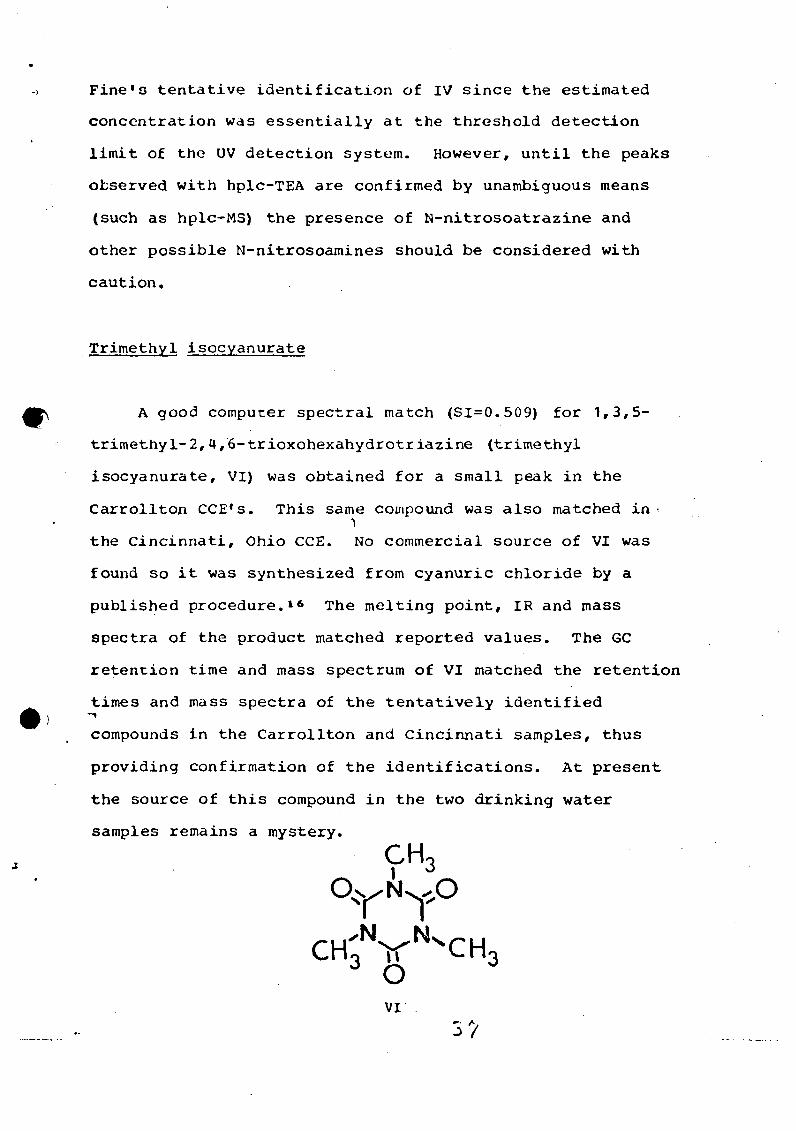
Fine's tentative identification of IV since the estimated
concentration was essentially at the threshold detection
limit of the UV detection system- However, until the peaks
observed with hplc-TEA are confirmed by unambiguous means
(such as hplc-MS) the presence of N-nitrosoatrazine and
other possible N-nitrosoamines should be considered with
caution.
Trimethyl isocyanurate
A good computer spectral match (Sl=0.509) for 1,3,5-
trimethyl-2,4,6-trioxohexahydrotriazine (trimethyl
isocyanurate, VI) was obtained for a small peak in the
Carrollton CCE's. This same compound was also matched in •
the Cincinnati, Ohio CCE. No commercial source of VI was
found so it was synthesized from cyanuric chloride by a
published procedure.16 The melting point, IR and mass
spectra of the product matched reported values. The GC
retention time and mass spectrum of VI matched the retention
times and mass spectra of the tentatively identified
compounds in the Carrollton and Cincinnati samples, thus
providing confirmation of the identifications. At present
the source of this compound in the two drinking water
samples remains a mystery.
CH3
oVI
Chloral
Chloral (trichloroacetaldchyde) was found in the
drinkinq water CCE's of six of the ten cities in the
National Organics Reconnaissance Survey (Table 2). This
frequent occurance leads to the postulation that its
formation, like the haloforms, is from chlorination of other
organic compounds during the addition of chlorine to the raw
and/or finished drinking water. The reaction mechanism of
chloral formation may be completely different from the
predominant reaction mechanism of haloform production. An
indication that chloral is a by-product of treatment rather
than a contaminant in the raw water from industrial
sources (it is a widely used monomer for
copolymerizations) is its presence in the drinking water
from the two cities that obtain their water supplies from
uncontaminated upland water (New York City and Seattle).
Chloral in water forms chloral hydrate.*7
Chloral hydrate ("knockout drops") is a hypnotic drug
sometimes used as a sedative and is considered "highly
toxic".*a The LD50 for oral injestion by rats is 285
mg/kg.19 Chloral hydrate applied to the skin of mice (4-5%
solutions in acetone) resulted in skin tumors in 4 of 20 of
? i

the animals.20 The highest concentration reported here for
chloral in drinking waters is only 5 ug/1 (Table 2).
Chloral can be synthesized by chlorinating ethanol,
acetaldehyde, polyethylene glycol, ethylene chlorohydrin,
chloroacetaldehyde and bis(2-chloroethyl) ether.»* Bellar
et al postulated the formation of chloral (VII) and chloral
hydrate (VIII) as intermediates in the reaction mechanism
involving conversion of ethanol to chloroform.21
,p ,0 ,0H^ CH_CH0OH > CHOC' >. CI.C-C' > Cl.C-CH > CHCl-# 3 2 3 H . 3 *H 3 N0H 3
Ethanol Acetaldehyde Chloral Chloral ChloroformHydrate
VII VIII
Rook22 has since demonstrated that chlorination of natural
humic substances in raw waters (specifically structures
containing the polyhydroxybenzene moiety) is the primary
source of haloforms in drinking waters although the reaction
mechanism remains to be explained.
Chloral was not identified in any of the NORS samples
analyzed by the inert gas stripping technique refered to as
Volatile Organics Analysis (VOA). To determine if chloral
(which exists as chloral hydrate in water) could be stripped
i from water under conditions similar to those used for VOA23,
31

Table 2. Concentration of Chloral Foundin Drinking Water Supplies
Drinking Water
Philadelphia, PA
Seattle, WA
Cincinnati, OH
Terrebonne Parish, LA
New York City, N. Y.
Grand Forks, N. D.
Cone, (yg/1)
5
3.5
2
1
0.02
0.01
chloral hydrate was prepared at a concentration of 1 ug/ml
in Ultra Pure Reagent Grade Water (New England Reagent
Laboratory, East Providence, RI). Five ml of this solution
was used to spike 500 ml of water previously stripped with
nitrogen for 20 minutes at a temperature of 95°C. The
spiked solution, containing chloral hydrate at 10 ug/1
(twice the highest concentration of chloral found in the 13-
city survey), was stripped again at 95° and the volatiles
were trapped on Tenax resin.23 Thermal desorption and
analysis by GC-MS failed to reveal any trace of chloral,
although chloroform was identified. Therefore, inert gas
stripping is not a suitable technique for isolating and
concentrating chloral from water prior to GC or GC-MS
analysis.
Chloral hydrate is known to decompose in neutral,
acidic and basic solutions to produce chloroform.17 At a pH
of 8 and temperature of 35°C its half-life is 2 days.l7 To
determine if the failure to detect chloral by the VOA
technigue was due to its rapid decomposition rather than its
high polarity, we conducted a kinetic study of chloroform
formation from chloral hydrate in Ultra Pure Reagent Grade
Water at 90°C. The results using direct aqueous
injection/flame ionization detector are shown in Figure 10
and summarized in Table 3. After 24 hours only about 2% of
H\
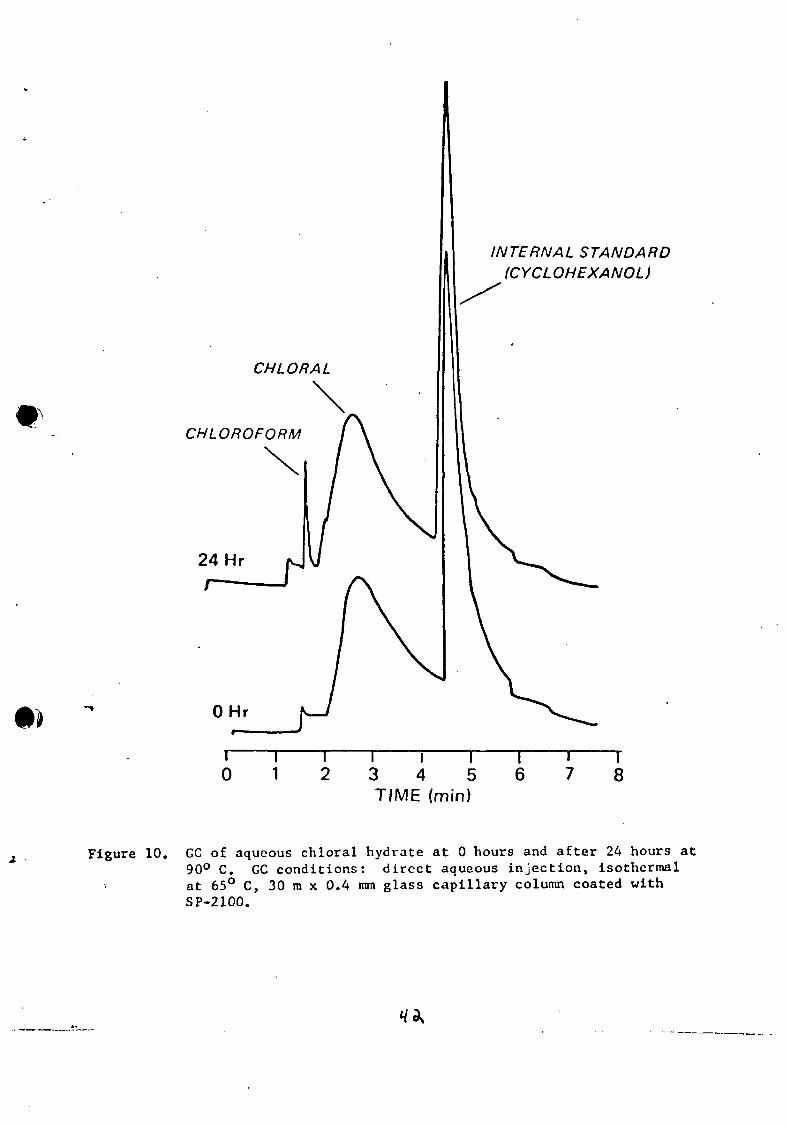
INTERNAL STANDARD(CYCLOHEXANOL)
CHLORAL
m
CHLOROFORM
24 Hr
I
0T i l I2 3 4 5
TIME (min)
i
7I8
Figure 10. GC of aqueous chloral hydrate at 0 hours and after 24 hours at90° C. GC conditions: direct aqueous injection, isothermalat 65° C, 30 in x 0.4 mm glass capillary column coated withSP-2100.

Table 3. Kinetic Study of the Formationof Chloroform from Chloral Hydrate
Time(hrs.)
0
1-2
3-5
9-10
23-24
Chloroform(mg/1)
0.02
0.06
0.07
0.10
0.13
Chloral(mg/1)
5.1
5.1
5.1
4.5
4.8
the chloral hydrate had decomposed to chloroform. Apparently
chloral hydrate is so polar it simply doesn't appreciably
strip out of aqueous solutions even at elevated temperatures.
Although these studies indicate a possible widespread
distribution of chloral hydrate in drinking waters, a data
base of thirteen samples is not sufficient to statistically
confirm this distribution. Additional studies on the
efficiency of chloral hydrate adsorption and desorption on
both activated carbon and XAD resins, as well as its
|\ frequency of occurrance and its suspected production from
chlorination treatment are needed.
Summary of Organic Compounds Found in CCE's of Thirteen
Finished Drinking Water Supplies
Table 4 provides detailed information on the compounds
identified in the three New Orleans area finished drinking
waters. Table 5 lists the compounds identified in the 10-city
National Organics Reconnaissance Survey CCE's. One hundred and
nine different compounds were identified in the CCE's of these
thirteen water supplies and eight more compounds were partially
identified (e.g., alkylbenzene -C ). Seventy percent of the
identified compounds have been confirmed by comparison with
standards.
A wide variety of chemical classes were present in these
CCE's. Table 6 summarizes some of these.
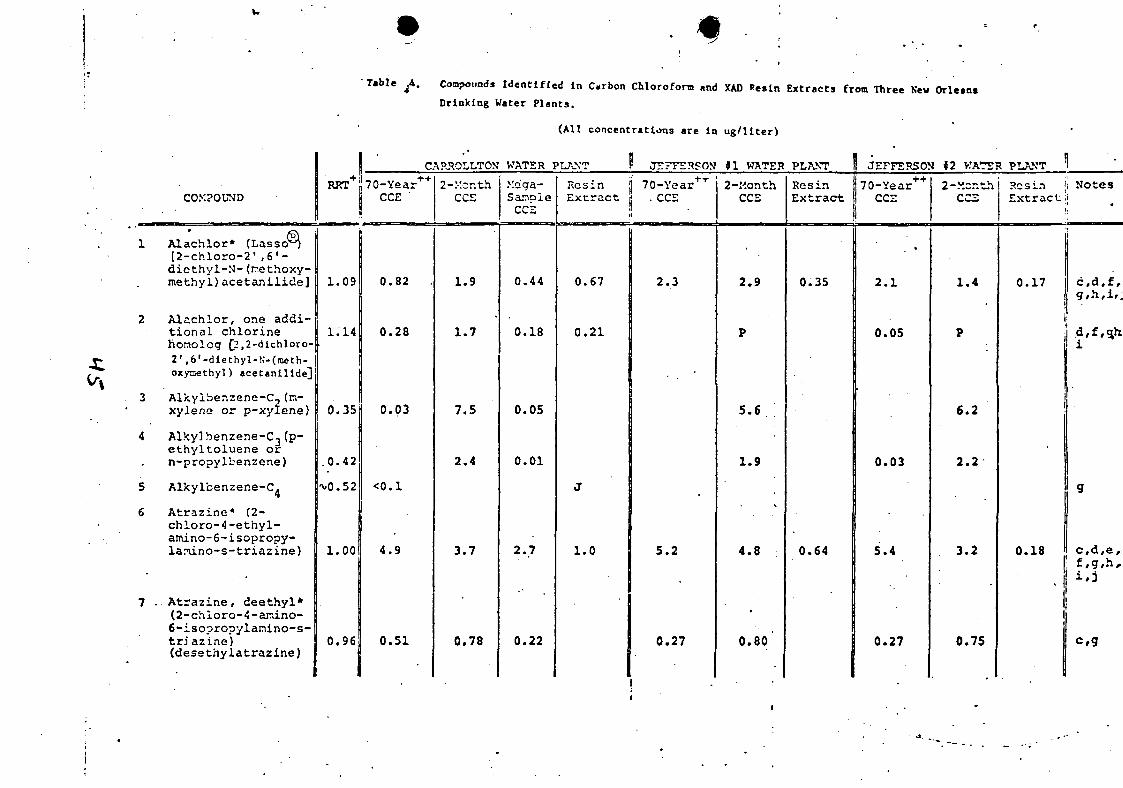
Table Compounds Identified in Carbon Chloroform and XAD Resin Extracts from Three New Orle.ns
Drinking Water Plants.
COMPOUND
1 Alachlor* (Lasso01)[2-chloro-2',6'-diethyl-N- (rr.ethoxy-methyl)acetanilide]
2 Alachlor, one addi-tional chlorinehonolog [2,2-dichloro-2',6'-diethyl-N-(raeth-oxynethyl) acetanllide]
3 Alkylbenzene-Cj(m-xylene or p-xylene)
4 Alkylbenzene-C3(p-ethyltoluene orn-propylbenzene)
5 Alkylbenzer.e-C,
6 Atrazine* (2-chloro-4-ethyl-amino-6-i sopropy-lanino-s-triazine)
7 .Atrazine, deethyl*(2-chioro-4-arro.no-6-iso?ro?ylanino-s-tri azine)(desethylatrazine)
1.09
1.14
0.35
. 0 . 4 2
M).52
1.00
0 . 9 6
CAPJ10LLT0N
| 70 -Year + +
j CCE
0.82
0 .28
0.03
4 . 9
0.51
2-.vor.thCCZ
1.9
1.7
7.5
2 . 4
3.7
0.78
(All concentrations are in
WATER PLANT P JE7TERPON
Xdga-Sano le
CCE
0.44
0.18
0.05
0.01
2 . 7
0.22
Resin jj 70-YearE x t r a c t t . CCE
l!
0.67
0 .21
J
1.0
2 . 3
5 . 2
0.27
ug/liter)
»1 WATER PLANT
2-y.onthCCE
2 . 9
P
5-6
1.9
4.8
0.80
ResinExtract
0.35
0.64
B
JEFFERSON *2 WATER PLANT 1
70-Year'M 'CCE
2 . 1
0.05
0.03
5.4
0.27
2-Mor.thCCE
1.4
P
6.2
2 . 2
3.2
0.75
Sesin j! NotesExtract!
0.17
0.18
c,d#f.
i '
c,d,e,
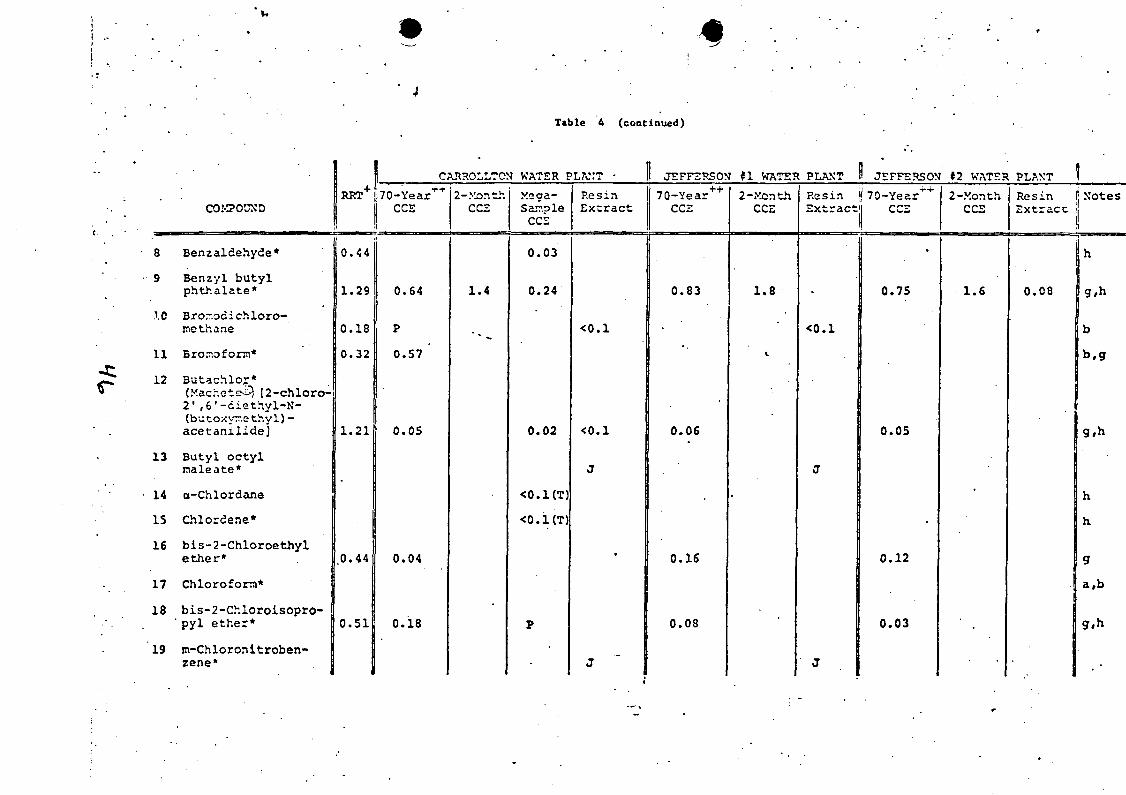
Table 4 (continued)
COMPOUND
8 Benzaldehyde*
9 Benzyl butylphthalate*
.10 Bror.odichloro-methane
11 Erorr.ofom*
12 Butachlor*(Machete^ t2-chloro-21 ,6'-diethyl-N-(butoxyr-.ethyl)-acetanilide]
13 Butyl octylnaleate*
14 a-Chlordane
IS Chlordene*
16 bis-2-Chloroethylether*
17 Chlorofora*
18 bis-2-Chloroisopro-' pyl ether*
19 m-Chloronitroben-zene*
RPT +
0.44
1.29
0.18
0.32
1.21
.0.44
0.51
CAttSOLLTCN WATER PLAMT -
TO-Year^CCS
0.64
P
0.57
0.05
0.04
0.18
2-yuDr.thCCS
1.4
Xega-Sar?.pleCCS
0.03
0.24
0.02
<0.1(T)
<0.1(T)
P
ResinExtract
<0.1
<0.1
J
•
J
JEFFSHSO>
70-Year++
CCS
0.83
0.06
0.16
0.08
J *1 WATEP
2-Xcri thCCS
1.8
•
[ PLANT
ResinExtract
<0.1
J
J
BP JEFFERSON
J70-Year'r'i'
0.75
0.05
•
0.12
0.03
f *2 WATES
2-MonthCCS
1.6
•
PLANT !
Resin 1 N'otesExtracc !
!
0.08
h
g,h
b
b.g
g,h
h
h
g
a,b
g,h
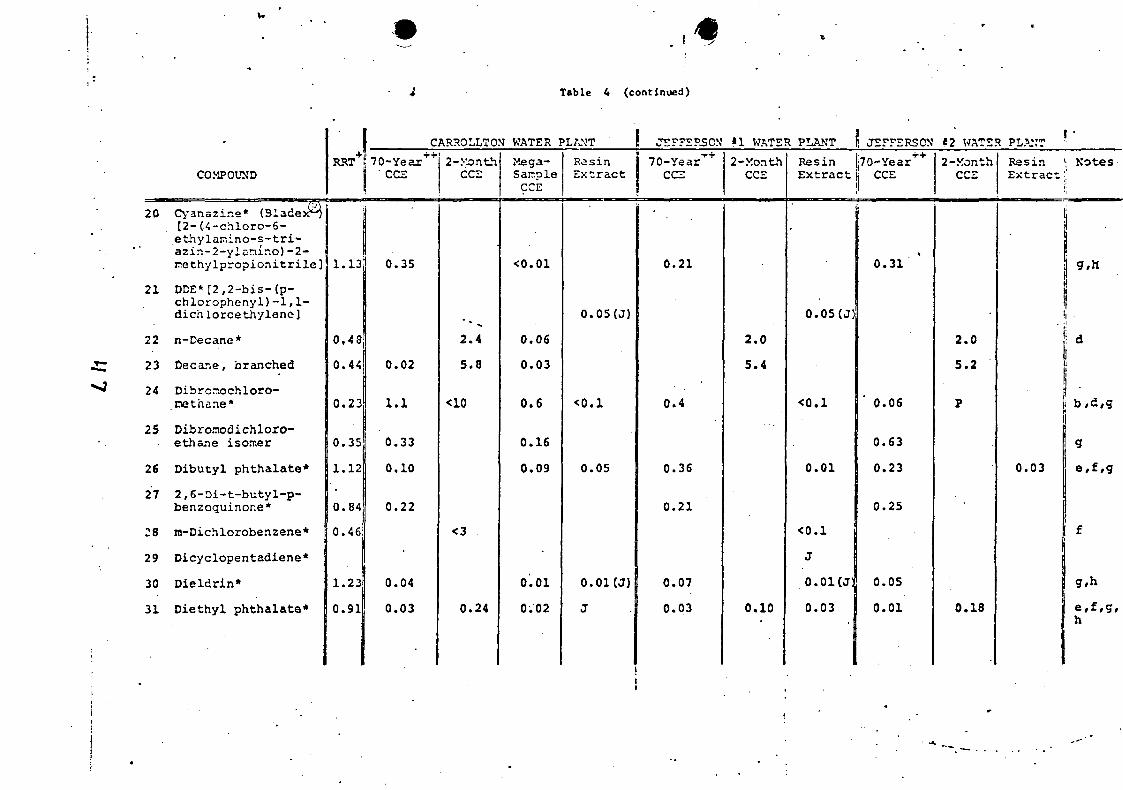
Table 4 (continued)
COMPOUND
20 Cyanazir.e* (BladexR[2- (4-chloro-6-ethylanino-s-tri-azir.-2-ylanir.o) -2 -ir.ethylpropionitrile]
21 DDE*[2,2-bis-te-ch lorophenyl) -1 ,1 -dichlorcethyleno]
22 n-Decane*
23 Decane, branched
24 Dibronochloro-.methane*
25 Dibromodichloro-eth&ne isomer
26 Dibutyl phthalate*
27 2,6-Di-t-butyl-p-benzoquinone *
28 ra-Dichlorobenzene*
29 Dicyclopentadiene*
30 Dieldrin*
31 Diethyl phthalata*
RRT+
1 . 1 3
0 . 4 8
0 . 4 4
0.23
0 . 3 5
1 .12
0 .84
0 . 4 6
1 .23
0 . 9 1
CARROLLTOM WATER PLANT
:' 7 0 - Y e a r + +
• CCE
0.35
0.02
1.1
0.33
0.10
0.22
0.04
0.03
2-MonthCCE
2.4
5.8
<10
<3
0.24
Mega-S ar.pl e
CCE
<0.01
0.06
0.03
0.6
0.16
0.09
0.01
0.02
ResinExtract
0.05(J)
<0 .1
0.05
0.01CJ)
J
JEFFERSON'
CCE
0.21
0 . 4
0.36
0.21
0.07
0.03
*1 WATER PLANT
2-XonthCCE
2 .0
5.4
0.10
ResinExtract
0.05{J)
<0.1
0.01
<0.1
J
O.OKJ:
0.03
i! JEFFERSONi70-Year' r +
1 CCE
0.31 '
0.06
0.63
0.23
0.25
0.05
0.01
«2 WATER PLA:,'T
2-MonthCCE
2 . 0
5 . 2
P
0.18
ResinExtract
0.03
1 •
\ Notes
1 .
g,H
[j -i
g
e,f,g
f
g ,h
e,f,g,h
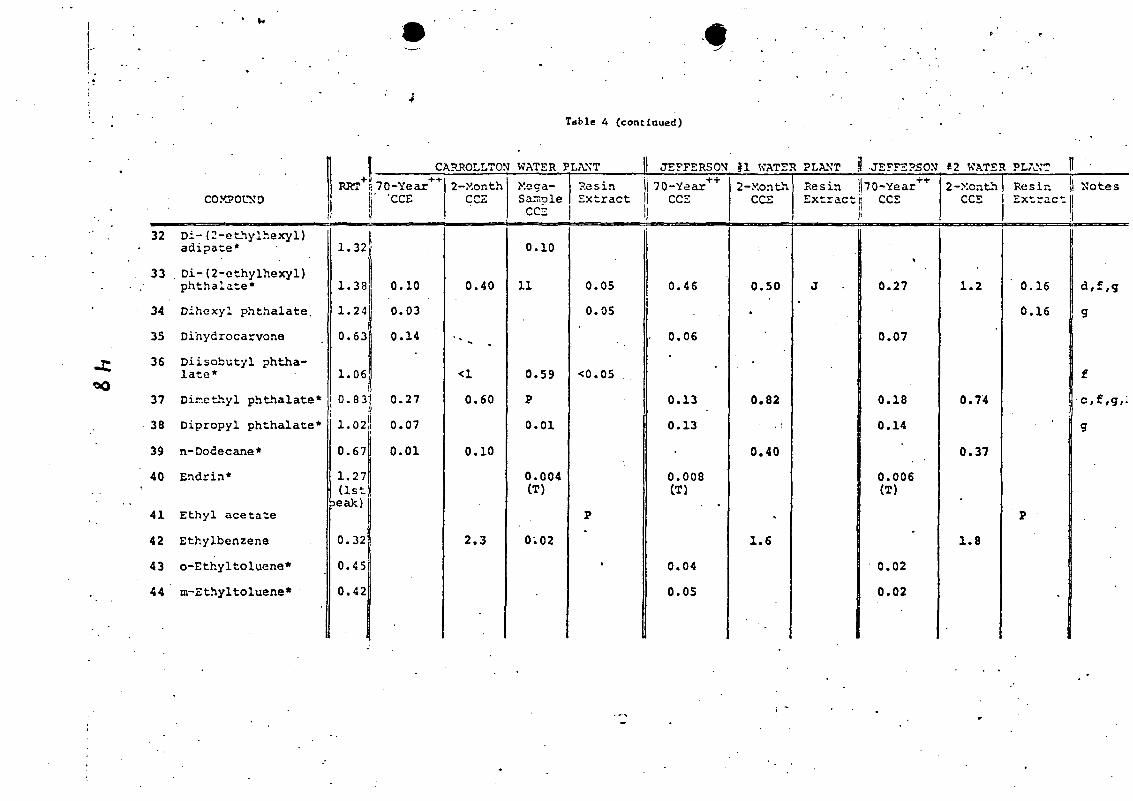
Table 4 (continued)
CARROLLTON WATER PLANT [1 JEFFERSON g l WATER PLANT j! JEFFERSON <2 WATER PLANT i
COMPOUND
32 Di-(2-ethylhexyl)adipate*
33 Di-(2-cthylhexyl)phthalate*
34 Dihexyl phthalate.
35 Dihydrocarvone
36 Diisobutyl phtha-late*
37 Dimethyl phthalate*
38 Dipropyl phthalate*
39 n-Dodecane*
40 Endrin*
41 Ethyl acetate
42 Ethylbenzene
43 o-Ethy1toluene*
44 m-Ethyltoluene*
RRT+
1.32
1.38
1.24
0.63
1.06
0.83
1.02
0.67
1.27(1st>eak)
0.32
0.45
0.42
!70-Year++
[ *CCE
0.10
0.03
0.14
0.271
0.07
0.01
2-Month
ccz
0.40
<1
0.60
0.10
2.3
•
>'.cga-SarraleCCE
0.10
11
0.59
P
0.01
0.004(T)
0.02
P.esinExtract
0.05
0.05
<0.05
P
•
i 70-Year1 CCS1
0.46
• 0.06
0.13
0.13
•
0.008CT1
0.04
0.05
2-MonthCCE
0.50
•
•
0.82
0.40
1.6
Resin j|70-Year'f"t'Extractij CCE
1'
J 0.27
0.07
0.18
0.14
0.006(T)
0.02
0.02
2-XonthCCS
1.2
0.74
0.37
1.8
Re sir.Extract
0.16
0.16
P
•
1 Notes
!
d.f,*
g
£
c,f ,g,:
g
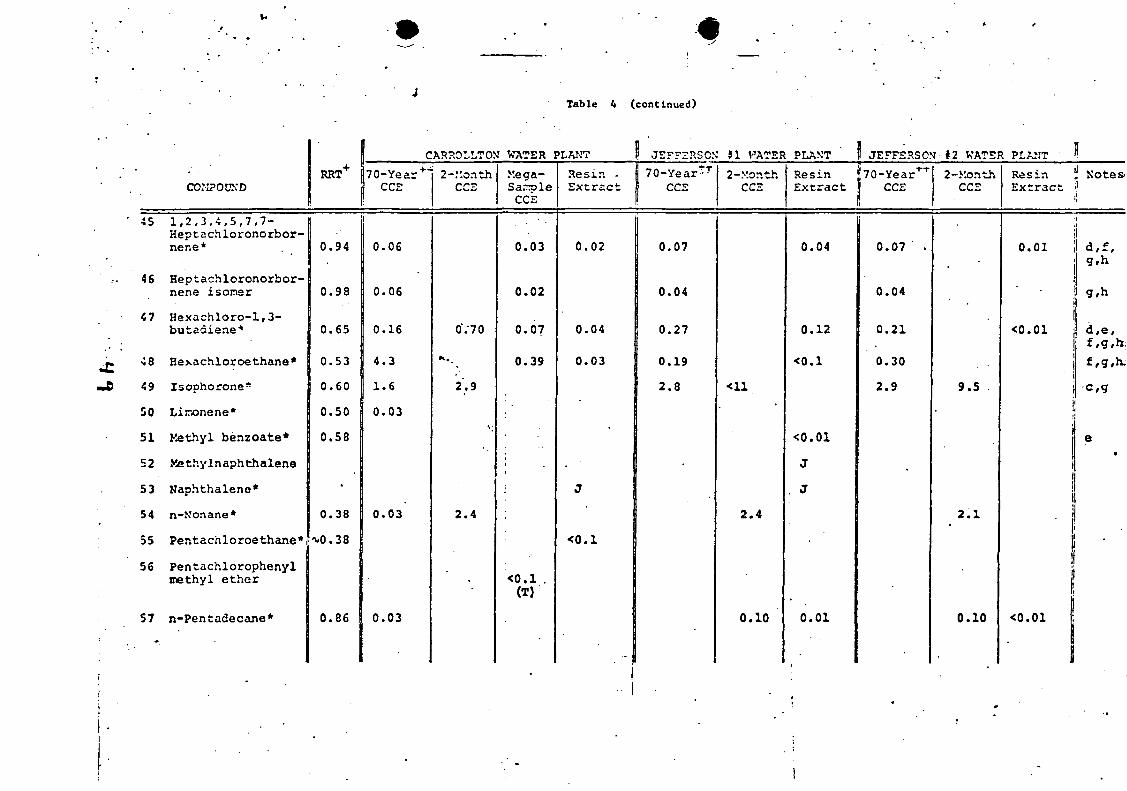
Table 4 (continued)
COMPOUND
45 1,2,3,4,5,7,7-Heptachloronorbor-nene*
46 Heptachloronorbor-nene isomer
47 Hexachloro-1,3-butadiene*
•18 Hexachloroethane*
49 Isophorone*
50 Lironene*
51 Kethyl benzoate*
52 tethylnaphthalene
53 Naphthalene*
54 n-Nonane*
55 Pentachloroethane*
56 Pentachlorophenylmethyl ether
57 n-Pentadecane*
RRT +
0.94
0.98
0.65
0.53
0.60
0.50
0.58
•
0.38
-v.0.38
0.86
CAR30LLT0N WATER PLANT
70-Year+"CCS
1
0.06
0.06
0.16
4.3
1.6
0.03
0.03
0.03
2-.".onthCC3
0V70
2.9
2.4
•
Mega-
CCE
0.03
0.02
0.07
0.39
•
'.
(T)
Resin -Extract
0.02
0.04
0.03
J
<0.1
! JEFFERSON
ccz
0.07
0.04
0.27
0.19
2.8
• »1 VATER
2-XonthCCS
2.4
0.10
PLANT
ResinExtract
0.04
0.12
<0.1
<0.01
J
. J
0.01
11 JEFFERSON! #2 WATER PLANT
1 CCE
0.07 .
0.04
0.21
0.30
2.9
2-MonthCCE
9.5
2.1
0.10
ResinExtract
0.01
<0.01
<0.01
I|| Notes
;
II
d,f,g.h
g.h
d,e,
f,g,h.
c,g
e

Teble 6 (coatlnued)
CO.XPOWfD
58 • Propdzine* [2-chloro-4,6-bis-(isoprcpylanino)-s-triazine]
59 Sirr.azine* [2-chloro-4,6-bis-(ethylanino)-s-triazine]
60 1,1,1,2-Tetra-chloroethane* .
61 Tetrachloroethy-lene*
62 n-Tetradecane*
63 Toluene*
64 1,1,2-Trichloro-ethane*
65 1,1,1-Trichloro-propane
66 1,2,3-Trich]oro-propane
67 n-Tridecane*
58 TrirvGthylbenzeneisoner
1RRT+
~1.0
•vl.O
0.30
0.26
0.80
0.22
0.21
•vO.07
0.36
0.72
0.46
CA3F.0LLT0N
70-Year+"*CC£
<0.1
0.04
0.02
0.35
0.01
0.04
2-".onthCCE
•
<1
0.10
11-
6.2
0.30
6.1
WATER I
Xcga-Sar-.pleCCE
<0.1
0.11
0.08
<0.2
<0.2
0.02
3LA::T
ResinExtract
J
<0.1
<0.1
<0.1
0.01
JEFFERSON' *1 V7ATSS
'70-Year++
CCE
<0.1
<0.1
0.20
0.10
0.45
2-XonthCCE
<5
0.10
7.1
8.5
0.17
5.1
t PLAN'T
ResinExtract
<0.1
<0.01
<0.1
JEFFERSON' *2 WATEF
,10-Ysaz't"rCCE
•
<0.1
<0.1
0.20
0.41
0.02
2-V.or.thCCS
<5
0.12
12
6.4
0.20
5.3
( PLANT
Re sir.Extract
Notes
-
g
b,g
b
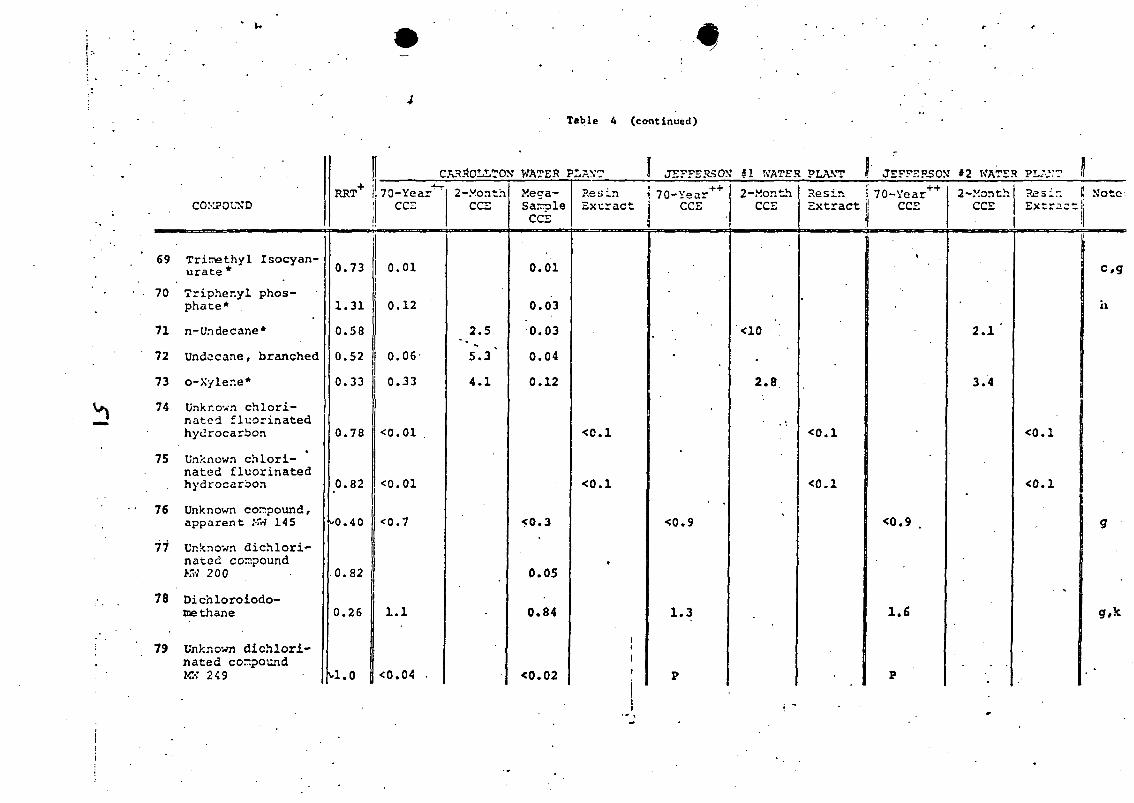
~
Table 4 (continued)
69
70
71
72
73
74
75
76
77
78
79
COMPOUND
Trinethyl Isocyan-urate *
Tripher.yl phos-phate*
n-Undecane*
Undecane, branched
o-Xyler.e*
Unknown chlori-nated fluorinatedhydrocarbon
Unknown chlori-nated fluorinatedhydrocarbon
Unknown cor.pound,apparent MW 145
Unknown dichlori-naced compoundKW 200
Dichloroiodo-ine thane
Unknown dichlori-nated cor.poundMtf 249
0.73
1.31
0.58
0.52
0.33
0.78
0.82
-0.4 0
0.82
0.26
H.O
1170-Year*"1"
CCE
1
0.01
0.12
0.06-
0.33
<0.01
<0.01
<0.7
1.1
<0.04 •
ARSOLI/TO'
2-MonthCCS
2.5
5.3'
4.1
ST WATER PLAN'?
Mega-SarroleCCE
0.01
0.03
0.03
0.04
0.12
<0.3
0.05
0.84
<0.02
1 JEFFERSON' tl WATE5
Resin ! 70-Year++
Extract i CCE
<e.i
<0.1
1
1
i
-
S0.9 '
1.3
P
2-MonthCCE
<10
2.8
! PLANT ! JEFFERSON *2 WATER PL.'.V?
Hesin !i 70-Year++
Extract j CCE
•
<0.1
<0.1
v
<0.9 .
1.6
P
2-MonthCCE
2.1 '
3.4
Extractt Note-
ic,g
ii
g

•
Table A (continued)
80
81
82
COMPOUND
Unknown
Unknown
Unknown
phthalate
phthalate
phthalate
RR
1 .
1 .
1 .
T +170-Yea]
•
22
24
36
CARROLLTOh
2-MonthCCE
1 WATER
Mega-Sar.ole
CCS
0. 01
0.01
0.12
PLANT
•
Resir.Extract
1 JEFFERSO
'•. 70-Year++
i CCS
f #1 WATER
2-MonthCCS
PLANT
ResinExtract
' JEFFERSON
CCS
#2 WATER PL.WT
2-Vor.thCCS
Resir.Extract
!
Note
* Confirmed by matching GC retention time and, in roost cases, mass spectrum with that of a standard.
Blank spaces indicate that compound was not detected in that specific sainple. •
+ Relative retention time (to atrazine); mostly determined by the GC computer system.
++ Concentration values for 70-year CCE compounds are sums of concentrations in CCE #1 (filter #1) and CCE 12 (filter #2).
J Detected only by Junk, USAEC-Ames Laboratory. Identified in the Carrollton or Jefferson No. 1 resin extracts by GC-KS,but not quantitated except for DDE and dieldrin. These co-pounds were not detected at SERL in the resin extracts.
P Present, usually in very low concentrations (<0.05 yg/1), but not quantitated due to interferences with other GC peaks orlack of a discernable GC peak (detected only by mass speczrorujtry).
T Detected only by Thruston at SERL by GC-MS after fractionation by colunn chromatography.
NOTES:
a Chloroform was identified at SERL only in the tetralin extract of the Carrollton Water.b These corr.pounds were also identified at the Water Supply Research Laboratory, EPA, Cincinnati, by VDA analysis of the
Carrollton water. :
c Also identified in the Carrollton CAE.d Also identified by Junk, USA2C-Ajr.es Laboratory, in the Carrollton resin extract.
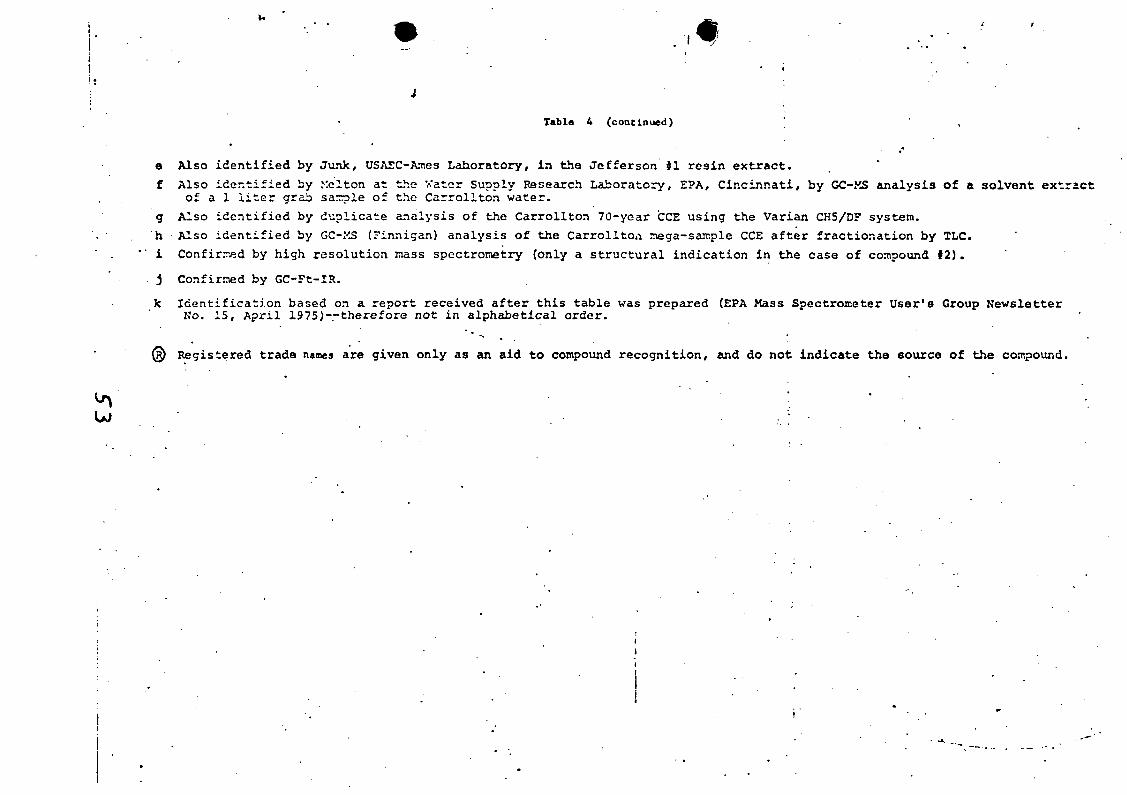
Table 4 (continued)
e Also identified by Junk, USAEC-Ames Laboratory, in tha Jefferson }1 resin extract.
f Also identified by Xelton at the Water Supply Research Laboratory, EPA, Cincinnati, by GC-XS analysis of a solvent extract
of a 1 liter grab sarnie of the Carrollton water.
g Also identified by duplicate analysis of the Carrollton 70-year CCE using the Varian CH5/DF system.
h Also identified by GC-KS (Finnigan) analysis of the Carrollton mega-sample CCE after fractionation by TLC.
i Confirrv;d by high resolution mass spectroinetry (only a structural indication in the case of compound #2).
j Confirmed by GC-Ft-IR.
k Identification based on a report received after this table was prepared (EPA Mass Spectrometer User's Group NewsletterNo. 15, April 1975)---therefore not in alphabetical order.
® Registered trada names are given only as an aid to compound recognition, and do not indicate tha source of the compound.

Table 5. Compounds Identified in Carbon Chlorofom Extracts froa Drinking Waters of 10 U. S. Cities.
•* (All concentrations are in ug/liter)
Conoound
1. Acetaldehyde*
2. Acetone*
3. Acetopher.one*
4. Atrazine*
5. Bromodichloromethane*
6. Brorr.oform*
7.. t-Butyltoluens
8. Canphor*
9. Chloral* (trichloroacetaldehyde)
10. Chlorobenzene*
11. Chlorodibromomethane*
12. Chloropicrin*
(trichloronitromethane)
13. p-Chlorotolucne*
14. Cunene* (isopropylbenzene)
15. Cyclohexanone*
16. Cymene isomer
17. 2,6-Di-t-butyl-p-benzoquinone*
13. Di-t-butyl ketone
19. Di-n-butyl phthalate*
20. o-Dichlorobenzene*
21. m-Dichlorobenzene*
22. p-Dichlorobenzene*
23. Diethyl nalonate*
24. Diethyl phthalate*
25. Di-(2-ethylhexyl) phthalate*
Grand N.Y. TerrebonneCincinnati Miami Otturrwa Philadelohi Seattle Forks Lawrence City Parish Tucson
1.0
0 . 1
2 . 0
0 . 5
4 . 5
1.5
0 . 5
1 .0
15
0.01
0.1
1.5
0.1
0.1
5.0
1.0
0.5
0.5
1.0
30
0.1
0.1
0.05
0.1
0.1
0.1
0 . 1
1.0
1.0
0.01
5 . 0
0 . 5
0 . 1
1.0
0 . 1
0 . 5
3 . 5
0.05
0.01
0.5
0.01
0.01
0.6
0.01
0.1
0.6
0.01
0.02
0.01
.0.04
0.08
1.3
0.02
0.4
0.01
2.0
.1.0
1.0
0.01
0.02
0.04
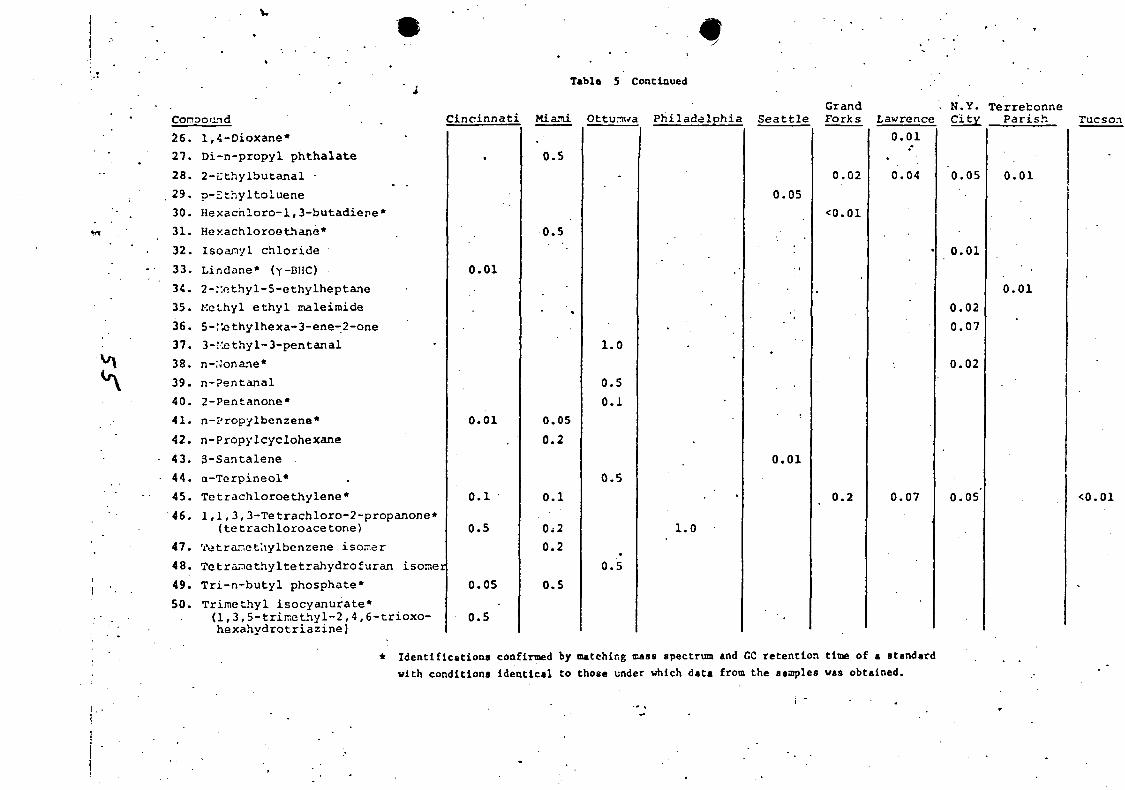
Conoo'ind Cincinnati
26. 1,4-Dioxane*
27. Di-n-propyl phthalate
28. 2-Ethylbutanal •
29. p-zthyltoluene
30. Hexachloro-1,3-butadiere*
31. Hexachloroethane*
32. Isoanyl chloride
33. Lindane* (y-BHC)
34. 2-:'.f>thyl-5-ethylheptane
35. tfethyl ethyl maleimide
36. 5-:tothylhexa-3-ene-2-one
37. 3-!'.ethyl-3-pentanal
38. n-Nonane*
39. n-?entanal
40. 2-Pentanone*
41. n-Propylbenzene*
42. n-Propylcyclohexane
43. 3-Santalene
44. a-Terpineol*
45. Tetrachloroethylene*
46. 1,1,3,3-Tetrachloro-2-propanone*
(tetrachloroacetone)
47. Tetrar.ethylbenzene. isoner
48. Tetra^cthyltetrahydrofuran isoner
49. Tri-n-butyl phosphate*50. Trimethyl isocyanurate*
. (l,3,5-trir.ethyl-2,4,6-trioxo-hexahydrotriazine)
0.01
0.01
0 . 1
0.5
0.05
0.5
Table 5 Continued
Grand '. N.Y. TerrebonneMiami Ottunwa Philadelphia Seattle Forks Lawrence City Parish Tucson
0.01
0 . 5
0 . 5
* *
0.05
0.2
0 . 1
0 , 2
0 .2
0 . 5
1.0
0 . 5
0 . 1
0 . 5
0 . 5
1.0
0.05
0.01
0.02
<0.01
0.2
0.04
0.07
Identifications confirmed by matching mass spectrum and CC retention time of a standardwith conditions identical to those under which data from the samples was obtained.
0.05
0.01
0.020.07
0.02
0.05
0.01
0.01
<0.01
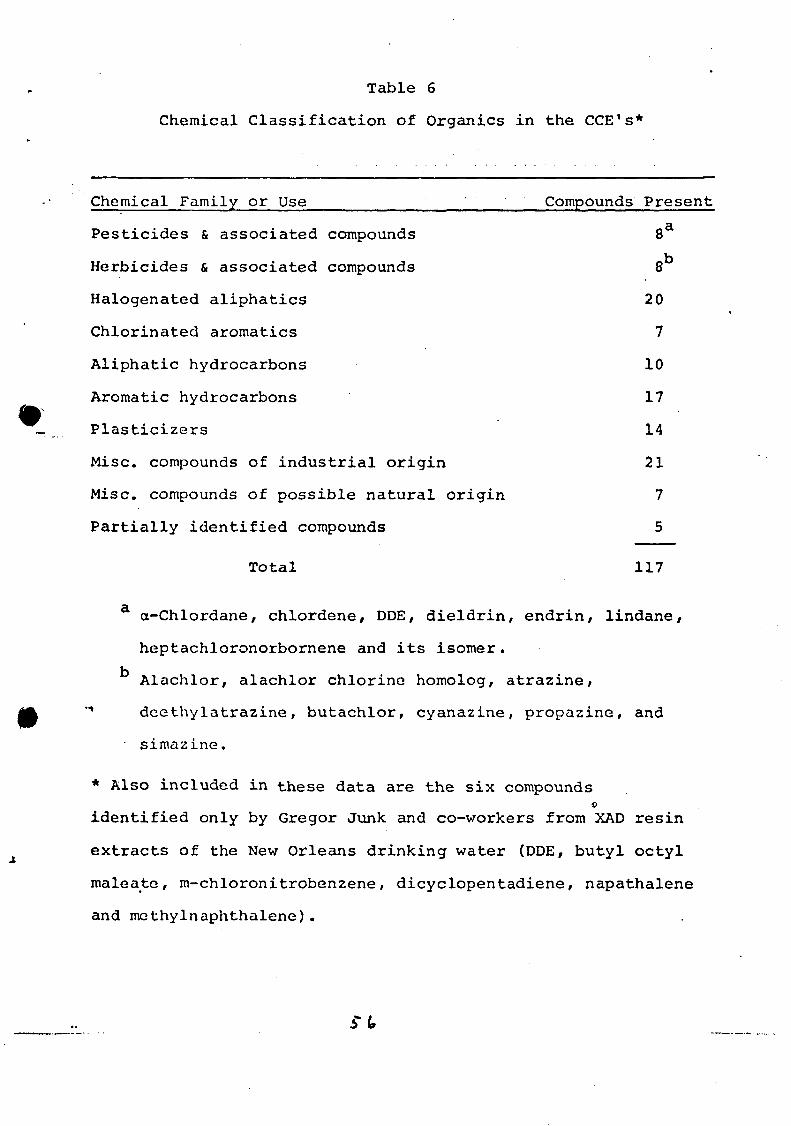
Table 6
Chemical Classification of Organics in the CCE's*
Chemical Family or Use Compounds Present
Pesticides & associated compounds 8
Herbicides & associated compounds 8
Halogenated aliphatics 2 0
Chlorinated aromatics 7
Aliphatic hydrocarbons 10
Aromatic hydrocarbons 17
Plasticizers 14
Misc. compounds of industrial origin 21
Misc. compounds of possible natural origin 7
Partially identified compounds 5
Total 117
ct-Chlordane, chlordene, DDE, dieldrin, endrin, lindane,
heptachloronorbornene and its isomer.
Alachlor, alachlor chlorine homolog, atrazine,
"* deethylatrazine, butachlor, cyanazine, propazine, and
• simazine.
* Also included in these data are the six compounds
identified only by Gregor Junk and co-workers from XAD resin
extracts of the New Orleans drinking water (DDE, butyl octyl
maleate, m-chloronitrobenzene, dicyclopentadiene, napathalene
and mcthylnaphthalene).
No polycyolic aromatic hydrocarbons (PAH1s) or
polychlorinated biphenyls (PCB's) were identified in any of
these extracts. However, many of the compounds listed in
Tables 4 and 5 have been identified previously in various
industrial wastewaters. 2I*' 2S It is our opinion that the
majority of these chemicals come from industrial or
municipal waste discharges although some of them may occur
naturally in the water (e.g. acetone, dihydrocarvone,
3-santalene); some may be produced by reaction of chlorine
with other chemicals (e.g. chloroform, dichlorobromomethane,
bromodichloromethane, bromoform, dichloroiodomethane and
perhaps, chloral hydrate); and some may originate from
agricultural runoff (e.g. dieldrin, endrin, lindane, atrazine,
alachlor etc.).
5*7
Recovery Studies
Recoveries from Carbon Filters in Series
Quantitative results in Table 4 for the "70 year" CCE
compounds are sums of the amounts recovered from two CAM
carbon filters in series—filter #1 and filter #2. Table 7
gives for each compound that was present at a concentration
>0.04 ug/l-the percent of the total concentration that was
recovered in each of the two filters for the Carrollton "70
year" sample.
Of the 29 compounds in Table 7, 24 were collected on
filter #1 to the extent of 96% or more, indicating <
quantitative adsorption on carbon (but not necessarily
quantitative recovery). These 24 include a wide variety of
compounds, indicating a generally high degree of adsorption.
However, there are exceptions. Three trihalogenated
methanes or ethanes were adsorbed to the extent of only 64
to 85% on filter #1, and more hexachloroethane was found on
filter #2 than #1.
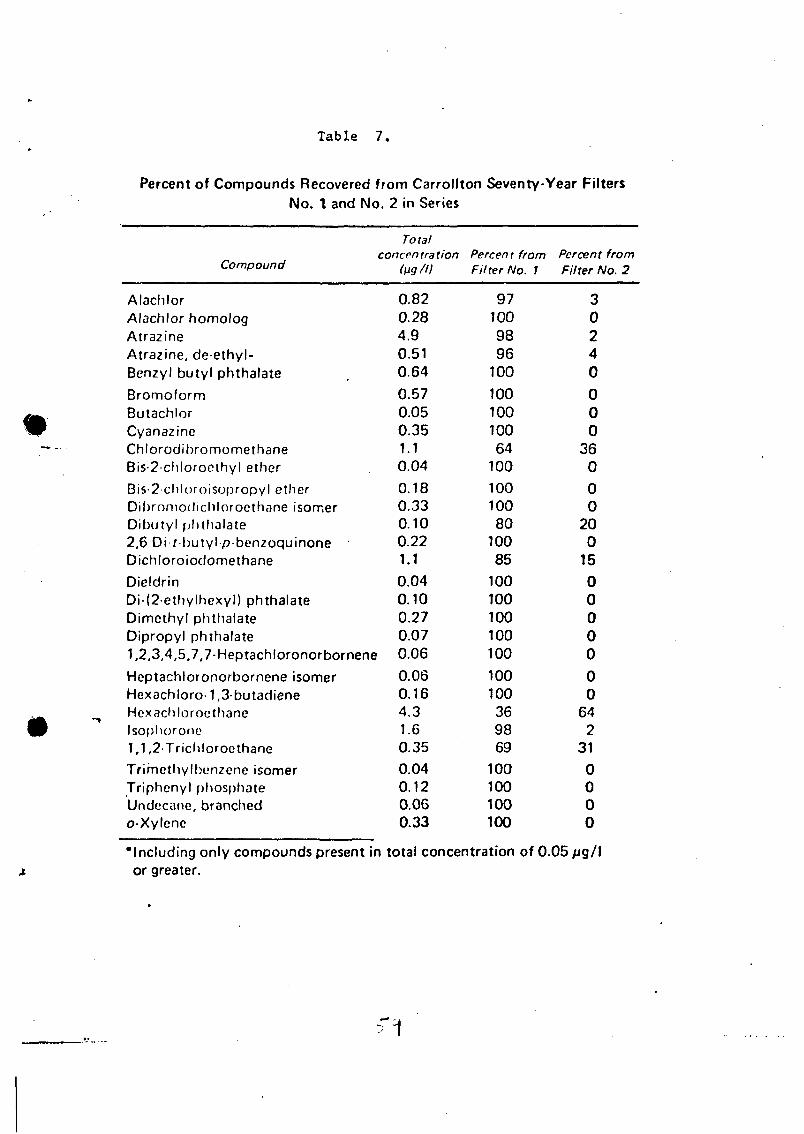
Table 7.
Percent of Compounds Recovered from Carrollton Seventy-Year FiltersNo. 1 and No. 2 in Series
Totalconcentration Percent from Percent from
Compound (^g/l) Filter No. 1 Filter No. 2
AlachlorAlachlor homologAtrazineAtrazine, de-ethyl-Benzyl butyl phthalateBromoformButachlorCyanazineChi orodibromome thaneBis-2chloroethyl etherBis-2 chloroisopropyl etherDibromodichlorocthane isomerDibutyl phthalate2,6 Dif butyl p-benzoquinoneDichloroiodomethaneDieldrinDi-(2ethylhexyl) phthalateDimethyl phthalateDipropyl phthalate1,2,3,4,5,7,7-HeptachloronorborneneHeptachloronorbornene isomerHexachloro-1,3-butadieneHexachloroethaneIsophorono1,1,2TrichloroethaneTrimethylbunzene isomerTriphenyl phosphateUndecane, branchedo-Xylene
0.820.284.90.510.640.570.050.351.10.040.180.330.100.221.1
0.040.100.270.070.060.060.164.31.60.350.040.120.060.33
971009896
100
10010010064
100
10010080
10085
100100100100100
100100369869
100100100100
30240
000
360
00
200
15
00000
00
642
31
0000
•Including only compounds present in total concentration of 0.05 //g/lor greater.
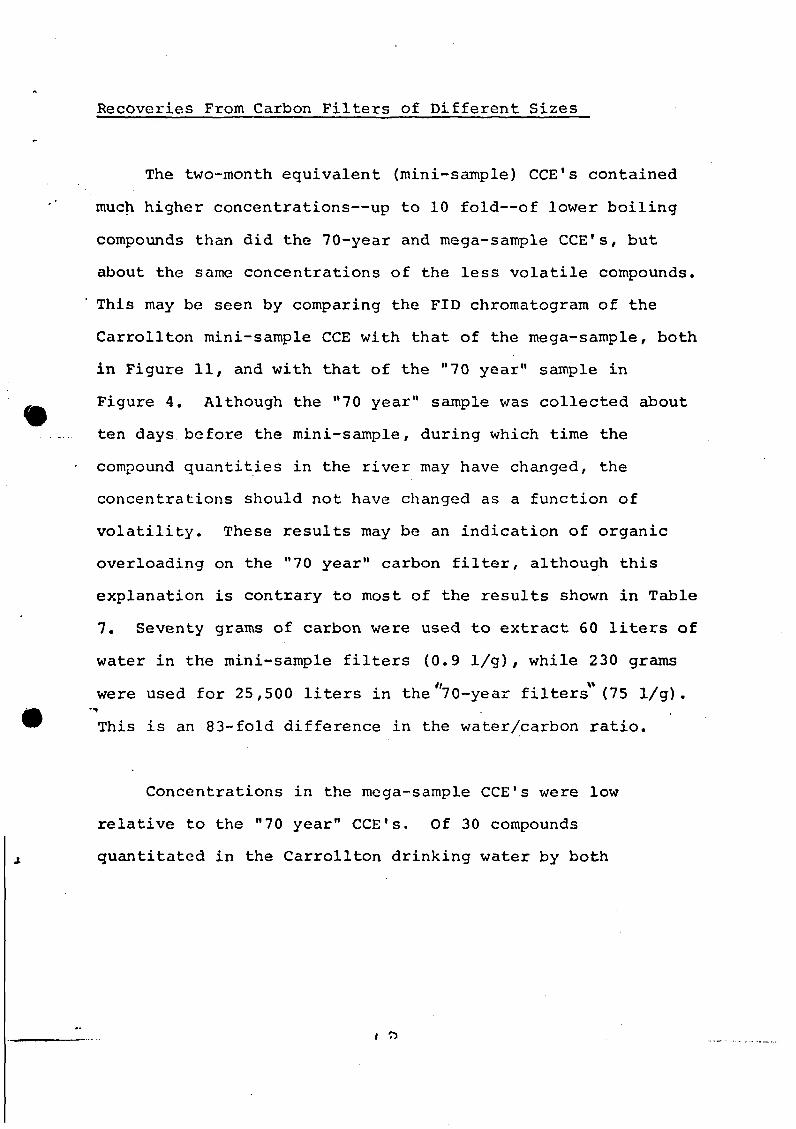
Recoveries From Carbon Filters of Different Sizes
The two-month equivalent (mini-sample) CCE's contained
much higher concentrations—up to 10 fold—of lower boiling
compounds than did the 70-year and mega-sample CCE's, but
about the same concentrations of the less volatile compounds.
This may be seen by comparing the FID chromatogram of the
Carrollton mini-sample CCE with that of the mega-sample, both
in Figure 11, and with that of the "70 year" sample in
Figure 4. Although the "70 year" sample was collected about
ten days before the mini-sample, during which time the
compound quantities in the river may have changed, the
concentrations should not have changed as a function of
volatility. These results may be an indication of organic
overloading on the "70 year" carbon filter, although this
explanation is contrary to most of the results shown in Table
7. Seventy grams of carbon were used to extract 60 liters of
water in the mini-sample filters (0.9 1/g), while 230 grams
were used for 25,500 liters in the '70-year filters (75 1/g).
This is an 83-fold difference in the water/carbon ratio.
Concentrations in the mega-sample CCE's were low
relative to the "70 year" CCE's. Of 30 compounds
quantitated in the Carrollton drinking water by both
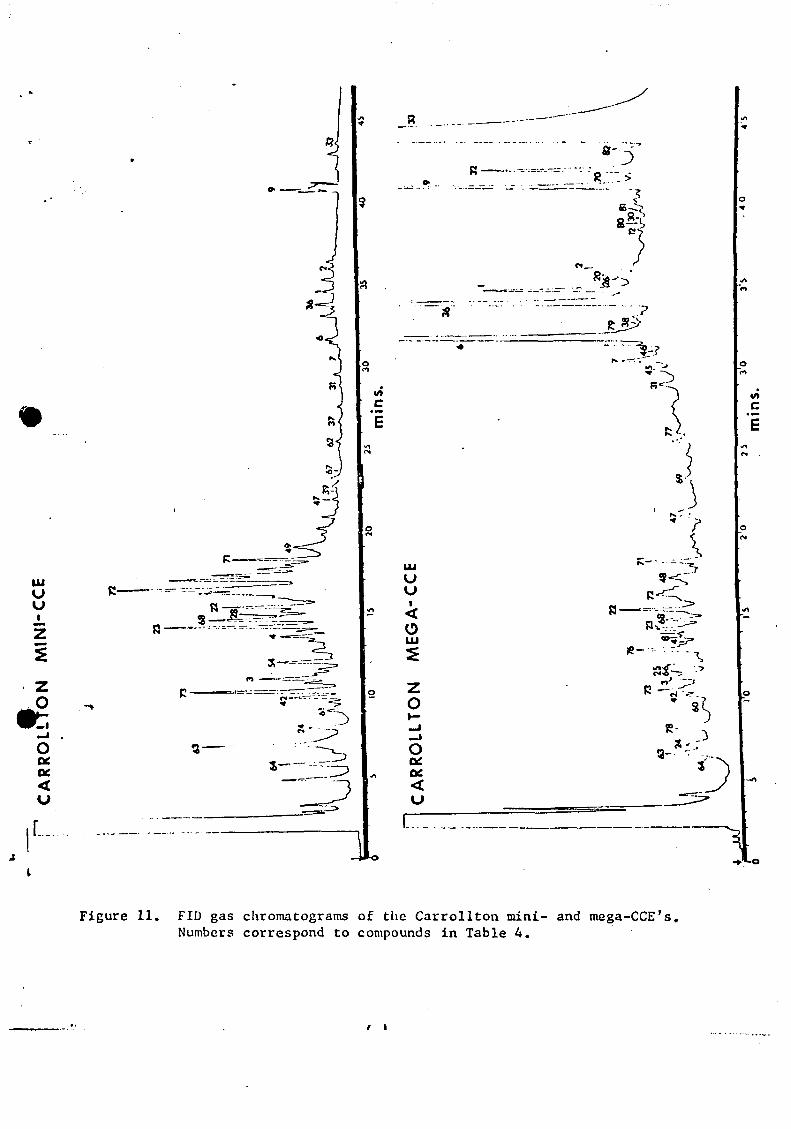
UJ
Ui
zI
o
<
iL..
o1X1
zo
oon<
rl •;?_
Figure 11. FID gas chromatograms of the Carrollton mini- and mega-CCE's.Numbers correspond to compounds in Table 4.

methods, the concentrations of 21 in the mega-sample were
between 25 and 76% of that found in the "70 year" sample.
The water/carbon ratio for the mega-sample was 57 1/g.
Several operational factors were biased against the
mega-sample quantitations relative to those for the "70
year" sample. The mega-sample carbon was dried for 10 days
before extraction, while the "70 year" sample carbon was
dried for only 2 days. The first step concentration of the
mega-sample CCE's was not as carefully controlled as it was
with the "70 year" CCE's in that direct distillation of the
chloroform was used for the mega-sample whereas vacuum
evaporation at room temperature was used for the 7 0-year
CCE's. However, recent quantitative studies by Webb26
indicate that the first step concentration is not as
critical as the final step concentration, which was the same
with all of these samples.
Recovery from Resin
Not enough data are available from the New Orleans
study to make a good comparison of XAD-resin vs. carbon
extraction efficiencies. More compounds and higher
concentrations were obtained from the carbon, but sampling
circumstances were biased against the resin technique. A
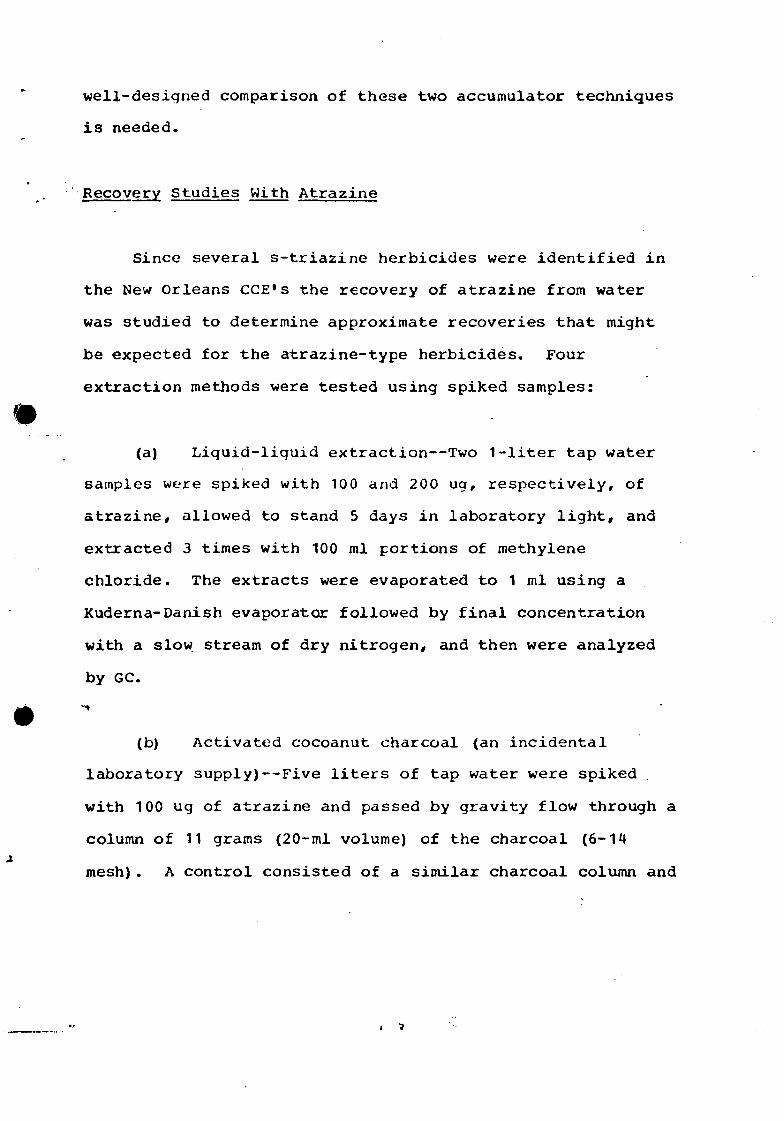
well-designed comparison of these two accumulator techniques
is needed.
Recovery Studies With Atrazine
Since several s-triazine herbicides were identified in
the New Orleans CCE's the recovery of atrazine from water
was studied to determine approximate recoveries that might
be expected for the atrazine-type herbicides. Four
extraction methods were tested using spiked samples:
(a) Liquid-liquid extraction—Two 1-liter tap water
samples were spiked with 100 and 200 ug, respectively, of
atrazine, allowed to stand 5 days in laboratory light, and
extracted 3 times with 100 ml portions of methylene
chloride. The extracts were evaporated to 1 ml using a
Kuderna-Danish evaporator followed by final concentration
with a slow stream of dry nitrogen, and then were analyzed
by GC.
(b) Activated cocoanut charcoal (an incidental
laboratory supply)--Five liters of tap water were spiked
with 100 ug of atrazine and passed by gravity flow through a
column of 11 grams (20-ml volume) of the charcoal (6-14
mesh). A control consisted of a similar charcoal column and

5 liters of unspiked water. For a direct recovery test, 100
ug of atrazine in 2 ml of chloroform was added directly to
11 grams of the same charcoal. The 3 charcoal samples were
air-dried at room temperature overnight, then extracted with
methylene chloride in a Soxhlet extractor for 6 hours. The
extracts were evaporated to 1 ml as in experiment (a), and
analyzed by GC.
(c) "Fine" mesh carbon (used at New Orleans)—
Experiment (b) was repeated with 3.5 grains (20-ml volume) of
the "fine" mesh Nuchar 190 carbon used in the New Orleans
study.
(d) . "Coarse" mesh carbon (used at New O r l e a n s ) —
Experiment (b) was repeated with 10 grams (20-ml volume) of
the "coarse" mesh carbon used for the New Orleans study.
The results are summarized in Table 8.
The results are summarized in Table 8.

Table 8
Recovery Studies Using Atrazine-Spiked Solutions
Experiment Description
(a) Methylene chloride extraction, 100 ug/1
Methylene chloride extraction, 200 ug/1
% Recovery
98%
95%
(b) Cocoanut charcoal/atrazine in water
Cocoanut charcoal/atrazine in CHCl2
29%
28%
(c) Nuchar 190 fine mesh/atrazine in water
Nuchar 190 fine mesh/atrazine in CHCl-,
92%
103%
(d) Nuchar 190 coarse/atrazine in water
Duplicate of above
Nuchar 190 coarse/atrazine in CHCl -
59%
71%
102%
~* From Table 8 it is seen that Nuchar 190 is an
acceptable carbon for adsorption/desorption of atrazine—
especially the fine mesh. Liquid-liquid extraction with
methylene chloride would also be a good method of recovery
for these herbicides. However, the cocoanut charcoal gave
r
very poor recoveries, probably because it was not desorbed
efficiently by methylene chloride.
Carbon Variance
One of the disadvantages of using activated carbon for
concentrating trace organics frcm water is the large
variance in both its "activity" (adsorption/desorption
characteristics) and its cleanliness. Table 8 provides an
insight into how much various types of carbon can differ in
their activities towards adsorbing/desorbing organic
compounds.
The Nuchar 190 used for the New Orleans study was
relatively free of background organic contaminants. Total
organic peak area summation as measured on the PEP-1 system
was 5.1 for the blank CCE. In contrast, the first carbon
tried for the NORS gave a peak area summation of 61.6. The
peak area summation for the chloroform solvent blank used in
the NORS was only 0.25 so the organics were clearly eluting
from the carbon. This carbon could not be used, but
satisfactory results were obtained with Filtersorb 300
(although Nuchar C-190 was cleaner there was not a
sufficient quantity on hand for the entire 10-city survey).
Table 9 summarizes the results ofvthese analyses.
u

.Table 9
Peak Area Summations of Various CCE Blanks
Peak AreaCCE Source ; Summation
First N0P5 CCE blank • 61.6
New Orleans Nuchar 190 5.1
Nuchar C-190 0.3
Filtersorb 3 00 1.2
Westvaco (sealed bag) 13.6
Westvaco (opened bag) 30.5
Probably the Westvaco open bag adsorbed organics from the
air although this is not known fox certain because the
history of the iiag is not known; the carbon was not from our
laboratory.
A procedure needs to be developed for pre-cleaning
carbon. Dunlap and shew have experienced some success by
boiling the carbon in organic free water with 5%
hydrochloric acid followed by washing with organic free
water and drying in a clean oven at 150°C for about 4
hours. 2?

CONCLUSIONS
Although we know much more now about trace organic
contaminants in our drinking waters than we did one or two
years ago, we still have a long way to go before we can feel
confident about their quantities and distribution. computerized
GC-MS has provided an efficient and cost-effective method of
identifying these compounds, but we are still perfecting
methods for concentrating and separating trace organics
A quantitatively and efficiently from water. Concurrently/ we
are just beginning to gather and organize data on trace organics
~~ so it can be computerized for output and assessment with useful
correlations such as geographic location, type of water, etc.
Concomitant with the availability of information pertaining to
the idontification of thousands of organic compounds in water
there will be a surge of research efforts relating to the health
and ecological effects of these compounds. At present there is
little evidence either for or against significant health
effects of most of these organic compounds at microgram per
liter concentrations.
The results described in this and other chapters of this
book arc clearly the initial efforts of a relatively new trend
in environmental chemistry—the qualitative and quantitative
analysis of trace organic compounds in environmental samples.
Drinking water is but one of many kinds of samples where this
information is sought. Awareness is finally increasing that
we need to know what and how much of various chemicals are
in our drinking waters in order to intellegently assess their
significance. This same logic applies to our rivers, lakes
and groundwaters which are the sources of our drinking waters.
We expect to learn much more about the occurrance and distri-
bution of these trace organic compounds—both natural and4
snythetic—in our environment over the next 10 years.

ACKNOWLEDGEMENTS
The authors thank Ronald G. Webb for the synthesis of
chloropicrin and trimethyl isocyanurate used as standards for
the confirmation of these two identifications. Thanks are
also due Ann Alford for providing some of the GC-MS data and
to Leo Azarraga and George Yager for GC-IR analysis of a
alachlor and its chlorine homolog. Advice and help from
William T. Donaldson and John M. McGuire is gratefully
appreciated. -
DISCLAIMER ,
Mention of commercial products and trade names is for
informational purposes only and does not imply endorsement by
the U.S. Environmental Protection Agency or the Athens
Environmental Research Laboratory.

REFERENCES
1. Region VI, Surveillance 5 Analysis Division,
"Industrial Pollution of the Lower Mississippi River in.
Louisiana", U.S. Environmental Protection Agency,
April, 1972.
2. Region VI, Surveillance & Analysis Division, "Draft
Analytical Report, New Orleans Area Water Supply
Study", U.S. Environmental Protection Agency Report EPA
906/10-74-002, November 1974.
3. U.S. Environmental Protection Agency, "Preliminary
Assessment of Suspected Carcinogens in Drinking Water—
Appendix". Interim Report to Congress, June 1975.
4. U.S. Environmental Protection Agency, "Preliminary
Assessment of Suspected Carcinogens in Drinking Water",
Interim Report to Congress, June 1975.
5. G. A. Junk, J. J. Richard, M. D. Grieser, D. Witiak, J.
L. Witiak, M. D. Arguillo, R. Vick, H. J. Svec, J. S.
Fritz, and G. V. Calder, "Use of Macroreticular Resins
in the Analysis of Water for Trace Organic
Contaminants", J^ Chromatogr. 99, 745-762, 1974.
6. Region VI, Surveillance 6 Analysis Division,
"Analytical Report, New Orleans Area Water Supply
Study", U.S. Environmental Protection Agency Report EPA
906/9-75-003, September 1975.
7. National Pollutant Discharge Elimination System,
Appendix A, Federal Register 38, #75, Part II, November
28, 1973.//
8. S. R. Heller, J. M. McGuire and W. L. Budde, "Trace
Organics by GC-MS", Environ. Sci. Technol. 9_, 210-213,
1975.
9. Mass spectrometry Data Centre, "Eight Peak Index of
Mass Spectra", 1st Ed., AWRE, Aldermaston, Reading,
England, 1970.
10. Weed Science Society of America, "Herbicide Handbook",
3rd Ed., Champaign, 111., 1974, pp 8-11.
11. D. D. Kaufman and P. C. Kearney in "Residue Reviews",
Vol. 32, F. A. Gunther and J. D. Gunther, Eds.,
Springer-Verlag Co., New York, N.Y., 1970, pp 235-266.
12. J. R. Plimmer and P. C. Kearney, "Free Radical
Oxidation of Pesticides", Weed Sci. Soc. Amer. Abstr.,
p. 20, 1968. . •
13. J. R. Plimmer, P. C. Kearney and U. Klingebiel, "s-
Triazine Herbicide Dealkylation by Free-Radical
Generating Systems", J^ Agr. Food Chem. 19, 572-573,
1971.
14. N. L1. Wolfe, R. C. Zepp, J. A. Gordon and R. C. '
Fincher, Bull, Envir. Contain. & Tox., 1975. In Press.
15. D. H. Fine, D. P. Rounbehler, N. M. Belcher and S. S.
Epstein, "N-Nitroso Compounds in the Environment",
presented at the International Conference on
Environmental Sensing and Assessment, Las Vegas,
Nevada, September 18, 1975, and at the Fourth IARC
Meeting, Tallinn, Estonia, U.S.S.R., October 16, 1975.
16. M. Cignitti and L. Paoloni, "Tautomeric Forms of Oxy
Derivatives of 1,3,5-Triazine. I. Infrared Spectra",
V
• v '•
Rend. 1st Super, Sanit. 23, 1037-1017, 1960; Chem.
Abstr. j>6, 3037, 1962.
17. F. I. Luknitskii, "The Chemistry of Chloral", Chem.
Rev. 75 (3), 259-289, 1975.
18. G. G. Hawley, "The Condensed Chemical Dictionary",
Eighth Ed., Van Nostrand Reinhold Co., New York, N.Y.,
1971, p. 195. .. \
19. H. C. Christensen, T. T. Luginhyhl and B. S. Carroll,
"The Toxic Substances List" 19 74 Edition, U.S. Dept. of
Health Education & Welfare, PHS, Nat. Inst. for
Occupational Safety and Health, Rockville, Md., 1974,
p. 194.
20. P. Ehubik and J. L. Hartwell, "Survey of Compounds
Which Have Been Tested for Carcinogenic Activity.
Supplement 2", U.S. Dept. of Health, Education and
Welfare, p. 42, 1969.
21. T. A. Bellar, J. J. Lichtenberg and R. C. Kroner, "The
Occurrence of Organohalides in Chlorinated Drinking
v\
Waters", U.S. Environmental Protection Agency Report
EPA-670/4-74-008, November 1974.
22. J. J. Rook, "Formation of Haloforms During Chlorination
of Natural Waters^1, Water Treatment and Examination 23,
234-243, 1974.
23. T. A. Bellar and J. J. Lichtenberg, "Determining
Volatile Organics at the ug/1 Level in Water by Gas
Chromatography", JAWWA 66, 739-744, 1974.
24. L. H. Keith, "Chemical Characterization of Industrial
Wastewaters by Gas Chromatography-Mass Spectrometry",
Sci. of Total Environ. 3, 87-102, 1974.
25. L. H. Keith, "Analysis of Organic Compounds in Two
Kraft Mill Wastewaters", U.S. Environmental Protection
Agency. Report No. EPA-660/4-75-005. June 1975.
26. R. G. Webb, "Isolating Organic Water Pollutants: XAD.
Resins, Urethane Foams, Solvent Extraction", U.S.
• Environmental Protection Agency Report No. EPA-660/4-
75-003, June 1975.
27. William J. Dunlap and D. Craig Shew, EPA, R. S. Kerr
Environmental Research Laboratory, Ada, OK, Private
Communication, November 3, 1975.

DISCUSSION OF LECTURES OF FREUDENTHAL AND GARRISON
Question Greve:
To our experience the contribution of agricultural pollution of
pesticides and herbicides is small in comparison with the indus-
trial pollution unless airoplanes are used in spraying these
substances. Is that also the experience in your country?
Answer Garrison;
According to the measurements of Junk in different locations of
the U.S., industial contribution seems to be the most important.
Arochlor probably comes from both sources.
Question Zoeteman;
What can be done with the data obtained by GC-MS in the survey
of surface water?
Answer Freudenthal:
The frequency and concentration of several substances can be con-
troled over different time periods, e.g. chlorophenols, when this
is necessary.
Question Zoeteman:
What is the future work in the U.S. in the survey of drinking waters
Answer Garrison:
There is a list of about 20 compounds monitored for in the whole
country and the survey analysis programm is extended to more cities
A total organic chlorine determination may also be included in the
survey.
Question Piet:
What is the detectable concentration of compounds in the complex
mixture of surface water components analysed by GC-MS and stored
in the computer and at what pressure is the plasma detector operatec
Answer Freudenthal:
The plasma detector is operated at about 5-10 Torr. The quantifica-
tion of organics in Rhine water can be done in the p.p.t. range
but strongly depends on interference of other substances present.

Question Rook;
What is the cause of the difference in the levels of atrazine
which are higher in the Mississippi than in the Rhine?
Answer Greve;
Atrazine has a limited use for specific purposes. From a
toxicological point of vieuw it is not so important.

v
CLOSING REMARKS
Ir. P. Santema
Director of the National Institute for Water Supply.
The director expresses his appreciation for the valuable contri-
bution of the different speakers, the discussion and the chairman.
The proceedings of the symposium will be available as soon as
possible and a similar symposium is planned in Amsterdam in the
spring of 1977, as a collaboration of the Environmental Protection
Agency (U.S.), The University of Amsterdam and The International
Reference Center at The Hague.
The hope is expressed that the symposium may have stimulated
future work and collaboration.