lifclR^^^ - IRC Wash
78
••./*•»•. % ':•••'• ••' <:i ..t'' : 'i~' : ''.' :iV: - 1: '' 1 -f 1 'f:' ; '•••'•' :'::'::•'•'••£"• •'W'.:-:.^ 1 '*,•;• rl'i; .-:')•:: ,y' ii ". i (-<:-'.!.! i V--. il .-i 1 ''. i ,:~":-ir'i'/( 1 -"-;!. i s. 1 --: 1 ; i v-> i :••• •).. • ; • •'.••...:*••.:.•• .;.•'.v-'-"• • j s v 4 "--;. :-.v;.i;V-V-r>j;-'--'-V- 1 W":••-•:,:•. ••:•••.;.,..•••. ;.: •••V';.:--.-,^ 1 '-:-•"••.:•••.•:•• •V • < : • " . > • .• i i . s • • • • ; • ( . . • . . ; . • . . \ . , • • » . . • . . • • • . • : • . . • : • . < ' " ' • . • • : . : . - . : * : . y h _ > : . : • : . ^lifclR^^^^
-
Upload
khangminh22 -
Category
Documents
-
view
5 -
download
0
Transcript of lifclR^^^ - IRC Wash

• • . / * • » • . % ':•••'• • • ' < : i . . t ' ' : ' i ~ ' : ' ' . ' : i V : - 1 : ' ' 1 - f 1 ' f : ' ; ' • • • ' • ' :'::'::•'•'••£"• • ' W ' . : - : . ^ 1 ' * , • ; • r l ' i ; . - : ' ) • : :
, y ' i i " . i ( - < : - ' . ! . ! i V - - . i l . - i 1 ' ' . i , : ~ " : - i r ' i ' / ( 1 - " - ; ! . i s . 1 - - : 1 ; i v - > i :••• • ) . . • ; • • ' . • • . . . :*•• . : . • • . ; . • ' . v - ' - " • • j s v 4 " - - ; .
: - . v ; . i ; V - V - r > j ; - ' - - ' - V - 1 W " : • • - • : , : • . • • : • • • . ; . , . . • • • . ; . : • • • V ' ; . : - - . - , ^ 1 ' - : - • " • • . : • • • . • : • •• V • < : • " . > • .• i i . s • • • • ; • ( . . • . . ; . • . . \ . , • • » . . • . . • • • . • : • . . • : • . < ' " ' • . • • : . : . - . : * : . y
h_ > : . : • : .
^lifclR^^^^
The Water Supply & Sanitation Situation in Rural BangladeshThe case of the villages selected for the 2002-2003 WatSan programme of NGO Forum
Prepared byResearch, Monitoring & Evaluation Cell
M
LIBRARY IRCPO Box 93190, 2509 AD THE HAGUE
Te!.: +31 70 30 689 80Fax: +31 70 35 899 64
BARCODE: j library
+31 70 30 689 60+31 70 35 899 64
NGO ForumFor Drinking Water Supply & Sanitation

First published March 2002© NGO Forum for Drinking Water Supply & Sanitation
All rights reserved. No part of this publication may be reproduced or translated in any means without priorpermission in writing from the publisher
Cover Design: Rakibul Hasan TalukdarCover page Photography: Saiful Alam Khan
Top Photograph : Survey through interview method in progress in Jessore districtBelow Photograph : Survey through PRA method in progress in Chittagong district
Graphics: WaresulHaque
Printing Supervision: Development Communication CellResearch, Monitoring & Evaluation Cell
Published by: NGO Forum for Drinking Water Supply & Sanitation4/6, Block-E, Lalmatia, Dhaka-1207, BangladeshE-mail: [email protected],Internet: http//www.ngo-forum.net
Printed by : S. N. Printers22, Central road, Dhanmondi, Dhaka-1205

Study Supervisedby
S.M.A. RashidMahmudur Rahman Chowdhury
Azahar Ali PramanikAvizit Reaz Quazi
Study Tools preparedby
Mahmudur Rahman ChowdhurySaiful Alam KhanAvizit Reaz Quazi
Data Entryby
BaharulAlamMs. Ummul Banim
Data Digitalisation Software preparedby
Ms. Shameem Akter Jahan Wrina
Data Analysisby
Mahmudur Rahman ChowdhuryMs. Shameem Akter Jahan Wrina
Avizit Reaz Quazi
Report preparedby
Avizit Reaz QuaziM.Phil., Ph.D.

Foreword
NGO Forum for Drinking Water Supply & Sanitation has dedicated itself to ensure the basic needs of safepotable water, sound sanitation practice and maintenance of personal hygiene for the distressed humanity.
Partnership & Networking Approach is the functioning mode of NGO Forum's program. It works as the non-government apex coordinating and service delivery agency of local, national & international NGOs, CBOs(Community Based Organisation) and private sector actors who implement safe water supply andenvironmental sanitation programme at the community level in Bangladesh. Currently NGO Forum works in acountrywide decentralised mechanism through around 600 partner NGOs and private sector actors with totalmanpower strengths of more than 38,000 workers. NGO Forum has divided its entire working area into 14regions.
Since the year 2000 NGO Forum under Community Managed WatSan program has been following VillageCoverage Concept to improve the WatSan status of the rural poor within a period of two years. It has selected280 underserved/unserved villages from 58 districts of Bangladesh to ensure 100% WatSan coverage withinthe period of 2002-2003 under the Community Managed WatSan programme.
However, before NGO Forum's intervention, Research Monitoring and Evaluation Cell (RME) conducted abaseline study in these selected villages in the first week of March 2002 to apprehend existing WatSansituation to comprehend directions for programme intervention with the assistance of Field Operation. Iappreciate the role of RME Cell in conducting the study and preparation of report. The findings of this studywould be useful for monitoring the changes and impacts in these villages due to NGO Forum's WatSanintervention for next two years.
I am sure that this study report would be also useful for other organisations who are working in thedevelopmental sector of Bangladesh as it provides socio-economic, demographic information along with thepresent water & sanitation status of 58 districts of Bangladesh.
S.M.A. RashidExecutive DirectorNGO Forum for Drinking Water Supply & Sanitation

Acknowledgement
For the completion of this report we are indebted to many. We are grateful to Mr. S.M.A. Rashid who not onlysupervised the study but also provided guidance, advice and moral support to prepare the report.
We wish to thank Mr Ahazar Ali Pramanik, Saiful Islam Khan and Mr. Maksudur Rahman for their supports in reportpreparation.
We also thank Ms Shameem Akhter Jahan for assisting in processing and analysing raw data. We want to thank Mr.Baharul Alam and Mr. Ummul Banim who had initiated the whole report preparation process through shouldering thedata entry responsibility.
We also wish to thank Ms Amena Israt Jahan for editing grammatical errors. We also want to acknowledge Mr. XavierSku, Ms Jinat, Ms Farah Naz for providing literature on WatSan sector, which had helped us to prepare the report.
We also offer our gratitude to Ms Rehana Akhter, Mr Rakibul Hasan Talukdar and Mr Waresul Haque for their help indesign the cover page and assisting the report printing process.
Last but not the least many thanks to Regional colleagues and PNGO staff who had carried out the field survey.
Avizit Reaz QuaziM.Phil., Ph.D.
Mahmudur Rahman Chowdhury

Table of ContentsPage No.
List of Tables & Figures — ,.——— — _ /L/&I Ul /nn/fcyiiflll/ira*""""""""" "•"• • • • • • •""• • • •" " i f
Location Map of the Surveyed Area ///Executive Summary IVIntroduction: 1-6
Background 1Study Objective(s) 2Study Methods - 3Survey Area and location 3Data Collection Methods & process 4Status of Respondents 5Limitation & Constrains and steps taken to overcome 5Data Compilation and Analysis — 6
Findings 7-28
Section: A: General Information 7-9
Total Households & Population— 7Yearly income & Principal Earning Source 7
WatSan Knowledge 8
WatSan Status (Diarrhoea Incidence) 9 ;;
Section: B: Access to Safe Water Supply & Water related habits-—— 10-19 '•
Water Supply hardware status (Total number of TW/pump/plants,) 11
Distance between kitchen and nearest TW/pump/plant 14Available (perceive) Safe and unsafe water point 14Arsenic affected villages and water points 14Safe functional point: 16 •:;Drinking habit & practices 17Safe Water use for most of the domestic purpose other than drinking 18Section: C: The Issue of Environmental Sanitation 20-28
Latrine Hardware Status 20Reasons for not having hygienic latrine 22Access to Village Sanitation Centre 22Defecation Sites 23Place for Disposing faeces of under five children 24Hand wash before meal 26Hand wash after defecation 26Hand wash after cleaning the bottom of Children 27Disposal of domestic waste 27
Conclusion 29-30 jAppendices -—

List of Tables & FiguresPa
ListofTable(s)
Table: A.1 Number of Households and people covered by the survey 7Table: A.2 Yearly income and principal earning source 8Table: A.3 Educational Background —- 8Table: A.4 Village having secular educational institutions — 8Table: A.5 WatSan knowledge - 9Table: A.6 Incidence of Diarrhoea 9
Table: B. 1 Water supply Hardware Status 12Table: B.2 Technology wise collection source 13Table: B.3.1 Water supply Hardware Status (TW/pump) 13Table: B.3.2 Water supply Hardware Status (Plant) 14Table: B.4 Distance between kitchen and nearest TW/pump/plant 14Table: B.5.1 Village information regarding water difficulty issue 15Table: B.5.2 Information regarding water points in respect of Water difficulties 15Table: B.6 Drinking Water sources 17Table: B.7 Drinking Water Related habits: The issue of Purification 18Table: B.8 Safe water used for most of the domestic purposes other than drinking 19
Table: C.1 Latrine Hardware Status • — 21Table: C.2 Information regarding the Village Sanitation Centre 23Table: C.3 The status of the surveyed Villages in respect of Mason 23Table: C.4 Defecation site 24Table: C.5 Distance between House & Latrine 25Table: C.6.1 Hand washing before meal --- 26Table: C.6.2 Hand washing after defecation —- 26Table: C.6.3 Hand washing after cleaning the bottom of the children 27
List of Figure(s)
Figure: Status of the respondents 5Figure: B. 1,1 Technology-wise ownership pattern 12Figure: B.1.2 Ownership pattern in respect of overall TW/pump/plant 12Figure: B.2 Geo-hydrological Region-wise Percentage of improper platform 16Figure: B.3 Households keep drinking Water pot cleaned and covered 18Figure: C.1 Latrine (Pit/Pour-Flush/Septic) Ownership pattern 22Figure: C.2 Reason for not having latrine other than completely open & hanging type latrine 22Figure: C.3 Disposal of faeces of under five children 24Figure: C.4 Faeces noticed in the courtyard 25Figure: C.5 Households Keep Ash/Soap/Water near latrine 27Figure: C.6 Disposal of domestic waste 27

List of Abbreviation
CBO Community Based OrganizationGHA Geo-Hydrological AreaHH HouseholdHSA Hilly & Stony AreaLWTA Low Water Table AreaNGOF NGO Forum for Drinking Water Supply and
SanitationNGO Non-Government OrganizationPNGO Partner Non-Government OrganizationRME Research Monitoring and Evaluation CellSWTA Shallow Water Table AreaTSA Total Surveyed AreaTW Tubewell ;VSC Village Sanitation CenterWatSan Water and SanitationWHO World Health Organization
• 1 :
l
II

BANGLADESH
Surveyed Thana
ThanaDistrict
H
A

Executive Summary
Since the year 2000 NGO Forum under Community Managed Watsan program has been following Village CoverageConcept to improve the WatSan status of the rural poor within a period of two years. It has selected 280 underserved/unserved villages from 58 districts of Bangladesh to ensure 100% WatSan coverage within the period of 2002-2003under the community managed WatSan program.
However, before the intervention, a baseline survey was conducted in these selected villages in the first week ofJanuary 2002 to apprehend existing WatSan situation to comprehend directions for program intervention. Nevertheless,following sample survey method the survey was conducted only in one village from each of the 58 districts. PRA andconversational interview methods were adopted to elicit information about WatSan hardware status and hygienepractices respectively. Observation was also made in few selected variables to overcome the limitations of PRA &conversational interview methods.
According to survey findings, the total number of household residing in the program-selected portion of 58 villages is17710 and the population is 96467. Moreover, apart from cultivation (37%), the highest percentage of households(29%) depends on the earning primarily coming from day labour. However, this percentage goes up to 40 % ifRickshaw, Van, & pushcart pulling, boat rowing and car driving are included. The primary earning source of the rest ofthe households is fishing related activity (3%), business (9%), working as household servant (1%) and Service (7%).
The principal earning sources (professions) implicate the poor economic status of the majority of households residing inthe survey area. According to survey 14.4 % households earn less than US $ 174 per annum, 22.7 % earn betweenUS$ 174 to 260, 17.2% earn between US $ 260-347, 17.6 % earn US$ 347 to 434. The rest 28.0% households earnmore than US$ 434. It implicates 54.3% households earn even less than one US dollar in a day.
The educational background of the people living in the surveyed area is as disappointing as the economic situation.23.9% of the population above 5 years of age are illiterate and 29.6 % only can write their name. People educatedbeyond class ten comprise only 6.1 %. Among them 3.4% have SSC/equivalent degree, 1.7 % studied up to HSC/equivalent, 0.8% have graduation and only 0.2% have post graduation level of education.
In spite of educational backwardness, the survey findings exhibit that the majority of respondents (65.3%) know thatconsuming surface water without any filtration and existence of improper sanitation are mainly responsible for diarrhoealdiseases. Nonetheless, findings regarding the diarrhoeal incidences indicate that knowledge on the reasons responsiblefor diarrhoea could not bring awareness about the same. The survey was conducted in the first week of March whendiarrhoeal occurrence remains relatively low in number. Still, 22.1% households experienced diarrhoeal incidence and3.8 % population above 5 years of age and 17.1% of under five children had faced diarrhoeal attacks with in a monthpreceding the day of survey conduction. This implies the existence of poor WatSan situation,
Nevertheless, the hardware status of water supply technology presents a better situation in the selected villages if thenumber of total TW/pump/plants is considered. The total number of TW/pump/plants found in the surveyed area is5064. 97.4 % of this falls in the suction mode category pumps which includes Number 6 TW (92.7%), Deep TW (2.1%), Conversion pump (1.7%) and locally made TW (0.9 %). The rest are force mode pump (deep-set fara-1.6%),plants (0.69%) and traditional well (0.3%). The locally made TW includes Darkol, mini-tubwell, and basherkol. However,one of the most noticeable findings is that one of the villages named Rajapuroi Bagerhat district situated in the coastalarea does not have even a single TW/pump/plants.
However, existence of considerable number of water points does not mean that every household has TW/pump/plantwithin their courtyard. In the entire-survey area nearly 26.6 % households have to cross more than 100 feet to getaccess to a TW/pump/plant. In the coastal and hilly & stony areas 46.5 % and 52.6% households do not haveTW/pump/plant within 100 feet respectively. Moreover, many Households residing in the coastal area, hilly & stonyarea, LWTA and SWTA cross 9000, 1200, 2000, and 2000 feet to get access to TW/pump/plants' water respectively.

However, a considerable percentage of households (62.2%) have access to TW/pump/plant within 50 feet. In thecoastal and hilly & stony area 42.8% and 40.7% households have access to TW/pump/plant within 100 feet respectivelywhile in the LWTA and SWTA, 66.5% and 70.9% households have access within 50 feet respectively.
The access to TW/pump/plant does not ensure access to safe water. TW/pump water may have arsenic, iron, salineand other mineral & chemical contamination. However, the findings show that people are not much aware about mineralcontamination of water available from TW/pumps. Majority (64.2%) respondents do not have any idea about the arseniccontamination. The findings regarding arsenic test of TW/pumps' water implicitly reveals the impact of thisunawareness. Survey findings show that water of 100% TW/pump has been tested for arsenic contamination only in7 % villages and not even a single water point is tested for arsenic contamination in 53% villages. It further shows thatin 7 % villages all tested-TW/pumps' water has unacceptable level of arsenic contamination while in 5.3% villages alltested TW/pumps' water is found to be safe.
However if focus is shifted from village to water point then findings show that water of only 23% TW/pumps had beentested for arsenic contamination and water of 49% tested TW/pumps has unacceptable level of arsenic contamination.The highest percentage of tested TW/pumps (80%) is found as unsafe in the coastal area while lowest percentagetested TW/pumps (21%) is found as unsafe point in the Hilly & Stony area. In the LWTA and SWTA, water of 33 % and54% tested TW/pumps are found having unacceptable level of arsenic contamination respectively.
Apart from arsenic contamination, iron contamination of water available from TW/pump also has to be taken care of inensuring safe water supply for the rural people. The Survey findings show that only in 25% villages 100% TW/pumpplant is reportedly free from unacceptable level of iron contamination. In respect of water point (TW/pump), water from25% TW/pump have unacceptable level of iron contamination. The highest percentage of iron contaminated waterpoints are located in the coastal area (46%) and the lowest percentage of iron contaminated TW/pump is situated in theSWTA. In the LWTA and Hilly & Stony area 25 % and 21% TW/pump plants reportedly having unacceptable level ofiron contamination respectively.
Besides iron and arsenic contamination, presence of high salinity is another important difficulty, which must beconsidered to assess the access to safe water supply. As per survey in the 50% villages of coastal area presence ofhigh salinity in the water of TW/pump are reported. However, it does not mean that all the water points in these villageshave high salinity problem. According to survey only 8% water points (TW/pump) are reportedly have salinity problem.All the water points situated in SWTA, LWTA & hilly & stony areas are reportedly free from high salinity.
Hence access to safe water supply cannot be ensured only through ensuring access to TW/pump but it has to be madesure that water available from TW/pump is free from high salinity, and unacceptable level of iron and arseniccontamination.
Survey findings shows that 6 1 % of the total functional water point that does not include Basherkol, Darkol & traditionalwell is free from high salinity, and unacceptable level of arsenic and iron contamination. Hence it can be said that 61%TW/Pump among the total available TW/pumps are safe functional points. However, geo-hydrological region wise,36%, 43%, 67% and 62 % functional water point is safe in the Coastal area, hilly & stony area, LWTA & SWTArespectively. However, not even a single functional safe point is available in the, Mahmud Kanda, Shreenathdi, Rajapur& Betagram villages located in the Coastal area.
The findings also implicates that in an average for 83, 54, 24 & 29 persons, a single functional safe water point isavailable in the Coastal area, hilly & stony area, LWTA & SWTA respectively. However, in the Gabrakhali village ofLWTA and Sheikh Hati village of SWTA for 1867 & 1616 persons a single functional point is available. In contrast, asingle functional safe water point is available for less than ten persons in Barunagaon village of SWTA, Barokona &Ragunathpur village of LWTA.
However, this situation cannot be accredited as real because all these water points, which were not tested for arseniccontamination, were identified as safe. Moreover, the presence of other minerals, except arsenic, iron and salt, are not

considered here. In addition, the bacterial issue has also been not taken care of. There is every possibility of bacterialcontamination of water available from TW/pump/plant. The survey shows that 50% households collect water from awater point, (TW/pump/plant) from which distance of latrine is less than 33 feet. In respect to bacterial contamination theminimum safe distance between latrine and water point is 33 feet. So survey findings does not present informationabout the average number of persons for single confirmed safe points but about the perceived safe points.
The presence of appropriate number of safe functional water points does not ensure the use of safe water. However, ifpeople are conscious about the necessity of using safe water they even cross long distance to get access to water thatthey perceive safe. The survey findings show that 81.4% households drink water collected from TW/pump/plant, whichare perceived to be safe and 13.3% from TW/pump/plants that are not safe. It means in the whole survey area 94.7%households drink water collected from TW/pump/plants. The rest of the households collect water from the traditionalwell/ponds (4.4%), river/canal (0.7%) and other sources (0.1%).
In the coastal area, 89.2% households drink TW/pump/plants' water but due to the absence of any TW/pump/plant inthe village 100% households of Rajapur village of Bagerhat district collect water from a sweet water pond. In the hilly &stony, and Low water Table area 96.7% and 95.6% households drink TW/pump/plant's water. However, it is the SWTAwhere the highest percentage of households (97%) drink water, collected from TW/pump/plants.
It is a very encouraging situation that even though the residents of the survey area are lagging behind in respect toeducation but a commendable percentage of households use TW/pump/plants' water. This shows the success ofawareness program carried out for decades by various government and non-government organisations. The successstory of awareness program regarding the use of water from TW/pump/plants become more revealing if one notices thedistance people are crossing to get access to TW/pump/plants. Survey shows that people even cross up to 9000 feet tocollect water from TW/pump/plants and nearly 11.8 % households cross more than 300 feet distance. However, thesame findings implicate the level of problem one is going to face to aware the people that even water available fromTW/pump is not always safe.
In contrast to drinking water habit, only 31.6%, 44.0%, 44.5% and 58.8 % households use water collected from safewater source for the purposes like gargling and mouth washing (during bathing, face washing, Uzu etc.), washing rawfood/vegetable and utensil, and for cooking respectively. This reflects the areas where awareness program has to bedirected.
The findings about the present sanitation situation of the selected villages reveal our nation's imbalanced WatSan effort& success. The survey explicitly implicates that rural people's access to safe sanitation is much lesser than the accessto TW/pump/plant.
During the survey two types of pour-flush (water sealed ring slab latrine & offset latrine) and one type of septic tanksystem latrine besides pit, open and hanging latrines were found in the entire survey area. All these six types of latrinetechnology are seen in all of the four hydrogeological areas. However, only the pour-flush type latrine popularly knownas wafer sealed ring slab latrine was found in the 100% surveyed villages. Nevertheless all water-seal Ring-Slabcategory latrine no longer can be called as hygienic latrine because 32% of them did not have proper water seal at thetime of survey. For 17710 Households only 2462 sanitary latrines are available. The number of hygienic latrines will beless than 2000 if the condition of the water seal is taken care of.
The survey findings further imply that only 4591 households (25.9%) have latrine, which include latrines that can beconsidered as hygienic (septic/water seal/ off set) or not completely unhygienic (pit). It means 12758 households (72%)do not have any types of hygienic/ semi-hygienic (pit) latrine and 361 households (2%)do not have independenthygienic/ semi-hygienic (pit) latrine but shared ones. During survey it was found that 54.8% of them are not able to usehygienic latrine due to financial constraints and 10.3 % due to lack of place. However, it was found that 63 % does notuse due to lack of awareness. (Total percentage is more than 100 because the question had multiple answers)
VI

Like the hardware situation, the findings about the use of hygienic latrine by the members of the households present adepressing scenario. According to the survey male members of 13.0%, 13.5% and 36.7% households of the entiresurvey area use hygienic latrine, pit and open/hanging latrine, respectively. The rest 36.7% households' male memberspractice open defecation. Whereas the male members of the highest percentage households (14.2%) use hygieniclatrine in the LWTA area, the lowest percentage households (10%) use it in the hilly & stony area. In the coastal andSWTA area male members of 13.7% & 11.7 % households use hygienic type latrine respectively.
The pattern of female defecation site is nearly the same as male. Females of 13.3%, 14.0% & 39.1% households usehygienic, pit and open/hanging latrine respectively. The rest 33.7% households' females practice open defecation, geo-hydrological region wise female member of 13.7%, 10%, 16.6% & 11.8% households use hygienic latrine in the coastal,hilly & stony, LWTA and SWTA respectively.
When the adults do not practice the use of hygienic latrine the better behavior cannot be expected from under fivechildren. The survey findings show that under five children of 6.2% households use hygienic latrine and 2.3% use pitlatrine. Among the rest 91.5% households 4.3 % use open/hanging latrine and 87.2% defecate in the openplace/courtyard/bush/other places. In the hilly & stony area majority of under five children of 92.7% households practiceopen defecation and in the coastal, LWTA & SWTA area 84.9%, 89.4% & 85.6% households' under five childrenpractice open defecation.
Only improving the hardware situation and ensuring the use of hygienic latrine do not eliminate the danger of impropersanitation related diseases. If one wants to reduce the rate of water & sanitation related diseases considerably,ensuring hygienic practice like proper hand washing, safe management of domestic waste and maintenance of hygienicenvironment is very much necessary.
The washing of both hands with soap before meal, after defecation and after cleaning the bottom of children can ensurethe decline of faecal-oral disease. However, the survey findings show that the present hand washing habit of the entiresurvey area is far behind than the needed one.
According to survey, members of 94.8 % households wash hand before taking meal. However, only 1.1 percenthouseholds' members wash both the hands with soap. However, the highest percentage of households' (87.7%)members washes one hand only with water. The members of the rest 2.0 % households wash one hand with soap. Thehand washing patterns of all the four geo-hydrological areas are nearly same. The members of 0.5%, 3,3%, 1.9 % and0.5% households wash both hands with soap in the coastal, hilly & stony, LWTA & SWTA respectively.
Washing of both hands with soap after defecation is very essential to avoid human excreta related diseases. The surveyfindings provide very depressing scenario. In the entire survey area nearly 5% households' do not practice separatehand washing after defecation and only 2.8 % practice both hand washing with soap after defecation. The highestpercentage of households (43.3%) practices the washing of one hand with only water. However, members of aconsiderable percentage (39%) of households washes one hand with ash/soil.
In many culture the excreta of young children are considered safe and are not treated with the same hygienic concernas the excreta of adult. This is totally wrong. Nevertheless, the survey findings shows that people of the surveyed areatreats the excreta of the children in the same way as they treat adults' one. Survey findings show that only 3.8%households practice washing of both hands after cleaning the bottom of the child while 6.6% wash one hand with soap.The majority of the households (55.4%) only wash one hand with only water. However, nearly 28% households'members wash one hand with ash/soil after cleaning the bottom of children.
The safe management of human excreta and related hygienic practice cannot ensure environmental sanitation if safemanagement of domestic waste along with industrial and other types of waste is not ensured. However, the surveyfindings reveal the unawareness of rural people in respect to disposal of domestic waste. According to survey majorityof household (53.5%) throw their domestic waste into any places and 10,2% households throw into water bodies. Only36.4% households dispose the domestic waste into fixed place/hole.
VII

The baseline survey of the selected villages shows that NGO Forum has to give relatively more emphasis on sanitationaspect. Sanitation intervention must show urgency on hygiene behavior than hardware intervention. In respect tointervention in the water sector, the test of water quality of all available functional water points, particularly shallow oneshas to be given more preference. Water related awareness program must emphasize on the danger of consumingarsenic contaminated water and the importance of using safe water for cooking, gurgling, washing raw food etc. Aboveail awareness program must be directed to initiate community level WatSan movement.
:•.,:.:?:»
VIII

Introduction
Access to safe and affordable supply of drinking water is universally recognised as a basic human need for the presentgeneration and a pre-condition for the development and care for the next. However, every year, millions of world'spoorest people die from preventable diseases caused by inadequate water supply and sanitation services. At any onetime around half of all people in developing countries suffers from one or more of the six main diseases associated withinadequate water supply and sanitation: diarrhoea, ascaris, dracunculiasis, hookwarm, schistosomiasis, and trachoma,1
Children and women are the main victims of inadequate water supply and sanitation.
Children are primarily vulnerable to preventable diseases, whichresults from lack of sanitation. Over three million children dieevery year from diarrhoeal disease and dehydration, and overhalf experience more than fifteen attacks of serious diarrhoeabefore the age of five. 2 In the year 2000, 16.7% under fivechildren have suffered from diarrhoea in Bangladesh.3
Besides Children, Women are the main sufferers of inadequatewater supply and sanitation as they ensure the water availabilityat home for domestic household needs, and manageenvironmental hygiene and sanitary services at the household.
Fetching and carrying water is part of daily routine for millions ofwomen around the world and they must endure the indignity,shame, and sickness as they carry water containers longdistances every day.4 Water container typically holds about 20litres of water and weights 20 kilograms. Carrying such a heavyweight on the head, back, or hip has severe health implicationsfor women, who commonly experience backache and joint pains.In extreme cases, curvature of the spine and pelvic deformitiesresults, creating complications in pregnancy and childbirth.5
With regard to sanitation, women often have different privacyrequirements from men. For example, in densely populatedsettlements without adequate sanitation, they are required to usepublic spaces in the cover of darkness in the early morning andlate evening, and can suffer health problems related to urineretention as a result.6
NGO ForumFor Drinking Water Supply & SanitationSince emergence in 1982 NGO Forum has,dedicated itself to ensure safe potable water%sound sanitation practice and maintenance of\personal hygiene for the distressed people ofBangladesh.
Partnership & Networking Approach is thefunctioning mode of NGO Forums program. It-works as the non-government apex coordinating^and service delivery agency of local, national <£gjinternational NGOs, CBOs (Community Basecif^Organisation) and private sector actors whd%implements safe water supply and]environmental sanitation programmes at thecommunity level in Bangladesh. Currently NGOForum works in a country-wide decentralisedmechanism through around 600 partner NGOs.iand private sector actors with a total manpower!strengths of more than 38,000 workers. NGCmForum's has divided its entire working area intci$14 regions. -|
The vision of NGO Forum is Improved Public?Health. Hence its mission is to contribute in theiimprovement of the public health status of thetjpoor and disadvantaged women, children and'men of Bangladesh.
NGO-Forum is an adaptive learning^organisation. Initially to fulfil its task follows),supply-driven approach but now it emphasizes'^on demand-responsive and community-,managed and shared services. Moreover itfbelieves in an integrated program in the form otintegration of Hardware (material) and Software,(training, Awareness program etc.) support.
The inadequate water and sanitation apart from health problem is also responsible for the aggravation of poverty of thepeople. The sickness increases the medical bill, decreases productivity of the person and eats up productive hours.Family also loses productive hours when family members have to collect water from long distances. All these ultimatelyput strains on the financial situation of a family and aggravate poverty.
1 DFID, "guidance manual on water supply and sanitation programmes,"'WELL, 1998, London, p-5.2 Ibid, p-7.3 UNICEF, "ProgotirPathey:2000,", Bangladesh Bureau of Statistics & UNICEF, Dhaka, 2000, p-654 DFID, opcit p-1.5 Ibid, p-45.8 ibid.

NGO Forum For Drinking Water Supply and Sanitation (NGO Forum), an apex body of non-government organisationsworking in the WatSan sector, realising the importance of the need of adequate and safe water supply and sanitation inimproving the primary public health and abating poverty of the people of Bangladesh has confined operation only withinthe development sector of drinking water supply and sanitation. \NG0.Forum>s viUage 5 e / e c f i o n Criteria
• Village is located in the operational area ofpartner organization of NGO-Forum.
• At least 300 households inhabit in the villageand majority people are relatively poor.
• With regard to big village, a portion of thevillage will be selected for WatSan program
• In respect of WatSan situation the villageis an under/low coverage one,
• At present in the village no othergovernment & non-government organizationis working there on WatSan Sector.
••• In the village, maximum 25% householdshave hygienic latrine.
• Inhabitants of the village have lowWatSan awareness
• In the village tubewell water hasunacceptable level of Arsenic/ Ironcontamination or the village water is affectedby the intrusion of salinity or the village is,facing severe problem in: accessing theiground water due to lowering off-underground water or due to the existence ofstony and hard underground layer.
Being realistic, NGO Forum under the concept of "Communitymanaged WatSan program" has been following the strategy ofensuring 100% WatSan coverage with in a period of two years inlimited number of villages selected from each district ofBangladesh.7 For the sustainability of the WatSan achievement inthe selected villages even after phase out, village-communitiesare motivated and empowered to take a lead in the process toensure proper 'ownership of the intervention'. NGO Forumadopted 'selected village WatSan coverage approach', with thebelieve that WatSan achievement in selected village will initiatethe process of replication in the neighbouring locality.
In the first phase of " Community-managed WatSan Program"NGO Forum worked in 240 villages for two years during theperiod January 2000- December 2001. External Researchers,Shahid Hossian Talukder, Rahat Uddin Ahmed & M. A. Momindescribed the impact of NGO Forum's Community-managedWatSan Program in these 240 villages, in the following words:
The achievement of WatSan initiative of the NGO Forum in terms of Social mobilisation for creating impacts on the level ofawareness, knowledge, practices and habits of people with regard to WatSan are outstanding. Within a short span of time, NGOForum with its limited resources has been able to mobilise a large network of partners for launching WatSan as a social movement.In the process, not only the capacity of the PNGOs has been developed but also the community capacity to implement and managethe WatSan software and hardware has been developed to a large extent. PNGOs have learned and acquired organisationalmanagement competencies and are capable to plan and manage not only WatSan intervention but also poverty alleviation activities.WatSan is a visible program in the intervention areas and the community people consider WatSan as Step 1 in their struggle forchange to attain better quality life".6
NGO-Forum for the second phase of "Community-managed WatSan Program" has selected 280 villages from 58districts out of its 59 working area districts.9 Before intervention, NGO-Forum had conducted a survey to document thevarious aspects of WatSan situation of these selected villages. The baseline data acquired from the survey isdocumented and analysed in the present report.
Objective(s) of the Study:
• To have an idea about the status of water supplying sources and sanitation situation of the selectedvillages,
• To apprehend the status and pattern of WatSan habits and practices and WatSan awareness level of thepeople residing the selected villages,
• To apprehend directions for WatSan intervention in these selected villages.
7 NGO-Forum operates in the 59 districts among the 64 of Bangladesh. NGO-Forum does not work in Barguna, Patuakhali, Ragamati, Bandarban& Khagrachari district because other Danida components are there.
8 Shahid Hossian Talukder, Rahat Uddin Ahmed & M. A Momin, "Impact Study on Behavioural Changes Towards WatSan Practices," NGOForum, 2002, Dhaka
9 Chandpur district is left out from the programme phase as NGO-Forum's does not get capable and interested local partner NGO through which itcan implements Community-managed WatSan program in the district based on partnership approach.

Study method:
Sample survey method was followed to conduct the study. Survey was carried out in all of the 280 selected villages butin 58 villages to document the patterns of WatSan situation in 280 selected villages.10 These 58 villages were selectedthrough selecting one village randomly from each administrative district where NGO Forum is going to intervene duringJanuary 2002-2003 period under the 'Community Managed WatSan program'. Selection of one village from each districtensures representation of all the four geo-hydological regions as well as arsenic, iron, & saline problem prone areas.Thus these 58 villages not merely 58 individual villages but sample villages of all those villages that are situated in thesame geo-hydrological & water-difficulty areas. Therefore study findings of these villages not only reflects the patternsof WatSan situation in these 58 villages only but also the all other unserved and underserved villages situated in thesame geo-hydrological areas,
Survey period, Survey area and Location
The field survey was conducted in 58 villages of 58 districts of Bangladesh in the first week of January 2002. Thesevillages represent not only the 4 geo-hydrological regions of Bangladesh but also water-difficulty areas whereunacceptable level of Iron and Arsenic contaminated water is available from tube-wells. The locations of these 58villages are given in the following table.
Location of the Surveyed villagesGeo-
HydrologicalRegion
Coastal Area
Hilly & StonyTable Area
Low Table Area
Sample Village
West Tetulia
West Charsamaiya
Suktagoan
Mahmudkanda
Salam Nagar
Char Rohita
CharJabbar
Rajapur
Shreenathdi
Dakkhin Goaldi
Rajapur
Betaqram
Khalilnagar
Razar Bil Noyapara
Monoharpur
Bamonpara
Kadoya
Gongaprosad
Baratara
Hashimpur
Horinadi
Bekashahara Gararon
Charpara
Komorpur
Subdia
Mazhqram
Raghunathpur
Rahayla
Gabrakhali
Hatkundolee
Gaglajani
MohGsh Chandrapur
Union
Gabindapur
Charsamiya
Suktagoan
Matibhanga
7 No. Mato Bhuiya
4 no Char rohita
16 no. CharJabbar
Ramsheel
Kandua
Tulasar
Dhansagar
Maguraghona
Khalilnaqar
Fashiakhali
Sharifpur
Namuza
Tilokpur
Potazia
Baratara
Hashimpur
Sahilpur
Bormi
Jinardi
Majbari
Padmabila
Shilaidah
Amihupi
Koylag
Gazirvita
Kaliara Gobragati
Kalampur
Kolom
Thana/Upazila
Mehendiqonj
Sadar
Razapur
Nazirpur
Dagan Bhuiyan
Sadar
Sudharam
Kotalipara
Sadar
Sadar
Shorankhola
Dumuria
Tala
Chokoria
Kulaura
Sadar
Sadar
Shahjadpur
Khetlal
Chandanish
Sadar
Sreepur
Polash
Pangsa
Sadar
Kumarkhali
Sadar
Bazitpur
Haluaghat
Sadar
Nalitabari
Singra
District
Barisal
Bhola
Jhalokati
Pirojpur
Feni
Laxmipur
Noakhali
Gopalgonj
Madaripur
Shariatpur
Bagerhat
Khulna
Satkhira
Cox's Bazar
Moulvibazar
BograNaogaon
Sirajgonj
Joypurhat
Chittagong
B. Baria
Gazipur
Norshingdi
Rajbari
Chuadanga
Kushtia
Meherpur
Kishoregonj
Mymensingh
Netrokona
Sherpur
Natore
Total H/H ofselectedportion
321300270293254323325309300280324300288298304276276290280336265324312275278270310310381257385325
No. of Sampled H/Hfor conversational
interview
3230272925323331302832302930302828292834273231282827313138263933
A portion of the table in the next page
10 In the first week of April survey was conducted in the rest 222 villages to prepare NGO-Forum region wise reports only for the use of concerned
regional office and staff. These reports will not have much text but mostly tables.

Geo-Hydrological
Reqion
Shallow Table
Area
Sample Village
Dhumihayatpur
Kharerbari
Radhakantapur
Shatrumardon
Barkona
Dopakhali
Borkoit
DGonai
Baroikhali
Pukhuria
Narashundapur
Monsurabad
Atlia
Achintanagar
Bara Khari
Sheikh Hati
Matharpara
Chakir PasharPathak
North Battrish
Hazari
Kazipara
Shibu
Shadekpur
Borchalia
Kazipara
Borunagaon
Shahbajpur
Union
RanihatiNimpara
Dogachhi
Paschim Pagla
Khanpur
Dopakhali
Borkoit
Sanora
Baroikhali
Baliakhora
Kashipur
North Chand
Ganganandapur
Padmakor
7 no Moqhi
Sheikh Hati
Guridaha
Chakir Pashar
Chandrapur
Shoulmari
Kurshamari
5 No.Shadekpur
BiroshreeDhakkamara
Salandor
Shahbajpur
Thana/Upazila
ChapainawabganjCharqhat
Sadar
Sadar
Birampur
Modhupur
Chandina
Dhamrai
Sreenagar
Ghior
Sadar
Sadar
Jikorgacha
Sadar
Sadar
Narail
Saghata
Rajarhat
Kaligonj
Jaldhaka
Kawnia
Chunamghat
JokigonjSadar
Sadar
Sadar
District
NowabgonjRajshahi
Pabna
Sunamgonj
Dinajpur
Tanqail
Comilla
Dhaka
Munshigonj
Manikgonj
Narayangonj
Faridpur
Jessore
Jhanaidah
MaguraNarail
Gaibandha
Kurigram
Lalmonirhat
Nilphamari
Rangpur
Hobigonj
Sylhet
Panchagorh
Thakurgaon
Jamalpur
Total H/H ofselected portion
307268300312
290311325340340315357320315285269321340300
321
325329261283285325327
No. of Sampled H/Hfor conversational
interview
31273031
2931323434323632323327323430
32
33332628293333
TiB
Survey conduction/ data collection Methods and process:
During field survey in the 58 sample villages, Social, Resource and Hazard mapping techniques of Participatory RapidAppraisal (PRA) and conversational interview methods were applied to collect necessary data. Whereas conversationalinterview method was followed primarily to apprehend information regarding WaiSan habits, practices and awarenesslevel of the people, PRA method was adopted essentially to have an idea about the water supplying and Sanitationrelated hardware status. 15-20 villagers were the participants of PRA and 10% sample households of thevillage/selected portion of the village were respondents for conversational interview. Besides, PRA and conversationalinterview methods observational method was also adopted to get an idea about the actual hygienic status maintainedby the community households. During 10% sample households survey through questionnaire, interviewer also observedthe hygienic status of the sample households with the help of the observational part of the questionnaire,
Data collection tools:
A semi-structured checklist for PRA method and a structured questionnaire for conversational interview were used fordata collection. For observing the hygienic status of the sample households the observational part of the questionnairewas used. To ensure the effectively, tools were pre-tested and finalised before launching of the actual survey.

Major variables of the survey
Village, households and household-member category were the ultimate units of survey. Numerous variables wereused to gather qualitative & quantitative information regarding these units. The major variables of the survey were:
• Total population & households• Water supplying technologies (TW/pump/plant)• The water-quality of TW/pump/plants• Category wise Latrine coverage• Hand washing practices• Incidence of diarrhoea
Economic status of the HouseholdCollection sources &Ownership pattern of TW/pump/plantWater sources for domestic purposePlace of defecationWaste disposal places
Selection of PRA participants and interview respondents:
In the villages, the people of Bangladesh generally live in scattered way in small clusters. At the time of selection ofparticipants for PRA session this cluster characteristic of rural Bangla was kept in mind. At least one participant fromeach cluster of the village was selected. The size of the PRA participant varied between 15-20 based on the totalnumber of households resides in the selected portion of the village. Moreover, among the total participants for eachPRA session gender balance was maintained. Furthermore, to achieve study objectives, especial attention was givento select those people who generally have better knowledge about the village. Therefore, besides ensuring selectionof at least one union council member and a teacher, Gram Samity members of locally active NGOs were preferred asparticipants.
In respect of selecting respondent-households for conversational interview, 10% households were selected throughusing systematic random sampling from the total households of the village. Moreover, interval of 10 households wasmaintained between each consecutive sample households. During interview conduction housewife and young familymembers were preferred as respondent to ensure better information.
Particular's of the inter view respondents (findings)Among the total respondents 67.2% are female and the rest are male. In respect of household-membership itegory, thv'ihighest number of respondents belongs to Housewife category (50%.) The rest are Household-Head categon i.i.7%) and|Other-member category (15.6%). The educational background of the respondents is not very attractive < )nly 7.6%%responds have studied beyond 10 standard.
Educational Background
Post Graduation 0.4%
Illiterate 24.7% —
Graduation/Equivelarit 1.2%H.S.C./Equivelant 2%
S.S.C/Equivelant 3.9%6th to 10thstanderd 16%
so40
30
20
10
O
Household Membership Category
50.7%
33.8%
Up to 5th standard 17.1%
15.5%
Household Housewife OthersHead
Limitation & Constrains, and steps taken to overcome:
Methods used during survey have some limitations but these methods were adopted due to lack of manpower, andfinancial and time constrains.
The problem with interview method is that respondents are generally cautious in giving real information. Theyperceive the possibility of misuse of information that can affect the interest and image of the family. There alwaysexist the possibility of hiding the real situation by the respondents. Due to this reason, observation method is the bestmethod for any survey that particularly deals with the socio-economic aspect, & habit and practices level of thepeople. However, this method could not been applied for this present study as it demands lengthy survey period,

huge finance and involvement of large number of man power which is not possible under the present situation of theorganisation. Hence the interview method was applied for data collection.
Nevertheless, it was ensured that the data collectors during interview conduction also make some observation onsome variables included in the questionnaire to overcome some of the limitation of the method. Moreover,experienced persons who know how to win the faith of the respondent and have practical WatSan knowledge wereinvolved in data collection. Moreover they were given extensive orientation including field practice to ensure clarityabout the variables used in the questionnaire and enhance skill in interview conduction. In addition, as a co-datacollector a person who is very much acquainted with the survey area and people was involved in the process toapprehend the real WatSan situation of the sample-households. Thus, in each village two persons, one as main datacollector (main interview) and another as co-data collector (co-interview) were involved in data collection thoughconversational interview method. All the main data collectors were staff of NGO Forum and were assisted by the fieldstaff of partner organisation as co-data collectors.
Like the interview method, PRA method also has some limitation. The success of PRA method and techniquedepends upon the knowledge level of participants, active participation of the participants and on good facilitation ofthe session. Therefore steps were taken to ensure the success of PRA method. As a first step, PRA session wasarranged only after the completion of data collection from sample households through interview method. This hadhelped to select appropriate participants. During the two days of interview period, data collectors meet variouspeople, which had helped them to select just participants. Moreover, PNGO staff who has good ideas about thevillage people also had assisted the selection process.
In respect of facilitation, the quality was ensured by ensuing facilitation by the staffs of NGO-Froum. NGO-Forum'sstaffs not only have enough experience in facilitating PRA session but also received orientation, just before thecommencement of the survey, specifically on the conduction of this PRA session. In addition, the data collectorsduring the conduction of interviews had moved around the village and acquired general idea of the village that helpedthe data collector to facilitate the session in right direction. Moreover, facilitator also received assistance from thePNGO field staffs having good knowledge about the concerned villages.
Data compilation and analysis:
RME cell personnel of NGO-Forum were involved in data compilation and analysis. Data were compiled by using dataentry software that was developed with the help of Visual Fox Pro. After compilation, data were edited and analysedwith the help of SPSS (Statistical Package for Social Science).
The findings of the study are discussed in the next successive sections. However, the major findings are alsodiscussed in the preceding Executive Summary section of the Report. In the main part of the report, findings primarilyare discussed geo-hydrological area wise, however, village wise information is incorporated in the appendix section.
6

Section: AGeneral Information
(Introducing the Surveyed Area)
Bangladesh has a low-income economy. The estimated per capita income was only US$ 386 in 20001 and the annualGDP growth rate was 4.5% in 2001.2 As a result poverty is the prime socio-economic phenomenon of the people of thecountry.3 A considerable number of people are deprived of basic needs like adequate food, clothing, shelter, education,health facilities, safe and adequate water and sanitation etc. The findings of the present study also reflect this povertyphenomenon of Bangladesh though these surveyed villages are in privilege situation in the sense that local NGOs areactive in the area.4
Household's yearly income:(Estimated)
Survey findings show that majorityof Households earn even less thanper capita income.
14.4 % Households earn less thanUS $ 174 per annum, 22.7 % earnbetween US$ 174 to 260, 17.2%earn between US $ 260-347, 17.6% earn US$ 347 to 434. The rest28.0 percentage households earnmore than US$ 434. ( see Table:A.2)
Number of Household and people covered by the survey;The total number of household residing in the surveyed 58 villages is 40426 andthe population is 20,6482, However, the total number of household living in theNGOForum's WatSan program selected portion of these villages is only 17710and the estimated population is only 96,467 (for details see table A: 1). Theaverage size of the household residing in the selected portion is 5,4 persons and8875 (50,1 %) households have under five children.
Table: A
-Geo-
hydrologicalarea
:$6astaiSrea : •:;:::
Hilly & Stony area
Low Table area
Shallow Table area
Total (58 villages)
:1; Number of Household and people covered by the survey
The Entire Village
Totalhousehold
15571
865
14067
9923
40426
Totalpopulati
on
69945
5667
76258
54612
206482
WatSan Selected Portion of the Village
PopulationMale
9121
1406
17472
14827
42826
Female
8300
1608
15991
14482
40381
<5Children
2921
505
5696
4138
13260
Total
20342
3519
39159
33447
96467
HouseholdTotalhousehold
3887
602
6938
6283
17710
Having -
* 5 :•/.:;
Children
: 206S
213
3362
3232 :
8 8 7 5 , •
Principal Earning sources:
The patterns of the principal earning source of the households residing in the surveyed area reveals the major reasonfor the low-income background of the majority people of the survey area. 37% Households' principal earning come fromagricultural activity and the land owning pattern of the country shows that only tiny number of family have sufficientagricultural land that can provide adequate earning.5 Apart from cultivation the highest number of households (29%)depends on the earning primarily comes from day labour. If Rickshaw, Van, & pushcart pulling, boat roaring and cardriving are included then this percentage goes up to 40 %. The primary earning source of the rest of the households isfishing related activity (3%), business (9%), Household servant (1%), Service (6%) and other professions (2)% (seetable-A.2).
1 Current world Album, BCS Publication, 2001, p-802 In the same year'balance of trade US $1,65 billion,'foreign debt116.59 billion, . - .
-see http://www.wordinformation.com/World/Asia/Banqladesri/kevfacts.asp9countrv-8803 Poverty can be defined as 'the state of deprivation of basic needs like adequate food, clothing, shelter, education & health facilities etc. If poverty
is explained in its narrowest sense of calorie consumption than at present nearly 48% people of Bangladesh living below the poverty line (2100-2200 kilocalories per day). •- Pragoter Pothay, op cit, 8
4 NGO Forum follows partnership approach to implement its WatSan program. Hence, it selects only those unserved and under served villageswhere potential PNGOs are available.
5 According to Novib figures (1992 p. 15) in 1991 the top 10 per cent of landowners owned 60 per cent of the land. The bottom 60 per cent oflandowners had only 1 per cent of the land (compared with 25 per cent in 1960). It can be seen that a substantial proportion (between 50 and60 per cent) of rural households are therefore functionally landless-Ministry of Foreign Affairs, Policy, and operation and Evaluation, "Evaluationof Netherlands funded NGOs in Bangladesh," Ridderprint B V Ridderkerk, Internet version.

GeohydrologicalArea
CoastalHASLWTASWTATSA
Table: A.2: Yearly income and principal earning source (data inYearly income in US$ ( US$ = 57.50 TK)<174
8.528.812.518.614.4
174-260
16.133.922.426.122.7
261-347
16.88.516.419.317.2
348-434
19.78.521.013.617.6
434>
38.920.327.722.428.0
Principal EamincAgricUlture
3836383737
DayLabor
2647302729
HH percentage)SourceFishingrelatedActivity
0700010303
Business/Condratorship
1004090909
Rickshaw/van/pushcartpulling/boatroaring/ cardrivinq1005111311
Working ashouseholdServant
0100010201
Pottering
0000000000
Blak-smithing
0000000000
Gold-Smithing
0000000000
Sen/ice
0705060707
Other
0204030202
Educational Status:
The educational background of >5 years old population of the surveyed villages exhibits a very frustrating situation.23.9% are illiterate and 29.6 % only can sign. People studied beyond 10 standard are only 6.3 %. Among them 3.4%have SSC/equivalent degree, 1.7 % studied up to HSC/equivalent , 0.8% has graduation and only 0.2 have postgraduation.
Table; A.3: Educational Background (% in total >5 years old population)Geo-hydrologicalareaCoastalHASLWTASWTATSA
Illiterate
17.527.126.025.423.9
Cansignonly29.720.632.627.329.6
Upto 5th
Standard
29.133.218.023.222.9
6lh to 10th
Standard
18.013.817,616.517.2
SSC/equivalent
3.11,83.34.03,4
HSC/equivalent
1.30.91.82.01.7
Graduation/equivalent
0.81.20.61.00.8
PostGraduation
0.40.30.10.20.2
Other
000.9000.40.2
Besides the financial poverty and awareness, absence of adequate academic institutions plays major role forbackwardness in education. The survey shows that majority of the villages do not have educational institution wherepeople can study beyond primary level though 100% surveyed villages have religious institution (see Appendix-A, TableA.3). Only 2.3 % villages have college and only 20.5 % have higher secondary school. However, 90 % villages haveprimary school and 60% enjoy the privilege of non-formal primary education run by NGOs (see Table-A.4 and for villagewise information see Appendix-A: Table: E)
Geo-hydro-logicalarea
CoastalHSALWTSWTTotal
Table: A.NGO School(Non-formal primaryeducation)
No institution053.85026.13040
17.75034.82529.4
2>38.50039.14530.6
4 Village having secular educational institutionPrimary (govt.
No institution07.70021.7109.9
153.85065.27561
2>38.55013.11529.1
Junior High School
No institution084.610091.310094
115,4008,7006
2>0000000000
(data in Village percentaceHigh School
No institution069.210073.97579,5
130.80026.12520,5
2>0000000000
College
No institution010010095.79597.7
100004.3052,3
2>0000000000
Other*
No institution069.210095.78086.2
130.8004.30510
2>000000153.8
' Under the other category consider K.G School
WatSan Knowledge
In spite of educational backwardness the survey findings shows that majority people are aware about the bad effect ofconsuming surface water without any filtration and existence of improper sanitation. However, majority people do nothave any idea about the arsenic contamination problem. 65.3% respondents know that diarrhoea! diseases occur if

unsafe surface water is drunk and proper sanitation is not maintained but only 35.8% people have Arsenic-contaminated water related awareness.
Thus the present WatSan awareness level of the surveyed area demand extensive awareness program particularly onarsenic contamination problem (see Table: A.5, for village wise data information see Appendix-A Table-A.4)
Table:A.5 WatSan KnowledgeGeo-hydrologicalArea
CoastalHSALWTASWTATSA
Can name the diseases occur due to the use of unsafe water and improper Sanitation (Multiple answer)Diarrhoea
70.145.062.967.065.3
Dysentery
20,833,326.627.926,1
Typhoid
2.36.72.77.14.4
Jaundice "•
1.65.01.43.52.3
Skindiseases7.015.014,219,214.5
Worm
3.4...6.04,84.8
Can not nameany one
26.845,034.428.931,2
Arsenic contaminatedwater relatedawareness
32.523.336.038.735.8
The WatSan Status of the Survey Area:
Even though considerable number of people of the surveyed area have knowledge about the factors responsible fordiarrhoeal diseases, still a sizeable portion of households have experienced diarrhoea incidence in one monthpreceding the day of survey. The survey was done in the first week of ~~"January and during this season diarrhoeal occurrence remains relatively Hp><?* episodes of more than two timeslow in number. Still the survey shows that 22.1% households Woose or waterv stools P('r (1*Y- Bhod
experienced diarrhoea incidence and population wise 3.8% >5 )me with stool.
year old and 17.1% under five children had faced diarrhoeal attacks with in last one munth. mis reveais me poorWatSan situation of the surveyed villages. (See Table-A.6; for village wise data see Appendix-A ,Table-A.1)
Geo-hydrological Area
CoastalHSALWTASWTATSA
Table: A.6: Incidence of% of HH experienced Diarrhoea
24.243.317.623.822.1
Diarrhoea within last one month% of >5 population experiencedDiarrhoea3.88.03.14.23.8
% of <5 population experiencedDiarrhoea20.421.913.118.617.1
Conclusion:
The findings on socio-economic, educational & awareness level, and the degree of diarrhoeal incidence show thatalong with the intervention of awareness program the financial limitation of the people of the area have to be kept inmind during overall WatSan intervention.

Section: B
Access to Safe Water Supply and Water related habits
Water is the essence of all living being.1 Without water, survival, even for a day becomes difficult. Easy access toadequate and safe water supply is very much necessary for improved public health service.
However, millions of people living in the rural area of developing countries do not have access to adequate and safewater. Nevertheless, the situation is not same in all developing countries. Bangladesh had made commendablesuccesses in providing access to tubewell water. More than 90 % of rural population have access to a tubewell within150 meters of their homes and 95% of the rural people drinks tubewell water.
Traditionally, rural water supply in Bangladesh was largely based on protected ponds. However, schemes for thecollection of groundwater through handpump tubewells for community water supplies in rural Bangladesh were takenas 1928.2 Since then up to 1993 millions of tubewells particularly shallow suction handpump had been sunk in ruralBangla. Major reasons behind this upward trend of tubewell installation in Bangladesh were: the existence of tubewellinstallation friendly geo-hydrological environment, and people's preference on tubewell technology due to availability ofbacterial contamination free water and being low cost technology.
However, with the discovery of arsenic contamination intubewell water in 1993 the success of Bangladesh turned into agreat failure. According to a survey report 59 out of 64 districtshave arsenic contaminated ground water.3
Since arsenic contamination problem is exposed various sectorsworking on Safe Water supply area has been making attemptsto develop technologies that can provide safe and adequatewater as well as the cost remain within the reach of poor. Thedevelopment of alternative technologies like AIRP, RWHS,Ringwell/ dugwell & PSF is the result of this effort. One of themain objectives of the survey is to acquire information regardingwater-related difficulties of surveyed areas to determine thetypes and degree of WatSan intervention for the area.
; Definition(s):
Access: distance to the nearest water-point &per capita availabilityAdequate: amount of water one requires tofulfill domestic needsSafe Water: free of bacterial ah$unacceptable level of mineral & chemicalcontamination and does not have immediateor latency affect on the human health / |consumed or used. -
Safe Water supply: withdrawal or abstractionot either ground or surface water as well asharvesting of rainwater; its subsequenttreatment, storage, ifahsmisshn anddistribution for domestic use.
1 Water makes up 50 to 90 per cent of the weight of living organisms. Protoplasm is a solution of water and fats, carbohydrates, proteins, andsalts. Water acts as a solvent, transporting, combining, and chemically breaking down these substances. Water also aids the metabolicbreakdown of proteins and carbohydrates. See- WATER in Encarta® 99 Desk Encyclopedia © 1987-1998 Microsoft Corporation.
2 M Feroze Ahmed & Md. Mujibur Raham, "water Supply & sanitation: Rural and Low-income urban communities," ITN-Bangladesh, Dhaka, 2000,p-297,
3 Elizabeth M. Jones," Arsenic 2000: An overview of the Arsenic Issue in Bangladesh (draft final)," Water Aid, Dhaka 2000, p-1

Water supply hardware status
The geo-hydrological condition & water difficulty determine the type of affordable technology that can be use to tapadequate and safe water. The people of Bangladesh have been using different types of safe water supply technologiesto meet the existing hydrological diversity of the country.
Geo-hydrological condition of BangladeshBased on geo-hydrological condition Bangladesh is divided into four regions, these are:Shallow table Area: Area where the static water level of under ground water remains within 25 feet (suction limit) round the year.Low Water Table Area: Area where the static water level of under ground water does not remain within suction limit (25 feet)round the year.Coastal Area: Area within the reach of seawater intrusion. Basic characteristic of the surface as well as ground water available inthe area is high salinity:Hilly & stony area,'Area where water cannot be easily accessed due to hilly environment and the existence of rock and stone inl h e s G l 1 New water difficultiesBesides the problem of bacterial contamination in the surface water, high salinity in surface and ground water and existence ofhigh level of iron contamination in ground water, over the past few years Bangladesh are facing two new trends of waterdifficulties. These are: 1) gradual decline of the ground water table, which leaves growing number of suction pumps useless and 2)the arsenic contamination problem. :
Types & categories
During survey it was observed that besides traditional well, the people of rural Bangla use various types of TW/pump/plants to tap water for domestic purposes. In the survey area, 7 types of suction mode pump, 1 type of force modepump, and 4 types alternative water supply technologies were found. However, apart from no 6 shallow and deepsuction type TW, no other types of water supply technology were found in all of the four geo-hydrological regions. Thesurvey findings exhibit that whereas conversion Pumps, AIRP and traditional well are found only in the LWTA, thelocally made shallow tubewell and PSF is found only in the SWTA. Notwithstanding, RWHS is found in Coastal &SWTA and Ring/Dug well is found in SWTA and LWTA. (See: Table: B.1)
Tips on underground Water Supply TechnologiesSuction mode TW/pump• No 6 TW: The name of the TW is bated on its barrel diameter in inches. However, it is basically a suction handpump and can
extract water practically from up to a depth of 22-24 feet. This pump is most appropriate technology for SWTA where groundwater level even in the dry season remains with in the suction limit (22-24 feet) and free from Arsenic contamination problem.
• Conversion pump: No 6 TW that is converted into semi-deep set pump is called conversion pump. Due to the lowering trendof under ground water level in some SWT areas water level goes below the suction limit in dry season but remain with in 12m. Conversion pump is created by extending the piston of No 6 TW up to 6 meters,
• Deep TW: Tubewell, which can extract water from deep aquifer and penetrates more than one irtipermeable aquifer, is calleddeep IW. However, in Bangladesh, a TW that extracts water from more than 75 m dept is known as deep TW. It, like no-6TW works under suction mode. Arsenic, Saline and Iron affected areas are suitable for Deep TW, (see- M Feoze Ahmed & MdMujibur Kahrnan, p-419 op cit)
Force mode pump :• Deep-set (tara) pump: In dry season, in many places the groundwater table goes below the suction limit As a result, shallow
suction mode pump fails to withdraw water. In 1984 to overcome this problem Tara Deep set pump was developed to extractwater from up to 15-meter below the ground surface. It is a force mode pump, Piston of this pump operates below the staticwater level to eliminate the limitation of the suction mode pump.
Alternative water supply technologies :In some area, the conventional TW &pump are not successful to provide safe water due to water difficulties like Salinity andArsenic contamination problem. As a result, new types of technologies known as alternative technologies are developed to getsafe water even in the water difficulties areas. These alternative technologies are Shallow Shrouded Tubewell SST), VeryShallow Shrouded Tubewell (VSST), Pond Sand filter (PSF), Rain Water Harvesting System (RWHS), Arsenic Iron Removal Rump(AIRP), Ring well, Dug well, etc.
Total number
The total number of TW/pump/plants found in the surveyed area is 5064. 97.4 % of this belong to suction mode typepumps which includes Number 6 TW (92.7%) Deep TW (2.13 %), Conversion pump (1.7%) and locally made TW (0.9%). The rest are force mode pump (deep-set Tara-1.6%), plants (0.69%) and traditional well4 (0.3%). The locally
The traditional well in Bangladesh is known as Patkuah and Edara. During survey traditional well was found irrKomorpur and Gaglajani village of
Rajbari and Sherpur district respectively.
11

made TW includes Darkol,5 mini-tubwell,6and basharkol,7. However, one of the most noticeable findings is that one ofthe villages named Rajapur of Bagerhat district situated in the Coastal area does not have even a singleTW/pump/plants.8 (See table B.1)
GHA
Coastal
HSALWTASWTATSA
TW& pumpTable: B.1 Water supply
Shallow TWN06TW
no584
150220217574693
%86.6
98.6892.29592.7
localmadeno00
00004848
%00
00002.60.9
Conversionpump
no00
00850085
%00
003.6001.7
Deep-set(Tara)
no00
02592182
%00
1.322.51.11.6
Hardware Status
Deep TW
no88
000812108
13.1
000.30.72.13
Plant(types and number)
RWHS
no01
00000708
%0.14
00000.40.2
AIRP
no00
00030003
%00
000.1000.06
PSF
no00
00000202
%00
00000.10.03
Ringweli/Dugwell
no01
00160320
%0.14
000.70.20.4
Traditionalwel
no00
00150015
%00
000.62000.3
Total
674
152238818505064
Ownership pattern
The TW/pump/plants found in the entire survey area evinces diverse ownership pattern. During survey, three patterns ofownership were noticed broadly. These ownership patterns are private ownership, community ownership andinstitution's ownership. Whereas TW/Pump/plants owned by single or multiple households fall under private ownershippattern, the TW pump/plants distributed by government/ non-government organisations and cost was shared by bothbeneficiaries and distributing organisations fall in the community ownership category. And TW/pump/plants owned byinstitution like school, hospital, organisation, etc fall in the institution's ownership pattern.
Figure: B.1.1 Figure: B.1.2
Technology-wise ownership pattern
TW N06 local made Conversion DeepSet Deep TW Plant traditional well(Tara)
• private • community D owned by institution
Ownership pattern in respect of overallTW pump/plant
Community 14%Owned byInstitution-3%
Private 83%
The ownership patterns present encouraging as well as very frustrating phenomenon. The survey finding reveals that 83% (includes 77% & 6 % owned by single and multiple HH respectively) the total TW/pump/plants have private ownership,which is an encouraging phenomenon as it indicates- that people no longer wait for government/developmentorganisation's initiatives, but they themselves are realising their own responsibility in ensuring their access to safe watersupply. (See Figure-B. 1.2)
However, same findings imply very ominous future if new trends of water difficulties like lowering of ground water tableand Arsenic contamination are taken into consideration. The ownership pattern shows that among the total privately
5 Darkol was found in the Shadekpur village of Hobigonj district that is located in the Sallow Table Area6 Mini-tubewell was found in the North Battirish Hazari village of Lalmonirhat district located in the Shallow Table Area. Local workshops make thiscategory of tubewell.
7 Basharkol WAS found in the Shibu village of Rangpur district located in the Shallow Table Area.8 See-Appendix: A., Table B.2.1&B.2.2 : :
12

owned tw/pump/plant only 0.1 % and 0.4% are Deep TW and Plants (Ring/dug well) respectively which perceived to besafe technologies in respect of bacterial and Arsenic contamination. The rest are no 6 Shallow TW (96%), locally madeshallow TW (1.14%), Conversion TW(1.9%), deep set tara (0.02%) and traditional well (0.4%) which no longer trusted assafe and adequate technologies. So the ownership pattern implicates the possibility of enhancement of people'sdependency on government/developmental agencies for safe water supply. (See Figure-B.1.1)
Collection source
TW/pump/ plants found in the whole survey area collected mainly from three sources. These sources are Market,Government agencies and NGOs (NGOF and other Ngos). However, few 20 Ring/Dug well and all of the 15 traditionalwells are not collected from any sources but privately constructed and needed construction materials are collected fromthe market. According to the survey findings majority of the No6 shallow TW (86%) and 100% conversion pump arecollected from Market. In contrast, majority of the Deep-set tara (93%) and Deep TW (81%) are collected fromgovernment sources. Nevertheless the most interesting findings is that except Ring/Dug well 100% of other availablethree types of Alternative technologies, RWHS, AIRP and PSF are collected exclusively from NGO Forum (for detailssee). Collection source of locally made Shallow TW is not mentioned in the concerned table, however, all of them arecollected from local market. (See table B.2)
Table: B.2 Technology wise collection source
GHA
CoastalHilly &StonyLWTASWTATSA
Tubewell & PumpNo6 Shallow TWMarket
7983
898686
Govt.
169
111111
NGOF
11
011
OtherNGO48
122
ConversionMarket0000
10000100
Govt.
0000
00000
NGOF
0000
00000
OtherNGO0000
00000
Deep-set TaraMarket
0000
1.69001
Govt.
00100
89.810093
NGOF
0000
6.78005
OtherNGO0000
1.69001
DeepTWMarket
100
0083.310
Govt
9000
87.516.781
NGOF
100
00001
OtherNGO800
12,5007
PlantsGHA
CoastalHilly &StonyLWTASWTATSA
RWHSprivatelyconstructed0000
000000
Govt.
0000
000000
NGOF
10000
00100100
OtherNGO0000
000000
AIRPprivatelyconstructed0000
000000
Govt.
0000
000000
NGOF
0000
10000100
OtherNGO
0000
000000
PSFprivatelyconstructed0000
000000
Govt.
0000
000000
NGOF
0000
00100100
OtherNGO
0000
000000
R/D Wellprivatelyconstructed10000
93.83385
Govt
0000
6.250005
NGOF
0000
000000
OtherNGO
0000
006710
Operational condition
Among the total 5064 TW/pump/plant available in the survey area 91% TW & pump and 94% alternative technologyplants were found in functional condition at the time of survey. It means nearly 9% TW/Pump and 6% of Plants were indysfunctional conditional. This is not very encouraging situation in the sense that if this percentage is converted intonumber of TW/Pump/Plant in overall national context then number of dysfunctional TW pump/ plants will go beyondhundred thousand. (See Table B.3.1 & B.3.2)
Table: B. 3.1 Water supply Hardware Status (TW/pump)GHA
CoastalHSALWTASWTATSA
Shallow TW(no6]functionalNo49798205916564310
dysfun.No8752143101383
Conversion pumpfunctionalNo0000700070
dysfun.No0000150015
deep-set (Tara)functionalNo0002391859
dysfun,No0000200323
DeepTWfunctionalNo86000511102
dysfun.No200030!06
OtherfunctionalNo0000074552
dysfun,No0000080311
Total TW/PumpfunctionalNo585100219717424624
%8766929491
dysfunctionalNo8952191108440
%1334080609
13

GHA
CoastalHSALWTASWTATSA
Ringwell/ DugwellfunctionalNo0100140318
dysfun.No0000020002
Table: B.RWHS
functionalNo0100000708
dysfun.No0000000000
3.2 Water supply Hardware Status (Plant)AIRPfunctionalNo0000030003
dysfun.No0000000000
PSFfunctionalNo0000000202
dysfun.No0000000000
Total plantsfunctionalNo0200171231
%100008910093.9
dysfun.No0000020002
%000011006,0
Distance between kitchen and nearest TW/pump/plant
The survey findings show that a considerable number of water points are available in the survey areas. However, itdoes not mean that every body has TW/pump/plant within their courtyard. Nearly 12% HHs in the entire survey areahave to cross more than 300 feet to get access to a TW/pump/plant and nearly 27% HHs do not have TW/Pump/plantwithin 100 feet.
In the coastal and hilly & stony area 46.5% and 52.6% households do not have access to tw/pump/plant within 100 feet.Moreover many HHs residing in the coastal, Hilly & Stony, LWT and SWTA cross 9000, 1200, 2000, and 2000 feetrespectively to get access to TW/pump/plants' water. However, a considerable percentage of HHs (40.7%) has accessto TW/Pump/plant within 50 feet. In the Coastal and Hilly & Stony area 42.8% and 40.7% HHs have access toTW/pump/plant within 50 feet respectively while in LWTA and SWTA 66.5 % and 70.9 % HHs have access within 50feet respectively. (See Table: B.4)
Table: B.4 Distance between kitchen and nearest TW/pump/plant (data In HH%)GHA
CoastalHilly &StonyLWTASWTATSA
Distance between kitchen and concerned TW/Pump/Plant in feet1-50HH%42.840.7
66.570.962.2
51-100HH%10.66,8
12.310.611.1
101-150HH%4.06.8
5.84,44.9
151-200HH%5.26.8
4.93.74.6
201-250HH%2.300
1.01.51.4
251-300HH%3,78.5
4.03,53.9
300+HH%31.330.5
5.65.511.8
Highestdistance90001200
200020009000
Lowestdistance53
222
Available (perceive) Safe and unsafe point
Mere access to functional TW/pump/plant does not ensure access to safe water supply. Water available from TW/Pumpmight have unacceptable level of mineral contamination. So to ensure access to safe water supply one has to ensurethat the water available from accessed functional TW/pump/plant is free from unacceptable level of mineralcontamination as well as from bacterial contamination. Through survey, attempt has been made to get the total numberof available safe functional water supply point by identifying unsafe water point. However, in identifying safe and unsafewater supply point survey was restricted only with the issue of Arsenic and iron contamination and the presence of highsalinity.
Arsenic issue:
Survey findings show that among the 57 villages9, water of 100% TW/pump has been tested for Arsenic contaminationonly in 7 % villages and not even a single water point is tested for Arsenic contamination in 53% villages. It further
Rajapur village of Bharhart does not have any TW/pump/plant. So this village is not considered in this section and total survey village hereconsidered as 57 instead of 58.
14

shows that in 7 % villages all tested-TW/pumps' water is found as Arsenic contaminated while in 5.3% villages all testedTW/pumps1 water is found as safe in respect of Arsenic contamination. (See Table 5.1)
GHA
Coasta1Hilly &StonyLWTA
SWTATSA
fable: B.5.1 Village information regarding water difficultyVillage information in respect of Percentage of TW/pump/plant had Arsenic test
0%TW/Pump
VNO7
1
12
MO30
V%
58.350
52.25052.6
1-10%TW/Pump
VNO1
00
03
0105
V%8.3
00
13
_ 0 5 i8.8
11-25%TW/Pump
VNO1
00
02
0306
V%8.3
00
8.7
1510.5
26-50%TW/Pump
VNO00
1
01
0103
V%00
50
4,4
055.3
51-99%TW/Pump
VNO1
00
04
0409
V%8.3
00
17.42015.8
100°/TW/Pump
VNO2
00
1
0104
V%16.700
4.4
057
Villageswheretestedarefrom
allTw
free
Arsenicproblem
VNO00
00
02
0103
V%00
00
8.7
055.3
issueVillageswhere alltested TW'swater hasunacceptable level ofArsenic
contaminatio
n
VNO02
00
02
0004
V%16.7
00
8.7
007
Villageswhere100%TW/pumpIS
reportedlyfree from
unacceptedlevel of ironcontaminationVNO03
00
05
0614
V%25
00
21,73024.6
Villageswhere 100%TW/Pumpreportedlyfree fromhigh salinity
VNO06
02
23
2051
V%50
100
100
10089.5
However if focus is shifted from village to water point then findings show that water of only 23% TW/pumps had beentested for Arsenic contamination, The findings further implies that 49% tested TW/pump are unsafe water point as wateravailable from these points contain unacceptable level of Arsenic contamination. The highest percentage of testedTW/pumps (80%) is found to be unsafe in the coastal area while lowest percentage tested TW/pumps (21%) is found asunsafe in the Hilly & Stony area. In the LWTA and SWTA water of 33 % and 54% tested TW/pump plants is foundhaving unacceptable level of Arsenic contamination respectively. (See Table: B.5.2)
GHA
CoastalHilly &StonyLWTASWTATSA
Table: B.5.2: Informatfori regarding water points In respect of Water difficultiesArsenic tested TW/PumpArsenictestedTW/pump
No18748
4284951158
%2832
182823
TW/pump haveunacceptedlevel of Arsenic
No14910
142268569
%8021
335449
TW have lessthan/ free ofArseniccontaminationNo3838
286227589
%2079
674651
TW/pump havingunaccepted levelof Iron
No30832
5813461267
%4621
251925
TW/pump havingunaccepted levelof Salinity
No5700
000057
%0800
00001
Safe functionalTW/pump
No24665
160611493066
%3643
676261
Averagepopulation forsinglefunctional safepointNo8354
242931
Iron contamination & presence of high salinity issue:
Apart from Arsenic contamination, Iron contamination of water available from TW/pump is also hindering the effort ofBangladesh in ensuring safe water supply for the rural people. The Survey findings show that only in 25% villages 100%TW/pump/plant is reportedly free from unacceptable level of iron contamination. In respect of water point 25% haveunacceptable level of iron contamination. Highest percentage of iron contaminated water points are located in thecoastal area (46%) and lowest percentage of iron contaminated TW/pump is situated in the SWTA. In the LWTA andHilly and Stony area 25 % and 21% TW/pump plants reportedly having unacceptable level of Iron contaminationrespectively. (See Table B.5.1 & B.5.2)
15

Besides Iron and Arsenic contamination, presence of high salinity is another important difficulty Bangladesh is facing insome areas to ensure safe water supply. Survey findings show that the salinity problem is limited only with in coastalbelt. As per survey findings in 50% villages of Coastal area presence of high salinity in the water of TW/pump isreported. However, it does not mean that all the water points exist in these villages have high salinity problem.According to survey 8% water points (TW/pump) reportedly have salinity problem. All the water points situated inSWTA, LWTA & Hilly & Stony areas are free from high salinity. (See Table B.5.1 & B.5.2)
Safe functional water point:
A point is identified as safe if water available from the point is reportedly free from high salinity and iron contaminationas well as the presence of Arsenic contamination is not confirmed by chemical testing.
Survey findings show that 61% of the total functional point which does not include Basherkol, Darkol & traditional well isfree from Arsenic, Iron & high salinity. Hence it can be said that 61% of total available point is safe functional points.However, geo-hydrological region wise, 36 % , 43%, 67% and 62 % functional water point is safe in the Coastal area,hilly & stony area, LWTA & SWTA respectively. However, in the, Mahmud Kanda, Shreenathdi, Rajapur & Betagramvillages located in the Coastal area not even a single safe functional point is available. (See Table B.5.2 and for villagewise data see Appendix-A, Table B.5)
The findings also implicates that in an average for 83, 54, 24 & 29 persons a single functional safe water point isavailable in the Coastal area, hilly & stony area, LWTA & SWTA respectively. However, in the Gabrakhali village ofLWTA and Sheikh Hati village of SWTA for 1867 & 1616 persons a single functional point is available. In contrast, inBarunagaon of SWTA, Barokona & Ragunathpur of LWTA, a single functional safe water point is available for less thanten persons. (See Table B.5.2 and for village wise data see Appendix-A, Table B.5)
However, this situation cannot be accredited as real because all those water points, which are not tested for Arseniccontamination, are identified as safe. Moreover, the presence of other minerals except Arsenic, Iron and Salt are notconsidered. In addition the bacterial issue is also not taken care of. There is every possibility of bacterial contaminationof water available from these TW/pump/plant. The survey shows that 50% HHs collect water from a water point(TW/pump/plant) from which distance of latrine is less than 33 feet. In respect of bacterial contamination the safedistance between latrine and Water point is 33. So survey findings does not present information about the averageconfirmed safe points but the perceived safe points. (See Appendix-A, Table B.5)
Platform situation
Ensuring easy access to only the functional and safe TW/pump/plants is not enough to eliminate the complete sufferingof the people. It is very essential that every functional and safe TW/pump/plant have proper platform. A platform isproper when, any portion of the concrete platform and attached drain is not broken or cracked or any portion is gonedown; Katcha-drain is attached with concrete one; the TW/pump does not have dangling root, and the soil of thesurrounding area of the concrete platform is not eroded. The absence of proper platform not only createsinconvenience to collect water but also can originate bacterial pollution in the area. According to the survey nearly65.6% TW pump/plants do not have proper platform. (See Figure B.2)
Figure: B.2 Geo-hydrological Region-wise Percentage of improper platform
Geo-
100
80 64.1% 67.2% 65.7% : 65.6%
hydrological;• region wise 6(J
percentageof improper 4 0
'; 20
0Coastal Area Hilly & Stony Area Low water table Area Shallow Table Area Total Survey Area
16

Water related habit and practices:
The presence of adequate number of safe functional water points in any area does not ensure the use of safe water forall domestic purposes by the inhabitants. The use of safe water for drinking as well other domestic purpose dependupon the level of knowledge about need and benefit of using safe water, awareness as well as habit and practices. Iftrie people are highly conscious and aware about the need of using safe water people even crosses long distance toensure access to safe water.
Drinking habit & practices
The survey findings show that 81.4% HHs drink water collected from TW/pump/plant, which are perceived to be safeand 13.3% from TW/pump/plants that are not safe. It means in the whole survey area 94.7% HHs drink water collectedfrom TW/Pump/plants. The rest HHs collect water from the traditional well/ponds (4.4%), river/canal (0.7%) and othersources (0.1%).
GHA
CoastalHilly & StonyLWTASWTATSA
Table: B.6 Drinking Water sources: (HH wiseTubewell/pump/plantsConsideredSafe
79.495.084.278.481.4
Unsafe
9.81.711.418.613.3
TotalTw/pump/plants89.296.795.697.094.7
information)Traditional sourceRain Water
0000000000
TraditionalWell/pond
9.81.74.21.74.4
River/canal
11.70.30.90.7
other
0000000.30,1
In the coastal area, 89.2% HHs drink TW/pump/plants' water but 100% HHs residing in the Rajapur village in Bagerhatdistrict who do not have access to any TW/pump/plant collect water from a sweet water pond for the drinking purpose.In the Hilly & Stony, and Low water Table area 96.7% and 95,6% HHs drink Tw/pump/plant's water. However, it is theSWTA where highest percentage of HHs (97,0%) drink water that is collected from TW/pump/plants, (See Table B.6,For village wise data see Appendix-A Table B.6)
It is very encouraging that even though the residents of the survey area are lacking behind in respect of education but acommendable percentage of HHs use TW/pump/plants' water for drinking purpose. This shows the success ofawareness program carried out for decades by various government and non-government organisations. The successstory of awareness program regarding the use of TW/pump/plants become more revealing if one notice the distancepeople cross to get access to TW/pump/plant. Survey shows that people even cross up to 9000 feet to collect waterfrom TW/pump/plants and nearly 11.8 % cross more than 300 feet distance. However, this findings at the same timeimplicates the level of problem one going to face to aware the people that even water available from TW/pump is notalways safe. (See table B.4)
The issue of purification:
The survey findings reveal that 5.2% HH collect water from sources other than TW/pump/plant. The possibility ofbacterial contamination of the water available from well, pond, canal, river is very high (See table B.6). So it is veryimportant that one should drink water from these sources only after complete purification. During survey information wascollect, about this 5.2% HHs as well as about those HHs who normally collected water from TW/pump/plant but withinlast one year they had to collect water at least for once from sources other than TW/pump/plant to know their practicesregarding the needed water purifying issue.
17

Survey findings show that nearly 52% HHs whenever had collected water from sources other than TW/pump/plant haddrunk without any form of purification. However, 32.7% HHs had been used fitkeri as purifying method and 6.7% HH hadboiled water before drinking. The practice of using of purifier table is completely absent. (See table B.7)
GHA
CoastalHilly & StonyLWTASWTATSA
Table: B.7: Drinking Water Related habits: The issue of PurificationWhen water is collected from sources other than TW/Pump/plant
purifying methodspurifying throughBoiling
6.3002.914.36.7
Sedimentationthrough Fitkeri use
66.7002.94.832.7
Filtration throughusing filter
2,10000001.0
Purifying throughuse of purifierTablets0000000000
Filtering throughStraining
000023.5007.7
Drink only afterpurification
25.010070.681.051.9
Habit regarding keeping Drinking Water pot cleaned and covered
The collection and preservation of safe water does not ensure drinking of safe water. Safe water can be polluted duringpreservation if the water pot is uncleane*d & not covered. The survey findings show that during the observation Drinkingwater pot of 51% households were found covered and 72% were cleaned. It further implicates that people of coastalareas are more aware about the maintaining of hygiene condition. (Figure B.3)
Figure: B.3: Households keeps Drinking Water pot cleaned and covered
Coastal Hilly & Stony
HKHfe* Covered drinking water pot
Water use for domestic purposes other than drinking
LWTA SWTA TSA
Cleaned drinking water pot
Merely drinking safe water does not ensure the elimination of water related diseases. There exists high risk of waterrelated health hazard if the use of safe water at least for the domestic purposes like gargling and mouth washing (duringbathing, face washing, Uzu etc.), Raw Food/vegetable washing, Utensil Washing and cooks10 are not taken care of.
In contrast to drinking water habit, where nearly 81.4% HHs drink water collected from safe water source (SafeTW/pump/plant), only 31.6%, 44.0%, 44.5% and 58.8% HHs use water collected from safe water source for the purposes
During cooking water get boiled and killed bacterial germs but Arsenic contamination can not be solved through boiling. So to avoid Arsenicrelated health hazard even for cooking use of safe water is essential.
18

like gargling and mouth washing (during bathing, face washing, Uzu etc.), Raw Food/vegetable washing, UtensilWashing and cooking respectively. (See table B.8)
GHA
CoastalHilly & StonyLWTASWTATSA
Table B.8: Safe water used for most of the domestic purposes other than drinkingGargling & Mouth washingSafe sources
HH%3.425.041.338,931.6
UnsafesourcesHH%96.675.058.761.168.4
Raw Food/ Vegetable WashingSafe sources
HH%10.335.657.150.944.0
UnsafesourcesHH%89.764.442.949.156.0
Utensil WashingSafe sources
HH%12.933.357.051.244.5
UnsafesourcesHH%87.166.743.048.855.5
CookingSafe sources
HH%28.761.770.064.858.8
UnsafesourcesHH%71.338.330.035.241.2
Conclusion:
The survey findings of the Water supply Hardware Status and people's water related habits show that inhabitants of thesurvey area need hardware as well as software support. However, the first thing NGO-F needs to do is the testing ofwater quality of all functional water points and then providing the hardware support as per need. The existence ofsufficient number of ponds & chal (roof) (see Appendix-A, table E) implicates that technologies like PSF and RWHS issuitable for most of the surveyed villages. In respect of Software support three major issues have to be taken care of.First, to aware people that TW/pump/plants cannot be treated as safe till the water quality is confirmed as safe throughthe process of testing. Second, to aware people that the use of safe water for the purposes other than drinking is alsoimportant to avoid health hazards. Thirdly, need of purifying of water when it is collected from sources other than safeTW/pump/plant.
:£(
19

Section: CThe Issue of Environmental Sanitation
Absence of proper environmental sanitation is the main factor responsible for the sufferings of millions of people of theworld. WHO estimates that more than 3 billion people in the world are without adequate means of excreta disposal.1 InBangladesh in the year 2000, 44% households had sanitary type latrine and improper solid waste management is anenvironmental hazard especially in the urban.2 The impact of this poor sanitation coverage on the health, dignity, andquality of life of the poor is shaming.3
According to WHO 3.3 million people die every year fromdiarrhoeal diseases and at any one time there are 1.5million suffering from parasitic worm infections stemmingfrom human excreta and solid wastes in the environment.Besides the costs of healthcare and lost productivity,community as a whole has to bear greater cost due to thecontamination of rivers and aquifers by untreated humanwaste.4
Hence it is vital to meet people's basic needs for disposalof human excreta and other wastes in a manner, which issafe for them and the wider community. NGO Forumfollowing the national policy of Bangladesh has beenincluded hardware as well as software activities to improvesanitation in the villages selected for WatSan intervention.
In this section of the report the baseline survey findingsregarding latrine hardware status and hygiene practicelevel are incorporated.
The term environmental sanitation means thecontrolling of all the factors in the physicalenvironment, which may have deleterious impacts onhuman health. In developing countries, it normallyincludes drainage, solid waste management, andvector control, in addition to the safe management ofhuman excreta. However, in this report the termenvironmental sanitation is used in narrowest senseby restricting within the issue of management ofhuman excreta and household waste only. Itincludes both the hardware (latrine and sewers, anddustbin) and the software (hygiene promotion) thatneeded to reduce faecal-oral, disease transmission:
National Rural Sanitation Policy principle ofBangladesh
* The rural sanitation programme shall support andpromote a range of technology options for waterand environmental sanitation....
•Behavioural development and changes in usercommunities shall be brought about through socialmobilisation and hygiene education...
Latrine Hardware Status:
The environmental conditions like water availability, geo-hydrological condition, and the permeability of the soil of aparticular area determine the types of hygienic latrine that can be used to ensure safe management of human excreta.Presently, organisations working in the rural sanitation sector of Bangladesh are popularising the water-sealed ring slabLatrine (Pour-Flush) as the most affordable and suitable sanitary type Latrine for the poor people residing in the ruralareas.
Primary features of affordable hygienic latrine:
• Effectively isolates faeces from the environment• Control Odour• Control insectAssure at least minimum level of convenience and privacy
' DFID, opcit p-8.2 UNICEF, "Progotir Pathey: 2000," op cit, p-93 DFID, p-8-94 DFID, p-8-9

Types & categories .
However, during survey two types of Pour-Flush (water sealed ring slab latrine & Offset latrine) and one types of Septictank system iatrine besides pit, open and hanging latrines were found in the entire survey area. All these six types oflatrine technologies are seen in all of the four geo-hydrologica! areas. However, only the Pour-Flash types latrinepopularly known as Water sealed Ring Slab latrine was found in the 100% surveyed villages. Nevertheless all 15%water-sealed Ring-Slab category latrine no longer can be called as hygienic latrine because 32% of them did not haveproper water sealed at the time of survey. (See Appendix-A, Table-C.1)
Hygienic Latrine technologies: r ,,...•.„••..
• Simple pit Latrine: It consists of a manually dug hole into a ground, a seat or squatting slab, a superstructure erected over it andpit hole cover. The pit is simply a hole in the ground into which excreta fall. Urine and other liquids soak into the ground andsolid materials are retained and decomposed in the pit. To hatch the pit hole to control odour and insect an appropriate pitcover is used, pit latrine without pit cover can not be considered as hygienic latrine but better than hanging and open latrine.
Water seal Latrine; This latrine is build with the modification of simple pit by incorporating of Pour-Flush technology with the• simple pit latrine. The most vital part of it is the water seal incorporated between the squatting plate, which essentially prevents
unpleasant odours and insect from entering the latrine compartment. If the water seal is broken its no longer remain hygienic.In Bangladesh this latrines arc popularly known as Ring-Slab latrine. The problem with the latrine is that at least 5 litres/person/day is needed to keep the latrine clean. :
Offset Latrine: It is a Water seal latrine but only difference with the ring slab is that instead of direct pit a completely off-set pit• connected to the pour-flush pan by a short length of 100 mm diameter pipe.
Septic Latrine: Latrine has well built superstructure and connected to a completely off-set concrete tank that ensures partial• treatment of excreta through sedimentation and anaerobic decomposition organic reaction processes.
Unhygienic latrine:
• Open latrine: Latrine that is connected by pipe to an open place or water body is called open latrine. Moreover, all thoseseptic/pit/offset/water seal latrine that fail to keep excreta within the tank/hole due to damages and excreta come out in theopen place are treated as open latrine.
• Hanging latrine: Elevated latrine structure with an open area below allowing faeces to fall into a water body, or on the ground.Hanging latrine typically built around the edge of a pond, canal, or a ditch.
The highest percentage of Offset & Septic Latrine is found in the Hilly & Stony area (6%) and LWTA (6%), and lowestpercentage is found in the Coastal area (02%). However, in contrast lowest percentage of water-seal ring slab latrine isfound in the Hilly and Stony area (06%) and highest percentage is seen in the LWTA (16%) as well as in the SWTA(16%). In the Coastal area the percentage of water-sealed latrine is 14%. In the entire survey area 20%, 15%, 4% &61% latrines are pit, water seal ring slab, Offset/septic & open/hanging respectively. (See Appendix-A, Table-C.1)
So the findings show the gloomy picture of the surveyed villages in respect of sanitary latrine coverage. For 17710Households only 2462 hygienic latrine (ring-slab, offset &septic) is available. If the condition of the water seal is takencare of then the number of sanitary latrine will be less than 2000. (See Appendix-A, Table-C. 1)
GHA
CoastalHilly &StonyLWTASWTATSA
PitNo
389104
86811532514
%
1117
193020
Water seaNo
48837
7536171895
Table C.1: Latrine Hardware Status(Ring Slab)%
1406
161615
% of RingSlab haveproperWater seal(qooseneck)2925
353132
Offset & SepticNo
6834
293172567
%
0206
060404
Open & hangingNo
2608427
267819197632
%
7371
585061
TotalLatrineNo
3553602
4592386112608
HouseholdNo
3887602
6938628317710
21

Ownership pattern of latrine (Pit, pour-Flush & septic) . .
The survey findings implicate about only two types of ownership pattern. These are private and other categoryownership. Whereas latrine owned by single or multiple households falls under the private ownership pattern, latrineowned by institutions are categorised as other category.
According to survey 99.51 % pit/ pour-Flush & septic type latrine have private ownership and only 0.49% have othercategory ownership. Among the 99.51% privately owned latrine 92.3% latrines have single household ownership andrest 7.25% have shared ownership. (Figure C.1)
Figure: C.1 Latrine (Pit/Pour-Flush/Septic) Ownership pattern
Owned by multiple households 7.25%% 1 p
• " ( •BW""" !
Other category ownership 0.49%
Owned by single household 92,3%
Reason for not having latrine other than completely open & hanging type latrine:
The ownership pattern implies that only 4591 households have latrine, which are not completely unhygienic. It means12758 households do not have any types of hygienic/ semi hygienic latrine and 361 households do not haveindependent latrine but shared one. During survey it was found that 54.8% of them are not able to use hygienic latrinedue to lack of finance and 10.3 % due to lack of place. However, it was found that 63 % does not use due to lack ofawareness. (See Figure-C.2)
Figure: C.2: Reason for not having latrine other than completely open & hanging type latrine (multiple answer)
Due to lackipf Finance j
10.3
Out; lo lack
Access to Village Sanitation Centre:
Even if the people of a given place have affordability and awareness still the hygienic latrine coverage might remain lowif people do not have easy access to, place/market from where they can purchase hygienic latrine hardware, andmason who can construct hygienic latrine. Hence to improve the sanitation coverage of an area it ensures enough shopand Village Sanitation Centre as well as trained mason. The survey findings show that among the total 58 villages 69%villages does not have any VSC. Moreover 17.2% village do not have any VSC within 5 km and inhabitants of 1.7%villages even could been able to mention about any nearest VSC. However, 51.7% villages have VSC within 0-1.65km.Nevertheless, VSC located in the villages and in the nearest distance of the village are run by three running authorities.The survey findings show that 51% VSC are run by private authority and 26% VSC are run by NGOF supported NGOs
22

or private producer. Government (6%) and other NGOs (17%) are running rest of the VSCs. (See Table C.2 and forvillage wise information -see Appendix-A table: C.2)
GHA
CoastalHillyLWTASWTATSA
Village without VSC
No0702201140
%53.8100875569
Table: C.2 Information regarding the Village Sanitation CentreVSCs distance-wise villages
0-1.65km
No0700111230
%53,80047.86051.7
1.66-3.3
No0102070010
%7,710030.40017,2
3.4-4.95km
No0200030207
%15.400131012
4.96km>
No0300020510
%23008.72517.2
Running authority of the VSC situated in the village ornearest distancePrivate
No7011314
r 35
%5450505051
Government
No0000020204
%0000080706
NGOF_supportedNo0401050818
%3150192926
otherNGOsNo0200060412
%1500231417
Status of the surveyed Villages in respect of Mason
The presence of sufficient number of VSCs in a particular area and the awareness as well as affordability of theresidents do not ensure the easy WaiSan intervention if sufficient number of mason who can set up hygiene latrine arenot available in the area. The survey findings made it very clear that the WatSan intervention in the number of surveyedvillages will not be very easy one. Nearly 40% villages do not have even a single person who can set up hygienic latrineand only 15.5% villages have mason more than 6 person. (See Table C.3 and for village wise information -seeAppendix-A table: E)
Table: C.3 :The status of the surveyed Villages in respect of MasonGHA
CoastalHillyLWTASWTATSA
Villages as per number of Mason available<1No0601120423
%46.25052.22039.7
1-2No0400040816
%30.80017.44027.6
3-5NO0201040310
%15,45017.41517.2
6-10No0000020305
%00008.7158.6
10>No0100010204
%7.7004,3106.9
The Status of hygiene practice:
Merely having hygienic latrine does not ensure safe environmental sanitation. The success of hardware interventiontotally depends upon the hygiene practice of the user. However the survey findings show that the residents of thesurveyed area are also lacking behind in respect of hygiene practices.
Defecation site:
To have in-depth information regarding the defecation habit during survey information was collected from all themember-categories of each sample household. These household member categories are male, female and under fivechildren. The survey findings reflect the habit of the majority member of a category.
The defecation site of Male members:
According to the survey majority male members of 13.0% households of the entire survey area use hygienic latrine and13.5% households' male members use the pit latrine. Among the rest 36.7% households' majority male member useopen/hanging latrine and 36.7% practices open defecation. Whereas the male members of highest percentagehouseholds (14.2%) use hygienic latrine in the LWTA area, the lowest percentage households (10%) use in the Hilly &
23

Stony area. In the Coastal and SWTA area male members of 13.7% & 11.7 % use hygienic type latrine respectively.(See table C.4)
Table: C.4: Defecation siteGHA
Coastal
Hilly &StonyArea
LWTA
SWTA
TSA
Defecation Sites
Hygienic Latrine
(Septic/Offset/water
seal Ring Slab)
HH Member category
MHH%
13.7
10.0
14.2
11.7
13.0
FHH%
13.7
10.0
14.6
11.8
13.3
C<5HH%
7.000
6.56.26.2
Pit
HH Member category
MHH%
8.816.7
11.6
18.1
13.5
FHH%
9.516.7
12.5
18.1
14.0
C<5HH%
1.100
1.74.32.3
Hanging/open
latrine
HH Member
category
MHH
53.6
63.3
34,0
26.9
36.7
FHH
55.9
63.3
37.0
28.8
39.1
C<5HH
7.07.3
2.43.94.3
open place/ bush/
others)
HH Member
category
MHH
24.0
10.0
40.2
43.3
36.7
FHH
20.9
10.0
35.9
41.3
33.7
C<5HH
84.9
92.7
89.4
85.6
87.2
UseSlipper
HH%
28,4
11.7
32.4
31.3
30.5
Have
cleaned
Slab
HH%
27,6
50
39.6
32,0
34.6
Surrounding
area of the
latrine found
cleaned
HH%
25.9
50
42.6
34.7
36.3
The defecation site of Female members
The pattern of female defecation site is nearly same as male members. The survey findings reveal that majority femalemembers of only 13.3% household use hygienic latrine and 14% households' female members use pit latrine. 39.1%households' majority female member use open/hanging latrine and the rest households' (33.7%) females practice opendefecation, geo-hydrological region wise female member of 13,7%, 10%, 14.6% & 11.8% households uses hygieniclatrine in the Costal, Hilly & Stony, LWTA and SWTA respectively. (See table C.4)
The defecation site of under five children;
The survey findings show that majority under five children of 6.2%, 2.3% & 4.3% households hygienic, pit &open/hanging latrine respectively. The rest 87.2% households' under five children practice open defecation. In the hilly& stony area under five children of 100% households use unhygienic latrine and in the Coastal, LWTA & SWTA area91.9%, 91.8% & 89.5% households' under five children use unhygienic latrine. (See table C.4)
The disposal of faeces of under five children:
In Bangladesh a large number of under five children do not use latrine. Many of the them who can walk defecate in thecourtyard, in home and other open places. Infants those cannot walk defecate mostly in their cloths. So the issue ofwashing the dirty cloths of infants and disposal of children faeces arises.
According to survey 3.8% households dispose children faeces in to the latrine and 11.8% throw into a fixed hole and47.6% do not dispose at any fixed place and throw anywhere they want. 13.3% households throw into garden, 14.5%wash into water bodies and 2.5% on the site of TW/pump/plant. The rest 6.4% households left open. (See-Figure-C.3)
Figure: C.3: Disposal of faeces of under five children
Left open 6.4%At Latrine 3.8%
At garden 13.3%
At Fixed place/hole 11.8%
I
Any Place 47.6%
Wash in the Water bodies 14.5%
Wash on the side of TW/Pump/Plant 2.7%
24

This unhygienic practice by the majority households became more evident when interviewers made observation of thesurrounding areas of the surveyed houses. Interviewers have seen faeces in the courtyards of 18.8% households of theentire surveyed area. In four hydrogeological areas faeces were noticed in the courtyard of 17.9%, 30%, 20% &16.9%,households situated in the Coastal, Hilly & Stony, LWTA & SWTA respectively. (See-Figure-4)
TOO
80
60
40
20
—
—
17.9
Figure: C. 4:
30.0
Faeces noticed
20.0
in the courtyard
16.9 18.8
SA
Slipper Use at time of defecation & keeping the pan slab and surrounding area of latrine clean:
The use of only hygienic latrine does not ensure the elimination of diseases related to improper sanitation. Along withthe use of hygiene latrine the hygiene practices like use of slipper during defecation, keeping the slab and surroundingareas of the latrine are also essential.
The survey finding show that in the entire survey area members of only 30.5% households use slipper duringdefecation, 34.6% HH keeps their latrine slab clean and surrounding area of latrine was found cleaned in 36.3 %households, In the coastal area members of 28,4% Households use slipper during defecation, 27.6% keeps their latrineslab clean and 25.9% households keep the surrounding area of their clean. However, in the hilly & stony area 11.7%Households' members use slipper during defecation and 50% Households members keeps pan slab & surrounding areaof their latrine clean. (See table C.4)
The findings of LWTA & SWTA present a better situation than the coastal & Hilly & Stony area in respect of slipper usebut do lacking behind over the cleanliness of latrine. In the LWTA 32.4% households & 31.3% households in theSWTA practice slipper use during defecation but only 39.6 % households of LWTA and 32% of SWTA kept theirlatrine's pan slab clean. However, 42.6% and 34.7% households of LWTA & SWTA kept the surrounding area of theirlatrine clean respectively (See table C.4).
Distance between latrine and houseDistance of latrine from house have impact on the cleanliness of latrine and latrine use. If the latrine is build adjacent to
house then people are forced to keep their latrine clean and also feel easy to use the latrine for defecation. Surveyshows that 27.8%, 35.5%, 12.1% households have latrine within 15, between 16-30 and 31-45 feet. The rest havelatrine beyond 45 feet distance from house. 5.5 % households have latrine beyond 100 feet distance from house (Seetable C.5)
Table: C5: Distance between House & LatrineGHA
Coastal
Hilly &Stony
LWTA
SWTA
TSA
Distance between House & Latrine (feet)
up to 1516.0
51.0
24.1
35.8
27.8
16-30
39.6
47.1
35.531.4
35.5
31-45
18.8
00
11.9
9.612.1
46-6013.6
00
11.7
11.6
11.5
61-753.200
1,93.02.5
76-100
2.000
6.86.25.2
100+
6.82.0
8.02.55.5
Highest
500160
500500500
Lowest014
150
Average3819
433638
25

Hand washing habits
The washing of both hands with soap before meal, after defecation and after cleaning the bottom of children can ensurethe decline of faecal-oral disease. However, the survey findings show that the present hand washing habit of the entiresurvey area is very disappointing. The practice of the majority members of the household has been described as thehabit of the entire household.
Hand washing before meal
According to survey members of 94.8 % households washes hand before taking meal and the members of 5.2%Households doesn't wash at all. Moreover only 5.1 percent households' members wash both the hand but only 1.1 %wash with soap. However, highest percentage of households' (87.7%) member washes one hand with only with water.The rest 2.0 % households' members wash one hand with soap. The hand washing patterns of all the fourhydrogeological areas are nearly same. The percentages of households washing both hands with soap in the coastal,Hilly & stony, LWTA & SWTA are 0.5%, 3.3%, 1.9 % and 0.5% respectively. (See-Table: C.6.1)
GHA
CoastalHilly & Stony AreaLWTASWTATSA
Table: C.6Wash one hand
With only waterHH%84%93.388.588.587.7
with SoapHH%1.01.72.91,62.0
.1 : Hand wash before mealBoth hand
With only waterHH%2.31.73.36.04.0
with SoapHH%0.53.31.90.51.1
Total Hand wash
HH%87.910096.696,594.8
Doesn't Washhand
HH%12.1003.43.55.2
Hand washing after defecation:
Washing of both hands with soap after defecation is very essential to avoid human excreta related diseases. The surveyfindings provide a very depressing scenario. In the entire survey area nearly 5% households' do not practice separatehand washing after defecation and only 2.8 % practice both hands washing with soap after defecation. The highestpercentage of households (43.3%) practices the washing of one hand with only water. However, a considerablepercentage (39%) of household wash one hands with ash/soil. (See-Table-C.6.2)
GHA
CoastalHilly & Stony AreaLWTASWTATSA
WashWithwaterHH%63.161.738.534.543.3
one handonly with Soap
HH%5.25.07.96.06,5
Table: C.6.2: Hand wash
with Ash/soil
HH%18.626.744.446.839.0
after defecationBoth handWithwaterHH%1.01,72.73.12.5
only with Soap
HH%1.01.73.43.32.8
with Ash/SOi!
HH%0.53.30.62.21.2
Do not Wash handseparately
HH%10.6002.43.94.7
Among the four geo-hydrological areas the situation of coastal area is gloomier. Even 11% households do not wash anyhand separately after defecation. Moreover, 63.1% households practice only washing of one hand with only water. Only1% washes both hands with soap. The situation of the hilly & Stony area is also not very encouraging one. Only 1.7 %households' members wash both hand with soap and 61.7% wash one hand with only water. In the LWTA & SWTAmembers of only 3.4% and 3.3% households wash both hand with soap respectively.
26

During survey to understand the awareness level of the members of households in respect of hand washing afterdefecation interviewers observed whether water & soap/Ash/Soil were kept near the latrine or not. The findings showthat only 8.4% households had water & soap/Ash/Soil near their latrines. (See Figure C.5)
Figure: C.5: Households Keep Ash/Soap/Water near latrine
100
80
60
40
20
I—
—
o L-""
Hand washina
4.2
Coastal
after cleanina the
2.2 ,V:4 .• : : ; • • ' • • ; •
Hilly & Stony
bottom of children
11.3
LWTA
9.4 8.4
SWTA TSA
In many culture the excreta of young children are considered safe and are thus not treated with the same hygienicconcern as the excreta of adult. This is totally wrong. Nevertheless, in respect of hand washing after defecation thesurvey findings shows that people of the survey area treats the children in the same way as they treat adult one.Survey finings show that only 3.8% households wash both hands with soap after cleaning the bottom of the child while6.6% wash one hand with soap. The majority of the households (55.4%) only wash one hand that also with only water.However, nearly 28% households' members wash one hand with ash/soil after cleaning the bottom of children.
Table: C.6.3 Hand wash after cleaninq the bottom of childrenGHA
Coastal
Hilly & Stony Area
LWTA
SWTA
TSA
Wash one hand
With only
water
HH%69.7
79.5
53.9
42,6
55.4
with Soap
HH%3.5008.87.26.6
with Ash/soil
HH%18.4
5.130.7
35.0
27.8
Both hand
With only
water
HH%1.02.60.02.71.2
with Soap
HH%5.02.64.62.33.8
with Ash/soi
HH%1.010.3
1.33.02.2
Do notWash handseparately
HH%1.5000.77.23.0
Disposal of domestic waste:
The safe management of human excreta and its related hygienic practice cannot ensure environmental sanitation if safemanagement of domestic waste along with industrial and other types waste is.not ensured. However, the surveyfindings reveal the unawareness of rural people in respect of disposal of domestic waste. According to survey majorityof household (53.5%) throw their domestic waste at any place and 10.2% households throw into water bodies. Only36.4% dispose the domestic waste into fixed place/hole. (See Figure C.6)
Figure: C.6: Disposal of domestic waste
55.4 515
36.4
10.2
• At a fixed place/hole
[ 3 Into the water bodies
[ 1 Any place
Coastal Hilly & StOfly LWTA SWTA ISA
27

Conclusion: The survey finding implicate that most of the surveyed villages demand all types of sanitation coverageintervention. Initially, software activities should be introduced to improve the awareness level of the people of theseareas particularly about the need and benefit of use of hygienic latrine as well as on hygienic practices. Secondly,steps should be taken to ensure suitable number of VSCs in all of the selected villages. Finally the use of hygieniclatrine by the inhabitants of the selected villages must be ensured.
28

Concluding Remarks & Recommendation
The people residing in the surveyed area are basically poor, academically backward and do not have minimum level ofaccess to confirmed safe water supply technology and environmental sanitation.
Nearly 54% households earn per day even less than one US $. The educational background of the people of thesurvey area is very depressing. Only 6.1% crossed 10th standard and 23.9% are illiterate. However, a considerablepercentage of respondents (65.3) were found aware about the factors responsible for diarrhoeal diseases but only35.8% have heard about the issue of arsenic contamination of water.
Even though a sizeable portion of the respondents has diarrhoeal disease related knowledge, still 22.1 % householdshave experienced diarrhoeal incidents within the 30 days preceding to field survey. This reveals the poor WatSansituation of the survey area. For 17710 households less than 2000 hygienic latrines are available and majority male,female and under five children category members of 13.0%, 13.3% and 6.2% use hygienic latrine respectively. Thefindings on hand washing habit also presents a very gloomy scenario. The majority members of only 1.1%, 2.8% and3.8 % households wash both hands with soap before meal, after defecation and after cleaning the bottom of thechildren respectively.
However, in respect to access to water and drinking water related habit the situation of the people living in the surveyarea present far better picture than the sanitation situation. On an average for 83, 54, 24 & 29 persons single functionalsafe point is available in the coastal, hilly &stony, LWTA & SWTA respectively. Nevertheless, this situation can notascribed as real because the presence of other minerals except arsenic, iron and salt are not considered in identifyingthe safe points. Moreover all those water points, which are not tested for arsenic contamination, are identified as safe.There is every possibility that a large number of the non-tested TW/pump are unsafe because 51% tested TW/pumpsare found as unsafe. Moreover the presence of unacceptable level of arsenic contamination in at least one TW/pump isconfirmed in 93% villages where at least one water point is tested for arsenic contamination.
The water-related habits of the people of the surveyed area also present better situation than sanitation related habits.Nearly, 81.4 % households collect water from safe TW/pump/plant for drinking purposes but only 31.8 %, 44.1%, 44.7%and 59% collect water from safe sources for gargling/ mouth washing/ bathing/ Uzu, washing raw vegetables/ fruit,utensil washing and cooking respectively.
All these findings implicate that the surveyed villages demand hardware as well as software intervention like awarenessprogram. The intervention sphere wise recommendations are as follows:
Awareness program:
The awareness program should emphasise on:• Use of safe water for domestic purposes other than drinking which is as important as the use for drinking purposes;• Danger of drinking/ consuming arsenic contaminated water;• Benefit of using alternative water supply technology like; PSF, AIRP, RWHS & Ring/ Dug well;• Boiling water before drinking if water is collected from sources other than TW/pump/plant;• Preserving water for domestic use only in the covered pot and regular cleaning of it;• Importance of using hygienic type latrine by all members of the household for all the time;• The use of a fixed place for defecation by under five children;• Importance of keeping the latrine clean;• Importance of proper washing of both hand with soap after defecation and washing the bottom of children & before
meal;• The disposal of domestic waste at a fixed hole;• Maintaining hygienic environment in the house and surrounding area;• Health benefit as well as economic benefit of using safe water & sanitation;

• Need of community level WatSan movement because mere maintenance of hygienic situation in the householddoes not ensure the improve health if hygienic environment in the entire area is not maintained;
• Importance of shouldering the responsibility of the management of safe water supply and environmental sanitationby the community
Hardware related interventions:
NGO Froum's WatSan hardware related intervention programs should emphasise on:• The testing of water quality of all TW/pump available in the selected villages before any other type interventions;• The installation of alternative water supply technologies like PSF/ RWHS /Ring/dug well based on the suitability for
the area;• Access to safe water point within 100 feet from the kitchen by every households;• The training of caretaker of the TW/pump/plant to ensure that they have enough skill to ensure proper
maintenance of TW/pump/plant;• Ensuring at least one hygienic latrine for every households• Upgrading the unhygienic latrine to hygienic one if it is technologically and financially viable;• If possible ensuring the existence of at least one VSC in every selected village.
30

Appendix-A

A. General InformationTable A. 1: Location of the Survey area. Population, Sample size end Dlrrhoearlal incidence
Hydro-geological
Area
Coastal
NGOFRegion
BarisalBarisalBarisal.BarisalCorniilaComiJIaComiilaFaridpurFaridpurFaridptjrKhulnaKhulnaKhulna
Coastal Area as a Whole
Hilly & StonyChittasongSylhet
Concerned PNGO
BIKALPA UNNAYAN KARMASUCHI (BUK1GRAMEEN JANO UNNYAN SONGSTHA (GJUS)PALLI PUNARGATHAN CLUB (PPC)ESKANDAR WELFARE FOUNDATION fEWFlSOCIETY FOR U^ew* AAD RURAi APVANCEMENT fS J RAJ
TRIEEOI WOMEN & SOCIAL DEVELOPMENT ASSOCiATlOV
UNNAYAN POR1KOLPONAY MANUSH [UPOMAISTARANKUR POLLY UNNAYAN KENDRA (APUK)SARIATPUR DEVELOPMENT SOCIETY (SDSiAGRADUT CLUBPROVATIUTTARAN
District
BarisalBholaJhalokatiPiroipurFeniLaxmipurNoakhaliGopalqoniMadarfpurShariatpurEaqerhatKhulnaSatkhira
INTEGRATED SOCIAL DEVELOPMENT EFFORT <!SDE>PALLI UNNAYAN KENDRA
Cox's BazarMoulvibazar
Hilly S Stony Area as a WholeLow
Low Area as a
Shallow
BograBoqraEloqraBograChitiaqonqCorniilaDhakaDhakaFaridpurJessoreJessoreJessore
WymensinaftMymensingnRajshahiRajshahiRaishahiRajstiahiSylhetDinajpurTansaiiwholeComillaDhakaDhakaDhakaDhakaFaridpurJessoreJessoreJessoreJessoreRangpurRanopurRanqpurRanopurRanopu:SylhetSylhetDinajpurDinajpurTangail
MOTHURA ISLAMIC SHAMAj KAl iYAN ?ARI SOD (MISKFj
SAW PAPflOGRAMME FOR PEOPLES DEVELOPMENT IPPDjAHEAD SOCIAL ORGANIZATION (ASOiPOLLI PROGOTI SANGSTHA (PPS)CHANGEBANGLADESH EXTENTOJ ELXJCA7K3N SERVICE |B£E£|GRAM BIKASH SHAYAK SANGSTHA (GBSSiMOHILA SAMAJ UNNYAN SANGSTHAflURAL ECONOMIC & SOCIAL WELFARE ORGANIZATION
ALOMANOB UNNYAN KENDHARAC-BangladeshADARSHA SAMAJ UHNYAN SONGSTHA (ASUS)COMMUNITY DEVELOPMENT ASSOCIATION (CDA)SRIZAN MOHILA SANGSTHA (SMS)PALLI KARMA SAHAYAK SANGSTHA (PKSS)JAGORANI JANO KALLYAN SANSSTHATRIBERTIGHT DEVELOPMENT COUNCILfTDC)SUCHONA SOMAJ KALLYAN SONGSTHAFRIENDS !N VIUAGE DEVELOPMENT BANGLADESH (FIVDBJ
UDBHABONSHEBA
Cev'ELOPMENT INITIATIVE FOR SOCIAL ADVANCEMENT <D-Sfl,\
SAMAJ-O-JATI GATHAN (SAJAG1GRAM KALLYAN SONGATHASOCK) ECONOMIC DEVELOPMENT AGENCY I'SEDAISOCIAL DEVELOPMENT ORGANIZATION ISDO)AMRA KAJ KORI (AKK!RURAL HE-CONSTRUCTION CENTRE(RRC)ACTION IN DEVELOPMENT {AID)ASSOCIATION FOR SOCIA^ ACTION & IMPROVEMENTPALLI DARIDRA KALLYAN SONGSTHAUDAYAN SWABOLOMBE SANGSTHA (USS)UDDOM SONGSTHA
SWAPNAN; R BAHUMUKHI SAMAJ KAUYAN SCNSSTHA (S8SKS
&ANDHAN BAKJMUKHI SAMAJIK UNWYAN SONS5THA (BBSUS|
ENDEAVOURANIRBAN ADARSHA SAMAJ KALYAN SAMITYDUDUMARI GRAM UNNAYAN SANGSTHA (DGUSJJANANEE SEBA SANGSTHAPROGRESS
BoqraNaoqaortSirajgonjJoypurhalChittaqonoB. BariaGazipurNorshinqdiRaibariChuadanqaKushtiaMeherpurKcslweqonjMvmensinqhNetrokonaSherpurNatoreNowabqonj
Ra shahiPabnaSunarnqonjD na:purTarpqail
ComillaDhakaMunsh qonjMa-iikc-onjNarayanqoniFaridpurJessoreJhanaidahMaquraNarailGa band haKuriqramLalmonirhatNilphamariRanqpurHobiconfSylhetPanchagorhThakurqaonJamalpur
Til ana
viehendiqonjSadarRazapurNazirpurDaqan BhuivanSadarSudha^amKotalsparaSadarSadarShoranhhotaDumuriaTala
Union
GabindapurCha'sarniya3uk:aqoanMatibhanga7 No. Ma\C Bhutya4 no Chat rohrta16 no. Char JabbarRamsieelKand-jaTulasarDhansagarMaqufaqhonaKhali Inaqar
ChokoriaKulaura
SadarSadarShahjadpurKhetlalChandanishSadarSreepurPolashPanqsaSadarKumarkhaliSadarBazitpurHaluaghatEadarNahtabariSinqraCrcapainawabqanCharghatSadarSadarBirarnpurMoohupur
ChandinaDhatnraiSreenagarGhiorSadarSadarJifcorgadraSadarSadarNarailSaghalaRajarhalKaliqoniJaldhakaKawniaChunaruqhatJokigohjSadarSadarSadar
FasfiiakhaliStiarifpur
NamuzaTilokpurPotazjaBarataraHashimpurSahilpurBorrniJinardiMajbariPadrrabilaSh:laidariAmjhupiKoylagGazirvitaKaliara GobraqaliKala-npurKolcrrRanihatiNimparaDogachhiPaschim PaqlaKhanpurDopakhaN
BorkoilSanoraBaraikhaliBaliakhoraKashipurNorth ChandGanqanandacurPadmakor7noMoghiSheikh HatiGuridahaChakEr PasharClrandraptrShoulmariKurshamari5 No.ShadekpurBfroshreeDhakkamaraSalandorShahbaipur
Sample village
WestTeluliaWesi CharsamaiyaSukfaqoanMa.nmudkandaSalaam NaqarChar RohJtaChar JabbarRajapurShreenalhdiDakkhin GoaldiRaiapurBelagramKhali Inaqar
Razar3il NoyaparaMonoharpur
BamonparaKadoyaGonqaprosadBarataraHashimpurHonnadiBekast^hara GararonCharparaKomorpurSubdiaMazhqramRaqhunathptirRahaylaGabrakhaliHalkundoleeGaqlajaniKiot-esh ChandrapurDhjTiihayatpurKnare-bariRachakaotapurSnatrurnardonBarkonaDopakhall
BorkoitDeonaiBaroiktialiPukhuriaNarashuodapurMonsijrabadAtliaAchinianaoarBara KhariSheikh MatiMatharparaChaki Pashar PaHiakNorth Battrish HazariKaziparaShibuShadekpurBorchaliaKaziparaBorunaqaonShahbaipur
Shallow Area as a wholeTolalSurvevArea ...';."•;"•-•.
Information ol theentire seleded
village
TolalHH
50O0447i 2 2
2 S3£54
425065060S784280
1298541544
1S5715O0365865276427290330
3500265324312300478650310500361257620437347268405
2700340350
t«67575412
1240315357357381265269TOO340393321484565261283505980900
392340426
Totalpopulation
150002227205013181464
22730520031704205144!645625172167
6994535002167566712762319'7502000
14700143915051433162933203250139243001867141437251925208212003105
1800016251000
7625834502072682013831851163926571254'•11435561355317016023200255216961682351055004500
54S12206482
Information of the portion oi the villageselected for WatSan program
Population
M
790642610591571730
1015757696624904669520
9121618788
1406572791750
10O0902557555596716523609638
1200680643987663815554
12031300720398
17472738694840637735764
1015602540745577915666395656747761550917673
1482742826
F
730602550556620698935714713574509557542
B30O
aa2726
16085817536507006335716656666814744925979O0629600963512567366901
1700509401
15991877710825596916689925534467683573900728645640721643596
10006C9
1448240381
<5
299338110171273299275219214243199169112
2921210295505125
78350300195311195181106154153157400558171375257160280375550159106
569S2161362421002003212651531071382C5230186290206228273330125130
4138132S0
Total
161915621270131814641727S225169016251441161213951174
20342171016093519127816221750200019301439150514331503115112541392250016671414232514321842120024793550138890S
3915918311540190713331651177422051294111416161355204516022120150216961682147620421412
3344796467
Household
Total
321300270293254323325309300260324300288
3837298304602276276290280336265324312275278270310310381257335325307268300312290311
69383253403403153573203152852693£1340300321325329261283285325327
62S317710
having<5
children162245
8096
152222189184151194152142
992088
1101032139978
25015016919777
12792
125109138200219156250214145
6575
26538
10433S2
20110216210O13019317112991
147185197175250176183180250105105
32328875
Information regarding incidence ofDiarrhoea withtn last one month
No. ofsurveyedsample
HH
32302729253233313028323029
386303060282829283427323.282827313138263933312730312935
6973234343236323233273234303233332628293333
6351780
HH%experien
ceddiarrhoe
a
3.16.711.113.828.021.969.732.310.025.015.646.727.624.240.046.743.317.932.10.03.6
44.125.912.535.521.47.118.522.66.57.93.8
20.512.16.53.7
23.36.5
10.358.117.653.114.732.46.3
38.940.69.40.0
37.012.55.910 037.560.639.426.917.910.315.26.1
23,822.1
% of populationexperienced
diarrhoea
5>
0.60.60.02.32.21.37.77.01.63.84.69.37.23.88.57.58.0£.28.10.00.06.32.01.36.03.51.02.32.21.42.20.02.42.90.60.03.21.71.6
15.53.1
11.13.46.70.75.93.70.80.06.54.20.61.8
10.78.07.32.81.42.41.40.64.23.S
<5
0.02.9
)5.04.5
21.145.052.323.515.814.3
0.037.521.420.415.828.621.96.30.00.05.9
34.527.326.722.735.7
7.125.022.2
0.05.64.3
15.45.65.6
11.112.9
0.04.3
43.813.150.0
0.08.34.6
25.033.3
7.70.0
40.020.012.5
9.118.832.627.316.716.73.8
16.75.9
18.617.1

Tabfe A .2: Principal earning source and yearly earning wise percentage
Hydra- geologicalArea
Coastal
Coastal Area as a
HBf i Stony
M l y i Stony Area
Low Area
Lour Area as a Wht
Shaltow Area
District
Barisal3holaJhatokaS^oipurFenfLaxmipurWsakhaSGopalgorJr/adaripurShariatourBaqertia!Khu'iaSatkniraVMeCox's BazarMrjutvibaza.'as a WholeBograNaoqaonSiajgonj^D'rDUftiatCliteqonqB EiariaGazicorNorshinodi
RajbaiiChuacanqaKush'iaMeierporJvs-anegoniM':rnensir>ghNe:rc'.cnaS-:=rpjrNa-areNbwatoori|FaishaiiPaonaSuramqoniCinair>JrTanqa:l
Sampa Village
* s ! TetjiiaiVe=* O-arsamaiyaSukiaaaanMa-rudkandaSalam NaqarCha- RcfiitaCha'JabbarRajapjrSnreer^tndiDaktehin GoaJdiRajapurBeiagramKhaiilnaoar
Rarar Bil NoyaparaMonsharpur
BamonparaKadoyaGoncjaprosadBarataraHashimpjrHoriryadiBekaahahara GararonCharparaKrynorpurSuodiaMazhgramRaqhunathpurRataylaGabrakhaliHatkundrjleeGaqlajaniMohesh C'lancrapurOhumihayatpurtoarerbariRaohakantapuiShatumardonBarkonaDopaihali
leC o r *DhateMiinsninonjMarikcwnf
NarajangKijFaricfcwrJessoreJhanaida^MaquraNaraiiSaibanonaKuriqramLalmonrrhaiNilpiiamariRanqpufHorxionj
SylhetPa-:naqorhTfiakuroacnJarrelpjr
Bor ir iDesna:6a.-o*-ialiPukhuriaNarasJiuncaDurVicisurabadAli.a£cmtanaqarBara KhariSheikh Hatf/atharparaCnakir Pashaf PathakNoit- Batlrish bazariKazipa'sShit,ShacekpurBorchaaa•vaziaaraBorunaaacT;Shahtijour
Sallow Area as a WholeTotal Survey Area
HHno.
2213032702932S43233253093002B0324330288
388729B30460227627629028033826532431227527827031G3103812573S53253u72S8300312290311
693332=-34C34G3 ' 54573203152352693213'030032132532S2612832S5325327
626317710
Pr raps l eamir>g sources
Agriculture
m%23312656
y-332765531952313838343636212441
Si35165549636321362626333C56'6347£8
163138372437515S41537043602923171753V9
•3
40323737
daily labour
HH1427273S13272535
919379
4230265043172;347
184166141632212257235713
1128293711423134303222
11611
3017
5
240
41574740223735316
o~2729
RsftreJatedac*ites
HK%31126425630C
10i
3. . T
0003005000108
a1
3000030052513
186
10700005031
00700033
Business*ccmractorship
HH%0
127
12119
127
16IS77
10103c
t211232
112S53644
11
S107
1023131
21!3695
271
126
a176
;317
4c
1145
IE1223
a9
9
Rickshaw.' va?Vpusrr-srt.1
bcfifpuiing icar driving
101295
1311121
21510141610365
? n
3418295
220651
3472
163
S740
121011
142
273T
178
1275
187
121111
c
1235500
1311
Working inWhefshouse
007003200
c1
33100000700232000030100
scn6261061
C0G30100u3
1G
C7230021
Potieiing
Km00000000000330000000000000000002000
c33000000
cG00000000
cG0080000
Black-smWng
HH%00300
00000001000u0000000000003000000101
c300000000I]
2310000000G00
GolrJ-smithing
HH%000000G301
0000000
c000000000000
cc0
030012
0CG30000002C13000000000
Service
S56
1013524
8131110
773S
1G4749
5941
111
3667
1396
16154
61319Ti
1420346
12223664b7
71
077
Others
Hrfii3
00
82
121
001123
5400002
C71£
0460000002O0
061
000000000
1300024L
1500022
Yearl
HH%12.50.0
11.10.0G.C8.0
53.029.00.00.03.20.00.08.5CO
39 317 J64 ;2.90.09.43.2
22.20.0
23.6C.C9.7
7.950.-3
7.70.03.20.0
13.36.5
17.2CO
12 53.12 3
23.40.00.03.10.C0.0
11.850.061.866.758.16.1
1;,600
53 6343.06.1
18.63.3
55.228.S14.4
earning wise HH % (in thousand taka j
10-15
HH%4C.63 j
22257.20.09.4
18.856.110.C10.70.0O.C
13316.11797.1
17J25.05.9
15.622.622.235.714851.G22 631226 941.09.1
25.829.646.7O.C3.1
22 622 4
9.40.05.9
3'.30.0
71.315.6CC7.4
25.032.426.725.660.613.8
3 317924 136.4
78.826.126.741.433.9217
15-20
HH%1881CG18527.60.0
29.118.86.5
16.732.19.7
16.713.816.835-721.413 f10.7
5.922.225.016.17.4
35.7
11.11S-416.15.37.7
28.215.212.90.0
13.39.7
24.11S.116.415 58.82.9
28.11 T.I15.656318 551915.62.93.39.7
21.221.923.136
13827.3
9.119.313.33.43.5
17.2
20-25
HH%9.4
40.022.217.226.012.5S.46.5
16-728 641.923.06.9
19.717.921.4
13.B0.0
11.829.618.832.314.87.1
14.83.2
29.034.27.77.7
45.545 240.713.36.5
24.138.721.021.955.926.56.32.83.1
15.645.518.53.12.9C.C3.33.33.1
26.90.0
20.715.200
13.616-70.0i i
17.6
25>
HH%13.816.725.937.!72.05B.C3.10.0
56.728.645.263^65.S38.=
28.61C.737.S0.0
73.537.03?.;25.i33.321.429.625 i22.618.47.7
15.430.;12.929.613.377.431.01S.427.750032435.334.436.1
6.312.56.1746 3CO3.36.59.1
15.646.22;.O
, _ 37.918.26.1
22.443.00.0
20.328,0

Table A.3: Educational Background
Hydro-geological Area
Coastal
District
BarisalBholaJhalokatiPirojpurFeniLaxmipurNoakhaliGopalgonjMadaripurShariatpurBagerhatKhulnaSatkhira
Sample village
West TetuliaWest ClwsamaiyaSuktagoanMahmudkandaSalam NaqarChar RohitaCharJabbarRajapurShreenalhdiDakkhin GoaldiRajapurBetagramKhalilnaqar
Coastal Area as a Whole
Hilly & StonyCox's BazarMoulvibazar
Razar Bil NoyaparaMonohapur
Hilly & Stony Area as a Whole
Low
BograNaogaonSirajqonjJoypurhalChiuagongB. BariaGazipurNorshingdiRajbariChuadangaKushtiaMeherpurKishoregonjMymonfiinqhNetrokonaShorpurNatoreNowabqoniRajshahiPabnaSunarriqonjDinajpurTangail
BamonparaKadoyaGongaprosadBaraiaraHashimpurHorinadiBekashahara Gararon
CharparaKomorpurSubdiaMazhgramRaghunathpurRahaylaGabrakhaliHatkundoleeGaglajaniMohe$h Chandrapur
DhumihayatpurKharerbariRadhakantapurShatrumardonBarkonaDopakhali
Low Area as a whole
Shallow
ComillaDhakaMunshigonjManikqorijNarayangonjFaridpurJessoreJhanaidahMaguraNarailGaibandhaKuriqramLalmonirhatNilphamariRangpurHobigonjSylhetPanchagorhThakurgaonJamalpur
BorkoitDeonaiBaroikhaliPukhuriaNarashundapurMonsurabadAtliaAchintanaqarBara KhariSheikh HatiMatharparaGhakir Pashar Pathak
North Baltrish Hazari
KaziparaShibuShadekpurBorchaliaKaziparaBorunagaonShahbaipur
Shallow area as a wholeTotal Survey Area
Total 5>population(Cal (ram10% HH)
166169144128137158207143129130174133125
194316-1161325115124159140222150
154149141101
129139139180107168140170118157172
127
142
3343171174194145238161121
153129
120167111
149125151144142123146180
30448655
Educational background of 5> (population wise %)
Illiterate
P 5>%25.318.97.66.316.115.816.429.411.619.28.630.123.217.531.123.027.114.821.023.96.45.926.05.219.567,421.835.726.622.313.946.752.4
20.035.652.227.918.124.626.0?4.020.79.8
19.34.6
44.123.120.923.320.029.318.020.138.443.027.147.923.619.941.725.423.9
Can signonly
P 5>%12.050.312.520.336.526.641.126.622.518.543.138.327.229.721.319.920.640.016.138.442.123.447.327.321.515.638.620.946.052.526.139.316.739.341.218.633.837.83B.635.232.621.137.420.643.424.B25.519.020.334.124.251.531.538.332.07.3
22.914.122.045.214.427.329.6
Upto 5thstandard
P%56.023.133.335.99.5
39.932.4
23.135.740.819.09.016.029.133.532.933.219.132.39.419.322.114.034.430.26.410.9S4.012.220.134.46.515.520,012.49.39.611.616.516.918.020.925.930.911.723.524.238.828.127.928.310.237.812.89.627.825.014.126.819.218.323.222.9
6th-10thstandard
P%4.87.7
36.12B.130.713.98.212.620.920.019.021.122.418.08.519.313.8
r 21.726.619.528.634.29.3
25.317.47.115.816.314.45.0
22.85.613.712.923.521.23.815.715.017.617.614.012.124.218.631.96.218.220.813.219.26.012.622.111.214.616.714,813.89.614.416.517.2
SSC/itsequivalent
P%0.60.08.37.0
2.91.91.04.23.10.84,01.58.03.11.22.51.81.72.4
4.42.17.72.05.24,02.15.00.80.7
0.02.20.00.64.32.46.80.65.28.7
4.23.35.83.46.73.410.10.00.0
2.60.8
5.01.80.0
1.33.24.64.20.07.3
4.18.3
4.03.4
HSC/itsequivalent
P%0.60.01.4
1.61.51.91.02.13.10.81.70.02.41.31.2
0.60.91.71.62.50.74.10.01.94.71.4
6.91.60.0
0.00.60.00.61.40.66.80.01.72.41.41.84.70.0
5.23.43.40.00.0
1.30.82.50.60.02.73.22.01.42.11.6
1.42.2
2.01.7
Graduation/its
equivalent
P%0.00.00.7
0.82.90.00.0
1.41.60.02.90.00.80.80.61.91.20.90.00.60.72.31.30.62.70.01.00.80.0
0.00.00.90.60.00.00.80.00.00.80.00.62.90.6
2.10.01.30.00.8
0.00.0
0.80.60.0
2.02.40.00.00.74.9
0.70.0
1.00.8
PostGraduation
/itsequivalent
P%0.60.00.00.00.00.0
0.00.71.60.01.70.00.00.40.6
0.00.30.00.01.30.00,00.00.00.0
o.o0.00.00.0
0.00.00.9
0.00.0
o.o0.80.00.00.00.00.10.60.00.50.0
0.40.00.00.0o.o0.00.0o.o0.00.00.70.70.00.0
0.00.6
0.20.2
Others
P%0.00.00.00.00.00.0
0.00.00.00.0
o.o0.00.00.01.80.00.90.00.00.00.00.50.00.00.00.00.00.00.0
0.00.00.0
0.00.00.0
0.00.00.00.00.00.00.0
i O 0 _0.00.0
0.0
o.o0.00.0o.o0.00.00.00.70.00.02.16.30.0
0.00.0
0.40.2

Table A.4: WatSan Knowledt
Hydro-
geological
Area
Coastal
District
Barisal
BholaJhalokati
PirojpurFeni
j_axmipurNoakhaliGopalgonj
Madaripur
Shariatpur
BagerhatKhulna
Satkhira
e
Sample Village
West Tetulia
West CharsamaiyaSuktagoan
MahmudkandaSalam Nagar
Char Rohita
CharJabbarRajapur
Shreenathdi
Dakkhin GoaldiRajapur
Betagram
KhalilnagarCoastal Area as a Whole
Hilly & StonyCox's Bazar
Moulvibazar
Hilly & Stony Area as a Who
Low
Bogra
Naogaon
SirajgonjJoypurhatChittagong
B. BariaGazipur
NorshingdRajbari
Chuadanga
Kushtia
MeherpurKishoregonj
MymensinghNetrokona
Sherpur
Natore
NowabgonjRajshahi
PabnaSunamgonj
DinajpurTangail
Razar Bil Noyapara
Monohapur
eBamonpara
KadoyaGongaprosad
BarataraHasliimpur
HorinadiBekashahara Gararon
CharparaKomorpur
Subdia
MazhgramRaghunathpur
Rahayla
GabrakhaliHatkundoleeGaylajani
Mohesh ChandrapurDhumihayatpur
KharerbariRadhakantapur
Shatrumardon
BarkonaDopakhali
Low Area as a whole
Shallow
ComillaDhakaMunshigonj
Manikgon
NarayangonjFaridpur
JessoreJhanaidahMagura
Narail
GaibandhaKurigram
LalmonirhatNilphamari
RangpurHobigonj
SylhetPanchagorh
Thakurgaon
Jamalpur
Borkoit
DeonaiBaroikhali
PukhuriaNaiashundapur
Monsurabad
Atlia
AchintanagarBara Khari
Sheikh Hati
Matharpara
Chakir Pashar PathakNorth Battrish Hazari
Kazipara
ShibuShadekpur
BorchaliaKazipara
Borunagaon
ShahbajpurShallow area as a whole
Total Survey Area
Diseases Occur (due to use of unsafe Water and improper Sanitation)Can Name the disease
Diarrhoea
HH%81.396.7
85.2
65.564.068.8
100.090.3
40.021.4
96.9
30.0
61.5
70.136.7
53.3
45.057.1
92.9100.0
92.961.8
96.375.0
58.157.146.4
11.5
35.5
51.678.9
23.113.2
66.780.6
59.383.3
61.3
93.154.862.9
93.8
76.597.1
81.325.0
56.390.3
87.988.9
50.039.4
90.0
100.018.2
39.453.8
32,055.2
97.066.7
67.0
65.3
Dysentery
HH%3.10.0
33.3
20.756.015.628.1
12.9
16.70.0
46.9
6.738.5
20.820.0
46.7
33.314.3
46.4100.057.1
41.233.3
21.932.3
28.6
7.1| _ 3.8
3.23.2
36.8
3.8, _ 5.3
21.248.4
25.936.7
3.220.7
19.426.6
62.529.4
61.8
46.916.7
3.19.7
21.244.4
6.36.166.7
12.518.2
15.23.84.0
41.4
66.718.2
27.9
26.1
Typhoid
HH%0.00.07.43.44,00.03.13.23.33.60.00.03.82.33.310.06.70.00.00.00.08.818.59.43.20.07.10.06.50.02.63.80.00.00.03.70.00.00.00.02.750.0
5.911.8
0.00.03.10.00.00.00.00.03.33.10.03.00.00.0
31.0
30.30.07.14,4
Jaundice
HH%3.10.07.40.04.00.03.10.03.30.00.00.00.01.63.36.75.00.00.00.00.00.03.76.30.03.60.00.00.00.02.60.00.09.10.00.00,00.06.90.01.4
25.05.98.80.00.03.10.03.00.00.00.06.70.00.03.00.00.010.3
3.00.03.52.3
s)
Skin Diseases
HH%0.00.011.13.40.0
31.36.30.00.00.00.0
26.7
11.57.013.3
16.7
15.03.6
28.662.10.014,7
29,6
6,322.6
0.010.7
3.86.53.215.8
0.00.03.0
64,518.5
23.30.013.8
0.014.2
87,529.4
58.8
3.155.6
0,019.4
18.2,_ 18.5
6.36.1
26.79.46.13.019.2
0.00.03.03.0
19.2
14.5
Worm
HH%0.00.011.1
0.00.00.00.0
29.0
0.00.00.00.03.83.40.00.00.00.014.317.20.05.9
22.2
0.06.50_0_0.00.03.20.018.4
0.0
_?JL_|15,2
6.511,1
3.30.06.93.26.031.3
0.023.5
6.32.80.00.00.00.00.06.13.30.00.00.00.00.017.2
3.00.04.84.8
Other
HH%0.00.00.00.00.00.00.00.00.00.00.00.00.00.03.30.01.70.00.00.00.02.90.00.00.00.00.00.00.00.00.00.00.00.00.00.00.00.00.00.00.10.00.00.00.00.00.00.00.00.00.00.00.00.00.00.00.00.00.00.00.00.00.1
Have no idea atall
HH%18.8
3.37.4
27.636.031.30.09.7
60.075.0
3.156.7
30.827.1
53.3
36.7
45.042.9
3.60.07.1
29.43.7
25.032.3
42.9
50.088.5
64.548.4
18.469.2
86.833.3
6,537.0
16.738.7
0.041.934.4
0.023.52.918,841.7
43,89.79.111.1
50.0
60.66.70.0
75.860.6
34.668.0
44.80.0
21.228.9
31.2
Know the HarmfulEffect of Drinking
ArsenicContaminated
Water
HH%15.626.7
48.1
44.875.018.8
29.00.0
26.77.1
25.0
66.751.7
32.5
3.343.3
23.328.6
21.458.6
39.334.477.8
46.941.9
28.635.7
11.1
29.09.7
78.9
11.5
17.960.667.7
48.1
3.332.321.4
12.9
36.054.8
35.364.7
40.6
61.1
15.671.9
62.533.3
21.9
2.930.0
18.8
21,245.5
42.321.4
13.863,6
45.538.7
35.8

B. Access to Safe Water Supply and Water related habits:
Table B 1.5: Water Supplying Hardware Status-TW and Pump (Point/Unit wise)
Hydra-geologicalArea
Ccastaf
Coastal Area as a W
Hilly S Starry
Hilly & Stony Area a
Low Area
Low Area as a W
StaffqwArea
DfeMct
BanalBholaJhalokatiPirojpurFeniLaxmipur
NsakhaliGopalCHH1
Madanpur
SKa-atp^rBaqerhatKhuina
Satkr-irahofe
Cox's BazaryoiAibazar
s a Whole
BograNaooaonSu2jfloni
JcvourhatChitlaqoneB. BariaGazipurND'ShirqdiBajba'iChuaclapqaKushtiaMeherpurKishoreqonfWymensinqhNetrc<onaSherpur
NatoreNowabqonflaishahi
PabnaSur^amcwniDinajpurTangailholeCorrillaDhakaMunshiqonManikqonNarav'anqo.ncaridpL-rJessoreJhanaidah
Mas-LiraNarailGaibarcdhaKurtpramLalmonirhal
Nilphama.nRanqpurHobiqonjSylhe!Paichaqortr^ la^rc.sonJama'our
Sample Village
West Telufa
West CnarsamaivaSjktacoan
fviahm.-dkancaS=la- Masar
CharRohitaChar Jatoar
Ra,apjrShreenattitfi
Dakkhin GoaldiRajapLT
BeiapramKhali: naqar
Fteza-1 3il Noyapara"onoharpur
iamonoaraKadova
GonqaprosadBarataraHastiimpur
HoJinad:
BekasrararaGararonCharpsraKomcpurSubdiaMazhqram
RaqhmairpurRahaylaGabrakhaliHatkurdoleeSaqlaia.ii
*.1ohesh ChandrapurOhumihavatpirKharertari
RadhakantapurShairumardonBarkonaDcpafcnali
BorkoilDeonai
BaroikhaliPiAiLria
Narashundapur.!jr=jrab-ada.tlia
Achntanagar3a'a KnaiiSheikh Maliniatia'para
Chakir Pasha- Paihak
J o n Battrish HajariKaziparaSnibuSfiadexpur
BorchaliaKaziparaBo'unaqaonShahoaiPL-r
Sallow Area as a WtioJe
Total Survey Area
Sa/kmTWiho-STW)
Functional
23
6345027148271057148497524696122
m•29
',5854
500725:
14Sso13112
36271191151366615212
16489
2059
74125133I K
9010712S
157563641
77213397714
229563
1656
4310
O/sfjnc:ional
No.408
14j l
09
'53400
1S7349621841
20
ei5536i
6305531
00319201432212311406145270
02231510
1013S3
Comerswn Pu:r D [sami
deep-set)
Furctonal
No.C000
a00000000D0000000006200a0a000o000008070000000000rj00o00000000
70
Dysfunctional
Mo.00000000
00
D
G00
0
00
00
000015000000000rj
0D000015000000000000000000aaa15
Tara (deep seijpunp
Furctonal
Nc3333•30000000000221
4
2
3012
402
a051303000000390
•o00000000000000000181859
Dysfunctonal
No.350t)000000000000D22420021001
001030000C112001a00000o000000000023
23
DeepTW
Functional
No.S153C2
1514913
10033
S6
000
000
01
000000000000000220503I15000rj
rj0
0000
aa ,aaa11102
DysfiincEiona'
Mo.01
1
a00000000020000000002000100000000c0
cc3accaaaaaaaaaaaa1aa00iG
Other TW.'Pump
Fureton-al
No.0
a0aC00
aaaaaaaaa0a0a00000700000000000000700
000
0000
00
030rj141
000
a4552
Dysfunctional
Mo-0000000000000000000000000200000060000000B000000orj
00
oo3aaaaa0a311
Total TWSPump
Functional
No.2916113452172123968105814653552481001231041331615551647656151641921737X119118140751521417489
2197
7=128105110951D7
131126
56964177
51331116
113
29581
17424S24
9455716310091619795Z9299879543668695%8887
93739392969197
8597S68998
9910010082M8^92
97
9890979988rco95SO95959286iBO98736417500989491
Dysfunctional
No-413143102153405
89316
52.20^52S84
24657
663
514
3200320211S123123i
140614527802381512
108440
%12E
452937093335aa1
13
613414
5412137277
aA
93
153141121
00IS1313g321031120523E5a14022736S302&9

Table B1.2 Water Supply Hardware Status-plant (Point/Unit wise)
Hydro-geological Area
^oasta!
Coastal Area as a Whole
Hilly S Stony
H i l l y * Stony Area ass Whole
Low A tea
Low Area as a Whole
Shallow Area
Qcjricl
iadsalHiolalhalokatiPirojpurFeniLaxmipurNoaktialiGopalgonjMadaiipurShariatpurBaqerfia!KnulnaSaikffina
Zox's Bazardojivibazar
BooraMaoqaonSirajgonjJoypurriatCWagcrgB.BariaGazipurNcrshirKfdiRajbariChuadanqaKushtiaMetierpurKistiofegonjrVtymensinghNshokonaSherpurNatoreMcwabponjRajshahiPabnaSunamgonjDi.najpurTar pail
ConillaD.iskaMunshigonjManiktjonjNarayanoorjFaridpurJess™J.ianaidahMaguraNarailGarbandhaKuriqramLalmonirhatNiiphamariRartgptirHobigonjSylhetPanchagortiThakurgaonJamalpur
Sample Village
WestTetuliaWest ChaisamaiyaSuktaqoanWaJimudka-idaSalam NagarCha-BohitaCha.'JabtarRajapujShieenathdiOakkhin GoaMiRajapurtetagramKhalilnagar
Razar Bil NoyapafaMonoharpur
SamonparaKadoyaGongaprosadBaraiaraHasNrnpufHonnadiBs-ashahara Ga'aronCharparaKomorpurSubdiaMazhgramRaqhunainpuiHadaylaGabrakhaliHatkundoleeGaglajaniMorssh ChandrarxjrDrumnayatpurKnars'bariRacha«antaourEharrynardonBarkor-aDopakhali
BorkoilDeonaiBaroiWianPukhuriaNaiashundapurMonsu/abadAfyAciintanaqarBara <hariSheik-i HatiMatharparaChakir Pasta PalhakNorth Batlrish HazatiKaziparaShibuShadekpu;BcrchaliaKajiparaBoruraqaonShahbsjpur
Sallow Area as a WlioleTotaJ Surrey Ama
Rinp/Xg Well
FuncGonaF
fto.00000000000
01000000000000010000004900001400000020000000000]
00318
Dystinciional
No-00000C0000000000000000000010000000100000200000000000000000000D2
RWHS
Functional
No.10000000000001000000000000000000000000000000000070000000D000078
Dysfunctional
No.00000000000000000000000000000000000000000000000000000000000000
a
AIRP
Functional
No.0000000000000000D00200000000I0000000000030000000000000000000003
Dysfunctional
Ha.0
a00000000000D00D000000000a0000000000000
a0000000000000000000000
PSF
Functional
No.000000000000000000000000000000000000000000000000200000000000022
Dysfunctional
No.000000000000000000000000000000000000000000000000000000000000000
Total Plant
Functional
No.100000000001020000020000000110000049000017000000290000000001001231
%100000000000000
1000000000 .000000
10010000000BO1000000«900000000000000000
10000
10094
Dysfuncftofial
No.0000000000010D00
a004000000f00000001000002000000218000000000000
a2
It00000000000000000000000000
10000000002000000110000000000000000000006

Table B 2.1: Coll
Hydro-geological Area
Coastal
Coastal Area as a Whole
H'llylStony
Hii lyiSionyAreaasaV
Low Area
Low Area as a Whole
Snallow Area
set on Sourci
Distrct •
Ba.nsal
JhaiokaiiPiropjrrenLajmipurNoakttalrGopalgonjMadanpurSKa.'iatourBagerhatKhu naSatkhlra
Ccxs BazarMou vioazar
VhdeBograNaogacnSirajgonJoypur Id
ChittaqonqB. EJana
Gaz ourNorshingdiRaibaHChuadangaKusitiaMeferpurKishcregonjMynens'nqhNetrokonaSherpurNatore
flaji laH~' '1hi
PaonaSunamqoniDinajpurTanga
ComillaDhakaMunshMan
gon|kgu i
Narayangonj-ardpurJessoreJhar aidahMaguraNararGaibar dhaKuiqramLalrr onimatNilphaman
SylhetPanchagcrh
JamalpurSallow Area as a Whole
i of the Existing
Sample Village
West Telulla
SiktagoanVanrudkanda^alarn NaqarChar HoniJaChar JabbarRaaDurSnreenalhrjiDakkhin GoakSRajaptirBetagramKnalilnaqar
Razar Bil NoyaparaMononarpur
BamonparaKadoyaGonqaprosadBarataraHashimpurHorinadiESekashahara GsraronC'fiarparaKomorpurSibdiaMazngramHaghunathpurHahaylaGabrakriaBHatkurxloteeGaqlajaniMohesh Chandrapu'Dhumihava'purKharerbariKadhakaniapu;ShatrumardontiaftonaLtopakhali
BorkoitDewiaiBaroikhaliPukhuriaNarasbundapurMonsurahadAiliaAchintanaqarBara KhanSheikh HatiMatba'paraChakir Hasbar HaitiakNorth BatsnsbHazariKaspara
irfisdekpurBe-=haiiaKaz para
Shihbajpur
Total Survey Area
Water Supply Hard ware-Tube wel(/pump(s) (Poirrt/Unit wise}
Wa.-kEt
No.IB
63672
081
7363
0• 40
1414S1
44BO
12412793
103
1744731
56042
143
47150
4~332d
124110
£-3147
0161101
195464
1161019434
102124936189
672120
00
u
6215124047
%67
50758S
089
38634
0653579SO•34
S39189799676
57160767B928096
279263
10093
3197
0
saS339B491
BeB49264937587SB
0803161
000
98
it,66
S TW Ino6)Govt
No
212921
161112u
158
952
11
1312112686
184
151212117
110
1203
65
1522
r232
106587
13
4""51
912
~~717
92115
0
532
%26
132511
10011551316i)
A5
IS4
12
9a
1i20
41033
4in22
a194
I'St
3801
aa
14012ti
11135
47an3
25131216*id)1915
16695
—-0
1111
NGO-No.
2
5000060
6040601
100040102
601000
dddn
40
40
44010
10
c6t00
c40C0
dd2
d
1?28
%
1
b00000000a
410
1100
c6c203002000
400rj
00000
9c109C0C
c0
c30££
bc
12
0
11
Ofler NGONo.
d
60000
121
6030
2293
151010940000
60
00
600
4d0•3
11624900
6
00000cc
7
1
d
13696
6
380000
i i1
d05
44
16
38i01
c1570Q000000
60
c0
cc0
1
3•S
££54£££00C
2'
uoC
222
Conversion
Ma'kei
No.0
00000
" dd00000
06000
0000
7700
040
c0000y-
0
c060
" S30
d0d£
4£
"" "t40000
c000
0rj
85
%
b
—Buuuuuu00
o40
uI)0I
uuuuu
100000
4LlLlL>0
uu
LI0
100
u140
u00000£L>
4L>L>UI)U
ULI
I
010C
GovtNo.
4
"~B0
000u0000000040rj
c00000000000000
0c00
c00
c0000
Vr
0££44600
cI0c
%4
6uuuuuuu000<JG0
4L>I)UUIUUU
d000d(I
4LlLl
0K
bV0
00
uuuL
0
cd•3
cL>I)I)
6l)
^
i0
c
NGO-
No.0
00000000000D0000000
c~S
00000000
-~TS00
s00
600
c00000I .
0000
0£0
00
—50
• ~ - B
1
%0
0000U
611
uuuuIIuub00Ll(J
o44I)I'
uuuuuuu0
—gIJ
4444C'Cl11
uuucuuI
u000
(J
4Ll
—f i
It
4Ci
Other NGO
No.0
500000000d
0
04000000000000000
400
0
cc00
b00000
4£40G00
00
00
0
0rj(
0
—a4000606000030
004440600006000d00g406b0
000
c0Lu
0£0
46Cific01
Taia
MarVel
No.0
00000
40
bb00000
b0000
4
400000t00
00
—JJ—$
440
4
cD0000000000
cd
00
—jj£1
~5i
%0
—5d
oI)I)
uuuuuu(1uubu0LlI)I)
46uuuuu
2U
u00Ll
—JJ• B
0
6Ii
1.7iiI000LUUt0Ll
£0
D
6u
u9I
Govt
No.0
—o00
c0000000D
022366
004oU290401330"00
c
530
0000
c44c000
cc00
202i76
%
4—5
llU
u000000
d0I)
164194luuiuuluu1do
uu
130130
0luU1 »
LlbL>L>
33luului
Quu0
10013090
U100
00
a£L>OI)UUUU
UU
u
1iRJ
14092
NGOF
No.
4
~B0
00000
d00
It00
-"B00000
0\00
dd
4002
100
0
0000
4d
d000
ibD00000u
0
0
0
bA
%0
40
u11
uuuuIJ
u0
I)uLl
4ill
uuI
106u0000(j
L>
iuu33L>II
• -BI,
u00
70000I
4
£LlII
4uII
uuI
1.
bi
Cther NGO
No.0
00d00
40
60
000
00
b00
000400
600000100fj
400
40
000000
c00
c00
04
4b0—50
ti
%4
5000000000
4000t0000000
0d0
4000
3300Q-
000002d
444oo40000000
000
41
Martel
No.
d
o01000
6000
00400000000
6000dd
00
—[J—5
00000032
d5
d0
£0
c>00
00
0
1011
%0
~z00
ILl
4I)
6uu61
uu000
u4u44u6u0u0
uo00
—fj4IJ
44L>
4u
luuluu
uIOL
u00000
d(J
4
00l l
—•fi
I)
8310
Deep™So1."
No.4
4
029
149
1210000
7900
t00000
d20001000
tl00
002207000
00
cfj0000
00
10d—502
%36
1000
1006d
lOfl144
92.311&LI
Ll
06
90000000000
140u44
164I)£)0
600
1—i0
100
1404
S7JII
4£1
164L>
5u00000
d0
100
dLl
—5
16.6781
NGQF
No.1
—5o40000000010
4400
460000000
u00000
—5I—ti
0600
40000
u0
000
00
000
—ET
ccc01
%
54
—o"0
6u0
u00
00
d10Ll
40
u0
uuuu00000
0d
41)
0—fi-"-fl
uuuu00
u0000(t
400L>0
uu
uu0
0
b1
Other NGO
Ho.0
000500100
o470
bib660i00
dddd000
400
——500000100000
00D
060000
0
dd
o4s
b
if00
330
b8000
ds00
00000
100
000
babQ00
00
1 B0000
130
ac000
6000
dd00
50050
97

Table B 2Hydirj-
geo»gjcal
Area
Joaslal
.2: Collection Source of the Existing Water Supply Hardware-Plant(s) (Point/Unit wise
DisWd
BarisalBho aJhaokal!->iroFerLaxmirjjr
Gopa°gonjNtadanpurSharialpuiBagertiatKhulnaSatkWra
1 Cox's Baza/Hl'ly &. Siony JMoulvibazar
Low Area
Low Area as
aograNaoqaonSJrajqonjJoypurhatUhiTiaqonqi. tiariaGazipurNorshinqdiRajbanCnuaaanga
Menerpur
Mymensinah
Sherpur
^wabqonj.HaishaJiiPabna3ur>3TigoniDiraipu/: anoailWhole
CC-TII la
Dha^aMunshigoniManikccni•varayanqonjFandpu-
JnanaicahV'aqura\ a railGaiDarchaKung;amLalmonirhatMlDhamanPanqpurKob qonj
Panchaqorh. haku-rqaonJa-nalpuf
Total Survey Area
Sample Village
West 1 etidaWest CharsamaiyaSuktaqoanMahmudkandaSalam Naga*Ohar HohiSa
RajaourShreenathdiDakkhm UoalcSRajapurBeraqra.TiKiiahmagar
Razar Bil NoyaparaMonciarpur
BamonDaraKadoyaGonqapfosadBarataraHasniraurHovinadiBekashahaia UsraronOiarparaKomorpurSubdia
Faq.-iunathpur
Gabrakhali
Uaolaiani
UhumihayalpurKharerbariRadJiakantepufShatrumardonBaikonaDopakhali
BoikoitDeonaiBatrikhaliKuWiunaNarashundapurMonsirrabsdAtliaAchinianaqarBara KhanSheikti HatiMa:harparaChakir Pashar PathakNorlh Bartrisn HazariKaziparaShibuShadetourBcrchaliaKazparaBorunagaonShahba|pur
RWHS
Market
No.000000
00
600
to
toto
tototototo0
b001}
B
B
B
— B000
00000IJ
0000000
0
00
00000
0
%
to0
totototo
0
aa0
600
00
000000
6to
5
5
—o—if
0
a00G0G-G1
a\i000
aa0
aaaaaaaa0
aa
Govt
No.00000
0
00
6toto6b0
aa00000000
B
—o
—o
B0
60
toto0000
Q0000000000000000
0
to000
01)
tlt l
bI)0
60
6
000000
00
u0
0
u
u
tl0
bb0
a00t)
ati0
ati(j
abbatia0ti
a0
a0
0
NGOF
No.1
aD000
000
000
0
toto0
tototototoaaa5
5
if
0000
b00000U00
0700
fl0
0000
B0
0
s
%1G0
00000
aaaaa6
0
d
000
0000000
5
5
5
000
0toto0tototototototo
1C-0
0tototo
tototototo0to
100
OhetHGO
No.
aaarj
a0
0
0000
6
0
B
00IJ
u0000
0
—a—o
—o
—o0
a0
ato0333D3
totototo0
toto
tototo•3
a0
a
%00000
0
000
00
to0
6
0
tototototo0
tototo
a"
s
if
aaaaa0-3
aat>
aaa•3
aaaa
a•3
aaaaa
AIAP
Market
No.
aaaaa0
000
00
fl0
0
00000000IJ
u
u
o
o
g000
000000i j
000
uuu
0
00u000
0
%
aaaai)
a00i)
00
b
0
0
000
000000'J
0
0
u
u0
u00000000000000
u0
000000
0
Goal
No.000000
000000
0
u
000
0000000
0
0
0
000
000000000IJ
0000IJ
0
000
"B0
c0
%
u0
u0
uu
00
u000
0IJ
0
u000000
u0
IJ
IJ
ou0
00000
utou000
00
u0u00IJ
00
u0
u0
ll
NGOF
No.00000
0
000000
00
002
to0IJ
IJ
000
1
0
0
0000
003000
b00
000L)
6000000000
3
I)
aI)
atl
aaaI)
000
0
0
0D
1000Li0ll0LI0
1UU
—B
—B
—B06Ll0t)
100t)0
aLl0
a0
a(J
oaa0
(J
a
a'J0(J
aItXJ
Other N'GO
No.0
aaaa5
aaaaa• "
aaG0
aaaaa-3
aa
—if
0
a
—ifaaa03
aaaa(j
0000000000000000
0
%000
btob
to0
totototo
toto
0
tototo0000u0
0
0
IJ
uto000000
000000000
a0aaaaaaaaa
PSF
Private
No000000
0
00u00
—o0
B
00
b000000
0
•5
B
B000
b0u0
a00aa•i
toto0
to0
0000000
0
%
u0
u0
uu
u00IJ00
00
ubu0
uuu0
uLl
—B
o6
—BLl
bu0L-0I)
aati0(J00'J00u00
0
uu
uu
11
Gcvt
No.0
u0000
0
u0
u0b
tob
00000
00000
0
B
B
— oc00C1
00
oaantoatototo000000
00000
0
%000000
0
00000
0
toto00
to000000
u
—B
—B
—B0
b000000
oI'
ca0
a0
ato0000
• 0
0000
0
NGOF
No.O
aaaaaaaaaa• j
aaaaaaaaa000
0
—5
—B
—B0000u00
00Ll00
020
aaQ
0
tototo000
2
%
aG
nti
at;
auaV>j
to
j
a•j
•j
•J
•j
•j
J•j
u
o
o—o
uuu0u0
uUt)
IDU
tun(JtJ
a'J00'J0u0IJ
IJ
\w
Other NGO
Mo.
a
aaa0
to00
a00
—o0
00
toto00
tototo0
—B
—B
—B
—B0
60
000
aaaaaaa0000
uuL)t)LJL!LI
ll
%0000
d0
0L)
1I)L)
b
b0
B
TfcGG0
3
a
•3
0
0
0000000u00LJ00GGGL:33
•3
0a
a0tototo
0
F»D WellPrivate
No.0
00060
0
~bba
aaaaaa0
a0000
0
B
—B
D
00
b0
150
baaaa00
to0
o|o
U
u0u1LlV
\1
%t)
ai)Li
5t)
t)I)
atl
IWJ
a—g
au0u0
uuLJU0
IUU
0
o
0
~mIUU
0t)0
aaa0•3
a0
uu0u0
6uuul)LlI)
IUULltl
K
Govt
No.0aataaacg
i.
0
00
000
00
c60
b0
—B
0
aaaaaa0i•300
u0000000000aa0
aaai
%LlLi
t>t
aaat
aa
00
0
L
L
0cuu0uL)
U
0
6I)
ao33ti'JU(JUUUU
u0
u00
U
L>
t l
at)tltlt)
1
NGOF
No.0
c0
aa
a0
cfj
c0
000c0c00b0
D
D
aaaaaa000000000000
6000aaaaaa0
%i)tttcatit
a0
0u
I.
b
LU0LlLl
cLlG1)O
a1
"Tf
—if
—iftl
touu0
tluuuuubi)0
uti
atiaaaati(j
ti
6
Other NGO
No.0
c0000
0a((
r
0
c000000
c00
b
b
aafj
00000uu00002000
b0aaaaa0
ato
2
%0
c0000
0{
60{
{
j
atototo00
c0000
—B
• a
1—if
r aaaaa00000u00
100
000
baaaaaa0
a0
10

Table B.3: Ownership pattern of the Existing Water Supply Hardware- TW/Pump/plant (Point/Unit wise)
Hydro-geological Area
Coastal
District
Barisal
Bhola
jhaiokatiPirojpur
Feni
Laxmipur
Noakhali
Gopalqonj
Madaripur
Shariatpur
Baqerhat
Khulna
Satkhira
Sample Village
West Tetulia
West Charsamaiya
Sjktagoan
Mahmudkanda
Salam Nagar
Char Rohita
Char Jabbar
Rajapur
Shreenathdi
Dakkhin Goaldi
Rajapur
BetagramKhalilnaqar
Coastal Area as a Whole
Hilly & StonyCox's BazarMoulvi bazar
Razar Bil Noyapara
Monoharpur
Hilly & Stony Area as a Whole
Low Area
BoqraNaoqaon
Sirajgoni
Joypurhat
Chittagong
B. Baria
Qazipur
Norshinqdi
Rajbari
ChuadangaKushtia
MeherpurKishorequnjMymensingh
Netrokona
Sherpur
NatoreNowabgonj
Rajshahi
Pabna
Sunamgonj
Dinajpur
Tangail
BamonparaKadoya
Gonqaprosad
BarataraHashimpur
HorinadiBekashahara Gararon
CharparaKomorpur
Subdia
MazhqramRaqhunathpur
RahaylaGabrakhali
HatkundoleeGaqlajaniMohesh Chandrapur
DhumihayatpurKharerbari
Radhakanlapur
Shalruniardon
Barkona
DopakhaliLow Area as a Whole
Shallow Area
ComillaDhaka
MunshigonjManikqonjNarayangon]
Faridpur
JessoreJhanaidahMagura
NarailGaibandha
Kurigram
LalmonirhatNilphamari
Rangpur
Hobigonj
Sylhet
PanchagorhThakurgaon
Jamalpur
Borkoit
Deonai
BaroikhaliPukhuriaNarashundapur
MonsurabadAtliaAchintanaqar
Bara Khari
Sheikh Hati
Matharpara
Chakir Pashar Pathak
North Battrish Hazari
Kazipara
Shibu
ShadekpurBorchalia
Kazipara
Borunagaon
ShahbajpurSallow Area as a Whole
Total Survey Area
Private
Owned by single household
No.18143661181
545104112940544671111279310017047317858511382415353314130110112691470
169101
1960
4811910194828611884416532424020108101
28962
14333909
%5562075736353556006587608069738985729375568971818734772587409891799297087928263918683857190645964745068619690698757777
Owned by multiple
householdNo.0040110001912001258013130030002206233700 _j6002500000
10416020516081614025140000000
116291
%0020013000191400890139002000220433190017001800000421020513 .06231403024000000066
Community
No.15151091115153520180228
1939152491733131623021129195152 1
141050117257
2641181114717113791111113103102215321245726
%4588501913886592202103552916151661524725420261962737554010401
1001361114691271482813112613530391100831
251314
Owned by institution
No.0123010254000182247020018105430312110640026014352223411062320024056138
%061060605550003423501002910362083290830023133422226110739200111033
Total
TW/Pump/
Plant
3317204883172338988506314967455971521431101381836355888263158701982038351331211427515217194110
2388
76131117113961211311327010143845933113112218
29683
1850
5064

Table B.4: Distance between kitchen and the TW/Pump/plant from where HH collect water for domestic purposes (feet)
Hydro-geological
Area
Coastal
District
BarisalBholaJhalokatiPirojpurFeniLaxmipurNoakhaliGopalgonjMadaripurShariatpiirBagerhatKhulnaSatkhira
Sample Village
West TetuliaWest Charsamaiya
SuktagoanMahmudkandaSalam NagarChar RohitaChar JabbarRajapurShreenathdiDakkhin GoaldiRajapurBetagramKhalilnagar
Coastal Area as a Whole
Hilly & StonyCox's BazarMoulvibazar
Razar Bil Noyapara
MonohapurHilly & Stony Area as a Whole
Low
BograNaogaonSirajgonjJoypurhatChittagongB. BariaGazipurNorshingdiRajbariChuadangaKushtiaMeherpurKishoregonjMymensinqhNetrokonaSherpurNatoreNowabgonjRajshahiPabnaSunamgonjDinajpurTangail
BamonparaKadoyaGongaprosadBarataraHashimpurHorinadiBakashahara Gararon
CharparaKomorpurSubdiaMazhgramRaqhunathpurRahaylaGabrakhaliHatkundoleeGaglajaniMohesh Chandrapur
DhumihayatpurKharerbariRadhakantapurShatrumardonBarkonaDopakhali
Low Area as a whole
Shallow
ComillaDhakaMunshigonjManikqonjNarayanqoniFaridpurJessoreJhanaidahMaquraNarailGaibandhaKurigramLalmonirhatNilphamariRangpurHobiqonjSylhetPanchaqorhThakurqaonJamalpur
BorkoitDeonaiBaroikhaliPukhuriaNarashundapurMonsurabadAtliaAchintanagarBara KhariSheikh HatiMatharparaCtiakir Pashar Pslhak
North BattrisH Hazarl
KaziparaShibuShadekpurBorchaliaKaziparaBorunaqaonShahbajpur
Shallow area as a wholeTotal Survey Area
TotalSample
HH
32302728253233243028030293482930592828282834273228282827313131263833302330312631
6773234343215313233273234303127322620293333
5971681
Distance between kitchen and the TW/Pump/planl from where HH collect water for domestic purposes(feet)
1-50
HH%9.46.714.857.188.028.124.237.550.078.60.0
43.389.742.848.333.340.771.478.696.4100.070.655.650.067.953.696.470.496.822.638.723.192.157.653.352.286.745.276.967.766.565.676.532.446.926.767.787.584.888.956.373.580.0100.081.593.830.855.086.2100.054.570.962.2
51-100
HH%9.416.73.717.94.015.63.016.710.03.60.016.710.310.610.33.36.8
21.414.33.60.017.618.59.43.6
21.43.60.03.219.425.80.02.618.220.026.110.012.911.519.412.36.38.88.818.820.016.112.56.13.715.620.613.30.07.43.119.25.06.90.0
21.210.611.1
101-150
HH%0.00.00.03.64.09.43.08.36.77.10.06.70.04.06.96.76.80.03.60.00.05.911.13.10.014.30.03.70.06.56.53.82.66.1
20.013.00.0
22.63.86.55.812.55.911.83.16.73.20.06.10.00.00.03.30.00.03.119.215.03.40,00.04.44.9
151-200
HH%3.116.73.710.70.06.36.18.36.70.00.00.00.05.210.33.36.83.60.00.00.00.00.06.33.610.70.014.80.012.96.5
23.10.03.03.34.33.312.97.70.04.93.15.92.99.40.03.20.00.03.712.52.93.30.03.70.03.810.00.00.09.13.74.6
201-250
HH%0.03.30.03.64.09.43.00.00.03.60.00.00.02.30,00.00.03.60.00.00.00.03.73.13.60.00.00.00.00.00.00.02.63.00.00.00.03.20.00.01.00.00.00.09.40.06.50.00.00.03.10.00.00.00.00.03.85.03.40.00.01.51.4
251-300
HH%0.06.77.43.60.00.09.10.06.73.60.06.70.03.710.36.78.50.00.00.00.00.07.412.510.70.00.00.00.03.216.134.60.06.10.00.00.00.00.03.24.03.10.05.93.113.33.20.00.03.73.12.90.00.07.40.015.410.00.00.09.13.53.9
300+
HH%78.150.070.4
i 3 i > _0.0
31.351.529.220.03.60.0
26.70.0
31.313.846.730.50.03.60.00.05.93.715.610.70.00.011.10.035.56.515.40.06.13.34.30.03.20.03.25.69.42.938.29.4
33.30.00.03.00.09.40.00.00.00.00.07.70.00.00.06.15.511.8
Highest
HH%1500900026805002101200160012001000500
02500
7590001200120012002504006050
600350100050020070
100065600500500250500500
2000200400200900
200010005002000144050030070500300120030020015
30015080030025015
50020009000
Lowest
HH%3030101471010101010055033636525510108510220101012455235523105101551010105
203283
20353320

Table B,5: Safe Water Poini Status (Point/Unit wise)
Hydro^ectogcal
Area
Coastal
Coastal Ares as
Hilly S Stony
Hll jS Stony Are
V
Low Area
Low Area as a Wt
Shallow Area
District
Barisal
Bhola
Jha.okati
^'ojpur
Laxmipur
Noakhali
Gopalcjoni
Madaripur
Shariaspur
Bagerhat
Khulna
Satkhira
Whole
Cox's Bazar
Moufvibazar
a as a Whole
Boqra
Naogaon
Siiajgoni
Joypumat
Chittaqonq
B Bare
jazlpurhflorshinodi
Raibari
Chuadanga
Ki.s-rSa
Meherpur
Kishoreqoni
dvrrensinc^i
Netrokona
Sterpur
Natore
Nowarxpnf
Rajsha-,1
Patina
Sunamqoni
Dinafpur
Tangail
wleComilla
Dhaka
AjnshkMnj
Manikgonj
Narayanceni
Faridpyr
Jessore
Jhanaidah
Magura
Narail
Gatandha
Kurigram
Lalmonrhat
Niphamari
flanspur
toWgoii
Sythel
Pancbaqorri
Thakjrqaon
amalpur
SampfeVlfage
West Telulia
West Charsama.ya
Suktagcan
Mahmudkanda
Salam Nagar
CnarRohrla
CharJabbar
Rajapur
Shrsenathdi
Dakkhin Goasdi
Rajapur
Betagram
KteBlnaijar
Razar Bll Wayapara
Mono-iarpwr
Bamonpara
Kadoya
Gongaprosad
Ba^atara
Hashimpur
Horinadi
Bekashahara Gararon
Giarpara
Kcmorpur
Sutaia
Mazhgram
ftagrwnarhpur
Bahama
GabrakhaK
Ha.t>Mdotee
Gaglajani
Mohesh Chandrarwr
Dhumiteyatpur
Kharerbari
Ra*.akantapur
Shaffiimardcfi
Barkcna
DopakhaS
Boiteit
rjeora
Baroikhali
Pukh.ria
Marashijndapur
Monsurabad
Atlia
Actiintaragar
BaraKnari
S*aknHa(
Mattiarpara
ChakirPashaiPathak
North Battnsh Hajari
Kazipaja
Shib-j
Shadekpur
Borchalia
Kazipaia
Borunatjaon
Shahbapur
Sallow Araa a s i Whole
Total Survey Area - ~ : -
Arsenic Tested Tubewells
TW having unaccepted lever d
arsenic
No.
S
0
0
2
oa2
0
85
0
0
54
0
149
0
10
to0
0
9
0
0
o0
0
32
14
16
7
0
0
0
2
0
20
40
0
2
0
0
142
o4
61
1
82
a72
35
o10
0
2
oo0
0
i
0
0
a266
569
%
100
rj
0
100
c0
9
0
87
0
0
93
0
80
C-
21
21
0
aeo0
0
0
0
0
100
70
62
100
0
0
0
2
0
16
68
0
!2
0
0
33
0
20
85
25
86
0
76
40
0
67
0
2
0
0
0
0
10
0
005449
TWtaing less than
unaccepted lertt/free &
ssenc CCTtaminale
Ho.
0
0
0
0
0
0
21
0
13
0
0
4
0
38
0
38
38
2
0
6
0
0
0
0
0
0
6
10
0
O
0
a118
0
109
19
0
15
0
1
236
0
(6
11
3
13
0
23
S3
12
5
0
Si
0
0
o0
9
0
0
(
227
589
%
0
0
0
0
a0
91
0
!3
0
0
7
0
20
0
79
79
100
0
40
0
0
0
0
0
0
30
38
0
0
0
0
98
0
84
32
0
88
0
103
67
0
80
15
75
14
0
2i
60
100
33
0
98
0
0
0
0
90
0
0
0
46
51
Total Arsenic Tested TW
No.
6
0
0
2
0
0
!3
0
98
0
0
58
0
187
0
48
482O
15
0
0
0
0
0
32
20
26
7
aa0
120
0
129
59
0
17
0
1
428
0
20
72
A
95
C
95
88
12
15
a84
fj
0
0
0
10
0
0
0
495
use
%19
0
0
4
a0
100
0
100
rj
0
94
0
28
0
49
321
0
51
0
0
0
0
0
59
13
38
4
0
0
0
94
0
94
89
0
103
0
1
18
0
15
62
4
99
0
74
72
17
15
0
100
0
0
0
0
45
0
0
0
28
23
HaviKj unaccepted level of Iron and Salt contamination
(reported case)
TW having unaccepted level
d Iron contai(iinaSk*l
No.
20
O
0
48
19
0
3
29
31
21
0
62
75
308
25
7
32
11
0
87
0
12
46
0
21
30
64
25
14
0
36
20
15
53
41
40
9
0
14
43
581
2
29
2
74
11
35
37
26
3
90
10
0
0
0
9
7
11
0
0
0
346
1267
%
63
0
0
100
23
0
13
76
32
25
0
100
M
46
45
7
21ac-
63
0
19
64
0
26
56
41
36
7
0
95
57
12
44
30
61
6
0
7
39
25
3
22
2
65
11
29
29
21
4
89
23
0
0
0
9
70
50
0
0
0
19
25
TW raving unaccepted
level o( saBniry
No.
15
1
10
24
0
0
1
0
0
6
0
0
0
57
0
0
0
0
0
0
0
0
0
0
0
0
0
ooo0
0
0
G
cc0
0
0
0
D
o0
0
rj
rj
0
rj
0
0
0
0
0
0
0
0
0
0
0
0
0
0
57
%
47
6
50
50
0
0
4
0
0
7
0
0
0
e0
0
a0
0
0
0
0
0
0
0
0
0
0
0
0
0
0
0
0
0
0
0
0
0
0
0
0
o0
0
0
0
0
0
0
0
o0
0
rj
0
0
0
0
0
0
D
1
Total TW
Spump
32
17
20
4i
83
17
23
38
98
65
0
62
KS
672
55
97
152143
110
138
183
S3
55
Hi
82
54
157
69
198
20
38
35
127
121
137
66
152
17
1S4
110
2357
76
131
117
113
96
121
129
123
70
101
«
B4
26
33
99
10
22
17
£96
83
1790
4971
Mo. of Safe water
point
Ho.
14
16
10
0
64
17
20
9
0
58
0
G
74
262
29
80
109
132
110
51
163
51
9
88
61
22
80
29
177
20
2
15
1'2
68
1:1
35
143
15
•m67
1761
76
{02
54
38
14
86
22
71
67
6
33
82
59
33
90
4
10
IS
296
S3
1244
3395
%
'2
94
50
0
77
100
87
24
0
65
0
0
50
42
53
62
72
92
100
37
100
81
16
100
74
35
51
41
09
103
5
43
84
56
?a47
94
88
93
61
74
too78
46
34
15
71
17
54
96
6
77
98
100
100
80
36
45
100
100
100
67
67
Ncofsafetecknal
water pent
No.
14
15
6
0
38
17
20
9
0
54
0
0
73
246
27
38
65
113
104
46
161
43
9
64
55
20
74
23
171
17
1
10
105
65
110
35
143
12
ISO
65
1606
74
99
44
38
13
72
22
65
53
1
31
75
51
33
53
3
a3
£95
81
1149
3066
%
42
88
30
0
46
100
87
24
0
64
0
0
49
38
49
39
43
79
95
33
68
63
16
73
67
32
47
33
86
85
3
29
79
54
77
47
94
71
ffi
59
67
97
76
38
34
14
60
17
49
76
1
72
B9
86
100
78
27
36
17
10C'
98
62
61
PopJatkmofthe
selected portonutlhe
village (Estimated)
No.
1819
1582
1270
1318
1464
1727
2225
1690
1625
!441
1612
1395
1174
HOA2
1710
1809
3519
1278
1622
1750
2KM
1930
1439
1505
1433
1503
1151
1254
1392
2500
1867
1414
2325
1432
1842
1200
2479
3550
1383
905
39159
1831
1540
1907
1383
1851
1774
220*
1294
1114
1616
1355
2045
1602
2120
1502
1696
1682
1476
2042
1412
33447
96467
Averace population for
single fjntfona safe
wattfccinl ^Estfniatedj
No.
130
105
212
0
39
102
111
138
0
27
0
0
16
83
63
46
54
11
16
38
12
45
163
24
26
75
16
55
B
147
1867
141
22
22
17
34
17
296
9
14
242516
43
36
142
25
100
20
21
1616
44
27
31
64
17
565
210
492
7
17
2931
% HH rewig TWpLjmrVplaiH in safe
^stance (cistance between TW & latrine
is mere to 33 feel)
HH%
71.4
16.7
30.0
50.0
16.7
78.9
62.5
50.0
14.3
20.0
0.0
84.2
70 4
55.7
10.0
0.0
5.6
86.7
0.0
20.8
0.0
61.5
47.6
31.6
63.6
77.8
50.0
41.7
72.2
20.0
50.0
EO.O
30.4
59.4
84.0
71.4
36.8
63.6
14.3
46.7
48.7
40.0
56.7
31.6
70.6
4.5
5.9
75.0
87.0
40.0
62.5
66.7
71.4
5.9
0.0
26.7
3O.0
50.0
44.4
26.7
81.0
48.7
48.3

Table B.6: Drinking Water Belated Habit
Hydro-
geological
Area
Coastal
District
BarisalBholaJhalokali,PirqjpurIcniLaxmipurNoakhahGopalgonjMadaripur•ShariaipurBagerliat
KhulnaSatkhira
Sample Village
West TetuliaWcM CharsamaiyaSukta^oanMahmudkandaSalan) NagarChar RohitaChar JabbarRajapurShreenathdiOakkhin CjoakliRajapurBetagramKhalilnagar
Coastal Area as a Whole
Hilly & StonyCox's Ra/arMoulvibazar
Ra/.ar Bil NoyaparaMnnoliapur
Hilly & Stony Area as a Whole
Low
BograNaogaon
SirajgonjJoypLirhatClnita^ongB. UariaCia/.ipurNorshingdi
RaibariChuadanga
KushtiaMchLTpur
KishoregonjMymcnsingh
Netrokona
SherpurNatoreNowab^onj
RajshahiPabnaSLinain£OnjDinajpurTangail
BainonparaKadoyaGongaprosadRaratara[ la^liiinpLirllojnmdiISckashahara GararonCharparaKomorpurSubdiaMazh^ram
RaghunaLhpurRahaylaGabrakhali1 latkundoleeGaj'lajani
Mobesh ChandrapufDhuitlihayalpurKharerbari
Radliakaniapiir"LShaUumardonBarkonaDopakhali
Low Area us u whole
Shallow
ComillaDhakaMunshiKonjManikgonjNarayangonjFaridpurJessoreJhanaidahMaguraNarailGaibandhaKurigraiTiLalmonirhalNilpbamariRanppnrllobi;>oniSylhutPanchagorhTh:ikiugtion
Jamalpuf
BorkoilDeonaiBaroikhaliPukhuriaNarashundapurMonsurabadAil ia
AchintanagarBara KhariSheikh HuliMatharparaChukir Pashar Pathal<North Ballnsh HazanKa/.iparaShibuSliadckpurUoiclialiaKaziparaBorunagaonSliabbajpur
Shallow area as a wholeTotal .Survey Area
Total
Sample
HH
3230
272'.)253233
3)3028323029
3883030602828292R34
273231
28282731
31382639333127
30302931
6963134
34323ft323233
273234
303233332fi
282933
33,6341778
Source of Drinking Water
1 ubewell/pump/pla
ntsSafe
HH%
96.9100.0100.093.11 ()().()96.9100.064.550.096.4
0.04G.796.679.496.793.395.096.4100.093.189.388.2100.093.8X0.678.682.1100,0100.0100,0
o.o100.094.9100.093.540.7100.093.365.564.5
84.296.8100.082.453.194.456.325.033.392.68-1.494.190.096,9b9.190.9!()().()71.441.4
100.093.978.481.4
Unsafe
HH%
3.1
0.00.00.00.00.00.012.950.0
3.60.0
53,3
3,49.80.03.31.73.60.00.010.711.80.06.39.73.617.9
o.o0.00.0
81.60.02.6
0.03.2
33.30.00.0
24.135.511,4
3.20.017.646.95.6
43.875.066.77,415.65.910.0
0.012.13.00.00.058.60.00.0IS.(,
13.3
Non-technological source
Rain water
HH%
0.0
0.00.00.00.00.0
o.o0.00.00.0
o.o0.00.00.0
o.o0,00.00.00.00.0
0.00.00.00.00.0
0,00.00,00.0
0.0
o.o0.00.0
0.00.00.0
0.00.00.00.0
0.00.0
o.o0.00.0
o.o0.00.0
o.o0.0
0.00.00.00.0
0.00.00.00.0
0.00.00.0
0.00.0
well/pond
HH%
0.0
0.00.06.90.03.1
0.09.70.00.0
100.0
0.00.09.80.03.31.70.00.0
0.0
o.oo.o0.00.09.717.9
0.0
o.o0.00.018.40.02.6
o.o3.2
25.90.06.710.3
0.04.2
0.00.00.00.00.00.00,00.00.0
0.00.00.03.118.2
o.o0.07.10.00.06.1
1.74.4
River/Canal
HH%
0.00.00.00.0
0.00.00.012.90.0
0.0
o.oo.o0.0
1.03.30.01.70.0
0.06.90.00.00.0
o.o0.0
0.0
o.oo.o0.0
0.0
o.o0.0
o.o0.00.00.00.0
0.00.0
o.o0.3
0.0
o.o0.00.00,00.0
0.00.00.0
0.00.00.00.0
o.o0.00.021.40.0
0.00.00.90.7
others
HH%
0.00.00.0
o.o0.00,00.00.00.00.0
_ O O _ J0.00.00.00.00.0
o.oo.o0.00.00.00,00.00.0
o.o0.00.00.00.00.00.00.00.0
0.00.00.0
0.00.00.00.0
0.00.0
o.o0.00.00.0
o.o0,00.00.0
0.00.00.00.00.06.1
0.00.00.00,0
0,00.30.1
Drinking water-
pot was found
cleaned
HH%
83.382.8100.093.1100.086.784.267.727.6
61.596.995.592..182.056.777.S66.788.5100.092.9100.093.985.279.242.357.764.322.260.085,7X6.857.741.0100,096,613.690.979.355.252.970.841.488.281.893,862.977.328.169.777.X35.5
0.00.0
75.046.7
0.080.039.1100.00.0
90.966.472.0
Drinking water
pot was found
covered
HH%
96.755.292.689.7
loo.o80.052.60.0
27.642.393.895.5M.569.993.337.066,7
o.o93.828.684.684.866.75X.311.538.532.1
11.16.7
60.77X.930.823.1100.072.49.177,351.741.40.0
45.411.473.584.840.642.940.90,03.0
37.029.0
0.00.025.06.70.076.030.4100.00.0
57.641.3
51.0

Table B.7 Drinking
Hydro-geological
Area
Coastal
Water Related Habit-
District
BarisalBholaJhalokatiPirojpurFeniLaxmipurNoakhaliGopalqonjMadaripurShariatpurBagerhatKriulnaSatkhira
Coastal Area as a Whole
Hilly 8, Stony Cox's BazarMoulvibazar
Sample Village
West TetuliaWest CharsamaiyaSuktagoanMahmudkandaSalam NagarChar RohitaChar JabbarRajapurShreenathdiDakkhin GoaldiRajapurBetagramKhalilnagar
Razar Bil NoyaparaMonohapur
Hilly & Stony Area as a Whole
Low
BoqraNaogaonSirajgonjJoypurhatChittaqongB. BariaGazipurNorshingdiRajbariChuadangaKushtiaMeherpurKishoregonjMymensinghN9trokonaSherpurNatoreNowabgonjRajshahPabnaSunamgonDinajpurTangail
Low Area as a whole
Shallow
ComillaDhakaMunshigonjManikqonjNarayangonjFaridpurJessoreJhanaidahMaguraNarailGaibandhaKurigramLalmonirhatNiiphamariRangpurHobigonSylhetPanchagorhThakurqaonJamalpur
BamonparaKadoyaGongaprosadBarataraHashimpurHorinadiBekashahara GararonCharparaKomorpurSubdiaMazhgramRaghunathpurRahaylaGabrakhaliHatkundoleeGaglajaniMohesh Chandrapur
DhumihayatpurKharerbariRadhakantapurShatrumardonBarkonaDopakhali
BorkoitDeonaiBaroikhaliPukhuriaNarashundapurMonsurabadAtliaAchintanagarBara KhariSheikh HatiMatharparaChakir Pashar Pathak
North Battrish HazariKaziparaShibuShadekpurBorchaliaKaziparaBorunagaonShahbajpur
Shallow area as a wholeTotal Survey Area
ssue of purification
TotalSample
HH
001201
5600
321
04810100
500003
500007011170031
340
010100000001
630
8100
21104
Information regarding the use of water from Non-technological source for drinking purposes
have used
Drank onlyafter
boiling
HH%0.00.0
100.00.00.0
100.00.00.00.00.0
3.10.00.0
6.30.00.00.00.00.00.00.00.00.00.00.00.00.00.00.00.00.0
0.00.0
0.0100.00.00.00.0
0.00.02.90.00.00.00.0
100.00.0
0.00.00.00.0
0.00.00.00.00.00,012.5100.00.00.014.36.7
Used afterpurifying through
(Fitkeri)
HH%0.00.00.0
50.00.00.0
40.00.00.0
0.090.60.00.066.70.00.0
0.00.00.00.00.00.00.00.00.020.00.00.00.00.0
0.00.0
0.00.00.00.00.00.00.00.0
2.90.00.0
100.00.00.0
0.00.00.00.00.00.00.0
0.00.00.00.00.00.00.00.04.832.7
Used afterfiltering
through filter
HH%0.00.00.050.00.0
0.00.00.00.00.00.0
0.00.02.10.00.00.00.00.00.00.0
0.00.00.00.00.00.00.00.00.00.00.00.0
0.00.00.00.00.00.00.00.00.00.00.0
0.00.00.00.00.0
0.00.00.00.00.0
0.00.00.00.0
0.00.00.0
0.01.0
Used after purifyingthrough purifier
tablets
HH%0.00.00.0
0.00.00.00.00.00.00.00.00.00.00.00.00.00.00.00.0
0.00.00.00.00.0
0.00.00.00.00.00,00.0
0.00.00.00.00.00.00.00.00.00.00.00.00.00.00.00.00.00.00.00.00.00.00.00.00.00.00.00.00.00.00.00.0
Drank afterstraining
HH%0.00.0
0.00.00.00.00.0
0.00.00.00.0
0.00.00.00.00.00.00.0
0.00.00.00.00.00.00.00.00.00.0
0.00.0
100.00.0
100.00.00.00.0
0.00.00.00.0
23.50.00.00.00.0
0.00.00.0
0.00.00.00.00.0
0.00.00.00.00.00.0
0.00.00.07.7
Used withoutany form of
purification/ filter
HH /o
0.00.00.00.0
0.00.060.0100.0
0.00.0
6.3100.00.025.0100.00.0
100.00.00.0
100.00.00.00.00.0
100.080.00.00.00.00.00.0
0.00.0
100.00.0
100.00.00.0
100.0100.070.60.00.00.00.00.00.00.00.00.00.00.00.0
100.0100.0100.0
0.0
87.50.00.00.0
81.051.9

Table B.8:
Hydro-geological
Area
Coastal
Water sources for purposes other than drinking
District
BarisalBholaJhalokatiPirojpurFeniLaxmipurNoakhaliGopalgonjMadaripurShariatpurBagerhatKhulnaSatkhira
Sample Village
West TetuliaWest CharsamaiyaSuktagoanMahmudkandaSalam NagarChar RohitaChar JabbarRajapurShreenathdiDakkhin GoaldiRajapurGetagramKhalilnagar
Coastal Area as a Whole
Hilly & StonyCox's BazarMoulvibazar
Razar Bil Noyapara
MonohapurHilly & Stony Area as a Whole
Low
BograNaogaonSirajgonjJoypurhatChittagongB. BariaGazipurNorshingdiRajbariChuadanqaKushtiaMeherpurKishoregonjMymensinghNetrokonaSherpurNatoreNowabqonjRajshahiPabnaSunamgonjDinajpurTangail
BamonparaKadoyaGongaprosadBarataraHashimpurHorinadiBekashahara Gararon
CharparaKomorpurSubdiaMazhgramRaghunathpurRahaylaGabrakhaliHatkundoleeGaglajaniMohesh ChandrapurDhumihayatpurKharerbariRadhakantapurShatrumardonBarkonaDopakhali
Low Area as a whole
Shallow
ComillaDhakaMunshigonjManikgonjNarayangonjFaridpurJessoreJhanaidahMaguraNarailGaibandhaKurigramLalmonirhatNilphamariRangpurHobigonjSylhetPanchagorhThakurgaonJamalpur
BorkoitDeonaiBaroikhaliPukhuriaNarashundapurMonsurabadAtliaAchintanagarBara KhariSheikh HatiMatharparaChakir Pashar PathakNorth Battrish HazariKaziparaShibuShadekpurBorchaliaKaziparaBorunagaonShahbajpur
Shallow area as a wholeTotal Survey Area
Garqlinq and mouth washing
Safe TW/Pump/Plants
HH /o
3.10.0
0.00.04.09.4
3.00.00.00.00.00.0
24.13.416.733.325.060.7100.03.4
60.72.911.128.167.721.478.63.7
90.316.10.03.892.315.283.918.590.09.765.522.641.33.1
94.15.9
43.827.86.325.033.392.63.147.110.093.857.666.77.70.037.9100.015.238.931.6
UnsafeSources
HH%96.9100.0100.0100.096.090.697.0100.0100.0100.0100.0100.075.996.683.366.775.039.30.096.639.397.188.971.932.378.621.496.39.7
83.9100.096.27.784.816.181.510.090.334.577.4S8.796.95.994.156.372.293.875.066.77.4
96.952.990.06.342.433.392.3100.062.10.084.861.168.4
Raw Food/ VegetableSafe
TW/Pump/PlantsHH%3.110.00.00.0
4.012.53.09.76.710.70.010.065.510.320.051.735.685.7100.013.882.111.848.153.180.625.082.163.096.864.57.97.792.363.683.925.990.019.465.551.657.112.5100.011.846.930.653.125.033.392.631.329.490.096.963.687.930.80.037.9100.042.450.944.0
UnsafeSources
HH%96.990.0100.0100.096.087.597.090.393.389.3100.090.034.589.780.048.364.414.30.086.217.988.251.946.919.475.017.937.03.2
35.592.192.37.736.416.174.110.080.634.548.442.987.50.088.253.169.446.975.066.77.4
68.870.610.03.136.412.169.2100.062.10.057.649.156.0
Utensil WashingSafe
TW/Pump/PlantsHH%3.13.30.0
3.416.09.46.16.5
3.37.1
0.020.093.112.923.343.333.382.192.913.882.111.859.356.380.617.982.166.796.874.20.019.292.357.683.925.990.013.365.551.6S7.06.3
100.08.8
46.930.653.125.033.392.643.838.290.093.857.684.838.50.037.9100.042.451.244.5
UnsafeSources
HH%96.996.7100.09fi.684.090.693.993.596.792.9100.080.06.9
87.176.756.766.717.97.186.217.988.240.743.819.482.117.933.33.2
25.8100.080.87.7
42.416.174.110.086.734.548.443.093.80.091.253.169.446.975.066.77.4
56.361.810.06.342.415.261.5100.062.10.057.648.855.5
CookingSafe
TW/Pump/PlantsHH%9.483.30.03.44.059.427.39.7
23.321.40.036.789.728.756.766.761.796.4100.010.389.361.8100.084.480.625.085.774.196.896.80.0
42.394.9100.093,540.790.023.365.561.370.035.5100.029.453.130.659.425.033.392.662.594.190.096.966.790.992.310.741.4100.093.864.858.8
UnsafeSources
HH%90.616.7100.096.696.040.672.790.376.778.6100.063.310.371.343.333.338.33.60.089.710.738.20.015.619.475.014.325.93.23.2
100.057.75.10.06.5
59.310.076.734.538.730.064.50.0
70.646.969.440.675.066.77.4
37.55.910.03.1
33.39.17.789.358.60.06.335.241.2

C. Issue of Environmental SanitationTable C.1: Sanitation Hardware Status (Unit)
Hydro-geological
Area
Coastal
District
Bansal
Bhola
Jhalokati
PirojpurFnni
Laxmipur
NoaktialiGopalgonj
MadaripurShariatpyr
Baqerhat
Khulna
Salkhira
Sample Village
WesiTeiulia
West Charsamaiya
Suktagoan
MahmudkandaSalam Naqar
Char RohitaChar Jabbar
Rajapur
ShreenathdiDahkhin Goaldi
RajapurBct;iqram
Khahnaqar
Coastal Area as a Whole
Hilly & StonyCox's Ba2arMoulvibazar
Razar Bil Nqy_aparaMonoharpur
Hilly & Stony Area as a Whole
Low Area
BoqraNaoqaon
Sirajgonj
Joypurhat
ChittagongB. BdFH
Gazipur
NprshingdiRajbariChuadanga
Kushlia
MeherpurKishorogonj
MymensinqhNetrokona
Sherpur
NatoreNowabgonj
RajshaliiPabna
Sunamgonj
Dinajpur
Tanqaii
BamonparaKadoya
Gongaprosad
BarataraHashimpur
Horinadi
Bekashahara GararanCHarpara
KomorpurSubdia
Mazhgram
Harjhunathpur
Rahayla
GabrakhaliHatkundolee
Gaglajani
Mohesh Chandrapur
Dhumihayalpur
KharerbariRadhakantapur
Shatrumardon
BarkonaDopakhali
Low Area as a Whole
Shallow Area
ComiilaDhaka
Munshigonj
Manikgonj
Narayangonj
Faridpyr
Jessore
JhanaidahMaqura
Narail
Gaibandha
KurigramLalmonirhat
Nilphamari
Rangpur
HobigonjSylhetPanchagorh
Thakurqaon
Jamalpur
BorkoitDeonai
Baroikhali
PukhuriaNarashundapur
MonsurabadAtlia
AchintanagarBara Khan
Sheikh HatiMatharpara
Chakir Pashar PathakNorth Baltrish Hazari
Ka7iparaShibu
Shadekpur
BorchaliaKazipara
Borunagaon
Shahbajpur
Shallow Area as g Whole
Total Survey Area
Total HHol the
selected portion
321
300
270
293
254
383325
309
300280324
300
2883887
298304602276276
290
280336
265324
312
275
278
270310
310
381257
385
325307
268300
312290311
6938
325340
340315357
320315
285269
321340
300321325
329
261
283285
325327
6283
17710
PttUlrkie
No
0
0
350
511
0
0
00
29193
116389
599
104
4670
021
23187
15
37
29
154
95
0
100
150
103
0
95
0
1613
86810
112
7
190
0110
10367
1930
11
106
207
71197
0
100
201153
2514
%
0
0
130
4
30
00
022
6441
112
3317
17
12
00
6
9
58! 39
134071
7203
0
40
53
039
014
6
19
1540
2
60
064
635771
021
74776
31
850
5219
30
20
Number of Ring Slab
No
43
39
2567
37
309
226641
24
4144
488
24
133758
32
3168
1054
69
1312
20
5123
621
40
4018
35
515
2035
32
75331
42
26
58171
43
3034
54
55
42
232
151811
21
60
34617
1895
%
13
139
23
309
37
22
1518
1415
14
84
621
5511
80
312
21
M4
2724
17
56
591015
18
76
631
1516
48
15
B
1850
25
1829
2016
79
168
138
591
3132
16
15
Number of Septic/Offset
No
0
20
84
8
1
01
7
1
10
2668
2
323418
5
227
2214
21
101
247
141
0
0
00
55
63
1048
5
2936
8
14
85
02017
17230
0144
1
67
2
12
8172
567
%
0
10
3
33
0
00
31
39
21
11
67
9
88
756
26
033
3
111
0
0
00
28
81
342
2
6934
31
012
1014
9
0
010
151
339
6
84
4
Hanging and open latrine
No
278259210
21179
271
315287
233232
78
5699
2608267
160
427152
14
22010
188224
470
225
05
0
1P5350
28
330104
0
64
131
28215
164
2678
18
120
293
230333
3190
130
0285
000
93
135170
2043
1919
7632
%
878678
7463
85
97
93
7883
59
1935
7390
5371
55
2481
12
5685(5
082
02
0
9592
41
8685
0
8554
9013775828
43
86
7394
1000
80
084
00
080
5970
1041
50
61
Total latrine
No.
321
300270
286125
320
325309
300280
132
300285
3553298
304602
276
58273
85
336265
324
38275
73217
132
132381
68
385122
193
75244
312114
2144592
65282
340315355
320173
163118
270340
53143
26116
23023223
192
1053861
12608
Ring Slab latrine
have proper
Gooseneck
Unit%
2525
50
2925
3350
5017
25
50
2525
2950
0
25
0
3333
43
405057500
040
0
1000
50
2550
50
050
5050
0
353325
33
5050
020
2525
1740
2533
00
500
5033
3331
32

Table C.2: Ownership pattern wise Septic/Offset/Ring Slab/ Pit latrine (Unit) & information regarding Ring Slab Production centre
Hydro-gsoloijtcaJ
Area
Coasts!
Coastal Area as a V
HiByS Stony
Hlltyi Stony Area
Low Table Area
Low Area asaWhc
Shalknv Area
District
Sarisa!3hola
Jhalokaiiy\fo\pu>
-eni
Laxmipur
NoakhaliGooalgoni
Madaripu*Snariaipijr
Bagerfiat
<hulna
Salkhira
Sample Ullage
WestTetuSaWest Orarsamaiya
SuktaqoanMahrrudkandaSslam Naoar
Char RohitaChaiJabbar
RaiapurShrcertathdiDakkhin GoaSdi
flajapureetacram
KhalilnaqarVlwle
Cox's Bazart/sulvibazaras a Whole
BoqraNaogaonS rajgonjjcvpurhat
ChitiaqonqB. BariaGazbur
NorshnqCi•tejbanCnuatranga
KusiitiarteherpurKishcregonjf/ymensinqh
Ke:rokonaSnerpur
NaioreNowaboonj
Raishahi
Pabna
SunamgonjDinajpurTanqailleComiUaDhaka
MunsniocnjManikflonjNarayangcrj
FaridpurJessareJna.naidah
Waqu'a
MarailGaibandhaKuriqram
LalmonirhatNilphamari
RangpurHcSigonj
SyShetPanchagorhThakuroaon
Jamafipur
Razar Bil Noyapara
Monoharpur
3amonpara
<adcyaGonqaprosad
BaraiaraHashimpurHonnaGlSekashahara Gararon
CharparaKomorpurSutaia
MaztiqramRaqhunaitipur
RahaylaGabrakhafc
HattundolaeGaqlajaniMonesh ChandrapurDhumihayatpur
KharerbariRadhakanlapur
Shatrumard&nbarkcna
"opakiiali
BorkoitDsonaiBaroikryfi
PukhuriaNarashundapurMonsurabad
MaAchintanagar
Bara KnanSheikh HatiMaLharpara
Chakit Pashar PathakNorth Battrsh Hszari
KaziparaShibii
ShadekpurBwchaliaKazjjaraBorunagaonStahtaipuf
Shallow Area as a WtiofeTotal Survey Area
Ownership wise SeptrtMsei'Ring Slab'Pil latnne
Total
4341
6075
4649
1022674864
244186945
31144175
124
44S375
14841
277
3850
73212132
7
3f'0
18153
11
113309960
1914
47162478522
1
173150
118270
5553
143262'i
95215
23172
621942
4976
Owned i y single K'H
Mo.352855663B47102260
<826
238
181656
31126157119445350
14733
272
293973
136131
729305513
1551t
113
309911
1775
«1i7
47
8320
0173124
i t :2286548
128261095
21223
17256
18034591
%816392919396
!0O:M93
10048969791
1008390%
1001M67
99939876
7B100
8899
1009475
10010060
100
too:w•00
94
939191
1009B910
100839684
1009190
10043too99
100too909332
Owned by muHpteH/H
No.S
1357800070
2765
860
IS1803G
251359
110
!61
0Q
1000
3S
a0003
1324
1502200
265
3705
150
900
005
125Ml
%1932
89
17
0
0
0100
50
2390
1310000
33172
24220
121
00
2500
200000679902900
174
14
09
100
39
000
0867
Other category
No.00000200001003000500
0000
000
00
0200000000070
00
001
00
05
0
00
04
03
0
01
1424
%000004000020000004
000
0•3
O
00
00
00
e000000000030000
10000020000
1701
00210
tn'orma"ion regarding Ring Slab production cenlre exit in Ihe village/nearest to Ihe village
VSC situated in
tne entire
Village
No.01
0
01
0
001
1
0
t1
6000
aaaGa0000i000t000000a1031
1
5100000201200010(0
1524
Distance between village
and nearest VSC (it the
village does not have
any VSC)
{In Miies)3a32014500
1000
282240232111
2
301
2
0622111204
37
00
0014
44
6
03
00
14
11
000
3
a109
Tne running authority ol ttie VSCfs) silualH) inttie village/nearest place
Total
No.
11
rti
1111
13112112
i
1112121111
261151
2
2112t
011
01-
2869
Prrvale
No.01
111
1
01
00
0•3
71011110111
00
u0011
\
1
0011
0
0
1131
a5o1010110120000001
1435
"k0
'00100100105100
0100
00
10000
54100
050
10010050
0
1C0ICCSCO
0
a3
a3
100
100100100
0
050
1000
010050
1000
1000
1000
500
33500
100100
00
00
00
too5051
Govt.
No.00000000000000000001o000
0000
000
001
0
0
0000
2000001001
00000000D0024
%0000
a00000000000000
50000c00000cQ
00
S30
00
00
a8a0a0a
50a0
330000000000076
NGOF Supported
No-1
1 .
5acc000i0
ii
4011
0
000
000
0
1
1
00
0
aa10000050331
110010001011010B
1B
%100
0
cc00000
1000
100100310
100500000
000
1000
100
tooIOC
0o0o0
10000o00
190o0
1000
605000
60000
1000
100100
0100
02926
Other NGO
No.00
0
00
01
01
00
0020r0
00
01
0
00
01
00
o000010101106010000011010000000004
12
%000000
1000
1000000
15000000
IOC0000
10000aa000
500
500
100100
0230
100000
00
100330
1000
00
00
0000
1417

Table C.3: Distance between House & Latrine (In Feet)
Hydro-geological
Area
Coastal
District
BarisalBholaJhalokatiPirojpurFeniLaxmipurNoakhaliGopalgonjMadaripurShariatpurBagerhatKhulnaSatkhira
Coastal Area as a Whole
Hilly & StonyCox's BazarMoulvibazar
Sample Village
West TetuliaWest CharsamaiyaSuktagoanMahmudkandaSalam NagarChar RohitaChar JabbarRajapurShreenathdiDakkhin GoaldiRajapurBetaqramKhaiiinagar
Razar Bil NoyaparaMonohapur
Hilly & Stony Area as a Whole
Low
BograNaogaonSirajgonjJoypurhatChittagongB. BariaGazipurNorshingdiRajbariChuadangaKushtiaMeherpurKishoregonJMymensinghNetrokonaSherpurNatoreNowabqonjRajshahiPabnaSunamgonjDinajpurTangail
Low Area as a whole
Shallow
ComillaDhakaMunshigonjManikgonjNarayangonjFaridpurJessoreJhanaidahMaquraNarailGaibandhaKurigramLalmonirhatNilphamariRangpurHobiqonjSylhetPanchagorhThakurgaonJamalpur
BamonparaKadoyaGonqaprosadBarataraHashimpurHorinadiBekashahara GararonCharparaKomorpurSubdiaMazhgramRaghunathpurRahaylaGabrakhaliHatkundoleeGaglajaniMohesh ChandrapurDhumihayatpurKharerbariRadhakantapurShatrumardonBarkonaDopakhaii
BorkoitDeonaiBaroikhaliPukhuriaNarashundapurMonsurabadAtliaAchintanagarBara KhariSheikh HatiMatharparaChakir Pashar PathakNorth Battrish HazariKaziparaShibuShadekpurBorchaliaKaziparaBorunagaonShahbajpur
Shallow area as a wholeTotal Survey Area
TotalSample HH
207262621292737532202725030215169
291034252914131416182796
243228142013714
41117272931343116232114614188162426101921
4051117
Distance between House & Latrinefln Feet)
Upto 155.0
28.611.511.542.920.77.40.0
42.920.00.015.025.916.046.757.151.00.066.769.030.038.248.013.814.37.7
28.618.811.17.4
22.20.0
20.821.910.70.010.038.528.6
_ZJ_j24.176.529.648.39.750.093.56.313.00.07.10.00.0
38.925.031.312.565.450.089.50.0
35.827.8
16-3030.042.919.250.042.941.463.066.742.960.043.830.022.239.650.042.947.150.033.324.170.029.444.051.750.053.828.631.316.733.344.466.716.721.914.335.745.053.828.664.335.517.625.937.941.950.06.5
68.830.447.628.60.035.761.125.050.025.019.230.05.34.831.435.5
31-4525.028.619.211.59.5
24.111.133.314.320.043.810.03.718.80.00.00.050.00.00.00.02.94.024.121.423.121.418.844.47.411.116.737.50.03.67.15.00.00.07.1
11.90.018.53.43.20.00.012.58.7
52.421.416.77.10.037.56.312.53.810.00.014.39.612.1
46-6040.00.034.619.24.813.814.80.00.00.06.35.00.013.60.00.00.00.00.06.90.02.94.03.40.015.414.325.011.129.622.216.716.715.610.721.410.00.0
42.914.311.70.022.20.0
29.00.00.06.3
34.80.0
28.683.328.60.00.012.58.33.810.00.019.011.611.5
61-750.00.07.73.80.00.0
i_3_Z_0.00.00.03.110.03.73.20.00.00.00.00.00.00.00.00.03.47.10.00.06.30.03.70.00.00.09.40.07.10.00.00.00.01.90.00.03.40.00.00.00.08.70.00.00.014.30.00.00.016.70.00.00.014.33.02.5
76-1000.00.07.70.00.00.00.00,00.00.03.10.07.42.00.00.00.00.00.00.00.011.80.00.00.00.07.10.011.111.10.00.04.215.617.928.610.00.00.07.16.85.93.73.416.10.00.00.00.00.07.10.014.30.012.50.08.37.70.05.3
38.16.25.2
100+0.00.00.03.80.00.00.00.00.00.00.0
30.037.0
i 6.83.30.02.00.00.00.00.014.70.03.47.10.00.00.05.67.40.00.04.215.642.90.0
20.07.70.00.08.00.00.03.40.00.00.06.34.30.07.10.00.00.00.00.016.70.00.00.09.52.55.5
Highest603510030060607040353595
50025050016024160452550303005015015050100701251505050
2005005001003001505080
5001001005001003030
20015045
20060803010050
20010050100280500500
Lowest15101012
L_108151710102505041014181051461010153107151020371030551515185510551010201540205151055853050
Average4025454222303229202539647738231619321516165520334032323347542832437715159752534334319323944171237433353534918382664202117843638

Table C4: Defecation site
Hydro-geological
Area
Coastal
District
BarisalBholaJhalokatiPirojpurFeniLaxmipurNoakhaliGopalgonjMadaripurShariatpurBagerhatKhulnaSatkhira
Sample Village
West TetuliaWest CharsamaiyaSuktagoanMahmudkandaSalam NagarChar RohitaChar JabbarRajapurShreenathdiDakkhin GoaldiRajapurBetagrannKhalilnagar
Coastal Area as a Whole
Hilly & StonyCox's BazarMoulvibazar
Razar Bil NoyaparaMonohapur
Hilly & Stony Area as a Whole
Low
BograNaogaonSirajgon]JoypurhatChittagongB. BariaGazipurNorshingdiRajbariChuadangaKushtiaMeherpurKishoregonjMymensinghNetrokonaSherpurNatoreNowabgonjRajshahiPabnaSunamgonjDinajpurTangail
Low Area as a wholeShallow Comilla
DhakaMunshigonjManikgonjNarayangonjFaridpurJessoreJhanaidahMaquraNarailGaibandhaKurigramLalmonirhatNilphamariRangpurHobigonjSylhetPanchagorhThakurgaonJamalpur
BamonparaKadoyaGongaprosadBarataraHashimpurHorinadiBekashahara GararonCharparaKomorpurSubdiaMazhgramRaghunathpurRahaylaGabrakhaliHatkundoleeGaglajaniMohesh ChandrapurDhumihayatpurKharerbariRadhakantapurShatrumardonBarkonaDopakhali
BorkoitDeonaiBaroikhaliPukhuriaNarashundapurMonsurabadAtliaAchintanagarBara KhariSheikh HatiMatharparaChakir Pashar PathakNorth Battrish HazariKaziparaShibuShadekpurBorchaliaKaziparaBorunagaonShahbajpur
Shallow area as a wholeTotal Survey Area
Defecation sites
Septic/Offset/RLatrine
ng slab
Member Category
M
HH%12.513.37.4
24.116.012.53.06.5
20.017.96.316.724.113.76.713.310.017.914.317.225.029.47.4
28.16.53.614.329.69.73.25.315.410.36.1
29.03.76.79.7
24.112.914.29.4'14.711.821.95.60.0
21.915.218.518.814.713.39.40.03.07.77.16.9
21.212.111.713.0
F
HH%12.513.37.4
24.116.012.53.06.5
20.017.96.316.724.113.76.713.310.021.414.317.225.035.37.4
28.16.53.614.329.69.73.25.315.410.36.1
29.03.76.79.7
24.112.914.69.414.711.821.95.60.0
21.915.218.521.914.713.39.40.03.07.77.16.9
21.212.111.813.3
C<5
HH%0.00.012.55.90.07.74.30.00.00.014.39.1
38.57.00.00.00.08.30.0
20.018.223.18.3
25.00.00.00.00.017.66.70.00.00.00.08.30.05.69.10.00.06.50.00.00.0
23.115.40.013.30.09.118.20.00.00.00.010.06,37.16.711.10.06.26.2
Pit
Member Category
M •
HH%0.00.014.83.44.03.10.00.00.00.09.4
50.031.08.83.3
30.016.714.33.60.00.05.97.4
50.06.514.314.344.425.80.02.60.05.10.0
35.50.0
30.00.06.93.211.63.1
35.32.96.30.00.031.336.418.559.40.03.3
31.39.13.0
26.967.90.0
30.36.118.113.5
F
HH%0.00.014.83.44.03.10.00.00.00.09.4
56.734.59.53.3
30.016.714.33.60.00.05.97.4
56.36.514.314.351.932.30.02.60.05.10.0
35.50.030.00.06.93.212.53.1
35.32.96.30.00.0
31.336.418.559.40.03.331.39.13.0
26.967.90.0
30.36.118.114.0
C<5
HH%0.00.012.50.00.00.00,00.00.00.00.00.00.01.10.00.00.00.00.00.00.00.00.00.00,00.07.716.75.90.03.20.00.00.08.30.00.00.00.00.01.70.00.00.015.40.00.06.70.00.0
27.30.00.00.04.80.06.37.16.75.60.04.32.3
Hanging/open Latrine
Member Category
M
HH%62.573.374.158.636.071.978.845.270.060.721.913.327.653.680.046.763.339.37.1
72.47.152.974.112.50.064.30.00.00.0
41.978.911.576.927.30.029.633.377.43.4
41.934.06.332.476.562.583.387.50.03.00.00.0
73.50.00.00.0
27.342.33.60.06.115.226.936.7
F
HH%65.676.774.162.140.071.981.848.473.360.725.013.331.055.980.046.763.342.93.6
75.93.652.981.512.50.0
78.60.00.00.0
45.286.811.582.130.30.033.340.090.33.4
45.237.06.3
32.482.468.888.993.80.03.00.00.0
79.40.00.00.0
27.350.03.60.06.115.228.839.1
C<5
HH%13.30.06.311.80.07.78.70.00.00.0
28.60.07.77.015.00.07.30.00.00.09.17.78.30.00.00.00.00.00.013.30.06.30.00.00.00.00.04.50,00.02.40.00.021.130.815.40.00.00.00.00.00.00.00.00.00.00.00.00.00.00.03.94.3
Openplace/bush/others
Member Category
M
HH%25.013.33.713.844.012.518.248.410.021.462.520.017.224.010.010.010.028.675.010.367.911.811.19.4
JJ7.117.971.425.964.554.813.273.17.766.735.566.730.012.965.541.940.281.317.68.89.4
12.546.945.563.021.911.883.359.490.966.723.121.493.142.466.743.336.7
F
HH%21.910.03.710.340.012.515.245.26.721.459.413.310.320.910.010.010.021.478.66.971.45.93.73.1
87.13.6
71.418.558.151.65.373.12.663.635.563.023.30.0
65.538.735.981.317.62.93.15.66.3
46.945.563.018.85.9
83.359.490.966.715.421.493.142.466.741.333.7
C<5
HH%86.7100.068.882.4100.084.687.0100.0100.0100.057.190.953.884.985.0100.092.791.7100.080.072.769.283.375.0100.0100.092.383.376.580.096.893.8100.0100.083.3100.094.486.4100.0100.089.4100.0100.078.930.869.2100.080.0100.090.954.5100.0100.0100.095.290.087.585.786.783.3100.085.687.2
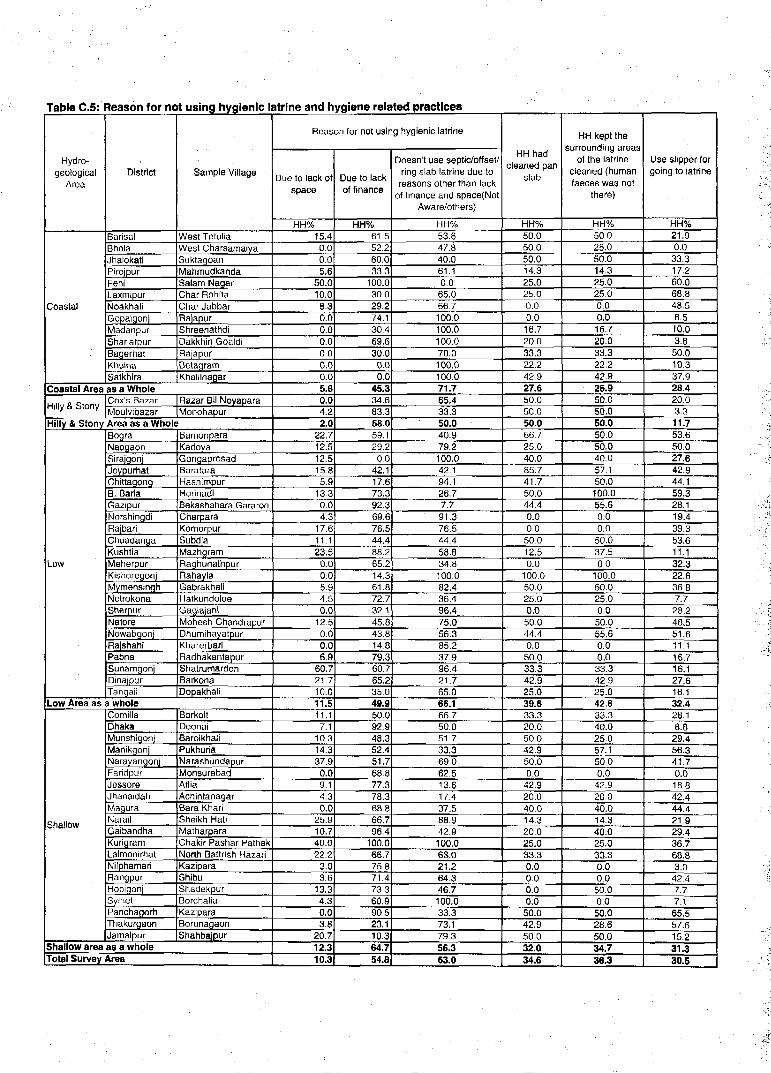
Table C.5:
Hydro-geological
Area
Coastal
Reason for not using hygienic latrine and hygiene related practices
District
BarisalBtiolaJhalokatiPirojpurFeniLaxmipurNoakhaliGopalgonjMadaripurShariatpurBagerhatKhulnaSatkhira
Sample Village
West TetuliaWest CharsamaiyaSuktagoanMahmudkandaSalam NagarChar RohitaChar JabbarRajapurShreenathdiDakkhin GoaldiRajapurBotaqramKhalilnagar
Coastal Area as a Whole
Hilly & StonyCox's BazarMoulvibazar
Razar Bil NoyaparaMonohapur
Hilly & Stony Area as a Whole
Low
BograNaogaonSirajgonjJoypurhatChittagongB. BariaGazipurNorshingdiRajbariChuadangaKushtiaMeherpurKishoregonjMymensinghNetrokonaSherpurNatoreNowabgonjRajshahiPabnaSunamgonjDinajpurTangail
BamonparaKadoyaGongaprosadBarataraHashimpurHorinadiBekashahara GararonCharparaKomorpurSubdiaMazhgramRaqhunathpurRahaylaGabrakhaliHatkundoleeGaglajaniMohesh ChandrapurDhumihayatpurKharerbariRadhakantapurShatrumardonBarkonaDopakhalf
Low Area as a whole
Shallow
ComillaDhakaMunshigonjManikgonjNarayangonjFaridpurJossoreJhanaidahMaguraNarailGaibandhaKurigramLalmonirhatNilphamariRangpurHobigonjSylhetPanchagorhThakurgaonJamalpur
BorkoitDeonaiBaroikhaliPukhuriaNarashundapurMonsurabadAtliaAchintanagarBara KhariSheikh HatiMatharparaChakir Pashar PathakNorth Battrish HazariKaziparaShibuShadekpurBorchaliaKaziparaBorunagaonShahbajpur
Shallow area as a wholeTotal Survey Area
Reason for not using hygienic latrine
Due to lack ofspace
HH%15.40.00.05.6
50.010.08.30.00.00.00.00.00.05.80.04.22.0
22.712.512.515.85.9
13.30.04.3
17.611.123.5
0.00.05.94.50.0
12.50.00.06.9
60.721.710.011.511.17.1
10.314.337.90.09.14.30.0
25.910.740.022.2
3.03.6
13.34.30.03,8
20.712.310.3
Due to lackof finance
HH%61.552.260.033.3
100.030.029.274.130.469.630.00.00.0
45.334.683.358.059.129.2
0.042.117.673.392.369.676.544.488.265.214.361.872.732.145.843.814.879.360.765.235.049.950.092.948.352.451.768.877.378.368.866.796.4
100.066.775.871.473.360.990.523.110.364.754.8
Doesn't use septic/offset/ring slab latrine due toreasons other than lack
of finance and space(NotAware/others)
HH%53.847.840.061.10.065.066.7100.0100.0100.070.0100.0100.071.765.433.350.040.979.2100.042.194.126.77.791.376.544.458.834.8100.082.436.496.475.056.385.237.996.421.765.066.166.750.051.733.369.062.513.617.437.588.942.9100.063.021.264.346.7100.033.373.179.356.363.0
HHhadcleaned pan
slab
HH%50.050.050.014.325.025.00.00.016.720.033.322.242.927.650.050.050.066.725.040.085.741.750.044.40.00.050.012.50.0
100.050.025.00.050.044.40.050.033.342.925.039.633.320.050.042.950.00.0
42,920.040.014.320.025.033.30.00.00.00.050.042.950.032.034.6
HH kept thesurrounding areas
of the latrinecleaned (humanfaeces was not
there)
HH%50.025.050.014.325.025.00.00.016.720.033.322.242.925.950.050.050.050.050.040.057.150.0100.055-60.00.050.037.50,0
100.050.02500.050.055.60.00.033.342.925-042.633.340.025.057.150-00.0
42.920.040.014.340-025.033.30.00.050.00.050.028.650.034.736.3
Use slipper forgoing to latrine
HH%21.90.033.317.260.068.848.56.510.03.650.010.337.928.420.03.311.753.650.027.642.944.159.328.119.439.353.611.132.322.636.87.728.248.551.611.116.716.127.616.132.428.18.8
29.456.341.70.018.842.444.421.929.436.768.83.0
42.47.77.165.557.615.231.330.5

Table C.6:
Hydra-geological
Area
Coastal
Dispose Infants Faeces & Waste materials
District
BarisalBholaJhalokatiPirojpurFeniLaxmipurNoakhaliGopalgonjMadaripurShariatpurBagerhatKhulnaSatkhira
Sample Village
West TetuliaWest CharsamaiyaSuktaqoanMahmudkandaSalam NagarChar RohitaChar JabbarRajapurShreenathdiDakkhin GoaldiRajapurBetagramKhalilnagar
Coastal Area as a WholeHilly & Stony Cox's Bazar
MoulvibazarRazar Bil NoyaparaMonohapur
Hilly & Stony Area as a WholeLow
Low Area as
Shallow
BograNaogaonSiraigoniJoypurhatChittagong8. BariaGazipurNorshingdiRajbariChuadangaKushtiaMeherpurKishoregonjMymensinghNetrokonaSherpurNatoreNowabqonjRaishahiPabnaSunamgoniDinajpurTangail3 wholeComiJIaDhakaMunshiqonjManikgonjNarayangonjFaridpurJessoreJhanaidahMaquraNarailGaibandhaKuriqramLalmonirhatNilphamariRangpurHobigonjSylhetPanchaqorhThakurqaonJamalpur
BamonparaKadoyaGongaprosadBarataraHashimpurHorinadiBekashahara GararonCharparaKomorpurSubdiaMazhqramRaqhunathpurRahaylaGabrakhaliHatkundoleeGaglajaniMohesh ChandrapurDhumihayatpurKharerbariRadhakantapurShatrumardonBarkonaDopakhali
BorkoitDeonaiBaroikhaliPukhuriaNarashundapurMonsurabadAtliaAchintanagarBara KhariSheikh HatiMatharparaChakir Pashar PathakNorth Battrish HaiariKaziparaShibuShadekpurBorchaliaKaziparaBorunagaonShahbajpur
Shallow area as a wholeTotal Survey Area
Dispose Infants Faeces
At Latrine
HH%0.00.05.90.07.10.00.00.00.00.030.87.70.03.55.39.57.50.00.00.00.00.00.00.0o.o9.115.40.0b.o0.03.36.30.06.70.00.00.00.08.30.02.40.014.35.650.036.411.10.00.00.00.016.70.00.00.00.00.08.30.00.00.05.13.B
At a fixedHole
HH%0.022.735.320.028.614.310.00.00.00.07.70.00.011.55.3
38.122.59.116.70.00.021.49.1
60.00.09.17.70.00.00.03.318.80.00.036.40.00.0
50.016.715.412.17.17.111.10.018.211.10.08.38.30.00.09.138.50.014.318.80.017.626.70.010.211.8
AtGarden
HH%64.727.35.9
40.014.342.925.013.357.116.715.461.550.032.00.00.00.054.50.00.00.07.10.00.014.30.023.10.058.30.00.00.011.10.09.114.30.015.08.37.79.10.00.00.00.00.00.025.033.358.311.10.00.00.00.00.00.00.00.06.70,06.213.3
Wash in thepond/river/
canal
HH%17.60.0
29.413,328.67.10.086.721.45.6
23.17.70-018.036.80.017.50.00.010.054.550.036.40.0
21.427.37.754.50.0
53.80.00.011.126.70.00.05.9
25.00-00.016.50.0
21.40.016.736.416.70.00.00.0
33.30.00.00.00.00.0
50.08.311.80-05.99.514.5
Wash at thesite of TW/
pump/ plant
HH%0.00.00.00.00.00.00.00.00.00.00.00.00.00.00.00.00.00.033.30.00.07.10.010.014.30.00.00.00.00.00.00.033.30.00.00.00.00.00.00.03.00.014.30.016.70.05.612.58.38.30.00.00.00.00.0
21.40.00.00.00.00.04.02.5
Anyplace
HH%11.850.017.613.321.421.465.00.021.461.123.10.0
37.528552.652.452.527.333.390.036.40.054.520.050.054.546.245.541.738.576.775.00.0
46.754.585.794.110.066.776.950.585.742.983.316.79.1
33.343.841.725.055.683.390.961.591.364.312.583.341.260.094.157.747.6
Leftopen
HH%5.90.05.913.30.014.30.00.00.016.70.0
23.112.56.50.00.00.09.116.70.09.114.30.010.00.00.00.00.00.07.716.70.0
44.420.00.00.00.00.00.00.06.47.10.00.00.00.0
22.218.88.30.00.00.00.00.08.70.018.80.029.46.70.07.36.4
Faeces wasseen in thecourtyard
HH%9.423.314.817.212.028.118.245.213.318.59,413.86.917.923.336.730.07.13.610.310.723.523.19.419.417.917.911.519.412.939.565.438.515.26.518.513.322.634.512.920.065.65.911.83.119.49.418.89.115.46.35.913.318.833.315.27.7
25.020.79.1
24.216.918.8
Disposes Waste materials
At a fixedHole/place
HH%62.556.733.331.088.031.36.10.03.40.018.856.772,434.616.760.0
L 38.367.967.90.0
71.444.142.365.63.253.675.018.567.716.118.415.47.76.1
67.73.713.358.162.135.537.653.129.414.728.119.43.1
37.568.833.328.15.973.362.524.230.315.47.179.363.642.435.836.4
Canal/river/ lake
/pond
HH%3.10.011.13.40.03.10.093.524.13.60.06.70.011.633.30.016.710.70.00.03.611.842.30.00.00.00.00.00.045.20.03.835.939.40.00.00.016.10.012.910.10.014.72.90.0
63.937.50.00.00.00.00.06.70.00.00.015.414.33.412.10.08.810.2
Anyplace
HH%34.443.355.665.512.065.693.96.5
72.496.481.336.727.653.750.040.045.021.432.1100.025.044.115.434.496.846.425.081.532.338.7
L81JLB0.856.454.532.396.386.725.837.951.652.346.955.982.471.916.759.462.531.366.771.994.120.037.575.869.769.278.617.224.257.655.453.5

D: Hand Washing Practices:Table D1: Hand Washing Before Meal (Household wise)
Hydro-geological Area
Coastal
District
BarisalBholaJhalokatiPirojpurFeniLaxmipurNoakhaliGopalgonjMadaripurShariatpurBagerhatKhulnaSatkhira
Sample Village
West TetuliaWest CharsamaiyaSuktagoanMahmudkandaSalam NagarChar RohitaChar JabbarRajapurShreenathdiDakkhin GoaldiRajapurBetagrarnKhalilnaqar
Coastal Area as a Whole
Hilly & Stony Cox's BazarMoulvibazar
Razar Bil NoyaparaMonohapur
Hilly & Stony Area as a Whole
Low
BograNaogaonSirajgonjJqypurhatChittagongB. BariaGazipurNorshingdiRajbariChuadanqaKushtiaMeherpurKishoregonjMymensinghNetrokonaSherpurNatoreNowabgonjRajshahiPabnaSunamgonjDinajpurTangail
BamohparaKadoyaGongaprosadBarataraHashimpurHorinadiBekashahara Gararon
CharparaKomorpurSubdiaMazhgramRaghunathpurRahaylaGabrakhaliHatkundoleeGaglajaniMohesh ChandrapurDhumihayatpurKharerbariRadhakantapurShatrumardonBarkonaDopakhali
Low Area as a whole
Shallow
ComiilaDhakaMunshigonjManikgonjNarayangonjFaridpurJessoreJhanaidahMaguraNarailGaibandhaKurigramLalmonirhatNilphamariRangpurHobigonjSylhetPanchagorhThakurgaonJamalpur
BorkoitDeonaiBaroikhaliPukhuriaNarashundapurMonsurabadAtliaAchintanagarBara KhariSheikh HatiMatharparaChaklr Pashar Pathak
North Battrish Hazari
Kaz|p_araShibuShadekpurBorchaliaKaziparaBorunagaonShahbajpur
Shallow area as a wholeTotal Survey Area
TotalSample
HH
32302729253233313028323029
3883030602828292834273231282827313137263933312730312931
6963234343236323233273234303233332627293333
6341778
Wash One hand
With onlywaterHH%96.983.3100.096.692.078.1100.025.830.0100.0100.096.796.684.086.7100.093.371.492.989.760.782.474.1100.0100.082.1100.0100.0100.096.897.3100.051.378.8100.0100.0100.0100065.5100.088.590.682.494.1100.069.456.3100.097.096.3100.0100.096.771.993.997.096.277.896.657,6100.088.587.7
With soap
HH%0.00.00.00.00.09.40.00.00.00.00.00.03.41.03.30.01.710.77.110.317.90.018.50.00.03.60.00.00.00.00.00.00.03.00.00.00.00.00.00.02.90.02.90.00.08.30.00.00.03.70.00.03.36.30.03.03.80.00.00.00.01.62.0
Both Hands
With onlywaterHH%0.016.70.03.44.06.30.00.00.00.00.00.00.02.33.30.01.77.10.00.03.614.70.00.00.00.00.00.00.00.00.00.00.015.20.00.00.00.0
34.50.03.39.411.85.90.016.70.00.03.00.00.00.00.0
21.90.00.00.00.03.4
42.40.06.04.0
With soap
HH%0.00.00.00.04.00.00.03.20.00.00.00.00.00.56.70.03.310.70.00.017.92.97.40.00.03.60.00.00.00.00.00.00.03.00.00.00.00.00,00.01.90.02.90.00.05.60.00.00.00.00.00.00.00.00.00.00.00.00.00.00.00.51.1
Total Handwash
HH%96.9100.0100.0100.0100.093.8100.029.030.0100.0100.096.7100.087.9100.0100.0100.0100.0100.0100.0100.0100.0100.0100.0100.089.3100.0100.0100.096.897.3100.051.3100.0100.0100.0100.0100.0100.0100.096.6100.0100.0100.0100.0100.056.3100.0100.0100.0100.0100.0100.0100.093.9100.0100.077.8100.0100.0100.096.594.8
Doesn'tWash
HH%3.10.00.00.00.06.30.0
71.070.00.00.03.30.012.10.00.00.00.00.00.00.00.00.00.00.010.70.00.00.03.22.70.0
48.70.00.00.00.00.00.00.03.40.00.00.00.00.0
43.80.00.00.00.00.00.00.06.10.00.0
22.20.00.00.03.55.2

Table D2: Hand Washing After Defecation (Household wise)
Hydro-geologicalArea
Coastal
District
BarisalBholaJhalokatiPirojpurFeniLaxmipurNoakhaliGopalgonjMadaripurShariatpurBaqerhatKhulnaSatkhira
Sample Village
West TetuliaWest CharsamaiyaSuktagoanMahmudkandaSalam NagarChar RohitaChar JabbarRajapurShreonathdiDakkhin GoaldiRajapurBetagramKhalilnagar
Coastal Area as a Whole
Hilly & Stony Cox's BazarMoulvibazar
Hilly & Stony Area as a Whole
Low
BoqraNaoqaonSirajqonjJoypurhatChittagongB. BariaGazipurNorshingdiRajbariChuadangaKushtiaMeherpurKishorogonjMymensinghNetrokonaSherpurNatoreNowabgon^RajshahiPabnaSunamgonjDinajpurTangail
Hazar Bil NoyaparaMonohapur
BamonparaKadoyaGongaprosadBarataraHashimpurHorinadiBekashahara GararonCharparaKomorpurSubdiaMazhgramRaghunalhpurRahaylaGabrakhaliHatkundoleeGaglajaniMohosh ChandrapurDhurnihayatpurKharerbariRadhakantapurShatrumardonBarkonaDopakhali
Low Area as a whole
Shallow
ComillaDhakaMunshigonjManikgonjNarayangonjFaridpurJessoreJhanaidahMaguraNarai!GaibandhaKurigramLalmonirhatNilphamariRangpurHobigonjSylhetPanchagorhThakurgaonJamalpur
BorkoitDeonaiBaroikhaliPukhuriaNarashundapurMonsurabadAtliaAchintanagarBara KhariSheikh HatiMatharparaChakir Pashar PathakNorth Battrish HazariKaziparaShibuShadekpurBorchaliaKaziparaBorunagaonShahbajpur
Shallow area as a wholeTotal Survey Area
Wash One hand
With onlywater
HH%15.653.377.858.640.087.575.871.053.396.484.473.331.063.160.063.361.742.928.655.225.038.222.228.16.5
46.43.63.70,0
41.997.496.223.712.129.088.920.096.83.4
71.038.571.982.435.33.1
30.668.80.00.051.90.0
58.860.00.06.1
21.269.275.044.80.030.334.643.3
With soap
HH%3.10.00.00.020.03.10.06.510.00.012.53.310.35.210.00.05.017.97.120.714.38.8
29.69.43.23.6
25.07.46.50.02.63.82.63.016.10.03.30.00.03.27.93.12.914.7
" 15.622.20.00.06.10.03.10.00.06.30.012.13.83.613.86.13.06.06.5
WithAsh/soil
HH%6.3
46.722.234.520.09.421.216.13.33.63.110.048.318.623.330.026.717.960.720.735.729.425.918.890.342.967.988.987.154.80.00.068.472.754.811.176.73.282.89.7
44.43.15.935.381.35.628.1100.084.840.796.941.236.787.536.463.619.23.6
41.451.566.746.839.0
Washing Both Hands
With onlywater
HH%0.00.00.03.44.00.00.00.00.00.00.00.06.91.03.30.01.77.10.00.010.711.811.10.00.00.00.00.00.00.00.00.00.06.10.00.00.00.00.016.12.79.40.011.80.036.10,00.00.00.00.00.00.00.00.00.00.00.00.00.00.03.12.5
With soap
HH%0.00.00.00.08.00.03.00.00.00.00.00.03.41.03.30.01.77.13.63.414.311.811.10.00.03.63.60.06.50.00.00.00.06.10.00.00.00.010.30.03.49.42.92.90.05.60.00.06.17.40.00.00.03.10.00.07.70.00.0
21.20.03.32.8
WithAsh/soil
HH%0.00.00.00.08.00.00.00.00.00.00.00.00.00.50.06.73.37.10.00.00.00.00.00.00.00.00.00.00.00.00.00.02.60.00.00.00.00.03.40.00.63.15.90.00.00.00.00.03.00.00.00.03.33.10.03.00.00.00.021.20.02.21.2
Do notWash
separately
HH%75.00.00.03.40.00.00.06.5
33.30.00013.30.010.60.00.00.00.00.00.00.00.00.0
43.80.03.60.00.00.03.20.00.02.60.00.00.00.00.00.00.02.40.00.00.00.00.03.10.00.00.00.0o.o0.00.057.60.00.017.90.00.00.03.94.7
KeepWater/Soap/
Ash nearlatrineHH%3.80.015.46.98.33.60.00.03.80.00.010.03.74.24.00.02.210.018.210.333.39.414.83.40.011.516.712.50.06.55.90.00.037.514.80.04.810.057.10.011.34.512.59.4
38.75.60.00.00.04.80.00.035.711.10.00.04.00.0
40.021.19.59.4S.4

Table D.3: Hand Washing After Cleaning Children's bottom (Household
Hydro-geological
Area
Coastal
District
BarisalBholaJhalokatiPirojpurFeniLaxmipurNoakhaliGopalqonjMadaripurShariatpurBagerhatKhulnaSatkhira
Sample Village
West TetuliaWest CharsamaiyaSuktagoanMahmudkandaSalam NaqarChar RohitaChar JabbarRajapurShreenathdiDakkhin GoaldiRajapurBetaqramKhalilnagar
Coastal Area as a WholeHilly & Stony Cox's Bazar
MoulvibazarRazar Bil NoyaparaMonohapur
Hilly & Stony Area as a Whole
Low
BograNaogaonSirajgonjJoypurhatChittagongB. BariaGazipurNorshingdiRajbariChuadangaKushtiaMeherpurKishoregonjMymensinghNetrokonaSherpurNatoreNowabgonjRajshahiPabnaSunamgonjDinajpurTangail
BamonparaKadoyaGongaprosadBarataraHashimpurHorinadiBekashahara Gararon
CharparaKomorpurSubdiaMazhgramRaghunathpurRahaylaGabrakhaliHatkundoleeGaglajaniMohesh ChandrapurDhumihayatpurKharerbariRadhakantapurShatrurnardonBarkonaDopakhali
Low Area as a whole
Shallow
ComillaDhakaMunshigonjManikgonjNarayangonjFaridpurJessoreJhanaidahMaguraNarailGaibandhaKurigramLalmonirhatNilphamariRangpurHobigonjSylhetPanchagorhThakurgaonJamalpur
BorkoitDeonaiBaroikhaliPukhuriaNarashundapurMonsurabadAtliaAchintanagarBara KhariSheikh HatiMatharparaChakir Pashar PathakNorth Battrish HazariKaziparaShibuShadekpurBorchaliaKaziparaBorunagaonShahbajpur
Shallow area as a wholeTotal Survey Area
TotalSample
HH
1822161614142315131813109
20120193911510121813131411121013143216111411516211113
306131419812151412129681124151611131417
263809
Wash One handWith only
waterHH%44.4100.081.375.00.050.087.080.0100.083.346.290.033.369.785.073.779.536.460.070.041.738.961.523.114.363.68.330.07.778.696.987.581.835.718.2
100.025.0100.027.369.253.930.871.421.112.575.073.30.025.058.311.150.075.09.1
54.226.7100.045.553.80.0
41.242.655.4
With soap
HH%0.00.06.30.07.114.38.70.00.00.00.00.011.13.50.00.00.027.320.010.08.311.17.723.114.318.216.710.015.40.00.06.30.00.018.20.06.30.09.17.78.815.414.35.3
25.016.70.00.08.30.00.00.012.518.20.06.70.00.0
23.114.30.07.26.6
WithAsh/soil
HH%38.90.012.518.87.128.64.320.00.016.753.810.055.618.45.05.35.118.220.020.016.722.27.746.271.418.275.060.069.221.43.16.318.250.063.60.068.80.054.515.430.730.87.1
42.162.50.0
20.0100.066.725.088.950.00.0
63.68.360.00.00.0
23.128.658.835.027.8
wise)Washing Both Hands
With onlywaterHH%0.00.00.00.07.17.10.00.00.00.00.00.00.01.05.00.02.60.00.00.00.00.00.00.00.00.00.00.00.00.00.00.00.00.00.00.00.00.00.00.0
0.015.47.115.80.00.06.70.00.00.00.00.00.00.00.00.00.00.00.00.00.02.71.2
With soap
HH%0.00.00.00.071.40.00.00.00.00.00.00.00.05.05.00.02.6 j9.10.00.033.322.215.40.00.0
0.00.00.00.00.00.00.00.014.30.00.00.00.00.07.74.67.70.00.00.00.00.00.00.08.30.00.00.00.00.00.00.00.00.0
28.60.02.33.8
With Ash/soil
HH%0.00.00.06.37.10.00.00.00.00.00.00.00.01.00.021.110.39.10.00.00.05.67.70.00.00.00.00.00.00.00.00.00.00.00.00.00.00.09.10.01.30.00.015.80.00.00.00.00.00.00.00.00.09.10.06.70.00.00.0
21.40.03.02.2
Do not Washseparately
HH%16.70.00.00.00.00.00.00.00.0
0.00.00.00.01.50.00.00.00.00.00.00.00.00.07.70.00.00.00.07.70.00.00.00.00.00.00.00.00.00.00.00.70.00.00.00.08.30.00.00.08.30.00.012.50.0
37.50.00.054.50.07.10.07.23.0

E: Supplementary Information for Hardware & Software Intervention
Hydro-geoJogicalArea
Coastal
District
BarisalBhoteJhalckatiPirosurFeniLaxmipur
GoralqoniMacaripu*SnariatpurBaqerhartKnulnaSat:h:r£
Sample Village
WeaTetnltaWesi CharsamaijaSuktagoanWahmurjfcartdaS a i n NaoarChar RohilaCharJabbarRaiapjrSnreeralrdiDa-:kriin GcialdiRaapurBe^qramKhalilnaqar
Coastal Area as a Whole
Hilly & Siony Cox's BazarMoulvibazar
Razar Sil Novaparaf.fonaharpur
Hil ly & Stony Area as a Whole
LowTabte
Low Area as a wiShallow Area
Bog faMaoqaonSiraiqonJopurhatChitlaosnc.B BansGai ourNorshi';qdiSaibariChUidanaa\jshlaMe-rerpLrKishoreoonjMymensiriqhNelrokonaShe-purNature\fowabqonRajshah;
PabnaSu^rr>qonjDinajwrTangailuleComitaDhakaMurxsh+qontMarikconjNa-ayarigcnjFar.dpu.-JessareJhanaicahMaduraNarailGaitendhaKungramLalmcr.irha!Wpha'nariRsngpjr-tobiconjSvlhel•^ancftaqorh
Thakurcaorcjamalptr
Shadow Area as a WildeTotal Survey Area
BamonparaKadoyaGooqapfosadBaralaraHashimpurHcinadiBefcasr-shara GararonCha-paraKorrorpurSubaiaMazhqram
BahamaGarxakhaliHatkurxidseGaqlajaniMohesr: CbandrapurDhumirayatpur^rarerbariRacrakantapur5-u=L'jmarrJon
BarkonaOcc£kriali
SorkoitOeoriaiSarcikhaliPuk'iunaNarasiun&pufWonsjrabsd
AtliaAchin'anaqarBa^a KnariShe < i HaiiVlarsrparaChakir Pashar PathakNorth Ba^risn HajariKajipsraSiibuSrtadeip*jrSomaliaK=;,paraSDrunaqaonShahKip:jr
Ecxaljfflial Inslifejfional
NGOSchoa
No-il
001
00272C
C30
1901
1!43235CC13t0
1
01203
C112
3423
3002112052311
00201
29S3
Primary
No.2220151£
1
1
11
120
1
34100150t1
011211111011
2
1
241121111112011120t111
2169
Junior High School
No.000000
\
0000C2000u00001000rj0
c00000010
a002
ccecc000000000000000
a4
High School
No-01
00100B0001
4•3
0
010
011000000001
000000101
61
01
00000
01
0000
a011
005
15
College
Mo.0000000r
0
r
1.
0
c000000000,000100
c0000000I.
0100•3
•3
00
a00I]
rj00000001
012
Madrasha
No.03210120
0
c11
1411
2511011
!
c0:
01
c1
010011
00
181
f0
00i
3131
acc1rj00109
43
Other
No.0CC
C01
001011
at
cc0
c0000000
aaa1000
c0000
c00
160000
a1
aa33
scc000000
1318
fleSgtae
Mosque
No.66c
22
17BB95L
102
3052
7521i
102£
31£
131
222r.
745;
763322253
23
A5226
3233
S3226
Temple1
churches
r*j.30
20000c
0021
a17
22C003
20I01
000
aa30
a00030i
14C0220
a0023101
a11211
a1750
For P S FMedium and big
size pone that havewater round the
year andappropriate for
PSF
No.3J
531105
14
06',
782
4
59i
anrj
364
164£
1101
17%
a2
322
022
03
1234
200
00341554200
18S21
561
275
For R W H S
Num- of Chal(Roof) that can
be use ascatchment
N!c.
is:1927C
18121162
3745SI9!1823
88712055
1652312271905C22
13211322
197
«1501ft2aI t3641
18921C
0'9940
10S101
24225
22676
1 «to
136379454
1742ES1223017«20
206
160170a5202
Human Resource
Number ofperson whocan repair/inslall T W
Mason
No.
31
00Ci
CBB10
10
1701
130
aaa0i
c1
c3
c01
0002.0t
052
23304
200
0302
1377001042
4566
Number of Masonwho can/ trained 10construct ring slab
No.0
16C22250
01i
aa
3205S201
00614
001
003000007
3233
634262002
15127
5
10102052
71171

Appendix-B

NGO Forum for Drinking Water Supply & Sanitation4/6, Blook-E, Lalmatia, Dhaka questionnaire no.
QuestionnaireFor
Household Based Data Collection of the Villages Selected for 2002-2003 to ImplementCommunity Managed WatSan Program
General Information
• NGO Forum Regional office name
• Partner Organisation's name
• Name of the selected village
• Address of the selected village
Union Thana/Upazila District.,
1. Information regarding the respondent
• Respondent's name : Father/ Husband's name,
b. (Female) ~^\ c. Trans gender
b. (Housewife)
• Sex : a. (Male)
Respondent's profile: a.(Household head)
Respondent's Educational Background
a. Illiterate T
c. (Other member)
d. 6th-10th standard L J
g. Graduate Equivalent
2. Household's information:
• Household's population: a. Male
b. Only can signature
e. S.S.C/Equivalent
c. Up to 5th Standard
f. H.S.C/ Equivalent
h. Post Graduate/ Equivalent i. Other (specify)
b. Female c. < 5 Children d) Total
Educational background of 5> age members of the Household (write the category wise persons)
a. Illiterate b. Only can signature c. Up to 5th Standard •
d. 6th-10th standard e. S.S.C/ Equivalent f. H.S.C/Equivalent
g. Graduate Equivalent h. Post Graduate/ Equivalent i. Other (specify)
Principal earning source of the Household
a. Agriculture I I b. Daily Labour I I c. Fish related profession I I d. Business/ Contractorship V~
g. Potteringe Rickshaw/ Van/pushcart pulling/ boat roaring/ car driving
i. Goldingsmithing
f. Working in other's houses
h. Blacksmithing . Other professions
Early earning pattern of the Household: (in taka)
b. Between 10,000 to 15 thousanda. < 10000 c. Between 15,000 to 20 thousand
d. Between 20,000 to 25 thousand e. More than 25 thousand

2. Which sources of water do your household members generally use for the following purposes( * mark
Uses ofwater
DrinkingCookingUtensil washingGargling/ Uzu/ washing face/bathingRaw Vegetable/ Fruitswashing
?in the appropriate column
Sources of waterFubewell/pump/plants
Safe Unsafe (haveunacceptablelevel of Arsenic/Iron Salinity)
Pond well Danal/River Rain water Others
3. What is the distance between your kitchen and the TW/pump/plant from where your family collets water?
a. Not applicable because we do not collect water from TW/Pump/plant b. Distance (feet)
4. Which type of purification method you have followed to purify water if" you had collected it frompond/lake/canal/river/traditional well/rainwater within last one year?
a. Not applicable L J b. Haven't purified
d. Have filtered through straining
d. Have used Fitkeric. Have drunk after boiling
e. Have used Filter I I f. Have used purifying tablets
5. Where do your household members (age more than 5 years) go for defecation? (* mark in the appropriate column)
Householdmember category
MaleFemale
Defecation siteSeptic/Offsetlatrine
Ring slab latrine Pit Latrine Hanging/ openLatrine
Open place/bush/others
6. What are the reasons for which your household members (age more than 5 years) do not use pit/septic/ring slab/offsetlatrine ? (Might have multiple answers)
a. Not applicable because household members use pit/septic/ring slab/offset latrine
b. Don't know/ unawareness _
e. Others (specify)
c. Due to lack of space | | d. Due to lack of finance
7. Do your household_members always wash hands before meal?
a. Do not wash b. wash one hand only with water
e. Wash both the hands only with water
c. wash one hand with soap
f. Wash both the hands with soap
8. Do your household members always wash hands after defecation?
a. Do not wash b. wash one hand only with water
e. Wash one hand with Soap
g. Wash both the hands with Ash/Soil
c. Wash one hand with Ash/ Soil
f. Wash both the hands only with water
h. Wash both the hands with Soap

9. Do your household members always wear slipper during defecation?
a. Use slipper b. Do not use slipper
10. Where your household members dispose of household waste?
a. At fixed place/hole I I b. At water bodies (canal/river/lake/ponds) I I c. Any place
WatSan knowledge related information
11. Do you know what happens if arsenic contaminated water is drunk?
a. Yes b.No
12. What types of diseases might occur if surface water is drunk water filtration/purification and due to existence of
improper sanitation? (Might have multiple answers)
a. Diarrhoea | | b. Dysentery | ] c. Typhoid
] g. Otherse. Skin disease
b. Dysentery
f. warm
d. Jaundice
h. Do not know
13, Did any of your household members having age more than 5 years have suffered diarrhoeal attack within last one
month?
- b.Noa. Yes I I if yes than how many persons •
The following questions are only applicable for those whose household have under five children
14. Not applicable because household does not have under five children
14,1. Did any of your household members (children) having age less than 5 years have suffered diarrhoeal attack within
last one month?
a. Yes Q if yes than how many persons b.No
14.2. Where does the under 5 children of your household defecate?
a. Not applicable for children having 0-2 years age
c. At ring-slab latrine
b. At septic/offset latrine
f. At open place/courtyard
d. At pit latrine
I—I g. Any place/bush/others
e. At open/hanging latrine L J
14.3. Where do you dispose of faeces of your household's under five children?
a. Not applicable because household does not have under five children
c. At fixed hole [~J d. At garden
g. Wash on the platform of TW/pump/plant
b. At latrine
f. wash in the pond/canal/lake/river
h. any place i. Left open
14.4. Do your household members always wash hands after cleaning the bottom of <5 children?
a. Not applicable because children themselves wash
d. Wash one hand with Ash/ Soilb. Do not wash c. wash one hand only with water
e. Wash one hand with Soap
g. Wash both the hands with Ash/Soil
f. Wash both the hands only with water
h. Wash both the hands with Soap

Observation:
15. Whether the drinking water pot is cleaned?
a. Not applicable because the pot is empty I—I b. Yes
16. Whether the drinking water pot is covered
a. Not applicable because the pot is empty/ there is no pot Q
17. Distance between house and latrine
a. Not applicable because household does not have any latrine
18. Whether ash/soap/soil/water is preserved near the latrine?
a. Not applicable because household does not have any latrine
LJ c. No L J
• c. No
b.Yes
b. distance —
c. No
— feet
b. Yes
19. Distance between latrine and TW/pump/plant
a. Not applicable because household does not have any latrine or TW/pump/planti i r™^"l i ii—i
b. Less than 7 feet I—I c. 7-15 feet d. 16-32 feet D e. More than 33 feet
20. Whether the ring slab latrine has proper gooseneck (water seal)?
a. Not applicable because household does not have any ring-slab latrine
b. Yes Q c. No
21. Whether the pan slab of septic/offset/ring-slab is cleaned?
a. Not applicable because household does not have any septic/offset/ring-slab latrine | |
"I c. Nob. Yes
22. Whether the surrounding areas of of septic/offset/ring-slab is cleaned? (faeces are not there)
a. Not applicable because household does not have any septic/offset/ring-slab latrine
c. Nob. Yes
23. Whether human excreta is seen in the courtyard
a. Yes I I b. No
Name of the Data Collector (NGO Forum Staff):-
Name of the Co-data Collector (PNGO Staff) :-
Signature:
Signature:

NGO Forum for Drinking Water Supply & Sanitation 14/6, Blook-E, Lalmatia, Dhaka f
Checklist 1For " • ' . • . ' J j
Baseline survey through WatSan Mappings of the Villages Selected for 2002-2003 toImplement Community Managed WatSan Program |
(Using 1, 4,5,17,18, 19 & 20 no variables collect information about the entire village and use rest of the variable to acquire data ,|about the Watsan selected portion of the village) )
Checklist for data collection through Social Mapping ." t
1. Information of the entire village:• Total population• Total Household
2. Information of the portion of the village selected for WatSan program• Population:
> Male ...> Female> under five children
• Number of Household:> Total households> Number of households having under five children
3. Principal Earning source wise Households figure:
Number of Households whose principal earning source is Agriculture |Number of Households whose principal earning source is day labour INumber of Households whose principal earning source is fish related economic activity 1Number of Households whose principal earning source is Business/ Contactorship iNumber of Households whose principal earning source is Rickshaw/Van/ Pushcart pulling or boat troaring or car driving |Number of Households whose principal earning source is working at others house JNumber of Households whose principal earning source is pottering INumber of Households whose principal earning source is the work of blacksmith |Number of Households whose principal earning source is the work of goldsmith |Number of Households whose principal earning source is service IOthers 1
Checklist for data collection through Resource and Hazard Mapping j
4. Number of school situated in the entire village ••••']NGO School |Primary School (up to 5th standard) :Junior High School (up to 8th standard)High School (up to 10th standard)College \ IMadrasha !Others : i

5. Number of school situated in the entire village• Mashzed• Mandir/ Church/ Pagoda :
6. Number of big & medium size ponds that can be use as catchment pond for PSF (Pond Sand Filter)(information about the Watsan selected portion)
7. Number of Roof that can be use as catchment for RWHS (Rain Water Harvesting System)(information about the Watsan selected portion)
8. Category and collection source wise number of functional and dysfuntional Tubewell/Pump/Plant availablein the the Watsan program selected portion:
• No 6 Tubewell (Shallow suction pump):> Government
. ' . . . . > Market> NGO Forum> Other NGOs
• Conversion Pump (Suction pump):> Government> Market
• ' • ' • > N G O Forum> OtherNGOs
• Deep Tubewell (deep suction pump):> Government> Market :
> NGO Forum '.> Other NGOs
• Tara Deep set Pump (Force mode pump):> Government> Market> NGO Forum •> OtherNGOs
• Arsenic Iron Removal plant:> Government> Locally made
' > NGO Forum> OtherNGOs
• Rain Water Harvesting System (RWHS):> Government
• > Locally made> NGO Forum ;> OtherNGOs
• Pond Sand Filter (PSF): . . . ' • •> Government> Locally made> NGO Forum> OtherNGOs
• Others:> Government
'• ' > Market/locally made> NGO Forum
> OtherNGOs

9. Ownership pattern wise number of Tubewell available in the Watsan program selected portion of the village:• Number of Private TW/Pump/plant:
> Owned by single household> Owned by multipale households
• Number of Community owned TW/pump/plant:• Number of TW/pump/plant owned by institution:
10. Number of TW/pump have tested for Arsenic contamination:• Number of tested TW/pump/plants' water have unacceptable level of arsenic contamination:• Number of tested TW/pump/plants' water does not have unacceptable level of arsenic contamination:
11. Number of TW/pump/plants' water reportedly have unacceptable level of Iron contamination:12. Number of TW/pump/plants'water reportedly have high salinity:13. Number of Safe TW/pump/plant situated in the Watsan program selected portion of the village
• Number of safe functional TW/pump/plants:• Number of safe dysfunctional TW/pump/plant
14. Number of TW/pump/plants does not have proper platform:• Number of TW/pump/plants does not have any platform :• Number of TW/pump/plants does not have drain• Number of TW/Pump/Plants' platform/drain have cracks .jy,
15. Category wise number of Latrine available in the in the Watsan program selected portion of the village ']l
• Number of septic/Offset latrine:• Number of Ring slab latrine: •'• Number of covered and uncovered pit latrine:• Number of open/hanging latrine u
16. Ownership pattern wise septic/offset/ring slab/pit latrine f• Number of Private latrine: f
> Owned by single household >!> Owned by multipale households ..£
• Others M17. Village sanitation Center related information:
• Number VSC situated in the entire village:• If there is no VSC in the entire village than the distance of nearest VSC (in Mile): '..:
18 Running authority of the VSC situated in the village/nearest one ,,N• Number VSC run by governmet: /'".<:• Number of VSC run by private producer 2• Number of VSC run with support of NGO Forum • *• Number of VSC run by other NGOs • j
19. Number of Mason available in the entire village who can make ring slab |20. Number of Mechanic available in the entire village who can repair/ install TW/pump/plants: j
%.