
255.1-87SL-3062.pdf - IRC
161
-
Upload
khangminh22 -
Category
Documents
-
view
4 -
download
0
Transcript of 255.1-87SL-3062.pdf - IRC


•f
INTERNATIONAL REFERENCE CENTRE FOR COMMUNITY WATERSUPPLY AND SANITATION $.
IRC is an internationally operating independent, non-profit organization dealingwith information and technology support for water and sanitation improvement.With its partners in developing countries and with United Nations agencies, donororganizations, and non-governmental organizations, IRC assists in the generation,transfer and application of relevant knowlegdc. The focus of this co-operation is onthe rural and urban fringe areas where the need for technical assistance is greatest.
Support is provided by means of publications, training and education, evaluationand advice, and development and demonstration. IRC's information-orientedprogrammes include: community participation including the role of women;hygiene education; human resources development; appropriate technologyincluding operation and maintenance; programme evaluation; and community-based financial management.
• ! ! • : . : • • • : • ! ; •
Requests for information about IRC should be addressed to IRC, P.O. Box 93190,2509 AD The Hague, The Netherlands.
• • • • • . • I • ' ' • . • • * • :

Slow sand filtrationfor community water supply
SLOW SAND FILTRATIONFOR COMMUNITY WATER SUPPLY
Planning, design, construction,operation and maintenance
J.T. Visscher, R. Paramasivam, A. Ramanand H.A. Heijnen
255
Technical Paper No. 24
International Reference Centre for CommunityWater Supply and Sanitation,The Hague, The Netherlands
Slow sand filtration for community water supply: planning, design, construction, operationand maintenance/Visscher, XT.; Paramasivan. R.; Raman, A.; Heijnen, H.A.The Hague: International Reference Centre for Community Water Supply and Sanitation,1987 x; 149 p.: 68 fig., 31 tab. :(Technical paper series; no. 24)Includes selected bibliographyISBN 90-6687-009-5
AbstractPresents established information on slow sand filtration, as well as guidelines resulting fromdemonstration projects in developing countries.In Chapter 2, the basic principles of community water supply and community participationare set out before entering into detailed discussion on the slow sand filtration process-mChapter 3. The overall system design is discussed in Chapter 4, and the cost of construction,operation and maintenance in Chapter 5. The information presented in these first chapters isillustrated in Chapter 6 with an example of planning and designing a slow sand filtrationsystem for a hypothetical community. Chapter 7 provides detailed information on thestructural design, which is further illustrated with design examples in Chapter 8. It should beunderstoodjiowevcr, that these examples are based on specific local conditions and may notbe directly applicable under other circumstances. In Chapter 9, construction guidelines arepresented, because the quality of construction can be greatly improved in many cases.Finally, Chapter 10 outlines detailed operation and maintenance procedures and sets out theimportance of proper training. The publication is concluded with a series of appendices.
Keywords: slow sand filtration/water treatment plants/guidelines/community participation/design/construction costs/operating costs/maintenance costs/construction/operation/main-tenance/planning
Copyright©by the International Reference Centre for Community Water Supply and Sanita-tion (IRC).
IRC enjoys copyright under Protocol 2 of the Universal Copyright Convention. Nevertheless,permisson is hereby granted for reproduction of this material, in whole or part, for educatio-nal, scientific, of development-related purposes except those involving commercial sale, prov-ided that (a) full citation of the source is given and (b) notification is given in writing to IRC,P.O. Box 93190, 2509 AD The Hague, The Netherlands.
IV

TABLE OF CONTENTSPage
Preface x
1. Introduction 1
2. Community Water Supply and Sanitation 4
2.1 Importance of safe water supply 4
2.2 Water sources 42.3 Treatment requirements 62.4 Water treatment by slow sand filtration 82.5 Selection of treatment system 122.6 Community involvement 122.7 Hygiene education 18
3. Principles of Slow Sand Filtration 20
3.1 The components of the filter 203.2 Treatment process 243.3 Results of slow sand filtration 273.4 Operation and control 29
4. Design Process 33
4.1 System capacity 334.2 Main components and sizing of the water supply system 364.3 Estimation of cost 39
5. Cost of Slow Sand Filters 40
5.1 Construction cost 405.2 Operation and maintenance costs 475.3 Cost comparison between slow and rapid sand filtration 48
6. Example of Planning and Designing a Slow Sand Filtration System 49
6.1 Feasibility study 496.2 Design procedure 496.3 Summary of design example 58
V

7. Structural Design Considerations 59
7.1 Design of filter box 597.2 Inlet structure 707.3 Outlet structure 727.4 System of underdrains 737.5 Filter control arrangements 767.6 Piping and pumping 797.7 Construction of the clear-water tank 80
8. Design Examples of Slow Sand Filters 81
9. Construction Guidelines 92
9.1 Preparation of a new filter 93
9.2 Building materials for slow sand filters 93
9.3 Selection of filter sand 97
10. Operation and Maintenance Procedures 101
10.1 The caretaker's role 101
10.2 Starting-up a new filter 10410.3 Daily operation 10710.4 Shutting down procedures 11010.5 Cleaning a filter bed 11110.6 Sand washing by hose 11310.7 Rc-sanding 11510.8 Record keeping 11710.9 Quality control 117
References 119
List of appendices 123
I Summary of WHO Guidelines for Drinking- WaterQuality 123II Design Considerations for Simple Pre-Treatment Systems 126III Chlorination 134IV Soil Investigation 136V Flow Measurement in Slow Sand Filters 138VI Water Quality Analysis 140
VI
VII Participating Institutions in the Slow Sand Filtration Projectand Documentation Centres
VIII Glossary143145
LIST OF TABLES
Table 2.1: Importance of water-and-sanitation-related intervention for infectiousdisease control
Table 2.2: Summary of considerations in slow sand filtrationTable 2.3: Guideline for the selection of a water treatment system for surface water in
rural areasTable 2.4: Community involvement in water supply projectsTable 3.1: Performance of slow sand filtersTable 4.1: Population growth factorsTable 4.2: Average amount of water use for various types of rural water suppliesTable 4.3: Example of estimate of water demand per capita for house connections in
rural areas in IndiaTable 4.4: General design criteria for slow sand filters in rural water supplyTable 5.1: Estimate of average cost per m1 of filter bed area of floor, underdrains,
gravel, filter sand and excavation for rural areas in India, 1983Table 5.2: Slow sand filters and total wall length for various design capacities with a
filtration rate of 0.1 m/hTable 5.3: Estimated costs per m2 of rectangular slow sand filters in rural areas in India,
1983Table 7.1: Applicability of various types of constructions for slow sand filtersTable 7.2: Criteria for dimensioning of underdrain system using perforated pipesTable 9.1: Summary of procedures in preparation of the sand filterTable 9.2: Recommended content of fines for normal and large aggregate concreteTable 10.1: Schedule of activities for caretakerTable 10.2: Procedures to start-up a new filterTable 10.3: Procedures in daily operation of the filtersTable 10.4: Procedures to shut down a filterTable 10.5: Procedures to clean a filter bedTable 10.6: Procedures to wash filter sand and filter scrapingsTable 10.7: Procedures to re-sand a filter
LIST OF FIGURES
Figure 1.1: Slow sand filter plant, Borujwada, India, 1983Figure 1.2: Slow sand filter plant, Ban Bangloa, Thailand, 1982
VII

Figure 2.1: River bed filtration, collection well, Borujwada, IndiaFigure 2.2: Horizontal flow-roughing filter under construction, Fau, SudanFigure 2.3: Women are the main users of the village water supplyFigure 2.4: Community support in digging trenches for the distribution network,
Alto de los Idolos, ColombiaFigure 3.1: Basic components of an outlet controlled slow sand filterFigure 3.2: Basic components of an inlet controlled slow sand filterFigure 3.3: Development of resistance in the filter bedFigure 3.4: Effect of sand size on removal of total coliform bacteria in slow sand
filtrationFigure 3.5: Slow sand filter pilot plant, Nagpur, IndiaFigure 3.6: Slow sand filter pilot plant, Cali, ColombiaFigure 3.7: Inlet controlled filter preceded by river bed filtration, Choro del Plata,
ColombiaFigure 3.8: Typical development of filtration rate in declining rate filtrationFigure 5.1: Layout of a filter plant with (n) rectangular unitsFigure 5.2: Circular brick masonry filter, Gezira-Region, Sudan, 1979Figure 5.3: Slow sand filter plant, Santa Rosa, Colombia, 1985Figure 6.1: Daily pattern of water use in an adjacent communityFigure 6.2: Components of the water supply systemFigure 6.3: Accumulated water inflow and outflow in elevated raw-water balancing
tank throughout a 24-hour periodFigure 6.4: Accumulated water production and water useFigure 6.5: Possible layout of the water treatment plantFigure 7.1: Structural design of filter boxFigure 7.2: Principle of universal compressive and tensile stressesFigure 7.3: Cross-section of filter wall constructed of masonry and ferrocementFigure 7.4: Cross-section of the wall of a ferrocement tankFigure 7.5: Construction of ferrocement tank using plastic pipe as the inside mouldFigure 7.6: Pressure diagram for rectangular filtersFigure 7.7: Pressure diagram for a wall of the filter boxFigure 7.8: Drainage system underneath filter boxFigure 7.9: Wall-floor connection in ferrocement and reinforced concreteFigure 7.10: Wall-floor connection in masonry and reinforced concreteFigure 7.11: Example of a reinforcement design for a wall-floor connectionFigure 7.12: Various linings for sloping wall filtersFigure 7.13: Inlet structureFigure 7.14: Outlet box of an outlet controlled filterFigure 7.15: Common systems of underdrains for slow sand filtersFigure 7.16: Filter medium supportFigure 7.17: Underdrain system made of corrugated PVC pipeFigure 7.18: Flow sheet for slow sand filtration installation (gravity flow)Figure 7.19: Gate valve for pipelinesFigure 7.20: Gate valve in open conduitFigure 7.21: Hydraulic gradient line in a slow sand filtration plant (gravity flow)Figure 7.22: Head losses through friction in PVC pipesFigure 8.1: Design features of design example IFigure 8.2: Design features of design example II
VIII

Figure 8.3: Design features of design example IIIFigure 8.4: Design features of design example IVFigure 8.5: Design features of design example VFigure 9.1: Relationship of water content, cement content and compression strength
for cement with a characteristic strength of 42.5 N/mm2
Figure 9.2: Example of grain size distribution of sandFigure 10.1: Basic valves in an outlet controlled filterFigure 10.2: Basic valves in an inlet controlled filterFigure 10.3: Tools used for operation and maintenanceFigure 10.4: Float valve for constant water levelFigure 10.5: Operator checking rate of filtration at the flow indicator, Borujwada,
IndiaFigure 10.6: Sand washing platformFigure 10.7: Re-sanding a slow sand filter
IX

Preface
This publication presents established information on slow sand filtration, as well asguidelines resulting from the International Research and Demonstration Project onSlow Sand Filtration sponsored by the Department of Research and Developmentof The Netherlands Ministry of Foreign Affairs. The project was initiated byinstitutions in Colombia, India, Jamaica, Kenya, Sudan and Thailand, incollaboration with the International Reference Centre for Community WaterSupply and Sanitation (IRC).
These guidelines cover design, construction, as well as operation andmaintenance procedures for water treatment plants using the slow sand filtrationprocess. Since a properly designed plant will only produce safe water if its caretakerknows how to keep it fully operational, training of caretakers must receive fullattention as early as the planning stage, and the plant design should facilitateoperation and maintenance.
This publication is the result of collaboration between Mr R. Paramasivam andMr A. Raman from the National Environmental Engineering Research Institute,Nagpur, India, Mr H. Heijnen, Community Water Supply and Sanitation Project,Pokhara, Nepal, and Mr J.T. Visscher, IRC, The Hague, The Netherlands. Theearlier IRC Technical Paper No. 11: "Slow Sand Filtration for Community WaterSupply in Developing Countries, a Design and Construction Manual", prepared byJ.C. van Dijk and J.H.C.M. Oomen, was an important source of information.
A special thanks goes to Ms C. van Wijk for her advice on communityparticipation and women's involvement, and to Mr T. Figee who advised on thetechnical drawings and sections dealing with construction. All drawings have beenprepared by Mr L. Huijg and final editing was done by Ms M. Simpson and Ms H.West.
Grateful mention is made of the following persons for reviewing, the draftdocument: Dr R.C. Ballance, Mr L. Chainarong, Mr G. Galvis, Professor L.Huisman, Professor K.J. Ives, Mr G.E. Nepomuceno, Professor M.B. Pescod, MrC.L.P.M. Pompe, Mr I.P. Toms, Mr J. Arboleda Valencia and Mr M. Wegelin.
X
1. Introduction
In many developing countries, treatment of water to make it fit for humanconsumption is still a major problem. Expensive and complex treatment plantshave been built but many of these do not function satisfactorily because ofinappropriate design, irregular power supply, and lack of fuel, chemicals,replacement parts and trained manpower. There is an obvious need for morereliable and simpler water treatment systems which can be maintained by localtechnicians without major contributions from external sources. Slow sand filtrationhas been identified as a method which can fulfil these requirements.
Institutions in Colombia, India, Jamaica, Kenya, Sudan and Thailand, havecooperated with IRC in an integrated research and demonstration project to fieldtest the process of slow sand filtration, and to develop practical guidelines for itsapplication in developing countries. This project started in 1976 with a researchprogramme to establish the reliability of the process under tropical conditions.Subsequently, the collaborating institutions set up a number of demonstrationprojects to test the effectiveness of this process at community level. Water supplysystems incorporating slow sand filters were built in selected villages by theagencies responsible for water supply in the participating countries (see Figure 1.1).These demonstration projects also provided an effective channel for the transfer ofknowledge from the research institutions to the water agencies. To ensure that thecommunities would benefit fully from the provision of safe drinking water, acommunity participation and health education component was included in theproject. Most participating communities were involved in the discussions anddecision-making and contributed to the schemes by providing labour and materials.In many of the schemes, caretakers selected from the communities wereresponsible for operation and maintenance.
The demonstration programme has shown that slow sand filtration is a simple,economical and reliable treatment method. Often, it will be the only reliable andeffective method to provide safe drinking water from surface water sources indeveloping countries. It was also found that it is essential to initiate the communityeducation and participation process prior to the introduction of a water supply. Ithelps to ensure that the needs of the people are met satisfactorily, that localresources are mobilized, and that facilities are used and maintained properly.Furthermore, project findings showed that hygiene education is a key element ininitiating discussion and change of community practices detrimental to hygiene andsanitation, without which the impact of a safe water supply is limited.
This publication is based on the results and practical experience gained from theSlow Sand Filtration Project, and on recent publications on the subject. It
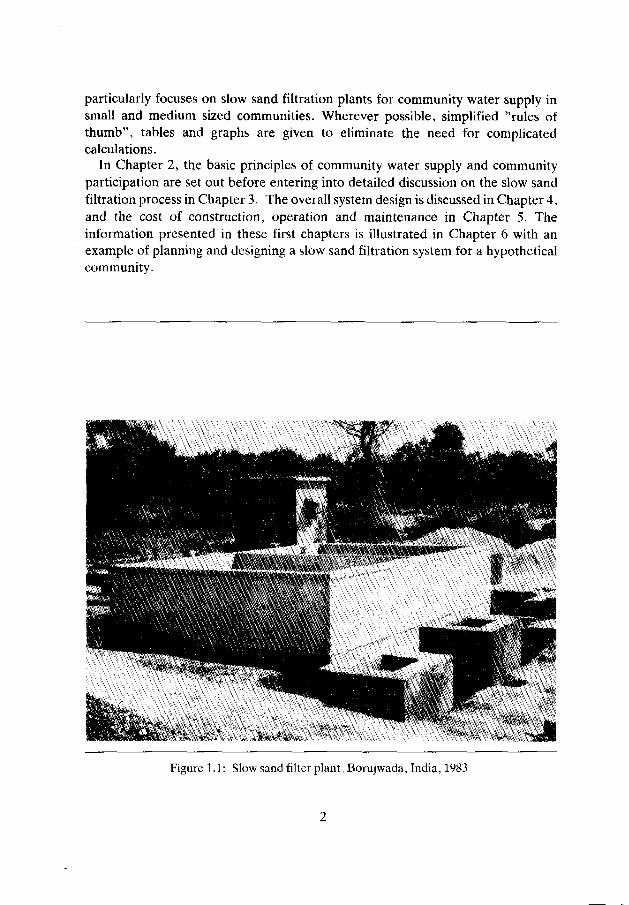
particularly focuses on slow sand filtration plants for community water supply insmall and medium sized communities. Wherever possible, simplified "rules ofthumb", tables and graphs are given to eliminate the need for complicatedcalculations.
In Chapter 2, the basic principles of community water supply and communityparticipation are set out before entering into detailed discussion on the slow sandfiltration process in Chapter 3. The overall system design is discussed in Chapter 4,and the cost of construction, operation and maintenance in Chapter 5. Theinformation presented in these first chapters is illustrated in Chapter 6 with anexample of planning and designing a slow sand filtration system for a hypotheticalcommunity.
Figure 1.1: Slow sand filter plant, Borujwada, India, 1983

INTRODUCTION
Chapter 7 provides detailed information on the structural design, which is furtherillustrated with design examples in Chapter 8. It should be understood, however,that these examples are based on specific local conditions and may not be directlyapplicable under other circumstances.
In Chapter 9, construction guidelines are presented, because the quality ofconstruction can be greatly improved in many cases. Finally, Chapter 10 outlinesdetailed operation and maintenance procedures and sets out the importance ofproper training.
The publication is concluded with a series of appendices which provideinformation on pre-treatment, water quality, soil investigation, flow measurement,chlorination and a listing of participating institutions in the Research andDemonstration Project on Slow Sand Filtration and documentation centres.
Figure 1.2: Slow sand filter plant, Ban Bangloa, Thailand, 1982
2. Community Water Supply andSanitation
2.1 IMPORTANCE OF SAFE WATER SUPPLY
Water which is safe to drink must be free of pathogenic organisms, toxic substancesand an excess of minerals and organic material. To be attractive to consumers,water should also be free from colour, turbidity, and odour, it should containsufficient oxygen, be acceptable in taste, and preferably be "cool".
In 1985, the World Health Organization published the "WHO Guidelines forDrinking-water Quality", which advises on tolerable levels for bacteriological,physical and chemical constituents in drinking water (see Appendix I). With the aidof these guidelines, individual countries are expected to formulate their ownnational standards for water quality based on local conditions.
The provision of a nearby water supply sufficient for the daily needs of consumerswill help greatly to decrease the incidence of skin and eye infections, and may alsoreduce diarrhoeal diseases and most worm infections, particularly if the water is ofreasonable bacteriological quality. However, the provision of sufficient safe waterwill not lead to a major improvement in health conditions unless it is continuouslyand correctly used, and domestic hygiene practices and the method of human wastedisposal are also improved. Ways to prevent the transmission of specific diseasesrelated to water and sanitation are set out in Table 2.1.
2.2 WATER SOURCES
Groundwater, surface water and sometimes rain-water are used as sources forcommunity water supply. Groundwater can be taken from springs or tapped fromwells or boreholes; surface water from streams, rivers, canals, ponds or lakes; andrain-water collected from the roofs of houses or from surface runoff areas. Becausethe value of the source depends on the quantity and quality of the water to beabstracted, careful selection is essential and must be based on a sufficiently detailedsurvey to ensure that it is reliable and provides water of satisfactory quality.

COMMUNITY WATER SUPPLY AND SANITATION
Table 2.1: Importance of water-and-sanitation-related intervention for infectious diseasecontrol
Disease
Diarrhoea
ViralBacterialProtozoal
Poliomyelitis andhepatitis A
Worm infections
Ascaris, TrichurisHookwormPinworm, dwarf tape-wormOther tapewormsSchistosomiasisGuinea wormOther worms withaquatic hosts
Skin infectionsEye infections
Insect-transmitteddiseases
MalariaUrban yellow fever,dengueBancroftianfilariasisOnchocerciasis
Waterquality
+ +
+ + ++
+
++
oo++ + +
o
o+
o
0
oo
Waterquantity/conve-nience
+ + ++ + ++ + +
+ + +
++
+ + +++0
0
+ + ++ + +
0
o
o0
Intervention*
Personalanddomestichygiene
+ + ++ + ++ + +
+ + +
++
+ + ++oo
o
+ + ++ + +
o
+
oo
Waste-waterdisposal
ooo
o
+
o
oo+o
o
o+
+
+ +
+ + +0
Excretadisposal
+ ++ +
+ +
+ + ++ + +
+ + ++ + ++ + +0
+ +
0
+
0
o
+ + +0
Foodsani-tation
+ ++ + ++ +
+ +
+ ++ +
+ + ++ + +oo
+ + +
oo
o
0
oo
* Degree of importance of intervention:+ + + high ++ medium + lowo negligible
** Vectors bred in water-storage containers
(after Ballancc Source: 1984)
5

Groundwater
Groundwater is often the most appropriate source for drinking water, provided itdoes not have a high mineral content, which makes it unpleasant or even harmful todrink and, which makes treatment necessary. Deep groundwater is generallybacteriologically safe, but shallow groundwater may contain bacterial and viralpollution from nearby pit latrines, septic tanks or cattle ponds.
Surface water
Surface water generally needs to be treated to be made safe for human consumptionunless the drainage area is uncultivated, unpopulated and well protected. Seasonaland even daily variation in the quality of surface water is common, for instance,turbidity may become very high in streams and rivers during rainy periods.
Rain-water
Usually, a community water supply system cannot rely on the collection of rain-water as its main source, because rainfall is often erratic. Reliability can beimproved by the provision of storage facilities, although only water for drinking andcooking purposes can usually be stored because of the cost involved. Therefore,rain-water is only appropriate as a source of supply in areas where surface water orgroundwater is scarce or of poor quality, for instance, in parts of the West JavaIslands in Indonesia where groundwater is brackish.
Rain-water usually contains very few impurities, but when the surface fromwhich it is collected is not clean, it will require treatment before it is safe to drink.
2.3 TREATMENT REQUIREMENTS
If water from the selected source cannot meet the quality requirements for drinkingwater, as indicated in national guidelines for the quality of drinking water or thoseof WHO (Appendix I), then it requires treatment. This will increase the cost andcomplicate operation and maintenance of the water supply system. For technicaland economic reasons, treatment is usually only feasible for removal of turbidity,biological impurities, iron, manganese, colour and odour. Of the methods appliedin community water supply, slow sand filtration has proven to be the most suitableand often cheapest treatment method in many cases.

COMMUNITY WATER SUPPLY AND SANITATION
General considerations for planning and designing water supply schemes indeveloping countries are:
° The quality of water supplied should not under any circumstances deterioratebelow certain acceptable limits during the period of time for which the system hasbeen designed.
c Sufficient water must be provided at all times, and at convenient locations.Where traditional sources remain competitive, their possible use will have to bediscussed and any improvements will have to be arranged with the users.
° Construction, operation, maintenance, and preferably repair should be withinthe competence of local technical staff or the users. Prior to construction, anassessment should be made of available skills in the community and the wateragency.
c A minimum of equipment should be used, and this should be sturdy, reliable andpreferably available locally.
0 Construction and operation costs should be reduced to a minimum, and limited orno use should be made of imported materials.
° The system design should minimize the need for chemicals and pumping, andallow for minimal operator's attendance, because wages are likely to be a heavystrain on budgets, especially in small communities.
° The system should be planned together with the community to enable adaptationto local needs and preferences, and to take full advantage of local skills andknowledge.
° Special steps should be taken to consult the women and to involve them in localmanagement of the scheme, because they are the first users and have a directinterest in keeping it functioning.
0 Appropriate systems should be included to monitor the performance of thetreatment system.
° Provision should be made to prevent, or deal with, possible deterioration of thequality of raw water or breakdown of the treatment system.
2.4 WATER TREATMENT BY SLOW SAND FILTRATION
Slow sand filtration is one of the most effective, simplest, and least expensive watertreatment processes and is therefore particularly suitable for rural areas indeveloping countries. Essentially, this process differs from rapid sand filtrationbecause of its biological nature, its high efficiency, and its suitability for village leveloperation and maintenance.
The basic process of slow sand filtration is as follows. Water slowly passesthrough a bed of fine sand at a rate of 0.1-0.3 m3/m2/h, thus improving its qualityconsiderably by removing turbidity and greatly reducing the number of micro-organisms (bacteria, viruses, cysts). Soon after the filtration process begins, a filterskin forms on the surface of the bed. This filter skin, or "Schmutzdecke", consists ofretained organic and inorganic material and a wide variety of biologically activemicro-organisms which break down organic matter. This biological activity andother treatment mechanisms extend through the upper layer of the sand bed,perhaps to a depth of about 0.4 m. Due to slow water movement and long retentiontime, slow sand filtration resembles the percolation of water through the subsoil,and the process effectively produces water comparable in quality to groundwater.
After the filter has been producing good quality water for several weeks, thefilter skin gradually clogs and cleaning of the filter will be necessary. This is done byscraping off the top few centimetres of the filter bed and then restarting thefiltration process.
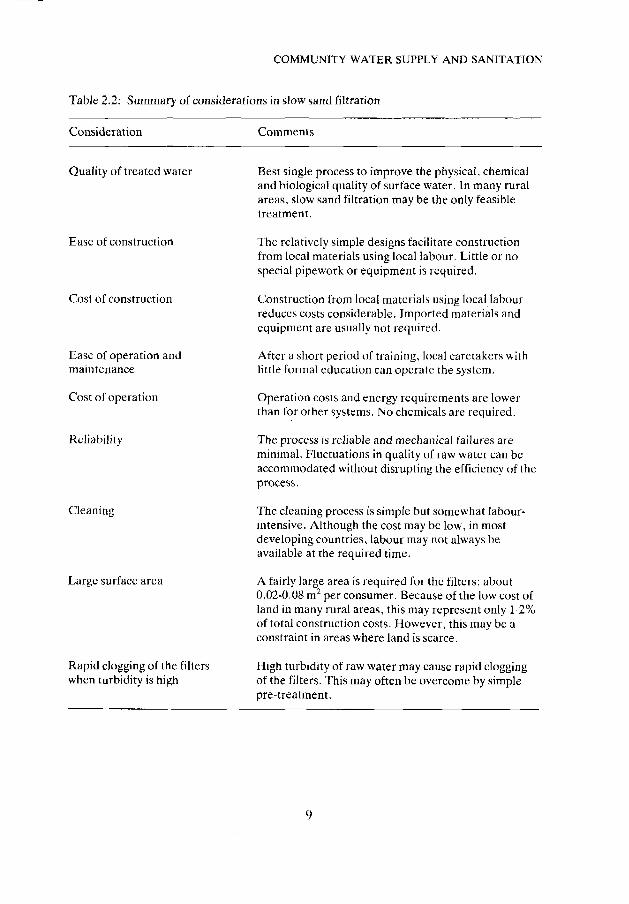
From the considerations set out in Table 2.2, it is clear that the application of slowsand filtration should be carefully evaluated when designing a water supply scheme.When surface water is more readily available than groundwater, slow sandfiltration will frequently prove to be the simplest, most economical and reliablemethod of preparing safe drinking water.
Pre-treatment of turbid surface water
Slow sand filters can only deal with water of low turbidity, for example, 20-30 NTU(ncphelometric turbidity units). Raw water with a turbidity level greater than50 NTU over periods of several weeks, or over 100 NTU for longer than a few days,causes rapid clogging of the slow sand filters. This would require frequent cleaningof the filters, which is not acceptable because of the increased work load and thereduction in production of treated water. The need to pre-treat the raw water toreduce initial turbidity therefore becomes paramount. Various simple methods arereadily available and easily applicable on a smaller scale, including river bedfiltration, horizontal flow-roughing filtration, vertical flow-roughing filtration andplain sedimentation.
8
COMMUNITY WATER SUPPLY AND SANITATION
Table 2.2: Summary of considerations in slow sand filtration
Consideration Comments
Quality of treated water
Ease of construction
Cost of construction
Ease of operation andmaintenance
Cost of operation
Reliability
Cleaning
Large surface area
Rapid clogging of the filterswhen turbidity is high
Best single process to improve the physical, chemicaland biological quality of surface water. In many ruralareas, slow sand filtration may be the only feasibletreatment.
The relatively simple designs facilitate constructionfrom local materials using local labour. Little or nospecial pipework or equipment is required.
Construction from local materials using local labourreduces costs considerable. Imported materials andequipment are usually not required.
After a short period of training, local caretakers withlittle formal education can operate the system.
Operation costs and energy requirements are lowerthan for other systems. No chemicals are required.
The process is reliable and mechanical failures areminimal. Fluctuations in quality of raw water can beaccommodated without disrupting the efficiency of theprocess.
The cleaning process is simple but somewhat labour-intensive. Although the cost may be low, in mostdeveloping countries, labour may not always beavailable at the required time.
A fairly large area is required for the filters: about0.02-0.08 m2 per consumer. Because of the low cost ofland in many rural areas, this may represent only 1-2%of total construction costs. However, this may be aconstraint in areas where land is scarce.
High turbidity of raw water may cause rapid cloggingof the filters. This may often be overcome by simplepre-treatment.
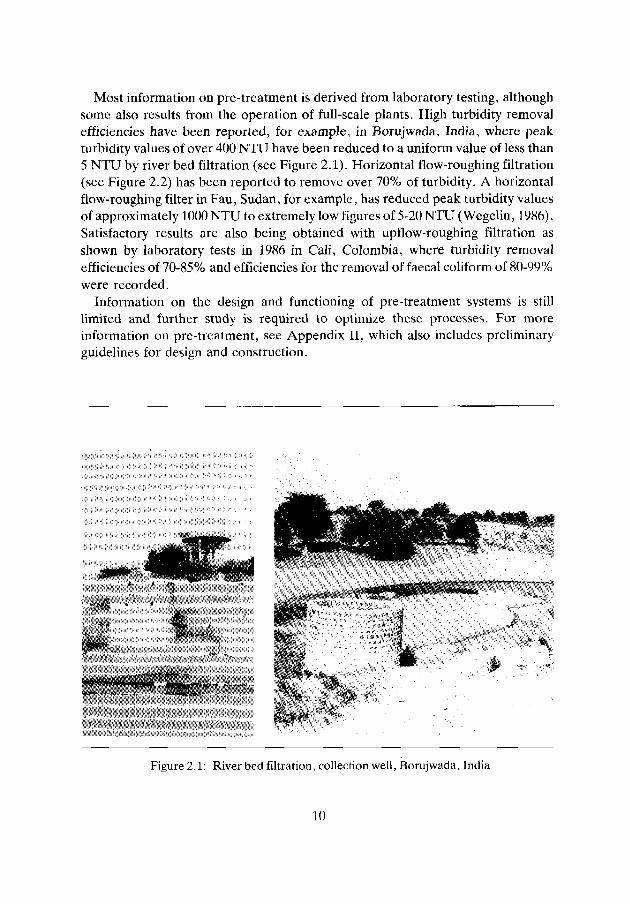
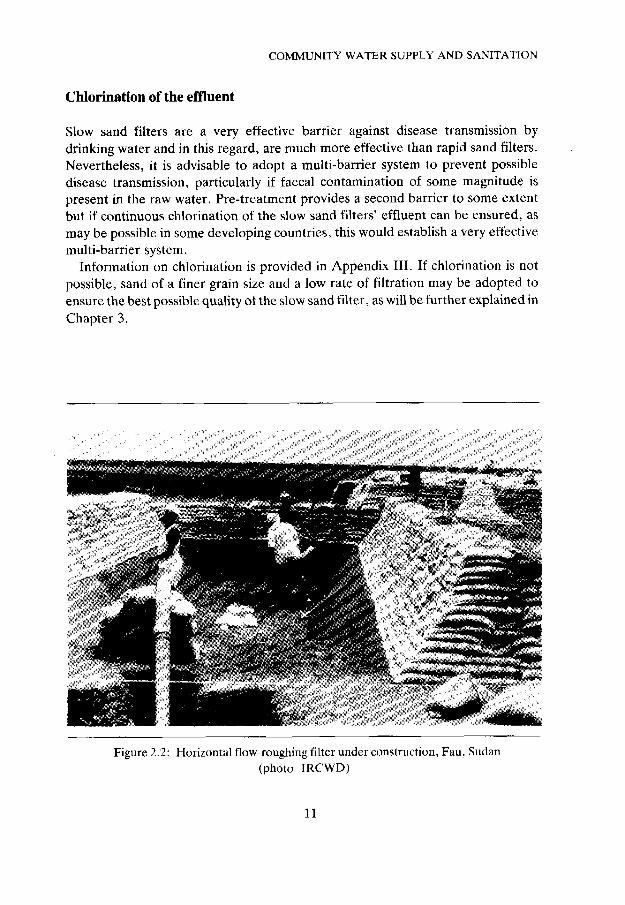
Most information on pre-treatment is derived from laboratory testing, althoughsome also results from the operation of full-scale plants. High turbidity removalefficiencies have been reported, for example, in Borujwada, India, where peakturbidity values of over 400 NTU have been reduced to a uniform value of less than5 NTU by river bed filtration (see Figure 2.1). Horizontal flow-roughing filtration(see Figure 2.2) has been reported to remove over 70% of turbidity. A horizontalflow-roughing filter in Fau, Sudan, for example, has reduced peak turbidity valuesof approximately 1000 NTU to extremely low figures of 5-20 NTU (Wegelin, 1986).Satisfactory results are also being obtained with upflow-roughing filtration asshown by laboratory tests in 1986 in Cali, Colombia, where turbidity removalefficiencies of 70-85% and efficiencies for the removal of faecal coliform of 80-99%were recorded.
Information on the design and functioning of pre-treatment systems is stilllimited and further study is required to optimize these processes. For moreinformation on prc-treatment, see Appendix II, which also includes preliminaryguidelines for design and construction.
w^^B^^^| i | i i i t t i^^
•<!•'" "• •'•'••"l";iJh
,.<i;vri . ||i i i i
Figure 2.1: Riverbed filtration, collection well, Borujwada, India
10
COMMUNITY WATER SUPPLY AND SANITATION
Chlorination of the effluent
Slow sand filters are a very effective barrier against disease transmission bydrinking water and in this regard, are much more effective than rapid sand filters.Nevertheless, it is advisable to adopt a multi-barrier system to prevent possibledisease transmission, particularly if faecal contamination of some magnitude ispresent in the raw water. Pre-treatment provides a second barrier to some extentbut if continuous chlorination of the slow sand filters' effluent can be ensured, asmay be possible in some developing countries, this would establish a very effectivemulti-barrier system.
Information on chlorination is provided in Appendix III. If chlorination is notpossible, sand of a finer grain size and a low rate of filtration may be adopted toensure the best possible quality of the slow sand filter, as will be further explained inChapter 3.
Figure 2.2: Horizontal flow-roughing filter under construction, Fau, Sudan(photo 1RCWD)
11

2.5 SELECTION OF TREATMENT SYSTEM
When surface water is not safe for human consumption and requires treatment, theguidelines given in Table 2.3 can be used to select a water treatment system,adopting slow sand filtration as the main process. The following parameters areused for selection:- turbidity expressed in nephelometric turbidity units (NTU);- faecal coliform count;- presence of guinea worm or schistosomiasis.In addition, if the oxygen content of the raw water is low, for example below 4 mg/1,aeration is required to prevent anaerobic conditions occurring in the slow sandfilter. Schistosomiasis has been included because it can be transmitted throughwater contact, but not usually through water ingestion.
2.6 COMMUNITY INVOLVEMENT
Water supply systems have not only to be designed and constructed, but have to beused and maintained. Continuous and correct use can be achieved more easilywhen the community has been given an opportunity to express its needs and pointsof view, and has been actively involved in planning and implementing the scheme(White, 1982; van Wijk, 1986). This implies that all villagers, or at leastrepresentatives of all village sections (men and women, different ethnic andreligious groups, rich and poor), are informed and consulted at an early stage of theproject about the following:- the benefits of a safe water supply;- their preferences and the technical and financial consequences of their choice;- the contributions expected of the community;- the method used to carry out the project.
In practice, it is not always easy to reach all sections of the community, inparticular the women. Women however, are most directly concerned with waterand sanitation as users, domestic managers, educators of children and protectors offamily health (see Figure 2.3), and thus should be actively involved in all aspects ofthe preparation, initiation, organization and maintenance of a safe water supply fortheir communities. Often, it will be possible to cooperate with female field workersin related departments or programmes, to request separate meetings with womenin the communities, or to consult them informally at their work places (van Wijk,1985).
12

COMMUNITY WATER SUPPLY AN
Table 2.3: Guideline for the selection of a water treatment system for surfacrural areas
Average raw water quality Treatment required
Turbidity: 0-5 NTUFaecal eoliform MPN*: 0Guinea worm or schistosomiasis notendemic
Turbidity: 0-5 NTUFaecal eoliform MPN*: 0Guinea worm or schistosomiasis endemic
Turbidity: 0-20 NTUFaecal eoliform MPN*: 1-500
Turbidity: 20-30 NTU(30 NTU for a few days)Faecal eoliform MPN*: 1-500
Turbidity. 20-30 NTU(30 NTU for several weeks)Faecai eoliform MPN*: 1-500
Turbidity: 30-150 NTUFaeeal eoliform MPN*: 500-5000
Turbidity: 30-150 NTUFaecal eoliform MPN*: > 5000
Turbidity: > 150 NTU
- No treatment
- Slow sand filtration
Slow sand filtration;Chlorination, if possible
Pre-treatment advantageous;Slow sand filtration;Chlorination, if possible
Pre-treatment advisable;Slow sand filtration;Chlorination, if possible
Pre-ireatment;Slow sand filtration;Chlorination, if possible
Pre-treatment;Slow sand filtration;Chlorination
Detailed investigation and possible pilotplant study required
* Faecal eoliform counts per 100 ml
Although the degree of community participation will vary greatly from countryto country and from culture to culture, an attempt has been made to define majordecisions on water supply in which the community should be actively involved (seeTable 2.4).
13
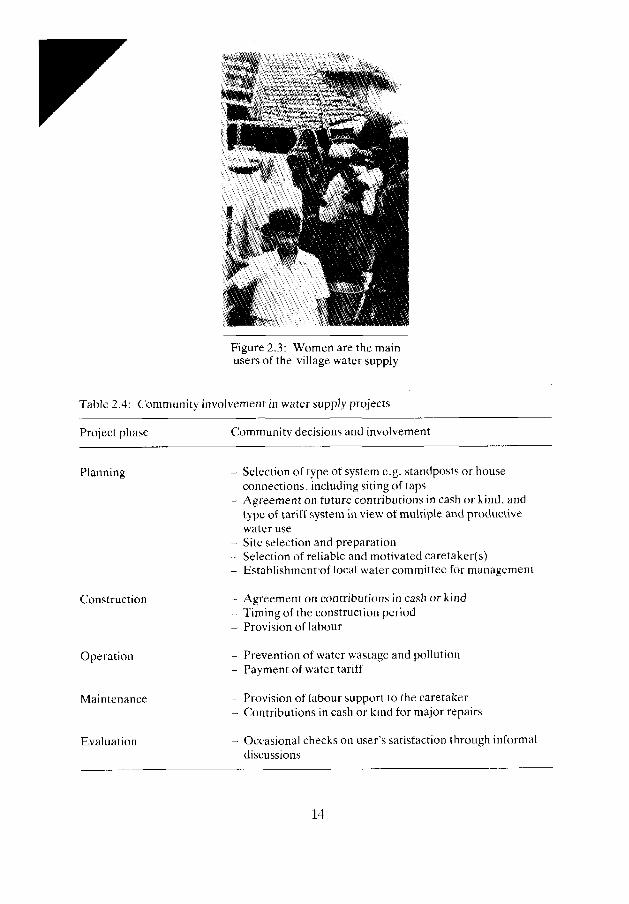
Figure 2.3: Women are the mainusers of the village water supply
Table 2.4: Community involvement in water supply projects
Project phase
Planning
Construction
Operation
Maintenance
Evaluation
Community decisions and involvement
Selection of type of system e.g. standposts or houseconnections, including siting of tapsAgreement on future contributions in cash or kind, andtype of tariff system in view of multiple and productivewater useSite selection and preparationSelection of reliable and motivated caretaker(s)Establishmcntof local water committee for management
Agreement on contributions in cash or kindTiming of the construction periodProvision of labour
Prevention of water wastage and pollutionPayment of water tariff
Provision of labour support to the caretakerContributions in cash or kind for major repairs
Occasional checks on user's satisfaction through informaldiscussions
14
COMMUNITY WATER SUPPLY AND SANITATION
Participation in planning
The importance of active involvement of the community in planning rural watersupply projects is increasingly being recognized. If community water supplysystems are to continue functioning and to be used by all, systems should be chosenwhich are acceptable and affordable for the community. This can be achieved bydetermining the expectations of the users and explaining to them the consequences,financially and otherwise, of possible options. In this way, well-reasoned decisionscan be made on the type of technology and level of service, for example standposts,group or house connections, and their location. Also, a satisfactory agreement canbe made on the obligations and rights of both the community and the water agency.Suitable arrangements will already have to be made at the planning stage for thepossible involvement of the community in construction, future maintenance andrevenue collection. For example, it may be arranged in consultation with thecommunity that cattle owners pay for the water their cattle use, or a differential ratesystem may be agreed in which poorer community members who use less water paya lower tariff.
The community, particularly the women, have valuable knowledge about thelocal situation and water sources which can be vital to the success of a water supplyproject. There are examples of treatment plants which cannot be used for part ofthe year because the water source dries up or the area is flooded. Such costlymistakes could have been prevented had the local community been consulted andthe area adequately surveyed. Consultation with the local community may alsoprevent conflicts over water use and help to find appropriate solutions to particularlocal problems. For example, the manure of freely grazing cattle was polluting thewater source of the village of Alto de los Idolos, Colombia. The water agencysuggested fencing the intake, but the village water committee did not consider thisfeasible because of the cost and risk of the fence being stolen, and requiring peopleto confine their animals was not compatible with the local patterns of land use andlabour. When the community understood the need to protect the water intake, theydevised their own solution and organized voluntary labour from all user householdsto plant thorn bushes as a natural fence. This solution proved to be very effective inpreventing the cattle grazing close to the intake.
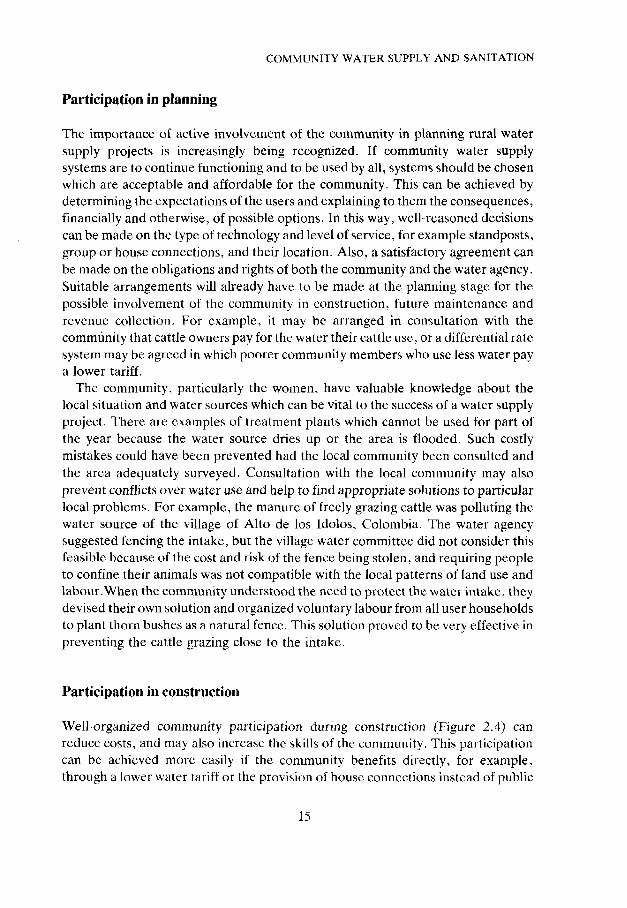
Participation in construction
Well-organized community participation during construction (Figure 2.4) canreduce costs, and may also increase the skills of the community. This participationcan be achieved more easily if the community benefits directly, for example,through a lower water tariff or the provision of house connections instead of public
15

standposts. To increase willingness to participate, construction work must beplanned for periods when the daily work load of the community is low, for example,outside the planting and harvesting seasons. It is also preferable to contract paidlabour from the community, including the future carctaker(s) of the plant, evenwhen the community does not have to contribute to construction costs.
Figure 2.4: Community support in digging trenches for the distributionnetwork, Alto de los Idolos, Colombia
16

COMMUNITY WATER SUPPLY AND SANITAT1
Participation in operation and maintenance
After a short period of training, community members are able to operate andmaintain slow sand filtration schemes, although daily routine tasks are best done byone or two caretakers selected from the community. Caretakers need adequatetraining and supervision and usually will need some form of compensation. In somecases, the provision of a tool kit and increased status may be a sufficient reward, orthe donation of a plot of land near the treatment plant and supply of a limitedquantity of raw water may be adequate compensation. However, when a caretakerreceives monthly payment, preferably from the community, this offers the mosteffective control mechanism to ensure that operation and maintenance tasks areproperly carried out.
Occasionally, the caretaker(s) may be assisted in labour intensive tasks by othermembers of the community, such as when cleaning and re-sanding the filters.Sometimes, this will be free labour but in other communities payment will berequired. The community members may also contribute considerably by handlingtaps with care and reporting leaking taps and pipes immediately, thus avoiding lossof treated water.
A good relationship with the community is therefore essential and can bestimulated by informal discussions between caretakers and community membersduring regular inspection visits of the distribution network. During these visits, thecaretaker can also assess whether users are satisfied with the supply.
Delegation of construction, management and administration tasks to thecommunity or a community-based organization has many advantages, providedthat it is officially authorized by the water agency or local government.
How to approach and involve the community
No blueprint can be given as to how the community can best be approached andinvolved. However, the first step will generally consist of contacting localauthorities to inform them about the project, and to request organization of ageneral meeting to inform the people and seek their views. Where it is difficult forwomen or certain sections in the community to raise questions or express theirviews, they may be consulted separately and informally. Local leaders can also beasked to hold a separate meeting of all village women, organized through the localwomen's organization or women leaders (van Wijk, 1985). All meetings should beheld at convenient times and places and active discussions should be encouraged.Early mornings and late afternoons, for example, may be inconvenient for ameeting, because women will be busy fetching water and preparing food. Daytimemay be equally inconvenient during the planting and harvesting seasons.
17

rAfter the concept of the programme has been introduced in the meeting, more
detailed planning and discussions will be required, for example on design,community support in construction, financing of the operation, and maintenance.These discussions and consultations can often best be held with a smaller group ofselected community members.
If a village committee already exists, it may be the most convenient partner in thediscussions, provided that it represents the interests of all villagers and not justthose of a specific group. Elsewhere, a special committee or sub-committee may beformed to make detailed arrangements for approval by the community. Thereafter,this committee may take responsibility for organizing community support and foradministration of the water supply after construction is completed. In either case,the committee will usually need some special training for their tasks in managementand financial administration.
Once the first contacts have been established, communities may become veryenthusiastic and rapid follow-up action will be required. In other cases, amotivation campaign or a hygiene education programme may be required toconvince certain or all community members of the new system's potential, and sopersuade them to participate. Tt should always be remembered that sufficient timemust be devoted to initiating this process of community participation, because it isoften of paramount importance for the long-term functioning and use of the newfacilities.
2.7 HYGIENE EDUCATION
Both community participation and the health impact of the new water supply can beincreased considerably by a hygiene education programme, in which therelationship between hygiene and the prevention of disease is demonstratedclearly. This will stimulate the community to use only the safe water supply, and willalso be an important step in demonstrating that provision of safe water alone docsnot prevent the transmission of disease.
Frequently, the potential health benefits of an adequate and accessible supply ofclean water arc not realized because injections continue to be transmitted by otherroutes. Improvements in sanitation and upgrading of the water supply system mustbe done simultaneously because both hygienic waste disposal and general hygieneimprovements are essential to control the spread of disease.
A hygiene education programme needs to be planned in consultation with thecommunity. Initially, it should aim to create awareness by discussing therelationships between disease, water, and sanitation. People are then in a betterposition to recognize aspects of their own behaviour and facilities which pose health
18

COMMUNITY WATER SUPPLY AND SANITATION
risks, and to take steps to change these practices (Boot, 1984).The required changes in local practices are best discussed together with the
technical improvements needed. When an atmosphere is created in whichdifficulties and constraints can be discussed openly, it becomes easier to findsolutions that are feasible and acceptable for all concerned. One topic relevant fordiscussion is the ways in which safe water may become re-polluted. It should bemade clear that water in the distribution system is safe and clean unless impuritiesenter this system through leaking or broken pipes. Damage must therefore bereported immediately to the caretaker as immediate repair is essential. Water mayalso become polluted during collection and storage in the home because:- dirty containers are used to fetch water from the distribution point;- water comes into contact with dirty hands of the person carrying it;- water is stored in uncovered containers, thus allowing pollution by dust or dirt;- water is drawn from storage containers with a dirty utensil, or dirty hands touch
the water when taking it out of the container.Hygiene education should not be restricted to water usage but should includesanitation and food hygiene. Food which is not hygienically prepared and stored is avery important source of disease. For further information, see the IRC OccasionalPaper "Making the links: guidelines for hygiene education in community watersupply and sanitation."
19
3. Principles of Slow Sand Filtration
3.1 THE COMPONENTS OF THE FILTER
Basically, a slow sand filter consists of a box containing:- a supernatant layer of raw water;- a bed of fine sand;- a system of underdrains;- an inlet and outlet structure;- a set of filter regulation and control devices.The water flow in a slow sand filter may be controlled at the outlet (Figure 3.1), orat the inlet of the filter (Figure 3.2), and the method chosen may slightly affect thestructure, the control devices and the functioning, as will be explained in Section3.4. These components are described briefly in this chapter, and in further detail inrelation to the design of a slow filtration system in Chapter 7.
Filter box
The total height of the filter box, including the floor, may range from 2.5 to 3.0 mand can be constructed of reinforced concrete, ferrocement, stone or brickworkmasonry. The filter box, effluent channel and clear-water storage reservoir shouldbe watertight to prevent losses and to avoid contamination of the treated water byshallow groundwater or surface runoff.
Inlet structure
The inlet structure is intended to allow water to flow into the filter withoutdamaging the filter skin on top of the sand bed. Usually, the inlet structure is a boxwhich can also be used to drain the supernatant water quickly.
Supernatant water layer
The supernatant water layer provides a head of water which is sufficient to drive theraw water through the bed of filter medium, while creating a detention period of
20

PRINCIPLES OF SLOW SAND FILTRATION
several hours for the raw water. A range of 1.0-1.5 m is a suitable depth for thesupernatant water layer. It is usual practice to maintain the supernatant water at aconstant level, but an alternative mode of operation which results in a graduallyincreasing level may also be used. This will be discussed further in Section 3.4.
Scum outlet
An outlet is necessary for the removal of scum, which may be formed from leaves,algae and other material floating on the supernatant water. This outlet may alsoserve as an overflow for the supernatant water.
Supernatant water
Biological layer
Filter bed ;;
Underdrain system .;< j_
Ventilation
Figure. 3.1; Basic components of an outlet controlled slow sand filter
A: raw-water inlet valveB: valve for drainage of supernatant water layerC: valve for back-filling the filter bed with clean waterD: valve for drainage of filter bed and outlet chamberE: valve lor regulation of the filtration rateF: valve for delivery of treated water to wasteG: valve for delivery of treated water to the clear-water reservoirH: outlet weirI: calibrated flow indicator
21

Supernatant water'_i Biological layer
Filter bed
.—Underdrain system — s'%£
Ventilation
Figure 3.2: Basic components of an inlet controlled slow sand filter
a: valve for raw-water inlet and regulation of filtration rateb: valve for drainage of supernatant water layerc: valve for back-filling the filter bed with clean waterd: valve for drainage of filter bed and outlet chambere: valve for delivery of treated water to wastef: valve for delivery of treated water to the clear-water reservoirg: inlet weirh: calibrated flow indicator
Filter bed
Although any inert, granular material can be used as the filter medium, sand isusually selected because it is cheap, inert, durable and widely available. Whenplaced in the filter, the sand should be free from clay, soil and organic matter.
The filter medium is described in terms of its effective size and uniformitycoefficient. The effective size (es, de or d,n) is the sieve opening which allowspassage of 10% (by weight) of the grains. The uniformity coefficient is the ratiobetween the effective size and the sieve opening through which 60% (by weight) ofthe grains will pass (d60); uniformity coefficient = dfto/dio.
22
PRINCIPLES OF SLOW SAND FILTRATION
Sand used in slow sand filters should be relatively fine, have an effective size inthe range of 0.15-0.30 mm, and a uniformity coefficient lower than 5 but preferablybelow 3. It is important that the effective grain size of the sand should not be finerthan necessary, because sand which is too fine will add to the initial head loss (Ellis,1985) although the quality of the effluent will be improved. If feasible, simple pilot-plant tests should be carried out to find the most suitable effective grain size.
The minimum thickness of the filter bed should be 0.5 m, but if slow sandfiltration is the only treatment, and the effective grain size is in the higher range, anincrease to 0.6 m would be advisable. To allow for periodic cleaning by removal of1-2 cm from the top sand layer, 0.3 m is usually added to bring the initial thicknessof the filter bed to 0.8 m (0.9 m). Successive cleanings of the filter, at intervals ofapproximately one to three months, will gradually reduce the thickness of the filterbed so that by the second or third year, the minimum thickness of the filter bed isreached. The filter bed then needs to be re-sanded, as will be discussed inSection 10.7.
Underdrain system
The underdrain system serves two purposes: firstly, it provides unobstructedpassage of treated water and secondly, it supports the bed of filter medium.Usually, it consists of a main and lateral drain constructed from perforated pipes, ora false floor made of concrete blocks or bricks, and is covered with layers of gradedgravel. These layers prevent the filter sand entering or blocking the undcrdrainsand ensure uniform abstraction of the filtered water. The thickness of theunderdrain system, including the gravel layers, may range from 0.3 to 0.5 m,although the depth of the underdrain system will be smaller if corrugated pipes areused (see Section 7.4).
Outlet chamber
The outlet chamber usually consists of two sections separated by a wall, on top ofwhich a weir is placed with its overflow slightly above the top of the sand bed. Thisweir prevents the development of below-atmospheric pressure in the filter bed,which could lead to the formation of air bubbles underneath the biological layer.The weir also ensures that the filter operates independently of fluctuations in thelevel of the clear-water reservoir.
By allowing the free fall of water over the weir, the oxygen concentration in thefiltered water is increased and the weir chamber should therefore be suitablyventilated to facilitate aeration.
23

3.2 TREATMENT PROCESS
In a slow sand filter impurities in the water arc removed by a combination ofprocesses: sedimentation, straining, adsorption, and chemical and bacteriologicalaction. Purification begins in the supernatant water layer where large particlessettle on the filter bed, and smaller particles agglomerate to scttleablc floes as aresult of physical, chemical, or biochemical interactions. Under the influence ofsunlight, algae, which have entered the filter with the raw water, grow andinfluence the purification process.
During the first few days, water is purified mainly by mechanical and physicalprocesses. The resulting accumulation of sediment and organic growth forms a thinlayer on the sand surface, which remains permeable and retains particles evensmaller than the spaces between the sand grains. As this layer (often referred to asthe biological skin or "Schmutzdecke") develops,it becomes the "living quarters"of vast numbers of micro-organisms which break down organic material retainedfrom the water, converting it into water, carbon dioxide and other oxides (PO4,NO3). Nitrogenous organic material will initially be converted into ammonia,which is then oxidized by specific autotrophic bacteria to nitrite and ultimately tonitrate.
Most impurities, including bacteria and viruses, are removed from the raw wateras it passes through the filter skin and the layer of filter bed sand just below. Theremoval of bacteria from the water is probably due primarily to the action ofpredators, such as protozoa. Those impurities carried deeper into the filter bed willcome into contact with, and become attached to, sand grains so that the sandparticles gradually become covered with a thin layer composed mainly of organicmaterial and micro-organisms. These in turn adsorb the impurities by variousattachment mechanisms. The purification mechanisms extend from the filter skinto approximately 0.3-0.4 m below the surface of the filter bed, gradually decreasingin activity at lower levels as the water becomes purified and contains less organicmaterial and nutrients. More products of the biological processes are removed ateven greater depths by physical processes (adsorption) and biochemical action(oxidation).
When the micro-organisms become well established, the filter will workefficiently and produce high quality effluent which is virtually free of disease-carrying organisms and biodegradable organic matter. The time taken for the filterto ripen depends on the quality of the raw water, but water temperature and oxygenlevels are also important factors. Ripening of a new filter may generally take aboutthree weeks, whereas a filter which has been cleaned in a single-day operation maytake only one to two days. The absence of ammonia in the filtrate is an indicationthat the ripening process is completed.
24

PRINCIPLES OF SLOW SAND FILTRATION
The activity of the micro-organisms lessens considerably as the temperaturedecreases, or as the oxygen concentration of the water in the filter medium fallsbelow 0.5 mg/1. A low oxygen concentration in the influent may even lead toanaerobic conditions in the filter, particularly when the temperature is high. Thismay result in the production of various obnoxious impurities and an unpalatableeffluent so, if necessary, the raw water should be pre-treated to prevent anaerobicconditions in the filter bed.
Continuous sedimentation and straining of particles will gradually increaseresistance in the filter skin (Figure 3.3), and after one to three months the resistancebecomes too high for the filter to produce sufficient safe water. Filtration capacitycan be restored by cleaning the filter, which is done by draining off the supernatantwater and removing the top 1-2 cm of the sand bed, including the filter skin.
•a
X
0-8-
0.6.
0.4.
0.2. .
7 8Time (weeks)
Figure 3.3: Development of resistance in the filter bed
Effect of algae
Algae develop in slow-moving or standing surface water as a result of the presenceof nutrients, such as nitrates, phosphates and sunlight, and may enter the filter with
25
the raw water and then proliferate in the supernatant water. They will be beneficialto the treatment process if they are in moderate numbers, particularly when theyform part of the filter skin.
However, algal blooms, that is excessive growth of algae, have created problemsin many slow sand filters. In some cases, algal blooms of free-floating, filter-blocking varieties, have resulted in very short filter runs. In other cases, oxygenconsumption at night by large numbers of algae has created anaerobic conditions infilters, leading to unpalatable effluents.
Certain types of algae form long filaments which attach to the surface of the sandin the filter, and in the hot season, entire filter beds can be covered with algae.During bright, warm conditions, oxygen bubbles produced by the algae maybecome attached in such quantities that large masses of algae float to the surface,pulling with them some of the sand and filter skin, and thus reducing the efficiencyof the filter. Furthermore, masses of algae have to be removed when the bed isdrained for cleaning so that it can be scraped properly.
Control of algae
Techniques to prevent or control troublesome algae growth in slow sand filtersinclude prc-treatment, shading, chemical treatment, biological methods andmanual removal.
Proper pre-treatment of the water by river bed filtration or horizontal roughingfiltration may be very effective in removing the majority of algae from the rawwater. This may lead to longer filter runs, particularly when combined withcovering of the filters to prevent subsequent algae growth in the supernatant water.Covering of the filters alone will not be sufficient if algae blooms have alreadydeveloped in the raw water. However, the shading principle can be used whenbuilding raw-water storage reservoirs, because construction of deep reservoirs willhelp to control the growth of algae.
Chlorination of the supernatant water to control algae growth has been tried, aswell as the addition of copper sulphate, the latter being particularly widely used forthe control of algal blooms in reservoirs. However, direct dosing into a slow sandfilter involves a great risk of accidental overdosing and a subsequent negative effecton the biological life in the filter, leading to deterioration of the effluent.
Although no hard data arc available, top-feeding fish, such as tilapia, may be ofvalue in controlling algae growth in slow sand filters. Under no circumstancesshould bottom-feeders be introduced, such as carp, as they may damage thebiological layer (Ellis, 1985). Finally, manual removal may be a suitable method ofcontrolling the growth of filamentous algae.
26

PRINCIPLES OF SLOW SAND FILTRATION
3.3 RESULTS OF SLOW SAND FILTRATION
The improvement of water quality brought about by slow sand filtration will differfrom place to place because the process depends on many factors, such as raw waterquality, grain size, the rate of filtration, temperature, and the oxygen content of thewater. An indication of the purification effect of a mature filter, that is a filter with afully developed filter skin, is summarized in Table 3.1, based on the work of Ellis(1985) and the results of the IRC Slow Sand Filtration Project. The figures are fromfilters which are being operated under varying conditions, and the results thereforeshow a wide range.
Table 3.1: Performance of slow sand filters
Parameter of Purification effect of slow sand filtrationwater quality
Colour 30-100% reduction
Turbidity Turbidity is generally reduced to less than 1 NTU
Faecal coliforms Between 95-100% and often 99-100% reduction in the level of
faecal coliforms
Cercariae Virtual removal of cercariae of schistosoma, cysts and ova
Viruses Virtually complete removal
Organic matter 60-75% reduction in COD
Iron and manganese Largely removed
Heavy metals 30-95% reduction
Grain size selection is a crucial factor in filter performance, as illustrated inFigure 3.4, which represents the results of 18 test runs with pilot filters at a filtrationrate of 0.12 m/h (Bellamy, 1985). Selection of a fine effective grain size will improvethe performance of the treatment process, although it will lead to an increase ininitial head loss.
If there has been little experience with slow sand filters in a certain region orcountry, it is preferable to test their performance with the raw-water source in smallpilot plants consisting, for example, of PVC pipes, oil drums or concrete sewerpipes (Figures 3.5 and 3.6).

100
| 99
a98
5utat>
era
>
97
96
_J [_ _J I
0.1 0.2 ~0.3 0.4 0.5 0.6 0.7Sand size (mm)
Figure 3.4: Effect of sand size on removal of total coliform bacteria in slow sand filtration(Bellamy, 1985)
Figure 3.5: Slow sand filter pilot plant, Nagpur, India
28

PRINCIPLES OF SLOW SAND FILTRATION
Figure 3.6: Slow sand filter pilot plant, Cali, Colombia
3.4 OPERATION AND CONTROL
The most attractive aspect of slow sand filtration is its simplicity of operation andcontrol because, after a short training period, the operational procedures can bemastered by a local caretaker.
Controlling the rate of filtration is the key to adequate functioning of a slow sandfilter. For surface water, operation at a rate between 0.1 and 0.2 m3/m2/h is usuallysatisfactory, because the filter tends to clog within a shorter period of time usinghigher rates of filtration, as well as causing deterioration in the quality of filteredwater. However, the rate may be increased to 0.3 m3/m2/h for short periods of oneor two days without undue harm, for example, while another filter is being cleaned.It is important to prevent rapid fluctuations in the filtration rate because bacterialflora in the filter bed require time to adjust to new situations.
29

Control of filtration rate of an outlet controlled filter
The rate of filtration can be regulated by the valve at the outlet of the filter (valve Ein Figure 3.1), Resistance will increase with the course of time, particularly in thefilter skin, and this valve will need to be opened further to maintain the original rateof filtration.
If the valve cannot be opened further, then cleaning of the filter bed is necessaryto restore the filtration rate. As cleaning means that the filter will be out of servicefor at least one or two days, two or more units should be constructed so that theother(s) can be operated, at a higher rate if necessary, while one is being cleaned orre-sanded. For example, if the total water output of a two-unit plant is to remain thesame, taking out one filter for cleaning means that the rate of filtration in the otherunit has to be doubled. In a plant with three filter units, the rate in the twofunctioning units will have to be raised by 50%. Thus, a larger number of units hasoperational advantages, but will be somewhat more costly, as will be explained inChapter 5.
Control of filtration rate of an inlet controlled filter
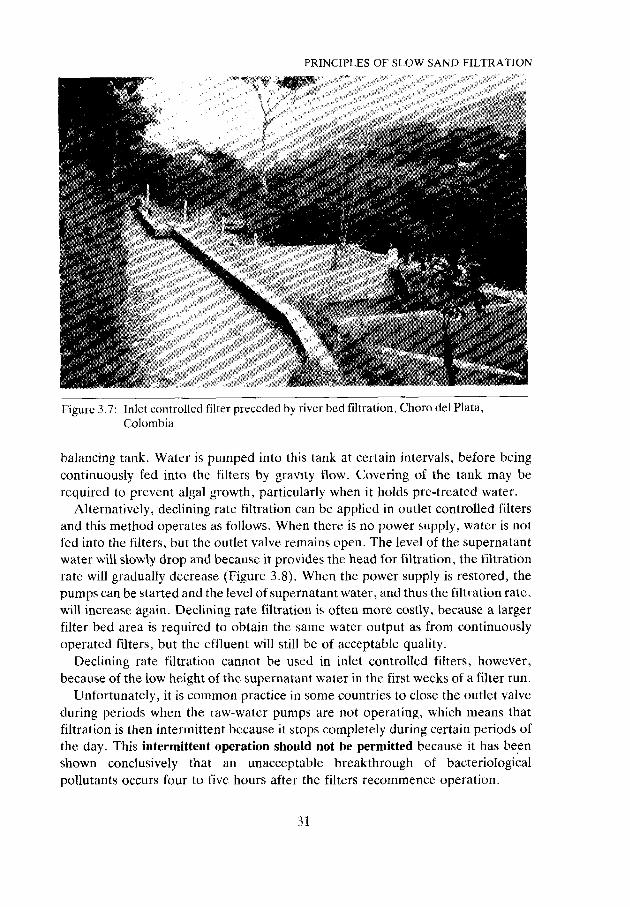
Another way to control the filtration rate is to set the raw-water inlet valve at therequired rate of flow (valve a in Figure 3.2). Initially, the level of the supernatantwater will be low, but with time it will gradually rise to compensate for the increasein filter resistance. The advantages of this method are that regular adjustment of thevalves is not necessary and the rising water level is an obvious indication that thefilter needs to be cleaned. On the other hand, removal of scum and algae becomesmore complicated. It has not been determined whether the ripening process isinfluenced by the lower retention time resulting from the initial low supernatantwater layer (see Figure 3.7). In areas where aquatic weeds can enter the filter andgrow in the filter skin, this method of controlling the filtration rate can only be usedin filters that are roofed.
Mode of operation
It is most effective to operate a slow sand filter continuously because good qualityeffluent is ensured, and the smallest filter area is used. Continuous operation of thefilter is feasible where raw water can be fed into the filters by gravity flow, but inmany cases the raw water has to be pumped. If continuous pumping cannot beguaranteed because of an intermittent power supply or lack of trained staff,continuous operation at a constant rate may be ensured by constructing a raw-water
30
PRINCIPLES OF SLOW SAND FILTRATION
Figure 3.7: Inlet controlled filter preceded by river bed filtration, Choro del Plata,Colombia
balancing tank. Water is pumped into this tank at certain intervals, before beingcontinuously fed into the filters by gravity flow. Covering of the tank may berequired to prevent algal growth, particularly when it holds pre-treatcd water.
Alternatively, declining rate filtration can be applied in outlet controlled filtersand this method operates as follows. When there is no power supply, water is notfed into the filters, but the outlet valve remains open. The level of the supernatantwater will slowly drop and because it provides the head for filtration, the filtrationrate will gradually decrease (Figure 3.8). When the power supply is restored, thepumps can be started and the level of supernatant water, and thus the filtration rate,will increase again. Declining rate filtration is often more costly, because a largerfilter bed area is required to obtain the same water output as from continuouslyoperated filters, but the effluent will still be of acceptable quality.
Declining rate filtration cannot be used in inlet controlled filters, however,because of the low height of the supernatant water in the first weeks of a filter run.
Unfortunately, it is common practice in some countries to close the outlet valveduring periods when the raw-water pumps are not operating, which means thatfiltration is then intermittent because it stops completely during certain periods ofthe day. This intermittent operation should not be permitted because it has beenshown conclusively that an unacceptable breakthrough of bacteriologicalpollutants occurs four to five hours after the filters recommence operation.
31

=5 O.i.
o
6am 12am
Pumps in operation
6 pm 12 pmTime
Figure 3.8: Typical development of filtration rale in declining rate filtration
32

4. Design Process
Two major stages can be identified when designing a slow sand filter for a particularlocation. In the first stage, decisions must be made about:- system capacity;- main components and sizing of the water supply system;- estimated construction and operating costs.The outcome of the first stage may be used as a basis for fund raising, planning andorganizational purposes. The second stage is the preparation of the system'sstructural design and a specification of the equipment and materials involved. Thestructural design is dealt with in Chapters 7 and 8.
4.1 SYSTEM CAPACITY
The most important factor to be determined when designing a water supply systemis the capacity of the plant, that is, the total quantity of water required per day, alsoreferred to as the daily water demand. This is difficult to estimate and depends onthe design period, the number of users the system is to serve, and the quantity ofwater to be provided per person per day.
Design period
The design period is the length of time for which the system is expected to provide acommunity with good quality water in sufficient quantities. This period should beneither too short, not less than ten years, nor too long because of economic reasonsand the difficulty of predicting future water demand. A suitable design period forslow sand filters is usually between ten and fifteen years.
Design population
After the design period has been selected, the design population must bedetermined. The projected population growth during that time may be derivedfrom available demographic data. Socio-economic factors should be taken into
33

account when estimating the rate of population growth, such as family planning,migration, changes in medical care and the level of economic prosperity. However,demographic data are not always reliable and should be checked against the actualpopulation in the area to be served by the new system. If necessary, additional datashould be collected.
It is essential that the water supply system is designed to meet the requirements ofthe population expected to be living in the community at the end of the designperiod by taking into account the design period and the annual growth rate. Thedesign population can therefore be calculated by multiplying the presentpopulation with a population growth factor as follows:
Pd = Pp (1 + 0.01 a)Y.
where:
Pd = design populationPp = present populationa = annual growth rate (%)y = design period
For example, if the present population of a community is 1200, the annual growthrate 3%, and the design period 15 years, then the population growth factor will be(1.03)15 = 1.56. This means that during 15 years, the population is likely to increaseto 1.56 x 1200, that is, to 1872. As the new water supply system has to be designedto provide sufficient water for the community at the end of the design period, itshould therefore be designed for 1872 people. The population growth factors forvarious combinations of annual growth rates and design periods are given in Table4.1.
Table 4
Design(years)
.1: Population growth
period
factors
Annual
2%
growth rate of population.
3% 4%
10 1.22 1.34 1.48
15 1.35 1.56 1.80
20 1.49 1.81 2.19
34
DESIGN PROCESS
Water demand per capita
The average amount ol water fetched from water supply systems in developingcountries ranges from 20 to 150 litres per person per day. However, this isinfluenced by many factors, such as quality and availability of the water, cost,cultural practices and climate (Table 4.2). The most important of these factors arethe time that people can afford to collect the water, the convenience andaccessibility of the water distribution points, and whether water is also used forwatering livestock.
Table 4.2: Average amount of water use for various types of rural water supplies
Type of supply Average daily Range of dailywater use water use(l/p/d) (1/p/d)
Point sources 15 5-25Piped supplies with stand-pipes 30 10-50Piped connection (single tap) 50 20-150
Based on Feachem et al (1977)
The data in Table 4.2 cannot be directly used to design a water supply systembecause they do not take into account that people are often unable to obtain theamount of water required due to intermittent operation of the supply system, orbecause of long waiting times at public standposts. The design of a water supplysystem must therefore be based on national, but preferably local, data on theamount of water to be supplied per person per day, taking into account theprevailing socio-economic conditions and preferences of the community. Whennational guidelines are not available, the water demand per capita can be estimatedfrom the water requirements for particular uses (see Table 4.3).
Calculation of the design daily water demand
The design daily water demand, that is, the total quantity of water the water supplysystem has to provide per day, can be calculated by multiplying the designpopulation by the quantity of water to be provided per person per day. However, ifwater losses and wastage arc not included in the water demand figures, the designdaily water demand should be increased by 20-30%.
35
fable 4.3: Estimate of water demand per capita for houseconnections in rural areas in India
Water usage
DrinkingCooking and cleaningAblutionFlushingBathingWashing clothesWatering livestock
Total water usage
1/d
51868
202018
95
Based on NEERI (1982)
4.2 MAIN COMPONENTS AND SIZING OF THE WATER SUPPLYSYSTEM
When the required treatment and the design daily water demand arc known, themain components and dimensions of the water treatment and distribution systemcan be determined.
In rural agricultural areas, water is usually fetched morning and evening, and thedemand may be quite high at these times. It may therefore be useful, within reason,to design the system for these high demands. Although the cost of the system will beincreased, insufficient water supply during peak hours leads to long queues andconsiderable wastage of time, and may also make community members return totraditional sources of water.
Preferably, the system design should ensure that the treatment system,particularly slow sand filters, can operate constantly with a daily capacity thatequals demand. In this section, general design features of the main components areprovided, which are illustrated with examples in Chapter 6.
Raw-water intake and pumps
In gravity water supply systems, the raw-water intake is designed for 24-houroperation. In pumped schemes, it will have to be based on the rate of discharge andthe operating time of the raw-water pumps. In most rural water supply systems,these pumps operate 8-16 hours per day, depending on the size of the communityand the availability of manpower, electricity and fuel.
36
DESIGN PROCESS
Raw-water balancing tank
When raw-water pumps arc not designed for continuous operation, a raw-waterbalancing tank will often be the best solution for ensuring continuous operation ofthe filters. Its capacity depends on the pump regime, which is explained in theexample in Chapter 6.
Pre-treatment unit
This unit will preferably be operated 24 hours per day under gravity flow. Inpumped systems, it is advisable to pre-treat the water before it is pumped, or touse a balancing tank to avoid discontinuous operation.
Slow sand filters
The design criteria for slow sand filters are indicated in Table 4.4. At a rate offiltration of 0.1 m/h, a continuously operated filter will produce 2.4 m3 of water perm2 of filter bed surface area per day. Thus, the total surface area required can bedetermined by dividing the design daily water demand by 2.4. This total surfacearea will be provided in several units rather than a single unit, the number requireddepending on the following:
0 At least two filters are required to ensure safe and continuous operation, and toallow one of the beds to be cleaned. In larger plants, the number of units can oftenbe increased at little additional cost to ensure greater flexibility in operation andmaintenance. An indication of a suitable number of rectangular units may beobtained with:
n = 0.5 N / X
where:n = total number of rectangular unitsA = total surface area
° The maximum size of the filter bed is generally 200 m2 in rural areas, to ensurethat cleaning can be carried out within a day.
° Asa rule, the minimum size of a filter bed is 5 m2, but experiments have shownthat filters of less than 1 m2 are equally efficient, provided raw water does not flowdirectly along the inside of the walls to the filter drains without being filtered. Thisis prevented if the walls have a rough surface.
37

Construction and operation costs differ from country to country, and fromsystem to system. Experienced engineers responsible for water supply systems willbe aware of approximate costs, or will be able to provide an estimation based on abill of quantities of materials required for the various units and pipelines.
Table 4.4: General design criteria for slow sand fillers in rural water supply
Design criteria
Design period
Period of operation
Filtration rate in the filters
Filter bed area
Height of filter bed:initialminimum
Specification of sand:effective sizeuniformity coefficient
Height of underdrainsincluding gravel layer
Height of supernatant water
Recommended level
10-15 years
24 h/d
0.1-0.2 m/h
5-200 m2 per filter, minimum of 2 units
0.8-0.9 m0.5-0.6 m
0.15-0.30 mm< 5, preferably below 3
0.3-0.5 m
m
Clear-water storage and pumping
The treated water is collected in a clear-water tank or clear-water well, from whichit can be directly distributed, or pumped to one or more higher level storagereservoirs. When supply by gravity is possible, the clear-water tank must have asufficient storage capacity to balance the continuous outflow from the filters againstfluctuating water demand. In other cases, the treated water will have to be pumpedfrom the clear-water well to a central, overhead storage tank, or to decentralizedtanks of sufficient capacity to enable continuous supply to consumers, even whenthe clear-water pumps are not operating.
38

DESIGN PROCESS
Distribution system
The distribution system should, within reason, be designed to meet the maximumhourly water demand of the community. Decentralized storage within thedistribution system may help to reduce the cost by enabling use of smaller diameterpipes.
4.3 ESTIMATION OF COST
The last step in the first design stage is to estimate the costs of construction,operation, and maintenance, and this is discussed further in Chapter 5. Thesefigures are important for fund-raising, but especially to determine whether theconsumers and the national government can meet the cost of the system. Althoughthe maintenance costs of slow sand filters arc low in comparison with othertreatment systems, the total maintenance costs of the water supply system maynevertheless put a heavy burden on the budget of rural communities.
39

5. Cost of Slow Sand Filters
5.1 CONSTRUCTION COST
The construction cost of slow sand filters is mainly determined by the cost ofmaterials such as cement, building sand, gravel, reinforcement steel, filter sand,pipes and valves. The cost of labour and land is usually of lesser importance. Inrural areas of India for example, the cost of land rarely exceeds 1% of the totalconstruction cost.
For a given filter bed area, the shape and number of filter units will have littleeffect on the cost per unit area of filter bed, but may influence the total wall lengthand the cost per unit length, and so affect the total construction cost.
To clarify this, the following equation to calculate the total construction costs of afilter, excluding the cost of pipes and valves, is given:
Q = Ca x A + C, x Lw
where:C, = total construction cost, excluding pipes and valvesCa = combined costs per square metre of filter bed area of floor, underdrains,
gravel, filter sand and excavationCi = cost of the walls per running metre of wall lengthA — total surface area (m2)Lw = total wall length (m)
Cost per square metre of filter bed area
An estimation of the cost per square metre of filter bed area in a particular countryor region can be based on the cost of excavation work, concrete, underdrains andfilter material (see Table 5.1).
40

COST OF SLOW SAND FILTERS
Table 5.1: Estimate of average cost per m2 of filter bed area of floor, underdrains, gravel,filter sand and excavation for rural areas in India, 1983
Items
Earthwork excavation
Foundation (concrete)
Floor (reinforcedconcrete)
Filter sand (lm) andgravel (0.3m)
Brick underdrain
Total cost per m2 offilter bed
Depth(m)
2.50
0.15
0.15
1.30
Unitratc/m'
10
330
885
200
280
Cost/m2
filter bed(in Indian Rp)*
25
50
135
260
30
Rp 500
* Exchange rate US$ I = Rp 10
Cost per running metre of wall length
The thickness of the wall and the type of building materials used will affect the costper unit wall length. Circular filters are only subject to tensile forces meaning thatthe wall thickness, and thus the cost per unit wall length, may be less, particularlyfor ferrocement filters. However, the advantage of a lower cost per unit wall lengthfor larger circular units is usually offset by the simpler design and lower labour inputrequired to construct rectangular units.
In the following example, using a concrete filter built in India in 1983, the averageconstruction costs per running metre of wall length are calculated. The wall heightof this particular slow sand filter was 2.7 m and the wall thickness was 0.23 m,therefore giving a wall volume per running metre of 0.23 x 2.7 x 1 = 0.62 m3. In1983, the average construction cost per volume of 1 m3 of concrete wall forwaterworks in India was Rp 1333 (US$ 133), including labour and material.Thus,the cost per running metre of wall length in this example was Rp 1333multiplied by 0.62, a total of Rp 830 (US$ 83).
41
Total wall length
The size, shape, and number of filter units will determine the total wall length of theslow sand filter plant. The total wall length of a filter plant with circular units may becalculated as follows:
Lwc = 2 Vn x 77 X A
where:Lwc = total wall length (m)n = number of filter unitsA = total surface area (m2)
Rectangular filters have the advantage of common wall construction if the unitsare constructed next to each other (Figure 5.1).
A
\ / 1
n x b
Figure 5.1: Layout of a filter plant with (n) rectangular units
42
COST OF SLOW SAND FILTERS
The total wall length of a filter plant with rectangular units may be calculated asfollows:
Lwr = n X b + /(n + 1)
where:Lwr = total wall length (m)n = number of unitsb = breadth of unit (m)/ = wall length of unit (m)
For a given surface area and number of units having common walls, the total walllength will vary with different combinations of (b) and (1) and becomes smallestwhen:
where:/ = wall length of unit (m)A = total surface area (m2)n = number of unitsb = breadth of unit (m)
For this value of (b), the equation for the minimum wall length for rectangularfilters is:
Lwm = 2/ (n + 1)
= 2 V2A (n + 1)
where:Lwm = smallest total wall length (m)/ = wall length unit (m)n = number of unitsA = total surface area (m2)
The dimensions and the total wall length of circular and rectangular filters arecompared in Table 5.2. For smaller filter areas, circular filters (Figure 5.2) seem to
43
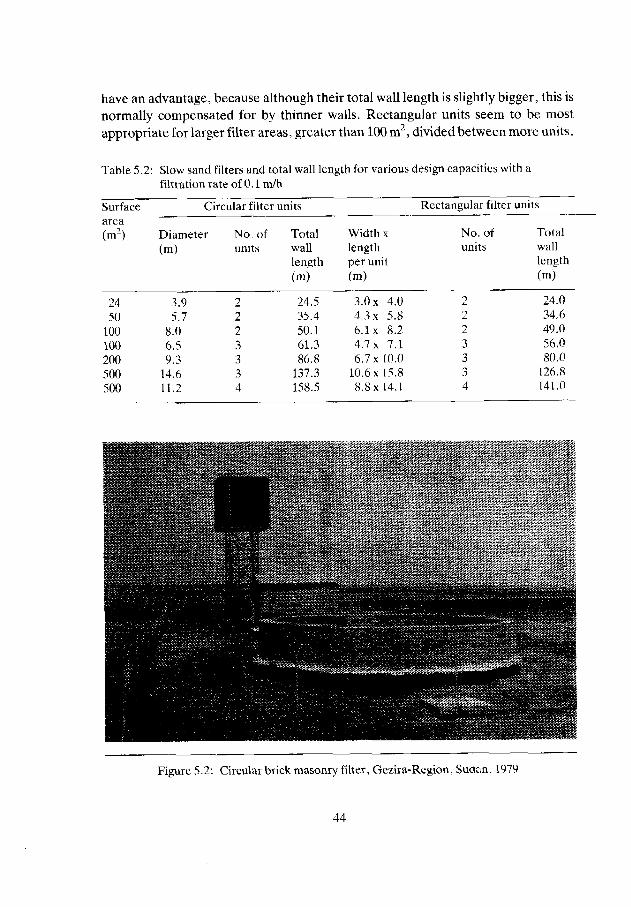
have an advantage, because although their total wall length is slightly bigger, this isnormally compensated for by thinner walls. Rectangular units seem to be mostappropriate for larger filter areas, greater than 100 m2, divided between more units.
Table 5.2: Slow sand filters and total wall length for various design capacities with afiltration rate of 0.1 m/h
Surfacearea(m2)
2450
100100200500500
cDiameter(m)
3.95.7
8.06.59.3
14.611.2
ircular filter units
No. ofunits
2223334
Totalwalllength(m)
24.535.450.161.386.8
137.3158.5
Rectangular filter units
Width xlengthper unit(m)
3.0 x 4.04.3 x 5.86.1 x 8.24.7x 7.16.7 x 10.0
10.6x 15.88.8x 14.1
No. ofunits
2223334
Totalwalllength(m)
24.034.649.056.080.0
126.8141.0
*
Figure 5.2: Circular brick masonry filter, Gezira-Region, Sudan, 1979
44
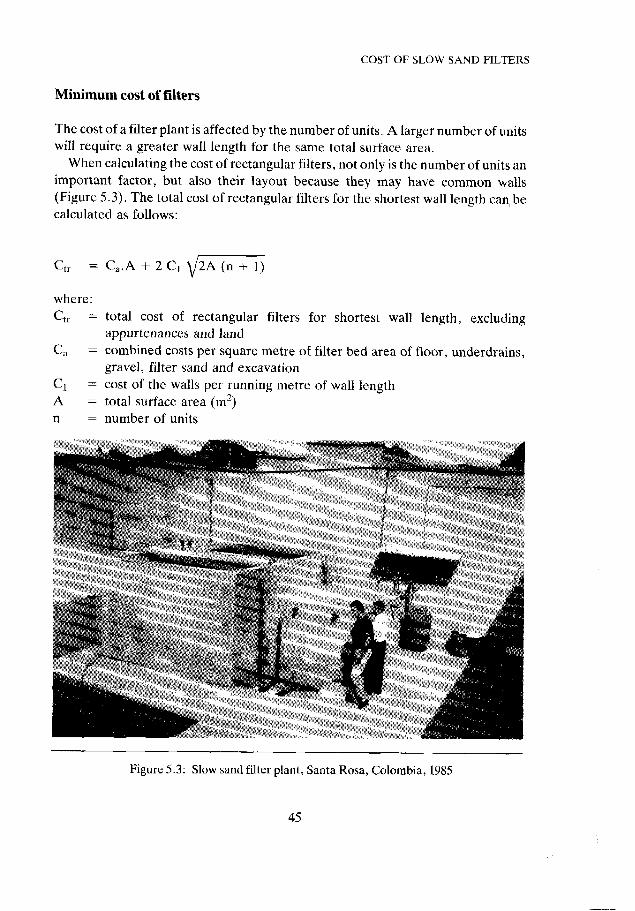
COST OF SLOW SAND FILTERS
Minimum cost of filters
The cost of a filter plant is affected by the number of units. A larger number of unitswill require a greater wall length for the same total surface area.
When calculating the cost of rectangular filters, not only is the number of units animportant factor, but also their layout because they may have common walls(Figure 5.3). The total cost of rectangular filters for the shortest wall length can becalculated as follows:
Ctr = Ca.A + 2 C, (n + 1)
where:Ctr = total cost of rectangular filters for shortest wall length, excluding
appurtenances and landCa = combined costs per square metre of filter bed area of floor, underdrains,
gravel, filter sand and excavationQ = cost of the walls per running metre of wall lengthA = total surface area (m2)n = number of units
Figure 5.3: Slow sand filter plant, Santa Rosa, Colombia, 1985
45
The total cost of circular filters can be calculated as follows:
Ctc - C;i.A + 2 C,yn X j r x A
where:Ctc = total cost of circular filters, excluding appurtenances and landCa = combined cost perm2 of filter bed area of floor, underdrains, gravel, filter
sand and excavationCi =* cost of the wall per running metre of wall lengthA = total surface area (m2)n = number of units
The cost per unit area of the filter bed (Ca) and per unit length of wall (C|)depends on local conditions, the price of construction materials and the cost oflabour. On the basis of the estimated values of (Ca) and (C|) for rural areas in Indiain 1983, that is, Rp 500 and Rp 830 respectively (see Table 5.1), the costs per squaremetre of rectangular slow sand filters with various capacities and numbers of unitshave been estimated (see Table 5.3). To obtain an estimate of the total constructioncost, about 15-20% should be added to these figures to allow for pipes, valves,appurtenances and land.
Table 5.3: Estimated costs per m2 of rectangular slow sand filters in rural areas in India,1983
Totalfilter
area (irr)
50100200300500
1000
Capacity*(m3/h)
510203050
100
* Rate of filtration 0.1 m/h** Exchanj>e rate US$ 1 = Rp
Cost per m2 based onunits (Rp
2
1.070.910.790.730.680.63
10
1000)**
3
1.160.970.830.770.710.65
number of filter
4
1.241.020.870.800.730.67
5
1.311.070.910.830.760.68
Economy of scale
The cost estimates given in Table 5.3 show that there is little economy of scale in theconstruction of slow sand filters, which means that there is little benefit in
46

COST OF SLOW SAND FILTERS
constructing plants for a long period. For example, assuming a community in ruralIndia would have a design demand of 20 m3/h in ten years and 30 m3/h in 20 years,constructing a plant for 30 m3/h (three units) would cost:
300 x 0.77 x 1000 = 231 000 Rp.
Constructing a plant for 20 m3/h (two units), and adding a unit of 10m3/h after tenyears, would require an initial investment of:
200 x 0.79 x 1000 = 158000 Rp.
Assuming that the present value of the additional unit which will have to beconstructed in ten years time is 91000 Rp, the total cost could be approximately
158000 + 91000 = 249000 Rp.
Thus, a design period of 10-15 years is adequate and will keep the initialinvestment low. Selecting a period of ten years, plus the option of constructing anextension thereafter, has the additional advantage that the estimation of futurewater demand will be less critical. Nevertheless, provisions for future extensionswill be necessary.
Design flexibility
The cost estimates calculated in Table 5.3 also show that an increase in the numberof units for the same area only increases the cost slightly. The division of a totalfilter area of 50 m2 over two units would be 8% cheaper than over three units, and16% cheaper than over four, while for a total filter area of 500 m2, the figures wouldbe 3.5% and 7% cheaper respectively. Taking into account that the requiredincrease in the filtration rate when cleaning one unit is 100% for two units, 50% forthree, and 33% for four, then the expenditure for a larger number of units over thesame filter area may well be considered acceptable.
5.2 OPERATION AND MAINTENANCE COSTS
The operation cost of a slow sand filter depends on the costs of labour, and energycosts if pumping is required, but general figures cannot be given because ofvariation in local situations. For example, small gravity supply systems only requireminimum attendance, and may not even need a watchman in remote areas. Theyrequire a larger labour input only when the filter needs to be cleaned. In contrast,large plants in pumped systems need continuous attendance by an operator and/or
47
watchman. When the pumps are operated 24 hours per day and the work is dividedinto three shifts, three operators, and possibly three watchmen, will therefore berequired. Additional labourers may also be required to clean the filters when theybecome clogged.
Maintenance costs will include minor repairs to the filters, and replacement ofsand washed out from the scrapings. Although the scrapings removed in thecleaning process can be washed, stored, and re-used, about 20% of the sand iswashed out from the scrapings together with the silt. Other maintenance costsrelate to the replacement of the filter's few moving parts, although these costs willalso be higher in pumped schemes.
5.3 COST COMPARISON BETWEEN SLOW AND RAPID SANDFILTRATION
A cost comparison of slow and rapid sand filtration schemes was carried out in Indiaduring 1983. The capital cost of slow sand filtration systems was shown to be lessthan that of rapid sand filtration systems, up to a capacity of 3000 m3/day. Whenoperation and maintenance costs were taken into account, the break-even pointwas 8000 m3/day.
Furthermore, the construction cost of a slow sand filter plant in Colombia, with acapacity of 1500 m3/day (design population 15 000 and a cost of US$ 35 000), wascompared with rapid sand filters. The cost for the rapid sand filters wasapproximately double that of the slow sand filters, merely because of the use ofimported equipment.
Thus, slow sand filtration schemes often prove more economically attractive forcommunities in many developing countries where a protected water supply isneeded.
48
6. Example of Planning and Designing aSlow Sand Filtration System
6.1 FEASIBILITY STUDY
This chapter details the planning and design procedures carried out whenintroducing a slow sand filtration system into a hypothetical village of 1200inhabitants, who at present collect untreated water from a river. In the example,the community applies to the water supply authority for a safe, convenient watersupply system because the river is some distance away and the untreated water isbelieved to be the source of much disease.
A preliminary survey team is sent to assess the technical and social feasibility of anew water supply system, as well as the possible economic and health benefits. Theteam collect demographic data, agree tentative locations for standposts withconsumers, survey an appropriate location for the treatment plant and the servicereservoir, investigate the availability of construction materials and suitable filtersand, and conclude that a water supply project is technically feasible and that thevillagers are sufficiently interested to guarantee implementation. However,personal observations and discussions with the local health worker, indicate thatmost intestinal diseases, attributed by the community to the water, are in fact theresult of poor hygiene, limited use of latrines, and unhygienic handling of food. Thesurvey team advises that a hygiene education programme should be carried outsimultaneously with the implementation of a new water supply system.
Health education must go hand-in-hand with technical provisions to achieve themaximum impact on health, but only the technical considerations in the design of awater supply system are discussed in this chapter.
6.2 DESIGN PROCEDURE
A number of steps have been identified in the design procedure lor the new watersupply system for the hypothetical village.These 17 steps are presented in this section. Assumptions made in each step arebased on the general design considerations presented in chapters 4 and 5. Figuresand data used are derived from the feasibility study referred to in section 6.1. The
49
procedure outlined serves primarily as an illustration, but it also indicates the typeof information required for the preparation of an adequate design. It does notindicate however how the water supply system can be introduced. For informationon this aspect see chapter 2.
Step 1: Selection of design period
The design period is set at 15 years, which means that after a planning andconstruction period of 2-3 years, the plant capacity will be adequate for at least 12 or13 years.
Step 2: Estimation of design population
The annual growth rate is estimated to be 3%. Thus, the present population of 1200is likely to increase by a factor of 1.56 in 15 years (see Table 4.1) to 1872 people, anda design population of 1900 is therefore selected.
Step 3: Calculation of design daily water demand
A distribution system with standposts is selected in consultation with thecommunity and the water consumption is estimated at 50 litres per capita per day.The water demand is estimated to be 60 litres per capita per day, including lossesand wastage (estimated to be 20%). The design daily water demand is calculated asfollows:
1900 x 60 = 114000 1/d = 114 nrVd (4.75 nrVh).
Step 4: Estimation of maximum hourly water demand
The daily pattern of water use in an adjacent community, which has a piped watersupply, is known (Figure 6.1). The total water consumption in this community is76 m3/d (3.17 m3/h) and the maximum hourly water consumption is 15 m3/h. Thus,the peak factor, that is the ratio between maximum and average hourly waterconsumption, is 15/3.17 = 4.7 nrVh.
Because conditions in the two villages are similar, the calculation is used toestimate the design hourly water demand for the new water supply system. Thisfigure is required for the design of the clear-water tank and distribution system. Theaverage hourly demand for the new system is thus 114/24 = 4.75 m3/h, and the
50
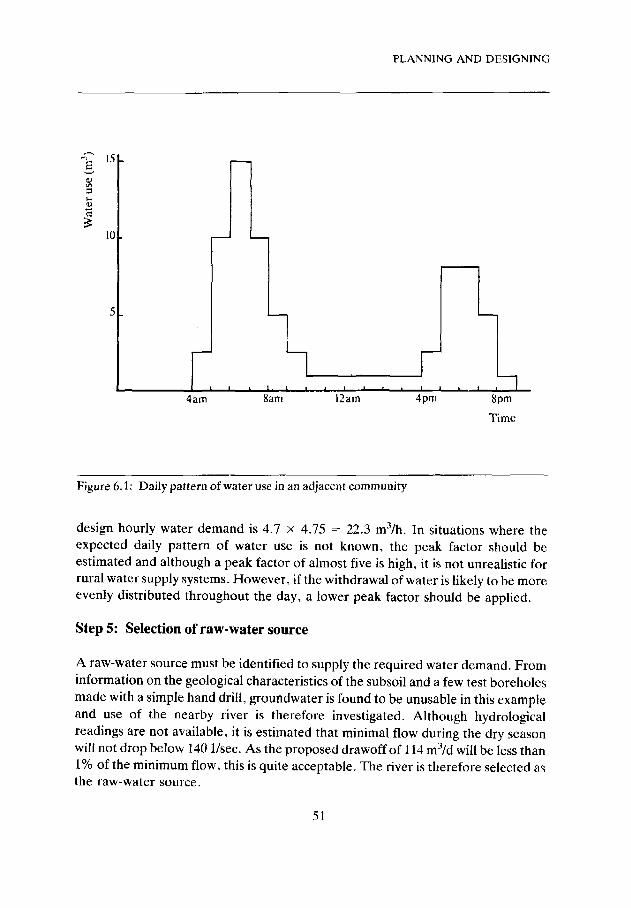
PLANNING AND DESIGNING
15
I
10
4am 8am 12am 4pm 8pm
Time
Figure 6.1: Daily pattern of water use in an adjacent community
design hourly water demand is 4.7 x 4.75 = 22.3 m3/h. In situations where theexpected daily pattern of water use is not known, the peak factor should beestimated and although a peak factor of almost five is high, it is not unrealistic forrural water supply systems. However, if the withdrawal of water is likely to be moreevenly distributed throughout the day, a lower peak factor should be applied.
Step 5: Selection of raw-water source
A raw-water source must be identified to supply the required water demand. Frominformation on the geological characteristics of the subsoil and a few test boreholesmade with a simple hand drill, groundwater is found to be unusable in this exampleand use of the nearby river is therefore investigated. Although hydrologicalreadings are not available, it is estimated that minimal flow during the dry seasonwill not drop below 140 1/sec. As the proposed drawoff of 114 m3/d will be less than1% of the minimum flow, this is quite acceptable. The river is therefore selected asthe raw-water source.
51
Step 6: Choice of treatment system
Information obtained from authorities upstream of the project indicate that most ofthe water quality parameters are within acceptable limits for human consumption,except for turbidity (5-100 NTU) and bacteriological parameters (faecal coliforms+ 100-1000/100 ml). A number of samples taken at the proposed site of the waterintake (at least one at low flow and one at high flow) confirm these findings.
On the basis of the guidelines in Section 2.5, it is decided to treat the water byplain sedimentation in a storage basin, followed by slow sand filtration (seeFigure 6.2). This treatment will reduce turbidity to less than one NTU, and will alsobring the microbiological parameters within acceptable levels for drinking water.
t I
River andintake
Pre-treatment Slow sandfiltration
Clear-waterstorage
Distribution system(standposts)
Figure 6.2: Components of the water supply system
Step 7: Location of raw-water intake
The location for the raw^water intake is determined taking into accountfluctuations in water quality and stability of the river bank. A location inside a riverbend is considered suitable. Flow velocities are low at this point and suspendedparticles will therefore settle, although the need for a sufficient water depth at alltimes may restrict the number of possible alternative intake locations. The intake islocated upstream from the village to limit contamination of the river water byexcreta.
52

PLANNING AND DESIGNING
Step 8: Location of treatment plant
Factors which influence the location of the treatment plant are:- location of the water intake;- availability of a suitable area;- topography;- soil properties;- groundwater level;- risk of flooding;- location of water intake and length of distribution system.The stability and bearing capacity of the soil determine the type of foundation, butpiles and piers are to be avoided if possible. Simple soil investigation methods aregiven in Appendix IV.
A high water-table which is close to the soil surface means that drainage will berequired during excavation and construction, and this adds to the complexity andcost of the project. Provisions must also be made to prevent the treated waterbecoming polluted by groundwater, and to prevent the construction being forcedup by water pressure (see Chaper 7).
In the example being discussed, it is possible to find a suitable location for thetreatment plant close to the water intake. This location has the added advantagethat the caretaker can look after the treatment plant and water intake withouttravelling long distances between the two.
Step 9: Selection of mode of operation
Continuous operation for 24 hours per day is most appropriate for slow sand filters.The raw water should preferably be taken from a higher elevation and fed bygravity to the filters, even if the length of the raw-water main has to be increased,because the reliability of the plant is increased by eliminating the need for pumping.Although an entire gravity supply system is often not possible, a detailed survey todetermine the potential of at least partial gravity flow is essential.
In the present example, the sedimentation pond is situated in such a way thatgravity flow of river water to the pond is possible, although the water then has to bepumped to the filters because of an insufficient difference in levels. To permitcontinuous operation of the filters, it is decided that a raw-water storage tankshould be constructed on a small elevation between the sedimentation pond and thefilters. Water will be pumped from the sedimentation pond into the storage tankand will then be fed continuously to the filters by gravity.
53
Step 10: Dimensioning of the sedimentation pond
A large sedimentation pond is constructed by erecting a dam beside the river bankand the dimensions of such a storage basin can be determined on the basis of thedesign criteria described in Appendix II. A detention time of two months waschosen and a depth of 8 m selected so that assuming about 2 in of water is lostthrough the build-up of silt, an effective depth of 6 m remains, requiring an area ofapproximately 1150 m2.
Step 11: Calculation of the raw-water pump capacity
Construction of an elevated raw-water storage tank increases the flexibility of thesystem, especially when considering the consequences of temporary power cuts,and reduces staff requirements. In addition, the provision of an elevated tank canbe cost-effective when continuous pumping cannot be guaranteed, rather thanincreasing the area of the filter bed and applying declining rate filtration. The size ofthe tank is determined by the number of hours of operation and the capacity of thepumps. In this instance, it is assumed that the operator will work eight hours per dayand operate the raw-water pumps in two shifts, from 6.0 a.m. to 10.0 a.m., and from4.0 p.m. to 8.0 p.m. Local circumstances may dictate another pattern of attendanceby the operator(s). The pumps are operated eight hours daily to pump the required114 nrVd, and so need to have a capacity of 114/8 = 14.25 m3/h (4 1/s).
Step 12: Dimensioning of the raw-water balancing tank
On the assumption that the elevated raw-water balancing tank is empty at 6.0 a.m.,the variation in the quantity of water in the tank throughout the day is given inFigure 6.3. The balancing tank needs to have a capacity of 47.5 m3 and in order tocut costs, it is decided that a simple tank, 25 m2 and 2.5 m deep, should beconstructed from raised earthen embankments and lined with black polythenesheets.
Step 13: Selection of size of filters
In this example, a design filtration rate of 0.1 m/h is selected because the relativelyhigh turbidity of the raw water would lead to rapid clogging of the filters at higherrates.
54
PLANNING AND DESIGNING
Because there is a continuous supply of raw water, the filter bed area can becalculated by dividing the average hourly water demand by the selected rate offiltration, that is, 4.75/0.1 = 47.5 m2 (48 m2).
o
S
o53
t-<m
I
100
60
20
6 am 10 am 2pm 6pm 10pm 2am 6amTime (hours of day)
. water inflow water outflow
Figure 6.3: Accumulated water inflow and outflow in elevated raw-water balancing tankthroughout a 24-hour period
The most appropriate size for a filter unit is determined by a combination ofconstruction and operational factors. In this case, a satisfactory solution may be theuse of two filters, each with a net area of 24 m2, although space should be reservedfor a third unit to allow for possible expansion. During cleaning of one filter, therate of filtration in the other would have to be increased to 0.2 m/h, but this will stillgive a good effluent quality.
Step 14: Dimensioning of the clear-water tank
Because the water can be supplied to consumers by gravity flow, the dimensions ofthe clear-water tank have to be determined using the daily pattern of water use andthe water production by the filters. Assuming that the expected water use pattern issimilar to that in the adjacent community (Figure 6.1), the accumulation curve ofwater demand and water production by the filter plant can be drawn as shown inFigure 6.4. The clear-water tank should provide a minimum storage capacity for thegreatest difference between the accumulated water consumption and production
55

figures, which in this case is 39.25 m3. If data on the expected pattern of waterconsumption are not available, the volume of the storage tank for gravity supplymay be assumed to be 40% of the daily water production of the plant.
120 m3
I 6(J
30
114m3
4am 8am 12am 4pm 8pm 12pm 4amTime (hours of day)
Water consumption Water production
Figure 6.4: Accumulated water production and water use
Additional storage of 8.75 m3 (two production hours) has been provided to caterfor minor interruptions, by increasing the net storage capacity required to48 m3. On the assumption that an acceptable variation in water level in the tank is1.6 m, the net area will have to be 30 m2.
Step 15: Hydraulic design
The hydraulic design of the water supply system (raw-water pumps, clear-waterdistribution) depends on the head loss in the treatment units, piping arrangements,
56
PLANNING AND DESIGNING
and the topography of the area. Whenever possible, the system should be based ongravity supply as it is simpler, more reliable, and more cost-effective if pumps arenot used. Even a partial gravity system, which may require a long pipeline, ispreferable to a fully pumped system and, in fact, a cost comparison on the basis ofcapital and recurrent costs will usually favour a gravity supply. A pumped systemhas higher recurrent costs due to energy requirements and additional maintenanceof the pumps.
Step 16: Design of the plant layout
The layout of the treatment plant is mainly determined by considerations forefficient operation and maintenance. An example of a layout is given in Figure 6.5,where an area is set aside for pre-treatment units, future extension, and basicservices such as operators' workshop, storage and a site road.
Workshop
•—. • WashingI I platform
Store
Sandstorage
Pre-treatmentunit
L
Figure 6.5: Possible layout of the water treatment plant
57

Step 17: Cost estimation
The estimation of costs for construction, operation, and maintenance of the systemcompletes the preliminary design procedures, and can be calculated on the basis ofaverage local cost figures for treatment plants and distribution systems. If thesefigures are not available, more detailed calculation based on the estimated quantityof building materials and labour levels for construction, operation and maintenanceis required. The information generated can be used in discussions with thecommunity, the appropriate authorities, and in fund raising.
6.3 SUMMARY OF DESIGN EXAMPLE
The example presented in this chapter can be summarized as follows:
Design period:Present population:Design population:Water demand:Water losses:Design daily water demand:Design hourly demand:Raw-water intake:Treatment:
Sedimentation pond:- size- depth of pondCapacity of raw-water pumps:Balancing tank for continuousoperation of slow sand filtration:- size- depthSlow sand filter:- number- size- rate of filtrationClear-water tank:- size- depth
15years1200190050 1/p/d20%114 m3/d (4.75 nvVh)22.3 m3/hriversedimentation,slow sand filtration
1150 m2
8m4 1/s
25 m2
2.5 m
224 m2
0.1 m/h
30 m2
2.5 m
58

7. Structural Design and DesignConsiderations
This chapter deals with the structural design of slow sand filters and describes thedesign of the main components. Because the details of a design depend on localconditions, it is not possible to provide "standard" designs for the variouscomponents. Such designs could only be prepared if there is little variation in localconditions in a region or country, particularly with respect to the groundwater-tableand the bearing capacity of the soil. Information on soil investigation is provided inAppendix IV to assist in making an appropriate design; general criteria for thedesign of pre-treatment units arc given in Appendix II; and information on thedesign of chlorination equipment and adequate storage of chlorine components isgiven in Appendix III.
7.1 DESIGN OF FILTER BOX
Slow sand filters consist of either a stiff box made from reinforced concrete, massconcrete, masonry, brickwork or ferrocement, or an excavated structure withprotected sloping walls. Filters with vertical walls may be circular or rectangular inshape, but those with protected sloping walls are usually rectangular (Figure 7.1).
• t ~Reinforcedconcretefilter box
Mass concreteor masonryfilter box
A-A
Protected slopingwall filter box
t - -- - - X
C-C
Figure 7.1: Structural design of filter box
59
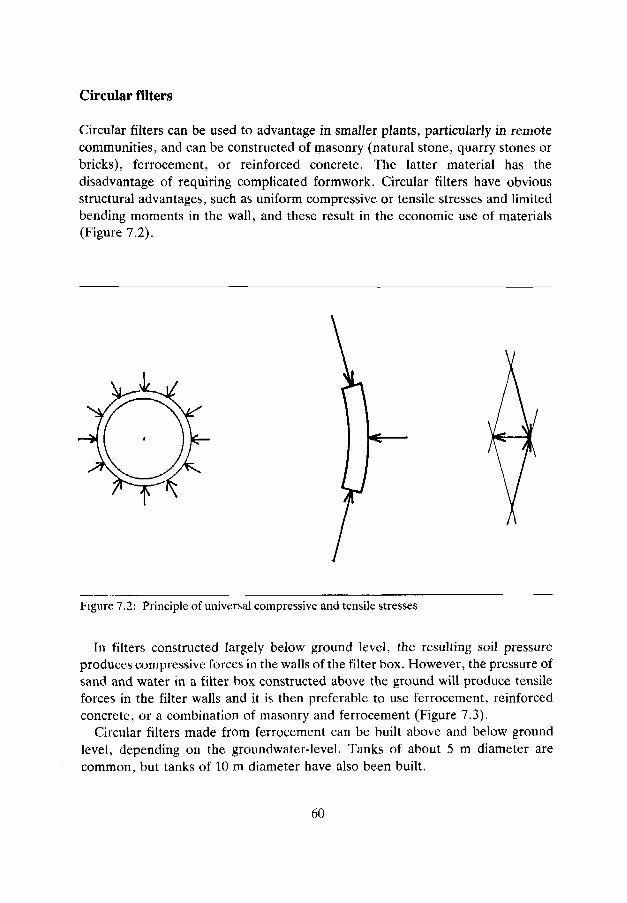
Circular filters
Circular filters can be used to advantage in smaller plants, particularly in remotecommunities, and can be constructed of masonry (natural stone, quarry stones orbricks), ferrocement, or reinforced concrete. The latter material has thedisadvantage of requiring complicated formwork. Circular filters have obviousstructural advantages, such as uniform compressive or tensile stresses and limitedbending moments in the wall, and these result in the economic use of materials(Figure 7.2).
Figure 7.2: Principle of universal compressive and tensile stresses
In filters constructed largely below ground level, the resulting soil pressureproduces compressive forces in the walls of the filter box. However, the pressure ofsand and water in a filter box constructed above the ground will produce tensileforces in the filter walls and it is then preferable to use ferrocement, reinforcedconcrete, or a combination of masonry and ferrocement (Figure 7.3).
Circular filters made from ferrocement can be built above and below groundlevel, depending on the groundwater-level. Tanks of about 5 m diameter arecommon, but tanks of 10 m diameter have also been built.
60
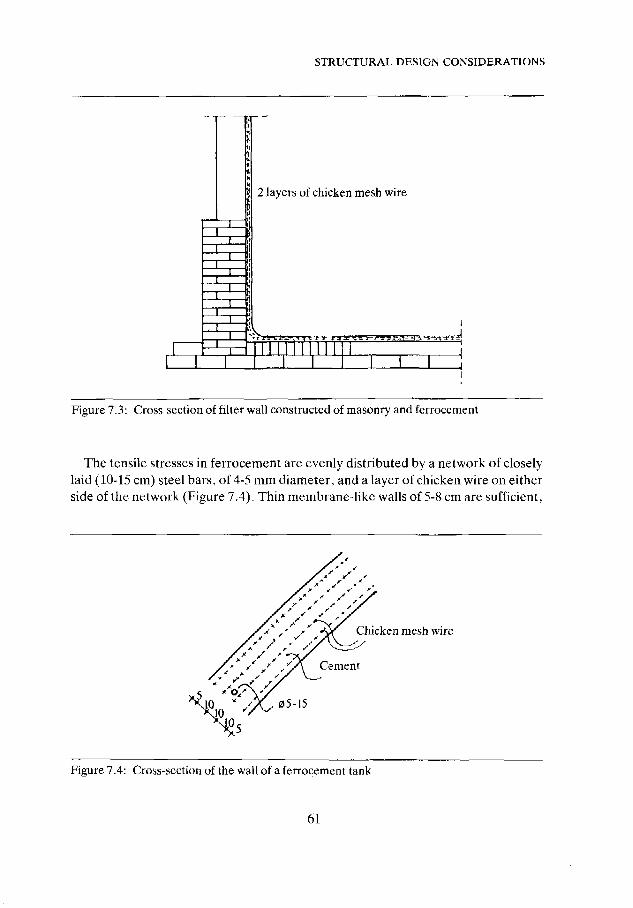
STRUCTURAL DESIGN CONSIDERATIONS
2 layers of chicken mesh wire
II 111 II I
Figure 7.3: Cross-section of filter wall constructed of masonry and ferrocement
The tensile stresses in ferrocement are evenly distributed by a network of closelylaid (10-15 cm) steel bars, of 4-5 mm diameter, and a layer of chicken wire on eitherside of the network (Figure 7.4). Thin membrane-like walls of 5-8 cm are sufficient,
Chicken mesh wire
Figure 7.4: Cross-section of the wall of a ferrocement tank
61

especially if only tensile stresses are present, as in circular filter boxes. Forcalculation of ferrocement dimensions, see publications by Watt, Sharma, et al(1980), and those published by the International Ferrocement Information Centre(Appendix VII).
Although the construction of ferrocement tanks is new in many places, localartisans can learn the trade quickly. Furthermore, construction is quicker and thecost is appreciably lower than for certain other materials. For example, theconstruction cost of a ferrocement tank in Nepal was only 30-50% of that for a stonemasonry tank. A team of one supervisor, two experienced masons/pipe fitters, and5-10 semi-skilled labourers, can complete two tanks with a diameter of 4 m withinfour weeks. Thus, ferrocement work carried out by a small team of artisans may bequite efficient if adequate training is provided, particularly in curing theferrocement.
A combination of brick masonry and ferrocement (Figure 7.3) is also worthconsidering. The brick wall is constructed first, serving as formwork for the thinlayer of ferrocement, and construction is therefore quick. An additional advantageis that the ferrocement is protected by the brickwork.
Figure 7.5: Construction of ferrocement tank using plastic pipe as the inside mould, Nepal,1986 (photo Heynen)
62

STRUCTURAL DESIGN CONSIDERATIONS
Rectangular filters
Provided the necessary skills are available, rectangular filters are usuallyconstructed of reinforced concrete, but smaller units may also be built in massconcrete or masonry. The amount of reinforcement depends on the dimensions ofthe filter box and the depth of the foundation. A pressure diagram for rectangularfilters constructed above ground level is presented in Figure 7.6.
Figure 7.6: Pressure diagram for rectangular filters
The piping and valves in rectangular filters are easily accessible and futureextensions can be incorporated easily. Both small and large boxes can be used,because experiments have shown that the quality of effluent from smaller units isequally good, provided short circuiting along the inside of the walls is prevented.This can be achieved by roughening the surface of the wall at the height of the sandbed, for example, by painting the walls with cement milk and covering it with a filmof coarse sand.
Smaller units have the advantage of ensuring watertight construction, which isimportant where the filter box is mainly below ground level. Also, shrinkage ofconcrete and masonry, differential settlements, and temperature stresses whichdepend on the span of the walls, are less in smaller units. Other factors which mayreduce shrinkage arc a low water-cement ratio, and improvement of thecompaction of the concrete mixture.
63

Foundation
The filter box may be constructed above, or partly below, ground level. Theminimum depth of the foundation must be 0.3 m in areas where sub-zerotemperatures do not occur, but when constructed below ground level, the wallshould extend at least 0.5 m above the ground to prevent dust, animals, and evenchildren entering the filter. A filter box placed largely below ground level hasstructural advantages because the load on the walls is smaller, due to the outsidesoil pressure compensating for the inside water pressure (Figure 7.7). However, theoutside soil pressure should only be partly taken into account in calculations ifsufficient compaction of the soil cannot be guaranteed after construction of the box.It should also be considered if adequate supervision of possible repairs, forexample, of pipes and valves, cannot be quaranteed, because excavation of soilnext to the box without draining the filter may result in serious cracks in the wall.The available head of the raw water may affect the possible excavated depth atwhich the filter box will be placed, but gravity flow through the entire treatmentplant is generally preferable.
Soil andwater pressure
Water-table
Water pressure
Water and sandpressure
Figure 7.7: Pressure diagram for a wall of the filter box
64
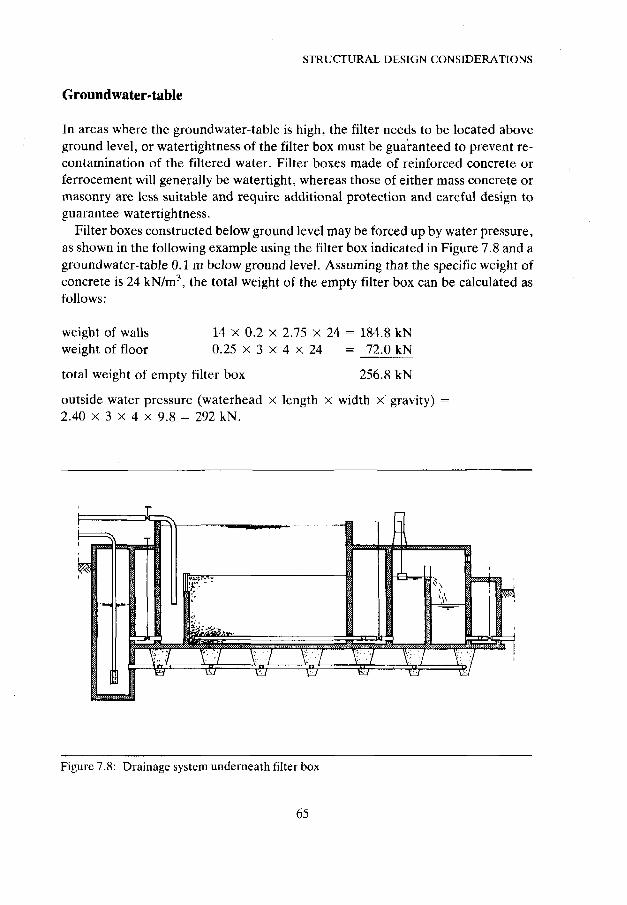
STRUCTURAL DESIGN CONSIDERATIONS
Groundwater-table
In areas where the groundwater-table is high, the filter needs to be located aboveground level, or watertightness of the filter box must be guaranteed to prevent re-contamination of the filtered water. Filter boxes made of reinforced concrete orferrocement will generally be watertight, whereas those of either mass concrete ormasonry are less suitable and require additional protection and careful design toguarantee watertightness.
Filter boxes constructed below ground level may be forced up by water pressure,as shown in the following example using the filter box indicated in Figure 7.8 and agroundwater-table 0.1 m below ground level. Assuming that the specific weight ofconcrete is 24 kN/m3, the total weight of the empty filter box can be calculated asfollows:
weight of wallsweight of floor
14 x 0.2 x 2.75 x 24 = 184.8 kN0.25 x 3 x 4 x 24 = 72.0 kN
total weight of empty filter box 256.8 kN
outside water pressure (waterhead X length x width x gravity) =2.40 X 3 X 4 x 9.8 = 292 kN.
Figure 7.8: Drainage system underneath filter box
65
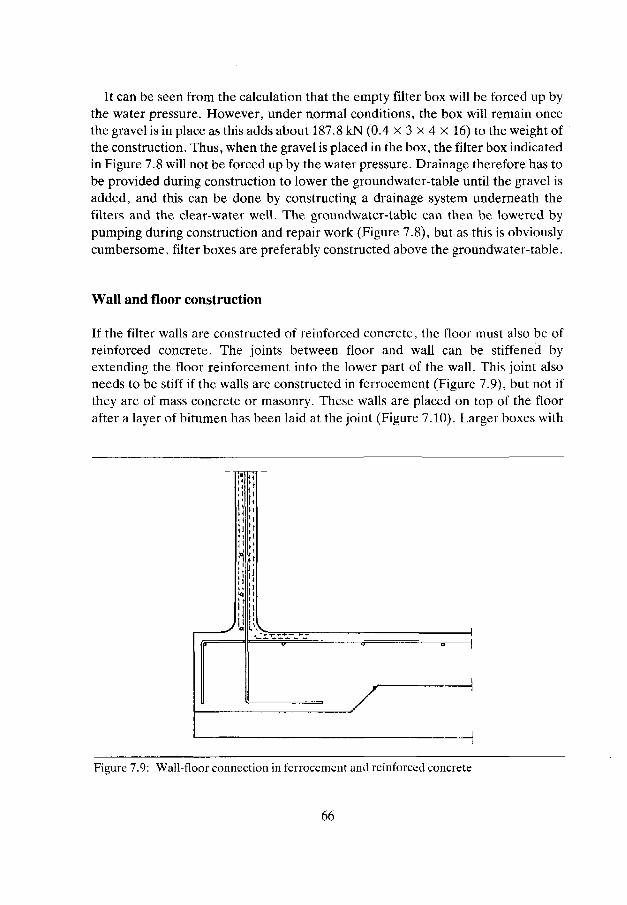
It can be seen from the calculation that the empty filter box will be forced up bythe water pressure. However, under normal conditions, the box will remain oncethe gravel is in place as this adds about 187.8 kN (0.4 x 3 x 4 x 16) to the weight ofthe construction. Thus, when the gravel is placed in the box, the filter box indicatedin Figure 7.8 will not be forced up by the water pressure. Drainage therefore has tobe provided during construction to lower the groundwater-table until the gravel isadded, and this can be done by constructing a drainage system underneath thefilters and the clear-water well. The groundwatcr-tablc can then be lowered bypumping during construction and repair work (Figure 7.8), but as this is obviouslycumbersome, filter boxes are preferably constructed above the groundwater-table.
Wall and floor construction
If the filter walls are constructed of reinforced concrete, the floor must also be ofreinforced concrete. The joints between floor and wall can be stiffened byextending the floor reinforcement into the lower part of the wall. This joint alsoneeds to be stiff if the walls arc constructed in ferrocement (Figure 7.9), but not ifthey are of mass concrete or masonry. These walls are placed on top of the floorafter a layer of bitumen has been laid at the joint (Figure 7.10). Larger boxes with
Figure 7.9: Wall-floor connection in ferrocement and reinforced concrete
66

STRUCTURAL DESIGN CONSIDERATIONS
mass concrete or masonry walls in particular will need a floor of reinforced concreteto ensure equal settlement. Small boxes, up to 5 m long and on solid ground, mayhave a floor of brickwork as well. If a layer of ferrocement is placed inside the box,larger boxes can also be completely constructed in brickwork.
Unequal loading of non-reinforced floors will result in the development ofcracks. Minimum reinforcement can be provided which is sufficient to prevent thedevelopment of cracks, for example, by placing steel bars of 6 mm diameter at150 mm intervals in both directions, and at both the top and bottom of the floor.
Bitumen-
Plaster
Figure 7.10: Wall-floor connection in masonry and reinforced concrete
Reinforcement of the wall and floor
The wall thickness and the required reinforcement of walls and floor depends onmany factors, such as the dimensions and shape of the filter box, the bearingcapability of the soil, and the load on the walls. Calculations for each possiblesituation are beyond the scope of this publication.
The quality of concrete and steel available in rural areas of developing countriesmay not be high and it is therefore advisable to use rather low values for the cubestrength of concrete and the tensile strength of the steel, for example, 17.5 N/mm2
67
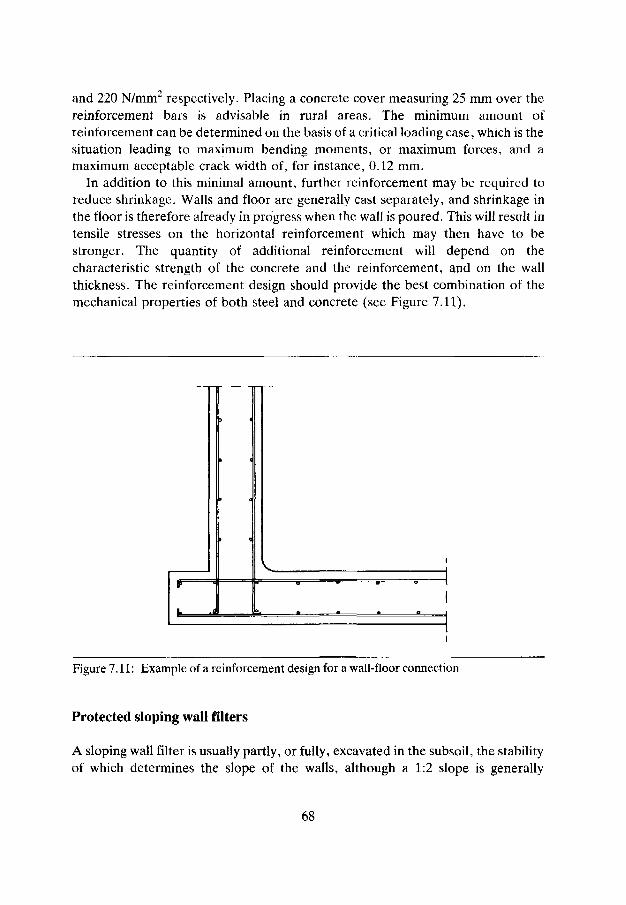
and 220 N/mm2 respectively. Placing a concrete cover measuring 25 mm over thereinforcement bars is advisable in rural areas. The minimum amount ofreinforcement can be determined on the basis of a critical loading case, which is thesituation leading to maximum bending moments, or maximum forces, and amaximum acceptable crack width of, for instance, 0.12 mm.
In addition to this minimal amount, further reinforcement may be required toreduce shrinkage. Walls and floor are generally cast separately, and shrinkage inthe floor is therefore already in progress when the wall is poured. This will result intensile stresses on the horizontal reinforcement which may then have to bestronger. The quantity of additional reinforcement will depend on thecharacteristic strength of the concrete and the reinforcement, and on the wallthickness. The reinforcement design should provide the best combination of themechanical properties of both steel and concrete (see Figure 7.11).
Figure 7.11: Example of a reinforcement design for a wall-floor connection
Protected sloping wall filters
A sloping wall filter is usually partly, or fully, excavated in the subsoil, the stabilityof which determines the slope of the walls, although a 1:2 slope is generally
68

STRUCTURAL DESIGN CONSIDERATIONS
satisfactory. Suitable materials for lining the walls are masonry, concrete tiles, orferrocement (Figure 7.12). Ferrocement seems a very promising choice, but its lowimpact-resistance is a slight disadvantage and special constructions are required tomake the filters accessible. The construction costs of sloping wall filters arerelatively low, and unskilled labourers can be used.
Figure 7.12: Various linings for sloping wall filters
Disadvantages of protected sloping wall filters include the following points:
° More land is required than for structures with vertical walls (the design area is thenet filter bed area at the minimum filter bed depth).
a Piping and filter control facilities are less accessible.
° Watertightness of the construction is difficult to guarantee. Where thegroundwater-table is low, this may not be important except for losses, but re-contamination of the filtered water may occur with a high groundwater-table.
° Fouling of the sloping walls may occur due to the growth of reeds and othervegetation.
A sloping wall filter may also be constructed in earthwork above ground level.This reduces the disadvantages, but also results in higher pressure in the upper layerof the soil, which may cause settlement and fissures. Various types of filter boxconstructions are summarized in Table 7.1.
69
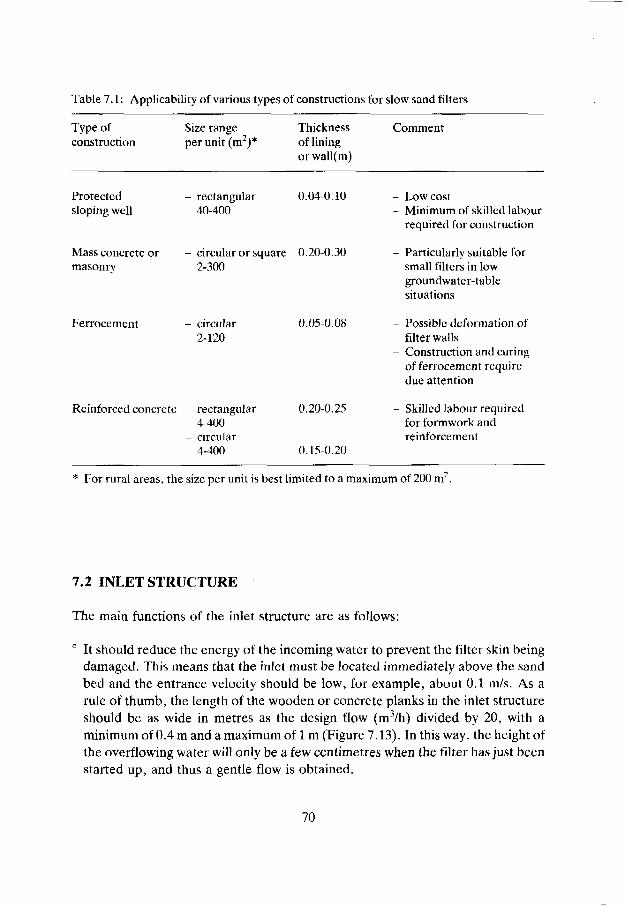
Table 7.1: Applicability of various types of constructions for slow sand filters
Type ofconstruction
Protectedsloping well
Mass concrete ormasonry
Ferrocement
Reinforced concrete
Size rangeper unit (m2)*
- rectangular40-400
- circular or square2-300
- circular2-120
- rectangular4-400
- circular4-400
Thicknessof liningorwall(tn)
0.04-0.10
0.20-0.30
0.05-0.08
0.20-0.25
0.15-0.20
Comment
- Low cost- Minimum of skilled labour
required for construction
- Particularly suitable forsmall filters in lowgroundwater-tablesituations
- Possible deformation offilter walls
- Construction and curingof ferrocement requiredue attention
- Skilled labour requiredfor formwork andreinforcement
* For rural areas, the size per unit is best limited to a maximum of 200 m2.
7.2 INLET STRUCTURE
The main functions of the inlet structure are as follows:
° It should reduce the energy of the incoming water to prevent the filter skin beingdamaged. This means that the inlet must be located immediately above the sandbed and the entrance velocity should be low, for example, about 0.1 m/s. As arule of thumb, the length of the wooden or concrete planks in the inlet structureshould be as wide in metres as the design flow (nrVh) divided by 20, with aminimum of 0.4 m and a maximum of 1 m (Figure 7.13). In this way, the height ofthe overflowing water will only be a few centimetres when the filter has just beenstarted up, and thus a gentle flow is obtained.
70
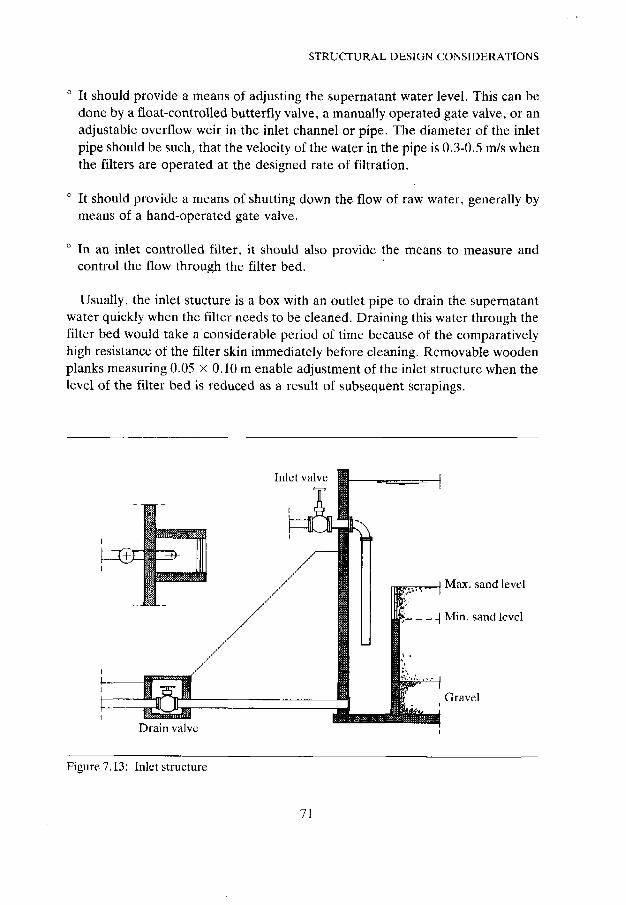
STRUCTURAL DESIGN CONSIDERATIONS
° It should provide a means of adjusting the supernatant water level. This can bedone by a float-controlled butterfly valve, a manually operated gate valve, or anadjustable overflow weir in the inlet channel or pipe. The diameter of the inletpipe should be such, that the velocity of the water in the pipe is 0.3-0.5 m/s whenthe filters are operated at the designed rate of filtration.
° It should provide a means of shutting down the flow of raw water, generally bymeans of a hand-operated gate valve.
° In an inlet controlled filter, it should also provide the means to measure andcontrol the flow through the filter bed.
Usually, the inlet stucture is a box with an outlet pipe to drain the supernatantwater quickly when the filter needs to be cleaned. Draining this water through thefilter bed would take a considerable period of time because of the comparativelyhigh resistance of the filter skin immediately before cleaning. Removable woodenplanks measuring 0.05 x 0.10 m enable adjustment of the inlet structure when thelevel of the filter bed is reduced as a result of subsequent scrapings.
Max. sand level
1 Min. sand level
Grave]
Drain valve
Figure 7.13: Inlet structure
71

7.3 OUTLET STRUCTURE
The main functions of the outlet structure are as follows:
° It should prevent the development of below-atmospheric pressure in the filterbed. Therefore, a simple overflow weir is often provided, with its crest slightlyabove the top of the sand bed.
° It should provide a means of draining the filter. A separate drain pipe is oftenincluded in the outlet structure to pass the water to waste.
0 It should provide a means of refilling the filter with clean water after it has beenscraped. This may be done through the system of underdrains.
° In an outlet controlled filter, it should be possible to measure the flow through thefilter bed. The overflow weir, mentioned above, may also be used for this purposeby means of a calibrated flow indicator, combined with a V-notch weir. Therelationship between the flow and height of water in a V-notch weir is explainedin Appendix V.
Flowindicator
Ventilation
Filter regulationvalve
Manhole
Figure 7.14: Outlet box of an outlet controlled filter
72
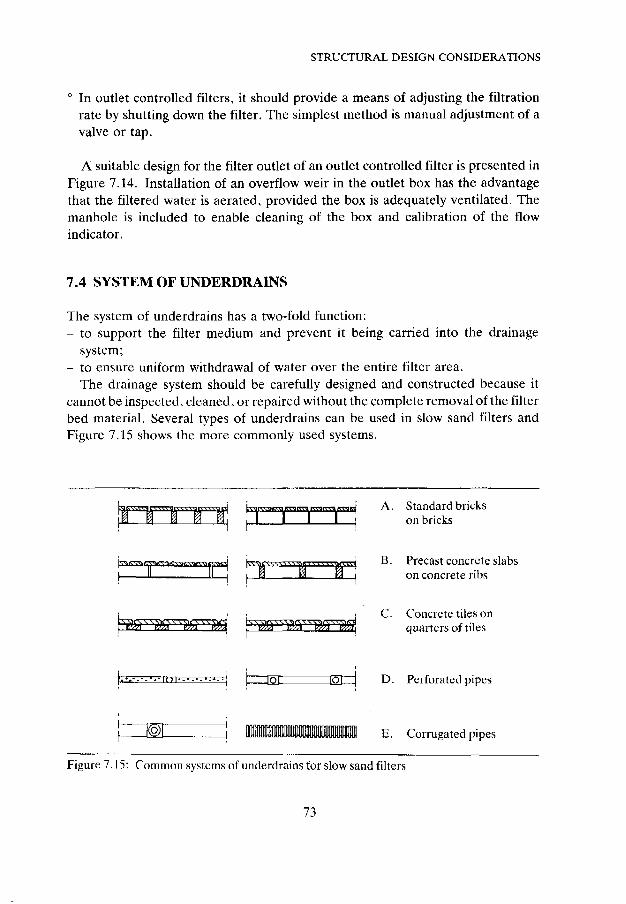
STRUCTURAL DESIGN CONSIDERATIONS
0 In outlet controlled filters, it should provide a means of adjusting the filtrationrate by shutting down the filter. The simplest method is manual adjustment of avalve or tap.
A suitable design for the filter outlet of an outlet controlled filter is presented inFigure 7.14. Installation of an overflow weir in the outlet box has the advantagethat the filtered water is aerated, provided the box is adequately ventilated. Themanhole is included to enable cleaning of the box and calibration of the flowindicator.
7.4 SYSTEM OF UNDERDRAINS
The system of underdrains has a two-fold function:- to support the filter medium and prevent it being carried into the drainage
system;- to ensure uniform withdrawal of water over the entire filter area.
The drainage system should be carefully designed and constructed because itcannot be inspected, cleaned, or repaired without the complete removal of the filterbed material. Several types of underdrains can be used in slow sand filters andFigure 7.15 shows the more commonly used systems.
A. Standard brickson bricks
B. Precast concrete slabson concrete ribs
C. Concrete tiles onquarters of tiles
35HIJ D. Perforated pipes
E. Corrugated pipes
Figure 7.15: Common systems of underdrains for slow sand filters
73

To prevent loss of filter medium through the openings in the underdrain system,graded layers of gravel are placed between the filter sand and the underdrainsystem. Generally, three layers of gravel with grain sizes of 1.0-1.4 mm, 4.0-6.0 mm, and 16.0-23.0 mm respectively are used in conventional systems. Each ofthese layers should be about 100-150 mm thick (Figure 7.16). Recently, corrugatedpipes have been introduced for slow sand filter underdrain systems, and often,these are only covered with one 100 mm thick layer of fine gravel.
! • ' . ' •
Filter sand 0.2-0.3 mm
'•7$
'.••.I
. . ' I
Coarse sand 1.0-1.4 mm
Gravel 4.0-5.6 mm
Gravel 16.0-23.0 mm
100
100
100
150
Figure 7.16: Filter medium support
Systems made from prefabricated concrete slabs, burned bricks or concrete tiles,have one feature in common, that is, water flows freely out of the sand bed over arelatively large area. These systems can therefore be relied upon withoutcalculation of the hydraulic characteristics, whereas systems using perforated pipesmust be designed more carefully (see Table 7.2).
74
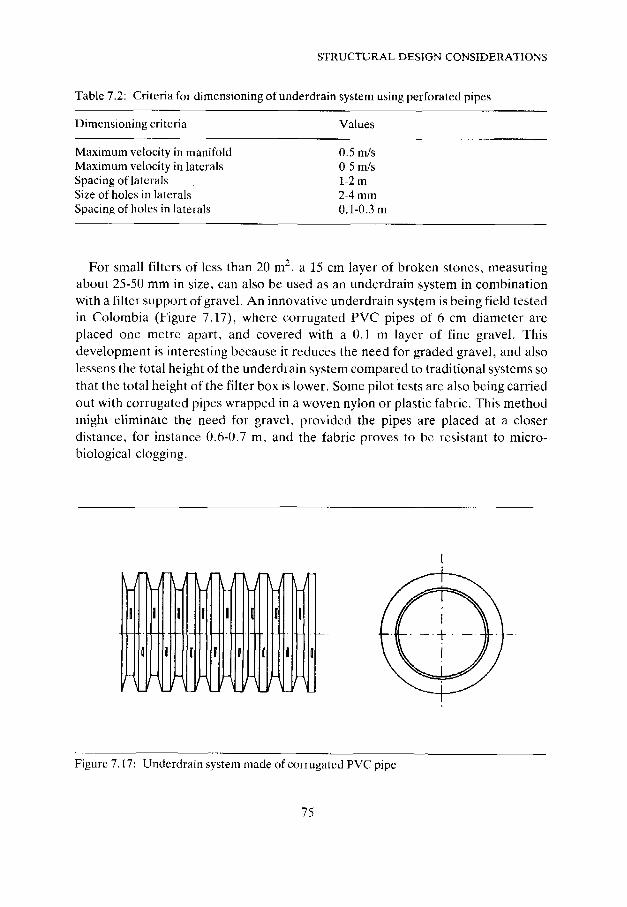
STRUCTURAL DESIGN CONSIDERATIONS
Table 7.2: Criteria for dimensioning of underdrain system using perforated pipes
Dimensioning criteria Values
Maximum velocity in manifoldMaximum velocity in lateralsSpacing of lateralsSize of holes in lateralsSpacing of holes in laterals
0.5 m/s0.5 m/s1-2 m2-4 mm0.1-0.3 m
For small filters of less than 20 m2, a 15 cm layer of broken stones, measuringabout 25-50 mm in size, can also be used as an underdrain system in combinationwith a filter support of gravel. An innovative underdrain system is being field testedin Colombia (Figure 7.17), where corrugated PVC pipes of 6 cm diameter arcplaced one metre apart, and covered with a 0.1 m layer of fine gravel. Thisdevelopment is interesting because it reduces the need for graded gravel, and alsolessens the total height of the underdiain system compared to traditional systems sothat the total height of the filter box is lower. Some pilot tests are also being carriedout with corrugated pipes wrapped in a woven nylon or plastic fabric. This methodmight eliminate the need for gravel, provided the pipes are placed at a closerdistance, for instance 0.6-0.7 m, and the fabric proves to be resistant to micro-biological clogging.
Figure 7.17: Underdrain system made of corrugated PVC pipe
75
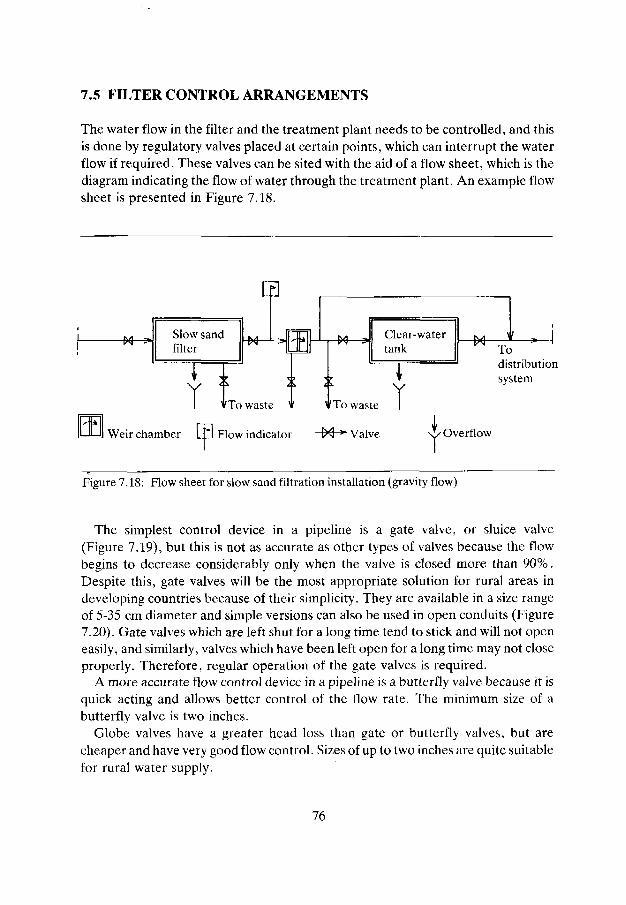
7.5 FILTER CONTROL ARRANGEMENTS
The water flow in the filter and the treatment plant needs to be controlled, and thisis done by regulatory valves placed at certain points, which can interrupt the waterflow if required. These valves can be sited with the aid of a flow sheet, which is thediagram indicating the flow of water through the treatment plant. An example flowsheet is presented in Figure 7.18.
Todistributionsystem
I Weir chamber Flow indicator M *" Valve Y Overflow
Figure 7.18: Flow sheet for slow sand filtration installation (gravity flow)
The simplest control device in a pipeline is a gate valve, or sluice valve(Figure 7.19), but this is not as accurate as other types of valves because the flowbegins to decrease considerably only when the valve is closed more than 90%.Despite this, gate valves will be the most appropriate solution for rural areas indeveloping countries because of their simplicity. They are available in a size rangeof 5-35 cm diameter and simple versions can also be used in open conduits (Figure7.20). Gate valves which are left shut for a long time tend to stick and will not openeasily, and similarly, valves which have been left open for a long time may not closeproperly. Therefore, regular operation of the gate valves is required.
A more accurate flow control device in a pipeline is a butterfly valve because it isquick acting and allows better control of the How rate. The minimum size of abutterfly valve is two inches.
Globe valves have a greater head loss than gate or butterfly valves, but arecheaper and have very good flow control. Sizes of up to two inches are quite suitablefor rural water supply.
76

STRUCTURAL DESIGN CONSIDERATIONS
Figure 7.19: Gate valve for pipelines
Figure 7.20: Gate valve in open conduit
77
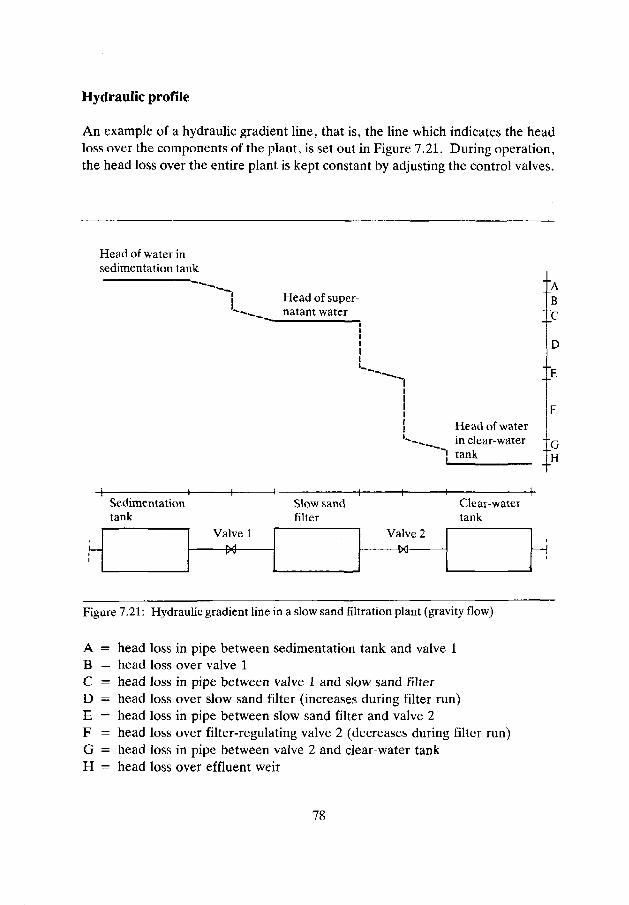
Hydraulic profile
An example of a hydraulic gradient line, that is, the line which indicates the headloss over the components of the plant, is set out in Figure 7.21. During operation,the head loss over the entire plant is kept constant by adjusting the control valves.
Head of water insedimentation tank
Head of super-natant water
Head of waterin clear-water
""! tank
Sedimentationtank
Slow sandfilter
Valve 1N
Clear-watertank
Valve 2—N
Figure 7.21: Hydraulic gradient line in a slow sand filtration plant (gravity flow)
A = head loss in pipe between sedimentation tank and valve 1B = head loss over valve 1C = head loss in pipe between valve 1 and slow sand filterD = head loss over slow sand filter (increases during filter run)E = head loss in pipe between slow sand filter and valve 2F = head loss over filter-regulating valve 2 (decreases during filter run)G = head loss in pipe between valve 2 and clear-water tankH = head loss over effluent weir
78

STRUCTURAL DESIGN CONSIDERATIONS
7.6 PIPING AND PUMPING
In water supply engineering, it is good practice to "over-design" the majorhydraulic elements of a treatment plant to at least 1.5 times the required capacity.This ensures that the treatment works can be extended without replacing pipes,valves and other appurtenances. Gate valves and filter control valves should bearranged in such a way that extensions can be connected and furthermore,vulnerable mechanical parts must be easily accessible for control and repair. Theinfluent and drain-pipes should be quite separate from clear-water pipes.
Centrifugal pumps are used in many water treatment plants. When designing thepipelines and pumps, it is necessary to know the required flow, the head loss in thepipeline and the treatment units, and the required pressure head. The head loss inpipelines can be easily derived from graphs available for most pipe materials, andan example graph, for PVC pipes, is shown in Figure 7.22.
B 10
ai5 10
Flow (litres per second)
Figure 7.22: Head losses through friction in PVC pipes
79

From Figure 7.22, it can be seen that a flow of 11/s (3.6 irrVh) will cause a head lossof 0.7 m water column per 1000 m PVC pipe, for a pipeline of 75 mm diameter. Pipefittings and bends will add further to this head loss. The head loss in the slow sandfilters amounts to 1 m water column and in pre-sedimentation tanks, between 0.05and 0.10 m water column.
7.7 CONSTRUCTION OF THE CLEAR-WATER TANK
The clear-water storage tank does not necessarily have to be located at thetreatment plant. Location in the village in fact has the advantage of a more constantflow in the transport pipe between the treatment plant and village. Also, two orthree smaller tanks can be built, with a total net volume that is equal to thecalculated required storage volume. This may reduce the cost of transport pipes assmaller diameters can be used, and may increase the reliability of the water supplysystem because when one tank is out of order, the others can still supply water.
The foundation for the clear-water tanks will generally be deep, because the lossof head through the filter is 1 m (Figure 7.21), and some variation in the water levelin the tank must be permitted to balance production and demand.
In small installations, the cover of the clear-water tank can be a simple structureof ferrocement or wood. For larger tanks, a cover of reinforced concrete orferrocement is advisable. When the clear-water tank is covered with a reinforcedconcrete slab, the structural design differs from that of slow sand filters because sidepressures are also transmitted to the cover. If the joints between cover and walls arestrengthened with extended reinforcement bars, the strength of the structureincreases, and it may therefore be possible to reduce the thickness of the walls.When calculating the dimensions of the floor and wall of the tank, the combinationof an empty tank and a high groundwater-table are critical. Careful considerationshould be given to whether the total weight of the construction should be increased,to prevent it being forced up by the water pressure.
The clear-water tank must be provided with ventilation pipes, a drain-pipe, anoverflow, and a manhole for inspection. If the tank also serves as a chlorine contactchamber, then the clear-water outlet pipe should be located at such a height abovefloor level, that the minimum detention time is 30 minutes.
80

8. Design Examples of Slow Sand Filters
Five designs for slow sand filters of varying capacities and constructed in differentmaterials are presented as examples (Figures 8.1 - 8.5). They are based on specificconditions and may not be suitable under other circumstances. When necessary,important local conditions are indicated, such as the height of the groundwater-table.
The first design is in brick masonry, because of the low water-table. Even ifcracks should develop, they will only result in water losses but will not lead to adeterioration of the effluent by inflow of groundwater. An alternative is to buildthis filter in masonry and ferrocement, as shown in Figure 7.3. The circularmasonry wall serves as an outside mould for the ferrocement and will take uppressure forces.
Thorough investigations of site conditions have taken place in the second design,which is a protected sloping wall filter with a ferrocement lining. Part of the soil hasbeen excavated and used for the bunds. A 40° inclination of the slope could beselected because the bunds are made of clay.
The third design is in ferrocement, where the filters are placed above groundlevel because of the high groundwater-table. The clear-water well has a smallstorage capacity because another storage tank has been constructed in the supplyarea.
The fourth and largest design example is in reinforced concrete and consists offour units. This allows for flexible operation, with only a 30% increase in filtrationrate required when one filter unit is out of operation. Provisions for chlorination ofthe effluent are included for this larger plant, which may provide water to acommunity of 5000-20000 people. Allowances are therefore not made fordischarging initially filtered water to waste.
The last design is a small concrete filter which differs widely from the othersbecause it is an inlet controlled filter.
Provisions for pre-treatment of the raw water have not been included in any ofthe designs, which are therefore only applicable for relatively clear surface water,with an average turbidity level of less than 20 NTU.If turbidity of the raw water ishigher, a pre-treatment unit must be incorporated, however. All designs allow forback-filling the filter units after cleaning, or re-sanding directly with the outflowfrom another unit. Initial filling through the underdrains may be achieved bymaking a temporary connection between the raw-water inlet and the outlet box. Ineach of the examples, an estimate of the building materials required forconstruction of the slow sand filter units is also provided. This estimate does notinclude construction materials for the clear-water well or other units.
81
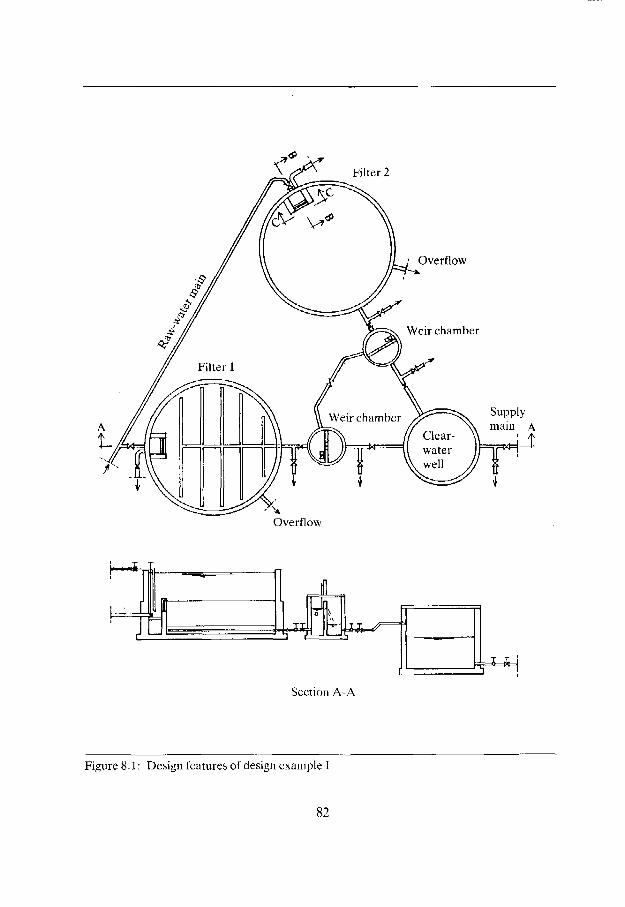
Filter 2
Overflow
Overflow
Section A-A
Figure 8.1: Design features of design example T
82

DESIGN EXAMPLES
General:Water-tableFoundation
Section B-B
3 m below ground levelstable soil
Section C-C
Slow sand filter:MaterialDesign capacityDesign flowNo. of unitsSizeHeight of filter box
brick masonry4.75 m3/h0.1 m/h20 5.60 m2.5 m
Height of underdrain system 0.3 mDepth of sand bed 0.9 m
Outlet box:MaterialSizeHeight
brick masonry01.40 m1.50 m
Clear-water tank in brick masonry:Size 03.10 mHeight 2.00 m
Bill of quantities for filter units:Steel 1200 kgConcrete (1:1 Vi;2Vi) 15 m3
Concrete (workfloor) (1:3:5) 5 m3
Mortar (1:2) 4 m3
Masonry 30 m3
Filter sand 45 m3
Filter gravel 15 m3
Gate valves 9Butterfly valves 2
Figure 8.1: Design features of design example I
83
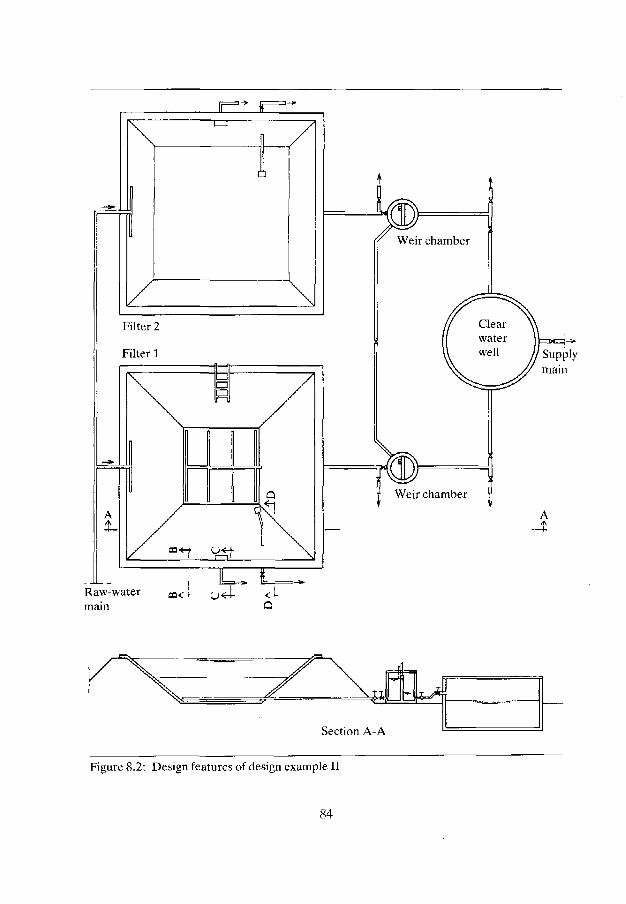
Supply
Raw-watermain
Section A-A
Figure 8.2: Design features of design example II
84
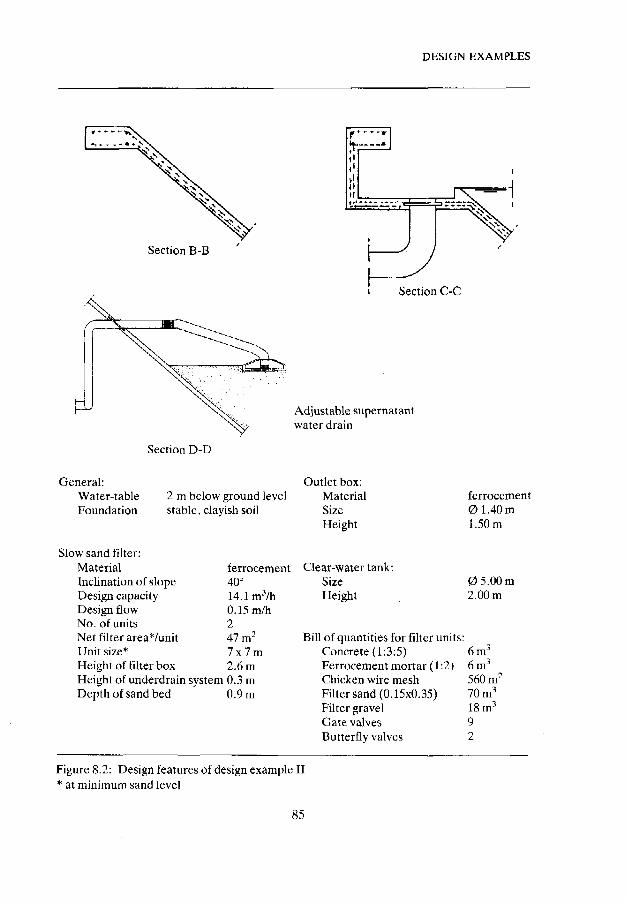
DESIGN EXAMPLES
Section B-B
Section C-C
Adjustable supernatantwater drain
Section D-D
General:Water-table 2 m below ground levelFoundation stable, clayish soil
Slow sand filter:MaterialInclination of slopeDesign capacityDesign flowNo. of unitsNet filter area*/unitUnit size*Height of filter boxHeight of underdrainDepth of sand bed
ferrocement40°14.1 nrVh0.15m/h247 m2
7x7m2.6 m
system 0.3 m0.9 m
Outlet box:MaterialSizeHeight
Cleat-water tank:SizeHeight
Bill of quantities for filter units:Concrete (1:3:5)Ferrocement mortar (1:2)Chicken wire meshFilter sand (0.15x0.35)Filter gravelGate valvesButterfly valves
ferrocement01.40 m1.50 m
0 5.00 m2.00 m
6 m3
6 m3
560 m2
70 m3
18 m3
92
Figure 8.2: Design features of design example II* at minimum sand level
85

Supply
main
Weir chamber Section B-B
Figure 8.3: Design features of design example III
86
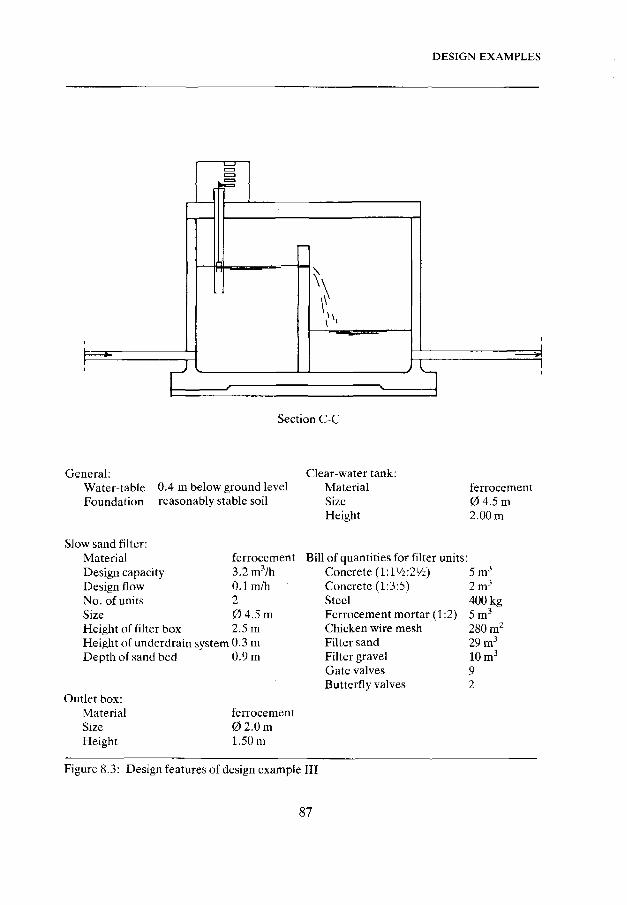
DESIGN EXAMPLES
1
General:
1
Section C-C
Water-table 0.4 m below ground levelFoundation reasonably stable soil
Slow sand filter:MaterialDesign capacityDesign flowNo. of unitsSizeHeight of filter box
ferrocement3.2 m3/h0.1 m/h20 4.5 m2.5 m
Height of underdrain system 0,3 mDepth of sand bed
Outlet box:MaterialSizeHeight
0.9 m
ferrocement0 2.0m1.50 m
Clear-water tank:MaterialSizeHeight
Bill of quantities for filter unitsConcrete {l:\Vr.2V2)Concrete (1:3:5)SteelFerrocement mortar (1:2)Chicken wire meshFilter sandFilter gravelGate valvesButterfly valves
ferrocement0 4.5 m2.00 m
5m 3
2 m3
400 kg5 m3
280 m2
29 m3
10 m3
92
Figure 8.3: Design features of design example III
87

A
Filter 4
Filter 3
Filter 2
Supply main
Clear-water Operationwell house
Filter 1
Chlorinationequipment
Section A-A
Figure 8.4: Design features of design example TV
88
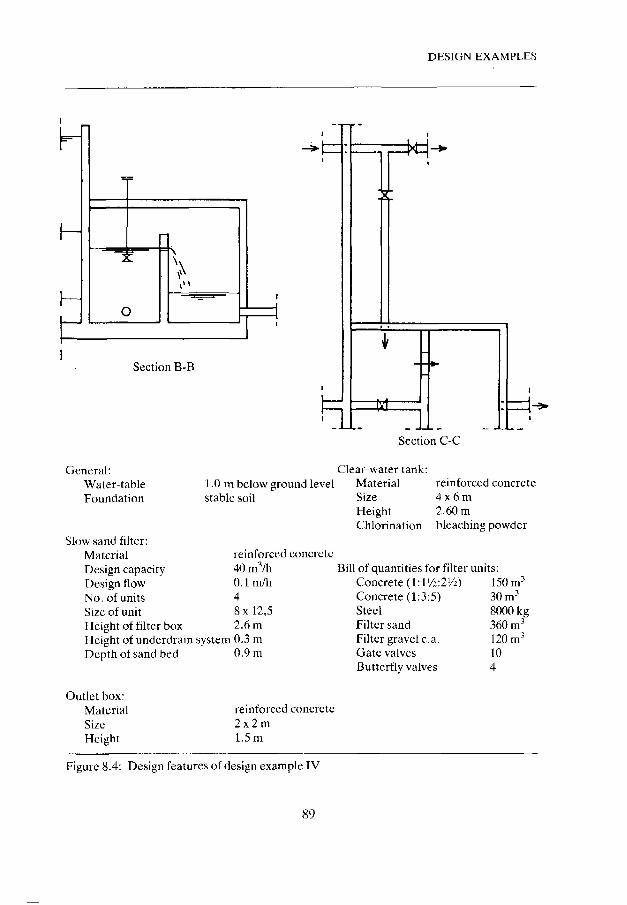
DESIGN EXAMPLES
H
i -
i -
Section B-B
1
1
1
{
y
.—pi
r
^ -
-: = * •
General:Water-tableFoundation
Slow sand filter:MaterialDesign capacityDesign flowNo. of unitsSize of unitHeight of filter box
1.0 m below ground levelstable soil
reinforced concrete40 m3/h0.1 m/h48 x 12,52.6m
Height of underdrain system 0.3 mDepth of sand bed
Outlet box:MaterialSizeHeight
0.9 m
reinforced concrete2x2m1.5 m
Section C-C
Clear-water tank:Material reinforced concreteSize 4 x 6 mHeight 2.60 mChlorination bleaching powder
Bill of quantities for filter units:Concrete (1:1'/2:2'/2)Concrete (1:3:5)SteelFilter sandFilter gravel c.a.Gate valvesButterfly valves
150 m3
30 m3
8000 kg360 m3
120 m3
104
Figure 8.4: Design features of design example IV
89

I A BL
LJFilter 1
I Supply main
o A
4
~e "
Section A-A
n
Figure 8.5: Design features of design example V
90

DESIGN EXAMPLES
1 I
r1 >; i
I
Section B-B
General:
Section C-C •
Water-table 2 m below ground levelFoundation stable soil
Slow sand filter, inlet controlled:MaterialDesign capacityDesign flowNo. of unitsSize of unitHeight of filter boxHeight of underdrain systemDepth of sand bed
reinforced concrete3.6 nvVh0.15m/h23 x4 m2.4 m0.2 m0.9 m
Outlet box:MaterialSizeHeight
Bill of quantities for filterConcrete (l:r/z;2)Concrete (1:3:5)SteelFilter sandFine gravelGate valvesButterfly valve
masonry1.5x2 m1.5 m
unit:15 m3
2 m3
1200 kg20 m-1
5 m3
42
Figure 8.5: Design features of design example V
91
9. Construction Guidelines
Good design docs not necessarily mean a good filter plant because much dependson the quality of materials used for construction, the available skills, and the qualityof supervision provided during construction. Too often, particularly in rural areas,insufficient attention is paid to the quality of construction and to the quality andcomposition of the materials used, resulting in many units with only a short lifespan. For example, sand used to make concrete in rural areas may contain clay andorganic matter, but if this material is not washed out, the concrete will be weaker.Concrete will also be of lower quality and less durable if it is not cured properly.Thus, the quality and durability of the structures will depend on the care taken bythe contractor or the construction department. These matters need to be discussedbeforehand with the contractor and progress should be regularly checked on thesite, especially if the contractor is not familiar with new materials being used.
Preparation should start with staking out and clearing the site, followed by theconstruction of storage facilities for vulnerable or valuable materials, such as pipes,cement and valves. Excavation can then begin on stable sites to lay the foundation.Only a simple foundation is required for sand or firm soil, for example, a layer ofcompacted coarse sand covered with a work floor of lean concrete (1:3:5) may besufficient. A complex pile foundation may be required for unstable sites but as thisinvolves high costs, it is better to look for another site.
The reinforcement of the floor, and the reinforcement which connects the floorand walls need to be placed first. Next, the concrete floor has to be poured and beproperly cured by keeping it wet for several days, also done if ferrocement is usedfor the walls. The external form should then be placed, followed by positioning ofthe wall reinforcement and the pipes which pass through the wall. When allreinforcement and pipes are correctly placed, the inner formwork can be erected inreadiness for mixing the concrete and pouring the walls. Preferably, pouring shouldnot be interrupted, and should not be done in the hottest part of the day.A qualified supervisor should pay close attention to the mixing of the concrete, asthis largely determines the strength and the lifetime of the construction. Carefulattention is also required for compacting and curing the concrete. Compaction canbe achieved by poking with a stick or a vibrating poker, and curing may be done byplacing a layer of water on the floor immediately after the concrete mix has beenplaced, so keeping it wet for several days and allowing chemical hardening to occur.Alternatively, the concrete can be cured by covering it with a cloth, paper, bananaleaves or sand, and spraying with water at intervals throughout the day.
92
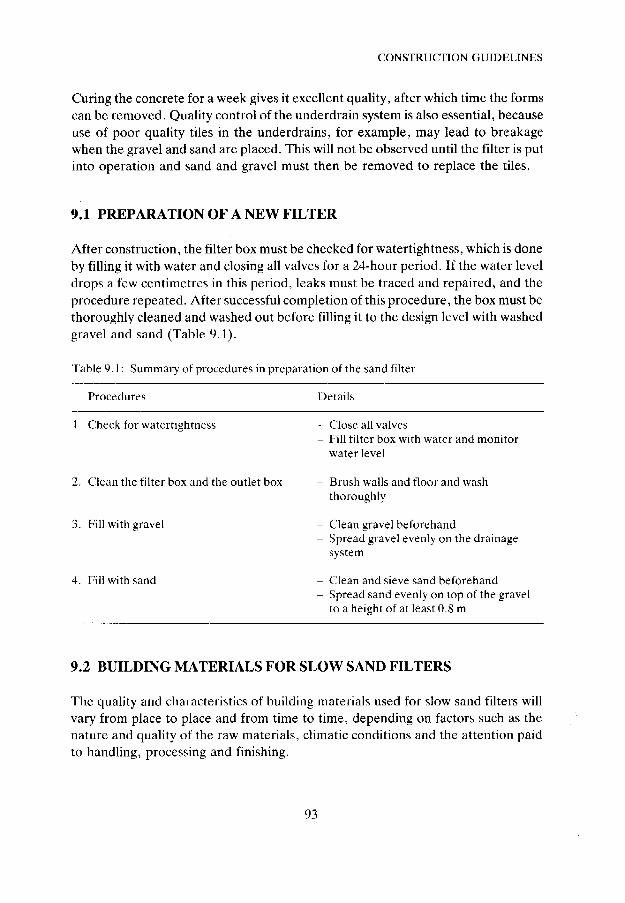
CONSTRUCTION GUIDELINES
Curing the concrete for a week gives it excellent quality, after which time the formscan be removed. Quality control of the underdrain system is also essential, becauseuse of poor quality tiles in the underdrains, for example, may lead to breakagewhen the gravel and sand are placed. This will not be observed until the filter is putinto operation and sand and gravel must then be removed to replace the tiles.
9.1 PREPARATION OF A NEW FILTER
After construction, the filter box must be checked for watertightness, which is doneby filling it with water and closing all valves for a 24-hour period. If the water leveldrops a few centimetres in this period, leaks must be traced and repaired, and theprocedure repeated. After successful completion of this procedure, the box must bethoroughly cleaned and washed out before filling it to the design level with washedgravel and sand (Table 9.1).
Table 9.1: Summary of procedures in preparation of the sand filter
Procedures Details
1. Check for watertightness - Close all valves- Fill filter box with water and monitor
water level
2. Clean the filter box and the outlet box - Brush walls and floor and washthoroughly
3. Fill with gravel - Clean gravel beforehand- Spread gravel evenly on the drainage
system
4. Fill with sand - Clean and sieve sand beforehand- Spread sand evenly on top of the gravel
to a height of at least 0.8 m
9.2 BUILDING MATERIALS FOR SLOW SAND FILTERS
The quality and characteristics of building materials used for slow sand filters willvary from place to place and from time to time, depending on factors such as thenature and quality of the raw materials, climatic conditions and the attention paidto handling, processing and finishing.
93
Concrete
Concrete consists of a mixture of sand, gravel, cement and water. It will often benecessary to test the quality of these components and international standards fortesting methods have been established for this purpose. Testing need notnecessarily be carried out on the building site and samples may therefore beexamined in a laboratory.
The quality of local cement is usually known and need not necessarily be tested.Care should be taken, however, that the cement is not stored for too long a period,and that it is stored in a dry place. Sand and gravel should be tested for organicmatter content, and their grain size distribution also has to meet certainrequirements. The water to be used should be clean, fresh and clear.
The proportion of these three components in the concrete mixture will depend ontheir characteristics. A mixture of one litre (1.25 kg) cement to 1.5 litres sand to2.5 litres gravel will usually give good results for watertight constructions. Tt isadvisable to base the mixture on the weight of the cement instead of on its volume,because loose cement has a greater volume than compacted cement. A mixture ofone litre (1.25 kg) cement to two litres sand to three litres gravel is often used forreinforced concrete constructions which do not have to be watertight.
In order to guarantee watertightness of the concrete, the following measuresneed to be taken:c Attention must be paid to the grain size distribution, especially the content of fine
material. The content of "fines" consists of the cement and the fraction of sandparticles smaller than 0.3 mm. Recommended levels are given in Table. 9.2.
° The amount of water per m3 concrete must be as low as possible and should besufficient to make the concrete just "workable". The effect of variation in initialwater quantity on the compression strength of several concrete mixtures is shownin Figure 9.1. It may be concluded that if the water content is increased from 140to 180 1/m3, the ultimate compression strength will decrease from 40 to30 N/mm2. Because a quantity of water, which may be quite high, will already beattached to the sand and gravel, it needs to be taken into account when calculatingthe quantity of water to be added. Therefore, no more than 120-140 litres shouldgenerally be added to prepare 1 m3 of concrete.
° When it is necessary to economize on cement, it is advisable to increase thelargest grain size of the gravel so that the content of cement can be decreased, forexample 50 mm instead of the usual 30 mm.
94
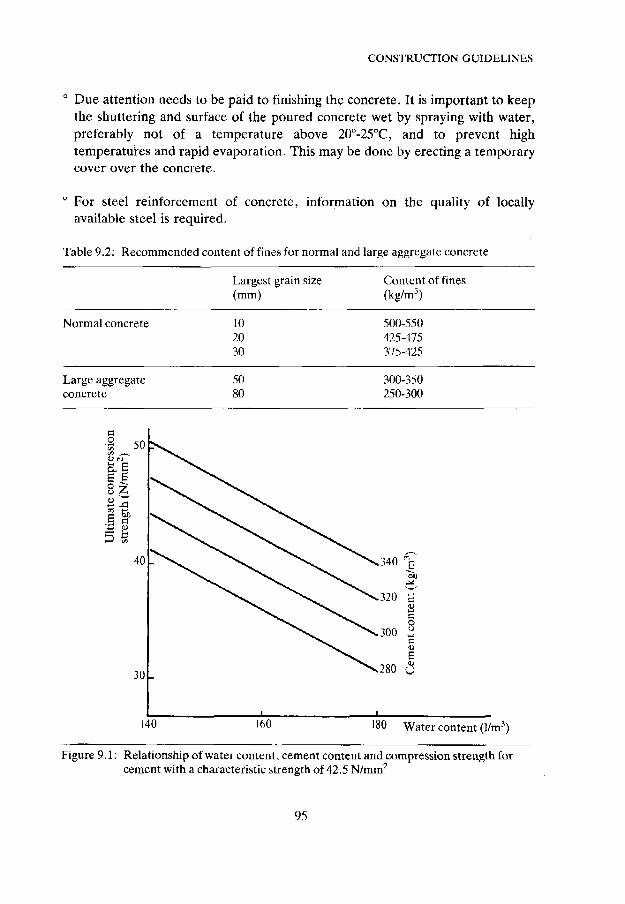
CONSTRUCTION GUIDELINES
0 Due attention needs to be paid to finishing the concrete. It is important to keepthe shuttering and surface of the poured concrete wet by spraying with water,preferably not of a temperature above 20°-25°C, and to prevent hightemperatures and rapid evaporation. This may be done by erecting a temporarycover over the concrete.
° For steel reinforcement of concrete, information on the quality of locallyavailable steel is required.
Table 9.2: Recommended content of fines for normal and large aggregate concrete
Normal concrete
Large aggregateconcrete
Largest grain size(mm)
102030
5080
Content of fines(kg/m3)
500-550425-475375-425
300-350250-300
ao 50
E E
Sza J3
1 «
40
30
140 160 180 Water content (1/m3)
Figure 9.1: Relationship of water content, cement content and compression strength forcement with a characteristic strength of 42.5 N/mm2
95

Ferrocement
Ferrocement consists of a sand-cement mortar which is heavily reinforced with rodsand chicken wire (reinforcement percentage by weight 0.9-1.1%). Thereinforcement consists of a network of vertical and horizontal rods of smalldiameter (4-5 mm), spaced at a distance ranging from 50 to 120 mm. A layer ofchicken wire (mesh size 20 mm) is placed on both sides of this network, which isthen embedded in mortar made of one part cement and two parts sand. The sandcontent should not contain silt and should be well graded. Coarse sand has theadvantage over fine sand that shrinkage will be lower, but the workability of themortar will be less. Fresh cement should preferably be used for the mortar, but if itis not available, the cement should be sieved before it is put in the mixture.
Ferrocement is particularly suitable for curved structural elements, such ascircular slow sand filters, because bending moments do not occur and a smalldegree of deformation is acceptable. Major advantages are also its low cost,simplicity in construction, and durability.
An inside or outside mould is usually used when constructing ferroecmentreservoirs. When an inside mould is used, the building process is as follows:
° The network of small diameter horizontal and vertical rods and a layer of chickenwire are placed on the mould and covered with a 10 mm thick layer of mortar.
° The mortar is spread onto the reinforcement with a trowel, up to the insidemould. A second layer of chicken wire and mortar is applied on top of the firstlayer.
° As soon as possible, normally within two hours, successive layers are added in thesame way until the required wall thickness is attained, usually between 40 andSO mm.
Careful curing is necessary, especially in warm, dry weather, to ensuresatisfactory adherence of the successive layers and a simple check can be made byrubbing a stone over the surface of the tank. A rather high sound indicates goodconstruction, whereas a low sound in a section suggests that the successive layersare not well bonded. To correct this, the weak part of the top layer can be cut away,the last but one layer roughened, and an extra layer of chicken wire placed on thedamaged spot. A layer of mortar should then be applied and cured properly.Leakages of tanks can be repaired in a similar way, but if the mortar is well curedand clean sand and fresh cement are used, weak sections are very rare.
To protect the structure from the weather and to obtain a high degree ofwatertightness, a finishing coat of tar epoxy or natural rubber may be required. The
96

CONSTRUCTION GUIDELINES
tank may be wrapped in plastic to protect it from acid groundwater whenconstructing below surface level. Up-to-date information on the applications offerrocement can be obtained from the Ferrocement Information Centre at AIT,Bangkok (see Appendix VII).
Masonry
Masonry and mortar should be of high quality to obtain a watertight structure. Thewall thickness of circular filters constructed below ground level with a diameter of5-10 m, should be about 0.2-0.3 m and should be carefully checked for leakages.Important points in their preparation are:- vertical joints should never be placed above each other;- the bricks should not be split in pieces smaller than half the standard size
available locally;- bricks which have been close to the oven fire should be used because they are
stronger;- the bricks or stones to be used should not take up more than 25% water.
Mortars for masonry consist of cement, sand and water. A mixture of one partcement and 2.0-2.5 parts sand is suitable. If the bricks are of low strength then thestrength of the mortar should also be reduced, for instance to 1:4, to preventdifferences in shrinkage between brickwork and mortar. This will lead to a lessrigid, watertight construction and the walls should be rubbed with a brush dipped ina mixture of one part cement and one part sand to improve watertightness. Formore information on particularly shallow brick tanks and testing the strength ofbrickwork walls, see Costa ct al (1981).
Quarry stone masonry may use a large quantity of mortar, particularly if thestones are irregular in shape and the spaces between are not filled with smallerstones. If this is the case, consideration should be given to whether construction inferrocement would be more efficient. In several locations, a combination ofmasonry and ferrocement is used. A 5-10 cm masonry wall is constructed and usedas an outside mould, on which a 2-3 cm layer of ferrocement is placed on the inside.This structure combines ferrocement's advantageous feature of good water-tightness, with the higher impact resistance and easy formwork of masonry.
9.3 SELECTION OF FILTER SAND
Slow sand filters require large quantities of sand and the cost involved maytherefore be considerable, particularly if it has to be transported over a long
97

distance. Fortunately, the specifications for filter sand are not very strict andsuitable sand can often be found locally. Whether local sand is suitable depends onthe following:- grain size and distribution;- silt content;- solubility.
Grain size and distribution
The most important parameters are grain size, which is determined by the effectivegrain size (es), and grain size distribution which is determined by the uniformitycoefficient (UC). These parameters affect the purification efficiency of the slowsand filter. The effective diameter, or effective size, is the sieve opening throughwhich 10% (by weight) of the grains will pass (es, de or d10). The uniformitycoefficient is the ratio between the effective diameter and the sieve openingthrough which 60% (by weight) of the grains will pass (d60):uniformity coefficient = dfiO/dio-
Sand used in slow sand filters should be relatively fine and have an effectivediameter in the range of 0.15-0.30 mm, and a uniformity coefficient lower than fivebut preferably below three. As explained in section 3.3, finer sand will give betterperformance of the filters in terms of water output quality, but will increase thehead loss of the system, thus reducing the period between two successive cleanings.
The effective size and the uniformity coefficient can be identified from a sieveanalysis, and the results can be set out in a table or plotted on a graph (Figure 9.2).The procedure is as follows:
° A representative sample oi' the sand is collected, for example a mixture of sandfrom four or five samples in a staked area. The sample is washed thoroughly toremove impurities and allowed to dry.
° A quantity of about 500 g of dried sand is then sieved through a series of standardsieves with the coarsest sieve on the top and the finest on the bottom. Sieving iscontinued for a period of 15 minutes and a mechanical sieve shaker is usedregularly.
0 The sand retained in the coarsest sieve is weighed, and that retained in each of thesubsequent sieves is added to the previous amount. It is weighed until the totalamount of sand retained has been weighed.
98
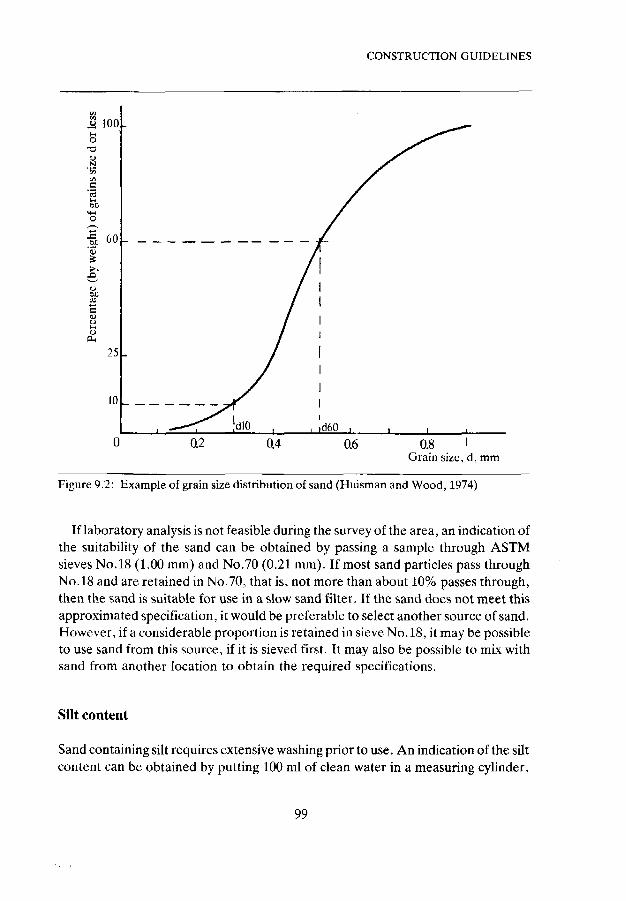
CONSTRUCTION GUIDELINES
jg 100o
a'3on
O
.SP
oMlIB
P-I
25
10
d600.2 0.4 0.6 0.8 I
Grain size, d, mm
Figure 9.2: Example of grain size distribution of sand (Huisman and Wood, 1974)
If laboratory analysis is not feasible during the survey of the area, an indication ofthe suitability of the sand can be obtained by passing a sample through ASTMsieves No.18 (1.00 mm) and No.70 (0.21 mm). If most sand particles pass throughNo. 18 and are retained in No.70, that is, not more than about 10% passes through,then the sand is suitable for use in a slow sand filter. If the sand does not meet thisapproximated specification, it would be preferable to select another source of sand.However, if a considerable proportion is retained in sieve No. 18, it may be possibleto use sand from this source, if it is sieved first. It may also be possible to mix withsand from another location to obtain the required specifications.
Silt content
Sand containing silt requires extensive washing prior to use. An indication of the siltcontent can be obtained by putting 100 ml of clean water in a measuring cylinder,
99
and adding the sand sample to make the volume up to 200 ml. The mixture shouldthen be shaken vigorously and the suspension allowed to settle. The turbidity of thewater in the cylinder, as well as the sediment, give a fair indication of the silt contentof the sand. As a guideline, sand requires washing before being placed in the filter ifthe silt content is greater than 1%.
Acid solubility
The filter sand should not contain considerable amounts of calcium carbonate,because this may gradually dissolve and increase the hardness of the water.Therefore, the acid solubility should not exceed 5% after 30 minutes. It should benoted, however, that this is not a strict requirement as a higher solubility issometimes an advantage. Only water containing aggressive carbon dioxide, forexample, will be able to dissolve the calcium carbonate and will lose itsaggressiveness in doing so. The carbon dioxide might otherwise have led tocorrosion of the distribution network.
The acid solubility can be determined by immersing a washed sand sample of10 g in 32 ml of concentrated hydrochloric acid, diluted one to one with distilledwater. This should be allowed to stand at room temperature for 30 minutes withoccasional stirring, then washed in distilled water, dried at 110°C for one hour andweighed. The percentage of acid solubility can then be calculated by dividing theloss of weight by the original weight, and multiplying the quotient by 100.
100

10. Operation and MaintenanceProcedures
10.1 THE CARETAKER'S ROLE
Adequate operation and maintenance of the water supply system is essential toguarantee regular supply of good quality drinking water. One or more persons willoften be made responsible for these tasks, and are usually known as caretakers oroperators.
Their main task is to ensure the proper functioning of the treatment plant, andthis requires knowledge and experience of the various tasks involved, henceadequate training. General faults which can be observed as a result of poor trainingand supervision include inadequate scraping of the bed, replacing the sandimmediately after washing, not refilling from the bottom, and bypassing filter units.The results of inadequate training can be illustrated by a situation where theconform count rose rapidly to very high levels following each filter cleaning, simplybecause the caretaker cleaning the filter was wearing the same boots that he wore toclean out septic tanks (Ellis, 1985).
Supervision should preferably be the responsibility of a regional or nationalauthority, and it must be as frequent as possible, but irregular in its timing. Regularhealth checks of the caretaker(s) are also required to ensure that carriers of entericdiseases are not employed to clean the filters, because a cholera carrier, forexample, may excrete 106 cholera vibrios per day, and yet feel perfectly well(Feachem, 1983). In addition, it is necessary to control the sanitary habits of theworkers while in the filter.
In most cases, the task of the caretaker will also involve maintenance of thedistribution system and repair of taps. Regular consultations and discussions withthe community, for example when inspecting the distribution network, will help tobuild good relationships and should increase the community's appreciation andwillingness to provide support.
There is also a promotional side to the caretaker's job because he will need todiscuss the importance of clean water and proper storage with the community. If,lor instance, purified water is collected in a dirty bucket or recontaminated inanother way, then the caretaker's efforts will be in vain. The community can alsohelp with the operation and maintenance of the water supply system by handlingthe system with care and reporting leakages. Good communication with the
101

community will also provide the opportunity to inform them in advance ofbreakdowns and repairs, thus enabling them to store water for these periods.Ideally, there should be interaction between the caretaker(s) and all levels of thecommunity.
To help the caretaker work successfully, the most important tasks and theirfrequency need to be detailed. Although the tasks involved in operation andmaintenance of slow sand filters will generally not differ greatly, their frequencystrongly depends on the local situation, as will other tasks which need to be done.Therefore, a work schedule has to be prepared for each plant and an example isgiven in Table 10.1.
Table 10.1: Schedule of activities for caretaker
Frequency Activity
Daily
Weekly
Monthly or less frequently
Yearly or less frequently
Every two years or lessfrequently
- Check the raw-water intake (some intakes may bevisited less frequently)
- Visit the slow sand filter• check and adjust the rate of filtration• check water level in the filter• check water level in the clear well• sample and check water quality
- Check all pumps- Keep the logbook of the plant
- Check and grease all pumps and moving parts- Check the stock of fuel and order, if needed- Check the distribution network, and taps, repair if
necessary- Communicate with users- Clean the site of the plant
- Scrape the filter bed(s)- Wash the scrapings and store the retained sand
- Clean the clear-water well•- Check the filter and the clear-water well for
watertightness
- Re-sand filter unit(s)
Table 10.1 does not include those tasks which have to be done only once. Tn thefollowing sections, detailed procedures are set out for all technical tasks associated
102

OPERATION AND MAINTENANCE
with the slow sand filtration process, and refer to the diagram of the outletcontrolled slow sand filter presented in Figure 10.1. Procedures to operate an inletcontrolled slow sand filter (Figure 10.2) are only slightly different, but thesedifferences in procedures will be explained.
D
G
H F
Figure 10.1: Basic valves in an outlet controlled filter
Figure 10.2: Basic valves in an inlet controlled filter
103
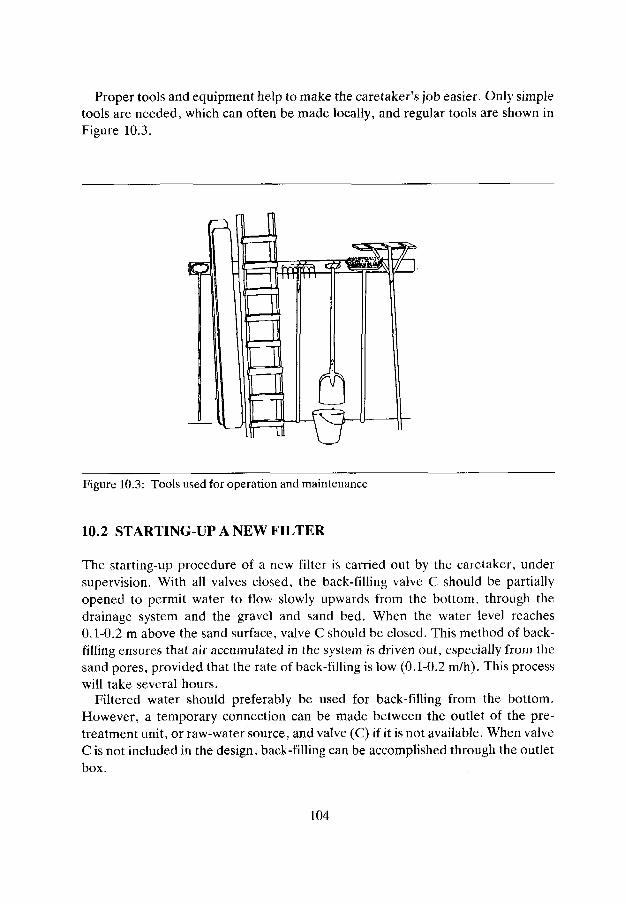
Proper tools and equipment help to make the caretaker's job easier. Only simpletools are needed, which can often be made locally, and regular tools are shown inFigure 10.3.
Figure 10.3: Tools used for operation and maintenance
10.2 STARTING-UP A NEW FILTER
The starting-up procedure of a new filter is carried out by the caretaker, undersupervision. With all valves closed, the back-filling valve C should be partiallyopened to permit water to flow slowly upwards from the bottom, through thedrainage system and the gravel and sand bed. When the water level reaches0.1-0.2 m above the sand surface, valve C should be closed. This method of back-filling ensures that air accumulated in the system is driven out, especially from thesand pores, provided that the rate of back-filling is low (0.1-0.2 m/h). This processwill take several hours.
Filtered water should preferably be used for back-filling from the bottom.However, a temporary connection can be made between the outlet of the pre-treatment unit, or raw-water source, and valve (C) if it is not available. When valveC is not included in the design, back-filling can be accomplished through the outletbox.
104

OPERATION AND MAINTENANCE
Irregularities in the sand surface may become apparent when the water level risesabove the surface. Drainage valve B and emptying valve D should then be openeduntil the water level falls to 0.1m below the sand level. These irregularities must becorrected because difficulties may arise as a result of puddles of water collecting indepressions when the filter is drained for cleaning. Valve B can also be used at thisstage, if necessary, to remove floating dirt. If a recharge valve is not provided,water can be added to the outlet box through the manhole and with valve E open,this water will recharge the filter.
Charging an outlet controlled filter
When the water has reached the required level of 0.1-0.2 m above the sand surface,the filter can be filled up to its working level. This is done by closing the back-fillingvalve C, and gradually opening the inlet valve A to allow water to enter the filterthrough the inlet box. The initial rate of filling should be slow to prevent scouring ofthe sand around the inlet, but as the layer of supernatant water rises, the rate offilling can be increased. When the working depth of the supernatant water isreached, the filter can be put into operation by opening the filter regulation valve E,permitting water to flow over the weir into the filtered water chamber. The rate offlow must also be controlled by the filter regulation valve E. Initially, it should be0.02 m/h, and increased gradually by 0.02 m/h every hour, until the design filtrationrate is reached (usually 0.1 m/h). If the flow rates during the ripening process aretoo low, excessive growth of unicellular green algae may occur which can penetratethe filter.
The filter must now be run continuously for several weeks to allow it to "ripen",which will take 1.-3 weeks in tropical areas and longer in more temperate regions.The time also depends on the nature of the raw water because the fewer micro-organisms it contains, the longer the ripening process.
As ripening proceeds, and the number of micro-organisms rises, a slight increasein head loss will occur in the filter bed and the filter skin will gradually becomevisible. These are signs that ripening is proceeding satisfactorily. During theripening process, the effluent is not bacteriologically safe and therefore must citherbe chlorinated, discharged as waste, or passed to another filter.
The quality of the filtered water should preferably be determined from analyseswhich sample both the bacterial counts and turbidity. Weekly samples should betaken during the first two weeks and daily samples in the next period, until theanalyses show that the water is safe. The water can then be passed into the watersupply system, by closing valve F and opening valve G. If bacteriological testing isnot possible, ammonia determinations can be used as a helpful alternative because
105
there should be no ammonia in the filtrate of a mature filter during the day. Ifneither bacteriological nor ammonia testing are possible, only tests for turbidityshould be carried out, allowing at least a three-week ripening period after the filterstarts to give clear water. Where chlorination equipment is available, the filteredwater can be used in the ripening period, provided it is properly chlorinated and theresidual chlorine content is checked regularly (Appendix III). The procedures forstarting-up a new filter are summarized in Table 10.2.
Table 10.2: Procedures to start-up a new filter*
Procedures Details
1. Back-fill with water
2. Drain upper 0.1 m of thebed
3. Level the sand surface
4. Charge the filter
5. Check water quality
6. Pass filtered water intosupply
- Open back-filling valve C until water appears above thesand surface
- Open supernatant drain valve B
- Level irregularities in sand surface
- Open back-filling valve C until water level is 0.2 mabove the sand surface
- Open inlet valve A and maintain constant supernatantwater level
- Open filter regulation valve E and maintain filtrationrate at 0.02 m/h
- Open the clear-water drainage valve F- Increase filtration rate 0.02 m/h every hour until design
rate is attained (usually 0.1 m/h)
- During ripening of the filter, check daily whether thefiltered water meets the agreed quality/criteria to be putinto supply
- When the quality of the filtered water is acceptable,close clear water drainage valve F and open distributionvalve G
In an inlet controlled filter, the filtration rate is maintained with the inlet valve a which ismanipulated in the same way as described for valve E (see Figures 10.1 and 10.2)
Charging an inlet controlled filter
When the water has reached the required level of 0.1-0.2 m above the sand surface,back-filling is stopped by closing valve c, and the inlet valve a is opened slightly until
106

OPERATION AND MAINTENANCE
the filtration rate is 0.02 m/h. The valve should be opened a little further every houruntil the design rate is reached, and the filter should then be allowed to ripen beforethe water is passed into the distribution system.
10.3 DAILY OPERATION
In outlet controlled filters, the supernatant water level is kept constant and thefiltration rate is controlled by the filter regulation valve E. When the filter hasreached its working condition, regular adjustment of the valve(s) is necessary toensure efficient operation and safe effluent. The filter should be run continuously,that is, for 24 hours per day at a constant rate of filtration, to obtain the best results.Declining rate filtration may only be used if absolutely necessary, for example,because of unexpected power cuts. One of the most important tasks of the operatoris therefore to prevent sudden changes in the rate of filtration, because these affectthe purification process and thus lower the quality of the filtered water. The mainprocedures in the daily operation of the filters are summarized in Table 10.3.
Table 10.3: Procedures in daily operation of the filters*
Procedures Details
1. Regulate supernatant Manipulate inlet valve A to maintain a constantwater level supernatanL water level
2. Remove scum and Regular removal is necessaryfloating dirt
3. Check rate of filtration Check flow indicator
4. Regulate rate of filtration Manipulate filter regulation valve E to maintain aconstant filtration rate
5. Decide when to clean the Cleaning is necessary when the filter regulation valve E isbed nearly completely opened
* In an inlet controlled filter, the procedures can be restricted to checking the flowindicator and height of the supernatant water, and removal of floating material (seeFigures 10.1 and 10.2)
Supernatant water level
The level of the supernatant water can be kept at the design level by manipulatingthe inlet valve A. With experience, the operator will learn how frequently to adjust
107
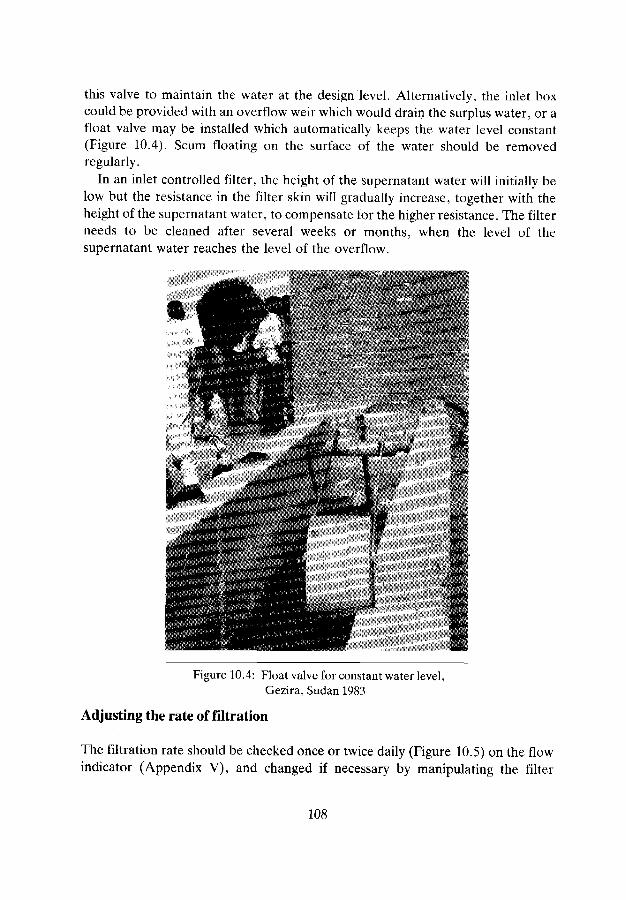
this valve to maintain the water at the design level. Alternatively, the inlet boxcould be provided with an overflow weir which would drain the surplus water, or afloat valve may be installed which automatically keeps the water level constant(Figure 10.4). Scum floating on the surface of the water should be removedregularly.
In an inlet controlled filter, the height of the supernatant water will initially below but the resistance in the filter skin will gradually increase, together with theheight of the supernatant water, to compensate for the higher resistance. The filterneeds to be cleaned after several weeks or months, when the level of thesupernatant water reaches the level of the overflow.
Figure 10.4: Float valve for constant water level,Gezira, Sudan 1983
Adjusting the rate of filtration
The filtration rate should be checked once or twice daily (Figure 10.5) on the flowindicator (Appendix V), and changed if necessary by manipulating the filter
108

OPERATION AND MAINTENANCE
regulation valve E. As the filter run progresses, however, the head loss builds up atan increasing rate and the valve needs to be opened further.
Large adjustments of the filter regulation valve indicate that the filter bed willsoon need to be cleaned. As this means that the filter will have to be taken out ofservice for 1-2 days, each plant should have at least two filter units. The caretakermust plan cleaning so that both filters are not out of operation at the same time,otherwise the continuity of supply is interrupted. Thus, a filter bed may sometimeshave to be cleaned before maximum head loss has been reached.
Figure 10.5: Operator checking rate of filtration at the flowindicator, Borujwada, India
Daily operation of an inlet controlled filter
In an inlet controlled filter, the quantity of water flowing into the filter is fixed bythe inlet valve a, and daily adjustment is not required. The increase in resistance iscompensated for by an increase in height of the supernatant water.
109
10.4 SHUTTING DOWN PROCEDURES
After a filter has been in operation for several weeks or months, depending onturbidity, the filter regulation valve E is fully open, and the rate of flow begins todecrease. This is an indication that the resistance of the filter bed is becoming toogreat and preparations must be made for cleaning it. Cleaning of inlet controlledfilters is required when the level of the supernatant water reaches the overflowlevel.
Removal of floating material
Floating matter, such as leaves and algae, must be removed because it may makedraining the bed difficult and complicates scraping. The level of the supernatantwater is firstly raised by slightly closing the filter regulation valve E and leaving theinlet valve A open. The water level will then rise and overflow through the scumoutlet, taking the scum with it.
In an inlet controlled filter, floating dirt can only be removed manually. Anexcessive amount of floating material can be removed by opening drainage valve B,so draining the supernatant water.
Drainage of the supernatant water
When as much scum as possible has been washed away, the inlet valve A must beclosed. Water will continue to filter into the system and the water level in the bedwill drop gradually. However, as the water level decreases, the filtration rate alsodecreases. If the water level drops slowly, the supernatant water may be drainedmore quickly by opening drainage valve B and valve D. While the water is draining,the walls of the filter should be brushed and washed clean.
When the water has reached the required level of about 0.1-0.2 m below the sandsurface, valves B, D and E must be closed. The bed is then ready for cleaning, andthe opportunity should be taken to check the inlet valve A and the drainagevalve B.
Maintaining the output of the plant
When one bed is shut down, the remaining bed(s) have to operate at a higher rate tomaintain the output of the filtration plant. Therefore, the filter inlet valves andfilter regulation valves on each of the other beds must be opened slightly in two orthree stages, until the required total output from the filtration plant has been
110
OPERATION AND MAINTENANCE
reached. The permissible maximum filtration rate, which is determined in thedesign stage, is usually 0.3 m/h and should not be exceeded in this operation. Theshutting down procedures are outlined in Table 10.4.
Table 10.4: Procedures to shut down a filter*
Procedures Details
1. Remove floating material - Partly close regulation valve E
2. Drain supernatant water - Close water inlet valve A- Fully re-open filter regulation valve E- Open drain valve B and empty valve D when water
level drops too slowly- Clean filter walls with a long brush- Close valve B and D when the first 0.2 m of the filter
bed is drained
3. Maintain water output of - Adjust the filtration rate in the other filter(s); do notthe plant exceed the rate of 0.3 m/h
* In an inlet controlled filter, scum must be removed by opening inlet valve a further (seeFigures 10.1 and 10.2)
10.5 CLEANING A FILTER BED
When the surface of the filter bed is dry enough, the upper layer of 1-2 cm must beremoved. This scraping process should be done as quickly as possible to limitinterference to the biological life in the deeper layers of the bed, and the methodused depends on the size of the bed. Usually, the material to be removed cannot bethrown over the side of the filter and must be loaded into a container, then carriedor lifted out of the bed to the sand washing area. As labourers will be in contact withthe sand, their boots and all equipment should be cleaned before use.
If steps are not provided, entry to the bed can be made by a short ladder, andboards must be laid down in order to prevent dirty surface material being pressedinto the sand. Firstly, a suitable area at the foot of the ladder or steps should bescraped and covered with boards, and the equipment is then placed on them. Thebed should be marked out in squares of about 3 x 3 m, by scraping narrow stripswhich are the width of a board. Boards should be placed on these clean strips andthe scraping can then be carefully completed in each square to the plannedthickness. When scraping has been completed and the dirty sand removed, the sandsurface should be levelled. It may also be necessary to adjust the inlet box to thenew sand level by removing a wooden plank or concrete plate.
Il l

Approximately 1-2 cm of sand should be removed, although the exact amountwill depend on the depth to which the silt has penetrated. This can be determinedfrom the colour of the sand, which is usually stained by the silt. After severalscrapings, the depth of the sand bed should be checked to determine whether itneeds to be re-sanded. Sometimes, the level at which re-sanding is required ismarked on the filter wall. General procedures for cleaning the filter bed aresummarized in Table 10.5.
Table 10.5: Procedures to clean a filter bed*
Procedures Details
1. Clean equipment
2. Enter the filter bed
3. Protect the filter bed
4. Scrape top layer
5. Remove the scrapingsfrom the filler bed
6. Remove equipment
7. Level the sand surface
8. Adjust the inlet box tothe sand level
9. Check depth of the sandbed
10. Re-charge the bed
11. Allow for ripening
12. Pass water into thesupply
13. Adjust the other filter(s)
- Clean all equipment, including boots or feet of thelabourers
- Enter the filter box using a short ladder
- Scrape a small area, cover it with boards, and place theequipment on these boards
- Mark out areas (3 x 3 m) by scraping narrow strips- Scrape upper 1-2 em of each area
- Carry scrapings to washing platform
- Remove all equipment
•- Use a scrape board or a fine dented rake u> level thesand surface
- Remove one wooden plank/metal bar if required
- Measure the height of wall above the filter bed
- Follow procedure in Section 10.2
- Ripening usually takes 1-2 days in tropical areas(provided cleaning takes no longer than 1 day)
- Close valve F and open valve G
Slowly reduce the filtration rate of the other filters tothe usual rate.
* See Figure 10.1
12
OPERATION AND MAINTENANCE
Recharging
Recharging should follow the procedure outlined in Section 10.2 and, to preventstarvation of the bacterial population in the deeper layers of the filter, should startdirectly after the cleaning operation has been completed. Preferably, re-chargingshould be done using filtered water from an adjacent filter and if this leads to atemporary reduction in output of the plant, the community should be informed inadvance.
A cleaned filter also needs to ripen, but this is a much faster process and may onlytake one or two days. In cases where bacteriological testing is not possible, absenceof ammonia in the filtrate is a suitable indication that the filter is ripe. Afterripening has been completed, the effluent of the cleaned filter can be put into thewater supply, and the filtration rate of the other filters may then be decreasedgradually.
10.6 SAND WASHING BY HOSE
The sand scrapings, and sometimes even new sand, must be washed to remove dirtbefore being placed in the filter (Table 10.6). Usually, it is cheaper to wash andstore the scraped sand than to use fresh sand for re-sanding the filters. Scrapingsshould be washed immediately after removal from the filter to prevent unpleasantodours. Washing with a hose is a simple method, for which a platform should be
Table 10.6: Procedures to wash filter sand and filter scrapings
Procedures Details
1. Place sand scrapings or - Immediate washing of the scrapings is required tonew sand on washing prevent unpleasant odoursplatform
2. Wash sand - Direct a hose on the sand and move the sand about; theprocedure usually takes one hour
3. Check whether sand is - Rub sand between handsclean
4. Dry sand - Remove weir to drain water from washing platform- Spread out sand on platform to dry in the sun
5. Store washed sand - Store washed and dried sand properly to preventpollution
113
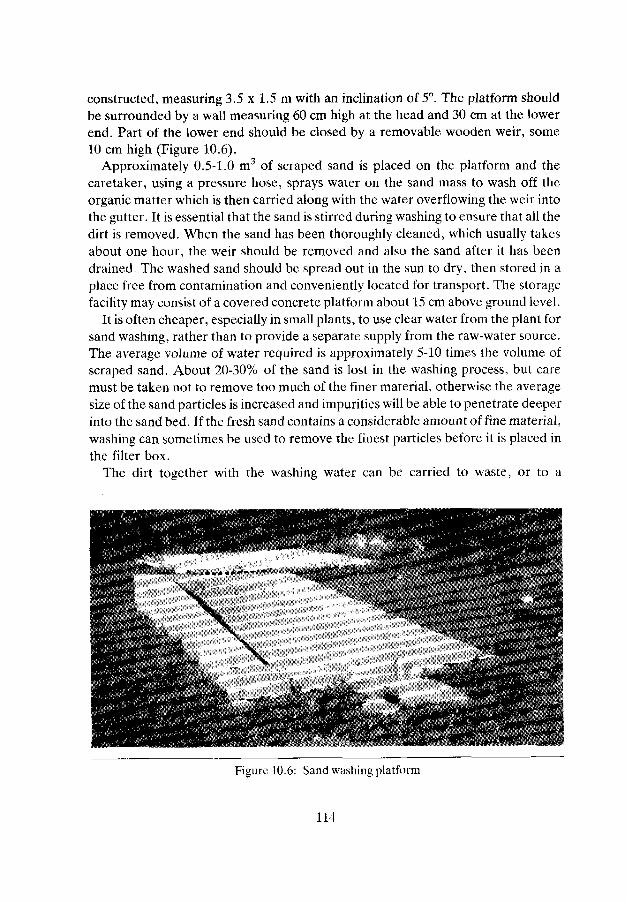
constructed, measuring 3.5 x 1.5 m with an inclination of 5°. The platform shouldbe surrounded by a wall measuring 60 cm high at the head and 30 cm at the lowerend. Part of the lower end should be closed by a removable wooden weir, some10 cm high (Figure 10.6).
Approximately 0.5-1.0 m3 of scraped sand is placed on the platform and thecaretaker, using a pressure hose, sprays water on the sand mass to wash off theorganic matter which is then carried along with the water overflowing the weir intothe gutter. It is essential that the sand is stirred during washing to ensure that all thedirt is removed. When the sand has been thoroughly cleaned, which usually takesabout one hour, the weir should be removed and also the sand after it has beendrained. The washed sand should be spread out in the sun to dry, then stored in aplace free from contamination and conveniently located for transport. The storagefacility may consist of a covered concrete platform about 15 cm above ground level.
It is often cheaper, especially in small plants, to use clear water from the plant forsand washing, rather than to provide a separate supply from the raw-water source.The average volume of water required is approximately 5-10 times the volume ofscraped sand. About 20-30% of the sand is lost in the washing process, but caremust be taken not to remove too much of the finer material, otherwise the averagesize of the sand particles is increased and impurities will be able to penetrate deeperinto the sand bed. If the fresh sand contains a considerable amount of fine material,washing can sometimes be used to remove the finest particles before it is placed inthe filter box.
The dirt together with the washing water can be carried to waste, or to a
-i*:tk '1
Figure 10.6: Sand washing platform
114
OPERATION AND MAINTENANCE
sedimentation pit, where they can be separated. The dirt must be periodicallyremoved from the sedimentation pit and can be disposed of by spreading it over theland.
A simple check of whether the sand is clean can be made by rubbing a handfulbetween the fingers; if there is any sign of dirt on the hand, then the sand is not cleanenough. Another method is to put a small quantity of the sand into a glass cylinder,add water, shake well and allow to settle. If the sand is clean, practically nosediment will appear on its surface.
Washing may not remove the strong coating of organic matter adhering to thegrains, but this may disintegrate during storage. Also dirt and dust may enter thestored sand and it is therefore recommended that the sand be washed again andpassed through a 6 mm sieve to remove coarse material before it is used to re-sandthe filter.
10.7 RE-SANDING
Re-sanding becomes necessary when successive scrapings have reduced thethickness of the sand bed to 50-60 cm. Fortunately, this rather lengthy operationonly has to be done every two or three years. For example, if the initial thicknessof the filter medium is 80 cm and six scrapings are done per year on average( 6 x 2 = 12 cm scrapings a year), then re-sanding would be necessary after2.5 years of operation. The decision to re-sand should be made well in advance andthe work planned, if possible, in a period of low water demand. Re-sanding maytherefore need to be done before the minimum thickness of the sand bed has beenreached.
Before re-sanding, the filter bed must be cleaned (Sections 10.5 and 10.6), andthe water level in the sand must be lowered almost to the gravel layer by opening theemptying valve (D). Sand may be replaced in one of two ways. The first method isused in small filters when most of the old sand is removed and stacked nearby. Thenew sand is then placed on top of the remaining thin layer (0.2 m) covering thegravel. After levelling the top of the new sand layer, the old sand, which is rich inmicro-organisms, is replaced on top of the new sand. This enables the re-sandedfilter to become operational within a minimum re-ripening period. New sandconsists of washed sand from earlier scrapings, added to approximately 30% freshsand to make up for losses in the washing process. These procedures aresummarized in Table 10.7.
The second method is used in larger filters. The old sand which has to be replacedis moved to one side, the new sand placed in position and the old sand replaced ontop of the new (Figure 10.7). This process is carried out in strips by removing the
115

Table 10.7: Procedures to re-sand a filter*
Procedures Details
1. Scrape off the top layer
2. Drain water from thefilter bed
3. Remove the sand
4. Refill the sand bed
5. Level sand surface
6. Adjust inlet box
7. Re-start filter unit
8. Allow filter bed to ripen
Follow procedures in Section 10.5 and 10.6
Open emptying valve D
Remove sand and place beside filter, or place to oneside in the filter
Place layer of fresh sand in the filterReplace the old sand on top of the fresh sand
Add timbers to adjust the inlet box to the sand level
Follow procedure in Section 10.2
Under tropical conditions, repening after re-sandingwill take 3-7 days
See Figure 10.2
Figure 10.7: Re-sanding a slow sand filter
116

OPERATION AND MAINTENANCE
material from the first strip, stacking it to one side in a long ridge, and filling thetrench with washed new sand. The adjacent strip is excavated and material removedfrom the second trench is used to cover the new sand in the first. When the entirebed has been re-sanded, the material from the first trench is used to cover the newsand in the last strip.
The filtration process is re-started as described in Section 10.2, but re-ripeningwill take less time, approximately 3-7 days under tropical conditions and up to twoweeks in more temperate areas.
The total removal of the sand should not be necessary under normal conditionsunless there has been deep penetration by silt, due to a rate of filtration which is toohigh. Total removal may also be required when the bicarbonate or carbonatecontent of the water is high, resulting in the deposition of crystalline carbonatesaround the sand grain, binding them together in hard impermeable lumps (Ellis,1985).
10.8 RECORD KEEPING
Day-to-day records provide valuable information on the performance of the filters,the work of the operating staff, and also data for planning improvements. Theserecords should be kept to a minimum, but to be of use, should include informationon the following:- quality parameters which have been checked;- interruptions to the intake of raw water;- cleaning of the inlet and sump;- changes in top water level or filtration rate;- interruptions to filter operation;- cleaning record (date and time, height of the sand, date and time of return to
operations);- distribution record (daily production where a water meter is provided,
breakdowns and repairs);- flushing of the distribution network.
10.9 QUALITY CONTROL
Constraints such as lack of adequate laboratory facilities and trained staff, longdistances involving unacceptable delays between sample collection and testing, andthe high cost of testing, make daily testing of most water quality parametersimpossible in rural water supply schemes. However, with training, caretakers can
117
carry out simple tests for turbidity and residual chlorine content. Wheneverpossible, the caretaker should perform at least the following tests, although regularsupervision is necessary to ensure reliability of the results:- turbidity of raw water at the intake to check whether the intake of water should
be stopped;- turbidity of the inflow and outflow of the filter to determine whether the filter
plant is functioning properly.Where chlorination is applied, the caretaker should also measure residual chlorinein the clear-water tank to check whether the water is being disinfected sufficiently.Complete physico-chemical and bacteriological tests on raw and treated watershould be periodically carried out by a higher level agency.
When a turbidity meter cannot be provided, visual comparison of the turbidity ofthe raw water, water inflow, and the water outflow will provide useful information.This can be done by comparing water samples in uniform glasses, placed side byside. Additional information on sampling is provided in Appendix VI.
118
References and selected bibliography
ACI (1974). Manual of concrete practice. Detroit, USA, American ConcreteInstitute.
Ballance, R.C., and Gunn, R.A. (1984). Drinking water and sanitation projects:criteria for resource allocation. WHO Chronicle, 38,6, 243-248.
Bingham, B. (1974). Fcrrocement: design, techniques and application.Cambridge, UK, Carnell Martime Press.
Boot, M. (1984). Making the links: guidelines for health education in communitywater supply and sanitation (Occasional Paper). The Hague, The Netherlands,IRC.
Buaseemuang, S., and Chainarong, L. (1983). Report on slow sand filtrationproject in Thailand. Bangkok, Thailand, PWA.
Cairncross, S., and Fcachem, R.G. (1983). Environmental health engineering inthe tropics: an introductory text. Bath, UK, John Wiley.
Dancy, H.K. (1975). A manual on building construction. London, UK,Intermediate Technology Publications Ltd.
Dijk, J.C. van, and Oomcn, J.H.C.M. (1978). Slow sand filtration for communitywater supply in developing countries: design and construction manual (TechnicalPaper no. 11). The Hague, The Netherlands, TRC.
Feachem, R., McGarry, M., and Mara, D. (1977). Water, wastes and health in hotclimates. London, UK, John Wiley.
Feachem, R.G. (1983). infections related to water and excreta. In: B.J.Dangerfield (ed.), Water supply and sanitation in developing countries. London,UK, Institute of Water Engineers and Scientists.
Heijnen, H.A., and White, A.T. (1981). Slow sand filtration for community watersupply in developing countries: report of an international meeting, Nagpur, India(Bulletin Series, no.16). The Hague, The Netherlands, IRC.
119

Hofkes, E.H. (ed.) (1981). Small community water supply systems in developingcountries (Technical Paper no. 18). The Hague, The Netherlands, IRC.
Huisman, L., and Wood, W.E. (1974). Slow sand filtration. Geneva, Switzerland,World Health Organization.
IRC (1977). Slow sand filtration for community water supply in developingcountries: a selected and annotated bibliography (Bulletin Series no.9).The Hague, The Netherlands, IRC.
Mann, H.T., and Williamson, D.L. (1976). Water treatment and sanitation, simplemethods for rural areas. London, UK, Intermediate Technology Publications Ltd.
McJunkin, H.F. (1982). Water and human health. Washington, DC, USA,USAID.
Morgan, W. (1976). Students' structural handbook. Newnes Butterworths.
Naninga, N. (1972). Foundation engineering. Delft, The Netherlands, DelftUniversity of Technology.
Paramasivam, P., Nathan, G.K., and Lee, S.L. (1979). Analysis, design andconstruction of Icrrocement water tanks. Journal of Ferrocemcnt, 9,3.
Paramasivam, R., Mhaisalkar, V.A., and Sundaresan, B.B. (1984). Slow sandfiltration and appropriate technology. 10 WEDC Conference: water and sanitationin Asia and the Pacific, 1983, Singapore.
Paramasivam, R. et al (1980). Effect of intermittent operation of slow sand filterson filtered water quality. Indian Journal of Environmental Health, 22, 136-150.
Reynolds, C.E., and Steedman, J.C.C. (1975). Reinforced concrete designer'shandbook. London, UK, Cement and Concrete Association.
Salazar, L.G. (1980). Agua potable para la zona rural Colombiana.Acodal, 96.
Santacruz, M., Visscher, J.T., and White, A.T. (1983). Informe del seminariointernational sobrc filtration lenta de arena para abastecimiento publico dc agua enpaises en desarrollo, 13-16 Julio 1982, Neiva, Colombia (Serio Boletfn no.18). TheHague, The Netherlands, IRC.
120
Saunders, R.J., and Warford, J.J. (1976). Village water supply. New York, USA,World Bank; John Hopkins University Press.
Sharma, P.C., and Gopalaratnam, V.S. (1980). Ferrocement water tank.Bangkok, Thailand, IFIC/AIT.
Sundaresan, B.B., and Paramasivam, R. (1982). Slow sand filtration research anddemonstration project, India (final report). Nagpur, India, NationalEnvironmental Engineering Research Institute.
Swiss Centre for Appropriate Technology. Manual for rural water supply(Publication no. 8). St. Galien, Switzerland.
Thanh, N.C., and Ouano, E.A.R. (1977). Horizontal flow coarse materialprefiltration. Bangkok, Thailand, Asian Institute of Technology.
Vigneswaran et al (1983). Water filtration technologies for developing countries.Bangkok, Thailand, EN SIC.
Visscher, J.T., and Veenstra, S. (1985). Manual for caretakers of slow sand filters.The Hague, The Netherlands, IRC.
Watt, S.B. (1978). Ferrocement water tanks and their construction. London, UK,Intermediate Technology Publications Ltd.
Wegclin, M., and Mbwette, T.S. A. (1982). Slow sand filter research project report(Research report, CWS 82.3). Dar es Salaam, Tanzania, University of Dar esSalaam.
Wegclin, M. (1986). Horizontal flow-roughing filtration: a design, constructionand operation manual (Report no.6). Diibendorf, Switzerland, IRCWD.
White, A.T. (1982). Community participation in water supply and sanitation:concepts, strategies and methods (Technical Paper no. 17). The Hague,The Netherlands, IRC.
Wijk-Sijbesma, C. van (1981). Participation and education in community watersupply and sanitation programmes: a literature review (Technical Paper no.12).The Hague, The Netherlands, IRC.
121

Wijk-Sijbesma, C. van (1985). Participation of women in water supply andsanitation: roles and realities (Technical Paper no.22). The Hague,The Netherlands, IRC.
Wijk-Sijbesma, C. van, and Heijnen, H.A. (1982). Report on the slow sandfiltration demonstration project in Colombia. The Hague, The Netherlands, IRC.
WHO. Community water supply and sewage disposal in developing countries.World Health Statistics Report, 26, 11.
WHO (1976). Surveillance of drinking-water quality (WHO Monograph Seriesno.63). Geneva, Switzerland, World Health Organization.
WHO (1983). Maximizing benefits to health. Geneva, Switzerland, World HealthOrganization.
WHO (1984). Guidelines for drinking-water quality. Vol.1: recommendations.Geneva, Switzerland, World Health Organization.
WHO (1984). Guidelines for drinking-water quality. Vol.2: health criteria andother supporting information. Geneva, Switzerland, World Health Organization.
WHO (1985). Guidelines for drinking-water quality. Vol.3: drinking-water qualitycontrol in small community supplies. Geneva, Switzerland, World HealthOrganization.
122

Appendices
I. SUMMARY OF WHO GUIDELINES FOR DRINKING-WATERQUALITY
The WHO Guidelines for Drinking-Water Quality aim to provide a basis for thedevelopment of standards which, if properly implemented, will ensure thatdrinking water supplies are safe and suitable for human consumption. However,these minimum standards do not relieve agencies of the need to strive for provisionof water of the best possible quality. Consumers assess water quality essentially onappearance, odour and taste, and guidelines for these constituents are set out inTable I.I. The absence of adverse sensory effects does not guarantee safe drinking-water quality because other parameters also have to be taken into account.
Table 1.1: Guidelines for appearance, odour and taste of drinking water
Parameter Advised tolerable level
Turbidity 5 NTU
1 NTU when disinfection is practised
Colour 15 true colour units (TCU)
Taste and odour Inoffensive to most consumersSource: WHO (1985)
I.I Guidelines for bacteriological water quality in piped supplies
Ideally, drinking water should not contain disease-carrying micro-organisms. As itis not feasible to isolate individual micro-organisms in the water, two groups ofindicator organisms arc used: conform organisms and faecal coliforms. Thedetection of faecal (thermo-tolcrant) coliform organisms, in particular Escherichiacoli, provides definite evidence of faecal pollution.
123

Table 1.2: Guidelines for bacteriological quality of piped water supplies
Water entering Water inthe distribution distributionsystem system
Percentage of samples 98% 95%without coliforms/100 ml.
Maximum no. ofcoliform 3* 3*organisms/100 ml.
No. of samples with faecal 0 0coliforms
* In occasional samples only, but not in consecutive samples.Source: WHO (1985)
Recommended sampling frequencies to test for bacteriological parameters areindicated in Table 1.3. With respect to the virological quality, it is recommendedthat drinking water should be free from any viruses infectious to man by using asource free from faecal contamination and waste water, or by adequate treatment.No guidelines have been set by WHO for biological contamination, for example byprotozoa, helminths, algae or other free-living organisms.
Table 1.3: Recommended sampling frequencies for bacteriological parameters
Population served Minimum number of samples per month
Less than 5000 one
5000 to 100 000 one per 5000 population
More than 100 000 one per 10 000 population
Source: WHO (1985)
1.2 Guidelines for physical and chemical contaminants
These guidelines are divided into inorganic constituents which may affect health(Table 1.4), and those of aesthetic consequence (Table 1.5).
124
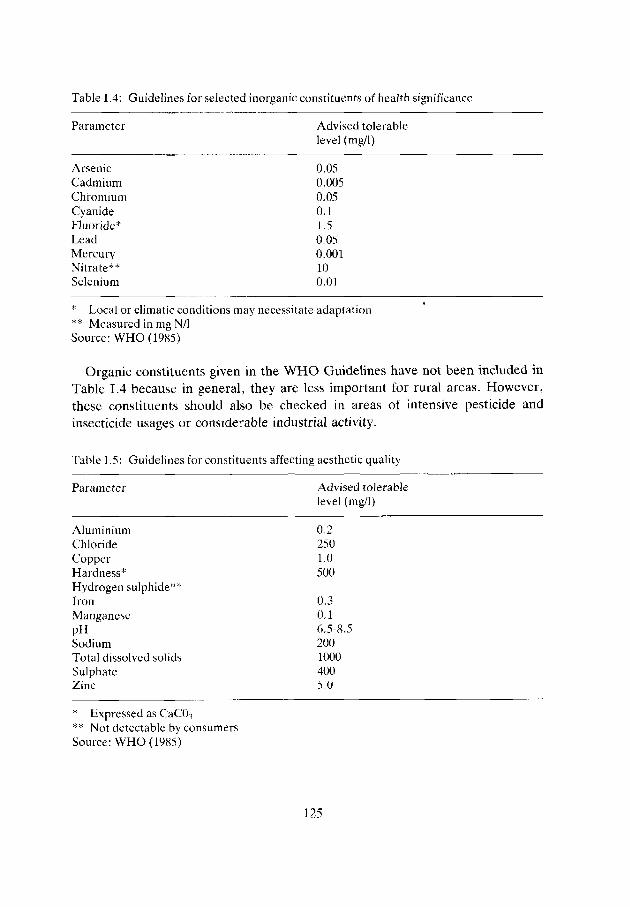
Table 1.4: Guidelines for selected inorganic constituents of health significance
Parameter Advised tolerablelevel (mg/1)
Arsenic 0.05Cadmium 0.005Chromium 0.05Cyanide 0.1Fluoride* 1.5Lead 0.05Mercury 0.001Nitrate** 10Selenium 0.01
* Local or climatic conditions may necessitate adaptation** Measured in mg N/lSource: WHO (1985)
Organic constituents given in the WHO Guidelines have not been included inTable T.4 because in general, they are less important for rural areas. However,these constituents should also be checked in areas of intensive pesticide andinsecticide usages or considerable industrial activity.
Table 1.5: Guidelines for constituents affecting aesthetic quality
Parameter
AluminiumChlorideCopperHardness*Hydrogen sulphide**IronManganesepi ISodiumTotal dissolved solidsSulphateZinc
Advised tolerablelevel (mg/1)
0.22501.0500
0.30.16.5-8.520010004005.0
* Expressed as CaCO-,** Not detectable by consumersSource: WHO (1985)
125
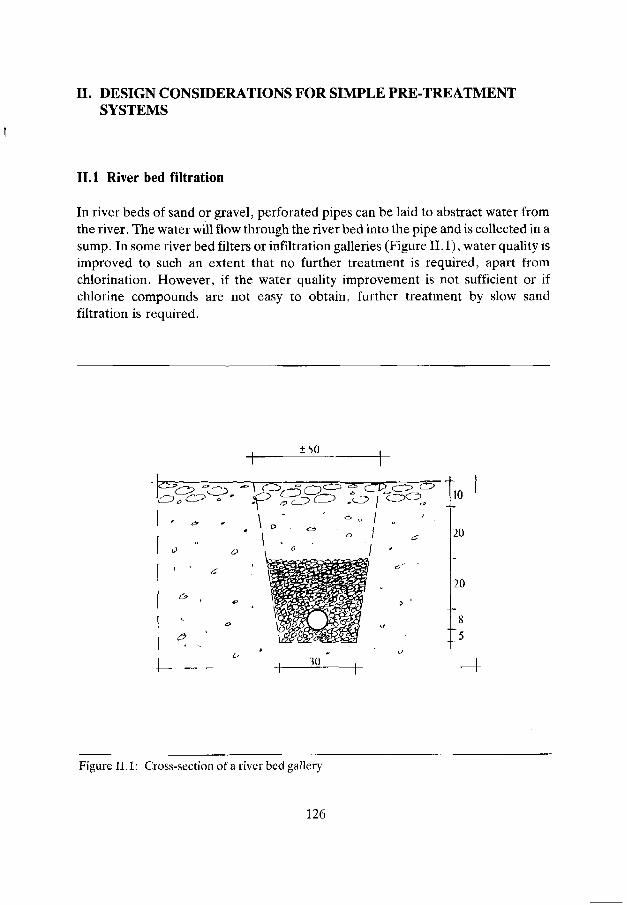
II. DESIGN CONSIDERATIONS FOR SIMPLE PRE-TREATMENTSYSTEMS
II. 1 River bed filtration
In river beds of sand or gravel, perforated pipes can be laid to abstract water fromthe river. The water will flow through the river bed into the pipe and is collected in asump. In some river bed filters or infiltration galleries (Figure II. 1), water quality isimproved to such an extent that no further treatment is required, apart fromchlorination. However, if the water quality improvement is not sufficient or ifchlorine compounds are not easy to obtain, further treatment by slow sandfiltration is required.
±50
10
20
20
Figure II. 1: Cross-section of a river bed gallery
126

In a river bed consisting of coarse material, the pipes can be laid with openingssmall enough to prevent the entry of river bed material. Drain-pipes should bepacked in one or more gravel layers in river beds of medium to fine sand. Therequired grain size of the gravel will depend on the material in the river bed. Theoutside layer should be fine enough to retain the river bed material, and the insidelayer should be somewhat larger than the drain openings. For example, for a riverbed with sand particles of effective size 0.2 mm and a drain-pipe with slots 3 mmwide, the gravel pack should consist of two layers which are each 0.1-0.2 m thick,one of grain size 1-2 mm and the other of 4-6 mm. The pipe should not be laiddeeper in the bed than necessary because of the cost of excavation, but the top ofthe gravel pack should usually be at least 0.5 m below the surface of the river bed. Inplaces where periods of high flow velocities may lead to scouring of the river bed,the pipe should be laid deeper. The length of pipe to be provided will depend on theyield that can be obtained per unit length of pipe. The yield is mainly based on thepermeability of the river bed, the depth at which the pipe is laid, the available waterhead, and the acceptable rate of infiltration, which is often taken to be 0.6-1.0 m/h.
The internal diameter of the drain-pipe should be at least 0.1 m. A largerdiameter pipe may be selected, provided that the flow velocity in the pipe isbetween 0.5 and 1.0 m/s at the end of the pipe. Lower velocities lead toaccumulation of fine particles which may have passed through the bed, andsubsequently to blockage of the pipe. Higher velocities cause friction losses in thepipe, leading to uneven withdrawal over the length of the pipe.
Two interesting modifications have been made in Colombia. Firstly, instead oflaying a pipe in the river bed, a weir was constructed in the river. A perforated pipewas laid upstream on the foot of the weir arrangement and was connected to twosumps, one on each side of the river. This considerably facilitates cleaning of thepipe. The pipe was covered with graded gravel of an effective size of 7-10 mm, anduniformity coefficient of 1.6-2.2 (Figure II.2). Secondly, an even simpler systemdiverted part of the flow from the river into a small channel in which the drain-pipeswere placed, covered with about 0.3 m of fine gravel. If clogging should occur, thissystem can easily be cleaned by raking the gravel.
II.2 Plain sedimentation
The prime factor in designing a plain sedimentation tank is the required detentiontime, which should be long enough to permit the suspended solids to settle. It mustbe based on information obtained from a series of samples taken under various flowconditions of the river, in both the dry and rainy seasons. The settling-velocity
127
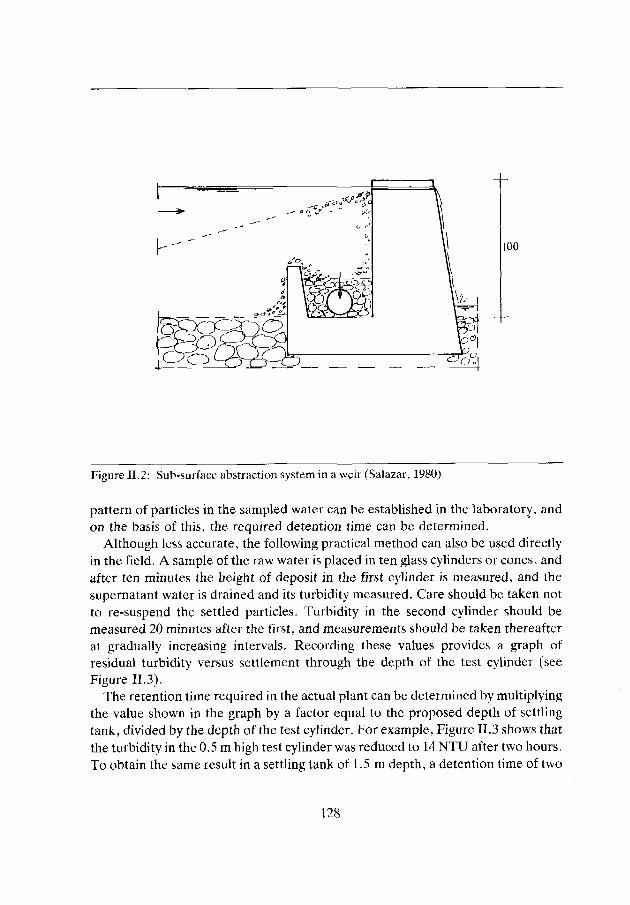
100
Figure II.2: Sub-surface abstraction system in a weir (Salazar, 1980)
pattern of particles in the sampled water can be established in the laboratory, andon the basis of this, the required detention time can be determined.
Although less accurate, the following practical method can also be used directlyin the field. A sample of the raw water is placed in ten glass cylinders or cones, andafter ten minutes the height of deposit in the first cylinder is measured, and thesupernatant water is drained and its turbidity measured. Care should be taken notto re-suspend the settled particles. Turbidity in the second cylinder should bemeasured 20 minutes after the first, and measurements should be taken thereafterat gradually increasing intervals. Recording these values provides a graph ofresidual turbidity versus settlement through the depth of the test cylinder (seeFigure II.3).
The retention time required in the actual plant can be determined by multiplyingthe value shown in the graph by a factor equal to the proposed depth of settlingtank, divided by the depth of the test cylinder. For example, Figure II.3 shows thatthe turbidity in the 0.5 m high test cylinder was reduced to 14 NTU after two hours.To obtain the same result in a settling tank of 1.5 m depth, a detention time of two
128

times 1.5 divided by 0.5, equalling six hours would be required. From the example,it can be seen that a longer detention time leads to a further decrease in turbidity,but this will require a larger tank,thus involving higher construction costs. On theother hand, passing larger quantities of turbid water to the filter leads to morefrequent cleaning. As a rule of thumb, it is preferable to reduce turbidity to10 NTU, provided this does not require a detention time of more than 12-24 hours.
Hours
Figure II.3: Example sedimentation curve of river water, using a settling column depth of0.5 m
Most sedimentation tanks are operated continuously and consist of a rectangularbox made of concrete or masonry, or a dug basin with protected sloping walls.Circular tanks with radial flow from the inside to the outside arc also used. Inrectangular tanks, the raw-water inlet is on one of the short sides of the tank, andthe outlet on the other short side. Inlet and outlet structures (Figure II.4) areessential to the proper functioning of the basin. The incoming flow should bedistributed as evenly as possible over the entire width of the basin to reducecurrents and short-circuiting. The outlet stucture usually consists of one or moreweirs across the entire width of the basin.
129
Inlet
1
D
Mi
l
-
-*
-»-•-*- * •
-
Outlet
i
Figure II.4: Plain sedimentation tank
The design criteria for rectangular sedimentation tanks, summarized inTable II. 1, are not applicable universally, but may serve as a guideline.
Sludge can sometimes be drained by a drain-pipe or a hose, but in rural areas,manual sludge removal is often the most appropriate method. After draining thetank, the deposited silt can be removed by shovels and buckets, or wheelbarrows. Ifsilt accumulation is slow, de-silting will only be required at the end of the floodseason, meaning that one tank can be built and that water can be bypassed directlyto the filter when the tank is being cleaned. If the sedimentation tank requiresregular cleaning, division into two compartments is necessary to guaranteecontinuous operation of the water treatment plant.
130

Table II.1: Design criteria for rectangular sedimentation tanks
Parameter
Detention timeSurface loadingDepth of basinOutlet weir overflow rateLength/width ratioLength/depth ratio for:
large basinssmall basins
Calculation*
V/QQ/AH0/RL/WL/H
Range of values
4-12 h2-10 m/d1.5-2.5 m3-10m3/mVh4:lto6:l
25:1 to 35:15:1 to 20:1
HLWRV0A
depth (m)length (m)width (m)total length of overflow of the outlet weir (m)volume of the basin: L x W x H (nr1)raw water feed flow (nrVh)surface area of the basin: L x W (m2)
Storage reservoirs
Because of the long detention time (usually several weeks to a few months),sedimentation will be quite effective in a storage reservoir. Additional storagecapacity of 40-80% may be required to compensate for losses due to evaporationand seepage, and to allow for the storage of deposited silt.
A storage reservoir can be constructed by erecting a simple earth dam up to about6 m high. To reduce seepage, small storage reservoirs can be lined with stabilizedsoil, concrete, or masonry. The silt may be removed by the raw-water source itselfduring flood flow, or by manual labour. In the first case, waste drains should beinstalled, whereas in the second case, bottom drains should be provided to improvethe removal of silt from the water. Access to a storage basin should be restricted to aminimum to limit pollution of the water. Routine maintenance of storage basinsshould include the removal of vegetation and weeds.
II.3 Horizontal flow-roughing filtration
Horizontal flow-roughing filtration is a treatment process which is mainly based onsedimentation, although with time, biological activity may also play a role. A
131
horizontal flow-roughing filter consists of a rectangular box, usually 1.0-1.5 mdeep, with the raw-water inlet on one side and the outlet on the other. The box isusually divided into three compartments packed with crushed stones of graded sizesfrom coarse to fine. Design criteria and a layout for such a filter are given in TableII.2 and Figure II.5, respectively. Experience with these filters is limited to date,but promising. Although turbidity removal will depend on local conditions,particularly on the type of turbidity, it will generally be greater than 70% and valuesof 90% have been reported. The deposit of suspended solids removed from the rawwater will slowly build up in the filter. After some time, this will reduce theefficiency of the filter and ultimately lead to complete clogging. However,efficiency can be restored by fully opening the underdrain system, so that most ofthe deposits will be flushed out by fast drainage. Nevertheless, some may remainand make subsequent fast drainage less effective and it may therefore becomenecessary to clean the filter material after several years. Cleaning can be carried outby removing and washing the filter material, and replacing it.
Research has been carried out at the Asian Institute of Technology, Bangkok,and the University of Dar es Salaam, Tanzania, and is still being carried out byIRCWD, Diibendorf, Switzerland, in a multi-country demonstration project onhorizontal flow-roughing filtration, and in the IRC Slow Sand Filtration Project(Figure 11.6). For more information, see the design and construction manual onhorizontal flow-roughing filtration published by IRCWD.
Table II.2: Preliminary design guidelines for horizontal flow-roughing filters
Parameter
Horizontal flow (m/h)Depth (m)Width (m)Length of filler media (m):
first compartment(15-2S mm)second compartment (8-15 mm)third compartment(4-8 mm)
Average suspended solidconcentration in raw
High (150mg/l)
0.5-0.751.0-1.51.0-1.5
3.0-5.02.0-4.01.0-3.0
water
Medium (100-150 mg/1)
0.75-1.51.0 -1.51.0 -5.0
3.0 -4.02.0 -3.01.0 -2.0
Source: Wegelin (1986)
132
Inlet First Second Thirdcompartment compartment compartment
F i ns W'J
Outlet
2.5 2m
Figure II.5: Layout of a horizontal, coarse media filter, based on Thanh and Quano (1977)and Wegelin (1986)
Figure 11.6: Pilot horizontal roughing filter, Delhi, India
133
III. CHLORINATION
Although well-operated slow sand filters can produce water of safe bacteriologicalquality, it is appropriate to include chlorination, wherever feasible, as an additionalbarrier to the transmission of disease by water. Chlorine can kill micro-organisms,such as bacteria, and its addition can therefore make water safe for humanconsumption. If applied as the last step, it provides some protection againstpossible defects in previous treatment processes. It also provides some protectionagainst possible pollution due to leakage in the distribution network, and preventsan aftergrowth of bacteria in the distribution system. The latter is often of minorimportance in rural water supplies because distribution networks are usually small.Although it is common in most countries to include chJorination in the treatmentprocess, chlorine compounds are not always readily available in rural areas ofdeveloping countries, and chlorine equipment is often out of operation.
The amount of chlorine that should be added is very small and must be carefullycontrolled. Too little is not effective, whereas too much affects the taste, which mayresult in consumers rejecting the water for drinking. When chlorine is added towater, some will react with impurities and only a part will remain available to reactfreely as residual chlorine. The amount of free residual chlorine will depend on thedosage added, the quality and nature of impurities, and the contact time, that is, thetime elapsed after chlorine has been added to the water. The chlorine dose shouldbe sufficient to provide a free residual of 0.5 mg/1 after 30 minutes of contact time,when the pH is below 8 (WHO, 1984 and 1985). Water should not be distributedbefore this time has elapsed. Further, research suggests that sufficient chlorineshould be added to keep a residual chlorine level of at least 0.2 mg/1 in thedistribution network.
For rural water supply schemes, bleaching powder and calcium hypochlorite areoften used as the source of chlorine. Calcium hypochlorite is a stable andconvenient product to use (60-70% available chlorine), although bleaching powderis more commonly used because of availability and cost. Tt consists of a mixture ofcalcium hypochlorite, calcium chloride and calcium hydroxide and contains 30%-35% of available chlorine when fresh, that is, 30-35 parts by weight of chlorine per100 parts by weight of bleaching powder. Bleaching powder should be handled withcare because it is bulky and comparatively unstable. When stored in closedcontainers in a cool place, the loss of available chlorine is limited to less than 5% in40 days. However, incorrect storage in open containers leads to a much higher lossin available chlorine, 50% or more in 40 days. Loss of available chlorine in chlorinesolution can be considerable and depends strongly on temperature and time (Figure111.1). Sunlight and heavy metals in the water may also considerably reduce theavailable chlorine content. Both the powder and the solution should be stored in a
134

Figure III. 1: Loss of available chlorine in chlorine solution in relation to temperature andtime (Ministry of Social Affairs, The Netherlands)
dark, well-ventilated, cool, dry place and in a closed container which is resistant tocorrosion.
The chlorine solution may be prepared by adding an amount of bleaching powderto a volume of water. This should be done in a well-ventilated space. Theconcentration of the solution should not be greater than 2.5%, and this may beobtained by mixing 2 kg of bleaching powder containing 25% available chlorine,with 20 litres of water. Firstly, a paste should be made by adding a little water to thebleaching powder, and this is then dissolved in the remaining amount of water.Bleaching powder contains insoluble particles which originate from low qualitylime, and the prepared solution should therefore be allowed to settle. Only theclear supernatant liquid should be poured or siphoned into the storage container ordosing equipment. Tf the insoluble material is not removed, it will soon clog flowmeters, valves and feed lines. The loss of chlorine in the deposit is very small.
II1.1 Dosing equipment
The chlorine solution is added at a controlled rate to the clear water. In smallschemes, a drip feed chlorinator can be used. In this device the glass tube inlet is
135
fixed below a float, and allows the solution to drip constantly to the dosing pointirrespective of the level of the liquid in the container.
The arrangement is useful for feeding chlorine solution into a water supply at aconstant rate, which can be regulated by a cock valve. Therefore, it is particularlyapplicable for use in combination with slow sand filters because these are alsooperated at a constant rate. Regular checking and cleaning of the drip outlet isnecessary to prevent clogging. To prevent loss of chlorine, the container should nothold more chlorine solution than is necessary for 3-5 days operation.
For optimum disinfection, the hypochlorite solution should be mixed as quicklyand as thoroughly as possible with the water to be treated. This may be facilitatedby locating the dosing point of the chlorine solution on top of the overflow weir inthe outlet chamber.
IV. SOIL INVESTIGATION
The behaviour of natural soils is very complex, and even advanced laboratoryanalyses cannot supply complete information on the reaction of the soil to the loadof the proposed structure. Thus, a large safety factor is required in design.Furthermore, only simple tests carried out at a low cost are justifiable within thescope of a rural water supply programme. The site investigation for a treatmentplant will generally comprise the collection of information, exploratory drilling,and subsurface sounding.
IV.l Collection of information
Information on geological and subsurface conditions in the selected area may beobtained from the government, other institutes, and also from individuals, forexample, local contractors who have been involved in subsoil exploration there. Avisual inspection of nearby buildings may also provide some useful information, forexample, cracks in walls and settlement indicate the presence of soil layers of highcompressibility.
IV.2 Exploratory drillings
Samples of the subsoil may be obtained for direct observation by drilling holes inthe selected area. Shallow holes up to a depth of about 5-10 m are usually madewith hand augers, and for deeper holes, machine drills are used. Hand drills and
136

augers are easy to construct and operate, especially for drilling in sand and clay.Harder layers, such as laterite or calcite, require the use of a tripod. Pressure can beincreased by a number of people sitting on the cross handle, while two men rotatethe drill.
Tn less cohesive soils and holes below groundwater level, a casing is required toprevent the hole caving in. Bailers or special sample spoons are also required forsampling the subsoil. In cohesive soils, samples of subsoil can be taken from thecontents of the auger. An indication of the mechanical properties of the soil, whichbasically depend on the size and structure of the particles, can be obtained fromthese samples.
Grain size and grain size distribution
Three methods can be used to indentify the grain size and distribution:
° Measuring with the aid of a microscope: this time-consuming method, which alsorequires counting the particles, should be used only to check results obtainedusing other techniques.
° Sieve analyses: this technique is appropriate for larger fractions which can be seenwith the naked eye (0.06 mm).
° Sedimentation: grains smaller than 0.06 mm can be separated from the largerfractions by washing, and the grain size distribution of the smaller fractionobtained from a sedimentation test.
A classification of grain fractions on the basis of the grain size is presented inTable IV.1. As indicated, the smaller fractions are divided into silt and clay. Asimple test to distinguish silt from clay is to knead a ball of soil under water; a siltball will fall apart, but a clay ball will not.
Table IV. I: Classification of grain fractions
Fraction Grain si/.e (mm)
Clay < 0.002Silt 0.002-0.06Sand 0.6-2Gravel 2-20Boulder > 20
Source: Naninga (1972)
1.37
The names of these fractions are also used for soil types. This can be veryconfusing because most soil types contain various fractions, so it is preferable to usea grain size distribution diagram. In general, sand soils are unconsolidated, high inporosity and low in compressibility, and clay soils are consolidated, low in porosityand high in compressibility.
Consistency
The consistency is also an important factor in determining soil stability. Terms usedto describe the degree of cohesion between soil particles and resistance todeformation are hard, plastic, and soft. In soils having a large fraction of fine grains,consistency depends greatly on the water content. If the water content increases,these soils may become unstable. A description of testing the soil consistency isbeyond the scope of this publication.
IV.3 Subsurface soundings
The information obtained from exploratory drillings will often not be sufficient.Soundings may have to be carried out to provide additional information on which tobase the decision about the type of foundation to be used, and whetherconsolidation of the subsoil is required. Soundings are also used to identify softspots in the subsoil between the drillings. However, a combination of soundingsand drillings is essential to obtain reliable information, particularly in areasunfamiliar to the investigator. Two methods of sounding are:
° Static soil penetrometer: in this method, a cone is pressed into the soil at astandard rate and the cone resistance measured. Resistance will be higher in firmsoils.
0 Standard penetration test: in its most simple form, a standard penetration testconsists of a rod or pipe which is driven into the ground by a drop weight. Recordsof the penetration with each blow indicate the relative density of the soil and itsbearing capacity.
V. FLOW MEASUREMENT IN SLOW SAND FILTERS
In slow sand filtration plants, it is necessary to measure the flow through the filtersand to adjust the filtration rate to a pre-set value. Flow measurements can be
138
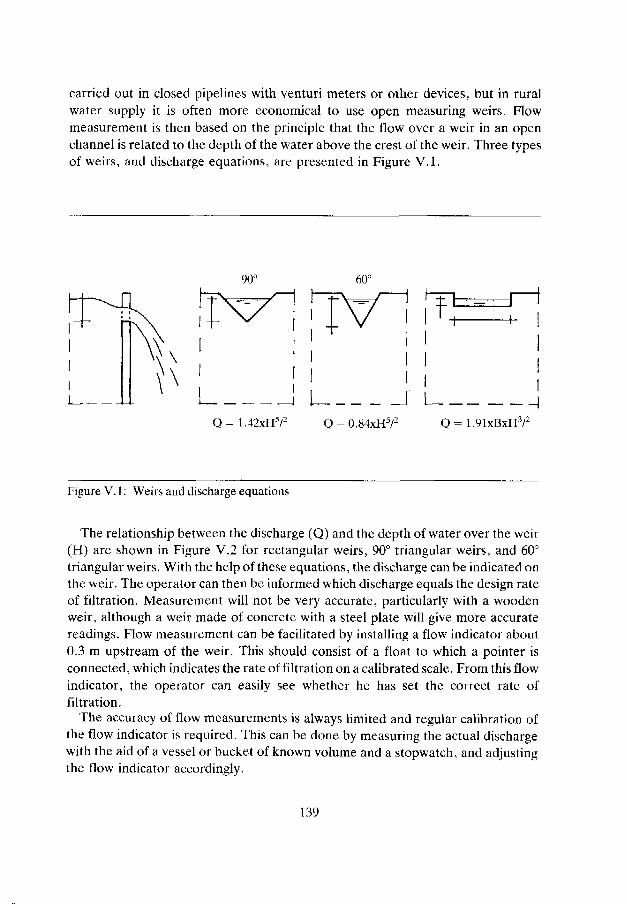
carried out in closed pipelines with venturi meters or other devices, but in ruralwater supply it is often more economical to use open measuring weirs. Flowmeasurement is then based on the principle that the flow over a weir in an openchannel is related to the depth of the water above the crest of the weir. Three typesof weirs, and discharge equations, are presented in Figure V.I.
Q=1.42xH5/2 = 0.84xH5/2 Q = 1.91xBxH:V2
Figure V. 1: Weirs and discharge equations
The relationship between the discharge (Q) and the depth of water over the weir(H) are shown in Figure V.2 for rectangular weirs, 90° triangular weirs, and 60°triangular weirs. With the help of these equations, the discharge can be indicated onthe weir. The operator can then be informed which discharge equals the design rateof filtration. Measurement will not be very accurate, particularly with a woodenweir, although a weir made of concrete with a steel plate will give more accuratereadings. Flow measurement can be facilitated by installing a flow indicator about0.3 m upstream of the weir. This should consist of a float to which a pointer isconnected, which indicates the rate of filtration on a calibrated scale. From this flowindicator, the operator can easily see whether he has set the correct rate offiltration.
The accuracy of flow measurements is always limited and regular calibration ofthe flow indicator is required. This can be done by measuring the actual dischargewith the aid of a vessel or bucket of known volume and a stopwatch, and adjustingthe flow indicator accordingly.
139

100,
I13(9
X10.
10 100Discharge (litres per second
Figure V.2: Discharge charts for three types of weirs
VI. WATER QUALITY ANALYSIS
Comprehensive testing of water quality is required for selection of the raw-watersource and to check the quality of the water over time, at least once a year butpreferably more frequently. Often, only a few samples can be taken which may notbe representative, and water quality analysis therefore needs to be combined withsanitary inspections. These inspections allow for an overall appraisal and provide adirect method of pin-pointing sources of contamination.
During the planning stage, data should be collected on variations in the quality ofthe raw-water source during both the dry and wet seasons. The degree of turbidityof the raw water is a particularly important parameter for slow sand filtration. Theturbidity level may be high, especially during the early stages of the rainy seasonwhen the runoff water is likely to carry debris and sediments from the river basinand the river bed. If data are not available from the water authorities, samples needto be taken by trained staff and analysed in a laboratory. In many countries, it maybe difficult to arrange for occasional testing by trained analysts, although a number
140
of routine physical, chemical and bacteriological tests also need to be carried out tocheck the functioning of the water treatment plant. A trained analyst will not beavailable for these tests and the caretaker therefore needs to take samples and sendthem to the laboratory as quickly as possible. Useful information on water qualitytesting can be found in WHO'S Guidelines for Drinking-Water Quality, Volume 3(1985), and in L.G. Hutton's Field Testing of Water in Developing Countries,WRC (1983).
VI. 1 Collection of a water sample
To obtain reliable results, it is essential that certain basic procedures are followed.To collect samples for physical and chemical analysis, the sampling device shouldbe washed out at least three times with a small quantity of the water to be sampled,and then filled and labelled immediately with time, date, and location. The samplesshould not be less than two litres and should be sent for analysis without delay.
Samples from a river, stream, lake or reservoir must represent the averagequality of the water. Therefore, it is undesirable to take samples from too close tothe bank, too far from the intake, or at too great a depth. Stagnant areas and loosematerial on the surface of the water should also be avoided. In the plant, the sampleshould be taken from places where the water is mixed, such as in the water inlet box,or from a tap which has been opened for at least five minutes.
VI.2 Bacteriological Examination
One parameter which requires more regular testing if possible, for example once amonth, is the bacteriological quality of the raw and the treated water, because ofthe risk of epidemics of water-borne diseases. Two basic methods developed for thedetection of indicator organisms are:
° Multiple tube method: in this technique, different quantities of water are addedto tubes containing a culture medium. The bacteria present in the waterreproduce, and in accordance with the number of tubes inoculated, the range ofdilutions made, and the number of tubes with a positive reaction, the mostprobable number (MPN) of bacteria present in the water may be determinedstatistically. This method is applicable to samples of raw as well as treated water,but test results are not ready for 48-96 hours.
141

Membrane filter method: in this technique, a measured volume of water isfiltered through a membrane which retains the bacteria on its surface. For wateranalysis, the pore diameter is usually 0.45 micrometer. The membrane is thenincubated on a suitable selective medium, which allows the bacteria to reproduceand to form colonies. The number of colonies counted relates directly to thebacteriological content of the water sample. This method is not suitable for turbidwater and membranes may not always be easy to obtain, but it is a simpletechnique and provides results within 24 hours. Samples for bacteriologicalanalysis have to be processed in a laboratory within 24 hours and if adequatetransport within this period cannot be guaranteed, portable equipment isrequired.
Collection of a sample for bacteriological investigation
Usually, smaller samples are required for bacteriological analysis, but theircollection requires special attention. In addition to being representative, thesample must also be free of contamination from other sources. Therefore,containers to collect samples for bacteriological analysis must be sterilized beforeuse, and these containers are usually obtained from the laboratory.
The bottles must not be opened until immediately before the sample is to betaken, and the stopper should be withdrawn and held pointing downwards. Bottlesmust not be washed and wherever possible, samples should be obtained from a tap.The tap should be flushed and sterilized (by heating) before the sample is collected.When sampling places are not easily accessible, for example a well, a sterilized jugand chain can be used to obtain the water which can then be poured into the bottle.The jug and chain can be sterilized by burning methylated spirit in the jug with thechain in it, and the sample is collected when the jug has cooled.
The sample bottles must be labelled with the following information immediatelyafter collection so that they can be identified:- name and address of laboratory to carry out the analysis;- source of sample;- type of analysis;- date and time of sample.
The sample should be packed in ice or refrigerated to prevent any bacteria frommultiplying or dying. The sample must be sent to the laboratory as quickly aspossible because analysis must start within 24 hours of collection.
When a bacteriological sample is taken after the chlorination stage, it must be de-chlorinated. If this is not done, any residual chlorine present in the sample willcontinue to exert its sterilizing action, and the results of the analysis will bear no
142

relation to the quality of the water at the time of sampling. The de-chlorinationshould be done according to instructions of the laboratory staff, and may well becarried out by them adding a crystal of sodium thiosulphate to the sample bottlebefore it is sterilized. A more detailed discussion of the various bacteriological testmethods is beyond the scope of this publication. (For more information, see theWHO Guidelines for Drinking-Water Quality, Volume 3, 1985).
VII. PARTICIPATING INSTITUTIONS IN THE SLOW SANDFILTRATION PROJECT AND DOCUMENTATION CENTRES
VII.1 Participating Institutions:
Instituto Naciona) de SaludDivision of Basic Rural SanitationAp. Aereo 80080Bogota, Colombia
UnivalleDepartemento de FluidosAp. Aereo 2188, Nacional 439Cali, Colombia
University of Science and TechnologyFaculty of EngineeringCivil Engineering DepartmentKumasi, Ghana
National Environmental Engineering Research InstituteNehru MargNagpur 440020, India
National Water CommissionP.O. Box 65Kingston, Jamaica
Ministry of HealthPublic Health DepartmentP.O. Box 30017Nairobi, Kenya
143

University of NairobiCivil Engineering DepartmentP.O. Box 310097Nairobi, Kenya
National Administration for WaterP.O. Box 381Khartoum, Sudan
University of KhartoumP.O. Box 321Khartoum, Sudan
Asian Institute of TechnologyP.O. Box 2754Bangkok 10501, Thailand
Provincial Waterworks Authority72 Jang Wattana Rd.Laksi BangkhenBangkok 10210, Thailand
VII.2 Documentation Centres:
AITAsian Institute of TechnologyP.O. Box 2754Bangkok 10501, Thailand
CIEHComite Inter Africain d'Etudes HydrauliquesB.P. 369Ouagadougou, Upper Volta
GRET34, Rue Dumont d'Urville75116 Paris, France
IFFIC/AITP.O. Box 2754Bangkok 10501, Thailand
144

IRCP.O. Box 931902509 AD The Hague, The Netherlands
IRCWDUeberlandstrasse 133CH-8600 DuebendorfSwitzerland
ITDGIntermediate Technology Development Group9 King StreetLondon WC2E 8HN, UK
WHODistribution and Sales Service1211 Geneva 27, Switzerland
World Bank1818 H. Street, N.W.Washington, DC 20433, USA
VIII. GLOSSARY
Aeration
Bacteria
Below-atmosphericpressure
A process to increase the oxygen content of water, forexample, by spraying it in the air.
Micro-organism of simple structure and small size. Most arecomposed of only one cell, and some are capable ofmovement. Some cause disease, but many others are useful.
When the overflow level in the filter outlet is lower than thesand surface (a common construction failure in manyplants), and the head loss in the filter skin exceeds theavailable head of the supernatant water layer, thus creatinga below-atmospheric pressure and releasing gases fromsolution in the water. The released gases in the low-pressureregion below the filter skin may form bubbles in the filterbed pores.
145

Biochemical action
Chemical OxygenDemand (COD)
Chlorine
Chlorination
Coagulation
Concretecompressivestrength
Declining ratefiltration
Decomposition
Depreciation
Design capacity
Chemical change resulting from the action of livingorganisms.
The amount of oxygen consumed by a specified oxidizingagent in the oxidation of the matter present in a (water)sample. The COD approximates the oxygen theoreticallyrequired for complete oxidation of the carbonaceous matterto carbon dioxide and water. This term is restricted to thestandard oxidation test employing a boiling solution ofpotassium dichromate acid.
A chemical element which is toxic for bacteria and viruses.
Addition of chlorine to eliminate bacteria and viruses,which might have passed through the preceding watertreatment process, to ensure that the water is safe fordrinking.
A chemical technique directed towards destabilization andinitial aggregation of colloidal and finely divided suspendedparticles by the addition of a floc-forming chemical or bybiological processes.
The maximum allowable force per unit of area without theoccurrence of shear or deformation.
A specific mode of operation of slow sand filters in which,periodically, the supernatant water level will gradually falland the water will be filtered at a continuously decliningrate.
Breaking down a complex substance into simplersubstances.
An estimated period (on the basis of experience) afterwhich equipment should be replaced due to wear and tear.
The capacity (m3/h) of a newly designed water supplysystem.
146
Design period The period a water supply system is designed for, withoutneed for extension.
Discharge of the Quantity of water which flows out of the pump per unit ofpump time.
Distribution system Network of pipes through which the water is transported tothe consumers.
Effective diameter
Effluent
Faecal coliforms
Flocculation
Flowcharacteristics
Freeboard
Gravity flow
Yearly growthrate
The size of the sieve opening through which 10% diameter(by weight) of the sand grains will just pass (symbol: d]0).Also indicated by "effective size."
Partially or completely treated water flowing out of atreatment plant.
Indicator organisms of faecal pollution, particularlyEscherichia coli, a bacterium which lives in the intestines ofman and other mammals. As it is excreted in faeces in largenumbers, its presence in water is indicative of the degree offaecal contamination and thus of the possible presence ofpathogenic organisms.
A slow mixing technique whereby destabilized particles areinduced to come together, make contact, and form largeragglomerates.
The data which define the nature of a river, for example,discharge and velocity.
The vertical distance between the maximum water level in atank and the top of the side walls, provided to prevent thewater from being blown over the walls.
Flow caused by gravity force.
The yearly rate of multiplication, expressed as the rate ofincrease in population per unit of population present (as apercentage).
147

Hydraulic feeder
Hydraulic gradient
Hydrological year
Influent
MPN
N,kN
NTU
Pathogen
Peak factor
Population growthfactor
Scum
Chemical dosing equipment consisting of non-mechanicalappliances.
A graph showing the subsequent loss of head inthe varioussections of a treatment unit passed through by the water tobe treated.
A year in the lifetime of a river which covers all variations inits hydrological characteristics due to rainfall, runoff,evaporation, artificial (man-made) withdrawals ordischarges, etc.
Untreated or partially treated water, flowing into a sectionof the treatment plant.
Most Probable Number: a statistical estimate obtained frombacteriological analysis of the number of viable bacteria in a(water) sample.
Newton, kiloNewton: the unit for measurement of force;1 N is approximately 9.8 kg ms"2; 1 kN = 9800 kg ms"2.
Nephelometric Turbidity Unit: unit for turbidity based onan internationally agreed standard solution. This turbiditymeasurement is based on the amount of light scattered bythe particles in suspension (1 NTU equals approximately1 FTU, Formazin Turbidity Unit).
pathogen or pathogenic organism is an organism whichcauses disease.
The ratio of maximum probable water use in a peak periodto the average rate of water use.
The total increase in population per unit of populationpresent, during a certain number of years.
A layer of fats, oils, grease and other floating particleswhich rise to the surface of the water.
148

Seepage
Sump, suction pit
Surface loading
Tensile strength
Transmissionpipeline
Turbidity
Uniformity
V-notch weir
Weir
Weir overflowrate
The loss of water from a canal or reservoir which percolatesinto the ground.
A tank or pit that is drained by a suction pipe or pump.
The maximum rate of flow to be treated per day per unitarea (m3/m2 d or CE/d). It may also be expressed as CE/h.
Strength of a material or component to resist a force whichstretches it.
Conducting pipeline through which water is carried overlong distances.
Cloudiness of water caused by the presence of suspendedmatter.
The coefficient of uniformity (UC) of granular material isthe ratio dgo/dio (see effective diameter).
A weir of V-shape used for measuring the discharge.
Device for measuring the flow of a liquid in an openchannel. The rate of flow is proportional to the head overthe weir.
The volume of liquid passing over the outlet weir of a tank,per unit length of weir at maximum flow.
149

publishes #ieby the G?jitr$ aQeeSsio wl Pa^erelated o r g a ^frtwIRC; [Several
^P^^X^llHii^