
evaluation of water treatment plants in india - IRC
474
FINAL REPORT EVALUATION OF WATER TREATMENT PLANTS IN INDIA SPONSOR CPHEEO, MINISTRY OF URBAN DEVELOPMENT, GOVERNMENT OF INDIA LIBRARY. ;;nrN':<, CENT;": 7 H':- Or A M D ••••.-vv;-: :;••; .VJÏ'-:. i-\i iM... ISN: .MCE Ï SUPPLY | NATIONAL ENVIRONMENTAL ENGINEERING RESEARCH INSTITUTE NEHRU MARG, NAGPUR -440020 JUNE 1989 Ä2-J//5? -
-
Upload
khangminh22 -
Category
Documents
-
view
0 -
download
0
Transcript of evaluation of water treatment plants in india - IRC

FINAL REPORT
EVALUATION OF WATER TREATMENT PLANTS IN INDIA
SPONSOR
CPHEEO, MINISTRY OF URBAN DEVELOPMENT,
GOVERNMENT OF INDIA
LIBRARY. ;;nrN':<,CENT;": 7 H':- OrA M D • • • • . - v v ; - : : ; • • ;
.VJÏ'-:. i-\i iM...
ISN:
.MCE ÏSUPPLY |
NATIONAL ENVIRONMENTAL ENGINEERINGRESEARCH INSTITUTE
NEHRU MARG, NAGPUR -440020
JUNE 1989
Ä2-J//5? -

FOREWORD
In the context of India's commitment to the goals of International DrinkingWater Supply and Sanitation Decade (IWSSD) and "Health for All by 2000 A.D.",investments in water supply sector have been stepped up significantly. Effectiveoperation and maintenance of the assets already created and the new facilities thatwould come up is a sine qua non to ensure a commensurate return in the form of safe,wholesome water to the public at minimum cost. The CPHEEO, Ministry of UrbanDevelopment, Govt. of India, sponsored a nation-wide survey of water treatment plantsto bring out the 'state of the art' of operation and maintenance, focus attention of theconcerned agencies on deficiencies, if any, and suggest practical measures for overallimprovement.
This report is presented in two parts. Part I presents the strategy adoptedfor the study, the salient findings and an objective analysis of the current status ofplanning, implementation and management of water works and practical recommen-dations for improvement. Part II of the report is addressed to the detailed appraisal ofeach of the water works selected for evaluation. The study involved review and analysisof engineering designs, in-depth assessment of the performance of each unit processand the present status with respect to O & M, plant personnel, laboratory facilities,finance and management. Practical recommendations for effecting improvement inoperation and maintenance have been suggested, wherever relevant.
The cooperation and assistance extended by the Chief Engineers of StatePHEDs/Water Supply Boards, senior engineers and the plant staff as also thesuggestions and guidance of Mr. V. Venugopalan, Adviser (PHEE), CPHEEO,Ministry of Urban Development, in the successful completion ofthe project are gratefullyacknowledged.
Nagpur (R. PARAMASIVAM)June, 1989. Project Leader

P R O J E C T P E R S O N N E L
WATER ENGINEERING DIVISION
Mr. Andey.S.P. Mr. Kelkar,P.S.
Mr. Bapat.S.K. Dr. MhaisaJkar.V.A.
Ms. Dhage.S.S. Mr. Ravindra Rao,R.
Ms. Joshi.N.S.
ZONAL LABORATORIES
Mr. AbooJC.M. Mr. Kulkami.A L.
Dr. BasuA-K. (Deceased) Mr. Manivel.U.
Mr. Biswas,A.K. Mr. Mehta.C.G.
Ms, Chandorkar,A.A. Dr. Mishra.R.P
Mr. Chattopadhayajsl. Mr. MolIa,S.H.
Mr. Dhaneshwar,R.S. Mr. Murthyjvl.R.K.
Mr. Elyas.S.I. Mr. Narayanswanù.V.S.
Mr. Ganguly A-K. Mr. NemaJ».
Mr. Gavane,A.G. Dr. Pandit ,R.K.
Ms. GUiMukherjee Ms. Pat U,MM.
Mr. Gokhe^H. Ms. Patkie.S.A.
Mr. Oovindwar,S.L. Mr. RaguramanfD.
Ms. GracyAnto Mr. Raman, A.
Mr. Oupto^.K. Mr. Ramarao,K.G.

Dr. Kankal,N.C. Mr. Rao.C.S.G.
Mr. Kothandaraman.V. Mr. Rcddy, R.C.
Mr. Sanyal^.B. M*. Subbtah,V.
Mr. Seth,A-K. Mr. Subrahmanyam.Y.V.
Mr. Shantikumar,L. Mr. TapanRout
Mr. Sharma,V.P. Mr. Thalcur,S.G.
Mr. Srinivasan,T.K. Mr. Tipnis.S.S.
Mr. SubbaRaoJC. Mr. Varma.S.R.
SECRETARIAL ASSISTANCE
Mr. Ded^Mtide, D.O. Mr. Panchpatkar, S.R.
Mr. Dhawalc.A.H. Ms. Sabjiwale, J.N.
Mr. Digfaekar, D.B. Mr. Swaminathan, G.
Mr. Kasture, PA.
PROJECT LEADER
Mr. R. ParanMsivani

CONTENTS
PART I- STATUS REPORT
Item Page
* LIST OF FIGURES i
* UST OF TABLES ü
* LIST OF PLATES iii
* LIST OF ANNEXURES iv
1. INTRODUCTION 1
2. OBJECTIVE AND SCOPE OF STUDY 2
3. METHODOLOGY 3
4. FINDINGS - AN OVERVIEW 8
5. SITUATION ANALYSIS 27
5.1 General 27
5.2 Source Protection and 27Water Quality Monitoring
5.3 Raw Water Intake 31
5.4 Treatment Flow Sheet and 31Process Design
31
32
32
33
34
35
35
5.5
5.6
5.7
5.8
5.9
5.10
5.11
Flow Measurement and Control
Chemical Dosing and Control
Coagulation and Flocculation
Sedimentation
Filtration
Disinfection
Laboratory forPlant Control
Contd

Item Page
5.12 Plant Maintenance and Records 35
5.13 Plant Personnel, Training and 36Manpower Development
5.14 Organizational and Financial 37
15IS Management Information system 38
5.16 Public Relations 38
5.17 Epilogue 39
6. RECOMMENDATIONS 40
PLATES 43
ANNEXURES 48

PART II - INDIVIDUAL PLANT APPRAISAL
State/City
ANDHRA PRADESH
Kumool
Rajahmundiy
Visflkhspfltnam
Warangal
ASSAM
Gauhati
BIHAR
Ranchi
CHANDIGARH (UT)
Chandigarh
DELHI (UT)
Delhi
GUJARAT
Baroda
Bhavnagar
Page
89
97
105
113
121
128
134
142
151
158
Goa 166
HARYANA
Hansi 173
Hissai 180
Rohtak 187
Contd

Slate/City Page
IIIMACHAL PRADESH
Shimla 195
JAMMU & KASHMIR
Jammu 203
Srinafar 210
KARNATAKA
Belgaum 219
Bijapur 226
Mysore 233
Shimog» 240
KERALA
Calicut 247
Thiiuvalla 255
Trichur 262
Trivandrum 269
MADIIYA PRADESH
Bhopal 277
Jabalpur 285
MAHARASHTRA
Aurangabad 293
Kolhapur 300
Nagpar 307
Pune 315
MANIPUR
Imphal 322
Contd
State/City Page
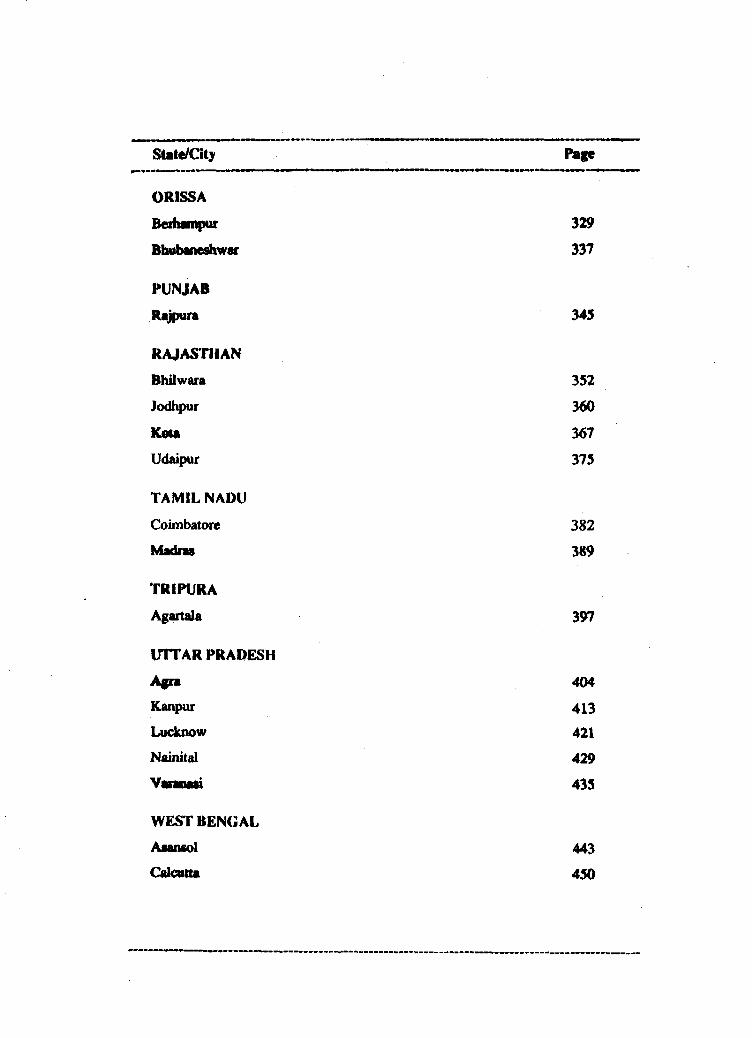
CRISSA
Befhampur 329
Bhubaneshwar 337
PUNJAB
Rajpura 34S
RAJASTHAN
Bhilwara 352
Jodhpur 360
Kota 367
Udaipur 375
TAMIL NADU
Coimbatore 382
Madras 389
TRIPURA
Agartala 397
UTTAR PRADESH
Agra 404
Kanpur 413
Lucknow 421
Nainital 429
Vtnraai 43S
WEST BENGAL
Aaansol 443
Calcutta 450

(i)
LIST OF FIGURES
Fig. Title Page
1. Evaluation Planning Diagram 4
2. Evaluation Operational Diagram S
3. Locations of Water Treatment 6Plants Evaluated
4. Classification of Water WorksEvaluated based on Plant Capacity (mid)
5. Classification of Water Works 10Evaluated based on Raw Water Sources
6. Classification of Water Works 11Evaluated based on O & M Agency
7. Chemicals Used in Water Treatment 16Plants Evaluated
8. Laboratory Facilities at Plant Site 26
9. Elements of Regional Carrying Capacity 29
10. Macro & Micr? Analysis for 30Water Supply Planning

(ü)
LIST OF TABLES
Table Title Page
1. List of Water Works Selectedfor Evaluation
2. Physico-chemical and 12Bacteriological Characteristicsof Raw Water Quality forPlants Evaluated
3. Performance of Plants at 17Various Stages of Treatment
4. Performance of Plants vis-a-vis 22CPHEEO Standards
5. Plan Outlay on Water Supply 28and Sanitation

(iii)
LIST OF PLATES
Title Page
* Reliable flow measuring system 43- A Prerequisite for plant control
* Well maintained chemical dosing system 43- A rare sight
* Single point addition of 44coagulant chemical- Not conducive for effective mixing
* Chemical dosing through a perforated pipe 44- Simple but effective
* Silted sedimentation tanks and 45aquatic weed growth- Result of neglected maintenance
* Clarifier flooded due to overloading 45- Not an uncommon scene
A sand filter without filter sand ! 46
* Uniform distribution of backwash water 46- Proof of good design and operation
* A well equipped laboratory 47- Vital for effective plant control
* Good housekeeping 47- An example to follow

(iv)
LIST OF ANNEXURES
Annexure Title Page
I Proforma for Selection of 48Water Treatment Plants
II Proforma for Collection of 49Engineering and Technical Data
in Checklist for Evaluation 59
IV Note on Plant Appraisal 62
V CPHEEO Standards for 65Drinking Water
VI Principles of Water Supply 69Source Protection
VII CPHEEO Design Norms for 72Treatment Units
VIE Note on Plant Maintenance 74and Records
IX Detailed List of 78Maintenance Activities
X Recommended Staffing Pattern 84for Water Works
XI Management Information System 85Format for Urban Water Supply

STATUS REPORT
• * • ; • : . • • • • . ; ' ; '

1. INTRODUCTION
India, a signatory to the U.N. Resolution on International Water Supply andSanitation Decade, (1981-1990), is committed to the goal of providing safe drinkingwater and adequate sanitation to all its citizens. The Mid-Decade review of theprogramme has shown that as of March 31,1985, the actual coverage of water supplyhas been 72.88 per cent and S6.20per cent in the urban and rural sectors respectively(l).The review also revealed that the single most important constraint to achieving the goalhas been inadequate financial resources. In the light of the progress achieved sofar in this sector and the various constraints experienced, the 'Decade* target for watersupply has been scaled down to 90 per cent for urban coverage and 85 per cent forrural coverage as against the original target of 100 per cent for both urban and rural.The allocation for VU Plan for water supply and sanitation has beenRs. 6522.47 croresas against the proposed outlay of Rs. 19883 crores.
The problem of supplying adequate quantity of safe water to the public doesnot end with the construction of water works. It is imperative that the assets created areoperated and maintained properly. Any deficiencies in operation and maintenanceof facilities would lead to thedeteriorationof thesystem, unproductive use of investmentand scarce resources and expose die public at large to the risk of water-borne diseasesdue to supply of water not conforming to prescribed standards. Therefore, the aspectof operation ami maintenance of water treatment systems
(1) International Drinking Water Supply and Sanitation Decade (1981-90) :India -status Paper, V.Vcnugopalan,J.IWWA,VoLXX,No.4,P-337(1988)

2. OBJECTIVE AND SCOPE OF STUDY
In the context of the Decade goal, a large number of new water treatment plantswill have to be built and the existing ones augmented. Creation of such capital intensiveutilities calls for not only sound planning but also development of systems to ensurecommensurate return in the form of a quality product i.e. safe, potable water to thepublic. Instances of poor operation and maintenance practices have, on manyoccasions, resulted in decreased utility or even early failure of newly constructedfacilities. It is against this backdrop that the Central Public Health and EnvironmentalEngineering Organisation (CPHEEO), Ministry of Urban Development, Governmentof India, retained NEERI to undertake an organised nation-wide survey and appraisalof urban water treatment plants.
The study addressed to an in-depth evaluation of the present status of operationand maintenance of water treatment plants from different parts of the country, so as tobring into focus the gaps and deficiencies, if any, and to suggest practical measures forimprovements in planning and design, as well as operation and maintenance of thesystems.
The scope of work comprised the following :
* Consultation with CPHEEO and the respective state Chief Engineer of Public HealthEngineering Department/ water supply agency for identification and selection oftreatment plants keeping in view such criteria as the size of the plant, source of rawwater and treatment flow-sheet
* Reconnaisance visit(s) to the selected plants for collection of design andengineering data including construction drawings
* Field visits for evaluation of raw water quality and plant performance at variousstages of treatment and discussions with senior engineers and plant staff
* A detailed study of the chemical dosing facilities and assessment of operation andupkeep of mechanical equipment
* A critical appraisal of the laboratory facilities, equipment and staff deployed foroperation, maintenance and management of water works
* An objective assessment of the above so as to bring out gaps in design, operation andmaintenance and practical suggestions for overall improvement

3. METHODOLOGY
Extensive preparatory and desk work was undertaken to delineate the plan ofwork and the logistics for field survey and evaluation as depicted in Figs. 1 and 2.Proformae were designed for selection of water treatment plants (Annexurel) andfor collection of detailed information on plant design and engineering data, waterquality and other relevant aspects such as laboratory facilities, plant personnel, costof operation and maintenance, etc. (Annexure II).
The selection of plants has been made keeping in view the plant size, source ofraw water, the treatment flow sheet and the agency responsible for operation andmaintenance so as to provide a representative sample of water works from differentparts of the country as shown in Fig. 3 and listed in Table 1. In many cities, a cluster ofwater treatment plants receiving raw water from one or more sources are located at oneplace. These have been constructed at different points of time. In such cases, the plantselected for evaluation has been specifically indicated.The design data andengineering details for the plants selected were obtained from the plant authorities bythe study teams. This information formed the basis for review of designs and evaluationof the plant performance. In order to ensure uniformity in methodology for field study,a checklist (Annexure HI) along with a note (Annexure IV) on plant appraisal wasprepared and finalised after detailed discussions with the project teams. The checklisthighlighted those aspects which need to be looked into in detail to facilitate an objectiveevaluation. The frequency of field visits was decided keeping in view the size of theplant, and available logistic support and to cover, as far as possible, different seasonsof the year so as to adequately reflect the plant performance due to changes in waterquality.

mVKTHM'I MMMM- UMMDLMOCD-OVIULOAiaO
mm «HMMCAL OMMK
ITC
INVUTIMTC MAMN«' MALFUNCTIOHHM Of
CCMIPMIKT-WAOtBtMTf M t M M
• TC.
or
INVICTMATt H / M M- MALFUNCTIONM <f
-rWlV<£m&NT- DITN. TIM ITC.
STUDY PERFOKMANCC OFSEDIMCHTATIOM UNIT
INVHTMAT! MAMN«
* FLO* TMMOUON TNC- t lMMt dtlMVAL- INLIT/OUTICT (TC.
mvttTWATt M M M- flLTHATION KATt
- »ABO traçtriC- tACK WAMt- MALFUNCTIOMINa «f
CM (TC.
•TUOY fO«T CNLOKtHATMNT t t T rUMWCD WATCHOUALITY
mvt»TI»ATt lÉAJwî*
CH» « OMMN, '0 • M wr TUCATMCNTUNIT«
APMMIK »LAUT «rtltATMVAUTWMITICt Or TNI»MftATtMML AN«/ORK W t PCFICKNCtC*MOTIVATI TO« eOMMCTIVIACTIONS
_L( «uceiWj
FIG. I EVALUATION PLANNING DIAGRAM

.D .O.
PKESENMENMCnON
/STORAGE
SOURCE(SURFACE/GROUND»
INTAKE
air
-1 ,.„. LJFLOW r PRECHLORWATION I I
l i ra T
FLOW r PRECHLORWATIONM E A S U R E I rCHCMlCALS
.POSTCHLORIN ATION
JrFLASHMIX UNIT
SLOWMIX UNIT IHSEDIMENTft-l
TK)N UNITp~ RSF/RF. -TO SUPPLY
• PHYSICO-CHEMICAL ftBACTERIOLOGICAL
• TREATABILITY
(JAR TEST d« DEMAND,ETC)
• CLARIFIERSLUOGt
I • FILTER(5) SAND
» B.W.WATER
0.0ODOURSOLUBLE IRONpH ETC
TUR8I0ITY • TURBIDITY IBACT.QUALITY« BACT j9ULPHATEETC
QUALITY I
> CI , DEMAND1iSAMPLE
• PHYSCO-CHEMTCN.«BACTERKXJOWCM.
• RESIDUAL CHLOMNE
• ALUMINIUM (SOLUBLE)
HG. 2 EVALUATION OPERATIONAL DIAGRAM

INDIA
FIG. 3 LOCATIONS OF WATER TREATMENT PLANTS EVALUATED

LIST OF WATER
ANDHRA PRADESH
Ktunool
Rajahmuodry
Visatrhanalnatn
Wanmgal
ASSAM
Oaubati
BIHAR
Ranchi
CHANDIGARH (UT)
Chandigarh
DELHI (UT)
Delhi
GUJARAT
Baroda
Bhavnagar
GOA
Goa
HARYANA
Hansi
Hissar
Robtak
HIMACHAL PRADESH
TABLE 1
WORKS SELECTED FOR
JAMMU & KASHMIR
Jammu
Srioagar
KARNATAKA
Belgaum
Bijapur
Mysore
Shimoga
KERALA
Calicut
Thinivalla
Trichur
Trivaodnim
MADHYA PRADESH
Bhopal
Jabalpur
MAHARASHTRA
Auiangabad
Kolhapui
Nagpnr
Puoe
MANIPUR
Imphal
EVALUATION
OR1SSA
Beifaantpwr
Bhubaneabwar
PUNJAB
Rajpura
RAJASTHAN
Bbilwara
Jodbpur
Koto
Udaipur
TAMIL NADU
Coimbatore
Madras
TRIPURA
Agaitala
UTTARPRADESH
Agra
Kanpur
Lucknow
Naioital
Varanasi
WEST BENGAL
Asaosol
Sbimla Calcutta

8
4. FINDINGS - AN OVERVIEW
While detailed information on each one of the plants evaluated is furnished inPart II of the report the salient findings of the survey are presented hereurtder.
The classification of water works evaluated based on the design capacity, therawwatersourceandtheO&Magency is presented in Fig.4 through Fig.6 respectively.Plants of less than 10 mid capacity constituted 18% ; 74% of the plants had a capacity lessthan 50 mid and 16% of the plants were of capacity larger than 100 mid. While all theplants were based on surface sources, the predominant source of raw water was riversfollowed by lakes and canals. The distribution of plants with respect to O & M agencyshowed that 45% of the plants were operated and maintained by the State Public HealthEngineering Departments, 37% by autonomous agencies like Water Supply Boardsand Jal Sansthans and 18% by local bodies such as Municipal Corporations,MtiMC^ttities etc. lit a few instances, there was dual control - one agency responsible forproduction and treatment while another was incharge of distribution.
Summary data on the physico-chemical and bacteriological quality of rawwater for all the plants evaluated is presented in Table 2. As regards the availabilityand the functionality of raw water flow measuring devices it was found that in sevenplants there was no provision for flow measurement and in the case of twenty plantsthe devices installed were not in working order. In the rest of the plants the deviceswere functional.
As regards the treatment flow sheet, with the exception of one, all the plantshad provision for coagulation - flocculation with alum. Lime addition was practisedinelevenplants to aid in coagulation. All the plants had rapid sand filters while in someof the older plants both slow sand filters and rapid sand filters were in use. In most ofthe plants, especially the larger ones, chlorine gas was used for disinfection. Bleachingpowder was used in smaller plants as also in large ones, when chlorine gas was in shortsupply (Fig. 7).
Summary data on the performance of plants at different stages of treatmentas judged by the yardsticks of turbidity and coliform group of organisms is presented inTable 3. Forty seven per cent of the plants surveyed were meeting the CPHEEOstandards (Annexure V) with respect to turbidity (< 2.5 NTU); seventy three per cent ofplants were satisfying the prescribed bacteriological quality (coliform absent) and onlythirty nine per cent of the plants were consistently producing (during all the visits) afinished water meeting in the CPHEEO standards for both turbidity and bacteriologicalquality (Table 4).
The status regarding laboratory facilities for routine plant control andmonitoring is presented in Fig. 8. Most of the plants did not fully meet the CPHEEOnorms. A noteworthy observation has been mat, in quite a good number of plants, thelaboratory facilities provided have not been put to use for want of competent staff.

CLASSIFICATION OF WATER WORKS EVALUATEDON PLRNT CRPflCITV (MLD)
< 10 11-25 26-50 51-75 76-100 101-200
HG. 4

CLASSIFICATION OF WATER WORKS EVALUATED# 1
Ü45
i2714
212
%%%%
RIVER
BfiSED ON RflW WATER S0URŒS
MUL .SOURCES
FIG. 5

CLASSIFICATION OF WATER WORKS EVALUATED8 1
451837
%%%
BfiSED ON 0 & M fiGENCY
PHED Local Bodies U/S Boards
HG. 6

I '
TABLE 2
PHYSICO • CHEMICAL AND BACTERIOLOGICAL CHARACTERISTICS OF RAW WATER QUALITY FOR PLANTS EVALUATED
NAME OF PL ANTTurbidity(NTU)
ANDHRA PRADESH
Kumool
Rajahmundry
Vi ulrhnnatpaflr)
Warangal
ASSAM
Gauhati
BIHAR
Ranclu
1-60
2.5-110
0.1-150
1.5-3.5
27-48
7.0-21
CHANDIGARH (UT)
Chandigarh
DELHI (UT)
Delhi
GUJARAT
Baroda
Bhavnagar
GOA
Goa-Opa
3.1-8.0
5.0-600
4.5-80
6.8-40
5.0-9.0
Hi
7.5-8.7
7.9-8.1
7.8-8.2
8.2-8.9
7.6
7.0
7.7-7.8
7.8-8.5
7.7-8.2
7.7-8.6
7.3-7.4
TAk.(CCO,)
140-188
92-94
64-94
96-124
44-56
36-46
71-74
86-144
100-160
110-180
24-48
PHYSICO-CHEMICAL
T.Hardne«(CaCCy
124-206
86-106
68-86
60-110
76-80
28-38
91-110
86-248
70-140
90-190
30-48
Calcium(C)
32-39
18-20
13-18
14-24
15-16
10-12
26-30
22-42
16-22
16-27
6-17
PARAMETERS
Miffntriuv(Mg)
11-26
9-13
8-12
6-13
9-10
1-2
6-10
6-35
7-20
12-29
1-4
n Chloride«(O)
61-133
11-17
9-11
16-20
3-4
4-22
3-17
7-58
40-60
50-130
5-20
Sulphates(SO4)
22-74
6-13
9
20-35
10-14
7-14
26
10-45
18-40
24-40
Tr.-3
Iron
(Fe)
0.1
0.1
0.7
0.2
1.3-I..6
0.6-1.8
0.15
Tr
-
-
Tr.-0.2
Fluoride
ff)
0.6-1.5
0.4-0.5
0.2-0.8
0.5-0.8
Tr.-0.2
0.4
0.2-0.5
0.2-0.4
-
-
-
Nitrate(NO,)
-
-
-
-
Tr.
Tr.
1.6-2
Tr.
1-4
<1.5
Tr.
BACTERIOLOGICALPARAMETERS
s Totti coliforai pxoli<MPNpeHO0ml)(MPN per 100 ml)
75-9300
4600-46000
9-240
460-2400
790-7900
490-680
540-1600
170-5400
240-2400
93-460
1100-2400
43-2400
4600-24
4-43
93-2400
110-790
110-680
300
-
93-230
23-240
Nil-150
Contd... _

Table 2 Coutd...
NAME OF P U
HARYANA
Hand
Hissar
Rdhiak
iNTTurbidity(NTU)
3.0-13
4.0-12
0.8-1.5
HIMACHAL PRADESH
Shimla 3.0
JAMMU & KASHMIR
Jsminu
Snn&gAr
KARNATAKA
Belgaum
Bijapur
Mysore
Shimoga
KERALA
Calicut
Thiruvalla
Trichur
Trivandrum
18
7.3
3.4-7.8
4.5-12.5
0.5-1.7
3.5-20
2.0
5.0-12
3.0-12.0
8.0
PH
7.8-9.0
7.6-8.5
7.8-9.0
7.5
83
7.9
6.5-7.8
7.5-7.8
73-7.6
7.0-7.1
7.3
6.6-6.8
6.5-6.8
6.8
TJUk.(CtOCy
40-88
64-80
60-74
68
76
48
22-30
86-116
80-122
26-64
36
8-30
12-28
20
PHYSICO-CHEMICAL
TJlMdneH
56-118
80-102
80-102
•
80
76
42
14-28
112-124
47-66
16-36
16
12-20
12-16
10
> Calcium(C)
14-28
32-36
22.-28
24
26
14
3-9
18-34
11-14
5-9
6
8
-
4
PARAMETERS
Mïjnewan Chloride*(Mg) {a )
5-12
4-17
5-8
5
3
I
2
9-19
3-9
1-3
0
0
-
0
7-16
7-9
5-10
7
6
2
4-9
13-34
6-20
9-22
720
8-10
3-5
3
(SOt)
23-28
12-14
28-64
16
6
2
2-23
19-33
Tr.-2
4-8
2
2-3
1-2
2
Iran(Fe)
Tr.-0.1
-
Tr
Tr
Tr
0.45
Tr.-0.1
Tr.
Tr.-0.3
0.5-0.8
1.4
0.2-0.4
1.2-1.3
0.4
Fluoride(F)
-
-
•
0.54
0.45
0 3
0.5-0.8
0.2
Tr.-0.3
Tr.-0.1
-
-
-
-
BACTERIOLOGICALPARAMETERS
Nitrates Totti coKfbnn Exoli(NO,) <MPNperlOOml)(MPNpCTl0Oml)
8-94
8-540
23-50
1.7 140
2.9 840
Tr. 14
23-1100
43-210
150-930
240-2400
130
0
79-920
5400
-
-
-
-
-
-
7-9
15-23
15-93
4-430
-
-
22
-
Coatd...

Table 2 Coot*,
NAME OF FLA)Turbidity(NTU)
MADHYA PRADESH
Bhopal
Jabalpor
5.0-19.0
15
MAHARASHTRA
Aurangabad
Kolhapur
Nagpur
Puoe
MANIPUR
Imphal
ORISSA
Berhampur
Bbubaneibwar
PUNJAB
Rajpur»
RAJASTHAN
Bhilwara
Jodhpur
Kota
Udaipui
6.0-27
12-1500
17-22
2.0-70
17-95
10
24
5.5
6.0
8.5-41
2.8-3.4
7.4-9.4
pH
7.9-8.1
7.8-8.4
7.7-8.5
7.4-8.2
8.4
7.3-7.6
7-8.5
7.9
7.7
8.2
7.8
7.4-7.8
7.5-8.1
7.4-7.9
TA*.(CCO,)
66-89
105-142
110-130
28-40
163-164
32-40
30-44
84
61
154
84
104-108
80-92
154-198
PHYSICO-CHEMICAL
T-Hardoui(COO,)
55-95
86-130
126-152
50-52
148-153
30-42
30-80
76
55
103
156
184-196
108-240
148-176
Calcium
<Ct)
14-34
23-32
20-27
11-17
37-39
9-10
12-14
18
17
32
29
35-41
29
34-38
PARAMETERS
Marietta(Mi)
2-4
7-12
16-22
2-6
12-15
1-5
4-12
7
3
6
21
22-23
9-41
16-20
• CUorid«
<a)
3-6
3-4
60-80
16-28
17-35
18-22
3-8
7
5
5
28
28-64
12-15
62-80
SvlpbautISO,)
<1
0-1
9-22
Tt.-10
13-24
T1.-8
12-13
1
4
27
2
3-7
2
3-15
Iron(ft)
0.2-0.8
0.3-2.2
0.1-0.5
0.2-0.7
0.2-1.9
0.2-0.4
0.4-2.8
0.3
2,7
Tr
0.6
-
0.1-0.4
0.3-0.4
Fluoride<F)
<0.1
0.17
-
-
0.4-0.8
-
Tr.-O.l
0.2
a 14
0.6
Nil
Nil
Nil
0.1-0.3
BACTERIOLOGICALPARAMETERS
Nitrites Totti coHftwn fctfoft(NO,) (MPNpertOOml)<MPNperlOOsil)
5-7
0.7-1.9
Tr.
M l
Tr.-2
Tr.
0.3-0.8
0.35
0.4
2.6
-
Nil
-
-
93-1600
500
240-1500
46000-1100000
9-240
2400-7240000
4300-13000
13
>1600
240
93
93->2400
28-75
93
23-1600
8-27
9-93
11-23
440
NU
2300-9200
4
1600
-
0
43-1100
0-23
4
Contd... ^

Table 2 Coned ~
NAMEOFPLA*
TAMIL NADU
Coimbatore
Madras
TRIPURA
Agartala
Turbidity(NTU)
3.0-4.0
5.5-8.8
36-37
UTT AR PRADESH
Agm
Kanpur
Lucknow
Nainital
Varanasi
WEST BENGAL
AsanwJ
Calcutta
5.0-10.
6.0-30
12-29
2.5-6.0
5.0-8.5
10-820
32-120
6.8-7.7
7.8-8.2
7.0
8.1-8.5
7.8-8.4
8.4-8.8
7.7-7.9
8.1-8.2
6.9-8.1
7.5
TJUk.(COO,)
12-21
34-206
64-81
200-280
35-240
230-255
260-300
180-200
29-70
189
PHYSICO-CHEMICAL PARAMETERS
(COO,)
8.0-12
78-240
54-100
262-360
76-174
160-196
360-414
142-172
84-92
140-150
Calcium(Ca)
2-3
14-90
14-20
38-71
31-47
29-38
50-63
33-34
18.19
33-48
Ma^wrim(M,)
0-2
3-10
5-12
41-47
9-18
21-24
48-63
14-21
10-11
S-15
i Chloride»<Ct)
5-7
41-125
3-5
114-274
3-38
6-8
7-13
20-29
2-6
11
Sulphates(SOJ
2-3
13-62
12-14
74-138
14-36
5-12
44-112
18-32
0-5
12-21
boa
0.2-0.3
Tr.
-
0.4-2
0.1-1.4
0.7-1.9
Tr.
Tr.
Tr.-5.7
1.3
Fluoride
m
0.1
<0.1
Tr.
0.5-0.6
tt2-0.5
0.4-0.5
0.1-0.12
0.3-0.4
0.4-O.t
0.06
BACTERIOLOGICALPARAMETERS
Nitrate* Total coliform E-coli(NO,) (MPNperl00ml)(MPNperlO0mI)
-
-
0.4-0.7
0.3-10
Tr.
Tr.
1.0-2.1
Tr.
-
-
70-11000
2400-4600
3500-24000
13000-24000
11000-35000
1700-9000
540-1600
1700-3500
21-2400
13000-24000
4-230
9-23
2800-24000
900-2300
5000-7000
50-1600
94-130
90-170
91
1700-2300

WATER TREATMENT PLANTS EVALUATED
0 5
No of Plants
18 15 20 25 35
FIG. 7

TABLE3
PERFORMANCE OP PLANTS AT VARIOUS STAGES OF TREATMENT
Name of thePlant
ANDHRA PRADESH
Kuroool
Rajahmundry
Vîsakhapsitnani
Warangal
ASSAM
BIHAR
Rancbi
CHANDIGARH (UT)
Chandigarh
DELHI (UT)
Delhi
Raw waterSOURS
Canal
River
River/
Canal
Rivet
Dam
Canal
River
Raw
10-60
2.5-110
0.1-150
13-33
27-48
7-21
3.1-8.0
30
Turbidity (NTU)
Set
1-10
0.8-26
0.1-S.5
1-3
5.2-9.0
3.7-14
2.6-6.6
1.5-5.0
HL
1-23
0.5-3
0.1-03
0.2-15
-
-
0.8-1.1
0.3-1.7
Fin.
0.8-4.5
0.5-1.0
0.1-3.0
0.2-1.0
1.2-5.0
1-33
0.8-1.0
0.4
Total Coliform (MPN/100 ml)
Raw Set Fd. Fin.
75-9300 460-2400 9-150 0-460
4600-46000 9300-15000 4600-9300 NU
0-240 0-930 23-930 0-15
460-2400 460-1500 0-93
790-7900 70-220 0-26
490-680 49-68 0-45
Nil
Nil
Nil
540-1600 60-280 20-130 NO
170 2.0 5.0 NU
Contd... *-,

Name of thePlant
GUJARAT
Baroda
Bhavnagar
GOA
Goa-Opa
HARYANA
Hansi
Hissar
Rotbak
HINfACHAL PRADESH
Shimla
JAMMU & KASHMIR
Jammu
Srinagar
Raw watersource
Reservoir
Reservoir/late
River
Canal
Canal
Canal
Stream
River
Lake.canalReservoir,Stream
Raw
4.5-80
6.8-40
5-9.3
3-13
4-12
0.8-1.5
3
18
7.3
Table 3
Tmtidity (NTU)
Set
6-10
4-18
5-5.5
2-12
1.5-2.5
1-1.5
25
9.2
4.3
FÜ.
3-6.0
3.5-13
0.8-2.5
1.7-95
1.4-4.0
1-1.5
1.5
1.1
2.8
Contd».
Fm.
-
-
-
2-4
1.8-20
0.8-1.0
-
1.4
5.6
Total Coliform (MPN/100 ml)
Raw
240-2400
93-460
1100-2400
8-94
8-540
23-50
140
840
14
Set
-
-
140-460
5-41
0-170
4-30
75
145
8
FiL
24-240
-
4-93
2-13
0-7
2.0
95
60
2
Fm.
-
0-23
NU
NU
NU
-
26
0
Cootd... S

Name of thePlant
KARNATAKA
Belgaum
Bijapur
Mysore
Shimoga
KERALA
Calicot
Thiiuvalla
Trichur
Trivaodnun
MADHYA PRADESH
Bbopal
Jabalpur
Raw watersource
Lake
Tank
Dam
River
River
Impoundment
Impeundment
River
Lake
River
Raw
3.4-7.8
4.5-12.5
0.5-1.7
3.5-20
2-5
5-50
3-10
8-50
5-19
15
Table 3 Contd».
Turbidity (NTU)
Set
2-4.5
6.5-8.0
0.3-1.2
2-8
5-6
5-25
4-10
6-50
13-4.0
Î.5
HL
0.3-1.0
1.7-4.2
0.2-0.5
1.5-2.0
1-4
3-6
1-5
3-20
1.5
1.0
Fin.
0.4-1.5
7.4-8.0
0.2-1.5
2.2-5.2
1-2
3-5
2-3
3-10
1.5-10
0.9-1.0
Total
Raw
23-1100
43-210
150-230
240-2400
130-460
170-1600
240-920
350-5400
93-1600
500
Coliforra
Set
7-43
4-240
23-240
43-460
47
540
350
2400
0-240
27-80
(MPN/I00ml)
FiL
0-4
0-93
4-93
0-43
33
170
130
330
0-21
18-50
Fin.
NU
0-4
0-4
NU
NU
Nu
Nu
Nil
NU
NU
Contd...

Name of thePlant
MAHARASHTRA
Aurangabad
Kolhapur
Nagpur
Pune
MANIPUR
Impbal
ORISSA
Beiftampur
Bhubaneshwar
PUNJAB
Rajpura
RAJASTHAN
Bhilwata
Jodhpur
Kota
Udaipur
Raw wittersource
River
River
River
River
River
Lake
River
Canal
River
Canal/lake
River
Lake
Raw
6-27
12-1500
17-22
2.5-70
17-95
10
24
5.5
6.0
8.5-58
2.8-3.4
6.4-10
Table 3
Turbidity (NTU)
Set
4.5-16
9-60
8-10
1.5-38
12-60
7.0
8.5
5.4
7.5
8-12
1.2-2.0
3.8-7.0
FiL
0.5-0.8
1.1-7.5
0.6-1.1
1.2-4.6
40
8.5-9.0
0.5-10
1.5
2.5
2.6-6.2
0.9-1.2
2.1-3.8
Cootd»
Fin.
-
-
0.5-1.0
-
7.2-9.0
14
1.5
2.0
4-5.0
1.3-2.6
1.5-4.0
Total Coliform (MPN/100 ml)
Raw
240-15000
46000-11x10'
9-240
-
4300-13000
13
>1600
240
93
93->2400
28-75
93
Set
43-2400
93-150
27
FiL
9-240
0-21
30-170
2400-724x10* 240-11x10'
93-1300
50
240
85
NU
0-43
43-75
4.0
2-49
23
4.0
35
NU
0-43
23-43
15
Fia
NU
NU
0-27
NU
NU
2.0
NU
8
NU
NU
NU
23
Contd..

Table 3 Contd-
Name of äiePlant
TAMIL NADU
Coimbatore
Madias
TRIPURA
Agartata
Raw watersource
Lake
Late
River
UTTAR PRADESH
Agra
Kanpur
Ludcnow
Nainitsl
Varanasi
WEST BENGAL
Asansol
Calcutta
River
River
River
Lake/spring
River
Dam
River
Raw
3-4
5.5-8.8
36-37
5-10
14-30
9.5-29
5.0
5-8.5
10-820
32-120
Torbidtty(NTU)
Set
0.2-1.8
3.5-13.6
11-12
2-5
7.5-12
5-11
2-8.0
20.8-25
1.5-15
HL
0.3-0.7
1.5-6.7
4.6
1.5-4.5
1.2-9.0
1.3-5.6
2.5
0.6-3.5
2.5-14
0.5-7.5
Fin.
0.2-1.3
2-6.4
4.0
2-3.5
1.507.0
Z5-6J
2.5
15-3.0
4.5-15
-
Raw
70-11000
2400-4600
3500-24000
13000-24000
11000-35000
230-9000
540-1600
1700-3500
21-2400
13000-24000
Total Colifonn
Set
0-7
0-9
540-920
230-3500
920-1400
33-16000
-
350-940
9.0
400-2700
(MPN/100ml)
KL
4-15
0-460
23-330
11-2400
220->2400
0-2200
-
8-1100
NU
11-1300
FID.
NÜ
NU
NU
0-33
NU
NU
NU
0-23
0-33
0-11

22
TABLE4
PERFORMANCE OF PLANTS VIS-A-VIS CPHEEO STANDARDS
Name of the plant
ANDHRA PRADESH
Kiunool
Rajahmundiy
Visakbapamam
Wanngal
ASSAM
Gauhati
BIHAR
Ranchi
CHANDIGARH (UT)
Chaadigaib
DELHI (UT)
Delhi
GUJARAT
Baroda
Bhavnagar
GOA
GOB
HARYANA
Hansi
Hissar
Rotatak
MEETING CPHEEO
Turbidity (NTU)<2.5
No
Yes
No
Yes
NO
No
Yes
Yes
No
No
Yes
No
Yes
Yes
STANDARDS
Total coliform- ve
Yes
Yes
Yes
Yes
Yes
Yes
Yes
Yes
No
No
Yes
Yes
Yes
Yes
Contd...

Table 4 Cootd
23
MEETING CPHEEO STANDARDS
Name of the plant TuibMity<NTU)<2.5
Total coliform-ve
HtMACHAL PRADESH
Shimto Yes
JAMMU & KASHMIR
Jammu
Sritugar
KARNATAKA
Belgaum
Bijapur
Mysore
Shàmoga
KERALA
Calicut
Tbintvalla
Trichur
Tnvaodntm
MADHYA PRADESH
Bhopal
Jabalpur
Yes
No
Yes
No
Yes
Yes
Yes
No
Yes
No
Yes
Yes
No
No
Yes
Yes
No
No
Yes
Yes
Yes
Yes
Yes
Yes
Yes
Conld...

Table 4 Coatd
24
Name of tbe plant
MAHARASHTRA
Aurangabad
Kolliapur
Nagpur
Pane
MAN1FUR
Imphal
ORISSA
Beihampur
Bhubaneshwar
PUNJAB
Rajpura
RAJA8THAN
Bbilwara
Jodhpur
Koto
Udaipur
TAMO, NADU
CoimtMUore
Madias
TR1FURA
Agartala
MEETING CPHEEO
Turbidity (NTU)<2.5
Yes
No
Yes
No
No
No
No
Yes
Yes
No
Yes
No
Yes
No
No
STANDARDS
Total coUform-ve
Yes
Yes
Yes
Yes
Yes
No
Yes
No
Yes
Yes
Yes
Yes
Yes
Yes
Yes
Contd...

25
Name of the plant
UTTAR PRADESH
Kanpur
Lucknow
Nainital
Vaianasi
WEST BENGAL
Asansol
Calcutta
Table 4 Contd.-
MEETING CPHEB
Turbidity (NTÜ)<2.5
No
No
No
Yes
No
No
No
0 STANDARDS
Total coliform-ve
No
Yes
No
Yes
No
No
No

26
LABORATORY FACILITIES AT PLANT SITE
Group I - Physico-Chemical and Bacteriological Analysis
Group U - Only Physico-Chemical Analysis
Group III - Only pH, Turbidity and Residual Chlorine
Group IV- No Facilities
FIG. : 8

27
5. SITUATION ANALYSIS
5.1 GeneralThe rapid growth in urban population inevitably exerts pressures on the civic
service«, especially water supply. Because of several constraints coverage of watersupply has not been keeping pace with the population growth. The production andsupply of adequate quantity of water still continues to be the major concern and pre-occupation of many a water supply agency. Hence, priority is accorded to thedevelopment of new works and operation and maintenance of already created facilitiesis given a low priority even to the extent of neglecting them. Paradoxically, whilethe rate of urban growth has been increasing, the Plan outlay for water supply as apercentage of total outlay has shown a decline during the Vu Plan as could be seen fromTable 5.
A fact that emerges from the study is that long term planning for water supplyto meet ale legitimate demands of both the present and the future has been lacking ingeneral. The growth in facilities has often been haphazard and bordering on "fire-fighting" approach. In this context a sound, holological approach to the resolution ofthe problem of drinking water supply based on the concept of regional carrying capacityas depicted in Fig. 9 and elaborated in Fig. 10 is imperative. The supportive capacityof die regional environment will determine the quantity of the water resourcesavailable and the assimilative capacity of the water body would determine its qualityto qualify for the intended use.
5.2 Source Protection and Water Quality MonitoringAll the treatment plants evaluated draw raw water from surface sources
aHhoughinafewcases the treated water supply is supplemented with tubewell waters.The chemical quality of raw water (Table 2) in general is within the limits prescribedbyCPHBEO. However, there are very few, if at all, water works which have a regularprogramme of raw water quality monitoring and surveillance.
The very first step in assuring a safe and acceptable public water supply isprotecting the source from pollution so as to minimise the future liability to the healthand well-being of the water consumer and the economic burden to the water supplyagency. With shrinking freshwater resources, the quality of raw water supplies maybe expected to deteriorate as a result of industrial and domestic waste discharges.This could be mitigated by judicious management and oversight of land use and humanactivities within the watershed involved. The principles to be followed in a water supplysource protection programme and the areas of concern to be incorporated into amonitoring and inspection programme are illustrated in Armexure VI.

28
Table 5
PLAN OUTLAY ON WATER SUPPLY AND SANITATION
Plan
3rd plan
4th plan
5th plan
6tfa plan
7th plan
Total outlay Outlay on water %supply and sanitation Total outlay
(Rupees in Croies)
8,576.5
15,782.5
39,426.2
97,500.0
180,000.0
105.7
458.9
1091.6
3907.80
5547.64
1.23
2.91
2.77
4.00
3.08
Source : "Institutional and financial issues relating to urban water supply andsanitation sector during the Eighth five year plan (1990-1995). Reportof the Sub-Group on Financial and Institutional Issues. Ministry ofUrban Development, Govt. of IndiaApnl 1989.

Economic ProgressQuality of Life
<
f>Output 1
. DBVBLOPMgMTALACTIVITIES
Input
yResources
\Hastes/Residuals
Environment
29
SupportiveCapacity
AssimilativeCapaci ty
CARRYING CAPACITY
FK3. 9 ELEMENTS OF REGIONAL CARRYING CAPACITY

R*ut*[Dornest ie /industrial ]
Sowrce ]
FIG. 10 MACRO AND MICRO ANALYSIS FOR WATER SUPPLY PLANNING
| Tield Estimotien j
Quality AtMssment
Purificatten
Transportation ftOistrikvtton
Operation ftMaintenance
Health Education
Impact Assessmentindutfna test benefit
anolrsit
ProjectImplementation

31
5.3 Raw Water IntakeA serious difficulty often experienced in river based water supplies is the
shifting of the river flow away from the intake works during lean months, especiallyin summer. Construction of bunds/channels to divert the flow to the intake involvesconsiderable expenditure of a recurring nature. On the other hand, there exists theproblem of silting of intakes during floods in monsoon causing difficulties in pumpingand quick wear and tear of the pumps. There have been instances of flocculators andsettling tanks being rendered inoperative due to deposition of silt carried over from theraw water. These point to the need for a careful study of the river regime prior to theselection of site for location of intake and appropriate provision in the design to mitigatethe problem.
5.4 Treatment Flowsheet and Process DesignAnalysis and review of design norms for the plants evaluated indicate that the
design criteria followed are,in general, within the range recommended by CPHEEO(AnnexureVlI). However, a decision on treatment flow sheet is often made as a matterof routine and not based on assessment of raw water quality and treatability studies tomeet the specified quality standards. There have been several instances where aerationhas been provided for raw waters drawn from flowing streams and rivers though thedecision is not dictated by water quality considerations. The high cost of such units doesnot justify the seemingly enhanced aesthetics of the plant. Further, the treatment plantsare designed unit by unit without considering the interactive nature of the constituentunit operations influencing the functionality and cost of the system as a whole.
5.5 Flow Measurement and controlA knowledge of the plant inflow is of vital importance for effective operation
and control of the various units, be it chemical dosing or division of flow betweenthe operating units. The evaluation study has revealed that in a majority (57%) of theplants, a reliable system of measuring the plant inflow is absent or where installed isdefunct for one reason or another. Often, the plant inflow is reckoned with the ratedcapacity of the pumps, which can be significantly different from the true value. Lackof reliable information on plant flow also leads to wasteful use of chemicals and otherresources. Use of even a small excess of chemical(s), especially in large plants, canmean a significant drain on the resources in the long run. Further, any effort ataugmentation of treatment capacity should be preceded by a critical appraisal ofthe existing facilities for their potential to handle larger flows for which a sound systemof flow measurement is a pre-requisite.
It has been observed in a few instances that when a sub system of a treatmentplant is designed as multiple units to operate in parallel, division of plant inflowequally between the units is not achieved due to defective construction resulting inunequal hydraulic grade line.Coirective measures for such deficiencies are neithersimple nor practical. A sure remedy is to ensure extra care and attention right at thetime of construction to eliminate such contingencies.

32
5.6 Chemical dosing and controlProvision forpre-chlorinationand lime addition has been made in a number
of plants. Pre-chlorination while improving the quality of raw water, also aids incoagulation and in the control of biological growth in settling tanks and filters. Limeaddition is practised to improve coagulation. The evaluation study has revealed that theaddition of these chemicals is often indiscriminate and not supported by laboratorytesting of water quality and treatability studies. Dosing of these chemicals, when notrequired, would only add to the cost of O & M without commensurate improvementin water quality.
Filter alum has been invariably used for coagulation of turbid waters. Inorder to facilitate gravity flow of the chemical solution to the point of application,the alum solutionizing tanks are usually located in the first floor of the chemicalhouse. The preparation of alum solution involves lifting of weighed quantities of thechemical manually to the solutionizing tanks, admitting a measured stream of water andkeeping the contents stirred by mechanical or other means to maintain a uniformconcentration of the solution. This operation is labour intensive and often not adequatelysupervised. A cost effective alternative, which will be free from most of theseproblems, is to construct the alum solutionizing tanks at ground level and to lift theprepared solution to the dosing tank by means of chemical pumps.
Also.the maintenance of alum solutionizing facilities and dosing equipmentinvariably leaves much to be desired. The constant head alum dosing gear is often ina state of disrepair due to corrosion and lack of proper maintenance. In many plantssurveyed, adequate stock of chemicals (Alum, lime and chlorine gas / bleaching powder)to last for even a few days was not maintained.
5.7 Coagulation and FlocculationThe manner of addition of alum solution to the incoming flow of raw water
is often not conducive for achieving good results. Point addition of alum in the rawwater channel is most common. The crude method of dumping alum blocks into the rawwater channel, especially during high turbidity season, -is also a common observation.Such practices not only lead to wastage of costly chemicals but also result in poorquality of product water. A simple, effective method of ensuring uniform dispersionof the coagulant is to add the solution through a perforated pipe placed across the entirewidth of the raw water channel just upstream of the .measuring weir. The turbulencegenerated at the weir would facilitate mixing of the chemical.
Initial mixing of chemicals and subsequent flocculation are usually achievedby electrically driven mechanical devices. While these devices function effectivelywhen operated and maintained properly, a tendency is evident among designengineers to overlook,if not ignore, consideration of simpler alternatives especially forsmall plants (upto 10 mid) where skilled operation and maintenance and adequatesupervision can not always be ensured. In such cases, hydraulic mixing devices could

33
provide a simple alternative consistent with functional efficiency. Similarly,hydraulic and pebble-bed flocculators could be equally effective as conventionalmechanical flocculators.
In a number of plants addition of alum is totally dispensed with during periodsof low turbidity (less than 20 NTU) on grounds of effecting economy. However, thisis achieved at the cost of product water quality. It is well established that a nominaldose of alum is a must for ensuring satisfactory bacteriological quality of filtered water.The nominal dose of alum also helps in better removal of other suspended impuritiesduring filtration. In contrast with the above practice, there have been instances whenalum is added to the incoming raw water but provision made for rapid mixing andflocculation is not used for effective pre-treatment.
It has also been observed in a few plants treating impounded waters of lowturbidity, that recycling a part of the clarifier sludge or retaining it in the clarifier for alonger period without desludging, aids in flocculation. The extent of recirculation andthe season when this could be practised with advantage will be site specific andtherefore, have to be decided after adequate field trials only.
5.8 Sedimentation
In large plants circular clariflocculators with provision for mechanical sludgecollection are most commonly used while horizontal-flow rectangular settling tanks orupflow sludge blanket clarifiers have been used in plants of smaller capacities.
Overloading of the clarifiers beyond the design limits has been a commonobservation in a number of plants. On the other hand.there have been instances when,because of continued drought conditions, some of the plants are very much underloaded.
Clariflocculators, with rotating bridge and sludge scraper arms are renderednon-functional during times of heavy silt accumulation. This contingency arisesespecially with plants treating highly turbid waters carrying considerable silt, foreffective removal of which provision is lacking in the design. Failure of flocculationand sludge removal mechanism during such critical periods results in forced shut downand reduced plant output. Lack of preventive maintenance of clarifier equipment is alsofound to result in their failure and pre-mature replacement.
In smaller plants which can not readily command technical resources, supportservices and competent personnel for operation and maintenance, horizontal-flowrectangular settling tanks without mechanical sludge removal are much to be preferredas space is generally not restricted and labour for cleaning the tanks is readilyavailable. Furthermore, a properly designed horizontal-flow rectangular settling tank,because of its better hydraulic efficiency, when overloaded, can still produce asatisfactory effluent as observed in the present study.

34
5.9 FiltrationWith the exception of a few plants which have both slow and rapid sand filters,
all the plants evaluated had conventional rapid sand filters. By and large, thecondition of the filters and their maintenance have been far from satisfactory. Most ofthe filter appurtenances such as filter rate setter, rate indicator, the rate controlequipment and the loss of head indicators were defunct for one reason or another. Rapidsand filters in general are backwashed once in 24 hours as a matter of routine with noregard to filtrate turbidity or the head loss development. Maintenance of the filter bedsin general has been poor as evidenced by the presence of mud balls, filter cracks,mounds and craters due to improper and inadequate backwashing, and defective/damaged underdrains resulting in unequal distribution of compressed air and backwashwater. While provision for backwashing in itself has been inadequate in manycases, absence of air scour due to non-functioning of air blowers/compressors resultsin inadequately cleaned filters with attendant problems. Many of the filters were insuch a bad shape as to warrant complete overhauling. Only in 47% of the water workssurveyed.the filters produced a filtrate with a turbidity less than 2.5 NTU, the standardprescribed by CPHEEO (Tablé 4).
In the tight of the most common observation that the rate setters, the filter ratecontrollers, and the rate indicators installed at the outlet of rapid sand filters are defunctand do not serve the intended purpose, there is a need for a simpler and rugged systemof rate control. This can be achieved by "influent flow-splitting" with the help of weirswhich divide the incoming water equally among the filters. As the filtration proceeds,the water level in the filter rises to compensate for the headloss buildup. This methodof filter control eliminates the need for expensive rate controllers and loss of headindicators. However, the filter box must be slightly deeper as the sill of the outlet weirwill be in level with the top of the sand bed. In view of the many advantages, this systemof rate control has much to commend for adoption, especially in smaller plants.
In traditional water works practice, the rapid filters and the pipe gallery areusually housed in a permanent building. This facilitates all weather operation of thefilters, especially in places with extreme weather conditions. Housing the filters hasalsobeenamatterofindividualpreferenceofthedesignengineer. However, oflate, dueto steep escalation in cost of water works construction, there have been welcomedepartures, in that the filters are 'open to sky' for effecting economy consistent withfunctional efficiency. Only the filter gallery is housed under a roof to enable allweather operation. The evaluation study has shown that not providing a roof overthe filters does not in any way affect their routine operation and maintenance but canlead to considerable economy (upto 30%) in construction cost.

35
5.10 DisinfectionDisinfection using chlorine gas/bleaching powder has been provided in all the
plants without exception. However, the practice leaves much to be desired both inmetropolitan plants and small works alike. Often, the chlorine dose is fixed arbitrarilyand not based on laboratory tests for chlorine demand. In niany cases, the bleachingpowder used has been of sub-standard quality and the problem is further aggravateddue to poor storage conditions. The chlorinators are characterised by leaky joints andcorroded parts, with the result chlorine gas from cylinders/tonne containers conveyedthrough pipes is directly bubbled into the raw/filtered water channels. The chlorinationrooms do not often satisfy the minimum safety requirements recommended by CPHEEO.
The survey has shown that only in 73 % of the plants evaluated, disinfectionhas been effective as confirmed by the absence of coliform group of organisms in thefinished water. In many plants facility for testing residual chlorine was lacking.
5.11 Laboratory for Plant controlThe general observation that the quality of final product water meets with the
CPHEEO recommendations does not necessarily imply that all the treatment units areoperated properly and function at their optimal level. For example, inspite of a poorquality of settled water, the filtrate turbidity could be within the acceptable limit butachieved at the expense of shorter filter runs than otherwise possible.
The need for routine laboratory tests for plant control needs no emphasis. Atthe minimum, these should include tests for turbidity and pH of water at various stagesof treatment and residual chlorine in finished water so as to ensure effective control onchemical dosing and plant operation. Further, for plants treating waters of fluctuatingquality, especially turbidity, a jar testing machine is essential to determine theoptimum chemical dose(s). In many a plant evaluated, facilities for these tests werenot available at the plant site. While most of the plants wereunderequipped, there werealso instances where the facilities available were not fully utilised. Lack ofsupervision, non-availability of competent staff, meagre allocation of funds and lackof interest and motivation among the staff were the major constraints for this not-so-happy situation.
5.12 Plant Maintenance and RecordsProper planning and scheduling of routine operation and maintenance activities
are vital in ensuring the functionality of water works. Presently, such an organisedsystem with effective supervision and managerial control is absent in most of the plantssurveyed. The maintenance, is by and large breakdown oriented and the conceptof preventive maintenance is rarely in vogue. The essential elements of an organisedmaintenance programme are outlined in Aimexure VIII and a detailed list ofmaintenance activities which can serve as a guide are presented in Annexure DC.

36
Another common observation, especially in the case of older plants, is the non-availability of relevant information and records pertaining to the plant. These includedetailed plans and drawings of each one of the components of the water works,O& M manuals, schedule of daily operation, schedule of inspection of machinery,records of equipment, records of water quality, recordsofkey activities of O&M, staffposition and inventory of stores. Knowledge of and ready access to this informationis vital for proper operation and maintenance of the plant, its performance appraisaland for planning facility expansion.
5.13 Plant Personnel, Training and Manpower DevelopmentThe performance of a plant will only be as good as the designer, the builder and
more importantly the operator allow it to be. Even the best designed and constructedplant cannot perform well in the hands of a poor operator. Therefore, competent plantpersonnel is a sine quo non to produce, at all times, a consistently good quality, safewater meeting the prescribed standards. A critical appraisal of this issue has broughtforth a few significant observations.
In most of the plants maintained by local bodies, there are too many plantpersonnel, especially at the lower level and their productivity is far from satisfactory.With the result, they constitute a major source of drain on the revenue receipts of thewaterworks. Excepting in a few states there are no well-defined norms prescribed forthe number of personnel at various levels vis-a-vis the size of the plant and treatmentflow sheet. Neither are their job descriptions clearly laid down. The other side of thecoin is that a definite policy for career and man-power development of plantpersonnel is lacking. Also, proper motivation and incentives aimed at development oftechnical skill and knowledge in plant operation with commensurate salaries appearsto be missing. In the light of a critical review and appraisal of the norms currently invogue, the recommended staffing pattern for water works is indicated in Annexure X.
Plant operators seem to be the weakest link in water supply sector due to lackof training and training facilities. Only a few states have established their own trainingcentres, mostly located in metropolitan cities but also catering to the needs of localbodies. While a number of training courses are organised by several agencies under thesponsorship of CPHEEOfor middle and higher level personnel, adequate programmesare not available for sub-professionals like filter operators and attendants.Necessarily .these courses have to be designed by *the state agencies in the locallanguage keeping in view the educational level of such personnel.
It is also observed that some of the training courses are essentially classroomoriented without adequate practical or "hands-on" training. This imbalance in thecourse contents needs to be removed through aproper blend of theory and practice. Alsoa system of certification of plant operators would seem very necessary in the light oflarge investments made on sophisticated plants to ensure their satisfactory performance.Necessary legal provision to this effect should be made by all the states. A system ofgradation of the operators should be devised through a National or State Board.

37
Another important observation regarding training programmes is the absenceof a follow-up by the funding agency and feed-back from the user departments. Anin-built mechanism by which the funding agency has ready access to informationregarding the post-deployment and performance of the trained manpower is lacking.Periodic review leading to measures for upgradation of technical and managerialskills through a continuing programme of career and manpower development of plantstaff at all levels should be undertaken.
5.14 Organisational and FinancialThe institutional structure for management of water supply in different states
takes different forms such as Public Health Engineering Departments (PHEDs), WaterSupply and Sewerage/Drainage Boards, Municipal Corporations, Municipalities etc.While uniformity in structure may not be feasible because of diverse local factors, thereshould be only one organisation in one urban area which will be fully responsible forwater supply and accountable to the public.
Very few local bodies have adequate qualified and competent engineering andtechnical personnel for planning, designing and implementing water supply projects ontheir own. Works of capital nature are, therefore, invariably assigned tothePHEDor Water Supply and Sewerage/Drainage Boards. While local bodies should take onthe full responsibility for operation and maintenance of water supply systems,experience has shown that most of them are reluctant to do so because of their weakresource base.
Limited experience has shown that privatisation or allowing commercialorganisations to manage operation and maintenance of water services could be effectiveand prevent valuable assets from deterioration. It is worth testing out this experiencefurther by incorporating, if necessary, appropriate statutory changes ia the charterof local governing institutions.
A major constraint in effective operation and maintenance of water supplysystems has been inadequate financial resources. Because of several contributingfactors, the revenue receipts from water supply rarely meet the expenditure incurredin the production and distribution of potable water. The shortfall is usually madeup,if at all, through other sources of revenue.
The problem could be tackled with recourse to the following :(i) Effective management of existing production and distribution facilities andgood-house keeping. Pilot studies conducted by NEERI in a number on Indiancities have shown that 17-44 % of the total water supplied is lost throughleakages and wastage from the distribution system. This is not only a loss ofprecious resource but also a drain on the revenue income of the water agency.Through an organised system of waste assessment, leak detection and controland preventive maintenance of water distribution system, the leakage could bereducedtolessthan 10 percent. This means postponing the need for capacityaugmentation or saving in the capital cost required for facility expansion, and

38
(ii) Application of the principle of cost recovery With recourse to metering ofsupplies, cross-subsidisation and progressive tariff structure with dueconsideration to serve the economically weaker sections of the population.
It is imperative that the water supply system must generate necessary funds tomeet the annual cost of operation and maintenance and to provide for a reserve formeeting the capital expenses for future improvement to the system. This will requiresuitable restructuring of water rates and tariff based on the cost of production, operationand maintenance and effective Collection of the same. It would be difficult to collectthe entire cost from the beneficiaries. But the systems have to be maintained properlyto utilise the investment already made and infrastructural facilities created and toprovide the basic need of water supply to the people. It might, therefore, be desirable tosubsidise the operation and maintenance for some period, say for (the next) S years. Itis expected that during this period the concerned local bodies will take appropriateaction to meter the supply and levy appropriate charges to recover fully the cost ofoperation and maintenance and any otherçharges of the water supply system. TheGovernment may decide on the quantumof subsidy to be provided for operation andmaintenance to each individual local body based on die actual financial positionand performance record of the local body.
5.15 Management Information SystemAn organised management information system (MIS) for collection, storage,
retrieval and dissemination of information on urban water supply has been lackingin most of die states. Such information is crucial and a vital input for effective planning,monitoring and policy formulation. A typical format for MIS data base for urban watersupply is given in Annexdre XI.
5.16 Public RelationsPerhaps, one of the most neglected aspects of water works management has been
public relations. The local elite and the common public in general are ignorant aboutthe source of their water supply, the various steps the water goes through before it isturned into a potable product, the complexities and cost involved in the process oftreatment and distribution. A general awareness and appreciation of this informationcould enlist the goodwill and cooperation of die consumers and pave the way for betterrelations" between the two. This could be achieved through the media, handouts, popularlectures and brochures and through 'fcpertdays' when the public are allowed free accessto the waterworks.
Voluntary agencies can piiy a useful toUf M Improving the quality of serviceto community from local bodies, facffibte community level dialogue in planning,motivation and monitoririg of water supply.

39
5.17 EpilogueSumming up, the present scenario of water works management in general is
less than satisfactory, if not gloomy. Planning for urban water supply is characterisedby a never ending race to catch up with the growing needs of the galloping populationand the depleting fresh water resources. There have been design and constructiondeficiencies leading to poor functionality of treatment plants. The weak resource baseof water supply agencies and the consequent meagre allocation of funds for O & Mcompounded by the apathy and negligence of the plant staff on one hand and the laxityand complacency among the supervisory staff on the other, have resulted in the pooroperation and maintenance of the valuable assets and decreased quality of serviceto the public. There is an imbalance in the staffing pattern reflecting in the sub-optimalperformance of plants and erosion of revenues. The overall situation points to the needfor innovation, dynamism and professionalism in this vital sector so as to guarantee tothe urbanités, adequate supply of safe water on a sustainable basis, a pie-requisite toattain the goal of "Health for AU by 2000 A.D."

40
RECOMMENDATIONS
The following recommendations emerge from the field observations of thesuivey teams, a critical appraisal of the performance and current status of operationand maintenance of water works and detailed discussions with senior engineers ofState PHEDs/Water Supply Boards,supervisory staff and plant personnel. Specificrecommendations for the individual plants evaluated are incorporated in Part H of thereport.
* A holological approach to the resolution of the problem of urban watersupply based on the concept of environmental carrying capacity is essential fora sustainable, long term solution.
* In keeping with the National Water Policy, highest priority should beaccorded to the drinking water needs while planning wafer resourcesdevelopment projects. Interaction and co-ordination between the variousagencies dealing with water should be ensured to minimise conflict of views andinterests. As part of long term planning, assured sources of water supplyincluding conjunctive use of surface and ground water to meet the needs ofcities should be identified and their linkages established with irrigation andmultipurpose projects.
* In order to achieve the U.N. goal of 'Health for AU by 2000 A.D.' andkeeping in view the backlog in coverage of urban water supply on one handand the growing needs on the other, there is an imperative need for increase inPlan allocation to the sector.
* There is equally a need for a more realistic estimate of water needs throughaccurate projection-of future population based on past growth trends, per capitawater demand and the requirements of other sectors of development.Augmentation of supply should be so planned and implemented that by the timethe existing capacity reaches its saturation, the facility expansion goes onstream.
* For effective administration and management of urban water supply thereshould be only one organisation in one .urban area fully responsible andaccountable to the public and vested with total autonomy, both financial andfunctional.
* A regular, organised programme of raw water quality monitoring andsurveillance need be undertaken by water supply agencies in order toimplement appropriate preventive and corrective measures for preservation andprotection of water quality and to obviate, in the long run, the need for complexwater treatment facilities or alternative sources to meet the quality standards.

41
* The design of treatment flow sheet should not be decided as a matter ofroutimbutbesedon alongteim assessment of water quality and scientificallycarried out tmatabUity studies to meet the prescribed standards of finishedwater quality.
* In the light ofthe recurring problem of silting of intakes experienced by waterworks based on river sources, a detailed study ofthe river regime should precedethe decision on siting of the intake. In order to mitigate the problem, a stillingchamber between the intake and the sump well should be provided togetherwith appropriate means for continuous/periodic removal of silt.
* It should be made mandatory for all water works to install mastermeters(Vcnturi/Orifice type) at the raw water pumping station(s) or a measuringflume/weir in the raw water inlet channel with appropriate indicating,recording and integrating system to provide accurate information on raw waterinflow which is vital for plant operation and control. The mastermeters shouldalso be installed in the clear water pumping stations to facilitate maintaininga record of the quantity of finished water put into the distribution system.
* In large plants handling considerable quantity of alum, the traditionalpractice of carrying manually alum blocks to elevated alumsolutionising tanks,which is beset with problems could be dispensed with in favour of ground levelalum solutionising tanks and dosing by chemical metering pumps.
* In small plants which cannot afford technical resources, support servicesand competent personnel for operation and maintenance, simple, proven systemssuch as horizontal-flow rectangular settling tanks (without mechanical sludgeremoval mechanism) should be preferred. Similarly, baffled hydraulic mixingdevices and pebble-bed flocculators, when properly designed could providesimple alternatives to conventional systems without compromising on thefunctional efficiency.
* In the light of the most common observation that in conventional rapid sandfilters, the filter rate control system is invariably defunct, the simple systemof influent flow splitting could be adopted with advantage, especially for smallplants (upto 20 mid).
* A well equipped laboratory with adequate and competent staff shouldform an integral part of all urban water works to ensure effective plant controland production of safe water at all times with minimum cost.
* Meagre allocation of funds and lack of management supervision have beenthe major contributing factors to the present unsatisfactory status of O & M of

42
water works. Measures to improve the financial resource base, especiallyof local bodies could include : i) systematic and regular waste and leakage surveyand detection followed by prompt corrective measures to bring about a reductionof the shortfalls in water production and improve the financial returns fromwater tariff, ii) levy of realistic water tariff for domestic, commercial andindustrial uses and full realization thereof, iii) concessional power tariff forwater works similar to that for agricultural purposes, iv) grant-in-aid from theState/Centre to the deserving cases based on their performance and v) infusionof professionalism in water supply management including selectiveprivatisation, if necessary.
* The most commonly prevalent'the squeaking wheel gets the grease' approachto the maintenance of water works should be discarded forthwith in favour ofan organised system of preventive maintenance with effective higher levelsupervision to improve functional reliability and productivity of waterworksas a whole.
* In large plants such as those serving metropolitan cities, introduction ofautomation should be considered as a time and labour saving measure and toensure quick response to changes in water quality and operational control.
* There is an urgent need for rationalisation of water works staffing pattern thatwould ensure effective operation and maintenance of costly assets, improveproductivity and reduce O & M costs.
* A system of certification of sub-professionals such as filter operators shouldbe evolved at the state level based on guidelines to be formulated at the nationallevel to ensure effective operation and maintenance of treatment plants.
* A continuing programme of training and manpower development aimedat upgradation of technical and managerial skills of water works personnel atall levels should be implemented by the water supply agencies. State leveltraining centres with adequate infJrastructural facilities should be established fortraining of sub-professionals. Necessary allocation of funds in the budget for thepurpose should be made mandatory.
* For effective planning, monitoring and policy formulation, an organisedManagement Information System (MIS) should be established at each statelevel for collection, storage, retrieval and dissemination of information onwater supply with appropriate linkages at the national level.
* There is an urgent need for enhanced support to R & D aimed at developmentof innovative and cost effective systems for water supply and treatment withrecourse to Operations Research tools.

43
RELIABLE FLOW MEASURING SYSTEMA PREREQUlsrrE FOR PLANT CONTROL
WELL MAINTAINED CHEMICAL DOSING SYSTEM- A RARE SIGHT

44
•;siNGLE;;::.pön^:;:'At>öl^^
CHEMICAL DOSING THROUGH A PERFORATED PIPE- SIMPLE BUT EFFECTIVE

45
SILTED SEDIMENTATION TANKS AND AQUATIC WEED GROWTHRESULT OF NEGLECTED MAINTENANCE
CLARIFIER FLOODED DUE TO OVERLOADINGNOT AN UNCOMMON SCENE

46
A SAND FILTER WTTHOUT FILTER SAND !
UNIFORM DISTRIBUTION OF BACKWASH WATERPROOF OF GOOD DESIGN AND OPERATION

47
A WELL EQUIPPED LABORATORY- VITAL FOR EFFECTIVE PLANT CONTROL
GOOD HOUSEKEEPING
AN EXAMPLE TO FOLLOW

.' " • e t . - , . " _ . . •'•'•'.!• • '••!••> • Ur''t? 4! : ' : ;
• : . \ '•" , • . - ! ' : - ä ' ; " V ' * ;
' . " ' ' , • , . ' ' - • , • • • ] > . ' •
• • ' i ï 1 ( ' ; ' ' ' ! ' >i
' - • T : . • - . " r ••'•!• . . ' • • ' ' • • L , ,._
• ' ! • • ; ' . ' ^ . â y 1 * 1 1 ' 1 " " " ^ 1 ! . ' " ( • : ' • " • • ' . • i ; ! : ! 11 ' V - •;• ' •' "
ANNEXURES
, • : !

48
Annexure 1
PRÜFOKMA FOR SELECTION OF WATER TREATMENT PLANTS
1. Name of Waterworks :
2. Location ;
3.
4.
5.
6. .
7.
8.
Year of construction
Design capacityof the plant
Design population
Augmentation/Modification, if anywith details
Present yield
Population (1981 census)of the city/town servedby the plant
9. Plant ownership
10. Agency in-charge ofoperation & maintenance
11. Source of raw water
12. Treatment flow sheet
SIGNATURE OF THE AUTHORITY

49
Annexure II
PROFORMA FOR COLLECTION OF ENGINEERING AND TECHNICALDATA FOR WATER TREATMENT PLANTS
Name/Location of Plant
1. Source of Raw WaterRiverLakeCanalImpounded reservoirAny otherLow Water Level (LWL)High Water Level (HWL)Expected yieldMaximum
Minimum
2. Raw Water Intake —Distance from the treatment works (famish details of intake with drawings)ScreensType (removable, fixed)Size of openingsArea of openingsMethod of cleaningSource(s) of Pollution, if any, in the vicinity (within 1 km) of intakeLocation and distance from intakeQuantity of waste dischargeCharacteristics (Physical, Chemical and Bacteriological) of the waste
3. Raw Water PumpingNo. of pumpsType (Furnish detailed specifications)Capacity of each pumfStandbyDiameter of rising main/gravity main
4. Raw Water Flow Measurementand ControlType of flow measuring device
— B e t a U e d dimensions ~~~^'Capacity : DesignMaximumProvisions for Flow rate indicator

so
_ Integrator (Total Row Meter)I> Flow Recorder
Arrangement for raw water flow control with details
5. Pre-treatment
CoagulationChemicals used for coagulationPoint(s) of applicationDesign doseType of feeda) Wet feedb) Dry fetfö
If wet feed, strength of solution used# No. of tanks> Size and capacity of each tank
If dry feed, give detailsDosing equipmentTypeDesign capacityMethod of dose controlPipes carrying the chemicalsMaterialSize
Chemical Mixingi) Mechanical
^ Size of flash mixer chamberDetention timeType of mixer (furnish details with drawings)Speed rpmHP.
ii) Hydraulica) Hydraulic Jump sketch with all dimensionsb) Channel typeLength of channelVelocity in channel for average flowNo., size and spacing baffles/finsIf fins, angle at which placedDetention time

51
Flocculatiun
i) MechanicalNo. of unitsDimensionsDetention timeNo. and size of paddlesSpeed : rpmHP.
ii) HydraulicType : end to end over and underNo. of tanksDimensionsNo.,size and spacing of bafflesVelocity at reduced SectionDetention time
6. Sedimentation
Type of unitHorizontal flowVertical flowMixed flowRadial flow
Geometry of unitSquareCircularRectangularNo. of units and dimensions of each unit(Furnish detailed drawings)Detention timeDesign surface overflow rateInlet arrangement
i)Weirii) Single pipein) Multiple pipeiv) With baffle boardsv) Baffles with multiple openings
Outlet arrangementi) End weirii) Circumferencial weiriii) Troughsiv) Orifices

52
Method of sludge collection and removalDetails of mechanical scraper (if any)In case of sludge blanket typeSide water depthSlope (hopper bottom)Bottom dimensionsInlet pipe diameterMaximum design depth of sludge blanketNo. and dimensions of clear water troughsMethod of sludge withdrawal
i) Hydrostatic removalii) Manual cleaningiii) Pumping
Method of sludge disposalLagoonWater courseTreatment
7. Filtration
Filter typeRapid gravityPressure filterSlow sandDual mediaPrinciple of operation
i) Constant rateii) Declining rate
Rapid Gravity FiltersNos. and size of filtersDesign rate of filtration
AverageMaximum
FreeboardNormal depth of water above sand bedMaximum permissible headlossNormal filter runFilter media detailsSand a) Effective size
b) Uniformity coefficientc) Depth

53
Supporting gravel, if anya) No. of layersb) Depth of each layerc) Size of each layer
Underdrainage systema) Typeb) Size lateralsc) Spacing of lateralsd) Diameter and spacing of openingse) Size of manifold
If any other type-give detailsWash water troughsShape and sizeNumbersSpacingLip elevation above unexpended sand bedSize of wash water gullet
If gyphon discharge systemNo. of syphonsSizeSpacingPiping : Influent pipe size Velocity
Effluent pipe size Velocity
Backwash arrangementsMethod of filter backwash Water/airSource of wäshwaterBackwash water tank capacityElevation with respect to filter bottomBackwash header pipe sizeWashwater outlet pipe diameterBackwashpipe diameter (of delivery) for each filterSurface wash details (if provided)Design backwash water rateControl loss of head while backwashingDesign per cent wastage in backwashingAuxiliary scour with compressed air (if used)Design rate of air supplyDelivery pressure - Duration of air supplyH.P of compressor motorCompressor capacityStorage tank capacityHow measuring devices for backwash rale and compressed air

34
Filter controlsType of rate controller (Furnish details)Rate of flow indicator (capacity range)Loss of head indicator (range)
Slow sand nitersShape No. and size of unitsDesign rate of filtration
AverageMaximum
Hours of filter operationFreeboardNormal depth of waterMaximum permissible headlossNormal filter runFilter media detailsSand : a) Effective size
b) Uniformity coefficientc) Depth
Supporting gravel, if any :a) No. of layersb) Depth of each layerc) Size of each layerUnderdrainage system (give details)Depth of sand scrapingMethod of sand washingQuantity of water required for sand washingPercent loss of sand in washingAverage time required to put the filter back into service after scrapingMinimum sand depth permittedAny extra filter bed area/unit providedFrequency of resanding overhaulingProvision for backfilling and draining of supernatantVentilation provided, if any
ChlorinationChlorine used asa) Chlorine gasb) Bleaching powderDirect feed or solution feedChionnator type (vacuum, pressure)CapacityMakeNumber of chlorinators

55
Average chlorine doseIf bleaching powder is usedMethod of dosingDesign capacityDose controlPoint(s) of applicationContact period provided
9. Clear or Treuled Wuter ReservoirMaterial of construction
Capacity : Compartments, if any and their capacitiesMWL of reservoirLWL of reservoirBottom reservoirFree boardProvision for :VentilationOverflowMosquito and other aquatic insectsProof arrangementAccess and cleaning
10. Clear Water PumpingSize of pump houseType of buildingType and no. of pumps H .P. - StandbyStandby powerFlow, measuring and recording devices
11. General Plant and Building DataPlant siteDistance from the cityAccess roadsRail sidingGround elevationProtection against floodingSize of propertyFencingLandscapingOutdoor lightingProvision for future expansionPlant layout

56
BuildingType of structureSize
FacilitiesDrinking waterToiletLocker roomWashroom and showerLunchroomToolroomWorkshop
Chemical StorageLocationLimeAlumBleaching powder/chlorineOtherUnloading and Handling methods and facilities
12. Laboratory Facilities
ChemicalDistilled water stillFuming cupboard and hoodJar testing machinepH meterColorimeterTurbidimeterResidual chlorine kitReagentsBalance
BacteriologicalRefrigeratorIncubatorOvenAutoclaveMicroscope
GeneralGlasswareSinksGasAirWater

57
ElectricityLightingFiie protection
13. Staff and Personnel Data
Designation No. Grade Qualification Years of Specialservice Training
if any
14. Financial AspectsCapital cost of treatment plantAnnual Expenditure
InterestDepreciationChemicals, power etc.Maintenance and repairs
Staff salaryCost of water treatment (per mid)Water RatesAnnual revenue from sale of water
15. Proforma for recording water quality parameters
Name / Location of Plant
(«eneralNature and source of sampleDate and time of collectionDate of examinationRemarks, if any
Physical CharacteristicsTemperature °CTurbidity (NTU)pH
Chemical Characteristics *Phenolphthalein Alkalinity ( CaCO, )Total alkalinity ( CaCO, )Total solids

38
Dissolved solidsTotal hardness ( CaCO, )Carbonate hardness (CaCO,)Non-carbonate hardness (CaCO,)Calcium (Ca)Magnesium (Mg)Chlorides (Cl)Sulphates (SO4)Iron (Fe)Manganese (Mn)Silica (SiO2)Sodium (Na)Potassium (K)Fluorides (F)Residual chlorine (Cl,)COD/Permanganate valueDissolved oxygen
Bacteriological QualityColiïorm (MPN/100 ml)Faecal coliform (MPN/100 ml)E.Coli (MPN/100 ml)Faecal Streptococci (MPN/100 ml)
All values except pH ans expressed as mg/L.
16. Preform« for characteristics of water works wastes
(From sedimentation tank/darifier and spent wash water)
Name/Location of Plant
General
Nature and source of sampleDate of collectionDate of analysisRemarks, if any
Physico-chemical characteristics *BOD (5 days)CODpHTotal solidsVolatile solidsTotal suspended solidsVolatile suspended solids• Except pH all values expressed in mg/L.

59
Annexure III
CHECKLIST FOR EVALUATION OF WATER TREATMENT PLANT
Name/Location of Plant
Intake
Observe and collect information on :* Condition and upkeep of the screens, problems in maintenance* Inlet port location(s), provision for isolation and selection of ports, area of
openings, etc.* Problems due to silt accumulation and its removal* Ease of access for maintenance and repairs* Source and nature of pollution in the vicinity of the intake.
Pumping and flow measurement* Avail ability of tools and spares* Facilities for day today maintenance* Problems in priming, if any* Standby unit (any provision for)* Standby power
Working condition <>r* Flow measuring device* Flow recorder and integrator (if used)* Raw water flow control deviceIf not working, reasons thereof.In case of small plants (less than 5 mgd), record now the plant inflow is regulated whena filter is shut down for backwash.
Water QualityRecord physico-chemical and bacteriological quality of water at different stages oftreatment in the appropriate proforma.
Pre-treatment* Frequency of tests for alum purity* Frequency of jar test* How does the actual dose compare with the jar test dose
Chemical dosing* Physical condition of alum solution and storage tanks, dosing equipment,
regulating valves, etc.* Protection against corrosion

60
* Material of pipe carrying alum solution* Observations on alum storage and handling* Continuity in alum dosing
Chemical Mixing and Flocculation* Working condition of mixers* Material for mixer paddle* Problems due to corrosion, if anyObserve* Roc formation - weak/satisfactory* Settleability of floes
Sedimentation* Clarity of settled water* Observed surface overflow rate* Observed weir loading* Compare these with the design values* Flow through time and displacement efficiency
FiltrationObserve* Influent turbidity* Filtrate turbidity* Rate of filtration* Initial headloss* Final headloss* Length of run* Duration of :
i) Air scourii) Backwash
* Down-time due to backwashing operation* Number of filters that can be washed at a timeAt die time of backwashing observe :* Uniformity in air agitation* Degree of sand expansion* Quality of wash water at the end of backwash* Clearance between wash water trough/gullet top and expanded sand bed* Physical condition of bed for presence of cracks, craters and undulation»Condition of filter appurtenances and problems, if any, with* Rate setter* Rater controller* Rate of flow indicator* Headloss indicator* Valves etc.Routine maintenance/servicing of the above and frequency

61
Chlorination* Separate chlorine room - provided/hot provided* Weighing platform - provided/not provided* Frequency of tests for chlorine demand* If bleaching powder is used, frequency of test for available chlorine* Strength of solution used* Actual dose of chlorine applied* Working condition of dosing equipment (chlorinator), solution tower* Type and condition of materials used for carrying chlorine solution* Observe for leaks of chlorine gas* Provision for ventilation* Safety equipment - available/not available
Waterworks Waste* Characteristics of sludge from sedimentation tank / clarifier/washwater
(Record data in appropriate proforma)* Volume of waterworks waste
(Total plant inflow - Total plant outflow)

62
Annextire IV
NOTK ON PLANT APPRAISAL
The object of appraisal is to verify and improve the functional efficiency ofthe plant components, to discover any utilizable reserve capacity for additional supplyand to ensure that adequate stocks of spares, accessories and consumable stores areavailable. The following guidelines may help in such appraisal.
Pumping StationsThe survey should assess : freedom from flood hazards, the cleanliness of pump
pits, priming arrangements, and the freedom of suction wells, suction pipes, and valvechambers from sources of pollution ; the quality, rating, capacity range and reliabilityof pump sets ; performance curves and reserve capacity for emergency intake andfiltered water pumps ; power adequacy and availability.
Chemical DosingIt is useful to check whether the dosage is in accordance with laboratory tests,
and to carry out a simple jar test on the spot for confirmation. The check should alsoensure that solution perparation and storage and chemical feeding conform to thestandard directions and that no improvizations have been adopted to cover stockdeficiency or plant disorder. Such deficiencies should be pointed out immediately andrecorded.
Coagulation and FlocculationFlash mixers and flocculators should be checked and their working conditions
recorded.Dosing efficiency and floe formation should be verified.Points of excessively high or low velocity in the flocculation chambers and
bad short-circuiting should be investigated.
SedimentationThe characteristics and functional efficiency of sedimentation basins are
influenced by their shape and size, the method of influent entry, the hydraulics of thetank, effluent weir location and sludge removal arrangements.
The basins should deliver clear effluents. The overflow tsàt and weir loadingshould be checked, sludge accumulation and decrease in quality of the passing waterare the usual defects to be looked for. Algal contamination can be decreased byprechlorination ; if such contamination persists the quality and turbidity of the influentraw water should be examined with a view to more radical measures.

63
In addition to the usual design norms for surface loading and weir overflowrates, the displacement efficiency as between theoretical detention period and actualflow through period should be a reliable parameter for a welldesigned basin. Thedegree of effluent clarity and its uniformity are good indications of the soundness ofthe design. Normally, a displacement efficiency of about 60 per cent is ideal, while afigure between 30 per cent and 50 per cent may be considered good ; if it is less than 30per cent some improvements are needed. The reserve capacity available from a basinmay be gauged by testing its displacement efficiency. If the efficiency is high enough,the basin may be overloaded in an emergency. If it is low, the test itself may help toexpose the aspects of the basin that need improvement. It is also necessary to checkthat the machinery for sludge scraping and sludge removal is maintained in goodworking order.
FiltrationThe turbidity of the influent and effluent water is reliable index of the efficiency
of filtration and also of the removal of bacteria in the case of slow sand filters.In order to assess the level of filter efficiency and its capacity for overload in
an emergency, a critical study of the following factors would be necessary; the lengthof the filter runs, filter-head buildups, the periodicity of filter cleaning and overhauling,the depth and texture of the sand layer in the filter and the condition of the filter graveland underdrain system.
In rapid sand gravity filters, a critical study would be required of the length offilter runs, the filtration rates, the duration of washing, washwater consumption, theefficiecy of filter washing, the hydraulics of filter washing, the reliability andefficiency of surface wash and air wash aids where provided, spacing of laterals,mudballs formation, loss of sand and displacement of gravel, undulations and cracksin the filter surface, consistency of filter effluent quality, general reliability of filterappurtenances, rate controllers, valves and indicators.
The actual output from the filter plant, should be studied, in quality and quantity,and the scope for available reserve capacity may be assessed. The necessity fortemporary additions at the inlet and outlet controls to cater for such overload may alsobe studied, if the initial design did not cover this aspect.
The inherent deficiencies of pressure filters also influence plant performance.The vertical type should be more satisfactory than the horizontal type. Hie surveyshould examine whether filter washing is done only with filtered water; whether inletand outlet pressure indicators are reliable; whether effluent quality is uniform; andwhether frequency of washing and consumption of washwater arenoimal. The searchfor a reserve capacity in such types of filter is somewhat restricted as visual inspection

64
of the filter bed is not possible at the time of cleaning. If the raw water is stable anddean, it can be assumed that a marginal reserve capacity exists and could be usedby increasing the pressure as much as possible with the available pumps and bystrict postchlorination; extra capacity could also be gained by working the filters .forlonger hours if normal demands required only part time working.
ChlorinationThe survey should examine the points of application from the point of view of
adequacy and of the method provided; the rating, capacity range, quality and reliabilityof the equipment; the condition of the working parts of the chlorinators and thesafety measures against escape of chlorine gas; whether the chlorine dosage is basedon laboratory tests and is applied correctly; whether the residual chlorine is maintainedin the most distant parts of the system; and the frequency and adequacy of sampling andlaboratory test.

Annexure V
CPHEEO STANDARDS FOR DRINKINC WATER
A) Physical and Chemical Standards :
The physical and chemical quality of water should not exceed the limitsshown in the table below :
S.No.
1.
2.
3.
4.
5.
6.
7.
8.
9.
10.
11.
12.
Characteristics
Turbidity(Units on J.T.U. scale)
Colour(Units on platinumcobalt scale)
Taste and Odour
pH
Total dissolved solids(mg/L)
Total hardness as CaCO3
(mg/L)
Chlorides as Q (mg/L)
Sulphates as SO4 (mg/L)
Fluorides as F (mg/L)
Nitrates as NO, (mg/L)
Calcium as Ca (mg/L)
Magnesium as Mg (mg/L)
* Acceptable
2.5
5.0
Unobjectionable
7.0 to 8.5
500
200
200
200
1.0
45
75
>30
**Cause forrejection
10
25
Unobjectionable
6.5 to 9.2
1500
600
1000
400
1.5
45
200
150
If there are 250 mg/L of sulphates, magnesium content can be increased to a maximumof 125 mg/L with the reduction of sulphates at the rate of 1 unit per every 2.5 units ofsulphate

66
S.No.
13.
14.
15.
16.
17.
18.
19.
20.
21.
22.
23.
24.
25.
26.
27.
28.
29.
Characteristics.
Iron as Fe (mg/L)
Manganese as Mn (mg/L)
Copper as Cu (mg/L)
Zinc as Zn (mg/L)
Phenolic compounds as Phenol(mg/L)
Anionic detergents as MB AS(mg/L)
Mineral Oil (mg/L)
Toxic Materials
Arsenic as As (mg/L)
Cadmium as Cd (mg/L)
Chromium as Hexavalent Or(mg/L)
Cyanides as CN (mg/L)
Lead as Pb (mg/L)
Selenium as Se (mg/L)
Mercury as Hg (mg/L)
Polynuclear aromatichydrocarbons (PAH) (ug/L)
Radio Activity
Gross Alpha activity (pCi/L)
Gross Beta activity (pCi/L)
•Acceptable
0.1
0,05
0.05
5.0
0.001
0.2
0.01
0.05
0.01
0.05
0.05
0.10
0.01
0.001
0.2
3.0
30.0
**Cause forrejection
1.0
0.5
1.5
15.0
0.002
l'.O
0.3
0.05
0.01
0.05
0.05
0.10
0.01
0.001
0.2
3.0
30.0

67
Notes:*1. The figures indicated under the column "acceptable" are the limitsupto which the water is generally acceptable to the consumers.
**2. Figures in excess of those mentioned under"acceptable" render the waternot-acceptable, but still may be tolerated in the absence of alternative andbetter source but upto the limits indicated under column "cause for rejection"above which the supply will have to be rejected.
3. It is possible that some mine and spring waters may exceed these radio activitylimits and in such cases it is necessary to analyse the individual radionuclidesin order to assess the acceptability or otherwise for public consumption.
B) Bacteriological Standards :
i. Water entering the distribution system :Coliform count in any sample of 100 ml should be zero. A sample of waterentering the distribution system that does not conform to this standard calls foran immediate investigation into both the efficacy of the purification process andthe method of sampling.
ii. Water in the distribution system shall satisfy all the three criteriaindicated below :
* E. Coli count in 100 ml of any sample should be zero.
* ColifoimorganismsnotinorethanlOperlOOmlshalJbepresentinanysample.
* Coliform organisms should not be detectable in 100 ml of any twoconsecutive samples or more than 50 % of the samples collected for theyear.
If colifonn organisms are found, resampling should be done. The repeatedfinding of 1 to 10 colifonn organisms in 100 ml or the appearance of highernumbers in any sample should necessitate the investigation and removal ofthe source of pollution.
Hi. Individual or small community supplies :E. Coli count should be zero in any sample of 100 ml and coliform organismsshould not be nwie than 3 per 100 ml. (If repeated samples show the presenceof colifonn organisms, steps should be taken to discover and remove the sourceof the pollution. If coUforms exceed 23 per 100 ml, the supply should bedisinfected.)

68
C) Virological Aspects :0.5 mg/L of free chlorine residual for one hour is sufficient to inactivate virus,even in water that was originally polluted. This free chlorine residual is to beinsisted in all disinfected supplies in areas suspected ofendemicky of infectioushepatitis to take care of the safety of the supply from virus point of viewwhich incidentally takes cace of safety from the bacteriological point of viewas well. For other areas 0.2 mg/L of fiée chlorine residual for half an hour shouldbe insisted.

69
Annexure VI
PRINCIPLES OF WATER SUPPLY SOURCE PROTECTION
The contamination, pollution and any degradation of the quality of water supplysources have damaging effects on health, well-being and economy, as well ason the general environment.
Water, being an essential of life, is one of the most valuable resources of man.Therefore, everyone has a natural right to safe, acceptable quality water fordrinking, culinary and other domestic uses.
The water purveyor, be it an individual, a utility or the municipality, has anatural right to good quality raw water.
The responsibility for preventing and abating pollution and contamination ofraw water sources rests with those who discharge, directly or indirectly, wasteproducts into the raw water sources or the land, as well as with those who causeunacceptable land use conditions within the watershed.
All water and land users are responsible for taking effective action to identifyand reduce to the lowest practical level pollution of raw water sources.
All levels of government and regional planning and water resources agenciesmust coordinate their efforts in managing, regulating and monitoring waterresources.
Land, water and air are interrelated resources, and planning for their protection,management and use must consider their mutual impacts and influences in anintegrated manner.
Where reasonable access to other water bodies is available, public watersupply source reservoirs must not be used for recreational purposes.
Primary body contact sports such as swimming, water-skiing and wading mustnot be allowed in water supply sources.
Distribution or equalizing reservoirs from which water is supplied directly tothe public requires the strictest of controls and must under no conditions orcircumstances be used for any type of recreation.

70
Control of the quality of water supply sources (including catchment basins,impoundments and distribution reservoirs) is imperative to facilitate the effec-tive and economical production of safe, adequate and aesthetically acceptablewater for domestic uses, and to enhance the economic value of the water formunicipal and industrial purposes.

71
WATER SUPPLY SOURCEMONITORING & INSPECTION CONSIDERATIONS
Watershed InspectionPhysical Conditions within the watershed, particularly near reservoirs, inrelation to :
- Erosion, sedimentation, silt movement
- Floating solids, debris, oil, grease, algal mats
- Excessive vegetative growth, unusually enriched growth of green grass(indicative of sewage contamination, e.g., by failure of septic tanks)
- Changes to water course path or conditions
- Slumping, terrain heaving, drift wood etc
Waste Disposal. Solid wastes dumping
. Disposal or spreading of sludges on land
. Oil drums, large chemical containers, other unwarranted industrial andhousehold materials, equipment, appliances, and goods
. Liquid waste discharges including septic tank effluents (pumpouts)
. Channelled or unchannelled surface run-offs orwashwater
Land Use. Changes in site use (number of people, additions to buildings, repairs or
additions to septic systems).
. Activities in watershed-recreation, waste disposal on land and injection wells,construction, forestry operations etc.
. Industrial storage facilities for fuels or chemicals.
. Aerial spraying of chemical pest or weed control agents within or surroundingthe watershed.
. Condition of any road crossing, causeways, beaches, slopes, etc.
. Grazing of domesticated animals (cattle, sheep, horses) and condition of theyards.
. Utilization of transportation corridors for the movement of materials whichmay result in contamination should an accident occur.

72
Annexure VU
CPHEEO DESIGN NORMS FOR TREATMENT UNITS
S.No. System component
1. Cascade aerator
2. Rapid mix unit
•Hydraulic
* Mechanical
3. Slow mix unit
»Hydraulic
* Mechanical
Design variable
Head required
Space required
Velocity
Head toss
Velocity gradient
Detention time
Head loss
Propeller speed
Power requirement
Velocity gradient
Velocity in channelspace bet.baffles
Head loss
Detention time
Detention time
Head loss
Power input
Paddle area
Peripheralvelocity of paddles
Range
0.5 - 3 m
0.5 - 0.65 mVmld
2 - 4 raps
15-60 cm
> 300 sec1
2 0 - 4 0 sec
2 0 - 6 0 cm of water
MOOrpm
1 - 3 watt /m'/hr
20-75 sec1
15 - 45 cm/sec
15 - 60 cm
10 - 30 min
20-30 min
15 cm
0.5 -1 watts/mVhr
10-25% of tanksectional area in theplane of the shaft
0.15-0.6 mps
Contd.

73
S.No. System component
4. Sedimentation unit
5. Rapid gravityfillers
Design variable
Surface overflow raie
* Horizontal flow
* Vertical flow
Detention time
Weir loading rate
Depth
Filtration rate
Area of one unit
Overall depth
Ratio of lengthto width
Permissible headloss
Depth of sand
Sand size
Backwash
• Air scour rate
• Wash water rate
.Wkhairscour
. Without airscour
Range
30 - 40 mVd/m1
4 0 - 5 0mVd/m1
2-2.5hr
300 - 1500mVd/m
2.5.4m
4.8~9.6nVtar
maxlOOm1
2.6 m
1.25-1.33
1.8 - 2 m
60 -75 cm
E.S. 0.45 -0.70 mmU.C. 1.3-1.7
600 - 900 Ipm/m2
atO.35kg/cm'fbr5mui
24-36 rn/hr
36m/hr

74
Annexure VIII
NOTE ON PLANT MAINTENANCE AND RECORDS
The primary goal of maintenance is to provide protection of the investment,whether it be public or private enterprise. There are three special areas ofmaintenance viz. house keeping, preventive maintenance and corrective maintenance.
HousekeepingMost of the times, the appearance of grounds and thebuildings is an accurate
indication of the preventive and corrective maintenance habits of the plant operator.Good housekeeping can help gain public support, and certainly make a lasting impressionon persons visiting the plant.
The water treatment plants (WTP) do not stay new but they can almost alwaysbe clean. A schedule for cleaning windows, washing walls and floors, and dusting isnecessary. Some maintenance items require daily attention, whereas others requireweekly, monthly, or even only annual consideration.
Proper paint is an important factor of housekeeping maintenance. Brightlypainted valve handles, clean shiny equipment surfaces and light airy interiors make aonce dull plant a pleasant place to work. Grounds beautification should also beconsidered equally as important as good maintenance of buildings and equipment. Agreen lawn adjacent to WTP, enhances the appearance tremendously. However,appearance is not the only advantage. A well kept lawn and trees keep the summertemperatures lower in buildings and prevent wind-blown dust from entering theequipment.
Preventive MaintenanceIt is of the utmost importance that all operators form the habit of keeping their
mechanical equipment in good repair. Successful preventive maintenance dependslargely on knowledge, persistent hard work, and a sincere interest. Knowledge can alsobe gained by experience.
Manufacturers should provide instructions on operation and maintenance,of the equipment which may include the following :
• information on proper method of installation, as correct installationis a prerequisite for proper operation
* lubrication instructions, which should be studied and carried out beforethe equipment is placed in operation

75
* an explanation of proper operation, so that incorrect operation can berecognized, as well as pointers to help locate reasons for failure
* procedures for dismantling and reassembling for repairs
* parts list and repair order instructions
In brief, the operator shouCTBe provided with all the essential needed for a programmeof preventive maintenance in his plant.
Preventive maintenance should be planned and scheduled operation designedto minimize deterioration and correct deficiencies on the spot. It is nothing more thana method of keeping facilities in good condition by assigning specific people to specifictasks on a predetermined schedule. It corrects defects in the early stages before theydevelop into major repairs or replacements.
Corrective MaintenanceCorrective maintenance means the repair or replacement of badly worn
parts, or parts which have physically failed in service. It refers to those situations whichhave passed the preventive maintenance stage, either gradually through normal wearand tear, or abruptly by physical failure.
For corrective maintenance, a stock of spare parts must be kept up to fullinventory, as the replacement part is generally needed yesterday. The supervisor /operator should also know which local supply house can serve him with needed materials,and which local machine and repair shop is equipped and has competent personnel toaid him, if necessary. If an efficient preventive maintenance programmeis carried out,corrective maintenance will be held to a minimum.
Plant RecordsMaintaining plant records is the keystone for good plant operation. Records
are necessary for various important reasons such as :
* an aid to better operation,
* proof of effective operation, and
* a journal for future reference
To avoid misinterpretation and confusion, records should be clear and concise,and information must be in common units. Uniformity and simplicity is necessary toassist others in making comparisons and analyses of records. With the aid of records,it is possible to determine the best time to take units out of service for repair or

76
maintenance. Trends noted in the records can serve as a guide to changes in operationalprocedures. This is especially true in a new plant or a remodelled plant whereprocedures are initially set up arbitrarily.
Records provide the basic data for proof of efficiency of operation. Awater treatment plant is designed to perform various functions and remove turbidityof raw water to a desirable limit in various unit operations. The record will indicatewhether the plant is obtaining this efficiency. If not, procedures should he studied todetermine what changes could increase the efficiency.
The use of records for future reference is of great importance. The plantincharge who will make reviews and studies of the records will be able to plan theoperations and maintenance effectively.
Equipment ManualsEach piece of equipment in operation at the plant has some type of manual,
giving all the pertinent information needed for operation, maintenance, spare partsordering, and lubrication. These manuals should be placed on file and made availableto all plant personnel at all times.
Routine Plant MaintenanceThis is to be generally accomplished by the shift operator. Each shift has its
specific duties which should be placed in a permanent record available to the operator,and subject to change. In conjunction with this, there should be a daily log listingthe equipment to be checked each shift.
Routine Operating ProcedureRoutine maintenance should be set up as a plant policy. Theçe should be
written up and placed in a permanent folder and accessible to the operator at alltimes. Any changes in operational procedures should be posted so that all the operatorsknow what is going on at all times, no matter which shift they are working.
Grease ChartThe grease chart should include all pieces of equipment that requires greasing,
which need lubrication on a monthly basis. All other equipment requiring speciallubricants and varied attention may be included in -annual maintenance schedule.
Equipment Maintenance InspectionPeriodic inspection, other than which appears on regular maintenance
schedules, pays dividends. If an operator or maintenance personnel notices that somepiece of equipment is not functioning properly, he should try to correct the faultimmediately. Whether or not the operation is corrected, the operator should reportit to the supervisor.

77
Annual Maintenance ScheduleThis schedule should include all maintenance projects for the entire year, such
as housekeeping, preventive and corrective maintenance, whether it occurs weekly,monthly, semiannually, or annually.
Daily Work LayoutA daily sheet which should be posted for three shifts, may include items
that appear on the Annual Maintenance Schedule, which are assigned in addition tonormal operational duties. There should also be some space for each operator to indicatewhether or not his work has been completed and space for his signature. The sheet mayalso have space for remarks or explanations, if necessary. The daily work sheet shouldbe made out a day ahead, giving the person in charge an opportunity to plan ahead.
Spare Furls Stock Level ControlThis record deals with the items which ate most responsible for the continuous
operation of the plant. The spare parts record should be listed on a separate sheet,following each specific piece of equipment in the maintenance record. Some unitswill have spare parts as part of the original equipment. Experience will also indicateas to which parts are critical items in the inventory.
Expendable Shop Supplies ControlBolts, nuts, nails, and screws are items which seem to be those that are never the
right size, but an adequate stock of these items will save a lot of time. A separate record,with a running inventory, should be kept which allows time to replenish the suppliesbefore they are depleted.
Tools & MaintenanceOperators can not be mechanics without tools. A plant must have good tools
and a basic amount of these are necessary, which should be available to the operators atall times. By placing all the tools on a panel board for us« and inspection, loss will bea negligent matter.

78
AnnextircIX
DETAILED LIST OF MAINTENANCE ACTIVITIES
It must be brought out «hat my «tempt to lirtmamienance activities necessarilyrefers to preventive maintenance activities compri*Jnf maintenance works andmaintenance oriented inspections. Such lists, in absence of any experience, could bedeveloped from the recommendations contained in standen! manuals viz. CPHEEOManual or from the equipment suppliers literature. The frequency recommendedfor an activity be initially adopted on an adhoc basis, keeping in view the fact mat mesanwarenrtsacrosaittaiidmattheaecowklaiidiho^
gained from time to time. The list c^siaintenanc«a^hritiespi««mtcdhHeunderi8meant to serve only as an initial guide.

79
Section/portto be attended
A. CENTRIFUGAL PUMPS
1. Bearings
2. Glands
3. Bearing«
4. Gauge*
5. Valve«
6. Exhaust pumpsand awilliaries
7. Impeller
B. ELECTRICAL MOTORS
1. Induction motor,stator and rotor
2. Slip rug device
3. Bearing
4. Windings
Maintenance to becarried out
Checking of temperature
Checking/changing ofgland packings
Checking/greasing
Replacement
Calibration
Changing of glandpacking
Checking/changing ofgland packings
Checking of impellerblades, sleeves, efficiency, rings,bearings, impeller nut etc.
Cleaning fey air blowerand general inspection
Closing of slip ringsand adjustment of carbon brushes,short circuiting jaws,oiling clutch etc.
Lubrication
Checking of motorafter taking out its rotor,dust blowing, checking ofend connections, testingof insulation, no-load testing
Frequency/TimeInterval betweentwo consecutiveactivities
2 month«
1 month
1 month
6 months
12 BMHMhfl
12 months
12 months
12 months
3 months
1 month
1 month
2 4 BtQtHsnW ' '

80
Section/ pan Maintenance to be Frequency/Tuneto be attended carried out Interval between
two consecutiveactivities
C POWER TRANSFORMER
1. Checking of silica gel, 6 monthstopping of transformer oil,temperature guage, vent pipe,voltage tap changing switch.(These works are not to beattended to in rainy season)
2. Filtration of oil, 12 monthschecking of di-electric8trength,viscosity of oil,terminal boxes, insulators,general tightening oflastners, stopping of leakages.
3. Functional test 12 months
4. Checking of core of 60 monthsthe transformer andits windings andinsulation condition.
D. SWrrCHGEARS (AIR OR OIL CIRCUIT BREAKERS)
1. Circuit breaker Checking of fastenings, 3 monthsmoving and fixed contacts,no vast coil, overload coH,interlock system, conditionof transformer oil, knifeswitches and insulation.
2. Oil tank Cleaning and topping of 12 monthsoil, checking dielectricstrength of transformer 'oil.
3. Contacts Changing of old and 12 monthssluggish transformer oilof circuit breaker changingof old and worn out contacts

81
Section/partto be attended
Maintenance to becarried out
E. ALUM DOSING EQUIPMENT
1. Saturation tank
2. Pipe and conduits
3. Measuring ofcontrol devices
Cleaning, checking ofacid resistant coating
Cleaning and removal ofdeposits
Checking and calibration
F. CLARIFLOCCULATOR AND THEIR DRIVE
1. Trolley wheels
2. Reduction gearbox
3. Turntablemechanism
4. Vertical slipring motor
5. Rail/track
6. Reduction gearbox
7. Rubber tyre ortaon wheels
8. M.S.Serapen
9. Turntablemechanisms
Lubrication
Checking and toppingof oil
Checking and toppingof oil
Dust blowing, checkingof carbon brushes,bearing etc.
Checking alignment
Checking of helicalor sporgear condition
Checking for wear andtear and its positioning
Checking feueren
Checking of ilssprockets, chains,sted balls and greaseboxes
Frequency/runeInterval betweentwo consecutiveactivities
12 months
1 month
1 month
1 month
1 month
3 months
3 months
6 mo«*«
12 months
6 months
12 month«
4 Ä .. . -M •
12 months

82
Section/ partto be attended
G. FILTERS
1. Filler media
2. Filter media
3. Underdrawnsystem
4. Sluice valvespacking
5. Guagesandindicators
6. Filter box
a CHLORINATORS
1. Indicator
2. Chlorine conveyingpipes and valves
3. Gasmasks
4. Gas leakage
5. Liquid trap
L SLUICE VALVES
1. Glands
2. Valve function
Maintenance to becarried out
Topping of sand
Checking ES and U.C
Checking of nozzles,pipes and dust etc.
Changing of gland
Checking accuracy andcalibration
Checking for leakages,cleaning. Lime washing
Checking and calibration
Checking and cleaning
Functional checks
Checking of leakage
Opening and cleaning
Chrficino and chtttlrinff ofglands in case of dailyoperated valves
Functional check in caseof rarely operated valves
Frequency/TimeInterval between 'two consecutiveactivities
6 months
60 months
60 months
12 months
1 month
6 months
1 month
lmonth
1 month
daily
lmonth
12 months
12 month«

83
Section/putto be attended
J. CLEAR WATER RESERVOIR
Maintenance to becanied out
RVOIR
1. Cleaning and limewashing of sides
2. Check for leakage
3. Check condition ofaccesses and airvents
Frequency/TimeInterval betweentwo consecutiveactivities
12 months
36 months
12 months
Note«:
1) The activities concerning valves, motors, pumps etc. are not repealed asrelevant activities will be applicable wherever these units exist
2) Some activities are based on CPHEEO recommendations with appropriatemodifications based on expérience

84
Annoxure X
RECOMMENDED STAFFING PATTERN FOR WATER WORKS
S.No. SYSTEM COMPONENT RECOMMENDED STAFF REMARKS
1. Raw water pump house Pump operator : One/shiftHelper : One/shift
2. Raw water rising main Fitter/Helper : One No.
3. Treatment plant
5. Plant laboratory
Filter operator : One/shiftHelpers : Two/shift
4. Clear water pump Pump operator : One/shifthouse Helper : One/shift
Chemist : One No.
Lab. Assistant : One No.Lab. Attendant : One No.
Pump operator should beIT1 certificate (wiremen/electrician) holder
For every eight km lengthor part thereof
For every 50 mid plant
capacity or part thereof
Pump operator should beITI certificate (wiremen/electrician) holder
For every 100 mid plant
capacity or part thereof
Note:
1. The above staffing pattern provides for the requirements at the water works only
2. Unskilled labour/mazdoor would be extra depending upon the size of the plant andspécifie needs
3. One Assistant Engineer will be incharge of plants with capacities upto 100 mid
4. For metropolitan cities with plants of capacities larger than 100 mid, the staff may besuitably increased

85
Annexure XI
MANAGEMENT INFORMATION SYSTEMFORMAT FOR URBAN WATER SUPPLY
IDENTIFICATION PARTICULARS1. Name of State/UT2. Name of the Town3. Population (as per 1981 census) : Total SC ST4. Class of Town5. Area (sq. km,.)6. No of households7. Slum (a) Nos.
(b) Population
DATA ON WATER SUPPLY8. Sources) of water supply :
PIPED WATER9. Installed Capacity (mid) :10. Actual water production (mid) :11. Adopted treatment :12. Year of installation :13. No of connections as on date
(a) House service connections :(b) Standposts :
14. Present Per capita supply (lpcd)(a) House service connections :(b) Standposts :
15. Category of present coverage : A/B/C/DA!16. Population covered by piped
water (in per cent) :17. Approximate length of
distribution network (km) :18. Water quality surveillance
Raw Water : Yes/NoTreated Water : Yes/NoDistribution points : Yes/No

SPOT SOURCES19. (a) Number of handpumps :
(b) Number of other sources :20. Population covered by spot
sources (in per cent)
OPERATING AND FINANCIAL DATA21. (a) Average cost of water
production : Rs. /1000 litres(b) Annual operation and
maintenance expenditure (Rs.)for the preceding three years 1 2
- Wages & salaries :- Consumables includingchemicals :- Others includingelectricity. . :
Total :
WATER RATE/TAX/CESS22. ' Tariff in effect since (date)
(i) Tariff (metered)a) domesticb) industrialc) commerciald) others
(ii) Water rate (unmetered)(iii) Water tax (unmetered)(iv) Cess/others, if any
23. Annual revenue earned in : 1 2 3the preceeding three years Rs
24. Name of the operation &maintenance agency :
25. Name & Designation of the :officer who furnished the information
Note A = Town fully covered - requires no augmentation till the year..B = Town fully covered - requires augmentation of service levelC = Town partly covered - needs extensionD = Town partly covered - needs augmentation and extensionE = Town having no safe water supply

87
EXPLANATORY NOTE
Item - 2. Write the name ofthe town as indicated in the Census (1981). If the townis also known by any other name, that may also be indicated withinparenthesis.
Item-4. The town is classified on the basis of population size as under:
Gassification Population size
I : 100,000 and above
II : 50,000 to 99,999
HI : 20,000 to 49,999
IV : 10,000 to 19,999
V : 5000to 9999.
VI : less than 5000
Item - 7. These items pertain to slum areas within the town. If no slum area isin the town,negative reply may be given instead of leaving the Hemblank.
Item - 8. Mention the presently exploited sources of raw water under this item.
Item - 9. State the total capacity of the existing water supply facilities installed.In case of different sources, give the break-up for respective source e.g.ground .water (20 mid) surface water from stream (30 mid) impoundingreservoirs (5 mid) etc.
Item -10. Mention present water production.
Item-11. Indicate the treatment flow sheet. For different sources, if thetreatment adopted is different, give details of the same.

Item - 12. Tnisitemreferetoyearofinstallationof watersupply system in the town.In case the water supply has been augmented the year of initialinstallation and year of augmentation may be stated. Where largediameter tube wells aie provided, indicate year-wise installation ofnumber of tube wells.
Item -15 . Under this item strike out the irrelevant code (A/B/C/D/E).
Item - 19. (a) State the number of handputnps if any .provided for drinking watersupply in the town.
(b) State the number of other drinking water sources and also indicatethe type of the source e.g. dug welts, tanks,ponds etc.
Item - 21. (a) While arriving at the cost of water production - capitalinvestment, debt service, depreciation etc. should be taken into accountalong with the establishment cost and other cost such as consumables,energy and others.

\
PART H
INDIVIDUAL PLANT APPRAISAL
•Ay

89
MUNICIPAL WATER WORKS - KURNOOL
INTRODUCTION
Kurnool town was first provided with 4.54 mid of protected water supply usingslow sand filters in the year 1914 with Tungabhadra river as the source. The supply wasaugmented to the present level of 29. S mid by tapping another source, viz. K.C. canal.The canal is fed from the barrage constructed across the river Tungabhadra atSunkesula. Presently, the Kurnool water works comprises four separate treatment plants.The plant with a design capacity of 6.8 mid with conventional pre-treatment and rapidsand filtration has been evaluated for its performance. The plant layout is shownin Fig 1.1 and the plant summary data is presented in Table 1.1. The plant is maintaintedby the Kumool Municipal Council. *
PLANT APPRAISAL
Raw water quality and flow measurement
The K.C. Canal remains closed for two months in a year for annual maintenancewhen the entire requirement is met from the river source. However, occasional waterscarcity has been reported particularly during summer. During such periods,difficulties are experienced due to change in the river flow regime. Instances havebeen recorded when the river flow had to be diverted to the intake over a distanceof 1-2 km by digging channels. Adequate provision for standby pumps has been madeat both the river and canal pump houses.
Raw water from both the sources is blended at the inlet chamber of pre-sedimentation tanks. These tanks, intended to serve as storage-cum-sedimentationunits prior to slow sand filtration, have a total capacity of 15.9 million litres. Whilesettled raw water flows under gravity to slow sand filters, low lift pumps have beeninstalled to pump settled (raw) water to the conventional treatment units, since gravityflow is not feasible. Water quality data for raw and finished water during different visitsto the plant is given in Table 1.2.
The flow measuring device, i.e. 'V* notch installed at the raw water inletchannel at the pre-sedimentation tanks was found corroded and in disuse. AVenturiflume has been provided at the inlet channel receiving raw water through low liftpumps to measure the plant inflow to the conventional treatment plant. The flowindicator was non-operational during the visit, and hence the plant inflow was computedby measuring the rise in water level in the clariflocculator over a known period. Whilethe design capacity of the plant is 6.8 mid, actual inflow was 6.4 mid and 8.17 mid asobserved during the two visits to the plant

90
Pre-treatmentAlum is used as the chemical coagulant. The chemical dosing was found far
from satisfactory. Neither alum solution of uniform strength was prepared nor the dosewas regulated. The mechanical flash mix unit was out of order and hence non-functional. Although the flocculators and sludge scraper mechanism were working,the floe formation was found poor. Not withstanding the fact that all the pre-treatmentunits satisfy the design criteria recommended byCPHEEO, their performance waspoor,primarily due to incorrect alum dose and ineffective rapid mixing. This wasevident from the settled water turbidity of 9.5 NTU as against the raw water turbidity of10 NTU (Table 1.3).
FiltrationThe filter equipment.viz. rate setters, rate of flow controllers and loss of head
indicators were found non-functional. Filter cleaning by air-scour followed by waterwash was satisfactory. The filters produced a filtrate of turbidity consistently less than2.5 NTU.
Disinfection
The filtered water is disinfected using bleaching powder. The storage andhandling of bleaching powder was far from satisfactory. There was very little availablechlorine in the bleaching powder resulting in inadequate chlorination. This wasconfirmed from the absence of residual chlorine in the finished water The turbidityof finished water was more than that of the filtrate during one of the visits caused dueto the addition of bleaching powder
Laboratory facilitiesThe laboratory equipment available at the plant include ; pH meter,
conductivity meter, jar-test apparatus and chloroscope.These were not in use as nochemist has beenposted at the plant for water quality testing and plant control.
Plant stafTThe staff at the plant include: Assistant Engineer (1 no.), Filter-bed supervisor
(6 nos.), Electrical operators (19 nos.), Fitters (3 nos.) and Helpers (12 nos.).None of the plant personnel had undergone any formal training in water works
operation and maintenance.

91
RECOMMENDATIONS
* The raw water flow measuring/indicating devices should be maintainedproperly since the knowledge of plant inflow is essential for proper controlof chemical dosages and plant operation.
* Steps should be taken to keep the rapid mix units in working condition toachieve chemical pre-treatment.
* Proper functioning of filter rate controllers and loss of head indicators isnecessary for control of filter operation. These equipment should, therefore, begot repaired/replaced.
* Proper dosage of chlorine as determined by chlorine demand test must beensured to maintain the desired level of residual chlorine in the finished water.The bleaching powder should confirm to the relevant IS specifications. As thecombined capacity of the plants is large, use of gas chlorinators should beexplored.
* A turbidity meter of the Hach type should be procured and the availablelaboratory equipment at the plant should be made use for the routine waterquality testing and plant control by appointing a trained chemist.
* The staff at the water works should be given formal training in operationand control of water treatment plant.

Rflff WftTER
FROMTANK
ITO SLOW SANDFILTERS
LOW LIFTPUMPING
CLARIFLOCCULATORS
FLASHMIXER
CLARIFLOCCULATOR
(NOT TO SCALE)
RAPID GRAVITYFILTERS
TO CWR
RAPIO GRAVITYFILTERS
TO CWR
HO 1.1 LAYOUT PLAN OF WATER TREATMENT PLANT, KURNOOL

93
TABLE 1.1
PLANT SUMMARY I>ATA -KURNOOL
GENERAL
Name and location
Year of construction
Design capacity
O & M Agency
Raw water source
Treatment flowsheet
ENGINEERING
Raw Water Pumping
: KumoolMunicipal Waterworks,Near Railway Station.
: 1965
: 6.81 mid
: Kurnool Municipality.
: Tungabhadra river & K.C. Canal
: Conventional with rapid sand filters
Tungabhadra river pump house.- 2 Nos., 125 HP & 100HP with discharge
capacity of 10,760 & 63561pmrespectively
K.C.Canal pump house--3 Nos..19,21 & 25 HP with discharge
capacity of 1000,1450 & 14901pmrespectively
Raw water flow measurement
Pre-treaiment
Coagulation
- Chemicals used
-Type of mixing
Flucculation
- Method / Type of unit
- No. & Dimensions
- Detention time
: V-notch and Parshall flume
: Alum
: Mechanical
: Mechanical/Clariflocculator
: 1 Nos., 4.88 m dia, 4.4 m SWD
: 20 minutes

94
Sedimentation
-Typeofunit(s)
- No. & size of unit(s)
- Surface overflow rote
- Detention time
nitration
~Typeofunit(s)
- No. &. size of unit(s)
«Rate of filtration
- Filter media
.Sand size
.Depth of sand
. Supporting gravel depth
- Backwash arrangements
-Method
Disinfection
-Chlorine gas/Bl.powder
Clear Water Reservoir
- Type.No. & Capacity
: Radial flow
: INos., 15.25mdia,3.5SWD
: 1.9m/hr
: 2 hr 30 min
: Rapid gravity filters
: 3 No«., 4.27 x 4.57 m
: 4.8m/hr
: E.S.-0.5mm,U.C.-1.5
: 75 cm
: 45 cm
: Air scour followed by water wash
Chlorine gas & Bleaching powder
: R.C.C., 2No.,0.68 million litres
-Pump details 50 HP-2 Nos, 15 HP-3 Nos, & 10 HP-4 Nos.

95
TABLE 1.2
PHYSICO-CHEMICAL AND BACTERIOLOGICAL QUALITY OFRAW AND FINISHED WATERS
KURNOOL MUNICIPAL WATER WORKS - KURNOOL
PARAMETER
Tuibidity(NTU)
pH
Total Alkalinity(CaCO,)
Hairiness (CaCO,)Total
Catbonate
NonCaibooate
Cilciuro (Ca)
Magnesium (Mg)
Chlorides (Ct)
Sulphates (SO4)
lion (Fe)
Fluoride (F)
ivisrr
RAW 1
10
8.7
178
206
178.
28
39.2
26.2
100
35.2
0.1
0.9
Bs*tort«Ugc«l (MPN/100 ML)
Total coUfoon
Fecal coUfotm
Fecal streptococci
93
43
43
15
FINISHED
4.5
8.7
172
204
172
32
40
26.2
102
33
NIL
0.9
NIL
NIL
NIL
NIL
II VISIT
RAW
1
8.7
188
160
160
NIL
32.8
18.9
133
22
NIL
1.5
75
75
75
43
FINISHED
0.8
8.7
182
156
156
NIL
32
18.4
133
23
NIL
1.4
NIL
NIL
NIL
NIL
m VISIT
RAW FINISHED
60
7.5
140
156
124
NIL
37
U
61
74
NIL
0.6
9300
2400
2400
2400
-
-
-
-
-
-
-
-
-
-
-
460
440
NIL
NIL
All the values except pH and iuibkfity aie expressed as mg/1

96
TABLE 13
PLANT PERFORMANCE AT VARIOUS STAGES OF TREATMENT
KURNOOL MUNICIPAL WATER WORKS - KURNOOL
PARAMETERS VISITS RAW SETTLED FILTERED FINISHEDWATER WATER WATER WATER
Tutbidity I 10 9.5 2.5 4.5(NTU)
II 1 I I 0.8
T.Coliform I 93 240 150 NIL(MPN/IOOMJ)
« 75 930 9 NIL
I 43 240 9 3(MPN/100ML)
II 75 430 9 NIL

97
RAJAHMUNDRY WATER WORKS - RAJAHMUNDRY
INTRODUCTION
Rajahmundry water works consists of three separate treatment plants. Theoldest plant is in operation since 1933 and the new one has been commissioned in 1988.The treatment plant of 12.71 mid design capacity constructed in the year 1974 withGodavari river as source was selected for performance evaluation. The plant providesfor conventional pre-treatment with alum followed by sedimentation, rapid sandfiltration and post-chlorination. The schematic flow sheet is shown in Fig 1.2 and theplant summary data is presented in Table 1.4. The plant is operated and maintainedby the Rajahmundry Municipality.
PLANT APPRAISAL
Raw water quality and flow measurementRaw water is drawn from river Godavari which is a perennial source. A bathing
ghat is located at a distance of about 300 m upstream of the intake which contributes tothe pollution potential of the source. This is evident from the high coliform count in rawwater (Table 1.5). Adequate measures for protection from floods have been taken atthé head works.
Raw water is pumped to the treatment plant where a Venturi flume has beenprovided to measure the plant inflow .The flow indicator installed at the flume was,however, non-functional.The plant inflow, as measured manually at the * V notch duringone of the visits, was found to be 10.91 mid as against the design value of 12.71 mid.
Pre-treatmentAlum is used as the chemical coagulant. Although alum solution tanks have been
provided they were not in use. A crude method of alum addition, i.e. dumping of alumcakes in the raw water channel was practised. The rapid mix unit was also found non-functional. Although mechanical floccujators were found working, uncontrolled doseof alum coupled with inadequate rapid mixing was found to result in poorcoagulation-rlocculation. Notwithstanding the fact that the plant was underloaded,considerable flooding of orifices at the clarifier outlet was noticed. This was because ofthe obstruction to the flow caused by the slimy growth at the orifices. The turbidityremoval efficiency of clarifier was found very poor as evident from the settled waterturbidity of 7 NTU when the raw water turbidity Was only 8 NTU (Table 1.6)

98
FiltrationThe filter sand used in the rapid gravity filters was found to conform to standard
specifications. The filter backwashing operation -air scour followed by water wash-wasfound satisfactory. The quantity of backwash water used was about 2.5 per cent of thetotal throughput from the filters. The filters were found to produce a good quality ofeffluent with a turbidity of 1 NTU or less.
Disinfection
The new chiorinators installed at the plant were functioning satisfactorily. Fora chlorine demand of 1 nig/1, estimated in the laboratory, the applied dose was observedto be 2 mg/l. The residual chlorine in the finished water at the clear water sump wasrecorded as 1 mg/l.
Laboratory facilitiesNo laboratory facilities are available at the waterworks excepting a chloroscope.
Plant staffThe operating staff at the treatment plant, apart from the Assistant Engineer-
incharge, includes Electricians ( 5 nos.), Filter-bed-operators < 3 nos.), Fitter (1 no.),Cleaners (13 nos.). The staff have not been provided with any formal training in plantoperation and maintenance.
Financial aspects
From the records, it was noted that the combined annual O <fe M cost in respectof the above plant and the 8.17 mid unit amounts to Rs. 26 lakhs while the revenue to themunicipality from water charges is of the order of about 10 lakh per year. The cost oftreatment works out to Rs. 0.56/m3.
RECOMMENDATIONS
* The bathing ghat situated close to the intake is a potential source of pollution.Steps should be taken to shift the bathing ghat to the downstream side of theintake.
* Uncontrolled dumping of alum cakes into the raw water channel must bediscontinued. The practice of preparing alum solution of required strength andthe application of the dose on the basis of jar test should be followed.
* Steps should be taken to keep the flash mixer in working condition toachieve effective coagulation.

99
* Proper house keeping by regular cleaning of clarifier orifices should beensured to prevent flooding and performance deterioration.
* A school is located inside the water works. It is necessary to shift the schoolpremises from the water works compound for the safety of the children andprotection of treatment works from unauthorised entry by the public.
* The plant should be provided with minimum laboratory equipment such aspH meter, turbidimeter and jar-test apparatus for better control of watertreatment plant and the staff trained in operation and maintenance.

RIVER GOOAVARI
INTAKETOWER
oCLEARWATERPUMPHOUSE
CLEARWATERPUMPS
CWR
OLD PUMPHOUSE
BATHING6HAT
STILLINGCHAMBER I
ALUM ADDITION
o FLASHMIXER
TO OLD UNIT
W7 «Id)TO
12
IIIIII
NEW UNIT
iI[
CLARIFLOCCULATORS
RAPID GRAVITYFILTERS
U-CHLOWNATOR
(NOT TO SCALE)
PIG 1.2 LAYOUT PLAN O F R A J A H M U N D R Y WATER SUPPLY SCHEME

101
TABLE 1.4
PLANT SUMMARY DATA - RAJAHMUNDRY
GENERAL
Name and location
Year of construction
Design capacity
O & M Agency
Raw water source
Treatment flowsheet
ENGINEERING
Raw water pumping
-Rising main
Raw water flow measurement
Pre-treatment
Coagulation
- Chemicals used
-Type of mixing with
Flocculation
- Method / Type of unit
- No. & Dimensions
- Detention time
RajahmundryMunicipal Waterworks,near old Railway bridge
1974
12.71 mid
Rajahmundry Municipality
Godavari river
Conventional with rapid sand filters
: 2 Nos, 25 HP, each 3 Nos, 45 HP, each
: 350 mm dia. 300 m length
: V-notch and a flume with a flow indicator
: Alum
: Mechanical mixer details 1 No.,2.3 m dia,3.65 m SWD 60 sec. detention time
: Mechanical/Clariflocculator
: 2 Nos each 8.5 m dia. 4.5 m SWD
: 45 minutes

102
Sedimentation
-Typeofunit(s)
- No. & size of unit(s)
- Surface overflow rate
- Detention time
Filtration
- Type of unit(s)
- No. A size of unit(s)
-Rate of filtration
- Filter media
.Sand size
.Depth of sand
. Supporting Gravel
- Backwash arrangements
.Method
Disinfection
- Bleaching powder/chlorine gas
dear Water Reservoir
- Type, No. & Capacity
-Pump details
Radial flow
2 Nos., each 17.7 m dia. 3.5mSWD
1.45 m/hr
2 hrs 30 minutes
Rapid gravity
2 Nos., each 7 m x 7 m
4.8 m/hr
E.S.-O.7mm,U.C.-1.5
60cm
50 cm. depth
Air scour followed by water wish
Chlorine gas
R.C.C., 1 No. 0.2 million litres
2 Nos,. 100 HP each

103
TABLE 1.5
PHYSICO-CHEMICAL AND BACTERIOLOGICAL QUALITY OP RAW AND FINISHED WATERS
RAJAHMUNDRY MUNICIPAL WATER WORKS • RAJ AHMUNDRY
PARAMETERS
Physke-cbcMkal
Tuibtdity (NTU)
pH
Total Alkalinity(CaCO3)
Hardness (CaCO,)Total
Caibooate
NooCMbooaie
Calcium (C«)
Magnesium (Mg)
Chlorides (O)
Sulphates (SO«)
In» (Fe)
Bactcrfetogkal (MPN/100 ML)
Total cotifon»
Fecal coUform
Rcnli
Fecal stieptococri
I
RAW
8
8.2
92
106
92
14
20
14
11
7
NIL
24000
24000
24000
2400
visrr
FINISHED
1
8.0
84
104
84
20
20
13
13
7
NIL
NIL
NIL
NIL
NIL
II
RAW
2.5
8.1
»*
86
86
NIL
18
10
17
13
NIL
4600
4600
4600
2400
VISIT
FINISHED
0.5
8.0
94
84
84
NIL
19
11
18
13
NIL
NIL
NIL
NIL
NIL
AU the values except pH and tuittdity aie expressed as ng/l

104
TABLE 1.«
PLANT PERFORMANCE AT VARIOUS STAGES OF TREATMENT
RAJAHMUNDRY MUNICIPAL WATER WORKS - RAJAHMDNDRY
Tinbidity(NTU)
PARAMETERS VISIT RAW SETTLED FILTERED FINISHED
WATER WATER WATER WATER
2-5 0.8 0.5 0.5
T.Coüfomi I 24000 9300 4600 NIL(MPN/100ML)
H 4600 9300 9300 NIL
I 24000 4300 460 NE,(MPN/100ML)
n 4600 2400 2400 NE-

105
TATIPUDI WATER TREATMENT PLANTVISAKHAPATNAM
INTRODUCTION
The fust water treatment plant for Visakhapatnam with a design capacity of2.73 mid was installed in the year 1903 since then the capacity has been increased fromtime to time to the present level of 109 mid. Water supply is drawn from different sources,viz. Hanumanth reservoir, river bed infiltration works and Tatipudi reservoir (Gosthaniriver). The plant with a design capacity of 45.4 mid commissioned in the year 1976 wasevaluated for its performance. The schematic flow sheet and plant summary data aregiven in Fig. 1.3 and Table 1.7 respectively. The plant is maintained by the MunicipalCorporation of Visakhapatnam.
PLANT APPRAISAL
Raw water quality and flow measurementRaw water from Tatipudi reservoir flows by gravity through a distance of 5
km to the treatment plant atKrishnapuram. The yield from the source has been quitesatisfactory and no scarcity of water has been experienced so far. Raw water is of veryhigh quality with exceptionally low turbidity (<1.0 NTU) during fair season. It is,however, reported that the turbidity is moderate during rainy season. The raw waterquality is given in Table 1.9.
A Parshall flume has been provided at the raw water inlet channel formeasurement of plant inflow. The flow indicator installed at the flume was non-functional. During the visit, the plant inflow was computed by noting the rise in waterlevel in the clarifier in known time and was found in the range of 45 to 54.5 mid againstthe design capacity of 45.4 mid.
Pre-treatmentAlum solution is applied at a single point in the raw water inlet channel just
upstream of the flume. Solution tanks have been provided in the chemical house and asystem for regulating-the dose of alum solution «also exists. However, during thevisit, alum addition was found discontinued due to low turbidity of raw water. Thesolution dosing system was, however, found unreliable.
The rotational speed of the mechanical mixer was found very low (6 to 8rpm) which is inadequate for effective mixing. The flocculators were workingsatisfactorily. During one of the visits when the plant was overloaded to the extent ofabout 20%, no deterioration in the performance of the individual units was observed,perhaps because of the low turbidity of raw water.

106
FiltrationThe depth of sand in all the filters was found in the range of 65-70 cms. The
average length of filter run has been reported as 24 hours and the filters are cleaned usingair-scour followed by water-wash. The quantity of backwash water works out to 180 m1,which is about 3 per cent of the total throughput of the filters. The filters were found toproduce a filtrate turbidity within the limits recommended by CPHEEO.
DisinfectionAlthough chlorinators have been installed at the water works, the dose of
chlorine applied was arbitrary in the absence of proper dose regulating system.
Laboratory facilitiesThe plant has been provided with minimum necessary equipment such as
Turbidimeter.pH meter, Jar-test apparatus and Chloroscope. However, the instrumentsaie not in use and no chemist has been employed at the plant.
Plant staffThe satff at the Tatipudi water works include Asst. Engineer (incharge),
electricians (2 nos), fitter (1 no), Filter bed operators (4 nos), helpers (6 nos), filter bedcleaners (4 nos), a watchman and a gardener. The operating staff at the water workshave not undergone any formal training for the job assigned. The plant housekeeping,in general, was found poor.
Financial aspectsThe annual cost of operation and maintenance of the treatment plant has been
reported as Rs. 56.7 lakhs and the cost of water treatment works out to Rs. 0.35/m3.
RECOMMENDATIONS
* The raw water flow indicating device installed at the plant shold be gotrepaired/replaced and maintained properly to enable proper operation andcontrol ofthe treatment plant.
* Conditioning of low turbidity raw waters by application of a nominaldose of alum is necessary for effective removal of turbidity and bacteria duringfiltration. It is,therefore, desirable to continue alum addition even when rawwater turbidities are low.
* Single point application of alum be discontinued and the solution addedacross the width ofthe channel through a perforated pipe. This would ensureproper dispersion of the coagulant into the incoming raw water.

107
* The alum solution doser should be got repaired and its functionality ensuredfor application of appropriate dosages.
* Measures should be taken to increase the present speed (6-8 rpm) of themechanical rapid mixer to about 100 rpm for achieving effective coagulation.
* There is no equipment for proper metering and regulation of chlorinedose. The present practice of bubbling chlorine gas directly into the filteredwater channel should be discontinued and measures taken to instal a chlorinatorof appropriate capacity.

wwvmrMAIN FROMTATIFUOI rouse
STILLING CHAMffR
CLARiFLOCCULATCftS
W**H MATERTàMK
CLIAR WATC*
CftVOtR
RAPID GRAVITY FILTER HOUSEFILTERS- TWOS
CLEAR WATERSUMP
PUMPHOUSE
TO TOWN SERVICE,, RESERVOIR
UtOT TO SCAIE)
FIG 1.3 LAY(XTTP1JVN OF VBAKHAPATNAM WATER TREATMENT PLANT

109
TABLE 1.7
PLANT SUMMARY DATA - VISAKHAPATNAM
GENERAL
Name and location
Year of construction
Design capacity
O A M Agency
Raw water source
Treatment flowsheet
ENGINEERING
Raw water gravity main
Raw water flow measurement
Pre-treatment
Coagulation
-Chemical used
- Type of mixing with
Ftocculation
- Method / Type of unit
- No. & Dimensions
- Detention time
: Tatipudi Water Treatment Plant,Krishnapuram,Visakhapatnam
: 1967
: 45.4 mid
: Visafchapamam Municipal Corporation
: Tatipudi Reservoir across Gosthani river
: Conventional with rapid sand filters
5762 m length, Prestressed Concrete,900mmdia
Parshall flume with Flow indicator of capacity0-2500 mVhr.
Alum
Mechanical mixer details 1 No.,2.5 m dia,3.75 SWD
Mechankal/Clariflocculator
2 Nos., each 13.3 m dia.
40 minutes

110
Sedimentation
-Typeofunit(s)
- No. À size of unit(s)
- Surface overflow rate
- Detention time
Filtration
-Typeofunit(s)
• No. & size of unit(s)
- Rate of filtration
- Filter media
.Sand size
. Depth of sand
. Supporting gravel
- Backwash arrangements
.Method
Washwater tank cap.
Disinfection
- Bleaching powder/Chlorine gas
Clear Water Reservoir
- Type, No. & Capacity
- Pump details
: Radial flow
2 Nos., each 30.5 m dia. 3.75 SWD
1.65 m/hr
3hrs
: Rapid gravity
7 Nos., each 9.45 x 7.0 m
: 6.0 m/hr
E.S.-0.7mm,U.C.-1.4
; 70 cm
: 45 cm depth
Air scour followed by water wash
180 m3
Chlorine gas
R.C.C., 1 No., 900 in3
3 Nos., 270 HP each with a dischargecapacity of 32900 lpm.

I l l
T A B L E U
PHYSICO • CHEMICAL AND BACTERIOLOGICAL QUALITY OFRAW AND FINISHED WATERS
TATIPUDI WATER TREATMENT PLANT - VLSAKHAPATNAM
PARAMETERS
PfcyskwcheMfcal
Tuibidity(NTU)
pH
Total Alkalinity
(CaCO,)
Hairiness (CaCO,)
Total
Caitwnate
Noa Caibooate
Calcium (Ca)
Magnesium (Mg)
Chlorides (Cl)
Sulphates (SO4)
Iron (Fe)
Fluoride (F)
BadcrMocicNl (MPN/100 ML)
Total cottfonn
Fecal coUfotnt
ILfioJi
Fecal streptococci
RAW
150
7.8
64
84
64
20
14
12
9
9
0.7
0.2
NIL
43
43
39
I VISIT
FINISHED
3
7.8
56
90
56
34
15
13
10
30
Tr.
0.2
9
NIL
NIL
NIL
RAW
0.1
8.2
94
86
86
NIL
18
10
11
NIL
NIL
0.8
NIL
4
4
2400
II VISIT
FINISHED
0.1
8.2
94
86
86
NIL
22
7
12
NIL
NIL
0.6
NIL
NIL
NIL
NIL
All the values except pH and turixdity ate expressed at mg/1

112
TABLE 1.9
PLANT PERFORMANCE AT VARIOUS STAGES OF TREATMENT
TAT1PUDI WATER TREATMENT PLANT • VISAKHAPATNAM
PARAMEIERS VISIT RAW SETTLED FILTERED FINISHEDWATER WATER WATER WATER
Ttuttdity I ISO 8.5 3.0 3.0(NTÜ)
n o.i o.i o.i o.i
T. Colifofm I 240 29 23 NIL(MPN/100ML)
H 9 NIL 930 NIL
I 43 9 9 NIL(MPN/100ML)
H 4 NIL 93 NIL

113
PRATAPRUDRA WATER WORKS - WARANGAL
INTRODUCTION
The city of Warangal had its first water supply system of 8.17 midcommissioned in the year 1939 with Dharmasagar tank as the source. The supply wasaugmented to 11.35 mid in the year 1968. In view of the limited capacity of the originalsource, the subsequent augmentation in the year 1982 has been based on Kakatiya Canalas the source of supply. The canal is fed from the lower Maneru dam constructedacross river Godavari in Karimnagar District. The raw water is drawn from twolocations, viz. behind Kakatiya University campus and near Autonagar at Desaipetandpumped to Prataprudra and Rudrambha water works respectively. The Pratapmdrawater treatment plant with a design capacity of 37.23 mid has been evaluated for itsperformance. The schematic flow sheet and the plant summary data are given in Fig. 1.4and Table 1.10 respectively. The plant is maintained by the State PHED andWarangal Municipality.
PLANT APPRAISAL
Raw water quality and flow measurementRaw water from Kakatiya canal is pumped to the treatment plant except during
the canal closure period when raw water is drawn from Dharmasagar Tank by gravity.Provision.therefore, has been made to pump canal water to Dharmasagar tank andbuildup storage to meet the requirement as above. No major source of pollution wasobserved in the vicinity of the canal intake. Data on raw water quality is given in Table1.11.
A Parshall flume along with a flow indicator device has been installed in the rawwater channel to measure the plant inflow. The plant inflow, as observed during thevisits, was found in agreement with the design value of 1550 mVhr. The plant is operatedonly for 16 hours day.
Pre-treatmentAlum solution Was applied in the raw water channel just upstream of the flume.
The dose of alum was not regulated properly as the solution dosing system wasdefunct. The division of alum coagulated water between the two clariflocculators wasfound unequal, due to defective construction resulting in difference in the MWL of thetwo clariflocculators. The mechanical sludge scrapers in both the clariflocculators werefound in disuse. The settled water had a turbidity of 3 NTU while the raw water turbiditywas 3.5 NTU (Table 1.12).

114
FiltrationThe specifications of the filter media used were found to comply with the
CPHEEO recommendations. The filter appurtenances were functioning satisfactorily.The filter initial headloss was found in the range 20-30 cm for a filtration rate of 6m/hr. The backwashing operation with air-scour followed by water wash wassatisfactory. The backwash water consumption was found to be about 2. S % of the totalthroughput of the filter. Although the filters produced a filtrate of acceptable turbidity,the reduction in turbidity was only marginal.
DisinfectionThe chlorinator installed at the treatment plant was not in use due to non-
availability of chlorine gas and hence bleaching powder was used for disinfection. Theavailable chlorine in the bleaching powder Was found to be very low (10 % ), due toimproper storage and handling.
Laboratory facilitiesThe laboratory equipment available at the treatment plant includes turbidimeter^H
meter and chloroscope. No qualified chemist has been posted at the plant.
Plant staffThe staff at the plant includes Assistant Engineer Incharge (1 no),Filter-bed
operators (5 nos),Pump operators (8 nos) and Helpers (14 nos). The plant staff havenot undergone any formal training in the operation and control of water works.
Financial aspectThe annual operation and maintenance cost of the plant was reported to be
Rs. 35.26 lakhs. The cost, of treatment works out to Rs. 0.26/ m*.
RECOMMENDATIONS
* At present single point application of alum dose just upstream of the flumeis practised. To ensure uniform dispersion of chemical coagulant, the alumsolution should be added through a perforated pipe placed across the width ofthe channel.
* The functionality of mechanical equipment for the calriflocculators andfilters should be restored and maintained.
* Inequitable distribution of the plant inflow between the two clariflocculatorsshould be got rectified to avoid overloading of one of the units.

115
* The bleaching powder used for disinfection should not be stocked for longperiods to avoid loss of chlorine. The quality of bleaching powder should begot tested frequently to ensure a minimum available chlorine of 30 per cent.
* Jar-test apparatus is necessary to fix optimum dose of alum for varying rawwater turbidities.
* The staffat the water works need adequate training to ensure proper operationand control of the plant.

KAKATIYà CANAL
SUMP
GRAVITY MAIN FROMDKARMA3A6AJ) TANK
RAW WATER
PUMP HOUSE
CLARIFLOCCULATOR
RAPID GRAVITY FILTERS
1NOT TO SCALE)
CLEAR WATERRESERVOIR
FOR WSTRBUTION
HO 1.4 LAYOUT PLAN OF PRATAPRUDRA TREATMENT WORKS, WARANGAL

117
TABLE 1.10
PLANT SUMMARY DATA - WARANGAL
GENERAL
Name and location
Year of construction
Design capacity
O& M Agency
Raw water source
Treatment flowsheet
ENGINEERING
Raw water gravity main
Raw water flow measurement
Pre-treatment
Coagulation
- Chemicals used
-Method of mixing with
Flocculation
- Method / Type of unit
- No. & Dimensions
- Detention time
: Prataprudra water Works Desaipet, Warangal
: 1984
: 37.2 mid
; Public Health Engineering Department/Warangal Municipality
: Kakatiya Canal
: Conventional with rapid sand filters
: 2 Nos., 100 HP each with a dischargecapacity of 13170 lpm
: Parshall flume with flow indicator of range0-2000 m3/hr
Alum
Mechanical mixer 1 No. details 2.3 m dia.,with 3.S m SWD, detention time- 30 sec
Mechanical/Clariflocculator
2 Nos, each 10.4 m dia. 4.9 m SWD
30 minutes

118
Sedimentation
-Typeofunit(s)
- No. & size of unit(s)
- Surface overflow rate
- Detention time
Filtration
- Type of unit(s)
- No. & size of unit(s)
- Rate of filtration
- Filter media
. Sand size
, Depth of sand
.Supporting graveldepth
- Backwash arrangements
Disinfection
- Bleaching powder/Chlorine gas
Clear Water Reservoir
- Type,No. & Capacity
- Pump details
: Radial flow
: 2 Nos., each 27.6 m dia 3.86 m SWD
; 1.45 m/hr
: 2 hr 40 min
: Rapid gravity filters
: 6 Nos. each 6.6x6.6
: 6.0 m/hr
: E.S-0.7mm tU.C-2.0
: 80 cm
: 45 cm
: Air scour followed by water wash
: Chlorine gas & Bleaching powder
: R.C.C.Circular, 1 No. 1 million litre capacity
: 2 Nos, 335 HP each with a dischargecapacity of 30,600 lpm

119
TABLE 1.11
PHYSICO-CHEMICAL AND BACTERIOLOGICAL QUALITY OPRAW AND FINISHED WATERS
PRATAPRUDRA WATER WORKS -WARANGAL
PARAMETERS
Physico-chemical
Tuibidity(NTU)
PH
Total Alkalinity(CaCO,)
Hairiness (CaCO,)Total
Caibonate
Non Caibonate
Calcium as (Ca)
Magnesium (Mg)
Chlorides as (Cl)
Sulphates (SO4)
boo (Fe)
Fluoride (F)
RAW
1.5
8.9
124
110
no
NIL
23
13
16
35
NIL
0.6
Bacteriological (MPN/100 ML)
Total colifonn
Fecal conform
fi£oJi
Fecal streptococci
460
93
93
150
I VISIT
FINISHED
0.2
8.7
118
110
110
NIL
22
13
18
35
NIL
0.6
NIL
NIL
NIL
NIL
RAW
3
8.6
96
60
60
NIL
14
6
19
27
NIL
0.8
750.
730
750
730
n visrr
FINISHED
1
8.8
96
78
78
NIL
13
6
17
27
NIL
0.7
NIL
NIL
NIL
NIL
mvisrr
RAW FINISHED
3.5
8.2
114
88
88
NIL
21
10
201
20
0.2
0.5
-
-
-
-
All the values except pH and turbidity aie expressed as tng/1

120TABLE 1.12
PLANT PERFORMANCE AT VARIOUS STAGES OF TREATMENT
PRATAPRUDRA WATER WORKS • WARANGAL
PARAMETERS VISIT RAW SETTLED FILTERED FINISHEDWATER WATER WATER WATER
TuibWity I 1.5 1 0.2 0 2(NTU)
D 3 2 1.5 1.0
HI 3.5 3.0 2.5
T.CoUfom. I 4<S0 460 93 N I L
(MPN/100ML)
H 750 Ï500 93 NIL
£t£eli I 93 240 23 NIL(MPN/100ML)
D 750 1500 93 NIL

121
GAUHATI WATER TREATMENT PLANT - GAUHATI
INTRODUCTION
Gauhati is the capital city of Assam and is most important centre of commerce,industry, communication and education in North-Eastem India. An attempt by theCorporation to supply potable water to the city through deep tubewells has not beensuccessful. Presently the city draws its water supply from river Brahmaputra.
The water treatment plant of 11.2 mid located at Panbazar was commissionedin the year 1976. The treatment flow sheet comprises of aeration, coagulation,flocculation, clarification^apid gravity filtration and post-chlorination. The schematicflow sheet of the plant is shown in Fig.2.1 and summary data is presented in Table 2.1.At present only 25 % of the corporation area is covered with piped water supply.
PLANT APPRAISAL
Raw water quality and flow measurementRaw water from river Brahmaputra is pumped to the treatment plant from an
intake fixed on the floating barge in the river. No source of pollution was observed inthe vicinity of the intake.Being a river source, considerable variation in rawwaterturbidity is reported. During the visits, the turbidity of raw water was in the range of27-48 NTU and chlorine demand was in the range of 1.2-1.4 mg/1 (Table 2.2).
A rectangular weir with a float operated pedestal type flow rate indicator hasbeen provided at the plant for raw water flow measurement. The plant inflow was foundto be 12.8 mid and the plant was overloaded to the extent of 13 %.
Pre-treatntentDue to low alkalinity of raw water, lime is used along with alum for coagulation.
The applied alum dose was reported to be 38 mg/1. However, the actual dose appliedwas found to be 20 mg/1- Chemical mixing and dosing units were in working condition.The performance of the clarifier was satisfactory and the settled water turbidity was inthe range of 5.2-9.0 NTU (Table 2.3).
FiltrationThe depth of sand in the filters was 56-60 cm with an E.S of 0.8 mm and U.C of
1.3. The filters were backwashed after 24 hours of run. Backwashing was found tobe inadequate and ineffective as seen by the presence of mud balls in the filters. Thefiltered water turbidity was 1.2 NTU. The headloss indicators of the filters were notworking properly.

122
DisinfectionBleaching powder is used for disinfection. The chlorine demand of filtered
water was found to be 0.7 mg/1. Finished water had a residual chlorine of more than 1.0mg/1 and was free from coliforms.
Laboratory facilitiesLaboratory facilities with necessary minimum equipment and reagents are
provided at the plant. Most of the equipments were found in working condition.
RECOMMENDATIONS
* The filter appurtenances should be repaired/replaced for better operation andcontrol of the filters.
* Effective backwashing of the filters should be carried out to avoid mudballformation.

ALUM
INTAKE
RIVERBRAMKAPUTRA
RAWWATER AERATORPUMPING
FLASHMIXER
FLOCCULATOR
i
CLARIFIER
RAPID SANDFILTERS
-CHLORINATION
CLEAR WATER RESERVOIR
FIG 2.1 GAUHATI WATER TREATMENT PLANT -SCHEMATIC

124
TABLE 2.1
PLANT SUMMARY DATA - GAUHATI
GENERAL
Name and location
Year of construction(Augmentation if any)
Design capacity
O & M Agency
Raw water source
Treatment flowsheet
ENGINEERING
Raw water pumping
-Rising main diameter
Raw water flow measurement
Pre-treatment
Aeration
Coagulation
- Chemicals used
-Type of mixing
- Detention time
Flocculation
- Method / Type of unit
- No. & Dimensions
- Detention time
: Gauhati Water Treatment Plant, Gauhati
: 1976
: 11.2 mid
: Public Health Engineering Department, Gauhati
: River Brahmaputra
: Conventional with Rapid Sand Filters
6 nos, centrifugal pumps 75 HP - 3 nos80 HP - 3 nos, (two Standby)
200 mm
Rectangular weir, 90 x 45 cm
Cascade aerator
Alum & lime (solution feed)
Mechanical flash mixer
25 sec
Mechanical flocculator
One, 8.76 m dia, 3.9 m depth
30 minutes

125
Sedimentation
-Typeofunit(s)
- No. & size of unit(s)
- Surface overflow rate
- Detention time
Filtration
-Typeofunit(s)
- No. & size of unit(s)
- Rate of filtration
- Filter media
.Sand size
.Depth of sand
- Backwash arrangements
. Method
. Wash water tank cap.
Disinfection
-Chemicals used
- Type of feed
Clear Water Reservoir
- Type, No. & Capacity
-Pump details
Mechanical Clarifier
One no, 19.6 m dia. and 3.9 m depth
1.56 m/hr
2 hrs 30 mimutes
Rapid Sand Filters
2 nos, 3.05 x 7.9 m each (twin bed)
4.8 m/hr
E.S.-0.8mm,U.C.-1.23
60 cm
Air scour & Water wash
198 itf
Bleaching powder
Solution feed
RCC, one, 245 m>
8 nos, centrifugal pumps 5 nos,100 HP each 3 nos, 50 HP each

TABLE 2.2
PHYSICO-CHEMICAL AND BACTERIOLOGICAL QUALITY OFRAW AND FINISHED WATERS
GAUHATI WATER TREATMENT PLANT- GAUHATI
126
PARAMETERS
Physico-chemical
Tuibidity(NTU)
pH
Total Alkalinity(CaCO3)
Conductivity (uS/cm)
Hardness (CaCO,)Total
Carbonate
. Non Caibonate
Calcium (Ca)
Magnesium (Mg)
Chlorides (Cl)
Sulphates (SO,)
Iron (Fe)
Fluoride (F)
Nitrate (NO3)
Bacteriological (MPN/100 ml)
Total coliform
Fecal colifoim
Fecal streptococci
RAW
27
-
56
150
80
56
24
16
10
4
14
1.5
ND
0.4
790
170
uo
68
I VISIT
FINISHED
1.2
-
48
150
85
48
37
17
10
4
23
ND
ND
0.3
0
0
0
0
n visrr
RAW
48
7.6
44
180
76
44
32
15
9
3
11
1.3,
0.2
0.4
7900
4900
790
140
FINISHED
5.0
7.2
46
190
78
46
32
15
10
3
2&
ND
0.1
0.4
0
0
0
0
All values except pH .Turbidity and Conductivity aie expressed as mg/1
ND - Not detectable

128
SWARNAREKHA WATER WORKS - RANCHI
INTRODUCTION
The Swamarekha water supply scheme has been commissioned in the year1972 to provide piped water supply to the city of Ranchi. Raw water from Getalsuddam constructed across river Swamarekha is pumped to treatment works located atRukka which is 25 km east of Ranchi. The present capacity of the plant is 111.2 midwhich provides for prechlorination, coagulation, flocculation, sedimentation, rapidgravity filtration and post-chlorination. The schematic flowsheet of the plant is shownin Fig. 3.1 and summary data is presented in Table 3.1. The plant is maintained by thePHEO, Govt. of Bihar. Further augmentation of the capacity to 170.2 mid is in anadvanced stage of completion.
PLANT APPRAISAL
Raw water qualityRaw water intake situated at about 1 km from the treatment plant is surrounded
by hilly areas. No potential sources of pollution were observed in the vicinity of theintake. Due to impoundment, the raw water quality was good. During the visits, the rawwater had turbidity in the range of 7-21 NTU, chlorine demand of 1.6-1.7 mg/1 andMPN coliform count in the range of 490-680 per 100 ml (Table 3.2).
Pre-treatmentRaw water is prechlorinated using bleaching powder solution. The flow meter
(Mahindra and Mahindra make) provided at the plant for raw water flow measurementwas not in working condition. Due to low alkalinity in raw water, lime was used as acoagulant aid. Reported doses of alum and lime were 14 ppm and 7 ppm respectively.Alum slabs were added at the Parshall flume in the raw water channel. The mechanicalflash mixer provided at the plant was not in working condition. The mixing paddlesof the clariflocculators were not working during the visits. The turbidity of settled waterwas 3.7-14 NTU (Table 3.3).
FiltrationOut of 20 rapid gravity filters, at present only 12 were being used. The depth
of sand in the filter was 56-61 cm. The rate of flow and headloss indicators were not inworking condition. Filters were backwashed after 18-24 hours of filter run usingcompressed air and water. Filter cracks and undulations were observed in the filtersindicating inadequate backwashing and poor maintenance of the filters.

129
Disinfection
Chlorine gas was used for post-chlorination. The chlorine demand of thefiltered water was 0.7-0.8 mg/1. Due to non-functioning of chlörinators, chlorine gasfrom cylinders was directly applied into the water. The finished water had a residualchlorine of more than 1.0 ppm and was free from coliforms.
Laboratory facilities
A laboratory fairly equipped with necessary instruments and other facilitieshas been provided at the plant but most of the instruments were not in workingcondition. The posts of chemist and laboratory assistant for the plant are vacant.
RECOMMENDATIONS
* The raw water flow measuring and indicating devices should be repairedand put into order to facilitate plant control operations.
* Flash mixer should be repaired and put into commission for effective pre-treatment.
* Filters should be backwashed properly to'avoid the formation of cracks andmud-balls.
* Instruments in the laboratory should be got repaired and necessary trainedprersonnel posted to ensure cost-effective treatment and a product water meetingthe quality standards.

ALUM
INT«
SCTALSUO
RAW WATERPUMPING
PLASHMIXER
CLARIFLOCCULATORS ( 6 NOS )
1 i t t
1-J-
RAPtO SANDFILTERSt 20 Has )
J. CHLORINATION
CLEAR WATERRESERVOIR
CLEAR WATERPUMP1N6
HO 3.1SWARNAREKHA WATER TREATMENT PLANT (RANCHI) - SCHEMATIC

131
TABLE 3.1
PLANT SUMMARY DATA RANCHI
GENERAL
Name and location
Year of construction(Augmentation if any)
Design capacity
O & M Agency
Raw water source
Treatment flowsheet
ENGINEERING
Raw water pumping
-Rising main diameter
Raw water flow measurement
Pre-treatment
Coagulation
- Chemicals used
-Type of mixing
- Detention time
Flocculation
- Method / Type of unit
- No. & Dimensions
- Detention time
Swamarekha Water SupplyScheme, Rukka, Ranchi
: 1972, (Augmented in 1985)
: 111.2 mid
: PHED, Ranchi
: Getalsud dam on Swamarekha River
; Conventional with Rapid Sand Filters
: 8 Nos., Vertical turbine pumps(5nos. standby)175 HP - 5 nos.150 HP - 3 nos.
: 1000 mm
: Mahindra and Mahindra Flowmeter
: Alum and lime (solution)
: Flash mixer 3 m dia, 5.4 m deep
: 30 sec
: Mechanical(Clariflocculator)
: Six nos.,each 13.7 m dia., 5.2 m SWD
: 60 minutes

131 A
Sedimentation
- Type of unit(s)
- No. & size of unit(s)
- Surface overflow rate
- Detention time
Filtration
- Type of unit(s)
- No. & size of unit(s)
- Rate of filtration
- Filter media
. Sand size
.Depth of sand
- Backwash arrangements
.Method
- Wash water tank cap.
Disinfection
- Chemicals used
-Type of feed
Dear Water Reservoir
- Type, No. & Capacity
- Pump details
Mechanical(Clariflocculator)
Six nos., each 36.5 m dia, 3.7 m SWD
0.86 m/hr
4.3 hrs
Rapid Sand Filters
12 Nos, 78 m2 each (twin bed)
4.5 m/hr
E.S.-0.56 mm, U.C.-1.54
60 cm
Air scour and water wash
341m3
Bleaching powder for prechlorinationChlorine gas for postchlorination
Direct feed
RCC, one no, 4500 m3
8 nos., Centrifugal pumps 400 HP each

132
TABLE .1.2
PHYSICO-CHEMICAL AND BACTERIOLOGICAL QUALITY OF RAW AND FINISHED WATERS
SWARNAREKHA WATER WORKS - RANCH!
II VISITivisrrPARAMETERS
RAW FINISHED RAW
Physico-cbenjcal
Turbidity (NTU)
pH
Total Alkalinity(CaCOs)
Conductivity (uS/cm)
HanJness (CaCO,)Total
Caibonate
Non Carbonate
Calcium (Ca)
Magnesium (Mg)
Chlorides (O)
Sulphates (SO4)
lion (Fe)
Fluoride (F)
Nitrates (NO,)
Bacteriological (MPN/100 ml)
Total colifoim
Fecal colifonn
Exoli
Fecal streptococci
7
7
36
179
28
28
0
10
1
22
14
1.2
0.2
0.2
490
170
110
170
1.0
74
36
199
34
34
0
12
1
26
18
Tr.
0.2
0.2
0
0
0
0
21
7
46
197
38
38
0
12
2
4
7
0.6
0.4
0.8
680
680
680
130
FINISHED
3.5
7
46
216
40
40
0
13
2
5
H
Tr.
0.4
0.7
0
0
0
0
All values except pH .Turbidity and Conductivity are expressed as mg/1Tr. - Traces

133
TABLE 33
PLANT PERFORMANCE AT VARIOUS STAUES OF TREATMENT
SWARNAREKHA WATER WORKS - RANCHI
PARAMETERS VISIT RAW SETTLED FILTERED FINISHEDWATER WATER WATER WATER
Turbidity I 7 3.7 - 1.0(NTÜ)
II 21 4 - 3.5
T.Colifonn I 490 68 0(MPN/100ml)
U 680 49 45
I HO 20(MPN/lOOml)
II 680 23

134
CHANDIGARH WATER WORKS - CHANDIGARH
INTRODUCTION
The union territory of Chandigarh draws its water supply from both surface andground water sources. The city, with a population of 4.5 lakhs (1981 census) issupplied with 155 mid of treated water. About 100 tube wells account for 86 mid of watersupply. Surface water drawn from Bhakra Main Line (BML) canal after treatment intwo plants of 22.7 mid and 45 mid capacity augments the supply to the city. Two moreplants of 68 and 22.7 mid capacity are under construction to further augment the watersupply. The 45 mid plant commissioned in 1983 and situated near Sector 39 has beenselected for study.
The treatment consists of alum addition and rapid mixing at the Parshallflume followed by tapered flocculation, sedimentation in rectangular horizontal flowsettling tanks, rapid gravity filtration and disinfection by chlorination. The plant layoutis shown in Fig 4.1 and the plant summary data is given in Table 4.1.
PLANT APPRAISAL
Raw water quality and How measurementRaw water from BML canal near village Kajauli is pumped through a 27 km
long RCC conduit to the treatment plant. The quality of raw water is good throughoutthe year due to impoundment at the Bhakra dam (Table 4.2). The high velocity of flowin the canal and the steep slopes of the canal banks minimise the chances of pollutiondue to human activities.
Three pumps each of 45 mid capacity have been provided for pumping rawwater. Two pumps run at a time ;one delivering raw water to treatment plant and theother through a storage tank to the 22.7 mid capacity plant in Sector 12 and for irrigation(without treatment). Provision has been made to draw, in times of emergency, raw waterfrom the storage tank for treatment at the 45 mid plant. Two diesel pumps each of 22.7mid capacity have been provided as standby.
The pumping station at Kajauli is so located as to have always a positive suctionhead. Facilities for day to day maintenance and necessary tools and spares areavailable.
Raw water enters the treatment plant through an inlet chamber (3 m x 3 m) andflows through a flow measuring Parshall flume. At the time of the visit, the plant inflowas indicated by the flow rate indicator was 21.2 x 100 m'/hr (51.88 mid).

135
Pre-treatmentAlum in solution form is added at the Parshali flume where mixing is achieved
by the hydraulic jump and three fins provided in the channel down stream. Three tankseach of 13160 litres capacity have been provided for preparation of alum solution. Thealum soluttonising and dosing arrangements were found in good working condition andalum mixing was complete as confirmed by tests for sulphate content in the alum dosedwater.
Tapered flocculation is achieved in three chambers in series. The sweep ofpaddles, H.P. of motor and rpm of mixer have been so designed that ' C valueprogressively decreases from 90-1 sec to 30 sec-1. Detention time provided in eachchamber is 10 minutes. As the raw water turbidity was very low (less than 5 NTU)floe formation could not be readingly observed. All metal parts of the flocculators arepainted during annual shut down for cleaning and maintenance.
The performance of horizontal flow rectangular settling tanks was satisfactoryas shown by the settled water turbidity. Considerable reduction in col iforms anaKQaHwas also achieved due to settling (Table 4.3).
FiltrationFour rapid gravity filters are designed to operate on declining rate principle. The
filters are open to sky and only the operating gallery is housed under a cover. One ofthe rapid gravity filters is a dual media filter using coconut shell as the top layer.There is no flow restricting orifice in the outlet pipe of the filter and the maximumallowable rate is controlled by manipulating the filtered water outlet valve. Filters arebackwashed when water reaches to predetermined level in the filter box. Length offilter run reported was 12 to 36 hours. The filtrate turbidity was less than I NTUthroughout the observation period. Thereby meeting the CPHEEO recommendations.In dual media filter, the.top coconut shell layer has been washed out duringbackwashing operation and recently additional sand has been placed to make up forthe overall depth of media. It was also reported that whenever prechlorination wasused, yellowish colour was leached out from the coconut shell media.
Filter backwashing is preceded by air scour for 5 minutes and is washed withwater for almost 10 to IS minutes longer than necessary. The turbidity of spent washwater was as low as 6.5 NTU at the fag end of the operation. No mud balls, cracks, etc.wens observed in the filter beds indicating satisfactory performance operation andmaintenance.
DisinfectionChlorinators were not available at plant to regulate and monitor the dose of
chlorine, which was fixed by trial and error. Chlorine gas is fed to a solutionizing towerand the chlorine solution is then mixed in the filtrate channel. Residual chlorine in thefinished water was 0.5 mg/1. It was reported that prechlorination using bleachingpowder solution is practised at the zonal pumping stations, when necessary.

136
Laboratory facilitiesLaboratory facilities available at the plant are adequate and all the instruments/
equipment are in working condition. Water quality analysis is done regularly andrecords maintained properly.
Plant stafTThe 45 mid plant is managed by four officers and 38 supporting staff both skilled
and unskilled. Operators and Laboratory Assistants are qualified with m certificates.Only helpers and chowkidars are non-metric. Officers have received formal training inoperation and maintenance ofwatertreatmentplants. The water works is one of the bestmaintained and operated treatment plants evaluated.
RECOMMENDATION
* Alum solution tanks arc provided in the second floor of the laboratorybuilding. It is cumbersome and labour intensive to manually lift alum slabsthrough a height of 10 m. The alum solutionising tanks can be provided at theground level and the alum solution pumped to the dosing tanks for gravity feed.This arrangement could be simple and cost effective.

J3ÏS «SO < V»
MWWATERINLET
FLUM
4 5 6
TAPPEREO FLOCULATION
MOT TO SCALE
f i
SETTLING TANK 2
SETTLING TANK 1
4
2
1>
RAPID GRAVITYFILTERS CLEAR
W A T E R
RESERVOIR
PUMP HOUSE
FIG 4.1 LAYOUT PLAN OF WATER TREATMENT PLANT, CHANDIGARH

138
TABLE 4.1
PLANT SUMMARY DATA - CHANDIGARH
GENERAL
Name and location : Water Treatment Plant in sector 39
: 1983
: 45 mid
Year of construction
Design capacity
O & M Agency
Raw water source
Treatment flowsheet
ENGINEERING
Raw water pumping
-Rising main diameter
Pre-treatment
Coagulation
- Chemicals used
- Type of mixing
- Method of mixing
Ftocculation
- Method / Type of unit
- No. & Dimensions
- Detention time
: Executive Engineer Public HealthDivision No. 1
: Canal from Bhakra Main Line
: Tapered flocculation, sedimentation withrapid sand, declining rate filtration andchlorination
: Centrifugal, ' 3 nos., capacity 45 mid eachstandby 2 nos. diesel - 22.5 mid each
: 1200 mm, M.S. cement
: Alum feric grade II
: Hydraulic near Parshall flume
: Addition of alum solution 5 per cent
; Tapered flocculators
: 3 nos., 6830x6830 mm each
: 10 minutes each

139
Sedimentation
-Typeofunit(s)
• No. & size of unit(s)
- Surface overflow rate
- Weir loading
- Detention time
Filtration
-Typeofunit(s)
- No. & size of unit(s)
- Filter media
. Sand size and
• Gravel size (mm)
. Depth of each layer(mm)
- Backwash arrangements.
.Method
. Wash water tank cap.
Disinfection
- Chemicals used
-Type of feed
- Chlorinator Details
Clear Water Reservoir
- Type, No. & Capacity
-Pump details
Rectangular,
2 nos., 122 x 38.5 x 4.55 m
0.4mVm2/hr.
210 mVm/day
2.2 hrs
Rapid gravity with declining rate
4 nos.,7.2 x 3 x 1.8 m each
12 to 24 mash, 760 mm depth ofsand single, sand media, dual media380 mm coconut shell, 380 mm sand
3-6,12-20,20-25,25-37,37-50
200, 75, 75,75,75
air scour and water wash
227 m3
Chlorine gas
Gravity feed
4 kg/hr Banco make
RCC, 2 nos., 4540 m* each
2 nos., 150 HP cap. 45 mid each

140
TABLE 4.1
PHYSICO-CHEMICAL AND BACTERIOLOGICAL QUALITY OFRAW AND FINISHED WATERS
CHANDIGARH WATER WORKS • CHANDIGARH
PARAMETERS
Phyake-chenücal
Tuibidity(NTU)
pH
Total Alkalinity(CaCO3)
CooductivityiuS/cm)
Hardness (CaCO3)Total
Caibonaie
Non caibonaie
Calcium (Ca)
Magnesium (Mg)
Chlorides ( a )
Sulphates (SO4)
Iron (Fe)
Fluoride (F)
Nitrates (NO3)
BacterisJogkai (MPN/100ML)
Total coliform
&£fiU
Fecal streptococci
RAW
3.1
7.7
74
235
91
74
17
26
6.3
3
26
0.2
0.2
1.6
1600
300.
8
ivisrr
FINISHED
0.8
7.4
69
235
91
69
22
26
6.3
7
28
Tr
0.2
1.9
0
0
0
RAW
8.0
8.8
71
292
110
71
39
30
10
17
27
Tr
0.5
2.0
540
-
-
n VISIT
FINISHED
1.0
7.6
70
255
110
70
40
30
10
17
34
Tr
0.5
2.2
0
-
-
Results ax» expressed as mg/L except for pH,conductivity and Tuibidity, Tr - Traces

141
TABLE 4.3
PLANT PERFORMANCE AT VARIOUS STAGES OP TREATMENT
CHANDIGARH WATER WORKS • CHANDIGARH
PARAMETERS VISIT RAW SETTLED FILTERED FINISHED
WATER WATER WATER WATER
Turbidity
(NTU)
D
3.1
8.0
2.6
6.6
0.8
1.1
0.8
1.0
T.Colifomi
(MPN/100ML)
n
1600 280
540 60
30-130 0
20
(MPN/100ML)
300 26 2-30 0

142
CHANDRAWAL WATER WORKS No. II - DELHI
INTRODUCTION
Delhi, the national capital, has an urban population of about 80 lakhs.The city is divided into two administrative blocks, the Delhi MunicipalCorporation, and the New Delhi Municipal Corporation, the latter being anenclave within the Delhi Municipal Corporation Area.
The water supply to Delhi is looked after by the Delhi Water Supplyand Sewage Disposal Undertaking (DWS&SDU)of the Delhi Municipal Corpo-ration. There are now five main water works with a total capacity of about 1680mid serving the city. Besides, a number of Ranney wells put down along the leftbank of the Jamuna yield about 90 mid. The per-capita water supply to the cityat present is reported to be about 225 litres per day.
In consultation with the DWS&SDU, the Chandrawal Water Works No.II has been selected for evaluation. There are two water treatment plants atChandrawal Water Works II, The Paterson Plant with a design capacity of 115mid and the Hindustan Construction Company (HCC) plant with a designcapacity of 135 mid. The Paterson Plant alone has been taken up for evaluation.The plant layout is shown inFig.5.1andsummarydataispresentedinTable5.1. '
PLANT APPRAISAL
Raw Water quality and flow measurementRaw water is drawn from the river Jamuna upstream of a barrage
constructed at Wazirabad. The intake point lies well upstream of the variouswastewater discharges into the river. There are no major sources of pollution ofthe river immediately above except for a bathing ghat at Wazirabad villageabout 1.5 km upstream. However, it is reported that about 16 km upstream, theeffluents from some tanneries are being ponded up and that these wastes enterthe river at times.
Data on raw water quality collected during different seasons is shownin Table 5.2. The turbidity of the raw water is reported to go upto about 3000NTU maximum during floods in the river. However, during the period of study,such high turbidities were not experienced due to failure of rains. In low flowseason, the turbidity is quite low. The coliform count is generally not very high(under 5000 per 100 ml.) except during freshes. In summer months, there isappreciable growth of algae in the impoundment at the intake created by theWazirabad barrage.
There is considerable silt deposition around the intake which may bedue to the effect of the Wazirabad barrage. Dragline excavators and dredgerboats have been provided to remove silt deposits and keep the waterways to theintakes clear.

143
There are 3 pumping stations at Wazirabad and they together serve thethree treatment plants. The total pumping capacity is 1863 mid whereas thepeak pumpage is 1200 mid. The standby pumping capacity being 50 % isadequate. The head works has two bulk electricity feeder lines and generallythere has been no problem due to power failure/shortage. A fully equippedworkshop is maintained by the Water Works Authority at Chandrawal WaterWorks II where minor and major repairs of the pumping plants can be carriedout.
There is no arrangement for measuring the pump discharges and atpresent flow estimates are being made on the rated capacity of the pumps whichcan not be considered reliable. The flow to Chandrawal Water Works II isregulated by regulating the pumping at the headworks. At times, excess wateris also wasted through clarifier scours. There are no flow indicating or flowintegrating devices at the measuring weirs in the channel to the Paterson plant.Moreover, the M.S. weir plates have collapsed. Measurement of flow by surfacefloat method indicated that the plant is overloaded to the extent of 30-40 %.Facilities for proper division of flow between various units are lacking.
PretreatmentPrechlorination is carried out at the water works year round with a view
to improving alum coagulation controlling algal problems experienced insummer and ensuring effective post disinfection. Chlorine demand of thewater is determined daily to regulate the prechlorination dose. Two vacuumtype chlorinators have been provided for prechlorination. The chlorine demandof the raw water is in the range 0.5- 0.8 mg/1. Chlorine is added as solution attwo points and as gas at one point in the main raw water channel. Chlorine dosecontrol is difficult to achieve due to lack of accurate information on plant inflow.As the prechlorination plant is at some distance from the main plant, thesupervision of the process is inadequate.
Filter alum is the coagulant used at the plant. Though jar test is beingdone regularly, there is no means for translating the determined dose into thequantity of alum to be added in a shift because of lack of raw water flow data.
An alum house has been constructed in two floors out of which first flooris used for preparing and storing alum solution from where it is fed by gravity tothe raw water channel. The floors and walls of the alum storage room are affectedby corrosion.
The alum solution pipings are of rigid PVC with CI sluice valves andthey are in good condition. The air-mixing arrangements in the solution storagetanks are not operating. Facilities for proper dosing and control of alum areabsent. Alum solution is "Point - added" at two points below the 3.8 m longmeasuring weir in the raw waterchannel. There is no provision for rapid (flash)mixing. Mixing takes place in the sub-channels feeding the three clarifiers.Complete mixing of the chemical in the entire bulk of water is not achieved

144
as confirmed by the considerable variation in the alum concentration (estimatebased on SO4 increase) at the inlets to the different flocculators of the plant.
The design detention times m the three flocculators are 23 min, 23 min,and 20 min. respectively. Hoc formation in the flocculators was satisfactorywhen alum addition was proper and there was no overloading. The design surfaceoverflow rate for the clarifiers is in the range 38 m/day-43 m/day. The clarifiers,however, are being overloaded to varying degrees.
All three clarifiers have been equipped with travelling sludge scrapers.Due to mechanical problems, the scrapers often get stalled.
FiltrationThe Paterson plant has 16 filter beds arranged in two rows on either side
of a common clear water channel-cum-filter gallery. Some of the filter inletvalves and wash water drain-out valves are leaking resulting in wastage of water.The glands of many of the filter valves are also leaking. The filter-rate-controller and the rate-setter are not working in any of the filters and the filtersare, in effect, operating at variable rates. The filter rate indicator and theloss of head gauges are no longer functioning in any of the filters. The auxiliaryfloats in the filter beds are not operational. The air lock arrangements of thesyphons are not working in most of the filter-beds. Filter washing is notsatisfactory. All the filters (5 Nos) to be washed in a shift are shut downsimultaneously which causes a high rise in the water level in other filters andalso overflow of clarified water from the inlet channel. Washwater and airdistribution are not uniform over the filter beds. There is mud ball formation inthe filters and mounding ofsand at places. The sand surfaces have developedcracks. The wash water tank is leaking and is not in use. Water for filter washis drawn from the clear water pumping main.
DisinfectionFiltered water is chlorinated at the head of the central filtered water
channel using two pressure feed chlorinators. The chlorine gas after measure-ment is directly let into a 150 mm dia. rigid PVC pipeline into which filteredwater is also let-in. The line runs for a length about 100 m before entering intothe filtered water channel.
The post-chlorination dose is fixed on a nominal basis.. There isconsiderable leakage of chlorine from the chlorinators and from the connectionsfrom the chlorine cylinders to the chlorinators and at the dosing point in thefiltered water channel.
Laboratory FacilitiesThe testing facilities of the Delhi Water Supply Undertaking consist
of a Central Laboratory at Wazirabad Water Works and plant laboratories at eachwater works. The Central Laboratory facilities are adequate for routine watertesting except for turbidity test for which facilities are lacking.

145
RECOMMENDATIONS
* In view of the potential danger of pollution of river Jamuna due todomestic and industrial discharges upstream, a regular programme ofraw water quality monitoring and surveillance should be considered tofacilitate preventive and corrective measures.
* Adequate arrangements for raw water flow measurement andregulation need to be provided for effective operation and control ofwater treatment units.
* The feasibility of interposing a detritus tank in the raw waterconveyance system to intercept the silt from reaching the clarificrsshould be explored.
* For chlorination (pre.intermediate and post) the practice of directlyconnecting the chlorine cylinders/tonne containers to the flow of waterin the channel should be discontinued and replaced by sound andappropriate system of chlorination with competent supervision.
* Considering the large quantity of chemicals used and the high costinvolved, careful control over chemical dosing should be ensured foroptimum results. Preparation of alum solution in ground level tanksand lifting it to dosing tanks with chemical pumps should be consideredas cost effective alternative to the present system.
* The practice of point addition of alum solution downstream of theweir, should be dispensed with in favour of applying alum solutionthrough a perforated pipe along the entire width of the channel upstreamof the weir for effective mixing.
* The condition of filters and appurtenances and their operation andmaintenance are far from satisfactory. The system needs a plannedoverhaul so that the plant output is not reduced significantly. Thefeasibility of operating the filters on declining rate principle should beexplored on an experimental basis.
* Measures need to be taken to prevent the pollution and nuisance causedby large number of pigeons in the filter house.
* The Central Laboratory and the plant laboratory should be providedwith a direct reading turbkUmeter such as that of Hach Company andfacilities for testing of water for toxic heavy metals and trace organicsat regular intervals.

146
«AW WATER CONDUITS FROM. W A Z I R A B A D
H.C C - HINDUSTAN CONSTRUCTION COMPANY PLANT
TO CHANDRAWALW.W. I
COMPRESSED AIRT A N K S - 9 NO.S
CHISRINATIONROOM
V
i
F6
F9
F7
F6
F9
FILTER G A L L I
F10
FII
F12
F4
ERV
F15
F3
F14
F2
F15
F1
F16
*
0FFICE
HCC
HCCPLANT
TO CLEARWATER TANK
PATERSON FILTER HOUSE
(NOT TO SCALE)
HO 5.1 LAYOUT PLAN OF PATERSON WATER TREATMENT PLANT - DELHI

147
TABLE 5.1
PLANT SUMMARY DATA - DELHIGENERAL
Name and location
Year of construction
Design capacity
O & M Agency
Raw water source
Treatment flowsheet
ENGINEERING
Raw water pumping
-Rising main diameter
Raw water flow measurement
Pre-treatment
Coagulation
- Chemicals used
-Type of mixing
- Mixing Details
Flocculation
- Method / Type of unit
- No. & Dimensions
- Detention time
Chandrawal Water WorksNo.IIJ»aterson Plant, North Delhi
1954
115 mid
Delhi Water Supply & SewageDisposal undertakingsRiver Jamuna
Conventional with rapid sandfilters
8 Vertical shaft turbine pumps+ 18 Horizontal centrifugal pumps,total capacity 1863 mid
2 nos.-900 mm each &3 nos.-1050 mm each
Rectangular sharp crested weirs 2 nos.,2.86 m long another 2.1 m longwith design capacity 1.3 m3/sec
Alum
Hydraulic
Length of channel 40 m,106 m, 127 m,and detention time 20 scc,120 sec,180 sec, respectively to clarifiers1,2,& 3; velocity in channel 1.3 mflat
Mechanical, Hocculators
3 nos, first two units 18.3 x 6.0 x 4.9 meach & Third unit 7.6 x 7.6 x 5.5 m,in2 parallel compartment.
2 Nos. 23 minutes each& third unit 20 minutes
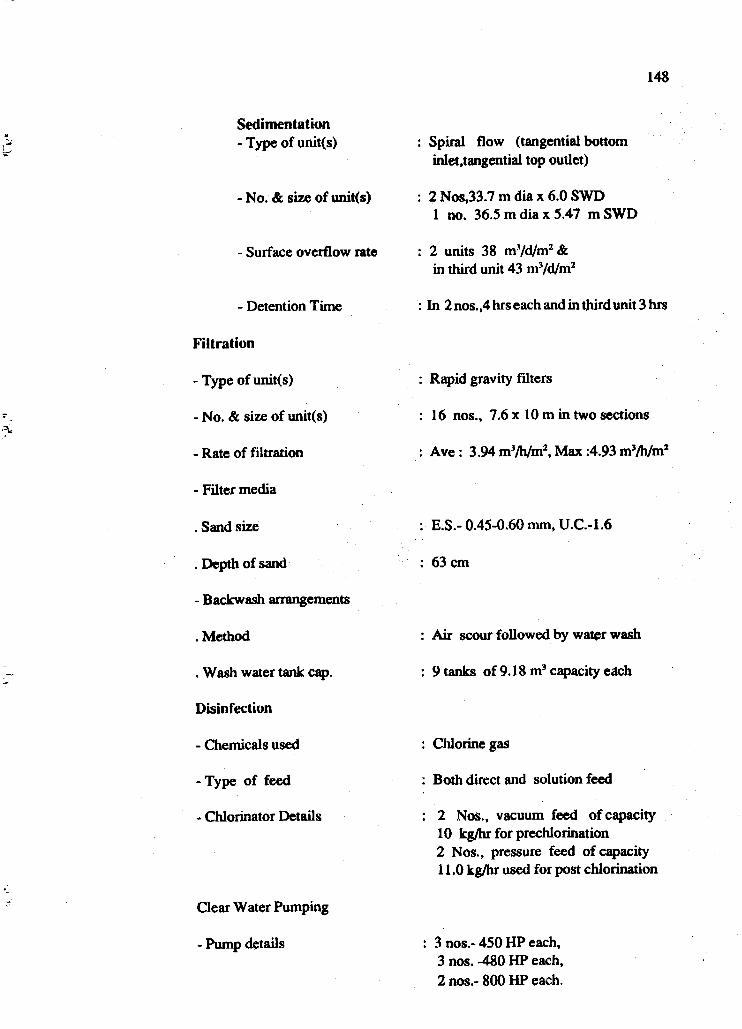
148
Sedimentation- Type of unit(s)
- No. & size of unit(s)
- Surface overflow rate
- Detention Time
Filtration
- Type of unit(s)
- No. & size of unit(s)
- Rate of filtration
- Filter media
. Sand size
.Depth of sand
- Backwash arrangements
.Method
. Wash water tank cap.
Disinfection
- Chemicals used
-Type of feed
- Chlorinator Details
Clear Water Pumping
- Pump details
Spiral flow (tangential bottominlet.tangential top outlet)
2 Nos,33.7 m dia x 6.0 SWD1 no. 36.5 m dia x 5.47 m SWD
2 units 38 m'/d/m2 &in third unit 43 m'/d/m2
In 2 nos. ,4 hrs each and in third unit 3 hrs
Rapid gravity filters
16 nos., 7.6 x 10 m in two sections
Ave : 3.94 m3/h/m2, Max :4.93 mVh/m2
E.S.- 0.45-0.60 mm, U.C-1.6
63 cm
Air scour followed by water wash
9 tanks of 9.18 m3 capacity each
Chlorine gas
Both direct and solution feed
2 Nos., vacuum feed of capacity10 kg/hr for prechlorination2 Nos., pressure feed of capacity11.0 kg/hr used for post chlorination
3 nos.- 450 HP each,3 nos. -480 HP each,2 nos.- 800 HP each.

149
TABLE 5.2
PHYSICO-CHEMICAL AND BACTERIOLOGICAL QUALITY OFRAW AND FINISHED WATERS
CHANDRAWAL WATER WORKS ti • DELHI
PARAMETERS
Physico-chemical
Tuibidity(NTU)
pH
Total Alkalinity(CaCO,)
Conductivity (uS/cm)
Hardness (CaCO,)
ivisrr n VISIT m VISIT IV VISIT
RAW RAW RAW
185
Bacteriological (MPN/100 ML)
Total coliform 5400
Fecal colifarm
250
940
414
700
170
RAW FINISHED
600
8.0
90
18
7.8
130
5
8.5
144
30
8.0
72
0.4
7.2
68
210
Total
Carbonate
Non Carbonate
Calcium (Ca)
Magnesium (Mg)
Chlorides (Cl)
Sulpbates(SO4)
Iron (Fe)
Fluoride (F)
93
90
3.0
28
6.0
7.0
10
Tr
0.2
138
130
8.0
22
20
13
15
Tr
0.2
248
144
104
42
35
58
45
Tr
0.4
86
86
0
22
8
16
20
Tr
0.3
170
33
225
18
Tr
NÜ
All values except pH .Turbidity and Conductivity are expressed as mgfl.

150
TABLE53
PLANT PERFORMANCE AT VARIOUS STAGES OF TREATMENT
CHANDRAWAL WATER WORKS II • DELHI
PARAMETERS RAW SETTLED FILTERED FINISHEDWATER WATER WATER WATER
Tmbidity 30 1.5-5 0.3-1.7 0.4(NTU)
T.Colifoim 170 2 5 NU(MPN/100ML)

151
NIMETA WATER TREATMENT PLANT - BARODA
-INTRODUCTION
The city ofBaroda, with a population of 7 lakhs draws its water supply fromShri. Sayaji Rao Sarovar located at a distance of 22 km from the city. Raw water fromthe reservoir flows by gravity to a treatment plant of 45 mid capacity providingconventional pre-treatment with alum coagulation followed by rapid sand filtrationand disinfection. The plant is maintained by Municipal Corporation, Baroda. Theschematic flow sheet is shown in Fig. 6.1 and the plant summary data is presented inTable 6.1 .Because of scanty rain fall and drought for the last three years, the Nimetawater works has not been getting adequate raw water supply. During the evaluation studyonly a few of the total component units were under operation.
PLANT APPRAISAL
Raw water quality and flow measurementRaw water from Shri. Sayaji Rao Sarovar is drawn through a9l0mmdia.
gravity main to the treatment plant. The raw water quality in the reservoir has been fairlygood during the period of evaluation (Table 6.2). During the drought period when thewater level in the reservoir goes down making it difficult to draw water under gravity,a standby arrangement comprising a sort of balancing reservoir with 5 pumps of 30 HPeach has been provided. Raw water is first drawn into the balancing reservoir and thenpumped to the inlet chamber of the treatment plant.
A rectangular weir has been provided in the raw water channel to measure the rawwater inflow to the plant. The plant inflow during the period of évaluation was in therange of 6.4 to 15.7 mid as against the design flow of 45 mid and the plant was thus verymuch underloaded.
Pre-treatmentAlum solution was applied at a single point at the upstream of the weir in the
raw water channel. The dosing system for controlled addition of alum was defunct.The applied dose of alum was found to be less jhan that determined by the jar testthough adequate stock of alum was available. Flocculation is achieved in a baffledchannel leading to horizontal-flow rectangular settling tanks.
Due to underloading, the computed surface overflow rate was in the range of2.1 to 5.1 m3/m2/day as against the design value of 14.8 mVmVday. Consequently, thedetention time was more than the design value. The settled water turbidity was lessthan 10.0 NTU (Table 6.3).

152
FiltrationOnly one filter out of 10 was in operation during the visit and it was overloaded.
The filtration rate varied from 5.7 to 12.1 m/hr as against the design «Me of 3.9m/ht.The performance of the filter was not satisfactory and the filtrate turbidity was in therange of 3-5 NTU (Table 6.3). None of the filter appurtenances was in workingcondition. Backwashing was carried out after 24 hrs of filter run using air and water.
DisinfectionChlorination was practised at the filtered water channel. Average chlorine
dose was recorded as 0.5 to 1.0mg/l. The contact period provided was 45 minutes. Thefinished water had a residual chlorine of 0.3 mg/1 at the plant which is inadequate.Thefinished water was not always safe from bacteriological point of view.
Laboratory facilitiesThere are no laboratory facilities except that a residual chlorine test kit is
available. No chemist is posted at the plant site and no regular monitoring of waterquality at various stages of treatment is done.
RECOMMENDATIONS
* Necessary arrangement for visual indication of raw water inflow need tobe provided for effective operation and control of the treatment units.
* The practice of point addition of alum solution at the upstream of therectangular weir should be dispensed with infavour of applying alum through aperforated pipe along the entire width of the channel. This will ensure effectivemixing
* The required alum dose for effective coagulation should be based on jartest experiments performed from time to time.
* All filter appurtenances which are defunct need be repaired and put intoworking order for effective operation and maintenance of filters.
* Minimum laboratory equipment such as pH meter, turbidimeter, jar testapparatus etc. and qualified, competent personnel should be provided at the plantfor effective operation and control. Existing staff should be imparted training intheir respective day-to-day routine.
* Proper operation and maintenance records for the plant should bemaintained.

H i ':
RAP© «UNITY HLTERS
ALUM
RAN WATER j j
* 1 r -• «
CHAMBER CHANNCL (2NOS)
StOMENtmCMTANKS(4 NOS)
BATT G
9
RY-A
RAMDCMMITY I
SCfNMENTAItONTANKS( 2 NOS.)
BATTERY-»
•
4 - Cui nMMJcrimi
i
%rcRS
CLEARWATERRESERVOIR
HG 6.1 NB4ETA WATER TREATMENT FIANT (SCHEMATIC) - BARODA

154
TABLE 6.1
PLANT SUMMARY DATA • BARODA
GENERAL
Name and location
Design capacity
O & M Agency
Raw water source
Treatment flowsheet
ENGINEERING
Raw water pumping
-Rising main diameter
Raw water flow measurement
Pre-treatment
Coagulation
- Chemicals used
- Method of mixing
Flocculation
- Method/Type of unit
- No. & size of unit(s)
: Nimeta Water Treatment Plant,Baroda (Gujarat)
: 45 mid
; Municipal Corporation, Baroda
: Reservoir
: Conventional with rapid sand filters
Normally gravity flow (pumps-5nos x 30 HP,used whenraw water level goes down)
910 mm ; 760 mm
Rectangular weir
Alum
Hydraulic (baffled channel)
Mechanical
2 Nos, 21.9 m x 10 mx5.15mSWD
- Detention time 15 minutes

155
Sedimentation
-Typeofunit(s)
• No. & size of unit(s)
- Surface overflow rate
- Detention time
Filtration
- Type of unit(s)
• No. & size of unit(s)
-Rate of filtration
- Filter media
.Depth of sand
- Backwash arrangements
.Method
Disinfection
- Chemicals used
-Type of feed
Clear Water Reservoir
: Battery A
: Rectangular,
: 4 nos, each33.75m x 15.05m
: 14.8 m/day
: 6.4 hr
: Rapid Gravity Filters
: 6 Nos.,each4.85m x 6.1 m
: 3.9m/hr
: 0.55 m
: Air scour and water wash
: Chlorine gas
: Solution feed
Battery B
Horizontal flow
2 Nos.each34.7m x 14.95m
6 1 hr
4 Nos. .each8.15m x 5.71 m
3.34 m/hr
0.75m
-Capacity 13638 m'

156
TABLE «.2
PHYSICO-CHEMICAL AND BACTERIOLOGICAL QUALITY OP
RAW AND FINISHED WATERS
NIMETA WATER TREATMENT PLANT-B ARODA
I VISIT II VISIT III VISIT
PARAMETERS
RAW FILTERED RAW FILTERED RAW FILTERED
Physico-chemical
Turbidity (NTU)
pH
Total Alkalinity(CaCO,)
Conductivity (uS/cm)
Hardness (CaCO,)Total
Carbonate
Non Carbonate
Calcium (Ca)
Magnesium (Mg)
Chlorides (Cl)
Sulphates (SO4)
Nitrate* (NO,)
g*ct«riel«ck»l (MPN/100 ML)
Total colifonn 430
Ejsti 230
Fecal stteptococci 93
80
7.9
100
349
70
70
0
16
7
50
18
2
5
8.0
70
379
70
70
0
16
7
40
61
1
93
23
9
4.5
7.7
160
420
140
140
0
22
20
50
21
4
240
93
93
3.0
8.0
ISO
420
140
140
0
22
20
50
29
1
23
9
9
35 3.4
8.2 7.8
160 170
513 51
92
92
0
21
10
60
40
1
2400
210
93
92
92
0
21
10
50
46
1
29
0
9
All values except pH,Tuibidity and Conductivity aie expressed as mg/1

157
TABLEéJ
PLANT PERFORMANCE AT VARIOUS STAGES OP TREATMENT
NIMETA WATER TREATMENT PLANT-BARODA
PARAMETERS
Tuibidàty
(NTU)
T.CoUform
(MPN/100ML)
E.COÜ
(MPN/100ML)
visrr
I
n
ni
i
u
m
i
n
m
RAW
WATER
80
4.5
35
430
240
2400
230
93
210
SETTLED
WATER
7.0
3.5
10
_
-
-
-
-
FILTERED
WATER
5.0
3.0
3.4
93
23
29
23
9
0

158
TAKTESHWAR FILTER PLANT,KRISHNANAGAR - BHAVNAGAR
INTRODUCTION
The city ofBhavnagarwithapopulationof3.5 lakhs draws its water supply fromtwo sources namely Shetrunji reservoir and Gaurishankar lake located at a distance of47 km and 5 km respectively from the water works at Takteshwar. The treatment plantconsists of three distinct streams with a total capacity of 31.7 mid. The first and secondstreams (designated battery A and B for reporting) each of 11.35 mid capacity commis-sioned in 1932 and 1935 respectively were taken up for performance evaluation. BatteryA consists of two settling tanks and three filters and battery B has twopre-settling tanks,two settling tanks and three filters. The third stream of 9 mid added in .the year 1962consists of one clariflocculator and two rapid gravity filters and was non-operationalduring the study period. Depending upon the availability of raw water, the inflow to thisbattery is diverted to the other two batteries. The schematic flowsheet is shown in Fig.6.2 and the plant summary data is presented in Table 6.4. The treatment works aremaintained by the Municipal Corporation of Bhavnagar.
PLANT APPRAISAL
Raw water quality and flow measurementRaw water from Shetrunji reservoir after two stage pumping flows by gravity
to the treatment works while from Gaurishankar lake it flows by gravity first and thenis pumped (dia. of rising main 600 mm.) to the treatment plant. Provision for standbypumps is adequate. Raw waters from Shetrunji reservoir and Gaurishankar lake areblended at the inlet chamber of the treatment plant.
Raw water quality in the reservoir and lake has been fairly good during the periodof evaluation (Table 6.5). No potential sources of pollution exist in the vicinity of intake.
Two rectangular weirs have been provided in the inlet chamber to measure theraw water inflow to battery A and battery B. The plant inflow during the period ofevaluation was in the range of 7.6 to 17 mid in battery A and 5.6 to 16.8 mid in batteryB as against the rated flow of 11.35 mid for both. *
Pre-treatmentAlum solution was applied at a single point at the upstream of the weir in the
raw water channel. The dosing system for controlled addition of alum was defunct.In battery A, flocculation was achieved in a baffled channel leading to horizontal
flow rectangular settling tanks. In battery B, a separate flocculation chamber has beenprovided. The settling tanks of both battery A and B were highly overloaded.

159
The computed SOR of settling tanks of battery A was in the range of 12.5 to 28 m'/m1/day as against the design value of 18.7 ni'/rnVday, while the corresponding figuresfor battery B was 11.1 to 33.3 m'/m'/day as against the design value of 22.5 m3/mVday. Consequently, the detention time was in the range of 2.7 to 6 hrs as against thedesign value of 4 hrs. However, in case of battery B the detention time was 2.1 to 6.4hrs as against the design value of 3.2 hrs. The settled water turbidity was more or lessthe same as that of the raw water (Table 6.6).
FiltrationThe filters in both the batteries were overloaded and their performance was far
from satisfactory. The filtration rate varied from 2.6 to 5.7 m/hr in battery A and inbattery B itvariedfrom 1.9 to 5.6 m/hr as against the design rate of 3.8 m/hr. Thedepthof sand in the filters was only 25 cm and practically there was no reduction in turbiditydue to filtration (Table 6.6). Reportedly, the depth ofsand was reduced from the originalvalue of 75 cm to facilitate overloading.
The filter appurtenances such as rate controller, rate of flow indicator andheadloss indicator in all the filters were not in working condition. Filters werebackwashed as a matter of routine once in 24 hrs. The sludge from settling tanks andspent filter backwash water are disposed off into the sea through an undergroundchannel. . .• •••*&$; . ,.. /, • • •.
DisinfectionChlorine gas was used for disinfection. As the chlorinator was out of order,
chlorine gas was directly applied at the filtered water channel leading to the clear waterreservoir. Average chlorine dose for the filtered water was recorded as 0.5-1.0 mg/1.The contact period provided was 45 min. The finished water had a residual chlorineof 0.2 mg/1 at the plant which is inadequate. The finished water was not always safefrom bacteriological point of view.
Laboratory facilitiesA small laboratory headed by a laboratory assistant has been provided at the plant
with necessary equipment like jar test machine, turbidimeter(Aplab), pH meter (colourcomparator) and chloroscope. However, the laboratory staff had not undergone anyformal training for routine quality control. Record keeping with respect to plantoperation was also found unsatisfactory.
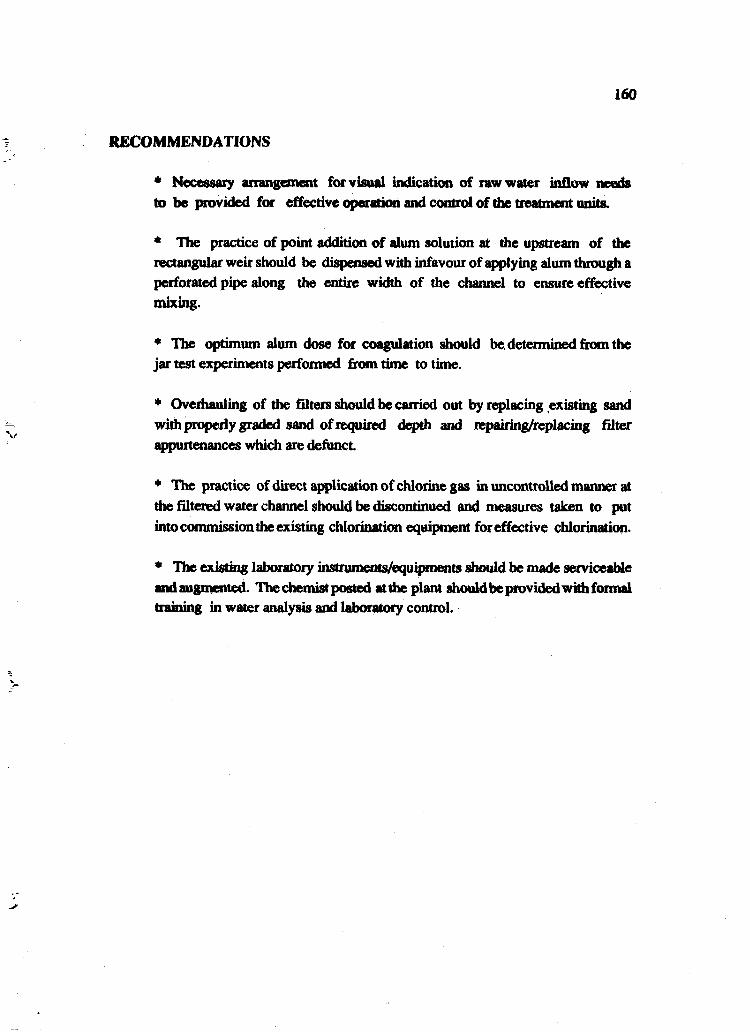
160
RECOMMENDATIONS
* Necessary arrangement for visual indication of raw water inflow needsto be provided for effective operation and control of the treatment units.
4 The practice of point addition of alum solution at the upstream of therectangular weir should be dispensed with infavour of applying alum through aperforated pipe along the entire width of the channel to ensure effectivemixing.
* The optimum alum dose for coagulation should be. determined from thejar test experiments performed from time to time.
* Overhauling of the filters should be carried out by replacing existing sandwith properly graded sand of required depth and repairing/replacing filterappurtenances which are defunct
* The practice of direct application of chlorine gas in uncontrolled manner atthe filtered water channel should be discontinued and measures taken to putinto commission the existing chlorination equipment for effective chlorination.
* The existing laboratory instruments/equipments should be made serviceableand augmented. The chemist posted at the plant should be provided with formaltraining in water analysis and laboratory control.

V*
ALUM
1J-
BAFFLED CHANNEL
RAWWATER
WLETCHAMBER
MAIN
RESERVOIR
INLETCHAMBER
ALUM
BAFFLEDCHANNEL
PRESETTLINGTANKS {2NOSJ
SEDIMENTATIONTANKS
(2 NOS)
BATTERY-A
SEDIMENTATIONTANKSt 2NOS)
FLOCCULATOR
BATTERY-8
RAPID GRAVITY HLTERS
CHLOR1 NATION
CLEARWATERRESERVOIR
RAP© GRAVITY FCTERS
HG 6.2 TAKTESWAR WATER TREATMENT PLANT (SCHEMATIC) - BHAVNAGAR O\

162
TABLE 6.4
PLANT SUMMARY DATA - BHAVNAGAR
GENERAL
Name and location
Year of construction(Augmentation if any)
Design capacity
O & M Agency
Raw water source
Treatment flowsheet
ENGINEERING
Takteshwar Filter Plant,Krishna Nagar, Bhavnagar
1934 and 1963 (Augmentation)
31.7 mid
Municipal Corporation, Bhavnagar
Reservoir and lake
Conventional with Rapid sand filters
Raw water pumping
- Rising main diameter
Raw water flow measurement
Pre>treatntent
- Balancing reservoir size
- Detention time
- Pre-settling tanks
- No. & size of unit(s)
Coagulation
- Chemicals used
-Type of mixing
: Reservoir220 HP x 6 nos
(Submersible andCentrifugal)
: 1000 mm(2 stages)
: Rectangular weirs
: 15.2 m x 18.3 m x
: 38 minutes
: battery A
î -
: Alum
Lake60 HP x 3 nos,85 HP x 1 no.
150 HP x 1 no.
450 mm (gravity main)-2 nos.600 mm
2m
battery B
2 nos, each9.2 m x 8.8 m x 4 m SWD
Alum
: Hydraulic (baffled channel)

163
Flocculation
- Method / Type of unit
-No. & size of unit
Sedimentation
-Typeofunit(s)- No. & size of unit(s)
Surface overflow rate
- Detention time
Filtration
-Typeofunit(s)
- No. & size of unit(s)
• Rate of filtration
- Filter media
. Sand size
. Depth of sand
- Backwash arrangements
.Method
Disinfection
- Chemicals used
-Type of feed
Clear Water Reservoir
- Capacity
- Pump details
Hydraulic
battery A
Mechanical
1 no.,4.7 m x 5.8 m
battery B
Rectangular Rectangular2 nos.,each 2 nos.,each13.66 m x 22.25 m 27.4 m x 9.2 mx 3.14 SWD x 2.99 m SWD
0.78 m/hr 0.9 m/hr
4hrs 3.2 hrs
Rapid gravity filters
6 nos.(single bed) each7.5 m x 5.5 m
3.8 m/hr
E.S - 0.5 mmU.C - 1.8
0.75 m
Air scour and water wash
Chlorine gas
Solution feed
17200 m3
75 HP x 2 nos.,30 HP x 1 no.

164
TABLE 6.5
PHYSICO-CHEMICAL AND BACTERIOLOGICAL QUALITY OF
RAW AND FINISHED WATERS
TAKTESHWAR FILTER PLANT -BHAVNAGAR
PARAMETERS
Physico-chemical
Tuitidity(NTU)
PH
Total Alkalinity
(CaCO,)
Conductivity (uS/cm)
HaiäDess(CaCO,)
Total
Caibonate
NooCaibooat«
Calcium (Ca)
Magnesium (Mg)
Chlorides (Cl)
Sulphates (SO,)
Nitrates (NO,)
ivisrr
RAW ]
7.8
8.2
110
401
110
110
•0
21
14
50
-
0.9
Bacteriological (MPN/100 ML)
Totti coUfonn
Rcoti
93
43
43
FINISHED
5.6
8.2
120
401
120
120
0
16
16
50
-
1.0
3
0
0
uvisrr
RAW
8.2
8.2
130
411
130
130
0
19
20
55
37
0.9
93
23
23
FINISHED
8.2
8.2
130
411
140
130
10
19
20
55
37
1.3
0
0
0
mvisrr
RAW FINISHED
20
8.6
170
485
200
170
30
30
30
70
24
1.8
93
43
43
13
8.6
170
485
180
170
10
27
27
70
24
1.5
21
0
14
AU values except pH,Tuibidity and Conductivity aie expressed as mg/l

163
TABLE é.6
PLANT PERFORMANCE AT VARIOUS STAGES OF TREATMENT
TAKTESHER FILTER PLANT-BHAVNAGAR
PARAMETERS VISIT RAW SETTLED FINISHED
WATER WATER WATER
TmUdity
(NTU)
7.8
8.2
6.8
8.2
5.6
8.2
20 19 13
T.Coiifwm
(MPN/100ML)
93
93
93 21
B.COÜ
(MPN/100ML)
43
23
m 43

166
OPA WATER WORKS - GOA
INTRODUCTION
Panjim, the capital of Goa has a population of about 4.5 lakhs (1981 census) andreceives its water supply from Opa water works situated about 27 Km away from city.The water works of 54 mid capacity commissioned in 1972 draws raw water from riverKhandepar. The treatment comprises aeration, pre-treatment with alum coagulationand sedimentation followed by rapid sand filtration and post-chlörination. Theschematic flow sheet is shown in Fig.7.1 and the plant summary data is presented in Table7.1. The plant is maintained by PWD, Goa.
PLANT APPRAISAL
Raw water quality and flow measurementA weir across the river Khandepar has been constructed downstream of
the intake to ensure adequate supply of raw water throughout the year. There are nopotential sources of pollution in the vicinity of the intake. Due to impoundment, theraw water quality is quite good (Table 7.2). The intake has M.S. removable screenswhich are cleaned manually. Six raw water pumps have been provided of which 2 arestandby. During the evaluation study it was observed that the standby pumps were alsoin use to increase the output. The flow recorder and integrator installed at the Venturiflume were not working and the actual flow measured indicated overloading of the plantby 15%.
Pre-treatmentChemical dosing and mixing tanks nave been provided for preparation of alum
and bleaching powder solutions. Alum mixing is achieved at the hydraulic jump.Bleaching powder is used, whenever necessary, for prechlorination. The mechanicalequipment in the clariflocculator was found in good working condition and though theplant was overloaded, the settled water quality was still satisfactory (Table 7.3).
FiltrationThe filters were properly operated and well maintained. However, the filter
head loss gauges were out of order. Coarse sand was reported to have been used in twofilters to facilitate higher filtration rates. The quality of filtrate was satisfying thestandards prescribed by CPHEEO (Table 7.3).

167
DisinfectionThe gas chlorinators were in good working condition. Chlorination was found
to be effective as confirmed by the absence of E.coli in the treated water (Table 7.3).Bleaching powder is also stocked at the plant for emergency use.
Laboratory FacilitiesA well equipped laboratory has been provided at the plant. A qualified chemist
andamicrobiologisthave been posted for routine analysis and control of the treatmentprocesses.
RECOMMENDATION
* The flow recorders and filter headloss guages should be got repaired to facilitateeffective plant control and filter operation.

Y -•'• • * " •
ALUM
RAWWATER
CLARIFLOCCULATOR
PUMPING
RAPIDGRAVITYFILTERS
:HLO« NATION
CLEANWAIBRESERVOIR
TO SUPPU
HG 7.1 OPA - WATER TREATMENT PLANT (SCHEMATIC), GOA

169
TABLE 7.1
PLANT SUMMARY DATA - GOA
GENERAL
Name & Location
Year of Construction
Design Capacity
O & M agency
Raw water source
Treatment Flowsheet
ENGINEERING
Raw water Pumping
- Rising main Diameter
Raw water flow measurement
Pre-treatment
Aeration
Coagulation
- Chemicals used for
- Method of inning
Flocculation
- Method (type of unit)
- No.and size of unit(s)
- Detention time
Opa Water Works.Opa Khandepar, Ponda, Goa
1972
54mld
Public Works Department, Goa
River Khandepar
Conventional with rapid gravity filters
6 Nos. of 13.5 mid cap. each including 2 standby
750 mm.
Venturi flume with MahindraElectro flow meter
Cascade type
Alum, lime
Hydraulic, Channel 3.5 m long
Mechanical(Clariflocculator)
2 Nos., 18mdia.each.
30 minutes

170
Sedimentation
- Type of unit(s)
- No. & size of units
- Surface over flow rate
- Detention time
Filtration
- Type of unit(s)
- No. & size of unit(s)
- Rate of filtration
-Filter media
. Sand size
. Depth of sand
. Gravel size
. Depth of each layer
-Backwash arrangements
. Method
. Wash water tank cap.
Disinfection
- Chemicals used
- Method of feeding
- Chlorinator Details
- Contact period
Clear Water Reservoir
- Type, No., &. capacity
- Clear Water Pumping
Circular clarifiers
2 Nos., 36 m dia. each.
1.12m/hr
2 hours
Rapid gravity filters
6 Nos.,12.2m x 7.6m each.
4.9nVhr
E.S.-0.6mm,U.C.-1.8
70 cm
6-12 mm 12-18 mm
25 cm 12 cm
Air scour & Water wash
Not provided.direct pumping
Chlorine gas + bl. powder
Solution feed
Two Nos., Pressure type Aqua Pura Corporaton7 kg/hr. capacity
3hrs
RCC, 3 tanks of 3030 m' capacity each
Gravity Flow

171
TABLE 7.2
PHYSICO-CHEMICAL AND BACTERIOLOGICAL QUALITY OFRAW AND FINISHED WATERS
OPA WATER WORKS PLANT-GO A
PARAMETERS
Pbysico-chemical
Tuibidity(NTU)
pH
Total Alkalinity(CaCO,)
Hardness(CaCOs)Total
Carbonate
Non Catbonate
Calcium (Ca)
Magaenum (Ms)
Chlorides (Cl)
Sulphates (SO,)
Iron (Fe)
I
RAW
0.5
7.4
26
32
26
6
6
4
12
Tr
0.2
Bacteriological (MPN/100 ML)
Total coliform
Fecal coliform
Fecal streptococci
2400
930
150
43
VISIT
FINISHED
0.8
7.0
26
32
26
6
6
4
12
Tr
• -
NU
NU
NU
NU
n
RAW
5.5
7.4
48
48
48
0
16
1.5
5
Tr
0.2
UOO
240
4
28
VISIT
FINISHED
0.5
7.3
50
50
50
0
16
2
5
Tr
-
NU
NU
NU
NU
nivisrr
RAW FINISHED
9.3
7.3
24
30
24
6
8
2.4
20
Tr
Tr
>140
NU
NU
NU
2.5
7.5
24
30
24
6
8
2.4
18
Tr
-
NU
NU
NU
NU
AU values except pH and turbidity are expressed as tng/1Tr-Traces

172
TABLE73
PLANT PERFORMANCE AT VARIOUS STAGES OF TREATMENT
OPA WATER WORKS PLANT - GOA
T.Colifon»(MPN/100ML)
(MEN/100 ML)
PARAMETERS VISIT RAW SETTLED FILTERED FINISHEDWATER WATER WATER WATER
TinWdity(NTU)
I
n
in
I
n
m
i
n
m
5.0
5.5
9.3
2400
1100
>140
150
4
0
5.0
5.0
5.5
460
460
140
23
0
0
-
-
-
93
7
4
0
0
0
0.8
0.5
15
0
0
0
0
0
0

173
HANSI WATER TREATMENT PLANT - HANSI
INTRODUCTION
Hansi town in Haryana has a population of 60,000 as per 1981 census.Presently, the city has two water treatment plants, viz. the old plant using conventionalmedia (4090 mVday) and the recently commissioned dual media (coconut shell andsand) filtration plant (4546mVday) located onHansi-Jindroadabout2km from Hansitown. Since the new plant is still to be fully operational, the old plant alone has been takenup for evaluation. Canal water after storage is pumped to the treatment plant whichprovides for conventional pre-treatment with alum coagulation and sedimentationfollowed by rapid sand filtration and disinfection. The plant commissioned in 1962is maintained by the PHED, Govt. of Haryana. The plant layout isshowninFig.8.1and summary data is presented in Table.8.1
PLANT APPRAISAL
Raw water quality and flow measurementRaw water from the Petwar Distributory of the Western Jamuna Canal is drawn
by gravity to storage-cum-sedimentation tanks of 28 days capacity. Due to the longstorage, the raw water is of high quality with low turbidity and coliform counts (Table8.2). Stored water is drawn through a floating intake to a sump from where it is pumpedto the treatment plant. There is no provision for measuring the plant inflow and flowregulation is achieved either by throttling the pump delivery valve or stopping the pump.Actual flow measurement at the time of visit indicated that the plant inflow was only 56per cent of the design flow-.
Pre-treatmentAlum in solution form is used as the coagulant. The dose of alum is fixed based
on past experience and not determined by jar tests. There is no provision for constantor proportionate dosing of alum solution. Alum mixing and flocculation is achieved ina baffled channel.
The coagulated and flocculated water is clarified in horizontal flow rectangularsettling tanks with hopper bottoms. The flocculated water enters the tank through 8numbers of CI. pipes placed along the width of the tank. As raw water turbidity itselfwas very low, the reduction due to sedimentation was not significant (Table 8.3).

174
Filtration and disinfectionThree open to sky filters have been provided each measuring 4 mx 4 m of
actual filter surfaces. No rate controllers have been provided and the filters are operatedon declining rate principle. No provision has been made for air scour and filters arebackwashed using water only. Backwashing was ineffective and considerable mudball formation was noticed in the filters. Filtered water is chlorinated using a solutionof bleaching powder. The finished water was free from coliform.
Laboratory facilitiesThe plant has no laboratory facilities to conduct the routine tests.
RECOMMENDATIONS
* Proper arrangement for raw water flow measurement should be providedto facilitate plant operation and control.
* Maintenance of filter bed needs to be improved by adequate/more frequentback washing.
* Arrangements should be made for periodic testing of water quality and to fixthe dose of chemicals in a rational way.

PUMP HOUSE
R W SUMP
RW
RW SUMP
CLEAR WATERTANK
C L E A R WATERTANK
F-)
F-2
F - 3
COAGULATIONCHANNEL ALUM
-'TANKmimim
SETTLING TANK
SETTLING TANK
t - RAPID GRAVITY FILTER
STORAGE CUM
SEDIMENTATION
TANK- 3 RAW WATER INLET CANAL
1N0T TO SCALE)
STORAGE CUMSEDIMENTATION
TANK - I
STORAGE CUMSEDIMENTATION
TANK-2
3ocw
PETWARDISTRIBUTORY
FK38.1 LAYOUT PLAN OF HANS I WATER TREATMENT PLANT

176
TABLE 8.1
PLANT SUMMARY DATA - HANSI
GENERAL
Name and location
Year of construction
Design capacity
O & M Agency
Raw water source
Treatment flowsheet
ENGINEERING
Raw water pumping
-Rising main diameter
Pre-treatment
Coagulation
- Chemicals used
- Type of mixing
- Details of mixing
Flocculation
- Method /Type of unit
- Dimensions
: Hansi Water Treatment Plant Hansi (Haryana)
: 1962
: 4.5 mid
: Public Health Engineering Depattment,(Haryana)
: Western Jamuna Canal
: Conventional with rapid sand filters
: 2 nos. ,25 HP each, Centrifugal pump of3.86 rnVmiri. capacity
: 300 mm.
: Alum
: Hydraulic
: Open baffled channel 37 nos.RCC baffles toS.T No. 1 43 nos. RCC baffles to S.T No.2
: Hydraulic baffled channel(over and underflow)
: Len«hofchannel28mtoS.Tland 37.5 m to S.T 2Total no. of baffles 43

177
Sedimentation
-Typeofunit(s)
- No. & size of unit(s)
- Surface Overflow Rate
• Detention time
Filtration
-Typeofunit(s)
- No. &, size of unit(s)
- Rate of filtration
- Filter media
.Sand size
.Depth of sand
- Backwash arrangements
.Method
. Wash water tank cap.
Disinfection
- Chemicals used
-Type of feed
Clear Water Pumping
- Type, No. & Capacity
-Pump details
: Clarifiers (Rectangular)
: 2 nos.,each 28m x 7.8m & 2.4m depth
: 9.45 mVmVday
: S hrs. 25 minutes
: Rapid gravity filters
: 3 nos.,each 4 m x 4 m
: 4.0 m'/mVhr.
: E.S.-0.2 to 0.4 mm
: 60cm
: Waterwash only
: 180 m} (common to both old and new plants)
: Bleaching powder
: Solution feed
: 2 nos., 27 m x 9 m x 2.8 m each
: 2 nos., centrifugal pumps ofcapacity 232 m'/hr,50 HP each

178
TABLE 8.2
FHYSICO-CHEMICAL AND BACTERIOLOGICAL QUALITY OFRAW AND FINISHED WATERS
HANSIWATER TREATMENT PLANT-HAN«
PARAMETERS
Phyako-cbettKal
Tuibidity(NTU)
PH
Total Alkalinity(CaCO,)
Conductivity JuS/cta)
Hairiness (CaCO})Total
CaibonaK
NonCaibooaie
Calcium (Ca)
Magnesium (Mg)
Chloride» (Cl)
Sulphates (SO,)
Iroo (Ife)
Bactwwbtiesl (MPN/100 ML)
Total cotifoan
Fecal cottfoi»
Fecal streptococci
ivisrr
RAW
3
7.8
88
270
118
88
30
28
12
16
28
0.1
8
2
FINISHED
2.0
7.2
86
256
134
86
48
31
14
18
35
0.1
NIL
NIL
NIL
RAW
13
9.0
40
102
56
40
16
14
5
7
23
TT.
9*
23
23
n VISIT
FINISHED
4
8.3
56
120
80
56
24
22
5
»3
28
0.1
NIL
NIL
NIL
All values except pH .Twfaidity and Conductivity am «xpeated as mg/L

179
TABLE«J
PLANT PERFORMANCE AT VARIOUS STAGES OF TREATMENT
HANSI WATER TREATMENT PLANT • HANSI
PARAMETERS
Tufbidity
(NTU)
T.CoUfonn
(MPN/100ML)
visrr
I
n
I
n
RAW
WATER
3
13
8
94
SETTLED
WATER
2
12
5
49
FILTERED
WATER
1.7
5
2
13
FINISHED
WATER
ZO
4.0
NIL
NIL

180
MAIN WATER WORKS - HISSAR
INTRODUCTION
Hissar, a major commercial-cum-industrial town of Haiyana, with a presentpopulation of about 1.2 lakhs is served by two water works, viz.(i) The Main WaterWorks (9.0 mid) and (ii) The Second Water Works (5.9 mid). The plant capacities arebeing augmented by 10.0 mid and 1.0 mid respectively.
The Main Water Works, commissioned in 1970 was taken up for evaluationstudy. Canal water drawn through storage tanks is pumped to the treatment plant whichprovides for alum coagulation, flocculation, sedimentation in upflow sludge blanketclarifiers, rapid sand filtration and post-chlorination. The plant owned by the MunicipalCommittee of Hissar is managed by the Public Health Engineering Department, Govt.of Haryana. The plant layout is shown in Fig.8.2 and summary data is presented inTable.8.4.
PLANT APPRAISAL
Raw water quality and flow measurementThe raw water from the Western Jamuna Canal is drawn through Hissar Major
Distributory. Two storage-cum-sedimentation tanks of 28 days capacity are provided,to tide over canal closure period. A bar screen has been installed in the inlet channelto remove gross floating debris. There are no point sources of pollution in the HissarMajor Distributory; however, there is bathing and washing of clothes by people andcattle wading in the channel. Raw water from storage tanks is drawn into a suctionwell through a floating intake and pumped to the treatment plant. The flowindicator-cum-integrator and recorder originally installed at the raw water inlet channel are indisrepair. No special arrangement exists for regulating plant inflow and it is effectedeither by stopping the pump or by throttling the delivery valve of the pump. Due to largedetention time provided in the storage tank, considerable improvement in raw waterquality is observed (Table 8.5).
Pre-treatmentAdequate provision has been made for alum solutionising and mixing tanks.
Mixing is achieved through hand operated mixing paddles. Alum solution is fed at thehead end of a baffled mixing channel. Flocculation and sedimentation is achieved inthe upflow sludge blanket clarifiers with a detention time of 2.83 hrs and surfaceoverflow rate of 1.33 m/hr. The performance of the sludge blanket clarifiers wassatisfactory and the settled water turbidity was less than 5 NTU (Table 8.6).

181
FiltrationTwo rapid gravity filters of 7 m x 7 m each have been provided with a design
filtration rate of 4.8 m/hr. The filters are backwashed using only filtered water as theair-blower provided for scour was out of order. The filter rate controllers, rate of flowindicators and loss of head-gauges in all the filters were not in working condition. Filterbackwashing was not effective and large cracks were observed in the filter beds. Theperformance of the filters has not been satisfactory and the filtered water turbidity was1.8 to 4.0 NTU (Table 8.6).
Disinfection
The disinfection of filtered water is carried out using bleaching powder solution.The dose is controlled by trial and error and not based on test for chlorine demand.Residual chlorine in finished water was 1.5 to 3 mg/l and the finished water was freefrom coliforms.
Laboratory facilities
No laboratory facilities are available at the plant site.
RECOMMENDATIONS
* Adequate arrangement should be provided for measurement and recordingof plant inflow.
* The rapid sand filters which are in a bad condition need to be overhauled,damaged laterals, if any, be replaced and supporting gravel and filter sand ofappropriate depth- and grading be placed in the filters. Effective backwashingof the filters should be ensured to prevent recurrence of the problem.
* In view of the expansion of the plant capacity, it is essential to establish alaboratory at the plant. The laboratory should be adequately equipped withnecessary facilities and trained staff fo facilitate effective plant control.

HISSAR MAJOR OtSTRIBUTORY -*/A//f-
/ / /
/ / /
X /
8
*
i
I
V „ .
Ia0i
I
<
6
e
•
•T "
7
m—-
LAWN
A
\
1
•
~ I M I F T C H A M N F I I N D E X ,
\. TRANSFORMAI« ROOM
J
STORAGE CUMSEDIMENTATIONTANK NO-2
2. PUMP CHAMBER
3. SUCTION WELL(RW)
4. SUCTION WELL (CW)
3. ALUM SOLUTION TANK
6. UP FLOW SLUDGE BLANKETCLARIFIERS
7 RAPfO GRAVITY FILTERS
8. CLEAR WATER TANKS
9. OHSR 10. STAFF QUARTERS
I I . FEEDING UNE FROM S S TANK TO
RW SUCTCM WELL12. BLEACHING POWDER SOLUTIONISINS
TANK
It
RW |
LAWN
11
ISTORAGE CUM SEDIMENTATION
TANK N O - )
1ENTRANCE
N OT TO SCALE)
HO 8.2 LAYOUT PLAN OF MAIN WATER WORKS - HISSAR

183
TABLE 8.4
PLANT SUMMARY DATA - IIISSAR
GENERAL
Name and location
Year of construction
Design capacity
O & M Agency
Raw water source
Treatment flowsheet
ENGINEERING
Raw water pumping
-Rising main diameter
Raw water flow measurement
Pre-treatment
Coagulation
- Chemicals used
-Type of mixing
Flocculation
- Method / Type of unit
Main Water Works Hissar, (Haryana)
1970
9 mid
Public Health Engineering Department,(Haryana)
Western Jamuna Canal
Conventional with Rapid Sand Filters
3 nos, Centrifugal pump,
35 HP, 15 HP & 55 HP respectively
450mm
Broad crested masonary weir
Alum
Hand operated mixing paddles
Mechanical,Oariflocculator

184
Sedimentation
-Typcofunit(s)
- No. & size of unit(s)
- Surface Overflow Rate
- Detention time
Filtration
- Type of unit(s)
- No. & size of unit(s)
- Rate of filtration
- Filter media
. Sand size
. Depth of sand
. Gravel size
. Depth of each layer
- Backwash arrangements'
.Method
Disinfection
- Chemicals used
-Type of feed
Clear Water Pumping
- Type, No. & Capacity
- Pump details
: Sludge Blanket type clarifier
: 6 nos., 7 mx 7 m x 7 m each
: 32m3/m7day
: 2 hr 50 minutes
: Rapid gravity filters
: 2 nos., 7 m x 7 m each
: 4.8mVm2/hr
: E.S.-0.45-0.7 mm U.C. -1.3 to 1.7
: 60cm
: 2 layers, first layer 20 mm to25 mm & second layer 8 mm to 15 mm
: 13.5 cm
: Wash water only
: Bleaching powder
: Solution feed.
: 2 nos., 22.87 m x 22.87 m x of Reservoir2.44 m each, 1276 m3 capacity
: 6 nos., Centrifugal pumps of 160 HP, 2 nos.-70HP each,75 HP, 65 HP and 45 HP respectively

185
TABLE 8.5
PHYSICO-CHEMICAL AND BACTERIOLOGICAL QUALITY OF
RAW AND FINISHED WATERS
MAIN WATER WORKS - HISSAR
PARAMETERS
Physico-chemical
Tuibidity(NTU)
pH
Total Alkalinity
(CaCO,)
Cooductivity(/uS/cm)
Haidoess CaCO,
Total
Caibonafe
NooCaibooate
I VISIT II VISIT
4
7.6
80
1.8
7.3
78
5
8
70
214
102
80
22
Calcium (Ca) 34
Magnesium (Mg) 4
Chlorides <d) 9
Sulphates (SO4) 12
Bacteriological (MPN/100 ML)
Total coUform 8
Fecal coUfotni NIL
220
NIL
NIL
190
23
4
185
112
78
34
34
-
9
90
70
20
28
5.0
8
14
86
62
24
-
-
9
NIL
NIL
m visrr
RAW FINISHED RAW FINISHED RAW FINISHED
2
7.4
62
12
8.5
64
1.8
7.9
60
184
80
64
16
24
5
8
12
540
350
NIL
NIL
All values except pH .Tuibidity and Conductivity are expressed as mg/l

186
TABLES.«
PLANT PERFORMANCE AT VARIOUS STAGES OF TREATMENT
MAIN WATER WORKS - HISSAR
PARAMETERS VISIT RAW SETTLED FILTERED FINISHED
WATER WATER WATER WATER
Turbidity I 4 1.5 1.4 1.8(NTU)
II 5 3 4 2
III 12 2.5 2.0 1.8
T.CoUfonn I 8 NIL NIL NIL(MPN/100ML)
II 23 4 NIL NIL
m 540 170 70 NIL

187
PHED SECOND WATER WORKS-ROHTAK
INTRODUCTION
Rohtak town in Haryanawith a population of about 1.8 lakhs (1981 census) hasthree water works viz (i) Old Municipal Plant (9.1 mid) (ii) PHED Second Water Works(9.1 mid) and (iii) Medical College Plant (4.5 mid). The source of water supply for allthe plants is the Western Jamuna Canal. The PHED second water works was selectedfor the evaluation study. The plant layout is shown in Fig.8.3 and summary data ispresented in Table 8.7. The plant was commissioned in 1979 is maintained by the StatePHED.
PLANT APPRAISAL
Raw water quality and flow measurementThere has been scarcity of water in the Western Jamuna Canal during the last
one year due to drought. As a result, there is often delay in the release of water intothe Sunari Minor branch channel which feeds the raw water storage tank at the waterworks and water supply to the town gets affected. .
There are no point sources of industrial pollution in the Sunari Minor branch ;however, there is cattle wading and washing of clothes and bathing in the channel.The quality of water reaching the water works is fair and the total coliform MPN doesnot generally exceed 250 per 100 ml (Table 8.8).
Only half the design requirements of raw water storage has been provided forin the first phase. There is heavy growth of rooted aquatic weeds (mainly Hydrilla) inthe storage tank. However, there is no significant growth of algae in the water. Becauseof the difficulty in keeping the storage tank empty without disrupting the water supply,the storage tank has not been deweeded so far. The two float-controlled swing typeofftakes in the storge tank are not working and the supply is being drawn from tankbottom all the time which is not desirable. Due to frequent interruption in electricsupply to Rohtak region, the plant operation is often restricted to 10-12 hours a day.There is 100% standby capacity for raw water pumping but no standby power.
The raw water flow indicator, integrator and/ecorder installed at the measuringflume, are not working.
Pre-treatmentProvision has been made for addition of both alum and lime for coagulation. The
quality of canal water after storage, being fairly good, alum coagulation is notpractised regularly. Alum solution tanks with stirrers have been provided but devices formeasuring and constant dosing of chemicals have not been provided. Storage spacefor chemicals is sufficient.

188
The standing wave at the raw water measuring flume could have been used forrapid mixing of the coagulant in the raw water. A mechanical flash mixer has beenprovided but its speed is very low (30 rpm) to be effective. The detention time (60 sec)of the flash mix chamber is adequate.
There is one circular clarifiocculator with 10 cm dia. orifices for dischargeof clarified water. The placement of the flocculator (one to either side of the centremounted on the moving bridge) is not satisfactory as it leaves more than 50 % of theplan area unswept by the paddles. During visits to the plant, alum was not being addedand functional efficiencies of the flocculator could not be assessed.
The design features of the settling zone of the clarifiocculator are found to besatisfactory with regard to side water depth, weir loading, surface overflow rate anddetention time. The orifice outlets into the effluent launder of the clarifier were foundto get submerged. The tip speed of the clarifier scraper bridge is greater than thedesirable maximum speed and is likely to stir up settled sludge. Sludge withdrawalarrangements of the clarifier are satisfactory.
FiltrationThe design rate of filtration (4.9 m/hr) is on the lower side. The other design
features of the filters are satisfactory except the following.The underdrain system is inadequate in regard to size of the manifold, number
and size of laterals and size and spacing of the perforations in the laterals.The filter rate setters, the filter rate controllers, the filter rate indicators, the
headloss gauges and the auxiliary floats in the filter beds are all not functional. Thefilters are now operating at variable rates and variable heads, the total flow through thefilters being controlled by the rate of raw water pumping.
The air and wash water distribution during filter backwash is not uniform. Thisis evident by the presence of heavy mounding of sand at places and deep pits elsewhere.There was also mixing of gravel with sand as seen at the surface of sand bed. Thefilter sand is mostly caked up with mud. There are extensive cracks in the filter surface.There seems to be short-circuiting of water through the filter bed without undergoingany filtration. The poor condition of the filter beds could be the result of deficienciesin the filter wash system. There was loss of sand during washing.
DisinfectionPost-chlorination alone is provided which is adequate. The dose is fixed
by trial and error to give the desired residual. A gaseous chlorinator had been installledat the water works but the equipment has never worked. Bleaching powder is beingused for chlorination and is added into the two clear water storage tanks separatelywhich cannot effect as through mixing as adding it into the filtered water conduit itself.The bleaching powder dosing arrangement does not ensure dosing of bleaching powdersolution at constant strength and therefore is not satisfactory. Sufficient chlorine

189
contact time (about 2 hours minimum) is available before chlorinated water is pumpedfor distribution. Clear water storage is adequate. No meter has been provided to recordthe total quantity of water supplied from the waterworks.
Laboratory Facilities and StaffThe laboratory facilities fall far short of the norms recommended by the
CPHEEO in terms of laboratory space and equipment. There is no turbidimeter whichis an essential equipment for plant control. The jar test equipment provided is notvery satisfactory. Junior Engineer partly incharge of the waterworks, is not able tolookafter the O & M requirements properly. There is a temporary chemist. There isno laboratory attendant or technician to assist the chemist. Filter and pump operatorshave no special training.
Plant recordsDaily records are maintained only for raw and clear water pumping operations
and residual chlorine tests. No records are kept for filter operation, raw water storagelevels etc. Actual flow measurements for raw water entering the works or the waterleaving the filters are not done.
RECOMMENDATIONS
• Additional raw water storage capacity may be provided as the storage nowprovided is only half of the design requirements.
* Float offtake in raw water storage tank and raw water flow measuring deviceshould be repaired.
* Constant rate alum solution feed device should be set right and the point ofalum addition may be shifted to achieve adequate mixing.
• Loss of head and filtration rate gauges as well as filter rate controllers needrepair.
* The plant should have a laboratory where some important tests such asturbidity, pH, chlorine demand, residual chlorine etc, to check the quality of rawwater and finished water can be regularly done by a Chemist/Bacteriologist.
• It is essential that log book records are maintained.

l.i V*
STORAGE CUM SEGMENTATION TANK I
6
-O
IdZ
Xo
STORAGE CUM SEOIMENTATION TANK It
(PROPOSED)
LEGENDA Row Wottr Suction
B Row S Otar Water Pump Houtt
C Clorif loeeulator
0 Filter Hont«
E Clear Water Tank
F Clear Mater ToAk
G Clear Water Suction Well
H Sludge S W«stt Woter Sumpft Pump House
FIGS.3 LAYOUT PLAN OF PHEDSBCOND WATER WORKS, ROHTAK

191
TABLE 8.7
PLANT SUMMARY DATA - ROHTAK
GENERAL
Name and location
Year of construction
Design capacity
O & M Agency
Raw water source
Treatment flowsheet
ENGINEERING
°«w water pumping
•Rising main diameter
Raw water flow measurement
Pre-treatment
Coagulation
- Chemicals used
-Type of mixing
- Details of mixing
Flocculation
- Method / Type of unit
- No. & Dimensions
- Detention time
PHED Second ater Works, Rohtak (Haryana)
1979
9.1 mid
Public Health Engineering DepartmenUHaryana)
Western Jamuna Canal
Conventional With Rapid Sand Filters
2 Nos, Centrifugal, 30 HP,7000 lit/min capacity
450 mm
Measuring Flume of 450 mmthroat width of capacity 1-15 mid
Alum
Mechanical, Motordriven stirrer
1.2 x 1.2 x 5.0 m mixer chamber size,2 HP, 60 sec. D.T.
Mechanical,Qariflocculator
lNo,8 .25mdia ,2HP
30 minutes

192
Sedimentation
-Typeofunit(s)
- No. & size of unit(s)
- Surface overflow rate
- Detention time
Filtration
-Typeofunit(s)
- No. & size of unit(s)
-Rate of filtration
- Filter media
. Sand size
.Depth of sand
. Gravel size
. Depth of each layer
- Backwash arrangements
.Method
. Wash water tank cap.
Disinfection
- Chemicals used
-Type of feed
Clear Water Pumping
- No.& Cap.of reservoir
-Pump details
Vertical entry horizontalflow type clariflocculator
1 No., 20.4 m dia, 4.1 m SWD
38 m'AnVday
2 hrs.35 minutes
Rapid gravity filters
4 Nos., each 6.5 x 3.35 m
4.88 m'/li/m1
E.S.- 0.35 to 0.65 mm U.C.-1.35 to 1.75 mm
60 cm "
Grit, 6-12 mm, 25-40 mm and 40-50 mm
30 cm (each layer 7.5 cm)
Air scour followed by water wash
87 m3
Bleaching powder
Solution feed
2 No., 2600 m3 total cap.
2 Nos., 75 HP each, 45 m head

193
TABLE M
PHYSICO-CHEMICAL AND BACTERIOLOGICAL QUALITY OFRAW AND FINISHED WATERS
PHED SECOND WATER WORKS - ROHTAK
PARAMETERS
Physico-chemical
Tuibidity (NTU)
pH
Total Alkalinity(CaCO,)
Conductivity (uS/cm)
Hardness (CaCO,)Total
Caibonate
Non Carbonate
Calcium (Ca)
Magnesium (Mg)
Chlorides (Cl)
Sulphates (SO4)
Iron (1%)
RAW
0.8
8.5
74
138
102
74
28
'29
7
10
64
0.1
Bacteriological (MPN/100 ML)
Total coliform
Fecal colifonn
Fecal streptococci
23
2
8
I VISIT
FINISHED
<1
8.5
-
-
-
-
-
_
-
-
-
NIL
NIL
NIL
RAW
1.5
7.8
72
150
80
72
8
24
5
6
45
-
•
50
7
7
nvisrr
FINISHED
0.8
8.0
-
-
-
-
-
-
-
NIL
NIL
NIL
ID VISIT
RAW Fl
1.5
9.0
60
145
88
60
28
22
8 .
5
28
0.1
30
4
11
INISHED
1.0
8.3
-
-
-
-
-
-
-
-
•
-
NIL
NIL
NIL
All values except pH .Tuibidity and Conductivity are expressed as mg/L

TABLE 8.9
PLANT PERFORMANCE AT VARIOUS STAGES OF TREATMENT
PHED SECOND WATER WORKS - ROHTAK
194
PARAMETERS VISIT RAW SETTLED FILTERED FINISHEDWATER WATER WATER WATER
TuiMdity(NTU)
n
0.8 1.0 1.0 <1
1.5 1.2 1.2 0.8
m 1.5 1.5 1.5 1.0
T.Colifonn(MPN/100ML)
n
23 13 1.0 NIL
50 4 1.2 NIL
m 30 1.5 NIL

195
DHALLI WATER WORKS - SHIMLA
INTRODUCTION
Shimla, the capital of Himachal Pradesh, had its first water supply schemecommissioned in the year 187S to serve a population of 16000. The supply wasaugmented from time to time by tapping raw water from different sources. Presentlythe total supply to the city is of the order of 30 mid. The two water treatment plantslocated at Dhalliviz. the slow sand filtration (SSF) plant of 4.5 mid with springs assource of raw water and the conventional rapid gravity filter plant of 8.2 mid capacityreceiving raw water from Cherot nullah were evaluated for their performance. Theschematic flow sheet is shown in Fig. 9.1 and the plant summary data given in Table 9.1.The treatment works are operated and maintained by the Irrigation and Public HealthDepartment of Himachal Pradesh.
PLANT APPRAISAL
Raw water quality and flow measurementThe raw water sources for the 4.5 mid SSF-plant are springs from protected,
wooded catchment area. Hence, the raw water is of high quality with low turbidity andcoliform count (Table 9.2). Spring water after roughing filtration at the source, flowsby gravity to the treatment works at Dhalli,
The raw water from Cherot nallah is also of fairly good quality (Table 9.2) andafter pre-filtration at the source is pumped against a head of 600 meters to theconventional rapid gravity filter plant at Dhalli. It is reported that the yield from boththe sources during summer is inadequate to meet the needs. There is no provision at thetreatment works to measure the inflow to the SSF plant. As for the conventional rapidgravity filter plant, the flow measuring weir is defective and does not facilitate accurateflow measurement. However, from the flow estimated at the time of visit, it was foundthat the plant was underloaded by 60 per cent.
Pre-treatmentAs the water quality from springs is good throughout, no pre-treatment is
provided before slow sand filtration. For the other plant drawing water from Cherotnallah, alum dosing is practised only during times of high turbidity and the dose is fixedarbitrarily. When alum is added, flocculation is achieved in the baffled channel leadingto the settling tanks. At the time of the visit when the raw water turbidity was 3 NTU,alum addition was dispensed with and hence, turbidity removal due to pre-treatmentwas marginal.

19t
FiltrationAs the raw water itself had a turbidity of 0.8 NTU, no significant reduction was
achieved in slow sand filters. However, there was considerable improvement inbacteriological quality. At the time of the visit, only 4 filters were in operation (dueto reduced plant inflow) while die other two were being resanded. Ail the filters arehoused under a roof and no algal growth on the filters wasvisible. The sand scraped fromthe filters is cleaned in a sand washing machine, dried and stored for reuse. It wasobserved that while resanding, the stored sand is directly placed on the top of existingsand in the filter. This practice is defective and leads to accumulation of impuritiesin the bottom layers and compaction of bed over a period of time with attendant problems.
The rapid sand filters were underloaded due to inadequate flow at the source.The filter appurtenances were in a state of disrepair. The filters were backwashed withraw water only and was not preceded by air scour as the air blower was out of order. Filterbackwashing has not only been ineffective but also most unscientific. The raw waterfrom the rising main is diverted for backwashing all the filters at the same time. Therate of rise of wash water (raw water) is also low and the wash water is not allowed todrain off excepting once in 2 or 3 months, before the filtration cycle is resumed. Withthe result the impurities in the filter bed are not removed but only loosenedtemporarily and retained in the bed during the fUeration cycle. This practice has notonly proved highly ineffective but also counter- productive as confirmed by the presenceof large cracks and undulations on the bed and worsening of the filtrate quality afterthe "so called" backwashing operation.
DisinfectionThe filtrate from slow sand filters is not chlorinated before supply while
the filtrate from rapid gravity filters is disinfected using bleaching powder solution.The dose applied is not controlled and there is no facility to measure residual chlorinein treated water.
Laboratory facilitiesLaboratory facilities available at the plant (turbidimeter and pH meter) are
not adequate for effective plant control. A separate laboratory is under construction atthe treatment plant.
Plant staffAn Assistant Engineer is incharge of the plant which is managed by 15 regular
staff members including a Junior Engineer and a Chemist. In addition 14 daily wageworkersare employed. The plant operators are neither qualified nor had undergoneformal training in operation and maintenance of water treatment plant.

197
Financial aspectsThe expenditure on operation and maintenance of the plant for the year 1987-
88 wasRs. 3.46 lakhs of which the staff salary alone accounted 64 per cent. The entireexpenditure is borne by the State Govt. The distribution system is with the MunicipalCorporation.
RECOMMENDATIONS
* To prevent cumulative fouling and compaction of the bottom layers of slowsand filters, the "throwing over" method of resanding should be followed.
* The rapid sand filters which are in a very bad condition should beoverhauled including replacement of sand, if necessary. The practice of back-washing of filters with raw water should be discontinued in favour of washingwith filtered water. Only one filter shouldbebackwashedatatimeandit shouldbe ensured that the filter is left in a clean condition before the filtration cyclestarts.
* The filtrate from both the slow sand and rapid gravity filters should bechlorinated so as to ensure a minimum residual chlorine as recommended byCPHEEO and the chlorine residual regularly monitored.

l t •• I»
CLARIFIER
LAB. CHEMICALHOUSE
CLARIFtERTO GRAVITY
MAIN TO GRAVITYMAIN
SLOW SAND FILTERS
RAPID GRAVITY FILTERS
SLOW SANO FLTERS
RAW WATER
FK3 9.1 LAYOUT PLAN OF DHALLI WATER WORKS, SHIMLA

199
TABLE 9.1
PLANT SUMMARY DATA • SHIMLA
GENERAL
Name and location
Year of construction(Augmentation if any)
Design capacity
O & M Agency
Raw water source
Treatment flowsheet
ENGINEERING
Raw water pumping
-Rising main diameter
Raw water flow measurement
Pre-treatment
Coagulation
- Chemicals useft
-Type of mixing
- Method of mixing
Flocculation
- Method / Type of unit
- No. & Dimensions
- Detention time
: Dhalli Water Works, Shimla
: 187S augmented in 1903 & 1971
: 12.7 mid
: Irrigation and Public Health EngineeringDepartment, Himachal Pradesh
: Streams from catchment area
: Prefiltration followed byi) Slow Sand Filters (4.5 mid)ii) Conventional with rapid sand filters
: 3 nos centrifugal (1 standby)cap. 227,127,150 m3/hr
: 3 nos. 125 mm - 2 nos. 175 mm -1 no.
: Rectangular weir
: Alum solution
; Hydraulic
: Baffled channel
: Hydraulic
: 28 nos. baffled chimel
: 1.5 min

200
Sedimentation
-Typeofunit(s)
-No. Asizeofunit(s)
- Surface overflow rate
• Detention time
Filtration
-Typeof unit(s)
• No. & size of unit(s)
-Rate of filtration
- Filter media
. Sand size
.Depth of sand
- Backwash arrangements
.Method
Disinfection
- Chemicals used
-Type of feed
Clear Water Reservoir
- Pump details
: Circular clarifier
: 2 nos., each 14 m dia, 3 m S W D
: 0.74 m/hr
:3hrs
: Rapid sand Slow sand
: 3 nos., each 8 nos.,each32.2 m2 232.5 m1
: 3.5 m/hr 0.1 m/hr
: Ë.S - 0.69 mm E.S - 0.24 mmU.C-1.8 U.C-2.5
:50 cm 60 cm
: Air scour and raw water wash
: Bleaching powder
: Solution feed
: Not provided
: Flow by gravjty

201
TABLE 9.2
PHYSICO-CHEMICAL AND BACTERIOLOGICAL QUALITY OFRAW AND FINISHED WATERS
DHALLI WATER WORKS -SHIMLA
PARAMETERS
Phyafm-dMwcal
Tuibidity(NTU)
PH
Total Alkalinity(CaCO,)
CûoductivityiMS/cm)
Hardness (CaCO,)Total
Caibomle
NonCorbonaie
Calcium (Ca)
Magneaiuin(Mg)
ChloridM(Cl)
Sulphates (SO,)
Iran (ft)
Fluoride (F)
Nittates (NO,)
Bacteriological (MPN/100 ML)
Total cohfonn
RAPID ORAVFTY FILTERS
RAW
3.0
7.5
68
190
80
68
12
24
5
7
16
Tr
0.5
1.7
140
FINISHED
1.5
7.5
66
187
78
«6
12
23
5
7
16
Tr
0.5
5.9
95
SLOW SAND FILTERS
RAW
0.8
7.5
44
110
50
44
6
14
3
7
4.4
Tr
0.5
1.3
55
FINISHED
0.8
7.5
42
105
50
42
8
14
3
7
4.4
Tr
0.5
1.4
10
AU tente »i« expressed as tng/L except for pH, Turbidity and conductivity. Tr - Traces

202
TABLE9J
PLANT PERFORMANCE AT VARIOUS STAGES OF TREATMENT
DALU WATER WORKS • SHIMLA
PARAMETERS RAW SETTLED FILTEREDWATER WATER WATER
TuAidity ROP 3.0 2.5 1.5(NTU)
SSF 0.8 • 0.8
T.coUfwm RGF 140 75 95(MPN/100ML)
SSF 55 - 10

203
SITLEE WATER WORKS - JAMMU
INTRODUCTION
Janunu, the winter capital of J&KState, with a present population of about4.0 lakhs draws its water supply from river Tawi and a battery of tubewells. The Sitleewater works with a designed capacity of 38 mid is located on the bank of river Tawi, 7km away from the city on Jammu-Udhampur highway. The tube wells numbering 47,provide a supply of about 30 mid. Water from river Tawi is pumped to the treatmentplant which provides for pre-sedimentation followed by conventional treatment withalum coagulation, sedimentation, rapid sand filtration and chlorination. The schematicflow sheet is shown in Fig. 10.1 and the plant summary data is presented in Table 10.1.The plant is maintained by the Public Health Engineering Department, J & KGovernment.
PLANT APPRAISAL
Raw water quality and flow measurementRaw water from river Tawi is drawn into an intake well and is pumped to the
treatment works. The intake well is provided with inlet ports at different levels operatedby sliding gates. The river water carries considerable silt load especially duringmonsoon season which leads to quick wear and tear of the pumps and problems inoperation and maintenance. At the time of the visit the raw water turbidity wasessentially colloidal in nature and there was practically no reduction in turbidity inthe pre-wdimentation tanks (Table 10.2).
E%c to non-availability of continuous power supply, the plant is worked only forabout 20 heurs a day. The flow measuring/indicating device installed at the raw waterchannel is not in working condition. Actual flow measurement at the time of thevisit indicated that the plant inflow was about 30 mid (underloaded by about 20 percent)as against the rated capacity of 38 mid.
Pre-treatmentThe alum dose applied was reported to vary fjom 10 kg/hr in fair season to 250
kg/hr during the monsoon period. It was reported that during monsoon period even withhigh dosage of alum, difficulties were experienced in proper coagulation of the turbidwaters. It was noted that the river water had low alkalinity (Table 10.2), insufficientfor proper floe formation. The equipment for controlled dosing of alum was out oforder. The rapid mixer and the clarifier sludge scraper mechanisms are Worked onlyduring times of high turbidity, âà the tame of the visit, «tue to non-functioning of therapid muter uiut,tftEtôoc formation was not effective. After pretreatment with alum

204
coagulation and sedimentation, the turbidity of pie-settled- water was reduced from 20NTU to 10 NTU only (Table 10.3).
FiltrationThe rapid sand filters have been renovated recently when the underdrains and
the filter media were replaced. While the filter rate controllers were working, the lossof head gauges were out of order. The operation and maintenance of the filters ingeneral was satisfactory.
DisinfectionIn the light of difficulties experienced by the water works authority in procuring
chlorine cylinders, only bleaching powder is used for disinfection. The supply ofbleaching powder is also irregular to meet the daily requirement and to maintainadequate residual chlorine in the water leaving the plant.
Laboratory facilitiesThe laboratory facilities available for routine plant control are inadequate and no
chemist has been posted at the plant.
Plant staffThe total strength of staff for routine operation and maintenance of the plant is
23 including the five supervisory staff of Assistant Engineer/Funior Engineer cadre.
Financial aspectsThe water tariff levied is very low (Rs.30 per 12 mm service connection per year)
and the revenue receipts on this account is Rs. 18.25 lakhs for the year 1987-88 asagainst the total expenditure of Rs. 230 lakhs. The shortfall is met by the Governmentfrom other sources of revenue.
RECOMMENDATIONS
* Provision for raw water flow measurement should be made to ensure effectivechemical dosing and plant control.
* During monsoon season when the raw water turbidity is high and alkalinity islow, lime addition may prove useful in achieving effective coagulation.
* The optimum dosages of chemicals should be decided based on regular jartests.
* The rapid mix unit and the clarifiocculator should be operated continuouslyfor effective removal of turbidity and bacterial load during pre-treatment.

205
N 4 -
•+•TOWR
RAPID ORAVtTY
CWR : CLEAR WATER RESCRVOIR
NOT TO SCALE
HO MM lAYOUTPLANCH»SrrtBB WATER TREATMENT PLANT, JAMMU

206
TABLE 10.1
PLANT SUMMARY DATA - JAMMU
GENERAL
Name and location
Year of construction
Design capacity
O & M Agency
Raw water source
Treatment flowsheet
ENGINEERING
Raw water pumping
-Rising main diameter
Raw water flow measurement
Pre-treatment
Pre-sedimentation
Detention time
Coagulation
- Chemicals used
-Type of mixing
Detention time
Flocculation
- Method / Type of unit
- No. & Dimensions
- Detention time
Jammu Water Treatment Plant, Sitlee (Nagrota)
1981
38 mid
Public Health Engineering Department, (J & K)
Tawi River
Conventional with rapid gravity filters
3 nos., vertical turbine pumps each150 HP with capacity 817.6 mVhr
60cm
Mahindra & Mahindra Pedestal type flowmeter
Circular tank, 33.5 m dia & 2.75 m SWDwith mechanical sludge scraper
1.5 hr
: Alum (solution)
: Mechanical flash mixer, 2 nos-
: 30 sec each
: Mechanical(clariflocculator)
: 2 nos., each 10.7 m dia. & 3.5 m SWD
: 30 min

207
Sedimentation
- Type of unit(s)
- No. & size of unit(s)
- Surface overflow rate
- Detention time
Filtration
- Type of unit(s)
- No. & size of unit(s)
- Rate of filtration
- Filter media
. Sand size
. Depth of sand
. Gravel size (mm)
. Depth of each layer
- Backwash arrangements
.Method
. Wash water tank cap.
Disinfection
- Chemicals used
-Type of feed
Clear Water Reservoir
- Type, No. & Capacity
- Pump details
Mechanical clariflocculator
2 nos., each 28.65 m dia, 3.5 m SWD
1.4m/hr
2.5 nr
Rapid gravity filters
6 nos., 7.9 x 7.9 m each
5 m/hr
E.S. - 0.6 mm, U.C. -1.4
75 cm
50-37, 37-13,13-10,10-8
75 mm, 75 mm, 100 mm, 100 mm
Air scour and water wash
270 m3
Bleaching powder
Solution feed
RCC, 1 no., 159 m3
10 nos.,each 300 HP -9 nos.7.5 HP -1 no.4 standby

208
TABLE 10.2
PHYSICO-CHEMICAL AND BACTERIOLOGICAL QUALITY OF
RAW AND FINISHED WATERS
STTLEE WATER WORKS - JAMMU
PARAMETERS
Physico-chemical
Tuibidity(NTU)
pH
Total Alkalinity
(CaCO,)
Cooductivity(uS/cm)
Haidoess(CaCO,)
Total
Caibonate
NonCorbonate
RAW
18
8.2
76
198
76
76
Calcium (Ca)
Magnesium (Mg)
Chlorides (Cl)
Sulphates (SO4)
Iron (Pe)
Fluoride (F)
Nitrates (NO,)
Bacteriological (MPN/100 ML)
Total colifortn
26
3
6
6
Tr
0.5
2.9
Mi
FINISHED
1.1
7.9
76
190
76
76
0
26
3
6
12
Tr
0.4
3.4
46
All results are expressed as mg/L except for pH, conductivity and tuibidity, Tr - Traces

209
TABLE 1OJ
PLANT PERFORMANCE AT VARIOUS STAGES OF TREATMENT
SITLEE WATER WORKS - JAMMU
PARAMETERS RAW PRESETT. SETTLED FILTERED FINISHEDWATER WATER WATER WATER WATER
Tuibidity 18 17 9.2 1.1 1.4(NTU)
T.coüfonn 840 660 145 60 26(MPN/100ML)

210
NISHAT WATER WORKS NO. 3 -SRINAGAR
INTRODUCTION
Srinagar City, the summer capital of the Jammu ft Kashmir State, is locatedat latitude 340N and longitude 750E and approximately 1580 m above MSL. Thepopulation of the city was about 570,000 as per 1981 census. The existing water supplyto the city has been developed in stages over the years, starting from 1931. At present,the water supply to the city comes from a number of treatment plants as noted below :
Treatment plant Source Capacity
1. Complex of 4 plants Dachigam 68 midatNishat stream
2. Alustand Treatment Sind Extension 22 midworks canal
3. Doodganga Treatment Doodganga 17 midworks stream
Total 107 mid
Besides these surface water supplies, there are a number of tube wells in thecity serving localised areas. Further augmentation of treatment capacity is in- progress.The Ntshat Water Works consists of four water treatment plants commissioned duringdifferent times. The plant'of 18 mid capacity constructed m 1979 has been selected forthe performance evaluation study in consultation with the PHED. The water supplysystem is constructed, maintained and operated by the Stale PHED. The plant layoutis shown in Fig. 10.2 and plant summary data is presented in Table 10.4.
PLANT APPRAISAL
Raw water quality and flow measurementThe raw water to the treatment plant complex at Nishat is drawn from four
sources, viz. HaxwanReservok,SharafKhul Canal, Dachigam Stream and Dal Lake.The supply from the Dachigam stream diminishes in extreme winter due to freezing ofthe stream in the upper reaches. However, as alternate sources are available, no scarcity

211
is experienced in winter. The supply is also temporarily affected by silt deposits at theoff-takes in the river during heavy rains.
The Dachigam stream is not subject to any significant pollution. The stream wateris of low turbidity (Table 10.5) most of the time except during rains in the catchmentwhen the turbidity and silt load goes up temporarily. The Harwan reservoir supply ispresettled and is always low in turbidity.
The Dal lake source at the point of tapping has been extensively monitored byNEERI and is found to be of good quality, physically, chemically and bacteriologicallysatisfying the criteria for waters which can be used for drinking water supply with onlychlorination. Raw water from Dal lake is used only during emergencies and involvespumping.
The Harwan Reservoir has an intake tower with a single inlet port at the bottom.From the intake tower, an RCC conduit 200 mm dia. 5000 m long conveys the water tothe treatment works. There is no device for measuring the discharge in the conduitbut its design capacity is 10 mid. From the S.K. canal, two plain pipe draw-offs havebeen provided, one to feed a roughing filter serving plants 2 and 3 and another directlyfeeding plant no.I. The direct offtake from the Dachigam stream consists of a smallchamber on the stream bank with an inlet port protected by bar screens.
The off-takes in the Dal lake consists of one fixed pumping station and anotherfloating pump barge. There are no arrangements* for measuring the actual rates ofpumping at both the pumping stations.
In plant No. 3, a Venturi flume is provided in the raw water channel to the flashmixer. The flow indicator installed over the flume is not reliable as its maximumcapacity is 2.88 mid whereas the plant capacity is 18 mid.
The main deficiency in the existing intake and raw water conveyancearrangements is that there is no way of estimating the supply drawn frorn the differentsources serving the Nishat .Water Works.
Pre-treatmentOnly part of the raw water flow to the Nishat Waterworks is pre-treated by
down-flow roughing filtration through beds of pebbles of 75 mm size.In view of the good quality of raw water from Harwan Reservoir and Dal lake,
the pre-treatment, provided is redundant while the S.K. canal water which often isturbid and carries silt is pre-treated only in part. It* is desirable that the pre-treatmentfacilities and the arrangement of sources to serve the different plants of Nishat are
Filter alum is used for chemical coagulation. Two high level alum solutlonising-cunvsolution storage tanks each of 2.5m3 capacity have been provided in the chemi-cal house. Each tank has a motorised stirrer. A constant head box has been providedfor feeding the alum solution.

212
The alum solution tanks, the motorised stirrers and the pipings are in goodcondition. The solution storage capacity of 2.5 tn'in each tank is found to be justsufficient (assuming a peak alum dose of 30 ppm and7.5 percent strength of alumsolution). Alum dosage rate at Ae plant is fixed not based on any jar test but only bytrial and error. Alum block» «me also added directly tö the raw water channel inaddition to alum solution doting. The float control device was not being maintainedat constant level which is necessary lor ensuring constant hydraulic rate of dosing.
A Hash mixer of 2 HPfwsfceen provided in a mixing chamber which is workedonly'off* one 'on'. The alumsoltition is added upstream of the throat of the VenturiHume. Adequate mixing is adtttved by the hydraulic jump at the Venturi flume.
A dariflocculator has been provided with overaH size of 28 m dia. x 3.84 mSWD wiftAecculator zone of I2.#i»dia. The detention periods in the floccculator zoneand the sMâs^zoaeasalsoâtesoËlace loading rate in the settling zone are satisfactorylor * e dssjgft flow. The floccuiater paddtes were not being worked all the time. Theclarifier sender bridge was also am being operated all the time though sludge bleedingwecommom. During the time a* stnrfy tbeclariflocculator was overloaded as couldbe seta fitem «he «eirs in ibe eH&fiat ïaunder which we» completely flooded.
FBtnUionThe <Sea|^ filtration rate being only 6 m/hr is satisfactory. The rate of flow
controllers toe rate indicators in none of the filters were working. However, theheadîossgaHS^iwierc functioning properly. The filter sand was not properly graded
of supporting gravel (25 cm) was found inadequate. The filter washingair and washwater distribution was not uniform. Filter sand was
al!»bdngc««Ssd ever into wash water gutters. Considerable mounding of the sandsurfaces and &mt laaßk« were observed at various places in the filter bed. The filtershave clogged u|«9»^eat «sctent(as observed from the high initial headfoss) and arenot able to deliver the design output. The filter output actually measured on threedifferent date« was only about 60 per cent of the design value. Overall, the filterperformance was far from satisfactory.
DisinfectionBleaching powder is used for disinfection. The chemical is dissolved in water
in a tank provided with a motorised stiner. From the tank, the solution is drawn to aconstant head box from where it is added to the water.
The bleaching powder dosage is not fixed based on chlorine demand test butby trial and error. As there is only one solution tank, die solution can not be settledbefore dosing is started. A constant level is not maintained in the dosing box.

213
Laboratory facilitiesAt present, no testing facilities are available at the plant except for residual
chlorine. No records are maintained for the residual chlorine tests.
RECOMMENDATIONS
* Because of frequent and sudden increase in turbidity in the Sharaf Khul Canalleading to treatment problems, the drawal from the canal may be dispensed withor restricted to fair weather season in favour of Dachigam stream and Harwanreservoir.
* Considering the multiplicity of sources serving the Nishat water works andtheir varying qualities, the pre-treatment facilities and the arrangement ofsources at Nishat be reorganised to minimise treatment needs.
* Adequate arrangements for raw water flow measurement and regulation needto be provided for effective operation and control of water treatment units.
* The chemical dosing step should be properly supervised as it is a criticalstep in water treatment. Alum dosage should be fixed by jar tests and the quantityadded should be regulated by weight and not by number of blocks. Logbooksshould be maintained for this unit process.
* The flocculators and the sludge scraper bridge should be operatedcontinuously.
* All the filter beds, require complete overhauling as the filter media is almostcompletely caked up, sand and gravel have mixed up the underdrain pipes appearto have broken/eroded at the perforations.
* The filter outlet controls which are now not working may be dispensed withand filters may be worked on declining rate filtration.
* Adequate laboratory facilities and trained staff shouldbeprovidedtoperformthe usual plant control tests, viz.-jar test, chlorine demand test and tests forresidual chlorine, pH and turbidity and, if possible, routine bacteriologicalanalysis.

• \ '• '
SHARA8 KHUL CANAL-
FROM HARWANRESERVOIR
MAINSFROM DAL
LEGEND
T.P. -TREATMENT PLANT
W.W.T.- WASH WATER TANK
C.W.R - CLEAR WATER RESERVOIR
T.P.-3- PLANT SELECTED FOR STUOY
R.CF.-RAPIO GRAVITY FILTER
CHEM.HOUSE
T.P.Vl
\ \CLARIFLOCCULATOR
TO DISTRIBUTION(NOT TO SCALE)
TO DISTRIBUTION
FIG 10.2 LAYOUT PLAN OF N1SHAT WATHt WORKS, SRINAGAR

215
TABLE 10.4
PLANT SUMMARY DATA • SRINAGAR
GENERAL
Name and location
Year of construction
Design capacity
O & M Agency
Raw water source
Treatment flowsheet
ENGINEERING
Raw water pumping
Raw water flow measurement
Pre-treatment
Coagulation
- Chemicals used
-Type of mixing
Flocculation
- Method / Type of unit
- No. & Dimensions
- Detention time
Nishat Waterworks No.3 Srinagar,J&K State
1979
18 mid
Public Health Engineering DepartmentJCashmir
i) Dachigam Streamii)Sarafkhul canal
iii) Harwan Reservoiriv) Dal lake
: Conventional with rapid sand filters
- Dal lake fixed pumping station :- 3 nos.,300 mm dia pumping main,77 m static head.-Dal lake floating pump barge :-4 nos.,600 mm dia pumping main, 81m static head
Venturi flume
Alum
Mechanical, motor driven with detailsstirrer, 2 HP, 35 sec detention time
Mechanical Clariflocculator
1 no., 12.4 m dia, speed 4 rpm, 3.8 m SWD
37 minutes

216
Sedimentation
-Typeofunit(s)
- No. & size of unit(s)
- Surface Overflow Rate
- Detention time
Filtration
- Type of unit(s)
- No. &, size of unit(s)
- Rate of filtration
- Filter media
. Sand size
.Depth of sand
. Gravel size
Depth of each layer
- Backwash arrangements
.Method
. Wash water tank cap.
Disinfection
• Chemicals used
: Clarifier
: lno . ,28mdia ,3 .8mSWD
: 36mVm2/day
: 2 hr 30 minutes
: Rapid gravity filters
: 3 nos., (twin beds) each 8.4 m x 5.6 m
: 5.75m3/mVhr
: E.S.-0.7mm,U.C.-1.66
: 75 cm
: 3 layers, 6-12 mm, 25-37 mm, 25-50 mm
: 5 cm. 7.5 cm, 7.5 cm respectively
: Air scour followed by water wash
: 227 m3
: Bleaching powder

217
TABLE 10.5
PHYSICO-CHEMICAL AND BACTERIOLOGICAL QUALITY OFRAW AND FINISHED WATERS
NISHAT WATER WORKS - SRINAGAR
PARAMETERS
Phyako-chemkaJ
Tuibidity(NTÙ)
pH
Total Alkalinity(CaCO,)
Conductivity j/aS/cm)
HanJness (CaCO,)Total
Caibonate
NonCaibooate
Calcium (Ca)
Magnesium (Mg)
Chlorides (Cl)
Sulphates (SO4)
lion (Fe)
Fluoride (F)
Nitrates (NO,)
Bactoriolocical (MPN/100 ML)
Total cotifonn
Fecal cotifonn
RAW
7.3
7.9
48
128
42
42
0
14
2
2
2
0.45
0.3
Tr.
14
8
FINISHED
5.6
7.7
-
-
-
-
-
-
-
:
-
-
0
0
All values except pH .Twbidity and Conductivity aie expressed as ntg/L

218
TABLE 10.«
PLANT PERFORMANCE AT VARIOUS STAGES OF TREATMENT
NISHAT WATER WORKS - SRINAGAR
PARAMETERS RAW SETTLED FILTERED FINISHEDWATER WATER WATER WATER
Turbidity(NTU)
7.3 4.3 2.8 5.6
T. CoUfonn(MPN/100ML)
14 8.0 2.0

219
BKLGAUM WATER WORKS - BELGAUM
INTRODUCTION
Belgaum, one of the largest cities in northern Kamataka, has a populationof 3 lakhs (1981 census) including that of the cantonment area. The city draws its watersupply from Rakaskop lake, which is an impoundment formed by a dam constructedacross the river Markandeya. Raw water from Rakaskop flows by gravity over adistance of 5 km to Hindalga from where it is pumped to treatment plants located atLaxmitek 3 km from Rakaskop. There are two treatment plants at Laxmitek havingcapacities of 27.2 mid and 13.6 mid. The plant of 27.2 mid constructed in the year 1962has been selected for evaluation. The treatment consists of aeration, alum addition,flash mixing, flocculation, sedimentation, filtration and post chlorination. Theplant layout is shown in Fig. 11.1 and summary data is presented in Table 11.1. Theplant is maintained by Kamataka Urban Water Supply and Drainage Board.
PLANT APPRAISAL
Raw water quality and flow measurementSince Hindalga is located on the bank of river Markandeya, provision for
drawing water, also from the river has been made. In order to conserve water in thelake, river water is pumped during rainy season when the turbidity of raw water isreported to be high. During the study period, the turbidity of raw water was in therange of 3-8 NTU with a coliform MPN of 23-1100 per 100 ml (Table 11.2). The plantinflow was measured based on the head over a pre-calibrated weir provided in the rawwater channel varied from 10 mid to 26.6 mid as against the design value of 27.2 mid.Part of the flow was diverted-to the new plant for trial runs. During all the three visits,the plant was underloaded.
Pre-treatmentA cascade type aerator with five concentric trays has been provided for aeration.
Alum solution for coagulation is applied in the raw water channel leading to flash mixer.During the visits the applied dose of alum was found to be 4 mg/1. The pre-treatmentunits were in good working condition. The settled water turbidity was in the range of2 to 4.5 NTU. Considerable reduction in coliform was also observed due to sedimenta-tion (Table 11.3).

220
FiltrationThe perfoimance of filters was satisfactory and the filtered water turbidity was
in the range of 0.4 to 1 NTU. The depth of sand in the filters was 84 cm with anE.S of 0.63 mm and U.C 1.65. The filter run during low turbidity period was reportedto be 2-3 days. There is no provision for air scour and only water is used forbackwashing.
tDisinfection
Chlorine gas is used for disinfection. Many a time when the chlorinator is outof order, chlorine gas is directly fed to filtered water or bleaching powder is used. Thefinished water had a residual chlorine of 0.5 mg/1 and was free from coliform as well as
Laboratory facilitiesA laboratory with necessary facilities to carry out physico-chemical as well as
bacteriological analysis of water has been provided at the plant. The laboratory is well-equipped and neatly maintained.
RECOMMENDATION
* The laboratory should be equipped with a jar testing machine.

VÄTERPUMPWGSTATION
DISTRIBUTION BYGRAVITY
ALUM
PLASHMIXER
AERATION
POSTCHLORINATION
CLEAR
WATER
RESERVOIR
FILTERBEDS
^FLOCCUL
(NOT TO SCALE)
FIG 11.1 LAYOUT PLAN OF BELGAUM WATER TREATMENT PLANT

222
TABLE 11.1
PLANT SUMMARY DATA-BELGAUM
GENERAL
Name and location
Year of construction
Design capacity
O & M Agency
Raw water source
Treatment flowsheet
ENGINEERING
Raw water pumping
- Rising main diameter
Raw water flow measurement
Pre-treatment
Aeration
Coagulation
- Chemicals used
-Type of mixing
- Detention time
Flocculation
- Method/Type of unit
- No. &. Dimensions
- Detention time
: Belgaum Water Treatment Plant, Belgaum
: 1962
: 27.2 mid
: Karnataka Urban Water Supplyand Drainage Board
: Rakaskop lake across river Markandaya
: Conventional with rapid sand filters
: S nos,(one standby)3 nos,200 HP, 250 m» /hr each,2 nos,250 HP, 340 m3 /hr each.
: 525 mm
: Rectangular sharp edged weir 1.22 m wide
: Cascade aerator
: Alum solution
: Mechanical, flash mixer
: 38 sec
: Mechanical flocculators
: 2 nos, each vol.of 252 m3
: 30 minutes

223
Sedimentation
- Type of unit(s)
- No. & size of unit(s)
- Surface Overflow Rate
- Detention time
Filtration
-Typeofunit(s)
- No. & size of unit(s)
- Rate of filtration
- Filter media
. Depth of sand
. Gravel size
. Depth of each layer
- Backwash arrangements
.Method
. Wash water tank cap.
Disinfection
- Chemicals used
-Type of feed
- Chlorinator Details
Gear Water Reservoir
- Type, No. & Capacity
-Pump details
: Radial flow type clarifier
: One, 30.5 m dia, 3.66 m SWD
: 1.55 m/hr
: 2 hrs 20 minutés
: Rapid sand filters
: 6 nos, each 10 m x 5.8 m
: 3.3 m/hr
: 70 cm
: 6 mm-1.3 cm, 3cm-3.8 cm, 3.8cm-5cm
: 7.5 cm
: Water wash only
: 227 m3
; Chlorine gas
: Solution
: Pressure type chlorinator
: RCC.two nos, 4540 m3 and 11350m3
: Distribution by gravity

224
TABLE 11.2
PHYSICO-CHEMICAL AND BACTERIOLOGICAL QUALITY OP
RAW AND FINISHED WATERS
BELGAUM WATER WORKS • BELGAUM
PARAMERERS
Physico-chemical
Tuibidity<NTU)
pH
Total Alkalinity(CaCO,)
Conductivity (uS/cm)
HaidDess(CaCOj)Total
Caibonate
NonCaibonate
Calcium (Ca)
Magnesium (Mg)
Chlorides (Cl)
Sulphates (SO4)
Iron (Re)
Fluoride (F)
I
RAW
3.4
6.5
30
173
20
20
0
-
-
9
10
ND
0.8
Bacteriological (MPN/100 ml)
Total colifonn
Fecal coUform
Fecal streptococci
' 1100
23
9
240
VISIT
FINISHED
1.0
6.2
26
354
22
22
0
-
-
11
10
ND
0.8
0
0
0
0
II
RAW
7.8
6.9
22
88
14
14
0
3
1
5
3
ND
0.6
23
23
23
43
VISIT
FINISHED
0.4
6.8
21
75
14
14
0
3
1
5
3
ND
0.6
0
0
0
0
nivisrr
RAW FINISHED
6.5
7.8
n
92
28
28
0
9
1
4
23
0.1
0.5
240
15
7
23
1.5
7.5
28
88
28
. 28
0
9
1
4
30
ND
0.4
0
0
0
0
All values except pH .Tuibidity and Conductivity are expressed as mg/1N.D.-Not detectable

225
TABLE Î U
PLANT PERFORMANCE AT VARIOUS STAGES OP TREATMENT
BELGAUM WATER WORKS - BELGAUM
PARAMETERS
TufMity(NTU)
T.CoUfofm(MPN/100nU)
EColi(MPN/lOOnd)
VISIT
I
II
III
I
n
m
i
n
m
RAWWATER
3.4
7.8
6.5
1100
23
240
9
9
7
SETTLEDWATER
2.6
2.0
4.5
43
23
7
0
9
0
FILTEREDWATER
0.5
0.3
1.0
4
0
4
0
0
0
FINISHEDWATER
1.0
0.4
1.5
0
0
0
0
0
0

226
UIJAPUK WATER WORKS - BIJAI'UR
INTRODUCTION
Bijapur town with a population of 1.43 lakhs (1981 census) receives its watersupply from two major sources viz. river Krishna and Bhutanal tank. Raw water fromeach source is treated separately at a plant of 10 mid capacity before supply to the city.For performance evaluation the 10 mid plant receiving raw water from Bhutanal tankwas selected. This plant located at a distance of 10 km from Bijapur was originallydesigned in 1910 by Er. Visvesvaraya for a population of 30000 adopting slow sandfiltration. Later on in the year 1976 these filters were replaced by rapid gravity filtersystem designed to serve the population of 1 lakh. The schematic flow sheet of the plantis shown in Fig. 11.2 and the plant summary data is presented in Table 11.4. The plantis maintained by city Municipal Council.
PLANT APPRAISAL
Raw water quality and flow measurementRaw water from Bhutanal tank is drawn by gravity through an intake tower
provided with inlet ports at three different levels. The bell mouthed inlets have beenprovided with screens to arrest floating matter.
During the evaluation study, the turbidity of raw water was in the range of7.0-12.5 NTU and total coliform MPN in the range of 43-210 per 100 ml (Table 11.5).It was reported that the turbidity of raw water in the tank goes upto 250 NTU duringrainy season.
During the study period, raw water inflow was 7.3 and 5.9 mid during first andsecond visit respectively. Thus, the plant was underloaded to the extent of 25-40 %.From time to time the seepage through the bunds of Bhutanal tank is collected in a welland is pumped to the sedimentation tank using 10 HP pump. During such pumping, rawwater drawal from Bhutanal tank is stopped.
Pre-treatmentRaw water from Bhutanal tank is drawn by gsavity into a receiving tank at the
plant site where alum solution is applied. Raw water is also chlorinated using bleachingpowder solution. A heavy chlorine dose of 3 to 5 mg/1 is applied at the receiving tankso as to leave a residual chlorine of0.8mg/l in the filtered water. The previous practiceof post-chlorination has been discontinued and only pre-chlorination is done.
A mechanical flash mixer has been provided at the plant with the mixingpaddles directly connected to a 5 HP motor with a speed of 1440 rpm. No provisionfor flocculation has been made at the plant. Due to inadequate flocculation, carry overof floes to the filters especially during high turbidity period was reported.

227
Four rectangular sedimentation tanks with a detention time of 3 hm and SOR of1.26 m/hr have been provided. No significant reduction in turbidity wag observedafter sedimentation (Table H.6). Occasionally, the settled water turbidity was morethan that of the raw water due to the addition of bleaching powder slurry forpre-chlorination and absence of effective flocculation.
FiltrationThe filters were underloaded due to reduced plant inflow. During second visit
only one filter was in operation and the other was under renovation. The depth of sandin the filters was S3 cm with an E.S of 1.07 mm andU.C of 2.3. Neither the depth northe size of sand confirmed to CPHEEO recommendations. Since the filter media wasoversized, the performance of the filters was not satisfactory (Table 11.6). The filtersare backwashed routinely after 48 hours of run using water only for a duration of10 minutes. The filter rate and headkws indicators were not in working condition.
Laboratory facilitiesNo laboratory facilities are available at the plant site for day-today control of
plant operation.
RECOMMENDATIONS
* When seepage water is pumped to the plant fortreatment, it shouldbe admitted to the receiving tank where chemical dosing is practised.This will ensure proper treatment of water.
* The present practice of applying a heavy dose of chlorine to rawwater only,, is not desirable. Pre-chlorination, if necessary, andpostchlorination should be practised separately to ensure ' effectivedisinfection.
* In the absence of flocculation facilities, the chemical addition andpie-treatment is ineffective. One of the existing settling tanks could beconverted into a flocculator as per detail« supplied to the plant authorities.
* Since the filter sand is oversized, it should be replaced with sandhaving E.S ofO.5-0.7 mm and U.C 1.3-1.7. The minimun depth ofsandshould be 60 cm.

BLEACHING POWDERSOLH.
ALUM
RECEIVING
TANKSETTLING
TANK •e
CNUHWNATtOW
e- FILTERBEOS
CLEAR VWTER
RESERVOtt
CLEAR WATERPUMP HOUSE
HO 11.2 BUAPUR WATER TREATMENT PLANT - SCHEMATIC

229
TABLE 11.4
PLANT SUMMARY DATA • BUAPUR
GENERAL
Name and location
Year of construction(Augmentation if any)
Design capacity
O & M Agency
Raw water source
Treatment flowsheet
ENGINEERING
Raw water pumping
Pre-treatment
Coagulation
- Chemicals used-Type of mixing- Detention time
Flocculation
: Bijapur Water Works, Bijapur
: 1976
: 10 mid
: Municipal Council, Bijapur
: BhutanalTank
: Conventional with Rapid Sand Filters(with prechlorination)
: Flow by gravity
: Alum solution: Mechanical Flash Mixer: 34 sec
-Method/Type of unit : Hydraulic channel with Baffles

230
Sedimentation
-Typeofunit(s)
- No. & size of unit(s)
- Surface overflow rate
- Detention time
Filtration
Type of unit(s)
- No. & size of unit(s)
- Rate of filtration
- Filter media
. Sand size
.Depth of sand
- Backwash arrangements
Method
. Wash water tank cap.
Disinfection
-Chemicals used
•Type of feed
Clear Water Reservoir
• No. & Capacity
- Pump details
Horizontal flow rectangular tanks
4 nos, 12.5 x 9.2 x 3.7 m - 2 units9.2 x 5.5x3.7 m - 2 units
1.26 m/hr
2 hrs 56 minutes
Rapid gravity filters
2 nos, 7.6 m x 6.7 m each
4.1 m/hr
E.S.-1.07 mm, U.C.- 2.3
53 cm
Water wash only
400m3
Bleaching powder
Solution feed
One 1362 m3
2 nos, 170 HP and 200 HP 5.45 midand 6.54 mid capacity

231
TABLE 11.5
FHYSICO-CHEMICAL AND BACTERIOLOGICAL QUALITY OF
RAW AND FINISHED WATERS
BUAPUR WATER WORKS • »UAPUR
PARAMETERSrnivuviDi jcai j
Phyâico-cfaepiic.1
Tufbidity(NTU)
pH
Total Alkalinity(CaCO,)
Conductivity (uS/cm)
Haidnetfl(CaCO})Total
Carbonate
Non Caibooate
Calcium (Ca)
Magnesium (Mg)
Chlorides (Cl)
Sulphates (SOJ
Fluoride (F)
I VISIT
RAW
12.5
7.8
116
1340
124
116
8
18
19
34
19
0.2
Bacteriological (MPN/100 ml)
Total coUfonn
Fecal colifonn
Fecal streptococci
210
43
15
43
FINISHED
8.0
7.4
114
1061
126
114
12
21
18
45
0.2
0
0
0
0
. D VISIT
RAW
7.0
7.7
86
340
112
86
36
26
12
13
30
0.2
43*
23
23
43
FINISHED
4.7
7.3
79
337
112
79
33
25
12
13
33
0.2
4
0
0
0
Ul
RAW
4.5
7.5
no
493
123
110
13
34
9
15
33
0.2
93
23
23
9
visrr
FINISHED
-
7.2
110
544
118
110
8
33
9
15
35
0.2
-
-
-
-
All values except pH .Tuibidity and Conductivity ate expressed as mg/1

232
TABLE l l .é
PLANT PERFORMANCE AT VARIOUS STAGES OF TREATMENT
BUAPUR WATER WORKS - BLJAPUR
PARAMETERS
Tuibidity
(NTU)
T.CbUform
(MPN/100ml)
E&di(MPN/100ml)
VISIT
I
n
m
I
n
m
i
n
m
RAW
WATER
12.5
7.0
4.5
210
43
93
15
23
23
SETTLED
WATER
8.0
6.5
7.0
240
IS
4
15
0
0
FILTERED
WATER
3.5
4.2
1.7
93
4
0
23
0
0
FINISHED
WATER
8.0
4.7
-
0
4
-
0
0
-

233
VANI VILAS WATER WORKS * MYSORE '
INTRODUCTION
The city of Mysore with a population of about 4.5 lakhs (1981 census) drawsits water supply from the KrishnarajaSagar dam constructed across the river Cauvery.Raw water from the dam flows by gravity through the right bank low level canal to theVani Vilas treatment plant which is located at Hongally village 29 km from Mysore city.The plant of 40 mid capacity commissioned in the year 1979 provides for conventionaltreatment consisting of alum dosing, flash mixing, flocculation, sedimentation, rapidgravity filtration and disinfection. The schematic flow sheet of the plant is shown inFig. 11.3 and the plant summary data is given in Table 11.7.
While the treatment plant is maintained by Kamataka Water Supply & DrainageBoard the distribution and revenue collection is by City Municipal Council.
PLANT APPRAISAL
Raw water quality and flow measurementDue to impoundment at the Krishnaraja Sagar dam, the turbidity of raw water
is low even during rainy season and the physico-chemical characteristics are fairlyuniform throughout the year. The turbidity of raw water was less than 2 NTU duringstudy period (Table 11.8). The raw water flow to the plant is measured in a Parshallflume fitted with a flow indicator and recorder which were in working condition. Theplant inflow during study period was only 22 mid (underloaded by nearly 45 %) dueto regulated water allocation because of drought.
Pre-treatmentAlum solution is used for coagulation and the dose is applied just prior to the
Parshall flume. Due to low turbidity of raw water (less than 2 NTU) a nominal doseof 5 mg/1 was applied. Two mechanical flash mixing units have been provided of whichone is kept as a standby.
As the plant was underloaded, the detention time in flocculator and clarifier wasfound to be 53 min and 280 min respectively. The turbidity of settled water was in therange of 0.2-1.2 NTU (Table 11.9).
FiltrationThe depth of sand in all the filters was around 60 cm. The headloss as well as
rate of flow indicators of all the filters were not in working condition. Due tounderloading, the rate of filtration was 2.3 m/hr only and filtrate turbidity was in therange of 0.2-0.5 NTU. The filters were backwashed once in 24 hours with water onlyfor 15 minutes.

234
DisinfectionFiltered water is disinfected using chlorine gas and occasionally with bleaching
powder.Thechlorinatorwasnotin working condition and the chlorine dose is manuallyregulated. The residual chlorine in the finished water was found to be 0.6 mg/1.
Laboratory facilitiesAdequate laboratory facilities with necessary equipment and reagents required
for physico-chemical as well as bacteriological analysis of water have been provided atthe plant. Most of the instruments are not in working condition. The laboratory ismanned by technical assistant (non-graduate) who has undergone training sponsoredby CPHEEO.
RECOMMENDATIONS
* The filter appurtenances should be repaired and put into working order tofacilitate» proper operation and control.
* The instruments in the laboratory should be repaired and a trained chemistwith supporting staff should be appointed for proper control and monitoring ofdie plant performance.

FLASHMIXER
CHLORNATION
1.1. 1
mi.
#-»
CLEARWATER SUMP
RAPt) GRAVITYFCTERS(4No»>
CL ARIFLOCCULATORS
FIG 11.3 MYSORE WATER TREATMENT PLANT - SCHEMATIC8

236
TABLE 11.7
PLANT SUMMARY DATA • MYSORE
GENERAL
Name and location
Year of construction
Design capacity
O & M Agency
Raw water source
Treatment flowsheet
ENGINEERING
Raw water pumping
Raw. water flow measurement
Pre-treatment
Coagulation
- Chemicals used
-Type of mixing
- Detention time
Flocculation
- Method / Type of unit
- No. & Dimensions
- Detention time
: Vani Vilas Water Works, Mysore
: 1979
: 40 mid
: Kamataka Urban Water Supplyand Drainage Board
: Krishna Raja Sagar Dam
: Conventional with Rapid sand filters
: Flow by gravity
: Crystal Dial type flowmeter
: Alum (Solution)
: Flash mixer, 2 nos, (One standby)
: 1 minute
: Mechanical/Glariflocculator
: 2 nos, 13.1 m dia, 3.5 SWD
: 34 minutes

237
Sedimentation
-Typeofunit(s)
- No. & size of unit(s)
- Surface Overflow Rate
- Detention time
Filtration
-Typeofunit(s)
- No. A size of unit(s)
-Rate of filtration
- Filter media
.Sand size
.Depth of sand
- Backwash arrangements
.Method
. Wash water tank cap.
Disinfection
- Chemicals used
-Type of feed
Clear Water Reservoir
- Type, No. & size
-Pump details
: Radial flow Clariflocculator
: 2nos, 32.9mdi».,3.5inSWD
: 1.16 m/hr
: 180 minutes
: Rapid gravity filters
: 4 nos, 10.3 x 9.7 m each
: 4.8 m/hr
: B.S.-0.64mm,U.C.-1.64
: 60cm
: Water wash only
: 4 lakh litres
: Chlorine gas
: Solution feed
: RCC, one, rectangular 30 x 20 x 3.5 m
: 2 nos, centrifugal (one standby),100 HP each

23«
TABLE ILS
PHYSICO-CHEMICAL AND BACTERIOLOGICAL QUALITY OF
RAW AND nNBÜED WATERS
VANI VILAS WATER WORKS • MYSORE
PARAMETERS
Physico-chemical
Tiubidity(NTU)
pH
Total Alkalinity(CaCO,)
Conductivity tuS/cm)
Haidoe«(CtCO})Total
Caftwoaie
NoaCaiboaate
Calcium (Ca)
Magnesium (Mg)
Chlorides (Cl)
Sulphates (SOJ
Iron (Fe)
Fluoride (F)
I VISIT
RAW
0.5
7.2
122
979
64
64
0
11
9
14
ND
ND
0.3
BMtMMofical (MPN/100 ml)
Total coUform
Fecal colifonn
Fecal streptococci
230
23
23
23
FINISHED
0.3
7.1
128
734
64
64
0
12
9
14
ND
ND
0.3
0
0
0
0
n VISIT
RAW
1.0
7.2
80
1139
66
66
0
14
8
20
1
ND
ND
930
93
15
93
FINISHED
1.5
7.2
80
938
65
65
0
14
7
20
1
ND
ND
•
-
-
-
m
RAW ]
1.7
7.6
114
364
47
47
0
13
4
6
2
0.3
ND
150
150
93
93
VISIT
FINISHED
0.7
7.5
112
316
45
45
0
12
3
6
3
ND
ND
4
0
0
4
AH values except pH .Tufbidty and Cooductivfcy a n expressed a« mg/1
N.D.-Not detectable

239
TABLE 11.9
PLANT PERFORMANCE AT VARIOUS STACKS OF TREATMENT
VAN! VILAS WATER WORKS -MYSORE
PARAMETERS VISIT RAW SETTLED FILTERED FINISHEDWATER WATER WATER WATER
Tuibidity(NTU)
T.Coüfbnn(MPN/lOOml)
I
Ü
in
I
n
m
0.5
1.0
1.7
230
930
150
0.3
0.8
1.2
43
240
23
0.25
0.5
0.4
4
93
4
0.25
1.5
0.7
0
-
4
ECnli
(MPN/100ml)
23
15
m 93

240
SHIMOGA WATER TREATMENT PLANT - SHIMOGA
INTRODUCTION
Shimoga town in Karnataka with a population of about 1.5 lakhs ( 1981 census)receives water from River Tunga after treatment at the Krishna Rajendra water workssituated 4 km from the town on the bank of the river Tunga. The plant designed totreat 13.5 mid and commissioned in the year 1977 is maintained by the ShimogaMunicipal Council. The treatment plant is of conventional type with provision foraeration, alum dosing, flash mixing, flocculation.sedimentation, rapid gravity filtrationand disinfection. The schematic flow sheet is shown in Fig. 11.4 and the plant summarydata is presented in Table 11.10.
PLANT APPRAISAL
Raw water qualityDuring the study period, raw water turbidity was in the range of 3.5-20 NTU with
low chlorides, hardness and fluorides. However, turbidity of raw water in river Tungawas reported to be high during monsoon season. The iron content in the water variedfrom 0.45-0.84 mg/l. Thecoliform count in raw water was in the range of 240 -2400MPN per 100 ml (Table 11.11).
Raw water from intake well ( 5.5 m dia & 13 m deep) is pumped to the headworks through two pumps of 100 HP each (one standby). There is no pollution due toindustrial or domestic discharges in a stretch of one km upstream of intake exceptwashing and bathing by men and cattle
Pre-treatmentAll the pre-treatment units have been designed for 27.3 mid while the filters are
designed for 13.5 mid only. The cascade aerator provided at the plant reduces ironconcentration in raw water by 50%.
The flow meter provided for measuring raw water inflow was not in workingcondition. Alum solution is used for coagulation. The dose is decided arbitarily and notbased on regular jar tests. The quantity of alum used, was reported to vary from 100 kgto 1500 kg per day depending upon the turbidity of raw waterMixing devices providedin alum solutionising tanks were corroded and not in operation.
Flash mixing is carried out in a chamber of 3.5 m diameter through a 3 HPmotor. It was observed that the flash mixer was not put into continuous operation. Lotof cracks were found in the flash mixing chamber walls.

241
Performance of the clarifier was satisfactory as observed from settled waterturbidity (0.3-1.2 NTU). Considerable reduction was observed in the bacterial countfollowing flocculation and sedimentation (Table 11.12).
FiltrationThere are three rapid gravity filters each with a capacity of 4.5 mid. Normal
filter runs were reported to be 24 hrs. Performance of the filters was satisfactory asobserved from filtrate turbidity which was less than 2 NTU. The headloss indicators andrate of flow indicators provided for the filters were not in working condition. Only wateris used for backwashing of the filters.
DisinfectionChlorination is carried out using chlorine gas/bleaching powder. The vacuum
type chlorinator installed at the plant was not in working condition. Chlorine demandof the filtered water was found to be 1.0 mg/1. While the residual chlorine in the finishedwater was 0.8 mg/1. The finished water was free from coiiform. During one of the visits,when bleaching powder was used for disinfection, an increase in turbidity of finishedwater was observed.
Laboratory facilitiesAdequate laboratory facilities with equipment like turbidimeter, residual
entérine kit, jar testing machine, oven and distillation still etc. have been provided at theplant. But most of the instruments were out of order and trained laboratory personnelwere not available.
RECOMMENDATIONS
* Raw water flow meter needs immediate repairs to enable measurementof plant inflow and process control.
* Regular jar tests need to be conducted to determine the optimum alum doserequirement.
* Flash mixer- should be used continuously for proper coagulation of water.
* Instruments in the laboratory should be repaired and trained chemist shouldbe appointed for proper operation and control of the plant.

l/G RESERVOIR
O
INTAKEWELL
PARSHALLFLUME
UT1
CtARIFLÛCCULATOR
DISTRIBUTION
CASCAOEAERATION
FLASHMIXING
RAPID SANDFILTERS
CHLORINATIONCHAMBER
FIG 11.4 SRKRISHNA RAJENDRA WATER IHEATMENT PLANT - SHIMOOA

243
TABLE 11.10
PLANT SUMMARY DATA - SIIIMOGA
GENERAL
Name and location
Year of construction
Design capacity
O & M Agency
Raw water source
Treatment flowsheet
ENGINEERING
Raw water pumping
-Rising main diameter
Rawwatcr flow measurement
Pre-treatment
Aeration
Coagulation
- Chemicals used
- Type of mixing
- Detention time
Flocculation
- Method / Type of unit
- No. & Dimensions
- Detention time
Shrikrishna Rajendra WaterWorks, Shimoga (Kamataka)
1977
13.5 mid
City Municipal Council, Shimoga
River Tunga
Conventional with Rapid Sand Filters
Two nos, (one standby), 100 HP each
60 cm CI .
Mahindra and Mahindra, capacity 1200 m3/hr
Cascade aerator (3 steps)
Alum (10% solution)
Mechanical Flash Mixer, 3.5 m dia., 2.2 m depth
2 minutes
MechanicaiyClariflocculator
One, 14.8 m dia, 4.9 m SWD
80 minutes

244
SedimentatftM
-Typeofunit(s)
- No. & size of unit(s)
- Detention time
Filtration
- Type of unit(s)
- No. & size of unit(s)
- Rate of filtration
- Filter media
. Sand size
. Depth of sand
- Backwash arrangements
.Method
- Washwater tank cap.
Disinfection
-Chemicals used
-Type of feed
• Chlorinator Details
Clear Water Reservoir
- Type, No.& Capacity,
- Pumg details
Clariflocculator
One, 34.6 m dia. and 4.9mSWD
4 hrs (for 13.5 mid)
Rapid Gravity Filters
3 nos, S.8 m x 5.8 m each
5m/hr
E.S.-0.45mm,U.C.-1.4
70 cm
Water wash only
136 m3
Chlorine gas, Bleaching powder
Solution feed
Vacuum type.cap 960 gm/hr
RCC, one, 227 m3
2 nos, centrifugal, 250 HP each

245
TABLE 11.11
PHYSICO-CHEMICAL AND BACTERIOLOGICAL QUALITY OFRAW AND FINISHED WATERS
SH1MOCA WATER TREATMENT PLANT - SHIMOGA
PARAMETERS
Tuibidity(NTU)
pH
Total Alkalinity(CaCO,)
Conductivity (uS/cin)
Haidness (CaCO,)Total
Caifoonate
Non Carbonate
Calcium (Ca)
Magnesium (Mg)
Chloride« (Q)
Sulphates (SO4)
Iron (Fe)
Fluoride (F)
I
RAW
3.5
7.1
52
772
16
16
0
5
1
19
4
0.5
0.1
Bacteriological (MPN/100 ml)
Total colifonn
Fecal colifonn
£L£oJi
Fecal streptococci
2400
430
430
23
VISIT
FINISHED
5.2
7.1
50
-
24
24
0
6
2
16
2
0.2
0.1
0
0
0
0
II
RAW
8.6
7.1
64
877
36
36
0
9
3
22
8
0.7
<0.1
240
23
4
9
VISIT
FINISHED
2.5
7.2
60
932
34
34
0
8
3
22
13
0.3
<0.1
0
0
0
3
III
RAW I
20.0
7.0
26
102
24
24
0
6
2
9
6
0.8
<0.1
240
93
23
23
VISIT
TNISHED
2.2
7.7
24
99
24
24
0
6
2
9
6
0.2
<0.1
0
0
0
0
All values except pH .Turbidity and Conductivity ate expressed as mg/I

246
TABLE 11.12
PLANT PERFORMANCE AT VARIOUS STAGES OF TREATMENT
SHIMOGA WATER TREATMENT PLANT - SHIMOGA
PARAMETERS VISIT RAW SETTLED FILTERED FINISHEDWATER WATER WATER WATER
Turbidily I 3.5 2.5 2 5.2(NTU)
0 8.6 2.0 1.5 2.S
Ul 20 8 2 2.2
I 2400 460 0
T.Colifoim n 240 43 4(MPN/100ml)
ffl 240 43 43
430 43
(MPN/lOOml)m 23

247
CALICUT WATER WORKS - MAVOOR
INTRODUCTION
Calicut town in Kerala draws its water supply from river Chaliyar. The waterworks designed to serve a population of 2.66 lakhs at the rate of 125 Ipcd is locatedat Mavoor which is about 20 km from Calicut. The treatment plant commissioned inthe year 1971 provides for conventional pre-treatment with alum followed bysedimentation, rapid sand filtration and chlorination. The schematic flow sheet is shownin Fig. 12.1 and the plant summary data is presented in Table 12.1. The plant isoperated and maintained by the Kerala Water Authority.
PLANT APPRAISAL
Raw water quality and flow measurementThough the Chaliyar river is perennial, the surface flow in the river gets
considerably reduced during summer. During such periods, the flow is diverted to theintake point by constructing earthen bunds on the downstream side. No major sourceof pollution exists in the nearby vicinity of the intake.- The chemical quality parametersof raw water are within the range (Table 12.2).
• A Venturi flume has been provided at the inlet channel to measure the plantinflow. However, there was no flow indicating device. The plant inflow was actuallymeasured at the time of the visit by installing a weir upstream of the flume andrecording the head over the weir. The plant inflow was found to be 28.6 mid against thedesign value of 36 mid. A perusal of available records indicated that the plant hadreceived 34 mid of raw water during the period 1979-80. The raw water pumps wereoperating at a decreased efficiency, it was noticed.
Pre-treatmentAlum and lime are added in sequence at the hydraulic jump in the raw water
inlet channel. These chemicals, however, were added in an uncontrolled manner,without proper solution dosing system. The consumption of chemicals was reported tobe of the order of 1 SO kg/day of alum and 100 kg/day of lime equivalent to a dose ofS mg/1 and 3 mg/1 of alum and lime respectively for a raw water turbidity of 2 NTU.Adequate stock of chemicals was found at the plant. The flocculating paddles and sludgescrapers in both the clariflocculators were found in disuse. The poor operation of pre-treatment units was found to result in deterioration of settled water quality as evidentfrom the turbidity which was 6 NTU as against a raw water turbidity of only 2 NTU(Table 12.3).

248
FiltrationThe filter appurtenances such as the rate of flow controllers, the rate setters,
headloss indicators etc. of all the four filters were non functional for one reason oranother. In the absence of any reliable flow rate controlling system, all the four filterswere operated at an arbitrarily adjusted filtration rates. The normal frequency of filterbackwashing was reported to be once in 24 hours, irrespective of head loss or filtrateturbidity. Considerable quantity of sand was found lost from the filters due to defectivebackwashing. During the visit, the turbidity removal in the filters was only marginalas observed from the filtrate turbidity of4NTU while the influent turbidity was 6 NTU(Table 12.3),
Disinfection
Pressure type chlorinator has been installed at the water works. The dose ofchlorine applied was found to be 1 mg/1 which was found inadequate to ensure aminimum residual chlorine of 0.2 mg/1 in the distribution system.
Laboratory facilities
Although laboratory equipment such as pH meter, turbidimeter and jar testapparatus etc. were available at the plant, these were not in good working conditionand hence in disuse. No chemist has been posted at the plant and no regular monitoringof water quality at various stages of treatment is carried out.
Plant staff
The staff at the water works include Assistant Engineers (2 nos.), Worksuperintendent (3 nos.), Operators (12 nos.) Electricians and fitters. The filter operatorshave not received any formal training.
Financial aspects
The approximate annual expenditure towards operation and maintenance of thetreatment plant was reported to beRs.35 lakhs.while the annual revenue from the saleof water has been about Rs. 20 lakhs. The cost of treatment works out to about Rs.
RECOMMENDATIONS
* The efficiency of raw water pumps has decreased by about 25 per cent. Itis, therefore, necessary to repair/replace the pumps so as to ensure that theircapacity matches with the rated capacity of the treatment plant.
• The existing raw water flow measuring device may be got either repairedor replaced with a new device of suitable capacity range.

249
• Simple, constant head chemical solution . dosing systems should beinstalled for controlled dosing of alum and lime. Dosages of chemicals should bedecided on the basis of jar tests to be conducted regularly.
• Equipment such as turbidimeter, jar test apparatus and pH meter etc.,provided at the plant should be made operative and maintained in good workingcondition.
• All the mechanical equipment and appurtenances of clariflocculatorsand rapid gravity filters should be made operative and maintained properly.
• The plant operators need training for improved operation andmaintenance.
• A qualified, trained chemist should be posted at the plant for routine waterquality testing and process control.

CHEMICALAOOITION
CHLORINATION
RAW WATER
FROM CHALIYARRIVER
AERATORHYDRAULIC
PUMPCLARIFLOCCULATOR RAPID GRAVITY FILTERS
12 NOS.)
CLEAR
WATER
RESERVOIR
TO DISTRIBUTION
FIG 12.1 CALICUT WATER WORKS, MA VOOR - SCHEMATIC

251
TABLE 12.1
PLANT SUMMARY DATA - CALICUT
GENERAL
Name and location
Year of construction
Design capacity
O & M Agency
Raw water source
Treatment flowsheet
ENGINEERING
Raw Water Pumping
- Rising main
Raw water flow measurement
Pre-treatntent
Aeration
Coagulation
- Chemicals used
- Type of mixing
Hocculation
- Method / Type of unit
- No. & Dimensions
- Detention time
Calicut Water Works, Mavoor
1971
36 mid
Kerala Water Authority
Chaliyar River
Conventional with rapid sand
sand filters
2 Nos., 250 HP each with discharge
capacity of 315 lpm
ôOOmmdia. Cast Iron, 350 m length
Venturi Flume
Cascades, 5 Nos.
Alum & Lime
Hydraulic
Mechankal/Clariflocculator
2 Nos., each 11.0 m dia., 4.25 SWD
30 minutes

252
Sedimentation
-Typeofunit(s)
- No. & size of unit(s)
- Surface overflow rate
- Detention time
Filtration
-Typcofunit(s)
- No. &. size of unit(s)
• Rate of filtration
-Filter media
. Sand size
.Depth of sand
. Supporting Gravel
- Backwash arrangements
.Method
. Wash water tank cap.
Disinfection
- Chlorine gas/Bl. powder
-Type of feed
-Chlorinator Details
Gear Water Reservoir
- Type, No. & Capacity
- Pump details
: Radial flow
: 2 Nos., each 27.4 m dia. 3.4mSWD
: l.Sm/hr
: 2 hrs 10 minutes
: Rapid gravity
: 4 Nos., (twin beds) each 9.10 x 8.50 m
: 4.8m/hr
: E.S.-0.6mm,U.C.-1.5
: 60cm
: 50 cm.; 2.5 to 50 mm size
: Air scour followed by water wash
: 304m3
: Chlorine gas
: Solution feed
: Pressure chlorinator of capacity 1.5 kg/hr
: R.C.C., lNo.,1800m3
: 4 Nos., 150 HP each.

253
TABLE 12.2
PHVSICO • CHEMICAL AND BACTERIOLOGICAL QUALITY OFRAW AND FINISHED WATERS
CALICUT WATER WORKS • MAVOOR
PARAMETERS
Physke-dieiaical
Turt»fity(NTU)
pH
Total Alkalinity(CaCO,)
Haidoess (CaCO,)Total
Cartwoaie
NooCatbooate
Calcivm (Cm)
Magnesium (Mg)
Chloride« (Cl)
Sulphates (SO,)
boa (Be)
BtcterMagkal (MPN/100 ML)
ToalcolifofA
RAW
2
7.3
36
16
16
NIL
5
1
720
2
1.4
130
I VISIT
FINISHED
2
7.1
34
16
16
NIL
5
1
750
3
1.3
*
0
n visrr
RAW FINISHED
5 1
6.8
6
20
6
14
-
12
NU
0.1
460 NU
AU the vaines except pH and twbàdity aie expressed as mg/1

234
TABLE 123
PLANT PERFORMANCE AT VARIOUS STAGES OF TREATMENT
CALICUT WATER WORKS • MAVOOR
PARAMETERS VISIT RAW SETTLED FILTERED FINISHEDWATER WATER WATER WATER
Twttdity(NTÜ)
T.Colifofm I 130 47 33 NIL(MPN/100ML)
H 460 - . NIL

255
THIRUVALLA WATER WORKS -THIRUVALLA
INTRODUCTION
The water works at Thiruvalla with a capacity of 24 mid serves the water supplyneeds of Thriruvalla and Changanacherry towns and the municipal areas in and aroundKuttanad with a population of 3.9 lakhs (1981 census). The plant, commissioned in theyear 1977, draws raw water from river Manimalaion and provides for pre-treatment withalum coagulation followed by sedimentation, rapid sand filtration and chlorination. Theplant layout is shown in Fig. 12.2 and plant summary data is presented in Table 12.4.
PLANT APPRAISAL
Raw water quality and flow measurementRiver Manimalaion has low surface flow during the period May-June but no
water scarcity has been experienced so far. However, due to change in the river flowregime during summer, raw water has to be diverted towards the intake point byconstructing temporary earthen bunds. The source is not well protected and activitieslike washing oftractors, ferry boats etc. take place right near the intake on upstream side.The.raw water has a low pH, low total dissolved solids and low alkalinity (Table 12.5).
A Parshall flume along with a flow indicator has been installed at the raw waterinlet channel to measure the plant inflow. At the time of the visit, the recorded plantinflow was 1200 mVhr as against a design value of lOOOnrVhr.
Pre-treatment
The cascade aerator provided at the treatment plant does not seem to serve anyuseful purpose other than improving the plant aesthetics. Lime is used as a coagulantaid in conjuction with alum. A fixed dose of alum and lime is applied irrespective of thechanges in raw water quality. At the time of the visit, the actual dose of alum and limeas applied to the raw water of 12 NTU turbidity, was 10 and 15 mg/1 respectively asagainst the corresponding jar test dose of 20 and 30 mg/1. The chemicals are added justupstream of the Parshall flume. The tanks provided for preparation of alum and limesolutions are not in use. The mechanical mixer in the flash mix unit was workingsatisfactorily while the flocculating paddles and sludge scrapers in both the clarifloc-culators were defunct for want of spares. Although the plant was overloaded and thechemical dosages were inadequate, still the settled water turbidity was low and withinthe acceptable limit because of low raw water turbidity (12 NTU).

256
FiltrationHie rapid gravity filters were reported to have been overhauled in the year 1987
when the filter sand was replaced. However, the performance of the filters was notsatisfactory as there was only a nominal reduction in turbidity due to filtration (Table12.6). Though provision has been made for air scour, the filters were washed with wateronly as the air blower was down for repairs with the result the backwashing wasineffective. Cracks were observed on die sand surface in all the filters. The fitlerappurtenances were also non-functional.
DisinfectionAs the gas chlorinator was not in working order, disinfection was achieved
using bleaching powder. The available chlorine in the bleaching powder used was foundtobe 32 per cent and the residual chlorine in the finished water was in the range of0.4-0.8 mg/1.
Laboratory facilitiesLaboratory facilities have been provided at the plant site. The available
equipment includes turbidimeter, pH meter, jar testing machine, residual chlorine kit,and chemical balance. However, these were not being used as no chemist has been postedat die plant.
RECOMMENDATIONS
* Measures should be taken to prevent/restrict human activities near the intaketo minimise the potential for pollution of raw water.
* Dosages of chemicals should be decided on the basis of jar test performedregularly.
* The sludge scraper mechanism for the clariflocculator should be got repairedand put into operation.
* In order to ensure clean filters and a filtrate of acceptable quality, effectiveback washing is a pre-requisite. The air blower should be got repaired im-mediately and put into operation to improve backwashing.
* A competent chemist with supporting staff should be posted at the plantfor routine laboratory testing and plant control.

CLARlFLOCCULATöR
FOUR TWINBED FILTERS
(RAPID GRAVITY)
CHEMICALHOUSE
AERATOR
CHEMICALADDITION
RAW WATER
FLASHMIXER
FILTER GALLERY
CLARIFUDCCULATOR
CKLORNATORROOM
CLEARWATERRESERVOIR
PUMP HOUSETOaSTRlOUTtON
(NOT TO SCALE)
FIG 12.2 LAYOUT FLAN OF WATER TREATMENT PLANT, THIRUVALLA

258
TABLE 12.4
PLANT SUMMARY DATA - THIRUVALLA
GENERAL
Name and location
Year of construction
Design capacity
O &. M Agency
Raw water source
Treatment flowsheet
ENGINEERING
Raw Water Pumping
- Rising main diameter
Raw water flow measurement
Pro-treatment
Aeration
Coagulation
- Chemicals used
- Type of mixing with
Ftocculation
• Method /Type of unit
- No. & Dimensions
- Detention time
Thiruvalla Water Treatment Plant, Thinivalla
1977
24 mid
Kerala Water Authority
River Manimalaion
Conventional with rapid sand filters
4 Nos., each 175 HP with a dischargecapacity of 9550 lpm
700 mm CX
Parshall flume with a flow indicator ofcapacity 0-2000 mVhr
Cascades, 4 Nos.
Alum & Lime
Mechanical mixer details 1 No, 2.7 m dia.,2.5 m SWD, 60 sec. detention time
Mechanical/Clariflocculator
2 Nos., each 10 m dia. 4.2 m SWD
40 minutes

259
Sedimentation
-Typeofunit(s)
- No. & size of unit(s)
- Surface overflow täte
- Detention time
Filtration
-Typeofunit(s)
- No. &. size of unit(s)
- Rate of filtration
-Filter media
. Sand size
.Depth of sand
. Supporting Gravel
- Backwash arrangements
.Method
Disinfection
- Bleaching powder/
-Chlorinator Details
- TypeJNo. & Capacity
- Pump details
: Radial flow
: 2 Nos., each 25 m dia. 3.3mSWD
: 1.2m/hr,
: 2hr40 minutes
: Rapid gravity filters
: 4 Nos. (twin bed),each 6.9 x 8.25 m
: 4.8 m/lu
: E.S.-0.45mm,q.C.-13
: 75 cm
: 30 cm. depth
: Air scour followed by water wash
: Chlorine gas & Bleaching Chlorine gas Powder
: Vacuum type 2 kg/hr capacitydear Water Reservoir
: R.C.C., 1 No.,with two compartments,1 million litres capacity
: 6 Nos., 60 HP each

260
TABLE 1X5
PHYSICO-CHEMICAL AND BACTERIOLOGICAL QUALITY OPRAW AND FINISHED WATERS
THIRUVALLA WATER WORKS - THIRUVALLA
PARAMETERS
Phytko-dMMiical
Tmbidity(NTU)
pH
Total Alkalinity(CaCO,)
Haidness (CaCO,)Total
Caibooue
NooCaibomte
Calcium (Ca)
Magnesium (Mg)
Chloride* (O)
Sulphates (SO4)
Iron (Fe)
ivisrr
RAW
5
6.6
30
20
20
NIL
5.0
2
8
2
0.2
Bacteriological (MPN/100 ML)
Total colifonn NIL
FINISHED
3
6.4
24
23
23
NIL
7
1
8
2
0.3
NIL
RAW
12
6.8
8
12
-
-
-
-
10
3
-
-
n VISIT
FINISHED
3
7.1
6
12
-
-
-
-
11
3
-
-
in VISIT
RAW FINISHED
50 5
6.4
12
20
12
8
-
8
NU
NU
170 Nil
AH the vatee* except pH and tuibidity aie expressed m mg/l

261
TABLE 1Z*
PLANT PERFORMANCE AT VARIOUS STAGES OF TREATMENT
THKUVALLA WATER WORKS • THDNUVALLA
PARAMETERS VISIT RAW SETTLED FILTERED FINISHEDWATER WATER WATER WATER
Tuibidity I S.O 5.0 3.0 3.0<NTU)
H 12.0 5.0 4.0 3.0
m 50 25 6 5
T.Coliform I NIL NIL NIL NIL(MPN/100ML)
II 1600 540 170 NIL
m 170 - - NIL
I 23 5 2 NIL(MPN/100ML)
n o o o o
m _ Not Tested

262
TRICHUR WATERWORKS -PEECHI
INTRODUCTION
Trichur water works which is located at Peechi reservoir has been designedto supply water to a population about 1.0 million (1981 census) of Trichur and theadjoining Panchayats of Kurkancherry, Ayyanthole and Nadathava. The source ofsupply is Peechi irrigation reservoir formed by constructing a dam across the riverManali. Water is drawn by gravity to the treatment works which provides for chemicalpre-treatment with alum followed by sedimentation, rapid sand filtration and chlorina-tion. The schematic flow sheet is given in Fig. 12.3 and the plant summary data ispresented in Table 12.7. The responsibility for plant operation and maintenance restswith the Kerala Water Authority.
PLANT APPRAISAL
Raw water quality and flow measurementThe raw water is drawn from near the surface of the reservoir. The problem of
odour in raw water has been reported particularly during the months of Novemberand December. The raw water is soft and corrosive as shown by low pH value, low totaldissolved solids and low alkalinity (Table 12.8). It is reported that the dissolved oxygencontent of raw water, at times, goes below 1 mg/1.
The flow indicator installed at the Parshall flume to measure the plant inflow wasfound working satisfactorily. During the visit, the flow recorded was 12.7 mid as againstthe design value of 14.5 mid.
Pre-treatmentThe applied dose of alum and lime was found as 25 mg/1 and 30 mg/1
respectively for a raw water turbidity of 12 NTU. No proper system of chemical dosingand control has been provided at the plant. The dose, therefore.was found to vary fromtime to time and in every shift. The method of preparation of alum and lime solutionswas also unscientific. The mechanical mixer and flocculating paddles were found inproper working condition. During the visit, the raw water turbidity itself was very low(3 NTU) and there was no significant improvement after sedimentation (Table 12.9).
FiltrationThree rapid gravity filters (twin bed) designed to operate at a filtration rate of
6.0 m/hr have been provided. The filter appurtenances viz. the rate setter, rate of flowcontroller, and the loss of head indicator in all the filters were not in workingcondition. Backwashing of filters is carried out once in 24 hours with air scour

263
followed by water wash. Backwashing was found ineffective as seen from the mudballfoimation and filter cracks.
DisinfectionAs the chlorinator installed at the water works was completely corroded and
inoperative, bleaching powder solution was used for disinfection. The dose of bleachingpowder was not properly regulated. The available chlorine in the bleaching powder usedwas found as 29-per cent while the residual chlorine in the finished water was 0.2 to 0.8mg/1.
Laboratory facilitiesNo laboratory facility exists at the plant site.
Plant staffThe staff at the plant include Assistant Engineer 1 No.),Water Works
Superintendant (1 No.),Operators (4 Nos.)and Cleaners (8 Nos.). The staff has notundergone any formal training in operation and control of water treatment plant.
Financial aspectThe annual expenditure on operation and maintenance of water treatment
system was reported to be about Rs. 11 lakhs. The cost of treatment works out to approx.Rs.0.2S/m3.
RECOMMENDATIONS
* An appropriate chemical dosing system should be installed immediatelyfor controlled addition of chemicals.
* All thefilterappurtenancesshouldbecheckedfortheirrunctionalityandstepstaken to repair/replace them.
* The filter backwashing should be improved by ensuring adequate durationof air scour followed by water wash.
* A new chlorinator should be installed in a properly designed chlorinationroom with necessary safety provisions. - Minimum laboratory equipmentlike pH meter, turbidimeter, jar test apparatus, residual chlorine kit etc. shouldbe provided for day to-day monitoring and control of the treatment processes.

CHEMICALADDITION
GRAVITY FlRAW WATERPEECM flESCRVOK o
ACRATORFLASHMtxe« CLARIFLOCCULATOR
( Z NOS.)
CHLORINATtON
t
HAPtD
2 31
GRAVITY FILTERS
CLEARWATERRESERVCM
TO
BG 12.3 TR1CHUR WATER WORKS, PEECHI - SCHEMATIC

265
TABLE 12.7
PLANT SUMMARY DATA • TR1CHUR
GENERAL
Name and location
Year of construction
Design capacity
0 A M Agency
Raw water source
Treatment flowsheet
ENGINEERING
Raw water gravity main
. diameter
Raw water flow measurement
Pre-treatment
Aeration
Coagulation
-Chemicals used
- Type of mixing with
Flocculation
- Method / Type of unit
- No. & Dimensions
- Detention time
Trichur Water WorksJPeechi
1961
14.5 mid
Kerala Water Audwrity
Peechi Irrigation Reservoir
Conventional wim rapid sand filters
183 m long Cl . Pipe
600mm
Panhall flume with flow indicating device.
Cascades, 4 Nos.
Alum & Lime
Mechanical mixing details 1 No, 3.65 m dia.1.8 SWD, 40 sec. detention time
Mechanical/Claiiflocculator
2 Nos, each 7.3 m dia. 3.95 m SWD
30 minutes

266
Sedimentation
-Typeofunit(s)
- No. A size of unit(s)
- Surface overflow rate
Filtration
-Typeofunit(s)
- No. & size of unit(s)
-Rate of filtration
- PÜter media
. Sand size
.Depth of sand
. Supporting Gravel
- Backwash arrangements
Method
Disinfection
- Bleaching powder/Chlorine gas
-Chlorinator Details
- Type,No. & Capacity
'Distribution
: Radial flow
: 2 Nos., each 24.4 m dia.
: 1.8m/hr
: Rapid gravity filters
: 3 Nos., each 4.25x5.5 m
: 4.8m/hr
B.S.-0.45mm,U.C-1.3
75 cm
40 cm. depth
: Ak scour followed by water wash
: Chlorine gas
: Vacuum type; capacity 5 kg/hr.Clear Water Reservoir
: R.C.C., 1 No.,wim four compartments,0.85 million litres capacity
: By gravity

267
TABLE 118
PHYSICO. CHEMICAL AND BACTERIOLOGICAL QUALITY OFRAW AND FINISHED WATERS
TRJCHUR WATER WORKS • PEBCHI
PARAMETERSI VISIT n VISIT mvisrr
RAW FINISHED RAW FINISHED RAW FINISHED
Tmfcidity(NTU)
pH
Total Alkalinity(CaCOs)
Hantoess(CaCO3)Total
Cafbooaie
NeaGaaofMs
Caltiam (Ca)
Magnesium (Mg)
Chloride« (O)
Sulphates (SOJ
Iron (FB)
3
6.5
28
12
12
NIL
3
1
3
1
1.3
Bt l fM»gka l (MPN/100 ML)
Total cotifcrai 79
2
6.5
30
28
28
NIL
9
2
5
14
1.5
0
12
6.8
12
16
-
-
-
-
5
2
2
10
7.6
8
16
8
8
6
NU
m
240 NO
AH the vafaes except pH and tniMdity are expraaaed at mg/1

268
TABLE l i t
PLANT PERFORMANCE AT VARIOUS STAGES OF TREATMENT
TR1CHUR WATER WORKS - PEECHI
PARAMETERS
Tuibidity(NTU)
T.CoWooa(MPN/100ML)
RColi(MPN/100ML)
visrr
I
n
I
n
i
n
RAWWATER
3
10
920
240
23
SETTLEDWATER
4
10
350
-
21
FILTEREDWATER
1
5
130
*
Not Te«ed
FINISHEDWATER
2
3
NIL
NIL
0

269
ARUVIKKARA WATER WORKS -TRIVANDRUM
INTRODUCTION
Trivandrum, the capital city of Kerala has its water works located at Aruvikkarawhich is about 22 km from the city. The treatment plant with a design capacity of SOmid was commissioned in the year 1973 and the capacity was augmented by 25 midin the year 1987. The SO mid plant with conventional pre-treatment using alumcoagulation and sedimentation followed by rapid sand filtration was selected forevaluation. The plant 1 ayout and summary data are given in Fig. 12.4 and Table 12.10respectively. The water works is maintained by the Kerala Water Authority,Trivandrum.
PLANT APPRAISAL
Raw water quality and flow measurementThe raw water source is Aruvikkara reservoir which is an impoundment formed
oya dam constructed across theKaramana river. The storage capacity of the reservoiris 628.26 million litres and there has been no scarcity of water even during summer.Adequate measures have been taken for protection of the source in the vicinity of theintake. The chemical quality of raw water (Table 12.11) is within the limitsrecommended by CPHEEO. The raw water turbidity is reported to be generally lowthroughout the year.
Raw water is pumped to the treatment plant through a 700 mm dia. rising main.A flow indicator along with an integrator installed in the raw water inlet channelnear the flume was non-functional. The plant inflow as measured by noting the headover the weirs in the filter outlet chambers was found to be 67.85 mid as against thedesign value of 50 mid. The reason for overloading (about 35 percent) is attributedto the difficulties in regulating the raw water control valves at the pump house in theabsence of flow indicating devices.
Pre-treatmentAlum and lime are used for coagulation and the chemicals in solution form
areaddedneartheflumeattherawwaterinletchannel. Pre-chlorinationusing bleachingpowder is also practised occasionally for algae control. No proper system of doseregulation has been provided, and a fixed quantity of 350 kg/day of alum and 300 kg/day of lime are added during the fair season. During monsoon when the raw waterturbidity is high, the alum dose is reported to be increased to threefold. Overloading ofthe units coupled with incorrect and unregulated dose of chemicals* non-functioningof mechanical mixers, and flocculators were found to result in poor pre-treatment. This

270
is evident from the settled water turbidity of 6 NTU and 8 NTU as compared to the rawwater turbidity of 8 NTU (Table 12.12).
FiltrationAll the filters were reported to have been overhauled during May-June, 1987
when the filter media including the underdrain plastic nozzles were replaced. Thefilter appurtenances were found non-functional. The frequency of filter backwashingwas once in 16 to 24 hours due to overloading. Since the air blower was under repair,only water wash was given which was found ineffective. Filter cracks and mudballswere observed in all the filters. In general, the performance of the filters wasunsatisfactory and during one of the visits, the turbidity of the settled water and thefiltrate was the same at 9 NTU (Table 12.12).
Disinfection
Filtered water is disinfected using chlorine gas. The dose applied was l.Smg/1which was adequate to provide a residual chlorine of 0.S mg/1 in the finished water.
Laboratory facilitiesA fairly well equipped laboratory with essential instruments/equipment and
other infrastnictural facilities is available at the plant for routine control tests. Theavailable equipment includes pH meter, turbidimeter, jar test apparatus and residualchlorine kit. These facilities have been established at the time of the augmentation of theplant capacity in the year 1987. A qualified chemist and a laboratory assistant have beenposted for water quality testing and plant control. However, the facilities are not beingutilised fully to improve the plant performance.
Plant staffIn addition to the laboratory staff, filter operators (7 nos), fitters (6 nos.), and
pump operators (12 nos.) have been posted at the water works under the directsupervision of one Assistant Engineer. The staff has not undergone any formal trainingin the operation and control of water treatment plant.
RECOMMENDATIONS
* Immediate steps should be taken to install the flow indicating devices forproper division and control of plant inflow between the two treatment plants.Proper regulation of flow through the rising mains should be ensured so thatthe plant overloading is within the design limits.
* The dose of chemicals should be fixed on the basis of raw water quality andtretability studies. For this purpose the available laboratory facilities should

271
be fully utilised. This would help improving the plant performance and alsoeffect economy in operation.
* Proper maintenance of mechanical mixer, flocculating paddles, sludgescrapers and filter appurtenances is necessary to improve the functionality ofthe treatment system.
* The present practice of backwashing the filters without air scour is foundinadequate resulting information ofmudballs and short filter runs. Auxiliaryair scour prior to water wash should be practised.
* The plant staff should be deputed to undergo formal training in water worksoperation and maintenance.

OAWaoCCULÄTöR CLARIFLOCCULÄR»
(NOT TO SCALE)
PIG 1Z4 LAYtKJT PLAN OF TRJVANDRUM WATER TREATMENT PLANT - ARUVKKARA

273
TABLE 12.10
PLANT SUMMARY DATA - TRIVANDRUM
GENERAL
Name and location
Year of construction
Design capacity
O &. M Agency
Raw water source
Treatment flowsheet
ENGINEERING
Raw Water Pumping
- Rising main
Raw water flow measurement
Pre-treattnent
Coagulation
- Chemicals used
- Type of mixing with
Flocculation
- Method / Type of unit
- No. SL Dimensions
: Aruvikkara Water Works, Trivandrum
: 1973
50 mid
Kerala Water Authority
Aruvikkara Reservoir
Conventional with rapid sand filters
6 Nos., each 170 HP with a dischargecapacity of 303 lps
500 m length, CI.,700 mm dia.
Parshall flume with flow indicating device
Alum A Lime
Mechanical mixer, 2.1 m dia, details 4.5 m. SWD
Mechanical/Clariflocculator
2 Nos., each 12.2 m dia.

274
Sedimentation
-Typeofunit(s)
- No. A size of unit(s)
Filtration
-Typeofunit(s)
- No. & size of unit(s)
•Rate of filtration
- Backwash arrangements
.Method
. Washwater tank cap.
Disinfection
- Chemicals used
- Chlorinator Details
- Type.No. & Capacity
- Pump details
: Radial flow
: 2 Nos., 34.20 m dia. 3 m SWD
: Rapid gravity filters
: 6 Nos., (twin bed) each 10.3 m x 6.6 m
: 4.8m/hr
Air scour and water wash
70 m»
: Chlorine gas, Bleaching powder forpre-chlorination
: Chlorinator with 3.5 kg/hr capacityClear Water Reservoir
: R.C.C., 1 No.,two compartments680 m» capacity
: 6 Nos, ISO HP each.

275
TABLE 1X11
PHYSICO-CHEMICAL AND BACTERIOLOGICAL QUALITY OFRAW AND FINISHED WATERS
ARIMKKARA WATER WORKS - TRIVANDRUM
PARAMETERS
Physico-chemical
Tuibidâty(NTU)
pH
Total Alkalinity(CaCO,)
Hantoess(CaCO,)Total
Catbonate
NoaCaiboiiate
Calcium (Ca)
Magnesium (Mg)
Chlorides (Q)
SalphaseKSO^
Inm (Fe)
ivisrr
RAW i
8
6.8
20
10
10
NIL
2
1
3
2
0.4
Bacterioloiical (MPN/100 ML)
Total colifonn
Focal streptococci
5400
340
FINISHED
3
6.9
25
20
20
NIL
3
2
5
5
0.5
0
-
n VISIT
RAW
8
6.8
12
4
-
-
-
•
6
NIL
-
5400
340
FINISHED
6
6.7
21
12
-
-
-
-
8
NIL
-
NIL
NIL
fflVISIT
RAW FINISHED
50 10
7.2
14
28
14
14
-
5
NIL
0.1
350 NIL
<50 NIL
All the values except pH and tubidity aie expressed as mg/1

276
TABLE 1X12
PLANT PERFORMANCE AT VARIOUS STAGES OF TREATMENT
ARUVIKKARA WATER WORKS • TRTVANDRUM
PARAMETERS VISIT RAW SETTLED FILTERED FINISHEDWATER WATER WATER WATER
Tuitoidàty I 8 6 3 3(NTU)
11 8 9 9 6
m 50 50 20 10
T.CoÜ I 5400 2400 330 NU(MPN/IOOML)
I 490 230 4 NU(MPN/IOOML)

277
LAXMINARAYANGIRI WATER TREATMENT PLANTBHOPAL
INTRODUCTION
Bhopal, the capital city of Madhya Pradesh has a population of about 8.5 lacs.The main source of water supply to the city is Upper Lake, Bhopal. The treatmentplant with a design capacity of 22.7 mid and located at Laxminarayangiri hills ismaintained by PHED, Bhopal. The schematic flow sheet is shown in Fig. 13.1 andthe plant summary data is presented in Table 13.1.
PLANT APPRAISAL
Raw water quality and flow measurementThe raw water pump house, which is on the bank of the lake, is located below
the MWL of the lake with the result the raw water pumps work under positive suctionmost of the time. No separate intake well has been provided at theheadworks and rawwater is directly pumped from the lake through the suction pipe and foot valves. Allraw water pumps (5 nos) including the standby units (2 nos) were found in workingcondition. The head works is 4.7 km away from treatment plant.
Hie Upper Lake receives domestic sewage discharge, though not in theimmediate vicinity of the intake. Bathing and washing of clothes was observed nearthe headworks. Increase in color and turbidity of raw water was reported during Ganeshfestival due to immersion of idols in the lake.
A Venturi flume has been provided to measure the plant inflow. Though theflow indicating device installed at the flume was found in working condition, the flowrecorder and integrator were not working. During one of the visits, the raw water inflowto the plant was 32.5 mid indicating overloading to the extent of 44 per cent. This wasdue to the inflow of 136 mVhr of raw water pumped into the plant from the rising mainof BHEL treatment plant. During the next visit, due to failure of monsoon, drawal ofwater from the lake was reduced to 17.7 mid to conserve the supply for summer, so theplant was underloaded to the extent of 22 per cent.
Samples of raw and finished water were collected and analysed for physico-chemical parameters (Table 13.2).It can be seen from die results that all the parametersare found to be within the recommended limits for potable purposes.
Pre-treatmentThe hydraulic impingement (jet)type flash mixer provided at the plant was in
disuse. The alum solution wasadded in the flash mixing chamber. The constant headalum dosing device was not functioning and hence the dose was controlled manually.

278
The reported concentration of alum solution and the dose of alum applied weresignificantly different from the actual values.
Pre-chlorination using chlorine gas is carried out at the water works round theyear with a view to improving coagulation and reducing algal growth in the treatmentunits. Only one chlorinator has been provided for pre as well as post-chlorination.
During the visit.one of the two flocculators was empty for repair of leaksand replacement of corroded flocculator paddles and the flow was bypassed tosedimentation tanks. During the next visit, both the flocculators were in operationand floe formation was found to be good.
Horizontal flow rectangular settling tanks have been provided and the tanks arecleaned once a year. Settled water turbidity was less than 8 NTU (Table 13.3) evenwhen the plant was overloaded thereby indicating the high efficiency of the settlingtanks.
FiltrationFilter appurtenances such as rate setters, rate controllers and headloss
indicators of all the filters were found in disuse. Filters were backwashed once in 24hours using air scour and water; however, when underloaded they were backwashedonce in 48 hrs. The backwashing operation was observed to be satisfactory. Though thefilter beds were clean, the sand depth in the filters was about 45-50 cm which is lessthan the minimum desired value of 60-75 cm (E.S - 0.50 mm, U.C-1.64). Accordingto the plant chemist, sand & gravel are replaced after every 5-6 years of use. Thesludge from sedimentation basin and spent backwash water from the filters aredischarged into a nearby nullah and is utilised for watering the PWD garden.
Filtrate turbidity was always less than 2 NTU (Table 13.3) even when the filterswere overloaded. During the first visit the filtered water was free from coliformbacteria indicating good performance of the filters.
DisinfectionPost chlorination is done using vacuum type chlorinator with chlorine gas.
The chlorine solution is injected into the pipeline carrying filtered water to the reservoirs.Only one chlorinator is used for pre and post chlorination. The total chlorine dose was4 kg/hr and the residual chlorine in the tap water at the plant was more than 1 mg/1.
Laboratory facilitiesA small laboratory with a trained chemist is provided at the plant with necessary
facilities and equipment like pH meter, turbidimeter, jar testing machine, distilled waterstUl.refrigeratoretc.Mostoftheinstrurnentsexceptjartesting machine were found inworking condition. In addition to this laboratory, there is a central laboratory at Bhopalwith all the facilities required for complete water analysis. Plant operation andmaintenance records are maintained properly. None of the filter operators had undergoneany formal training.

279
RECOMMENDATIONS
* In view of the discharge of domestic sewage and anthropogenic activitiesat the Upper Lake.the raw water quality should be monitored regularly tofacilitate preventive and corrective measures.
* The flash mixer should be put into commission so as to ensure propermixing of chemicals and formation of microflocs.
* The mixers in the alum solutionising tanks should be put into regularoperation for complete dissolution of alum slabs and to maintain a solutionof uniform strength.
* The filter appurtenances such as rate setters, rate controllers and head lossindicators should be got repaired for effective operation and maintenance ofthe plant
* During scarcity periods, the feasibility of recycling filter backwashwater after sedimentation can be explored. This also can improve the efficiencyof settling and filtration by providing nucleii for the formation of floes whenraw water is difficult to coagulate.

'UPPER/ LAKE
CHLORtWTJON
PUMPHOUSE
ALUM
FLASH VENTURI FMIXER FLUME
IÛCCULATC(2 NOS)
1RS
<tlrruuriiTiTinM
TANKS < 2 NOS.)
I 2 3
RAPID GRAVITYFILTERS
4
(
i
CLEARWATERRESERVOIR
FIG 13.1 LAXMINARAYANGIRI WATER TREATMe>fT PLANT (SCHEMATIC) - BHOPAL

281
TABLE 13.1
PLANT SUMMARY DATA-BHOPAL
GENERAL
Name and location
Year of construction
Design capacity
Oft M Agency
Raw water source
Treatment flowsheet
ENGINEERING
Raw water pumping
-Rising main diameter
Raw water flow measurement
Pre-treatment
Coagulation
- Chemicals used
* Method of mixing
- Detention time
Ftocculation
- Method /Type of unit
- No. &. size of unit(s)
: Laxminarayangiri water treatment plant(Bhopal)
: 1964
: 22.7 MLD
: Public Health Engineering Department, Bhopal
: Upper Lake, Bhopal
: Conventional with rapid sand filters(with pre-chlorinatkm)
: Centrifugal pumps-5 nos; 300 HP x 2 nos,220 HP x 2 nos,200 HP (2 pumps connectedin series),standby - 2 nos.
: 530 mm
: Venturi flume
: Alum
: Mechanical (Jet type)
: 2 minutes
; Mechanical
: 2 nos,each 7.5 m x 7.5 m x 4.35 m SWD
- Detention time : 30 minutes

282
Sedimentation
-Typeofunit(s)
-No. Asizeofunit(s)
- Surface over flow rate
- Detention time
Filtration
-Typeofunit(s)
- No. & size of unit(s)
-Rate of filtration
- Filter media
.Depth of sand
. Gravel size & depth
- Backwash arrangements
Method
. Wash water tank cap.
Disinfection
• Chemicals used
-Type of feed
- Ghlorinator Details
Clear Water Reservoir
- No. & Capacity
- Pump details
: Rectangular, Horizontal flow
: 2 nos, each 30 m x 10.5 m x 3.3 m SWD
: 1.5 m/hr
: 2 hr 30 minutes
: Rapid sand filters (open to sky)
: 4 nos,(twin beds), each 8.5 m x 7.6 m
: 4.8 m/hr
:0.75 m
: 4.5 mm - 0.076 m15 mm -0.076 m25 mm -0.15 m
: Air scour, water wash
:227 m*
: Chlorine gas
: Solution feed
: Vacuum type
: 3 nos, each 6800 m»
: By gravity

TABLE 13.2
PHYSICO-CHEMICAL AND BACTERIOLOGICAL QUALITY OFRAW AND FINISHED WATERS
LAXMINARAYANGDU WATER TREATMENT PLANT - BHOPAJL
283
PARAMETERS
PhTske-dkemkal
Tuibtdity(NTU)
pH
Total Alkalinity(CaCO,)
Conductivity (uS/cm)
Haidoess(CaCO,)Total
Caibooate
NonCaibonate
Calcium (Ca)
Magnesium (Mg)
Chlorides (G)
Sulphates (SO4)
lion (Fe)
Fluoride (F)
Nitrates (NO,)
RAW
5.0
7.9
89
166
95
89
6
34
3
3
1
0.2
0.1
5
Bacteriological (MPN/100 ML)
Total coliform
B-coli
Fecal streptococci
93
23
7
I VISIT
FINISHED
1.5
7.8
92
166
90
90
0
34
1
7
1
0.2
0.1
4
0
0
RAW
19
8.1
66
156
55
55
0
15
4
6
N.D.
0.8
0.2
7
1600
1600
6
AH values except pH,Tuibidity and Conductivity are expressed as mg/1
N D . - Not detectable
n VISIT
FINISHED
2.0
7.9
49
156
55
49
6
14
5
12
8
N.D.
0.1
3
0
0
0

284
TABLE 1X3
PLANT PERFORMANCE AT VARIOUS STAGES OF TREATMENT
LAXMD4ARAYANGIRI WATER TREATMENT PLANT - BHOPAL
PARAMETERS VISIT RAW SETTLED FILTERED FINISHEDWATER WATER* WATER WATER
TuibkBty I S.O 2.4 1.5 1.5(NTU)
II 19 8.0 2.0 2.0
T.CoUfonn I 93 0(MPN/100ML)
n 1600 240
BCnti I 23 0MPN/100ML
II 1600 80
Pie-chlorinalioa is practised

285
LALPUR WATER TREATMENT PLANT - JABALPUR
INTRODUCTION
The water treatment plant at Lalpur (Jabalpur) was constructed in the year 1980for a design population of 7,83,000 (1986) with river Nannada as the source of rawwater. The plant located 8 Ian from Jabalpur city has a capacity of 42 mid and ismaintained by PHED, Madhya Pradesh, which meets the salary of plant and laboratorystaff and expenditure on operation and maintenance. However, the cost of powerand chemicals, is met by the Jabalpur Municipal Corporation which also collects thewater revenue. The treatment comprises chemical addition downstream oftheParshallflume in the raw water channel, flash mixing, flocculation and sedimentation inclariflocculators, rapid gravity filtration and chlorination. The schematic flow sheet isshown in Fig. 13.2 and the plant summary data is presented in Table 13.4. The plant isoperated only for 16 hours/day because of inadequate storage capacity of overheadservice reservoirs.
PLANT APPRAISAL
Raw water quality and flow measurementThe intake well on the river bank is provided with openings at different levels
to facilitate drawal of water from different depths. The inlet ports are provided withscreens to prevent entry of floating debris. The river water flows to a sump wellthrough a tunnel of 1.5 m dia. and 185 m long. The problem of silt/sand entry into thesump has been reported during monsoon seasons. For periodic removal of silt/sanda grid of G.I. pipes fitted with nozzles and connected to an air compressor is laid inthe tunnel and sump well. A bucket elevator with an endless chain and two pumpsof 40 HP each are provided for the removal of silt/sand.
A bathing ghat known as Gwari ghat is located about 1 km upstream of the intake.Raw water is pumped through 600 mm dia. CI . rising main to the treatment plant
located about 300 m away from the raw water sump. Adequate provision for standbypumps has been made.
A Parshall flume has been installed for raw water flow measurement. The floatoperated flow indicating device was in working condition but not the flow recorder andthe integrator. Raw water inflow to the plant measured at site by lowering the waterlevel in clariflocculator(s) and observing the rise in level for a known period of time,was found to be 39.2 mid thereby indicating that the plant was slightly underloaded.Physico-chemical quality parameters for raw and finished water (Table 13.5) arewithin the limits recommended by CPHEEO.

286
Pre-treatmentAlum and lime are used for coagulation. Lime addition is practised only during
monsoon period and prior to alum addition. Lime and alum solution are conveyed inPVC pipes provided with Ç J. sluice valves which are in good condition.
The strength of alum solution used and the dose of alum applied were reportedmuch higher than actually found. The S % alum solution was found to be only of 1 %strength. Similarly the actual alum dose applied was only 16.4 mg/1 as against thereported value of 39 mg/1. Provision has been made to store adequate quantity ofchemicals. All chemicals like alum, lime and bleaching powder/chlorine are suppliedby Municipal Corporation on requisition from PHED. The alum and lime dosingfacilities were found in good working condition with the exception of a mixing paddlein one of the alum solutionising tanks. Flash mixing was found to be effective.
Mechanical gadgets such as flocculator paddles, sludge scraper bridge werefound in working order. The sludge bleeding is done continuously. Performanceofclariflocculator as observed from the settled water turbidity (3.5 NTU) was foundto be satisfactory (Table 13.6). It was reported by the plant chemist that during fan-season when the raw water turbidity is low and colloidal in nature, it is difficult tocoagulate and that retention of a part of the sludge for longer period in the flocculatorimproves the efficiency of flocculation and sedimentation. This was also confirmedby actual laboratory tests.
FiltrationThe rapid sand filters are open to sky and operated at a normal filtration rate
of 4.5 m/hr. The filter appurtenances such as rate setters, rate controllers andheadlossindicators of all the filters were not in working condition. The filtered water turbidityfrom all the filters was less than 1 NTU (Table 13.6).
Filters are backwashed once in 32 hrs with air scour (3-4 minutes) followedby water wash (5-6 minutes). The filters were in good condition and free from mud ballformation. The depth of sand in all the filters was found to be 70-75 cms with an E.S of0.68 mm and U.C of 1.40. The sludge from the claifiers and filter backwash waterare discharged into a Nullah which ultimately joins the river.
DisinfectionChlorine gas is used for disinfection. As the chlorinator was not in working
order, chlorine gas is fed into the filtered water channel leading to the clear waterreservoir. The dose is fixed by trial and error by testing for the residual chlorinein the clear water reservoir outlet. The chlorine gas was found leaking, resultingin the corrosion of filter appurtenances. The contact period provided is 30 minutes.The finished waterhad a residual chlorine of 1.0 mg/1 and was found free fromcoliforms.

287
Laboratory facilitiesA small laboratory headed by a qualified chemist has been provided at the plant
with necessary facilities and equipment like jar test machine, Aplab turbidimeter,microscope, chemical balance and necessary chemicals. None of the filter operators hadundergone any formal training. Record keeping with respect to plant operation wasmost unsatisfactory and no log books were maintained.
RECOMMENDATIONS
* The raw water flow recorder and integrator should be repaired and
reinstalled.
* The filter appurtenances such as rate setters, rate controllers, headlossgauges need to be repaired for effective operation and maintenance of thefilters.
* The practice of direct application of chlorine gas in uncontrolled mannerat the filtered water channel should be discontinued and measures betakenfor repairing the chlorinator.
* The use of Aplab Turbidimeter should be discontinued and a newone which works on Nephelometric principle may be procured. Laboratoryfacilities at the plant should be augmented with pH meter, turbidimeter,magnetic stirrer etc. for effective control of treatment processes.
* The chemist and other operating staff be trained for proper operation,maintenance and control of the plant
* Proper records for operation and maintenance of the plant should bemaintained.

FLASHMIXER
LIME ALUM
PUMPMGSTATION
PARSHALLFLUME
CHLORMfATION
CLEARWATER
RESERVOfft
RAPtO GRAVITY FILTERS
FIG 13.2 LALPUR WATER TREATMENT PLANT (SCHEMATIC) - JABALPUR

289
TABLE 13,4
PLANT SUMMARY DATA -JABALPUR
GENERAL
Name and location
Year of construction
Design capacity
O & M Agency
Raw water source
Treatment flowsheet
ENGINEERING
Raw water pumping
: Lalpur Water Treatment Plant, Jabalpur(M.P.)
: 1983
: 42 mid
: Public Health Engineering Department, Jabalpur
: River Narmada
: Conventional with rapid gravity filters
: Vertical turbine pumps 220 HPx4Nos,each4.5 mgd standby 2 nos.
•Rising main diameter
Raw water flow measurement
Pre-treatment
Coagulation
_ Chemicals used
-Type of mixing
- Detention time
Flocculation
- Method / Type of unit
- No. & size of unit(s)
- Detention time
: 600mm
: Parehall flume
: Lime, Alum
: Mechanical
: 30sec
: Mechanical(Clariflocculator)
: 2 Nos, each 13.0 m dia x 3.15 m SWD
: 30 minutes

290
Sedimentation
-Typeofunit(8)
-No.Asù»ofunh(g)
- Suif ace overflow rat«
- Detention time
Filtration
-Typeofunit(i)
- No. A size of unk(s)
-Rate of filtration
- Filter media
. Sand size
Depth of sand
. Of avel s&e A depth
- Backwash arrangements
.Method
. Washwater tank cap.
Disinfection
- Chemicals used
- Type of Coed
- Chlorinator Details
Gear Water Reservoir
- Type, No. & Capacity
- Pump details
: Circular
: 2 Nos, each 19.8S m x 3.13 m SWD
: 1.25 nVhr
: 2 hr 30 min.
: Rapid Sand Filtere
: 6 Nos (twin beds) each 7.73 m x 8.92 m(open to sky)
: 4.8
: B.S-16730 mesh(mni),U.C-1.1 to 1.3
: 0.68 m
: 57 x 37 mm - 75 mm37 x 12 mm-75 mm12 x 6 mm - 75 mm6 x 2.5mm -150 mm
: Ak scour and water wash
: 720 m'
: Chlorine gas
: Solution feed
: Pressure type
: Circular
: Vertical turbine pumps 220 HP x 6 Nos(3 aie standby)

TABLE U.5
PHYSICO-CHEMICAL AND BACTERIOLOGICAL QUALITY OPRAW AND FINISHED WATERS
LALPUR WATER TREATMENT PLANT . JABALPUR
PARAMETERS
Pfc7fk*-chcmkal
TmUdity(NTU)
PH
Total Alkalinity(CaCO,)
Conductivity fuS/cm)
Ha«dness(CaCO3)Total
Caftante
Non Caftante
Cafeitm (Ca)
Mafneaiwn(Mi)
Chlorides (Cl)
Iron (Fe)
Fluoride (F)
Nitrates (NOj)
BaicUiiaiagttai (MPN/lOOml)
Total colifotat
Haft
Fecal streptococci
AD values exen* DtLTmbkUtv
I VISIT
RAW
15
7.8
142
290
130
130
0
32
12
4
Tr
Z2
0.2
2
500
8
500
and Conductivity
FINISHED
1.0
7.5
125
290
130
125
5
32
12
6
15
0.3
0.2
2
0
0
0
ran expresse
RAW
15
8.4
105
160
86
86
0
23
7
3
1
0.3
0.2
1
500
27
170
HVISIT
FINISHED
1.0
7.5
91
165
86
86
0
23
7
6
7
Tr
0.2
2
0
0
0
datfoo/l Tr-Traces

292
TABLE L U
PLANT PERFORMANCE AT VARIOUS STAGES OF TREATMENT
LALPim WATER TREATMENT PLANT - JARALPUR
PARAMETERS VISIT RAW SETTLED FILTERED FINISHEDWATER WATER WATER WATER
y I IS 3.5 1.0 1.0
<NTU)0 IS 3.5 1.0 1.0
T.Cotiftm I 500 27 8(MPM/HXM)
n 500 80 23
B.CMI I 8 4 0 0
II 27 80 17 0

293
PHEROLE WATER WORKS - AURANGABAI)
INTRODUCTION
The city of Aurangabad receives its water supply from Pherole water workslocated at village Pherole, 18 Kin away from Aurangabad city. It serves a population ofabout 4 lakh persons. The plant with 27.6 mid capacity was commissioned in the year1976 and has been augmented in the year 1984 with a 28 mid conventional watertreatment plant. The total capacity of the plant is 55.6 mid. It receives raw water fromJayakwadi dam constructed across river Godavari. The treatment comprises aeration,pre-treatment with chemical coagulation followed by rapid sand filtration and post-chlorination. The schematic flow sheet is shown in Fig. 14.1 and the plant summary datais presented in Table 14.1. The plant is operated and maintained by MWSSB.
PLANT APPRAISAL
Raw water quality and flow measurementRaw water from Jayakwadi dam is pumped in two stages-first to a reservoir at
village Dhorkin and then to Pherole water treatment plant. No potential source ofpollution is observed near the intake which is provided with fixed screens to removefloating debris. Though adequate supply ofraw water is available all through the year,contrary to expectations, the turbidity in raw water during summer is higher than thatin winter. This is due to the shallow water depth and high wind velocities during summerresulting in the stirring up and suspension of bottom sediments near the intake. Algalgrowth was also observed in the impounded reservoir. Raw water quality was found tobe fairly good (Table 14.2). The flow indicator and recorder installed at the plant arein working condition.
Pre-treatmentRaw water was pre-chlorinated using bleaching powder. Proper dosing of alum
and bleaching powder was observed and floe formation in the flocculator wassatisfactory. However, the clarifier scraper bridge was not found in working conditionleading to problems in desludging.
FiltrationThe filters were operated and maintained well. The filter rate controller and
other appurtenances were all in good working condition. The filter performance wassatisfactory and the filtrate quality was meeting the standards prescribed by CPHEEO.The overall performance of the various units was satisfactory.

294
DisinfectionDisinfection of filtered water is achieved using chlorine gas. Though a
chlorination room has been provided, the chlorine cylinder was kept outside the roomin the open. Residual chlorine was found to be in the range of 1.6 to 2,0 mg/1 in thefinished water.
Laboratory facilitiesThe water works is provided with essential laboratory facilities which include
Aplab turbidimeter, chemical balance and residual chlorine comparator. Fortnightlywater samples are sent to the state Public Health Laboratory at Aurangabad forphysico-chemical and bacteriological analysis.
RECOMMENDATIONS
• The travelling bridge with sludge scraper arm should be put into workingcondition so as to facilitate effective desludging of the clarifier and ensureits good performance.
* Formal training of the plant operators would help enhance their skill levelleading to better performance of the plant.

ALU« «BLCACWN6POWDER
RAW —WATER
FLASH-MIXERC U M - «*»>">FLOCCULATOR GRAVITY
FILTERS
•D
CHLORINATION
CLEAR WATERRESERVOIR
TO SUffLY
FIO14,1PHAROLE TREATMENT PLANT (SCHEMAT1Q, AURANGABAD

296
TABLE 14.1
PLANT SUMMARY DATA • AURANGABAD
GENERAL
Name and location
Year of construction(Augmentation if any)
Design capacity
O & M Agency
Treatment flowsheet
ENGINEERING
Raw water pumping
Pherole Water Woiks, Aurangabad
1976,(Augmentation in 1982)
55.6 mid
Maharashtra Water Supply & Sewerage Board
Conventional with rapid gravity filters andprechlorination
: 4 Nos., Vertical turbine, 400 HP, of whichone is standby
- Rising main diameter
Raw water flow measurement
Pre-treatment
Aeration
Coagulation
-Chemical used
-Method of Mixing
- Detention time
Flocculation
: 700 mm
: Flow recorder provided.
: Cascade type
: Alum
: Mechanical
: 45 Sec
-Method /Type of units : Mechanical(clariflocculators)
-No. & size of units : 2 Nos., 12.8 m dia. each
- Detention time : 30 minutes

297
Sedimentation
-Typeof unit(s)
- No. and size of onit(s)
- Surface overflow rate
- Detention time
Filtration
-Typeofunit(s)
- No. & size of unit(s)
-Rate of filtration
Filter media
.Sand size
. Gravel size
Backwash arrangements
.Method
. Washwater tank cap.
Disinfection
- Chemicals used
-Type of feed
- Chlorinator Details
- Clear water Reservoir
- No. & capacity
- Pump details
: Circular clarifier»
: 2Nos,36mdiaeach and4.5mSWD
: 1.3m/hr
: 3hrs
: Rapid gravity filters
: 10Nos, n.25mx4meach
: 5m/hr
: E.S.-0.6mm,U.C.-1.5
: 4.5 - 7.5 mm
: Air scour + water wash
: 500m»
: Chlorine gas/bleaching powder
: Solution feed
: Pressure type
: 2 Nos of 1175 m3 capacity each
: 3 Pumps, Centrifugal type, 475 HP

298
TABLE 142
PHYSICO-CHEMICAL AND BACTERIOLOGICAL QUALITY OPRAW AND FINISHED WATERS
PHEROLE WATER WORKS - AURANGABAD
PARAMETERS
TuiHdity(NTU)
pH
Total Alkalinity(CaCO,)
Hardness (CaCO,)Total
Carbonate
Non Carbonate
Calcium (Ca)
Magnesium (Mg)
Chlorides (Cl)
Sulphate« (SO4)
Iron (Fe)
Nitrates (NO,)
RAW
6
8.5
no
126
110
16
24
16
72
9
0.3
Tr
BacterMtofkal (MPN/100 ML)
Totalcoliform
Fecal colifonn
Fecal streptococci
-
-
-
-
I VISIT
FINISHED
0.5
8.3
110
126
110
16
24
16
70
9
-
Tr
-
-
-
n
RAW
27
7.7
120
152
120
32
27
20
80
15
0.1
Tr
15000
390
• -
93
VISIT
FINISHED
0.8
7.8
120
152
120
32
27
20
80
25
-
Tr
0
0
-
0
RAW
27
7,8
130
140
130
10
20
22
60
22
0.5
Tr
240
93
9
9
mvisrr
FINISHED
0.7
7.6
130
140
130
10
20
22
60
37
-
Tr
0
0
0
0
AB values except pH and turbidity are expressed M mg/1Tr - Traces

299
TABLE 14J
PLANT PERFORMANCE AT VARIOUS STAGES OF TREATMENT
PHEROLE WATER WORKS - AURANGABAD
PARAMETERS VISIT RAW SETTLED FILTERED FINISHEDWATER WATER WATER WATER
TuMdity I 6 4 • 0.5(NTU)
H 25 16 - 0.8
m 27 7.5 - 0.7
T.Coüfonn I(MPN/100ML)
H 15000 2400 240
m 240 43 9
EJCûli I(MPN/100ML)
n
m

300
BAWDA WATER WORKS- KOLHAPUR
INTRODUCTION
The city of Kolhapur with a population of 3.4 lakhs (1981 census) draws itswater supply from the river Panchaganga. The river water is treated at Bawda waterworks, situated about 4 km away from the city. The plant with a design capacity of43 mid has been commissioned in the year 1978 and provides for pre-chlorination,followed by conventional treatment with rapid sand filtration and post-chlorination. Theschematic flow sheet is shown in Fig 14.2 and the plant summary data is presented inTable 14.4.
PLANT APPRAISAL
Raw water quality and now measurementThe raw water intake for the water works is located upstream of a weir across
the river constructed by the Irrigation Department. The intake well has been providedwith fixed screens at three different levels to prevent entry of floating matter.Considerable human activity by way of bathing and washing is observed near dieintake. The turbidity of raw water is reported to be very high during monsoon. Aturbidity of 1500NTU was observed during one of die visits. While the chemicalparameter« of raw water quality are within the limits prescribed by CPHEEO, thebacteriological analysis indicates high degree of pollution (Table 14.5 ).
The raw water flow indicator and recorder installed at the Parshall flume werenot in working condition.
PretreatmentAlum and bleaching powder are dosed at The flow measuring flume. The flash
mixer installed at the plant was not working. The mechanical fiocculators and thetravelling bridge with sludge scrapers were also non-functional.
FiltrationDeep cracks, surface undulation and mudball formation were observed in the
filters indicating ineffective backwashing and poor maintenance. Loss of head gaugesand rate controllers were out of order and the filters were backwashed once in 24 hrsas amatter of routine. The E.S. of sand was observed to be much larger than the reportedvalue indicating heavy coating of sand grains. The physico-chemical and bacteriologicalquality of filtrate was within the recommended limits of CPHEEO (Table 14.6).

301
DisinfectionChlorine gas was directly bubbled into the clear water channel resulting in
ineffective diffusion and corrosion of metal fixtures. A high residual chlorine wasobserved in the finished water. A new chlorination house with all safety measures isunder construction.
Laboratory FacilitiesThe plant laboratory is equipped with turbidimeter (Aplab), residual chlorine
test kit, weighing balance, glassware and reagents. While Jar test apparatus, pH meteretc. are not available. No chemist is posted at the plant and the water samples are sentto the state Public Health laboratory for analysis.
RECOMMENDATIONS
*The pollution of raw water due to human activities near the intake shouldbe prevented/controlled
• Flow measuring devices, mechanical sludge scrapers of the clarifiera, loss ofhead gauges in the filters need to be repaired and kept in working condition
• Backwashing of the filters needs substantial improvement in order to avoidmud ball formation and filter cracks.
* Additional laboratory facilities should be provided and competent staffposted for effective monitoring and control of unit operations
* Formal training should be arranged for die plant staff to ensure betteroperation and maintenance of the plant.

ALUM 4- »LEACHING —,po woe«
RAW _WATER
CLARt-FLOCCULATOR
RAPIDGRAVITYFILTERS
PUMPING
CHIORI NATION
CLEAR WATERRESERVOIR
TO SUPPLY
KG 14.2 BAWDA WATER TREATMENT PLANT (SCHEMATIC), KOLHAPUR

303
TABLE 14.4
PLANT SUMMARY DATA - KOLHAPUR
GENERAL
Name & Location
Year of construction
Design Capacity
O & M Agency
Raw water source
Treatment flow sheet
ENGINEERING
Raw water Pumping
- Rising main Diameter
Raw water flow measurement
Pre-treatment
Aeration
Coagulation
- Chemicals used
-Type of mixing
- Method of mixing
Flocculation
- Method /type of unit
- No. & size of unit(s)
- Detention time
Bawda water works, Kolhapur.
1978
43 mid.
Maharashtra Water Supply and Sewerage Board
River Panchaganga
Pre-chlorination and Conventional treatmentwith rapid gravity filters
3 Nos., Vertical turbine, 250 HP, 10.8 lakh tphcapacity of which one is a standby
750mm
ParsnaU flume
Cascade type
Alum, bleaching powder
Mechanical
Flash mixer, 3 m dia.
Mechanical(clariflocculator)
2 Nos., 11.52 m dia. each
30 minutes

304
Sedimentation
-Type of unit
• No. ft size of units
- Surface overflow rate
» Detention time
Filtration
-Typeofunit(s)
- No. & size of unit(s)
-Rateof filtration
Filter media details
.Sand size
.Depth of sand
. Gravel size (mm)
. Depth of each layer(cm)
- Backwash arrangements
Method
. Washwater tank cap.
Disinfection
- Chemicals used
-Type of feed
- Chiorinator Details
- Contact period
dear Water reservoir
- Type, & capacity
-Clear Water Pumping
: Circular clarifier
: 2Nos.,32.92mdia.each
: 1.22 m/hr
: 2 hrs 30 min.
: Rapid gravity filters
: 4 Nos.; 94 m2 area each
: 5 m/hr
: E.S. - 0.55 to 0.6 mm U.C. -1.55
: 64cm
: 38-50,13-38,6-13,3-6
: 7.6,7.6,10,10
: Air scour + water wash
: 227 m3
: Chlorine gas
: Solution feed
: 3 No., Vacuum type
: 1 hour
: Maaonary of 2500 m3
: 2 Pumps., Centrirugal325 H.P.

305
TABLE 14.5
PHYSICO-CHEMICAL AND BACTERIOLOGICAL QUALITY OFRAW AND FINISHED WATERS
BAWD A WATER WORKS PLANT - KOLHAPUR
PARAMETERS
Ptysko-dieaücal
TmM<fity(NTU)
pH
T**fl< Altnlinity
(CaCOs)
Haidnen(CaCO,)Total
Caibonate
NoaCaibonate
Calcium (Ca)
Map«à»i(Mg)
Chlorides (Cl)
Sulphate* (SO4)
boo (Pe)
Nitrates (NO,)
ivisrr
RAW
12
8.2
40
52
40
12
11
6
2$
Tr
0.2
LI
Bacteriological (MPN/100 ML)
Total cotilonn
Fecal colifonn
Fecal streptococci
46000
460
•
28
FINISHED
1
8.0
38
52
38
14
11
6
28
Tr
-
-
NU
NU
- •
NU
n visrr
RAW j
30
7.4
30
50
30
20
17
2
16
10
0.5
1.4
46000
93
23
28
FINISHED
5
7.7
30
50
30
20
17
2
16
6
-
-
NU
NU
NU
NU
ffl VISIT
RAW FINISHED
1500
7 «
28
50
28
22
14
3
26
2
0.7
4.4
1.1x10⁶
150
11
93
7.5
7.1
28
50
28
22
14
3
26
2
- '.
-
NU
NU
NU
NU
AM vaines except pH and tuibidity aie.expwaaeâ M mgA

306
TABLE 14.4
PLANT PERFORMANCE AT VARIOUS STAGES OF TREATMENT
BAWDA WATB* WORKS PLANT • KOLHAPUR
PARAMETERS VISIT RAW SETTLED FILTERED FINISHEDWATER WATER WATER WATER
Turbidity
(NTU)
n
m
12
30
1500
20
60
1
5
7.5
T.CoUfwm(MPN/100ML)
I
n
m
46000
46000
ISO
ISO
NU
21
1.U106 93
NU
NU
NU
(MPN/100ML)I
n
m
23
11
NU
NU
NU
NU
NU
NU

307
KANHAN WATKR WORKS - NAGPUR
INTRODUCTION
Nagpurcity, with an estimated (1986) population of IS lakhs draws its watersupply from three major sources viz. Pench canal (113.5 mid), river Kanhan(127mld)and Gorewada lake (13.5 mid). In addition, Wunna water works, receiving raw waterfrom Wunna irrigation canal supplies about 32 mid of treated water to the defenceestablishments and nearby villages.
The water works at Kanhan operated and maintained by the NagpurMunicipal Corporation has been selected for evaluation. The conventional treatmentplant commissioned in the year 1942 was subsequently augmented to meet theincreasing water needs of the city. The waterworks consists of two streams: (i)theold plant with a design capacity of 59 mid and (ii) the new plant with a design capacityof 68 mid. The new plant was evaluated for its performance. The schematic flow sheetis shown in Fig. 14.3 and the plant summary data is given in Table 14.7.
PLANT APPRAISAL
Raw water quality and flow measurementAdequate flow in the river is available to meet the needs throughout the year.
However, in recent years the flow regime in summer gets shifted away from the intakewells. Temporary bunds of sand bags are erected every year to divert the flow to theintake wells. The river upstream is polluted occasionally due to disposal of fly ash fromKoradi thermal power plant causing problems in treatment-high coagulant dose, shortfilter runs, coating of sand grains by oily substances etc.
For major part of the year, the physico-chemical quality of raw water is fairlyuniform with a turbidity of less than 25 NTU (Table 14.8). During monsoon, theturbidity of river water goes very high (upto 1200 NTU) and considerable amount ofsand and silt is drawn into the intake well causing problems in raw water pumping.During peak monsoon, heavy silt load from raw water is carried right upto theclarifier«, rendering the sludge scraper mechanism inoperative.
The raw water flow indicator provided near the aerator was not functioningand the rectangular flow measuring weir was in damaged condition. Actual flowmeasurements (by lowering the water level in the clariflocculator and noting thetime taken to refill) indicated that the plant was underloaded to the extent of 37 to 52par cent.

308
Pre-treatmentFilter alum is used as the coagulant. The mixing paddles in the alum solutionising
tanks and the flash mixer were not functioning. During rainy season, alum slabs wereadded at the aerator to supplement the alum dose.
During one of the visits the actual alum dose applied to the raw water with aturbidity of 22 NTU was found to be 36 mg/1 as against the reported value of SS mg/l.The jar test dose to obtain a residual turbidity of less than 5 NTU, was found to be 20 mg/1, while the dose applied was much higher.
As the plant was underloaded, the detention time in the clarifier was muchhigher (6 hr 20 min to 8 hr) as against the design value of 3 hr. The SOR was in rangeof0.56 -0.71 m/hr as compared to the design value of l.Om/hr.The travelling bridgewith sludge scraper mechanism was found working in only one of the two clarifloccu -lators. The turbidity of settled water, however, was within the limits recommendedby CPHEEO (Table 14.9).
FiltrationThe filters were underloaded and the rate of filtration was 2.88 to 3.64 m/
hr as against the design rate of 6.4 m/hr .The filter appurtenances such as rate controllers,rate of flow indicators and head loss gauges of all the filters were not in workingcondition. The sand used in the filters had an E.Sof0.7 mm and U.C of 1.3.
The filters were backwashed once in 24 hrs irrespective of the head lossor filtrate turbidity. The filters were maintained clean and no cracks or undulations wereobserved on the sand bed and the turbidity of finished water was within the limitsprescribed by CPHEEO (Table 14.9)
DisinfectionDuring one of the visits the gas chlorinators were in operation; however, during
the next visit, the chlorinators were under repair and direct feeding of chlorine gas waspractised. The finished water had a residual chlorine of 1.2 mg/l and was free fromcoliforms.
Laboratory facilitiesA well equipped laboratory ha» been provided at me plant for complete physico-
chemical and bacteriological analysis. Turbidity and residual chlorine measurements aredone regularly. A qualified chemist with supporting staff has been posted at thelaboratory.

309
RECOMMENDATIONS
* Necessary steps should be taken to prevent occuience of pollution due to flyash disposal from the thermal power plant upstream.
* Optimum alum dose as determined by jar test should be applied for effectivecoagulation, flocculation. The practice of dumping of alum slabs in raw waterchannel should be dispensed with.
* All mechanical gadgets in clariflocculators and filters should begotrepaired and kept in good working condition for effective plant operation andcontrol.
* The plant operators should be deputed for formal training courses to updatetheir knowledge and skills. This will help improve the overall functioningof the plant.

PUMP
HOUSE SETTLING TANKS42 Not.
HOT TO SCÄ.E
FLASH MIXER
/riLI
ALUM TANKS
NLTKRS
SLUDU
" *ULA RI
FLOCCULATOR
AERATOR
WELLCLARI>LOCCULATOR
FIO 14.3 LAYOUT PLAN OF KANHAN WATER WORKS. NAGPUR

311
TABLE 14.7
PLANT SUMMARY DATA - NAGPUR
GENERAL
Name and location
Year of construction(Augmentation if any)
Design capacity
O AM Agency
Raw water source
Treatment flowsheet
ENGINEERING
Raw water pumping
-Rising main diameter
Raw water How measurement
Coagulation
-Type of mixing
-Method of mixing
FtoccuUtion
- Method /Type of unit
-No. ft Size
Kanhan Water Works, Nagpur Maharashtra
1965 (Augmented in 1971)
68.2 mid
Municipal Cofporation of Nagpur
River Kanhan
Conventional wkh rapid sand filters
3 Pumps of Horizontal Centrifugal,1 pump of Vertical Centrifugal,of which 2 are standby
690 mm
A Rectangular weir A Mahindra ElectroftowFloat operated indicator
: Cascade aerator of 3.0 m dia
: Alum solution
; Mechanical
: Rash mixer of 4.5 m dia with detention timeof 2 minutes ft 25 tpm speed.
: Mechaaical(Oariflocculator)
: 2 Nos. (i) 13.4 m dia x 4.5 m SWD(ii)16.8mdiax4.5i»SWD
- Detention time 34 minutes

312
Sedimentation
-Typeofunit(s)
- No. A size of unit(s)
- Surface overflow rate
- Detention time
Filtration
Typeofunit(s)
- No. A size of unit(s)
-Rate of filtration
-Filter media
. Sand size A depth
. Gravel size (mm)
. Depth of each layer
- Backwash arrangement
.Method
. Washwater tank cap.
Disinfection
-Chemicals used
-Type of feed
• Chlorinator Details
- Contact period
Clear Water Reservoir
-Type,No. & Capacity
: Circular clarifiers
: 2Nos.(i)33.5mdiax4.5mSWD(ii)47.2mdiax4.5mSWD
: 1 m/hr
: 3hr
: Rapid gravity
: 6 Nos.(twin bed) 9.7 m x 7.6 m each
: 6.4 m/hr
: E.S - 0.7 mm, U.C. - 1.3, 60 cm depth
: 50-37,37-12,12-6,6-2.5
: 10,10,10,15 (cm)
: Air scour + water wash
:1818 m3
: Chlorine sas A Bl.nowder in emersencv
: Solution feed
: Two Nos. Vacuum A Pressure type
: 30 minutes
: Cement concrete, 3 Nos, 2 of 567 ms cap«and lo f 1816 m3 capacity

313
TABLE 148
PHYSICO-CHEMICAL AND BACTERIOLOGICAL QUALITY OPRAW AND FINISHED WATERS
KANHAN WATER WORKS -NAGFUR
PARAMETERS
Phygk»-cta«ûcal
Turtw*ty<NTU)
pH
Tout Alkalinity(CCO,)
Conductivity iiuS/cm)
Haidness(CaCO,)Total
Carbonate
Non Carbonate
Calcium (Ca)
Magnésium (Mg)
Chlorides (a>
Sulphates (SO4)
bon (Fe)
Fluoride (F)
Nitrates (NO,)
i VISIT
RAW
17.0
8.4
163
400
140
148
0
39
12
17
13
0.2
0.4
Tr
BMtarMogkal (MPN/100 ML)
Total colifonn
&£oJi
Fecal streptococci
9
4
21
FINISHED
0.S
8.3
158
152
152
0
38
14
33
20
ND
0.7
Tr
0
0
0
RAW
22
8.4
164
520
153
153
0
37
15
35
24
1.9
0.8
Tr
240
80
50
nvisrr
FINISHED
1.0
7.8
152
600
152
152
0
36
51
41
ND
11
Tr
0
0
0
mvisrr
RAW FINISHED
210
84«
189
640
158
158
0
39
IS
38
15
0.2
0.8
Tr
540
170
170
0.9
7.9
176
700
154
154
0
38
14
44
38
ND
0.6
Tf
0
0
0

314
TABLE 149
PLANT PERFORMANCE AT VARIOUS STAGES OF TREATMENT
KANHAN WATER WORKS - NAGFUR
PARAMETERS
Tnifaidity(NTÜ)
T.CoUfotm(MPN/100ML)
(MPN/100ML)
VISIT
I
nm
I
n
m
i
nm
RAWWATER
17
22
210
9
240
540
4
80
170
SETTLEDWATER
8
10
12•
27
350
4
240
FILTEREDWATER
0.6
1.1
10
30
70
49
17
23
33
FINISHEDWATER
0.5
1.0
0.9
0
0
0
0
0
0

315
CANTONMENT WATER WORKS - PUNE
INTRODUCTION
The Cantonment water woiks Pune is a very old plant constructed in 1885 withslow sand filters. Subsequently, it was augmented by replacing slow sand filters withrapid gravity filter plants to the present capacity of 101 mid meeting the needs of about5 lakh people. The source of raw water is the Right Bank canal fed from Khadakwasaladam constructed across the Mutha river. The plant provides for conventional treatmentwith rapid gravity filters. The treatment flow sheet is shown in Fig. 14.4 and plantsummary data is presented in Table 14.10. The plant is maintained by MWSSB.
PLANT APPRAISAL
Raw water quality and flow measurementDue to natural impoundment at Khadakwasala dam and regular maintenance
of the canal by the Irrigation Department, the raw water has a low turbidity. Duringmonsoon visit a turbidity of 70 NTU was recorded. Adequate supply of raw water isavailable throughout the year to meet the needs. However, the canal water is subjectedto pollution due to public use. The screens provided at the canal intake are damageddue to corrosion. The raw water flow recorder was found to be in working order, thoughits reliability was in doubt. The physico-chemical quality of raw water is fairly good(Table 14.11).
Pre-treatmentFacilities for controlled dosing and mixing of chemicals were found
inadequate. Also the strength of alum solution was found to vary considerably. The alumdosed raw water was flowing through rectangular settling tanks without proper floccu-lation. The flow division between the tanks was also not equal. Reduction in turbiditydue to sedimentation wasnot significant (Table 14.12). In the absence of mechanicalsludge scraper arrangement the rectangular settling tanks were desludged once a yearafter emptying the tanks.
FiltrationA few of the rapid sand filters have been converted into dual media (sand-
coconut shell) and declining rate filters. The filter appurtenances such as the rate of flowcontrollers, headloss gauges etc. were not in working condition. Undulations andcracks were observed in the filter beds indicating poor operation and maintenance andinadequate backwashing. The turbidity of filtered/ finished water was not meeting thestandards prescribed by CPHEEO.

316
DisinfectionFiltered water is disinfected using chlorine gas/bleaching powder. There is
no provision for separate chlorination room. The product water was free fromcolifonns indicating that chlorination was effective.
Laboratory Facilities
The Public Health Laboratory of the state Government is located in the samecampus. Water samples aie sent to this laboratory for physico-chemical and bacterio-logical analysis. At the plant site, only residual chlorine and turbidity are tested. APaterson type turbidimeter is used to measure turbidity.
RECOMMENDATIONS
* Alum dosing and flocculation equipment should be procured and installedfor controlled chemical addition and effective flocculation.
* The optimum alum dose should be decided based on regular jar tests.
* The loss of head guages and rate of flow indicators should begotrepairedto facilitate filter operation and control.
* Improvement in filter backwashing is necessary to avoid formation of mudballs, development of cracks, undulations etc. in the filter bed.
* The staff engaged m operatic« shttild be iinpartedfc^nuütt^performance of the plant.
* A separate chlorination room with adequate safety arrangements shouldbe provided.

•>. . ] >
ALUM ftBLEACHING POWOCR
RAW —WATER
PUMPINO
SEDIMENTATION TANKSFILTER
CHLORINATION
CLEAN WATER RESERVOIR
TO
FIG 14.4 CANTONMENT WATER TREATMENT (SCHEMATIC), PUNE

TABLE 14.10
PLANT SUMMARY DATA - PUNE
31»
GENERAL
Name & Location
Year of construction
Design Capacity
O & M Agency
Raw water source
Treatment flowsheet
ENGINEERING
Cantonment water works, Pune
1885 (Augmented in 1915,1930,1961,1978 & 1984)
101 mid.
Maharashtra Water Supply andSewerage Board
Khadakwasala Dam (Right bank canal)
Pre-chlorination and conventional treatmentwith rapid gravity filters
Raw water pumping
- Rising main Diameter
Raw water flow measurement
Pre-treatment
Coagulation
- Chemicals used
-Method of mixing
Sedimentation
-Type of Unit
- No. & size of units
-Detention time
: 4 Nos.l standby
: 750 mm
: Encon systems ultrasonic flowith indicator
: AlunUkne, bleaching powder
: Hydraulic
: Rectangular
: 5 No«
: 4hrs30mins.

319
Filtration
-Typeofunit(s)
- No. A size of filters
- Rate of filtration
- Filter media details
.Sand size
.Depth of sand
. Gravel Size & depth
.Method of backwash
. Washwater tank cap.
Disinfection
- Chemicals used
- Chlorination details
dear Water reservoir
: Rapid gravity filters
: 23 Nos.,i ) 9 m x 6 m -4bedsii) 6 m x 2.4 m-10 bedsi i i )9mx6m -9 beds
: 4.3m/hx (AV)
: E.S.- 0.5 mm, U.C.-1.5
: 50-60 cm
: 2 mm to 5 mm -7.5 cm5 mm to 10 mm - 7.5 cm15 mm to 25 mm - 7.5 cmabove 25 mm-15 cm Backwash arrangements
: Air scour -»• Water wash
: 2.5 lakh litres* 11.3 lakh litres
: Chlorine gas/Bleaching powder
: 3 Nos., Vacuum type
-No.,Type & Capacity : 2Nos.,Stonemasonaryof6400M3

320
TABLE 14.11
PHYSICO-CHEMICAL AND BACTERIOLOGICAL QUALITY OFRAW AND FINISHED WATERS
CANTONMENT WATER WORKS - PUNE
PARAMETERS
PhystaHcbmiksl
Turbidity<NTU)
pH
Total Alkalinity(CaCO,)
Hardness CaCO,Total
Carbonate
Non Catoooate
Calcium (Ca)
Magnésium (Mg)
Chloride» (Q)
Sulphates (SO4)
Iron (Fe)
Nitrates (NO,)
ivisrr
RAW FINISHED
Z5
7.6
38
32
32
0
10
1.5
ft
Tr
0.3
Tr
Bacteriological (MPN/100 ML)
Total coiifocm
Mm-
4.6x10⁶
NU
1.2
7.8
38
30
30
0
10
1
16
Tr
-
-
Nil
NU
All values except pHaod turbidity are expntMdaan
Tr-Traoet
nvisrr
RAW
6.0
7.3
32
32
32
0
8
3
22
Tr
0.2
Tr
2400
NU
ISA
FINISHED
3.5
6.8
28
32
28
4
8
3
22
Tr
-
-
NU
NU
mvisrr
RAW FINISHED
70.0
7.6
40
42
40
2
9
5
20
8
0.4
Tr
7.2x10⁶
-
4.6
7.2
40
45
40
5
9
6
20
10
-
-
NU
-

321
TABLE 14.12
PLANT PERFORMANCE AT VARIOUS STAGES OF TREATMENT
CANTONMENT WATER WORKS-PUNE
PARAMETERS VISIT RAW SETTLED FILTERED FINISHEDWATER WATER WATER WATER
Turbidity(NTÜ)
T.Colifonn(MPN/100ML)
(MPN/100ML)
I
n
m
I
nm
i
nm
2.5
6.0
70.0
4.6x10*
2400
7.2x10*
Nil
NU
Nil
1.5
5.0
38
U .
930
240
NU
NU
NU
NU
460
NU
NU
NU
1.2
3.5
4.6
NU
NU
NU
NU
NU
NU

322
NINGTHEMPUKHRI WATER WORKS - IMPHAL
INTRODUCTION
Itnphal, the capital city of Manipur with a population of 30,000 (1981 census)draws its water supply from Imphal river. There are three water treatment plants meetingthe water supply needs of the city, viz. (i) Ningthempukhri water works (4.5 mid), (ii)Kanchup water works (14.5 mid) and Singda water works (18.2 mid). The Ningthem-pukhri water works commissioned in the year 1982 was selected for evaluation study.The treatment plant provides for pre-settling, aeration, chemical dosing, flashmixing, flocculation,sedirnemation, rapid gravity filtration and disinfection. The plantlayout is shown in Fig. 15.1 and summary data is presented in Table 15.1.
PLANT APPRAISAL
Raw water qualityImphal river, the source of raw water passes through the city and receives
sullage, sewage and other run-off throughout the year. Raw water from the river ispumped intermittently (10-12 hrs) from an intake well to a large kuchha settling tanklocated in a crowded locality. The settling tank is not fenced and protected and is usedfor bathing, washing of clothes and cattle. Raw water is highly polluted as observed fromthe high coliform count of 4300-13000 per 100 ml. Turbidity of raw water was in therange of 17-95 NTU during study period (Table 15.2).
Pre-treatmentAs the alkalinity of raw water » low (30-40 mg/1), alum along with lime is used
for coagulation. I>ietoriort~functioning of dosing equipnient and regulating valve, alumslabs aie dumped into the raw water channel leading to flash mixer. The actual alumdose w«g found to be 13 mg/1 as agianst die reported dose of 50 mg/1.
Dtoe to incorrect dosing of <XN»$i)att cheniicaU, floe fomiation was notsatutfactory. The turbidity of $eal«dw«ter was in the rangeof 12-60 NTU. The sludgescraper mechanism of the clarifier was «ot working. As there ate only 3 filter units,when one of them is taken out for backwashing, due to absence of flow regulation tothe plant, the clarifier is[flooded resulting the overflow and wastage of water.
Filtration ' . . ' / , < '. ., : ' ' /; 'The condition of filters and their maintenance was far from satisfactory. The
sand depth in the filters was found to bo »»he range of 38-46 cm and at some places,there wai hardly any sand. Tbeheadloipaod filter rate indicators were not in workingcondition. The air compressortoakicimrwjtfoutof order. Heavy mud baUforrnation

323
and cracks were observed in the filters continuing inadequate backwashing andI>oor maintenance. Frequency of filter backwashing was reported to be 12 hours. Theperformance of the filters was not satisfactory and the filtrate turbidity was in the rangeof 7.2-40 NTU (Table 15.3).
DisinfectionBleaching powder was used for chorination of filtered water. Chlorine dose was
reported to be 3 mg/l. The finished water had a residual chlorine of more than 1.0 mg/1 and was free from coliforms.
Laboratory facilitiesNo laboratory facilities are available at the plant site.
RECOMMENDATIONS
* The kuccha settling tank should be fenced andprotected from the humanactivities to prevent pollution of raw water.
* The clarifier sludge scraper mechanism should be repaired and broughtinto use for proper operation of the clarifier.
* Therapidgravityfiltersneedtobeoverhauled with proper depth and gradingof sand and gravel.
* The filter appurtenances need to be repaired/replaced to facilitate properoperation and control.

* ' • '
AERATOR
RIVER IMPHAL
M I X E R
CtARIFLOCCULATOR
RAPIO S A W FILTERS
CHLORINATXW
(NOT TO SCALE)
CLEAR WATER RESERVOIR
HO 15.1 LAYOUT R A N OF IMPHAL WATBR TREATMENT PLANT, MAN [PUR

325
TABLE 15.1
PLANT SUMMARY DATA - IMPHAL
GENERAL
Name and location
Year of construction
Design capacity
O & M Agency
Raw water source
Treatment flowsheet
ENGINEERING
Raw water pumping
»Rising main diameter
Raw water flow measurement
Pre-treatment
Aeration
Coagulation
- Chemicals used
-Type of mixing
- Detention time
Ftocculation
- Method / Type of unit
- No. & Dimensions
- Detention time
Ningthempukhri Water Works, Imphal
1982
4.5 mid
Public Health Engineering Department, Imphal
River Imphal
Conventional with Rapid Sand
Filters (with presettling)
: Two nos, (one standby), vertical turbine,
50HPeach
: 300 mm
: Float type, capacity 400 m'/hr
: Cascade type aerator
: Lime & Alum
: Flash Mixer,
: 45 sec
: Mechanical(Clariflocculator)
: One, 6.5 m dia, 3.5 m SWD
: 30 minutes

326
Sedimentation
-Typeofunit(s)
- No. & size of unit(s)
- Surface overflow rate
- Detention time
Filtration
-Typeofunit(s)
• No. & size of unit(s)
-Rate of filtration
-Filter media
. Sand size
.Depth of sand
. Gravel size
. Depth of each layer
- Backwash arrangements
, Method
. Wash water tank cap.
Disinfection
- Chemicals used
-Type of feed
Qear Water Reservoir
- Type, No. & Capacity
-Pump details
: Mechaiücal(Clariflocculator)
: One', 16.5 m dia. and3.5mSWD
: 1.05 m/hr
: 3hrs
: Rapid sand filters
: 3 nos, each 4.2 x 5.2 m
: 4.1 m/hr
: E.S.-0.5mm,U.C.-1.3
: 80 cm
: 5 to 10 mm
; 10 cm
: Air scour & Water wash
: 82.8 m3
: Bleaching powder
: Solution feed by manual mixing
: RCC, one, 1270 m'
: 2 nos, centrifugal pumps 50 HP each

327
TABLE 15.2
PHYSICO-CHEMICAL AND BACTERIOLOGICAL QUALITY OPRAW AND FINISHED WATERS
NINGTHEMPUKHRI WATER TREATMENT PLANT - IMPHAL
PARAMETERS
Phyrico-dienücal
Turbidity (NTÜ)
PH
Total Alkalinity(CaCO,)
Conductivity OuS/cm)
Hardness (CaCO3)Total
Caibooate
Non Carbonate
Calcium (Ca)
Magnesium (Mg)
Chlorides (Q)
Sulphates (SO4)
Iron (Fe)
Fluoride (F)
Nitrate (NO3)
ivisrr nvisrr
RAW FINISHED RAW FINISHED
47
7.0
30
122
30
30
0
12
7
8
12
2.8
ND
0.3
Bacteriological (MPN/lOOml)
Total colifonn
Fecal cotifomi
Exoli
Fecal streptococci
All values except pH ,T«
13000
3300
3300
4600
ubiety and Oofkhi
7.2
7.0
24
133
38
24
14
15
9
8
18
0.7
ND
0.3
0
0
0
0
ctivityarec
95
8.5
38
145
80
38
42
12
12
4
-
11
.
0.8
9200
9200
9200
45
messed as
-
7.0
37
145
80
37
43
12
12
4
-
0.3
-
0.7
-
-
-
-
invisrr
RAW FINISHED
17
7.5
44
129
52
44
8
14
4
4
13
0.4
0.1
0.3
4300
4300
2300
2100
9
7.5
42
143
50
42
8
11
5
5
19
0.2
0.1
0.2
0
0
0
0
ND-Not detectable

328
TABLE 15 J
PLANT PERFORMANCE AT VARIOUS STAGES OF TREATMENT
NINGTHEMPUKHRI WATER TREATMENT PLANT - ÏMPHAL
PARAMEIERS VISIT RAW SETTLED FILTERED FINISHEDWATER WATER WATER WATER
Tuibidity(NTU)
T.Colifotm(MPN/100ml)
(MPN/100ml>
I
nin
I
nm
i
n
m
47
95
17
13000
9200
4300
3300
9200
2300
70
60
12
1300
130
93
490
45
20
7.2
40
49
49
33
11

329
DAKHINPUR WATER WORKS - BERHAMPUR
INTRODUCTION
Piped water supply to Berhampur, a major coastal town of southern Orissa wascommissioned in the year 1905 for a population of 30,000 with an impounded reservoiratDakhinpur as the source of raw water. The treatment plant comprised slow sand filters(6 Nos.) with a design capacity of 2.7 mid. Subsequently,the water supply to the townwas augmented to a total of 6.8 mid in the year 1967 by constructing another reservoirand by providing additional (4 nos) slow sand filters each of 0.45 mid capacity and arapid gravity filter of 2.27 mid capacity. The plant layout is shown in Fig. 16.1 and theplant summary data is presented in Table 16.1.
PLANT APPRAISAL
SourceThe raw water storage reservoirs are fed by the tenth Rishikuly a distributory canal
which flows through a distance about 112 km. Visual observation during the visitshowed that the raw water turbidity in reservoir No. 1 was apparently much higherthan that in reservoir No .2. In spite of this, the capacity of reservoir No.2 could notbe fully utilised due to the presence of a hump in the western side of the reservoir.
Raw water from Dakhinpur reservoir flows through a 600 mm dia. gravity mainto the treatment plant located closeby. While there is no pre-treatment for slow sandfilters the rapid gravity filters are preceded by chemical pre-treatment with flocculationin baffled channel followed by sedimentation. Alum slabs were dumped into the baffledmixing channel with the result there was no proper control on the dose. The settlingtanks were not operated and desludged properly and were practically in disuse.
Slow Sand Filters
There is no provision to measure/regulate the plant inflow. Out of ten slowsand filters 2 were out of commission for renovation. The depth of sand was as littleas 15-20 cm in the remaining filters. The sand in the filters had an E.S of 0.35 mmand U.C of 2.3. There was no significant reduction in turbidity after filtration (Table16.2). All valves and rate control devices were found badly corroded and in disuse.Loss of head gauges and rate indicator devices have not been provided in any of thefilters. No specific criteria were followed for filter cleaning. The overall operationand maintenance of slow sand filters was most unsatisfactory.

330
Rapid Sand FilterThe rapid gravity filter, designed and constructed departmentally, had many
deficiencies. The minimum appurtenances such as rate of flow controller, rate indicatorand loss ofhead gauges and valves required for proper operation and maintenance havenot been provided. The filter maintenance was far from satisfactory. There was verylittle sand in the filter and the gravel layers were exposed. The filtered water turbidity(17 NTU) was more than the raw water turbidity (10 NTU) (Table 16.3).
DisinfectionPost-chlorination using bleaching powder solution was ineffective as confirmed
from the poor bacteriological quality of finished water.
laboratory FacilitiesThere were no laboratory facilities at water works, neither the operators had
undergone any formal training in plant operation.
RECOMMENDATIONS
* The point of abstraction of raw water should be shifted to the farthestwestern side of reservoir No. 2 so as to minimise the suspended solids andturbidity content of raw water entering the treatment plant.
* In order to enable maximum use of raw water stored in the reservoirs asuitable opening connecting the two reservoirs be provided
* The raw water reservoir (No.l) should be desiltedto increase the storagecapacity and to improve the quality of raw water.
* The present practice of pre-chlorination at the source by uncontrolledaddition of bleaching powder needs to be discontinued. If raw water qualitywarrants pre-chlorination, the same should be done at the treatment plant
* Provision should be made for measuring the raw water inflow to the plantand its regulation.
* Proper control on alum dosing and operation of settling tanks should beensured for effective pre-treatment.

Vf
331
* All the slow sand fflteis and rapid sand filtersneed to be overhauled withproper depth of sand and gravel and provided with necessary regulating valvesand appurtenances.
* Minimum laboratory facilities such as a residual chlorine kit and turbiditymeter should be provided at the plant site for effective operation and control ofthe plant.
* The plant staff must be imparted formal training in routine operation andmaintenance of the plant and record keeping.

RESERVOIR N0.2 RESERVOIR NO. I
1
BAFFLEDCHANNEL
SETTUNG TANKSU N O S J
CLEARWATER
STORAGE
±RAPID SANE
FILTER(I NO.)
CHLORMATON
1 _
1
t6
12
t7
13
\
f8
4
t4
3
1
10
t NOT TO SCALE)SLOW SAND FILTERS
HO 16.1 LAYOUT PLAN OF DAKHINPUR WATER WORKS - BERHAMPUR

333
TABLE 16.1
PLANT SUMMARY DATA - BERHAMPUR
GENERAL
Name and location
Year of construction(Augmentation if any)
Design capacity
O & M Agency
Raw water source
Treatment flowsheet
ENGINEERING
Raw water pumping
-Rising main diameter
Pre-treatment
Coagulation
- Chemicals used
• Method of mixing
Sedimentation
-Typeofunit<s)
- No. & size of unit(s)
Dakhinpur Water Works Berhampur (Orissa)
1905 and 1967(Angmentation)
6.8 mid
Public Health Engineering Department,Berhampur
Reservoir
Conventional with Slow Sandand Rapid Sand Filters
By gravity system
600 mm
Alum
Hydraulic (baffled channel)
: Rectangular, Horizontal flow
: 2 Nos, 7.8 m x 3.6 m

334
Filtration
-Typeofunit(s)
- No. & size of unit(s)
-Rate of filtration
- Backwash arrangements
.Method
Disinfection
- Chemicals used
-Type of feed
Clear Water Reservoir
-Capacity
- Pump details
: S S F
: Water wash
RGF(open to sky)
: 10 Nos.,each 1 No., 16.5 m x 16.5 m4.65m x 4.3 m
: 0.07 m/hr
: Bleaching powder
: Solution feed
: 250m»
; 50 HP x 2 Nos.

335
TABLE U.2
PHYSICO- CHEMICAL AND BACTERIOLOGICAL QUALITY OFRAW AND FINISHED WATERS
DAKHINPUR WATER WORKS • BERHAMPUR
PARAMETERS
TuiHdity<NTU)
pH
Total Alkalinity(CaCO,)
Conductivity fciS/an)
Haiäness(CaCO,)Total
Caibonate
NonCaibonate
Calcium (Ca)
Magnesium (Mg)
Chlorides (Cl)
Sulnhalw(SO4)
boo (Be)
Fbwcide (F)
Nitrates (NO,)
Bacteriological (MPN/100 ML)
Total cotifonn
TViTll ^wtntiww^ffi
RAW
10
7.9
84
175
76
76
0
18
7
7
1
0.3
0.2
0.3
13
4
0
FINISHED(RGF)
17
8.1
86
172
68
68
0
20
5
7
3
1.1
0.2
N.D.
2
0
2
FINISHED(SSF)
8.5
8.1
86
175
64
64
0
17
5
7
1
0.3
0.2
0.9
23
2
23
NX>.-Not detectable

336
TABLE 1 6 3
PLANT PERFORMANCE AT VARIOUS STAGES OF TREATMENT
DAKMNPUR WATER WORKS BERHAMPUR
PARAMETERS RAW SETTLED FILTEREDWATER WATER WATER
SSF RGF
Tuibkfity 10 7.3 8.5 17(NTU)
T.CoUfon» 13 SO 23 2(MPN/100ML)
(MPN/100ML)

337
PALASUNI WATER TREATMENT PLANT - BHUBANESHWAR
INTRODUCTION
The water treatment plant at Palasuni (Bhubaneshwar) was constructed in theyear 1974 for a design population of 1,18,590 with river Kuakhai as the source of rawwater. Theplanthasacapacityof27.2 mid and is maintained by PHED,Govt. of Orissa.The treatment comprises addition of chemicals (lime and alum) upstream of the Venturiflume in the raw water channel, flash mixing, flocculation, sedimentation in horizontalflow rectangular settling tanks, rapid gravity filtration and post chlorination.
Presently about 60-65 mid of water is drawn from the headworks located atKuakhai of which 40 mid will be treated at the newly constructed water treatment plantwhich is under commissioning. According to PHED officials, the present source isadequate to meet the total requirement of 100 mid. The schematic flow sheet is shownin Fig. 16.2 and the plant summary data is presented in Table 16.4.
PLANT APPRAISAL
Raw water quality and flow measurementNo proper intake structure has been provided and river water is drawn directly
by the pumps. It was, however, reported that a proposal for providing a proper intakeis under consideration. The problem of silt/sand draft through the pumps to the treatmentplant has been experienced. This was reported to be of a recurring nature. Nosource(s)of pollution were observed in the vicinity of the headworks. Raw water is pumpedthrough a 600 mm dia.C.I. rising main to the treatment plant located about 5 km fromthe source of supply. Provision of standby pumps was found adequate.
A Venturi flume has been provided in the raw water channel to measure the rawwater inflow to the plant. The float operated flow indicating device (Mahindra make)installed at the flume was in working condition. At the time of the visit the plant wasoverloaded (by 57%) and the flow was beyond the capacity range of flow meter. Theoverloading of the plant was confirmed by actual measurement at site by lowering thewater level in sedimentation basin and observing the rise in level for a known timeinterval.
The physico-chemical quality of raw and finished water samples are given inTable 16.5. All the parameters are found to be within the acceptable range for potablepurposes except turbidity and total iron. The higher value of total iron is attributed tothe presence of turbidity. Higher turbidity in finished water is due to addition ofbleaching powder in the form of a slurry.

338
Pre*treatmentLime and alum were a l l i e d at the raw water inlet channel. The method of
addition of these chemicals was found unsatisfactory. These chemicals conveyedthrough plastic pipes were added at single points, with lime followed by alum.
At the time of visit, when the raw water turbidity was 26 NTU, a lime dose of11.0 mg/1 and an alum dose of 36 mg/1 was reported to have been applied. However, theactual dose of lime and alum added was found to be 4.4 mg/1 and 38.7 mg/1 respectively.
While rapid mix units were in working condition the flocculators were not in usedue to silt accumulation to the extent of 2 to 2.5 m. The scour valves were also foundchoked. It was reported by the plant authorities that the sludge from the sedimentationbasin was removed frequently in order to avoid any choking problem. Though the plantwas overloaded to the extent of 57 per cent, the performance of the sedimentation basinas judged from the settled water turbidity was satisfactory (Table 16.6).
FiltrationThe filters were operated at rates higher than the design rateof4.8nVhr. The
exact rate of filtration for individual filters could not be ascertained mainly because : (i)the rate of flow indicator was defunct, (ii) due to overloading, the filtered water outletchamber was flooded. The filtered water turbidity from individual filters was in therange 0.5-9 NTU. However, the finished water (after chlorination) was free fromcoliforms.
The filter appurtenances such as rate controller, rate of flow indicator andheadloss indicators in all the filters were found defunct. It was informed that the ratecontrollers were intentionally tampered with in order to facilitate overloading/Thefilters were backwashed once in 24 hrs as a matter of routine with no considerationto headloss or filtrate turbidity. Only hardwash without air-scour is practised. Whilethe design provides for a backwash rate of 40 m/hr, actual backwashing rate was foundto be 20 m/hr as measured by the rise in water level over a known period of time duringbackwashing.
The depth of filter sand in all the filters was observed to be less than desiredvalue as considerable sand has been lost during backwashing even to the extent ofexposing the gravel layers. The sand depth was also very uneven.
DisinfectionChlorination using bleaching powder solution is practised. Adequate residual
chlorine was observed m the sample collected from the clear water sump. The bleachingpowder solution was fed in the form of aslurry as against the desired practice of feedingsupernatant only. This resulted in an increase in the turbidity of filtered water in clearwater sump.

339
• Laboratory facilitiesV A PHED Laboratory for water analysis has been established in a building
adjacent to the treatment plant. The laboratory undertakes water quality testing fordie various treatment plants maintained by PHED in the state.
The laboratory is equipped with trained and qualified staff and instruments/equipment necessary for testing of essential parameters of physico-chemical andbacteriological quality of water. None of the filter operators had undergone anyformal training. Record keeping with respect to plant operation was found mostunsatisfactory as no log books are maintained.
RECOMMENDATIONS
* Provision of a properly designed intake at the river to reduce the silt/sanddraft through the pumps is essential to ensure satisfactory performance of the
* Necessary arrangements for raw water flow measurement and controlneed to be provided for effective operation and control of water treatment units
* Considering the large quantity of chemicals used and high cost involved,careful control over chemical dosing should be ensured for optimum results
* The practice ofpoint addition of alum solution upstream of flume, shouldbe dispensed with in favour of applying alum solution through a perforatedpipe along the entire width of the channel upstream of the flume for effectivemixing
* Mechanical flocculators be repaired and put into operation
* Filter appurtenances such as rate controlkrs,rate of flow indicators and head-loss gauges in all the filters need to be put into working order for effectiveoperation and maintenance of the plant. Overhauling of all the filters be carriedout to ensure proper grading and depth of «and and gravel
* The bleaching powder solution should be allowed to settle, preferablyovernight, and only the supernatant be added to the filtered waterdtscardingthe bottom sediment
* Operating staff may be trained for proper operation, maintenance andcontrol of the plant
* Proper operation and maintenance records be maintained

CKJORIIWnOR
INLET VENTUR) FLASHCHAMBER FLUME MIXER
«NOS»
FLDCCULÄTORS(2N0S)
SEDIMENTATIONTANKS (2NOS»
RAPID GRAVITYFILTERS
CLEARWATERRESERVOIR
FIG 16.2 PALASUNI WATER TREATMENT PLANT (SCHEMATIC) BHUBANESHWAR

341
TAULE 16.4
PLANT SUMMARY DATA- BIIUBANESIIWAK
GENERAL
Name and location
Year of construction
Design capacity
O & M Agency
Raw water source
Treatment flowsheet
ENGINEERING
Raw water pumping
-Rising main diameter
Raw water flow measurement
Pre-treatment
Coagulation
- Chemicals used
- Type of mixing
- Method of mixing
- Detention Time
Flocculalion
- Method / Type of unit
- No. & Dimensions
- Detention time
: Palasuni Water Treatment plant,Bhubaneshwar (Orissa)
: 1974
: 27.2 mid
: Public Health Engineering DepartmtBhubaneshwar
: River Kuakhai
: Conventional with rapid gravity tilt
: 110HPx3Nos, 115HPxlNo .100 HP x 2 Nos
: 600 mm
: Venturi flume
: Lime, Alum
: Flash mixing
: Mechanical
: 2 minutes
: Mechanical
: 2Nos , each l2mx6mx 3.75 m SWD
: 30 minutes

343
TABLE 16.5
PHYSICO - CHEMICAL AND BACTERIOLOGICAL QUALITY OFRAW AND FINISHED WATERS
PALASUNI WATER TREATMENT PLANT - BHUBANESHWAR
PARAMETERS
Physico-chemical
TuiMdily (NTU)
P"
Total Alkalinity(CaCO,)
Conductivity tuS/cm)
Hardness (CaCO,)Total
Carbonate
Non Carbonate
Calcium <Ca)
Magnesium (Mg)
Chlorides (O)
Sulphates <S<\)
Iron (Fe)
Fluoride (F)
Nitrates (NO,)
Bacteriological (MPN/100 ML)
Total cotifonn
Usä
Fecal streptococci
RAW
24
7.7
61
123
55
55
0
17
3
6
4
2.7
0.1
0.4
>1600
1600
4
FINISHED
12
8.4
66
154
66
66
o19
5
9
9
0.7
0.1
1.8
0
0
0
All values except pH.Tuibidity and Conductivity are expressed as mg/1

344
TABLE lt.*
PLANT PERFORMANCE AT VARIOUS STAGES OF TREATMENT
PALASUNI WATER TREATMENT PLANT • BHUBANESHWAR
PARAMETERS RAW SETTLED FILTERED FINISHEDWATER WATER WATER WATER
Tuffaidily
(NTU)24 1.5 12
T. Coüfoon(MPN/100ML)
>1600 240
(MPN/100ML)1600
•v-

345
KAJPUKA WAI KR WORKS - KAJI'UKA
INTRODUCTION
Rajpura, a small town in Punjab with a present population of 56,000 drawsits water supply from Bhakra canal (Narwana branch). Raw water from canal ispumped through a 3 km long rising main into two storage reservoirs at the plant site.Stored water is drawn into an intake well and is pumped to the treatment plant. Thetreatment plant of 14.3 mid capacity commissioned in the year 1985 provides forcoagulation.tapered flocculation, sedimentation in horizontal flow settling tanks fol-lowed by rapid gravity filtration and disinfection. The schematic flow sheet is shownin Fig. 17.1 and the plant summary data is presented in Table 17.1. The plant ismaintained by the Punjab Water Supply and Sewerage Board.
PLANT APPRAISAL
Raw water quality and flow measurementDue to long storage.the raw water has a low turbidity and bacterial count (Table
17.2). During rainy season the raw water turbidity is reported to reach a maximum of80 NTU. A ParshaU flume is provided for raw water flow measurement. The flowrecorder was in working condition. The plant output was restricted due to the limitedcapacity of the existing over head service reservoirs. At the time of visit the plant inflowwas only 6.4 mid.
Pre-treatmentThe alum dosing facilities, mechanical rapid mixers and flocculators were in
working condition but not in operation as the raw water turbidity was low. Alumaddition was also discontinued. It was reported that alum dosing is practised only whenraw water turbidity is of the order of 50 NTU or more. Due to non-functioning of pre-treatment facilities turbidity did not show any appreciable reduction after sedimentation(Table 17.3).
FiltrationThe rapid gravity filters are open to sky and only the operating gallary is under
cover. Only three filters were in operation during the study, due to reduced inflow to theplant. All the appurtenances of rapid gravity filters were in working conditioKexceptone head loss indicator. The filtrate turbidity was within the limits recommended byCPHEEO. The filters were backwashed at a terminal head loss of 1.8 meter and thelength of run was reported 48 to 72 hours in fair season and not less than 24 hours inmonsoon season.

346
The spent backwash water and the sludge bleed from sedimentation tanks are collectedin a sump well and pumped into two holding tanks. The supernatant is returned to theraw water storage tanks by gravity and the bottom sludge is removed periodically anddisposed off on low lying areas.
DisinfectionThe filtered water is disinfected using chlorine gas. The chlorinator was in
working condition and the reported dose of chlorine was on an average 1 kg/hr. At thetime of the visit no residual chlorine was detected in the finished water. Chlorination wasinadequate as confirmed by the poorbacteriological quality of the finished water (Table17.3).
Laboratory facilitiesAdequate laboratory facilities for routine physico-chemical analysis are
available at the plant. Tests for turbidity, pH and residual chlorine are carried out by theplant operators. Jar testing is done only during monsoon season. Records are maintainedfor plant inflow, pumping schedules etc.
Plant staffOne Junior Engineer is incharge of the plant supported by operators (7 nos.),
helpers and chowkidars(7 nos). AU the pump operators and fitters are JTI certificateholden}. The operation and maintenance of the plant, in general* is satisfactory.
Financial aspectsThe total expenditure for the year 1987 -88 was Rs. 14.2 lakhs; the staff salary
accounted for 17 per cent, chemical and power 69 per cent and maintenance and repairs14 percent. Information on revenue receipts for the year 1987 - 88 was not available.However, for the year 1986 - 87 the revenue from sale of water was Rs. 13.2 lakhs.
RECOMMENDATIONS
* Even during periods of low turbidity, a nominal dose of alum should beadded to raw water and flash mixing provided for effective removal ofimpurities in the filter.
* Laboratory tests should be conducted regularly to decide the optimum doseof alum and chlorine.

I ,'• y.;
! • !
STAFF«QUARTERS
FLOCCULATORSÏTORS j
SETTLING
TANKS-
RAPID GRAVITY
FILTERS
r*i
CPOÖRPUMPHOUSE
> FUTURE 1 RESEfhOR
NOT TO SCALE
_i
D•* -D
SETTUNS TANKSFOR WASTE WATER
4 RECYCLE
STORAGE ANDPRE-SEDIMENTATIONTANK
STORAGE ANDPftE-SEGMENTATIONTANK
RG 17.1 LAYOUT JtAN OF RAJPURA WATER TREATMENT tUOTT

348
TABLE 17.1
PLANT SUMMARY DATA - RAJ PUR A
GENERAL
Name and location
Year of construction
Design capacity
O & M Agency
Raw water source
Treatment flowsheet
ENGINEERING
Raw water pumping
-Rising main diameter
Raw water flow measurement
Pre-treatment
Coagulation
- Chemicals used
- Type of mixing
- Detention time
Flocculation
- Method / Type of unit
- No. & Dimensions
- Detention time
Rajpura Water Works, near village Bhadak,Patiala
1985
14.3 mid
Punjab Water Supply and Sewerage Board
Bhakra main canal
Conventional with rapid gravity filters
3 nos., centrifiigal,each 275 mVhrone standby
410 mm
Reliable make, float operated
Alum
Mechanical, flash mixer 1.5 x 1.5 x 2.4 m
33 sec.
Mechanical Tapered flocculators
3 no., each 5.65 m x 5.65 m x 3.66 m
35 min,(36 rpm 5 HP, 21 rpm 3 HP, 14 rpm % HP)

349
Sedimentation
-Typeofunit(s)
-No. &sizeofunit(s)
- Surface overflow rate
- Detention time
Filtration
-Typeofunit(s)
- No. & size of unit(s)
- Rate of filtration
> Filter media
. Sand size
.Depth of sand
. Gravel size (mm)
.Depth of each layer
- Backwash arrangements
.Method
. Wash water tank cap.
Disinfection
- Chemicals used
• Type of feed
- Chlorinator Details
dear Water Reservoir
- Type, No. & Capacity
- Pump details
: Rectangular
: 1 no., 35.9 m x 1017 m x 3*m
; 1.55 m/hr
: 2hre
: Rapid gravity filters
: 5 nos., each 30 m3
: 4 m/hr
: E.S-0.62mm,U.C-1.6
: 68cm
: 50-37,37-12,12-6,6-2.5
: 80mm
: Air scour and water wash
: 227 m3
: Chlorine gas
: Solution feed
: Prwiure type, one no., chloro control make
: RCC, 1 no. 2455 mJ
: 2 nos., 135 HP, Centrifugal, 1 standby

350
TABLE 17.2
PHYSICO-CHEMICAL AND BACTERIOLOGICAL QUALITY OFRAW AND FINISHED WATERS
RAJPURA WATERWORKS - RAJPURA
PARAMETERS RAW FINISHED
1.5
8.1
154
252
104
104
0
31
6.3
5
28
Tr
0.6
1.9
Tuibidity(NTU)
pH
Total Alkalinity(CaOO,)
CooductivityiMSAan)
Hardness (CaCO,)Total
Caibonate
NooCofbgMté
Calcium (Ca)
Magnesium (Mg)
Chlorides (CO
Sulpbates(SO4)
In» (R)
Fluoride (F)
Nitnies (NO,)
BaclariolsgJCTl (MPN/100 ML)
Total cobfonn
5.5
8.2
154
262
103
103
0
32
6
5
27
Tf
0.6
2.6
24C
All results are expressed as mg L except for pH, conductivityandtnibidity Tr-Traces

351
TABLE 173
PLANT PERFORMANCE AT VARIOUS STAGES OF TREATMENT
RAJPURA WATER WORKS • RAJPURA
PARAMETERS RAW SETTLED FILTERED FINISHEDWATER WATER WATER WATER
Tuibidlty(NTU)
5.5 5.4 1.5 1.5
T.coJifom(MPN/100ML)
240 85 35

352
BHILWARA WATER WORKS - BHILWARA
INTRODUCTION
Bhilwara is a fast developing district town ofRajasthan. Water supply to thecity with a population of 1.22 lakhs ( 1981 census) is drawn from Meja dam on Kothaririver, about IS km away from the town. The first water treatment plant of 4 mid wascommissioned in 1959 and the capacity was augmented in 1976 by construction of a9.1 mid plant.In addition about 900 mVday of water is obtained from 11 tubewclls. Theplant of 9.1 mid capacity has been selected for evaluation. The schematic flowsheet isshown in Fig.18.1 and the plant summary data is presented in Table 18.1.The plantis maintained by PHED, Govt. ofRajasthan.
PLANT APPRAISAL
Raw water quality and flow measurementRaw water from Meja dam is pumped to large earthen storage cum
pre-sedimentation tanks. Due to severe drought conditions, sufficient quantity of rawwater was not available at the time of evaluation study. During fair season, raw waterhas a low turbidity (<10 NTU). In summer due to low water level in the dam/pre-sedimentation tanks the bottom sediments are sucked along resulting in turbidwater. Considerable algal growth was also observed in the pre-sedimentation basins.The physico-chemical and bacteriological quality of raw water was fairly good (Table18.2).
A Venturi flume provided for flow measurement was out of commission due toa pipe running through it. Raw water flow could not be measured during the visit by anyaccurate method.
Pre-treatmentA heavy dose of chlorine (about 7 mg/1) was applied using bleaching powder
presumably for control of algae in raw water. Bleaching powder was added manuallyonce in two hours and thedose is not controlledproperly. The alum dosing facilities wereout of order and alum slabs were dumped into the raw water channel. This resulted inuneven dosing with no proper control. The performance of the clariflocculator wasnot satisfactory as was evident from the settled water turbidity which was even more thanthat of raw water (Table 18.3). The poor efficiency can be attributed to the presence ofalgae and inadequate alum dose. The settled water showed a residual chlorineconcentration of 4 mg/1 and was free from coliform and E.co|i. The clarifier bleed alongwith the spent backwash water was drained into the pre-sedimentation basins andrecycled.

353
FiltrationThe operation and maintenance of filters which are open to sky was far from
satisfactory. The flow rate controllers were not in working condition. Very short filterruns of 10 hr duration were observed. The filter backwashing was ineffective aswas evident from the high initial headloss. The filters were working on declining rateprinciple with an initial filtration rate of 6.75 m/hr declining to 2.45 m/hr at the endof the filter cycle. The residual chlorine concentration in filtrate was 3 mg/1.
DisinfectionThe filtrate with 3 mg/1 of residual chlorine was further chlorinated using
chlorine gas. The finished water had a very high concentration (8 mg/1) of residualchlorine causing serious taste and odour problems.
Laboratory facilitiesNo laboratory facilities were available at the plant to facilitate any meaningful
control of plant operation.
Plant staffThe staff for routine O & M of the plant consists of Junior Engineer (1 no.),
Senior Filter Assistants (1 no.), Junior Filter Assistants (3 nos.) and helpers (10 nos.).
RECOMMENDATIONS
* Steps should be taken to minimise evaporation losses from the dam andthe storage basins supplying raw water to the treatment plant.
* The raw water intake well constructed at the Meja dam site should becommissioned at the earliest to reduce the problem of drawal of bottom mudwith the raw water.
* Appropriate flow measuring / indicating devices should be installed foreach one of the treatment plants to facilitate proper operation and control.
* Indiscriminate addition of bleaching powder / chlorine gas should bediscontinued and proper dose of chlorine based on chlorine demand test beapplied to maintain a residual as recommended by CPHEEO.
* The alum preparation and dosing devices should be brought into workingcondition and the alum dose controlled as per jar tests.

354
* All the filter appurtenances should be got repaired to facilitate filteroperation and control and the efficiency of filter backwashing improved tomaintain the filters clean.
* Minimum laboratory facilities along with competent personnel shouldbe provided at the plant for effective plant monitoring and control.

I.*- • k . * J.l>
PORTABLE , -PUMPS W
C.W.R.
-p>-
• • •
PUMPNG MAN FROMMEJA DAM
PRESEDMENTATIONTANKS
M j.
CLARIFIEft
OLO
FILTER NO 2
OLO
FILTER NO)
TO PRESEOMENTA-TION TANKS
TO PRESED4MENTATIONj TANKS
I LNEW
FILTER NO. 1
NOT TO SCALE CLARIFLOCCULATOR
NEW
FILTER NO. 2
RG 18.1 LAYOUT PLAN OF BfflLWARA WATER TREATMENT PLANT

356
TABLE 18.1
PLANT SUMMARY DATA - BHILWARA
GENERAL
Name and location
Year of construction
Design capacity
O ft M Agency
Raw water source
Treatment flowsheet
ENGINEERING
Raw water pumping
-Rising main diameter
Pre-trcatment
Pre-sedimantation
Pre-chlorination
Coagulation
- Chemicals used
-Type of mixing
Flocculation
- Method / Type of unit
-No. &Sizeofunit(s)
- Detention time
: Bhilwara Water Works, Bhilwara
: 1976
: 9.1 mid
: Public Health Engineering Department,Govt. ofRajasthan
: Impoundment (Dam on Kothari River)
: Pre-chlorination and conventional treatmentwith rapid gravity filters
: 2 centrifugal pumps of 4.5 lakh lits/hr capacity
; 610 mm
: 4 tanks, 91.5 m x 91m each
: Bleaching powder
: Alum, solution feed
: Hydraulic
: Mechanical(Claritlocculator)
: 1 No., 5 m diameter
: 40 minutes

357
Sedimentation
-Typeofunit(s)
- No. A size of unit(s)
- Surface Overflow Rate
- Detention time
Filtration
-Typeofunit(s)
• No. & size of unit(s)
• Rate of filtration
- Filter media
.Sand size
.Depth of sand
- Backwash arrangements
.Method
. Wash water tank cap.
Disinfection
- Chemicals used
-Type of feed
- Chlorinator Details
Clear Water Reservoir
- Type, & Capacity
- Pump details
; Circular Clarifier
: l n o , 12mdia. ,3.2mSWD
: 1 m/hr
: 3 hours
: Rapid gravity filters (open to sky)
: 2 nos.,9.6 m x 5.35 m each
: 4nVhr
: B.S.-0.5mm,U.C.-1.6
: 60cm
: Air scour + water wash
: 75 m»
: Chlorine gas
; Wet feed
: Chloronome, 1 no.
: RCC, 1335 m3
: 3 pumps of40 HP each 2 pumps of 30 HP each

338
TABLE 18.2
PHYSICO-CHEMICAL AND BACTERIOLOGICAL QUALITY OFRAW AND FINISHED WATERS
BHILWARA WATER WORKS • BHILWARA
PARAMETERS
Pbyiko-chewufl
Ttut>idity(NTU)
pH
Total Alkalinity(CaOO,)
CoodoctivityiuS/cm)
HudnesMCaCO,)Total
Caibooale
NoaCuboaaie
Ctiàm (Ca)
Magnesium (Mg)
Chlorides ( a )
Sulphates (SO,)
Iioa (Pe)
Bactcrielofkai (MPN/100 ML)
Total coUfom
PBcalcolifom
E-colj
Fecal SMfitoGooci
All values exoeot DH,tuibkfitv and cooduc
RAW
6.0
7.8
84
200
156
84
72
29
21
28
2
0.6
93
0
0
7
tivity ate «xDiesaed as a
FINISHED
2.0
7.5
80
-
256
80
176
80
32
30
5
-
0
0
0
0
ME/I

359
TABLE 1«J
PLANT PERFORMANCE AT VARIOUS STAGES OP TREATMENT
BHILWAJtA WATER WORKS -BHILWARA
PARAMETERS RAW SETTLED FILTERED FINISHEDWATER WATER WATER WATER
Tuittdity(NTU)
7.5 2.5 2.0
T.Cobfom(MPN/100ML)
93
(MPN/100ML)

360
JODHPUR WATER WORKS - JODHPUR
INTRODUCTION
Jodhpur is located in the semi arid desert of Rajasthan. The first conventionalwater treatment plant of 11.4 mid capacity was constructed in 1938 with Hemawasreservoir on river Bandi as raw water source. Due to rapid growth in population thescheme was augmented twice, first in 19S9 with 18.2 mid plant drawing raw water fromJawai Sagar about 152 km away and the second in 1976 with 25 mid. Two plants of 11.4and 18.2 mid capacity have been selected for evaluation. The schematic flow sheet ofthe plant is shown in Fig. 18.2 and the plant summary data is presented in Table 18.4. Theplants are maintained by the PHED, Govt. of Rajasthan.
PLANT APPRAISAL
Raw water quality and flow measurementAs the taw water is brought from a long distance through a canal, many villages
enroute including Pali town draw water from the same canal. The raw water sources areinadequate to meet the needs, the drought conditions worsening the situation. Rawwater is pumped in 8 stages to the treatment plant on Chopasani hills and the surplus,whenever available is pumped to Takhat Sagar, a balancing reservoir constructed at anelevation on a nearby hillock. During the evaluation study, raw water supply wasaugmented from Takhat Sagar. Due to inadequacy of raw water, the plants wereunderloaded and at times shut down completely.
Considerable evaporation loss occurs at the Takhat Sagar balancing reservoir.Filter backwash along with clarifier sludge is discharged back into the canal near theintake. This coupled with interruptions in canal water supply makes the plant controldifficult, adversely affecting the performance. Algal growth in the reservoir was alsoobserved.
Considerable fluctuation in raw water turbidity was caused due to recycling ofwaterworks waste making it difficult to control the alum and chlorine doses. Chemicaland bacteriological quality parameters, however, were within acceptable limits forraw water source (Table 18.5 ). The plant inflow could not be measured as the flowmeasuring devices were out of order.
Pre-treattnentThe aeration unit that has been installed does not serve any useful purpose.
During summer pre-chlorination is practised reportedly for algae control and to improvethe raw water quality.

361
Alum dose control has been difficult due to sudden changes in water quality withthe result the same dose was applied all through the day. The present practice ofdischarging filter backwash into the canal near the intake sump should be discontinuedand only the supernatant be recycled after settling in a holding tank. The settled waterturbidity ranged from 8 to 12 NTU. Following pre-chlorination substantial reductionin bacteriological count was also observed in settled water (Table 18.6 ).
FiltrationThe filters were operated at high initial rates ranging from 7.6 to 9.5 m/hr
resulting in short filter runs of about 16 hrs duration. Initial headloss was very high(76 to 105 cm) thereby indicating inadequate backwashing. The rate controllersand head loss indicators were not in working condition. Turbiditywise the filterperformance was not satisfactory though the filtrate was free from E.coli presumablydue to pre-chlorination.
DisinfectionFiltered water was chlorinated using chlorine gas. A high residual chlorine
(4 mg/1) was observed in the clear water reservoir and the finished water was free fromcount (Table 18.6).
Laboratory facilitiesA full-fledged laboratory has been set up in the city about 10 km away from the
plant.
RECOMMENDATIONS
* Pre-chlorination should be practised all through the year and the dose ofchlorine controlled by regular chlorine demand test
* In view of the perennial water scarcity conditions as a conservation measurethe water works waste should be taken through a holding tank and thesupernatant recycled to the plant.
* Control over chemical dosing should be ensured based on regular laboratorytests.
* The condition of filters need to be improved through adequate backwashingto leave the filters clean and by putting the appurtenances into working order forproper filter control.

s , " ' 1
CLAIM FLOCCULATOR
F 17
. T
1
\
L T6
i
E R
•
S5-
ALUMDOSIMG
TOC W.R.C.W.R.
C L A
r iR I F I E R S
« •
PUMP HOUSEINTAKE ON
OPEN CHANNEL
MOT TO SCALE
AERATION
F 14
L T3
E R4s2
A
I
ALUMDOSING
HO 18.2 LAYOUT PLAN OF JODHPUÄ WATER TREA1MBNT PLANT - KKDHPUR

363
TABLE 18.4
PLANT SUMMARY DATA - JODHPUR
GENERAL
Name and location
Year of construction(Augmentation if any)
Design capacity
O A M Agency
RAW water source
Treatment flowsheet
ENGINEERING
Raw water pumping
Raw water flow measurement
Pre-treatment
Aeration
Coagulation
- Chemicals used
-Type of mixing
Ftocculation
- Method / Type of unit
Jodhpur Water Works Chopasini Hills, Jodhpur
1938 (1959)
29.6 mid (11.4 +18.2 mid)
Public Health Engineering Department,Govt. ofRajasthan
Canal from Jawai Sagar.
Conventional with rapid gravity filters
: Raw water pumped from a distance of150 km with 8 lifting stations
: Float and Venturi flume
: A (11.4 mid)
: Provided
: Alum, limewet feed
: Hydraulic
: Not provided
B (18.2 mid)
not provided
Alum wet feed
Hydraulic
Mechanical(Clariflocculator)
-No. &Sizeofunit(s) 1 no.,8.6 m dia.

364
Sedimentation
-Typeofunit(s)
-No.&sizeofunit(s)
- Surface overflow rate
Filtration
-Typeofunit(s)
- No. & size of unit(s)
-Rate of filtration
-Filter media
.Sand size
.Depth of sand
- Backwash arrangements
.Method
. Washwater tank cap.
Disinfection
-Chemicals used
-Type of feed
Clear Water Reservoir
- Type, No. & Capacity
• Pumpdetails
: A (11.4 mid)
: Rectangular
: 3 nos.,
:
: Rapid gravity filters
: 4 nos.,7 m x 5.5 m
: 4.8 m/hr
: E.S.-0.6mm, U.C.-
: 60 cm
B (18.2 mid)
Circular clarifier
1 no.,27 m dia.
0.7 m/hr
3 nos.,8.7 m x 3.3 m
4.8 m/hr
1.5
: Air scour and water wash
: 91m3
: Chlorine gas and hi.
: Direct feed
: RCC,2nos.,3632 m1
each
: Supply by gravity
powder
RCC, 4 nos.2270 m3
each

365
TABLE 1&5
PHYSICO-CHEMICAL AND BACTERIOLOGICAL QUALITY OFRAW AND FINISHED WATERS
JODHPUR WATER WORKS - JODHPUR
PARAMETERS
Pbytko-cbemkal
TiiiMdhy(NTU)
pH
Total Aflnlmtty<C«CO,)
CooductivityfoiS/cm)
Hante»(CaCO})Total
Caitoooale
NoaCMbonate
Calcium (Ci)
Magnesium (Mg)
Chlorides (Cl)
Sulphates (SOJ
Fluoiide (F)
A
8.5
7.8
108
390
196
108
88
42
22
64
7
NU
BactarietofksJ (MPN/100 ML)
Totti coUfofm
Fecal colifonn
Rcoü
Fecal streptococci
All values exctat oRturix
93
43
43
0
iditvandc
I VISIT
RAWB
41
7.4
104
270
184
104
80
35
23
28
3
NU.
>2400
1100
1100
0
onductivitv m exm
FINISHED
5.0
7.5
106
350
-
-
-
-
60
16
•*
0
0
0
0
•essed as me/1
RAWA
58
7.8
148
360
240
148
92
55
27
44
5
0.5
2400
23
0
43
II VISIT
PINCHEDB
32
7.1
140
350
208
140
68
38
27
32
3
0.5
0
0
0
0
4
7.6
124
320
240
124
116
38
35
36
9
0.4
0
0
0
0

366
TABLE 18.*
PLANT PERFORMANCE AT VARIOUS STAGES OF TREATMENT
JODHPUR WATER WORKS - JODHPUR
PARAMETERS VISIT RAW SETTLED FILTERED FINISHEDWATER WATER WATER WATER
A B A B A B
Turbidity(NTU)
I 8.5 41 8,5 12 5.0 6.2 5.0
U 32 58 8.0 10 2.6 3.6 4.0
T.CoUfonn(MPN/100ML)
I
n
93
2400
>2400 9 43
43 23
E.COÜ
(MPN/100ML)I
n
43 1100 4

367
KOTA WATER WORKS, AKELGARH - KOTA
INTRODUCTION
The city of Kota with a population of 3.S8 lakhs (1981 census) draws its watersupply from river Chambal. The first water supply scheme for the city wascommissioned in 1927 with slow sand filters of 6.8 mid capacity. Subsequently,the water supply has been augmented from time to time with conventional rapid gravityfilters to the present total capacity of 45 mid. The conventional 18.2 mid rapid sand filterplant and 6.8 mid slow sand filter plant have been taken up for evaluation. The schematicflow sheet is shown in Fig. 18.3 and plant summary data is presented in Table 18.7. Theplants are maintained by the Public Health Engineering Department, Govt. of Rajasthan.
PLANT APPRAISAL
Raw water quality and flow measurementImpounded water from upstream of a barrage constructed across the perennial
river Chambal is pumped to the treatment plants located at Akelgarh on the right bankof the river. The potential for pollution of raw water is very little. Due to impoundment,the raw water turbidity is very low, less than 5 NTU. Occasional rise in turbidity duringrainy season is reported for a short period. Other physico-chemical characteristics arewell within the limits recommended byCPHEEO. Raw water coliform MPN of lessthan 100 was observed during the visit (Table 18.8). There are two intakes from whereraw water is pumped to the treatment plants. The rising mains are interconnected andthe flow is regulated through gate valves. Due to frequent manipulation of valves whenthe pumps are put on or offj raw water flow to the individual treatment plant changesfrequently. There is no provision for measuring the flow to the individual treatmentplant. In the case of 18.2 mid plant, a Venturi type flow measuring flume has beenprovided but the flow indicating and recording devices were out of order.
Pre-treatmentThe slow sand filters are preceded by large sedimentation basins in which
the turbidity gets reduced from 2.8 to 1.0 NTU. As for rapid sand filtration plant, sincethe raw water has a low turbidity (2.8 to 3.4 NTU), coagulant addition is not practisedfor nearly 10 months of the year. In the absence of alum addition, only a marginalreduction in turbidity is obtained after sedimentation. The chemical characteristics ofwater remain unchanged during the passage of water through various treatment units(Table 18.9).

368
FiltrationDuring the visits, the rapid sand filters were either underloaded or were not in
operation. Normal filter runs of 22.5 to 27 hrs with a terminal headloss of about 2.5 mwere reported. The efficiency of filters in removal of coliform bacteria was notsatisfactory (Table 18.9). Baclcwashing of filters was ineffective and higher rates ofbackwash should be applied to maintain a reasonably clean bed. Loss of head gauges andrate controllers were not working in all the filters. Considerable quantity of settledwater was diverted to the clear water reservoir bypassing the filters.
The performance of slow sand filters was comparatively better. There wasreduction in coliform count and the turbidity of filtrate was 0.5-1.0 NTU (Table 18.9).
DisinfectionFiltered water from all the treatment plants is chlorinated at the clear water
reservoir before distribution. A high residual chlorine (5.0 mg/l) was observed inthe finished water during the visits. The heavy dose of chlorine fixed arbitrarily leadsto wastage of the chemical, odour problem and corrosion of equipment. During nighthours, the drawal from clear water reservoir is reduced and flooding of the reservoiroccurs. This leads to a rise in water level in the filtered water channels resulting inthe submergence of the rectangular weirs in the filter outlet chambers.
Laboratory facilitiesLaboratory facilities are not available at the plant site and the samples for routine
analysis are sent to the Public Health laboratory located in the city.
RECOMMENDATIONS
* Raw water pumps for each one of the treatment plants should, as far as possible,be of the same duty to optimise their use and to provide for flexibility inoperation and plant control.
* As adequate quantity of raw water is available throughout the year,manipulation of flow to the individual plant through interconnected valves in thepipelines should be minimised to facilitate smooth operation and control of theplants.
* The practice of dispensing with alum dosing during major part of the yearshould he discontinued and a nominal dose ofalumbeaddedto ensure effectivetreatment. Similarly, bypassing of settled water to clear water reservoir withoutfiltration should be avoided.

369
* The plant output should be optimised and as far as possible maintaineduniform by proper scheduling of clear water pumping to avoid overflow andwastage.
* The filter rate controllers, rate indicators and loss of head gauges should be gotrepaired and installed for proper operation and control of filters.
* Controlled chlorination should be ensured by regular laboratory testing forchlorine demand so as to leave enough residual chlorine at the treatment plantand in the distribution system.

SS F SLOW SANO FILTERS
RGF RAPID GRAVITYFILTERS
CWR CLEAR WATERRESRVOIR
PRÉSEDt UENTATÏONI T V, N KS I
INTAKE ONRIVER CHAM6AL
NOT TO SCALE
PHS 18.3 LAYOUT PLAN OF KOTA WATER TREATMENT PLANT

371
TABLE 18.7
PLANT SUMMARY DATA-KOTA
GENERAL
Name and location
Year of construction(Augmentation if any)
Design capacity
O & M Agency
Raw water source
Treatment flowsheet
ENGINEERING
Raw water pumping
-Rising main diameter
Raw water flow measurement
Pre-treatment
Presedimentation tanks
Coagulation
- Chemicals used
-Type of mixing
Flocculation
- Method / Type of unit
-No. ofunit(s)
- Detention time
: Kota waterworks, Akelgarh,Kota
: RSF in 1956 (SSF in 1927)
: 18.2 mid+ 6.8 mid (SSF)
: Public Health Engineering Department,Govt.of Rajasthan
: River Chambal
: Conventional with rapid gravity filtration(RGF), Slow sand filtration (SSF)with pre-sedimentation
: Centrifugal, 3 intake pump stations
: 450 mm for SSF & 450 mm for RGF
: Venturi flume
: For SSF, 4 Nos, 31m x 31 m
: Alum (only during rainy season), solution feed
: Mechanical
: Mechanical(clariflocculator)
: 1 No.
: 30 min

372
Sedimentation
-Typeofunit(s)
- No. & size of unii(s)
- Surface overflow rate
- Detention time
Filtration
• Typeofunit(s)
- Size of unit(s)
-Rate of filtration
- Filter media
.Depth of sand
. No. of gravel layer
. Depth of each layer
- Backwash arrangements
.Method
. Wash water tank cap.
Disinfection
- Chemicals used
-Type of feed
- Chlorinator Details
Clear Water Pumping
- No.& Cap.ofreservoir
-Pump details
; Circular clarifier
: lNo.,27.4mdia.
: lm/hr.
: 2hrs.
: SSF-8N0S,
: 20.1m x 21.3meach
: 0.1 m/hr
• —•
: -
: -
• —
: -
RGF- 3 Nos
7.8m x 6.2meach
4.8 m/hr
60 cm
5 t o 6
IS cm
Air scour & water wash
227 m*
: Chlorine gas/Bl.powder
: Solution feed
: 5 Nos
: One, 2724 m3
: Two pumps of 680 m* fti capacity each +2 standby

373
TABLE 18.8
PHYSICO-CHEMICAL AND BACTERIOLOGICAL QUALITY OFRAW AND FINISHED WATERS
KOT A WATER WORKS - KOT A
PARAMETERS
Physico-chemical
Tuitoà<fity(NTU)
pH
Total Alkalinity
(CaCO,)
Conductivity fciS/cm)
Hardness (CaCO3)Total
Carbonate
NoaCaibonate
Calcium (Ca)
Magnesium (Mg)
Chlorides (Q)
Sulphates (SO4)
lion (Fe)
Bacteriological (MPN/100 ML)
Total coliform
Fecal coufoim
ILfifiU
Fecal streptococci
RAW
2.8
8.1
92
230
108
92
16
29
9
15
2
0.1
28
0
0
4
1 VISIT
FINISHED
2.6
8.0
94
270
132
94
38
37
10
23
3
0.1
0
0
0
0
RAW
3.4
7.5
80
150
240
80
160
29
41
12
2
0.4
75
43
23
4
nvisrr
FINISHED
1.3
-
-
155
-
-
-
-
-
-
0
0
0
0
All values except pH,tuibidity and conductivity ate expressed as mg/I

374
TABLE 18.9
PLANT PERFORMANCE AT VARIOUS STAGES OF TREATMENT
KOTA WATER WORKS - KOTA
PARAMBTBRS
Turtwtity(NTU)
T.Coüfonn(MPN/100ML)
visrr
I
n
i
n
RAWWATER
2.8
3.4
28
75
SETTLEDWATER
2.0
1.2
43
75
FILTEREDWATER
0.9
1.2
23
43
FINISHEDWATER
2.6
1.3
0
0
fL£o!i(MPN/100ML)
23 15

375
UDAIPUR WATER WORKS - UDAIPUR
INTRODUCTION
Udaipur, the city of lakes is a popular tourist resort. The lakes FatehSagarandPfchholaare the main sources of water supply to the city. The first watertreatment plant of 3.4 mid was commissioned in 1932 at Fateh Sagar and the capacitywas subsequently augmented by construction of additional plants. DoodhTalai waterworks of 13.6 mid capacity situated at Pichholajheel has been selected for study. Theplant provides for pre-chlorination followed by conventional treatment with rapid sandfiltration and post-chlorination. The schematic flow sheet for the plant is shown inFig. 18.4 and the summary data is presented in Table 18.10. The plant is maintained byPHED, Govt. of Rajasthan.
PLANT APPRAISAL
Raw water quality and flow measurement
During the evaluation study, due to total failure of monsoon, water available inlake was not adequate to run the plant at its rated capacity. It was underloaded to theextent of 40 to 50 per cent and, in 1987 summer, raw water from other lakes was pumpedto the plant as an emergency measure.
The raw water source is polluted due to human activities like bathing, washingand discharge of hotel wastes and sewage from nearby localities. Growth of waterhyacinth was observed in the lake. Raw water had a high chlorine demand and odourproblem. The raw water turbidity was low and fairly uniform throughout the year(Table.18.11)
A Venturi flume provided for flow measurement was observed in damagedcondition. The raw water flow could not be measured during the visit by any accuratemethod.
PrelreatmentConsidering the pollution level» die raw water is prechlorinated with 5 to 8
mg/1 of chlorine round the year. The chloronome was out of order and chlorine gaswas directly fed into the channel through locally fabricated column. Frequent leakageof gas has resulted in the corrosion of metallic futures at plant site.
During the first visit, alum dosing device was found to be out of order and manualfeeding was resorted to. Subsequently, the valves of alum feeding tanks wererepaired/replaced. Hydraulic mixing of alum was achieved.

376
As the plant was underloaded to the extent of 50 per cent, the detention time inclariflocculator was almost double the design value. Even with extended detention time,no appreciable reduction in turbidity was obtained. The turbidity of settled waterranged from 4 to 7 NTU with a raw water turbidity of 6 to 10 NTU (Table 18.12).Dueto heavy organic load, settled sludge had become septic and patches of sludge werecarried over. The actual alum dose applied for a raw water turbidity of 6 to 10 NTU wasquite, high (74 ppm). Traces of residual chlorine were observed in settled water.
FiltrationThe filter appurtenances such as the rate controllers, rate of flow indicators,
and headloss gauges, were not in working condition. Short filter runs of 5 to 6 hrsduration were observed. Backwash rates provided were found inadequate. This wasalso evident from the high initial headloss of 180-190 cm after backwashing.
DisinfectionChlorine gas was used for disinfection. The chloronomes were found out of
order and chlorine gas leakage has damaged the valves and fittings due to corrosion.Bacteriological quality of clear water from reservoir was satisfactory (Table 18.12).
Laboratory facilitiesPresently the laboratory is located at a distance of about 1 km. In order to monitor
the performance of the plant effectively, certain instruments like turbidimeter, chloro-scope, jar testing machine should be provided at plant site.
RECOMMENDATIONS
* Necessary measures should be taken to prevent pollution at the source.
* Essential equipment like the chloronomes and alum dosing gear shouldbe repaired and reinstalled without delay.
* The clarifier should be desludged regularly to avoid accumulation of sludgeand development of anaerobic conditions.
* The backwashing operation should be made more effective so as to leavea clean bed.
* All the filter appurtenances should be repaired and brought into workingorder to facilitate proper operation and control of the" filters.

ik, '
CLA RI FLOCCULATOft
C LEAR WATER
RESERVOIR
NOT TO SCALE
FILTERS
CHLORINATION
I CHJORINEALUM (PRE CHLORINATION)
PUMP HOUSEINTAKE ON PICHHOLA
LAKE
FIG 18.4 LAYOUT PLAN OF DOODHTALAI WATER TREATMENT PLANT - ÜDAIPUR

378
TABLE 18.10
PLANT SUMMARY DATA - UDAIPLR
GENERAL
Name and location
Year of construction
Design capacity
O & M Agency
Raw water source
Treatment flowsheet
ENGINEERING
Raw water pumping
-Rüsmg main diameter
Raw water flow measurement
Pre-treatment
Doodh Talai Water Works Udaipur (Rajasthan)
1975
13.6 mid
Public Health Engineering Department,Rajasthan
Pichhola lake
Pre-chlorination and Conventional treatmentwith rapid sand filters
Three, Centrifugal type HP -125 & 215
450 mm
Venturi flume
Prechlorination
Coagulation
- Chemicals used
-Type of mixing
Flocculation
- Method/Type of unit
- No. & size of unit(s)
- Detention time
; Chlorine gas through column
: Alum
: Hydraulic
: Mechanical(clariflocculator)
: 1 No.,12.0 m dia.,4.5 m SWD
: 40 minutes

379
Sedimentation
-Typeofunit(s)
- No. & size of unit(s)
- Surface Overflow Rate
- Detention time
Filtration
-Typeofunit(s)
- No. & size of unit(s)
-Rate of filtration
- Filter media
. Sand size
.Depth of sand
- Backwash arrangements
.Method
. Wash water tank cap.
Disinfection
- Chemicals used
-Type of feed
- Chlorinator Details
Gear Water Pumping
- No. & Capacity
- Pump details
: Circular Clarifier
: lNo. ,29mdia,4 .5mSWD
: 1 m/hr.
: 4hrs.
: Rapid gravity filters
: 2 Nos., 7.9 m x 10.7 m each
: 4 m/hr.
: E.S.-0.64mm,U.C.-1.56
: 60 cm
: Air scour & Water wash
: 177 m»
: Chlorine gas
: Solution feed
: Locally fabricated, column type, 2 Nos.
: 1 NO., 3600 m*
: Gravity supply

380
TABLE 18.11
PHYSICO-CHEMICAL AND BACTERIOLOGICAL QUALITY OFRAW AND FINISHED WATERS
UDAIPUR WATER WORKS -UDAIPUR
PARAMETERS
Physico-chemical
Turt»dity(NTU)
pH
Total Alkalinity(COO,)
Conductivity CuS/cm)
HaidnessCCaCO,)Total
Cubonate
NooCaibooMe
Calcium (Ca)
Magnesium (Mg)
Chloride» (CI)
SulphaiM<SO4)
Iron (Fe)
Fluoride (F)
RAW
10
7.4
154
505
268
154
114
34
45
62
3
0.4
0.3
Bacteriological (MPN/100. ML)
Total coUfonn
Fecal coUfoim
Fecal streptococci
All values except Danube
93
15
4
7
ditvandcoodoc
I VISIT
FINISHED
1.5
7.2
138
520
-
-
-
-
-
-
-
23
9
0
o
stivitv aie expressed as
RAW
6.4
7.9
198
520
176
176
0
38
20
80
15
0.3
0.1
-
-
-
me/1
n VISIT
FINISHED
4.2
7.1
148
545
184
148
36
54
12
84
49
-
-
-
-
-
-

381
TABLE 18J2
PLANT PERFORMANCE AT VARIOUS STAGES OP TREATMENT
UDAIPUR WATER WORKS • UDAIPUR
PARAMEIERS VISIT RAW SETTLED FILTERED FINISHEDWATER WATER WATER WATER
TuMdity I 10 4.2-7.0 2.1-3.8 1.5(NTU)
n 6.4 3.8-4.8 2.8-3.2 4.2
T.CottfiMn I 93 4 15 23(MPN/100ML)
(MPN/100ML)

382
SIRUVANI WATER WORKS - COIMBATORE
INTRODUCTION
The major source of water supply to the city ofCoimbatore is Indira Gandhireservoir formed by the construction of a dam across river Siruvani. Impoundedriver water drawn through a 1.5 km long tunnel is provided complete conventionaltreatment consisting of aeration, alum dosing, flash mixing, flocculation, sedimenta-tion, rapid gravity filtration and disinfection. The plant commissioned in the year 1980is of 100 mid capacity and serves a population of 12 lakhs and is maintained by TamilNadu Water Supply and Drainage Board (TWAD). The schematic flowsheet is shownin Fig. 19.1 and summary data is presented in Table 19.1.
PLANT APPRAISAL
Raw Water quality and flow measurementDue to impoundment at source, the turbidity of raw water is low and the physico-
chemical characteristics do not vary much throughout the year. The turbidity of rawwater during study period was in the range of 3.0-4.0 NTU. The raw water is soft havinghardness in the range of 9-12 mg/1 with low coliform count (Table 19.2).
The raw water inflow to the plant is measured by a venturiflume fitted with aflow indicator, recorder and integrator ( Mahindra and Mahindra make). The plantinflow was found to be nearly equal to design capacity of the plant.
Pre-treatmentThe diffused air aeration system provided at the plant was not functioning.
Alum in the form of solution is applied at the raw water channel after aeration chamber.Due to very low turbidity, alum dose was also found to be low (16 mg/1). The chemicalpre-treatment was effective as evidenced by good floe formation.
The turbidity of settled water was 0.23 to 1.8 NTU. Significant reduction incoliform, count was also observed due to flocculation and sedimentation. The clarifiedwater recorded either zero or single digit bacterial count during the study (Table 19.3).
FiltrationThe rapid gravity filters were operated at an average filtration rate of 6 m/hr.
The filters were well-maintained. The normal filter run when the turbidity was lowwas 48 hrs. The rate of flow indicators and loss of head gauges provided were in goodworking condition. The filters are backwashed using filtered water preceded by air-scour. The rate of backwash water is about 36 m/hr and delivered at about a static headof 15 m, Flow measuring devices for backwash water and compressed air have beenprovided.

383
The filtrate turbidity varied from 0.23 NTU to 0.6 NTU with nil count of JThe functional efficiency of the filters was very good and the operation and maintenanceof filters quite satisfactory.
DisinfectionThe disinfection of filtered water is carried out at the clear water reservoir using
bleaching powder solution. The finished water at the plant had a residual chlorine of0.4-0.5 mg/1 and was free from coliforms.
Laboratory facilitiesNo laboratory facility is available at the plant site.
RECOMMENDATION
* Adequate laboratory facilities with minimum required equipment and trainedchemist should be provided at the plant to ensure proper operation and controlof the plant.

INDIRAGANDHIRESERVOIR
DIFFUSED AIRAERATOR
IMS/KM«USE CLARlFUOCCUtATOfl
ALUM ADOITION
FLASHMIMER
RAPIDGRAVITY
FILTERS
TO SUPPUf
CHLORVtATlON
FIG 19.1 CO1MBATORE WATER TREATMENT PLANT - SCHEMATIC

385
TABLE 19.1
PLANT SUMMARY DATA -COIMBATORE
GENERAL
Name and location
Year of construction
Design capacity
O& M Agency
Raw water source
Treatment flowsheet
ENGINEERING
Raw water pumping
Raw' water flow measurement
Pre-treatment
Aeration
Coagulation
• Chemicals used
-Type of mixing
- Detention time
Flocculation
- Method / Type of unit
- No. & Dimensions
- Detention time
: Siruvani Water Works Coimbatore
: 1980
: 101.4 mid
: Tamilnadu Water Supply andDrainage Board (TWAD)
: Indira Gandhi Reservoir across river Siruvani
: Conventional with Rapid sand filters
: Flow by gravity
; Mahindra and Mahindra flowmeter
: Diffused aeration system 16.2 x 23.4 m chamber
: Alum (Solution)
: Flash mixer,2nos
: lmin
: Mechanical/Clariflocculator
: 2 nos, 17 m dia,4 m SWD
: 30 min

386
Sedimentation
-Typeofunit(s)
- No. &. size of unit(s)
- Surface overflow rate
- Detention time
Filtration
-Typeofunit(s)
-No. &sizeofunit(s)
- Rate of filtration
- Filter media
. Depth of sand
. Gravel size & depth
- Backwash arrangements
.Method
. Wash water tank cap.
Disinfection
- Chemicals used
-Type of feed
Clear Water Reservoir
- Type, No. & Capacity
- Pumg details
Qariflocculator
2 no«, 52 m dia, 3 m SWD
l.lm/hr
180 minutes
Rapid Gravity Filters
16 nos, 7.4 x 8.6 m(twin bed) each
4.5 m/hr
62 cm
3-6 mm 15 cm depth6-10mm 10 cm10-13 mm 10 cm13-37 mm 7.5 cm37-55 mm 7.5 cm
Air scour and water wash
5 lakhs litres
Bleaching powder
: Solution feed, manual
: RCC,One,4500m3
: Gravity supply

387
TABLE 19.2
PHYSICO . CHEMICAL AND BACTERIOLOGICAL QUALITY OFRAW AND FINISHED WATERS
SIRUVANJ WATER WORKS • COIMBATORE
PARAMETERS
Physico-chemical
TuiWdity(NTU)
PH
Total Alkalinity(CaCO,)
Conductivity JuS/cm)
Hardness (CaCOj )Total
Carbonate
Non Carbonate
Calcium (Ca)
Magnésium (Mg)
Chlorides (CI)
Sulphates (SO4)
Iron (Fe)
Fluoride (F)
I VISIT
RAW )
4.0
6.8
12
51
8
8
0
3
1
5
2
0.2
0.1
Bacteriological (MPN/100 ml)
Total coUform
Fecal coliform
£Lodi
Fecal streptococci
1100
1100
28
460
FINISHED
0.2
6.7
10
43
8
8
0
3
1
5
3
0.1
0.1
0
0
0
0
nvisrr
RAW
3.7
7.6
21
269
9
9
0
2
1
7
2
0.3
0.1
11000
750
230
4600
FINISHED
0.5
7.4
19
258
8
8
0
2
1
6
3
0.3
0.1
0
0
0
0
ffl VISIT
RAW FINISHED
3.0
7.7
12
66
12
12
0
3
1
5
2
0.2
0.1
70
7
4
9
1.3
7.7
10
63
12
12
0
3
1
5
3
0.1
0.1
0
0
0
0
All values except pH .Turbidity and Conductivity ate expressed as rog/1

388
TABLE 19.3
PLANT PERFORMANCE AT VARIOUS STAGES OF TREATMENT
SIRUVANI WATER WORKS • COIMBATORE
PARAMETERS VISIT RAW SETTLED FILTERED FINISHEDWATER WATER WATER WATER
Turbidity(MTU)
n
4.0 0.23 0.39 0.19
3.7 1.2 0.7 0.5
m 3.0 1.8 0.6 1.3
T.Coüiorm(MPN/lOOml)
1100 0
11000 7
ni 70 IS
(MPN/lOOml)28
230
m

389
KILPAUK WATER WORKS - MADRAS
INTRODUCTION
Madras, the capital of Tamil Nadu is the fourth largest metropolis in thecountry and has a population of 32.7 lakhs as per 1981 census. The city draws its watersupply from four reservoirs, viz. (i) Poondi.(ii) Cholavaram,(iii) Red Hills and (iv)Chembarampakkam. The first three are interconnected by open channels and RCCmains and water from Poondi and Cholavaram can flow by gravity to Red Hills. Thesethree lakes supply about 200 mid of water to the city through its treatment works atKilpauk.
In addition about S3 mid of ground water extracted from Minjur, Panjetty andTamaraipakkam well fields is supplied to the industries. The city supply has beenaugmented by about 25 mid from the above well fields. About 7 mid of water is beingextracted from Thiruvanmiyur and southern coastal aquifer south of Thiruvanmiyur.Thus, the quantity of water that can be supplied to the city in a year of normal rainfallis about 240 mid.
The Kilpauk water works consists of old slow sand filters of 68 mid capacityand rapid gravity filters of 182 mid capacity with conventional pre-treatment comprisingof alum addition, coagulation, flocculation and sedimentation. The plant layout is shownin Fig. 19.2 and the summary data is presented in Table 19.4. The plant is maintainedby Madras Metropolitan Water Supply and Sewerage Board (MMWSSB).
PLANT APPRAISAL
Raw water qualityBeing from an impounded source, the raw water has alow turbidity. During the
evaluation study the turbidity of raw water was in the range of 5.5 to 8.8 NTU with acoliform content of 2400 to 4600 MPN per 100 ml. During drought periods, groundwater from the well fields is blended with surface water due to which the dissolved solidsin the raw water goes high (Table 19.5).
Water from Red Hills lake is drawn for treatment through an intake tower andtwin roughing filter basin which arrests floating coarse material. During summer, whenthe water level falls below the bottom-most inlet, raw water is pumped into the conduits.Bathing and cattle washing by people from the nearby village were observed in thevicinity of the intake.

390
Pre-treatment
Rapid gravity filter systemRaw water is received at the treatment plant in two sump wells where pre-
chlorination is carried out. Hie chlorine dose varies from 3 to 5 mg/1. Chlorine gasfrom cylinder is fed directly into the water and this practice leads to loss of chlorinegas. Pre-chJorinated water is then pumped to an elevated stilling chamber with a weirwhere alum solution is added. The flow over the weir creates heavy turbulencethereby achieving initial mixing. l ime (3 to 10 mg/1) is also added to raw water asa coagulant aid. The dose of lime is applied in the flow distribution box located nearthe clariflocculators.
No reduction in turbidity of raw water was observed due to sedimentation andthe settled water turbidity was more than raw water turbidity. This is attributed to useof lime slurry, improper flocculation and insufficient alum dose (Table 19.6).
FiltrationThere are 24 nos. of rapid gravity filters with a total output of 182 mid at a
filtration rate of 3.8 m/hr. Depth of sand in all the filters was 62 cm with an E.S greaterthan 0.75 mm. Normal filter runs was reported to be 24 to 48 hrs. Filter backwash ispreceded by air scour for 2 minutes. Rate of application of wash water found to be 24 m/hr (which is less than CPHEEO recommended rate). The performance of the filterswas not satisfactory as judged by the turbidity of filtered water which was in the rangeof 1.5-6.7 NTU (Table 19.6)
Slow sand filter systemThere are 14 slow sand filter beds with design filtration rate of 0.06 m/hr as
against the normal rate of 0.1 m/hr. Raw water is directly admitted into the filters.OccassfonaUy prechlorination is practised to control algal problem. Depth of sand kithe filters was only 15-20 cm. Sand washing machines have been provided at the plantto wash the sand and reuse the same in the bed. During times of acute shortage of rawwater in the lake, the filters are operated intermittently on alternate days. Normal filterruns were reported to be 3 to 6 months with a maximum permissble headtoss of 60cm. The performance of the filters was not satisfactory. The turbidity of filteredwater was in the range of 2.2- 5.4 NTU and cotiformMPN in the range of 23 to 240 par100ml.
DisinfectionPoet-chlorination is carried out in the clear water reservoir by directly bubbling
chlorine gas. Residual chlorine in finished water was 0.5 to 0.6 mg/1. Chlorinationwas found to be effective as observed from the absence of coliform andfLcoJiin thefinished water.

391
Laboratory facilitiesThe plant has a well-equipped laboratory with trained staff to carry out physico-
chemical and bacteriological analysis of water. Water quality monitoring is carried outsystematically and records are weU maintained.
RECOMMENDATIONS
* A perennial source of raw water of adequate and reliable yield should beidentified to make optimum use of the treatment plant capacity - A flowmeasuring device should be installed to record the raw water inflow and facilitateits regulation and control of chemical dosing and other unit operations ofthe plant.
* The filter appurtenances such as rate of flow indicators, should be rectifiedfor proper operation and control of the filters.
* The Slow sand filters should have a minimum sand depth of 45 cm to ensuresatisfactory performance and practice of intermittent operation should bediscontinued in favour of continuous operation.
* Direct addition of chlorine gas from chlorine cylinder should be avoidedand the chlorinator should be repaired and put to use.

\ rINTAKE« D V J TOWER omKi-jrwix$7v THSSB /-LAKE / )
O T — *
> '
r—J
/
1 ,CLEAR WETERPUMP HOUSE
J •—"1 SUMP
KSLOW SAND
(14 Net.) '
'CLEAR \H WATER J
VRESERVOR/
1FOR DISTRIBUTION
j — '
D—
RAPIDGRAVITYFILTERS( HUtm]
I
PRECHU»»UnON
RAWVKTER1 IMMHOUSE
1
RAP»GRAVITYFLTERS( • N H . )
1
KnUffiS\ \CHAM8CR ^»SiwwU SOX
1
\
4-V A U M
CLARFIÛCCU-LATORS ^f \_
oou
CLARIFUOCCULATORSo
MOT TO SCALE)
FIQ 19.2 LAYOUT PLAN OP K1LPAUK WATBR TREATMENT PLANT, MADRAS

393
TABLE 19.4
PLANT SUMMARY DATA - MADRAS
GENERAL
Name and location
Year of construction(Augmentation if any)
Design capacity
O & M Agency
Raw water source
Treatment flowsheet
ENGINEERING
: Kilpauk Water Works Madras
: 1957 (Augumented in 1969 by 136 mid).
: 250 mid
: Madras Metropolitan Water Supply andSewerage Board (MMWSSB).
: Poondi, Cholavaram and Red Hills lakes(interconnected)
: i) Conventional with Rapid sand filters- 182mldii) Slow sand filters - 68 mid
Raw water pumping
Raw water flow measurement
Pre-treatment
Coagulation
- Chemicals used
-Type of mixing
Flocculation
- Method/Type of unit
- No. & Dimensions
Six pumps220 HP;72 mVmin - 2 nos.120HP;31.8mVmin-lno.51 HP ;15.9 mVmin - 2 nos.105HP;31.8mVmin-lno.
; Sharp edged suppressed weir of length 4.8 m.
Alum and lime (solutions)
Hydraulic jump
Mechanical(Clariflocculators)
6 nos, 11 m dia x 4.3 SWD 2 nos. 22.7 mid each15.5 m dia x 5.5 m SWD-4 nos, 34 mid each
- Detention time 27 min-2 nos, 42 min-4nos

394
Sedimentation
-Typeofunit(s)
-No.Asizeofunit(s)
- Surface overflow rate
- Detention time
Filtration
-Typeofunit(s)
- No. A size of unit(s)
- Rate of filtration
- Filter media
.Sand size
.Depth of sand
. Gravel size
.Depth of Gravel
- Backwash arrangements
Method
. Wash water tank cap.
Disinfection
- Chemicals used
-Type of feed
- Chlorinator Details
Clear Water pumps
: Mechanical/Clariflocculators
: 6 nos, 30.5 m dia x 4.3 m SWD2nos. 22.7 mid each 42.7 m dia x 5.5 m SWD,4 nos, 34 mid each
: 1.5 m/hr (22.7 mid) 1.1 m/hr (34 mid)
: 2 hrs SO min (22.7 mid) 4 hrs 50 min (34 mid)
Rapid Sand
24 nos11 m x 7.6 m
Slow Sand
14 nos,61 m x 55 m
3.8 m/hr 0.06 m/hr
E.S. - 0.3 mm
62 cm
2.5 mm-50 mm
40 cm
air scour and water
340.5 m1
Chlorine gas
Solution feed
15 cm
9mm-18
10 cm
wash
6 nos,capacity 12.5 kg/hr
7 nos, each575 HP,5.450mJ/hr3nos.325 HP, 2.72mJ/hr-4nos.

395
TABLE 19.5
PHYSICO-CHEMICAL AND BACTERIOLOGICAL QUALITY OFRAW AND FINISHED WATERS
KJLPAUK WATER WORKS -MADRAS
PARAMETERS
Phyako-dwmkal
Tuibidity(NTU)
pH
Total Alkalinity(CaCO,)
Conductivity iflSfau)
Hardness (CaCO,)Toatal
Carbonate
Noo Carbonate
Calcium (Ca)
Magnésium (Mg)
Chloride« (O)
Sulphate« (SO4)
Iron (Fe)
Fluoride (F)
ivisrr
RAW
5.5
7.8
34
697
78
34
44
14
10
41
13
Tr
-
Bacteriological (MPN/100 ml)
Total colifonn
Fecal coUform
Lssä
Fecal streptococci
All values exceot DH ,TUI
2400
2400
-
1500
[bkUtvandCooi
FINISHED
-
7.6
28
680
72
28
44
11
10
67
15
Tr
-
0
0
0
0
iuetivitvaree:
nvisrr
RAW FINISHED
8.8
7.9
118
337
145
118
27
44
9
67
53
ND
<0.1
4600
150
23
210
raressed asms/I]
4.2
8.0
130
825
170
130
40
48
12
80
62
ND
<0.1
0
0
0
0
"TO-No
m VISIT
RAW
6.0
8.2
206
880
240
206
34
90
4
125
62
ND
<0.1
2400
15
9
240
«delectable
FINISHED
• a . -
2.0
8.0
154
790
200
154
46
70
6
100
59
ND
<0.1
0
0
0
0
Tr.-Traces

396
TABLE 19.«
PLANT PERFORMANCE AT VARIOUS STAGES OF TREATMENT
KILPAUK WATER WORKS • MADRAS
PARAMBTBRS VISIT RAW SETTLED
WATER WATER
FILTERED FINISHED
WATER WATER
ROF SSF
TurtMdtty(NTU)
T.CoUfon»
(MPN/100ml)
B.Cnli(MPN/100ML)
I
U
m
i
n
m
i
n
m
5.5
8.8
6.0
2400
4600
2400
23
8.2
13.6
3.5
6.7
2.5
1.5
5.4
2.2
3.5
240
23
93
6.4
4.2
2.0
0
0
0
0
0
0
0

397
AGARTALA WATER WORKS • AGARTALA
INTRODUCTION
Agartala, the capital of Tripura State with a population of 1.31 lakhs (1981census) meets its water needs from surface as well as ground water sources. Themunicipal water works of capacity 6.8 mid constructed in 1966 and situated nearcollege Tilla was taken up for evaluation. The treatment plant draws raw water fromriver Howrah and provides for aeration, coagulation, flocculation, sedimentation, rapidgravity filtration and disinfection. The schematic flowsheet is shown in Fig. 20.1 andsummary data is present in Table 20.1. The plant is maintained by the PHED, Govt. ofTripura.
PLANT APPRAISAL
Raw water quality and flow measurementRaw water from river Howrah drawn through an intake well, is pumped to the
treatment works situated 100 m away. The screens provided at the intake well were foundcorroded. Considerable human activity was observed in the river near the raw waterintake point. During the evaluation study, the turbidity of raw water was 37 NTU. Dueto prevailing pollution, raw water coliform count was in the range of 3500-24000 per100 ml (Table 20.2).
Plant inflow as measured at the ' V notch was found to be nearly equal to designflow ; however, the plant was operated only for about 18 hours a day due to intermittentpower supply which is reported to be a regular feature.
Alum is used as the coagulant and the solution is applied in the channel leadingto the flocculators. Lime addition is also practised occasionally. No mechanical flashmixer is provided and chemical mixing is achieved in the baffled channel. Theperformance of theclariflocculator was satisfactory as observed by the considerablereduction in turbidity as well as bacterial count in the settled water (Table 20.3).
FiltrationThe rate of flow and headloss indicators of the filters were not in working
condition. Depth of sand in the filters was around 60 cm. Filters were backwashed usingair and water after 24 hrs of filter run. Backwashing was ineffective as observed fromthe persence of mudballs in the filters. In general, the performance of the filters was notsatisfactory and the filtrate turbidity was in the range of 4-4.6 NTU.

398
DisinfectionBleaching powder is used for chlorination of filtered water. The chlorine demand
of filtered water was 1.0 mg/land thé finished water had a residual chlorine of 0.2mg/1 and was found to be free from coliforms.
Laboratory facilitiesA fairly well equipped laboratory with a chemist for routine testing and plant
control is available at the plant. However, most of the instruments were not in workingcondition.
RECOMMENDATIONS
* Immediate measures should be taken to prevent pollution of raw waterdue to human activities near intake well.
* The filter backwashing operation should be improved to keep the filtersclean and to avoid mudball formation. The filter appurtenances need to berepaired and maintained in working condition to facilitate proper operationand control.
* The instruments in the laboratory should be got repaired/replaced tomonitor water quality and plant control.

RIVERHAORA
ALUM
AERATOR
RAPID SANDFILTERS
CLARIFLOCCULATOR
PUMP HOUSE
~7CHLORINATION
CLEAR WATER RESERVOIR
FIG 20.1 AGARTALA WATER TREATMENT PLANT - SCHEMATIC

400
TABLE 20.1
PLANT SUMMARY DATA • AGARTALA
GENERAL
Name and location
Year of construction
Design capacity
0 & M Agency
Raw water source
Treatment flowsheet
ENGINEERING
Raw water pumping
-Rising main diameter
Raw water flow measurement
Pre-treatment
Aeration
Coagulation
- Chemicals used
-Type of mixing
- Method of mixing
- Detention time
Flocculation
- Method / Type of unit
- No. & Dimensions
- Detention time
Agartala Water Treatment Plant, College Tula.
1966
6.8 mid
Public Health Engineering Department Agartala
River Haora
Conventional with Rapid Sand Filters
: Three nos, centrifugal pumps,each of capacity 189.3 nïThr (one Standby)
: 45 cm
: V notch
: Cascade aerator
: Alum (7% solution)
: Hydraulic
: Rectangular channel with 10 baffles each of size0 .5x0.15x0,5 m, placed
: 35 sec
: Mechanical(Clariflocculator)
: One, 5.3 m dia, 4.0 m SWD
: 19 minutes

401
Sedimentation
-Typeofunit(s)
- No. & size of unit(s)
- Surface overflow rate
- Detention time
Filtration
- Type of unit(s)
- No. &. size of unit(s)
- Rate of filtration
- Filter media
. Sand size
.Depth of sand
. Gravel size
. Depth of each layer
- Backwash arrangements
. Method
. Wash water tank cap.
Disinfection
-Chemicals used
-Type of feed
Clear Water Reservoir
- Type, No. & Capacity
-Pump details
Mechanical(Clariflocculator)
One no, 21 m dia. and3.0mSWD
0.87 m/hr
3 hrs 24 mimutes
Rapid Sand Filters
2 nos, 9.8 x 4.5 m each (twin bed)
4.8 m/hr
E.S.-0.55mm,U.C.-1.5
60 cm
5 mm to 25 mm
4 layers each 11 cm
Àir scour & Water wash
75.7 m3
Bleaching powder
Solution feed
RCC, one, 15 lakh lits.
3 nos, centrifugal pumps each of capacity189 mVhr

402
TABLE 20.2
PHYSICO - CHEMICAL AND BACTERIOLOGICAL QUALITY OFRAW AND FINISHED WATERS
AGARTALA WATER TREATMENT PLANT - AGARTALA
I VISITPARAMETERS
RAW
Physico-chemical
Tuibidity (NTU)
pH
Total Alkalinity(CaCO,)
Hardness (CaCO,)Total
Carbonate
Non Carbonate
Calcium (Ca)
Magnesium (Mg)
Chlorides (CI)
Sulphates (SO4)
Fluoride (F)
Nitrate (NO,)
Bacteriological (MPN/100 ml)
Total coliform
Fecal coliform
Fecal streptococci
37
7,0
64
100
64
36
20
12
5
14
0.4
24000
24000
24000
16000
FINISHED
4.6
7.0
52
125
52
73
20
18
5
22
0.8
0
0
0
II VISIT
RAW FINISHED
36
7.0
81
54
54
0
14
5
3
12
0.1
0.7
3500
3500
2800
1100
4
7.0
78
72
72
0
19
6
7
23
0.1
0.5
0
0
0
0
All values except pH and Turbidity are expressed as mg/1

403
TABLE 203
PLANT PERFORMANCE AT VARIOUS STAGES OF TREATMENT
AGARTALA WATER TREATMENT PLANT • AGARTALA
PARAMETERS
Tuibidity
(NTÜ)
T.Colifenn
(MPN/lOOml)
(MPN/lOOml)
VISIT
I
II
I
n
I
n
RAW
WATER
37
36
24000
3500
24000
2800
SETTLED
WATER
12
11
920
540
920
350
FILTERED
WATER
4.6
-
23
330
13
130
FINISHED
WATER
4
0
0
0
0

404
AGRA WATER WORKS - AGRA
INTRODUCTION
Agra water works is the oldest plant in Uttar Pradesh. The first plant witha capacity of 27 mid was constructed in 1888 with plain sedimentation of Yamuna riverwater followed by slow sand filtration. The plant has been subsequently augmented instages and the present capacity is 198 mid which is again inadequate to meet the needsof thegrowingpopulationofthecity. The present supply is also supplemented with tubewell waters and further augmentation is under consideration.
There are three raw water mains, all interconnected, four clariflocculators, twonew settling tanks (Hudson type), four batteries of rapid gravity filters and six slow sandfilters as shown in the plant layout (Fig. 21.1). The plant summary data is given in Table21.1. No detailed drawings were available for any of the plants. The water works ismaintained by Agra Jal Sansthan.
PLANT APPRAISAL
Raw water quality and flow measurementThe surface flow in river Yamuna, the source of raw water, has been depleting
over the years and is inadequate to meet the needs during summer season. To tide overthe situation, water from Keetham reservoir is diverted into river Yamuna during Mayand June. The surface flow in the river has drifted away from the intake well. A channelabout 1 SO m long, 6-8 m wide and 1 -1.2 m deep has been dug to get desired raw waterflow at the intake. Constant vigilance is maintained and dredgers are used whennecessary to ensure sufficient flow towards the intake well.
The river is heavily polluted in its entire stretch of 200 km. The river waterat the intake was highly polluted (chlorine demand 4-8 mg/1), and algae laden. Noneof the flow measuring devices originally provided at the plant was in working condition.Flow measurement at the time of visit by float method indicated a plant flow of 162 mid.
Pre-treatmentIn view of the poor quality of raw water, pre- chlorination has been resorted to.
Chlorine gas conveyed through plastic tubing is directly bubbled into the raw waterchannel at two locations. In the absence of proper diffusers, chlorine gas was escapinginto the atmosphere as abandoned by the heavy chlorine experienced in the vicinity.According to plant authorities, prechlorination has helped in the control of algae invarious units and in improving the performance of the settling tanks and filters.However, control on pre-chlorination was far from satisfactory.

405
Alum dosingAlum solutionising and dosing tanks originally provided near the Parshall
flumes are in disuse. Alum filled in a basket made ofwiremesh is immersed in the rawwater intake well from where the alum mixed water is pumped to the settling tanks/clariflocculators. Requisite quantity of alum is added hourly into the cage.
As the raw water quality fluctuates, jar tests are conducted regularly andaccordingly the number of alum bricks to be added is decided by the plant chemist.Except in baffled-channel flocculator where formation of microflocs was observed, theflocculator paddles were not in working condition.
SedimentationDuring one of the visits, the plant was underloaded to the extent of 14 per cent.
The effluent turbidity from the sedimentation tanks and clariflocculators ranged between2.0 and 5.0 NTU compared to raw water with 8 NTU. The'Hudson type'sedimentationtanks gave a relatively better performance. During another visit when the raw waterturbidity was low, the clarified water did not show any improvement.
FiltrationOne battery of rapid sand filters of 45 mid capacity is kept neat and clean. The
filter box of 90 mid capacity plant was leaking very heavily at the expansion joints asalso all the valves, leading to considerable loss of water. No filter appurtenance is inworking condition. Filter operators are illiterate and supervision is poor. Filters arebackwashed once in 24 hours irrespective of the headloss or the filtrate turbidity. Largecracks and undulations and mud ball formation were noticed in the sandbed. Thebackwash water distribution was uneven as observed at thetimeof backwashing.
The depth of sand in some of the filters was less than 60 cm. The operation andmaintenance of the filters was far from satisfactory as confirmed by the poor efficiencyof the filters.
In slow sand filters, flow measuring devices were all missing and the flow ratewas adjusted by trial and error. The effluent quality from slow sand filters wascomparatively better than rapid sand filters.
DisinfectionThere are seven chlorinators but all of them were not in working order during the
time of visits. Chlorine gas was injected directly into clear water reservoir. The residualchlorine in finished water was satisfactory.
Laboratory facilities and staffThe laboratory facilities provided are adequate with experienced and trained
staff. For operation and maintenance of the plant, 12 filter attendants, 5 chlorinemechanics and 40 Khalasis exclusively look after the plant. Apart from this staff from

406
pumping station helps in repair works. Filter operators and khalasi are uneducated andhave not received any formal training.
Financial AspectsThe annual expenditure for 1985-86 was 113.2 lakhs whereas the annual
revenue from sale of water is 146 lakhs. The staff salary accounts for nearly 54 per centof the expenditure. Chemicals and energy 16.2 and 10.6 per cent respectively andmaintenance and repairs 19.2 per cent.
In view of the frequent change in the raw water quality in river Yamuna,Regular monitoring of river water quality is recommended to enable adequate controlon treatment and to ensure a finished water of prescribed standards.
RECOMMENDATIONS
* As the river water source is highly polluted, provision for drawal ofraw water directly from Keetham reservoir may be considered as an alternative
* Instead of dumping alum slabs at the intake alum solution should be fedfor prechlorination. - Flow measurement devices, filter appurtenances arenecessary for proper control over unit operations
* Overhauling ofunderdrains is necessary. Proper sand and gravel should beprovided in the filters.
* Loss of chlorine gas can be avoided by providing packed gravel bed towersfor prechlorination in canal water
* Chlorinators are essential for controlled dosing arrangement based onchlorine demand of filtrate

407
zo Mao
\ \\M
St«\
s F
S MOD
OFFICE
ST - SETTLING TANKCWR - CLEAR M»TER RCSCHVOIR
« - $AMPLINa POINTCF - CLAftlFLOCCVUtTORPN - PUMP NOUSCC - CLARIFIERF - FLOCCULATOR
SW - SUMP WELL(PI - PATERSON
R«F - RAPID «RAVITY FILTERSSCF - SLOW SAND FILTERS
NOT TO SCALE
FIG 21.1 LAYOUT PLAN OF AGRA WATER WORKS
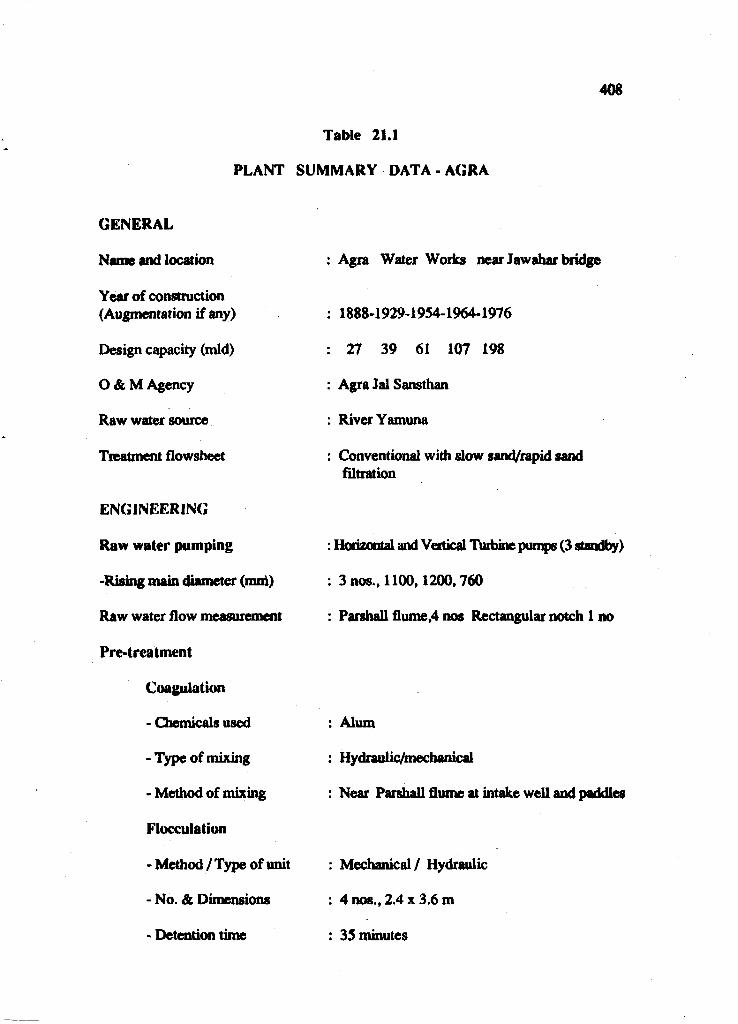
408
Table 21.1
PLANT SUMMARY DATA - AGRA
GENERAL
Name and location
Year of construction(Augmentation if any)
Design capacity (mid)
O & M Agency
Raw water source
Treatment flowsheet
ENGINEERING
Raw water pumping
-Rising main diameter (mni)
Raw water flow measurement
Pre-treatment
Coagulation
- Chemicals used
-Type of mixing
• Method of mixing
Flocculation
- Method / Type of unit
- No. & Dimensions
- Detention time
: Agra Water Works near Jawahar bridge
: 1888-1929-1954-1964-1976
: 27 39 61 107 198
: Agra Jal Sansthan
; River Yamuna
: Conventional with slow sand/rapid sandfiltration
: Horizontal and Vertical Turbine pumps (3 standby)
; 3 nos., 1100,1200.760
: Parshall flume,4 nos Rectangular notch 1 no
Alum
Hydraulic/mechanical
Near Parshall flume at intake well and paddles
Mechanical/ Hydraulic
4 nos., 2.4 x 3.6 m
35 minutes

409
Sedimentation
-Typeofunit(s)
- No. & size of unit(s)
Filtration
-Typeofunit(s)
- Capacity (mid)
-No. ofunit(s)
- Size of unit(s) (m)
- Rate of filtration
- Filter media
. Sand size
. Depth of sand
. Gravel size
. Depth of each layer
- Backwash arrangements
. Method
. Wash water tank cap.
Filtration
- Type of unit(s)
- No. & size of unit(s)
- Rate of filtration
- Filter media
- Sand size
Pre-settling: Rectangular Circular
: 2 4
: Rapid Gravity Filters
: U.3 22.7 45 91
: 4 3 5 10
: 5.4x4.4,7.6x10.9,10.7x7.6,9.1x8.5 ,4.4x4.4
: 4.8to6m/hr
: E.S.- 0.5 to 0.7 mm U.C.-1.5 to 1.8
: 60 cm
: 2.5-6 6-12 12-38 38-50 mm
: 150 75 150 76 mm
: Air + water through overhead reservoiror direct pumping
: 45 and 110 m*
: slow sand filtersjtectangular
: 6 nos., (61 x 30.5 m)
: 0.1 m/hr
: E.S.-0.3 to 0.4 mm U.C.-2.8 to 3.0

410
• Depth of sand
- Depth of each layer
-Underains
- Depth of sand scraping
- Average time required to putfilter back into service afterscraping
Disinfection
- Chemicals used
-Type of feed
Gear Water Reservoir
• Type, No. & Capacity
- Number
-Pumpdetails
: 76 cm
: 200mm
: Brickwork
: 10-20 mm
: 1 to 2 days
: Chlorine gas/Bleaching powder
: Pressure / gravity
: Rectangular RCCLime and brick
: 3 3
: Centrifugal, Vertical Turbine3 nos., 13 nos.

411
TABLE 21.2
PHYSICO • CHEMICAL AND BACTERIOLOGICAL QUALITY OFRAW AND FINISHED WATERS
AGRA WATER WORKS • AGRA
PARAMETERS
PhysicO'Chemical
Tuibidity(NTU)
PH
Toul Alkalinity(CaCO,)
CooductivityOuS/cm)
Hardness (CaCO,)Total
Carbonate
NooCorbonate
Calcium (Ca)
Magnesium (Mg)
Chlorides (Cl)
Sulpbates(SO4)
boo (He)
Fluoride (F)
Nitrates (NO,)
I VISIT
RAW
5.0
8.5
280
1535
360
280
80
71
45
114
-
0.4
-
0.3
Bacteriological (MPN/100 ML)
Total couform
Fecal colifonn
Fecal streptococci
13000
2300
2300
0
FINISHED
3.7
8.0
220
1680
348
220
128
65
47
H7
-.
0.1
-
2.0
0
0
0
0
n VISIT
RAW FINISHED
8.0
8.3
236
I960
312
236
76
48
47
274
138
-
0.5
-
24000
24000
900
-
2.0
8.5
220
2050
304
220
84
48
47
274
131
-
0.5
-.
17-33
17-33
0
. . . i . . . . . . . .4—
mvisrr
RAW FINISHED
10
8.1
200
1470
262
200
62
38
41
124
74
2
0.5
9.7
16000
-
-
•
2
7.9
230
288
230
58
35
49
154
100
0.4
0.6
6.1
14
-
-
-
All results ate expressed as mg/L except for pH, conductivity and Turbidity

412
TABLE 21.3
PLANT PERFORMANCE AT VARIOUS STAGES OF TREATMENT
AGRA WATER WORKS • AGRA
PARAMETERS VISIT RAW SETTLED FILTERED FINISHED
Turbidity
(NTU)
T.coUfoim
(MPN/100ML)
I
n
i
n
m
5.0
8.0
13000
24000
16000
4.0-5.0
2.0-4.8
m
-
230-3500
1.6-4.5
1.5-3.0
46-2400
11-79
22-2400
3.5
ZO
0
33
14

413
BËNAZHABER WATER WORKS - KANPUR
INTRODUCTION
Hie first piped water supply scheme for Kanpur city was commissioned in theyear 1892 with a design capacity of 18 mid for a population of 2 lakhs. Since then thesupply has been augmented from time to time and presently the supply including thatfrom tube wells is about 200 mid serving a population of nearly 17 lakhs. The rawwater source is river Ganga tapped directly and through the lower Ganga Canal. Thetreatment consists of alum coagulation, flocculation and sedimentation in rectangularsettling tanks followed by filtration (both slow and rapid) and chlorination. Theplant layout is shown in Fig.21.2 and the plant summary data is given in Table. 21.4 Thetreatment plant is operated and maintained by Kanpur Jal Sansthan.
PLANT APPRAISAL
Raw water quality and flow measurementRaw water from lower Ganga canal passes through two manmade lakes which
are now nearly silted up. The dredged channel in river Ganga supplies about 160 midof raw water to the treatment plant. As the river flow changes very frequently, themaintenance of the channel presents difficulties. Dredging of raw water channel andmaintenance of intake and pumps are facilitated by a workshop put up near the site.Wastewater from "Purana nallah" joins upstream of the intake well. The physico-chemical and bacteriological quality of raw water is presented in Table 21.5. Pollutionpotential of both the canal water and the river-water is quite significant. Raw waterflow is estimated based on the rated pump capacities as there is no flow indicating andrecording devices at the water works.
Pre-treatmentRaw water from dredged channel is pumped to horizontal flow settling
basins (land 2) operated in parallel. One of the tanks is completely silted up and isfull of weeds and aquatic growth. Another tank is out of commission for the last twoyears for modifications. Works of capital nature including cleaning and desilting ofsettling tanks is with U.P. Jal Nigam which has not been able to desilt the tanks for wantof funds. Due to buildup of silt load on the common wall of settling tanks 2 and 3, partof the wall has collapsed and a temporary wall of sand bags has been provided.
Alum blocks are added to the presettled water in the baffled channel leadingto settling tanks 3 and 4. Flocculation in the baffled channel is not complete. The mixerassembly in the flocculator has been removed as it was out of order. Being of very oldconstruction the clariflocculators are in a dilapidated condition. Settling efficiency of

414
the clariQocculators 3 and 4 is satisfactory as indicated by water quality Table 21.6. Dueto financial constraints the alum stock available was inadequate to meet even a few daysrequirements.
FiltrationAll the appurtenances of rapid gravity filters are out of order. The depth of sand
in the filters is 20-30 cm only and the sand is coarse. The filtration efficiency is verypoor. Filter sand is periodically treated with bleaching powder to avoid slime growthand coating on sand grains. In the new plant two filters have been converted into dualmedia filters with bituminous coal as top layer. These filters are reported to give longerruns with better quality of filtrate than the conventional sand filters. Backwashingof filters is carried out once a day with air scour for 2 minutes followed by watenvashfor 10 minutes.
Most of the slow sand filters are with shallow depth of coarse (E.S. 0.44 mm,U.C. 1.8) sand. The normal filter run reported is 60 days. Out of 36 slow sand filters12 are idle for want of resanding. The filter appurtenances are not in working order.Two filters were under renovation at the time of visit.
Disinfection
There are in all seven chlorinators working satisfactorily. Separate chlorinatorshave been installed for filtrate from slow sand filters and two batteries of rapid sandfilters. The chlorine demand of filtered water is estimated daily and an average 2 - 2.5mg/1 chlorine dose is appliedso as to maintainaresidual of 1 to 1.5mg/l at the clear waterreservoir. Safety equipment at the chlorine house are available. Pre-chlorination isalso practised at the raw water intake channel when river water quality is poor.
Laboratory facilitiesAdequate laboratory facilities aie available at the plant and water quality testing
is done regularly at various stages of treatment. Log books are maintained forbacteriological analysis, turbidity, chlorine applied and plant inflow.
Plant staffThe total staff employed exclusively for water works is about 340 of which only
6 are of supervisory cadre. Most of the operating staff are not qualified and have noformal training in O & M of waterworks.
Financial aspectsThe statement expenditure for the year 1985-86 (last available) indicates the
following breakup. Chemicals and power 62 per cent, staff4alaiy35percent, operationand maintenance 3.0 per cent

415
RECOMMENDATIONS
* Hie wastewaier outfalls upstream ofthe river intake should be diverted toprevent pollution of raw water.
* Provision for raw water flow measurement should be made to ensure effectivechemical dosing and plant control.
* The plain sedimentation tanks which have been silted up, need to be desiltedand renovated into 'Hudson type'settlers which have been reported to performbetter.
* A flocculation chamber with necessary mixing arrangements should beprovided for effective pre-treatment.
* Rapid and slow sand filters need to be resanded with sand of appropriatespecifications so as to provide a filtered water meeting the prescribed qualitystandards.
* The clear water reservoirs must be cleaned periodically to avoid sludgeaccumulation.

u• Ott» HECK.
T«; F I L ™TO CWRHO-I
FILTER
[ , HEW HECK FILTEIt
M •'• TO UHptfR 6BOUHO CHAHEL TOOLO MEC*
UNDER CROUNO CHANCL
7*~ y
SLOW ÏANO FILTERS
TO C D « HO. 4CWR; CLEAR WATER RESERVOIR
Nat t« TO CWR NO. 2
HG 21.2 LAYOUT PLAN OF BENAZHABER WATER WORKS, KANPUR

417
TABLE 21.4
PLANT SUMMARY DATA - KANPUR
GENERAL
Name and location
Year of construction
: Benazaber Water Works, Kanpur
(Augmentation if any)
Design capacity (mid)
0 & M Agency
Raw water source
Treatment flowsheet
ENGINEERING
Raw water pumping
-Rising main diameter (mm)
Raw water flow measurement
Pre-treatment
Coagulation
- Chemicals used
-Type of mixing
- Method of mixing
Flocculation
- Method / Type of unit
: 1892 1937 1977
: 18 180 138
: Kanpur Jal Sansthan
: River Ganga, lower Ganga canal
: Conventional with slow sand/rapid sand filters
: Ganga CanalVertical Centrifugal6 nos., 4 nos.,40 HP each 140 HP each
: 1x1200 mm 1x700 mm1 x 6 0 0 mm 1x600mm2 x 5 0 0 mm
: not available
: Alum
: Hydraulic
: Near Parshall flume
: Mechanical, Rectangular

418
Sedimentation
- TvDe of unit(s)
-No. &sizeofunit(s)
- Detention time
Filtration
-Typeofunit(s)
- No. & size of unit(s)
-Rate of filtration
- Filter media
. Sand size (mm)
. Depth of sand (mm)
. Gravel size (mm)
. Depth of each layer
- Backwash arrangements
.Method
. Wash water tank cap.
Disinfection
- Chemicals used
-Type of feed
• Chlorinator Details
Clear Water Reservoir
- Type, No. & Capacity
-Pump details
: Secondary Presett!
: 2Nos,
: Ihr
: Rapid gravity
: 6,7.3 x 5.5 m6,7.6x7.6 m4, 9.8 x 7.6 m
ling ifctangMllitr Rectimgultp
2 Nos9 0 x 6 1 x 4 m
2hrs
Slow sand
16,61x30.4 m
: 4.4toll.7m/hr0.1nVhr
: 0.5-0.7
: 60
: 2.5-50
: 7.5 to 15 (cm)
0.2-0.35
76
Brick underdrain
: Air scour + Water wash
: 327 mJ
: Chlorine gas
: solution feed
: Vacuum type
: RCC, 33450 m3
: Centrifugal, 15 nos.

419
TABLE 21.5
PHYSICO-CHEMICAL AND BACTERIOLOGICAL QUALITY OFRAW AND FINISHED WATERS
KANPUR WATER WORKS - KANPUR
PARAMETERS
Physico-chemical
Tuibidity(NTU)
pH
Total Alkalinity(CaCO,)
CoDductivity(DS/cm)
Hardness (CaCO,)Total
Carbonate
NonCorbonafc
Calcium (Ca)
Magnesium (Mg)
Chlorides ( d )
Sulphates (SO«)
Iron as Fe
Fluoride(F)
I VISIT
RAW FINISHED(Rl) (R2) • (Rl)
30.0
8.3
210
390
116
116
> 0
37
18
16
15
1.1
-
Bacteriological (MPN/100 ML)
Total coliform
Fecal colifonn
Rcoli
35000
35000
5000
23.0
8.0
120
250
112
112
0
31
9
8
16
1.3
-
-
1.6
7.8
185
370
-
-
35
17
16
17
Tr
0
0
0
14.0
8.1
240
490
184
184
0
43
18
38
38
0.7
0.5
0*
0
0
nvisnr
RAW FINISHED(R2)
30.0
8.1
120
260
120
120
0
29
12
6
29
1.4
0.3
11000
7000
7000
7.0
7.6
190
-
190
190
0
42
21
27
39
0.4
0.4
0
0
0
mvisrr
RAW FINISHED(Rl) (R2)
6.0
7.8
190
490
138
138
0
-
-
14
19
0.2
0.3
- • '
-
27.0
8.2
135
240
76
76
0
-
-
3.
14
0.9
0.2
- . '
. -
2.2
8.0
170
490
130
130
0
-
-
18
25
0.1
0.3
. ^ • ' '
-
-
Results are expressed as mg/L except for pH, Tuibidity and conductivity* Piechlorinated raw water

420
TABLE 21.6
PLANT PERFORMANCE AT VARIOUS STAGES OF TREATMENT
KANPUR WATER WORKS • KANPUR
PARAMETERS VISIT RAW SETTLED FILTERED FINISHEDWATER WATER WATER WATER
Tuibidity(NTU)
I
n
25-30
14-30
7.5 1.2-2.5
9.5-12 2.5-9.0
1.5
7.0
T.coUform(MPN/100ML)
I
n
3500 920 220-1600 °
0-11000 0-1400 72400 0
(MPN/100ML)I
n
5000 30 20
0-7000 0-1400 72400

421
AISHBAG WATER WORKS - LUCKNOW
INTRODUCTION
Lucknow, the capital city of Uttar Pradesh with a population of 9 lakhs (1981census) draws its water supply from river Gomati and a network of tube wells. The firsttreatment plant commissioned in 1894 consisted of slow sand filters preceded by plainsedimentation of the river water. Subsequently the plant capacity was augmented withconventional rapid gravity filters with chemical pretreatment. The present total capacityof the plant is 172 mid. The city supply is further augmented by providing 130 tubwellswith a total yield of 120 mid. The water works located at Gaughat is operated andmaintained by Lucknow Jal Sansthan.
River water drawn through intake well is pumped through three rising mainsdischarging into a common inlet chamber at the treatment works. Required quantityof alum slabs (arrived at by jar tests) are dumped periodically into this chamber. Noseparate mixing arrangements have been provided. The alum mixed water flows throughalong (215 m) rectangular channel feeding the three sedimentation tanks. Settled waterfrom these tanks flows to 10 slow sand filters and 3 batteries of rapid sand filters witha total capacity of 127 mid. A separate pipeline laid underground delivers45mldofalumdosed water to a clariflocculator and then to a battery of rapid sand filters. The schematiclayout of the plant is shown in Fig. 21.3 and plant summary data is given in Table 21.7.
PLANT APPRAISAL
Raw water quality and flow measurementAs the surface flow at the intake point has receded, raw water is diverted to the
intake through an open channel about 200 meters long. The channel is dredged regularlyto maintain the flow. No master meters are provided at the pumping station pumpdischarges and the flow is reckoned by the rated capacity of pumps. Raw water flowmeasured at the time ofvisit indicated that the plant was overloaded by 25 per cent. Thephysico-chemical characteristics of the river water are within the prescribed limits foruse as raw water Table 21.8.
Pre-treatmentThe plain settling tanks originally provided for slow sand filters are used as sedi-
mentation tanks SÉer alum addition. One of the settling tanks has been modified into'Hudson type'sédimentation tank while the other two were silted up. The Hudson typebaffled channel flocculator / sedimentation tank was, therefore, overloaded. Due to this,the floe formation was poor, reduction in turbidity due to sedimentation was onlymarginal and bacterial removal efficiency was''not satisfactory.

422
The flocculator paddles and the sludge scraper mechanism for the 45 midclariflocculator were not in working condition and the efficiency of the unit was verypoor.
FiltrationThe operation and maintenance of rapid sand filters was far from satisfactory.
The depth of sand in all the filters was less than the minimum value recommended byCPHEEO. Defective washing has resulted in loss of sand. Heavy cracks and undulationswere observed in the filter beds. Filter rate controllers, rate indicators, loss of headgauges and other appurtenances were not in working condition.
Renovation and overhauling of two of the filters was in progress at the time ofvisit. It was reported that the nozzle type underdrain system used in the filters was afailure as it got choked leading to reduced filter output and ineffective backwashing.
The slow sand filters also received alum coagulated settled water. The depth ofsand was less than the minimum desirable value. Resanding of filters has not been donedue to financial constraints and two filters were out of service only because sand was notavailable. Floating algal scum on the slow sand filters was not cleaned. The flowmeasurement devices were missing and the filtration rate was adjusted by trial and error.In general, the maintenance of the filters was very poor.
DisinfectionA new chlorination system has been installed recently and the unit operation has
been given out on contract to a private enterpreneur. It was a unique experience to seethat the chlorination system has been well maintained and the water works authoritieshave had no difficulties in ensuring proper chlorination.
Financial AspectsThe financial administration of the water works has not been satisfactory. The
annual revenue receipt from sale of water is of the order of Rs. 250 lakhs. The expenditureon staff salary and electricity charges for the year 1986 was Rs. 149 lakhs and Rs. 1 SOlakhs respectively. The allocation for maintenance and repairs was Rs. 16 lakhs whichwas highly inadequate.
Plant StaffThe regular staff employed for plant operation and maintenance including the
distribution system is 1086. Additionally about 500 daily wage workers are employed.The operation and maintenance staff employed at the water works alone is about 150.However, the plant maintenance has been poor due to non-cooperation and apathy on thepart of the staff. The operators had not received any formal training in filter operationand control.

423
Laboratory facilitiesAdequate laboratory facilities with qualified and trained staff are available at
the plant.
RECOMMENDATIONS
* Provision for raw water flow measurement should be made to ensure effectivechemical dosing and plant control.
* Optimum alum dose (based on jar test) should be applied in solution formand arrangements for rapid mixing and flocculation be made to improve effi-ciency of chemical pre-treatment.
* The plain settling tanks should be converted into'Hudson type' settling tankswith desludging arrangements.
* Overhauling /renovation of existing rapid and slow sand filtere be undertakenso as to produce a filtrate that will meet with the prescribed quality standards.
* The clear water reservoirs m which considerable sludge accumulation hasbeen observed must be cleaned periodically.
* The contract system of maintenance found successful for chlorination mayfurther be extended and tried forthe whole treatment plant.

424
CF CLARIFLOCCULATORST SETTLING TANKRSF RAPID S AND FILTERSSSF SLOW SAND FILTERSPM PUMP HOUSECWR CLEAR WATER RESERVOIRLAB LABORATORY
NOT TO SCALE
HO 21.3 LAYOUT PLAN OF AJSHBAGH WATER WORKS. LUCXNOW

425
TABLE 21.7
PLANT SUMMARY DATA - LUCKNOW
GENERAL
Name and location
Year of construction(Augmentation if any)
Design capacity (mid)
O & M Agency
Raw water source
Treatment flowsheet
ENGINEERING
Raw water pumping
-Rising main diameter
Raw water flow measurement
Pre-treatment
Coagulation
- Chemicals used
• Type of mixing
- Method of mixing
Flocculation
- Method / Type of unit
- No. & Dimensions
: Lucknow Water Works, Aishbag
: 1892 1923 1929 1953 1975
.:. 48 62 72 127 172
: Lucknow Jal Sansthan
: River Gomati
: Conventional with rapid and slow sand filters
: 7 pumps + 4 standby
: 1200,680,500 mm
: Not provided
Alum
Hydraulic
Near inlet channel to settling tank
Hydraulic/Mechanical both
Not available

426
Sedimentation
-Typeofunit(s)
- No. & size of unit(s)
• Surface Overflow Rate
- Detention time
Filtration
-Typeofunit(s)
- No.& size of unit(sXm)
- Rate of filtration(m/hr)
- Filter media
. Sand size
. Depth of sand (an)
. Gravel size (mm)
. Depth of layers (mm>
- Backwash arrangements
.Method
. Wash water tank cap.
Disinfection
- Chemicals used
• Type of feed
- Chlorinator Details
Gear Water Reservoir
- Type, No. & Capacity
- Pump details
Rectangular
3 nos., 76 x 61 x 5.4 m
12.3 mVmVday
10.5 hrs.
Rapid gravity filtersA B C
SSP
10 8 55.4x6 12x6 10.5x7.6
4.7 5 6
Sand sand sand
E.S.-0.5-0.55 mmÜ.C.-1.7
55
2.5-63,2.5-63,2.5-63,
75 to 125
1060x30
0.1
sand
0.29-0.352-3
60
2.5-50
75-100
Air scour + Water wash Scraping
1136 m3
Chlorine gas
Gravity feed
Auqamake
RCC and masonary, 19089 m3
Centrifugal pumps, 4 nos., total 887 - HP

427
TABLE 21.8
PHYSICO-CHEMICAL AND BACTERIOLOGICAL QUALITY OFRAW AND FINISHED WATERS
LUCKNOW WATER WORKS • LUCKNOW
PARAMETERS
Tuittdity (NTU)
pH
Total Alkalinity(CaCO,)
Conductivity«uSA»>)
Haidoess (CaCO,)Total
Calcium (Ca)
Magneaium (Mg)
Chlorides (Ci)
Sulphates^)
Iron (F«)
Fluoride (F)
Nitrates (NO3)
ivisrr
RAW 1
29
8.6
236
440
184
36
23
6
5
z--
Bacteriological (MPN/100 ML)
Total coUfonn
Fecal colifonn
9000
9000
1600
FINISHED
2.5
8.4
230
440
182
36
22
9
5.4
0.2
-
-
0
0
0
nvisrr
RAW
12
8.4
230
325
160
29
21
7
12
0.7
0.5
-
1700
260
140
FINISHED
5.4
8.4
220
325
160
29
21
10
20
0.3
0.6
-
0
0
0
ravisiT
RAW
23
8.8
255
430
196
38
24
8
10
1.6
0.4
0.3
3500
50
50
FINISHED
3.8
8.7
245
430
193
30
24
8.5
12
0.2
0.4
0.3
9
0
0
Results ate expressed as mg/L except for pH, conductivity and turbidity

428
TABLE 21.9
PLANT PERFORMANCE AT VARIOUS STAGES OF TREATMENT
LUCKNOW WATER WORKS - LUCKNOW
PARAMETERS VISIT RAW SETTLED FILTERED FINISHED
WATER WATER WATER WATER
Turbidity
(NTU)
T.coUftvm(MPN/100ML)
(MPN/100ML)
I
n
m
i
n
m
i
n
m
29
12
23
9000
1700
3500
1600
140
50
5-11
10-11
8-9
1.5-5.0
2.5-5.4
1.9-3.9
300-700 240-500
350-490 0-27
940-16000 1800-2200
130-270 4-14
33-110 0-14
3.8
0-50 0-40

429
MALLITAL WATER WORKS - NAINITAL
INTRODUCTION
Nainital water supply commissioned in 1898 is one of the oldest in the State ofU.P. The present population (permanent residents) of the city is about 50,000, whileduring peak summer it increases to one lakh due to tourist inflow. The water supplyneeds of the city are met from Nainital lake and springs. The treatment plant for lakewater consists of two rapid gravity filters of 3.5 mid capacity constructed in 1958 andtwo pressure filters of 2 mid capacity commissioned in 1986. The supply is furtheraugmented (1.5 mid) from a spring with chlorination as the only treatment.
Raw water from Nainital lake is directly pumped to the rapid gravity andpressure filters without any pre-treatment. The filtrate is chlorinated before distributionthrough overhead reservoirs. The schematic flow sheet is shown in Fig 21.4 and plantsummary data given in Table 21.10 . The plant is owned and maintained by KumaonJal Sansthan. «
PLANT APPRAISAL
Raw water qualityAlthough the spring water is of good quality, it is of limited yield while abundant
raw water is available from the lake receives considerable amount of waste waterdischarges from 28 outfalls from all sides. One of the waste water outfalls drains in thevicinity of raw water intake. Due to shifting of waterline in the lake, especially duringsummer, floating pumps are installed to meet the water needs. There is no provisionfor standby pumps. The lake water turbidity remains below 10 NTU throughout theyear Table 21.11.
Filtration »There is no prevision for alum addition and raw water is directly pumped to the
filters. Filtration is not effective and the turbidity removal is only marginal. The poorperformance of the filters is also due to coarse sand used both in rapid gravity filters (E.S.- 0.85 mm and U.C. -1.3) and pressure filters (E.S.-0.78 mm and U.C.-1.4 ). The filterappurtenances are also not in working condition.
DisinfectionFiltered water is disinfected using chlorine gas or a solution of bleaching powder.
The chlorinator was in working condition and at the time of visits, dose was 0.2 to 0.4mg/1.

430
Laboratory facilitiesThe laboratory facilities at the plant are inadequate for routine testing and process
control. However, laboratory staff and plant personnel are adequate to ensure properoperation and maintenance.
Financial AspectsThe annual O & M expenditure on the plant is Rs. 55 lakhs whereas total revenue
from sale of water is only Rs. 30 lakhs. The break-up of expenditure is - staff salary 17per cent,repairs and maintenance 5 per cent and energy charges 78 per cent.
RECOMMENDATIONS
* Standby pumps for raw and treated water are necessary to avoid interruptionin water supply.
* Direct filtration with a nominal dose of alum will improve the treated waterquality. Hence, provision for alum dosing is a must.
* The existing laboratory facilities need to be augmented to ensure regularwater quality monitoring and process control.

LAKE WATER
RGF RGF
3-5 MLO
CWR
PF
SPWINC WATER
PF
2-OMLO
Not to Seal*
I-»MLO
R6F : RAPID GRAVITY FILTERSPF . PRESSURE FILTERS
CWR : CLEAR WATER RESERVK*
PIG 21.4 LAYOUT PLAN OP MALLILAL WATER WORKS» NAINTTAL

432
TABLE 21.10
PLANT SUMMARY DATA -NAINITAL
GENERAL
Name and location
Year of construction(Augmentation if any)
Design capacity
O & M Agency
Raw water source
Treatment flowsheet
ENGINEERING
Raw water pumping
-Rising main diameter
-Raw water flow measurement
Filtration
-Typeofunit(s)
-No. & size of untt(s)
- Filter media
. Sand size
. Depth of sand
. Gravel size
Nainital Water Works, Mallital.
1898 1986
2.0 mid 3.5 mid
Kumaon Jal Sansthan
Lake Nainital, springs
Direct filtration.
Six centrifugal pumps 20-30 HP capacity.
230 mm,200 mm,100 mm, 63 mm
Rectangular weir
: Rapid gravity filters.
: 2 Nos, 2.33 m x 5.8 m
: E.S.-0.85 mm,U.C-1.3
: 0.6m
: 2.5-50 nun, 5 layers

433
.Depth of each layer : 75 mm
- Backwash arrangements
.Method : Air scour + water wash
. Wash water tank cap. : 4 6 0 m3
Disinfection
- Chemicals use* : Chlorine gas/Bleaching powder
- Type of feed : Pressure type
- Chlorinator Details : Aqua make
Clear Water Reservoir
- Type, No. & Capacity : RCC, 1 no., 306 m*
-Pumpdetails : Centrifugal, multi-stage total capacity 800HP.

434
TABLE 21.11
PHYSICO - CHEMICAL AND BACTERIOLOGICAL QUALITY OFRAW AND FINISHED WATERS
NAINITAL WATER WORKS - NAINITAL
PARAMETERS
Physico-chemical
Tuibidity(NTU)
pH
Total Alkalinity(CaCO,)
CoadactmtyfeS/cni)
Haiduess (CaCO3)Total
Carbonate
NonCofbonale
Calcium (Ca)
Magnesium (Mg)
Chlorides (CI)
Sulphate* (SO4)
Iron (Fe)
Fluoride (P)
Nitnue(NO,)
ivisrr
RAW(RI) (R2)
3.0
7.7
300
«SO
414
300
114
63
ND
13
96
ND
0.1
1.8
Bacteriological (MPN/100 ML)
Total coliionn
££Oji
540
130
5 0
7.7
260
770
3%
260
136
61
ND
11
112
0.1
0.1
2.1
0
0
FINISHED
2.5
7.9
280
-
392
280
112
68
ND
12
98
0.1
0.1
1.8
0
94
Results ate expressed as mg/L except for pH, Tmbidityand conductivity. ND - Not Detectable
(Rl)
6.0
7.8
280
860
360
280
80
50
58
7
44
0.1
0.1
1
1600
0
n VISIT
RAW(R2)
15
7.9
280
870
404
280
124
50
48
9
50
0.1
0.1
1.8
0
0
FINISHED
2.5
7.9
280
870
380
-
-
51
61
11
40
-
0.1
1.3
0
0

435
BHELPURA WATER WORKS - VARANASI
INTRODUCTION
The city of Varanasi with a population of 7 lakhs (1981 census) drawn its watersupply from the river Ganga. The earliest plant constructed in the year 1892 comprisedslow sand filters of 63.5 mid preceded by plain sedimentation. Subsequently in 1956the plant capacity was augmented to 125 mid by providing rapid gravity filters only .Thesupply has been further augmented by 100 mid through tube wells. The treatment forriver water consists of alum coagulation, sedimentation in rectangular settling tanks,filtration through rapid gravity/slow sand filters and chlorination. The schematic flowsheet is shown in Fig 21.5 and plant summary data is presented in the Table 21.12. Theplant is operated and maintained by Varanasi JalSansthan.
PLANT APPRAISAL
Raw water quality and flow measurementRaw water from the Ganga is pumped to the treatment plant located 2 km away.
One of the water outfalls from the city joins the river about 500 m upstream of the intake.A rectangular weir has been provided in the raw water channel for flow measurementbut the flow indicating and recording system was absent. Pumping is done intermittenlyso as to avoid overflow through the settling tanks, when the subsequent units are unableto handle the plant inflow. Flow measurement at the time of visit indicated that the plantwas underloaded to the extent of 17 per cent.
Pre*treatm«ntAlum dosing facilities were added to the plant only in 1986. However, provision
for chemical mixing has not been made. It was reported that except during monsoonseason alum is not used due to poor financial condition of the Jal Sansthan.
Though the plant capacity was augmented by constructing rapid gravityfilters, no provision has been made for additional sedimentation tanks. At the time of thevisits, two tanks were silted up and the flow was bypassed while the third tank was beingdesilted. Considerable weed growth was observed in the silted tanks. Sedimentation wasmore or less totally ineffective as confirmed by observation that the turbidity of both rawand settled water was practically the same.
FiltrationOnly four out of 14 slow sand filters were in operation during the time of
visit. Rest were out of commission for cleaning. The four slow sand filters in use werealso not operated and maintained properly. Profuse growth of algae and weeds was

436
observed in the filters. All the filter appurtenances were missing or stolen. The flow ratewas adjusted by trial and error by noting the head over the ' V notch at the outlet as therewas no flow indicating device.
As for rapid gravity filters, the situation was similar. All the filters wereworking without rate controllers and rate indicators. The filters were overloaded andthe filtration efficiency was very poor as turbidity removal was only marginal. One ofthe rapid gravity filters was out of service for want of repairs. Filter backwashing wasineffective and sand depth was uneven over the filter area. The filter outlet valves wereleaking heavily.
Disinfection
Filtered water is disinfected by bubbling chlorine gas directly into the filteredwater channel. None of the chlorinators was in working order and many of them hadbeen dismantled. Chlorine odour was felt in and around the filter area indicating heavyleakage of chlorine gas. Bleaching powder solution was used for disinfection whenchlorine gas was in short suppply.
Laboratory FacilitiesAvailable laboratory facilities are adequate for regular monitoring of the plant
performance. However, these facilities were not being used.
Plant StaffThe number of personnel of different categories available at the plant for
operation and maintenance is 108. The labour for cleaning and maintenance of slow andfilters is 35; but still 10 filters were out of service for cleaning and the rest were notmaintained satisfactorily.
Financial AspectsAs per the statement of expenditure for the year iS>«S5-86 an amount of nearly
Rs. 81 lakhs was spent on salary and Rs. 40 lakhs on operation and maintenance. Theelectricity bill for the year was Rs. 125 lakhs which the Jal Sansthan has been unable topay. The annual revenue receipts from sale of water was only around Rs.121 lakhs.

437
RECOMMENDATIONS
* The sewer outfall upstream of the river intake should be diverted to preventpollution of raw water.
* To ensure proper mixing of alum, baffles should be provided in the raw waterchannels. Alternatively, a separate flocculation chamber with mixing arrange-ment be provided.
* The plain sedimentation tanks which have been silted up completely, need tobe desilted and renovated into Hudson type settlers with desludging facilities.
* The slow sand filters need to be resanded to a depth of 80-100 cm ; cleaningof the filters must be done at the appropriate time by scraping the top layer of thesand and routine maintenance be ensured by removing floating algae and weedsfrom the filters.
* A number of rapid sand filters need complete overhauling includingreplacement of sand and gravel of appropriate size and depth and provision ofnecessary appurtenances for proper operation and control.
* The present practice of bubbling chlorine gas directly into the filteredwater channel should be discontinued in favour of preparing a concentratedsolution of chlorine gas and applying the same to the filtered water. Chlorinatorsof adequate capacity need to be installed so as to regulate and control the rateof chlorine dose.
* A review and rationalisation of the staff structure at the plant and reduceexpenditure on salary component.
* The possibility of entrusting the O & M of the plant on contract toprofessionally competent agencies may be considered.

m
\
U f
H
ST SETTLING TANK
»iRGF RAPID GRAVITY FILTERSSSF SLOW SAND FILTERSCWR < . W S S ^ WATER
RESERVOIR
-»- •
M
- »
*—*
CHLORINATION
z ALUM
T•~Tl
ST I
j
1
2
3
4
BY BUBBLING GAS DIRECT1
CWRI
•
— *
— *
•—m
Vf
u.
J[
SOL. TANK
ST a— V A L U M TANKI_c5 —__,
9
6
7
CWRa
6
-
* •
-
*
-4 «-
10
, - »
SS
F
, 1
CWRB
PUMPHOUSf
ROAD — » •Not to
1 OFFICE
Scol«
t
t 1
A NO
MON
I
INA
'
iu
t12
tLA8
l'il!
ST
<
M
T
ö f
1 • • ' 1
m
i
- l. 2
. ^9
- T- 8- 9
t13
T
1
1
oflC
"114
' 1
HO 21.5 LAYOUT PLAN OF BHELPURA WATER WORKS, VARANASI

439
TABLE 2M2
PLANT SUMMARY DATA - VARANASI
GENERAL
Name and location
Year of construction(Augmentation if any)
Design capacity
0 & M Agency
Raw water source
Treatment flowsheet
ENGINEERING
Raw water pumping
-Rising main diameter
Raw water flow measurement
Pre-treatment
Coagulation
- Chemicals used
-Type of mixing
Sedimentation
-Typeofunit(s)
- No. & size of unit(s)
- Surface overflow rate
- Detention time
: Varanasi water works, Bhelpura.
: 1892 1956 1961
'..: 63.5, 104, 125
: Varanasi Jal Sansthan
: River Ganga
: Convential with slow sand filtersand rapid sand filters
: 5 Nos., 200-750 HP range
: 760 mm CI pipe 1200 mm Hume pipe
: Rectangular weir
: Alum solution, alum blocks
: Hydraulic
; Plain sedimentation tanks Rectangular
: 3 nos., 135 x 78 x 5.4 m each
: 4 m*An2/day
: 11 hours

440
Filtration
-Typeofunit(s)
- No. & size of unit(s)
- Rate of filtration
- Filter media
. Sand size
.Depth of sand
. Gravel size
. Depth of each layer
* Backwash arrangements
.Method
. Wash water tank cap.
Disinfection
- Chemicals used
-Type of feed
- Chlorinator Details
Clear Water Reservoir
- Type, No. & Capacity
- Pump details
RGF
9 nos.,10.8x7.9 m,
3.3m/hr
SSF
14 nos.,6 0 x 3 0 m
O.lm/hr
E.S.-0.72 mmU.C-2.0
0.6 m
12-50 mm
2 layers250 mm each
E.S.-0.2-0.5 mmU.C-1.5
0.6 m
125 mm
1 layer230 mm
Air scour + water wash
1136 m3
Chlorine gas
solution, gravity
Paterson type, 3
feed
nos.
Brick masonary, 3 nos 840 m3
5 nos., Centrifugal pumps 245-365 HP

TABLE 21,13
PHYSICO - CHEMICAL AND BACTERIOLOGICAL QUALITY OFRAW AND FINISHED WATERS
BHELPURA WATER WORKS - VARANASI
441
PARAMETERS
Physico-chemical
Tmbidity(NTU)
pH
Total Alkalinity(CaCO,)
CoDdoctivityiuS/cm)
Hardness (CaCO,)Total
Caibonate
NooCorbona»
Calcium (Ca)
Magnesium (Mg)
Chlorides (Cl)
Sulphates (SO,)
Iron (Fe)
Fluoride (F)
Nitrates (NO3)
Bacteriological (MPN/100 ML)
Total coüfonn
Fecal cotiform
RAW
8.5
8.1
180
360
142
142
0
34
14
20
18
• -
0.3
-
1700
1400
170
I VISIT
FINISHED
3.0
8.2
180
360
142
142
0
34
14
20
20
-
0.3
-
23
2
0
nRAW
5.0
8.2
200
520
172
172
0
34
21
29
32
0.1
0.3
1.2
3500
1700
90
VISIT
FINISHED
2.5
8.0
215
500
170
170
0
32
22
31
32
0.1
0.3
1.2
0
0
0
All results are expressed asmg/L except for pH, conductivity and Tuibidity

442
TABLE 21.14
PLANT PERFORMANCE AT VARIOUS STAGES OF TREATMENT
BHELPl'RA WATER WORKS - VARANASI
PARAMETERS
Turbidity(NTU)
T.colifonn(MPN/100ML)
(MPN/100ML)
VISIT
I
n
I
n
I
n
RAWWATER
8.5
5.0
1700
3500
170
90
SETTLEDWATER
8.0
1.9
940
350
90
0
FILTEREDWATER
1.5-3.5
0.8-0.9
49-1100
90-340
13-70
o
FINISHEDWATER
3.0
2.5
23
0
0
0

443
KALYANESHWARI WATER WORKS - ASANSOL
INTRODUCTION
Kalyaneshwari water treatment plant located at Kalyaneshwari about 25 kmfrom Asansol was commissioned in the year 1972. The plant with a design capacity of47.2 mid serves about 200 villages in the Raniganj coalfield area which covers theentire Asansol sub-division of the district Burdwan. The source of raw water to the plantis Mython dam constructed across river Borakar. The treatment plant provides foraalum and lime addition, coagulation, flocculation, sedimentation, rapid gravity filtrationand chlorination. The schematic flowsheet of the plant is shown in Fig. 22.1 and summarydata is presented in Table 22.1. The plant is operated and maintained by the PHED, Govt.of West Bengal.
PLANT APPRAISAL
Raw water quality and flow measurementRaw water from the Mython dam flows to the treatment plant by gravity for most
of the time. However, provision for pumping of raw water has been made to meet anydifficult situation during periods of drought. As the dam area is well protected, nohuman activity or any other potential source of pollution was observed in the vicinityof raw water intake. Considerable variation in raw water turbidity (10-820 NTU) wasobserved during the visits. Raw water has a low alkalinity (of 29-70 mg/1) with chlorinedemand of 2-3 mg/1 (Table 22.2).
Raw water inflow to the plant is measured in aVenruri flume fitted with a flowindicating, recording and integrating system (Mahindra and Mahindra make) which wasin good working condition. The plant was working more or less at its rated capacity.
Pre-treatmentAlum solution is used for coagulation. During monsoon, when turbidity of raw
water is high and alkalinity is low, lime is used along with alum. The actual alum doseapplied was found to be less than the reported dose. The performance of the clarifierwas satisfactory as observed from the settled water turbidity which was in the range of20.8-25 NTU.(Table 22.3). There is scope for improvement in performance with propercontrol on chemical dosing and clarifier operation.
FiltrationRate of flow indicators and headloss indicators in some of the filters were not
in working condition. The depth of sand in filters was found to be around 63 cm. Filtersare backwashed using water only. Frequency of filter backwashing was reported to be

444
once in 48 his. The performance of the filters was not satisfactory as observed from thefiltered water turbidity which wa* in the range of 2.5-15 NTU (Table 22.3).
DisinfectionChlorine gas is used for disinfection. Chlorination control was not effective as
observed from the presence of coliforms in finished water during one of the visits.
Laboratory facilitiesA laboratory with minimum required facilities has been provided at the plant.
Some of the instruments were not in working condition.
RECOMMENDATIONS
* The instruments in the laboratory should be repaired and a trained chemistposted to carry out regular testing of water for proper plant control.
• The filters should be properly backwashed and maintained to improve theirperformance.

ALUM
MAI THONRESERVOIR
PLASHMIXER
1 fr T
RAPtO GRAVITYFILTERS ( 6 NOS)
CLAR1F LOCCULATORS
J[ *
-CHLORINATION
CLEAR WATER RESERVOIR
HG 22.1 KALYANESHWARI WATER TREATMENT PLANT (SCHEMATIC) - ASANSOL

446
TABLE 22.1
PLANT SUMMARY DATA - ASANSOL
GENERAL
Name and location
Year of construction
Design capacity
O & M Agency
Raw water source
Treatment flowsheet
ENGINEERING
Raw water pumping
-Rising main diameter
Raw water flow measurement
Pre-treatment
Coagulation
- Chemicals used
-Type of mixing
- Detention time
Flocculation
- Method / Type of unit
- No. & Dimensions
- Detention time
: Kalyaneswari Water Treatment Plant, Asansol
: 1972
: 472 mid
: Public Health Engineering Department,West Bengal
: Mython dam on river Borkar
: Conventional with Rapid Sand Filters
: 5 nos, centrifugal pumps each of cap.153.3 lit/sec (2 Standby)
: 750 mm
: Venturi meter, (Mercury flow system)
Alum & lime (solution feed)
Mechanical flash mixing
1 minute
Mechanical(Clanflocculator)
two, 14.6 m dia, 3.96 m SWD
40 minutes

447
Sedimentation
-Typeofunit(s)
• No. & size of unit(s)
- Surface overflow rate
- Detention time
Filtration
-Typeofunit(s)
- No. & size of unit(s)
-Rate of filtration
- Filter media
.Sand size
.Depth of sand
. Gravel size
.Depth of each layer
- Backwash arrangements
. Method
- Wash water tank cap.
Disinfection
-Chemicals used
-Type of feed
- Chlorination Details
Clear Water Reservoir
- Type, No. & Capacity
- Pump details
Mechanical(Clariflocculator)
2 nos., 38.1 m dia. and 3.05 m SWD
1.02 m/hr
3hrs
Rapid sand filters
6 nos, each 67.4 m2 (twin bed)
4.9 m/hr
E.S.-0.5mm,U.C.-1.5
63 cm
0.25 cm - 5 cm
7.6 cm-15 cm
Water wash only
563 m3
Clorihe gas
Solution feed
Pressure Chlorinators, 2 nos
RCC, one., 410 m3
5 nos, 350 HP each capacity 184 L/sec

448
TABLE 22.2
PHYSICO • CHEMICAL AND BACTERIOLOGICAL QUALITY OFRAW AND FINISHED WATERS
ASANSOL WATER TREATMENT PLANT - ASANSOL
PARTAMETERS
Tuibidity(NTU)
pH
Total Alkalinity(CaCO,)
Conductivity 6uS/cm)
HaidDess(CtCO,)Total
Carbonate
NooCaibonate
Calcium (Ca)
Magnesium (Mg)
Chlorides (Q)
Sulphates (SO4)
Iron (Be)
Fluoride (F)
RAW
10.0
8.1
70
197
92
70
22
18
11
6
2
0.5
0.8
Bacteriological (MPN/100 ml)
Total colifoim
Fecal coliform
ÊsoU
Fecal streptococci
21
-
-
2
I VISIT
FINISHED
2.5
7.9
72
211
90
72
18
18
10
6
9
0.3
0.8
0
-
- •
6
n visrr
RAW
820
6.9
29
320
84
29
55
18
10
2
1
ND
0.5
2400
-
-
79
FINISHED
15
6.8
18
187
74
18.4
55.6
17
10
3
28
ND
0.4
33
-
-
4
mvisrr
RAW
170
7.5
70
275
-
-
-
-
6
5
5.7
0.4
91
91
91
230
FINISHED
4.5
7.0
60
221
-
-
-
-
6
27
0.4
0.2
0
0
0
0
All values except pH .Turbidity and Conductivity are expressed as mg/1ND - Not detectable

449
TABLE 223
PLANT PERFORMANCE AT VARIOUS STAGES OF TREATMENT
ASANSOL WATER TREATMENT PLANT • ASANSOL
PARAMETERS VISIT RAW SETTLED FILTERED FINISHEDWATER WATER WATER WATER
TuiMdity I 10 2.5 Z5
(NTU) H 820 25 14 15
m 170 20.8 - 4.5
T.Colifonn I 21 - - 0(MPN/100ml)
H 2400 - - 33
m 91 9 0 0
(MPN/lOOml)
m 9i

450
PALTA WATER WORKS • CALCUTTA
INTRODUCTION
Calcutta, the capital of West Bengal is one of the largest metropolitan towns inthe country. Pal ta waterworks constructed in phases from 1870 onwards with Hooglyriver as raw water source caters to the needs of a major part of Calcutta city. Thetreatment plant have both slow sand as well as rapid sand filtration systems with a totalcapacity of 728 mid. The old plant consists of slow sand filters of 373 mid and rapidgravity filters of 82 mid capacity with conventional pre-treatment.The new plant with acapacity of 273 mid provides for alum dosing, flash mixing, flocculation, sedimentation,rapid gravity filtration and disinfection. The schematic flowsheet is shown in Fig.22.2and summary data is presented in Table 22.4. The plants are maintained by CalcuttaMunicipal Corporation.
PLANT APPRAISAL
Raw water quality and flow measurementBeing a river source, there is a considerable variation in raw water turbidity.
During the study period, the turbidity of raw water was in the range of 32-120 NTU.The' raw water is also highly polluted as evidenced by the high coliform count of13000-24000 MPN per 100 ml and chlorine demand of 2.1-2.2 mg/1 (Table 22.5).
At the raw water pumping stations of the old plant a master meter of the Venturitype has been installed for flow measurement. However, the flow indicator andrecorder system was not functioning. In the new plant, Venturi flumes with floats andindicators are provided but indicators were not in working condition. Plant inflow iscalculated on the basis of working hours of pumps and their capacities.
Old plant
Pre-treatmentAlum solution is used for coagulation. The chemical pre-treatment was effective
as evidenced by good floe formation. Hie settled water turbidity at the outlet ofclariflocculators was in the range of 13-15 NTU. Significant reduction in coliformcount was also observed due to flocculation and sedimentation. The settled water fromthe clariflocculators is stored in kuchcha holding basins having a detention time of 72hours. The turbidity of settled water fed to filters from the holding basins was in therange of 3.0-8.2 NTU (Table 22.6 ). Algal growth was observed in the holding basin.

451
FiltrationRapid gravity filters : There are 12 rapid gravity filters with design filtration
rate of 4.5 tafia. Headloss and filter rate indicators were not in working condition.Depth of sand in one of the filters was 33 cm with ES.of 0.54-0.79 mm and U.C. of1.25-1.67. Hie filters are backwashed routinely after 24 hours of run using water onlyfor a duration of 12 minutes. Undulations were observed on the filter beds. The filtrateturbidity was in the range of 0.5-1.4 NTU.
Slow sand filtersThere are 53 slow sand filters wfth the design filtration rate of 0.1 m/hr. Depth
of sand in the filters was around 77 cm withE.S. of 0.19-0.23 mm and U.C. of 2-2.87.Normal filter runs were reported to be 72-120 days. Average time required to put thefilter back into service after cleaning (scraping) was reported to be 4 days and thefrequency of resanding once in 19 months. Occasionally, pre-chlorination is practisedto control algae in filter beds. The performance of the filters was not quite satisfactory,the turbidity of filtered water was in the range of 2.0-2.5 NTU and coliform MPN inthe range of 11-1300 per 100 ml.
DisinfectionChlorination of filtered water is carried out using chlorine gas. The average
chlorine demand of filtered water was 1 mg/1. Chlorination control was not effectiveas evidenced from the presence of coliforms in finished water during one of the visits(Tabte22.6 ).
New Plant
Pre-treatment:Alum solution is used for coagulation and is applied at the flash mixing chamber.
The flash mixing units were not in working condition. Rotating bridges ofclarifiocculators, however, were found working. The settled water turbidity was in therange of 1.5-15 NTU. Significant reduction in coliform count was also observed dueof flocculation and sedimentation.
FiltrationThere are 31 rapid sand filters with design filtration rate of 4.6 m/hr. The
headloss and filter rate indicators were not in working condition. Depth of sand in thefilters was 50 cm with E.S. of 0.64-0.66 mm and U.C. of 1.91-2.19. Filters werebackwashed after 24 hours of run using only water. No backwash water tank is provided.The filtered water from the pumping station manifold is pumped directly for

452
backwashing of the filters at a pressure of 2.8 kg/cm 2. Undulations on the filter bedswere observed and the performance of the filters was not satisfactory as observed fromthe turbidity of filtered water (0.5-3.6 NTU).
DisinfectionChlorine gas is used for disinfection. The dose is applied at the sump of the clear
water pumping station. The finished water had a residual chlorine of more than 0.2 ppmand was free from coliform.
Laboratory facilitiesAdequate laboratory facilities with necessary instruments required for physico-
chemical as well as bacteriological analysis of water have been provided at the plant.
RECOMMENDATIONS
* The raw water flow measuring system at both the old and new plants shouldbe put into working condition to know the plant inflow and to facilitate properchemical dosing and effective plant control.
* The filter rate and headloss indicators should be repaired/replaced for properoperation and the underdrains of filters showing undulations on the bed shouldbe examined and repaired, if necessary.
* The facilities and personnel available at the central laboratory need to bereviewed and strengthened, if necessary, to ensure effective monitoring andcontrol of the treatment plants.

OLDINDUCEJETTY
oc
3
NEWINTAKEJETTY
CLARIFLOCCULATORS (6 NOS)
ALUM
RAWWATER UXER
,. PUMPING1/ STATIONIII
Ö) CO) CoDETENTION BASIN
RAPID SANDFILTERS(12 NOS)
n
a—DALUM ,
ARAW FLASHWATER MIXERPUMPWGSTATION
4 T
SLOW SAND FILTERS(»NOS)
T, , , , HIGH PRESSURE
...I , t ,i T^-L, PUMPING STATION
RAPID SAND FLTERS(31 NOS)
CLARIFLOCCULATORS ( 6 NOS)
HG 22.2 PALTA WATER WORKS (SCHEMATIC) - CALCUTTA

454
TABLE 22.4
PLANT SUMMARY DATA -CALCUTTA
GENERAL
Name and location
Year of construction(Augmentation if any)
Design capacity
O & M Agency
Raw water source
Treatment flowsheet
ENGINEERING
Raw water pumping
-Rising main diameter
Raw water flow measurement
Pre-treatment
Coagulation
- Chemicals used
-Type of mixing
- Detention time
Flocculation
* Method / Type of unit
- No. & Dimensions
- Detention time
: Palta Water Works Barracpore, Calcutta
: In Phases from 1870 onwards
: 727 mid
: Calcutta Municipal Corporation
: River Hooghly
: i) Conventional with rapid gravity filtrationii) Slow Sand Filtration
(Old plant)
: 4 nos., 3 nos., 9 mlh each 1 no, 7.8 mlh
: 2 nos., 137 cm each
: Venturi flume with indicator
Alum
Mechanical flash mixer
5 sec
Mechanical Qariflocculator
6 Nos., 21.2 m dia.,6 m SWD
40 minutes

455
Sedimentation
- Type of unit(s)
- No. & size of unit(s)
- Surface overflow rate
- Detention time
Filtration
-Typeofunit(s)
- No. & size of unit(s)
-Rote of filtration
- Filter media
.Sand size
.Depth of sand
. Gravel size
. Depth of each layer
- Backwash arrangements
.Method
(Slow sand filters)
- No. & size of unit(s)
- Rate of filtration
- Filter media
. Sand size
. Depth of sand
. Gravel size
Mechanical(Clariflocculator)
6 nos.,54.8 m dia,,5.5 m SWD
1.58 mVmVhr
3.5 hrs.
Rapid gravity filters, Slow sand filters(Rapid gravity filters)
12 nos.each 4.6 x 6.8 m x 2 (twin bed)
4.5m/hr
E.S.- 0.5-0.66 mm, U.C.- 2.0
63.5 cm
2.5 mm - 60 mm
7.5cm-15cm
: Water wash only
53 nos., 61 x 30.5 m - 30 nos. 61 x 64 m - 6 nos.61x98 m-17 nos.
O.lm/hr
E.S.- 0.2-0.3 mm, U.C.- 2.5
76 cm
6 mm - 25 mm

456
Disinfection
- Chemicals used
-"type of feed
- Chlorinator Details
Clear Water pumping
Raw water pumping
-Rising main diameter
Raw water flow measurement
Pre-treatment
Coagulation
- Chemicals used
-Type of mixing
- Detention time
Plocculation
- Method / Type of unit
- No. & Dimensions
- Detention time
Sedimentation
-Type of unit(s)
- No. & size of unit(s)
- Surface overflow rate
- Detention time
: Chlorine gas
: solution feed
: Vacuum type total 6 nos.
: 4 nos.(2 standby), 1500 HP centrifugal - 3 nos.1630 HP Turbine -1 no.
(New plant 273 mid)
: 3 nos. .centrifugal pumps (one standby)eachwith capacity 7.9 ml/hr
: 2 nos., each 1.2 m dia.
: Venturi flume with float indicator
Alum
Mechanical flash mixer
3 sec
Mechanical(Clariflocculator)
6 Nos., 18 m dia.x 6.4 m SWD
50 minutes
Mechanical(Clariflocculator)
6 nos.,each 41 dia.,5.2 m SWD
1.77m7m2/hr
3hrs.

457
Filtration
• No. & size of unit(s)
• Rate of filtration
- Filter media
.Sand size
.Depth of sand
. Gravel size
. Depth of each layer
-Backwash arrangements
Method
Disinfection
- Chemicals used
-"type of feed
Clear Water pumping
31 nos., each 3.5 x 11.25 m x 2 (twin beds)
4.6m/hr
E.S.- 0.5-0.66 mm,
63,5 cm
2.5mm - 60 mm
7.5 cm to 15 cm
Water wash only
Chlorine gas
solution feed
4 nos. (2 standby) Centrifugal 1150 HP (2 nos),1300 HP (1 no.) Turbine 1630 HP (1 no.)

458
TABLE 2X5
PHYSICO-CHEMICAL AND BACTERIOLOGICAL QUALITY OFRAW AND FINISHED WATERS
PALTA WATER WORKS -CALCUTTA
PARAMETERS
Physico-chemical
Tufbidtty(NTU)
pH
Total Alkalinity(CaCO,)
Haittoess (CaCO3)Total
Caibonate
Non Caitxnate
Calcium (Ca)
Magnesium (Mg)
Chlorides (CO
Sulphates (SO4)
Iron (Fe)
Hooride (F)
RAW
32
-
189
150
150
0
34
16
11
21
1.3
0.1
Bacteriological (MPN/100 ml) '
Total colifonn
Fecal colifonn
E.colj
Fecal streptococci
13000
3400
2700
1700
ivisrr
FINISHEDold new
-
7.5
181
144
144
0
33
15
10
25
0.1
0.1
11
8
0
2
3.6
7.5
174
142
142
0
33
14
11
25
0.1
0.1
0
0
0
0
RAW
120
7.5
188
140
140
0
48
5
11
12
-
0.1
24000
24000
24000
2300
n VISIT
FINISHEDold new
-
7.5
179
136
136
0
43
6
10
19
-
0.1
0
0
0
0
0.5
7.5
180
148
148
0
48
7
10
20
-
0.1
0
0
0
0
AU values except pH and Turbidity are expressed as mg/1

459
TABLE 22.«
FIANT PERFORMANCE AT VARIOUS STAGES OF TREATMENT
PALT A WATER WORKS - CALCUTTA
PARAMETERS
Turtidâty(NTÜ)
T.Colifomw(MPN/IOOMI)
E-Coü4MPN/100ml)
(Ntwpbot)
PARAMETERS
Twt*ftty(NTU)
visrr
i
n
i
n
i
n
visrr
i
RAW CLARIFIED SETTLEDkwccltt tu
32 13.0
120 15.0
13000 -
24000 400
2700
24000 200
RAWWATER
32
nfr
3.0
8.2
-
-
CLARIFIEDWATER
15.0
FILTEREDSSF
2.4
2.5
11
1300
0
490
ROF
1.4
0.5
790
40
110
40
FILTEREDWATEF
3.6
t
FINISHED
-
11
0
0
0
FINISHEDWATER
120 1.5 0.5
T. Coliforms(MPN/100ml)
(MPN/100ml)
I
n
I
n
13000
24000
2700
24000
2700
680
2700
200
72
230
37
130
0
0
0
0