District Census Handbook, 25-Hamirpur, Uttar Pradesh
194
DISTRICT CENSUS HANDBOOK 1951 HAMIRPUR DISTRICT
-
Upload
khangminh22 -
Category
Documents
-
view
1 -
download
0
Transcript of District Census Handbook, 25-Hamirpur, Uttar Pradesh
DISTRICT CENSUS HANDBOOK 1951
HAMIRPUR DISTRICT


FOREWORD
Several States, including Uttar Pradesh, have been publishing village statistics
by districts at each census. In 1941 they were published in U. P. under the title
"District Census Statistics" with a separate volume for each district. In the 1951
census, when the tabulation has been more elaborate than ever in view of the require ..
ments of the country, the district ... wise volume has been expanded into a "District
Census Handbook", which now contains the District Census Tables (furnishing
data with break ... up for census tracts within the district), the District Index of Non ..
agricultura.l Occupations, agricultural statistics from 1901;02 to 195°"'51 and other
miscellaneous statistics in addition to the usual village population statistics. The
village population statistics also are given in an elaborate form giving the division
of the population among eight livelihood classes and other details.
2. It may be added here that a separate set of district ... wise volumes giving only
population figures of rural areas by villages and of urban areas by wards and mohallas
and entitled "District Population Statistics" has already been published. This
separate series was necessitated by the urgent requirements of the U. P. Government •
for elections to local bodies.
3. The number of District Census Handbooks printed so far is fony ... two
Special arrangements for speeding up the printing have now been made and it is
noped that the remaining Handbooks will be printed before the end of 1955.
ElAMPUR:
October 31, 1955.
RAJESHW ARI PRASAD, I.A.S.,
Sup,erintendent, Censu! Oper.ations,
Uttar Pradesh


11. r-ITR~DUcn()N
A-The District
B-Analysis of the Statistics
C-Explanatory Note,oll the StatistiCf.
CONTENTS
PART I-DISTRICT CENSUS TABLES
_A-GIlNEllAL POPULATION TABL_
A~I Area, Houses and Population
A~ll Variation in Population during Fifty Years
A-III Towns and Villages Classified by Population
A~lV Towns Classified by Population with Variations since 1901
A-V Towns attanged Tenitorially with Population by Livelihood Classes
B Area and Pophlation of District and Tehsils by Livelihood Oasses
:8-ECONOMIC TABLES-
iii-x
1
B-1 Livelihood Classes and SulJ..classes '10--13
B-D Secondary Means of Livelihood '4-25
B-III Employers, Employees and Independent Workers ill Industries aad Scn1ces by DiYiliou
and Sub-divisions
B-IV U.-mplo~~nt by Livelihood Classes
IrIdcx of Non-agricultural Occupations
. A::-HOUJIIHOLD AND AC.B (SAMl'U) TAB.LD-
Cl Household (Size and Composition)
CIl Livelihood Classes by Age-groups
C-I1I Age and Civil Condition
C-IV Age and Literacy
C.v Single Year Age Returns
D-SoCiIoL AND CuLTUllAL TABLES-
D-l Languaaes (i) Mother Tongue
(ii) Bilingualism
D-ll Religion
D-Ill Scheduled Castes
D~IV Migrants
D·V (i) Displaced persoos by year of arrival in India
(ii) Displaced persons by Livelihood Classes
D-VI Non-Indian Na~ionals
J).vn Livelihood Classes by Educational Standards
' ..
.•.
PART II-VILLAGE, TOWN, PARGANA AND THANA STATISTICS
Primary Census Abstract
2 Paraana and Thana-wise Population
PART Ill-MISCELLANEOUS STATISTICS
Vital Statistics
2 Agricultural Statistics-(i) Rainfall
(ii) Area as classified with details of area under cultivation
(iii) Cropped Area
(iv) Irrigated Area
3 Live-Stock, Agricultural Machinery and Implements
-4 List of Primary Schools
26-53
52-5J
54-51
84
85
B6-87
86-81
1.18-91
92-93
92-93
101-137
138
140-143
14-4-145
14~149
150-165
16~169
170-173
174-176

(NT RODUCTION
A-THE DISTRICT
1. Hamirpur is the central district of Bundelkhand, lying between Banda on the east and Jhansi on the west. On the north it runs with Jalaun, Kanpur and a corner of Fatehpur. On the south it is bounded by Vindhya Pl"adesh. In the recent transfer of enclaves under "The Provinces and States (Absorpt~on of Enclaves) Order, 1950", it lost 1'4 square miles to Vindhya Pradesh wIde it gained 338'8 square miles from the former States of Bihat, Garrauli, Na;gawan, Raba'!, Jagni, t:larila, Baoni., Beri and Charkhari. The district as now constituted has a total area of 2,744 square miles and its population in 1951 was 6'7 lakhs. There are six tehsils-Hamirpur, Maudaha and Mahoba in the east, Rath and Kulpahar in the we6t and Charkhari in the centre. Rath is the largest tehsil of the district with an area of 655 square miles and Charkhari is the smallest of them with an area of 159 sqare miles, the area of other tehsils being Maudaha 604 square miles, Kulpahar 591 square miles, Hamirpur 416 square miles and Mahoba 354 square miles. The district has 9 parganas and 19 thanas.
2. The distr:ct falls roughly into two parts. The northern portion is fIat plain, consisting Topographymainly of black soils, except where the land has suffered from the erosion of the numerous streams by which it is traversed. Towards the south the surface rises, the soils becoming lighter in character. Numerous out-crops of gne~ss rock, tending to cluster into low ranges, surrounded by uneven broken country and over-grown for the most part; with stunted jungle, appear. 'Ihe dividing line between these two tracts of country runs roughly east and west through the town ot Hath. A few miles further south the hills become more frequent. North of the town of Rath no hills are found and there is nothing to relieve the monotonous stretch of black cotton soil, which break up into barren ravines as it approaches the banks of the large rivers and into less unfertile though no less unsightly Takar hillocks along the smaller streams. The south portion conta'ns a number of lakes of great value for irrigation purposes.
3. The rivers of the district comprise the Yamuna, Betwa, Dhasan, Ken, Barma and Drainar.e several minor streams. These rivers and streams constitute the natural drainage lines of the country. Their course, with the exception of the Urmel, is from south to north-east, and as in other portions of Bundelkhand owing to the rapid nature of the slope, they carry off the surplus water quickly and in every case cause considerable scour. The Barma river pri:l.ctically divides. the district into two equal portions. The western part is drained by the l'arwaha and is much. less broken than that to the east. East of the Barma the water shed lies close to that river and there is generally a steeper gradient which is reflected in the more easterly trend of the streams. Though they prov;de a ready means of escape for rainfall, which is often heavy in. the tract, all these channels are destrnctive and tend to spread. By denuding the surface soil in hilly tracts and by carrying off the organic matter and other soil constituents in the level plains, they are constantly and steadily impoverishing the soil, except where the land is protected by embankments.
4. The soils consist of the well known Bundelkhand varieties, mIr, kabar, parua and SoilS' rakar, the two former being commonly known as black and the latter two as light soils. Mar is often called "black cotton soil". It varies greatly. in colom, -~nce and fertility but is. marked by the constant characteristios of being highly argillaceous, calcareous and adhesive. It has small lumps of kankar. It is friable and retentive of moisture and possesses a high degree of fertilits:. Kabar is m~ch le~s retentive of moi.sture, parua is a light coloured sandy soil and rakar IS a refuse so'l whIch occurs on SlOplllg ground where the action of water has tended to denude the earth of all its better qualities. A very small portion of the soil is alluvial and some of it is kachhwara. The entire district with the possible exception of southern Rath, is precarious. The soils being either extremely retentive of mo!sture or extremely porouS, for the most part requ're well distributed and regular rain but the seasons during which conditions are favourable in both locali.ties are extremely few. A season in which the rainfall is seriously deficient, especially if it ceases at the beginning of September, is more disastrous than any other. But while light soils can generally rid themselves of excessive moisture, this brings peculiar soils in its train in black soil tracts in the shape of an extension of the growt;h of kans. Th's gral:>s is inherent jlJ the soils of Bundelkhand and has a special affinity for mar and kabar.
5. The figures of the classification of area during the last 50 years are given in Table 2 ClassiCicadon of Part III of thiil volume. The proporbion of area under the various categories works out as of area follows for 1950-51 :
Particulars
Cultivated area
Culturable w"ste (excluding current fallow)
Current fallow
forest
Area not available fvr cultivation of which-
(a) Covere d with u ater
(b) Under sites, 1-oads and buildings
(c) Barren
~.,.__....·.~·"L·.;_'_C
ActUal figures (in acres) Percen.age
1,012,569 56'9-
385,9(6 21'7
127,453 7'2
5,522 0'3
247,445 13-9
58,513 3'~
35,961 Z'Q
15J,Q71 8'6
- ------~. '-'~ ---- ----"-

Climate and lI'ainfaU
lnoigatiOD
Crop.
ii
Re or~h~ figure in the a~:>ove ~able regarding culturable waste taken from the Season and Crop P, lS, h~wever, mJsleadlI~g. , The ~tate Agriculture Department conducted in 1949-50 a.
~~a~eldl en9Ulry thro~gh the DlstrlCt OfflCers regarding the nature of this area in each district. e 0 owmg analysls of the area resulted from this enquiry:
Particulars
Total culturable waste (A+B+C)
A-Area under culturable waste land not available for immediate cultivaticll '"
(i) Forest under any legal enactment
(ii) Groves , ... (iii) Forests of timber trees
(iv) Thatching grasses, shrubs and bushes
(v) Land kept for grazing
B-Area under culturable waste land available ·for immediate cultivation but which could not be cultivated
Of whlch due to-
(i) Kans growth
(ii) Threshing floors
(iii) Malaria '"
(iv) Floods
(vkLack of drains
(vi) Lack of water
, (vii) Distance from abadi
(viii) Damage from wild animals
(ix) Other causes ....
C-Area under culturable waste land that can be brought under immediate cultivation after some improvements besides the area given against ' B ~
Area (in acres) Percentago
313,66~ 100
17! ,010 54'52
4,791 1'53
7,380 2'35
5,408 1'73
6,439 2'05
146,992 46'86
44,605 14'22
2,531 0'81
8,314 2'65
55 0'02
54 0'02
97 0'03
1,S24 0'61
4,556 1'45
6,'373 2'03
20,698 6'60
98,049 31'26
From the above it will appear tha,t of the total area r~corde~ as cult~rable waste, only 31'3 per cent. was really capable of bemg brought under ImmedIate cultIvation after some
improvements. Thus the land area cultivated and cultivable per Gapita works out to 229'3 cents of which
171'3 cents have already been brought under cultivation and only 14'7 cents can be further brought under the plough after some improvements.
6. In a country so entirely dependent on the character of the seasons the distribution of the rainfall is muc~ more. important than the actual amo~nt. Continuous rain. in July and August checks kharif sowmg and prevents proper weedmg. An early cessatIOn of the rains leaves the kabar too hard, to plou~h ~hile heav~ rain late in the season ma~es thorough ploughing for the rabi impoSSIble. If thls goes on for two or three. years, kans IS almost sure to get a hold which it will keep for many years. The average ralllfall for the last quinquennium was 35'28 inches. During the last 50 years the highest rainfall of 51'21 inches was recorded in the year 1IH<J-20 and the lowest 14'60 inches in the year 1918-19.
The climate of, Hamirpur. is characterized by ,int~nse hea~ and dryness especially in the north where the blazmg glare of the hot weather day IS lIttle relIeved by the grateful shade of spacious groves. In ,the south of the d;~trict the, heat is a~cumulated by numerous rocks and rocky hills durmg the day, and radmted at mght rende~IDg the heat more severe. On the other hand the atmosphere]s generally clear and free from the grosser particles of dust. The rainy season is malarious and has given the climate a notoriety for unhealth~ness, though the town of Hamirpur itself is ordinarily considered healthy on account of its good drainage. But people of northern districts generally dislike the district for its greater warmth and the increased liability to fever.
7. Irrigat;.on is derived from canals, wells, reservo;rs and othu sources. There is practically no irrigation by tube-wells. In 1950-51 the irrigated area from canals covered 86 per cent., from wells 13 per cent. and from other sources-only one per cent.
8. More acreage is sown under rabi crops than under kharif crops. The area under rabi in 1950-51 wa::; 651,949 acres, that under kharif 385,245 acres and that under zaid crops :356 acres. The principal rabi crop is gram followed by wheat while the principal kharif crop
is Juar.
iii
B-ANALYSIS OF THE STATISTICS
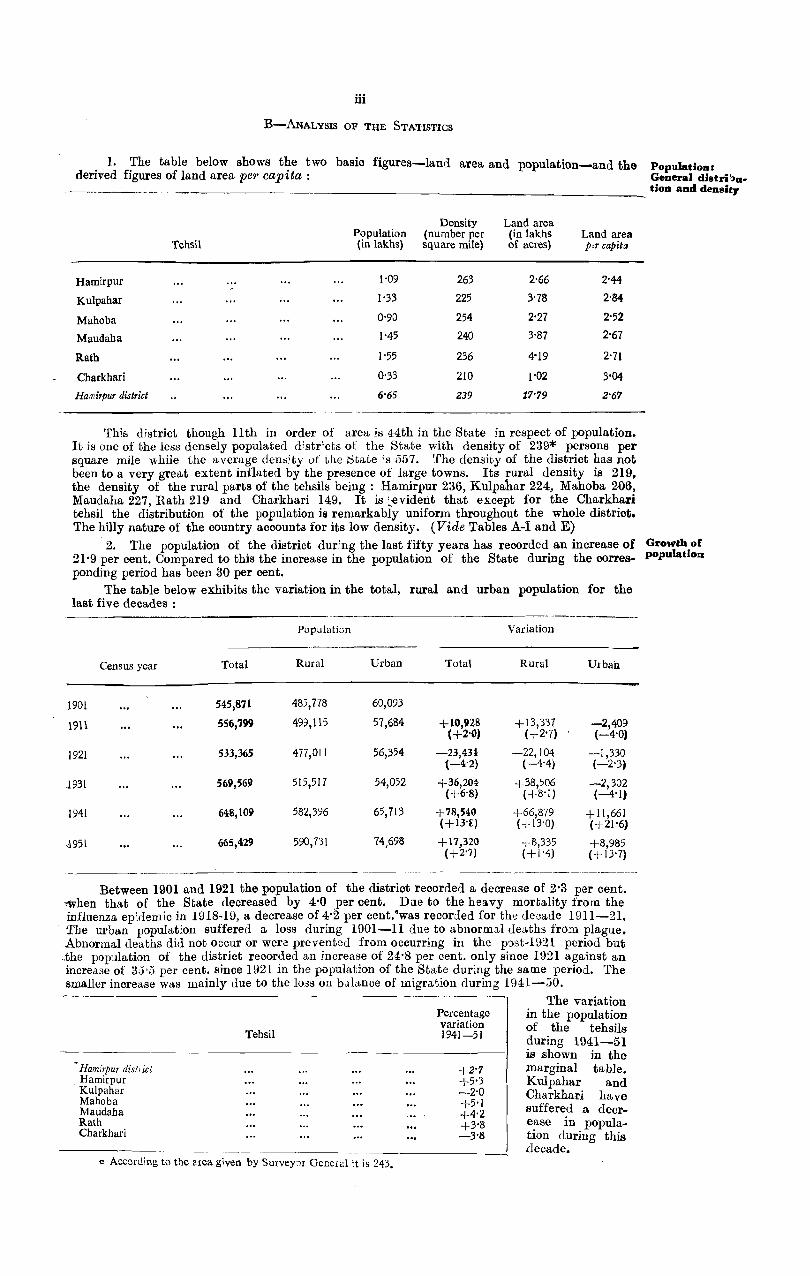
Population: 1. The table below shows the two basic figures-land area and population-and the derived figures of land area per capita: General distrilJlt _
_________________________________ tion and densif)'
Density Land area Population (number per (in lakhs Land area
Tehsil (in lakhs) square mile) of acres) per capita
Hamirpur 1'09 263 2'66 2'44
Kulpahar 1'33 225 3'78 2-84
Mahoba 0'90 254 2'27 2'52
Maudaha 1'45 240 3'87 2'67
Rath 1'55 236 4'19 2'71
Charkhari 0'33 210 1'02 3'04
Ha:l1irpur district 6'65 239 17'79 2'67
This d;strict though 11th in order of area is 44th in the State in respect of population. It is one of the less densely populated d'str'cts of the State with density of 239* persons per square mile ",hile the average den,:dy 01 the t)Gate ;s 557. The density of the district has not been to a very great extent inflated by the presence of large towns. Its rural density is 219, the density of the rural parts of the tehsils being: Hamirpur 236, KUlpahar 224, Mahoba 206, Maudaha 227, Rath 219 and Charkhari 149. It is ~evident that except for the Charkhari tehsil the distribution of the popUlation is remarkably uniform throughout the whole district. The hilly nature of the country accounts for its low density. (Vide Tables A-I and E)
2. The popUlation of the district dur:ng the last fifty years has recorded an increase of 21'9 per cent. Compared to this the increase in the population of the State during the corresponding period has been 30 per cent.
The table below exhibits the variation in the total, rural and urban popUlation for the last five decades:
-------Population Variation
Census year Total Rural Urban Total Rural Urban
1901 545,871 485,778 60,093
1911 556,799 499,115 57,684 +10,928 (+2'())
+13,337 -2,409 ( +2'7) (-4'0)
1921 533,365 477,011 56,354 -23,434: -22,104 -1,330 (-4'2) (-4'4) (-2'3)
.1931 569,569 515,517 54,052 +36,204 +38,506 -2,302 (+6'S) (+8'1) (-4'1,
1941 648,109 582,396 65,713 +78,540 +66,879 +11,661 (+ 13'£) (+13'0) (+21'6)
..1951 665,429 590,731 74.698 +17,320 +8,335 +8,985 (+2'7) (+1'4) (+13'7)
. -~-~----~-- -----~----- ------ ------
Between 1901 and 1921 the popUlation of the district recorded a decrease of 2'3 per cent. ,when that of the State decreased by 4'0 ,per cent. Due to the heavy mortality from the influenza ep;demic in 1918-19, a decrease of 4'2 per cent:was recorded for th'J decade 1911-21. The urban population suffered a loss during 1901-11 due to abnorma.l deaths from plague. Abnormal deaths did not occur or were prevented from occurring in the p()st-1921 period but ,the population of the district recorded an increase of 24'8 per cent. only since 1921 against an increase of 3:h3 per cent. since 1921 in the population of the State during the same period. The smaller increase was mainly due to the 103S on b,llance of migration during 1941-30.
• Hamirpur distl ict , Hamirpur
Kulpahar Mahoba Maudaha Rath Charkhari
Tehsil
Percentage variation 1941-51
+2'7 +5'3 -2'0 +5'1 +4'2 +3'8 -3'8
-----~------------------------------~ o Accnrding to the area given by SurveY::>I General it is 243.
The variation in the population of the tehsils during 1941-51 is shown in the marginal table. Kulpahar and Charkhari ha ve suffered a decrease in population during this Llecade~
Growtho! population
Vital Stadealee
iv
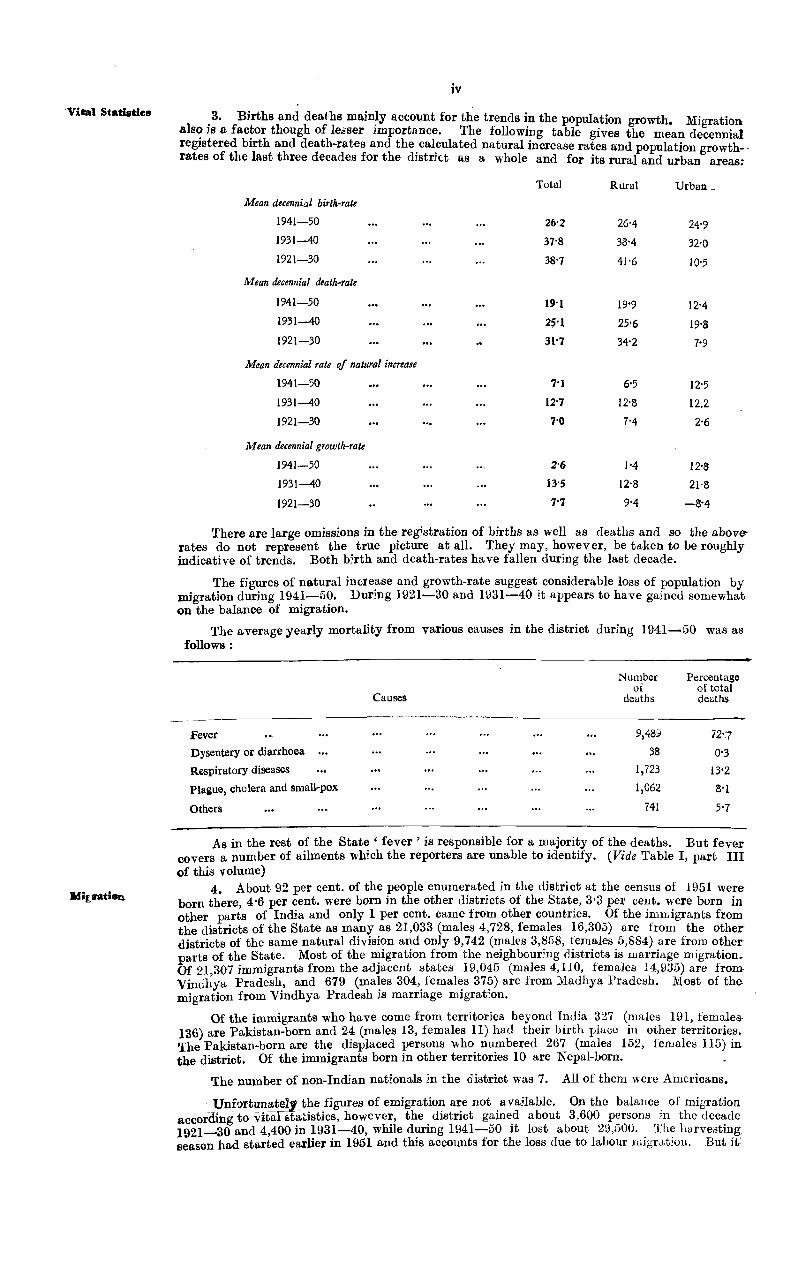
.3. Births and deaths main~y account for the trends in the population growth. Migration als~]s a fac~or though of leoser Importance. The following table gives the mean decennial reglstered birth and death-rates and the calculated natural increase rates and popUlation growth-rates of the last three decades for the district as a whole and for its rural and urban areas;
Total Rural Urban _
Mean decennial birth-rate
1941-50 26'2 26'4 24'9 1931-40 37'S 31:3-4 32'0 1921-30 38'7 41'6 10'5
Mean decennial death-rate
1941-50 11)'1 19'9 12'4 1931-40 2$'1 25'6 19'8 1921-30 31'7 34'2 7'9
Mean decennial rate of natural increase
1941-50 7'1 6'5 12'5
1931-40 12"7 12'8 12.2
1921-30 7'0 7-4 2'6
Mean decennial growth-rate
1941-50 2'6 1'4 12-8
1931-40 I3-S 12-8 21-8
1921-30 7'7 9-4 -IN
There are large omissions in the registration of births as well as deaths and so the aboverates do not represent the true picture at all. They may, however, be taken to be roughly indicative of trends. Both bIrth and death-rates have fallen during the last decade.
rfhe figures of natural incle~se and growth-rate suggest considerable loss of popUlation by migration during 1941-50. Durmg 1921-30 and 1931-40 it appears to have gained somewhat on the balance of migration.
The average yearly mortality from various causes in the district during 1941-50 was as follows:
Number Percentage of of total
Causes deaths deaths
Fever 9,489 72-7
Dysentery or diarrhoea 38 0-3
Respiratory diseases 1,723 13'2
Plague, cholera and small-pox 1,062 8-1
Others 741 5'7
As in the rest of the State' fever' is responsible for a majority of the deaths. But fever covers a number of ailments which the reporters are unable to identify. (Vide Table I, part III of this volume)
4. About 92 per cent. of the people enumerated in the district at the census of 1951 were born there, 4'6 per cent. were born in the other districts of the State, 3'3 per cent. were born in other parts of India and only 1 per cent. came from other countries. Of the imlLigrants from the districts of the State as many as 21,033 (males 4,728, females 16,305) are from the other districts of the same natural division and only 9,742 (males 3,858, females 5,884) are from other parts of the State. Most of the migration from the neighbour;ng districts is marriage migration. Of 21,307 immigrants from the adjacent states 19,045 (males 4,110, females 14,v35) are from Vindhya Pradesh, and 679 (males 304, females 375) are from Madhya Pradesh. lYJost of themigration from Vindhya Pradesh is marriage migrat;on.
Of the immigrants who have come from territories beyond India 327 (males 191, females 136) are Pakistan-born and 24 (males 13, females ll) had their birth place in other territories. rfhe Pakistan-born are the displaced persons who numbered 267 (males 152, females 115) in the district. Of the immigrants born in other territories 10 are Nepal-born. .
The number of non-Indian nationals in the district was 7. All of them were Americans •
. Unfortunate11 the figures of emigration are not avaHable. On the balance of migration accorrun-g to -vi£alstatistics, however, the district gained about 3,600 persons in the decade 1921-30 and 4,400 in 1931-40, while during 1941-50 it lost about 29,500. The harvesting, season had started earlier in 1951 and this accounts for the loss due to labour migra,tion. But it

should be borne in mind that the figures contain an element of registrat:on error and are only indicative of treJ:1ds_
5. We may now analyse the growth of population in the district during the last thirty years in relation to the growth of cultivation during the same period. The marginal table ~hows t~ese fjgures. Figure" of area shown under census years are quinquennial averages for the fIve years ending with the crop year immediately preceding the Census Year'. It is obYious
Census year Population"
Net area sown
(in acres)
Area of cultivation per capita (in cents)
--------------------------------------------' 1921 1931 1941 1951
440,245 502,689 575,538 665,429
739,098 758,760 883,960 923,067
169-9 151-0 153-7 138-S
that cultivation has failed to keep pace with popUlation. The cultivated ~.rea per capita has gone down to 138'8 cents in 1951 from 169'9 cents in 1921. Magnitude of this drop is about onefifth of the 1921 level. It means that (other things being equal) every man, woman and child must expect to get less food and other agricultural produce from the land in 1951 than in 1921.
6. It may be examined whether this shortage has been compensated by an increase in the yield per acre. Increase in yield can be brought about by more dOl1ble cropping, !Lore irrigation, better fertilisation and better culture. The average (quinquennial) area sown more than once was 44,131 acres in 1921. It is showing a steady decline and has come do\yu to 32,425 acres in 1951. The figures of double crop cultivation per capita in cents are as below:
Particulars
Double crop cultivation per capita in cents Un irrigated double crop cultivation per capita in cents Irrigated double crop cultivation per capita in cents
Quinquennial average for the year preceding
1951 1941 1931
4-9 6-3 S-1 4-S 6-2 8-0
0-1 0-1 0-1
1921
10·1 10'0
0'1
It is evident that the double cropped area has not kept pace with the rate of growth of population.
Decline of cultivation per capita
Double cropped area per capita
7. The average area irrigated in the district was 43,504 acres in 1921. The figures were Irrigated arca 42516 acres for 1931, 69,243 acres for 1941 and 78,091 acres for 1951. The average area per CliP ita irrigated more than once has been practically negligible:
The figures of irrigation per capita are shown in the table below: -- - ---------------------------------------_
Particulars
Irrigated single crop cultivation per capita in cents -Irrigated double crop cultivation per capita in cents
1951
11·7
0-1
1941
)2'0
0-1
Years
1931
8'4
0-1
1921
S (I
0'1
The figure for 1941 shows an increase in irrigated crop cultivation per capita over that of 1931, but there is a slight decrease in 1951.
8. The percentage of cropped area under food crops began to decline and that under nonfood crops began to rise ever since HH6-21. It is only in the last quinquennium (1946-51) that this tendency ~as been reverse~. The percentage o~' croppe~ area under food crops was 85 in 1916-21; It came to 83 m 1926--31 and agaIn to 82 m 1936-41 but has shot up to 90 in 1946-51.
The proportionate area under different crops in the district between 19U and 1951 was as below:
Total Percentage of cropped area under
Quinquennial cropped average of area Rice Wheat Barley Juar Bajra Gram Others
---__ 1911-16 739,26l 0'2 % 2-7 21-0 5·2 29-7 31·6-
1916-21 7(i6,83l 0-3 ))-7 2-8 21-9 5-0 31-13 26-5
1921-26 793,634 0-4 14-8 1'8 20·5 3-5 32-3 26-7
1926-31 810,297 0-4 14-0 2-3 20-8 2'S 32-3 27·4
1931-36 872,228 0'2 18-2 1-6 18-9 2-3 32·0 26-8:
1936-41 932,149 0'4 IS-9 1-4 17-S 2'8 31-2 27'7
1941-46 969,253 0-6 16·6 1-3 22-0 3'7 31-5 24-3
1946-51 970,517 1-2 21-2 1-9 19-1 1-7 35-9 19'()
-------------------_._--o The figures of population of the various censuses relate to the then lay-out of the district.
Cropped area
Live-stock, ploughs and carts
Villages and towns
Occupation. , livelihood pattern
vi
Indigo and opium are two· non-food crops which have gone out of cultivation. Cotton too is practically out of cultivation. The area under cotton crop was 64,371 acres in 1902-03 In 1950-51 it was only 332 acres. In 1901-02 the area under indigo and opium was 448 and 780 acres respectively while in 1950-51 it is nil in both cases. Oil seeds are the [most important non-food crops. The area under sugarcane and hemp has also risen but their cultivation is limited. '
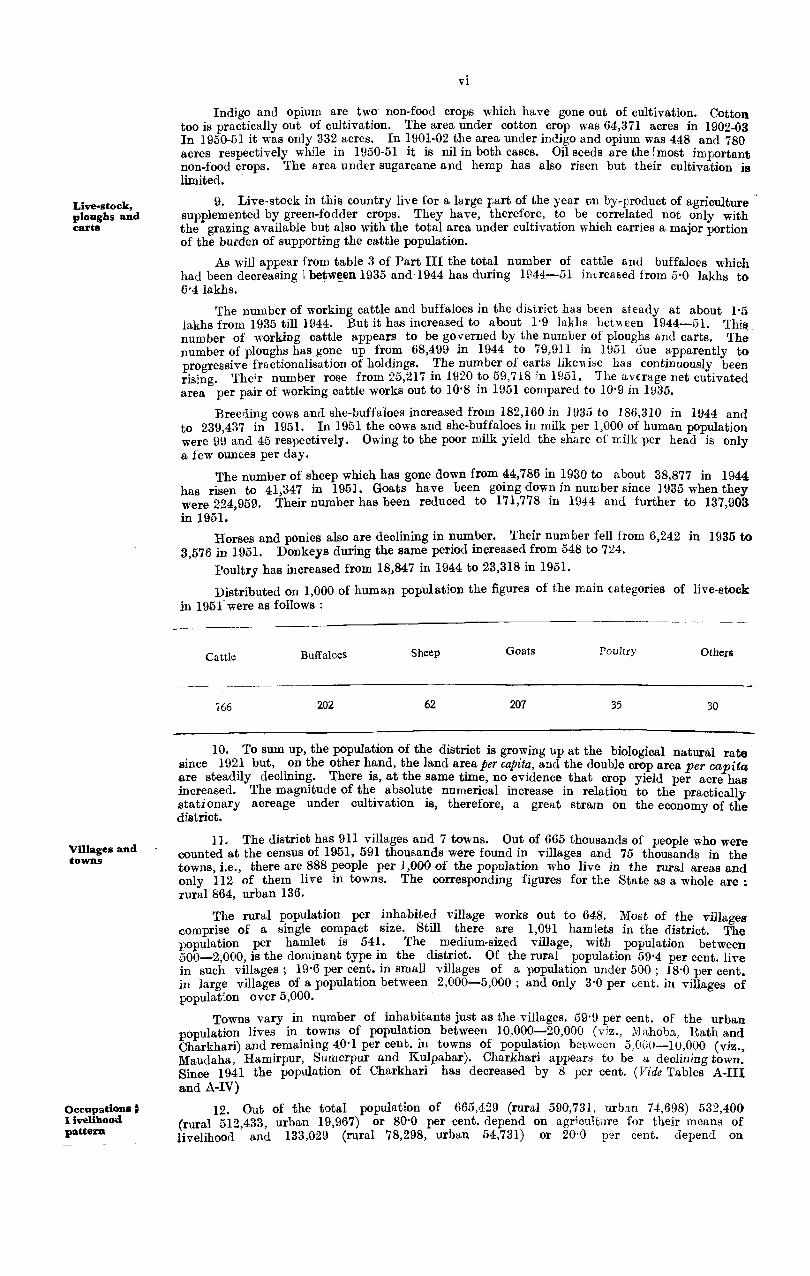
9. Live-stock in this country live for a large part of the year pn by-product of agriculture· supplemented by green-fodder crops. They have, therefore, to be correlated not only with the grazing available but also with the total area under cultivation which carries a major portion of the burden of supporting the cattle population.
As will appear from table 3 of Part III the total number of cattle and buffaloes which had been decreasing lbetw4!en 1935 and 1944 has during H144-51 imreased from 5'0 lakhs to 6·4Iakhs.
The number of working cattle and buffaloes in the di::.trict has been steady at about 1.5 iakhs from 1935 till 1944. But it has increased to about 1'9 lakhs bet"een 1944-51. This number of working cattle appears to be governed by the number of ploughs and carts. ~Ihe· number of ploughs has gone up from 68,499 in 1944 to 79,9Il in 11)51 due apparently to progressive fractionalisation of holdings. .The ~umber of ca~ts lik?" ise has continuously. been rising. Their number rose from 25,217 m 1920 ~o 59,718 m Hl51. The avuage net cutIvated area per pair of working cattle works out to 10'8 m 1951 compared to 10'9 in HiS5.
Breeding cows and she-buffaloes increased from 182,160 in 1935 to 186,310 in 1944 and to 239,437 in 1951. In 1951 the cows and she-buffaloes in milk per 1,000 of human population were 99 and 45 respectively. Owing to the poor milk yield the share of rri1k per head is only a few ounces per day.
The number of sheep which has gone down from 44,786 in 1930 to r.bout 38,877 in 1944 has risen to 41,347 in 1951. Goats have been going dow~ in number since 1935 when they were 224,959. Their number has been reduced to 171,778 In 1944 and further to 137,903 in 1951.
Horses and ponies also are declining in number. Their number fell from 6,242 in 1935 to 3,576 in 1951. Donkeys during the same period increased from 548 to 724.
Poultry has increased from 18,847 in 1944 to 23,318 in 1951.
Distributed on 1,000 of human population the figures of the main categories of live-stock in 1951" were as follows:
Cattle Buffaloes Sheep Goats Poultry Others
"i66 202 62 207 35 30
10. To sum up, the population of the district is growing up at the biological natural rate since 192.1 but, .o~ the other ~and, the land ar?a per capita, and the double crop area per capita are steadIly dechnmg. There IS, at the same tnne, no evidence that crop yield per acre has incr~ased. The magnitude of th~ a~solut~ numerical increase in relation to the practically statlonary acreage under cultIvatIOn IS, therefore, a great strain on the economy of the district.
II. The district has 9Il villages and 7 towns. Out of 665 thousands of people who were counted at the census of 1951, 591 thousands were found in villages and 75 thousands in the towns, i.e., there are 888 people per 1,000 of the population who live in the rural areas and only 112 of them live in towns. The corresponding figures for the State as a whole are: rural 864, urban 136.
The rural popUlation per inhabited village works out to 648. Most of the villages comprise of a single compact size. Still there are 1,091 hamlets in the district. The population per hamlet is 541. The medium-sized village, with popUlation between iJOO-2,000, is the dominant type in the district. Of the rural popUlation 59'4 per cent. live in such villages; 19'6 per cent. in small villages of a popUlation under 500; 18'0 per cent. in large villages of a population between 2,000-5,000; and only 3'0 per cent. in villages of populati.on over 5,000.
Towns vary in number of inhabitants just as the villages. 59'9 per cent. of the urban population lives in. t?wns of populati?n between 10,000-:20,000 (viz., ]\J:1hoba" Rath and Charkhari) and remalD1l1g 40'1 per cent. lD towns of populatIOn between 5,000-10,000 (viz., Maudaha, Hamirpur, Sumerpur and Kulpahar). Charkhari appears to be a declining town. Since 1941 the population of Charkhari has decreased by 8 per cent. (Vide Tables A-III and A-IV)
12. Out of the total population of 665,429 (rural 590,731, urb:1n 74,698) 532,400 (rural 512,433, urban 19,967) or 80'0 per cent. depend on agriculture for their means of livelihood and 133,029 (rural 78,298, urban 54,731) or 20'0 per cent. depend on

vii
non-agricultural sources. The following table gives the distribution of 100 persons of the total '<rural and urban population of the district unier the different liveHho:d classe3:
Agricult ural classes Non-agricultural classes
Description Total I II In IV Total V VI VII VIII
--------------~----~---------- ~
Total 80'0 56'1 6'7 14'8 2'4 20'0 8'0 3'4 0'7 7'9
Rural 86'S 60'!j 7'2 16'5 2'5 13'2 7'2 1'8 0'1 4'1
Urban 26'7 20'5 3'1 1'2 1'9 73'3 14'4 15'8 5'4 3H
It is obvious that the district is one of the more predominantly agricultural districts of the State. Here as many as 80'0 per cent. of the people depend on agriculture as against ·74'2 per cent. in the whole State.
Of the total popUlation of the district 324,415 persons (males 133,676, females 190,739) . ~r 48-8 per cent. have been classHied as non-earning dependauts. The percentage of nono earning dependants in the agricul~ural population wor~s O.lt to ~ 7'2 and th~t among non-agri,.cultural population as 54'9. It wIll be observe~ that III the maIn they conSIst of women. The male non-earn;ng dependants are mostly chIldren. 126,441 persons (males 23,522, females 102,919) 01' lU'O per cent. of the popUlation are earning ~epend,ants. Among the agriculturists their proportion is 20'9 per cent. and among non-agriculturists they form only 11'4 per cent. Agrioulture is a family occupation and it provides work to the women and grown up children in the family. The remaining 214,573 persons (males 18~,794, fem~les 29,779) or 32'2 per oent •
.,of the population consists of self-supporting persons. TheJr proportIon among agrioulturists is .31'9 per oent. and among non-agriculturists 33'7 per cent. Of the self-supporting persons 169,742 (males 146,560; females 23,182) belong to the agricultural classes and 44,831 persons
. (males 38,234, females 6,597) to the non-agricultural classes. On an average two self-support. ing persons maintain three non-earning dependants.
Of the 44,831 self-supporting persons belonging to the non-agricultural olasses 1 441 persons (males 982, females 459) earn their livelihood from non-productive sources. 01. the :remaining 43,390 self-supporting persons (rural 26,270, urban 17,1'20) 735 (rural 304, urban 431)
,..or 1'7 per cent. are employers, 10,119 (rural 5.215, urban 4,904 or 23'3 per cent. are employees . ..and 32,536 (rural 20,751, urban 11,785) or 75 per cent. are independent workers. The distribution of 10,000 self-supporting persons of non-agrioultural ocoupations classified
<according to the economic divisions is as follows:
• Self-supporting
Name of division
All Industries and Services
.O-Primary industries not elsewhere specified
I-Mining and quarrying
_2-Processing and manufacture-foodstuffs, textiles, leather and products thereor
3_Processing and manufacture-metals, chemicals and products thereof
.4-Processing and manufacture-not elsewhere specified
5-Construction and utilities
··6-Commerce
7-Transport, storage and communications
.S-Health, education and public administration
. 9-Services not elsewhere specified
There is no large scale or small scale industry of any note in the district.
persons by divisions
W,OOO
539
5, 1,906
3-62
1,151
651
J,682
385
1,106
2,163
13. In the district, the propor~i.on of population depending on agriculture for the;" l' - l' h d 79 1:* t·· 19~ Th . loA. I ve r-oo ,was .'0 per ~en . lD;)1. e ~nfortunate fact is that the agrioulbural proportion has been mcreaslDg ever SInce 1901 when the flgure stood at 63'8 per oent. It was 69'6 p t in .1911, 73'0 per cent. in 1921 and 79'5 per cent. in 1951. The actual number of perae; sce~. .-depend on agriculture has increased to 528,793 in 1951 from 292,554 in 1901 or b~ :O'~
-_.-------.---- . , ~The figure inc1ud~s earning dependants according to.their secondary means of livelihood while the fiO'ure
.8~ 0 10 paragraph 12 mcludes earnmg dependants accordmg to their principal means of 1ivelih~od and he c; tho -<hfference, n
Variation ill tla. livelihood p1tterll
HGusesand Iw_holds
viii
per cent .. while the cultivated area has increased only by 45'8 per cent. This has resulted in theprogressIve fragmentation and sub-division of holdings and pressure on impoverished soil. There ~ppears . to have been a gradual decline in village arts and handicrafts. The cumulative result 18 a ~all tn the proportion of workers and a corresponding rise in the dependency. The prGportlon of workers in the total population in 1951 was 51'2 per cent. (agricultural 41'7 per cent. all~ non-agricultural 9'5 per cent.) against 62'7 per cent. (agricultural 46'4 per cent., non?-grlCultural 16'3 per cent.) in 1921. The population of non-earning dependants has consequently ~ncreased from 37'3 per cent. (agricultural 26'6 per cent., non-agricultural 10'7 per cent.)· ~n 19?1 to 48'8 per cent. (agricultural 37'8 per cent., non-agricultural ll'O per cent.). All this IS an mdex of the increasing unemployment and under-employment. It is only by division of the population to cottage and other industries that the present severe disequilibirium in the economy of the district can be redressed. (Vide Tables B-I, B-II and B-III)
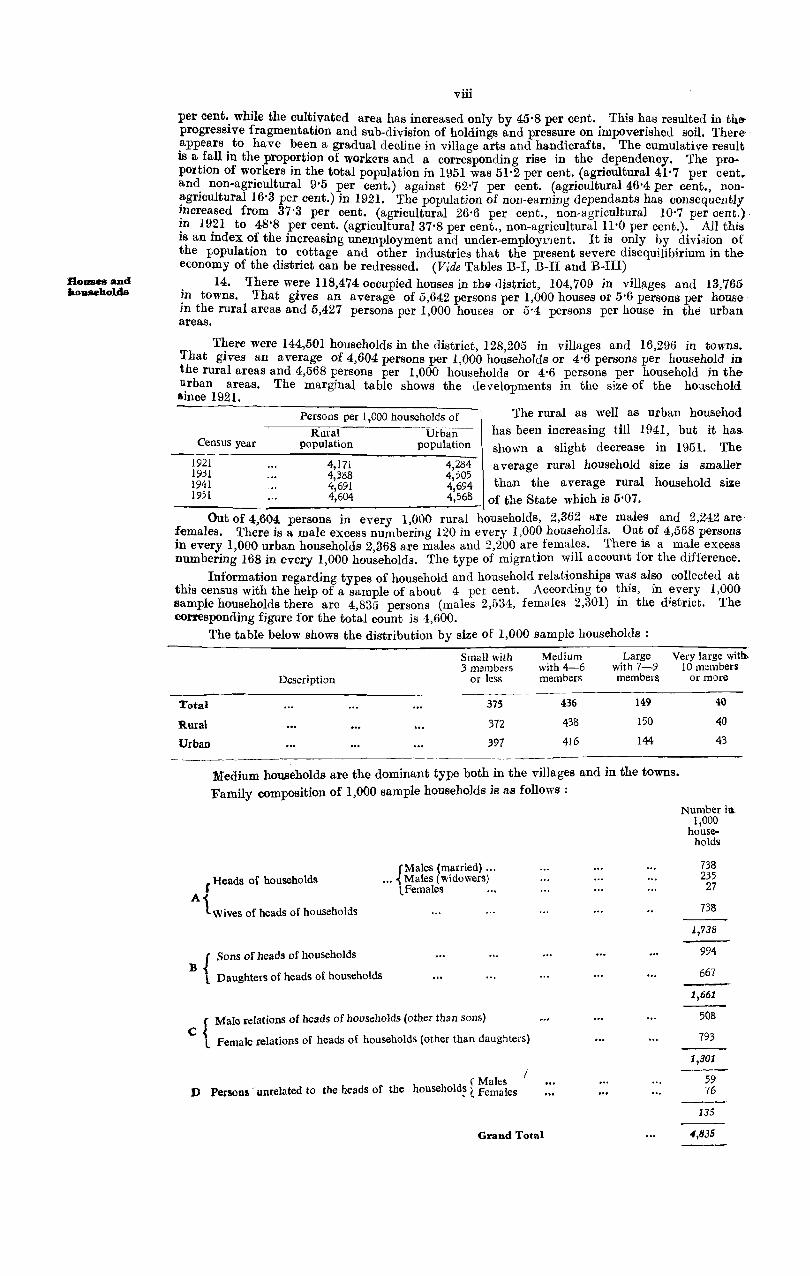
14. 'lhere were 118,474 occupied houses in thf# district, 104,709 in villllges and 13,765 ~n towns. That gives an average of 5,642 persons per 1,000 houses or 5'6 persons per house m the rural areas and 5,427 persons per 1,000 hou~es or 5'4 persons per house in the urban areas.
T~ere were 144,501 households in the district, 128,205 in villages and 16,296 in towns. That glVes an average of 4,604 persons per 1,000 households or 4'6 persons per household in the rural areas and 4,568 persons per 1,000 households or 4'6 persons per household in the ~rban areas. The marginal table shows the developments in the size of the household &lnce 1921.
Persons per 1,000 households of The rural as well as urban househod Rural Urban-- has been increa~ing till 1941, but it has
Census year population population shown a slight decrease in 1951. The
1921 4,171 4,284 average rural household size is smaller 1931 4,388 4,505 1941 4,691 4,694 than the average rural household size 1951 4,604 4,568 of the State whioh is 5'07.
Out of 4,604: persons in every 1,000 rural households, 2,362 are males and 2,242 are females. There is a male excess numbering 120 in every 1,000 households. Out of 4,568 persons in every 1,000 urban households 2,368 are males and 2,200 are. fema~es. There .is a ma:le. excess numbering 168 in every 1,000 households. The type of migratIOn WIll account for the dIfference.
Information regarding types of household and household relatio?ships wll:s al~o collected at this census with the help of a sample of about 4 pet cent. Accordmg to ~hlS, ill ~ve~y 1,000 sample households there are 4,835 persons (males 2,534, females 2,301) m the d'strlCt. The corresponding fjgure for the total count is 4,600.
The table below shows the distribution by size of 1,000 sample households:
Small with Medium Large Very large wit». 3 members with 4-6 with 7-9
Description or less members members
Total 375 436 149
Rural 372 438 150
Urban 397 416 144
Medium households are the dominant type both in the villages and in the towns. Family composition of 1,000 sample households is as follows:
r Heads of households
A 1 Wives of heads of households
{
Sons of heads of households
B Daughters of heads of households
(Males (married) ... ... {Males (widowers)
lPemales ...
r Male relations of heads of hOlJseholds (other than sons) C{ . L Female relations of heads of households (other than daughters)
( Males D Persons . unrelated to the headS of the household~ l. Females
I
Grand Total
10 m~mbers or more
40
40
43
Number ill 1,000
households
738 235
27
738
1,738
994
667
1,661
508
793
1,301
59 76
135
4,835

ix
Sons outnumber the daughters of the heads of households. The latter leave the homes of their parents after marriage. Female relations (other than daughters) outnumber the, male relations (other than sons). Such females are generally tho.,e who become members of these households by marr:age. (Vide Tables A-I and C-l)
15. In the district as a whole the sex-ratio was 946, i.e., there were 94ti lemales to every Sex-ratio 1,000 males. It varied among the tehsils. The lowest value wae 906 ill Hamirpur tehsil. The highest value was 976 in Charkhari tehs;!. The ratio was 956 in Kulpahar, 954 in Rath, 952 in Mahoba and 947 in Maudaha. lVIale migration from Charkhari appears to be the cause of higher sex-ra; io of the tehsil.
The Sex-ratio is smaller in towns than in villages. For the district as a whole the sexratio in villages is as high as 948 mainly due to migration while that in towns is only 928.
The corresponding figure of sex-rat~o for the district was 963 in 1921, 957 in 1931 and 958 in 1941 against 940 in 1951. The sex-ratio has been going down.
16. The number in each age-group in the district is shown below as a percentage of the Age-structure total number of all ages in the total, rural and urban population sep"rately:
Total populaticn Rural populution Urban popUlation -----_._-
Age-group Persons Males Females Males Femuks Mak, Females
Infants and young children 0-4 13'9 7'3 6'6 7-2 6'6 8'1 5'7
Boys and girls 5-14 24'7 13'4 11'3 13-4 11'3 13'5 1l'3
Young men and women 15-34 32'6 16'9 15'7 17'0 15'8 16'5 14'9
Middle-aged men and women 35-54 21'9 11'5 10'4 11'5 10'5 11'5 9'9
Elderly pers~ns 55 and over 6'9 H 3'g 3'0 3'7 4'0 4-6
--- ----.~
It will be seen that the population is progressive. 38'6 per cent. of the population is of age uuder 15 and only 6'9 per cent. of it consists of elderly persons. (Vide Table C-II)
17. Out of 10,000 persons in the district there are 5,225 males and 4,775 'females~: Among them 2,289 males and 1,499 females are unmarried. If we reckon males and females together the unmarried people are 37'9 per cent. of' the population.
Of the males 43'8 per cent. were unmarried, 49'8 per cent. were married and 6'4 per cent. were widowed or divorced. Among the females 31'4 per cent. were unmarried, 54'1 per cent. were married and 14'5 per cent. were widowed or divorced.
Of the married maleS'7'9 per cent. were of ages below 15, 51'0 per cent. were of ages 15-34, 34'9 pe-r cent. were of ages 35-54 and 6'2 per cent. were of ages 55 and over. Among the married females 13'0 per cent. were of ages below 15, 56'3 per cent. were of ages 15-34, 26'8 per cent. were of ages 35-54 and 3'9 per cent. were elderly women. .
Marriage is univers&l. Among males and females aged 35 years and over only 8' ° per-cent. of the males and 1'5 per cent. of the females were found unmarried. Most of the females are married before they attain the age of 25. Child marriage is still prevalent. 9'9 per cent. of the males of ages 0-14 and 18'9 per cent. of the females of ages 0-14 were returned as married. (Vide Table C-IlI)
18. Over 99'9 per cent. of the people of the district returned Hindi, Hindustani or Urdu as their mother-toni?ue. Am~ng the. other J?ot~er-tongues spoken the main is Punjabi (0'06 per cent.). Of thet\'ti5 lakhs of people III the dIstrIct only 107 or 0'02 per cent. were bilingual (in an Indian language). Those whose mother-tongue is other than Hindi, Hindustani or Urdu are generally t~e .m;g~ants wht? are able to speak any of these as a subsidiary language. Persons returning HlndI, Hmlustam or Urdu as secondary language were 84 or 78'5 per cent. of those who were bilin gual in some Indian language. (Vide Table D-I)
19. OClt of 1.oPOO p:Jpulation of the district the number of people belonging to different religions is : Hindus \:),3ti3, Muslims. ti24, Sikhs 4, ~hristians 5 and Jains 4 ~ o~ 10,000 popula~ tion in villages the number" are: Hmdus 9,617, MuslIms 378, Jains3 and ChristIans 2; and of 10000 population in towns the numbers are: Hindus 7,354, lVIuslims 2,574, Sikhs 32, Christians 32' Jai.ns 7 and others 1. l\Iu3lims, Sikhs aIlll Christians are generally concentrated in the urban areas of the district as is the case in the other parts of the State.
There were 145 thousand persons belonging to the Scheduled Castes in the district. Their number per 10,000 of popUlation works out to 2,181. In villages they are 2,262 for every 10,000 and in the towns their number per 10,000 is only 1,537. In the district there were 26 Anglo-Indians of whom 12 were males and 14 were females. (Vide Tables D-ll and D-lII)
20. The number of displaced persons in tbe district at the Census was only 267 (males 152, females 115). Most of them came to the district in 1947, the year of partition of India. (Vide Table D-V)
21. The percentage of male literacy was 17'5 in the district while that of female literacy was 2'3 only. As compared to this the percentage of literates among males in 1931 was 10'0;
o The corresponding figures {or the total count are 5,1)9 and 4,86!.
Marital statUE
Languages
ReUgionand special groups
Displaced persons
Literacy
Processing of ..:ensus data
Tracts
x
among females the percentage of literates in 1931 was 0'6 only.* On .January 1, 1951 there were 503 primary schools in the district with enrolment of 27,806. (Vide Table D-VII)
C-EXPLANATORY NOTE ON THE STATISTICS
The statistics in this volume have been presented in three parts: I-District Census Tables
II_Village, Town, Pargana and Thana Statistics
III-Miscellaneous Statistics Parts I and II contain census data. A brief account of the system of sorting of census
slips and preparation of tables and abstract therefrom is given below. '
Part III contains statistics throwing light on special aspects of populat;on and its growth ~ These have been derived from miscellaneous sources. Table 1, "Vital Statistics", has been prepared from the published and unpublished records of the Director of Medical and Health Services, Table 2, "Agricultural Statistics", from the Annual Season and Crop Reports, Table 3 "Live-Stock, Agricultural Machinery and Implements", from the published figures of Live~ Stock Census and Table 4, "List of Primary Schools", from information specially supplied by District Inspector of Schools.
2. The census data presented here has been derived from the census slips by a process of sorting, c0D?-pil?'t~~n and tab.ula~ion. In previous censuses the slips were first sorted by religion and thIS dIVISIon was mamtamed throughout so that all data was cross-tabulated by religion. This procedure has been abandoned at this census and substituted by a division based on economic characteristics of the population. The whole populat:on has been divided into eight livelihood classes, four of which are of the agricultural category and four of nonagricultural category as follows :
Agricultural Classes-
I-Cultivators of land wholly or mainly owned; and their dependants
II-Cultivators of land wholly or mainly unowned; and their dependants
III-Cultivating labourers; and their dependants
IV -Non-cultivating owners of land; agricultural rent receivers; and their dependants
Non-agricultural Classes-
V-Production (other than cutivation)
VI-Commelce
VII-Transport
VIII-Other services and miscellaneous sources
Another special feature of the sorting of this census was the separation, from the ver7 t t of slips of displaced persons and of a 10 per cent. random sample from the remainder. ~~fs has enabled the data of displaced p~rsons to be :rresented separately, while the 10 per cent. sample has been utilized for the preparatIOn o~ Age Tables. . .
The slips of this census have been copIed by Households mto a NatIOnal Register of C't' which has been prepared village-wise for rural areas and mohalla/ward-wise for urban a:e::.ns'Table C-I is based on a 4 per cent. sample extracted from this Register.
3. The slips were first sorted by villa,ges for the prepara:ti?n o~ the Primary Census Abstract. For the purpose of further sortI_ng the State was. dIVIded mto t~acts consisting of (a) rural tracts, comprising th~ rural populatIOn of eac~. tehsIl, (b) urban .Ctf)' tracts, comp~is. th opulation of areas whIch had been declared as CItIes, (c) urban non-clf)' tracts, comprisIDg ~~~ oe ~lation of urban areas of a.district excluding areas de?lared. as cities. Each tract was
t Pt dP a unI't for sorting of slIps. All data were compIled fIrst by tracts and then by rea e as . d t f d' t' (. h
districts. This volume presents the tractd-witseh
'la ~ )or onhe'l
IsthrlCtd.wIt. th~ exception of A and E Tables, which ha ,:"e been I pre~entset t e S\ -wIse: w lee IstrlCt-wise data for the whole State is contained m the fo lowmg a e vo umes .
Part I-B-Subsidiary Tables
Part II-A-General Population Tables
Part II-B-Economic Tables
I>art II-C-Age and Social Ta.bles
• The numbers per mille (of the 10 per cent. sample population) of each sex aged 5 years and over who were returned as literates are as below:
1951
207
Males
1931
116
1951
26
Females
1931
7

xi
4. Detailed explanatory notes are appended to each State table in the printed volumes EzplaaatOl'y ··of State tables. They apply to the tables in this volume also and should be referred to when Dotes necessary. A few notes of some of the tables are reprojuced below:
Table A-I-Column 5 relating to "hamlets" has been introduced for the firat time. Any distinctive cluster or agglomeration of houses has been treated as a "hamlet".
A clear distinction has been made in this census between a "House" and a "Household". A house is any human dwelllng having a separate main entrance whUe a household is any commensal unit living in a census house. In previous censuses the figures undp.r "Occupied Houses" used to be that of households, while the figures under columns 7-9 of the present table refer to occup~ed census houses as distinct from households.
The Economic Tables-The Indian Census Economi.c Classification Scheme, 1951, together with the occupational division and sub-division adopted for the census are given in Part II-B of the Report.
Table B-I-Each of the eight li.velihool classes mentioned above has been divided into three sub-classes, with reference to the economic status, as follows :
(i) Self-supporting persons;
(ii) Non-earning dependants ; and
(iii) Earning dependants
'l'hese were defined in the .Instructions to Enumerators as follows : "A 'self-supporting peraon' is one who is in receipt of an income and that income is
sufficient at least for his own maintenance. To be 'self-supporting' a person Deed not be able to support his family. All that is necessary is that he should be earning sufficient for his personal needs. For purposes of this question the person enumerated is the unit and not the family or household. Anyone who is not a 'self-supporting> person in this sense is a 'dependant'. A 'dependant' may be either an 'earning dependent" or a 'non-earning dependant'. The test is whether he secures a regular (and not casual) income, even though it may be small. Such income may be in cash or kind; it may be continuous or seasonal employment. When the income which he secures is not sufficient to support h,m that person is an 'earning dependant'. A peraon who does not earn any income either in cash or kind is a 'non-earning dependant'. Where two or more members of a family household jointly cultivate land and secure an income therefrom, each of them should be regarded as earn;ng part of the income. None of them is, therefore, anon-earning dependant. Each of them should be classed either a 'self-supporting person" or 'an earning dependant' according to the share of income attributable to each. The same applies to any other business carried on jointly. The share of the income is what the head of household deems it to be. This does not mean that everyone who works is necessarily a self-supporting person or an earning dependant. Thus, for instance. a housewife who cooks for the famUy, brings up the children or manages the household is doing very valuable work. Nevertheless, her economic status is that of a non-eaming dependant, if she does not also earn an income, and should· be recorded as such. "
Economically active, Semi-active ana Passive persons-All non-earning dependants are economically passive. They include persons performing house-work or other domestic or personal services for other membera of the same family households. But they do not include" unpa.id family workers" or persons who take part along with the members of the family household in carrying on cultivation or a home industry as a family enterprise.
All earning dependants are economically semi-active only. Though they contribute to the carrying on of economic activities, the magnitude of their individual contribution is deemed to be too small to justify their description as economically active. (Their contribution to economic activity is, however, taken into account in the tabulation of data based on secondary means of livelihood.)
All self-supporting persons are, ordinarily economically active with the exception of the .following classes and groups :
(a) All self-supporting persons of Agricultural Class IV.
Cb) The following groups of self-supporting persons who are included in Non-agricultural ·Class VIn and derive their principal means of livelihood from miscellaneous sources (otherwise ,than through economic activity) :
(i) Persons Ii ving principally on income from _non-agricultural property; (ii) Persons living principally on pensions, remittances, scholarships and funds;
(iii) Inmates of alms-houses and receipients of doles; (iv) Beggars and vagrants; and
(v) All other persons living principally on income derived from non-productive activities.
Table B-II-For a self-supporting person who has more than one means of Ii velihood the <secondary means of livelihood is the livelihood next in importance to his principal means of livelihood. For an earning dependant it is the source from which he secures his own income, where there are more than one subsidiary occupat~ons only the one providing the largest income .nas been taken into Itccount.

xii
Table B-III-"Employers", "Employees" and "Independent Workers" have been defined as follows in the Instructions to -Enumerators :
An "employer" is only that person who has necessarily to employ other person in order to carryon the business from which he secures his livelihood. Thus if a person employs a cook or any other person for domestic services, he should not be recorded as an "employer" merely for that reason.
An "employee" is a person who ordinarily works under some ocher .F'rson tor a saiary" or a wage in cash or kind as the means of earning his livelihood. There may be persons who are employed as managers, superintendents, agents, etc., and in that capacity control other workers. Such persons are also employees only and should not be regarded as 'employers '.
An "independent worker" means a person who is not employed by anyone else and who also does not employ any body else in order to earn his livelihood. (Sweepers, dhobies, kahars, etc., who work for several masters are independent workers. If, however, any of them accepts whole-time employment under one master he becomes" employee ". Daily wage-earners who work for different masters are likewise independent workers. But if they accept employment under one master, e.g., under a factory, they become "employees".) .
Tables C-II, C-III, C-IV and C-V-The figures presented in these tables are based on Bingle year age-returns and have not been smoothed.
Tables D-V (i) and (ii)-For the purpose of these tables a "displaced person" has been oefined as follows :
"A displaced person means any person who has entered India having left or being compelled to leave his home in Western Pakistan on or after the 1st March, 1947, or his home in Eastern Pakistan on or after the 15th October, 1946, on account of civil disturbances or on account of the setting up of the two Dominions of India and Pakistan,'"
PART I
DISTRICT CENSLJS TABLES


OJ of :3 c
to ....
Tehsil rJ V)
2
District Total
Hamirpur ...
2 Kulpahar
3 Mahoba
4 Maudaha
5 Rath
6 Chllrkhari
~ .,!:J
6 :::I
'" -a .;:; {) Tehsil Total r/J
,1 2 10
District Total 665,419
Hamirpur 109,316
2 Kulpahar 132,982
3 Mahoba 90,034
4 Maudaha 144,816
5 Rath 154,820
6 Charkhari 33,461
------------------------
3
A -GENERAL POPULATION TABLES
A-I -Area, Houses and Population
Area in
TABLES A-I & A-II -
Occupied houses
squara miles Villages Hamlets Towns Total Rural Urbao
3 4 5 6 7 8 9
2,779 911 1,091 7 lIB,474 104,709 13,765
416 140 203 2 20,:302 17,555 2,647
591 246 283 22,901 21,8131 1,020
354 95 114 17,415 13,697 3,718 I
604 165 191 25,984 24,014 1,970
655 207 237 25,936 23,221 2,715
159 58 63 6,036 4,341 1,695
Population
Persons Males Females
Rural Urban Total Rural Urban Total Rural Urban
11 12 13 14 15 16 17 18
590,731 74,698 341,992 303,245 38,741 323,437 287,486 35,951
94,310 15,00 .. 6 57,347 49,280 8,067 51,969 45,030 6,939
127,915 5,067 67,970 65,363 2,607 65,012 62,552 2,460
70,790 19,244 46,123 36,340 9,783 43,911 34,450 9,461
134,918 9,898 74,396 69,184 5,212 70,420 65,734 4,686
140,968 13,852 79,220 72,026 7,194 75,600 68,942 6,658
21,830 11,631 16,936 11 ,052 5,884 16,525 10,778 5,747
NOTE-The area figures given in column 3 are based on the district re~ords of tehsil areas. The area of the district as communicated by the Surveyor General of India is 2,744 square miles.
A-II -Variation in Population during Fifty Years
Net Variati.on
Years Persons Variation 1901-1951 Males Variation Females Variation
2 3 4 5 6 7 8 -------- --.--.-,--._
1901 545,871 274,031 271,840
1911 556:799 +10,928 280,9;9 +6,903 275,860 +4,020
1921 533,365 -23,434 271,660 -9,279 261,705 -14,155
1931 569,569 +36,204 291,052 +19,392 278,517 +16,812
1941 648,109 + 78,540 331,084 +40,032 317,025 +38,508
1951 665,429 +17,320 +119,558 341,992 +10,908 323.437 +6,412 -----_----- ~ _- -_-- ------ - -- ---------- -_ -----------_
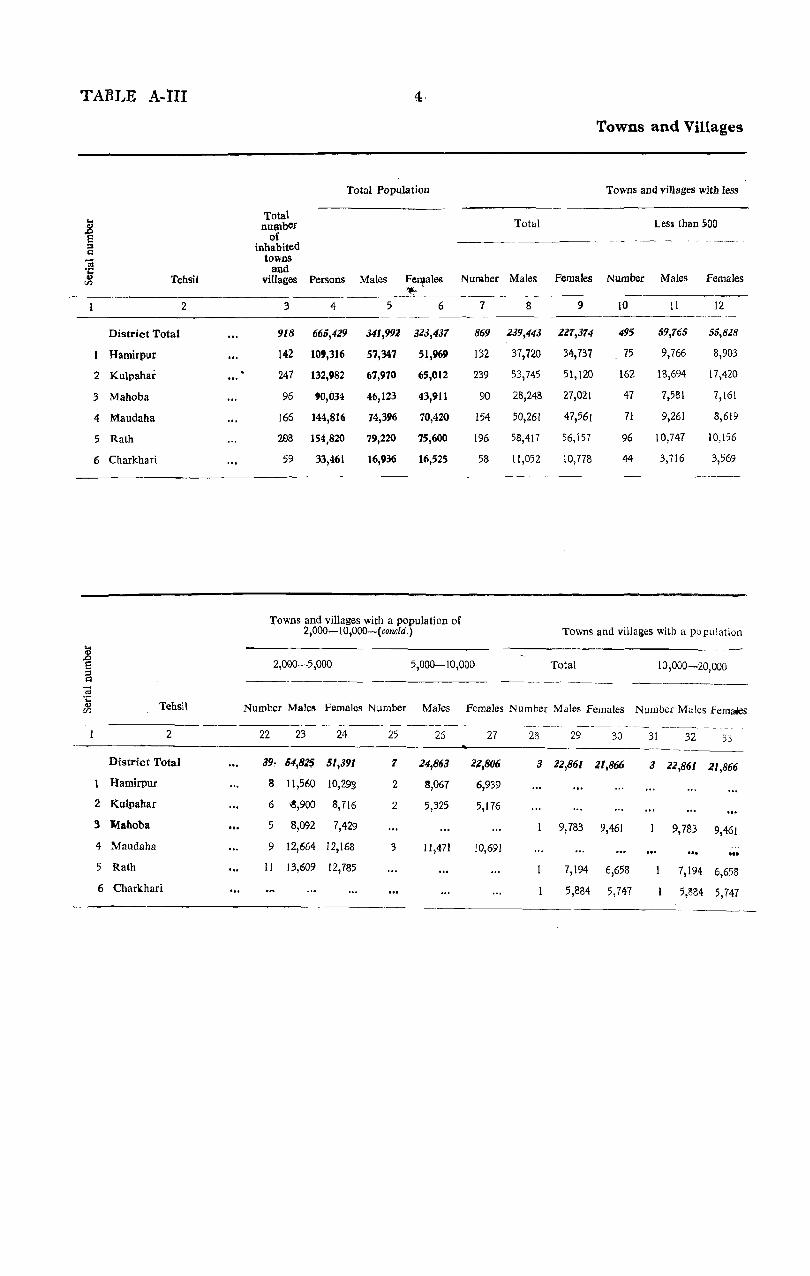
TABLE A-III 4,
Towns and Villages
Total Population Towns and villages with less
.8 Total number Total Less than ~OO
e of ----~-----
::s inhabited Q towns
] and r;Il Tehsil villages Persons Males FeIJ,lales NU[)iber Males Females Number Males Females
~.
2 3 4 5 6 7 8 9 10 II 12
District Total 918 665,419 341,991 313,437 869 139,443 117,374 495 59,765 55,818
HamirpuI 142 10',316 57,347 51,969 132 37,720 34,737 75 9,766 8,903
2 Kulpahar 247 132,982 67,970 65,012 239 53,745 51,120 162 18,694 17,420
3 Mahoba 96 '0,034 46,123 43,911 90 28,248 27,021 47 7,581 7,161
4 Maudaha 166 144,816 74,396 70,420 154 50,261 47,561 71 9,261 8,619
5 Rath 2£)8 154,820 79,220 75,600 196 5S,417 56, i57 96 10,747 10,156
6 Charkhari 59 33,461 16,936 16,525 58 11,052 10,778 44 3,716 3,569
Towns and villages with a population of 2,OOO-IO,000-(concld.) Towns and villaies with a population
,_, ., .0
2,090-5,000 E 5,000-10,000 Total 10,000-20,000 a 3 '"' Tehsil .,
Number Males Females Number Males Females Number Males Females Number Ma!es Females CI'l
-~- ------- ----2 22 23 24 25 26 27 28 29 30 31 32 33
District Total 39, 54,825 51,391 7 24,863 22,806 3 21,861 21,866 3 21,861 21,866
Hamirpur 8 11,560 10,293 2 S,067 6,939
2 Kulpahar 6 -8,900 8,716 2 5,325 5,176
3 Mahoba 5 8,092 7,429 9,783 9,461 9,783 9,461 4 Maudaha 9 12,664 12,168 3 11,471 10,691 ... 5 Rath II 13,609 12,785 7,194 6,658 7,194 6,658
6 Charkhari 5,884 5,747 5,~84 5,747

5
Classified by Population
than 2,000 p0puiation
500-1,000 1,000-2,000
-------- _. --------
Number Males Females Number Males .-----~-- ---~----------- --------._ - _--- .. ~- _---_._ -_._ ."_----------.--_
13 14 15 16 17 ---------~- -_
244 88,485 84,368 130 91,193
36 12,776 11,694 21 15,178
55 20,431 19.67:1 22 14,620
29 10,167 9,689 14 10,500
55 20,367 19,594 28 20,633
61 21,7[8 20,745 39 25,952
8 3,026 2,966 6 4,310
--------
0[-10,000 and above ------------ -----_-
20,000-50,000 50,000-100,000
Number Males Females Number Males
34 35 36 37 38
Females
TABLE A-III
Towns and villages with a population of 2,000-10,000
Total
Number Males Females -~----------~~-~----------
18 19 20 21
87,1'l8 46 79,688 74,197
14,140 10 19,627 17,232
14,021 8 14,225 13,892
.JO,I7l 5 8,092 7,429
19,348 12 24,135 22,859
25,255 II 13,609 12,785
4,243
100,000 and above
Females Number Males Females
39 40 41 42
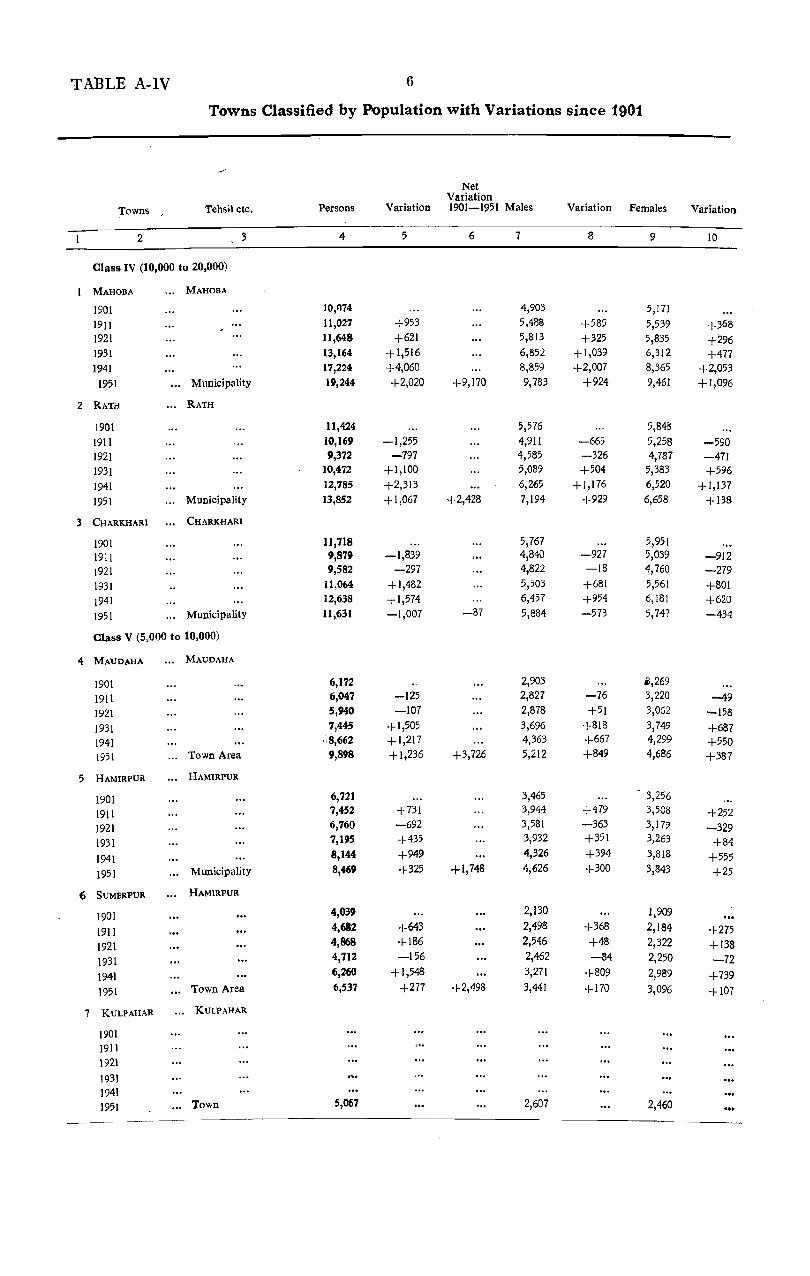
TABLE A-IV 6
Towns Classified by Population with Variations since 1901
Net Variation
Towns Tehsit etc. Persons Variation 1901-1951 Males Variation Females Variation
2 3 4 5 6 7 8 9 10
Class IV (10,000 to 20,000)
MAHOBA MAHOBA
1901 10,074 4,903 5,171
1911 11,027 +953 5,48$ +585 5,539 +368 1921 11,648 +621 5,813 +325 5,835 +296 1931 13,164 +1,516 6,852 +1,039 6,312 +477 1941 17,224 +4,060 8,859 +2,007 8,365 +2,053
1951 Municipality 19,244 +2,020 +9,170 9,783 +924 9,461 +1,096
2 RATH RATH
1901 11,424 5,5'16 5,848
1911 10,169 -1,255 4,911 -665 5,258 -590 1921 9,372 -797 4,585 -326 4,787 -471 1931 10,472 +1,100 5,089 +504 5,383 +596
1941 12,785 +2,313 6,265 +1,176 6,520 +1,137
1951 Municipality 13,852 +1,067 +2,428 7,194 +929 6,658 +138
3 CHARKHARI CHARKHARI
1901 11,718 5,767 5,951
1911 9,879 -1,839 4,840 -927 5,039 -912
1921 9,582 -297 4,822 -18 4,760 -279
1931 11,064 +1,482 5,503 +681 5,561 +801
1941 12,638 +1,574 6,457 +954 6,181 +620
1951 Municipality 11,631 -1,007 -87 5,884 -573 5,747 -434
Class V (5,000 to 10,000)
4 MAUDAHA MAUDAHA
1901 6,172 2,903 ii, 269
1911 6,047 -125 2,827 -76 3,220 --49
1921 5,940 -107 2,878 +51 3,062 -158
1931 7,445 +1,505 3,696 +818 3,749 +687 1941 '-,8,662 +1,217 4,363 +667 4,299 +550 1951 Town Area 9,898 +1,236 +3,726 5,212 +849 4,686 +387
5 HAMIRPUR HAMIRPUR
1901 6,721 3,465 3,256
1911 7,452 +731 3,944 +479 3,508 +252
1921 6,760 -692 3,581 -363 3,179 -329
1931 7,195 +435 3,932 +351 3,263 +84
1941 8,144 +949 4,326 +394 3,818 +555
1951 Municipality 8,469 +325 +1,748 4,626 +300 3,843 +25
6 SUMERPUR HAMIRPUR
1901 4,039 2,130 1,909
1911 4,682 +643 2,498 +368 2,184 +275
1921 4,868 +186 2,546 +48 2,322 +138
1931 4,712 -156 2,462 -84 2,250 -72
1941 6,260 +1,548 3,271 +809 2,989 +739
1951 Town Area 6,537 +277 +2,498 3,441 +170 3,096 +107
7 KULPAHAR KULPAHAR
1901 1911 1921
1931 1941 1951 Town 5,067 2,607 2,460
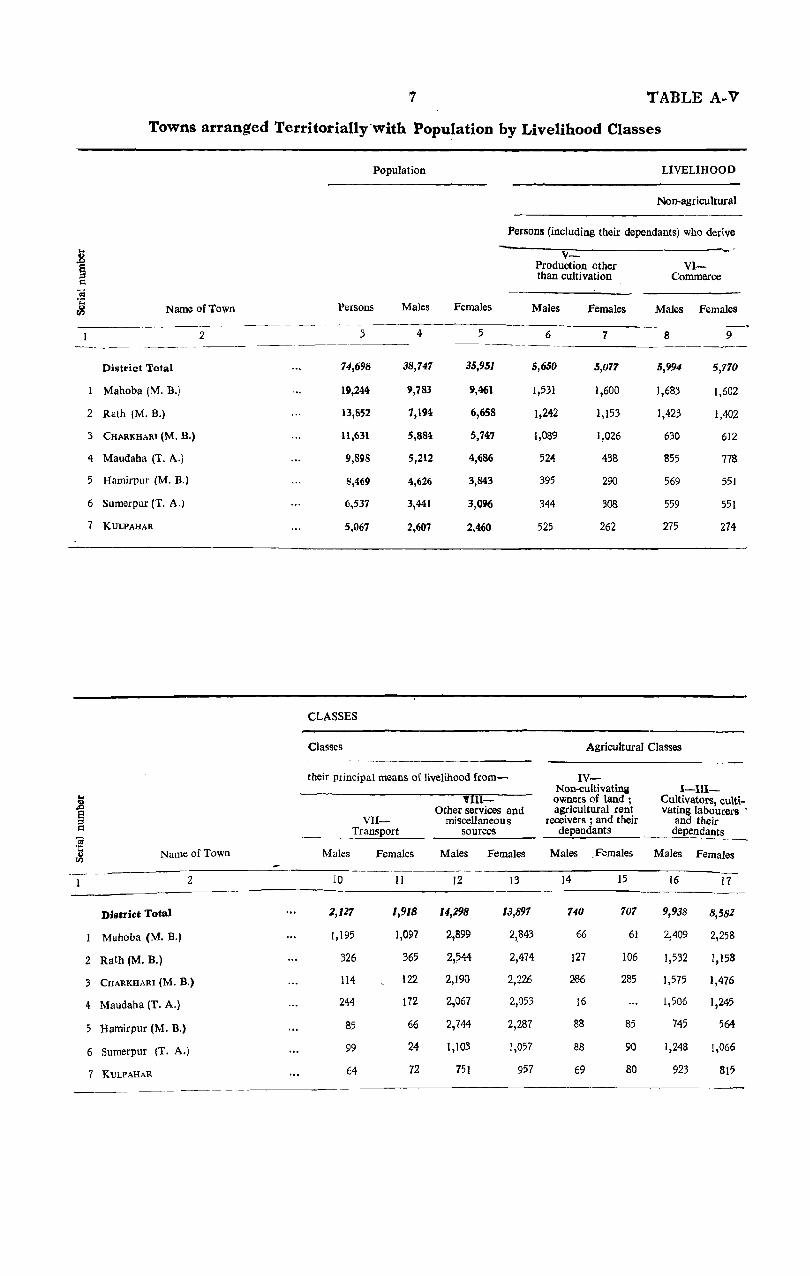
7 TABLE A-V
Towns arranged Territorially'with Population by Livelihood Classes
Population LIVELIHOOD
Non-agricultural
Persons (including their dependants) who derive
,g v-a Production other VI-i5 than cultivation Commerce
~ t Name of Town Persons Males Females Males Females Males Females rIl
2 :3 4 5 6 7 8 9
District Total 74,698 38,747 35,951 5,650 5,077 5,994 5,770
Mahoba (M. B.J 19,244 9,783 9,461 1,531 1,600 1,683 1,602
2 Rath (M. B.) 13,852 1,194 6,658 1,242 1,153 1,423 1,402
3 CHARKHARI (M. B.) 11,631 5,884 5,141 1,089 1,026 630 612
<} Maudaha (T. A.) 9,898 5,212 4,686 524 438 855 778
5 Hamirpur (M. B.) 8,469 4,626 3,843 395 290 569 551
6 Sumerpur (T. A.) G,537 3,441 3,096 344 308 559 551
7 KULPAHAR 5,067 2,607 2,460 525 262 275 274
CLASSES
Classes Agricultural Classes
their principal means of livelihood from- IV-Non-<:ultivating I-Ill-... ,.1II- owners of land ; Cultivatorl!, culti-<I)
.c Other services and agricultural rent vating labourers . e ::> VII- miscellaneou s receivers; and their and their r:: Transport sources dependants dependants t;j 't:;
Name of Town Males Females Males Females Males . Females Males Females .. III
2 10 II 12 13 14 15 16 17
District Total 2,127 1,918 14,298 13,897 140 707 9,938 8,582
Mahoba (M. B.) 1,195 1,097 2,899 2,.843 66 61 2,409 2,258
2 Rath (M. B.) 326 365 2,?44 2,474 127 106 1,532 1,158
3 CHARKHARI 1M. B.) 114 122 2,190 2,226 2B6 285 1,575 1,476
4 Maudaha (T. A.) 244 172 2,067 2,053 16 1,506 1,245
5 Hamirpur (M. B.) 85 66 2,744 2,287 88 85 745 564
6 Sumerpur (T. A.) 99 24 1,103 1,057 88 90 1,248 1,066
7 KULPAHAR 64 72 751 957 69 80 923 815

TABLE E 8
Area and Population of District and
Population Percentage
... .8 1951 1941 8 ::I l:I ;; .;:: Area in square u District and tehsil miles Persons Males Females Porsons 1941-1951 {f.l
----------2 3 4 5 6 7 8
District Total", 2,779 665,429 341,992 323,437 648,109 +Z'7 Rural Total 2,699 590,731 303,245 287,486 582,396 +1'4 Urban Tutal 80 74,698 38,747 35,951 65,713 +13'7
Hamirpur-Total 416 109,316 57,347 51,969 103,770 +5'3 Rural 400 94,310 49,280 45,030 89,366 +5'5 Urban 16 15,ll06 8,067 6,939 14,404 +4'2
2 Kulpahar-Total 591 132,982 67,970 65,012 135,765 -2'0 Rural 572 J27,915 65,363 62,552 135,765 -5'8 Urban 19 5,067 2,607 2,460
3 Mahoba-Total 354 90,034 46,123 43-,911 85,654 +5'1 Rural 343 70,790 36,340 34,450 68,430 +3'4 Urban 11 19,244 9,783 9,461 17,224 +11'7
" Maudaha-Total 604 144,816 74,396 70,420 138,932 +4'2 Rural 594 134,9111 ~9,lB4 65,734 130,270 +3'6 Urban 10 9,B98 5,212 4,686 8,662 +14'3
5 Rath-Total 655 154,820 79,220 75,(iOO 149,195 +3'8 Rural 643 140,968 72,026 68,942 136,410 +3'3 Urban 12 13,852 7,194 6,658 12,785 +8'3
6 Charkhari-Total 159 33,461 16,936 16,525 34,793 -3'8 Rural 147 21,830 11,052 10,778 22,155 -1-5 Urban 12 11,631 5,884 5,747 12,638 -8,0
LIVELIHOOD
Agricultural Classes-( concld,) Non-agricultural
Persons (including
IV-Non-cultivating owners .. of land; agricultural rent
~ III-Cuitivatinlliabourers receivers ; and their V-Production other 0 and their dependants dependants than cultivation Q
<a -.;;:: District and tehsil Males Females Males Females Males Females v
{f.l
2 16 17 18 i':1 'J{) 21
District Total, .. 48,216 49,996 7,595 8,597 28,371 24,650
Rural Total 47,729 49,600 6,855 7,890 22,721 19,573 Vtban Total 487 396 740 707 5,650 $,077
Hamirpur-6,918 6,450 1,272 1,268 3,334 Total 2,732
Rural 6.814 6,395 1,096 1,093 2,595 2,134 Urban 104 55 176 m 739 598
2 Kulpahar- 6,106 Total 10,626 J 1,198 1,753 2,092 5,193 Rural 10,514 11,112 1,(;84 2,012 5,581 4,931 Urban 112 86 69 80 525 262
3 Mahoba- 912 3,957 Total 6,310 6,671 1,032 3,784 Rural 6,237 6,595 846 971 2,426 2,184 Urban -/3 76 66 61 1,531 1, 1000
4 Maudaha-1,232 /,471 4,894 3,970 Total 10,858 11,484
Rural 10,842 11,459 1,216 1,471 4,370 3,532
Urban 16 25 16 524 438
5 Rath-Total 11,660 12,248 1,873 2,083 8,469 7,452 Rural 11,533 12,149 1,746 1,977 7,227 6,299 Urban 127 99 127 106 1,242 1,153
.6 Charkhari 1,519 Total 1,844 1,945 553 651 1,611 Rural 1,789 1,890 267 366 522 493
Urban 55 55 286 285 1,089 1,026
NOTE-The areas given in column 3 are based on the district records of tehsi1 areas,
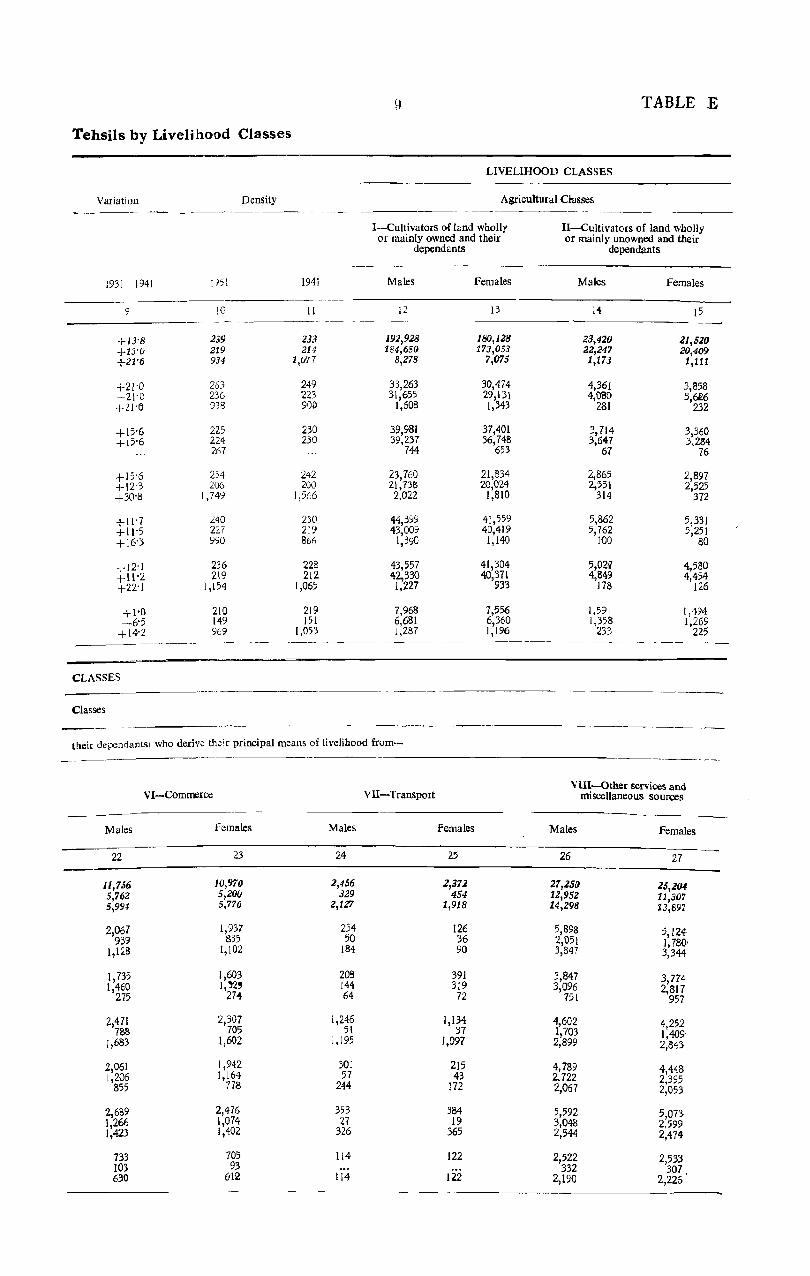
Tehsils by Livelihood Classes
Variation Density -_ -~----~~~--
1931 1941 1?51 194i
9 [0 [[
+J3'8 239 233 +13-0 219 214 +21'6 934 1,077
+21'0 263 249 +21'0 236 223 +2H) 938 900
+15'6 225 230 +15'6 224 230
267
+15'6 254 242 +12'3 206 200 +30'8 1,749 1,566
+11'7 240 230 +11'5 227 219 +16'3 990 866
+12'1 236 228 +11'2 219 212 +22'1 1,154 1,065
+1'0 210 219 -6'5 149 151
+14'2 9E9 1,053
TABLE E
LIVELIHOOD CLASSES
Agricultural C~asses
I-Cultivators of land wholly or mainly owned and their
dependants
Males Females
[2 !3
J92,928 180,J28 184,650 1'73,053
8,2'78 '1,0'75
33,263 30,474 31,655 29,131
1,603 1,343
39,981 39,237
744
37,401 36,748
653
23,760 21,834 21,738 20,024 2,022 1,810
44,399 41,559 43,009 40,419
1,390 1,140
43,557 41,304 42,330 40,371 1,227 933
7,968 6,681 1,287
7,556 6,360 1,196
-- --------------II-Cultivators of land- wholly or mainly unowned and their
dependants
Males Females
14 15
23,420 21,520 22,247 20,409 1,1'13 1,111
4,361 3,858 4,080 3,~
281 232
3,714 3,360 3,647 3,284
67 76
2,865 2,897 2,551 2,525
314 372
5,862 5,331 5,762 5,251
100 80
5,0217 4,580 4,849 4,454
178 126
1,591 [,494 1,358 1,269
233 225 _----------------- -------
CLASSES
Classes
----t!leir dependants) who deriv~ their principal means of livelihood from--
-----_. ----
VII-Transport VIII-Other services and
VI-Commerce miscellaneous sources
Males Females Males females Males Females
22 23 24 2' 26 27
JI,7S6 10,970 2,456 2,312 27,150 25,204 5,762 5,200 329 454 12,952 11,307 5,994 5,770 2,127 1,918 14,298 13,897
2,067 1,93'1 234 126 5,898 5,124-939 835 ,0 36 2,051 1,780'
1,1:1.8 1,102 184 90 3,847 3,344
1,735 1,603 203 391 3,847 3,774 1,460 1,Y2' 144 319 3,096 2,817
275 274 64 72 751 957
2,471 2,307 1,246 1,134 4,602 4,252 788 705 51 37 1,703 1,409
1,683 1,602 1.195 1,097 2,899 2,843
2,061 1,942 301 215 4,789 4,448 1,206 1,164 57 43 2,722 2,395
855 778 244 172 2,067 2,053
2,689 2,476 353 384 5,592 5,On 1,266 1,074 27 19 3,048 2.599 1,423 1,402 326 365 2,544 2,474
733 705 114 122 2,522 2,533 103 93 332 307 630 6'12 114 122 2,190 2,226
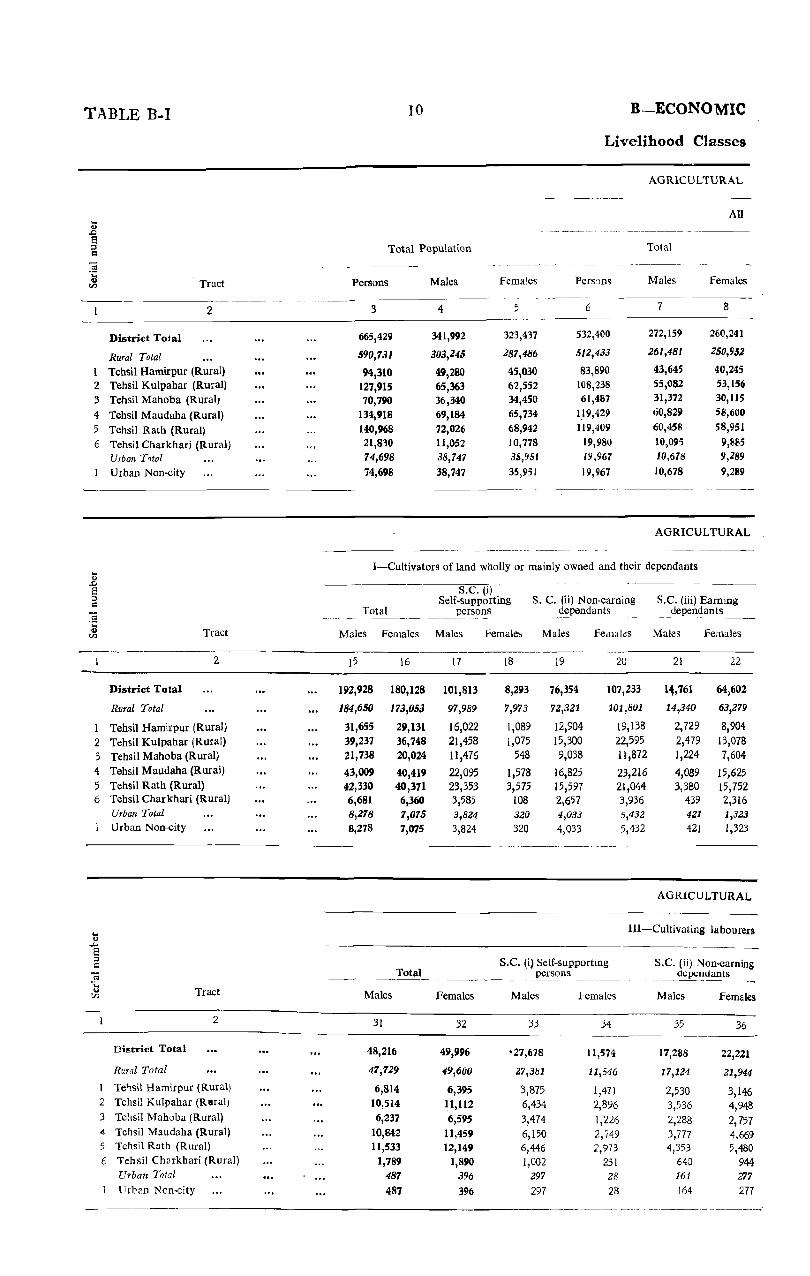
TABLE B-1
District Total
Rural Total
Tract
2
Tehsil Hamirpur (Rural) 2 Tehsil Kulpahar (Rural) 3 Tehsil Mahoba (Rural) 4 Tehsil Maudaha (Rural) 5 Tehsil Rath (Rural) 6 Tehsil Charkhari (Rural)
Urban Total
Urban Non-city
District Total
Rural Total
Tract
2
Tehsil Hamirpur (Rural) 2 Tehsil Kulpahar (Rural) 3 Tehsil Mahoba (Rural) 4 Tehsil Maudaha (Rural) 5 Tehsil Rath (Rural) 6 Tehsil Charkhari (Rural)
Urban Total Urban Non-city
10 B-ECONOMIC
Livelihood Classes
AGRICULTURAL
All ~~-.- _._"._- --- ------------ - -----~_
Total Population Total .----.--------~ ---_--
Persons Males Females PerS8ns Males Females -------_-,,----~~ --_.
:3 4 5 6 7 8
665,429 341,992 323,437 532,400 272,159 260,241
590,731 303,245 287,486 512,433 261,481 250,952
94,310 49,280 45,030 83,890 43,645 40,245
127,915 65,363 62,552 108,238 55,082 53,156
70,790 36,340 34,450 61,487 31,372 30,115
134,918 69,184 65,734 119,429 4;0,829 58,600
140,968 72,026 68,942 119,409 60,458 58,951
21,830 11,052 10,778 19,980 10,095 9,885
74,698 38,147 35,951 1'1,967 10,678 9,289
74,698 38,747 35,951 19,967 10,678 9,289
AGRICULTURAL
I-Cultivators of land wholly or mainly owned and their dependants
s.c. (iJ Self-supporting S. C. (ii) Non-earning
Total ___ ~yers:m~~.. dependants
Males Females Males
192,928
184,650
31,655 39,237 21,738
43,009 42,330 6,681 8,218
8,278
16
180,128
173,053
29,131 36,748
20,024
40,419 40,371 6,360 7,075 7,075
17
101,813
97,989
16,022
21,458
11,476
22,095 23,353 3,585
3,824
3,824
Females Males
18
8,293
7,973
1,089
1,075 548
1,578 3,575
108
320
320
19
76,354
72,321
12,904 15,300
9,038
16,825 15,597 2,657 4,033
4,033
Females
20
107,233
101,801
19,138 22,595
11,872
23,216 21,044 3,936 5,432
5,432
s.C. (iii) Earning dependants
Males
21
1,*,761
14,340
2,729
2,479 1,224
4,089 3,380
439 421
421
Females
22
64,602
63,279
8,904
13,078
7,604
15,625 15,752 2,316 1,323
1,323
-----------------------_ ... _-_._ ....
AGRICULTURAL
... Ill-Cultivating labourers \I)
..a 2 ;:J S.C. (i) Self-supporting S.C. (ii) Non-earning Q
-;;; Total ~--_p~!~~._-_- ~~ __ dependant_s __ .;:; .. Tract Males Females til Males Females Males Females
2 31 32 33 34 35 36
District Total 48,216 49,996 -27,678 1l,574 17,288 22,221
Rural Total 47,729 49,600 27,381 11,546 17,124 21,944
Tel)sil Hamirpur (Rural) 6,814 6,395 3,875 1,471 2,530 3,146 2 Tehsil Kulpahar (Raral) 10,514 11,112 6,434 2,896 3,536 4,948 3 Tehsil Mahoba (Rural) 6,237 6,595 3,474 1,226 2,288 2,757 4 Tehsil Maudaha (Rural) 10,842 11,459 6,150 2,749 3,777 4,669 5 Tehsil Rath (Rural) 11,533 12,149 6,446 2,973 4,353 5,480 6 Teh sil Charkhari (Rural) 1,789 ],890 1,002 231 64D 944
Urban Total 487 396 297 28 164 277 Urbw Nen-city 487 396 297 28 164 277
"-~-~- ---------__ --- ----------.:

'TABLES 11 TABLE B-1
:and Sub-classes
CLASSES
Classes
S. C. (i) Se)t.supporting S. C. (ii) Non-earning S. C. (iii) Earning persons ---_-- dependants dependants
Males Females Males Females Males Femaies
" 9 10 II 12 13 14
146,560 23,182 105,420 145,927 20,179 91,132 141,573 22,677 100,254 138,704 19,654 89,571
22,773 3,053 17,378 24,945 3,494 12,247 31,054 4,722 20,645 30,474 3,383 17,960 16,925 2,100 12,527 16,551 1,920 11,464 31,828 5,025 23,380 31,299 5,621 22,276 33,538 7,288 22,387 29,677 4,533 21,986
5,455 489 3,937 5,758 703 3,638 4,987 505 5,166 7,223 525 1,561 4,987 505 5,166 7,223 525 1,561
CLASSES-(contd.)
II-Cultivators of land wholly or mainly unowned and their dependants
S.C. ti) Self-supporting Total persons
Males Females Males Females
23 24 25 26 ----------------"---- --_
23,420
22,247
4,080 3,647 2,551 5,762 4,849 1,358 1,173 1,173
CLASSES-(eolltd. i
and their dependants
21,520
20,409
3,626 3,284 2,525 5,251 4,454 1,269 1,111
1,111
S.C. (iii) Earning dependants
12,603
12,078
2,185 2,233 1,414 2,871 2,653
722 525 525
Males Females
37 38
3,250 16,201
·1,224 16,110
409 1,778 544 3,268
475 2,612
915 4,041
734 3,696
147 715 26 91
26 91
656
606
159 89 37
182 116 23 50
50
Males
39
7,595
6,855
1,096 1,684
846 1,216 1,746 2~7
140 740
S. C. (ii) Non-earning S.C. (iii) Earning dependants dependants
Males Females Males Females
27 28 29 30
8,949 11,766 1,868 9,098
8,364 10,83i 1,805 8,970
1,533 2,023 312 1,444 1,111 1,352 303 1,343 950 1,400 187 1,088
2,336 2,687 555 2,382 1,848 2,176 348 2,162
536 695 100 551 585 933 63 128 585 933 63 128
IV-Non-cultivating owners of land; agricultural rent receivers; and their dependants
Total S.C. (i) Self-supporting
persons ----- .....
Females Males Females
40 41 42
8,597 4,466 2,659
7,890 4,125 2,552
1,093 691 334 2,012 929 662
971 561 289 1,471 712 516 1,977 1,086 624
366 146 127 701 341 107
707 341 !O7
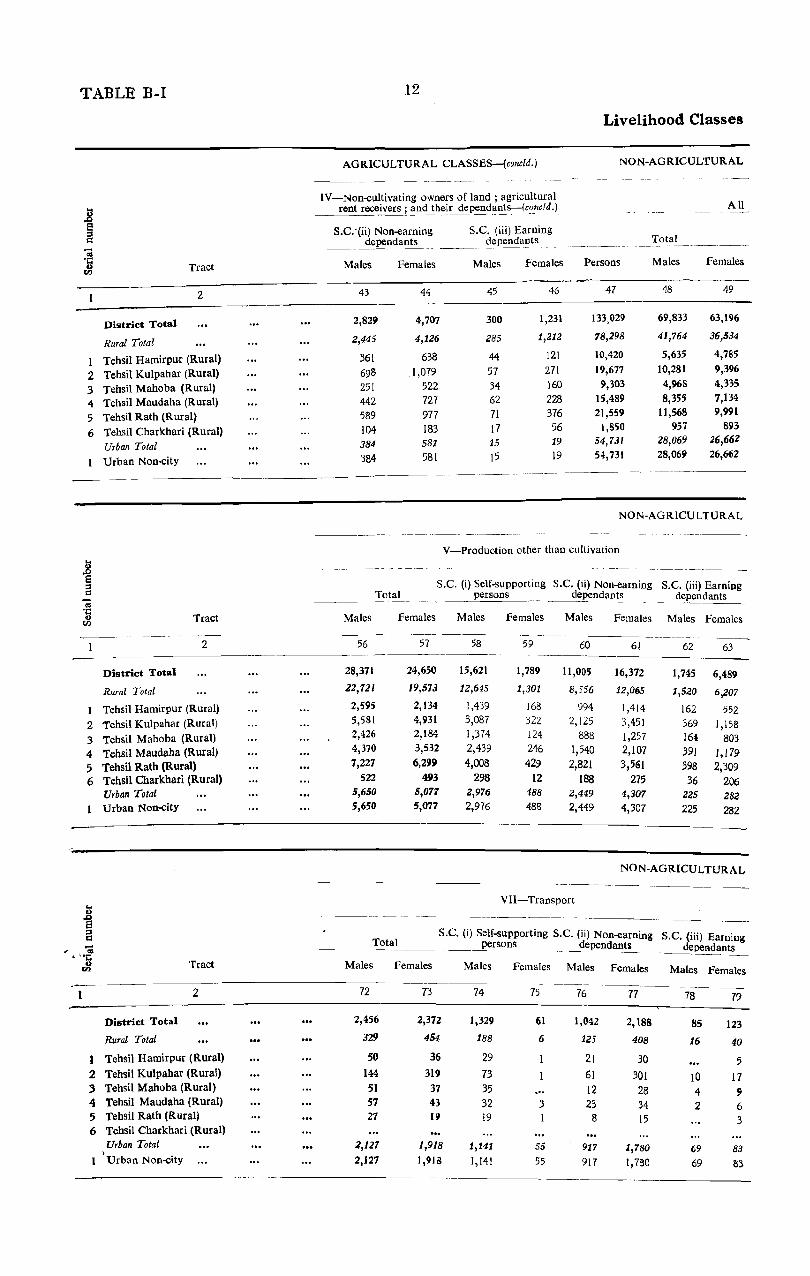
TABLE B-I
-;; .;::: o til
District Total
Rural Total
Tract
2
I Tehsil Hamirpur (Rural) 2 Tehsil Kulpahar (Rural) 3 Tehsil Mahoba (Rural) 4 Tehsil Maudaha (Rural) 5 Tehsil Rath (Rural) 6 Tehsil Charkhari (Rural)
Urban Total
Urban Non-city
... .8 8 ::l c::
:! .... Tract <>
til
---------2
District Total
Rural Total
1 Tehsil Hamirpur (Rural)
2 Tehsil Kulpahar (Rural)
3 Tehsil Mahoba (Rural)
4 Tehsil Maudaha (Rural)
5 Tehsil Rath (Rural) 6 Tehsil Charkhari (Rural)
Urban Total Urban Non-city
... 4)
.D 8 ::s c
~ ;.~ 4) Tract til
2
District Total
Rural Total
I Tehsil Hamirpur (Rural)
2 Tehsil Kulpahar (Rural) 3 Tehsil Mahoba (Rural) 4 Tehsil Maudaha (Rural) 5 Tehsil Rath (Rural) 6 Tehsil ChaIkhari (Rural)
Urban Total , 1 Urban Non-city
12
AGRICULTURAL CLASSES-(eoncld.)
IV-Non-cultivating owners of land; agricultural rent receivers; and thei~~pendal1!s::-(c?_ncld.)
S.C:(ii) Non-earning S.C. (iii) Earning dependants __ ____t!e penda~ts
--~
Livelihood Classes
NON-AGRICULTURAL
All
Total .---~~- ----_. -~--~----
Males Females Males females Persons Males Females
---.. -43 44 45 46 47 48 49
2,829 4,707 300 1,231 133,029 69,833 63,196
2,445 4,126 285 1,212 78,298 41,764 36,534
361 638 44 121 10,420 5,635 4,785
698 .1,079 57 271 19,677 10,281 9,396
251 522 34 160 9,303 4,968 4,335
442 727 62 228 15,489 8,355 7,134
589 977 71 376 21,559 11,568 9,991
104 183 17 56 1,850 957 893
384 581 15 19 54,731 28,069 26,662
384 581 15 19 54,731 28,069 26,662 . ___ .
NON-AGRICULTURAL
V-Production other than cultivation . __ ._-- --_-- - - - - -- -_._----------_-
S.C. (i) Self-supporting S.C. (ii) Non-earning S.C. (iii) Earning Total persons dependants dependants
_-~_
-.----~--
Males females Males Females Males Females Males Females ._------ -~---- -----
-.-~-------
56 57 58 59 60 61 62 63
28,371 24,650 15,621 1,789 11,00'5 16,372 1,745 6,489 21,721 19,57J 12,615 1,301 8,556 12,0(>5 1,520 6,207
2,595 2,134 1,439 168 994 1,414 162 552 5,581 4,931 3,087 322 2,125 3,451 369 1,158 2,426 2,184 1,374 124 888 1,257 164 803 4,3'10 3,532 2,439 246 1,540 2,107 .391 1,179 7,227 6,299 4,008 429 2,821 3,561 398 2,309
522 493 298 12 188 275 36 206 5,650 5,077 2,976 488 2,449 4,307 225 282 5,650 5,077 2,976 488 2,449 4,307 225 282
NON-AGRICULTURAL
VII-Transport
S.C. (i) Self-supporting S.C. (ii) Non-earning Total S.C. (iii) Earning
_~ ~rs?_l1S _ _ __ ~pe!l(jants dependants
Males Females Males Females Males Females Males Females
72 73 74 75 76 77 78 79
2,456 2,372 1,329 61 1,042 2,188 85 123 329 454 188 6 125 408 16 40
50 36 29 21 30 5 144 319 73 61 301 10 17 51 37 35 12 28 4 9 57 43 32 3 23 34 2 6 27 iii 19 8 15 3
2,127 1,918 1,141 55 917 1,780 69 83 2,127 1,918 1,141 55 917 1,780 69 83

and Sub-classes-(concld.)
CLASSES
Classes
----------
S.C. (i) Self-supporting persons
--------- ------
Males Females
50 51
38,23~ 6,597
23,720 3,470
3,222 593
5,782 790
2,911 326
4,754 830
6,551 874
500 57
14,514 3,127
14,514 3,127
~--~~--
CLASSES-(eontd.)
13
s.c. (ii) Non-earning ~ ________ dependal!l~ _ _ _
Males Females
52 53 - -----_-~-----~----~~-_--
28,256 44,812
15,577 22,9(;6
2,113 3,147 3,904 6,614 1,764 2,629 2,953 4,273 4,442 5,780
401 523
12,679 21,846 12,679 21,845
---_--.- -------- ------ _--_- ------
'TABLE B-1
s.c. (iii) Earning ___ __d~nd<ln~_
Males Females
------ ------_ 54 55
-.. --~---~-- '''~------
3,343 11,787
2,467 10,098
300 1,045 595 1,992 293 1,380 648 2,031 575 3,337
56 313
876 1,689 876 1,(:83
~-~--- ----------- ~~-~--~-~--
Mates
11,756
5,162
939
1,460 783
1,206 1,266
103
5,994
5,994.
CLASSES-(concld.}
)V1alcs
80
27,2;0
12.952
2,051
3,096
1,703
2,712
3,0:18
332
14,298
14,298
Total
Tct~l
Fema1e~
10,910
5,2QQ
835
1,319
705
1,164 1,074
93
5,7i!J
;,770
Fcm:,lcs
81
25,2G'i:
11,307
1,78)
2,817
1,40)
2,3);;
2,599
3\i7
13A97 13,897
VI-Commerce
S.C. (i) Self-supporting persons
Males females
S.C. Oi) Non-earning ____ ~d_eJ)endants_~~
Males females
S.c. (iii) Earning depenrlant's
Mdes
~---~~-~----~------- ---------- ----~----~----
68 69
6,358 940 4,903 8,731
3,Z89 526 2,150 3,573
515 [02 374 596 835 108 560 984 435 44 306 507 697 169 416 704
.758 98 448 713 49 5 46 69
3,06'J 414 2,753 5,158
3,069 414 2,753 5,158
~~----~~ --~------------------.-------
YIll-Other servic~s and miscellaneous SJurces
S.C (i) 'Self~supporh16 _~~sons __
Males FemJles
S.c. (ii) Non-earning dCPCJl~~!lts
Males
70 7!
495 J ,OS(l
323 1,101
50 137 65 237 4/ 1:54 ')j 29! 60 26';
(:) 19 172 198
172 1';'3
S.c. (lii) Earn'ng dependants
Maks Fell1aks . __ ------------------------ ----~-----~.-~,--~---'
82 83 84 85 86 87 --_._- ---_. _----_-_-
----~-- - ----"----_--- --- --._--._-----
H,n6 3,807 11,306 17,521 1,01S 3,876
'7,598 1,637 4,746 6,920 602 2,750
1,239 322 724 1,10'" 86 351 1,787 359 1,158 1,873 151 580 1,067 158 558 837 76 414 1.586 412 974 1,428 162 555 1,766 346 1,165 1,491 117 il62
153 40 167 179 12 8" :.)
7,328 I 2,170 6,%1) 10,601 410 1,126 7,328 2,170 pea lO,WI 41(' 1,126

rAll liE B-lI
Total
14
Cultivation of owned land
Self-supporting persons
Earning dependants
Livelih Jod Classes Males Females Males Femaies Males Females
2 3 4 --------------------
All Agricultural Classes ...
I_Cultivators o[ land wholly or mainly owned
II-Cultivators of land wholly or mainly un:lwned
Ill_Cultivating labourers
IV_Non-cultivating <?wners of land; agncu}-turu} rent receivers
All Non-agricultural Classes
V-Production other than cultivation
VI-Commerce
VII-Transport
Vill-Other services and miscellaneous sources
All Agricultural Classes ...
I-Cultivators of land 'lYhclly or mainly owneu
ll-Cultl\'ratoIs of land wholly or mainly unowned
Ill-Cultivating labourerS
IV-Non-cultivating own-ers of land: agricultural rent receivers
An Non-agricultural Classes
V-ProductiQ)U other than cultivati(')n
VI-Commerce
VII-Transport
VlII-Olher services and m'sccllaneous sources
A 11 Agricultural Classes
I-Cultivators of land wholly or mainly owned
ll-Cultivators of land whollY or mainlY unowned
llI-Cultivating labourers
I V-Non-cultivating own-ers of land; agricul' tur,,) rent receivers
All Non-agricultural Classes
V-Production other than cultivatioJJ
VI-Commerce
\ 11-Transport
V'll-Cther services and ml~c'ella[]e()us sources
12,554
11,575
302
512
165
2,0~O
808
369
16
847
2,615
2,454
47
£.99
15
181
63
41
,77
1,556
1,382
89
39
46
436
197
59
12
168
59,564
58,003
600
85Z
109
973
458
.'57 15
343
8,553
8,306
100
137
10
IIJ
51
13
46
11,602
11,341
le7
123
31
)29
102
36
4
~7
560
lSI
281
128
1,724
660
298
9
757
94
17
72
5
J43
42
33
68
116
66
11
39
387
179
49
7
152
5
99
9
66
24
96
26
13
3
54
21
7
Ii
3
20
3
16
16
2
11
3
14
4
3
7
6
11,994
JI,575
lSI
231
37
316
/48
71
7
90
2,521
2,454
:0
27
10
38
21
8
9
1,440
1,382
23
28
7
49
18
10
5
16
7
59,465
58,003
591
786
85
877
432
144
12
289
8,53;l
8,306
93
126
7
91
~8
12
30
1l,586
11,341
105
112
28
215
98
33
4
cO
Secondary Means
)',umLc[ of perSJOS deriving thelr
Total
,
Cultivation of unowned
Self-supporting persons
Males Femah:s Males females
8
2,58;
1,281
983
15
S92
317
83
3
189
317
302
40
2
55
16
9
30
330
220
91
1<!3
6
/15
70
12
33
9
~,388
194
6,028
143
21
177
112
6
51)
10 11 ._--_ .. _-_ 1,445
1,158
274
13
5~1
288
lJ
J
177
District
142
59
72'
Il
19
6
8
4
Tehsil Hamirpur
[,IZO
10
1,104
6
25
9
2
13
630
If)
590
22
47
26
5
15
100
73
27
52
15
29
4
j
5
2
2
Tehsil Kulpabar
128 5
110
12 4
6
5
II 5
29
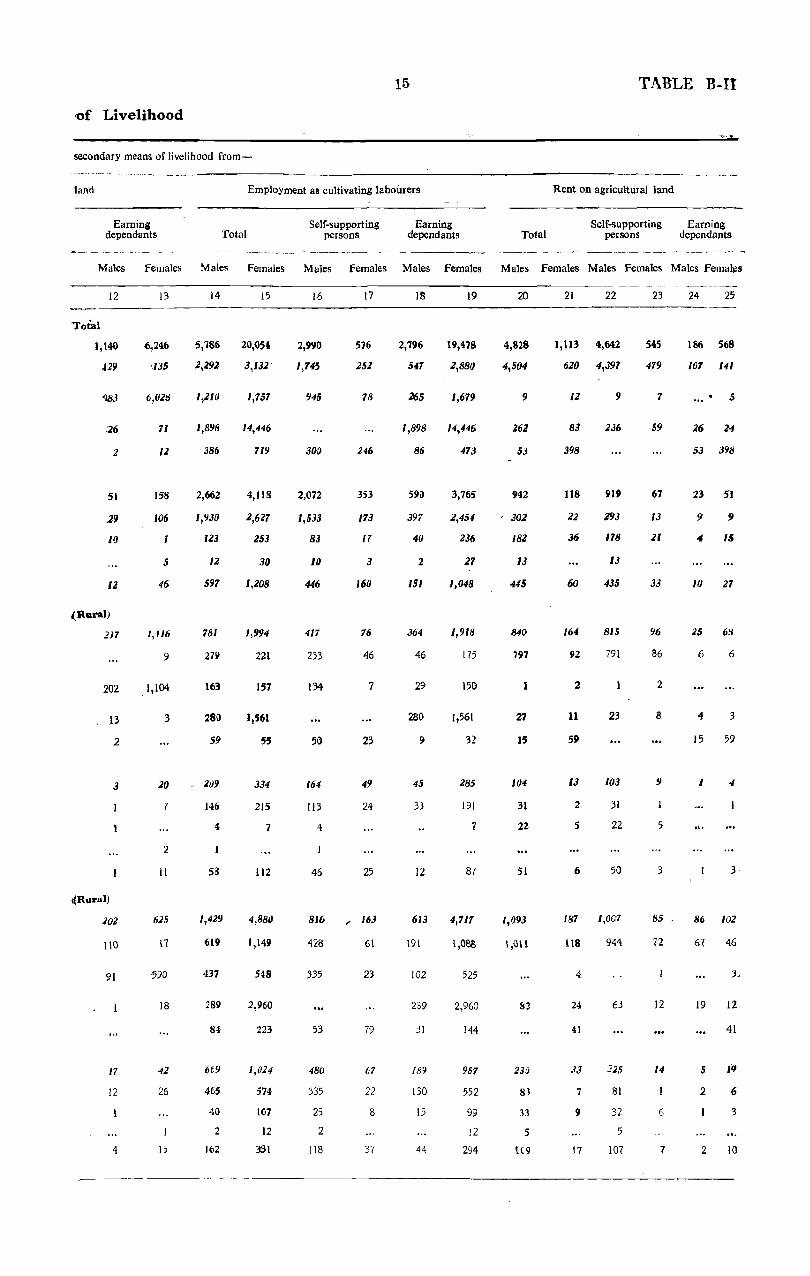
15
'of Livelihood
secondary means of livelihood from-
lana
Earning dependants Total
Employment as cultivating labourers
Self-supporting persons
Earning dependants
TABLE B-II
Rent on agricultural land
Self-supporting Earning Total persons dependants
'Males females Males Females Males females Males Females Males Females Males Females Males Femal~s
12
"Total
1,140
J29
.26
2
51
.29
10
12
(Rural)
217
202
13
2
3
4Rural)
202
1\0
91
17
12
4
13
6,246
135
6,028
71
12
158
106
5
46
1,116
9
1,104
3
20
7
2
11
625
590
18
42
26
15
14
5,186
2,292
1,210
1,898
J86
2,662
1,930
Il3
12
597
781
27~
163
280
59
:109
146
4
5a
1,429
619
437
289
84
6£9
465
40
2
162
15
20,0$4
3,132
1,757
14,446
719
4,118
2,627
Z53
30
1,208
1,994
221
]57
1,561
55
334
215
7
112
4,880
1,14.9
548
2,960
223
1,024
574
107
12
3:31
16
2,990
1,74.S
945
300
2,072
1,533
83
10
446
417
233
134
50
164
113
4
46
816
428
335
53
480
335
25
2
118
17
516
252
78
246
353
173
17
3
160
76
46
7
23
49
24
25
, 163
6\
23
79
67
22
8
37
18
2,796
547
265
1,898
86
590
397
40
2
151
364
46
29
280
9
45
33
12
613
191
102
239
31
189
130
15
44
19
19,418
2,880
1,679
14,446
473
3,765
2,454
2.16
21
1,048
/,918
[75
150
1,561
32
285
191
7
87
4,717
I,OSS
525
2,960
144
957
552
99
12
294
20
4,828
4,504
9
262
53
942
302
18Z
13
445
840
797
1
27
15
104
31
22
51
1,093
1,\\\1
82
231)
8l
33
5
tc9
21 22
1,113 4,(j42
620 4,397
12
83
398
118
22
36
60
164
92
2
11
59
13
2
5
6
9
236
919
193
118
IJ
435
815
791
23
103
31
22
50
187 1,007
liS 944
4
24
41
33
7
9
17
63
81
32
5
107
23
545
479
7
59
67
J.1
zt
33
96
86
2
a
9
5
3
85
72
12
14
E
7
24 25
186 5(j8
107 141
5
26 24
53 398
23 51
9 9
15
10 27
25 6S
6
4
15
I
.,.
6
3
59
4
3
86 102
61 46
19
5
2
2
12
41
6
3
10

TABLE B-II
Livelihood Classes
All Agricultural Classes ...
I-Cultivators of land wholly or mainly. owned
ll-C!:ultivators of land wholly or mainly unowned
Ill-Cultivating labourers
IV-Non-cultivating own-ers of land ; agricultural rent receivers
AU Non-agricultural Classes
V -Producti.on other than culti.vation
VI-Commerce
VII-Transport
'aU-Other services and miscellaneous sources
All Agricultural Classes ...
i-Cultivators of land wholly or mainly owned
ll-Cultivators of land wholly or mainly unown~d
Ill-Cultivating labourers
IV_Non-cultivating <?wners of land; agncul-tural rent receivers
All Non-agricultural Classes
V-Production other than cultivation
VI-Commerce
Vll-Transport
VIlI-Other services and misccllaneous sources
All Agricultural Classes
I-Cullivators of land wholly or mainly owned
II-Cultivators of land whully or mainly uno\\;ncd
Ill-Ctiltiva'ting labourcrs
IV-Non-cultivating owners of land; agricul-tllral rent receivers
An Non-agricultu'ral Classes
V--Production other than cultivation
VI-Commerce
"V ll-Trans port
YIn-Other services and miscellaneous sources
Total
16
Production other than cultivation
Self-supporting persons
Earning dependants
Males Females Males Females Males Females
26
10,907
7,176
1,513
1,845
373
2,13V
1,403
199
23
505
1,133
743
157
193
40
201
127
20
54
2,367
1,725
305
281
56
348
255
25
7
til
27
2,201
1,391
286
396
128
3,006
2,661
131
II
203
276
167
35
56
Ii
294
274
12
8
408
247
45
88
28
';03
356
26
21
2B
7,637
5,326
I,IJO
883
298
883
385
138
10
350
886
608
117
124
37
84
32
16
36
1,451
224
95
42
·123
65
17
j
29
281
145
20
73
43
67
26
II
29
38
6
II
8
8
3
3
2
33
15
9
9
6
2
4
30
3,270
1,850
383
962
75
1,247'
1,018
61
13
155
247
135
40
69
3
117
95
4
10
W6
635
.81
186
,,25
190
8
4
23
3[
1,920
1,246
266
323
85
2,939
2,635
W)
10
174
238
[54
2);
45
10
Zli6
271
')
6
375
232
45
79
19
397
356
24
17
Secondary Means
Number of persoos deriving tkeir
Total
Com-
Self-supporting persons
Males Females Males, Females
32
2,653
2,135
232
97
189
686
208
554
9
115
365
297
33
12
23
97
20
72
5
492
40-k
38
17
33
109
31
5S
20
33
989
743
108
59
79
982
163
734
12
73
34 35
District
2,425
1,956
213
78
178
533
159
271
8
95
113
55
4
17
37
35
9
If
I
16
Tehsil Ha:mirpur
107
EO
IS
5
7
118
4
III
3
239
1M
25
23
17
133
74
12
323
267
28
7
21
51
II
35
5
16
100
5
Tehsil Kulpahar
469
386
38
13
32
72
24
33
15
16
7
6
3
2.
--------_._- .----- ... _--

of Liveli~....{cootd.)
~qndary mClans of livelihood from-
merce
Totpl
T1:anspoJt
Self-sUj>PQtting persons
17
Earni~ ~
- TABLE B-ll
Other services and miscellaneous sources
Total Self-supporting Earning
persons dependants
Males Females Males Fem~O$ Ma~ Pemales Males Females ¥a1es Females Males Fcm~1l M~ .females
36 37
'Total-(cl1ncld.)
228
119
19
19
II
353
49
283
I
20
876
688
104
42
947
154
725
II
51
4Rural)-lcOncld.)
42
30
5
"2
-40
9
37
91
70
15
3
108
2
• Rural)-( conClil.)
23 213
18
4
t
7
25
5
161
25
16
II
130
47
72
11
137
11)0
26
I
11)
86
9
20
44
13
Il
9
2
20
8
11
4
2
2
.'! .•
10
1
1
14
4
6
3
I
2
2
- 2
- 2
2
2
125
89
25
I
10
41
6
16
10
9
Ii
8
2
19
7
II
3
2
---- ------------------
41
5
4
1
3
I
I
J
1
42
12
II
1
45
3
4
34
4
I
1
1
5 5,935
3 4,291
1
I
11
3
6
:1
2
1
I
458
531
1,681
594
140
38
909
181
608
78
51
44
14
7
61
993
779
37
62
115
197
75
I))
102
45 46
2,'" ;,382
1,681 3,929
443
622
211
3,177
738
63
54
2,322
339
209
57
46
27
253
31
221
391
206
52
95
38
252
76
(;
170
3'11J
SOl
963
502
liB
16
333
704
551
72
40
41
32
11
7
14
891
704
31
45
III
/25
66
14
115
19
113
1.~
136
42
5
2
89
55
25
4
10
16
·9
9
50
14
2
24
10
2/
3
)8
49
718 3,H'
92 ~
22 68
2lJ &2
516 1,233
71 Z8f
57 184
II
3
36
II
SO 141#
3 3-1
1
-... 47 212
102 341
75 In
6
17
4
50
71
28
12 131.
9 73
5 6
57 152

TABLE B-II
, :! • t1veiihood Classes'
AU _A-gdcultiltal Cla.see
I-:-,Cultivatofs '. of land wholly or mainly owned
II-Cultivators of land. wholly or mainly unowned
llI:-~Cultivating labourers.
IV","",Non-cultivating own~. crs of land; agricul-tural rent receivers
, AU IV~..ap,i,cultural Classes .
'W-Production other than cultivation
VI-Commerce ...
VlI ..... Transport
VIII-Other ' ,services and , miscellaneous sources
All A,Jicultural Classes
I-Cultivators of land wholly or mainly owned
II-Cultivators of land wholly or mainly unowned
Ill-Cultivating labourers
IV-Non-cultivating owners of land; agricul· tural rent receivers
All I'Ton..a,ricuitural Classes
V ...... Production other than cultivation
VI_Commerce
VII-:-Transport
VlII-Other services and miscellaneous sources
All ~p"lcu1tllral Classes
I-Cultivators of land wholly or mainly owned
II-Cultivators of land wholly ot mainly unowned
Ill_Cultivating labourers
IV-Non-cultivating ownerS of land; agricultural rent receivers
AU Non.agricultural Classes
V-Production other than cultivation
VI-Commerce
Vll-:Iransport
VIII-Other services and misctl1aneous 'l)"fceS
---~--~ ---.
Total
Mates
1;109
, 1,011
21
64
13
218
98
42
1
77
3,S03
,~,227
70
173
33
.346.
132
62
152
3,11;
2,697
56
131
33
469
225
51
193
113
Cultivation of owned land
;:~ t: 4
7~0(J2
6,816
.. ( 56
; :.123
... __ c:7
::'123
62
, ,20
1
40
\'~~S04 ~ ....
154
302
24
.222
, 114
42
2
64
160
94
23
218
114
34
70
38
4
26
8
,112
67
33
71
8
6
2
1
4
2
122 29
14
76
32
249
85
38
126
151
33
95
23
424
201
42
181
\.
20
9
19
4
3
12
J4
18
6
18
8
2
8
. 1,071
1,011 '6.,816
17 '. 56
38 ~ 111
5
46
31
9
3,381 !
3,227
56
91
9;
47
24
26
1,966
2,S97
23
36
]0
45
24
9
IZ
, i 5
, '116
58
19
38
14,475
14,024
154
2132
15
203
110
39
2
52
~4,121
14,474
160
76
17
200
106
32
SecoAdary Mean!.
'Nuniber ofPcirS0QS deriving thci~
,. 142
43
'7
38
24
4
10
I,OS3
536
316
200
111
70
15
32
610
380
184
44
2
180
114
24
Cultivation of unowned
\~ 116
707
,
13
11
2
1,899
109 '~'
.1,706
74
JO
16
10
1
5
,,',488
34
1,428
24
2
65
49
2
14
Self-supporting' persons
Males Females;
11 , .
Telisil Mahoba
45
43
.36
22
4
10
Te~sil Maudaba.
128
533
194
101
63
13
3l
,125
5&
I
......
Tehsil Ratb. ,
413 8
372
39
2
110
103
21
41
l
6-
3
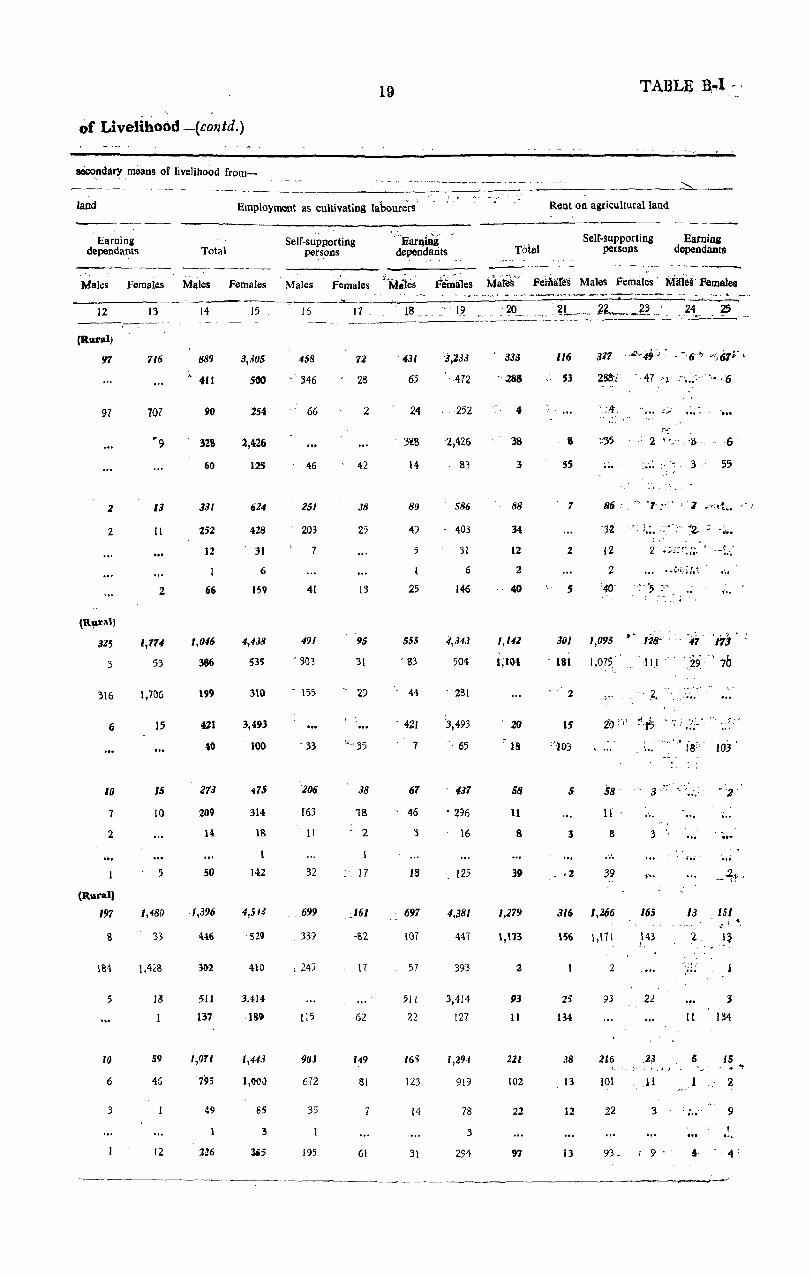
19
of Livelihood-(contd.}
sOco!'dary . means of livelihood from-
land Employment as cultivating laboure"rs'
Earning depen~ants Total
--_"._-_._ Self-supporting
persons 'Earllilia
dependants
TABLE B,"!I ' .
Rent on agricultural land
Total Self-supporting EarniJli
persons dependants
Males Females Males Females Males Females "·M.le~ Females M~w~,j Feh1i1:res Males Femal~s' 'Miii~g Females
12
(Rural)
91
97
2
z
316
6
10
7
2
(Rutal)
191
8
184
5
10
6
13
716
707
13
II
2
1,114
53
1,1C>6
15
15
10
5
1,480
1~
59
46
12
14
889
411
32&
60
331
252
12
66
1,046
386
199
113
209
U
50
1,396
511
137
I "ril 7'95
49
15
3,305
SOO
254
2,426
125
624
428
31
6
159
4,438
535
3\0
3,493
, 100
314
IS
142
4,5fl
529
4\0
3,414
189
1,443
1,00,)
85
:3
liS
16
458
346
66
46
251
203
7
4[
491
, 3\)3
- 155
. 33
'206
I63
!l
32
699
339
; 245
liS
9tH
672
35
1')5
17 ,
12
28
2
42
38
25
13
95
31
29
38
'18
2
_ 17
, :161
·82
17
62
149
81
7
61
18 .. " " [~
, 431
65
24
3~8
14
81J
49
5
I
25
555
~ 83
44
, 421
7
61
- 46
3
18
697
IO?
57
511
22
16~
123
14
31
'3,'133
" ,472
, ,252
'2,426
83
586
403
31
6
146
4,343
504
- 281
3,493
65
, 437
• 296
16
[25
4,381
447
393
3,414
127
I,Z94
919
78
3
294
., ~ _. _, ." ..... ~. __ •• _T>~.,.,._.". ______ .____ _ __ _
, 333
. 288
4
38
3
88
34
12
2
40
1,142
1;104
20
18
58
11
8
39
1,219
1,lH
2
93
11
221
102
97
116
53
S5
1
z
5
301
181
2
IS
"'J03
5
·2
317 :''"'''49:'· -'6'~ '··:61r . 28!l~ , ,47 "J.'.: '.~~" "·:6
o :,4",
3
-... '6
55
',32 " J.:. :"., ,'" "2.:: •••
1,095 .' 118'" 41 '1'13>'
)9 7b 1,075 II) "
~ ..
58
11,
B
39
. t.,
3
.,. :4' .• : ..';:.J': ,~. ~., '. f ... .. ,,', is'"
._ r • •...
'i •• -
316 1,266 165 13 151
156 \,171
25
134
38
13
12
2
93
216
101
22
143 i.
22
.23
11.
3
13 93, i 9 "
.; ;. ~ ..
3
II 134
2
9
I '"
It '4:
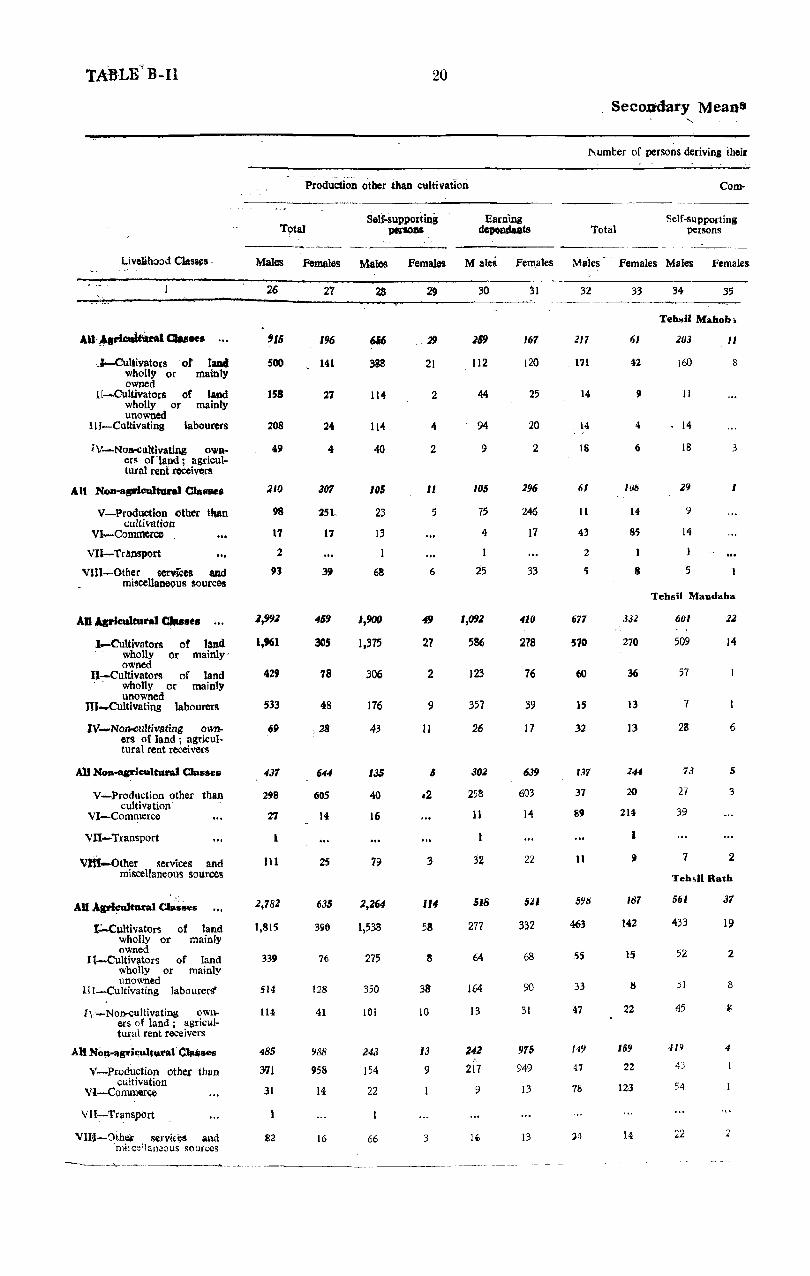
TAnLE" B-Il
Livolihood Classes -
J-Cul,ivato1'S of l_ wholly or mainly owned
U-Cultivators of land wholly or mainly unowned
11 I-Cultivating labourers
iV-Noa-cultivating owners orland; agricultural rent recei~rs
All Non-apl~ Classe.
V-Production other than caW vation .
VI-Commerce
VII-Transport
VIlI-Other services arad miscellaneous sources
An Agricultural ~.e8
l-Cultivators of land wholly or mainly/ owned
II-Cultivators of land . wholly or mainly
unowned Ill_Cultivating labourers
IV-Non,.cultjtJsting owners of land; agricul· tural rent recei~rs
AU NOIl~c .. ltural Classes
V-Production other than cultivation
VI-Commerce
VII-Transport
Vm-Other services and miscellaneous sources
AU Apicaklll'al Claims
I.:...cl.lltivators of land whollY or mainly owned
I t-Cultivators of land whoily or mainly unowned
HI-Cultivating labourers'
IV-Non-cultivating own-ers of land; agricultural rent receivers
All Notl-apil;ulw.-.J ~.8eoJ
V-Production other tban cultivation
Vi-Commer~
Y U-:-Transport
VlJJ-~ther serVl~~ ~nd 'mi,cellanc:Jus sources
----.---~ .. ------.
20
. Production other than cultivation
Total Self-supporting
}1IIl'I(l» Earlling
dcpoDdaats
Seco~dary Means "
Number of persons deriving their
Total
Com-
Self-supporting persons
Males Females Males Females M alei Females Males Females Males Females
26
915
500
158
208
49
210
98
17
2
93
2,992
1,1161
4211
533
69
437
298
21
1
III
2,782
1,815
339
514
114
485
3171
31
82
27
196
141
27
24
4
301
lSI
17
39
459
305
78
48
28
644
605
14
25
635
396
76
128
41
988
958
14
16
28
114
105
23
13
68
1,900
1.375
306
176
43
135
40
16
79
2.264
1,5313
275
350
101
243
154
22
66
.29
21
2
4
2
II
5
6
49
27
2
9
11
6
3
114
58
38
10
13
9
3
30
269
112
44
94
9
105
75
4
I
25
1,092
586
123
357
26
302
2513
II
32
518
277
64
164
13
242
217
9
I"
31
IlI1
120
25
20
2
296
246
17
33
410
278
76
39
17
639
603
14
22
51/
332
68
90
31
975
949
13
13
32
217
111
14
14
18
61
11
43
2
5
677
510
60
15
32
137
37
89
11
5'JS
403
55
33
47
149
47
78
:H
33
61
42
9
4
6
J()/j
14
85
8
332
270
36
13
13
244
20
214
I
9
181
142
IS
8
22
159
22
123
14
Tehsil Mahob 1
203
160
II
14
18
29
9
14
5
II
8
3
I
Tehsil Maudaha
6lJI
509
57
'l
28
73
27
39
22
14
6
5
3
7 2
Teb.il Ratb
561
433
52
31
45
-11'1
43
54
22
31
19
2
8
4
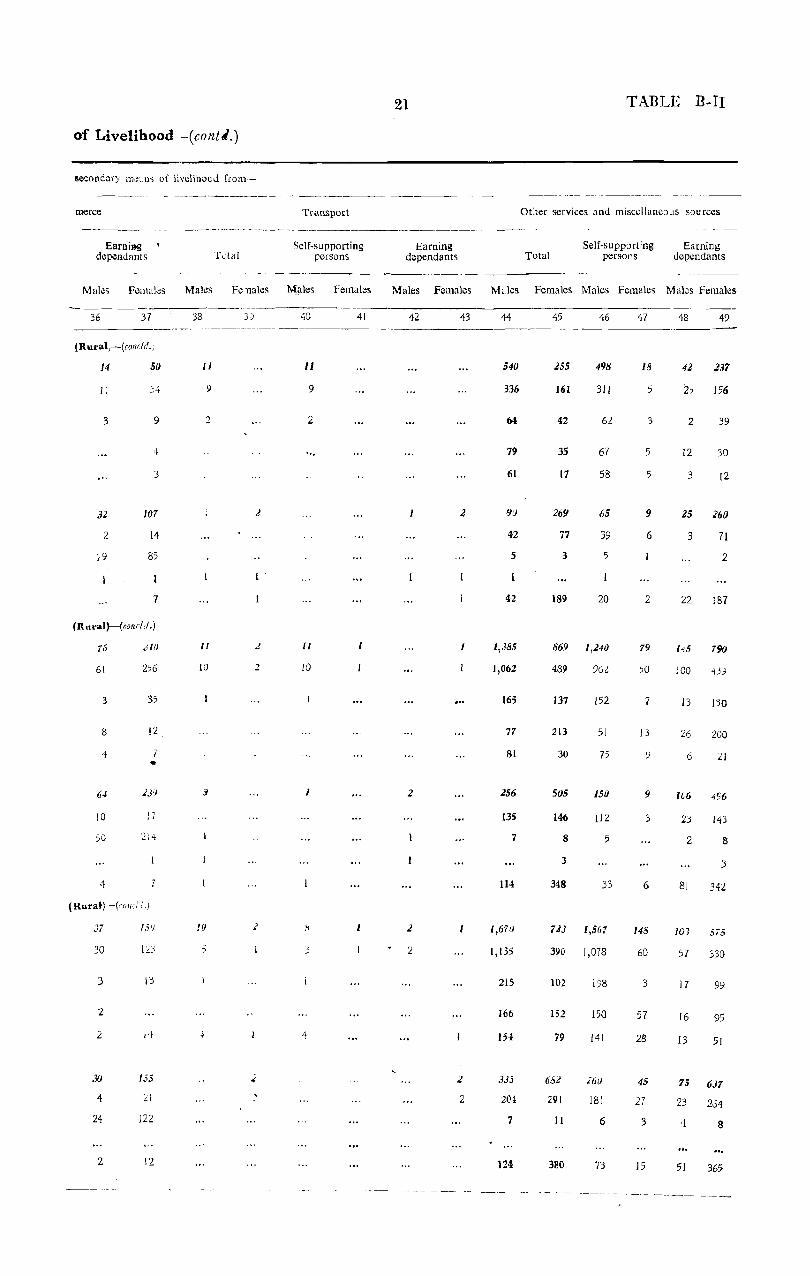
of Livelihood -(conti.)
sc';ondnry m!~~ll" of Evelino!.)J frot11-
merce
Earnia-g depeadants Tlltal
Transport
Self-supporting persons
Mal~~ FCi11al~5 Males Fe 11alcs M[lles Females
36 37
{Rural,-(collcld.,I
14
1:
3
31
2
,9
so
9
3
107
14
85
7
(Rural)-( conch/.j
;6
61 256
3 35
8 12
4 •
64
10 17
50
4 7
(Rura})-(cnllci i.)
37
30
3
2
2
30
4
24
2
151)
155
21
122
12
38
II
9
2
II
10
J
to
.~
3)
2
I·
2
2
40
II
9
2
II
10
4
41
21
Earning dependants
Males Females
42
2
43
2
2
TABLE B-II
Other services and misccHanc:JLls sources
Total Self-supporting
persor,s Earning
dependants
Males Females Males Females Males Females
44
540
336
64
79
61
9{)
42
5
42
1,385
1,062
165
77
81
256
135
7
114
1,671)
1,135
215
166
154:
335
204
7
124
45
255
161
42
35
17
269
77
3
189
46
498
311
62
67
58
liS
39
5
20
869 1,240
489 962
137
213
30
505
146
8
3
348
152
51
75
150
112
5
33
7JJ 1,567
39() 1,078
102
152
79
682
291
II
380
198
150
141
260
181
6
73
47
18
5
3
5
5
9
6
2
79
50
7
13
9
3
6
148
60
3
57
28
45
27
3
15
---_- - -
48
4:&
2
12
3
25
3
22
1~5
100
13
26
G
lC6
23
2
81
10]
57
17
16
49
237
156
39
30
12
260
71
2
187
790
43;1
130
200
21
143
8
j
342
S75
330
99
95
13 51
75 637
23 204
8
51 365
- ------ -_ ---
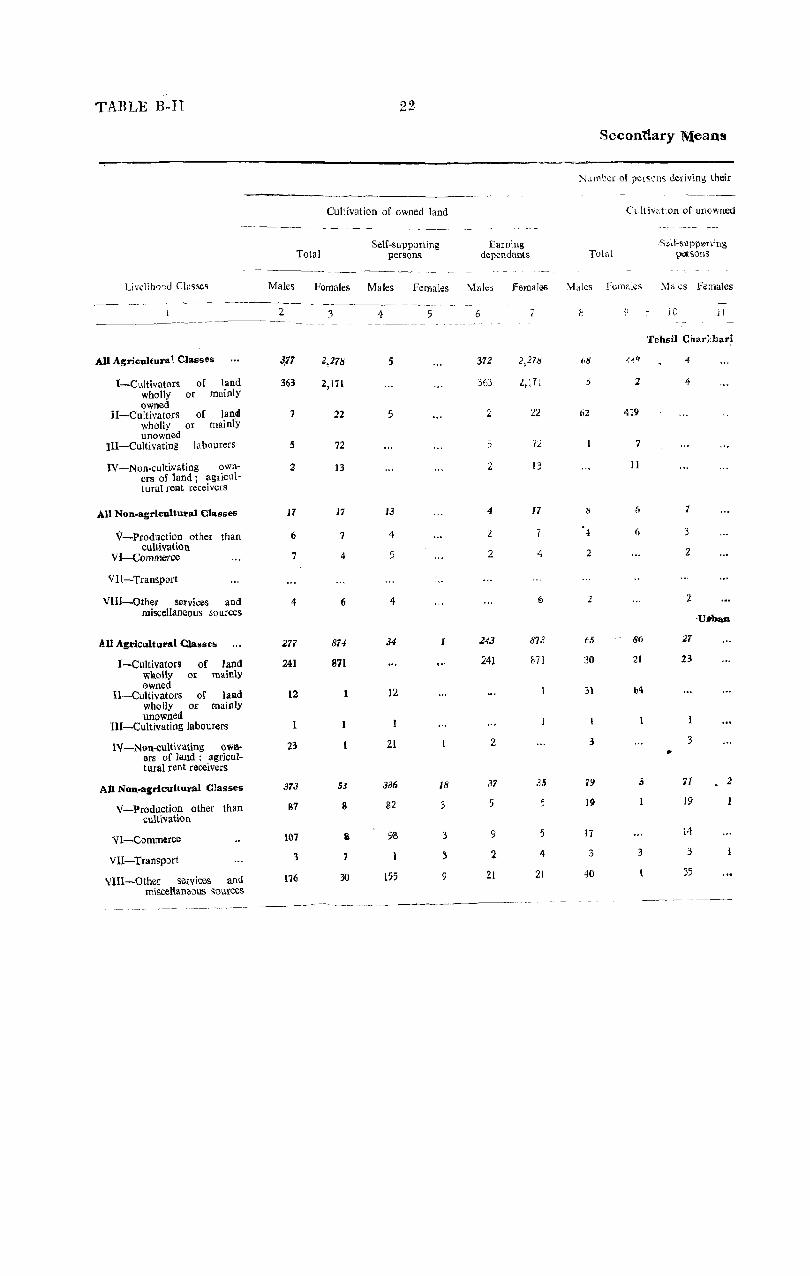
TARLE B-II 22
Cultivation of owned land ~- ~--------------~.------- --_-,-
Total Self-supporting
persons Earning
dependanls
Males Females Males Females \II a I~s
2 3 ------------- - _------- --~-- -
All Agricultural Classes
I-Cultivators of land wholly or mainly owned
II-Cultivators of lanlll wholly or mainly unowned
Ill-Cultivating labourers
IV -Non-cultivating own-ers of land i agricultural relit receivers
All Non_agricultul."al Classes
\I-Production other than cultivation
VI-Commerce
VII-Transport
VIII-Other services and miscellaneous sources
All AgdCliltural Classes
I-Cultivators of land wkolly or mainly owned
U-Cultivators of lalild wholly or mainly unowned
HI-Cultivating labourers
IV-Nl)n-cultivating 0""1'\-illS of land; agricultUfal rent receivers
All Non-agricultural Classes
V-Production other than cultivation
VI-Commerce
VII-Transport
VUI-Other servi<.:es and miscellaneous sources
31'1
363
7
5
2
17
6
7
4
277
241
12
23
373
87
107
3
176
2,278
2,171
22
72
13
11
7
4
6
874
871
53
8
a 7
30
4
5
5
J3
4
5
4
34
12
21
3J6
82
155
5
18
3
3
3
9
6
372
363
5
2
4
2
2
243
241
2
37
5
9
:2
21
2,27~
2,:7,
22
72
[3
17
7
4
873
871
35
5
4
21
Secontlary Means
NUlllter ot pel~';'ns deriving their
Total
62
.~
2
2
30
3\
3
79
19
17
3
40
Cu It iVe,tion of unowned
2
7
II
(,
6
86
21
.5
3
,Sd[-supp®niIlg pcl"sons
10 11
Tehsi:l Char;,hari
•
4
4
3
2
21
23
3
71
19
14
3
35
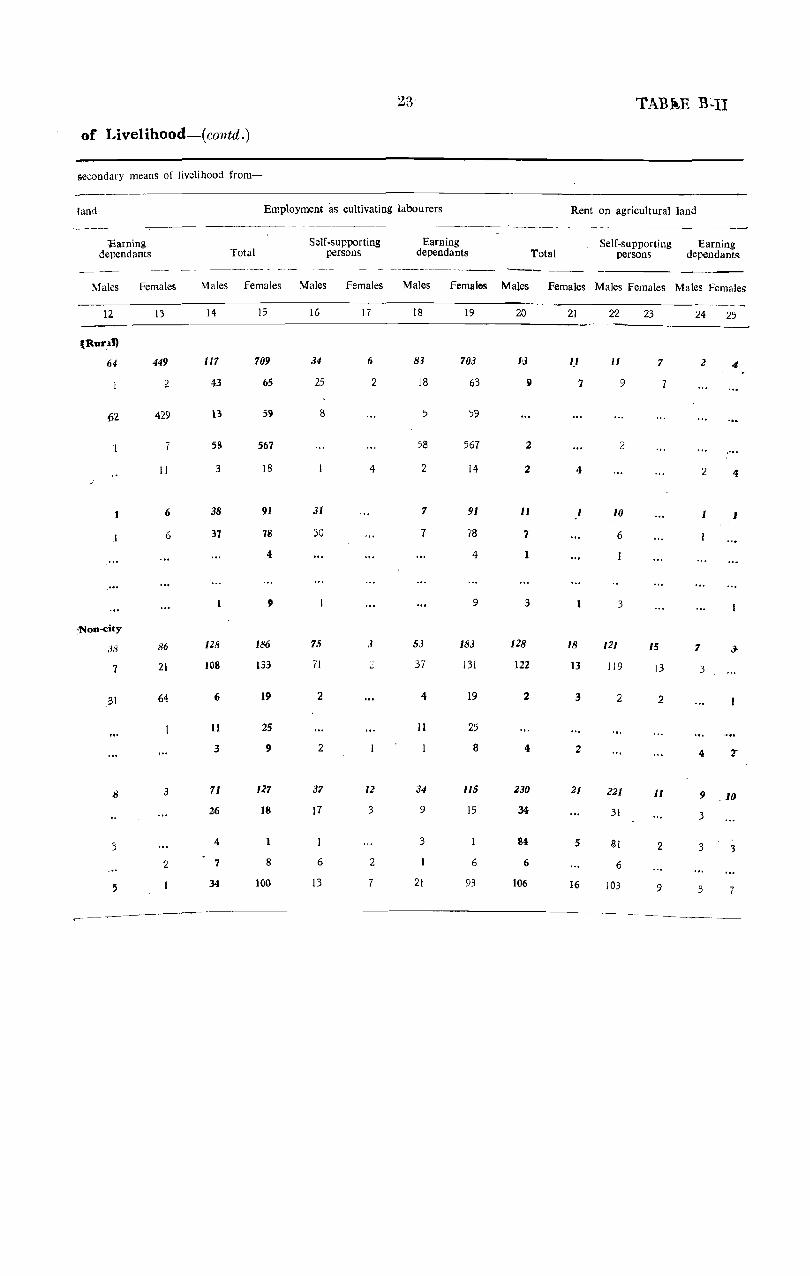
23' TABAE B~II
or Livelihood-( contd.)
secondary means of livelihood from-
_-----
land Employment as cultivating labourers Rent on agricultural land ,--~------~~
, -----~ ----- --,-----"---,
'Earning Self-supporting Earning Self-supporting Earning dependants Total persons dependants Total persons dependants
_------- _- _._--_-_. - _. --- ----------------_.
Males Females Males Females Males Females Males Females Males Females Males Females Males females
12 13 14 15 16 17 18 19 20 21 2-2 23 24 25
{Rur~])
64 449 117 709 34 6 83 703 1'3 I) 11 7 2 4
2 43 65 25 2 18 63 9 7 9 7
62 429 13 59 1\ 5 59
7 58 567 58 567 2 2
II 3 18 4 2 14 2 4 2 4
6 38 91 31 7 91 II 1 to I
:I 6 37 78 30 7 78 7 6
4 4 1
... 9 9 3 3
,Non-city
38 86 128 186 7."1 ,i 53 183 128 18 12/ 15 7 3-
7 21 108 133 71 37 131 122 13 119 13 3
31 64 6 19 2 4 19 2 3 2 2
11 25 11 25
3 9 2 8 4 2 4 T
8 3 71 127 37 12 34 115 230 21 221 II 9 ,10
26 18 17 3 9 15 34 31 3
3 4 3 84 5 81 2 3 3
2 7 8 6 2 6 6 6
5 34 100 13 7 21 93 106 16 103 9 3 7
----_

TABLE B-II 24
S.econdary Means
Number of persons deriving their
Production other than cultivation Com-._-------
Self· supporting Earning Self-supporting Total persons dependants Total persons
Livelihood Classes Males Females Males Females Males Females Males Females Males Females,
26 27 28 29 30 31 32 33 34 35
Tehsil Charkhari
All Agricultural Classes 390 86 224 6 166 80 74 47 68 10
I-Cultivators of land 179 22 134 45 21 59 24 53 wholly or mainly owned
land II_Cultivators of 81 15 whollY or mainly
52 2 29 13 5 7 5
unowned Ill-Cultivating labourers 102 42 19 83 41 3 4 3
IV-Non-cultivating ?wn- 26 ers of land; agncul-
1 19 2 9 5 7 12 7 9
tural rent receivers
AU Non-agricultural Classes 47 37 16 31 37 1 52
V-Production other than 29 30 7 22 30 43 cultivation
VI-Commerce 6 2 6 2 8
VII-Tran~port
VIII-Other services and 12 5 9 3 5 miscellaneous sources
Urbao_ All Agricultural Classes 328 141 256 12 72 129 230 26 200 I
I-Cultivators of land 253 119 193 10 60 109 171 21 148 wholly or mainly owned
ll-Cultivators of land 44 10 42 2 10 27 22 wholly or mainly unowned
Ill-Cultivating labourels 14 10 5 9 9 3 2 3 IV - Non-culti vating own- 17 2 16 29 2 27 ers of land: agricul-
tural rent receivers
All Non-agricultural Classes 402 333 177 24 225 309 332 168 188 17 V-Production other than 225 167 64 7 161 180 61 13 44 4 cultivation
VI-Commerce 73 46 54 5 19 41 214 119 96 3
VII-Transport 12 II 5 7 10 7 10 7
VIlI-Other services and 92 89 54 miscellaneous sources
II 38 78 50 26 41 9
~---.-.~ -~--------- -----_. __ --

25 TABLE'B-I!
of Livelihood-(concld.)
secondary means of livelihood from-
merce Transport Other sClrvices and miscellaneous sources
Earning Self-supporting Earning Self-supporting l!arning . dependants 'total persons dependants Total persons dependants
Males Females Males Females Males Females Males Females Males Females Males Females Males Females
36 37 38 39 40 41 42 43 44 45 46 47 48 49 _.-.Rural)--(concld.)
6 37 183 93 173 tI 10 87
6 24 128 37 122 2 6 35
6 27 22 25 2 22
4 10 26 10 2 24
3 18 8 16 2 2 6
5~ 16 109 4 12 109
43 7 42 4 3 42
8
• 9 66 9 66
Non-city-( concld.)
30 2S 7Z 3 64 8 2 383 287 369 27 74 260
23 20 58 2 51 7 244 189 201 19 43 170
5 9 11 62 31 42 20 31
2 13 55 7 2 6 53
2 2 5 5 64 12 59 6 5 6
144 151 78 6 37 2 41 4 70S 1,107 327 45 378 1,062
17 9 7 2 5 2 117 75 89 3 28 72
118 116 17 14 3 95 33 81 14 32
9 42 3 10 32 3 36 S'l 9 2 27 49
9 17 12 8 4 457 948 148 39 309 909
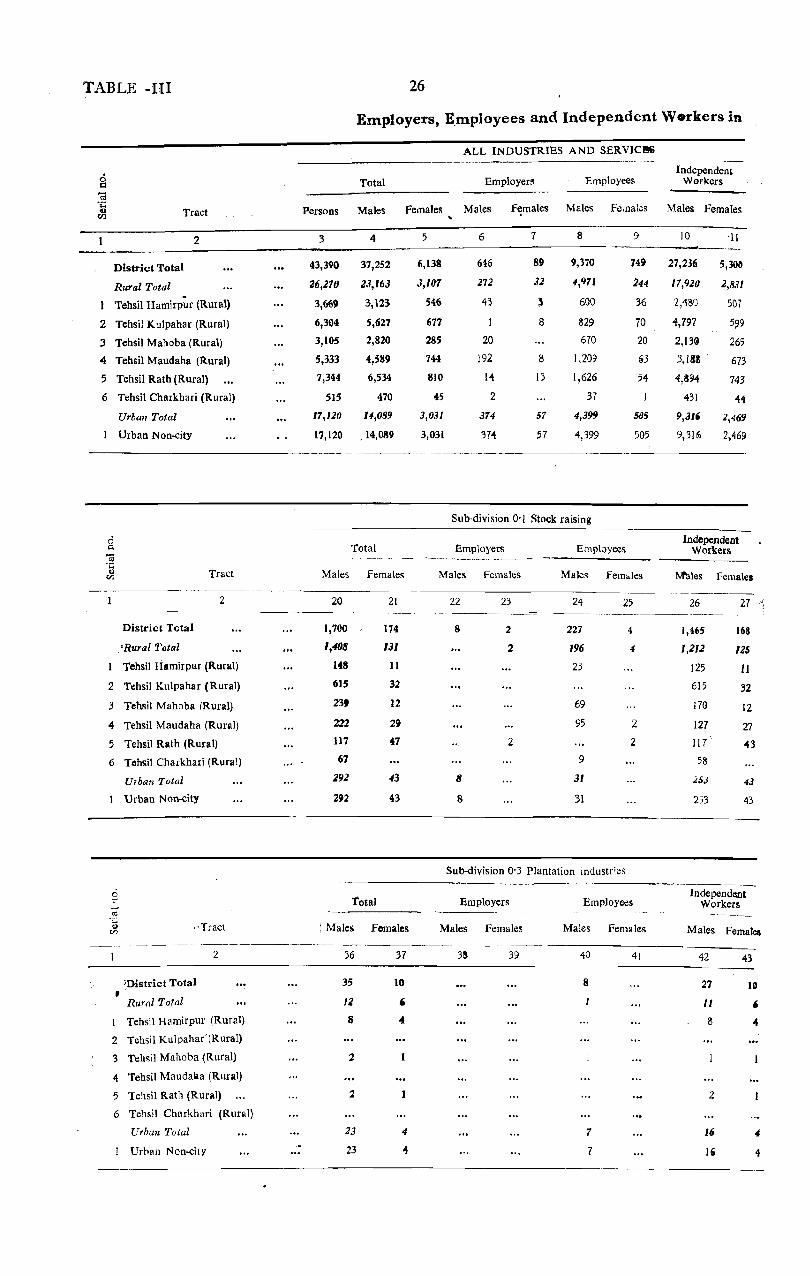
TABLE -III
Tract
District Total
Rural Total
2
Tehsil Hamirp~r (Rural)
2 Tehsil Kulpahar (Rural)
3 Tehsil Mahoba (Rural)
4 Tehsil Maudaha (Rural)
5 Tehsil Rath (Rural)
6 Tehsil Chllrkhari (Rural)
Urban Total
Urban Non-city
District Total
'Rural Total
Tract
2
Tehsil Hllmirpur (Rural)
2 Tehsil Kulpahar (Rural)
3 Tehsil Mahoba (Rural)
4 Tehsil Maudaha (Rural)
5 Tehsil Rath (Rural)
6 Tchsil Charkhari (Rural)
Urban T(Jtal
Urban Non-city
"Tract
'District Total .. Rural Total
2
I Tehsil Hamirpur (Rural)
2 Tehsil Kulpaha{ (Rural)
3 Teh~il Mahoba {Rural)
4 Tehsil Maudalia (Rural)
5 Tehsil Rath (Rural)
6 Tehsil Charkhari (Rural)
Urban Total
Urban Non-city
26
Employers, E_mployees and Independent W.rkers in
ALL INDUSTRIES AND SERVICJI!!G
Total Employers Employees Independent
Werkers
Persons Males Females Males Females Males Fe ,nates Males Females
3
43,390
Z6,27(J
3,669
6,304
3,105
5,333
7,344
515
17,120
17,120
4
37,252
23,163
3,\23
5,627
2,&20
4,589
6,534
470
14,089
,14,089
Total
Males Females
20
1,700
1,4011
148
615
239
222
117
67
292
292
Total
21
174
131
11
32
12
2!1
47
43
43
: Males Femaleg
35
lZ 8
2
23
23
37
10 , 4
4
'I
5
6,138
3,107
546
677
285
744
810
45
3,031
3,031
6
646
272
43
20
192
1'1
2
374
37'1
7
89
32
3
a
8
13
57
57
8
9,370
4,971
600
829
670
1,209
1,626
37
4,399
4,399
9
749
244
36
70
20
133
54
505
505
Sub-division 0'1 Stock raising
Employers
Male$ Females
22
8
8
8
23
2
2
2
Employees
Males felD<,les
24
227
196
23
69
95
9
31
31
25
4
4
2
2
Sub-division 0'3 Plantation industries
Employers Employees
Males Females Males Females
10
27,236
17,920
2,480
4,797
2,13@
3,1!1!
4,894
'131
9,3"
9,31lii
-II
5,3011
2,831
507
599
265
673
743
44
2,-169
2,469
Independent Workers
M'ales Females
26
1,465
I,ZIZ
J25
615
170
127
117\
58
253
253
27
168
125
11
32
12
27
43
43
43
Jndependent Workers
Males Females
3S __ ---- --:---------
39 40
7
7
41 42
27
11
8
:2
43
10 , ..
4
4
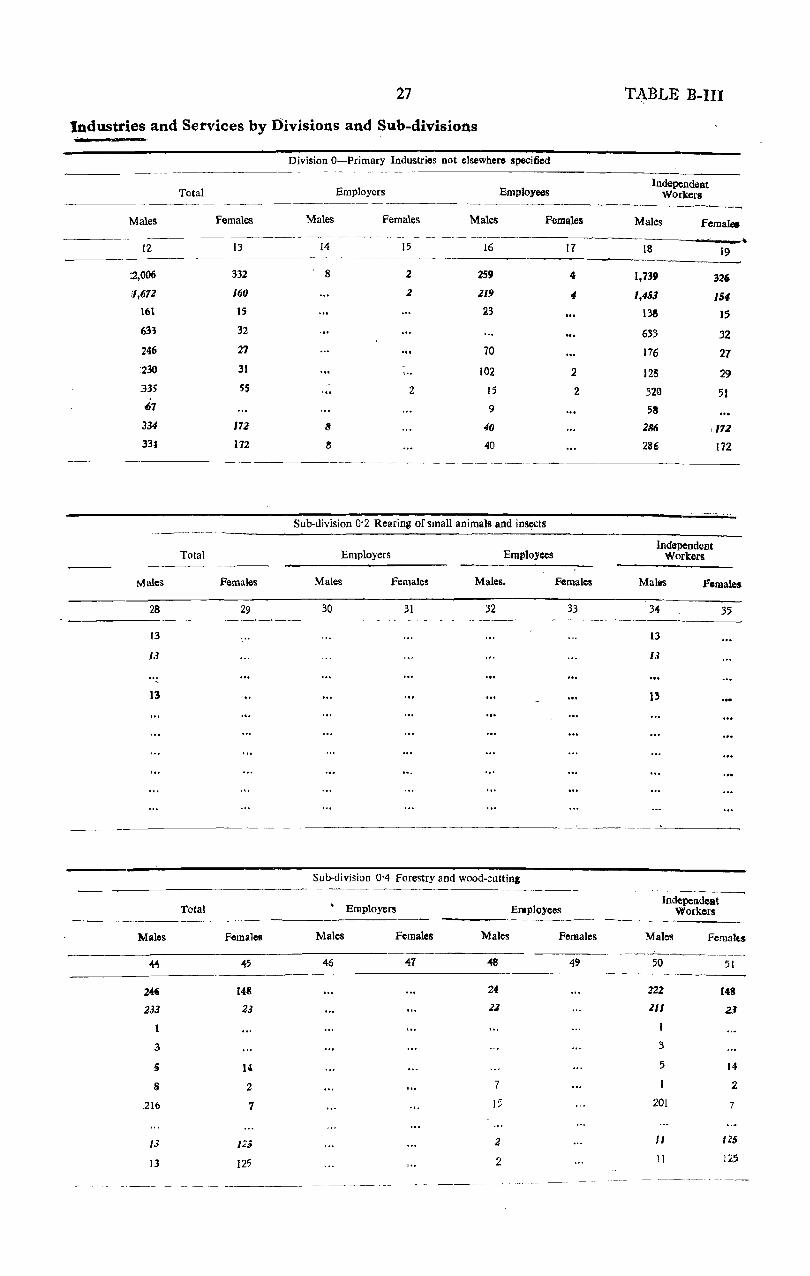
27
1ndustries and Services by I)ivisions and Sub-divisions
Division O-Primary Industries not elsewhere specified
Total Employers Employees --~~--------
Males Females Males Females Males Females
~~-------
12 13 14 15 16 17 -~-- ~--------
:2,006 332 8 2 259 4
1/,672 160 2 219 4
161 15 23
633 32
246 27 70
230 31 ... 102 2 33; 55 2 15 2
07 9
334 172 8 40
33~ 172 Il 40
Sub-division 0'2 Rearing of small animals and ins~ts
Total Employers Em~loyces
Males Females Males Females Males. Females
28 29 30 31 32 33
13
13
,
13
Sub-division 0-4 Forestry and wood-:::uttin,
Total . Employers Employees
--.---Males Females Males Females Males Females
44 45 46 47 4S 49
2'" WI 24
233 23 21
1
3
S 14
8 2 7
.216 7 15
13 125 2
13 125 2
--- .-~----- ----~----~ .- ----------------~ -~--'---- --
TABLE B-III
IndependeBt Workers
Males Females
18 19
1,739 326
1,453 154
138 15
6'3 32
176 27
125 29 320 51 58
286 ,172
2ati 172
Independent Workers
Males
34
13
13
13
.Fomales
35
lndepelldellt Workers
Males Fornalls
50 51
222 loiS
211 23
1
3
5 14
I 2
201 7
II 125
II 125
------~- --~ ~--

TABLE B-1I1 '
Tract
2
District Total
Rural Total
Tehsil Hamirpur (Rural)
2 Tehsil Kulpahar (Rural)
3 Tehsil Mahoba (Rural)
4 Tehsil Maudaha (Rural)
5 Tehsil Rath (Rural)
6 Teasil Charkhari (Rural)
Urban Total
Urban Non-city
0 <= -; .;::; u Tract In
2
District Total
Rural Total
1 Tehsil Hamirpur (Rural)
2 Tehsil Kulpahar (Rural)
3 Tehsil Mahoba (Rural)
<I Tehsil Maudaha (Rural)
5 Tehsil Rath (Rural)
6 Tehsil Charkhari (Rural)
Urban Total
Urban Non-city
0 = 3 ..
Tract G:I <Zl
2 .. -~ -.-----~-~~~
District Total
Rural Total
Tehsil Hamirpur (Rural)
2 Tehsil Kulpahar (Rural)
3 Tehsil Mahoba (Rural)
4 Tehsil Maudaha (Rural)
5 Tehsil Rath (Rural)
6 Tehsil Charkhari (Rural)
Urban Total
Urban Non-city
. Employers, Employees and Independent Workers in
Total
Males Females
52
12
6
4
2
6
6
Sub-division 0'6 Fishing
:Employers
Males Females
54 55
Employees
Males Females
56 51
Sub-division 1'5 Stone-quarrying, clay and sand-pits
Males
68
237
231
231
6
6
Total
Females
69
Employers Employees
Males Females Males Females
10 71 12 13
Sub-division 2'0 Food industries otherwise unclassified
Total Emplo$'ers Employees
Males Females Males Females Males Females
84 85 86 87 88 89
422 23 37 2
191 13 27 2
18 8 2
15
3 ,I
154 3 25
; 231 10 10
231 10 10
Independent Workers
Males Females
58
12
6
4
Z
6
6
59
Independent Workers
Males
14
237
2il
231
6
6
Females
75
Independent Workers
Males Females
90 91
385 21
164 II'
18 6
14
2 1
129 J
,221 10
221 10
---~-~--~------------. -~.---
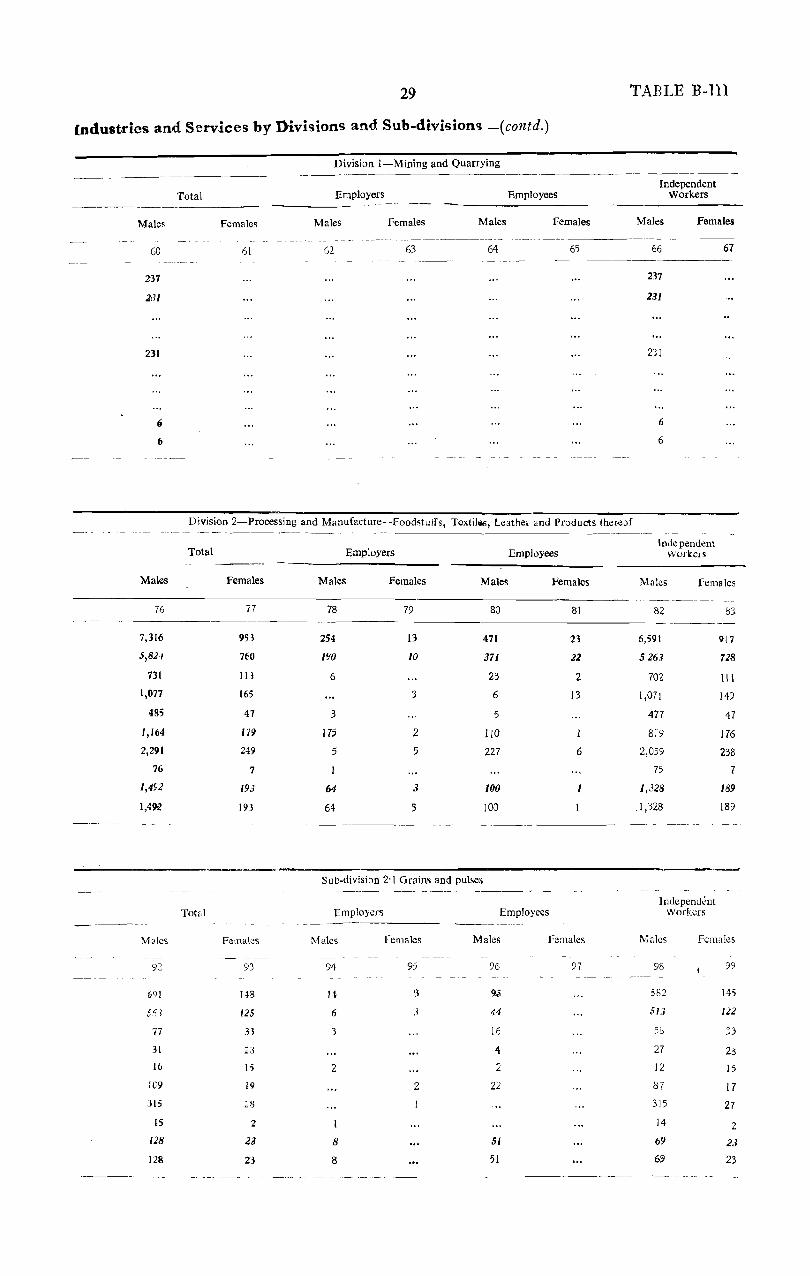
29
(ndustdes and Services by Divisions and Sub-division'!; -(contd.)
Males
60
237
2'31
231
6
6
Total
Females
61
Division I-Mining and Quarrying
Employers Employees
Males Females Males Females
62 63 64 65
TARLE B-Ill
Independent Workers
Males Females
66
237
231
2:)1
6
6
61
Division 2-Proeessing and Manufacture--Foodstulfs, TextiIIiS, Leather and Products thereof --- --- --------- .----~ _- , -_- ------ ----_ "-- --
Total Employers Independent
Employees Wmke;s ----
Males Females Males Females MaleS Females Males Females
-_-_---- -----76 77 78 79 80 81 82 8],
_---_--
7,316 953 254 I3 471 23 6,591 9(7
5,82-1 7fO 190 10 371 22 5263 728
731 113 6 23 2 702 III
1,077 165 3 6 13 1,071 149
485 47 3 5 477 47
1,164 179 175 2 110 1 8i-9 176
2,291 249 5 5 227 6 2,059 238 76 7 75 7
1,4ft2 193 64 3 100 1 1,328 189
1,4ge 193 64 3 100 _1,328 189
Sub-division 2'1 Grains and pulses ---_ .. _-
Indcpellll~nt Tot81 Employers Employees Workers
------ ------ -----------
M"Ies Fen--.a\cs Males females Malc~ Females M~les females
-- -_---
92 93 94 95 96 97 98 99 -- - - - --
6111 H8 H '3 9.5 552 145
5,,1 125 6 3 44 51,) 1J2
77 33 3 16 )0 33
31 23 4 27 23 16 I; 2 2 12 15
lC9 19 2 22 87 17
315 ~tl 315 27
15 2 I 14 2
128 23 8 51 69 23
128 23 8 51 6S1 23 ---_-----. -_---_--- ------.. ---- .
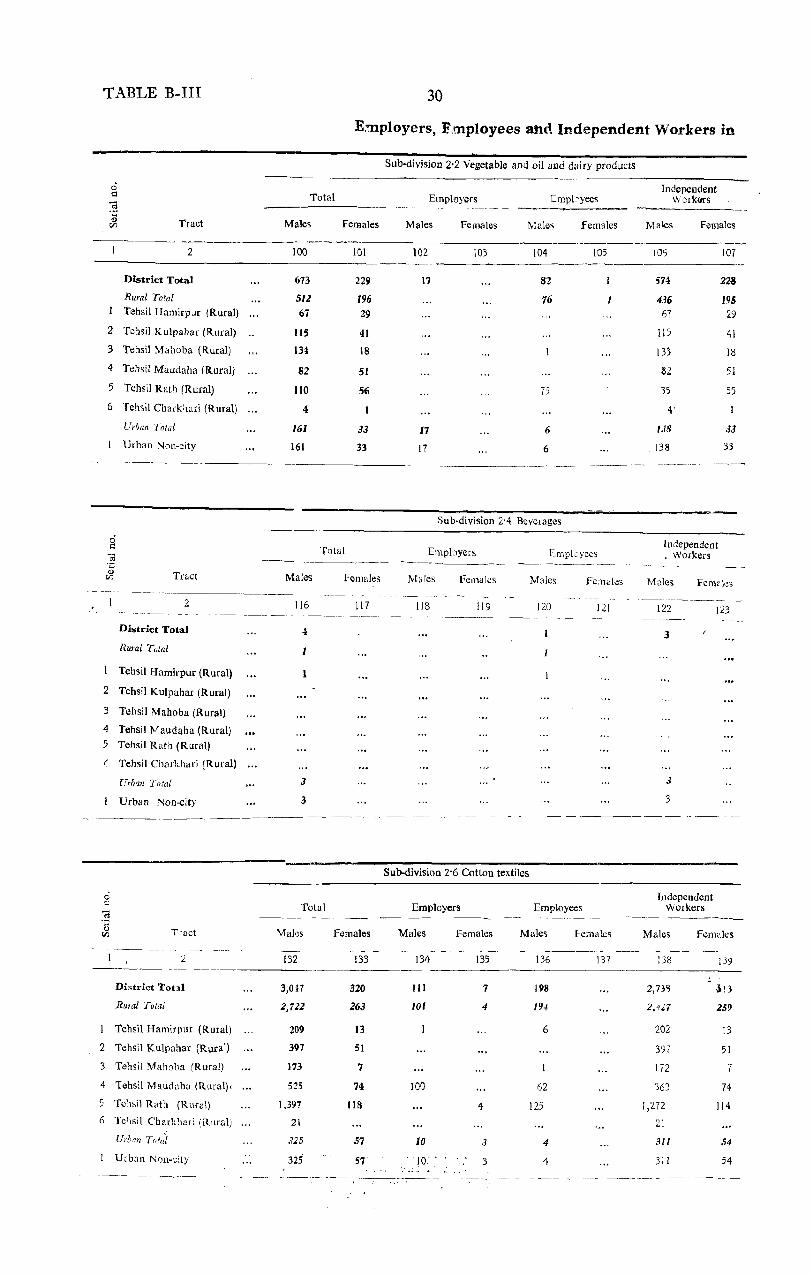
TABLE B-III
,.; d ';;j .;:; Q
Tract r;n
2
))istrict Total
Rural Total
Tehsil H amirpur (Rural)
2 Tchsil Kulpailar (Rural) .. 3 Tehsil Mahoba (Rural)
4 Tehsil Maudaha (Rural)
5 Tehsi! Ruth (Rural)
6 Tehsil Chark!luri (Rural)
Urban Total
Urban Non-~ity
......___._---.--~----
Tract
2
District Total
Rural Total
Tehsil Hamirpur (Rural)
2 Tehsil Kulpahar (Rural)
3 Tellsi! Mahoba (Rural)
4 Tehsi! M audaha (Rural) 5 Tehsil Rath (Rural)
I' Tehsil Charkhari (Rural)
Urban Total
Urban Non-city
0 ~
3 ~ Twet til
-------- -~ --------.
2
Dhtdct Totd
Rural Total
Tehsil Hamirpuf (Rural)
2 Tehsil Kulpahar (Rural)
3 Tehsil Mahoba (Rural)
4 Tehsil Maudahu (Raral),
5 Te~1gi! Rath (Rural)
6 Tehsil Char!dwri (Rural)
Urban Tot;/
Urban Non-:ity
-----
30
Employers, Fmployees anrl Independent Workers in
Total
Males Females
- ". __ .. _-_. 100 101
673 229
512 196
67 29
115 41
131 18
B2 51
110 56
4
161 33
161 33
Total
Males remales
116 117
J
3
Total
Males females
132 133
3,047 320
2,722 263
209 13
397 51
173 7
525 74
1,397 llS
21
325 57
325 57
-----"'-
Sub-division 2'2 Vegetable and oil and dairy products
Independent EmphJyers Empbyees Work(Ks
-------- -~
Males Females Males Females Males Females
.-----102 103 104 105 106 107
17 82 574 228
76 436 195 67 29
115 41
133 18
82 51
75 35 55
4
17 6 138 33
17 6 138 33
----------.-~-- --~ - --.-~---- -_._- -_.--
Sub·division 2'4 Beverages
Empbyers EmpLyecs
Males Females Males Fe:n~les
118 119 120 121
Sub-division 2'6 Cotton textiles
Employers Employees ------
Ma!es Females Males Females
-----------~ 134 135 136 137
III 7 198
101 4 194
6
100 62
4 125
10 3 4
10- 3 4 , ~. _,
Independent . Workers
]\laies FClmks
122 J23
3
3
3
Independent Workers
-~-----~-------
Males Females
138 139
2,n~ in 2,127 259
202 13
397 51
172 7
363 74
1,272 114
21
311 .;4
311 54 .,------ ------ --_- ,-- -----------------_
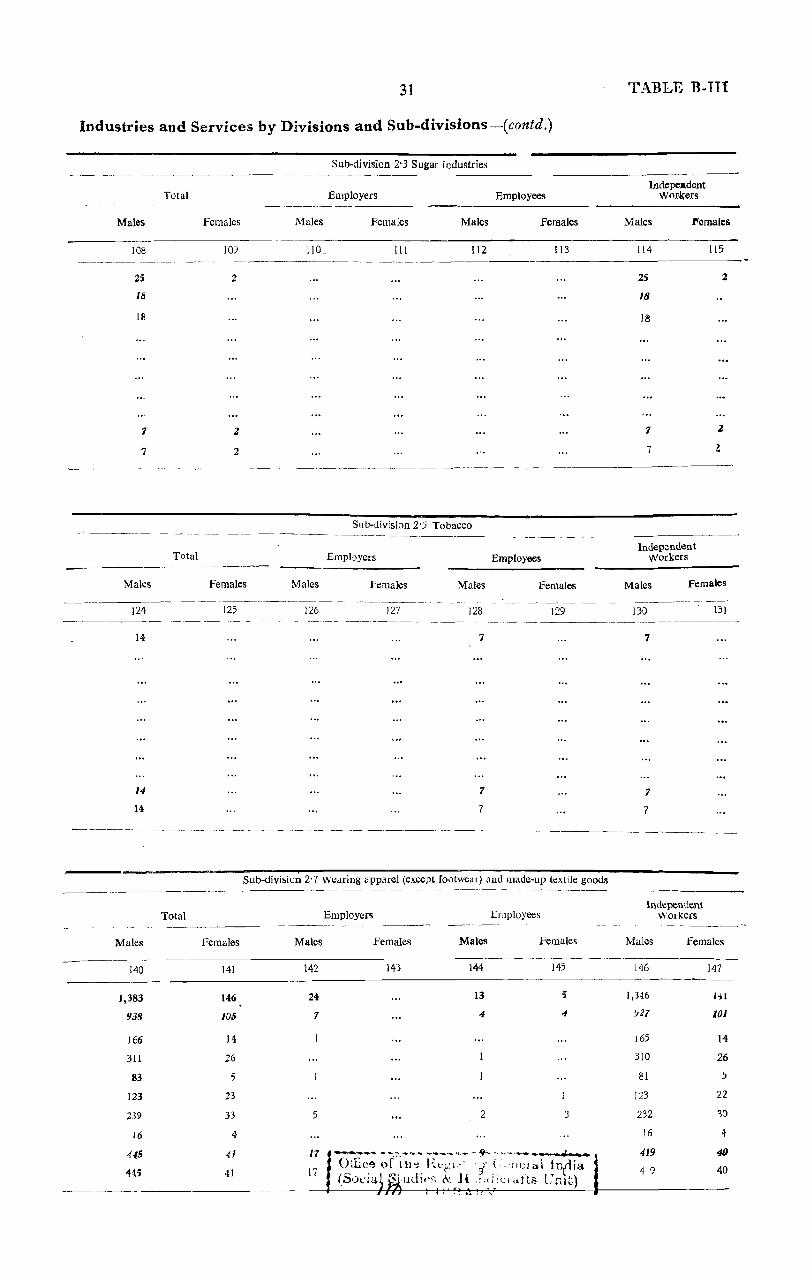
31
Industries and Services by Divisions and Sub-divisions-(contd.)
Males
108
25
18
18
7
7
Males
Total
Total
Females
10;!
2
Z
2
Males
110
---------
Females Males
Sub-division 2'3 Sugar industries
Employers Employees
Females Males Females
III 112 113
Sub-division 2'5 Tobacco
Employers Employees
females Males Females ----- ----- ~ ~ ------- ---- - - ---~------- --------- ---
124
14
14
Males
140
1,383
938
166
311
83
123
239
16
445
445
125
Total
Females
141
146
105
14
26
5
23
33
4
41
41
126 127 128 ------------------
7
7
7
129
Sub-division 2'7 Wearing apparel (except footwear) and made-up textile goods
Employers Employees -_------ ----
Males
142
24
7
5
17
17
Females Males Females
143 144 145
13 5
4 4
2 3
-..... • - -.":' ........... - ...... --.• _ '1 ...... - -9- - .. " ......... __ __ • .J •
Oilic~ of t1}~ Hl'f ' :-' ii (- neJ1>.i ~nfia (SOCiil (\L H -';(I:;~i<t,tt8 emt)
TABLE B-III
Indepeadent WOfl<;ers
Males ,ll'emales
114
25
18
18
7
1
Independent Workers
115
2
2
l
Males Females
130
7
7
7
\31
independent Workers
Males Females
146 147
1,346 141
'J27 101
165 J4
310 26
81 5
123 22
232 30
16 <+
419 40
4'9 40

TABL~ B-III
c:i CI
d 'c II> Twct In
2
District Total
Rural Total
Tehsil Hamirpur (Rural)
2 Tehsil Kulpahar (Rural)
3 Tehsil Mahoba (Rural)
4 Tehsil Maudaha (Rural)
5 Tehsil Rath (Rural)
6 Tehsil Charkhari (Rural)
Urban Total
Urban Non-city
c:i CI
-;;; ';:: .. Tract In
2
District Total
Rural Total
Tihsil Hamirpur (Rural)
2 Tehsil Kulpahar (Rural)
:3 Tehsil Mahoba (Rural)
4 Tehsil Maudaha tR,laIal)
5 Tehsil Rath (Rural)
6 Tehsil Charkhari (Rural)
Urban Total
Urban Non-city
Tract
2
District Total
RUFf.l Total
Tehsil Hamirpur (lltural)
2 Tehsil Kulpahar (Rural)
3 Tehsil Mahoba (Rural)
4 Tehsil Maudaha (Rural)
5 Tehsil Rath (Rural)
6 Tchsil Charkhari (Rural)
Urban Total
Urban Non~city
32
Employers, Employees and Independent Workers in
Sub-division 2'8 Textile industries otherwise unclassified ~----
Total Employers Employees Independe:1v
Workers
Males Females Males Females Males Females Males Females _._------ -
148 149 150 151 152 153 154 I55
38 9 3 34 9
12 4 12 4
2 2
I
6 6
3 3-
3 3
26 5 3 ZZ 5
26 5 3 22 5 ------ ---~ ._-----
Division 3-ProcessinliJ: and Manufacture-MetalS, Chemicals and Product~ thereof ----" -~---------- ------~------~--------~
Independent Total Employers Employees Workers
Males
164
1,500
1,006
78
154
iO
200
481
13
494
494
Males
180
7
7
7
Females
165
73
62
40
4
2
15
II
11
Total
Femaks
18!
Males Females Males Females Males Females ---- -~---. --------- ----_._--_._------_
166 167 168 169
9 72 22
68 ZZ
22
67
9 4
9 4
Sub-division 3'! Iron and steel (basic manufacture)
Employers Employees
Males Females Males Females
182 183 184 !~5
170
1,419
938
78
154
80
133
481
12
481
481
Independint Workers
171
5t
40'
18
4
2
15
It
II
Males Females
!~6
7
7
7
187
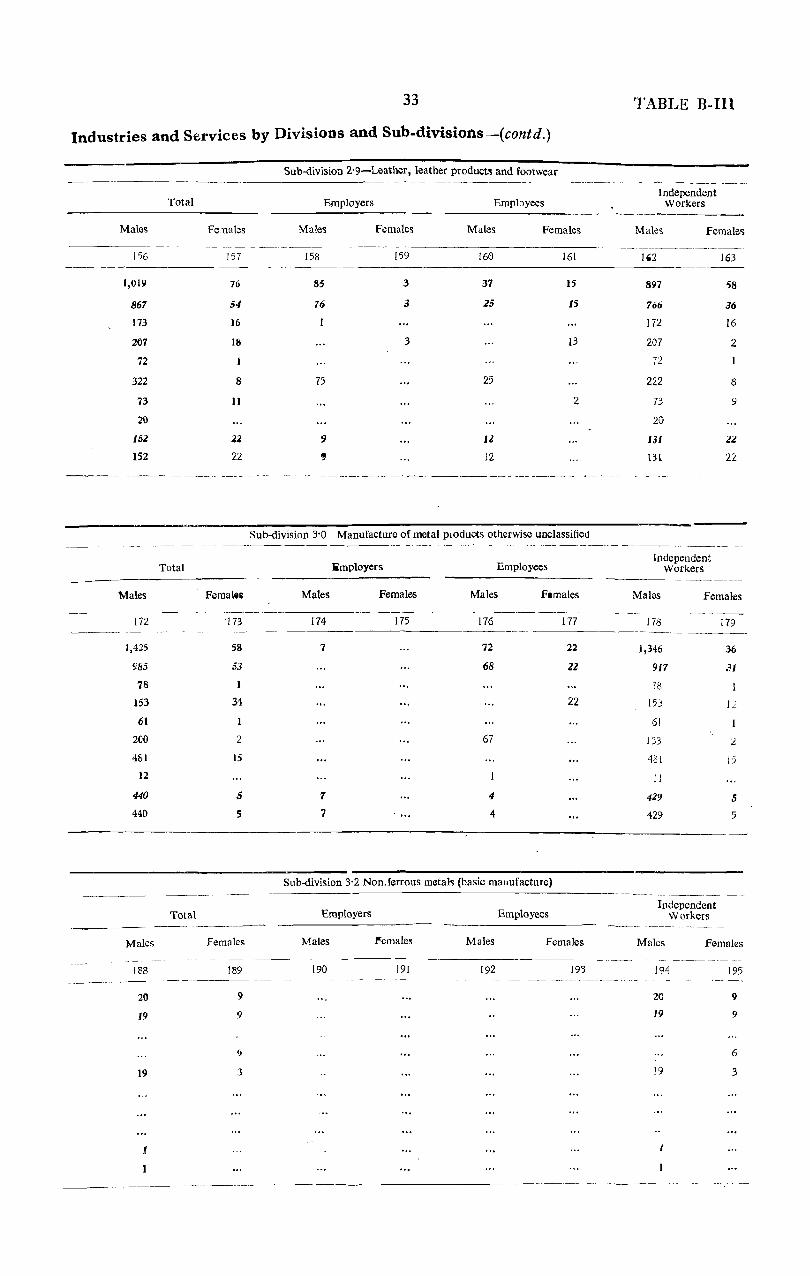
33
Industries and Services by Divisions and Sub.divisions -(contd.)
Sub-division 2'9 Leather, leather products and footwear ----------------------------------------
Males
156
1,019
867
173
207
72
322
73
21)
152
152
Total
--------
Total
Males
172 --~------~----
1,425
985
78
153
61
200
481
12
440
440
Employers Employees
Males Females Males Females ---- _- - -----------
157 158 159 160 161
76 85 3 37 15
S4 76 3 2S 15
16
18 3 13
8 75 25
11 2
22 9 lZ
22 , i2
Sub-division 3'0 Manufacture of metal products otherwise unclassified
1imployers Employees
Femalta Males Females Males Flmales
----_----'173 174 175 176 177 --------~----~----
58 7 72 22
53 68 22
I
34 22
2 67
15
5 7 4
5 7 4
Sub-division 3'2 Non. ferrous metals (basic manufacture) ------ --------------------------------------------------
Total Employers Employees
Males Females Males l""emales Males Females
188 189 190 191 192 193 -------- -------
20 9
19 9
19 3
1
--------------- ----------
TABLE B-Ill
- -~---Independent
Workers
Males Females --_"---------_"_ .. -_---
1'2 163
897 58
766 36
172 16
207 2
72
222 8
73 9
20
IJI 22
I3l 22
Independent Workers
Males Females
178
J,346
911
78
15j
61
133
481
11
429
429
Independent Workers
179
36
.31
12
2
1 :)
5
5
Males Females
194
20
19
19
195
9
9
6
3
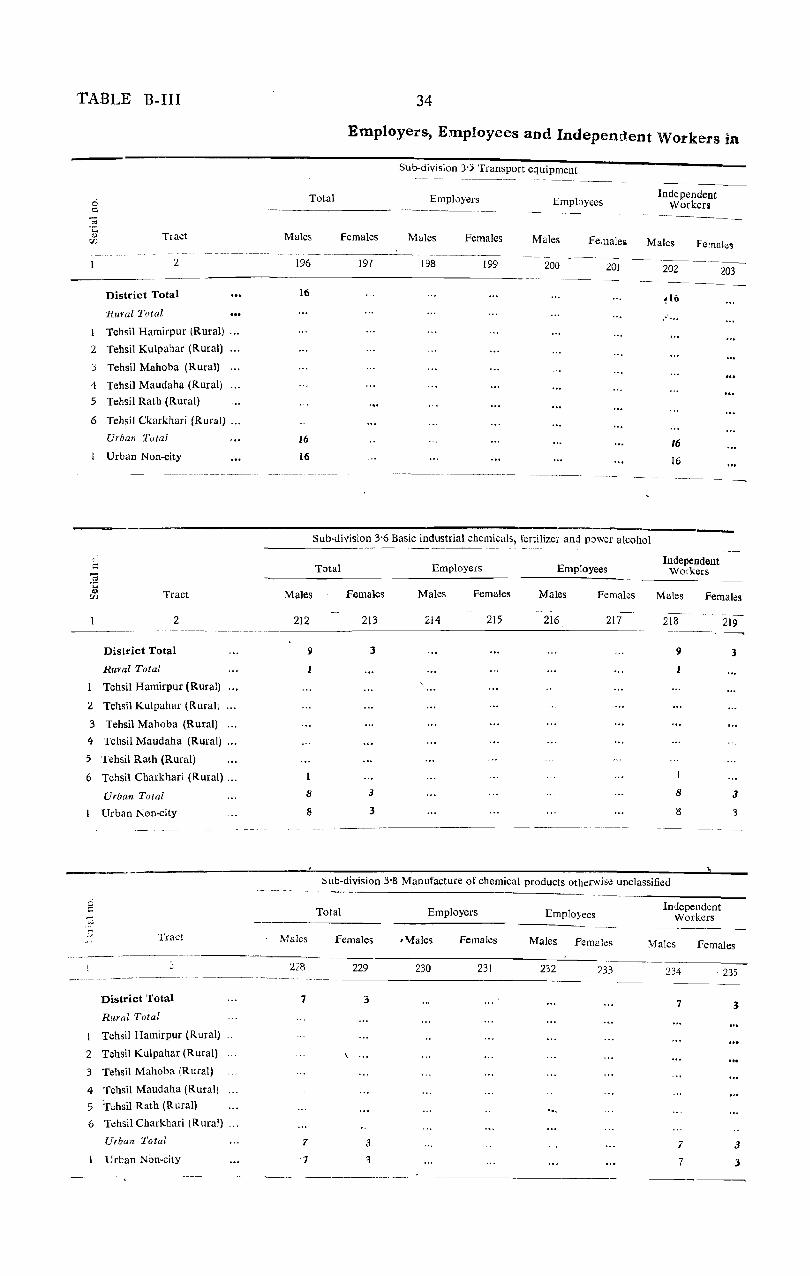
TABLE B-III
Total
Tract Males
34
Employers, Employees and Indepenr)ent Workers in
Sub-division 3'} Transport equipment ---- -~-.- ----__ ._- -----.~-_-~
Employers Ernpbyees
Females Males Females Males Fealale~
Independent Workers
Males Females -----_. ------ -----_ - -----_. __ -- ------- -
2
District Total
Rural Total
1 Tehsil Hamirpur (Rural) ...
2 Tehsil Kulpahar (Rural)
3 Tehsil Mahoba (Rural)
4 Tehsil Maudaha (Rural)
5 Tehsil Rath (Rural)
6 Tehsil Ckarkhari (Rural) ...
c: -:Il .c; .. 'J)
2
3
4
5
6
_\J
I
2
3
4
5
6
Urban TUlal
Urban Non...:ity
Tract
2
District Total
Rural Total
Tehsil Hamirpur (Rural)
Tehsil Kulpahar (Rural)
Tehsil Mahoba (Rural)
Tehsil Maudaha (Rural) ...
Tehsil Rath (Rural)
Tchsil Charkhari (Rural) ...
Urban Total
Urban Non-city
Tract
District Total
Rural Total
Tehsil Hamirpur (Rural)
Tehsil Kulpahar (Rural)
Tehsil Mahoba (Rural)
Tehsil Maudaha (Rural)
T~hsil Rath (Rural)
Tehsil Charkhari (Rural)
Urban Total
Urban Non-city
-,
196
16
16
16
Males
212
II
8
8
Males
228
7
7
1
197 198 199 200 201
__ --------- -.--~~.-- ---------
202
~16
... : ...
16
16
203
-- -_---_ -_ -_
Sub-division 3'6 Basic industrial chemicals, fertilizer and pc>wer alcohol -~-------
Employees Independent
Total Employers Workers
Females Males Females Males Females Males Females ---.-
213 214 215 216 217 218 219
3 9 3
1
3 8 3
3 8 3 -_ ------
Sub-division 3'8 Manufacture of chemical products otherwise unclassified
Total
Females
229
3
, ...
3
3
Employers
,Males Females
230 231
Employees
Males Femaks
232 233
"_
Independent Workers
Males
234
7
7
7
Females
. 235
3
3
3
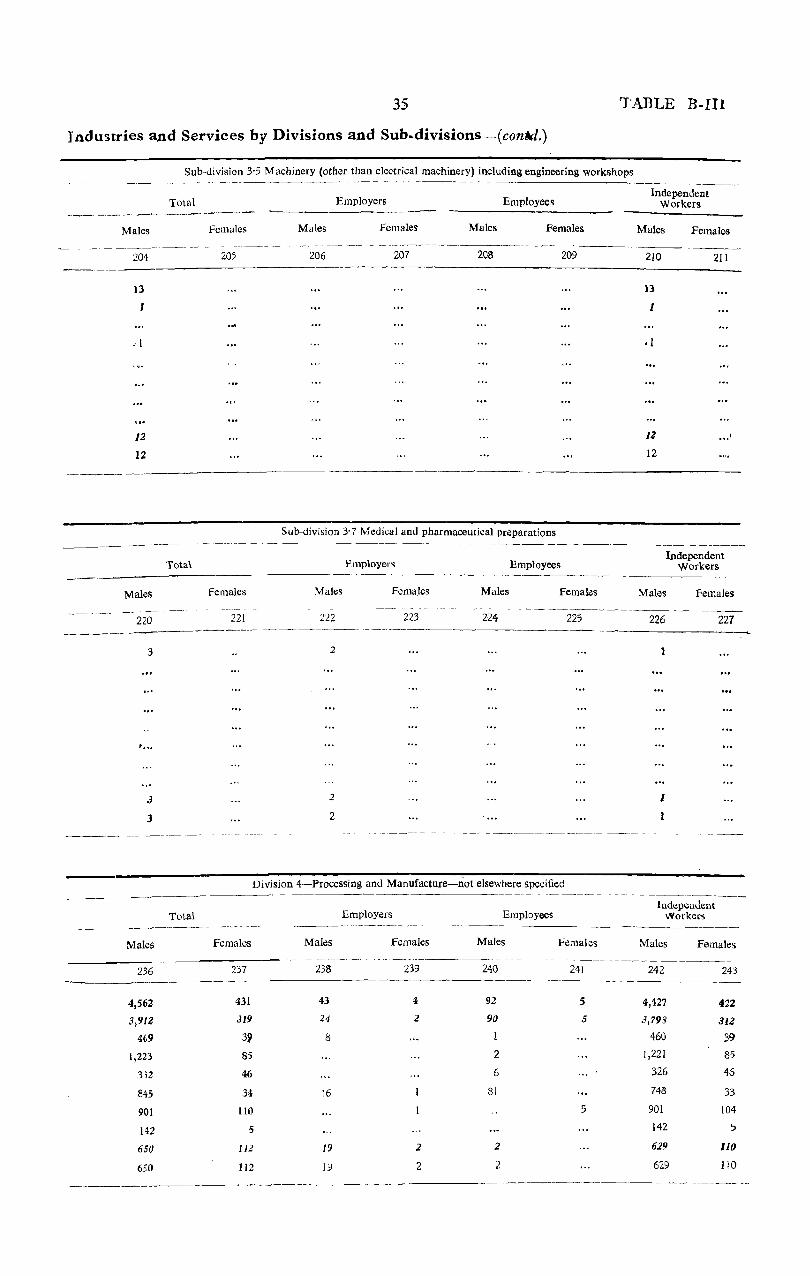
35 TABLE B-Ill
Industries and Services by Divisions and Sub-divisions--(contJ.)
Males
204
13
.1
12
12
Males
220
Sub-division 3'5 Machinery (other than electrical machinery) including engineering workshops
Total Employers Employees
Females Males Females Males Females
205 206 207 208 209
Sub-division 3'7 Medical and pharmaceutical preparations
Total Employers Employees
Females Males Females Males Females
221 222 223 224 225 -~------ ----------------------_.
3
3
3
Males
236
4,562
3,912
4~9
1,223
332
845
901
142
650
650
Total
2
2
2
Division 4-Processing and Manufacture-not elsewhere specified
Females
237
431
319
3? 85
46
34
110
5
III
112
----------------- ---_._-------
Males
43
24
8
16
19
19
Employers
Females
239
4
2
2
2
Employees
Males Females
-- -----.-~
240 241
92 5
90 5
I
2
6
81
5
2
2
Independent Workers
Males
210
13
I
12
12
Females
211
••• f
Independent Workers
Males Females
226 227
1
Iudepe[ll.lent Workers
Males Females
242 243
4,427 422
3,793 3lZ 460 39
1,221 85
326 46
748 33
901 104
142 5
629 110
629 110
---------_._------_---_---_._----------
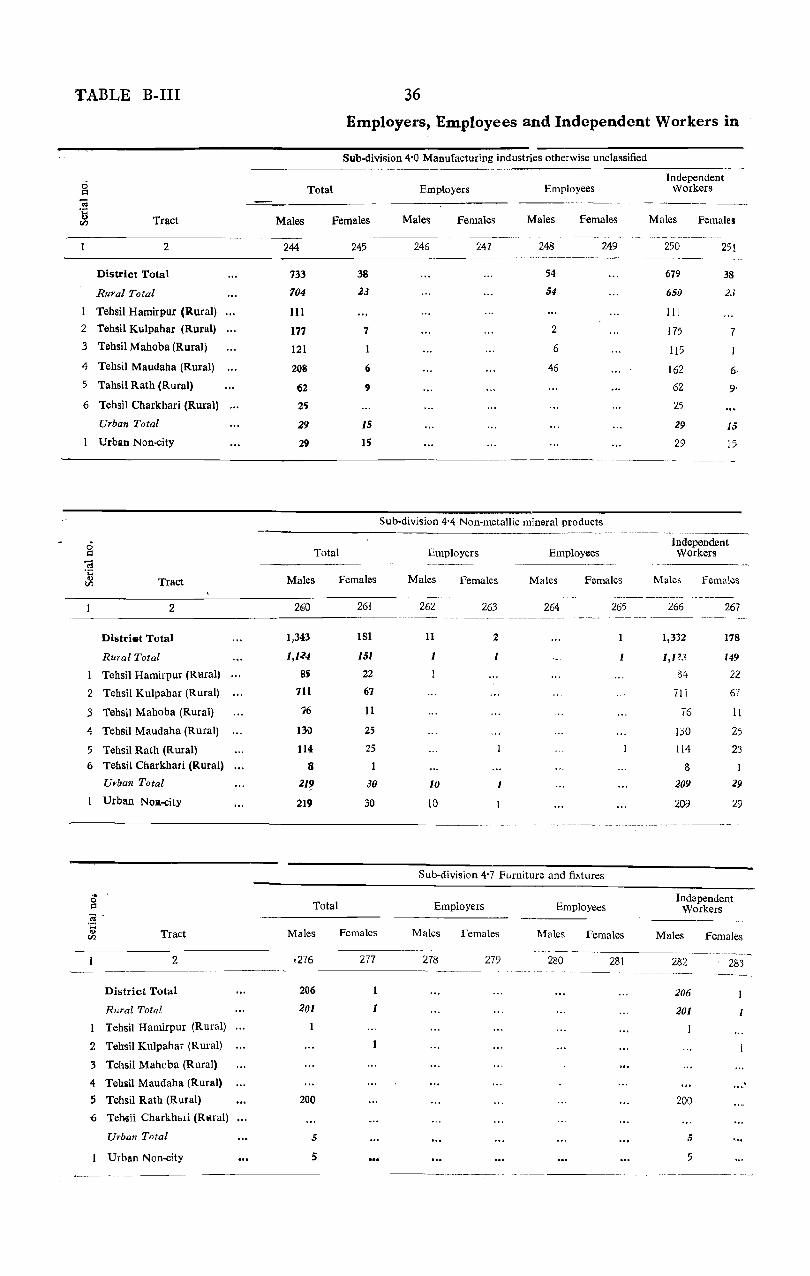
TABLE B-III
c5 c:: <; ' .. u Tract w
2
District Total
Rural Total
Tehsil Hamirpur (Rural)
2 Tehsil Kulpahar (Rural)
3 Tehsil Mahoba (Rural)
4 Tehsil Maudaha (Rural)
5 Tahsil Rath (Rural)
6 Tehsil Charkhari (Rural)
Urban Total
Urban Non-city
0 c:: -; ';::; ..,
Tract 00
2
Distri.t Total
Rural Total
Tehsil Hamirpur (Rural)
2 Tehsil Kulpahar (Rural)
3 Tehsil Mahoba (Rural)
4 Tehsil Maudaha (Rural)
5 Tehsil Rath (Rural) 6 TehsiL Charkhari (Rural)
Utban Total
Urban Noa-city
g .
Tract
7.
36
Employers, Employees and Independent Workers in
Sub-division 4'0 Manufacturing industries otherwise unclassified
Total
Males Females
244 245
733 38
704 23
III
177 7
121
208 6
62 \)
25
29 15
29 15
Total
Males Females
260 261
1,343 181
1,134 151
81j 22
711 67
76 11
130 25
114 25
8
219 30
219 30
Total
Males Females
,276 277
Independent Employers Employees Workers
-.------
Males Females Males Female,s Males Females -----"._---, ,-- - -_._---_-_.------ ----------
246 247 248 249 250 251
54 679 38
54 650 23
III
2 175 7
6 115
46 162 6·
62 9'
25
29 15
29 15 ---------------- --
Sub-division 4'4 Non-metallic mineral products
Independent Employers Employ€es Workers
- ----_-_------- -
Males Females Males Females Males Females ~ -- - --~----------- ---~--.-.- -----~--
262 263 264 265 -_--- ------------
11 2
10 I
10
Sub-division 4'7 Furniture and fixtures
Employers Employees
Males Females Males Females
278 279 280 281
266 267 ---- --"--------
1,332 178
1,1?3 149
84 22
711 67
76 II
130 25
114 23
B
209 29
209 29
Independent Workers
Males Females
282 283 ---------- ~---------- ---------- -- .-.--~ ~~- -~-------~-----
District Total
Rural Total
Tehsil Hamirpur (Rural)
2 Tehsil Kulpahar (Rural)
3 Tehsil Mahoba (Rural)
4 Tehiil Maudaha (Rural)
5 Tehsil Rath (Rural)
6 Tehtlii Charkhari (RlIIral)
Urban Total
Urban Non-city
206
201
200
5
5
206
201
200
5
5
-~------.

37 TABLE B-Ill
Industries and Services by Divisions and Sub~divisions ----'l( contd.)
~------------------------------------------------------------------------------------Sub-divisiJn 4'2 Bricks, tiles and other structural clay products
-------- -------Males
252
61
4
2
57
57
females
253
Employers
Males Females
,254 255
Employees Independent
Workers ---------- --------------------Males Females
256 257
Males
258
61
4
.2
I
57
57
Femal0!l
259
1
Sub-division 4'6 Wood and wood products other than furniture and fit'ltures
--------=-~. ---_-
Males
----------268
2,182
1,848
246
333
130
506
r 524
1()9
334
334 --------
Males
284
2
2
2
Total
females
-.-.-~-------. --269
---~---. _------
Total
160
134
7
\0
34
3
76
4
26
26
Females
285
10
10.
10
----------_----
Employers Employees
Males Females Males Female!> . "--'-"-~-"' -----.. -
270 27t 272 273 --_-- ------
32 2 37 4
23 ;is 4
7
16 35
4
9 Z
9 2
Sub-division 4'8 Paper and paper products
Emph_lyers ____ _ Employees
Males Females Males Females
286 287 288 289
---~-~---
Independent Workers
~--.
Males Females
274
2,113
1,790
239
333
130
455
524
109
323
323
Independent Workers
275
154
129
10
34
2
72
4
2S
25
Males Females
290 291 ----- ------- ---------------
2
2
2
10
10
10

TABLE B-III
0 1:1 0; "ii
Tract 1:1) Males
2
38
Employe'1's, Employees and Independent Workers in
Sub-division 4'9 Printing and allied industries
Total Employers Employees
females Males Females Males Females
294
Independent Workers
Males Females
297 298 29<; ------------------~~-----------------------------------
292 293 295 296
District Total
Rural Total
Tehsil Hamirpur (Rural)
2 Tehsil Kulpahar (Rural)
3 Tehsil Mahoba (Rural)
4 Tehsil M audaha (Rural)
5 Tehsil Rath (Ruwl)
6 Tehsil Charkhari (Rural)
Urban Total
Urban Non-city
0 c:I
'@
°ti TIm:t V1
-_._----2
District Total
Rural Total
Tehsil Hamirpur (Rural)
2 TehsiJ Kulpahar (Rural)
3 Tehsil Mahoba (Rural)
4 Tehsil Maudaha (Rural)
5 Tehsil Rath (Rural)
6 Tehsil Charkhari (Rural)
Urban Total
Urban Non-city
0 s:;
<Ii ';::; 4j Tract If]
_-_ .. 2
District Total
Rural Total
Tehsil Hamirpur (Rural)
2 Tehsil Kulpahar (Rural)
3 Tehsil Mahoba (Rural)
4 Tehsil Maudaha (Rural)
5 Tehsil Rath (Rural)
6 Tehsil Charkhari (Rural)
Urban Total
Urban Non-city
35
31
25
2
3
4
4
40
40
40
Sub-division 5'1 Construction and maintenance-buildings
Total Employers Employees
Males Females Males Females Males Females
308 309 310 311 312 313
683 61 5 6 100 2
345 43 5. I 97 2
93 5
89
119 13 96
26 27
18 3 2
338 18 5 3
338 18 5 3
34 40
30
24
2
3
4
4
Independent Workers
40
40
Males Females
------314 315
578 53
243 40
88
88
23 13
26 27
18
335 13
335 13
Sub-division 5'4 Construction and maintenance operations-irrigation and other agricultural works
Total Employers Employees Independent
Workers
Males Females Males .. Females Males Females Males Females --~-----
324 325 326 327 328 329 330 331
44 3 27 3 17
25 3 8 3 17
8 3 8 3
2 2
15 15
Ig 19
19 19
------- -----------.--- _-- ----_._---------- ._--
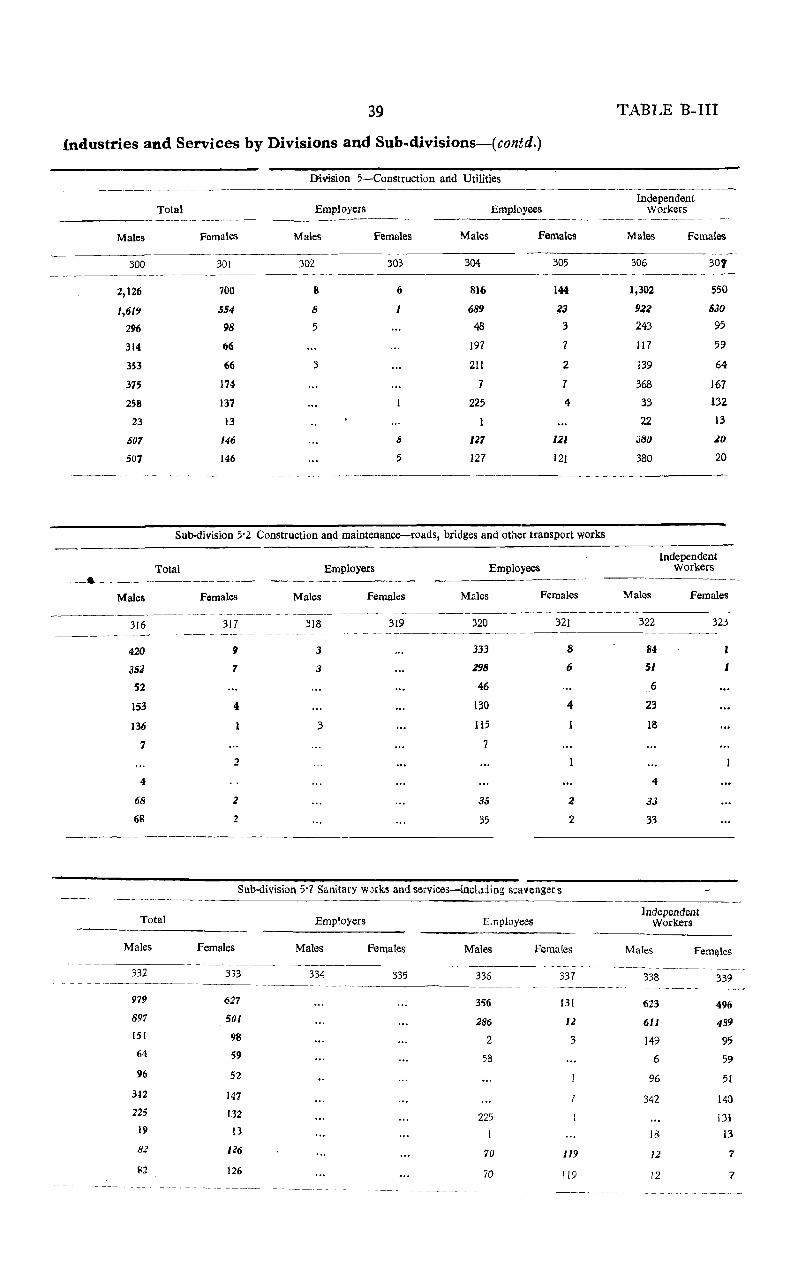
39 TABLE B-III
industries and Services by Divisions and Sub-divisions-(contd.)
)}ivillion 5-Construction and Utilities
Independent Total Employers Employees Workers
_._,"-------- ~---- - - -.-.-~~-.---
Males Females Males Females Males Females Males Females
300 301 302 303 304 305 306 301 --~.- --
2,126 700 8 6 816 144 1,302 550
1,619 554 8 I 689 23 922 530
296 98 5 48 3 243 95
314 66 197 7 117 59
353 66 3 211 2 139 64
375 174 7 7 368 167
258 137 225 4 33 132
23 13 22 13
507 146 5 1Z7 121 J80 2Q
507 146 5 127 121 380 20
"------" ----- ---~-- -.-._"---"
Sub-division 5'2 Construction and maintenance-roads, bridges and other transport works
Total Employers -.---~------~-- -"---------
Males Females Males Femaks Males
Employees ---
Females Males
Independent Workers
Females
"----- -"-- -"--_-- -- -"--~-"--- ----- -----_~---~--------------316
420
351
52
153
136
7
4
68
68
Total
Males
332
979
897
lSI
64
96
3!2
225
19
82
82
317 -" -~------- ---
9
7
4
2
2
2
318 319 --_ .. _.--_--
3
3
3
320
333
298
46
130
115
7
35
35 "
321
8
6
4
2
2
Sub-division 5'7 Sanitary w.}rks and service3-inclu:ling s::avenger s
Employers E.nployees
Females Males Females Males Females
322
84
51
.6
23
18
4
33
33
323
1
Independent Workers
Males Fem~les
----~.~---~----
333 334 335 336 337 338 339 .- ---~---- ------- -----
627 356 131 623 496 501 286 IZ 611 489
98 2 3 149 95 59 58 6 59 52 96 51
147 7 342 14() 132 225 131 lJ 18 13
lZ6 70 119 12 7
126 70 119 12 7 """--.~ --_-- -- --- - -_-------
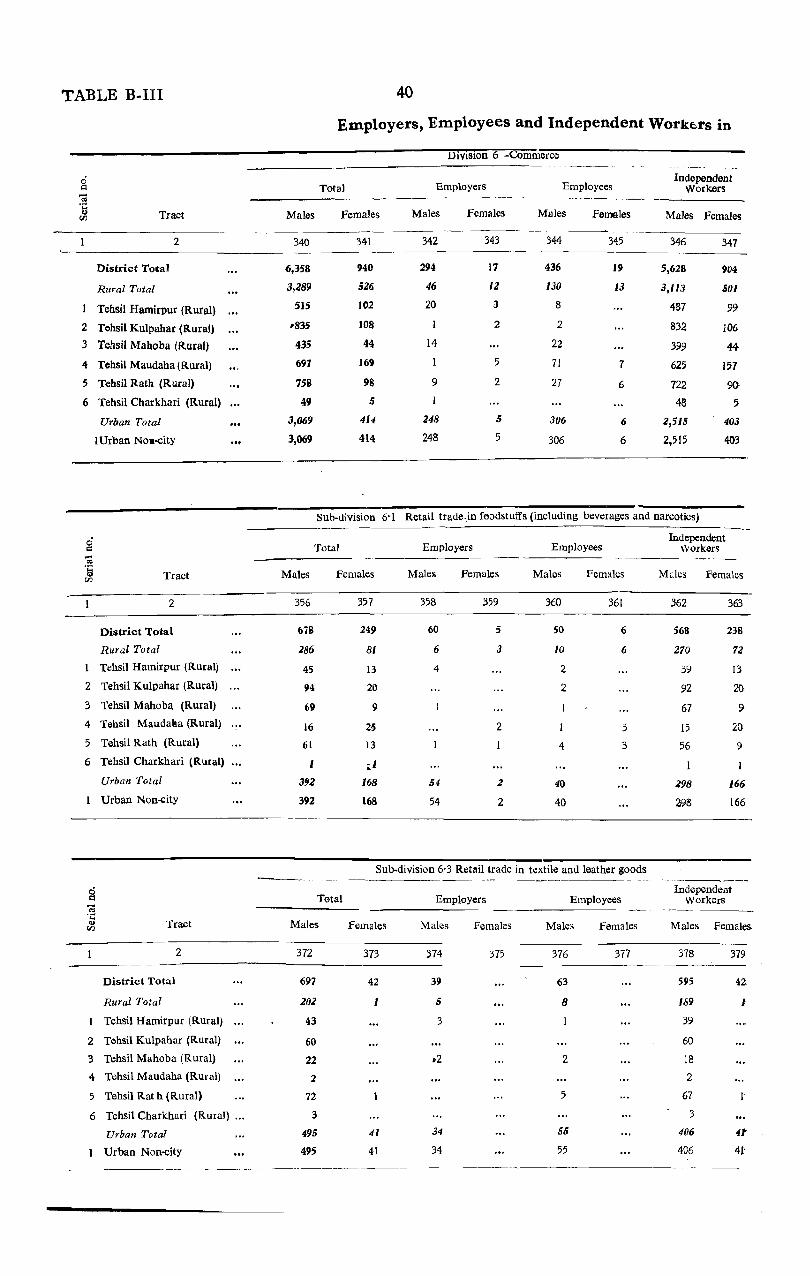
TABLE B-III 40
Employers, Employees and Independent Workers in
-------------------------------------------------------------------DOh~~~&iiornn~6~-~C~ommnnm~ef~c=e---------------------------
Tract
2
District Total
Rural Total
Tehsil Hamirpur (Rural)
2 Tehsil Kulpahar (Rural)
3 Tehsil Mahoba (Rural)
4 Tehsil Maudaha (Rural)
5 Tehsil Rath (Rural)
6 Tehsil Charkhari (Rural)
Urban Total
g
lUrban NOll-city
Tract
2
District Total
Rural Total
I Tehsil Hamirpur (Rural)
2 Tehsil Kulpahar (Rural)
3 Tehsil Mahoba (Rural)
4 Tehsil Maudaka (Rural)
5 Tehsil Rath (Rural)
6 Tehsil Charkhari (Rural)
Urban Total
Urban Non-city
Tract
2
District Total
Rural Total
Tehsil Hamirpur (Rural)
2 Tehsil Kulpahar (Rural)
3 Tehsil Mahoba (Rural)
4 Tehsil Maudaha (Rural)
5 Tehsil Rat h (Rural)
6 Tehsil Charkhari (Rural) ...
Urban Total
Urban Non-city
Males
340
6,358
3,189
515
.835
435
697
758
49
3,069
3,069
Total
Females
341
940
516
102
108
44
169
98
5
414
414
Employers
Males
342
294
46
20
14
9
148
248
Females
343
17
11
3
2
5
2
5
5
Employees
Males
344
436
130
8
2
22
71
27
306
306
Females
345
19
13
7
6
6
6
Independent Workers
Males Females
346
5,628
3,113
487
832
399
625
722
48
2,515
2,515
347
904
501
99
106
44
157
90
5
403
403
Sub-division 6'1 Retail trade.,in f<)odstuffs (including beverages and narcotics)
Total
Males
356
678
186
45
94
69
16
61
1
3'Z
392
Females
357
249
81
13
20
9
25
13
.. I
168
168
Employers
Males
358
60
6
4
54
54
Females
359
5
3
2
:2
2
Employees Independent
Workers ----- -_-----
Males
360
50
10
2
2
4
40
40
Females
361
6
6
3
3
Mules Females
362
568
270
39
92
67
15
56
298
298
363
238
71
13
20·
9
20
9
166
166
Sub-division 6'3 Retail trade in textile and leather goods
Total
Males Females
372
697
ZOZ
43
60
22
2
72
3
495
495
373
42
41
41
Employers
Males Females
374
39
5
3
34
34
375
Employees
Males Females
376
63
8
2
5
55
55
377
Independent Workers
Males Females
378
595
1/j9
39
60
18
2
67
3
406
406
379
42
J
I
41
41'

41 TABLE B-III
Industries and Services by Divisions and Sub-divisions -( contd.)
G Division 6·0 Retail trade otherwise unclassified
~----.---' ---~-
Employers Employees Independent
Tolal Workers
Males females Malc5 Females Males Females Males Females
------348 349 350 351 352 353 354 355
-----.-_-_ -------,---~------.---.---
3,88; 596 141 12 171 13 3,573 571
2,241 42' 28 9 22 7 2,191 405
386 88 II 3 5 370 85
522 E8 2 521 86
280 30 8 10 262 30
453 128 3 4 452 121
561 83 6 7 3 543 79
39 4 38 4
1,644 175 113 3 149 6 1,382 166
1,644 175 113 3 149 6 1,382 166
~--------"----------- - - _- -----~-_
Sub-division 6·2 Retail trade in fuel (including petrol)
Incependent
Total EmpJoyer!§ Employees Workers
Males females Males Females Males Females Males Females -----~ -------.
365 366 367 368 369 364
370 37! -, -----
62 27 7 4 51 n
28 18 28 18
f. 2
IB 18
:1 2
2 I" 2 16
2 2
4 4
34 9 7 4 23 9
34 9 7 4 23 9
Sub-division 6·4 Wholesale trade in foodstuffs
Total Employers Employeei independent
Workers
Maks Femal\;s Males Females Males Females Males Females
-~----------.-
3BO 381 382 383 384 385 386 387 ----- ----
899 40 68 7'1
418 6 17 395
38 2 36
139 139
55 2 .... 9 44
153 153
32 2 8 22
4131 34 51 396
481 34 51 396

TABLE B-III 42
Employers, Employees and Independent Workers in
Sub-division 6'5 Wholesale trade in c~mmodities other than foodstuffs
ci Total Employers Employees
Independent Q
Workers -= ';:; Males OJ Tract Females Males Females Males Females Male5 Ul
Females
2 388 389 390 391 392 393 394 395 -~~
District Total 33 19 7 7 19 19 Rural Total 10 9
- Tehsil Hamirp~r (Rural) ...
2 Tehsil Kulpahar (Rural) ...
3 Tehsil Mahoba (Rural) 9 8 4 Tehsil Maudaha (Rural)
5 Tehsil Rath (Rural)
6 "fehsil Charkhari (Rural)
Urban Total 23 19 6 7 10 19 Urban Non-city 23 19 6 7 10 19
-----~-~-~-~
Division 7-Transp;:>rt, Storage and Communications
ci Employers Employees Independent
Q Total Workers :"§
Males Females Males Females Males Females Males Females ...
Tract 11) (/)
2 404 405 406 407 408 409 410 411 _--
District Total 1,611 61 25 42 '50 13 636 6
Rural Total 429 6 361 6 68
I Tehsil Hamirpur (Rural) ... 33 1 12 21
2 Tehsil Kulpahar (Rural) ... 88 1 57 31
3 Tehsil Mahoba (Rural) 37 23 14
4 Tehsil Maudaha (Rural) ... 42 3 40 3 2
5 Tehsil Rath (Rural) 229 2U
6 Tehsil Charkhari (Rural)
Urban Total 1,182 55 Z5 42 5S9 7 568 6
Urban Non-city 1,182 55 25 42 589 7 568 6
Sub-divi$ion 7'1 Transport by road
0 Total • Employers Employ~ Independent
Q WO.zkers OJ '5 Tract ", Males Females Males Females Males Females MaoI.::s Females
2 420 421 422 423 424 425 426 427 ~_,.., --~
District Total 811 42 25 42 187 599
Rural Total 81 14 67
Tehsil Hamirpur (Rural) ... 21 21
:2 Tehsil KI11pahar (Rural) 33 .... 3 30
.3 Tehsil Mahoba (Rura1) 15 1 14
,4 Tehsil Maudaha (Rural) 2 . "~ 2
5 Tehsil Rath (Rural) 10 10
,6 Tc.hsil Charkhari (Rurd) ,
Urban Total 7JO 42 25 42 173 532
Urban Non-city 730 42 25 42 173 532 --,------ ------_-

43 TAB.LE B-III
Industries and Services by Divisions and Sub-divisions -(contd.)
Sub-division 6'S Money-lending, banking and other financial business
Independent Total Employers Employees Workers
Males Females Males Females Males Females Males Females
396 ·397 :il98 399 400 401 402 403 --~--~-
104 7 73 31 7
104 5 13 31 5
2 2
3 3
71 70
30 :3 27
2 2
2 .. , 2
Sub-division 7'0 Transp()rt and communications otherwise unclassified and incidental services
Total
Males
412
-----------
Males
428
2
2
2
Total
Employers Employees
Females Males Females Males Females
413 414 415 416 417 ------------------------ _------- --------
4
4
4
Females
429
Sub-division 7'2 Transp:Jrt by water
Employers Employees
Males Females Males Females
430 431 432 433 ------ __ --------
---- .- --------- -----
Independent Workers
Males Females
418 419
4
-4
4
Independent Workers
Males
434
2
.0' ••
2
2
Females
435
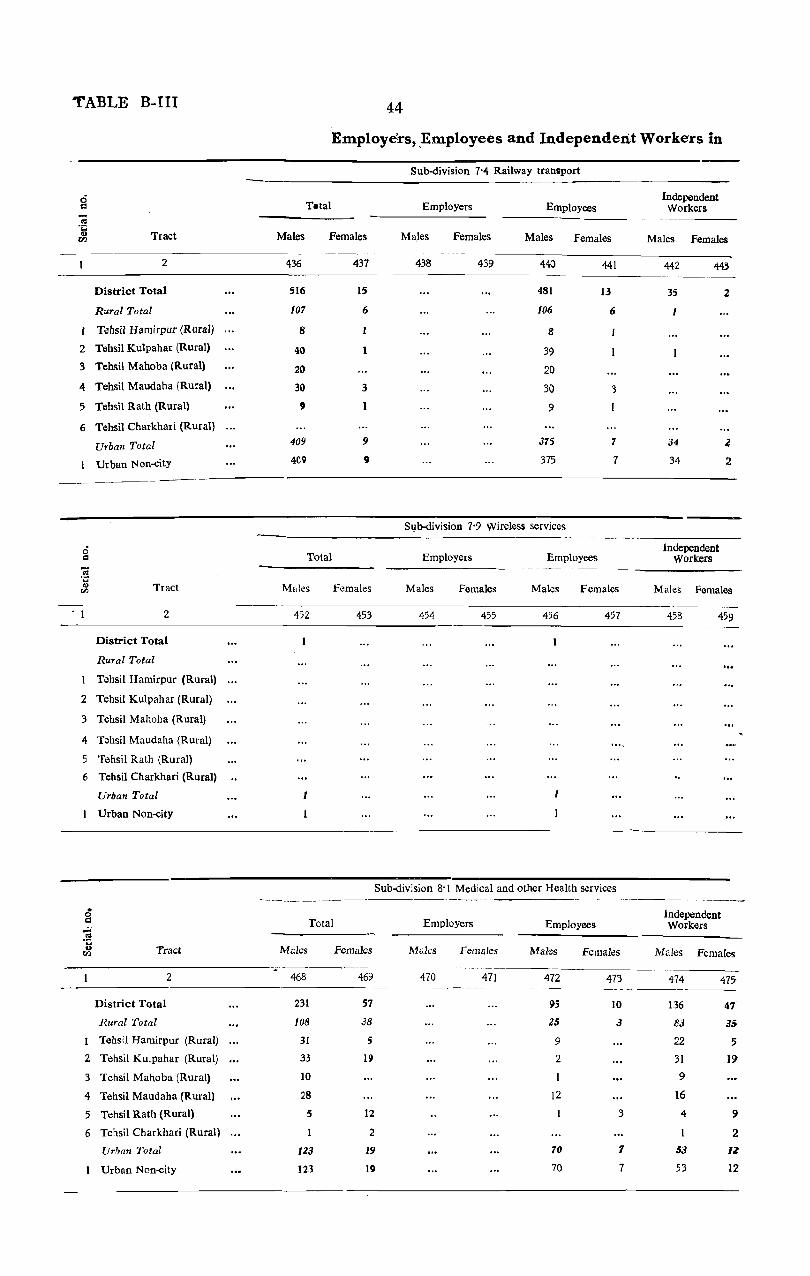
TABLE B-III
6 t:I -til ';:; <I) Tract !Zl
2
District Total
Rural Total
Tehsil Hamirpur (Rural)
2 Tehsil Kulpahar (Rural)
3 Tehsil Mahoba (Rural)
4 Tehsil Maudaha (Rural)
5 Tehsil Rath (Rural)
6 Tehsil Charkhari (Rural)
Urban Total
Urban Non-city
0 1:1
<U ';:; Q) Tract VI
2
District Total
Rural Total
Tehsil Hamirpur (Rural)
2 Tehsil Kulpahar (Rural)
3 Tehsil Mahoha (Rural)
4 Tehsil Maudaha (Rural)
5 Tehsil Rath (Rural)
6 Tehsil Charkhari (Rural)
Urban Total
Urban Non-city
8 .;; til 'C .. Tract til
2
District Total
Rural Total
Tehsil Hamirpuf (Rural)
2 Tehsil Kulpahar (Rural)
3 Tehsil Mahoba (Rural)
4 Tehsil Maudaha (Rural)
5 Tehsil Rath (Rural)
6 Tehsil Charkhari (Rural)
Urban Total
Urban Non-city
44
Employers, ,Employees and Independent Workers in
Sub-division 7'4 Railway transport
Tetal Employers Employees
Males Females Males Females Males Females '--- - .---~------ -
436 437 438 439 440 441
516 IS 481 13
107 6 106 6
8 8
40 39
20 20
30 3 30 3
9 9
409 9 375 7
409 9 375 7
Sqb-<iivision 7'9 Wireless services
Total Employers Employees
Independent Workers
Males Females
442 44' '---_
35 2
34 l
34 2
Independent Workers
~~------ -------------Males Females Males Females Males Females Males Females
452 453 454 455 456 457 458 459 --------------- ~----
1
Sub-div:sion 8'1 Medical and other Health services ----~-----
---._-__ ._ - -------_,
Employers Independent
Total Employees Workers
Males Females Males Females Males Females Males Females
468 469 470 471 472 473 474 47~ , ~-----
231 57 95 10 136 47
108 38 15 3 83 35
31 5 9 22 5
33 19 2 31 19
10 I 9
28 12 16
5 12 3 4 9
2 I 2
123 19 70 7 53 IZ
123 19 70 7 53 12

45
Industries and Services by Divisions and Sub-divisions-(contd.)
Sub-division 7'6 Postal services
Total Employers Employees
Males Females Males Females Males Fcma'es
444 445 446 447 448 449
281 281
241 241
4 4
15 15
2 2
10 10
lie 210
40 <0
40 40
Oivisit'ln 8-Health, Education and Public Administration
Total Employers Employees -~---- --_--- ----
'Males Females Males females Malcs Females
~---
460 461 462 463 464 465 -------------__ -----
4,550 250 2 4,342 194
2,4.0'1 139 2 2,45J 88
385 24 2 344 16
493 49 462 27 274 6 265 6
699 19 633 19 734 29 730 20
22 2 19 1,943 121 1,889 106
1,943 121 1,889 106 - -- ---------------------
Sub-division 8'2 Educational services and Research _----
Total Employe,s Employees
Males females Males Females Wales Females
476 477 4i8 479 480 481
1,182 148 2 I,IJO 139
848 64 2 '17'1 58
122 15 2 103 12
167 17 167 14
125 6 125 6
281 17 231 17
d4-i 9 141 9
9 7
334 84 333 81
334 84 333 81
TABLE B-III
Independent Workers
Malcs Females
450 451
Independent Workers
Males femaks
466 467
206 56
152 41 %l 8
31 22 9
66
4 9
3 2 54 15
54 15
Independent Workers
Males Females
482 483 --------------------
'10 II
69 6
17 3
3
50
2
I 3
.3
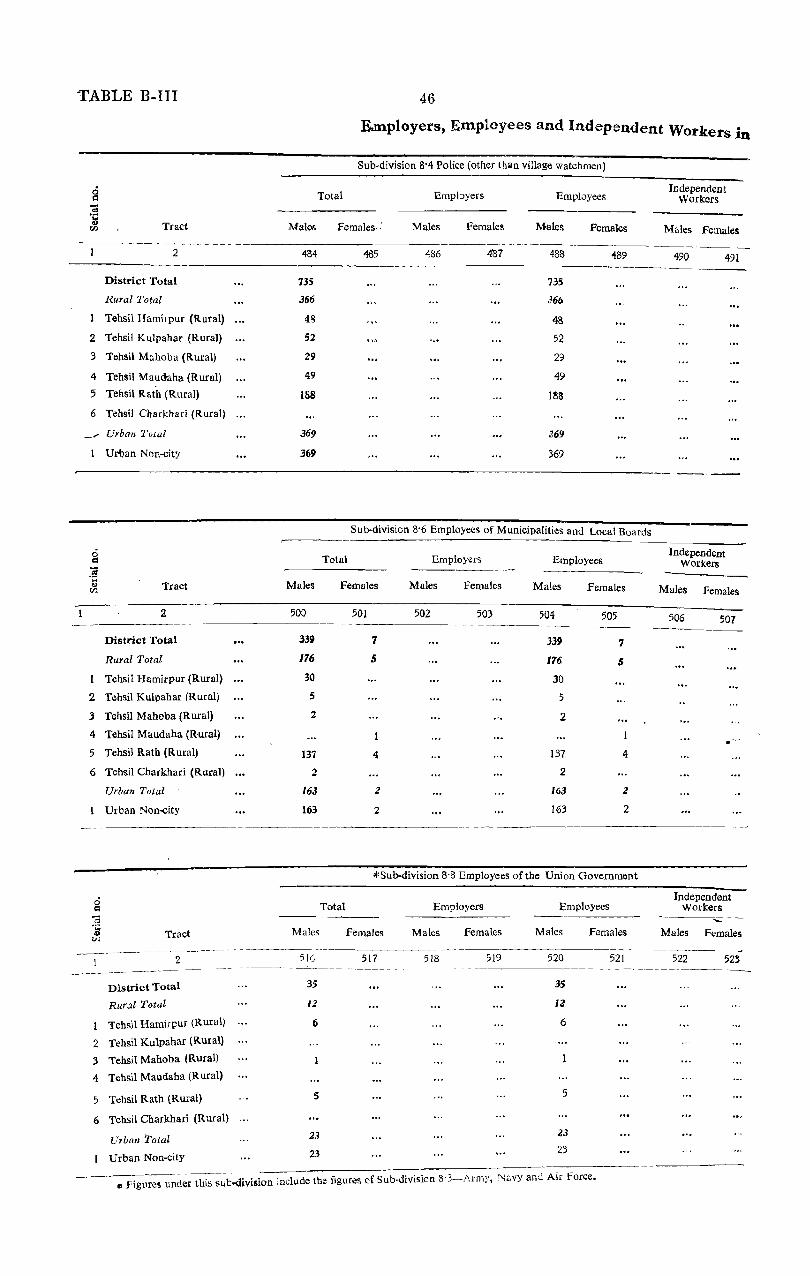
TABLE B-III
Tract
2
District Total
Rural Total
Tehsil Hamirpur (Rural)
2 Tehsil Kulpahar (Rural)
3 Tehsil M .. hoba (R.ural)
4 Tehsil Maudaha (Rural)
5 Tehsil Rath (Rural)
6 Tehsil Charkhari (Rural)
_'" Urban Total
1 Urban Non-city
0 c:I
:'§ .. ., Ul
2
3
4
5
6
Tract
2
District Total
Rural Total
Tehsil Hamirpur (Rural)
Tehsil Kulpahar (Rural)
Tehsil Mahoba (Rural)
Tehsil Maudaha (Rural)
Tehsil Rath (Rural)
Tehsil Charkhari (Rural)
Urban Total
Urban Non-city
Tract
2
District Total
Rural Total
Tehsil Hamirpur (Rural)
2 Tehsil Kulpahar (Rural)
3 Tehsil Mahoba (Rural)
4 Tehsil Maudaha (Rural)
5 Tehsil Rath (Rural)
6 Tehsil Charkhari (Rural)
Urban Total
Urban Non-city
46
Employers, Employees and Independent Workers in
Sub-division 8'4 Police (other (han village watchmen)
Total Employers Employees Independent
Workers
Males
484
735
366
49
52
29
49
188
369
369
Males
500
339
176
30
5
2
137
2
163
163
Males
Females-- Males Female~ Males Females
485 486 487 488 0489
735
366
48
52
29
49
1M
369
369
Sub-division 8'6 Employees of Municipalities and Local Boards
Total Employers Employees
Females Males Females Males Females
501 502 503 504 505
7 339 7
5 176 S
30
5
2
4 137 4
2
2 163 2
2 163 2
*Sub-division 8'8 Employees of the Union Government
Total Employers Employees
Females Males Females Males Females
Males Females
490 491
Independent Workers
Males females
506 507
Independent Workers
~--
Males Ft:males
-.----- ._-----------------------------516
35
IZ
6
5
23
23
517 518 519 520 521 522 523 -----------~------- ----_
35
lZ
6
5
23
23
.. figt1res under this sub.division include the figures of Sub-division S-3-Army, Navy and Air Force.
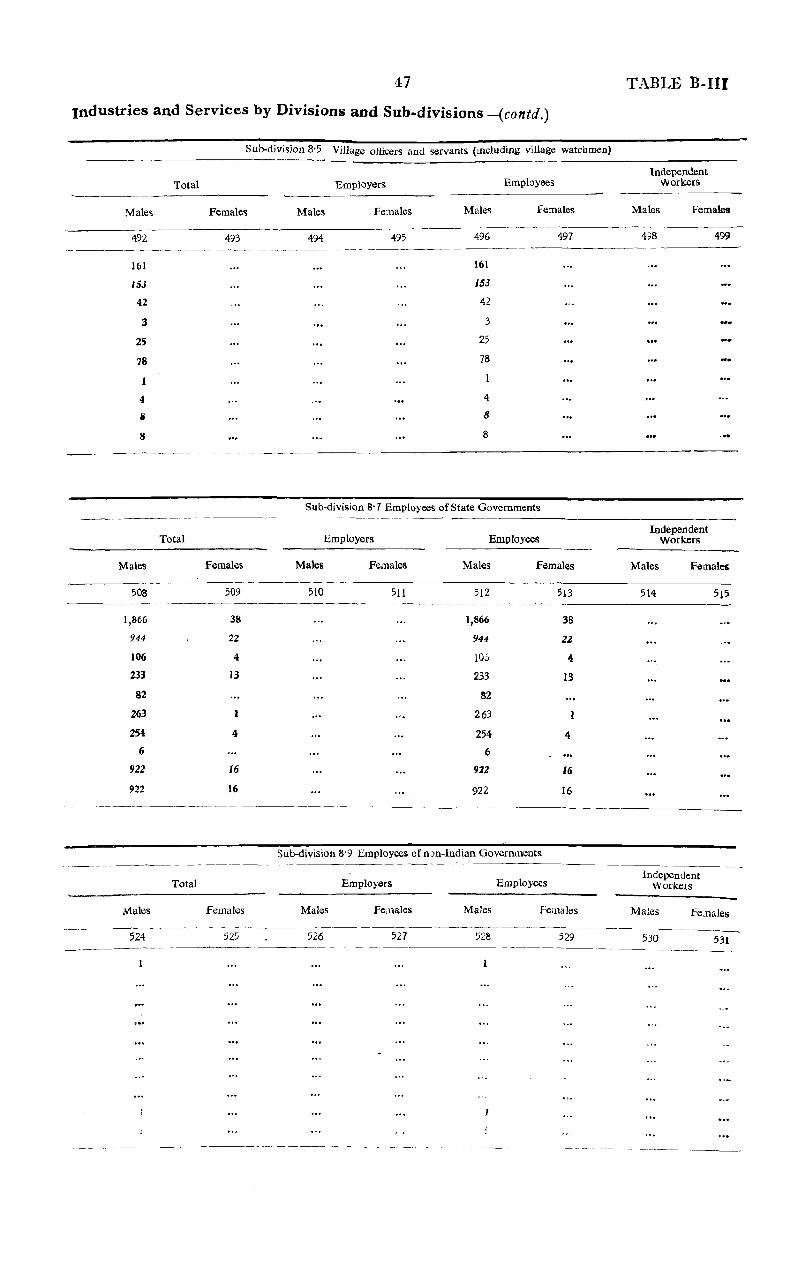
47
Industries and Services by Divisions and Sub-divisions -(contd.)
Males
492
Hil
153
42
3
25
78
4
i
8
Males
508
1,866
944
106
233
82
263
254
6
922
922
Males
524
Sub-division 8'5 Village oiticers and servants (mcluding village watchmen) ------
Total Employers Employees
Females Males Females Males Females
494 0495 496 497
161
ISJ
42
3
25
78
1
4
8
8
Sub-division 8'7 Employees of State Governments
Total Employers Employees
Females Males Females Males Females
509 510 511 512 513
38 1,866 38
22 944 22
4 105 4
I3 233 13
S2
263
4 254 4
6
16 912 16
16 922 16
-------
Sub-division 8'9 Employees of non-Indian Governments
Total Employers Employees
Females Males Females Males Females
525 526 527 528 529
TABLE B-III
Independent Workers
Males Females
4j8 499
Independent Workers
Males Females
514 515
Independent Workers
Males Fe.nales
530 531 --------_

TABLE B-III 48
Employers, Employees and Independent Worke'rs . In
Division 9-Services not elsewhere specified
ci Employers
Independent c Total Employees Workers :3 ....
Males Females 'I) Tract Males Females Males Fell1ales Males Females t/}
2 532 533 534 535 536 53'{ 538 539 ----- -~-~----
District Total 6,986 2,393 3 5 1,932 325 5,051 2,068
Rural Total 1,574 591 1 5 590 61 1,982 525
Tehsil Hamirpur (Rural) 455 153 2 141 11 312 139
2 Tehsil Kulpahar (Rural) 810 131 3 103 707 128
3 Tehsil Mahoba (Rural) 347 45 68 12 279 33
4 Tehsil Maudaha (Rural) 337 133 98 24 239 109
5 Tehsil Rath (Rural) 547 116 2 173 10 374 104
6 Tehsil Charkhari (Rural) 78 13 7 i 1 12
Urban Total 4,412 1,807 1,342 264 3,069 1,543
Urban Non-city 4,412 1,807 1,342 264 3,069 1,543
Sub-division 9'1 Domestic services
0 Independent Q Total Employers Fmployees Workers
-;;j ';::; 0 Tract Males Females Males Females Males Females Males Females rFl
2 548 549 550 551 552 553 554 555
District Total 1,360 147 1,360 147
Rural Total 310 52 310 52
1 Tehsil Hamirpur (Rural) 61 13 6'1 13
2 Tehsil Kulpahar (Rural) 88 88
3 Tehsil Mahoba (Rural) 63 10 63 10
4 Tehsil Maudaha (Rural) 84 24 84 24
5 Tehsil Rath (Rural) 8 4 8 4
6 Tehsil Charkhari (Rural) 6 1 6
Urban Total 1,050 95 1,050 95
Urban Non-city 1,058 95 1,050 95
Sub-division 9'3 Laundries and laundry services
0 Independent Q Total Employers Employees Workers ] ..
Tract Males Females Males Females Males Females Males Females 0 t/}
2 564 565 566 567 568 569 570 571 ~-~---
District Total 448 215 2 96 350 215
Rural Total 337 159 :1 6 339 159
Tehsil Hamirpur (Rural) IS3 21 2 180 21
2 Tehsil Kulpahar (Rural) 103 46 103 46
~ Tehsil Mahoba (Rural) 21 II 21 11
4 Tehsil Maudaha (Rural) 5 31 5 31
5 Tehsil Rath (Rural) 16 43 5 II 48
6 Tehsil Charkhari (Rural) 9 2 9 2
U,'ban Total III 56 90 21 56
Urban Non-city III 56 90 21 56
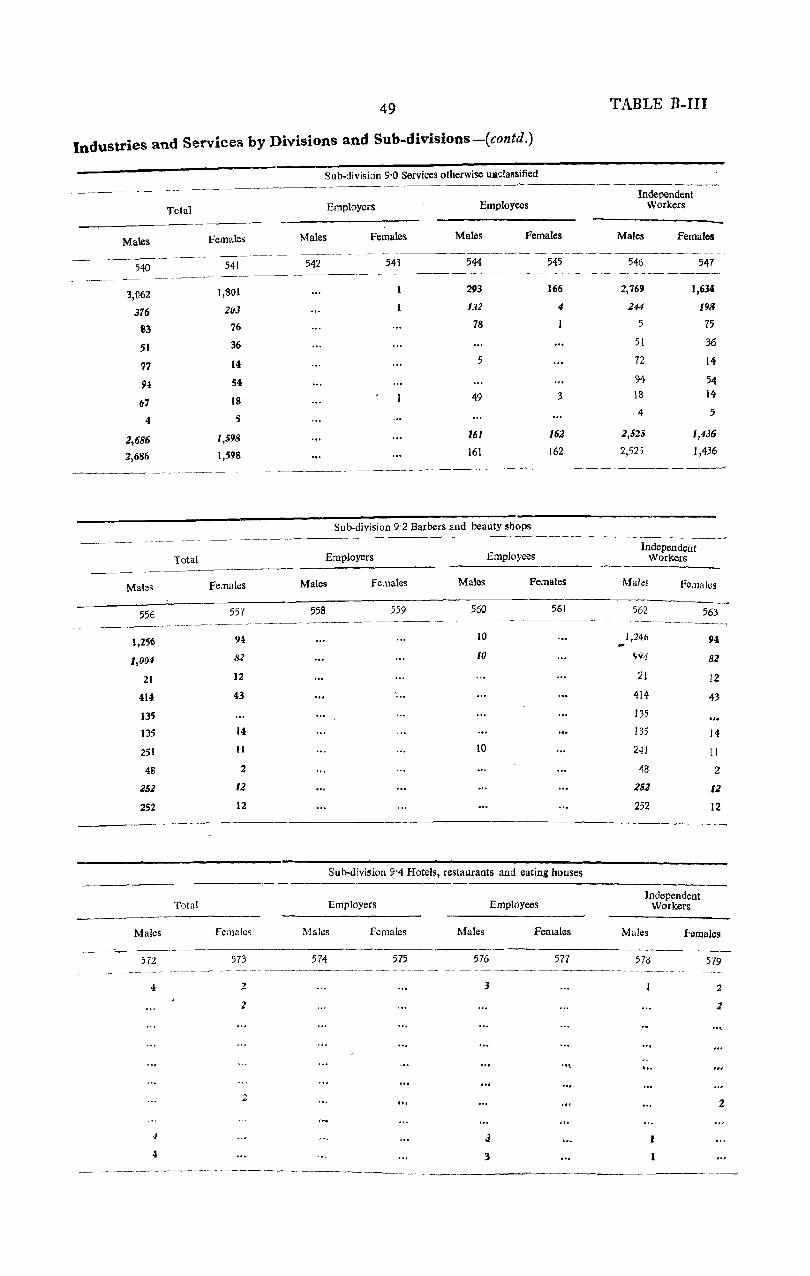
49
Industries and Services by Divisions and Sub-divisions-(contd.)
-------
Total
Males females
540 541
3,1l62 1,801
376 203
83 76
51 36
77 14
94 54
67 18
4 5
2,686 1,598
2,686 1,598
------.-~.---.. ~--- - - -
Males
1,256
1,004
21
414
135
135
251
48
252
252
Males
572
4
4
4
Total
Total
Fe.nates
94
8]
12
43
14
II
2
12
12
Females
573
2
2
2
Sub-division 9'0 Services otherwise uaclassified
Employers Employees
Males Females Males Females
----------
542 543 544 545
293 166
132 4
78
5
49 3
161 162
161 162
Sub-division 9·2 Barbers and beauty shop~
Employers
Males Fe.\1at~s
559
Employees
Males
560
10
10
10
Females
561
Sub-division 9'4 Hotels, restaurants and eating houses
Employers
Ma]"s females
574 575
Employees
Males
576
3
J
3
Females
577
'"
TABLE B-III
Independent Workers
Males Females
546 547
2,769 1,634
244 198
5 75
51 36
72 14
94 54 18 14
4 5
2,525 1,436
2,525 1,436
Independent Workers
Males fe,nales
-562
1,246
9'}.j
21
414
135
135
241
48
252
252
Independent Workers
563
94
81
12
43
14
11
Z
II
12
Males Females
578
...
I
I
579
2
2
2

TABLE B-III 50
0 -=
'OJ li til
2
3 4
5
6
0 CI
'OJ .~ tlJ
2
3
4
5
6
Employers, Employees and Independent Workers in
Sub-diviSion 9·5 RecreatIOn services ---.--.-~-------- ---.-~
Total Employers EmployelJs Independent
Workers
Tract Males Females Males Females Males Females Males Females
2 580 581 582 583 584 585 586 587
District Total 301 69 42 7 251l 62
Rural Total 179 45 25 1 154 44
Tehsil Hamirpur (Rural) 14 27 14 27
Tehsil Kulpahar (Rural) 28 28
Tehsil Mahoba (Rural) 22 2 22 2
Tehsil Maudaha (Rural) 2 2
Tehsil Rath (Rural) III 14 25 86 13
Tehsil Charkhari (Rural) 2 1 2
Urban Total 122 24 17 6 104 18
Urbalil Non-<:ity 122 24 17 6 104 18
Sub-division 9·7 Arts, letters and journalism --------------------------~-~---~--
Tract
2
District Total
Rural Total -Tehsil Hamirpur (Rural)
Tehsil Kulpahar (Rural)
Tehsil Mahoba (Rural)
Tehsil Maudaha (Rural)
Tehsil Rath (Rural)
Tehsil Charkhari (Rural)
Urban Total
Urban Non-city
Males
596
8
8
8
Total Employers
Females Males Females
597 598 599
Employees
Males Females
600 601
Independent Workers
Males Females
602 603
8
8
8
NOTE-Self supporting persons who are not econ~mically active have
Non-productive sources of livelihood
!-PerSlrns living prinCipally on income from non-agricultural property Total
Rural
Urban
n-Persons living principally on pensions, remittances, scholarships Total and funds
Rural
Persons
2
20
20
282
32
250
Males Females
3 4
5 15
5 15
253 29 , 29 3
224 26
Ill-Inmatea of alms-houses an:! recipients of doleS
Urban
Total 1
Rural
Urban 1
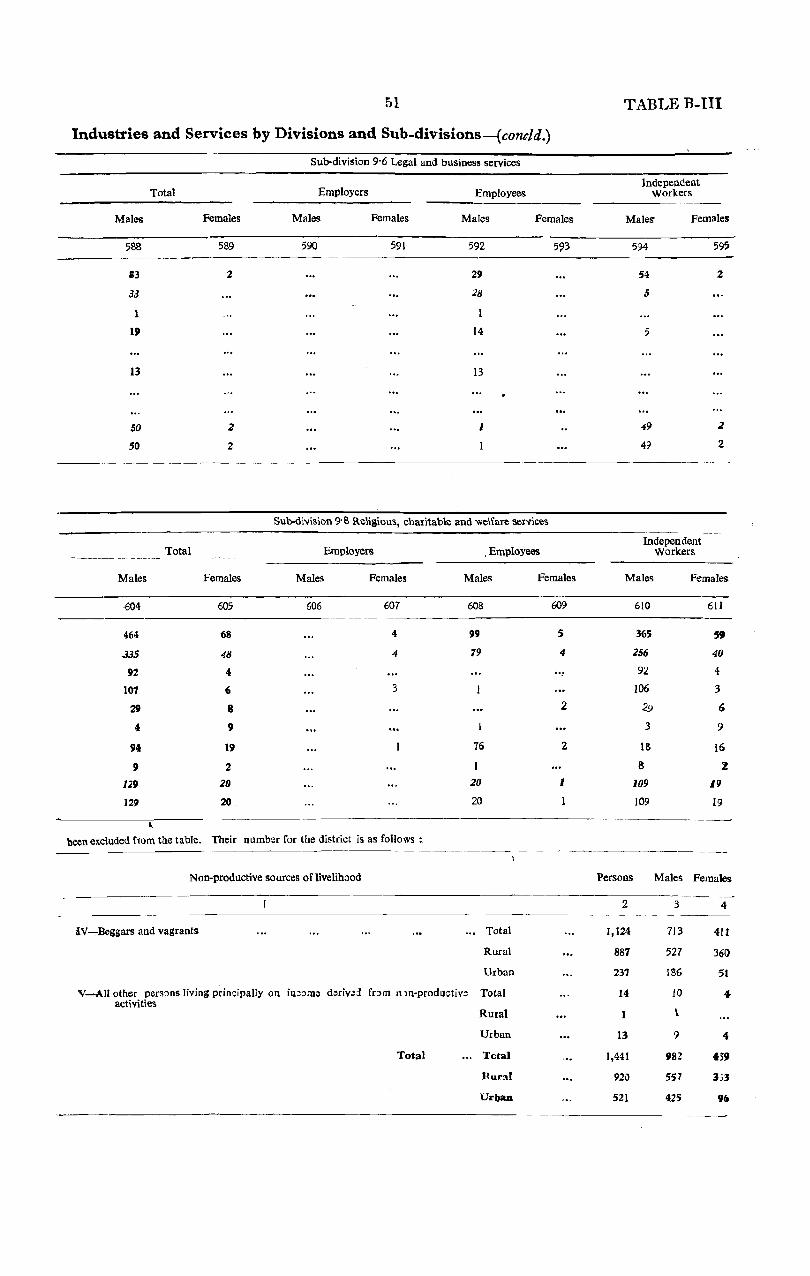
Industries and Services by Divisions and Sub-divisions-(contld.)
Sub-division 9·6 Legal and business services
Total Employers Employees
Male!! Females Males Females Males Females
-~--------
588
113
33
1
IP
13
SO
50
Total
589
2
2
2
590 591 592
29
Z8
1
14
13
I
1
Sub-division 9·8 Religious, chulitable and weWalt services
Employers . EmploYee!!
593
Males Females Males Females Males Females
·ffi4 605 606 607
464 68 4
-335 .[8 4
92 4
107 6 3
29 8
4 9
94 19
P 2
129 20
129 20
, been excluded flom the table. Their numb~r for the district is as follows :.
Non-productive sources of livelihaod
IV-:-Beggars and vagrants
608
99
19
76
20
20
Total
Rural
Urban
V-AII other pers:>ns living pdncipally on in;:omo d~riv;}j fc:>m n)ll·prodLlctiv~ Total activities
Total
Rural
Urban
Total
Rural
Urban
609
5
4
...
2
2
I
TABLE B-III
Independent Workers
MaleS' Females
594
54
5
5
49
49
595
2
2
2
~--~- -- -. __ -Independent
Workers
Males Females
610 611
165 59
256 40
92 4
106 3
29 6
3 9
18 16
8 Z
109 II)
109 19
Persons Males Females
2 3 4 ----~-
1,124 713 411
887 527 36()
237 186 51
14 10 .. I \
13 9 4
1,441 982 4;9
920 557 353
521 425 91i

TABLE B-IV
Livelihood Classes
ALL CLASSES
AU Agricultural Classes
I-Cultivators of land ~holly or mainly owned and theIr depen-dants
II-Cultivators of land wholly or mainly unowned and their dependants
III-Cultivating labourers and their dependants
IV-Non-cultivating owners, of land; agricultural rent receIvers; and their dependants
All Non-agricultural Cla~ses
V-Production other than cultivation
VI-Commerce
VII-Transport
VllI-Other services and miscellaneous sources
ALL CLASSES
All Agricultural Classes
I-Cultivators of land wholly or mainly owned and their dependants
lI-Cultivatols of land wholly or mainly unowned and their dependants
Ill-Cultivating labourers and their dependants
IV-Non-cultivating owners of land; agricultural rent receivers; and their dependants
All Non-agricultural Classes
V-Production other than cultivation
VI-Commerce
Vll-Transport
VllI'::_Other services and miscellaneous sources
ALL CLASSES
All Agricultural Classes
I-Cultivators of land wholly or mainly owned and their dependants
II-Cultivators of land wholly or mainly unowned and their dependants
HI-Cultivating labourers and their do:pendants
IV_Non,cultivating owners of land; agricultural rent receivers; and their dependants
All Non-agricultural Classes
V_Production other than cultivation
VI-Commerce
Vll-Transport
VIH-Other services and miscellaneous source~
Persons
2
665,42!J
532,400
373,056
44,940
98,2U
16,192
133,029
53,021
·22,726
4,828
52,454
590,731
512,433
357,703
42,656
97,329
14,745
78,298
42,294
10,962
783
24,259
74,698
19,967
15,353
2,284
883
1,447
54,731
10,727
11,764
4,045
28,195
52
Total Population
Males
3
341,992
272,159
19:1,928
23,420
48,216
7,595
69,833
28,371
11,756
2,456
27,250
303,245
261,481
184,650
22,247
47,729
6,1)55
41,764
22,721
5,762
329
12,952
38,747
10,678
8,278
1,173
487
740
28,069
5,650
5,994
2,127
14.298
Females
4
323,437
260,'141
180,128
2/,520
49,996
8,597
63,196
24,650
10,970
2,37Z
25,204
287,486
250,952
173,053
20,409
49,600
7,890
36,534
19,573
5,200
454
11,307
35,951
9,289
7,075
1,111
396
707
2.6,662
5,077
5,770
1,918
13,897
Unemployment by
Number of persons outside the labour force
Males
5
135,430
107,386
77,063
8,940
17,428
·3,955
28,044
9,991
5,128
1,053
11,869
117,160
102,220
73,030
8,355
11,264
3,571
14,940
7,545
2,375
136
4,884
18,ZlI)
5,166
4,033
585
164
384
13,104
2,44~
2,753
917
6,985
Females
6
193,043
146,644
105,841
11,768
21,20Z
4,833
46,399
16,445
B,915
Z,189
18,850
163,878
139,421
100,409
10,835
23,925
4,252
24,457
12,138
3,757
409
8,153
29,165
7,223
5,432
933
277
581
21,942
4,307
5,158
1,780
10.697
N umber of persons gainfully employed
Males Females
7 8
District
206,552 130,387
164,765 113,591
115,859 74,Z87
14,480 9,75Z'
30,786 25,788-
3,640 3,761'
41,787 16,796,
18,377 8,205
6,628 Z,055
1,403 18~
15,379 6,353"
186,075
159,Z53
111,614
l3,892
30,463
3,284
26,822
15, 179 3,387
193
8,066
20,471
5,512
4,245
588
323
356
14,965
3,201
3,241
1,'210
7,313
Rurzl.
/23,601
111,525
72,644
9,574
25,66)1
12,07(;,
7,435
1,443-
45
3,153-
Urbao.
6,786-
2,06~
1,64>
17S
126
4,72()
770
612
ISS
3,20c)
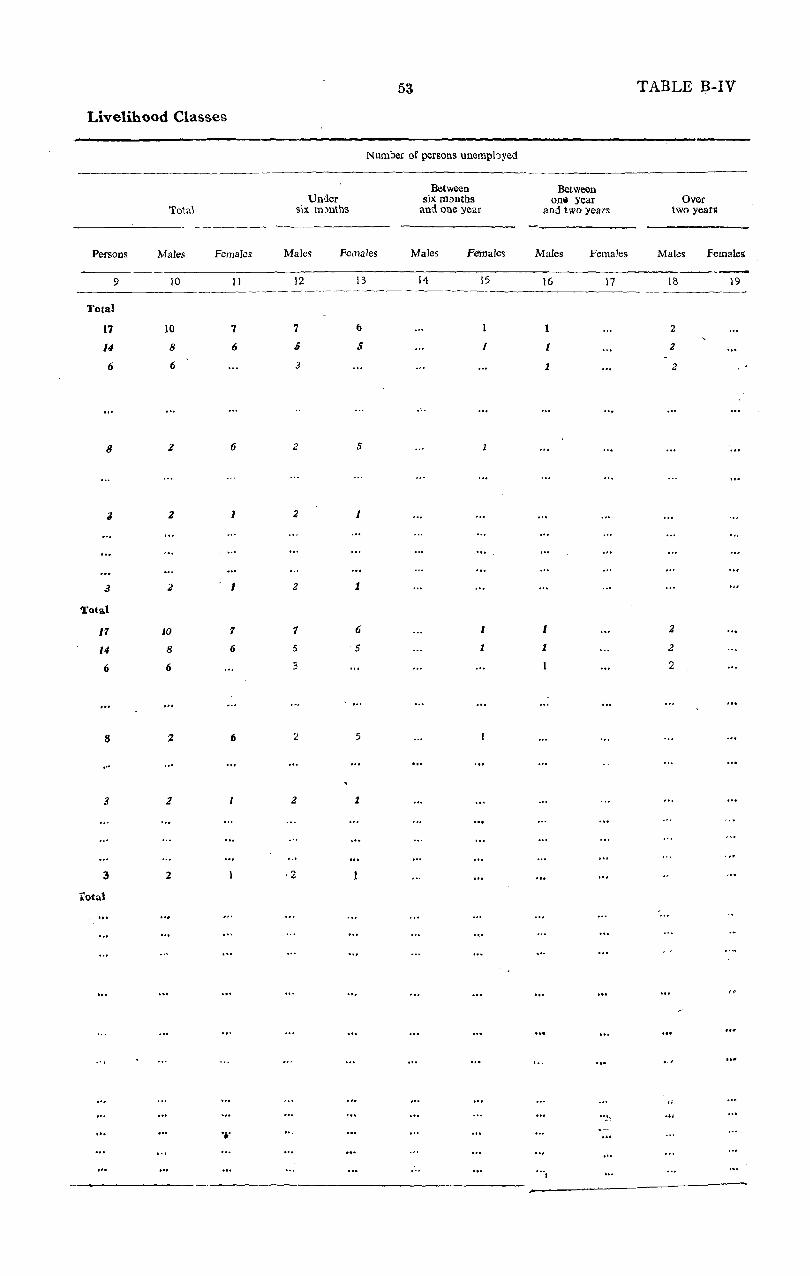
Livelihood Classes
Total
PenODS Males Females
9 10 11
Total
17 10 7
14 8 6
6 6
8 z 6
2
3 2 J
Total
11 10 7
14 8 6
6 6
8 z 6
3 2
3 2
rotal
"_"
Under six m)nths
53
Number of persons unempbyed
Between six ffi:>llths
and one year
Males Females Males Fe'rnales
12 13 14 15
7 6 1
oS ,; J
3
2 5
2 1
2 1
1 6 I
5 5 1
3
2 5
2 1
-2
Between OUIt year
and two years
Males Females
16 17
I
1
I
1
TABLE B-IV
Over two yean;
Males Females
18 19
2
2
2
2
2
2

Code no. Occupation
2
ALL INDUSTRIES
SERVICES
AND
DivisiGn O-Primary Industries not elsewhere specified
(!l'1 Stock raising
O'll
0'12
Herdsmen and shepherds
Breeders and keepers of cattle and buffaloes
.0'2 116m'ing of small ar.imals and insects
0'21
Rearing of hens
0'22 Beekeepers
0-3 l<lantation industries
0'31 Owners, manag~rs and workers
of tea plantation
0'30 Garden:ng of fru:ts
0'4 Forestry and uood-cuitillg
0'42
G rass-cutters
ether forest produce collectors
0'44 Collectors of cow-dung an:.! preparation of dung-cakes
0'6 Fishing
0'60 Catching and selling of fish
Division I-Mining and
Q.uarrying
1'5 Stone-quarrying, clay and sand-pits Bajri extraction
Division 2-Processing and
Manufacture - Foolstuffs, Textiles, Leather and Products thereof
2'0 }(od industries otherwise unclassified
2'01 Canning and preservation of
fruits and vegetables:
2'03 Slaughter, preparation and pre
servation of meat, including sale
2·00 Halwais
2'1 . Grains and pulses
2'11
Pers:ms engaged in manual
dehusking and flour grinding 2'12 Millers of cereals and pulses ...
2'13 Grain parchers (bharbhoonjas) '" 2' 2 Vegetable oil and dailY products ...
2'21 Vegetable oil pressers and
2'23
refiners; oil kolku drivers
Ghee, buttet and cheese manufacture
Milkmen
2'3 Sugar, industries
2'31 Gur manufacture i n~ludinJ gUT
kolhu drivers
54
Index of N on-agricultural Occupations
Persons
3
43,390
2,338
1,874
98 98
1,176
1,776
13
12
45
2
<43 43
394
385
382
:3
9
12
12
237
23'1
237
8,269
445
121
323 839
123 123
170 546 902
814
88
85
3 2'1
14
Code Males Females nJ. Occupation
4 5 2
37,252 6,138 2'30 Other manufactures and refining of raw sugar, syrup and
granulated or clarified sugar from sugarcane or from sugar
beets
2,006 332
1,700
70 70
1,630
1,630
13
12
35
2
33
33
246
246
245
12
12
237
237 237
7,316
422
114
307 691
55 55
150
486 673
589
84 84
25
14
174
2~
28
146
146
2'4 Beterages
2'43 ke manufacturers
2'40, Making of aeratd water and
vinegar
2'5 Tobacco
2'51 Manufacture of bidis
2'50 Manuf(;cture of raw le<:f tobacco
and tobacco products
2'6 Cntloll Ilxlills
2'61 10 Dhunia
10 10
148
D9
137
2
9
953
23
2'62
Cotton spinning
Cotton weaving
2'7 Weal'ing apparel (except fo.tu;ear) lllld made-up textile goods
2'71 Tailors, milliners, dress-makers ,illd darner6
Patl('[Jgiri
2'73 Fur dressers and dyers 2'70
Makers of made up textile goods 2-8 Textile industries otherwise un
classified 2'82
Wool spinning 2'86
Manfuacture of daris
2'80 All other insufficiently described textile mdustries
2'9 Leather, leather products and Jootwear
2'91 Tanners and all other workers
in leather
2'92 7 Cobblers
All other makers and repairers
of boots, shoes and sandals
16 2'90 Makers and repairers of all
U8 other leather products 68 Divisbn 3-Processing and
68
20
Manufacture-Metals, Chemicals and Products there
of
60 3'0 ManuJacture of metal products 229 otherwise unclassified
225 3'01
4
3 2
3,02
Manuf<:·~ture of ag[icultural
impknents
Blacksmiths and other workers in iron
Worker in copper, brass and bell. metal
Kalaigars
Persons Males Females
3
13
4
3
14
3
II
3,367
500 500
2,867
181
2,686
1,529
1,296
24 24
203 6
6 47
3 3
41 41
3
1,095
83
899 348
551
113
1,483
962
118
844
167 159
4
11
4
3
14
-3
II
3,047
497 497
2,550
10
2,540
1,383
1,172
17 17
193 1
38
3 3
35 35
1,019
62
848 348
500
109
1,500
1,425
9J5
~3
817
166 159
7
5
2
320
3 3
317
171
146
146
124
7
7
10 5
5 9
6 6 3
76
21
51
51
4
73
58
47 20
27
--------------__ .1__ _________________ _
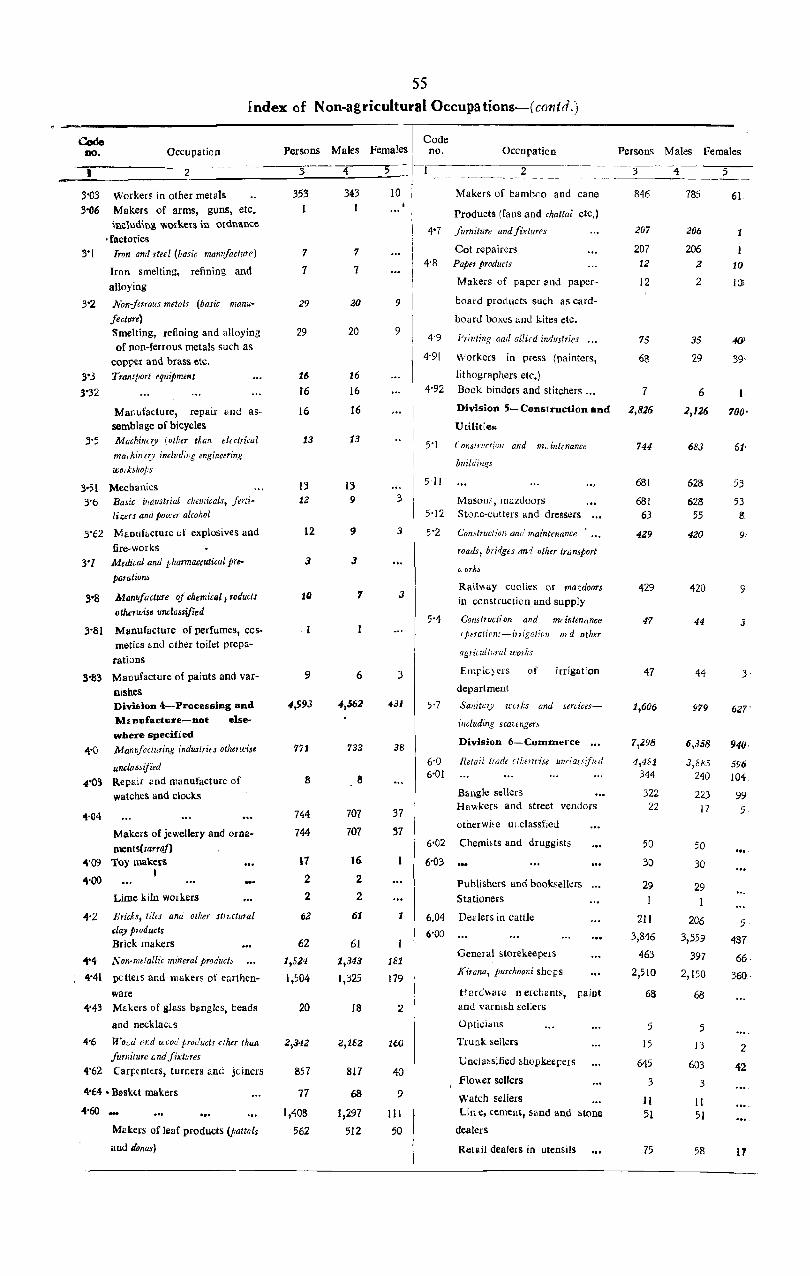
55 Index of Non-agriculturaIOccupations-(contd.)
Code DO, Occupation
Code Persons Males Females no. occupation Persons Males Females
J 2 '---5' 4 5 --.---------;2~-------3~---4- --;5,...----
.3'03 Workers in other metals
31J6 Makers of arms, guns, etc_
including ViOl ken in ordnance ,factories
S-I Iron and steel (basic mamifaclure)
Iron smelting, refining and
alloying
3-2 Non:ferrous metals (basic manu
fectlm) Smelting, refining and alloying
of non-ferrous metals such as
copper and brass etc,
3-3 Transport equipmmt
3-32
M a~ ufacture, repair and assemblage of bicycles
3'5 Machintry (otlitT ttan ellCtrical
ma,hirlfry incltldil!g engineering
wOIkshojJS
3-51 Mechanics 3'6 Basic j'ltlUstrial c/umicols, ferti
lizer s and power alcohol
3'(2 M"nufl<ctule 01' explosives and
fire-works 3"7 Medi.ai and pharmaceutical pre
parations
3-8 Manifacture of chemical i roducts otherwise unclassified
3'81 ManufactuIe of perfumes, cosmetics ~nd other toilet prepa
rations
3-83 Manufacture of paints and var
nishes Divi.ion 4-Processing and M~nufacture-Dot else
where specified
4'0 Manufactming industries otheru:ise
uncias'ified
4-03 Repair "nd manufacture of watches and clocks
Makers of jewellery and orna
ments(sarraj) Toy makers
I
Lime kiln workers
4'2 Bricks, tiles ana other stnetural .lay products Brick makers
4'4 Non-metallic mineral products
4'41 pc tiel s and makers of earthen
ware 4'43 Makers of glass b~Dglcs, I::eads
and necklacLs
4'6 WOLd or;d u'cod products cther than
furniture GndfixtMl!s
4'62 CaIl:enters, turLers and joiners
4'64 • Basktt makers
4'60
Maker5 of leaf products (pattals
and tfonas)
353
7
7
29
29
16
16
16
13
13 12
12
3
lQ
I
9
4,S93
771
8
744
744
17
2
2
62
62
1,524
1,504
20
2,342
851
77
1,408
562
343
7
1
20
20
16
16
16
13
13 9
9
3
7
6
4,562
733
8
707
707
16
2
2
61
61
1,343
1,325
IS
2,Ui2
817
68
1,297
512
10
9
9
3
3
3
3
43J
38
37
37
1
181
179
2
1(iO
40
9
III
50
Makers of bambco and cane
Products (fans and chattai etc,)
4-7 furniture andfixtur~s
Cot repa irers 4'8 Paper products
Makers of paper and paper
board products such as card
board boxes and kites etc,
4'9 Printing aad allird industries
4'91 Workers in press (painters,
lithographers etc,)
4'92 Book binders and stitchers ...
5 II
Division 5-Construction and
Utilit:es
bllildings
Mason,', m&zdoors 5'12 Stone-,utters and dressers
5 '2 Con,truction and maintenance • '"
roads, bridges an1 other tr{lnsport
U orks
Railway coolles or ma:::doors in construction and supply
5'4 Constructi On and mrintenance (pfralir'n:-i>,i.gatiol1 m d other
agriwilliwi wOlks
Emplqers
department
of irrigation
Sanit,;]y uHks anJ sen ices-
jflcluding scatfngers
Division 6-Commerce
6'0 Retail tradt ""mdse unr/assi/itd 6-01
Bangle sellers Hawkers and street vendors
otherwi,e ucclassfied
6'02 Cherni~ ts and druggists
6-03
Publishers and booksellers
Stationers
6.04 De~lers in cattle
6'00
General storekeepers
Kirana, purchooni shops
1-' ard"'~rc nerch.mts, paint lind varnish sellers
Opticians
Trunk sellers
Uncla~sified ~h()pkeepeIs
Flo\\er sellers
Wa tch sellers Lin: e, (ement, s~nd and stone
dealers
Ret~il dealers in utensils
846
207
207 12
12
75
68
7
2,826
744
681
681 63
429
429
47
47
1,606
7,1.98
4,461 344
322 22
50
30
29
211
3,846
463
2,510
68
5
15
645
3
II 51
75
785
206
206 2
2
35
29
6
2,126
683
628
628 55
420
420
44
44
979
6,358
3,865 240
223 17
50
30
29 I
206
3,359
397
2,150
68
5
13
603
3
II 51
58
61
1
10
IQ;
40'
1
700'
61,
53
53 8
9
9
3
627'
940,
596 104
99 5
5
487
66,
360,
2
42
17
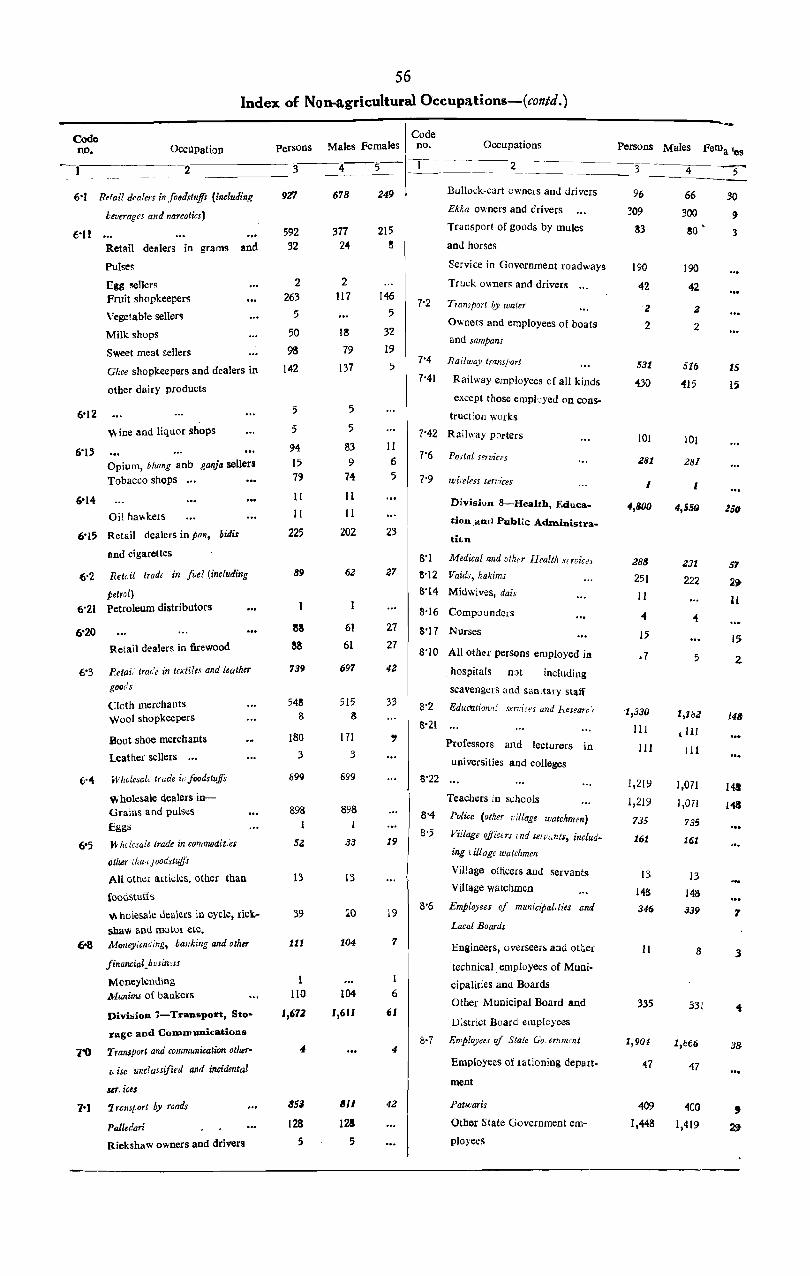
56
Index of Non-agricultural Occup:1.tions-(contd.)
Code DO. OccUPation
6'1 Refail dealers in .fo~tlstu.Jfs (inc!utling
beverages and narcotics)
0'13
Retail dealers in grams and
Pulses
Egg !!CHers Fruit shopkeepers
Vegetable sellers
Milk shops
Sweet meat sellers
Ghee shopkeepers and dealers in
other dairy products
Wine and liquor shops
... Opium, bhang anb ganja sellers
Tobacco shops
Oil ha",kers
6'15 Retail dealers in pan, bitlis
and cigarettes
.ti'2 Retlit trade in fuel (including
petrol) 6'21 Petroleum distributors
Retail dealers in firewood
6'3 Retai: trade in {lxtiles and leather
goo,! s
Cloth merchants Wool shopkeepers
Boot shoe merchants
Leather sellers ,,,
6'04 Whdesd, tr"de ilifoodstuffs
wholesale dealers inGrains and pulses
Eggs
6'5 l1hGiEsale trade in commoait:es
other l"a,1 J oodstujfs
All other a[tid~s, otiler tilan
[oodstuffs
v. holesale dealers in cycle, rick
shaw and muter etc, 6'8 Money/eliding, banking and other
financial. busin,ss
Moneylending lVlunims of bankers
Divi>;ion 7-Transport, Sto
rage and CODlmlUlications
7'0 Transport and commullication other
l' ise unclassified and incidental
seT. ices
1.1 7 ram/,ort by roads
Palledari
Riekshaw owners and drivers
Persons
592 32
2 263
5
50
98 142
5
5
94
15 79
II
II
225
89
8a 88
739
548 8
180
3
899
898
5Z
13
39
111
110
1,6ll
4
8SJ
128
5
678
377 24
2 117
13
79
137
5
5
83 9
74
11
II
202
62
61
61
697
515 8
171
3
699
898
33
13
20
104
104
1,611
8/1
125
5
249
215 8
146
5
32
19
5
11 6 5
23
27
27
27
42
33
,
19
19
7
1 6
61
4
42
Code no, Occupations
2
Bullock-cart owners and drivers
Ekka owners and crivers
Transport of goods by mules
aDd horses
Service in Government roadways
Truck owners and drivers
7'2 Transport by water
Owners and employees of boats
and sampans
7'4 Railway trans/'ort
7'41 Railway employees of all kinds
except those employed on cons
truction works
7'42 Railway pDrters
7'6 Postal services
7'9 wirelNs services
Division 8-Health, Educa.
tiOD ,and Public Administra_
ti(;n
S'l Medical and other Health sffvices
8'12 Vaids, hakims
8'14 Midwives, dais
8'16 CompDunders
S'I7 NUrses
S'IO All other persons employed ia
hospitals n::lt including
scavengers and sanitary staff
8'2 EdlictItion{// senices and J\esearc',
8'21
8'22
Professors and lecturers in
uni versi ties and colleges
Teachers in s.:hools
13'4 Police (other village watchmen)
8'5 Village oJjic<TS wd servunts, includ
ing ~illage watchmen
Village officers and servants
Village watchmen
8'6 Employees of municipal<ties ana
Lacal Boards
Engineers, ove[seer~ and other
technical. employees of Muni
cipalities and Boards
Other Municipal Board and
D:strict Board employees
8' 7 Employees of State Go. erllm{nt
Employees of lationing depart
ment
Patwaris
Other State Government em
ployees
Persons Males Ferna les
3
96
309
83
190
42
'2
2
531
-430
101
281
I
4,800
288
251
II
4
15
.7
'1,330
III
III
1,219
1,219
735
161
13
148
346
II
335
1,904
47
409
1,448
4
66
300 80 •
190
42
2
2
516
415
101
281
I
4,SSQ
231
222
5
1,182
llIl
III
1,071
1,071
735
161
13
148
339
8
331
47
400
1,419
30
C)
3
15
15
Z5f1
57
2~
Ii
15
4
148
14!
148
7
3
4
38

57
Index of NOll-agricultural Occupations-(concld.)
Co~e no. Oceu patiOfl Persons Males I Cede
Fen.ales no. tJecupation Persons Males Females
2 3 4 5 ·2 -~-----.--- .. -- ~-'-------~~--- - -----_-.. _- "'-_ -~----.-___ -_ ,,8·8 Employees of the Union Gorernment
Other Union Government employees
8'9 Employees of non·Indian Governments
Division 9-Services not elsewhere specified
9'0 Services otherwise unclassified
9.00 Independent labourers
9'1 Domestic services (but not including services rendered by members oj
jamily households to one another)
9'12 Cooks
9'10 Domestic servants
9' 2 Barbers and beauty shops
Barbers
Lady hair dressers etc.
9-3 Laundries and laundry services
Dhohis
35
35
t
9,384
4,863
4,863 4,863
1,507
37
1,470 1,470
l,:-J50
1,256
94
663
663
35
35
1
6,986
3,062
3,062 3,062
1,360
37
1,323
J,323
1,256
1,256
448
448
2,398
1,801
1,801 1,80l
14'1
147 147
94
94
215
215
9'4 Hotels, restaurants am eating houses
Employees of hotels and restaurants
9' 5 Recreation services
Cinema emp.byees
Dancers and singers
Employees in thi:iatre
Musicians
9'6. Legal alld business services
9'61 Lawyers
9'62 Clerks of lawyers and petition writers
9'7 Arts, letters and Journalism 9'73 Photographers
9'S Religious, charitable ant/llo welfare services
9'82
Panditai
Persons engaged in religious
edifices
.Figures under this sub-division include the figures of sub-division S'3-Army, Navy and Air Force.
3
6
6
370
60
12
156
142
85
26 26
59
8
S 532
513 513
19 19
4
4
4
301
60
12
128
101
83 24 24
59
8
8 461
449 449
15 15
NOTE-This index gives the number of self-supporting persons, males and females, having as their prinCipal means of livelihood, the productive occupations arranged according to diviSions, sub-divisions and groups of Industries and Services according to the Indian Census Economic Classification Scheme.
5
2
2
69
28
41
z 2 2
68
64 64
4 4

TABLE C-I 58
C -HOUSEH OLD AND AGE
Household
SAMPLE
Total Household Population Total Sample of Household Population Total number of
number of sample Classes households ·Persons Males Females households Persons Males Females
2 3 4 5 6 7 8 9
All Classes-
Total 144,501 664,704 341,423 323,281 5,371 25,970 13,610 12,360
Rural 12B,205 590,261 302,834 287,427. 4,i6'\ 23,266 12,159 11,107
Urban 16,296 74,443 38,589 35,85~ 605 2,704 1,451 1,253
Agricultural Classes-
Total 4,099 20,724 10,817 9,907
Rural 3,9,15 20,022 10,449 9,573
Urban 154 702 368 3)4
Non-agricultural Classes-
Total 1,272 5,246 2,793 2,453
Rural 821 3,244 1,710 1,534
Urban 451 2,002 1,01'13 919
SAMPLE
Composition of
Infants, nan-adults and
Infants {age less than Non-adults (age 1_ Other male Other female I year) 20 years}
Sons of Daughters relations relations heads of of heads of of heads of of heads of
Classes households households households households Males Females Males Females
20 21 22 23 24 25 26 27
All Classes-
Total 5,336 3,584 2,729 4,2% 475 518 6,522 5,595
Rural 4,755 3,208 2,448 3,8511 432 4,12 5,793 5,030
Urban 581 376 281 41')2 43 76 729 565
Agricultural Classes-
Total 4,224 .2,865 2,264 3,511 384 440 5,179 4,432
Rural 4,079 2,763 2,191 3,406 374 381 5.005 4,318
Urban 145 102 73 105 10 59 174 114
Non-agricultural Classes-
Total 1,112 719 465 745 91 78 1,343 1,163
Rural 676 445 257 448 58 61 788 711.
Urban 436 274 208 297 33 17 555 451
---~-.--.-.-
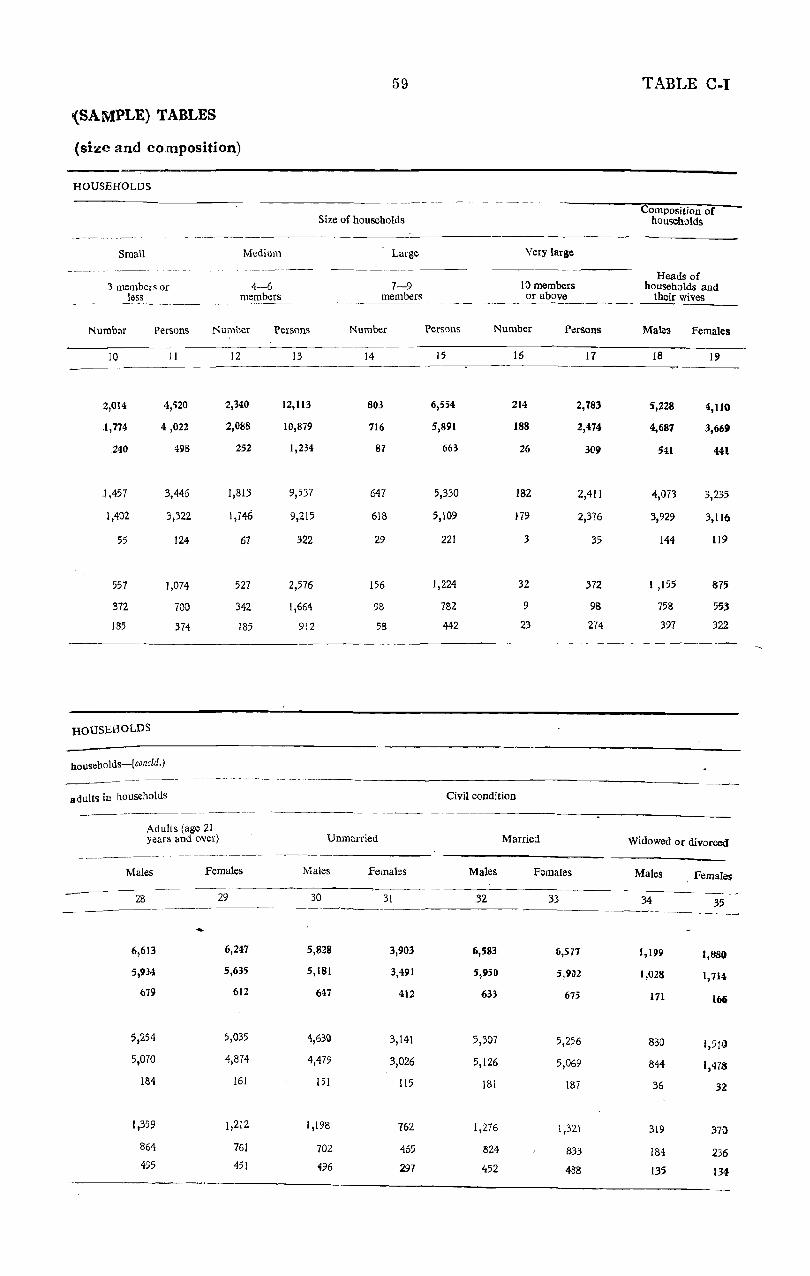
59 TABLE C-I
(SA MPLE) TABLES
(size and composition)
HOUSEHOLDS
Composition of Size of households households
Small Medium Large Very large
""--_ .. _-- -------~-----
Heads of 3 members or 4-6 7-9 10 members households and
less members members or above their wives
Numb:lf Perllons Number Persons Number Persons Number Persons Malea Females
10 11 12 13 14 15 16 17 18 19
2,014 4,520 2,340 12, 113 803 6,554 214 2,783 5,228 4,110
1,774 4,022 2,0813 10,879 716 5,891 188 2,474 4,687 3,66'
.240 498 252 1,234 87 663 26 309 541 441
,1,457 3,446 1,813 9,537 647 5,330 182 2,411 4,073 3,235
1,402 3,322 1,746 9,215 618 5,109 179 2,376 3,929 3,116
55 124 67 322 29 221 3 35 144 119
557 1,074 527 2,576 156 1,224 32 372 I ,155 875
372 700 342 1,664 98 782 9 98 758 553
185 374 185 912 58 442 23 274 397 322
HOUSEHOLDS
households-( concld.) --------- _.-_--_ --_._---
adult~ in households Civil condition
Adults (age 21 years and over) Unmarried Married Widowed or divorced
-------------~-
Males Females Males Females Males Females Males Females
28 29 30 31 32 33 34 35
6,613 6,247 5,828 3,903 6,583 6,517 1,199 1,880
5,934 5,635 5,181 3,4!)1 5,950 5,91)2 1,028 1,714
679 612 647 412 633 675 171 166
5,254 5,035 4,630 3,141 5,3D7 5,256 880 1,510
5,070 4,874 4,479 3,026 5,126 5,069 844 1,478
184 161 15 I 115 181 187 36 32
1,359 1,212 1,198 762 1,276 1,321 319 370
864 761 702 465 824 833 184 236 495 451 i96 297 452 4B8 135 134
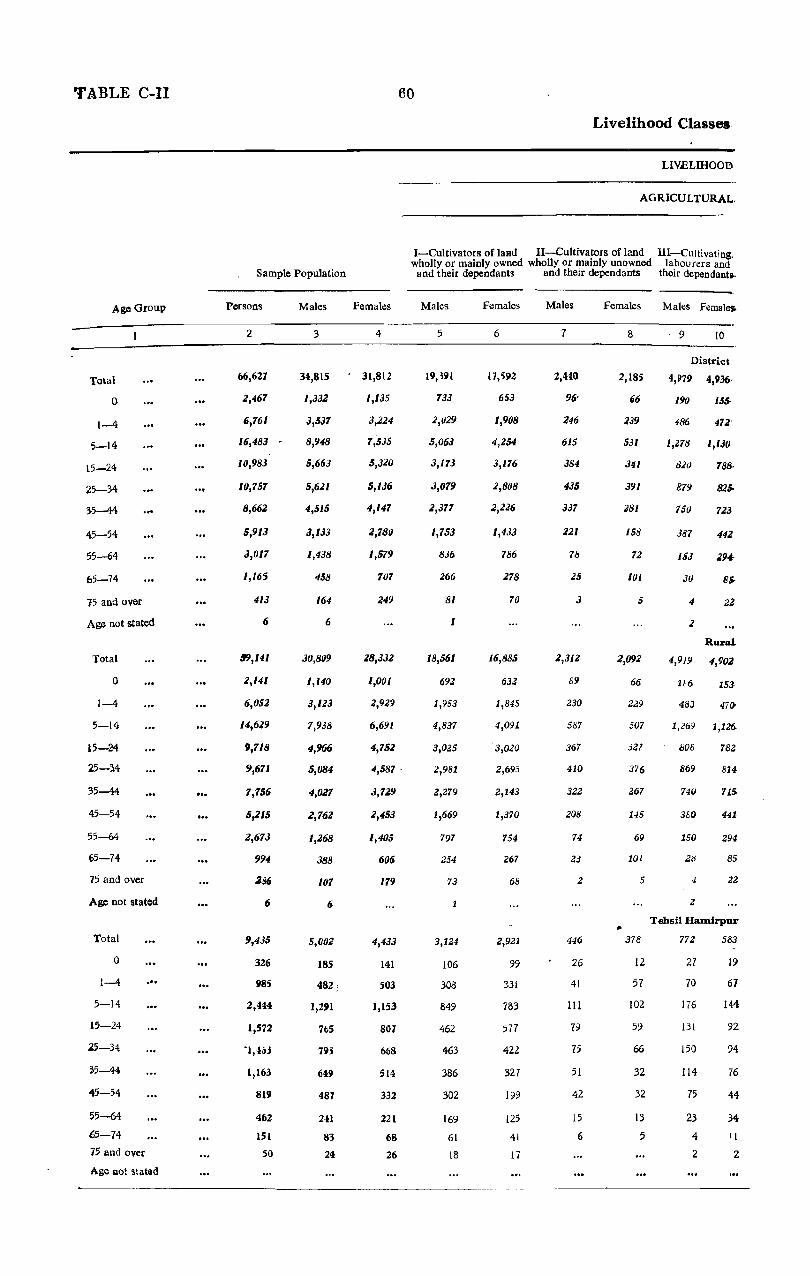
TABLE C-II
Sample Population
Age Group Persons Males Females
60
Livelihood Classes
LIVELIHOOD
AGRICULTURAL.
I-Cultivators of laRd II-Cultivators of land Ill-Cultivating, wholly or mainly owned wholly or mainly unowned labourers and
and their dependants and their dependants their dependanti-
Males Females Males Females Males females.
------------------~~----~------~.---------------------------------------2 3 456 789
Tota}
o
1-4
5-14
l5-24
25-34
35-44
45-54
55-64
65-74
75 anu over
Age oot stated
Total
o 1-4
5-14
15-24
25-14
35-44
45-54
55-64
(;5-74
15 and over
Age not stated
Total
o 1-4
5-14
15-24
25-34
~5-44
45-54
~5--64
65-74
."
15 and over
Age Rot statod
...
66,627
2,461
6,161
16,483
10,983
10,151
8,662
5,913
3,017
1,165
413
6
89,141
2,141
6,052
14,629
9,118
9,671
7,156
5,215
2,613
994
286
6
9,435
326
985
2,444
1,572
"1,4i)j
1,163
819
462
151
50
34,815
1,332
3,531
8,948
5,663
5,621
4,515
3,133
1,438
458
164
6
30,809
1,140
3,133
7,938
4,966
5,084
4,021
2,762
1,268
388
101
6
5,002
185
482.:
1,291
765
795
649
487
2U
83
24
31,812
1,135
3,224
7,535
5,3]0
5,136
4,141
2,180
1,579
107
249
28,332
1,001
2,9]9
6,691
4,752
4,587 '
3,729
2,453
1,405
606
179
4,433
141
503
1,153
801
668
sa 332
221
68
26
19,UI
733
],029
5,063
3,173
3,079
2,377
1,753
836
266
81
1
18,561
692
1,953
4,837
3,025
2,981
2,279
1,669
797
254
73
1
3,124
106
308
849
462
463
386
302
169
61
18
17,592
653
1,908
4,254
3,176
2,808
2,2:16
1,433
786
278
70
16,885
632
1,845
4,091
·3,020
2,695
2,143
1,370
754
267
68
2,921
99
331
783
577
422
327
199
125
41
17
2,440
96-
246
615
384
435
337
221
78
25
3
2,312
89
230
587
367
410
322
21)8
74
<:3
2
446
26
41
111
79
75
51
42
15
6
2,18;
66
239
531
341
391
i81
158
72
101
5
2,092
66
229
507
321
376
267
145
69
101
5
378
12
51
102
59
66
32
32
13
5
10
District
4,979 4,936.
190 155,
486 47Z:
1,278 1,130
820 788-
879 82S-
750 723
387 442
153 294-
30 8.
4 22
2
Rural
4,919 4,902
116 153
483 47()
1,269 1,126
808 782.
869 814
740 715
360 441
150 294
28 85
22
2
Tehsil HaIDirpur
772
21
70
176
131
150
114
75
23
4
2
583
19
67
144
92
94
76
44
34
!I
2

by Age Groups
CLASSES
CLASSES
IV-Non-cultivating owners of land; agricultural
rent receivers; and their dependants
-rotal
'7otaI
~Rural)
Malell
11
~831
.37
',18
.211
91
·106
94
96
51
32
16
I
134
J2
70
,200
88
96
88
50
29
13
104
2
14
25
6
18
16
6
10
5
2
Females
12
884
24
53
181
98
109
138
119
99
46
II
814
23
45
169
89
105
121
110
94
44
11
118
6
30
10
19
19
13
17
2
2
()l TABLE C-II
NON-AGRICULTURAL CLASSES
Persons (including their dependants) who derive their principal means of livelihood from- ._
V-Production other than cultivation
Males
13
2,750
100
263
716
455
49]
349
235
106
23
10
I
2,194
78
206
581
354
397
286
188
81
15
7
251
10
23
61
36
44
39
27
11
Females
14
2,449
93
241
599
420
428
321
173
111
31
20
1,923
77
192
464
319
333
258
142
93
29
17
171
4
15
35
37
29
21
10
13
4
3
VI-Commerce
Males
15
1,246
45
117
314
2JJ
174
191
118
47 .
19 '
10
631
24
47
145
95
103
98
65
39
13
z
101
6
11
27
16
15
11
10
2
3
Females
16
1,095
46
108
261
190
191
114
91
50
19
8
536
22
48
129
82
94
51
28
10
II
81
5
5
19
7
15
12
13
3
2
VIII-Other services and VII-Transport miscellaneous sources
Males
17
266
32
31
68
53
38
16
13
5
3
37
5
10
5
6
3
3
1
Z
1
4
2
Females
IS
218
18
22
61
52
36
12
II
4
I
18
4
4
6
t
2
Males Females
19 20
2,912
99
281
677
410
418
401
310
156
60
39
I
1,421
58
129
309
224
222
211
162
76
24
5
1
200
tI
15
42
34
29
32
25
11
2
2
2,453
80
181
505
255
341
322
353
151
14Q
113
1,162
28
99
201
. 129
164
156
193
74
7()
48 '
179
2
22
40
24
23
26
21
16
3
2

TABLE C-Il
Age Group
Total
o 1-4
5-14
15-24
25-3-t
.35-44
45-54
55-64
65-74
75 and over
Aie no' stated
Total
o
1-4
5-14
15-24
25-34 ;;_ ...
.35-44
45-54
55-64
65-74
75 and oVllr
Ag. nOL IItatod
Total
o 1--4
5-14
15-24
25-34
.3'-44 45-:;. 5)-64
65-H
75 and ov • .v
Age not Itited
, ..
Sample Population
Persons
2
12,800
395
1,293
3,133
2,066
2,029
1,671
1,212
Slii
306
99
1,014
269
740
l,7IS
1,100
1,1S2
917
613
23
1
13,480
530
1,412
3,401
2,183
2,247
1,791
1,112
563
197
44
Males
3
6,586
214
687
1,739
I,Cl6S
1,049
839
619
278
66
29
3,646
140
~67
971
SSO
587
SIS
307
154
44
10
1
1,U6S
278
727
1,855
1,148
I,HiS
949
602
231
96
14
62
Livelihood Classes.
LIVELIHOOD
AGRICULTURAL
I-Cultivators of land II-Cultivators of land III-Cultivating wholly or mainly owned wholly or mainly unowned labourers and
Females
4
6,214
181
606
1,394
J,OOI
980
832
593
317
240
'10
3,428
129
373
804
sso 565
462
306
158
Ci8
13
6,4J;l
252
685
1,546
1,035
1,079
842
510
l12
101
JO
and their dependants and their dependants their dependants
Males
5
3,892
131
423
995
632
624
475
379
175
42
16
2,102
82
231
559
320
337
287
175
82
21
4,405
175
456
1,188
723
718
54.!
371
155
65
12
Females
6
3,568
119
401
849
618
569
473
293
166
65
15
1,[;09
75
210
446
337
315
247
163
76
35
5
3,929
160
446
,66
687
641
461
309
184
511
14
Males
7
410
17
313
109
68
77
50
35
12
2
2
265
9
26
83
32
45
35
23
9
3
562
21
66
138
78
101
95
46
12
5
Females Males Females.
9 I()
TehsU Kulpahar
373
20
75
60
83
50
7
78
270
15
43
69
40
40
35
12
12
2
2
S20
23
57
121
79
88
83
24
7
2
1,042 . 1,108
213
107
2S9
164
171
167
81
2))
280
9t-
242
IS ..
IS&'
155-
117
76-
17
TehsU lViahoba..
660
28
56
183
III
108
97
47
26
4
Tehsil Ma .. d~
1,103 .,110
48 46.
101 105
280 262-
IS:;. 154-
16) 174
bJ 91
51
19-
~.------------~---------- --------------------------------------------------

TABLE C-II
by Age Groups-(contd.)
CLASSES
CLASSES NON-AGRICULTURAL CLASSES
, Persons (including their dependants) who derive their principal means of livelihood from-IV-Non-cultivating
owners of land; agricultural rent receivers; and their
dependantll
Males
(Rural)
(Rural)
(Rural)
11
204
9
19
59
24
23
21
29
9
1
"
7
10
14
10
H
7
12
39
25
19
18
16
8
5
Females
12
321
7
12
44
19
29
SS
'4 25
17
14
10
18
15
10
11
138
5
7
31
10
19
18
16
23
5
4
V-Production other than cultivation
Males
13
510
14
47
153
92
78
57
42
20
2
245
10
2J
61
36
41
:l4
22
15
3
424
14
42
117
66
14
58
36
10
5
'l.
Females
14
498
19
61
127
80
70
67
37
23
10
253
iii
24
63
39
47
29
7
" 2
361
12
31
92
51
69
51
26
23
4
2
VI-Commerce
Males Females
15
145
4
11
40
24
17
17
18
12
94
2
1
21
15
13
11
3
3
2
HZ
9
14
31
22
19
213
12
5
2
16
134
.3
12
33
26
lIS
17,
12
7
:3
,
69
" ...
HS
10
13
12
" 2
2
113
5
13
30
19
IS
7
8
8
4
VIII-Other services and Vll-Transport miscellaneou!l sources
Males
17
18
1.
8
2
2
.3
7
,
2
6
Females Males .Females
18 19 20
1Q
,l
3
2
4
1
,
3
.... <r ...
365
11
41
86
59
57
49
34
21
1
li11
7
12
40
~
30
31
20
7
4
284
11
3:£
61,
44,
39
39
40
13
5
302
5
5
21
10
19
37
93
20
50
42
U3
1
16
32
40
11
16
26
4)
" 44 44
24
13 7
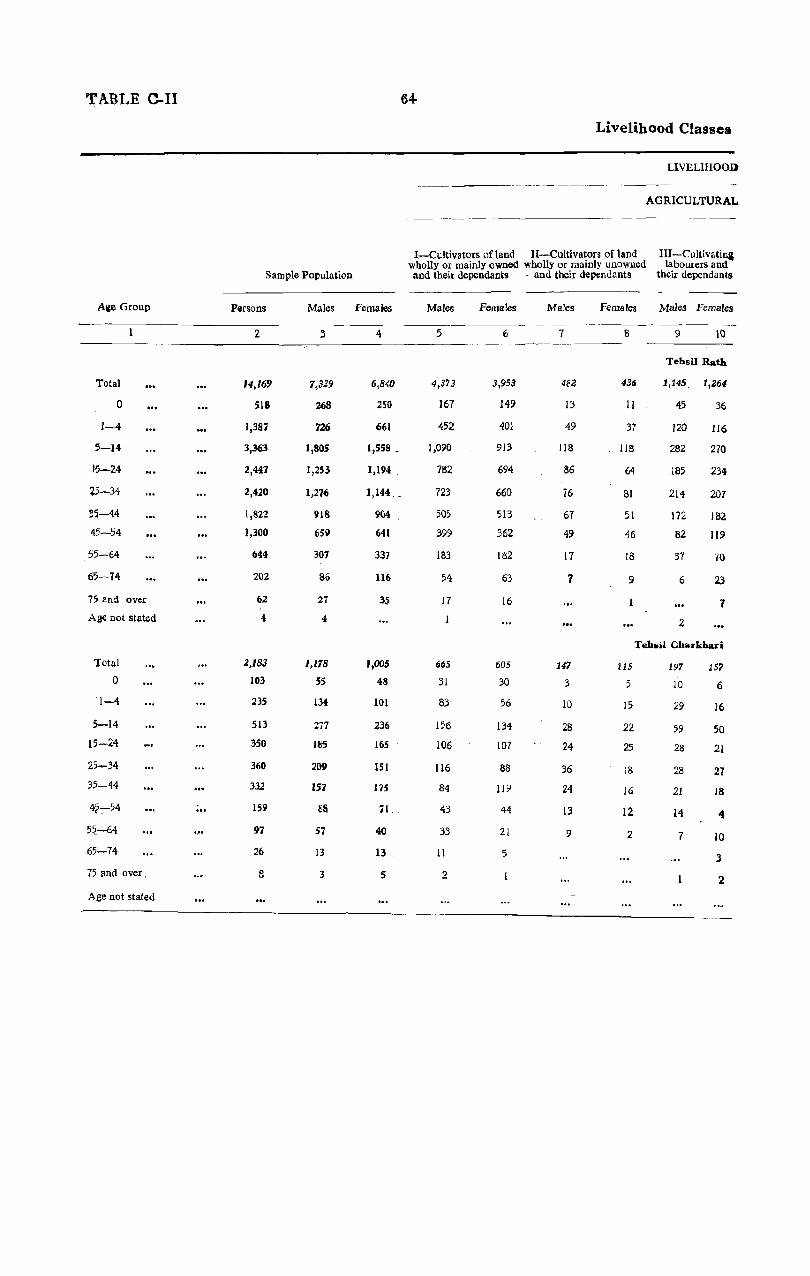

65 TABLE C-lf
by Ace Groups -( contd.)
CLASSES
CLASSES NON-AGRICULTURAL CLASSES
Persons (including their dependants) who derive their prindpal means of livelihood from-IV-Non-cultivating
owners of land; agricultural VIII-Othor services and rent receivers; and their V-Production other
dependants than cultivation VI-Commerce VII--'Transport miscellaneous Sources
Males Females Males females Males female, Males Females Males Feriiales -----~------ .. -----~--~ ---._----_._ ---
II 12 13 14 15 16 17 18 19 20
{Rural)
162 193 702 595 117 128 2 1 346 270
7 27 31 5 16 11
11 12 67 54 2 '14 25 27 53 37 174 133 14 25 73 62
15 33 115 108 16 20 53 40
23 22 150 108 28 28 62 38
18 27 83 84 22 14 51 :)3
22 29 55 39 15 12 37 34
9 16 25 26 15 a 21 17
:; 7 5 7 ' 4 5 6
6 3 5 2. 2
(Rural)
30 42 62 45 32 11 45 30
3 3 2 3 5 2
2 4 4, 7 2 4 3
6 9 15 14 6 4 7 3
II 3 9 4 2 5 5
3 6 10 10 11 2. 5
9 15 6 3 2. 9 5
4 3 6 2 2 6 5
3 3 2 :I 4
2 2

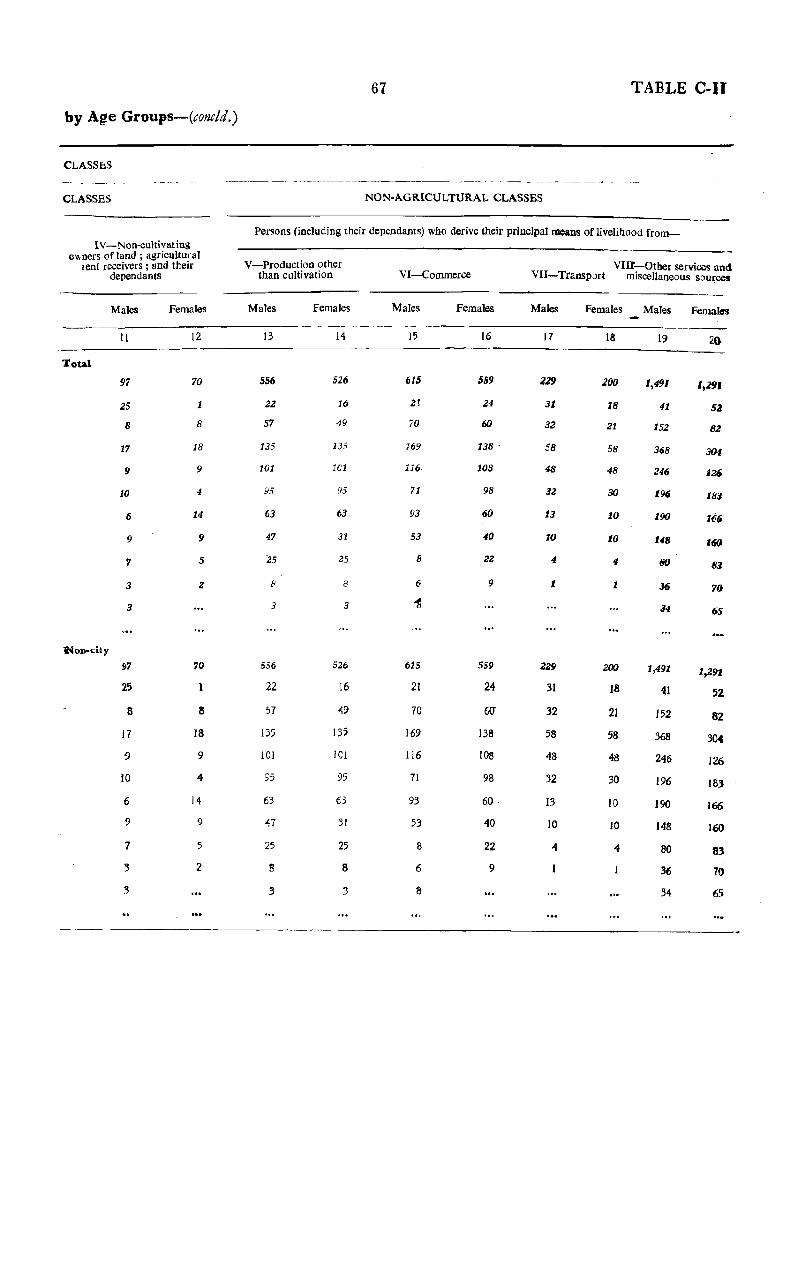
67 TABLE C-JI
by Age Groups-(concld.)
CLASSES ----~---~----.- ----,--,- - --- -------- _ .. ---------- - -_-_----------
CLASSES NON-AGRICULTURAL CLASSES
Persons (including their dependants) who derive their principal means of livelihood from-IV-Non-cultivating
owners of land; agricultural V-Production other VIIf-Other services and cent receivers; !lnd their
dependants than cultivation VI-Commerce VII-Transp::>rt miscellaneous s~urces
Males Females Males Females Males Females Males Females Males Females
II 12 13 14 15 16 17 18 19 20-
'Total
97 70 556 5Z6 615 559 129 200 1,491 1,19'
25 1 22 16 2! 24 31 18 41 SZ
8 8 57 49 70 60 32 21 152 82
17 18 135 135 169 138 - 58 58 368 304
9 9 101 ;01 116 108 48 48 246 126
10 4 95 95 71 98 32 3() 19(1 18:1
6 14 63 63 93 60 13 10 190 166
9 9 47 31 53 40 10 10 148 t6tJ
7 5 25 25 8 22 4 4 tKJ 8:1
3 2 [< 8 6 9 1 1 36 70
3 3 3 ~ 34 65
~oD-cit)'
97 70 556 526 615 559 Z29 ZOO 1,491 1,291
25 22 16 21 24 31 18 11 52
8 8 57 49 70 60' 32 21 152 82
J7 IS 135 135 169 138 58 58 368 304
9 9 )01 101 116 108 48 48 246 126
!O 4 95 95 71 98 32 .30 196 183
6 14 63 63 93 60 13 10 190 166-
9 9 ~7 31 53 40 10 10 148 160
7 5 25 25 8 22 4 4 80 83
3 2 8 8 6 9 36 70
:3 3 3 8 34 65
---

TABLE C-III
Tract
District Total
Rural Total
2
1 Tehsil Hamirpur (Rural)
2 Tehsil Kulpahar (Rural)
3 Tehsil Mahoba (Rural)
" Tehsil Maudaha (Rural)
5 Tehsil Rath (Rural)
6 Tehsil Charkhari (Rural)
Urban Total
Urban Non-city
Tract
District Total
Rural~Total
2
1 Tehsil Hamirpur (Rural)
2 Tehsil Kulpahar (Rural),
3 Tehsil Mohoba (Rural)
4 Tehsil Maudaha (Rural)
5 Tehsil Rath (Rural)
6 Tehsil Charkhari (Rural)
Urban Total
Urban Non-city
Tract
District Total
Rural Total
2
I Tehsil Hamirpur (Rural)
. 2 Tohsil Kulpahar (Rural).
3 Tchsil Mahoba . Rural)
~ ,ehsil Maudaha (Rural)
5 Tehsil Rath (Rural)
6 Tchsil Charkhari (Rural)
[ rhan Total
Urban Non-city
68
S~mple Population
Total Unmarried Married
Age and Civil
Widowed or divarced
Persons Males Females Males Females Males Females Males Females
3
66,627
59,141
9,435
12,800
7,074
13,4110
14,169
.2,183
7,486
7,486
Unmarried
4
34,815
30,809
5,002
6,586
3,646
7,068
7,329
1,178
4,006
4,006
5.
31,812
28,332
4,433
6,214
3,428
6,412 6,840
1,005
3,480
3,480
6
15,253
13,416
2,305
2,808
1,602
3,186
2,989
526
1,8.37
1,837
7
9,985
8,959
1,524
1,890
1,062
2,109
2,015
359
1,026
1,026
Age 15 24-{concld.)
Married Widowed or
divorced
8
17,324
15,410
2,359
3,335
1,810
3,500
3,822
5M
1,9f.1
1,914
Total
9
17,214
15,088
2,311
3,328
1,862
3,239
(3,845
503
2,116
2,126
10 II
2,238 4,613
1,983 4,1185
338 598
44i 996
23~ 50!
382 1,064
518 !l80
68 143
255 318
255 328
Age
Unmarried
Males Females . Males Femal~s M .. ks Fcm"les Males Females MaI.:s Females
- 26
1,475
1,265
225
250
135
316
282
57
210
210
27 .... 28
200 4,092
141) 3,619
13 523
42 794
7 407
13 811
60 957
5 127
60 471
60 473
29
4,991
4,499
778
936
534
984
1,112
155
492
492
30
96
82
17
21
8
21
14
14
14
Age i5-54-(concld.}
Unmarried
Males Females
50
218
195
51
33
17
51
36
7
23
23
51
46
46
40
Married
Males
52
2,399
Ztl/TV
348
459
246
455
495
67
329
Fem"ks
53
J,426
1,174
189
244
154
216
340
31
Z52
252
31
129
llJ
16
23
9
38
22
5
16
16
32
5,621
5,081
795
1,0<l9
587
1,168
1,276
209
537
537
33
5,136
4,5S7
668
980
565
1,079
1,144
151
549
549
Widowed or divorced
Males
54
516
4,)7
88
127
44
96
I2!
14
19
19
Females
55
1,308
1,233
142
309
152
290
300
40
75
75
34
S~8
5J9
105
91
74
125
114
20
39
39
Total
35
25
24
2
13
6
2
1
I
Age
Males Fem"les
56 57
1,438 1,519
1,268 1,405
241 221
278 317
154 158
231 332
307 337
57
170
170
40
174
174

69 TABLE C-III
Condition
Age 0 Age 1-4 Age 5-14 Age 15-24
Total Total Total Unmarried Married Widowed or
divoroed Total
Males Femilles Males Females Males
12
1.,332
:1,140
185
214
140
278
268
55
192
192
13
1,135
1,001
141
181
129
252
250
48
134
114
14
3,537
3,123
482
6s-t
367
727
726
134
414
414
3,224
2,929
503
606
373
6'35
661
101
295
295
16
8,948
7,938
1,291
1,739
971
1)855
1,805
277
1,010
1,010
---~ --- ~~~--------~------------
25-34
Married Widowed or
divorced Total
Females Males
17
7,535
6,6'11
1,153
1,394
S04
1,5ti
1,558
236
B44
SU
18
7,564
6,661
I, ~25
1,459
797
1,568
1,477
235
903
903
Unmarried
Females Males Females Males Females Males Females
19
5,260
4,724
862
952
553
1,142
1,032
183
536
536
Age 35-44
20 21
1,364 2,245
1,257 1,941
163 283
276 434
173 250-
282 400
322 511
41 52
107 304
107 - 304
Married
22 23
20
20
3
4
5
6
Widowed or divoroed
30
26
3
8
4
9
4
4
24
5,663
4,966
765
1,065
550
1,148
1,253,
185
697
697
25
5,320
4,7SZ
S01
1,001
550
I,03S
1,194
16S
56B
568
Age 45-54
Total
Males Females Males Females Males Females Males Females Males Females Males Females Males Females
36
4,737
-4,274
645
902
472
991
1,075
183
463
463
55-64
37
4,693
4,172
606
883
518
975
1,051
139
526
526
38
316
281
45
56
41
46
87
6
35
35
39
413
391
60
84
47
98
91
II
22
22
40
4,515
4,027
M9
839
SIS
949
918
157
4SB
4SB
41
4,Ul
3,729
514
832
462
842
904
175
41B
418
42
414
J67
91
56
.52
96
60
12
47
47
Unmarried Married Widowed or
divoroed
Males Femal~s MOiles
58 59 60
99 8 837
93 8 744
27 138
10 6 169
14 88
19 133
19
4
6
6
183
-33
9.1
93
Females Males
61 62
428 502
339 431
47 76
98 99
37 52
61 79
87
9
89
89
105
20
71
71
Females
63
1,143
1,058
174
213
121
270
249
31
85
85
43
41l
4B
2
15
5
6
20
Total
44
3,652
J,24()
499
691
406
769
750
125
412
412
Males Females
64
459
388
83
66
41
96
86
13
70
70
65
707
606
68
240
68
101
116
13
101
101
45
3,182
2,811
396
637
355
594
722
117
361
361
46
419
420
59
92
57
84
108
20
29
29
Age 65-74
Unmarried
Males Females
66
31
29
9
6
5
5
2
2
2
2
67
16
16
[5
47
917
860
116
180
107
243
176
38
57
57
48
3,133
2,762
487
619
307
602
659
88
371
371
49
2,780
2,453
332
591
30i
SIO
641
71
327
327
Married
Males Females
68 69
197 172
170 109
35 4
33 70
15 12
49 9
32
6
27
27
14
(jJ
63
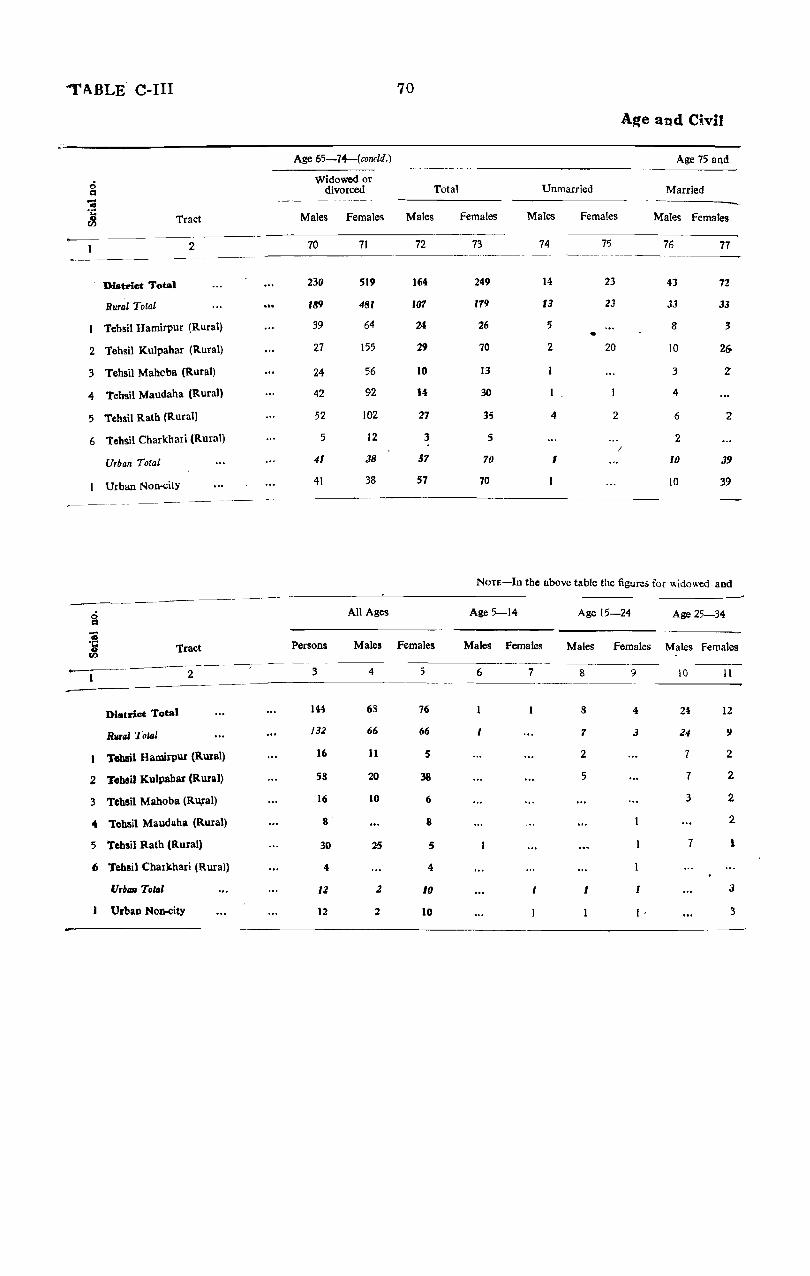
'TABLE C-IlI 70
Age and Civil
. Age 65-74-(conald.) Age 75 and
-----
0 Widowed or d divorced Total Unmarried Married
:3 .. Tract Males Females Males Females Males Females Males Females ~
2 70 71 72 73 74 75 76 77
DIstrict Total 230 519 164 249 14 23 43 72
RUTIII Total 189 4S1 101 119 13 23 33 33
Tehsil Hamirpuf (Rural) 39 64 24 26 5 8 .3 •
2 Tehsil Kulpahar (Rural) 27 155 29 70 2 20 10 2G
:3 Tehsil Malwba (Rural) 24 56 10 13 3 Z
4 Tehsil Maudaha (Rural) 42 92 14 30 4
5 Tehsil Rath (Rural) 52 102 27 35 4 2 6 2'
6 Tehsil Charkhari (Rural) 5 12 3 5 2
U,ban Total 41 38 57 70 I 10 39
Urban NOlKity 41 38 57 70 10 39
NOTE-In the above table the figure, for widowed and
g All Ages Age 5-14 Age 15-24 Age 25-34
ai -5 fIl
Tract Persons Males Females Males Females Males Females Males Females
2 3 4 5 6 7 8 9 10 11
District Total 144 63 76 8 4 21 12
R",al Totsl 131 66 66 '1 3 14 51
Tobail Hamirpur (Rwal) 16 II 5 2 7 2
2 TehaiJ Kulpabat (Rural) 58 20 38 5 7 2
3 Tehail Mahoba (RUJal) 16 10 6 3 2-
.. Tehsil Maudaha (Rural) 8 8 2.
5 'l'chsil Ralh (Rural) 30 25 5 7 1
,; Tehail Charkhari (Rural) .. 4
llrba Tots' 12 2 10 I I 3
Urban Non-city 12 2 10 I· 3
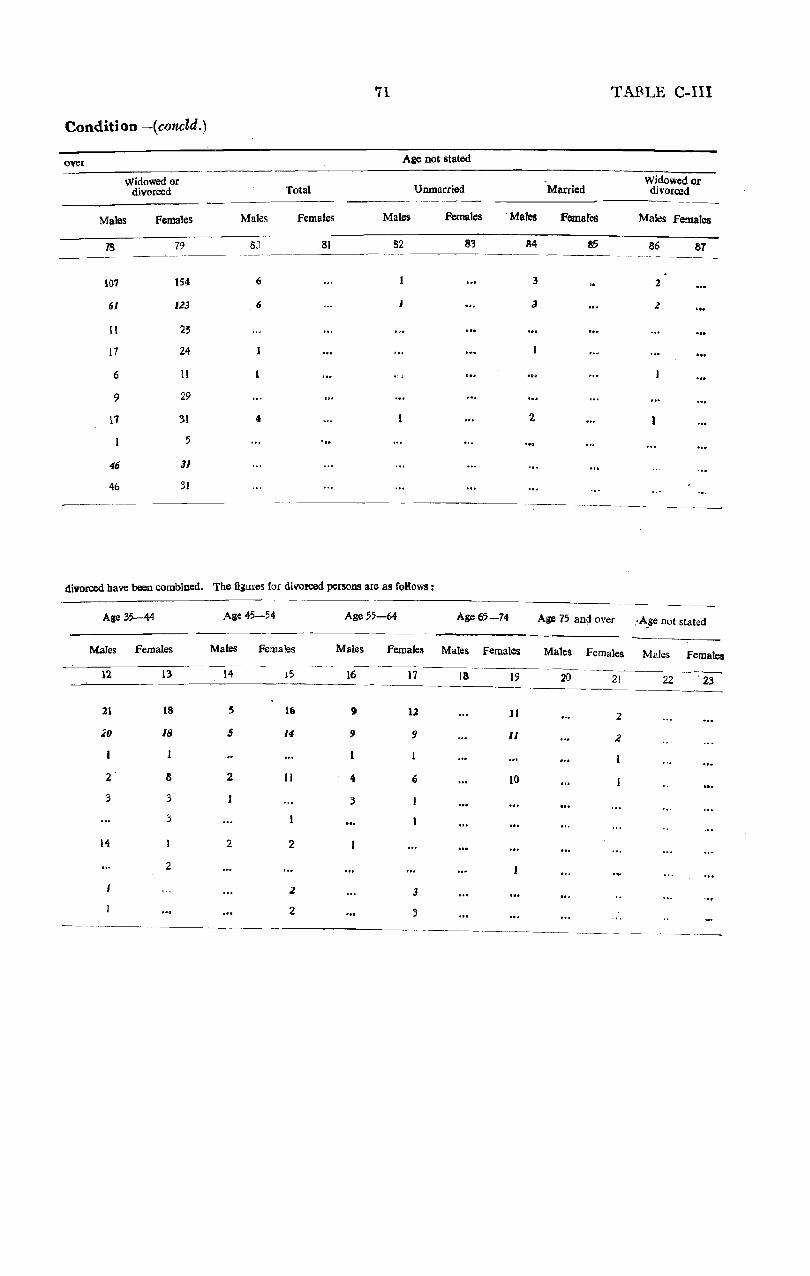
71 TAFLE C-III
Condition -(concld.)
over Ase not stated
Widowed or Widowed 01 divorced Total Unmarried Married divorced
Males Females Males Females Males Females 'Males Fcmares Mal~ Females
7S 79 8,1 81 82 8.3 M 85 86 87
1(11 154 6 3 2
61 123 6 3 2
II 23
17 24
6 It
9 29
17 31 " I 2
5
46 31
46 31
~--
divorced bave been combined. Tbe figures for divo:rced persons are as foKows :
Age 35--44 Age 45-54 Age 55-64 Age 65-14 Age 75 and over :A_se not stated
Males Females Males Females Males Females Males Females Males Females Males Females
12 13 14 15 16 11 18 19 20 21 22 123
21 18 5 1(; 9 12 11 2
~O 18 5 14 9 9 II 2
2 S 2 II .. , 10
3 3 3
3
14 2 2
2
Z 3
2 :3
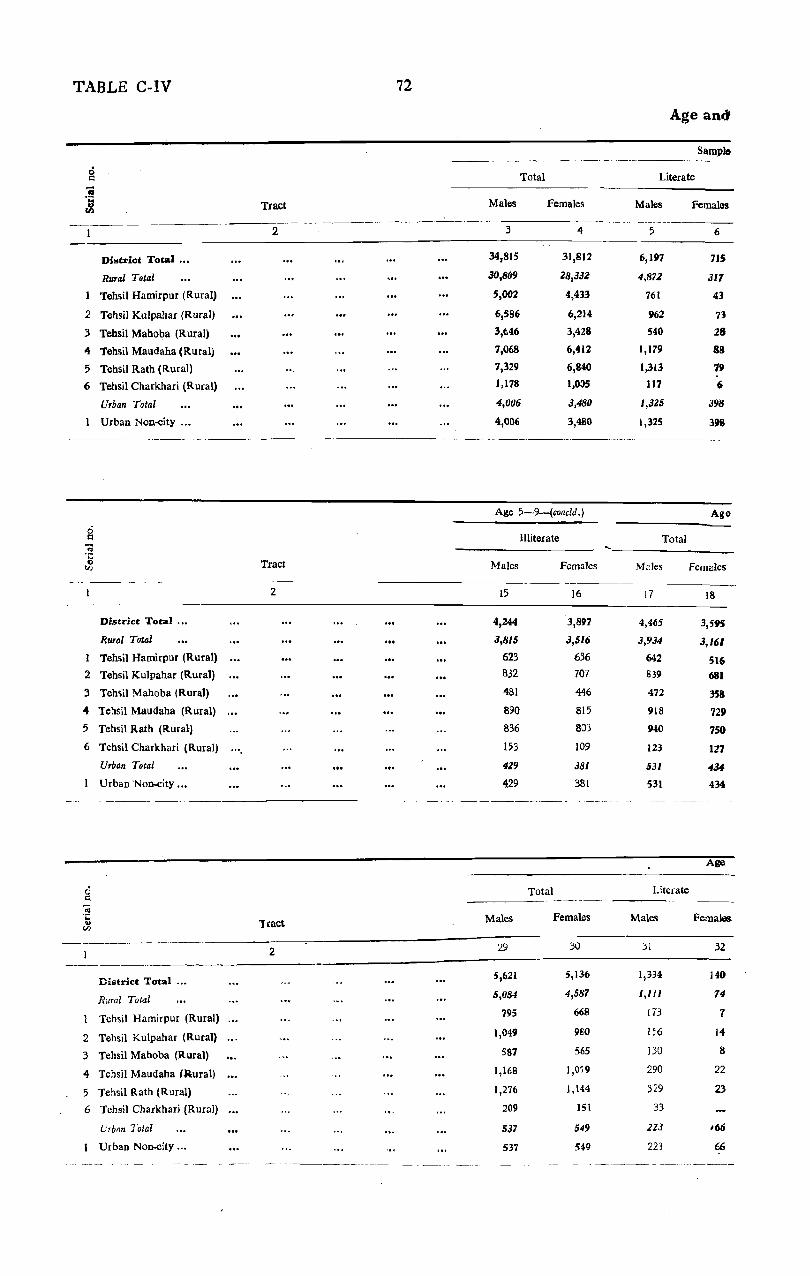
TABLE C-IV
District Total ...
Rural Total
Tehsil Hamirpur (Rural)
2 Tehsil Kulpahar (Rural)
3 Tebsil Maboba (Rural)
4 Tehsil Maudaha (Rural)
5 Tehsil Rath (Rural)
6 Tehsil Charkhari (Rural)
Urban Total
Urban Non~ity ...
0 tl -os .;:: 0
Vl
District Total ' .•
Rural Total
1 Tehsil Hamirpur (Rural)
2 Tehsil Kulpahar (Rural)
:3 TehsiJ Mahoba (Rural)
4 Tehsil Maudaha (Rural)
5 Tehsil Rath (Rural)
6 Tebsil Charkhari (Rural)
Urban Total
Urban 'Non-city .••
0 = ";;j 'C II> Vl
._----_ .. _-----_.-
---_------District Total ...
Rural Total
Tehsil Hamirpur (Rural)
2 Tehsil Kulpahar (Rural)
:3 Tebsil Mahoba (Rural)
4 Tehsil Maudaha (&ural)
5 Tehsil Rath (Rural)
6 Tchsil Charkhari (Rural)
Urbnn Total
Urban No~ity ...
...
-- _._-------
Tract
2
Tract
2
Tract
2
- -------- -_._-
72
Age and
Samplo -----~ -_-__ . ---
Total Literate
Males Females Males Females
-.---.~--_-----:3 4 5 6
34,815 31,812 6,197 7)5
30,899 28,332 4,872 311
5,002 4,433 761 43
6,586 6,214 962 73
3,M6 3,428 540 28
7,068 6,412 1,179 88
7,329 6,840 ),313 79 ),178 1,0:>5 117 0
4,006 3,480 1,325 398
4,006 3,480 1,325 398
--__ ---------------
Age 5-9-(concld.) Age
Illiterate Total
Males Females Males Females
15 16 17 18
4,244 3,897 4,465 3,595
3,815 3,516 3,934 3,161
623 636 642 516 832 707 839 681
481 446 472 358
890 815 918 729
836 803 940 750
153 109 123 127
429 381 531 434
429 381 531 434
---------- -~- ------ ----- --- -
Age
Total Literate
Males Females Males Female&
29 30 51 32
5,621 5,136 1,334 140
5,084 4,587 1,lll 74
795 668 li'3 7
1,049 980 156 14
587 565 130 8
1,168 1,0'i9 290 22
1,276 1,144 329 23
209 151 33
537 549 ZZJ 166
537 549 223 66
--------_----_------ -----.~ .. - ---~.
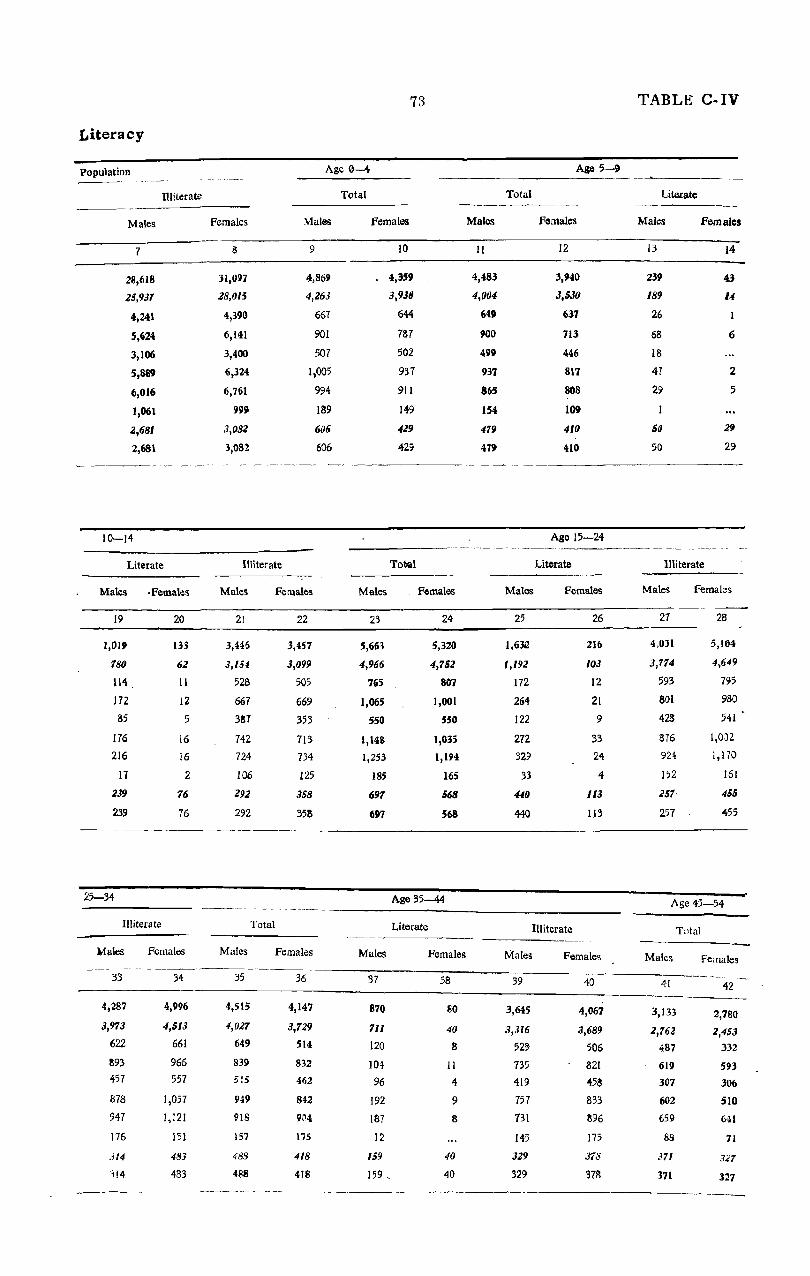
Literacy
Population
Males
7
28,618
25,931
4,241
5,624
3,106
5,689
6,011;
1,061
2,681
2,681
10-14
lUiterate
Literate
Males
19
1,019
180
1\4
172
135
176
216
17
239
239
25-34
. Females
20
133
62
11
12
5
16
16
2
16
76
Illiterate
Males
33
4,287
3,973
622
893 457
878
947
176
.f14
''114
Females
34
4,996
4,513
661
966
557
1,057
!,121
151
483
483
73
Age 0-4
Females
8
31,097
28,015
4,390
6,141
3,400
6,324
6,761
999
3,082
3,082
Males
9
4,869
4,263
667
901
507
1,005
994
189
606
606
Illiterate
Males
21
3,U!)
J,1S1
528
667
387
742
724
106
292
292
Females
22
3,457
3,099
505
669
353
713
734
125
358
358
Total
Females
Males
23
5,653
4,966
71i5
1,065
550
1,148
1,253
185
691
697
10
4,359
3,938
644
787
50Z
937
911
149
419
429
Total
Females
24
5,320
4,752
807
1,001
550
1,035
1,194
165
568
568
Age 35-44
Males
II
4,483
4,004
649
900
499
937
865
154
4i9
419
Total
Males
25
1,6312
1,192
172
264
122
272
329
33
440
440
Ago 5-~
Females
12
3,940
3,530
637
113
446
811
808
109
410
410
Age 15-24
Literate
Females
26
216
103
12
21
9
33
24
4
113
113
--------~ -------------~--------
Males
35
4,515
4,027
649
839
515
949
918
157
488
4118
Total
Females
36
4,147
3,729
514
832
462
842
904
175
418
418
Males
37
870
711
120
104
96
192
187
12
159
159 _
Literate
Females
38
80
40
8
11
4
9
8
40
40
Illiterate
Males
39
3,645
.1,316
52~
735 419
757
731
145
329
329
Females
40
4,067
3,689
506
S21
0458
833
896
175
316
378
TABLg C-IV
Literate
Males
13
239
189
26
68
IS
47
29
51}
50
Females
14
43
14
6
2
5
29
29
lUiterate
Males
27
4,031
3,714
593
801
428
B76
924
152
251
257
Females
28
5,164
4,649
795
980
541
1,0)2
1,170
161
455
455
Age 45-54
Total
Males Females
41
3,133
2,162
487
619
307
602
659
88
.171
371
42
2,780
2,453
332
593
306
no 641
71
327
327

TABLE C-IV 74
Age and
Age 45 54 (concld.)
----------------Literate Illiterate
District Total ."
Rural Total
Tebsil Hamirpur (Rural)
2 Tehsil Kulpahar (Rural)
:I Tehsi! Mahoba (Rural)
4 Tehsil Maudaha (Rural)
5 Tehsil Rath (Rural)
6 Tehsil Charkhari (Ruul)
Urban Total
Urban Non-city ...
Tract
2
Tract
2 ------.--------------
Distrlct Total
Rural Total
Tehsil Hamirpur (Rural)
2 Tehsil Kulpahar (Rural)
3 Tehsil Mahoba (Rural)
4 Tehsil Maudaha (Rural)
5 Tehsil Rath (Rural)
6 Tehsil Charkhari (Rural)
Urhan Total
Urban Non-city
Males
".
Age 65-74-(concld.)
llliterate
Males Females
57
336
281
72
17
36
75
69
12
55
55
58
655
606
68
240
68
101
116
13
49
49
43
618
492
87
86
49
133
125
12
126
126
_-------- ----------------------------------------
Males
59
1M
107
24
29
10
14
27
3
57
57
Females
44
37
19
4
6
2
4
3
18
18
Total
l'emales
60
249
179
26
70
13
30
35
5
70
70
Males
45
2,515
2,270
400
533
258
469
534
76
245
245
Females
46
2,743
2,434
328
587
304
506
638
71
309
309
Age 75
Literate
Mdes Females
61
45
26
9
5
4
2
5
19
19
62
NOTE-Persons who can read but cannot write were separately enumerated in the Census. In the taMe their
ci o
Tract
2
District Total
Rural Total
Tebsil Hamirpur (Rural)
2 Tehsil Kulpahar (Rural)
3 Tebsil Mahoba (Rural)
4 Tehsil Maudaha (Rural)
5 Tehsil Rath (Rural)
6 Tehsil Cbarkbari (Rural)
Urban Total
Urban Non-city
All ages Age 5-9 -- --_ .. _---------
Persons Males Females Males Females
776
667
71
117
42
219
183
35
109
109
4
610
528
68
40
40
199
154
27
82
S2
5
166
139
3
77
2
20
29
8
27
27
6
55
48
6
10
18
10
7
7
7
10
7
7
3
3
Age 10-14 Age 15-24
Males Females Males Females
8
100
76
10
4
5
25
30
2
24
24
9
33
23
3
II
5
3
10
10
10
112
99
7
7
39
37
7
[3
13
11
34
28
II
10
5
6
6

75 TABLE C-IV
Literacy -( concld.)
Age 55-64 Age 65 14
Total Literate Illiterate Total Literate
Males Females Males Females Males Females Males Females Males Females
47 48 49 50 51 52 53 54 55 56
1,433 1,579 316 9 1,122 1,570 458 707 122 52
1,268 1,405 262 5 1,006 1,400 388 606 107
241 221 49 192 221 83 68 11
278 317 57 3 221 314 66 240 49
154 158 28 126 158 44 68 8
231 332 46 2 IS5 330 96 101 21
307 337 75 232 331 86 116 17
57 40 7 50 40 13 13
170 174 54 4 116 110 10 101 15 52
170 174 54 4 116 170 70 101 15 52
and over Age not stated
Illiterate
Males Females
63 64
119 2"9
81 i79
15 26
24 70
6 13
12 30
22 35
2 5 38 10
38 70
Total
Males Females
65 66 .- .---~-- ------
6
6
1
1
4
Males
67
2
2
Literate'
Females
68
Illiterate
Males Females
69
4
4
3
10
number has been included in the column for" illiterate". The number of such semi-literate persons is as fo~ows :
Age 25-34 Age 35-44, Age 45-54 Age 55-64 Age 65-74 Age 75 and over Age Dot stated .
Males Females Males Females Males Females Males Females Males Females Males Females Males Fema;es
12 13 14 15 16 17 18 19 20 21 22 23, 24 25
127 34 ll4 38 57 4 31 6 II 7 3
119 30 94 37 52 28 6 10 7 2
18 12 10 3 2 6 19 8 33 2 6 2 2 7 9 4 4
52 4 40 18 6
31 7 20 3. 15 7 3 2 2 5 5 3 2 2 6 .8 4 20 I 5 J 3 I 8 4 20 5 3 3
----------- _- ----_------ ------~----------"--~-.---- ________ O_" _____ ~_ ---------.
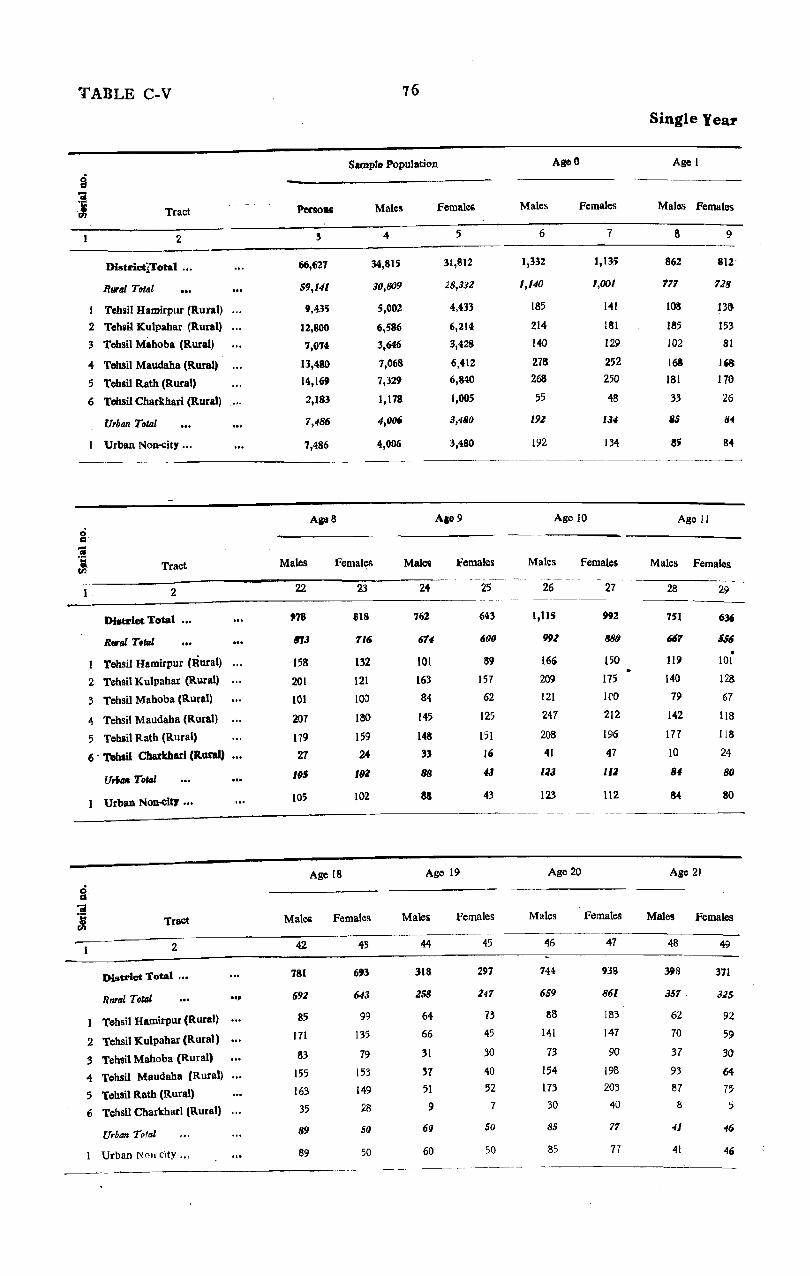
TABLE C-V
Tract
2
District;Total .•.
Rurlll Total
I Tehsil Hamirpur (Ruul)
2 Tch8i~ Kulpahar (Rural)
3 Tehsil Mahoba (Rural) -
4 Tchsil Maudaha (Rural)
5 Tehlil Rath (Rural)
6 Tehsil Charkhari (Rural)
Urban Total
Urban Non~it)' .•.
Tract
2
Dlatrlct Total ."
Rural T,tal
I Tehsil Hamirpur (Rural)
2 Tehsil Kulpahar (Rural)
3 Tehsil Mahoba (Rural)
4 Tehsil Maudaha (Rural)
5 Tehlil Rath (Rural)
6 'Tohlil Charkhari (Rural)
Urban No~itJ •••
Tract
2
District Total •••
Rural Total
Tehsil Hamirpur (Rural)
2 Tehsil Kulpahar (Rural)
3 Tehsil Mahoba (Rural)
04 Tehsil Maudaha (Rural)
5 Tehsil Rath (Rural)
6 Tehsil Charkhari (Rural)
Urban Toflll
Urban N01l city",
.. ,
76
Sample Population
PerSOH
66,621
59,141
9,435
12,800
7,014
13,480
14,169
2,183
1,486
7,486
Males
22
'78 613
15S
201
101
201
179
27
105
105
Males
4:
34,815
30,809
5,002
6,586
3,646
7,068
7,329
1,178
Femal~
23
818
116
132
121
100
180
159
24
101
102
4,006
4,006
Age [8
Females
5
31,812
28,332
4,431
6,214
3,428
6,412
6,840
1,00;
3,4MO
3,480
AI09
Malee Females
24
762
614
101
163
84
145
148
33
88
88
Age 19
25
643
6()(J
S~
157
62
125
151
1(j
43
43
Malel Females Males Females
42
781
69Z
85
171
153
155
163
35
89
89
45
693
643
99
135
79
153
149
28
50
50
44
318
Z58
64
66
31
37
51
9
6(}
60
45
297
247
n 45
30
40
52
7
50
50
Age 0
Males Females
6
1,332
1,140
IS5
214
140
27S 268
55
191
192
7
1,135
1,001
111
HII
129
252
250
48
134
134
Age 10
Males Females
26
l,llS
992
166
209
121
247
208
41
123
123
Age 20
Males
46
744
659
88
141
73
154
173
30
85
85
27
992
88f}
150
115
Iro 212
196
47
liZ
112
Females
41
938
861
183
147
90
198
203
40
77
77
Single lear
Age I
Malos Females
8
862
111
108
185
102
1M
lSI
33
B5
8,
Age 11
9
812-
118
13()
153
81
168
178
26
84
84
Males Females
28
7st
661
119
140
79
142
177
10
IU
Age 21
29
. 101
128
67
118
1[13
24
80
80
Males Females
48
398
351
62
70
37
93
87
8
41
41
49
371
325
92
59
30
64
75
5
46

Age Returns
Age 3
Male.. Females Males Females
10
817
150
115
148
90
199
166
32
91
97
Age 12
11
788
109
116
165
82
166
153
27
19
79
12
926
808
123
175
93
192
191
34
118
118
Agl! 13
13
8;6
193
129
154
117
191
181
21
63
63
Males Femall!s Males females
30
1,070
923
136
203
123
215
210
34
l4'1
147
31
780
6'J2
85
148
89
167
176
27
88
Age 22
Males
50
32
71)1
624
105
144
64
123
166
22
80
BO
Females
51
33
556
496
83
117
55
106
119
II
10
70
77 TARLE C-V
Agl! 4 Age 5 AgeG Age 7
Males Females Males Females Males Females Males FGmales
14
'902
188
136
179
82
168
188
35
114
114
Age 14
15
768
699
12B
134
93
160
157
27
69
69
Males Females
34
825
728
It 4
143
85
191
179
t6
91
97
35
621
537
92
113
47
126
141
18
84
Age 23
16
980
876
138
In
119
213
189
44
104
104
Age 15
17
81H
79Z
133
161
96
190
1116 26
99
99
Males Females
36
635
561
71
127
55
147
140
21
114
12"
37
521'1
439
7I
104
49
86
1I6
13
90
90
Males Females Males
52 53 54
16
951
843
135
ISB
106
200
180
34
108
103
19
876
780
167
136
104
171
176
26
96
96
Age 16
Male"
Age 24
38
774
663
92
134
81
161
175
20
III
111
Female3
55
Females
39
'757
637
62
17B
615
129
176
24
1"()
120
20
812
138
lIT
175
89
172
169
16
74
14:
Age 11
21
.712
64Z
116
133
84
151
136
17
If}
70
Males Females
Males
56
420
348
6t
81
32
93
75
6
72
Age 2)
"ri
264
118
50
57
21
47
47
6
36,
36
57 ,---,~-.---------------------------
Ci76
638
80
124 70
156
185
23
38
38
636
604
84
90 62
158
179
31
32
I 32
310
283
67
57
56
11
21
27
288
252
30
64 37
56
60
5
36
36
557
501
95
93 54
95
148
22
so
50
5~7
516
63
122 84
104
137
6
31
31
1,012
913
122
189 119
220
22:5
38
99
'99
890
715
11&
126 106
231
169
Z5
liS
115

TI\BLE C.V
Tract
2
District Total
Rural Total
Tehsil Hamirpuf (Rural)
2 Tehsil Kulpahar (Rural)
3 Tehsil Mahoba (Rural)
04 Tehsil Maudaha (Rural)
5 Tehsil Rath (Rural) ,
6 Tehsil Charkhari (Rural)
Urban Total
Urban Non-city ...
Tract
2
District Tetal
Rural Total
Tehsil Hamirpur (Rural)
2 Tehsil Kulpahar (Rural)
3 Tehsil Mahoba (Rural)
4 Tehsil Maudaha (Rural)
5 Tehsil Rath (Rural)
6 Tehsil Charkhari (Rural)
Urban Total
Urban Non-city .••
Tract _- ------ ---------2
District Total
Rural Total
Tehsil Hamirpur (Rural)
2 Tehsil Kulpahar (Rural)
3 Tehsil Mahoba (Rural)
4 Tehsil Maudaha (Rural)
5 Tchsil Rath (Rural)
6 Tehsil Charkhari (Rural)
Urban Total
I Urban Non-city •••
Age 26
Males Females
58
511
444
69
\10
52
715
136
19
67
67
Males
76
887
777
96
152
107
205
ISS
29
110
110
Age 35
59
500
428
65
101
50
94
101
17
72
Females
Age 44
77
959
814
119
176
104
203
150
62
145
1'15
Males Females
94
194
173
53
_20
22
37
38
3
21
21
95
184
16S
2,*
76
12
20
31
2
19
19
78
Age 27
Males Females
60
361
291
74 53
31
57
70
6
70
70
Males
78
638
577
63
122
81
132
159
20
61
61
Age 36
61
239
176
24
44
23
37
44
4
63
63
Females
Age 45
79
495
446
65
94
55
96 123
13
49
49
Males Females
96
950
827
100
194
94
196
218
25
123
123
97
825
7Z1
117
12::1
91
172
191
21
104
IC4
Age 28
Males Females
62
745
638
76
121
SO
155
179
27
1(11
107
Age 37
63
757
681
96
128
80
181
175
23
74
74
Males Females
80
212
203
52
2S
20
50 42
II
9
9
Age 46
81
113
100
13
26
15
20
24
2
13
13
Single Year
Age 29
Males Females
64
260
218
46
34
18
67
40
13
42
42
Age 315
65
16(i
150
13
45
19
31
39
3
Ui
16
Males Females
82
453
385
74
i4
36
114
71
16
68
68
Age 47
83
392
371
55
77
41
72
119
7
21
21
-----------..
Males Females
98
244
203
46
46
26
33
42
10
41
41
99
153
U5
12
31
22
30
45
5
13
13
Males Females
]00
151
115
45
19
7
26
15
3
36
35
101
101
92
5
44
12
9
22
9
9
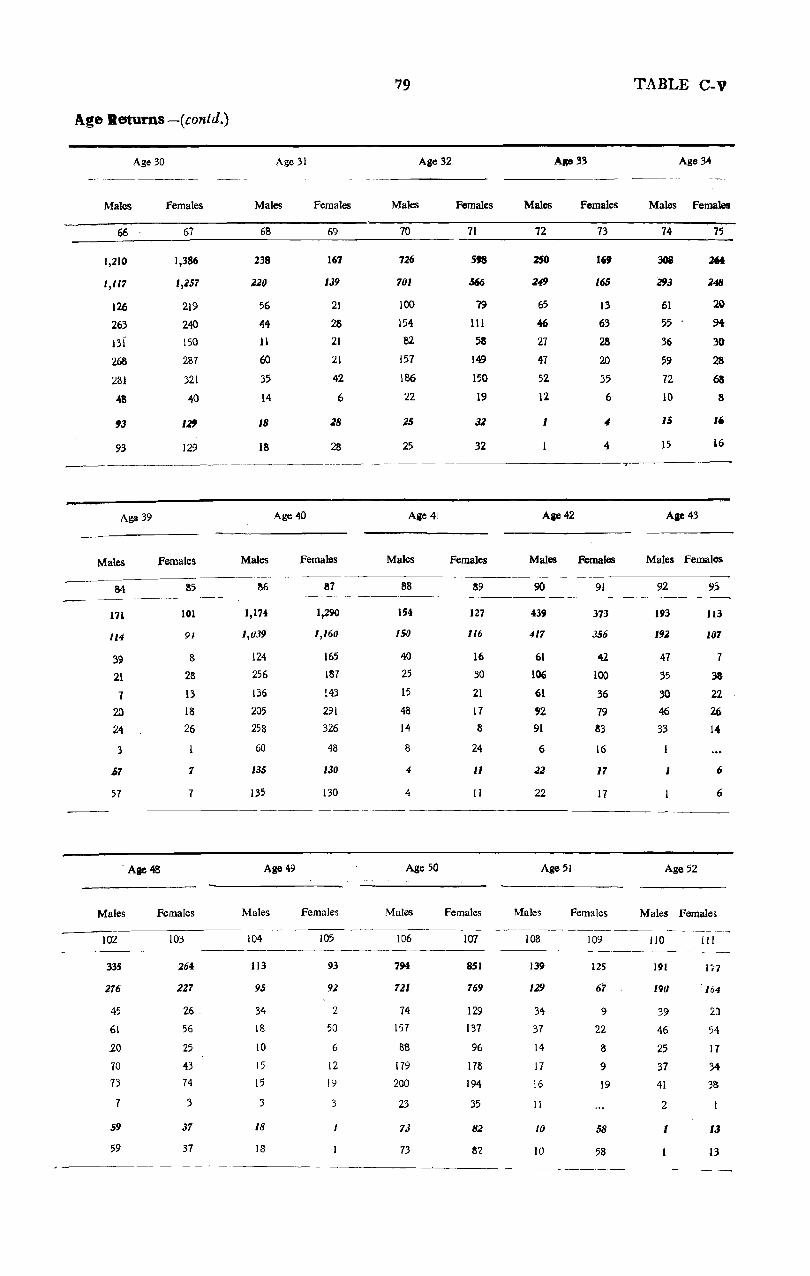
A.ge Returns -(contd.)
Males
66
1,210
1,111
126 263
131
268
281
-is
93
93
Age 30
Females
67
1,386
1,251
219
240 150
287
321
Ita
I~
129
Age 31
Males
68
238
220
56
44
11
60
35
14
18
IS
Females
69
167
139
21
2S
21
21
42
6
28
28 ~------------- .. --.~--~-----
Age 39 Age 40
Males Females Males Females
85 S4 ----_-----~---------
86 87
79
Age 32
Males
70
726
101
100
154
82
157
186
22
25
25
Age 41
Males
88
Females
71
Sts
S66
79
III 5S
149
150
19
32
32
Females
89
Age 33
Males
72
250
249
65
46
27
47
52
12
1
Aae42
Females
73
I" 16S
I' 63
2S
20
35
6
4
Males .Females
90 91
TABLE C-V
Age >4
Males Females
74 75
308 .26t
293 248
61 2Q
55 94
36 30
59 2S
72 68
10 8
15 16
15 16
Ale 43
Males Females
92 ---------~-------------------- __ -----_---~
171
114
39 21
1
20
24
3
~1
57
101
91
8
28
13
18
26
1
7
- Aae 48
Males
102
335
276
45
61
20 70
73
7
59
59
Females
103
264
211
26 _
56
25
43
74
3
37
37
1,174
l,tJ39
124
256
136
205
258
60
135
135
1,290
1,160
165
187
t43
291
326
48
131!
130
IS4
/Sf)
40
25
15
48
14
8
4
4
127
116
16
30
21
17
8
24
11
II
439
411
61
106
61
'2 91
6
23
22
373
356
42
100
36
79 83
16
11
17
193
192
47
35
30
46
33
1
113
101
7
38
22 26
14
o
6
----- -_---- -----------------------
Age 49
Males
104
113
95
34
18
10
15
15
3
18
18
Females
105
93
92
2
50
6
12
l'>l
3
Age 50
Males
106
794
121
74
157
88
179
200
23
73
73
Females
107
851
769
129
137
96
178
194
35
81
Age 51
Males Females
lOB
139
129
34
37
14
17
16
II
10
10
109
125
67
9
22
8
9
19
58
58
Age 52
Males Female'!
110
191
190
39
46
25 37
41
2
I
III
li7
'164
20
54
17
34
38
13
13

'r.ABLE: c.;-V
Tract
2.
District Total . ,.
Rural Total
Tehsil Hamirpur (Rural)
2 Tehsil Kulpahar (Rural)
3 Tehsil Mahoba (Rural)
.4 Tehsil Maudaba (Rural)
.5 Tehsil Rath (Rural)
6 Tebsil Cbarknari (Rural)
Ur.11II TO/llIl
Urban Non-city ...
Tract
2
Diatrict Total
RIIr.' To,.l
Tcbsil Hamirpur (Rural)
2 Tcbsil Kulpabar (Rural)
3 Tehail Mahoba (Rural)
4 Tcbsil Maudaha (Rural)
5 Tehsil Ratb (Rural,
, Teban Chatkhari (R.ural)
UrfJl1II Total
I
Urban Non-cit1 ...
Tract
2
District Total ...
R.,al ToltJl
1 Tebsit Hamirpur (Rural)
.2 TehsB Kulpaha( (Rural)
3 Tebsil Maboba (Ruraij
" Tehsil Maudaha (Rural)
5 Tehsil Rath (Rural)
6 Tehsil Charkhari (Rural)
U,J,(III T,tal
Urban Non-city ...
Age~3
Males
112
" 93
25
22
15
12
IS
(;
6
Males
132
28
18
6
6
5
3
7
Females
Age 63
113
83
83
9
35
IS
!!
13
Females
133
61
61
4
24
11
II
II
Age 73
Males
152
IS
IS
2
-4
" -4
Females
153
17
17
14
2
80
Age 54
Males Females
114
117
113
45
19
a 17
21
3
4
4
Age 64
115
103
93
3
35
11
15
26
3
10
10
Males females
134
37
36
7
10
2
4
to 2
2
2
Age 74
135
41
31
3
15
5
5
4
9
9
Males Females
154 155
18
18
1
2
9
27
26
21
3
Age 55
Males
116
432
313
15
M
46
75
82
11
59
59
Females
117
3M
340
71
33
42
103
82
9
44
44
Age 65
Male~
136
U5
159
40
24
14
38
37
6
36
.36
Females
137
285
liS
32
43
35
50
47
8
10
70
Age 75
Males
156
63
39
.7
13
3
I
104
14
24
Females
157
47
38
6
5
5
13
8
9
g .
Single Year
Age 56
Males Females
liB
138
104
19
22
14
16
21
6
34
34
Age 66
123
114
12
44
II
II
34
2
9
9
Males Female!
135
34
19
4
5
I
2
6
IS
15
Age 16
139
57
51
I
37
3
5
5
6
6
Males Females
158 159
17
II
4
2
2
2
6
6
48
48
46
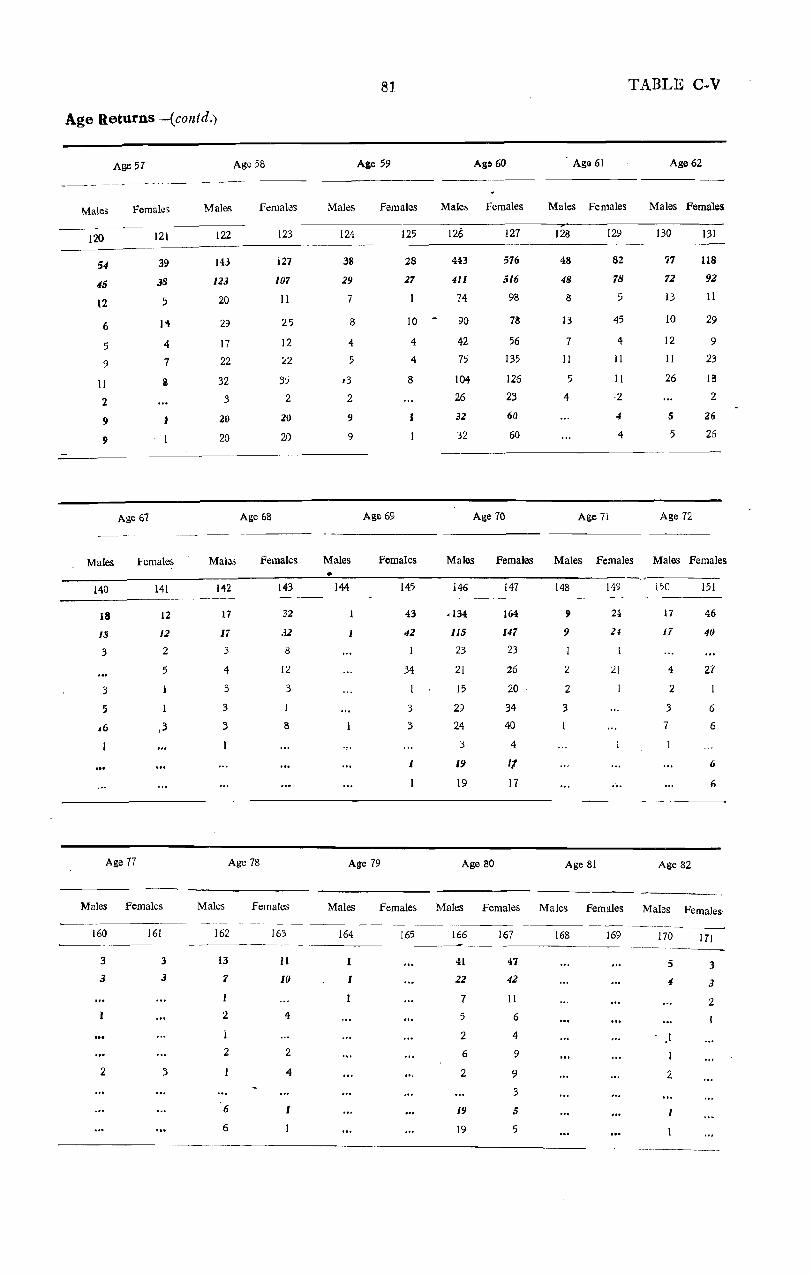
Age Returns -(contd.)
Age 57
Males
120
54
45
12
6
5
9
11
2
9
9
Males
140
18
18
3
3
5
Females
Age 61
121
39
38
5
1'4
4
7
$
f'cmales
141
12
12
2
5
3
Age 77
Age 58
Males Females
122
143
113
20
29
17
22
32
3
20
20
Age 68
123
127
107
11
25
12
22
35
2
20
20
Males Females
142
17
17
3
4
3
3
3
Age 78
143
32
32
8
12
3
8
Males
124
38
29
7
8
4
5
,3
2
9
9
Males •
144
81
Age 59
Females
Age 69
125
28
27
10
4
4
8
Females
145
43
42
34
3
3
I
Age 79
Age 60
Males Females
126
443
411
74
90
42
75
104
26
32
32
127
576
516
98
Age 70
78
56
135
126
23
60
60
Males Females
128
48
48
8
13
7
II
5
4
129
Age 7i
82
78
5
45
4
II
II
·2
4
4
TABLE C-V
Age 62
Males Females
130
77
72
13
10
12
11
26
5
5
Age 72
131
I1S
92
11
29
9
23
18
2
26
26
Males Females Males Females Males Females
146
<134
115
23
21
15
29
24
3
19
19
Age SO
147
164
147
23
26
20
34
40
4
11
17
148
9
9
2
2
3
Age 81
149
24
24
21
.' ..
150
17
17
4
2
3
7
Age 82
151
46
40
27
6
6
MaJes females Males Females Males Females Males Females Males females Males Females
160
3
3
2
161
3
3
3
162
13
7
I
2
2
6
6
-- .--- --- -----163
11
10
4
2
4
I
I
164
1
I
165 166
41
22
7
5
2
6
2
19
19
167
47
42
II
6
4
9
9
3
5
5
168 169 170 171 -------_-
5
4
2
I
3
3
2
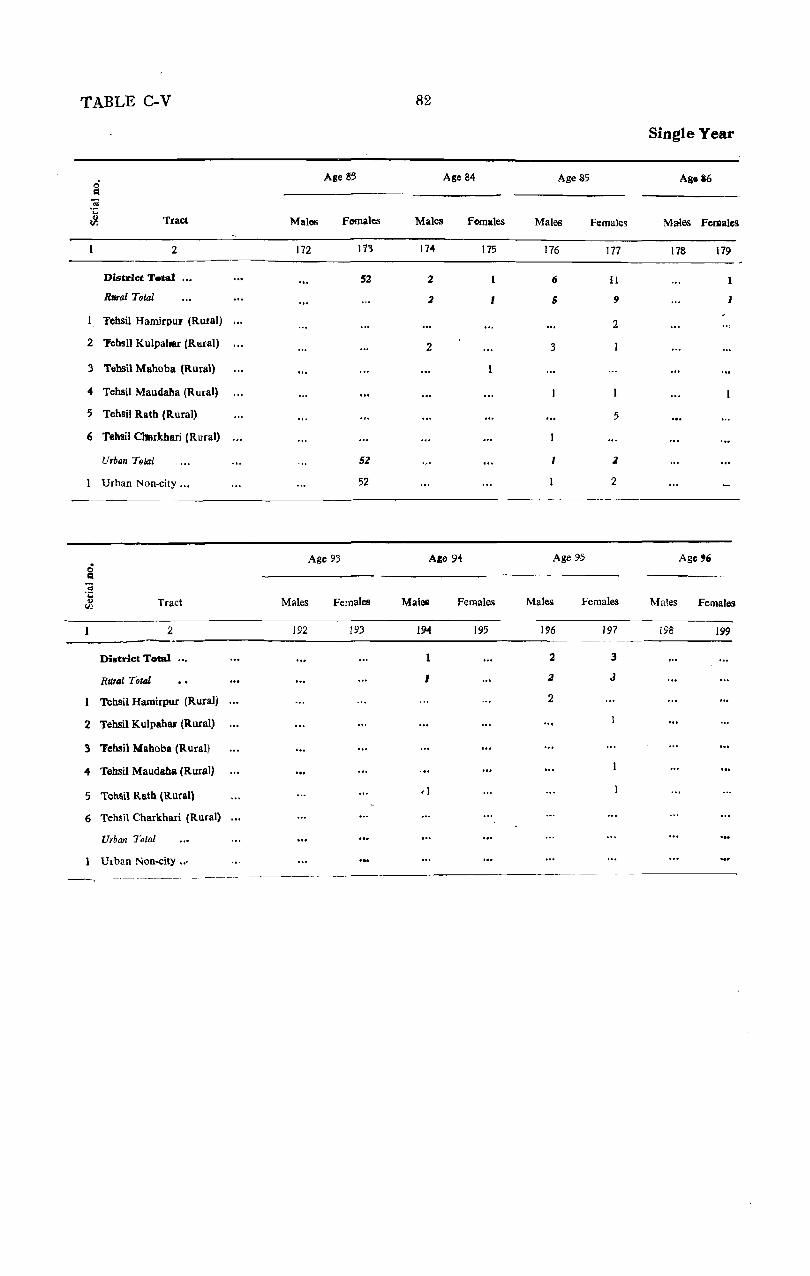
TABLE C-V 82
Single Year
15 Age 8:3 Age 84 Age $5 Agei6
ca :3 .... .. Tract Maltl6 Fomales Males Females Males Females Ma<les Females fIl
2 172 113 174 175 176 177 178 179
District T.tal S2 2 (I II
Raral Total 2 5 9 1
1 TehsiJ Hamirpul (Rural) 2
2 'lchsil Kuipabar (Rtlral) 2 3
3 Tebsil Mahoba (Rural)
4 Tehsil Maudafla (Rural)
5 Tehsil Rath (Rural) 5
6 Tahsil ClIBrkhari (R IIral)
Urban T9lal 52 2
Urban Non-city ". 52 2
8 Age 93 Ale 94 Age 95 Age"
-; 0;::
<D Tract \lJ Males Females Malell Females Males Females Males Females
2 192 193 19-4 195 1% 197 198 199
District Total 2 3
RUT"I Total I 2 J
Tebsil Hamirpur (Rural) 2
2 Tehsil Kulpahar (Rural)
3 "ehsil Naboba (Rural)
-4 Tebsil Maudaba (Rural)
5 Tehsil Ratb. (Rural)
6 Tehsil Charkhari (Rural)
Urban T(}lal
Urban Non-city".

TABLE C-V
Age Returns-{conlld.)
Age 87 Age 88 Age 89 Age 90 Age!H Age 92
Males Females Males Females Males Females Malei Fema1e6 Males Felllales Males Female!
180 181 182 Iffi 184 185 186 187 188 189 190 191
2 7 17 2 2
1 2 7 16 2 2
-5
'" 2
3 3
2 :3
I
-----
Age 97 Age 98 Age 99 Age 100 Age not stated
--Males FellMlles Males FellHlles Males Females Mates Females Males Females
200 201 202 203 204 205 206 207 208 209
6
I 6
...
4
. ~.
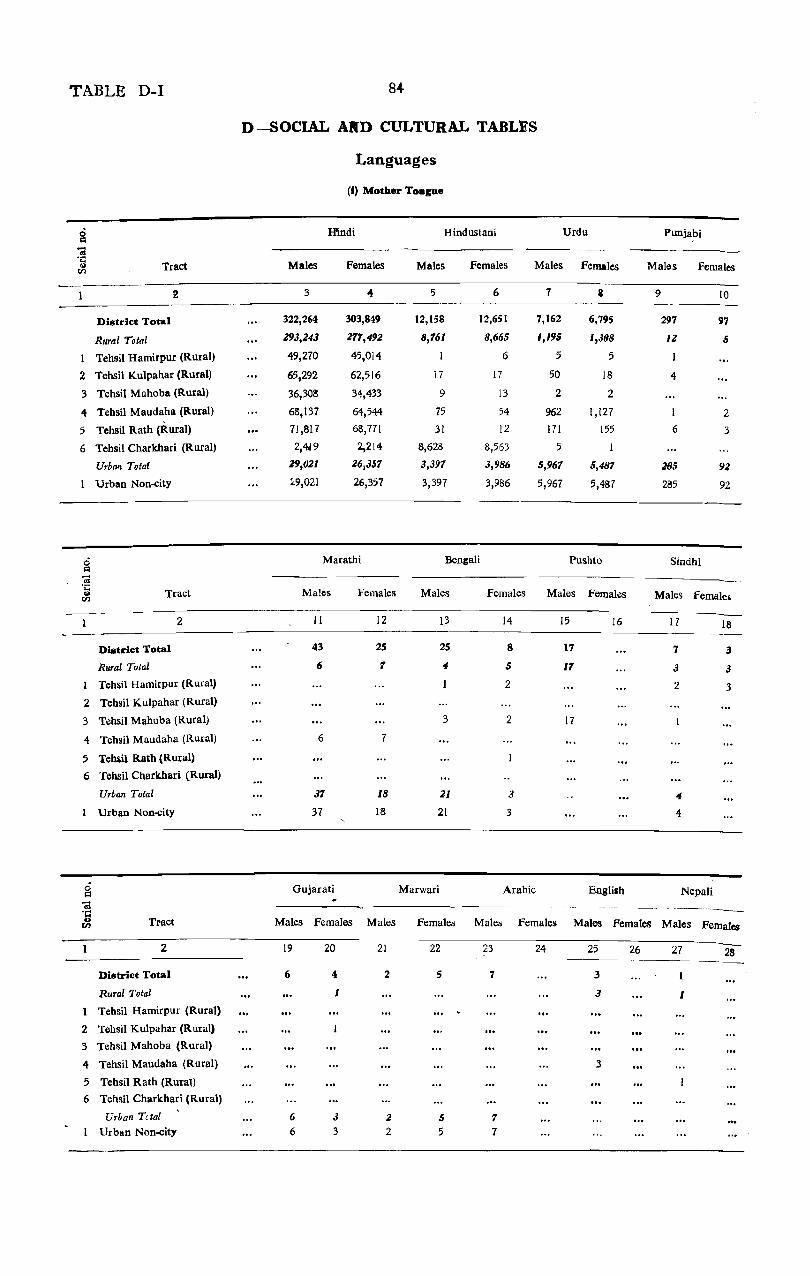
TABLE D-I 8 ....
D-SOCIAL AWD CULTURAL TABLES
Languages
<I) Motber Toagae
g Hindi Hindustani Urdu Puniabi
'd ·0
Tract Males Females Males Females Males Females Males Females u rn
2 3 4 5 6 7 a 9 10
District Total 322,264 303,849 12,158 12,651 7,162 6,795 297 97
Rural Total 293,243 277,4'J2 8,761 8,665 1,19$ 1,398 12 5
I Tehsil Hamirpur (Rural) 49,270 45,014 I 6 5 5
2 Tehsil Kulpahar (Rural) 65,292 62,516 17 17 50 18 4
3 Tehsil Mahoba (Rural) 36,308 34,433 9 13 2 2
4 Tehllil Maudaha (Rural) 68,137 64,544 75 54 962 1,127 1 2
5 Tehsil Rath (Rural) 71,817 68,771 31 12 171 155 6 3
6 Tehsil Charkhari (Rural) 2,4d9 2,214 8,628 8,563 5
Urban Tota! 29,021 26,357 3,397 3,986 5,967 5,487 z.s5 92
Urban Non-city L9,021 26,357 3,397 3,986 5,967 5,487 285 92
0 Marathi Bencali Pushto Sindhi 1:3 -<U .;:;
Tract Males Females Males Females Males Females Males u Female~ ron
2 II 12 13 14 15 16 17 18
Di.trict Total 43 25 25 8 17 7 3
Rural Total 6 7 4 5 17 3 3
I Tehsil Hamirpur (Rural) 2 2 3
2 Tehsil Kulpahar (Rural)
3 Tehsil Mahoba (Rural) 3 2 17
4 Tehsil Maudaha (Rural) 6 7
5 Tehiil Rath (Rural)
6 Tehsit Charkhari (Rural)
Urban Total 37 18 21 3 4
Urban Non-city 37 18 21 3 4
0 Gujarati Marwari Arabic English Nepali CI
'd -- -~~--·c ---_. __ . ___
0 Tritct Males Females Males Females Males Females Males Females Males Females rIl
2 19 20 21 22 23 24 25 26 27 28
District Total 6 4 2 5 7 3
Rural Total 3 I
Tehsil Hamirpur (Rural)
2 Tehsit Kulpahar (Rural)
3 Tehsil Mahoba (Rural)
4 Tehsil Maudaha (Rural) 3
5 Tehsil Rath (Rural)
6 Tehsil Charkhari (Rural)
Urban Tdal 6 3 2 5 7 Urban Non-city 6 3 2 5 7
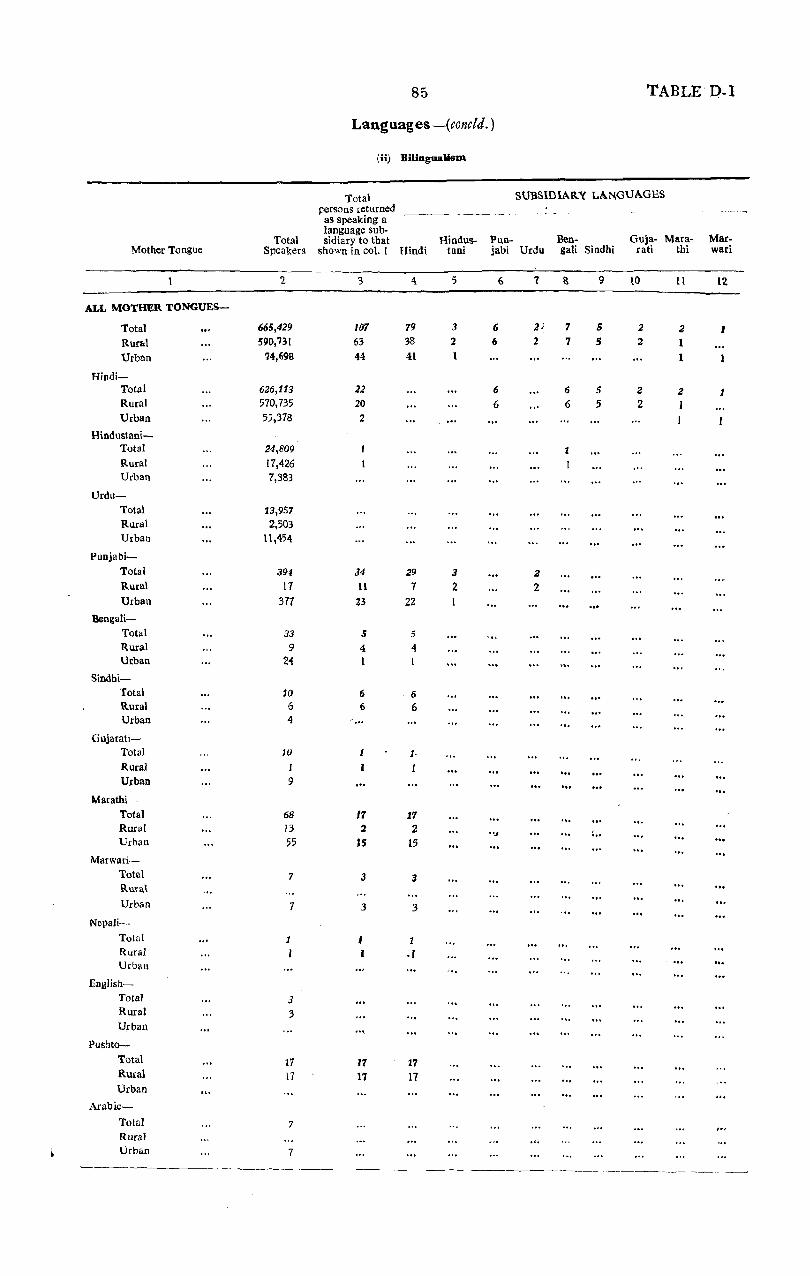
85 TABLE D-1
Languages-(concld. )
(ii) Bilingualism
Total SUBSIDIARY LA.NGUAGES persons returned as speaking a
Total language sub-
Hindus- Ben- Guja- Mara- Mar-sidiary to that Pun-Mother Tongue Speakers shown in col. I Hindi tani jabi Urdu gali Sindhi rati thi wari
'2 3 4 5 6 7 ~ 9 to II 12-
ALL MOTHER TONGUES-
Total 665,429 107 79 3 6 2~ 1 5 2 2 I Rural 590,731 63 38 2 6 2 7 5 2 1 Urban 74,698 44 41 1 1 1
Hindi-Total 626,113 22 6 6 5 2 2 1 Rural 570,735 20 6 6 5 2 I Urban 55,378 2
Hindustani-Total 24,809 1 Rural 17,426 I Urban 7,383
Urdu-Total 13,957 Rural 2,503 Urban tl,454
Punjabi-Total 394 34 29 3 2 Rural 17 1l 7 2 Z Urban 377 23 22
Bengali-Total 33 5 5 Rural 9 4: 4: Urban 24 1
Sindhi-Total 10 6 6 Rural 6 6 6 Urban 4:
Guiarati-Total 10 1-
Rural I 1 I ... Urban 9
Marathi --Total 68 11 17 Rural 13 2 2
.... .... , Urban 55 IS 15
Marwari-Total 7 3 3 Rm:a\
Urban 7 3 3 Nepali-
Total 1 I 1 Rural I .J Urball
English-Total 3 Rural 3 Urban
Pushto-
Total 17 11 17 Rural 17 17 17 Urban
Arab ic-
Total 7 Rural Urban 7

'TABLES D-ll & D.IlI 86
1
2
3
Tract
2
District Total
Rural Total
Tehsil Hamirpur (Rural)
Tehsil Kulpahar (Rural)
Tehsil Mahoba (Rural) ...
4 Tehsil Maudaha (Rural)
5 Tehsil Rath (Rural)
6 Tehsil Charkhari (Rural)
Urban Total
I
2
3
4
5
6
Urban Nan-city
Tract
2
District Total
Rural Total
Tehsil Hamirpur (Rural)
Tehsil Kulpahar (Rural)
Tehsil Mahoba (Rural) .. .
Tehsil Maudaha (Rural) .. .
Tehsil Rath (Rural)
Tehsil Charkhari (Rural)
Urban Total
Urban Non-city
D-II-Reli.
Hindu
Total Population Total Arya Others Sikh
Persons Males Females Males Fe:nales Mal~s F~males Males Fe.llales Mal~s Fe.nales
3 / 4
665,42P 341,992
590,131 303,245
94,310 49,280
127,915 65,363
70,790 36,340
134,918
140,968
21,830
14,698
74,698
69,184
72,026
11,052
38,747
38,747
Total Population
5
323,43'7
287,486
45,030
62,552
3i,450
65,734
68,942
10,778
35,951
35,951
6
320,301
291,631
47,768
63,136
35,491
64,857
69,459
10,926
28,670
28,670
Total
7
302,72i
216,463
43,700
60,460
33,617
61,415
66,599
10,672
8
67
28
20
7
9
31
15
15
26,261 39 22
26,261 39 22
10 II
320,240 302,687
291,609 276,448
47,748 43,685
63,136
35,490
60,460
33,617
64,850 61,415
69,459 66,599
10,926 10,672
12
146
13
2
2
4
1
4
13
107
28,631 26,239 133 107
28,631 26,239 133 107
D-III -Scheduled
AGRICULTURAL .--~------ ---------------~---
I-Cultivators of land wholly oc
mainly owned and their dependants
II-Cultivators of land wholly or mainly unowned and their
dependants
III-Cultivatina labourers aDd thea
dependants
Persons Males Females Males Females Males Females Males Fe:nClJes Males Females
3
145,125
133,643
16,606
33,034
16,983
27,503
34,367
5,150
11,482
11,482
4
71,625
65,665
8,218
16,815
8,030
13,374
17,149
2,079
5,960
5,%0
5 6 7 8 9
73,500
67,978
8,388
16,219
8,'S]
57,158
55,984
7,191
14,265
6,887
60,958 23,844 :24,415
59,754 23,225 23,753
7,405
14,609
7,854
14,129 11,518 12,481
17,218 14,320. 14,664
3,071 1,803 2,741
5,522 1,114 1,204
5,522 1,174 1,204
3,~61
5,590
2,989
4,697
5,347
),04)
619
619
3,642
5,833
3,136
5,204
4,869
1,069
662
662
10
7,165
6,916
891
1,629
720
1,444
1,751
481
249
249
II
6,975
6,702
875
1,382
789
1,363
1,792
501
273
273
12
25,360 28,532
25\098 18,321
2,639 2,765
6,788 7,129
3,120 3,824
5,261 5,736
7,028 7,755
262 1, lIS
262 205
262 205
NOTE I-A second count of the Scheduled Castes was carried out from the National Register of Citizens and the figures were given (;) this count are
Serial number Tract
I 2
District Total Rural Total
I Tehsil Hamirpur (Rural) 2 Tehsil Kulpahar (Rural) 3 Tehsil Mahoba (Rural) 4 Tehsil Maudaha (Rural) 5 Tehsil Ra th (Rural) 6 Tehsil Charkhari (Rural)
Population j
146,857 135,534
16,527 34,553 17,062 27,534 34,065
5,793
According to an amendment to)he State Table D-lli (in Vol. 11, Part H-C-Age and Social Tables)
Non: 2-The following statcment shows thc number of perscns
Persons 26 Males 12
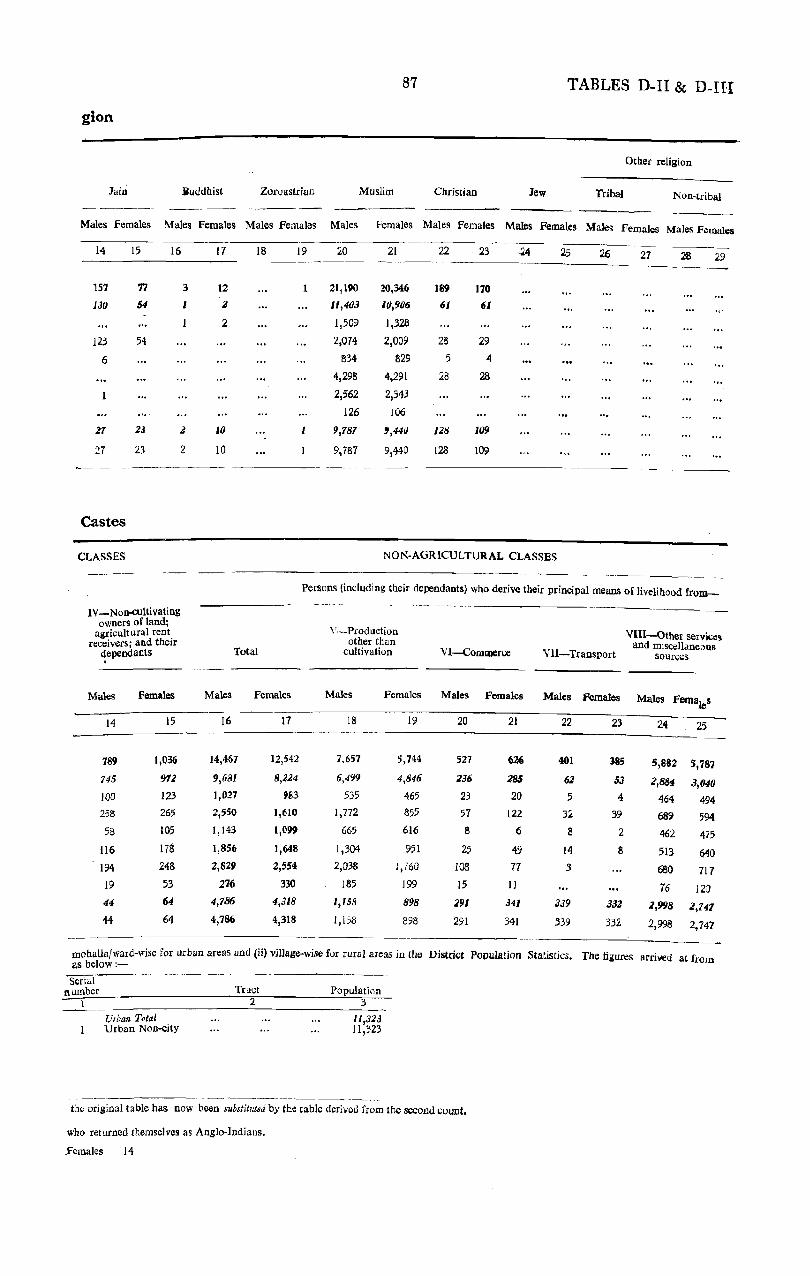
87 TABLES D-II & D-IH
gion
Other religion
Jain :iuddhist Zoroastrian Muslim Christian Jew Tribal Non-tribal -----_---
Males Females Males Females Males Females Males f'emales Males Females Males Females Males Females Males Females
14 15 16 17 18 19 20 21 22 23 ~4 25 26 27 28 29
157 77 3 12 1 21,190 20,346 189 170
130 54 I Z 11,403 10,906 61 61
I 2 1,509 1,328
123 54 2,014 2,009 28 29
6 834 829 5 4
4,298 4,291 28 28
2,562 2,343
126 106
21 23 Z 10 9,181 ',44IJ lZ8 109
27 23 2 10 9,787 9,440 128 109
Castes
CLASSES NON-AGRICULTURAL CLASSES
-- --Persons (including their dependants) who derive their principal means of livelihood from-
IV-Non-cultivating owners of land;
"-Production VIII-Other services agricultural rent. receivers; and theIr other than and miscellaneous
dependants Total cultivation VI-Commerce Vll-Transport Sour.;:es
Males Females Males Females Males Females Males Females Males Females Males FemaleS
14 15 16 17 18 19 20 21 22 23 24 25
789 1,036 14,467 12,542 7,657 5,7<1:4 527 626 401 385 5,882 5,787
745 972 9,681 8,224 6,499 4,846 236 285 62 53 2,884 3,040 100 123 1,027 983 535 465 23 20 5 4 464 494 258 265 2,,50 (,(itO 1,772 855 57 122 32 39 689 594 58 105 1,143 (,C99 665 616 8 6 a 2 462 475
116 17S 1,856 1,648 1,304 _951 25 49 14 8 513 640 194 248 2,829 2,55<1 2,038 1,l6G lOS 77 3 680 717 19 53 276 330 185 199 15 lJ 76 120 44 64 4,786 4,318 1,158 898 291 341 339 331 2,998 1,141 44 64 4,786 4,318 1,i58 898 291 341 339 332 2,998 2,747
mahalla/ward-wise for urban areas and (ii) village-wise for rural areas in tfle District Population Statistics. The figures arrived at from as below:-
Serial number
Urban T"tal Urban Non-city
Tract 2
Population 3
lJ,323 1l,:;<23
the original table has now been substituted by the table derived from tbe second count.
who returned themselves as Anglo-Indians.
females 14

TABLE D-IV
District State, etc. or Country
where born
2
Persons
:3
88
District Total
Males Females
5
Mig-
DISTRICT, TRACT, ETC.
Rural Total
Persons Males Females
6 7 ------~-~~~------------------------------------------------------------
TOTAL POPULATION
A Born in India ...
I Within the State of eolUDeration (i) District of enunwration
(ii) Other districts
II States in India beyond the State of enumeration
(i) States adjacent to the State of enumeration ... I Punjab 2 Delhi 3 Madhya Bharat 4 Rajasthan ... 5 Vindhya Pradesh 6 Bihar 7 Madhya Pradesh 8 Himachal Pradesh
(ii) 0 ther States I Assam 2 Bombay :3 Madras '" Orissa .. , 5 Jammu and KashmiJ; 6 Hyderabad 7 Mysore 8 P. E. P. S. U. 9 Saurashtra
10 Travancore-Cochin 11 Ajmer 12 Bhopal 13 Bilaspur 14 Cutch 15 Coori 16 Manipur 17 Tripura 18 West Bengal... ... 19 Andaman and Nicobar Islands
(Iii) J 2 3
Elsewhere in India Chandernagore Sikkim ... Foreign PossellSions
B Co_tries in Asia beyoDd India m-eluding U. S. S. R.
1 Afghanistan 2 Burma , Ceylon '" China 5 Nepal 6 Pakistan 7 Straits Settlements and Malaya 8 U. S. S. R. 9 Elsewhere in Asia
10 Unspecified
C Co_tries in Europe escladiag U.S.S.R.
I United Kingdom and Northern Ireland 2 Eire 3 Elsewhere 4 Unspecified
D Co_tries in Africa I Kenya 2 Mauritius :3 Mozambique ... '" Union of South Africa 5 Elsewhere 6 Unspecified
E Countries in America 1 Canada 2 United States .. . :3 Elsewhere .. . " Unspecified. .. .
F Co_tries in Australasia 1 Australia ... 2 New Zealand ... :3 Elsewhere 4 Unspecified
G Born at Sea
665,429
665,078
643,448 612,613 iJO,115
21,630
21,301 207 24
343 926
19,045 83
679
323 1
92 4
10 3
40
12 4 1
68 34
54
338
I 10
327
13 4 2
7
341,992
341,788
336,352 327,766 -
8,586
5,436
5,291 157 12 86
592 4,110
36 304
139 1
56 2 3 2
24
12 2 1 1
20
IS
201
10 191
3
2
323,437
323,290
307,096 284,901 12,189
16,194
16,010 50 12 257 334
14,935 47
375
184
36 2 7 1
16
2
67 14
39
137
1
136
10 4 1
5
590,731
590,655
572,364 548,450 23,904
18,301
18,132 56 6
224 562
16,e69 35
3110
169
26 1
10
37
65 4:
25
70
1 2
67
6 4 2
303,245
303,191
!99,06~r 293,636
5,432
4,123
4,012 37 2· 53
324 3,476
16 164
51
13
3
22
1
11
53
2 51
287,486
287,464
273,2S6 254,814
18,412
14,178
14,060 19 4
17l 23S
13,393 11)
216
118
II 1 7
15
64 4
14
'"
17
1
16
5 4 1
.. , .. ,
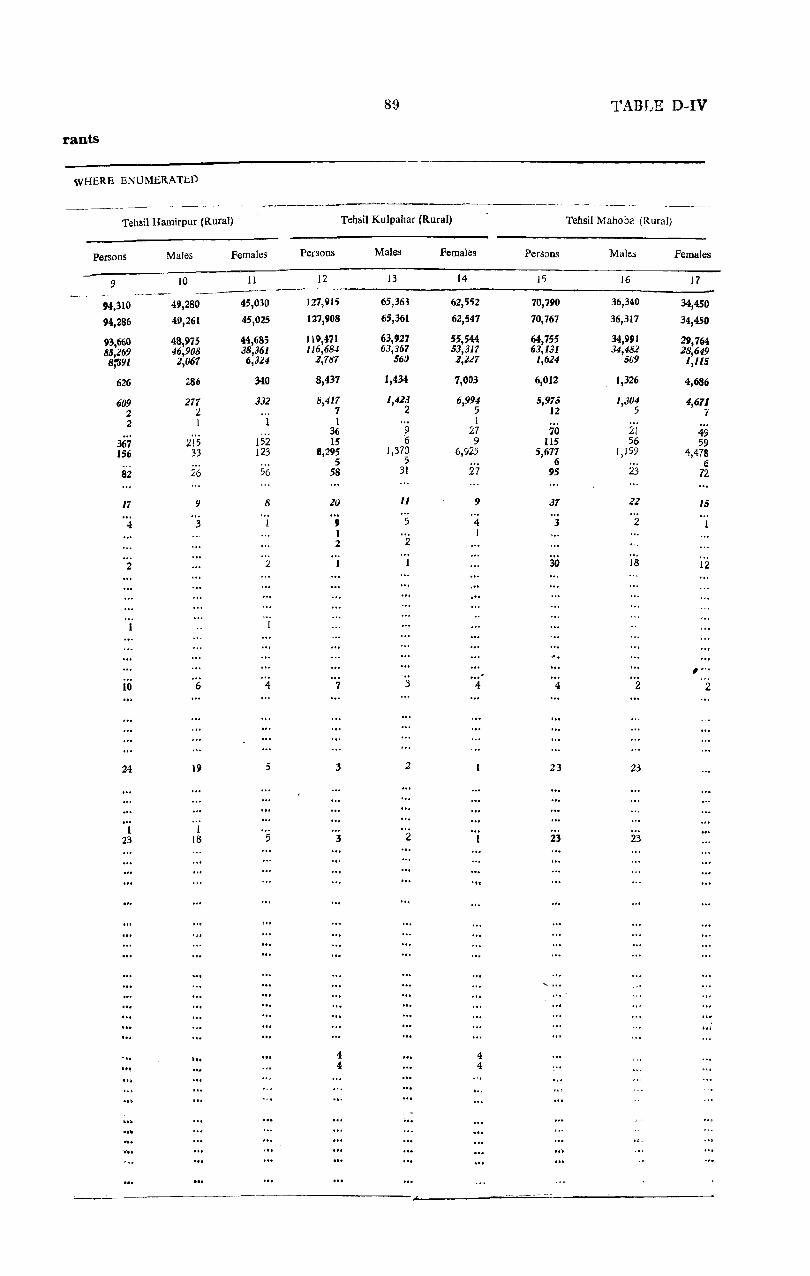
89
rants
WHERE ENUMERATED
------ _._-_._-_._-----Tehsil Hamirpur (Rural) Tehsil Kulpahar (Rural)
Persons
9
94,310
94,286
93,660 85,269 8;591
626
609 2 2
367 156
82
17
4
2
10
24
1 23
lit
... ... ,.
Males Females Persons
10 11 12 ---_._ ..• _---_._ 49,280
41\261
48,915 46,908
2,067
286
277 2 l
215 33
26
9
3
6
19
I 18
'"
45,030
45,025
44,685 38,361 6,324
340
332
152 123
56
8
2
4
5
5
127,915
127,908
119,471 116,684
2,787
8,437
8,417 7 1
36 15
1l,295 5
58
20
9 I 2
7
3
3
4 4
Males Females
13 14
65,363 62,552
65,361 62,547
63,927 55,544 63,367 53,317
56() 1,247
1,434 7,O~3
1,413 6,994 2 5
1 9 27 1; 9
1,370 5
6,925
31 27
II 9
5 4 1
2
,"
3 4
2
2
• ~ t
4 4
...
TABLE D-IV
Tehsil Mahoba (Rural)
Persons Males Females
15 16 17
70,790 36,340 34,450 70,767 36,317 34,450
64,755 34,9111 29,764 63,131 34,482 18,649
1,624 509 1,IlS
6,012 1,326 4,686
5,975 1,304 4,611 12 5 7
70 21 49 115 56 59
5,677 1,199 4,478 6 6
95 23 72
37 21 15
3 2
30 18 12
, ... 4 2 2
23 23
23 23
...
.,;
.,. ..
Ie • ....

TABLE 1)-IV
District States, etc. or Country
where born
2
TOTAL POPULATION A Born in India I Within the State of enuD1eration
(i) District of enumeration
(ii) Other districts II States in India beyond the State of enuD1eration
(i) States adjacent to the State of mumeration
I Punjab 2 Delhi 3 Madhya Bharat 4 Rajasthan 5 Vindhya Pradesh 6 Bihar 7 Madhya Pradesh .,. S Himachal Pradesh ."
(ii)
1 2 3 4 5 6 7 8 9
10 11 12 13 14 15 16 N 18 19
Other States Assam Bombay Madras Orissa ", J::!mmu and Kashmir Hyderabad Mysore P. E. P. S. U. Saurashtn;l Travancore-Cochin Ajmer Bhopal Bilaspur Cutch Coorg Manipur Tripura West Bengal Andaman and Nicobar Islands
(iii) Elsewhere in India
I Chandernagore 2 Sikkim •.• 3 Foreign Possessions
B ,C!)untries in Asia beyond India including U.S.S.R. I Afghanistan 2 Burma 3 Ceylon 4 China 5 Nepal 6 Pakistan '" " . 7 Strait Settlements and Malaya 8 U. S. S. R. ." ", 9 Elsewhere in Asia ...
10 Unspecified
C Countries in Europe excluding U. S. S. R.
I United Kingdom and Northern Ireland 2 Eire 3 Elsewhere 4 Unspecified
D Countries in Africa
E
1 Kenya 2 Mauritius 3 Mozambique '" 4 Union of South Africa 5 Elsewhere 6 Unspeeified
Countries in AD1erica
I Canada 2 United States 3 Elsewhere 4 Unspecified
F Countries in Australasia
I Australia :< New Zealand 3 Elsewhere 4 Unspecified
G Born at Se:l
90
Tehsil Maudaha (Rural)
Persons
18
134,918 134,904
132,785 126,677
6,198
2,119
2,041
18 I
92 45
1,778 8
99
78
6
7
4
57
3
12
11
2
2
Males
19
69,184 69,180
68,383 67,088
1,295
797 791
14 1
19 37
647
73
6
3
3
3
Females
20
65,734
65,724
64,402 59,589
4,813
1,322
1,250 4
73 8
1,131 8
26
72
5
7
56
3
9
8
DISTRICT, TRACT, ETC.
Tehsil Rath (Rural)
Persons Males Famales
21
140,968 1·10,960
140,218 135,508
4,770 (82
667 17 2
17 18
553 16 44
15
3
8 3
8
1 7
22
12,026 72,020
'il,862 70,935 _
927
158
156
14
1 10
110 II 10
2
2
6
I 5
23
t8,942 68,940
68,416 64,573
3,843
524 511
3 2
16 8
443 5
34
13
... 8 3
2
2

rants -(concld.)
WHERE ENUMERATED
Tehsil Charkhari (Rural) . ------~---------.---.- .-- _-----
Persons Males Females
24 25 26
21,830 1l,OS2 10,77&
21,830 11,052 10,778
21,405 10,930 10,475
21,181 10,856 10,325
224 74 150
425 122 303
423 121 302
9 3 6 2 2
410 117 293 ...
2 I
2
I
·1
.. (
..-------------
91
Urban Total
------- -
Persons
27
74,698 74,423 71,094
64,2i3
6;871
3,329
3,175 151 18
119, 364
2,176 48
21n
154 I
66 3
3 3
11 4. 1 3
30
29
268
8 260
7
7
Males
28
38,747 38,597 37,284
34,130
3,154
1,313
1,225
120 10 33
268 634 20
140
88 1
43 2
2 2
II 2 1
20
4.
148
8 140
2
2
Females
29
35,951 35,826 33,810
30,093
3,717
2,016
1,950
31 8
86 96
1,542 28
159
66
23 1
I 1
2
3 10
25
120
120
5
,0.
5
Persons
30
74,698 74,423 71,094 64,223
6,871
3,329 3,175
151 18
119 364
2,176 48
2'9
154 1
66 3
3 3
11 4 1 3
30
29
268
8 260
7
7
TABLE D~IV
Urban Non-city
Males
31
38,747 38,597
37,284
34,130
3,154
1,313 1,225
120 10 33
268 634 20
14Q
88 I
43 2
2 2
11 2 1 ...
20
4.
148
3 140
2
... 2
Females
32
35,'51 35,826 33,110
30,093
3,'117 2,016 1,950
31 8
86 96
1,542 28
159
66
23 I
2
3 10
25
120
120
5
5

TABLES D-V & ])..VI 92
(i) -Displaced persons by
DISPLACED PERSONS
Total Population of Displaced Persons 1946 1947 194B
----District Persons Males Females Males Females Males Females Males Females
H<lmirpur
District
Hamirpur
District
Hamirpur
District
District Total
RUNI Total
Urban Total
2
267
3
152
1946
Males Females
21 22
1946
Males Females
37 38
Total Population of Displaced Persons
4
115
Persons M<lles Females
2
267
30
237
152
l!1
133
3
115
11
104
;)
1947
Males Females
23 24
1947
Males Females
39
_ ...
I-Cultivators of land wholly or mainlJ owned and their
dependants
Males Females
4 5
6 7 8 9 10
129 9B 20 15
DISPLACED PERSONS
19418 1949
Males Females Males FemaliS
25 26 27
DISPLACED PERSONS
1948 1949
Males Females Males Females
41 42 43
D-V (ii) -Displaced persons by
Il-Cultivatorl of land wholly or mainly
unowned and their dependants
Males Females
6 7
AGRICULTURAL
III-Cuitivating labourers and their
dependant,
Males Females \
9
NOTE-Village-wise and tehsil-wise figures of displaced
D-VI-Non-Indian
Total Population
District Pers(',rH Males Females
2 3 4
Hamirpur 7 4 3

year of arrival in India
pROM WEST PAKISTAN
1949 1950
Males females Males Females
11 12 13 14
FROM EAST PAKISTAN
1950
Males Females Males
29 30 31
2
-------~---------
PROM DISTRICT UNSTATED -- ------- -------- --------
1950
Males Females Males
45 46 47
Livelihood Classes
CLASSES
93
1951
Males
15
1951
Females
32
TABLES D-V & D-VI
Date unstated - ---~--------
Females Malet> Females
16 17 18
Date unstated
Males Females
33 34
Children born in India
Males Females
19 20
Children born -in India
Males Females
35 36
----------------------- ----------_ 1951 Date unstated
Females Males Females
48 49 50
NON·AGRICULTURAL CLASSES
---_-- --- -- -~-
Children born in India
Males Females
51 52
Persons (including;their dependants) who derive their principal means of livelihood fcom-
IV - NOll-Cultivating owners of land; agri
cultural rent receivers; and their dependants
Males Female:;
----_-~~
- 11 12
V-Production other than CUltivation
Males Females
13 14
7 8
7 8
VI-Commerce
Males Females
15 16
71 56
4 2
67 54
perSO[lS "IiI! be found in the Primary Census Abstract in Part II of this Volume.
Am~rican
~r(Jes femaks
5 6
4 :3
VIII-0ther servic~s
VII-Transport and miscellaneous
Sources
Males Females Males Females
17 18 19 20
17 5 57 44.
4 2 11 5
13 3 b,6 39

TABLE D-VII ,94
Livelihood Classes by
AGRICULTURAL --------"-------
I-Cultivators of lI-Cultivators of land wholly or land wholly or mainly owned mainly unowned III-CultivAtins and their depen- and their depeo.- labourers and
All Classes 4dants dants their dependants -_.---------- .-
Educational Standards Persons Males Females Males Females Males Females Males Females
-----2 3 4 5 6 7 8 9 10
Distrh:t
;'iterate 62,016 55,(J49 6,967 34,119 2~840 1,512 93 1,293 335
Middle School 2,807 2,579 228 932 23 33 1 39
Matriculate or S. L. C. 1,044 972 72 20i 5 7 J
Higher Secondary Intermediate in Arts 324 315 9 34 2
or Science Degrees or Diplomas 1,043 984 59 238 2 3
Graduates in Arts or 89 68 21 14 I
Science Post-Graduates in Arts 36 36 2
or Science Teaching 427 411 16 35
Engineering Agriculture Veterinary Commerce I
Legal 9 9 4
Medical 18 18 6
Others 462 440 22 176 1 3
Total 67,234 59,899 7,33S 35,52g 2,872 1,55S 94 1,335 335
Rural
Literate 47,674 43,987 3,681 31,8)2 2,382 1,338 47 1,272 331
Middle School 1,762 1,712 50 796 12 24 36
Matriculate or S. L. C. 273 260 13 106 2 3
His:her Secondary Intermediate in Arts 41 40 1 19
or Science Degrees or Diplomas 8S5 849 6 213 1 3
Graduates in Arts or 24 21 3 (I 1 Science
Post-Graduates in Arts 4 4 2
or Science Teaching 398 396 2 29 Engineerins Agriculture Veterinary Commerce I 1 Legal 5 5 3
Medical III 16 5 Others 407 406 1 165 3
Total 51),605 46,848 3,157 32,966 2,398 1,366 48 1,311 33,
Tehsil Hamirpur
Literate ~,12~ 7,471 653 5,430 408 274 10 III 4 i\·fiddle School 257 250 7 J2~ 3 J Matriculate or S. L.C. 37 36 1 19
Higher Secondary Intermediate in Arts 7 7 3
or Science Degrees or Diplomas 111 109 2 23 Graduates in Arts or
Science Post-Graduates in Arts
or Science Teaching S6 55 7 Engineering Agricult lifO
Veterinary Commerce 1 d Legal 2 2 2 Medical 3 3 Gthers 48 47 1 13
Total 8,5f6 7,873 663 5,599 411 2'?S 10 111 4

Educational Standards
CLASSES
IV-Non-cultivating owners of land ;
agricultural rent V-Production receivers; and their other than
, dependants cultivation -----_---__ ._ Males Females Males Females
II 12 13 14
'rotal
1,813 309 4,497 328 77 13 72 9
37 }3 1
5 3
23 2 J 1
6 1
1
3
2 I
II 2
1,955 324 4,598 339
Total
1,456 197 3,121 117
62 2 30 2
12 6
2
18 1
3
3 1
1 1
10
1,550 199 3,158 119
(II ural)
337 47 454 19 15 7 2 I
4 , I
3
358 4'1 462 19
95
NON-AGRICULTURAL CLASSES
VI-Commerce VIl-TransJ:l0rt -~
Males Females Males Females
15 16 17 18
5,138 972 608 183 :IS} 31 34 24 69 54 23
17 4 3
3J 4 7 2 7 4 2
II I
1
14 4 I 5,509 1,007 707 235
2,357 155 64 19 47 2 3 3
II 10 I
3 1 2
1
2,416 151 78 23
430 30 16 6
5 2
435 30 18 6
TABLE D-VII
VIII-Other services and miscellaneous
sources
Males
19
6,069
1,140 574
252
671
36
21
370
I
3 11
235 8,712
2,547 714 114
18
610 8
2
362
10 227
4,003
419 .91 12
4
82
45
3 34
615
Females
20
1,901 121
43
4
48 11
16
15 2,129',
439 28 10
S 2
2
1 482
129 4 1
Z
136

TABLE D-VIJ 96
Livelihood Classes by
AGRICULTURAL I-Cultivators of II-Cultivators of
land wholly or land wholly or mainJy owned mainly unowned III-Cultivating
and their depen- and their depen- labourers and All Classes dants dants their dependants
Educational Standards Persons Males Females Males Females Males Females Males Females
2 3 4 5 6 7 3 9 10
Tehsil KlIlpahar Literate 10,115 ·9,145 970 6,293 438 193 5 264 314-Middle School 467 452 15 1711 I II 35 Matriculate or S. L. C. 74 67 7 20 2 2
Higher Secondary Intermediate in Arts 9 9 6
Oft Science Degrees or DiplomlJS 101 100 18 Graduates in Arts or 6 5 4
Science Post-Graduates in Arts
or Science Teaching 44 44 3 Engineering Agriculture Veterinary Commerce Legal ·1
Medical 4 4 Others 45 45 10
Total 10,766 9,773 993 6,520 441 204 6 301 314
Tehsil Maboba
Literate 5,535 5,217 318 3,~0 213 127 175 4
Middle School 301 292 9 150 2 3
MatricuiatiJ Of S. L. C. 42 42 20 Higher Secondary "
Intermediate in Arts 4 4 or Science
Degrees or Diplomas 53 53 31 Graduates in Arts or
Science Post-Graduates in Arts
or Science Teachina 8 8 5
I Engineering Agriculture Veterinary Commerce Legal Medical 2 2 Others 42 42 25
Total 5,935 5,608 327 3,882 215 130 175 4
Tebsi1 Malldaha
Literate 10,750 9,807 943 7,450 717 340 17 285 S.
Middle School 369 355 14 176 5 6
Matriculate or S. L. C. 65 63 2 22
Higher Secondary
Intermediate in Arts 11 10 6
or Science Degrees or Diplomas 434 432 2 73 2
Graduates in Arts or 6 5 Science
Post-Graduates in Arts 2 2 or Science
Teaching 281 280 10 Engineering Agriculture Veterinary Commerce Legal Medical 4. 4. 4 Others 140 140 57 2
Total 11,629 10,667 962 7,727 723 349 17 286 8
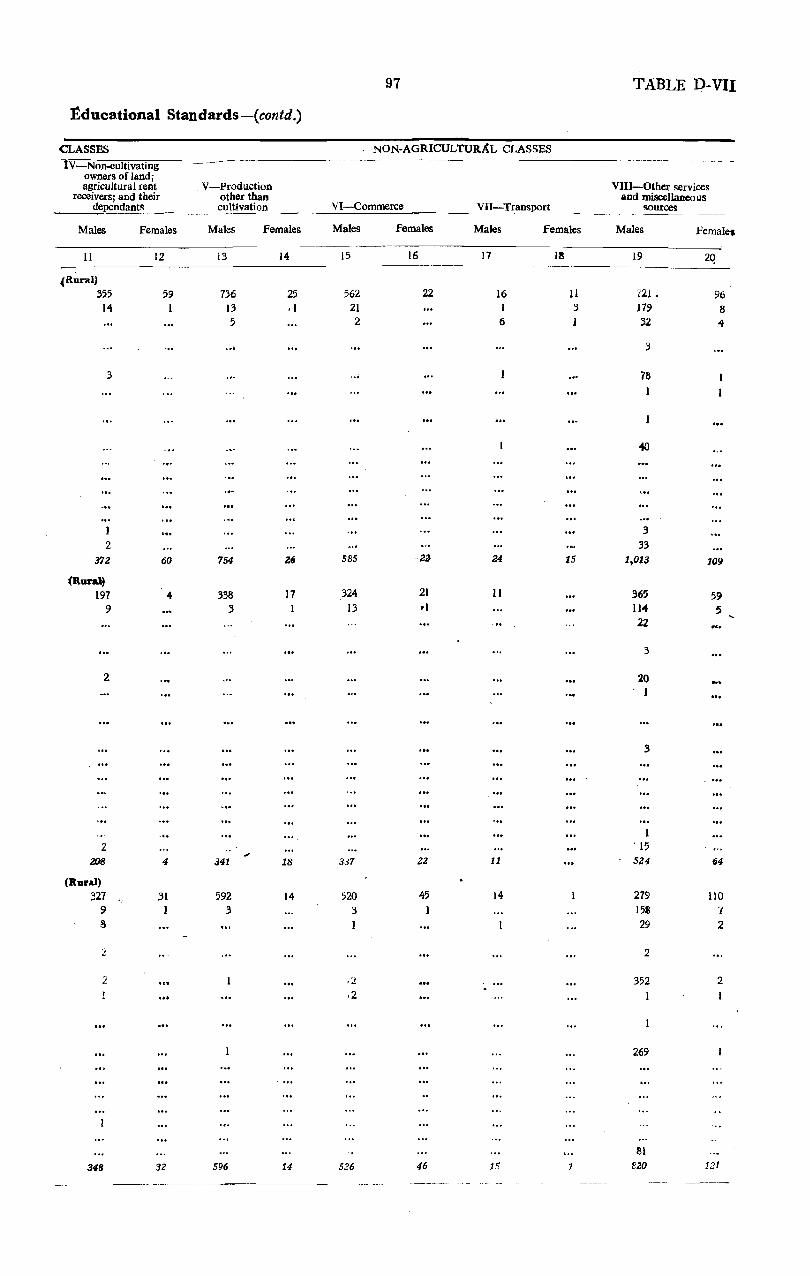
£ducational Standards-(contd.)
CLASSES -IV NOlHlultivating
owners of land; agricultural rent
receivers; and their dependant~ __ _
Males
11
• Rural)
355 14
3
2 372
~Rura))
197 9
2
2 208
(Rural) 327
9 8
:.!
2
348
Females
12
59
60
...
4
31 I
32
V-Production other thaD cultivation
Males Females
13
736 13 5
....
754
338 .3
341
592 .3
596
14
25 .1
26
17
... 18
14
14
97 TABLE D-VII
NON-AGRICULTURAL CLASSES ------------ - -----------,
VI-Commerce
Males
15
562 21 2
585
324 13
337
520 .3 1
.2 ,2
526
Females
16
22
23-
21 rI
2Z
45
46
VII-Transport
Males Females
17 18
16 11 1 3 6 1
24 15
11
11
14
1'5
VIII-Other services and miscellaneous
sources
Males
19
721. 179 32
.3
78
.3 .33
1,013
365 114 22
3
20 , I
.3
1 ' 15 524
279 1511 29
2
352
269
81
BZO
Females
2Q
96 8 4
109
59 5
64
110
7 2
2
121
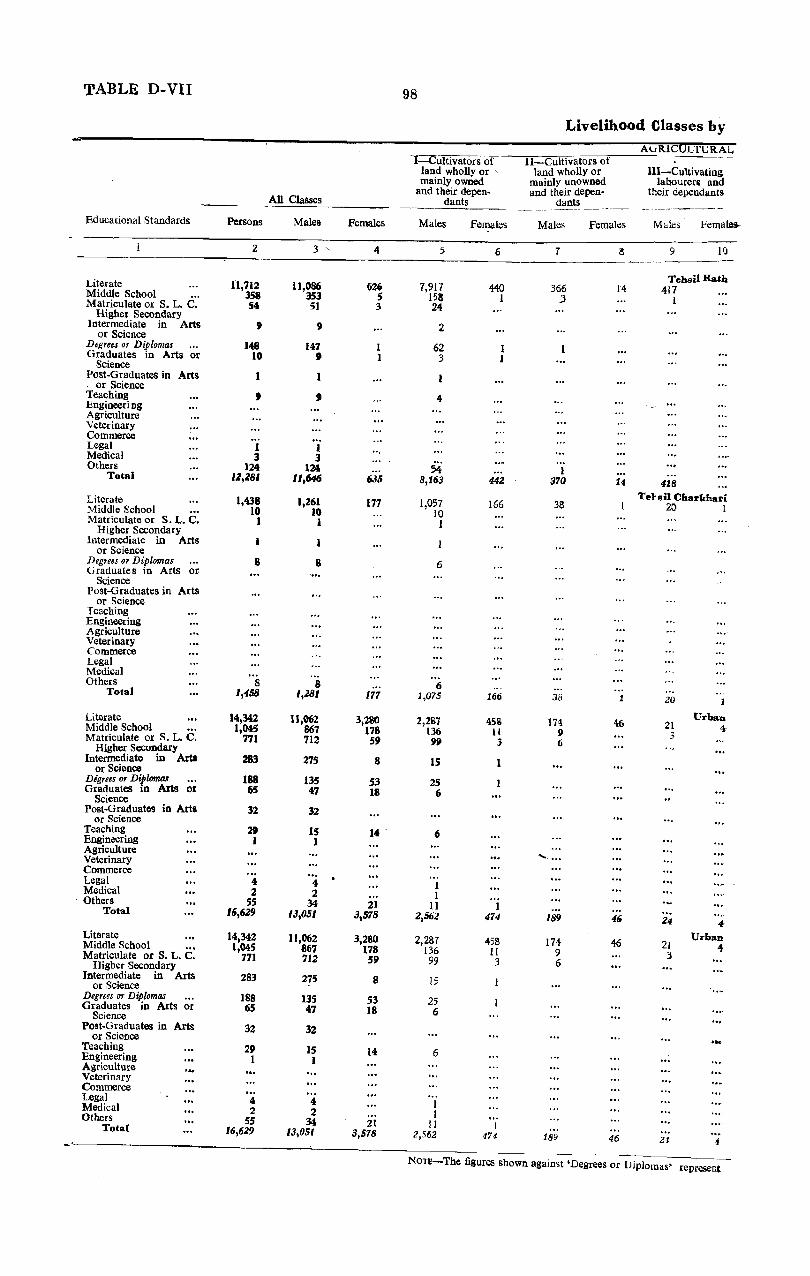
TABLE D-VII
Educarional Standards
Literate Middle School Matriculate or S. L. C.
Highet Secondary Intermediate in Arts
or Science Degrees or Diplomas Graduates in Arts or
Science Post-Graduates in Arts
or Science Teaching Engineeri og Agriculture Veterinary Commerce Legal Medical Others
Total
Literate Middle School Matriculate or S. L. C.
Higher Secondary Intermediate in AIts
or Science Degrees or Diplomas Graduates in Arts or
Science Post-Graduates in Arts
or Science Teaching Engineering Agriculture Veterinary Commerce Legal Medical Others
Total
Literate Middle School Matriculate or S. L. C.
Higher Secondary Intermediate in Arta
or Science Digrees or Diplomas Graduates in Arts OJ)
Science Post-Graduates in Arts
or Science Teaching Engineering Agriculture Veterinary Commerce Legal Medical Others
Total
Literate Middle School Matriculate or S. L. C.
Higher Secondary Intermediate in Arts
or Science Degrees or Diplomas Graduates in Arts or
Science Post-Graduates in Arts
or Science Teaching Engineering Agriculture Veterinary Commerce Legal Medical Others
Total
Persons
2
fl,712 358 54 ,
148 10
1 ,
1 3
124 11,181
1,438 10 1
1
8
8 1,458
14,342 1,045
771
Z83
188 tiS
32
29 I
4 2
55 16,619
14,342 1,045
771
283
188 65
32
29 1
4 2
SS 16,629
All Classes
Males
3 '
11,086 353 51
9
147 , 1
!II
1 3
124 11,646
1,261 10
1
8
8 1,28,
11,062 867 712
275
135 47
32
15 1
4 2
34 13,051
11,062 867 712
275
135 47
32
15 1
4 2
34 13,051
Females
4
62. 5 3
1 1
635
177
111
3,2110 178 59
8
53 18
14 .
21 3,518
3,280 178 59
8
53 18
14
21 3,518
98
t=Cultivators of land wholly or ' mainly owned
and their dependants
Males
5
7,917 158 24
2
62 3
4
54 8,163
1,057 10 1
6
6 1,075
2,21'.7 136 99
15
25 6
6
1 1
II 2,562
2,287 136 99
15
25 6
6
1 I
11 2,562
Females
6
440 1
I I
442
166
166
4511. 11 J
1
1 474
-458 11 3
I 474
Livelihood Classes by
ll-Cultivators of land wholly or
mainly unowned and their depen-
_ dan~~ ____ _
Males
7
366 3
1 370
38
31J
174 9 6
.,,_' ...
189
174 9 6
189
Females
14
1
46
46
46
46
AURICULTURAL
Ill-Cultivating labourers and
their dependants
Males Fema~
9 10
TehsilRath 417
I
418 Tel- sil Charkhari
20 1
20 1
Urban 21 4-
J
24 '" Urban
21 4 3
...
NOTE-The figures Shown against 'Degrees or IJiplomas' represent.
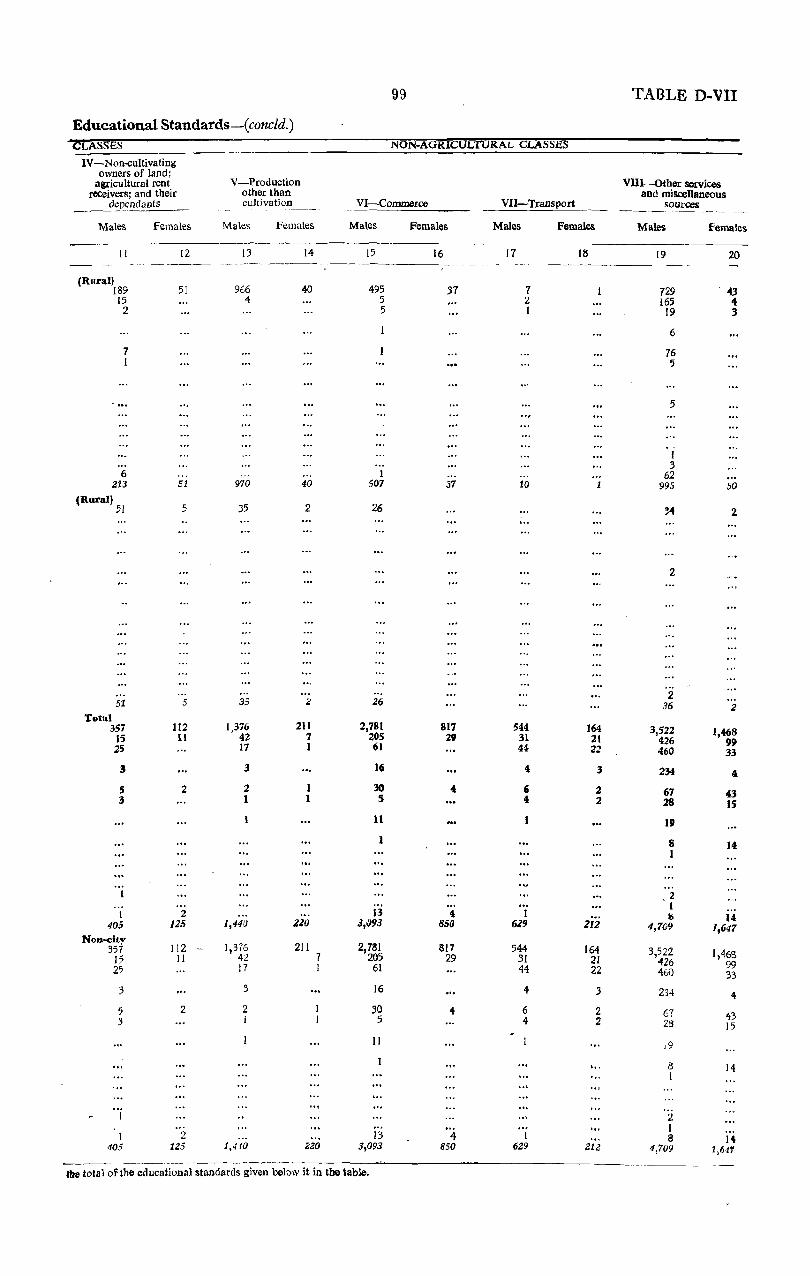
Educational Standards-( concld.) CLASSES
IV -Non-cultivating owners of land;
agricultural rent receivers; and their
dependants
Males
II
(Rural) 189 15 2
7 1
. ...
6 213
(Rural) 51
51 Total
357 15 25
3
S 3
1
1 4.05
Non-dtv 357
15 25
3
5 3
I 405
Females
12
51
51
5
5
112 II
2
2 125
112 11
2
2 125
-
V-Production other than cultivation
Males
13
966 4
970
35
35
1,376 42 17
3
2 1
1,440
1,376 4~ 17
3
2 I
Females
14
40
40
2
... <:
211 7 1
1 1
ZZO
211 7 I
1,4-tO ~ZO
99
NON-AGRICULTURAL CLASSES
VI-Commerce
Males
15
495 5 5
I 507
26
36
2,781 205 61
16
30 5
11
1
13 3,{)93
2,731 205
61
16
30 5
11
13 3,093
Females
16
37
817 29
..
4 850
817 29
4
4 850
VII-Transport
Males
17
7 2 1
10
544 31 44
4
6 4
1
1 6Z9
544 31 44
4
6 4
I 629
Females
HI
164 21 22
3
2 2
'" 212
164 21 22
.3
2 2
'"
212
the total ofthe educational standards given below it in the table.
TABLE D-Vn
VIll-Other services and miscellaneous
sources ---Males Females
19 20
729 43 [65 '" 19 3
6
76 5
5
1 3
62 995 50
'4 2
2
2 36 Z
3,522 1,468 426 99 460 33
234 4
67 43 28 IS
19
8 14 1
2 1 S 14
4,109 1,641
3,522 1,46B 426 99 460 33
234 4
67 43 28 15
19
8 14 I
2 I 8 14
4,709 1,64'1

PART II
VILLAGE, TOWN, PARGANA AND THANA STATISTICS

102
Primary Censas
Total no. of persons Inmates or enumerated (includiag :nsi ltution s
No. of Occupied inmates of institutions and houseless 0 the houses and housel~s personsl persons = hamlets No. of .g~Nllme of Village or in the Area in No. of house-8 . Town/Ward village Pargana Thana acres houses holds Persons Males Females M F
--_-----. 2 3 4 5 6 7 8 9 10 II 12 13
-----~---
TEHSIL HAMIRPUR
I Abdullahpur Hamirpur Korara 239 Unpopulated 2 Amirta 2 Sumerpur Hamirpur .. , 287 64 70 359 181 178 3 Arazi Dhanpura Do. Binwar 127 Unpopulated 4 Arazi Khandehi Jar ... Do. Do. 137 Unpopulated 5 Arllzi Mutnazia Padhri Do. SumerpuI .. , 9 Unpopulated 6 Arazi Sagar Do. Binwal' 177 Unpopulated 7 Arazi S.midhanpura Do. Do. 105 Unpopulated B Atraiya 2 Do. Sumerpur ... 1,856 86 86 477 249 228 9 Atrar I Do. Binwar 2,271 132 150 '149 409 340
10 Babina Do. Sumerpur ... 540 Unpopulatej II Bachrauli 3 Hamirpur Korara 3,782 214 265 1,467 758 709 12 Badanpur 1 Do. Hamirpur ... 898 15 15 102 58 44 13 Badanpur 1 Sumerpur Snmerpur 825 61 76 410 213 197 14 Bahrauli Danda Do. Do. 822 Unpopulated 15 Bahrauli Darya Do. Do. 253 Unpopulated 16 Baije IsIllmpur I Hamirpur Korara 1,571 20 20 108 58 50 17 Brahminpur I Do. Do. 476 8 8 43 24 19 18 Banda 1 Sumerpur Binwar 1,455 177 189 857 458 399 19 Bank I Do. Sumerpur .. , 1.029 79 87 410 216 194 20 Banki 2 Do. Do. 2,034 274 337 1,576 814 762 21 Bara Gaon 1 Do. Hamirpur 1,694 86 105 498 287 211 22 Bardaha Sahjana 1 Do. Do. 737 67 77 359 U!7 172
Danda 23 Bardaha Sahjana Do. Do. 380 Unpopulated
Darya 24 Barkhera 1 Do. Sumerpur ... 1,466 106 133 672 342 330 25 llary;a .3 Hamirpuc Korara 1,257 71 80 468 250 218 26 Barwa 3 Sumerpur Sumerpur ... 1,315 77 83 500 252 248 27 Bendrapuri ... 1 Hamirpur Korara 1,564 16 17 98 54 44 28 Beri 1 Do. Do. 3,394 454 477 2,311 ],258 1,053 3 4 29 Bhakaul Sumerpur Hamirpur ... 1,653 Unpopulated 30 Bhainsapali 1 Hamirpur Korara 1,477 89 99 468 230 238 31 Bhamora 1 Sumerpur Sumerpur ... 394 39 69 316 157 159 32 Bhatpura Danda 1 Hamirpur Korara 936 120 150 &8 432 376 33 Bhatpura Darya Do. Do. 246 Unpopulated 34 Bhauli Danda 2 Do. Do. 1,645 229 339 1,768 972 796 35 Bhauli Darya Do. Do. 516 Unpopula!ed 36 Bhawaniyan 1 Sumerpur Sumerpur ... 1,579 104 119 544 276 268 37 Bhilwan Danda 2 Hamirpur Hamirpur ... 253 34 34 161 83 78 38 Bhilwan Darya Do. Do. 94 Unpopulated 39 Bhitri Do. Korara 522 Unpopulated 40 Bhonra Danda SumerpUr Sumerpur .,. aS5 690 775 829 434 395 41 Bhonra Darya Do. Do. 75 Unpopul&ted 42 Bidokhar Medni I Do. Do. 2,749 207 259 1,161 581 580 43 Bidokhar PUra J Do. Do. 2,737 282 291 1,293 652 641 44 Bilanhdi I Do. Do. 414 50 59 297 150 147 45 Bilota 4 Hamirpur Korara 1,427 128 134 756 397 359 46 Chakauthi 1 Do. Do. 1,011 70 80 384 197 1l>7 47 Chak Jamrehi Teer '" Do. Do. ... 52 Unpopulated 411 Chandaukhi Sumerpur Hamirpur ... 1,489 86 113 485 260 225 49 Chandauli Jar Do. Sumerpur ... S44 12 12 63 32 31 50 Chandauli Teer Do. Hamirpur ... 275 42 46 243 126 117 51 Chand Purwa Buzurg Do. Sumerpur ... 3,262 282 300 1,648 849 799 52 Chand Purwa Khurd Do. Do. 770 Unpopulated 53 Cbandupur Danda ... 5 Hamirpuf Hamirpur ... 1,362 59 116 387 195 192 54 Chandupur Dalya Do. Do. 365 Unpopulated 55 Chhani Buzurg I Sumerpur Binwar 2,873 208 228 1,048 548 500 56 Chhani Khurd 1 Do. Do. 2,564 392 398 1,778 936 842 ')7 Damar I Hamirpur .. Korara 3,548 155 155 719 391 328 58 Daryr.pur I Sumerpur Sumerpur ... 1,320 103 167 564 297 267 59 Deviganj 1 Hamirpur Korara 1,115 34 37 215 114 101 60 Deogaon I Sumerpur Sumerpur ... 2,209 289 289 1,384 699 685 61 Dhanpura 1 Do. Binwar 1,114 100 123 591 286 305 62 Dhundpur 2 Do. Sumerpur '" 1,526 143 173 869 456 413 63 Gahtauli I Do. Do. 879 41 42 203 109 94 64 Gauri I Do. Do. 736 32 33 146 76 70 65 Gimuhan Danda I Eamirpur Korara 721 51 62 412 218 194 £6 Gimuhan Darya Do. Do. 160 Unpopulated 67 Gujraura 1 Do. Do. 1,627 35 38 185 90 95 68 Gulabganj 2 Do. Do. 802 21 22 105 56 49 69 Haraulipur 2 Do. Do. 775 28 ,0 181 107 74 70 Helapur Danda 1 Sumerpur Hamirpur ... 554 93 III 514 283 291 71 Hc!apur Darya Do. Do. 141 Unpopulated 72 Indrapuri I Hamirpur Korara 1,372 18 18 j24 72 52 73 lngotha 1 Sumerpllf Sumerpur ... 6,987 533 721 3,293 1,782 1,511 74 lsauli 1 Do. Do. 680 24 30 163 811 74 75 ltra I Do. Do. YOI 10 13 50 25 25 76 Jakhela 1 Hamirpur Korara 1,593 135 139 589 321 268 77 Jalala I Sumerpur Sumerpur 543 42 45 246 135 III
-----~~ -.--~.~ -----------

103
- Abstract-( contd.)
Displaced . persons ~terates
M F
14 15
(RURAL)
4 5
M F
16 17
21
69 58
124 6
31
2 1
112 10
158 5
27
49 32
128 2
323
27 91
266
22 6
15
127 182 36 26 4
3:i
136
4
162 186 30 41 6
166 36 36 16 16 26
10 9
11 44
1 358
18
32 26
9 3
3
7
13
2
31
5
16
20 4
35
14 10 3 1
12
18 2 1 9
23 2 2
2 6
41
AGRICULTURAL CLASSES NON-AGRICULTURAL CLASSES
Il-Cultiva- IV-Non-cul-tors of land tivating own-
I-Cultivators of land wholly or mainly owned
and their dependants
wholly or ers of land j mainly un- III-Cultivat- agricultural V-Produc-
owned ting labourers rent receivers; tion other and their and their and their than cul-dependants dependants dependants tivation
M F M F
18
70
193 276
635 55
160
48 23
264 179 566 250 147
286 170 177 39
685
171 97
337
710
184 62
252
377 472 114 296 100
159 12 73
635
183
234 477 264 215 104' 400 184 340
61 51
180
75 41 74
234
53 971
75 14
114 102
19 20 21
71 4
188 9 a 232 34 25
632 7 11 41 3 3
147 5 3
39 15
223 68 58 158 518 45 37 174 1 2 131 13 10
272 164 181 31
559
179 106 303
646
173 69
223
358 447 106 287 104
141 8
68 591
180
196 438 218 193 90
382 208 304
54 50
154
76 39 50
224
43 879
63 13 80 87
10 23 7
10 54
8 4 7
3
18 8
86
32
46 32
15
28
5
113 37 24 30
3 38 64 21 18 5 9
2 9
30
10 188
I 94 6
13 19 9
11 51
7 7 8
2
17 I
82
29
34 19
19
31
8
106 24 26 17 2
44 65 23 8 2
16
7 21
5 144
4 72 9
M F M F M F
51 54 35 37
21 15 23 16 69 54 4 3 13 13
33 16 16 2 20 12
31 35 8 5 4 3
8 10 I 4
65 66 12 14 18 13 30 30 I 3 88 86 23 34 34 29 22 ?3 14 14 13 6
II I 8
21 27 35 25 30 27 12 6 2 2
248 218 41 36
33 29 9 14 48 43 4 1 46 35 8 4
116 87 21 10
43 47 I 2
31 30 30 32
61 62 40 51 47 50 16 25 16 13 2 39 32 27 31 13 15
78 72 223 2
49 48 103 97 6 8
3
58 61 9 13 176 16j 20 10 78 73 1 20 25 13 15 4 5
194 192 23 20 3 6 45 37 20 22 14 11 15 21
4 10 8 10 8
7 12 ') 3 2 3
35 53
9 4 321 275 II 8
9 7 5 4 10 8 54 60 20 14 5
9 11 5 3
82
4
21
53
13 2
12
34 59 9
II 25
12
27
2
46 140
7 2 2
29 7
13 1
18
1 1 I 9
141
6 8 4
74
3
15
14
10 1
6
30 58 11 4
18
4
31
3
38 122
4 I 4
26 5
10
16
2
3
78
47. 46
VllI-Other services and
VI-Com- VIl-Trans- miscellaneous merce port Sources 0
a -8
M F M F M F8
3
5
7
2
5 2 5
2
5 6
41
3 3
39
4
2
3 23
3
6
7
37 40
5 2
... 9
6
18
6
2
2
2 1 6
I 8
30
2 3
17
2
6
5 27
2
2
11
34 34 1 1
... 9
7
2
25
... 8
3
4 3
2
2
",/.. , ....
32 33 I
18
3 8
40
5
26 4
53
5
16 6
15
104
5 I
10
30
14 10
21
34 35 10 2
5
40
2
51 46 12 15 I
21 5
11
10 1
4
5
132
I 13 2
3 ... 5 6 7
I 8 II 9
10 35 II
12 4 13
14 15 16 17
23 18 2 19
52 20 21
9 22
23
12 24 1 25
13 26 27
83 28 29
6 30 ~l
8 32 3)
18 3'* 3, 19 36 5 37
3& 39
16 40 41
45 42 34 43 10 44 4,
46 47
6 4S 49 5()
3D 51 52 5} 54
52 5:; 43 56
6 57 15 5S
)9 32' 6()
t 61 10 6l
63 6 64
65 (,6
3 67 .68 6'J
10 70 71 72
1,)2 73.,':' •• ... ;)4' .c. 7)
6 /'1 76 2 .... 77
---" ----------,----,-,
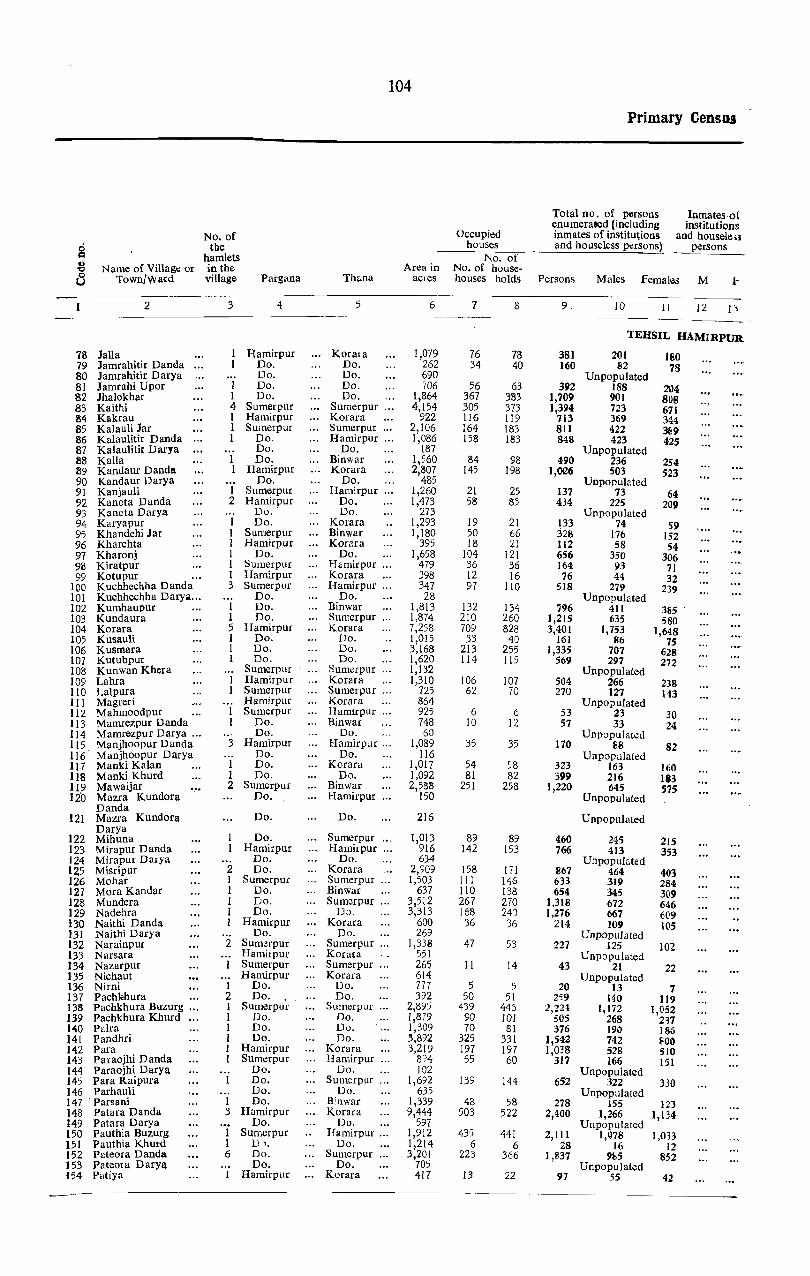
104
Primary Censas
Total no. of persons Inmates· of enumera)ed (including institutions
No. of Occupied inmates of institutions and housele;~ ci the houses and houseless persons) persons c= hamlets No. of 4)
Name of Village or in the Area in No. of house-'1:1 0 Town!Waxd village Pargana Thana acres houses holds Persons Males Females M 1-U
2 3 4 5 6 7 8 9. 10 II 12 J)
TEHSIL HAMIRPUR
78 Jalla Hamirpur Korara 1,079 76 78 381 201 180 79 Jamrahitir Danda Do. Do. 262 34 40 160 82 78 80 Jamrahitir Darya Do. Do. 690 Unpopulated 81 Jamrahi Upor I Do. Do. 706 56 63 392 188 204 82 Jhalokhar I Do. Do. 1,864 367 383 1,709 901 808 83 Kaithi 4 Sumerpur Sumerpur 4,154 305 373 ],394 723 671 84 Kllkrau 1 Hamirpur Korara 922 116 119 713 369 344 85 Kalauli Jar 1 Sumerpur Sumerpur ... 2,106 164 183 811 422 ~9 86 Kalaulitir Danda I Do. Hamirpur ... 1,086 158 183 848 423 425 87 Kalaulitir Darya Do. Do. 187 Unpopulated 88 Kalla 1 Do. Binwar 1,560 84 98 490 236 254 89 Kandaur Danda 1 Hamirpur Korara 2,807 145 198 1,006 503 523 90 Kandaur Darya Do. Do. 485 Unpopulated 91 Kanjauli I Sumerpur Hamirpur 1,260 21 25 137 73 64 92 Kanota Danda 2 Hamirpur Do. 1,473 58 85 434 225 209 93 Kanota Darya Do. Do. 273 Unpopulated 94 Karyapur 1 Do. Korara 1,293 19 21 133 74 59 95 Khandehi Jar I Sumerpur Binwar 1,180 50 66 328 176 152
'! •••
96 Kharehta I Hamirpur Korera 395 18 21 112 58 54 97 Kharonj 1 Do. Do. 1,658 104 121 656 350 306 98 Kiratpur 1 Sumerpur H.mirpur ... 479 36 36 164 93 71 99 Kotupur ... 1 Hamirpur Korara 398 12 16 76 44 32
100 Kuchhechha Danda 3 Sumerpur Hamirpur 347 97 11O 518 279 239 101 Kuchhechha Darya ... Do. Do. 28 Unpopulated 102 Kumhaupur 1 Do. Binwar 1,813 132 134 796 411 385 103 Kundaura I Do. Sumerpur 1,874 210 260 1,215 635 580 104 Korara 5 Hamirpur Korara 7,258 709 828 3,401 1,753 1,648 105 Kusauli I Do. Do. 1,015 33 40 161 86 75 106 Kusmara I Do. Do. 3,168 213 255 1,335 707 628 107 Kutubpur I Do. Do. 1,620 114 115 569 297 272 108 Kunwan Khera Sumerpur Sumerpur 1,132 Unpopulated 109 Lahra Hamirpur Korara 1,310 106 107 504 266 238 110 Lalpura Sumerpur Sumerpur 725 62 70 270 127 143 111 Magreri Hamirpuf Korara 864 Unpopulated 112 Mahmoodpur Sumerpur Hamlrpur ... 925 6 6 53 23 30 113 Mamrezpur Danda Do. Binwar 748 10 12 57 33 24 114 Mamrezpur Darya ... Do. Do. 60 Unpopulated 115 Manjhoopur Danda 3 Hamirpur Hamirpur ... 1,089 35 35 170 B8 82 116 Manjhoopur Darya Do. Do. 116 Unpopulated 11.7 Manki Kalan 1 Do. Korara 1,017 54 58 323 163 160 lIS Manki Khurd 1 Do. Do. 1,092 81 82 399 216 113 119 Mawaijar 2 Sumerpur Binwar 2,588 251 258 1,220 645 575 120 Mazra Kundora Do. Hamirpur 150 Unpopulated
Danda 121 Mazra Kundora Do. Do. 216 Unpopulated
Darya Do. Sumerpur 1,013 89 89 122 Mihuna 460 245 215
123 Mirapur Danda Hamirpur Hamirpur ... 916 142 153 766 413 353 124 Mirapur Darya Do. Do. 634 Unpopulated 125 Misripur 2 Do. Korara 2,909 158 171 867 464 403 126 Mohar 1 Sumerpur Sumerpur 1,503 III 146 633 319 284 127 Mora Kandar 1 Do. Binwar 637 110 138 654 345 309 128 Mundera 1 Do. Sumerpur 3,5('2 267 270 1,318 672 646 129 Nadehra 1 Do. Do. 3,313 168 240 1,276 667 609 130 Naithi Danda 1 Hamirpur Korara 600 36 36 214 109 105 131 Naithi Darya Do. Do. 269 Unpopulated 132 Narainpur 2 Sumerpur Sumerpur 1,338 47 53 227 125 102 133 Narsara Hamirpur Korara 551 Unpopulated 134 Nazarpur Sumerpur Sumerpur 265 11 14 43 21 22 135 Nichaut Hamirpur Korara 614 Unpopulated 136 Nirni 1 Do. Do. 777 5 5 20 13 7 137 Pach~hura 2 Do. Do. 392 50 51 2~9 140 119 138 Pachkhura Buzurg '" 1 Sumerpu~ Sumerpilr 2,895 439 446 2,221 1,172 1,052 139 Pachkhura Khurd 1 Do. Do. 1,879 90 101 505 268 2,7 HO Palra 1 Do. Do. 1,309 70 81 376 190 186 141 Pandhri 1 Do. Do. 3,892 325 331 1,542 742 ~OO 142 Para I Hamirpur Korara 3,219 197 197 1,038 528 510 143 Paraojhi Danda 1 Sumerpur Hamirpur 814 55 60 317 166 151 144 Paraojhi Darya Do. Do. 102 Unpopulated 145 Para Raipura Do. Sumerpur 1,692 139 144 652 322 330 146 Parhauli Do. Do. 635 Unpopulated 147 Parsani I Do. Binwar 1,339 48 58 278 155 123 148 Patara Danda 3 Hamirpuf Korara 9,444 503 522 2,400 1,266 1,134 149 Patara Darya Do. Do. 597 Unpopulated 150 Pauthia Buzurg 1 Sumerpur Hamirpur ... 1,912 435 441 2,111 1,078 1,033 151 Pauthia Khurd I D~. Do. 1,214 6 6 28 16 12 152 Pateora Danda 6 Do. Sumerpur .. , 3,201 223 366 1,837 9~5 852 153 Pateora Darya Do. Do. 705 Unpopulated (54 Patiya Hamirpllf Korara 417 13 22 97 55 42
---~-~-"

105
Abstract-{contd.)
Displaced persons
M F
14 15
Literates
M F
16 17
(RURAL} c-(contd. !
7
70 18 155 13 150 53 16 1 59 6 80 6
25 12 81 5
15 25
13
28 t 2 I
28 3
21 103 4 518 56
66 5 26
21 '2.5 2
8
2
8 13
123 15
20 40
43 17 30
126 127 17
34
I 16
319 36 14
157 41 36
31
20 223
92
135
1 3
6
3 5 5
2
13
2
6 13
3
5
AGRICU~TURAL CLASSES NON-AGRiCULTURAL CLASSES
ll-CLlltiva- IV-Non~ul-tors of land tivating own-
wholly or ers of land; I-Cultivators or land wholly or mainly owned
and their dependants
mainly un- IlI-CuItivat- agricultural V-Produc-owned ting labourers rent receivers; tion other
and their and their and their than cul-depend3E_~~ dependants dependants tivation
VllI-Other serVices and
VI-Cam- VII-Trans- miscellaneo US merce port sources <5
---- r::l
~ M F M F M F M F M F M F M F M F8 ---------------------------------~
18
129 72
164 438 677 320 322 281
149 :2.98
51 136
72 148
35 322
81 42
168
177 408 633
52 484 255
170 51
22 7
57
61 65
388
142 265
213 290 85
365 433 ~4
9)
17
109 714 208 135 467 329
88
222
71 914
637 16
730
53
19 20 21
102 14 16 70
176 410 118 95 620 4 9 306 296 34 24 275 15 16
160 8 10 332 52 44
43 12 7 128 43 38
57 130 14 18 39 13 4
279 5 3 65 1 32 2
142 2
152 149 146 385 43 48 636 114 110 45 14 11
443 I I 245 2
166 3 55 36 32.
30 4 20 13
55 25 21
58 79 80 53 99 95
336 Ito 95
114 75 69 222 42 31
191 52 41 220 2 5 86 143 132
364 133 115 396 50 49 97 1
84 1 I 7
15
97 12 7 648 89 57 175 7 II 127 6 10 485 81 91 330
66 7 7
221 12 13
53 19 13 817 50 37
623 48 33 12
621 55 40
4t
22 23 24 25 26 27 28
33 35 9 10 7
8 6 2 160 139 15
13 12 5 43 32 43 43 2 87 91
36 42 19 71 80 6
9 [0 23 21 10
2 2 5 1 2 4 2 5
21 21 1 10 6
59 62 2
47 47 I 88 77 2
237 267 77 11 II 3
IZQ 107 23 18 13 7
64 53 27 3i:I
2
4 5 2
21 20 45 30 3 97 97 19
17 27 86 83
104 81 8 27 21 8 42 26 22 99 96 68 65 33 5 4
9 9 6
4 4
12 7 13 10
160 174 45 24 30 32 34 11
109 130 2 126 132
60 61
47 51
22 27 15 138 149 7
150 134 49
8f5 72 8
2
10 II 8
4 8 8 II 6~ 68 51 28 9 8 9
5 4 4 16 19 3 I 6 7
19 9 8 I 7 53 44 6 3
[ 4 10 Y 10
6 3 6 I 3 3
II 14 3 2
2 7 689 I 41 32 7 4
70 342 257 183 159 5 2 3 I
23 42 23 5 9 5 I 7 2
12 \I 3 2 2 3 4 3
2 3 3
25 ;4 12
4 3 3 1 I 5
7 59 57 10 18 21 19 23 20 1 31 34
36 35 29 4 2
2
6 5 23 78 61
15 10 10 8 59 62
48 31 4 9
19 20
10 12 12 6 81 52
62 101 95
9 29 37
2
12 8 I I :3 :3
23 23 20 II
16 20 9 3 '5 4
13 15 13 14 5 13
8 10
% 40
24 29
27 14
30
2
19
3
13
3L 32 33 I
5 9 78 1 79
80 6 10 81
55 57 82 16 12 63
I 2 84 5 3 85
33 33 86 87
15 14 88 :; 15 10 89
90 91
4 2 92 93 94 95 96 97 98 99
j I 15 7 100
5
12
101 22 23 102 46 33 103
166 149 104 3 ... 105
32 22 106 9 5 107
108 14 8 109 1 12 110
I I 1 ... ll~
5 5 113 114
'" 115 116
I ... 117 1 2 lIS
16 10 119 120
121
7 I 122 4 3 123
124 16 18 125 3 6 126
27 23 127 21 13 128 28 23 129 5 2 130
131 ... 132
133 2 134
135 ... 136 ... 137
70 69 138 5 8 139 1 I 140
II 9 141 12 3142 2 ... 143
144 14 15 145
146 16 8 147 40 33 148
149 69 57 150
... 151 35 47 152
153 ... 154
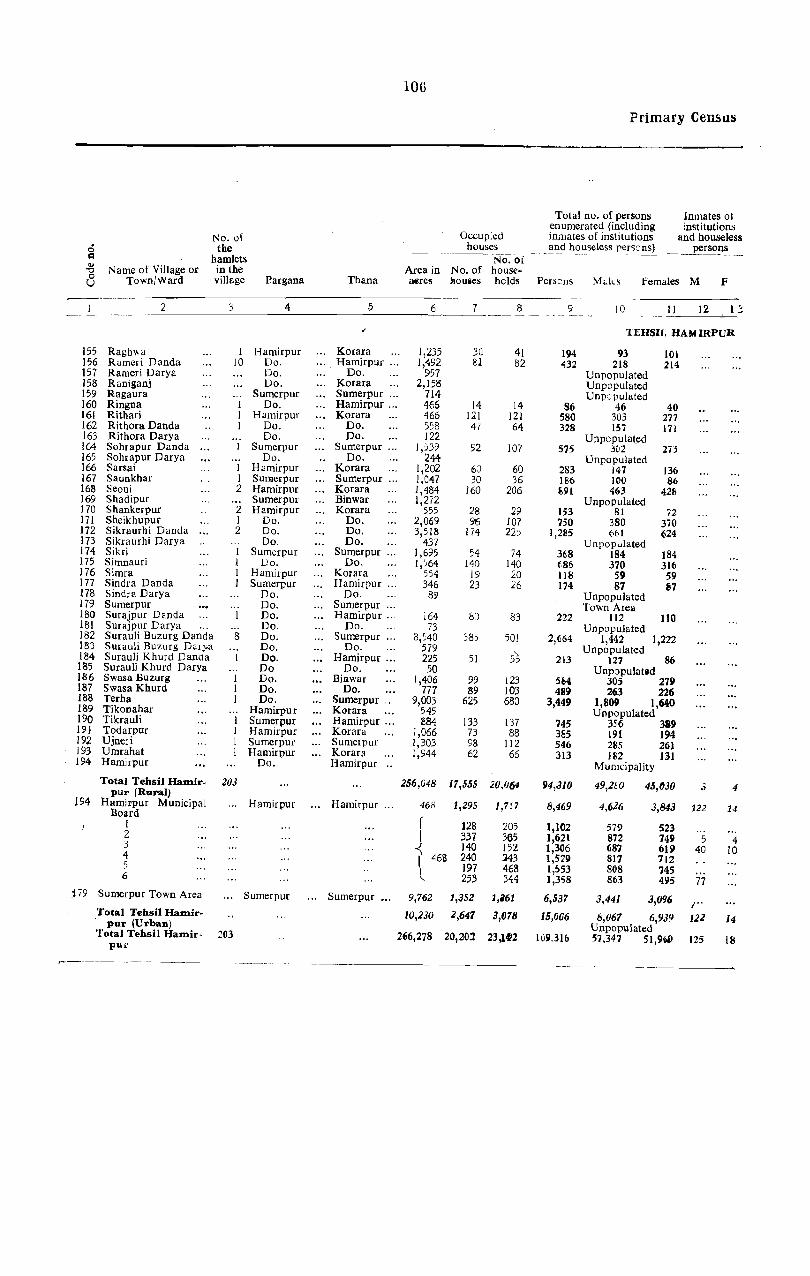
106
Primary Censas
Total no. of persons Inmates 01 enumerated (including institutions
No. of Occup:ed inmates of institutions and houseless 0 the houses _;lnd hO_:Iseless perS'2Ds) ___ ~rso~
--_ No.-of -c:I hamlets 0-
Name of Village or in the Area in No. of house-"0 0 Town/Ward village Pargana Thana aercs Mouies holds Perseus Mdes females M F U
--~----
2 3 4 5 6 7 8 9 10 II 12 1 ::: -------
"' TEHSIl. HAMIRPUR
155 Ragh\\a I Hamirpur KoraIa 1,235 30 41 194 93 101 156 Rameri Danda 10 Do. Hamirpuf 1,492 81 82 432 218 214 157 Rameri Darya Do. Do. 957 Unpopulated 158 Raniganj Do. KoraIa 2,158 Unpopulated 159 Ragaura Sumerpur Sumerpur ... 714 Unpe pula ted 160 Ringna Do. Hamirpur ... 466 14 14 86 46 40 161 Rithari Hamirpur Korara 466 l:ll 121 580 303 277 162 Rithora Danda Do. Do. 558 47 64 328 157 171 163 Rithora Darya Do. Do. 122 Unpopulated 164 Sohrapur Danda Sumcrpur Sumcrpur 1,539 92 107 575 3(12 273 165 Sohrapur Darya Do. Do. 244 Unpopulated 166 Sarsai I Hamirpur KoraIa 1,202 6:) 60 283 147 136 167 Saunkhar I Sumerpur Sumerpur ... 1,047 30 36 186 100 86 168 Seoni 2 Hamirpur Korara 1,484 160 206 f.91 463 428 169 Shadipur Sumerpur Binwar 1,272 Unpopulated 170 Shankerpur 2 Hamirpur Korara 555 28 29 153 81 72 I7l Sheikhupur I Do. Do. 2,069 % 107 750 380 370 172 Sikraurhi Danda 2 Do. Do. 3,518 174 225 1,285 661 624 173 Sikraurhi Darya Do. Do. 437 Unpopulated 174 Sikri Sumerpur Sumerpur ... 1,695 54 74 368 184 184 175 Simnauri Do. Do. 1,564 140 140 t86 370 316 176 Simra Hamirpur Korara 554 19 20 liS 59 59 177 Sindra Danda Sumerpur Hamirpur '" 346 23 26 174 87 87 178 Sindra Darya Do. Do. 89 Unpopulated 179 Sumerpur Do. Sumerpur '" Town Area 180 Surajpur Danda Do. Hamirpur .. 164 8el 83 222 112 110 181 Surajpur Darya Do. Do. 73 Unpopulated 182 Surauli Buzurg Danda 8 Do. Sumerpur ... 8,540 ::85 501 2,664 1,442 1,222 183 Surauli Buzurg Dary.a Do. Do. 579 , UnpopUlated 1M Surauli Khurd Danda Do. Hamirpur ... 225 51 55 213 127 86 185 Surauli Khurd Darya Do Do. 50 UnpJpulatid 186 Swasa Bllzurg Do. Biawar 1,406 99 123 SSt 305 219 187 SWasa Khurd Do. Do. 777 89 103 489 263 226 188 Terba DQ. Sumerpur .. 9,003 625 680 3,449 1,809 1,640 189 Tikooahar Hamirpur Korara 545 Unpopulated 190 Tikrauli Sumerpur Hamirpur ... 884 133 137 745 356 359 191 Todarpor Hamirpu~ Korara 1,066 73 88 385 191 194 192 Ujne:i Sumerpur Sumerpur 1,303 98 112 546 285 261 193 Umrahat Hamir-pur Korara 1,944 62 66 313 182 131 194 Hamirpur Do. Hamirpur .. Municipality
Total Tehsil Hamir- 203 256,048 17,555 20,064 94,3W 49,2W 45,030 3 4 pUr (Rural) 194 Hamil'pur Municipal Hamirpur Hamirpur 468 1,295 1,717 8,469 4,626 3,843 122 14 Board r I 128 205 1,102 579 523
2 I 337 365 1,621 872 749 5 4 3 -< 140 152 1,306 687 619 40 10 4 I 46B 240 :M3 1,529 817 712 5 l 197 468 1,S53 808 745 6 253 344 1,358 863 495 77
jl9 Sumerpur Town Area Sumerpur Sumerpur 9,762 1,J52 1,i61 6,537 3,441 3,096 ",. Total Tehsil Hamir- 10,230 2,647 3,078 15,006 8,067 6,939 122 14 pur (Urban) Unpopulated Total Tehsil Hamir- 203 266,278 20,20:1 23,1412 11l9.31b 57.347 51,96&J 125 18 pur
,_------ -._------ ------._--

107
A bstract-. (eontd.)
AGRICULTURAL CLASSES NON-AGRICULTURAL CLASSES
Uisplaced oerSODS
ll-Cultivators of land
I-Cultivators of wholly or land wholly or mainly un-mainly owned owned aad
and their their Literates dependants dependants
M F M F M F M F
14 15 16 17 18 19 30 21
Ii lJRAL-(concld.\
8 63 72 17 13 12 150 150 29 32
7 27 29 11 6 40 6 169 168 36 28 26 105 109 13 9
48 5 127 116 81 8b
16 105 92 8 11 4 90 83 2 I
70 3 303 266 51. 55
2 62 56 18 16 25 2 312 297 II 12 81 4 561 526 I 2
22 112 126 33 31 25 219 205 27 21
1 43 43 II 12 2 59 52 19 24
36 5 63 71 3 2
72 1,010 838 58 50
21 2 55 35 23 13
41 9 175 156 50 46 38 1 156 140 41 31
365 40 993 929 136 j 38
32 1 179 220 60 57 33 5 112 102 27 27 95 18 141 132 43 33 20 113 82 58 4)
IV-Non-cultivating owners of land;
Ill-Cuhiva- agricultural V-Producting labourers rent receivers; tion other
and their and their than cul-dependants dependants tivation
VIII-Other services and
VI-Com- VII-Trans- miscellaneous merce port sources o
Q
.g M F M F M F M F M F M fl r3
22 23 24 25 26 27 2B 29 30 31 32 33
11 13 27 25
61 54 23 25
51 33
31 33 6 2
61.) 59
30 30 44 44
26 20 5';) 36 4 ::3 7 7
36 26
171 159
33 22
32 ~5
47 39 442 366
62 54 29 32 54 56 10 5
2 2 I I
3 2 5 3 3 6 6 1 ) 13 20
II 9 8 5
3 2
15 12 19 13
2 4 5 7 17 18 11 8
4 1 6 3 10 7 41 31
I I 2 4
4 4
63 55 40 28
2 5 7
14 20 17 13 L 1 6 2
::;5 60 59 61
13 19 26 26 16 22 2 I 8 11 16 .10
19 1
2
4
5 7
2 2
14
4
6 10 47
2 1
11
14 8
7
13
3 5
3 6
13
3
5 10 37
2 6
12
I 155 10 6 156
157 158 159
... 160 9 6 161 I ... 162
163 22 17 164
165 ... 166 •.. 167
10 10 168 169
I ... 170 15 17 171 20 21 172
173 I ... 174
12 10 175 .. : 176 ... 177
178 179
6 7 ISO lSI
86 79 182 183
'" 4 184 185
11 14 186 ! ::l 187
77 49 188 189
14 11 190 4 \ 4 191
12 7 192 1 1 193
194
,6 6 7,781 672 31,655 29,131 4,080 3,626 6,814 6,395 1,096 1,093 2,595 2,134 939 835 50 36 2,051 1,780
.39 31 1,2M 422
18 7
11
3
100 40 14 I 6 271 71 6 104 33
418 Ie7 5 310 81
9;!2 159
680
227 48 35 49
169 152
928
521
20] 19 17 36
149 ':19
43 32
8
6
6 23
6 ... 3
5 18
822 238 200
47 31 2,126 581 1,608 1,34'3 281 232
22
2 1
19
11
7
... 4
88
7 20
4 6
39 12
82 44 88
85 395 290 569 551
9 34 15 46 52 29 80 43 151 151
5 61 48 121 138 3 108 89 159 132
39 54 42 85 75 58 53 7 3
90 344 308 559 551
85 66 2,744 2,287 194
15 16 40
9 4 I
9 240 231 20 556 480 26 420 382
5 486 441 2 45t 433 4 591 314
99 24 1,103 1,057 1,9
104 55 176 175 739 598 1,128 1,102 184 90 3,847 ,1,344
53 37 9,907 1.253 33,263 30,474 4,361 3,858 6,918 6,450 1,272 1,268 3,334 2,732 2,067 1,937 234 1265,898 5,124

108
Primary Censu:;
..,.
Total no. of persons Inmates of enumerated (including instituti:ms
No. of Occupied inmates of institutions and houseless ci the houses ann houscless persons) persons c:l hamlets No. of -8 Name of Village or in the Area in No. of house-8 TownjWard village Pargana Thana acres houses holds Persons Males Females M F
2 3 4 5 '1 7 8 9 10 II 12 13 .. -----~~- -~~--~~
TEHSIL KULPAHAR
j Abraura ... Kulpahar Aj-ner 209 Unpopulated 2 Ajner l Do. ... Do. 5,423 419 542 2,463 1,302 1,161 81 3 Akona 2 Do. Do. 1,338 141 172 780 395 385 4 Akoni 1 Do. Do. 742 39 61 328 175 153 5 Akthauhan 6 Do. Kulpahar ... 5,183 157 377 1,757 899 8511 6 Alipura I Do. Panwari 254 10 II 40 20 20 7 Alipura 1 Do. Do. 385 71 99 444 232 212 3 Amanpura I Do. Mahobkanth 727 61 72 313 151 162 9 Amarpura 1 Do. Ajner 409 I I 3 I 2
10 Amilia I Do. Mahobkanth 321 20 28 107 63 44 11 Andwara 1 Do. Kulpahar ... 1,727 169 265 l,e93 539 554 12 Argha*mau I Do. Ajner 1,339 54 71 346 182 164 13 Ari 2 Do. Do. 3,166 153 200 1,022 523 499 14 Asthon 2 Do. Kulpahar ... 2,995 155 194 775 385 390 15 Atani Mauf Do. Ajner 561 Unpopulated 16 Ata: Patha Do. Kulpahar ... 524 39 45 169 86 83 17 BacheOla Do. Ajner 264 Unpopulated 18 Bachhechhar Kalan Do. -Do. 1,466 90 108 512 250 262 19 Bachhechhar Khurd Do. Kulpahar 436 74 94 41g 222 197 20 Bagol Do. Do. 1,493 29 39 171 97 74 21 Baghora Do. Ajner 4,181 179 212 993 493 500 22 Bagrajan Do. Do. 340 1 I 9 5 4 23 Bagrauni Do. Mahobkanth 698 26 28 105 59 46 24 Bagwaho Do. Srinagar 664 143 211 956 498 458 25 Bahadurpur Kalan ... Do. Pan\\ari 1,379 79 112 487 241 246 26 Bahadurpur Navabad Do. Dt'. 131 Unpopulated 27 Ealcheur I Do. Srinagar 990 43 51 291 146 151 28 Bambauri Beldaran ... I Do. Kulpahar .,. 2,231 85 112 449 223 226 29 Bamhauri Khurd ... 4 Do. Do. 1,162 52 62 354 185 169 30 Bamhauri Kurmin '" 1 Do. Mahobkanth 864 55 79 297 159 13$ 31· Bammrura I Do. Ajner 807 24 42 165 85 ~o 32 Bamolia J Do. Do. 774 24 33 148 86 62 33 Bamor .. - Do. Do. 27 Unpopulated 34 Barano 1 Do. Pamlari 488 6 7 43 21 22 35 Barimda Buzurg I Do' Mabbkanth 631 33 41 174 92 82 36 Barenda Khurd I Do. Ajner .. 356 88 102 478 248 230 37 Bar Kachha Do. Kulpahar ... 174 Unpopulated 38 Barkhera 1 Do. Ajner 1,538 71 88 401 217 184 39 Basaria Jaitpur 1 Do. Do. 231 21 31 151 80 71 40 Basaria Panwari 1 Do. Mahobkanth 715 45 78 254 129 125 41 Baura 1 Do. Kulpahar 1,889 58 75 364 177 187 42 Behar Do. Panwari 432 Unpopulated 43 Bela Tal Do. Kulpahar ... 1,337 Unpopulated 44 Benda Do. Panwari 2,767 196 250 1,169 632 537 45- Beri Do. Ajner 627 31 56 251 124 127 46 Berjo Do. Mahobkanth 907 70 89 440 220 220 47 Bhadarwara Do. Srinagar 869 8 18 69 38 31 48 Bhagari Do. Ajner 1,517 105 125 547 283 264 49 Bhagaura Do. Do. 341 Unpopulated 50 Bhagauri Do. Panwari 265 Unpopulated 51 Bhandwara Do. Mahobkanth 668 33 41 164 118 76 52 Bharwara Do. Panwari 1,492 172 432 1,773 890 883 3 53 Bhateora Do. Kulpahar ___ 1,494 73 78 398 198 200 54 . Bhartoria Kalan Do. Panwari 3,309 156 229 903 434 469 55 Bhilauni DOl Kulpahar ... 1,580 Unpopulated 56 Bhujpura Do. Mahobkanth 705 68 73 436 226 210 57 Bhura Do. DC', 913 15 15 147 76 71 58 Bihar Do. Kulpahar ... 980 68 96 405 193 212 59 Bihat Do. Mahobkanth 1,879 46 70 234 119 . 115
·60 Bijaipur Do. ... Kul:p-ahar ... 2.,221 20 190 995 507 488 61 Bijauri Do. Ajner 784 71 82 364 203 161 62 Bijrari Do. Panwari 1,284 71 91 438 215 223 63 Binora Do. Mahobkanth 387 Unpopulated 64 Budhaura 1 Do. Kulpahar 995 85 98 478 ?52 226 65 Budhwara 1 Do. Ajner 3,212 219 259 1,102 510 532 66 Budaura I Do. Panwari 723 33 45 182 94 118 67 Budero I DC'. Do. 1,408 181 278 1,164 593 571 68 Budhi I Do. Do. 530 9 16 49 23 26 69 Bud Khero I Do. Ajner 375 15 20 76 43 33 70 Chamarra I Do. Mahobkanth 955 48 63 265 145 120 71 Chamarua 1 Do. Ajner 677 81 94 424 202 222 72 Chandanhas Do. Mahobkanth 578 Unpopulated 73 Chapka Do. Do. 322 10 20 91 47 44 74 Charkharia Do. Srinagar ... 681 UnpDpulated 75 Charua Do. Kulpahar ... 534 21 29 117 63 54 76 Chauka j Do. Mahobkanth 2,182 139 163 65. 349 307 77 Chhanc!'hri I Do. Panwari 140 15 22 120 61 59 78 Chhatarwera 1 Do. Mahobkanth 1,703 95 104 449 226 223 79 Chhatesar 1 Do. Panwari 516 25 33 123 61 62
-~-- ---~-- --- ----.-~----. --~~.~
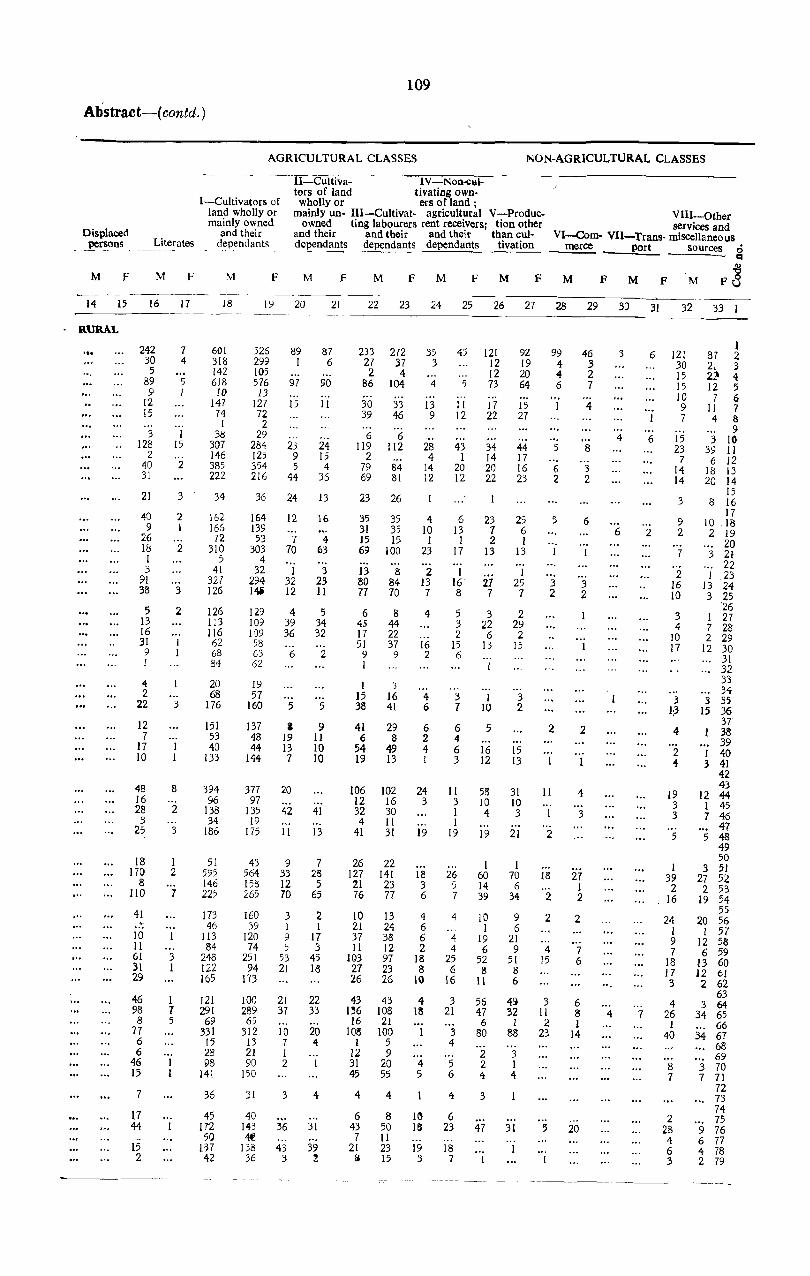
109
Abstract-( contd.)
Displaced persons
M F
14 15
RURAL
AGRICULTURAL CLASSES NON-AGRICULTURAL CLASSES
-----lI-Cultiva---~ _ IV-Non-<:l:Il-tors of land tivating own·
I-Cultivators of wholly or ers of land; land wholly or mainly un- llI-Cultivat- agricultural V-Produc-mainly owned owned ting labourers rent receivers; tion other
and their and their and their and their than cul-Literates dependants _ _~~pendants dependants dependants tivation
VllI-Other services and
VI-Com- VII-Trans- miscellaneous merce port Sources 0
M
16
242 30 5
89 9
12 15
3 128
2 40 31
21
40 9
26 18 1 3
91 38
5 13 16 31
9 /
4 2
22
12 7
17 10
48 16 28
3 25
18 170
8 lID
41 .. ~ 10 II 61 31 29
46 98 8
77 6 6
46 15
7
17 44
15 2
17
7 4
5 1
I 15
2
3
2 I
2
3
2
3
8
2
3
I 2
7
3 I
1 7 5
M
18
60[ 318 142 618
10 147 74
I 38
307 146 385 222
34
162 166 72
310 5>
41 327 126
126 1[3 116 62 68 84
20 68
176
151 53 40
133
394 %
138 34
186
51 595 146 225
173 46
113 84
248 122 165
121 291 69
331 15 28 1i18
141
36
45 172 50
137 42
F M
19 20 21
526 299 105 576 13
127 72 2
29 284 125 354 216
36
164 139 53
303 4
32 294 14i
129 109 1rJ9 58 63 62
19 57
160
137 48 4'1
144
377 97
135 19
175
43 564 158 265
160 39
120 74
251 94
173
100 289 65
312 IS 21 90
150
31
40 1'13 4€
138 36
89 1
97
15
-_. 23
9 5
44
24
12
7 70
1 32 12
4 39 36
6
5
a 19 13 7
20
42
11
9 33 12 70
3 I 9 5
53 21
21 37
10 7 I 2
3
36
43 3
87 6
90
II
24 15 4
36
13
16
4 63
3 23 11
5 34 32
2
5
9 II 10 10
41
13
7 28 5
65
2 I
17 3
45 18
22 33
20 4
4
31
39 2
F M F M F M F M F M
22 23 24 25 26 27 28 29 30 31
233 272 27 37 2 4
86 104
30 33 39 46
6 6 119 112
2 79 84 69 81
23 26
35 35 31 35 15 15 69 100
13 11 80 84 77 70
6 8 45 44 17 22 51 37 9 9 1
1 :; 15 16 33 41
41 29 6 8
54 49 19 13
106 102 12 16 32 30 4 II
41 31
26 22 127 141 21 23 76 77
10 13 21 24 37 38 II 12
103 97 27 23 26 26
43 43 136 108 16 21
103 100 1 5
12 9 31 20 45 55
4 4
6 8 43 50 7 II
21 23 16 15
35 45 3
4 5
13 II 9 12
28 43 4 I
14 20 12 12
4 6 10 13 1 1
23 17
2 I 13 16· 7 8
4 5 .3 2
16 15 2 6
4 3 6 7
6 6 2 4 4 6 I 3
24 11 3 3
1 I
19 19
18 26 3 5 6 7
4 4 6 6 4 2 4
18 25 8 6
10 16
4 3 13 21
:3 4
4 5 5 6
4
10 6 16 23
19 18 3 7
121 92 12 19 12 20 73 64
17 15 22 27
34 44 14 17 20 16 22 23
23 25 7 6 2 1
13 13
1 21 25 7 7
3 2 22 29 6 2
13 15
1 3 10 2
5
16 15 12 13
58 31 10 10 4 3
19 21
I I 60 70 14 6 39 34
10 9 I 6
19 21 6 9
52 51 11 8
11 6
56 4~ 47 32 6 1
80 88
2 3 2 I 4 4
3
47 31
99 46 4 3 4 2 6 7
4
5 8
6 3 2 2
5 6
3 3 2 2
2 2
II 4
3
2
18 27 1
2 2
2 2
4 7 15 6
3 6 11 8 2 I
23 14
5 20
3 6
4 6
6 2
4 7
CI
F M
32 33
121 30 15 15 10 9 7
15 23 7
14 14
3
9 2
7
2 16 10
3 4
10 17
.3 1:3
4
2 4
19 3 3
5
I 39 2
16
24 1 9 7
18 17
.3
4 26
1 40
8 7
2 28 4 6 .3
1 87 2 21 3 2~ 4 12 5
7 6 II 7 4 8
9 3 10
39 II 6 12
18 13 20 14
15 8 16
17 10 18 2 19
20 3 21
22 1 .23
13 24 3 25
26 I 27 7 28 2 29
12 30 31 32 33 34
3 35 15 36
37 38 39
I 40 3 41
42 43
12 44 I 45 7 46
47 5 48
49 50
3 51 27 52
2 53 19 54
55 20 56
1 57 12 58 6 59
13 60 12 61 2 62
63 3 64
34 65 66
34 67 68 69
3 70 7 71
72 73 74 75
9 76 6 77 4 78 2 79

no Primary Censas
Total no. of persons Inmates of
Occupied enumerated (including institutions
No. of inmates of institutions and houseless g the houses and bousele~s persons) persons
-na1ntet1r- -No. of ~ Name of Village or in the Area in No. of house-0 Town/ward village Pargana Thana acres houses holds Persons Males Females M F U
--__ .. -
2 3 4 5 6 7 8 9 10 11 12 1.3 ------------~--
TEHSIL KULPAHAR
80 Chhedimau 2 Kulpahar Kulpahar ... 1,622 30 - 33 7'1 40 34 81 Churari I Do. Do. 2,649 147 168 754 385 369 821 Dadri I Do. Mahobkanth 1,755 130 131 536 269 267 83 Deoganpura I Do. Panwari 1,024 70 113 455 224 231 84 Deogaon Do. Mahobkanth 938 Unpopulated 85 Dhanawan 1 Do. Panwari 1,259 7 7 31 16 IS 86 Dharwar I Do. Mahobkanth 1,954 59 65 262 136 126 87 Dhawar I Do. Do. 1,242 83 117 487 256 231 88 Dhawarra I Do. Ajoer 1,664 264 312 1,113 570 543 89 Dhumgir Do. Kulpahar .. 1,037 Unpopulated 90 Didaura Do. Mahobkanth 259 II 19 76 36 40 91 Didwara Do. Do. 2,410 155 177 789 408 381 92 Dinai Do. Panwari 2,248 Unpopulated 93 Dulara Do. Mahobkanth 2,124 154 203 1164 421 443 94 Dwasi Do. Kulpahar .,. 744 19 19 73 35 38 95 Gahlaund Do. Panwari .,. 368 Unpopulated 96 Gahpura Do. Ajner 284 Unpopulated 97 Ganj Do. Do. 645 70 72 304 169 135 98 Garaura Do. Mahobkanth 885 31 43 179 89 90 99 Gangudho Do. Panwari 409 51 64 255 136 1~9
100 Garotha Do. Do. 582 Unpopulated 101 Garo Do. Mahobkanth 997 67 73 323 161 162 102 . Garrauli Do. Panwan '" 190 49 63 254 123 131 103 Gaurahri Do. Do. 3,51 I 471 518 1,991 1,001l 983 104 Ghangbola Do. Ajner 712 80 93 372 203 169 105 Ghatera Do. Mahobkanth 1,251 54 55 267 132 135 106 Ghisalni Do. AiDer 747 15 20 84 52 32 107 Ghurwasmau Do. Panwari 281 Unp;.lpulated 108 Ghutai Do. Mahobkanth 2.4a9 168 188 725 370 355 109 Gorkha Do. Kulpaoor '" 3;756 136 164 773 398 375 110 Govindpura Do. Panwari 182 Unpopulated III Gurha 1 Do. Ajner 663 54 72 330 158 172 112 Gugaura 1 Do. Panwari 885 68 74 417 208 2(9 113 Gund 1 Do. Ajner 1,017 44 ,4 215 104 III 114 Haibatpur Brahmi- I Do. Panwari 466 7 7 29 16 13
nan. 115 Hiabatpur Khagaran 1 0(1. Do. 980 32 33 233 130 103 116 Hansla I Do. Mahobkanth 389 13 26 153 71 82 117 Hilwa 1 Do. Ajner 1,124 37 47 232 121 III 118 Indora 1 Do. Kulpahar .,. 1,311 12 13 61 36 25 119 Indrahta 1 Do. Ajner 1,294 74 89 422 225 197 120 ltaura Buzurg 1 Do. ... Mahobkanth 827 65 78 378 185 193 121 It wan 1 Do. Panwari 283 I 3 13 7 6 122 Jagatpuf urf Garhia I Do. Ajner 566 35 35 177 95 82 123 Jagpura Buzurg 1 Do. Panwari 231 14 16 106 44 62 124 Jagpura Khurd Do. Ajner 541 Unpopulated 125 Jaiwarl 1 Do. Do. 1,728 78 84 362 196 166 126 Jaipurt 3 Do. Kulpahar 9,740 1,021 1,161 5,434 2,718 2,716 127 Jakha I Do. Panwari 1,033 131 191 796 383 413 128 Jakhi Do. Do. 205 Unpopulated 129 lamala Do. Do. 708 II 13 53 27 26 130 Jaraula Do. Do. 780 Unpopulated 131 Jateora Do. Ajner 265 6 7 34 18 16 132 Kaithora Do. Do. I,OBI 145 173 835 431 404 ~
133 Kajriwar Do. Mahobkanth 197 Unpopulated 134 Kamala Do. Panwari 555 Unpopulated 135 Kamalpura Do. Kulpahar ... 612 60 78 403 217 186 136 Kanora Do. Mahobkanth 490 16 58 259 124 135 137 Kankua Do. Do. 1,331 234 286 1,194 610 58'1 138 Kanti Do. Kulpahar ... 845 6 7 32 20 12 139 Karehradang Do. Do. 1,592 11 16 124 71 53 i"5. 140 Karehra Khurd Do. Panwari 1,860 135 241 1,019 507 512 141 Karehra Khurd Khera Do. Mahobkanth 659 2 4 31 19 12 142 Karimbar Do. Do. 309 Unpopulated !. ~~ 143 Karpharia Do. Srinagar 217 27 29 142 70 72 144 Karra Do. Ajner 1,835 23 24 110 65 45 145 Karri Jadid Do. Do. 542 Unpopulated 146 Kasari Do. Panwari 381 Unpopulated 147 Kashipur 3 Do. Mahobkanth 4,107 40 47 987 511 476 148 Kbairaria I Do. Kulpahar .,. 623 36 48 193 94 99 149 Khama I Do. Ajner 1,001 86 103 520 288 232 150 Kbangarra I Do. Panwari 967 23 25 159 71 88 151 Khonaria I Do. Kulpahar '" 407 27 27 139 'ils 61 152 Khera Nankhari I Do. Panwari 506 13 32 lOis 58 50 153 Kbero Kalan 1 Do. Mahobkanth 987 11 58 259 137 122 154 Khiria Buzurg Do. Do. 373 UnpJpulated 155 Khiria Jadid Do. Sri nagar ... 991 Unpopulated 156 Kheria Kalan Do. Ajner 950 119 137 594 308 286 157 Kheria Khurd Do.· Mahobkanth 642 10 13 46 24 22
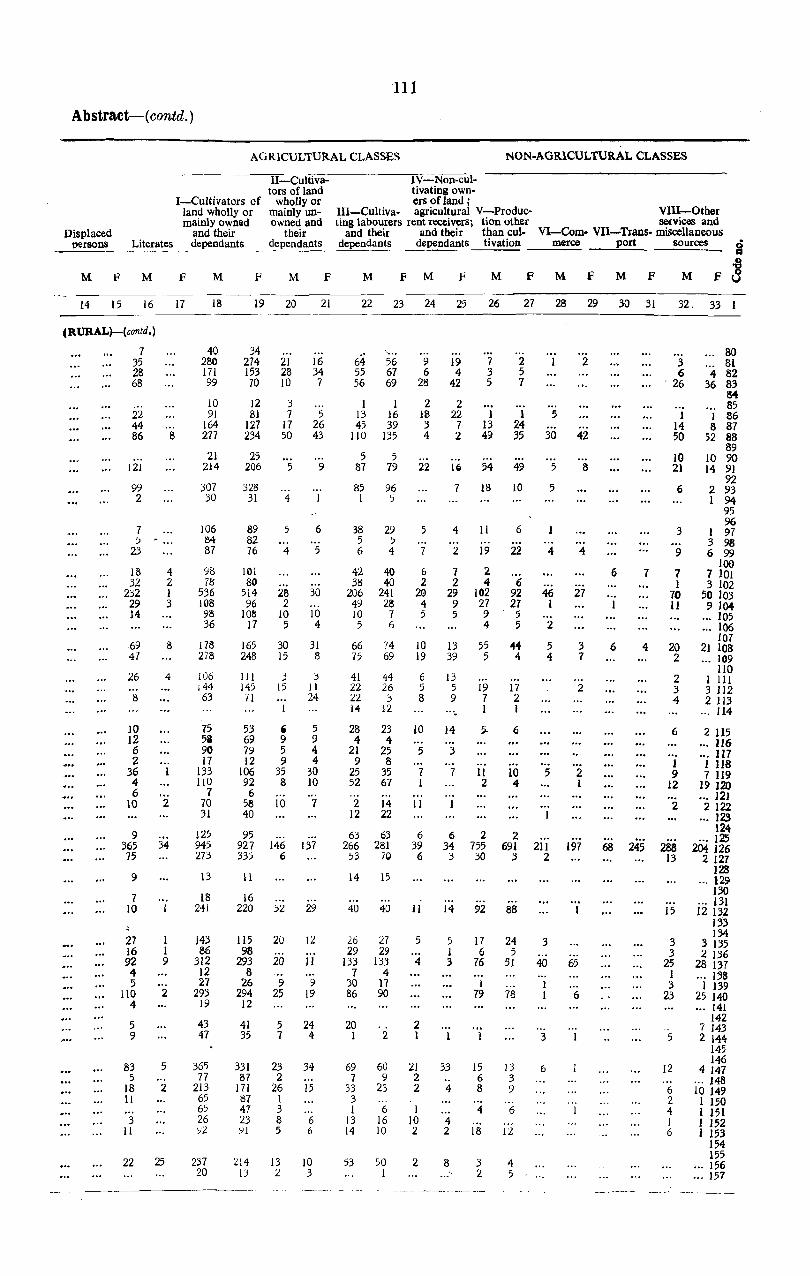
111
Abstract-(contd.)
AGRICULTURAL CLASSES NON-AGRICULTURAL CLASSES
II-Cultivators of land
I-Cultivators of wholly or land wholly or mainly un-mainly owned owned and
and their their Displaced oe[sons Literates _d_e.o_pe_n_d_an_t_s _ dependants
M F M F
14 15 16 17
,( RlJRAL)-(contd.)·
7 35 28 68
22 44 86 8
121
99 2
7 5 ~
23
18 4 32 2
232 I 29 3 14
69 8 47
26 4
8
10 12 6 2
36 4 6
10
9 365 75
9
7 10
27 16 92 4 5
110 4
5 9
83 5
18 11
3 II
22
2
34
'" f
1 1 9
2
5
2
25
M
18
40 280 171 99
10 91
164 277
21 214
307 30
106 84 87
98 78
536 108 98 36
178 278
106 J44 63
75 51 90 17
133 110
7 70 31
125 945 273
13
18 241
143 86
312 12 27
293 19
43 47
365 77
213 65 65 26 ;,;2
237 20
M F
19 20 21
34 274 153 70
21 28 10
16 34 7
12 81
127 234
::3 7
17 50
5 26 43
25 206
328 31
5 9
4
89 82 76
5
4
6
5
101 80
514 96
108 17
165 248
III J45 71
28 2
10 5
30 15
::3 15 '" I
30
10 4
31 8
;)
11 24
53 , 5 69 9 9 79 5 4 12 9 4
106 35 30 92 8 10 6
58 10 7 40
95 927 146 137 335 6
II
16 220 32 29
115 20 12 98
293 20 11 8
26 9 9 294 25 19 12
41 5 24 35 7 4
331 23 34 87 2
171 26 15 87 I 47 3 23 8 6 'oJ 1 5 6
214 13 10 13 2 3
IV-Non-cultivating owners of land j
Ill-Cultiva- agricultural V-Producting labourers rent receivers; tion other
and their and their than cuI-dependants dependants tivation
M F M F M F
VllI-Other services and
VI-Com· VlI-Trans- miscellaneous merce port sources
M F M F M
22 23 24 25 26 27 28 29 30 31 32, 33
64 55 56
1 13 45
110
5 87
85 I
38 5 6
42 38
206 49 10 5
66 75
41 22 22 14
'. .. 56 67 69
1 16 39
135
5 79
96 5
29 5 4
40 40
241 28
7 6
74 69
44 26
::3 12
28 23 4 4
21 25 9 8
25 35 52 67
2 14 12 22
63 63 266 281
53 70
14 15
40 40
26 27 29 29
133 133 7 4
30 17 86 90
20 I 2
69 60 7 9
33 23 3 I 6
13 16 14 10
53 50 I
9 6
28
2 18 3 4
22
5
7
6 2
20 4 5
10 19
6 5 8
10
5
7 I
11
6 39
6
11
5
4
2 1
21 2 2
1 ]0 2
2
19 4
42
2 22
7 2
Hi
7
4
2
7 2
29 9 5
13 39
13 5 9
14
3
7
6 34 3
14
5 I 3
33 .. 4
4 2
8
7 3 5
2 5 7
1 13 49
1 24 35
54
18
11
19
2 4
102 27 9 4
55 5
19 7 1
49
10
6
22
6 92 27 5 5
.014 4
17 2 I
5- 6
It 10 2 4
2 2 755 691 30 3
92 88
17 24 6 5
76 51
I 79 78
15 13 6 3 8 9
4 6
18 12
3 4 2 5
5
30
5
5
4
46 1
2
5 4
5
211 2
3
40
3
6
2
42
4
27
3 7
2
2 1
197
65
6
6 7
6 4
68 245
3 6
" 26
1 14 50
10 21
6
3
9
7 1
70 lJ
20 2
2 3 <4
80 81
4 82 36 83
84 85
1 86 8 87
52 88 89
10 90 14 91
92 2 93 1 94
95 96
1 97 3 98 6 99
100 7 101 3 102
50 103 9 104
... 105
... 106 107
21 108 ." 109
1I0 I III 3 112 2 113
". 114
6 2 115 ... 116 '" Jl7
I I 118 9 7 119
12 19 120 '" J21
2 2 122 '" 123
124 '" 125
28B 204 J26 13 2 127
128 '" 129
130 '" 1.31
15 12 132 133 1:34
3 .3 135 3 2 136
25 28 137 I ... 138 3 1 139
23 25 140 '" 141
142 7 143
5 2 144 145 146
12 4 147 '" 148
6 1O 149 2 1 150 4 I 151 1 1 152 6 I 153
154 155
... 156 ... 157
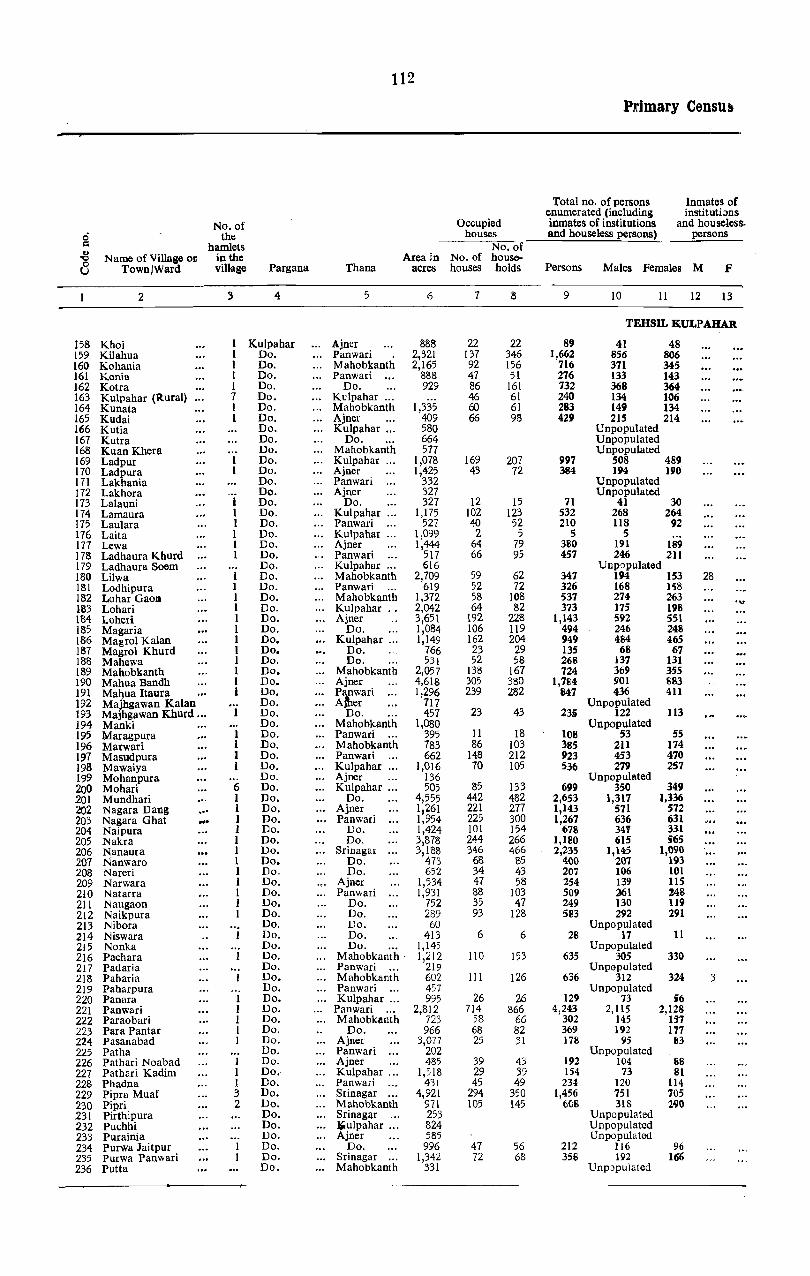
112
Pdmary Censu~
Total no. of persons Inmates of enumerated (including instituti;JIlS
No. of Occupied inmates of institutions and houseless. 0 the houses and houseless persons) persons c hamlets No. of v 'Q Name of Village or in the Area in No. of house-0 TownjWard village Pargana Thana acres houses holds Persons Males Females M F U
2 3 4 5 6 7 8 9 10 11 12 13
TEHSIL KULPAHAR
158 Khoi 1 Kulpahar Ajner 888 22 22 89 41 48 159 Kilahua 1 Do. Panwari 2,321 137 346 1,662 856 806 160 Kohania I Do. Mahobkanth 2,165 92 156 716 371 345 161 Konia 1 Do. Panwari ... 888 47 51 276 133 143 162 Kotra 1 Do. Do. 929 86 161 732 368 364 163 Kulpahar (Rural) 7 Do. Ku1pahar ... 46 61 240 134 106 164 Kunata I Do. Mahobkanth 1,335 60 61 283 149 134 165 Kudai 1 Do. Ajner 409 66 98 429 215 214 166 Kutia Do. Kulpahar ... 580 Unpopulated 167 Kutra Do. Do. 664 Unpopulated 168 Kuan Khera Do. Mahobkanth 577 Unpopulated 169 Ladpur Do. Kulpahar ... 1,078 169 207 997 508 489 170 Ladpura Do. Ajner 1,425 43 72 384 194 190 171 Lakhania Do. Panwari 332 Unpopulated 172 Lakhora Do. Ajner 327 Unpopulated 173 Lalauni 1 Do. Do. 327 12 15 71 41 30 174 Lamaura I Do. Kulpahar .. , 1,175 102 123 532 268 264 175 Laulara 1 Do. Panwari 527 40 52 210 118 92 176 Laita I Do. Ku1pahar ... 1,099 2 5 5 5 177 Lewa 1 Do. Ajner 1,444 64 79 3110 191 189 178 Ladhaura Khurd 1 Do. Panwari 517 66 95 457 246 211 179 Ladhaura Soem Do. Kulpahar ... 616 Unpopulated 180 Lilwa 1 Do. Mahobkanth 2,709 59 62 347 194 153 28 181 Lodhipura I Do. Panwari 619 52 72 326 168 158 182 Lohar GaoD 1 Do. Mahobkanth 1,372 58 108 537 274 263 IS3 Lohari 1 Do. Ku1pahar .. 2,042 64 82 373 175 198 ." 184 Loheri 1 Do. Ajner 3,651 192 228 1,143 592 55l 185 Magaria 1 Do. Do. 1,084 106 119 494 246 248 186 Magrol Kalan 1 Do. Kulpahar ... 1,149 162 204 949 4134 465 187 Magrol Khurd 1 Do. Do. 766 23 29 135 68 67 188 Mahewa I Do. Do. 531 52 58 268 137 131 189 Mahobkanth 1 Do. Mahobkanth 2,057 138 167 724 369 355 190 Mahua Bandh 1 Do. Ajner 4,618 305 380 1,7M 901 ~83
191 Mahua ltaura 1 Do. Panwari ... 1,296 239 282 847 436 411 192 Majhgawan Kalan Do. A.ftIer ... 717 Unpopulated 193 Majhgawan Khurd ... Do. Do. 457 23 43 235 122 113 194 Manki Do. Mahobkanth 1,080 Unpopulated 195 Maragpura Do. Panwari 395 11 18 108 53 55 196 Marwari Do. Mahobkanth 783 86 103 385 211 174 197 Masudpura Do. Panwari 662 148 212 923 453 470 19!3 Mawaiya Do. Kulpahar ... 1,016 70 105 536 279 257 199 Mohanpura Do. Ajner 136 Unpopulated 200 Mohari 6 Do. Kulpahar ... 505 85 133 699 350 349 201 Mundhari I Do. Do. 4,555 442 482 2,653 1,317 1,336 202 Nagara Dang ,., 1 Do. Ajner 1,261 221 277 1,143 571 i72 203 Nagara Ghat ... 1 Do. Panwari 1,954 225 300 1,267 636 631 204 Naipura 1 Do. Do. 1,424 101 154 678 34'f 331 205 Nakra I Do. Do. 3,878 244 266 1,180 615 565 206 Nanaura 1 Do. Srinagar 3,188 346 466 2,235 1,145 1,090 207 Nanwaro 1 Do. Do. 473 68 85 400 207 193 208 Nareri I Do. Do. 652 34 43 207 106 101 209 Narwara I Do. Ajner 1,534 47 58 254 139 115 210 Natarra 1 Do. Panwari 1,931 88 103 509 361 :248 211 Naugaon I Do. Do. 752 35 47 249 130 119 212 Naikpura 1 Do. Do. 289 93 128 583 292 291 213 Nibora Do. Do. 60 Unpopulated 214 Niswara Do. Do. 413 6 6 28 17 11 215 Nonka Do. Do. 1,145 Unpopulated 216 Pachara Do. Mahobkanth· 1,212 110 153 635 305 330 217 Padaria Do. Panwari 219 Unpopulated 218 Paharia Do. Mahobkttnth 602 111 126 636 312 324 3 219 Paharpura Do. Panwari 457 Unpopulated 220 Panara Do. Kulpahar ... 995 26 26 129 73 i6 221 Panwari Do. Panwari 2,812 714 866 4,243 2,115 2,128 222 Paraobari Do. Mahobkanth 723 58 66 302 145 In 223 Par,a Pantar Do. Do. 966 68 82 369 192 117 224 Pasanabad Do. Ajner 3,077 25 31 178 95 83 225 Patha Do. Panwari ... 202 Unpopulated 226 Pathari Noabad I Do. Ajner 485 39 43 192 104 88 227 Pathari Kadim I Do. Kulpahar ,,, 1,518 29 39 154 73 81 228 Phadna 1 Do. Panwari 431 45 49 234 120 114 229 Pipra Muaf 3 Do. Srinagar 4,921 294 350 1,456 751 705 230 Pipri 2 Do. Mahobkanth 971 105 145 ME 318 2-90 231 Pirthipura Do. Sri nagar 253 Unpopulated 232 Puchhi Do. ~ulpahar ... 824 Unpopulated 233 Purainia Do. Ajner 585 Unpopulated 234 Purwa Jaitpur Do. Do. 996 47 56 212 116 96 235 PUIwa Panwari Do. Srinagar 1,342 72 68 35ti 192 16"6 236 Putta Do. Mahobkanth 331 UnpJpulated
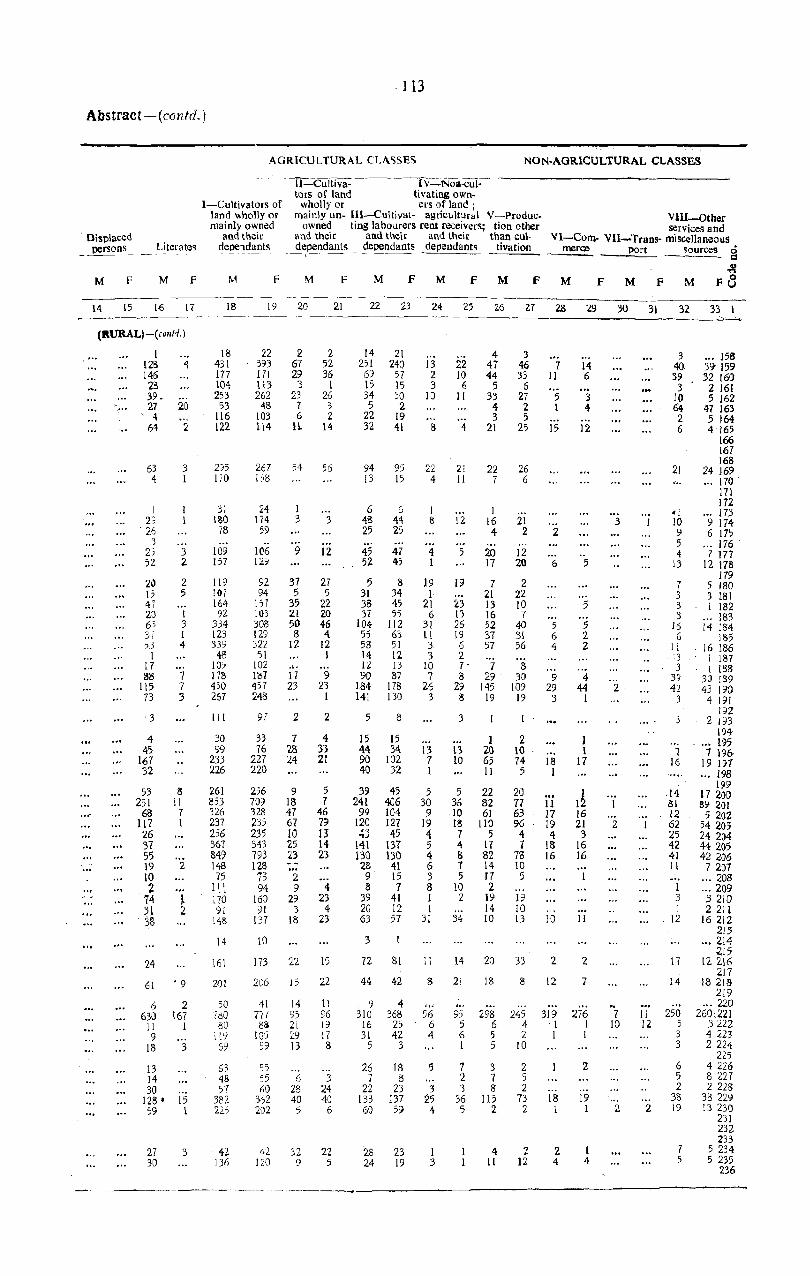
113
Abstract-(contd. )
, Displaced _ persons
M F
14 15
Literates
M f
[6 l7
(ftURAL)-(cont{)
I 12!i 146 2B 39. 27
, <\ 64
63 4
1 2)
, 26 3
25 52
20 I? 47 20 6' 31 ,3
1 17 88
115 73
'3
4 45
167 32
53 251
68 117 26 37 55 19 10 2
74 31 3&
24
61
6 63>0
11 9
18
13 14 30
128 • 59
27 30
4
20
2
3 I
3 2
2 5
I 3 1 4
7 7 3
8 II 7 I
2
• 9
2 167
1
3
15 l
3
AGRICULTURAL CLA'lSES NON·AGRlCULTURAL CLASSES
I-Cultivators of land ~holly or mainly owned
and their clependant~
- --U=Cu!tiva· 1 V -No.-cul· tors of land tivating own·
wholly or ers of land; mainly un· III-Cuitivat- agricultural V-Produc.
owned ting labourers rent receivers; tion other and their and their and their than cui-dependants dependants dependants tivation
--1-- -
Vill-Other services and
VI-Corn- VII-Trans· miscellaneous meree port sources 0
1::1
-8 M F M F M F M F M F M F M F M F8 18
18 431 177 104 253
53 116 122
295 170
31 I~O 78
109 157
119 107 164 92
334 123 339
48 105 178 450 267
III
30 99
233 226
261 853 326 237 256 367 849 148
75 11.1, 170 91
148
14
16l
201
50 780 80
11'1 69
63 48 51
382 225
42 136
19 20 21 22 23 24 25 26 27 Z8 29 30 31 32 33 I ,-- -'-------------------____ --"-'-"-0
22 393 171 U3 262
48 103 il4
267 !'i8
24 174 59
lil6 129
92 94
1'17 103 308 129 322 51
102 1a1 457 248
91
33 76
227 220
256 709 328 235 235 343 m 128
73 94
160 91
137
10
173
206
41 777
8i) 105
59
55 55 60
3(,2 202
42 120
2. 67 29 3
23 7 6
H.
54
I 3
9
37 5
35 21 50 8
12
17 23
2
7 '28 24
9 15 47 67 10 25 23
2 9
29 3
18
22
15
14 95 21 29 13
6 28 40
')
32 9
2 52 36
I 26
3 2
14
56
3
12
27 5
22 20 46 4
12 I
9 23
I
2
4 33 21
5 7
46 79 13 14 23
4 23
4 23
15
22
11 % D t7 8
3 24 40
6
22 5
14 251 6? 15 34 5
22 32
94 13
6 48 25
45 52
5 31 38 37
104 55 58 14 12 90
184 141
5
15 44 90 40
39 241
99 120
AO "lJ
141 130 28
9 8
39 20 63
3
72
44
9 31U
16 31
5
26 7
22 133 60
28 24
21 240
57 15 30 2
19 41
95 15
G 44 27
47 4:5
8 34 45 55
112 63 51 12 13 37
178 130
8
15 34
102 32
45 406 104 127 ~5
137 130
41 15 7
41 12 57
81
42
4 368
25 42
3
[8 8
23 137 59
23 19
13 2 3
10
8
22 4
I 8
4 1
19 I
21 6
31 tl 3 3
10 7
26 3
13 7 1
5 30 9
19 <I 5 4 6 3 8 1 I
31
11
8
56 6 4
5
3 25
4
1 3
22 10 6
II
4
21 11
12
5
19
:t3 13 26 1'J 6 2 7 -8
29 8
3
13 10
5 36
,10 IS 7 4 8 7 5
10 2
34
14
21
95 5 6 1
7 2 3
36 5
4 47 44
5 33 4 3
21
22 7
I 16 4
20 17
7 21 13 16 52 37 57
7 29
145 19
I 20 65 11
22 82 61
110 5
17 82 14 £7 2
19 14 [0
20
18
298 6 5 5
3 / 8
115 2
4 II
3 46 33
6 27 2 5
25 .
26 6
21 2
12 20
2 22 10 7
40 31 56
8 30
109 19
2 10 74 5
20 77 63 96 4 7
78 10 5
19 10 13
33
8
245 4 2
10
2 5 2
73 2
2 12
7 II
5 1
15
2
6
5 6 4
9 29
3
18 1
11 17 19 4
18 16
10
2
12
319 I I
18 I
2 4
14 6
3 4
12
5
5
5 2 2
4 44
I
) 1
17
1~ 16 21 3
16 16
11
2
7
276 I l
2
19 1
I 4
3
2
2
" 7 10
2
II 12
2
3 ... J56 40 39 159 39 32 160 3 2 161
10 5 162 64 47 163 2 5 164 6 4 165
166 167 168
21 24 169 ." 170'
171 172
.j ••. 173 10 9 174 9 6 175 5 ... 176 4 7 177
13 12 178 179
7 5 180 3 3 181 3 1 182 3 ... 183
16 14 184 6 185
1 r . 16 186 3 I 187 3 t 188
39 30 189 42 43 190
3 4 19r 192
3 2 193 194
.... 195 1 7'196-
16 19 111 '" 198
199 .14 17200 81 89 201 12 5 21)2 62 54 203 25 24 204 42 44205 41 42206 11 7 207
... 208 1 ". 209 3 3 2/0 I 2 211
12 16212 2/3
... 214 215
17 122\6 217
14 18218 219
.•. 220 250 260.221
5 3222 3 4 223 3 2 224-
225 6 4 226 5 8 227 2 2 228
38 38 229 19 [3 230
231 232 233
7 5 234 5 5 235
236

114
Primary Censds
Total no. of persons Inmates of enumerated (including :nstitutitms
No. of Occup;ed inmates of institutions and house less
8 the houses and houseless persons) ____ persons __ ...... hamlets No. of '" Name ot Village or in the Area in No. of house-"0 0 , Town/Ward village Pargana Thana acres houses holds Persons Males Females M F u
-_-- -~ _._ - ------------ ) 2 I, 5 6 7 8 9 10 11 12 13 ----_------ --------------------~.----.- ------_. --_-_ .. -.-
TEI'ISIL KULPAHAR
237 Ragoli· I Kulpahar ... Ajner 417 11 15 77 36 41 238 RagoJ.i Buturg 1 Do. Srinagar 579 58 81 386 204 182 239 Ragoli Kh~d I Do. Do. 409 27 32 138 69 69 .l40 Raimaipur 1 Do. Panwari 195 3 5 ~6 80 6 241 Raipura Hardo Nisf 1 Do. Mahobkanth 788 9 9 29 21 8 242 Raipura Kalan Do. Ajner 548 Unpopulated -243 Rajauni Do. Mahobkanth 513 78 III 569 290 279 244 Rajpura Do. Ajner 326 29 38 220 III 109 24) Rampura Kadim Do. Ku~pahar ... 524 8 8 27 14 13 246 Rampur Nauabad Do. Ajner 518 Unpopulated 247 Ramupura Do. Do. 953 61 87 387 207 ISO 248 Ranipura Do. Kulpahar ... 1,134 Unpopulated 249 Rawatpur Kalan 1 Do. Mahobkanth 458 39 48 194 92 102 ... 250 Rawatpur Khalsa 1 Do. Ajner 888 45 60 284 140 144 251 Rawatpur Khurd I Do. Kulpahar ... 673 54 66 278 ISO 121:! 252 Rewai 1 Do. Mahobkanth 2,179 131 143 639 327 :'12 253 Richha 1 Do. Panwari 2,106 91 137 620 314 :'06 254 Riehhara I Do. Mahobkanth 515 21 26 105 56 4~
25) Rikhwaho I Do. Sri nagar 149 57 15 351 11'/ 1'14 256 Rupnaul I Do. Pan\\ari 1,367 12 12 57 36 21 257 Ruri Kalan I Do. Mahobkanth 2,956 217 237 1,035 514 511 258 Ruri Khurd 1 Do. Do. 468 31 38 181 100 01 259 Sagunia Muaf I Do. Ajner 1,041 159 205 883 4ii 412 260 Saharra I Do. ... Kulpahar ... 387 I I I 1 261 Senth Wara I Do. Ajner 443 12 17 63 31 32 262 Salaiva Khalsa 1 Do. Panwari 1,078 I I 7 173 766 404 362 263 Salaiya Muaf I Do. Ajner 1,42; 127 166 6M 365 319 264 Silarpura 1 Do. Panwari 865 67 70 346 191 ISS 265 Salat 1 Do. Kulpahar ... 4,863 185 2()5 1'31 482 449 266 Santhar I Do. Mahobkanth 944 5 14 7J 15 38 267 Saragpura 1 Do, Panwari 495 12 13 84 40 44 268 Sarangpura I Do. Mahobkanth 689 27 33 139 71 68 269 Satari I Do. Kulpahar ... 2,610 141 186 900 471 4:l9 270 Sataura 1 Do. Mahobkanth 197 5 19 b4 45 39 271 Sela Khalsa 1 Do. Kulpahar 1,675 49 63 264 148 116 272 Sela Muaf I Do. Srinagar 999 15 22 96 52 44 273 Saingarpura Do. Panwari 467 Unpopulated 274 Seondhi 00. Do. 5,989 241 311 1,401 'B7 ~b4
275 Shergarh 00. Do. 629 45 (56 296 147 149 276 Segon Do. Ajner 1,858 146 152 t,43 334 3"9 277 Sikanderapur Do. Panwari 490 Unpopulated 278 Simaria Do. /' ... Do. 854 45 69 305 iS2 153 279 Singhain Do. Do. 900 Unpopulated 280 Sirmaul Do. Kulpahar ." 1,190 57 68 359 187 172 28t Sonakpura Do. Do. 530 6 7 34 12 22 282 Saunra Do. Mahobkanth 3,027 205 259 1,086 544 542 283 Sukhaura Do. Panwari 274 Unpopukted 284 Sungra 1 Do. Kulpahar ... 2,229 435 555 2,342 1,11!2 I, ItO 285 Supa 7 Do. Mahobkanth 10,044 777 S:14 3,6.,0 1,!!39 1,1141 286 Sawasa Muafi 1 ['0. Slinagar ... 2,253 87 112 575 304 211 287 Siawan I Do. Ajner 587 180 210 879 455 424 288 Tagaria Dc. Panwari 571 Unpopulated 289 Taiya Do. Mahobkanth 1,674 170 238 994 502 492 290 Teli Pahari Do. Do. 2.552 95 129 554 29a 264 291 Thalaura Va. Do. 366 22 29 150 73 n -
Srinagar :':. 292 Thateora L'o. 930 43 50 290 144 146 293 Thurat L'o. Mahobkanth 2,473 161 171 7(9 369 340 294 Tikaria D,. Do. 1,318 99 139 587 284 303 295 Tikaria Jaitpur Do. Ajner 2,190 159 197 1166 425 441 296 Tikaria Pan\>iari Do. Kulpahar ... 1,02.1 25 36 149 76 73 297 Tingra Do. Mahobkanth 642 36 46 212 96 . 116 298 Tola Chaharum Do. Panwari .680 Unpopul, ted 299 Tola Pantal' Do. Mahobkanth 1,709 118 143 627 320 307 300 Tola Seam Do. Srinagar :':,418 81 258 553 263 290 ."301 Tudar D'J. Mahobkar.th 605 15 16 98 51 41 302 TLlrra Mohar DL). Panwari J,211 69 234 1,087 582 5uj 303 Udaipura Do. Kulpahar ... 572 I I 1 1 304 Udan OJ. Panwari 276 17 23 112 60 52 30) Umrai Do. Mahobkanth 1,048 80 117 445 236 2Q9 3Cl'i Kulpahar Do. Kulpahar Tilwn Area
Total TehsU Kulpa- iSJ .,. 366,091 21,881 28,-!:ll 1,2'1,915 65,363 62.552 1.30 1 har (Rural) TlHSIL KULPAHAR
306 Kulpahar Town Area ... 12,085 1,020 1,170 5,067 2,6(J7 2,460 . .. Total Tehsil Kulpa- 00. 12,085 1,020 1,170 5,067 2,607 2,460
hat' (Urban) Total Tehsii Kulpa- 2113 ... 378,176 22,901 29,708 132,982 67,970 65,012 130
har -----_ - --~--- --
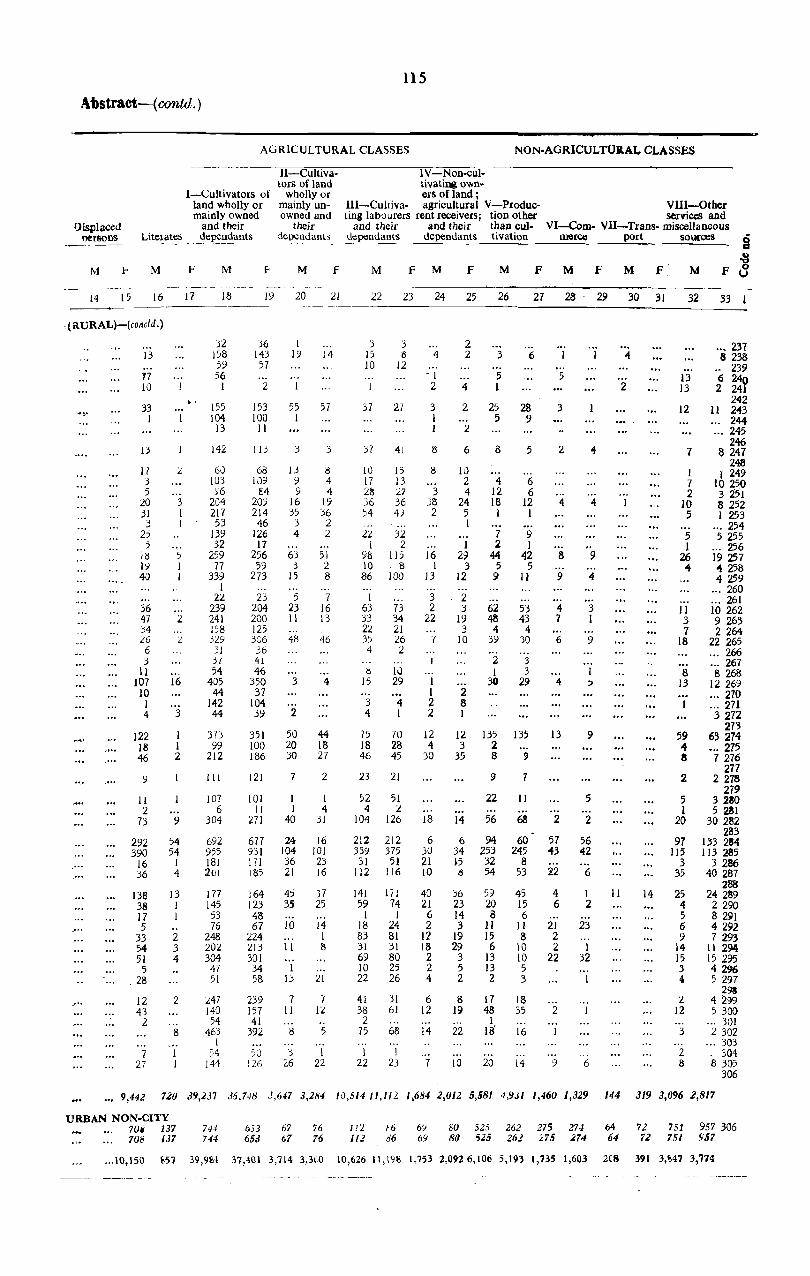
115
Abstract-( contd. )
AGRICULTURAL CLASSES NON-AGRICULTUIilAL CLASSES
----~- --- -~-'I'l---rC;----uTlt~iv-a-~-------;I7CV;---;N0"7o-n---cul-
I-Cultivators or land wholly or mainly owned
and their
tors of land tivatiIl8 own-wholly or ers of land j
mainly un- Ill-Cultiva- agricultural V-Producowned and ting labourers rent receivers; tion otber
their and their and their than cul-
VIII-Other services aDd
VI-Com- VII-Trans- miscellaneous Displaced T>etSODS _ ,=,i~~~~s _ _d~I1liants_ dependants dependanls dependants tivation merce port soocces
---~
M M
14 15 16
: (RURAL)-(colfcld.)
"'!o.
.....
_,. ..
13
17 10
33 1
jj
17 .3 5
20 .31
3 25
5 l(l I~ 40
36 47 ::l4 26
6 .3
11 107 10 I 4
122 It! 46
9
II 2
73
292 390
16 36
138 38 17 5
33 54 51 5
28
12 43
2
7 27
3 1 I
5 1 I
2 ... 2
16
3
1 1 2
9
54 54
1 4
13
2 3 4
2
8
F
17
..
M
18
32 158 59 56
I
155 104
13
142
60 103 %
204 217 53
139 32
259 77
339 I
2l 239 241 158 329
31 37 54
405 44
142 44
375 99
212
II!
107 6
304
692 955 181 2.0 I
177 145 53 76
248 202 304
47 51
247 140 54
463 1
54 144
f M
19 20
36 143 57
2
153 100
11
IIJ
68 109
fA 20) 214 46
126 17
256 59
273
23 204 200 125 j06 36 41 46
350 37
104 39
351 100 186
121
101 II
271
677 931 171 185
164 123 48 67
224 213 301 34 58
239 157 41
392
50 J26
I 19
55 1
U 9 9
16 35
3 4
63 .3
J5
5 23 11
48
3
2
50 20 30
7
I I
40
24 104 36 2[
45 35
10
II
I 13
7 II
8
3 26
F
II
14
57
3
8 4 4
19 36
2 2
51 2 8
.. -7
16 13
46
4
44 18 27
2
1 4
31
16 101 23 16
37 25
14 I 8
21
7 1:.1
5
I 22
M F M F
22 23 24 25
3 15 10
37
37
10 17 28 36 ?4 ... 22
1 98 10 86
I 63 33 22 35 4
i:S 15
3 4
75 18 46
23
52 4
104
212 339
31 112
141 59
1 18 83 31 69 10 22
41 38 2
75
1 22
3 8
12
27
41
15 13 27 36 43
32 2
115 8
100
73 34 21 26 2
10 29
4 I
70 28 45
21
51 2
126
212 375 51
116
lil 74
I 24 I'll 31 80 25 26
31 61
68
1 23
4
-I 2
3 I I
8
8
3 38 2
16 I
13
3 2
22
7
1 I 2 2
12 4
30
18
6 30 21 10
40 21 6 2
12 18 2 2 4
6 12
14
7
2 2
4
2
2
6
iO 2 4
24 5 I
I 29
3 12
2 3
19 3
10
2 8 1
12 3
35
14
6 34 ~5 8
36 23 14 3
19 29
3 5 2
8 19
22
[0
M
26
3
5 1
25 5
8
4 12 18 1
7 2
44 5
9
62 48 4
39
2 1
30
135 2 8
9
22
56
94 253 32 54
5) 20 8
11 15 6
13 13 2
17 48
I 18'
20
F M F M F
27 28 29 30 31
6
28 9
5
6 6
12 I
9 I
42 5
l}
53 43
4 30
3 3
29
135
9
7
II
6S
60 245
8 53
45 15 6
II 8
10 10 5 3
18 35
16
14
5
3
2
4
S
9
4 7
6
4
13
2
57 43
22
4 6
21 2 2
22
2
9
4
9
" 3 1
9
,
9
5
2
56 42
6
1 2
23
1 32
6
2
II 14
M
32
13 13
12
7
I 7 2
10 5
5 1
26 4
1 I 3 7
18
8 13
59 4 8
2
5 1
20
97 115
3 35
25 4 5 6 9
14 15 3 4
2 12
3
2 8
33
'" 237 8 238
.. 239 6 240 2 241
242 11 243
244 '" 245
246 8 247
248 I 249
1025,0 3 271 S 252 I 253
'" 254 5 255
... 256 19257 4 258 4 ~9
'" 260 '" 261 10 262 9 263 2264
22 265 ... 266 ... 267 8 268
12 269 '" 270 ... 271 3 272
273 63 214 ... 275 7 276
277 2278
279 3 280 5 281
30 282 283
133 284 113 285
3 286 40 287
288 24 289 2 290 8 291 4 292 7 293
11294 15 295 4296 5 297
291 4 299 5 300
... 301 2 302
... 303 . S04 8305
306
9,442 7.J() 39,1.37 .~6.74.s 3,647 3,284 10,514/1,112 1,684 2,012 5,581 4,9.31 1,460 1,329 144 319 3,096 2,817
URBAN NON-CITY 70. 137 708 137
744 744
6j3 67 76 653 67 76
112 06 6Y EO 525 262 275 274 64 72 751 957 306 J 11 1f6 69 80 525 262 275 274 64 7Z 751 957
... 10,150 857 39,9~'" 37,401 3,714 3,%0 10,626 1l,\'J8 1,753 2,0926,106 5,193 1,735 1,603 2(8 391 3,1j47 3,774
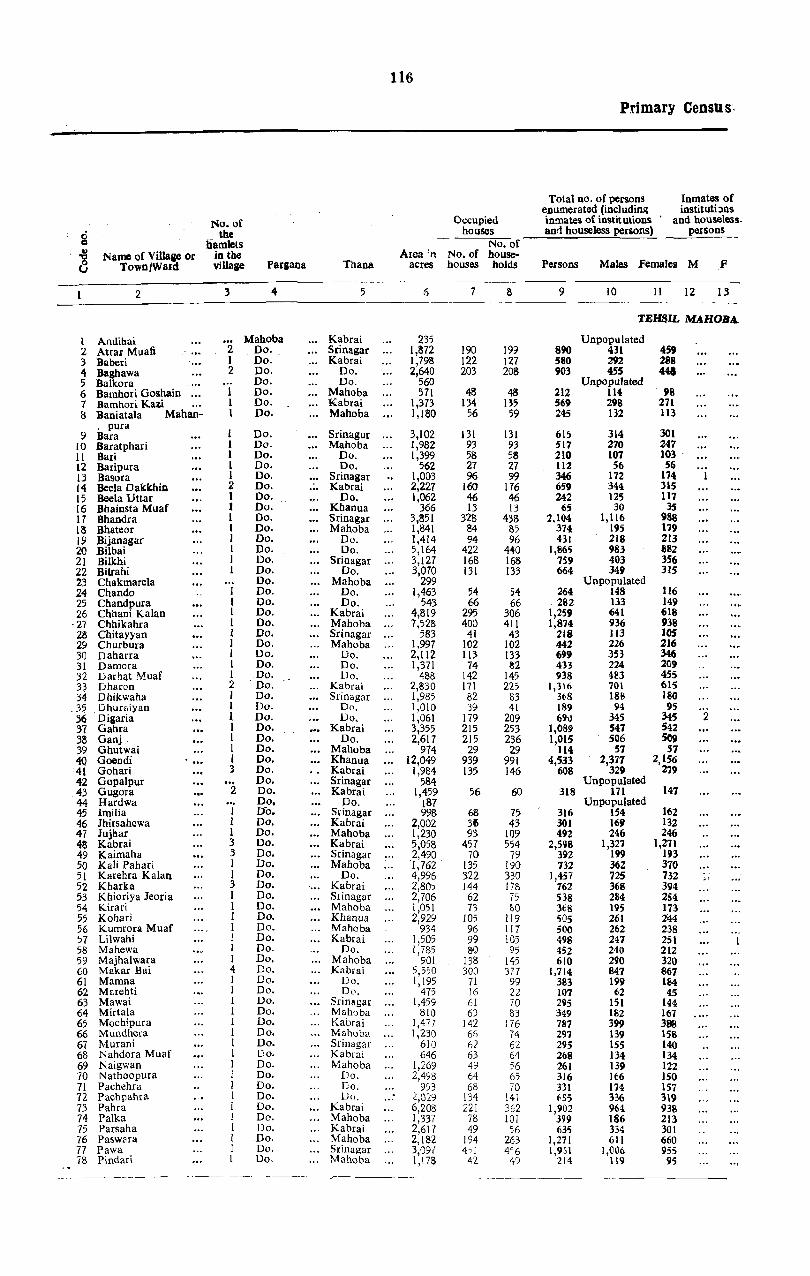
116
Primary Census·
Total no. of persons Inmates of enumerated (includin~ instituti:>ns
No. of Occupied ill!l1ates of institutions and houseless.
g the houses ann houseless persons) persons hamlets No. of .,
Name of Villaae or in the Area 'n No. of house-..., 8 Town/Ward village Pargana Thana acres houses holds Persons Males .females M .f
2 3 4 5 (-) 7 S 9 10 11 12 13 ----_ ..
TEHSIL MAHOBA.
I Anllihai ... Mahoba Kabrai 235 Unpopulated 2 Atrar Muafi 2 Do. Srinagar 1,1372 190 I9;l 890 431 459 3 BabeIi I Do. Kabrai 1,793 122 127 SilO 292 288 4 Baghawa 2 Do. Do. 2,640 203 208 903 455 441 5 Ballcora Do. Do. 560 Unpopulated 6 Bamhori Goshain I Do. Mahoba 571 48 48 212 114 98 7 Barnhori Kau I Do. Kabrai 1,373 134 135 569 298 271 8 Baniatala Mahan- I Do. Mahoba 1,180 56 59 245 132 113
, pura I Do. Srinagur 3,102 131 314 301 9 Bara 13l 615
10 Baratphari 1 Do. Mahoba 1,982 93 93 517 270 247 11 Bari I Do. Do. 1,399 58 58 210 107 103 . 12 Baripura 1 Do. Do. 562 27 27 112 56 56 t:.l Basora I Do. ... Sri nagar 1,003 96 99 346 172 174 14 Beela Dakkhin 2 Do. Kabrai 2,227 160 116 659 344 315 15 Beela Uttar 1 Do. Do. 1,062 46 46 242 125 117 16 Bhainsta Muaf I Do. Khanua 366 13 13 65 30 35 17 Bhandra I Do. Sri nagar 3,851 328 438 2.104 1,116 988 18 Bhateor 1 Do. Mahoba 1,841 84 85 374 195 119 19 Bijanagar I Do. Do. 1,414 94 96 431 218 213 20 Bilbai I Do. Do. 5,164 422 440 1,865 983 882 21 Bilkhi 1 Do. Srinagar 3,127 168 168 759 403 356 22 Bilrahi I Do. Do. 3,070 131 133 664 349 315 23 Chakmarela Do. Mahoba 299 Unpopulated 24 Chando J Do. Do. 1,463 54 54 264 148 116 25 Chandpura 1 Do. Do. 543 66 66 282 133 149 26 Chhani Kalan I Do. Kabrai 4,819 295 306 1,259 641 618
·27 Chhikahra I Do. Mahoba 7,528 400 411 1,874 936 938 28 Chitanan I Do. Srinagar 583 41 43 218 113 105 29 Churbura I Do. Mahoba 1,997 102 102 442 226 216 30 Daharra I Do. Do. 2,112 113 133 699 353 346 31 Damora 1 Do. Do. 1,371 74 82 433 224 209 32 Darhat Muaf I Do. Do. 488 142 145 938 4~3 455 3~ Dharon 2 Do. Kabrai 2,830 171 225 1,316 701 615 34 Dhikwaha I Do. Srinagar 1,985 82 83 368 ISS 180 3~ Dhuraiyan I Do. Do. 1,010 39 41 189 94 95 36 Digaria 1 Do. Do. 1,061 179 209 69l) 345 345 2 37 Gahra 1 Do. Kabrai 3,355 215 253 1,0S, 547 542 38 Ganj. I Do. Do. 2,617 215 236 1,015 506 509 39 Ghutwai 1 Do. Mahoba 974 29 29 114 57 57 40 Goendi I Do. Khanua 12,049 939 991 4,533 2,377 2,1S6 41 Goha.ri 3 Do. Kabrai 1,984 135 146 608 329 279 42 Gopalpur Do. Srinagar 584 Unpopulated 43 Gugora 2 Do. Kabrai 1,459 56 60 318 171 147 44 Hardwa Do. Do. 187 Unpopulated 45 Imilia 1 D-o. Srinagar 998 68 75 316 154 162 46 Jhirsahewa I Do. Kabrai 2,002 36 43 301 169 132 47 Jujhar I Do. Mahoba 1,230 93 109 492 246 246 "IS Kabrai 3 Do. Kabrai 5,058 457 554 2,598 1,327 1,271 49 Kaimaha 3 Do. Srinagar 2,490. 70 79 392 199 193 50 Kali Pahari 1 Do. Mahoba 1,762 135 190 732 362 310 51 Karehra Kalan 1 Do. Do. 4,996 322 330 1,457 725 732 ..
" 52 Kharka 3 Do. Kabrai 2,805 144 178 762 368 394 53 Khioriya Jeoria I Do. Slinagar 2,706 62 75 538 284 254 54 Kirari 1 Do. Mahoba 1,051 73 80 3t8 195 173 55 Kohari I Do. Khanua 2,929 105 119 505 261 244 56 Kurnrora Muaf 1 Do. Mahoba 934 96 117 500 262 238 57 Lilwahi I Do. Kabrai 1,505 99 105 498 247 251 58 Mahewa 1 Do. Do. 1,785 SO 95 452 240 212 59 Majhalwara I Do. Mahoba 901 138 145 610 290 320 60 Makar Bai 4 Do. Kabrai 5,5)0 300 377 1,714 847 867 61 Mamna I Do. Do. 1,195 71 99 3113 199 184 62 Marehti I Do. Do. 475 16 22 107 62 45 63 Mawai 1 Do. Sri nagar 1,459 61 70 295 151 144 64 Mirtala 1 Do. Mahoba 810 63 83 349 182 167 65 Mochipura 1 Do. Kabrai 1,477 142 176 787 399 311t! 66 Mundhera I Do. Mahoba 1,230 66 74 297 139 ISS 67 Murani I Do. Srinagar 610 62 62 29; 155 140 68 Nahdora Muaf 1 Do. Kabrai 646 63 64 268 134 134 69 Naigwan I Do. Mahoba 1,269 49 56 261 139 122 70 Nathoopura j Do. Do. 2,498 64 65 316 166 150 71 Pachehra I Do. Do. 993 68 70 331 174 157 72 Pachpahra I Do. Do. ... 2,029 134 141 (-55 336 319 73 Pahra I Do. Kabrai 6,208 221 362 1,902 964 938 74 Palka 1 Do. Mahoba 1,337 78 101 399 186 213 75 Parsaha I Do. Kabrai 2,611 49 56 635 334 301 76 Paswara I Do. Mahoba 2,182 194 263 1,271 611 660 77 Pawa 1 Do. Srinagar 3,097 4)1 4"6 1,961 1,006 955 78 Pindari 1 Do. Mahoba 1,17B 42 49 214 119 95
~_------ ---- .---~_--~----~ -----~ .- .~--------- ---------_ ..

117
~bstract-- (contd.)
AGRlCULTURAL CLASSES NON-AGRICULTURAL CLASSES
Displaced persons Literates
Il-Cultiva- IV-Non-cul-tors of land tivating own-
I-Cultivators of wholly or ers of land i land wholly or mainly un- llI-Cultiva- agricultural V-Produc-mainly owned owned and ting labourers rent receivers; tioD other
and their their and their and their than cul-dependants de~~dants dependants dependants tivation
VllI-Othcr services and
VI-Com- VII-Trans- miscellaneous merce port sources
M F M F M F M f M F M F M F M F M F M
~---------- ------ _------
14 15 16 Ii
(RURAL)
5
99 54
738
16 33 26
38 46 24 6
13 32 24 ,6
154 52 12
217 29 17
19 1) 9';1
177 3 5
35 21 42
198' 24 12 18
116 77 9
419 75
27
10 24 36
147 22 55 93 45
15 10 9 6
56 50
194 29 1 8
25 39 13 9
14 13
6 I
155 18 13 21 43 52
15
I 2
4
2 3 6
5 I 2
6)
S 15 2
17 16
2 I 9 2 I
2
8 2
12 3
... 7 I
." 3
II [
2 3
18
303 173 280
74 150 109
246 174 ;6 18
102 180
72 24
804 115 161 ;89 329 286
101 77
237 55 I 93
156 251 139 392 348 137 70
25) 250 3 )5 43
1,323 119
124
127 97
164 719 85
207 36~ 264 218 151 123 194 163 13? 166 453 139
118 115 DO 78 98 73 65
148 lIS 178 581 100 196 389 572
75
19 20 21
330 17 16 171 25 19 283 17 15
65 9 9 148 51 38 97
236 150 47 15 86
162 79 :26
700 92
140 505 299 250
tl2 75
212 551 81
135 224 127 339 326 138 63
25( 237 3,)(
36 1,137
93
(30
120 97
163 664
85 211 32') 26? 20J 143 100 172 178 117 181 420 129
92 '06 [22 86 92 83 50
134 107 187 577 102 164 397 527 60
28 21 16 13 2 3
14 19 24 28 9 7 2 7 9 6
16 16 8 7
40 39 2
2
II 13 143 153 119 96 1 I 11 2 8
28 33 14 II
7 7 10 5 4 3
2) 17 117 108 33 39
7 6 283 278 27 ,29
6 10 I
II 13 ';10 93 38 34 10 5
1)1 140 40 52 22 15 12 5 25 26
28 26 14 14
I 153 177
14 15
5 9 4 I
25 33 9 13
20 20 26 22 13 9 16 15 3 4
53 55 9 13
36 38 31 37 38 41 20 20
22 23 24 25 26 27 28 29 30 31
64 68 9 12 44 52 2 7 53 52 18 20
15 10 10 9 36 32 26 27 12 8 6 1
27 36 36 41 18 21 19 25 38 43 65 1I 37 25
1 223 216
41 46 36 41
175 166 44 34 28 30
6 6 17 27
137 149 97 97 8 13
36 48 40 53 40 44 50 86
296 ' 247 16 14 14 16 4) 41 95 110 93 101 4 7
412 432 43 45
9 6
10 25 57 31 33 48
177 178 48 44
124 [36 112 146 49 60 20 18 14 13 79 85 46 48 36 26 49 42 64 66
140 16'i [9 25
13 26 49 50
114 123 10 6 52 45 22 15 37 39
2 3 Z\) 22 51 42
186 176 59 81 73 67 75 93
190 180 13 II
4 6 6 8 3 4
2 22 22 5 6
18 17 4 2
1 38 . 32 1 2 8 10
7 3
(4 17 1
,.'
6 19
11 7
25 13 2
51 10
24
4 1 2
29 2
10 7 1
4 12 10 7
15 l).
7 3
7
26 3
7
2 I( 10
II 26 37
4
9 3
15 17
4 9
14 I 9 8 1 I
22 10 4
42 9
2
2 4
34 1
14 16 3
I 8
13 12 15 18 10 2
8 1
24 1
I 6 I 2
II 24
5 21 43 43
2
23 21 24 18 39 43
3 4 17 8 2 3
22 10 8
13 6 2
53 14 8
104 II 25
9 17 59
120
27 17 9
31 4 9 1
30 30 3:1
(
152 18
4
6 1
23 96 12 5
60 4
II
8 10 10 2
27 38 21
7 5
21 33 4 6 I 3 7
24 25 13 2
47 93
4
14 6 7
17 7
40 18 23
104 8'
20
4 21 44
(30
20 21 8
23 5 7 2
29 31 29
4 145
9
6
12 107
13
60 5 6
13 5 5 5
33 36 10
9 2
21 44 3 4
3 5
19 19 5 2
43 95
I
6 5 7 7 5 4
11 10
4 1
3
3 I 2
25 2
1 6
15
"
J 2 9
2 12 3
69 77
7
2 52
14 5 7 6
10
6 12 6
[9
2 3
2 2
49
4 28 41
8 4
2 3 3
28
4 7
24
5 4
3 10 3
52 68
7
I 58 I
.. 15 4 4 5 7
3 II 7
13 2
, .. J 5
41
2 28 44
8 6
... 1 2
2 2
2
13
3
2 4
14 15
32 33 1
I 9 7 2
17 14 3 35 25 4
5 3 I 6 7 8 7 3 4 8
19 14 '2 14 5
44
8 3 5
12 14 2
25 '/
45 16
5 If 2 8
26 9 5 3
18 24 .. , 8j 35
I 12 II
151 14 6
38 5 6 6 4 2 3
15 B
50 3
62 I 9
50 6 I
10
9 67 60 5
12 I:> 35
3
15 9 15 10 3 II 9 12 7 13
24 14 15 16
6 17 2 18 I 19 8 20
13 21 3 22
23 15 24 -6 25
38 26 21 27
28 I 29 6 30 ') 31 1 32
17 33 8 34
10 35 3 36
24 37 26 38
3:1 68 40 26 41
42 2 43
44 45
2 46 5 4T
137 48, 15 49 4 50
34 51 1 52
11 53 2 54 5 55
56 4 57
16 58 10 59 52 60 3 61
45 62 63
7 64 37 65
6 66 67
9 68 69 70
5 71 56 72 46 73
7 74 7 75
19 76 25 77
I 78
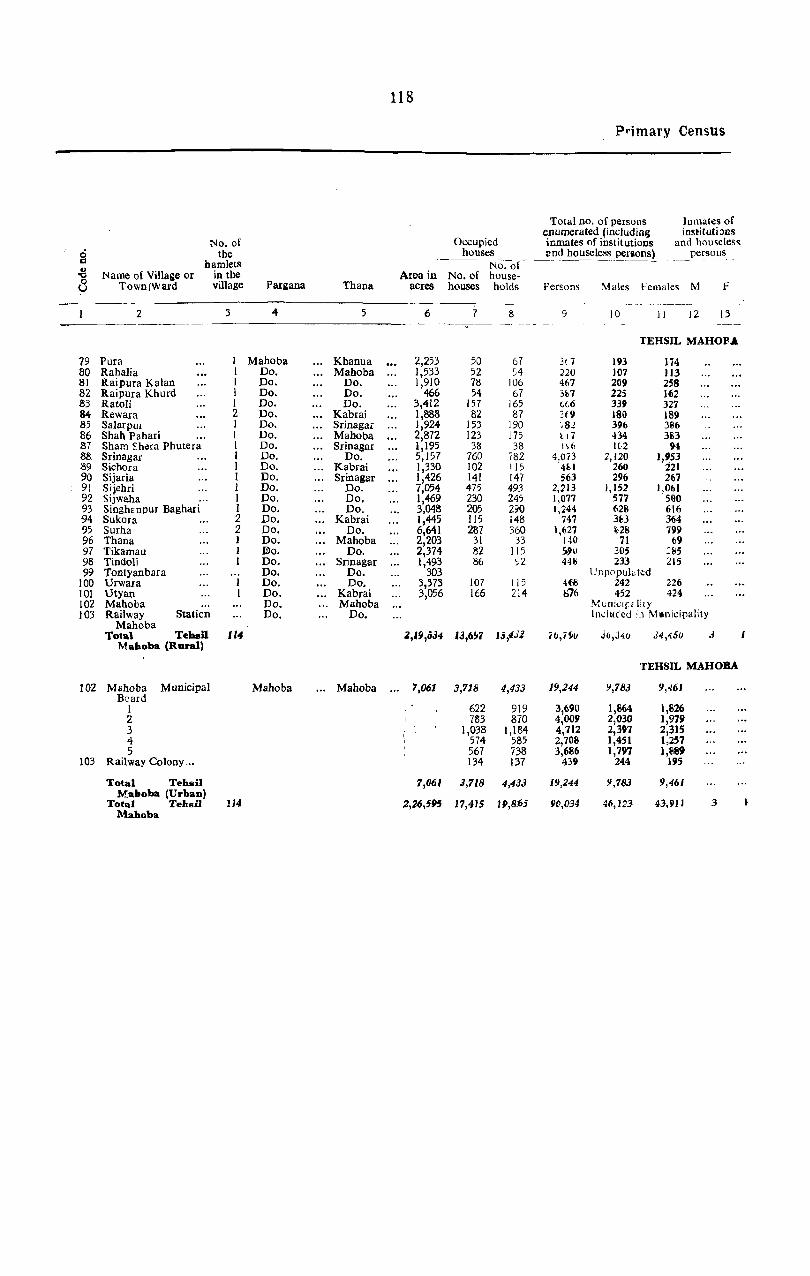
118
P"irnary Census
Total no. of persons Inmates of enumerated (including ins~ituti:)l]s
No. of Occupied inmates of institutions and houseless ci the houses Dncl housel~~ peElLons) persons Cl hamlets No. of -8 Name o{ Village or in the AlOO in No. of house-8 Townlward village Pargana Thana acres houses holds Persons Males l:emales M F
-~-----
2 :3 4 5 6 7 8 9 10 11 12 13 --.-- -_. -- --~
TEHSIL MAHOF.A
79 Pura I Mahoba Khanua 2,253 50 67 3(7 193 174 80 Rahalia 1 Do. Maboba 1,533 52 54 220 107 J13 81 Raipura Kalan I Do. Do. 1,910 78 106 4(>7 209 258 82 Raipura Khurd 1 Do. Do. 466 54 67 3b7 225 162 83 Ratoli I Do. Do. 3,412 157 165 (,(.6 339 327 84 Rewara 2 Do. Kabrai 1838 82 87 ::f9 180 189 85 Salarpur I Do. Srinagai' 1;924 153 190 ',82 396 386 86 Shah Pahari 1 Do. Mahoba 2,872 123 175 117 -B4 383 87 Sham Ehera Phutera 1 Do. Srinagar 1,195 38 38 I ~6 1(2 94 88 Srinagar 1 Do. Do. 5,157 760 i82 4,073 2,120 1,953 89 Siebora 1 Do. Kabrai 1,330 102 115 4~1 260 221 90 Sijaria 1 Do. Srinagar 1,426 141 147 563 296 267 91 Sijehri I Do. Do. 7,054 475 493 2,213 1,152 1,061 92 Sijwaha 1 Do. Do. 1,469 230 245 1,077 577 5aO 93 Singhtnpur Baghari 1 Do. Do. 3,048 205 290 1,244 628 616 94 Sukora 2 Do. Kabrai 1,445 115 148 747 3~3 364 95 Surha 2 Do. Do. 6,641 287 360 1,627 t28 799 96 Thana I Do. Mahoba 2,203 31 33 140 71 69 97 Tikamau 1 IDo. Do. 2,374 82 115 S,u 305 :85 98 Tindoli 1 Do. Sri nagar 1,493 86 ~2 448 233 215 99 Tontyanbara Do. Do. 303 Unp(\pul~t\!:d
100 Urwara Do. Do. 3,373 107 1 15 4 (lIS 242 226 101 Utyan Do. Kabrai 3,056 166 214 676 452 424 102 Mahoba Do. Mahoba Muni<':lp1ilY 103 Railway Station Do. Do. Im:ltlc'cd in I\hinicipality
Maboba Total Tehsil 114 Z,19,S34 13,6~7
Maboba (Rural) 15,4J1 i(J,i~u Jb,3 .. u 34,<:.5u J I
TEHSIL MAHOBA
102 Mahoba Municipal Maboba ... Maboba Board
7,061 3,718 4,433 19,144 ':1,783 9,461
1 622 919 3,690 1,864 1,826 2 7153 870 4,009 2,030 1,979 3 1,038 1,184 4,712 2,397 2,315 4 574 585 2,708 1,451 1,257 5 567 738 3,686 1,797 1,8fl9
103 Railway Colony ... 134 137 439 244 195
Total Tehsil 7,061 3,718 4,433 19,244 9,783 9,461 Mahoba (Urban)
114 19,8.65 3 ) Total Teltsil 2,:26,595 17,415 JlC,D-34 46,123 4],911 Mahoba

119
A bstract-( contd. )
AGRICULTURAL CLASSES NON-AGRICULTURAL CLASSES
lI-Cultiva- IV-Non-cul-tors of land ti'fating own-
l-Cultivators of wholly or ers or land j land wholly or mainly un- Ill-Cultivat- agricultural V-Produc- Vlll-Other mainly owned owned ting labourers rent receivers; tion other services and
[)isplaced and their and their and theit" and their than cul- VI-Corn- VII-Trans- miscellaneous _perso~ Literates dependants dependants dependants dependants tivation merce port sources 0
-~----- - --. ~----- CI
-8 M F M P M F M P M F M F M P M F M F M F8
\4 \5 16 \1 18 19 20 21 22 23 24 25 26 27 2B 29 30 31 32 33 \
(IlUIlAL)-(concld.)
12 113 97 8 14 62 55 2 4 I 5 2 2 2 79 8 3 35 34 11 9 39 31 8 16 5 6 I 3 8 14 80
25 176 208 2 9 18 2 7 18 18 4 5 81 33 3 148 9S 48 33 21 26 1 1 4 3 3 J 82 54 1 209 200 7 7 78 79 21 21 12 10 4 1 8 9 83 23 2 114 126 26 16 31 39 3 .. 2 I I 2 3 1 84 52 3 250 222 13 23 45 60 9 11 52 46 1 26 24 1:5 41 1 358 309 5 2 25 30 25 24 14 14 1 2 6 2 86 11 .3 77 65 6 8 13 11 4 3 2 3 4 87
435 33 1,007 850 9 21 409 473 12 17 328 315 172 137 5 2 178 138 38 44 1 182 150 21 20 29 32 4 9 10 1 14 9 89 28 J 181 148 4 7 88 99 I 16 8 7 4 90
242 20 746 668 82 65 161 202 4 28 114 81 45 16 91 89 3 250 214 38 22 142 143 16 22 85 70 24 14 22 15 92 72 316 288 55 56 163 180 30 40 35 22 8 10 21 20 93 60 1 224 198 54 56 57 60 3 10 10 2 .3 3 4 32 31 94
217 12 508 511 60 55 143 155 10 5 46 30 20 9 41 34 95 7 51 52 1 1 14 12 1 4 4 96 ... 56 2 187 170 21 19 39 45 20 22 33 24 5 5 97
30 155 141 7 5 27 22 I I 30 31 13 15 98 99
57 2 171 155 6 6 48 49 3 8 5 6 II 100 70 4 266 246 36 39 86 80 10 10 19 12 4 5 31 32 101
102 103
6 ... 5,923 3Jl 21,7.18 ~t),(jZ4 2,551 2,5.i.5 6,.2:i7 6,595 846 971 2,4Z6 2,184 788 705 51 37 1,70J 1,409
URBAN NON-CITY
11 17 2,819 901 2,0213 1,810 314 3713 73 76 66 61 1,531 1,600 t,683 1,602 t,195 1,091 2,899 13,843 102
613 235 454 428 36 20 6 12 1 151 143 232 233 380 401 605 588 .. 4 350 110 619 518 23 3a 1 5 6 2 2813 369 373 354 151 127 569 566 7 7 885 299 300 276 I7l 243 21 20 23 29 520 379 593 547 164 128 605 693 1 384 116 233 134 27 27 29 24 19 15 161 204 164 184 162 135 656 534
450 89 416 454 57 44 16 15 18 14 411 505 314 284 105 114 460 459 9 6 137 52 7 233 192 4 3 103
21 11 2,819 901 2,022 1,810 314 312 1J 76 66 61 1,531 1,600 1,683 1,602 1,195 1,091 1,899 2,84.1
27 17 8,742 1,232 23,760 21,834 2,865 2,897 6,310 6,671 912 1,032 3,957 3,784 2,471 2,307 1,246 1,134 4,602 4,252
----~
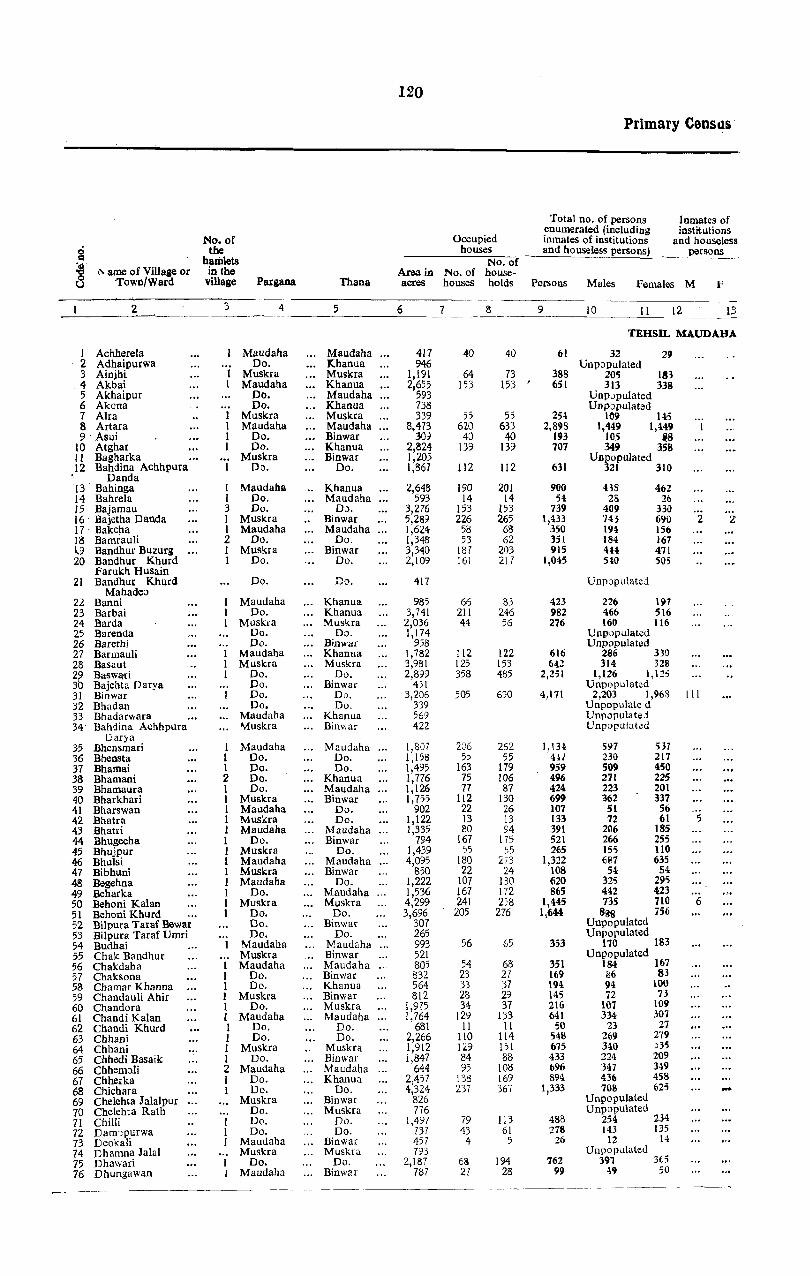
120
Primary Censcls
Total no. of persons Inmates of
No. of Occupied enumerated (including institutions inmates of institutions and house less
0 the houses and houseless persons) ~~sons = hamlets ;g No. of " ame of Village or in the Area in No. of house-
(3 -Town/Ward village Pargaua Thana acres houses holds Persons Males Females M F
2 ;:, 4 5 6 7 8 9 [0 [ 1 12 13
TEHSIL MAUDAHA
I Achherela Maudaha Maudaha 417 40 40 61 32 29 2 Adhaipurwa Do. IChanua 946 Unpopulated 3 Ainjhi Muskra Muskra 1,[91 64 73 388 205 183 4 Akbai Maudaha Khanua 2,655 153 153
, 651 313 338 5 Akhaipur Do. Maudaha 593 UnpJpulated 6 Akona Do. Khanua 738 Unpopulated 7 Alra Muskra Muskra 339 55 55 254 109 145
.8 Artara Maudaha Maudaha 8,473 620 633 2,898 1,449 1,449 9 Asui Do. Binwar 3D} 4:) 40 193 105 liB
10 Atghar Do. Khanua 2,824 139 139 707 349 3511 II Bagharka Muskra Binwar 1,205 Unpopulated 12 Bahdina Achhpura Do. Do. 1,867 112 112 631 321 310
Danda 13 . Bahinga 1 Maudaha ... Khanua 2,648 190 201 900 438 462 14 Bahrela 1 Do. Maudaha 593 14 14 54 28 26 15 Bajamau 3 Do. OJ. 3,276 153 153 739 409 330 16 Bajetha Danda 1 Muskra Binwar 5,289 226 265 1,433 743 690 2 Z 17 Bakcha 1 Maudaha Maudaha [,624 58 68 350 194 156 18 Bamrauli 2 Do. Do. 1,348 53 62 351 184 167 19 Bandhur Buzurg 1 Muskra Binwar 3,340 187 203 915 4~~ 471 20 Bandhur Khurd I Do. Do. 2,[09 161 217 1,0~5 5~0 505
Farukh HUsain 2[ Bandhur Khurd Do. Do. 4[7 Unpoplllatd
Mahadeo 22 Banni Maudaha Khanua 985 66 83 423 226 197 23 Barbai Do. Khanua 3,74[ 2I[ 246 982 466 516 24 Barda Muskra Muskra 2,036 44 56 276 160 116 25 Barenda Do. Do. 1,174 Unpopulated 26 Barethi Do. Binwar 958 Unpopulated 27 Barmauli Maudaha Khanna [ ,782 1[2 [22 616 286 330 28 Basaut Muskra Muskra 3,98[ [25 [53 642 314 328 2~ Basw<\'ri Do. Do. 2,899 358 485 2,251 1,126 1,125 30 Bajehta Darya Do. Binwar 431 Unpopulat~d
31 Binwar Do. Do. 3,206 505 690 4,171 2,203 1,968 [[I
32 Bhadan Do. Do. 339 Unpopulate d 33 Bhadarwara Maudaha Khanua 569 UnpopulateJ 34 Bahdina Achhpura ~.fuskra Binv>ar 422 Unpopulated
Darya 35 Bhensmari 1 Maudaha Maudaha 1,807 206 262 1, 13~ 597 537 36 Bhensta 1 Do. Do. 1,[:)8 5::> 55 411 230 217 37 BhaInai 1 Do. Do. 1,495 163 179 959 509 450 38 Bhamani 2 Do. Khanua 1,776 75 106 496 271 225 39 Bhamaura 1 Do. Maudaha 1,126 77 87 424 223 201 40 Bharkhari 1 Muskra Binwar 1,755 1[2 130 699 362 337 41 Bharswan I Maudaha Do. 902 22 26 107 51 56 . .. 42 Bhatra I Muskra Do. 1,122 [3 13 133 72 61 5 43 Bhatri 1 Maudaha Maudaha 1,335 80 94 391 206 185 44 Bhugecha 1 Do. Binwar 794 167 175 521 266 255 45 Bhujpur 1 Muskra Do. 1,439 55 55 265 155 110 46 Bhulsi 1 Maudaha Maudaha 4,095 180 273 1,322 61\7 635 47 Bibhuni 1 Muskra Binwar 850 22 24 108 54 54 48 Begehna 1 Maudaha Do. 1,222 107 130 620 325 295 49 Beharka 1 Do. Maudaha 1,536 167 172 865 442 423 50 Behoni Kalan 1 Muskra Muskra 4,299 24[ 2;8 1,445 735 710 6 51 Behoni Khurd 1 Do. Do. 3,696 205 276 1,644 888 756 52 Bilpura Tarar Bewar Do. Binwar 307 Unpopulated 53 Bilpura Taraf Umri Do. Do. 265 Unpopulated 54 Budhai Maudaha Maudaha 993 56 65 353 170 183 55 Chak Bandhur Muskra .. Hinwar 52[ Unpopulated 56 Chakdaha I Maudaha Maudaha .. 805 54 68 351 184 167 57 Chaksona 1 Do. Binwar 832 23 27 169 ,,6 83 58 Chamar Khanna I Do. Khanua 564 33 37 194 9<l 100 59 Chandauli Ahir 1 Muskra Binwar 812 28 29 145 72 73 60 Chandora I Do. Muskra [,975 34 37 216 107 109 61 Chandi Kalan l Maudaha Maudaha 1,764 [29 133 641 334 307 62 Chandi Khurd I Do. Do. 68[ II II 50 23 27 63 Chhani 1 Do. Do. 2,266 110 114 5~8 269 279 64 Chhani 1 Muskra Muskra [,912 129 151 675 340 )35 65 Chhedi Basaik 1 Do. Binwar 1,847 84 88 433 224 209 66 Chhemoli 2 Maudaha Maudaha 644 95 108 696 347 349 67 Chherka I Do. Khanu:l 2,457 138 169 894 436 458 68 Chichara 1 Do. Do. 4,324 237 367 1,333 70S 625 69 Chelehta Jalalpur Muskra Binwar 826 Unpopulated 70 Chelehta Rath Do. Muskra 776 Unpopulated 71 Chilli Do. Do. 1,497 79 113 488 254 234 72 Damwurwa Do. Do. 737 43 6[ 278 143 135 73 Deokali Maudaha Binwar 457 4 5 26 12 14
74 Dhamna Jalal Muskra Muskra 793 Unpopcllated 75 Dhawari Do. Do. 2,187 6S 194 762 391 365
76 Dhungawan Maudaha Binwal' 787 27 28 99 49 50
--_ ------------- ----------

I2l
A bstract-( contd. )
AGRiCULTURAL CLASSES NON-AGRICULTURAL CLASSES
Oisplaced p~rsons
M
14
F
15
-(tt{'1RAL)
ll-Cultiva- 1 V-Non-cul-tors of land tivating own-
wholly or ers of land; mainly un- lll-Cuitiva- agricultural V-Producowned and ting labourers rent receivers; tion other
their and their and their than cul-Literates
I_Cultivators of land wholly or mainly owned
and their dependants dep~n_da_nt~ dt!j)e.~d~.l_lts__ _(i~pendants tivation ._
M
17 26
21 387
12 65
14
90 5
80 134 34 8
40 56
9 90 41
14 45
243
617
23 24
107 16 20 -.. 10 5
99 2
10\ 4
42 99
106 3iG
20
1 ~
10
13 6')
4 3
64 4
13 II
191
23 iO 5
60
16
65 I
10
F
Ii
.-. It
2
10 6 2
1 6
6 10
43
14
4 1 I
2
2 I
12 I
19
2
16
4
2
3
M
32,
15l 18B
78 921
87 228
227
242 24
243 ' 349
83 141 301 358
149 325 128
213 208 651
982
343 16i) 352 203 154 234
34 47
163 145 129 SOO
18 230 216 4)0 :'~})
120
)73 ~B (1)
61 ]1)5
278 20
203 253 193 124 317 4~4
J52 92 12
253 44
M F
19 20 21
29
143 205
107 880
74 220
220
10 20
5 93
3 - 6
58
7 2j
3 96
8
53
246 31 36 LO 1
197 92 63 321 18t 166
54 59 52 124 25 24 341 50 44 337 41 44
i42 18 10 341 33 34 81
254 14 19 203 13 12 633 ~3 46
841 2;)4 186
2~8 40 45 152 34 25 320 34 27 167 11 12 132 29 21 217 24 28
35 39 8 5
143 141 39 37 98
444 27 39 :::3 7 1
18i 8 7 226 6) 46 47.3 43 33 4; i 25 24
14)
154 53 70 '3 99 2~4
23 190 272 177 2iO 341 4;6
pg i.58 14
226 41
33
... 8 6
.. -5
19 3
63 2:5 24
33 4
8
25
4
24
61 23 16
2) 2
6 2
M
22
28 46
10 230
12 86
16
23
21 61
26 293
13 104
22
99 119 2 3
29 3'1 12J 145
31 27 9 10
44 37 65 63
18 19 44 61 23 21
38 38 35 57
162 174
564 516
74 68 16 16 60 44 27 26 33 34 41 44 16 20
I 3 27 26 56 54 19 12 78 70
4 4 58 70 66 57 70 IO}
112 153
2
8 7 14 12 6 9
II 10 10
28 21 2 2
24 % 41 38 28 29 25 29 44 ~4
177 164
49 58 32 34
116 I! 1
24
8
4 8
Ii 2 2
23 J
7 18
14 29
8 Its 4
69
9
7 2
20
2 1
16
5 1 5 6
.. -50
3
I 5 6
I 2
7 16
2 3
2 1
F M F
25 26 27
I 17
2 10
4
16 2
22 :)
15 16
12 22
I'i 101
2 9
II
2;;
31 48
3 8
32 30
5 12
3 76
7
11
17
24 24
3 8
26 23
11 15 10 43 16 11
5 4
10 4 2 18 20 21 P 119 137
80 165 154
94 88 9 3 5 I 43 43 4 2 I 733
17 12 7
2 14 12 1 7 7
13 3 :; 6
I 5\ 46 I I 2
14 16 Its 9 18 22
9-5 7)
33 83 36
,., "-
'0 J
2 10
8 4
3
4 7
2. 1 3
8
6 27
2. 26 22 21
8 8
9
3
8
7 7 2
31 l:i 8
13 2
10
VIII-Other services and
VI-Com- VII-Trans- miscellaneous merce port Sources 0
M
28
3
20
4
L-
10
6 j
4
2 6
')
2
3 18
43
10 I 8 7
3
3 2
15 I
1 3J 16
2
5
2
5 I 4
2
2
-- ~-- --. -_. - ----- Q
F- M
29
6
2)
5
2
12
{I
4 2
I 6
10
I ::3
19
47
6
9 5
3
1 5
16 1
7 23 17
4
2
4
2 2
4
G
30 31
3 3
3 3
M
32
4 23
1 76
I [3
20
6 15 13
I 8
] 6
33 I
I 2
6 3 ') 4
<; 6
4 I 65 (:),
1 9 7 10
II 2 12
16 1:3; 14-
4 15 1) 16
l.:l 17 I I c; 7 V
16 2')
2l
12 5 U-10 16 23' 2 2 24
21 Z6
'7 (;, t.l I? 14 28
1 J;i IC4 ?~ jO
I {(~ )'14 3l 32 33 :,4
36 52 35 I [0 36
12 6 37 14 IO 38 2 4 3')
28 21 40 1 1 41
42 J 2 43 ') 2 44 1 45
I, J:J '16 22 i 6 47
) 43 3) ~6 I,)
II l; 5') 22 ] 6 ~ 1
9
?L 53
10 54 ,;~
~6 57 ~8 0Sl
L 60 ') 16 61 i .' 2 62
14 12 63 7 12 64 I 1 65 4 4 66
19 16 67 12 5 68
69 ,0
, 2 7I 4 4 n
73 74
7 8 75 ,6

122
Primary Censlls
Total no. of persons Inmates of enumerated (including institutions
No. of O~~upied inmates of institutions and housel.ess
0 the houses and housele~s persons) persons c:: hamlets No. of .. ,', 'line at Village or in the Area in No. of house-'0 0 Town/Ward village Pargana Th,'na , acres houses holds Persons Males Females M F U
-_. --------~----- ---.------_.-2 5 "I 5 6 7 8 9 10 II 12 13
-----._-----------
TEHSIL MAUDAHA
77 Diha Muskra Binwar 452 Unpopulated 78 Dikhtaura Do. Muskra 475 Unpopulated 79 Dohri I Maudaha Binwar 467 10 12 53 27 26 80 Fatehpur I Do. Maudaha 925 65 76 289 145 144 81 Fatehpurwa Khandeh I Do. Khanua 1,73'5 59 75 337 180 157 82 Gadaria Khera I Do. Maudaha 276 4 4 14 9 5 83 Gahroli 2 Do. Do. 1,079 63 73 315 139 176 84 Ga'1roli I Muskra Muskra 7,770 1,023 1,227 5,322 2,731 2,591 3 7 85 Gakheri Maudaha Maudaha 793 Unpopulated 86 Galihamau I Muskra Binwar 862 21 23 101 56 45 87 Garha 3 Maudaha Maudaha 2,017 157 158 771 416 355 88 (lora I Muskra Muskra 556 72 77 326 161. l(j5 89 Gahbra I Maudaha Khanua 710 13 13 85 45 40 90 Ghandua I Do. Kabrai 1,859 54 64 326 156 170 91 Ghatkana I Do. Maudaha 715 70 79 369 182 187 92 Gidhras Maudaha Do. 490 Unpopu1atej 93 Gurha Do. Khanua 2,087 121 124 564 279 285 94 Gundela Muskra Muskra 3,139 198 216 1,003 521 482 9:; Gurdaha Maudaha Maudaha 2,870 145 147 704 311 333 96 Gusyari Do. Khanua 2,110 163 231 1,142 5~7 55; 2 97 Helpur Do. Binwar 557 Unpopulated 98 Himau1i Do. Khanua 889 54 72 326 J.l7 179 99 Husena Muskra Muskra 3,113 152 188 911 462 449
100 Ichauli Maudaha Khanua 3,508 170 175 853 412 441 101 Imelia MuS'kra Muskra 2,8D4 454 527 2,362 1,180 1,11!2 10 102 Itwan Do. Do. 627 UnpopulateJ 103 lalla I Do. Binwar 1,428 9 10 55 31 24 104 lignoda I Maudaha Khanua 936 76 85 345 184 161 105 Kahra I Do. Kabrl,li 5,483 3B5 444 1,715 908 L07 106 Kaimaha I Do. Do. 1,098 67 80 356 182 174 107 Kaimokhar 1 0o. ... Binwar 1,232 77 100 488 250 . 238 lOB Khamaria I Do. Khanua 724 96 128 610 307 303 10Sl Kamhariya I Do. Maudaha 1,775 302 330 1,327 665 662 110 Kandholi I Muskra Muskra 2,056 171 206 942 485 457 III Kapsa I Maudaha Khanua 1,718 103 135 635 326 309 112 Karahia 2 Do. ... Maudaha 5,717 340 414 1,840 942 8118 113 Kargoan I Do. Binwar 3,005 149 179 792 410 382 3 114 Kher I Do. Maudaha 1,202 52 68 364 202 162 115 Kheri 1 Do. Do. 1,026 54 67 342 178 164 116 Khandeh 2 Do. Khanua 6,755 412 513 2,459 1,252 1,207 117 Khandehi I Do. Binwar B88 12 14 65 30 35 118 Khandehi L0dhan I Muskra Muskra 1,702 137 270 1,281 674 607 119 Khanna I Maudaha Khanua 4,365 359 420 1,795 907 8~8
120 Kharela 4 Muskra Muskra 15,799 1,439 1,667 6,942 3,528 3,414 9 4 121 Khera I Do. Do. 732 7 9 49 29 20 122 Kherwhi 1 Maudaha Khanua 674 56 73 365 180 185 123 Kishanpur I Do. .. Maudaha 496 30 34 Ib5 90 115 124 Kiswahi I Do. Do. 3,424 180 212 1,255 647 (OS 125 Kulkuman 1 Do. ... Khanua 1,080 84 91 433 229 204 126 Kunetha 1 Do. Binwar 3,441 215 261 1,412 736 676 127 Kusme1a Do. Maudaha 236 Unpopulated I:2Zl Lachhmanpur Do. Do. 461 UnpJpulated 129 Lad"f I Do. Khanua 1,470 90 105 516 283 233 130 Larond I Do. Do. 1,261 106 128 663 352 311
!3I Lewa 2 Do. Maudaha 1,906 ,135 144 677 383 294 132 Lodhamau I Muskra Binwar 704 34 88 230 128 102 133 LodhipUf Jdalpur I Do. Do. 1,249 201 209 965 478 4~7
134 Lodh:p,.H Rath Do. Muskra 428 Unpopulated 13~ Man;ha Maudaha Maudaha 1,291 166 187 791 407 3114 136 Madarpur Do. Do. 1,275 90 139 687 345 342 D7 Mahera ;'vfuskra Binwar 4,052 187 319 1,607 815 792
B8 Makraon Maudaha Maudaha 4~117 145 179 768 414 354
139 Masgnon Muskra Muskra 2,415 209 248 1,131 546 5~5
140 Masgaw~.n Maudaha Binwar 1,469 65 75 314 164 [;0
141 Maudaha Do. Maudaha To\\n Area 142 Mawai K1urd Do. Khanua 4,910 283 356 1,655 858 797 143 MawaiA Do. Maudaha 808 24 1') 173 91 82 144 Maharka Do. Binwar 649 UnpJpulated 145 Mihuna I Muskra Muskra 1,555 64 76 412 221 :91
146 Muskara I Du. Do. 4,385 584 768 3,1135 1,998 l,(i37
147 Mutni I Maude. h., B·nwar 1,127 108 139 649 317 332 148 Naikpufl',a 2 Dc. Khanua 1,315 141 143 HiI: 355 359 149 Naraich 1 Do. M211daha 2,038 155 156 719 335 3b4 150 Naugawan Muskra Muskra 599 Unp:·pulated 151 Nauranga Do. Do. 779 Unp~pulated
152 Neoria I Maudaha Binwar 2,730 120 160 E52 4n 400 153 Newada 2 Mlilskra Do. 2,499 303 349 1,814 h 922 li92 154 Noorpur MUlidaha Kh,'nua 687 Unpcpulated
------_---------_ .. _--.-~-.- ----_

123
Abstract-( contd.)
AGRICULTURAl_, CLA,)SES NON-AGRICULTURAL CLASSES
Displaced persons
F
l-Cultivat')rs of lanj wholly or mainly owned
and their Literates _~ependants_
M F 1'.1 F
ll-Cultiva- -- -----TI-=Non:::c-ul--torS of land tivatisg own-
wholly or ers of land; mainly un- HI-Cullival- agricultural V-Produc-
",wned ting lab:mrers rent receivers; tion other and their and their and t'leir than cul-de\)enda~~s _~ependar:ts _depen_~Il~ tivation
M F M F M F M F
Vlll~Other services and
VI-Com- VII-Trans- miscellaneous _~ port Sources g
M F M F M
---.----------~--::----- -,
18 19 20 21 22 14 15 17 16 23 33 I 24 26 27 28 29 30 31 25 32
(RURAL)-(contd,)
2 3
25 JJ
11 640
,.
47 26
17 5
48 72 35
100
4 92 58
209
1 29
J27 29 34 11 56 77 7
165 50 18 I
339 4
112 120 801
36 I
99 22
141
11 3
81 6
127
4 57
100 ~6 83 20
119 23
9 482
J6 4> 34
27 151
J 4
73
2
6 :; 3 I
2 I
18
1 ;, I
6
13 2
22
10 59
7 I 4 6
II
1 6 9
2 2
4 I
9 6
52
3 3
35
25 25
138 8
93 1,478
39 313 118 34
102 97
127 3)7 221 398
102 243 24~ 613
21 74
433 J 37 180 240 445 280 218 687 321 113 133 650
29 421 531
1,369 26
142 53
417 183 495
138 220 238 109 242
332 255 535 236 465 107
599 t4
164 1,349
25] 234 204
310 519
25 27
116 5
109 1,307
32 267 126 35
li6 104
132 304 190 391
115 228 26:J 590
20 76
353 13':> 110 218 459 260 204 649 :l08 95
118 657
31 371 509
1,281 20
134 66
392 168 472
106 189 177 87
240
309 246 516 208 410 98
544 62
138 1.253
255 219 2~6
284 505
i3~ 14 8 8
15 15 121 122
17 13 25 18 8 I
13 15 46 35
49 4:J 22 20 M 77 8 8
II 12 89 83 32 35
175 Iii
2 2 l') i')
92 93 3 4
38 37 14 12 20 21 27 26 36 45 9 6
52 43 16 13
107 91
62 57 80 63
431 406
3 10 9 6
65 5, 6 3
89 63
24 24 42 34 24 22 6 2
41 30
26 19 26 23 53 51 32 41 13 14 28 22
15 14 7 4
41 42 46 40 24 17 25 36 10 7
57 43 102 III
I J 37 38 20 16
26 38 575 71.4
... 28 32 II 35 7 4
29 37 33 44
59 65 134 125 40 47
106 80
15 33 76 83 5b 70
199 226
.. , 51 60
197 203 )4 33 02 ~4 21 29
156 151 127 117 49 54
110 119 31 32 13 10 17 17
183 161 J
89 99 1:'4 183 684 795
27 28 7 4
93 97 30 28
101 97
89 76 63 55 61 46
9 6 144 162
28 31 29 42
101 120 71 65 56 70 16 13
124 127 10 13
7 :3 )46 346
Ii) 16 36 46 4j 42
i2. 59 153 116
2
I 105
23 2
2. 3 I 7
8 3 4
36
15 I 1 4 3
11 1
11 7
10 4
54 1
19 20
5
24
16 8 3
6
2 9
19 2 I 4
12
J 20
10
8 17
5
3 100
.- .
20
I 5
10
6 2 9
49
LO
j
19 7 4 1
13 10 5 4
61 3
16 33 15
5
17
13 14 9 4 9
II 6
16
I II
17
2 40
22
7 23
30 9
2 280
16 15 4 6 2
20 22 6
28
5 30 15 40
2 II 64 2
2 29 16 21 32
9 11 5
110
65 43
739
3 19 28 5
21
8 13 32 4
28
19 60 35 4 2
64 5
3 76 4 9
28
I 67
27 5
2 199
12
19 3 2
19
6 31 13 33
2 2
53 I
12 II 14 29 7 6 4
107
52 30
628
2 18 26 2
13
5 10 25 3
24
7 4) 2;
.)
3
6')
2 4) 3 8
17
1 72.
7 6 I I
2 57 61
2
2 2
2 5 5
14 17
4 4 6 5
20 18 28 33
9 3 30 26
4 6 2 3
12 7
II 12
2 4 1 2
15 21 .. ,
5 4 I
10 10 I I
77 61
15 14 9 21
2- 3 U 17
2
25 13
.,. 2
17 II
33 2 I 2
115
II 5
3 2
22 31 14 26
2 15 40 89
15 77
5 3 I
II 28 4
58 21
I 3
73
15 36
141
2 2
13 4
23
4 4
13 ... 6
17 6
32 36
2 7
34 4
6 103
19 25
2 52
77 78 79
32 80 6 81
82 7 83
88 84 85 86
.6 87 3 88
89 I 90 2 91
92 19 93 25 94 12 95 30 96
97 3 91'1
17 99 27 100 80 101
102 -.- 103 12 104 59 105
I 106 3 107
.... 108 13 109 39 lID 6 III
37 112 13 113
1 114 8 115
63 116 ... 117 8 118
33 119 143 120
'" 121 2 122 I 123
16 124 2 125
26 126 127 128
3 129 6 130 8 131
.. , 132 10 133
134 10 135 16 136 23 137 14 138 3 139 2 140
141 25 142
2 143 144
6 14') 85 1~6
1 147 25 148 19 149
150 151
3 152 48 153
154
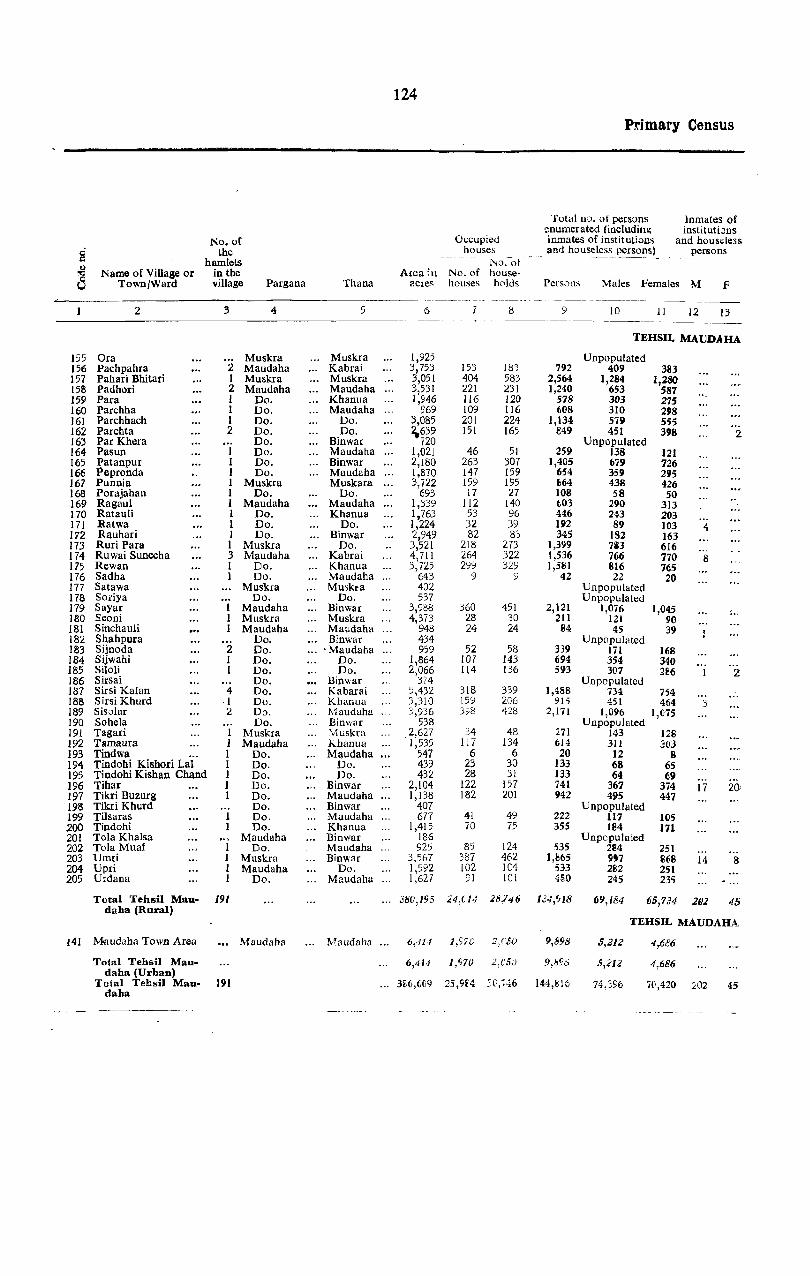
124
Pdmary Census
TotaillCl. of persons Inmates of enumerated (includinl( instituti:ms
No. of O(;cupied innlates of instit utions and houselesSe 0 the houses ._._aD_d__houseless_,,~r~_t:Il~ persons c hamlets i'.o~-ot
.--_. __ -- ----~
<> ,., Name of Village or in the Aica ;n No. of house-0 TownjWard village Pargana Thana acres houses holds Persons Males Females M F U
-_----- -- . _-_ - --~ ~-- ---_-----_-- ._ 2 3 4 5 6 7 is 9 10 11 12 13
---_.-... _-------- ------
TEHSIL MAUDAHA
155 Ora Muskra Muskra 1,925 Unpopulated 156 Pachpahra 2 Maudaha Kabrai 3,753 153 183 792 409 383 157 Pahari Bhitari 1 Muskra Muskra 3,051 404 583 2,564 1,284 1,280 158 Padhol'i 2 Maudaha Maudaha 3,531 221 231 1,240 653 587 159 Para I Do. Khanua 1,946 116 120 578 303 275 160 Parchha I Do. Maudaha 969 109 116 t08 310 298 161 Parchhach 1 Do. Do. 3,085 201 224 1,134 579 555 162 Parebta 2 Do. Do. ~639 151 165 849 451 398 2 163 Par Khera Do. Binwar 720 Unpopulated 164 Pasun I Do. Maudaha 1,021 46 51 259 138 121 165 Patanpur I Do. Binwar 2,180 263 307 1,405 679 726 166 Pepronda I Do. Maud~ha 1,870 147 159 654 359 295 167 Punnia I Muskra Muskara 3,722 159 195 ~64 438 426 168 Porajahan 1 Do. Do. 693 17 27 108 58 50 169 Ragaul I Maudaha Maudaha 1,339 112 140 t03 290 313 170 Ratauli I Do. Khanua 1,763 53 96 446 243 203 171 Ratwa 1 Do. Do. 1,224 32 39 192 89 103 4 172 Rauhari I Do. Binwar 2,949 82 83 345 IS2 163 173 Ruri Para 1 Muskra Do. 3,521 218 273 1,399 7i3 616 174 Ruwai Sunecha 3 Maudaha Kabrai 4,71 I 264 322 1,536 766 770 8 175 Rewan I Do. Khanua 3,7'2.5 299 32!:! 1,58J 816 765 176 Sadha 1 Do. Maudaha 643 9 9 42 22 20 177 Satawa Muskra Mu,kra 402 Unpopulated 178 Soriya Do. Do. 537 Unpopulated 179 Sayar Maudaha Binwar 3,'188 360 451 2,121 1,076 ],045 180 Seoni Muskra Muskra 4,373 28 30 211 121 YO
... 181 Sinchauli Maudaha Maudaha 948 24 24 84 45 39 182 Shahpura Do. Binwar 434 Unpopulated 183 Sijnoda 2 Do. 'Maudaha 959 52 58 339 171 Hi8 1M Sijwahi 1 Do. Do. 1,864 107 143 694 354 340 185 Siloli I Do. Do. 2,066 114 136 593 307 2B6 2 186 Sirsai Do. Binwar 374 Unpopulated 187 Sirsi Kalan 4 Do. Kabarai 5,432 318 339 1,488 734 754 188 Sirsi Khurd ·1 Do. KhanuCl 3,310 159 20G 915 451 464 j 189 Sisolar 2 Do. Maudaha 3,936 )'78 428 2,171 1,096 1,075 190 Sohela Do. Binwar 538 Unpopulated 191 Tagari I Muskra Muskra 2,627 34 48 271 143 128 192 Tamaura 1 Maudaha Khanua 1,535 117 134 614 311 303 193 Tindwa I Do. Maudaha 547 6 6 20 12 8 194 Tindohi Kishori Lal I Do. Do. 439 23 30 133 68 65 195 Tindohi Kishan Chand I Do. Do. 432 28 31 133 64 69 196 Tihar 1 Do. Binwar 2,104 122 157 741 367 374 17 20, 197 Tikri Buzurg 1 Do. Maudaha 1,138 182 201 942 495 447 198 Tikri Khurd Do. Binwar 407 Unpopulated 199 Tilsaras Do. Maudaha 677 41 49 222 117 105 200 Tindohi Do. Khanua 1,415 70 75 355 184 171 201 Tola Khalsa Maudaha Binwar 186 Unpopulated 202 Tola Muaf 1 Do. Maudaha 925 85 124 535 284 251 203 Umri 1 Muskra Binwar 3,567 387 462 1,865 9'7 868 14 8 204 Upri I Maudaha Do. 1,592 102 IC4 533 282 251 205 Urdana I Do. Maudaha 1,627 91 101 4~O 245 235
Total Tehsil Mau· 191 daha (Rural)
;380,195 2:4,(,14 28/46 1.54,':118 69,184 65,734 2IJ2 45
TEHSI'L MAUDAHA
HI :Maudaha Town Area Maudaha ... Maudaha 6,414 1,970 2,(50 9,898 5,212 4,686
Total Tehsil Mau. 6,414 1,C,70 2,f5J 9,8<.'5 5,212 4,686 daha (Urban)
Total Tehsil Mau· daha
191 366,tC9 25,9£4 2(',~46 144,816 74.396 70,420 ~02 45

125
'!\'bstract- (fUn td. ')
AGRICUL TURAL CLASSES NON-AGRICULTURAL CLASSES
n;'p:aced nersons
1\1 f
Literutcs
:\1
I-Cultivators of land wholly or mainly owned,
and their depcnr.lant~
M F
ll-Cultivators of land
wholly or mainly unowned and
their dependants
M f
IV-Non-cultivating owners of land;
Ill-Cult iva- agricultural V-Producting labourers rent receivers; tion other
and their and their than cuI-dep~nd~~ dependants tivation
1\1 F M F M F
VIII-Other services and
VI-Com- VII-Trans- miscellaneous merce port sources
M F M F M
14 15 16 Ii 16 19 20 21 22 23 24 25 26 27 28 29 30 31 32 33 -----~-------~ --------------- ------.... ---------------------~--__:_
(RURAL)-(co .cU,)
5~ 70 24 28 3
97 43
17 136
31 50 21 53 21
2 10 94
133 172
3
219 1
J6 49 50
99 97
160
7 39 'j
II 3
56 78
16 18
33 112
45 21
7 3 1
2
:2 I~
2 9 1
j;i
I
12
16
6 2
2 8
7
3 6
1 6
257 64) 518 174 234 396 254
95 4~1 266 259 36
102 149 52
\37 342 49'0 638
17
720 103
24 10, 235 191
45\ 273 663
III 16J
II)
41 38
257 384
83 128
140 647 192 183
207 601 447 169 225 381 238
91 5':4 2U3 251
31 119 121 62
115 251 482 ~84
13
716 81
19 98
216 184
450 293 681
101 161
6 48 45
252 343
72 114
128 560 170 ItA
37 125 37 49 29 41 92
3 28 ... 3·'
1 18 I';)
9 310
i8 35 5
62 13
15 3) 20 3
8\, 30
103
10 48 2 9
12 5
16
15 10
64 26
8 17
34 131 39 29 25 4; 67
6 19
34
10 16 18 9
225 70 41 7
62 6
13 42 22 3
2 28 88
II 43
2 10 9 6
13
15 16
57 30
5 20
84 103 243 291
40 51 60 62 16 21 96 87 53 57
15 8 128 144 82 76 87 103 20 17 93 100 43 39 9 II
33 38 48 51
117 136 72 71
196 160 5 3
I I 28 24 55 64 75 64
153 151 84 87
117 1,14
16 12 79 66
9 7 9 12
69 83 66 66
II 14 32 36
32 27 141 129 37 39 21 31
10 43 12
I 18
8 3 3 2 I
4 2
2 22
12
3 5 3
19 4
50
1 3
2
20 16 20
23 37 17
1 9
16 1
6 9 I 5
.. 2 2
7 33
24
3 II 6
24 6
55
I 6
2
21 15 14
8 159 36
5 6 7
31
4 14 2
35
1'5 20 6
66 33 19
15
2
24 27
10 22 82
12
2 17 8
2 2
19 108 21 16
8 130 20
1 3 4
17
4 8 I
24
10 24 10
74 43 12
17
18 16
15 20 58
19
1 16 13
3 I
13 86 17 14
9 16
8 10
6 11 4
I I 1 I 3
11 1
16
3
14 19 34
3 1
1 7
13
5 7
2 37 3 2
8 13
I I
5 6
3 9 7
I ;, I
I 4 9
23
6
2 '7
19 9
38
2
8 II
I 2
3 22 4 I
2
2
4
2
2
4 56 8
14 24 13 10
7 14 2
18 I
70 3
2 14 30 29
55
14 7
6 19 47
2 8
1
2 10 6
I 3
7 22
1 6
155 156
79 157-8 158'
12 159 15 160 17 161 12 162
163 3 164
13 165 2 166 9 .67 I 168
69 169 170 t71
... 172 11 173 23 174 20 175 .. , 176
177 178
43 179 ~O 181
... 182 1 1-83 7 184 6 185
186 3 187
21 188 41 189
190 1 191 8 192
,. 193 .,. i S'4 2 195 7 196 1 197
198 ... 199 2 200
201 2 202
26203 2 204 5 205
2 3 /1),840 782 4,l,(i!)(j <1' . .:1'1 ",762 5,251 10,84211,459 1,216 1,471 4,370 3,532 1,206 1,164 57 43 2,722 2,395
URBAN NON~CITY
4 5 1,599 le7 1,3,0 1, 14U leO EO
4 5 1,59'J 1~7 I, ,'10 1.1<1) leo 80
16
16
25
25
16
J(j
524 438 855 778 214 172 2,067 2,053 141
524 438 855 778 244 172 2,067 2,053
6 812,139 %9 H,399 '1!5-;9 ;,f62 ;,331 )(l,858 11,484 1,232 1,471 4,t94 3,970 2,061 1,912 301 215 4,789 4,448
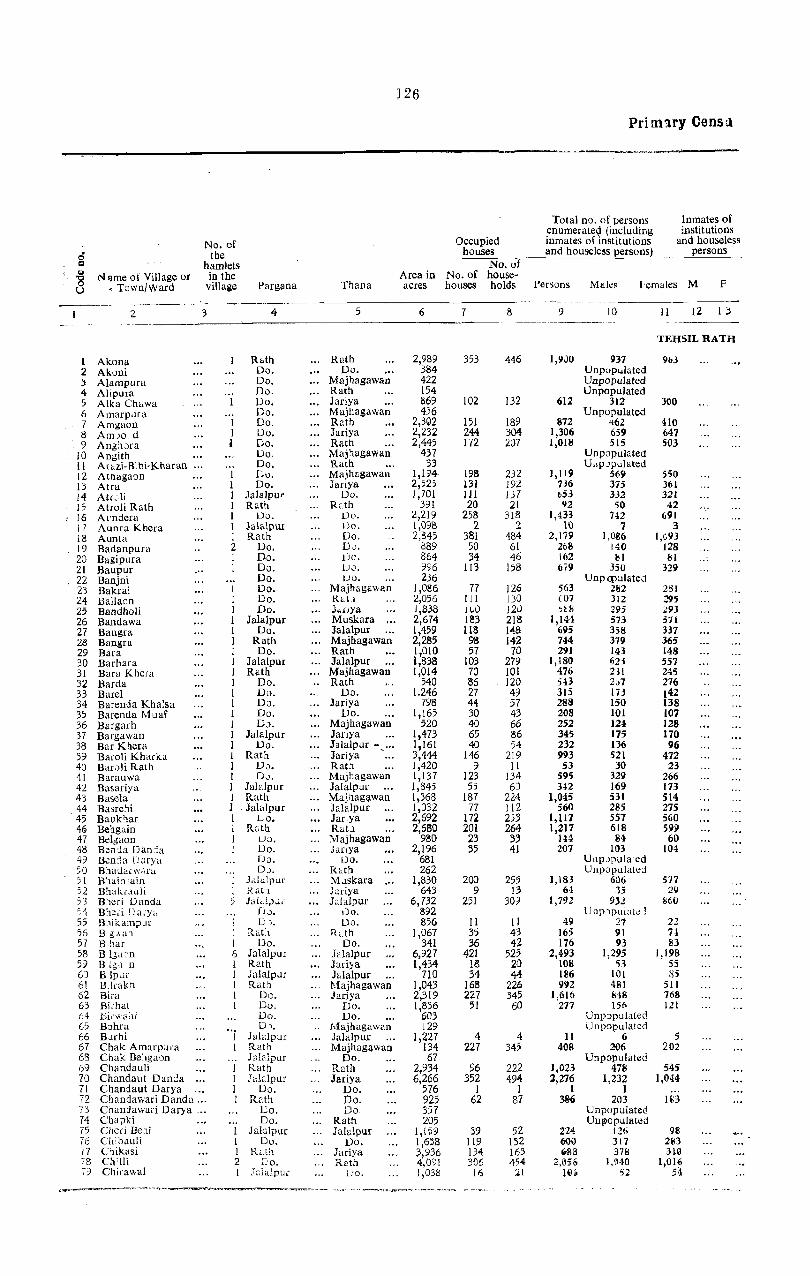
126
Prim'lfY CenSll
Total no. of persons Inmates of enumerate\! (including institutions
No. of Occupied inmates of institutions and houseless
0 the houses and houseless persons) persons c:I hamlets
No. of --------- ----
-8 N 'lme ot Village or in the Area in No. of house-0 '. Town/Ward village Pargana Thana acres houses holds Persons Males Females M F U
----------2 3 4 5 6 7 8 9 10 11 12 D
-~--.----- --~--- -------
TEHSILRATH
1 Akona Rbth Rath 2,989 353 4'16 1,9JO 937 963 2 Akoni Do. Do. 384 Unp()pl.I.lated ;, Alampura Do. Majhagawan 422 Unpopulated 4 Alipura Do. Rath 154 Unpopulated 5 Alka Chawa Do. Jariya 869 102 132 612 312 300 6 Amarpclfa Do. Majhagawan 456 Unpopulated 7 Amgaon I Do. Ruth 2,3Q2 151 189 872 '162 410 8 AmJo. d I Do. Jariya 2,232 244 304 1,306 659 647 9 Ang:1Jra i Do. Rath 2,445 172 207 1,018 515 503
10 Angith Do. Majhagawan 437 Unpopulated II Ar"zi-B:bi-Kharan ... Do. Rath 33 UllpJpulated 12 Atnagaon 1 Do. Majhagawan 1,194 19B 232 1,119 569 550 13 Atra I Do. Jariya 2,52; 131 192 736 375 361 14 AtrJli J Ja!alpu r Do. 1,701 III 137 b53 332 321 15 Atroli Rath I Rath Rr.th 391 20 21 \12 50 42 16 Al'ndera I Do. Do. 2,219 25B 318 1,433 742 691 1 7 Aunra Khera 1 Jalalpur 1)0. 1,098 2 2 \0 7 3 18 Aunta I Rath Do. 2,845 381 484 2,179 1,086 I,C93 19 Badanpura 2 Do. DJ. 889 50 61 268 140 128 20 Bagipura I Do. Ue. 864 34 46 162 81 81 21 Baupur I Do. i)0. 'FJ6 113 158 (J'i9 350 329 22 Banjni Do. uo. 236 Unp(\)ulated 23 Bakrai 1 Do. Majhagawan 1,086 77 126 563 282 281 24 llallacl1 I Do. Ratl 2,056 III 130 (07 312 295 25 Bandholi I Do. h.nya 1,838 1uO 120 ~H! 295 ;:93 26 Bandawa 1 Jalalpur Muskara ... 2,674 IS3 218 1,144 573 571 27 Bangra 1 Do. JaJalpur 1,459 lIS 1~8 695 358 337 28 Bangra 1 Rath Majhagawan 2,285 9B 142 744 379 365 29 Bara I Do. Rath 1,010 57 70 291 143 148 30 Barhara I Jalalpur Jalalpur 1,83B 103 279 1,180 623 557 31 Bara Khera 1 Rath Majhagawan 1,014 70 101 476 211 245 32 Barda I Do. .. Rath 540 86 120 543 2(J7 276 33 Barel I Do. Do. 1.246 27 49 31S 173 142 34 Barenda Khalsa I DQ. Jariya 798 44 57 288 150 138 35 Barenda Muaf I Do. Do. 1,165 30 43 208 101 107 36 Bargarh I OJ. Majhagawan 520 40 66 252 124 128 37 Bargawan J Jalalpur Janya 1,473 65 86 345 175 170 38 Bar Khcra 1 Do. Jalalpur - •.... 1,161 40 54 232 136 96 39 Baroli Kharka 1 Rath Jariya 3,444 146 219 993 521 472 40 BarJli Rath 1 OJ. Rath 1,420 9 11 53 30 23 41 Barauwa I OJ. Majhagawan 1,137 123 134 595 329 266 42 Basariya I JaJaJpur JalaJpur 1,845 55 6) 342 169 173 43 Basela I Rath Majl1ag</-wan 1,368 187 224 1,M5 531 514 44 Basre3i 1 JalaJpur Jalalpur 1,032 77 112 560 285 275 45 Baukl-Jar 1 VO. Jar,ya 2,692 172 253 1,117 551 560 413 Behgain 1 R;;tn RaL1 2,6130 201 264 1,217 618 599 47 Belgaon J Du. Majhagawan 980 23 33 114 84 60 48 BenJa Danja 1 Do. Jariya 2,196 35 41 207 103 104 49 Ben:la LJarya LJo. Uo. 681 UnpJPula'ed 50 B:ladarw"ra OJ. R"th 262 UnpQPulateJ 51 B'1ai::uain 1 LLlpur Muskara 1,830 200 255 1,183 606 577 52 Bhakrauli 1 R(it 1 hriya 643 9 13 6·1 35 29 53 B'lCri Danda 5 JaL!.' .. .: Jdalpur 6,732 251 30) 1,792 9.32 860 ~4 B!1~.:i [)ary~, DJ. 00. 892 UnpJpulat" 1 55 B:likamp.lr 1 DJ. Do. 856 II II 49 27 22 56 B g Aa.1 I flat} Ruh 1,067 35 43 165 91 74 57 B har 1 Do. Do. 341 36 42 176 93 83 58 B L;uJn 6 JaJaJpur JalaJpur 6,927 421 525 2,493 1,295 1,198 59 B 1';1 n 1 Rath Jariya 1,434 18 20 108 53 55 6) B Jpur I JalaJpur JalaJpur 710 34 44 186 101 85 61 B lrak:1 1 Rael Majhagawan 1,043 168 226 992 481 511 62 Bira I Do. Jariya 2,319 227 345 1,616 8'18 768 63 Hirhat I Do. Do. 1,836 51 60 277 15(> 121 64 Hirwa;-li Do. Do. 603 Unlnpulated 65 Bahra
"j D,). .. j\1ajhagawan 129 Unpopulated
66 Barhi Ja12,)pur JaJaJpur 1,221 4 4 II 6 5 67 Chak Amarpura I Rath Majhag~wan 134 227 345 408 2{}6 202 68 Chak Be:,gaon Jalalpur Do. 67 UnpopUlated 69 Chandalili I Rath Rath 2,934 96 222 J,023 478 545 70 Chandallt D anda I J"l::Jpu, Jariya 6,266 352 494 2,276 1,232 1,044 7! Chand aut Darya 1 Do. Do. 576 1 I 1 I 72 Chandawari Danda ... I Rr.th Do. 925 62 87 386 203 Hl3 T5 Chandawari Darya ... Do. Do. 357 Unpopulat<ld 74 Chapki Do. Rath 205 LJn~opulated 75 CIICfi Beai I Ja(.alpur Jalalpur 1,[59 39 52 224 126 98 76 Chibauli 1 Do. Do. 1,6313 1l.9 132 600 317 2~3 77 C'1ikasi I Ruh Jariya :3,936 134 163 ~8 378 3HJ 78 Ch'lli 2 L'o. R2.th 4,091 306 454 2,1}56 1,040 1,016 ~9 Chirawal 1 J~Jalpur 1)0. 1,038 16 21 I~li 52 54
, __ -~"-'----.'--"~~'n.<~...,..,.,_.......,.......~=,.~-,._ ,. ~--","",-"-~""",' .. <-~- -,-~ .....
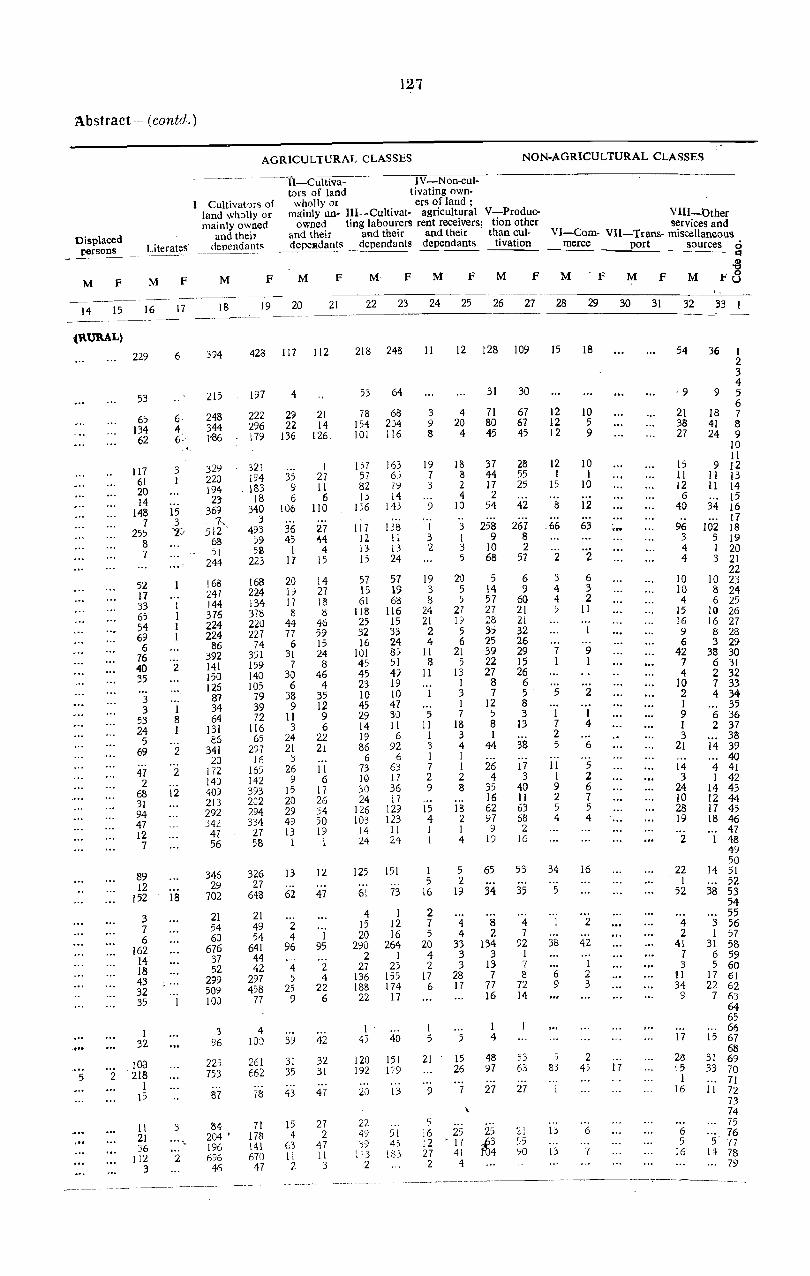
127
Abstract -- (contd.)
AGRICULTURAL CLASSES NON-AGRICULTURAL CLASSES
- ------- n Cultiva- -- IV-Non-cuJ-tors of land tivating own-
I-Cultivators of wholly or ers of land; land wholly or mainly un- Ill-Cultivat- agricultural V-Produc-mainly owned owned ting labourers rent receivers; tion other
VIlI-Other services and
VI-Com- Vll-Trans- miscellaneous Displaced
persons
and theil and their alld their and their than cul-Literates- dependants depelildants dependants dependants tivation fierce port sources 0
- Q ~----=~~~
M f M f
14 15 16 17
(RURAL)
."
5
229
53
65 134 62
117 61 20 14
148 7
255 8 7
52 11 33 65 54 69 6
76 40 35
3 3
53 24 5
69
47 2
68 31 94 47 12 7
89 12
152
3 7 6
162 14 18 43 32 35
I 32
100 2 -218
I 15
II 21 36
112 3
6
6 4 6-
3 I
15 3 -1;
....
2
I 8 I
2
2
12
18
3 •• o\,
2
M
18
394
215
248 344 1'86
329 220 194 23
369 -7-.
512 -68 SI
244
168 247 144 376 224 224
86 392 141 150 126 87 34 64
131 ~6
341 20
172 140 409 213 292 342 47 56
346 29
702
21 54 60
676 37 52
299 509 100
3 96
225 753
87
84 204 " 196 696 46
F
19
423
197
222 296 179
321 1~4
, 183 18
340 3
493 59 513
223
168 224 134 378 220 227
74 351 159 140 105
79 39 72
116 65
297 16
165 142 393 202 294 334
27 58
326 27
648
21 49 54
641 44 42
297 458
77
4 10)
261 662
78
71 178 141 670
47
M
20
117
4
29 22
136
35 9 6
106
36 45
I 17
20 19 17 8
44 77
6 31 7
30 6
38 9
II 3
24 21
3 26
9 15 20 29 49 13 1
13
62
2 4
96
4 5
25 9
39
31 35
43
15 4
63 II 2
112
21 14
126
1 21 11 6
110
27 ,\4
4 15
14 27 18 8
46 59 15 24 8
46 4
35 12 9 6
22 21
11 6
17 26 :54 50 19 I
12
47
I 95
2 4
22 6
42
32 31
47
27 2
47 II 3
F
21
.g M F M F M f' M F M F M F8
22 23 24 25 26 27 28 29 30 31 32 33
218
53
78 154 101
1'> 7 57 82 13
136
117 12-13-h
57 15 61
118 25 32 16
101 45 45 23 10 45 29 14 19 86
6 73 10 30 24
126 103
14 24
125
61
4 15 20
290 2
27 136 186 22
1 45
120 192
20
22 49 'j9
173 2
248
64
68 204 116
163 65 79 14
143
138 II 13 24
57 19 68
116 15 33 24 85 51 41 19 10 47 30 II 6
92 6
63 17 36 17
129 123
11 24
151 .--73
1 12 16
264 1
25 155 174 17
40
151 179
13
51 45
t83
11 12
3 4 9 20 8 4
19 16 7 6 3 2
4 9 10
.. I 3 3 1 2 3
5
19 20 3 5 8 5
24 27 21 19
2 5 4 6
II 21 8 5
11 13 1 3 I
5 7 11 18
I 3 3 4 1 I 7 I 2 2 9 8
15 18 4 2 I 1 I 4
I 5 5 2
16 19
2 7 4 5 4
20 33 4 3 2 3
17 28 6 17
I 5 5
21 15 26
9 7
5 J6 25 12 • 17 27 41 2 4
\
128
31
71 80 45
37 44 17 2
54
258 9
10 68
5 14 57 27 28 35 25 39 22 27
8 7
12 5 8 I
44
26 4
35 16 62 97 9
19
65
34
8 2
134 3
13 7
77 16
1 4
48 97
27
109
30
67 67 45
28 55 25
42
267 8 2
57
6 9
60 21 21 32 26 29 15 26
6 5 8 3
13
38
17 3
40 11 63 68 2
16
53
35
4 7
92 I 7 8
72 14
53 63
27
21 55 '10
15
12 12 12
12 1
15
8
.66
2
3 4 4 5
7 1
5
I 7 2 5
11 I 9 2 5 4
34
5
38
6 9
5 83
13
13
18
10 5 9
10 I
10
12
63
2
6 3 2
11
9 1
2
1 4
6
5 2 6 7 5 4
16
2
42
1 2 3
2 45
6
7
17
54
'9
21 38 27
15 II 12 6
40
96 3 4 4
10 10 4
15 16 9 6
42 7 4
10 2 I 9 I 3
21
14 3
24 10 28 19
2
22 1
52
4 2
41 7 3
11 34 9
17
28 ~:5
I 16
6 5
16
36 I 2 3 4
9 5 6
18 7 41 8 24 9
10 II
9 12 II 13 II 14
15 34 16
17 102 18
5 19 I 20 3 21
22 10 23 8 24 6 25
10 26 16 27 8 28 3 29
38 30 6 31 2 32 7 33 4 34
35 6 36 2 37
38 14 39
40 4 41 1 42
14 43 12 44 17 45 18 46
47 48 49 50
14 51 52
38 53 54 55
3 56 1 57
31 58 6 59 5 60
17 61 22 62 7 63
64 65 66
15 67 68
31 69 33 70
71 11 72
73 74 75 76
:5 77 14 78
79
--------------

128
Primary Census
Total no. of persons Inmates of enumerated (includimt inslituti:ms
Occupied No. of inmates of institutions and houseless 0 the houses ann hcuseless persoI1s1 __ l'_erso~ c hamlets No. of -8 Name o[ Villaae or in the AIeain No. of house-0 TownlWard village Pargana Thana acres houses holds Persons Males Females M U f'
2 3 4 5 I'i 7 8 9 10 II 12 13 _~~---~--"
TEHSILRATH
80 Chirpura JaJalpur Jalalpur 235 Unpopulated 81 ChuUa Rath Rath 148 Unp.pulated 82 Churha Do. Majhagawan 1,204 72 98 440 216 224 83 Churwa Do. Rath 896 32 41 168 71 97 84 Dadri Do. Do. 1,212 61 77 385 189 196 85 Danda Jalalpur Jalalpur 1,249 Unpopulated 86 Dando 2 Do. Jariya 2,128 50 62 21)1) 157 133 87 De:>khari I Do. Jalalpur ... 1,923 16 16 liB S6 6l 88 Deora I Rath Majhagawan 552 66 86 317 188 li9 89 Dhagwan I Jalalpur Jariya 2,210 188 253 1,()2S S22 ~03 90 Dhagwan I Rath Majhagawan 1,379 123 150 683 3S5 328 91 Dhamna I Do. Rath 1,575 318 404 1,691 813 878 92 Dhanaura I Do. Do. 864 35 41 156 87 69 93 Dhanaura I Do. Do. 2,678 313 3~ 1,793 8'9 594 94 Dharaupur Jalalpur Jalalpur 800 Unp0pulated 95 Dhauhal Buzurg 2 DC'. Do. 3,743 161 203 1,091 554 S37 96 Dhauhal Khurd Do. Do. 1,241 Unpopulated 97 Diha Rath Rath 262 Unpopulated 98 Dikhtaura Do. Do. 267 Uopopulated 99 Gahuli Jalalpur Jalalpur 401 40 47 176 96 80
100 Galiha Rath Rath 834 138 163 771 384 387 101 Garhar Do. Majhagawan 605 'II 45 209 III 98 102 Ghungsi Do. Rath 964 1 1 3 1 2 103 Ghurauli Do. Jariya 1,371 30 33 160 78 82 1{)4 Giraura Do. Rath 578 Unpopulated 105 Girwar Do. Majhagawan 1,829 138 197 871 437 434 [
106 Gohand Do. Do. 3,392 519 664 3,026 -1,560 1;466 25 107 Gohani Panwari Do. Do. 2,240 143 197 894 449 445 108 Gohni Rath Do. Rath 2,141 112 123 631 317 l14 109 Govindpura Do. Do. 386 Unpopulated 110 Gugarwara Do. Majhagawan 861 20 20 97 46 51 I II Gursara Do. Do. 364 Unpopulated 112 Gutakwara Do. Jariya 681 67 98 400 203 197 113 Hajipur Salaiya JalaJpur Jalalpur 1,191 Unpopulated 114 Hansaupur Sesa 1 Do. Do. 1,632 7 8 45 26 19 115 Harduwa 1 Rath Jariya 1,729 82 87 443 225 218 116 Harsundi [ JaJaJpur JalaJpur 2,510 102 163 803 399 404 117 Hemanpura 3 Do. Do. 718 29 29 169 98 '91 118 lkthallra [ Rath Majhagawan 1,407 77 97 469 228 241 119 lkthaur 1 Do. Do. 317 12 13 45 21 24 120 Inchaura 1 Do. Jariya 2,557 85 115 639 358 281 121 Indarpura 1 Jalalpur Jalalpur 2,766 134 200 909 483 426 122 Ingoi Do. Rath 1,274 Unpopulated 123 Islampur 1 Rath Jaliya 7,138 186 264 1,227 646 581 124 Italiya 1 Do. Do. 3,688 341 471 2,157 1,086 1,071 125 Italiya I Do. Majhagawan 1,91:9 104 121 561 308 253 126 Itaya} I Do. Rath 1,028 59 61 311 166 145 127 Itora Gang I Do. Do. 282 16 23 99 47 52 128 Itora":.Rath 1 Do. Do. 748 171 238 1,081 516 565 129 lakheri I Jalalpur Do. 1,560 191 239 1,007 516 491 130 lalalpur I Do. Jalalpur 251 167 190 908 470 438 IO 131 Jamagawan Rath .. Jariya 851 Unpopulated 132 Jamkhuri Do. Do. 888 53 75 344 17,8 166 133 Jamori Danda JaJalpur Do. 2,225 76 96 S02 253 249 134 Jamori Darya Do. Do. 579 Unpopulated 135 Jamra Rath Rath 572 Uopopulated 136 Jarakhar I Do. Majhagawan 3,811 366 481 2,299 1,211 1,088 137 Jariya I Do. Jariya 2,068 92 94 1,028 554 474 :)
138 Jariya I Jalalpur Do. 630 19 19 91 43 48 139 Jhennabira 2 Rath Majhagawan 2,611 185 223 964 508 466 ... 140 Jher Moli Do. Jariya 937 Unpopulated 141 Jigni Do. Majhagawan 9,864 328 410 1,926 929 997 142 Jitkheri Danda Jalalpllf Jmiya 3,497 85 116 6C!4 313 291 143 Jitkheri Darya Do. Do. 203 Unpoplllat~d
144 Kachv,a Rath Do. 2,173 95 273 1,237 599 638 145 Kadaura Jalalpur hh:lpur 1,911 44 52 37.t3 166 157 146 Kadipura Do. Do. 618 Unpopulated 147 Kaimokhar 1 Ruth Jariya 1,26') 54 62 248 130 118 148 Kaitha 3 Do. Rath 2,818 196 238 1,248 644 604 149 Kaithi 1 Do. Do. 1,361 185 223 670 348 322 150 Kanera I Jalalpuf Jalalpllf 232 4 4 22 12 10 151 Kargawan I Rath Rath 1,152 72 89 f-' 379 :309 170 152 Karhi I Do. Jariya 1,378 85 III 513 252 261 153 Karyari 1 \0 D.o. Do. 3,095 137 154 8i7 417 4(lO 154 ltaraundi 1 ·Do. Rath 1,358 114 165 685 339 346 155 Karpura Do. 190. 1,342 Ur,populared 156 Katchri 8 JaJalpaf JaJalpuF 2,396 46 58 350 186 1M 157 Keotra- 1 Do. Do. 482 18 111 98 49 49 158 Kesarganj 1 Do. Jariya 436 I I 5 3 2
_--~.----. -----_.---- ----~--"--
.-~.----

129
Abstract-( contd.)
AGRICULTURAL CLASSES NON-AGRICULTURAL CLASSES
t1igplaced p~rsons
. I-Cultivators of land wholly or mainly owned
and their Literates dependants
ll-Cultiva- lV-Non-cul-tors of land tivating own-
wholly or ers of land; mainly un- Ill-Cult iva- agricultural V-Produc-owned and ting labourers rent receivers; tion other
their and their and their than eu}-~lcpendant~ dependants dependants tivation
VIlI-Other services and
VI-Com- VII-Trans- miscellaneous merce port Sources '. o =
M F 1\1 M F M F M F M F M F M F M F M
14 15 16 17 18 19 20 21 -----_._---_.-._----._ .. - ._-... _. --_ ..
,{RURAL)-(contd.)
54 13 30
33 5
i8 IDa III 105
13 151
150
20 88 7
3
56 275
19 26
4
35
1 26 22 3
10 4
90 69
210 257 81 9 2
162 28
124
17 11
489 145
2 60
229 25
76 7
10 67 60
32 64 8
27
3 2
3 126 2 44
102
:3 114 51
I 119 6 28~ 9 211 2 542 4 47
18 4~)
14 362
67 5 183
84 1
59
2 257 20 844
317 154
34
99
25 121
2 319 68
174 II
3 244 1 212
7 359 13 647 8 156
103 44
21 197 345
18 195
132 207
25 1,063 4 252
39 3 264
27 434 176
3 308 104
65 375
3 232 8
I 162 4 156
362 259
128 44 3
130 16 12 58 I
102 12 15
104 9 8 55
118 9 9 258 45 51 179 10 6 61 ~ 3 I
37 7 4 4) 33 37
338 61 68
58 186 40 35 76 2
58
250 18 18 799 59 54 .319 II 7 147 6 12
43 2. 2
101 15 12
19 JI3 61 69 328 17 13 66 23 19
181 2 2 II 2 2
. 186 32 25 171 64 48
326 66 61 648 68 72 134 53 35
91 9 4 46
215 108 103 308 30 27 193 17 12
117 204 g 6
976 7 3 208 31 23
39 2 3 232 45 31
501 22 17 170 17 13
322 64 62 99 15 17
53 12 5 375 79 75 210 27 33
8 4 2 135 6 5 161 33 37 337 1 270
118 24 17 44 5 5 2
22 23 24 25 26 27 28 29 30 31
34 53 16 18 34 37
24 15 3 3
17 27 78 96 95 95 68 75 19 13
177 182
58 68
28 21 100 111 10 It
5 12
83 89 250 218
46 49 46 53
2
33 30
14 12 24 30
5 4 21 21
I 37 34
112 146
75 77 123 115 77 68 22 26
3 3 104 128 66 88 41 44
36 38 29 .29
14 52 80 73
I 142 134
156 205 66 67
73 99 27 26
29 36 55 51 45 44
... 33 22 24 27 32 40 41 51
15 13
4 5 15 7 I 4 2 I 4 7 22 18
4 I 3 2 4
22 17 18 II 12 19 85 53 5 7 15 16 2 1 140 134 5 5 9 9
17 \4 180 \74
18 16 34 26
I 2 5 44 39
12 8 4 2
12 11
19 22 22 22 44 53 201 180 31 30 38 33 15 19 84 76
3 6 4
7 3 29 26
1 3 5 17 8 9 14 14 II
4 7 9 7 10
I 20 14 8 9 62 34
8 7 72 49 13 26 153 139 3 4 3 2 8 3 15 16
3 4 16 67 65 5 3 45 37
13 13 90 80
9 11 5 5
69 31 I 125 109 2 5
29 27 17 21
95 127 105 75 II 15 31 15
13 15112108 3 II 10
7 9 II 7 36 30 74 57
2 3 32 23
3 I 2 4 27 27 2 2 19 II
19 12 18 12
7 6
2
5 2
27
17
3
13 83
2 4
2 4
3 4
10 45 3
15 7
39
.3
23 5
4
9 3
8 5
6 4
3 7
4
2
8 2
24
18
5
12 80
4 1
2 3
4 2
12 35 2
11 8
30
5
11 7
4
6 3
15 2
4 2
5 5
3
2
7 8
3
------~----.---.--.--~---.-~.---.--- .. ---
3Q
19 7
15
3
3 17 17 31
35
18
15 1
25 79 4 8
20
7 12 2
24 I
21 21
56 37 13 4
21 13 75
35 53
7
88 9
21 1
6 19 3
2 3 I 2
7
33
80 81
15 82 16 83 17 84
85 4 86
87 7 88
18 89 23 90 28 91
1 92 34 93
94 16 95
96 97 98 99
11 100 I 101
... 102
... 103 104
21 105 82 106
:3 107 6 108
109 ... I iO
III 25 112
113 ." 114 9 115 5 116 2 117
24 118 '" 119 18 120 16 121
122 49 123 36 124
8 125 5 126
... 127 27 128 20 129 64 130
131 •.. 132 .•. 133
134 139
12 136 46 137 ... 138 7 139
140 6~ 141 7 142
143 17 144 3 145
146 8 147
12 148 4 149
... 150 :: )51
152 I 153 I 154
155 6 156
'. 157 ... 158
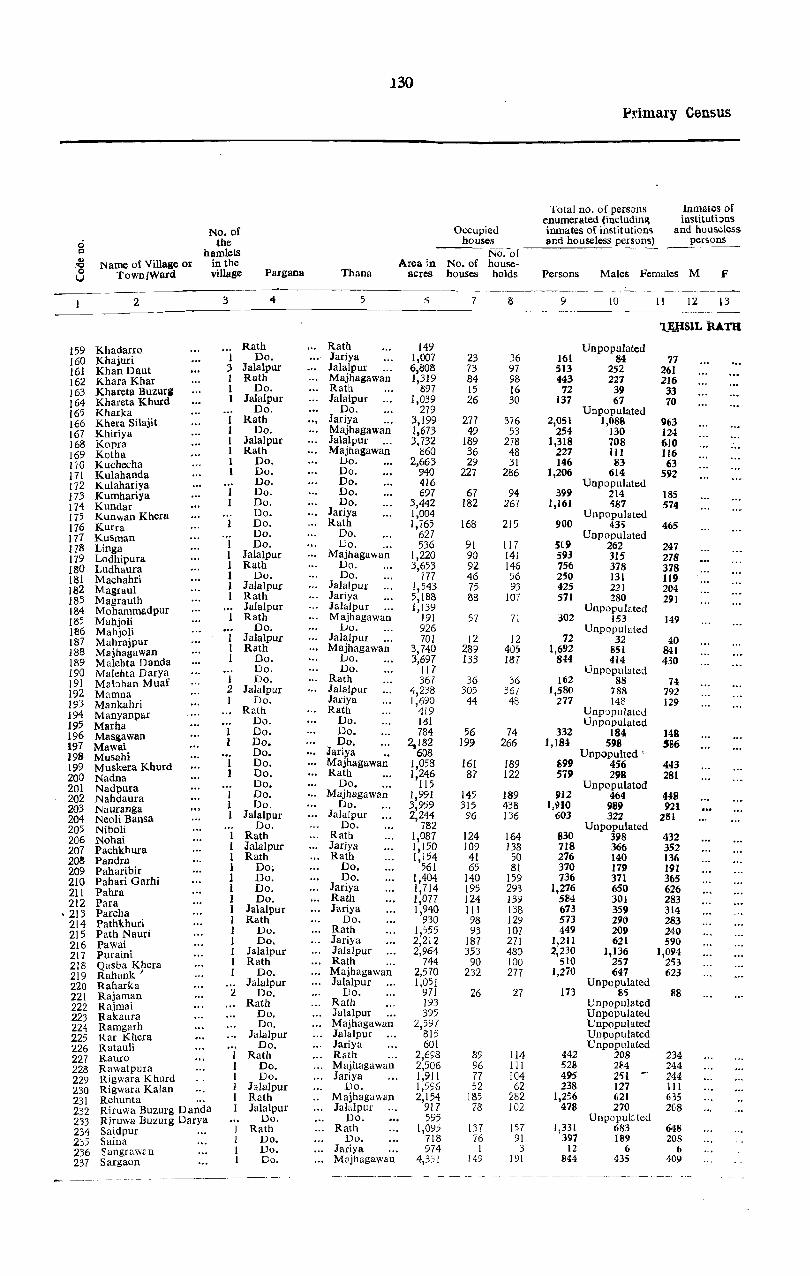
o c ... 'Q o U
Name or Village or Town/Ward
No. of tbe
hamlets in the village Pargana Thana
130
Ol,;cupied houses
No. of Area in No. of house
acres houses holds
Primary Census
Total no. of persons enumerated (includin~ inmates of institution~ and houseless persons)
Inmates of instituti::ms
and houseless persons
Persons Males Females M F
__ ~ _______ 2 _____________ 3------4------------5--_______ ~ ______ 7 _____ 8_· ______ 9 _______ IO __ II 12 13
159 160 161 162 163 164 165 166 167 168 169 170 171 172 173 174 175 176 177 178 179 180 181 182 183 184 185 186 187 188 189 190 191 192 193 194 195 196 197 198 199 200 201 202 203 204 205 206 207 20S 209 210 211 212
·213 214 215 216 217 218 219 220 221 222 223 224 225 226 227 228 229 230 231 232 233 234 235 236 237
Khadarro Khajuri Khan Daut Khara Khar Khareta Buzurg Khareta Khurd Kharka Khera Silajit Khiriya Kopra Kotha Kuchecha Kulahanda Kulahariya Kumhariya Kundar Kunwan Khera Kurra Kusman Linga Lodhipura Ludhaura Machahri Magraul Magrauth Mohammadpur Mahjoli Mahjoli Mahrajpur Majhagawan Malehta Danda Malehta Darya Mabhan Muaf Mamna Mankahri Manyanpar Macha Masgawan Mawai Musahi Muskera Khurd Nadna Nadpura Nahdaura Nauranga Neoli Bansa Niboli Nohai Pachkhura Pandra Paharibir Pahari Garhi Pahra Para Parch a Pathkhuri Path Nauri Pawai Pllraini Qasba Khcra Rahank I
Raharka Rajaman Rajrnai Rakaura Ramgarh Rar Khera Ratalili Rauro Rawatpura Rigwara Khurd Rigwara Kalan Rehunta Riruwa Buzul'g Danda Riruwa Buzurg Darya Saidpur Saina Sangrawzn Sargaon
Rath 1 Do.
;} Jalalpur I Rath 1 Do. I Jalalpur
Do. I Rath I Do. 1 Jalalpur I Rath I Do. I Do.
Do. Do. Do. Do. Do. Do.
I Do. I Jalalpur 1 Rath 1 Do. I JalaJpur I Rath
Jalalpur Rath
Do. Jalalpur Rath
Do. Do.
I Do. 2 Jalalpur 1 Do.
Rath Do. Do. Do. Do. Do. 00. Do.
I Do. I Do. I JalaJpur
Do. I Rath 1 JaJalpur 1 Rath I Do; 1 Do. I Do. I Do. I Jalalpur 1 Rath 1 Do. I Do. I JaJaipur I Rath I Do.
Jalalpur 2 Do.
Rath Do. Do.
Jalalpur Do.
Rath Do. Do.
Jalalpur Rath Jalalpur
Do. Rath
Do. Do. Do.
------_.--- - ---- --_._-------------
Rath Jariya Jalalpur ". Majhagawan Rath Jalalpur
Do. J . anya ". Majhagawan Jalaillur .. , Majhagawan
Vo. Do. Do. Do. Do.
JariYa Rath
Do. Do. . ..
Majhagawan Do. Do.
Jalalpur Jariya JalaJpur Majhagawan
Vo. Jalalpur ". Majhagawan
Vo. Do.
Rath JaJalpllf Jariya Rath
Do. Do. Do.
Jariya .. Majhagawan Rath
Do. '" Majhagawan
Do. Jala1pur
Do. Rath Jariya Rath
Do. Do.
Jariya Rath Jariya
Do. Rath Jariya Jalalpur Rath Majhagawan Jaialpllr
Do. Ralh Jalalpur Majhagawan Jalalpur Jariya Rath Majhagawan Jariya
Do. MajhagaW<iD Jalalpur
Do. Rath
Do. Jariya Majhagawan
149 1,007 6,808 1,319
897 1,039
279 3,199 1,673 3,732
860 2,663
940 416 697
3,442 1,004 1,765
627 536
1,220 3,653
777 1,543 5,188 1,139
191 926 701
3,740 3,697
117 361
4,238 1,690
419 lSI 784
2,182 608
1,058 1,246
115 1,991 3,959 2,244
782 1,087 1,150 1,154
561 1,404 1,714 1,077 1,940
930 1,555 2,212 2,964
744 2,570 1,051
971 ]93 395
2,597 815 601
2,698 2,506 1,911 1,55'6 2,154
917 595
1,095 718 974
4,35]
23 73 84 15 26
277 49
189 36 29
227
67 182
168
91 90 92 46 75 88
57
12 289 133
36 305 44
56 199
161 87
145 315 96
124 109 41 65
140 195 124 III 98 93
187 353
90 232
26
89 96 77 52
185 78
137 76
I 149
36 97 98 16 30
3i6 53
278 48 31
286
94 267
215
117 141 146 56 93
107
71
12 40, 187
36 367 48
74 266
189 122
189 438 136
164 138 50 81
159 293 139 138 129 107 271 480 100 277
'l.7
114 III 104 62
282 102
157 91 3
191
161 513 443
72 137
2,051 254
1,318 227 146
1,206
399 1,161
900
SG9 593 756 250 425 571
302
72 1,692
844
162 1,580
277
332 1,181
699 579
912 1,910
603
830 718 276 370 736
1,276 584 673 573 449
1,21I 2,230
510 1,270
173
442 528 495 238
1,256 478
1,331 397
12 fl44
Unpopulated 84
252 227 39 67
Unpopulated 1,088
130 708 III 83
614 Unpopulated
214 587
Unpopulated 435
Unpopulated 262 315 378 131 221 280
UnpClpuli-,ted 153
Unpopulated 32
851 414
Unpopulated 88
788 148
Unp::JplIlated Unpopulated
184 598
Unpopulted ' 456 298
Unpopulated 464 989 322
Unpopulated 398 366 140 179 371 650 301 359 290 209 621
1,136 257 647
Unpopulated 85
Unpopulated Unpopulated Unpopulated Unpopulated Unpopulated
208 2fi4 251 127 621 270
Unpopukted 683 189
6 435
U:..JISIL RATH
77 261 216 33 70
963 124 610 116 63
592
185 574
465
247 278 378 119 204 291
149
40 841 430
74 792 129
148 586
443 281
448 921
2!H
432 352 136 191 365 626 283 314 283 240 590
1,094 253 623
ISS
234 244 244 III 635 2C8
648 208
6 409

) 31
Abstract-( contd.)
Displaced persons
_--._-----
1\1 F
14 15
Literate,
!VI f
AGRICULTURAL CLASSES NON-AGRICULTURAL CLASSES
--~--------;-I~l ~C'-ul"-ti'-v-a--------;l;;-V;---'N:-;--on--c-u"l--
I-Cultivators of land wholly or mainly owned
and their rlen~nrlrnt~
tors of land tivating own-wholly or ers of land;
mainly Un- lll-Cuitivat- agricultural V-Produc-owned ting labourers rent receivers; tion other
and their and their and their than cul-~~dependantj; dependants dependants tivation
VllI-Other services and
VI-Com- VII-Trans- miscellaneous __!!!Cree port Sources 0
- - ~-~-~~-- 1:1
1\1 F M F M F M F M F M F M F M ---_-- ~----~-~--------------------------~~--~----.--
16 17 18 19 20 21 22 23 24 25 26 27 28 29 30 31 34 33 I
(RURAL)-(;ontd.)
34
23 4 2
376 5
180 5 5
82
7 97
78
78 61 48 40 32 62
28
31 303 64
5 88
I
30 72
39 27
84 160 36
77 88 20 29 32 77 32 46 61 21
101 101 27
121
4
26 20 36
5 81 49
223 29 1
62
5
19
7 2
6
4
2
6 I
6
8
20 1
6 1
5 6 8
4 4 I
3 I 2 I 1 I 5 3 I 7
9
31
51 214 129 39 49
669 82
384 93 20
271
139 303
26\
139 206 257 68
152 133
104
2':1 424 214
77 446
90
103 421
281 206
214 57S 194
228 290
93 105 212 336 108 280 150 lIS 346 636 89
335
62
137 158 164
137 321 136
324 133
6 224
46 240 128 33 50
615 69
326 83 16
265
III 326
290
134 196 232 67
143 133
93
38 447 215
63 495
79
84 ~89
262 196
270 557 156
250 289
93 123 199 313 105 248 128 143 306 636 86
304
62
138 130 162 :6
339 96
315 151
5 195
3 20
6
,5 17 84
1
23
17
36
18 16 18 14 4 I
15
2 80 95
:, 36 10
25 10
44 17
Z7 57 45
4l 13
7 15 36 67 17
18 8 9
80 8
40
13
4 34 13 I
27 60
83 13
51
16
7
10 15 87
27
13
31
15 II 18 7 6 I
17
1 71 81
I 26
7
24 5
36 15
12 52 52
46 9 3
15 25 60 14
22 6
II 72 10 29
16
4 36 12
31 50
65 II
61
24 23 38
9
163 17
161 8
28 190
45 207
79
47 72 48 31 34 19
20
191 37
3 249
9
43 102
81 21
82 119 38
69 29 28 34 65 70 66 56 45 20
113 265 40
153
7
39 41 43 15 88 40
122 7
76
I' 12 27
12
118 32
141 19 23
191
48 182
76
48 55 59 25 35 29
21
211 44
5 241
10
30 126
99 26
131 127 33
76 30 28 31 60 77 58 49 57 27
113 253
38 173
7
51 37 48 17 95 40
119 34 1
80
2 5 7
.3
7 I
24 3
2
I 5
2
12 11 14 6
12
5 22
1 9 6
1 16
22
2 62 12
13 7 5 6 6
14 22 IS 2
16 18 6
20 3
9 26
7 I
10 12
18 24
6
4 2
11
2 17 13
6
4
5
12 6
22 6
8
3
1 2
33
6 5
22
26 1
5 68 12
17 9 5 6
19 20 17 16 6
10 16 5
16 16
15 21$ 10 2 13 7
16
4 4 3
25 25
173 153 4 2
23 12 1 I
17 16 57 44
23 20 44 39
42 46
30 24 4 8
21 19 7 6
20 13 69 75
5 7
62 52 22 26
4 5 27 16 29~ 22
9 9 24 23
14 10 45 35
34 14 101 69
9 6
21 17 20 9
5 6 9 9
35 35 146 122 68 73
8 I 55 52 28 39 92 95
109 100 89 81 67 56
3
13 21 II 5 9 5
12 9 120 110
9 8
84 89 5 2
59 46
3
25 I
19
10
5
3
3 3 6
2
14 5
7
5
6 17 15
1 .3
2 8
8 4
12 21
6 9
3 3 4
16 6
9 2
7
4
23 I
14
8
6
3
2 1 3
3
8 7
4
6
2 9
16
2 3
2 4
ID 5
13 15 13 4
1 1 2
12 5
12 4
9
159 160
4 7 161 8 9 162
... 163
... 164 165
36 44 166 8 3 167
13 13 168 ... 169
18 8 170 61 51 171
172 6 6 173 4 4 174
175 12 14 176
IU 13 12 178 3 I 179
14 25 180 5 8 181
II 7 182 44 42 183 -
1M 8 7 185
186 1 •.. 187
75 50 188 19 24 18Y
I~O ... 1\)1
14 4 192 4 6 193
194 19;'
3 1 196 24 21 197
198 9 4 199 9 S 200
201 19 14202 55 39 203 9 6204
20) 23 26 206
-4 3 207 2 1 20B 9 7 209
17 27210 15 32 211 12 12212
.,. 213 12 8214 15 10 215 31 36216 19 13 217 5 8 21B-
40 41 219 220
2 221 222 223 224 225 226
6 5 221 II 7 228 12 6 229 7 5 230
39 40 231 7 2 232
233 43 32 234
5 6235 ... 2.36
12 15 231
---._------- - ------ ------_-- ----------------------------
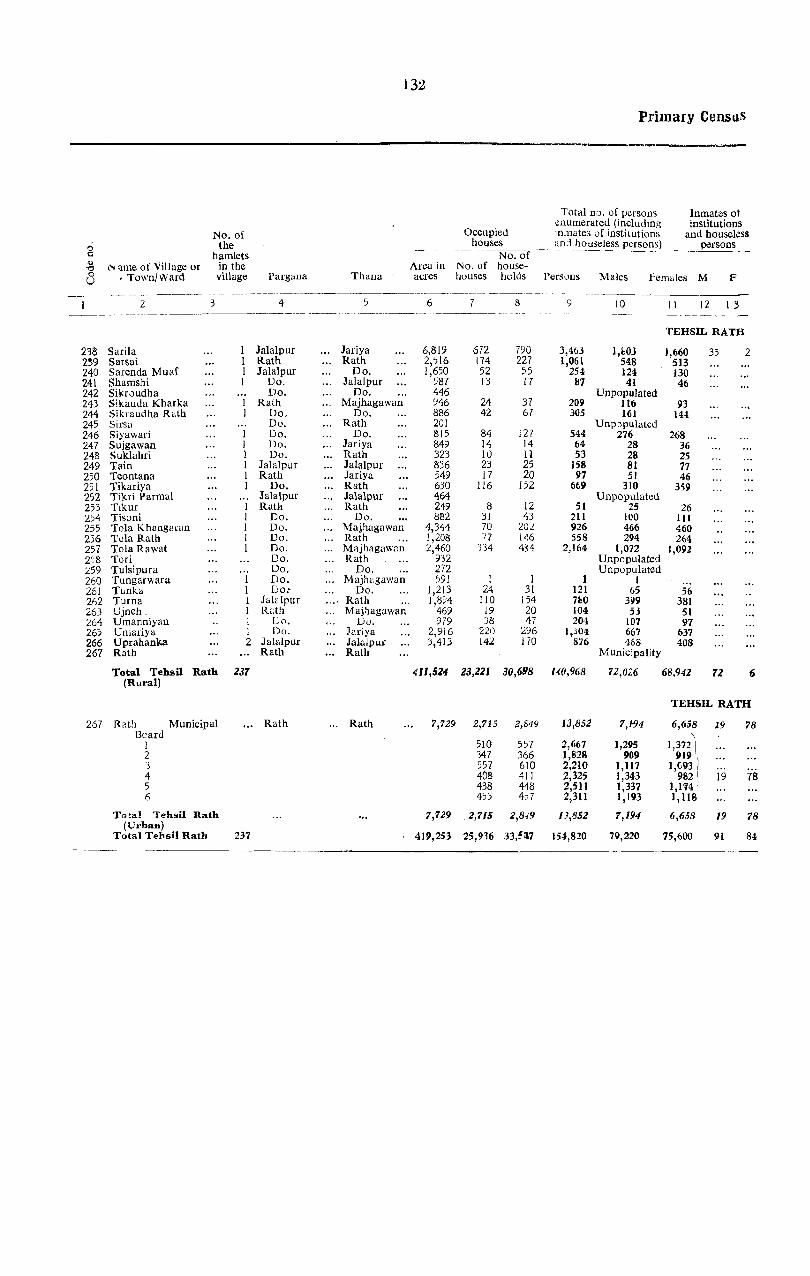
132
Primary CensllS
Total no. of persons Inmates 01 enumerated (including institutions
No. of Occupied in;l1ates of institutions and houseless 0 the houses ___ ilI1:1_fl_~useless persons) ____ persons_ CI hamlets
--~------.---
No. of ... (" \Ime of Village or in the Area in No. of house-"0 0 , Town/Ward village Pargana Thana acres houses hollis Persons Males females M F U
-- _---- - --. ---~---------- ----._-_--_-------- -----_ -------- _---_------
2 3 4 5 6 7 8 9 10 It 12 1 :3 -_-__ -- ----- --~-~-- ----_.- ------------------- -----_---_
TEHSIL RATH
238 Sarila 1 Jalalpur Jariya 6,819 672 790 3,463 l,b03 1,660 35 2 239 Sarsai 1 Rath Rath 2,516 174 227 1,061 548 513 240 Sarenda Muaf 1 Jalalpur Do. 1,650 52 55 254 124 130 241 Shamshi I Do, Jalalpur 587 13 17 87 41 46 242 Sikr0udha Do. Do. 446 Unpopulated 243 Sikauda Kharka Rath Majhagawan 946 24 37 209 116 93 244 Sikraudha R"th Do, Do. 886 42 67 305 161 144 245 Sirsa Do. Rath 201 Unp:Jpulatcd 246 Siyawari 1 Do. Do. 815 84 127 544 276 2{)8 247 Sujgawan I Do. Jariya 849 14 14 64 28 36 248 Suklahri 1 Do. Rath 323 10 11 53 28 25 249 Tain I Jalalpur Jalalpur 836 23 25 H8 81 77 250 Teontana I Rath Jariya 549 17 20 97 51 46 251 Tikariya 1 Do. Rath 630 116 152 6(,9 310 359 252 Tikri Parmal Jala\pur Jalalpur 464 Unpopulated 253 Tikur Rata Rath 249 8 12 51 25 26 254 Tisoni Do. Do. 882 31 43 211 100 III 255 Tola l{hang~ran Do. Majhagawan 4,344 70 20L 926 466 460 256 Tala Rath Do. Rath 1,208 7] 146 558 294 264 257 Tala Rawat Do. Majhagawan 2,460 334 434 2,164 1,072 1,092 2~8 Tori Do. Rath 932 Unpopulated 259 Tulsipura Do. Do. 272 Unpopulated 260 Tungarwara 1 Do. Majhagawan ')91 I I 1 1 261 Tunka 1 Do: Do. 1,213 24 31 121 65 56 262 Turna I JaJdpur Rath 1,8~4 110 154 7110 399 381 263 Ujneh. 1 Rath Majhagawan 469 19 20 104 53 51 264 Umanniyan I Do. Do. 979 38 47 204 107 97 265 Umariya 1 Do. Jariya 2.916 2:20 296 1,30'1 667 637 266 Uprahanka 2 Jaialpur Jalalpur );413 142 170 876 468 408 267 Rath Rath Rath MuniCipality
Total Tehsil Rath 237 411,524 23,221 30,698 140,968 7Z,Oi.6 68,942 72 6 (Rural)
TEHSIL RATH
267 Ratb Municipal ... Rath ... Rath 7,729 2,715 2,649 13,8S:J 7,194 6,658 19 78 Ikard
1,372'\ 1 510 557 2,667 1,295 2 347 366 1,828 909 919 \ 3 557 610 2,210 1,117 I,M3 I 4 408 411 2,325 1,343 982 1 19 78 5 438 448 2,511 1,337 1,1'i4 ; 6 455 457 2,311 1,193 I, ll8
Tota! Tehsil (Urban)
Rath 7,729 2,715 2,8;9 IJ,852 7,194 6,658 19 78
Total Tehsn Rath 237 419,253 25,916 33,~~7 154,820 79,220 75,600 91 84 - -~~-----------

133
A bstract-( contd.)
AGRICULTURAL CLASSES NON-AGRICULTURAL CLASSES
l1-Cultiva- IV-Non-cul-tors of land tivating own-
I_Cultivators of wholly or ers of land ; VIII-Other land wholly or mainly un- III-Cult iva- lIiricllltural V-Produc-
mainly owned owned and ting labourers rent receivers; tion other services and Displaced and their their and their and their than cul- VI-Com- Vll-Trans- miscellaneous
dependants dependants dependants dependants tivation merce port sources .. Literates .... necsons c:t
M F M F M F M F M F M F M F M P M F M F ~ 14 15 16 17 IS 19 20 21 22 23 24 25 26 27 213 29 30 31 32 33
(RlJRAL)-(concld)
380 48 901 863 105 116 190 199 96 104 209 155 109 91 2 4 191 128238 132 12 336 307 21 18 52 53 16 15 98 98 4 5 21 1723!J
9 81 85 7 5 25 31 9 7 I 2 I 240 1 32 38 4 4 3 4 I ... 241
242 48 87 76 9 6 4 I I 5 4 3 2 7 3243 6 104 82 7 4 3') 32 3 4 7 3 4 13 12 244
245 19 179 178 14 , 16 37 34 3 25 26 4 5 14 9246 3 19 22 9 14 '" 247 5 15 8 11 10 I 2 5 I 248-6 55 56 3 7 11 4 3 3 2 I 7 6 ... 249 5 36 32 9 9 4 I I 2 I 2 25(} 23 174 196 51 49 48 58 I 29 48 4 4 4 3 251
252 10 12 18 2 2 .3 2 3 I 5 3 253 2 ." 90 91 4 1 .3 12 I 4 2 3 .,. 254 58 3 179 172 65 33 105 162 19 16 81 62 2 1 15 14255 69 5 152 131 3 2 71 74 3 6 59 48 I I 5 2 256 149 2 634 607 79 80 149 179 29 48 118 125 19 17 44 36 257 258 259 I .. ... 260 10 I 33 23 9 7 14 22 8 2 2 261 40 2" 252 226 30 21 61 86 8 6 37 37 Iv 4 262 13 47 48 6 3 ... 263 29 3 73 69 8 7 16 14 5 4 5 3 264 38 9 419 398 31 24 66 74 27 22 90 90 14 13 20 16 265 14 14 274 226 70 60 96 102 II 12 10 3 4 5 3 ... 266 267
5 2 JI,589 627 42,,130 40,171 4,849 4,454 1l,533 12,149 1,746 1,977 7,2276,299 1,266 1,074 27 19 3,048 2,599
.{URBAN) NOli-CITY
29 25 1,331 318 1,227 933 178 126 127 99 127 106 1,242 1,153 1,423 1,402 326 365 2,Q4 2,474 261 5 2 197 173 29 19 25 30 4 6 . 222 217 314 . 288 63 134 441 503 :3 2 228 48 64 68 65 49 60 42 12 7 74 S4 161 IS5 25 54 440 430 248 200 24 13 12 4 12 18 182 161 129 195 32 17 478 4B5 357 170 30 27 11 5 30 23 239 205 148 119 98 66 430 367 7 5 663 182 93 71 14 7 45 22 383 366 395 383 .54 43 353 282 16 16 440 88 2621 251 16 II 19 121 24 30 142 120 268 232 54 51 402 4D5
29 25 1,331 318 1,227 933 178 126 127 99 127 106 ',242 ','53 1,423 1,402 326 365 2,544 2,474 :H 2712,920 945 43,551 41,304 5,027 4,580 11,660 12,248 1,873 2,083 8,469 7,452 2,689 2,476 353 384 5,592 5,073

134
Primary Census
Total no. of ,persons Inmates of enumerated {including institutions
No. of Occupied inmates of institutions and honseleas 0 the houses and housele~~ p~rsonsL persons
:,a hamlets No. of , ,<0
Name of Village or in the Area JD No. or house-, 1'O
'6 Town/Ward vlllage_ , Pargana Thana acres houses holds Persons Males Females M F
,I 2 3 4, 5 ,6 7 ' 8 9 10 11 .J2 13
TEHSIL CHARKHml'
1 Aichana I Chalkhari Charkhari ... 2,550 66 79 782 398 384 2 Atrauli 1 Do. Do. 754 II 17 59 31 28 3 Bagron 2 Do. Do. 2,892 139 139 711 369 342 ~ Balhari I Do. '" Do. 1,466 146 152 ' (i82 344 3i8
I Do. .;. ..
5 Bamhori Kalan Do. 5,482 314 332 1,598 827 771 6 Bamhori Khurd I Do. Do. 609 24 26 141 73 68
,7 Bamnetha 1 Do. Do. 552 22 22 73 32 41 8 Bamoria ·Do. Do. 8S6 Unpopulated 9 Bamrara Do. Do. 2,885 160 196 875 435 440
Do: ..
10 Bapretha Do. 2,1:':1 128 12S 608 311 291 II Barain Do. Do, 2,299 1>9 172 832 420 412 1.2 Bari Do. Do. 2,00S 80 80 ,323 167 15(; ~3 Beri Khera Do. Do. 319 Unpopulated 14 Bijalpura J Do. Do. 197 2 2, 9 7 2 15 Brijpura 1 Do. Do. 1,013 ~~ 25 1,24 63 61 (6 Chhani Khurd I Do. Do. 80S 29 )32 63 69
~ Dumduma .. ,." 1 Do. Do. 971 13 15 '.11 35 36 Dayalpura Do. Do. 1,266 Unpopulated
~~ Fatebpur 2 Do. Do. 1,780 84 134 393 ' 1Il6 207 Garari I Do. Do. 1,169 13 13 (it 33 31
2.1 Ghutwai I Do. Do. 895 23 33 79 51 28 22 Gopalpura I Do. Do. 785 14 17 t9 31 38 23 Guarha I Do. Do. 6,,119 374 392 1,784 886 898 24 Guptmau Elo. Do. 423 UnpopUlated 2; Imh Khera I 00. Do. 486 18 18 C9 35 34 26 Imiliya 2. Do. Do. 4,592 90 99 577 296 281 27 Itwan Do. Do. 823 Unpopulated 28 Jardinganj Do. Do. 1,238 16 17 48 25 23 29 Jarauli .1)0. Do. , 1,277 206 225 925 453 472 30 Jaswari Do. Do. 692 Unpopulated 31 Jataura I Do. Do. 1,212 65 65 270 132 138 32 Kakra 1 Do. Do. 607 I I 7 5 2 33 Kakun 1 Do. Do. I 199 51 52 269 lSI 1I8 34 Kamal Khera 1 Do. Do. 1;535 65 71 317 151 166 35 Kanera 1 Do. Do. 524 38 38 152 70 82 36 Kaneri 1 Do. Do. 805 14 16 66 31 35 37 Karoura Bajpai Do. Do. 595 Unpopulated 38 Khiriya Do. Do. 281 Unpopulated 39 Kiratpura 1- Do. Do. 1,182 57 64 300 171 129 ~ 40 Kohari Do. Do. 558 UnpopUlated " 41 Kuan Do. Do. 2,700 190 229 I,p46 521 525 42 Kumrai Do. Do. 1,555 Unpopulated ' 43 Kurauradang / Do. Do. 712 34 34 172 92 80 44 Kusarma Do. Do. 500 39 39 181 84 97 45 Latoura Do. Do. 1,066 Unpopulated 46 Lohpuri " Do. Do. 357 Unpopulated 47 Maharajpur Do. Do. 620 31 31 173 101 72 48 Majhol Do. Do. 990 10 12 65 28 37
--49 Mitlainganj "Do. Do. 535 Unpopulated ,0 Murkui Do. Do. 1,107 Unpopulated 51 Natarra Do. Do. 1,793 89 99 413 206 201 52 Nibwari Do. Do. 828 UnpopUlated 53 Nousara Do. Do. 605 65 65 280 146 134 54 Padora Do. Do. 1,282 58 66 260 131 129 55 Paretha Do. Do. 4,434 230 252 1,168 588 580 56 Panchampura Do. Do. 866 24 26 98 56 42 57 Patha Do. Do. 2,651 192 230 1,084 536 548 58 Patishtha Do. Do. 294 Unpopulated 59 Pupwara Do. Do. 1,124 38 43 215 121 94 60 Ragaul Do. Do. 1,070 Unpopulated 61 Rahuniya 1 Do. Do. 695 41 47 195 911 96 62 Rainpur (G umanpufa) I Do. Do. 4 4 33 19 14 63 Rajoura I Do. Do. 848 1 1 10 6 4 64 Rawai 1 Do. Do. 1,631 411 432 1,1>73 952 921 65 Ra"shanpura 1 Do. Do. 496 51 61 294 145 149 Ob Sabua 1 Vo. Do, 930 78 85 373 193 Il>O 67 Salua 1 Do. Do. 929 73 73 329 154 175 68 Santoshpura I Do. Do. 909 8 8 40 19 21 69 Sheohar 1 Do. Do, 1,304 63 63 262 133 129 70 Sijoura I Do. Do. 120 33 44 154 'is 79 71 Suhajna ~ 1)0. Do. 1,403 73 80 352 176 176 72 Sudamapuri 2 Do. Do. 883 32 32 155 85 70 73 Udaipura I Do. Do. 633 4 4 12 6 6 74 Ujrendi 1 Do. Do. 351 9 11 50 21 23 75 Charkhari Do, Do. Municipality 76 Malkhanpur Kachh- Do. Do. 19 37 37 134 71 63
warn Total Tehsil Char- 63 94,Wl 4,341
khari (Rural) 4,727 21,830 1l,052 10,778 -, Z
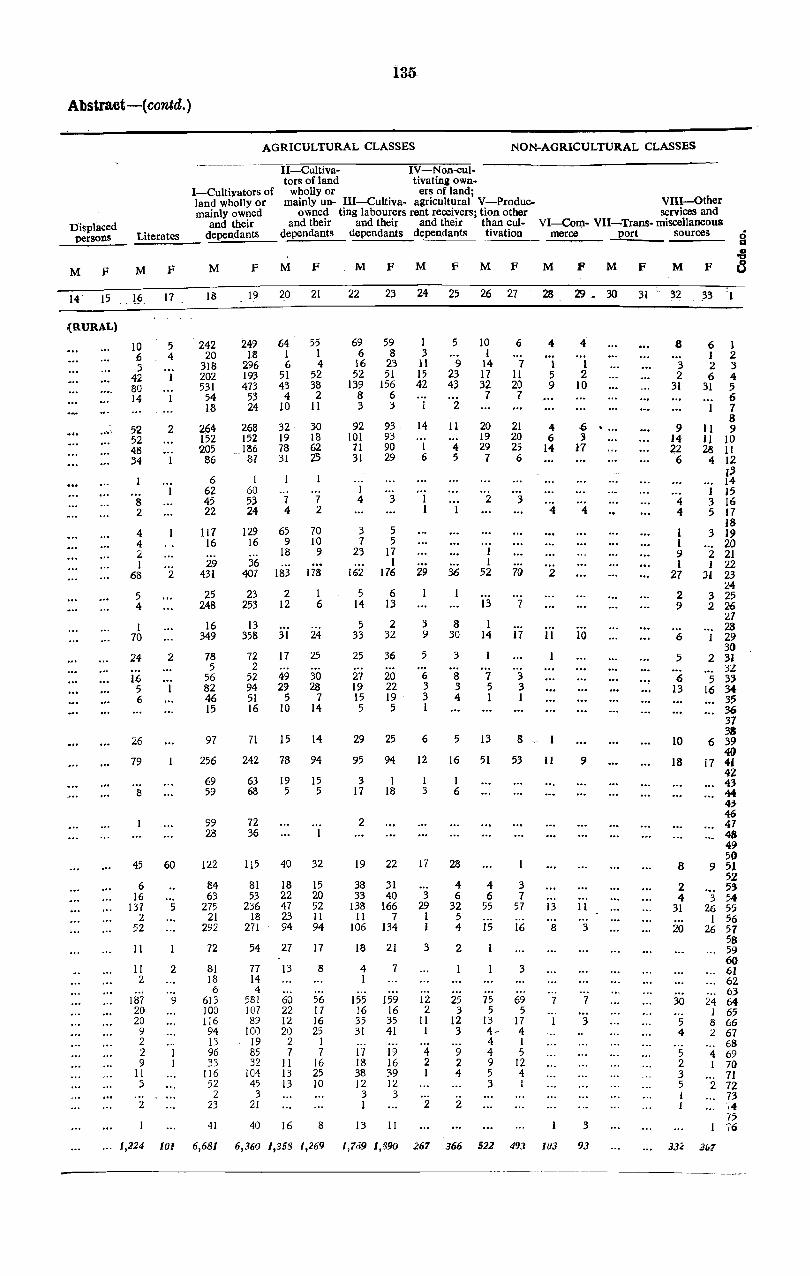
Abstract-(contd. )
Displaced persons
M F
Literates
M F
14' 15 ,~~, 17
(RURAL)
.......
10 ,6 3
42 80 14
5'2 52 48 34
8 2
4 4 2 I
68
5 4
I 70
24
16 5 6
26
79
8
45
6 16
137 2
52
11
11 2
187 20 20
9 2 2 9
It 3
2
5 4
2
2
2
60
5
2
9
AGRICULTURAL CLASSES NON-AGRICULTURAL CLASSES
'----------'---U-Cultiva- IV-Non-cuI-tors of land tivating own-
I-Cultiyators of wholly or ers of land; land wholly or mainly un- llI-Cultiva- agricultural V-Produc-mainly owned owned ting labourers rent receivers; tion other
and their and their and their and their than cul-
VIII-Other services and
VI-Com- VII-Trans- miscellaneous dependants dependants dependants dependants tivation merce' port sources
M
Iii
242 20
318 202 531
54 18
264 152 205 86
6 62 45 22
Il7 16
29 431
25 248
16 349
78 5
56 82 46 15
97
256
69 59
99 28
122
84 63
275 21
292
72
81 18 6
613 100 116 94 13 96 33
116 52
2 23
41
F M F
19 20 21
249 113
296 193 473
53 24
268 152 IS6 87
1 60 53 24
129 16
36 407
23 253
13 358
72 2
52 94 51 16
71
242
63 68
72 36
115
SI 53
236 18
271
54
77 14 4
581 107 89
100 . 19
85 32
104 45
3 21
40
64 1 6
51 43
4 10
32 19 78 31
7 4
65 9
18
183
2 12
31
17
49 29
5 10
15
78
19 5
40
18 22 47 23 94
27
13
60 22 12 20
2 7
11 13 13
16
55 1 4
52 38 2
11
30 18 62 25
7 2
70 10
9
178
L 6
24
25
30 28
7 14
14
94
15 5
32
15 20 52 II 94
17
8
56 17 16 25
I 7
16 25 10
8
M F M F M F M F M F
22 23 24 25 26 27 28 29 _ 30 31
69 6
16 52
139 8 3
92 101 71 31
I 4
3 7
23
162
5 14
5 33
25
27 19 15 5
29
95
3 17
2
19
38 33
138 II
106
18
4 I
155 16 35 31
17 18 38 12
3 I
13
59 8
23 51
156 6 3
93 93 90 29
3
5 5
17 1
176
6 13
2 32
36
20 22 19 5
25
94
1 18
22
31 40
166 7
134
21
7
159 16 35 41
19 16 3,9 12
3
11
1 3
11 15 42
14
I 6
29
3 ')
5
6 3 3 1
6
12
I 3
17
3 29
1 1
3
12 2
II 1
4 2 1
2
5
9 23 43
2
11
4: 5
36
8 30
3
8 3 4
5
16
1 6
28
4 6
32 5 4
2
25 3
12 3
9 2 4
.. 2
10 1
14 17 32 7
20 19 29
7
2
I 1
52
13
I 14
7 5 1
13
51
4 6
55
15
75 5
13 4-4 4 9 5 3
6 4:
7 1 11 5 20 9 7
21 4 20 6 25 14 6
3 4:
70 2
7
17 11
3 3 1
S _ 1
53 11
3 7
57 13
16 8
3
69 7 5
17 4 1 5
12 4 1
4:
1 2
10
-6 .... 3
1:7
4:
10
9
11
3
7
3
3
M F
32 ,33 '1
B
3 2
31
9 14 22
6
4 4
1 I 9 1
27
2 9
6
5
6 13
10
18
8
2 4
31
20
.30
5 4
5 2 3 5 I I
6 1 1 2 2 3 6 4
31 5 6 7 8
11 9 11 10 28 11 4 12
I' J4 1 15 3 16 5 17
18 3 19
20 2 21 1 22
31 23 24
3 25 2 26
27 28 29 3()
2 31 32
5 33 16 34
35 36 37 38
6 39 4()
17 41 42 43 44 4J 46 47 48 49 50
9 51 52 53
3 54 26 55
1 56 26 57
58 59 60 61 62 63
24 64 J 65 8 66 2 67
68 4 69 I 70
71 2 72
73 ,4 '15 76
1,224 101 6,681 6,360 1,358 1,269 1,7ij9 1,890 267 366 522 493 103 93 33~ 3lJ7
----_" -------_
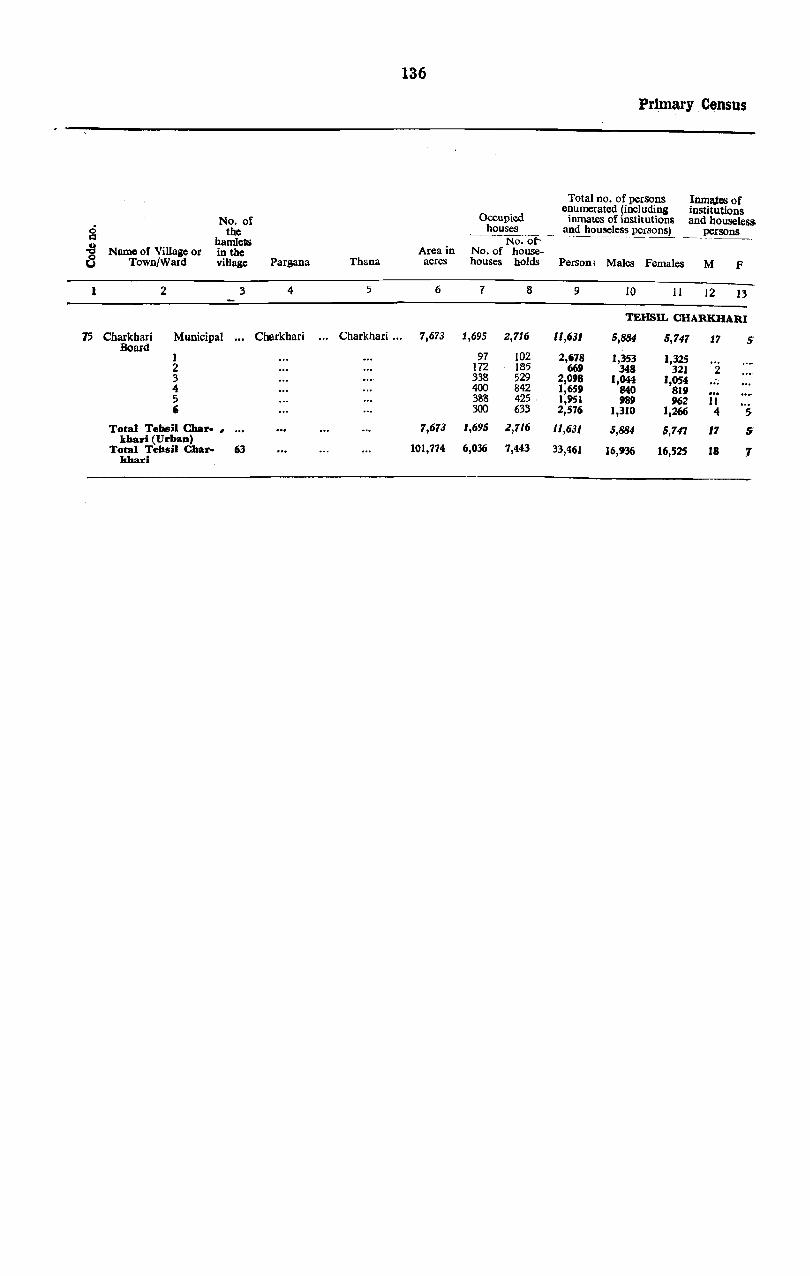
136
Primary C~nsus
Total no. of persons Inm~es of
Occupied enumerated (including institutions
No. of inmates of institutions and houseless 0 the houses and houscless persons) persons .:: hamlets No.ot--8 Name of Village or in the Area in No. of house-a Town/Ward village Pargana Thana acres houses holds Person; Males Females M F
I 2 3 4 5 6 7 8 9 10 11 12 13
TEHSIL CHARKHARI
75 Charkhari Municipal Cbarkhari Charkhari '" 7,673 1,695 2,716 11,631 5,884 5,747 17 5 Board
102 1 97 2,678 J,353 1,325 2 172 1135 669 348 321 2 3 338 529 2,098 J,044 J,054 '" 4 400 842 J,659 840 819 5 388 425 1,951 989 962 II , 300 633 2,576 1,3JO 1,266 4 5
Total Tebsil Char- , 7,673 1,695 2,716 11,631 5,884 5,747 17 Ii khari (Urban)
101,774 6,036 7,443 33,461 Total Tehsil Char- 63 16,936 16,525 18 7 khari
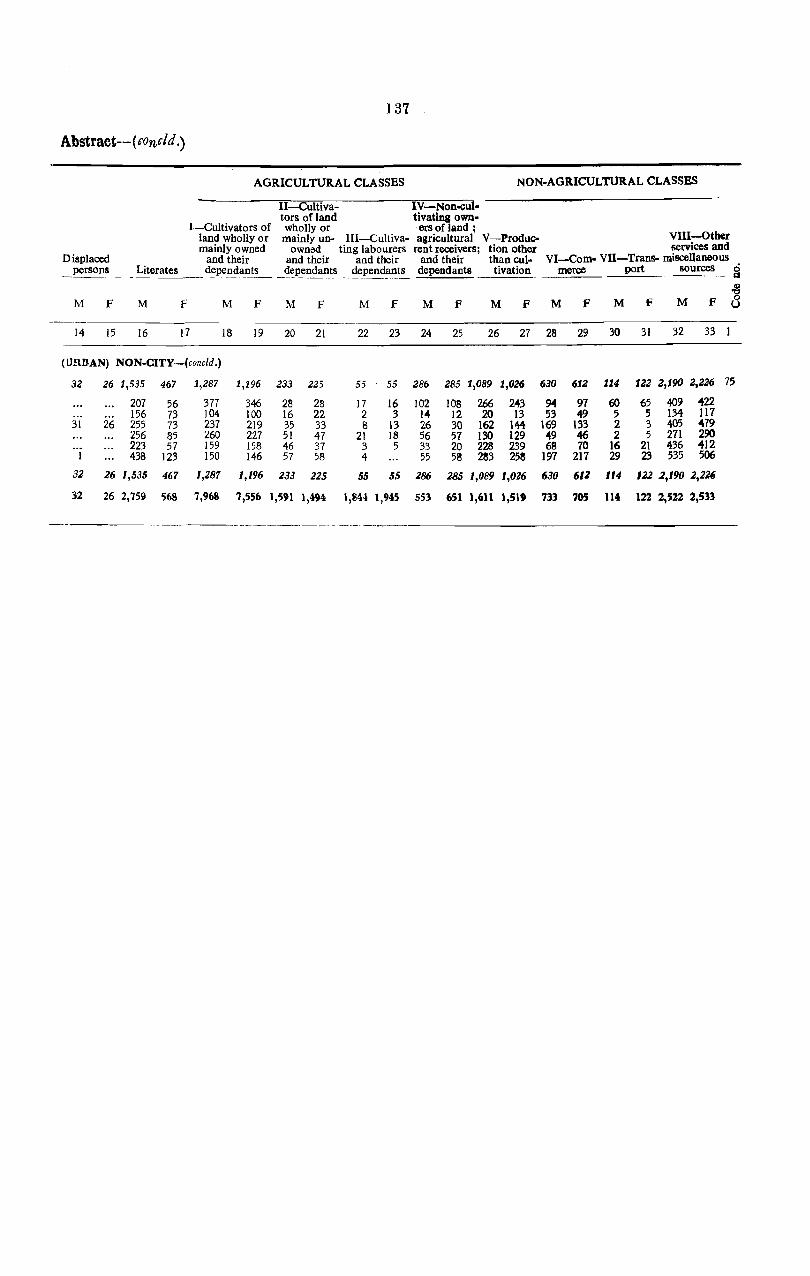
] 37
Abstract--( concld.)
AGRICULTURAL CLASSES NON-AGRICULTURAL CLASSES
II-Cultiva- IV-Non-cul-tors of land tivating own-
I-Cultivators of wholly or -ers of land; land wholly or mainly un- III-Cultiva- agricultural V-Produc- VIII-Other mainly owned owned ting labourers rent receivers; tion other services and
Displaced and their and their and their and their than cui- VI-Com- VII-Trans- miscellaneous persons~~ Literates d~pe_n~ants _ d~~nda~_ts dependants dependants tivation merce port sources 0
------ Q
-8 M F M f M F M F M F M F M F M F M F M F 0
U
14 15 16 17 18 19 20 21 22 23 24 25 26 27 28 29 30 31 32 33
(LJRnAN) NON-CITY-Cconcld.)
32 26 1,535 467 1,287 1,196 233 225 55 55 286 285 1,089 1,026 630 612 114 122 2,190 2,226 75
207 56 377 346 28 28 17 16 102 loa 266 243 94 97 60 65 409 422 156 73 104 100 16 22 2 3 14 12 20 13 53 49 5 5 134 Il7
31 26 255 73 237 219 35 33 13 13 26 30 162 144 169 133 2 3 405 479 256 85 260 227 51 47 21 18 56 57 130 129 49 46 2 5 271 290 223 57 159 158 46 37 3 5 33 20 228 239 68 70 16 21 436 412 438 123 150 146 57 58 4 55 58 283 258 197 217 29 23 535 506
32 26 1,535 467 1,287 1,196 233 225 55 55 286 285 1,089 1,016 630 612 114 122 2,190 2,226
32 26 2,759 56S 7,968 7,556 1,591 1,494 1,ti44 1,945 553 651 1,611 1,519 733 70S 114 122 2,522 2,533
------------~~--.--- - ------

138
Pargana and Thana-wise Population
(I) PARGANAS
Population
No. of Villages and No. of
Towns houses Persons Males Females Selial
no. Name of Parsana
2 3 4 5 6 7
TEliSIL HAMIRPUR
61 7,583 43,775 23,152 20,623 81 12,619 6;,541 34,195 31,346
1 Hamirpur 2 Sumerpur
TEHSlL KULPAHAR
Kulpahar 247 22,901 132,982 67,970 65,012:
TEHSlL MAHOBA
Mahoba 96 17,415 PO,034 46,123 43,911
TEHSIL MAUDAHA
118 16,445 88,949 45,638 43,311 48 9,')39 55,861 2S,758 27,109
"
,1. Maudaha ,2 Muskr8
TEHSIL RATH
151 20,495 118,980 60,650 58,330 57 5,441 35,840 18,570 17,270 1 Rath
~ Ja!alpur
TEHSIL CHARKHARI
1 Charkhari 59 6,036 33,461 16,936 16,525
(ii) THANAS
Population
No. of Selia! Villages and No. of
DO. Name of Thana Towns houses Persons Males Females
l 3 4 5 6 7
TEHSIL HAMlRPUR
1 Kotara 53 5,790 32,469 17,055 15,414 2 Hamirpur 28 3,454 19,934 10,557 9,377 3 Binwar 14 1,882 9,919 5206 4,713 ... Sumerpur 47 9,076 46,994 24:529 22,465
TEHSIL KULPAHAR
1 Ajner 57 4,964 -27,647 14,305 13,342 2 Kulpahar 49 5,844 34,027 17,321 16,706· 3 Panwari 60 5,218 32,526 16,562 15964 ... Mahobkanth 65 5,472 30,213 15,416 14:857 5 Srinagar 16 1,403 8,509 4,366 4,143
TEHSIL MAHOBA
1 Kabrai 28 4,085 23,065 11,802 11,263 2 Srinagar 25 4,420 21,704 11,220 10,484 3 Mahoba 39 7,787 39,795 20,240 19,555 4 Khanua 4 1,123 5,470 2,861 2,609-
TEHSIL MAVDAHA
1 Maudaha 58 8,610 45,857 23,750 22,107 2 Khanua 34 4,596 25,374 12,M7 1Z,507 3 Muskra 29 6,597 37,853 19,353 18,495 ... Binwar 39 4,940 29,519 15,266 14,253 5 Kabrai 6 1,241 6.213 3,155 3,0513
TEHSIL RATH
1 Rath 67 9,988 55,069 27,938 27,131 2 Majhagawan 51 6,611 39,081 19,905 19,176 3 Jariya 53 5,794 36,321 18,785 17,536 ~ Jalalpur 35 3,160 22,022 11,413 10,609 5 Muskra 2 383 2,327 1,179 1,14!
TEHSIL CHARKHARI
I Charkhari 59 6,036 33,461 16,936 16,525
PART III
MISCELLANEOUS ST ATISTICS
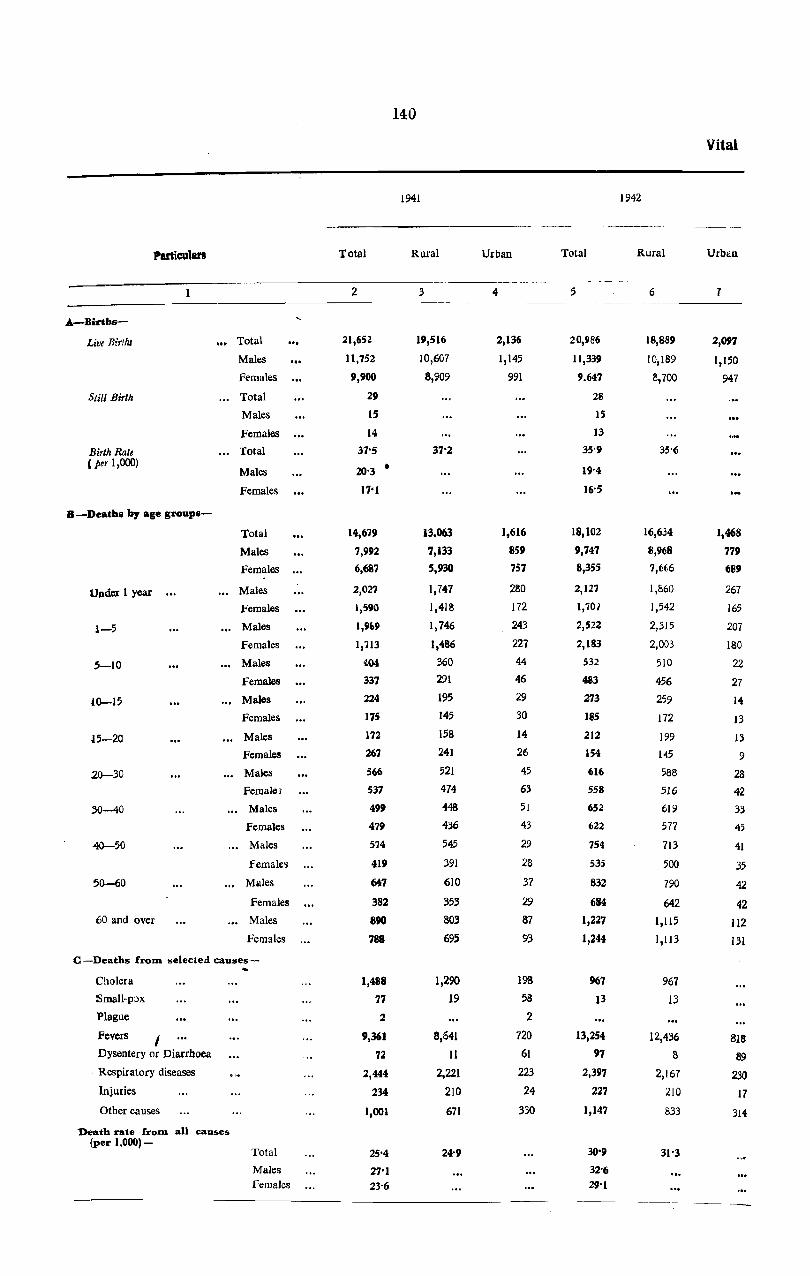
140
Vital
1941 1942
-_----
Particu18l'1 Total Rural Urban Total Rural Urban
2 3 4 5 6 1 -~--------
A-Births-
Live Births Total 21,65Z 19,516 2,136 20,986 18,889 2,097
Males 11,752 10,607 1,145 11,339 IO,IS9 1,150
Females 9,900 13,909 991 9.647 ~,700 947
Still Birth Total 29 28
Males IS 15
Females 14 13
Birth Rate Total 37'5 37'2 35'9 35'6 ,per 1,000)
Males 20'3 • IN
Females 1'1'1 16'5
B-Deaths by age groups-
Total 14,679 13.063 1,616 18,102 16,634 1,468
Males 7,992 7,133 859 9,747 S,961 7'19
Females 6,687 5,930 757 8,355 7,(l~6 6S9
Under 1 year Males 2,027 1,747 280 2,127 1,860 267
Females 1,590 1,418 172 1,701 1,542 165
1-5 Males 1,9&9 1,746 243 2,522 2,315 207
Females 1,713 1,486 227 2,183 2,003 180
5-10 Males 4.04 360 44 532 510 22
Females 337 291 46 483 456 27
;(0-15 Males 224 195 29 273 259 14
Females 175 145 30 185 172 13
15-20 Males 172 158 14 212 199 IJ
Females 267 241 26 154 145 9
20-30 Males 566 521 45 616 588 2S
Female; 537 474 63 558 5J6 42
30-40 Males 49' 448 51 652 619 33
Females 47' 436 43 622 577 45
<40-50 Males 574 545 29 754 713 41
Females 41' 391 28 535 500 35
50-60 Males 647 610 37 832 790 42
Females 382 353 29 684 642 42
60 and over Males 890 803 87 1,227 1,115 112
Females 788 695 93 ],244 1,113 131
C -Deaths frolU selected causes-
Cholera 1,488 1,290 1913 967 967
!Small-p:>x 77 19 58 13 13
Plague 2 2
Fevers I 9,361 13,641 720 ]3,254 12,436 8113 Dysentery or Diarrhoea 72 11 61 97 8 89
Respiratory diseases 2,444 2,221 223 2,397 2,167 230 Injuries 234 210 24 227 210 17
Other ea uses 1,001 671 330 1,147 833 314
Death rate frolU all causes (per 1,000)-
Total 25'4 24'9 30" 31'3
Males 27'1 32'6 Females 23'6 29'1

Statistics
Total
8
'5,874
8,636
1,238
11
7
4
26'8
14'6
12'2
15,866
8,752
7,114
1,674
1,295
1,776
1,442
484
388
276
191
242
161
597
507
685
614
771
579
S81
692
1,366
1,245
646
94
12,154
37
1,993
213
729
290
.215
1943
Rural
9
14,463
7,888
6,575
14,330
7,950
6,380
1,504
1,181
1,568
1,291
439
354
251
176
227
132
566
441
635
555
712
538
828
637
1,220
1,073
556
94
11,108
17
1,795
197 563
Urban
10
1,411
748
663
1,536
802
734
170
J 14
208
149
45
34
25
15
15
29
31 66
50
59
59
41
53
55
146
172
90
1,046
20
198
16
166
Total
11
16,064
8,729
7,335
12
7
5
26'8
14'6
122
13,546
7,609
5,937
1,279
996
1,319
999
443
324
249
183
258
149
602
438
681
587
766
540
767
582
1,245
1,139
864
177
10,175
20
1,59'1
208
508
22'6
24'9
20'2
141
1944
Rural
12
14,482
7,903
6,579
26'7
12,239
6,840
5,399
1,097
897
1,150
904
391
302
225
167
241
138
553
387
638
536
709
504
708
5.37
1,12B
1,027
805
169
9,318
5
1,405
197
340
Urban
13
1,582
826
756
1,307
769
538
182
99
169
95
52
22
24
16
17 II
49
51
43
51
57
36
59
45
117
112
59
8
857
15
189
II
163
Total
14
19,650
10,861
8,789
3
1
2
32'4
17'9
14'5
16,272
8,990
7,282
),666
),244
),550
1,295
517
409
380
252
314
236
754
620
880
832
910
696
1124
618
1,195
J.OSO
2,274
169
10,878
;1'1
2,100
179
652
29'0
24'5
1945
Rural
15
17,684
9,781
7,903
14,954
8,230
6,724
1,462
1,138
1,373
1,172
491
385
356
226
292
207
709
571
827
771
853
666
765
582
1,102
1,006
2,143
149
10,206
9
1,857
:67
423
2'·, , -
Urban
16
1,318
760
558
204
106
177
123
26
24
24
26
22 29
45
49
53
61
57
30
59
36
93
74
131
20
672
II
243
12 22:)
--~ _. --------------------~
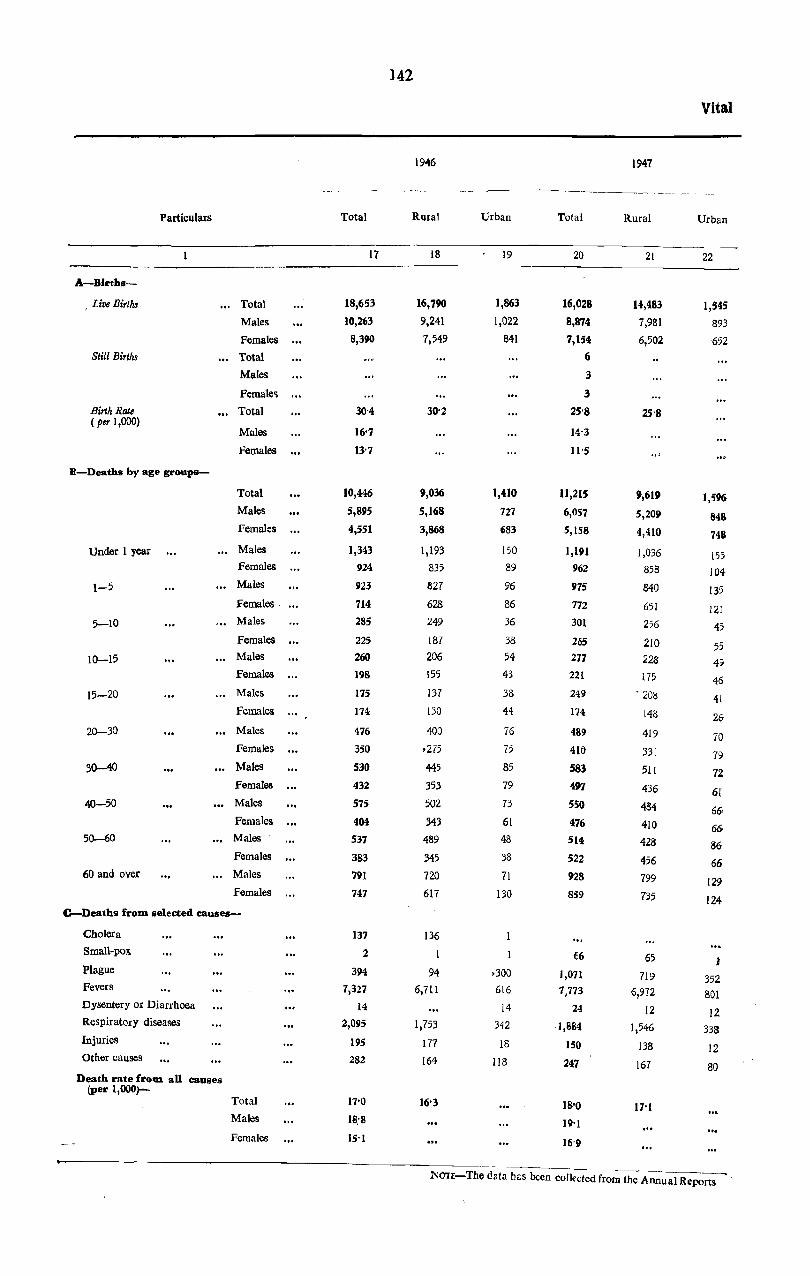
)42
Vital
1946 1947
------- ---_ .. _---,-_. ~.--------------
Particulars Total Rural Urban Total Rural Urban
17 18 19 20 21 22
A-Births-
Live Births Total 18,653 16,790 ],863 16,028 14,483 1,545 Males 10,263 9,241 1,022 8,874 7,981 893 Females 8,390 7,549 841 7,154 6,502 652
Still Births Total 6
Males 3
Female .. 3
Birth Rate Total 30'4 30'2 25'8 25'8 (per 1,000)
Males 16-7 14'3
Females 13'7 ll'5
Il-Deaths by age groups-
Total 10,446 9,036 1,410 11,215 9,619 1,596 Males 5,895 5,168 727 6,057 5,209 848 Females 4,551 3,868 683 5,158 4,410 74&
Under 1 year Males 1,343 1,193 150 1,191 1,036 155 Females 924 835 89 962 858 104
1-5 Males 923 827 96 975 840 135 Females 714 628 86 772 651 121
5-10 Males 285 249 36 301 256 45 Females 225 187 38 265 210 55
10-15 Males 260 206 54 277 228 49 Females 198 155 43 221 175 46
15-20 Males 175 137 38 249 . 208 41 Females 174 130 44 174 148 2&
20-30 Males 476 400 76 489 419 70 Females 350 ,275 75 410 33[ 79
30-40 Males 530 445 85 583 5U 72 Females 432 353 79 497 436 61
40-50 Males 575 502 73 550 484 66 Females 404 343 61 476 410 66
50-60 Males 537 489 48 514 428 86 Females 383 345 38 522 456 66
60 and over Males 791 720 71 928 799 129 Females 747 617 130 859 735 lU
C--Deaths from selected causes-
Cholera 137 136 Small-pox 2 (j6 65 I Plague 394 94 ,300 1,071 719 352 Fevers 7,327 6,7l1 616 7,773 6,972 801 Dysentery 011 Diarrhoea 14 14 24 12 12 Respiratory diseases 2,095 1,753 342 1,884 1,546 338 Injuries 195 177 18 150 138 12 Other causes 282 164 118 247 167 ao
Death rate froQl all causes (per 1,000)-
Total 17'0 16'3 18'0 17-1 Males 18:8 19-1 ... Females 15-l 16'9
!'IOTt-The data has been collected from the Annual RepOlts
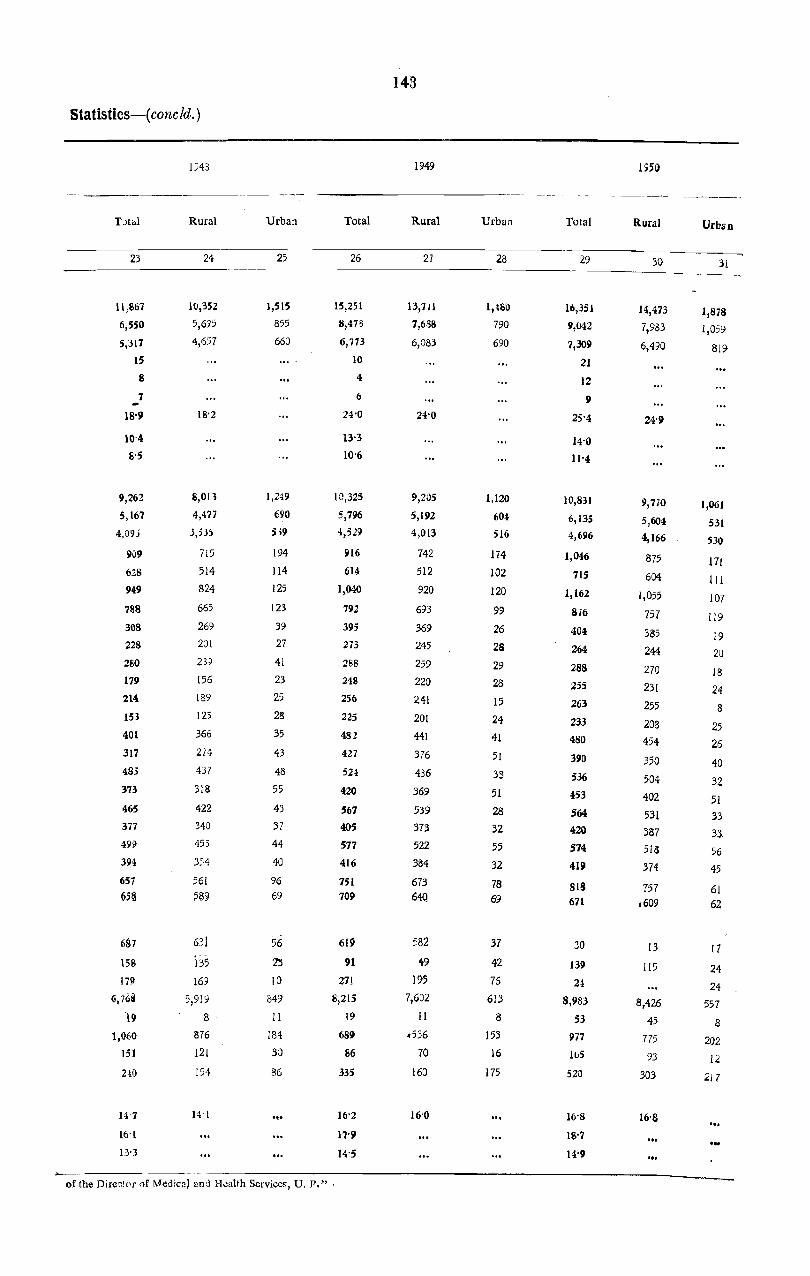
Statistics-( cone ld. )
T:Jtal
23
11,867
6,550
5,317
15
8
7 -18'9
10'4
8'5
9,262
5,167
4,095
909
628
949
788
308
228
2BO
179
214.
153
401
317
485
373
465
377
49~
394
657
95§
687
15S
179
6.76~
'19 1,0(.0
151
2W
1543
Rural
24
10,352
5,695
4,657
18'2
8,013
4,477
3,535
715
514
824
665
269
201
2D
156
189
125
366
214
437
318
422
340
455
354
63i
i35 169
5,919
8
876
121
154
Urban
25
1,515
855
660
1,249
690
5;9
194
114
125
123
39
27
41
23
25
28
35
43
48
55
43
37
44
40
96 69
56
~
10
849
11
184
30
86
....
Total
26
15,251
6,473
6,773
10
4.
6
24'0
13-3
10'6
10,325
5,796
4,529
916
614
1,040
792
395
273
288
248
256
225
482
427
52~
420
567
405
577
416
751
709
619
91
271
8,215
19
689
86
335
of the Direct:'r of Medica) and I-kalth Services, U. P." .
143
1949
Rural
27
13,711
7,688
6,083
24-0
9,205
5,192
4,013
742
512
920
693
369
245
259
220
241
201
441
376
486
369
539
373
522
384
673
64Q
582
49
195 7,602
II
.536
70
160
Urban
28
1,480
790
690
1,120
604
516
174
102
120
99
26
28
29
28
15
24
41
51
33
51
28
32
55
32
78 69
37
42
76
613
8
153
16
175
'"
Total
29
16,351
9,042
7,309
21
12
9
25'4
14'0
11-4
10,831
6,135
4,696
1,046
7IS
1,162
816
404
264
288
255
263
233
480
390
536
453
564
420
574
419
818 671
30
139
24
8,983
53
977
lu5
520
16'8
IS'7
l4'9
Rural
30
14,473
7,983
6,i90
24'9
9,710
5,604 4,166
875
604
1,055
757
385
244
270
231
255
208 454
350
504
402
531
357
518
374
757 1609
13
115
8,426
45
775
93
303
16-8
Url1an
31
1,878
1,059
819
1,061
531
SJO
171
I II
107
119
i9
20
18
24 8
25
26
40
32
51 33
33
56
45
61 62
17
24
24 557
8
202
12
217
...
...

Year
1901-02
1902-03
1903-04
1904-05
1905-06
Total for 1901-06 ",
Quinquennial average-I 901-06
1906-07
1907-08
1908-09
1909-10
1910-11
Total f)r 1906-11
Quinquennial aver-age-1906-ll
1911-12
1912-13
1913-14
1914-15
1915-16
Totalfor 1911-16 .. ,
Quinquennial average-191 1-16
1916-17
1917-18
1918-19
1919-20
1920-21
Total for 1916-21
Quinquennial average-I 91 6-21
1921-22
1922-23
1923·24
1924·25
1925·26
144
Agricultural Statistics
From April 1 to August 31
Normal
2
Number During of rainy the year days
3 4
Inches Inches
29'40
29'40
29'40
29-40
29'40
29'40
147'01)
29'40
29'40
29'40
29'40
27-73
145'33
29'07
27'73
27'73
26'97
26'97
26'97
136'37
27'28
26'97
26'97
26'97
27'11
27'll
25'13
24'7.3
34'22
30'37
22'17
21
27
32
4~
37
27
166
13'53 17
24'53 31
14'11 27
36'77 38
22'01
111'00
22'20
38'55
31'72
10'29
45'04
18'13
143'73
23
136
38
39
18
41
29
165
28'74 33'0
25'18 35
26'47 37
28'62 33
I-Rainfall
From September I to October 31
From November I to March 31 Total
Number Number Number During of rainy During of rainy During of rainy
Normal the year days Normal the year days Normal the year days
5 6
Inches Inches
7'05
7'05
7'05
7'05
7'05
7'05
35'25
7'05
7'05
7'05
7'05
6'92
35'12
7'02
6'92
6'92
7'01
7'01
7'01
34'87
7'01
7'01
7'01
6'81
6'81
16'55
0,08
2'07
5'20
10'01
33'111
20'26
IN3
0'97
2'57
6'73
39'26
7'21
10'38
1'26
5'90
1'98
26'73 _
5'35
3'84
4'78
11'03
5'05
7
7
13
4
7
11
36
17
6
2
6
8
39
9
IS
2
8
4
38
9
8
7
8 9
Inches Inches
2'01
2'01
2'01
2'01
2'01
2'01
10'05
2-01
2'01
2'01
2'01
2'01
1'86
9'90
1'98
1'86
, 1'84
I'S3
1'83
1'83
9'19
1'84
3'17
1'10
0'97
0'67
5'18
U'09
2'22
1'55
2'76
0'38
1'48
0'35
I' 31
1'91
0'14
3'05
0'27
2'58
1'67
1'08
1'61 .
10 II 12
Inches Inches
7 38'46 44'85
3 38'46 25')11
3 33'45 37'26
2 38'46 36'2!
8 38'46 37' 3 j
2~ 192'31) 181'62
13
32
47
36
50
46
46
225
4 38'46 35'39 ·38
7 38'46 36'02 44
4 38'46 15-46 33
6 38-46 40'82 SO
36'51 29'09 32
22 190'35 156'78 197
35'07 31'36
3(1'51
36'49 42'24
6 35'81 14-60
35'81 51'21
3 3;'81 22'69
14 180'43 178'41
39-4
50
55
26
50
36
217
2'8 36'09 35'68 43-4
5 35'81 30'69 49
2 35'81 32'33 47
4 35'69 41'26 4-1
35-56 40'59 45
5 35"66 37'80 54
Totalfor 1921-26 .. , 135'}3
34'98
28'61
143'86
28'77
34
43
182
4'27
28'97
5'79
10
6
40
8'0
1'83
1'83
1'71
1'74
1'74
S'85
1'77
0'56
4'92
9-04 17 17S'63 182-67 239
QuinQ.uennial aver· aae-1921-26
6'93 N 35'73 36'53 47-8

1926-27
1927-28
1928-29
1929-30
1910-31
Year
Total for 1926-31 .. _
Quinquennial average-1926-31
1931·32
1932-33
1933·34
1934·35
1935-36
Total for 1931-36 ...
Quinquennial average-I 931--36
1936-31
1937·38
1938-3~
1939-40
1940-41
Total for 1936-41 ...
Quinquennial aver· age-l 936-41
1941-42
1942-4)
1943-44
1944-45
194,-46
Total for 1941-46 ...
Quinquennial aver· age--1941-46
,1 946-47
1947-4S
1948-49
1949-50
'195&-51
Total for 1946-51 _ ..
Quinquennial average-I 946-51
145
_ AgricultUral Statistics-( contd,)
From April I to August 31
I-Rainfall-(concld. )
From September I to October 31
-------- ,-__ ._ .. _------
From November 1 to March 31 Total
Number Number Number Number During of rainy During
Normal the year days Normal the year
2 3 4
Inches Inches
27-11
27-11
27-11
21-11
27-11
135'55
27-11
27-11
27'11
27'07
27'07
27'07
135-43
27-07
26'36
26'36
26-36
132'51
26'50
26-36
26-36
26'36
26'36
25-97
I3I'U
24-00
21-98
17'63
26-43
36'25
126'29
25'26
18-76
16-27
15-52
23-78
18-00
92'31
31
31
22
31
34
149
29-8
24
19
28
28
26
125
18-47 25-0
35-35 313
18'28 25
34'95 36
25-26 28
21'46 24
135'30 151
21-06 30-2
15-14 21
23'86 35
26-76 . 30
-25-31 33
17-99 27
109-06 ·146
26'28 ~~21-81 29'2
25'97 28'88
25")"1
25'97
25-97
25'97
12Sh35
29-02
28-87
25-38
19'54
131-69
35
31
36
25
2.5
152
.5 , 6
Inches Inches
6'81
6-81
6-81
6'81
6'81
34-05
6'81
6'81
6'81
6'81
6'81
6-81
34'05
6'81
6'82
6'82
6'82
6'82
34-09
6'82
6'82
6'81
6'74
6'74
6'74
19'59
6-78
5'58
0'95
5'23
38'13
7'63
14'73
5'0.5
5'60
9'71
4'27
39-36
7'87
6-14
4-95
4-58
6'43
3-39
7'44
8-33
6-34
2-24
9-21
33'56
2'80
8'46
7'81
9'91
4'15
33'19
of rainy During ofrainy During of rainy days Normal the year days Normal the year days
7
18
7
8
2
8
43
15
IS
9
11
4
47
IN
8
7
7
7
5
34
6
8
11
'\
12
38
5
12
13
6
45
9-0
9
Inche_s Inches
1'74
J'74
1'74
1'74
S'70
1'74
1'74
1'74
1'74
1'74
8'70
1-74
1'74
1-67
1'67
1-67
1-67
S'42
1'68
1'57
1'70
1-79
8'50
1-70
1'131
8'98
1-80
0'28
8'74
2-84
1'36
0-80
14'02
2'80
0'71
0'71
1'91
1-38
I-57
6'28
1-26
3'79
1-15
0'33
1'32
J-71
S'30
1-66
!H5
... 1'21
4'00
0-55
0'98
10'39
Z-08
2'76
.2-88
1-14
1'57
3'15
U'SO
10 11 12
Inches Inches
35'66 43'87
11 35-66 37"50
7 35-66 26'05
4 35'66 28'74
:3 35'66 42'28
13
50
49
37
37
45
26 .178-30 178-44 218
2 35'66 34:20 41
2 35'66 22'03 29
3 3H2 23'03 40
3 35-62 34'87 42
6 35'62 23'81 36
16 178-18 137'97 186
6 35'62 4,5-28 52
3 34'85 24'36 35
2 34'85 39-86 45
4 34-85 33-01 39
6 34'85 26'56 35
21 115-02 169'09 206
4-2 35'00 33'82, 41'2
8 34-&5 20'23 35
3 31'85 33'40 46
9 31'S; 37'10 47
2 31-88 28'10 39
3~:50 28'18 40
23 173-93 153'01 207
4'6 34'79 30-60 41-4
6 34-50 34-44 46
6 34'50
34'49
40'36
37-gB
4 34'52 36'86
6 34-52 26-84
49
48
42
37
Z5 172'53 176'38 222
5-0 34'51 35-28 44'4

146
Agricultural
II-_'hoea as classified with
. Other uncultiva~d
Year Total area Forest Not avaIlable for land excluding
cultivation current fallows
-_--------------2 3 4 5
-- ----- ---
Acres Acres Acres Acres
1901-02 1,464,770 230,668 459,429
1902-03 1,464,768 229,216 439,418
1903-04 1,464,744 229,311 428,054
1904·05 1,464,744 229,311 428,054
1905-06 1,464,744 6,342 229,311 421,712
Total for 1~1-06 7,323,770 1,147,817 2,176,667
Quinquennial average-1901-06 1,464,754 229,563 435,334
1906-07 1,464,744 6,342 229,311 421,712
1907-08 1,467,101 6,342 240,152 398,526
1908·09 1,467,139 6,342 241),379 382,932
1909-10 1,467,151 6,638 23/l,532 360,482
1910-11 1,467,151 6,638 237,884 375,898
Total for 1906-11 7,333,298 32,302 1,186,258 1,939,550
Quinquennial average-1906-11 1,466,660 6,460 237,252 381,910
191HZ 1,467,158 6,638 239,252 38),165
1912-13 1,467,158 6,638 238,8:10 33::,725
1913·14 1,467,161 6,638 237,422 401,291
1914·15 1,467,155 12,6313 238,876 382,884
1915·16 1,467,155 12,649 238,205 349,633
Total for 1911-16 7,335,787 45,201 1,192,645 1,896,698
Quinquennial average-l 911-16 :1,467,158 9,040 238,529 379,310
1916·17 1,467-,172 12,649 238,460 337,279
1917·18 1,467,177 i2,649 237,650 328,935
1916-19 1,467,173 i2,541 234,820 336,297
1919-20 1,467,204 12,541 236,614 337,844
1920-:41 1,467,210 12,541 233,525 343,707
Total for 1916-21 7,335,936 62,921 1,181,069 1,684,062
Quinquennial average-1916-21 1,467,181 12,584 236,214 336,812
1921-22 - 1,467,156 12,541 234,105 352,608
1922-23 1,467,163· 12,541 234,596 348,349
1923·24 1,467,161 12,5313 234,669 351,470
1924-25 1,467,157 12,538 234,175 357,964
1925-26 1,561,494 12,538 239,724 390,556
Total for 1921-26 7,430,131 62,696 1,177,269 1,800,947
Quinquennial average-1921-26 1,486,026 12,539 235,454 360,189 --~---

147
sta tistics-( contd.)
details of area under cultivation
--,~~~-~-.------------------------
Current fallows
6
Acres
;80,018
73,94 [
82,359
82,359
82,359
401,036
80,207
82,359
330,549
163,92[
130,[37
118,599
825,565
165,113
141,287
1[3,996
322,848
90,347
64,322
732,800
146,560
65,934
100,010
326,849
:144,5!3
[36,925
774,231
154,846
97,075
1~1,2[4
113,565
131,512
128,316
581,682
116,337
Net area sown during the year, i_e_ cul
tivated area
7
Acres
694,655
722,193
725,020
725,020
725,020
3,591,908
718,382
- 725,020
49[,538
673,565
731,368
728,132
3,349,623
669,925
699,816
724,909
498,962
742,410
802,346
3,468,443
693,689
812,850
787,933
556,666
735,692
740,512
3,633,653
726,731
770,827
760,463
754,919
730,968
790,360
3,807,'>37
761,507
Percentage of differ-Normal cuI- ence between tivated area columns 7 and 8
Details of area not available for cultivation
" Covered with water
Sites. roads and bllildinas, etc_ Barren 1aad5
--~----.~~---------~---
8 9 10 11 12
Acres Acres Acre!
691,000
691,000 +4-9
69[,000 -28-9
69[,000 -2-5
69[ ,000 +5-8
691,000 +5-4
3,455,000 -3-0
691,000 -3-0
69[,000 +1-3
69[,000 +4-9
691,000 -27-11
691,000 +7-4
69[,000 +16-1
3,455,000 +0-4:
691,000 +0-4:
691,000 +17-6
691,000 +14-0
694,000 -19-8
694,000 +6-0
694,000 +6-7
3,464,000 +4·1)
692,800 +4-'
694,000 +11-1
694,000 +9-6
694,000 +8-8
694,000 +5-3
694,000 +13·9 ;
3,470,000 +9-7
694,000 +9-7

148
Agricultural
II-Area as classified with
Other uncultivated Not available for land excluding
Yw Total area Forest cultivation current fallows
2 3 4 5
Acres Acres Acres Acres
1926·27 1,561,494 12,538 240,699 403,200
1927-28 1,561,494 12,538 240,010 410,330
1928·29 1,561,494 12,5313 238,558 405,844
1929-30 1,561,439 12,538 237,472 409,31()
J930-31 1,561,439 12,538 238,741 395,329
Total fOJ; 1926-31 7,807,360 62,690 1,195,480 2,024,013
Quinquerinial averago-192£-31 1,561,472 12,538 239,096 404,802
1931-32 1,561,439 12,538 238,576 :391,472
1932-33 1,561,439 12,654 236,556 389,114
1933-34 1,561,439 12;654 235,202 375,415
1934-35 1,561,439 12,654 237,403 373,134
1935-36 1,561,439 10,994 236,435 368,743
Total for 1931-36 7,807,195 61,494 1,184,172 1,897,878
Quinquennial average-1931-36 1,561,439 12,299 236,834 379,576
1936-37· 1,561,439 4,529 236,596 362,363
1937-38 1,561,440 3,790 ~235,906 355,900
1938-39 1,562,700 4,677 235,608 349,454
1939-40 1,562,751 4,695 234,147 343,229
1940-41 1,562,817 4,695 232,138 337,180
Total for 1936-41 7,8Il,153 22,386 ,
1,174,395 1,748,126
Quinquennial average-1936-41 ... 1,562,230 4,477 234,879 349,625
1941-42 ... 1,562,801 4,677 230,704 334,680
194243 1,563,201 4,677 231,359 323,536
1943-44 ... 1,563,280 4,677 229,725 :31.8,635
1944-45 1,561,951 3,035 228,703 318,133
194546 1,561,659 3,675 228,101 313,706
Total for 1941-46 7,812,892 20,741 1,148,592 1,608,61)0
Quinquennial average-1941-% 1,562,578 4,148 229,718 321,738
1946-47 ... 1,561,659 3,990 229,365 314,86l
194748 ..1,561,659 3,736 229,052 320,399
1948-49 1,561,659 3,471 228,426 323,77&
1949-50 1,779,070 4,791 248,200 386,578
1950-51 ... 1,778,955 5,522 247,445 585,96Q
Total for 1946-51 8,243,002 21,510 1,182,488 1,731,584
Quinquennial average-1946-51 1,648,601 4,302 236,498 346,317

149
Statist ie s-( contd.)
details of area under cultivation-(eomld.)
Details of area not available for cultivation
Net area sown dur- Percentage of differ-ing the year, i,e. cuI- Normal cuI- ence between Covered with Sites, roads and
Current fallows tivated area tivated area columm 7 and 8 water buildings, etc. Barren lan:1I
------.- -.--.-~ .. _- -- ------~------
6 7 8 9 to II 12
Acres Acres Acres Acres Acres Acre~
147,406 757,651 694,000 +9'2
127,434 771,182 694,00D +11'1
115,690 7813,864 694,000 +13'7 51,165 32,324 l55,069
216,378 685,741 694,OOCl -1'2 50,439 32,3213 154,705
81,741 833,090 694,00J +20'0 52,600 32,316 154,160
688,649 3,836,528 3,470,000 +10'6
137,730 767,306 694,000 +10.6
~4,336 834,517 718,0<J3 +16'2 52,261 32,238 154,077
95,315 827,800 718,00~ +15'3 50,809 32,247 153,500
19,803 858,365 723,000 +18'7 49,534 32,214 153,454
37,228 851,020 723,000 +17-7 52,055 32,195 153,153
85,888 859,379 723,OOD +18'9 51,417 32,163 152,855
432,570 4,231,081 3,605,000 +11'4 256,076 161,057 767,039
86,514 846,216 721,000 +IN 51,215 32,211 153,408
79,90D 878,051 723,000 +21'4 52,030 32,081 152,485
31,8:11 883,953 723,000 +22'3 51,311 32,074 152,521
17,266 895,695 723,000 +23'9 52,043 32,018 1.51,547
77,964 902,722 723,000 +24'9 50,881 31,953 151,313
70,525 918,279 723,000 +27'0 49,176 31,943 151,019
387,546 4,478,700 3,615,000 +23'9 255,441 160,069 758,885
77,509 895,740 723,(01) +23'9 51,OSS 32,t)l4 151,777
71,4)7 921,':133 723,00~ +27-4 48,622 31,882 150,200
79,340 924,289 723,000 +27'8 50,222 31,879 149,258
{55,156 945,087 723,OOC) +30'7 49,742 .31,821 148,162
81,212 930,868 723,000 +28'8 49,076 31,813 147,814
82,345 933,832 723,000 +29'2 49,302 31,792 147,007
379,,"0 4,655,409 3,615,000 +28'8 246,964 159,187 742,441
75,892 931,082 723,000 +28'8 49,393 .31,837 148,488 -107,049 906,392 723,000 +25'4 50,70; 31,809 146,851
138,884 869,588 ,723,OJO +20'3 50,865 31,n9 146,408
113,502 892,482 914,000 -2'4 50,894 31,786 145,746
126,458 1,013,043 914,000 +10'8 59,169 36,083 152,948
127,453 1,012,569 914,000 +108 58,513 35,961 152,971
613,146 4694,074 4,188,000 +12'1 270,146 167,41B 744,924
12H69 93~,8i5 831,600 +12'1 54,029 33,484 148,985
.------~----------.---
NOTE-Figure3 in colam' 10, 11 ,nd 12 for th;: y~ar 193}·31 t )ta\ to 239,076 W:l :reas th~ t)tal sh)uld have b~~11 233,741 ,

1901-02
1902-03
1903-04
1904-05
1905-06
Year
10tal for 1901--06
Quinquennial average-1901-06
19U6-07
1907-OS
1908-09
1909-10
1910-11
Total for 1906--11
Quinqueonialaverage-I906-11
1911-12
1912-13
1913-1i
1914-15
. 1915-16
Total fOIi 1911-16
Quinquennial averago-J9J J-16
. 1916-11
1917-]8
1915-19
1919-20 •
1920-21
Total fOI 1916-21 i .. ·
Quinquennial average-1916-21
1921-22
1922-23
1923-24
1924-25
1925-2'
Total for· 1921-26
Quinquennial average-1921-26
Total
2
Acres
1,621
1,621
1,308
1,370
1,824
1,090
7,213
1,443
1,783
1 .. 237
1,203
1,071
1,985
7,285
1,457
1,861
2,464
2,314
1,203
2,597
10,439
2,088
2,476
2,660
2,185
2,541
3,150
Early
13,012
2,603
Irrigated
3
Acrell
71
122
69
36
299
60
15
6
84
9
35
149
30
6
185
4
52
248
49
2
5
2
3
12
2
150
Rice
Total
Acres
386
386
492
441
725
1,322
3,366
673
289
151
630
466
397
(,933
387
131
174
482
276
479
1,542
308
190
128
67
118
234
737
147
Late
Agricultural
IU-Cropped
Wheat
Total
Irrigated Total Irrigated Total
5 6 7 8 -~------.---- ---
Acres Acres
3,453
3,240
1,758
2,007
2,007
12,465
2,493
62 2,007
295 1,800
286 1,811
118 2,549
65 2,412
826 - ~IO,579
165 2,116
70 2,072
45 1,388
413 1,833
321 1,543
104 2,31>2
953 9,2Ui
)!IO 1,844
40 1,992
77 2,638
286 2,796
149 1,479
272 3,076
824 11,981
165 2,396
Il9 2,666
41 2,788
18 2,252
69 2,659
88 3,384
335 13,749
67 2,750
Acres
133
417
355
154
66
1,125
225
&5
51
4n
330
139
1,102
220
46
78
471
153
324
1,072
214
121
41
23
71
91
347
69
Acres
22,767
30,958
48,855
48,855
48,855
2oo,2tO
4O,OS~
48,855
9,398
16,548
40,292
59,437
174,~30
34,906,
98,031
101,874
20,477
49,118
85,082.
354,582
70,916
119,112
159,356,
29,079
90,468
52,340
450,355
90,On
78,954
107,748.
129,63:;1,
138,305
134,089
588,735
117,747
---------------------------------~---------------------~----------------
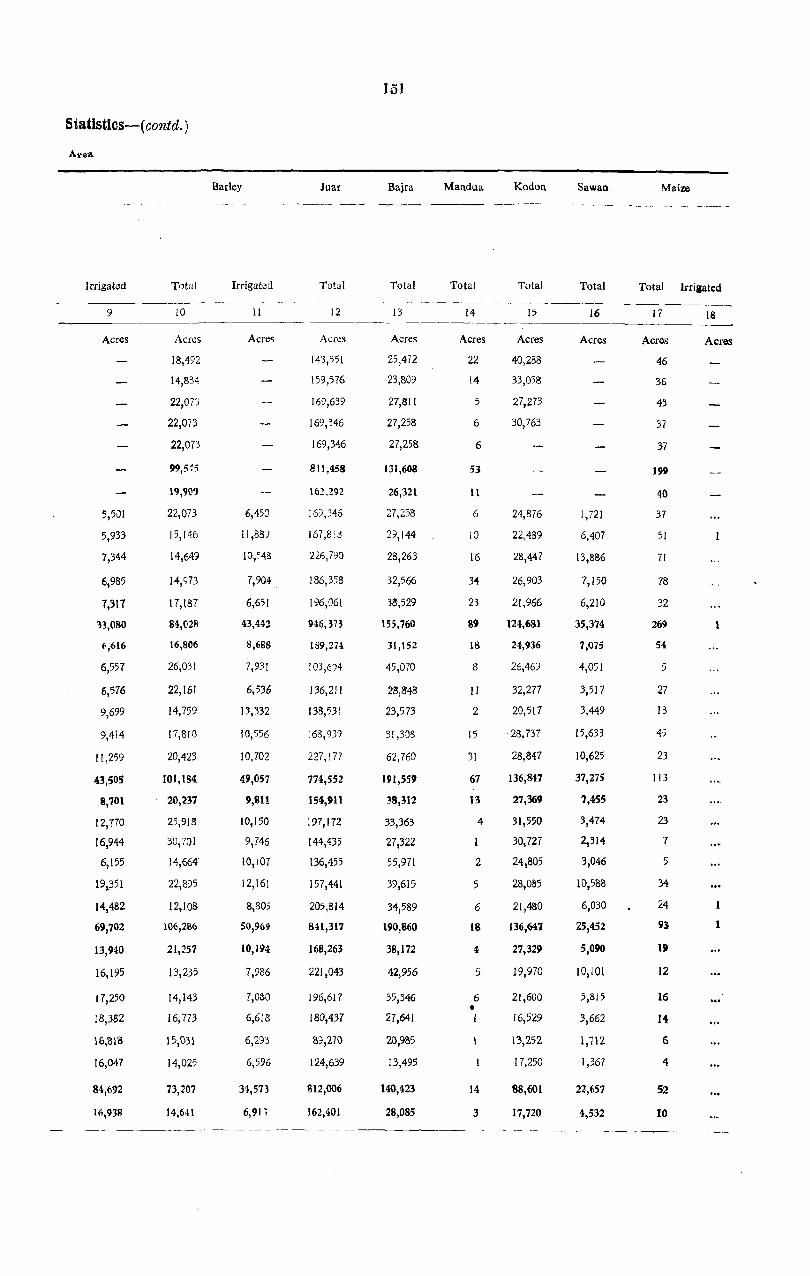
Statistics-( contd. )
Area
Irrigated
9
Acres
5,501
5,933
7,344
6,985
7,317
33,080
~,616
6,557
6,576
9,699
9,414
11,259
4.3,505
8,701
12,770
16,944
6,155
19L351
14,482
69,702
13,940
16,195
17,250
18,382
16,818
16,047
M,692
16,938
Total
10
Acres
18,492
14,834
22,073
22,Oi3
22,073
99,5~5
19,909
22,073
15,146
14,649
14,973
17,187
84,028
16,806
26,031
22,161
14,759
17,810
20,423
101,184
20,237
25,918
30,701
14,664'
22,895
12,108
106,21$6
21,257
13,235
14,143
16,773
15,031
14,025
73,207
14,641
Barley
Irrigated
il
Acres
6,450
11,88)
10,:"48
7,904,
6,651
43,442
8,688
7,931
6,536
13,332
10,556
10,702
49,057
9,811
10,150
9,745
10,107
12,161
8,805
50,969
10,194
7,986
7,030
6,618
6,293
6,596
3i,573
6,91 ;
Juar
Total
12
Acres
143,551
159,576
169,639
169,346
169,346
811,458
16~,292
169,346
167,813
226,790
186,358
[96,06[
946,373
189,2H
103,694
136,211
138,53l
168,939
227,177
774,552
154,911
197,172
[44,435
136,455
157,44[
205,814
8H,317
168,263
221,043
196,617
180,437
89,270
124,639
812,006
162,401
151
Baira
Total
13
Acres
25,472
23,809
27,811
27,258
27,258
131,608
26,321
27,258
29,144
28,263
32,566
38,529
155,760
31,152
45,070
28,848
23,573
31,303
62,760
191,559
38,312
33,363
27,322
55,97[
39,615
34,589
190,860
38,172
42,956
35,346
27,641
20,985
13,495
140,423
28,085
Mandua
Total
14
Acres
22
14
5
6
6
53
11
6
10
16
34
23
89
18
8
II
2
15
31
67
13
4
2
5
6
18
4
5
6 • 1
14
3
Kodou
Total
15
Acres
40,288
33,058
27,273
30,763
24,876
22,489
28,447
26,903
21,966
124,681
24,936
26,469
32,277
20,517
28,737
28,847
136,847
27,369
31,550
30,727
24,805
28,085
21,480
136,647
27,329
19,970
21,600
16,529
13,252
17,250
88,601
17,720
Sawan
Total
16
Acres
1,721
6,407
13,886
7,150
6,2[0
35,374
7,075
4,051
3,517
3,449
15,633
10,625
37,275
7,455
3,474
2,314
3,046
10,588
6,030
25,452
5,090
10,[01
5,815
3,662
1,112
1,367
22,657
4,532
Maize
Total Irrigated
17
Acres
46
36
43
37
37
199
40
37
51
71
78
32
269
54.
5
27
13
45
23
113
23
23
7
5
34
24
93
19
12
16
I4
6
4
52
10
18
Acres
1
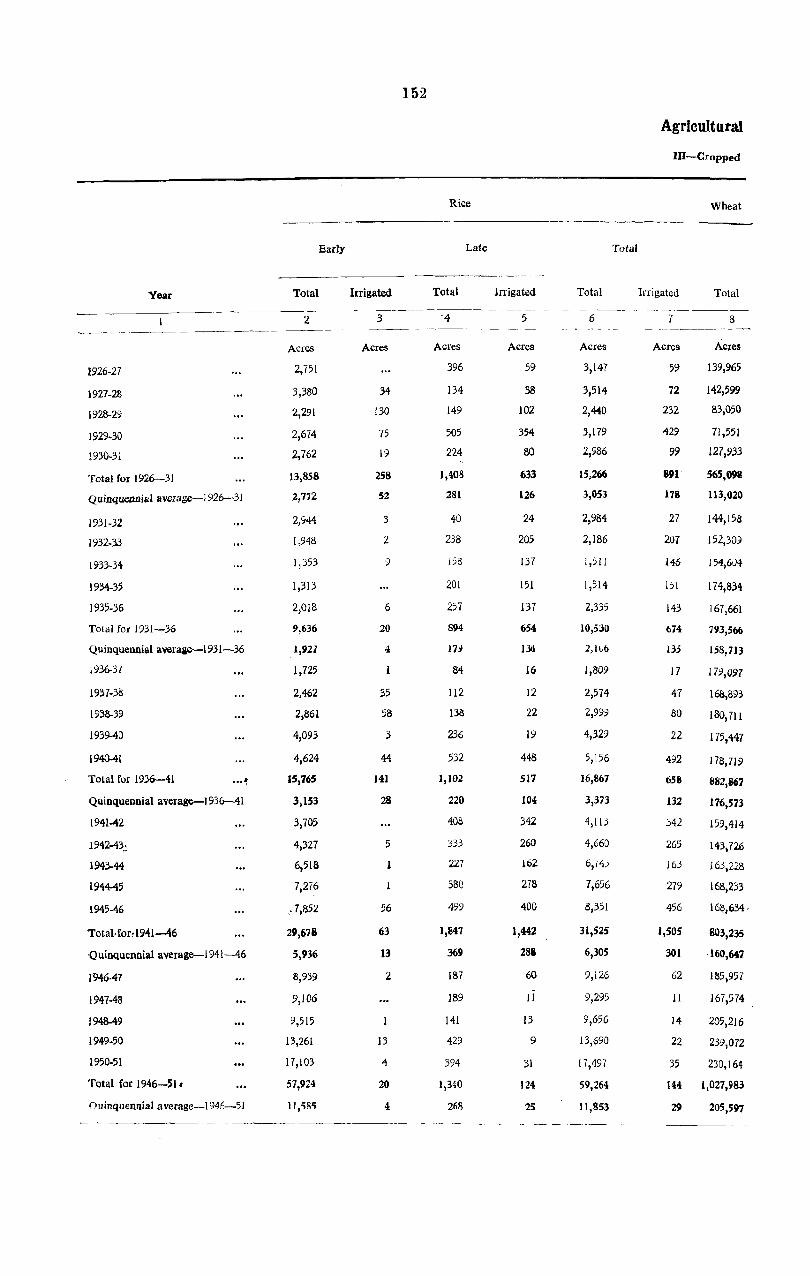
J926-27
1927-28
1928-29
1929·30
1930·31
Year
Total for 1926--31
Quinquennial avelage-l926-3J
1931-32
1932.3.3
1933-34
1934-35
1935-36
TOlal for 1931-36
Quinquennial averaae-1931-36
1936-31
1 937-3B
1938-39
1939-40
1940-41
Total for 1936-41 ... ~ Quinquennial average-l 936-4 1
1941-42
1942-43.\
1943-44
1944-45
1945-46
Total,for; I 941--46
Quinquennial average-1941-46
1946·47
1947-48
1948-49
1949-50
1950-51
Total for 1946-51.
Ouinquennial average-I 946-51
Total
Acres
2,751
3,380
2,291
2,674
2,762
Early
13,858
2,772
2,944
1,948
1,353
1,313
2,078
9,636
1,921
1,725
2,462
2,861
4,093
4,624
15,765
3,153
3,705
4,327
6,518
7,276
,. 7,852
29,678
5,936
8,939
9,106
9,515
13,261
17,103
57,924
11,<;85
Irrigated
Acres
34
130
75
19
258
52
3
2
')
6
20
4
35
58
3
44
141
28
5
56
63
13
2
13
4
20
4
1 !)2
Rice
Total
Acres
396
134
149
505
224
1,403
281
40
238
158
201
257
894
IU
84
112
138
236
532
1,102
220
408
333
227
380
499
1,847
369
187
189
141
429
394
1,340
268
Late
Irrigated
Acrcs
59
38
102
354
80
633
126
24
205
137
151
137
654
}3!1
16
12
22
19
448
517
104
342
260
162
278
400
1,442
288
60
Jl
13
9
31
124
25
Total
Acres
3,147
3,514
2,440
3,179
2,986
15,266
3,053
2,984
2,186
1,511
1,514
2,335
10,530
2,1~6
J,809
2,574
2,999
4,329
5,156
16,867
3,373
4,113
4,660
6,(4)
7,656
8,351
31,525
6,305
9,126
9,295
9,656
13,690
[7,497
59,264
11,853
Total
Agricultural
In-Cropped
Wheat
Irrigated Total
7 8
Acres Acres
59 139,965
72 142,599
232 83,050
429 71,551
99 J27,933
891 565,098
178 113,020
27 144,158
2.07 J 52,309
146 154,604
lSI 174,834
143 167,661
674 793,566
13j 153,713
J 7 179,097
47 168,893
80 lBO,711
22 175,447
492 J 78,719
658 882,867
132 176,573
34.2 159,414
265 143,726
163 163,228
279 168,233
456 168,634·
1,505 803,235
301 160,647
62 1135,957
11 167,574
14 205,216
22 239,072
35 230,164
144 1,027,983
29 205,597

S tatistics-{ contd. )
Area-(contd.}
Irrigated
9
Acres
19,427
2,419
16,755
22,339
17,977
78,917
15,783
15,471
t 9, HI8
19,839
29,448
26,788
110,734
22,147
22,635
26,278
31,056
30,273 .
24,446
134,688
26,938
21,484
32,293
31,223
29,319
31,846
146,165
29,2330
27,233
29,112
31,700
35,558
35,634
159,237
31,847
.
Total
10
Acres
15,772
20,617
20,017
14,664
20,564
91,.634
18,327
16,391
12,346
12,693
13,103
13,888
68,421
13,684
15,106
12,049
14,190
12,069
12,846
66,260
13,252
10,592
12,912
13,572
12,187
11,384
60,647
12,129
14,849
15,122
20,813
22,409
17,923
91,1l6
18,223
Barley
Irrigated
1J
Acres
7,452
2,369
8,154
10,629
8,512
37,116
7,423
5,509
4,929
4,461
5,458
6,468
26,825
5,365
-5,821
5,680
5,859
5,388
4,173
26,921
5,384
3,958
7,121
5,496
4,381
4,584
25,540
5,108
4,582
5,348
5,434
5,657
5,449
26,470
5,291
Juar
Total
12
Acres
153,066
176,968
126,430
192,922
194,468
843,854
168,771
175,124
137,846
186,423
162,399
162,63)
824,422 _
10-1,83-1
151,992
152,636
171,391
173,791
181,416
831,226
166,245
165,370
231,425
232,639
203,892
234,922
],068,248
213,650 \
192,364
183,218
160,052
199,586
190,926
926,116
18;,229
Bajra
Total
13
Acres
18,113
17,634
23,960
24,063
31,512
115,282
23,056
24,449
16,773
20,161
19,393
20,126
100,902
20,180
20,165
24,140
25,522
28,692
30,741
129,260
25,852
37,347
41,216
39,539
33,649
26,339
178,090
35,618
20,331
20,965
14,540
14,322
11,968
82,126
16,425
Mandua
Total
14
Acres
3
2
3
9
2
Kodon
Total
15
Acres
15,916
14,459
15,602
17,775
16,695
80,447
16,089
12,448
2·' 13,166
3
2
4
1
9
10
2
10,375
15,861
19,721
12,071
14,414
19,703
19,365
19,023
17,86'1
16,742
92,699
18,540
17,067
21,604
24,906
20,964
17,121
101,662
20,333
18,094
18,338
16,959
15,635
13,448
82,474
16,-195
Sawan
• Total
16
Acres
2,063
4,302
7,144
9,088
7,701
30,298
2,253
2,130
1,320
1,547
. 3,891
11,141
2,228
2,842
3,233
2,237
2,625
3,539
14,476
2,895
3,070
6,848
7,145
4,260
4,Oil
25,394
5,079
2,839
2,054
1,198
610
694
7,)9;
!,179
Total
17
Acres
2
13
22
34
21
;92
18
8
13
5
12
18
56
11
23
16
14
12
18
83
11
12
24
21
4
10
71
14
13
8
6
8
10
45
I)
Maize
Irrigated
18
Acres
---- - ---~ -..

19OHl2
1902-03
1903..()4
1904:-05
1905-06
Year
Total tor 1901~
Quinquennial average-1901--%
1906·07
1901·08
1908-09
1909·10
1910-11
Total for 1906-11
Quinquennial average-1906-11
1911-12
1912·13
1913·14
1914·15
1915·16
Total fot 1911-16
Quinquennial averago-1911-16
1916-11
1917-18
1918-19
}919-20
1920-21
Total for 1916-21
Quinquennial average-1916-21
1921-22
1922-23
1923-24
1924-25
1925-26
Total for 1921-26
Quinquennial average-1921-26
Gram
Total
19
Acres
253,379
195,320
178,630
178,630
178,630
P84,589
196,918
Irrigated
20
Acres
178,630 2,024 ... 66,149 4,968
192,585 3,068
218,207 2,809
207,720 4,111
863,291 16,980
172,658 3,396
286,273 5,128
215,814 4,331
111,551 15,431
272,734 14,621
211,072 14,716
1,097,450 54,227
219,490 10,845
238,887 12,625
278,918
160,157
284,165
255,432
1,217,559
243,512
230,268
253,505
222,865
270,374
304,300
1,281,312
256,2;;2
14,808
7,018
21,693
17,583
73,727
14,745
17,437
17,136
16,105
15,115
12,761
78,554
15,711
154
Fruits and vegetables including root crops
Potatoes
Total
21
Acres
6
5
7
4
4
2
4
5
19
4
Irrigated
22
Acres
6
4
7
4
4
2
4
5
19
4
Fruits and vegetables other than potato
Total
23
Acres
1,937
2,338
2,137
2,270
2,270
10,953
2,190
2,270
2,515
2,355
2,143
1,828
11,111
2,222
1,743
2,275
2,177
2,115
2,232
10,542
2,108
lL742
1,839
2,098
1,519
1,702
8,900
1,780
1,605
1,798
1,911
1,940
1,855
!I, 109
1,822
Irrigated
24
Acres
864
1,200
1,091
992
841
4,988
998
863
901
938
1,272
915
4,895
979
643
559
975
926
690
3,793
759
667
706
691
745
672
3,481
696
Agricultural
III-Cropped
Other food crops
Total Irriaated
25
Acres
65,251
70,209
63,951
60,229
90,992
350,638
70,128
64,395
55,327
65,486
53,831
59,525
298,564
59,713
39,596
49,373
50,610
51,827
66,681
258,087
51,617
60,503
48,423
51,963
50,349
62,022
273,260
54,652
68,921
59,872
55,946
33,483
42,598
260,820
52,164
26
Acres
51
366
189
DO
84
820
164
100
85
1,351
!O3
67
1,706
341
53
64
693
138
168
1,116
223.
62
51
61
132
74
381)
77

Statistics-( COf?,td. )
Area-(cIJn!d, )
Total food crops
Total
27
Acres
574,658
533,392
542,181
541,474
54[,474
2,733,179
546,636
541,474
376,254
590,907
SSJ,084
610,9'.Q
2,704,6~
541>,930
633,043
593,776
387,493
639,324
717,335
2,971,476
594,295
713,740
726,687
481,042
666,648
654,63U
3,262,747
652,549
689,740
699,258
657,672
587,022
657,012
3,290,704
658,141
Irrigatedc
21'1
Acres
15,030
25,354
22,671
18,977
19,078
101, \\0
20,222
20,747
18,486
-45,027
36,333
,37,916
UB,509
31,702
36,287
42,205
26,391
54,437
42,233
201,553
40,311
42,473
42,275
41,884
39,180
36,248
202,060
40,412
155
Linseed Til Rapeseed Groundnut
-~-.---- _ .... ,----- ---------
Total Total Total Irrigated Total Irrigated
29 30 31 32 ._,.- --.----------------------
Acres
17,314
37,282
40,959
40,959
40,959
177,473
35,495
40,959
507
8,063
18,835
24,476
92,840
18,568
46,051'1
65,419
751
14,598
18,589
145,415
29,083
28,297
35,709
331
25,500
6,350
96,187
19,237
10,785
16,290
47,337
55,811
44,575
174,798
34,960
Acres
67,186
99,080
112,009
115,119
115,119
508,513
101,702
115,119
77,316
60,754
116,864
110,980
481,033
96,206
91,319
67,285
89,476
79,577
73,947
401,604
80,321
69,393
37,676
56,076
34,783
67,167
265,095
53,019
64,448
48,783
53,510
78,458
72,401
317,600
63,520
Acres
6
15
24
24
24
93
19
24
102
40
11
77
254
51
146
46
12
50
24
278
56
106
76
41
96
22
341
68
75
93
204
152
237
766
153
Acres
10
5
2
18
4
1
3
5
7
17
3
3
2
7
5
5
22
4
4
3
9
2
Acres Acres
Otho" oilseeds
Total
35
Acres.
898
721
592
594
594
3,399
680
594
1,171
418
840
928
3,951
790
1,175
910
944
1,004
831
614
643
2,176
1,137
1,783
6,353
1,271
1,2[4
627
1,376
3,808
4,028
11,053
2,211
oThe total irrigated food crops area shown in col;mn no. 28 wi 11 n::lt correspond with the total of irrigated areas shown for indivi. dual food crops owing to the omission of the irrigated areas of certain ,:rops.

Year Total Irrigated
156
Fruits and vegetables including root crops
Potatoes
Total Irrigated
Fruits and vegetables other than potato
IrrigateJ
Agricultural
HI-Cropped
Other food crops
Total Irrigated
----------------------------------------------------------
1926-27
1921-28
1928-2~
1929-::l0
1930-31
Total for 1926-31
Quinquennial averllge-1926-31
1931-32
1932-33
1933-34
1934-35
1935-36
Total for 1931-36
QUinquennial average-1931-36
1936-37
1937-38
1938-39
1939--40
1940--41
Total for 1936-41
Quinquennial average-1936-41
1941--42
1942-43
1943-44
1944-45
• 1945--46
Total for 1941-46
~ Quinquennial average-1941-46
• 1946-47
1947--48
1948-49
194~-50
1950-51
Total br 1946-51
Quinquennial average-1946-51
19
Acres
257,062
223,243
346,443
179,191
302,555
1,308,494
261,699
242,333
299,071
246,741
306,88)
300,281
1,395,315
279,063
305,159
284,510
287,211
284,831
291,853
1,453,564
290,713
329,810
291,677
311,836
312,833
280,861
1,527,017
305,403
313,539
317,696
356,505
380,021
376,318
1,744,079
348,816
20
Acres
18,321
445
19,912
23,577
15,942
78,197
15,639
13,127
20,745
20,266
30,035
28,312
112,485
22,497
20,447
28,051
31,243
33,271
25,794
138,806
27,761
32,414
41,102
35,561
32,661
35,897
177,635
35,527 •
25,734
31,421
35,227
38,886
36,760
168,028
33,606
---_- - ----_,-------
21
Acres
4
7
8
5
10
34
7
5
7
23
16
12
63
13
15
3
5-
15
14
52
10
'9
7
11
16
11
54
II
12
II
7
24
60
114
23
22
Acres
4
6
7
10
5
32
6
5
7
23
16
12
63
13
15
3
5
15
14
52
10
8
5
11
14
11
49
10
12
10
7
23
56
108
22
Acres
2,061
2,480
2,336
2,111
J,829
10,817
2,163
2,057
2,496
1,813
1,975
2,677
11,018
2,204
2,487
2,729
2,665
2,796
2,550
13,217
2,646
2,301
2,343
2,344
2,182 '
2,127
11,291
2,259
2,234
2,485
2,414
2,468
2,808
12,t09
2,482
24 2') 26
Acre~ Acres Acr~
766 50,170 116
90B 58,901 109
906 50,238 851
966 72,837 385
875 64,799 )02
4,421 296,945 1,563
88t 5',389 313
830 54,093 95
966 45,727 112
970 54,547 224
1,029 55,145 202
I,O~6 57,147 164
4,871 266,659 "7 914 53,332 159
1,022 54,015 207
951 57,708 257
1,026 60,205 195
1,002 61,777 222
958 66,913 246
4,959 3()0,618 1,121
992 ' 60,124 225
J,027 63,463 262
995 82,805 477
949 83,440 311
829 74,284 277
835 79,807 379
4,635 383,799 1,706
927 76,760 341
896 65,792 328
927 66,092 375
875 58,596 376
1,076 69,101 468
1,051 67,946 714
4,825 327,527 Z,261
965 65,505 45%
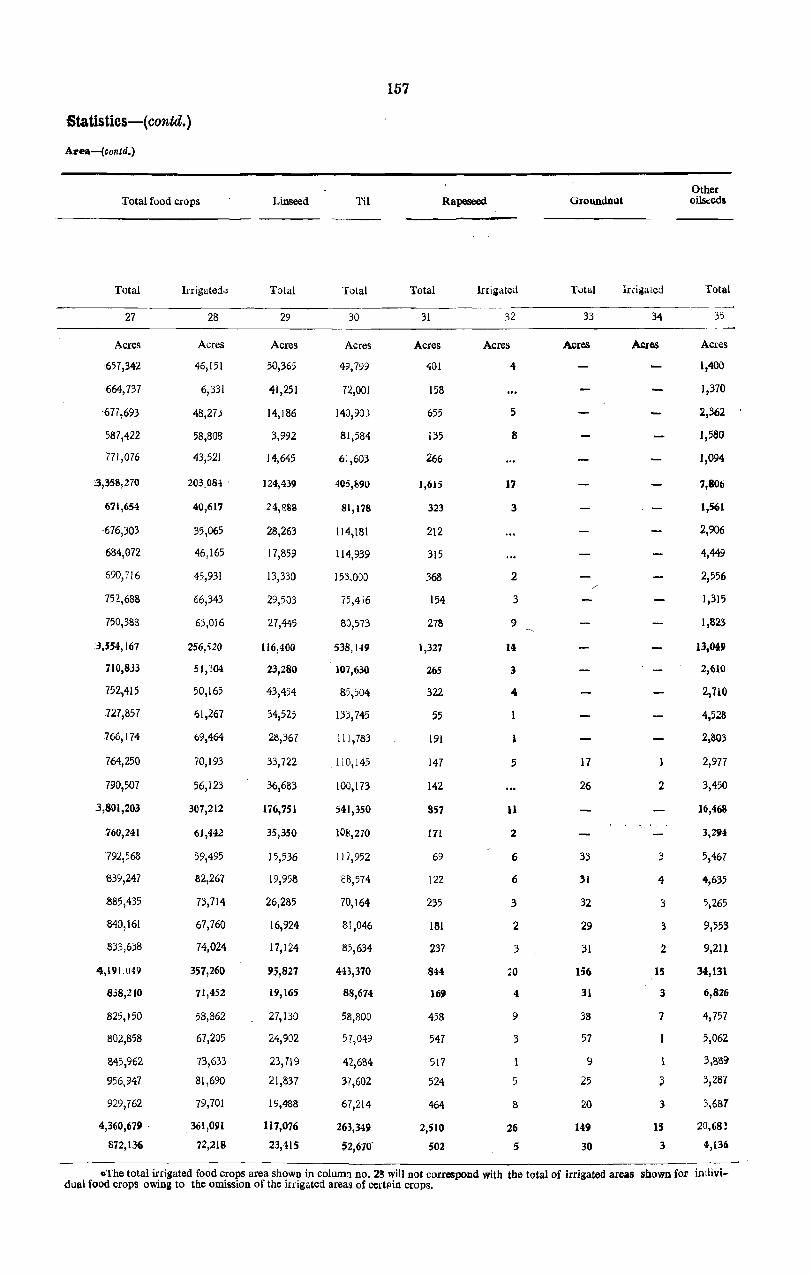
Statistics-( contd.)
Area-(&ontd.)
Total food crops
Total
27
Acres
'657,342
664,737
-677,693
587,422
771 ,076
3,358,270
671,654
-676,303
'684,G72
690,716
752,688
750,383
:3,554,167
710,833
752,415
727,857
766,174
764,250
790,507
3,801,203
760,241
792,568
839,247
885,435
840,161
833,638
4,191.ut9
838,210
825,150
802,858
845,962
956,947
929,762
4,360,679 -
872,136
Irrigated.;:;
28
Acres
46,151
6,331
48,27J
58,808
43,521
203,08-i
40,617
35,065
46,165
45,931
66,343
63,016
256,;20
51,304
50,165
61,267
69,464
70,193
56,123
307,212
61,442
59,495
82,267
73,714
67,760
74,024
357,260
11,452
58,862
67,205
73,633
81,690
79,701
,361,091
72,218
Linseed
Total
29
Acres
50,365
41,251
14,186
3,992
14,645
124,439
24,888
28,263
17,859
13,330
29,503
27,445
116,400
23,280
43,454
34,525
28,367
33,722
36,683
176,751
35,350
15,536
19,95~
26,285
16,924
17,124
9';,827
19,165
27,130
24,902
23,7[9
21,837
19,488
117,076
23,115
Til
Total
30
Acres
451,799
72,001
140,90,1
81,584
61,603
405,S90
81,178
114,181
114,939
153.000
75,456
80,573
538,149
101,630
85,504
133,745
111,783
110,145
100,173
541,350
117,952
e8,574
70,164
81,046
85,634
443,370
88,614
58,800
57,049
42,684
37,602
67,214
263,349
52,610-
157
Rapeseed
Total
31
Acres
401
158
655
135
266
1,615
323
212
315
368
154
278
1,327
265
322
55
191
147
142
857
171
69
122
235
181
237
844
169
458
547
517
524
464
2,510
502
32
Acres
4
5
8
17
3
2
3
9
14
3
1
5
11
2
6
6
3
2
.3
20
4
9
3
1
5
8
26
5
GroundDut
Total
33
Acres
17
26
33
31
32
29
31
156
31
38
57
9
25
20
149
30
Irrigaled
34
Acres
2
.3
4
.3
3
2
IS
3
7
:3
.3
15
3
Other oilseed,
Total
35
Acres
1,400
1,370
2,362
1,580
1,094
7,806
1,561
2,906
4,449
2,556
1,315
1,823
13,049
2,610
2,710
4,528
2,803
2,971
3,450
16,468
3,294
5,467
4,635
5,265
9,553
9,211
3",131
6,826
4,757
5,062
3,B8~
3,281
3,681
20,68!
4,136
oThe total irrigated food crops area shown in column no. 28 will not correspond with the total of irrigated areas shown for indiviilual food crops owing to the omission of the irrigated areas of certl'in crops.
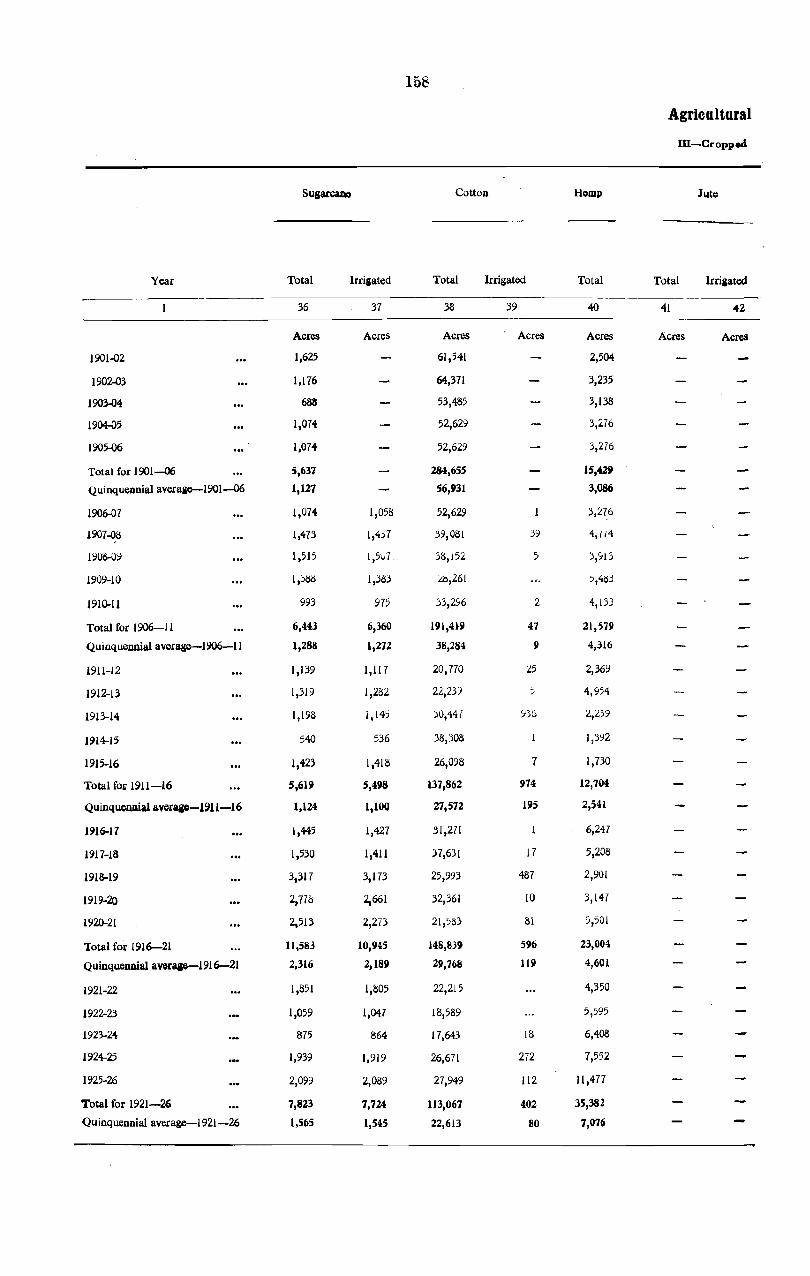
158
Agricultural
In-Cropped
SugarcallD Cotton Hemp Jute
Year Total Irrigated Total Irrigated Total Total Irrigated
36 37 38 39 40 "II 42
Acres Acres Acres Acres Acres Acres Acres
1901-02 1,625 61,541 2,504
1902-03 1,176 64,371 3,235
1903-04 688 53,485 3,138
1904-05 1,074 52,629 3,276
1905-06 1,074 52,629 3,276
Total for 1901~ 5,637 284,655 15,429
Quinquennial average-I901--06 1,127 56,931 3,086
1906-07 1,074 1,058 52,629 3,276
1907-08 1,473 1,437 39,081 39 4,714
190a-Q9 1,515 1,501 3~,152 5 3,913
1909-10 1,31S8 1,383 :':8,261 5,483
1910-11 993 975 33,296 2 4,133
Total for 1906-11 6,443 6,360 IIH,41-9 47 21,579
Quinquennial average-I906-11 1,288 1,27Z 38,284 9 4,316
1911-12 1,139 1,1l7 20,770 25 2,369
1912-13 1,319 1,262 22,239 5 4,954
1913-14 1,198 1,145 30,447 936 2,259
1914-15 540 536 38,308 1,392
1915-16 1,423 1,418 26,098 7 1,730
Total fOI11911-16 5,619 5,498 137,862 974 12,704
Quinquewlial avera&O-I~1l-16 1,124 1,100 27,572 195 2,541
1916-17 1,445 1,427 31,271 6,247
1917-18 1,530 1,411 37,631 17 5,208
191~19 3,317 3,173 25,993 487 2,901
1919-20 2,778 2,661 32,361 10 3,147
1920-21 2,513 2,273 21,583 81 5,501
Total for 1916-21 11,583 10,945 148,839 596 23,004
Quinquennial average-1916-21 2,316 2,189 29,768 119 4,601
1921-22 1,851 1,805 22,215 4,350
1922-23 1,059 1,047 18,589 5,595
1923-24 875 864 17,643 18 6,408
1924-25 1,939 1,919 26,671 272 7,552
1925-26 2,099 2,089 27,949 112 11,477
Total for 1921-26 7,823 7,724 113,067 402 35,382
QUinquennial average-1921-26 1,565 1,545 22,613 80 7,076

Statistics-( contd.)
Area-(contd.)
Total
43
Acres
448
354
273
273
273
1,621
324
273
61
146
242
911
194
:m 77
43
8
43
482
96
240
429
212
77
40
998
200
71
51
'37
46
20
225
45
Indigo
Irrigated
44
Acres
2
2
2
2
9
2
Opium
Total
45
Acres
780
694
674
674
674
3,496
699
674
674
135
Irrigated
46
Acres
674
674
135
159
Tobacco
Total Irrigated
47
Acres
747
653
615
615
615
3,245
649
615
547
585
582
766
3,095
619
836
723
221
624
649
3,053
611
722
655
.322
83.3
228
2,760
552
504
661
862
602
350
2,979
596
48
Acres
592
545
568
553
718
2,976
595
796
691
221
592
611
2,IHl
502
671
594
.321
788
226
2,600
520
480
619
814
571
331 •
2,815
563
Fodder crops
Total Irrigated
49
Acres
\32
la2
18S
189
169
880
176
189
!55
127
147
165
783
157
198
, 18l
160
167
170
877
175
209
133
147
155
127
771
154
165
185
222
172
174
918
184
50
Acres
8
5
2
.3
18
4
2
6
21
30
6
21
14
4
8
47
9
Other nOD-food crops
Total Icrigated
51
Acres
1,404
1,220
1,551
1,567 <
1,567
1,309
1,462
1,567
765
1,227
2,350
2,034
7,~43
1,589
4,075
3,481
685
1,610
2,220
12,011
2,414
3,793
5,202
1,272
4,081
1,126
15,474
3,095
1,425
2,099
3,567
3,952
1,S14
12,857
2,571
52
Acres
1,132
522
761
1357 ,
4,802
960
912
595
645
667
976
3,195
759
1,482
2,181
915
J 1-460
841
6,879
1,376
716
951
1,545
1,672
1,394
6,27&
1,256
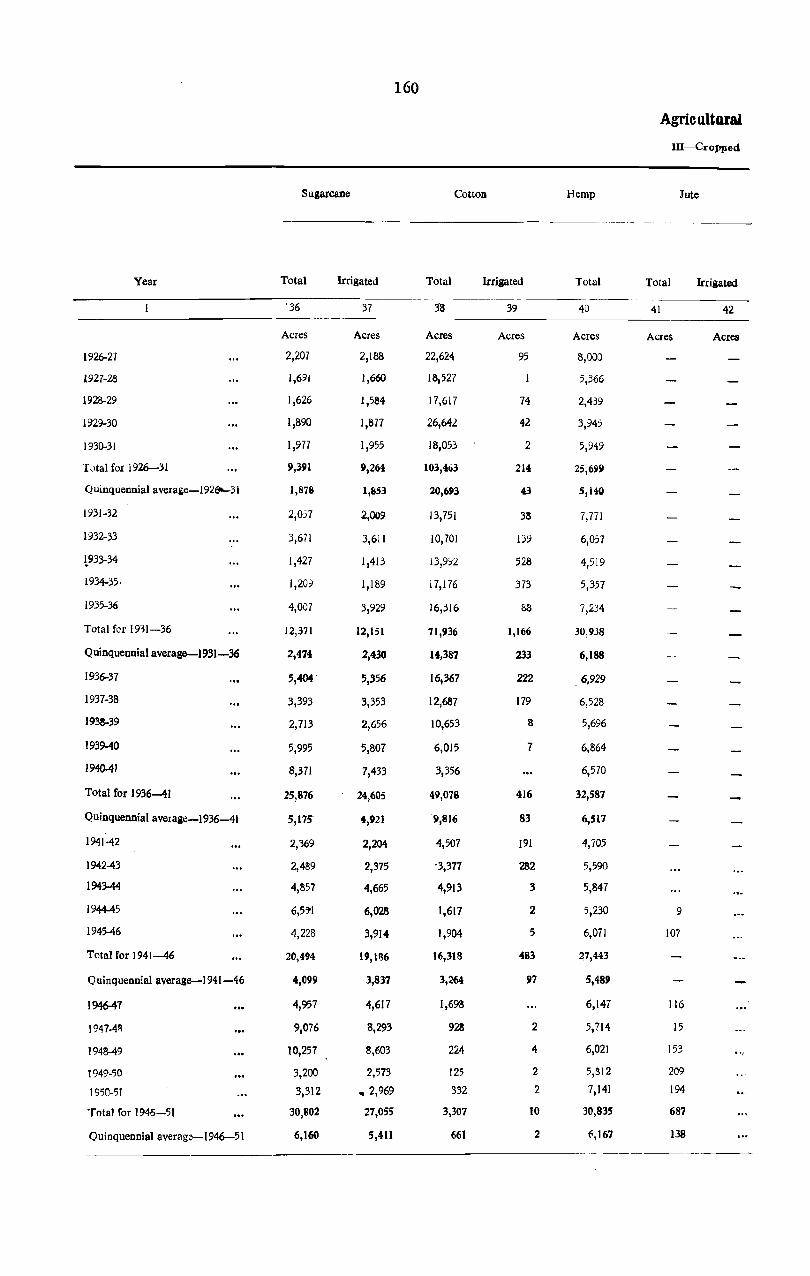
160
Agric altura!
III-Cropped
Sugarcane Cotton Hemp Jute
Year Total Irrigated Total Irrigated Total Total Irrigated ----~--
'36 37 38 39 40 41 42
Acres Acres Acres Acres Acres Acres Acres
1926-21 2,207 2,188 22,624 95 8,000
1927-28 1,691 1,660 18,527 5,366
1928-29 1,626 1,584 17,617 74 2,439
1929-30 1,890 1,877 26,642 42 3,945
1930-31 1,977 1,955 18,053 2 5,949
TJtal for 1926-31 9,391 9,264 103,463 214 25,699
Quinquennial average-192(jo....31 1,878 1,853 20,693 43 5,140
1931-32 2,057 2,009 13,751 38 7,771
1932-33 3,671 3,611 10,701 139 6,057
t933-34 1,427 1,413 13,9;;12 528 4,519
1934-35, 1,209 1,189 17,176 373 5,357
1935-36 4,007 3,929 16,316 88 7,234
Total for 1911-36 12,371 12,151 71,936 1,166 30,938
Quinquennial average-193l-36 2,474 2,430 14,387 233 6,188
1936-37 5,404' 5,356 16,.367 222 6,929
1937-38 3,393 3,353 12,6S7 179 6,528
1938-39 2,713 2,656 10,653 8 5,696
1939-40 5,995 5,807 6,015 7 6,864
1940-41 8,371 7,433 3,356 6,570
Total for 1936-41 25,876 24,605 49,078 416 32,587
Quinquennial average-I 936-4 I 5,17' 4,921 ",816 83 6,517
1941·42 2,369 2,204 4,507 191 4,705
1942-43 2,489 2,375 '3,317 282 5,590
1943-44 4,857 4,665 4,913 3 5,847
1944-45 6,5'1 6,028 1,611 2 5,230 9
1945-46 4,228 3,914 1,904 5 6,071 107
Total for 1941-46 20,494 19,136 16,318 483 27,443
Quinquennial average-1941-46 4,099 3,837 3,264 97 5,489
1946-41 4,957 4,617 1,698 6,147 116
1947-4~ 9,076 8,293 928 2 5,714 15
1948-49 10,257 8,603 224 4 6,021 153
1949-50 3,200 2,513 125 2 5,812 209
1950-51 3,312 .2,969 332 2 1,141 194
Total for 1945-51 30,1102 27,055 3,307 10 30,835 687
Quinquennial average-1946-51 6,160 5,411 661 2 6,167 138
.. _ .~ ----_--
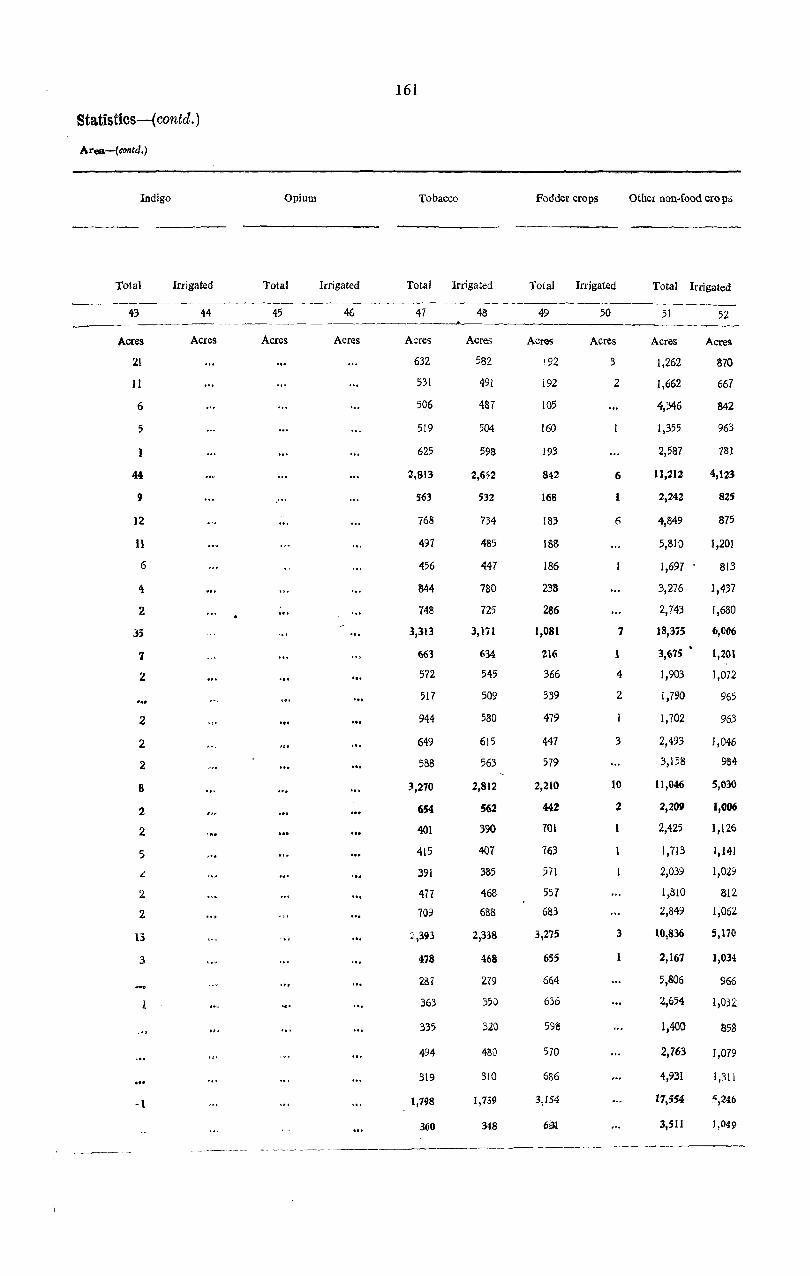
161
statistics-( contd.)
Area-(contd.)
Indigo Opium Tobacco Fodder crops Other non-food cco p,;;
Total Irrigated Total Irrigated Total Irrigated Total Inigated Total Irrigated
43 44 45 46 47 48 49 50 51 52
Acres Acres Acres Acres Acres Acres Acres Acres Acres Acres
21 632 582 \92 3 1,262 870
11 531 491 192 2 1,662 667
6 506 487 105 4,346 842
5 519 504 160 1,355 963
625 598 193 2,587 781
44 2,813 2,6~2 842 6 11,212 4,123
9 ,'. 563 532 168 1 2,242 825
12 768 734 183 (i 4,849 875
11 497 485 188 5,810 1,201
6 456 447 186 1,697 813
4 844 no 238 3,276 1,437
2 748 725 286 2,743 1,680
35 3,313 3,171 1,081 7 18,375 6,006
1 663 634 216 1 3,675 1,201
2 572 545 366 4 1,903 1,072
517 509 339 2 1,790 965
2 944 580 479 1,702 963
2 649 615 447 3 2,493 1,046
2 588 563 579 3,158 9134
8 3,270 2,812 2,210 10 11,046 5,030
2 654 562 442 2 2,209 1,006
2 401 390 701 2,425 1,126
5 415 407 763 1,713 1,141
L :391 385 571 2,039 1,029
2 477 468 557 1,810 812
2 709 688 683 2,849 1,062
13 1,393 2,338 3,275 3 10,836 5,170
.3 478 468 655 2,167 1,034
281 279 664 5,806 966
363 350 636 2,654 1,032:
335 320 598 1,400 858
494 480 570 2,763 1,079
319 310 686 4,931 1,311
-1 1,798 1,739 3,154 11,554 5,246
360 348 631 3,5Il 1,049
--~------- ---~-.~--~ ------_

162
Agricnltural
III-Cropped
Total non-food crops Kharif Rabi
Ye~ Tota I Irrigated. Total Irrigated Total Irrigatod
53 54 55 56 57 58
Acres Acres Acres Acres Acres Acres
1901-02 154,585 412,634 316,286
1902-03 208,983 459,506 282,462
1903-04 214,196 461,494 294,550
1904-05 216,993 463,584 294,550
1905~06 216,993 463,584 294,550
Total for 1901-06 1,011,750 2,260,802 1,482,398
Quinquennial average-1901-06 202,350 452,160 296,480
1906-07 216,993 3,463 463,584 1,428 294,550 16,854
1907-08 126,140 2,602 407,038 2,758 94,345 24,555
1908-09 . 114,855 2,859 469,893 1,980 235,032 "2,926
1909-10 174,907 3,296 462,918 J,752 296,361 20,186
1910-11 178,090 2,955 475,740 1,267 3J2,930 20,531
Totalfor 1906-11 810,985 15,175 2,219,173 9,185 1,233,218 105,052
Qui.nquenn'ial average-1906-11 162,197 3,035 455,834 1,837 246,644 21,010
[91 I~I2 le8,396 3,066 337,801 1,522 463,243 22,054
1912-13 166,635 2,831 348,915 1,544 411,199 19,586
1913-14 126,196 4,417 363,059 8,860 149,580 39,765
1914-15 137,878 2,076 418,360 784 358,381 36,863
1915-16 125,724 3,254 503,188 1,850' 339,403 38,996
Total for 1911-16 724,829 15,644 1,971,323 14,560 1,721,806 157,264
Quinquennial average-1911-16 144,966 3,129 394,265 2,912 344,361 31,453
1916-17 142,337 3,839 437,985 1,651 417,868 38,269
1917-Ja 124,892 4,393 339,810 1,662 511,511 44,734
1918-19 92,788 5,000 364,743 5,807 208,127 24,861
1919-20 104,948 5,305 361,231 2,888 429,931 56,510
1920-21 106,440 3,612 430,799 2,912 329,599 42,397
Total for 1916-21 571,405 22,149 1,934,568 14,920 1,691,036 206,771
Quinquennial average-1916-21 114,281 4,430 386,914 2,984 379,407 41,354
1921-22 107,103 3,214 459,734 1,997 336,700 43,371
1922-23 94,037- 2,907 397,510 1,264 395,489 43,706
1923-24 132,041 4,384 366,732 1,102 422,718 44,984
1924-25 179,163 4,963 278,744 2,496 487,096 41,406
1925-26 165,124 4,116 320,070 2,490 501,715 37,628
Total for 1921-26 677,468 19,584 1,822,790 9,349 2,143,718 211,095
Quinquennial average-1921-26 135,494 3,917 364,558 ],870 428,743 42,219
.. The total irrigated non-food crops area shown in column no. 54 will not correspGad with the total or irrigated areas shown for injividual non-food crops owing to the omission of thC'irrigated areas of certain crops.,

Statistics-( coned.)
Area-(contd.)
Zaid
Total
59
Acres
323
A07
333
333
333
'1,729
346
333
1,011
837
712
350
3.243
649
395
297
1,055
961
468
3,176
635
224
253
960
434
672
2,548
510
409
296
263
345
351
],664
333
Irrigated
60
Acres
211
643
624
335
235
2,018
410
237
187
819
762
324
2,329
466
. 206
202
723
344
536
2,011
402
319
212
182
241
246
1,200
240
Total
Total
61
Acres
729,2H
742,375
756,377
758,467
758,467
3,744,929
748,986
758,467
502,394
705,762
759,991
789,020
3,515,634
703,127
801,439
760,411
513,694
777,702
843,059
3,696,305
739,261
856,077
851,579
573,830
791,596
761,070
3,834,152
766,831
796,8B
'793,295
789,713
766,185
822,136
3,968,172
793,631
163
Irrigated
62
Acres
19,211
18,144
17,931
17,931
17,931
91,148
18,230
18,493
27,956
25,530
22,273
22,033
116,285
23,257
23,813
21,317
49,444
38,409
41,170
174,153
31,831
40,126
46,598
31,391
- 59,742
45,845
223,702
44,740
45,687
45,182
46,268
44,143
40,364
221,6t4
44,329
Net area cropped during the year
Total
63
Acres
694,655
722,193
725,020
725,020
725,020
3,591,908
718,382
725,020
491,538
673,565
731,368
728,132
3,349,623
669,925
699,816
724,909
498,962
742,410
802,346
3,468,443
693,689
812,850
787,933
~56,666
735,692
740,512
3,633,653
726,731
770,827
760,463
754,919
730,968
790,360
3,807,537
761,507
Irrigated
64
Acres
19,211
18,144
17,931
17,931
17,931
91,148
18,230
17,931
27,248
25,226
22,029
21,848
114,282
22,856
23,670
21,230
47,856
38,202
40,977
171,935
34,387
40,014
46,492
30,506
59,531
45,644
222,187
44,437
45,587
45,082
46,183
44,033
40,226
221,111
44,222
Area cropped more than once
Total
65
Acres
34,588
20,182
31,357
33,447
33,447
153,021
30,604
33,447
10,856
32,197
28,623
60,888
166,011
33,202
101,623
35,502
14,732
35,292
40,713
227,862
45,572
43,227
63,646
17,164
55,904
20,558
200,499
40,100
26,016
32,832
34,794
35,217
31,776
160,635
32,127
Irrigated
Acres
562
708
304
244
185
2,003
401
143
87
1,588
207
193
2,218
444
112
106
885
211
201
1,515
303
100
100
85
11 () _
138
533
107

1926.27
1927-28
1928-29
1929-30
1930-31
Year
Total for 1926-31
Quinquennial average-1926-31
1931-32
1932-33
1933-34
1934-35
1935-36
Total for 1931-36
Quinquennial average-1931-36
1936-37
1937-38
1938-39
1939-40
1940·41
Total fOE 1936-41
Quinquennial average-1936-41
1941-42
1942-43
1943-44
1944-45
1945-46
Total for 1941-46
Quinquennial average-1941-46
1946-47
1947-48
1948-49
1949-50
1950-51
Total for 1946-51
Quinquennial average-l 946-5 I
164
Total non-food crops
Total
53
Acres
136,903
142,760
184,751
121,807
106,993
693,214
138,643
174,953
164,497
191,537
134,532
141,455
806,974
161,3~5
163,533
198,107
165,333
169,473
163,098
859,544
171,909
154,167
127,672
120,601
123,986
128,790
655,216
131,043
110,858
107,004
89,806
76,448
107,788
491,904
98,381
Irrigatedo
54
Acres
4,829
2,821
3,160
3,502
3,373
17,685
3,537
3,786
5,657
3,303
4,550
6,967
24,263
4,853
7,512
5,767
4,757
8,252
9,611
35,111111
7,180
4,380
5,148
6,488
7,630
6,222
21),868
5,1)74
6,003
10,053
9,916
4,413
4,925
35,310
7,062
Kharif
Total
55
Acres
327,349
375,574
390,608
435,071
407,141
1,935,743
387,149
411,217
357,121
449,416
356,586
376,280
1,950,620
390,124
367,970
420,197
415,604
421,594
426,386
2,051,751
410,350
424,315
492,701
485,252
447,352
476,165
2,325,785
465,157
384,308
377,121
323,524
363,139
385,245
1,833,337
366,667
Irrigated
56
Acres
2,581
1,977
4,283
2,972
2,243
14,056
2,SU
2,301
4,105
2,378
2,027
4,470
15,281
3,056
6,028
4,003
3,138
6,31~
7,910
27,39&
5,419
2,949
3,190
5,084
6,398
4,362
21,t~3
4,397
4,993
8,681
8,988
3,061
3,590
29,313
5,862
Agricultural
III-Cropped
Rabi
Total
57
Acres
466,491
431,511
471,062
273,091
470,545
2,112,700
422,540
439,680
490,893
432,348
530,023
515,009
2,407,953
481,590
547,587
505,351
515,473
511,60;1
526,465
521,297
521,688
473,627
520,381
516,261
485,579
2,517,536
503,507
551,367
532,380
611,925
669,897
651,949
3,~17,518
603,504
Irrigated
58
Acres
48,122
6,863
46,600
58,588-
44,360
204,533
40,901
36,305
47,262
46,506
68,398
65,142.
263,613-
52,723
51,349-
62,761
70,797
71,917
57,180
314,00i '
62,801
60,309
83,732
74,766-
68,526
75,268
362,601
72,520
59,594-
68,275
74,306
82,763
80,751
365,689'
73.138
o The total irrigated non-food crops area shown in column no. 54 will not correspond with the total of irrigated areas shown for dividual non-food crops owing to the omission of the irrigated areas of certain crops.
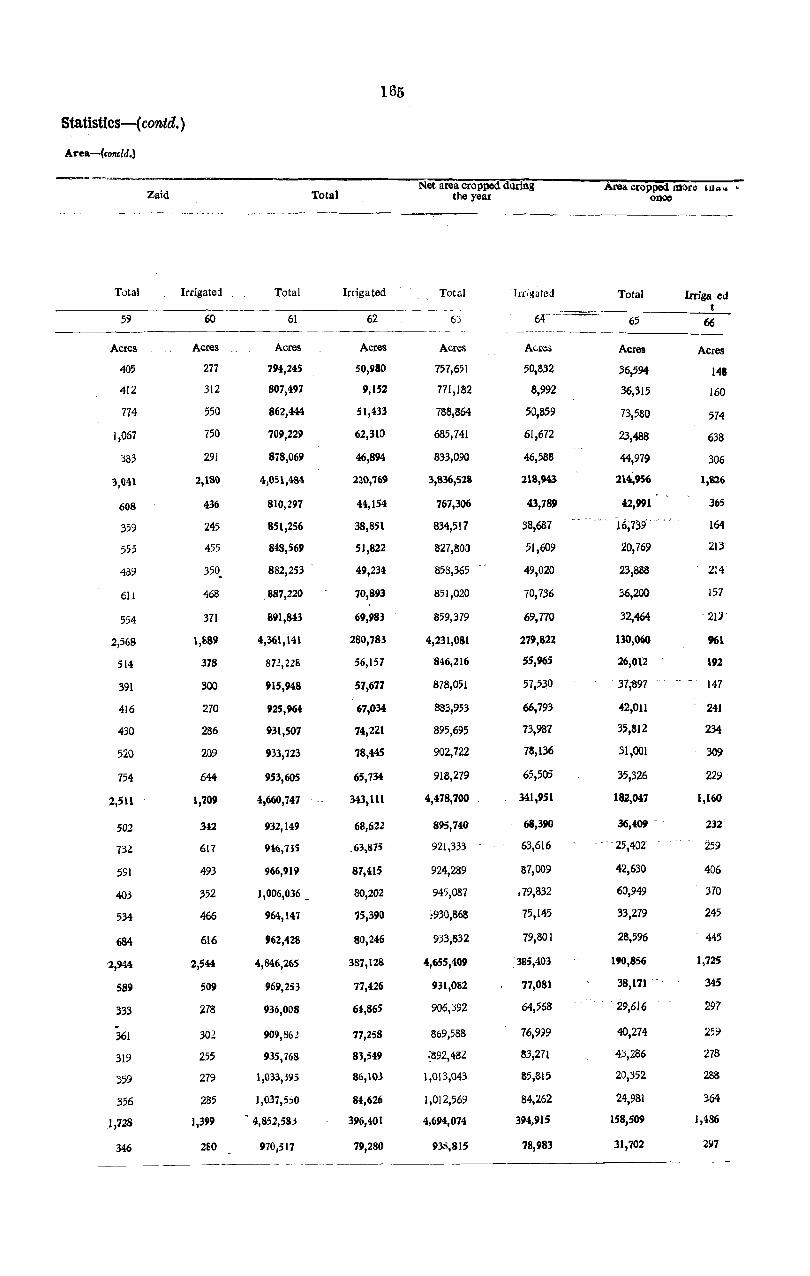
Statistics-( contd.)
AC'ea-(concld.}
Zaid
Total Irrigated
Total
Total
Net area cropped during the year
Irrigated Total
------------------------------- -
59 60
Acres
405
412
774
1,067
383
3,Qn
608
359
555
489
ell
554
2,568
514
391
416
430
520
754
2,511
502
731.
591
403
534
684
589
333 . 361
319
359
356
1,728
346
Acres
277
312
550
750
291
2,18\)
436
245
455
350.
468
371
1,889
378
300
270
286
209
644
1,709
3i2
617
493
352
466
616
2,544
509
278
302
255
279
285
],399
260
61
Acres
794,245
807,497
862,444
709,229
878,069
4,051,484
810,291
851,256
848,569
882,253
.887,220
891,843
4,361,141
87.?,228
915,948
925,964
931,507
933,723
953,605
4,660,747
932,149
966,919
1,006,036 _
964,147
962,428
4,846,265
969,253
936,008
909,86!
935,768
1,033,395
1,037,5,:)0
4,852,58J
970,517
62 63
Acres
50,980
9,152
51,433
62,310
46,894
220,769
44,154
38,851
51,822
49,234
70,893
69,983
280,783
56,157
57,677
67,034
74,221
78,445
65,734
343,111
68,622
.63,875
87,415
80,202
75,390
80,246
381,128
77,426
64,865
77,258
83,549
86,103
84,626
396,401
79,280
Acres
757,651
771,182
788,864
685,741
833,090
3,836,528
767,306
834,517
827,80:)
858,365
851,020
859,379
4,231,081
8~6,216
878,051
8S3,953
895,695
902,722
918,279
4,478,700
895,740
921,333
924,289
945,087
:930,868
933,832
4,655,409
931,082
906,392
869,588
i892,4SZ
1,013,043
1,012,569
4,694,074
938,815
50,832
8,992
50,859
61,672
46,588
218,943
43,781'
38,687
51,609
49,020
70,736
69,770
219,822
55,965
51,530
66,793
73,987
78,136
65,505
341,951
68,31'0
63,616
87,009
.79,832
75,145
79,801
385,403
77,081
64,568
76,9')9
113,271
85,815
84,262
394,1'15
78,983
Area cropped mOt" UI .. ,. • ODoe
Total
65
Irriga ed t
66 ~--- ---------
Acres
36,594
36,315
73,580
23,488
44,979
214,956
42,991
'16;139·· .
20,769
23,888
36,200
32,464
130,060
26,01"2
. 37;897
42,011
35,812
31,001
35,326
182,047
36,4(W - .
-_ 25,402
42,630
60,949
33,279
28,596
190,856
38,171
. 29,616
40,274
43,286
20,352
24,981
158,509
31,702
Acres
148
160
574
638
306
1,826
365
164
213
214
157
·21J
961
192
147
241
234
309
229
1,160
232
259
406
370
245
445
1,725
345
297
259
278
28S
364
1,486
21017

166
Agrlc ultural
IV --Irrigated
Irrigated
Irrigated
Wells
Government Private Tube Other Year canals canals Reservoirs Total
2 .3 4 5 6 7 .
Acres Acres Acres Acres Acres Acres
1901-02 2,556 926 15,62t
1902-03 2,162 S31 15,04:7
1903-04 2,639 1,045 14,142
1904-05 2,639 1,045 14,142
1905-06 2,639 1,045 14,142
Total for 1901-06 12,635 4,892 13,092
Quinquennial average-I90I-06 2,527 978 14,619
1906-07 2,639 14,142
1907-08 3,544 1,726 21,413
1908-09 3,713 999 19,301
1909-10 3,837 602 16,920
1910-11 6,608 253 14,EOt
Total for 1906--11 20,341 3,580 86,380
Quinquennial average-I906-11 4,068 716 17,276
1911-12 9,141 447 13,734
1912-13 8,216 723 12,122
1913-14 32,031 530 14,931
1914-15 24,755 713 12,294
1915-16 27,592 819 12,3.30
Total for 1911-16 101,735 3,232 65,411
QuinqaeJlllial averase-191l-16 20,341 646 13,082
1916-17 27,855 808 11,155-
1917-18 33,522 637 12,044
1918-19 .; ... 12,788 776 16,574
1919-20 43,963 -467 14,613
1920-21 ~' t···· 31,446 424 13,464-
Total for 1916--21 )49,574 3,1l2 61,8;(}
Quinquennial average-1916--2} 29,915 622 13,510,
1921-22 32,084 394 12, 779
1922-23 32,209 324 12,18c);
1923-24 33,037 310 12,406
1924-25 31,469 459 11,774,
1925-26 27,327 423 12,1.39.
Total for 1921-26 156,126 1,910 61,278
Quinquennial average-1921-26 31,225 382 12,256

statistics-( conta.)
Area-(contd .)
area
by-
Other sources
8
Total
9
Acres Acres
108
106
105
105
105
529
106
1,1?0
565
1,213
670
383
3,981
796
348
169
364
440
236
1,557
312
196
289
368
4811
310
1,651
330
330
369
430
331
337
1,797
359
19,211
18,144
17,931
17,931
17,931
91,148
18,230
17,931
27,248
25,226
22,029
21,848
114,282
22,856
23,670
21,230
47,856
38,202
40,977
171,935
3~,3S7
40,011
46,492
30,506
59,531
45,6H
222,187
44,437
45,587
45,082
46,183
44,033
40,226
221,111
44,222
Masonry
Actually used
10
8,000
5,106
5,191
5,109
4,833
28,239
5,M8
4,611
4,432
4,576
4,781
4,734
23,134
4,621
4,375
4,390
4,926
5,029
4,881
23,601
4,720
4,704
4,618
4,606
4,421
4,546
22,895
4,579
167
Number of wells
Available
II
10,248
10,346
9,6LZ
9,589
9,589
49,394
9,879
9,589
6,448
7,135
7,593
7,697
38,462
7,692
7,761
7,817
8,008
8,336
8,441
40,363
8,073
8,463
8,470
8,627
8,813
8,878
43,251
8,650
8,932
9,000
9,056
9,080
9,269
45,337
9,067
Non-masonry
Actually used
12
1,40:)
1,744
1,543
1,207
1,036
6,930
1,386
819
776
1,547
948
775
4,865
973
564
534
1,331
844
806
4,079
816
704
636
547
628
550
3,065
613
Available
13
1,293
1,093
1,829
1,862
1,862
7,939
1,588
1,862
1,851
1,822
1,635
1,405
8,575
1,715
1,206
1,127
1,908
1,354
1,2l6
6,811
1,362
1,040
983
1,712
1,348
1,257
6,340
1,268
1,171
1,106
1,034
1,101
1,017
5,429
1,086
Ne'." rr:as~nry . \<el:s bu'lt
dUlir g tl1e ycr,r in Juc'ed . ~n column 11
14
39
34
28
101
20
8
177
148
74
407
81
90
61
203
442
149
945
189
64
49
174
238
92
617
123
73
55
80
64
78
350
70
Number of
reservoirs
15
167
149
153
153
153
77S
ISS
66
29
27
34
156
31
34
34
34
35
172
34
36
36
36
36
36
180
36
36
36
36
36
36
180
36
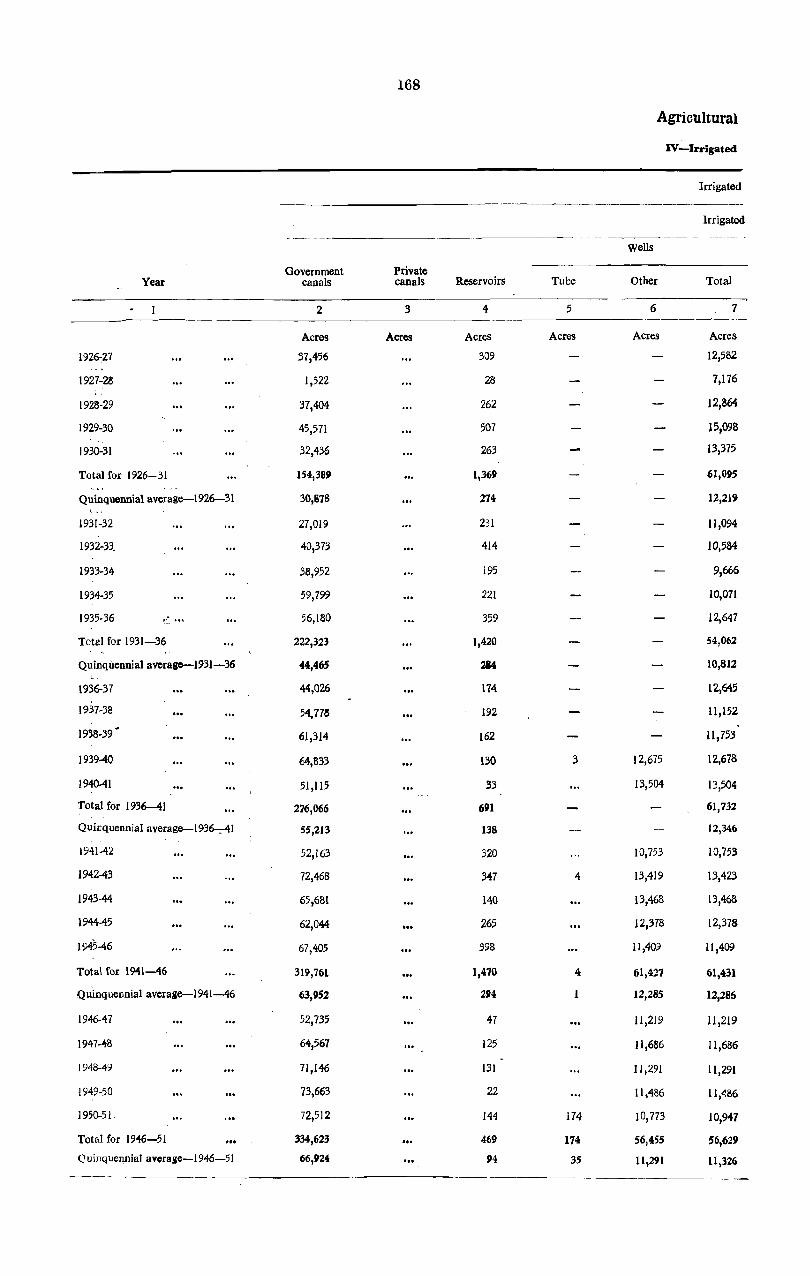
168
Agricultural
IV-Irrigated
Irrigated
Irrigated
Wells
Government Private Year canals canals Reservoirs Tube Other Tota}
2 3 4 5 6 7
Acres Acres Acres Acres Acres Acres
1926·27 37,456 309 12,582
1927-28 1,522 28 7,176
1928-29 37,404 262 12,864
1929-30 45,571 507 15,098
1930-31 32,436 263 13,375
Total for 1926-31 154,389 1,369 61,095 1,,-- .. ,
Quinquennial average-1926-31 30,878 274 12,219 <,
1931-32 27,019 231 11,094
1932-33. 40,373 414 10,584
1933-34 38,952 195 9,665
1934-35 59,799 221 10,071
1935·36 p- .... 56,180 359 12,647
Tctal for 1931-36 222,323 1,420 54,062
Quinquennial averago-1931-36 44,465 214 10,812
1936-37 44,026 174 12,645
1937-38 54,775 192 11,152
1938-39 # 61,314 162 11,753
1939-40 64,833 130 3 12,675 12,678
194041 51,115 33 13,504 13,504
Total for 1936-41 276,066 6Pl 61,732
Quinquennial average-1936-:-41 55,213 138 12,346
1941-42 52,163 320 10,753 10,753
1942-43 72,468 3-47 4 13,419 13,423
1943-44 65,681 140 13,468 13,468
1944-45 62,044 265 }2,378 12,378
1:;45.46 67,405 398 1l,40;l 11,409
Total for 1941-46 319,761 1,470 4 61,427 61,431
Quinq uennial average-1941-46 63,952 294 1 12,285 12,286
1946·47 52,735 47 ll,219 11,219
1947-~8 64,567 125 Il,6S6 11,686
1948-49 71,146 131 11,291 11,291
1949-50 73,663 22 11.486 11,486
1950-51 72,512 144 174 10,773 10,947
Total for 19.of6-51 334,623 469 174 56,455 56,629
QuinqueI)1lial avcragc-1946-51 (;6,924 94 35 ll,29 1 Ll,326
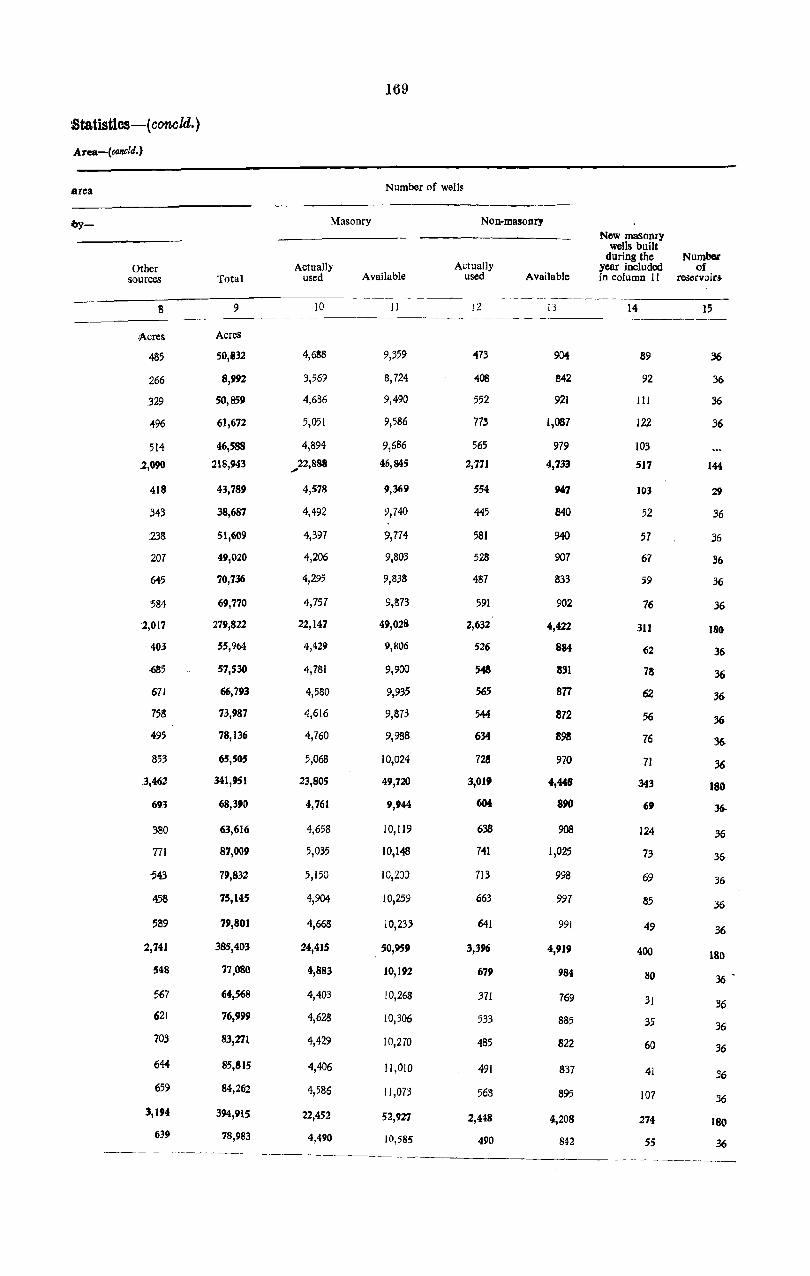
:Statistlcs-( condd.)
Area-(eoneltl.)
area
Other sources
8
Total
9
Acres Acres
485
266
329
496
514
.2,090
418
343
238
207
645
"584
2,017
403
-685
611
758
495
853
3,462
693
380
771
-543
458
589
2,741
548
567
621
703
644
659
3,194
639
50,832
8,992
50,859
61,672
46,588
218,943
43,789
38,687
51,609
49,020
70,736
69,770
279,822
55,964
57,530
66,793
73,987
78,136
65,505
341,951
68,390
63,616
87,009
79,832
75,145
79,801
385,403
77,080
64,568
76,999
83,271
85,815
84,262
394,915
78,9B3
169
Number of wells
Masonry
Actually used
10
4,688
3,569
4,636
5,051
4,894
,,22,888
4,578
4,492
4,397
4,206
4,295
4,757
22,147
4,429
4,781
4,580
4,616
4,760
5,068
23,805
4,761
4,658
5,035
5,150
4,904
4,668
24,415
4,883
4,403
4,628
4,429
4,406
4,586
22,452
4,490
Available
II
9,359
8,724
9,490
9,586
9,686
46,845
9,369
9,740
9,774
9,803
9,838
9,873
49,028
9,806
9,900
9,935
9,873
9,988
10,024
49,720
9,'44
10,119
10,148
10,200
10,259
10,233
50,959
10,192
10,268
10,306
10,270
11,010
11,073
52,927
10,585
Non-masonry
Actually used Available
12
473
408
552
773
565
2,771
554
445
581
528
487
591
2,632
526
5<tIS
565
544
634
725
3,01'
604
638
741
713
663
641
3,396
679
371
533
485
491
563
2,448
490
13
904
S42
921
1,087
979
4,733
947
840
940
907
833
902
4,422
884
831
877
1372
1398
970
890
908
1,025
998
991
991
4,919
984
769
885
822
837
895
4,208
842
New masonry wells built
dUring the Number year included of in column 1 I reservJirt
14
89
92
III
122
103
517
103
52
57
61
59
76
311
62
78
62
56
76
71
343
69
124
73
69
85
49
400
80
31
35
60
41
107
274
55
15
36
36
36
36
144
29
36
36
36
36
36
180
36
36
.36
36
36
.36
180
.36-
36
36
36
36
36
IS!)
.36
36
36
36
36
36
180
36 "------------------------------~------
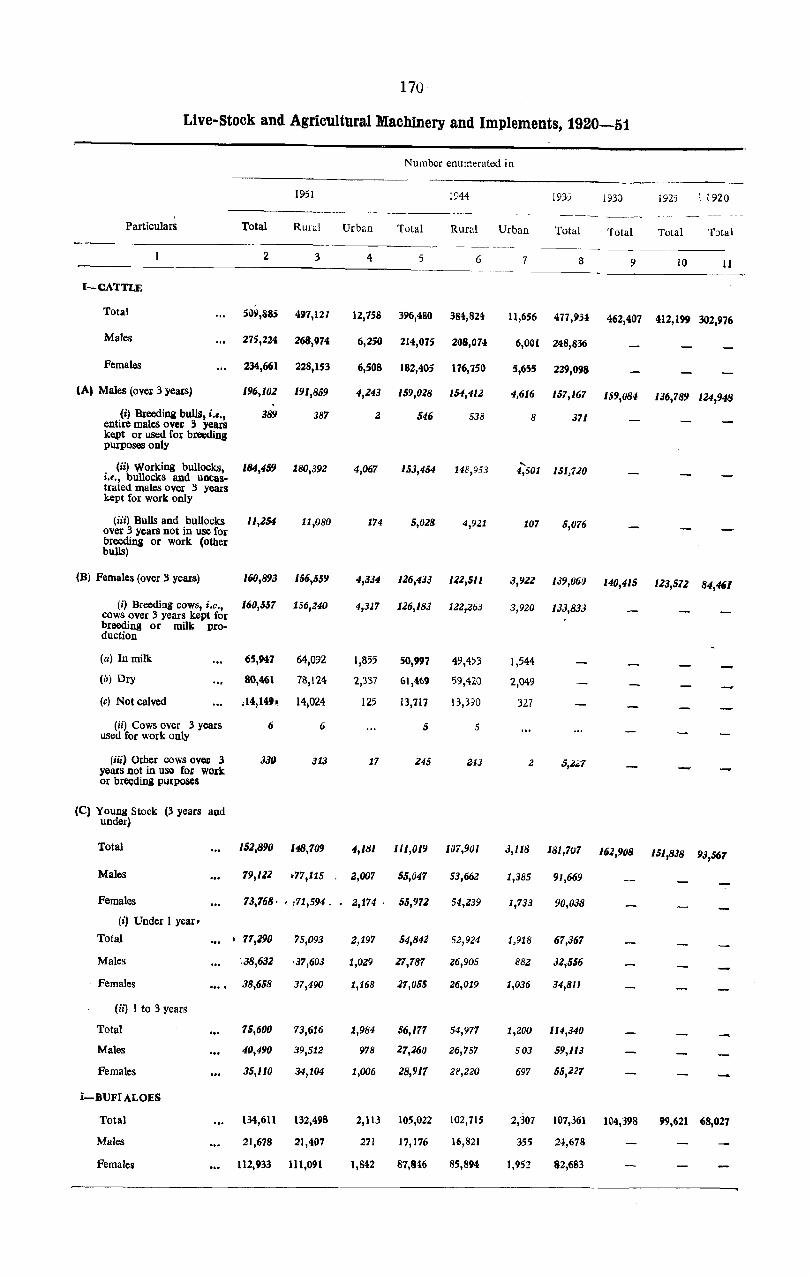
170
Live-Stock and Agricultural Machinery and Implements, 1920-51
Number enumerated in
1951 1944 1935 1930 1925 ' 1920 ------
Particulars Total RUld Urban Total Rural Urban Total Total Total Total
2 3 4 5 6 7 8 9 10 II
I-CATTLE
Total 50!l,88S 497,121 12,758 396,480 384,824 11,656 471,93,1 462,407 412,199 302,976
Males 275,224 268,974 6,250 214,075 208,074 6,001 248,836
Females 234,661 228,153 6,508 182,405 176,750 5,655 229,098
(A) Males (over 3 years) 196,101 191,859 4,143 159,018 154,4i.J 4,616 151,161 159,084 136,789 U4,948
(i) Breeding bulls, i.e., 389 387 2 546 538 8 371 entire males over 3 years kept or used for breeding purposes only
(ii) Working bullocks, 184,459 180,392 4,067 153,454 ....
148,953 4,501 15/,710 i.e., bullockS and uncas-trated males over 3 years kept for work only
(iii) Bulls and bullocks 11,154 11,080 174 5,028 4,921 107 5,016 over 3 years not in use for breeding or work (other bulls)
(B) Females (over 3 years) 160,893 156,559 4,334 116,433 111,511 3,911 IJ9,06() 140,415 113,511 84,4'1
(i) Breedin8 cows, i.e., 160,557 156,Z40 4,317 116,183 112,263 3,920 133,833 cows over 3 years kept for breeding or milk pro-duction
(a) In milk 65,947 64,092 1,855 50,997 49,453 1,544
(0) Dry 80,461 7B,l24 2,337 61,469 59,420 2,049
(c) Not calved ;14,149~ 14,024 125 13,717 13,390 327
(ii) Cows over 3 years 6 6 5 5 used for work only
(iii) Other cows OVCt 3 years not in use fo& work
330 313 17 245 Z43 z 6,J~1
or breeding purposes
(C) Young Stock under)
(3 years and
Total 15Z,890 148,109 4,181 111,019 107,901 3,118 181,707 161,908 161,838 93,561
Males 19,1l2 t77,115 Z,007 55,047 53,662 1,385 91,669
Females 13,168· , ,71,594 . Z,174 . 55,972 54,239 1,733 90,038
(i) Under 1 year,
Total • 17,190 75,093 2,197 54,842 52,924 1,918 67,367
Males 38,631 ,37,603 1,029 17,787 26,905 882 32,556
Females 38,658 37,490 1,168 27,055 26,019 1,036 34,811
(ii) 1 to 3 years
Total 15,600 73,616 1,984 56,177 54,977 1,200 114,340
Males 40,490 39,512 978 21,260 26,757 503 59,113
Females 35,110 34,104 1,006 28,917 2B,220 697 55,127
I-BUFI ALOES
Total 134,611 132,498 2,113 105,022 102,715 2,307 107,361 Hl4,398 99,621 68,027
Males 21,678 21,407 271 17,176 16,821 355 2<1,678
Females 112,933 111,091 1,842 87,846 85,894 1,952 82,683

171
Live-Stock and Agricultural Machinery and Implements, 1920-51-(contd.)
Number enumerated in
1951 1944 1935 1930
-------,.--- -_._-- -- '"''
Particulars Total Rural Urban Total Rural Urban -Total Total
2 3 4 5 6 7 8 9 .. -_-- --------------------------
(A) Males (over '3 years)
(i) Breeding bulls, i.e., entire males over '3 years kept or used for breeding purposes only
(ii) Working bullocks, i.e., bullocks and uncastrated males over '3 years kept for work only
(iii) Bulls and bullocks over '3 years not in use for breeding or work (other bulls)
(B) Females (over 3 years)
4,34,1
10S
3,345
291
79,161
(i) Breeding cows, i.e., 78,880 cows over '3 years kept for breeding or milk pro-duction
(a) In milk
(b) Dry
(c) Not calved
(ii) Cows over '3 years used for work only
(iii) Other cows over 3 years not in use for work or breeding purposes
(C) Young Stock (3 years and under)
Total
Males
Females
(i) Under I year
Total
Males
Females
(ii) 1 to '3 years
Total
Males
Females
29,966
41,572
7,342
110
171
51,109
17,337
33,77J
27,024
IIJ,41)4
16,61IJ
24,085
6,933
11,/52
4,258
6'1Z
3,285
281
71,8JI
77,563
29,439
40,794
7,280
110
168
50,399
17,149
33,250
26,615
10,296
16,319
23,784
6,853
16,931
83
13
60
10
1,310
477
778
62
3
710
188
522
409
108
301
301
80
221
2,803
314
1,320
109
60,308
60,127
28,499
25,501
6,127
73
108
41,911
14,373
27,538
l3,699
9,799
13,900
18,212
4,574
13,638
2,708
370
2,237
101
53,915
58,734
27,910
24,8[9
6,005
73
108
41,091
14,113
26,979
23,138
9,596
13,542
17,954
4,517
13,437
95
4
83
8
6,604
1,870
4,103
631
1,393 'SIJ,335
1,393
589
6112
122
819
260
55g
561
a03
358
258
57
201
48,327
2,008
50,422
18,074
32,348
14,014
10,065
13,959
16,398
8,009
18,389
4,136
53,740
1925 1920
Total Total
10 11
4,747 3,860
49,074 38,19'
45,800 25,971
In-SHEEP 41,347 40,367 980 38,877 37,857 1,020 43,9!H 44,786 37,856 31,332
(i) Up:to I year
(iiJ I to '3 years
Total
Males
Females
(iii) Over '3 years
Total
Males
Females
6,397
11,179
2,728
8,451
6,271
10,970
2,698
8,272
23,771 23,126
1,936 1,1'63
21,835 21,263
126 10,216
209 28,661
30 3,137
179 25,524
645
73
572
9,896
27,961
3,078
21,t'8.1
320
700
59
641

172
Live-Stock and Agricultural Machinery and Implements, 1920-51-(contd.)
Particulars
iV-GOATS
(i) Up to I yelU
(ii) I to 3 years
Total
MaLes
Females
(iii) Over 3 years Total
Males
Females
V-HORSES AND PONIES ...
(.1 Up to 1 year
(ii) I to 3 years
Total
Males
Females
(iii) Over 3 years
Total
Males
Females
VI-DONKEYS
(i) ' Up ~to Lyear
(ii) l:to.3·years
Total
Males
Females
(iii) .Over·S years
Total
Males
!Females
VII-OTHER ANIMALS
(i) Mules
(ii).Camels
(iii) Pigs
vm-POVLTRY
(i)-: Fowls.
(a) Hens.
(b) Cocks
(e) Chickens
(ii) Ducks
(a) Ducks
(Ill Drakes
(e) Ducklings
Number enumerated in
1951 1944 1935 1930 1925 1920
Total Rural Urban Total Rural Urban Total Total Total Total
2 3
137,903 131,857
Z6,1I4
40,324
10,093
24,971
38,595
9,558
30,Z31 :29,037
71,465
4.625
66,840
3,576
Z48
735
424
311
J,S'J3
1,49:4
1,101
724
212
96
63
416
2.1
205
68,291
4,408
63,883
3,349
238
707
411
296
2,404
1,368
1,036
545
209
82
22
60
254
'19
175
15,748· 14,879
282 166
Zi9 269
15,187 14,444
23,318 19,956
lZ,295 19,031
8,501
5,054
8,740
1,023
'507
342
174
6,934
4,478
7,619
925
449
317
159
4
6,046
1,143
5 6
171,778 165,893
54,161 52,172
1,729 117,617 113,721
535 10,872 10,595
1,194 106,745 103,126
3,174
217
2,957
227
10
28
13
15
189
1Z4
65
179
3
14
11
3
1.32
30
869
116
10
3,9S9
408
456
257
199
3,O'J5
1,644
1,451
399
15,790
.96
159
'143 15,535
3,362 18,8<17
3,264 18,085
1,567
576
1,121
98
58
25
6,888
3,611
7,586
'162
288
251
223
3,687
393
426
242
184
2,868
1,5Z1.
1,347
c 216
15,087
19
127
14,941
14,906
14,242
5,289
2,969
5,984
664
253
237
174
I 8 9 10 11
5,885 224,959 156,620 141,547 101,167
1,989
3,896
2'1'1
3,619
272
15
30
15
15
227
1.23
104
183
703
77
32
594
3,941
3,843
1,599
642
1,602
98
35
14
49
6,242
548
720
102
618
6,243
754
596
132
464
6,112 5,325
757
424
102
322
54'
~95
101
388
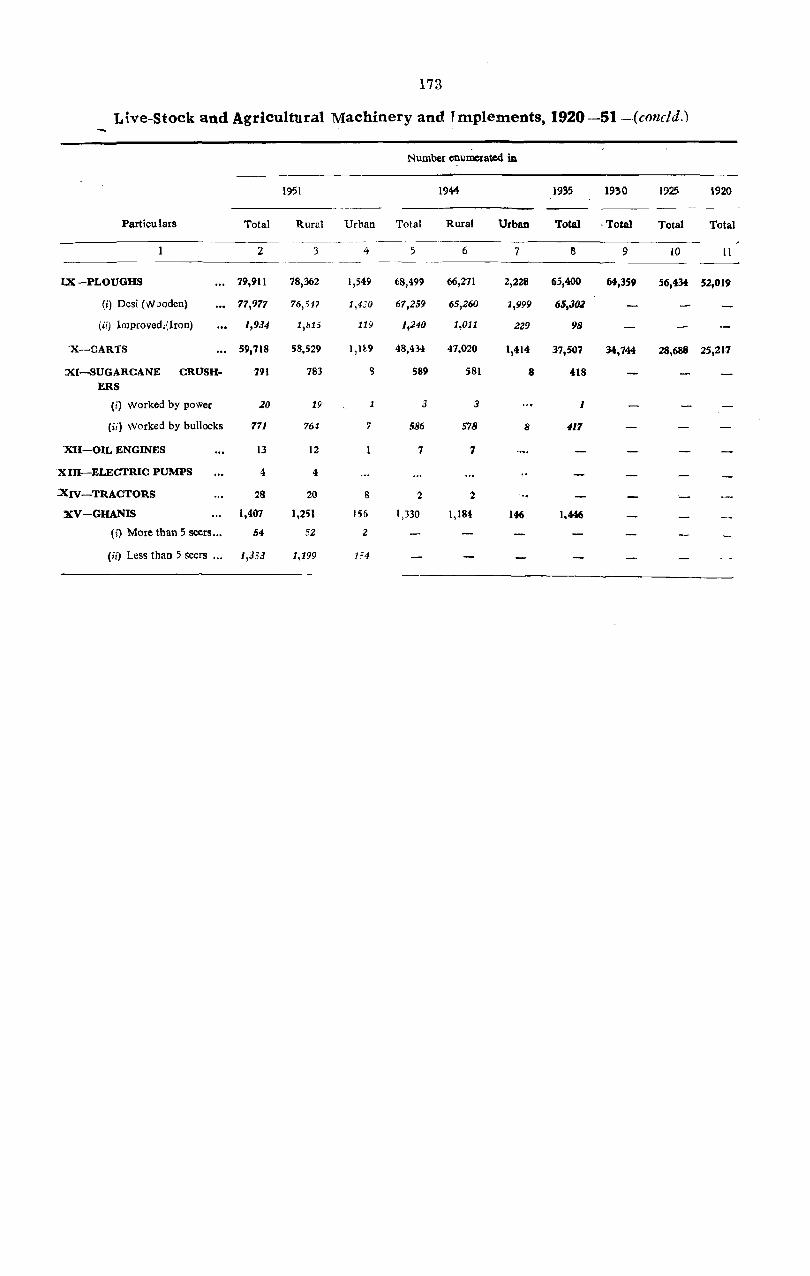
173
Ltve-Stock and Agricultural Machinery and' mplements, 1920-51--(conc/d.)
Number enll1DClatcd in
1951 19# 19'5 1930 1925 1920
-----Particu tars Total Rural Urban Total Rural Urban Total -Total Total Total
2 3 4 5 6 7 S 9 10 11 _-------
LX-PLOUGHS 79,911 78,362 1,549 68,499 66,271 2,228 65,400 64,359 56,434 52,019
(i) Desi (Wooden) 77,917 76,547 1,430 67,259 65,260 1,999 65,302
(iiJ Improved,{Iron) 1,934 1,815 119 1,240 1,011 229 98
-X-CARTS 59,718 58.529 1,1i9 48.4H 47,020 1,414 37,507 34,744 28,688 25,217
XI-SUGARCANE CRUSH- 791 783 S 589 581 8 418 ERS
(i) Worked by power 20 19 3 3 1
(ii) Worked by bullocks 711 764 7 586 5'18 8 411
XII-OIL ENGINES 13 12 7 7
XIII-ELECTRIC PUMPS .. .. :XIV-TRACTORS 28 20 8 2 2
XV-GUANIS 1,407 1,251 156 1,330 1,184 146 1.446
(i) More than 5 seers ... 54 52 2
(iij Less than 5 seers ... 1,353 1,199 1."4
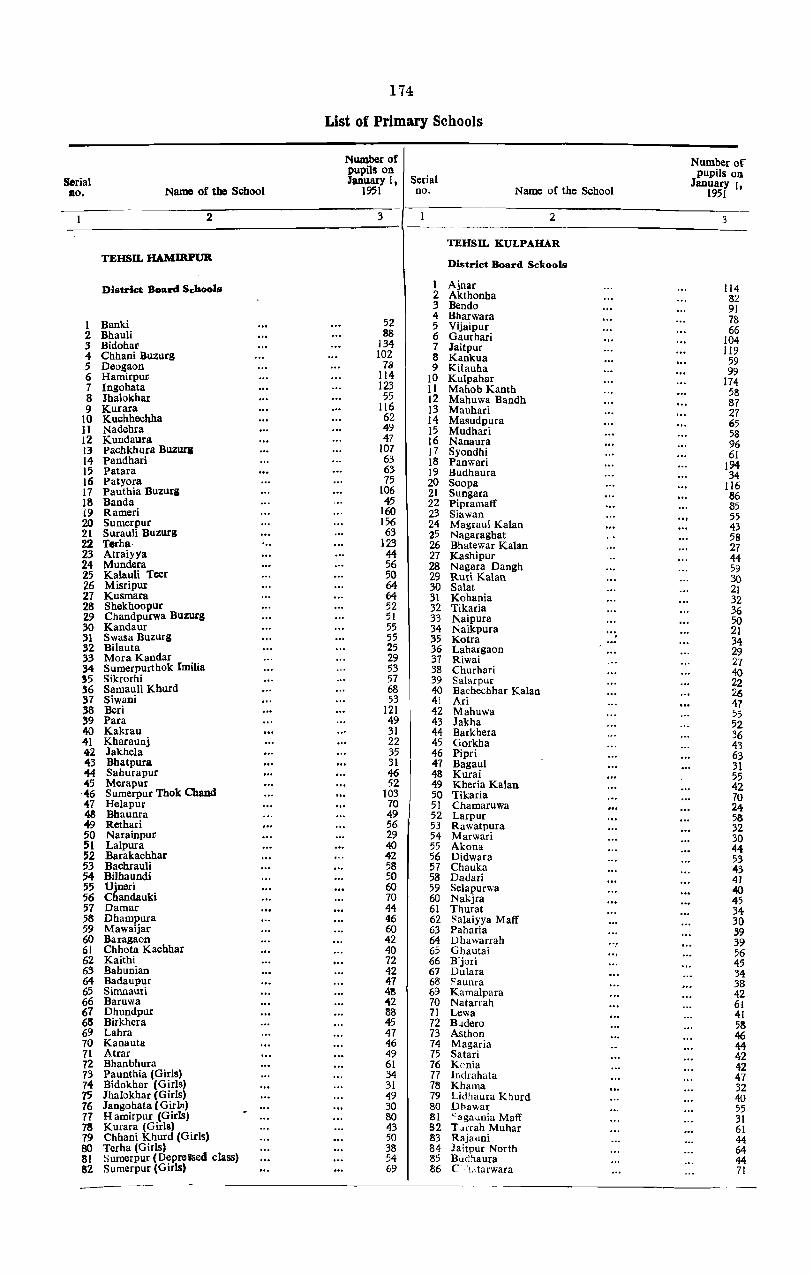
174
List of Primary Schools
Nwnber of Number of" pupils on
Serial pupils on
Serial January I, January I, no. Name of tho School 1951 no. Name of the School 1951
2 3 2 3
TEHSIL KULPAHAR TEHSIL HAMIRPUR District Board Scltools
District Board Schools I Ajnar 114 2 Akthonha 82 3 Bendo 91
52 4 Bharwara 78 I Banki 5 Vijaipur 66 2 Bhauli 88 6 Gaurhari 104 3 BidohaF 134 7 Jaitpur 119 4 Chhani Buzurg 102 S Kankua 59 5 Deogaon 78 9 Kilaulla 99 6 Hamirpuf 114 10 Kulpahar 174 7 Ingohata 123 II Mahob Kanth 58 8 lhalokhar 55 12 Mahuwa Bandh 87 9 Kurara 116 13 Mauhari 27 10 Kuchhechha 62 14 Masudpura 65
11 Nadehra 49 15 Mudhari 58 12 Kundaura 47 16 Nanaura 96 13 Pachkhura Buzuri 107 17 Syondhi 61 14 pandhaIi 63 18 Panwari 194 15 Patara 6} 19 Budhaura 34 16 Patyora 75 20 Soopa 116 17 Pauthia Buzurg 106 21 Sungara 86 18 Banda 45 22 Pipramaff 85 i9 Rameri 160 23 Siawan 55 20 Sumerpur 156 24 Magraul Kalan 43 21 Surauli Buzurg 63 25 Nagaraghat 58 22 Terha· ' .. 123 26 Bhatewar Kalan 27 23 Atraiyya 44 27 Kashipur 44 24 Mundera 56 28 Nagara Dangh 59 25 Kalauli Teer 50 29 Ruri Kalan 30 26 Misripur 64 30 Salat 21 27 Kusmara 64 31 Kohania 32 28 Shekhoopur 52 32 Tikaria 36 29 Chandpurwa Buzurg 51 33 Naipura 50 3O Kandaur 55 34 Naikpura 21 31 Swasa Buzurg 55 35 Kotra .
34 32 Bilauta 25 36 Lahargaon 29 33 Mora Kandar 29 37 Riwai 27 34 Sumerpurthok Imilia 53 38 Churhari 40 '5 Sikrorhi 57 39 Salarpur 22 36 Samauli Khurd 68 40 Bachechhar Kalan 26 37 Siwani 53 41 Ari 47 38 Deri 121 42 Mahuwa 55 39 Para 49 43 Jakha 52 40 Kakrau 31 44 Barkhera 36 41 Kharaunj 22 45 Gorkha 43 42 Jakhela 35 46 Pipri 63 43 Bhatpura 31 47 Bagaul 31 44 Sahurapur 46 48 Kurai 55 45 Merapur 52 49 Kheria Kalan 42 46 Sumerpur Thok Chand 103 50 Tikaria 70 47 Helapur 70 51 Chamaruwa 24 48 Bhaunra 49 52 Larpur 58 49 Rethari 56 53 Rawatpura 32 50 Narainpuxr 29 54 Marwari 30 51 Lalpura 40 55 Akona 44 52 Barakachhaxr 42 56 Didwara 53 53 Bachrauli 58 57 Chauka 43 54 Bi1haundi 50 58 Dadari 41 55 Ujneci 60 59 Selapurwa 40 56 Chandauki 70 60 Nakjra 45 57 Damar 44 61 Thurat 34 58 Dhampura 46 62 ~alaiyya Maff 30 59 Mawaijar 60 63 Paharia 39 60 Baragaon 42 64 Dhawarrah 39 61 Chhota Kachhar 40 65 Ghautai 56 62 Kaithi 72 66 Bijori 45 63 Bahunian 42 67 Dulara 34 64 Badaupur 47 68 !'aunra 38 65 Simnauri 4~ 69 Kamalpara 42 66 Baruwa 42 70 Natarrah 61 67 Dhundpur 88 71 Lewa 41 68 Birkhera 45 72 Budero 58 69 Lahra 47 73 Asthon 46 70 Kanauta 46 74 Magaria 44 71 Atrar 49 75 Satari 42 72 Bbanbhura 61 76 Krnia 42 73 Paunthia (Girls) 34 77 Indrahata 47 74 Bidokhar (Girls) 31 78 Khama 32 75 Jhalokhar (Girls) 49 79 Lidhaura Khurd 40 76 Jangohata (Girln) 30 80 Dhawar 55 77 Hamirpur (Girls) 80 81 "agaunia Maff 31 78 Kurara (Girls) 43 82 TMrah Muhar 61 79 Chhani Khurd (Girls) 50 83 Rajauni 44 80 Terha (Girls) 38 84 Jaitpur North 64 81 Surnerpur (Depressed class) 54 85 Buohaura 44 82 Sumerpur (Girls) 69 86 C'l;,!arwara 71

175
List of Primary Schools-( contd.)
Number of Number of pupils on pupils OB
Serial January I, Serial January I, no. Name of the School' 1951 no. Name of the School ' 1951
2 3 2 3 .---------
TEHSIL KULPAHAR-(concld.) 58 Mahoba (Depressed class) 64 59 Shrinagar (Depressed class) 56
District Board Schools-(concld.) 60 Mahoba (Islamia) 66 61 Bilgaon 21
87 Byarja 41 62 Srinagar (Girls) 63 88 Richha 44 63 Mahoba Khas (Girls) 64 89 Teia 51 90 Kaithora 50 TEHSIL MAUDAHA 91 Bhagri 36 92 Segaun 45 District Board Schools 93 Karhara Khurd 61 94 Kunata 35 1 Artara 127 95 Kulpahar West 22 2 Basw .. ri 92 96 Rikhwah 33 3 Binwar 127 97 Lamaura 37 4 Bhensamari 61 98 Tala Soyam 28 5 Beharka 47 99 Bagwaha 66 6 Bihooni Khu£d 93
100 Luhendi 61 '7 Gahrauli 162 , 101 Kulpahar (Girls) 92 S Ichauli 55 102 Mudhari (Girls) 28 9 Imilia 86 103 Ajnar (Girls) 41 10 Khaudehi Lodhan 62 104 Jaitpur (Girls) 50 11 Khaudeh 101 105 Panwari (Girls) 36 12 Khanna 69 106 Mahuwa Bandh (Girls) 26 13 Kharela Old 124 107 Kohania (Girls) 8 14 Lodhiour Niwada 39 108 Sungra (Girls) 49 15 Maudaha S7 109 Nanaura (Girls) 41 16 Maudaha Thok Hussainia 79 llO Akthonha (Girls) 26 17 Mawai Khurd 70
18 Muskara 150 TEHSIL MAHOBA 19 Mutni 47
20 Naraich 53 District Board Schools 21 Pahori Bhithari '98
22 Patanpur 50 1 Bhandra 65 23 Rewan ' 84 2 Chhikahra 51 24 Sayar 56 3 Gahra 69 25 Sisolar 91 4 Geyondi 94 26 Umari ~82 5 Kabrai 76 27 rlaudhar Khurd 64 6 Mahoba Khas 205 25 Kiswahi 52 7 Mahoba City 160 29 Gusiyari i~ 3 Mahoba Station 62 30 Bhaubhai :51 9 Makarbai 62 31 Parchhach 60
10 Paswara 41 32 Rewai 43 11 Pawa 57 33 Chlchara 60 12 Sijhari 61 34 Kharela New 71') 13 Shrinagar 122 35 Musgaon 50 14 Surha 60 36 Karhaiyya 81 15 Ganj 52 37 Kahra 69 16 Pabra 59 38 BhuIsi 32 17 Sukaura 43 39 Gaundela 47 IS Sa]arpur 44 40 Laraund 35 19 Atrar 26 41 Barda 35 20 Bilbai 62 42 Baudhar Buzurg 31 21 Sijwaha 21 43 Gurha 39 22 Karhra Kalan 37 44 Baijmau 43 23 Mahewa 26 45 Sirsi Kalan 60 24 Singhapur Baghari 20 46 Barbhauli 36 25 Bhatewar 23 47 Pipraunda 51 26 Chhani Kalan 59 48 Barbai 40 27 Barat Pahari 25 49 Tikri Buzurg 52 28 Puca 20 50 Ncwria 39 29 Kharka 38 51 Ruri Para 62 30 Baniya Tala 49 52 Tolamalf 25 31 Kaimaha 43 53 Padhori 80 32 Dal'hat 52 54 Gurdaha 35 33 Bilrahi 70 55 Bhamani 44 34 Urwara 48 56 Bahinga 42 35 Bara 29 57 Kunetha 56 36 Dharaun 56 58 Bamhaura 30 37 Digaria 42 59 MakraOll 35 38 Shah Pahari 38 60 Lewa 59 39 Raiwara 26 61 Garha 27 40 Bilkhi 29 62 Mahera 63 41 Daharra 19 63 Teehar 47 42 Baghwa 53 64 Bhaturi 45 43 Baweri 38 65 Chandi Kalan 48 44 Untian 36 66 Basauth 39 45 Kali Pahari 54 67 <;:jwahi 25 46 Mirtala 24 68 Si,~hauli 35 47 Kidari 24 69 Bcjetha 66 48 Sichaura 33 70 <:ijnaura 43 49 Ratauli 32 7 Madarpur 35 50 Mamna 25 72 Chhani Bakchha 60 51 Jujhar 48 73 Hussaina 45 52 Damaura 37 74 Silauli 44 53 Pachpahara 42 75 Kandhauli 51 54 Makarbai (Girls) 20 76 Machha 31 55 Urwara (Girls) 48 77 Atghar 35 56 Goendi (Girls) 51 78 Punnia 43 57 Pahra (Girls) 23 79 Bigahna 30
-~-------
----~--

Serial no. NalDO of tho School
2
TEHSIL M.\UDAHA-(eoncl •. )
District Board Schools-(Clncli.)
SO Chilli Purwa 81 Kargaon 82 Sirsi Khurd 53 Kul Kunwa "\ 84 Para Ladar 85 Dhawari 136 Akhbai 137 Binwar (Girls) 88 Muskara (Girls) 89 Gahrauli (Girls) 90 Amilia (Girls) 91 Bihooni Khurd (Girls) 92 Sisolar (Girls) 93 Patanpur (Girls) 94 Sayar (Girls) 9' Artara (Girls) 96 Lodhipur Niwada (Girls) 97 Kharcla (Girls) 9S Muskara (Depressed class) 99 Binwar (Depressed class)
100 Maudaha (lsmlamia) 101 Kamharia (Islamia)
TEHSIL RATH District Board Sclaool.
1 Amund 2 Atrauli Dhaiwan !I Aunta .. Barhara 5 Bilgaon 6 Bilrakh 7 Chandaut 8 Dhamna 9 Dhagwan
10 Gohand 11 Is)ampur 12 Dhanauri 13 Itaura 14 Jarakhar 15 Jalalpur 16 Jaria 17 Kachhuwa Kalan 18 Kulenhda 19 Majhgawan :':0 Malehta 21 Mamna 22 Khera Shilajeet 23 Nahdaura 24 Nauranga 25 Puraini 26 Rahank 27 Rehunta 28 Rath Khas 29 Ra.h South 30 Saidpur 31 Tola Rawat 32 Chilli 33 Syawari 34 Magrauth 35 Bira 36 Dhaulal Buzuri 37 Itailia 38 Sarsai 39 Kupra 40 Tola Khaugarau 41 Akona 42 Qundera 43 Daudon 44 Bargawan 45 Kariyari· 46 Pach Khura 47 Amarpura 48 Bungra 49 Italia 50· Sarila 51 Jigni 52 Chikasi 53 Kuchhechha 54 Karondi 55 Parchha 56 Chhibauli 57 Muskara Khurd 58 Bara Kharka 59 Basrehi 60 Gohani Panwari 61 Amgaon 62 Pahra
176
List of Primary Schools -( condl )
NumbcIOr pupils on January 1, Serial
1951 no.
Number of pupils on
January I, 1951
3
44 47 50 39 46 51 22 29 46 59 43 29 23 24 28 40 45 22 23 31 91 27
60 56
133 54 79 59 60 74 55
106 64 74 92
119 60 95 66 65 90 66 71
101 63 89 65 68 38
166 115 66 83 60 59 60 60 60
100 59 60 25 74 56 28 22 20 28 23 26 46
164 101 30 28 33 21 20 6() 28 29 32 35 74
Name of tbe School
----~---
63 Kaitha 64 Lodhipura 65 Hanundi 66 Bandhauli 67 Bakrai 68 Neoli Bansa 69 Barda 70 Sargaon 71 Bhainsayan 72 Jhinna Beera 73 Naudna 74 Umaria 75 Nauhai 76 Basela 77 Bangra 73 Kurrak 79 IChhaura 80 Anghaura 81 Rathnauri 82 Rawatpura 83 Khadra Khar 84 Jit Kiri 85 Harduwa 86 Athgaon 37 Bhendi as Bankhar 89 Path Khuri 90 lndrapura 91 Raurau 92 Lidhaura 93 Khalka Churha 94 Baruwa 95 Atra 96 Chandauli 97 Chand Wari 98 Reruwa Buzurg 99 Mawai
100 Uprahanka 101 Barauli 102 Masgawan 103 Kaithi 104 Baudawa' 105 Kargawan
2
106 Khera Shilajeet (Girls) 107 lara Khar (Girls) 108 Malehta (Girls) 109 Gohand (Girls) 110 Sarita (Girls) III ligni (Girls) 112 Quendera (Girls) r 13 Said pur (Girls) 114 Rehunta (Girls) 115 Bilgaon (Girls) 116 Majhagawan (Girls) 117 Dhamna (Girls) 118 Dhauhal Buzurg (Girls) 119 Puraini (Girls) 120 Rath (Depressed class) 121 Majhagawan (Depressed class) 122 Rath (lslamia)
Municipal Board Schools
123 Achhut 124 IsIamia 125 Dakhin 126 Kha!'. 127 Maktab Nisva (Girls) 128 Chandsaria (Girls) 129 Magrauth (Girls) 130 Rath Proper (Girls)
TEHSIL CHARKHARI
District Board Schools
3
49 42 63 31 72 40 51 24 50 60 61 81 65
103 23 57 48 91 i4 47 18 31 50 68 59 38 52 57 26 47 3~1
46 3, ~8 33 30 35 5-1. ~
42 33 ,1 45 36 30 42 20 37 39 31 25 26 IS 23 40 32 29 21 36 1a 90
146 90
108 ISS 32 55 16 50
1 Jujharganj 53 2 Amar Ganj 100 3 Rayaupur 87 4R~ ~ 5 Bamhauri Kalan 60 6 Gurha 57 7 larauli 54 8 Kai<un 46 9· Bapretha 4l
10 Pahretha 36 11 Patha 24 \ 2. Bamrara 2.5 13 Parsaha 39 14 Kunwa ...... 62 15 D. C. S. Charkhari (Depressed cla~ '" 42 , • S. Charlchmi (Islainit) .. ';.: • _. '.~. -, ~~ 7()Gb(t.dchafi (6~1~ .' , ;' :~:~:; I" r o! ! n~J!~~