Participatory Rural Appraisal (PRA)
198
5SBJOJOH 1SPHSBN PO 1BSUJDJQBUPSZ 3VSBM "QQSBJTBM (13") BOE $PNNVOJDBUJPO 4USBUFHJFT JODMVEJOH *OUFHSBUFE 8BUFSTIFE .BOBHFNFOU 26-29 4FQUFNCFS 2019 &Žƌ ƚŚĞ /&^ WƌŽďĂƟŽŶĞƌƐ ŽĨ ϮϬϭϴͲϮϬ BĂƚĐŚ͕ /'E&A͕ DĞŚƌĂĚƵŶ 1BSUJDJQBUPSZ 3VSBM "QQSBJTBM (13") (5PPMT & 5FDIOJRVFT) $PNQJMFE & &EJUFE CZ Bharat. S. Sontakki P.Venkatesan VKJ. Rao ,&$5-1$$50 +\GHUDEDG
-
Upload
khangminh22 -
Category
Documents
-
view
0 -
download
0
Transcript of Participatory Rural Appraisal (PRA)
5SBJOJOH 1SPHSBN PO
1BSUJDJQBUPSZ 3VSBM "QQSBJTBM (13") BOE $PNNVOJDBUJPO 4USBUFHJFT JODMVEJOH *OUFHSBUFE 8BUFSTIFE .BOBHFNFOU 26-29 4FQUFNCFS 2019
&Žƌ ƚŚĞ /&^ WƌŽďĂƟŽŶĞƌƐ ŽĨ ϮϬϭϴͲϮϬ BĂƚĐŚ͕ /'E&A͕ DĞŚƌĂĚƵŶ
1BSUJDJQBUPSZ 3VSBM "QQSBJTBM (13") (5PPMT & 5FDIOJRVFT)
$PNQJMFE & &EJUFE CZ
Bharat. S. Sontakki P. Venkatesan
VKJ. Rao
,&$5-1$$50 +\GHUDEDG

i
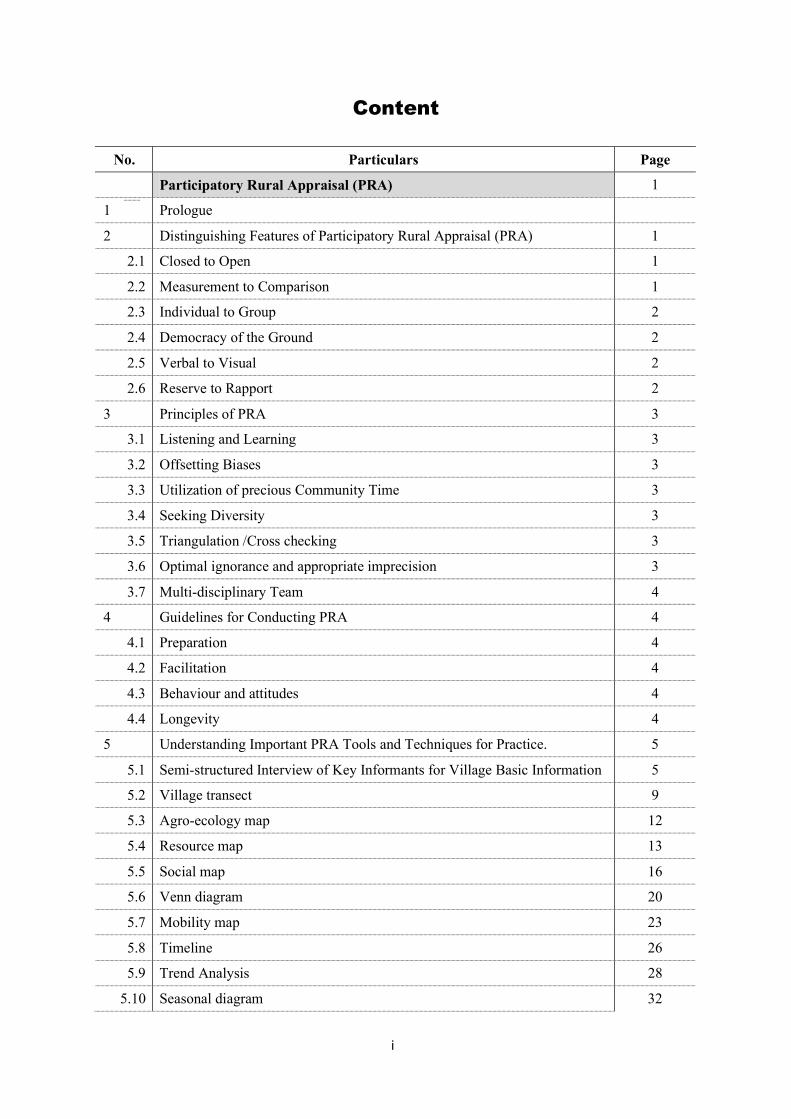
Content
No. Particulars Page
Participatory Rural Appraisal (PRA) 1
1 Prologue
2 Distinguishing Features of Participatory Rural Appraisal (PRA) 1
2.1 Closed to Open 1
2.2 Measurement to Comparison 1
2.3 Individual to Group 2
2.4 Democracy of the Ground 2
2.5 Verbal to Visual 2
2.6 Reserve to Rapport 2
3 Principles of PRA 3
3.1 Listening and Learning 3
3.2 Offsetting Biases 3
3.3 Utilization of precious Community Time 3
3.4 Seeking Diversity 3
3.5 Triangulation /Cross checking 3
3.6 Optimal ignorance and appropriate imprecision 3
3.7 Multi-disciplinary Team 4
4 Guidelines for Conducting PRA 4
4.1 Preparation 4
4.2 Facilitation 4
4.3 Behaviour and attitudes 4
4.4 Longevity 4
5 Understanding Important PRA Tools and Techniques for Practice. 5
5.1 Semi-structured Interview of Key Informants for Village Basic Information 5
5.2 Village transect 9
5.3 Agro-ecology map 12
5.4 Resource map 13
5.5 Social map 16
5.6 Venn diagram 20
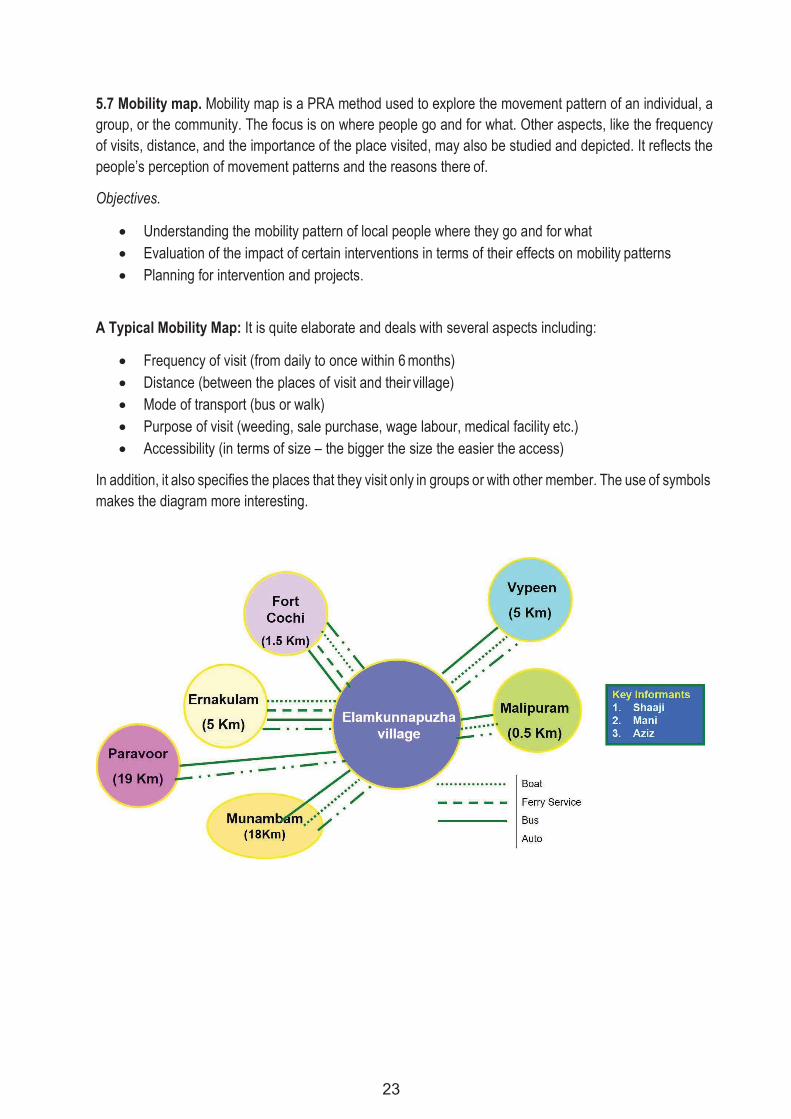
5.7 Mobility map 23
5.8 Timeline 26
5.9 Trend Analysis 28
5.10 Seasonal diagram 32
ii
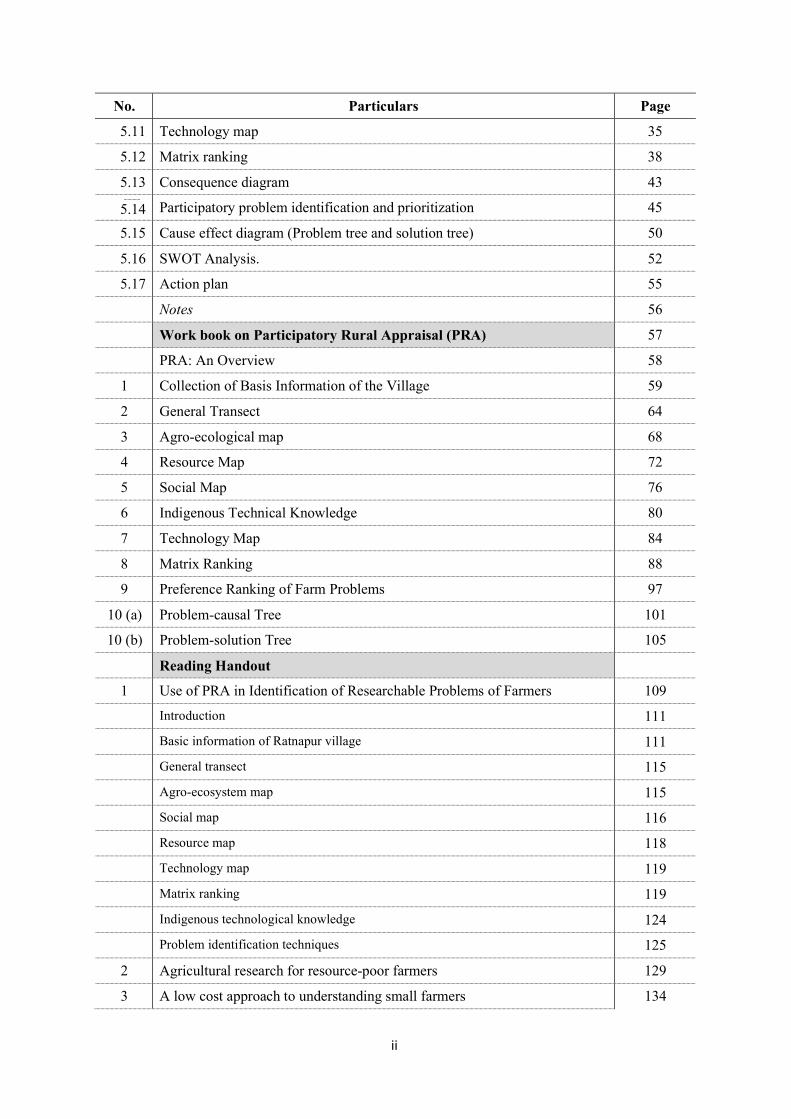
No. Particulars Page
5.11 Technology map 35
5.12 Matrix ranking 38
5.13 Consequence diagram 43
5.14 Participatory problem identification and prioritization 45
5.15 Cause effect diagram (Problem tree and solution tree) 50
5.16 SWOT Analysis. 52
5.17 Action plan 55
Notes 56
Work book on Participatory Rural Appraisal (PRA) 57
PRA: An Overview 58
1 Collection of Basis Information of the Village 59
2 General Transect 64
3 Agro-ecological map 68
4 Resource Map 72
5 Social Map 76
6 Indigenous Technical Knowledge 80
7 Technology Map 84
8 Matrix Ranking 88
9 Preference Ranking of Farm Problems 97
10 (a) Problem-causal Tree 101
10 (b) Problem-solution Tree 105
Reading Handout
1 Use of PRA in Identification of Researchable Problems of Farmers 109
Introduction 111
Basic information of Ratnapur village 111
General transect 115
Agro-ecosystem map 115
Social map 116
Resource map 118
Technology map 119
Matrix ranking 119
Indigenous technological knowledge 124
Problem identification techniques 125
2 Agricultural research for resource-poor farmers 129
3 A low cost approach to understanding small farmers 134
iii
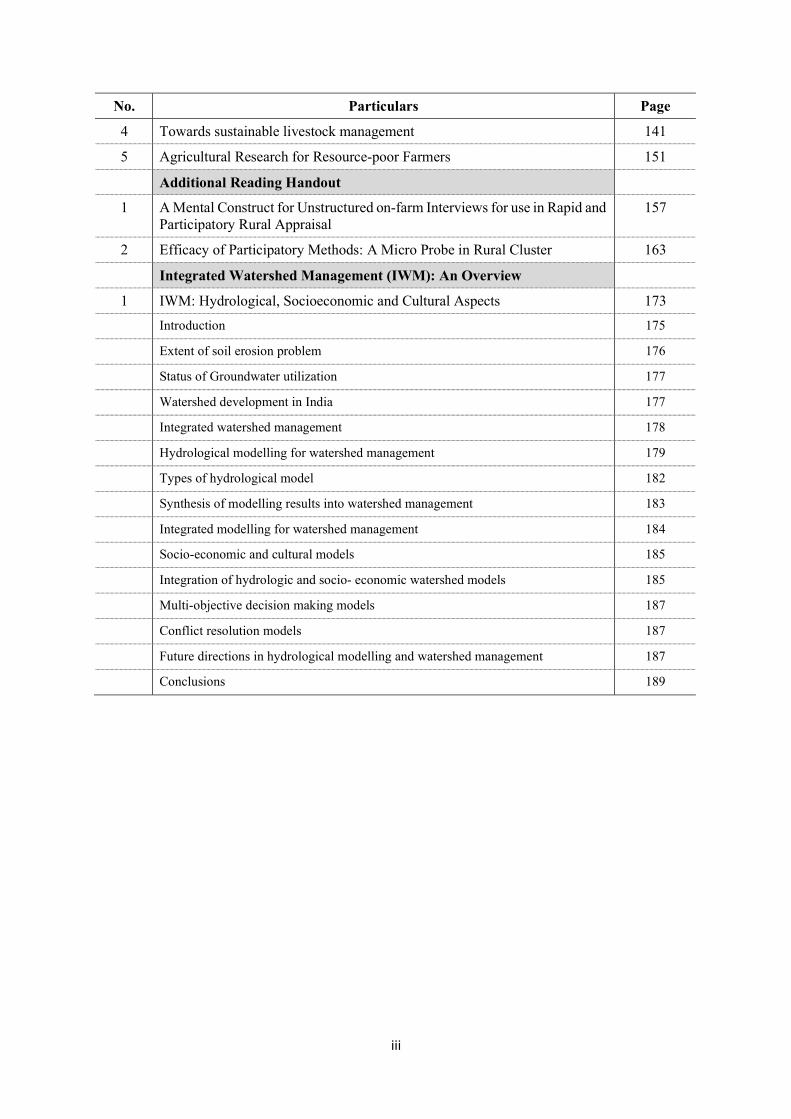
No. Particulars Page
4 Towards sustainable livestock management 141
5 Agricultural Research for Resource-poor Farmers 151
Additional Reading Handout
1 A Mental Construct for Unstructured on-farm Interviews for use in Rapid and Participatory Rural Appraisal
157
2 Efficacy of Participatory Methods: A Micro Probe in Rural Cluster 163
Integrated Watershed Management (IWM): An Overview
1 IWM: Hydrological, Socioeconomic and Cultural Aspects 173
Introduction 175
Extent of soil erosion problem 176
Status of Groundwater utilization 177
Watershed development in India 177
Integrated watershed management 178
Hydrological modelling for watershed management 179
Types of hydrological model 182
Synthesis of modelling results into watershed management 183
Integrated modelling for watershed management 184
Socio-economic and cultural models 185
Integration of hydrologic and socio- economic watershed models 185
Multi-objective decision making models 187
Conflict resolution models 187
Future directions in hydrological modelling and watershed management 187
Conclusions 189

iv
1
Participatory Rural Appraisal (PRA) - An Overview
1. Prologue.
The word “appraisal” in PRA has a much broader connotation than its dictionary meanings as “estimation of the value of asset/goods” or “an act of estimation/assessment of nature, quality and importance of asset”. Once a project is identified, a preliminary assessment is followed by the technical appraisal of the concerned project. The stage of appraisal precedes that of planning and design and is normally done by technical experts. The experts calculate the internal rate of return (IRR) of a project to determine whether the project would achieve some minimum acceptable IRR on the resources invested. Now dimensions of conventional project appraisal include gender analysis, social impact assessment and environmental impact assessment as done by experts. They might choose to consult different groups of people associated with the resource-flows, the final decision- making will, however, be with such experts.
Internationally this is often referred to as Participatory Rural Appraisal, abbreviated “PRA”. It is a further evolutionary stage of the RRA approach. In it, emphasis is placed on empowering local people to assume an active role in analyzing problems and drawing up plans, with outsiders mainly acting as “facilitators”. Here it is no longer the external experts but rather the local people themselves who “own” the results of the study. This enables them to assume responsibility for implementing the activities based on them. PRA methods are successful within the scope of programs that support participatory development cooperation, e.g. approaches as “participatory technology development”, farmer back to farmer/farmer experimenter networks” “participatory action research”.
PRA is a way of enabling local (rural and urban) people to analyze their living conditions, to share the outcomes and to plan their activities. It’s a “handing over the stick to the insider” in methods and action. The outsider’s role is that of a catalyzer, a facilitator and convenor of processes within a community, which is prepared to alter their situation
2. Distinguishing Features of Participatory Rural Appraisal (PRA).
PRA is the result of a response to overcome the limitations of ‘top-down’ approach to development, the pitfalls of the questionnaire survey method of inquiry, and the problem of biases. There have thus been major shifts and reversals in PRA including:
2.1 Closed to Open. The major shift in PRA is from a closed system to an open system (of methods, behaviour, and processes), enabling it to capture the realities of the people. It enables outsiders to get the emic, i.e., internal perspective, rather than the dominant etic, i.e., outsider’s perspective. In questionnaires, the repose of the basis of preset questions that reflect the outsiders’ understanding. But in PRA, the people determine what goes into a diagram, figure, or calendar. In a matrix, for instance, the local people to do not just score but also determine the items to be judged as well as the criteria on which to judge. There is a conscious attempt in PRA to encourage and enable the people to involve themselves in and control such processes. Thus, one of the major strengths of PRA is the shift from a predetermined and closed approach to a participatory and open approach.
2.2. Measurement to Comparison. Traditionally, in the top-down approach to development and the questionnaire method of inquiry, the emphasis has been on absolute measurement. PRA marks a major shift in emphasis from measurement to comparison. Comparison is easier, faster, cheaper, and less sensitive than measurement. All this makes the participation of people easier. Trends and changes are captured easily and quickly even where baseline data are not available.
2
2.3. Individual to Group. In both the top-down approach to development and the questionnaire method of inquiry, the basic element of interface between outsiders and the people is the individual respondent. In PRA, it is group work; transect, maps, calendars, matrices, scoring, ranking, etc., are all done by a group of people. If it is true that semi- structured interviews take place with individuals, but the focus is on working with groups. Because PRA is a group activity even sensitive topics can be covered better than in one-to-one interactions. The group interaction provides greater and more in-depth information and analysis in a much shorter time than the members could do individually in the same span of time in the non-participatory approaches.
2.4. Democracy of the Ground. Another shift in PRA is from tables and paper to the ground. This has many advantages. The use of the ground means that more people can participate in parallel as equals. Use of the ground also has an anti-elite bias which allows the not so literate and not so articulate to participate actively along with the elite and the literate. The elite among the local people find working on the ground. Uncomfortable and, in certain areas, beneath their dignity. The problem with paper is that those who are not very familiar with the use of paper and pen feel inhibited. Making modifications on items and exercises done on paper become difficult. There is strong tendency among people to carry on with mistakes to avoid making the map all over again. While on the ground with chalk, sand, soil, etc., alterations can be carried out easily whenever there is a need without much effort.
2.5. Verbal to Visual. Most PRA methods like participatory diagramming rely more on visuals and symbols, in comparison to questionnaire surveys and semi-structured interviews, which rely on verbal communication. The use of visuals has many advantages. The non-literate and not so articulate persons are able to use the visuals as a medium in which to express their priorities and realities. In drawing or making the visuals, the inhibitions are lost and the participants express themselves more openly. The making of the visuals allows the local people to think through the process and come out with points that they are not consciously aware of but realize as the process goes on. Visualization also helps the participants to see and understand the inter connections between various issues, which in other modes of interaction, is missing. When social mapping is done, for instance, once the purpose is explained and the process initiated, the participants get involved in the process. More than one person can be involved in doing the visual at the same time but in a verbal mode only one person can speak at a time. It is important to note that though the use of visuals and symbols are characteristic of PRA, the verbal mode still plays an important role in it. The verbal mode also supplements the visualization process. Generally, the outputs and diagrams are interviewed. This helps the outside facilitators as well as the local people to clarify various aspects related to the issue under study.
2.6. Reserve to Rapport. An important reversal in PRA is from reserve to rapport. Good rapport is characteristic of all well facilitated PRA. Hence PRA lays a emphasis on rapport with the local people. The initial interactions with the local people are focused on rapport building and the shift is from reserve to rapport. While the questionnaire and other traditional methods of inquiry lead to boredom among the respondents as well as the researchers, PRA tends to increase the level of their involvement.
Town live come to light, about which they were previously unaware. The use of local materials adds scope for articulating and expressing their realities in their own creative ways. It is quite common that the local people, despite their busy schedules, hand on for hours while the exercise is carried out. While the researchers using questionnaires get bored, the PRA facilitators find fieldwork exhilarating. Each experience is different and full of learning and fun.
Though there are critics who do not think that rapport can be built so fast, practical experience has shown that sincere and open behaviour on the part of facilitators and good facilitation skills and use of participatory methods actually help develop rapport quickly.
3
3. Principles of PRA.
The principles of PRA have evolved over time. Interestingly, new principles are still being added to the list. What distinguishes these principles is that these are induced rather than deduced, and based on practice and experience of what works and what does not work. Chambers (1997) has listed the following principles.
3.1. Listening and Learning. PRA is based on the principle of listening and learning through participatory interactions and learning progressively. The local people have their knowledge, their experience, their history and culture, their views and ideas and their priorities and preferences. Listening to local people helps in portraying their “worldview”, which otherwise remains latent and not revealed. The greater the interaction with otherwise remains capacity of a listener rather than a speaker, the greater is the learning achieved. Such learning can increase progressively. Proper learning can take place with appropriate mental and physical setup of a learner. If a learner wishes to learn, then, it is important to be mentally prepared to listen, learn and show respect towards those from whom such learning can take place.
3.2. Offsetting Biases. PRA aims at offsetting biases, which generally accompany a “rushed” appraisal by professionals for quick results. Professionals tend to appraise samples at convenient times when the weather is favourable; consult would-be-beneficiaries (mostly men) who are generally better off; and professionally tend to look at those aspects which they think are important. In order to offset such biases, PRA, encourages relaxed listening and learning, seeking participation from people who are relatively worse off, visiting remote and interior locations and visiting local communities at their convenience. This process should try to have involvement-of those who would otherwise never get a chance to speak, here may be some initial hesitation, but the local people start enjoying it as new facts about their, the poorest people, women, disadvantaged groups in remote areas etc. still important is that the team must refrain from any value judgment about others.
3.3. Utilization of precious Community Time. About learning from local people, PRA is based on the principle of utilizing precious community time in the best possible way. Local community members are busy in pursing local livelihoods and it is important to keep track of their time and learn as much as time permits. This also implies that community members are requested to spare their time for interaction at their convenient time. The learning should also be focused so as to make proper utilization of such time.
3.4. Seeking Diversity. PRA involves learning from diverse conditions and different actors. It consults with more of difference rather than looking for representativeness of results or data collected. It is looking for diverse events, different processes and forces, which help in understanding of issues from different perspectives. For any analysis, greater the diversity, betters is the understanding of “reality”.
3.5. Triangulation /Cross checking. Triangulation is adopted as a principle to improve trust worthiness of data. It will be done by changing the team composition, the sources of information and the techniques applied. There is need that each activity or phenomenon is considered from different viewpoints and studied using different techniques. The process of cross-checking is an important principle of PRA for minimizing errors and doing mid-way corrections. Since there are different sources from which information can flow it is important to cross-check the reliability and validity of the data by putting it to different tests. There exists different ways to check the validity of the data in PRA such as changing methods, locations, timing, groups, teams, etc.,
3.6. Optimal ignorance and appropriate imprecision. In order to minimize cost and time, the principle of optimal ignorance is a handy principle for PRA facilitators to keep in mind. It means knowing what is worth-knowing and knowing enough to serve the purpose and not knowing the rest or not trying to find out more. Associated with this is
4
seeking appropriate imprecision or avoiding precision of information that is not necessary. These principles of PRA help in making learning iterative, in facilitating participatory sessions, in making such processes interactive, innovative and informational and in making effective use of time.
3.7. Multi-disciplinary Team. The scientific team conducting PRA must have fairly broad base, meaning thereby inclusion of scientists of all important disciplines relevant to the area of study. It is also important to have female scientists in the team so that rural women could be effectively involved in the appraisal exercise. The team should identify among themselves one member who should work as Team Leader/Facilitator. Another member should be identified to work as Process Recorder or Content Recorder. While interacting with the villagers he/she should not jump directly to the objective of the study but first develop rapport with them. The responsibility of rapport building may be assigned to one member of the team who could work as Environment Controller.
4. Guidelines for Conducting PRA.
4.1. Preparation. Preparation is undertaken prior to the surveys to ensure that all available secondary data on the locality and subject has been reviewed, allowing suitable villages to be identified to capture a broad sample, before surveying commences. It is also sensible to enlist the help of external collaborators, preferably with detailed knowledge of the locality, and bearing no prejudice or hierarchical position.
4.2. Facilitation. The external professional displays good facilitation skills, which aims to enable local people to undertake some or all of the investigation, mapping, modelling, diagramming, ranking, scoring, quantification, analysis, presentation and planning themselves. Analysis is then shared with outsiders, but the information stays with the people who generated it. In order to capture all that is to be observed and recorded during a PRA, it is recommended that a minimum of two external facilitators (sometimes three depending on the method used) are employed. This will allow information to be recorded in detail, whilst a facilitator observes the interaction between participants. It is also useful to generate some feedback from the villagers surveyed on design methods employed.
4.3. Behaviour and attitudes. The behaviour and attitudes of external facilitators are of primary importance, more important than methods even. All-important attitudes include: critical self-awareness and embracing error, sitting down, listening and learning, not lecturing but allowing the villagers to be the main teachers and analysts. It means that outsiders must take time to reflect on how their role in community interactions change and what they must learn to do and to stop doing, if local people are to benefit from this.
4.4. Longevity. Participatory approaches are not substitutes for, but are rather an integral part of, long term dialogue and sustained interaction. A single, brief participatory exercise with a group of local people will not lead to positive and lasting change. PRAs are not a panacea to qualitative surveying. PRAs work most effectively where they are carried out over a sufficient length of time, with the facilitators living amongst the community under survey and absorbing themselves in community life. In this way, mutual respect will be gained, and less formal information can be extracted. In addition, the longer the survey, the greater and more representatives the sample will be.
------------------------------------------------------------------------------------------------------------------------------------------------------ ------------------------------------------------------------------------------------------------------------------------------------------------------ ------------------------------------------------------------------------------------------------------------------------------------------------------ ------------------------------------------------------------------------------------------------------------------------------------------------------ ------------------------------------------------------------------------------------------------------------------------------------------------------ ------------------------------------------------------------------------------------------------------------------------------------------------------ ------------------------------------------------------------------------------------------------------------------------------------------------------ ------------------------------------------------------------------------------------------------------------------------------------------------------
5
5. Understanding Important PRA Tools and Techniques for Practice.
PRA is a growing combination of approaches and methods that facilitate the sharing, cross-fertilization, analysis, evaluation and enhancement of livelihood experiences and life conditions among key actors or stakeholders within a specified setting. The following PRA tools are applicable to the process of capturing information relating to the key areas for investigation:
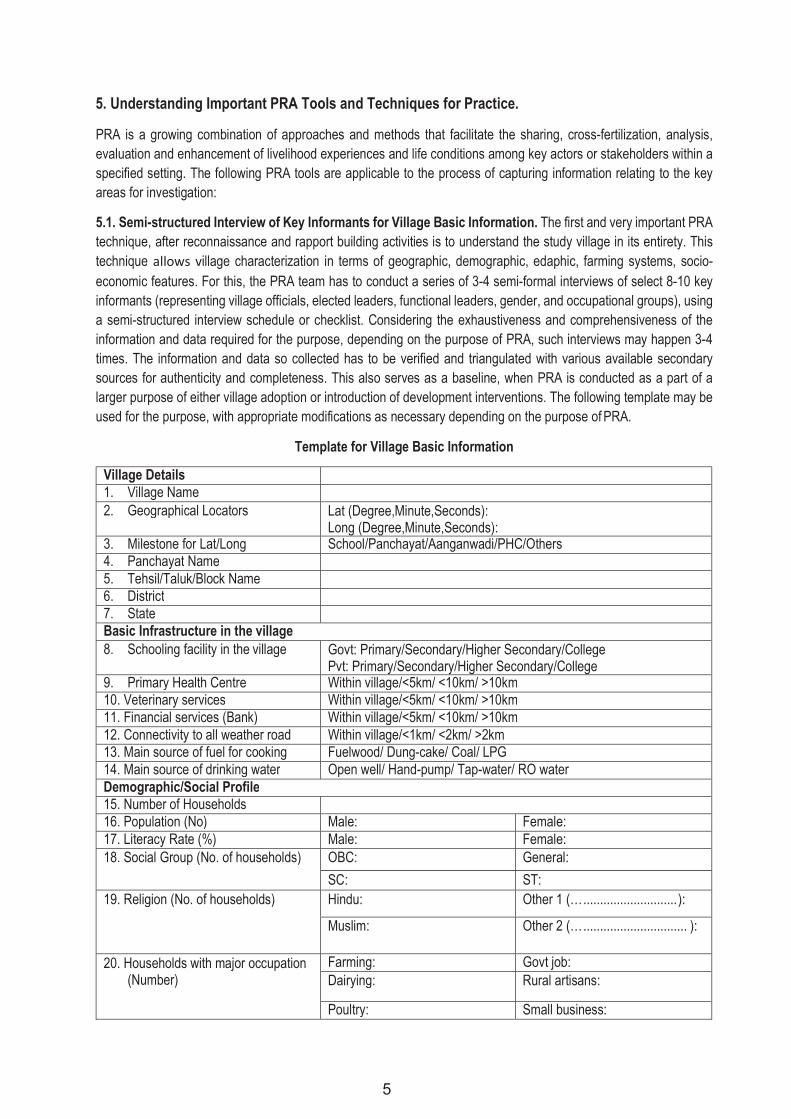
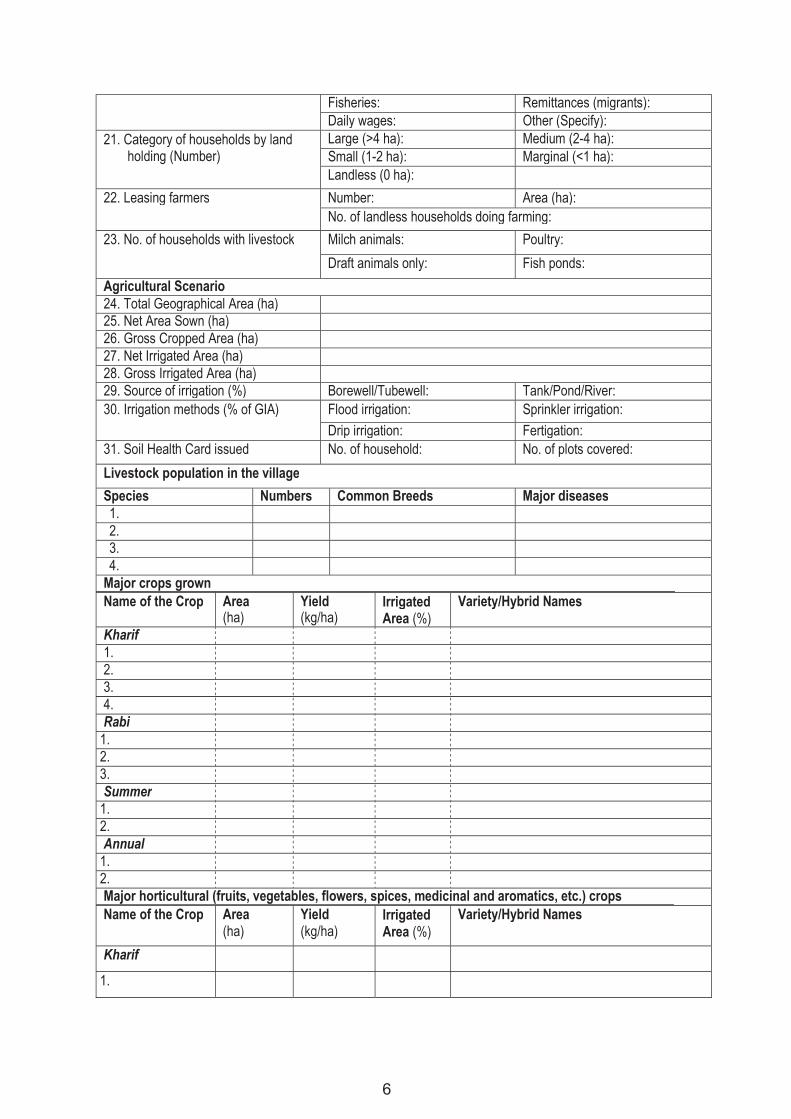
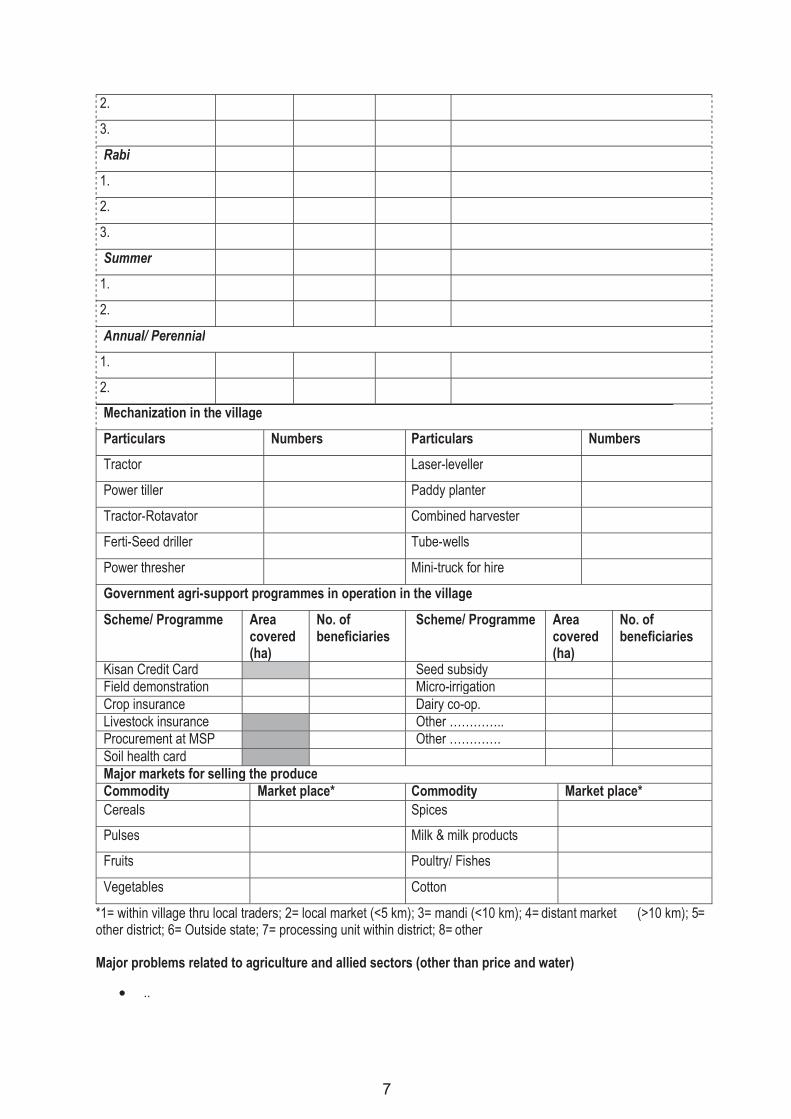
5.1. Semi-structured Interview of Key Informants for Village Basic Information. The first and very important PRA technique, after reconnaissance and rapport building activities is to understand the study village in its entirety. This technique allows village characterization in terms of geographic, demographic, edaphic, farming systems, socio- economic features. For this, the PRA team has to conduct a series of 3-4 semi-formal interviews of select 8-10 key informants (representing village officials, elected leaders, functional leaders, gender, and occupational groups), using a semi-structured interview schedule or checklist. Considering the exhaustiveness and comprehensiveness of the information and data required for the purpose, depending on the purpose of PRA, such interviews may happen 3-4 times. The information and data so collected has to be verified and triangulated with various available secondary sources for authenticity and completeness. This also serves as a baseline, when PRA is conducted as a part of a larger purpose of either village adoption or introduction of development interventions. The following template may be used for the purpose, with appropriate modifications as necessary depending on the purpose of PRA.
Template for Village Basic Information
Village Details
1. Village Name
2. Geographical Locators Lat (Degree,Minute,Seconds): Long (Degree,Minute,Seconds):
3. Milestone for Lat/Long School/Panchayat/Aanganwadi/PHC/Others 4. Panchayat Name
5. Tehsil/Taluk/Block Name
6. District
7. State
Basic Infrastructure in the village 8. Schooling facility in the village Govt: Primary/Secondary/Higher Secondary/College
Pvt: Primary/Secondary/Higher Secondary/College 9. Primary Health Centre Within village/<5km/ <10km/ >10km 10. Veterinary services Within village/<5km/ <10km/ >10km 11. Financial services (Bank) Within village/<5km/ <10km/ >10km 12. Connectivity to all weather road Within village/<1km/ <2km/ >2km 13. Main source of fuel for cooking Fuelwood/ Dung-cake/ Coal/ LPG 14. Main source of drinking water Open well/ Hand-pump/ Tap-water/ RO water Demographic/Social Profile 15. Number of Households
16. Population (No) Male: Female: 17. Literacy Rate (%) Male: Female: 18. Social Group (No. of households) OBC: General:
SC: ST: 19. Religion (No. of households) Hindu: Other 1 (… ............................ ):
Muslim: Other 2 (… ............................... ):
20. Households with major occupation (Number)
Farming: Govt job: Dairying: Rural artisans:
Poultry: Small business:
6
Fisheries: Remittances (migrants): Daily wages: Other (Specify):
21. Category of households by land holding (Number)
Large (>4 ha): Medium (2-4 ha): Small (1-2 ha): Marginal (<1 ha): Landless (0 ha):
22. Leasing farmers Number: Area (ha): No. of landless households doing farming:
23. No. of households with livestock Milch animals: Poultry:
Draft animals only: Fish ponds:
Agricultural Scenario 24. Total Geographical Area (ha)
25. Net Area Sown (ha)
26. Gross Cropped Area (ha)
27. Net Irrigated Area (ha)
28. Gross Irrigated Area (ha)
29. Source of irrigation (%) Borewell/Tubewell: Tank/Pond/River: 30. Irrigation methods (% of GIA) Flood irrigation: Sprinkler irrigation:
Drip irrigation: Fertigation: 31. Soil Health Card issued No. of household: No. of plots covered:
Livestock population in the village
Species Numbers Common Breeds Major diseases 1.
2.
3.
4.
Major crops grown Name of the Crop Area
(ha) Yield (kg/ha)
Irrigated Area (%)
Variety/Hybrid Names
Kharif
1.
2.
3.
4.
Rabi
1.
2.
3.
Summer
1.
2.
Annual
1.
2.
Major horticultural (fruits, vegetables, flowers, spices, medicinal and aromatics, etc.) crops
Name of the Crop Area (ha)
Yield (kg/ha)
Irrigated Area (%)
Variety/Hybrid Names
Kharif
1.
7
2.
3.
Rabi
1.
2.
3.
Summer
1.
2.
Annual/ Perennial
1.
2.
Mechanization in the village
Particulars Numbers Particulars Numbers
Tractor Laser-leveller
Power tiller Paddy planter
Tractor-Rotavator Combined harvester
Ferti-Seed driller Tube-wells
Power thresher Mini-truck for hire
Government agri-support programmes in operation in the village
Scheme/ Programme Area covered (ha)
No. of beneficiaries
Scheme/ Programme Area covered (ha)
No. of beneficiaries
Kisan Credit Card Seed subsidy
Field demonstration Micro-irrigation
Crop insurance Dairy co-op.
Livestock insurance Other …………..
Procurement at MSP Other ………….
Soil health card
Major markets for selling the produce Commodity Market place* Commodity Market place* Cereals Spices
Pulses Milk & milk products
Fruits Poultry/ Fishes
Vegetables Cotton
*1= within village thru local traders; 2= local market (<5 km); 3= mandi (<10 km); 4= distant market (>10 km); 5= other district; 6= Outside state; 7= processing unit within district; 8= other
Major problems related to agriculture and allied sectors (other than price and water)
..

8
..
…
Names of the key informants:
------------------------------------------------------------------------------------------------------------------------------------------------------ ------------------------------------------------------------------------------------------------------------------------------------------------------ ------------------------------------------------------------------------------------------------------------------------------------------------------ ------------------------------------------------------------------------------------------------------------------------------------------------------ ------------------------------------------------------------------------------------------------------------------------------------------------------ ------------------------------------------------------------------------------------------------------------------------------------------------------ ------------------------------------------------------------------------------------------------------------------------------------------------------ ------------------------------------------------------------------------------------------------------------------------------------------------------ ------------------------------------------------------------------------------------------------------------------------------------------------------ ------------------------------------------------------------------------------------------------------------------------------------------------------ ------------------------------------------------------------------------------------------------------------------------------------------------------ ------------------------------------------------------------------------------------------------------------------------------------------------------ ------------------------------------------------------------------------------------------------------------------------------------------------------ ------------------------------------------------------------------------------------------------------------------------------------------------------ ------------------------------------------------------------------------------------------------------------------------------------------------------ ------------------------------------------------------------------------------------------------------------------------------------------------------ ------------------------------------------------------------------------------------------------------------------------------------------------------ ------------------------------------------------------------------------------------------------------------------------------------------------------ ------------------------------------------------------------------------------------------------------------------------------------------------------ ------------------------------------------------------------------------------------------------------------------------------------------------------ ------------------------------------------------------------------------------------------------------------------------------------------------------ ------------------------------------------------------------------------------------------------------------------------------------------------------ ------------------------------------------------------------------------------------------------------------------------------------------------------ ------------------------------------------------------------------------------------------------------------------------------------------------------ ------------------------------------------------------------------------------------------------------------------------------------------------------ ------------------------------------------------------------------------------------------------------------------------------------------------------ ------------------------------------------------------------------------------------------------------------------------------------------------------ ------------------------------------------------------------------------------------------------------------------------------------------------------ ------------------------------------------------------------------------------------------------------------------------------------------------------ ------------------------------------------------------------------------------------------------------------------------------------------------------ ------------------------------------------------------------------------------------------------------------------------------------------------------ ------------------------------------------------------------------------------------------------------------------------------------------------------ ------------------------------------------------------------------------------------------------------------------------------------------------------ ------------------------------------------------------------------------------------------------------------------------------------------------------ ------------------------------------------------------------------------------------------------------------------------------------------------------ ------------------------------------------------------------------------------------------------------------------------------------------------------
9
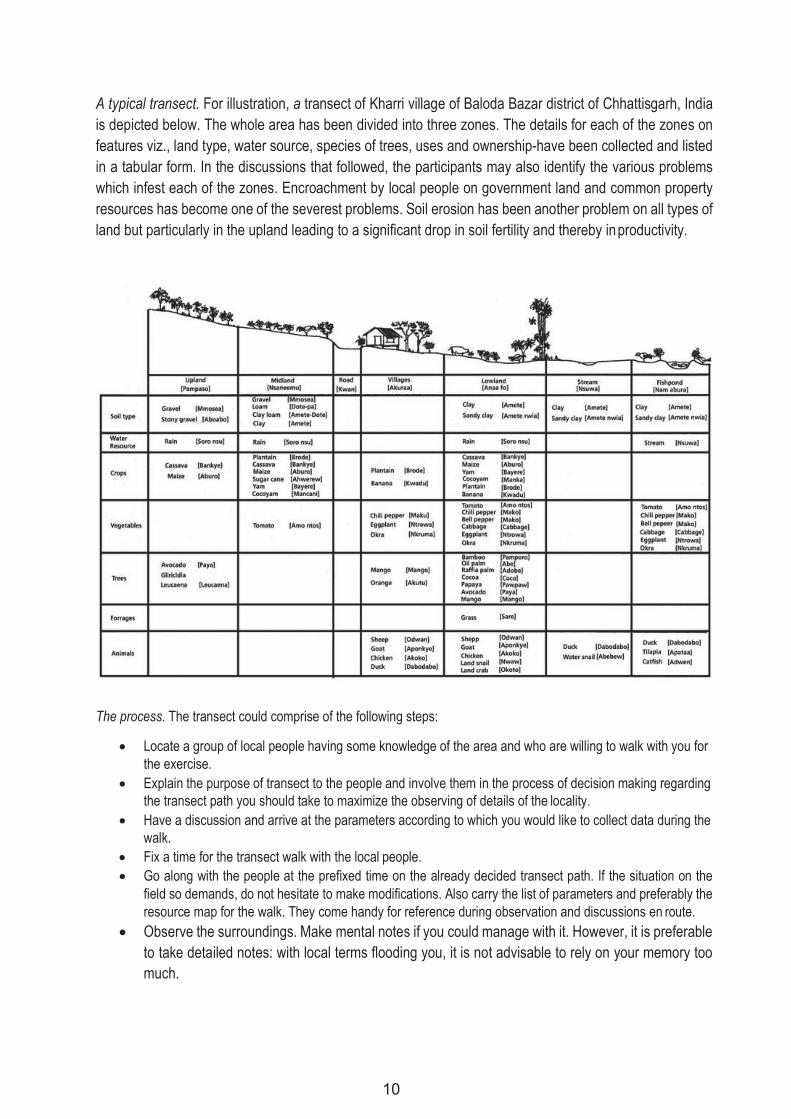
5.2 Village transect. Village transect is another PRA method used to explore the spatial dimensions of people’s realities. It has been popularly used for natural resource management. It provides a cross-sectional representation of the different agro-ecological zones and their comparison against certain parameters including topography, land type, land usage, ownership, access, soil-type, soil fertility, vegetation, crops, problems, opportunities and solutions.
It is also known as general transect. It involves making a long walk inside the village along with key informant (KI) villagers and locating the various items that are found in the village like soil, crops, animals, problems, etc. Start with a transect walk, decide the route with varied features, take at least three routes, two along both the sides of village and one passing through the village, ensure participation of villagers. Discuss while conducting transect walk. Identify topography (Agroecological niches) like upland, medium land, low land, road, residential area, field bunds, ponds, stream, hillock, marshy land, common land, forest land, orchards, arable land, non arable land etc. Write down above transect line, in local language along with translation in English. Mention one niche once only, no matter how often it occurs. Transect is not an imaginary line passing through the village. General convention is that put highlands on left and lowlands on right. Put pictorial of niches on top. Now fill up the transect matrix with reference to following variables in each agro- ecological niches: soil type, water resources, crops, vegetables, trees, forests, agroforestry, forages, animal, interventions, problems and opportunities. While listing the species, also list species not available at present, but grown at other time of season. Give the names of key informants.
Though natural resources remain the focus of any transect, this does not mean that there is no place for the depiction of social aspects. Various social aspects for e.g., the caste and ethnic determinants of a settlement access and control and gender-related dimensions are captured in detail, depending upon the objectives of the exercise.
A transect is different from resource map despite areas of overlap. The resource map provides a bird’s-eye view of the locality with a focus on natural resources. A Transect, however, depicts a cross-sectional view of the different agro-ecological zones and provides a comparative assessment of the Zones on different parameters. It is generally done after a resource map and therefore helps in triangulation. It also helps in taking forward the process of problem identification and planning for the development of the natural resources in the area.
Transect differs from a historical transect in that the focus here is geographical while the focus in the latter is on trends or changes over time on aspects related to natural resources. It is generally like a snapshot of the same transect at different points of time.
Objectives
Appraisal of natural resources in terms of status, problems and potential Verification of issues raised during other PRA exercises particularly during social mapping, natural
resources mapping, etc. Planning of various interventions and checking the relevance of the planned interventions Monitoring and evaluation of interventions and projects.
10
A typical transect. For illustration, a transect of Kharri village of Baloda Bazar district of Chhattisgarh, India is depicted below. The whole area has been divided into three zones. The details for each of the zones on features viz., land type, water source, species of trees, uses and ownership-have been collected and listed in a tabular form. In the discussions that followed, the participants may also identify the various problems which infest each of the zones. Encroachment by local people on government land and common property resources has become one of the severest problems. Soil erosion has been another problem on all types of land but particularly in the upland leading to a significant drop in soil fertility and thereby in productivity.
The process. The transect could comprise of the following steps:
Locate a group of local people having some knowledge of the area and who are willing to walk with you for the exercise.
Explain the purpose of transect to the people and involve them in the process of decision making regarding the transect path you should take to maximize the observing of details of the locality.
Have a discussion and arrive at the parameters according to which you would like to collect data during the walk.
Fix a time for the transect walk with the local people. Go along with the people at the prefixed time on the already decided transect path. If the situation on the
field so demands, do not hesitate to make modifications. Also carry the list of parameters and preferably the resource map for the walk. They come handy for reference during observation and discussions en route.
Observe the surroundings. Make mental notes if you could manage with it. However, it is preferable to take detailed notes: with local terms flooding you, it is not advisable to rely on your memory too much.

11
Ask questions to clarify things you are not clear about to the local people accompanying you. Listen carefully to what they say. Also listen to the discussions they have amongst themselves. Encourage them to explain as you move.
If necessary, stop at certain locations for detailed discussions on the points emerging. It also gives you a breather and time to not down details.
Use this opportunity to clarify issues emerging from the social map, resource map and other methods.
Collect and bring some leaves, grass, etc., which you find interesting but are not familiar with. It helps to refer to them in discussions later and also in documentation.
Two Sets of Processes. You need to observe and carry out the following:
After returning, draw a transect on a large sheet of paper. Let the local people take the lead in drawing the transect diagram. Use your notes and the notes of other members of the transect team, while making the diagram.
Show the transect to others in the locality and ask them their views. Clarify your doubts
This helps you to triangulate the details. You can also use details generated from other methods to triangulate the findings of transect.
------------------------------------------------------------------------------------------------------------------------------------------------------ ------------------------------------------------------------------------------------------------------------------------------------------------------ ------------------------------------------------------------------------------------------------------------------------------------------------------ ------------------------------------------------------------------------------------------------------------------------------------------------------ ------------------------------------------------------------------------------------------------------------------------------------------------------ ------------------------------------------------------------------------------------------------------------------------------------------------------ ------------------------------------------------------------------------------------------------------------------------------------------------------ ------------------------------------------------------------------------------------------------------------------------------------------------------ ------------------------------------------------------------------------------------------------------------------------------------------------------ ------------------------------------------------------------------------------------------------------------------------------------------------------ ------------------------------------------------------------------------------------------------------------------------------------------------------ ------------------------------------------------------------------------------------------------------------------------------------------------------ ------------------------------------------------------------------------------------------------------------------------------------------------------ ------------------------------------------------------------------------------------------------------------------------------------------------------ ------------------------------------------------------------------------------------------------------------------------------------------------------ ------------------------------------------------------------------------------------------------------------------------------------------------------ ------------------------------------------------------------------------------------------------------------------------------------------------------ ------------------------------------------------------------------------------------------------------------------------------------------------------ ------------------------------------------------------------------------------------------------------------------------------------------------------ ------------------------------------------------------------------------------------------------------------------------------------------------------ ------------------------------------------------------------------------------------------------------------------------------------------------------ ------------------------------------------------------------------------------------------------------------------------------------------------------ ------------------------------------------------------------------------------------------------------------------------------------------------------ ------------------------------------------------------------------------------------------------------------------------------------------------------ ------------------------------------------------------------------------------------------------------------------------------------------------------ ------------------------------------------------------------------------------------------------------------------------------------------------------
12
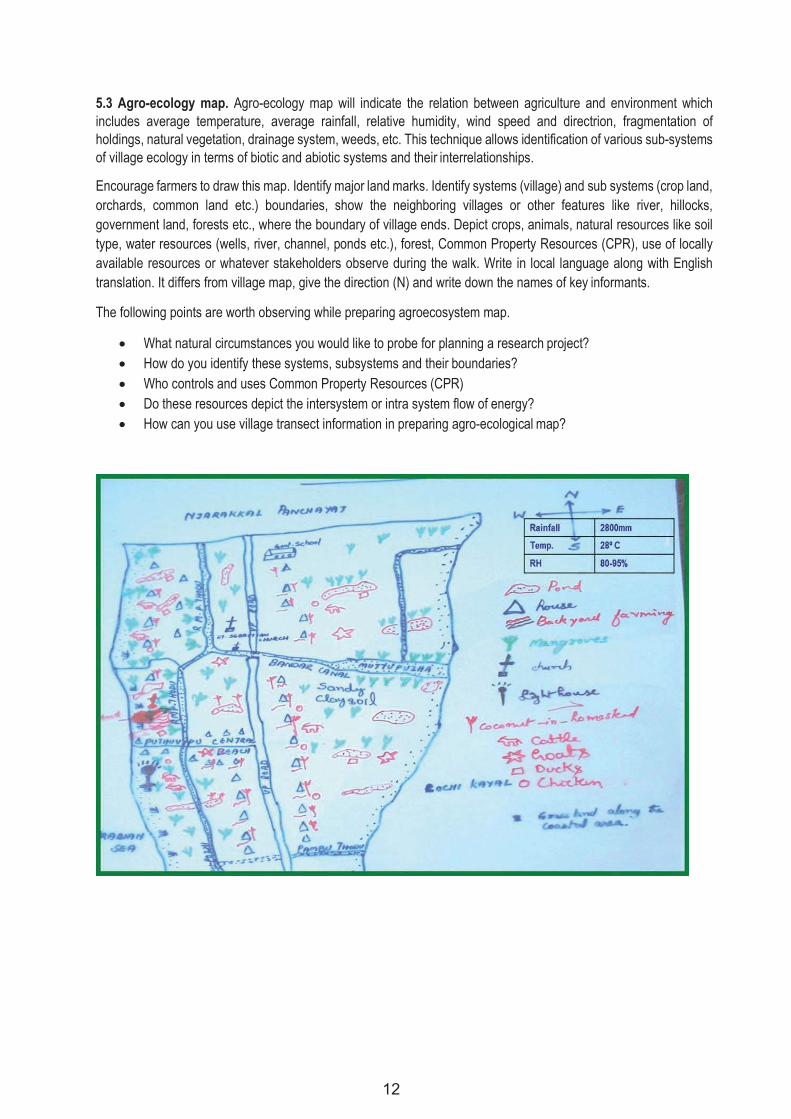
5.3 Agro-ecology map. Agro-ecology map will indicate the relation between agriculture and environment which includes average temperature, average rainfall, relative humidity, wind speed and directrion, fragmentation of holdings, natural vegetation, drainage system, weeds, etc. This technique allows identification of various sub-systems of village ecology in terms of biotic and abiotic systems and their interrelationships.
Encourage farmers to draw this map. Identify major land marks. Identify systems (village) and sub systems (crop land, orchards, common land etc.) boundaries, show the neighboring villages or other features like river, hillocks, government land, forests etc., where the boundary of village ends. Depict crops, animals, natural resources like soil type, water resources (wells, river, channel, ponds etc.), forest, Common Property Resources (CPR), use of locally available resources or whatever stakeholders observe during the walk. Write in local language along with English translation. It differs from village map, give the direction (N) and write down the names of key informants.
The following points are worth observing while preparing agroecosystem map.
What natural circumstances you would like to probe for planning a research project? How do you identify these systems, subsystems and their boundaries? Who controls and uses Common Property Resources (CPR) Do these resources depict the intersystem or intra system flow of energy? How can you use village transect information in preparing agro-ecological map?

13
5.4 Resource map. Resource map is one of the most commonly used PRA methods next to social map. While the social map focuses on habitation, community facilities, roads, temples, etc., the resource map focuses on the natural resources in the locality and depicts land, hills, rivers, fields, vegetation, etc. A resource map may cover habitation as well. At times, the distinction between the resource map and social map may get blurred.
A resource map in PRA is not drawn to scale. It is not done by experts but by the local people. The local people are considered to have an in-depth knowledge of the surroundings where they have survived for a long time. Hence the resource map social map drawn by the local people is considered to be accurate and detailed. It important to keep in mind, however, that it reflects the people is perceptions rather than precise measurements to scale. Thus, a resource map reflects how people view their own locality in terms of natural resources.
Objectives. Resource maps have been used for depicting of various aspects related to the natural resources management of a locality including:
Topography, terrain and slopes Forest, vegetation and tree species Soil-type, fertility, erosion and depth Land and land use, command area, tenure, boundaries and ownership Water, water bodies, irrigation sources, rivers and drainage. Watershed development, various soil and water conservation measures, denuded areas, etc. Agricultural development, cropping pattern, productivity, etc.
14
The following information is elicited from resource map.
Transport facilities information Communication facilities information Health and welfare societies information Supply and service agencies information Agricultural implements found in the village information Animals used for agriculture information Marketing facilities information Processing industries information Financial facilities information Advisory facilities information Community pastures or grazing land information Natural service versus AI for various animals information Labour availability for various purposes information Storage facilities information Carcass disposal facilities for animals’ information Other resources used for agriculture information
Resource maps have been found especially useful because they provide a focused spatial structure for discussion and analysis. They help to create a common understanding amongst the participants as well as a baseline for monitoring and evaluation. The process of creating a resource map is full of joy and it instils self-confidence amongst the participants, which later makes the interaction more meaningful. Resource maps have been found particularly useful for analysis of problems, looking at solutions and planning for action. Resource maps have been used to generate discussions among the participants about natural resources, their entitlement and utilization, problems related to deforestation and soil erosion, etc. The focus gradually shifts from gradually shifts from the identification and prioritization of problems related to the natural resources, to planning for intervention.
It is the construction of a map of the village by the participant village using rangoli powder /chart and marker pens. The map shows the resources, infrastructure facilities available in the village and also depicts the social set up of the village. Further, it gives an idea about the resources like soil, water, forest etc.
Methodology. For the above exercise, charts which were pasted together to form a big sheet was given to the participants along with a lot of colour marker pens. The participants were given a briefing on the exercise and its purpose. One of the participants would initiate the exercise by marking the entrance of the village followed by drawing the road and the path entering into it. Having felt that the exercise was very interesting, many more will join him/her and assist in locating few important structures of the village such as Temples, Schools, Water tank, Shops, Phone booths, Public latrines, Primary health centres, Milk society unit, etc. They differentiated each structure using different colours like green colour for paddy, yellow colour for settlements, blue colour for water bodies so on and so forth. It took around one to one and a half hour to finish the exercise.
Soon after the completion of the exercise, one participant may volunteer to elicit some of the important resources, infrastructure facilities, farming community settlements using the map drawn.
15
Process of Resource Mapping. The mapping process remains quite similar to that of a social map. Only the focus is different. The main steps include:
• Select a proper place for preparing a resource map of the area in consultation with the local people. • Fix the time and invite people from different sections of the society. Ensure that the marginalized groups
and women definitely participate. • Start the exercise at the fixed time. First explain the purpose of the exercise. Ask them to start
showing the major resources. Encourage them to use locally available material in a creative way and to make the map as representative as possible.
• Do not interfere. Allow them to do it on their own. In case they get stuck, help them out. • Listen carefully to the discussions they have, while preparing the map. Note down the relevant points. • In case the participants are not representing the aspects you are interested in, have patience. • Wait till the mapping process comes to an end. Ask them un-intrusive question without disturbing the
process. Some helpful questions include: • What about…? • Can you show me…in the map?
• Ask them to explain the map including the various symbols, visuals and colours used. • Ask them to depict and discuss the problems and opportunities in keeping with the objectives of the
resource map. • At the end, ask them whether anybody would like to make any modifications or additions. • Keep an eye on who is actively involved and who is marginalized. Try to involve the marginalized
groups and women in the process. • Interview the map. Interviewing it provides valuable insights into the status of natural resources. It helps
you to clarify your doubts and know about aspects you are interested in.
Material Required. The resource map along with social map has been the favourite of local people who let loose their creativity using a range of materials. Seeds of different types, soil, chalks, coloured powder, stones and pebbles, twigs, leaves, paper, and cardboard have all been used for making resource maps. The list, however, is not exhaustive.
Time Required. Two to three hours may be required for doing resource mapping. The time may vary considerably depending upon the details aimed at.
------------------------------------------------------------------------------------------------------------------------------------------------------ ------------------------------------------------------------------------------------------------------------------------------------------------------ ------------------------------------------------------------------------------------------------------------------------------------------------------ ------------------------------------------------------------------------------------------------------------------------------------------------------ ------------------------------------------------------------------------------------------------------------------------------------------------------ ------------------------------------------------------------------------------------------------------------------------------------------------------ ------------------------------------------------------------------------------------------------------------------------------------------------------ ------------------------------------------------------------------------------------------------------------------------------------------------------ ------------------------------------------------------------------------------------------------------------------------------------------------------ ------------------------------------------------------------------------------------------------------------------------------------------------------ ------------------------------------------------------------------------------------------------------------------------------------------------------ ------------------------------------------------------------------------------------------------------------------------------------------------------ ------------------------------------------------------------------------------------------------------------------------------------------------------
16
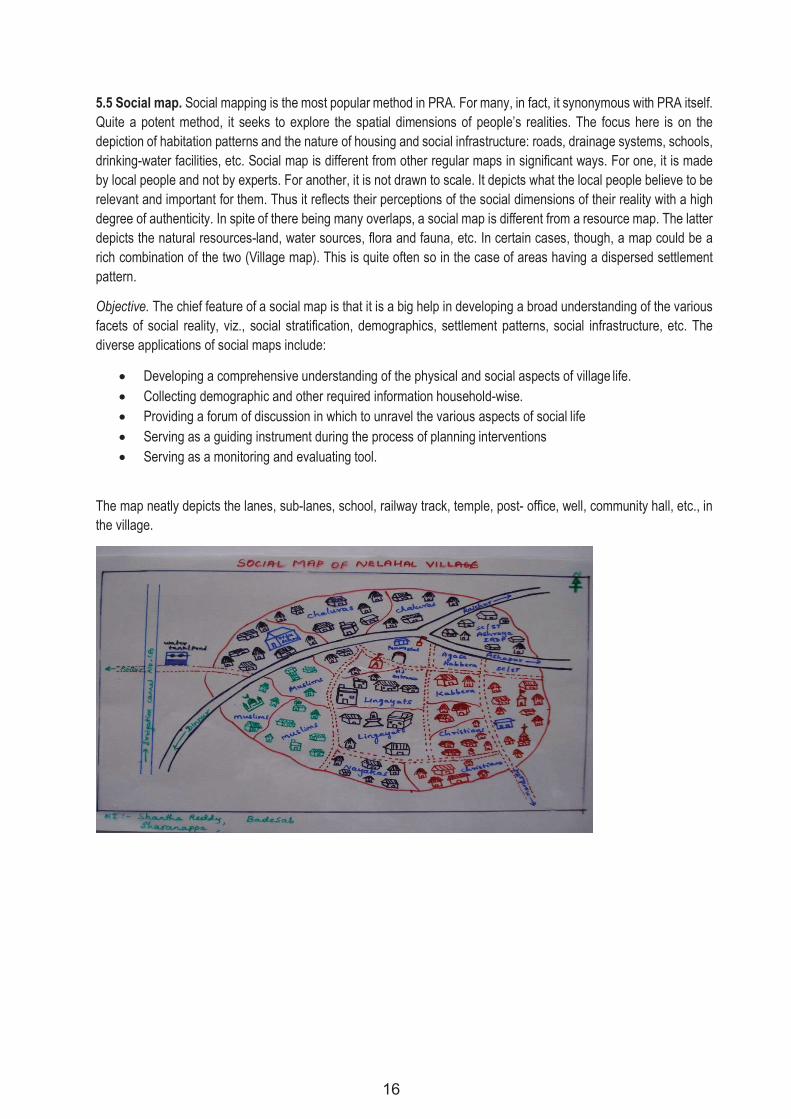
5.5 Social map. Social mapping is the most popular method in PRA. For many, in fact, it synonymous with PRA itself. Quite a potent method, it seeks to explore the spatial dimensions of people’s realities. The focus here is on the depiction of habitation patterns and the nature of housing and social infrastructure: roads, drainage systems, schools, drinking-water facilities, etc. Social map is different from other regular maps in significant ways. For one, it is made by local people and not by experts. For another, it is not drawn to scale. It depicts what the local people believe to be relevant and important for them. Thus it reflects their perceptions of the social dimensions of their reality with a high degree of authenticity. In spite of there being many overlaps, a social map is different from a resource map. The latter depicts the natural resources-land, water sources, flora and fauna, etc. In certain cases, though, a map could be a rich combination of the two (Village map). This is quite often so in the case of areas having a dispersed settlement pattern.
Objective. The chief feature of a social map is that it is a big help in developing a broad understanding of the various facets of social reality, viz., social stratification, demographics, settlement patterns, social infrastructure, etc. The diverse applications of social maps include:
Developing a comprehensive understanding of the physical and social aspects of village life. Collecting demographic and other required information household-wise. Providing a forum of discussion in which to unravel the various aspects of social life Serving as a guiding instrument during the process of planning interventions Serving as a monitoring and evaluating tool.
The map neatly depicts the lanes, sub-lanes, school, railway track, temple, post- office, well, community hall, etc., in the village.
17
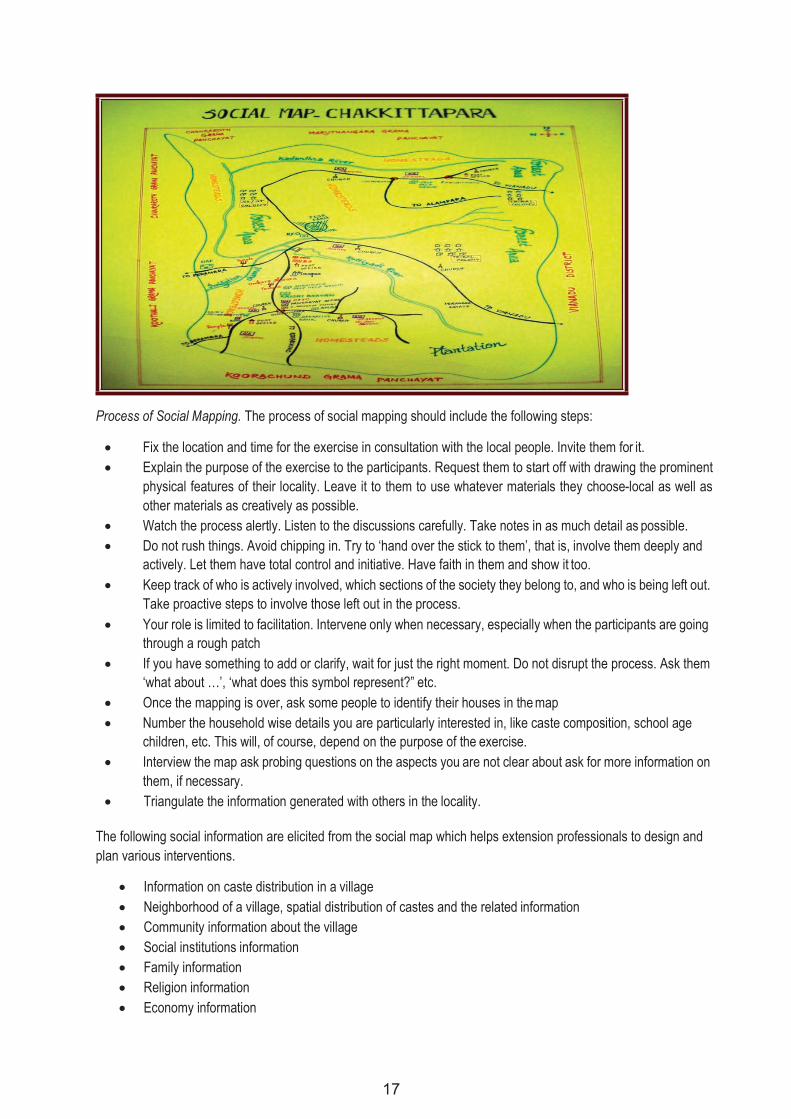
Process of Social Mapping. The process of social mapping should include the following steps:
Fix the location and time for the exercise in consultation with the local people. Invite them for it. Explain the purpose of the exercise to the participants. Request them to start off with drawing the prominent
physical features of their locality. Leave it to them to use whatever materials they choose-local as well as other materials as creatively as possible.
Watch the process alertly. Listen to the discussions carefully. Take notes in as much detail as possible. Do not rush things. Avoid chipping in. Try to ‘hand over the stick to them’, that is, involve them deeply and
actively. Let them have total control and initiative. Have faith in them and show it too. Keep track of who is actively involved, which sections of the society they belong to, and who is being left out.
Take proactive steps to involve those left out in the process. Your role is limited to facilitation. Intervene only when necessary, especially when the participants are going
through a rough patch If you have something to add or clarify, wait for just the right moment. Do not disrupt the process. Ask them
‘what about …’, ‘what does this symbol represent?” etc. Once the mapping is over, ask some people to identify their houses in the map Number the household wise details you are particularly interested in, like caste composition, school age
children, etc. This will, of course, depend on the purpose of the exercise. Interview the map ask probing questions on the aspects you are not clear about ask for more information on
them, if necessary. Triangulate the information generated with others in the locality.
The following social information are elicited from the social map which helps extension professionals to design and plan various interventions.
Information on caste distribution in a village Neighborhood of a village, spatial distribution of castes and the related information Community information about the village Social institutions information Family information Religion information Economy information
18
Government institution information in the village Information on educational background of villagers’ Social groups information in the groups Leadership patterns existing in the village Value systems information of the village Social interactions information Cooperation information Competition information Conflict information Assimilation information Accommodation information Caste structure information Media of communication information Social norms, folkways, mores information about the village Social evils like dowry, alcoholism, child labour, prostitution information Religion, leadership pattern and customs existing in the society information
Site selection for social mapping. Location of the site for mapping is quite crucial. Hence, you would do well to keep the following points in mind while selecting the site:
Location. Is it a central place? Will it be convenient for everyone?
Exclusion. Will it comfortable for all sections of society to come there? For example, a temple courtyard or school premises could be a good site for social mapping, but in some of the Indian villages the weaker sections of society may not get entry there. Likewise, areas dominated by particular social groups may not be easily accessible to others. Similarly, domination of particular individuals may keep away those who do not get along with them
Suitability. Is there enough shade for the participants? Is the surface fairly smooth for the exercise? Even as you must keep these points in mid while selecting the site, the best bet is to ask the local people to do it. Then visit the proposed site along with the participants and see if it is suitable in view of the factors mentioned above. Just in case, check with some local people if there is anything about the site which could hinder the participation of any section of the society. In case the perspective of a specific group is particularly important for you, mapping a site in their locality could prove useful.
Transferring social map on to paper. Social maps can be drawn on the ground or directly on a large sheet of paper. Social maps are commonly made on the ground with locally available material. Hence they are not safe and permanent. They need to be copied onto paper immediately. Usually the map is copied onto a large sheer of paper with all the details. This is necessary for other exercises, discussions, and later, for monitoring purposes. Moreover, it saves the trouble of doing the map all over again.
Number of participants. Of all the PRA methods, social mapping makes for the active involvement of the largest number of participants. This is all the more so when it is done on the ground. Each person has something or the other to look for in the map. It is quite often seen that when the mapping is over, old persons and young children alike try to locate their houses. And mostly, they are not only able to identify their own houses but those of others too. Moreover, those who appear to be mere onlookers tend to point out errors and omissions while the process is on. What is remarkable is that all of them follow avidly whatever is happening even if they are not actively involved in it.

19
Material required. A wide range of materials has to be used for social mapping. It can well be extended further. Usually leaves, twigs, matchboxes, seeds, colour soils and powders, utensils, thread, etc., have been used. The list is by no means exhaustive.
Time required. The time required for social mapping may very quiet a lot. It is influenced by various factors including the size of the locality, the interest of the participants, the nature and extent of the details sought and the type of materials used.
Scope for improvisation and complementarity with other methods. Social mapping is a versatile method in that it is amenable to innumerable improvisations at the villagers’ levels.
------------------------------------------------------------------------------------------------------------------------------------------------------ ------------------------------------------------------------------------------------------------------------------------------------------------------ ------------------------------------------------------------------------------------------------------------------------------------------------------ ------------------------------------------------------------------------------------------------------------------------------------------------------ ------------------------------------------------------------------------------------------------------------------------------------------------------ ------------------------------------------------------------------------------------------------------------------------------------------------------ ------------------------------------------------------------------------------------------------------------------------------------------------------ ------------------------------------------------------------------------------------------------------------------------------------------------------ ------------------------------------------------------------------------------------------------------------------------------------------------------ ------------------------------------------------------------------------------------------------------------------------------------------------------ ------------------------------------------------------------------------------------------------------------------------------------------------------ ------------------------------------------------------------------------------------------------------------------------------------------------------ ------------------------------------------------------------------------------------------------------------------------------------------------------ ------------------------------------------------------------------------------------------------------------------------------------------------------ ------------------------------------------------------------------------------------------------------------------------------------------------------ ------------------------------------------------------------------------------------------------------------------------------------------------------ ------------------------------------------------------------------------------------------------------------------------------------------------------ ------------------------------------------------------------------------------------------------------------------------------------------------------ ------------------------------------------------------------------------------------------------------------------------------------------------------ ------------------------------------------------------------------------------------------------------------------------------------------------------ ------------------------------------------------------------------------------------------------------------------------------------------------------ ------------------------------------------------------------------------------------------------------------------------------------------------------ ------------------------------------------------------------------------------------------------------------------------------------------------------ ------------------------------------------------------------------------------------------------------------------------------------------------------ ------------------------------------------------------------------------------------------------------------------------------------------------------ ------------------------------------------------------------------------------------------------------------------------------------------------------ ------------------------------------------------------------------------------------------------------------------------------------------------------ ------------------------------------------------------------------------------------------------------------------------------------------------------ ------------------------------------------------------------------------------------------------------------------------------------------------------ ------------------------------------------------------------------------------------------------------------------------------------------------------ ------------------------------------------------------------------------------------------------------------------------------------------------------ ------------------------------------------------------------------------------------------------------------------------------------------------------ ------------------------------------------------------------------------------------------------------------------------------------------------------ ------------------------------------------------------------------------------------------------------------------------------------------------------ ------------------------------------------------------------------------------------------------------------------------------------------------------ ------------------------------------------------------------------------------------------------------------------------------------------------------
20
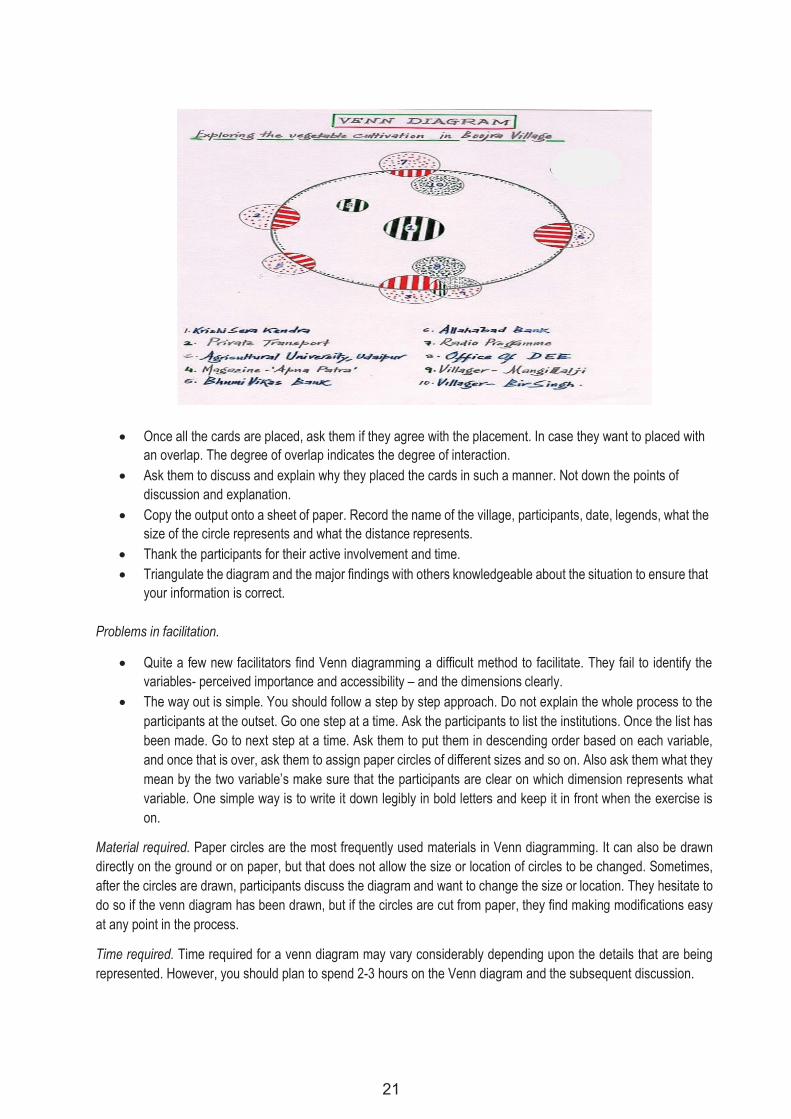
5.6 Venn diagram. Venn diagram is one of the commonly used methods in PRA to study institutional relationship and is sometimes also referred to as institutional diagram. It is however, popularly known as Chapati diagram (Chapati means ‘round bread’ in Hindi) as the method uses circles of various sizes to represent institutions or individuals. The bigger the circle, the more important is the institution or individual. The distance between circles represents, for example, the degree of influence or contact between institutions or individuals. Overlapping circles indicate interactions and the extent of overlap can indicate the level of interaction.
Objectives.
To study and understand local people’s perceptions about local institutions, individuals, programmes, etc. The method provides valuable insights into and analyses of the power structure, the decision- making
process, etc., the need to strengthen the community’s institutions can also be ascertained. The relative importance of services and programmes has also been studied using the Venn diagram
Venn diagram is particularly useful when you want to study and analyse i) various institutions and individuals and their influence on the local people, ii) various groups and individuals in the locality and their influence and iii) main actors in the community and their conspicuous and inconspicuous influence.
The venn diagram elicits a wide array of information like a) relative importance of various institutions in the village, b) relationship among them, c) linkages among them, d) weaknesses with respect to decision making process, e) development of the village by institutions, f) duplication of efforts among institutions, g) gap identification between institutions, h) objectives and felt needs of farmers, and i) concentration of power within villages
In fact, you can use a Venn diagram if you are inclined to use a simple participatory visual method and have.
A number of items to be studied: institutions, individuals, diseases, social groups, natural resources or any of their combinations;
To study these items in relation to a few variables, preferably two, which could include importance, prevalence and perceived proximity?
Process. The suggested steps in the process of doing a venn diagram are as follows:
Explain the purpose for the exercise to the participants Ask them to list the various institutions, individuals, etc, as per the objectives of the exercise Ask them to write and / or depict them on small cards. Visual depiction becomes necessary if there are non-
literate participants. Ask the participants to place the cards on one of the variable of study, e.g., perceived importance of the
institutions, in a descending order. Once the cards are arranged in an order. Ask them whether they agree or would like to make modifications. Encourage them to make changes, if they are interested.
Ask them to assign paper circles of different sizes (cut and kept ready) to the institutions or individuals in such a way that the bigger the circle, the higher that institutions or individual ranks on that variable. Past on the circles the cards with names of institutions or individual. If you want, you can simply note down or depict the institutions or individuals on the circles.
Draw a circle on the ground representing the community. circle in such a way that those high on the second variable, close together, while those low on the variable are kept representing the community.
Ask them to place the accessibility, are kept away from the circle
21
Once all the cards are placed, ask them if they agree with the placement. In case they want to placed with an overlap. The degree of overlap indicates the degree of interaction.
Ask them to discuss and explain why they placed the cards in such a manner. Not down the points of discussion and explanation.
Copy the output onto a sheet of paper. Record the name of the village, participants, date, legends, what the size of the circle represents and what the distance represents.
Thank the participants for their active involvement and time. Triangulate the diagram and the major findings with others knowledgeable about the situation to ensure that
your information is correct.
Problems in facilitation.
Quite a few new facilitators find Venn diagramming a difficult method to facilitate. They fail to identify the variables- perceived importance and accessibility – and the dimensions clearly.
The way out is simple. You should follow a step by step approach. Do not explain the whole process to the participants at the outset. Go one step at a time. Ask the participants to list the institutions. Once the list has been made. Go to next step at a time. Ask them to put them in descending order based on each variable, and once that is over, ask them to assign paper circles of different sizes and so on. Also ask them what they mean by the two variable’s make sure that the participants are clear on which dimension represents what variable. One simple way is to write it down legibly in bold letters and keep it in front when the exercise is on.
Material required. Paper circles are the most frequently used materials in Venn diagramming. It can also be drawn directly on the ground or on paper, but that does not allow the size or location of circles to be changed. Sometimes, after the circles are drawn, participants discuss the diagram and want to change the size or location. They hesitate to do so if the venn diagram has been drawn, but if the circles are cut from paper, they find making modifications easy at any point in the process.
Time required. Time required for a venn diagram may vary considerably depending upon the details that are being represented. However, you should plan to spend 2-3 hours on the Venn diagram and the subsequent discussion.

22
Scope for improvisation and complementarily with other methods. Venn diagram is a versatile method with ample scope for improvisation and application in widely diverse areas.
Please keep track of the points arising out of discussion among the participants right from the beginning. These provide equally valuable insights, if not more important ones, than the output itself.
Copy the diagram on a piece of paper with legends and details of the participants, facilitators locality and date. Thank the participants for their active participation and valuable time. Later triangulate the findings with other key information to ensure that the information generated to correct. Please keep track of the points arising out of discussion among the participants right from the beginning. These
provide equally valuable insights, if not more important ones, than the output itself. Copy the diagram on a piece of paper with legends and details of the participants, facilitators locality and date. Thank the participants for their active participation and valuable time. Later triangulate the findings with other key information to ensure that the information generated to correct.
------------------------------------------------------------------------------------------------------------------------------------------------------ ------------------------------------------------------------------------------------------------------------------------------------------------------ ------------------------------------------------------------------------------------------------------------------------------------------------------ ------------------------------------------------------------------------------------------------------------------------------------------------------ ------------------------------------------------------------------------------------------------------------------------------------------------------ ------------------------------------------------------------------------------------------------------------------------------------------------------ ------------------------------------------------------------------------------------------------------------------------------------------------------ ------------------------------------------------------------------------------------------------------------------------------------------------------ ------------------------------------------------------------------------------------------------------------------------------------------------------ ------------------------------------------------------------------------------------------------------------------------------------------------------ ------------------------------------------------------------------------------------------------------------------------------------------------------ ------------------------------------------------------------------------------------------------------------------------------------------------------ ------------------------------------------------------------------------------------------------------------------------------------------------------ ------------------------------------------------------------------------------------------------------------------------------------------------------ ------------------------------------------------------------------------------------------------------------------------------------------------------ ------------------------------------------------------------------------------------------------------------------------------------------------------ ------------------------------------------------------------------------------------------------------------------------------------------------------ ------------------------------------------------------------------------------------------------------------------------------------------------------ ------------------------------------------------------------------------------------------------------------------------------------------------------ ------------------------------------------------------------------------------------------------------------------------------------------------------ ------------------------------------------------------------------------------------------------------------------------------------------------------ ------------------------------------------------------------------------------------------------------------------------------------------------------ ------------------------------------------------------------------------------------------------------------------------------------------------------ ------------------------------------------------------------------------------------------------------------------------------------------------------ ------------------------------------------------------------------------------------------------------------------------------------------------------ ------------------------------------------------------------------------------------------------------------------------------------------------------ ------------------------------------------------------------------------------------------------------------------------------------------------------ ------------------------------------------------------------------------------------------------------------------------------------------------------ ------------------------------------------------------------------------------------------------------------------------------------------------------ ------------------------------------------------------------------------------------------------------------------------------------------------------ ------------------------------------------------------------------------------------------------------------------------------------------------------
23
5.7 Mobility map. Mobility map is a PRA method used to explore the movement pattern of an individual, a group, or the community. The focus is on where people go and for what. Other aspects, like the frequency of visits, distance, and the importance of the place visited, may also be studied and depicted. It reflects the people’s perception of movement patterns and the reasons there of.
Objectives.
Understanding the mobility pattern of local people where they go and for what Evaluation of the impact of certain interventions in terms of their effects on mobility patterns Planning for intervention and projects.
A Typical Mobility Map: It is quite elaborate and deals with several aspects including:
Frequency of visit (from daily to once within 6 months) Distance (between the places of visit and their village) Mode of transport (bus or walk) Purpose of visit (weeding, sale purchase, wage labour, medical facility etc.) Accessibility (in terms of size – the bigger the size the easier the access)
In addition, it also specifies the places that they visit only in groups or with other member. The use of symbols makes the diagram more interesting.
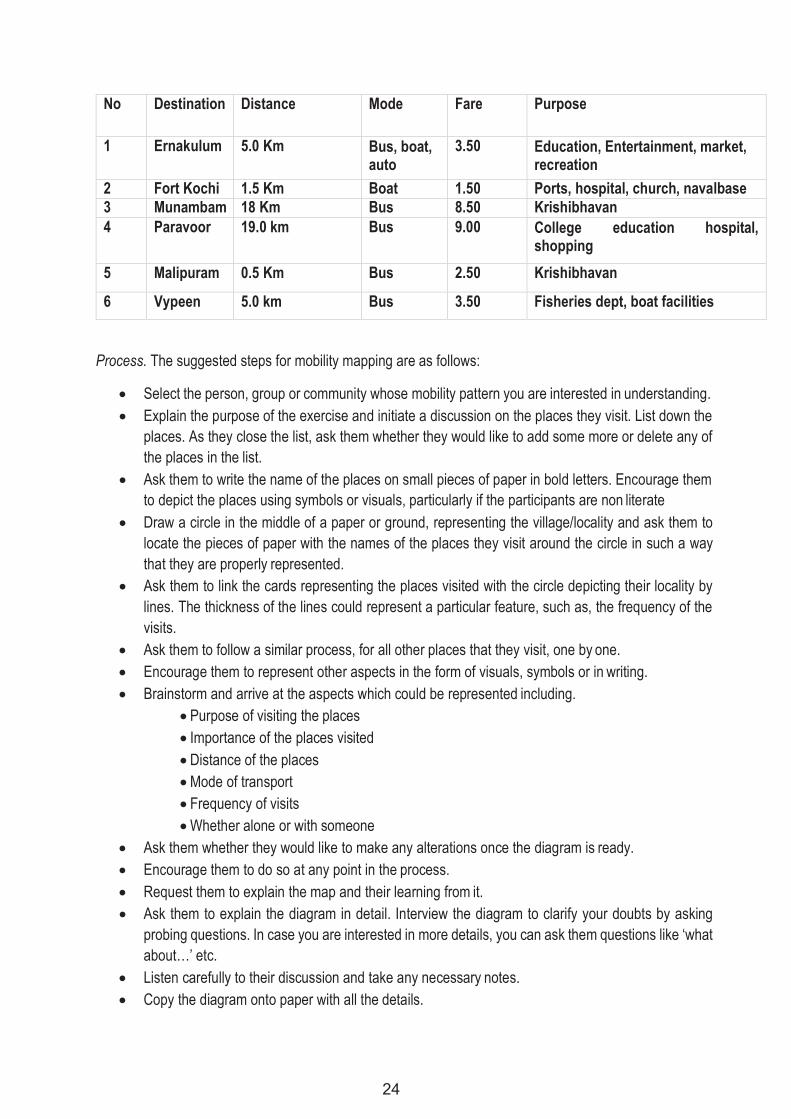
24
No Destination Distance Mode Fare Purpose
1 Ernakulum 5.0 Km Bus, boat, auto
3.50 Education, Entertainment, market, recreation
2 Fort Kochi 1.5 Km Boat 1.50 Ports, hospital, church, navalbase 3 Munambam 18 Km Bus 8.50 Krishibhavan 4 Paravoor 19.0 km Bus 9.00 College education hospital,
shopping
5 Malipuram 0.5 Km Bus 2.50 Krishibhavan
6 Vypeen 5.0 km Bus 3.50 Fisheries dept, boat facilities
Process. The suggested steps for mobility mapping are as follows:
Select the person, group or community whose mobility pattern you are interested in understanding. Explain the purpose of the exercise and initiate a discussion on the places they visit. List down the
places. As they close the list, ask them whether they would like to add some more or delete any of the places in the list.
Ask them to write the name of the places on small pieces of paper in bold letters. Encourage them to depict the places using symbols or visuals, particularly if the participants are non literate
Draw a circle in the middle of a paper or ground, representing the village/locality and ask them to locate the pieces of paper with the names of the places they visit around the circle in such a way that they are properly represented.
Ask them to link the cards representing the places visited with the circle depicting their locality by lines. The thickness of the lines could represent a particular feature, such as, the frequency of the visits.
Ask them to follow a similar process, for all other places that they visit, one by one. Encourage them to represent other aspects in the form of visuals, symbols or in writing. Brainstorm and arrive at the aspects which could be represented including.
Purpose of visiting the places Importance of the places visited Distance of the places Mode of transport Frequency of visits Whether alone or with someone
Ask them whether they would like to make any alterations once the diagram is ready. Encourage them to do so at any point in the process. Request them to explain the map and their learning from it. Ask them to explain the diagram in detail. Interview the diagram to clarify your doubts by asking
probing questions. In case you are interested in more details, you can ask them questions like ‘what about…’ etc.
Listen carefully to their discussion and take any necessary notes. Copy the diagram onto paper with all the details.
25
Triangulate the diagram and other details generated during discussions with others in the locality.
Material required: Locally available material including stones, seeds, chalks and cards of different colours can be used for the mobility map.
Time required: Time required for the mobility map may vary between one to two hour. This depends, however, on various factors such as the subject of the exercise, the interest of the participants in the topic, details aimed at, etc.
Scope for improvisation and complementarily with other methods. Mobility maps can be used effectively in combination with other PRA methods.
------------------------------------------------------------------------------------------------------------------------------------------------------ ------------------------------------------------------------------------------------------------------------------------------------------------------ ------------------------------------------------------------------------------------------------------------------------------------------------------ ------------------------------------------------------------------------------------------------------------------------------------------------------ ------------------------------------------------------------------------------------------------------------------------------------------------------ ------------------------------------------------------------------------------------------------------------------------------------------------------ ------------------------------------------------------------------------------------------------------------------------------------------------------ ------------------------------------------------------------------------------------------------------------------------------------------------------ ------------------------------------------------------------------------------------------------------------------------------------------------------ ------------------------------------------------------------------------------------------------------------------------------------------------------ ------------------------------------------------------------------------------------------------------------------------------------------------------ ------------------------------------------------------------------------------------------------------------------------------------------------------ ------------------------------------------------------------------------------------------------------------------------------------------------------ ------------------------------------------------------------------------------------------------------------------------------------------------------ ------------------------------------------------------------------------------------------------------------------------------------------------------ ------------------------------------------------------------------------------------------------------------------------------------------------------ ------------------------------------------------------------------------------------------------------------------------------------------------------ ------------------------------------------------------------------------------------------------------------------------------------------------------ ------------------------------------------------------------------------------------------------------------------------------------------------------ ------------------------------------------------------------------------------------------------------------------------------------------------------
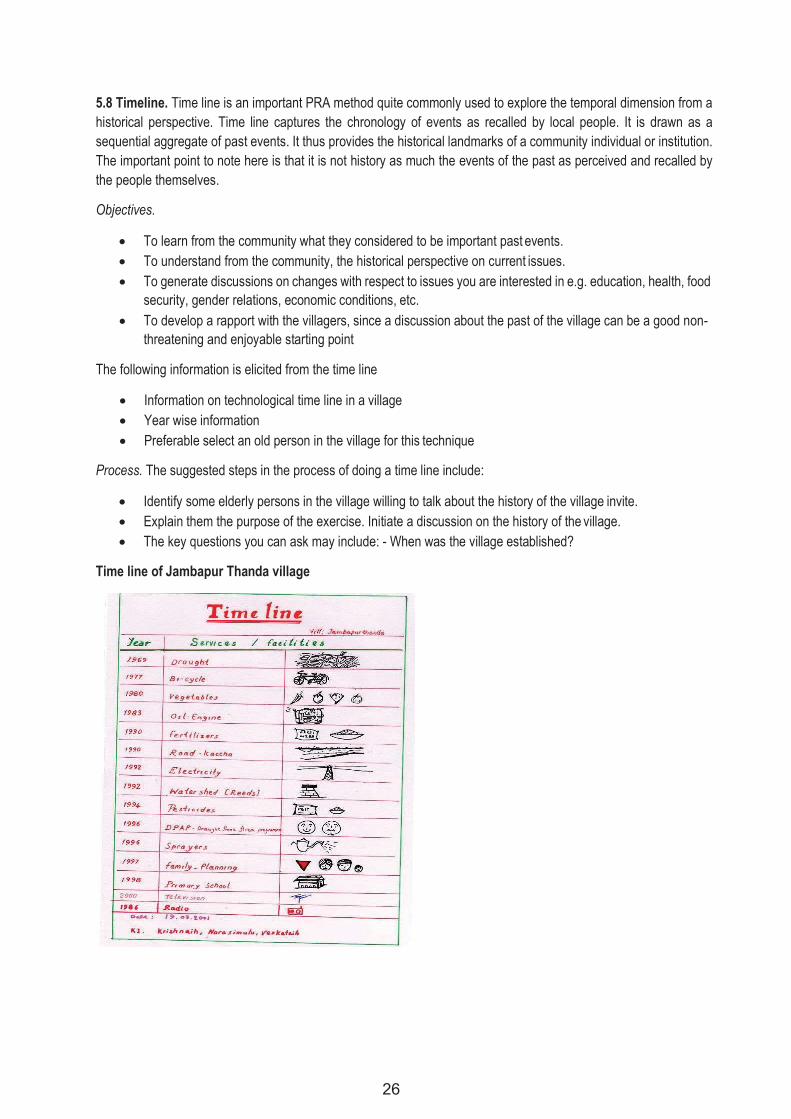
26
5.8 Timeline. Time line is an important PRA method quite commonly used to explore the temporal dimension from a historical perspective. Time line captures the chronology of events as recalled by local people. It is drawn as a sequential aggregate of past events. It thus provides the historical landmarks of a community individual or institution. The important point to note here is that it is not history as much the events of the past as perceived and recalled by the people themselves.
Objectives.
To learn from the community what they considered to be important past events. To understand from the community, the historical perspective on current issues. To generate discussions on changes with respect to issues you are interested in e.g. education, health, food
security, gender relations, economic conditions, etc. To develop a rapport with the villagers, since a discussion about the past of the village can be a good non-
threatening and enjoyable starting point
The following information is elicited from the time line
Information on technological time line in a village Year wise information Preferable select an old person in the village for this technique
Process. The suggested steps in the process of doing a time line include:
Identify some elderly persons in the village willing to talk about the history of the village invite. Explain them the purpose of the exercise. Initiate a discussion on the history of the village. The key questions you can ask may include: - When was the village established?
Time line of Jambapur Thanda village
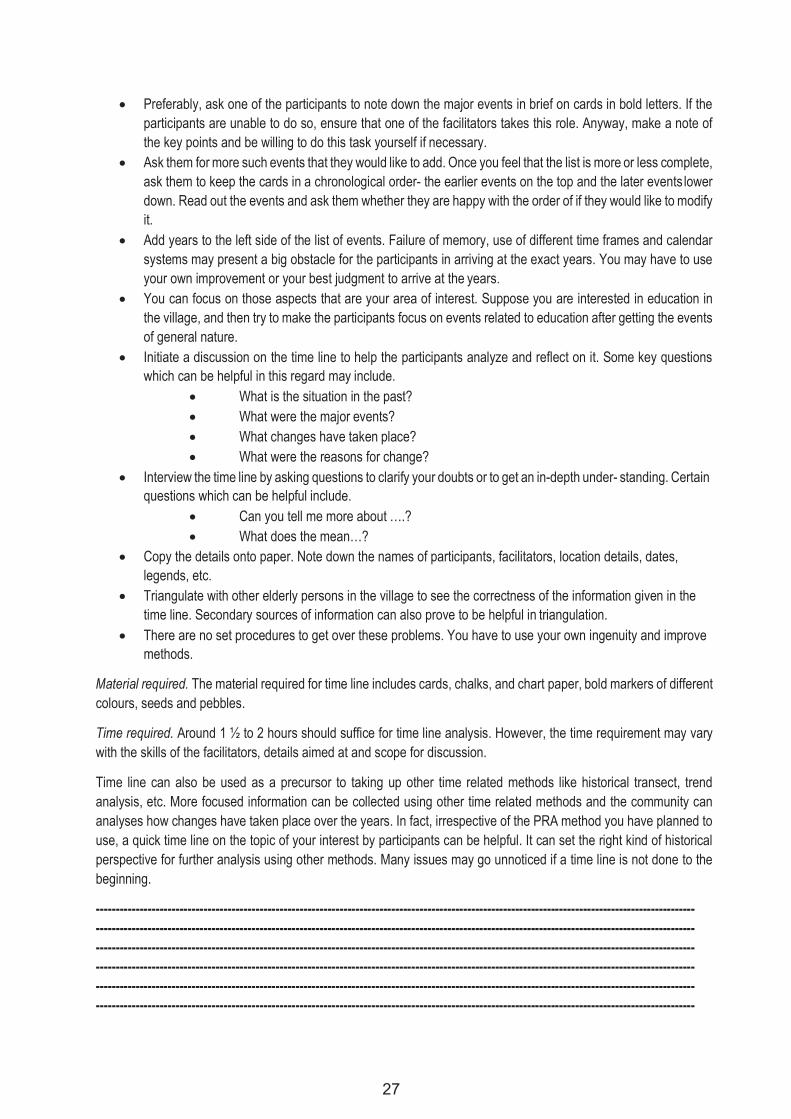
27
Preferably, ask one of the participants to note down the major events in brief on cards in bold letters. If the participants are unable to do so, ensure that one of the facilitators takes this role. Anyway, make a note of the key points and be willing to do this task yourself if necessary.
Ask them for more such events that they would like to add. Once you feel that the list is more or less complete, ask them to keep the cards in a chronological order- the earlier events on the top and the later events lower down. Read out the events and ask them whether they are happy with the order of if they would like to modify it.
Add years to the left side of the list of events. Failure of memory, use of different time frames and calendar systems may present a big obstacle for the participants in arriving at the exact years. You may have to use your own improvement or your best judgment to arrive at the years.
You can focus on those aspects that are your area of interest. Suppose you are interested in education in the village, and then try to make the participants focus on events related to education after getting the events of general nature.
Initiate a discussion on the time line to help the participants analyze and reflect on it. Some key questions which can be helpful in this regard may include.
What is the situation in the past? What were the major events? What changes have taken place? What were the reasons for change?
Interview the time line by asking questions to clarify your doubts or to get an in-depth under- standing. Certain questions which can be helpful include.
Can you tell me more about ….? What does the mean…?
Copy the details onto paper. Note down the names of participants, facilitators, location details, dates, legends, etc.
Triangulate with other elderly persons in the village to see the correctness of the information given in the time line. Secondary sources of information can also prove to be helpful in triangulation.
There are no set procedures to get over these problems. You have to use your own ingenuity and improve methods.
Material required. The material required for time line includes cards, chalks, and chart paper, bold markers of different colours, seeds and pebbles.
Time required. Around 1 ½ to 2 hours should suffice for time line analysis. However, the time requirement may vary with the skills of the facilitators, details aimed at and scope for discussion.
Time line can also be used as a precursor to taking up other time related methods like historical transect, trend analysis, etc. More focused information can be collected using other time related methods and the community can analyses how changes have taken place over the years. In fact, irrespective of the PRA method you have planned to use, a quick time line on the topic of your interest by participants can be helpful. It can set the right kind of historical perspective for further analysis using other methods. Many issues may go unnoticed if a time line is not done to the beginning.
------------------------------------------------------------------------------------------------------------------------------------------------------ ------------------------------------------------------------------------------------------------------------------------------------------------------ ------------------------------------------------------------------------------------------------------------------------------------------------------ ------------------------------------------------------------------------------------------------------------------------------------------------------ ------------------------------------------------------------------------------------------------------------------------------------------------------ ------------------------------------------------------------------------------------------------------------------------------------------------------
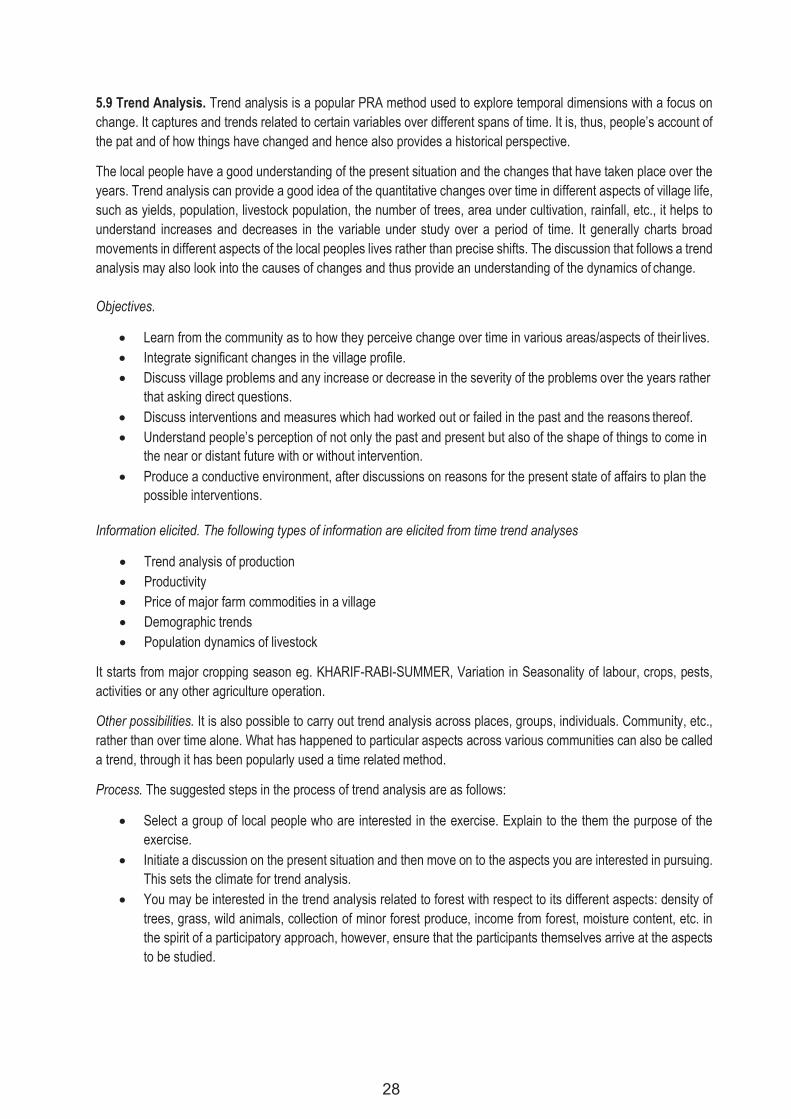
28
5.9 Trend Analysis. Trend analysis is a popular PRA method used to explore temporal dimensions with a focus on change. It captures and trends related to certain variables over different spans of time. It is, thus, people’s account of the pat and of how things have changed and hence also provides a historical perspective.
The local people have a good understanding of the present situation and the changes that have taken place over the years. Trend analysis can provide a good idea of the quantitative changes over time in different aspects of village life, such as yields, population, livestock population, the number of trees, area under cultivation, rainfall, etc., it helps to understand increases and decreases in the variable under study over a period of time. It generally charts broad movements in different aspects of the local peoples lives rather than precise shifts. The discussion that follows a trend analysis may also look into the causes of changes and thus provide an understanding of the dynamics of change.
Objectives.
Learn from the community as to how they perceive change over time in various areas/aspects of their lives. Integrate significant changes in the village profile. Discuss village problems and any increase or decrease in the severity of the problems over the years rather
that asking direct questions. Discuss interventions and measures which had worked out or failed in the past and the reasons thereof. Understand people’s perception of not only the past and present but also of the shape of things to come in
the near or distant future with or without intervention. Produce a conductive environment, after discussions on reasons for the present state of affairs to plan the
possible interventions.
Information elicited. The following types of information are elicited from time trend analyses
Trend analysis of production Productivity Price of major farm commodities in a village Demographic trends Population dynamics of livestock
It starts from major cropping season eg. KHARIF-RABI-SUMMER, Variation in Seasonality of labour, crops, pests, activities or any other agriculture operation.
Other possibilities. It is also possible to carry out trend analysis across places, groups, individuals. Community, etc., rather than over time alone. What has happened to particular aspects across various communities can also be called a trend, through it has been popularly used a time related method.
Process. The suggested steps in the process of trend analysis are as follows:
Select a group of local people who are interested in the exercise. Explain to the them the purpose of the exercise.
Initiate a discussion on the present situation and then move on to the aspects you are interested in pursuing. This sets the climate for trend analysis.
You may be interested in the trend analysis related to forest with respect to its different aspects: density of trees, grass, wild animals, collection of minor forest produce, income from forest, moisture content, etc. in the spirit of a participatory approach, however, ensure that the participants themselves arrive at the aspects to be studied.
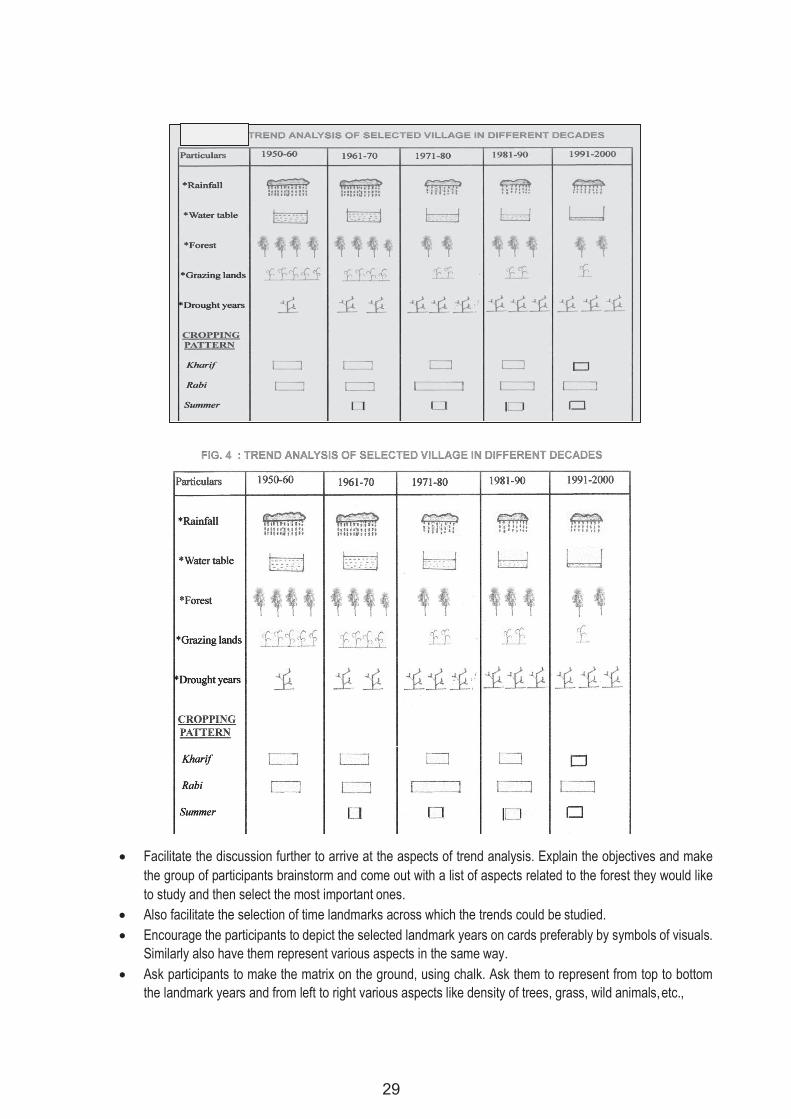
29
Facilitate the discussion further to arrive at the aspects of trend analysis. Explain the objectives and make the group of participants brainstorm and come out with a list of aspects related to the forest they would like to study and then select the most important ones.
Also facilitate the selection of time landmarks across which the trends could be studied. Encourage the participants to depict the selected landmark years on cards preferably by symbols of visuals.
Similarly also have them represent various aspects in the same way. Ask participants to make the matrix on the ground, using chalk. Ask them to represent from top to bottom
the landmark years and from left to right various aspects like density of trees, grass, wild animals, etc.,
30
Take up one of the aspects, say, and density of trees. Ask the participants to depict the situation today in the relevant cell using symbols, visuals, seeds, sticks, sand, etc., as the case may be, leave the choice to the participants.
Move to the next time landmark and so on. After the completion of one aspect, move to the next one and follow the same process till the time all the cells are filled in.
Once the diagram is ready, ask them whether they are satisfied with it or whether they would like to make any change.
Also find out whether they would like to add new aspects coming up during the process. This is the time to ask them to depict certain aspects which did not figure in their list but which you are
interested in studying. Ask the participants to explain the diagram. Encourage them to discuss their findings and reflect on them
some key questions for the discussion could include. Major trends and findings Causes of the trends What can be done? Who can play a role in it? What can the participants and local peoples do themselves? What can they do with a little assistance from outside?
Interview the diagram. Ask questions to clarify your doubts and gain an in depth Understanding the trend.
Copy the diagram onto a sheet of paper with details of the legend, the scoring system, the participants and facilitators, and the location and date. Thank the participants for their active involvement and for their time.
Triangulate the diagram and other findings generated during the discussion with others having knowledge about the topic.
Fixing landmark years. The major landmark years are quite critical to the process of trend analysis. The landmark years should be decided based on two factors. First, they should be relevant to the topic of the study to capture the change in all their details and diversity. Second, they should be friendly to the participants so that they are able to relate to the years easily. If the landmark year is such that the participants are not really familiar with it, they would not be able to give a correct picture of the situation in the year. Thereby the purpose of the exercise itself gets defeated.
There are two common practices. You can select fixed intervals-present, 10 years back, 20 years back, etc., and note down the years. Or, instead selecting fixed time intervals, you can identify the years that may have implications for the topic of trend analysis you have selected. For example, if you want to study the trends related to forests in a village in India, you could consider time landmarks such as the year of Indian independence, the year of forests, the year of the introduction of joint forest management, the present year, and any other year with some direct implication for forests. Please keep in mind, however practice you follow the decision should be taken with the active involvement of the participants.
Reflecting on trend analysis.
Facilitating discussions on the trends can bring rich dividends in terms of furthering an understanding of change. Remember that while the diagram is no doubt important. Perhaps even more important are the discussions, reflections and analyses which follow. See that such discussion and analyses are encouraged.

31
Interviewing the trend analysis provides you with an opportunity to further your understanding of the peoples perception of trends of change over the year, clarify doubts about certain abrupt changes and see how the problems can be solved in light of the aspirations of the local people.
Material required. The material required for trend analysis includes cards, chalks, chart paper, bold markers of different colours, seeds and pebbles.
Time required. Around 2-2 ½ hour should suffice for trend analysis. But the time requirement may vary with details aimed at and topics for discussion.
Scope for improvisation and complementarily with other methods. Trend analysis is a versatile PRA method that has been used in widely varied contexts and it complements other PRA methods quite well. It has also proved quite suitable for improvisation and innovation.
------------------------------------------------------------------------------------------------------------------------------------------------------ ------------------------------------------------------------------------------------------------------------------------------------------------------ ------------------------------------------------------------------------------------------------------------------------------------------------------ ------------------------------------------------------------------------------------------------------------------------------------------------------ ------------------------------------------------------------------------------------------------------------------------------------------------------ ------------------------------------------------------------------------------------------------------------------------------------------------------ ------------------------------------------------------------------------------------------------------------------------------------------------------ ------------------------------------------------------------------------------------------------------------------------------------------------------ ------------------------------------------------------------------------------------------------------------------------------------------------------ ------------------------------------------------------------------------------------------------------------------------------------------------------ ------------------------------------------------------------------------------------------------------------------------------------------------------ ------------------------------------------------------------------------------------------------------------------------------------------------------ ------------------------------------------------------------------------------------------------------------------------------------------------------ ------------------------------------------------------------------------------------------------------------------------------------------------------ ------------------------------------------------------------------------------------------------------------------------------------------------------ ------------------------------------------------------------------------------------------------------------------------------------------------------ ------------------------------------------------------------------------------------------------------------------------------------------------------ ------------------------------------------------------------------------------------------------------------------------------------------------------ ------------------------------------------------------------------------------------------------------------------------------------------------------ ------------------------------------------------------------------------------------------------------------------------------------------------------ ------------------------------------------------------------------------------------------------------------------------------------------------------ ------------------------------------------------------------------------------------------------------------------------------------------------------ ------------------------------------------------------------------------------------------------------------------------------------------------------ ------------------------------------------------------------------------------------------------------------------------------------------------------ ------------------------------------------------------------------------------------------------------------------------------------------------------ ------------------------------------------------------------------------------------------------------------------------------------------------------ ------------------------------------------------------------------------------------------------------------------------------------------------------ ------------------------------------------------------------------------------------------------------------------------------------------------------ ------------------------------------------------------------------------------------------------------------------------------------------------------ ------------------------------------------------------------------------------------------------------------------------------------------------------ ------------------------------------------------------------------------------------------------------------------------------------------------------ ------------------------------------------------------------------------------------------------------------------------------------------------------ ------------------------------------------------------------------------------------------------------------------------------------------------------ ------------------------------------------------------------------------------------------------------------------------------------------------------ ------------------------------------------------------------------------------------------------------------------------------------------------------ ------------------------------------------------------------------------------------------------------------------------------------------------------
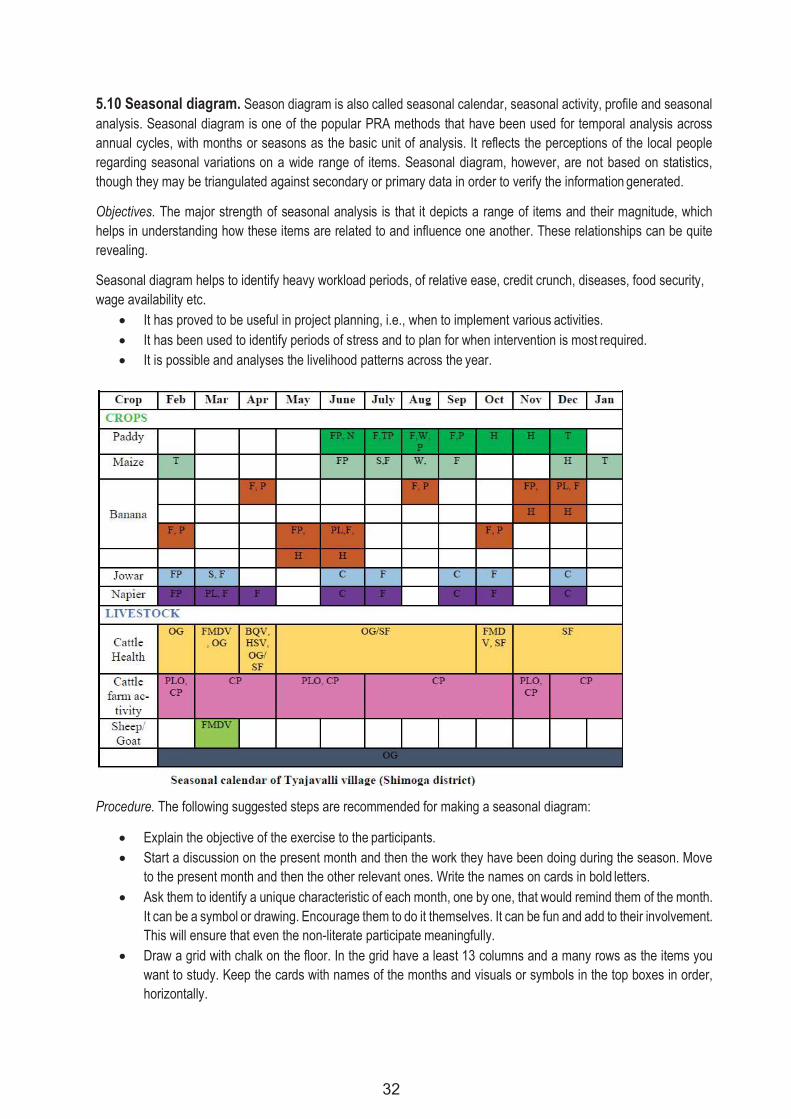
32
5.10 Seasonal diagram. Season diagram is also called seasonal calendar, seasonal activity, profile and seasonal analysis. Seasonal diagram is one of the popular PRA methods that have been used for temporal analysis across annual cycles, with months or seasons as the basic unit of analysis. It reflects the perceptions of the local people regarding seasonal variations on a wide range of items. Seasonal diagram, however, are not based on statistics, though they may be triangulated against secondary or primary data in order to verify the information generated.
Objectives. The major strength of seasonal analysis is that it depicts a range of items and their magnitude, which helps in understanding how these items are related to and influence one another. These relationships can be quite revealing.
Seasonal diagram helps to identify heavy workload periods, of relative ease, credit crunch, diseases, food security, wage availability etc.
It has proved to be useful in project planning, i.e., when to implement various activities. It has been used to identify periods of stress and to plan for when intervention is most required. It is possible and analyses the livelihood patterns across the year.
Procedure. The following suggested steps are recommended for making a seasonal diagram:
Explain the objective of the exercise to the participants. Start a discussion on the present month and then the work they have been doing during the season. Move
to the present month and then the other relevant ones. Write the names on cards in bold letters. Ask them to identify a unique characteristic of each month, one by one, that would remind them of the month.
It can be a symbol or drawing. Encourage them to do it themselves. It can be fun and add to their involvement. This will ensure that even the non-literate participate meaningfully.
Draw a grid with chalk on the floor. In the grid have a least 13 columns and a many rows as the items you want to study. Keep the cards with names of the months and visuals or symbols in the top boxes in order, horizontally.
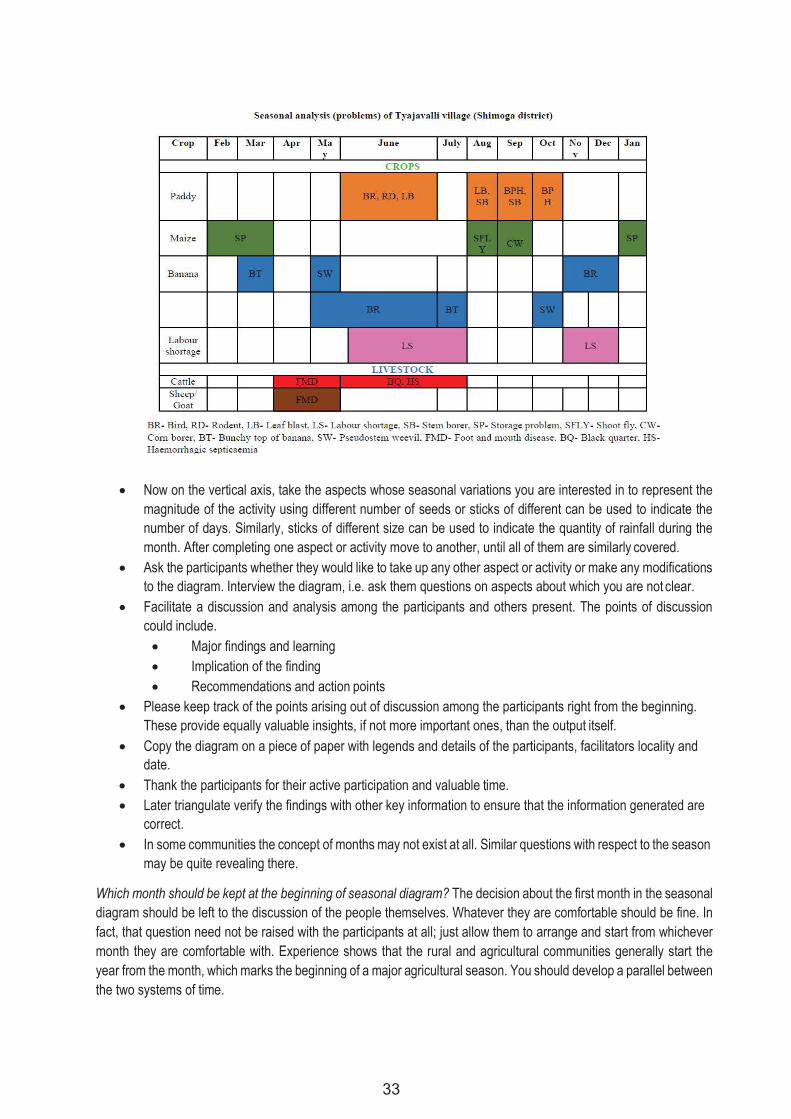
33
Now on the vertical axis, take the aspects whose seasonal variations you are interested in to represent the magnitude of the activity using different number of seeds or sticks of different can be used to indicate the number of days. Similarly, sticks of different size can be used to indicate the quantity of rainfall during the month. After completing one aspect or activity move to another, until all of them are similarly covered.
Ask the participants whether they would like to take up any other aspect or activity or make any modifications to the diagram. Interview the diagram, i.e. ask them questions on aspects about which you are not clear.
Facilitate a discussion and analysis among the participants and others present. The points of discussion could include. Major findings and learning Implication of the finding Recommendations and action points
Please keep track of the points arising out of discussion among the participants right from the beginning. These provide equally valuable insights, if not more important ones, than the output itself.
Copy the diagram on a piece of paper with legends and details of the participants, facilitators locality and date.
Thank the participants for their active participation and valuable time. Later triangulate verify the findings with other key information to ensure that the information generated are
correct. In some communities the concept of months may not exist at all. Similar questions with respect to the season
may be quite revealing there.
Which month should be kept at the beginning of seasonal diagram? The decision about the first month in the seasonal diagram should be left to the discussion of the people themselves. Whatever they are comfortable should be fine. In fact, that question need not be raised with the participants at all; just allow them to arrange and start from whichever month they are comfortable with. Experience shows that the rural and agricultural communities generally start the year from the month, which marks the beginning of a major agricultural season. You should develop a parallel between the two systems of time.
34
Where to make the seasonal diagram: on the ground or on paper? Seasonal diagrams done on the ground with chalks, seeds, powder, symbols, sticks, etc., have several advantages: like providing more space for people to participate, providing flexibility for change if desired, and enabling everyone to see what is happening and to contribute meaningfully. Floors with square or rectangular tiles are even useful as they save you the burden or making the grids.
Symbols and visuals. While working with largely non-literate communities’ symbols are most commonly used. But even with literate communities symbols are useful. Experience has shown that people are quick to find something unique with which to represent the month. Symbols or diagrams used commonly include:
Fruits and crops unique to the month Equipment, work, clothing, games, etc., unique to the month Unique items or articles associated with the festivals falling during the month, etc. Seasonal aspects, e.g. rain snow, sun etc.
Material required. Seeds, cards, marker pens, chalk of different colours and other locally available materials like twigs pebbles, etc., should suffice.
Time required. The time required for doing a seasonal diagram may vary depending on a host of factors, including the topic, interest of the participants, depth of information and analysis aimed at two to three hours,. However, should be sufficient.
Scope for improvisation and complementarily with other methods. Improvisation, creativity and flexibility are the hallmarks of PRA methods and seasonal diagram is no exception.
Seasonal calendar. It shows the seasonal patterns in rural areas related to rainfall, farming practices, employment etc over the months in a year.
------------------------------------------------------------------------------------------------------------------------------------------------------ ------------------------------------------------------------------------------------------------------------------------------------------------------ ------------------------------------------------------------------------------------------------------------------------------------------------------ ------------------------------------------------------------------------------------------------------------------------------------------------------ ------------------------------------------------------------------------------------------------------------------------------------------------------ ------------------------------------------------------------------------------------------------------------------------------------------------------ ------------------------------------------------------------------------------------------------------------------------------------------------------ ------------------------------------------------------------------------------------------------------------------------------------------------------ ------------------------------------------------------------------------------------------------------------------------------------------------------ ------------------------------------------------------------------------------------------------------------------------------------------------------ ------------------------------------------------------------------------------------------------------------------------------------------------------ ------------------------------------------------------------------------------------------------------------------------------------------------------ ------------------------------------------------------------------------------------------------------------------------------------------------------ ------------------------------------------------------------------------------------------------------------------------------------------------------ ------------------------------------------------------------------------------------------------------------------------------------------------------
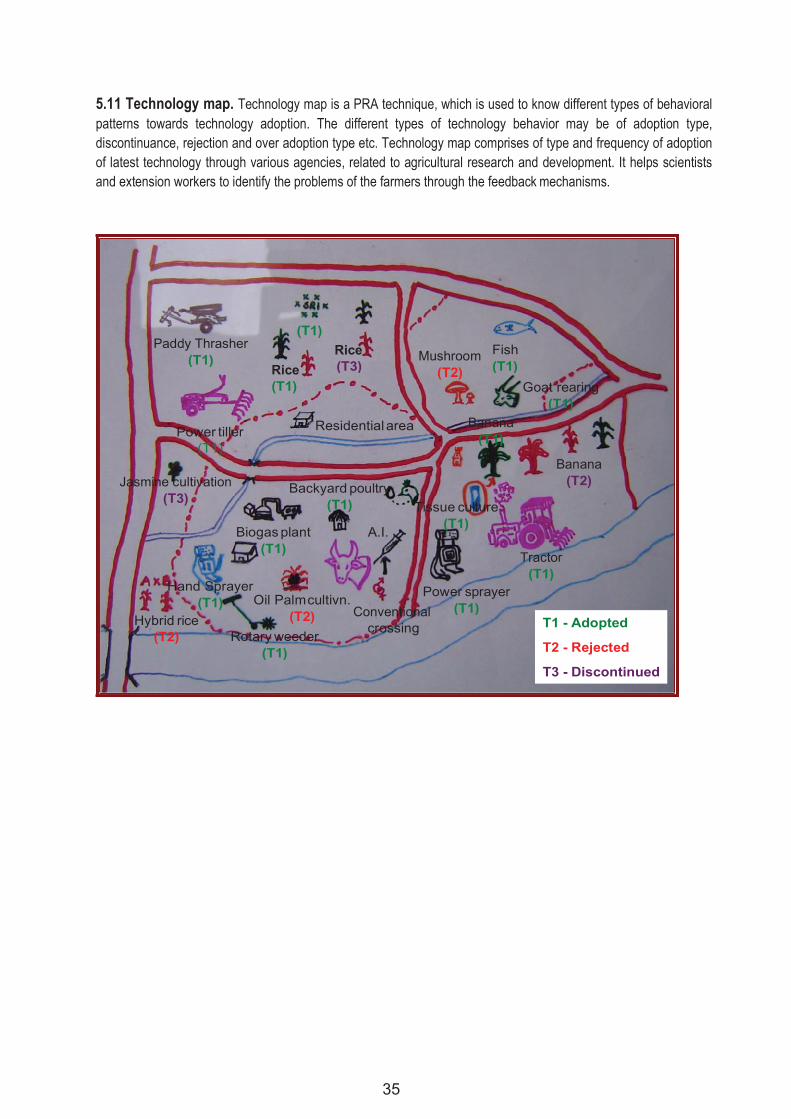
35
(T1) Paddy Thrasher Rice Fish
(T1) (T3) Mushroom
(T1)
Rice (T2) (T1) Goat rearing
(T1)
Power tiller Residential area Banana
(T1) (T1)
Banana Jasmine cultivation Backyard poultry (T2)
(T3) (T1) Tissue culture
Biogas plant A.I. (T1)
(T1)
Tractor (T1)
Hand Sprayer Power sprayer (T1) Oil Palm cultivn.
Conventional (T1)
Hybrid rice (T2) crossing T1 - Adopted
(T2) Rotary weeder (T1) T2 - Rejected
T3 - Discontinued
Conventional crossing
Rotary weeder (T1)
(T2)
Power sprayer (T1)
Oil Palm cultivn. (T2)
Tractor (T1)
Hand Sprayer (T1)
Hybrid rice
Tissue culture (T1)
A.I. Biogas plant (T1)
Banana (T2)
Backyard poultry (T1)
Jasmine cultivation (T3)
Banana (T1)
Residential area Power tiller (T1)
Goat rearing (T1)
Fish (T1)
Mushroom (T2)
Rice (T3)
(T1)
Rice (T1)
Paddy Thrasher (T1)
T1 - Adopted
T2 - Rejected
T3 - Discontinued
5.11 Technology map. Technology map is a PRA technique, which is used to know different types of behavioral patterns towards technology adoption. The different types of technology behavior may be of adoption type, discontinuance, rejection and over adoption type etc. Technology map comprises of type and frequency of adoption of latest technology through various agencies, related to agricultural research and development. It helps scientists and extension workers to identify the problems of the farmers through the feedback mechanisms.
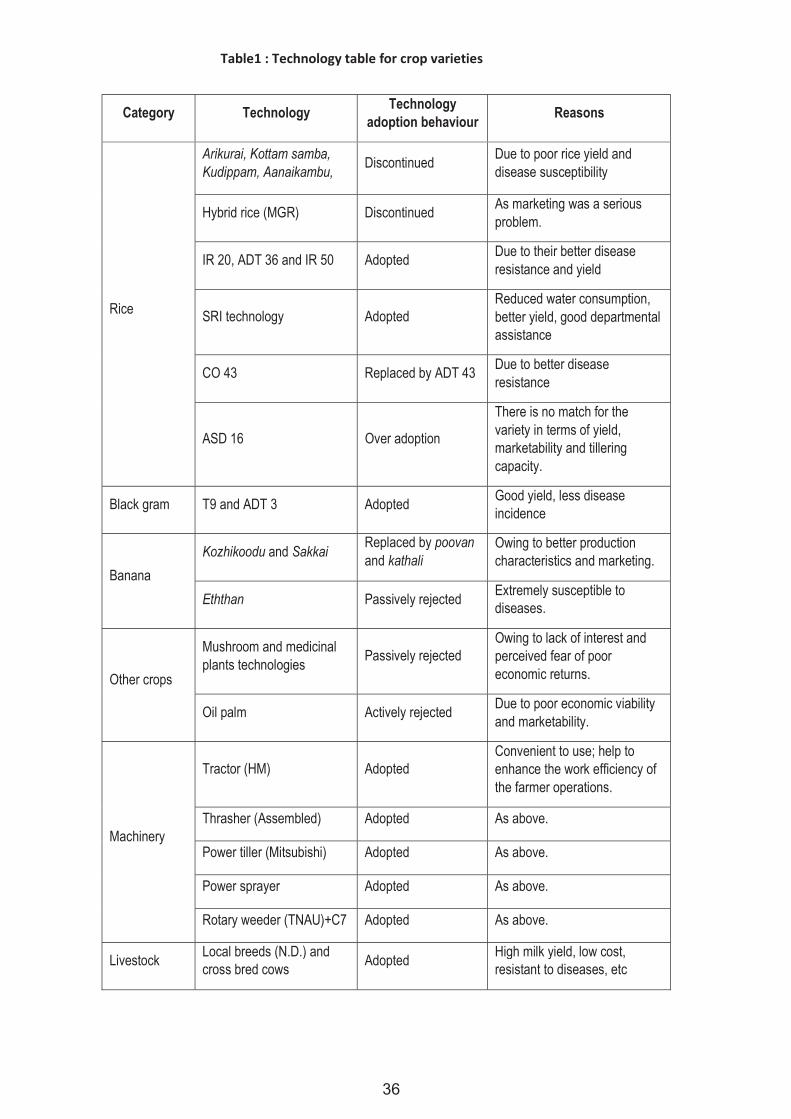
36
Table1 : Technology table for crop varieties
Category Technology Technology
adoption behaviour Reasons
Rice
Arikurai, Kottam samba, Kudippam, Aanaikambu,
Discontinued Due to poor rice yield and disease susceptibility
Hybrid rice (MGR) Discontinued As marketing was a serious problem.
IR 20, ADT 36 and IR 50 Adopted Due to their better disease resistance and yield
SRI technology
Adopted
Reduced water consumption, better yield, good departmental assistance
CO 43 Replaced by ADT 43 Due to better disease resistance
ASD 16
Over adoption
There is no match for the variety in terms of yield, marketability and tillering capacity.
Black gram T9 and ADT 3 Adopted Good yield, less disease incidence
Banana
Kozhikoodu and Sakkai Replaced by poovan and kathali
Owing to better production characteristics and marketing.
Eththan Passively rejected Extremely susceptible to diseases.
Other crops
Mushroom and medicinal plants technologies
Passively rejected
Owing to lack of interest and perceived fear of poor economic returns.
Oil palm Actively rejected Due to poor economic viability and marketability.
Machinery
Tractor (HM)
Adopted
Convenient to use; help to enhance the work efficiency of the farmer operations.
Thrasher (Assembled) Adopted As above.
Power tiller (Mitsubishi) Adopted As above.
Power sprayer Adopted As above.
Rotary weeder (TNAU)+C7 Adopted As above.
Livestock Local breeds (N.D.) and cross bred cows
Adopted High milk yield, low cost, resistant to diseases, etc
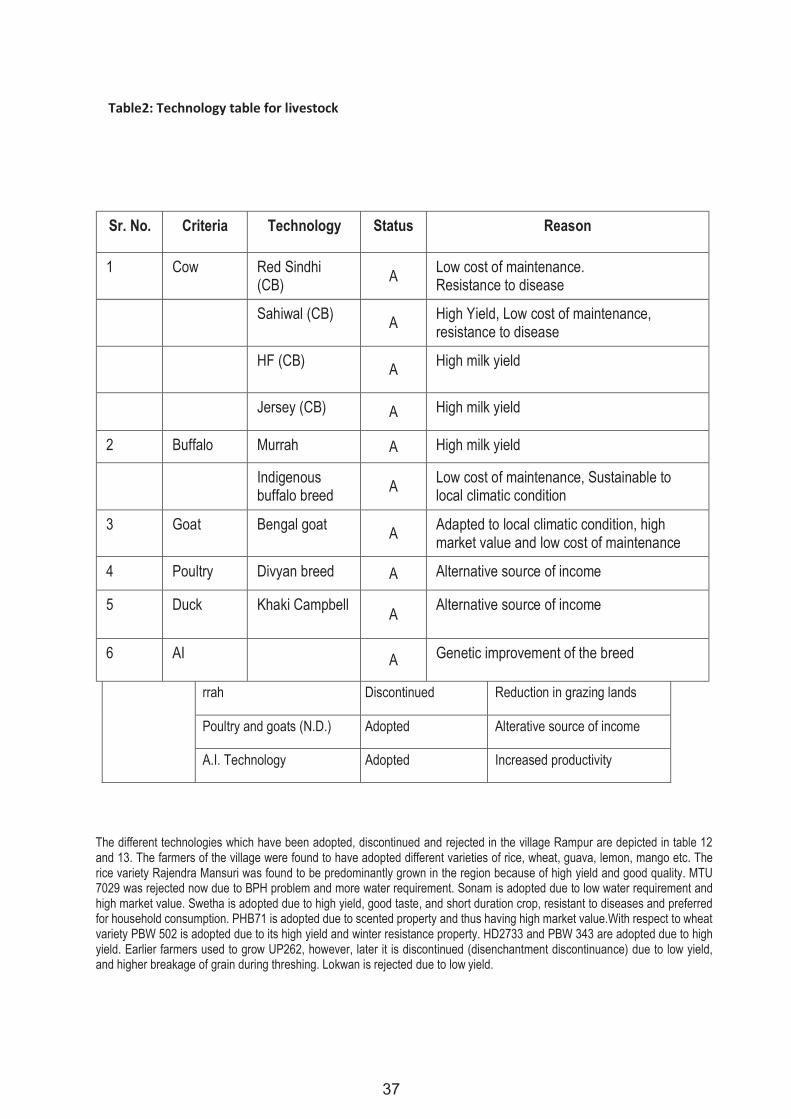
37
Table2: Technology table for livestock
Sr. No. Criteria Technology Status Reason
1 Cow Red Sindhi (CB) A
Low cost of maintenance. Resistance to disease
Sahiwal (CB) A
High Yield, Low cost of maintenance, resistance to disease
HF (CB) A High milk yield
Jersey (CB) A High milk yield
2 Buffalo Murrah A High milk yield
Indigenous buffalo breed
A Low cost of maintenance, Sustainable to local climatic condition
3 Goat Bengal goat A
Adapted to local climatic condition, high market value and low cost of maintenance
4 Poultry Divyan breed A Alternative source of income
5 Duck Khaki Campbell A
Alternative source of income
6 AI A Genetic improvement of the breed
rrah Discontinued Reduction in grazing lands
Poultry and goats (N.D.) Adopted Alterative source of income
A.I. Technology Adopted Increased productivity
The different technologies which have been adopted, discontinued and rejected in the village Rampur are depicted in table 12 and 13. The farmers of the village were found to have adopted different varieties of rice, wheat, guava, lemon, mango etc. The rice variety Rajendra Mansuri was found to be predominantly grown in the region because of high yield and good quality. MTU 7029 was rejected now due to BPH problem and more water requirement. Sonam is adopted due to low water requirement and high market value. Swetha is adopted due to high yield, good taste, and short duration crop, resistant to diseases and preferred for household consumption. PHB71 is adopted due to scented property and thus having high market value.With respect to wheat variety PBW 502 is adopted due to its high yield and winter resistance property. HD2733 and PBW 343 are adopted due to high yield. Earlier farmers used to grow UP262, however, later it is discontinued (disenchantment discontinuance) due to low yield, and higher breakage of grain during threshing. Lokwan is rejected due to low yield.
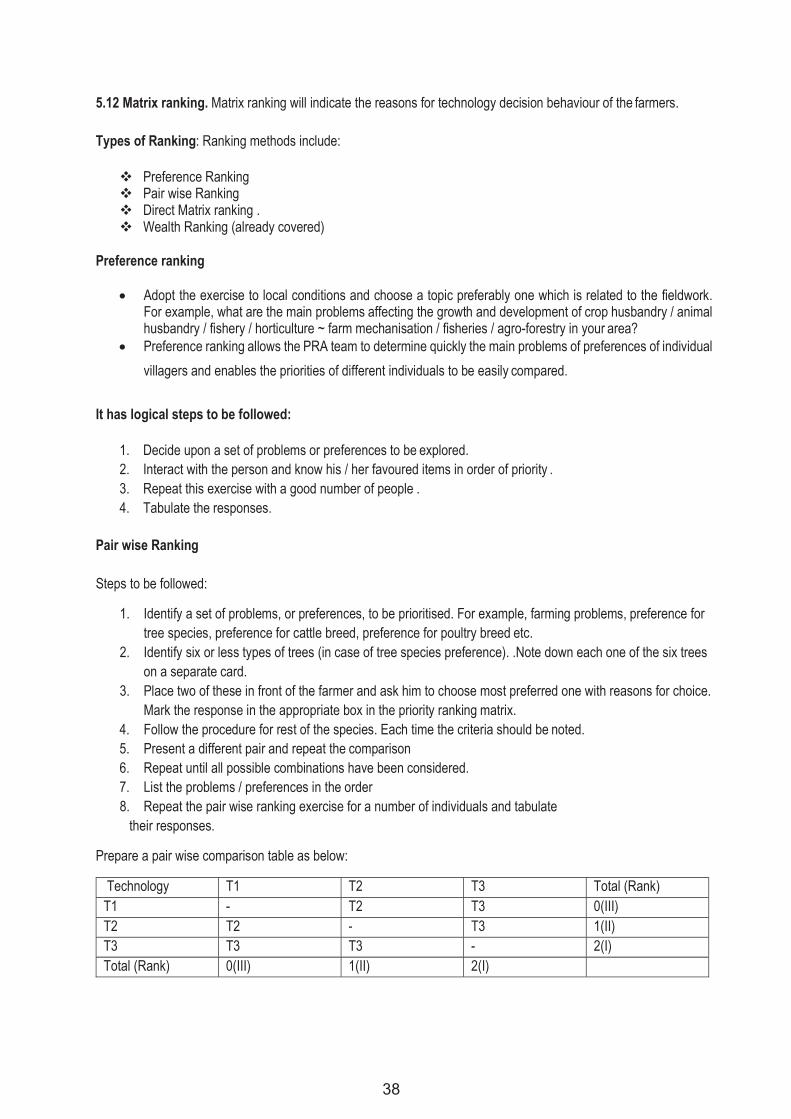
38
5.12 Matrix ranking. Matrix ranking will indicate the reasons for technology decision behaviour of the farmers.
Types of Ranking: Ranking methods include:
Preference Ranking Pair wise Ranking Direct Matrix ranking . Wealth Ranking (already covered)
Preference ranking
Adopt the exercise to local conditions and choose a topic preferably one which is related to the fieldwork.
For example, what are the main problems affecting the growth and development of crop husbandry / animal husbandry / fishery / horticulture ~ farm mechanisation / fisheries / agro-forestry in your area?
Preference ranking allows the PRA team to determine quickly the main problems of preferences of individual
villagers and enables the priorities of different individuals to be easily compared.
It has logical steps to be followed:
1. Decide upon a set of problems or preferences to be explored. 2. Interact with the person and know his / her favoured items in order of priority . 3. Repeat this exercise with a good number of people . 4. Tabulate the responses.
Pair wise Ranking
Steps to be followed:
1. Identify a set of problems, or preferences, to be prioritised. For example, farming problems, preference for tree species, preference for cattle breed, preference for poultry breed etc.
2. Identify six or less types of trees (in case of tree species preference). .Note down each one of the six trees on a separate card.
3. Place two of these in front of the farmer and ask him to choose most preferred one with reasons for choice. Mark the response in the appropriate box in the priority ranking matrix.
4. Follow the procedure for rest of the species. Each time the criteria should be noted. 5. Present a different pair and repeat the comparison 6. Repeat until all possible combinations have been considered. 7. List the problems / preferences in the order 8. Repeat the pair wise ranking exercise for a number of individuals and tabulate
their responses.
Prepare a pair wise comparison table as below:
Technology T1 T2 T3 Total (Rank) T1 - T2 T3 0(III) T2 T2 - T3 1(II) T3 T3 T3 - 2(I) Total (Rank) 0(III) 1(II) 2(I)
39
Matrix Ranking
Scoring and ranking, especially using matrices, for systematic comparison of technologies according to locally
generated criteria. Various matrix rankings and scoring are used to understand farmers' decision-making processes,
comparing preferences for different technological options between individuals and between different groups and
eliciting decision criteriae. Specific criterion or reason related a specific behavioural decision like adoption,
discontinuance, over adoption, ejection, passive rejection, disenchantment discontinuance etc., is also called Direct
Matrix ranking.
Purpose of Matrix Ranking .
Matrix ranking has been used by researchers for various purposes:
planning
institution ranking,
livestock preferences,
fodder preferences,
constraints and wild fodder,
disease issues,
animal losses,
problem and solution ranking,
success ranking
household tasks and livestock
A number of variables can be ranked and scored by using a matrix.
Matrices enable a range of different items to be assessed against selected criteria
Preferences, attitudes and priorities of farmers towards a particular thing (crop; varieties,
tree spices, vegetables, livestock categories, and soil) and the reasons for the same can be known by matrix ranking
Historical matrices are used to analyse how situation has changed over time and
indicators of that change.
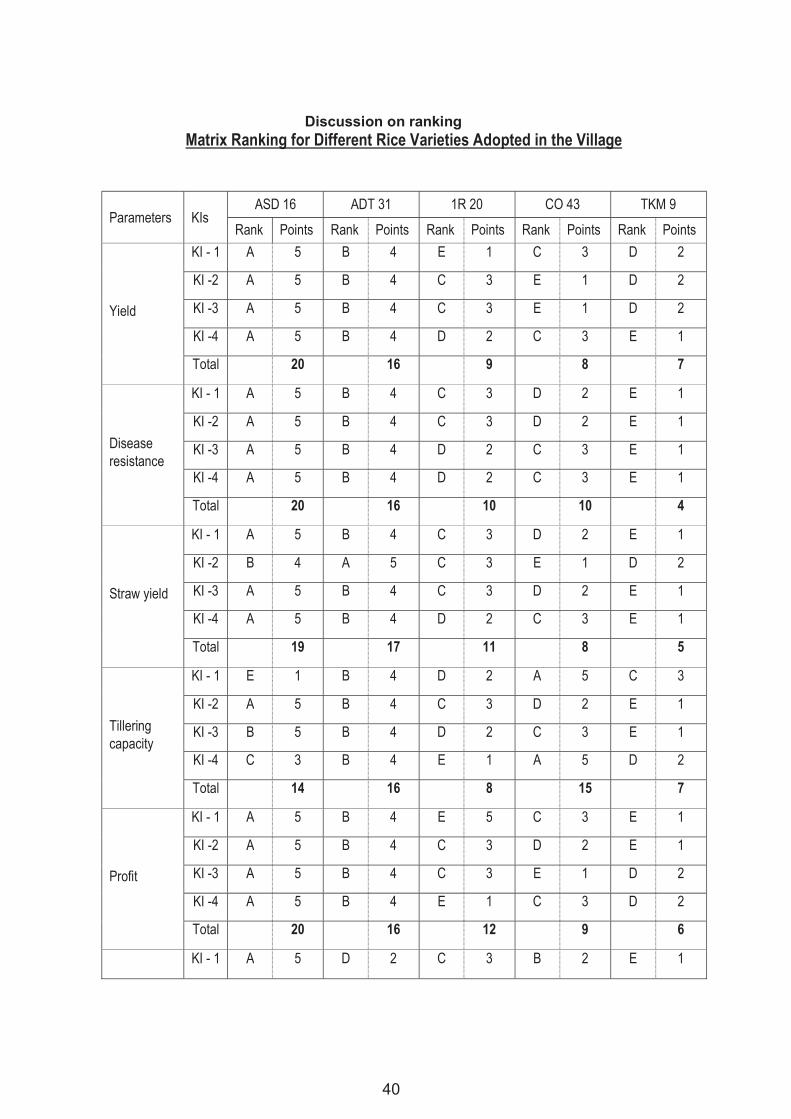
40
Discussion on ranking Matrix Ranking for Different Rice Varieties Adopted in the Village
Parameters
KIs
ASD 16 ADT 31 1R 20 CO 43 TKM 9
Rank Points Rank Points Rank Points Rank Points Rank Points
Yield
KI - 1 A 5 B 4 E 1 C 3 D 2
KI -2 A 5 B 4 C 3 E 1 D 2
KI -3 A 5 B 4 C 3 E 1 D 2
KI -4 A 5 B 4 D 2 C 3 E 1
Total 20 16 9 8 7
Disease resistance
KI - 1 A 5 B 4 C 3 D 2 E 1
KI -2 A 5 B 4 C 3 D 2 E 1
KI -3 A 5 B 4 D 2 C 3 E 1
KI -4 A 5 B 4 D 2 C 3 E 1
Total 20 16 10 10 4
Straw yield
KI - 1 A 5 B 4 C 3 D 2 E 1
KI -2 B 4 A 5 C 3 E 1 D 2
KI -3 A 5 B 4 C 3 D 2 E 1
KI -4 A 5 B 4 D 2 C 3 E 1
Total 19 17 11 8 5
Tillering capacity
KI - 1 E 1 B 4 D 2 A 5 C 3
KI -2 A 5 B 4 C 3 D 2 E 1
KI -3 B 5 B 4 D 2 C 3 E 1
KI -4 C 3 B 4 E 1 A 5 D 2
Total 14 16 8 15 7
Profit
KI - 1 A 5 B 4 E 5 C 3 E 1
KI -2 A 5 B 4 C 3 D 2 E 1
KI -3 A 5 B 4 C 3 E 1 D 2
KI -4 A 5 B 4 E 1 C 3 D 2
Total 20 16 12 9 6
KI - 1 A 5 D 2 C 3 B 2 E 1
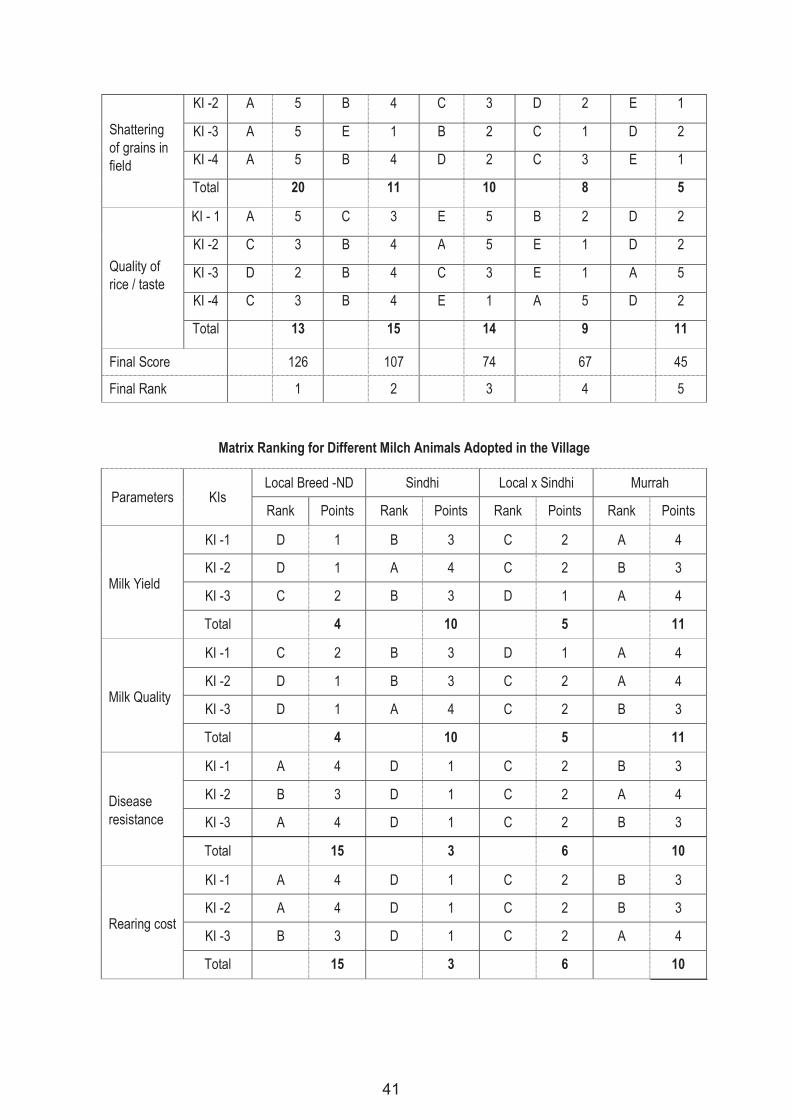
41
Shattering of grains in field
KI -2 A 5 B 4 C 3 D 2 E 1
KI -3 A 5 E 1 B 2 C 1 D 2
KI -4 A 5 B 4 D 2 C 3 E 1
Total 20 11 10 8 5
Quality of rice / taste
KI - 1 A 5 C 3 E 5 B 2 D 2
KI -2 C 3 B 4 A 5 E 1 D 2
KI -3 D 2 B 4 C 3 E 1 A 5
KI -4 C 3 B 4 E 1 A 5 D 2
Total 13 15 14 9 11
Final Score 126 107 74 67 45
Final Rank 1 2 3 4 5
Matrix Ranking for Different Milch Animals Adopted in the Village
Parameters
KIs
Local Breed -ND Sindhi Local x Sindhi Murrah
Rank Points Rank Points Rank Points Rank Points
Milk Yield
KI -1 D 1 B 3 C 2 A 4
KI -2 D 1 A 4 C 2 B 3
KI -3 C 2 B 3 D 1 A 4
Total 4 10 5 11
Milk Quality
KI -1 C 2 B 3 D 1 A 4
KI -2 D 1 B 3 C 2 A 4
KI -3 D 1 A 4 C 2 B 3
Total 4 10 5 11
Disease resistance
KI -1 A 4 D 1 C 2 B 3
KI -2 B 3 D 1 C 2 A 4
KI -3 A 4 D 1 C 2 B 3
Total 15 3 6 10
Rearing cost
KI -1 A 4 D 1 C 2 B 3
KI -2 A 4 D 1 C 2 B 3
KI -3 B 3 D 1 C 2 A 4
Total 15 3 6 10

42
Cost of the Animal
KI -1 A 4 D 1 C 2 B 3
KI -2 A 4 D 1 B 3 C 2
KI -3 A 4 D 1 B 3 C 2
Total 12 3 8 7
Final Score 50 29 30 49
Final Rank 1 4 3 2
------------------------------------------------------------------------------------------------------------------------------------------------------ ------------------------------------------------------------------------------------------------------------------------------------------------------ ------------------------------------------------------------------------------------------------------------------------------------------------------ ------------------------------------------------------------------------------------------------------------------------------------------------------ ------------------------------------------------------------------------------------------------------------------------------------------------------ ------------------------------------------------------------------------------------------------------------------------------------------------------ ------------------------------------------------------------------------------------------------------------------------------------------------------ ------------------------------------------------------------------------------------------------------------------------------------------------------ ------------------------------------------------------------------------------------------------------------------------------------------------------ ------------------------------------------------------------------------------------------------------------------------------------------------------ ------------------------------------------------------------------------------------------------------------------------------------------------------ ------------------------------------------------------------------------------------------------------------------------------------------------------ ------------------------------------------------------------------------------------------------------------------------------------------------------- ------------------------------------------------------------------------------------------------------------------------------------------------------ ------------------------------------------------------------------------------------------------------------------------------------------------------ ------------------------------------------------------------------------------------------------------------------------------------------------------ ------------------------------------------------------------------------------------------------------------------------------------------------------ ------------------------------------------------------------------------------------------------------------------------------------------------------ ------------------------------------------------------------------------------------------------------------------------------------------------------ ------------------------------------------------------------------------------------------------------------------------------------------------------ ------------------------------------------------------------------------------------------------------------------------------------------------------ ------------------------------------------------------------------------------------------------------------------------------------------------------ ------------------------------------------------------------------------------------------------------------------------------------------------------ ------------------------------------------------------------------------------------------------------------------------------------------------------ ------------------------------------------------------------------------------------------------------------------------------------------------------ ------------------------------------------------------------------------------------------------------------------------------------------------------ ------------------------------------------------------------------------------------------------------------------------------------------------------
--------------------------------------------------------------------------------------------------------------------------- ------------------------------------------------------------------------------------------------------------------------------------------------------ ------------------------------------------------------------------------------------------------------------------------------------------------------ ------------------------------------------------------------------------------------------------------------------------------------------------------
43
5.13 Consequence diagram. Technological consequences caused by a technology to an individual / social system as a result of adoption or rejection of a technology needs to be studied, the same is achieved through technology assessment discussed in the previous chapter, and these are also called Impact diagrams. They need to be mapped as a flow diagram discussed in the illustration below:
Purpose
Consequence diagram helps to know the various changes which a technology can. cause among the fanners. This
will be useful in predicting the consequences of similar technologies so that positive consequences could be promoted
and negative consequences could be avoided or minimised. This will help the extension worker to prepare extension
strategies cautiously. It will be a guide for researchers to incorporate factor of positive consequences and eliminate
factor of negative consequences while developing technologies.
Positive consequences may be
a) increased production or effectiveness,
b) higher income, c) more leisure, etc;
the negative consequences are
Procedure
a) greater cost of cultivation
b) more pests and diseases
c) low yields etc.,
1. Identification of technologies. The technologies for which consequences are to be assessed must be identified by discussing with the key informants and observation
2. Ask farmers for the consequences of the technology that has accrued to him after adoption of the technology
3. repeat it for better validation with other farmers, for common consequences both positive and negative.
4. Draw the consequence diagram by placing the technology in the centre of the circle drawn and placing
positive consequences on the upper side and negative consequences on the lower side of the centre box. Indicate the consequences with arrows up or down.
5. Related consequences are connected by arrows and independent consequences are kept independently.
But all consequences must be connected to the technology by arrows.
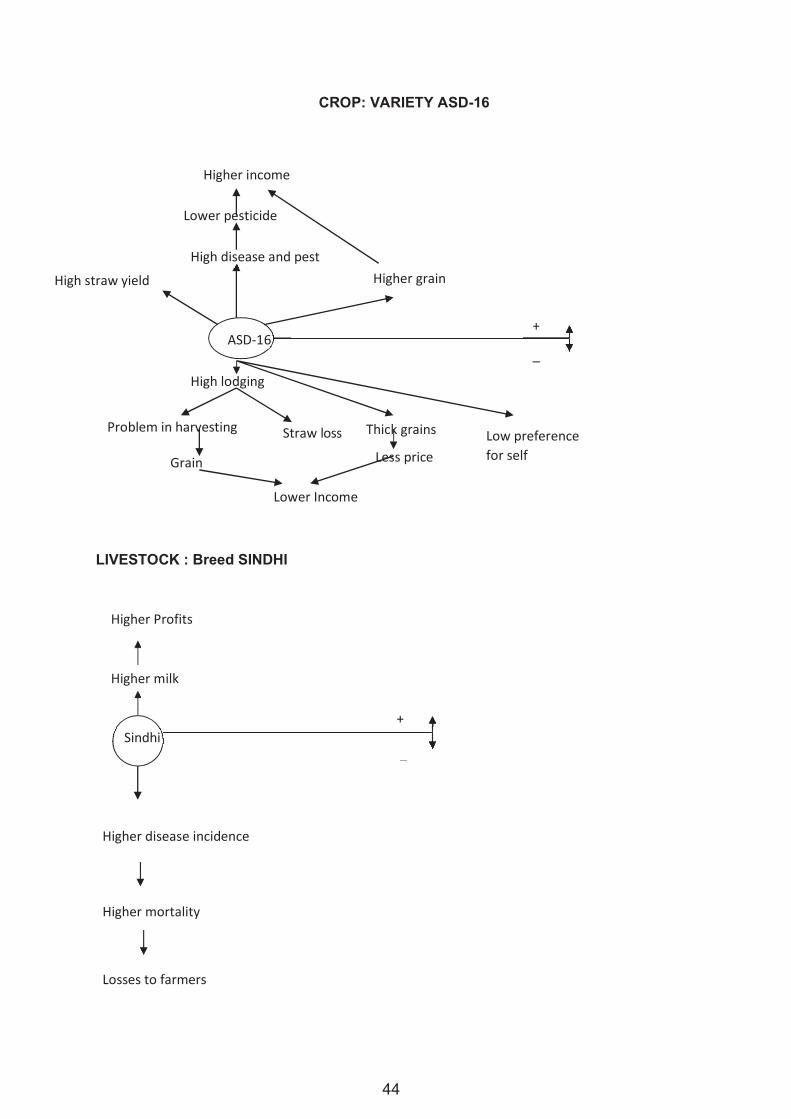
44
Higher Profits
Higher milk
+ Sindhi
_
Higher disease incidence
Higher mortality
Losses to farmers
CROP: VARIETY ASD-16
Higher income
Lower pesticide
High disease and pest
High straw yield Higher grain
+ ASD-16
_
High lodging
Problem in harvesting Straw loss
Grain
Thick grains
Less price Low preference for self
Lower Income
LIVESTOCK : Breed SINDHI
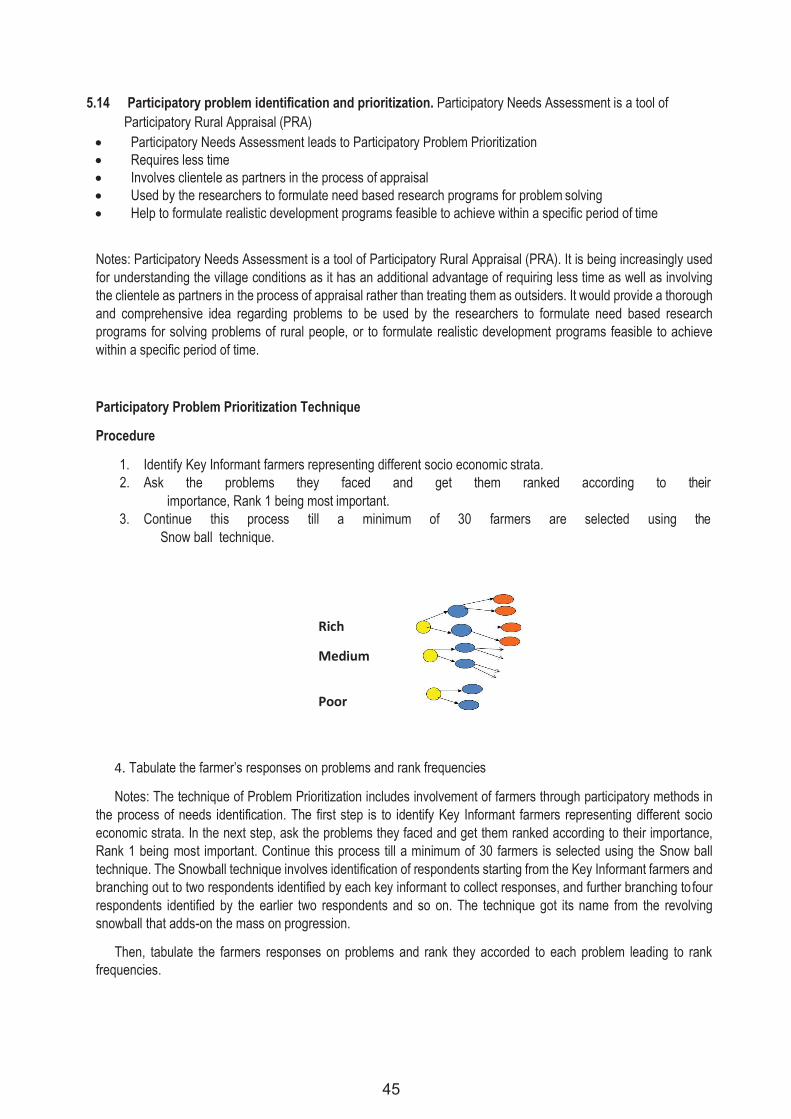
45
5.14 Participatory problem identification and prioritization. Participatory Needs Assessment is a tool of Participatory Rural Appraisal (PRA)
Participatory Needs Assessment leads to Participatory Problem Prioritization Requires less time Involves clientele as partners in the process of appraisal Used by the researchers to formulate need based research programs for problem solving Help to formulate realistic development programs feasible to achieve within a specific period of time
Notes: Participatory Needs Assessment is a tool of Participatory Rural Appraisal (PRA). It is being increasingly used for understanding the village conditions as it has an additional advantage of requiring less time as well as involving the clientele as partners in the process of appraisal rather than treating them as outsiders. It would provide a thorough and comprehensive idea regarding problems to be used by the researchers to formulate need based research programs for solving problems of rural people, or to formulate realistic development programs feasible to achieve within a specific period of time.
Participatory Problem Prioritization Technique
Procedure
1. Identify Key Informant farmers representing different socio economic strata. 2. Ask the problems they faced and get them ranked according to their
importance, Rank 1 being most important. 3. Continue this process till a minimum of 30 farmers are selected using the
Snow ball technique.
Rich
Medium
Poor
4. Tabulate the farmer’s responses on problems and rank frequencies
Notes: The technique of Problem Prioritization includes involvement of farmers through participatory methods in the process of needs identification. The first step is to identify Key Informant farmers representing different socio economic strata. In the next step, ask the problems they faced and get them ranked according to their importance, Rank 1 being most important. Continue this process till a minimum of 30 farmers is selected using the Snow ball technique. The Snowball technique involves identification of respondents starting from the Key Informant farmers and branching out to two respondents identified by each key informant to collect responses, and further branching to four respondents identified by the earlier two respondents and so on. The technique got its name from the revolving snowball that adds-on the mass on progression.
Then, tabulate the farmers responses on problems and rank they accorded to each problem leading to rank frequencies.
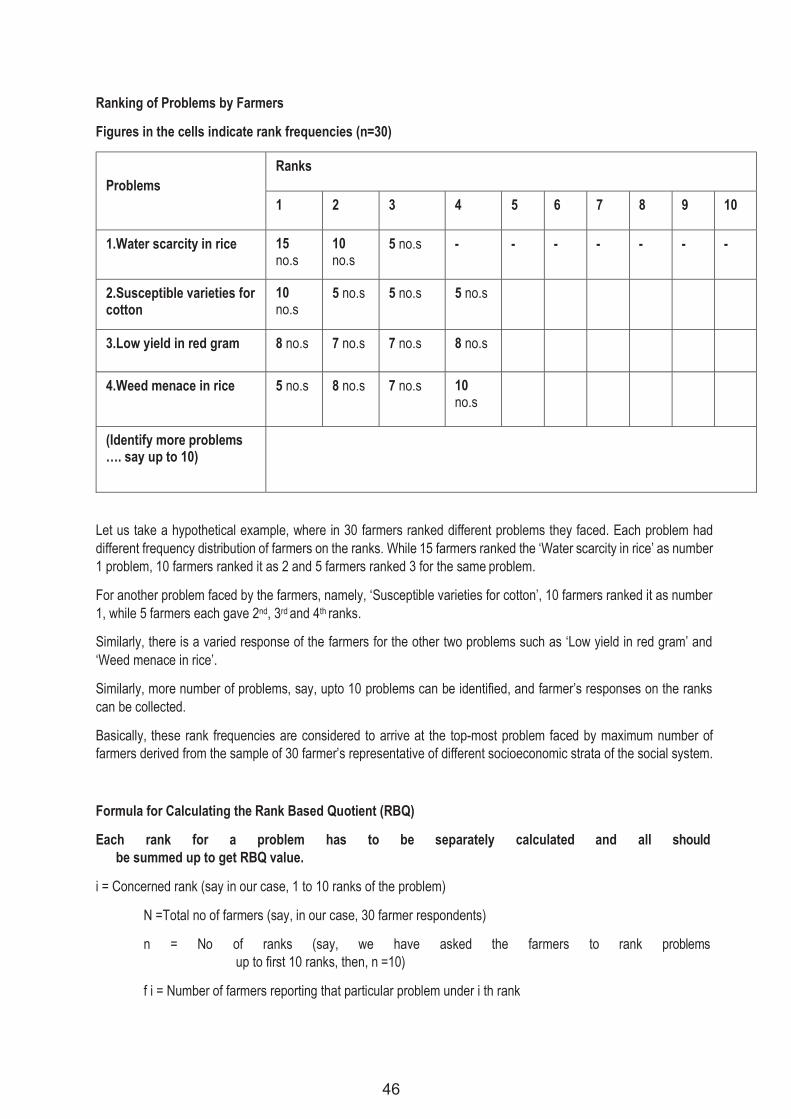
46
Ranking of Problems by Farmers
Figures in the cells indicate rank frequencies (n=30)
Problems
Ranks
1 2 3 4 5 6 7 8 9 10
1.Water scarcity in rice 15 no.s
10 no.s
5 no.s - - - - - - -
2.Susceptible varieties for cotton
10 no.s
5 no.s 5 no.s 5 no.s
3.Low yield in red gram 8 no.s 7 no.s 7 no.s 8 no.s
4.Weed menace in rice 5 no.s 8 no.s 7 no.s 10 no.s
(Identify more problems …. say up to 10)
Let us take a hypothetical example, where in 30 farmers ranked different problems they faced. Each problem had different frequency distribution of farmers on the ranks. While 15 farmers ranked the ‘Water scarcity in rice’ as number 1 problem, 10 farmers ranked it as 2 and 5 farmers ranked 3 for the same problem.
For another problem faced by the farmers, namely, ‘Susceptible varieties for cotton’, 10 farmers ranked it as number 1, while 5 farmers each gave 2nd, 3rd and 4th ranks.
Similarly, there is a varied response of the farmers for the other two problems such as ‘Low yield in red gram’ and ‘Weed menace in rice’.
Similarly, more number of problems, say, upto 10 problems can be identified, and farmer’s responses on the ranks can be collected.
Basically, these rank frequencies are considered to arrive at the top-most problem faced by maximum number of farmers derived from the sample of 30 farmer’s representative of different socioeconomic strata of the social system.
Formula for Calculating the Rank Based Quotient (RBQ)
Each rank for a problem has to be separately calculated and all should be summed up to get RBQ value.
i = Concerned rank (say in our case, 1 to 10 ranks of the problem)
N =Total no of farmers (say, in our case, 30 farmer respondents)
n = No of ranks (say, we have asked the farmers to rank problems up to first 10 ranks, then, n =10)
f i = Number of farmers reporting that particular problem under i th rank
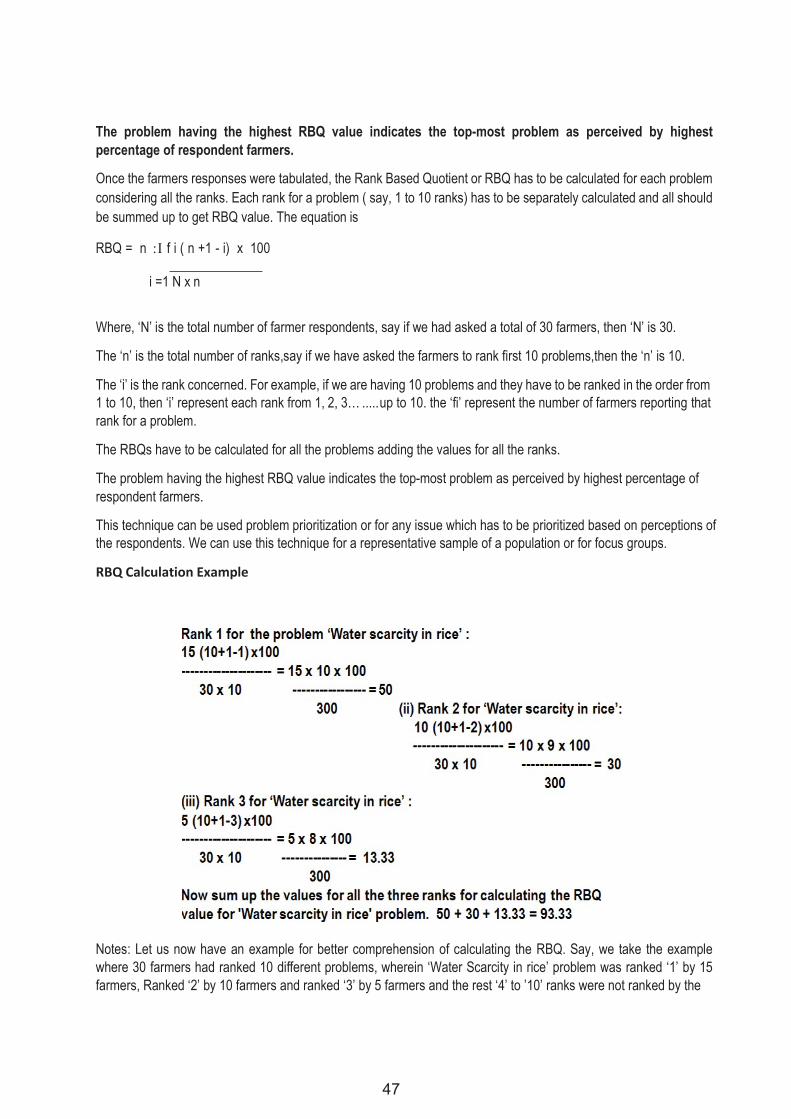
47
The problem having the highest RBQ value indicates the top-most problem as perceived by highest percentage of respondent farmers.
Once the farmers responses were tabulated, the Rank Based Quotient or RBQ has to be calculated for each problem considering all the ranks. Each rank for a problem ( say, 1 to 10 ranks) has to be separately calculated and all should be summed up to get RBQ value. The equation is
RBQ = n f i ( n +1 - i) x 100
i =1 N x n
Where, ‘N’ is the total number of farmer respondents, say if we had asked a total of 30 farmers, then ‘N’ is 30.
The ‘n’ is the total number of ranks,say if we have asked the farmers to rank first 10 problems,then the ‘n’ is 10.
The ‘i’ is the rank concerned. For example, if we are having 10 problems and they have to be ranked in the order from 1 to 10, then ‘i’ represent each rank from 1, 2, 3… ..... up to 10. the ‘fi’ represent the number of farmers reporting that rank for a problem.
The RBQs have to be calculated for all the problems adding the values for all the ranks.
The problem having the highest RBQ value indicates the top-most problem as perceived by highest percentage of respondent farmers.
This technique can be used problem prioritization or for any issue which has to be prioritized based on perceptions of the respondents. We can use this technique for a representative sample of a population or for focus groups.
RBQ Calculation Example
Notes: Let us now have an example for better comprehension of calculating the RBQ. Say, we take the example where 30 farmers had ranked 10 different problems, wherein ‘Water Scarcity in rice’ problem was ranked ‘1’ by 15 farmers, Ranked ‘2’ by 10 farmers and ranked ‘3’ by 5 farmers and the rest ‘4’ to ’10’ ranks were not ranked by the
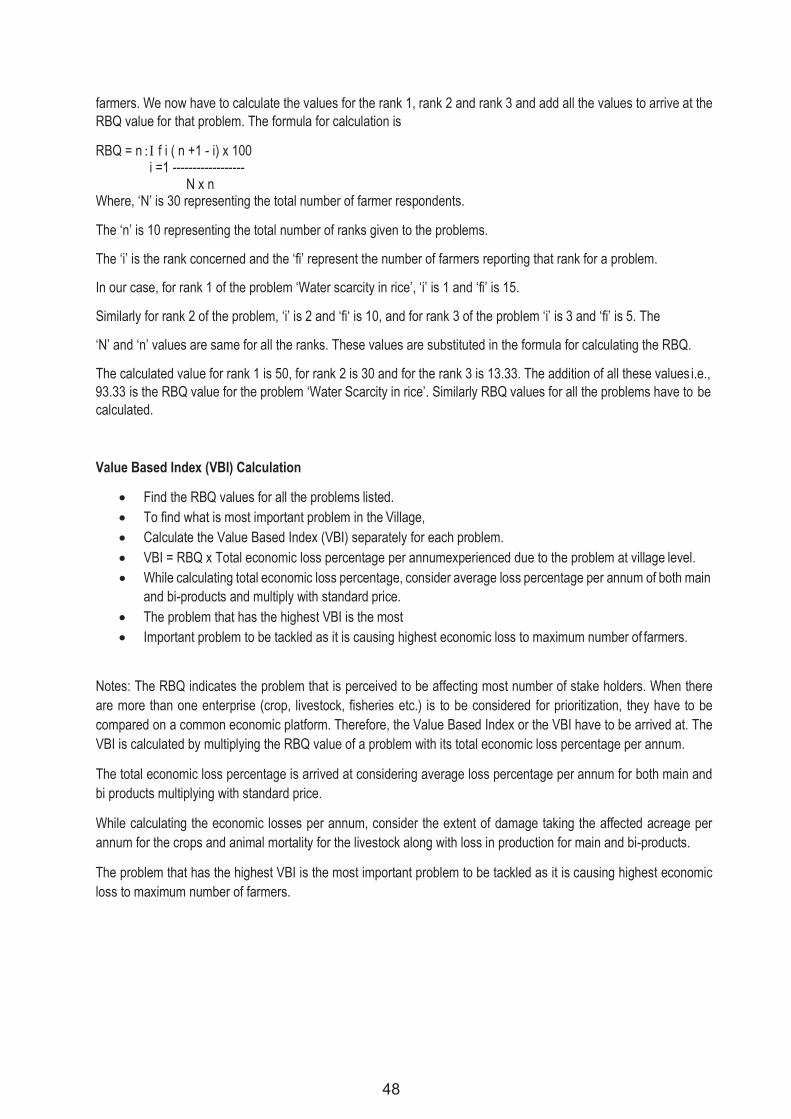
48
farmers. We now have to calculate the values for the rank 1, rank 2 and rank 3 and add all the values to arrive at the RBQ value for that problem. The formula for calculation is
RBQ = n f i ( n +1 - i) x 100 i =1 ------------------
N x n Where, ‘N’ is 30 representing the total number of farmer respondents.
The ‘n’ is 10 representing the total number of ranks given to the problems.
The ‘i’ is the rank concerned and the ‘fi’ represent the number of farmers reporting that rank for a problem.
In our case, for rank 1 of the problem ‘Water scarcity in rice’, ‘i’ is 1 and ‘fi’ is 15.
Similarly for rank 2 of the problem, ‘i’ is 2 and ‘fi‘ is 10, and for rank 3 of the problem ‘i’ is 3 and ‘fi’ is 5. The
‘N’ and ‘n’ values are same for all the ranks. These values are substituted in the formula for calculating the RBQ.
The calculated value for rank 1 is 50, for rank 2 is 30 and for the rank 3 is 13.33. The addition of all these values i.e., 93.33 is the RBQ value for the problem ‘Water Scarcity in rice’. Similarly RBQ values for all the problems have to be calculated.
Value Based Index (VBI) Calculation
Find the RBQ values for all the problems listed. To find what is most important problem in the Village, Calculate the Value Based Index (VBI) separately for each problem. VBI = RBQ x Total economic loss percentage per annumexperienced due to the problem at village level. While calculating total economic loss percentage, consider average loss percentage per annum of both main
and bi-products and multiply with standard price. The problem that has the highest VBI is the most Important problem to be tackled as it is causing highest economic loss to maximum number of farmers.
Notes: The RBQ indicates the problem that is perceived to be affecting most number of stake holders. When there are more than one enterprise (crop, livestock, fisheries etc.) is to be considered for prioritization, they have to be compared on a common economic platform. Therefore, the Value Based Index or the VBI have to be arrived at. The VBI is calculated by multiplying the RBQ value of a problem with its total economic loss percentage per annum.
The total economic loss percentage is arrived at considering average loss percentage per annum for both main and bi products multiplying with standard price.
While calculating the economic losses per annum, consider the extent of damage taking the affected acreage per annum for the crops and animal mortality for the livestock along with loss in production for main and bi-products.
The problem that has the highest VBI is the most important problem to be tackled as it is causing highest economic loss to maximum number of farmers.
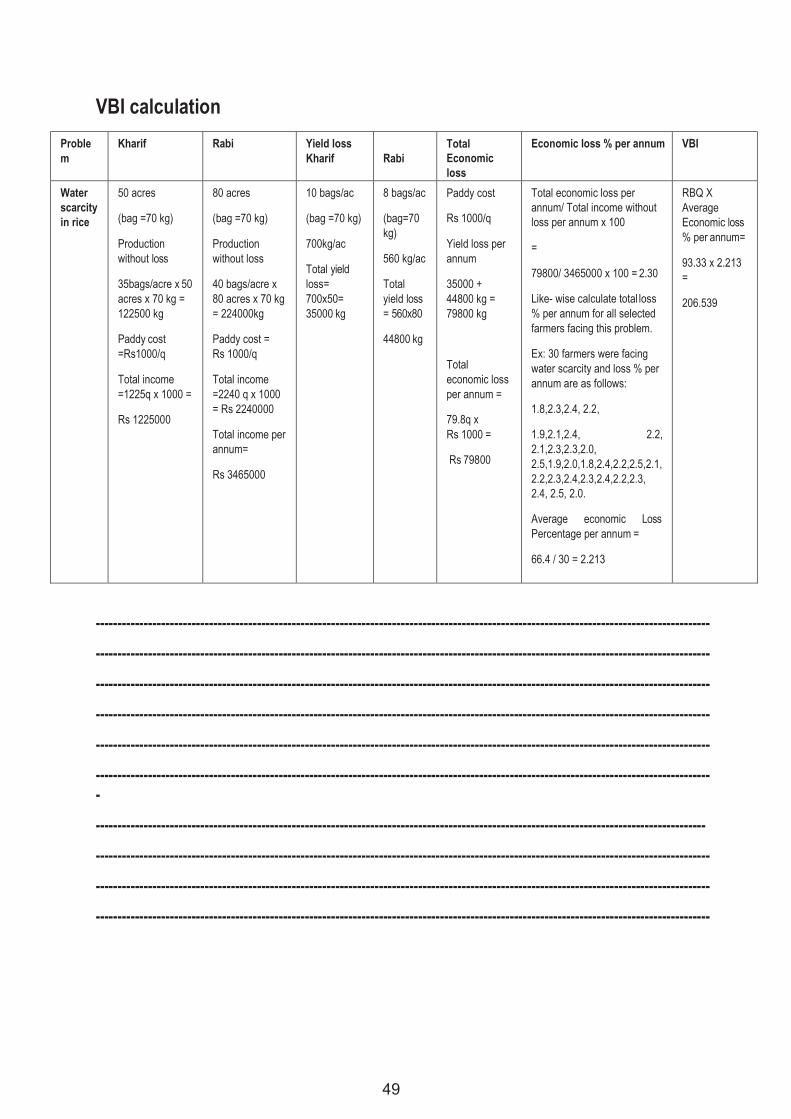
49
VBI calculation
Proble m
Kharif Rabi Yield loss Kharif
Rabi
Total Economic loss
Economic loss % per annum VBI
Water scarcity in rice
50 acres
(bag =70 kg)
Production without loss
35bags/acre x 50 acres x 70 kg = 122500 kg
Paddy cost =Rs1000/q
Total income =1225q x 1000 =
Rs 1225000
80 acres
(bag =70 kg)
Production without loss
40 bags/acre x 80 acres x 70 kg = 224000kg
Paddy cost = Rs 1000/q
Total income =2240 q x 1000 = Rs 2240000
Total income per annum=
Rs 3465000
10 bags/ac
(bag =70 kg)
700kg/ac
Total yield loss= 700x50= 35000 kg
8 bags/ac
(bag=70 kg)
560 kg/ac
Total yield loss = 560x80
44800 kg
Paddy cost
Rs 1000/q
Yield loss per annum
35000 + 44800 kg = 79800 kg
Total economic loss per annum =
79.8q x Rs 1000 =
Rs 79800
Total economic loss per annum/ Total income without loss per annum x 100
=
79800/ 3465000 x 100 = 2.30
Like- wise calculate total loss % per annum for all selected farmers facing this problem.
Ex: 30 farmers were facing water scarcity and loss % per annum are as follows:
1.8,2.3,2.4, 2.2,
1.9,2.1,2.4, 2.2, 2.1,2.3,2.3,2.0, 2.5,1.9,2.0,1.8,2.4,2.2,2.5,2.1, 2.2,2.3,2.4,2.3,2.4,2.2,2.3, 2.4, 2.5, 2.0.
Average economic Loss Percentage per annum =
66.4 / 30 = 2.213
RBQ X Average Economic loss % per annum=
93.33 x 2.213 =
206.539
---------------------------------------------------------------------------------------------------------------------------------------------
---------------------------------------------------------------------------------------------------------------------------------------------
---------------------------------------------------------------------------------------------------------------------------------------------
---------------------------------------------------------------------------------------------------------------------------------------------
---------------------------------------------------------------------------------------------------------------------------------------------
--------------------------------------------------------------------------------------------------------------------------------------------- -
--------------------------------------------------------------------------------------------------------------------------------------------
---------------------------------------------------------------------------------------------------------------------------------------------
---------------------------------------------------------------------------------------------------------------------------------------------
---------------------------------------------------------------------------------------------------------------------------------------------
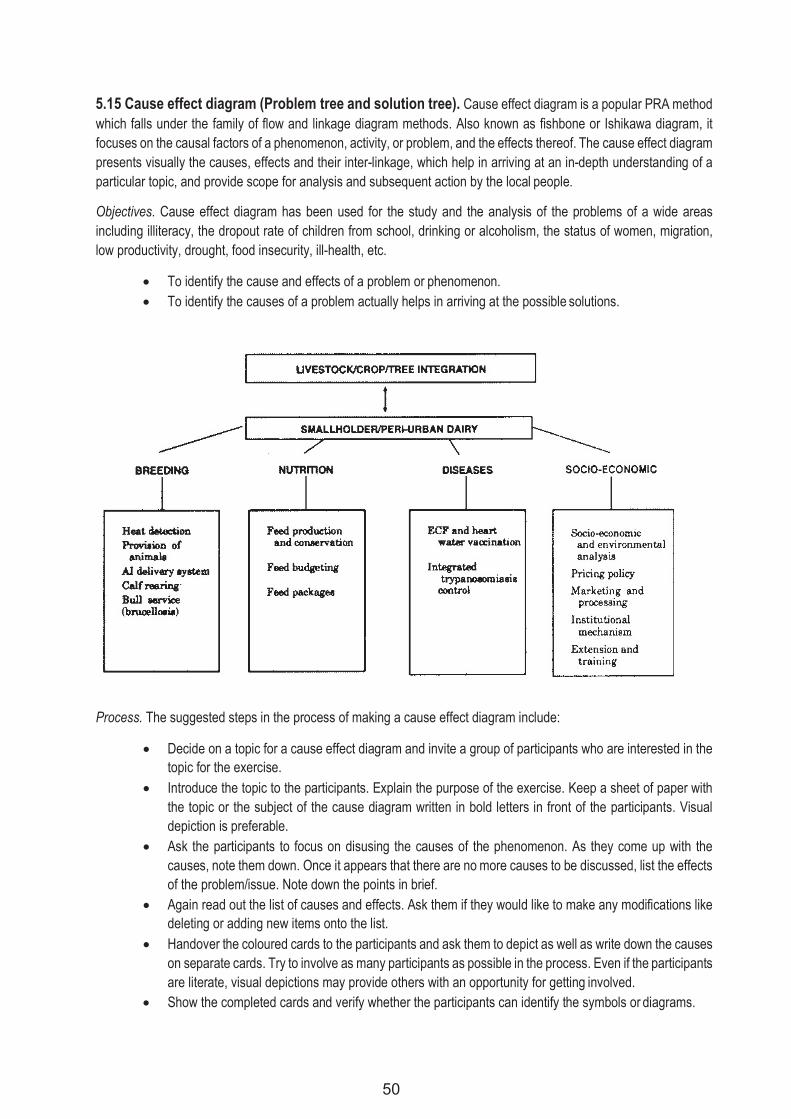
50
5.15 Cause effect diagram (Problem tree and solution tree). Cause effect diagram is a popular PRA method which falls under the family of flow and linkage diagram methods. Also known as fishbone or Ishikawa diagram, it focuses on the causal factors of a phenomenon, activity, or problem, and the effects thereof. The cause effect diagram presents visually the causes, effects and their inter-linkage, which help in arriving at an in-depth understanding of a particular topic, and provide scope for analysis and subsequent action by the local people.
Objectives. Cause effect diagram has been used for the study and the analysis of the problems of a wide areas including illiteracy, the dropout rate of children from school, drinking or alcoholism, the status of women, migration, low productivity, drought, food insecurity, ill-health, etc.
To identify the cause and effects of a problem or phenomenon. To identify the causes of a problem actually helps in arriving at the possible solutions.
Process. The suggested steps in the process of making a cause effect diagram include:
Decide on a topic for a cause effect diagram and invite a group of participants who are interested in the topic for the exercise.
Introduce the topic to the participants. Explain the purpose of the exercise. Keep a sheet of paper with the topic or the subject of the cause diagram written in bold letters in front of the participants. Visual depiction is preferable.
Ask the participants to focus on disusing the causes of the phenomenon. As they come up with the causes, note them down. Once it appears that there are no more causes to be discussed, list the effects of the problem/issue. Note down the points in brief.
Again read out the list of causes and effects. Ask them if they would like to make any modifications like deleting or adding new items onto the list.
Handover the coloured cards to the participants and ask them to depict as well as write down the causes on separate cards. Try to involve as many participants as possible in the process. Even if the participants are literate, visual depictions may provide others with an opportunity for getting involved.
Show the completed cards and verify whether the participants can identify the symbols or diagrams.
51
Repeat the same process for the effects using the other coloured cards. Put the cards with causes on one side and those with effects on the other side of the paper with the
topic written on it. Ask the participants to link the cards with chalk to show their linkages and connectivity. Listen to the discussions participants encourage in and note down the points. Once the diagram is ready, ask the participants to have a look and make alterations if required.
Note down the diagram on a sheet of paper with details.
Interview the diagram: ask questions on aspects about which you have doubts or want to get a more in-depth understanding.
Ask the participants to explain the diagram to the gathering. Later ask them to discuss the diagram and come up with their own findings and reflections. Remember that the diagram is not the end. The discussions and analysis are equally important if not more.
Thank the participants for their active participation and time. Triangulate the diagram with others in the village.
Flexibility in diagramming. There can be other ways of making a cause effect diagram. You can draw it on the ground with chalk or on paper with pencil directly. That gives you some amount of flexibility, no doubt, but it has some problems as the participant still have to write the causes and effects. People feel hesitant to erase mistakes and make any major changes. The use of cards helps them to see the linkage since cards can be physically moved and placed at various places to reveal the possible patterns. It does not involve much effort and at the worst, the lines may have to be redrawn.
Ask Why? At times simply asking causes of a problem may not really stimulate enough discussion to lead to the identification of causes. A quick way of identifying causes has been to keep a sheet of paper with the topic written in the middle and to ask the people as to why that problem is there. People start identifying various causes. You can go to the root causes by further questioning the causes identifying. On the effect side the common question can be “what happens of (the topic)?”. You can go further by asking the effects of identified effects. Depending upon the objective of the exercise, you can draw a line when you feel satisfied.
Material required. The material required may vary considerably depending upon the process. Cards of small sizes, seeds colours, markers, calks, large-sized paper, etc., are required in any case.
Time required. The time required for cause and effect diagram depends on the topic, interest of the participants scope for discussion, etc., in any cases approximately a minimum of two hours should be planned for.
Scope for improvisations and complementarily with other methods. A number of improvisations are possible with the cause effect diagram. You can give weightages or scores to the causes as well as to the effects. It given an idea about the perceived importance of the causes as well as the effects. The scoring can be done with seeds first for the causes and later for the effects as well. Ranking the causes and effects identified is another possibility. A simpler way out is to ask the participants to put the cards in a descending order so that the card on the top is the most important and the one at the bottom the least important.
------------------------------------------------------------------------------------------------------------------------------------------------------ ------------------------------------------------------------------------------------------------------------------------------------------------------ ------------------------------------------------------------------------------------------------------------------------------------------------------ ------------------------------------------------------------------------------------------------------------------------------------------------------ ------------------------------------------------------------------------------------------------------------------------------------------------------ ------------------------------------------------------------------------------------------------------------------------------------------------------ ------------------------------------------------------------------------------------------------------------------------------------------------------
52
5.16 SWOT Analysis. SWOT analysis is a systematic approach to understand the environment. SWOT is the acronym for Strengths, Weaknesses, Opportunities and Threats. An Opportunity is a favourable condition in the environment. It enables the enterprise to consolidate its position. Growing demand is an example of an opportunity. A Threat is an unfavourable condition in the environment. It creates a risk e.g. threat of growing competition. A Strength is an inherent capacity which an organization can use to gain strategic advantage over its competitors. Superior research and development facilities, for example, enable a firm to develop new products and thereby gain competitive advantage. A Weakness is an inherent limitation or constraint which creates a strategic disadvantage. For example, overdependence on single product is potentially risky.
SWOT analysis helps an enterprise in matching its strengths and weaknesses with opportunities and threat operating in the environment. An effective strategy is one that capitalizes on the opportunities through the use of strengths and neutralizes the threats by minimizing the impact of weaknesses. SWOT is generally used by organizations to analyze their internal strengths and weaknesses, and its operating environment’s opportunities and threats. It is used at preliminary stages of planning and decision making and acts as a precursor to developing a plan or finding a solution that takes into consideration many different internal and external factors. This exercise aims at maximizing the potential of the strengths and opportunities while minimizing the impact of the weaknesses and threats in order to achieve best results.
On considering the application of this technique to village, the SWOT analysis identifies the internal strengths and weaknesses of the Village as a whole and examines the external opportunities and threats that the farm business faces. The SWOT analysis helps to provide direction for the farm business and serves as a basis for the farm’s business plans. Once all of the strengths, weaknesses, opportunities and threats to the farming operation have been listed, the information should be combined and strategies developed. Draw up plans to take advantage of the strengths and opportunities, counter the threats if possible and minimize or reduce the weaknesses. Pay close attention to strengths that can help the villagers achieve their goals and objectives and use the SWOT analysis to give an overall look at the current position of the operation. Then use the analysis to plan future strategies and to manage the farming operation. Develop strategies that will strengthen the weak areas or take advantage of the strengths and opportunities. Give close attention to developing strategies that focus or capitalize on the strengths of the operation.
In terms of agricultural economy, the SWOT analysis provides a complete image of the agricultural production units and systems by studying simultaneously the internal characteristics and external influences upon them, taking into account both positive and negative variables. The SWOT analysis is used primarily to assess the situation on the ground and it is the fundamental step in drafting the development programmes.
Methodology: The SWOT analysis is based on in-depth analysis of primary and secondary data. Data analysis has been carried out in different manners for the purpose of capturing inputs from literature review, interviews of key informants, case studies, and field surveys. One of the methods that can be used in village set – up is given as follows: Conduct a meeting of the Key informants and Village leaders and giving them brief introduction describing the planning process and the agenda i.e. SWOT analysis. A few groups of 6-8 members will be made. All the participants will first be told to generate silent ideas on the placards in their groups. Once all the ideas are recorded in a group, a prioritized list is prepared for Strengths, Opportunities, Weaknesses and Threats of the village. A master list of all items receiving group votes will be created and participants will be asked to vote a final time to prioritize the master list of all of the four aspects. This way considering the final votes of all the participants, a SWOT analysis matrix can be drawn as follows:
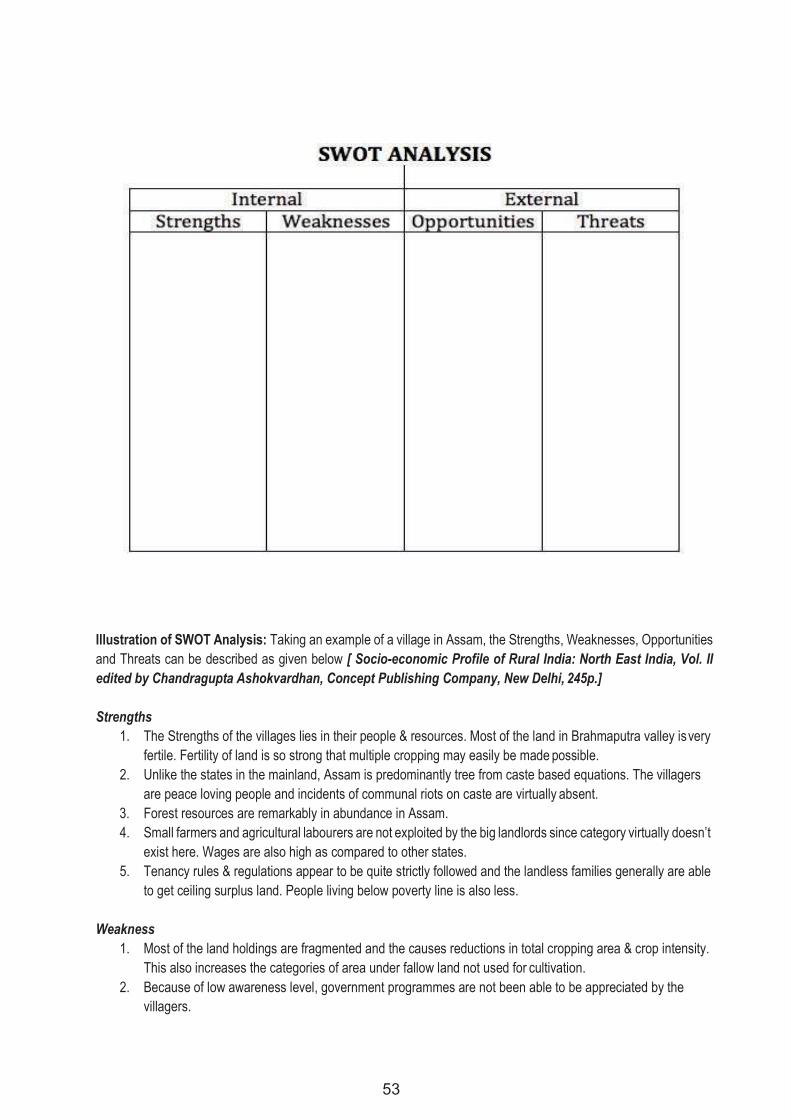
53
Illustration of SWOT Analysis: Taking an example of a village in Assam, the Strengths, Weaknesses, Opportunities and Threats can be described as given below [ Socio-economic Profile of Rural India: North East India, Vol. II edited by Chandragupta Ashokvardhan, Concept Publishing Company, New Delhi, 245p.]
Strengths
1. The Strengths of the villages lies in their people & resources. Most of the land in Brahmaputra valley is very fertile. Fertility of land is so strong that multiple cropping may easily be made possible.
2. Unlike the states in the mainland, Assam is predominantly tree from caste based equations. The villagers are peace loving people and incidents of communal riots on caste are virtually absent.
3. Forest resources are remarkably in abundance in Assam. 4. Small farmers and agricultural labourers are not exploited by the big landlords since category virtually doesn’t
exist here. Wages are also high as compared to other states. 5. Tenancy rules & regulations appear to be quite strictly followed and the landless families generally are able
to get ceiling surplus land. People living below poverty line is also less.
Weakness
1. Most of the land holdings are fragmented and the causes reductions in total cropping area & crop intensity. This also increases the categories of area under fallow land not used for cultivation.
2. Because of low awareness level, government programmes are not been able to be appreciated by the villagers.
54
3. Heavy dependence exists on primary activities. Very few secondary and tertiary sector jobs are available. Therefore, the people either migrate or depend on agriculture.
4. Another weakness is the poor communication system. A lot has to be done to improve the status of roads, transport and communication.
5. Because of heavy migration and immigration, original settlers become gradually deprived of their own lands. Most of the locals are either marginal farmers or they work as agricultural labourers.
6. Health-care infrastructure is lacking in most of the villages. Maternity health centres do not exist in most of the villages.
7. Most of the villages lack modern Irrigation facilities. 8. Around 50 percent of the surveyed villages are not fully electrified.
Opportunities
1. Improvement in yield level of crops is possible by reducing fragmentation and introducing latest farming technology, irrigation, chemical fertilizers, pesticides etc.
2. As most of the villages have natural ponds, pisciculture can be easily strengthened and improved and unemployed youths can be encouraged and trained.
3. Duck farming has high potential in some of the villages. 4. Cottage and handicraft industry has real scope because of natural resources and the people’s interest in it.
This industry can be commercialized by forming co-operative society which would buy products and sell outside the village at a higher price than what the people are getting from the middlemen.
5. Underground water resources can be used for irrigation purposes. 6. Cultivation of bamboos can be promoted for commercial purposes. Agro-based industries have high prospect
which may even become backbone of the rural economy.
Threats
1. Alarmingly rising communal tendency, unheard of earlier, in recent years. 2. Tendency of migration of youths to town in search of jobs. 3. Perpetual flood that the villages face almost every year. 4. A system of cultivation, known as jhumming, practiced by the tribals in the hill districts, is understood to be
depleting forest resources and caused soil erosion. 5. Because of heavy immigration to the villages, most of the lands are being transferred from the locals to the
alien people. As a result, permanent settlers are feeling discontented and frustrated. 6. Growing unemployment in the villages are creating a situation leading to unrest, idleness, tension and
adverse feelings towards government. 7. In some of the villages, people are getting addicted to drugs and alcoholism. Border villages are more
susceptible to this. 8. Growing deforestation in Assam is causing ecological imbalances and natural depletion.
Conclusion SWOT analysis of village would help in framing policy prescriptions for the planners while plans for the districts are being prepared. A village is probably a microcosm of a State and reflects overall socio- cultural traditions of people. A village survives because of certain inherent strong traditions which bind the people together. So, SWOT is an attempt to investigate Strengths, Weaknesses, Opportunities and Threats that exist in villages. The basis of this attempt is of course the observations and findings of the Scientists trainees during their survey of the respective villages.
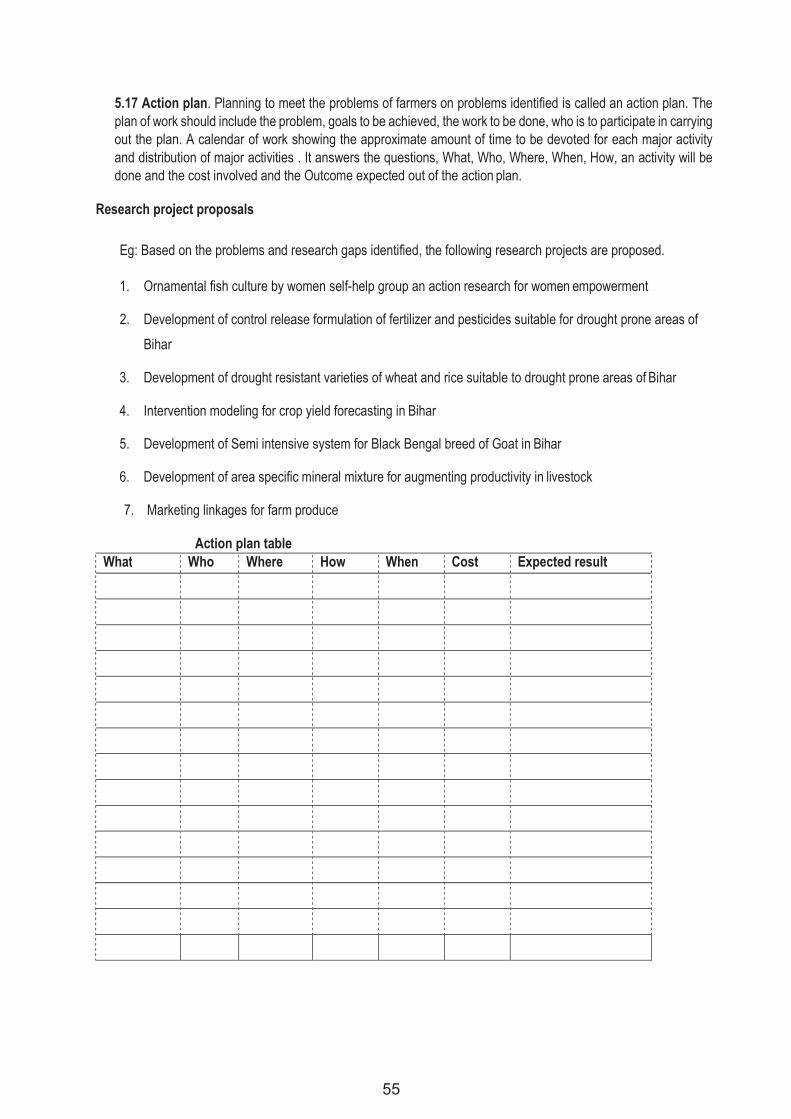
55
5.17 Action plan. Planning to meet the problems of farmers on problems identified is called an action plan. The plan of work should include the problem, goals to be achieved, the work to be done, who is to participate in carrying out the plan. A calendar of work showing the approximate amount of time to be devoted for each major activity and distribution of major activities . It answers the questions, What, Who, Where, When, How, an activity will be done and the cost involved and the Outcome expected out of the action plan.
Research project proposals
Eg: Based on the problems and research gaps identified, the following research projects are proposed.
1. Ornamental fish culture by women self-help group an action research for women empowerment
2. Development of control release formulation of fertilizer and pesticides suitable for drought prone areas of
Bihar
3. Development of drought resistant varieties of wheat and rice suitable to drought prone areas of Bihar
4. Intervention modeling for crop yield forecasting in Bihar
5. Development of Semi intensive system for Black Bengal breed of Goat in Bihar
6. Development of area specific mineral mixture for augmenting productivity in livestock
7. Marketing linkages for farm produce
Action plan table What Who Where How When Cost Expected result

56
57
Training Program on
Participatory Rural Appraisal (PRA) and Communication Strategies including IWM
26-29 September 2019
Work Book on
Participatory Rural Appraisal (PRA)
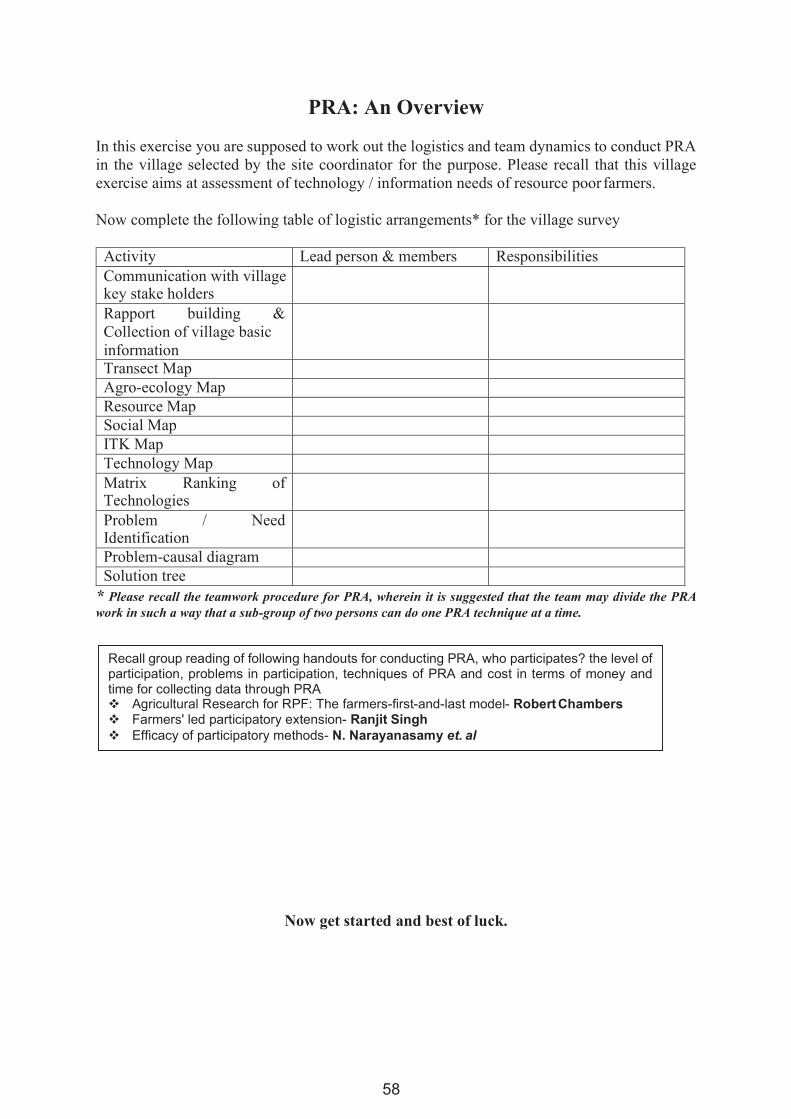
58
Recall group reading of following handouts for conducting PRA, who participates? the level of participation, problems in participation, techniques of PRA and cost in terms of money and time for collecting data through PRA Agricultural Research for RPF: The farmers-first-and-last model- Robert Chambers Farmers' led participatory extension- Ranjit Singh Efficacy of participatory methods- N. Narayanasamy et. al
PRA: An Overview
In this exercise you are supposed to work out the logistics and team dynamics to conduct PRA in the village selected by the site coordinator for the purpose. Please recall that this village exercise aims at assessment of technology / information needs of resource poor farmers.
Now complete the following table of logistic arrangements* for the village survey
Activity Lead person & members Responsibilities Communication with village key stake holders
Rapport building & Collection of village basic information
Transect Map
Agro-ecology Map
Resource Map
Social Map
ITK Map
Technology Map
Matrix Ranking of Technologies
Problem / Need Identification
Problem-causal diagram
Solution tree
* Please recall the teamwork procedure for PRA, wherein it is suggested that the team may divide the PRA work in such a way that a sub-group of two persons can do one PRA technique at a time.
Now get started and best of luck.
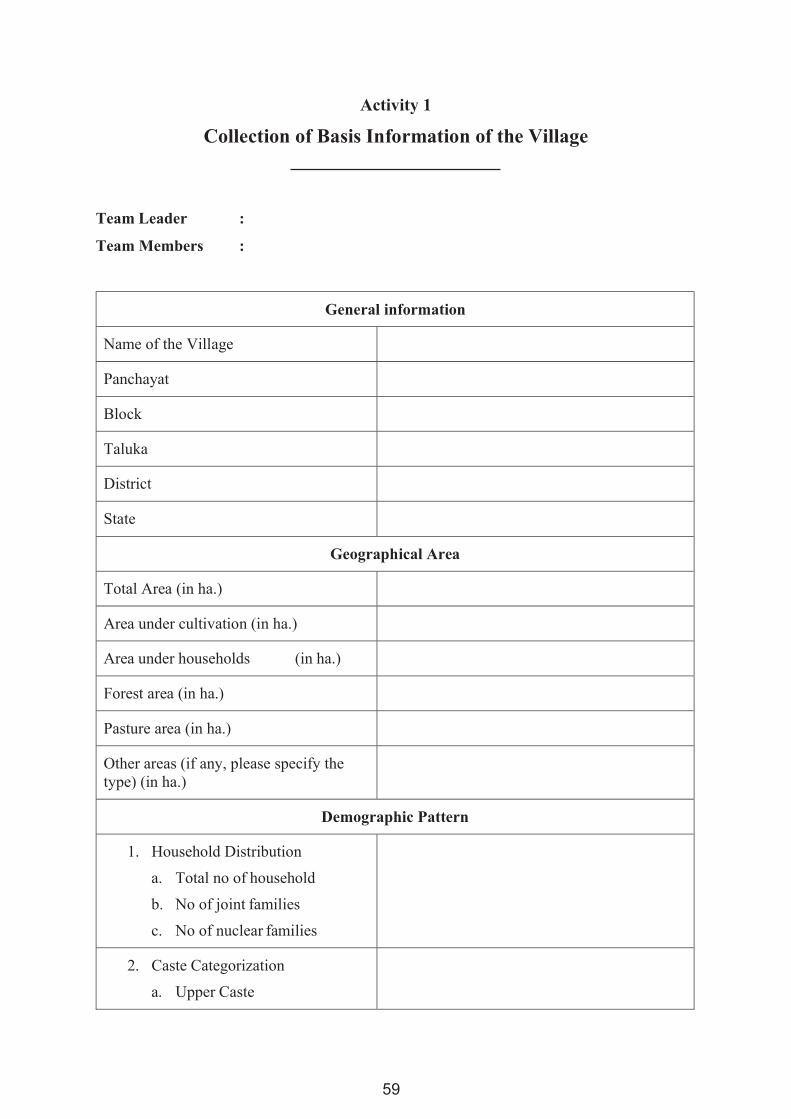
59
Activity 1
Collection of Basis Information of the Village
Team Leader :
Team Members :
General information
Name of the Village
Panchayat
Block
Taluka
District
State
Geographical Area
Total Area (in ha.)
Area under cultivation (in ha.)
Area under households (in ha.)
Forest area (in ha.)
Pasture area (in ha.)
Other areas (if any, please specify the type) (in ha.)
Demographic Pattern
1. Household Distribution
a. Total no of household
b. No of joint families
c. No of nuclear families
2. Caste Categorization
a. Upper Caste
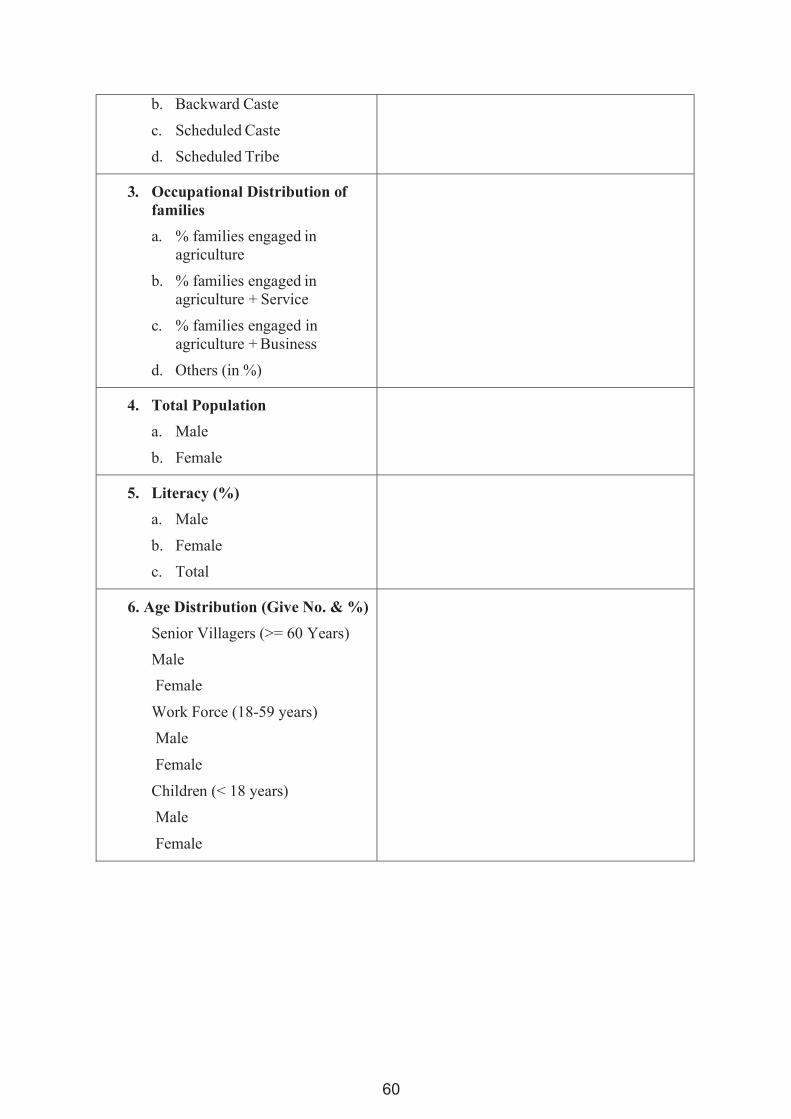
60
b. Backward Caste
c. Scheduled Caste
d. Scheduled Tribe
3. Occupational Distribution of families
a. % families engaged in agriculture
b. % families engaged in agriculture + Service
c. % families engaged in agriculture + Business
d. Others (in %)
4. Total Population
a. Male
b. Female
5. Literacy (%)
a. Male
b. Female
c. Total
6. Age Distribution (Give No. & %)
Senior Villagers (>= 60 Years)
Male
Female
Work Force (18-59 years)
Male
Female
Children (< 18 years)
Male
Female
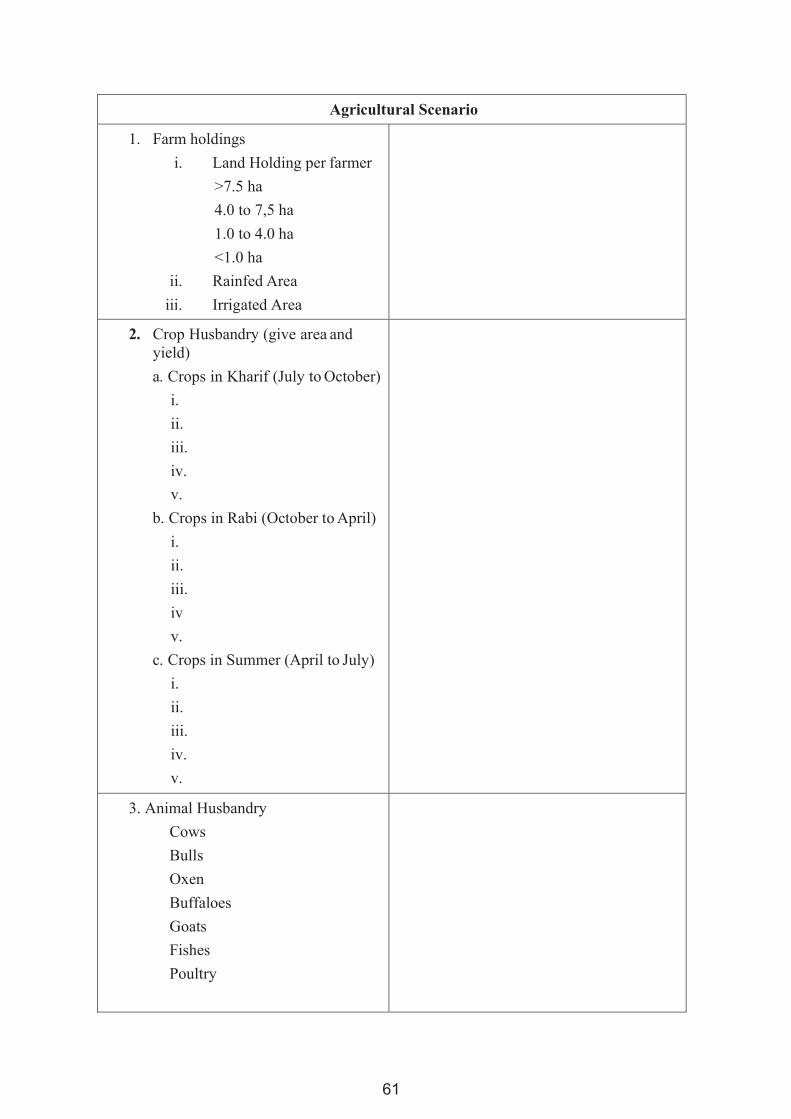
61
Agricultural Scenario
1. Farm holdings
i. Land Holding per farmer
>7.5 ha
4.0 to 7,5 ha
1.0 to 4.0 ha
<1.0 ha
ii. Rainfed Area
iii. Irrigated Area
2. Crop Husbandry (give area and yield)
a. Crops in Kharif (July to October)
i.
ii.
iii.
iv.
v.
b. Crops in Rabi (October to April)
i.
ii.
iii.
iv
v.
c. Crops in Summer (April to July)
i.
ii.
iii.
iv.
v.
3. Animal Husbandry
Cows
Bulls
Oxen
Buffaloes
Goats
Fishes
Poultry
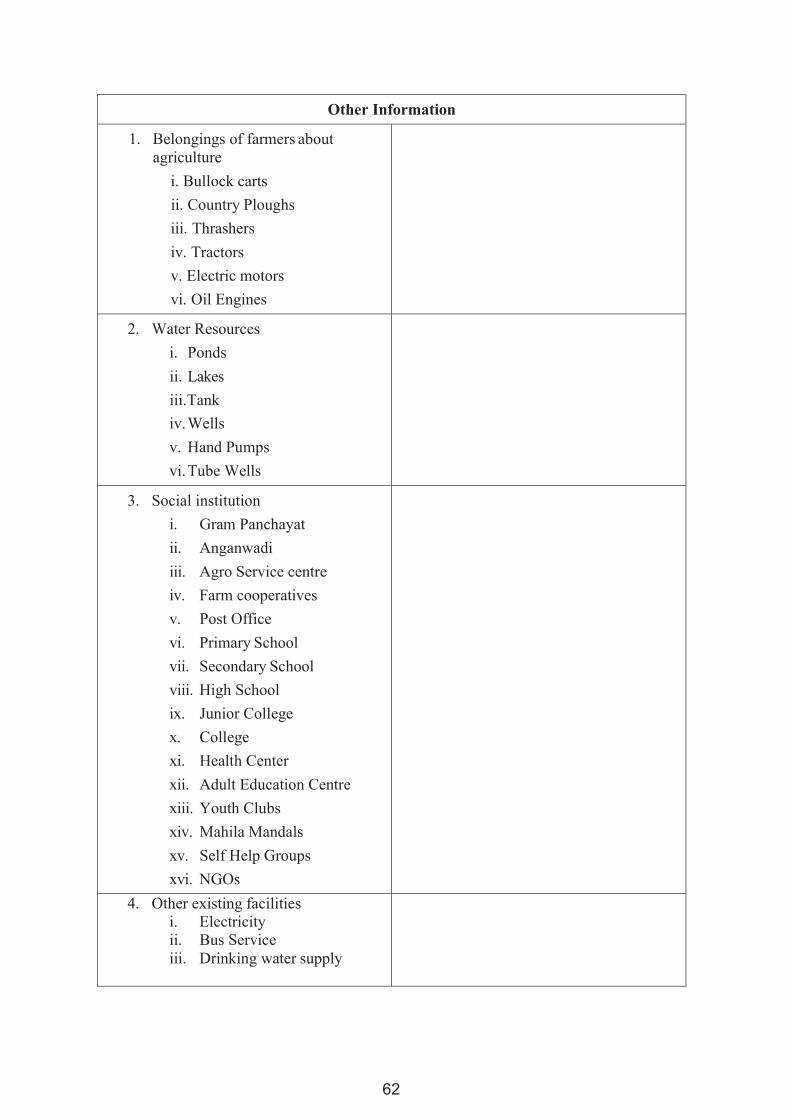
62
Other Information
1. Belongings of farmers about agriculture
i. Bullock carts
ii. Country Ploughs
iii. Thrashers
iv. Tractors
v. Electric motors
vi. Oil Engines
2. Water Resources
i. Ponds
ii. Lakes
iii.Tank
iv. Wells
v. Hand Pumps
vi. Tube Wells
3. Social institution
i. Gram Panchayat
ii. Anganwadi
iii. Agro Service centre
iv. Farm cooperatives
v. Post Office
vi. Primary School
vii. Secondary School
viii. High School
ix. Junior College
x. College
xi. Health Center
xii. Adult Education Centre
xiii. Youth Clubs
xiv. Mahila Mandals
xv. Self Help Groups
xvi. NGOs
4. Other existing facilities i. Electricity ii. Bus Service iii. Drinking water supply
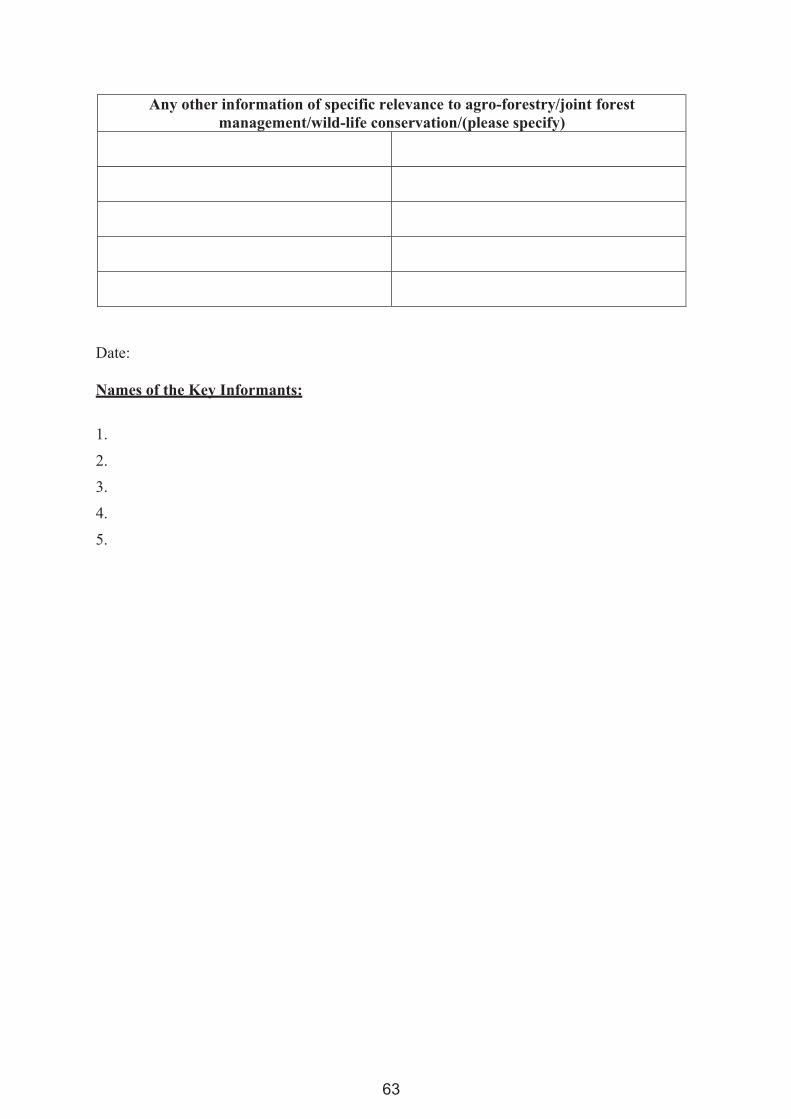
63
Any other information of specific relevance to agro-forestry/joint forest management/wild-life conservation/(please specify)
Date:
Names of the Key Informants:
1.
2.
3.
4.
5.

64
Activity 2.
General Transect
Team Leader:
Team Members:
Instructions:
1. Recollect your discussions based on reading of Reading Handout – 1, 2 and 3The team must have surely agreed upon what is expected to be done in General Transect. Please reproduce the points agreed upon with reference to Transect in the box given below:
2. The team must be now ready with the decision as to who will lead the work in this technique and also the other members (not more than 2) to do this technique.
3. The identified sub-team will then select key informants (4 -5) for this technique.
4. Explain the purpose and procedure of this technique to the KIs
5. Start your transect walk.
6. Remember transect is making a long walk inside the village and locating the various items that are found in the village like soil, crops, animals, problems, etc.
7. Keep on probing for details while walking and recording the same.
8. Keenly observe your surroundings to record the key features.
9. Try to figure out different agro-ecological niches like upland, medium land, low land, road, residential area, field bunds, ponds, stream, hillock, marshy land, common land, forest land, orchards, arable land, non arable land etc.
10. Write down agro-ecological niches above transect line, in local language along with translation in English
65
11. Do not forget to decide the route with varied features, take at least three routes, two along both the sides of village and one passing through the village, ensure active participation of the KI's.
12. Mention a niche once only, no matter how often it occurs.
13. Transect is not an imaginary line passing through the village. General convention is that put highlands on left and lowlands on right.
14. Put pictorial of niches on top.
15. Now fill up the transect matrix with reference to following variables in each agro-ecological niches: Soil type, water resources, crops, vegetables, trees, forests, agroforestry, forages, animal, interventions, problems and opportunities.
16. While listing the species, also list species not available at present, but grown at other time of season.
17. Mention the names of KI's.

66
Record your observations here on following issues
How did you select agro-ecological niches (point 9 on previous page)?
What variables in each agro-ecological niche, you have in mind to discuss and observe (point 15 on previous page)?
Do you expect any contrasts in variables in different niches, with respect to problems and opportunities?
How can you use the information from transect to plan research?

67
Draw the Village Transect in this Box
Key Informants: Date:
68
Activity 3.
Agro-ecological map
Team leader:
Team Members:
Instructions:
1. Recollect your discussions based on reading of Reading Handout – 1, 2, 3 and 4. You
must have surely agreed upon what is expected to be done in Agro-ecological Map. Please reproduce the points agreed upon with reference to Agro-ecological Map in the box given below:
2. The team must be now ready with the decision as to who will lead the work in this
technique and also the other members (not more than 2) to do this technique.
3. The identified sub-team will then select key informants (4 -5) for this technique.
4. Explain the purpose and procedure of this technique to the Kis
5. Start your Agro-ecological map
6. Encourage farmers to draw this map. Identify major land marks.
69
7. Identify systems (village, neighboring villages) and sub systems (crop land, orchards, common land etc.) boundaries, show the neighboring villages or other features like river, hillocks, government land, forests etc., where the boundary of village ends.
8. Depict crops, animals, natural resources like soil type, water resources (wells, river, channel, ponds etc.), forest, Common Property Resources (CPR), use of locally available resources or whatever stakeholders observe during the walk.
9. Ensure that you record agro-ecological resources and not non-living items like tractor, TV and radio etc.
10. Write in local language along with English translation.
11. It differs from village map, give the direction (N) and write down the names of KI's
70
Record your observations here on following issues
In the light of your observations based on Reading Handout – 3, answer the following questions.
a) What natural circumstances you would like to probe for planning a research project?
b) How do you identify these systems, subsystems and their boundaries?
c) Do these resources depict the intersystem or intra system flow of energy?
d) How can you use village transect information in preparing agro-ecological maps?
71
Draw the Agro-ecological Map in this Box
Key Informants: Date:
72
Activity 4.
Resource Map
Team Leader:
Team Members:
Instructions:
1. Recollect your discussions based on reading of Reading Handout – 1, and 2. . By now you must have surely agreed upon what is expected to be done in Resource Map. Please reproduce the points agreed upon with reference to Resource Map in the box given below:
2. Ensure the participation of all stakeholders (male, female, old, young and children)
3. Depict main crops, trees, animals, common property resources, houses, school, farm implements, luxury items, communication items, social resources like women groups, Self Help Groups (SHG), local self-government etc.
4. Write down the names of KI's
73
Try to link resource map with General Transect and Agro-ecological map. Is there any relationship with agro-ecological niches, agro-ecological resources and farmers’ economic circumstances?
Try to link with trend diagrams and time line, Do the resources are changing with time?' Is this change influencing farmers' goals?
Try to link resource map with technology map, Do the pace of change also exist in technology and what is their relationship?' These changes are due to technological changes or policy changes?
How these changes influence agricultural research and national policies?
Food for Thought

74
Recall your reading of Reading Handout -3 and record your observations here on following issues:
What ideas on economic circumstances of farmers' can be generated from resource map?
How national policies can be linked with farmers' resources?
Do the farmers' goal changing with change in resources?
Can resource map help to group farmers' into recommendation domains?

75
Draw the Resource Map in this Box
Key Informants: Date:
76
Activity 5.
Social Map
Team Leader:
Team Members:
Instructions:
1. Using your observations of Reading Handouts 1 and 3, reproduce the points agreed upon with reference to social map in the box given below:
2. Identify suitable location where villagers generally gather and comfortably draw social map.
3.You can ideally select school premise, village choupal, gram panchayat premise, etc.
4. Select those villagers who have a very good understanding of the village social life as the Key Informants.
5. Brief the Kis about the purpose and procedure of the social mapping.
6. Be ready with the agreed upon check list for gathering information about the various issues of social map (recall the issues identified and documented in the social map in Reading Handout - 1).
7. Draw a village map indicating North direction in the top right edge.
8.Guide and facilitate the KIs in putting all the information on social map.
9.Show the location of houses, their spread indicating the major features like caste, type of house, leadership, social facilities and their sharing, social issues, social evils, conflicts, cooperation, etc. using appropriate legend.

77
What is the significance of social issues on technology adoption behavior of farmers?
What is the need for social map in identifying technology / information needs assessment?
Food for Thought
78
Record your observations on social map with reference to the following points in this box
What are the village boundaries?
What are the types their location and spread of houses?
What are the basic amenities, their location and social sharing?
What are the social institutions of the village?
What are the leadership issues in the village?
What type of social stratification is observed in the village?
What are the social norms of the village?
What kind of social processes like cooperation and conflicts are observed with reference to farming?
Are there any social blocks to the free information flow in the village?
What social issues are promoting and prohibiting the prosperity of RPFs in the village?
79
Draw the Village Social Map in this Box
Key Informants: Date:
80
Food for Thought
How ITKs can be used for research planning for RPF?
Do RPF have specific ITK which is not used by others?
Which ITKs are specific to the region of your study?
Can ITK help in designing research project encouraging locally available resources?
Activity 6.
Indigenous Technical Knowledge
Team Leader:
Team Members:
Instructions:
1. Recall your discussions of Reading Handouts 1 and 5. Your team must have surely agreed upon what is expected to be done in ITK. Please reproduce the points agreed upon with reference to ITK in the box given below:
2. Please refer NATP identified areas on next page for documenting ITK.
3. Collect information through proper interviewing technique.
4. Select KI's like school teacher, VDO, RPF etc.
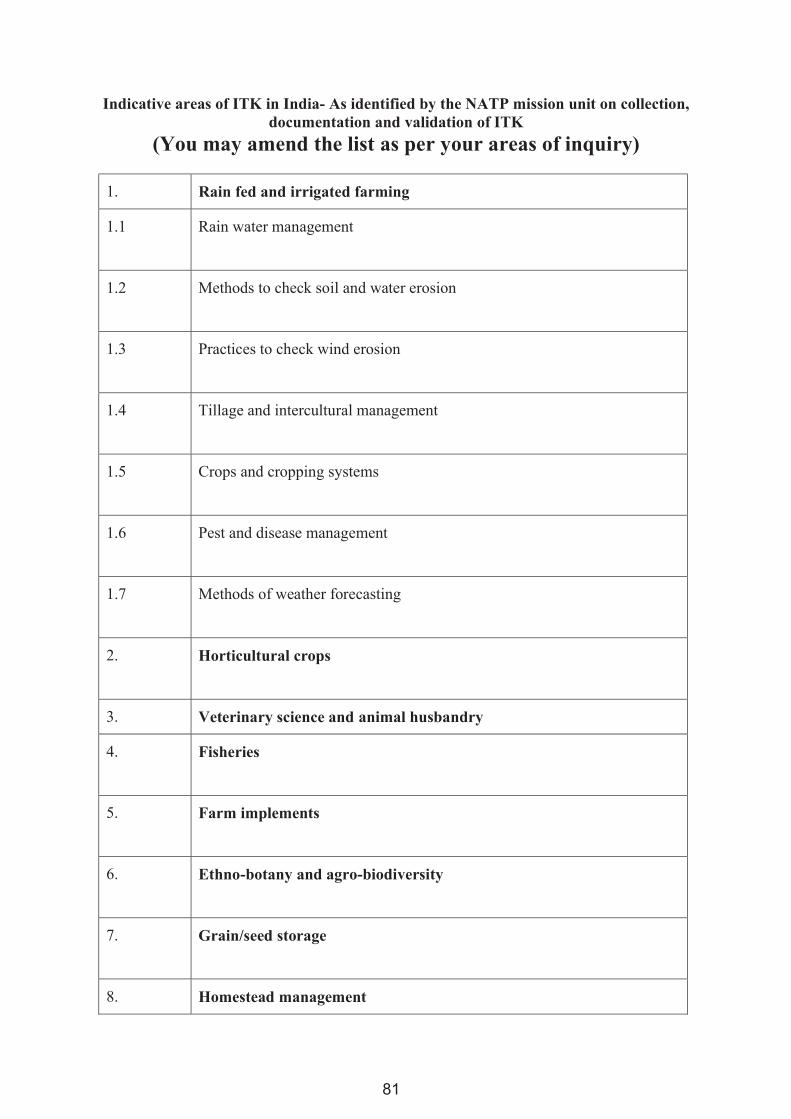
81
Indicative areas of ITK in India- As identified by the NATP mission unit on collection, documentation and validation of ITK
(You may amend the list as per your areas of inquiry)
1. Rain fed and irrigated farming
1.1 Rain water management
1.2 Methods to check soil and water erosion
1.3 Practices to check wind erosion
1.4 Tillage and intercultural management
1.5 Crops and cropping systems
1.6 Pest and disease management
1.7 Methods of weather forecasting
2. Horticultural crops
3. Veterinary science and animal husbandry
4. Fisheries
5. Farm implements
6. Ethno-botany and agro-biodiversity
7. Grain/seed storage
8. Homestead management
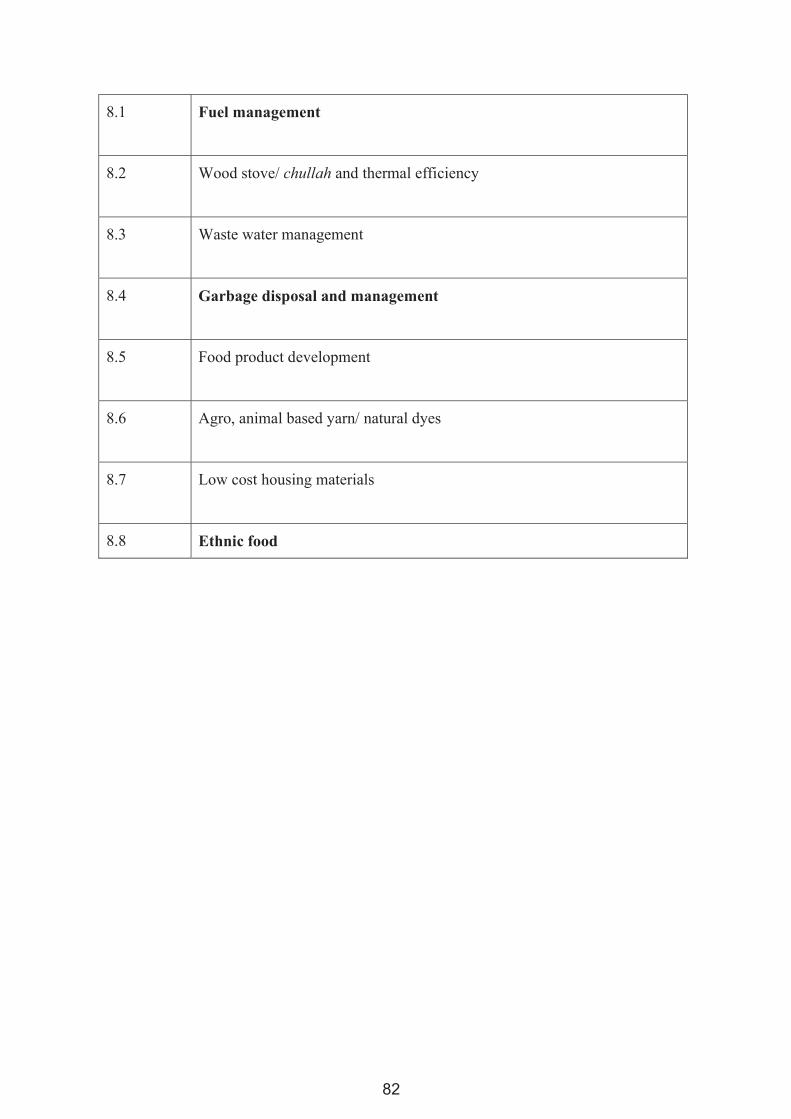
82
8.1 Fuel management
8.2 Wood stove/ chullah and thermal efficiency
8.3 Waste water management
8.4 Garbage disposal and management
8.5 Food product development
8.6 Agro, animal based yarn/ natural dyes
8.7 Low cost housing materials
8.8 Ethnic food
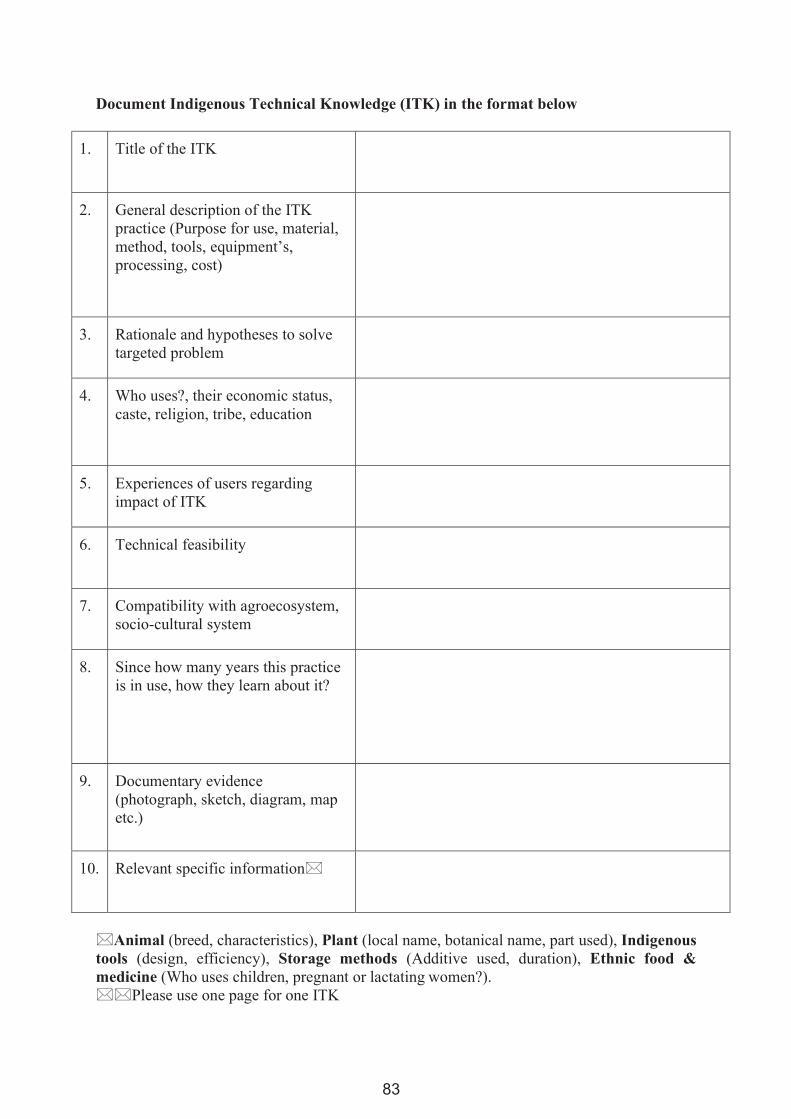
83
Document Indigenous Technical Knowledge (ITK) in the format below
1. Title of the ITK
2. General description of the ITK practice (Purpose for use, material, method, tools, equipment’s, processing, cost)
3. Rationale and hypotheses to solve targeted problem
4. Who uses?, their economic status, caste, religion, tribe, education
5. Experiences of users regarding impact of ITK
6. Technical feasibility
7. Compatibility with agroecosystem, socio-cultural system
8. Since how many years this practice is in use, how they learn about it?
9. Documentary evidence (photograph, sketch, diagram, map etc.)
10. Relevant specific information
Animal (breed, characteristics), Plant (local name, botanical name, part used), Indigenous tools (design, efficiency), Storage methods (Additive used, duration), Ethnic food & medicine (Who uses children, pregnant or lactating women?). Please use one page for one ITK

84
Activity 7.
Technology Map
Team Leader:
Team Members:
Instructions:
1. Recall your discussions of Reading Handouts 1 and 4. Your team must have surely agreed upon what is expected to be done in Technology Map. Please reproduce the points agreed upon with reference to Technology Map in the box given below:
2. Give the detailed account of technologies available in the village and its treatment by the farmers.
3. Show clearly the adoption, rejection, discontinuance and over-adoption depending on farming and farmers' situation.
4. Prepare two technology maps one each for crop related technologies and animal related technologies.
5. Select KI's for this activity
85
Record your observations here on following issues
How technological needs can be identified through technology maps?
How technology maps can assist in technology gap analysis?

86
Draw the Technology Map for Crops in this Box
Key Informants: Date:

87
Draw the Technology Map for Animals in this Box
Key Informants: Date:

88
Activity 8.
Matrix Ranking
Team Leader:
Team Members:
Instructions:
1. Recall your discussions of Reading Handouts 1 and 5. Your team must have surely agreed upon what is expected to be done in Matrix Ranking for technology adoption behaviour of farmers. Please reproduce the points agreed upon with reference to Matrix Ranking for technology adoption behaviour of farmers in the box given below:
2. Select five RPFs who have experienced the consequences of the technologies to be matrix
ranked on a set of agreeable indicators as key informants.
3. Select about five important indicators like yield, income, employment generation, cost of cultivation, etc. (you are free to add other agreeable indicators to RPFs on discussion with the KIs.
4. Do separate matrix ranking for adoption and rejection of crop and animal technologies, so that finally there will be 4 matrix ranked tables.
5. Select comparable technologies, practices, etc. for matrix ranking as perceived important by the KIs.
6. Mention the indicators in rows and technologies to be compared in columns.
7. Please note that the ranks are given with respect to each indicator for all the technologies compared, e.g., if there are 5 technologies for comparison, then there shall be only 5 ranks.
8. After giving the ranks, convert the ranks to rank values, e.g., if there are five ranks, first rank will have a rank value of 5 and so on.
9. Add the rank values in each cell and sum it up row-wise and column-wise.
10. Higher column-wise totals indicate that the technology in question has been adopted, rejected and over-adopted to a higher level as the case may be.
11. Higher cell totals indicate the higher importance of indicator in question.

89
What information is expected as output by doing technology matrix mapping and how is this information useful in technology / information needs assessment of farmers?
Food for Thought

90
Please record your observations on matrix ranking with reference to the following points in this Box.
1. What are the technologies selected for comparison?
2. What were the agreeable indicators?
3. What is the need to convert ranks to rank values?
4. What do the column and row totals indicate?
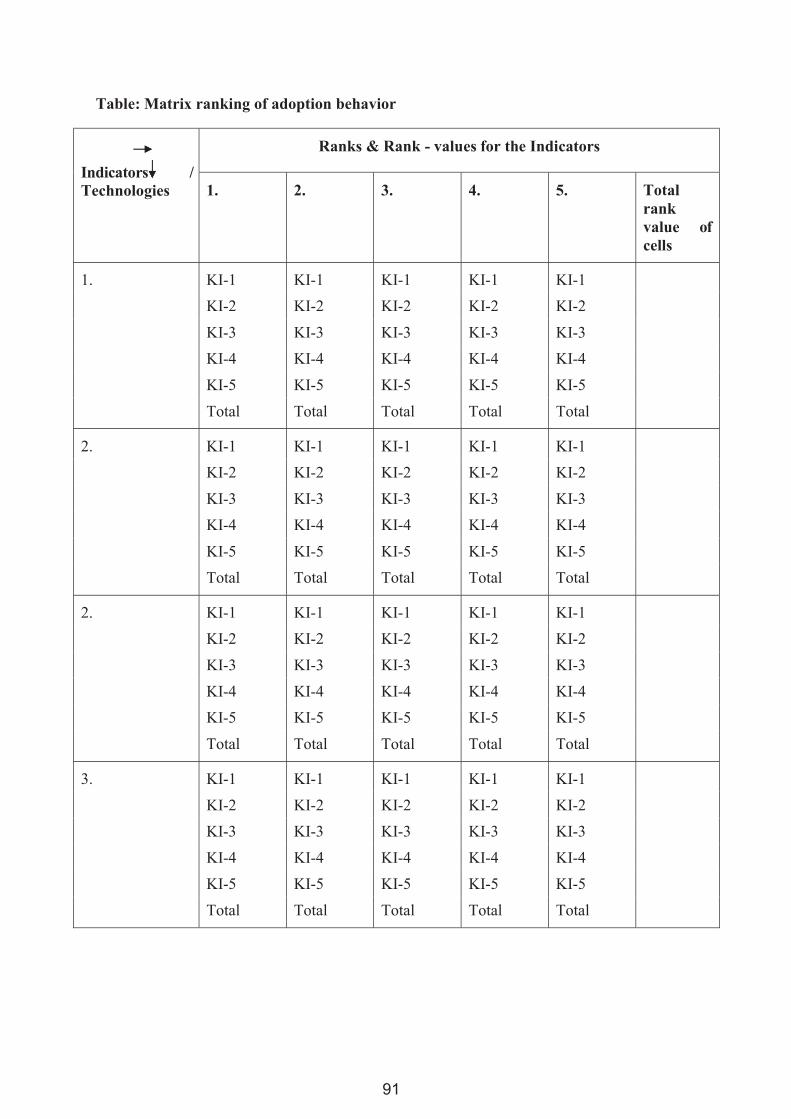
91
Table: Matrix ranking of adoption behavior
Indicators / Technologies
Ranks & Rank - values for the Indicators
1. 2. 3. 4. 5. Total rank value of cells
1. KI-1 KI-1 KI-1 KI-1 KI-1
KI-2 KI-2 KI-2 KI-2 KI-2 KI-3 KI-3 KI-3 KI-3 KI-3 KI-4 KI-4 KI-4 KI-4 KI-4 KI-5 KI-5 KI-5 KI-5 KI-5 Total Total Total Total Total
2. KI-1 KI-1 KI-1 KI-1 KI-1
KI-2 KI-2 KI-2 KI-2 KI-2 KI-3 KI-3 KI-3 KI-3 KI-3 KI-4 KI-4 KI-4 KI-4 KI-4 KI-5 KI-5 KI-5 KI-5 KI-5 Total Total Total Total Total
2. KI-1 KI-1 KI-1 KI-1 KI-1
KI-2 KI-2 KI-2 KI-2 KI-2 KI-3 KI-3 KI-3 KI-3 KI-3 KI-4 KI-4 KI-4 KI-4 KI-4 KI-5 KI-5 KI-5 KI-5 KI-5 Total Total Total Total Total
3. KI-1 KI-1 KI-1 KI-1 KI-1
KI-2 KI-2 KI-2 KI-2 KI-2 KI-3 KI-3 KI-3 KI-3 KI-3 KI-4 KI-4 KI-4 KI-4 KI-4 KI-5 KI-5 KI-5 KI-5 KI-5 Total Total Total Total Total

92
4. KI-1
KI-2
KI-3
KI-4
KI-5
Total
KI-1
KI-2
KI-3
KI-4
KI-5
Total
KI-1
KI-2
KI-3
KI-4
KI-5
Total
KI-1
KI-2
KI-3
KI-4
KI-5
Total
KI-1
KI-2
KI-3
KI-4
KI-5
Total
5. KI-1 KI-1 KI-1 KI-1 KI-1
KI-2 KI-2 KI-2 KI-2 KI-2 KI-3 KI-3 KI-3 KI-3 KI-3 KI-4 KI-4 KI-4 KI-4 KI-4 KI-5 KI-5 KI-5 KI-5 KI-5 Total Total Total Total Total
Total rank value of the columns
Key Informants: Date:

93
Table: Matrix ranking of rejection behavior
Indicators / Technologies
Ranks & Rank - values for the Indicators
1. 2. 3. 4. 5. Total rank value of cells
1. KI-1 KI-1 KI-1 KI-1 KI-1
KI-2 KI-2 KI-2 KI-2 KI-2 KI-3 KI-3 KI-3 KI-3 KI-3 KI-4 KI-4 KI-4 KI-4 KI-4 KI-5 KI-5 KI-5 KI-5 KI-5 Total Total Total Total Total
2. KI-1 KI-1 KI-1 KI-1 KI-1
KI-2 KI-2 KI-2 KI-2 KI-2 KI-3 KI-3 KI-3 KI-3 KI-3 KI-4 KI-4 KI-4 KI-4 KI-4 KI-5 KI-5 KI-5 KI-5 KI-5 Total Total Total Total Total
2. KI-1 KI-1 KI-1 KI-1 KI-1
KI-2 KI-2 KI-2 KI-2 KI-2 KI-3 KI-3 KI-3 KI-3 KI-3 KI-4 KI-4 KI-4 KI-4 KI-4 KI-5 KI-5 KI-5 KI-5 KI-5 Total Total Total Total Total
3. KI-1 KI-1 KI-1 KI-1 KI-1
KI-2 KI-2 KI-2 KI-2 KI-2 KI-3 KI-3 KI-3 KI-3 KI-3 KI-4 KI-4 KI-4 KI-4 KI-4 KI-5 KI-5 KI-5 KI-5 KI-5 Total Total Total Total Total
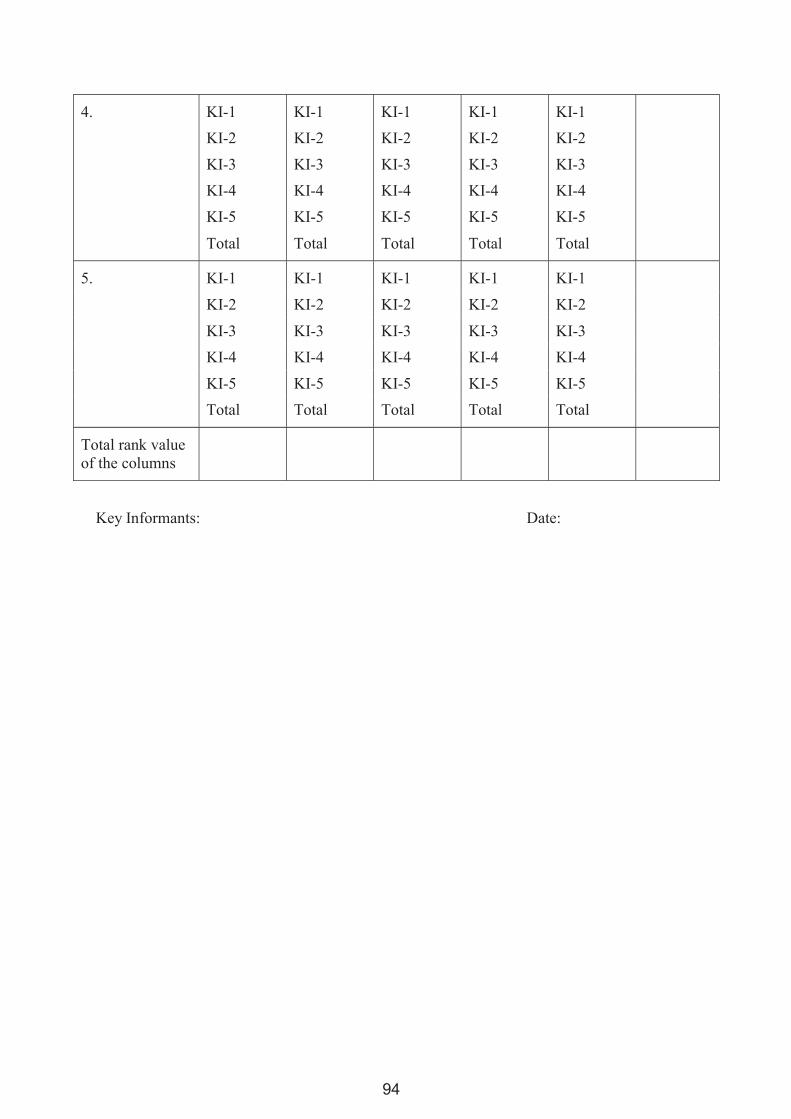
94
4. KI-1
KI-2
KI-3
KI-4
KI-5
Total
KI-1
KI-2
KI-3
KI-4
KI-5
Total
KI-1
KI-2
KI-3
KI-4
KI-5
Total
KI-1
KI-2
KI-3
KI-4
KI-5
Total
KI-1
KI-2
KI-3
KI-4
KI-5
Total
5. KI-1 KI-1 KI-1 KI-1 KI-1
KI-2 KI-2 KI-2 KI-2 KI-2 KI-3 KI-3 KI-3 KI-3 KI-3 KI-4 KI-4 KI-4 KI-4 KI-4 KI-5 KI-5 KI-5 KI-5 KI-5 Total Total Total Total Total
Total rank value of the columns
Key Informants: Date:
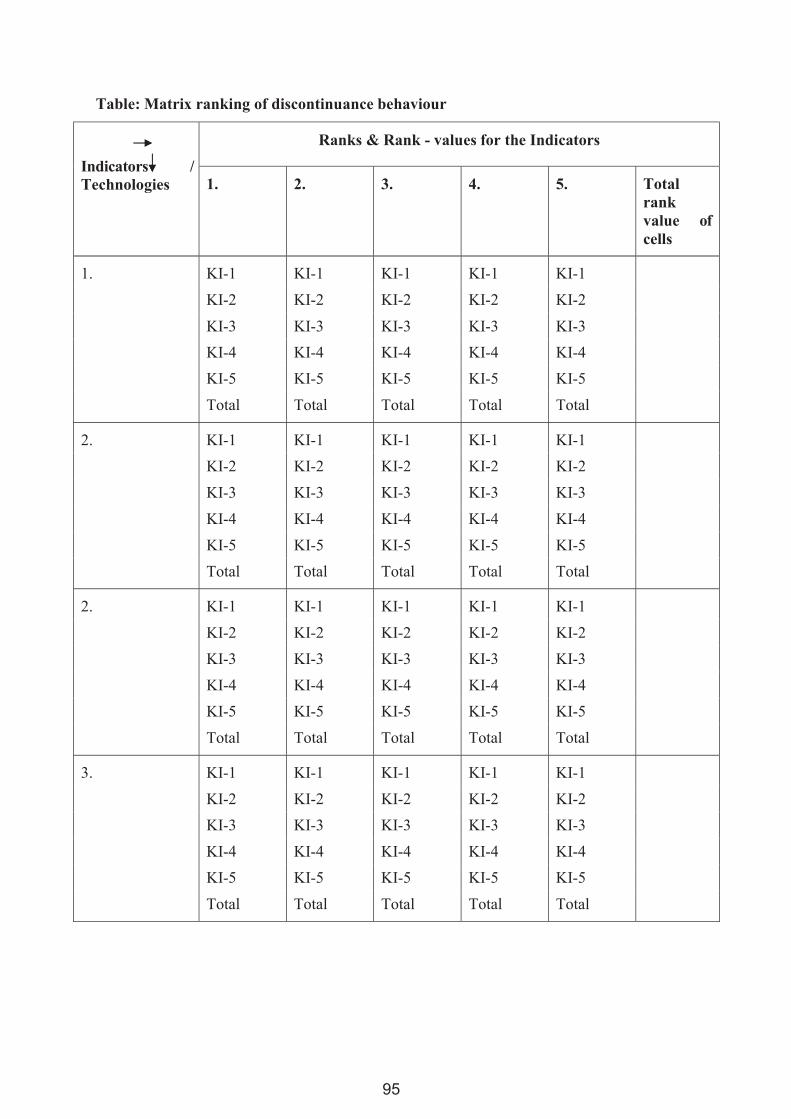
95
Table: Matrix ranking of discontinuance behaviour
Indicators / Technologies
Ranks & Rank - values for the Indicators
1. 2. 3. 4. 5. Total rank value of cells
1. KI-1 KI-1 KI-1 KI-1 KI-1
KI-2 KI-2 KI-2 KI-2 KI-2 KI-3 KI-3 KI-3 KI-3 KI-3 KI-4 KI-4 KI-4 KI-4 KI-4 KI-5 KI-5 KI-5 KI-5 KI-5 Total Total Total Total Total
2. KI-1 KI-1 KI-1 KI-1 KI-1
KI-2 KI-2 KI-2 KI-2 KI-2 KI-3 KI-3 KI-3 KI-3 KI-3 KI-4 KI-4 KI-4 KI-4 KI-4 KI-5 KI-5 KI-5 KI-5 KI-5 Total Total Total Total Total
2. KI-1 KI-1 KI-1 KI-1 KI-1
KI-2 KI-2 KI-2 KI-2 KI-2 KI-3 KI-3 KI-3 KI-3 KI-3 KI-4 KI-4 KI-4 KI-4 KI-4 KI-5 KI-5 KI-5 KI-5 KI-5 Total Total Total Total Total
3. KI-1 KI-1 KI-1 KI-1 KI-1
KI-2 KI-2 KI-2 KI-2 KI-2 KI-3 KI-3 KI-3 KI-3 KI-3 KI-4 KI-4 KI-4 KI-4 KI-4 KI-5 KI-5 KI-5 KI-5 KI-5 Total Total Total Total Total

96
4. KI-1
KI-2
KI-3
KI-4
KI-5
Total
KI-1
KI-2
KI-3
KI-4
KI-5
Total
KI-1
KI-2
KI-3
KI-4
KI-5
Total
KI-1
KI-2
KI-3
KI-4
KI-5
Total
KI-1
KI-2
KI-3
KI-4
KI-5
Total
5. KI-1 KI-1 KI-1 KI-1 KI-1
KI-2 KI-2 KI-2 KI-2 KI-2 KI-3 KI-3 KI-3 KI-3 KI-3 KI-4 KI-4 KI-4 KI-4 KI-4 KI-5 KI-5 KI-5 KI-5 KI-5 Total Total Total Total Total
Total rank value of the columns
Key Informants: Date:

97
Activity 9. Preference Ranking of Farm Problems
Team Leader:
Team Members:
Instructions:
1. Recall your discussions of Reading Handouts 1 and 4. Your team must have surely agreed upon what is expected to be done in preference ranking of farm problems. Please reproduce the points agreed upon with reference to preference ranking of farm problems in the box given below:
2. In this technique, the farm problems faced by the resource poor farmers will be identified
and ranked as per their severity.
3. Collect information on the farm problems of 30 RPFs using snow-ball sampling technique.
4. Ask each of the 30 farmers to indicate the farm problems faced by him/her and rank them in order of severity. E.g., if a farmer indicates five problems ask him to rank these five problems by giving ranks of I to V in decreasing order of their severity. Also ask the farmer to indicate the extent of monitory loss due to these problems for the village as a whole.
5. After you collect information from all the 30 RPFs, prepare an exhaustive list of the problems faced by them.
6. Convert the ranks of problems to rank values. E.g., If a given problem has received ranks from I to VI, then the rank values will be 6, 5, 4, 3, 2 and 1 for the ranks I, II, III, IV, V and VI, respectively.
7. Work out the summated rank values for each problem by simply adding up all the rank values.
8. Work out the average magnitude value expressed in terms of monitory loss on village basis by dividing the sum of magnitude value by the number of farmers reporting this problem.
98
9. Multiply the summated rank values of each problem with its magnitude value (measured in terms of monitory loss due that problem on a village basis) to arrive at village magnitude value for each problem.
10. Rank the problems based on their village magnitude value in decreasing order.
11. Then categorize the problems as developmental, extension and researchable.
12. Now, try to isolate the researchable problems and select the top most researchable problem that has the highest village magnitude value among the researchable problems.
13. Use the top most researchable problem for delineating problem-causal diagram and problem-solution tree in Activity

99
Please record your observations on preference ranking of problems with reference to the following points in this Box.
What is the need to multiply the summated rank value of a given problem with its
magnitude value? Can you distinguish between researchable and non-researchable problems? How do you justify the researchable problems? Whether the farmers are aware of the possible solutions to these problems?
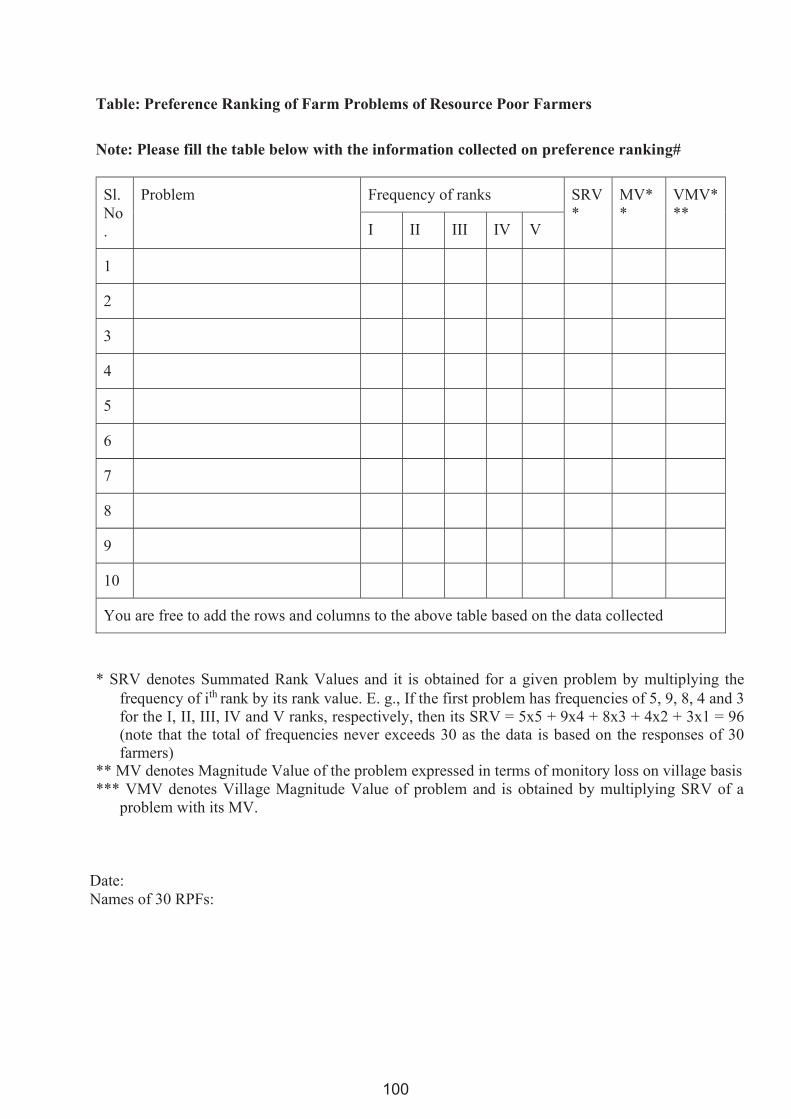
100
Table: Preference Ranking of Farm Problems of Resource Poor Farmers
Note: Please fill the table below with the information collected on preference ranking#
Sl. No .
Problem Frequency of ranks SRV *
MV* *
VMV* **
I II III IV V
1
2
3
4
5
6
7
8
9
10
You are free to add the rows and columns to the above table based on the data collected
* SRV denotes Summated Rank Values and it is obtained for a given problem by multiplying the frequency of ith rank by its rank value. E. g., If the first problem has frequencies of 5, 9, 8, 4 and 3 for the I, II, III, IV and V ranks, respectively, then its SRV = 5x5 + 9x4 + 8x3 + 4x2 + 3x1 = 96 (note that the total of frequencies never exceeds 30 as the data is based on the responses of 30 farmers)
** MV denotes Magnitude Value of the problem expressed in terms of monitory loss on village basis *** VMV denotes Village Magnitude Value of problem and is obtained by multiplying SRV of a
problem with its MV.
Date: Names of 30 RPFs:
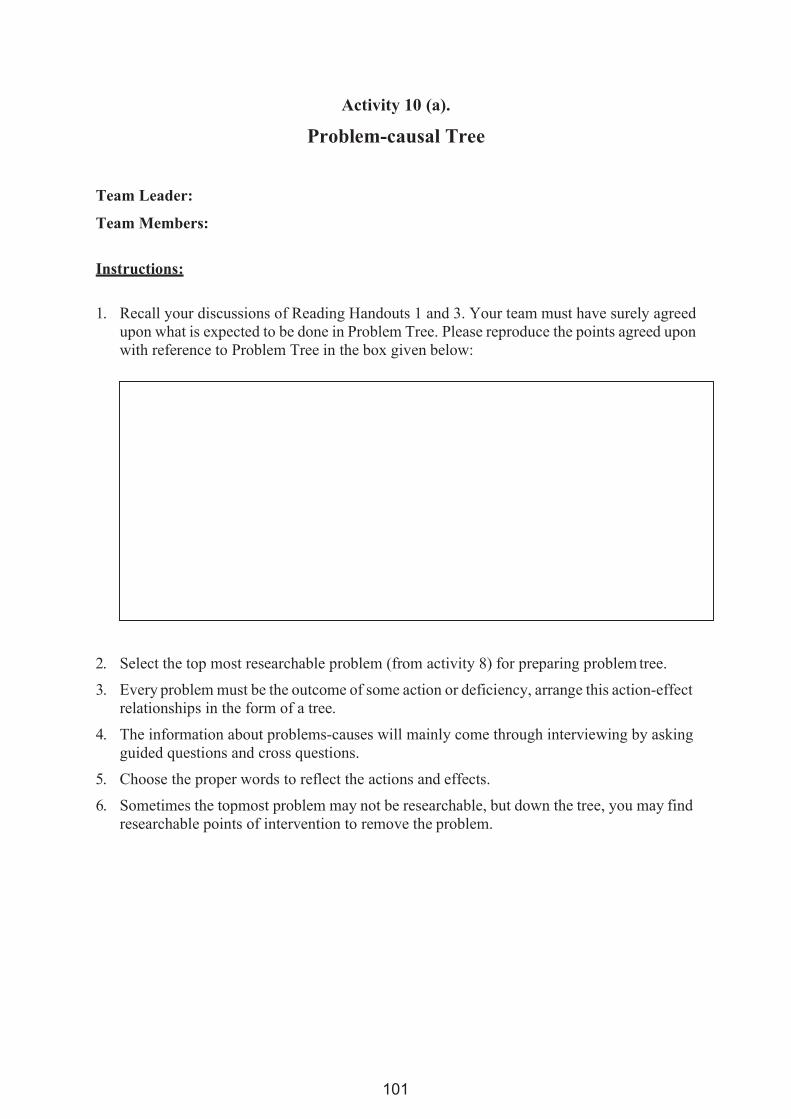
101
Activity 10 (a).
Problem-causal Tree
Team Leader:
Team Members:
Instructions:
1. Recall your discussions of Reading Handouts 1 and 3. Your team must have surely agreed upon what is expected to be done in Problem Tree. Please reproduce the points agreed upon with reference to Problem Tree in the box given below:
2. Select the top most researchable problem (from activity 8) for preparing problem tree.
3. Every problem must be the outcome of some action or deficiency, arrange this action-effect relationships in the form of a tree.
4. The information about problems-causes will mainly come through interviewing by asking guided questions and cross questions.
5. Choose the proper words to reflect the actions and effects.
6. Sometimes the topmost problem may not be researchable, but down the tree, you may find researchable points of intervention to remove the problem.
102
What types of problems they are?
Research problems
Technology transfer problems
Farm adoption problems
What are the causes of problems?
How these problems are related to poverty? issues?
Food for Thought
103
Record your observations here on following issues
Are the problems of RPF different than others? Can problems be addressed through research only? How can needs be identified from the problem tree?

104
Draw the Problem Tree in this Box
Key Informants: Date:
105
Activity 10 (b).
Problem-solution Tree
Team Leader:
Team Members:
Instructions:
1. Recall your discussions in Reading Handouts. Your team must have surely agreed upon what is expected to be done in Solution Tree. Please reproduce the points agreed upon with reference to Solution Tree in the box given below:
2. Convert problem tree already drawn in activity 8 to solution tree by revising it accordingly
at each hierarchy level. E. g., low return from agriculture to high return from agriculture; lack of information availability to information available, and high cost of input to low cost of input and so on so forth.
3. In solution tree we reach to the solution for the top most problem through the visualized circumstances at each hierarchy level.
4. All solutions cannot be points of interventions for research to remove the problem
5. Find out the points of research interventions as per the specialization of your multi- disciplinary team, mandate of your research station and facilities available.
6. The Solution Tree may also be referred to as Need Hierarchy Diagram.
7. Also check the information available in consequences diagrams.

106
Record your observations here on following issues
What type of needs you expect for problem solving? What sorts of linkages are required to satisfy the needs of RPF? Do these needs reflect in village transect, agro ecology map and resource map?

107
Draw the Solution Tree in this Box
Key Informants: Date:

108
109
Training Program on
Participatory Rural Appraisal (PRA) and Communication Strategies including IWM
26-29 September 2019
Reading Handout-1 (Case study)
Use of PRA in Identification of Researchable Problems of Farmers
110
It is worth noting that this FET is based on the same premise as that of your distance training unit 4. The focus is on aligning agricultural research to the technology and information needs of farmers in general and poor farmers in particular. In the FET, the participants work in the village for about 10 days to collect data using 22 different PRA techniques and organize a village seminar. In your case, we have restricted the exercise to a day for practising 10 PRA techniques relevant for generating information on technology and information needs assessment. Hence we have restricted the case to only those 10 PRA techniques that will be practiced by you.
Reading Handout-1 (Case study)
Use of PRA in Identification of Researchable Problems of Farmers
About the Case: The National Academy of Agricultural Research Management located at
Hyderabad, India conducts a Field Experience Training of 21 days duration for the ARS
Probationers as a part of the their Foundation Training. The FET emphasizes on the
experiential learning of PRA tools and techniques by providing hands-on experiences during
training at NAARM and FET Center including the presentations at NAARM, the FET village
and FET Centers. The FET is based on the principles of seeing is believing and learning by
doing using multi-disciplinary participatory approach. The overall objective of the Field
Experience training (FET) is to provide the Agricultural Research Services (ARS) probationers
an opportunity to gain first hand experience and insight into agricultural and rural development
scenario and the problems of the farming community in particular. The specific objectives are:
To provide an opportunity to the scientist-trainees to interact with the farming community and gain insight into their ways of living, needs, resources, priorities, technology diffusion and adoption process, problems and prospects.
To gain an insight into and develop an appreciation of Indigenous Technical Knowledge (ITK) of the farmers and the ways and means to build on them to generate appropriate technologies.
To discuss, probe, identify and prioritize field problems related to agriculture and to develop a multi-disciplinary project for solving the top most researchable problem.
Inculcating in them the culture of teamwork in an interdisciplinary/multidisciplinary context.
This case pertains to the Field Experience Training of ARS Scientist-Probationers conducted by NAARM, Hyderabad. A team of 3 ARS Scientist Probationers conducted this exercise in Ratnapur village of Sindewahi taluka, Chandrapur district in Maharahstra
111
INTRODUCTION
The achievement in the field of agriculture had changed the country’s state to self-
sufficiency in food production despite its burgeoning population during the post independence
era. This tremendous success can be attributed to the relentless efforts in the villages where
from our demand for agriculture commodities are made. Thanks to the government policies
through green, white and blue revolutions over the past decades. At this juncture, as we are into
the 21st century a challenge, is left before us. Will India be able to feed the population in the
next 25 years? This is mainly due to the expansion in our population in which we have crossed
the one billion marks and a plateau has been reached as for as food grain production is
concerned. To increase the food grain production beyond this stage another super green
revolution is essential, where the need based experiments at the field level are to be properly
integrated with the recommendations of the agricultural research stations. In order to achieve
this target we have to carry out need based farming system research keeping in view the
indigenous technological knowledge for the benefit of the farming community.
A direct interaction with farming community in this existing condition is necessary to
understand various agricultural practices followed by them. The Field Experience Training
(FET) is conducted on that ground to get an unbiased view about how the farmer struggles
against natural vagaries as well as anthropomorphic interventions so that the actual needs of
the farmers are understood and accordingly research strategy could be modified, formulated
and prioritized.
In the present study, survey through PRA (Participatory Rural Appraisal) techniques
was carried out on the socio-economic status of the farmers, impact of the adopted
technologies, existing resources, applicability of the available technologies for the particular
domain, smooth implementation and follow up by different organizations and development
agencies. An action plan thus formulated would improve the farming community and to the
nation as a whole.
BASIC INFORMATION OF RATNAPUR VILLAGE
The Village Ratnapur is located about 14 km East of Sindewahi. This village is
surrounded by Navargaon in the north, forest in the west and Shivni in the south. The village
is also the Gram Panchayat of its surrounded villages Purkepar, Khandla, Shivni and
Nachanbhatti.
Now, this case illustration has to be read as a group activity and record the points of discussion. At the end the group must answer the diagnostic questions given at the end of the case.
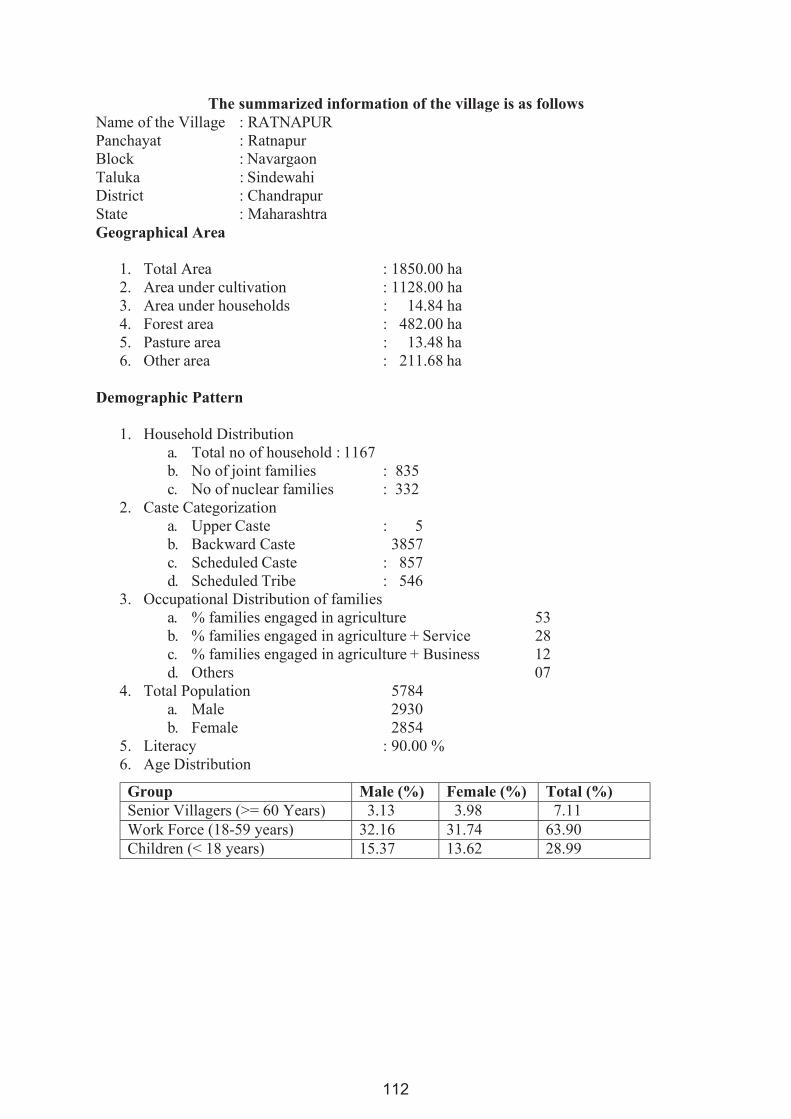
112
The summarized information of the village is as follows Name of the Village : RATNAPUR Panchayat : Ratnapur Block : Navargaon Taluka : Sindewahi District : Chandrapur State : Maharashtra Geographical Area
1. Total Area : 1850.00 ha 2. Area under cultivation : 1128.00 ha 3. Area under households : 14.84 ha 4. Forest area : 482.00 ha 5. Pasture area : 13.48 ha 6. Other area : 211.68 ha
Demographic Pattern
1. Household Distribution
a. Total no of household : 1167 b. No of joint families : 835 c. No of nuclear families : 332
2. Caste Categorization a. Upper Caste : 5 b. Backward Caste 3857 c. Scheduled Caste : 857 d. Scheduled Tribe : 546
3. Occupational Distribution of families a. % families engaged in agriculture 53 b. % families engaged in agriculture + Service 28 c. % families engaged in agriculture + Business 12 d. Others 07
4. Total Population 5784 a. Male 2930 b. Female 2854
5. Literacy : 90.00 % 6. Age Distribution
Group Male (%) Female (%) Total (%) Senior Villagers (>= 60 Years) 3.13 3.98 7.11 Work Force (18-59 years) 32.16 31.74 63.90 Children (< 18 years) 15.37 13.62 28.99
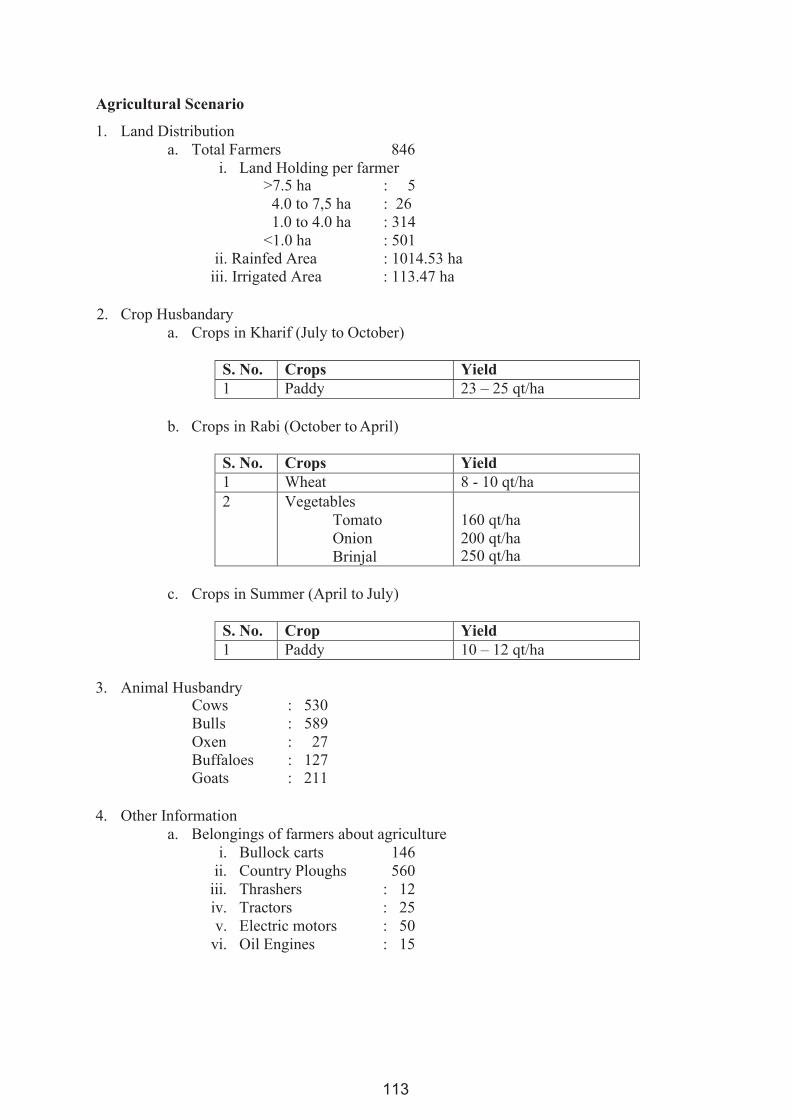
113
Agricultural Scenario
1. Land Distribution a. Total Farmers 846
i. Land Holding per farmer >7.5 ha : 5
4.0 to 7,5 ha : 26 1.0 to 4.0 ha : 314
<1.0 ha : 501 ii. Rainfed Area : 1014.53 ha
iii. Irrigated Area : 113.47 ha
2. Crop Husbandary a. Crops in Kharif (July to October)
S. No. Crops Yield 1 Paddy 23 – 25 qt/ha
b. Crops in Rabi (October to April)
S. No. Crops Yield 1 Wheat 8 - 10 qt/ha 2 Vegetables
Tomato Onion Brinjal
160 qt/ha 200 qt/ha 250 qt/ha
c. Crops in Summer (April to July)
S. No. Crop Yield 1 Paddy 10 – 12 qt/ha
3. Animal Husbandry
Cows : 530 Bulls : 589 Oxen : 27 Buffaloes : 127 Goats : 211
4. Other Information
a. Belongings of farmers about agriculture i. Bullock carts 146
ii. Country Ploughs 560 iii. Thrashers : 12 iv. Tractors : 25 v. Electric motors : 50
vi. Oil Engines : 15
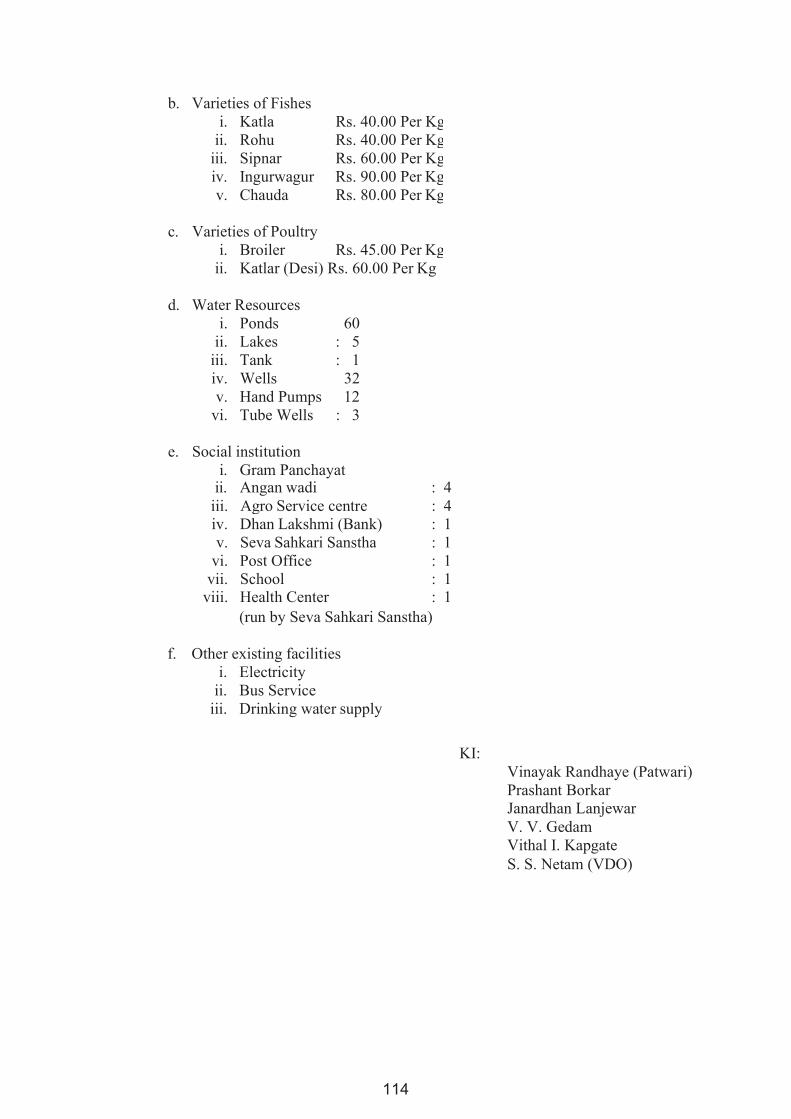
114
b. Varieties of Fishes i. Katla Rs. 40.00 Per Kg
ii. Rohu Rs. 40.00 Per Kgiii. Sipnar Rs. 60.00 Per Kgiv. Ingurwagur Rs. 90.00 Per Kgv. Chauda Rs. 80.00 Per Kg
c. Varieties of Poultry i. Broiler Rs. 45.00 Per Kg
ii. Katlar (Desi) Rs. 60.00 Per Kg
d. Water Resources i. Ponds 60
ii. Lakes : 5 iii. Tank : 1 iv. Wells 32 v. Hand Pumps 12
vi. Tube Wells : 3
e. Social institution i. Gram Panchayat
ii. Angan wadi :
4
iii. Agro Service centre : 4 iv. Dhan Lakshmi (Bank) : 1 v. Seva Sahkari Sanstha : 1
vi. Post Office : 1 vii. School : 1
viii. Health Center : 1 (run by Seva Sahkari Sanstha)
f. Other existing facilities
i. Electricity ii. Bus Service
iii. Drinking water supply
KI: Vinayak Randhaye (Patwari) Prashant Borkar Janardhan Lanjewar V. V. Gedam Vithal I. Kapgate S. S. Netam (VDO)
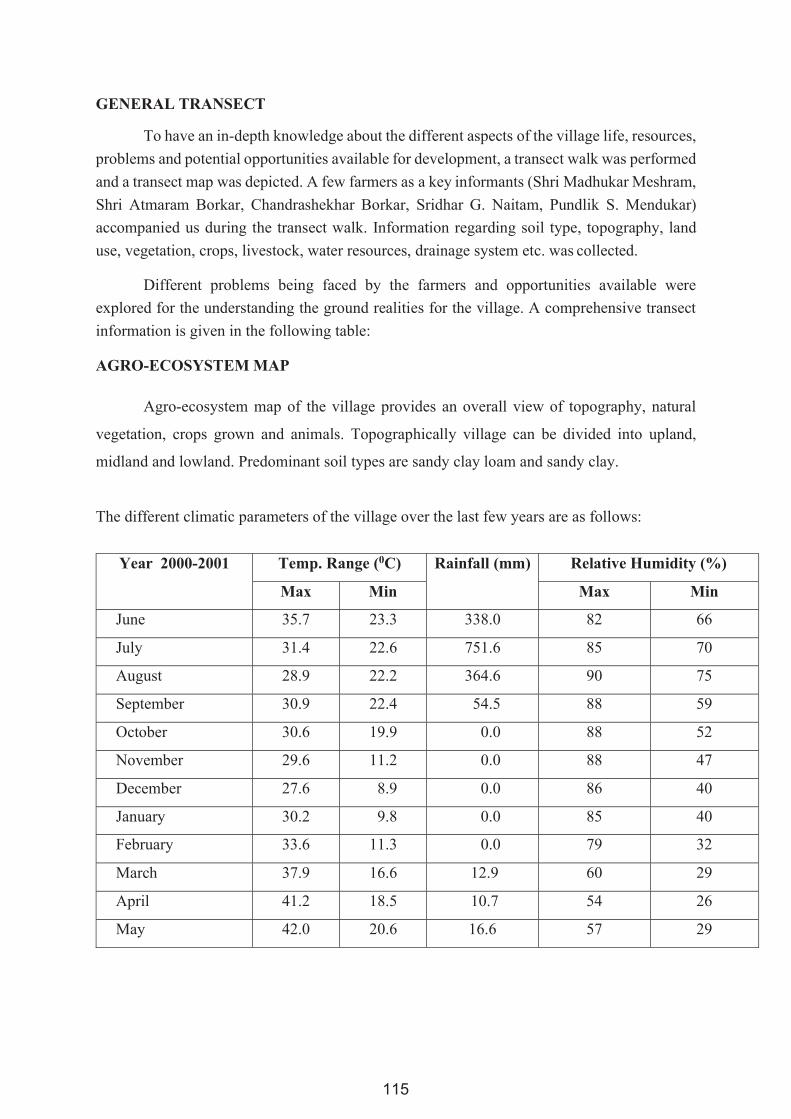
115
GENERAL TRANSECT
To have an in-depth knowledge about the different aspects of the village life, resources,
problems and potential opportunities available for development, a transect walk was performed
and a transect map was depicted. A few farmers as a key informants (Shri Madhukar Meshram,
Shri Atmaram Borkar, Chandrashekhar Borkar, Sridhar G. Naitam, Pundlik S. Mendukar)
accompanied us during the transect walk. Information regarding soil type, topography, land
use, vegetation, crops, livestock, water resources, drainage system etc. was collected.
Different problems being faced by the farmers and opportunities available were
explored for the understanding the ground realities for the village. A comprehensive transect
information is given in the following table:
AGRO-ECOSYSTEM MAP
Agro-ecosystem map of the village provides an overall view of topography, natural
vegetation, crops grown and animals. Topographically village can be divided into upland,
midland and lowland. Predominant soil types are sandy clay loam and sandy clay.
The different climatic parameters of the village over the last few years are as follows:
Year 2000-2001 Temp. Range (0C) Rainfall (mm) Relative Humidity (%)
Max Min Max Min
June 35.7 23.3 338.0 82 66
July 31.4 22.6 751.6 85 70
August 28.9 22.2 364.6 90 75
September 30.9 22.4 54.5 88 59
October 30.6 19.9 0.0 88 52
November 29.6 11.2 0.0 88 47
December 27.6 8.9 0.0 86 40
January 30.2 9.8 0.0 85 40
February 33.6 11.3 0.0 79 32
March 37.9 16.6 12.9 60 29
April 41.2 18.5 10.7 54 26
May 42.0 20.6 16.6 57 29
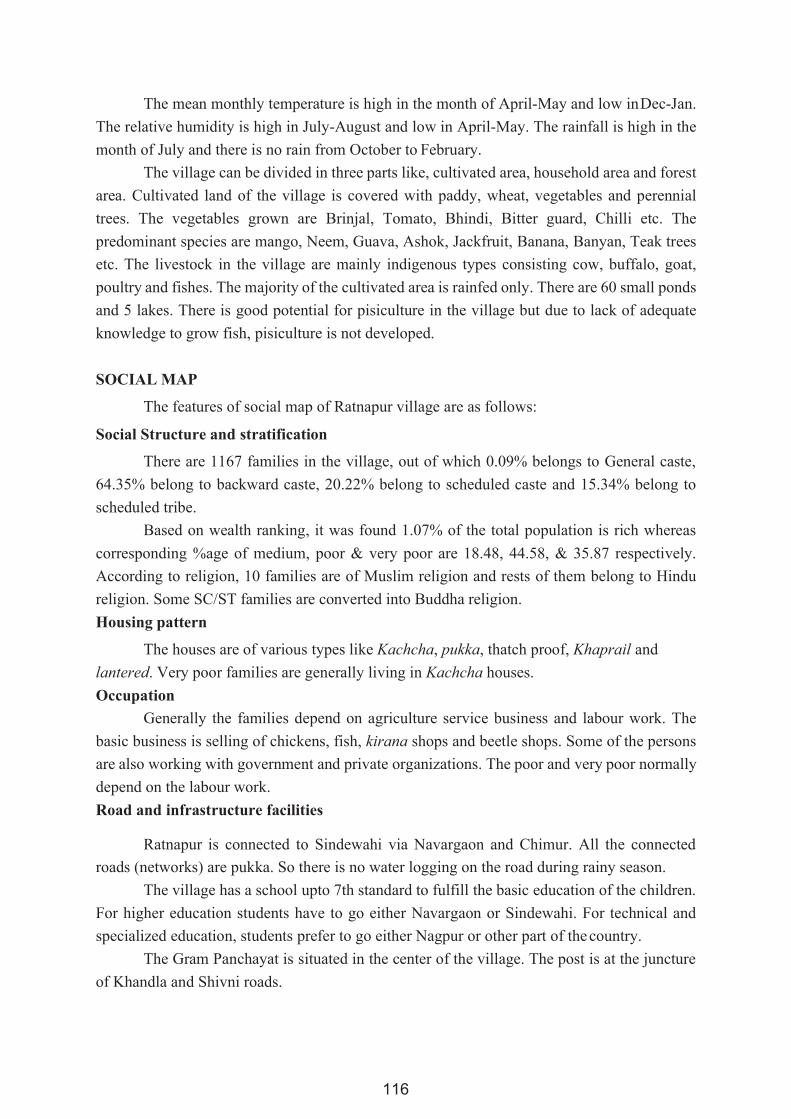
116
The mean monthly temperature is high in the month of April-May and low in Dec-Jan.
The relative humidity is high in July-August and low in April-May. The rainfall is high in the
month of July and there is no rain from October to February.
The village can be divided in three parts like, cultivated area, household area and forest
area. Cultivated land of the village is covered with paddy, wheat, vegetables and perennial
trees. The vegetables grown are Brinjal, Tomato, Bhindi, Bitter guard, Chilli etc. The
predominant species are mango, Neem, Guava, Ashok, Jackfruit, Banana, Banyan, Teak trees
etc. The livestock in the village are mainly indigenous types consisting cow, buffalo, goat,
poultry and fishes. The majority of the cultivated area is rainfed only. There are 60 small ponds
and 5 lakes. There is good potential for pisiculture in the village but due to lack of adequate
knowledge to grow fish, pisiculture is not developed.
SOCIAL MAP
The features of social map of Ratnapur village are as follows:
Social Structure and stratification
There are 1167 families in the village, out of which 0.09% belongs to General caste,
64.35% belong to backward caste, 20.22% belong to scheduled caste and 15.34% belong to
scheduled tribe.
Based on wealth ranking, it was found 1.07% of the total population is rich whereas
corresponding %age of medium, poor & very poor are 18.48, 44.58, & 35.87 respectively.
According to religion, 10 families are of Muslim religion and rests of them belong to Hindu
religion. Some SC/ST families are converted into Buddha religion.
Housing pattern
The houses are of various types like Kachcha, pukka, thatch proof, Khaprail and
lantered. Very poor families are generally living in Kachcha houses.
Occupation
Generally the families depend on agriculture service business and labour work. The
basic business is selling of chickens, fish, kirana shops and beetle shops. Some of the persons
are also working with government and private organizations. The poor and very poor normally
depend on the labour work.
Road and infrastructure facilities
Ratnapur is connected to Sindewahi via Navargaon and Chimur. All the connected
roads (networks) are pukka. So there is no water logging on the road during rainy season.
The village has a school upto 7th standard to fulfill the basic education of the children.
For higher education students have to go either Navargaon or Sindewahi. For technical and
specialized education, students prefer to go either Nagpur or other part of the country.
The Gram Panchayat is situated in the center of the village. The post is at the juncture
of Khandla and Shivni roads.
117
First aid medical facilities are also available in the village itself. There is one hospital
run by cooperative society. There are also three private medical practitioners in the village. For
major illness, people are used to go either Navargaon or Sindewahi.
Social Organizations and decision making
The apex body of the village is Gram Panchayat. The members of the gram Panchayat
constituted the following committees for their respective work
1. Jawahar Gram Samridhi Yojana Samiti
2. Sarvjanik Bandhkam Samiti
3. Samaj Kalyan Samiti
4. Shikshan Samiti
5. Takrar Nivaran Samiti
6. Arogya Samiti
7. Bij ani Panipurvatha Samiti
All the matters go to related committee for further discussion and come out with the
fruitful results. If not possible, they prefer to go to court.
Family and religion
According to religion, 10 families are of Muslim religion and rests of them belong to
Hindu religion. Some SC/ST families are converted into Buddha religion. So there are three
types of religious community in the village. Families are joint as well as nuclear in every caste
and religion. There is only one Brahmin family in the village belong to general category which
is a joint family.
Health and Sanitation
First aid medical facilities are also available in the village itself. There is one private
hospital run by cooperative society. There are three private medical practitioners in the village.
For major illness, people are used to go either Navargaon or Sindewahi. There is no veterinary
hospital in the village so people have to go Navargaon for the treatment of their livestock.
Education
The village has a school up to 7th standard to fulfill the basic education of the children.
For higher education students have to go either Navargaon or Sindewahi. For technical and
specialized education, students prefer to go either Nagpur or any other part of the country.
Marriage System
Generally, the marriages are settled in the village itself. Love marriages are allowed in
the village. There is also a dowry system. In dowry system, the money is given to groom side
by the bride side varying from Rs 5,000.00 to Rs 1,50,000.00 depending on the social status of
the family. Nobody is against this dowry system. Some people are accepting it directly while
others are accepting it as a gift from the bride side.
Religious Institutions
118
Since the majority of the populations are Hindu, so there are many temples in the
village. One Boudh temple is also constructed for the converted people by Boudh samaj. There
is no mosque in the village so the Muslims are used to go to Navargaon for their prayer. All
the festivals are celebrated and all the peoples are participated in these functions without
considering their religion or caste.
Some of the major festivals are as follows
Festival of Durga and Sharda Devi (Sept-Oct)
Bullock Race (January)
Mahashivratri (Feb-Mar)
Janmastami (Aug)
Holi (Feb-Mar)
Diwali (Oct-Nov)
Dashera (Oct)
Eid-ul-milad (according to moon)
RESOURCE MAP
Resource wise the village Ratnapur is neither very poor nor very rich. This village is
having all the general facilities except the veterinary hospital. The geographical area of the
village is 1850 hectare and the total population is 5784.
Cultivated land of the village is covered with paddy, vegetables and perennial trees.
The vegetables grown are Brinjal, Tomato, Bhindi, Bitter guard, Chilli etc. The trees are
mango, Neem, Guava, Ashok, Jackfruit, Banana, Banyan, Teak etc. The livestock in the village
are mainly indigenous types consisting cow, buffalo, goat, poultry and fishes. The majority of
the cultivated area is rainfed only.
Livestock
The total livestock population of the village is 1484 out of which the cows, bulls, oxen,
buffaloes and goats are 530, 589, 27, 127 and 211 respectively. There is no Jersey cow in the
village. All the livestock are desi. The Animal husbandry practices like artificial insemination,
livestock management is absent in the village. For artificial insemination in the livestock, the
villagers are used to go to Navargaon. Non-availability of veterinary services inside the village
is one of the major problems. There are two poultry farms having around 500 in each farm.
Some of the villagers are also having 10-12 chicks in their house. The varieties are of mainly
Desi and Broiler type.
Agriculture Inputs and Marketing
Agricultural inputs like seeds, fertilizers and pesticides are available in the village itself.
All the other basic inputs like Tractor and bullocks for field preparation available in the village.
For carrying of goods, the village used bullock carts and tractors. There are 60 ponds, 5 lakes
and 3 tube wells available for the irrigation during the water scarcity period.
119
TECHNOLOGY MAP
The technology map for crops, animals and farm implements give the details account
of various technologies that are available in the village and its treatment by the farmers. The
technology map clearly shows the adoption, rejection, discontinuance (disenchantment) and
over adoption depending upon the ecological conditions, financial conditions and socio-
economic structures prevailing in the village.
The technology maps for crops, animals and farm implements for the village Ratnapur
have been prepared by discussing with Key Informants. Three key informants those who have
good knowledge about agricultural practices were selected to gather information for technology
map. They were encouraged to discuss about various technology that are being currently
adopted, previously adopted discontinued technologies and technologies that are rejected in
crops and animals. The following information was derived from the discussion.
CROPS
The farmers of Ratnapur village are using three varieties of paddy PKV-
HMT,Sindewahi-4, Sakoli-6. They are also using mechanical technology like tractor, sprayer
etc. They are also using pesticides and fertilizers.
The villagers discontinued local rice varieties. The main reasons quoted by them low
yield and availability of alternative technology.
ANIMALS
The villagers are using artificial insemination for conception. They adopted poultry
mainly from 3 years back. They rejected the improved cow breed Jersey due to its high
mortality rate.
A pictorial presentation of the identified technologies has been shown in the technology map.
MATRIX RANKING
It is an analytical test to identify the research and development problems through
ranking adoption, discontinuance, rejection, over adoption, reinvention of various technology
for crops and animal sciences.
Matrix ranking for crops
Adoption: In Ratnapur village, major agricultural crop is paddy. Most adopted varieties are
PKV-HMT, Sindewahi-4, Sakoli-6. The main indicators for their adoption are high yield, good
quality, easiness in milling and thrashing and long storage. From matrix ranking technique, it
is clear that the most important indicator is good quality of grains and the most adopted variety
is PKV-HMT.
Matrix ranking for Animals

120
Adoption: Two villagers in the village have adopted the poultry in large scale. In matrix
ranking, two indicators, easy to grow and marketing price are most important factor for its
adoption.
Active rejection: The active rejection of improved cow breed Jersey was due to high mortality
rate and its poor adaptability.
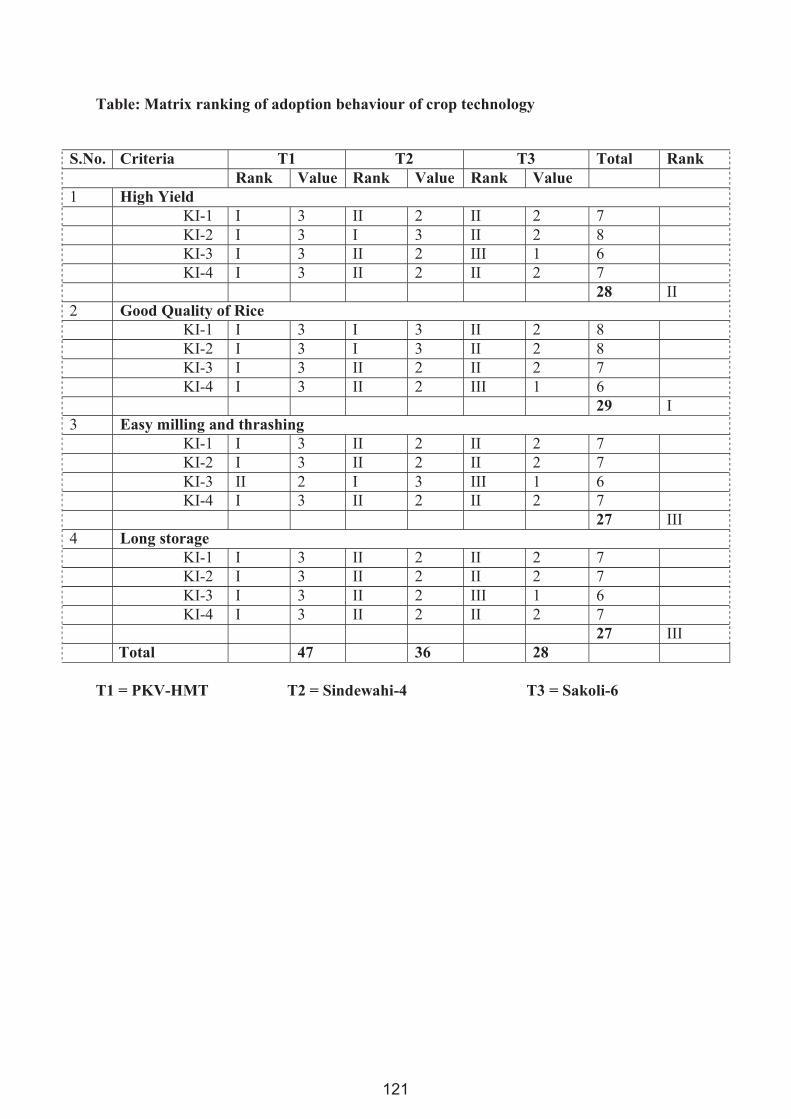
121
Table: Matrix ranking of adoption behaviour of crop technology
S.No. Criteria T1 T2 T3 Total Rank
Rank Value Rank Value Rank Value
1 High Yield KI-1 I 3 II 2 II 2 7
KI-2 I 3 I 3 II 2 8
KI-3 I 3 II 2 III 1 6
KI-4 I 3 II 2 II 2 7
28 II 2 Good Quality of Rice
KI-1 I 3 I 3 II 2 8
KI-2 I 3 I 3 II 2 8
KI-3 I 3 II 2 II 2 7
KI-4 I 3 II 2 III 1 6
29 I 3 Easy milling and thrashing
KI-1 I 3 II 2 II 2 7
KI-2 I 3 II 2 II 2 7
KI-3 II 2 I 3 III 1 6
KI-4 I 3 II 2 II 2 7
27 III 4 Long storage
KI-1 I 3 II 2 II 2 7
KI-2 I 3 II 2 II 2 7
KI-3 I 3 II 2 III 1 6
KI-4 I 3 II 2 II 2 7
27 III Total 47 36 28
T1 = PKV-HMT T2 = Sindewahi-4 T3 = Sakoli-6
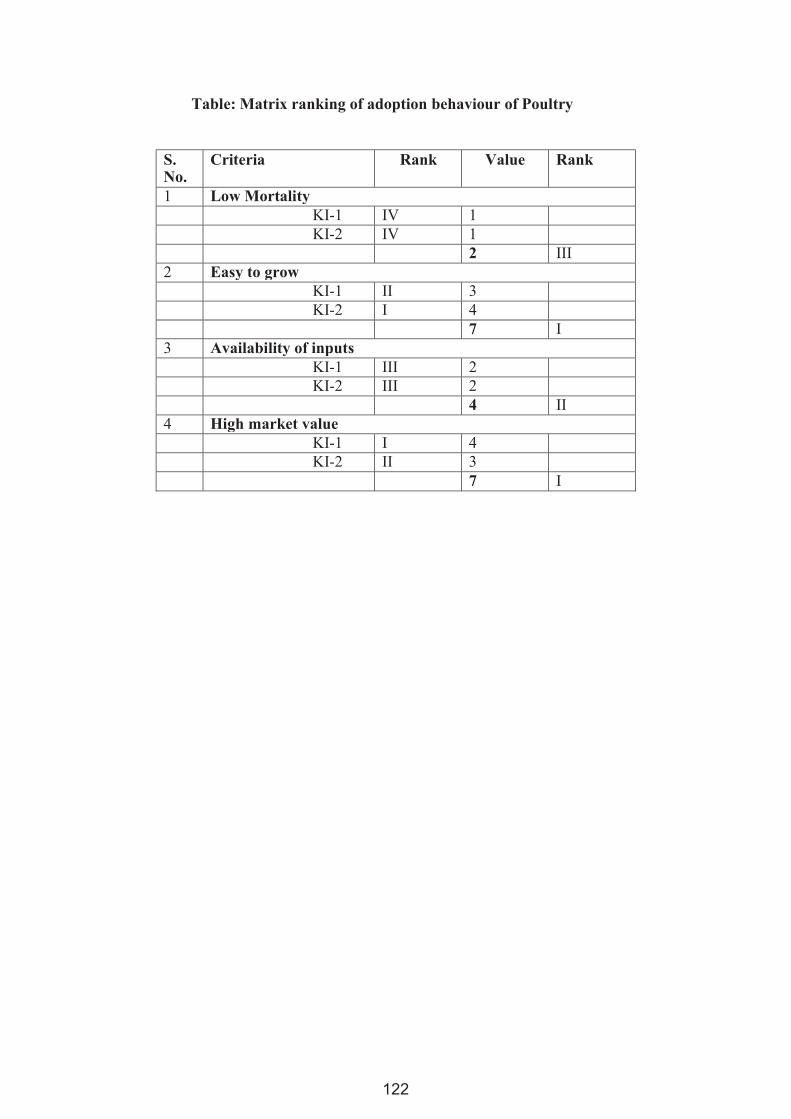
122
Table: Matrix ranking of adoption behaviour of Poultry
S. No.
Criteria Rank Value Rank
1 Low Mortality KI-1 IV 1
KI-2 IV 1
2 III 2 Easy to grow
KI-1 II 3
KI-2 I 4
7 I 3 Availability of inputs
KI-1 III 2
KI-2 III 2
4 II 4 High market value
KI-1 I 4
KI-2 II 3
7 I
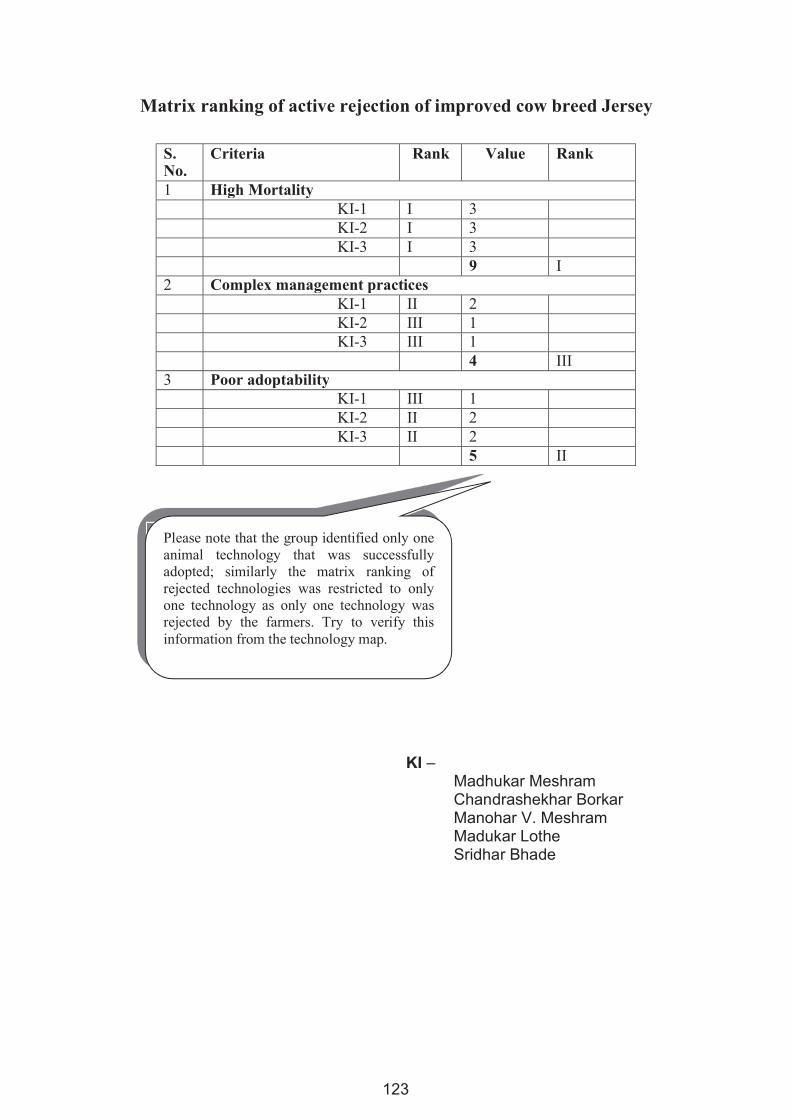
123
Please note that the group identified only one animal technology that was successfully adopted; similarly the matrix ranking of rejected technologies was restricted to only one technology as only one technology was rejected by the farmers. Try to verify this information from the technology map.
Matrix ranking of active rejection of improved cow breed Jersey
S. No.
Criteria Rank Value Rank
1 High Mortality KI-1 I 3
KI-2 I 3
KI-3 I 3
9 I 2 Complex management practices
KI-1 II 2
KI-2 III 1
KI-3 III 1
4 III 3 Poor adoptability
KI-1 III 1
KI-2 II 2
KI-3 II 2
5 II
KI –
Madhukar Meshram Chandrashekhar Borkar Manohar V. Meshram Madukar Lothe Sridhar Bhade
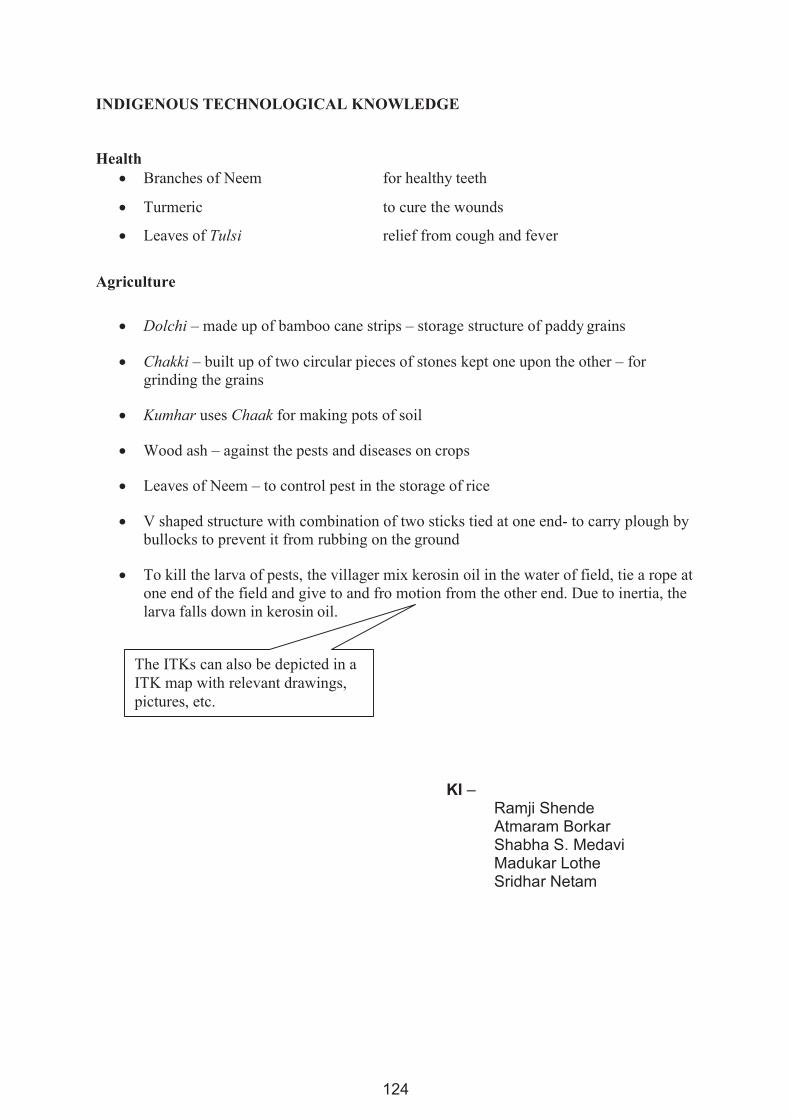
124
INDIGENOUS TECHNOLOGICAL KNOWLEDGE
Health Branches of Neem for healthy teeth
Turmeric to cure the wounds
Leaves of Tulsi relief from cough and fever
Agriculture
Dolchi – made up of bamboo cane strips – storage structure of paddy grains
Chakki – built up of two circular pieces of stones kept one upon the other – for grinding the grains
Kumhar uses Chaak for making pots of soil
Wood ash – against the pests and diseases on crops
Leaves of Neem – to control pest in the storage of rice
V shaped structure with combination of two sticks tied at one end- to carry plough by bullocks to prevent it from rubbing on the ground
To kill the larva of pests, the villager mix kerosin oil in the water of field, tie a rope at
one end of the field and give to and fro motion from the other end. Due to inertia, the larva falls down in kerosin oil.
The ITKs can also be depicted in a ITK map with relevant drawings, pictures, etc.
KI – Ramji Shende Atmaram Borkar Shabha S. Medavi Madukar Lothe Sridhar Netam
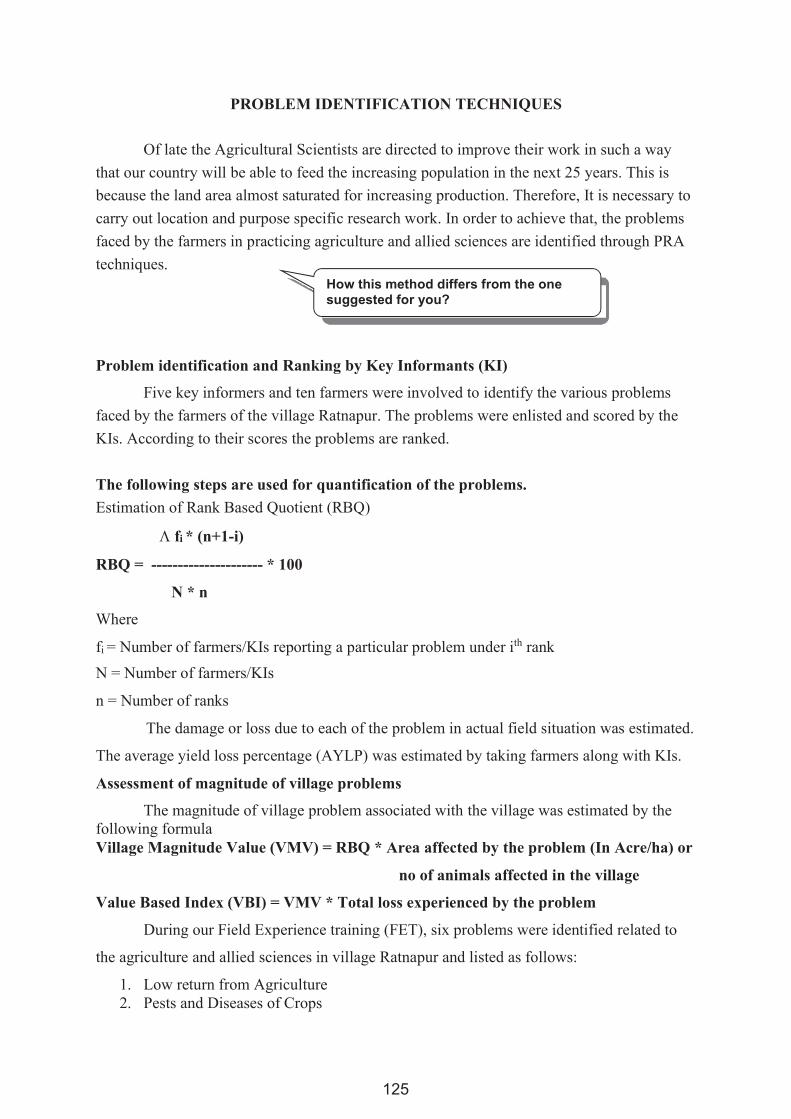
125
How this method differs from the one suggested for you?
PROBLEM IDENTIFICATION TECHNIQUES
Of late the Agricultural Scientists are directed to improve their work in such a way
that our country will be able to feed the increasing population in the next 25 years. This is
because the land area almost saturated for increasing production. Therefore, It is necessary to
carry out location and purpose specific research work. In order to achieve that, the problems
faced by the farmers in practicing agriculture and allied sciences are identified through PRA
techniques.
Problem identification and Ranking by Key Informants (KI)
Five key informers and ten farmers were involved to identify the various problems
faced by the farmers of the village Ratnapur. The problems were enlisted and scored by the
KIs. According to their scores the problems are ranked.
The following steps are used for quantification of the problems.
Estimation of Rank Based Quotient (RBQ)
fi * (n+1-i)
RBQ =
Where
--------------------- * 100
N * n
fi = Number of farmers/KIs reporting a particular problem under ith rank
N = Number of farmers/KIs
n = Number of ranks
The damage or loss due to each of the problem in actual field situation was estimated.
The average yield loss percentage (AYLP) was estimated by taking farmers along with KIs.
Assessment of magnitude of village problems
The magnitude of village problem associated with the village was estimated by the following formula Village Magnitude Value (VMV) = RBQ * Area affected by the problem (In Acre/ha) or
no of animals affected in the village
Value Based Index (VBI) = VMV * Total loss experienced by the problem
During our Field Experience training (FET), six problems were identified related to
the agriculture and allied sciences in village Ratnapur and listed as follows:
1. Low return from Agriculture 2. Pests and Diseases of Crops
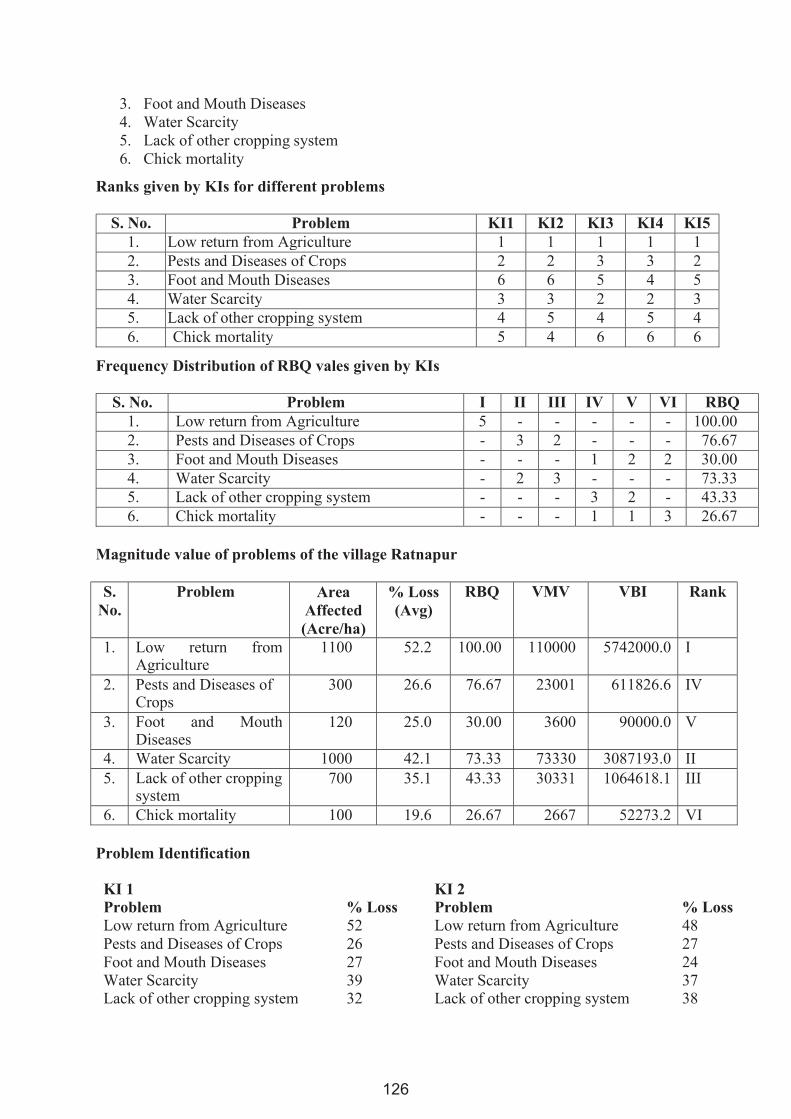
126
3. Foot and Mouth Diseases 4. Water Scarcity 5. Lack of other cropping system 6. Chick mortality
Ranks given by KIs for different problems
S. No. Problem KI1 KI2 KI3 KI4 KI5 1. Low return from Agriculture 1 1 1 1 1 2. Pests and Diseases of Crops 2 2 3 3 2 3. Foot and Mouth Diseases 6 6 5 4 5 4. Water Scarcity 3 3 2 2 3 5. Lack of other cropping system 4 5 4 5 4 6. Chick mortality 5 4 6 6 6
Frequency Distribution of RBQ vales given by KIs
S. No. Problem I II III IV V VI RBQ 1. Low return from Agriculture 5 - - - - - 100.00 2. Pests and Diseases of Crops - 3 2 - - - 76.67 3. Foot and Mouth Diseases - - - 1 2 2 30.00 4. Water Scarcity - 2 3 - - - 73.33 5. Lack of other cropping system - - - 3 2 - 43.33 6. Chick mortality - - - 1 1 3 26.67
Magnitude value of problems of the village Ratnapur
S.
No. Problem Area
Affected (Acre/ha)
% Loss (Avg)
RBQ VMV VBI Rank
1. Low return from Agriculture
1100 52.2 100.00 110000 5742000.0 I
2. Pests and Diseases of Crops
300 26.6 76.67 23001 611826.6 IV
3. Foot and Mouth Diseases
120 25.0 30.00 3600 90000.0 V
4. Water Scarcity 1000 42.1 73.33 73330 3087193.0 II 5. Lack of other cropping
system 700 35.1 43.33 30331 1064618.1 III
6. Chick mortality 100 19.6 26.67 2667 52273.2 VI
Problem Identification
KI 1 KI 2
Problem % Loss Problem % Loss Low return from Agriculture 52 Low return from Agriculture 48 Pests and Diseases of Crops 26 Pests and Diseases of Crops 27 Foot and Mouth Diseases 27 Foot and Mouth Diseases 24 Water Scarcity 39 Water Scarcity 37 Lack of other cropping system 32 Lack of other cropping system 38
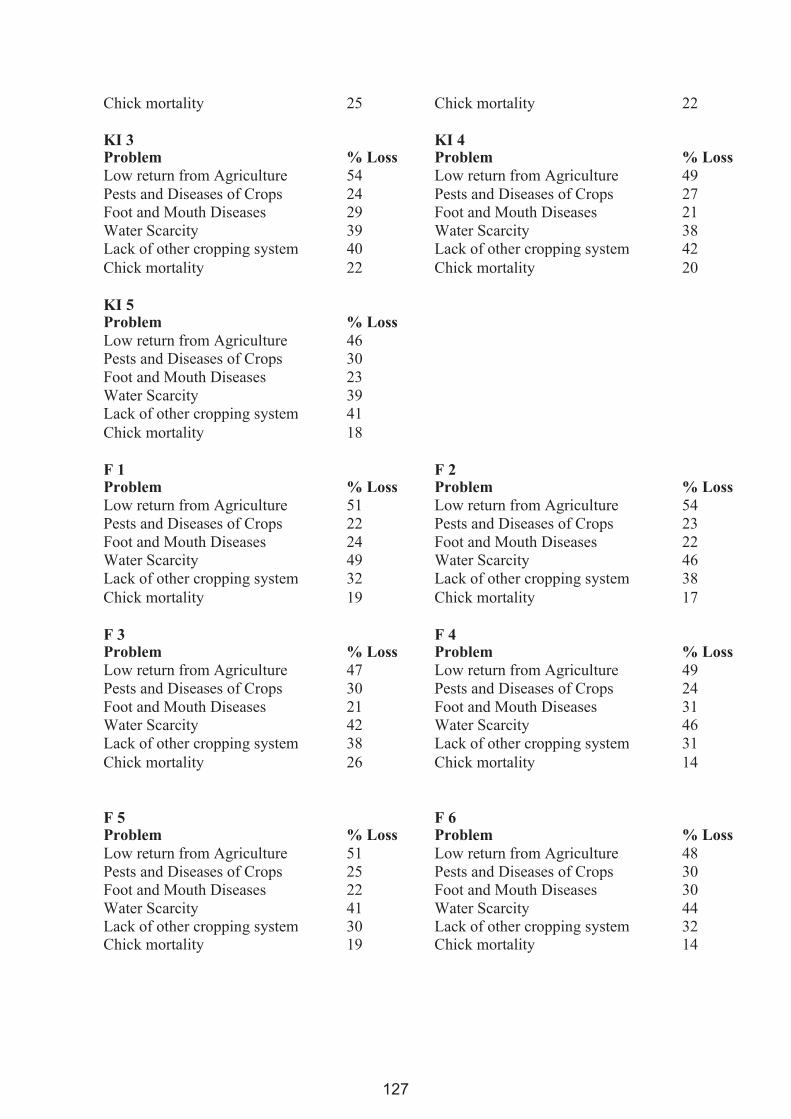
127
Chick mortality 25 Chick mortality 22
KI 3 Problem
% Loss
KI 4 Problem
% Loss
Low return from Agriculture 54 Low return from Agriculture 49 Pests and Diseases of Crops 24 Pests and Diseases of Crops 27 Foot and Mouth Diseases 29 Foot and Mouth Diseases 21 Water Scarcity 39 Water Scarcity 38 Lack of other cropping system 40 Lack of other cropping system 42 Chick mortality 22 Chick mortality 20
KI 5 Problem
% Loss
Low return from Agriculture 46
Pests and Diseases of Crops 30
Foot and Mouth Diseases 23
Water Scarcity 39
Lack of other cropping system 41
Chick mortality 18
F 1 Problem
% Loss
F 2 Problem
% Loss
Low return from Agriculture 51 Low return from Agriculture 54 Pests and Diseases of Crops 22 Pests and Diseases of Crops 23 Foot and Mouth Diseases 24 Foot and Mouth Diseases 22 Water Scarcity 49 Water Scarcity 46 Lack of other cropping system 32 Lack of other cropping system 38 Chick mortality 19 Chick mortality 17
F 3 Problem
% Loss
F 4 Problem
% Loss
Low return from Agriculture 47 Low return from Agriculture 49 Pests and Diseases of Crops 30 Pests and Diseases of Crops 24 Foot and Mouth Diseases 21 Foot and Mouth Diseases 31 Water Scarcity 42 Water Scarcity 46 Lack of other cropping system 38 Lack of other cropping system 31 Chick mortality 26 Chick mortality 14
F 5 Problem
% Loss
F 6 Problem
% Loss Low return from Agriculture 51 Low return from Agriculture 48 Pests and Diseases of Crops 25 Pests and Diseases of Crops 30 Foot and Mouth Diseases 22 Foot and Mouth Diseases 30 Water Scarcity 41 Water Scarcity 44 Lack of other cropping system 30 Lack of other cropping system 32 Chick mortality 19 Chick mortality 14
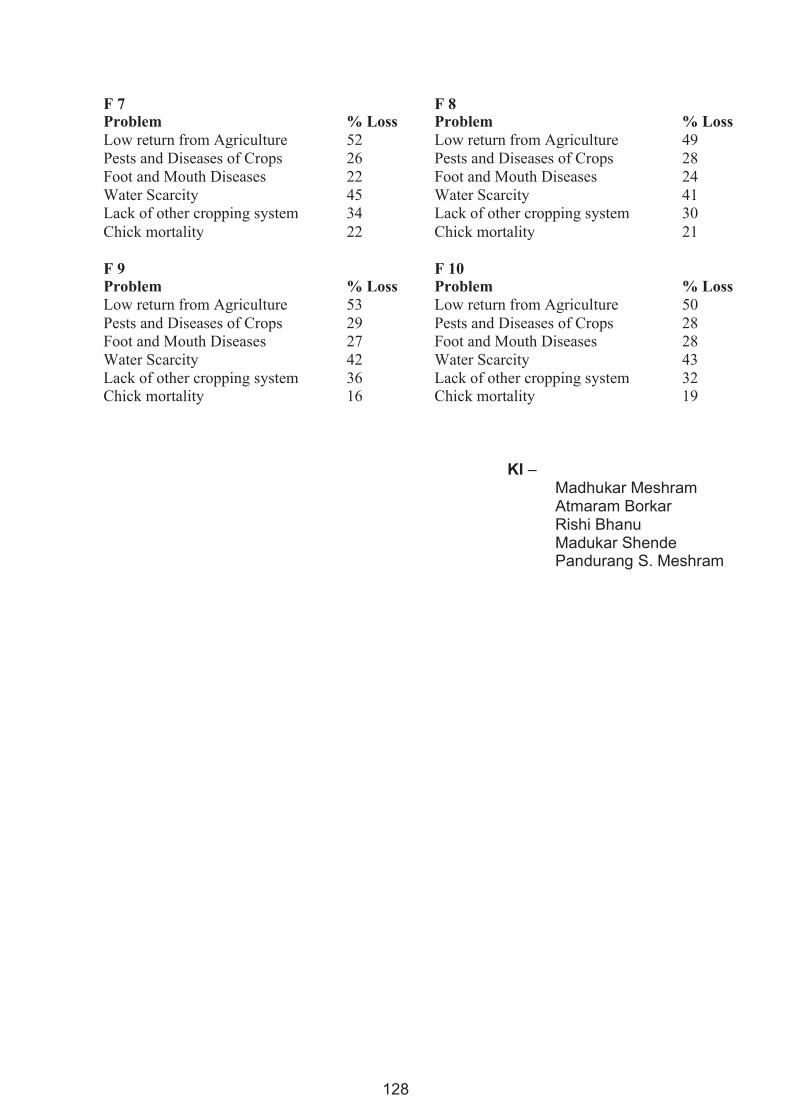
128
F 7 Problem
% Loss
F 8 Problem
% Loss
Low return from Agriculture 52 Low return from Agriculture 49 Pests and Diseases of Crops 26 Pests and Diseases of Crops 28 Foot and Mouth Diseases 22 Foot and Mouth Diseases 24 Water Scarcity 45 Water Scarcity 41 Lack of other cropping system 34 Lack of other cropping system 30 Chick mortality 22 Chick mortality 21
F 9 Problem
% Loss
F 10 Problem
% Loss
Low return from Agriculture 53 Low return from Agriculture 50 Pests and Diseases of Crops 29 Pests and Diseases of Crops 28 Foot and Mouth Diseases 27 Foot and Mouth Diseases 28 Water Scarcity 42 Water Scarcity 43 Lack of other cropping system 36 Lack of other cropping system 32 Chick mortality 16 Chick mortality 19
KI – Madhukar Meshram Atmaram Borkar Rishi Bhanu Madukar Shende Pandurang S. Meshram
129
Training Program on
Participatory Rural Appraisal (PRA) and Communication Strategies including IWM
26-29 September 2019
Handout-Reading 2
AGRICULTURAL RESEARCH FOR RESOURCE-POOR FARMERS
130
Handout-Reading 2
AGRICULTURAL RESEARCH FOR RESOURCE-POOR FARMERS (Part-I):
THE FARMER-FIRST-AND-LAST MODEL
Rural poverty is much less a problem of total food availability than of who produces the food and who has the income to buy it. A high priority is therefore to enable the tens of millions of resource-poor farm families to increase their production and improve its stability. The normal ‘transfer of technology’ (TOT) model for agricultural research has built-in biases which favour resource-rich farmers whose conditions resemble those of research stations. TOT approaches have been modified through on-farm trials and demonstrations but the basic model and approach remain the same. A second emerging model is ‘farmer-first-and-last’ (FFL). This starts and ends with the farm family and the farming system. It begins with a holistic and interdisciplinary appraisal of farm families’ resources, needs and problems, and continues with one-farm and with-farmer R and D, with scientists, experiment stations and laboratories in a consultancy and referral role. FFL fits the needs and opportunities of resource-poor farm families better than TOT, but there are obstacles to its development and introduction. These can be tackled step-by-step, through combinations of methodological innovation, interdisciplinary including the social sciences and provision of suitable resources, rewards and training. FFL approaches promise a greater contribution from agricultural research to the eradication of rural poverty.
Model A: Transfer-of Technology
The transfer-of-technology (TOT) model is deeply embedded in the thinking of many professions and discipline around the world. It is part of the structure of centralized knowledge in which power, prestige and professional skills are concentrated in well-informed ‘cores’ or centers. These cores or centers generate new technology which then spreads (or does not spread) to the peripheries. Highly trained civil, mechanical and agricultural engineers, medical scientists, agronomists and others develop technologies in laboratories, workshops and experiment stations and then attempt to transfer them to would-be clients. This approach has held immense successes in industry and agriculture with resource-rich clients. For example, the development of mechanization through combine harvesters, tractors and threshers by agricultural engineers, and the development of high-yielding technological packages by plant-breeders and others have enabled many of the resource-rich to increase their productivity and profitability. But the approach has also had severe shortcomings for would-be clients who are resource-poor.
Source: Chambers, R. & Ghildyal, B.P.,1984 ‘Agricultural research for resource-poor farmers: the farmer- first-and-last model’, Agricultural Administration, 20 (1), pp1-30.
131
Model B: Farmer-First-and-Last
The farmer-first-and-last (FFL) model entails fundamental reversals of learning and location. These, we argue, are necessary if research and the technology it generates are better to fit the needs and conditions of RPF families.
FFL differs from TOT in starting not with scientists and their perception and priorities, but with RPF families and theirs. It begins with a systematic process of scientists learning from and understanding RPF families, their resources, needs and problems. The main focus of research and learning is the resource-poor farm rather than the research station and the laboratory. Research problems and priorities are identified by the needs and opportunities of the farm rather than by the professional preferences of the scientist.
The sharp distinction which we see between TOT and FFL has been blurred by some of the many meanings given and ‘farming systems research’. Farming systems research sometimes means ‘upstream’ research, in which elements of a farming system are evolved and investigated on an experiment station. This is a TOT approach. In contrast, there is ‘downstream’ farming systems research which starts and ends with farmers, beginning with systematic attempts to understand the farm family and farming system. This is an FFL approach.
Four Prototypes and Variants
FFL approaches are not entirely new, but they have not been fully explored, fitted together, and evolved. Several variants have been described in the literature. They are still being developed and so can be considered prototypes. They include CIMMYT’s approach to planning technologies appropriate to farmers; the Sondeo method of rapid appraisal; ICRAF’s D and D (diagnosis and design) for agro-forestry; and the farmer-back-to-farmer methodology of CIP. These will be briefly described and then compared.
1. CIMMYT. The CIMMYT approach emphasizes the farmer as the primary client of
agricultural research, and farmer circumstances as the basis for planning research. It pays much attention to the methods whereby farmer circumstances are identified. Farmers are grouped into ‘recommendation domains’ – groups of farmers for whom more or less the same recommendations can be made. There is a focus on a target crop. Rapid appraisals are conducted by an agronomist and an economist working together. Background information is assembled. An exploratory survey is carried out, using a checklist of farmer circumstances, classified as: natural circumstances; external socio- economic circumstances of markets and institutions; farmers’ goals and resources’ relevant features of the total farming system; and description of production practices for the target crop (Byerlee and Collinson 1980:13). This is followed by a formal verification survey with a questionnaire (which, however, may will be superfluous after a well-conducted exploratory survey). Analysis of data and prescreening of technological components then lead to the identification of ‘best bets’ and on-farm experiments with these.
132
2. Sondeo. The Sondeo approach developed by Hildebrand (1981) in Guatemala is strongest in its technique for the creative combination of disciplines in rapid appraisal to generate new technology. A zone with homogeneous farming practices is identified, in which are to be farm trials of technologies which are as yet not specified. A team leader and ten members – five of them agronomists and animal scientists, and five from socio-economics – conduct a very rapid appraisal. They work in pairs – one agronomist or animal scientist with one socio-economist – changing partners each day for five days. They visit the area, and interview farmers and to identify feasible and suitable improvements, and all brainstorm together each evening. At the end of the five days, many three-cornered discussions – between farmers, social scientists and biological scientists – have contributed to proposals for improved farm practices. A report is written under pressure and provides innovations for the Technology Testing Team which then works in the area with on-farm and with-farmer trials.
3. ICRAF’s D and D. ICRAF’s diagnosis and design (D and D) methodology sets out to
identify promising candidate agro-forestry technologies. Major emphasis is placed on the farm household management unit and the satisfaction of its needs. The methodology also seeks to address a broader range of production and conservation objectives than most farming systems research, emphasizing productivity, sustainability and adoptability. A minimal team includes one or more representatives of agricultural science (general agronomy, horticulture, and livestock sciences), forestry (in the broadest sense), social science (sociology/anthropology, human geography and economics), and natural sciences concerned with land resource survey (ecology, soils science, climatology). The application of D and D procedures by a multidisciplinary team usually entails about two weeks to carry out the diagnostic survey, analyse the results and develop appropriate design concepts for agro-forestry interventions to improve the existing land use system. There is a four stage procedure – prediagnostic, diagnostic, design, and follow-up-planning. The D and D procedures are seen as part of a of a continuing learning process and may be repeated.
4. CIP’s farmer-back-to-farmer. The original farmer-back-to-farmer research was
conducted on potato storage in Peru by biological scientists and an anthropologies following 25 years of failure in potato storage work. The anthropologist learnt about farm families’ objectives and their knowledge of and problems with potato storage, and acted as a link between then and the biological scientists, bringing the latter into direct learning contract with the farmers. There were four stages- establishing a common definition of the problem; interdisciplinary team research seeking a solution; testing and adaptation of the proposed technology on-farm, with farmers contributing ideas; and ‘farmer evaluation: the last judgment’. The result was an improved and adaptable technology which met farmers’ objectives, used materials to which they had access, fitted in with their traditional house design, and above all was adopted by them. A key element was changes of perception and priority on the part of the scientists. For example, what appeared losses to scientists were not necessarily losses to farmers, who had uses for shriveled or spoiled potatoes.
133
Five thrusts
Innovations with parts of variants of FFL have doubtless already been developed in various places. Any attempt develops and introduce the FL model on a wider scale can be seen to require five complementary thrusts:
i. Methodological innovation. Eclectic use of elements of methods already developed
elsewhere need to be combined with innovation in and for local conditions, with special stress on resource-poor areas and farm families. By analogy with the collection of genetic material, methodological material needs to be collected from different environments. Access is needed to be relevant experience in other countries, and some of this is already available on journals.
ii. Inter-disciplinary. Full interdisciplinary entails collaborative work between farmers, technical scientists and social scientists. In practice, it is rare for either technical scientists or social scientists to be properly equipped for this sort of work. Moreover, social scientists are usually hard to get hold of. Few institution can muster a combination of, say agricultural sciences, and sociology and social anthropology. The best feasible may often be that farmers and agricultural scientists together do the best they can.
iii. Resources. Rapid appraisals require resources for travel and work out of station, as does on-farm and with-farmer R and D. vehicles and funds for travel are not always absolutely essential in practical terms but their availability will often be a precondition for effective FFL work.
iv. Rewards. Apart from exceptional individuals, scientists need to feel that they will be rewarded for behaviour which is both inconvenient and liable to be less productive initially in professional terms, for example publications. One measure is to encourage self-critical writing about experience with methodologies such as rapid appraisals. Another is to recognize exceptional work in this field through promotions and rewards, putting it on a par with high-status genetic and microbiological work. An annual competition with an award for the best FFL R and D is one way of doing this.
v. Training. How to learn from farmers, like how to manage an organization, is a set of skills that most people think they have; but like management, learning from farmers has specialized techniques and can be taught and learnt (see for example Rhoades 19820. techniques for diagnostic survey, analysis and design can also be taught. University curricula can be developed to include farming systems. Attitude changes are more difficult, but simulation games like “Green Revolution” (Chapman 1983) and ‘Monsoon’ (Staley 1981) can help, and further simulation games in which scientists play RPFs could be devised.
Success will depend critically on the style and quality of the face-to-face relationships of scientists and farmers. For this, there is no substitute for learning by doing. Unless that relationship is truly one of scientists diligently learning from farmers, in a humble role, only the form of farmer-first-and-last will be achieved and not the substance. The most essential is learning by doing, with colleagues correcting each other if they slip in to the habitual roles of teacher instead of learner.
134
Training Program on
Participatory Rural Appraisal (PRA) and Communication Strategies including IWM
26-29 September 2019
Reading Handout – 3
A LOW COST APPROACH TO
UNDERSTANDING SMALL FARMERS
135
Reading Handout – 3
A LOW COST APPROACH TO UNDERSTANDING SMALL FARMERS
INTRODUCTION
Understanding the way in which the farmer weighs information on rainfall, soils, markets and available production techniques and then allocates his resources to provide reliable food supplies and cash incomes is the key to understanding the small farmer. This systems view, in turn, is the key to relevant research and development efforts which seek to realize national policy objectives whilst, at the same time, providing farmers with improved production techniques to better their own needs and priorities.
Agricultural research has been the major provider of new technology to the traditional sector and its historical orientation was on commodity and disciplinary lines. However, recent efforts have focused the use of a systems perspective to identify researchable problems and opportunities among small farm populations as the operational niche for FSR. It has been increasingly recognized that a systems perspective has two major advantages.
(1) It allows an understanding of how and why the farmer, in managing several enterprises, makes compromises on the optimum technical management of any one enterprise.
(2) It allows the application of wider, more relevant, productivity criterion of physical yield per unit of land area beloved of classical agricultural research.
The evaluation of local circumstances
Accepting the rationality of the small farmer and aware of his needs and priorities, an evaluation of the local circumstances within which he must operate identifies many of the management problems posed by his production environment. It establishes a context within which to interpret his choices of product, of management strategy and of production techniques.
This exploratory Survey is a pivotal procedure in the sequence of methods for understanding small farmers. Detailed guidelines are used to focus unstructured interviews with farmers from the target group. A set of guidelines for an investigation into present and possible management of the maize crop accompany this reading as an Appendix. Such guidelines may be pre-focused on to a particular problem such as ox mechanization, dry season feeding of animals, or increased protein production. The content is narrowed by the evaluation of local circumstances preceding the Explanatory Survey.
Michael Collinson, International Maize and Wheat Improvement Centre, PO Box 25171, Nairobi, Kenya.

136
The Verification Survey
The Exploratory Survey uses almost an anthropological approach to understanding the local farming system. It is followed by a formal survey aimed at verifying that the picture obtained from discussions with a group of farmers is indeed valid for the target population as a whole. The formal survey verifies the descriptive features of the system, the priorities and preferences of local farmers and their problems in terms of resource constraints and the importance attributed to hazards faced. In addition to verifying the picture of the farming system, the survey has three other objectives.
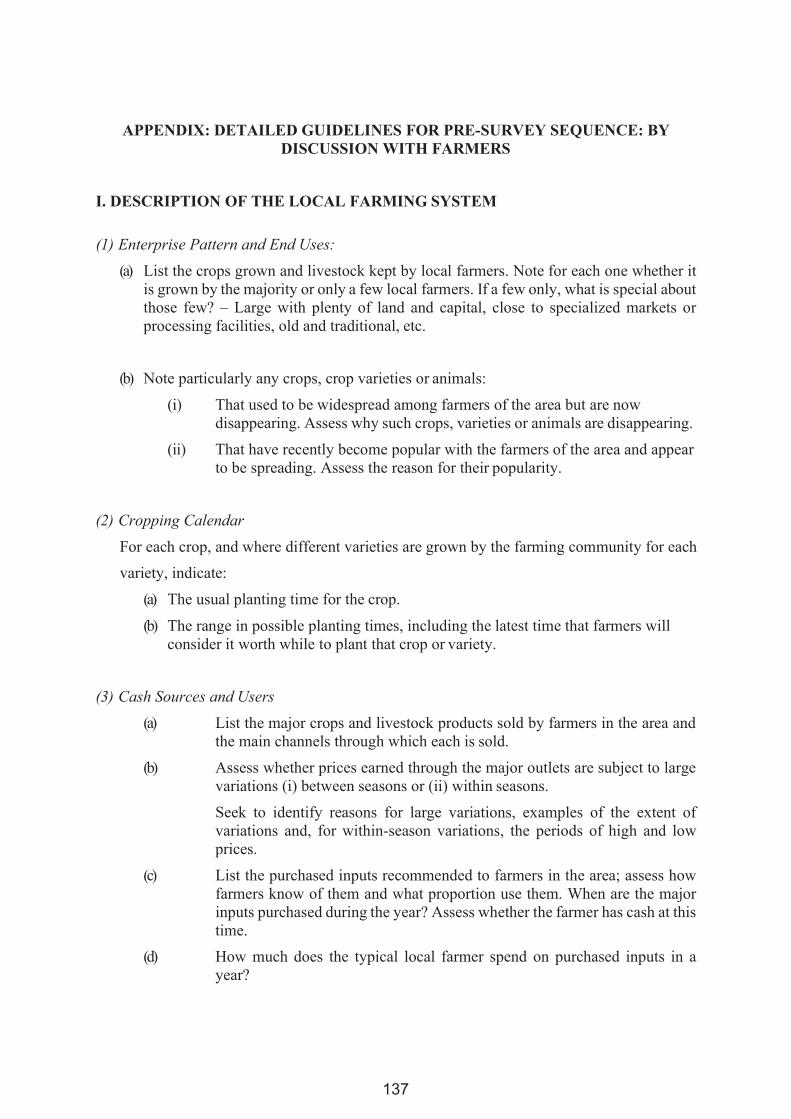
137
APPENDIX: DETAILED GUIDELINES FOR PRE-SURVEY SEQUENCE: BY DISCUSSION WITH FARMERS
I. DESCRIPTION OF THE LOCAL FARMING SYSTEM
(1) Enterprise Pattern and End Uses:
(a) List the crops grown and livestock kept by local farmers. Note for each one whether it is grown by the majority or only a few local farmers. If a few only, what is special about those few? – Large with plenty of land and capital, close to specialized markets or processing facilities, old and traditional, etc.
(b) Note particularly any crops, crop varieties or animals:
(i) That used to be widespread among farmers of the area but are now disappearing. Assess why such crops, varieties or animals are disappearing.
(ii) That have recently become popular with the farmers of the area and appear to be spreading. Assess the reason for their popularity.
(2) Cropping Calendar
For each crop, and where different varieties are grown by the farming community for each
variety, indicate:
(a) The usual planting time for the crop.
(b) The range in possible planting times, including the latest time that farmers will consider it worth while to plant that crop or variety.
(3) Cash Sources and Users
(a) List the major crops and livestock products sold by farmers in the area and the main channels through which each is sold.
(b) Assess whether prices earned through the major outlets are subject to large variations (i) between seasons or (ii) within seasons.
Seek to identify reasons for large variations, examples of the extent of variations and, for within-season variations, the periods of high and low prices.
(c) List the purchased inputs recommended to farmers in the area; assess how farmers know of them and what proportion use them. When are the major inputs purchased during the year? Assess whether the farmer has cash at this time.
(d) How much does the typical local farmer spend on purchased inputs in a year?
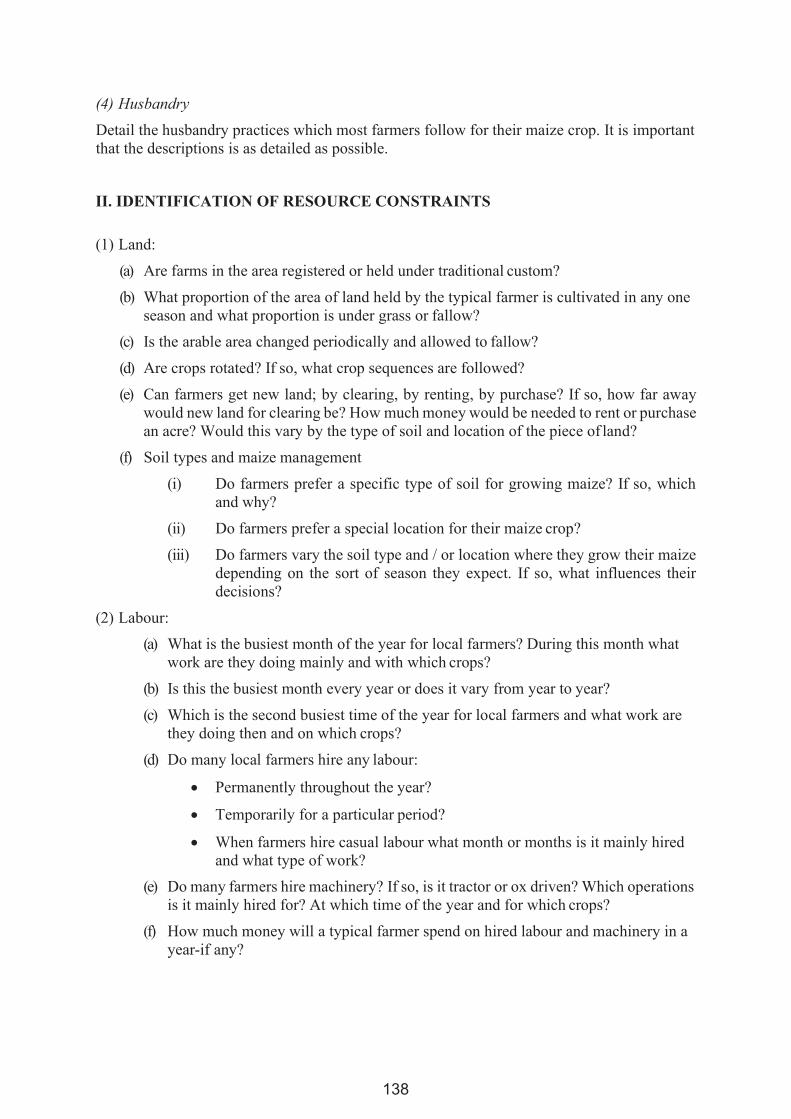
138
(4) Husbandry
Detail the husbandry practices which most farmers follow for their maize crop. It is important that the descriptions is as detailed as possible.
II. IDENTIFICATION OF RESOURCE CONSTRAINTS
(1) Land:
(a) Are farms in the area registered or held under traditional custom?
(b) What proportion of the area of land held by the typical farmer is cultivated in any one season and what proportion is under grass or fallow?
(c) Is the arable area changed periodically and allowed to fallow?
(d) Are crops rotated? If so, what crop sequences are followed?
(e) Can farmers get new land; by clearing, by renting, by purchase? If so, how far away would new land for clearing be? How much money would be needed to rent or purchase an acre? Would this vary by the type of soil and location of the piece of land?
(f) Soil types and maize management
(i) Do farmers prefer a specific type of soil for growing maize? If so, which and why?
(ii) Do farmers prefer a special location for their maize crop?
(iii) Do farmers vary the soil type and / or location where they grow their maize depending on the sort of season they expect. If so, what influences their decisions?
(2) Labour:
(a) What is the busiest month of the year for local farmers? During this month what work are they doing mainly and with which crops?
(b) Is this the busiest month every year or does it vary from year to year?
(c) Which is the second busiest time of the year for local farmers and what work are they doing then and on which crops?
(d) Do many local farmers hire any labour:
Permanently throughout the year?
Temporarily for a particular period?
When farmers hire casual labour what month or months is it mainly hired and what type of work?
(e) Do many farmers hire machinery? If so, is it tractor or ox driven? Which operations is it mainly hired for? At which time of the year and for which crops?
(f) How much money will a typical farmer spend on hired labour and machinery in a year-if any?
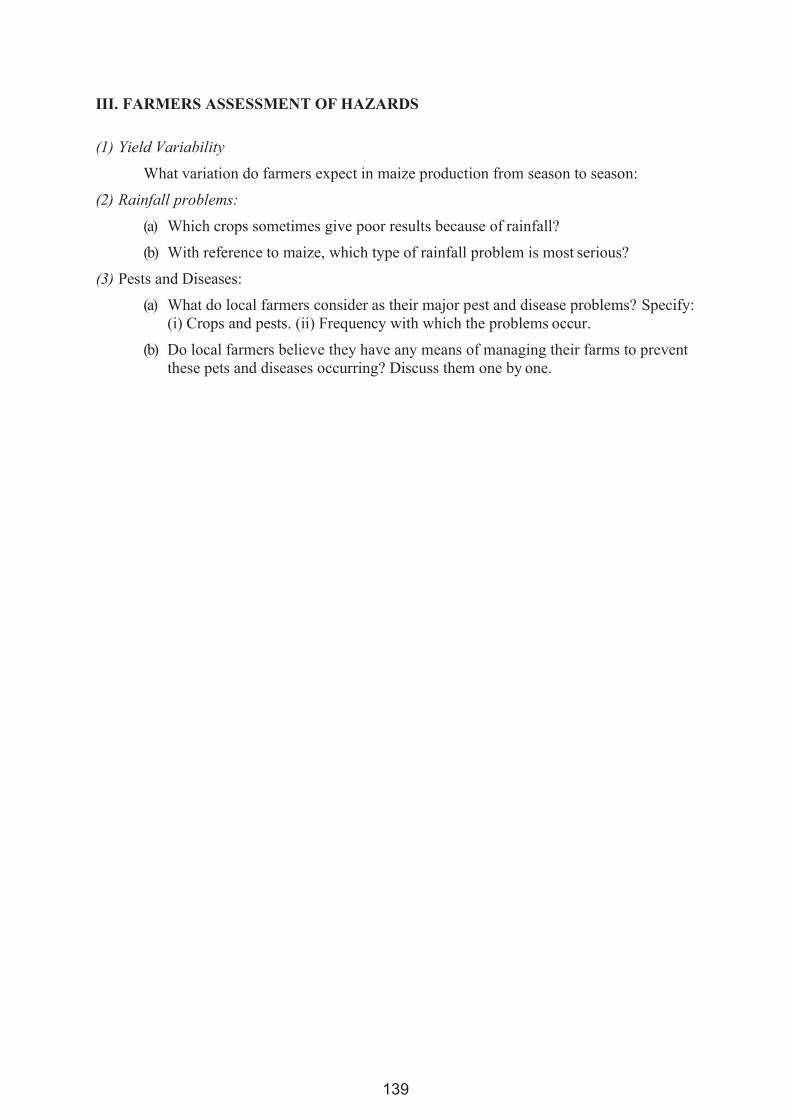
139
III. FARMERS ASSESSMENT OF HAZARDS
(1) Yield Variability
What variation do farmers expect in maize production from season to season:
(2) Rainfall problems:
(a) Which crops sometimes give poor results because of rainfall?
(b) With reference to maize, which type of rainfall problem is most serious?
(3) Pests and Diseases:
(a) What do local farmers consider as their major pest and disease problems? Specify: (i) Crops and pests. (ii) Frequency with which the problems occur.
(b) Do local farmers believe they have any means of managing their farms to prevent these pets and diseases occurring? Discuss them one by one.

140
141
Training Program on
Participatory Rural Appraisal (PRA) and Communication Strategies including IWM
26-29 September 2019
Reading Handout – 4 (Case Illustration 1)
TOWARDS SUSTAINABLE LIVESTOCK MANAGEMENT
142
You too have individual reading, group working and farmer interface through village visit
Reading Handout – 4 (Case Illustration 1)
TOWARDS SUSTAINABLE LIVESTOCK MANAGEMENT
Constraints and opportunities for conversion
from free range grazing to managed feeding in Bundelkhand, India
EXECUTIVE SUMMARY
Introduction.
The study is a result of collaboration between the Indian Grassland and Fodder Research Institute (IGFRI), Jhansi and the International Centre for development oriented Research in Agriculture (ICRA), The Netherlands. It was conducted from April to July 1998 by an interdisciplinary team of two scientists from IGFRI and four expatriate scientists – all participating in ICRA’s research training programme.
The problem of free range grazing.
The Bundelkhand covers a semi-arid area of 72,000 km2 in the central part of India. It supports a population of 12 million people, as well as more than 10 million cattle and buffaloes, forming a major component of the agricultural systems. Growing human and animal populations has resulted in an increased pressure on the land, which in turn has lead to a decline in the productivity and availability of grazing lands (natural grasslands, wastelands and forests). The potential of these grazing lands to provide the required feed is further limited by the concentration of the annual rains during the short monsoon period. These factors mean that the region suffers from a serious shortage of livestock feeds for most of the year, leaving many farmers with little option but to allow their animals to free range graze.
Looking for ways to solve the problem: opportunities for conversion to managed feeding.
IGFRI and development organizations in the Budelkhand feel that intensification of livestock production could reduce the problem of free range grazing. Intensification is believed to lead farmers to replace their current large numbers of free grazing, low productive animals by smaller numbers of partly or largely stall-fed, more productive animals. In an effort to stimulate this change, IGFRI has developed technologies for fodder production for irrigated, rain-fed and rehabilitated lands. The latter has included grasslands, wastelands and forests. Although technically sound, none of these technologies have been widely adopted by the Budelkhand farmers.
In your case problem if it is not defined, you have to find out top most researchable problem of RPF
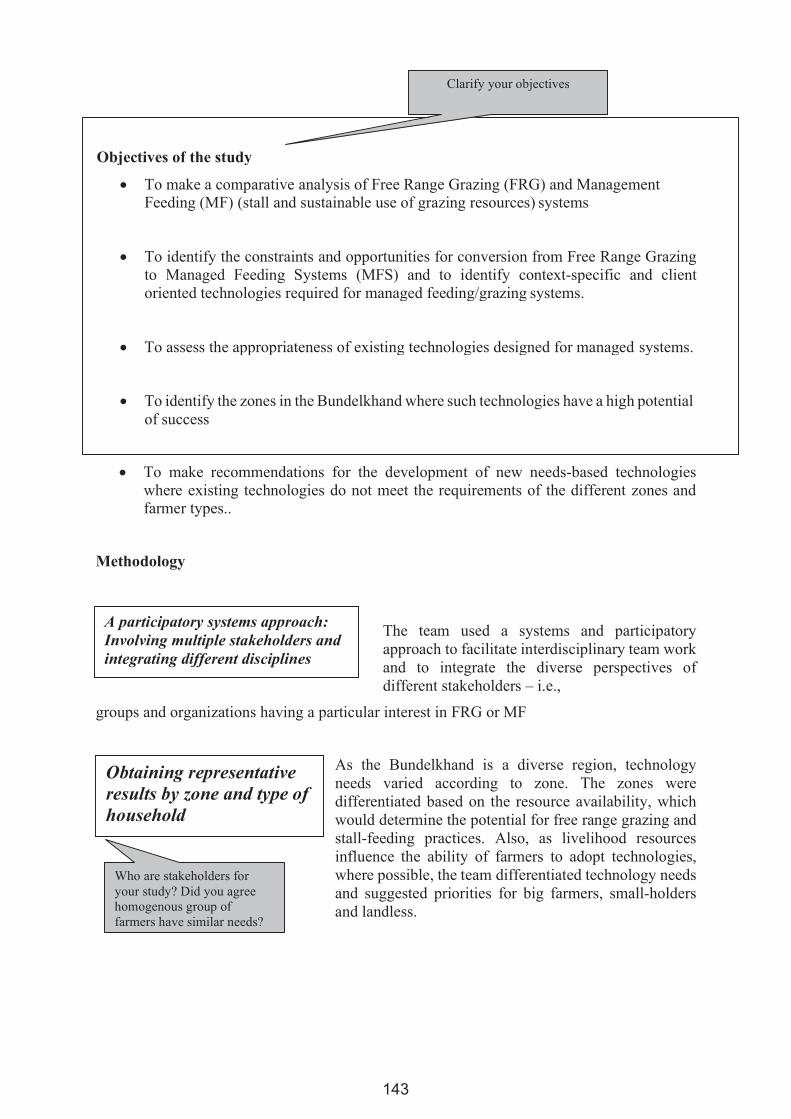
143
To make recommendations for the development of new needs-based technologies where existing technologies do not meet the requirements of the different zones and farmer types..
Methodology
The team used a systems and participatory approach to facilitate interdisciplinary team work and to integrate the diverse perspectives of different stakeholders – i.e.,
groups and organizations having a particular interest in FRG or MF
As the Bundelkhand is a diverse region, technology needs varied according to zone. The zones were differentiated based on the resource availability, which would determine the potential for free range grazing and stall-feeding practices. Also, as livelihood resources influence the ability of farmers to adopt technologies, where possible, the team differentiated technology needs and suggested priorities for big farmers, small-holders and landless.
Clarify your objectives
Objectives of the study
To make a comparative analysis of Free Range Grazing (FRG) and Management Feeding (MF) (stall and sustainable use of grazing resources) systems
To identify the constraints and opportunities for conversion from Free Range Grazing to Managed Feeding Systems (MFS) and to identify context-specific and client oriented technologies required for managed feeding/grazing systems.
To assess the appropriateness of existing technologies designed for managed systems.
To identify the zones in the Bundelkhand where such technologies have a high potential of success
Who are stakeholders for your study? Did you agree homogenous group of farmers have similar needs?
Obtaining representative results by zone and type of household
A participatory systems approach: Involving multiple stakeholders and integrating different disciplines
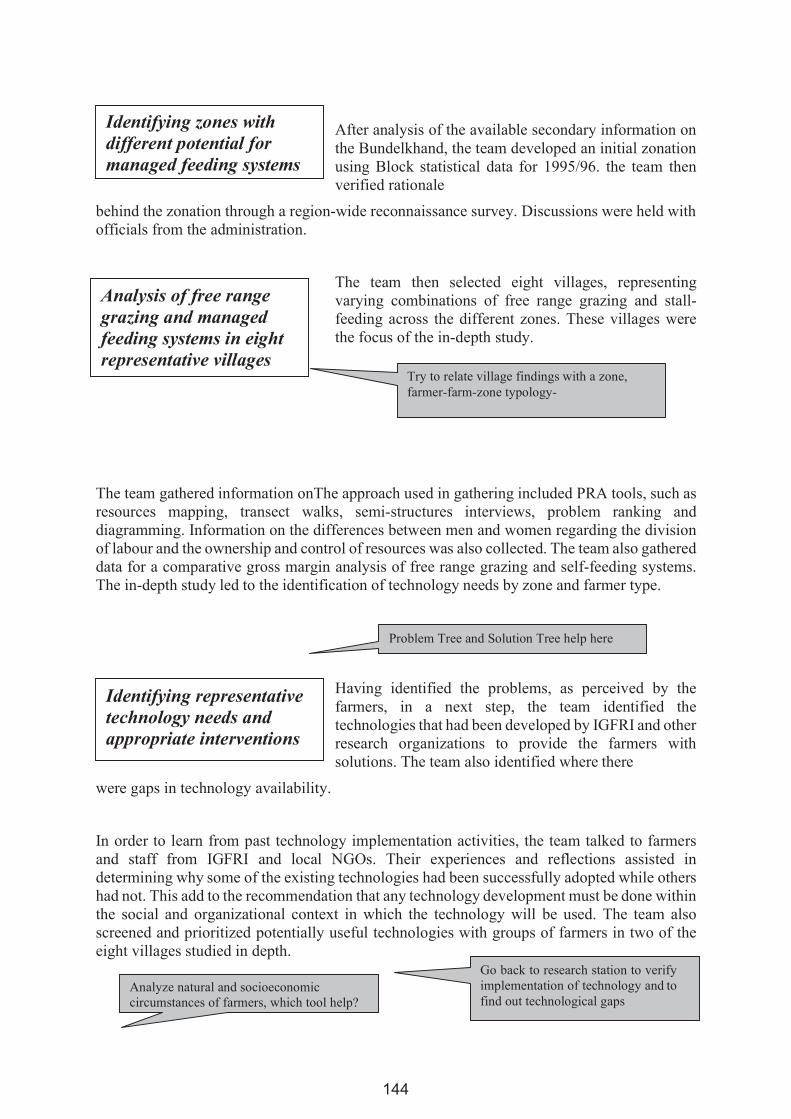
144
Go back to research station to verify implementation of technology and to find out technological gaps
Try to relate village findings with a zone, farmer-farm-zone typology-
Problem Tree and Solution Tree help here
Analyze natural and socioeconomic circumstances of farmers, which tool help?
After analysis of the available secondary information on the Bundelkhand, the team developed an initial zonation using Block statistical data for 1995/96. the team then verified rationale
behind the zonation through a region-wide reconnaissance survey. Discussions were held with officials from the administration.
The team then selected eight villages, representing varying combinations of free range grazing and stall- feeding across the different zones. These villages were the focus of the in-depth study.
The team gathered information onThe approach used in gathering included PRA tools, such as resources mapping, transect walks, semi-structures interviews, problem ranking and diagramming. Information on the differences between men and women regarding the division of labour and the ownership and control of resources was also collected. The team also gathered data for a comparative gross margin analysis of free range grazing and self-feeding systems. The in-depth study led to the identification of technology needs by zone and farmer type.
Having identified the problems, as perceived by the farmers, in a next step, the team identified the technologies that had been developed by IGFRI and other research organizations to provide the farmers with solutions. The team also identified where there
were gaps in technology availability.
In order to learn from past technology implementation activities, the team talked to farmers and staff from IGFRI and local NGOs. Their experiences and reflections assisted in determining why some of the existing technologies had been successfully adopted while others had not. This add to the recommendation that any technology development must be done within the social and organizational context in which the technology will be used. The team also screened and prioritized potentially useful technologies with groups of farmers in two of the eight villages studied in depth.
Identifying representative technology needs and appropriate interventions
Analysis of free range grazing and managed feeding systems in eight representative villages
Identifying zones with different potential for managed feeding systems
145
Natural, socioeconomic factors and national policies influence farmers decisions of particular practice
Conditions favouring free range grazing or managed feeding
The team found that free range grazing and managed feeding were not mutually exclusive practices, but often coexisted, both at zonal, village and house/herd level. However, the relative importance of the two systems varied between zones, villages in each zone and households in each village.
The picture which gradually emerged from the analysis of the Block level statistical data used in the zonation and the village studies, showed that the relative importance of free range grazing and stall-feeding at zonal, village and household level depended mainly on the relative availability of fodder from crop residues versus fodder from natural grasslands, wastelands and forests. Hence, the major factors or conditions which influence the relative importance of free grazing and stall-feeding include:
Cropping intensity
Proximity to forests, wastelands and fallow lands
Access to markets for milk and fodder
Special pattern of free range grazing and managed feeding systems
The zonation is based on the geographical distribution of the major factors influencing the balance between free range grazing and stall feeding, such as cropping intensity and proximity to forests, wastelands and fallow lands. On this basis, the team distinguished four zones as follows:
The poor rain-fed zone (Zone 1).
This Zone, in the south of the Bundelkhand, is characterized by poor soils, undulating topography predominantly rain-fed agriculture and relatively large availability of wastelands, forests and fallow lands for grazing. The availability of fodder from crop residues is limited, due to poor soils and the limited cropped areas, whereas available grazing resources are relatively large. Free range grazing low
The forest zone (Zone 2)
This zone, also in south of the Bundelkhand, is characterized by poor soils, undulating topography, predominantly rain-fed agriculture on a smaller proportion of the area than in the previous zone, and very large available forest areas. There is limited availability of fodder from crop, but the large areas of open forests that are available for grazing and the protected forests that provide fodder for cut and carry.
The rich rain-fed zone (Zone 3)
This zone, in the north of the Bundelkhand, is characterized by better soils and relatively flatter topography than the previous two zones. The human population density is higher than in the south and a much larger proportion of the area is occupied by crops, the majority of which are rain fed, leaving less wasteland, forest and fallow land for grazing. Hence, the fodder from grazing resources) is much less than in the
146
Analyze farmers’ decision in systems perspectives and find out technological needs, which can wok under prevailing circumstances and available resources
previous two zones but there is a greater fodder availability from crop residues than in the south. However, as the density of the grazing animals– which is correlated with the high human population density – is substantially higher than in the south. The result of this is that the fodder availability per animal is the lowest in the region. This severe fodder shortage means that the opportunities for stall feeding are limited, leaving farmers with little choice but to leave their animals for free range grazing on the limited grazing land that is available.
The irrigated zone (Zone 4)
This zone, also in the north of the Bundelkhand, is characterized by better soils, relatively flatter topography, predominantly irrigated agriculture and very little
available wasteland, forest and fallow land for grazing. As in the previous zone, the human population density is relatively high and crops occupy an even larger part of the area, leaving still less grazing resources. Thus, stall-feeding is relatively more important in this zone.
147
Technological needs are region and farmer-specific, identify them as per mandate of the research station. Some technology may be on shelf, What are the reasons?' distinguish research, extension and adoption needs.
Economic rationale for free range grazing or managed feeding
The team did a partial budgeting analysis of a free range grazing system, a purely stall fed system and two mixed systems involving stall feeding and free range grazing. For the calculations, the team used best estimates of major variables determining the gross margin. These best estimates were based on information collected from farmers, direct observations, literature and expert knowledge. This comparative economic analysis, which will need further refinement and verification, suggests that if real economic costs to the farmer are considered, but environmental and social costs to the community ignored-free range grazing is the only system that gives a positive gross margin. Stall feeding is only sustainable (i.e. giving a positive cash flow), when farmers do not consider the cost of family labour and family capital and rely almost exclusively on home grown crop residues.
The potential for further intensification of livestock production and the technologies needed therefore have to be looked at in relation to the resources available at zonal village and household level. Finally, there seems to be little or no scope for intensification of livestock production in the poor rain-fed and forest zones, where free range grazing is the dominant practice. As home grown crop residues are limited in these areas and large grazing resources are available, the technology needs of these zones are concerned with the development and maintenance of the productive capacity of the grazing resources.
Technology needs for conversion to stall-feeding and recommendations.
The main conclusion form the analysis is that the potential for intensification of livestock production is a function of the degree of intensification of crop production. Thus, irrigation and other techniques increasing water availability to crops are the key to the solution of the problems associated with free range gazing. Wherever possible, the emphasis should therefore be on extending the irrigated area and developing low cost water harvesting and conservation facilities and techniques. The team has not investigated the scope for such improvements in the various zones, partly because it did not possess the expertise needed and partly because these techniques fall outside the mandate of IGFRI. The teams recommendations have therefore focused on technologies needed from IGFRI by zone and household type.
For the poor rainfed zone (Zone 1), little potential exists for improving crop production on a significant scale. Thus, in order to meet the fodder requirement of the area, waste land rehabilitation schemes and grazing-land management schemes are required.
In the forest zone (Zone 2), there is potential for dramatically increasing the productivity of the severely degraded forests through what is locally called Joint Forest Management (JFM) schemes. These schemes are intended to be a joint activity between
Page | 109
148
the villagers who reside close to the forest and the implementing agency, most frequently the Forest Department or a local NGO.
In the rich rainfed zone (Zone 3), despite the current larger fodder deficit than in the poor rainfed zone, there is more potential for technologies that increase crop production to supply the needs of the large animal population of the area. This is because crop production in the zone is almost double that in the poor rainfed zone. Considering the current fodder deficit and extreme pressure on grazing resources, development of technologies for this area should be of priority for IGFRI.
The irrigated zone (zone 4) has the greatest potential for increasing fodder production and so should be targeted as such. On larger farms there is scope for the production of green fodder on a small scale if competitive with other allocations. On medium and smaller farms there is more scope for the selection and breeding of crop varieties for irrigated conditions that produce both high yields of quality grain for human consumption and highly nutritious and palatable residues for animal feed, i.e. dual purpose crops.
In addition to targeting the technologies according to zone, the wide range of farmer types across the region means that solutions must also be tailored differently dependent on whether the farmers are large-scale small holders or landless. The landless animal owner, for example, would benefit from the increased employment opportunities and the increased fodder availability that would be provided through wasteland rehabilitation and grass land management schemes. Provision of improved fodder crop varieties, improved cropping schemes (fodder/food inter-crops) and improved animals should be targeted at the larger scale farmers. The small-holder would benefit from dual purpose (food and fodder) crop varieties – enabling maximum use to be made of the limited land availability.
The team found that some of the require technologies are available, but are ‘on the shelf’ in the research institutes. Some of the reasons for this gap were:
Poor linkage between technology sources and the beneficiaries.
Limited institutional collaboration, which hinders technology transfer and feedback.
Weak attendance to the development of social-organization, managerial and legal systems giving the people concerned a sense of ownership and responsibility needed to sustain the use of technologies on communal land and in forest areas.
The team proposes the following measures to bridge these gaps:
Using a participatory approach where different stakeholders take part in
planning and implementing research and development activities.
Strengthening the collaboration both between and within the institutions in
planning and implementing research and development activities.
149
Creating an enabling environment for the beneficiaries to be able to sustain the adoption of technologies.
Team proposes Two Research Proposals for IGFRI, Jhansi
1. On farm verification of the various ways of improving the palatability and nutritive
value of crop residues used as feeds in the Bundelkhand.
Objectives
To enable the livestock to take in more of the crop residue by addition of other substances that will make it more attractive and palatable
To enable the livestock to get more nutrients from the same quantities taken by adding ingredients which will raise the nutritive value of crop residues.
To enable the local breeds of cattle to express their full potential by providing them with more balanced diets.
To provide knowledge to farmers on the available technologies to improve dry fodder foe livestock consumption through education.
To analyse the economic justification for applying the technology in terms of net returns per unit.
Expected outputs
It is expected that with the addition of ingredient to improve the palatability and the nutritive value of crop residues used as feed. Animals will take in more of the feed and will acquire enough nutrients from it to enable them to improve upon their productivity.
Farmers will learn the various ways of improving the quality of feed for their livestock and the technology over their current practice.
2. Participatory evaluation and management of different silvipastoral systems for sustainable fodder and fuel wood production from community lands in Bundelkhand under grazing and cut and carry regime.
Objectives
To assess the needs of farmers and their criteria for evaluation of grasses, legumes, trees and their combinations in silvipastoral systems.
To identify economically and environmentally sustainable silvipastoral systems under grazing and cut and carry regime.
To develop management systems for establishment, maintenance and utilization of silvipastoral systems by the communities themselves.
150
Food for Thought
Expected outputs
A list of farmers criteria for evaluation of silvipastoral system
Data on productivity of different grasses and trees along with fodder legume under different technological management regime.
A silvipasture on around 50 ha of community lands
Community management formula for sustainable establishment, maintenance and utilization of silvipasture
Enhanced modes of collaboration between stakeholders.
Exercise: Please respond to the following questions
Please record your comments and submit to NAARM project team through site coordinator Do you think these research proposals will help to solve the problem? Can you identify that which project suits to which zones? Any other comments?
151
Training Program on
Participatory Rural Appraisal (PRA) and Communication Strategies including IWM
26-29 September 2019
Reading Handout - 5 Agricultural Research for Resource-poor
Farmers
152
“not with scientists and their perceptions and priorities, but with RPF families and theirs. It begins with a systematic process of scientists learning from, an understanding, RPF families, their resources, needs and problems. The main focus of research and learning is the resource- poor farm, rather than the research station and the laboratory. Research problems and priorities are identified by the needs and opportunities of the farm family rather than by professional preferences of the scientist. The research station and the laboratory have a referral and consultancy role, secondary to, and serving, the RPF family. The criterion for excellence is not the rigour of on-station or in-laboratory research, or yields in research station or resource-rich farmer conditions, but the more rigorous test of whether new practices spread among the resource poor”
Reading Handout - 5
Agricultural Research for Resource-poor Farmers
Part II: A Parsimonious Paradigm
A Parsimonious Paradigm
An alternative to TOT is the Farmer-first-and-last (FFL) model. This differs from TOT in involving reversals of normal professional tendencies. It has been described as starting
Agricultural Revolution
The need for FFL paradigm is acute. The RPF farming systems, especially those of hinterlands, present an entirely new order of challenge to agricultural research for which experience of research for the cores is misleading. The ecological and social complexity and diversity of RPF farming systems can only be covered through a new and strict parsimony of demands on research resources. This requires two simplifications:
1. to avoid large surveys and massive multi-dimensional data analysis: Large scale surveys with long multi-disciplinary questionnaires conform to professionalism but lead to normal error and normal impotence. Approaches for agricultural, farming systems, agro-forestry, and agro-ecosystem research have been developed and described by a number of research workers. RRA more generally has been pioneered in several places with the University of Khon Kaen in Thailand in the vanguard. RRA techniques are proving to replicable and more increasingly accepted as respectable. They deserve careful scrutiny and inventive development as part of the new paradigm, since to be cost-effective and feasible, it has to go quickly to the point.
2. to reduce dependence on multi-disciplinary teams: social scientists in particular advocate multi-disciplinary teams. Their desirability is now almost an article of faith.
Source: Robert Chambers and James Higgins, 1987
153
They have their virtues but also costs in mobilizing the teams, managing their interactions, handling logistics and report writing. More seriously, they are not widely replicable. International Agricultural Research Centers themselves have their own form of high level research station bias. They have the resources, flexibility and contacts to be able to hire agricultural economists and social anthropologists, and to field teams of social and agricultural scientists together. But this is more difficult to do in national systems. IARCs such as CIMMYT have made significant progress by supporting the building of FSR teams in national systems, but it is unrealistic to suppose that national multi-disciplinary teams will be feasible on anything like an adequate scale in the foreseeable future. Most research stations will be without social scientists, or if they have them, will not be inclined or able to give them their head even if they are trained in FSR. Moreover, problems of transport, fuel and days-out allowances have, in most countries, made it harder for teams to get to the field. In practice, a single scientist, or a pair, may manage to get out using a small vehicle if they are lucky, or motorcycle, bicycle, or public transport, but a team of the size fielded by an IARC is usually out of the question. In any case, the principle of parsimony and replicability points to diagnosis by single or paired scientists; and since personal commitment and even sacrifice are involved, it may be at first only one or a pair who are prepared and able to act.
Resource-Poor Farm Families and Scientists: Whose knowledge counts?
The past decade has seen increasing recognition and documentation of the richness, validity and usefulness of knowledge of rural people in general and farmers in particular. This recognition has been strong in Latin America, Africa, and swidden farming areas of Southeast Asia, though weaker in South Asia.
For this paper, it is unnecessary to recite the evidence. The emergent consensus among those who have studied indigenous technical knowledge (ITK), as it has been called is that its categories, constructs and content differ from those of modern science, are more closely linked to farming experience, and capture much that modern science misses. ITK provides currency of terms and concepts which are often of more utility for RPF farming practice than those of scientists. One implication is that most efficient formulation of problems and issues for research will take place within the medium of the language and concepts of farmers, rather than those of scientists. Farmers and their knowledge have four advantages over scientists and scientists’ knowledge which are not often wholly recognized.
The first is their knowledge of the whole farming system including interactive GE effects. Although this recognized in principle, the extent and significance of the knowledge of the less directly agricultural aspects-access to inputs, risk, market relations, food processing, storage and use-is often undervalued by professionals. Farmers will almost always take a broader view of the implications of technical change than scientists.
Second studies of ITK show that climatic and physical factors do not determine what is grown; they only set limits to what is possible. And these limits are less determinate than
154
many scientists assume and accept as RPFs manage to modify and exploit micro-environments and climates, adaptations which are hard to reproduce in on-station conditions.
Third, farming as an activity is highly time-driven. To maintain a livelihood in variable intra- annual and inter-annual environments and economic conditions, farmers have to innovate and adapt in order to survive. Agricultural researchers come and go; farmer’s knowledge provides a continuous stream of understanding and experience.
Fourth, there is the increasingly appreciated prevalence of experimentation by farmers. To most normal professionals, research and experimentation are activities conducted only by trained outsiders, on research stations, and not by farmers, on their fields.
PRACTICAL NEEDS AND OPTIONS
For scientists to enable RPFs to discuss and articulate their problems and priorities requires face-to-face learning at the outset of research programming. There is no substitute for this. The old prescription of feedback of farmers’ problems through extension has not worked well, and prevents the clarifying dialogue in which scientists and farmers can match their different systems of knowledge and find out how to get the best of both. The direct meeting is the crux, the occasion and process on which attention must be focused.
Training scientists in reversals
It is a major reversal for scientists to switch from believing as they have been taught, that their knowledge is superior and RPF’s are ignorant, to recognizing their own areas of ignorance and being willing, even eager, to learn from RPFs. The force of example and training through apprenticeship can be effective for this sort of change but is bound to be limited in scale.
Identifying and working with RPF families
Resource-rich farmer bias is a well-known weakness in rural contacts by agricultural and social scientists. If the farm families met are RRFs there is a danger that needs or constraints crucial for RPFs will be unwittingly screened out. Much of the FSR literature ignores this point. Where the bias is mentioned, advice on how to offset it tends to be geographical and refer to domains defined by production ‘problems’ specified by researchers rather than types of farm families within a certain area. ‘Resource-poor’ is then defined by the soils-water- topography-vegetation environment rather then by size, farm labour or capital resources. The physical and biological environments are relevant and important but do not encompass the whole spectrum of resource-poverty. Using them to define resource-poverty neglects, to take one example, single-female-headed farm families who are now quite often over one-third of the farm families in rural areas in Sub-Saharan Africa. Even within resource-poor environments, some categorization of the population is likely to be desirable for not all RPFs are poor in the same way. Simple and quick techniques are needed for scientists to offset
155
Exercise: Please answer the following question
What are three most important points about parsimonious paradigm?
biases and, within homogeneous categories of RPFs, to find farm families who are willing and able to engage in discussion and dialogue.
Farmer groups and panels
Whether farmers or outsiders are alone or in groups affects their behaviour and relations. The individual interview is attractive when outsiders come as a team. The more multi-disciplinary FSR becomes, the more likely this is. One bad tendency, is for the many outsiders to stand and talk to one another while the one farmer stands aside and watches, alienated. With teams of outsiders, the balance of numbers shifts power and the center of discussion in their favour. With farmers groups and panels, the balance of numbers shifts power and the center of discussion towards them.
Groups and panels have disadvantages: one person may dominate; people may come and go; all may defer to one important person; no one may wish to speak because the members have not discussed what party line to put; sensitive personal information cannot be sought or probed. But groups and panels have advantages; more knowledge can be tapped, and cross- checking can be automatic if members correct each other. Groups and panels in such ways can be good sources of information, to be extracted by the outsider.
Conclusion
Yet if our thesis is correct, FFL should enable scientists in national systems, given appropriate attitudes and skills, to serve RPFs more practically and cost-effectively. The last step or link in the FFL model, of handing initiative to farmers to do their own appraisal, is parsimonious, avoiding heavy survey and complicated analysis. It is the next logical step of simplification in rapid rural appraisal. It appears feasible even where scientists are few, or where only one or two want to explore the approach: by requiring the commitment of only one or two scientists, it offers scope for widespread adoption. It has the immense advantage of enabling national agricultural research systems better to adopt to and serve the great ecological, social and economic diversity of RPF farm conditions.

156
157
Training Program on
Participatory Rural Appraisal (PRA) and Communication Strategies including IWM
26-29 September 2019
Additional Reading Handout - 1
A Mental Construct for Unstructured on-farm
Interviews for use in Rapid
and
Participatory Rural Appraisal
158
Additional Reading Handout - 1
A Mental Construct for Unstructured on-farm
Interviews for use in Rapid and Participatory Rural Appraisals1
In the literature practical guidance on fieldwork procedures is neglected. It is the purpose of
this paper to suggest a procedure, which could aid on-farm interviews. The basic premise of this paper is that administrators, planners and academics all need to obtain at first had more understanding of farmer motivation and behaviour. Unfortunately, very little, if any additional time is available and shortcut methods must be explored.
Sources of bias
Fascination with analytical technique is not the only danger facing political and professional
groups concerned with rural development, who use various forms and combinations of information collection and assessment. All practical methods of investigation have serious imperfections and misunderstanding of the true nature of rural problems in common place. There are four main sources of information:
1. Official statistics and reports;
2. Official contacts, surveys and field observations;
3. Formal research;
4. Official myths, hunches and unverified hypotheses.
Official statistics and reports are likely to suffer from serious distortion, omissions and
inaccuracies. Indeed, certain information at the local level is often falsified. However, these deficiencies are generally well known, and less likely to be a source of error than the bias, which arises from the casual nature of most official field contacts and investigations.
In the haste to help alleviate abject poverty in the Third World the needs for ‘instant’ insights from formal research has far outrun the resources available. This means that there are still numerous gaps in our knowledge. Furthermore, in such a situation a few selected, well-researched and / or well- publicized projects can have a is proportionate impact. On-farm interviews using procedure below can help us to plug gaps and verify weak hypotheses in a rapid cost-effective manner.
A Framework of Interviews
Experience with structured pre-set questionnaires of the Farm Management Survey has not
generally been very rewarding in Africa. For example, Moris reports on forty farm surveys in East Africa conducted during the 1960s and argues that only two or three studies have been fully analyzed and reported. There must be doubt as to whether the thousands of so-called ‘Farm Management Studies’ published in the Indian sub-continent have been a cost-effective means of investigation
1 IAN CARRUTHERS: Agrarian Development Unit, School of Rural Economics & Related Studies, Wye College (University of London), Nr. Ashford, Kent TN25 5 AH, UK
159
On-farm interviews that are being carried out without lengthy pre-set questionnaires. It describes a procedure designed to elucidate information on the farmer’s production and related social activities. It is intended to discipline the interviewer to provide a systematic but flexible line of enquiry. In essence it is simply a thinly disguised procedure for marginal analysis. More specifically it enables the interviewer to establish:
1. Identification of existing farming practices
2. Exposure of the rationale for the present practices
3. Understanding of the changes proposed and the reasons for the proposed changes.
The review procedure outlined in Table 1 is self-explanatory. A critical review of local farming practice centered on the individual farm can be undertaken using either farmers as key informants or, if time is restricted, local extension officers. In the latter case the objective is to elucidate the officers detailed knowledge of local farming and questions are asked of him about a modal farm or farms in this district. If the objective is to learn about low-income farmers, dairy farmers, or some-such target group then the ‘model’ can be specified before questioning.
The review procedure provides a framework for specifying, in a systematic manner, the farm and off-farm enterprises, the activities involved in production, their sequence and location and the individuals responsible at each stage. It forms the basis for enquiry and discussion with the farmer and is preceded with column by column (box 1.1, 1.2, 1.3, 1.4, 1.5, 2.1 and so forth). The farmer response should be noted and later written up as a case study, with more complete and clearer picture emerging when several cases are compared as in a traditional farm management study.
It is argued that a research worker or practical investigator who followed this critical evaluation procedure should reveal the nature, extent and linkages between social and economic aspects of village life. It will produce much richer insight into opportunities and constraints for public policy than alternative more casual investigations or rigid questionnaires.
It may also be an efficient way of extending our conceptual understanding, generating inductively, plausible testable hypotheses regarding the rural situation. However, it is important not to adopt too academic a stance ’lest the best be the enemy of the good’. Our objective is not to claim to eliminate, by adoption of a critical evaluation procedure, the influence of preconception, casual empiricism and prejudice, but merely to improve the quality of the ‘telling circumstantial evidence’ presently used.
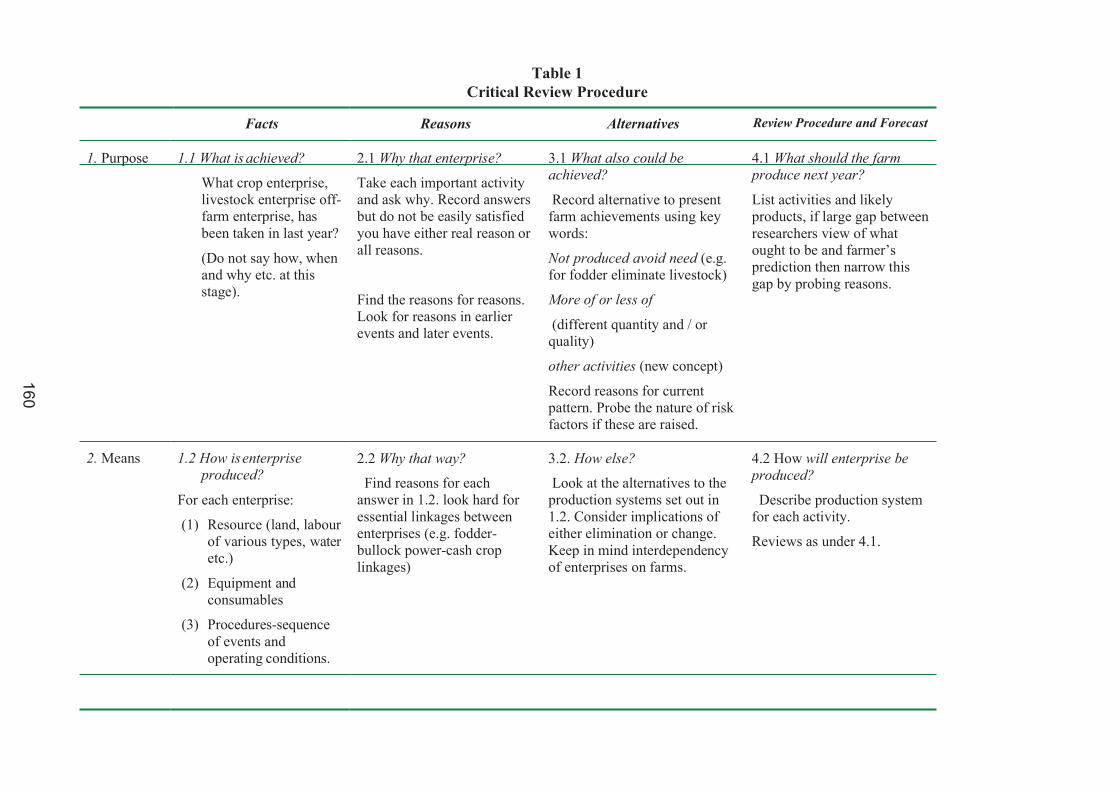
Table 1 Critical Review Procedure
Facts Reasons Alternatives Review Procedure and Forecast
1. Purpose 1.1 What is achieved?
What crop enterprise, livestock enterprise off- farm enterprise, has been taken in last year?
(Do not say how, when and why etc. at this stage).
2.1 Why that enterprise?
Take each important activity and ask why. Record answers but do not be easily satisfied you have either real reason or all reasons.
Find the reasons for reasons. Look for reasons in earlier events and later events.
3.1 What also could be achieved?
Record alternative to present farm achievements using key words:
Not produced avoid need (e.g. for fodder eliminate livestock)
More of or less of
(different quantity and / or quality)
other activities (new concept)
Record reasons for current pattern. Probe the nature of risk factors if these are raised.
4.1 What should the farm produce next year?
List activities and likely products, if large gap between researchers view of what ought to be and farmer’s prediction then narrow this gap by probing reasons.
2. Means 1.2 How is enterprise produced?
For each enterprise:
(1) Resource (land, labour of various types, water etc.)
(2) Equipment and consumables
(3) Procedures-sequence of events and operating conditions.
2.2 Why that way?
Find reasons for each answer in 1.2. look hard for essential linkages between enterprises (e.g. fodder- bullock power-cash crop linkages)
3.2. How else?
Look at the alternatives to the production systems set out in 1.2. Consider implications of either elimination or change. Keep in mind interdependency of enterprises on farms.
4.2 How will enterprise be produced?
Describe production system for each activity.
Reviews as under 4.1.
16
0
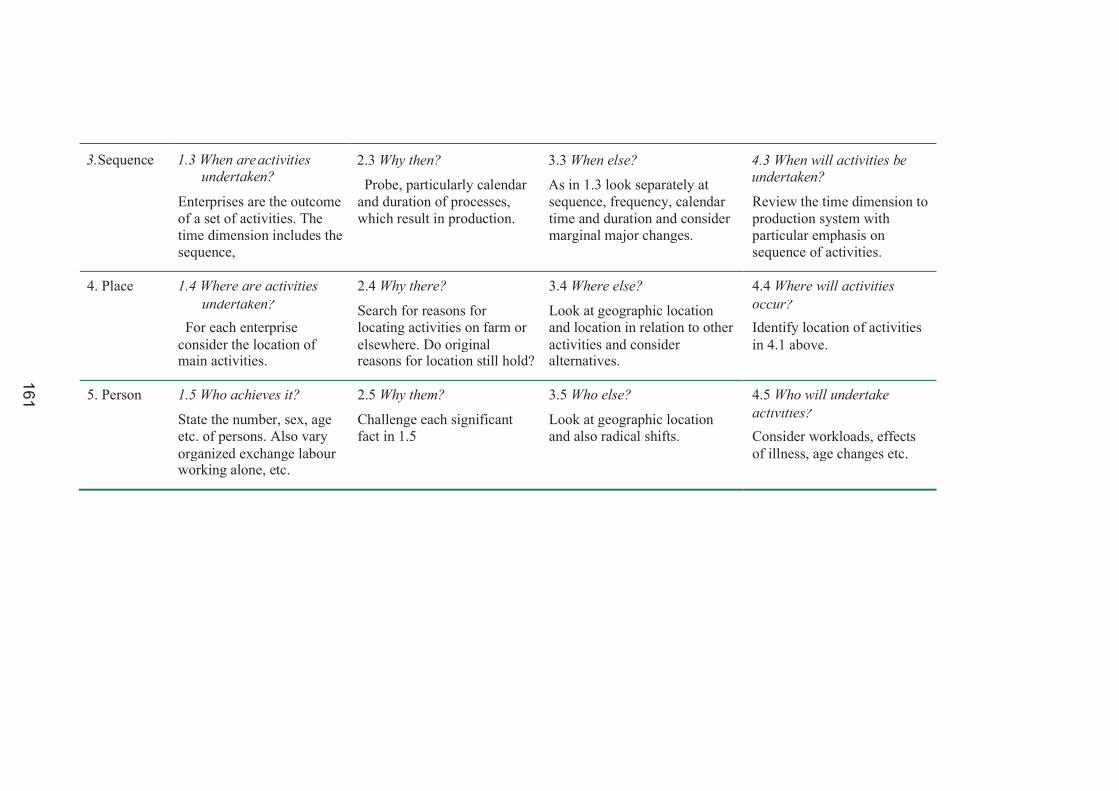
3. Sequence 1.3 When are activities undertaken?
2.3 Why then?
Probe, particularly calendar
3.3 When else?
As in 1.3 look separately at
4.3 When will activities be undertaken?
Enterprises are the outcome of a set of activities. The time dimension includes the sequence,
and duration of processes, which result in production.
sequence, frequency, calendar time and duration and consider marginal major changes.
Review the time dimension to production system with particular emphasis on sequence of activities.
4. Place 1.4 Where are activities 2.4 Why there? 3.4 Where else? 4.4 Where will activities
undertaken?
For each enterprise Search for reasons for locating activities on farm or
Look at geographic location and location in relation to other
occur?
Identify location of activities consider the location of
main activities. elsewhere. Do original reasons for location still hold?
activities and consider alternatives.
in 4.1 above.
5. Person 1.5 Who achieves it? 2.5 Why them? 3.5 Who else? 4.5 Who will undertake
State the number, sex, age etc. of persons. Also vary
Challenge each significant fact in 1.5
Look at geographic location and also radical shifts.
activities?
Consider workloads, effects organized exchange labour
working alone, etc. of illness, age changes etc.
16
1

162
163
Training Program on
Participatory Rural Appraisal (PRA) and Communication Strategies including IWM
26-29 September 2019
Additional Reading Handout – 2
Efficacy of Participatory Methods: A Micro Probe in Rural Cluster
164
Additional Reading Handout-2
Efficacy of Participatory Methods: A Micro Probe in a Rural Cluster
Participatory Rural Appraisal (PRA) as a development methodology has primarily been evolved to appraise the rural resources, problems and requirements.
Participatory Rural Appraisal (PRA) as a development methodology has
primarily been evolved to appraise the rural resources, problems and requirements. In course of time, it was realized that as a development tool, it could not just stop with committing the people in analyzing their situations, conditions and problems but must go beyond this and extend to analysis, planning and action. The design of PRA therefore has to be refashioned to cover both are diagnosis and development action. PRA in the changed context has thus, been defined as a “family of approaches and methods to enable rural people to share, analyze and enhance their knowledge of life and conditions, to plan and to act”.
Criticisms
However, the rapid spread and application of PRA has invited sharp criticisms too.
The criticisms are:
(i) they are biased, impressionistic and unreliable. They constitute an enquiry that is
‘undisciplined and sloppy’. They are said to involve subjective observations and respond fast to the selected members of the community.
(ii) terms like informal and qualitative are used to imply poor quality or second-rate
work.
(iii) rigour and accuracy are assumed and therefore and therefore to be in contradiction
with participatory methods.
(iv) PRA is prone to poor and gender-sensitive.
N. Narayansamy, M. P. Borain and B. Bhaskar, ICSSR Project, Department of Adult Conitinuing Education and Extension, Gandhigram Rural Institute, Gandhigram, Tamil Nadu, India
165
Methodology
We have, for the purpose of the experiments, chosen three different villages. Each
village is distinctly different from the other in terms of size, caste, settlement pattern, occupation etc. For instance, one village (Chellakuttur, TN) is predominantly of nomads with joint family system as the rule. The other two villages are smaller in size. Yet, a lot of difference could be seen in terms of caste composition, occupation and pattern of settlement etc. the purpose of choosing three different new villages for the experiment is to ensure that size and homogeneous nature of the population do not have much influence on the participation.
Our experience of organizing PRA in more than 100 villages of different size and composition have conclusively proved that ‘the size of the village in terms of number of households is a major determinant in enlisting people’s participation and thereby quickly completing the appraisal’. Similarly, a homogeneous village in terms of caste composition provides a very enabling environment to complete the appraisal as rapidly as possible. Conducting experiments on the effectiveness of PRA vis-à-vis survey in such a small, homogeneous village is likely to bring biased results. Hence, we have chosen a combination of three villages, which are different in nature.
Social mapping under PRA and conventional survey method are the methods chosen to compare the data. The reason for selecting the participatory mapping from among the menu of methods of participatory mapping has now been increasingly used as an alternative for collecting the demographic and other quantitative data.
Analysis of Results
Having discussed the methods followed to collect and compile the data in detail,
the analysis of data with reference to four criteria of efficacy viz., rapidly, cost effectiveness, accuracy and participation is presented.
Rapidly (Time involved). The factors to be considered for the time taken to complete the process of data collection, analysis and reporting are:
training time
time taken for conducting PRA/Survey
time required for the kind and volume of data to be collected
time taken for cross checking of data
time required for data management
time taken for dissemination of data
166
The steps involved in conducting PRA methods which influence time and duration are:
(i) type of data required;
(ii) rapport building;
(iii) techniques whether ‘visual’ or ‘a combination’;
(iv) probing on various issues;
(v) copying of ‘visual’ output on paper;
(vi) taking of notes; and
(vii) cross checking of data.
The time involved to collect data under the two methods clearly demonstrated in one
study that survey has taken 299 per cent of time than PRA for all the three villages put together. The time taken to complete a survey per household is 14.40 minutes while for the PRA, it is 4.81 minutes for all the villages put together.
Village-wise analysis of the time taken under two methods presents more or less similar
trend. Wherein the survey consumed around 300 per cent of the time than PRA. However, there are variations in the time taken across the villages. For instance, the time taken to complete the survey per household for Chellakuttur is 15.50 minutes and for PRA 5.04 minutes whereas for other two villages the survey time per household is much less and more or less same as with PRA. The survey time, for Pannaikulam is 12.98 minutes and for Karuthakkapatti 4.50 minutes.
The variation in the time taken in the first village and the other two villages has some
basis. The first village is a comparatively bigger village. The bigger is likely to pose problems like building-up rapport, enlisting participation of different groups of people, finding the right key informants, bringing several kinds of leaders around, etc. all these factors have influence on duration of PRA. Hence, it is understandable that PRA in a comparatively bigger village takes more time. But the size of the village does not have any influence on the time taken to complete the survey.
The time taken per unit (per household) under different components like rapport-
building, data collection, data analysis, reporting and sharing shows that data collection takes much time both under survey and PRA followed by data analysis, rapport building and reporting. We have not shared the data collected out of survey with the respondents.
In the final analysis, it can be said that PRA takes much less time than the survey
methods whether in a big or small village. The findings of an earlier study corroborate this. The time taken by PRA in different settings does differ. Big village takes much time to complete PRA exercise (mapping) whereas a smaller village takes less time.
167
While comparing the time taken to collect data under two methods, we have included
only the researchers’ time and not included the time spent by the participation from the community. It is argued by earlier studies elsewhere that time is one of the main factors in an analysis of cost effectiveness. If community time is not included and/or when no compensation is offered, PRA is cost-effective. They report that comparing research/facilitators and community time makes PRA absorb approximately 240 per cent more of every one’s time than the survey.
Further, there are certain other advantages of participatory mapping. They are as follows:
data are generated on completion of such mapping and are readily available
at one location as compared to conventional census listing of households where data are collected from door to door and are available only after its formal processing and publication;
both the researchers and participants from the community can have a map of the village which otherwise is very difficult to get;
the maps so drawn by the villagers can further be used for PRA exercises like wealth ranking and some times for future visioning. The exercise gives them the confidence that they can also do it;
the information is theirs. they express it, own it and share it;
they often enjoy the creativity of what they are doing and what they see and learn through their presentation and analysis.
Thus, the multiple benefits of PRA exercise like mapping the community is likely to outweigh the ‘cost’, if at all any, borne by the community.
168
Cost-effectiveness
Robert Chambers described survey as a long and dirty method, which means data
collection in a large questionnaire survey, can be costly and time consuming. The practitioners of PRA claim that it is cost-effective.
The total cost of conducting survey of 213 households works out to Rs. 2,340
whereas the cost of collecting the same data under PRA is Rs. 964. Thus, the cost of conducting survey for a set of census data was 243 per cent more than the cost incurred on PRA for collecting the same data.
Village-wise analysis of the cost shows that the cost of conducting survey and PRA
was higher in Chellakuttur than in the other two villages. The reason is quite obvious. The time taken to complete the survey and PRA was high in the village and therefore the highest cost. Again, village-wise comparison of cost data (total as well as unit cost) shows that the cost of organizing survey was 262 per cent more than PRA in Chellakuttur, 216 per cent in Pannaikulam and 214 per cent in Karuthakkapati. The results of the study have clearly shown that organizing PRA for collecting census data is less costly.
Accuracy
Trustworthiness pf data largely depends on the accuracy of data. The survey data
are considered to be trustworthy, accurate and are amenable to the very powerful and rigourous techniques of modern statistical analysis. Whereas PRA data, it is often said, are not amenable to the rigour and accuracy.
Field studies proved that the data, especially quantitative data, collected
through PRA are as accurate as the data collected through conventional methods. Such field studies are limited. Substantial and convincing evidence need to be produced through more rigorous field studies to prove the efficacy of PRA over conventional method.
Regarding the number of households and type of houses, survey and PRA output
the same results and there are absolutely no differences. There is an insignificant variation in population especially in the case of big village – the variation being there. The survey results were found to be accurate to further verification of the data by comparing PRA and survey data house by house. In the case of small villages PRA perfectly matched with the survey data. Even such minor variations could be avoided through careful triangulation.
Data on the landless were similar in both the cases. But there are variations when
the data on extent of land owned were examined. The variation is quite negligible. Here again the survey data was found to be more accurate than PRA data. This is also understandable as the data provided by participants of PRA are ‘near accurate’ date.
169
Regarding the data on cattle population, there is very slight difference between two
sets of data. Here, PRA data proved to be more accurate as some of the respondents during survey have not counted ‘calves’ under cattle population whereas under PRA all the animals including ‘calves’ have been considered.
Age-wise classification of the total population under the two methods also revealed
a slight variation in the data. The data collected through survey was found to be more accurate.
Regarding literacy, the data collected under the two methods were accurate and
exactly tallied even in the case of small villages. There is slight variation between the two sets of data in Chellakutur and the survey data was found to be more accurate on further crosschecking.
It can be concluded that data collected through PRA (quantitative) could be as
accurate as data collected through survey.
Participation
Participatory Rural Appraisal aims at empowerment orientation or transformational
participation. This would mean active participation of people in different stages of the project viz., appraisal, analysis, planning, execution, monitoring and evaluation. Empowerment starts at the appraisal stage itself. Participants are empowered to gather data on themselves using mostly visual media. The data, thus, gathered are analyzed and shared among themselves and also with the outsiders. The data analyzed by them mostly help them to find out their problems and solutions and thus enable them to take decision on the further course of action. Participation of people at the appraisal stage is, therefore, crucial and critical.
PRA stipulates participation of different categories of people – the old and young, men and women, literates and illiterates and so on. More specifically, outsiders should see that views/opinion/voice of the marginalized, oppressed, downtrodden, and the poor are properly and fully taken into account. But then this may not invariably happen? The reasons are many. Some are internal – related to the participants. Some are external in nature – related to outsiders.
It could be observed from the data that there were just eight participants at the start
of the exercise. It slowly increased and went up to 29 at the close 2 ¼ hours. And it came down 18 at the close of the exercise. It may be noted that at the start of the exercise, men were more in number whereas at the close of the exercise, women were more in number. Though we follow the rule of ‘closing the group’ we could not strictly adhere to such rule as participants are likely to join the middle of the exercise and some are likely to leave. We cannot force them to remain throughout the exercise. Further, the village being comparatively bigger with a high population, it took much time for us to collect the data.
170
As the time passed, the interest of some participants waned and hence they left. However, it should be noted that a majority of the participants stayed back till the exercise was over.
The other two villages are comparatively smaller. It took less time to complete the
exercise. The team could sustain the interests of the participants. Only very few participants left in the middle of the exercises. There were 12 participants at the start of the exercise (in Pannaikulam) and went up to 20 at 2 ½ hours and came down to 17 at the close of the exercise. The presence of women was nearly equal to men.
The analysis shows: (i) presence of women and men nearly or in equal number; (ii)
a sustained physical presence of participants throughout the exercise; and (iii) the influence of time over their participation. As the time for completing the exercise increased, the participants were likely to leave.
We have so far analyzed the physical presence of participants in the exercise. Now,
we will examine the ‘active participation of the participants’ in the exercise. In an exercise like mapping, every one cannot actively participate at a time. Some may participate in the form of ‘gathering participants for mapping’; some may participate ‘by gathering material for the exercise’; some may participate by actually ‘drawing the map on the ground’; and some may participate by ‘giving information’ and so on. This would mean that all could not actively participate throughout the exercise. Yet, if a particular contributes in one form or the other in successful completion of the exercise, he/she may be termed as an active participant. It may be noted that of the 69 participants from the three villages put together, around 74 per cent of the participants were active. Village-wise analysis shows that the percentage of active participants was found to be more in the case of smaller village. For instance, the percentage of active participants was 75 in Pannaikulam and 85 in Karuthakkapatti, whereas in Cjellakuttur, it was 65.
It could also be noted that women were found to be more active in general. For
instance, of the total of 12 women participants in Chellakuttur, 75 per cent were active; whereas the percentage of active men participants was 59. the same trend could be seen in other villages too.
Participation in different stages of PRA exercise indicates the involvement of
women in all stages. However, they are found to have played a predominant role in gathering the participants and the material for mapping. In activities like ‘mapping, giving information and analysis of information, their participation was found to be nearly equivalent to me.
171
Conclusion
Participants in PRA is quite high and active. Contrary to some of the findings of the earlier studies, the women participated very actively. Participation of women, if properly facilitated, would be better than the participation of men. The participatory methods, therefore, proved to be effective. However, it must be noted that we have experimented with participatory mapping only for collection of quantitative data too. But then, PRA’s strength lies in the collection of qualitative data too. PRA’s efficacy in gathering, analyzing and reporting of qualitative data is therefore a potential and promising area for systematic by social scientist.

172
173
Training Program on
Participatory Rural Appraisal (PRA) and Communication Strategies including Integrated
Watershed Management
26-29 September 2019
Integrated Watershed Management: Hydrological, Socio- economic and Cultural Aspects
Manoranjan Kumar
Principal Scientist (SWCE), Central Research Institute for Dryland Agriculture,
Santosh Nagar, Saidabad PO, Hyderabad – 500059, Telangana
174
Integrated Watershed Management: Hydrological, Socio- economic and Cultural Aspects
Manoranjan Kumar
Principal Scientist (SWCE), Central Research Institute for Dryland Agriculture, Santosh Nagar, Saidabad PO, Hyderabad – 500059, Telangana
Abstract
Integrated watershed management is an effective preference to achieve optimal utilization of natural resource through practical planning. This is particularly important in the view of current scenario of climate change and agriculture. The integrated watershed management is basically a concept and approach in order to achieve the sustainable development of land and water resources with specific reference to agriculture and livelihood. Watershed development projects are designed with focus to dovetail the use of water, soil, forest and pasture resources with agricultural productivity. The moisture conservation and increasing irrigation potential through tank and aquifer based water harvesting are major activities of various watershed development projects. Water is a critical component in a host of environmental processes and economic, social, and political activities. However, in recent years, watershed management practices that were once praised for their broad benefits to society, have become the focus of criticisms for their adverse and unexpected environmental or socio-economic impacts. Thus, policy makers and watershed managers needs to understand how different human activities affect watershed processes, and in turn how the variable nature of the hydrologic cycle affects humans’ well-being. Watershed models provide efficient tools for integrated studies of the major hydrological and socio-economic aspects of watersheds. The watershed modeling evolved from representing hydrologic processes to interdisciplinary studies. The interdisciplinary studies lead to decipher complexity and integration of environmental, social and economic functions to facilitate a holistic understanding of watersheds and associated human activities. The watershed Models essentially helps to quantify the different parameters of underlying processes involved in hydrological, ecological, environmental, hydro- geochemical and socioeconomic aspects of watersheds. Thus provide detailed and organized understanding of watershed subsystems function, which is essential to integrated water resources management and decision making.
Key words: Watershed management, Hydrological Models, Agriculture, Livelihood
175
Introduction
Soil and water both as natural resources play a critical role in variety of economic, social and environmental activities. The optimal management of these resources, with minimum adverse impact to ecology is essential for sustainable development. Watershed is a concept that represents land area usually contains a well-connected stream network, minimal spatial variability in various hydrological parameters and well defined outlet or discharge point, where the representative area drains when rainfall occurs. The safe disposal of runoff without affecting region specific ecology including social and environmental aspect is extremely important. To attain these objectives, watershed management practice is the only option.
Watershed management implies the judicious utilization of land and water resource for increased productivity with minimum depletion of natural resource base. The watershed management concept essentially adopts the soil and water conservation practices in the watershed for implementing resource conservation technologies (RCTs). Rainfall interaction with soil resulted into the soil erosion which can be contained using RCTs. The major goal of RCT adaptation is to maintain land capability in different aspect such as soil fertility, water resource, drainage, flood protection, reduction in sediment loss, maintaining ecology for increase productivity for human consumption. RCTs adaptation with recommended management practices (RMPs) of crops and livestock holds the key of sustainable productivity particularly in rainfed areas. Srinivasa Rao et al 2015, prescribed in details to achieve the livelihood security in Indian rainfed farming. This includes bridging the yield gaps in prevailing crops amid biotic and abiotic stresses coupled with RMPs to realize the potential. These are indeed required to implement on watershed basis as it provide avenues to integrate many enterprises in a unit. The watershed management and multiple use concept, involves integration of various livelihood enterprises to meet the food, fibre, fuel and fodder requirement of the inhabitants. Srinivasa Rao et al 2014 enlisted those outcomes in form of doable farming technologies specific to 10 agro-climatic regions of India that form basis for various watershed management activities.
The multiple use management is either resource based or area based. In resource based multiple use represents various alternative use of one or more natural resources e.g. national horticulture mission or bamboo mission; whereas area based represents mixes of products and facilities in a particular area such integrated watershed development program (IWDP) and other watershed development program. Area based watershed management program are more frequent in Indian rural settings which forms almost 70% of country population. While planning area based watershed management program, it is important to consider the physical, biologic, economic and social factor. Singh (2003) compiled various products obtainable from management of multiple resource of the watershed (Table 1). Rao and Gopinath, 2016, Location-specific rainfed technologies are available to cope with different drought situations based on extensive research
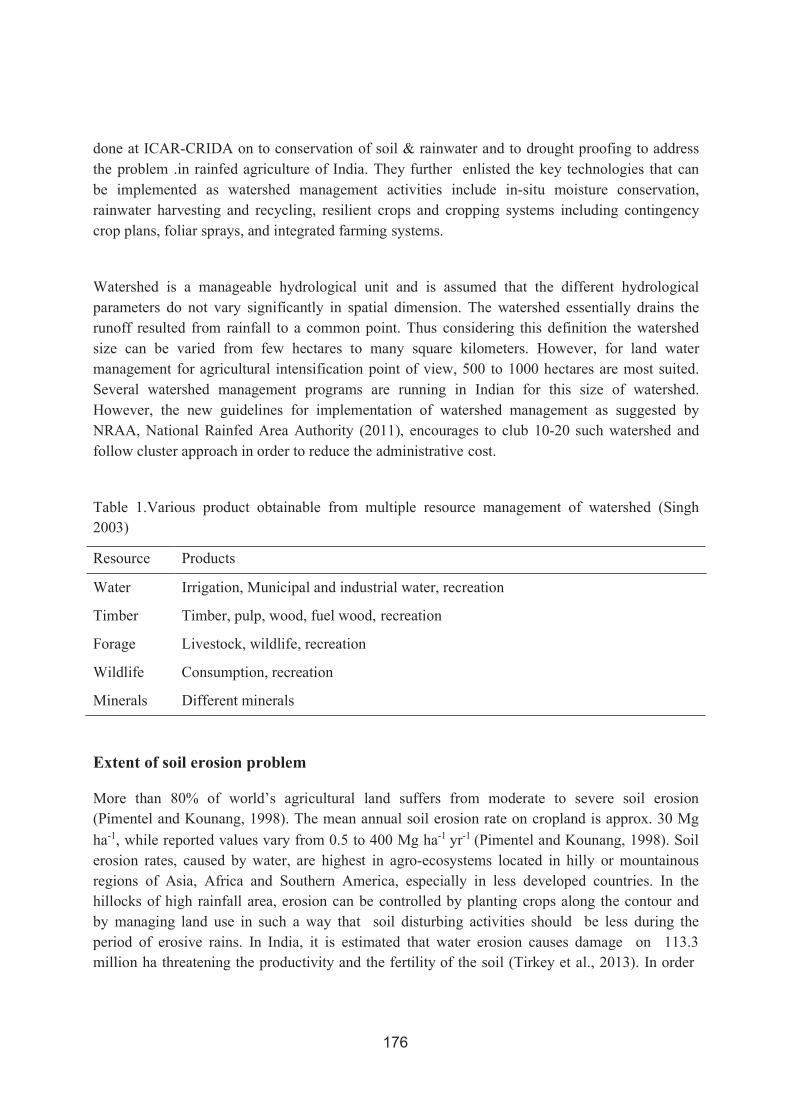
176
done at ICAR-CRIDA on to conservation of soil & rainwater and to drought proofing to address the problem .in rainfed agriculture of India. They further enlisted the key technologies that can be implemented as watershed management activities include in-situ moisture conservation, rainwater harvesting and recycling, resilient crops and cropping systems including contingency crop plans, foliar sprays, and integrated farming systems.
Watershed is a manageable hydrological unit and is assumed that the different hydrological parameters do not vary significantly in spatial dimension. The watershed essentially drains the runoff resulted from rainfall to a common point. Thus considering this definition the watershed size can be varied from few hectares to many square kilometers. However, for land water management for agricultural intensification point of view, 500 to 1000 hectares are most suited. Several watershed management programs are running in Indian for this size of watershed. However, the new guidelines for implementation of watershed management as suggested by NRAA, National Rainfed Area Authority (2011), encourages to club 10-20 such watershed and follow cluster approach in order to reduce the administrative cost.
Table 1.Various product obtainable from multiple resource management of watershed (Singh 2003)
Resource Products
Water Irrigation, Municipal and industrial water, recreation
Timber Timber, pulp, wood, fuel wood, recreation
Forage Livestock, wildlife, recreation
Wildlife Consumption, recreation
Minerals Different minerals
Extent of soil erosion problem
More than 80% of world’s agricultural land suffers from moderate to severe soil erosion (Pimentel and Kounang, 1998). The mean annual soil erosion rate on cropland is approx. 30 Mg
ha-1, while reported values vary from 0.5 to 400 Mg ha-1 yr-1 (Pimentel and Kounang, 1998). Soil erosion rates, caused by water, are highest in agro-ecosystems located in hilly or mountainous regions of Asia, Africa and Southern America, especially in less developed countries. In the hillocks of high rainfall area, erosion can be controlled by planting crops along the contour and by managing land use in such a way that soil disturbing activities should be less during the period of erosive rains. In India, it is estimated that water erosion causes damage on 113.3 million ha threatening the productivity and the fertility of the soil (Tirkey et al., 2013). In order
177
to restore the productivity of the soil and to prevent further damage, planning, conservation and management of the catchments are inevitable. Hence, gauging stations are needed to record the runoff and sediment yield. In cases of unguaged areas, runoff and soil loss estimation methods like SCS curve number method and Revised Universal Soil Loss Equation (RUSLE) can be adopted.
Status of Groundwater utilization
The rapid industrialization, population growth, climate change and agricultural activities resulted in over-utilization of the fresh water resources leading to reduction of groundwater level in many parts of India (Kadam et al., 2012). The scarcity of water in India is a well known fact in spite of higher average annual rainfall of 1,170 mm compared to the global average of 800 mm (Jasrotia, 2009). India is the largest user of groundwater for irrigation in the world and the drawn amount of groundwater is estimated to be 210 billion cubic meters (BCM)/year compared to 105 billion cubic meters in China and 100 billion cubic meters in US (Shankar et al, 2011). 60.4 percent of the net irrigated area is irrigated using groundwater (2005-06 agricultural censuses). According to the CGWB (Central Ground Water Board), 15 percent of the administrative blocks are over- exploited and are growing at a rate of 5.5 percent per annum. The most substantial decline in groundwater level is observed in north western India over a period of 30 years (1980 to 2010). In many parts of Gujarat and Rajasthan, groundwater level fell more than 16 meters (Sekhri, 2012). The depletion of groundwater resources has increased the cost of pumping, caused seawater intrusion in coastal areas and has raised questions about sustainable groundwater supply as well as environmental sustainability (Rejani et al., 2009). Hence, optimal groundwater management and recharging of aquifers are very essential.
Watershed development in India
The government of India has identified the watershed management as a part of approach to improve agricultural production and alleviate poverty in rainfed regions. The various watershed management programs are implemented in India since the 1970s. These programs majorly aim to restore degraded watersheds in rainfed regions to increase their carrying capacity by rainwater harvesting, reduction in soil erosion and thus improving soil nutrient and carbon content in order to produce higher agricultural yields and other benefits. As the majority of India’s rural poor live in these regions and are dependent on natural resources for their livelihoods and sustenance, improvements in agricultural translates into improvement in human welfare as well as strengthening national food security (Ahmad et al., 2011; GOI, 2011; Kerr, 2002).
The major focuses of watershed management program practiced in India are however, on rainfed regions. This is particularly important as these areas represent 60 percent of arable land in India and producing 50% of country’s agricultural output that supports 40 percent of the nation’s
178
population (Planning Commission, 2012). Despite of these, the rainfed region of the county are characterized by low productivity, fragment land holding, vulnerability due to both geographical and climatic conditions, and also poor land and water management. This results into the lower productivity of rainfed areas in which crop productivity is almost one third of national average. There are several agro-climatic zones of rainfed area at different geographical elevation ranging from sea shore to hill and mountain. The brief historical development in watershed management programs in India is presented in Table 2.
Table 2. Historical development of watershed management program
Year Program/policy/guidelines
1973 Drought prone area program (DPAP)
1977 Desert development program (DDP)
1989 Integrated watershed development program(IWDP); Integrated afforestation and eco development scheme
1991 National watershed development project for rainfed area (NWDPRA)
1993 Indo-German watershed development program.
1999 Watershed development fumd
2003 Hariyali guidelines
2005 Mahatma Gandhi national rural employment guarantee scheme (MGNREGS)
2006 National rainfed area authority
2009 Integrated watershed management program
2011 Common guidelines for watershed development.
2015 PMKSY
2019 Jal-shakti mission
Integrated watershed management
In present context, apart from issues pertaining to resource conservation and productivity, climate resilience becomes an important aspect in integrated watershed management. The vertical of climate resilience in integrated watershed management includes practice, intervention and implementation of knowledge based optimal utilization of resources. This implies efficient integration and management of natural resource, diversified farming system and allied enterprises to ensure food, nutrition and livelihood security. This developed model indeed helps
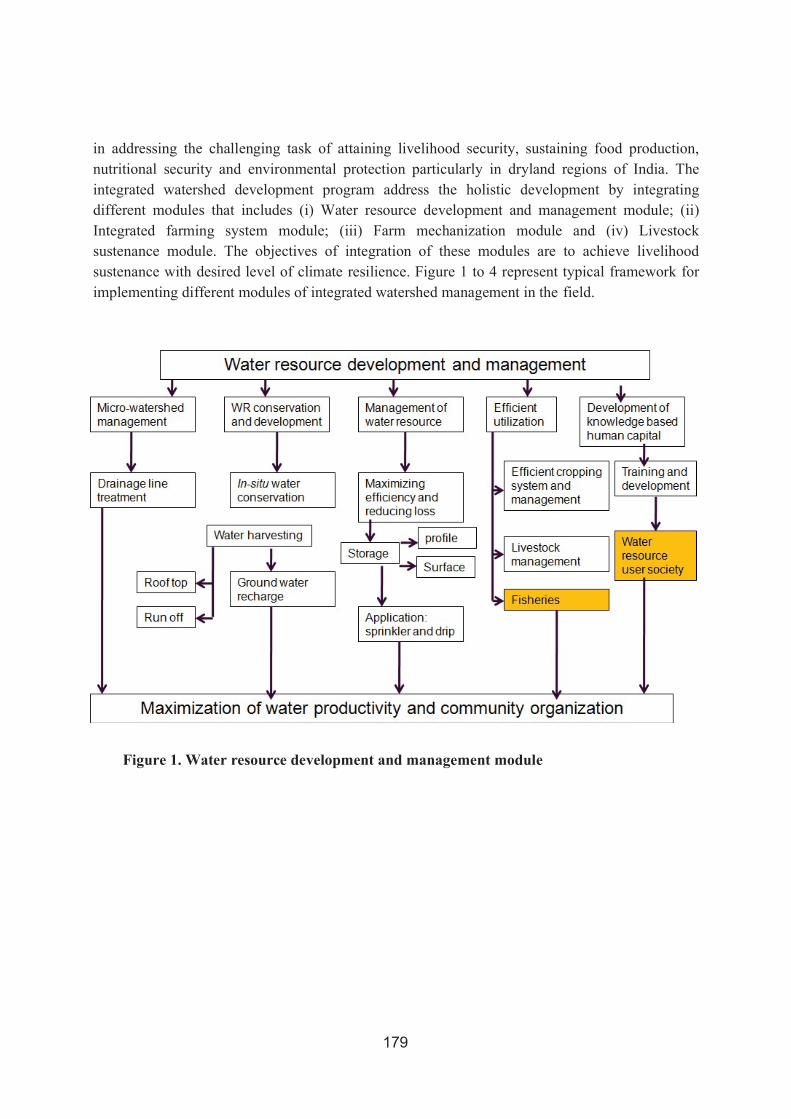
179
in addressing the challenging task of attaining livelihood security, sustaining food production, nutritional security and environmental protection particularly in dryland regions of India. The integrated watershed development program address the holistic development by integrating different modules that includes (i) Water resource development and management module; (ii) Integrated farming system module; (iii) Farm mechanization module and (iv) Livestock sustenance module. The objectives of integration of these modules are to achieve livelihood sustenance with desired level of climate resilience. Figure 1 to 4 represent typical framework for implementing different modules of integrated watershed management in the field.
Figure 1. Water resource development and management module
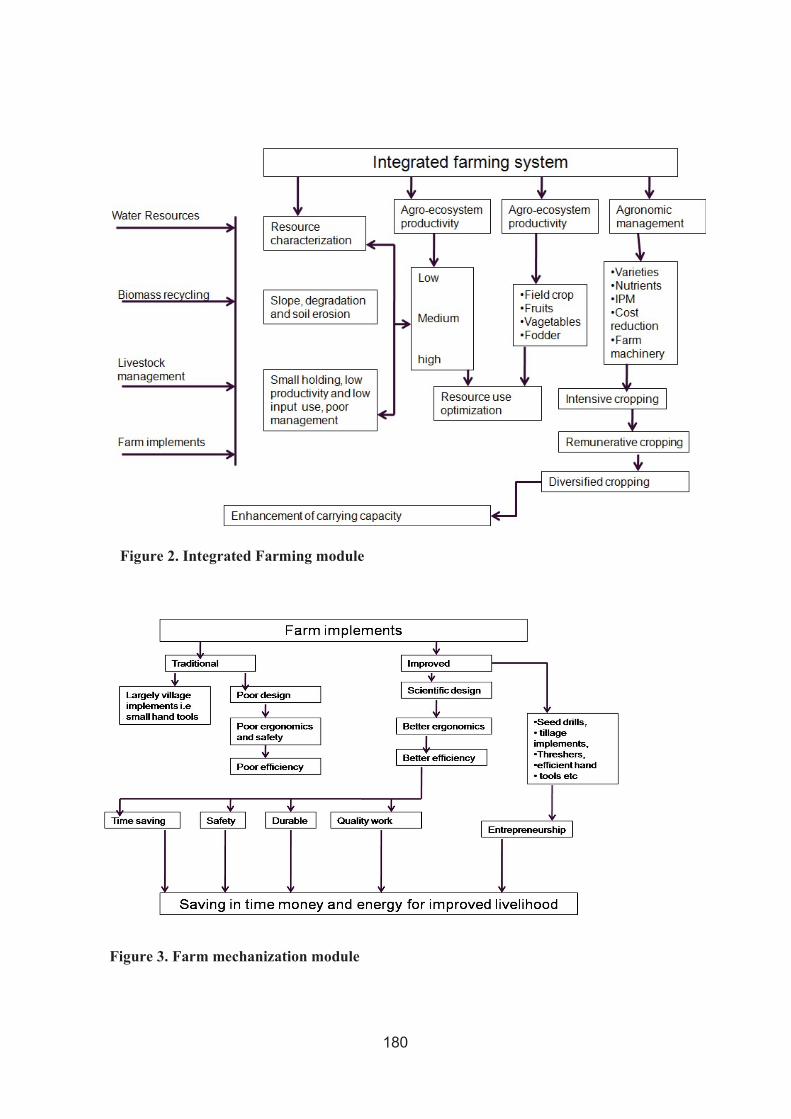
180
Figure 2. Integrated Farming module
Figure 3. Farm mechanization module
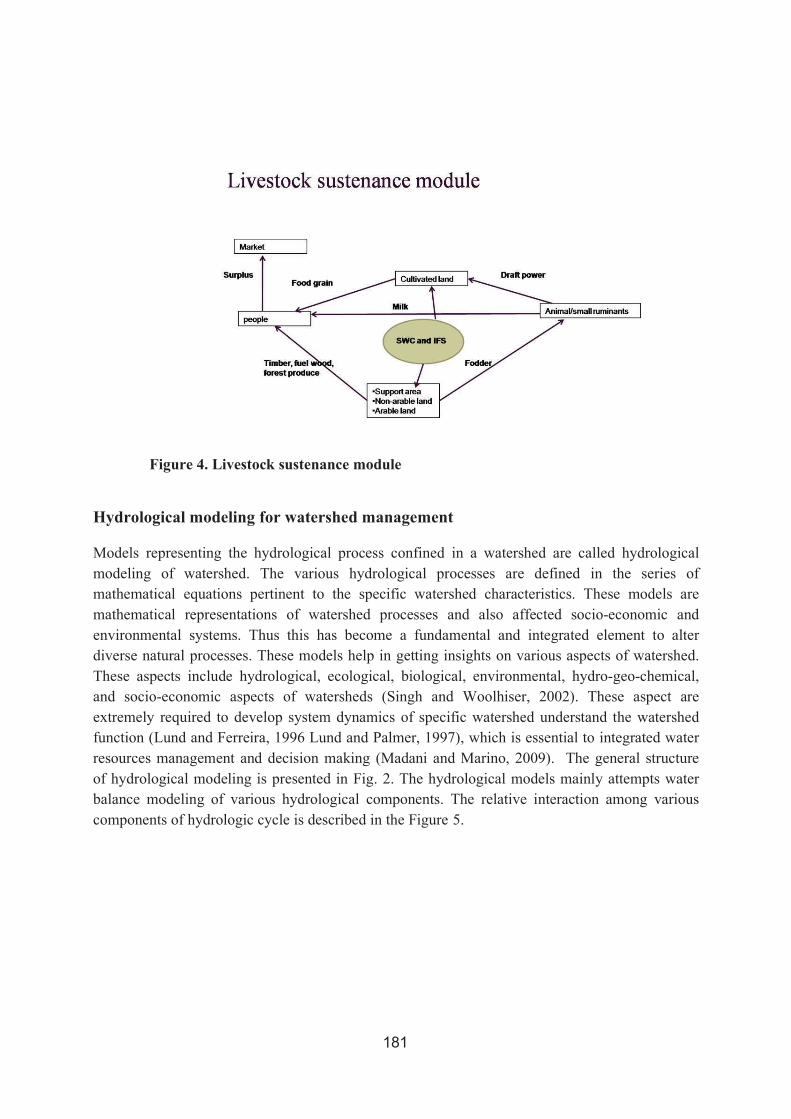
181
Figure 4. Livestock sustenance module
Hydrological modeling for watershed management
Models representing the hydrological process confined in a watershed are called hydrological modeling of watershed. The various hydrological processes are defined in the series of mathematical equations pertinent to the specific watershed characteristics. These models are mathematical representations of watershed processes and also affected socio-economic and environmental systems. Thus this has become a fundamental and integrated element to alter diverse natural processes. These models help in getting insights on various aspects of watershed. These aspects include hydrological, ecological, biological, environmental, hydro-geo-chemical, and socio-economic aspects of watersheds (Singh and Woolhiser, 2002). These aspect are extremely required to develop system dynamics of specific watershed understand the watershed function (Lund and Ferreira, 1996 Lund and Palmer, 1997), which is essential to integrated water resources management and decision making (Madani and Marino, 2009). The general structure of hydrological modeling is presented in Fig. 2. The hydrological models mainly attempts water balance modeling of various hydrological components. The relative interaction among various components of hydrologic cycle is described in the Figure 5.
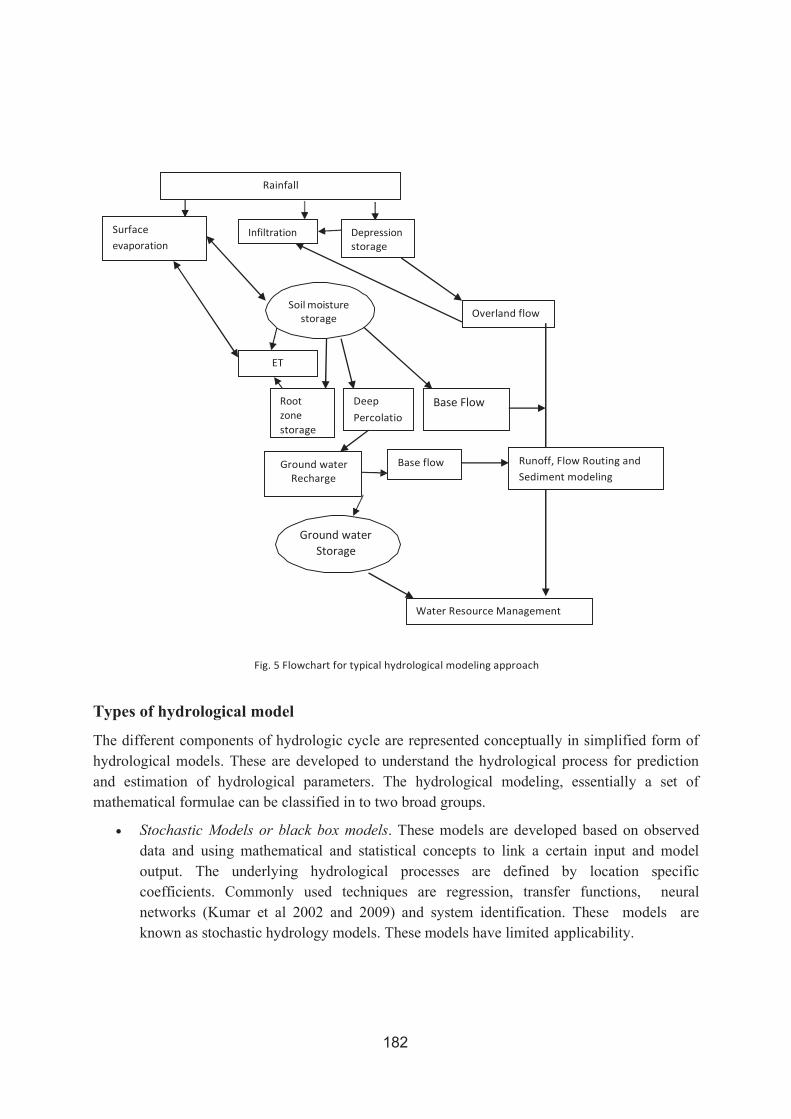
182
Runoff, Flow Routing and Sediment modeling
Ground water Recharge
Deep Percolatio
Root zone storage
Base flow
Ground water
Storage
Water Resource Management
Fig. 5 Flowchart for typical hydrological modeling approach
Types of hydrological model
The different components of hydrologic cycle are represented conceptually in simplified form of hydrological models. These are developed to understand the hydrological process for prediction and estimation of hydrological parameters. The hydrological modeling, essentially a set of mathematical formulae can be classified in to two broad groups.
Stochastic Models or black box models. These models are developed based on observed data and using mathematical and statistical concepts to link a certain input and model output. The underlying hydrological processes are defined by location specific coefficients. Commonly used techniques are regression, transfer functions, neural networks (Kumar et al 2002 and 2009) and system identification. These models are known as stochastic hydrology models. These models have limited applicability.
Infiltration Depression storage
Soil moisture storage
Base Flow
ET
Overland flow
Surface evaporation
Rainfall
183
Process-Based Models. These models represent the physical processes observed and mathematical relationships are derived based on physical interaction among the factors. Typically, such models contain representations of surface runoff, subsurface flow, evapotranspiration, and channel flow in separately and form as a parameters for water or energy balance and thus are more complicated. These models are also known as deterministic hydrology models. Deterministic hydrology models can be subdivided into single-event models and continuous simulation models.
Simulation models: Simulation models consist of surface water models, groundwater models (flow and transport), composite models containing both (surface and groundwater) and agricultural hydro-salinity models. These models utilize simulation and optimization approach. Simulation models take physical parameters and engineered designs or management plans as inputs and generate detailed predictions of outcomes. Simulation is widely applied in the detailed design phase of projects for quantitative performance and impact analysis of a limited number of alternative designs.
Synthesis of modeling results into watershed management
Watershed modeling for management includes development of models to analysis “what if” scenario for various options. In the past, water resource professionals have been developed, attempted and evaluated several hydrological models to solve various watershed management problem, yet watershed management models are still in evolving phase. Since hydrological processes involved in watersheds are highly complex and non-linear in nature, there is difficulty in developing model to address watershed problem in terms of approach, application and reliable understanding of the management problem. During 60’s, watershed modeling efforts were limited to quantitative computation of individual hydrologic processes (Singh and Woolhiser, 2002). Various components of the hydrologic cycle, such as surface runoff, infiltration, groundwater flow, and evapotranspiration, were modeled separately, but due to lack of data and computing capability hindered more integrated analysis (Freeze and Harlan, 1969; Chen et al., 1982). Next paradigm shift in watershed management and modeling was to develop simulation model to develop decision support system (DSS). These support systems were developed primarily to assess the effect on watershed response to a specific activity and accordingly to suggest the development and management options. The main criteria in these DSS were to select a treatment and its relative effect on runoff and soil loss.
It is extremely important for policy planners and watershed managers to have firsthand understanding and knowledge of how various human activities affects watershed processes and also to know, how the dynamic nature of the hydrologic cycle affects life. Integrated watershed modeling, aims to provide efficient tools for integrated studies of the major physical, socio- economic, and cultural aspects of watersheds. There is a paradigm shift from rainfall-runoff modeling of watershed to the integrated watershed modeling. However, watershed modeling is
184
still evolving in terms of approach, application, and ability to provide users with a comprehensive and reliable understanding of problems at a reasonable cost and within a specified timeframe. Watershed management decision making is a complex process and several factors needs to be looked in while balancing biophysical and socio-economical concerns. Now a day the public is actively participating in environmental decisions through public debates, and so there is a need for efficient technology transfer from public agencies to stakeholders. Application of information technology thus has a profound influence on watershed management over the past decade. Advances in data acquisition through remote sensing, data utilization through geographic information systems (GIS), and data sharing through the Internet have provided watershed managers access to more information for management decisions.
Integrated modeling for watershed management
The integrated model links biophysical modeling with village scale socio-economic and cultural models (Fig. 6). This approach is necessary to develop a holistic understanding of interactions between land, water, and people and draw appropriate conclusions as to the causes of differences in the resilience of households and the communities. The hydrologic models provide an assessment of the availability of surface and groundwater resources for watershed development under different climate scenarios. The crop models simulate yields as well as water use and recharge which feed back into the next season hydrology. Water availability and crop productivity are the main links between the biophysical and socio-economic models (Merritt et
al., 2011). This information in addition to survey data detailing access to land, water and common pool resources as well as network and demographic data is input to the socio-economic and cultural models which simulate the response of social and economic indicators for groups differentiated on social (e.g. gender, caste) or economic (e.g. landless, landholders) characteristics or cultural differences (with respect to its demographics, status of its social groups (tribes), sectoral shifts etc.). Issues of equity needs to be assessed by analysing trade-offs within and between villages.
Two options exist in how to link the biophysical models to the socio-economic and cultural models: (a) full integration where the socio-economic and cultural models are dynamically updated with information from scenarios arises from crop and hydrology models, or (b) outputs from the biophysical models are used as inputs to the socio-economic and cultural models. The nature of the integration will depend on the structure of the socio-economic and cultural models, i.e. how responsive they are and the complexity, scale and linkages of the groundwater, surface water and crop models developed by project partners.
185
Socio-economic and cultural models
Optimization methods or socio-economic and cultural models are geared obtain alternatives based on selecting values for decision variables that provide the best value of an objective function, subject to a set of mathematical constraints. Some advantages of optimization models are that they can help to screen a large number of potential alternatives, generate new alternatives that otherwise may have been overlooked, and provide an intuitive means of trade-off analysis. Also, optimization results need to be interpreted carefully, as the “optimal” outcomes may be overly optimistic and not achievable in practice (Mirchi et al., 2009). These process based models have been used in a wide range of studies, including rainfall-runoff prediction, flood mitigation design, water supply development, safety assessment of water infrastructure, land use planning, irrigation planning, hydropower operations, and surface and groundwater quality protection.
Integration of hydrologic and socio- economic watershed models
Integration of hydrologic and socio- economic watershed models form the hydro economic models, often based on optimization methods, possess the advantage of facilitating economic studies by maximizing or minimizing some specified economic objective function subject to a series of constraints. Hydro economic models have been applied to analyze water resources management practices and its potential economic and environmental impacts, (i) to address trade-offs and interactions among various stakeholder groups; (ii) to evaluate long term drought management and flood mitigation plans; (iii) to improve water resources operation policies and strategies; (iv) to suggest climate change adaptation strategies; and (v) to improve water quality and quantity for ecosystems.
Harou et al., 2009 describe hydro-economic watershed models as solution-oriented tools that foster formulation of new strategies to promote water-use efficiency and transparency of decision making, thus contributing to integrated water resources management. However, maximizing the economic value of water use serves as the only driver of decisions in hydro-economic models as economic valuation of many social and environmental objectives remains difficult. Integrated modeling of watershed-scale hydrological, environmental, and economic aspects of water use often requires simplified representation of natural processes (Heinz et al., 2007). Thus, water resources management decisions which are solely based on hydro-economic models may not be comprehensive and a holistic model and approach are required for integrated water resources management.
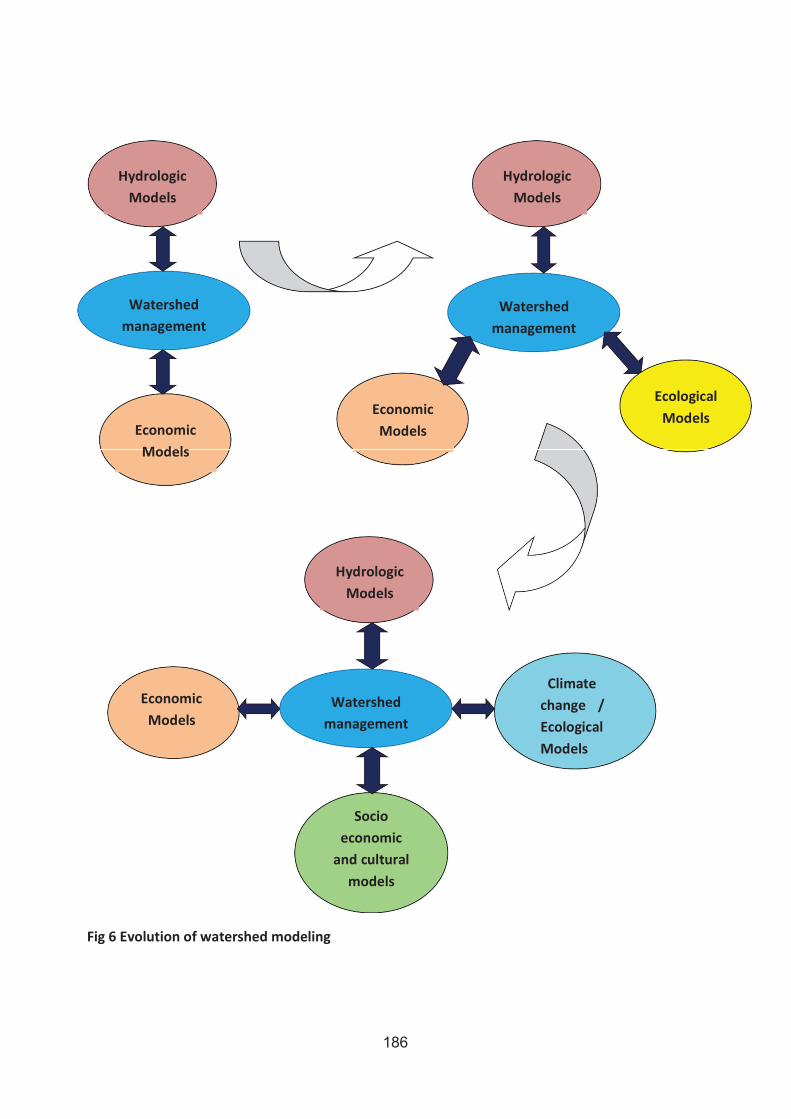
186
Hydrologic Models
Hydrologic
Models
Watershed management
Watershed management
Economic Models
Economic Models
Ecological Models
Hydrologic Models
Economic Models
Watershed
management
Climate change / Ecological Models
Socio economic
and cultural models
Fig 6 Evolution of watershed modeling
187
Multi-objective decision making models
Watershed planning and management decisions almost always consider multiple goals, many of which are conflicting. Often it is impossible to aggregate the goals into a single criterion or performance measure in the alternative ranking and selection process (Makowski et. al. 1996). Thus, multi-criteria (or multi-objective) decision support methods are widely applied for water policy planning and evaluation, strategic watershed planning and management, and infrastructure development (Hajkowicz and Collins, 2007). Multiple criteria analysis techniques have aided water resources practitioners to select decision or design alternatives in such areas as river basin planning and development, water resources development, land use management, groundwater/surface water allocation, watershed restoration, and water resources quality.
Conflict resolution models
The multitude of watershed planning and management objectives inevitably leads to conflicts among watershed stakeholders, or interest groups. In many cases, however, different stakeholder groups share common interests (e.g., a homeowner along a river may be primarily concerned about flood risk reduction but may also value the riverine ecosystem), or they may be able to reach compromise agreements (e.g., development of one portion of the floodplain may be offset by enhancing wetlands in another portion). Conflict resolution models essentially seek to promote compromise through holistic understanding of technical, socioeconomic, political, and environmental aspects of the problem (Lund and Palmer, 1997).
Future directions in hydrological modeling and watershed management
Despite the complexity and uncertainty of various watershed processes, many engineering-based models have been successfully calibrated, verified, and applied by decision makers. Our ability to model hydrologic processes with greater accuracy, and at finer spatial and temporal resolution, will continue to improve with (i) increased use of remotely sensed data (e.g., satellite observations); (ii) increased computational capacity; and (iii) improvements in GIS and database management systems. However, computational capacity, data availability, and model complexity will not increase at the same rate, and thus there is always a danger of two types of “modeling error”: (1) Developing an overly complex model that cannot be properly calibrated and verified using available data, or (2) Developing a model that fails to make proper use of available, high-quality data. While future watershed process models may suffer from either of these two kinds of error, it is likely that integrated watershed management models will suffer primarily from the first kind. Determining “the best” set of watershed management practices is complicated by a host of regional and global-scale socioeconomic, cultural, political, climatic, and biogeochemical factors. Even setting the global-scale issues aside, our ability to account for and predict dynamic, interactive socio-economic, policy and cultural aspects of watershed systems is still questionable. To do this reliably, fundamental advances in economics and
188
other social sciences may be required. However, even as planning and management model complexity outpaces observational data, proper recognition and accounting of uncertainty in predicted socio-economic, policy and cultural outcomes will be critical to determining areas where improved understanding is most needed. Increased experience with integrated models, and analysis and documentation of this experience, will also further enhance the understanding of the role of models in watershed planning, management, and decision making.
Conclusions
Natural and anthropogenic processes within watersheds are complex, dynamic, and spatially variable. Previous experiences of unsuccessful or unsustainable watershed planning and management practices manifest how a lack of understanding of watershed subsystems can cause environmental disasters as well as socioeconomic problems affecting humans’ well- being. Watershed modeling has become a commonplace tool for water resources system design, planning, and management at an affordable cost and within a reasonable timeframe. The computer revolution in the mid 1960’s and continuous growth in computational capacities, along with other advances in data collection and management, has allowed watershed models to evolve from describing only physical processes to describing the interaction of social, economic, cultural and environmental systems objectives in support of decision making. The gradual shift from merely employing engineering-based simulation models to applying integrated hydro-economic models, and more recently multi-criteria/multi-objective decision making and conflict resolution models, is an indicator of promising changes in the traditional paradigm for the application of watershed models. More holistic understanding of watershed systems, consideration of multiple stakeholder values, objectives and behavior, and improved abilities to predict and plan for future impacts are likely to lead to more sustainable watershed planning and management decisions.
References
Ahmad, J., Alam, D., Haseen, S., 2011. ‘Impact of climate change on agriculture and food security in India’. International Journal of Agriculture, Environment and Biotechnology. Vol. 4 (2): 129– 137.
Ch. Srinivasa Rao and K. A. Gopinath. 2016. Resilient rainfed technologies for drought mitigation and sustainable food security. MAUSAM, 67, 1 (January 2016), 169-182 pp.
Chen, C. W., Dean, J. D., Gherini, S. A. & Goldstein, R. A. 1982. “Acid rain model hydrologic module.” J. Environ. Eng. ASCE 108 (E3), 455-472.
Cherukumalli Srinivasa Rao, Rattan Lal, Jasti V.N.S. Prasad, Kodigal A. Gopinath, Rajbir Singh, Vijay S. Jakkula, Kanwar L. Sahrawat, Bandi Venkateswarlu, Alok K. Sikka and Surinder M. Virmani. 2015. Potential and Challenges of Rainfed Farming in India. Advances in Agronomy, Volume 133, 113-181pp
189
Freeze, R. A. & Harlan, R. L. 1969.” Blueprint for a physically-based, digitally-simulated hydrologic response model” J. Hydrol., 9, 237-258
Government of India, 2011. “Common Guidelines for Watershed Development Projects – 2008” (Revised edition 2011). National Rainfed Area Authority, Planning Commission. New Delhi, India.
Hajkowicz, S. & Collins, K. 2007. “A review of multiple criteria analysis for water resources planning and management”, Water Resources Management, 21, 1553-1566.
Harou, J. J., Pulido-Velazquez, M. A., Rosenberg, D. E., Medellin-Azuara, J., Lund, J. R. & Howitt, R. 2009. “Hydro-economic models: concepts, design, applications and future prospects”, J. of Hydrol., 375, 334-350.
Heinz, I., Pulido-Velasquez, M., Lund, J. & Andreu, J. 2007. “Hydro-economic modeling in river basin management: implications and applications for the European Water Framework Directive”, Water Resour Manage, 21, 1103-1125. J. Hydrol. Eng., 7(4), 270-292
Jasrotia, A. S., Majhi, A. and Singh, S. 2009. “Water Balance Approach for Rainwater Harvesting using Remote Sensing and GIS Techniques, Jammu Himalaya, India”, Water Resources Management, 23: 3035–3055.
Kadam, A.K., Kale, S.S., Pande, N.N., Pawar, N.J. and Sankhua, R.N. 2012. “Identifying Potential Rainwater Harvesting Sites of a Semi-arid, Basaltic Region of Western India, Using SCS-CN Method”, Water Resour Manage 26:2537–2554.
Kerr, J., Pangare, G., Pangare, V.L., 2002. “Watershed development projects in India: An evaluation”, International Food Policy Research Institute, Research Report 127. Washington DC. Retrieved from: http://www.ifpri.org/sites/default/files/pubs/pubs/abstract/127/rr127.pdf
Kumar, M, Raghuwanshi, N S, Singh, R., Wallander, W W., and Pruitt, W. O. 2002. “Evapotranspiration estimation using artificial neural network”, Journal of Irrigation and Drainage Engineering, ASCE 128(4): 224:233 pp
Kumar, M, Raghuwanshi, N.S. and Singh, R. 2009, “Development and validation of generalized artificial neural network (GANN) model for evapotranspiration estimation”, Journal of Hydrologic Engineering, ASCE, Vol.44, No.2:131-140pp
Lund, J. R. & Ferreira, I. 1996. “Operating rule optimization for Missouri River reservoir system”, J. Water Resour. Plan. Manage., 122(4), 287-295.
Lund, J. R., Palmer, R. N. 1997. “Water resource system modeling for conflict resolution”, Water Resources Update, 108, 70-82.
Madani, K. & Mariño, M. A. 2009. “System dynamics analysis for managing Iran’s Zayandeh-Rud river basin”, Water Resour Manage, 23(11), 2163-2187, doi: 10.1007/s11269-008-9376-z.
Makowski, M., Somlyody, L. & Watkins, D. 1996. “ Multiple criteria analysis for water quality management in the Nitra Basin”, Water Resources Bulletin, 32, 937–947.
Merritt, W.S., V.R. Reddy, K.V. Rao, P. Pavelic, S. Ahmed, R. Ranjan, B.F.W. Croke and G. J. Syme. 2011. “Integrated modelling for understanding watershed development impacts on social and biophysical systems”, 19th International Congress on Modelling and Simulation, Perth,
190
Australia, 12–16 December 2011. http://mssanz.org.au/modsim2011.
Mirchi, A., Watkins Jr., D., and Madani, K. 2009. “Modeling for watershed planning, management and decision making”, Chapter 6. In: Watersheds: Management, Restoration and Environment (Editor: Jeremy C. Vaughn), BN: 978-1-61668-667-3.
National Rainfed Area Authority. 2011. “Common guidelines for watershed development projects-2008”, Revised editions-2011, National rainfed area authority, Planning commission, 2011.
Pimentel, D. and Kounang, N. 1998. “Ecology of soil erosion in ecosystems”, Ecosystems 1: 416-246.
Rejani,R., Jha, M. K. and Panda, S. N. 2009. “Simulation-Optimization Modelling for Sustainable Groundwater Management in a Coastal Basin of Orissa, India”, Water Resources Management, 23: 235-263.
Shankar, P. V., Kulkarni, H., & Krishnan, S. 2011. “India's Groundwater Challenge and the Way Forward”, Economic and Political Weekly, 46(2).
Sheetal Sekhri. 2012. “Sustaining Groundwater: Role of Policy Reforms in Promoting Conservation in India”, Report of Indian Policy forum 2012. India International Centre, New Delhi.
Singh, R V. 2003. “Watershed planning and management”, second editions, Yash publishing home, 1-10 pp
Singh, V. P. & Woolhiser, D. A. 2002. “Mathematical modeling of watershed hydrology”, Journal of Hydrologic Engineering, Vol. 7, No. 4, July/August 2002, pp. 270-292
Srinivasa Rao, Ch., Ravindra Chary, G., Mishra, PK., Subba Reddy, G., Sankar, GRM., Venkateswarlu, B. and Sikka, AK. 2014. Rainfed farming – A compendium of Doable Technologies. All India Coordinated Research Project for Dryland Agriculture, Central Research Institute for Dryland Agriculture, Hyderabad. Pages 194.
Tirkey, A.S., Pandey, A.C., and Nathawat, M.S. 2013. “Use of Satellite Data, GIS and RUSLE for Estimation of Average Annual Soil Loss in Daltonganj Watershed of Jharkhand (India)”, Journal of Remote Sensing Technology, 1(1): 20-30

130(3". %*3&$5034
%S. 4.,. 4PBN +PJOU %JSFDUPS (J/D), *$"3-/""3. &NBJM : TPBN!OBBSN.PSH.JO .PCJMF : 9440945340
%S. #IBSBU 4. 4POUBLLJ )FBE, &YUFOTJPO 4ZTUFN .BOBHFNFOU, *$"3-/""3. &NBJM : CIBSBUTT!OBBSN.PSH.JO .PCJMF : 9440965798
%S. 1. ,SJTIOBO 1SJODJQBM 4DJFOUJTU & )FBE, 1.& $FMM, /""3. /PEBM 0GåDFS GPS *(/'" .P6 &NBJM : LSJTIOBOBST!ZBIPP.DPN .PCJMF : 9498050062 / 9398680285
View publication stats
*$"3-/BUJPOBM "DBEFNZ PG "HSJDVMUVSBM 3FTFBSDI .BOBHFNFOU 3BKFOESBOBHBS, )ZEFSBCBE-500030, 5FMBOHBOB, *OEJB +91-40-24581300/333, 'BY: 091-40-24015912 FNBJM: EJSFDUPS!OBBSN.PSH.JO, XFCTJUF: IUUQT://OBBSN.PSH.JO