Data collection for “Flood Risk Assessment for Dungsum Chu ...
33
1 | 33 Data collection for “Flood Risk Assessment for Dungsum Chu Basin in Samdrup Jonkhar” Compiled by. T. Asali Peiris (AIT) and Engineers from Flood Engineering and Management Division Bhutan
-
Upload
khangminh22 -
Category
Documents
-
view
1 -
download
0
Transcript of Data collection for “Flood Risk Assessment for Dungsum Chu ...
1 | 3 3
Data collection for
“Flood Risk Assessment for Dungsum Chu Basin in
Samdrup Jonkhar”
Compiled by. T. Asali Peiris (AIT) and Engineers from Flood Engineering and Management
Division Bhutan
2 | 3 3
CONTENTS
Sl.
No.
Chapter Page
Number
1 Background and Context 3
2 Overview of Data Collected 3
3 Period of Field Survey 5
4 Questionnaire Survey for Flood Vulnerability
Assessment
6
5 Highlights from Flood Vulnerability Survey 9
6 River Cross-section Survey 16
Annex A: Questionnaire Survey Form 17
3 | 3 3
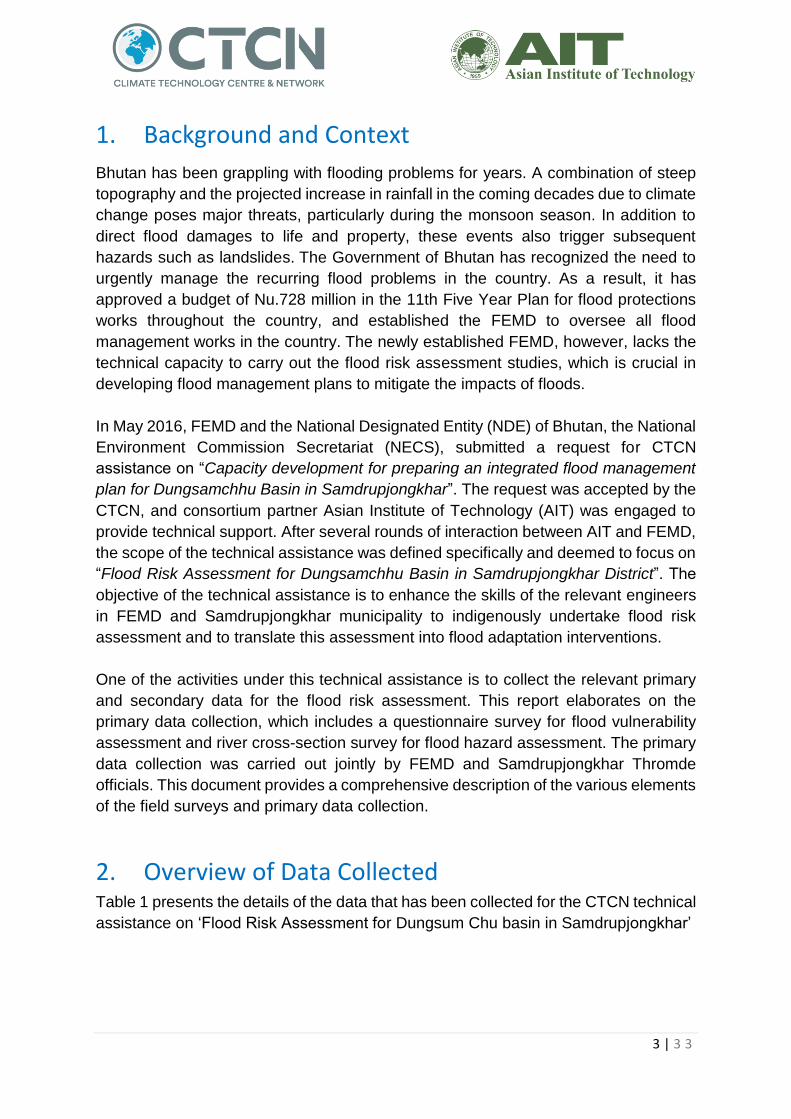
1. Background and Context
Bhutan has been grappling with flooding problems for years. A combination of steep
topography and the projected increase in rainfall in the coming decades due to climate
change poses major threats, particularly during the monsoon season. In addition to
direct flood damages to life and property, these events also trigger subsequent
hazards such as landslides. The Government of Bhutan has recognized the need to
urgently manage the recurring flood problems in the country. As a result, it has
approved a budget of Nu.728 million in the 11th Five Year Plan for flood protections
works throughout the country, and established the FEMD to oversee all flood
management works in the country. The newly established FEMD, however, lacks the
technical capacity to carry out the flood risk assessment studies, which is crucial in
developing flood management plans to mitigate the impacts of floods.
In May 2016, FEMD and the National Designated Entity (NDE) of Bhutan, the National
Environment Commission Secretariat (NECS), submitted a request for CTCN
assistance on “Capacity development for preparing an integrated flood management
plan for Dungsamchhu Basin in Samdrupjongkhar”. The request was accepted by the
CTCN, and consortium partner Asian Institute of Technology (AIT) was engaged to
provide technical support. After several rounds of interaction between AIT and FEMD,
the scope of the technical assistance was defined specifically and deemed to focus on
“Flood Risk Assessment for Dungsamchhu Basin in Samdrupjongkhar District”. The
objective of the technical assistance is to enhance the skills of the relevant engineers
in FEMD and Samdrupjongkhar municipality to indigenously undertake flood risk
assessment and to translate this assessment into flood adaptation interventions.
One of the activities under this technical assistance is to collect the relevant primary
and secondary data for the flood risk assessment. This report elaborates on the
primary data collection, which includes a questionnaire survey for flood vulnerability
assessment and river cross-section survey for flood hazard assessment. The primary
data collection was carried out jointly by FEMD and Samdrupjongkhar Thromde
officials. This document provides a comprehensive description of the various elements
of the field surveys and primary data collection.
2. Overview of Data Collected Table 1 presents the details of the data that has been collected for the CTCN technical
assistance on ‘Flood Risk Assessment for Dungsum Chu basin in Samdrupjongkhar’
4 | 3 3
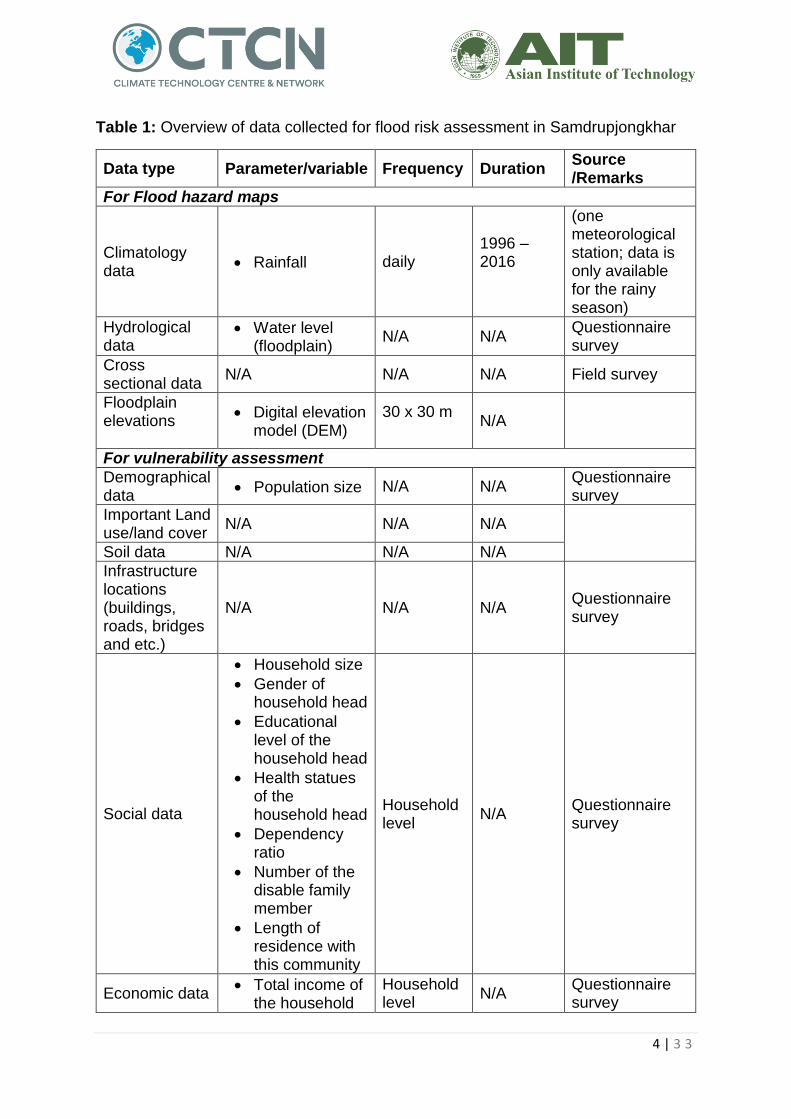
Table 1: Overview of data collected for flood risk assessment in Samdrupjongkhar
Data type Parameter/variable Frequency Duration Source /Remarks
For Flood hazard maps
Climatology data
Rainfall daily 1996 – 2016
(one meteorological station; data is only available for the rainy season)
Hydrological data
Water level (floodplain)
N/A N/A Questionnaire survey
Cross sectional data
N/A N/A N/A Field survey
Floodplain elevations
Digital elevation model (DEM)
30 x 30 m
N/A
For vulnerability assessment
Demographical data
Population size N/A N/A Questionnaire survey
Important Land use/land cover
N/A N/A N/A
Soil data N/A N/A N/A
Infrastructure locations (buildings, roads, bridges and etc.)
N/A N/A N/A Questionnaire survey
Social data
Household size
Gender of household head
Educational level of the household head
Health statues of the household head
Dependency ratio
Number of the disable family member
Length of residence with this community
Household level
N/A Questionnaire survey
Economic data Total income of
the household
Household level
N/A Questionnaire survey
5 | 3 3
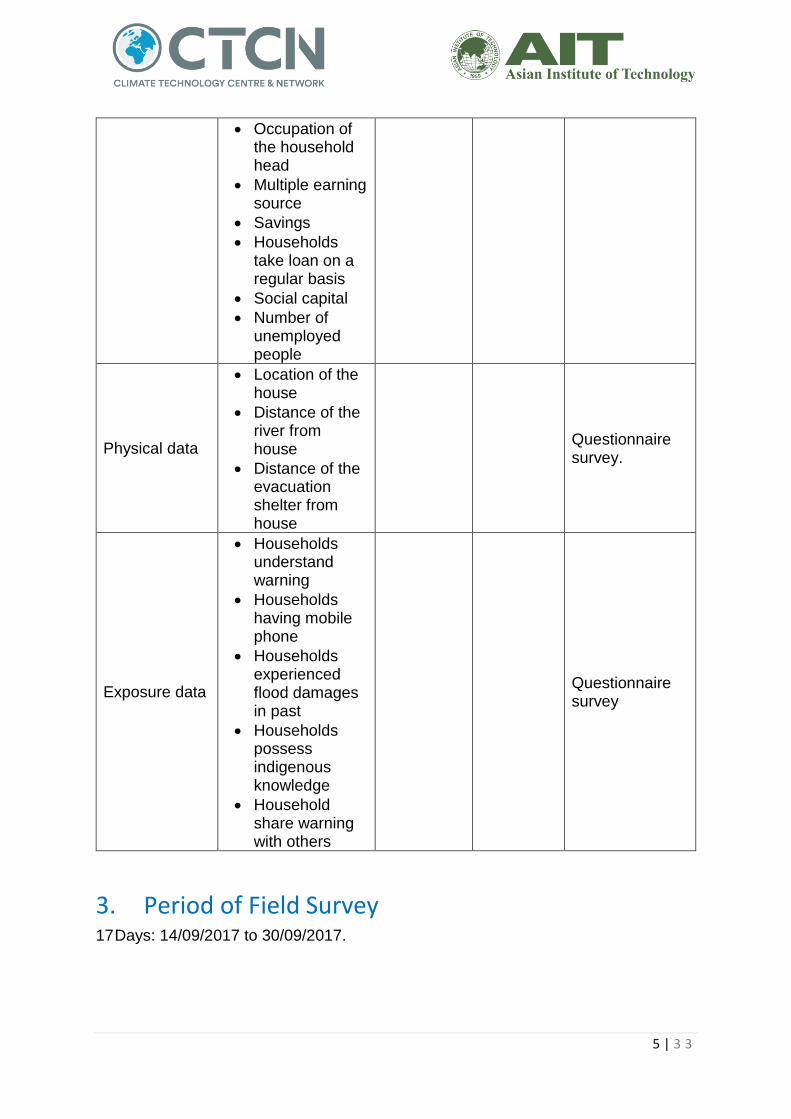
Occupation of the household head
Multiple earning source
Savings
Households take loan on a regular basis
Social capital
Number of unemployed people
Physical data
Location of the house
Distance of the river from house
Distance of the evacuation shelter from house
Questionnaire survey.
Exposure data
Households understand warning
Households having mobile phone
Households experienced flood damages in past
Households possess indigenous knowledge
Household share warning with others
Questionnaire survey
3. Period of Field Survey 17 Days: 14/09/2017 to 30/09/2017.
6 | 3 3
4. Questionnaire Survey for Flood Vulnerability
Assessment
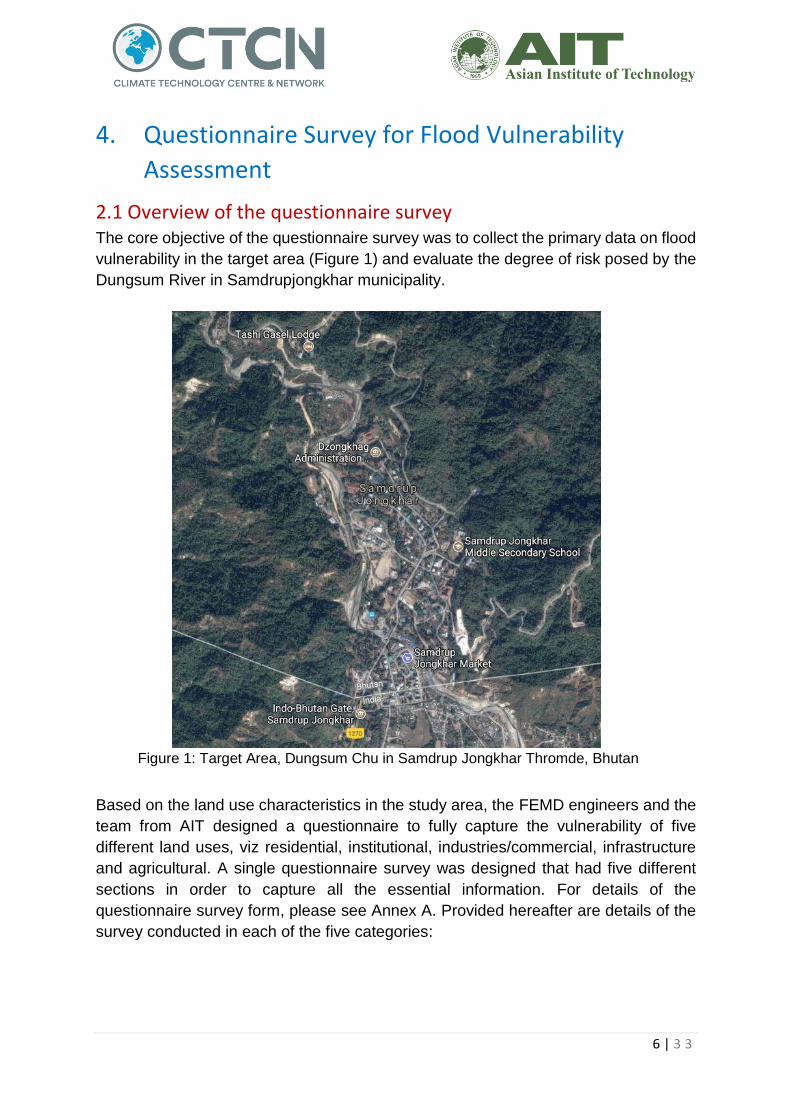
2.1 Overview of the questionnaire survey The core objective of the questionnaire survey was to collect the primary data on flood
vulnerability in the target area (Figure 1) and evaluate the degree of risk posed by the
Dungsum River in Samdrupjongkhar municipality.
Based on the land use characteristics in the study area, the FEMD engineers and the
team from AIT designed a questionnaire to fully capture the vulnerability of five
different land uses, viz residential, institutional, industries/commercial, infrastructure
and agricultural. A single questionnaire survey was designed that had five different
sections in order to capture all the essential information. For details of the
questionnaire survey form, please see Annex A. Provided hereafter are details of the
survey conducted in each of the five categories:
Figure 1: Target Area, Dungsum Chu in Samdrup Jongkhar Thromde, Bhutan
7 | 3 3
1. Residential: 230 households were interviewed uniformly across the study area.
The samples were taken from houses near the river and also away from the river to
spatially overlay the vulnerability on the hazard maps to estimate the risk.
2. Institutional: As per the land use map, 10 institutions were interviewed. These
includes hospitals (2), schools (3), regional labour and human resources (1), road
safety and transport authority of Bhutan (1), royal Bhutan police (1), forestry
division(1) and municipality (1).
3. Industries/Commercial: 26 interviews were conducted at different locations as per
the land use map, 3-4 interviews in each area.
4. Infrastructure: 4 interviews were conducted with the offices dealing with
infrastructure developments such as Department of Road, Bhutan Power
Corporation, Municipality and Bhutan Telecom Limited.
5. Agriculture: As per the site investigation, Samdrupjongkhar municipality area does
not have adequate agricultural land. Further, the land use map also does not show
agricultural land in the Thromde. Therefore, survey was not taken for agricultural
land use.
All data which are collected from the questionnaire survey has been uploaded to a
specially created website (https://ctcnbhutan.wixsite.com/capacitybuilding)
2.2 Enumerators for vulnerability assessment The list of officials involved for the vulnerability assessment survey is given in Table
2.
Table 2: Enumerators for vulnerability assessment
No Name Agency
1. Megnath Neopaney Flood Engineering and Management Division
2. Pema Cheda Flood Engineering and Management Division
3. Kedhar Kr.Adhikari Flood Engineering and Management Division
4. Kezang Phuntsho Flood Engineering and Management Division
5. Pelden Wangchuk Flood Engineering and Management Division
6. Sonam Dhendup Samdrupjongkhar Municipal
7. Dechen Chezom Samdrupjongkhar Municipal
8. Jigme Gyeltshen Samdrupjongkhar Municipal
9. Sangay Dorji Samdrupjongkhar Municipal
10. Sherub Wangda Samdrupjongkhar Municipal
11. Sonam Dendup Samdrupjongkhar Municipal
8 | 3 3
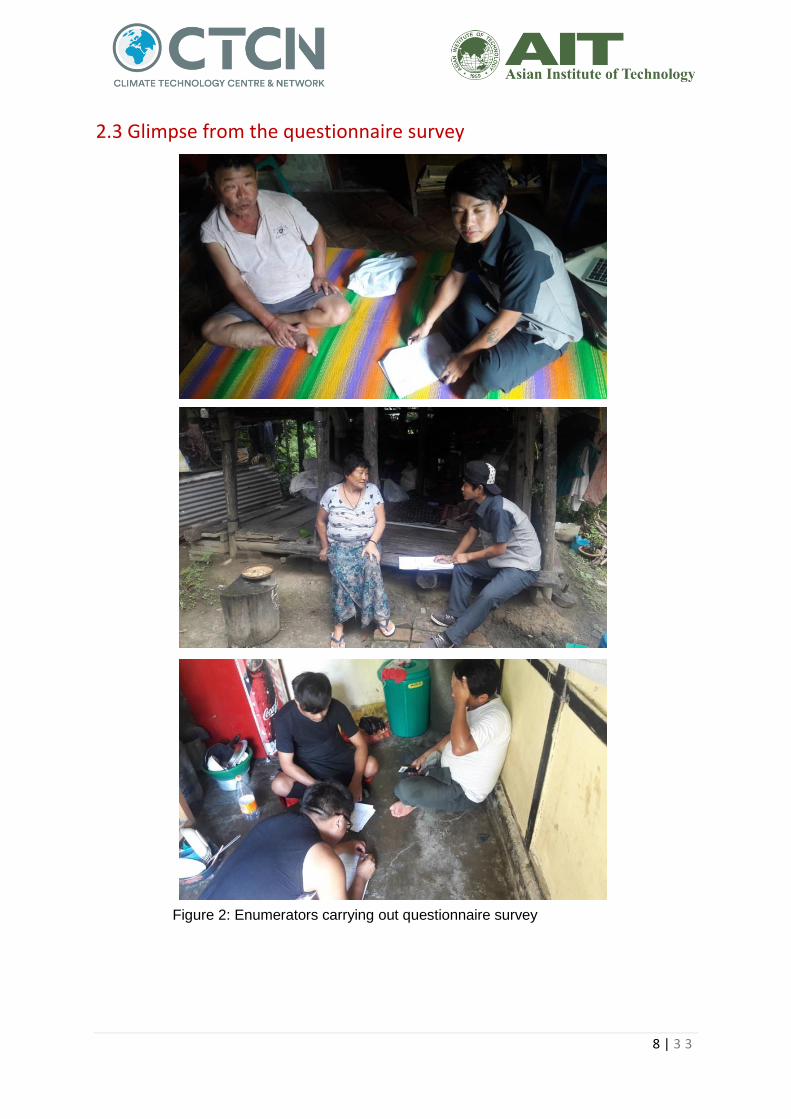
2.3 Glimpse from the questionnaire survey
Figure 2: Enumerators carrying out questionnaire survey
9 | 3 3
5. Highlights from Flood Vulnerability Survey
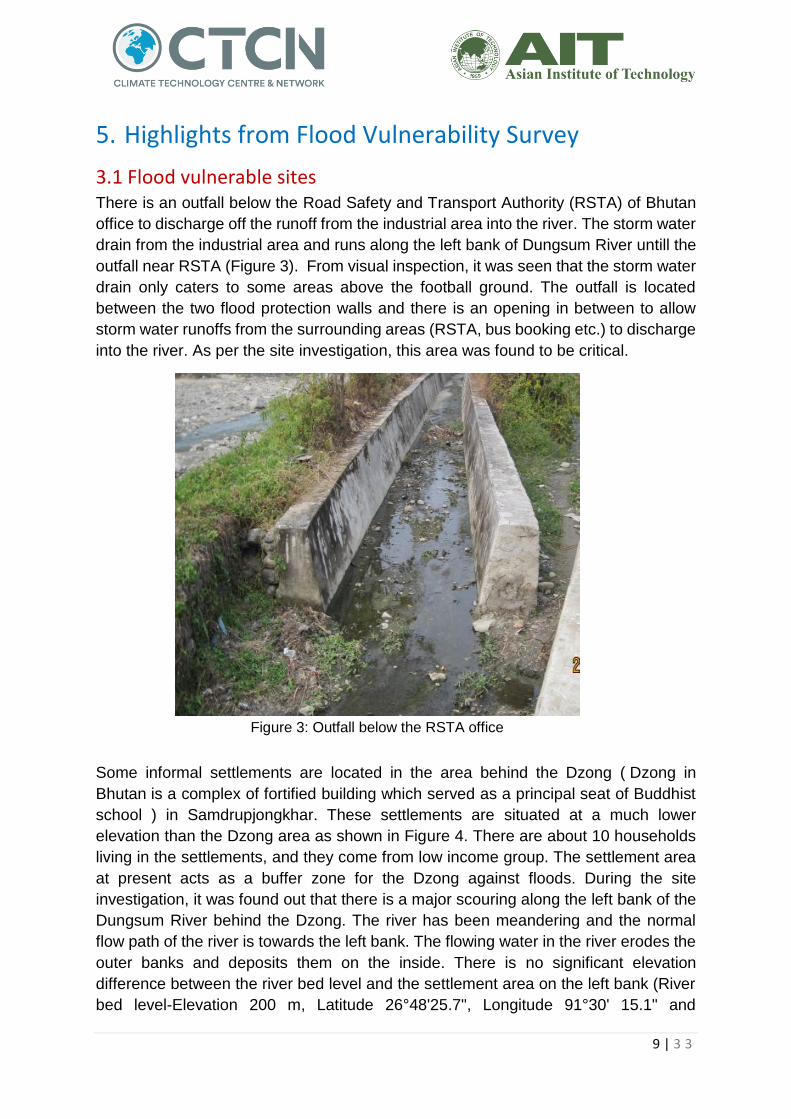
3.1 Flood vulnerable sites There is an outfall below the Road Safety and Transport Authority (RSTA) of Bhutan
office to discharge off the runoff from the industrial area into the river. The storm water
drain from the industrial area and runs along the left bank of Dungsum River untill the
outfall near RSTA (Figure 3). From visual inspection, it was seen that the storm water
drain only caters to some areas above the football ground. The outfall is located
between the two flood protection walls and there is an opening in between to allow
storm water runoffs from the surrounding areas (RSTA, bus booking etc.) to discharge
into the river. As per the site investigation, this area was found to be critical.
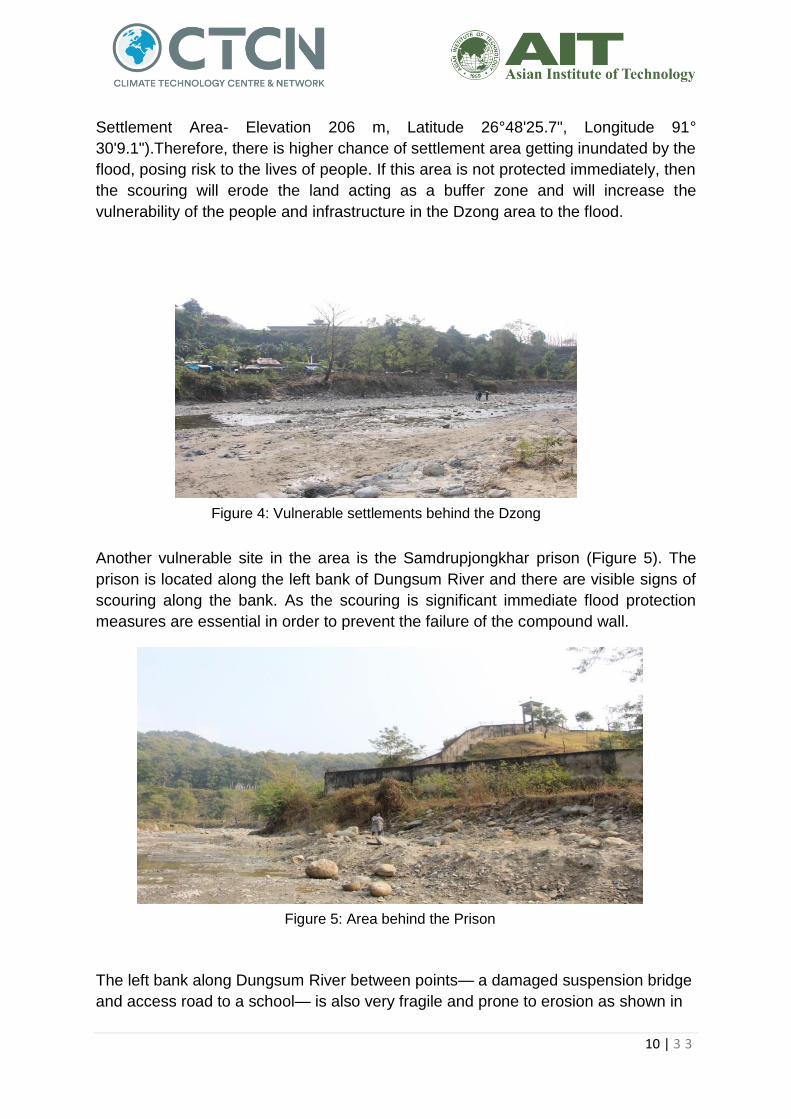
Some informal settlements are located in the area behind the Dzong ( Dzong in
Bhutan is a complex of fortified building which served as a principal seat of Buddhist
school ) in Samdrupjongkhar. These settlements are situated at a much lower
elevation than the Dzong area as shown in Figure 4. There are about 10 households
living in the settlements, and they come from low income group. The settlement area
at present acts as a buffer zone for the Dzong against floods. During the site
investigation, it was found out that there is a major scouring along the left bank of the
Dungsum River behind the Dzong. The river has been meandering and the normal
flow path of the river is towards the left bank. The flowing water in the river erodes the
outer banks and deposits them on the inside. There is no significant elevation
difference between the river bed level and the settlement area on the left bank (River
bed level-Elevation 200 m, Latitude 26°48'25.7", Longitude 91°30' 15.1" and
Figure 3: Outfall below the RSTA office
10 | 3 3
Settlement Area- Elevation 206 m, Latitude 26°48'25.7", Longitude 91°
30'9.1").Therefore, there is higher chance of settlement area getting inundated by the
flood, posing risk to the lives of people. If this area is not protected immediately, then
the scouring will erode the land acting as a buffer zone and will increase the
vulnerability of the people and infrastructure in the Dzong area to the flood.
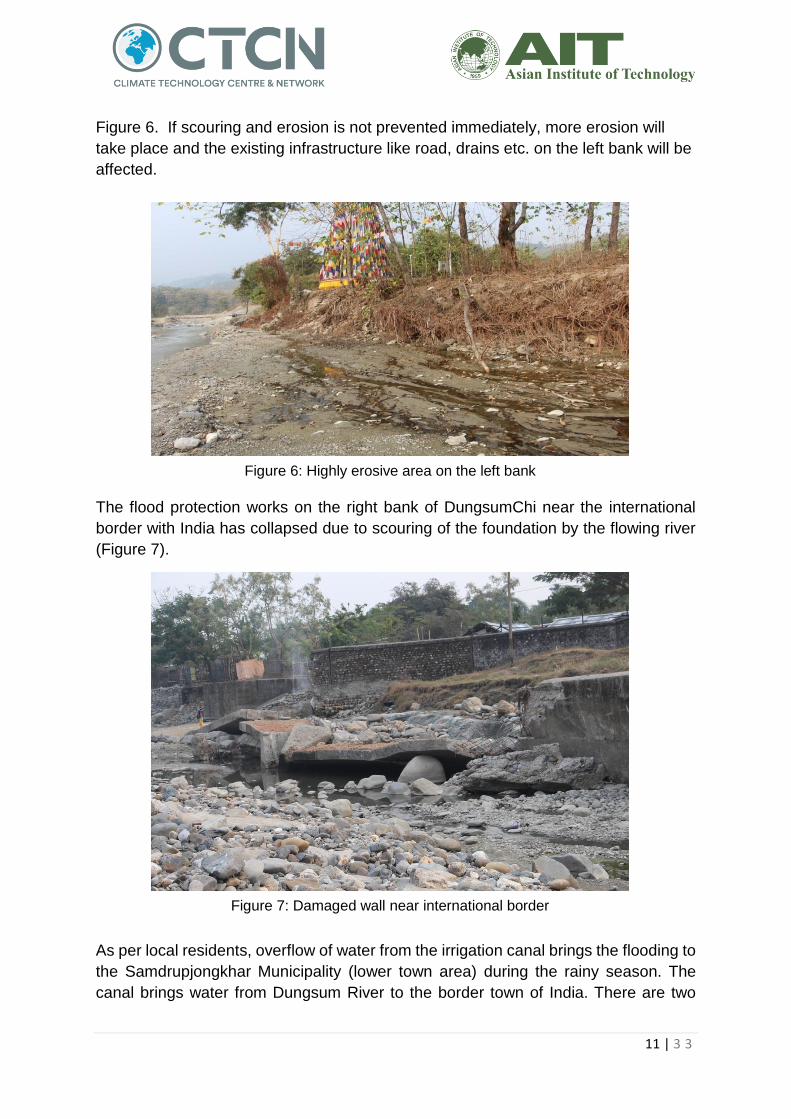
Another vulnerable site in the area is the Samdrupjongkhar prison (Figure 5). The
prison is located along the left bank of Dungsum River and there are visible signs of
scouring along the bank. As the scouring is significant immediate flood protection
measures are essential in order to prevent the failure of the compound wall.
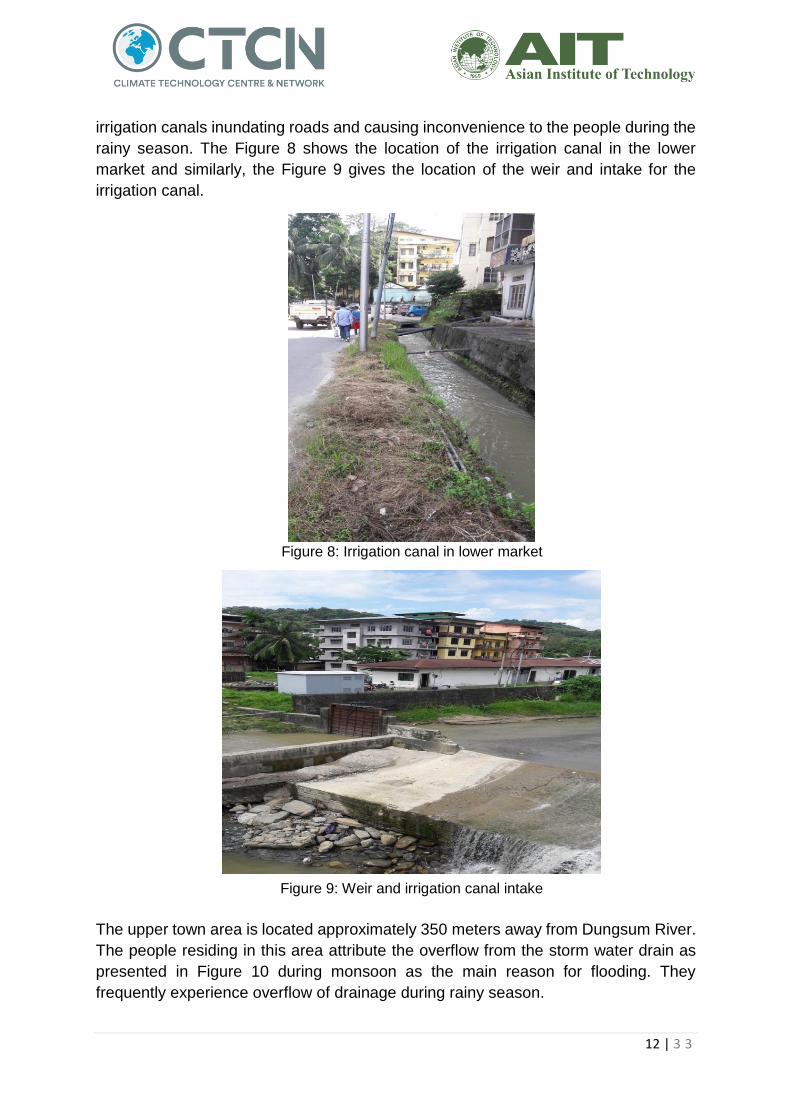
The left bank along Dungsum River between points— a damaged suspension bridge
and access road to a school— is also very fragile and prone to erosion as shown in
Figure 4: Vulnerable settlements behind the Dzong
Figure 5: Area behind the Prison
11 | 3 3
Figure 6. If scouring and erosion is not prevented immediately, more erosion will
take place and the existing infrastructure like road, drains etc. on the left bank will be
affected.
The flood protection works on the right bank of DungsumChi near the international
border with India has collapsed due to scouring of the foundation by the flowing river
(Figure 7).
As per local residents, overflow of water from the irrigation canal brings the flooding to
the Samdrupjongkhar Municipality (lower town area) during the rainy season. The
canal brings water from Dungsum River to the border town of India. There are two
Figure 6: Highly erosive area on the left bank
Figure 7: Damaged wall near international border
12 | 3 3
irrigation canals inundating roads and causing inconvenience to the people during the
rainy season. The Figure 8 shows the location of the irrigation canal in the lower
market and similarly, the Figure 9 gives the location of the weir and intake for the
irrigation canal.
The upper town area is located approximately 350 meters away from Dungsum River.
The people residing in this area attribute the overflow from the storm water drain as
presented in Figure 10 during monsoon as the main reason for flooding. They
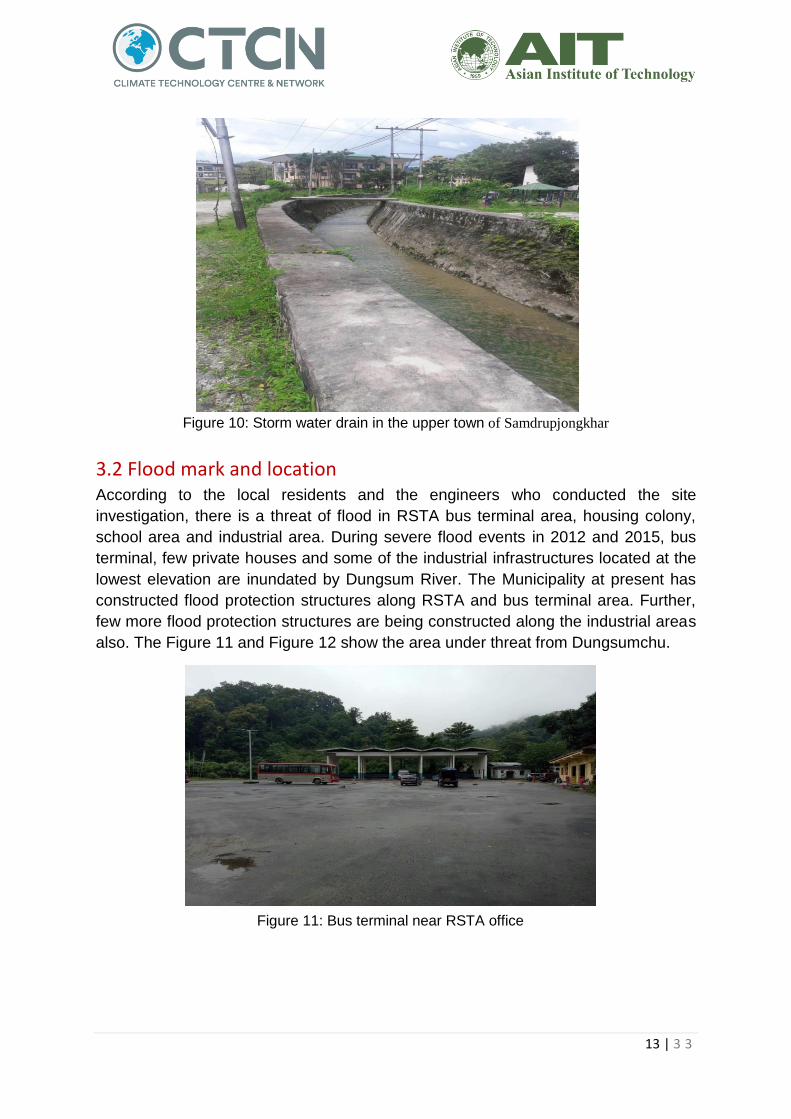
frequently experience overflow of drainage during rainy season.
Figure 8: Irrigation canal in lower market
Figure 9: Weir and irrigation canal intake
13 | 3 3
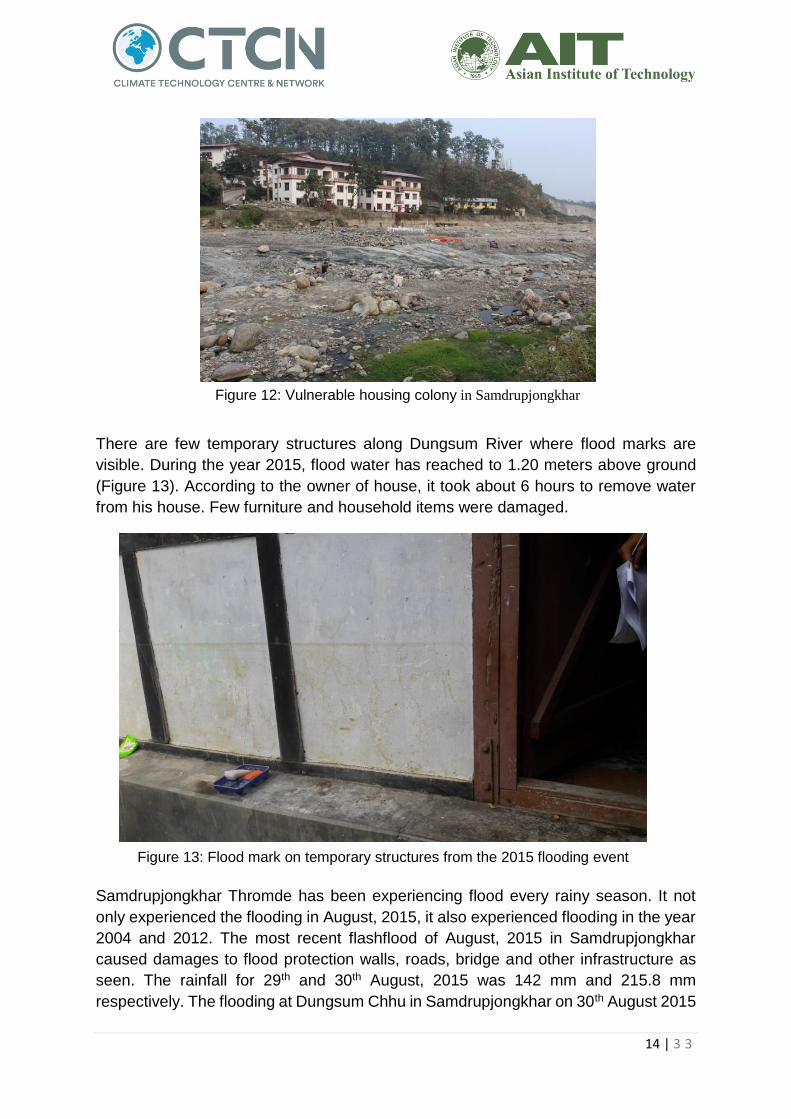
3.2 Flood mark and location According to the local residents and the engineers who conducted the site
investigation, there is a threat of flood in RSTA bus terminal area, housing colony,
school area and industrial area. During severe flood events in 2012 and 2015, bus
terminal, few private houses and some of the industrial infrastructures located at the
lowest elevation are inundated by Dungsum River. The Municipality at present has
constructed flood protection structures along RSTA and bus terminal area. Further,
few more flood protection structures are being constructed along the industrial areas
also. The Figure 11 and Figure 12 show the area under threat from Dungsumchu.
Figure 10: Storm water drain in the upper town of Samdrupjongkhar
Figure 11: Bus terminal near RSTA office
14 | 3 3
There are few temporary structures along Dungsum River where flood marks are
visible. During the year 2015, flood water has reached to 1.20 meters above ground
(Figure 13). According to the owner of house, it took about 6 hours to remove water
from his house. Few furniture and household items were damaged.
Samdrupjongkhar Thromde has been experiencing flood every rainy season. It not
only experienced the flooding in August, 2015, it also experienced flooding in the year
2004 and 2012. The most recent flashflood of August, 2015 in Samdrupjongkhar
caused damages to flood protection walls, roads, bridge and other infrastructure as
seen. The rainfall for 29th and 30th August, 2015 was 142 mm and 215.8 mm
respectively. The flooding at Dungsum Chhu in Samdrupjongkhar on 30th August 2015
Figure 12: Vulnerable housing colony in Samdrupjongkhar
Figure 13: Flood mark on temporary structures from the 2015 flooding event
Flood mark of 2015
15 | 3 3
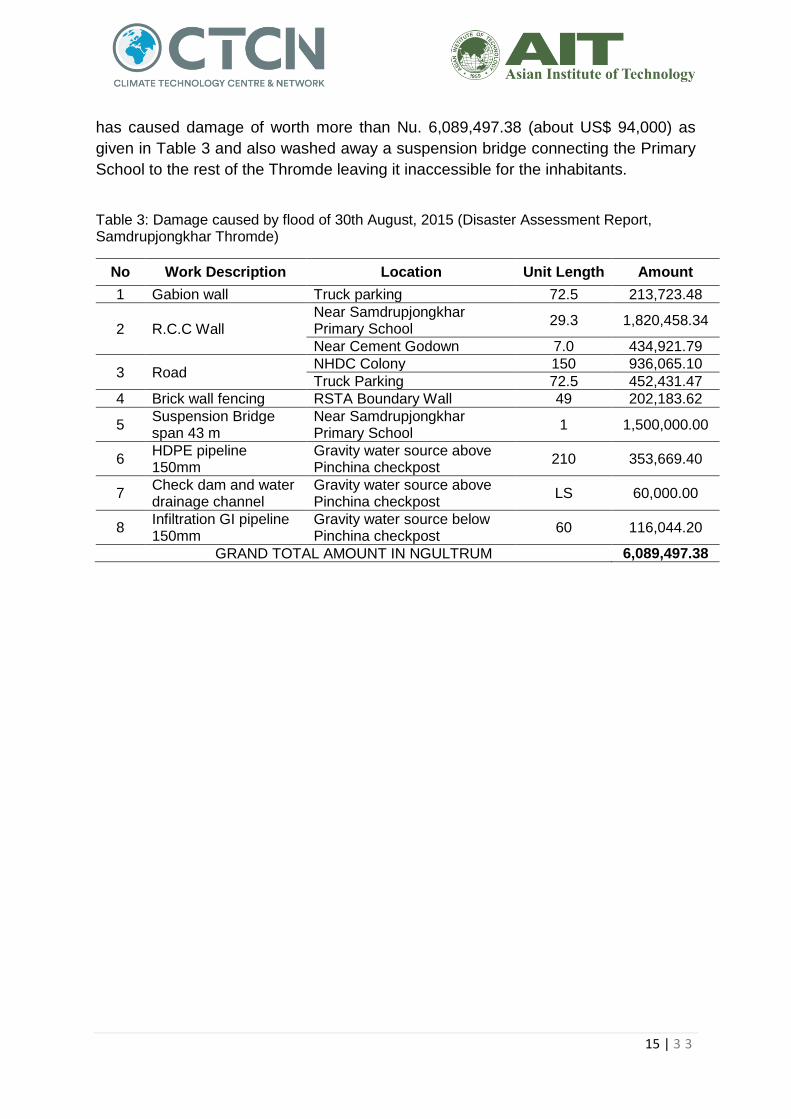
has caused damage of worth more than Nu. 6,089,497.38 (about US$ 94,000) as
given in Table 3 and also washed away a suspension bridge connecting the Primary
School to the rest of the Thromde leaving it inaccessible for the inhabitants.
Table 3: Damage caused by flood of 30th August, 2015 (Disaster Assessment Report, Samdrupjongkhar Thromde)
No Work Description Location Unit Length Amount
1 Gabion wall Truck parking 72.5 213,723.48
2 R.C.C Wall Near Samdrupjongkhar Primary School
29.3 1,820,458.34
Near Cement Godown 7.0 434,921.79
3 Road NHDC Colony 150 936,065.10
Truck Parking 72.5 452,431.47
4 Brick wall fencing RSTA Boundary Wall 49 202,183.62
5 Suspension Bridge span 43 m
Near Samdrupjongkhar Primary School
1 1,500,000.00
6 HDPE pipeline 150mm
Gravity water source above Pinchina checkpost
210 353,669.40
7 Check dam and water drainage channel
Gravity water source above Pinchina checkpost
LS 60,000.00
8 Infiltration GI pipeline 150mm
Gravity water source below Pinchina checkpost
60 116,044.20
GRAND TOTAL AMOUNT IN NGULTRUM 6,089,497.38
16 | 3 3
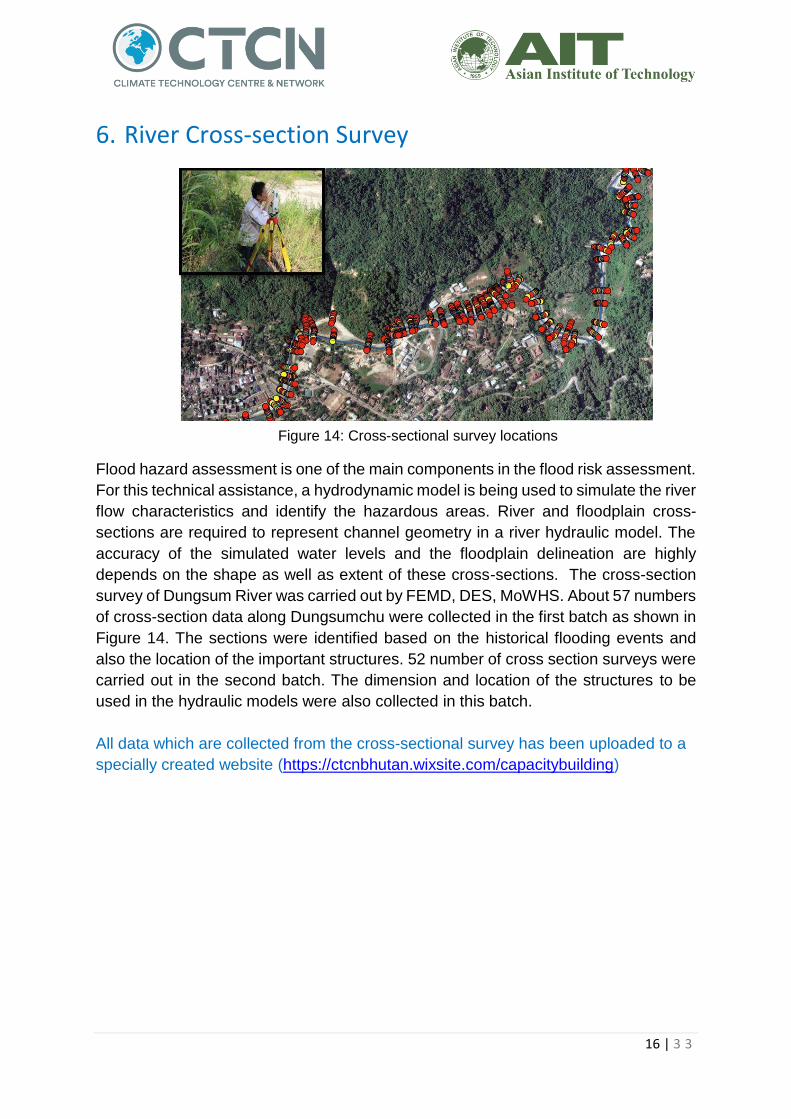
6. River Cross-section Survey
Flood hazard assessment is one of the main components in the flood risk assessment.
For this technical assistance, a hydrodynamic model is being used to simulate the river
flow characteristics and identify the hazardous areas. River and floodplain cross-
sections are required to represent channel geometry in a river hydraulic model. The
accuracy of the simulated water levels and the floodplain delineation are highly
depends on the shape as well as extent of these cross-sections. The cross-section
survey of Dungsum River was carried out by FEMD, DES, MoWHS. About 57 numbers
of cross-section data along Dungsumchu were collected in the first batch as shown in
Figure 14. The sections were identified based on the historical flooding events and
also the location of the important structures. 52 number of cross section surveys were
carried out in the second batch. The dimension and location of the structures to be
used in the hydraulic models were also collected in this batch.
All data which are collected from the cross-sectional survey has been uploaded to a
specially created website (https://ctcnbhutan.wixsite.com/capacitybuilding)
Figure 14: Cross-sectional survey locations
17 | 3 3
Annex A: Questionnaire Survey Form
18 | 3 3
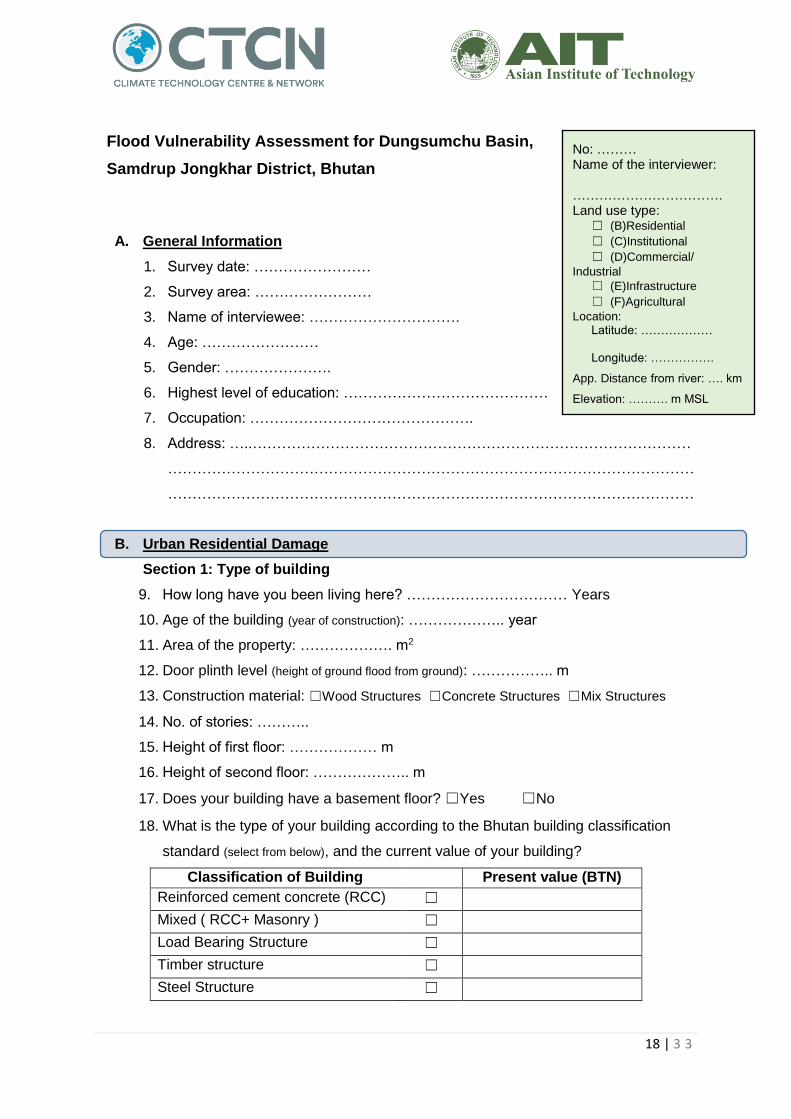
A. General Information
1. Survey date: ……………………
2. Survey area: ……………………
3. Name of interviewee: ………………………….
4. Age: ……………………
5. Gender: ………………….
6. Highest level of education: ……………………………………
7. Occupation: ……………………………………….
8. Address: …..………………………………………………………………………………
………………………………………………………………………………………………
………………………………………………………………………………………………
B. Urban Residential Damage
Section 1: Type of building
9. How long have you been living here? …………………………… Years
10. Age of the building (year of construction): ……………….. year
11. Area of the property: ………………. m2
12. Door plinth level (height of ground flood from ground): …………….. m
13. Construction material: ☐Wood Structures ☐Concrete Structures ☐Mix Structures
14. No. of stories: ………..
15. Height of first floor: ……………… m
16. Height of second floor: ……………….. m
17. Does your building have a basement floor? ☐Yes ☐No
18. What is the type of your building according to the Bhutan building classification
standard (select from below), and the current value of your building?
Classification of Building Present value (BTN)
Reinforced cement concrete (RCC) ☐
Mixed ( RCC+ Masonry ) ☐
Load Bearing Structure ☐
Timber structure ☐
Steel Structure ☐
No: ……… Name of the interviewer: ……………………………. Land use type: ☐ (B)Residential
☐ (C)Institutional
☐ (D)Commercial/
Industrial
☐ (E)Infrastructure
☐ (F)Agricultural
Location: Latitude: ……………… Longitude: …………….
App. Distance from river: …. km
Elevation: ………. m MSL
Flood Vulnerability Assessment for Dungsumchu Basin,
Samdrup Jongkhar District, Bhutan
19 | 3 3
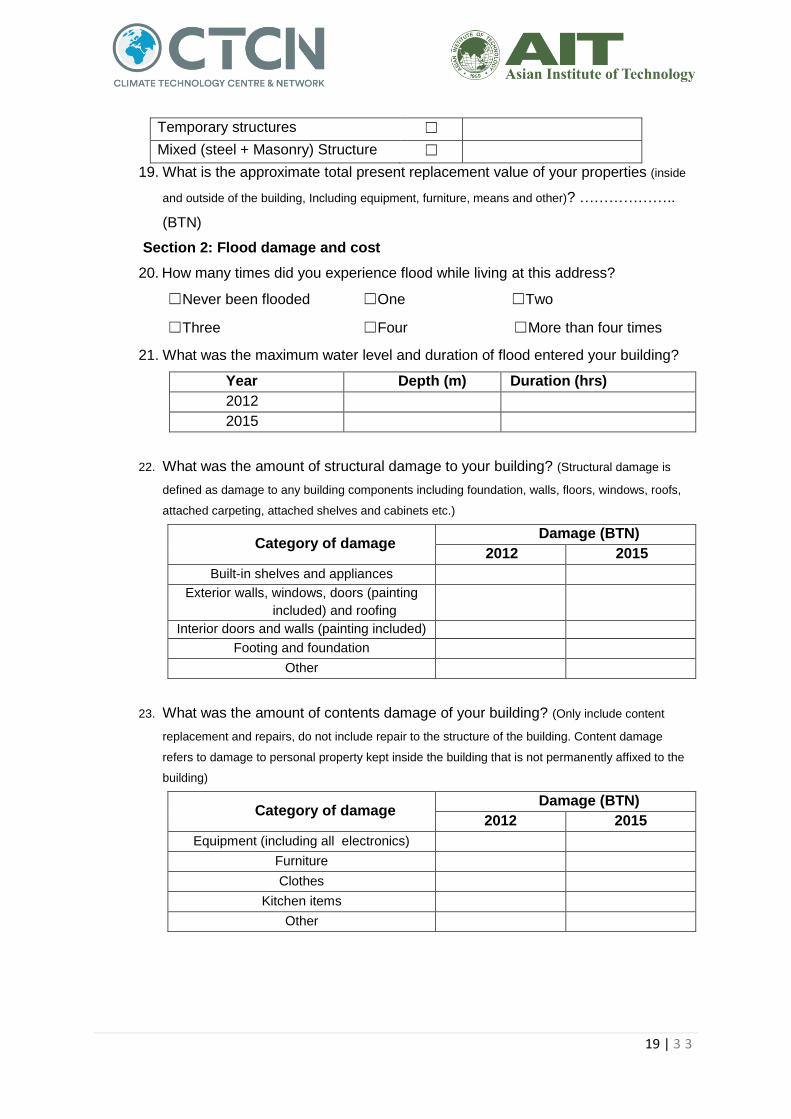
Temporary structures ☐
Mixed (steel + Masonry) Structure ☐
19. What is the approximate total present replacement value of your properties (inside
and outside of the building, Including equipment, furniture, means and other)? ………………..
(BTN)
Section 2: Flood damage and cost
20. How many times did you experience flood while living at this address?
☐Never been flooded ☐One ☐Two
☐Three ☐Four ☐More than four times
21. What was the maximum water level and duration of flood entered your building?
Year Depth (m) Duration (hrs)
2012
2015
22. What was the amount of structural damage to your building? (Structural damage is
defined as damage to any building components including foundation, walls, floors, windows, roofs,
attached carpeting, attached shelves and cabinets etc.)
Category of damage Damage (BTN)
2012 2015
Built-in shelves and appliances
Exterior walls, windows, doors (painting
included) and roofing
Interior doors and walls (painting included)
Footing and foundation
Other
23. What was the amount of contents damage of your building? (Only include content
replacement and repairs, do not include repair to the structure of the building. Content damage
refers to damage to personal property kept inside the building that is not permanently affixed to the
building)
Category of damage Damage (BTN)
2012 2015
Equipment (including all electronics)
Furniture
Clothes
Kitchen items
Other
20 | 3 3
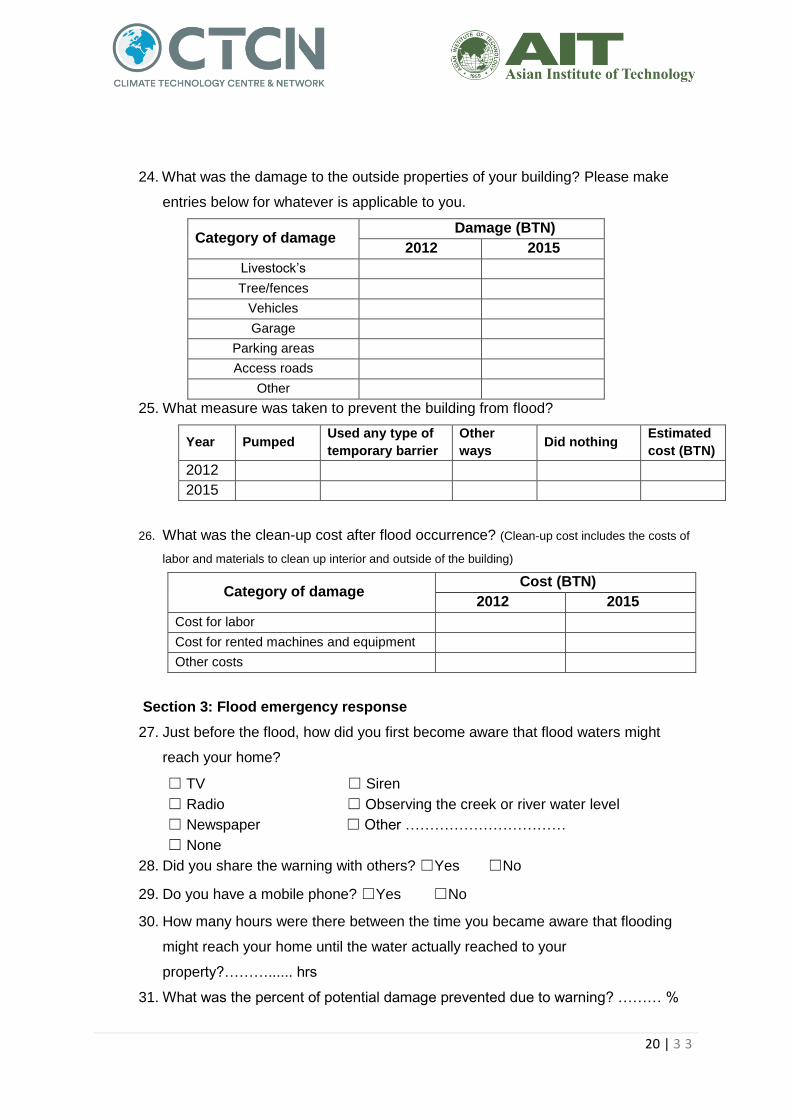
24. What was the damage to the outside properties of your building? Please make
entries below for whatever is applicable to you.
Category of damage Damage (BTN)
2012 2015
Livestock’s
Tree/fences
Vehicles
Garage
Parking areas
Access roads
Other
25. What measure was taken to prevent the building from flood?
Year Pumped Used any type of
temporary barrier
Other
ways Did nothing
Estimated
cost (BTN)
2012
2015
26. What was the clean-up cost after flood occurrence? (Clean-up cost includes the costs of
labor and materials to clean up interior and outside of the building)
Category of damage Cost (BTN)
2012 2015
Cost for labor
Cost for rented machines and equipment
Other costs
Section 3: Flood emergency response
27. Just before the flood, how did you first become aware that flood waters might
reach your home?
☐ TV ☐ Siren
☐ Radio ☐ Observing the creek or river water level
☐ Newspaper ☐ Other ……………………………
☐ None
28. Did you share the warning with others? ☐Yes ☐No
29. Do you have a mobile phone? ☐Yes ☐No
30. How many hours were there between the time you became aware that flooding
might reach your home until the water actually reached to your
property?………...... hrs
31. What was the percent of potential damage prevented due to warning? ……… %
21 | 3 3
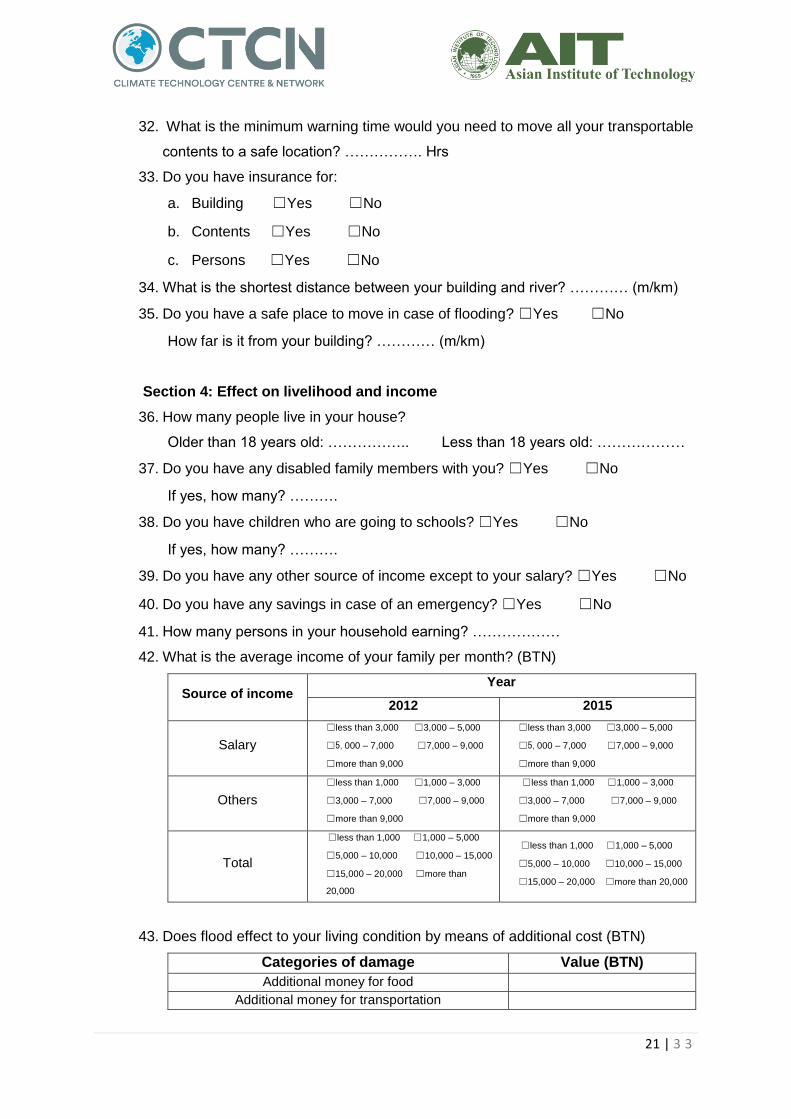
32. What is the minimum warning time would you need to move all your transportable
contents to a safe location? ……………. Hrs
33. Do you have insurance for:
a. Building ☐Yes ☐No
b. Contents ☐Yes ☐No
c. Persons ☐Yes ☐No
34. What is the shortest distance between your building and river? ………… (m/km)
35. Do you have a safe place to move in case of flooding? ☐Yes ☐No
How far is it from your building? ………… (m/km)
Section 4: Effect on livelihood and income
36. How many people live in your house?
Older than 18 years old: …………….. Less than 18 years old: ………………
37. Do you have any disabled family members with you? ☐Yes ☐No
If yes, how many? ……….
38. Do you have children who are going to schools? ☐Yes ☐No
If yes, how many? ……….
39. Do you have any other source of income except to your salary? ☐Yes ☐No
40. Do you have any savings in case of an emergency? ☐Yes ☐No
41. How many persons in your household earning? ………………
42. What is the average income of your family per month? (BTN)
Source of income Year
2012 2015
Salary
☐less than 3,000 ☐3,000 – 5,000
☐5,000 – 7,000 ☐7,000 – 9,000
☐more than 9,000
☐less than 3,000 ☐3,000 – 5,000
☐5,000 – 7,000 ☐7,000 – 9,000
☐more than 9,000
Others
☐less than 1,000 ☐1,000 – 3,000
☐3,000 – 7,000 ☐7,000 – 9,000
☐more than 9,000
☐less than 1,000 ☐1,000 – 3,000
☐3,000 – 7,000 ☐7,000 – 9,000
☐more than 9,000
Total
☐less than 1,000 ☐1,000 – 5,000
☐5,000 – 10,000 ☐10,000 – 15,000
☐15,000 – 20,000 ☐more than
20,000
☐less than 1,000 ☐1,000 – 5,000
☐5,000 – 10,000 ☐10,000 – 15,000
☐15,000 – 20,000 ☐more than 20,000
43. Does flood effect to your living condition by means of additional cost (BTN)
Categories of damage Value (BTN)
Additional money for food
Additional money for transportation
22 | 3 3
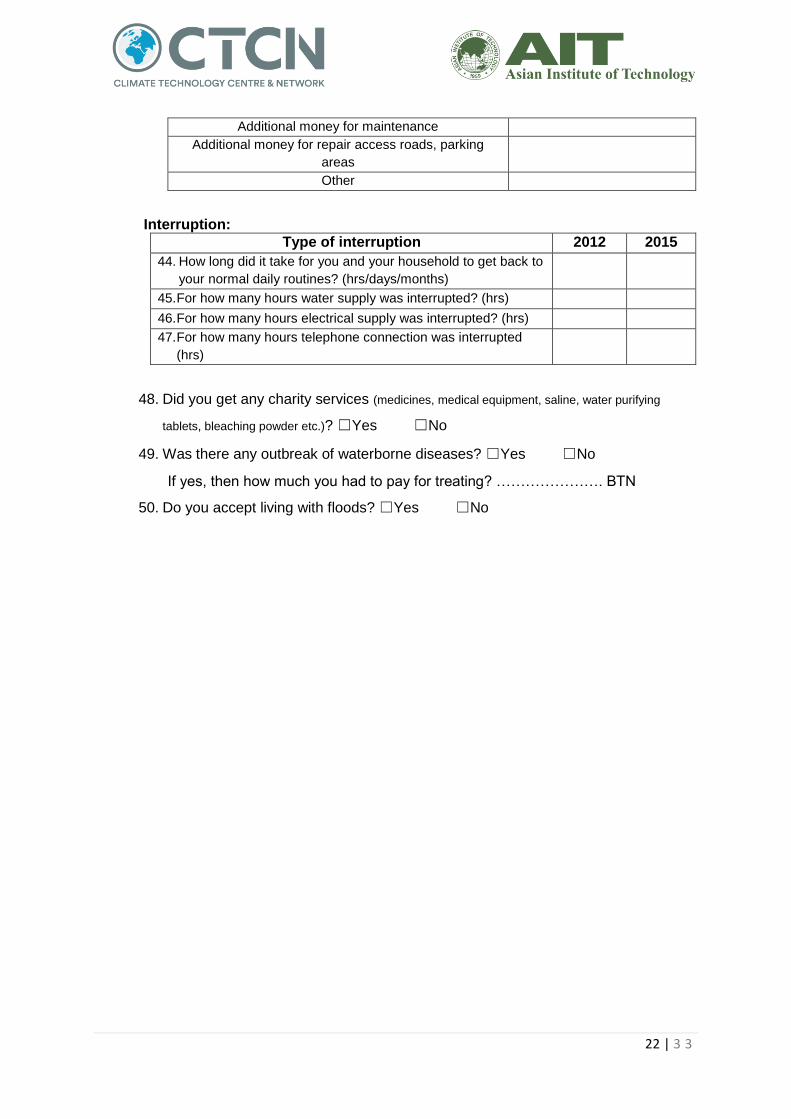
Additional money for maintenance
Additional money for repair access roads, parking
areas
Other
Interruption:
Type of interruption 2012 2015
44. How long did it take for you and your household to get back to
your normal daily routines? (hrs/days/months)
45. For how many hours water supply was interrupted? (hrs)
46. For how many hours electrical supply was interrupted? (hrs)
47. For how many hours telephone connection was interrupted
(hrs)
48. Did you get any charity services (medicines, medical equipment, saline, water purifying
tablets, bleaching powder etc.)? ☐Yes ☐No
49. Was there any outbreak of waterborne diseases? ☐Yes ☐No
If yes, then how much you had to pay for treating? …………………. BTN
50. Do you accept living with floods? ☐Yes ☐No
23 | 3 3
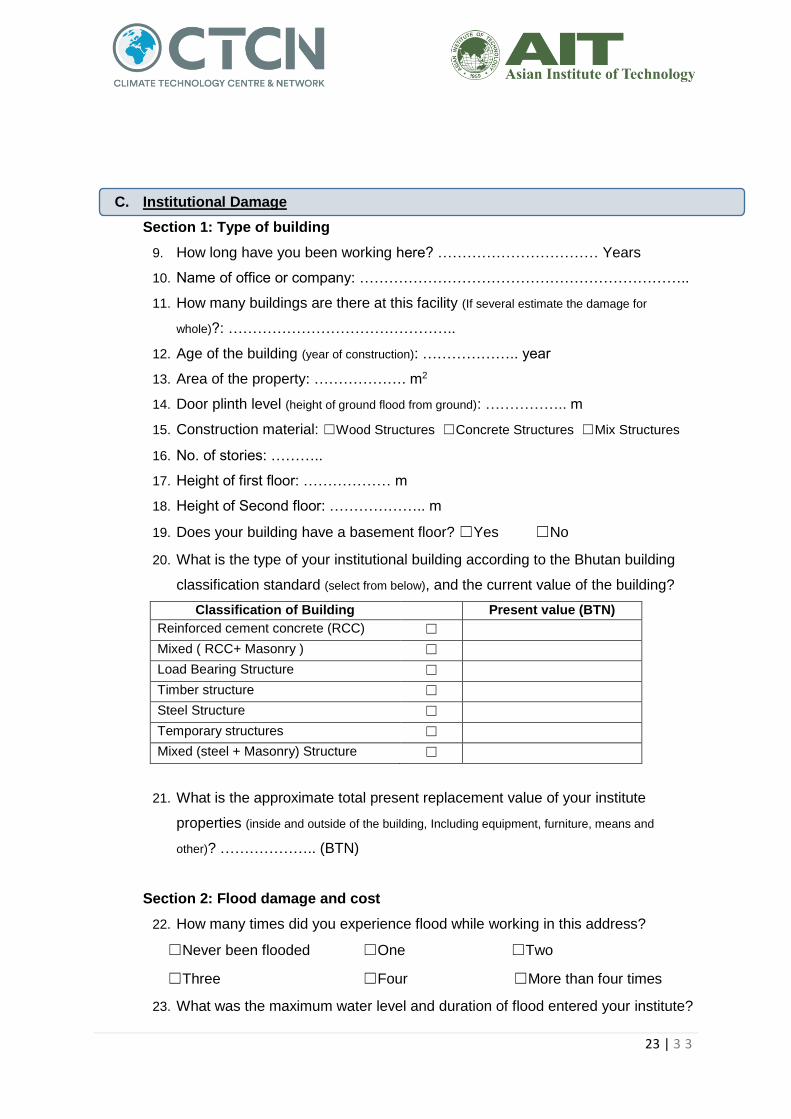
C. Institutional Damage
Section 1: Type of building
9. How long have you been working here? …………………………… Years
10. Name of office or company: …………………………………………………………..
11. How many buildings are there at this facility (If several estimate the damage for
whole)?: ………………………………………..
12. Age of the building (year of construction): ……………….. year
13. Area of the property: ………………. m2
14. Door plinth level (height of ground flood from ground): …………….. m
15. Construction material: ☐Wood Structures ☐Concrete Structures ☐Mix Structures
16. No. of stories: ………..
17. Height of first floor: ……………… m
18. Height of Second floor: ……………….. m
19. Does your building have a basement floor? ☐Yes ☐No
20. What is the type of your institutional building according to the Bhutan building
classification standard (select from below), and the current value of the building?
Classification of Building Present value (BTN)
Reinforced cement concrete (RCC) ☐
Mixed ( RCC+ Masonry ) ☐
Load Bearing Structure ☐
Timber structure ☐
Steel Structure ☐
Temporary structures ☐
Mixed (steel + Masonry) Structure ☐
21. What is the approximate total present replacement value of your institute
properties (inside and outside of the building, Including equipment, furniture, means and
other)? ……………….. (BTN)
Section 2: Flood damage and cost
22. How many times did you experience flood while working in this address?
☐Never been flooded ☐One ☐Two
☐Three ☐Four ☐More than four times
23. What was the maximum water level and duration of flood entered your institute?
24 | 3 3
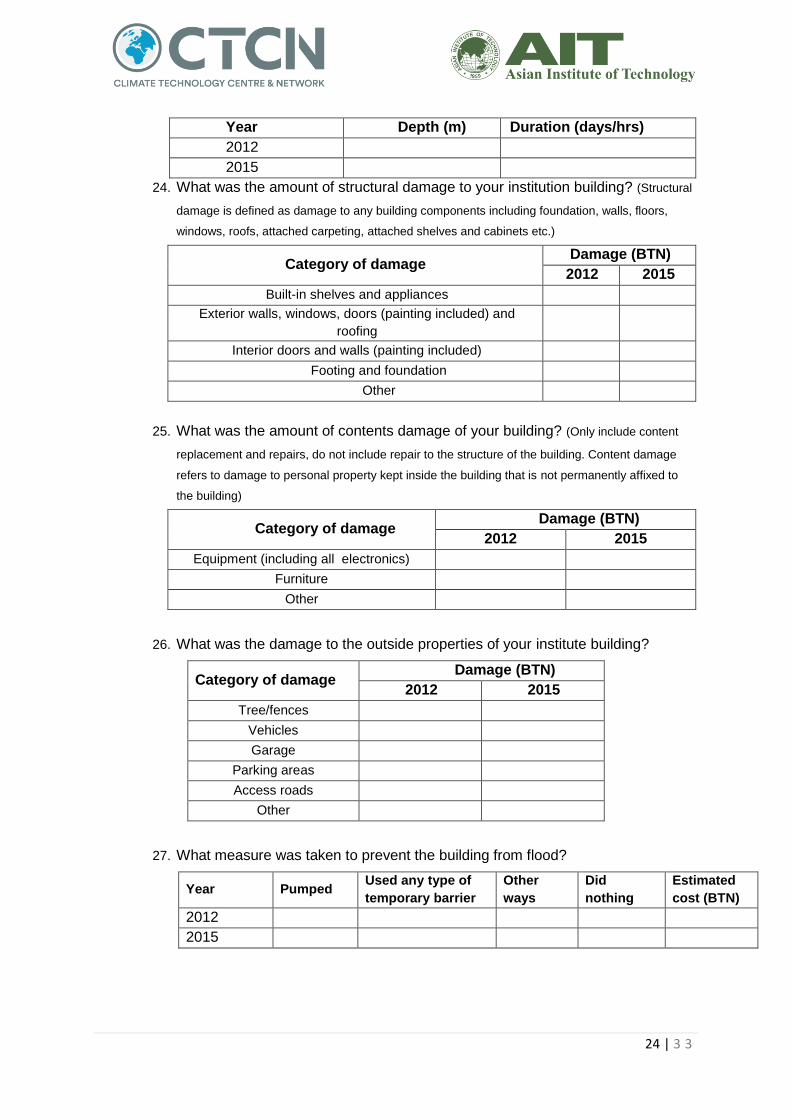
Year Depth (m) Duration (days/hrs)
2012
2015
24. What was the amount of structural damage to your institution building? (Structural
damage is defined as damage to any building components including foundation, walls, floors,
windows, roofs, attached carpeting, attached shelves and cabinets etc.)
Category of damage Damage (BTN)
2012 2015
Built-in shelves and appliances
Exterior walls, windows, doors (painting included) and
roofing
Interior doors and walls (painting included)
Footing and foundation
Other
25. What was the amount of contents damage of your building? (Only include content
replacement and repairs, do not include repair to the structure of the building. Content damage
refers to damage to personal property kept inside the building that is not permanently affixed to
the building)
Category of damage Damage (BTN)
2012 2015
Equipment (including all electronics)
Furniture
Other
26. What was the damage to the outside properties of your institute building?
Category of damage Damage (BTN)
2012 2015
Tree/fences
Vehicles
Garage
Parking areas
Access roads
Other
27. What measure was taken to prevent the building from flood?
Year Pumped Used any type of
temporary barrier
Other
ways
Did
nothing
Estimated
cost (BTN)
2012
2015
25 | 3 3
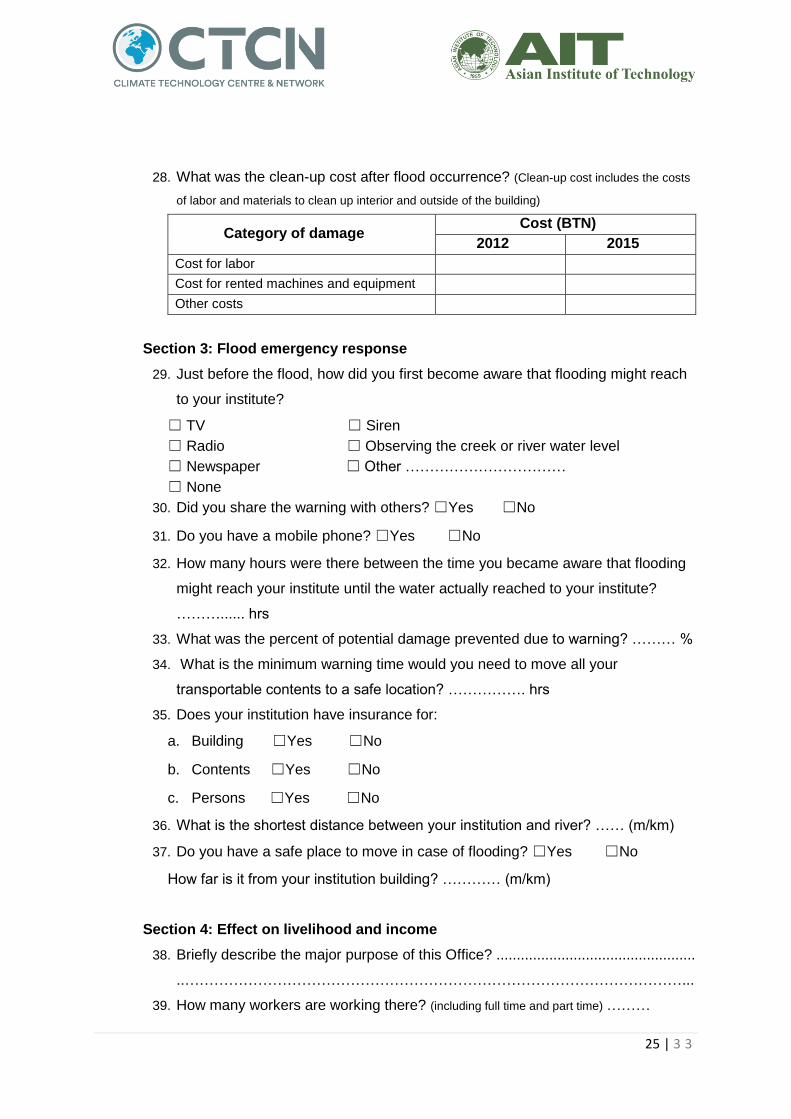
28. What was the clean-up cost after flood occurrence? (Clean-up cost includes the costs
of labor and materials to clean up interior and outside of the building)
Category of damage Cost (BTN)
2012 2015
Cost for labor
Cost for rented machines and equipment
Other costs
Section 3: Flood emergency response
29. Just before the flood, how did you first become aware that flooding might reach
to your institute?
☐ TV ☐ Siren
☐ Radio ☐ Observing the creek or river water level
☐ Newspaper ☐ Other ……………………………
☐ None
30. Did you share the warning with others? ☐Yes ☐No
31. Do you have a mobile phone? ☐Yes ☐No
32. How many hours were there between the time you became aware that flooding
might reach your institute until the water actually reached to your institute?
………...... hrs
33. What was the percent of potential damage prevented due to warning? ……… %
34. What is the minimum warning time would you need to move all your
transportable contents to a safe location? ……………. hrs
35. Does your institution have insurance for:
a. Building ☐Yes ☐No
b. Contents ☐Yes ☐No
c. Persons ☐Yes ☐No
36. What is the shortest distance between your institution and river? …… (m/km)
37. Do you have a safe place to move in case of flooding? ☐Yes ☐No
How far is it from your institution building? ………… (m/km)
Section 4: Effect on livelihood and income
38. Briefly describe the major purpose of this Office? .................................................
..…………………………………………………………………………………………...
39. How many workers are working there? (including full time and part time) ………
26 | 3 3
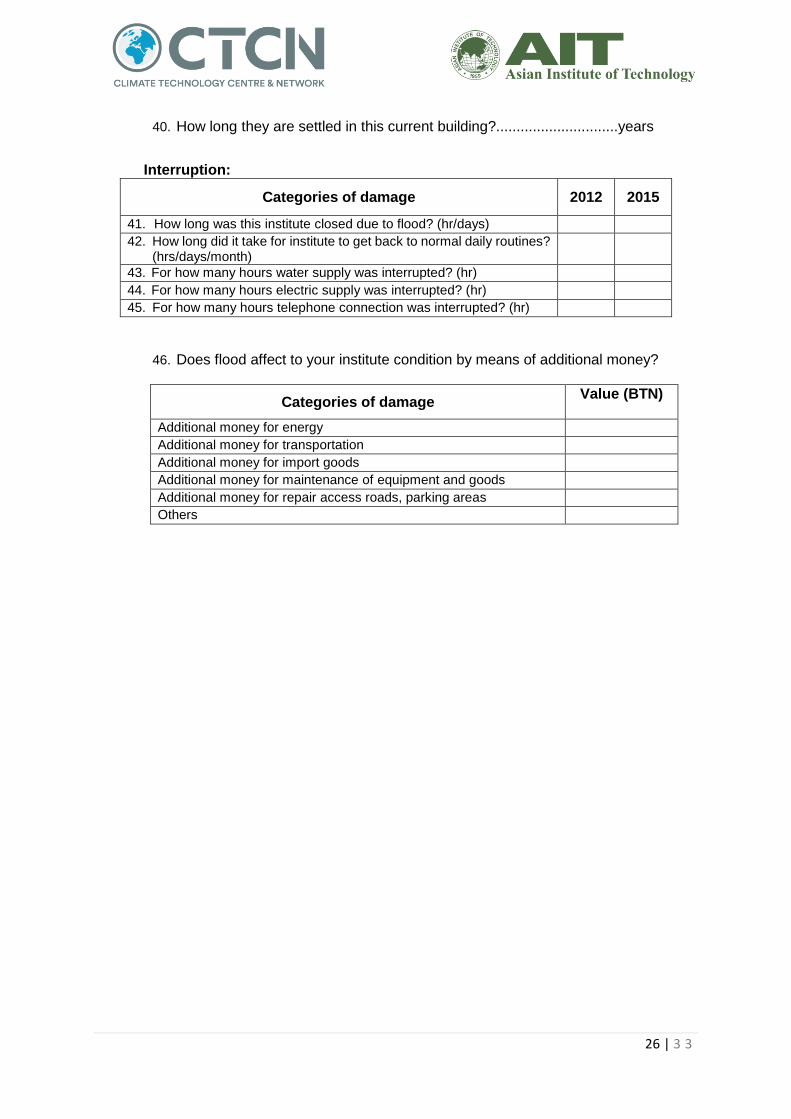
40. How long they are settled in this current building?..............................years
Interruption:
Categories of damage 2012 2015
41. How long was this institute closed due to flood? (hr/days) 42. How long did it take for institute to get back to normal daily routines?
(hrs/days/month)
43. For how many hours water supply was interrupted? (hr) 44. For how many hours electric supply was interrupted? (hr) 45. For how many hours telephone connection was interrupted? (hr)
46. Does flood affect to your institute condition by means of additional money?
Categories of damage Value (BTN)
Additional money for energy Additional money for transportation Additional money for import goods Additional money for maintenance of equipment and goods Additional money for repair access roads, parking areas Others
27 | 3 3
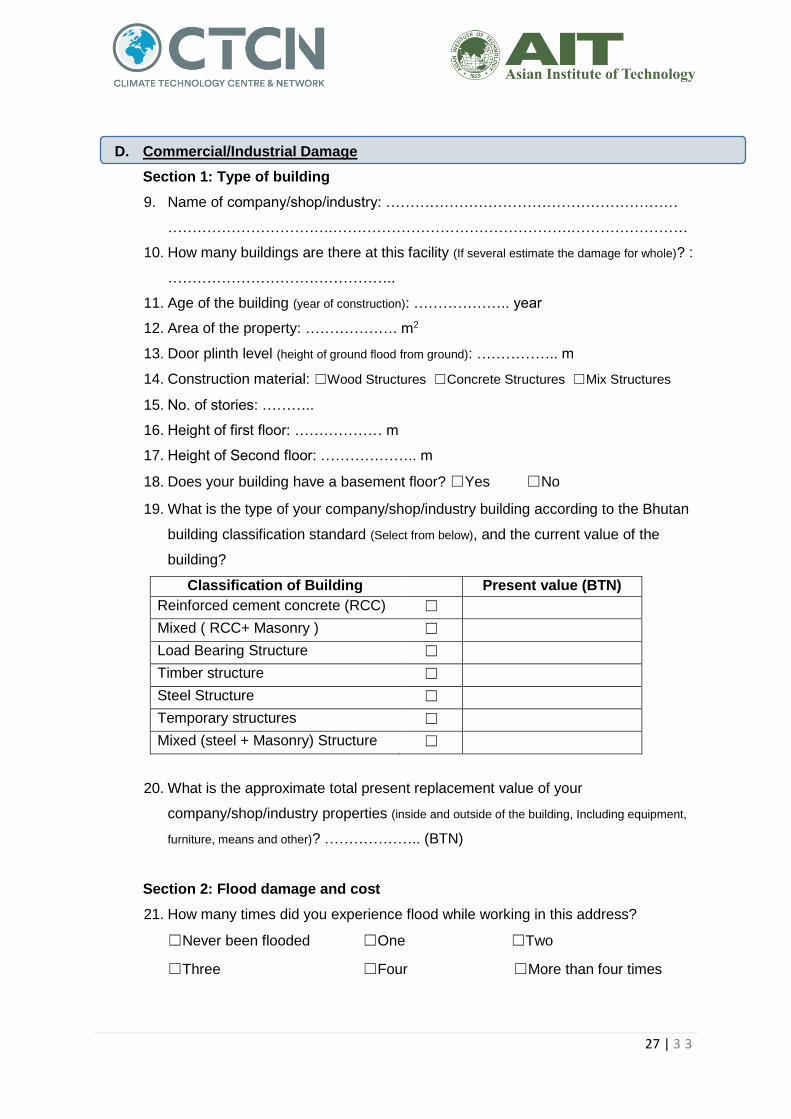
D. Commercial/Industrial Damage
Section 1: Type of building
9. Name of company/shop/industry: ……………………………………………………
…………………………….………………………………………….……………………
10. How many buildings are there at this facility (If several estimate the damage for whole)? :
………………………………………..
11. Age of the building (year of construction): ……………….. year
12. Area of the property: ………………. m2
13. Door plinth level (height of ground flood from ground): …………….. m
14. Construction material: ☐Wood Structures ☐Concrete Structures ☐Mix Structures
15. No. of stories: ………..
16. Height of first floor: ……………… m
17. Height of Second floor: ……………….. m
18. Does your building have a basement floor? ☐Yes ☐No
19. What is the type of your company/shop/industry building according to the Bhutan
building classification standard (Select from below), and the current value of the
building?
Classification of Building Present value (BTN)
Reinforced cement concrete (RCC) ☐
Mixed ( RCC+ Masonry ) ☐
Load Bearing Structure ☐
Timber structure ☐
Steel Structure ☐
Temporary structures ☐
Mixed (steel + Masonry) Structure ☐
20. What is the approximate total present replacement value of your
company/shop/industry properties (inside and outside of the building, Including equipment,
furniture, means and other)? ……………….. (BTN)
Section 2: Flood damage and cost
21. How many times did you experience flood while working in this address?
☐Never been flooded ☐One ☐Two
☐Three ☐Four ☐More than four times
28 | 3 3
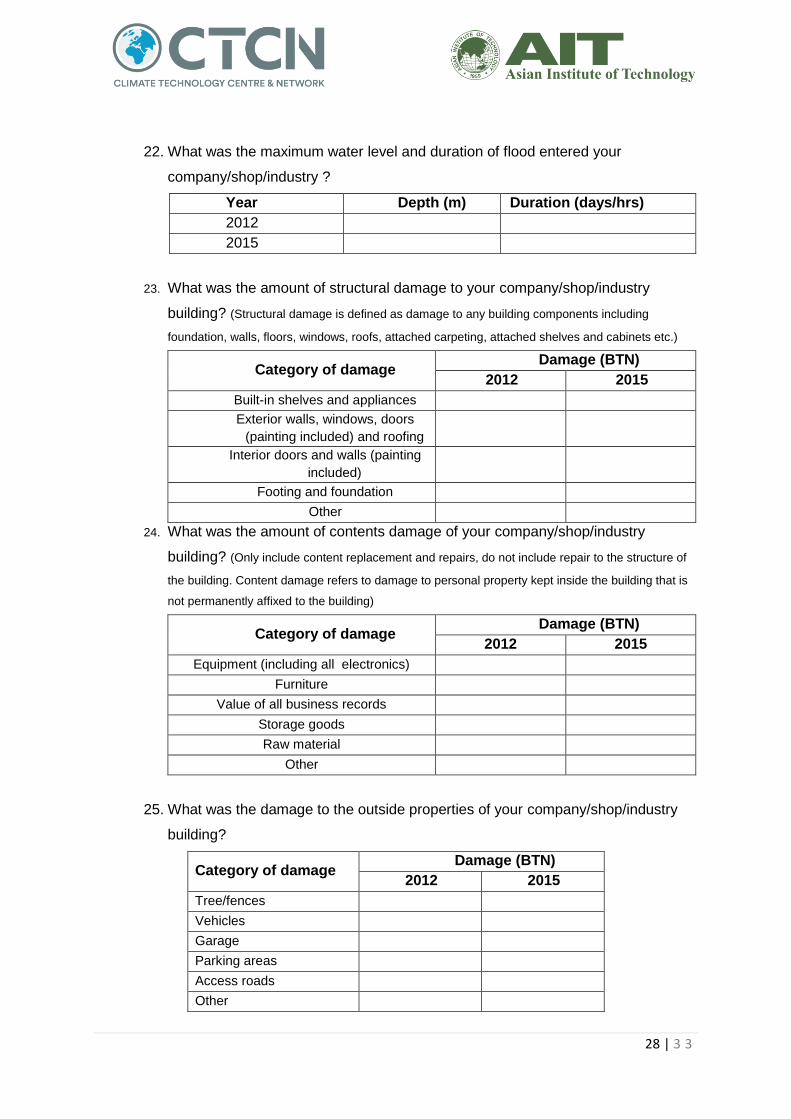
22. What was the maximum water level and duration of flood entered your
company/shop/industry ?
Year Depth (m) Duration (days/hrs)
2012
2015
23. What was the amount of structural damage to your company/shop/industry
building? (Structural damage is defined as damage to any building components including
foundation, walls, floors, windows, roofs, attached carpeting, attached shelves and cabinets etc.)
Category of damage Damage (BTN)
2012 2015
Built-in shelves and appliances
Exterior walls, windows, doors
(painting included) and roofing
Interior doors and walls (painting
included)
Footing and foundation
Other
24. What was the amount of contents damage of your company/shop/industry
building? (Only include content replacement and repairs, do not include repair to the structure of
the building. Content damage refers to damage to personal property kept inside the building that is
not permanently affixed to the building)
Category of damage Damage (BTN)
2012 2015
Equipment (including all electronics)
Furniture
Value of all business records
Storage goods
Raw material
Other
25. What was the damage to the outside properties of your company/shop/industry
building?
Category of damage Damage (BTN)
2012 2015
Tree/fences
Vehicles
Garage
Parking areas
Access roads
Other
29 | 3 3
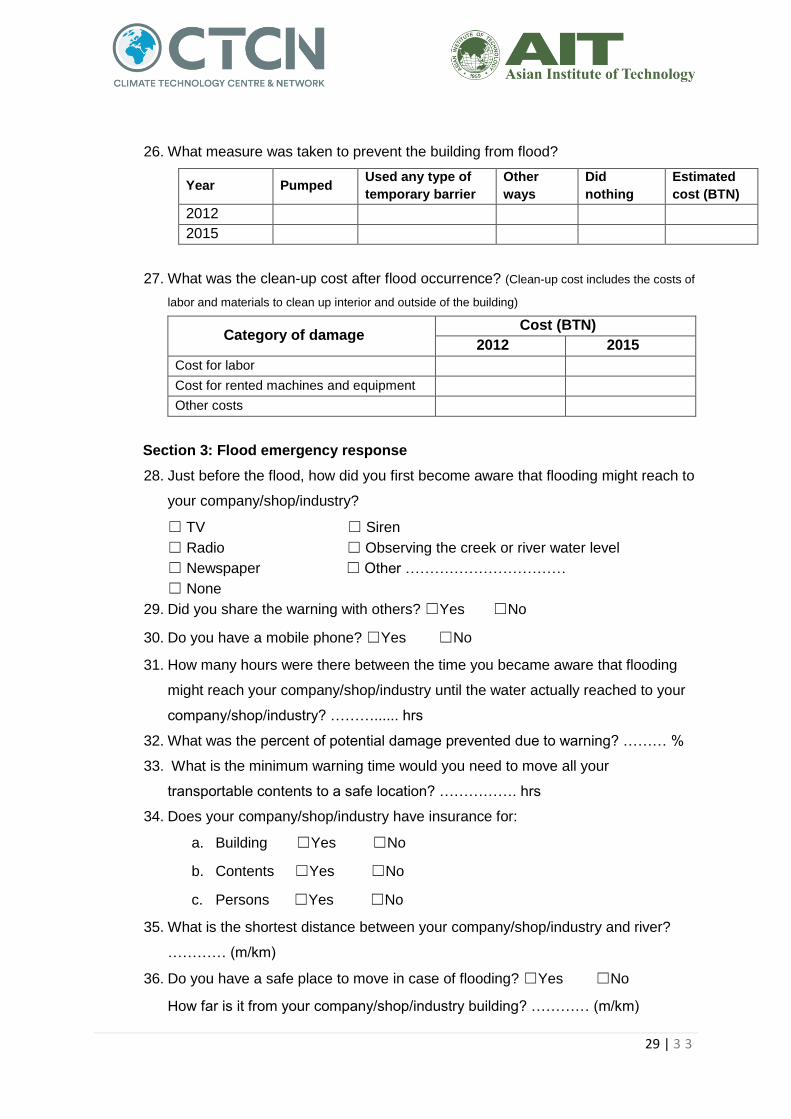
26. What measure was taken to prevent the building from flood?
Year Pumped Used any type of
temporary barrier
Other
ways
Did
nothing
Estimated
cost (BTN)
2012
2015
27. What was the clean-up cost after flood occurrence? (Clean-up cost includes the costs of
labor and materials to clean up interior and outside of the building)
Category of damage Cost (BTN)
2012 2015
Cost for labor
Cost for rented machines and equipment
Other costs
Section 3: Flood emergency response
28. Just before the flood, how did you first become aware that flooding might reach to
your company/shop/industry?
☐ TV ☐ Siren
☐ Radio ☐ Observing the creek or river water level
☐ Newspaper ☐ Other ……………………………
☐ None
29. Did you share the warning with others? ☐Yes ☐No
30. Do you have a mobile phone? ☐Yes ☐No
31. How many hours were there between the time you became aware that flooding
might reach your company/shop/industry until the water actually reached to your
company/shop/industry? ………...... hrs
32. What was the percent of potential damage prevented due to warning? ……… %
33. What is the minimum warning time would you need to move all your
transportable contents to a safe location? ……………. hrs
34. Does your company/shop/industry have insurance for:
a. Building ☐Yes ☐No
b. Contents ☐Yes ☐No
c. Persons ☐Yes ☐No
35. What is the shortest distance between your company/shop/industry and river?
………… (m/km)
36. Do you have a safe place to move in case of flooding? ☐Yes ☐No
How far is it from your company/shop/industry building? ………… (m/km)
30 | 3 3
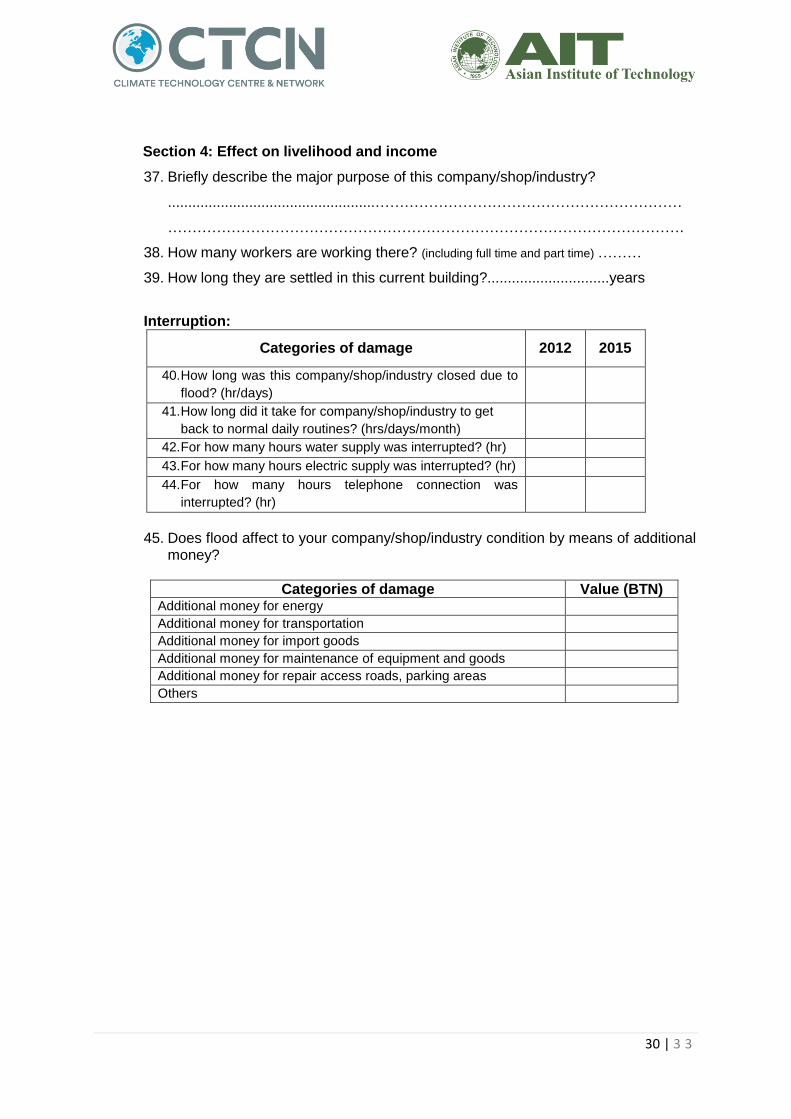
Section 4: Effect on livelihood and income
37. Briefly describe the major purpose of this company/shop/industry?
...................................................………………………………………………………
…………………………………………………………………………………………….
38. How many workers are working there? (including full time and part time) ………
39. How long they are settled in this current building?..............................years
Interruption:
Categories of damage 2012 2015
40. How long was this company/shop/industry closed due to
flood? (hr/days)
41. How long did it take for company/shop/industry to get
back to normal daily routines? (hrs/days/month)
42. For how many hours water supply was interrupted? (hr)
43. For how many hours electric supply was interrupted? (hr)
44. For how many hours telephone connection was
interrupted? (hr)
45. Does flood affect to your company/shop/industry condition by means of additional
money?
Categories of damage Value (BTN) Additional money for energy Additional money for transportation Additional money for import goods Additional money for maintenance of equipment and goods Additional money for repair access roads, parking areas Others
31 | 3 3
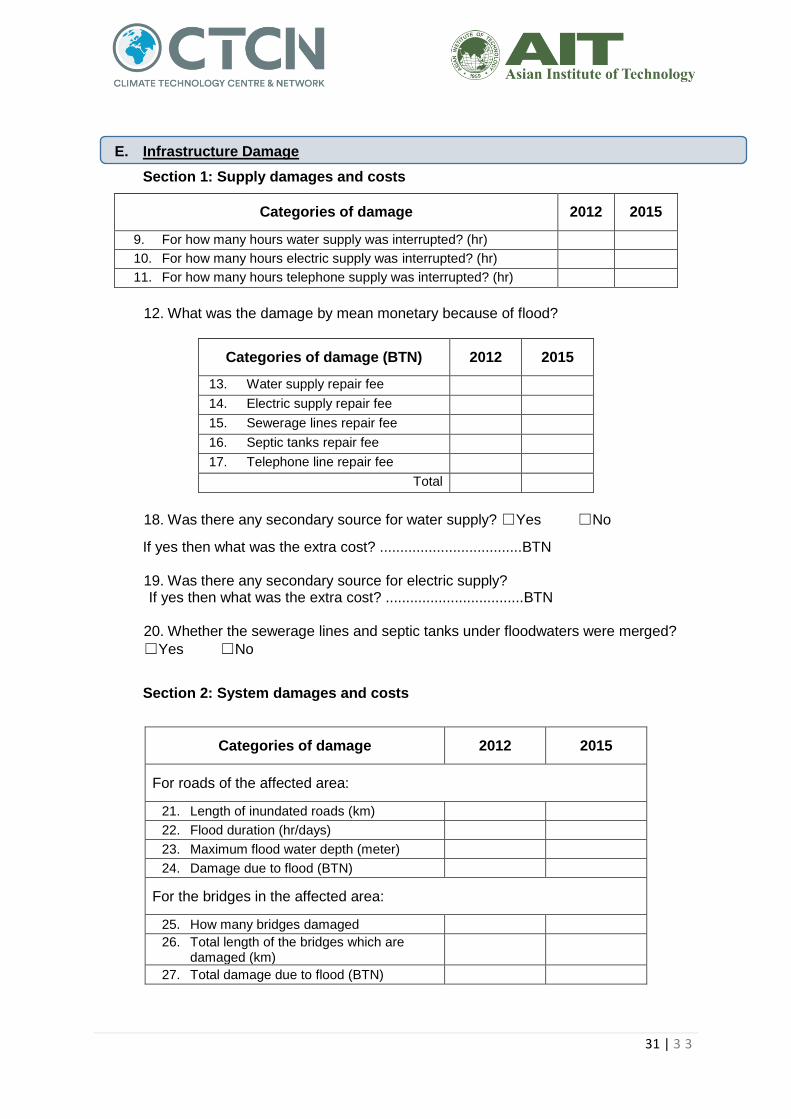
E. Infrastructure Damage
Section 1: Supply damages and costs
Categories of damage 2012 2015
9. For how many hours water supply was interrupted? (hr)
10. For how many hours electric supply was interrupted? (hr)
11. For how many hours telephone supply was interrupted? (hr)
12. What was the damage by mean monetary because of flood?
Categories of damage (BTN) 2012 2015
13. Water supply repair fee
14. Electric supply repair fee
15. Sewerage lines repair fee
16. Septic tanks repair fee
17. Telephone line repair fee
Total
18. Was there any secondary source for water supply? ☐Yes ☐No
If yes then what was the extra cost? ...................................BTN
19. Was there any secondary source for electric supply? If yes then what was the extra cost? ..................................BTN
20. Whether the sewerage lines and septic tanks under floodwaters were merged?
☐Yes ☐No
Section 2: System damages and costs
Categories of damage 2012 2015
For roads of the affected area:
21. Length of inundated roads (km) 22. Flood duration (hr/days) 23. Maximum flood water depth (meter) 24. Damage due to flood (BTN)
For the bridges in the affected area:
25. How many bridges damaged 26. Total length of the bridges which are
damaged (km)
27. Total damage due to flood (BTN)
32 | 3 3
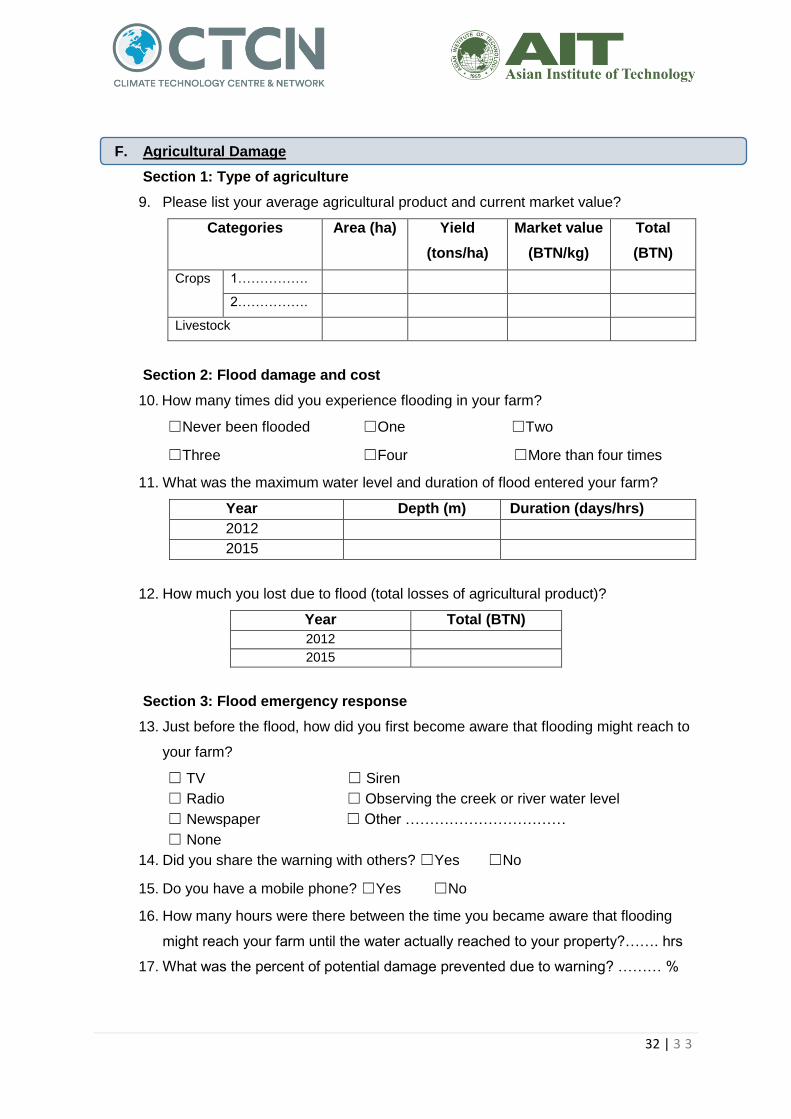
F. Agricultural Damage
Section 1: Type of agriculture
9. Please list your average agricultural product and current market value?
Categories Area (ha) Yield
(tons/ha)
Market value
(BTN/kg)
Total
(BTN)
Crops 1…………….
2…………….
Livestock
Section 2: Flood damage and cost
10. How many times did you experience flooding in your farm?
☐Never been flooded ☐One ☐Two
☐Three ☐Four ☐More than four times
11. What was the maximum water level and duration of flood entered your farm?
Year Depth (m) Duration (days/hrs)
2012
2015
12. How much you lost due to flood (total losses of agricultural product)?
Year Total (BTN)
2012
2015
Section 3: Flood emergency response
13. Just before the flood, how did you first become aware that flooding might reach to
your farm?
☐ TV ☐ Siren
☐ Radio ☐ Observing the creek or river water level
☐ Newspaper ☐ Other ……………………………
☐ None
14. Did you share the warning with others? ☐Yes ☐No
15. Do you have a mobile phone? ☐Yes ☐No
16. How many hours were there between the time you became aware that flooding
might reach your farm until the water actually reached to your property?……. hrs
17. What was the percent of potential damage prevented due to warning? ……… %
33 | 3 3
18. What is the minimum warning time would you need to move all your transportable
contents to a safe location? ……………. hrs
19. Do you have insurance for farm ☐Yes ☐No
20. What is the shortest distance between your farm and river? ………… (m/km)
Section 4: Effect on livelihood and income
21. How long have you been doing this farm? …………………………… Years
22. Do you have any other source of income except to your income from farm?
☐Yes ☐No