GWRC Hazard Mitigation Plan
334
GWRC Hazard Mitigation Plan Adopted: To Be Determined Expires: 2017 D R A F T
-
Upload
khangminh22 -
Category
Documents
-
view
0 -
download
0
Transcript of GWRC Hazard Mitigation Plan

GWRC Hazard Mitigation Plan Adopted: To Be DeterminedExpires: 2017
D R A
F T
wcameron
Typewritten Text

This page intentionally left blank.
D R A
F T

George Washington Regional Commission
Hazard Mitigation Plan
March 2012
D R A
F T

This page intentionally left blank.
D R A
F T

Hazard Mitigation Plan
George Washington Regional Commission
March 2012
i
CONTENTS
Acknowledgements……………………………………………………………………………………………………………………………….. v
Executive Summary………………………………………………………………………………………………………………………………. vi
Chapter 1 – Introduction……………………………………………………………………………………………………………………… 1-1
I. Scope……………………………………………………………………………………………………………………………….. 1-1
II. How To Use This Document……………………………………………………………………………………………… 1-1
III. The Planning Commission…………………………………………………………………………….………………….. 1-2
Chapter 2 – Regional Profile………………………………………………………………………………………………………………… 2-1
I. Location and Geography………………………………………………………………………………………….. 2-1
II. Population……………………………………………………………………………………………………………….. 2-4
III. History of the GWRC Region…………………………………………………………………….……………….. 2-5
Chapter 3 – The Planning Process………………………………………………………………………………………………..………. 3-1
I. Local Government / Community Participation……………………………………………………..……. 3-2
II. Step 1: Get Organized – Building the Planning Team………………………………………………..… 3-2
III. Step 2: Plan for Public Involvement – Engaging the Public…………………………………..……… 3-2
IV. Step 3a: Coordinate with other Departments and Agencies……………………………….……… 3-3
V. Step 3b: Relationship to Other Community Planning Efforts and Hazard
Mitigation Activities…………………………………………………………………………………………………… 3-3
VI. Step 4: Assess the Hazard…………………………………………………………………………………….……. 3-4
VII. Step 5: Assess the Problem……………………………………………………………………………….………. 3-4
VIII. Step 6: Set Planning Goals…………………………………………………………………………………….…… 3-5
IX. Step 7: Review Possible Mitigation Activities……………………………………………………………… 3-5
X. Step 8: Draft an Action Plan…………………………………………………………………………………..…… 3-5
XI. Step 9: Adopt the Plan………………………………………………………………………………………………… 3-6
XII. Step 10: Implement the Plan, Evaluate its Worth, Revise as Needed………………………….. 3-6
Chapter 4 – Hazard Identification and Risk Assessment (HIRA)……………………………………………………………..4-1
I. Regional Hazard Identification…………………………………………………………………………………..……… 4-2
A. Dam Failure………………………………………………………………………………………………………….. 4-3
B. Drought & Extreme Heat……………………………………………………………………………………….4-6
C. Wildfires ……………………………………………………………………………………………………………. 4-12
D. Earthquakes……………………………………………………………………………………………………….. 4-13
E. Sinkholes & Landslides….……………………………………………………………………………………. 4-17
F. Flooding & Erosion………………………………………………………………………………………………4-19
G. Hurricanes & Thunderstorms.……………………………………………………………………………..4-22
H. Tornadoes………………………………………………………………………………………………………….. 4-28
I. Winter Storms & Nor’easters……………………………………………………………………………… 4-30
D R A
F T

Hazard Mitigation Plan
George Washington Regional Commission
March 2012
ii
J. Multi-Hazard Correlation……………………………………………………………………………………. 4-35
K. Critical vs. Non-Critical Hazards…………………………………………………………………………. 4-35
L. Probability of Occurrences…………………………………………………………………………………. 4-35
II. Region Specific Hazard Identification………………………………………………………………….…………… 4-37
A. Caroline County………………………………………………………………….……………………………….4-37
B. Town of Bowling Green………………………………………………………………….……………………4-37
C. Town of Port Royal………………………………………………………….……….……………………….. 4-37
D. City of Fredericksburg………………………………………………………………….…………………….. 4-55
E. King George County………………………………………………………………….………………………… 4-64
F. Spotsylvania County………………………………………………………………….……………………….. 4-79
G. Stafford County………………………………………………………………….…………………………….. 4-99
Chapter 5 – Vulnerability Assessment………………………………………………………………………………………………….. 5-1
I. Regional Vulnerability Assessment……………………………………………………………………………… 5-1
A. Drought………………………………………………………………………………………………………………… 5-1
B. Non-Rotational Wind, Winter Storms, and Tornadoes…………………………………………..5-2
C. Hurricane Regional Vulnerability Assessment………………………………………………..……. 5-2
D. Regional Severe Storm Vulnerability…………………………………………………………………….. 5-4
E. Tornado Vulnerability…………………………………………………………………………………………… 5-4
F. Regional Flood Vulnerability………………………………………………………………………………….5-5
G. Regional Wildfire Vulnerability………………………………………………………………………………5-7
II. Region Specific Vulnerability Assessment………………………………………………………………….5-18
A. Caroline County…………………………………………………………………………………………………..5-19
B. Town of Bowling Green……………………………………………………………………………………….5-20
C. Town of Port Royal………………………………………………………………………………………………5-20
D. City of Fredericksburg………………………………………………………..………………………………. 5-33
E. King George County……………………………………………………………………………………………. 5-46
F. Spotsylvania County…………………………………………………………………………………………… 5-64
G. Stafford County………………………………………………………………………………………………….. 5-79
Chapter 6 – Capability Assessment………………………………………………………………………………………………………. 6-1
I. Regional Capability Assessment…………………………………………………………………….……………. 6-1
A. Federal Capabilities……………………………………………………………………………………..………. 6-3
B. State Capabilities…………………………………………………………………………………………………. 6-4
C. Regional Capabilities……………………………………………………………………………………………. 6-8
II. Jurisdiction Capability Assessment……………………………………………………………………………. 6-12
A. Caroline County…………………………………………………………………………………………………. 6-12
B. Town of Bowling Green……………………………………………………………………………………….6-12
C. Town of Port Royal…………………………………………………………………………………….………. 6-12
D R A
F T

Hazard Mitigation Plan
George Washington Regional Commission
March 2012
iii
D. City of Fredericksburg………………………………………………………………………………..………. 6-18
E. King George County…………………………………………………………………….……………………. 6-21
F. Spotsylvania County…………………………………………………………………………………..………. 6-24
G. Stafford County…………………………………………………………………………………………………. 6-27
Chapter 7 – Mitigation Strategy………………………………………………………………………………………………………..…. 7-1
I. Planning Process……………………………………………………………………………………………………….. 7-1
II. Mitigation Alternatives………………………………………………………………………………….……….…. 7-1
A. Identification and Analysis of Mitigation Techniques………………………………............. 7-2
B. Prioritizing Alternatives………………………………………………………………………………………… 7-4
III. Goals, Objectives and Strategies………………………………………………………………………………… 7-5
A. Goals and Strategies…………………………………………………………………………………………….. 7-5
B. Regional Goals, Objectives and Strategies……………………………………………….………….. 7-6
C. Local Mitigation Strategies……………………………………………………………………….…………. 7-9
Chapter 8 – Monitoring, Evaluation, and Update…………………………………………………………………………………. 8-1
I. Adoption…………………………………………………………………………………………………………………….. 8-1
II. Implementation…………………………………………………………………………………………………………..8-1
III. Integration……………………………………………………………………………………………………….……….. 8-1
IV. Public Involvement……………………………………………………………………………………….…………… 8-2
V. Monitoring and Maintenance………………………………………………………………………………………8-3
Appendix A – Adoption Resolution.………………………………………………………………………………………………………… A
Appendix B – Crosswalk………………………………………………………………………………………………………….……………… B
Appendix C – Meeting Materials……………………………………………………………………………………………….……………. C
Appendix D – 2006 Strategy Update………………………………………………………………………………………….………….. D
Appendix E – Public Outreach………………………………………………………………………………………………………………... E
D R A
F T

Hazard Mitigation Plan
George Washington Regional Commission
March 2012
iv
This page intentionally left blank.
D R A
F T

Hazard Mitigation Plan
George Washington Regional Commission
March 2012
v
ACKNOWLEDGEMENTS The George Washington Regional Commission (GWRC) would like to acknowledge the participation and service of the local and regional representatives that assisted with the development of this plan. A Mitigation Advisory Committee (MAC) was utilized to facilitate the plan’s development. The MAC comprised of GWRC staff, local emergency management staff, and local planning staff. These staff provided day-to-day plan development guidance and draft review. GWRC Director of Regional Planning & Regional Demographer, Kevin Byrnes, facilitated the development of each committee. The Mitigation Advisory Committee was as follows:
Table i-1. MAC Committee Members
Name Jurisdiction Department/Agency
Eddie Allen City of Fredericksburg Fredericksburg Fire Department
Doug Boggs Spotsylvania County Spotsylvania County Fire/Rescue/ Emergency Services
Kevin Byrnes George Washington Regional Commission George Washington Regional Commission
Michael Carter Stafford County Stafford County Fire/Rescue
Mike Finchum Caroline County Caroline County Planning
Mark Garnett Caroline County Caroline County Fire & Rescue
Amy Howard Virginia Department of Emergency Management VDEM/Recovery & Mitigation
David Layman Caroline County Caroline County Fire Dept
Steve Lynd King George County King George Fire/Rescue/Emergency Services
Paul Lupe Stafford County Stafford County Fire/Rescue
Wanda Parrish Spotsylvania County Spotsylvania County Planning Department
Bruce Sterling Virginia Department of Emergency Management VDEM/Region 2
Stephen Manster Town of Bowling Green Mayor’s Office
Alex Long Town of Port Royal Town of Port Royal
D R
A F
T

Hazard Mitigation Plan
George Washington Regional Commission
March 2012
vi
EXECUTIVE SUMMARY
The region represented by the George Washington Regional Commission (GWRC) is vulnerable to a number of natural hazards including the effects of flood and wind damage caused by hurricanes, northeasters, winter storms, and tornadoes. Fresh in the minds of the residents of the GWRC region is the recent natural disasters including Hurricane Irene, Tropical Storm Lee, the Mineral VA, Earthquake, and the snowstorms of 2009 and 2010. Other major disasters include Hurricane Isabel, which hit in September of 2003. For the most part, the last 50 years have been relatively free of disasters throughout the GWRC region. However, the last few decades of exponential growth within the region have placed more development in the way of potential disasters. This increases the potential for severe economic and social consequences if a major disaster or other catastrophic event were to occur. Such an event could cost the town, city, and county governments, residents, and businesses millions of dollars in damages to public buildings and infrastructure, lost tax revenues, unemployment, homelessness, and emotional and physical suffering for many years to come. The GWRC Hazard Mitigation Plan has been constructed in accordance with the requirements of the Disaster Mitigation Act of 2000 (DMA 2000) and will provide the communities and its citizens with a better understanding of the natural hazards the communities face, the assets vulnerable to those hazards, and the strategies available to mitigate those hazards. The plan will also help the communities build support for mitigation activities, develop more effective public education policies regarding mitigation and disasters, integrate mitigation processes into other community programs and processes and post-disaster recovery activities, and obtain disaster related grants in the aftermath of a disaster. As part of the 2006 planning initiative and the 2012 update, the MAC analyzed and prioritized the natural hazards that threaten the GWRC region. The Plan focuses on the hazards that have the highest probability of occurring. The MAC considered and analyzed the potential impacts of these hazards, which were listed in the Plan’s Vulnerability Assessment section. The MAC also evaluated current capabilities in mitigating certain types of hazards; this evaluation went into the Capability Assessment section of the plan. The Hazard Identification (Chapter 4), Vulnerability Assessment (Chapter 5), and the Capability Assessment (Chapter 6) were reviewed by the MAC, which then assembled to develope goals, objectives, and possible mitigation strategies. With the developed list of mitigation strategies, the Committee prioritized those strategies and made recommendations as to the actions that would be appropriate given the potential strategies. This process formed the basis for this Mitigation Plan Update. Table i-2 lists those communities to which this plan update applies.
Table i-2. 2012 Participating Communities
2012 Plan
Caroline County City of Fredericksburg
King George County Town of Bowling Green
Spotsylvania County Town of Port Royal
Stafford County
D R A
F T

Hazard Mitigation Plan
George Washington Regional Commission
March 2012
1-1
CHAPTER 1 - INTRODUCTION The Disaster Mitigation Act of 2000 (DMA 2000), approved by Congress and signed into law (Public Law 106-390) in October 2000, is a key component of the Federal government’s strategy to reduce the rising cost of disasters in the United States. The Act establishes the Pre-Disaster Mitigation Program (PDM) and new requirements for the post-disaster Hazard Mitigation Grant Program (HMGP). The Act’s requirements emphasize the importance of mitigation planning at the local level. In an effort to highlight the importance of planning in the mitigation process, DMA 2000 requires local governments to develop and submit natural hazard mitigation plans in order to qualify for PDM and HMGP grant funding. Specifically, the Act requires that the plan demonstrate “a jurisdiction’s commitment to reduce risk from natural hazards, serving as a guide for decision makers as they commit resources to reducing the effects of natural hazards.” The final plan must be adopted by the jurisdiction and then approved by the Federal Emergency Management Agency (FEMA) in order for communities to remain eligible for HMGP funding and to become eligible for PDM funding for future mitigation planning and project implementation. In order to facilitate DMA 2000 compliance for its member jurisdictions (including the two towns), the George Washington Regional Commission (GWRC), in conjunction with its member jurisdictions and other regional agencies and area constituents, developed this Mitigation Plan Update pursuant to the requirements of DMA 2000. This plan covers natural hazards only. Each of the chapters have been updated to reflect new information and strategies for the 2012 update. Changes include updates to the hazards that have occurred, review and revision of current capabilities, review and update of the previous plan’s mitigation strategies, as well as reconsideration of the region’s mitigation goals and strategies. Hazard Mitigation is defined as any sustained action taken to reduce or eliminate long-term risk to human life and property from hazards. Planning is the process of setting goals, developing strategies, and outlining tasks and schedules to accomplish these goals. In preparing this plan, the MAC identified natural hazards that threaten its member jurisdictions; ranked these hazards; determined the likely impacts of those hazards; assessed the vulnerability of its communities to the studied hazards, as well as the region’s current capability to address those hazards; set mitigation goals; and determined and prioritized appropriate strategies that would lessen the potential impacts of hazard events.
I. Scope
The GWRC Hazard Mitigation Plan is a multi-jurisdictional plan that identifies goals, information, and measures for hazard mitigation and risk reduction to make its communities more disaster resistant and contribute to the region’s long-term sustainability. The plan not only addresses current concerns, but will also guide and coordinate mitigation activities and local policy decisions for future land use. FEMA has encouraged communities throughout the United States to incorporate hazard mitigation planning into the local comprehensive planning process through the development of local and regional hazard mitigation plans. As communities make decisions on future growth, development, and land use, the incorporation of hazard mitigation analysis into the process promises to reduce future damages from the natural hazards that will inevitably occur over time, and thus avoid future loss of life and property damage. This Plan follows FEMA’s DMA 2000 planning requirements and associated guidance for developing Local Hazard Mitigation Plans. This guidance sets forth a four-task mitigation planning process: 1) organize resources, 2) assess hazards and risks, 3) develop a mitigation plan, and 4) evaluate your work. The plan also utilizes the process set forth in FEMA’s Crosswalk Reference Document for Review and Submission of Local Mitigation Plans.
D R A
F T

Hazard Mitigation Plan
George Washington Regional Commission
March 2012
1-2
II. How to Use This Document
The GWRC Hazard Mitigation Plan has been developed as a regional mitigation plan. Each jurisdiction-specific section has been designed to allow for each jurisdiction’s review and acceptance, independent of the material in the remainder of the plan that applies to the entire region. Chapter 4, Section I of this plan identifies each of the natural hazards that the region faces and provides some background and descriptive history of the hazards across the GWRC region. Chapter 4, Section II provides jurisdiction-specific profiles of the hazards that are considered most critical. The Region’s vulnerability to those hazards based on historical occurrence and other evidence of risk is assessed in Chapter 5, Section I. Jurisdiction specific vulnerabilities are provided in Chapter 5, Section II. Jurisdiction-specific capability assessments, designed to demonstrate the mitigation tools and capabilities that each jurisdiction may employ, is presented in Chapter 6. Chapter 7 of the plan outlines broad, region-wide mitigation goals, objectives, and strategies, while also providing jurisdiction-specific mitigation goals, objectives, and strategies. Finally, Chapter 8 provides plan implementation and maintenance information that applies across the region as each community updates its material in this plan and implements mitigation projects that follow the priorities and objectives set forth in this planning effort. Of note, each jurisdiction’s elected leadership will be asked to adopt the portions of the plan that apply region-wide and those portions that apply specifically to each respective jurisdiction. Each jurisdiction will then be responsible for updating and maintaining the plan document. The DMA regulations require that the jurisdictions formally review their plans at least once every five years, coinciding with specifications in the Code of Virginia that call for local Comprehensive Plan review at least every five years. Many communities across the country that have developed hazard mitigation plans have found that more frequent updates are often warranted based on the occurrence of natural disasters and subsequent shifts in hazard mitigation priorities. For more information on plan monitoring and updating procedures, please refer to Chapter 8.
III. The Planning Commission
Participation in this plan update remained identical to that of the original 2006 plan. Table 1-1 lists those communities to which this plan update applies.
Table 1-1. 2012 Participating Communities
2012 Plan
City of Fredericksburg
Town of Bowling Green
Town of Port Royal
Caroline County
King George County
Spotsylvania County
Stafford County
D R A
F T
Hazard Mitigation Plan
George Washington Regional Commission
March 2012
2-1
CHAPTER 2 - REGIONAL PROFILE
This information (i.e., data, statistics) in this section was updated per the 2012 plan update initiative.
I. Location and Geography
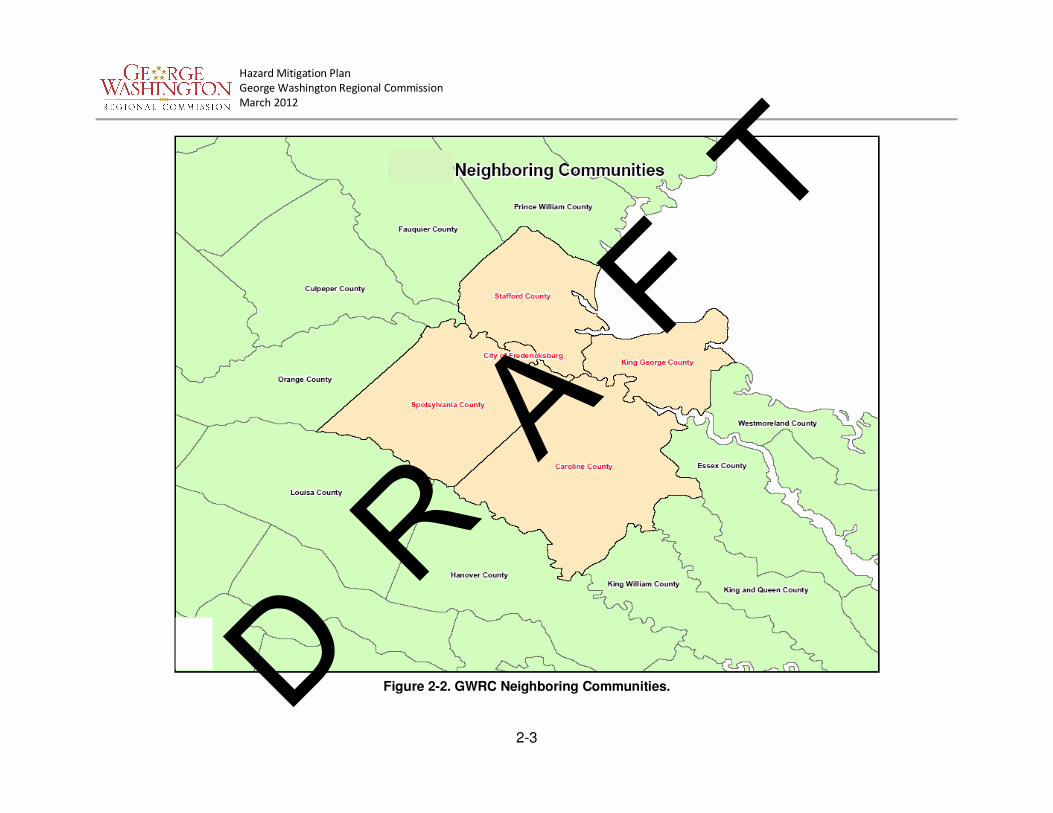
The GWRC region, centered around the City of Fredericksburg, is located in northeastern Virginia and includes the Towns of Port Royal and Bowling Green, the City of Fredericksburg, and the Counties of Caroline, King George, Spotsylvania and Stafford (Figure 2-1). Neighboring communities are presented in Figure 2-2. The 1,410 square mile region surrounds the fall line of the Rappahannock River, the transitional area from the Virginia Northern Piedmont eastward into the Virginia Coastal Plain. The GWRC region has been Virginia’s fastest growing region for nearly three decades. In 2010, the population of the area was more than 325,000 persons. In 2001, the population of the area was approximately 250,000. Regional population and economic growth is due, in part, to the region’s relative proximity to the Washington, D.C area. The City of Fredericksburg, along with Stafford and Spotsylvania Counties, are part of the Washington D.C. Primary Metropolitan Statistical Area (PMSA), a variation on the traditional Metropolitan Statistical Area (MSA) designation that the U.S. Census Bureau instituted 1993. Caroline County (and the Towns of Bowling Green and Port Royal) is part of the Richmond, VA Metropolitan Statistical Area (MSA). Despite its rapid growth, the GWRC region continues to retain a special character and offer high quality of life by offering residents a lower cost of living relative to other portions of the Washington, D.C. area along with a strong, local economic base and a variety of cultural and recreational opportunities. Interstate 95 follows the fall line that divides the GWRC region into two distinct physiographic regions, the Northern Piedmont and the Coastal Plains. The Piedmont is a rolling to hilly landscape comprising the western portions of Spotsylvania and Stafford Counties. The level Coastal Plain covers sections of eastern Spotsylvania and Stafford Counties, the majority of Caroline County and the Towns of Bowling Green & Port Royal, and the entirety of King George County. The GWRC region contains portions of three major Virginia riverine watersheds: the Potomac, the Rappahannock, and the York. The upper reaches of each watershed are typical Piedmont uplands with streams and rivers flowing across the fall line on their way to the Chesapeake Bay. Tidal marshes and flats are common throughout the lower portions of the major Chesapeake Bay tributaries. There are several predominant soil types found within the Region. Because the area covers several major physiographic regions, each has a different set of soil characteristics and properties. The red and yellow clays of the Piedmont uplands are predominant in the western portions of the region, giving way to the sandy loam and sandy clay loams of the coastal plain towards the east. The intermediate fall line zone has a combination of both soil types. D R
A F
T

Hazard Mitigation Plan
George Washington Regional Commission
March 2012
2-2
Figure 2-1. GWRC Vicinity Map. D R A
F T
Hazard Mitigation Plan
George Washington Regional Commission
March 2012
2-3
Figure 2-2. GWRC Neighboring Communities. D R
A F
T

Hazard Mitigation Plan
George Washington Regional Commission
March 2012
2-4
II. Population
As previously mentioned, the GWRC region has been Virginia’s fastest growing region for almost 30 years. Between the 1990 and 2000 Census counts, the region grew by over 41 percent; the Region’s growth rate from 2000-2010 slowed somewhat to 35.98%. (see Table 2-1).
Table 2-1. Regional Population Statistics.
Jurisdiction 1990
Census 2000
Census
Percent Change ’90 – ‘00
2010 Census
’00 – ‘10 % Change
Projected 2020
’10 – ‘20 % Change
Caroline County 19,217 22,121 +15% 28,545 29.04% 34,867 22.15%
Town of Port Royal
204 184 28.7% 1,111 18.70% 1,250 12.51%
Town of Bowling Green
727 964 9.8% 126 -31.52% 110 -12.70%
City of Fredericksburg
19,027 19,279 +1% 24,286 25.97% 27,163 11.85%
King George County 13,527 16,803 +24.2% 23,584 40.36% 30,234 28.20%
Spotsylvania County 57,403 90,395 +57.5% 122,397 35.40% 161,473 31.93%
Stafford County 61,236 92,446 +51% 128,961 39.50% 169,778 31.65%
PD 16 Regional Total
170,410 241,044 +41.4% 327,773 35.98% 423,515 29.21%
Source: U.S. Bureau of Census, 1990, 2000, and 2010 Summary Tape File (SF-1), Table P001 found at www.census.gov. Projections from
GWRC/FAMPO Draft 2040 Long-Range Constrained Transportation Plan Update, 2011.
The GWRC region’s dynamic growth the past three decades is due, in part, to its strategic location overlapping both the Washington D.C. and Richmond, VA metropolitan areas and multi-modal transportation access to the U.S. eastern seaboard. The region, located in the heart of Virginia’s “urban crescent”, is centrally located between Washington, D.C. to the north and the Virginia state capital in Richmond, to the south. This has proven to be a profitable location for a wide range of national and international companies. Continued regional economic growth is projected for the region (see Table 2.2), which, along with the Region’s competitive location between the Washington and Richmond MSAs, will bring continued population growth (see Table 2.1).
Table 2-2. Regional Employment Estimates and Projections, 2010 – 2020.
NAICS
Code Description
2010 Jobs
2020 Jobs
2010-2020
Change
2010-2020
% Change
2011 Avg. Annual Wage
2011 Establishm
ents
11 Agriculture, Forestry, Fishing and
Hunting 1,441 1,311 -130 -9% $16,569 32
21 Mining, Quarrying, and Oil and Gas
Extraction 299 314 15 5% $38,160 9
22 Utilities 312 334 22 7% $109,307 11
23 Construction 9,234 10,245 1,011 11% $43,585 965
31-33 Manufacturing 2,789 2,718 -71- 3% $53,521 169
42 Wholesale Trade 4,057 4,267 210 5% $55,869 343
D R A
F T

Hazard Mitigation Plan
George Washington Regional Commission
March 2012
2-5
44-45 Retail Trade 18,868 20,271 1,403 7% $28,244 941
48-49 Transportation and Warehousing 4,446 4,589 143 3% $46,900 229
51 Information 1,812 1,936 124 7% $51,363 107
52 Finance and Insurance 8,514 10,218 1,704 20% $68,862 341
53 Real Estate and Rental and Leasing 6,896 8,878 1,982 29% $18,109 294
54 Professional, Scientific, and Technical
Services 11,645 15,435 3,790 33% $73,235 971
55 Management of Companies and
Enterprises 1,205 1,275 70 6% $70,090 54
56 Administrative, Support and Waste
Management & Remediation Services 6,444 7,970 1,526 24% $26,204 380
61 Educational Services 1,983 2,625 642 32% $23,501 92
62 Health Care and Social Assistance 14,966 19,940 4,974 33% $49,562 1,179
71 Arts, Entertainment, and Recreation 2,879 3,159 280 10% $11,389 89
72 Accommodation and Food Services 11,575 13,394 1,819 16% $17,224 581
81 Other Services (except Public
Administration) 7,342 8,609 1,267 17% $27,769 673
90 Government 27,765 31,018 3,253 12% $84,340 263
Total 144,472 168,506 24,034 17% $48,761 7,723
Source: EMSI Complete Employment - 2011.4
III. History of the GWRC Region
Caroline County Caroline County was created in 1727 through the division of portions of King William, King and Queen, and Essex Counties. Caroline County was named for Caroline, the wife of King George II of England. Like each of the GWRC jurisdictions, Caroline County holds a wide variety of both Virginian and American history. Among its most notable historical figures, the County claims George Rogers Clark as a native son. Clark, along with Merriweather Lewis and the Corps of Discovery, opened the newly purchased Louisiana territory in 1803-1804. Clark’s, manservant, York, one of the more highly acclaimed members of the Corps of Discovery was also a Caroline County native. During the Civil War, more than one million men marched or camped in Caroline County. Confederate troops, under the command of General George E. Pickett fought Union troops near Milford in 1864. Confederate General Stonewall Jackson died in Guinea after mistakenly being shot by his Confederate troops at Chancellorsville. John Wilkes Booth, the assassin of President Lincoln, was allegedly shot by federal troops in Caroline County. Caroline County covers roughly 549 square miles and remains primarily rural. The County has two incorporated towns: Bowling Green, the County seat; and the historic Town of Port Royal. The County also hosts the United States Army’s Fort A.P. Hill, which operates under its own jurisdiction. The Fort is a 76,000 acre installation that provides year round administrative and logistical support and training for the U.S. Army’s Active Army, reserves, and other branches of the military and the U.S. Government. Caroline County is located within 30 miles of the City of Richmond, Virginia.
D R A
F T

Hazard Mitigation Plan
George Washington Regional Commission
March 2012
2-6
Town of Bowling Green
The Town of Bowling Green, with a population of 1023, has been the County seat of Caroline County since 1803. It is located 72 miles south of Washington, D.C., 108 miles southeast of Baltimore, Maryland and 35 miles north of Virginia's Capital, Richmond. The Town traces its origins back to the 1670’s, when Major John Hoomes established his “Bowling Green” plantation under charter from the English Crown. The Town’s history includes three centuries of colonial and modern Virginia development. The Town has hosted such notable historical figures as George Washington and the Marquis de Lafayette. Union General Ulysses S. Grant occupied Bowling Green during the Civil War (1864) and John Wilkes Booth, assassin of President Abraham Lincoln, was apprehended in a farmhouse near the town in 1865. Bowling Green has a well-documented historic district highlighted by the Bowling Green Farm, a brick dwelling that dates back to the 17th Century.
Town of Port Royal
The Town of Port Royal was settled in 1652 when John Catlett and his half brother, Ralph Rowzee patented 400 acres. The Town was once the only chartered town in Caroline County, and is the County’s oldest incorporated town. An important colonial shipping port for tobacco to Britain, it later served as a warehouse center and mover of grain, freight, and passengers on three-masted schooners. Traces of this colorful past can still be found today in the historic Town of Port Royal, which is listed in its entirety on the National Register of Historic Places.
City of Fredericksburg
Fredericksburg is an independent city situated along the Rappahannock River and bordered by Spotsylvania and Stafford Counties. The City was founded in 1728 and named after Prince Frederick Louis of Wales, the father of King George III of England. Fredericksburg was incorporated as a town in 1781 and became an independent city in 1879. The historic part of the city itself only covers 40 square blocks, but the City of Fredericksburg encompasses 10 square miles. The historic district has over 350 original buildings built before 1870. The Fredericksburg area was the boyhood home of young George Washington, James Monroe practiced law here, and Thomas Jefferson also lived in the City. Many Civil War battles were fought in or near the City, including the Battle of Fredericksburg in 1862. The City changed hands between the Union and Confederate Armies on several occasions. The City of Fredericksburg is located just one hour south of Washington D.C. and 45 minutes north of the City of Richmond. Though the City itself only covers approximately 10 square miles, growth and development have occurred in the urbanizing areas surrounding the City. Fredericksburg is closely linked to Stafford and Spotsylvania Counties both of which spread out many miles in all directions. The Fredericksburg, Spotsylvania, and Stafford area is one of the fastest-growing areas in the Commonwealth and is one of the top 20 in the nation.
King George County
King George County, named for King George I of England, was formed in 1720 from Richmond County. Known as the “Gateway to the Northern Neck,” King George County is home to 23,584 (2010 Census) citizens. Like the other jurisdictions in the region, King George County’s roots are deeply imbedded in both the founding of the country and in its rural past. The County is a little over 183 square miles (113,920 acres), of which 72,718 acres are forested, and 38,105 acres are agricultural. Both the Potomac and the Rappahannock Rivers border the County. The County’s location, near both the Washington and Fredericksburg urban areas, and the serenity of Virginia’s scenic Northern Neck offer a
D R A
F T

Hazard Mitigation Plan
George Washington Regional Commission
March 2012
2-7
unique and vivid perspective of an emerging Virginia. Among the County’s claims to fame, King George is home to St. Paul’s Episcopal Church where George Washington attended services as a youth and where James Madison, the Country’s fourth president, was born. Agriculture continues to be an economic anchor in King George County, but because of the County’s proximity to the Washington D.C. and Fredericksburg areas and its two major thoroughfares (State Route 3 and U.S. Route 301), a growing state of the art fiber optics and telecommunications network is developing in the County. King George County is also the host community to one of the world’s premier research and development centers, the Naval Surface Warfare Center at Dahlgren, the region’s largest employer.
Spotsylvania County
Spotsylvania County, named after Alexander Spotswood, Colonial Governor of Virginia, was formed in 1721 and has played host to a wide variety of Virginia’s history. Much of Spotsylvania County’s early development is attributed to Spotswood’s ironworks founded in the early 1700’s. Spotswood’s "Iron Mines Company," a mining and smelting operation, was founded in 1725 at Germanna. This was the first fully equipped iron furnace in the colonies and was Spotsylvania County’s first industry. A blast furnace, also founded by Spotswood, was operated in this area from 1730 through 1785. Remnants of the ironworks are still found in the County. Under Spotswood’s resourceful leadership, a road network for transporting the iron was laid out, and skilled laborers to build the roads were imported from Germany. Upon his death in 1740, Spotswood left behind a nearly self-sufficient iron empire that set in motion the rise of America’s iron and steel industry. Spotswood’s furnace was acquired in 1842 by the United States Government, which set up a forge and foundries. Here, the government made hundreds of cannons to supply the army in the Mexican War. At that time, it was one of the most important cannon works in the country. Four major Civil War battles were fought on Spotsylvania County soils, including one of the bloodiest of the war, the Battle of Spotsylvania Court House in May 1864. Here the armies of Ulysses S. Grant and Robert E. Lee participated in one of the most intense clashes in American history: the Union attack on the Confederate-held "Bloody Angle." This battle marked the beginning of the fall of the Confederacy. It was in Spotsylvania County, at the Battle of Chancellorsville, that Stonewall Jackson fell to the misguided fire of his own men. The National Park Service maintains more than 4,400 acres of the Civil War battlefields in various locations throughout Spotsylvania County.
Stafford County
Like each of the jurisdictions in the GWRC region, Stafford County has been home to a wide variety of Virginia’s history. Captain John Smith explored the Chesapeake Bay region from Jamestown to present-day Stafford. The legendary Indian princess, Pocahontas, was kidnapped from Stafford’s Marlborough Point. The Brents of Maryland established the first English Catholic settlement in Virginia, on Aquia Creek, and opened it to all faiths. All of this took place before Stafford County was formally established in 1664. Stafford’s fisheries, tobacco plantations, iron works and flourmills were major suppliers of Great Britain in the Colonial period. George Washington and George Mason lived in Stafford as youngsters. James Hunter’s Iron Works was one of the major industrial plants in the Revolutionary era and supplied the colonial army with arms in its fight for independence. Aquia sandstone provided stone for the White House, the U.S. Capitol, and trim for private homes. In addition, Stafford’s Anthony Burns was the subject of America’s first major fugitive slave case.
D R A
F T

Hazard Mitigation Plan
George Washington Regional Commission
March 2012
2-8
During the Civil War, the bloody Battle of Fredericksburg took place across the banks of the Rappahannock River in December 1862. Chatham Manor, in Stafford County, was used as the Union headquarters and a hospital to treat the wounded. It was in Stafford, the next spring that Union General Hooker bogged down his army on the famous “Mud March,” on his way to another Union defeat at the Battle of Chancellorsville. The citizens of Stafford might have been the first in the world to suffer the devastating effects of a modern war, having hosted the entire Union Army from 1862-1863. Over 125,000 men (more than today’s County population) had to be housed, fed, warmed and entertained, straining the County’s resources to the point of collapse. Prosperity did not return until World War I when the U.S. Marine Corps came to Quantico. At that time, the County was primarily agricultural, with the exception of fishing industries situated along the Potomac River. In World War II, the wide expansion of the Marine Corps base created new employment opportunities. A Civilian Conservation Corps camp was located in Southern Stafford during this time. With the completion of I-95 in the 1960’s and the recent addition of commuter rail, Stafford is one of Virginia’s fastest growing localities.
D R A
F T

Hazard Mitigation Plan
George Washington Regional Commission
March 2012
3-1
CHAPTER 3 - THE PLANNING PROCESS
For the 2012 update, the GWRC retained Dewberry and Davis, LLC to assist with the facilitation and overall compilation of the region’s Mitigation Plan Update. Dewberry staff, a combination of professional mitigation experts, planners, and engineers, assisted GWRC with the following tasks/processes:
• Establishment of a Mitigation Advisory Committee to assist with the organization and development of the GWRC -Hazard Mitigation Plan Update;
• Fulfillment of all DMA requirements as established by federal regulations, following FEMA’s planning guidance;
• Facilitation of the planning process; • Identification of the data requirements and documentation necessary to augment that data;
• Development and facilitation of the public input process will be coordinated by the sub-consultant, Spangler Erkert & Associates;
• Production of the draft and final plan documents; and • Submission for acceptance by the Virginia Department of Emergency Management (VDEM) and
FEMA Region III. As previously mentioned, Dewberry staff assisted GWRC with the establishment of the process for this planning effort, utilizing the DMA2K planning requirements and FEMA’s associated guidance. This guidance is structured around a broad, four-phase approach. The planning process incorporated another 10-step planning process that satisfies the planning requirements of several other federal programs, including FEMA’s Flood Mitigation Assistance (FMA) program and flood control projects authorized by the U.S. Army Corps of Engineers. The process employed in this plan assisted the Mitigation Advisory Committee (MAC) with planning for the mitigation of natural hazards. The approach for the planning process followed the steps presented in Table 3-1 below.
Table 3-1. DMA and FMA Planning Cross Reference.
Disaster Mitigation Act Planning Regulations (44 CFR 201.6)
FMA Planning Steps
1.0 Planning Process
201.6(c)(1) 1. Get Organized
201.6(b)(1) 2. Plan for Public Involvement
201.6(b)(2) & (3) 3. Coordinate with other Departments and Agencies
2.0 Risk Assessment
201.6(c)(2)(i) 4. Assess the Hazard
201.6(c)(2)(ii) & (iii) 5. Assess the Problem
3.0 Mitigation Strategy
201.6(c)(3)(i) 6. Set Planning Goals
201.6(c)(3)(ii) 7. Review Possible Mitigation Activities
201.6(c)(3)(iii) 8. Draft an Action Plan
4.0 Plan Maintenance
201.6(c)(5) 9. Adopt the Plan
201.6(c)(4) 10. Implement, Evaluate, Revise
D R A
F T

Hazard Mitigation Plan
George Washington Regional Commission
March 2012
3-2
Local Government / Community Participation The DMA2K planning regulations and guidance stress that each local government seeking the required FEMA approval of its mitigation plan must:
• Participate in the process;
• Detail areas within the Planning Area where the risk differs from that facing the entire area;
• Identify specific projects eligible for funding; and
• Ensure that the governing bodies adopt the plan. To help define the participation process in this plan, Dewberry assisted the GWRC staff with the identification of potential MAC members. See Appendix C for MAC meeting agendas and meeting minutes. Participation by the committee was defined as follows:
• Attending the MAC meetings;
• Providing data that is requested by the MAC; • Reviewing and providing comments on draft plans;
• Advertising, coordinating, and participating in the Public Input; and
• Coordinating plan adoption by the individual communities.
Step 1: Get Organized – Building the Planning Team
The MAC was comprised of key GWRC and local stakeholder representatives. The GWRC Director of Planning and Regional Demographics, Kevin Byrnes, chaired the MAC. With the Committee’s commitment to participate, Dewberry’s first step was to establish both a framework and organization for the development of this Plan. The Committee met four times during the planning period. Typical attendees of each meeting included representatives from local first response agencies, planning departments, public works, forestry, utilities and infrastructure, local emergency management personnel, and other community leaders. In addition, the Virginia Department of Forestry, private industry, as well as the Virginia Department of Emergency Management (VDEM) participated on the MAC. A list of MAC members is included in the Acknowledgements section at the front of this Plan. Attendance and agendas for each of the MAC meetings are on file at the GWRC office in Fredericksburg and can be referenced in Appendix C. While the MAC was assembled to assist with the development of this plan, the committee structure may also facilitate updates of the plan over time as needed by the member communities and/or as required by the Act.
Table 3-2. Committee Meetings..
Date Meeting Topic
November 15, 2010 Kickoff Meeting
July 12, 2011 Mitigation Goals Meeting
October 4, 2011 Regional Strategies and Public Outreach
Step 2: Plan for Public Involvement – Engaging the Public This section is to be addressed by Spangler Erkert & Associates following the draft plan submittal; to be completed during the winter of 2011-2012.
D R A
F T

Hazard Mitigation Plan
George Washington Regional Commission
March 2012
3-3
Step 3a: Coordinate with other Departments and Agencies Early in the planning process, the Committee determined that the participation of other state and federal agencies would be beneficial in the data collection, mitigation and action strategy development, and plan approval process. Representatives from the following key agencies were invited to participate on the Committee:
• FEMA Region III (Mitigation Planning Division);
• Virginia Department of Forestry;
• Virginia Department of Emergency Management (Mitigation Planning Division); • Virginia Department of Conservation and Recreation (Division of Dam Safety and Floodplain
Management); and
• Rappahannock Area Health District Neighboring communities and academic institutions were contacted directly and provided with the opportunity to review and comment on the plan. See Appendix C for correspondence. In addition to the agencies listed above, the Committee used the resources of the agencies set forth below in the development of this Plan. Specifically, technical data, reports, and studies were obtained from these agencies either through web-based resources or through personal contact with the agencies.
• National Climatic Data Center (NCDC)
• Virginia Department of Emergency Management (VDEM)
• Virginia Department of Conservation and Recreation (DCR)
• Colorado State University, Tropical Meteorology Project
• Virginia Department of Health (VDH)
• National Oceanic and Atmospheric Association (NOAA)
• Federal Emergency Management Agency (FEMA)
• National Weather Service (NWS)
• U.S. Geological Survey (USGS)
• U.S. Census Bureau • University of Mary Washington
Step 3b: Relationship to Other Community Planning Efforts and Hazard Mitigation Activities Coordination with other community planning efforts is paramount to the success of a hazard mitigation plan. Hazard mitigation planning involves identifying existing community policies, tools, and actions that will reduce a community’s risk and vulnerability to natural hazards. The Committee identified a variety of comprehensive planning mechanisms such as land use and master plans, emergency operations plans, and municipal ordinances and building codes that guide and control community development. Integrating existing planning efforts, mitigation policies, and action strategies into this Hazard Mitigation Plan establishes a credible and comprehensive plan that ties into and supports other community programs. This Plan, therefore, links the specific natural hazards that present a risk to the community with the existing mitigation elements found in community programs, other planning documents, and regulations. The development of this Plan utilized information included in the following community plans, studies, reports, and initiatives:
D R A
F T

Hazard Mitigation Plan
George Washington Regional Commission
March 2012
3-4
• Municipal Comprehensive Plans from GWRC region localities
• Codified Ordinances from GWRC region localities
• Virginia Uniform Statewide Building Code – 2009
• Jurisdiction Comprehensive Plans
• Emergency Operations Plans from GWRC region localities
• Flood Insurance Study and Flood Insurance Rate Maps for the GWRC region
• GWRC region Tax Assessor and Land Use data
• Commonwealth of Virginia Hazard Mitigation Plan
Step 4: Assess the Hazard
The MAC conducted a Hazard Identification study to determine which hazards threaten the region. Research focused on previous occurrences of natural hazards, those that might occur in the future, and the likelihood of their occurrence or recurrence. The hazards identified and investigated in the GWRC region include:
Table 3-3. Hazard Identification Reference Table.
2006 GWRC Hazard Type 2012 Realigned Hazard Type from State Plan
Plan Reference Section
2012 Section Heading
Dam Failure Dam Failure 4.A Dam Failure
Drought Drought 4.B
Drought & Extreme Heat Extreme Heat Drought
Wildfire Wildfire 4.C Wildfires
Earthquakes Earthquake 4.D Earthquakes
Expansive Soils Sinkholes 4.E
Sinkholes & Landslides
Landslides Landslides
Erosion Flooding 4.F
Flooding & Erosion
Flooding Flooding
Hurricanes Non-Rotational Wind 4.G
Hurricanes & Thunderstorms
Thunderstorms Non-Rotational Wind
Tornadoes Rotational Wind 4.H Tornadoes
Northeasters Winter Storms 4.I
Winter Storms & Nor’easters
Winter Storms Winter Storms
Step 5: Assess the Problem Once the hazard identification step was complete, the MAC conducted vulnerability assessments to describe the impact that each identified hazard would have upon the GWRC region and its respective jurisdictions. The MAC also conducted capability assessments to determine the current ability of each jurisdiction to mitigate the hazards through existing policies, regulations, programs, and procedures. The analyses identified areas where improvements could or should be made.
D R A
F T

Hazard Mitigation Plan
George Washington Regional Commission
March 2012
3-5
Step 6: Set Planning Goals Planning goals were established to incorporate improvement areas identified in Step 5 into the Mitigation Plan. The MAC set goals, formulated as public policy statements, that:
• Represent basic desires of the community;
• Encompass all aspects of the community, public and private;
• Are nonspecific, in that they refer to the quality (not the quantity) of the outcome; • Are future-oriented, in that they are achievable in the future; and
• Are time-independent, in that they are not scheduled events.
Additionally, goals from other community programs and priorities were identified and discussed. This Multi-Objective Management (MOM) assisted the MAC in striving for efficiency by combining projects/needs from various community programs and plans that are similar in nature or location. Combining projects/needs through MOM effectively results in access to multiple sources of funding to solve problems that can be “packaged” and broadens the supporting constituency base by striving towards outcomes desired by multiple stakeholder groups.
Step 7: Review Possible Mitigation Activities Following the goal setting meeting, the MAC undertook a brainstorming session to generate a set of viable alternatives that would support the selected goals. The MAC focused on the following categories of mitigation measures:
• Prevention; • Property Protection;
• Structural Projects;
• Natural Resource Protection;
• Emergency Services; and • Public Information.
A facilitated discussion examined and analyzed potential alternatives. Similar to the goal-setting activity, the MAC included all previously recommended mitigation actions from existing mitigation plans in its review. After old and new mitigation actions had been identified, the MAC members used a decision-making process recommended by FEMA to prioritize mitigation measures.
Step 8: Draft an Action Plan
The prioritized mitigation measures were further developed into an action plan that identifies the following for each measure:
• Responsible office;
• Priority (high, medium, or low); • Cost estimate;
• Benefit to the community;
• Potential funding sources; and
• Schedule for completion.
D R A
F T

Hazard Mitigation Plan
George Washington Regional Commission
March 2012
3-6
Step 9: Adopt the Plan
Each jurisdiction within the GWRC region shall adopt the plan through its respective governing body.
Step 10: Implement the Plan, Evaluate its Worth, Revise as Needed
Step 10 is critical to the overall success of hazard mitigation planning. Upon adoption, the All-Hazards Mitigation Plan faces the truest test of its worth, implementation. Many worthwhile and high priority mitigation actions have been recommended. The MAC must decide which action to undertake based upon priority and available funding. In addition, the All-Hazards Mitigation Plan requires maintenance. There will be an ongoing effort to monitor and evaluate the implementation of the plan, and to update the plan as progress, roadblocks, or changing circumstances are recognized.
D R A
F T

Hazard Mitigation Plan George Washington Regional Commission March 2012
4-1
CHAPTER 4 - HAZARD IDENTIFICATION AND RISK ASSESSMENT (HIRA)
The hazard identification and risk assessment (HIRA) process provides information that allows a community to better understand its potential risk and associated vulnerability to hazards. This information provides the framework for a community to develop and prioritize mitigation strategies and to implement plans to help reduce both the risk and vulnerability from future hazard events. The HIRA followed the methodology described in FEMA publication 386-2 “Understanding Your Risks – Identifying Hazards and Estimating Losses” (FEMA, 2002) and was based on a four-step process:
1. Identify Hazards; 2. Profile Hazard Events; 3. Inventory Assets; and 4. Estimate Losses.
The HIRA covers Planning Steps 4: Assess the Hazard and Step 5: Assess the Problem. The HIRA for the GWRC region was prepared in the following format: REGIONAL HAZARD IDENTIFICATION For the 2012 plan update, the GWRC Mitigation Advisory Committee reviewed the 2010 Commonwealth of Virginia Hazard Mitigation Plan, as well as the hazard events over the preceding five years, and agreed with the hazard rankings for each jurisdiction in the state plan. Additionally, the committee chose to use the State’s Hazard Type language as an update to the 2006 hazard type, to ensure better alignment with the state’s rankings and methodologies. Hazards that were ranked High, Medium-High (and Medium for Caroline County) were further investigated in the Vulnerability Assessment. Furthermore, updates to this chapter mostly include historical occurrence updates, hazard profile updates, and new rankings. COMMUNITY SPECIFIC HAZARD IDENTIFICATION Chapter 4, Section II presents the community-specific sections where those natural hazards that affect each member jurisdiction differently are discussed. REGIONAL VULNERABILITY ASSESSMENT Chapter 5, Section I describes vulnerabilities that are common to all communities within the GWRC region.
COMMUNITY-SPECIFIC VULNERABILITY ASSESSMENT Chapter 5, Section II presents the vulnerability assessments that were performed for each jurisdiction for critically identified hazards and the results of these analyses. REGIONAL CAPABILITY ASSESSMENT Chapter 6, Section I presents State, Regional, and Federal mitigation capabilities that are common to all communities within the GWRC region. COMMUNITY-SPECIFIC CAPABILITY ASSESSMENT Chapter 6, Section II describes each jurisdiction’s capability to deal with the hazards from both a response and a policy capability. A capability assessment matrix was used for this purpose. D R
A F
T

Hazard Mitigation Plan George Washington Regional Commission March 2012
4-2
I. Regional Hazard Identification
The GWRC steering committee reviewed the hazards included in the 2006 plan as well as the Commonwealth of Virginia’s Hazard Mitigation Plan when updating their 2012 hazard identification study. After reviewing the hazard events over the preceding five years, the committee chose to utilize the state’s Hazard Type (i.e. naming system) for each hazard, and also to utilize their hazard ranking system as a the catalyst to begin their Hazard identification and Risk Assessment update. The natural hazards identified and investigated in the 2012 Update (utilizing the 2010 state hazard type) include the following:
Table 4-1. Profiled Hazards.
2006 GWRC Hazard Type 2012 Realigned Hazard Type from State Plan
Reference Section
Section Heading
Dam Failure Dam Failure A Dam Failure
Drought Drought B
Drought & Extreme Heat Extreme Heat Drought
Wildfire Wildfire C Wildfires
Earthquakes Earthquake D Earthquakes
Expansive Soils Sinkholes E
Sinkholes & Landslides
Landslides Landslides
Erosion Flooding F
Flooding & Erosion
Flooding Flooding
Hurricanes Non-Rotational Wind G
Hurricanes & Thunderstorms
Thunderstorms Non-Rotational Wind
Tornadoes Rotational Wind H Tornadoes
Northeasters Winter Storms I
Winter Storms & Nor’easters
Winter Storms Winter Storms
Historical data was collected for all hazard types. By examining the historical occurrences of each hazard, along with the impacts, the MAC was able to identify the hazards that pose the most significant risks to the region. This identification will allow the jurisdictions within the region to focus their hazard mitigation planning efforts on the hazards most likely to have an impact on the region in the future. Prioritizing the potential natural hazards that threaten the GWRC region required analysis of two factors: the probability that a certain type of natural hazard would affect the region and the potential extent and severity of the damage caused by that hazard. The probability of occurrence for each hazard was determined using existing technical analyses, such as the FEMA Flood Insurance Study. When data was not available, the probability was based on the history of events.
D R A
F T

Hazard Mitigation Plan George Washington Regional Commission March 2012
4-3
A. Dam Failure
For the purposes of this plan, dam failure is addressed as a natural hazard because flooding conditions are a consequence. Dam failure can occur if hydrostatic pressure behind the dam exceeds its design capacity or the crest of the dam is overtopped and rushing flood water scours the base of the dam. The Virginia Soil and Water Conservation Board (VS&WCB) established the Virginia Dam Safety Program to provide for safe design, construction, operation and maintenance of dams to protect public safety. Dams that meet specific regulatory criteria are regulated. The owner of each regulated dam is required to apply to the VS&WCB for an operation and maintenance certificate. The application must include an assessment of the dam by a licensed professional engineer, an operation and maintenance plan, and an emergency action plan. The emergency action plan is filed with the appropriate local emergency official and the Department of Emergency Services. A dam may be exempt from the regulation if any of the following criteria apply:
• The dam is less than six feet in height;
• The dam has a capacity less than 50 acre-feet and is less than 25 feet in height;
• The dam has a capacity of less than 15 acre-feet and is more than 25 feet in height; • The dam is used primarily for agricultural purposes and has a capacity less than 100 acre-feet (if
use or ownership changes, the dam may be subject to regulation);
• The dam is owned or licensed by the Federal Government; or • The dam is operated for mining purposes under 45.1-222 or 45.1-225.1 of the Code of Virginia.
Regulated dams are assigned a hazard classification based on the downstream loss anticipated in the event of dam failure. It should be noted that hazard potential is not related to the structural integrity of the dam. The hazard potential classification speaks to the level of risk to life and economic loss the dam imposes on downstream properties and facilities. The classification scheme used by the VS&WCB is listed below.
• Class I - dams which upon failure would cause probable loss of life or excessive economic loss
• Class II - dams which upon failure could cause possible loss of life or appreciable economic loss • Class III - dams which upon failure would not likely lead to loss of life or significant economic loss
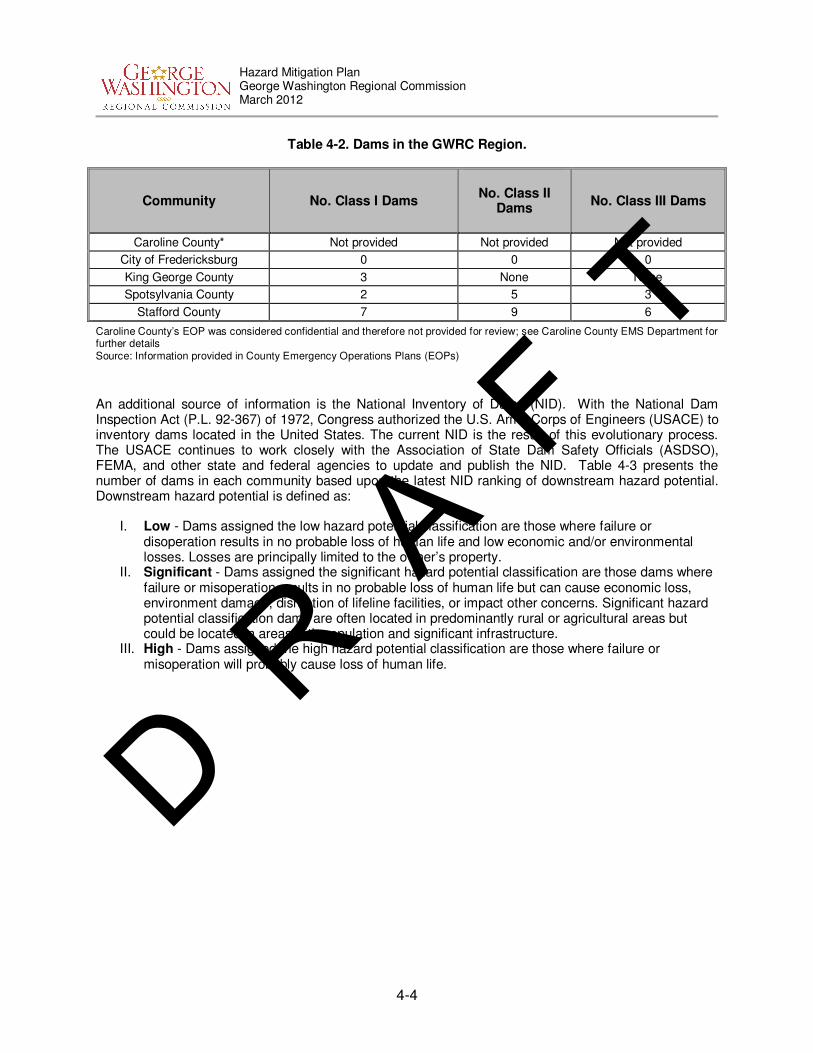
• Class IV - dams which upon failure would not likely lead to loss of life or economic loss to others Table 4-2 provides the number of dams in classes I through III in each community within the GWRC region. The information contained in the table was provided by each county’s Emergency Operations Plans (EOPs). Class IV dams do not require an emergency action plan and have, therefore, have not been included in the table. For further community-specific information on dams, please contact the office of the local emergency management coordinator. D R
A F
T
Hazard Mitigation Plan George Washington Regional Commission March 2012
4-4
Table 4-2. Dams in the GWRC Region.
Community No. Class I Dams No. Class II
Dams No. Class III Dams
Caroline County* Not provided Not provided Not provided
City of Fredericksburg 0 0 0
King George County 3 None None
Spotsylvania County 2 5 3
Stafford County 7 9 6
Caroline County’s EOP was considered confidential and therefore not provided for review; see Caroline County EMS Department for further details Source: Information provided in County Emergency Operations Plans (EOPs)
An additional source of information is the National Inventory of Dams (NID). With the National Dam Inspection Act (P.L. 92-367) of 1972, Congress authorized the U.S. Army Corps of Engineers (USACE) to inventory dams located in the United States. The current NID is the result of this evolutionary process. The USACE continues to work closely with the Association of State Dam Safety Officials (ASDSO), FEMA, and other state and federal agencies to update and publish the NID. Table 4-3 presents the number of dams in each community based upon the latest NID ranking of downstream hazard potential. Downstream hazard potential is defined as:
I. Low - Dams assigned the low hazard potential classification are those where failure or disoperation results in no probable loss of human life and low economic and/or environmental losses. Losses are principally limited to the owner’s property.
II. Significant - Dams assigned the significant hazard potential classification are those dams where failure or misoperation results in no probable loss of human life but can cause economic loss, environment damage, disruption of lifeline facilities, or impact other concerns. Significant hazard potential classification dams are often located in predominantly rural or agricultural areas but could be located in areas with population and significant infrastructure.
III. High - Dams assigned the high hazard potential classification are those where failure or misoperation will probably cause loss of human life.
D R A
F T

Hazard Mitigation Plan George Washington Regional Commission March 2012
4-5
Table 4-3. National Inventory of Dams in GWRC Region.
Community
Downstream Hazard Potential
High Significant Low Total Dams
Caroline County 2 10 27 39
City of Fredericksburg 0 0 1 1
King George County 1 0 7 8
Spotsylvania County 2 6 10 18
Stafford County 3 14 5 22
PD 16 Total 8 30 50 88
Source: National Inventory of Dams (http://geo.usace.army.mil/pgis/f?p=397:12:783673426788509).
Figure 4-1. Spatial Distribution of Dams by Hazard Classification, PD 16.
D R A
F T

Hazard Mitigation Plan George Washington Regional Commission March 2012
4-6
Past Occurrences Although a historical log of dam failures for the Commonwealth of Virginia has not been prepared by the Virginia Soil and Water Conservation Board (VS&WCB), MAC representatives have noted dam failures in the GWRC region. In recent history, Grant Lake within the Lake Wilderness subdivision of Spotsylvania County was placed under “alert” condition due to the potential for subsidence/sinkhole. Stafford County officials identified the potential threat of earthen dam failure at Lake Arrowhead in 2008. Likelihood of Future Occurrences The VS&WCB issues certificates to the owner of each regulated dam for a period of six years. If a dam has some deficiency but does not pose imminent danger, the board may issue a two-year conditional certificate during which time the owner is to correct the deficiency. After a dam is certified by the board, periodic inspections by an engineer are required.
B. Drought and Extreme Heat
Drought Source: http://www.drought.unl.edu/dm/monitor.html
A drought is a period of drier-than-normal conditions that results in water-related problems. All areas of Virginia are susceptible to severe drought, which is defined by a combination of intensity and duration. In a one-year time frame, droughts are considered large when the 12-month rainfall averages approximately 60 percent of normal. On a multi-year time scale, 75 percent of normal rainfall indicates a serious problem. High summer temperatures can exacerbate the severity of a drought. Normal high summer temperatures in the central and northern Virginia areas can reach the 90 degree Fahrenheit mark and higher. Most of the soil is relatively wet, and a great deal of the sun’s energy goes toward evaporation of the ground moisture. However, when drought conditions eliminate soil moisture, the sun’s energy goes toward heating the ground surface and temperatures reach into the low 100’s, further drying the soil. This can have a devastating effect on crops, stream levels and water reserves. A short-term precipitation deficit of six summer weeks can often ruin crops. Droughts lasting a year, which occur in the Mid-Atlantic when the region receives 60 percent of the typical 40 inches of rain, begin to draw down water wells and livestock ponds and decrease stream flows and water reserves. A common indicator of drought is the Palmer Drought Severity Index (PDSI). The PDSI is a soil moisture algorithm calibrated for relatively uniform regions. It is used by many U.S. government agencies and states to trigger drought relief programs. It was also the first comprehensive drought index developed in the United States. The classifications of the PDSI are presented in Table 4-4 (Hayes, 2005). D R
A F
T

Hazard Mitigation Plan George Washington Regional Commission March 2012
4-7
Table 4-4. Palmer Classifications.
Palmer Classifications
4.0 or more Extremely wet
3.0 to 3.99 Very wet
2.0 to 2.99 Moderately wet
1.0 to 1.99 Slightly wet
0.5 to 0.99 Incipient wet spell
0.49 to -0.49 Near normal
-0.5 to -0.99 Incipient dry spell
-1.0 to -1.99 Mild drought
-2.0 to -2.99 Moderate drought
-3.0 to -3.99 Severe drought
-4.0 or less Extreme drought
Source: Hayes, 2005.
The PDSI indicates that for the period of 1895 through 1995 the GWRC region was in a severe to extreme drought five to 10 percent of the time (Figure 4-2). During periods of drought, the Governor of Virginia has called for a ban of open burning in an effort to reduce the risk of wildfire. Although the severity of droughts to occur is relatively small compared with the rest of the nation, the entire GWRC is subject to some drought conditions (Figure 4-4Figure 4-4. Drought Occurrence and Severity in Virginia.). Past Occurrences There have been five major droughts in Virginia that have affected the communities in the GWRC region since the early 1900’s. The drought of 1930-32 was one of the most severe droughts recorded in the state. The droughts of 1938-42 and 1962-71 were less severe; however, the cumulative stream flow deficit for the 1962-71 drought was very damaging due to its long duration. The droughts of 1980-82 and 1998-99 were the least severe for the state; however, the drought of 1998-99 hit the communities of the GWRC region particularly hard. The drought of 1930-32 had a tremendous impact on Virginia. Numerous rivers completely dried up, crops were totally destroyed, drinking water was difficult to come by, forest fires burned approximately 300,000 acres of land (over 30 times the current annual average) and average summer temperatures were in the low 100’s. After adjusting for inflation, the estimated losses for this drought were $1 billion. If the same drought were to occur in Virginia today, the devastation would be much greater due to the increased population and its demand for water resources. D R
A F
T

Hazard Mitigation Plan George Washington Regional Commission March 2012
4-8
The drought of 1998-99 had a particularly hard impact on the communities of the GWRC region. The region received some of the lowest rainfall totals in over 120 years. This led to the loss of crops, depletion of water and feed reserves and a number of brush fires. Many stream-gauging stations reported stream flow at or below 10 percent of the normal flow. The Rappahannock River at Fredericksburg was at 14 percent of its normal flow, 70 percent of the pasturelands were in poor to very poor condition and many crops in the region were reduced by 30 percent. On December 1, 1998 the Governor of Virginia declared a state of emergency and called for federal aid. Losses in the Commonwealth grew to nearly $190 million. The dry conditions in July of 2007 were particularly harsh to the GWRC region. The Short-Term Palmer Index for the region in July was on the border between moderate and severe drought. The averaged rainfall totals for the region reached as high as six inches below its normal. As a result, many jurisdictions in the region imposed restrictions on water use. The USDA reported deteriorated soil moisture conditions for the counties of King George, Caroline, and Stafford. There was noticeable crop damage, specifically to corn and soybeans. The USDA estimated that the production of corn for 2007 would be up to 60 percent below the average annual yield. Moreover, the hayfields and pastures for cattle herds were brown from the lack of precipitation. In fact, the USDA rated 70 percent of the pasturelands as in either poor or very poor condition. This forced farmers to search for alternative sources of feed and/or prematurely sell off their herds. By August of 2007 conditions began to improve until another dry spell affected the region in September. The averaged rainfall totals for September were between 8 to 10 inches below normal. The National Drought Monitor listed much of the region under extreme drought conditions through the end of the month. Many localities continued the water use restrictions that were set in July. At this time the summer harvest was in full effect, soybean yield was only between 20 to 40 percent per acre according to a USDA report. By the end of the month the USDA designated several counties throughout the Commonwealth as
Figure 4-2. Palmer Drought Severity Index. Source: Hayes, 2005.
D R A
F T

Hazard Mitigation Plan George Washington Regional Commission March 2012
4-9
drought disaster areas. The one year period from April of 2007 to March of 2008 was the 9th driest period in the region’s history and the driest since 2002. The average precipitation totals for that year were over 7 inches off the region’s 5-year average. Stream flow discharge in the major creeks and rivers of the region were severely low relative to their average that summer. For example, the Rappahannock River near Fredericksburg was running at a competency of only 24 percent of its 10-year average for the months of June through September. The summer of 2010 was harsh to the GWRC region. The month of July was the warmest month the region has ever seen. The region experienced over 20 days of temperatures exceeding 90 degrees. The summer of 2010 was the 8th driest and the worst since 1998. The region only reached 68 percent of its average rainfall. The drought conditions were particularly harsh to the region’s agriculture. A USDA report at the end of July claimed that 50 percent of the dry land corn crop was lost to severely dry conditions within the region. By the middle of August the 69 percent of the state’s corn conditions were rated as either very poor or poor. There was also noticeable “browning out” of the hayfields and pastures. The apparent lack of precipitation had a noticeable effect on the region’s water. Streamflow discharge for the region’s rivers and streams were noticeably lower than their 10-yr average for the months of June through September 2010 (NOAA, 2011). Likelihood of Future Occurrences VDEM rates Virginia’s drought risk as “Significant,” with Virginia communities experiencing approximately 20 years of severe drought in the last century, which has caused millions of dollars of damage. Proper mitigation planning can lessen a drought’s impact and keep communities from being severely impacted by drought conditions. There has been one Federally-declared disaster in the GW Region (Figure 4-3).
Figure 4-3. Federally Declared Drought Disasters in Virginia Source: VA State Plan.
D R A
F T

Hazard Mitigation Plan George Washington Regional Commission March 2012
4-10
Based on data compiled from the National Drought Mitigation Center, the US Department of Agriculture, and NOAA, there is a low to moderate likelihood of drought occurrence in the GW Region (Figure 4-4).
Extreme Heat
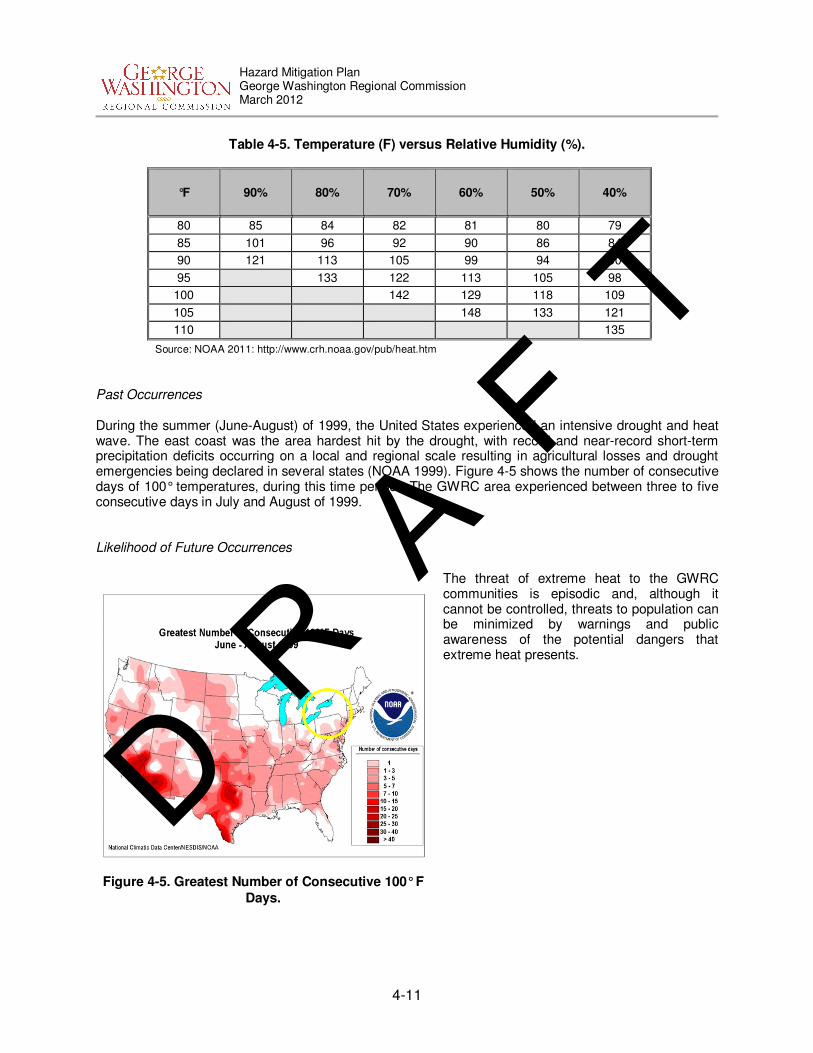
The extreme heat hazard, often referred to as the silent killer, results from high daily temperatures combined with high relative humidity. High relative humidity retards evaporation, robbing the body of its ability to cool itself. On average, approximately 175 Americans die as a result of extreme heat exposure every year (NOAA 2004). When heat gain exceeds the level the body can remove, body temperature begins to rise, and heat related illnesses and disorders may develop. The Heat Index (HI) is the temperature the body feels when heat and humidity are combined. Table 4-5 presents the HI that corresponds to the actual air temperature and relative humidity. This chart is based upon shady, light wind conditions. Exposure to direct sunlight can increase the HI by up to 15°F. (NOAA 2004). Although the severity of extreme heat is relatively small compared with the rest of the nation, the entire GWRC region is subject to high temperatures (Figure 4-5).
Figure 4-4. Drought Occurrence and Severity in Virginia.
D R A
F T
Hazard Mitigation Plan George Washington Regional Commission March 2012
4-11
Figure 4-5. Greatest Number of Consecutive 100° F
Days.
Table 4-5. Temperature (F) versus Relative Humidity (%).
°F 90% 80% 70% 60% 50% 40%
80 85 84 82 81 80 79
85 101 96 92 90 86 84
90 121 113 105 99 94 90
95 133 122 113 105 98
100 142 129 118 109
105 148 133 121
110 135
Source: NOAA 2011: http://www.crh.noaa.gov/pub/heat.htm Past Occurrences During the summer (June-August) of 1999, the United States experienced an intensive drought and heat wave. The east coast was the area hardest hit by the drought, with record and near-record short-term precipitation deficits occurring on a local and regional scale resulting in agricultural losses and drought emergencies being declared in several states (NOAA 1999). Figure 4-5 shows the number of consecutive days of 100° temperatures, during this time period. The GWRC area experienced between three to five consecutive days in July and August of 1999. Likelihood of Future Occurrences
The threat of extreme heat to the GWRC communities is episodic and, although it cannot be controlled, threats to population can be minimized by warnings and public awareness of the potential dangers that extreme heat presents.
D R A
F T

Hazard Mitigation Plan George Washington Regional Commission March 2012
4-12
C. Wildfires
Source: http://www.dof.virginia.gov/gis/datadownload.shtml
A wildfire is an uncontrolled fire spreading through vegetative fuels, possibly consuming structures. They often start unnoticed and spread quickly, often causing dense smoke that fills the area for miles around. The magnitude of a wildfire can range from a very localized event that produces little or no damage to a blaze that consumes many thousands of acres and damages buildings and infrastructure. Naturally occurring and non-native species of grasses, bush, and trees fuel wildfires. (FEMA 386-2) Generally, there are three major factors to consider in assessing a community threat from wildfires: topography, vegetation, and weather. The type of land cover in an area affects a number of factors including ease of ignition, the intensity with which a fire burns, and the facilitation of wildfire advancement. Topographic variations, such as steeper slopes, can lead to a greater chance of wildfire ignition. Generally speaking, steeper slopes are predisposed to convective pre-heating, which warms and dries the vegetative cover. Also, slopes that generally face south receive more direct sunlight than those facing north. Direct sunlight in turn dries vegetative fuels, thereby creating conditions that are more conductive to wildfire ignition. Population density has a causal relationship to wildfires because an overwhelming majority of the wildfires in Virginia are ignited intentionally or unintentionally by humans. Travel corridors increase the probability of human presence, which increases the potential for wildfire ignition. Hence, areas closer to roads have a higher ignition probability. The hurricanes of the past few years, especially Hurricane Isabel, have brought down hundreds of trees. This increase in potential fuel has initiated a public awareness campaign by the Virginia Department of Forestry (VDOF) to educate the public to this increased hazard. Geographically, wildfire risk as determined by the Virginia Department of Forestry (VDOF) varies across the GWRC region. Approximately 40.5 percent of the GWRC region is located within a high fire risk zone. Past Occurrences Source: http://www.dof.virginia.gov/resinfo/index.shtml
There were approximately 856 wildfire incidents in the GWRC region between 1995 and 2008. This resulted in over 1600 acres burned and over $400,000 in damages. Fortunately, with a reasonable response, over $61 million in damages were saved. The majority of these fires were caused by humans; over 70 were determined to be caused by either lightning or some unknown cause. (VDOF, 2008). See Section II for historical wildfire data for each GWRC community. Likelihood of Future Occurrences Using the factors described above, VDOF assigned a “fire-risk” rating of low, moderate, or high to various areas throughout the GWRC region. With this system, VDOF has determined that approximately 40.5 percent of the GWRC area is in a high fire risk zone, 50.2 percent is in a moderate fire risk zone and 9.3 percent is in a low fire risk zone. It is apparent that wildfires are a danger within the GWRC area. The area’s specific vegetative cover, topography and urban characteristics (relatively high population and dense road networks in some areas) furnish an environment with a predominantly high fire risk. Historical evidence shows that many historic fires could have been prevented with proper mitigation, lessening the negative impact on the environment and the citizens of the GWRC area.
D R A
F T

Hazard Mitigation Plan George Washington Regional Commission March 2012
4-13
D. Earthquakes
Source: www.nationalatlas.gov
An earthquake is a sudden motion or trembling of the earth caused by an abrupt release of stored energy in the rocks beneath the earth’s surface. According to the Virginia Department of Mines, Minerals and Energy (DMME), Virginia has a moderate earthquake risk (similar to most states on the eastern seaboard). This risk assessment is further supported by the USGS. The USGS rates areas of the United States for their susceptibility to earthquakes based on a two percent probability of a given peak acceleration (%g) being exceeded in a 50 year period. The GWRC region lies in an area of moderate seismic risk, with a peak acceleration of six to 10 %g, which is considered a moderate hazard probability. Figure 4-6 also displays the probability of exceeding a certain ground motion, expressed as peak ground acceleration (PGA). This particular map shows the 10 percent probability of exceeding normal ground motion in 50 years. This translates to a one in 475 chance of normal ground motion being exceeded by the amount shown on the map annually.
Past Occurrences The first recorded earthquake in Virginia occurred in 1774. Since then, over 300 earthquakes have been recorded within or near the boundaries of the state. Nineteen of these events had a magnitude of four or higher on the Richter scale. The largest earthquakes in Virginia were the 1897 Giles County earthquake and more recently a 5.8 magnitude quake occurring at 1:51 pm EDT on August 23, 2011, and centered near Mineral, VA. The Giles County earthquake was felt in over 11 states (approximately 280,000 square miles) and also had an estimated magnitude of 5.8. The Mineral earthquake was reportedly felt as far north as Boston, as far south as Georgia and as far west as Chicago. Effects of the earthquake were
Figure 4-6. Peak Acceleration with 2% Probability of Exceedance in 50 Years. D R A
F T

Hazard Mitigation Plan George Washington Regional Commission March 2012
4-14
reported from over 8,434 zip codes, ranging from weak (II-III intensity) to very strong (VII intensity). A map of the responses is shown in Figure 4-7.Figure 4-7. USGS Community Internet Intensity Map for August 23, 2011 Event. Figure 4-8 (from the Virginia Division of Mineral Resources, September, 2004) presents the epicenter locations from 2,460 earthquakes in the southeast United States.
Figure 4-7. USGS Community Internet Intensity Map for August 23, 2011 Event. Source: http://earthquake.usgs.gov/earthquakes/dyfi/events/se/082311a/us/se082311a_ciim.jpg
D R A
F T

Hazard Mitigation Plan George Washington Regional Commission March 2012
4-15
Previous Occurrence and Likelihood of Future Occurrences According to DMME, Virginia and the GWRC region have a moderate earthquake risk. Although there have been a large number of earthquakes in Virginia since 1774, most have been very small in magnitude and rarely caused damage. One exception was the Magnitude 5.8 earthquake that occurred on August 23, 2011 with an epicenter in Mineral, Virginia. Although there was little physical damage outside of Mineral, strong vibrations were felt throughout the GWRC region. Figure 4-9 shows the levels of vibrations felt throughout the region as a result of this earthquake.
Figure 4-8. Epicenter Locations (2460) in the Southeastern United States. Source: Virginia Division of Mineral Resources, September, 2004
D R A
F T

Hazard Mitigation Plan George Washington Regional Commission March 2012
4-16
Virginia has experienced quakes of a larger magnitude in the past, and will likely experience more at some point in the future. However, compared to the frequency of other hazards such as hurricanes and floods, the frequency with which larger, damaging earthquakes occur in Virginia is considerably lower.
Figure 4-9. Shake Map for August 23, 2011 Earthquake Source: USGS D R A
F T

Hazard Mitigation Plan George Washington Regional Commission March 2012
4-17
E. Sinkholes and Landslides
Sinkholes
Sinkholes are natural depressions of land surfaces. A karst topography is one formed over limestone, dolomite, or gypsum and is characterized by sinkholes, caves, and underground drainage. Excessive pumping of groundwater from karst aquifers may lower the water table and cause a sudden loss of buoyant forces that stabilize the roofs of cavernous opening. Human-induced changes in surface water flow and infiltration may also cause collapse. Sinkholes can form suddenly and depending on their size and location can cause significant damage to infrastructure and other structures in their vicinity. Areas over abandon mines or those with aging underground infrastructure are also at risk of experiencing collapse/sinkholes. Karst areas are generally only in western portions of Virginia and the GWRC region is not considered to be within a karst area. Sinkholes in the area are more likely to be caused by failed underground infrastructure and in general no one particular jurisdiction is more at risk than any other.
Landslides
A landslide is the movement of any mass of rock, soil, or debris down a slope. This process, known as mass movement, is driven by gravity and may occur instantaneously or quite imperceptibly. Landslides are usually triggered by heavy rainfall, rapid snow melt, stream incision, or earthquakes, while certain man-made changes to the land, such as slope modification or drainage alteration, can greatly increase the likelihood of landslides. In terms of magnitude or severity, landslides are capable of wrecking buildings, rupturing gas, water, and sewer mains, and knocking out power and telephone lines while blocking transportation routes. Soil creep and slumping cause property damage gradually, whereas rock slides and debris flows can sweep away people and property instantaneously. In the United States, landslides annually cause up to $2 billion in damages and take between twenty-five and fifty lives. Landslides occur in many manifestations and are usually classified according to the type of material involved and the mode of downslope movement. The material can range from loose earth to blocks of solid rock to tree trunks. Modes of transport include freefall, bouncing, sliding down a slip surface, flowing in a slurry, or moving particle-by-particle. The following are some of the more important types of mass movement: Rockfalls: entail large blocks of bedrock breaking off a cliff face and tumbling downslope.
Rockslides: occur when a detached section of bedrock moves down an inclined surface, frequently along a bedding plane.
Earthslides: involve masses of soil moving down a slip face, usually the top of the bedrock.
Creep: is the slow, continuous, imperceptible downslope movement of soil and rock particles.
Slumps: result from the rotation of a cohesive unit of soil or rock down a slip surface, leaving a curved scarp.
Debris: flows develop on steep slopes as a result of heavy rainfall or rapid snow melt that saturates the soil, which under the extra weight and lubrication breaks loose and becomes a slurry that takes everything with it, including large trees and houses. Channeled debris flows can reach speeds approaching a hundred miles an hour and strike without warning.
Avalanche: is a term reserved for landslides composed of snow and ice.
D R A
F T

Hazard Mitigation Plan George Washington Regional Commission March 2012
4-18
Landslides are Virginia's most widespread geologic hazard. The most disastrous landslide events are associated with heavy rainfall along the steep slopes of the Blue Ridge Mountains and the Appalachians, but slumping, sliding, and creep can occur even on fairly gentle slopes if local conditions exceed the natural stability of the site. Areas that are prone to mass movement include areas of previous landslides; the bases of steep slopes, particularly slopes burned by forest and brush fires; the margins of drainages; and developed hillsides, particularly where septic systems are used. Research in North Carolina has revealed that about fifty-six percent of recent landslides happened on slopes that had been altered in some way by development. As is apparent in the Figure 4-10 below, landslide potential is considered high in Stafford County and moderate in King George County and low in Spotsylvania County, Caroline County and the City of Fredericksburg.
Past Occurrences Data regarding past occurrences of sinkholes and landslides in the Commonwealth of Virginia is somewhat sparse. Records indicate several instances of previous events having occurred in western portions of the state and in Richmond, with only very spotty sinkhole and landslide occurrences in the GWRC region. One such documented instance involved a sinkhole measuring approximately 10 feet across and occurred next to Route 17 Warrenton Road near Berea, VA on July 23, 2010 due to drainage infrastructure failure. A search of available data does not indicate previous landslide occurrences of any significance in the region. Likelihood of Future Occurrences Sinkholes and landslides are considered to be low probability, and potentially high-impact events. Although future occurrences of either hazard are possible in the region, determining such probabilities is virtually impossible.
Figure 4-10. Landslide Potential in Virginia. Red = high potential; orange = moderate potential; yellow = moderate to low potential; green = low potential
Source: Virginia Dept. of Mines, Minerals and Energy, http://www.dmme.virginia.gov/DMR3/landslides.shtml
D R A
F T

Hazard Mitigation Plan George Washington Regional Commission March 2012
4-19
F. Flooding and Erosion
Flooding
Flooding is the most frequent and costly natural hazard in the United States. Nearly 90 percent of presidential disaster declarations result from natural events in which flooding is a major component. Excess water from snowmelt, rainfall, or storm surge accumulates and overflows onto adjacent floodplains, the lowlands adjacent to rivers, lakes, and oceans that are subject to recurring floods. While many floodplain boundaries are mapped by FEMA’s National Flood Insurance Program (NFIP), floods sometimes go beyond the mapped floodplains or change courses due to natural processes (e.g., erosion, sedimentation, etc.) or human development (e.g., filling in floodplain or floodway areas, increased imperviousness within the watershed from new development, or debris blockage including cars, trailers, and propane tanks). All of the jurisdictions in the GWRC are mapped by the NFIP, and all participate in the NFIP (note that the Towns of Bowling Green and Port Royal participate through Caroline County). In addition, Stafford County participates in the Community Rating System (CRS Class 8). Since the floodplains in the United States are home to over nine million households, most property damage results from inundation by sediment and debris-filled water. There are four basic types of floods that afflict Virginia’s communities, depending on the region of the state examined: coastal flooding (tidal and storm surge), urban flooding, flash flooding, and riverine flooding. The GWRC region is most susceptible to urban flooding and flash flooding. Low-lying areas adjacent to rivers, streams, and creeks are susceptible to riverine flooding. In addition, portions of the Potomac and Rappahannock Rivers in the region are subject to tidal flooding. Urban flooding often occurs in highly impervious (pavement/rooftops/concrete) areas. Impervious surfaces do not allow water to be absorbed into the ground and increase the speed and amount of water that “runs off” property. When areas are without proper drainage, or storm drains become clogged, streets become streams and water gathers in low-lying areas. With enough rain, underpasses can rapidly fill trapping motorists and streets can accumulate enough water to submerge cars or carry them wherever the water flows. Flash floods occur quickly and in a short period of time. Rain falls at such a high rate that water does not have time to be absorbed into the ground. It flows downhill into ditches, lowlands and small streams. As the heavy rain continues, ditches overflow, drains back up, water ponds in lowlands and streams rise over their banks. Streams and creeks can become raging rivers in just minutes. Motorists are often surprised by flash floods, and unfortunately often become victims of the flash flood. More than half of flash flood deaths in the United States occur in automobiles. Riverine floods occur when heavy rains fall over a large area. In many cases in Virginia, it begins as widespread flash flooding of small streams. Approximately 60 percent of Virginia's river floods begin with flash flooding from tropical systems passing over or near the state. Riverine flooding also occurs because of successive rainstorms. Rainfall from any one storm may not be enough to cause a problem, but with each successive storm's passage over the basin, rivers rise until eventually they overflow their banks. If it is late winter or spring, melting snow in the mountains can produce added runoff that can compound flood problems. Embrey Dam
The Embrey Dam was constructed in 1910 along the Rappahannock in order to provide hydroelectricity to the Fredericksburg region, which it did for over 50 years. As the population of the area grew and the needs of the communities changed, the Embrey Dam was no longer needed. In an effort to re-open this waterway to migrating fish species, the decision was made to remove the dam. On February 23, 2004 a 100-foot section of the dam was blown open releasing its impounded water. The United States Army Corps of Engineers returned in 2005 to completely remove the Dam, including removal of sediment
D R A
F T

Hazard Mitigation Plan George Washington Regional Commission March 2012
4-20
buildup completely removed the dam in 2006, making the Rappahannock River a 185 mile free flowing river. The removal of the dam is not anticipated to alter the 100-year floodplain (Reinhart 2004). Past Occurrences Flooding of vacant land or land that does not have a direct effect on people or the economy is generally not considered a problem. Flood problems arise when floodwaters cover developed areas, locations of economic importance, infrastructure, and any other critical facility. There have been over 20 significant flash floods in the GWRC area between 1996 and 2003, which demonstrates the GWRC area’s susceptibility to future flooding events. The flash flooding and urban flooding that occurs is often brought on by powerful thunderstorms that can dump one to four inches of rain in a matter of a few hours. Small creeks and streams as well as overtaxed drainage systems often cannot cope with the quick influx of rain waters. Their banks can quickly overtop resulting in dozens of flooded roads as well as personal and private property damage. The Rappahannock River has had four major floods since the early-1970’s. These floods exceeded the flood stage by two to 21 feet. The “flood stage" refers to the height of the river or stream at which flooding and property damage begins. Once the water rises above flood stage, damage is expected. Under the right conditions, flood events can be exceptionally damaging. One such event occurred on February 22, 2003. Powerful rains coupled with a large amount of snowmelt produced flash flooding over the Spotsylvania, Fredericksburg and Stafford areas. The rain washed out dozens of roads and caused the closure of others because of standing water. There were also several reports of uprooted trees as well as personal and private property damage. See Section II for historical flooding data for each GWRC community. Likelihood of Future Occurrences The terms "10-year," "50-year," "100-year," and "500-year" floods are used to describe the estimated probability of a flood event happening in any given year. A 10-year flood has a 10 percent probability of occurring in any given year, a 50-year event has a two percent probability, a 100-year event has a one percent probability, and a 500-year event has a 0.2 percent probability. While unlikely, it is possible to have two 100-or even 500-year floods within years or months of each other. The potential for flooding can change and increase through various land use changes and changes to the land surface. A change in environment can create localized flooding problems inside and outside of natural floodplains through the alteration or confinement of natural drainage channels. These changes can be created by human activities or by other events, such as wildfires, earthquakes, or landslides.
Erosion
Shorelines along Virginia’s rivers and coasts are especially desirable building sites for homes and associated community businesses. These areas should be monitored for shoreline erosion. Shoreline erosion is accentuated by heavy rainfall and the increased wave activity associated with severe storms, such as tropical storms and hurricanes. Periods of significant erosion and flood events often occur simultaneously. In the GWRC region, areas along the banks of the Potomac and Rappahannock Rivers are most susceptible to erosion. The erosion rates (magnitude/severity) in the area are not well documented and vary year to year and storm to storm.
D R A
F T

Hazard Mitigation Plan George Washington Regional Commission March 2012
4-21
During severe storms, damage to structures might not be limited to flooding, but also might involve shoreline erosion from rising floodwaters or storm surges that result in the undermining and destruction of homes, businesses, roadways, bridges and utility lines. Scour, caused by storm water undermining bridge supports and foundations, is the number one destroyer of bridges. Bridge scour might compromise access by highway and rail service. Shoreline erosion is generally an ongoing hazard and does not typically occur in discrete events making reporting of previous occurrences generally impossible. Even so, significant storm events, including those such as Hurricane Isabel where storm surge and wave action are increased are likely to lead to periods of accelerated erosion. The likelihood of future occurrences is difficult to quantify for similar reasons. As long as there remains unprotected shoreline, erosion can be expected to continue into the future.
D R A
F T

Hazard Mitigation Plan George Washington Regional Commission March 2012
4-22
G. Non-Rotational Wind (i.e. Hurricanes and Thunderstorms)
Hurricanes and Tropical Storms
Hurricanes and tropical storms, as well as tropical depressions, are all tropical cyclones. According to the National Hurricane Center (NHC), once they have formed, tropical cyclones maintain themselves by extracting heat energy from the ocean at high temperatures and releasing heat at the low temperatures of the upper troposphere. Hurricanes and tropical storms bring heavy rainfall, storm surge, and high wind, all of which can cause significant damage. These storms can last for several days, and therefore have the potential to cause sustained flooding and high wind conditions. Of particular importance to communities susceptible to hurricane damage is the track of an approaching storm. Proximity and direction of hit are important when determining impacts and subsequent damage from the storm. Hurricane season in the North Atlantic runs from June 1st until November 30th, with the peak season between August 15 and October 15. The average hurricane duration is 12 to 18 hours. Wind speeds may be reduced by 50 percent within 12 hours. These storms are capable of producing a large amount of rain in a short period; as much as six to 12 inches of rain has occurred within a 12 to 16 hour period. The entire GWRC region is at risk for hurricane damage. In 1971, wind engineer Herbert Saffir and hurricane expert Dr. Robert Simpson developed a scale to classify hurricanes. The Saffir-Simpson scale rates the intensity of hurricanes based on wind speed and barometric pressure measurements. The National Weather Service uses the scale to predict potential property damage and flooding levels from imminent storms. Although the scale assigns a wind speed and surge level to each category of storm, in recent years, there has been more and more recognition of the fact that wind speed, storm surge and inland rainfall are not necessarily of the same intensity for a given storm. Therefore, there is some interest in classifying hurricanes by separate scales according to each of these risks. However, the Saffir-Simpson Scale is still the most widely used classification tool for hurricanes. The scale is outlined in Table 4-6.
D R A
F T

Hazard Mitigation Plan George Washington Regional Commission March 2012
4-23
Table 4-6. Saffir-Simpson Scale and Typical Damages.
Category Sustained Wind Speeds (mph)
Tidal Surge (ft)
Pressure (mb)
Typical Damage
Tropical Depression
<39 -- --
Tropical Storm 39-73 -- --
Hurricane 1 74-95 4-5 > 980
Minimal – Damage is done to shrubbery and trees, unanchored manufactured homes are damaged, some signs are damaged, no real damage is done to structures on permanent foundations.
Hurricane 2 96-110 6-8 965-980 Moderate – Some trees are toppled, some roof coverings are damaged, and major damage is done to manufactured homes.
Hurricane 3 111-130 9-12 945-965
Extensive Damage – Large trees are toppled, some structural damage is done to roofs, manufactured homes are destroyed, and structural damage is done to small homes and utility buildings.
Hurricane 4 131-155 13-18 920-945 Extreme Damage – Extensive damage to roofs, windows, and doors, roof systems on small buildings completely fail, some curtain walls fail.
Hurricane 5 > 155 > 18 < 920
Catastrophic Damage – Roof damage is considerable and widespread, window and door damage is severe, there are extensive glass failures, some buildings fail completely.
Source: National Weather Service, National Hurricane Center, 2005.
Over time, researchers and meteorologists have further refined the analysis of the wind damage that hurricanes can produce by differentiating the concept of sustained winds from peak gusts. Sustained winds are measured over longer periods of time, typically a minute. A peak gust is the highest two to five second wind speed.
D R A
F T

Hazard Mitigation Plan George Washington Regional Commission March 2012
4-24
1
2
3
4
5
6
7
10
9
17
14
20
22
15 2
1
13
12
8
19
16
11
18
Past Occurrences Historically, hurricanes have come close enough to Virginia to produce hurricane force winds (>74 mph) approximately three times every twenty years. Recently, the GWRC region’s communities were damaged by Hurricanes Floyd (September, 1999), Isabel (September, 2003) and Jeanne and Gaston (2004), Ernesto (2006, Irene (2011). Hurricane Floyd moved through the area dropping four to five inches of rain within 24 hours and generated winds in excess of 40 mph. Trees and power lines were knocked down, roads flooded; over 5,500 homes were left without power. Hurricane Isabel was much more destructive. Its impact on the Commonwealth of Virginia was staggering; resulting in $1.6 billion in damages with over 1,186 homes and 77 businesses completely destroyed 9,110 homes and 333 businesses with major damage and over 107,000 homes and 1,000 businesses with minor damage. Hundreds of power lines were blown down leaving almost two million electrical customers without power. Crop losses were calculated to be $59.3 million, with another $57.6 million in damages to farming infrastructure. Tropical Depression Ernesto struck the region on August 29, 2006. King George and Caroline County among others were declared as major disaster areas. There were 7 fatalities with total damages (not including economic losses) exceeding $118 million. Over six hundred homes were destroyed or damaged. The storm surge and excessive rain led to flooding throughout Northern Virginia. Tropical Storm Lee was a broad tropical disturbance originating in the Gulf of Mexico in the beginning of September and working its way north. The storm struck the state of Virginia on September 8 & 9, causing widespread damage. Nationally, the storm caused several deaths spurred numerous tornadoes (Official numbers have not been released as of yet, 12/6/2011). Within Virginia, the storm caused millions of dollars worth of damages. On November 17, 2011, Remnants of Tropical Storm Lee was declared a Major Disaster in Virginia by the President. This action makes Public Assistance available for reimbursement of disaster related costs. In evaluating the localized threat of hurricanes and tropical storms to the region, the MAC analyzed hurricane track data from the National Oceanic and Atmospheric Association (NOAA) from 1851 to 2008 to identify storms that have posed a threat to the area (Table 4-7). Based on these data, 30 storms, including hurricanes, tropical storms, tropical depressions, and extratropical storms tracked through or impacted the GWRC region during that time period. Of the 31 storms, eleven were tropical depressions and extra-tropical storms (winds <39 mph), and eleven were tropical storms (winds of 39-73 mph). In addition, the 2004 hurricane season was one of the most severe in recorded history. Five separate
Figure 4-11. Historic Hurricane Tracks, by Severity, in Vicinity of PD 16. Source: http://csc.noaa.gov/hurricanes/#app=1834&3e3d-selectedIndex=0
D R A
F T

Hazard Mitigation Plan George Washington Regional Commission March 2012
4-25
tropical cyclones (Charley, Frances, Ivan, Jeanne, and Gaston) of varying magnitude hit the eastern and Gulf coasts of the United States. It should be noted that the GWRC communities have been affected by storms that did not track across its borders. High winds and large rain events associated with passing storms have caused localized damage in the past. Examples include Hurricanes Camille (1969), Agnes (1972), Bertha (1996), Floyd (1999), and Gaston (2004).
Thunderstorms
Thunderstorms are defined as localized storms, always accompanied by lightning, and often having strong wind gusts, heavy rain and sometimes hail or tornadoes. Thunderstorms can produce a strong out-rush of wind known as a downburst, or straight-line winds which may exceed 120 mph. These storms can overturn mobile homes, tear roofs off of houses and topple trees. The entire GWRC region is at risk for thunderstorm damage. Approximately 10 percent of the thunderstorms that occur each year in the United States are classified as severe. A thunderstorm is classified as severe when it contains one or more of the following phenomena:
• Hail measuring ¾ inch or greater; • Winds gusting in excess of 50 knots (57.5 mph); or
• A tornado. • A severe thunderstorm watch is issued by the National Weather Service when the weather conditions
are such that a severe thunderstorm is likely to develop. This is the time to locate a safe place in the home and to watch the sky and listen to the radio or television for more information.
• A severe thunderstorm warning is issued when a severe thunderstorm has been sighted or indicated by weather radar. At this point, the danger is very serious and it is time to go to a safe place, turn on a battery-operated radio or television, and wait for the "all clear" from authorities.
Among the hazards that thunderstorms can bring is ground striking lightning. Lightning can strike up to 10 to 15 miles from the rain portion of the storm. The lightning bolt originates from the upper part of the thunderstorm cloud known as the anvil. A thunderstorm can grow up to eight miles into the atmosphere where the strong winds aloft spread the top of the thunderstorm cloud out into an anvil. The anvil can spread many miles from the rain portion of the storm, but it is still a part of that storm. Lightning from the anvil may strike several miles in advance of the rain. Lightning bolts may also come from the side or back of the storm, striking after the rain and storm may seem to have passed or hitting areas that received little or no rain. Past Occurrences There have been seven people injured and well over $100,000 in property damage caused by lightning strikes in the GWRC area between 1993 and 2003. The majority of the damage caused by lightning in the area involved home strikes, small brush fires, power line failures and animal deaths. For example, in June of 1994, lightning killed three cows and downed several trees and power lines in the GWRC area, resulting in over 7,500 residents left without power. A similar instance occurred in August of 1996 where lightning hit multiple power lines, transformers and homes. Minor property damage occurred and 2,100 people were left without power. Like many other natural hazards that can affect a very small area but have a large impact on the area affected, air-to-ground lightning strikes are likely to occur far more frequently than current statistics would indicate. This information is based upon best available data. HIRA research was done through the end of See Section II for historical thunderstorm data for each GWRC community.
D R A
F T

Hazard Mitigation Plan George Washington Regional Commission March 2012
4-26
Table 4-7. Historic Hurricanes in Vicinity of GWRC Communities, 1851 to 2008.
Month, Year Map Reference Name Pressure
(mb) Wind (mph)
Wind (knots)
Category*
1876 1 Not Named NA 58 50 TS
1878 2 Not Named NA 46 40 TS
1883 3 Not Named NA 92 80 H1
1885 4 Not Named NA 46 40 TS
1886 5 Not Named NA 40 35 TS
1893 6 Not Named NA 35 30 H2
1893 7 Not Named NA 40 35 TS
1899 8 Not Named NA 58 50 TS
1915 9 Not Named NA 46 40 TD
1927 10 Not Named NA 40 35 TS
1928 11 Not Named NA 46 40 TS
1929 12 Not Named NA 40 35 ET
1933 13 Not Named NA 58 50 TS
1939 14 Not Named NA 40 35 TD
1944 15 Not Named NA 40 35 TS
1945 16 Not Named 1012 35 30 TS
1954 17 Hazel 970 92 80 ET
1960 off map Camille NA 29 25 TD
1979 18 Bob 1010 23 20 TD
1981 19 Bret 1006 35 30 TD
1999 off map Floyd NA 69 60 H1
2000 off map Gordon 1006 29 25 TD
2003 off map Isabel 975 63 55 H1
2004 off map Charley And Bonnie H1
2004 off map Frances H1
2004 20 Ivan 1000 17 15 H1
2004 21 Jeanne 994 58 50 H1
2004 off map Gaston 1002 35 30 TD
2005 22 Cindy 1006 26 22.5 ET
2006 off map Ernesto 1008 46 40 TS
2008 off map Hanna 1007 35 30 H1
Source: National Weather Service, National Hurricane Center, 2005. Source: NOAA, National Hurricane Center, 2011 data * Category “Local” Hurricanes include: (# of regional occurrences)
H2 = Category 2 (96 – 100 mph) (1) H1 = Category 1 (74 – 95 mph) (8) TS = Tropical Storm (39 – 73 mph) (12) TD =Tropical Depression (17 – 38 mph) (7) ET = Extra-tropical Storm (3) NA – Data not available
D R A
F T

Hazard Mitigation Plan George Washington Regional Commission March 2012
4-27
Likelihood of Future Occurrences VDEM rates Virginia’s overall wind risk as “High,” and the GWRC communities are no exception. Historical occurrences of high winds generated by hurricanes and tropical storms are a strong indication of future events. With proper planning, the impact and amount of damage caused by high winds can be lessened. According to Minimum Design Loads for Buildings (ASCE 7-05), the design wind speed for the GWRC region is less than 90 mph (Figure 4-12. ASCE Design Wind Speeds for Virginia.).
Figure 4-12. ASCE Design Wind Speeds for Virginia. Source: VA State Plan.
D R A
F T
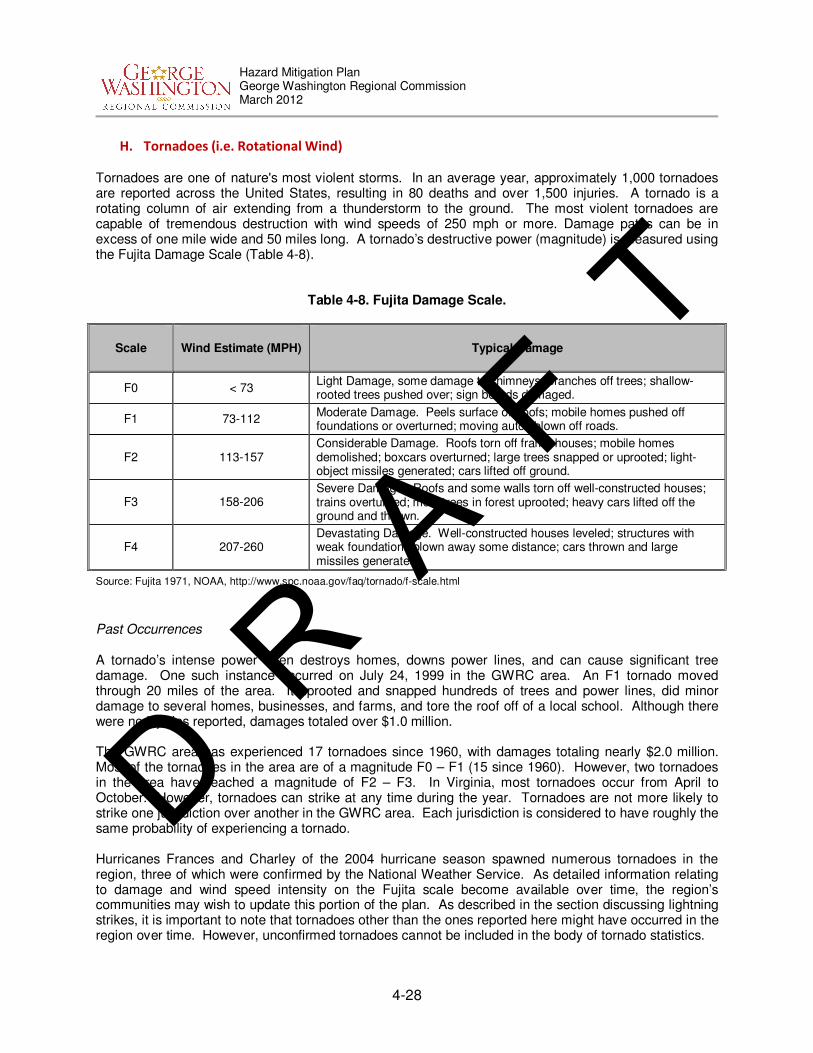
Hazard Mitigation Plan George Washington Regional Commission March 2012
4-28
H. Tornadoes (i.e. Rotational Wind)
Tornadoes are one of nature's most violent storms. In an average year, approximately 1,000 tornadoes are reported across the United States, resulting in 80 deaths and over 1,500 injuries. A tornado is a rotating column of air extending from a thunderstorm to the ground. The most violent tornadoes are capable of tremendous destruction with wind speeds of 250 mph or more. Damage paths can be in excess of one mile wide and 50 miles long. A tornado’s destructive power (magnitude) is measured using the Fujita Damage Scale (Table 4-8).
Table 4-8. Fujita Damage Scale.
Scale Wind Estimate (MPH) Typical Damage
F0 < 73 Light Damage, some damage to chimneys; branches off trees; shallow-rooted trees pushed over; sign boards damaged.
F1 73-112 Moderate Damage. Peels surface off roofs; mobile homes pushed off foundations or overturned; moving autos blown off roads.
F2 113-157 Considerable Damage. Roofs torn off frame houses; mobile homes demolished; boxcars overturned; large trees snapped or uprooted; light-object missiles generated; cars lifted off ground.
F3 158-206 Severe Damage. Roofs and some walls torn off well-constructed houses; trains overturned; most trees in forest uprooted; heavy cars lifted off the ground and thrown.
F4 207-260 Devastating Damage. Well-constructed houses leveled; structures with weak foundations blown away some distance; cars thrown and large missiles generated.
Source: Fujita 1971, NOAA, http://www.spc.noaa.gov/faq/tornado/f-scale.html
Past Occurrences A tornado’s intense power often destroys homes, downs power lines, and can cause significant tree damage. One such instance occurred on July 24, 1999 in the GWRC area. An F1 tornado moved through 20 miles of the area. It uprooted and snapped hundreds of trees and power lines, did minor damage to several homes, businesses, and farms, and tore the roof off of a local school. Although there were no injuries reported, damages totaled over $1.0 million. The GWRC area has experienced 17 tornadoes since 1960, with damages totaling nearly $2.0 million. Most of the tornadoes in the area are of a magnitude F0 – F1 (15 since 1960). However, two tornadoes in the area have reached a magnitude of F2 – F3. In Virginia, most tornadoes occur from April to October. However, tornadoes can strike at any time during the year. Tornadoes are not more likely to strike one jurisdiction over another in the GWRC area. Each jurisdiction is considered to have roughly the same probability of experiencing a tornado. Hurricanes Frances and Charley of the 2004 hurricane season spawned numerous tornadoes in the region, three of which were confirmed by the National Weather Service. As detailed information relating to damage and wind speed intensity on the Fujita scale become available over time, the region’s communities may wish to update this portion of the plan. As described in the section discussing lightning strikes, it is important to note that tornadoes other than the ones reported here might have occurred in the region over time. However, unconfirmed tornadoes cannot be included in the body of tornado statistics.
D R A
F T

Hazard Mitigation Plan George Washington Regional Commission March 2012
4-29
See Section II for historical tornado data for each GWRC community.
Likelihood of Future Occurrences Every locality in the GW Region has a medium-high to high tornado risk compared with the rest of the state; note that this risk is relatively low compared to other regions of the US (Figure 4-13).
Figure 4-13. Average Number of Tornadoes per Year. Source: VA State Plan.
D R A
F T

Hazard Mitigation Plan George Washington Regional Commission March 2012
4-30
Source: VDEM 2004
I. Winter storms and Nor’easters
Winter Storms
Winter storms can combine different types of precipitation including snow, freezing rain, and ice, as well as high winds, and cold temperatures. These storms can range from being a minor inconvenience to crippling, and potentially life-threatening events. Winter storms can be very disruptive, particularly in areas where they do not occur frequently. Strong winds with these intense storms can knock down trees, utility poles, and power lines. Heavy accumulations of ice can bring down trees, electrical wires, telephone poles and lines, and communication towers. These storms can disrupt communications and power for days while utility companies work to repair the potentially extensive damage. Even small accumulations of ice may cause extreme hazards to motorists and pedestrians. Heavy snow can immobilize a region and paralyze a community, stranding commuters, stopping the flow of supplies, and disrupting emergency and medical services. Accumulations of snow can collapse buildings and knock down trees and power lines. In rural areas, homes and farms may be isolated for days, and unprotected livestock may be lost. The cost of snow removal, repairing damages, and loss of business can also have a significant economic impact on communities.
It is quite common for the rain-snow line to fall right over Petersburg, Richmond, or Fredericksburg. Heavy snow often falls in a narrow 50-mile wide swath approximately 150 miles northwest of the low pressure center (see Figure 4-14 - Low pressure center or storm center is represented by an "L"). The GWRC area often finds itself within this 50-mile wide swath of dangerous winter weather.
Figure 4-14. Local Precipitation Map. D R
A F
T

Hazard Mitigation Plan George Washington Regional Commission March 2012
4-31
Past Occurrences It is also not uncommon for the GWRC area to experience sleet, freezing rain and ice storms. Table 4-9 identifies significant winter storm events in the GWRC region.
Table 4-9. Significant Winter Storm Events – GWRC Region.
Date Description
January 6-8, 1996
Much of the eastern seaboard received 1 to 3 feet of snow during the “Blizzard of ’96.” Wind gusts of over 50 mph were common and resulted in blizzard conditions for much of the east coast, including Virginia. Many areas of Virginia received over 20 inches of snow. Numerous accidents and flood related damages were reported in the area, along with 13 deaths in Virginia. Virginia, along with Ohio, Pennsylvania, Maryland, West Virginia and New York were declared Presidential Disaster Areas. All totaled, the blizzard and resulting flooding killed an estimated 187 people and caused approximately $3 billion in damages along the eastern seaboard.
January 25, 2000
A significant winter storm dumped over one foot of snow across much of central and eastern Virginia, with isolated amounts close to two feet. Caroline County reported over 12 inches of accumulation. There was also significant blowing and drifting of snow as winds gusted over 30 mph during the storm. This resulted in very hazardous conditions and snow drifts of 3 to 5 feet.
February 22, 2001
A winter storm dropped 2 to 5 inches of snow in the GWRC area. The amount of snow itself is not as significant as the amount of time in which it dropped. Several areas received a brief period of heavy snow at the beginning of the event, which created whiteout conditions. An interstate pileup of record proportions (131 vehicles) occurred in Stafford County on I-95 around 10:30 AM. Across Virginia, officers responded to 1520 crashes involving a total of 400 vehicles.
January 02, 2002
A winter storm dumped 7 to 8 inches of snow in Caroline County and other areas across central and eastern Virginia. Local law enforcement agencies reported numerous accidents and most schools were closed through January 4
th due to slippery road
conditions.
February 06, 2003
A winter storm produced 4 to 7 inches of snow across the piedmont of central Virginia and the Virginia Northern Neck. Some of the highest snow amounts in the region occurred in Caroline County. Very slippery road conditions lasted through February 7
th, resulting in
numerous accidents and school closings.
February 15, 2003
A winter storm produced 4 to 9 inches of snow, along with sleet and freezing rain, across central and eastern Virginia. Caroline County had some of the highest snow amounts with 9 inches of accumulation. Very hazardous road conditions lasted through February 18
th.
Local law enforcement agencies reported several accidents and schools in the area were closed.
February 5, 2004
A winter storm produced one to two tenths of accumulated ice on roads and surfaces. The ice coated surfaces downed power lines and felled trees. This resulted in school closures/delays, automobile accidents, and scattered power outages. In Stafford County, an automobile accident claimed the lives of two students as they travelled to school. A third student was seriously injured.
December 5, 2005 A winter storm produced 4 to 6.5 inches of heavy snow in Northern Virginia. The storm was a heavy wet snow that caused trees to fall and property damages of 40k.
D R A
F T

Hazard Mitigation Plan George Washington Regional Commission March 2012
4-32
February 12, 2006
A historic snowstorm occurred through the night of February 11th to the morning of the 12
th
in Northern and Central Virginia. Snowfall accumulation was between 8 and 14 inches. There were several instances of downed powerlines and trees due to the heavy snow, causing outages in some areas. Total outages were reported to be around 300,000 in the Greater Washington/Baltimore region. Amtrak reported major delays. Total property damage was estimated at 250k.
March 1, 2009 A winter storm produced up to nine inches of snow in Spotsylvania and Stafford Counties.
December 18, 2009
A winter storm produced between 19 and 23 inches of snow across the counties of Stafford and King George. President Obama and FEMA would declare this storm a natural disaster in February of the following year. The Commonwealth of Virginia received over 29 million in financial assistance to be spread across 48 counties and 10 independent cities for public assistance, snow removal, and hazard mitigation.
January 30, 2010 A winter storm produced between 5 and 12 inches of snow across Northern Virginia.
February 5, 2010
A winter storm produced between 8 and 17 inches across the region. Power outages were reported throughout the area due to the weight of the snow on trees and power lines. Total damage was estimated at 5k. Governor McDonnell declared a state of emergency and several schools in the area were closed through the following week.
Source: Watson 2004. NCDC 2011.
Likelihood of Future Occurrences There were six recorded winter storm events in the GWRC region between 1996 and 2003 (a seven year period), suggesting a near annual recurrence interval. Since 2003, there have been seven recorded winter events over a period of seven years. These storms exceeded five inches of accumulated snow or less than an inch of accumulated ice. Winter storms in the region have knocked down power lines, created slippery road conditions resulting in automobile accidents and fatalities, school closures, and delayed commutes. A particular storm in 2009 was declared as a natural disaster by the Commonwealth of Virginia and FEMA, resulting in over $29 million in financial assistance to the state for cleanup and payouts to private and public utility damages. The region has identified the probability of occurrence for winter storms as high.
Nor’easters
Northeasters are slow moving, low-pressure systems that typically form either in the Gulf of Mexico or in the Atlantic Ocean. Although typically associated with winter storm events, Northeasters can occur during anytime of the year. Low-pressure systems develop into storms that bring strong northeast winds, heavy rains/precipitation and storm surge to coastal areas. The winds and storm surge resulting from northeasters are generally less intense than that of hurricanes. However, unlike hurricanes, these storms can linger for several days over a given area allowing larger accumulations of precipitation as well as more damage to structures, since they are exposed to wind and flooding for longer periods of time. The Dolan-Davis Scale (1993), as presented in Table 4-10, was developed to identify and classify the damages that may occur during these storm events. This scale is a useful tool for estimating the damage potential of a northeaster. This scale is especially useful to those communities in the GWRC region that experience tidal flooding.
D R A
F T
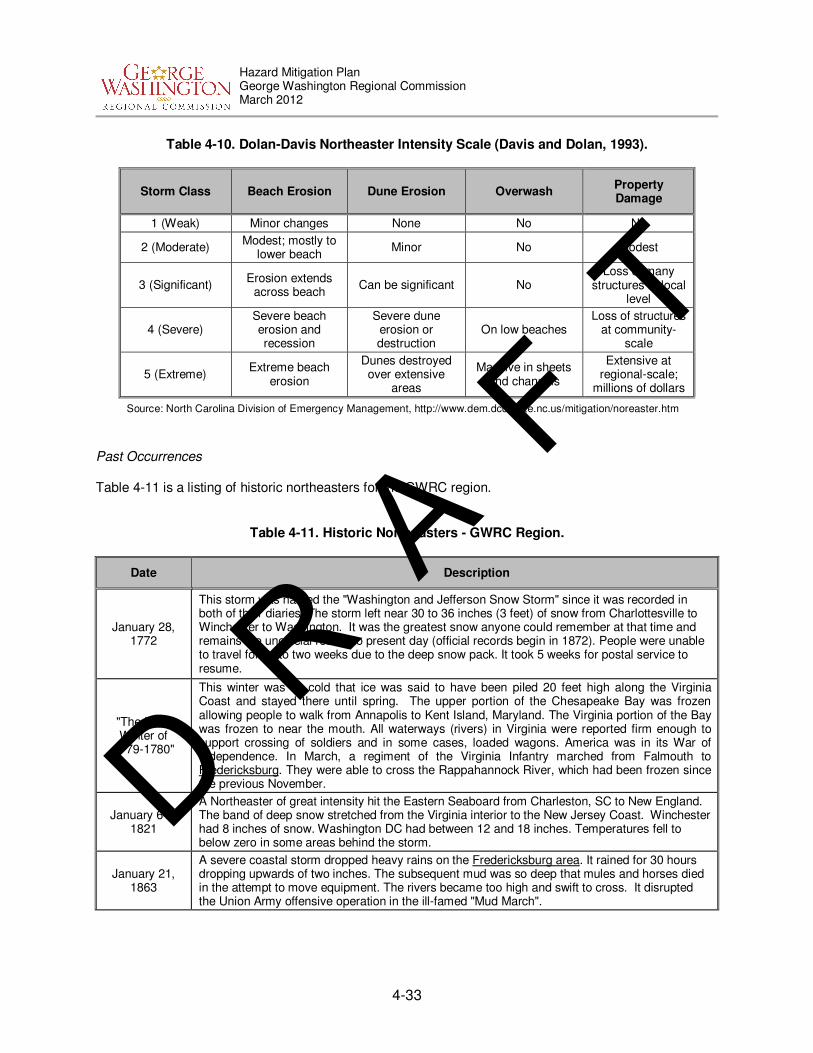
Hazard Mitigation Plan George Washington Regional Commission March 2012
4-33
Table 4-10. Dolan-Davis Northeaster Intensity Scale (Davis and Dolan, 1993).
Storm Class Beach Erosion Dune Erosion Overwash Property Damage
1 (Weak) Minor changes None No No
2 (Moderate) Modest; mostly to
lower beach Minor No Modest
3 (Significant) Erosion extends
across beach Can be significant No
Loss of many structures at local
level
4 (Severe) Severe beach erosion and recession
Severe dune erosion or destruction
On low beaches Loss of structures
at community-scale
5 (Extreme) Extreme beach
erosion
Dunes destroyed over extensive
areas
Massive in sheets and channels
Extensive at regional-scale;
millions of dollars
Source: North Carolina Division of Emergency Management, http://www.dem.dcc.state.nc.us/mitigation/noreaster.htm
Past Occurrences Table 4-11 is a listing of historic northeasters for the GWRC region.
Table 4-11. Historic Northeasters - GWRC Region.
Date Description
January 28, 1772
This storm was named the "Washington and Jefferson Snow Storm" since it was recorded in both of their diaries. The storm left near 30 to 36 inches (3 feet) of snow from Charlottesville to Winchester to Washington. It was the greatest snow anyone could remember at that time and remains the unofficial record to present day (official records begin in 1872). People were unable to travel for up to two weeks due to the deep snow pack. It took 5 weeks for postal service to resume.
"The Hard Winter of
1779-1780"
This winter was so cold that ice was said to have been piled 20 feet high along the Virginia Coast and stayed there until spring. The upper portion of the Chesapeake Bay was frozen allowing people to walk from Annapolis to Kent Island, Maryland. The Virginia portion of the Bay was frozen to near the mouth. All waterways (rivers) in Virginia were reported firm enough to support crossing of soldiers and in some cases, loaded wagons. America was in its War of Independence. In March, a regiment of the Virginia Infantry marched from Falmouth to Fredericksburg. They were able to cross the Rappahannock River, which had been frozen since the previous November.
January 6-7, 1821
A Northeaster of great intensity hit the Eastern Seaboard from Charleston, SC to New England. The band of deep snow stretched from the Virginia interior to the New Jersey Coast. Winchester had 8 inches of snow. Washington DC had between 12 and 18 inches. Temperatures fell to below zero in some areas behind the storm.
January 21, 1863
A severe coastal storm dropped heavy rains on the Fredericksburg area. It rained for 30 hours dropping upwards of two inches. The subsequent mud was so deep that mules and horses died in the attempt to move equipment. The rivers became too high and swift to cross. It disrupted the Union Army offensive operation in the ill-famed "Mud March".
D R A
F T

Hazard Mitigation Plan George Washington Regional Commission March 2012
4-34
Date Description
January 13-14, 1912
An arctic cold wave struck the region with subzero temperatures. Washington DC fell to -13°F, Quantico fell to -16°F, Fredericksburg -11°F, Culpeper -20°F, Lincoln (Loudoun County) -25°F, Woodstock -22°F, Harrisonburg -25°F , Staunton -12°F and Lexington -16°. In Rockingham County and Loudoun County these were the coldest temperatures ever recorded beating the arctic blast in February 1899.
February 15-16 and March 20-21, 1958
Over 14 inches of snow fell in Northern Virginia in the Washington area in a mid-February storm. Transportation was paralyzed. Two deaths in Virginia were attributed to the storm. Another Northeaster struck on March 21, dropping another 10 to 15 inches in the central mountains and across northern Virginia.
February 10-11, 1983
Known as the "Blizzard of '83", this storm event covered an unusually large area of Virginia with more than a foot of snow. The storm set a new 24-hour snowfall record in Lynchburg with 14.6 inches, Roanoke with 18.6 inches and Richmond with 16.8 inches. Richmond received 18 inches total and parts of Northern Virginia measured as much as 30 inches on the ground. Winds gusted over 25 mph all day on February 11 in the Richmond area causing three-foot high drifts. This was the third heaviest snowfall on record for Richmond for the last 100 years. The cost of clearing the snow from state roads came to $9 million.
February 2-3 and February
16, 1996, Storms
A continuing series of Alberta clippers followed by strong Northeasters struck the Commonwealth. The storm on February 2-3 dropped one to two feet of snow from Charlottesville to Fredericksburg and across the Northern Neck. 6 to 10 inches of snow fell to the north of the heavy snow band and significant icing occurred to the south of the band. Some counties along the North Carolina border saw approximately half of its population lose power. The ice caused approximately a half million dollars in damage and caused widespread disruptions in the Hampton Roads area. Following the fresh snow and ice came a cold wave from the 3rd through the 6th with many areas dropping below zero. On the 5th, several places set new records. Lynchburg set a new all-time record low temperature reaching -10° F and Burkes Garden recorded -22° F, which is one of the coldest temperatures ever recorded in Virginia. On the 16th, another Northeaster moved up the coast dumping 6 to 12 inches of snow in a swath across Virginia from Nottoway to Fredericksburg with Charlottesville on the west side of the heavy band and Richmond on the east side.
Winter of 1995-1996
Much of Virginia, mainly north and west of Richmond, had either a record seasonal snow total or a top three snowfall for the 20
th century. Lynchburg set a new record with 57 inches of snow and
Dulles with 62 inches. Blacksburg had 76 inches. Bluemont recorded 87 inches. Fredericksburg and the Northern Neck saw nearly 60 inches of snow. Roanoke recorded its third snowiest season with 53.4 inches.
January 24-25, 2000
The Northeaster spread heavy snow into Virginia during the night of the 24th and through the 25th. Storm warnings were posted for the late news on the 24th, but those who went to bed early without catching the news were startled to see the heavy white stuff falling in the morning. Several inches of snow was on the ground at daybreak, with winds gusting at 25 to 45 mph creating blizzard conditions in some areas. The region was at a standstill. Airports and transit systems were shut down. Schools were closed. Federal, state and county government offices were closed or quickly closed once the full impact of the storm was realized. Some federal employees in Northern Virginia who begin their commutes well before the government shutdown at 7 am were left battling the storm to attempt to return home. Drifts of four to five feet were common. Snow mixed with sleet and freezing rain in some of the eastern counties.
Source: VDEM 2011. Likelihood of Future Occurrences According to the neighboring emergency management agency of North Carolina, the frequency of major northeasters (class four and five on the Dolan-Davis Scale) has increased in recent years. In the period 1987 to 1993, at least one class four or five storm has occurred each year along the Atlantic seaboard of the United States, a situation duplicated only once in the last 50 years.
D R A
F T

Hazard Mitigation Plan George Washington Regional Commission March 2012
4-35
J. Multi-Hazard Correlation
While this plan investigates individual hazard history and occurrence, it should be noted that hazards typically occur together or result in other hazards later in time. For example, hurricanes are defined by sustained wind speed but not all hurricane damage is from wind. Heavy rains associated with these storms and storm surge generated by waters piled up on shore result in devastating flooding. The effects of natural hazards can last years after the initial devastating events. High wind events blow down trees, which can increase the wildfire hazard for years to come due to an increase in downed dead or dying woody debris. In addition, uprooted trees in low-lying or typically damp areas can cause other problems. The root bulb from the fallen tree can excavate large holes in the landscape, which when filled with rainwater can provide breeding grounds for mosquitoes.
K. Critical vs. Non-critical Hazards
Based on readily available data, local knowledge and observations, the steering committee performed a two-stage evaluation of above-mentioned hazards utilizing the Natural Hazard Ranking Sheet. First, they grouped the hazards into two categories; critical and non-critical hazards (Table 4-12). • Non-critical hazards: those hazards resulting in slight to negligible property damages (less than 25%
of critical and non-critical facilities and infrastructure); moderate to negligible quality of life lost; injuries or illnesses do not result in permanent disability and there are no deaths; and critical facilities are shut down for less than one week.
• Critical hazards: those hazards resulting in severe to moderate property damages (greater than 25% of critical and non-critical facilities and infrastructure); injuries or illnesses result in permanent disability and at least one death; and critical facilities are shut down for more than 1 week.
Secondly, the MAC, in conjunction with the consulting team, ranked each critical hazard based on the probability of occurrence (Table 4-12). Hazards that ranked critical with a medium to high probability of occurrence were then investigated further and a vulnerability analysis was performed.
L. Probability of Occurrence
The probability of occurrence of a hazard event provides an estimation of how often the event occurs. This is generally based on the past hazard events that have occurred in the area and the forecast of the event occurring in the future. This is done by assigning a probability factor, which is based on yearly values of occurrence. The numerical value assigned to each category will be used to determine the risk rating of each hazard. These values were assigned by high, medium, and low occurrence: • High – Frequent events with a well documented history of occurrence. Annual probability greater
than 1. • Medium – Occasional occurrences with at least two or more documented historic events. Annual
probability is between 0.1 and 0.99. • Low – Rare occurrences with at least one documented or anecdotal historic event. Annual
probability less than 0.1.
D R A
F T

Hazard Mitigation Plan George Washington Regional Commission March 2012
4-36
Table 4-12. Hazard Identification Results.
Caroline County Town of Bowling
Green Town of Port
Royal City of
Fredericksburg King George
County Spotsylvania
County Stafford County
Hazard type
Critical vs.
Non-Critical
Probability of
Occurrence
Critical vs. Non-Critical
Probability of Occurrence
Critical vs. Non-
Critical
Probability of
Occurrence
Critical vs. Non-Critical
Probability of
Occurrence
Critical vs. Non-
Critical
Probability of
Occurrence
Critical vs. Non-Critical
Probability of
Occurrence
Critical vs.
Non-Critical
Probability of
Occurrence
Dam Failure C L C L C L C N/A C L C L C L
Drought & Extreme Heat
NC M NC M NC M C M-H C M-H C M NC M-H
Earthquakes NC L NC L NC L NC M NC L-M NC M-L NC L
Flooding C L C L C L C H NC M-H NC H C H
Sinkholes and Landslides
NC L NC L NC L NC L-M NC L NC L NC L-M
Hurricanes and
Thunderstorms
NC H NC H NC H NC H NC H NC H NC H
Tornadoes C M-H C M-H C M-H C H C H C M-H C H
Wildfires C M-H C M-H C M-H C M-H C M C M C M-H
Winter storms and
Nor’easters C M-H C M-H C M-H C H C H C H C H
D R A
F T

Hazard Mitigation Plan George Washington Regional Commission March 2012
4-37
II. Community Specific Hazard Identification
This section presents the community-specific sections where those natural hazards that affect each member jurisdiction differently are discussed.
A. Hazard Identification: Caroline County, including the Towns of Bowling Green and Port Royal
For the 2012 plan update, the GWRC steering committee reviewed the 2010 Commonwealth of Virginia Hazard Mitigation Plan, as well as the hazard events over the preceding five years, and determined a hazard ranking for each of the hazards below. For this update, the committee chose to use the State’s Hazard Type language as an update to the 2006 hazard type, to ensure better alignment with the state’s rankings and methodologies. The new rankings can be seen below in Table 4-13. For Caroline County, Town of Bowling Green and Town of Port Royal, hazards that ranked high and medium-high were then investigated further and a vulnerability analysis was performed
Table 4-13. Prioritization of Natural Hazards – Caroline County, Towns of Bowling Green and Port Royal.
2006 Hazard Type 2012 Realigned
Hazard Type from State Plan
2012 Section Heading 2010 Hazard
Ranking from State Plan
2012 Hazard Ranking from
County
Dam Failure Dam Failure Dam Failure N/A Low
Drought Drought Drought and Extreme Heat
Medium
Medium
Extreme Heat Drought
Wildfire Wildfire Wildfires Medium Medium-High
Earthquakes Earthquakes Earthquakes Medium-Low Low
Expansive Soils Sinkholes Sinkholes and Landslides
Low
Low
Landslides Landslides
Flooding Flooding Flooding and Erosion Low Low
Hurricanes Non-Rotational Wind Non-Rotational Wind
Medium-High Medium
Thunderstorms Non-Rotational Wind Medium-High High
Tornadoes Rotational Wind Tornadoes Medium-High Medium-High
Northeasters Winter Storms Winter Storms and Nor’easters
Medium-High
Medium-High
Winter Storms Winter Storms
Wildfires In evaluating the localized threat of wildfires to Caroline County (including the Towns of Bowling Green and Port Royal), the MAC analyzed data documented by the Virginia Department of Forestry. These data included wildfires that occurred between the years 1995-2001 with a total number of acres burned, forest or non-forest, greater than 1 acre. Fires occurring on federal lands were not included. These past occurrences are presented in Table 4-14. Locally, the 77 wildfires have burned over 535 acres, with only one (1) incident resulting in a burn of over 40 acres. Based on information from 1995-2001, Caroline County averages 12.8 wildfires per year. From 2002-2008 there were 137 observed fires with an
D R A
F T

Hazard Mitigation Plan George Washington Regional Commission March 2012
4-38
additional burn of 348 acres. Based on that information over a 7-year period Caroline County averaged approximately 19.05 wildfires per year. Therefore, the probability of future occurrences is ranked as high.
Flooding
In evaluating the localized threat of hurricanes to Caroline County (including the Towns of Bowling Green and Port Royal), the MAC analyzed NOAA data from 1950-2010 to identify storms that may have posed a threat to the communities. The analysis included both floods and flash floods that impacted the region. These past occurrences are presented in Table 4-15. Flooding has caused:
• Property and road damage; • Displacement of individuals;
• Road closures; Historically there have only been six recorded flooding events in Caroline County. Therefore the probability of future occurrences is ranked as low.
Non-Rotational Wind (Hurricane and Thunderstorms)
In evaluating the localized threat of hurricanes to Caroline County (including the Towns of Bowling Green and Port Royal), the MAC analyzed NOAA hurricane track data from 1851 to 2004 to identify storms that may have posed a threat to the communities. The analysis included hurricanes, tropical storms, tropical depressions, and extratropical storms, which passed through the region and the effects on the local community. These past occurrences are presented in Table 4-16. Locally, the eleven (11) hurricanes have caused:
• Heavy rain; • Gusty and high sustained winds;
• Flooding and property damage; and
• Multiple power outages. In July of 2001 a thunderstorm produced lightning that injured two boys at a Boy Scout Jamboree at Fort A.P. Hill in Caroline County. The probability of future occurrences is ranked as medium. With 11 hurricanes occurring between 1954 and 2004, Caroline County experiences approximately 0.22 hurricanes per year D R
A F
T
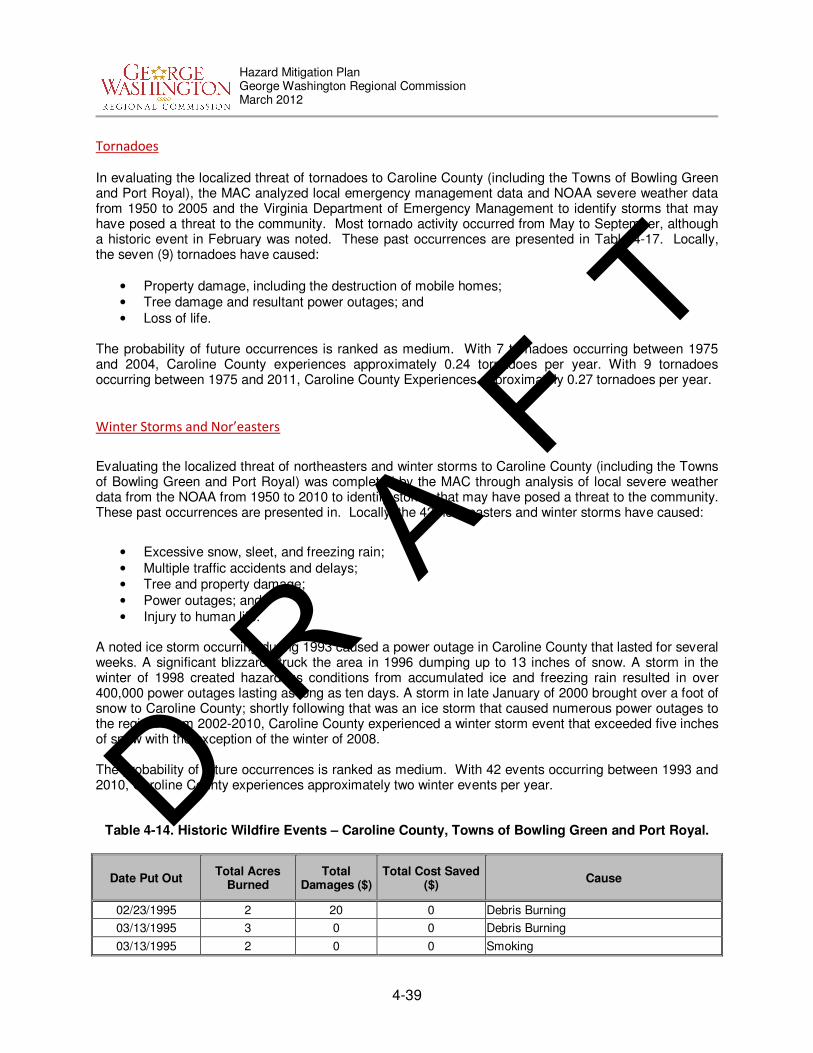
Hazard Mitigation Plan George Washington Regional Commission March 2012
4-39
Tornadoes
In evaluating the localized threat of tornadoes to Caroline County (including the Towns of Bowling Green and Port Royal), the MAC analyzed local emergency management data and NOAA severe weather data from 1950 to 2005 and the Virginia Department of Emergency Management to identify storms that may have posed a threat to the community. Most tornado activity occurred from May to September, although a historic event in February was noted. These past occurrences are presented in Table 4-17. Locally, the seven (9) tornadoes have caused:
• Property damage, including the destruction of mobile homes; • Tree damage and resultant power outages; and
• Loss of life. The probability of future occurrences is ranked as medium. With 7 tornadoes occurring between 1975 and 2004, Caroline County experiences approximately 0.24 tornadoes per year. With 9 tornadoes occurring between 1975 and 2011, Caroline County Experiences approximately 0.27 tornadoes per year.
Winter Storms and Nor’easters
Evaluating the localized threat of northeasters and winter storms to Caroline County (including the Towns of Bowling Green and Port Royal) was completed by the MAC through analysis of local severe weather data from the NOAA from 1950 to 2010 to identify storms that may have posed a threat to the community. These past occurrences are presented in. Locally, the 42 northeasters and winter storms have caused:
• Excessive snow, sleet, and freezing rain;
• Multiple traffic accidents and delays; • Tree and property damage;
• Power outages; and
• Injury to human life. A noted ice storm occurring during 1993 caused a power outage in Caroline County that lasted for several weeks. A significant blizzard struck the area in 1996 dumping up to 13 inches of snow. A storm in the winter of 1998 created hazardous conditions from accumulated ice and freezing rain resulted in over 400,000 power outages lasting as long as ten days. A storm in late January of 2000 brought over a foot of snow to Caroline County; shortly following that was an ice storm that caused numerous power outages to the region. From 2002-2010, Caroline County experienced a winter storm event that exceeded five inches of snow with the exception of the winter of 2008. The probability of future occurrences is ranked as medium. With 42 events occurring between 1993 and 2010, Caroline County experiences approximately two winter events per year.
Table 4-14. Historic Wildfire Events – Caroline County, Towns of Bowling Green and Port Royal.
Date Put Out Total Acres
Burned Total
Damages ($) Total Cost Saved
($) Cause
02/23/1995 2 20 0 Debris Burning
03/13/1995 3 0 0 Debris Burning
03/13/1995 2 0 0 Smoking
D R A
F T

Hazard Mitigation Plan George Washington Regional Commission March 2012
4-40
Date Put Out Total Acres
Burned Total
Damages ($) Total Cost Saved
($) Cause
03/16/1995 2 0 0 Incendiary
03/17/1995 2 0 0 Debris Burning
03/18/1995 2 75 0 Smoking
03/22/1995 3 0 0 Debris Burning
03/26/1995 2 0 0 Smoking
04/05/1995 7 0 0 Smoking
04/25/1995 1 0 0 Equipment Use
03/24/1996 2 0 0 Children
07/10/1996 13 0 0 Incendiary
02/20/1997 1 0 0 Railroad
02/27/1997 1 0 0 Incendiary
04/01/1997 18 0 0 Smoking
04/04/1997 1 0 0 Incendiary
04/04/1997 1 0 0 Incendiary
06/26/1997 2 0 0 Equipment Use
10/10/1997 3 0 0 Smoking
12/20/1997 3 0 0 Smoking
03/15/1998 1 0 0 Children
03/28/1998 22 0 0 Smoking
04/03/1998 28 0 0 Lightning
04/05/1998 1 0 0 Equipment Use
07/02/1998 1 0 0 Children
07/06/1998 3 0 0 Debris Burning
07/07/1998 1 0 0 Miscellaneous
07/07/1998 1 0 0 Smoking
07/20/1998 2 0 0 Incendiary
08/06/1998 1 0 200 Incendiary
09/05/1998 3 0 0 Smoking
09/05/1998 1 0 0 Smoking
09/07/1998 1 0 0 Smoking
09/07/1998 30 0 0 Miscellaneous
09/12/1998 1 0 0 Smoking
10/02/1998 1 0 0 Smoking
11/16/1998 1 0 0 Incendiary
11/29/1998 4 0 0 Debris Burning
11/30/1998 5 500 0 Smoking
12/06/1998 1 0 0 Smoking
12/08/1998 6 0 0 Incendiary
01/29/1999 2 0 0 Debris Burning
03/07/1999 3 0 0 Smoking
03/17/1999 14 0 0 Debris Burning
03/18/1999 1 0 0 Children
D R A
F T

Hazard Mitigation Plan George Washington Regional Commission March 2012
4-41
Date Put Out Total Acres
Burned Total
Damages ($) Total Cost Saved
($) Cause
04/08/1999 145 0 0 Miscellaneous
04/28/1999 3 0 0 Incendiary
05/01/1999 13 0 0 Miscellaneous
05/10/1999 2 0 0 Debris Burning
05/11/1999 1 0 0 Children
05/22/1999 3 0 0 Smoking
06/01/1999 1 0 0 Debris Burning
11/08/1999 3 0 0 Smoking
01/01/2000 1 0 0 Incendiary
05/19/2000 1 0 0 Miscellaneous
06/13/2000 3 0 0 Miscellaneous
10/31/2000 1 0 0 Debris Burning
11/07/2000 7 0 0 Debris Burning
12/05/2000 6 0 0 Railroad
01/04/2001 11 0 0 Debris Burning
01/30/2001 18 0 0 Debris Burning
02/06/2001 13 0 100 Debris Burning
02/08/2001 1 0 0 Miscellaneous
02/21/2001 1 0 0 Miscellaneous
02/21/2001 5 0 0 Debris Burning
03/14/2001 1 0 0 Smoking
03/16/2001 3 0 0 Miscellaneous
03/26/2001 1 0 0 Railroad
05/02/2001 1 0 0 Children
05/14/2001 15 0 0 Debris Burning
10/24/2001 3 0 0 Debris Burning
10/27/2001 3 0 0 Incendiary
10/27/2001 6 500 0 Debris Burning
10/27/2001 37 0 0 Equipment Use
10/28/2001 1 0 0 Debris Burning
11/05/2001 6 0 0 Incendiary
11/20/2001 13 0 0 Incendiary
2/1/2002 5 0 90000 Debris Burning—Rural Burner
2/2/2002 15 0 0 Utility Row
2/12/2002 2 0 300000 Hot Ashes
2/14/2002 2 0 0 Debris Burning—Rural Burner
2/16/2002 0.3 0 0 Smoking
2/21/2002 1 0 150000 Children—Juvenile
2/23/2002 1 200 250000 Children—Juvenile
3/6/2002 0.2 0 0 Utility Row
3/7/2002 0.5 0 150000 Smoking
3/7/2002 0.1 0 0 Equipment Use—Lawnmower
D R A
F T

Hazard Mitigation Plan George Washington Regional Commission March 2012
4-42
Date Put Out Total Acres
Burned Total
Damages ($) Total Cost Saved
($) Cause
3/8/2002 2 0 50000 Hot Ashes
3/10/2002 18 0 600000 Smoking
3/15/2002 5 0 250000 Debris Burning—Rural Burner
3/30/2002 0.2 0 0 Camping—Hot Ashes
4/9/2002 0.1 0 0 Child—Age 7-
4/16/2002 0.5 0 0 Electric Fence
5/16/2002 1 0 100000 Hot Ashes
5/17/2002 1.5 0 500000 Incendiary—Automobile
5/27/2002 1 0 100000 Children—Juvenile
6/2/2002 10 0 0 Prescribed Burn
6/5/2002 0.5 0 0 Smoking
8/4/2002 0.5 0 0 Debris Burning—Land Clearing
8/9/2002 0 0 0 Smoking
8/14/2002 1.5 2000 160000 Children—Juvenile
8/16/2002 8 0 0 Lightning
8/24/2002 2 0 0 Smoking
9/13/2002 0.2 0 0 Debris Burning—Rural Burner
11/30/2002 0.5 0 0 Utility Row
5/12/2003 4.6 0 200000 Railroad
12/23/2003 0.2 0 150000 Debris Burning
1/13/2004 0.1 0 0 Person in Car
2/17/2004 0 0 0 Person in Car
2/25/2004 0.2 0 50000 Hot Ashes
2/27/2004 0.1 0 10000 Smoking
2/28/2004 0.1 0 0 Smoking
2/29/2004 0.5 0 0 Debris Burning—Rural Burner
3/5/2004 0.1 0 0 Smoking
4/18/2004 0.1 0 0 Smoking
4/29/2004 0.2 0 0 Children—Juvenile
12/27/2004 1 0 150000 Debris Burning—Rural Burner
2/14/2005 1 0 0 Rural Burner
3/16/2005 0.3 0 0 Incendiary
4/6/2005 1.6 0 0 Debris Burning
4/15/2005 4 0 75000 Debris Burning
4/16/2005 9.5 0 50000 Debris Burning
4/18/2005 0.5 0 55000 Debris Burning
5/12/2005 1 0 0 Railroad
9/7/2005 0.1 0 0 Children—Juvenile
10/5/2005 0.2 0 300000 Smoking
11/5/2005 0.1 0 0 Equipment Use—Car
11/12/2005 1.5 0 500000 Utility Row
11/13/2005 0.5 0 0 Debris Burning—Rural Burner
D R A
F T

Hazard Mitigation Plan George Washington Regional Commission March 2012
4-43
Date Put Out Total Acres
Burned Total
Damages ($) Total Cost Saved
($) Cause
11/16/2005 0.1 0 0 Debris Burning—Rural Burner
2/2/2006 0.1 0 0 Debris Burning—Rural Burner
2/16/2006 0.3 0 0 Debris Burning—Rural Burner
3/5/2006 0.7 0 0 Debris Burning—Rural Burner
3/8/2006 0 0 0 Debris Burning—Rural Burner
3/10/2006 3 0 0 Debris Burning—Rural Burner
3/10/2006 0.2 0 50000 Debris Burning—Rural Burner
3/12/2006 1 0 0 Utility Row
3/16/2006 36 0 50000 Smoking—Cigar Ash
3/20/2006 0.2 0 0 Incendiary
3/27/2006 0.2 0 100000 Children—Juvenile
3/31/2006 0.1 0 0 Children—Juvenile
4/7/2006 0.1 0 0 Smoking
4/9/2006 0.5 0 0 Utility Row
4/13/2006 0.1 0 0 Debris Burning—Rural Burner
4/15/2006 0.2 0 0 Lightning
4/24/2006 0 0 0 Railroad
5/27/2006 0.2 0 0 Debris Burning—Rural Burner
7/31/2006 0 0 0 Automobile
8/17/2006 0.1 0 0 Smoking
8/19/2006 0.1 0 0 Smoking
8/27/2006 1 0 75000 Debris Burning—Rural Burner
12/6/2006 1 0 0 Hot Ashes
12/12/2006 1 0 0 Utility Row
2/5/2007 0.1 0 0 Debris Burning—Rural Burner
2/22/2007 0 0 0 Utility Row
3/3/2007 3.5 0 0 Smoking
3/6/2007 0 0 250000 Wood Furnace
3/12/2007 0 0 0 Smoking
3/19/2007 2 0 200000 Hot Ashes
3/23/2007 0 0 100000 Railroad
3/29/2007 0 0 0 Railroad
4/3/2007 0.1 0 0 Debris Burning—Rural Burner
4/25/2007 0.1 0 0 Smoking
6/1/2007 5.5 1000 0 Unknown
6/12/2007 0.1 0 0 Smoking
7/6/2007 0 0 0 Smoking
7/6/2007 0.1 0 0 Fireworks
7/8/2007 0 0 0 Smoking
7/18/2007 0 0 0 Utility Row
7/22/2007 0 0 0 Automobile
7/22/2007 0.1 0 0 Hot Ashes
D R A
F T
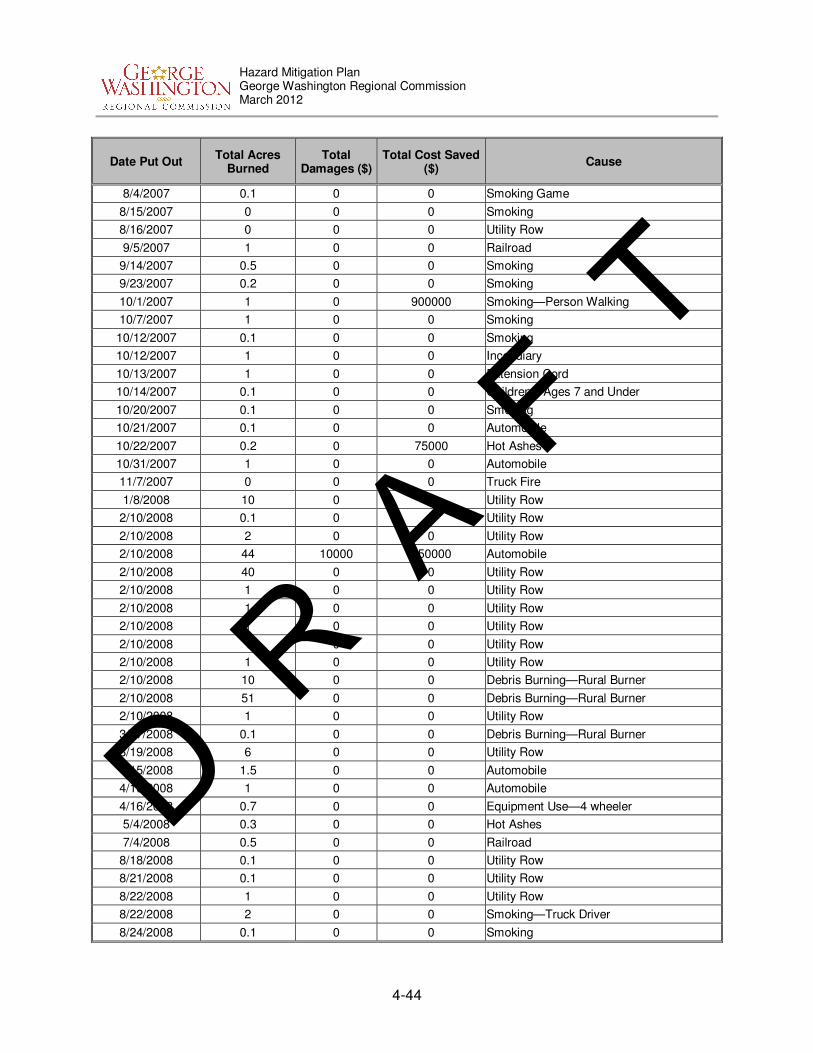
Hazard Mitigation Plan George Washington Regional Commission March 2012
4-44
Date Put Out Total Acres
Burned Total
Damages ($) Total Cost Saved
($) Cause
8/4/2007 0.1 0 0 Smoking Game
8/15/2007 0 0 0 Smoking
8/16/2007 0 0 0 Utility Row
9/5/2007 1 0 0 Railroad
9/14/2007 0.5 0 0 Smoking
9/23/2007 0.2 0 0 Smoking
10/1/2007 1 0 900000 Smoking—Person Walking
10/7/2007 1 0 0 Smoking
10/12/2007 0.1 0 0 Smoking
10/12/2007 1 0 0 Incendiary
10/13/2007 1 0 0 Extension Cord
10/14/2007 0.1 0 0 Children—Ages 7 and Under
10/20/2007 0.1 0 0 Smoking
10/21/2007 0.1 0 0 Automobile
10/22/2007 0.2 0 75000 Hot Ashes
10/31/2007 1 0 0 Automobile
11/7/2007 0 0 0 Truck Fire
1/8/2008 10 0 0 Utility Row
2/10/2008 0.1 0 0 Utility Row
2/10/2008 2 0 0 Utility Row
2/10/2008 44 10000 150000 Automobile
2/10/2008 40 0 0 Utility Row
2/10/2008 1 0 0 Utility Row
2/10/2008 1 0 0 Utility Row
2/10/2008 1 0 0 Utility Row
2/10/2008 1 0 0 Utility Row
2/10/2008 1 0 0 Utility Row
2/10/2008 10 0 0 Debris Burning—Rural Burner
2/10/2008 51 0 0 Debris Burning—Rural Burner
2/10/2008 1 0 0 Utility Row
3/17/2008 0.1 0 0 Debris Burning—Rural Burner
3/19/2008 6 0 0 Utility Row
4/15/2008 1.5 0 0 Automobile
4/16/2008 1 0 0 Automobile
4/16/2008 0.7 0 0 Equipment Use—4 wheeler
5/4/2008 0.3 0 0 Hot Ashes
7/4/2008 0.5 0 0 Railroad
8/18/2008 0.1 0 0 Utility Row
8/21/2008 0.1 0 0 Utility Row
8/22/2008 1 0 0 Utility Row
8/22/2008 2 0 0 Smoking—Truck Driver
8/24/2008 0.1 0 0 Smoking
D R A
F T

Hazard Mitigation Plan George Washington Regional Commission March 2012
4-45
Date Put Out Total Acres
Burned Total
Damages ($) Total Cost Saved
($) Cause
8/30/2008 0 0 0 Railroad
Totals 883.8 $14,295 $6,190,300
Source: Virginia Department of Forestry, 2009
Table 4-15. Historic Flooding Events – Caroline County. Towns of Bowling Green and Port Royal.
Table 4-16. Historic Hurricane Events – Caroline County, Towns of Bowling Green and Port Royal.
Storm Name
Date Category Total Est. Damage
Descriptions
Hazel October 15,
1954 Hurricane Unknown
The Free-Lance Star reported flooding and property damage.
Connie August 12,
1955 Hurricane Unknown
The Free-Lance Star reported flooding and property damage.
Diane August 17,
1955 Hurricane Unknown
The Free-Lance Star reported flooding and property damage.
Camille September
1960 Hurricane Unknown The Free-Lance Star reported massive flooding.
Date Event Comments
January 19,1996 Urban/Stream
Flood
Low lying areas of Caroline County roads experienced flooding from heavy rain and snow melt. Clogged storm drains further assisted this problem.
September 16, 1999 Flood
Caroline County received heavy rain from the remnants of Hurricane Floyd. Recorded rainfalls in the eastern portion of Caroline County exceeded 7 inches.
Several roads in the region were washed out.
The effects of Floyd were evident across the Commonwealth of Virginia and Maryland. The NCDC classified this as a 500-yr flood of record.
Agriculture losses and property damages were reported at an estimated value of 122K.
July 28, 2000 Flash Flood Heavy rains caused the flooding of secondary roads near Sparta in Caroline County.
March 20, 2003 Flood
Numerous roads closed across Caroline County and the surrounding areas due to high water. Roads closed included German School Road, Route 781, Route 615, Route 606, Route 644, Route 613, Route 658, Route 698, and Route 611.
June 26, 2006 Flash Flood Heavy rains caused the closure of portions of Rte. 625 near Central Point in Caroline County.
June 28, 2006 Flash Flood Heavy rains caused flash flooding and the closure of portions of Ladysmith Road near Bowling Green.
Source: National Climatic Data Center, 2011.
D R A
F T

Hazard Mitigation Plan George Washington Regional Commission March 2012
4-46
Floyd September
16, 1999 Tropical Storm
No estimate available.
Gusty winds from 30 to 50 mph
2 to 5 inches of rain
16,000 power outages
Isabel September
18, 2003 Tropical Storm
$55.1M– property
$130,000– crop
Highest sustained wind was73 mph
Uprooted thousands of trees and downed numerous power lines
Over 2 million Virginians without power
Charley
And Bonnie
August 18,
2004 Hurricane Unknown
Highest sustained wind was 73 mph
Uprooted trees and downed numerous power lines
Over 2 million Virginians without power
Heavy rain and wind gust
Frances September
8, 2004
Hurricane Unknown
Generated 9 tornadoes in Central Virginia
High winds
Large amounts of rainfall/flooding
Ivan September
17, 2004 Hurricane Unknown
Spawned unconfirmed tornadoes
Power outage (66,000)
Heavy rain/flooding
Jeanne September
28, 2004 Hurricane Unknown
Flash flooding/heavy rainfall
Power outage
Gaston August 30,
2004 Tropical
Depression Unknown
Hard rains that processed flooding
Roads under water
Power outage (99,600 statewide)
Source: NOAA 2004, VWC 2004, and local emergency management.
Table 4-17. Historic Tornado Events – Caroline County. Towns of Bowling Green and Port Royal.
Date Magnitude Property Damage
($) Descriptions
March 24, 1975
F1 25K NA
July 8, 1977 F0 25K NA
August 12, 1977
F0 25K NA
June 26, 1988
F0 0K NA
April 1, 1998
F2 200K
Supercell thunderstorm produced a tornado along a 9 mile path extending from near Coatesville in northwest Hanover County eastward into south central Caroline county southeast of Ruther Glen. The damage path was nearly continuous along this track, with damage intensity ranging from F0/F1 to strong F2/F3. Damage path ranged from approximately 200 yards wide to near one quarter of a mile wide at its widest.
Two mobile homes were destroyed in Caroline county. Several churches sustained damage, and several outbuildings were severely damaged or destroyed.
One minor injury in Caroline county.
September 8, 2004
F1 25K Town of Bowling Green - F1 tornado damaged or destroyed several buildings. Numerous trees downed or sheared.
This tornado tracked into King George County.
D R A
F T

Hazard Mitigation Plan George Washington Regional Commission March 2012
4-47
Date Magnitude Property Damage
($) Descriptions
September 17, 2004
F1 500K
F1 tornado downed numerous trees near Cosbys Corner. Many trees snapped off 10 feet above ground level. Cinderblock detached garage (30 x 32 foot) totally destroyed. Two vehicles damaged minor damage to home, and mobile home destroyed by falling tree.
F1 tornado downed numerous trees on Friendship Road. Many trees snapped off 10 feet above ground level. One tree fell on a house and caused significant damage.
Town of Port Royal - F1 tornado downed numerous trees near the intersection of Route 615 and Route 728 around Four Winds Golf Course. Many trees snapped off about 10 feet above ground level, and significant damage to 2 homes.
April 20, 2008
F0 15K
A supercell thunderstorm produced a tornado with F0 intensity 1 mile West South West of Sparta in Caroline County at around 15:45.
The tornado destroyed the roof and exterior siding of a resident’s garage blowing debris over a half-mile away.
Top speeds of this tornado were estimated between 75 and 85 mph.
April 26, 2011
F1 NA F1 tornado touches ground at Carmel Church in Caroline County. It travelled for a distance of one mile with a width of 100 yards. Wind gusts were recorded between 86 and 110 mph. Damage unknown.
Source: National Climatic Data Center, 2005; Virginia Department of Emergency Management, 2011 NA = Data not available.
Table 4-18. Historic Northeaster and Winter Storm Events – Caroline County. Towns of Bowling Green and Port Royal.
Date Event Property Damage
($) Comments
December 23, 1998
Ice Storm 20M
A major ice storm affected central and eastern Virginia from Wednesday, December 23rd into Friday, December 25th. A prolonged period of freezing rain and some sleet resulted in ice accumulations of one half inch /0.50/ to one inch /1.00/ in many locations. The heavy ice accumulations on trees and power lines caused widespread power outages across the region. Approximately 400,000 customers were without power during the maximum outage period, Christmas Eve day. Some customers were without power for about ten days. Many accidents occurred due to slippery road conditions, especially bridges and overpasses. Many secondary roads were impassable due to fallen tree limbs and in a few cases, whole trees.
January 8, 1999
Winter Weather
0
Sleet, freezing rain and freezing drizzle occurred off and on during Friday, January 8th across portions of the piedmont of central Virginia into the Virginia northern neck. This precipitation resulted in ice accumulations on many roads and bridges, and in turn, several accidents were reported.
D R A
F T

Hazard Mitigation Plan George Washington Regional Commission March 2012
4-48
Date Event Property Damage
($) Comments
January 15, 1999
Winter Weather
0
A strong arctic cold front moved slowly southeast across the Mid-Atlantic region from late on the 13th to midday on the 15th. By 9am on the 15th, ice accumulations from one quarter to nearly one inch occurred north of a line from Augusta County to Spotsylvania County. The ice this storm left behind had a large impact on the region. Hundreds of car accidents, slip and fall injuries, downed trees, and power outages were reported. In Stafford County, a jackknifed tractor trailer closed State Route 3 and 621, and Interstate 95 had to be temporarily shut down to clear fallen trees. Over 215,000 customers lost power from the storm across Northern Virginia, and Central Virginia reported over 6,000 additional outages.
March 9, 1999 Winter Storm 0
An area of low pressure moved from the Ohio Valley to North Carolina from late on the 8th through the evening of the 9th. Snowfall rates were in excess of 1 1/2 inches per hour in many locations during the storm. Stafford County received between 4 to 8 inches. Spotsylvania and King George County received between 2 and 6 inches. The City of Fredericksburg reported over 100 accidents. On Interstate 95 in Spotsylvania County, a woman was killed in a morning car accident.
The combination of a weakening storm over the Ohio Valley, and a developing storm off the South Carolina coast produced 2 to 5 inches of snow across portions of the Virginia piedmont eastward into the Virginia northern neck Tuesday afternoon into early morning Wednesday. Beaverdam in Hanover county and Hague in Westmoreland county received 5 inches of snow. Ruther Glen in Caroline county and King and Queen in King and Queen County received 4 inches of snow.
January 19, 2000
Winter Storm 0
An area of low pressure moved from west to east across the Mid-Atlantic region on the 20th, dropping 2 to 6 inches of snow between midnight and mid-afternoon. Gusty winds of 35 to 45 MPH developed during the afternoon causing the snow to drift across roadways and reduce visibilities in open areas.
Two to three inches of snow fell overnight as an area of low pressure passed south of the region. The highest amounts were measured along a line from Caroline county in the north, through the city of Richmond, then along the southern shore of the James River to near the Newport News area. Snow briefly fell heavily after midnight, creating hazardous driving conditions.
D R A
F T

Hazard Mitigation Plan George Washington Regional Commission March 2012
4-49
Date Event Property Damage
($) Comments
January 25, 2000
Winter Storm 0
A significant winter storm dumped over one foot of snow across much of central and eastern Virginia, with isolated amounts of up to 19 inches reported. There was also significant blowing and drifting of snow as winds gusted over 30 mph during the storm. The Richmond International Airport was closed during this storm. A very cold air mass built into the region after the storm, preserving the snowpack for over a week in many areas. Snow drifts of 3 to 5 feet were reported, especially in the south central Virginia counties of Dinwiddie, Brunswick, and Mecklenburg. Specific county totals were: Mecklenburg county 13 to 16 inches, Lunenburg county 13 to 14 inches, Brunswick county 12 inches, Nottoway county 12 to 15 inches, Dinwiddie county including Petersburg city 14 to 18 inches, Prince George county including Hopewell 10 to 15 inches, Chesterfield county including Colonial Heights 9 to 15 inches, Charles City county 15 inches, Henrico county including Richmond city 10 to 12.5 inches, New Kent county 16 inches, Hanover county 9 to 12 inches, King William county 12 to 16 inches, King and Queen county 14 to 16 inches, Caroline county 12 inches, Essex county 16 to 17 inches, Richmond county 11 to 12 inches, Westmoreland county 12 to 13 inches, and Northumberland county 12 inches.
January 30, 2000
Ice Storm 465K
Cold air was in place east of the Blue Ridge Mountains on the 29th and 30th, keeping surface temperatures below freezing. Low pressure moved from the Lower Mississippi Valley northeastward to the Mid-Atlantic region early on the 30th, creating the perfect conditions for freezing rain around the Fredericksburg area, a mix of sleet and snow east of Skyline Drive, and moderate snowfall in the mountains. Ice accumulations between 1/4 and 3/4 of an inch coated roads, trees, and power lines in Fredericksburg and Stafford, Spotsylvania, and King George Counties. Electrical outages were reported as trees and branches weighed down by ice fell onto power lines. Disruptions affected 3000 customers in Fredericksburg and Spotsylvania and King George Counties. At one point, 300,000 people were without power in the Richmond vicinity due to the weight of ice downing trees and power lines. One Richmond TV station was knocked off the air for 45 minutes Two people were reported injured in Richmond; one while cutting downed trees with a chainsaw, another in a sledding accident.
February 12, 2000
Winter Storm 0
A low pressure system tracked eastward from the Ohio valley and spread mainly light snow, sleet, and freezing rain across portions of central and eastern Virginia. Accumulations ranged from one to two inches, with one report of three inches of snow received from southern Louisa County. Warmer air moved in during the late afternoon and changed the precipitation over to rain. D R A
F T

Hazard Mitigation Plan George Washington Regional Commission March 2012
4-50
Date Event Property Damage
($) Comments
February 22, 2001
Winter Storm 0
This system produced mainly light to moderate snowfall across the region between 9 AM and 10 PM. Snowfall amounts ranged from 2 to 5 inches. A 50 vehicle crash occurred on the northbound lanes near Masaponax in Spotsylvania County. The accident occurred as motorists crested the top of a hill, hit near zero visibility, and slammed on their breaks. Three people were treated for serious injuries and another 18 suffered minor injuries. The highway remained closed for three hours while the wreckage was cleared. A 30 vehicle pileup occurred on the southbound lanes just north of the Falmouth/Route 17 interchange in Stafford County. As whiteout conditions struck, three cars slid into each other. Within seconds, the minor fender bender turned into a pileup including tractor trailers, cars, trucks, and an empty bus. Three people were injured and the highway was blocked for nearly three hours.
January 2, 2002
Winter Storm 0
A winter storm produced 5 to 8 inches of snow across the piedmont of central Virginia, the Virginia northern neck, the middle peninsula, and the Virginia eastern shore. Some specific higher snow totals included: City of Richmond 7-8", City of Colonial Heights 8", Gloucester Point in Gloucester county 8", Mechanicsville in Hanover county 8", Nassawadox in Northampton county 8", Parksley in Accomack county 7", and Ruther Glen in Caroline county 7.5". Local law enforcement agencies reported numerous accidents. Most, if not all schools in the area, were closed Thursday, January 3rd and Friday, January 4th due to very slippery road conditions.
January 19, 2002
Winter Storm 0
Low pressure that moved across North Carolina on the 19th brought mixed precipitation to the region between 6 AM and 11 PM. In most locations, the precipitation started off in the form of snow, then changed to a mix of sleet and rain around midday.
A winter storm produced a mixture of snow, sleet, and freezing rain across portions of central Virginia. Snowfall totals were 2 to 4 inches, except up to 5 inches occurred in parts of Fluvanna County. Local law enforcement agencies reported numerous accidents due to very slippery road conditions.
December 4, 2002
Winter Storm 0
A winter storm produced 4 to 7 inches of snow along with less than 1/4 inch of ice across the piedmont of central Virginia and the Virginia northern neck. Some specific higher snow totals included: Louisa in Louisa county 7", Cumberland in Cumberland county 6", Goochland in Goochland county 5.5", Blackstone in Nottoway county 6", Ruther Glen in Caroline county 5", Farmville in Prince Edward county 5", Powhatan in Powhatan county 5.5", Palmyra in Fluvanna county 5", Amelia in Amelia county 5", Ashland in Hanover county 4.5", King William in King William county 5", Tappahannock in Essex county 5", and Montross in Westmoreland county 4". Local law enforcement agencies reported numerous accidents. Most, if not all schools in the area, were closed Thursday, December 5th and Friday, December 6th due to very slippery road conditions.
December 11, 2002
Winter Weather/mix
0
Freezing rain caused minor ice accumulations on trees, power lines, bridges and overpasses across portions of the central Virginia Piedmont. A few power outages and accidents were reported.
D R A
F T

Hazard Mitigation Plan George Washington Regional Commission March 2012
4-51
Date Event Property Damage
($) Comments
January 6, 2003
Winter Weather/mix
0
A weak winter storm produced only a dusting to 1 inch of snow across portions of central and eastern Virginia. Some specific snow totals included: City of Hampton 1", Eastern Newport News 1", City of Suffolk 1", City of Norfolk 0.5", Pembrooke area of Virginia Beach 0.5", Gloucester in Gloucester county 0.5", and Ruther Glen in Caroline county 0.5". Accumulations from this storm were mostly on cars and grassy areas, with roadways remaining generally wet although some slush was reported.
January 14, 2003
Winter Weather/mix
0
A weak winter storm produced one half (0.5) to one and one half (1.5) inches of snow across portions of the Virginia northern neck, middle peninsula, and Hampton Roads area. Some specific snow totals included: Kilmarnock in Lancaster county 1.5", Saluda in Middlesex county 1.5", King and Queen in King and Queen county 1-1.5", City of Newport News 1", City of Williamsburg 1", Ruther Glen in Caroline county 0.75", and Wallops Island in Accomack county 0.5".
January 16, 2003
Winter Storm 0
A winter storm produced 4 to 8 inches of snow across portions of central and eastern Virginia. Some specific higher snow totals included: Toano in James City county 8", Northern portion of York county 8", Gloucester in Gloucester county 7", Deltaville in Middlesex county 6.5", Mathews in Mathews county 6.5", Chincoteague in Accomack county 6", City of Newport News 6", Eastville in Northampton county 5.5", City of Hampton 5", City of Williamsburg 5", Surry in Surry county 5", West Point in King and Queen county 5", and Mangohick in King William county 5". Local law enforcement agencies reported numerous accidents. Most, if not all schools in the area, were closed Friday, January 17th due to very slippery road conditions.
January 30, 2003
Winter Storm 0
A winter storm produced 3 to 5 inches of snow across portions of central Virginia. Some specific higher snow totals included: Crewe in Nottoway county 5", Farmville in Prince Edward county 4", Trenholm in Powhatan county 4", Gum Spring in Louisa county 4", Montpelier in Hanover county 4", Fife in Goochland county 4", Ashby in Cumberland county 4", and Ruther Glen in Caroline county 4". Local law enforcement agencies reported numerous accidents. Most, if not all schools in the area, were dismissed early on Thursday, January 30th due to very slippery road conditions.
February 6, 2003
Winter Storm 0
Low pressure tracked from the Gulf Coast to the Carolinas on the 6th then off the Atlantic coast on the 7th. This storm dropped light to moderate snow between the evening of the 6th and Noon on the 7th. Accumulations ranged from 3 to 7 inches.
A winter storm produced 4 to 7 inches of snow across the piedmont of central Virginia and the Virginia northern neck. The higher snow amounts occurred in Caroline, Cumberland, Essex, Fluvanna, Goochland, Hanover, and Louisa counties. Local law enforcement agencies reported numerous accidents. Most, if not all schools in the area, were closed Friday, February 7th due to very slippery road conditions.
D R A
F T
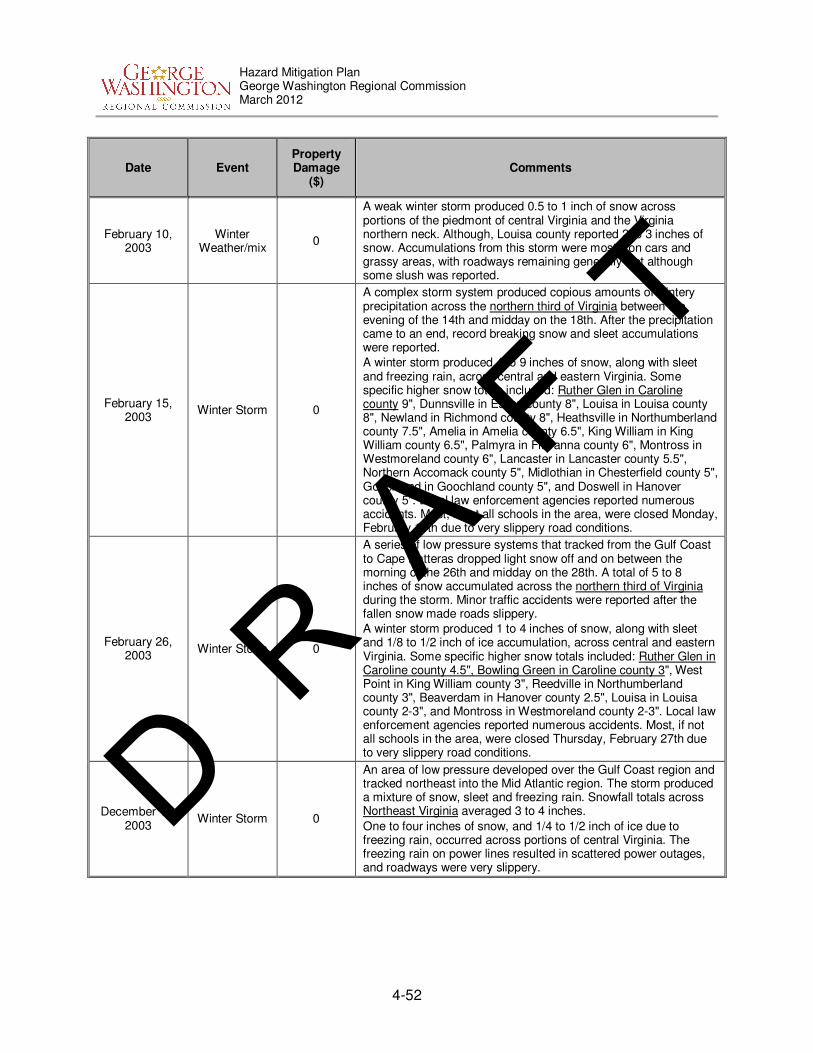
Hazard Mitigation Plan George Washington Regional Commission March 2012
4-52
Date Event Property Damage
($) Comments
February 10, 2003
Winter Weather/mix
0
A weak winter storm produced 0.5 to 1 inch of snow across portions of the piedmont of central Virginia and the Virginia northern neck. Although, Louisa county reported 2 to 3 inches of snow. Accumulations from this storm were mostly on cars and grassy areas, with roadways remaining generally wet although some slush was reported.
February 15, 2003
Winter Storm 0
A complex storm system produced copious amounts of wintery precipitation across the northern third of Virginia between the evening of the 14th and midday on the 18th. After the precipitation came to an end, record breaking snow and sleet accumulations were reported.
A winter storm produced 4 to 9 inches of snow, along with sleet and freezing rain, across central and eastern Virginia. Some specific higher snow totals included: Ruther Glen in Caroline county 9", Dunnsville in Essex county 8", Louisa in Louisa county 8", Newland in Richmond county 8", Heathsville in Northumberland county 7.5", Amelia in Amelia county 6.5", King William in King William county 6.5", Palmyra in Fluvanna county 6", Montross in Westmoreland county 6", Lancaster in Lancaster county 5.5", Northern Accomack county 5", Midlothian in Chesterfield county 5", Goochland in Goochland county 5", and Doswell in Hanover county 5". Local law enforcement agencies reported numerous accidents. Most, if not all schools in the area, were closed Monday, February 17th due to very slippery road conditions.
February 26, 2003
Winter Storm 0
A series of low pressure systems that tracked from the Gulf Coast to Cape Hatteras dropped light snow off and on between the morning of the 26th and midday on the 28th. A total of 5 to 8 inches of snow accumulated across the northern third of Virginia during the storm. Minor traffic accidents were reported after the fallen snow made roads slippery.
A winter storm produced 1 to 4 inches of snow, along with sleet and 1/8 to 1/2 inch of ice accumulation, across central and eastern Virginia. Some specific higher snow totals included: Ruther Glen in Caroline county 4.5", Bowling Green in Caroline county 3", West Point in King William county 3", Reedville in Northumberland county 3", Beaverdam in Hanover county 2.5", Louisa in Louisa county 2-3", and Montross in Westmoreland county 2-3". Local law enforcement agencies reported numerous accidents. Most, if not all schools in the area, were closed Thursday, February 27th due to very slippery road conditions.
December 14, 2003
Winter Storm 0
An area of low pressure developed over the Gulf Coast region and tracked northeast into the Mid Atlantic region. The storm produced a mixture of snow, sleet and freezing rain. Snowfall totals across Northeast Virginia averaged 3 to 4 inches.
One to four inches of snow, and 1/4 to 1/2 inch of ice due to freezing rain, occurred across portions of central Virginia. The freezing rain on power lines resulted in scattered power outages, and roadways were very slippery.
D R A
F T

Hazard Mitigation Plan George Washington Regional Commission March 2012
4-53
Date Event Property Damage
($) Comments
January 25, 2004
Winter Storm 0
An area of low pressure developed off the coast of North Carolina and tracked north. This storm produced widespread snow, sleet and freezing drizzle over the region. Two to four inches of snow fell over the Central Foothills and the Northern Piedmont of Virginia. The snow mixed with sleet and finally changed over to freezing drizzle before tapering off. Several other minor accidents occurred according to Emergency Operations Centers. Dozens of school districts closed.
Four to as much as six inches of snow and sleet fell across portions of central Virginia. Some higher amounts included: Farmville in Prince Edward county 6", Cumberland in Cumberland county 6", Montpelier in Hanover county 6", Columbia in Fluvanna county 5", Goochland in Goochland county 5", Glen Allen in Henrico county 5", and Tappahannock in Essex county 5". The snow and sleet produced very slippery roadways, which resulted in numerous accidents and school closings for a few days.
February 17, 2004
Winter Weather/mix
0 One half inch to two inches of snow fell across portions of central Virginia and the Virginia northern neck. The snow produced slippery roadways, which resulted in a few accidents.
December 19, 2004
Winter Weather/mix
0
One half inch to as much as three inches of snow fell across central and eastern Virginia. The snow produced slippery roadways, which resulted in several accidents. The highest amounts were reported at Lawrenceville in Brunswick county 3", Montross in Westmoreland county 3", South Hill in Mecklenburg county 2", and Sandston in Henrico county 2".
January 25, 2004
Winter Storm 0
Snow accumulation in Central Virginia reached as high as 6 inches.
The snow and sleet produced very slippery roadways, which resulted in numerous accidents and school closings for a few days.
February 17, 2004
Winter Weather/Mix
0
Snow accumulation of .5 to 2 inches occurred across portions of Central Virginia.
The snow produced slippery roadways, resulting in a few accidents.
December 19, 2004
Winter Weather/Mix
0
Snow accumulation of .5 to 3 inches fell across Central and Eastern Virginia.
The snow produced slippery roadways, resulting in several accidents.
January 19, 2005
Winter Weather/Mix
0
Snow accumulation of .5 to 2 inches occurred across portions of Central Virginia.
The snow produced slippery roadways, resulting in a few accidents.
January 21, 2005
Winter Weather/Mix
0
Snow accumulation of .5 to 3 inches fell across Central and Eastern Virginia.
The snow produced slippery roadways, resulting in several accidents
January 22, 2005
Winter Storm 0
Freezing rain produced .25 to .75 of an inch of ice across portions of Central Virginia.
The freezing rain caused power outages, and roadways were very slippery resulting in numerous accidents.
D R A
F T

Hazard Mitigation Plan George Washington Regional Commission March 2012
4-54
Date Event Property Damage
($) Comments
January 29, 2005
Winter Storm 0
A mixture of freezing rain, sleet, and snow produced .25 to .5 of an inch of ice and 1 inch of snow across Central Virginia.
The freezing rain on power lines caused outages, and roadways were slippery causing automobile accidents.
February 3, 2005
Winter Weather/Mix
0
Snow accumulation of .5 to 2 inches fell across the region. A few isolated areas reported close to 4 inches of snow.
The snow produced slippery roadways, resulting in several accidents.
February 24, 2005
Winter Storm 0
Snow accumulation of 2 to 4 inches fell across Central Virginia.
The snow produced slippery roadways, resulting in numerous accidents.
Bowing Green in Caroline County reported 3.5 inches of snow.
February 28, 2005
Winter Weather/Mix
0
Snow accumulation of .5 to 2.5 inches of snow fell across Central Virginia.
Ruther Glen in Caroline County reported 2 inches.
The snow produced slippery roadways, resulting in several accidents.
December 5, 2005
Winter Storm 0
A winter storm produced 4 to 7 inches of snow and sleet across Central Virginia.
Ruther Glen in Caroline County reported 4.5 inches of snow.
The snow caused hazardous driving conditions, resulting in several reported accidents.
February 12, 2006
Winter Storm 0
A winter storm produced 4 to as much as 8 inches of snow across Caroline County.
The highest amounts were reported in Corbin (8’’), Bowling Green (6”), Ruther Glen (5”), and Burruss Corner (4.3”).
The snow caused hazardous driving conditions, which resulted in numerous accidents.
April 7, 2007 Heavy Snow 0 Snow accumulation of 4 to 6 inches occurred in Central Virginia.
March 1, 2009 Winter Storm 0
Snowfall amounts were between 6 and 11 inches across Caroline County.
Several school closures were reported across the area.
January 30, 2010
Winter Storm 0 Snowfall amounts were between 8 and 12 inches across the county.
February 5, 2010
Winter Storm 0 Snowfall amounts were between 8 and 11 inches across Caroline County.
December 25, 2010
Winter Weather
0 Snowfall amounts were between 2 and 4 inches across Caroline County.
Source: National Climatic Data Center, 2011.
D R
A F
T

Hazard Mitigation Plan George Washington Regional Commission March 2012
4-55
B. City of Fredericksburg Hazard Identification
For the 2012 plan update, the GWRC steering committee reviewed the 2010 Commonwealth of Virginia Hazard Mitigation Plan, as well as the hazard events over the preceding five years, and determined a hazard ranking for each of the hazards below. For this update, the committee chose to use the State’s Hazard Type language as an update to the 2006 hazard type, to ensure better alignment with the state’s rankings and methodologies. Those rankings can be seen below in Table 4-19. For the City of Fredericksburg, hazards that ranked high were then investigated further and a vulnerability analysis was performed.
Table 4-19. Prioritization of Natural Hazards – City of Fredericksburg.
2006 Hazard type 2010 State Hazard
Type 2012 Section Heading
2010 State Ranking for City
of Fredericksburg
2012 Hazard Ranking by
City
Dam Failure N/A Dam Failure N/A N/A
Drought Drought Drought and Extreme Heat Medium-High Medium High
Extreme Heat Drought
Wildfire Wildfire Wildfires Medium-High Medium-High
Earthquakes Earthquakes Earthquakes Medium Medium
Expansive Soils Sinkholes
Sinkholes and Landslides
Medium-Low Medium-Low
Landslides Landslides Medium Medium
Flooding Flooding Flooding and Erosion High High
Hurricanes Non-Rotational Wind Non-Rotational Wind
High High
Thunderstorms Non-Rotational Wind High High
Tornadoes Rotational Wind Tornadoes High High
Northeasters Winter Storms Winter Storms and Nor’easters High High
Winter Storms Winter Storms
Flooding
Flooding is one of the most significant natural hazards faced by the City of Fredericksburg. The primary source of floodwaters affecting the City is riverine flooding from the Rappahannock River that occurs in conjunction with heavy rains associated with hurricanes, tropical storms and northeasters. Urban and flash flooding also affects the City. Flooding can occur during any season of the year. Listed in Table 4-20 and Table 4-21 are the significant flood events for the City of Fredericksburg along the Rappahannock River (FEMA 1979; NOAA 2004). Areas located with the 100-year flood boundary as delineated on the FEMA FIRM are at risk of flooding. Low-lying areas that border streams and creeks are particularly at risk. Any areas where waters can pond due to obstruction to the stormwater system are also susceptible to flooding. FEMA published a Flood Insurance Study (FIS) for the City of Fredericksburg dated January 1979, then provided an update in September, 2007. The Flood Insurance Rate Maps (FIRMs), which accompany this FIS, delineate the 100- and 500-year flood hazard boundaries for flooding sources within the City limits. Individual FIRM panels are available at the FEMA Map Service Center (http://msc.fema.gov/). The
D R A
F T

Hazard Mitigation Plan George Washington Regional Commission March 2012
4-56
FIS states that the 100-year base flood elevations for the Rappahannock River range from approximately 38 to 45 feet (referenced to the National Geodetic Vertical Datum, 1929). In addition, this study established a floodway for the Rappahannock River for its entire reach within the City. Noted Problem Areas The MAC representatives for the City of Fredericksburg noted two locations within the community where flooding was a known concern: the City Dock area and Kenmore Bottom. Within the City Dock area, located near Lower Sophia Street, structures have begun to flood prior to the Rappahannock River reaching flood stage (18 ft). During previous flood events, these structures noted flooding beginning at a stage of approximately 12 ft. Kenmore Avenue below the University of Mary Washington, also known as the Kenmore Bottom area, is prone to flash flood events. Residents within this area have noted basement flooding, impacts to the sanitary and storm sewer systems, and restricted access within the area due to flood waters overtopping roadways. The probability of future occurrences is ranked as high. A 100-year event has a one percent probability of occurring in any given year. The 100-year floodplains for the City of Fredericksburg have been identified.
Non-Rotation Wind (Hurricane and Thunderstorms
In evaluating the localized threat of hurricanes to the City of Fredericksburg, the MAC analyzed NOAA hurricane track data from 1851 to 2004 to identify storms that may have posed a threat to the community. The analysis included hurricanes, tropical storms, tropical depressions, and extratropical storms which passed through the region and the affected the local community. These past occurrences are presented in Table 4-22. Locally, the eleven (11) hurricanes have caused:
• Heavy rain;
• Gusty and high sustained winds; • Flooding and property damage; and
• Multiple power outages. In July of 2001 a thunderstorm produced lightning that struck a home injuring its resident in Fredericksburg. The probability of future occurrences is ranked as medium. With 11 hurricanes occurring between 1954 and 2004, the City of Fredericksburg experiences approximately 0.22 hurricanes per year.
Tornadoes
In evaluating the localized threat of tornadoes to the City of Fredericksburg, the MAC analyzed local emergency management data and NOAA severe weather data from 1950 to 2005 to identify storms that may have posed a threat to the community. Three tornado events are noted as crossing into the City limits. The most costly event occurred in 1999 and caused approximately $20,000 worth of damage. As stated in other community-specific sections numerous tornadoes have occurred across the region. These past occurrences are presented in Table 4-23. Locally, the three (3) tornadoes have caused:
D R A
F T

Hazard Mitigation Plan George Washington Regional Commission March 2012
4-57
• Excessive winds and lightning;
• Large hail; and
• Tree and property damage.
The probability of future occurrences is ranked as medium. With three tornadoes occurring between 1999 and 2004, the City of Fredericksburg experiences approximately 0.6 tornadoes per year.
Winter Storms
In evaluating the localized threat of northeasters and winter storms to the City of Fredericksburg, the MAC analyzed local NOAA severe weather data from 1851 to 2004 to identify storms that may have posed a threat to the community. These past occurrences are presented in Table 4-24. Locally, the 24 northeasters and winterstorms have caused:
• Excessive snow, sleet, and freezing rain; • Multiple traffic accidents and delays;
• Tree and property damage;
• Power outages; and • Injury and loss of life.
The probability of future occurrences is ranked as medium. With 24 events occurring between 1993 and 2004, the City of Fredericksburg experiences approximately 2.8 winter events per year.
Table 4-20. FIS - Summary of Significant Flood Events – City of Fredericksburg.
Flood Discharge 1(cfs) Frequency Interval
1 (yrs) * Crest
2(ft)
May 27, 1771 N/A N/A --
June 1, 1889 96,000 45 32.2
May 23, 1901 N/A N/A 27.2
May 13, 1924 66,900 16 25.1
October 1, 1924 N/A N/A 22.8
April 26, 1937 134,000 125 39.1
October 16, 1942 140,000 145 42.6
August 19, 1955 N/A N/A 26.9
June 22, 1972 107,000 60 39.1
June 29, 1995 N/A N/A 25.1
September 8, 1996 N/A N/A 26.9 1 City of Fredericksburg Flood Insurance Study dated, January 1979
2 NOAA advanced Hydrologic Prediction Service http://ahps.erh.noaa.gov/cgi-bin/ahps.cgi?lwx&fedv2#Historical * The flood stage for the Rappahannock River is 18.0 feet
D R A
F T

Hazard Mitigation Plan George Washington Regional Commission March 2012
4-58
Table 4-21. Historic Flood Events – City of Fredericksburg.
Date Event Comments
September 3, 2000 Flash Flood
The City of Fredericksburg was hit especially hard by flash flooding after a total of 2.24 inches of rain fell.
Several residents of homes and ground floor apartments reported damaged from rapidly rising water that entered the structures through sewer systems, basement windows, and doors.
Several motorists had to be rescued from their cars after driving into flooded sections of roadway. Some cars were submerged up to their windshields in water.
High water blocked access to Mary Washington Hospital.
A 4-foot-deep sinkhole appeared along Snowden Hills Boulevard after the deluge.
July 10, 2003 Flash Flood
In Fredericksburg, an apartment building was struck by lightning.
Also, two homes in Normandy Village on Woodford Street caught fire after being hit by lightning.
Lightning also damaged asphalt on William Street at Sunken Road. Cowan Boulevard was closed by flooding.
July 13, 2005 Flash Flood
In Fredericksburg, reports of flooding occurred in the early evening.
Fall Hill Avenue closed due to high water.
There were reports of additional flooding on roads leading to Mary Washington Hospital. Several cars stalled at the hospital entrance.
August 25-26, 2006 Flash Flood
Persistent rain across a 5 day period resulted in double digit rainfall totals across Northern Virginia.
There were extensive power outages across the region and the VRE was temporarily inoperable.
In Fredericksburg, the Rappahannock River was out of its banks at the Falmouth Bridge on U.S. 1.
At Alum Springs Park a woman and her children stalled their pickup truck.
Total estimates of property damage were 10K.
Source: NOAA 2011
Table 4-22. Historic Hurricane Events – City of Fredericksburg.
Storm Name
Date Category Total Est. Damage
Descriptions
Hazel October 15,
1954 Hurricane Unknown The Free-Lance Star reported flooding and property damage.
Connie August 12,
1955 Hurricane Unknown The Free-Lance Star reported flooding and property damage.
Diane August 17,
1955 Hurricane Unknown The Free-Lance Star reported flooding and property damage.
Camille September
1960 Hurricane Unknown The Free-Lance Star reported massive flooding.
Floyd September
16, 1999 Tropical Storm
No estimate available.
Gusty winds from 30 to 50 mph
2 to 5 inches of rain
16,000 power outages
D R A
F T

Hazard Mitigation Plan George Washington Regional Commission March 2012
4-59
Storm Name
Date Category Total Est. Damage
Descriptions
Isabel September
18, 2003 Tropical Storm
$55.1 million – property
$130,000 – crop
Highest sustained wind was73 mph
Uprooted thousands of trees and downed numerous power lines
Over 2 million Virginians without power
Charley
And Bonnie
August 18,
2004 Hurricane Unknown
Highest sustained wind was 73 mph
Uprooted trees and downed numerous power lines
Over 2 million Virginians without power
Heavy rain and wind gust
Frances September
8, 2004
Hurricane Unknown
Generated 9 tornadoes in Central Virginia
High winds
Large amounts of rainfall/flooding
Ivan September
17, 2004 Hurricane Unknown
Spawned unconfirmed tornadoes
Power outage (66,000)
Heavy rain/flooding
Jeanne September
28, 2004 Hurricane Unknown
Flash flooding/heavy rainfall
Power outage
Gaston August 30,
2004 Tropical
Depression Unknown
Hard rains that processed flooding
Roads under water
Power outage (99,600 statewide)
Source: NOAA 2004, VWC 2004, and local emergency management.
Table 4-23. Historic Tornado Events – City of Fredericksburg.
Date Magnitude Property Damage
($) Descriptions
July 24, 1999
F1 20K
Spotsylvania County tornado crossed over the City of Fredericksburg Warm and humid air ahead of a cold front combined to produce scattered thunderstorms across the northern half of Virginia from midday through sunset.
The first batch of thunderstorms developed over Rockingham County around 12:30 PM EDT and moved eastward to the Potomac River by 3:00 PM EDT. These storms produced winds in excess of 55 MPH, large hail, frequent lightning, and a tornado that crossed parts of Orange, Spotsylvania, and Stafford County.
A tornado developed near Lake of the Woods in Orange County. It stayed on the ground for 20 miles and moved across northern Spotsylvania County, the city of Fredericksburg, and the northwest portion of Stafford County. The tornado was of F1 strength for most of its path, occasionally weakening to F0 strength in some locations.
Next, the storm passed directly over the southern half of the city of Fredericksburg, downing several more trees and power lines, blocking roads and knocking power out for 12,000 customers. Nine buildings in the city were significantly damaged.
D R A
F T

Hazard Mitigation Plan George Washington Regional Commission March 2012
4-60
May 7, 2004
F1 10K
At 7:51 p.m., an F1 tornado touched down near Shiloh. At least a dozen dwellings and 10 boats were damaged. Several trees were also uprooted or had their tops ripped out along the storm’s three-mile path. In Stafford County, 80 to 90 mph winds destroyed two homes and caused major damage to 20 others. The Japazawas Subdivision in eastern Stafford County had approximately 40 trees down. Three Amtrak trains were stalled between the Chatham area of Stafford and Fredericksburg due to downed trees and power lines. In Spotsylvania County, the main stage at the re-enactment of the Battle of Spotsylvania collapsed due to strong winds. A number of tents and a couple of portable toilets were also blown over. Estimated damages were $10,000.
September 17, 2004
F1 0K A thunderstorm moved from Spotsylvania County into the eastern portion of the City of Fredericksburg. No property damage was reported, with debris scattered along Dixon Street.
Source: National Climatic Data Center, 2005; NOAA 2004 and VDEM
Table 4-24. Historic Northeaster and Winter Storm Events – City of Fredericksburg.
Date Event Rain Fall (in.)
Comments
December 28, 1993
Heavy Snow 0
January 28, 1995 Heavy Snow 0
January 9, 1996 Heavy Snow 0 Low and mid-level lift ahead of an "Alberta Clipper" added insult to injury only a day after the "Blizzard of '96", dumping 4 inches of snow in a 5 hour period near the tidal Potomac River.
January 12, 1996 Heavy Snow 350K
Less than one week after the crippling "Blizzard of '96", a new winter storm dumped substantial snow across northern and western Virginia.
The snow changed to freezing rain and sleet along the tidal Potomac River shortly before tapering off. The changeover suppressed accumulations to 4 or 5 inches in this region. In other portions of northern Virginia, snowfall totals were as follows: in the piedmont, 5 to 7 inches; at higher elevations, 6 to 10 inches.
In southern Stafford Co (VAZ055), a woman was injured when a carport collapsed. Luckily, she was protected from serious injury by the automobile, which had its windows shattered.
February 2, 1996 Heavy Snow 0
A vigorous upper level jet stream induced low-level lifting of warm moist air over a stationary arctic front extending from Tidewater Virginia through the Tennessee Valley early on the 2nd, producing a 75 mile-wide band of heavy snow which extended from the central piedmont through the Northern Neck region.
The heaviest snows fell in a narrow band from northern Albemarle Co through King George Co. Accumulations in these areas ranged from 8 to 13 inches, and snowfall rates were as high as 3 inches per hour.
February 2, 1996 Heavy Snow 0
The continuation of a strong upper-level jet stream, combined with additional mid-level dynamics, generated surface low pressure over central Georgia by evening on the 2nd. As the low moved to near Cape Hatteras overnight, a broad area of heavy snow overspread all of northern Virginia. Areas that received 4 to 13 inches during an early morning event (on the 2nd) picked up an additional 4 to 6 inches, leaving most areas from the central piedmont through the northern neck with a grand total of 12 to 18 inches.
D R A
F T

Hazard Mitigation Plan George Washington Regional Commission March 2012
4-61
Date Event Rain Fall (in.)
Comments
February 16, 1996
Heavy Snow 0
A strong "Alberta Clipper", diving southeast from the upper Midwest into the deep south, linked up with subtropical moisture lurking along the southeast U.S. coast to develop a classic nor'easter, which moved from northeast South Carolina to off the Virginia Capes during the day on the 16th. As the area of low pressure intensified, it wrapped Atlantic moisture well to the west, where modified arctic air was pouring in from southern Canada. The result was a thin band of heavy snow which extended from southwest Virginia through the upper eastern shore of Maryland.
February 8, 1997 Heavy Snow 25K A winter storm dumped 4 to 8 inches of heavy, wet snow across all of northern and western Virginia on the 8th.
January 14, 1999 Winter
Weather 0
A strong arctic cold front moved slowly southeast across the Mid-Atlantic region from late on the 13th to midday on the 15th. By 9am on the 15th, ice accumulations from one quarter to nearly one inch occurred north of a line from Augusta County to Spotsylvania County. The ice this storm left behind had a large impact on the region. Hundreds of car accidents, slip and fall injuries, downed trees, and power outages were reported. In Stafford County, a jackknifed tractor trailer closed State Route 3 and 621, and Interstate 95 had to be temporarily shut down to clear fallen trees. Over 215,000 customers lost power from the storm across Northern Virginia, and Central Virginia reported over 6,000 additional outages.
March 9, 1999 Winter Storm 0
An area of low pressure moved from the Ohio Valley to North Carolina from late on the 8th through the evening of the 9th. Snowfall rates were in excess of 1 1/2 inches per hour in many locations during the storm. Stafford County received between 4 to 8 inches. Spotsylvania and King George County received between 2 and 6 inches. The city of Fredericksburg reported over 100 accidents. On Interstate 95 in Spotsylvania County, a woman was killed in a morning car accident.
January 20, 2000 Winter
Weather 0
An area of low pressure moved from west to east across the Mid-Atlantic region on the 20th, dropping 2 to 6 inches of snow between midnight and mid-afternoon. Gusty winds of 35 to 45 MPH developed during the afternoon causing the snow to drift across roadways and reduce visibilities in open areas.
January 25, 2000 Northeaster 0
Low pressure off Cape Hatteras rapidly intensified late on the 24th and developed into a nor'easter which tracked northward along the Eastern Seaboard on the 25th. Very heavy snow and near-blizzard conditions were seen throughout the day east of the Blue Ridge Mountains, resulting in extremely hazardous travel conditions. Wind gusts of up to 45 MPH were recorded and several roads were drifted shut by blowing snow. The governor of Virginia declared a state of emergency as the storm battered the eastern part of the state. D R A
F T

Hazard Mitigation Plan George Washington Regional Commission March 2012
4-62
Date Event Rain Fall (in.)
Comments
January 30, 2000 Ice Storm 0
Cold air was in place east of the Blue Ridge Mountains on the 29th and 30th, keeping surface temperatures below freezing. Low pressure moved from the Lower Mississippi Valley northeastward to the Mid-Atlantic region early on the 30th, creating the perfect conditions for freezing rain around the Fredericksburg area, a mix of sleet and snow east of Skyline Drive, and moderate snowfall in the mountains. Ice accumulations between 1/4 and 3/4 of an inch coated roads, trees, and power lines in Fredericksburg and Stafford, Spotsylvania, and King George Counties. Electrical outages were reported as trees and branches weighed down by ice fell onto power lines. Disruptions affected 3000 customers in Fredericksburg and Spotsylvania and King George Counties.
February 12, 2000
Winter Weather
0
Low pressure moved from Tennessee to the North Carolina Coast on the 12th, spreading snow across the Central Shenandoah Valley and the Northern and Central Piedmont. Periods of light snow occurred from sunrise to late afternoon with accumulations ranging from 1 to 5 inches. A period of freezing drizzle also occurred around sunset.
December 13, 2000
Winter Weather
0
A strong cold front brought chilly air into the region on the 12th. By the afternoon of the 13th, an upper level disturbance brought warm air into the mid levels of the atmosphere and caused snow that fell from the system to melt to rain on its way down. When the rain hit the ground where temperatures were below freezing, ice accumulated.
February 22, 2001
Winter Storm 0
This system produced mainly light to moderate snowfall across the region between 9 AM and 10 PM. Snowfall amounts ranged from 2 to 5 inches. A 50 vehicle crash occurred on the northbound lanes near Masaponax in Spotsylvania County. The accident occurred as motorists crested the top of a hill, hit near zero visibility, and slammed on their breaks. Three people were treated for serious injuries and another 18 suffered minor injuries. The highway remained closed for three hours while the wreckage was cleared. A 30 vehicle pileup occurred on the southbound lanes just north of the Falmouth/Route 17 interchange in Stafford County. As whiteout conditions struck, three cars slid into each other. Within seconds, the minor fender bender turned into a pileup including tractor trailers, cars, trucks, and an empty bus. Three people were injured and the highway was blocked for nearly three hours.
January 3, 2002 Winter Storm 0
Low pressure tracked across extreme southeast Virginia during the morning of the 3rd. This storm brought light to moderate snowfall to the Central Piedmont and Fredericksburg areas between 5 AM and 3 PM. In Stafford County, an inch of snow caused slippery roads and delayed school openings. In Spotsylvania and King George Counties, snowfall totals ranged from 3 to 5 inches.
January 19, 2002 Winter
Weather 0
Low pressure that moved across North Carolina on the 19th brought mixed precipitation to the region between 6 AM and 11 PM. In most locations, the precipitation started off in the form of snow, then changed to a mix of sleet and rain around midday.
December 5, 2002
Winter Storm 0
This storm produced accumulating snowfall across the entire region as it moved by. Across the Central Piedmont and Fredericksburg area, freezing rain and sleet was mixed in with the snow. The snow and sleet accumulations ranged from 4 to 6 inches in this area.
D R A
F T

Hazard Mitigation Plan George Washington Regional Commission March 2012
4-63
Date Event Rain Fall (in.)
Comments
February 6, 2003 Winter Storm 0
Low pressure tracked from the Gulf Coast to the Carolinas on the 6th then off the Atlantic coast on the 7th. This storm dropped light to moderate snow between the evening of the 6th and Noon on the 7th. Accumulations ranged from 3 to 7 inches.
February 14, 2003
Winter Storm 8.9M
A complex storm system produced copious amounts of wintery precipitation across the northern third of Virginia between the evening of the 14th and midday on the 18th. After the precipitation came to an end, record breaking snow and sleet accumulations were reported.
February 26, 2003
Winter Weather/mix
0
A series of low pressure systems that tracked from the Gulf Coast to Cape Hatteras dropped light snow off and on between the morning of the 26th and midday on the 28th. A total of 5 to 8 inches of snow accumulated across the northern third of Virginia during the storm. Minor traffic accidents were reported after the fallen snow made roads slippery.
December 14, 2003
Winter Weather/mix
0
An area of low pressure developed over the Gulf Coast region and tracked northeast into the Mid Atlantic region. The storm produced a mixture of snow, sleet and freezing rain. Snowfall totals across Northeast Virginia averaged 3 to 4 inches.
January 25, 2004 Winter
Weather/mix 0
An area of low pressure developed off the coast of North Carolina and tracked north. This storm produced widespread snow, sleet and freezing drizzle over the region. Two to four inches of snow fell over the Central Foothills and the Northern Piedmont of Virginia. The snow mixed with sleet and finally changed over to freezing drizzle before tapering off. Several other minor accidents occurred according to Emergency Operations Centers. Dozens of school districts closed.
Source: National Climatic Data Center, 2005.
D R A
F T

Hazard Mitigation Plan George Washington Regional Commission March 2012
4-64
C. King George County Hazard Identification
For the 2012 plan update, the GWRC steering committee reviewed the 2010 Commonwealth of Virginia Hazard Mitigation Plan, as well as the hazard events over the preceding five years, and determined a hazard ranking for each of the hazards below. For this update, the committee chose to use the State’s Hazard Type language as an update to the 2006 hazard type, to ensure better alignment with the state’s rankings and methodologies. Those rankings can be seen below in Table 4-25. For King George County, hazards that ranked high and medium-high were then investigated further and a vulnerability analysis was performed.
Table 4-25. Prioritization of Natural Hazards – King George County.
2006 Hazard type 2010 State Hazard
Type 2012 Section Heading
2010 State Hazard
Ranking for King George
County
2012 Hazard Ranking from King George
County
Dam Failure N/A Dam Failure N/A Low
Drought Drought Droughts and Extreme Heat Medium-High Medium-High
Extreme Heat Extreme Heat
Wildfire Wildfire Wildfires Medium Medium
Earthquakes Earthquakes Earthquakes Medium-Low Medium-Low
Expansive Soils Sinkholes Sinkholes and Landslides Low Low
Landslides Landslides
Flooding Flooding Flooding and Erosion Medium-High Medium-High
Hurricanes Non-Rotational Wind Non-Rotational Wind High High
Thunderstorms Non-Rotational Wind
Tornadoes Rotational-Wind Tornadoes High High
Northeasters Winter storms Winter Storms and Nor’easters High High
Winter Storms Winter storms
Drought
According to the National Climatic Data Center, there have been fourteen drought events reported in GWRC region between January 1, 1950 and July 30, 2005. These past occurrences are presented in Table 4-26. Locally, droughts have caused:
• Requests to the Governor for disaster status; • Voluntary and mandatory reductions in water usage;
• Reduction in crop yields:
• Grazing losses;
• Increase in forest and brush fires; and • Reduction in streamflow and water table.
D R A
F T

Hazard Mitigation Plan George Washington Regional Commission March 2012
4-65
The probability of future occurrences is ranked as medium. According to the National Weather Service, Climate Prediction Center, drought development in the GWRC region, including King George County, is likely through December 2005.
Wildfire
In evaluating the localized threat of wildfires to King George County, the MAC analyzed data from the Virginia Department of Forestry from 1995 to 2008 and Local Emergency Management (prior to 1995) to identify incidents that may have posed a threat to the community. These past occurrences are presented in Table 4-27 and Table 4-28. Locally the 39 wildfires have burned over 3600 acres across King George County. The 39 fires across a 45 year time period relates to an average of .86 fires per year. Therefore, the probability of future occurrences is ranked as medium.
Flooding
In evaluating the localized threat of floods to King George County, the MAC analyzed data from the NOAA from 1950-2010 to identify incidents that may have posed a threat to the community. These past occurrences are presented in Table 4-29. There have only been five floods in the area since 1950. The probability of future occurrences is ranked as medium-high.
Non-Rotational Wind (Hurricanes and Thunderstorms) In evaluating the localized threat of hurricanes to King George County, the MAC analyzed NOAA hurricane track data from 1851 to 2004 to identify storms that may have posed a threat to the community. The analysis included hurricanes, tropical storms, tropical depressions, and extratropical storms which passed through the region and affected the local community. These past occurrences are presented in Table 4-30. Locally, the eleven (11) hurricanes have caused:
• Heavy rain;
• Gusty and high sustained winds; • Flooding and property damage; and
• Multiple power outages. Hurricane Isabel, occurring in 2003, resulted in trees down over every road in the County. Debris removal was the initial problem in getting roads open for use. Several roads took three to four days to clear. There was low to moderate damage to hundreds of homes. Fortunately, no families were displaced, although approximately 200 citizens utilized the shelter during the storm. Ice and water were requested from the State. Power outages around the County lasted for up to 15 days. Hurricane Frances, occurring in 2004, spawned at least two tornadoes which caused minor damage to five homes in the Berry Planes subdivision. Again in 2004, Hurricane Ivan spawned two tornadoes which caused moderate damage to 25 homes in the Lake Jefferson subdivision and surrounding areas of Igo Road and Little Chatterton Lane. Tropical Storm Lee was a broad tropical disturbance originating in the Gulf of Mexico in the beginning of September and working its way north. More than 20 inches of rain fell between September 8 & 9 throughout Virginia. The rain caused flooding, washed out roads, and toppled trees. King George County Service Authority suffered about $40,000 in losses according to Deputy Emergency Management
D R A
F T

Hazard Mitigation Plan George Washington Regional Commission March 2012
4-66
Coordinator Steven Lynd1. On November 17, 2011, Remnants of Tropical Storm Lee was declared a
Major Disaster in Virginia by the President. This action makes Public Assistance available for reimbursement of disaster related costs. The probability of future occurrences is ranked as medium. With 11 hurricanes occurring between 1954 and 2004, the King George County experiences approximately 0.22 hurricanes per year.
Tornadoes
In evaluating the localized threat of tornadoes to King George County, the MAC analyzed local emergency management data and NOAA severe weather data from 1950 to 2010 to identify storms that may have posed a threat to the community. Most tornado activity occurred from May to September, although a historic event in February was noted. These past occurrences are presented in Table 4-31. Locally, the nine (9) tornadoes have caused:
• Property damage, including the destruction of boats;
• Tree damage and resultant power outages; and
• Loss of life. Multiple tornadoes during the 2004 season caused damage throughout the County:
• A tornado in Waugh Point Area destroyed one house with three occupants inside, uprooted huge trees, twisted tops out of huge trees, and rolled 15 large boats off trailers at marina. Significant damage was noted to a second house.
• A tornado started at Port Conway near Montigue Baptist Church and continued to Shiloh area. There was moderate damage to the church, extensive tree damage, and debris from trees in roadways.
• A tornado came from Caroline County across the Rappahannock River and moved through the Sealston area just missing the Sealston Elementary school. The tornado continued into Stafford County where there was extensive home damage in a subdivision. Debris from damaged trees caused minor cosmetic damage to some homes.
• A tornado came from Caroline County across Dogue to Rokeby and continued through Lake Jefferson subdivision and down to Little Chatterton Lane. There was moderate damage to 35 homes from falling trees. One home on Windy Hill was partially destroyed when the roof was lifted off and walls blown out of the garage. Debris from trees was moderate except for isolated roads in the Lake Jefferson subdivision, specifically Daws Drive and Igo Road.
The probability of future occurrences is ranked as medium. With 9 tornadoes occurring between 1960 and 2010, the King George County experiences approximately 0.21 tornadoes per year.
Winter Storms
In evaluating the localized threat of winter storms to King George County, the MAC analyzed local NOAA severe weather data from 1950 to 2005 to identify storms that may have posed a threat to the community. These past occurrences are presented in Table 4-32. Locally, the 29 northeasters and winterstorms have caused:
• Excessive snow, sleet, and freezing rain;
1 County Reimbursed for Expenses for Damages from Tropical Storm Lee. Cathy Dyson. November, 22, 2011.
D R A
F T

Hazard Mitigation Plan George Washington Regional Commission March 2012
4-67
• Multiple traffic accidents and delays;
• Tree and property damage;
• Power outages; and
• Injury and loss of life. A noted winter event in January 2000 cause power outages to over 3,000 customers in King George County, the City of Fredericksburg; and Spotsylvania County. The probability of future occurrences is ranked as medium. With 24 events occurring between 1993 and 2004, King George County experiences approximately 2.8 winter events per year.
Table 4-26. Historic Drought Events – King George County.
Date Crop
Damage ($)
Descriptions
August 14, 1980
0 Via resolution, King County Board of Supervisors requested that the Governor of Virginia declare King George County a disaster area due to drought.
September 1, 1983
0 Via resolution, King County Board of Supervisors requested that the Governor of Virginia declare King George County a disaster area due to drought.
September 15, 1988
0 Via resolution, King County Board of Supervisors requested that the Governor of Virginia declare King George County a disaster area due to drought.
August 7, 1995
0
Dry weather, combined with periods of excessive heat, caused some damage to several crops, and limited the production of healthy livestock, during a month-long period that extended through mid-September. August, normally one of the wettest months, was the sixth-driest on record at Washington/National Airport (Arlington County), with barely seven-eighths of an inch (normal: 3.91 inches). Across the region, monthly precipitation averaged one to two inches, with virtually all of it falling before August 7th. The drought continued into mid-September, when it was alleviated somewhat by steady rains late on the 16th and early on the 17th. However, mean temperatures were much lower in September, ironically due to drier air masses, which allowed temperatures to plummet into the 50s on several mornings. Nonetheless, Washington/National broke an all-time record for consecutive days without measurable precipitation, with 33.
February 18, 1997
0 Via resolution, King County Board of Supervisors requested that the Governor of Virginia declare King George County a disaster area due to drought.
August 1, 1998
0
Persistent high pressure brought unusually dry weather during the entire month for much of northern and central Virginia. Only 0.45 inches of rain fell at Washington Dulles Airport, which was significantly less than the normal of 3.94 inches. Similar readings were found across most of central and northern Virginia. The lack of rainfall substantially reduced crop yields. The lack of rainfall also contributed to increasingly dry timber and brush. The U.S. Forest Service reported the George Washington and Jefferson National Forests were twice as dry as normal, and five fires broke out in these parks during the first week of the month. A water emergency was declared in Spotsylvania Co (VAZ056) on the 30th as the Ni River reservoir had neared dangerously low levels. D R
A F
T

Hazard Mitigation Plan George Washington Regional Commission March 2012
4-68
Date Crop
Damage ($)
Descriptions
November 1, 1998
0
This was the fifth month in a row that drought conditions were seen across Northern Virginia. Persistent high pressure over the Southeast U.S. forced rain producing low pressure systems to steer north of the region. Only 0.91 inches of rain fell at Reagan National Airport in Arlington County during the month of November, 2.19 inches below normal. The 5 month total at the airport was only 5.78 inches, 11.38 inches below normal. The independent cities of Fredericksburg received only 1.0 inches. By the end of the month, the Ni Reservoir, main water supply in Spotsylvania County, had only backup reserve water left and was at a record low level. The county was forced to continue mandatory water restrictions and buy additional water from Stafford County. The agricultural community continued to suffer through the second worst drought in the past 100 years. This was the first year the Farm Service Agency had to make direct payments for grazing losses. The drought has also contributed to a nearly unprecedented amount of forest and brush fires. Sixty-five fires were reported across Virginia between November 1st and 20th. Stafford County reported several significant brush fires during the month, and dozens of smaller fires burned in several other locations.
December 1, 1998
0
This was the sixth month in a row that drought conditions were seen across Northern Virginia. Only 1.74 inches of precipitation fell at Washington Reagan National Airport in Arlington County during December, 1.38 inches below normal. In the past 127 years, only one other July through December on record (1930) received less precipitation than the last half of 1998. The 6 month total at the airport was only 7.45 inches, 12.82 inches below normal. The Ni Reservoir, main water supply in Spotsylvania County, remained at a record low level through the month. Mandatory water restrictions continued across the county for the fifth straight month, and on the 8th, county businesses were banned from using water outdoors. The Palmer Index rated Northern Virginia in a severe to extreme drought, and the Governor declared a state of emergency across Virginia on December 1st due to the dry weather and resulting extreme fire danger. An open burning ban continued across Virginia through December 10th.
May 1, 1999 0
High pressure was the dominant weather feature across Northern Virginia during the month. Conditions on the Shenandoah and Rappahannock River were also extremely dry. Some stations in these two watersheds reported streamflow at or below the 90th percentile exceedence, which rivaled minimum daily mean flow values of the drought of 1980-82. With such low water tables, Spotsylvania County was forced to reinstate voluntary water restrictions. The Ni River Reservoir, main water source for the county, had already dipped 4 inches below the spillway by mid month. The lack of precipitation also played havoc with spring planting and livestock maintenance. Trees were prematurely shedding leaves in orchards, hay and pastureland were wilting, and watering holes and irrigation sources were slowly drying up.
June 1, 1999 0
High pressure was the dominant weather feature across Northern Virginia during the month. This weather pattern directed rain producing low pressure systems north of the region and continued the climatological drought that has gripped the area since last summer. By the last week of June, the Palmer Drought Index, a measure of long term drought conditions, indicated Northern Virginia was in a severe drought. Flows in the Potomac, Shenandoah, and Rappahannock basins, were equal to or slightly below minimum June daily mean flow values recorded during the 1980-82 drought. Many gauging stations reported streamflow at or below the 90 percent exceedence, and a few reported streamflow values at or below the 95th percentile. Streamflow of the Rappahannock River at Fredericksburg was only 14% of normal. With such low water tables, the city of Fredericksburg was forced to start voluntary water restrictions. The Ni River Reservoir, main water source for Spotsylvania County, dipped 16 inches below full by mid month.
D R A
F T

Hazard Mitigation Plan George Washington Regional Commission March 2012
4-69
Date Crop
Damage ($)
Descriptions
July 1, 1999 83.0M
High pressure was the dominant weather feature across Northern Virginia during the month. This forced most rain producing storm systems to steer north of the region and resulted in the continuation of the climatological, meteorological, and hydrological drought that had plagued the area since last summer. Many stations on the Shenandoah and Rappahannock watersheds reported streamflow at or below the 90 percent exceedence, which rivaled minimum daily mean flow values of the drought of 1980-82. The Rappahannock River was approaching 10% of normal flow, and west of Fredericksburg was flowing with just a few feet of water. Twenty miles upstream of Fredericksburg, the river was too shallow for canoes. The Ni River Reservoir, main water source for Spotsylvania County, dipped 4 inches below the spillway by mid month. In addition to agricultural lands, forest and rural vegetation were also dangerously dry. The Virginia Department of Forestry reported a record fire season January through July, 1320 fires burning 6146 acres. This number already exceeded the amount of fires reported in 1998. During the month of July alone, 61 fires burned 280 acres. The Cumulative Severity Index, a measure of fire danger which ranges from 1 to 800, gave Northern Virginia a rating of 628 by month's end. Animal control officials also attributed an increase of wildlife entering populated areas in search of food and water to the drought.
August 1, 1999
41.7M
High pressure was the dominant weather feature across Northern Virginia through the 24th of August. Most rain producing storm systems steered north of the region through the period. This resulted in the continuation of the climatological, meteorological, and hydrological drought which has plagued the area since last summer. Heavy rain fell east of the Blue Ridge Mountains on the 25th and 27th, helping to fill surface reservoirs. Unfortunately, because most of the rain fell in the form of thunderstorm downpours, most of the moisture ran off into rivers before it had the chance to seep into the aquifer supply. Via resolution, on August 17, 1999, the King County Board of Supervisors requested that the Governor of Virginia declare King George County a disaster area due to drought.
September 1, 1999
5.0M
Rainfall from two land falling hurricanes made a tremendous impact on the drought that plagued the region since the summer of 1998. Across Northern Virginia, the greatest amount of rain fell north of a line from Staunton to Fredericksburg. The water shortage came to an end in this area by mid month. Locations to the south recorded a major increase in water supplies, upgrading their condition from an extreme drought to a mild drought, but not enough rain fell to completely wipe out the shortage. The Ni River Reservoir returned to 71% of its capacity by the end of the month, allowing officials in Spotsylvania County to lift mandatory water restrictions that were in effect for 13 months.
August 6, 2002
0 Via resolution, King County Board of Supervisors requested that the Governor of Virginia declare King George County a disaster area due to drought.
July 17-31, 2007
0
The Mid Atlantic hydrologic service area experienced severe agricultural drought conditions from the middle of July in 2007 through the end of the month in King George County. Some locations averaged as high as six inches below normal. Some jurisdictions restricted water use. Several locations were included in primary natural disaster areas due to reductions in farm production.
September 25-30, 2007
0
The Mid Atlantic hydrologic service area obtained severe agricultural drought conditions from September 25
th of 2007 through the end of the month in King George County. Some
locations averaged rainfall totals as high as 8 to 10 inches below normal. Severe drought status was obtained in July before conditions slightly improved. Several jurisdictions continued water use restrictions.
Source: National Climatic Data Center, 2011; and local emergency management
D R A
F T

Hazard Mitigation Plan George Washington Regional Commission March 2012
4-70
Table 4-27. Wildfire History (prior to 1995) – King George County.
Date Location Descriptions
March 14, 1963
Dogue The King George News reported 79 acres of woodlands burned. One out building destroyed.
April 20, 1963 Route 301 & 205 and
East towards Westmoreland
As reported in the Free-Lance Star / Richmond Times-Dispatch / King George News, 3500 acres of woodland burned and two to four homes in King George County. Started by a Burn Barrel.
January 11, 1966
2.5 miles east of King George Courthouse
The Free-Lance Star reported 36,000 gallons of fuel (Kerosene, Gasoline, and heating oil) burned destroying 4 of 5 tanks at the Southern States Petroleum Service Station. Several acres of woodlands also burned. Ashland Mill Road by Canterbury.
August 22, 1966
1.5 miles west of King George Courthouse
The Free-Lance Star reported saw mill and grounds destroyed by fire. Where current Post Office is on Rt. 3
Easter 1968 County Wide Seven fires totaling 22 acres and one home destroyed
July 23, 1969 County Wide The King George News reported an electrical storm came through King George causing structural fires.
July 12, 1986 NA 10 acres lost in field fire
Source: Local emergency management; NA = Data not available.
Table 4-28. VDOF Historic Wildfire Events – King George County.
Date Put Out Total Acres
Burned
Total Damages
($)
Total Cost Saved
($) Cause
03/17/1995 1 0 8000 Miscellaneous
08/25/1995 1 0 0 Debris Burning
06/26/1997 1 0 0 Miscellaneous
03/27/1998 1 0 0 Debris Burning
03/30/1998 14 500 0 Incendiary
09/06/1998 3 0 60000 Smoking
05/07/1999 1 0 0 Children
08/24/1999 2 0 0 Smoking
11/17/1999 1 0 0 Debris Burning
01/28/2001 18 0 0 Miscellaneous
02/20/2001 0 0 5000 Miscellaneous
03/19/2001 2 0 0 Smoking
03/07/2002 5 0 0 Debris Burning—Rural Burner
09/06/2002 2 0 0 Debris Burning—Rural Burner
03/25/2003 0.5 0 85000 Hot Ashes
04/23/2003 0.2 0 0 Utility Row
04/16/2005 0.7 0 0 Land Clearing
03/05/2006 0.3 0 0 Debris Burning—Rural Burner
03/11/2006 0.2 0 0 Debris Burning—Rural Burner
03/13/2006 0.3 0 0 Children—Juvenile
03/19/2006 2 0 215000 Children—Juvenile
D R A
F T

Hazard Mitigation Plan George Washington Regional Commission March 2012
4-71
Date Put Out Total Acres
Burned
Total Damages
($)
Total Cost Saved
($) Cause
04/05/2006 0.2 0 0 Children—Juvenile
04/03/2007 0.2 0 0 Debris Burning—Rural Burner
04/03/2007 0.1 0 0 Debris Burning—Rural Burner
04/10/2007 0.1 0 0 Debris Burning—Rural Burner
07/02/2007 0.2 0 0 Fireworks
07/11/2007 15 0 75000 Unknown
02/10/2008 7.8 0 150000 Debris Burning—Rural Burner
02/10/2008 2.3 0 0 Utility Row—Powerline
02/10/2008 1.8 0 0 Utility Row—Powerline
02/10/2008 1.7 0 0 Debris Burning—Rural Burner
03/26/2008 0.5 0 0 Debris Burning—Rural Burner
03/28/2008 1 0 0 Children—Juvenile
Totals 87.1 500 598000
Source: Virginia Department of Forestry, 2008.
Table 4-29. Historic Flood Events—King George County.
Date Event Comments
January 28, 1998 Flood
An intense and lingering Nor’easter produced a large area of heavy rains across Central and Northeastern Virginia.
Many streams in King George County flooded and several road closures occurred.
February 4, 1998 Flood
A powerful nor’easter dropped between 2 and 4 inches of rain across Northern Virginia resulting in widespread minor to moderate flooding.
Hundreds of roads were closed across the region.
The dam at Lake Jackson was reported to be over 6 feet above flood stage.
Several school districts closed for the following day due to the flooding and continued threat of heavy rain.
Property damage estimates were 5K.
September 16, 1999
Flash Flood
Hurricane Floyd produced thunderstorms releasing 2 to 5 inches of rain across Northern Virginia.
King George County reported numerous felled trees and over 16,000 power outages were reported across Northern Virginia.
July 14, 2000 Flash Flood
A powerful cold front produced heavy rainfall, hail, and winds in excess of 55mph in Northern Virginia.
King George County received over 3 inches of rain.
Numerous felled trees and closed roads reported.
D R A
F T

Hazard Mitigation Plan George Washington Regional Commission March 2012
4-72
Date Event Comments
March 20, 2003 Flood Across the region of Northern Virginia between 1.5 and 2.5 inches of rain fell.
In King George County, water overflowed from ditches onto roads.
Source: NOAA, 2011
Table 4-30. Historic Hurricane Events – King George County.
Storm Name
Date Category Total Est. Damage
Descriptions
Hazel October 15,
1954 Hurricane Unknown The Free-Lance Star reported flooding and property damage.
Connie August 12,
1955 Hurricane Unknown The Free-Lance Star reported flooding and property damage.
Diane August 17,
1955 Hurricane Unknown The Free-Lance Star reported flooding and property damage.
Camille September
1960 Hurricane Unknown The Free-Lance Star reported massive flooding.
Floyd September
16, 1999 Tropical Storm
No estimate available.
Gusty winds from 30 to 50 mph
2 to 5 inches of rain
16,000 power outages
Isabel September
18, 2003 Tropical Storm
Unknown
Trees down over every road in County. High winds to 85 mph sustained with gusts to 101mph. Over 300 emergency calls, low to moderate damage to 100’s of homes, no families displaced, almost 200 in shelter during storm, ice and water request from State, power outages Countywide for up to 15 days. Isolated power outages longer. EOC operational for 5 days. Shelters opened for one night. Debris removal initially a problem getting roads open. Some roads took 3-4 days to clear. VDOT debris removal continued for one month.
Major damage to infrastructure was County wide. Federal Declaration received. FEMA arrived and individual assistance provided. Major damage to many homes, some not inhabitable. Shelter opened with 85 people sheltered during storm. At least one crab business reportedly flooded.
Charley
And Bonnie
August 18,
2004 Hurricane Unknown
Highest sustained wind was 73 mph
Uprooted trees and downed numerous power lines
Over 2 million Virginians without power
Heavy rain and wind gust
2-4 inches of rain, mild winds, indirect hit to area. No damage noted
Frances September
8, 2004
Hurricane Unknown
At least two tornadoes touched down causing minor damage to 5 homes in the Berry Planes subdivision. Other areas affected were woods only. No Presidential Declaration received. Moderate wind gusts and rains. Indirect hit – hurricane.
D R A
F T

Hazard Mitigation Plan George Washington Regional Commission March 2012
4-73
Storm Name
Date Category Total Est. Damage
Descriptions
Ivan September
17, 2004 Hurricane Unknown
At least two tornadoes touched down causing moderate damage to 25 homes in the Lake Jefferson subdivision and surrounding areas of Igo Road and Little Chatterton Lane. Other areas affected were woods only. No Presidential Declaration received. Moderate wind gusts and rains. Indirect hit - hurricane.
Jeanne September
28, 2004 Hurricane Unknown
2-4 inches of rain and moderate winds across the County. No damage reported. Tornado Watch in affect – none received. Indirect hit.
Gaston August 30,
2004 Tropical
Depression Unknown
Hard rains that processed flooding
Roads under water
Power outage (99,600 statewide)
2-4 inches of rain, mild winds, indirect hit to area. No damage noted
Source: NOAA 2004, VWC 2004, local emergency management, The Free Lance and Daily Star.
Table 4-31. Tornado History – King George County.
Date Magnitude Property Damage
($) Descriptions
February 18, 1960
F1 0K
September 5, 1979
F1 250K
Late 1990’s NA NA
NSWCDD to Ferry Dock Road in Dahlgren
Tornado came through naval base twisting off enormous trees with minor damage to some homes mostly from falling trees. Continued through Ferry Dock Road and across Potomac Drive with tree damage.
July 2, 1999 F1 10K Parts of southern King George County lost power after downed trees fell onto power lines.
July 10, 2003
F0 0
F0 tornado touched down approximately 5 miles southeast of Falmouth near Route 3
The tornado moved northeast and damaged trees until it lifted near Route 218 on the King George County line
May 7, 2004
F1 10K
At 7:51 p.m., an F1 tornado touched down near Passapatanzy. At least a dozen dwellings and 10 boats were damaged. Several trees were also uprooted or had their tops ripped out along the storm’s three-mile path. In Stafford County, 80 to 90 mph winds destroyed two homes and caused major damage to 20 others. The Japazawas Subdivision in eastern Stafford County had approximately 40 trees down. Three Amtrak trains were stalled between the Chatham area of Stafford and Fredericksburg due to downed trees and power lines. In Spotsylvania County, the main stage at the re-enactment of the Battle of Spotsylvania collapsed due to strong winds. A number of tents and a couple of portable toilets were also blown over. Estimated damages were $10,000.
D R A
F T

Hazard Mitigation Plan George Washington Regional Commission March 2012
4-74
Date Magnitude Property Damage
($) Descriptions
Fall 2004 NA NA
4 Tornadoes spawned from multiple back to back hurricanes
Tornado in Waugh Point Area destroyed one house with three occupants inside, uprooted huge trees, twisted tops out of huge trees, rolled 15 large boats off trailers at marina. Significant damage to a second house.
Tornado started at Port Conway near Montigue Baptist Church and continued to Shiloh area. Moderate damage to church, extensive tree damage, Debris from trees in roadways.
Tornado came from Caroline County across the Rappahannock River moved through Sealston area just missing Sealston Elementary school. Continued into Stafford County where there was extensive home damage in a subdivision. Debris from damaged trees minor cosmetic damage to some homes.
Tornado came from Caroline County across Dogue to Rokeby and continued through Lake Jefferson subdivision and down to Little Chatterton Lane. 35 homes with moderate damage from falling trees, one home on windy hill partially destroyed when roof was lifted off and walls blown out of garage. Two barns destroyed by wind, Little Chatterton with moderate damage from tree falling on home. Not a lot of debris from trees except for isolated roads in Lake Jefferson subdivision Daws Drive and Igo Road.
September 8, 2004
F1 7K
At 3:57 p.m., an F1 tornado moved from Caroline County along the Stafford-King George County line. Numerous large trees up to three feet in diameter were uprooted and had their tops ripped from them along Route 3 near Sealston. The storm was rated an F1 due to the extensive tree damage observed. Damage was estimated at $7,000.
September 17, 2004
F1 500K Tornado reported in the Fairview Beach area.
Source: NOAA 2004 and local emergency management; NA = Data not available.
Table 4-32. Historic Northeaster and Winter Storm Events – King George County.
Date Event Property Damage
($) Comments
December 28, 1993
Heavy Snow 0
January 28, 1995
Heavy Snow 0
January 9, 1996 Heavy Snow 0 Low and mid-level lift ahead of an "Alberta Clipper" added insult to injury only a day after the "Blizzard of '96", dumping 4 inches of snow in a 5 hour period near the tidal Potomac River.
January 12, 1996
Heavy Snow 350K
Less than one week after the crippling "Blizzard of '96", a new winter storm dumped substantial snow across northern and western Virginia.
In southern Stafford Co (VAZ055), a woman was injured when a carport collapsed. The snow changed to freezing rain and sleet along the tidal Potomac River shortly before tapering off. The changeover suppressed accumulations to 4 or 5 inches in this region. In other portions of northern Virginia, snowfall totals were as follows: in the piedmont, 5 to 7 inches; at higher elevations, 6 to 10 inches.
D R A
F T

Hazard Mitigation Plan George Washington Regional Commission March 2012
4-75
Date Event Property Damage
($) Comments
In southern Stafford Co (VAZ055), a woman was injured when a carport collapsed. Luckily, she was protected from serious injury by the automobile, which had its windows shattered.
February 2, 1996
Heavy Snow 0
A vigorous upper level jet stream induced low-level lifting of warm moist air over a stationary arctic front extending from Tidewater Virginia through the Tennessee Valley early on the 2nd, producing a 75 mile-wide band of heavy snow which extended from the central piedmont through the Northern Neck region.
The heaviest snows fell in a narrow band from northern Albemarle Co through King George Co. Accumulations in these areas ranged from 8 to 13 inches, and snowfall rates were as high as 3 inches per hour.
February 2, 1996
Heavy Snow 0
The continuation of a strong upper-level jet stream, combined with additional mid-level dynamics, generated surface low pressure over central Georgia by evening on the 2nd. As the low moved to near Cape Hatteras overnight, a broad area of heavy snow overspread all of northern Virginia. Areas that received 4 to 13 inches during an early morning event (on the 2nd) picked up an additional 4 to 6 inches, leaving most areas from the central piedmont through the northern neck with a grand total of 12 to 18 inches.
February 16, 1996
Heavy Snow 0
A strong "Alberta Clipper", diving southeast from the upper Midwest into the deep south, linked up with subtropical moisture lurking along the southeast U.S. coast to develop a classic nor'easter, which moved from northeast South Carolina to off the Virginia Capes during the day on the 16th. As the area of low pressure intensified, it wrapped Atlantic moisture well to the west, where modified arctic air was pouring in from southern Canada. The result was a thin band of heavy snow which extended from southwest Virginia through the upper eastern shore of Maryland.
February 8, 1997
Heavy Snow 25K A winter storm dumped 4 to 8 inches of heavy, wet snow across all of northern and western Virginia on the 8th.
January 14, 1999
Winter Weather
0
A strong arctic cold front moved slowly southeast across the Mid-Atlantic region from late on the 13th to midday on the 15th. By 9am on the 15th, ice accumulations from one quarter to nearly one inch occurred north of a line from Augusta County to Spotsylvania County. The ice this storm left behind had a large impact on the region. Hundreds of car accidents, slip and fall injuries, downed trees, and power outages were reported. In Stafford County, a jackknifed tractor trailer closed State Route 3 and 621, and Interstate 95 had to be temporarily shut down to clear fallen trees. Over 215,000 customers lost power from the storm across Northern Virginia, and Central Virginia reported over 6,000 additional outages.
March 9, 1999 Winter Storm 0
An area of low pressure moved from the Ohio Valley to North Carolina from late on the 8th through the evening of the 9th. Snowfall rates were in excess of 1 1/2 inches per hour in many locations during the storm. Stafford County received between 4 to 8 inches. Spotsylvania and King George County received between 2 and 6 inches. The city of Fredericksburg reported over 100 accidents. On Interstate 95 in Spotsylvania County, a woman was killed in a morning car accident.
D R A
F T

Hazard Mitigation Plan George Washington Regional Commission March 2012
4-76
Date Event Property Damage
($) Comments
January 20, 2000
Winter Weather
0
An area of low pressure moved from west to east across the Mid-Atlantic region on the 20th, dropping 2 to 6 inches of snow between midnight and mid-afternoon. Gusty winds of 35 to 45 MPH developed during the afternoon causing the snow to drift across roadways and reduce visibilities in open areas.
January 25, 2000
Northeaster 0
Low pressure off Cape Hatteras rapidly intensified late on the 24th and developed into a nor'easter which tracked northward along the Eastern Seaboard on the 25th. Very heavy snow and near-blizzard conditions were seen throughout the day east of the Blue Ridge Mountains, resulting in extremely hazardous travel conditions. Wind gusts of up to 45 MPH were recorded and several roads were drifted shut by blowing snow. The governor of Virginia declared a state of emergency as the storm battered the eastern part of the state.
January 30, 2000
Ice Storm 0
Cold air was in place east of the Blue Ridge Mountains on the 29th and 30th, keeping surface temperatures below freezing. Low pressure moved from the Lower Mississippi Valley northeastward to the Mid-Atlantic region early on the 30th, creating the perfect conditions for freezing rain around the Fredericksburg area, a mix of sleet and snow east of Skyline Drive, and moderate snowfall in the mountains. Ice accumulations between 1/4 and 3/4 of an inch coated roads, trees, and power lines in Fredericksburg and Stafford, Spotsylvania, and King George Counties. Electrical outages were reported as trees and branches weighed down by ice fell onto power lines. Disruptions affected 3000 customers in Fredericksburg and Spotsylvania and King George Counties.
February 12, 2000
Winter Weather
0
Low pressure moved from Tennessee to the North Carolina Coast on the 12th, spreading snow across the Central Shenandoah Valley and the Northern and Central Piedmont. Periods of light snow occurred from sunrise to late afternoon with accumulations ranging from 1 to 5 inches. A period of freezing drizzle also occurred around sunset.
December 13, 2000
Winter Weather
0
A strong cold front brought chilly air into the region on the 12th. By the afternoon of the 13th, an upper level disturbance brought warm air into the mid levels of the atmosphere and caused snow that fell from the system to melt to rain on its way down. When the rain hit the ground where temperatures were below freezing, ice accumulated.
February 22, 2001
Winter Storm 0
This system produced mainly light to moderate snowfall across the region between 9 AM and 10 PM. Snowfall amounts ranged from 2 to 5 inches. A 50 vehicle crash occurred on the northbound lanes near Masaponax in Spotsylvania County. The accident occurred as motorists crested the top of a hill, hit near zero visibility, and slammed on their breaks. Three people were treated for serious injuries and another 18 suffered minor injuries. The highway remained closed for three hours while the wreckage was cleared. A 30 vehicle pileup occurred on the southbound lanes just north of the Falmouth/Route 17 interchange in Stafford County. As whiteout conditions struck, three cars slid into each other. Within seconds, the minor fender bender turned into a pileup including tractor trailers, cars, trucks, and an empty bus. Three people were injured and the highway was blocked for nearly three hours.
D R A
F T

Hazard Mitigation Plan George Washington Regional Commission March 2012
4-77
Date Event Property Damage
($) Comments
January 3, 2002 Winter Storm 0
Low pressure tracked across extreme southeast Virginia during the morning of the 3rd. This storm brought light to moderate snowfall to the Central Piedmont and Fredericksburg areas between 5 AM and 3 PM. In Stafford County, an inch of snow caused slippery roads and delayed school openings. In Spotsylvania and King George Counties, snowfall totals ranged from 3 to 5 inches.
January 19, 2002
Winter Weather
0
Low pressure that moved across North Carolina on the 19th brought mixed precipitation to the region between 6 AM and 11 PM. In most locations, the precipitation started off in the form of snow, then changed to a mix of sleet and rain around midday.
December 5, 2002
Winter Storm 0
This storm produced accumulating snowfall across the entire region as it moved by. Across the Central Piedmont and Fredericksburg area, freezing rain and sleet was mixed in with the snow. The snow and sleet accumulations ranged from 4 to 6 inches in this area.
February 6, 2003
Winter Storm 0
Low pressure tracked from the Gulf Coast to the Carolinas on the 6th then off the Atlantic coast on the 7th. This storm dropped light to moderate snow between the evening of the 6th and Noon on the 7th. Accumulations ranged from 3 to 7 inches.
February 14, 2003
Winter Storm 8.9M
A complex storm system produced copious amounts of wintery precipitation across the northern third of Virginia between the evening of the 14th and midday on the 18th. After the precipitation came to an end, record breaking snow and sleet accumulations were reported.
February 26, 2003
Winter Weather/mix
0
A series of low pressure systems that tracked from the Gulf Coast to Cape Hatteras dropped light snow off and on between the morning of the 26th and midday on the 28th. A total of 5 to 8 inches of snow accumulated across the northern third of Virginia during the storm. Minor traffic accidents were reported after the fallen snow made roads slippery.
December 14, 2003
Winter Weather/mix
0
An area of low pressure developed over the Gulf Coast region and tracked northeast into the Mid Atlantic region. The storm produced a mixture of snow, sleet and freezing rain. Snowfall totals across Northeast Virginia averaged 3 to 4 inches.
January 25, 2004
Winter Weather/mix
0
An area of low pressure developed off the coast of North Carolina and tracked north. This storm produced widespread snow, sleet and freezing drizzle over the region. Two to four inches of snow fell over the Central Foothills and the Northern Piedmont of Virginia. The snow mixed with sleet and finally changed over to freezing drizzle before tapering off. Several other minor accidents occurred according to Emergency Operations Centers. Dozens of school districts closed.
December 5, 2005
Heavy Snow 40K
A winter weather storm produced 4 to 6.5 inches of snow across Northern Virginia.
There were reports of trees down in due to heavy snow accumulations.
February 11, 2006
Heavy Snow 250K
Storm snowfall across Northern Virginia produced between 8 and 14 inches.
There were reports of isolated drifting of snow and downed powerlines throughout the region.
This caused over 300,000 customers to be without power in the greater Washington/Baltimore area.
D R A
F T

Hazard Mitigation Plan George Washington Regional Commission March 2012
4-78
Date Event Property Damage
($) Comments
December 19, 2009
Winter Storm 0 Snowfall amounts were reported between 16 and 21 inches across King George County.
January 26, 2011
Winter Storm 0
Snowfall accumulation totaled up to 7.5 inches in Central Virginia.
The heavy snow fell in the evening rush hour, causing traffic accidents and stranded vehicles. Numerous power outages were also reported.
January 30, 2010
Winter Storm 0 Snowfall accumulation was between 5 and six inches in King George County.
Source: National Climatic Data Center, 2011.
D R A
F T

Hazard Mitigation Plan George Washington Regional Commission March 2012
4-79
D. Spotsylvania County Hazard Identification
For the 2012 plan update, the GWRC steering committee reviewed the 2010 Commonwealth of Virginia Hazard Mitigation Plan, as well as the hazard events over the preceding five years, and determined a hazard ranking for each of the hazards below. For this update, the committee chose to use the State’s Hazard Type language as an update to the 2006 hazard type, to ensure better alignment with the state’s rankings and methodologies. Those rankings can be seen below in Table 4-33. For Spotsylvania County, hazards that ranked high and medium-high were then investigated further and a vulnerability analysis was performed.
Table 4-33. Prioritization of Natural Hazards. Spotsylvania County.
2006 Hazard type 2010 State Hazard
Type 2012 Section Heading
2010 State Ranking for
Spotsylvania County
2012 Hazard Ranking from Spotsylvania
County
Dam Failure N/A Dam Failure N/A Low
Drought Drought Drought and Extreme Heat Medium Medium
Extreme Heat Drought
Wildfire Wildfires Wildfires Medium Medium
Earthquakes Earthquakes Earthquakes Medium-Low Medium-Low
Expansive Soils Sinkholes Sinkholes and Landslides Low Low
Landslides Landslide
Flooding Flooding Flooding and Erosion High High
Hurricanes Non-Rotational Wind Non-Rotational Wind High High
Thunderstorms Non-Rotational Wind
Tornadoes Tornadoes Rotational Wind Medium-High Medium-High
Northeasters Winter Storms Winter Storms and Nor’easters High High
Winter Storms Winter Storms
Drought
In evaluating the localized threat of droughts to Spotsylvania County, the MAC analyzed NOAA data from 1951 to 2011 to identify incidents of droughts that posed a threat to the community. These past occurrences are presented in Table 4-34. Locally, droughts have caused:
• Requests to the Governor for disaster status; • Voluntary and mandatory reductions in water usage;
• Reduction in crop yields:
• Grazing losses; • Increase in forest and brush fires; and
• Reduction in streamflow and water table.
D R A
F T

Hazard Mitigation Plan George Washington Regional Commission March 2012
4-80
There have been 10 incidents of drought that affected King George County in a 12 year period from 1995 to 2007; Spotsylvania experiences .8 droughts per year. The probability of future occurrence is ranked as medium.
Wildfires
In evaluating the localized threat of wildfires to Spotsylvania County, the MAC analyzed data from the Virginia Department of Forestry from 1995-2008 to identify incidents that posed a threat to the community. The past occurrences are presented in Table 4-35. There have been 232 wildfire events since 1995. That is an average of 17.85 fires per year. Therefore, the probability of future occurrences is rated as medium.
Flooding
In evaluating the localized threat of floods to Spotsylvania County, the MAC analyzed NOAA data from 1951 to 2011 to identify incidents of flooding that may have posed a threat to the community. The analysis included both floods and flash floods. The past occurrences are presented in Table 4-36. There have been 19 flooding events in King George County since 1993. That’s an average of 1.11 floods per year. Therefore, the probability of future occurrences is rated as high.
Non-Rotation Wind (Hurricane and Thunderstorms) In evaluating the localized threat of hurricanes to Spotsylvania County, the MAC analyzed local emergency management data and NOAA hurricane track data from 1851 to 2004 to identify storms that may have posed a threat to the community. The analysis included hurricanes, tropical storms, tropical depressions, and extratropical storms which passed through the region and affected the local community. These past occurrences are presented in Table 4-37. Locally, the eleven (11) hurricanes have caused:
• Heavy rain;
• Gusty and high sustained winds; • Flooding and property damage;
• Road closures; and
• Multiple power outages. Hurricane Isabel, occurring in 2003, caused power outages in 85 percent of the County, lasting for up to nine days. Lightning from a thunderstorm in May of 1996 struck a tree in Spotsylvania County. The tree landed on a resident leaving him unconscious. A separate lightning strike started a fire in an abandoned trailer. The probability of future occurrences is ranked as medium. With 11 hurricanes occurring between 1954 and 2004, Spotsylvania County experiences approximately 0.22 hurricanes per year.
Tornadoes In evaluating the localized threat of tornadoes to Spotsylvania, the MAC analyzed local emergency management data and NOAA severe weather data from 1950 to 2005 to identify storms that may have
D R A
F T

Hazard Mitigation Plan George Washington Regional Commission March 2012
4-81
posed a threat to the community. Most tornado activity occurred from May to September, although a historic event in February was noted. These past occurrences are presented in Table 4-38. Locally, the nine (9) tornadoes have caused:
• Property damage, including the destruction of mobile homes;
• Damage to the stage of the re-enactment of the Battle of Spotsylvania;
• Tree damage and resultant power outages; and • Personal injury.
Noted tornadoes occurring during 1998, 2000, and 2002 have damaged homes, industrial buildings, and mobile homes:
• In 1998, a tornado along Route 17 Bypass / CSX Railroad / Route 608 Benchmark Road damaged one home and one industrial building.
• In 2000, a tornado along Hickory Ridge Road destroyed one single wide trailer. The path of the tornado started behind Berkeley Elementary School and continued northeast to Route 608.
• In 2002, a tornado in the Paytes Area was spotted. No building damage was reported. The probability of future occurrences is ranked as medium. With 9 tornadoes occurring between 1960 and 2004, Spotsylvania County experiences approximately 0.21 tornadoes per year.
Winter Storms
In evaluating the localized threat of winter storms to Spotsylvania County, the MAC analyzed local NOAA severe weather data from 1950 to 2005 to identify storms that may have posed a threat to the community. These past occurrences are presented in Table 4-39. Locally, the 31 northeasters and winterstorms have caused:
• Excessive snow, sleet, and freezing rain; • Multiple traffic accidents and delays;
• Tree and property damage;
• Power outages (over 3,000 customers in one incident); and
• Injury and loss of life. A noted ice storm occurring during 1993 left one-third of the County without power for up to seven days. Two emergency shelters were utilized. The probability of future occurrences is ranked as medium. With 31 events occurring between 1993 and 2010, Spotsylvania County experiences approximately 1.82 winter events per year. D R
A F
T

Hazard Mitigation Plan George Washington Regional Commission March 2012
4-82
Table 4-34. Historic Drought Events – Spotsylvania County.
Date Crop
Damage ($)
Descriptions
August 7, 1995
0
Dry weather, combined with periods of excessive heat, caused some damage to several crops, and limited the production of healthy livestock, during a month-long period that extended through mid-September. August, normally one of the wettest months, was the sixth-driest on record at Washington/National Airport (Arlington County), with barely seven-eighths of an inch (normal: 3.91 inches). Across the region, monthly precipitation averaged one to two inches, with virtually all of it falling before August 7th. The drought continued into mid-September, when it was alleviated somewhat by steady rains late on the 16th and early on the 17th. However, mean temperatures were much lower in September, ironically due to drier air masses, which allowed temperatures to plummet into the 50s on several mornings. Nonetheless, Washington/National broke an all-time record for consecutive days without measurable precipitation, with 33.
August 1, 1998
0
Persistent high pressure brought unusually dry weather during the entire month for much of northern and central Virginia. Only 0.45 inches of rain fell at Washington Dulles Airport, which was significantly less than the normal of 3.94 inches. Similar readings were found across most of central and northern Virginia. The lack of rainfall substantially reduced crop yields. The lack of rainfall also contributed to increasingly dry timber and brush. The U.S. Forest Service reported the George Washington and Jefferson National Forests were twice as dry as normal, and five fires broke out in these parks during the first week of the month. A water emergency was declared in Spotsylvania Co (VAZ056) on the 30th as the Ni River reservoir had neared dangerously low levels.
November 1, 1998
0
This was the fifth month in a row that drought conditions were seen across Northern Virginia. Persistent high pressure over the Southeast U.S. forced rain producing low pressure systems to steer north of the region. Only 0.91 inches of rain fell at Reagan National Airport in Arlington County during the month of November, 2.19 inches below normal. The 5 month total at the airport was only 5.78 inches, 11.38 inches below normal. The independent cities of Fredericksburg received only 1.0 inches. By the end of the month, the Ni Reservoir, main water supply in Spotsylvania County, had only backup reserve water left and was at a record low level. The county was forced to continue mandatory water restrictions and buy additional water from Stafford County. The agricultural community continued to suffer through the second worst drought in the past 100 years. This was the first year the Farm Service Agency had to make direct payments for grazing losses. The drought has also contributed to a nearly unprecedented amount of forest and brush fires. Sixty-five fires were reported across Virginia between November 1st and 20th. Stafford County reported several significant brush fires during the month, and dozens of smaller fires burned in several other locations.
December 1, 1998
0
This was the sixth month in a row that drought conditions were seen across Northern Virginia. Only 1.74 inches of precipitation fell at Washington Reagan National Airport in Arlington County during December, 1.38 inches below normal. In the past 127 years, only one other July through December on record (1930) received less precipitation than the last half of 1998. The 6 month total at the airport was only 7.45 inches, 12.82 inches below normal. The Ni Reservoir, main water supply in Spotsylvania County, remained at a record low level through the month. Mandatory water restrictions continued across the county for the fifth straight month, and on the 8th, county businesses were banned from using water outdoors. The Palmer Index rated Northern Virginia in a severe to extreme drought, and the Governor declared a state of emergency across Virginia on December 1st due to the dry weather and resulting extreme fire danger. An open burning ban continued across Virginia through December 10th.
D R A
F T

Hazard Mitigation Plan George Washington Regional Commission March 2012
4-83
Date Crop
Damage ($)
Descriptions
May 1, 1999 0
High pressure was the dominant weather feature across Northern Virginia during the month. Conditions on the Shenandoah and Rappahannock River were also extremely dry. Some stations in these two watersheds reported streamflow at or below the 90th percentile exceedence, which rivaled minimum daily mean flow values of the drought of 1980-82. With such low water tables, Spotsylvania County was forced to reinstate voluntary water restrictions. The Ni River Reservoir, main water source for the county, had already dipped 4 inches below the spillway by mid month. The lack of precipitation also played havoc with spring planting and livestock maintenance. Trees were prematurely shedding leaves in orchards, hay and pastureland were wilting, and watering holes and irrigation sources were slowly drying up.
June 1, 1999 0
High pressure was the dominant weather feature across Northern Virginia during the month. This weather pattern directed rain producing low pressure systems north of the region and continued the climatological drought that has gripped the area since last summer. By the last week of June, the Palmer Drought Index, a measure of long term drought conditions, indicated Northern Virginia was in a severe drought. Flows in the Potomac, Shenandoah, and Rappahannock basins, were equal to or slightly below minimum June daily mean flow values recorded during the 1980-82 drought. Many gauging stations reported streamflow at or below the 90 percent exceedence, and a few reported streamflow values at or below the 95th percentile. Streamflow of the Rappahannock River at Fredericksburg was only 14% of normal. With such low water tables, the city of Fredericksburg was forced to start voluntary water restrictions. The Ni River Reservoir, main water source for Spotsylvania County, dipped 16 inches below full by mid month.
July 1, 1999 83.0M
High pressure was the dominant weather feature across Northern Virginia during the month. This forced most rain producing storm systems to steer north of the region and resulted in the continuation of the climatological, meteorological, and hydrological drought that had plagued the area since last summer. Many stations on the Shenandoah and Rappahannock watersheds reported streamflow at or below the 90 percent exceedence, which rivaled minimum daily mean flow values of the drought of 1980-82. The Rappahannock River was approaching 10% of normal flow, and west of Fredericksburg was flowing with just a few feet of water. Twenty miles upstream of Fredericksburg, the river was too shallow for canoes. The Ni River Reservoir, main water source for Spotsylvania County, dipped 4 inches below the spillway by mid month. In addition to agricultural lands, forest and rural vegetation were also dangerously dry. The Virginia Department of Forestry reported a record fire season January through July, 1320 fires burning 6146 acres. This number already exceeded the amount of fires reported in 1998. During the month of July alone, 61 fires burned 280 acres. The Cumulative Severity Index, a measure of fire danger which ranges from 1 to 800, gave Northern Virginia a rating of 628 by month's end. Animal control officials also attributed an increase of wildlife entering populated areas in search of food and water to the drought.
August 1, 1999
41.7M
High pressure was the dominant weather feature across Northern Virginia through the 24th of August. Most rain producing storm systems steered north of the region through the period. This resulted in the continuation of the climatological, meteorological, and hydrological drought which has plagued the area since last summer. Heavy rain fell east of the Blue Ridge Mountains on the 25th and 27th, helping to fill surface reservoirs. Unfortunately, because most of the rain fell in the form of thunderstorm downpours, most of the moisture ran off into rivers before it had the chance to seep into the aquifer supply.
D R A
F T

Hazard Mitigation Plan George Washington Regional Commission March 2012
4-84
Date Crop
Damage ($)
Descriptions
September 1, 1999
5.0M
Rainfall from two land falling hurricanes made a tremendous impact on the drought that plagued the region since the summer of 1998. Across Northern Virginia, the greatest amount of rain fell north of a line from Staunton to Fredericksburg. The water shortage came to an end in this area by mid month. Locations to the south recorded a major increase in water supplies, upgrading their condition from an extreme drought to a mild drought, but not enough rain fell to completely wipe out the shortage. The Ni River Reservoir returned to 71% of its capacity by the end of the month, allowing officials in Spotsylvania County to lift mandatory water restrictions that were in effect for 13 months.
July 17-30, 2007
0
The Mid Atlantic hydrologic service area experienced severe agricultural drought conditions from mid July through the end of the month. This area included Spotsylvania, Stafford, and King George Counties.
Some locations averaged six inches below normal, leading to some jurisdictions restricting water use.
Damage estimates were not available due to current harvest progress.
Several locations were included in primary natural disaster areas due to reductions in farm production.
September 25-30, 2007
0
The Mid Atlantic hydrologic service area experienced severe agricultural drought conditions from September 25
th through the end of the month. This area included
Spotsylvania, King George, and Stafford Counties.
Some locations received as much as 10 inches below normal, leading to continued restrictions on water use.
Damage estimates were not available.
Several locations were included in primary natural disaster areas due to reductions in farm production.
Source: National Climatic Data Center, 2005.
Table 4-35. Historic Wildfire Events – Spotsylvania County.
Date Put Out Total Acres
Burned
Total Damages ($)
Total Cost Saved
($) Cause
01/14/1995 2 0 0 Smoking
02/22/1995 2 0 180000 Children
02/23/1995 20 2700 300800 Debris Burning
02/24/1995 1 1000 2000 Incendiary
03/14/1995 1 400 100000 Debris Burning
03/17/1995 1 100 0 Children
03/17/1995 1 800 29000 Debris Burning
03/19/1995 1 0 200000 Incendiary
03/22/1995 1 250 0 Children
03/26/1995 1 0 0 Smoking
03/27/1995 1 100 0 Debris Burning
03/31/1995 1 300 205000 Debris Burning
04/02/1995 4 100 201400 Children
04/02/1995 1 100 0 Children
04/04/1995 3 1000 0 Smoking
D R A
F T

Hazard Mitigation Plan George Washington Regional Commission March 2012
4-85
Date Put Out Total Acres
Burned
Total Damages ($)
Total Cost Saved
($) Cause
04/08/1995 2 5700 31000 Miscellaneous
04/08/1995 1 5000 450000 Children
04/15/1995 1 500 40000 Children
04/21/1995 1 200 0 Smoking
04/27/1995 1 200 0 Debris Burning
03/05/1996 1 100 0 Children
03/13/1996 3 0 90000 Debris Burning
03/16/1996 2 0 200000 Smoking
03/23/1996 2 0 0 Debris Burning
03/25/1996 2 0 310000 Debris Burning
03/25/1996 1 100 300000 Debris Burning
04/08/1996 1 0 80000 Children
04/08/1996 1 500 75000 Miscellaneous
04/19/1996 1 700 600000 Children
04/23/1996 7 10500 2000 Debris Burning
04/23/1996 3 0 500000 Miscellaneous
04/25/1996 2 300 162000 Debris Burning
02/19/1997 2 100 200000 Miscellaneous
02/21/1997 1 0 0 Smoking
02/25/1997 4 0 0 Smoking
03/06/1997 1 0 0 Miscellaneous
03/11/1997 2 200 60500 Debris Burning
03/11/1997 1 0 0 Smoking
03/12/1997 1 0 0 Children
03/12/1997 1 100 50 Miscellaneous
03/16/1997 1 200 150000 Debris Burning
03/24/1997 2 400 40000 Debris Burning
03/27/1997 1 0 500000 Children
03/30/1997 1 100 0 Children
04/01/1997 4 200 20000 Children
04/01/1997 2 400 550000 Equipment Use
04/02/1997 3 500 500 Children
04/03/1997 3 0 50000 Smoking
04/07/1997 5 500 100500 Debris Burning
04/19/1997 1 150 0 Smoking
04/30/1997 2 400 0 Children
05/12/1997 1 300 90000 Debris Burning
05/20/1997 5 0 0 Debris Burning
05/28/1997 3 400 0 Smoking
07/14/1997 1 100 400 Smoking
08/01/1997 1 0 0 Debris Burning
08/29/1997 1 0 0 Railroad
D R A
F T

Hazard Mitigation Plan George Washington Regional Commission March 2012
4-86
Date Put Out Total Acres
Burned
Total Damages ($)
Total Cost Saved
($) Cause
03/14/1998 2 50 5025 Debris Burning
03/29/1998 4 0 0 Debris Burning
03/29/1998 1 0 0 Children
04/02/1998 1 100 0 Debris Burning
04/06/1998 2 0 0 Debris Burning
04/07/1998 1 100 0 Children
04/13/1998 1 0 0 Children
04/13/1998 1 400 0 Children
04/13/1998 1 200 0 Children
08/05/1998 7 100 160000 Debris Burning
08/06/1998 1 0 0 Miscellaneous
09/06/1998 2 0 0 Debris Burning
09/07/1998 2 0 0 Children
09/09/1998 1 100 80000 Lightning
10/18/1998 1 900 0 Smoking
10/28/1998 2 500 305000 Debris Burning
11/01/1998 1 500 1000000 Campfire
11/02/1998 1 500 0 Miscellaneous
11/08/1998 1 100 0 Children
11/28/1998 1 100 0 Incendiary
11/30/1998 4 100 190000 Debris Burning
12/01/1998 1 500 0 Campfire
12/02/1998 1 500 2000000 Children
12/19/1998 1 0 80000 Children
03/18/1999 38 1200 300000 Debris Burning
03/28/1999 2 500 315000 Debris Burning
03/28/1999 1 100 750000 Smoking
03/30/1999 2 0 0 Equipment Use
03/31/1999 8 2000 305000 Debris Burning
04/14/1999 3 800 0 Smoking
04/17/1999 6 2200 3000 Smoking
04/17/1999 2 200 311000 Smoking
05/11/1999 1 0 2000 Smoking
05/21/1999 1 200 0 Children
08/05/1999 30 5000 505000 Debris Burning
08/07/1999 1 400 75000 Children
08/08/1999 2 0 0 Children
08/11/1999 1 0 0 Equipment Use
11/07/1999 3 100 0 Children
11/16/1999 3 100 255000 Miscellaneous
01/13/2000 3 500 250500 Miscellaneous
02/25/2000 1 0 0 Miscellaneous
D R A
F T

Hazard Mitigation Plan George Washington Regional Commission March 2012
4-87
Date Put Out Total Acres
Burned
Total Damages ($)
Total Cost Saved
($) Cause
03/04/2000 1 0 0 Incendiary
03/05/2000 3 200 0 Campfire
03/05/2000 1 0 0 Campfire
03/15/2000 1 400 150000 Debris Burning
03/27/2000 1 0 0 Children
03/31/2000 1 500 20000 Debris Burning
04/01/2000 2 500 102000 Debris Burning
04/01/2000 1 6500 12000 Debris Burning
04/13/2000 1 0 100 Equipment Use
10/18/2000 1 0 73000 Debris Burning
01/30/2001 10 1000 100000 Miscellaneous
01/30/2001 4 1500 303500 Debris Burning
01/30/2001 2 0 0 Miscellaneous
01/30/2001 1 0 0 Debris Burning
04/10/2001 13 1000 0 Incendiary
04/10/2001 1 700 400 Debris Burning
04/15/2001 9 250 0 Debris Burning
04/19/2001 1 200 0 Children
04/20/2001 2 200 115000 Debris Burning
04/22/2001 9 400 0 Incendiary
04/30/2001 1 0 0 Debris Burning
07/16/2001 4 1000 0 Miscellaneous
07/16/2001 1 0 0 Debris Burning
07/17/2001 1 0 0 Smoking
08/20/2001 17 500 0 Incendiary
10/22/2001 5 0 0 Campfire
11/05/2001 3 100 1000 Debris Burning
11/06/2001 1 50 130000 Debris Burning
11/12/2001 2 300 0 Miscellaneous
11/12/2001 1 500 60000 Smoking
11/14/2001 1 1000 0 Incendiary
11/17/2001 1 0 0 Smoking
04/10/2001 1 700 400 Debris Burning
04/15/2001 9 250 0 Debris Burning
02/01/2002 1 0 100000 Utility Row
02/04/2002 1 0 0 Prescribed Burn
02/17/2002 0.2 0 0 Hot Ashes
02/27/2002 0.1 0 1000000 Incendiary
02/28/2002 0.1 0 600000 Incendiary
02/28/2002 0.1 0 600000 Incendiary
02/28/2002 0.2 0 750000 Incendiary
03/01/2002 0.2 0 200000 Hot Ashes
D R A
F T

Hazard Mitigation Plan George Washington Regional Commission March 2012
4-88
Date Put Out Total Acres
Burned
Total Damages ($)
Total Cost Saved
($) Cause
03/05/2002 1 0 500000 Truck Fire
03/06/2002 2 0 0 Children—Juvenile
03/10/2002 10 1500 625000 Debris Burning—Rural Burner
03/15/2002 2 50000 0 Debris Burning—Stump Pile
04/02/2002 0.1 0 0 Incendiary
04/04/2002 1 0 0 Children—Juvenile
04/08/2002 4 1000 300000 Debris Burning—Rural Burner
04/14/2002 3 100 100000 Children—Juvenile
04/17/2002 1 300 0 Incendiary—Automobile
05/24/2002 0.1 200 0 Incendiary—Automobile
05/31/2002 0.2 200 0 Incendiary—Automobile
06/07/2002 2 1000 100000 Lightning
06/12/2002 3 500 250000 Incendiary
06/20/2002 6 0 0 Prescribed Burn
06/22/2002 7 1000 0 Prescribed Burn
06/24/2002 4 0 0 Debris Burning—Rural Burner
07/11/2002 2 500 50000 Smoking
07/12/2002 0.2 0 0 Debris Burning—Rural Burner
07/22/2002 4 2000 0 Prescribed Burn
07/23/2002 1 200 0 Debris Burning—Rural Burner
08/092002 1 0 80000 Debris Burning—Rural Burner
08/18/2002 0.1 100 0 Equipment Use—Vehicle Brake
01/26/2003 0.2 0 100000 Debris Burning—Rural Burner
03/24/2003 0.1 0 230000 Debris Burning—Urban Burner
03/25/2003 1 0 250000 Children—Juvenile
04/06/2003 1 0 100000 Children—Juvenile
10/02/2003 3 0 0 Children—Juvenile
11/13/2003 1.5 0 0 Utility Row
2/23/2004 0.2 0 0 Children—Juvenile
02/29/2004 1 0 0 Debris Burning—Rural Burner
03/03/2004 0.2 0 150000 Debris Burning—Rural Burner
03/12/2004 9 0 1000000 Children—Juvenile
03/21/2004 0.1 0 0 Children—Juvenile
03/25/2004 0.1 0 0 Unknown
03/07/2005 2 0 400000 Incendiary—Juvenile
03/07/2005 4 0 0 Incendiary—Juvenile
03/19/2005 2 0 0 Incendiary
03/19/2005 2 0 0 Children—Juvenile
03/20/2005 0.2 0 100000 Children—Child Age Under 7
03/22/2005 0.1 0 200000 Debris Burning—Rural Burner
04/16/2005 1 0 0 Debris Burning—Rural Burner
4/26/2005 0.1 0 0 Children—Juvenile
D R A
F T

Hazard Mitigation Plan George Washington Regional Commission March 2012
4-89
Date Put Out Total Acres
Burned
Total Damages ($)
Total Cost Saved
($) Cause
05/10/2005 2 0 0 Debris Burning—Rural Burner
06/20/2005 2 400 0 Land Clearing
3/5/2006 0.1 0 250000 Unknown
03/09/2006 3 0 0 Land Clearing
03/09/2006 0.1 0 0 Debris Burning—Rural Burner
03/132006 1 0 0 Children—Juvenile
03/13/2006 2 0 0 Hot Ashes
03/13/2006 0.2 0 0 Hot Ashes
03/15/2006 0.6 0 800000 Utility Row
03/18/2006 2 0 0 Debris Burning—Rural Burner
03/19/2006 0.2 0 3000000 Incendiary—Juvenile
03/19/2006 0.1 0 600000 Smoking
03/19/2006 0.1 0 0 Children—Child Under Age 7
03/25/2006 0.1 0 0 Children—Juvenile
03/27/2006 0.2 0 100000 Debris Burning—Rural Burner
03/27/2006 0.2 0 0 Debris Burning—Rural Burner
04/01/2006 0.1 0 0 Debris Burning—Rural Burner
04/02/2006 0.2 0 0 Children—Juvenile
04/19/2006 0.2 0 300000 Debris Burning—Rural Burner
05/03/2006 3 0 900000 Smoking—Construction
02/23/2007 0.2 0 200000 Children—Juvenile
03/08/2007 0.4 0 0 Children—Juvenile
03/10/2007 0.2 0 500000 Debris Burning—Rural Burner
03/13/2007 4 0 300000 Debris Burning—Rural Burner
03/13/2007 0.1 0 0 Equipment Use—Lawnmower
03/29/2007 1 0 150000 Smoking—Automobile
03/29/2007 0 0 0 Incendiary—Juvenile
03/31/2007 0 0 200000 Debris Burning—Rural Burner
04/02/2007 0.1 0 0 Debris Burning—Urban Burner
04/04/2007 0.5 0 0 Incendiary—Automobile
04/23/2007 0.1 0 0 Debris Burning—Rural Burner
04/24/2007 0.1 0 0 Children—Juvenile
07/13/2007 0.2 0 700000 Children—Juvenile
09/10/2007 2 0 0 Debris Burning—Rural Burner
10/16/2007 0.7 0 0 Children—Juvenile
10/21/2007 0.1 0 0 Children—Juvenile
02/10/2008 1 0 0 Debris Burning—Rural Burner
02/10/2008 0.2 0 700000 Debris Burning—Rural Burner
02/10/2008 2.7 0 0 Utility Row
02/11/2008 2 0 500000 Utility Row
02/19/2008 1 0 500000 Utility Row
03/02/2008 0.2 0 750000 Children—Juvenile
D R A
F T

Hazard Mitigation Plan George Washington Regional Commission March 2012
4-90
Date Put Out Total Acres
Burned
Total Damages ($)
Total Cost Saved
($) Cause
03/21/2008 1 0 0 Utility Row
03/21/2008 0.1 0 175000 Children—Juvenile
03/22/2008 0 0 400000 Children—Juvenile
03/28/2008 0.2 0 0 Debris Burning—Rural Burner
04/15/2008 0.1 0 0 Debris Burning—Rural Burner
04/15/2008 0.1 0 0 Incendiary
05/05/2008 2.5 1000 0 Equipment Use
Totals 509.6 130,500 32,589,075
Source: Virginia Department of Forestry, 2008
Table 4-36. Historic Flood Events – Spotsylvania County.
Date Event Comments
April 16, 1993 Flash Flood N/A
January 19-22, 1996
Flood
River flooding occurred across the Commonwealth of Virginia starting in the early morning of January 19
th. Snowmelt with a liquid
equivalency of 2 to 3 inches combined with another 1 to 3 inches of rainfall caused the worst regional flooding in over a decade.
River flooding began at the headwaters of all basins, continuing downstream for the next 3 days. Crests ranged from 3 to 21 feet above the flood stage.
High water caused millions in damages, closed roads, destroyed homes and businesses, and even forced the evacuation of several towns.
Total property damage estimates were at 15 million and crop damages were at 81K.
June 18, 1996 Flash Flood
Thunderstorms in Spotsylvania County produced residential and small stream flooding in the central region of the county.
In the subdivision of Spotslee, water was reported at least 2 feet high.
Further west, several small streams were out of their banks.
Total property damage estimates were 10K.
January 28, 1998 Flood
A nor’easter lingering in the area produced heavy rains across the central and northeastern regions of Virginia.
Widespread minor to moderate flooding of small streams, creeks, and low-lying areas occurred across the Northern Neck of Virginia.
The Virginia Department of Transportation reported over 150 roads closed in the area due to standing water or creeks that exceeded bankful.
High wind gusts exceeding 30 mph combined with highly saturated soil caused isolated cases of felled trees and power lines.
Property damage estimates were around 2.5K.
D R A
F T

Hazard Mitigation Plan George Washington Regional Commission March 2012
4-91
Date Event Comments
February 4, 1998 Flood
A powerful nor’easter dropped between 2 and 4 inches of rain across Northern Virginia resulting in widespread minor to moderate flooding.
Hundreds of roads were closed across the region.
The dam at Lake Jackson was reported to be over 6 feet above flood stage.
Several school districts closed for the following day due to the flooding and continued threat of heavy rain.
Property damage estimates were 5K.
June 23, 1998 Flash Flood
A series of strong to severe thunderstorms in Northern and Central Virginia produced rainfall totals between 2 and 6 and wind gusts between 60 and 80 mph.
Flooding of several low-lying areas occurred and streams in the area over spilled their banks.
The storms knocked out power to at least 12,500 customers in Northern and Central Virginia.
September 16, 1999
Flash Flood
Storms from Hurricane Floyd produced rainfall totals just shy of 6 inches in Spotsylvania County.
The same area observed wind gusts between 30 and 50 mph.
Wind gusts caused several trees to fall down combined with high water forced the closure of several roads in the county.
September 3, 2000 Flash Flood
Heavy thunderstorms produced a total rainfall of 2.5 inches in only 50 minutes in Spotsylvania County
Across the county Rtes. 17 and 1, Leavells Road, and Loreilla Park Drive were flooded and closed.
February 22, 2003 Flood
In Spotsylvania County a storm produced between 1.5 to 3 inches of rain combined with the snowmelt of a massive snowstorm led to widespread flooding across Northern Virginia.
In Spotsylvania County, 1 primary and 7 secondary roads were flooded and 1 private road was washed out. County officials rescued 4 people, 2 horses, and six dogs from flood waters.
March 20, 2003 Flood Across the region of Northern Virginia between 1.5 and 2.5 inches of rain fell.
In Spotsylvania County, a handful of roads were caused by flooding.
September 18, 2003
January 14, 2005 Flood Flooding and a mudslide reported in Central Virginia.
June 26-27, 2006 Flash Flood
Persistent rain across a 5 day period resulted in double digit rainfall totals across Northern Virginia.
There were extensive power outages across the region and the VRE was temporarily inoperable.
Debris was reported over the road near Jefferson Davis High and Spotsylvania Parkway due to receded flood waters.
November 16, 2006
Flood
Thunderstorms hit Northern Virginia producing floods throughout the region.
In Spotsylvania County, several trees were downed.
School buses in the county were forced to return students to school due to flooding on county roadways between Massaponax Church and Leavells.
D R A
F T

Hazard Mitigation Plan George Washington Regional Commission March 2012
4-92
Date Event Comments
July 29, 2007 Flash Flood
A cold front combined with a low pressure system triggered thunderstorms across Central and Northern Virginia. Several of these storms were severe producing damaging winds and large hail.
Law Enforcement officials in Spotsylvania County reported water over the road at Teton Drive and Landsdowne Road.
A mudslide was reported on Route 1.
May 9, 2008 Flood
Numerous strong to sever thunderstorms struck the area of Central and Northern Virginia. Two tornadoes occurred in Central Virginia.
These storms produced damaging winds that drowned trees and power lines.
Spotsylvania County Emergency Management reported that West Catharpin Road in Logan was closed due to high water.
May 11, 2008 Flood
Thunderstorms in the Northern Virginia region produced strong gusty winds and heavy rains.
Several trees and power lines fell across the region.
Spotsylvania County Emergency Management reported numerous road closures due to flooding. Many of these roads remained closed through the following afternoon.
June 2, 2009 Flash Flood
Thunderstorms producing high amounts of heavy rainfall resulted in flooding in areas of Spotsylvania County.
Water was flowing over Courthouse Road. Flooding at the intersection of West Catharpin and West Pamunkey roads caused their closures.
June 3, 2009 Flash Flood Thunderstorms producing heavy rains led to flash flooding in Spotsylvania County.
As a result, Brock Road near American Legion Road was closed.
September 30-October 1, 2010
Flash Flood
The remnants of Tropical Storm Nicole brought up to 5 inches of rain to the Northern Virginia region.
Water had spilt over onto Route 17 in Spotsylvania County. A report on rainfall for the county claimed it had received near 5.5 inches.
Elys Ford Road closed due to flash flooding conditions on the Rapidan River.
Source: NOAA, 2011.
Table 4-37. Historic Hurricane Events – Spotsylvania County.
Storm Name
Date Category Total Est.
Damage Descriptions
Hazel October
15, 1954 Hurricane Unknown The Free-Lance Star reported flooding and property damage.
Connie August 12,
1955 Hurricane Unknown The Free-Lance Star reported flooding and property damage.
Diane August 17,
1955 Hurricane Unknown The Free-Lance Star reported flooding and property damage.
Camille September
1960 Hurricane Unknown The Free-Lance Star reported massive flooding.
D R A
F T

Hazard Mitigation Plan George Washington Regional Commission March 2012
4-93
Table 4-38. Historic Tornado Events – Spotsylvania County.
Date Magnitude Property Damage
($) Descriptions
February 18, 1960
F1 0K
September 5, 1979
F1 250K
1998 F1 NA Local emergency management reports tornado activity along the Rt. 17 Bypass / CSX Railroad / Rt. 608 Benchmark Road. One home and one industrial building are damaged.
July 2, 1999 F1 10K
Parts of southern Spotsylvania County lost power after downed trees fell onto power lines
Most of the downed trees were in the Falmouth area.
2000 F1 NA Local emergency management reports tornado activity along Hickory Ridge Road destroying one single-wide trailer. The area impacted started behind Berkeley Elementary School continuing northeast to Rte. 1 and 608.
2002 F1 NA Local emergency management reports tornado activity in the Paytes area. No building damage was reported.
July 10, 2003
F0 0K
F0 tornado touched down approximately 5 miles southeast of Falmouth near Route 3
The tornado moved northeast and damaged trees until it lifted near Route 218 on the Spotsylvania County line
Floyd September
16, 1999 Tropical Storm
No estimate available.
Gusty winds from 30 to 50 mph
16,000 power outages
5.97 inches in Spotsylvania
In Spotsylvania County, several trees were downed and high water closed several roads in the eastern portion of the county.
Isabel September
18, 2003 Tropical Storm
$55.1 million – property
$130,000 – crop
85% of County was without power for up to 9 days
Charley
And Bonnie
August 18,
2004 Hurricane Unknown
Highest sustained wind was 73 mph
Uprooted trees and downed numerous power lines
Over 2 million Virginians without power
Heavy rain and wind gust
Gaston August 30,
2004 Tropical
Depression Unknown
Hard rains that processed flooding
Roads under water
Power outage (99,600 statewide)
Frances September
8, 2004 Hurricane Unknown
Ivan September
17, 2004 Hurricane Unknown
Spawned unconfirmed tornadoes
Power outage (66,000) Heavy rain/flooding
Jeanne September
28, 2004 Hurricane Unknown
Flash flooding/heavy rainfall
Power outage
D R A
F T

Hazard Mitigation Plan George Washington Regional Commission March 2012
4-94
Date Magnitude Property Damage
($) Descriptions
May 7, 2004
F1 10K
At 7:51 p.m., an F1 tornado touched down near Shiloh. At least a dozen dwellings and 10 boats were damaged. Several trees were also uprooted or had their tops ripped out along the storm’s three-mile path. In Stafford County, 80 to 90 mph winds destroyed two homes and caused major damage to 20 others. The Japazawas Subdivision in eastern Stafford County had approximately 40 trees down. Three Amtrak trains were stalled between the Chatham area of Stafford and Fredericksburg due to downed trees and power lines. In the County of Spotsylvania, the main stage at the re-enactment of the Battle of Spotsylvania collapsed due to strong winds. A number of tents and a couple of portable toilets were also blown over. Estimated damages were $10,000.
September 17, 2004
FO 500K
F0 tornado touched down approximately 5 miles southeast of Falmouth near Route 3
A thunderstorm moved from Spotsylvania County into the eastern portion of the City of Fredericksburg. No property damage was reported, with debris scattered along Dixon Street.
At 4:29 p.m., emergency personnel witnessed a weak tornado in the New Crest Area that caused minor damage to homes and trees.
At 5:05 p.m., a brief tornado touched down near Holladay. It was videotaped by a local fire fighter. No damage or injuries were reported.
May 11, 2006
F0 80K
A cold front, combined with a strong upper-level disturbance caused widespread severe thunderstorms.
Tornado touched down near Mastins Corner and continued northeast. Damage path was about 5 miles long and 75 yards wide.
Structural damage was noted, due to falling trees and limbs.
May 11, 2006
F0 35K
A cold front combined with a strong upper-level disturbance caused widespread severe thunderstorms.
A small tornado formed from this storm, hitting the Fredericksburg Spotsylvania Military Park.
All damage was to trees only.
Source: National Climatic Data Center and local emergency management; NA = Data not available.
Table 4-39. Historic Northeaster and Winter Storm Events – Spotsylvania County.
Date Event Rain Fall (in.)
Comments
December 28, 1993
Heavy Snow 0
January 28, 1995 Heavy Snow 0
January 9, 1996 Heavy Snow 0 Low and mid-level lift ahead of an "Alberta Clipper" added insult to injury only a day after the "Blizzard of '96", dumping 4 inches of snow in a 5 hour period near the tidal Potomac River.
D R A
F T

Hazard Mitigation Plan George Washington Regional Commission March 2012
4-95
Date Event Rain Fall (in.)
Comments
January 12, 1996 Heavy Snow 350K
Less than one week after the crippling "Blizzard of '96", a new winter storm dumped substantial snow across northern and western Virginia.
In southern Stafford Co (VAZ055), a woman was injured when a carport collapsed. The snow changed to freezing rain and sleet along the tidal Potomac River shortly before tapering off. The changeover suppressed accumulations to 4 or 5 inches in this region. In other portions of northern Virginia, snowfall totals were as follows: in the piedmont, 5 to 7 inches; at higher elevations, 6 to 10 inches.
In southern Stafford Co (VAZ055), a woman was injured when a carport collapsed. Luckily, she was protected from serious injury by the automobile, which had its windows shattered.
February 2, 1996 Heavy Snow 0
A vigorous upper level jet stream induced low-level lifting of warm moist air over a stationary arctic front extending from Tidewater Virginia through the Tennessee Valley early on the 2nd, producing a 75 mile-wide band of heavy snow which extended from the central piedmont through the Northern Neck region.
The heaviest snows fell in a narrow band from northern Albemarle Co through King George Co. Accumulations in these areas ranged from 8 to 13 inches, and snowfall rates were as high as 3 inches per hour.
February 2, 1996 Heavy Snow 0
The continuation of a strong upper-level jet stream, combined with additional mid-level dynamics, generated surface low pressure over central Georgia by evening on the 2nd. As the low moved to near Cape Hatteras overnight, a broad area of heavy snow overspread all of northern Virginia. Areas that received 4 to 13 inches during an early morning event (on the 2nd) picked up an additional 4 to 6 inches, leaving most areas from the central piedmont through the northern neck with a grand total of 12 to 18 inches.
February 16, 1996
Heavy Snow 0
A strong "Alberta Clipper", diving southeast from the upper Midwest into the deep south, linked up with subtropical moisture lurking along the southeast U.S. coast to develop a classic nor'easter, which moved from northeast South Carolina to off the Virginia Capes during the day on the 16th. As the area of low pressure intensified, it wrapped Atlantic moisture well to the west, where modified arctic air was pouring in from southern Canada. The result was a thin band of heavy snow which extended from southwest Virginia through the upper eastern shore of Maryland.
February 8, 1997 Heavy Snow 25K A winter storm dumped 4 to 8 inches of heavy, wet snow across all of northern and western Virginia on the 8th.
January 14, 1999 Winter
Weather 0
A strong arctic cold front moved slowly southeast across the Mid-Atlantic region from late on the 13th to midday on the 15th. By 9am on the 15th, ice accumulations from one quarter to nearly one inch occurred north of a line from Augusta County to Spotsylvania County. The ice this storm left behind had a large impact on the region. Hundreds of car accidents, slip and fall injuries, downed trees, and power outages were reported. In Stafford County, a jackknifed tractor trailer closed State Route 3 and 621, and Interstate 95 had to be temporarily shut down to clear fallen trees. Over 215,000 customers lost power from the storm across Northern Virginia, and Central Virginia reported over 6,000 additional outages.
D R A
F T

Hazard Mitigation Plan George Washington Regional Commission March 2012
4-96
Date Event Rain Fall (in.)
Comments
March 9, 1999 Winter Storm 0
An area of low pressure moved from the Ohio Valley to North Carolina from late on the 8th through the evening of the 9th. Snowfall rates were in excess of 1 1/2 inches per hour in many locations during the storm. Stafford County received between 4 to 8 inches. Spotsylvania and King George County received between 2 and 6 inches. The city of Fredericksburg reported over 100 accidents. On Interstate 95 in Spotsylvania County, a woman was killed in a morning car accident.
January 20, 2000 Winter
Weather 0
An area of low pressure moved from west to east across the Mid-Atlantic region on the 20th, dropping 2 to 6 inches of snow between midnight and mid-afternoon. Gusty winds of 35 to 45 MPH developed during the afternoon causing the snow to drift across roadways and reduce visibilities in open areas.
January 25, 2000 Northeaster 0
Low pressure off Cape Hatteras rapidly intensified late on the 24th and developed into a nor'easter which tracked northward along the Eastern Seaboard on the 25th. Very heavy snow and near-blizzard conditions were seen throughout the day east of the Blue Ridge Mountains, resulting in extremely hazardous travel conditions. Wind gusts of up to 45 MPH were recorded and several roads were drifted shut by blowing snow. The governor of Virginia declared a state of emergency as the storm battered the eastern part of the state.
January 30, 2000 Ice Storm 0
Cold air was in place east of the Blue Ridge Mountains on the 29th and 30th, keeping surface temperatures below freezing. Low pressure moved from the Lower Mississippi Valley northeastward to the Mid-Atlantic region early on the 30th, creating the perfect conditions for freezing rain around the Fredericksburg area, a mix of sleet and snow east of Skyline Drive, and moderate snowfall in the mountains. Ice accumulations between 1/4 and 3/4 of an inch coated roads, trees, and power lines in Fredericksburg and Stafford, Spotsylvania, and King George Counties. Electrical outages were reported as trees and branches weighed down by ice fell onto power lines. Disruptions affected 3000 customers in Fredericksburg and Spotsylvania and King George Counties.
February 12, 2000
Winter Weather
0
Low pressure moved from Tennessee to the North Carolina Coast on the 12th, spreading snow across the Central Shenandoah Valley and the Northern and Central Piedmont. Periods of light snow occurred from sunrise to late afternoon with accumulations ranging from 1 to 5 inches. A period of freezing drizzle also occurred around sunset.
December 13, 2000
Winter Weather
0
A strong cold front brought chilly air into the region on the 12th. By the afternoon of the 13th, an upper level disturbance brought warm air into the mid levels of the atmosphere and caused snow that fell from the system to melt to rain on its way down. When the rain hit the ground where temperatures were below freezing, ice accumulated. D R A
F T
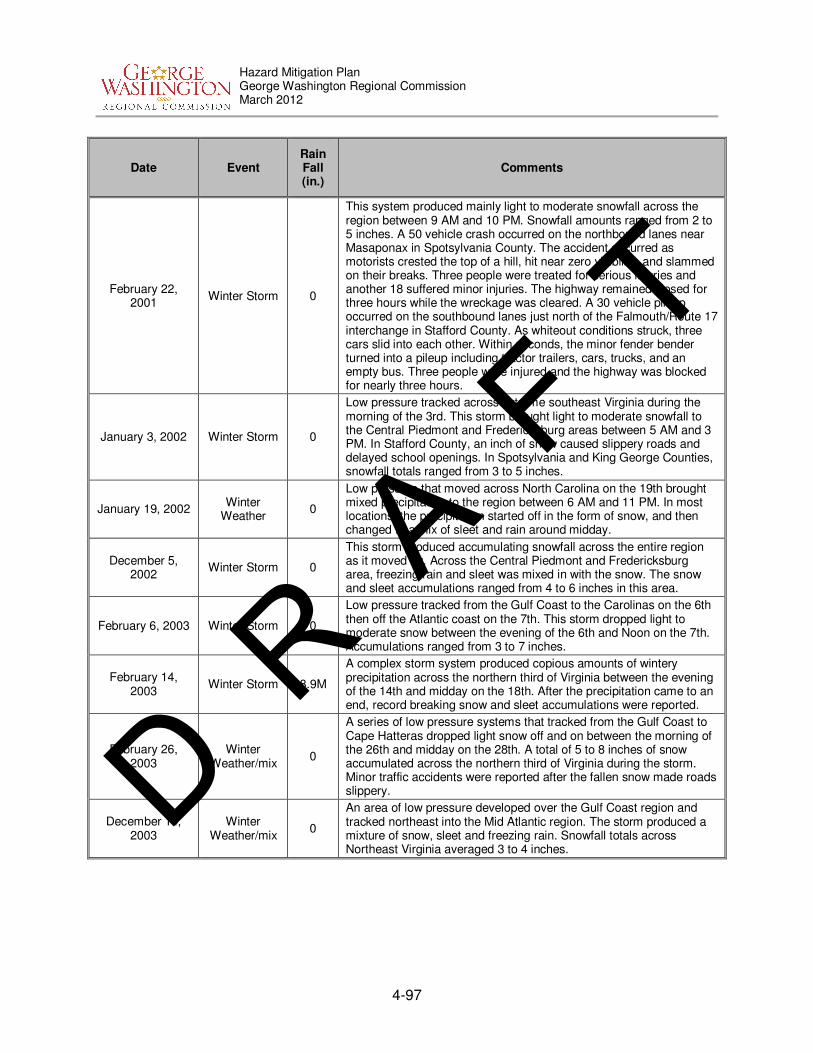
Hazard Mitigation Plan George Washington Regional Commission March 2012
4-97
Date Event Rain Fall (in.)
Comments
February 22, 2001
Winter Storm 0
This system produced mainly light to moderate snowfall across the region between 9 AM and 10 PM. Snowfall amounts ranged from 2 to 5 inches. A 50 vehicle crash occurred on the northbound lanes near Masaponax in Spotsylvania County. The accident occurred as motorists crested the top of a hill, hit near zero visibility, and slammed on their breaks. Three people were treated for serious injuries and another 18 suffered minor injuries. The highway remained closed for three hours while the wreckage was cleared. A 30 vehicle pileup occurred on the southbound lanes just north of the Falmouth/Route 17 interchange in Stafford County. As whiteout conditions struck, three cars slid into each other. Within seconds, the minor fender bender turned into a pileup including tractor trailers, cars, trucks, and an empty bus. Three people were injured and the highway was blocked for nearly three hours.
January 3, 2002 Winter Storm 0
Low pressure tracked across extreme southeast Virginia during the morning of the 3rd. This storm brought light to moderate snowfall to the Central Piedmont and Fredericksburg areas between 5 AM and 3 PM. In Stafford County, an inch of snow caused slippery roads and delayed school openings. In Spotsylvania and King George Counties, snowfall totals ranged from 3 to 5 inches.
January 19, 2002 Winter
Weather 0
Low pressure that moved across North Carolina on the 19th brought mixed precipitation to the region between 6 AM and 11 PM. In most locations, the precipitation started off in the form of snow, and then changed to a mix of sleet and rain around midday.
December 5, 2002
Winter Storm 0
This storm produced accumulating snowfall across the entire region as it moved by. Across the Central Piedmont and Fredericksburg area, freezing rain and sleet was mixed in with the snow. The snow and sleet accumulations ranged from 4 to 6 inches in this area.
February 6, 2003 Winter Storm 0
Low pressure tracked from the Gulf Coast to the Carolinas on the 6th then off the Atlantic coast on the 7th. This storm dropped light to moderate snow between the evening of the 6th and Noon on the 7th. Accumulations ranged from 3 to 7 inches.
February 14, 2003
Winter Storm 8.9M
A complex storm system produced copious amounts of wintery precipitation across the northern third of Virginia between the evening of the 14th and midday on the 18th. After the precipitation came to an end, record breaking snow and sleet accumulations were reported.
February 26, 2003
Winter Weather/mix
0
A series of low pressure systems that tracked from the Gulf Coast to Cape Hatteras dropped light snow off and on between the morning of the 26th and midday on the 28th. A total of 5 to 8 inches of snow accumulated across the northern third of Virginia during the storm. Minor traffic accidents were reported after the fallen snow made roads slippery.
December 14, 2003
Winter Weather/mix
0
An area of low pressure developed over the Gulf Coast region and tracked northeast into the Mid Atlantic region. The storm produced a mixture of snow, sleet and freezing rain. Snowfall totals across Northeast Virginia averaged 3 to 4 inches.
D R A
F T

Hazard Mitigation Plan George Washington Regional Commission March 2012
4-98
Date Event Rain Fall (in.)
Comments
January 25, 2004 Winter
Weather/mix 0
An area of low pressure developed off the coast of North Carolina and tracked north. This storm produced widespread snow, sleet and freezing drizzle over the region. Two to four inches of snow fell over the Central Foothills and the Northern Piedmont of Virginia. The snow mixed with sleet and finally changed over to freezing drizzle before tapering off. Several other minor accidents occurred according to Emergency Operations Centers. Dozens of school districts closed.
January 30, 2005 Winter Storm 0
A storm system brought a mix of snow, sleet, and freezing rain affecting most of Central Virginia.
Freezing rain accumulated to around .25 inches resulting in hazardous driving conditions.
December 5, 2005
Heavy Snow 40K
A winter weather storm produced 4 to 6.5 inches of snow across Northern Virginia.
There were reports of trees down in Spotsylvania County due to heavy snow accumulations.
February 11, 2006
Heavy Snow 250K
Storm snowfall across Northern Virginia produced between 8 and 14 inches.
There were reports of isolated drifting of snow and downed powerlines throughout the region.
This caused over 300,000 customers to be without power in the greater Washington/Baltimore area.
March 1, 2009 Winter Storm 0 A low pressure system produced storms releasing averaged snowfall totals of 5 inches across Spotsylvania County and the rest of Northern Virginia.
January 30, 2010 Winter Storm 0 Snowfall amounts between 5 and 6 inches were reported across Spotsylvania County.
February 16, 2010
Winter Storm 0
Snowfall totaled up to 1.5 inches in Chancellorsville in Spotsylvania County.
There were several reports of accidents during rush hour near Fredericksburg and Chancellorsville.
December 16, 2010
Winter Storm 0 Snowfall was estimated around 4 inches in Spotsylvania County.
Source: National Climatic Data Center, 2011.
D R A
F T

Hazard Mitigation Plan George Washington Regional Commission March 2012
4-99
E. Stafford County Hazard Identification
For the 2012 plan update, the GWRC steering committee reviewed the 2010 Commonwealth of Virginia Hazard Mitigation Plan, as well as the hazard events over the preceding five years, and determined a hazard ranking for each of the hazards below. For this update, the committee chose to use the State’s Hazard Type language as an update to the 2006 hazard type, to ensure better alignment with the state’s rankings and methodologies. Those rankings can be seen below in Table 4-40. For Stafford County, hazards that ranked high were then investigated further and a vulnerability analysis was performed.
Table 4-40. Prioritization of Natural Hazards. Stafford County.
2006 Hazard type
2010 State Hazard Type
2012 Section Heading 2010 State
Ranking for Stafford County
2012 Hazard Ranking from
Stafford County
Dam Failure N/A Dam Failure N/A Low
Drought Drought Drought and Extreme Heat Medium-High Medium-High
Extreme Heat Drought
Wildfire Wildfires Wildfires Medium-High Medium-High
Earthquakes Earthquakes Earthquakes Medium Low
Expansive Soils Sinkholes Sinkholes and Landslides
Medium-Low Medium-Low
Landslides Landslide Medium Low
Flooding Flooding Flooding and Erosion High High
Hurricanes Non-Rotational Wind Non-Rotational Wind High High
Thunderstorms Non-Rotational Wind
Tornadoes Tornadoes Rotational Wind High High
Northeasters Winter Storms Winter Storms and Nor’easters High High
Winter Storms Winter Storms
Flooding
Flooding in Stafford County can occur at any time throughout the year but is more frequent during the fall and spring. The most severe flooding events have been associated with intense rainfall from hurricanes and tropical storms. The FIS has identified the historic flooding events listed in Table 4-41 and Table 4-42. D R
A F
T

Hazard Mitigation Plan George Washington Regional Commission March 2012
4-100
Table 4-41. Historic Flood Events (Prior to 1995) – Stafford County.
Year of flood Discharge (cfs) Recurrence Interval
(years)
1937 134,000 135
1943* 140,000 140
1955 74,000 20
1972 107,000 30
*The flood of 1943 crested 45 feet above normal levels. Source: FEMA 1992
Table 4-42. Historic Flood Events – Stafford County.
Date Event Comments
March 4, 1993 Flood/Flash Flood
Moderate to heavy rain inflicted the region of Northern Virginia dumping 1 to 4 inches of rain, leading to widespread flooding.
Several roads were closed and cars were damaged trying to traverse flooded sections of roads.
Excessive rainfall and runoff caused several rivers of the Shenandoah Valley to flood as well.
January 19-22, 1996
Flood
River flooding occurred across the Commonwealth of Virginia starting in the early morning of January 19th. Snowmelt with a liquid equivalency of 2 to 3 inches combined with another 1 to 3 inches of rainfall caused the worst regional flooding in over a decade.
River flooding began at the headwaters of all basins, continuing downstream for the next 3 days. Crests ranged from 3 to 21 feet above the flood stage.
High water caused millions in damages, closed roads, destroyed homes and businesses, and even forced the evacuation of several towns.
Total property damage estimates were at 15 million and crop damages were at 81K.
July 14, 1996 Flash Flood A severe thunderstorm in Stafford County produced heavy rainfall resulting in the flooding of several roads including sections of Rt. 1, Plantation Drive, and several side streets.
September 8, 1996 Flash Flood
A slow-moving thunderstorm caused substantial local flooding in Stafford County.
Federal highway 1 was flooded at Boswell’s Corner.
Automobiles reported flooding, and evacuations were required into the Potomac Hills.
Total property damage estimates were 40K.
January 28, 1998 Flood
A nor’easter lingering in the area produced heavy rains across the central and northeastern regions of Virginia.
Widespread minor to moderate flooding of small streams, creeks, and low-lying areas occurred across the Northern Neck of Virginia.
The Virginia Department of Transportation reported over 150 roads closed in the area due to standing water or creeks that exceeded bankful.
High wind gusts exceeding 30 mph combined with highly saturated soil caused isolated cases of felled trees and power lines.
D R A
F T

Hazard Mitigation Plan George Washington Regional Commission March 2012
4-101
Date Event Comments
February 4, 1998 Flood
A powerful nor’easter dropped between 2 and 4 inches of rain across Northern Virginia resulting in widespread minor to moderate flooding.
Hundreds of roads were closed across the region.
The dam at Lake Jackson was reported to be over 6 feet above flood stage.
Several school districts closed for the following day due to the flooding and continued threat of heavy rain.
Property damage estimates were 10K.
September 16, 1999 Flash
Storms from Hurricane Floyd produced rainfall totals between 2 and 4 inches in Stafford County.
The same area observed wind gusts between 30 and 50 mph.
Wind gusts caused several trees to fall down combined with high water forced the closure of several roads in the county
There were reports of over 16,000 power outages across the region of Northern Virginia.
September 3, 2000 Flash Flood
Thunderstorms with heavy rainfall brought a couple inches of rain leading to flash flood incidents in Stafford County.
Stafford County Officials received reports of road flooding across the southern portion of the county. A vehicle in Falmouth was damaged by flood waters.
June 13, 2002 Flash Flood
Scattered thunderstorms with high wind and heavy rainfall produced flash flood conditions throughout Northern Virginia.
In the northern portion of Stafford County, powerful winds knocked down trees and power lines onto Rtes. 610, 643, 628, and 630.
Wind gusts of 54mph were recorded resulting in a chimney being knocked down.
Up to 1.5 feet of water covered the intersection of Route 610 and Route 1.
February 22, 2003 Flood
In Stafford County a storm produced between 1.5 to 3 inches of rain combined with the snowmelt of a massive snowstorm led to widespread flooding across Northern Virginia.
Red Fern Lane in Stafford County was flooded along with four other secondary roads.
Total damage estimates were 100K.
March 20, 2003 Flood
Across the region of Northern Virginia between 1.5 and 2.5 inches of rain fell.
In Stafford County, many secondary roads were underwater.
May 15, 2003 Flood
A series of thunderstorms struck the region of Northern Virginia producing between 2 and 4 inches of rain.
Several road closures in Stafford County were reported due to flooding.
June 14, 2003 Flash Flood
Scattered thunderstorms with high winds and heavy rains moved through Northern Virginia that afternoon.
Stafford County rainfalls exceeding 2 inches resulting in flooding in the northern portion of the county.
Route 1, Decatur Road, and Mountain View Road were partially closed due to flooding.
July 10, 2003 Flash Flood
Thunderstorms with high winds, frequent lightning, hail, heavy downpours, and isolated tornadoes moved through Northeast Virginia that evening.
Up to 3 inches of rain caused several roads to flood including southbound I-95. Trees and power lines were felled as well.
An F0 and F1 tornado both touched ground in Stafford County.
D R A
F T
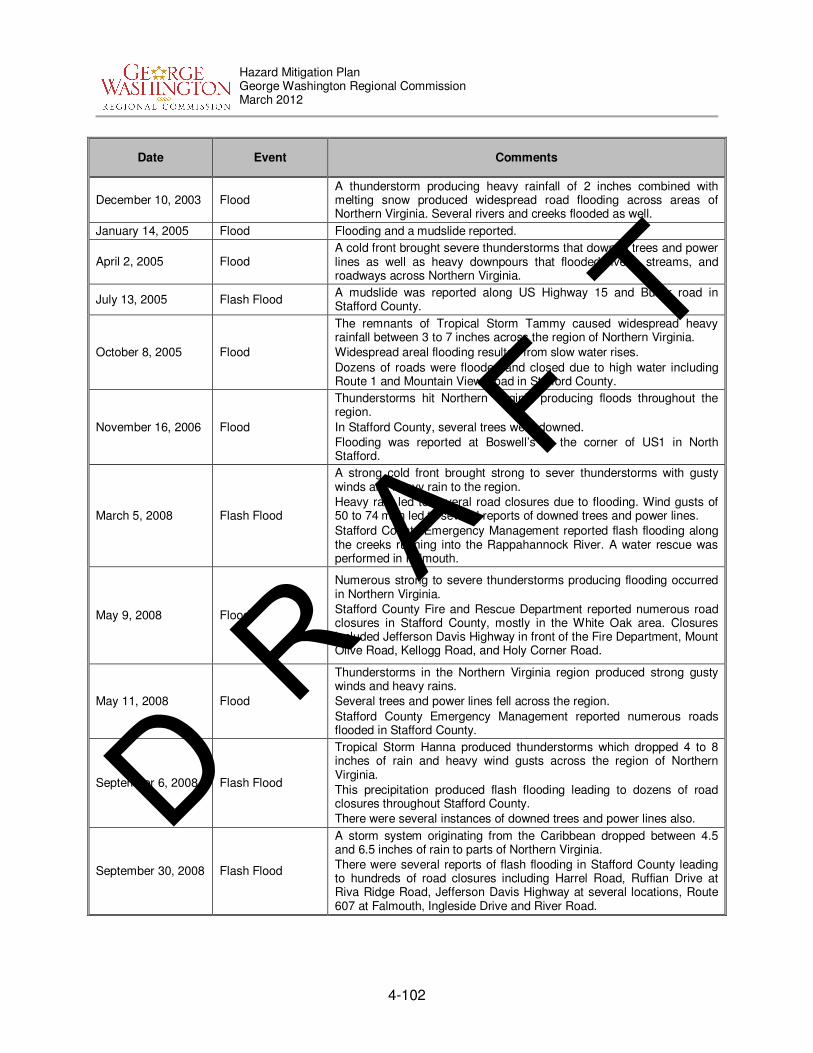
Hazard Mitigation Plan George Washington Regional Commission March 2012
4-102
Date Event Comments
December 10, 2003 Flood A thunderstorm producing heavy rainfall of 2 inches combined with melting snow produced widespread road flooding across areas of Northern Virginia. Several rivers and creeks flooded as well.
January 14, 2005 Flood Flooding and a mudslide reported.
April 2, 2005 Flood A cold front brought severe thunderstorms that downed trees and power lines as well as heavy downpours that flooded rivers, streams, and roadways across Northern Virginia.
July 13, 2005 Flash Flood A mudslide was reported along US Highway 15 and Butler road in Stafford County.
October 8, 2005 Flood
The remnants of Tropical Storm Tammy caused widespread heavy rainfall between 3 to 7 inches across the region of Northern Virginia.
Widespread areal flooding resulted from slow water rises.
Dozens of roads were flooded and closed due to high water including Route 1 and Mountain View Road in Stafford County.
November 16, 2006 Flood
Thunderstorms hit Northern Virginia producing floods throughout the region.
In Stafford County, several trees were downed.
Flooding was reported at Boswell’s at the corner of US1 in North Stafford.
March 5, 2008 Flash Flood
A strong cold front brought strong to sever thunderstorms with gusty winds and heavy rain to the region.
Heavy rain led to several road closures due to flooding. Wind gusts of 50 to 74 mph led to several reports of downed trees and power lines.
Stafford County Emergency Management reported flash flooding along the creeks running into the Rappahannock River. A water rescue was performed in Falmouth.
May 9, 2008 Flood
Numerous strong to severe thunderstorms producing flooding occurred in Northern Virginia.
Stafford County Fire and Rescue Department reported numerous road closures in Stafford County, mostly in the White Oak area. Closures included Jefferson Davis Highway in front of the Fire Department, Mount Olive Road, Kellogg Road, and Holy Corner Road.
May 11, 2008 Flood
Thunderstorms in the Northern Virginia region produced strong gusty winds and heavy rains.
Several trees and power lines fell across the region.
Stafford County Emergency Management reported numerous roads flooded in Stafford County.
September 6, 2008 Flash Flood
Tropical Storm Hanna produced thunderstorms which dropped 4 to 8 inches of rain and heavy wind gusts across the region of Northern Virginia.
This precipitation produced flash flooding leading to dozens of road closures throughout Stafford County.
There were several instances of downed trees and power lines also.
September 30, 2008 Flash Flood
A storm system originating from the Caribbean dropped between 4.5 and 6.5 inches of rain to parts of Northern Virginia.
There were several reports of flash flooding in Stafford County leading to hundreds of road closures including Harrel Road, Ruffian Drive at Riva Ridge Road, Jefferson Davis Highway at several locations, Route 607 at Falmouth, Ingleside Drive and River Road.
D R A
F T

Hazard Mitigation Plan George Washington Regional Commission March 2012
4-103
The Federal Emergency Management Agency (FEMA) has published a Flood Insurance Study (FIS) for Stafford County, dated February 4, 2005. The Flood Insurance Rate Maps (FIRMs), which accompany this FIS, delineate the 100- and 500-year flood hazard boundaries for flooding sources identified in areas of growing development or areas predicted to have future development at the time of the report. Individual FIRM panels are available at the FEMA Map Service Center (http://msc.fema.gov/). Table 4-43 identifies those streams within the County on which FEMA has performed detailed engineering analysis and, as a result of that analysis, has developed flood elevations and a floodway. Other streams within the County were studied by FEMA by approximate methods. These streams have a 100-year flood hazard boundary, but flood elevations and floodways have not been calculated.
Table 4-43. Water Bodies in Stafford County Studied by Detailed Methods.
Stream Name
Accokeek Creek Potomac Creek
Aquia Creek Rappahannock River
Austin Run Rappahannock River: Left Channel
Tributary 3 to Austin Run Tributary 1 to Rappahannock River
Claiborne Run Rocky Run
England Run Tributary 1 to Chopawamsic Creek
Falls Run Whitsons Run
Little Falls Run
Source: FEMA 2005
The Potomac River forms the eastern border of the County and also poses a flooding threat due to tidal flooding associated with the river. The cyclical rise and fall of coastal waters are linked to the gravitational attraction of the moon and the sun. In this area the tide range is 1-2 feet (FEMA 1992) depending on location. Tidal fluctuations in nature occur independent of climatic changes. Therefore, the position of the tide can amplify the effects of rising floodwaters. The 100-year still water elevations for the Potomac River range from 7.4 to 7.7 feet (NGVD 1929) (FEMA 1992). Noted Problem Areas MAC representatives for Stafford County noted several areas within the community that are affected by frequent flooding. These include:
• Repeated road closures due to flooding and debris at: o River Road; o Vista Woods, Grafton Village, and Argyle Hills; o Harrell Road at the CSX Crossing; and o Aquia Drive, requiring emergency access from Decatur Road.
• Riverine flooding in several neighborhoods including: o The Falmouth area, which is often evacuated; and o The Aquia Harbour area with over 1000 homes affected.
• Tidal flooding at the marina area.
The probability of future occurrences is ranked as high. A 100-year event has a one percent probability of occurring in any given year. The 100-year floodplains for Stafford County have been identified.
D R A
F T

Hazard Mitigation Plan George Washington Regional Commission March 2012
4-104
Wildfires
In evaluating the localized threat of wildfires to Stafford County, the MAC analyzed data from the Virginia Department of Forestry from 1995-2008 to identify incidents of wildfires that may have posed a threat to the community. Fires were most common in Stafford County from the month of February until April. The past occurrences are presented in Table 4-44. Since 1995 there have been 74 incidents of wildfire burning approximately 194.8 acres of land with $44,000 in damages. This amounts to an average of 5.69 fires per year. Therefore, the probability of future occurrences is rated as medium-high.
Non-Rotational Wind (Hurricanes and Thunderstorms)
In evaluating the localized threat of hurricanes to Stafford County, the MAC analyzed NOAA hurricane track data from 1851 to 2004 to identify storms that may have posed a threat to the community. The analysis included hurricanes, tropical storms, tropical depressions, and extratropical storms which passed through the region and affected the local community. These past occurrences are presented in Table 4-46. Locally, the eleven (11) hurricanes have caused:
• Heavy rain;
• Gusty and high sustained winds; • Flooding and property damage;
• Road closures; and
• Multiple power outages. The probability of future occurrences is ranked as medium. With 11 hurricanes occurring between 1954 and 2004, Stafford County experiences approximately 0.22 hurricanes per year.
Tornadoes
In evaluating the localized threat of tornadoes to Stafford County, the MAC analyzed local emergency management data and NOAA severe weather data from 1950 to 2005 to identify storms that may have posed a threat to the community. Most tornado activity occurred from May to September, although a historic event in February was noted. These past occurrences are presented in Table 4-46. Locally, the seven (11) tornadoes have caused:
• Property damage, including the displacement of boats in dry dock;
• Damage to the stage of the re-enactment of the Battle of Spotsylvania;
• Tree damage and resultant power outages. Noted tornadoes occurring during 2003 and 2004 damaged homes, downed trees, and caused power outages for several days.
• In 2003, a tornado along the Belle Plains Area damaged homes due to wind and fallen trees. Power outages lasted for several days.
• In 2004, a tornado along the Stafford and Garrisonville Road Area caused damage to trees and homes. Wind damage to a trailer park in the Widewater / Boswells Corner area was noted.
The probability of future occurrences is ranked as medium. With 11 tornadoes occurring between 1960 and 2008, Stafford County experiences approximately 0.22 tornadoes per year.
D R A
F T

Hazard Mitigation Plan George Washington Regional Commission March 2012
4-105
Winter Storms
In evaluating the localized threat of winter storms to Stafford County, the MAC analyzed local NOAA severe weather data from 1950 to 2005 to identify storms that may have posed a threat to the community. These past occurrences are presented in Table 4-47. Locally, the 24 northeasters and winter storms have caused:
• Excessive snow, sleet, and freezing rain;
• Multiple traffic accidents (noted incident on Route 17) and delays; • Tree and property damage;
• Power outages; and
• Injury and loss of life. A noted winter weather event during 2002 resulted in a traffic accident involving over 100 vehicles on southbound interstate 95 due to icy and white-out conditions. The interstate was closed for several hours. Additional traffic accidents during the 2004 winter season resulted in the death of 3 teenagers, in separate accidents, due to wet or icy road conditions. The probability of future occurrences is ranked as medium. With 33 events occurring between 1993 and 2010, Stafford County experiences approximately 1.94 winter events per year.
Table 4-44. Historic Wildfire Events - Stafford County.
Date Put Out Total Acres Burned Total
Damages ($)
Total Cost Saved ($)
Cause
03/25/1995 2 500 260000 Campfire
03/27/1995 1 200 0 Children
04/01/1995 3 500 0 Children
04/04/1995 3 1200 205000 Miscellaneous
04/07/1995 3 500 200000 Children
04/09/1995 1 500 46000 Smoking
04/22/1995 3 0 0 Miscellaneous
04/24/1995 1 0 0 Children
03/06/1996 1 0 36000 Miscellaneous
03/16/1996 2 0 7500 Debris Burning
04/17/1996 2 0 0 Incendiary
04/17/1996 1 0 0 Incendiary
04/23/1996 1 0 250000 Smoking
03/16/1997 2 0 0 Children
03/22/1997 1 0 0 Miscellaneous
03/24/1997 1 100 0 Debris Burning
04/02/1997 1 100 0 Debris Burning
03/28/1998 2 0 0 Children
03/31/1998 3 500 0 Debris Burning
03/31/1998 1 0 0 Miscellaneous
03/31/1998 1 100 0 Debris Burning
D R A
F T

Hazard Mitigation Plan George Washington Regional Commission March 2012
4-106
Date Put Out Total Acres Burned Total
Damages ($)
Total Cost Saved ($)
Cause
04/02/1998 3 200 0 Children
04/02/1998 3 300 95000 Debris Burning
04/02/1998 2 0 0 Debris Burning
04/05/1998 1 0 0 Miscellaneous
04/06/1998 7 0 0 Smoking
04/06/1998 1 0 0 Children
04/13/1998 5 0 0 Children
10/29/1998 5 500 0 Smoking
10/30/1998 1 500 500000 Debris Burning
12/30/1998 1 0 0 Children
03/20/1999 1 0 0 Children
03/29/1999 1 0 0 Miscellaneous
03/30/1999 4 0 0 Miscellaneous
03/31/1999 1 500 100000 Debris Burning
04/06/1999 3 1000 0 Children
04/06/1999 2 1200 200000 Children
04/08/1999 5 1500 1518000 Children
04/08/1999 1 100 0 Children
04/08/1999 1 200 2250000 Children
04/14/1999 2 0 0 Children
04/14/1999 1 0 0 Smoking
03/06/2000 2 500 201000 Children
04/10/2000 1 0 0 Children
11/01/2000 3 3000 0 Smoking
05/01/2001 7 0 0 Campfire
11/07/2001 1 2500 340000 Smoking
11/12/2001 4 300 305000 Children
11/12/2001 3 20300 2000 Miscellaneous
11/26/2001 3 500 0 Smoking
02/26/2002 0.2 0 0 Incendiary
02/26/2002 4 0 0 Fishermen
02/26/2002 0.1 0 0 Debris Burning—Urban Burner
03/01/2002 0.2 0 1200000 Incendiary—Juvenile
03/07/2002 5 5000 2000000 Railroad
03/24/2002 2 100 0 Children—Juvenile
04/06/2002 4 200 0 Smoking
05/16/2002 1 300 0 Incendiary
07/18/2002 1 0 0 Children—Juvenile
08/12/2002 1 100 960000 Children—Juvenile
12/02/2002 8 0 0 Equipment Use—ATV
03/15/2004 1 0 0 Children—Juvenile
04/19/2004 1 0 0 Children—Juvenile
D R A
F T

Hazard Mitigation Plan George Washington Regional Commission March 2012
4-107
Date Put Out Total Acres Burned Total
Damages ($)
Total Cost Saved ($)
Cause
04/19/2004 8 0 0 Debris Burning—Rural Burner
03/17/2005 2 0 0 Children—Juvenile
06/28/2005 4 1000 600000 Debris Burning—Rural Burner
11/13/2005 1 0 0 Children—Juvenile
02/25/2006 2 0 0 Children—Juvenile
02/27/2006 7 0 0 Debris Burning—Rural Burner
03/02/2006 3 0 0 Incendiary—Mental Cases
03/05/2006 3 0 0 Children—Juvenile
03/14/2007 0.3 0 0 Debris Burning—Rural Burner
03/03/2008 24 0 271000 Children—Juvenile
03/25/2008 1 0 500000 Debris Burning—Rural Burner
Totals 194.8 44,000 12,046,500
Source: Virginia Department of Forestry, 2008.
Table 4-45. Historic Hurricane Events – Stafford County.
Storm Name
Date Category Total Est. Damage
Descriptions
Hazel October 15,
1954 Hurricane Unknown The Free-Lance Star reported flooding and property damage.
Connie August 12,
1955 Hurricane Unknown The Free-Lance Star reported flooding and property damage.
Diane August 17,
1955 Hurricane Unknown The Free-Lance Star reported flooding and property damage.
Camille September
1960 Hurricane Unknown The Free-Lance Star reported massive flooding.
Floyd September
16, 1999 Tropical Storm
No estimate available.
Gusty winds from 30 to 50 mph
16,000 power outages
5.97 inches in Spotsylvania
Isabel September
18, 2003 Tropical Storm
$55.1 million – property
$130,000 – crop
Charley
And Bonnie
August 18,
2004 Hurricane Unknown
Highest sustained wind was 73 mph
Uprooted trees and downed numerous power lines
Over 2 million Virginians without power
Heavy rain and wind gust
Gaston August 30,
2004 Tropical
Depression Unknown
Hard rains that processed flooding
Roads under water
Power outage (99,600 statewide)
Frances September
8, 2004 Hurricane Unknown
D R A
F T

Hazard Mitigation Plan George Washington Regional Commission March 2012
4-108
Storm Name
Date Category Total Est. Damage
Descriptions
Ivan September
17, 2004 Hurricane Unknown
Spawned unconfirmed tornadoes
Power outage (66,000) Heavy rain/flooding
Jeanne September
28, 2004 Hurricane Unknown
Flash flooding/heavy rainfall
Power outage
Source: NOAA 2004, VWC 2004, and local emergency management.
Table 4-46. Historic Tornado Events – Stafford County.
Date Magnitude Property Damage
($) Descriptions
February 18, 1960
F1 0K
September 5, 1979
F1 250K
July 24, 1999
F1 10K Parts of southern Stafford County lost power after downed trees fell onto power lines
Most of the downed trees were in the Falmouth area.
September 24, 2001
F0 0.1K
At 4:00 p.m., the thunderstorm that produced the tornado near Sealston in King George County crossed into east Stafford County. A brief touch down occurred near Belle Plain. Minor tree damage was noted and later the same tornado briefly touched down near Aquia Bay Marina at the end of Aquia Creek Road, displacing three boats in dry dock. Damage was estimated at $10,000.
At 4:18 p.m., an F0 tornado touched down in north Stafford County near Boswells Corner. Initially, the storm produced minor damage to trees, and siding and shingles were torn from a few homes. Minutes later, the storm produced extensive tree damage to the Crystal Lakes neighborhood. Damage was estimated at $50,000.
July 10, 2003
F0 0K
In Stafford County, an F0 tornado touched down approximately 5 miles southeast of Falmouth near Route 3. The tornado moved northeast and damaged trees until it lifted near Route 218 on the King George County line. The tornado was approximately 50 yards wide and was on the ground for 5 miles.
September 8, 2004
F0 10K
The thunderstorm which produced the tornado near Sealston in King George County continued into east Stafford County. A brief touch down occurred near Belle Plain (almost 4 miles NE of White Oak). Minor tree damage was noted and later the same tornado cycled and another brief touch down occurred near Aquia Bay Marina at the end of Aquia Creek Road (approximately 5 miles S of Aquia). Minor tree damage was noted there and 3 boats in dry dock were displaced. Power outage for several days.
September 17, 2004
F1 10K
At 4:42 p.m., a tornado touched down in central Stafford County near Stones Corner. The storm tracked north-northeast and lifted near Stafford. The damage was limited to mature trees and large limbs. The tornado had a six-mile intermittent track, continuing into Prince William County. Damage was estimated at $10,000.
Tree damage to homes. Wind damage to a trailer park in Wildwater/Boswells Corner area.
D R A
F T

Hazard Mitigation Plan George Washington Regional Commission March 2012
4-109
Date Magnitude Property Damage
($) Descriptions
May 11, 2006
F0 25K
A thunderstorm produced a tornado near Falmouth in Stafford County.
The tornado caused noticeable tree damage on both sides of Interstate 95 near the Rte. 17 interchange.
May 8, 2008
F2 10.0M
The National Weather Service determined that a low-end F2 tornado struck the England Run North subdivision in Berea in Stafford County.
There were 160 homes damaged and nearly destroyed within that subdivision. 25 of those were categorized as uninhabitable.
June 4, 2008
F1 25K
The National Weather Service announced that an F1 tornado touched down in southern Fauquier County travelling 10 miles into Stafford County.
Mainly tree damage was observed.
June 4, 2008
F1 20K
An F1 tornado touched down in southern Stafford County 3 miles south of Ramouth.
Maximum winds were estimated at 95 mph.
Mainly tree damage was observed.
Source: National Climatic Data Center 2011 and local emergency management; NA = Data not available.
Table 4-47. Historic Northeaster and Winter Storm Events – Stafford County.
Date Event Property Damage
($) Comments
December 28, 1993
Heavy Snow 0
January 28, 1995
Heavy Snow 0
January 9, 1996 Heavy Snow 0 Low and mid-level lift ahead of an "Alberta Clipper" added insult to injury only a day after the "Blizzard of '96", dumping 4 inches of snow in a 5 hour period near the tidal Potomac River.
January 12, 1996
Heavy Snow 350K
Less than one week after the crippling "Blizzard of '96", a new winter storm dumped substantial snow across northern and western Virginia.
In southern Stafford Co (VAZ055), a woman was injured when a carport collapsed. The snow changed to freezing rain and sleet along the tidal Potomac River shortly before tapering off. The changeover suppressed accumulations to 4 or 5 inches in this region. In other portions of northern Virginia, snowfall totals were as follows: in the piedmont, 5 to 7 inches; at higher elevations, 6 to 10 inches.
In southern Stafford Co (VAZ055), a woman was injured when a carport collapsed. Luckily, she was protected from serious injury by the automobile, which had its windows shattered.
February 2, 1996
Heavy Snow 0
A vigorous upper level jet stream induced low-level lifting of warm moist air over a stationary arctic front extending from Tidewater Virginia through the Tennessee Valley early on the 2nd, producing a 75 mile-wide band of heavy snow which extended from the central piedmont through the Northern Neck region.
D R A
F T

Hazard Mitigation Plan George Washington Regional Commission March 2012
4-110
Date Event Property Damage
($) Comments
The heaviest snows fell in a narrow band from northern Albemarle Co through King George Co. Accumulations in these areas ranged from 8 to 13 inches, and snowfall rates were as high as 3 inches per hour.
February 2, 1996
Heavy Snow 0
The continuation of a strong upper-level jet stream, combined with additional mid-level dynamics, generated surface low pressure over central Georgia by evening on the 2nd. As the low moved to near Cape Hatteras overnight, a broad area of heavy snow overspread all of northern Virginia. Areas that received 4 to 13 inches during an early morning event (on the 2nd) picked up an additional 4 to 6 inches, leaving most areas from the central piedmont through the northern neck with a grand total of 12 to 18 inches.
February 16, 1996
Heavy Snow 0
A strong "Alberta Clipper", diving southeast from the upper Midwest into the deep south, linked up with subtropical moisture lurking along the southeast U.S. coast to develop a classic nor'easter, which moved from northeast South Carolina to off the Virginia Capes during the day on the 16th. As the area of low pressure intensified, it wrapped Atlantic moisture well to the west, where modified arctic air was pouring in from southern Canada. The result was a thin band of heavy snow which extended from southwest Virginia through the upper eastern shore of Maryland.
February 8, 1997
Heavy Snow 25K A winter storm dumped 4 to 8 inches of heavy, wet snow across all of northern and western Virginia on the 8th.
January 14, 1999
Winter Weather
0
A strong arctic cold front moved slowly southeast across the Mid-Atlantic region from late on the 13th to midday on the 15th. By 9am on the 15th, ice accumulations from one quarter to nearly one inch occurred north of a line from Augusta County to Spotsylvania County. The ice this storm left behind had a large impact on the region. Hundreds of car accidents, slip and fall injuries, downed trees, and power outages were reported. In Stafford County, a jackknifed tractor trailer closed State Route 3 and 621, and Interstate 95 had to be temporarily shut down to clear fallen trees. Over 215,000 customers lost power from the storm across Northern Virginia, and Central Virginia reported over 6,000 additional outages.
March 9, 1999 Winter Storm 0
An area of low pressure moved from the Ohio Valley to North Carolina from late on the 8th through the evening of the 9th. Snowfall rates were in excess of 1 1/2 inches per hour in many locations during the storm. Stafford County received between 4 to 8 inches. Spotsylvania and King George County received between 2 and 6 inches. The city of Fredericksburg reported over 100 accidents. On Interstate 95 in Spotsylvania County, a woman was killed in a morning car accident.
January 20, 2000
Winter Weather
0
An area of low pressure moved from west to east across the Mid-Atlantic region on the 20th, dropping 2 to 6 inches of snow between midnight and mid-afternoon. Gusty winds of 35 to 45 MPH developed during the afternoon causing the snow to drift across roadways and reduce visibilities in open areas.
D R A
F T

Hazard Mitigation Plan George Washington Regional Commission March 2012
4-111
Date Event Property Damage
($) Comments
January 25, 2000
Northeaster 0
Low pressure off Cape Hatteras rapidly intensified late on the 24th and developed into a nor'easter which tracked northward along the Eastern Seaboard on the 25th. Very heavy snow and near-blizzard conditions were seen throughout the day east of the Blue Ridge Mountains, resulting in extremely hazardous travel conditions. Wind gusts of up to 45 MPH were recorded and several roads were drifted shut by blowing snow. The governor of Virginia declared a state of emergency as the storm battered the eastern part of the state.
January 30, 2000
Ice Storm 0
Cold air was in place east of the Blue Ridge Mountains on the 29th and 30th, keeping surface temperatures below freezing. Low pressure moved from the Lower Mississippi Valley northeastward to the Mid-Atlantic region early on the 30th, creating the perfect conditions for freezing rain around the Fredericksburg area, a mix of sleet and snow east of Skyline Drive, and moderate snowfall in the mountains. Ice accumulations between 1/4 and 3/4 of an inch coated roads, trees, and power lines in Fredericksburg and Stafford, Spotsylvania, and King George Counties. Electrical outages were reported as trees and branches weighed down by ice fell onto power lines. Disruptions affected 3000 customers in Fredericksburg and Spotsylvania and King George Counties.
February 12, 2000
Winter Weather
0
Low pressure moved from Tennessee to the North Carolina Coast on the 12th, spreading snow across the Central Shenandoah Valley and the Northern and Central Piedmont. Periods of light snow occurred from sunrise to late afternoon with accumulations ranging from 1 to 5 inches. A period of freezing drizzle also occurred around sunset.
December 13, 2000
Winter Weather
0
A strong cold front brought chilly air into the region on the 12th. By the afternoon of the 13th, an upper level disturbance brought warm air into the mid levels of the atmosphere and caused snow that fell from the system to melt to rain on its way down. When the rain hit the ground where temperatures were below freezing, ice accumulated.
February 22, 2001
Winter Storm 0
This system produced mainly light to moderate snowfall across the region between 9 AM and 10 PM. Snowfall amounts ranged from 2 to 5 inches. A 50 vehicle crash occurred on the northbound lanes near Masaponax in Spotsylvania County. The accident occurred as motorists crested the top of a hill, hit near zero visibility, and slammed on their breaks. Three people were treated for serious injuries and another 18 suffered minor injuries. The highway remained closed for three hours while the wreckage was cleared. A 30 vehicle pileup occurred on the southbound lanes just north of the Falmouth/Route 17 interchange in Stafford County. As whiteout conditions struck, three cars slid into each other. Within seconds, the minor fender bender turned into a pileup including tractor trailers, cars, trucks, and an empty bus. Three people were injured and the highway was blocked for nearly three hours.
D R A
F T

Hazard Mitigation Plan George Washington Regional Commission March 2012
4-112
Date Event Property Damage
($) Comments
January 3, 2002 Winter Storm 0
Low pressure tracked across extreme southeast Virginia during the morning of the 3rd. This storm brought light to moderate snowfall to the Central Piedmont and Fredericksburg areas between 5 AM and 3 PM. In Stafford County, an inch of snow caused slippery roads and delayed school openings. In Spotsylvania and King George Counties, snowfall totals ranged from 3 to 5 inches.
January 19, 2002
Winter Weather
0
Low pressure that moved across North Carolina on the 19th brought mixed precipitation to the region between 6 AM and 11 PM. In most locations, the precipitation started off in the form of snow, and then changed to a mix of sleet and rain around midday.
December 5, 2002
Winter Storm 0
This storm produced accumulating snowfall across the entire region as it moved by. Across the Central Piedmont and Fredericksburg area, freezing rain and sleet was mixed in with the snow. The snow and sleet accumulations ranged from 4 to 6 inches in this area.
February 6, 2003
Winter Storm 0
Low pressure tracked from the Gulf Coast to the Carolinas on the 6th then off the Atlantic coast on the 7th. This storm dropped light to moderate snow between the evening of the 6th and Noon on the 7th. Accumulations ranged from 3 to 7 inches.
February 14, 2003
Winter Storm 8.9M
A complex storm system produced copious amounts of wintery precipitation across the northern third of Virginia between the evening of the 14th and midday on the 18th. After the precipitation came to an end, record breaking snow and sleet accumulations were reported.
February 26, 2003
Winter Weather/mix
0
A series of low pressure systems that tracked from the Gulf Coast to Cape Hatteras dropped light snow off and on between the morning of the 26th and midday on the 28th. A total of 5 to 8 inches of snow accumulated across the northern third of Virginia during the storm. Minor traffic accidents were reported after the fallen snow made roads slippery.
December 14, 2003
Winter Weather/mix
0
An area of low pressure developed over the Gulf Coast region and tracked northeast into the Mid Atlantic region. The storm produced a mixture of snow, sleet and freezing rain. Snowfall totals across Northeast Virginia averaged 3 to 4 inches.
January 25, 2004
Winter Weather/mix
0
An area of low pressure developed off the coast of North Carolina and tracked north. This storm produced widespread snow, sleet and freezing drizzle over the region. Two to four inches of snow fell over the Central Foothills and the Northern Piedmont of Virginia. The snow mixed with sleet and finally changed over to freezing drizzle before tapering off. Several other minor accidents occurred according to Emergency Operations Centers. Dozens of school districts closed.
February 5, 2004
Winter Weather/Mix
0
A low pressure system produced freezing rain and sleet in Northern Virginia. 1 to 2 tenths of ice accumulated.
The ice coated surfaces downed power lines and felled trees.
There were several school closures/delays, automobile accidents, and power outages.
In Stafford County, an automobile accident claimed the lives of two students as they traveled to school. A third student was seriously injured.
D R A
F T

Hazard Mitigation Plan George Washington Regional Commission March 2012
4-113
Date Event Property Damage
($) Comments
December 5, 2005
Heavy Snow 40K
A winter weather storm produced 4 to 6.5 inches of snow across Northern Virginia.
There were reports of trees down in Stafford County due to heavy snow accumulations.
February 11, 2006
Heavy Snow 250K
Storm snowfall across Northern Virginia produced between 8 and 14 inches.
There were reports of isolated drifting of snow and downed powerlines throughout the region.
This caused over 300,000 customers to be without power in the greater Washington/Baltimore area.
February 24, 2007
Winter Storm 0
A low pressure system produced storms that released 5 inches of snow with some locations reporting as much as 11 inches in Northern Virginia.
Sleet and freezing rain mixed with snow at times causing icy conditions on roadways.
Several schools delayed school openings by two hours due to icy roadways on Monday, February 26
th.
March 1, 2009 Winter Storm 0 A low pressure system produced storms releasing averaged snowfall totals of 5 inches across Stafford County and the rest of Northern Virginia.
December 18, 2009
Winter Storm 0 A winter storm produced snowfall amounts between 19 and 23 inches across Stafford County.
January 30, 2010
Winter Storm 0 Snowfall amounts around 5 to 6 inches were reported across Stafford County.
February 2, 2010
Winter Weather
0 Snowfall averaged 3 to 4 inches across the county.
February 5, 2010
Winter Storm 5K
Snowfall amounts between 13 and 17 inches were reported across Stafford County.
Power outages were reported due to the weight of the snow on trees and power lines.
School closures continued through the following week.
Source: National Climatic Data Center, 2011
D R A
F T

Hazard Mitigation Plan George Washington Regional Commission March 2012
4-114
This page intentionally left blank.
D R A
F T

Hazard Mitigation Plan George Washington Regional Commission March 2012
5-1
CHAPTER 5 - VULNERABILITY ASSESSMENT
The vulnerability assessment estimates the extent of injury and damages that may result from a hazard. Vulnerability can be quantified in those instances where there is a known, identified hazard area, such as a mapped floodplain. In such an instance the numbers and types of buildings subject to the identified hazard can be counted and their values tabulated. For those natural hazards not tied to a specific geographical location, such as severe weather, information is available where the potential impacts can be developed or inferred. Past events can also serve as a rough predictor of the future. Where the data was available, rough estimates of annualized damages and the number of hazard events is noted. In the previous section, the MAC identified eight natural hazards as critical, with medium to high hazard potential. These hazards affect either the GWRC region as a whole or have a specific geographical hazard area. Data availability also limits the granularity with which a vulnerability assessment can be performed for any particular hazard. With this in mind, the MAC categorized the hazards as follows:
Regional Vulnerability Assessment
• Drought; and • Severe Weather, including
o Extreme temperatures; o Northeasters; o Thunderstorms; o Tornadoes; and o Winter Storms.
Community Specific Vulnerability Assessment
• Flooding; • Hurricanes; and
• Wildfire.
I. Regional Vulnerability Assessment
The two types of natural hazards that were classified as affecting the entire GWRC region were drought and severe weather. For these hazards, the potential impacts are presented below.
A. Drought
Drought impacts may include physical, bio-physical, social and economic consequences. Physically, there may be a reduction in water supply for drinking, domestic, and irrigation purposes with a subsequent impact of increased pumping costs. The ground water level may be depleted and the flow of perennial water sources reduced. Bio-physical impacts include damage to crop quantity and quality, damage to wildlife and habitat, an increase in invasive/noxious weeds, and the deterioration of water quality. Economically, there may be a loss in livestock production and increased prices for commodities. The agricultural industry is the seventeenth largest industry for the GWRC region. In 2002 there were 1011 farms in the Counties of Caroline, King George, Spotsylvania, and Stafford. By, 2007 the number decreased to 997. Logically, the total acreage of farms decreased in the years of 2002-2007 from 173,591 acres to 161,313 acres for the region. The market value of crops in the region for 2007 was $26,237,000 this comes out to an average of $26,315 per farm (The Census of Agriculture, 2007). The
D R A
F T

Hazard Mitigation Plan George Washington Regional Commission March 2012
5-2
market value of 2010 crops exceeded $40million for the region (NASS, 2010). This leaves the potential economic impact of a drought to the region as staggering. Incidents of drought in the GWRC region have caused significant crop damage. In ten periods of drought from 1986 to 1999 the region saw total crop damages exceeding $1.3million (all crop and property damages in 2009 dollars unless otherwise noted). This is roughly the equivalent of $100,000 in crop damages occurring annually. The period of drought and excessive heat in the summer of 1995 claimed the lives of seven inhabitants of the region (SHELDUS 2011). In the summer of 2007 a drought impacted the region causing the USDA to designate Caroline and King George Counties as primary disaster areas. The Secretary of Agriculture also determined Spotsylvania, Stafford, and the aforementioned counties as contiguous disaster areas due to hydrological drought conditions and extreme heat. The drought in the summer of 2010 placed the counties of King George, Spotsylvania, Stafford, and Caroline under the primary natural disaster area designation.
B. Non-Rotational Wind, Winter Storms, and Tornadoes
The severe weather evaluated as part of this vulnerability assessment included: extreme temperatures, northeasters, thunderstorms, tornadoes, and winter storms. Impacts to the George Washington region as a result of severe weather could include damage to infrastructure, particularly damage to overhead power and communication lines, road closures, and interruption in business and school activities. In the case of tornadoes, severe damages can occur to buildings. Utility outages can impact anything relying on electricity without a redundant power supply (e.g., a generator, solar power, or redistribution plan), and include secondary impacts such as interruption to water and sewage services, heat and refrigeration, fuel supplies, computers and cell phones. If interruption to business occurs for an extended period, economic impacts can be severe. Also of concern would be the impacts on populations with special needs such as the elderly and those requiring the use of electric medical equipment. Although typically short-lived, delays in emergency response services can also be of concern. Depending on the nature of a given storm, all areas within the George Washington region are equally at risk; however, those areas relying on above ground utilities could suffer the greatest damage.
C. Hurricane Regional Vulnerability Assessment
Hazards U.S. – Multi Hazard (HAZUSMH) was utilized to perform a wind hazard analysis for the George
Washington Region. HAZUSMH software is a multi-hazard loss estimation program that was developed under a cooperative agreement between the National Institute of Building Sciences and FEMA. The
current version of HAZUSMH has the ability to calculate earthquake, wind, and flood hazards as well as potential economic losses associated with these hazards. The software is designed with the flexibility to perform loss estimations at three different levels. Level 1 utilizes all default parameters built into the software. Levels 2 and 3 require user defined scenarios and building inventory data. For the purpose of this Plan, a Level 1 wind analysis was performed to calculate the wind hazard for the George Washington Region. Table 5-1 lists the total dollar value of exposed structures based on occupancy type for the George Washington Region.
D R A
F T

Hazard Mitigation Plan George Washington Regional Commission March 2012
5-3
Table 5-1. Total Dollar Value of Exposed Structures from HAZUS – GW Region.
Occupancy Type Total $ Value Exposed Structures
Residential 12,962,651,000
Commercial 1,416,201,000
Industrial 181,449,000
Agricultural 21,895,000
Religion 154,232,000
Government 43,011,000
Education 56,754,000
Total 14,836,193,000
Source: HAZUS
The default data set provided with the HAZUSMH software is based on the 2000 census data. It is recognized that the current development trends in the George Washington Region may render the 2000
census data, with which HAZUSMH is programmed, somewhat obsolete. However, this analysis depicts the probability of occurrence and can generally be used to estimate potential damages due to high winds.
The two options provided by HAZUSMH software for wind analysis are the probabilistic and deterministic methods. The probabilistic scenario is the default option for the software and activates a database of many thousands of storm tracks and intensities. This scenario generates hurricane hazards based on set return periods. These return periods define the statistical probability that a storm of a given size and intensity could occur within any year. The deterministic method analyzes hazards associated with a user defined storm event. The user inputs the storm track, forward speed, and wind speed and allows for the creation of “what-if” scenarios. The probabilistic wind analysis was chosen because it provides the statistical probability for a range of hurricane events and presents a comparison of these events. The probabilistic analysis was used to generate structural loss estimations for hurricane events with specific recurrence intervals; 10-, 20-, 50-, 100-, 200-, 500-, and 1000-year. The recurrence interval is the average interval of time within which the given hurricane event will be equaled or exceeded once. Because residential structures comprise a significantly large percentage of the occupancy classification within the region, these data are presented in Table 5-2 below. Minor damage to a structure is defined as receiving minimal damage and is habitable without repairs. A moderately damage structure is uninhabitable. Minor repairs are necessary to make it habitable. These repairs will take less than 30 days. Severely damaged structures are currently uninhabitable; extensive repairs are necessary to make habitable. These repairs will take more than 30 days. Totally destroyed structures are at a total loss. These structures are not economically feasible to rebuild (VDEM 2007). Figure 5-1 shows the peak wind gusts, ranging from 66mph to 72mph, generated from a hurricane with a 100-year recurrence interval. The total residential loss from a 100-year recurrence interval is displayed in Figure 5-2 below.
D R A
F T
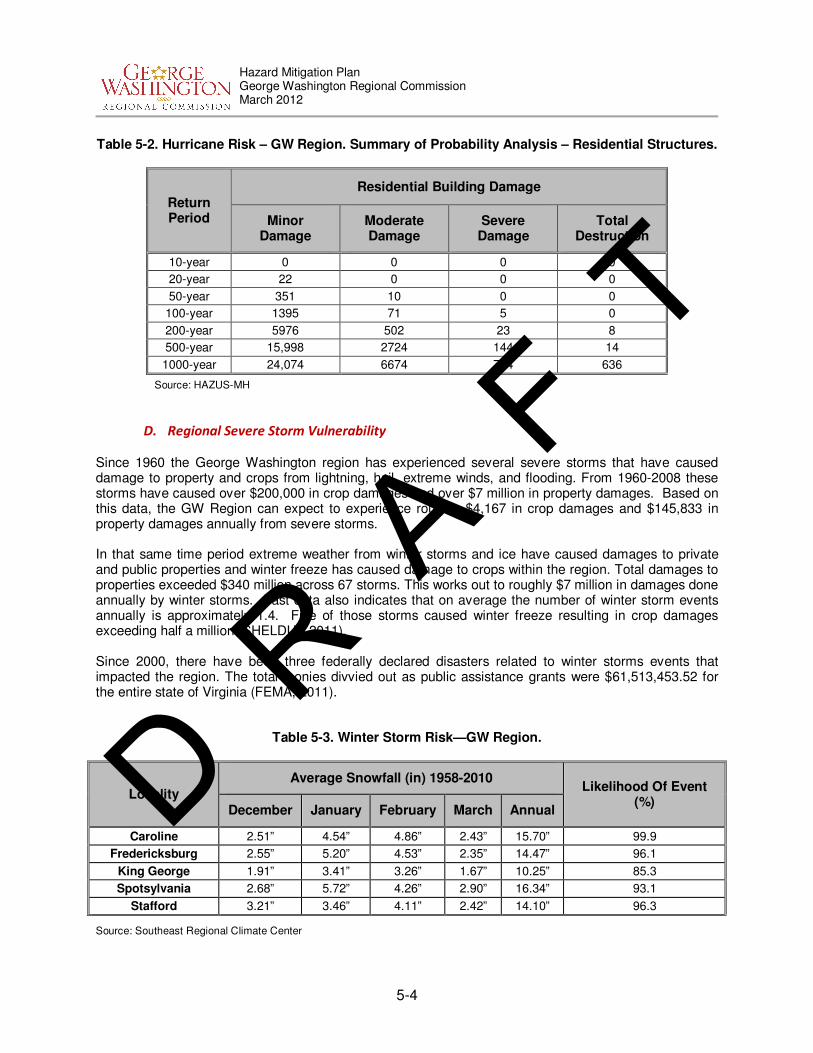
Hazard Mitigation Plan George Washington Regional Commission March 2012
5-4
Table 5-2. Hurricane Risk – GW Region. Summary of Probability Analysis – Residential Structures.
Return Period
Residential Building Damage
Minor Damage
Moderate Damage
Severe Damage
Total Destruction
10-year 0 0 0 0
20-year 22 0 0 0
50-year 351 10 0 0
100-year 1395 71 5 0
200-year 5976 502 23 8
500-year 15,998 2724 144 14
1000-year 24,074 6674 744 636
Source: HAZUS-MH
D. Regional Severe Storm Vulnerability
Since 1960 the George Washington region has experienced several severe storms that have caused damage to property and crops from lightning, hail, extreme winds, and flooding. From 1960-2008 these storms have caused over $200,000 in crop damages and over $7 million in property damages. Based on this data, the GW Region can expect to experience roughly $4,167 in crop damages and $145,833 in property damages annually from severe storms. In that same time period extreme weather from winter storms and ice have caused damages to private and public properties and winter freeze has caused damage to crops within the region. Total damages to properties exceeded $340 million across 67 storms. This works out to roughly $7 million in damages done annually by winter storms. Past data also indicates that on average the number of winter storm events annually is approximately 1.4. Five of those storms caused winter freeze resulting in crop damages exceeding half a million (SHELDUS 2011). Since 2000, there have been three federally declared disasters related to winter storms events that impacted the region. The total monies divvied out as public assistance grants were $61,513,453.52 for the entire state of Virginia (FEMA, 2011).
Table 5-3. Winter Storm Risk—GW Region.
Locality
Average Snowfall (in) 1958-2010 Likelihood Of Event
(%) December January February March Annual
Caroline 2.51” 4.54” 4.86” 2.43” 15.70” 99.9
Fredericksburg 2.55” 5.20” 4.53” 2.35” 14.47” 96.1
King George 1.91” 3.41” 3.26” 1.67” 10.25” 85.3
Spotsylvania 2.68” 5.72” 4.26” 2.90” 16.34” 93.1
Stafford 3.21” 3.46” 4.11” 2.42” 14.10” 96.3
Source: Southeast Regional Climate Center
D R A
F T
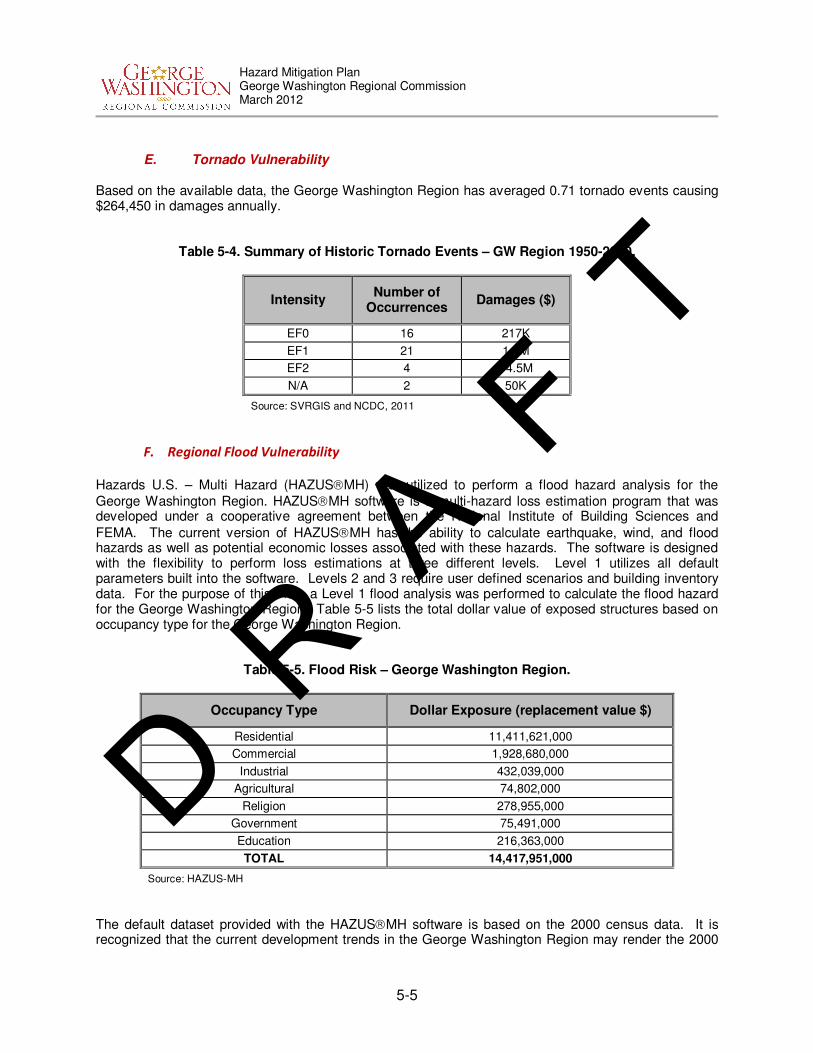
Hazard Mitigation Plan George Washington Regional Commission March 2012
5-5
E. Tornado Vulnerability
Based on the available data, the George Washington Region has averaged 0.71 tornado events causing $264,450 in damages annually.
Table 5-4. Summary of Historic Tornado Events – GW Region 1950-2010.
Intensity Number of
Occurrences Damages ($)
EF0 16 217K
EF1 21 1.1M
EF2 4 14.5M
N/A 2 50K
Source: SVRGIS and NCDC, 2011
F. Regional Flood Vulnerability
Hazards U.S. – Multi Hazard (HAZUSMH) was utilized to perform a flood hazard analysis for the
George Washington Region. HAZUSMH software is a multi-hazard loss estimation program that was developed under a cooperative agreement between the National Institute of Building Sciences and
FEMA. The current version of HAZUSMH has the ability to calculate earthquake, wind, and flood hazards as well as potential economic losses associated with these hazards. The software is designed with the flexibility to perform loss estimations at three different levels. Level 1 utilizes all default parameters built into the software. Levels 2 and 3 require user defined scenarios and building inventory data. For the purpose of this Plan, a Level 1 flood analysis was performed to calculate the flood hazard for the George Washington Region. Table 5-5 lists the total dollar value of exposed structures based on occupancy type for the George Washington Region.
Table 5-5. Flood Risk – George Washington Region.
Occupancy Type Dollar Exposure (replacement value $)
Residential 11,411,621,000
Commercial 1,928,680,000
Industrial 432,039,000
Agricultural 74,802,000
Religion 278,955,000
Government 75,491,000
Education 216,363,000
TOTAL 14,417,951,000
Source: HAZUS-MH
The default dataset provided with the HAZUSMH software is based on the 2000 census data. It is recognized that the current development trends in the George Washington Region may render the 2000
D R A
F T

Hazard Mitigation Plan George Washington Regional Commission March 2012
5-6
census data, with which HAZUSMH is programmed, somewhat obsolete. However, this analysis depicts the probability of occurrence and can generally be used to estimate potential damages due to high surging waters.
The three hazard type options provided by HAZUSMH software for flood analysis are the riverine, coastal, and riverine and coastal scenarios. The necessary scenario for any given situation depends upon the geography of the region. If the area is inland with a stream hydrology, then the riverine scenario should be used. If however, the area is along the coast then either the riverine and coastal, or coastal scenario should be used. The user cannot run any analysis without first defining the scenario. These return periods define the statistical probability that a flood event of a given intensity could occur within any year. The riverine and coastal flood analysis was chosen because the George Washington Region is situated on the coast (in Stafford and King George Counties) while maintaining an active stream hydrology. This scenario provides the statistical probability for a range of flood events and presents a comparison of those events. The coastal and riverine analysis was used to generate structural loss estimations, agricultural loss estimations, and shelter requirements for flood events with specific recurrence intervals; 10-, 20-, 50-, 100-, 200-, and 500-year. The recurrence interval is the average interval of time within which the given flood event will be equaled or exceeded once. Because residential structures comprise a significantly large percentage of the occupancy classification within the region, these data are presented in Figure 5-4 below. Total residential loss from a 100-year flood event is $49,988,000. Figure 5-5 depicts the number of displaced individuals from a 100-year flood event. The total number of displaced individuals from a regional 100-year flood event is 5775 persons. Figure 5-7 shows the 100-year floodplain for the GWRC region with 2010 census blocks that intersect it. The map displays the population (in 2010 Census numbers) that would be affected by a 100-year flood event. The total agricultural losses are listed in Table 5-6 below. Table 5-7 lists the number of critical facilities in the 100-year floodplain for each locality. Figure 5-6 shows the 100-year flood plain and plots the location of the GW Region critical facilities in relation.
Table 5-6. Agricultural Loss – George Washington Region.
Crop Type
Caroline Fredericksburg King
George Spotsylvania Stafford TOTAL
Loss ($)
Corn 817,494.09 N/A 119,654.00 214,915.21 150,813.49 1,302,876.79
Corn Silage
4,025,064.98 N/A 128,691.53 896,703.26 179,339.19 5,229,798.96
Soybeans 581,361.80 N/A 93,049.80 151,766.00 102,142.47 928,320.07
Wheat N/A N/A 73,807.52 96,127.05 23,618.65 193,553.22
TOTAL 5,423,920.87 N/A 415,202.85 1,359,511.52 454,913.80 7,653,549.04
Source: HAZUS-MH
D R A
F T
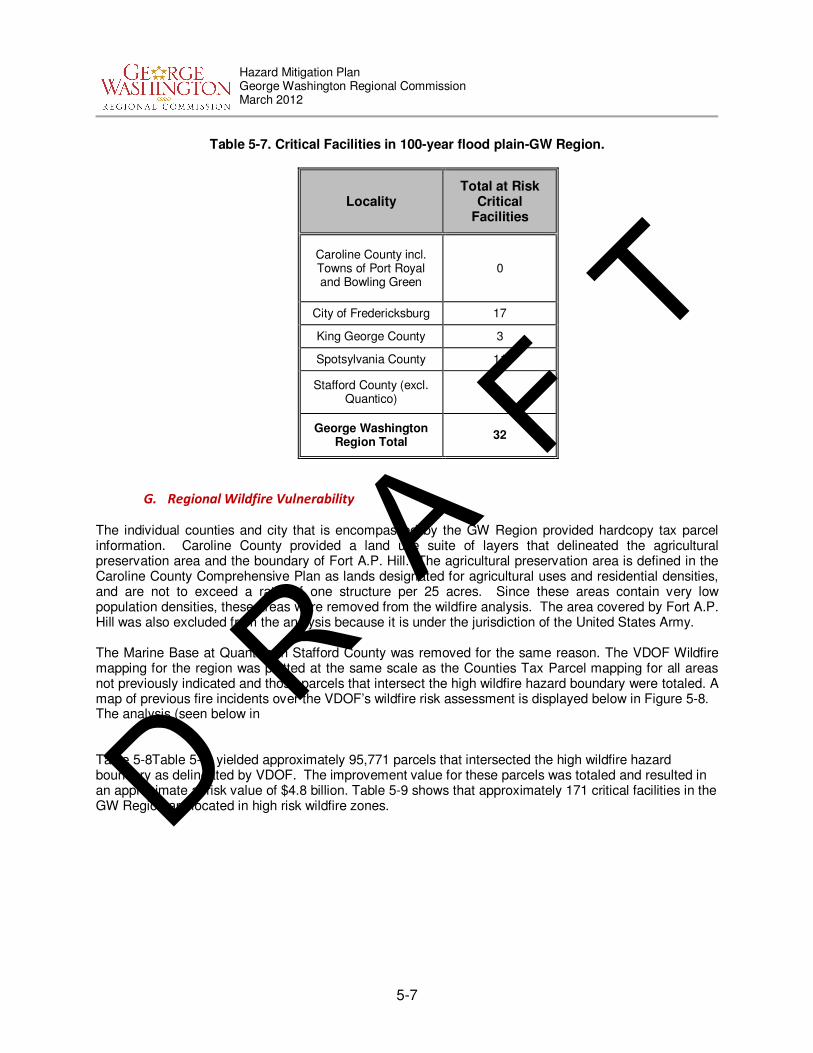
Hazard Mitigation Plan George Washington Regional Commission March 2012
5-7
Table 5-7. Critical Facilities in 100-year flood plain-GW Region.
Locality Total at Risk
Critical Facilities
Caroline County incl. Towns of Port Royal and Bowling Green
0
City of Fredericksburg 17
King George County 3
Spotsylvania County 11
Stafford County (excl. Quantico)
1
George Washington Region Total
32
G. Regional Wildfire Vulnerability
The individual counties and city that is encompassed by the GW Region provided hardcopy tax parcel information. Caroline County provided a land use suite of layers that delineated the agricultural preservation area and the boundary of Fort A.P. Hill. The agricultural preservation area is defined in the Caroline County Comprehensive Plan as lands designated for agricultural uses and residential densities, and are not to exceed a ratio of one structure per 25 acres. Since these areas contain very low population densities, these areas were removed from the wildfire analysis. The area covered by Fort A.P. Hill was also excluded from the analysis because it is under the jurisdiction of the United States Army. The Marine Base at Quantico in Stafford County was removed for the same reason. The VDOF Wildfire mapping for the region was plotted at the same scale as the Counties Tax Parcel mapping for all areas not previously indicated and those parcels that intersect the high wildfire hazard boundary were totaled. A map of previous fire incidents over the VDOF’s wildfire risk assessment is displayed below in Figure 5-8. The analysis (seen below in Table 5-8Table 5-8) yielded approximately 95,771 parcels that intersected the high wildfire hazard boundary as delineated by VDOF. The improvement value for these parcels was totaled and resulted in an approximate at risk value of $4.8 billion. Table 5-9 shows that approximately 171 critical facilities in the GW Region are located in high risk wildfire zones. D R
A F
T
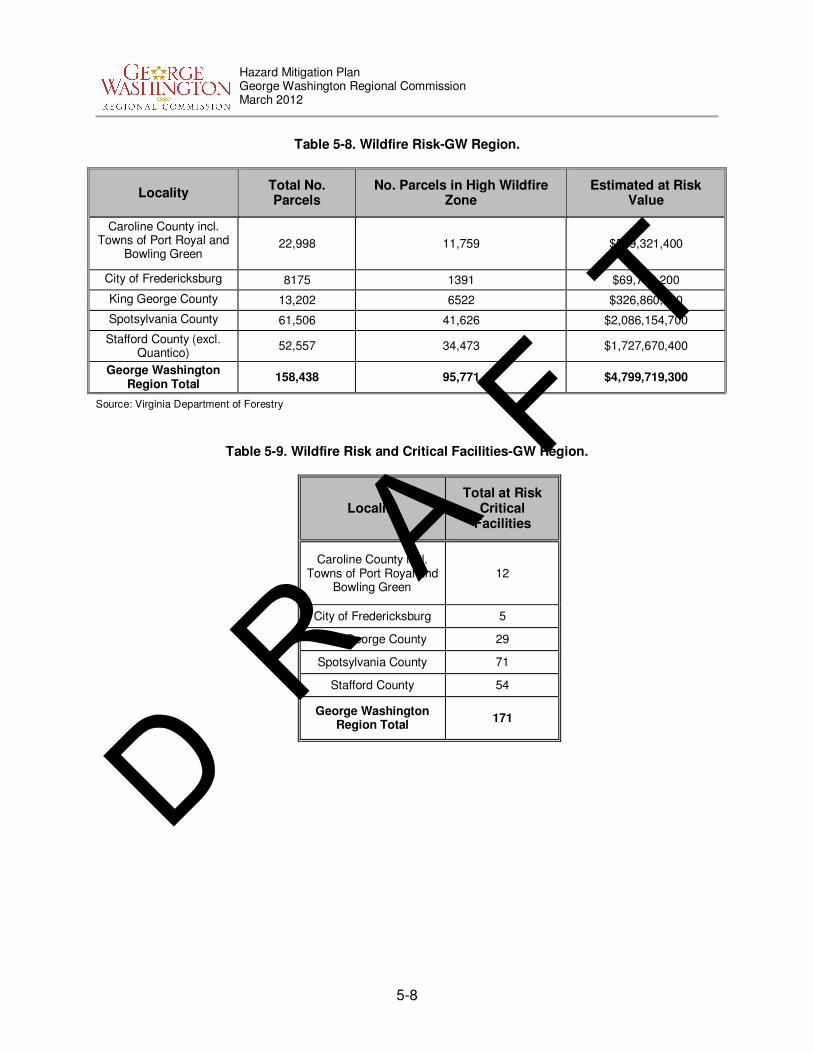
Hazard Mitigation Plan George Washington Regional Commission March 2012
5-8
Table 5-8. Wildfire Risk-GW Region.
Locality Total No. Parcels
No. Parcels in High Wildfire Zone
Estimated at Risk Value
Caroline County incl. Towns of Port Royal and
Bowling Green 22,998 11,759 $589,321,400
City of Fredericksburg 8175 1391 $69,712,200
King George County 13,202 6522 $326,860,000
Spotsylvania County 61,506 41,626 $2,086,154,700
Stafford County (excl. Quantico)
52,557 34,473 $1,727,670,400
George Washington Region Total
158,438 95,771 $4,799,719,300
Source: Virginia Department of Forestry
Table 5-9. Wildfire Risk and Critical Facilities-GW Region.
Locality Total at Risk
Critical Facilities
Caroline County incl. Towns of Port Royal and
Bowling Green 12
City of Fredericksburg 5
King George County 29
Spotsylvania County 71
Stafford County 54
George Washington Region Total
171
D R A
F T

Hazard Mitigation Plan George Washington Regional Commission March 2012
5-9
Figure 5-1. Peak Wind Gust (mph) 100-yr Distribution.
D R A
F T

Hazard Mitigation Plan George Washington Regional Commission March 2012
5-10
Figure 5-2. Total Residential Loss 100 Year Hurricane- GW Region.
D R A
F T

Hazard Mitigation Plan George Washington Regional Commission March 2012
5-11
Figure 5-3. Historic Tornado Events.
D R A
F T

Hazard Mitigation Plan George Washington Regional Commission March 2012
5-12
Figure 5-4. Total Residential Loss – GW region. D R A
F T

Hazard Mitigation Plan George Washington Regional Commission March 2012
5-13
Figure 5-5. Total Displaced Population—GW Region. D R A
F T

Hazard Mitigation Plan George Washington Regional Commission March 2012
5-14
Figure 5-6. Floodplains and Critical Facilities - GW Region.
D R A
F T
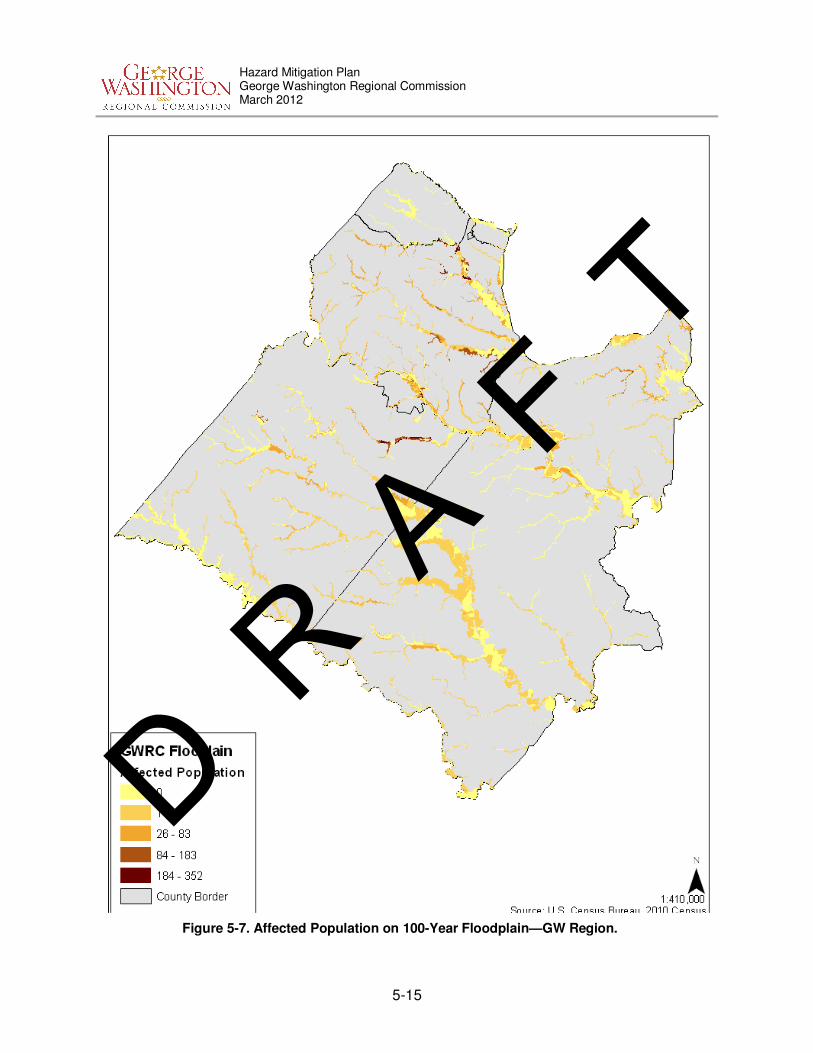
Hazard Mitigation Plan George Washington Regional Commission March 2012
5-15
Figure 5-7. Affected Population on 100-Year Floodplain—GW Region.
D R A
F T

Hazard Mitigation Plan George Washington Regional Commission March 2012
5-16
Figure 5-8. Wildfire Risk—GW Region.
D R A
F T

Hazard Mitigation Plan George Washington Regional Commission March 2012
5-17
Figure 5-9. Wildfire Risk and Critical Facilities—GW Region.
D R A
F T

Hazard Mitigation Plan George Washington Regional Commission March 2012
5-18
II. Community Specific Vulnerability Assessment
The MAC identified three hazards to the GWRC region for which specific geographical hazard areas have been defined: flooding, hurricanes, and wildfires. Community vulnerability can be quantified in these instances where there is a known, identified hazard area. The numbers and types of buildings subject to the identified hazard can be counted and their values tabulated. Further, information may be collected on the location of critical community facilities (e.g., a fire station), historic structures, and valued natural resources (e.g., an identified wetland or endangered species habitat) that are within the specific hazard area. Past events can also serve as a rough predictor of the future. Where the data was available, rough estimates of annualized damages and the number of hazard events is noted. Together, these values portray the impact, or vulnerability, of that area to that hazard. However, it is important to note that these values could be refined one step further, with regard to the percent of probable impact. For example, when a flood occurs, the event seldom causes the total destruction of an area. In fact, we know from NFIP insurance claims that a flood with an average depth of 2-feet above the ground is likely to cause approximately 20 percent damage to structures in the aggregate (those with basements, no basements, and second stories). Thus, if the 100-year flood were estimated to be 2-feet deep, a more accurate description of flood vulnerability would be a 1 percent annual chance of incurring a loss of 20 percent of the values tabulated in the 100-year floodplain, not including the additional impacts of damage to infrastructure and economic disruption. This allows a community to measure the cost-effectiveness of alternative mitigation projects under consideration. The benefits of a mitigation project are the future losses avoided, or in this example, that portion of the value of the 1 percent annual chance of 20 percent damage that is protected by the project. In recent years, FEMA has developed a concept to highlight the impact that repetitively flooded structures have had on the NFIP. The term “repetitive loss,” as applied to the NFIP, refers to any property for which two or more flood insurance claims in excess of $1,000 each in a 10-year period of time have been paid. In 1998, FEMA reported that the NFIP's 75,000 repetitive loss properties have already cost $2.8 billion in flood insurance payments and numerous other flood prone properties continue to remain at high risk in the Nation's floodplains. While these properties make up only 1-2 percent of the flood insurance policies currently in force, they account for 40 percent of the Country's flood insurance claim payments. A report on repetitive loss structures completed by the National Wildlife Federation found that 20 percent of these structures are listed as being outside of the 100-year floodplain (Conrad et al. 1998). For flooding, hurricane, and wildfire hazards, the MAC has inventoried the following as a means of quantifying vulnerability:
• Development Trends within each jurisdiction;
• Critical Facilities; • Community Impact; and
• Total Values at Risk (i.e., types, numbers, and value of land and improvements). Sections II.A through II.E present the vulnerability assessment of each community within the GWRC region to the hazards of flooding, hurricanes, and wildfires. D R
A F
T

Hazard Mitigation Plan George Washington Regional Commission March 2012
5-19
A. Caroline County and Town of Bowling Green and Town of Port Royal Vulnerability
Assessment
Development Trends
The Caroline County Department of Economic Development promotes the goals of business recruitment, job creation, business retention, and marketing in the County. Caroline has a civilian labor force population of 14,313 as of March 2011 and an unemployment rate of 8.5% according to the Virginia Employment Commission. Commercial investment has been successful through the recruitment of the CFC Farmers Market and the move of the Virginia State Fair from Richmond to Caroline. The Caroline County Strategic Plan promotes education with an increased emphasis on school-to-work, alternative education, and workforce training programs. Over half (51.4%) of Caroline County’s workforce consists of management, professional, sales, and office professions. According to the Strategic Plan, “Caroline County will maintain, expand and diversify its economic base by working with existing industries, attracting new industries, promoting tourism, and improving its commercial and retail base in order to provide a wider range of employment, income and services for County residents.” Caroline County’s population increased from 19,217 in 1990 to 22,121 in 2000 (15.1% increase). The 2010 Census reported the population in Caroline County at 28,545 persons. This is a 29% increase from 2000. A population projection for 2015 is 32,300 in Caroline County, this is an increase 13.2% from 2010. (U.S. Census Bureau, American FactFinder, 2011.)
Critical Facilities
In order to assess the vulnerability of a community to natural hazards, the MAC and the consulting team conducted an inventory of the residential and non-residential structures within Caroline County and identified critical facilities (Table 5-10). The critical facilities are the community’s assets that are the most important or vital to emergency management functions. Critical facilities include:
• Emergency Operation Center (EOC); • Emergency Communications Center (ECC) / 911;
• Law Enforcement Offices;
• Fire / Rescue Stations;
• Emergency Medical Services (EMS); • Power;
• Communications;
• Water;
• Wastewater Treatment Plants (WWTP); • Shelters; and
• Administration Buildings / Courthouse. Critical facilities are those facilities that warrant special attention in preparing for a disaster and/or facilities that are of vital importance to maintaining citizen life, health, and safety during and/or directly after a disaster event. MAC member representatives from Caroline County provided the inventory of critical facilities for the county.
D R A
F T

Hazard Mitigation Plan George Washington Regional Commission March 2012
5-20
Town of Bowling Green MAC member representatives from Caroline County provided the inventory of critical facilities for the Town of Bowling Green. The listing of critical facilities includes emergency response facilities and public facilities (Table 5-11).
Town of Port Royal MAC member representatives from Caroline County provided the inventory of critical facilities for the Town of Port Royal. The listing of critical facilities is listed in Table 5-12.
Table 5-10. Critical Facilities – Caroline County.
Facility Name
Street Location Facility
Type
Dept Fire & Rescue Admin.
Emergency Operations Center 17202 Richmond Turnpike Caroline County
Fire-Rescue Admin/EOC
Upper Caroline Fire Dept1 12581 Stonewall Jackson
Rd Woodford Fire Dept
Frog Level VFD.2 30240 Richmond Turnpike Hanover Fire Dept
Ladysmith VFD. 2 17420 Jefferson Davis Hwy Ladysmith Fire Dept
Sparta VFD. 2 23280 Sparta Rd Sparta Fire Dept
Port Royal VFD. 2 435 King Street Port Royal Fire Dept
Frog Level VRS 29415 Richmond Turnpike Ruther Glen Rescue Squad
Ladysmith VRS 18287 Jefferson Davis Hwy Ladysmith Rescue Squad
Rappahannock Elec. Field Ofc. 14380 Fredericksburg
Turnpike Caroline County Power Co. local office
St. Johns Sub-Station Rt. 725 & 639
five miles east of I-95 Ruther Glen Electrical Sub Station
Communications Transmit Tower Varies Varies Communications
Communications Receive Towers Varies Varies Communications
WWUZ CH 2451 Penola Rd. Communications
Cell & Microwave Towers Varies Varies Communications
Caroline Co. STP 22101 Rogers Clark Blvd Ruther Glen Wastewater
Ladysmith Primary2 9075 Chance Place Ruther Glen School / Shelter
Bowling Green Primary2 17176 Richmond Turnpike Milford School / Shelter
Bowling Green Elem 16261 Richmond Turnpike Caroline County School / Shelter
Ladysmith Elem2 7278 Ladysmith Rd Ruther Glen School / Shelter
Caroline Middle2 13325 Devils Three Jump
Rd Milford School / Shelter
Caroline High School 19155 Rogers Clark Blvd Milford School / Shelter
Caroline County Courthouse Main Street and Court
House Lane Bowling Green Administration Building
D R A
F T

Hazard Mitigation Plan George Washington Regional Commission March 2012
5-21
Facility Name
Street Location Facility
Type
Additional significant structures
CSX/Amtrak Railway Varies Varies Transportation
Plantation gas Pipeline Varies Varies Gas
Columbia Gas Pipeline Varies Varies Gas
School Board Office 16221 Richmond Turnpike Caroline County School Board
Pneumansend Regional Jail 11093 S.W. Lewis Memorial
Dr. Caroline County Jail
Lake Caroline Dam 75 Saratoga Cove Ruther Glen Office
Lake Land’or Dam 319 Land’or Drive Ruther Glen Office
1 Data taken from FEMA HAZUS-MH program
2 Data provided by GWRC
Source: HAZUS and GWRC.
Table 5-11. Critical Facilities – Town of Bowling Green.
Facility Name Street Town Facility Type
State Police 101 Ennis St. Bowling Green Police Departments
Caroline Sheriff Admin. 118 Courthouse Ln. Bowling Green Police Departments
Bowling Green Police Dept 117 Butler St. Bowling Green Police Departments
Bowling Green Fire Dept 130 Courthouse Ln. Bowling Green Fire Dept
911 Center 108B Courthouse Ln. Bowling Green 911 Center
Bowling Green Rescue Squad1
132 Courthouse Ln. Bowling Green Rescue Squad
Water Main Controls/Ground Storage
Well 107 Butler St. Bowling Green Water
Fort AP Hill Route 301 & State Route
608 Bowling Green Wastewater
Wastewater Treatment Plant
219 Anderson Ave. Bowling Green Wastewater
Sewer Pump Station 104 Lacy Lane Bowling Green Sewer
Sewer Pump Station 16356 Heritage Pines
Circle Bowling Green Sewer
Town Hall 117 Butler Street Bowling Green Administration Building
Additional significant structures
Dialysis Center 102 W. Broaddus Ave. Bowling Green Medical
Nursing Home 116 Anderson Ave. Bowling Green Medical
Source: Data provided by the Town of Bowling Green.
D R A
F T

Hazard Mitigation Plan George Washington Regional Commission March 2012
5-22
Table 5-12. Critical Facilities – Town of Port Royal.
Facility Name Street Town Facility Type
Port Royal V.F.D. 1 435 King Street Port Royal Fire Dept
Town Water Storage Tank 435 King Street Port Royal Water
Town Hall 419 King Street Port Royal Administration 1 Data provided by GWRC
Source: Data provided by the Town of Port Royal.
Non-Rotational Wind Vulnerability
Hazards U.S. – Multi Hazard (HAZUSMH) was utilized to perform a wind hazard analysis for Caroline
County. HAZUSMH software is a multi-hazard loss estimation program that was developed under a cooperative agreement between the National Institute of Building Sciences and FEMA. The current
version of HAZUSMH has the ability to calculate earthquake, wind, and flood hazards as well as potential economic losses associated with these hazards. The software is designed with the flexibility to perform loss estimations at three different levels. Level 1 utilizes all default parameters built into the software. Levels 2 and 3 require user defined scenarios and building inventory data. For the purpose of this Plan, a Level 1 wind analysis was performed to calculate the wind hazard for Caroline County. Table 5-13 lists the total dollar value of exposed structures based on occupancy type for Caroline County.
The default data set provided with the HAZUSMH software is based on the 2000 census data. It is recognized that the current development trends in Caroline County may render the 2000 census data,
with which HAZUSMH is programmed, somewhat obsolete. However, this analysis depicts the probability of occurrence and can generally be used to estimate potential damages due to high winds.
Table 5-13. Total Dollar Value of Exposed Structures from HAZUS – Caroline County.
Occupancy Type Total $ Value
Exposed Structures
Residential 1,069,417,000
Commercial 59,405,000
Industrial 6,830,000
Agricultural 2,147,000
Religion 14,336,000
Government 3,150,000
Education 1,504,000
Total 1,156,789,000
Source: HAZUS-MH
The two options provided by HAZUSMH software for wind analysis are the probabilistic and deterministic methods. The probabilistic scenario is the default option for the software and activates a database of many thousands of storm tracks and intensities. This scenario generates hurricane hazards
D R A
F T

Hazard Mitigation Plan George Washington Regional Commission March 2012
5-23
based on set return periods. These return periods define the statistical probability that a storm of a given size and intensity could occur within any year. The deterministic method analyzes hazards associated with a user defined storm event. The user inputs the storm track, forward speed, and wind speed and allows for the creation of “what-if” scenarios. The probabilistic wind analysis was chosen because it provides the statistical probability for a range of hurricane events and presents a comparison of these events. The probabilistic analysis was used to generate structural loss estimations for hurricane events with specific recurrence intervals; 10-, 20-, 50-, 100-, 200-, 500-, and 1000-year. The recurrence interval is the average interval of time within which the given hurricane event will be equaled or exceeded once. Because residential structures comprise a significantly large percentage of the occupancy classification within Caroline County, these data are presented in below. Figure 5-10 shows the peak wind gusts, ranging from 61mph to 69mph, generated from a hurricane with a 100-year recurrence interval. Figure 5-11 displays the total residential loss by census block for a 100-year recurrence interval.
Table 5-14. Hurricane Risk - Caroline County. Summary of Probabilistic Analysis – Residential Structures.
Return Period
Residential Building Damage
Minor Damage
Moderate Damage
Severe Damage
Total Destruction
10-year 0 0 0 0
20-year 1 0 0 0
50-year 5 0 0 0
100-year 95 2 0 0
200-year 296 14 1 0
500-year 1,691 294 18 14
1000-year 2,307 599 66 56
Source: HAZUS
Severe Storm Vulnerability Since 1960 Caroline has experienced 75 severe storms (roughly 1.6 annually) that have caused damage to property and crops from lightning, hail, extreme winds, and flooding. From 1960-2008 these storms have caused $22,000 in crop damages and $430,000 in property damages or the equivalent of $458 in crop damages and $8,958 in property damages annually. The storms have taken the lives of 2 residents and injured 13 people. In that same time period extreme weather from winter storms and ice have caused damages to private and public properties and winter freeze has caused damage to crops within the region. Total damages to properties exceeded $61 million across 54 storms or roughly $1.3 million annually. Four of those storms caused winter freeze resulting in crop damages resulting in damages of approximately $94,000 (SHELDUS 2011). The risk for winter storm events for Caroline County and its independent towns is listed below in Table 5-15.
D R A
F T
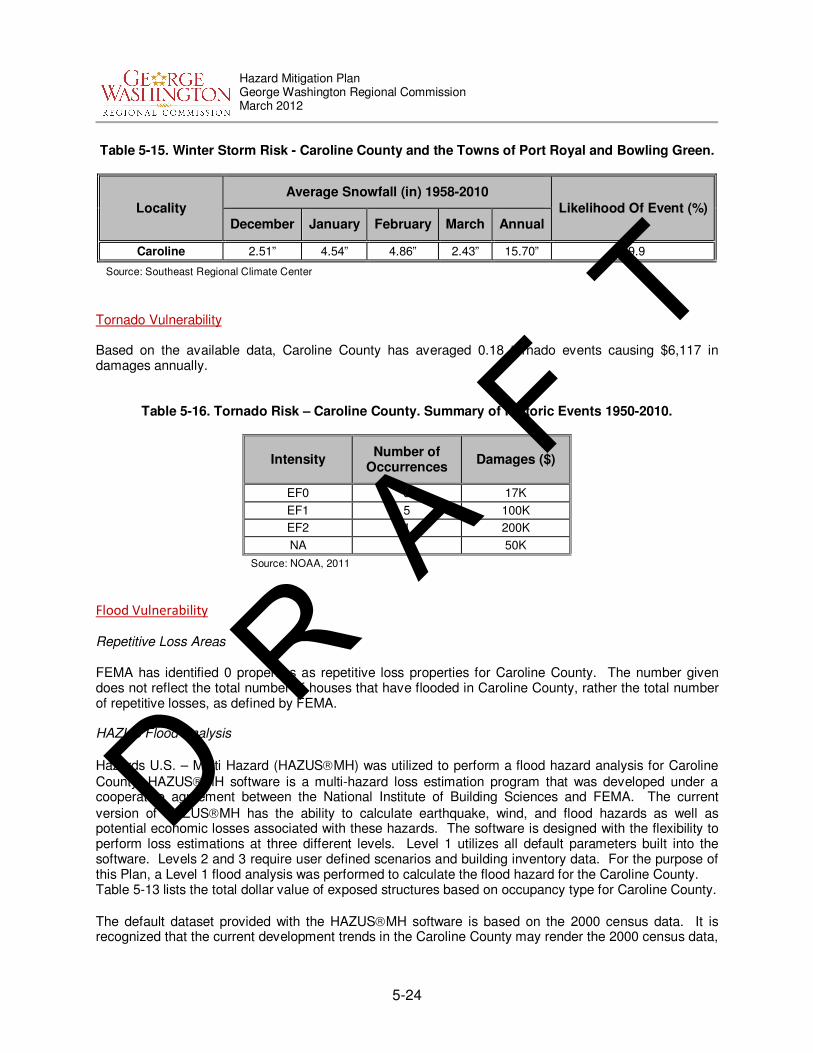
Hazard Mitigation Plan George Washington Regional Commission March 2012
5-24
Table 5-15. Winter Storm Risk - Caroline County and the Towns of Port Royal and Bowling Green.
Locality
Average Snowfall (in) 1958-2010
Likelihood Of Event (%) December January February March Annual
Caroline 2.51” 4.54” 4.86” 2.43” 15.70” 99.9
Source: Southeast Regional Climate Center
Tornado Vulnerability Based on the available data, Caroline County has averaged 0.18 tornado events causing $6,117 in damages annually.
Table 5-16. Tornado Risk – Caroline County. Summary of Historic Events 1950-2010.
Intensity Number of
Occurrences Damages ($)
EF0 3 17K
EF1 5 100K
EF2 1 200K
NA 2 50K
Source: NOAA, 2011
Flood Vulnerability
Repetitive Loss Areas FEMA has identified 0 properties as repetitive loss properties for Caroline County. The number given does not reflect the total number of houses that have flooded in Caroline County, rather the total number of repetitive losses, as defined by FEMA. HAZUS Flood Analysis
Hazards U.S. – Multi Hazard (HAZUSMH) was utilized to perform a flood hazard analysis for Caroline
County. HAZUSMH software is a multi-hazard loss estimation program that was developed under a cooperative agreement between the National Institute of Building Sciences and FEMA. The current
version of HAZUSMH has the ability to calculate earthquake, wind, and flood hazards as well as potential economic losses associated with these hazards. The software is designed with the flexibility to perform loss estimations at three different levels. Level 1 utilizes all default parameters built into the software. Levels 2 and 3 require user defined scenarios and building inventory data. For the purpose of this Plan, a Level 1 flood analysis was performed to calculate the flood hazard for the Caroline County. Table 5-13 lists the total dollar value of exposed structures based on occupancy type for Caroline County.
The default dataset provided with the HAZUSMH software is based on the 2000 census data. It is recognized that the current development trends in the Caroline County may render the 2000 census data,
D R A
F T

Hazard Mitigation Plan George Washington Regional Commission March 2012
5-25
with which HAZUSMH is programmed, somewhat obsolete. However, this analysis depicts the probability of occurrence and can generally be used to estimate potential damages due to high surging waters.
The three hazard type options provided by HAZUSMH software for flood analysis are the riverine, coastal, and riverine and coastal scenarios. The necessary scenario for any given situation depends upon the geography of the region. If the area is inland with a stream hydrology, then the riverine scenario should be used. If however, the area is along the coast then either the riverine and coastal, or coastal scenario should be used. The user cannot run any analysis without first defining the scenario.
Table 5-17. Flood Risk – Caroline County and the Towns of Bowling Green and Port Royal.
Occupancy Type Dollar Exposure (replacement value $)
Residential 889,530,000
Commercial 149,857,000
Industrial 32,928,000
Agricultural 7,758,000
Religion 34,712,000
Government 9,295,000
Education 12,091,000
TOTAL 1,136,171,000
Source: HAZUS-MH
The riverine analysis was chosen for Caroline County. This scenario provides the statistical probability for a range of flood events and presents a comparison of those events. The coastal and riverine analysis was used to generate structural loss estimations, agricultural loss estimations, and shelter requirements for flood events with specific recurrence intervals; 10-, 20-, 50-, 100-, 200-, and 500-year. The recurrence interval is the average interval of time within which the given flood event will be equaled or exceeded once. Agricultural damage from a 100-year event is listed below in Table 5-18. Because residential structures comprise a significantly large percentage of the occupancy classification within the region, these data are presented in Figure 5-13 below. The total damages to residential structures were $9,832,000. The number of displaced persons from a 100-year event is displayed below in Figure 5-14. The total number of displaced Caroline County residents was 1160 people. Figure 5-15 shows the 100-year floodplain for the Caroline County with 2010 census blocks that intersect it. The map displays the population (in 2010 Census numbers) that would be affected by a 100-year flood event. D R
A F
T

Hazard Mitigation Plan George Washington Regional Commission March 2012
5-26
Table 5-18. Agricultural Loss – Caroline County and the Towns of Bowling Green and Port Royal.
Crop Type Loss ($)
Corn 817,494.09
Corn Silage 4,025,064.98
Soybeans 581,361.80
TOTAL 5,423,920.87
Source: HAZUS-MH
Wildfire Vulnerability
Caroline County provided hardcopy tax parcel information dated at a scale of 1”=600’. Caroline County also provided a land use suite of layers that delineated the agricultural preservation area and the boundary of Fort A.P. Hill. The agricultural preservation area is defined in the Caroline County Comprehensive Plan as lands designated for agricultural uses and residential densities, and are not to exceed a ratio of one structure per 25 acres. Since these areas contain very low population densities, these areas were removed from the wildfire analysis. The area covered by Fort A.P. Hill was also excluded from the analysis because it is under the jurisdiction of the United States Army. The VDOF Wildfire mapping for Caroline County was plotted at the same scale as the Caroline County Tax Parcel mapping for all areas not previously indicated and those parcels that intersect the high wildfire hazard boundary were totaled. The analysis (listed below in Table 5-19) yielded approximately 11,759 parcels that intersected the high wildfire hazard boundary as delineated by VDOF. The improvement value for these parcels was totaled and resulted in an at risk value of $589,321,400 for Caroline County.
Table 5-19. Wildfire Risk—Caroline County.
Total No. Parcels No. Parcels in High
Wildfire Zone Estimated at Risk Value
22,998 11,759 $589,321,400
Source: Data provided by Caroline County
D R
A F
T

Hazard Mitigation Plan George Washington Regional Commission March 2012
5-27
Figure 5-10. Peak Wind Gust (mph) Distribution Caroline County.
D R A
F T

Hazard Mitigation Plan George Washington Regional Commission March 2012
5-28
Figure 5-11. Total Residential Loss 100 Year Hurricane - Caroline County . D R A
F T
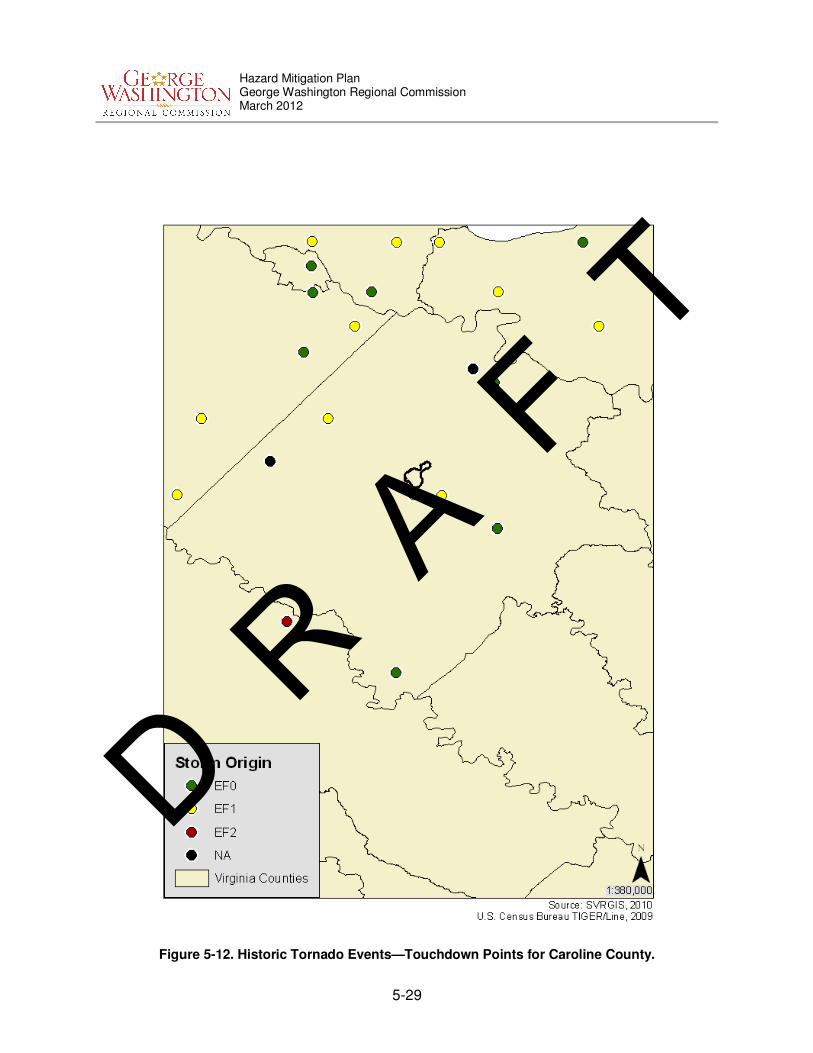
Hazard Mitigation Plan George Washington Regional Commission March 2012
5-29
Figure 5-12. Historic Tornado Events—Touchdown Points for Caroline County.
D R A
F T
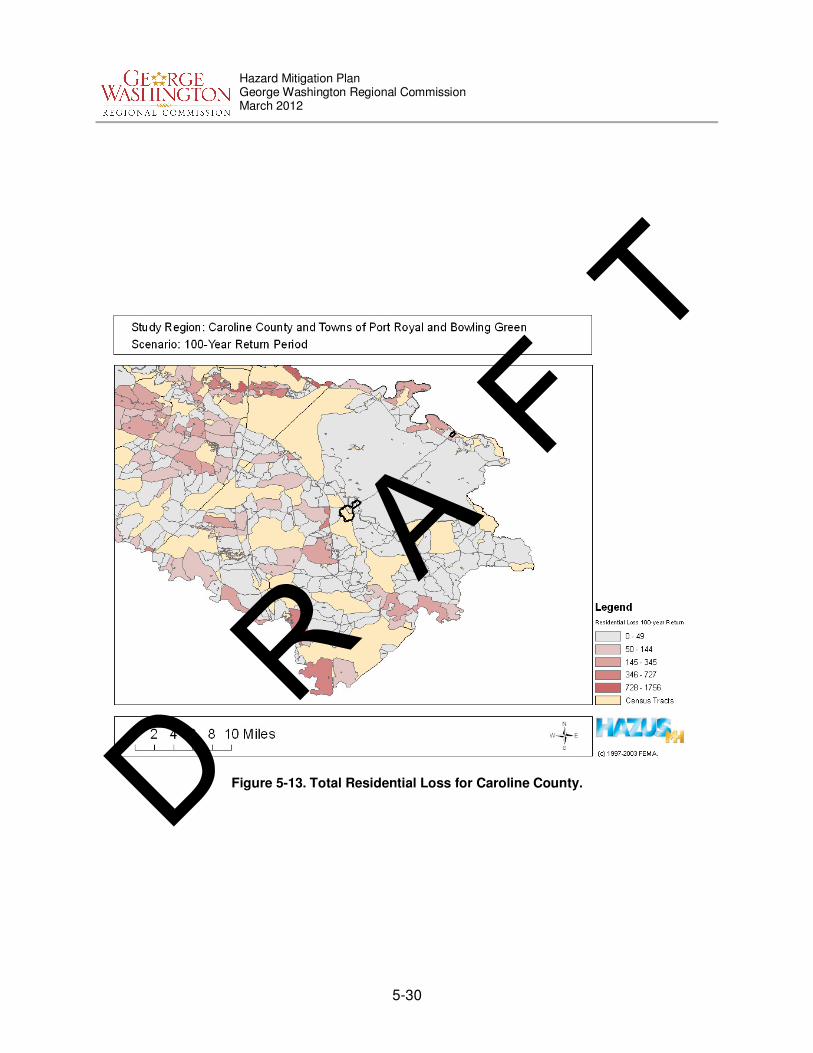
Hazard Mitigation Plan George Washington Regional Commission March 2012
5-30
Figure 5-13. Total Residential Loss for Caroline County. D R A
F T

Hazard Mitigation Plan George Washington Regional Commission March 2012
5-31
Figure 5-14. Displaced Population for 100-year Flood Event—Caroline County. D R A
F T

Hazard Mitigation Plan George Washington Regional Commission March 2012
5-32
Figure 5-15. At Risk Population for Flood Event—Caroline County.
D R A
F T

Hazard Mitigation Plan George Washington Regional Commission March 2012
5-33
B. City of Fredericksburg Vulnerability Assessment
Development Trends
The City of Fredericksburg’s business development relies heavily upon tourism. The City’s Tourism and Business Development Department considers its primary function to be the promotion of tourism to assist development of the local travel industry. As of September 30, 2004, 13,560 jobs were held in the service industry and 4,440 jobs were held in the trade industry. Out of 25,187 employment positions in Fredericksburg, these sectors accounted for 53.8% and 17.8%, respectively (a total of 71.6% of Fredericksburg jobs). Service-related businesses (food and hotel/motel) made up 20.5% of taxable sales in 2004 with $215,720,808 of Fredericksburg’s total of $1,047,573,565 in taxable sales. The largest identifiable business group was the food industry, which had 235 dealers and $199,427,478 in sales during 2004. Sixteen hotel/motel businesses accounted for $16,293,330. Fredericksburg’s population increased from 19,027 in 1990 to 19,279 in 2000 (1.3% increase). 2010 Census data reports that the City of Fredericksburg’s population is 24,286 persons. This is a 26% population increase from 2000. A population projection for Fredericksburg’s 2015 population is 25,200, an increase of 3.8%. (City of Fredericksburg, Virginia, 2005).
Critical Facilities
In order to assess the vulnerability of a community to natural hazards, the MAC conducted an inventory of the structures and critical facilities within the City of Fredericksburg (Table 5-20). The critical facilities are the community’s assets that are the most important or vital to emergency management functions. Critical facilities include:
• Emergency Operation Center (EOC);
• Emergency Communications Center (ECC) / 911; • Law Enforcement Offices;
• Fire / Rescue Stations;
• Emergency Medical Services (EMS); • Power;
• Communications;
• Water;
• Wastewater Treatment Plants (WWTP); • Shelters; and
• Administration Buildings / Courthouse. Critical facilities are those facilities that warrant special attention in preparing for a disaster and/or facilities that are of vital importance to maintaining citizen life, health, and safety during and/or directly after a disaster event. MAC member representatives from the City of Fredericksburg provided the inventory of critical facilities for the county.
D R A
F T

Hazard Mitigation Plan George Washington Regional Commission March 2012
5-34
Table 5-20. Critical Facilities – City of Fredericksburg.
Facility Name
Street City Facility Type
Emergency Operation Center Fredericksburg Fire Dept.
Station 2 101 Altoona Dr Fredericksburg EOC
Executive Plaza Office Building
601 Caroline St. Fredericksburg Police and Fire
Fredericksburg Police Hdqrs / E911 Center
2200 Crowan Blvd Fredericksburg Police Departments / Communications
Fredericksburg Sheriff 513 Prince Edward St Fredericksburg Police Departments
Fredericksburg Fire Dept Station 2
101 Altoona Dr. Fredericksburg Fire Dept
Fredericksburg Rescue Squad 510 William St. Fredericksburg Fire Dept
Fredericksburg Fire Inspection
Station 1 601 Princess Anne St. Fredericksburg Fire Dept
Verizon 901 Prince Edward St Fredericksburg Communications
Powhatan Site
Police #2 Fire and Rescue #1
1500 block Powhatan St
Fredericksburg Radio Repeater
Ashby Street Site
Police #1 1 Learning Lane Fredericksburg Radio Repeater
Police Radio Voter 601 Caroline St Fredericksburg Radio Repeater
Police Radio #3 1001 Sam Perry Blvd Fredericksburg Radio Repeater
Police Radio Voter 11800 Tidewater Trail Fredericksburg Radio Repeater
Courtland Water Pumping Station
Ashby Street Fredericksburg Water Pumping
Station
Powhatan Water Pumping Station
Powhatan St and Cowan Blvd
Fredericksburg Water Pumping
Station
Lafayette Blvd Pumping Station
Central Rd and Lafayette Blvd
Fredericksburg Water Pumping
Station
Motts Run Reservoir Water Treatment Plant
13000 Trench Hill Lane
Fredericksburg Water Treatment
Plant
Normandy Village Sewage Pump Station
Fall Hill and Village Ln Fredericksburg Sewage Pump
Station
Bragg Hill Sewage Pump Station
Roffman Road Fredericksburg Sewage Pump
Station
Rts 2 and17 Area Sewage Pump Station
Dixon and Lansdowne Rd
Fredericksburg Sewage Pump
Station
Snowden Sewage Pump Station
Mary Washington Blvd and Jefferson Davis
Hwy Fredericksburg
Sewage Pump Station
Caroline Street Sewage Pumping Station
Caroline and Ford Street
Fredericksburg Sewage Pumping
Station
Fall Hill Sewage Pumping Station
Cowan Blvd Fredericksburg Sewage Pumping
Station
City of Fredericksburg Wastewater Treatment
700 Beulah Salisbury Rd.
Fredericksburg Wastewater
Treatment Plant
Hugh Mercer Elementary 2100 Cowan Blvd. Fredericksburg School / Shelter
D R A
F T

Hazard Mitigation Plan George Washington Regional Commission March 2012
5-35
Facility Name
Street City Facility Type
James Monroe High 2300 Washington Ave. Fredericksburg School / Shelter
Walker-Grant Middle One Learning Ln. Fredericksburg School / Shelter
Lafayette Upper Elementary 3 Learning Ln Fredericksburg School/Shelter
City Hall 715 Princess Anne
Street Fredericksburg Administration
Additional significant structures
Mary Washington Hospital 1001 Sam Perry Blvd. Fredericksburg Hospital
National Guard Army 1700 Jefferson Davis
Highway Fredericksburg Military
FBI Field Office (local) 1440 Central Park Blvd Fredericksburg Federal
Government
Non-Rotational Wind Vulnerability
Hazards U.S. – Multi Hazard (HAZUS-MH) was utilized to perform a wind hazard analysis for the City of
Fredericksburg. HAZUSMH software is a multi-hazard loss estimation program that was developed under a cooperative agreement between the National Institute of Building Sciences and FEMA. The
current version of HAZUSMH has the ability to calculate earthquake, wind, and flood hazards as well as potential economic losses associated with these hazards. The software is designed with the flexibility to perform loss estimations at three different levels. Level 1 utilizes all default parameters built into the software. Levels 2 and 3 require user defined scenarios and building inventory data. For the purpose of this Plan, a Level 1 wind analysis was performed to calculate the wind hazard for City of Fredericksburg. Table 5-21 lists the total dollar value of exposed structures within the City based on occupancy type. The default data set provided with the HAZUS-MH software is based on the 2000 census data. It is recognized that the current development trends in the Fredericksburg region make the 2000 census data obsolete. However, this analysis depicts the probability of occurrence and can generally be used to estimate potential damages due to high winds.
D R A
F T

Hazard Mitigation Plan George Washington Regional Commission March 2012
5-36
Table 5-21. Total Dollar Value of Exposed Structures from HAZUS - City of Fredericksburg.
Occupancy Type Total $ Value Exposed Structures
Residential 1,113,819,000
Commercial 407,459,000
Industrial 21,365,000
Agricultural 1,439,000
Religion 16,152,000
Government 4,694,000
Education 5,515,000
Total 1,570,443,000
Source: HAZUS-MH
HAZUSMH software provides two options for wind analysis, probabilistic and deterministic. The probabilistic scenario is the default option for the software and activates a database of many thousands of storm tracks and intensities. This scenario generates hurricane hazards based on set return periods. These return periods define the statistical probability that a storm of a given size and intensity could occur within any year. The deterministic method analyzes hazards associated with a user defined storm event. The user inputs the storm track, forward speed, and wind speed and allows for the creation of “what-if” scenarios. The probabilistic wind analysis was chosen because it provides the statistical probability for a range of hurricane events and presents a comparison of these events. The probabilistic analysis was used to generate structural loss estimations for hurricane events with specific recurrence intervals; 10-, 20-, 50-, 100-, 200-, 500-, and 1000-year. The recurrence interval is the average interval of time within which the given hurricane event will be equaled or exceeded once. Since “residential” comprised a significantly large percentage of the occupancy classification these data are presented in Table 5-22 below. Figure 5-16 shows the peak wind gusts generated from a hurricane with 100-year recurrence interval. Figure 5-17 displays the total loss from a 100-year event.
D R A
F T

Hazard Mitigation Plan George Washington Regional Commission March 2012
5-37
Table 5-22. Hurricane Risk - City of Fredericksburg. Summary of Probabilistic Analysis – Residential Structures.
Return Period
Residential Building Damage
Minor Damage
Moderate Damage
Severe Damage
Total Destruction
10-year 0 0 0 0
20-year 7 0 0 0
50-year 53 4 0 0
100-year 246 28 2 0
200-year 342 44 2 0
500-year 1,252 388 21 10
1000-year 1,589 704 55 30
Source: HAZUS-MH
Severe Storm Vulnerability
Since 1960 Fredericksburg has experienced 61 severe storms (approximately 1.27 annually) that have caused damage to property and crops from lightning, hail, extreme winds, and flooding. From 1960-2008 these storms have caused $7,400 in crop damages and $487,000 in property damages or the equivalent of $154 in crop damages and $10,146 in property damages annually. The storms have taken the life of 1 resident. In that same time period extreme weather from winter storms and ice have caused damages to private and public properties and winter freeze has caused damage to crops within the region. Total damages to properties are estimated at $2 million across 56 storms. In annualized terms, this is the equivalent of $41,667 in property damages and 1.17 winter storm events each year. Four of those storms caused winter freeze resulting in crop damages resulting in damages of approximately $44,700 (SHELDUS 2011). The risk for winter storm events for King George County and its independent towns is listed below in Table 5-23.
Table 5-23. Winter Storm Risk—Fredericksburg.
Locality
Average Snowfall (in) 1958-2010
Likelihood Of Event (%) December January February March Annual
Fredericksburg 2.55” 5.20” 4.53” 2.35” 14.47” 96.1
Source: Southeast Regional Climate Center
Tornado Vulnerability
Based on the available data, Fredericksburg has averaged 0.03 tornado events causing $333 in damages annually.
D R A
F T

Hazard Mitigation Plan George Washington Regional Commission March 2012
5-38
Table 5-24. Tornado Risk - City of Fredericksburg.
Intensity Number of
Occurrences Damages ($)
EF0 1 0
EF1 1 20K
Flood Vulnerability
Repetitive Loss Areas FEMA has identified 4 properties as repetitive loss properties for the City of Fredericksburg. The number given does not reflect the total number of houses that have flooded in City of Fredericksburg, rather the total number of repetitive losses. HAZUS Flood Analysis
Hazards U.S. – Multi Hazard (HAZUSMH) was utilized to perform a flood hazard analysis for the City of
Fredericksburg. HAZUSMH software is a multi-hazard loss estimation program that was developed under a cooperative agreement between the National Institute of Building Sciences and FEMA. The
current version of HAZUSMH has the ability to calculate earthquake, wind, and flood hazards as well as potential economic losses associated with these hazards. The software is designed with the flexibility to perform loss estimations at three different levels. Level 1 utilizes all default parameters built into the software. Levels 2 and 3 require user defined scenarios and building inventory data. For the purpose of this Plan, a Level 1 flood analysis was performed to calculate the flood hazard for the Fredericksburg. Table 5-25 lists the total dollar value of exposed structures based on occupancy type for Fredericksburg.
Table 5-25. Flood Risk - City of Fredericksburg .
Occupancy Type Dollar Exposure (replacement value $)
Residential 114,560,000
Commercial 97,586,000
Industrial 68,641,000
Agricultural 3,197,000
Religion 41,706,000
Government 15,526,000
Education 22,361,000
TOTAL 363,577,000
Source: HAZUS-MH
The default dataset provided with the HAZUSMH software is based on the 2000 census data. It is recognized that the current development trends in the Fredericksburg may render the 2000 census data,
with which HAZUSMH is programmed, somewhat obsolete. However, this analysis depicts the probability of occurrence and can generally be used to estimate potential damages due to high surging waters.
D R A
F T

Hazard Mitigation Plan George Washington Regional Commission March 2012
5-39
The three hazard type options provided by HAZUSMH software for flood analysis are the riverine, coastal, and riverine and coastal scenarios. The necessary scenario for any given situation depends upon the geography of the region. If the area is inland with a stream hydrology, then the riverine scenario should be used. If however, the area is along the coast then either the riverine and coastal, or coastal scenario should be used. The user cannot run any analysis without first defining the scenario. The riverine analysis was chosen. This scenario provides the statistical probability for a range of flood events and presents a comparison of those events. The riverine analysis was used to generate structural loss estimations, agricultural loss estimations, and shelter requirements for flood events with specific recurrence intervals; 10-, 20-, 50-, 100-, 200-, and 500-year. The recurrence interval is the average interval of time within which the given flood event will be equaled or exceeded once. Residential structures comprise a significantly large percentage of the occupancy classification within the region. The data displaying the lost damages from residential structures is presented in Figure 5-19 below. Total damages to residential structures in Fredericksburg were $1,088,000. The number of displaced persons from a 100-year event is displayed below in Figure 5-20. The total number of displaced Fredericksburg residents was 225 people. Figure Figure 5-21 shows the 100-year floodplain for the Fredericksburg with 2010 census blocks that intersect it. The map displays the population (in 2010 Census numbers) that would be affected by a 100-year flood event.
D R A
F T

Hazard Mitigation Plan George Washington Regional Commission March 2012
5-40
Figure 5-16. Peak Wind Gust (mph) Distribution.
D R A
F T

Hazard Mitigation Plan George Washington Regional Commission March 2012
5-41
Figure 5.2.2b Total Residential Loss for
City of Fredericksburg
Figure 5-17. Total Residential Loss 100 Year Hurricane - City of Fredericksburg. D R A
F T
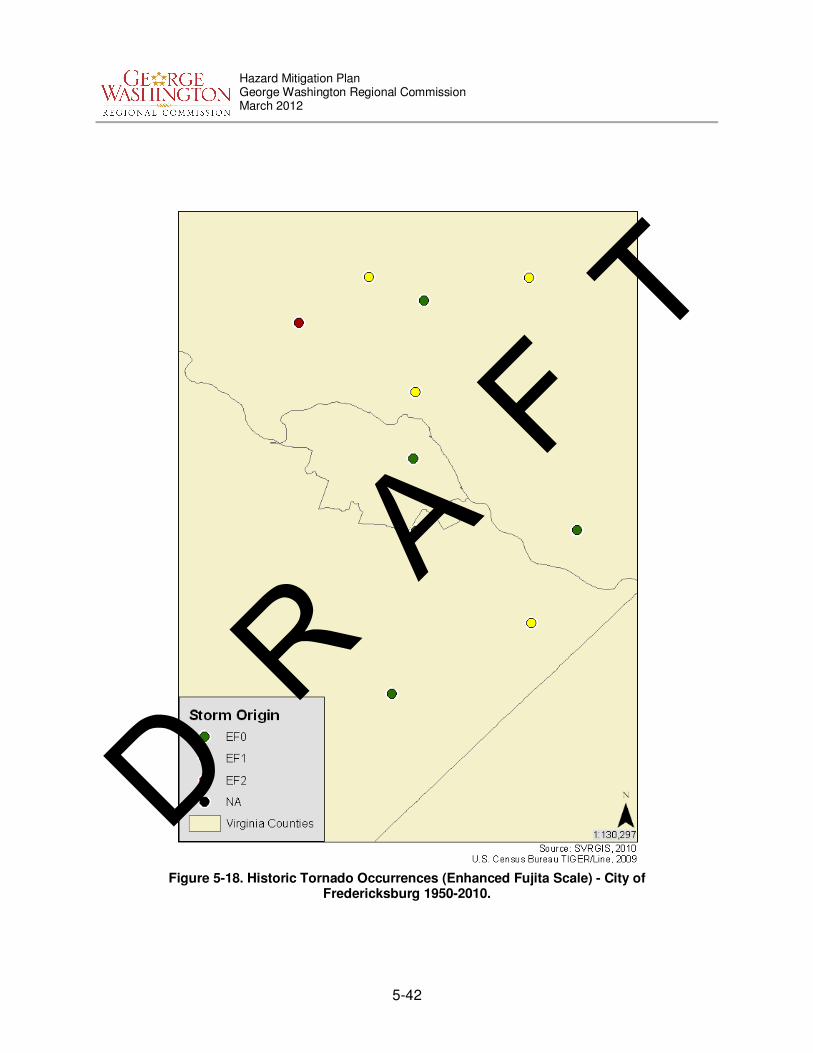
Hazard Mitigation Plan George Washington Regional Commission March 2012
5-42
Figure 5-18. Historic Tornado Occurrences (Enhanced Fujita Scale) - City of Fredericksburg 1950-2010.
D R A
F T

Hazard Mitigation Plan George Washington Regional Commission March 2012
5-43
Figure 5-19. Total Residential Loss - City of Fredericksburg. D R A
F T

Hazard Mitigation Plan George Washington Regional Commission March 2012
5-44
Figure 5-20. Displaced Population for 100-year Flood Event – City of Fredericksburg. D R A
F T

Hazard Mitigation Plan George Washington Regional Commission March 2012
5-45
Figure 5-21. At Risk Population for Flood Event - City of Fredericksburg.
D R A
F T

Hazard Mitigation Plan George Washington Regional Commission March 2012
5-46
C. King George County Vulnerability Assessment
Development Trends
The King George County Comprehensive Plan promotes the goals of business recruitment, job creation, business retention, and marketing in King George County. The second listed commercial implementation strategy of the Plan’s Land Use Strategy is to “encourage the creation of an environment to attract businesses and employees for the public and private sectors.” King George County has a civilian labor population of 10,569 and an unemployment rate of 8.1% according to the Virginia Economic Development Partnership. The local Business Appreciation Event held May 18, 2011, is used as a tool to attract and retain businesses to King George County. The county’s largest employers are U.S. Naval Surface Warfare Center at Dahlgren and Rowe Concrete, LLC. Other large employers include Computer Sciences Corporation and Synetics, Inc. (Source: Virginia Economic Development Partnership). Over half (61.2%) of King George County’s workforce consists of management, professional, sales, and office professions. King George County’s population increased from 13,527 in 1990 to 16,803 in 2000 (24.2% increase). 2010 Census data for King George County reported a population of 23,584 persons. This is an increase of 40.4%. The Virginia Economic Development Partnership expects the population to reach 28,700 persons by 2015, an increase of 21.7% from 2010. (King George County, Virginia, 2005).
Critical Facilities
In order to assess the vulnerability of a community to natural hazards, the MAC conducted an inventory of the structures and critical facilities within King George County (Figure 5-26). The critical facilities are the community’s assets that are the most important or vital to emergency management functions. Critical facilities include:
• Emergency Operation Center (EOC);
• Emergency Communications Center (ECC) / 911; • Law Enforcement Offices;
• Fire / Rescue Stations;
• Emergency Medical Services (EMS); • Power;
• Communications;
• Water;
• Wastewater Treatment Plants (WWTP); • Shelters; and
• Administration Buildings / Courthouse. Critical facilities are those facilities that warrant special attention in preparing for a disaster and/or facilities that are of vital importance to maintaining citizen life, health, and safety during and/or directly after a disaster event. MAC member representatives from King George County provided the inventory of critical facilities for the County.
D R A
F T

Hazard Mitigation Plan George Washington Regional Commission March 2012
5-47
Table 5-26. Critical Facilities – King George County.
Facility Name
Street Location Facility
Type
King Georges Sheriff’s Office
9483 Kings Highway King George EOC
King George Fire Tower & Rescue Inc. Company
1 8122 Kings Highway King George EOC/Fire Department
King George Fire & Rescue Inc. Company 2
16147 Dahlgren Road King George Fire Department
King George Fire & Rescue Inc. Company 3
6060 Riverview Drive King George Fire Department
Dahlgren Rescue Squad Inc. Station 1
8086 Kings Highway King George Rescue Station
Dahlgren Rescue Squad Inc. Station 2
16037 Dahlgren Road King George Rescue Station
EMS Tower 8562 Dahlgren Road. Behind King George
Middle School King George
Communications Tower
Owens Tower Dahlgren Road – Intersection of Dahlgren
Rd. and Owens Drive. West of 15049 Dahlgren Rd
King George Communications
Tower
Sheriff’s Office Tower 9483 Kings Highway – King George
Courthouse Complex King George
Communications Tower
Accurate Tower 6269 Caledon Road – Located at Accurate
Auto Parts King George
Communications Tower
Sba Towers, Inc Rt 3 Near Rt. 605 King George Cell Tower
Stc Three, LLC 6269 Caledon Road King George Cell Tower
Sba Towers, Inc 7104 Tanley Road (Rt 3 & 677) King George Cell Tower
Stc Three, LLC 8562 Dahlgren Road King George Cell Tower
Sbc Tower Holdings LLC Rt 624 & Rt 206 King George Cell Tower
Crown Atlantic Company, LLC
US 301 James Madison Parkway King George Cell Tower
Sba Towers, Inc Rt 301 near Rt 218 King George Cell Tower
Sba Towers, Inc Rt 301 near Allnut King George Cell Tower
VA Commonwealth Dept. of State Police
Off Rt 301 near State Rd King George Cell Tower
Sba Towers, Inc Rt 3 near Rt 205 Intersection King George Cell Tower
Sbc Tower Holdings LLC US 301 & Rt 3 King George Cell Tower
Sba Towers, Inc 13300 James Madison Parkway King George Cell Tower
Comorn-Northern Neck Electrical Cooperative
6350 St. Stephens Road King George Power Substation
Office Hall-Northern Neck Electrical
Cooperative 12081 James Madison Parkway King George Power Substation
Arnolds Corner Storage Tank
8085 Kings Highway King George Water Tanks/Wells
Arnolds Corner Well 10087 Arnolds Court King George Water Tanks/Wells
D R A
F T
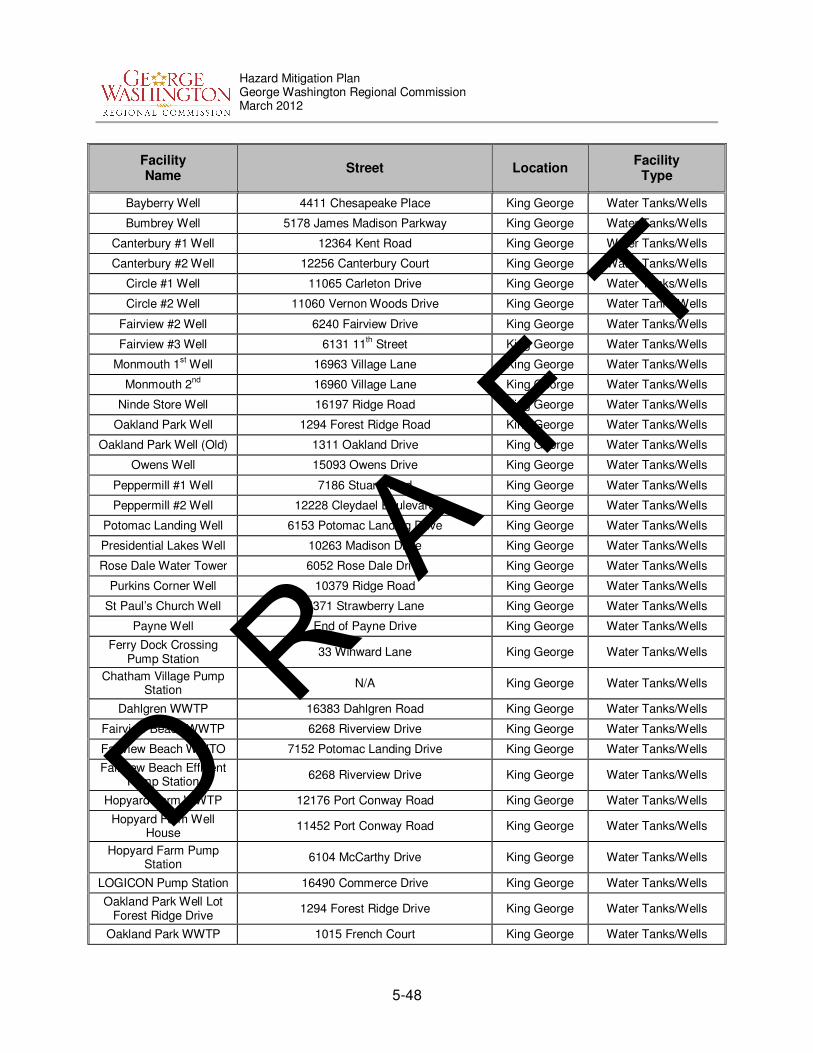
Hazard Mitigation Plan George Washington Regional Commission March 2012
5-48
Facility Name
Street Location Facility
Type
Bayberry Well 4411 Chesapeake Place King George Water Tanks/Wells
Bumbrey Well 5178 James Madison Parkway King George Water Tanks/Wells
Canterbury #1 Well 12364 Kent Road King George Water Tanks/Wells
Canterbury #2 Well 12256 Canterbury Court King George Water Tanks/Wells
Circle #1 Well 11065 Carleton Drive King George Water Tanks/Wells
Circle #2 Well 11060 Vernon Woods Drive King George Water Tanks/Wells
Fairview #2 Well 6240 Fairview Drive King George Water Tanks/Wells
Fairview #3 Well 6131 11th Street King George Water Tanks/Wells
Monmouth 1st Well 16963 Village Lane King George Water Tanks/Wells
Monmouth 2nd
16960 Village Lane King George Water Tanks/Wells
Ninde Store Well 16197 Ridge Road King George Water Tanks/Wells
Oakland Park Well 1294 Forest Ridge Road King George Water Tanks/Wells
Oakland Park Well (Old) 1311 Oakland Drive King George Water Tanks/Wells
Owens Well 15093 Owens Drive King George Water Tanks/Wells
Peppermill #1 Well 7186 Stuart Road King George Water Tanks/Wells
Peppermill #2 Well 12228 Cleydael Boulevard King George Water Tanks/Wells
Potomac Landing Well 6153 Potomac Landing Drive King George Water Tanks/Wells
Presidential Lakes Well 10263 Madison Drive King George Water Tanks/Wells
Rose Dale Water Tower 6052 Rose Dale Drive King George Water Tanks/Wells
Purkins Corner Well 10379 Ridge Road King George Water Tanks/Wells
St Paul’s Church Well 5371 Strawberry Lane King George Water Tanks/Wells
Payne Well End of Payne Drive King George Water Tanks/Wells
Ferry Dock Crossing Pump Station
33 Winward Lane King George Water Tanks/Wells
Chatham Village Pump Station
N/A King George Water Tanks/Wells
Dahlgren WWTP 16383 Dahlgren Road King George Water Tanks/Wells
Fairview Beach WWTP 6268 Riverview Drive King George Water Tanks/Wells
Fairview Beach WWTO 7152 Potomac Landing Drive King George Water Tanks/Wells
Fairview Beach Effluent Pump Station
6268 Riverview Drive King George Water Tanks/Wells
Hopyard Farm WWTP 12176 Port Conway Road King George Water Tanks/Wells
Hopyard Farm Well House
11452 Port Conway Road King George Water Tanks/Wells
Hopyard Farm Pump Station
6104 McCarthy Drive King George Water Tanks/Wells
LOGICON Pump Station 16490 Commerce Drive King George Water Tanks/Wells
Oakland Park Well Lot Forest Ridge Drive
1294 Forest Ridge Drive King George Water Tanks/Wells
Oakland Park WWTP 1015 French Court King George Water Tanks/Wells
D R A
F T

Hazard Mitigation Plan George Washington Regional Commission March 2012
5-49
Facility Name
Street Location Facility
Type
Project Faith 10250 Faith Drive King George Water Tanks/Wells
Purkins Corner WWTP 11224 Henry Griffin Road King George Water Tanks/Wells
SAFT Well 16966 Dahlgren Road King George Water Tanks/Wells
Sheetz Pump Station 11265 Kings Highway King George Water Tanks/Wells
Sealston Pump Station 11046 Fletchers Chapel Road King George Water Tanks/Wells
Dahlgren Tech Center N/A King George Water Tanks/Wells
Owens Storage Tank N/A King George Water Tanks/Wells
10th Street Pump Station 17024 10t St King George Sewage Pump Station
12th Street Pump Station 17145 12
th St King George Sewage Pump Station
Bayberry Pump Station 15596 Cape Fear Lane King George Sewage Pump Station
Comfort Inn Pump Station
4661 James Madison Parkway King George Sewage Pump Station
Fas Mart Pump station 8181 Kings Highway King George Sewage Pump Station
Fairview Beach 8th Street
Pump Stations 6155 Eight Street King George Sewage Pump Station
Fairview Beach Crab House Pump Station
6129 Fairview Drive King George Sewage Pump Station
Fairview Beach Marina Grinder Pump
6338 Riverview Drive King George Sewage Pump Station
Fairview Beach Slick’s Grinder Pump
6088 Sixth Street King George Sewage Pump Station
Ferry Dock Pump Station 17161 Ferry Dock Road King George Sewage Pump Station
Food Lion/Purkins #3 Pump Stations
9063 Kings Highway King George Sewage Pump Station
Gordon Drive Pump Stations
5405 Gordon Drive King George Sewage Pump Station
Kings Highway/Purkins Pump Station #1
10479 Kings Highway King George Sewage Pump Station
Main Pump Station 16389 Dahlgren Road King George Sewage Pump Station
McDonalds Pump Station
5265 James Madison Parkway King George Sewage Pump Station
Middle School Pump Station
8562 Dahlgren Road King George Sewage Pump Station
Monmouth Pump Station 16960 Village Place King George Sewage Pump Station
Oakland Park Pump Station
1015 French Court King George Sewage Pump Station
Potomac Landing Pump Station
6153 Potomac Landing Drive King George Sewage Pump Station
Pump Station #5 5006 Potomac Drive King George Sewage Pump Station
Pump Station #6 4292 Potomac Drive King George Sewage Pump Station
Purkins Pump Stations #2 RR3-HSL
9062 Kings Highway King George Sewage Pump Station
Williams Creek Pump Station
16276 Dahlgren Road King George Sewage Pump Station
D R A
F T

Hazard Mitigation Plan George Washington Regional Commission March 2012
5-50
Facility Name
Street Location Facility
Type
Dahlgren WWTP 16383 Dahlgren Road King George Sewer Treatment Facilities/Water
Treatment Facilities
Fairview Beach WWTP 6268 Riverview Drive King George Sewer Treatment Facilities/Water
Treatment Facilities
Oakland Park WWTP 1015 French Court King George Sewer Treatment Facilities/Water
Treatment Facilities
Purkins Corner WWTP/Auto Dialer
11224 Henry Griffin Road King George Sewer Treatment Facilities/Water
Treatment Facilities
Presidential Lakes WWTP
9475 Inaugural Drive King George Sewer Treatment Facilities/Water
Treatment Facilities
King George High School
8246 Dahlgren Road King George Schools/Shelter Sites
King George Middle School
8562 Dahlgren Road King George Schools/Shelter Sites
King George Elementary School
10381 Ridge Road King George Schools/Shelter Sites
Potomac Elementary School
16495 Fifteenth Street King George Schools/Shelter Sites
King George Citizens Center
8076 Kings Highway King George Schools/Shelter Sites
Sealston Elementary 11048 Fletchers Chapel Road King George Schools/Shelter Sites
Administration Center 10459 Courthouse Drive King George Administration
King George Courthouse Complex
9483 Kings Highway King George Administration
Potomac Gateway Welcome Center
3450 James Madison Parkway King George Administration
Service Authority Office 9207 Kings Highway King George Administration
King George Animal Shelter
11377 Citizens Way King George Administration
King George Sheriff’s Office
10445 Government Center Blvd King George Administration/Sheriffs
Office
King George Library 9533 Kings Highway King George Administration
Additional significant structures
VDOT Edgehill Area Maintenance Headquarters
12379 State Road King George VDOT Maintenance
Building
King George County School Bus Garage
10350 Millbank Road King George School Owned Fuel
Station
Harry Nice Memorial Bridge
James Madison Parkway (Rt 301), North end of County at Maryland State Line. North of
3540 James Madison Parkway King George Bridge
Rappahannock River Bridge
James Madison Parkway (Rt 301), South end of County at King George/Caroline
King George Bridge
D R A
F T

Hazard Mitigation Plan George Washington Regional Commission March 2012
5-51
Facility Name
Street Location Facility
Type
County line. South of 17062 James Madison Parkway
Williams Creek Bridge East of 16278 Dahlgren Road King George Bridge
Muddy Creek Bridge Kings Highway and Stafford County Line King George Bridge
Machadoc Creek Bridge Windsor Drive / East of 16314 Windsor Drive King George Bridge
Machadoc Creek Bridge James Madison Parkway / Between 6186
and 6323 James Madison Parkway King George Bridge
Source: Data provided by the King George Office of Emergency Management.
Non-Rotational Wind Vulnerability
Hazards U.S. – Multi Hazard (HAZUS-MH) was utilized to perform a wind hazard analysis for King
George County. HAZUSMH software is a multi-hazard loss estimation program that was developed under a cooperative agreement between the National Institute of Building Sciences and FEMA. The
current version of HAZUSMH has the ability to calculate earthquake, wind, and flood hazards as well as potential economic losses associated with these hazards. The software is designed with the flexibility to perform loss estimations at three different levels. Level 1 utilizes all default parameters built into the software. Levels 2 and 3 require user defined scenarios and building inventory data. For the purpose of this Plan, a Level 1 wind analysis was performed to calculate the wind hazard for King George County. Table 5-27. Total Dollar Value of Exposed Structures from HAZUS - King George County. lists the total dollar value of exposed structures based on occupancy type for King George County. The default data set provided with the HAZUS-MH software is based on the 2000 census data. It is recognized that the current development trends in King George County may render the 2000 census data obsolete. However, this analysis depicts the probability of occurrence and can generally be used to estimate potential damages due to high winds.
Table 5-27. Total Dollar Value of Exposed Structures from HAZUS - King George County.
Occupancy Type Total $ Value Exposed Structures
Residential 858,392,000
Commercial 94,012,000
Industrial 13,357,000
Agricultural 867,000
Religion 10,150,000
Government 16,503,000
Education 6,592,000
Total 999,873,000
Source: HAZUS-MH
D R A
F T

Hazard Mitigation Plan George Washington Regional Commission March 2012
5-52
HAZUSMH software provides two options for wind analysis, probabilistic and deterministic. The probabilistic scenario is the default option for the software and activates a database of many thousands of storm tracks and intensities. This scenario generates hurricane hazards based on set return periods. These return periods define the statistical probability that a storm of a given size and intensity could occur within any year. The deterministic method analyses hazards associated with a user defined storm event. The user inputs the storm track, forward speed, and wind speed and allows for the creation of “what-if” scenarios. The probabilistic wind analysis was chosen because it provides the statistical probability for a range of hurricane events and presents a comparison of these events. The probabilistic analysis was used to generate structural loss estimations for hurricane events with specific recurrence intervals; 10-, 20-, 50-, 100-, 200-, 500-, and 1000-year. The recurrence interval is the average interval of time within which the given hurricane event will be equaled or exceeded once. Since the residential data comprised a significantly large percentage of the occupancy classification, these data are presented in Table 5-28. Figure 5-22 shows the peak wind gusts, ranging from 69 mph to 71 mph, generated from a hurricane with 100-year recurrence interval. The total loss to residential structures is displayed in Table 5-28 below. Table 5-28. Hurricane Risk-King George County - Summary of Probabilistic Analysis – Residential
Structures.
Return Period
Residential Building Damage
Minor Damage
Moderate Damage
Severe Damage
Total Destruction
10-year 0 0 0 0
20-year 1 0 0 0
50-year 26 1 0 0
100-year 33 1 0 0
200-year 157 8 1 0
500-year 797 97 5 2
1000-year 1,916 538 52 40
Source: HAZUS-MH
Severe Storm Vulnerability
Since 1960 King George has experienced 61 severe storms (roughly 1.27 annually) that have caused damage to property and crops from lightning, hail, extreme winds, and flooding. From 1960-2008 these storms have caused approximately $8,000 in crop damages and $1,100,000 in property damages, the equivalent of $167 in crop damages and $22,917 in property damages annually. In that same time period extreme weather from winter storms and ice have caused damages to private and public properties and winter freeze has caused damage to crops within the region. Total damages to properties are estimated at $2,400,000 million across 59 storms. On an annualized basis, this works out to approximately $50,000 in property damage and 1.23 winter storm events per year. Four of those storms caused winter freeze resulting in crop damages resulting in damages of approximately $95,800
D R A
F T

Hazard Mitigation Plan George Washington Regional Commission March 2012
5-53
(SHELDUS 2011). The risk for winter storm events for King George County and its independent towns is listed below in Table 5-29. Winter Storm Risk - King George..
Table 5-29. Winter Storm Risk - King George.
Locality Average Snowfall (in) 1958-2010
Likelihood Of Event (%)
December January February March Annual
King George 1.91” 3.41” 3.26” 1.67” 10.25” 85.3
Source: Southeast Regional Climate Center
Tornado Vulnerability
Based on the available data, King George County has averaged 0.10 tornado events causing $12,783 in damages annually.
Table 5-30.Tornado Risk - King George County. Historic Events 1950-2010.
Intensity Number of
Occurrences Damages ($)
EF0 1 0
EF1 4 517K
EF2 1 250K
Source: SVRGIS
Flooding Vulnerability
The MAC representatives for King George County did not rank flooding as a critical hazard. However, because there is a defined geographic hazard area, vulnerability to flooding was quantified. Digital floodplain boundaries digitized from the FEMA effective FIRMs and digital tax parcel data were provided by the King George County GIS Department. These two layers were intersected to determine the number of parcels that were at risk to the 100-year flood. Parcels within the 100-Year flood zone that did not have building valuation data in the tax parcel data were assumed to have no structures. Thus, from a total of 10,967 parcels, 6,226 were assumed to have structures. The analysis showed that 704 buildings were at risk from the 100-yr flood. The improvement value (structure only, not land value) from the tax assessor’s database was used to determine the value of at risk property. A total value of approximately $123,825,500 is at risk from the 100-year flood event. Results of this flood analysis are presented in Table 5-31. Flood Risk - King George County.
D R A
F T

Hazard Mitigation Plan George Washington Regional Commission March 2012
5-54
Table 5-31. Flood Risk - King George County.
Occupancy Type
Total No. Buildings No. Buildings in 100-year
Flood Zone Estimated at Risk Value
Residential 1,933 133 30.4 million
Agricultural 3,884 547 82.4 million
Commercial 396 24 11.0 million
Other 13 0 0
TOTAL 6,226 704 123.8 million
Source: Data provided by community
Repetitive Loss Areas Including flood insurance claims paid as a result of flood damage caused by Hurricane Isabel in 2003, FEMA has identified zero structures as repetitive loss structures for King George County. HAZUS Flood Analysis
Hazards U.S. – Multi Hazard (HAZUSMH) was utilized to perform a flood hazard analysis for King
George County to expand on the analysis conducted in 2006 (Table 5-31). HAZUSMH software is a multi-hazard loss estimation program that was developed under a cooperative agreement between the
National Institute of Building Sciences and FEMA. The current version of HAZUSMH has the ability to calculate earthquake, wind, and flood hazards as well as potential economic losses associated with these hazards. The software is designed with the flexibility to perform loss estimations at three different levels. Level 1 utilizes all default parameters built into the software. Levels 2 and 3 require user defined scenarios and building inventory data. For the purpose of this Plan, a Level 1 flood analysis was performed to calculate the flood hazard for the King George County. Table 5-32 lists the total dollar value of exposed structures based on occupancy type for King George County.
The default dataset provided with the HAZUSMH software is based on the 2000 census data. It is recognized that the current development trends in the King George County may render the 2000 census
data, with which HAZUSMH is programmed, somewhat obsolete. However, this analysis depicts the probability of occurrence and can generally be used to estimate potential damages due to high surging waters.
The default dataset provided with the HAZUSMH software is based on the 2000 census data. It is recognized that the current development trends in the King George County may render the 2000 census
data, with which HAZUSMH is programmed, somewhat obsolete. However, this analysis depicts the probability of occurrence and can generally be used to estimate potential damages due to high surging waters. D R
A F
T

Hazard Mitigation Plan George Washington Regional Commission March 2012
5-55
Table 5-32. Flood Risk - King George County.
Occupancy Type Dollar Exposure (replacement value $)
Residential 792,530,000
Commercial 147,887,000
Industrial 21,914,000
Agricultural 25,030,000
Religion 21,275,000
Government 13,531,000
Education 9,771,000
TOTAL 1,031,938,000
Source: HAZUS-MH
The default dataset provided with the HAZUSMH software is based on the 2000 census data. It is recognized that the current development trends in the King George County may render the 2000 census
data, with which HAZUSMH is programmed, somewhat obsolete. However, this analysis depicts the probability of occurrence and can generally be used to estimate potential damages due to high surging waters.
The three hazard type options provided by HAZUSMH software for flood analysis are the riverine, coastal, and riverine and coastal scenarios. The necessary scenario for any given situation depends upon the geography of the region. If the area is inland with a stream hydrology, then the riverine scenario should be used. If however, the area is along the coast then either the riverine and coastal, or coastal scenario should be used. The user cannot run any analysis without first defining the scenario. The riverine and coastal analysis was chosen for King George County. This scenario provides the statistical probability for a range of flood events and presents a comparison of those events. The coastal and riverine analysis was used to generate structural loss estimations, agricultural loss estimations, and shelter requirements for flood events with specific recurrence intervals; 10-, 20-, 50-, 100-, 200-, and 500-year. The recurrence interval is the average interval of time within which the given flood event will be equaled or exceeded once. Because residential structures comprise a significantly large percentage of the occupancy classification within the region, these data are presented in Figure 5-25 below. The total damages to residential structures were $2,321,000. The number of displaced persons from a 100-year event is displayed below in Figure 5-26. The total number of displaced King George County residents was 228 people. Figure 5-27 shows the 100-year floodplain for the King George County with 2010 census blocks that intersect it. The map displays the population (in 2010 Census numbers) that would be affected by a 100-year flood event. D R
A F
T

Hazard Mitigation Plan George Washington Regional Commission March 2012
5-56
Table 5-33. Agricultural Loss – King George County.
Crop Type Loss ($)
Corn 119,654.00
Corn Silage 128,691.53
Soybeans 93,049.80
Wheat 73,807.52
TOTAL 415,202.85
Source: HAZUS-MH
Drought Vulnerability
The risk assessment section of this plan identified the threat of droughts and extreme heat as medium-high. The extreme heat and dry conditions that exist during periods of drought cause significant damage to the agricultural industry. According to the 2007 Agriculture Census, the County of King George has 180 farms, an increase of 7% since 2002 (169). The acreage of farms in King George was approximately 36,723 in 2007. The average farm size was 204 acres with crop sales per farm exceeding $24,700. Of the over 36,000 acres in farmland within King George County, 42% was used as cropland. Another 39% of farmland was used for woodland and 15% as pasture. The five largest crop items in King George were forage (land used for all hay and haylage, grass silage, and greenchop), soybeans, corn for grain, wheat for grain, and vegetables. The top livestock item was cattle and calves (USDA, 2008). Figure 5-24 depicts drought prone areas in Virginia by displaying the number of drought occurrences in a county’s history. King George County has experienced 66-85 droughts in their history, with seven major instances in the last century. These droughts were in 1930-’32, ’38-’42, ’62-’71, ’80-’82, ’98-’99, ’06-’08, and the summer of 2010. Crop loss estimates were only available for the two droughts of the last decade. The harvest of 2007 for corn and soybeans was noticeably lower than in previous years. This was due to deteriorated soil moisture conditions from a region-wide drought, according to the USDA. Corn production for the state was sixty percent below the annual percent yield. Land used for forage/pasture was significantly affected by the dry conditions, forcing many farmers to prematurely sell their cattle.
D R A
F T

Hazard Mitigation Plan George Washington Regional Commission March 2012
5-57
Figure 5-22. Peak Wind Gust (mph) Distribution. King George County.
D R A
F T

Hazard Mitigation Plan George Washington Regional Commission March 2012
5-58
Figure 5-23. Total Residential Loss 100 Year Hurricane - King George County. D R A
F T

Hazard Mitigation Plan George Washington Regional Commission March 2012
5-59
Figure 5-24. Historic Tornado Occurrences (Enhanced Fujita Scale) - King George
County 1950-2010.
D R A
F T

Hazard Mitigation Plan George Washington Regional Commission March 2012
5-60
Figure 5-25. Total Residential Loss - King George. D R A
F T

Hazard Mitigation Plan George Washington Regional Commission March 2012
5-61
Figure 5-26. Displaced Population for 100-year Flood Event - King George County. D R A
F T

Hazard Mitigation Plan George Washington Regional Commission March 2012
5-62
Figure 5-27. At Risk Population for Flood Event - King George .
D R A
F T

Hazard Mitigation Plan George Washington Regional Commission March 2012
5-63
Figure 5-28. Drought Prone Areas in Virginia. By County. Source: Drought Impact Reporter, National Drought Mitigation Center, 2011
D R A
F T

Hazard Mitigation Plan George Washington Regional Commission March 2012
5-64
D. Spotsylvania County Vulnerability Assessment
Development Trends
Spotsylvania County’s close proximity to Washington, D.C. has given the region a recent dramatic population and business increase. The county’s development trend is based on its technology and manufacturing industries and suburban housing for Washington D.C./Northern Virginia commuters. Major employers include CVS Pharmacy (distribution warehouse, 450 employees), and Diversified Mailing Services (commercial mailing service, 300 employees). Spotsylvania County has a civilian labor force of 66,618 with an unemployment rate of 5.8% according to 2010 data from the Virginia Economic Development Partnership. Demographics Daily ranked Spotsylvania as the #1 small-business sector in the U.S., and the County takes pride in the diversity of small businesses within its borders. Small businesses experienced a 182% growth rate between 1993 and 1998, and the County population has grown 57.5% in the past ten years, from 57,403 in 1990 to 90,395 in 2000. Spotsylvania County holds the rank of 13th fastest growing county in the U.S 2010 Census data reports a population of 122,397 persons. This is an increase of 35.4% from 2000. A population projection for 2015 in Spotsylvania County is 133,400 persons. This is an increase of 9%. (Spotsylvania County, Virginia, 2005).
Critical Facilities
In order to assess the vulnerability of a community to natural hazards, the MAC conducted an inventory of the structures and critical facilities within Spotsylvania County (Table 5-34). The critical facilities are the community’s assets that are the most important or vital to emergency management functions. Critical facilities include:
• Emergency Operation Center (EOC);
• Emergency Communications Center (ECC) / 911; • Law Enforcement Offices;
• Fire / Rescue Stations;
• Emergency Medical Services (EMS); • Power;
• Communications;
• Water;
• Wastewater Treatment Plants (WWTP); • Shelters; and
• Administration Buildings / Courthouse. Critical facilities are those facilities that warrant special attention in preparing for a disaster and/or facilities that are of vital importance to maintaining citizen life, health, and safety during and/or directly after a disaster event. MAC member representatives from Spotsylvania County provided the inventory of critical facilities for the county.
Table 5-34. Critical Facilities – Spotsylvania County.
Facility Name Street Location Facility Type
Brokenburg Fire & Rescue 11701 Volunteer Dr Spotsylvania Fire/EMS
D R A
F T

Hazard Mitigation Plan George Washington Regional Commission March 2012
5-65
Facility Name Street Location Facility Type
Courthouse Fire Company 1
9107 American Legion Drive
Spotsylvania Fire
Partlow Fire Company 3 3221 Partlow Road Spotsylvania Fire
Partlow Rescue Station 3 3530 Partlow Road Spotsylvania EMS
5-Mile Fork Rescue Station 5
7030 Harrison Road
Spotsylvania EMS
5-Mile Fork Fire Company 5 5992 Plank Road Spotsylvania Fire
Salem Church Road Fire Company and Rescue
Station 6
5700 General Semmes Road
Spotsylvania Fire/EMS
Wilderness Fire Company and Rescue Station 7
10501 Orange Plank Road
Spotsylvania Fire/EMS
Thornburg Fire Company and Rescue Station 8
6429 Jefferson Davis Hwy.
Spotsylvania Fire/EMS
Belmont Fire Company and Rescue Station 9
7100 Belmont Road Spotsylvania
Fire/EMS
Fire Company and Rescue Station 1
7200 Courthouse Commons Blvd
Spotsylvania Fire/EMS
Fire Company and Rescue Station 4
4804 Bancroft Rd Fredericksburg Fire/EMS
Salem Fields Fire Company and Rescue Station 10
11201 Gordon Road
Fredericksburg Fire/EMS
Ni River Water Trtmt Plt 10516 Gordon
Road Spotsylvania Potable Treatment
Motts Run Water Treatment Plant
13000 Trench Hill Lane
Fredericksburg Potable Treatment
FMC Wastewater Treatment Plant
11801 Capital Drive Fredericksburg Water Treatment
Massaponax Wastewater Treatment Plant
10900 HCC Drive Fredericksburg Water Treatment
Stoneybrook Wastewater Treatment Plant
6758 BB Sparrow Lane
Fredericksburg Water Treatment
Thornburg Wastewater Treatment Plant
5225 Mudd Tavern Road
Woodford Water Treatment
County Courthouse 9111 Courthouse
Road Spotsylvania Administration
Holbert Building 9104 Courthouse
Road Spotsylvania Local Government
Marshall Center 8800 Courthouse Road, 2nd Floor
Spotsylvania Local Government
Code Compliance/DSS 9019 Old Battlefield
Blvd Spotsylvania Local Government
Animal Control Office 450 TV Drive Fredericksburg Local Government
Joint Fleet Maintenance Facility
6921 North Roxbury Road
Spotsylvania Local Government
Utilities Administration Office
600 Hudgins Road Fredericksburg Local Government
Voter Registration 9106A Courthouse
Road Spotsylvania Local Government
D R A
F T

Hazard Mitigation Plan George Washington Regional Commission March 2012
5-66
Facility Name Street Location Facility Type
911/EOC/Sheriff/Fire Administration
9119 Dean Ridding Lane
Spotsylvania Public Safety Bld/911/EOC
School Transportation Office
6921 N Roxbury Mill Rd
Spotsylvania School/Support Facility
Cedar Forest Elementary 3412 Massaponax
Church Rd Fredericksburg School/Shelter Site
Battlefield Elementary 11108 Leavells Rd Fredericksburg School/Shelter Site
Battlefield Middle 11120 Leavells Rd Fredericksburg School/Shelter Site
Berkeley Elementary 5979 Parlow Rd Spotsylvania School/Shelter Site
Brock Road Elementary 10207 Brock Rd Spotsylvania School/Shelter Site
Career and Technical Center High
6713 Smith Station Rd
Spotsylvania School/Shelter Site
Chancellor Elementary 5995 Plank Rd Fredericksburg School/Shelter Site
Chancellor High 6300 Harrison Rd Fredericksburg School/Shelter Site
Chancellor Middle 6320 Harrison Rd Fredericksburg School/Shelter Site
Courthouse Road Elementary
9911 Courthouse Rd
Spotsylvania School/Shelter Site
Courtland Elementary 6601 Smith Station
Rd Spotsylvania School/Shelter Site
Courtland High 6701 Smith Station
Rd Spotsylvania School/Shelter Site
Freedom Middle 7315 Smith Station
Rd Fredericksburg School/Shelter Site
Harrison Road Elementary 6230 Harrison Rd Fredericksburg School/Shelter Site
Lee Hill Elementary 3600 Lee Hill
School Dr Fredericksburg School/Shelter Site
Livingston Elementary 6057 Courthouse
Rd Spotsylvania School/Shelter Site
Massaponax High 8201 Jefferson
Davis Hwy Fredericksburg School/Shelter Site
Ni River Middle 11632 Catharpin
Rd Spotsylvania School/Shelter Site
Parkside Elementary 5620 Smith Station
Rd Fredericksburg School/Shelter Site
Post Oak Middle 6959 Courthouse
Rd Spotsylvania School/Shelter Site
Riverbend High 12301 Spotswood
Furnace Rd Fredericksburg School/Shelter Site
Riverview Elementary 7001 North
Roxbury Mill Rd Spotsylvania School/Shelter Site
Robert E. Lee Elementary 7415 Brock Rd Spotsylvania School/Shelter Site
Salem Elementary 4501 Jackson Rd Fredericksburg School/Shelter Site
Smith Station Elementary 7320 Smith Station
Rd Fredericksburg School/Shelter Site
Spotswood Elementary 400 Lorraine Ave Fredericksburg School/Shelter Site
Spotsylvania High 6975 Courthouse
Rd Spotsylvania School/Shelter Site
D R A
F T

Hazard Mitigation Plan George Washington Regional Commission March 2012
5-67
Facility Name Street Location Facility Type
Spotsylvania Middle 8801 Courthouse
Rd Spotsylvania School/Shelter Site
Thornburg Middle 6929 North
Roxbury Mill Rd Spotsylvania School/Shelter Site
Wilderness Elementary 11600 Catharpin
Rd Spotsylvania School/Shelter Site
Source: Data provided by the Spotsylvania Fire, Rescue, and Emergency Management
Non-Rotational Wind Vulnerability
Hazards U.S. – Multi Hazard (HAZUSMH) was utilized to perform a wind hazard analysis for
Spotsylvania County. HAZUSMH software is a multi-hazard loss estimation program that was developed under a cooperative agreement between the National Institute of Building Sciences and
FEMA. The current version of HAZUSMH has the ability to calculate earthquake, wind, and flood hazards as well as potential economic losses associated with these hazards. The software is designed with the flexibility to perform loss estimations at three different levels. Level 1 utilizes all default parameters built into the software. Levels 2 and 3 require user defined scenarios and building inventory data. For the purpose of this Plan, a Level 1 wind analysis was performed to calculate the wind hazard for Spotsylvania County. Table 5-35. Dollar Value of Exposed Structures from HAZUS – Spotsylvania County. lists the total dollar value of exposed structures based on occupancy type for Spotsylvania County.
The default data set provided with the HAZUSMH software is based on the 2000 census data. It is recognized that the current development trends in the GWRC region, and particularly in Spotsylvania County, may render the 2000 Census data obsolete. However, this analysis depicts the probability of occurrence and can generally be used estimate potential damages due to high winds.
Table 5-35. Dollar Value of Exposed Structures from HAZUS – Spotsylvania County.
Occupancy Type Total $ Value Exposed Structures
Residential 4,796,986,000
Commercial 486,242,000
Industrial 69,741,000
Agricultural 5,324,000
Religion 55,793,000
Government 6,195,000
Education 30,123,000
Total 5,450,404,000
Source:HAZUS-MH
HAZUSMH software provides two options for wind analysis, probabilistic and deterministic. The probabilistic scenario is the default option for the software and activates a database of many thousands of storm tracks and intensities. This scenario generates hurricane hazards based on set return periods. These return periods define the statistical probability that a storm of a given size and intensity could occur within any year. The deterministic method analyses hazards associated with a user defined storm event.
D R A
F T

Hazard Mitigation Plan George Washington Regional Commission March 2012
5-68
The user inputs the storm track, forward speed, and wind speed and allows for the creation of “what-if” scenarios. The probabilistic wind analysis was chosen because it provides the statistical probability for a range of hurricane events and presents a comparison of these events. The probabilistic analysis was used to generate structural loss estimations for hurricane events with specific recurrence intervals; 10-, 20-, 50-, 100-, 200-, 500-, and 1000-year. The recurrence interval is the average interval of time within which the given hurricane event will be equaled or exceeded once. Since residential comprised a significantly large percentage of the occupancy classification these data are presented in Table 5-36 below. Figure 5-29 shows the peak wind gusts, ranging from 66mph to 68mph, generated from a hurricane with 100-year recurrence interval. The total loss to residential structures is displayed in Figure 5-30 below. Table 5-36. Hurricane Risk - Spotsylvania County. Summary of Probabilistic Analysis - Residential
Structures.
Return Period
Residential Building Damage
Minor Damage
Moderate Damage
Severe Damage
Total Destruction
10-year 0 0 0 0
20-year 8 0 0 0
50-year 171 3 0 0
100-year 499 20 0 0
200-year 3,068 287 8 6
500-year 4,820 632 23 17
1000-year 6,839 1,204 61 51
Source: HAZUS-MH
Severe Storm Vulnerability
Since 1960 Spotsylvania has experienced 104 severe storms (approximately 2.17 events annually) that have caused damage to property and crops from lightning, hail, extreme winds, and flooding. From 1960-2008 these storms have caused approximately $6,600 in crop damages and $4,380,000 in property damages, the equivalent of $138 in crop damages and $91,250 in property damages annually. In that same time period extreme weather from winter storms and ice have caused damages to private and public properties and winter freeze has caused damage to crops within the region. Total damages to properties are estimated at $2,800,000 million across 62 storms. On an annualized basis, this works out to be approximately $58,333 in property damage and 1.29 winter storm events per year. Five of those storms caused winter freeze resulting in crop damages resulting in damages of approximately $50,000 (SHELDUS 2011). The risk for winter storm events for Spotsylvania County and its independent towns is listed below in Table 5-37.
D R A
F T

Hazard Mitigation Plan George Washington Regional Commission March 2012
5-69
Table 5-37. Winter Storm Risk—Spotsylvania.
Locality
Average Snowfall (in) 1958-2010 Likelihood
Of
Event (%) December January February March Annual
Spotsylvania 2.68” 5.72” 4.26” 2.90” 16.34” 93.1
Source: Southeast Regional Climate Center
Tornado Vulnerability
Based on the available data, Spotsylvania County has averaged 0.17 tornado events causing $8,367 in damages annually.
Table 5-38. Tornado Risk - Spotsylvania County Historic Events 1950-2010.
Intensity Number of
Occurrences Damages ($)
EF0 4 115K
EF1 5 387K
EF2 1 NA
Source:SVRGIS
Flooding Vulnerability
A flood vulnerability assessment analysis was performed for Spotsylvania County using valuation data from the Spotsylvania County tax assessor’s database and GIS data including parcel location and 100-Year (or 1% chance) flood zones from Spotsylvania County. The parcel and flood zone layers were analyzed in a GIS environment to determine which parcels were located within the 100-Year flood zone. No specific structure layer was available; therefore, the structure location was estimated to be the parcel centroid. The total value of structures within the flood zone was then calculated by linking the selected parcels to the tax assessor’s valuation data via a Property Information Number (PIN). Parcels within the 100-Year flood zone that did not have building valuation data in the tax assessor’s database were assumed to have no structures. Thus, from a total of 61,792 parcels, 36,885 were assumed to have structures. It was determined that there are 410 structures within the 100-Year flood zone in Spotsylvania County. The total value of those structures is estimated to be $106.8 million (Table 5-39).
D R A
F T

Hazard Mitigation Plan George Washington Regional Commission March 2012
5-70
Table 5-39. Flood Risk – Spotsylvania County.
Occupancy Type Total No. Buildings No. Buildings in 100-
year Flood Zone Estimated at Risk Value
Agriculture 14,050 137 $17.9 million
Residential 21,296 246 $49.4 million
Commercial / Industrial
957 24 $39.1 million
Other 582 3 $0.4 million
Total 36,885 410 $106.8 million
Source: Data provided by Spotsylvania County
A regional map of the 100-year floodplains and the jurisdictions’ critical facilities is provided in Appendix B, Map B-5. Repetitive Loss Areas Including flood insurance claims paid as a result of flood damage caused by Hurricane Isabel in 2003, FEMA has identified zero structures as repetitive loss structures for Spotsylvania County. HAZUS Flood Analysis
Hazards U.S. – Multi Hazard (HAZUSMH) was utilized to perform a flood hazard analysis for
Spotsylvania County to expand on the analysis conducted in 2006 (Table 5-39). HAZUSMH software is a multi-hazard loss estimation program that was developed under a cooperative agreement between the
National Institute of Building Sciences and FEMA. The current version of HAZUSMH has the ability to calculate earthquake, wind, and flood hazards as well as potential economic losses associated with these hazards. The software is designed with the flexibility to perform loss estimations at three different levels. Level 1 utilizes all default parameters built into the software. Levels 2 and 3 require user defined scenarios and building inventory data. For the purpose of this Plan, a Level 1 flood analysis was performed to calculate the flood hazard for the Spotsylvania County. Table 5-40 lists the total dollar value of exposed structures based on occupancy type for Spotsylvania County.
The default dataset provided with the HAZUSMH software is based on the 2000 census data. It is recognized that the current development trends in the Spotsylvania County may render the 2000 census
data, with which HAZUSMH is programmed, somewhat obsolete. However, this analysis depicts the probability of occurrence and can generally be used to estimate potential damages due to high surging waters.
D R A
F T

Hazard Mitigation Plan George Washington Regional Commission March 2012
5-71
Table 5-40. Flood Risk - Spotsylvania County.
Occupancy Type Dollar Exposure (replacement value $)
Residential 4,582,712,000
Commercial 837,154,000
Industrial 167,274,000
Agricultural 14,802,000
Religion 84,021,000
Government 9,485,000
Education 98,242,000
TOTAL 5,793,690,000
Source: HAZUS-MH
The default dataset provided with the HAZUSMH software is based on the 2000 census data. It is recognized that the current development trends in the Spotsylvania County may render the 2000 census
data, with which HAZUSMH is programmed, somewhat obsolete. However, this analysis depicts the probability of occurrence and can generally be used to estimate potential damages due to high surging waters.
The three hazard type options provided by HAZUSMH software for flood analysis are the riverine, coastal, and riverine and coastal scenarios. The necessary scenario for any given situation depends upon the geography of the region. If the area is inland with a stream hydrology, then the riverine scenario should be used. If however, the area is along the coast then either the riverine and coastal, or coastal scenario should be used. The user cannot run any analysis without first defining the scenario. The riverine analysis was chosen for Spotsylvania County. This scenario provides the statistical probability for a range of flood events and presents a comparison of those events. The coastal and riverine analysis was used to generate structural loss estimations, agricultural loss estimations, and shelter requirements for flood events with specific recurrence intervals; 10-, 20-, 50-, 100-, 200-, and 500-year. The recurrence interval is the average interval of time within which the given flood event will be equaled or exceeded once. Agricultural damage from a 100-year event is listed below in Table 5-41. Because residential structures comprise a significantly large percentage of the occupancy classification within the region, these data are presented in Figure 5-32 below. The total damages to residential structures were $16,162,000. The number of displaced persons from a 100-year event is displayed below in Figure 5-33. The total number of displaced Spotsylvania County residents was 2075 people. Figure 5-34 shows the 100-year floodplain for the Spotsylvania County with 2010 census blocks that intersect it. The map displays the population (in 2010 Census numbers) that would be affected by a 100-year flood event. D R
A F
T

Hazard Mitigation Plan George Washington Regional Commission March 2012
5-72
Table 5-41. Agricultural Loss – Spotsylvania County.
Crop Type Loss ($)
Corn 214,915.21
Corn Silage 896,703.26
Soybeans 151,766.00
Wheat 96,127.05
TOTAL 1,359,511.52
Source: HAZUS-MH
D R A
F T

Hazard Mitigation Plan George Washington Regional Commission March 2012
5-73
Figure 5-29. Peak Wind Gust (mph) Distribution.
D R A
F T
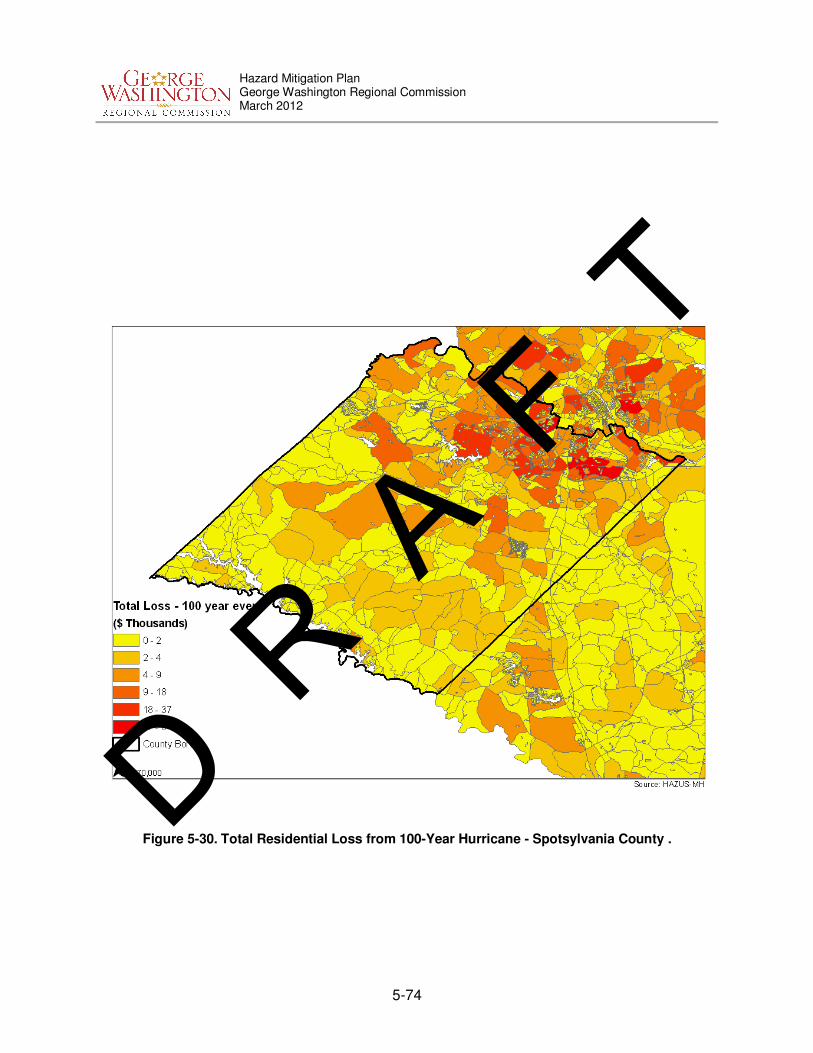
Hazard Mitigation Plan George Washington Regional Commission March 2012
5-74
Figure 5-30. Total Residential Loss from 100-Year Hurricane - Spotsylvania County . D R
A F
T

Hazard Mitigation Plan George Washington Regional Commission March 2012
5-75
Figure 5-31. Historic Tornado Occurrences (Enhanced Fujita Scale) - Spotsylvania County 1950-2010.
D R A
F T

Hazard Mitigation Plan George Washington Regional Commission March 2012
5-76
Figure 5-32. Total Residential Loss for Spotsylvania. D R A
F T

Hazard Mitigation Plan George Washington Regional Commission March 2012
5-77
Figure 5-33. Displaced Population for 100-year Flood Event—Spotsylvania County. D R A
F T

Hazard Mitigation Plan George Washington Regional Commission March 2012
5-78
Figure 5-34. At Risk Population for Flood Event—Spotsylvania.
D R A
F T
Hazard Mitigation Plan George Washington Regional Commission March 2012
5-79
E. Stafford County Vulnerability Assessment
Development Trends
Stafford County’s close proximity to Washington, D.C. has allowed its economic base to capitalize on government-related industry and high-tech jobs. Major employers include GEICO Insurance (regional headquarters, 3900 employees), McLane Mid-Atlantic (retail distribution, 850 employees), and Intuit, Inc. (computer services, 600 employees). Northrop Grumman (information technology/engineering) and BAE Systems (weapon systems) employ an additional 585 high-tech professionals. The U.S. Marine Base Quantico occupies 32,753 acres of Stafford County and employs 6,959 civilians ($48 million civilian payroll). The FBI relocated its National Lab to Stafford in 2003 and employs 900 persons, with an additional 900 employees at the FBI Academy and the local FBI office. New jobs in Stafford County rose 5.6% annually between 1999 and 2004, and as of 2010 the county had a civilian labor force of 67,313 and an unemployment rate of 5.8% according to the Virginia Economic Development Partnership. The number of businesses in Stafford County grew 34% from 1999 to 2004. As of July 8, 2005, Stafford County had 104 active commercial developments claiming an approximate 2.5 million square feet of office space. Stafford County had a population of 92,446 in 2000 and the 2010 Census reports a population of 128,961 persons, an increase of 39.5%. The 2015 population projection for Stafford County is 138,300 an increase of 7.2% from 2010. (Stafford, Virginia, 2005).
Critical Facilities
In order to assess the vulnerability of a community to natural hazards, the MAC conducted an inventory of the structures and critical facilities within Stafford County ( Table 5-42). The critical facilities are the community’s assets that are the most important or vital to emergency management. Critical facilities include:
• Emergency Operation Center (EOC);
• Emergency Communications Center (ECC) / 911; • Law Enforcement Offices;
• Fire / Rescue Stations;
• Emergency Medical Services (EMS); • Power;
• Communications;
• Water;
• Wastewater Treatment Plants (WWTP); • Shelters; and
• Administration Buildings / Courthouse. Critical facilities are those facilities that warrant special attention in preparing for a disaster and/or facilities that are of vital importance to maintaining citizen life, health, and safety during and/or directly after a disaster event. MAC member representatives from Stafford County provided the inventory of critical facilities for the county.
D R A
F T

Hazard Mitigation Plan George Washington Regional Commission March 2012
5-80
Table 5-42. Critical Facilities – Stafford County.
Facility Name Street City Facility Type
Stafford Sheriff's Office
1300 Courthouse Rd
Stafford Sheriff/EOC
Aquia Harbor Police
1040 Aquia Dr Stafford Police Dept
Dept. of Fire, Rescue, and Safety
1300 Courthouse Rd
Stafford Fire/Rescue
Stafford Volunteer Fire Assn
2080 Jefferson Davis Hwy
Stafford Fire Dept
Rock Hill Volunteer Fire Dept
2133 Garrisonville Rd
Stafford Fire Dept
Stafford County Fire Marshall
1225 Courthouse Rd
Stafford Fire Dept
Falmouth Volunteer Fire Assn
250 Butler Road Falmouth Fire Dept
Widewater Volunteer Fire Assn
749 Widewater Road
Stafford Fire Dept
Mountain View Volunteer Fire &
Safety 924 Kellog Mill Rd Stafford Fire Dept
Hartwood Volunteer Fire Assn
67 Hartwood Church Road
Hartwood Fire Dept
White Oak Volunteer Fire
12 Newton Road Falmouth Fire Dept
Berea Fire Station 22 Sebring Drive Stafford Fire Dept
Aquia Harbour Volunteer Rescue
1001 Washington Drive
Stafford Rescue
White Oak Volunteer Rescue
535 White Oak Rd Falmouth Rescue
Rock Hill Volunteer Rescue
1565 Garrisonville Rd
Stafford EMS
Stafford Rescue Squad
2147 Jefferson Davis Hwy
Stafford EMS
Brooke Fire House 222 Andrew Chapel Rd
Stafford Fire/EMS
Potomac Hills Fire Station
3528 Jefferson Davis Hwy
Stafford Fire/EMS
Smith Lake Water Treatment Facility
370 Doc Stone Rd Stafford Potable Water
Abel Lake WTP Route 653 Stafford Potable Water
Aquia Sanitary District
Route 631 Stafford Wastewater
Randall Ranny L. STP
Not Given Stafford Wastewater
Richard Schwartz Not Given Stafford Wastewater
Stafford County Administration
Center
1300 Courthouse Rd
Stafford Administration
D R A
F T

Hazard Mitigation Plan George Washington Regional Commission March 2012
5-81
Facility Name Street City Facility Type
Garrisonville Elementary
100 Wood Dr Stafford School/Shelter Site
A.G. Wright Middle 100 Wood Dr Stafford School/Shelter Site
Widewater Elementary
101 Den Rich Rd Stafford School/Shelter Site
Stafford Middle 101 Spartan Dr Stafford School/Shelter Site
Conway Elementary
105 Primmer House Rd
Fredericksburg School/Shelter Site
Hampton Oaks Elementary
107 Northhampton Blvd
Stafford School/Shelter Site
Stafford Elementary
1349 Courthouse Rd
Stafford School/Shelter Site
Kate Walker Barrett Elementary
150 Duffey Dr Stafford School/Shelter Site
Brooke Point High 1700 Courthouse
Rd Stafford School/Shelter Site
Ferry Farm Elementary
20 Pendleton Rd Stafford School/Shelter Site
Park Ridge Elementary
2000 Parkway Blvd Stafford School/Shelter Site
Margaret Brent Elementary
2125 Mountain View Rd
Stafford School/Shelter Site
Mountain View High
2135 Mountain View Rd
Stafford School/Shelter Site
Winding Creek Elementary
475 Winding Creek Rd
Stafford School/Shelter Site
Rockhill Elementary
50 Wood Dr Stafford School/Shelter Site
Grafton Village Elementary
501 Deacon Rd Fredericksburg School/Shelter Site
Colonial Forge High
550 Courthouse Rd
Stafford School/Shelter Site
Anthony Burns Elementary
60 Gallery Rd Stafford School/Shelter Site
Anne E. Moncure Elementary
75 Moncure Ln Stafford School/Shelter Site
Rodney E. Thompson Middle
75 Walpole St Stafford School/Shelter Site
H.H. Poole Middle 800 Eustace Rd Stafford School/Shelter Site
North Stafford High 839 Garrisonville
Rd Stafford School/Shelter Site
Heim Middle School
320 Telegraph Rd Stafford School/Shelter Site
Source: Data provided by the Stafford County Fire and Rescue Department.
Non-Rotational Wind Vulnerability
Hazards U.S. – Multi Hazard (HAZUS-MH) was utilized to perform a wind hazard analysis for Stafford
County. HAZUSMH software is a multi-hazard loss estimation program that was developed under a
D R A
F T

Hazard Mitigation Plan George Washington Regional Commission March 2012
5-82
cooperative agreement between the National Institute of Building Sciences and FEMA. The current
version of HAZUSMH has the ability to calculate earthquake, wind, and flood hazards as well as potential economic losses associated with these hazards. The software is designed with the flexibility to perform loss estimations at three different levels. Level 1 utilizes all default parameters built into the software. Levels 2 and 3 require user defined scenarios and building inventory data. For the purpose of this Plan, a Level 1 wind analysis was performed to calculate the wind hazard for Stafford County. Table 5-43 lists the total dollar value of exposed structures based on occupancy type for Stafford County. The default data set provided with the HAZUS-MH software is based on the 2000 census data. It is recognized that the current development trends in Stafford County make the 2000 census data obsolete. However, this analysis depicts the probability of occurrence and can generally be used estimate potential damages due to high winds.
Table 5-43. Total Dollar Value of Exposed Structures from HAZUS – Stafford.
Occupancy Type Total $ Value Exposed Structures
Residential 5,124,037,000
Commercial 369,083,000
Industrial 70,156,000
Agricultural 12,118,000
Religion 57,801,000
Government 12,469,000
Education 13,020,000
Total 5,658,684,000
Source:HAZUS-MH
HAZUSMH software provides two options for wind analysis, probabilistic and deterministic. The probabilistic scenario is the default option for the software and activates a database of many thousands of storm tracks and intensities. This scenario generates hurricane hazards based on set return periods. These return periods define the statistical probability that a storm of a given size and intensity could occur within any year. The deterministic method analyses hazards associated with a user defined storm event. The user inputs the storm track, forward speed, and wind speed and allows for the creation of “what-if” scenarios. The probabilistic wind analysis was chosen because it provides the statistical probability for a range of hurricane events and presents a comparison of these events. The probabilistic analysis was used to generate structural loss estimations for hurricane events with specific recurrence intervals; 10-, 20-, 50-, 100-, 200-, 500-, and 1000-year. The recurrence interval is the average interval of time within which the given hurricane event will be equaled or exceeded once. Since residential use comprised a significantly large percentage of the occupancy classification these data are presented in Table 5-44. Figure 5-35 shows the peak wind gusts, ranging from 66mph to 68mph, generated from a hurricane with 100-year recurrence interval. Figure 5-36 displays the total loss to residential structures from a 100-year recurrence interval.
D R A
F T

Hazard Mitigation Plan George Washington Regional Commission March 2012
5-83
Table 5-44. Hurricane Risk - Stafford County. Summary of Probabilistic Analysis – Residential Structures.
Return Period
Residential Building Damage
Minor Damage
Moderate Damage
Severe Damage
Total Destruction
10-year 0 0 0 0
20-year 5 0 0 0
50-year 96 2 0 0
100-year 522 20 1 0
200-year 2,113 149 4 1
500-year 7,438 1,313 77 70
1000-year 11,423 3,629 510 459
Source:HAZUS-MH
Severe Storm Vulnerability
Since 1960 Stafford has experienced 99 severe storms (roughly 2 severe storm events annually) that have caused damage to property and crops from lightning, hail, extreme winds, and flooding. From 1960-2008 these storms have caused approximately $7,700 in crop damages and $2,110,000 in property damages, the equivalent of $160 in crop damages and $43,958 in property damages annually. In that same time period extreme weather from winter storms and ice have caused damages to private and public properties and winter freeze has caused damage to crops within the region. Total damages to properties are estimated at $2,300,000 million across 60 storms. On an annualized basis, this works out to be approximately $47,917 in property damage and 1.25 winter storm events per year. Four of those storms caused winter freeze resulting in crop damages resulting in damages of approximately $45,800 (SHELDUS 2011). The risk for winter storm events for Stafford County and its independent towns is listed below in Table 5-45.
Table 5-45. Winter Storm Risk - Stafford.
Locality Average Snowfall (in) 1958-2010
Likelihood Of Event (%)
December January February March Annual
Stafford 3.21” 3.46’ 4.11” 2.42” 14.1” 96.3
Source: Southeast Regional Climate Center
Tornado Vulnerability
Based on the available data, Stafford County has averaged 0.23 tornado events causing $169,417 in damages annually. The calculation of annualized damages is skewed to a considerable extent due to a particularly damaging EF-2 tornado event on May 8, 2008, in Berea that caused $10 million in property damages.
D R A
F T

Hazard Mitigation Plan George Washington Regional Commission March 2012
5-84
Table 5-46. Tornado Risk—Stafford County: Historic Events 1950-2010.
Intensity Number of
Occurrences Damages ($)
EF0 7 85K
EF1 6 80K
EF2 1 10.0M
Source: SVRGIS
Flooding Vulnerability
A flood vulnerability assessment analysis was performed for Stafford County using valuation data from the Stafford County tax assessor’s database and GIS data including 100-Year flood zone and structure location layers from Stafford County. The structure and flood layers were analyzed in a GIS environment to determine how many structures were located within a 100-Year flood zone. The tax assessor’s database and the GIS structure data layer do not have unique matching attributes suitable for attribute joining for all structures. Approximately 62% of the buildings can be linked to the tax assessor’s database via the Property Information Number (PIN) – this number is located in both the GIS Building layer and the tax assessor’s database. The remaining 38% of the buildings can only be manually matched to the tax assessor’s database. The total value of the structures was extrapolated from the 62% of the known values. It was determined that 1,916 structures are located within the 100-Year flood zone in Stafford County. The total value of those structures is estimated at $339.4 million (Table 5-47. Flood Risk – Stafford County.).
Table 5-47. Flood Risk – Stafford County.
Occupancy Type
Total Buildings No. Buildings in 100-year Flood
Zone Estimated at Risk Value
Residential 20287 721 $127.7 million
Agricultural 19577 556 $98.5 million
Commercial / Planned
Development 924 61 $10.8 million
Other / Unidentified
15116 578 $102.4 million
Total 55,904 1,916 $339.4 million
Source: Data provided by Stafford County
D R A
F T

Hazard Mitigation Plan George Washington Regional Commission March 2012
5-85
Repetitive Loss Areas Including flood insurance claims paid as a result of flood damage caused by Hurricane Isabel in 2003, FEMA has identified 10 properties as repetitive loss properties for Stafford County. This number was later revised to nine (9). Six (6) of these properties are situated in a historic district. The numbers given does not reflect the total number of houses that have flooded in Stafford County, rather the total number of repetitive losses. HAZUS Flood Analysis
Hazards U.S. – Multi Hazard (HAZUSMH) was utilized to perform a flood hazard analysis for Stafford
County (to expand on the analysis conducted in 2006 Table 5-47). HAZUSMH software is a multi-hazard loss estimation program that was developed under a cooperative agreement between the National
Institute of Building Sciences and FEMA. The current version of HAZUSMH has the ability to calculate earthquake, wind, and flood hazards as well as potential economic losses associated with these hazards. The software is designed with the flexibility to perform loss estimations at three different levels. Level 1 utilizes all default parameters built into the software. Levels 2 and 3 require user defined scenarios and building inventory data. For the purpose of this Plan, a Level 1 flood analysis was performed to calculate the flood hazard for the Stafford County. Table 5-48 lists the total dollar value of exposed structures based on occupancy type for Stafford County.
The default dataset provided with the HAZUSMH software is based on the 2000 census data. It is recognized that the current development trends in the Stafford County may render the 2000 census data,
with which HAZUSMH is programmed, somewhat obsolete. However, this analysis depicts the probability of occurrence and can generally be used to estimate potential damages due to high surging waters.
The three hazard type options provided by HAZUSMH software for flood analysis are the riverine, coastal, and riverine and coastal scenarios. The necessary scenario for any given situation depends upon the geography of the region. If the area is inland with a stream hydrology, then the riverine scenario should be used. If however, the area is along the coast then either the riverine and coastal, or coastal scenario should be used. The user cannot run any analysis without first defining the scenario.
D R A
F T

Hazard Mitigation Plan George Washington Regional Commission March 2012
5-86
Table 5-48. Flood Risk - Stafford County.
Occupancy Type Dollar Exposure (replacement value $)
Residential 5,032,289,000
Commercial 696,196,000
Industrial 141,282,000
Agricultural 24,015,000
Religion 97,241,000
Government 27,654,000
Education 73,898,000
TOTAL 6,092,575,000
Source: HAZUS-MH
The riverine and coastal analysis was chosen for Stafford County. This scenario provides the statistical probability for a range of flood events and presents a comparison of those events. The coastal and riverine analysis was used to generate structural loss estimations, agricultural loss estimations, and shelter requirements for flood events with specific recurrence intervals; 10-, 20-, 50-, 100-, 200-, and 500-year. The recurrence interval is the average interval of time within which the given flood event will be equaled or exceeded once. Agricultural damage from a 100-year event is listed below in Table 5-49. Because residential structures comprise a significantly large percentage of the occupancy classification within the region, these data are presented in Figure 5-38 below. The total damages to residential structures were $12,651,000. The number of displaced persons from a 100-year event is displayed below in Figure 5-39. The total number of displaced Stafford County residents was 185 people. Figure 5-40 shows the 100-year floodplain for the Stafford County with 2010 census blocks that intersect it. The map displays the population (in 2010 Census numbers) that would be affected by a 100-year flood event.
Table 5-49. Agricultural Loss – Stafford County.
Crop Type Loss ($)
Corn 150,813.49
Corn Silage 179,339.19
Soybeans 102,142.47
Wheat 23,618.65
TOTAL 454,913.80
Source: HAZUS-MH
D R A
F T

Hazard Mitigation Plan George Washington Regional Commission March 2012
5-87
Figure 5-35. Peak Wind Gust (mph) Distribution.
D R A
F T

Hazard Mitigation Plan George Washington Regional Commission March 2012
5-88
Figure 5-36. Total Residential Loss from 100-Year Hurricane - Stafford County. D R A
F T

Hazard Mitigation Plan George Washington Regional Commission March 2012
5-89
Figure 5-37. Historic Tornado Occurrences (Enhanced Fujita Scale). Stafford County 1950-2010.
D R A
F T

Hazard Mitigation Plan George Washington Regional Commission March 2012
5-90
Figure 5-38. Total Residential Loss for Stafford . D R A
F T

Hazard Mitigation Plan George Washington Regional Commission March 2012
5-91
Figure 5-39. Displaced Population for 100-year Flood Event - Stafford County. D R A
F T

Hazard Mitigation Plan George Washington Regional Commission March 2012
5-92
Figure 5-40. At Risk Population for Flood Event - Stafford.
D R A
F T

Hazard Mitigation Plan
George Washington Regional Commission
March 2012
6-1
CHAPTER 6 - CAPABILITY ASSESSMENT
The capability assessment provides each member jurisdiction with a better understanding of its own preparedness levels and its capability to mitigate against natural hazards. This assessment will assist the GWRC communities to more accurately focus the goals, objectives, and proposed actions of this plan. For the 2012 update, the MAC took two approaches in updating its 2006 capability assessment for its member jurisdictions. First, an inventory/matrix of common mitigation activities from the 2006 plan was updated to identify activities and actions that were either in place, needed improvement, or could be undertaken, if deemed appropriate. Second, the MAC updated information on existing policies, regulations, and plans. These documents were reviewed by the jurisdictions to determine if they still contributed to reducing hazard related losses, or if they, inadvertently, contributed to increasing such losses.
I. Regional Capability Assessment
Federal, State and Regional mitigation capabilities that are common to all communities within the GWRC planning area are presented below. The mitigation capabilities of each community are individually identified and presented in Sections II A-E below.
D R A
F T
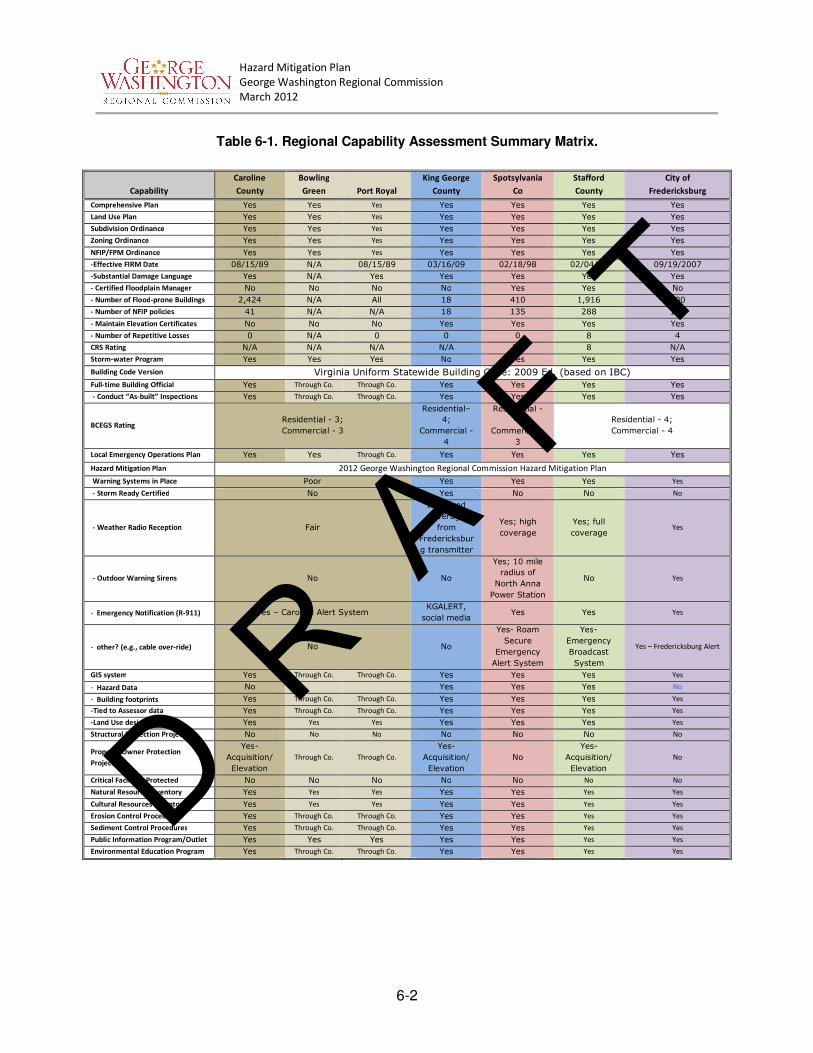
Hazard Mitigation Plan
George Washington Regional Commission
March 2012
6-2
Table 6-1. Regional Capability Assessment Summary Matrix.
Capability
Caroline
County
Bowling
Green Port Royal
King George
County
Spotsylvania
Co
Stafford
County
City of
Fredericksburg
Comprehensive Plan Yes Yes Yes Yes Yes Yes Yes
Land Use Plan Yes Yes Yes Yes Yes Yes Yes
Subdivision Ordinance Yes Yes Yes Yes Yes Yes Yes
Zoning Ordinance Yes Yes Yes Yes Yes Yes Yes
NFIP/FPM Ordinance Yes Yes Yes Yes Yes Yes Yes
-Effective FIRM Date 08/15/89 N/A 08/15/89 03/16/09 02/18/98 02/04/05 09/19/2007
-Substantial Damage Language Yes N/A Yes Yes Yes Yes Yes
- Certified Floodplain Manager No No No No Yes Yes No
- Number of Flood-prone Buildings 2,424 N/A All 18 410 1,916 300
- Number of NFIP policies 41 N/A N/A 18 135 288 164
- Maintain Elevation Certificates No No No Yes Yes Yes Yes
- Number of Repetitive Losses 0 N/A 0 0 0 8 4
CRS Rating N/A N/A N/A N/A No 8 N/A
Storm-water Program Yes Yes Yes No Yes Yes Yes
Building Code Version Virginia Uniform Statewide Building Code: 2009 Ed. (based on IBC)
Full-time Building Official Yes Through Co. Through Co. Yes Yes Yes Yes
- Conduct “As-built” Inspections Yes Through Co. Through Co. Yes Yes Yes Yes
BCEGS Rating Residential - 3;
Commercial - 3
Residential–
4;
Commercial -
4
Residential -
4;
Commercial -
3
Residential - 4;
Commercial - 4
Local Emergency Operations Plan Yes Yes Through Co. Yes Yes Yes Yes
Hazard Mitigation Plan 2012 George Washington Regional Commission Hazard Mitigation Plan
Warning Systems in Place Poor Yes Yes Yes Yes
- Storm Ready Certified No Yes No No No
- Weather Radio Reception Fair
Improved
coverage
from
Fredericksbur
g transmitter
Yes; high
coverage
Yes; full
coverage Yes
- Outdoor Warning Sirens No No
Yes; 10 mile
radius of
North Anna
Power Station
No Yes
- Emergency Notification (R-911) Yes – Caroline Alert System KGALERT,
social media Yes Yes Yes
- other? (e.g., cable over-ride) No No
Yes- Roam
Secure
Emergency
Alert System
Yes-
Emergency
Broadcast
System
Yes – Fredericksburg Alert
GIS system Yes Through Co. Through Co. Yes Yes Yes Yes
- Hazard Data No Yes Yes Yes No
- Building footprints Yes Through Co. Through Co. Yes Yes Yes Yes
-Tied to Assessor data Yes Through Co. Through Co. Yes Yes Yes Yes
-Land Use designations Yes Yes Yes Yes Yes Yes Yes
Structural Protection Projects No No No No No No No
Property Owner Protection
Projects
Yes-
Acquisition/
Elevation
Through Co. Through Co.
Yes-
Acquisition/
Elevation
No
Yes-
Acquisition/
Elevation
No
Critical Facilities Protected No No No No No No No
Natural Resource Inventory Yes Yes Yes Yes Yes Yes Yes
Cultural Resources Inventory Yes Yes Yes Yes Yes Yes Yes
Erosion Control Procedures Yes Through Co. Through Co. Yes Yes Yes Yes
Sediment Control Procedures Yes Through Co. Through Co. Yes Yes Yes Yes
Public Information Program/Outlet Yes Yes Yes Yes Yes Yes Yes
Environmental Education Program Yes Through Co. Through Co. Yes Yes Yes Yes
D R A
F T
Hazard Mitigation Plan
George Washington Regional Commission
March 2012
6-3
A. Federal Capabilities
The National Flood Insurance Program (NFIP)
Established in 1968, the NFIP provides flood insurance in nearly 20,000 communities across the United States and its territories that agree to regulate new development in identified Special Flood Hazard Areas through the adoption and enforcement of a minimum Flood Damage Prevention Ordinance. The program also requires, as a condition of every federally-backed mortgage within an identified Special Flood Hazard Area, the purchase and maintenance of a flood insurance policy for the life of the loan. Community participation in the NFIP is voluntary. Flood insurance is designed to provide an alternative to disaster assistance to reduce the escalating costs of repairing damage to buildings and their contents caused by floods. Flood damage is reduced by nearly $1 billion a year through communities implementing sound floodplain management requirements and property owners purchasing of flood insurance. Additionally, buildings constructed in compliance with NFIP building standards suffer approximately 80 percent less damage annually than those not built in compliance. In addition to providing flood insurance and reducing flood damages through floodplain management regulations, the NFIP identifies and maps the Nation's floodplains. Mapping flood hazards creates broad-based awareness of the flood hazards and provides the data needed for floodplain management programs and to actuarially rate new construction for flood insurance. On September 30, 2010, the President signed the National Flood Insurance Program Re-extension Act of 2010, which Congress passed on September 24, 2010. This extends the National Flood Insurance Program until September 30, 2011.
The Coastal Barrier Resources Act (CoBRA)
Established in 1972, the COBRA is environmental legislation administered by the U.S. Fish and Wildlife Service. The legislation provides for the identification and protection of Coastal Barrier Resources. The Act further prohibits the availability of federally-backed assistance within identified areas, including grants, loans, mortgages and federal flood insurance.
Coastal Zone Management Act (CZMA)
Established in 1972, and amended by the Coastal Zone Protection Act of 1996, the CZMA defines a national interest in the effective management, beneficial use, protection and development of the coastal zone and identifies the urgent need to protect the natural system from these competing interests. The Virginia Department of Environmental Quality (DEQ) oversees the Virginia Coastal Resources Management Program, which was established to protect and manage an area known as Virginia's "coastal zone.” All seven of the GWRC communities are located in the coastal zone as defined by Virginia’s Coastal Resources Management Area. The program has produced a large number of publications and assisted in the development of numerous projects to support their ten primary goals, available online. GWRC is developing a regional green infrastructure plan under a CZM-funded grant to be completed in September, 2011. This plan will identify core areas where high value natural habitats and forested areas are recommended for conservation emphasis.
D R A
F T
Hazard Mitigation Plan
George Washington Regional Commission
March 2012
6-4
Environmental Protection Agency’s Chesapeake Bay TMDLs
In 1998, major portions of Chesapeake Bay and its tidal tributaries within Virginia were identified as not meeting water quality standards and listed as impaired. Areas of the Bay and tidal rivers within Maryland, Delaware and the District of Columbia are also on the federally approved list of impaired waters. The main pollutants causing these impairments are nitrogen, phosphorus, and sediment. Significant efforts have been taken and resources expended by federal, state, and local governments and other interested parties throughout the entire 64,000 square mile Chesapeake Bay watershed. Despite these efforts the water quality goals under the Clean Water Act have yet to be met. Because these Bay waters remained impaired in 2008, the six Chesapeake Bay Watershed States (Virginia, Maryland, Delaware, West Virginia, Pennsylvania, and New York), the District of Columbia, and U.S. Environmental Protection Agency agreed that a Total Maximum Daily Load (TMDL) needed to be developed. EPA has assumed primary responsibility for the establishment of the Bay TMDL with assistance from the Bay watershed states. The target date for completing this is December 31, 2010, although under a federal court consent decree EPA must complete the Bay TMDL no later than May 1, 2011. The Chesapeake Bay TMDL will address all segments of the Bay and its tidal tributaries that are impaired. As with all TMDLs, a maximum aggregate watershed pollutant loading necessary to achieve the Chesapeake Bay’s water quality standards will be identified. This aggregate watershed loading will be divided among the Bay states and major tributary basins, as well as by major source categories [wastewater, urban storm water, agriculture, air deposition]. Each community in the watershed will be required to develop a watershed implementation plan (WIP), demonstrating how the locality will achieve the target pollution reduction goals assigned to them.
Military Installations
Several military installations within the GWRC planning area are not addressed herein: Quantico Marine Corps Base, Fort A.P. Hill, and the Naval Surface Warfare Center Dahlgren Division. Liaisons from these facilities were invited to participate in the MAC and the planning process leading to the creation of this report.
B. State Capabilities
Virginia Department of Emergency Management (VDEM)
VDEM’s Strategic Plan 2004-2013 This plan recognizes and prepares for Virginia’s changing demographics and increasing threats over the current ten-year period. Goals, strategies and resources are built around the mission statement, which is “to protect the lives and property of Virginia’s citizens from emergencies and disasters by coordinating the state’s emergency preparedness, mitigation, response, and recovery efforts.”
D R A
F T

Hazard Mitigation Plan
George Washington Regional Commission
March 2012
6-5
Commonwealth of Virginia Emergency Operations Plan (State EOP), September, 2007: This plan consists of a Disaster Recovery Plan, a Hazard Mitigation Plan, and five hazard-specific volumes. The mitigation goals and project prioritization criteria from Section 4 of Virginia’s Hazard Mitigation Plan are:
� Goal 1 - Structural Mitigation Projects - Maintenance of critical communication, transportation, or
supply chain management operations, beneficial impacts for multiple agencies/organizations, feasibility, cost and funding, and multi-hazard mitigation;
� Goal 2 - Policy, Planning and Funding Human health and safety, preparedness, economic recovery, multi-hazard mitigation, and health care and shelter;
� Goal 3 - Information and Data Development - Human health, safety or economic stability, multi-
hazard mitigation, beneficial impacts for multiple agencies/organizations, feasibility, and information quality and security; and,
� Goal 4 - Education and Outreach Activities – Number of people and property affected, beneficial
impacts for multiple agencies/organization, multi-hazard mitigation, transferability and adaptability, and simplicity and consistency.
Virginia Emergency Alert Systems (EAS) Stations
Virginia is divided into 14 LOCAL AREAS (formerly "operational areas") which coordinate EAS activities under the direction of the Local Emergency Communications Committee (L.E.C.C.). The LECC Chair and Vice-Chair are appointed by the FCC and the State Chair; they are also members of the State Emergency Communications Committee (S.E.C.C.). The George Washington Region is divided into Area 2 “Fredericksburg Local Area” (including City of Fredericksburg, and Stafford, Spotsylvania, King George, and Fauquier Counties) and part of the “Richmond Extended Local Area” (including Caroline County). Specific AM/FM radio stations provide updated disaster and directional information to listeners in the Commonwealth. Thirty-seven radio stations cover fourteen regions in Virginia, including: Northern Va.-D.C. (2 AM stations, 2 FM stations), Richmond extended area (2 AM stations, 2 FM stations), and Fredericksburg [1 AM station (WRVA-AM), 2 FM stations (WFLS-FM, WBQB-FM), North Anna Early Warning Siren System], which provide coverage for the GWRC planning area.
2010 Statewide Communication Interoperability Plan
Interoperability is the ability of public safety agencies to talk across disciplines and jurisdictions via radio communications systems, exchanging voice and/or data with one another on demand in real time, when needed, and as authorized. The lack of interoperable communications is not a new public safety problem, but new events continue to remind us of the pressing problem it poses to public safety departments and emergency response agencies. Major events, like September 11, 2001, and Hurricane Katrina in 2005, as well as ongoing day-to-day operations, demonstrate the need for improved communications systems and collaboration and planning among various jurisdictions. The Virginia SCIP has served as the backbone for regional and local interoperable communications planning. It establishes a future vision for communications interoperability and aligns the Common-wealth’s emergency response agencies with that vision and the goals, objectives, and initiatives for achieving that vision. The first Virginia statewide plan was released in FY 2005 and it defined statewide
D R A
F T
Hazard Mitigation Plan
George Washington Regional Commission
March 2012
6-6
initiatives designed to improve interoperable communications. The 2010 SCIP expands on the previous year’s initiatives and ensures compliance with the SAFECOM requirements for statewide planning. The GWRC Region is divided between two sub-state Regional Preparedness Advisory Committee (RPAC) regions: Region 1 (with Caroline and King George Counties) and Region 2 (with Spotsylvania and Stafford Counties and the City of Fredericksburg). The GWRC Board of Directors has asked GWRC staff to work with local public safety agencies to encourage collaboration and cooperation, leading to potential cost-sharing or other economy-of-scale benefits arising from regional cooperation.
Virginia Department of Conservation and Recreation (VDCR)
Chesapeake Bay Regulations
As part of Virginia’s commitment to help preserve and restore the resources of the Chesapeake Bay, the Virginia General Assembly adopted the Chesapeake Bay Preservation Act in 1988. The Chesapeake Bay Preservation Area Designation and Management Regulations were adopted in 1990 and amended in December 2001. The revised regulations took effect in March 2002 and localities had until December 31, 2003 to revise their local ordinances to become consistent with the new language. The regulations require that communities east of Interstate 95, the “Tidewater” area of Virginia, regulate and enforce the use of Resource Protection Areas (RPAs) and Resource Management Areas (RMAs). The RPA is relevant to floodplain management because new development within the designated area must maintain a 100-foot buffer from the waterline of any perennial stream, as defined by the regulations. This includes all tidal water bodies in coastal areas. Both the GWRC and the VDCR provide technical assistance and guidance to communities in enforcing the regulations. All 84 local governments subject to the Chesapeake Bay Preservation Act are required to have ordinance provisions addressing land development in Chesapeake Bay Preservation Areas that minimizes impervious cover, minimizes land disturbance and preserves indigenous vegetation. DCR Chesapeake Bay Local Assistance staff members have reviewed local ordinances to identify specific provisions that address these issues and other provisions that protect water quality. To facilitate this effort, the staff is using two checklists that contain example ordinance provisions that address minimization of impervious cover, minimization of land disturbance and maintenance of indigenous vegetation. All seven local governments (including the Towns of Bowling Green and Port Royal in Caroline County) are in compliance with Chesapeake Bay Preservation Act requirements.
Virginia Flood Damage Reduction Act
Virginia's General Assembly enacted the Virginia Flood Damage Reduction Act of 1989. This legislation was the result of several disastrous floods or coastal storms that hit the state between 1969 and 1985. To improve Virginia's flood protection programs and place related programs in one agency, responsibility for coordination of all state floodplain programs was transferred in 1987 from the Water Control Board to DCR. DCR was named manager of the state's floodplain program and designated coordinating agency of the National Flood Insurance Program under the act, §10.1-602, and a governor's memorandum released in July 1997. Floodplain Management Program staff works with localities to establish and enforce floodplain management zoning. Localities use the program's state model ordinances, in which minimum standards for local regulations are set, to write their own. Local governments can set more restrictive standards to ensure higher levels of protection for residents in flood hazard areas. Also, the state has used the Virginia
D R A
F T

Hazard Mitigation Plan
George Washington Regional Commission
March 2012
6-7
Uniform Statewide Building Code to set construction standards for structures built in Federal Emergency Management Agency designated flood hazard areas. Floodplain zoning regulates how development is allowed within floodplains. The program's main goal is to protect people and their property from unwise floodplain development. It also protects society from costs associated with developed floodplains.
Virginia Dam Safety Act
The Virginia Soil and Water Conservation Board established the state’s dam safety regulations as a result of the passage of the Virginia Dam Safety Act. The Dam Safety Program’s purpose is to provide for safe design, construction, operation and maintenance of dams to protect public safety. The program enforces permit requirements related to the construction and alteration of impounding structures. All dams in Virginia are subject to the Dam Safety Act unless specifically excluded. Inundation mapping is required for all Class I and Class II dams in the Commonwealth. Dam Safety Program officials recommend mapping for all classified dams (VS&WCB, 2005). The Virginia Dam Safety Act, Article 2, Chapter 6, Title 10.1 (10.1-604 et seq) of the Code of Virginia and Dam Safety Impounding Structure Regulations (Dam Safety Regulations), established and published by the Virginia Soil and Water Conservation Board (VSWCB). New regulations were put into effect Sept. 26, 2008, which regulations require dam break inundation zone mapping in order to identify areas that will be subject to flooding during a dam failure.
Shoreline Erosion Advisory Service (SEAS)
VDCR's Shoreline Erosion Advisory Service promotes environmentally acceptable shoreline and riverbank erosion control measures to protect private property and reduce sediment and nutrient loads to the Chesapeake Bay and other waters of the Commonwealth. In addition, the program promotes research for improved shoreline management techniques to protect and enhance Virginia's shoreline resources. Since SEAS was created in 1980, VDCR has provided technical advice about tidal shoreline erosion problems to more than 7,000 clients. They include landowners, local governments and environmental agencies. SEAS program activities also help local governments deal with sediment and nutrient loads from shoreline erosion and, of course, address the Commonwealth's obligation to reduce sediment and nutrient loads in the Chesapeake Bay and its tributaries.
Virginia Department of Forestry (VDOF)
The Virginia Department of Forestry (VDOF) is responsible for the protection of 15.8 million acres of forest land from fire, insects and disease. The principle goals of the Forest Protection Program are to prevent injury or loss of human life, minimize property damage and protect resources. VDOF has a well-defined and organized forest protection team, with every member of the Department having fire responsibilities. The ability to adapt to emergencies enables a small formal fire suppression force to limit annual fire losses to an average of less than 8,200 acres (10-year average). This low average is accomplished through coordination with local fire departments, forest industry, federal agencies, other state agencies and VDOF organized volunteer fire crews.
D R A
F T

Hazard Mitigation Plan
George Washington Regional Commission
March 2012
6-8
In 2010, the Department completed a statewide assessment of the state forestry resource (“The State of
The Forest – 2010”) and a strategic plan (“Strategic Plan: Harnessing the Winds of Change”) document,
both in response to congressional mandate in the passage of the 2008 Farm bill.
Virginia Marine Resources Commission (VMRC):
The Virginia Marine Resources Commission was established in 1875 as the Virginia Fish Commission. The Virginia Wetlands Act was passed in 1972 and placed under the management of VMRC, as was the 1980 Coastal Primary Sand Dune Protection Act. In 1982, the General Assembly broadened the 1972 Wetlands Act to include non-vegetated wetlands. The Habitat Management Division issues three types of Environmental Permits: subaqueous or bottomlands, tidal wetlands, and coastal primary sand dunes. The division's authority specifically regulates physical encroachment into these valuable resource areas. The permit process relies on a single Virginia joint local/state/Federal permit application. The review process takes into account various local, state and Federal statutes governing the disturbance or alteration of environmental resources. The Marine Resources Commission plays a central role as an information clearinghouse for all three levels of review. Applications receive independent yet concurrent review by the community’s Wetlands Board, the VMRC, the Virginia Department of Environmental Quality, and the U.S. Army Corps of Engineers.
Department of Housing and Community Development
The Commonwealth of Virginia is responsible for enacting the Virginia Uniform Statewide Building Code (VUSBC), and each county or city is responsible for enforcing the code locally. As of the last quarter of 2010, the VUSBC is based on the 2006 International Building Code, International Plumbing Code, International Mechanical Code, and International Fire Protection Code, and the 1999 National Electrical Code. The 2006 version of the IBC has been incorporated into the VUSBC, and the 2009 version of the IBC is expected to go into effect in the near future. The code contains the building regulations that must be complied with when constructing a new building or structure or an addition to an existing building, maintaining or repairing an existing building, or renovating or changing the use of a building or structure. Enforcement of the VUSBC is the responsibility of the local government’s building inspections department. The VUSBC contains enforcement procedures that must be used by the enforcing agency. As provided in the Uniform Statewide Building Code Law, Chapter 6 (36-97 et seq.) of Title 36 of the Code of Virginia, the USBC supersedes the building codes and regulations of the counties, municipalities and other political subdivisions and state agencies related to any construction, reconstruction, alterations, conversion, repair or use of buildings and installation of equipment therein. The USBC does not supersede zoning ordinances or other land use controls that do not affect the manner of construction or materials to be used in the construction, alteration, or repair.
C. Regional Capabilities
George Washington Regional Commission (GWRC) One of 21 Planning District Commissions in the Commonwealth of Virginia, GWRC is a political subdivision representing seven local governments. Planning District Commissions are voluntary
D R A
F T

Hazard Mitigation Plan
George Washington Regional Commission
March 2012
6-9
associations created pursuant to the Virginia Area Development Act adopted in 1969. The purpose of planning district commissions, as set out in the Code of Virginia, Section 15.2-4207 is "…to encourage and facilitate local government cooperation and state-local cooperation in addressing on a regional basis problems of greater than local significance." GWRC serves as a resource of technical expertise to its member local governments. Specific programs affiliated with GWRC include coastal zone environmental planning, regional all-hazards mitigation planning, transportation, ridesharing, telecommuting, and environmental concerns, which are described below. Under the recommendation of the 2006 Regional All-Hazards Mitigation Plan, GWRC established a regional clearinghouse of GIS data to support emergency contingency planning. In the summer of 2010, the region received parcel and building footprint data layers from the City of Fredericksburg and Caroline County, completing regional coverage of these important data layers for mitigation planning. Through the regional scenario planning process being implemented by FAMPO and GWRC, every parcel in the region has been coded according to a common land use classification system (“Place Type Pallet”), advancing the region’s capacity to look at regional land use problems through a common “lens”.
Fredericksburg Area Metropolitan Planning Organization (FAMPO) Based upon the 1990 Census, the Fredericksburg, VA area was designated an urbanized area (population greater than 50,000). To continue receiving federal funds for transportation improvements, federal law requires all urbanized areas in the United States to conduct the "3-C" (continuing, comprehensive and cooperative) transportation planning process. In response to the Census designation, a "Memorandum of Understanding" was signed in November 1992 between the Commonwealth of Virginia (and its participating agencies), the three jurisdictions (City of Fredericksburg, & Counties of Spotsylvania and Stafford), and the Potomac and Rappahannock Transportation Commission (PRTC) to create the Fredericksburg Area Metropolitan Planning Organization (FAMPO) FAMPO’s policy board is the federally-recognized transportation policy board for the “urbanized” portion of Planning District 16, which includes the City of Fredericksburg and Spotsylvania and Stafford counties. FAMPO is responsible for developing a Constrained Long Range Plan (CLRP), managing the regional Transportation Improvement Program (TIP) and developing an annual Unified Planning Work Program (UPWP). In addition, FAMPO also prepares critical regional transportation planning studies. Transportation planning activities in Caroline and King George Counties through the VDOT’s Rural Transportation Planning Assistance Program is coordinated with FAMPO’s urban transportation planning program. Staffing for FAMPO is provided by the George Washington Regional Commission.
GWRideConnect
GWRideConnect is the ridesharing agency that serves the Region, and promotes ridesharing and transportation demand management (TDM) techniques to assist persons seeking transportation options to their workplaces and other destinations. The program promotes, plans, and establishes transportation alternatives to improve air quality, reduce congestion, and improve the overall quality of life for the citizens in the region. The GWRideConnect program assists in the creation of new commuter pools (cars, vans, and buses) and works toward keeping these pools successfully operating. The program also acts as an information clearinghouse for persons interested in the benefits, services and options of mass transportation. GWRideConnect distributes match letters and packets containing information on van, car and bus pools, as well as information on the Virginia Railway Express (VRE), Washington Metro System and telecommuting.
D R A
F T

Hazard Mitigation Plan
George Washington Regional Commission
March 2012
6-10
GWRideConnect contracts with the Washington Metropolitan Area Transportation Authority to accept Metrocheks (tax free transit subsidies) from area vanpools. GWRideConnect also subsidizes vanpools through the Van Start and Van Save program and, in cooperation with the Virginia Division of Risk Management, established the AdVANtage self-insurance program for vanpool operators. These programs allow GWRideConnect to aid vanpools in the crucial start-up period and to assist existing vanpools that may be in danger of folding.
Fredericksburg Regional/Woodbridge Telework Centers The George Washington Regional Commission operates three telework centers providing employees with an alternative workspace that is more geographically convenient to where they live. The GoTelework.org Telework Centers are located along Interstate 95 in Fredericksburg, Stafford and Woodbridge. The centers enable federal and private-sector employees to avoid long commutes by providing professional office space close to home. Each center provides the services necessary for employees to be productive, including high-speed Internet access and on-site technical support, all at a reasonable cost. Contact GoTelework.org today for additional information and questions about the Telework Program. The main purpose of these centers is enabling people to avoid long commutes to their normal workplace. Not everyone who teleworks can or chooses to do so from their house. The General Service Administration has notified GWRC that the existing contract for the 3 centers operated by GWRC will terminate, effective March 31, 2011. GWRC is exploring alternative arrangements to keep these centers open or to replace them through partnerships with other operators in the Region.
Fredericksburg Regional Alliance (FRA)
FRA is a public, private economic development marketing partnership created to provide CEOs, presidents, corporate real estate executives, facility planners, and site selection consultants with a single source for comprehensive demographic and economic information on the Fredericksburg Region -- which includes the City of Fredericksburg and the counties of Caroline, King George, Spotsylvania, and Stafford -- while also providing a wide range of services designed to facilitate the site selection process. By working in cooperation with local economic development offices, the Virginia Employment Commission (VEC), educational institutions, and other regional groups, the Alliance is able to offer a truly comprehensive collection of services and information, including: demographic and economic data; community tours; site, building, and office space inspections; industry-specific wage, workforce, and labor availability information; tax and cost of living comparisons; financing options; and confidential project-specific proposals from localities.
The Rappahannock River Basin Commission (RRBC) The RRBC’s mission and purpose as stated in Section 62.1-69.27 of the Code of Virginia is: "(T)o provide guidance for the stewardship and enhancement of the water quality and natural resources of the Rappahannock River Basin. The Commission shall be a forum in which local governments and citizens can discuss issues affecting the Basin's water quality and quantity and other natural resources.” The RRBC’s Water Allocation Group was created in the spring of 2000 to facilitate and encourage the planning for water allocation, including water supply and discharge in the Rappahannock. Participants included local and state elected officials, representatives of utilities departments in the basin, local, state and federal environmental agencies and others. The Water Allocation Group was chaired by the Chair of
D R A
F T

Hazard Mitigation Plan
George Washington Regional Commission
March 2012
6-11
the Rappahannock River Basin Commission. The Water Allocation Group developed many recommendations for the Commission which have in turn been adopted and forwarded to member localities and the Commonwealth of Virginia. A major project of the Water Allocation Group was the development of the Water Supply Planning Model. According to the US EPA, the Rappahannock River and the Chesapeake Bay are degraded. The nutrient pollution issues in the Rappahannock are driven mostly by non-point sources, such as agriculture, land development, forestry, septic systems and lawn management. Non-point sources are regulated to a far less degree than point sources. This means that more effort must be invested on communication, coordination, cooperation, and incentives to achieve success in addressing the nonpoint source issues than for the point source issues. The projections for success associated with various strategies in the RTS are based on the inputs and outputs of a model. The true measure of success however will be the results found from monitoring the quality of the waters of the Rappahannock basin. The Non-Point Source Pollution Working Group (NPWG) was formed by the RRBC in 2005. Excess amounts of nutrients and sediment flow into the River and the Bay from the land and from the air (nonpoint source pollution) and from wastewater treatment plants and from industrial facilities (point source pollution). The Rappahannock "Tributary Strategy" (RTS) identified nutrient and sediment reduction goals necessary to achieve water quality and aquatic habitat restoration objectives for the Bay by 2010, in accordance with the Chesapeake Bay Agreement of 2000. Attainment of these goals and objectives will require a major effort on the part of all levels of government, landowners and the public. A “real world” focus to the implementation of strategies is viewed as important and essential to maximizing the opportunities for achieving the greatest possible return on investments made in addressing nonpoint source pollution. Opportunities to share experiences and to forthrightly discuss practical solutions will aid all stakeholders in avoiding possible pitfalls, unintended consequences and the repetition of mistakes. The Non-Point Working Group has been active in reviewing and commenting on Chesapeake Bay Preservation Act Phase III compliance review, revisions to the State storm water management regulations and, most recently, the draft Chesapeake Bay Total Maximum Daily Load (TMDL) allocations in the draft State Plan. To assist in water resource and quality planning the Rappahannock Basin has several documents out to assist the local communities. These documents are Guiding Principles for Water Resource Planning, Planning for Groundwater use in the Rappahannock Basin, and Groundwater Planning: Recommendations by the Water Allocation Group to the Rappahannock River Basin Commission.
D R A
F T

Hazard Mitigation Plan
George Washington Regional Commission
March 2012
6-12
II. Jurisdiction Capability Assessment
A. Caroline County, including the Town of Bowling Green and the Town of Port Royal Capability
Assessment
As an additional tool to assist with the examination of the hazards identified and to evaluate the community’s ability to plan, develop, and implement hazard mitigation activities, the MAC developed a local capability assessment for Caroline County and the Towns of Bowling Green and Port Royal. This assessment is designed to highlight both the regulatory tools available to the community to assist with natural hazard mitigation and the other community assets that may help facilitate the planning and implementation of natural hazard mitigation over time. The capability matrices presented in Table 6-2 outline the current and planned programming that will impact the ability of Caroline County, the Town of Bowling Green, and the Town of Port Royal, respectively, to plan for and mitigate against natural hazards.
Form of Governance
Caroline County is governed by an elected Board of Supervisors and administered on a day-to-day basis by a County Administrator and departmental staff. The Town of Bowling Green is governed by an elected Town Council and Mayor and administered on a day-to-day basis by a Town Manager. The town of Port Royal has a Council/Manager form of government, which is under the control of a professional manager. The mayor chairs council meetings.
Guiding Community Documents
Caroline County has a range of guidance documents and plans for each of their departments. These include a comprehensive plan, suggested facility development standards, utilities plans, capital improvement plans, and emergency management plans. The County uses building codes, zoning ordinances, subdivision ordinances, and various planning strategies to address how and where development occurs. One essential planning document to the County is its Comprehensive Plan.
Comprehensive Plan, 2010
• Presents policies and strategies for growth management plan and recognizes the value in preserving the desired rural characteristics of the County
• Ensures responsible stewardship of the County’s natural and historic resources, including riparian buffers, floodplains, wetlands, and historic structures and places
• Plans for continued growth and development in designated growth areas, including: o Bowling Green/Milford Primary Growth Area o Skinker’s Neck Growth Area o Carmel Church and Ladysmith Sub-areas o Secondary Growth Areas – Port Royal, Chilesburg, Dawn, and Cedon
• Plans for necessary transportation enhancements and improvements to service projected growth • Plans for operation and expansion of public facilities to accommodate expected growth in the
County. Facilities include water and sewer service facilities, public libraries, first response emergency services facilities (fire/EMS stations), and parks and recreation facilities.
D R A
F T

Hazard Mitigation Plan
George Washington Regional Commission
March 2012
6-13
Zoning & Development Standards
• Identifies existing federal and state regulations.
• Most of document recommends policies and standards for new and existing development.
Building Codes The Commonwealth of Virginia is responsible for enacting the Virginia Uniform Statewide Building Code, which the County is responsible for enforcing locally. The Uniform Statewide Building Code was based on the IBC, IRC, and IFPC. The Building Code Effectiveness Grading Schedule (BCEGS) assesses the building codes in effect in a particular community and how the community enforces its building codes, with special emphasis on mitigation of losses from natural hazards. Municipalities with well-enforced, up-to-date codes should demonstrate better loss experience, and insurance rates can reflect that. The BCEGS program assigns each municipality a BCEGS grade of 1 (exemplary commitment to building-code enforcement) to 10. The BCEGS grade for Caroline County is presented in Table 6-2.
Public Education Among the public outreach mechanisms available in Caroline County, the County’s website provides County residents with pertinent information, provides an on-line complaint form, and answers several Frequently Asked Questions (FAQs). The County also posts most of its guiding documents, including the Comprehensive Plan on this site. The Town of Bowling green also provides public outreach through its website. It, too, provides residents and visitors with timely information and guidance.
Emergency Preparedness Caroline County utilizes a SMS and email notification system, Twitter, and the County’s website to notify residents of emergency and non-emergency information. The Town of Bowling Green also utilizes a
cable access channel to notify residents of information which may include emergency preparedness.
The tables below represent the identified capabilities of the Towns and Caroline County. All data was
provided by a representative of that jurisdiction.
Table 6-2. Capability Matrix - Caroline County
Capability Caroline County
Comprehensive Plan Yes
Land Use Plan Yes
Subdivision Ordinance Yes
Zoning Ordinance Yes
NFIP/FPM Ordinance Yes
-Effective FIRM Date 15-August-89
-Substantial Damage Language Yes
D R A
F T

Hazard Mitigation Plan
George Washington Regional Commission
March 2012
6-14
Capability Caroline County
- Certified Floodplain Manager No
- # of Floodprone Parcels 2,424
- # of NFIP policies 41
- Maintain Elevation Certificates No
- # of Repetitive Losses 0
CRS Rating N/A
Stormwater Program Yes
Building Code Version
Full-time Building Official VA USBC 2009 Edition (based on IBC)
- Conduct “As-built” Inspections Yes
BCEGS Rating Residential - 3; Commercial - 3
Local Emergency Operations Plan Yes
Hazard Mitigation Plan Yes
Warning Systems in Place Poor
- Storm Ready Certified No
- Weather Radio Reception Fair
- Outdoor Warning Sirens No
-Emergency Notification (SMS Text) Yes – Caroline Alert System
-other? (e.g., cable over-ride) No
GIS system No
-Hazard Data No
-Building footprints No
-Tied to Assessor data No
-Land Use designations No
Structural Protection Projects No
Property Owner Protection Projects Yes-Acquisition/Elevation
Critical Facilities Protected No
Natural Resource Inventory Yes
Cultural Resources Inventory Yes
Erosion Control Procedures Yes
Sediment Control Procedures Yes
Public Information Program/Outlet Yes
Environmental Education Program Yes
Source: Data provided by Community.
D R A
F T

Hazard Mitigation Plan
George Washington Regional Commission
March 2012
6-15
Table 6-3. Capability Matrix - Town of Bowling Green
Capability Town of Bowling Green
Comprehensive Plan Yes
Land Use Plan Yes
Subdivision Ordinance Yes
Zoning Ordinance Yes
NFIP/FPM Ordinance Yes
-Effective FIRM Date N/A
-Substantial Damage Language N/A
- Certified Floodplain Manager No
- # of Floodprone Buildings N/A
- # of NFIP policies N/A
- Maintain Elevation Certificates No
- # of Repetitive Losses N/A
CRS Rating N/A
Stormwater Program Yes
Building Code Version
Full-time Building Official VA USBC 2009 Edition (based on IBC)
- Conduct “As-built” Inspections Yes
BCEGS Rating Residential – 3; Commercial – 3
Local Emergency Operations Plan Yes
Hazard Mitigation Plan Yes
Warning Systems in Place Yes
- Storm Ready Certified No
- Weather Radio Reception Yes
- Outdoor Warning Sirens No
-Emergency Notification (R-911) No
-other (e.g., cable over-ride) Yes-Cable-Emergency Alert System
GIS system Yes
-Hazard Data N/A
-Building footprints N/A
-Tied to Assessor data N/A
-Land Use designations N/A
Structural Protection Projects No
Property Owner Protection Projects No
Critical Facilities Protected No
Natural Resource Inventory Yes
Cultural Resources Inventory Yes
D R A
F T

Hazard Mitigation Plan
George Washington Regional Commission
March 2012
6-16
Capability Town of Bowling Green
Erosion Control Procedures Yes
Sediment Control Procedures Yes
Public Information Program/Outlet Yes
Environmental Education Program No
Source: Data provided by Community.
Table 6-4. Capability Matrix – Town of Port Royal
Capability Town of Port Royal
Comprehensive Plan Yes
Land Use Plan Yes
Subdivision Ordinance Yes
Zoning Ordinance Yes
NFIP/FPM Ordinance Yes
-Effective FIRM Date 2010
-Substantial Damage Language N/A
- Certified Floodplain Manager No
- # of Floodprone Buildings 0
- # of NFIP policies N/A
- Maintain Elevation Certificates No
- # of Repetitive Losses 0
CRS Rating N/A
Stormwater Program No
Building Code Version
Full-time Building Official VA USBC 2009 Edition (based on IBC)
- Conduct “As-built” Inspections Yes
BCEGS Rating Residential – 3; Commercial – 3
Local Emergency Operations Plan No
Hazard Mitigation Plan Yes
Warning Systems in Place Yes – Fire House
- Storm Ready Certified No
- Weather Radio Reception Yes; Fire House
- Outdoor Warning Sirens No
-Emergency Notification (R-911) No
-other (e.g., cable over-ride) No
D R A
F T

Hazard Mitigation Plan
George Washington Regional Commission
March 2012
6-17
Capability Town of Port Royal
GIS system No
-Hazard Data N/A
-Building footprints N/A
-Tied to Assessor data N/A
-Land Use designations N/A
Structural Protection Projects No
Property Owner Protection Projects No
Critical Facilities Protected Fire House
Natural Resource Inventory No
Cultural Resources Inventory Yes
Erosion Control Procedures Chesapeake Bay Act
Sediment Control Procedures Chesapeake Bay Act
Public Information Program/Outlet No
Environmental Education Program No
Source: Data provided by Town of Port Royal, Alex Long ; 01/01/2012
D R A
F T

Hazard Mitigation Plan
George Washington Regional Commission
March 2012
6-18
B. City of Fredericksburg Capability Assessment
As an additional tool to assist with the examination of the hazards identified and to evaluate the community’s ability to plan, develop, and implement hazard mitigation activities, the MAC developed a local capability assessment for the City of Fredericksburg. This assessment is designed to highlight both the regulatory tools available to the community to assist with natural hazard mitigation and the community assets that may help facilitate the planning and implementation of natural hazard mitigation over time. The capability matrix presented in Table 6-5 outlines the locality’s current and planned programming that
will impact the community’s ability to plan for and mitigate against natural hazards.
Form of Governance
A six-member City Council and a Mayor govern the City of Fredericksburg. The Mayor and two Council members are elected at large while the remaining four Council members are elected from the City’s four wards. The City Manager and the various departments under the City Manager’s authority carry out the day-to-day administration of the City’s services and programming.
Guiding Community Documents
The City of Fredericksburg has a range of guidance documents and plans for each of their departments. These include a comprehensive plan, public works, and public utilities plans, capital improvement plans, and emergency management plans. The City uses building codes, zoning ordinances, subdivision ordinances, and various planning strategies to address how and where development occurs. One essential way the jurisdiction guides its future is through policies laid out in the Comprehensive Plan.
Comprehensive Plan, 2007
• Presents policies and strategies for growth management plan and recognize the value in preserving the desired rural characteristics of the City.
• Recognizes the value of the City’s considerable natural, cultural, and historic resources.
• Recognizes the impacts of regional facilities, transportation corridors, and hospital facilities
• Ensures that development is done in an environmentally sensitive, planned manner that serves to preserve environmentally sensitive features such as floodplains, wetlands and natural topography.
• Develops a well planned, efficient, effective and safe transportation system that meets local, regional and interstate transportation needs.
• Preserves the City's historic resources that provide valuable information about the proud history of the City and its residents.
• Recognizes State and federal flood and other water resource regulations, including the Chesapeake Bay Preservation Act.
Zoning & Development Standards
• Identifies existing federal and state regulations.
• Recommends policies and standards for new and existing development.
D R A
F T

Hazard Mitigation Plan
George Washington Regional Commission
March 2012
6-19
Building Codes
The Commonwealth of Virginia is responsible for enacting the Virginia Uniform Statewide Building Code, which the City is responsible for enforcing locally. As of October of 2003, the Uniform Statewide Building Code is based on the IBC, IRC, and IFPC. The Building Code Effectiveness Grading Schedule (BCEGS) assesses the building codes in effect in a particular community and how the community enforces its building codes, with special emphasis on mitigation of losses from natural hazards. Municipalities with well-enforced, up-to-date codes should demonstrate better loss experience, and insurance rates can reflect that. The BCEGS program assigns each municipality a BCEGS grade of 1 (exemplary commitment to building-code enforcement) to 10. The BCEGS grade for the City of Fredericksburg is presented in Table 6-5.
Public Education
Among the readily available public outreach mechanisms available in the City of Fredericksburg, the City’s website provides City residents with pertinent information, including local events and information on the City’s rich cultural history, and answers several Frequently Asked Questions (FAQs). The City also posts most of its guiding documents, including the Comprehensive Plan on this site.
Emergency Preparedness
The City of Fredericksburg utilizes a cable access channel, Reverse 911, and Fredericksburg Alert (email and text message capability) to notify residents of information which may include emergency preparedness.
Table 6-5.Capability Matrix - City of Fredericksburg
Capability City of Fredericksburg
Comp Plan Yes
Land Use Plan Yes
Subdivision Ordinance Yes
Zoning Ordinance Yes
NFIP/FPM Ordinance Yes
-Effective FIRM Date 19-September- 2007
-Substantial Damage Language Yes
- Certified Floodplain Manager No
- # of Floodprone Buildings 300
- # of NFIP policies 164
- Maintain Elevation Certificates Yes
- # of Repetitive Losses 4
CRS Rating N/A
Stormwater Program Yes
D R A
F T

Hazard Mitigation Plan
George Washington Regional Commission
March 2012
6-20
Building Code Version
Full-time Building Official VA USBC 2009 Edition (based on IBC)
- Conduct “As-built” Inspections Yes
BCEGS Rating Residential - 4; Commercial - 4
Local Emergency Operations Plan Yes
Hazard Mitigation Plan Yes
Warning Systems in Place Yes
- Storm Ready Certified No
- Weather Radio Reception Yes, Poor
- Outdoor Warning Sirens No
-Emergency Notification (R-911, Fredericksburg Alert) Yes
-other? (e.g., cable over-ride) Yes - Emergency Alert System
GIS system No
-Digital Hazard Data No
-Digital Building footprints No
-Tied to Assessor data No
-Land Use designations No
Structural Protection Projects No
Property Owner Protection Projects No
Critical Facilities Protected No
Natural Resource Inventory Yes
Cultural Resources Inventory Yes
Erosion Control Procedures Yes
Sediment Control Procedures Yes
Public Information Program/Outlet Yes
Environmental Education Program Yes
Source: Data provided by Community.
D R A
F T

Hazard Mitigation Plan
George Washington Regional Commission
March 2012
6-21
C. King George County Capability Assessment As an additional tool to assist with the examination of the hazards identified and to evaluate the community’s ability to plan, develop, and implement hazard mitigation activities, the MAC developed a local capability assessment for King George County. This assessment is designed to highlight both the regulatory tools available to the community to assist with natural hazard mitigation and the community assets that may help facilitate the planning and implementation of natural hazard mitigation over time. The capability matrix presented in Table 6-6 outlines the locality’s current and planned programming that will impact the community’s ability to plan for and mitigate against natural hazards.
Form of Governance
The County is governed by an elected five member Board of Supervisors and administered on a day-to-day basis by a County Administrator and departmental staff.
Guiding Community Documents
King George County has a range of guidance documents and plans for each of their departments. These include a comprehensive plan, subdivision ordinance, zoning ordinance, capital improvement plans, and emergency management plans. In addition, the King George County Service Authority administers the standards and specifications governing water and sewer utility service. The County uses building codes, zoning ordinances, subdivision ordinances, and various planning strategies to address how and where development occurs. One essential way the jurisdiction guides its future is through policies laid out in the Comprehensive Plan.
Comprehensive Plan, adopted May 25, 2000 The County’s current Comprehensive Plan outlines the County’s future planning goals, including:
• Preserve the Rural Characteristics of King George County;
• Encourage land use patterns that sustain and enhance the health, safety, morals, order, convenience, prosperity and general welfare of the residents of King George County;
• Promote a healthy, diversified economy in the County; • Encourage protection of critical environmental resources and maintain renewable natural
resources for future generations;
• Encourage a balance of residential zoning classifications to meet the needs of all county residents while concentrating and guiding growth in and around service districts as designated in this Plan;
• Seek to manage through-traffic flow on principal roads in such a manner as to minimize the impact on local-traffic flow;
• Protect water supplies and assure an adequate quality and quantity of water; and
• Encourage the construction and control of central sewage facilities in designated areas.
Zoning & Development Standards
• Identifies existing federal and state regulations.
• Provides policies and standards for new and existing development as allowed by the Code of
Virginia.
D R A
F T

Hazard Mitigation Plan
George Washington Regional Commission
March 2012
6-22
Subdivision ordinance, adopted December 17, 2002
The purpose of this ordinance is to establish standards for the subdivision of land and development
procedures for King George County.
Building Codes
The Commonwealth of Virginia is responsible for enacting the Virginia Uniform Statewide Building Code, which the County is responsible for enforcing locally. The 2009 edition of the Uniform Statewide Building
Code took effect 3/1/2011, which is based on the IBC, IRC, and IFPC.
The Building Code Effectiveness Grading Schedule (BCEGS) assesses the building codes in effect in a particular community and how the community enforces its building codes, with special emphasis on mitigation of losses from natural hazards. Municipalities with well-enforced, up-to-date codes should demonstrate better loss experience, and insurance rates can reflect that. The BCEGS program assigns each municipality a BCEGS grade of 1 (exemplary commitment to building-code enforcement) to 10. The BCEGS grade for King George County is presented in Table 6-6.
Public Education
Among the readily available public outreach mechanisms available in King George County, the County’s website provides County residents with pertinent information, provides an on-line complaint form, and answers several Frequently Asked Questions (FAQs). The County posts most of its guiding documents, including the Comprehensive Plan on this site. KGALERT also serves as a source of public education through the availability and presentation of disaster and emergency preparedness information. Public information is also provided through articles published I the local weekly newspaper, The Journal, and the daily regional newspaper, The Free Lance Star. King George County Department of Fire, Rescue and Emergency Services will launch their own department website in the spring 2011. The Emergency
Management Division will provide timely preparedness and disaster information on this website.
Emergency Preparedness
The County is served by Metrocast Cable, which provides cable services for County residents. King George County does not have access to override the cable channel for emergency information purposes; there is no EAS Activation capability. The County does have access to the public access channel for posting information. Emergency notifications are provided to citizens and businesses through KGALERT,
CityWatch (Reverse 911) local radio station announcements, and Twitter (kgva_firerescue) postings.
Table 6-6. Capability Matrix - King George County.
Capability King George County
Comprehensive Plan Yes
Land Use Plan Yes
Subdivision Ordinance Yes
Zoning Ordinance Yes
NFIP/FPM Ordinance Yes
D R A
F T

Hazard Mitigation Plan
George Washington Regional Commission
March 2012
6-23
Capability King George County
-Effective FIRM Date March 16, 2009
-Substantial Damage Language Yes
- Certified Floodplain Manager No
- # of Floodprone Buildings 18
- # of NFIP policies 18
- Maintain Elevation Certificates Yes
- # of Repetitive Losses 0
CRS Rating N/A
Stormwater Program No
Building Code Version
Full-time Building Official VA USBC 2009 Edition (based on IBC)
- Conduct “As-built” Inspections Yes
BCEGS Rating Residential – 4; Commercial - 4
Local Emergency Operations Plan Yes
Hazard Mitigation Plan Yes
Warning Systems in Place Yes
- Storm Ready Certified Yes
- Weather Radio Reception Improved coverage due to Fredericksburg transmitter
-Emergency Notification (R-911) Yes
-other? (e.g., cable over-ride) KGALERT, social media
GIS system Yes
-Hazard Data Yes
-Building footprints Yes
-Tied to Assessor data Yes
-Land Use designations Yes
Structural Protection Projects Yes
Property Owner Protection Projects No
Critical Facilities Protected Minimal
Natural Resource Inventory Yes
Cultural Resources Inventory Yes
Erosion Control Procedures Yes
Sediment Control Procedures Yes
Public Information Program/Outlet Yes
Environmental Education Program Yes
Source: Data provided by Community.
D R A
F T

Hazard Mitigation Plan
George Washington Regional Commission
March 2012
6-24
D. Spotsylvania County Capability Assessment
As an additional tool to assist with the examination of the hazards identified and to evaluate the community’s ability to plan, develop, and implement hazard mitigation activities, the MAC developed a local capability assessment for Spotsylvania County. This assessment is designed to highlight both the regulatory tools available to the community to assist with natural hazard mitigation and the community assets that may help facilitate the planning and implementation of natural hazard mitigation over time. The capability matrix presented in Table 6-7 outlines the locality’s current and planned programming that will impact the community’s ability to plan for and mitigate against natural hazards.
Form of Governance
The County is governed by an elected Board of Supervisors and administered on a day-to-day basis by a
County Administrator and subsequent departmental staff.
Guiding Community Documents
Spotsylvania County has a range of guidance documents and plans for each of their departments. These include a comprehensive plan, public works, and public utilities plans, capital improvement plans, and emergency management plans. The County uses building codes, zoning ordinances, subdivision ordinances, and various planning strategies to address how and where development occurs. One
essential way the jurisdiction guides its future is through policies laid out in the Comprehensive Plan.
Comprehensive Plan, adopted November 2008
• Presents policies and strategies for growth management and recognizes the value in preserving the desired rural characteristics of the County.
• Strategizes to preserve the natural environment, “open space” and areas deserving special attention while providing sufficient designated growth areas to accommodate expected demand for business and residential growth.
• Strategizes regulating open burning, and considers eliminating open burning for land clearing. Statewide fire prevention code adopted.
• Ensures that development is done in an environmentally sensitive, planned manner that serves to preserve environmentally sensitive features such as floodplains, wetlands and natural topography.
• Develops a well planned, efficient, effective and safe transportation system that meets local, regional and interstate transportation needs.
• Preserves the County's historic resources that provide valuable information about the proud history of the County and its residents.
• Improves planning information resources by completing, performing and maintaining surveys of existing resources, land uses, and facilities.
• Recognizes State and Federal flood regulations.
Zoning & Development Standards
• Identifies existing federal and state regulations.
• Contains standards for development and redevelopment.
D R A
F T

Hazard Mitigation Plan
George Washington Regional Commission
March 2012
6-25
Building Codes
The Virginia Uniform Statewide Building Code (USBC) is a state regulation promulgated by the Virginia Board of Housing and Community Development, a Governor-appointed board, for the purpose of establishing minimum regulations to govern the construction and maintenance of buildings and structures. The international codes are adopted by reference in the USBC. The USBC supersede the building codes and regulations of the counties. Enforcement of the provisions of the USBC for construction and
rehabilitation shall be the responsibility of the local building department. The 2009 edition became
effective 3/1/2011.
The Building Code Effectiveness Grading Schedule (BCEGS) assesses the building codes in effect in a particular community and how the community enforces its building codes, with special emphasis on mitigation of losses from natural hazards. Municipalities with well-enforced, up-to-date codes should demonstrate better loss experience, and insurance rates can reflect that. The BCEGS program assigns each municipality a BCEGS grade of 1 (exemplary commitment to building-code enforcement) to 10. The BCEGS grade for Spotsylvania County is presented in Table 6-7.
Public Education
Among the readily available public outreach mechanisms available in Spotsylvania County, the County’s website provides County residents with pertinent information, provides updates on County programming and events, and answers several Frequently Asked Questions (FAQs). The County also posts most of its guiding documents, including the Comprehensive Plan on this site. The County’s cable station airs
information and updates 24 hours a day and includes links to information sources.
Emergency Preparedness
Spotslyvania County utilizes a Roam Secure Public Notification System to notify residents of important information. The County does have access to override all cable channels for EAS activation. Additionally, the Department of Fire, Rescue, and Emergency Management website has links to multiple
websites providing information on emergency preparedness.
Table 6-7. Capability Matrix - Spotsylvania County
Capability Spotsylvania County
Comp Plan Yes
Land Use Plan Yes
Subdivision Ordinance Yes
Zoning Ordinance Yes
NFIP/FPM Ordinance Yes
-Effective FIRM Date 18-February-98
-Substantial Damage Language Yes
- Certified Floodplain Manager Yes
- # of Floodprone Buildings 410
- # of NFIP policies 135
D R A
F T

Hazard Mitigation Plan
George Washington Regional Commission
March 2012
6-26
Capability Spotsylvania County
- Maintain Elevation Certificates Yes
- # of Repetitive Losses 0
CRS Rating No
Stormwater Program Yes
Building Code Version USBC 2009 Edition (based on IBC)
Full-time Building Official Yes
- Conduct “As-built” Inspections Yes
BCEGS Rating Residential - 4; Commercial - 3
Local Emergency Operations Plan Yes
Hazard Mitigation Plan Yes
Warning Systems in Place Yes
- Storm Ready Certified No
- Weather Radio Reception Yes; high coverage
- Outdoor Warning Sirens Yes; 10 mile radius around the North Anna Power Station
-Emergency Notification (R-911) Yes
-other (e.g., cable over-ride) Yes- Roam Secure Emergency Alert System
GIS system Yes
-Hazard Data Yes
-Building footprints Yes
-Tied to Assessor data Yes
-Land Use designations Yes
Structural Protection Projects No
Property Owner Protection Projects No
Critical Facilities Protected No
Natural Resource Inventory Yes
Cultural Resources Inventory Yes
Erosion Control Procedures Yes
Sediment Control Procedures Yes
Public Information Program/Outlet Yes
Environmental Education Program Yes
Source: Data provided by Community.
D R A
F T
Hazard Mitigation Plan
George Washington Regional Commission
March 2012
6-27
E. Stafford County Capability Assessment As an additional tool to assist with the examination of the hazards identified and to evaluate the community’s ability to plan, develop, and implement hazard mitigation activities, the MAC developed a local capability assessment for Stafford County. This assessment is designed to highlight both the regulatory tools available to the community to assist with natural hazard mitigation and the community assets that may help facilitate the planning and implementation of natural hazard mitigation over time. The capability matrix presented in Table 6-8 outlines the locality’s current and planned programming that
will impact the community’s ability to plan for and mitigate against natural hazards.
Form of Governance
The County is governed by an elected Board of Supervisors and administered on a day-to-day basis by a
County Administrator and subsequent departmental staff.
Guiding Community Documents
Stafford County has a range of guidance documents and plans for each of their departments. These include a comprehensive plan, public works, and public utilities plans, capital improvement plans, and emergency management plans. The County uses building codes, zoning ordinances, subdivision ordinances, and various planning strategies to address how and where development occurs. One
essential way the region guides its future is through policies laid out in the Comprehensive Plan.
Comprehensive Plan, adopted December 2010
• Plans and analysis of the County’s transportation, land use, environmental, and public resources. • Accounts for the County’s desire to retain the viability of its agricultural enterprises and heritage;
implement a multi-faceted economic development program; establishment of adequate public infrastructure for planned growth and development trends; and improve and enhance both the man-made and natural environment in the County.
• Accounts for urban, suburban, and rural/agricultural land uses in designated corridors.
Zoning & Development Standards
• Identifies existing federal and state regulations.
• Recommends policies and standards for new and existing development.
Building Codes
The Commonwealth of Virginia is responsible for enacting the Virginia Uniform Statewide Building Code, which the County is responsible for enforcing locally. As of October of 2003, the Uniform Statewide Building Code is based on the IBC, IRC, and IFPC. The Building Code Effectiveness Grading Schedule (BCEGS) assesses the building codes in effect in a particular community and how the community enforces its building codes, with special emphasis on mitigation of losses from natural hazards. Municipalities with well-enforced, up-to-date codes should demonstrate better loss experience, and insurance rates can reflect that. The BCEGS program assigns each municipality a BCEGS grade of 1 (exemplary commitment to building-code enforcement) to 10. The BCEGS grade for Stafford County is presented in Table 6-8.
D R A
F T

Hazard Mitigation Plan
George Washington Regional Commission
March 2012
6-28
Public Education
Among the readily available public outreach mechanisms available in Stafford County, the County’s website provides County residents with pertinent information, provides updates on County programming and events, and answers several Frequently Asked Questions (FAQs). The County also posts most of its guiding documents, including the Comprehensive Plan on this site. The County launched both Twitter
and Facebook pages in 2010 to expand its public outreach initiative.
Emergency Preparedness Stafford utilizes a cable access channel, Reverse911, and Stafford Alert to notify residents of important
information. The County does have access to override all cable channels for EAS activation.
Table 6-8. Capabilities Matrix - Stafford County.
Capability Stafford County
Comp Plan Yes
Land Use Plan Yes
Subdivision Ordinance Yes
Zoning Ordinance Yes
NFIP/FPM Ordinance Yes
-Effective FIRM Date February 4, 2005
-Substantial Damage Language Yes
- Certified Floodplain Manager Yes
- # of Floodprone Buildings 1,916
- # of NFIP policies 288
- Maintain Elevation Certificates Yes
- # of Repetitive Losses 8
CRS Rating N/A
Stormwater Program Yes
Building Code Version
Full-time Building Official USBC 2009 Edition (based on IBC)
- Conduct “As-built” Inspections Yes
BCEGS Rating Residential - 4; Commercial - 4
Local Emergency Operations Plan Yes
Hazard Mitigation Plan Yes
Warning Systems in Place Yes
- Storm Ready Certified No
- Weather Radio Reception Yes; full coverage
- Outdoor Warning Sirens No
D R A
F T

Hazard Mitigation Plan
George Washington Regional Commission
March 2012
6-29
Capability Stafford County
-Emergency Notification (R-911) Yes
-other? (e.g., cable over-ride) Yes-Emergency Broadcast System
GIS system Yes
-Hazard Data Yes
-Building footprints Yes
-Tied to Assessor data Yes
-Land Use designations Yes
Structural Protection Projects No
Property Owner Protection Projects Yes-Acquisition/Elevation
Critical Facilities Protected No
Natural Resource Inventory Yes
Cultural Resources Inventory Yes
Erosion Control Procedures Yes
Sediment Control Procedures Yes
Public Information Program/Outlet Yes
Environmental Education Program Yes
Source: Data provided by Community.
D R A
F T

Hazard Mitigation Plan
George Washington Regional Commission
March 2012
6-30
This page intentionally left blank.
D R A
F T

Hazard Mitigation Plan
George Washington Regional Commission
March 2012
7-1
CHAPTER 7 – 2012 MITIGATION STRATEGY
This section of the Hazard Mitigation Plan describes the most challenging part of any such planning effort the development of a Mitigation Strategy. It is a process of:
1. Setting mitigation goals, 2. Considering mitigation alternatives, 3. Identifying objectives and strategies, and 4. Developing a mitigation action plan.
In being comprehensive, the development of the strategy included a thorough review of all natural hazards and identifies far-reaching policies and projects intended to not only reduce the future impacts of hazards, but also to assist counties and municipalities achieve compatible economic, environmental and social goals. In being strategic, the development of the strategy ensures that all policies and projects are linked to established priorities and assigned to specific departments or individuals responsible for their implementation with target completion deadlines. When necessary, funding sources are identified that can be used to assist in project implementation.
I. Planning Process
The hazard mitigation planning process conducted by the MAC is a typical problem-solving methodology:
• Describe the problem (Hazard Identification),
• Estimate the impacts the problem could cause (Vulnerability Assessment),
• Assess what safeguards exist that might already or could potentially lessen those impacts (Capability Assessment), and
• Using this information, determine what, if anything, can be done, and select those actions that are appropriate for the community in question (Develop an Action Plan).
When a community decides that certain risks are unacceptable and that certain mitigation actions may be achievable, the development of goals and objectives takes place. Goals and objectives help to describe what actions should occur, using increasingly narrow descriptors. Initially, long-term and general statements known as broad-based goals are developed. Goals then are accomplished by meeting objectives, which are specific and achievable in a finite time period. In most cases there is a third level, called strategies, which are detailed and specific methods to meet the objectives. The MAC discussed regional goals and objectives for this plan at two points in the planning process. First, they attended a workshop on July 12, 2011, to discuss the results of the hazard identification and risk assessments and to begin developing the mitigation strategy by discussing the 2006 mitigation goals. These original goals were broad and the committee felt that in general, they still were applicable to the 2012 plan update. Then, during the mitigation strategies development conference call on September 8, the committee finalized the regional goals and added two additional objectives to goal 3. Following the development of the regional goals, each jurisdiction set out to develop their own action plans and update their 2006 actions. Weekly conference call question and answer sessions where held during the month of September to assist the jurisdictions when needed. After the individual actions plans were developed the committee convened on October 4 to discuss regional mitigation strategies. In doing so, the committee reviewed the individual action plans and found several themes among the various action plans. Many of the jurisdictions had actions relating to the development of a preparedness guide, a special needs registry/plan, and each had several flood-related actions as well. The committee
D R A
F T

Hazard Mitigation Plan
George Washington Regional Commission
March 2012
7-2
considered all of these themes and developed six regional actions that they will work to accomplish within the next planning cycle.
II. Mitigation Alternatives
During the month of September, member jurisdictions were asked to develop their new 2012 action plans. During the weekly conference calls, the jurisdictions were provided a range of alternatives that were identified and prioritized by each jurisdiction. These alternatives are presented below.
A. Identification and Analysis of Mitigation Techniques
In formulating the GWRC’s mitigation strategy, a wide range of activities were considered in order to help achieve the general regional goals in addition to the specific hazard concerns of each participating jurisdiction. This includes the following activities as recommended by the Emergency Management Accreditation Program (EMAP):
1) The use of applicable building construction standards; 2) Hazard avoidance through appropriate land-use practices; 3) Relocation, retrofitting, or removal of structures at risk; 4) Removal or elimination of the hazard; 5) Reduction or limitation of the amount or size of the hazard; 6) Segregation of the hazard from that which is to be protected; 7) Modification of the basic characteristics of the hazard; 8) Control of the rate of release of the hazard; 9) Provision of protective systems or equipment for both cyber or physical risks; 10) Establishment of hazard warning and communication procedures; and 11) Redundancy or duplication of essential personnel, critical systems, equipment, information
materials.
All activities considered by the MAC can be classified under one of the following six (6) broad categories of mitigation techniques:
Prevention
Preventative activities are intended to keep hazard problems from getting worse, and are typically administered through government programs or regulatory actions that influence the way land is developed and buildings are built. They are particularly effective in reducing a community’s future vulnerability, especially in areas where development has not occurred or capital improvements have not been substantial. Examples of preventative activities include:
• Planning and zoning • Building codes
• Open space preservation
• Floodplain regulations
• Stormwater management regulations • Drainage system maintenance
• Capital improvements programming
• Shoreline / riverine / fault zone setbacks
D R A
F T

Hazard Mitigation Plan
George Washington Regional Commission
March 2012
7-3
Property Protection
Property protection measures involve the modification of existing buildings and structures to help them better withstand the forces of a hazard, or removal of the structures from hazardous locations. Examples include:
• Acquisition
• Relocation • Building elevation
• Critical facilities protection
• Retrofitting (e.g., windproofing, floodproofing, seismic design techniques, etc.)
• Safe rooms, shutters, shatter-resistant glass • Insurance
Natural Resource Protection
Natural resource protection activities reduce the impact of natural hazards by preserving or restoring natural areas and their protective functions. Such areas include floodplains, wetlands, steep slopes and sand dunes. Parks, recreation or conservation agencies and organizations often implement these protective measures. Examples include:
• Floodplain protection
• Watershed management
• Beach and dune preservation • Riparian buffers
• Forest/vegetation management (e.g., fire resistant landscaping, fuel breaks, etc.)
• Erosion and sediment control
• Wetland preservation and restoration • Habitat preservation
• Slope stabilization
Structural Projects
Structural mitigation projects are intended to lessen the impact of a hazard by modifying the environmental natural progression of the hazard event through construction. They are usually designed by engineers and managed or maintained by public works staff. Examples include:
• Reservoirs
• Dams / levees / dikes / floodwalls / seawalls
• Diversions / detention / retention • Channel modification
• Beach nourishment
• Storm sewers
Emergency Services
Although not typically considered a “mitigation” technique, emergency service measures do minimize the impact of a hazard event on people and property. These commonly are actions taken immediately prior to, during, or in response to a hazard event. Examples include:
D R A
F T

Hazard Mitigation Plan
George Washington Regional Commission
March 2012
7-4
• Warning systems
• Evacuation planning and management
• Emergency response training and exercises
• Sandbagging for flood protection • Installing temporary shutters for wind protection
Public Education and Awareness
Public education and awareness activities are used to advise residents, elected officials, business owners, potential property buyers, and visitors about hazards, hazardous areas, and mitigation techniques they can use to protect themselves and their property. Examples of measures to educate and inform the public include:
• Outreach projects
• Speaker series / demonstration events
• Hazard map information
• Real estate disclosure • Library materials
• School children educational programs
• Hazard expositions
B. Prioritizing Alternatives
Through discussion and a qualitative analysis by the jurisdiction committee representative, each jurisdiction used the STAPLE/E (Social, Technical, Administrative, Political, Legal, Economic, and Environmental) Criteria to prioritize the appropriate mitigation alternatives for their community. This methodology requires that social, technical, administrative, political, legal, economic, and environmental considerations be taken into account when reviewing potential actions for the area’s jurisdictions to undertake. This process was used to help ensure that the most equitable and feasible actions would be undertaken based on a jurisdiction’s capabilities. Table 7-1, below, provides information regarding the review and selection criteria for alternatives.
Table 7-1. STAPLEE Review and Selection Criteria for Mitigation Alternatives.
STAPLE/E Review and Selection Criteria for Alternatives
Social
• Is the proposed action socially acceptable to the community(s)?
• Are there equity issues involved that would mean that one segment of a community is treated unfairly?
• Will the action cause social disruption?
Technical
• Will the proposed action work?
• Will it create more problems than it solves? • Does it solve a problem or only a symptom?
• Is it the most useful action in light of other community(s) goals?
Administrative
D R A
F T

Hazard Mitigation Plan
George Washington Regional Commission
March 2012
7-5
STAPLE/E Review and Selection Criteria for Alternatives
• Can the community(s) implement the action? • Is there someone to coordinate and lead the effort?
• Is there sufficient funding, staff, and technical support available?
• Are there ongoing administrative requirements that need to be met?
Political
• Is the action politically acceptable?
• Is there public support both to implement and to maintain the project?
Legal
• Is the community(s) authorized to implement the proposed action? Is there a clear legal basis or precedent for this activity?
• Are there legal side effects? Could the activity be construed as a taking? • Is the proposed action allowed by a comprehensive plan, or must a comprehensive plan be amended to allow the
proposed action? • Will the community(s) be liable for action or lack of action?
• Will the activity be challenged?
Economic
• What are the costs and benefits of this action?
• Do the benefits exceed the costs?
• Are initial, maintenance, and administrative costs taken into account? • Has funding been secured for the proposed action? If not, what are the potential funding sources (public, non-
profit, and private)? • How will this action affect the fiscal capability of the community(s)?
• What burden will this action place on the tax base or local economy? • What are the budget and revenue effects of this activity?
• Does the action contribute to other community goals, such as capital improvements or economic development?
• What benefits will the action provide?
Environmental
• How will the action affect the environment?
• Will the action need environmental regulatory approvals?
• Will it meet local and state regulatory requirements?
• Are endangered or threatened species likely to be affected?
Ranking was completed in order of relative priority based on the STAPLE/E criteria, as well as the strategy’s potential to reduce vulnerability to natural hazards.
III. Goals, Objectives and Strategies
A. Goals and Strategies
Through a series of meetings the following goals and strategies for the Region were accepted by the MAC. The goals and strategies form the basis for the development of a Mitigation Action Plan and specific mitigation projects to be considered for the Region. The process consisted of 1) setting goals, 2) considering mitigation alternatives, 3) identifying strategies, and 4) developing an action plan results in a mitigation strategy.
D R A
F T

Hazard Mitigation Plan
George Washington Regional Commission
March 2012
7-6
Community officials should consider the goals that follow before making community policies, public investment programs, economic development programs, or community development decisions for their communities. In addition, Regional strategies have been developed for each goal. These strategies state a more specific outcome that the jurisdictions of the GWRC region expect to accomplish over the next five years. The strategies will outline the specific steps necessary to achieve that end. The jurisdictions came to an agreement upon what the regional and goals should be. Those goals then also applied to each individual community. Table 7-2 lists those goals and objectives. Section B provides a table of all of the regional and community specific mitigation actions; section C provides community specific mitigation action plans.
Table 7-2. 2012 Mitigation Goals & Objectives.
# Goals & Objectives
Goal 1: Reduce the future impacts and losses from identified hazards.
Goal 2: Educate and engage the public regarding hazards, their impacts, and feasible actions.
Goal 3: Maximize the impact of public resources through effective coordination among agencies and
the efficient use of technology.
Objective 1: Enhance inter-operable emergency communications among all agencies.
Objective 2: Enhance public/private partnerships.
Goal 4: Improve and enhance emergency management capabilities.
B. Regional Goals, Objectives and Strategies
See next page.
D R A
F T

Hazard Mitigation Plan
George Washington Regional Commission
March 2012
7-7
GWRC Regional Mitigation Action Plan
Mitigation Action Plan 1. GWRC Region.
ID Number Year Project Description
Hazards Being Mitigated
Lead/Support Agency
Funding Source
Target Completion
Date Interim
Measure of Success
Priority – (High,
Medium, Low) D
am
Failu
re
Dro
ug
ht
& E
xtr
em
e H
eat
Wi ld
fire
s
Eart
hq
uakes
Sin
kh
ole
s &
Lan
dslid
es
Flo
od
ing
& E
rosio
n
Hu
rric
an
es &
T
hu
nd
ers
torm
s
To
rnad
oes
Win
ter
Sto
rms &
N
or’
easte
rs
Strategies brought forward from 2006
GWRC-4 2006 It is recommended to establish a minimum standard for GIS capabilities and data throughout the GWRC region as jurisdictions begin to add GIS to their current hazard mitigation capabilities. Completed and Ongoing.
X X X X X X X X X GWRC Local On-going Continued transmission
of GIS datasets to central ftp site
Medium
GWRC-6 2006 It is recommended to improve the flexibility of the transportation network through coordination with the Virginia Department of Transportation (VDOT) and neighboring regions. The following actions were suggested by the HMPC:
This is an objective. Please refer to GWRC 6.1 – 6.7
GWRC-6.1 2006
Improve signage along major interstates and thoroughfares with interactive signs, operated by VDOT, to provide hazard warnings, including weather reports during tornado and hurricane events, road closings and blockages. The signs can also alert motorists to call 511 for road conditions, or to tune their radios to the emergency radio station for up-to-date conditions. Suggested locations include I-95 and Routes 1, 3, 17, 301, and 610
X X X X X X X X X GWRC/FAMPO FAMPO Unified Planning Work
Program On-going
Incorporation in LRTP as program
recommendation Low
GWRC-6.2 2006 Investigate emergency lane/shoulder improvements for Emergency Services access on all primary roads
X X X X X X X X X GWRC/FAMPO FAMPO Unified Planning Work
Program On-going
Recommendations in special corridor studies
Low
GWRC-6.3 2006 Identify and publicize local evacuation routes throughout the region. X X X X X X X X X GWRC/FAMPO FAMPO Unified Planning Work
Program On-going
Incorporation in LRTP as program
recommendation High
GWRC-6.4 2006 Identify traffic plan/alternate routes due to closures on primary routes such as 1, 3, 17, 301, and 610
X X X X X X X X X GWRC/FAMPO FAMPO Unified Planning Work
Program On-going
Recommendations in special corridor studies
Low
GWRC-6.5 2006 Coordinate locally with VDOT on updates to VDOT’s Regional Transportation Plans X X X X X X X X X GWRC/FAMPO FAMPO Unified Planning Work
Program On-going
Incorporation in LRTP as program
recommendation Medium
GWRC-6.6 2006 Purchase and place into operation AM radio stations along routes to relay emergency information to motorists during a disaster or emergency
X X X X X X X X X
GWRC Regional Inter-operability Communications
Committee
Committee meeting minutes
On-going Grant award to fund AM
station broadcast equipment.
Low
GWRC-6.7 2006 Facilitate discussions with neighboring regions on traffic flow for emergency service vehicles
X X X X X X X X X
GWRC Regional Inter-operability Communications
Committee
Committee meeting minutes
On-going
Reciprocal operating agreement or other
instrument documenting coordination effort.
Medium
GWRC-8 2006 It is recommended to investigate and potentially purchase the equipment required to eliminate radio communication gaps in valleys.
X X X X X X X X X
GWRC Regional Inter-operability Communications
Committee
Local On-going Adoption of MOUs Medium
D R A
F T

Hazard Mitigation Plan
George Washington Regional Commission
March 2012
7-8
ID Number Year Project Description
Hazards Being Mitigated
Lead/Support Agency
Funding Source
Target Completion
Date Interim
Measure of Success
Priority – (High,
Medium, Low) D
am
Failu
re
Dro
ug
ht
& E
xtr
em
e H
eat
Wi ld
fire
s
Eart
hq
uakes
Sin
kh
ole
s &
Lan
dslid
es
Flo
od
ing
& E
rosio
n
Hu
rric
an
es &
T
hu
nd
ers
torm
s
To
rnad
oes
Win
ter
Sto
rms &
N
or’
easte
rs
Goal 1: Reduce the future impacts and losses from identified hazards.
GW1.1
(formerly GWRC-2)
2006 Evaluate the vulnerability of the region’s critical facilities to hazards and make recommendations for improving resiliency; focusing on generator power to shelters.
X X X X X X X X X GWRC
FEMA Unified Hazard Mitigation
Assistance Funding
2016 Define critical facility High
GW1.2 2012 Review regional compliance with the NFIP on an annual basis and make recommendations where appropriate.
X X X GWRC
FEMA Unified Hazard Mitigation
Assistance Funding
Annually Determine review
parameters High
Goal 2: Educate and engage the public regarding hazards, their impacts, and feasible actions.
GW2 2012 Develop a regional preparedness guide focusing on natural hazards to disseminate to the public by 2013.
X X X X X X X X X GWRC
FEMA Unified Hazard Mitigation
Assistance Funding
2013 Identify funding source and determine hazards to be included in guide
Low
Goal 3: Maximize the impact of public resources through effective coordination among agencies and the efficient use of technology.
Objective 1: Enhance inter-operable emergency communications among all agencies.
GW3.1
(formerly GWRC-7)
2006 Continue to improve regional inter-operable emergency communications and planning by coordinating data and information- sharing across all technologies (i.e. mapping and CADD, when possible)
X X X X X X X X X GWRC
FEMA Unified Hazard Mitigation
Assistance Funding
Ongoing
Develop information sharing plan to focus on sharing GIS datasets,
MOUs, and IT procurement documents
Medium
GW3.2
(formerly GWRC-3)
2006
Refine and make available to the jurisdictions, the current regional critical facilities database maintained by the GWRC. Ensure common definition of critical facilities among the region and map each location using GIS.
X X X X X X X X X GWRC
FEMA Unified Hazard Mitigation
Assistance Funding
2013 Define critical facility Low
Objective 2: Enhance public/private partnerships.
Goal 4: Improve and enhance emergency management capabilities.
GW4 2012 Develop a regional special needs registry and plan by 2016. X X X X X X X X X GWRC
FEMA Unified Hazard Mitigation
Assistance Funding, EMPG
funding
2013 Identify funding source Medium
D R A
F T

Hazard Mitigation Plan
George Washington Regional Commission
March 2012
7-9
C. Local Mitigation Strategies
In formulating a mitigation strategy, a wide range of activities were considered in order to help achieve the goals and to lessen the vulnerability of the GWRC area to the effects of natural hazards. Strategies were ranked by each community. Ranking was completed in order of relative priority based on the STAPLE/E criteria, as well as the strategy’s potential to reduce vulnerability to natural hazards. Actions were given a ranking of high, medium or low, with the following meanings:
• High (H) – implement in the short-term
• Medium (M) – implement in the long-term • Low (L) – implement only as funding becomes available
When deciding on which strategies should receive priority in implementation, the communities considered:
• Time – Can the strategy be implemented quickly?
• Ease to implement – How easy is the strategy to implement? Will it require many financial or staff resources?
• Effectiveness – Will the strategy be highly effective in reducing risk?
• Lifespan – How long will the effects of the strategy be in place?
• Hazards – Does the strategy address a high priority hazard or does it address multiple hazards? • Post-disaster implementation – Is this strategy easier to implement in a post-disaster
environment?
In addition, the anticipated level of cost effectiveness of each measure was a primary consideration when developing mitigation actions. Because mitigation is an investment to reduce future damages, it is important to select measures for which the reduced damages over the life of the measure are likely to be greater than the project cost. For structural measures, the level of cost effectiveness is primarily based on the likelihood of damages occurring in the future, the severity of the damages when they occur, and the level of effectiveness of the selected measure. Although detailed analysis was not conducted during the mitigation action development process, these factors were of primary concern when selecting measures. For those measures, that do not result in a quantifiable reduction of damages, such as public education and outreach, the relationship of the probable future benefits and the cost of each measure was considered when developing the mitigation actions. Each jurisdiction’s mitigation strategy can be
found below.
D R A
F T

Hazard Mitigation Plan
George Washington Regional Commission
March 2012
7-10
Caroline County Mitigation Action Plan
Mitigation Action Plan 2. Caroline County.
ID Year Project Description
Hazard Being Mitigated
Lead/Support Agency
Funding Source
Target Completio
n Date Interim Measure of
Success
Priority – (High,
Medium, Low) D
am
Fa
ilure
Dro
ugh
t &
Ext
rem
e H
ea
t
Wild
fire
s
Ea
rthq
ua
kes
Sin
kho
les
& L
an
dslid
es
Flo
od
ing
& E
rosio
n
Hu
rric
an
es
&
Th
un
de
rsto
rms
To
rnad
oe
s
Win
ter
Sto
rms &
N
or’e
aste
rs
CC-3 2006 Investigate safeguards against severe weather including hurricane clips, safe rooms, community shelters, and /or model shelters
Pending
CC-6 2006 Establish a minimum standard for GIS capabilities and data throughout the region as jurisdictions being to add GIS to their current hazard mitigation capabilities
Pending
CC-7 2006 Establish a clearinghouse of GIS data for all jurisdictions. This will allow all jurisdictions to have access to compatible data in order to better assess the region and each community’s vulnerability to the natural hazards
Pending
CC-8 2006 Enhance the Caroline Alert system to provide information and warnings to citizens and businesses on specific events throughout the region
Pending
CC-9 2006 Improve the flexibility of the transportation network through coordination with the Virginia Department of Transportation (VDOT) and neighboring regions
Pending
CC-10 2006 Establish a common means of communication, such as one radio frequency or equipment to connect existing radio frequencies, for use by all emergency services departments in the region
Pending
C1 2012 Evaluate the vulnerability of critical facilities to natural hazards and improve service redundancy to facilities where appropriate.
X X X X X X X X X
Department of Fire-Rescue and Emergency
Management
Local funding
2015
Compile a list of facilities to be evaluated and the capabilities
considered crucial for their operation by June 2014
High
C2 2012 Develop an Earthquake preparedness, response, and recovery brochure for distribution at public outreach events, i.e. county fair.
X
Department of Fire-Rescue and Emergency
Management
HMGP grant
funding 2014
Develop outreach materials, or identify appropriate outreach materials for dissemination by
June 2013.
Medium
C3 2012
Conduct annual outreach to each FEMA-listed repetitive loss and severe repetitive loss property owner, providing information on mitigation programs (grant assistance, mitigation measures, flood insurance information) that can assist them in reducing their flood risk.
X X
Department of Fire-Rescue and Emergency
Management
FEMA Unified Hazard
Mitigation Assistance
funding
Ongoing
Develop outreach materials, or identify appropriate outreach materials for dissemination by
June 2013.
Medium
D R A
F T
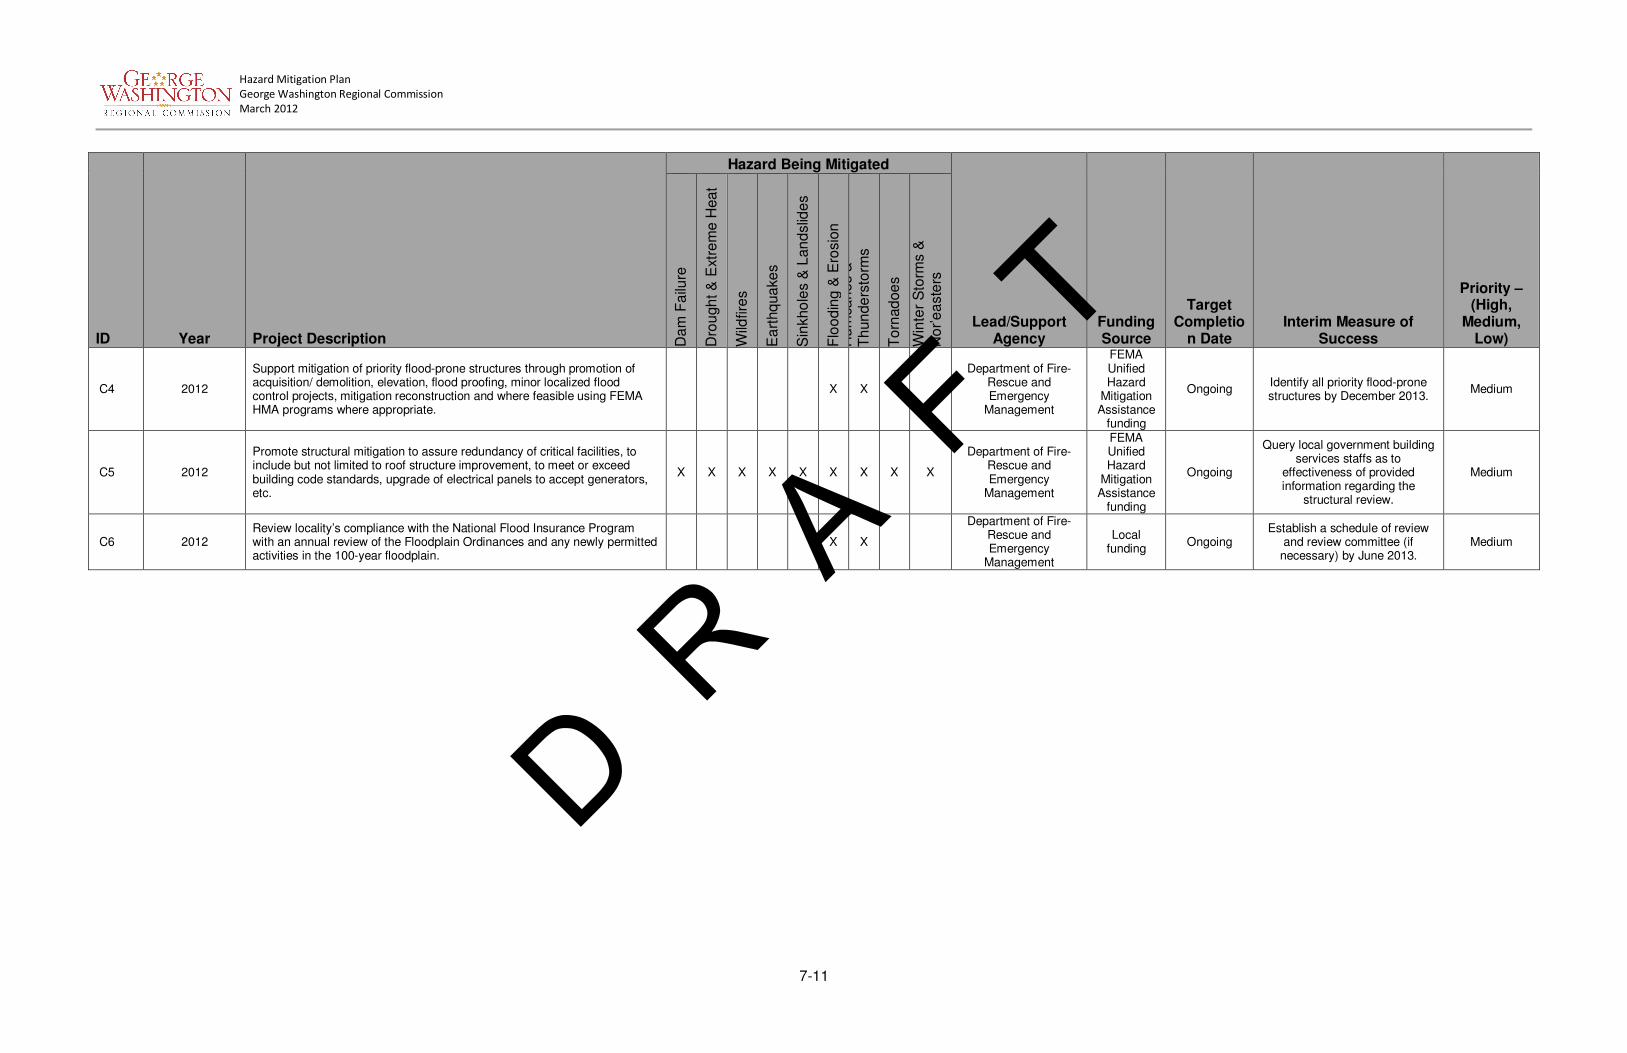
Hazard Mitigation Plan
George Washington Regional Commission
March 2012
7-11
ID Year Project Description
Hazard Being Mitigated
Lead/Support Agency
Funding Source
Target Completio
n Date Interim Measure of
Success
Priority – (High,
Medium, Low) D
am
Fa
ilure
Dro
ugh
t &
Ext
rem
e H
ea
t
Wild
fire
s
Ea
rthq
ua
kes
Sin
kho
les
& L
an
dslid
es
Flo
od
ing
& E
rosio
n
Hu
rric
an
es
&
Th
un
de
rsto
rms
To
rnad
oe
s
Win
ter
Sto
rms &
N
or’e
aste
rs
C4 2012
Support mitigation of priority flood-prone structures through promotion of acquisition/ demolition, elevation, flood proofing, minor localized flood control projects, mitigation reconstruction and where feasible using FEMA HMA programs where appropriate.
X X
Department of Fire-Rescue and Emergency
Management
FEMA Unified Hazard
Mitigation Assistance
funding
Ongoing Identify all priority flood-prone structures by December 2013.
Medium
C5 2012
Promote structural mitigation to assure redundancy of critical facilities, to include but not limited to roof structure improvement, to meet or exceed building code standards, upgrade of electrical panels to accept generators, etc.
X X X X X X X X X
Department of Fire-Rescue and Emergency
Management
FEMA Unified Hazard
Mitigation Assistance
funding
Ongoing
Query local government building services staffs as to
effectiveness of provided information regarding the
structural review.
Medium
C6 2012 Review locality’s compliance with the National Flood Insurance Program with an annual review of the Floodplain Ordinances and any newly permitted activities in the 100-year floodplain.
X X
Department of Fire-Rescue and Emergency
Management
Local funding
Ongoing Establish a schedule of review
and review committee (if necessary) by June 2013.
Medium
D R A
F T
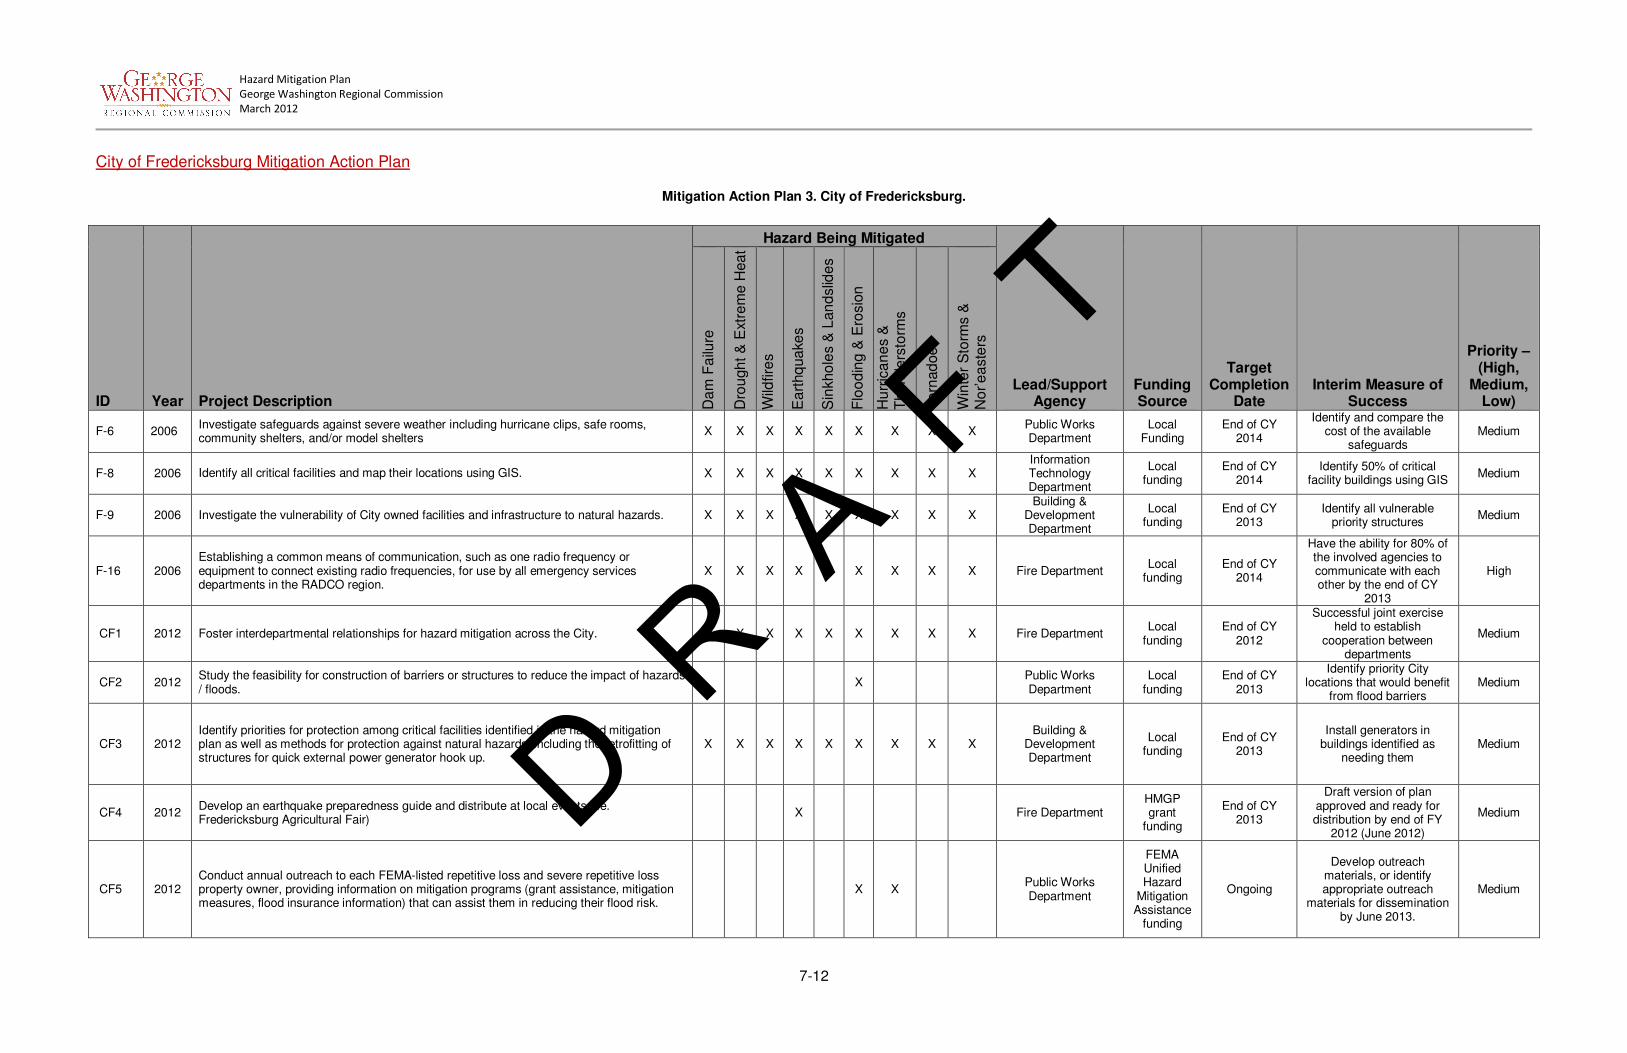
Hazard Mitigation Plan
George Washington Regional Commission
March 2012
7-12
City of Fredericksburg Mitigation Action Plan
Mitigation Action Plan 3. City of Fredericksburg.
ID Year Project Description
Hazard Being Mitigated
Lead/Support Agency
Funding Source
Target Completion
Date Interim Measure of
Success
Priority – (High,
Medium, Low) D
am
Fa
ilure
Dro
ugh
t &
Ext
rem
e H
ea
t
Wild
fire
s
Ea
rthq
ua
kes
Sin
kho
les
& L
an
dslid
es
Flo
od
ing
& E
rosio
n
Hu
rric
an
es
&
Th
un
de
rsto
rms
To
rnad
oe
s
Win
ter
Sto
rms &
N
or’e
aste
rs
F-6 2006 Investigate safeguards against severe weather including hurricane clips, safe rooms, community shelters, and/or model shelters
X X X X X X X X X Public Works Department
Local Funding
End of CY 2014
Identify and compare the cost of the available
safeguards Medium
F-8 2006 Identify all critical facilities and map their locations using GIS. X X X X X X X X X Information Technology Department
Local funding
End of CY 2014
Identify 50% of critical facility buildings using GIS
Medium
F-9 2006 Investigate the vulnerability of City owned facilities and infrastructure to natural hazards. X X X X X X X X X Building &
Development Department
Local funding
End of CY 2013
Identify all vulnerable priority structures
Medium
F-16 2006 Establishing a common means of communication, such as one radio frequency or equipment to connect existing radio frequencies, for use by all emergency services departments in the RADCO region.
X X X X X X X X X Fire Department Local
funding End of CY
2014
Have the ability for 80% of the involved agencies to communicate with each other by the end of CY
2013
High
CF1 2012 Foster interdepartmental relationships for hazard mitigation across the City. X X X X X X X X X Fire Department Local
funding End of CY
2012
Successful joint exercise held to establish
cooperation between departments
Medium
CF2 2012 Study the feasibility for construction of barriers or structures to reduce the impact of hazards / floods.
X
Public Works Department
Local funding
End of CY 2013
Identify priority City locations that would benefit
from flood barriers Medium
CF3 2012 Identify priorities for protection among critical facilities identified in the hazard mitigation plan as well as methods for protection against natural hazards, including the retrofitting of structures for quick external power generator hook up.
X X X X X X X X X Building &
Development Department
Local funding
End of CY 2013
Install generators in buildings identified as
needing them Medium
CF4 2012 Develop an earthquake preparedness guide and distribute at local events (i.e. Fredericksburg Agricultural Fair)
X
Fire Department HMGP grant
funding
End of CY 2013
Draft version of plan approved and ready for distribution by end of FY
2012 (June 2012)
Medium
CF5 2012 Conduct annual outreach to each FEMA-listed repetitive loss and severe repetitive loss property owner, providing information on mitigation programs (grant assistance, mitigation measures, flood insurance information) that can assist them in reducing their flood risk.
X X
Public Works Department
FEMA Unified Hazard
Mitigation Assistance
funding
Ongoing
Develop outreach materials, or identify appropriate outreach
materials for dissemination by June 2013.
Medium
D R A
F T

Hazard Mitigation Plan
George Washington Regional Commission
March 2012
7-13
ID Year Project Description
Hazard Being Mitigated
Lead/Support Agency
Funding Source
Target Completion
Date Interim Measure of
Success
Priority – (High,
Medium, Low) D
am
Fa
ilure
Dro
ugh
t &
Ext
rem
e H
ea
t
Wild
fire
s
Ea
rthq
ua
kes
Sin
kho
les
& L
an
dslid
es
Flo
od
ing
& E
rosio
n
Hu
rric
an
es
&
Th
un
de
rsto
rms
To
rnad
oe
s
Win
ter
Sto
rms &
N
or’e
aste
rs
CF6 2012 Support mitigation of priority flood-prone structures through promotion of acquisition/ demolition, elevation, flood proofing, minor localized flood control projects, mitigation reconstruction and where feasible using FEMA HMA programs where appropriate.
X X
Building & Development Department
FEMA Unified Hazard
Mitigation Assistance
funding
Ongoing Identify all priority flood-
prone structures by December 2013.
Medium
CF7 2012 Promote structural mitigation to assure redundancy of critical facilities, to include but not limited to roof structure improvement, to meet or exceed building code standards, upgrade of electrical panels to accept generators, etc.
X X X X X X X X X Building &
Development Department
FEMA Unified Hazard
Mitigation Assistance
funding
Ongoing
Query local government building services staffs as
to effectiveness of provided information regarding the
structural review.
Medium
CF8 2012 Review locality’s compliance with the National Flood Insurance Program with an annual review of the Floodplain Ordinances and any newly permitted activities in the 100-year floodplain.
X X
Public Works Department
Local funding
Ongoing
Establish a schedule of review and review
committee (if necessary) by June 2013.
Medium
CF9 2012 Develop hazard loss processes that influence the way land and buildings are developed and built.
X X X X X X X X X Building &
Development Department
Local funding
End of CY 2015
Establish preliminary standards for building
development that meet hazard loss prevention
expectations
Low
D R A
F T

Hazard Mitigation Plan
George Washington Regional Commission
March 2012
7-14
King George County Mitigation Action Plan
Mitigation Action Plan 4. King George County.
ID Year Project Description
Hazard Being Mitigated
Lead/Support Agency
Funding Source
Target Completion
Date Interim Measure of
Success
Priority – (High,
Medium, Low) D
am
Fa
ilure
Dro
ugh
t &
Ext
rem
e H
ea
t
Wild
fire
s
Ea
rthq
ua
kes
Sin
kho
les
& L
an
dslid
es
Flo
od
ing
& E
rosio
n
Hu
rric
an
es
&
Th
un
de
rsto
rms
To
rnad
oe
s
Win
ter
Sto
rms &
N
or’e
aste
rs
KG-17 2006 Evaluate County/region interoperability problems, propose corrective actions, and seek grants to fund interoperable communications.
X X X X X X X X X
Department of Fire Rescue and
Emergency Services /Sheriffs Office
DHS, AFG/SHSP grants
2015
2013 - Meet with Sheriffs Office and other regional
entities to identify problem and possible solutions.
2. Determine potential solutions and funding source.
M
KG1 2012 Evaluate hazards to critical facilities and shelters, analyze their potential risks, identify mitigation and emergency planning actions, and prioritize actions based on the potential for risk reductions.
X X X X X X X X X Department of Fire
Rescue and Emergency Services
County 2015
2013 - All critical facilities and shelters identified, and
potential risks/vulnerabilities evaluated.
M
KG2 2012 Conduct more enforcement and inspections related to building and fire codes, and Virginia codes.
X X X X X X X X X
Department of Fire Rescue and
Emergency Services & Community
Development
County Ongoing 2012 - Meet with building and fire personnel monthly to plan
inspections. M
KG3 2012 Establish a policy that encourages builders of new homes in the County to provide connections for home generators.
X X X X X X X X X Community
Development County 2014
2013 - Policy has been developed, meetings held
with large builders in County. M
KG4 2012 Provide funding to Community Development for County flyover to improve mapping in disaster preparedness activities.
X X X X X X X X X Community
Development HMGP grant 2015
2013 - Source for funding identified, funds requested.
M
KG5 2012 Establish a “hotline” for citizens to call for non-emergency information during a disaster.
X X X X X X X X X Department of Fire
Rescue and Emergency Services
County 2012
2012 - Policy established that phone line will be set up for all emergency events, existence
of line routinely communicated to public.
H
KG6 2012 Develop additional ways (both web-based and paper) to educate the public, businesses, e.g., EM website, Twitter, Facebook, AM radio stations, and newspapers.
X X X X X X X X X Department of Fire
Rescue and Emergency Services
County 2013
2012 - EM website completed, Twitter and Facebook sites routinely
utilized.
M
KG7 2012 Develop/purchase additional signage for use at all designated emergency shelters.
X X X X X X X X X
Department of Fire Rescue and
Emergency Services /Social Services
EMPG grant 2014 2012 - Needed signs have been identified, sources for their procurement identified.
M
D R A
F T

Hazard Mitigation Plan
George Washington Regional Commission
March 2012
7-15
ID Year Project Description
Hazard Being Mitigated
Lead/Support Agency
Funding Source
Target Completion
Date Interim Measure of
Success
Priority – (High,
Medium, Low) D
am
Fa
ilure
Dro
ugh
t &
Ext
rem
e H
ea
t
Wild
fire
s
Ea
rthq
ua
kes
Sin
kho
les
& L
an
dslid
es
Flo
od
ing
& E
rosio
n
Hu
rric
an
es
&
Th
un
de
rsto
rms
To
rnad
oe
s
Win
ter
Sto
rms &
N
or’e
aste
rs
KG8 2012 Complete purchase and installation of new electronic emergency notification sign at Company 1 and explore signs for other companies.
X X X X X X X X X Department of Fire
Rescue and Emergency Services
HMGP grant 2012 2011 - Type and size of sign
determined, contract awarded.
H
KG9 2012 Partner with schools, churches, civic groups, and volunteers to communicate on emergency issues and increase their involvement in emergency planning and response.
X X X X X X X X X Department of Fire
Rescue and Emergency Services
County Ongoing
2012 - Meet with School staff, churches, and civic groups to
discuss proposal and emergency planning and
response.
M
KG10 2012 Provide additional information on the risks of earthquakes and plans to mitigate their damage in the County.
X
Department of Fire Rescue and
Emergency Services County 2013
2012 - Information on risks of earthquakes identified, and distributed to schools, news
media, and civic groups.
M
KG11 2012 Evaluate the Fairview Beach/Company 3 facility to identify safety, fire, and building deficiencies, develop a plan for their correction, and correct deficiencies.
X X X X X X X X X
Department of Fire Rescue and
Emergency Services & KGFR
County 2018
2012 - Facility evaluated to identify and prioritize
deficiencies and violations of building and fire codes and
safety regulations, corrective action plan developed.
M
KG12 2012 Expand the LEPC to include more County businesses and associations, and continue to make it an "all hazards" organization.
X X X X X X X X X Department of Fire
Rescue and Emergency Services
County 2012
2012 - Local businesses identified and contacted and informed of what the LEPC is and how they can participate.
H
KG13 2012 Improve County policies, codes, and regulations to reduce or eliminate impacts of known natural hazards.
X X X X X X X X X
Department of Fire Rescue and
Emergency Services & Community
Development
County Ongoing
2013 - County policies, codes, and regulations associated
with impacts of natural hazards identified, a team of
Community Development and DFRES staff set up to review
them.
M
KG14 2012 Investigate and implement structural projects that will reduce or eliminate the effects of natural hazards on public and private property in the County.
X X X X X X X X X
Department of Fire Rescue and
Emergency Services / SERV AUTH/GEN PROP/SCHOOL
SYSTEM
County 2015
2013 - County property evaluated to identify
vulnerabilities to natural hazards, recommendations developed to mitigate the
risks.
M
KG15 2012
Conduct annual outreach to each FEMA-listed repetitive loss and severe repetitive loss property owner, providing information on mitigation programs (grant assistance, mitigation measures, flood insurance information) that can assist them in reducing their flood risk.
X X X X X X X X X Department of Fire
Rescue and Emergency Services
FEMA Unified Hazard Mitigation
Assistance funding Ongoing
2013 - FEMA-listed repetitive loss property in the County
identified, potential mitigation actions identified, and
contacts made with property owners to discuss auctions.
M
D R A
F T

Hazard Mitigation Plan
George Washington Regional Commission
March 2012
7-16
ID Year Project Description
Hazard Being Mitigated
Lead/Support Agency
Funding Source
Target Completion
Date Interim Measure of
Success
Priority – (High,
Medium, Low) D
am
Fa
ilure
Dro
ugh
t &
Ext
rem
e H
ea
t
Wild
fire
s
Ea
rthq
ua
kes
Sin
kho
les
& L
an
dslid
es
Flo
od
ing
& E
rosio
n
Hu
rric
an
es
&
Th
un
de
rsto
rms
To
rnad
oe
s
Win
ter
Sto
rms &
N
or’e
aste
rs
KG16 2012
Support mitigation of priority flood-prone structures through promotion of acquisition/ demolition, elevation, flood proofing, minor localized flood control projects, mitigation reconstruction and where feasible using FEMA HMA programs where appropriate.
X
Department of Fire Rescue and
Emergency Services
FEMA Unified Hazard Mitigation
Assistance funding Ongoing
2013 - All flood-prone structures identified and
mapped on GIS, and proposed actions determined to mitigate the risk of floods.
M
KG17 2012
Promote structural mitigation to assure redundancy of critical facilities, to include but not limited to roof structure improvement, to meet or exceed building code standards, upgrade of electrical panels to accept generators, etc.
X X X X X X X X X Department of Fire
Rescue and Emergency Services
FEMA Unified Hazard Mitigation
Assistance funding Ongoing
2013 - Critical facilities evaluated to identify structural
weaknesses and electrical deficiencies, and plans
established to upgrade them.
M
KG18 2012 Review locality’s compliance with the National Flood Insurance Program with an annual review of the Floodplain Ordinances and any newly permitted activities in the 100-year floodplain.
X
Department of Fire Rescue and
Emergency Services Local funding Ongoing
2013 - Identified all permitted projects in 100 year flood
plain, and first annual review of Floodplain Ordnances
completed.
M
D R A
F T

Hazard Mitigation Plan
George Washington Regional Commission
March 2012
7-17
Spotsylvania County Action Plan
Mitigation Action Plan 5. Spotsylvania County.
ID Year Project Description
Hazard Being Mitigated
Lead/Support Agency Funding Source
Target Completion
Date Interim Measure of
Success
Priority – (High,
Medium, Low) D
am
Fa
ilure
Dro
ugh
t &
Ext
rem
e H
ea
t
Wild
fire
s
Ea
rthq
ua
kes
Sin
kho
les
& L
an
dslid
es
Flo
od
ing
& E
rosio
n
Hu
rric
an
es
&
Th
un
de
rsto
rms
To
rnad
oe
s
Win
ter
Sto
rms &
N
or’e
aste
rs
SP-3 2006 Develop advisory development design standards based upon FIREWISE principles and defensible space.
X
FREM/DOF Local Ongoing Develop written guidance. Medium
SP-6 2006 Develop a regional public awareness program X X X X X X X X X FREM Local Ongoing Program is developed Medium
SP-7 2006 Develop a Weather Spotter program
X X X X FREM & National Weather
Service Local / Federal
Ongoing
Identify the relevant information to be included,
and the events that they are to be presented/distributed at.
Medium
SP-8 2006 Establish a minimum standard for GIS capabilities and data throughout the region as jurisdictions begin to add GIS to their current hazard mitigation capabilities.
X
X X X X X X X GIS Local Ongoing Standard established Medium
SP-9 2006
Establish a clearinghouse of GIS data for all of the jurisdictions in the region. This will allow all jurisdictions to have access to compatible data in order to better assess the region and each community’s vulnerability to natural hazards
X
X X X X X X X GIS Local Ongoing Data sharing established Medium
SP-11 2006 Improve the flexibility of the transportation network through coordination with the Virginia Department of Transportation (VDOT) and neighboring regions
X
X X X X X X X VDOT/ FAMPO/ Planning Federal/
State/ Local Ongoing Coordination is occurring Medium
SP-12 2006 Investigate the feasibility of establishing a common means of communication such as one radio frequency or equipment to connect existing radio frequencies, for use by all emergency services departments in the region
X X X X X X X X X FREM/RPAC-I Federal/
State/ Local Ongoing
Coordination is occurring Medium
SP-13 2006 Investigate and potentially purchase the equipment required to eliminate radio communication gaps in valleys
X X X X X X X X X FREM/RPAC-I Federal /
State / Local Ongoing
Funding is available Medium
SP1 2012 Develop and conduct an education campaign on Earthquake Safety
X
Fire, Rescue, and Emergency Management
HMGP grant funding
Identify the relevant information to be included,
and the events that they are to be presented/distributed at.
Medium
SP2 2012 Develop an emergency preparedness guide for distribution at public events X X X X X X X X X Fire, Rescue, and Emergency
Management HMGP grant
funding 2014
Identify the materials to be included in the guide and the
events that they are to be distributed at.
Medium
D R A
F T

Hazard Mitigation Plan
George Washington Regional Commission
March 2012
7-18
ID Year Project Description
Hazard Being Mitigated
Lead/Support Agency Funding Source
Target Completion
Date Interim Measure of
Success
Priority – (High,
Medium, Low) D
am
Fa
ilure
Dro
ugh
t &
Ext
rem
e H
ea
t
Wild
fire
s
Ea
rthq
ua
kes
Sin
kho
les
& L
an
dslid
es
Flo
od
ing
& E
rosio
n
Hu
rric
an
es
&
Th
un
de
rsto
rms
To
rnad
oe
s
Win
ter
Sto
rms &
N
or’e
aste
rs
SP3 2012
Promote structural mitigation to assure redundancy of critical facilities, to include but not limited to roof structure improvement, to meet or exceed building code standards, upgrade of electrical panels to accept generators, etc.
X X X X X X X X X Spotsylvania County Building
Department
FEMA Unified Hazard
Mitigation Assistance
funding
Ongoing
Query local government building services staffs as to
effectiveness of provided information regarding the
structural review.
Medium
SP4 2012 Review locality’s compliance with the National Flood Insurance Program with an annual review of the Floodplain Ordinances and any newly permitted activities in the 100-year floodplain.
X X
DCR/ Spotsylvania Code Compliance
Local funding
Ongoing Establish a schedule of
review and review committee (if necessary) by June 2013.
Medium
SP5 2012
Conduct annual outreach to each FEMA-listed repetitive loss and severe repetitive loss property owner, providing information on mitigation programs (grant assistance, mitigation measures, flood insurance information) that can assist them in reducing their flood risk.
X X
DCR/ Spotsylvania Code Compliance with FREM
FEMA Unified Hazard
Mitigation Assistance
funding
Ongoing
Develop outreach materials, or identify appropriate outreach materials for
dissemination by June 2013.
Medium/Low
SP6 2012
Support mitigation of priority flood-prone structures through promotion of acquisition/ demolition, elevation, flood proofing, minor localized flood control projects, mitigation reconstruction and where feasible using FEMA HMA programs where appropriate.
X X
DCR/ Spotsylvania Code Compliance with FREM
FEMA Unified Hazard
Mitigation Assistance
funding
Ongoing Identify all priority flood-prone
structures by December 2013.
Medium/Low
D R A
F T

Hazard Mitigation Plan
George Washington Regional Commission
March 2012
7-19
Stafford County Action Plan
Mitigation Action Plan 6. Stafford County.
ID Year Project Description
Hazard Being Mitigated
Lead/Support Agency
Funding Source
Target Completion
Date Interim Measure of
Success
Priority – (High,
Medium, Low) D
am
Fa
ilure
Dro
ugh
t &
Ext
rem
e H
ea
t
Wild
fire
s
Ea
rthq
ua
kes
Sin
kho
les &
Lan
dslid
es
Flo
od
ing
& E
rosio
n
Hu
rric
an
es
&
Th
un
de
rsto
rms
To
rnad
oe
s
Win
ter
Sto
rms &
N
or’e
aste
rs
ST-1 2006 Conduct annual outreach to each FEMA-listed repetitive loss and severe repetitive loss property owner, providing information on mitigation programs (grant assistance, mitigation measures, flood insurance information) that can assist them in reducing their flood risk.
X X
Emergency Management
(FR)/County Public Information
FEMA Unified Hazard
Mitigation Assistance
funding
Ongoing
Develop outreach materials, or identify appropriate outreach materials for dissemination by
June 2013.
Medium
ST-2 2006 Ensure proper elevation through retrofit and anchoring of mobile homes and other attendant appurtenances located in the floodplain to reduce the risk of future flood damage.
X
Planning/Public Works/Emergency
Management
FEMA Unified
Hazard
Mitigation
Assistance
funding
2015 Identify all mobile homes
located in flood-prone areas by December 2013
Medium
ST-4 2006 Develop and adopt building code requirements protecting the wildland urban interface, specifically utilizing best practices such as the FIREWISE program.
X
Fire and Rescue Department
Local funding 2015 Have one FIREWISE
Community Completed by 2013 Medium
ST-6 2006 Investigate the development of a tree-trimming program to protect life and property from falling debris during high wind events. Determine feasibility of partnering with local contractors.
X X X Public Utilities Local funding 2013
Develop a prioritized list of work that needs to be done, and the budget to do it with. Reach out
to local vendors for a price estimate.
Low
ST-7 2006 Identify all critical facilities using GIS X X X X X X X X X
Geographic Information
Systems/Emergency Management
Local funding 2013 Identify a list of critical facilities
and identify them on a map Medium
ST-10 2006 Establish a minimum standard for GIS capabilities and data throughout the region as jurisdictions begin to add GIS to their current hazard mitigation capabilities
X X X X X X X X X
Geographic Information
Systems/Emergency Management
Local funding 2015
Conduct a region wide assessment of GIS capabilities and create a GIS subcommittee
to work on standards for the region
Low
ST-11 2006 Establish a clearinghouse of GIS data for all jurisdictions. This will allow all jurisdictions to have access to compatible data in order to better assess the region and each community’s vulnerability to natural hazards
X X X X X X X X X
Geographic Information
Systems/Information Technology/Emerge
ncy Management
FEMA Unified Hazard
Mitigation Assistance
funding
2015 Establish a centrally located
GIS clearinghouse for regional data sharing
Low
D R A
F T

Hazard Mitigation Plan
George Washington Regional Commission
March 2012
7-20
ID Year Project Description
Hazard Being Mitigated
Lead/Support Agency
Funding Source
Target Completion
Date Interim Measure of
Success
Priority – (High,
Medium, Low) D
am
Fa
ilure
Dro
ugh
t &
Ext
rem
e H
ea
t
Wild
fire
s
Ea
rthq
ua
kes
Sin
kho
les &
Lan
dslid
es
Flo
od
ing
& E
rosio
n
Hu
rric
an
es
&
Th
un
de
rsto
rms
To
rnad
oe
s
Win
ter
Sto
rms &
N
or’e
aste
rs
ST1 2012 Upgrade aging equipment and technologies in the EOC/JOC. X X X X X X X X X Emergency
Management (FR) EMPG 2012
Conduct a current capabilities assessment of the EOC/JOC
and determine which equipment needs to be replaced/updated. Include priorities for upgrades.
High
ST2 2012 Evaluate how the ECC's ability to manage surge capacity during an emergency can be augmented.
X X X X X X X X X Emergency
Management (FR) Local funding 2012
Create a Draft Communications Manual for Review by Jan 2012
Medium
ST3 2012 Develop Stand-by contracts and MOUs with private companies for surge logistical support durring an emergency; specifically, emergency energy supplies to critical facilities.
X X X X X X X X X Planning/Public
Works/Emergency Management
Local funding 2013
Identify a list of critical facilities that are in need of such support and a list of the vendors in the
area that can provide such services.
Medium
ST4 2012 Support mitigation of priority flood-prone structures through promotion of acquisition/ demolition, elevation, flood proofing, minor localized flood control projects, mitigation reconstruction and where feasible using FEMA HMA programs where appropriate.
X X
Planning/Emergency Management
FEMA Unified Hazard
Mitigation Assistance
funding
Ongoing Identify all priority flood-prone structures by December 2013.
Medium
ST5 2012 Promote structural mitigation to assure redundancy of critical facilities, to include but not limited to roof structure improvement, to meet or exceed building code standards, upgrade of electrical panels to accept generators, etc.
X X X X X X X X X Public Works/Code
Enforcement
FEMA Unified Hazard
Mitigation Assistance
funding
Ongoing
Query local government building services staffs as to
effectiveness of provided information regarding the
structural review.
Medium
ST6 2012 Review locality’s compliance with the National Flood Insurance Program with an annual review of the Floodplain Ordinances and any newly permitted activities in the 100-year floodplain.
X X
Planning Local funding Ongoing Establish a schedule of review
and review committee (if necessary) by June 2013.
Medium
ST7 2012 Develop an Earthquake/Landslide Awareness course for all County and School Staff.
X X
Emergency Management (FR)
LEMPG 2012 Develop Draft Materials by
Spring 2012 Low
D R A
F T

Hazard Mitigation Plan
George Washington Regional Commission
March 2012
7-21
Town of Bowling Green Action Plan
Mitigation Action Plan 7. Town of Bowling Green.
ID Year Project Description
Hazard Being Mitigated
Lead/Support Agency
Funding Source
Target Completion
Date Interim Measure of
Success
Priority - (High,
Medium, Low) D
am
Fa
ilure
Dro
ugh
t &
Ext
rem
e H
ea
t
Wild
fire
s
Ea
rthq
ua
kes
Sin
kho
les
& L
an
dslid
es
Flo
od
ing
& E
rosio
n
Hu
rric
an
es
& T
hun
de
rsto
rms
To
rnad
oe
s
Win
ter
Sto
rms &
No
r’ea
ste
rs
B1 2012 Evaluate the vulnerability of critical facilities to natural hazards and identify a shelter facility within the Town limits
X X X X X X X X X
Town Administrator / County Department of Fire and Rescue /
Emergency Management
Local funding
2015
1. Identify the facilities to be identified and the criteria that
they must meet.
2. Establish special needs and transportation resources
registry
High
B2 2012 Improve current stormwater management system by establishing an adequate maintenance program to clear storm drains.
X X
X Public Works
Local funding /
Grant funding
2014
1. Develop a Cooperative Working Agreement with
VDOT 2. Identify maintenance to be
performed, maintenance scheduling, and parties
responsible
High
B3 2012 Develop an earthquake preparedness brochure, for distribution at major public events around Bowling Green.
X
Caroline County Office of Emergency
Management
HMGP funding
2014
Identify materials to be included in the brochure and
the events they will be distributed at
High
B4 2012 Investigate establishing a secondary electrical power feed X X X X X X X X X Town Administrator /
Power Suppliers Local
Funding 2015
Identify resources for establishing a secondary
electrical supply, and conduct a cost analysis
Medium
B5 2012
Evaluate critical facilities and shelters to evaluate their resistance to all hazards and make recommendations on ways they can be strengthened or hardened (specifically as they relate to back-up power and electrical systems).
X X X X X X X X X
Town Administrator / Caroline County Dept of Fire and rescue /
Emergency Management
Local funding
2013
1. Identify the type of backup to be implemented and which
facilities they are to be installed in.
2. Identify potential contractors that can provide
this service, and obtain a written estimate.
Medium
D R A
F T

Hazard Mitigation Plan
George Washington Regional Commission
March 2012
7-22
ID Year Project Description
Hazard Being Mitigated
Lead/Support Agency
Funding Source
Target Completion
Date Interim Measure of
Success
Priority - (High,
Medium, Low) D
am
Fa
ilure
Dro
ugh
t &
Ext
rem
e H
ea
t
Wild
fire
s
Ea
rthq
ua
kes
Sin
kho
les
& L
an
dslid
es
Flo
od
ing
& E
rosio
n
Hu
rric
an
es
& T
hun
de
rsto
rms
To
rnad
oe
s
Win
ter
Sto
rms &
No
r’ea
ste
rs
B6 2012 Investigate the feasibility of implementing an outdoor warning system using sirens and visual notification systems.
X X X X X X X X X Emergency
Management (FR) HMGP funding
2013
1. Identify the types of systems available and
conduct cost/benefit analysis 2. Identify parties responsible
for implementation, maintenance, and operation
Medium
B7 2012
Conduct annual outreach to each FEMA-listed repetitive loss and severe repetitive loss property owner, providing information on mitigation programs (grant assistance, mitigation measures, flood insurance information) that can assist them in reducing their flood risk.
X X
Emergency Management
(FR)/County Public Information
FEMA Unified Hazard
Mitigation Assistance
funding
Ongoing
Develop outreach materials, or identify appropriate outreach materials for
dissemination by June 2013.
Medium
B8 2012
Support mitigation of priority flood-prone structures through promotion of acquisition/ demolition, elevation, flood proofing, minor localized flood control projects, mitigation reconstruction and where feasible using FEMA HMA programs where appropriate.
X X
Planning/Emergency
Management
FEMA Unified Hazard
Mitigation Assistance
funding
Ongoing Identify all priority flood-
prone structures by December 2013.
Medium
B9 2012
Promote structural mitigation to assure redundancy of critical facilities, to include but not limited to roof structure improvement, to meet or exceed building code standards, upgrade of electrical panels to accept generators, etc.
X X X X X X X X X Public Works/Code
Enforcement
FEMA Unified Hazard
Mitigation Assistance
funding
Ongoing
Query local government building services staffs as to
effectiveness of provided information regarding the
structural review.
Medium
B10 2012 Review locality’s compliance with the National Flood Insurance Program with an annual review of the Floodplain Ordinances and any newly permitted activities in the 100-year floodplain.
X X
Planning
Local funding
Ongoing Establish a schedule of
review and review committee (if necessary) by June 2013.
Medium
D R A
F T

Hazard Mitigation Plan
George Washington Regional Commission
March 2012
7-23
Town of Port Royal Action Plan
Mitigation Action Plan 8. Town of Port Royal.
ID Year Project Description
Hazard Being Mitigated
Lead/Support Agency Funding Source
Target Completion
Date Interim Measure of
Success
Priority – (High,
Medium, Low) D
am
Fa
ilure
Dro
ugh
t &
Ext
rem
e H
ea
t
Wild
fire
s
Ea
rthq
ua
kes
Sin
kho
les
& L
an
dslid
es
Flo
od
ing
& E
rosio
n
Hu
rric
an
es
& T
hun
de
rsto
rms
To
rnad
oe
s
Win
ter
Sto
rms &
No
r’ea
ste
rs
P1 2012
Conduct annual outreach to each FEMA-listed repetitive loss and severe repetitive loss property owner, providing information on mitigation programs (grant assistance, mitigation measures, flood insurance information) that can assist them in reducing their flood risk.
X X
Emergency Management
(FR)/County Public Information
FEMA Unified Hazard
Mitigation Assistance
funding
Ongoing
Develop outreach materials, or identify appropriate outreach materials for dissemination by June
2013.
Medium
P2 2012
Support mitigation of priority flood-prone structures through promotion of acquisition/ demolition, elevation, flood proofing, minor localized flood control projects, mitigation reconstruction and where feasible using FEMA HMA programs where appropriate.
X X
Planning/Emergency Management
FEMA Unified Hazard
Mitigation Assistance
funding
Ongoing Identify all priority flood-
prone structures by December 2013.
Medium
P3 2012
Promote structural mitigation to assure redundancy of critical facilities, to include but not limited to roof structure improvement, to meet or exceed building code standards, upgrade of electrical panels to accept generators, etc.
X X X X X X X X X Public Works/Code
Enforcement
FEMA Unified Hazard
Mitigation Assistance
funding
Ongoing
Query local government building services staffs as to
effectiveness of provided information regarding the
structural review.
Medium
P4 2012 Review locality’s compliance with the National Flood Insurance Program with an annual review of the Floodplain Ordinances and any newly permitted activities in the 100-year floodplain.
X X
Planning Local
funding Ongoing
Establish a schedule of review and review
committee (if necessary) by June 2013.
Medium
P5 2012 Develop an Earthquake preparedness, response, and recovery brochure for distribution at public outreach events.
X
Emergency Management Agency
HMGP grant funding
2014
Develop outreach materials, or identify appropriate outreach materials for dissemination by June
2013.
Medium
D R A
F T

Hazard Mitigation Plan
George Washington Regional Commission
March 2012
7-24
This page intentionally left blank.
D R A
F T
Hazard Mitigation Plan
George Washington Regional Commission
March 2012
8-1
CHAPTER 8 – PLAN MONITORING, EVALUATION AND UPDATE
The long-term success of the George Washington Regional Commission’s mitigation plan is directly correlated with its routine monitoring, evaluation, and updating. This process ensures that the plan remains up to date and is retained as a useful tool for preventing and mitigating damages from known hazards.
I. Adoption
Seven local governments in south central Virginia participated in this planning process and formally adopted this plan by resolution of their governing board. The adoption process itself took several months, as significant coordination by the Region, the Mitigation Advisory Committee, as well as local representatives, was necessary in order to 1) place the plan review and adoption on the appropriate meeting agendas in each jurisdiction, 2) produce and provide copies in official meeting packets, 3) facilitate the actual adoption, 4) collect the adoption resolution, and 5) incorporate the adopted resolutions into the final Hazard Mitigation Plan.
II. Implementation
Upon adoption, the plan faces its biggest test: implementation. While this plan puts forth many worthwhile, and “High” priority recommendations, which action to undertake first will be the first decision that the George Washington Regional Commission and its participating communities faces. Funding of mitigation strategies is always a critical issue when it comes to implementation. Therefore, pursuing low or no-cost high-priority recommendations may be one approach that a community chooses to take. An example of a low-cost, high-priority recommendation would be to install flood level markers on bridges to warn of high water levels. Another implementation approach is to prioritize those actions that can be completed in a relatively short amount of time. Being able to publicize a successful project can build momentum to implement the other parts of the plan. An example of an effective but easy-to-implement strategy is to participate in the National Weather Service’s StormReady program. Monitoring funding opportunities should be done simultaneously with the implementation effort. Funding can be leveraged to implement one of the more costly recommendations. The following section, Integration, discusses other areas of planning and growth that may present opportunities for accomplishment of multiple planning goals, and potential funding sources. Other funding opportunities should also be pursued such as pre- and post-disaster funds, special district budgeted funds, state or federal ear-marked funds, and grant programs, including those that can serve or support multi-objective applications.
III. Integration
It is important to the long-term implementation of the plan that the underlying principles of this Hazard Mitigation Plan are incorporated into other community plans and mechanisms, such as:
• Comprehensive Planning • Stormwater Management Plans
• Capital Improvement Program Budgeting
• Emergency Operations Plans • Disaster Recovery Plans
D R A
F T

Hazard Mitigation Plan
George Washington Regional Commission
March 2012
8-2
The capability assessment section of this plan provides insight into the current comprehensive plans for each community. The emergency management coordinator for each jurisdiction will provide a copy of this plan to the planning director and work with them to ensure that the appropriate information from this plan is incorporated into the next update of their comprehensive plan. Information from the hazard identification and risk assessment as well as mitigation goals and strategies may be directly included as a comprehensive plan element or will be included in other elements, as appropriate. Projects that require large investments, such as acquisition or road retrofits, are candidates for inclusion in capital improvement plans. Mitigation is most successful when it is incorporated within the day-to-day functions and priorities of government and development. This integration is accomplished by a constant effort to network and to identify and highlight the multi-objective, “win-win” benefits to each program, the communities and their constituents. This effort is achieved through monitoring agendas, attending meetings, and sending memos. Simultaneous to these efforts, it will be important to constantly monitor funding opportunities that can be utilized to implement some of the higher cost recommended actions. This will include creating and maintaining a repository of ideas on how any required local match or participation requirement can be met. Then, when funding does become available, the GWRC communities will be in a position to take advantage of an opportunity. Funding opportunities that can be monitored include special pre- and post-disaster funds, special district budgeted funds, state or federal ear-marked funds, and grant programs, including those that can serve or support multi-objective applications. With adoption of this plan, the GWRC communities will attempt to:
• Pursuing the implementation of the high-priority, low/no-cost recommended actions.
• Keeping the concept of mitigation in the forefront of community decision-making by identifying and stressing the recommendations of the Hazard Mitigation Plan when other community goals, plans and activities are discussed and decided upon.
• Maintaining a constant monitoring of multi-objective, cost-share opportunities to assist the participating communities in implementing the recommended actions of this plan for which no current funding or support exists.
In addition, the communities of the George Washington Regional Commission remain committed to the National Flood Insurance Program. They will continue to enforce floodplain regulations and undertake other actions to remain in compliance with the program.
IV. Public Involvement
Public participation in guiding community documents is an important part of the planning process. It allows community residents to recognize, evaluate, and vet the actions of its government. Significant changes or amendment to the plan may require a public hearing prior to adoption. Determination of this requirement will need to be made on a case-by case basis by the regional commission and the steering committee. If it is determined that it is necessary to hold a public hearing, in order to involve the public in the maintenance, evaluation, and revision process, then one or all of the following may be considered:
D R A
F T

Hazard Mitigation Plan
George Washington Regional Commission
March 2012
8-3
• Advertising meetings of the MAC in the local newspaper, public bulletin boards, and/or municipal or county office buildings;
• Designating willing and voluntary citizens and private sector representatives as official members of the MAC’s mitigation plan steering committee;
• Utilizing local media to update the public of any maintenance and/or periodic review activities taking place;
• Using the jurisdiction’s website to advertise any maintenance and/or periodic review activities taking place; and
• Keeping copies of the Plan in public libraries and making it accessible via public websites.
V. Monitoring & Maintenance
Plan Maintenance requires an on-going effort to monitor and evaluate the implementation of the plan, and to update the plan as progress, roadblocks, or changing circumstances are recognized. The Director of Regional Planning and Regional Demographer for the George Washington Regional Commission will be responsible for monitoring this plan. The county administrator, or town manager will be responsible for appointing one or more representatives (e.g. emergency coordinator, planning director) to a group convened by the GWRC. It is expected that the group- convened by the Planning District Commission will function as an adjunct to the Regional Emergency Managers Group that already meets on a regular basis. The working group, within 60 days of adoption of the plan, will develop evaluation criteria to judge the progress of implementation of the plan.
Annual Review
The GWRC will make an annual request to the working group representatives for an update to be provided by January 31, on the progress of the implementation of their mitigation Action Plans. These updates will begin in 2013 and will include corrective action plans if needed based on the evaluation criteria set by the working group. The annual progress reports will be consolidated by GWRC and shared with the Virginia Department of Emergency Management. The GWRC Director of Planning, in coordination with the working group, will determine annually if an update of the plan is needed and the mechanism for doing so. Factors to consider when determining if an update is necessary include:
• Decreased vulnerability as a result of implementing recommended actions,
• Increased vulnerability as a result of failed or ineffective mitigation actions,
• Increased vulnerability as a result of new development (and/or annexation), • New state/federal laws, policies, or programs, and/or
• Changes in resource availability.
Five Year Review
At a minimum, the plan update will be initiated by the GWRC no less than four years after plan adoption; the GWRC will seek grant funding no less than three years after plan adoption. A comprehensive plan review will be completed and adopted no less than five years after the adoption of this plan review.
D R A
F T

Hazard Mitigation Plan
George Washington Regional Commission
March 2012
8-4
Disaster Declarations
A major event, such as a Presidentially-declared disaster, may trigger a need to review the plan. If such an event occurs in the GWRC region, the working group will coordinate to determine how best to review and update the plan. The updating of the plan will be by written changes and submissions, as the GWRC communities and the working group deem appropriate and necessary. Major changes to the plan will be submitted to the state and to FEMA Region III. Public notice will be given and public participation will be invited, at a minimum, through available web postings and press releases to the local media outlets, primarily newspapers and radio stations. In addition, the Region will keep information about the plan on its website and displayed in its office. The participating jurisdictions will continue to use the plan as a resource in developing new plans and community preparedness information; they will discuss the plan at public presentations and seek input continuously during the next planning cycle. Evaluation of progress can be achieved by monitoring changes in the vulnerability identified in the plan. Changes in vulnerability can be identified by noting:
• Lessened vulnerability as a result of implementing recommended actions,
• Increased vulnerability as a result of failed or ineffective mitigation actions, and/or, • Increased vulnerability as a result of new development (and/or annexation).
Updating of the plan will be by written changes and submissions, as the George Washington Regional Commission communities and the working group deem appropriate and necessary.
D R A
F T

Hazard Mitigation Plan
George Washington Regional Commission
March 2012
APPENDIX A – ADOPTION
PLACEHOLDER
D R A
F T

Hazard Mitigation Plan
George Washington Regional Commission
March 2012
This page intentionally left blank.
D R A
F T

Hazard Mitigation Plan George Washington Regional Commission March 2012
APPENDIX B - CROSSWALK
PLACEHOLDER
D R A
F T

Hazard Mitigation Plan George Washington Regional Commission March 2012
This page intentionally left blank.
D R A
F T

Hazard Mitigation Plan George Washington Regional Commission March 2012
APPENDIX C – MEETING MATERIALS
D R A
F T

Hazard Mitigation Plan George Washington Regional Commission March 2012
This page intentionally left blank.
D R A
F T

George Washington Regional Commission
Hazard Mitigation Plan Update
Kickoff Meeting
Fredericksburg, Virginia
November 15, 2010
1:30pm
I. Welcome & Introductions
II. Committee and Dewberry
III. Schedule and Plan Update Process
IV. Next Steps
V. Wrap Up & Future Meetings
Project Websites
SharePoint Site: http://projects.dewberry.com/GWRC2010/default.aspx
Email [email protected] if you need your password reset or other technical support
D R A
F T

George Washington
Regional Commission
Hazard Mitigation Plan UpdateKick-off MeetingNovember 15, 2010
Meeting Agenda
1. Welcome & Introductions
2. Committee and Dewberry
3. Schedule and Plan Update Process
4. Next Steps
5. Wrap Up & Future Meetings
Corporate Overview
• 50 years in Northern Virginia
• 2,000 professionals
• More than $300 M annual revenue
• Core service: Emergency Management and Hazard Mitigation
Certified Woman Business Enterprise that specializes in
developing a broad collection of communication
materials targeted to launch and manage community
outreach campaigns and related services.
Committee and Dewberry
• We are here to:
– Coach you through the process
• Inform you of “how” to update a plan
– Lend technical expertise and consultation
– Review and Crosswalk the draft and final plan sections
• You need to:
– Participate & make the final decisions
– Collect data, analyze data, and draft the plan
Schedule Tools We Use
• Facilitated Meetings
• Public Workshops (if chosen by Committee)
• Secure GWRC Project Share SiteD R A
F T

SharePoint• http://projects.dewberry.com/GWRC2010/default.aspx
• Requires: Username and Password
Participating Jurisdictions
• City of Fredericksburg
• Town of Bowling Green
• Town Port Royal
• Caroline County
• King George County
• Spotsylvania County
• Stafford County
FEMA Definition: Mitigation
Sustained actions taken to reduce or eliminate long-term risk to people and property from
hazards and their effects.
Why does hazard mitigation
matter?
VDEM Hazard Mitigation Definition
…is a sustainable action that will reduce
or eliminate injury to citizens, damages to structures and allow continuity of critical society functions…
George Washington RC
All Hazards Mitigation PlanFEMA Approved on September 13, 2006
Hazard Identification TableHazard type Critical vs. Non-Critical Probability of Occurrence
Flooding Critical High
Northeasters
Winter StormsCritical High
Wildfire Critical High
Hurricanes Critical Medium
Tornadoes Critical Medium
Biological Hazards Critical Low
Dam Failure Critical Low
Thunderstorms Non-Critical High
Drought Non-Critical Low
Earthquakes Non-Critical Low
Expansive Soils Non-Critical Low
Extreme Heat Non-Critical Low
Landslides Non-Critical Low
Presidentially Declared Disasters
D R A
F T

FEMA Requirements
• The updated plan must identify the completed, deleted, or deferred actions or activities from the previously approved plan as a benchmark for progress.
– Reporting on mitigation strategies on an annual basis keeps mitigation progress in the forefront, prevents loss of information due to staff turnover, and prevents having to potentially piece together 5 years of information.
FEMA Requirements
• If mitigation actions remain unchanged from the previously approved plan, the updated plan must indicate why changes are not necessary.– The mitigation strategies spreadsheet allows you to track the reasons that certain actions have not been changed such as: lack of funding, manpower, vulnerability has increased, etc.
FEMA Requirements
• Document how the community was kept involved during the plan maintenance process over the previous five years
Repetitive Loss Properties
(As of 9-4-2008)
Community Name Number of Rep Loss Properties
City of Fredericksburg 4
Stafford County 9
Revised State Hazard Mitigation
PlanExample of Hazard Ranking
D R A
F T

Historical Frequencies
(Tornado)Probability (Hurricane Wind)
Identified Weaknesses in
Existing PlanDiscussion with Planning Committee
• What do you like about current plan?
• Are there other efforts currently going on in your community that we should be aware of?
• Have the necessary people/departments been asked to participate?
• What would you like changed in the revision?
Understanding Requirements
• New FEMA Local Plan Requirements
– Clear roadmap on update process
– Incorporate previous plan crosswalk comments
– Integrate NFIP program
– Describe current status of projects
– Address critical facilities
2006 Table of Contents• Introduction
• Regional Profile
• The Planning Process (Public Outreach!!!)
• Hazard Identification and Risk Assessment (HIRA)
• Vulnerability Assessment
• Capability Assessment
• Mitigation Goals and Objectives
• Plan Implementation and Maintenance
Background Information
• Introduction
• Regional Profile
• Location & Profile of Participating Jurisdictions
• Demographics
– Census Data and Projects
• Land Use and Development
– Jurisdiction Specific data
• Planning Process
D R A
F T

FEMA Guidance for HIRA• Identify/Validate Hazards
– Which hazards are significant enough to warrant further investigation or update?
– Examine how is each hazard defined and refine as necessary
• Must update the hazard profiles– Identify Location (geographic areas affected) and Intensity of hazards
– Update Previous Occurrences (recent disasters)
Hazard Identification• 2006 Identified Hazards
Biological Hazards/ EpidemicsDam FailureDroughtEarthquakesExpansive SoilsExtreme HeatFlooding
HurricanesLandslideNortheastersThunderstormsTornadoesWildfiresWinterstorms
Steering Committee:
Does this still represent
your region?
Any hazards missing?
Capability Assessment Update
• Circulate capability assessment matrix found on page 18 to all jurisdictions
• Update each jurisdiction's information in the section
– Guiding Community Documents• Comprehensive Plans, Planning and Zoning, Building Codes
• Public Education (Outreach)
Mitigation Goals, Objectives &
Projects• Inventory and assess status of 2006 mitigation actions
• Develop regional goals and projects by Steering Committee
• Facilitate development of jurisdiction-specific goals and projects
• Create mitigation strategy tracking tool for use over next 5 years
Plan Production and Adoption
• Circulate drafts early and often via SharePoint
• Submit completed plan with crosswalk to
VDEM
• Provide adoption resolution templates
• Compile adoption notices and submit full plan to VDEM (Amy Howard) and FEMA
Public Involvement
• Provide opportunities for
– the public to comment during draft stage and prior to plan approval
– neighboring jurisdictions to be involved in hazard mitigation activities and the planning processD R
A F
T

Public Involvement
• Create presentations
• Create mailers:– to notify the public of the Hazard Mitigation Plan Update and
– to serve as an invitation to public meetings
• Hold public meetings to present the updated plan and provide for both collaborative sessions and individual dialogue with stakeholders
• Prepare maps as illustration boards to show hazard vulnerabilities
Public Involvement
• Write plan-specific brochures
• Have web postings of
– key plan elements and
– draft-final version; place hard copies at local libraries
• Use social networking sites: Follow us on Twitter to receive the latest updates to the plan.
• Write newspaper articles (if, say, a plan revision can be linked to a recent disaster event); or to notify of a public meeting
Notice of public meeting.
Public Involvement
• Issue press releases specific to the plan or to alert the onset of a specific hazard season; include these written pieces in e-newsletters
• Broadcast a public service announcement on local radio and/or TV stations
• Create survey to receive public comments and to receive feedback
Public Involvement
• Document how the public was involved
• Document how the public will continue to be involved; include in plan update
Dewberry documented and included a list of public meetings and events in the Central Shenandoah Valley All-Hazards Mitigation Plan
Capability Assessment UpdateNext steps…
• Circulate capability assessment matrix found on pg 18 to all jurisdictions
• Update jurisdiction information starting on pg 161
– Guiding Community Documents• Comprehensive Plans, Planning and Zoning, Building Codes
• Public Education (Outreach)
• Kevin will disseminate information to update
– Each jurisdiction will update their section and send back to Kevin
– Dewberry will review all updates against FEMA requirements and crosswalk
What’s Next?• Periodic conference calls
– Next: Capability Assessment Update
• Data gathering for Capability Assessment
• Data gathering for HIRA
• Initiation of Public Outreach
• Reporting on 2006 Plan Accomplishments
D R A
F T

D R A
F T

George Washington Regional CommissionGeorge Washington Regional CommissionGeorge Washington Regional CommissionGeorge Washington Regional Commission ---- Hazard Mitigation Plan UpdateHazard Mitigation Plan UpdateHazard Mitigation Plan UpdateHazard Mitigation Plan Update
Hazard Identification, Vulnerability Assessment & Hazard Identification, Vulnerability Assessment & Hazard Identification, Vulnerability Assessment & Hazard Identification, Vulnerability Assessment &
Mitigation Goals MeetingMitigation Goals MeetingMitigation Goals MeetingMitigation Goals Meeting
FredericksburgFredericksburgFredericksburgFredericksburg, Virginia, Virginia, Virginia, Virginia, July , July , July , July 12121212, 201, 201, 201, 2011, 10:00AM1, 10:00AM1, 10:00AM1, 10:00AM
I.I.I.I. Welcome & Introductions Welcome & Introductions Welcome & Introductions Welcome & Introductions
II.II.II.II. Hazard Identification and VulnerHazard Identification and VulnerHazard Identification and VulnerHazard Identification and Vulnerability Assessment ability Assessment ability Assessment ability Assessment –––– Ryan Flaherty and Julia MolineRyan Flaherty and Julia MolineRyan Flaherty and Julia MolineRyan Flaherty and Julia Moline
III.III.III.III. Mitigation Goals Mitigation Goals Mitigation Goals Mitigation Goals –––– Carrie SperanzaCarrie SperanzaCarrie SperanzaCarrie Speranza
IV.IV.IV.IV. Next StepsNext StepsNext StepsNext Steps
V.V.V.V. Wrap Up & Future MeetingsWrap Up & Future MeetingsWrap Up & Future MeetingsWrap Up & Future Meetings
Project WebsitesProject WebsitesProject WebsitesProject Websites
SharePoint Site: http://projects.dewberry.com/GWRC2010/default.aspx Email [email protected] if you need your password reset or other technical support
D R
A F
T
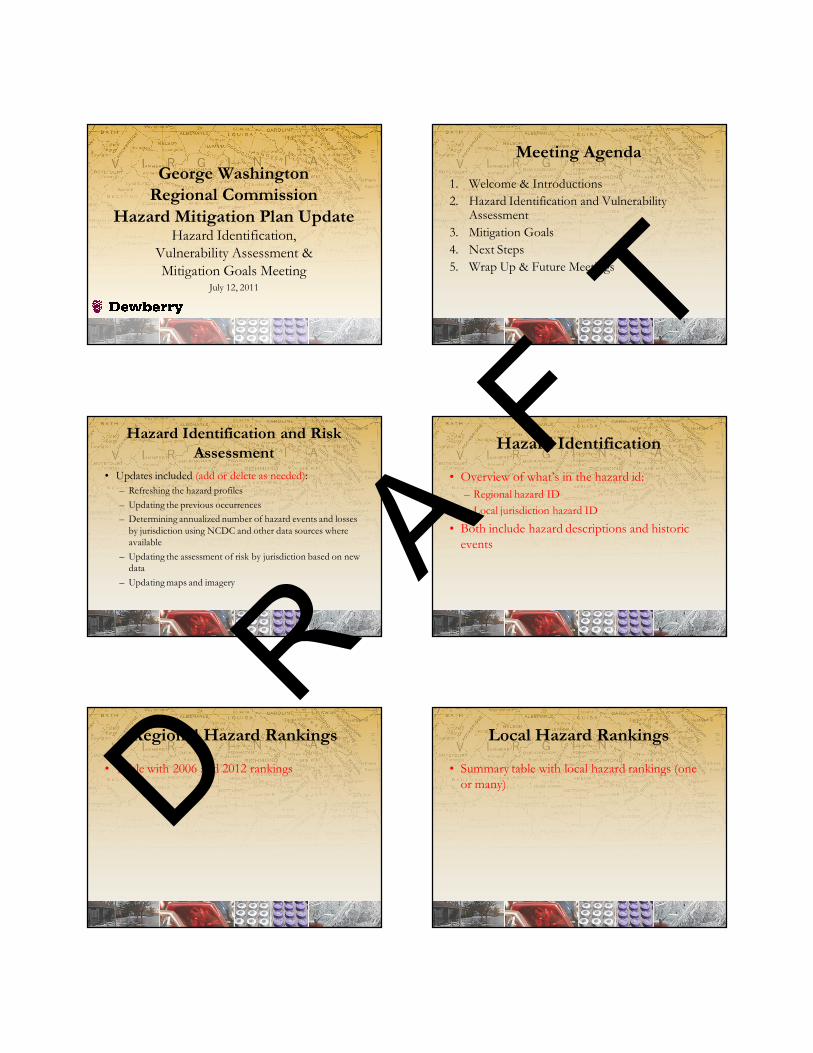
George Washington
Regional Commission
Hazard Mitigation Plan UpdateHazard Identification,
Vulnerability Assessment &
Mitigation Goals MeetingJuly 12, 2011
Meeting Agenda
1. Welcome & Introductions
2. Hazard Identification and Vulnerability Assessment
3. Mitigation Goals
4. Next Steps
5. Wrap Up & Future Meetings
Hazard Identification and Risk
Assessment
• Updates included (add or delete as needed):
– Refreshing the hazard profiles
– Updating the previous occurrences
– Determining annualized number of hazard events and losses by jurisdiction using NCDC and other data sources where available
– Updating the assessment of risk by jurisdiction based on new data
– Updating maps and imagery
Hazard Identification
• Overview of what’s in the hazard id:
– Regional hazard ID
– Local jurisdiction hazard ID
• Both include hazard descriptions and historic events
Regional Hazard Rankings
• Table with 2006 and 2012 rankings
Local Hazard Rankings
• Summary table with local hazard rankings (one or many)D R
A F
T

Hazard ID: Data Sources
• Discussion of where the data came from
Federally Declared Disasters
• XX disasters (since [year]) have included at least one community in the GWRC planning area
• Disaster Types:
– Severe Storms and Flooding
– Tornadoes
– Tropical Storms & Hurricanes
– Winter Storms (Blizzards, Ice Storms)
Vulnerability Assessment
• Overview of what’s in the vulnerability assessment:
– Hazard maps
– Loss estimates
– Etc.
HAZUS MH
• Level I Analysis• Nationally-developed data for building square footage, building value, population characteristics, costs of building repair and economic data (broken down by census division units)
– Hurricane Winds
– Earthquake (via Commonwealth of Virginia hazard mitigation plan)
• HAZUS is not required in Local Mitigation Plans, however, communities are encouraged to use HAZUS to form a scientific basis from which the mitigation strategy is developed.
Flood
• Hazard overview
• How was the analysis done
• What data did you use
• Etc.
Flood Risk
• Flood maps (regional and/or local)D R A
F T

Flood Vulnerability
• Discussion of expected losses, highest vulnerabilities (specific areas), etc.
Repeat for each hazard
Regional Goals
Goal: general guideline that describes what GWRC would like to
achieve
Objective: specific and measurable strategies that must be implemented to achieve the identified goals
Action: more specific than an objective with identified
responsible parties, timeframes, and potential funding sources
Regional Goals
GOAL #1: Reduce the future impacts and losses from identified
hazards.
GOAL #2: Educate and engage the public regarding hazards,
their impacts, and feasible actions.
GOAL #3: Maximize the impact of public resources through
effective coordination and the efficient use of technology.
GOAL #4: Improve and enhance emergency management
capabilities.
Next Steps
• Update old actions
• Develop new actions
• Public Outreach D R A
F T

July 12, 2011 Mitigation Advisory Committee Meeting Minutes
1. Kevin Byrnes of the GWRC, called the HIRA and Mitigation Goals meeting to order at 10am and
asked the attendees to introduce themselves around the table. 2. Ryan Flaherty of the GWRC, presented the findings of the Hazard Identification and Vulnerability
Assessment (HIRA). The presentation included a discussion of the data analysis and subsequent hazard rankings and dollar losses from each hazard described in the plan. No issues/concerns were raised about the analysis or results.
3. Following the HIRA presentation, Carrie Speranza of Dewberry, presented the 2006 mitigation goals to the committee and asked for their review and approval for the 2012 plan. The following goals, and two objectives, were developed:
o Reduce the future impacts and losses from identified hazards. o Educate and engage the public regarding hazards, their impacts, and feasible actions. o Maximize the impact of public resources through effective coordination among agencies
and the efficient use of technology. Enhance interoperable communications among all agencies. Enhance public/private partnerships.
o Improve and enhance emergency management capabilities. 4. Carrie Speranza described the mitigation strategy “coaching timeline” that will be followed to
update this particular piece of the plan. (please see attachments) 5. The meeting was adjourned at 11:25am.
NEXT STEPS:
o The committee will review the HIRA document to be disseminated for review in the next couple weeks.
o The committee will review and update their 2006 mitigation actions (handed out at the meeting and attached to this email).
o The committee will develop new mitigation actions based upon the HIRA results for incorporation into the plan update.
o The committee will discuss and finalize the mitigation goals (and two objectives) developed at this meeting, at the next EM monthly meeting in August.
o Following the EM monthly meeting, and after each jurisdiction has developed draft mitigation actions, Dewberry will conduct a conference call with the committee to help finalize the mitigation actions and answer any questions that may arise in the process.
D R A
F T

D R A
F T

George Washington Regional Commission - Hazard Mitigation Plan Update
Regional Strategies and Public Outreach Meeting
Fredericksburg, Virginia, October 4, 2011, 8:30AM
I. Welcome & Introductions
II. Mitigation Strategy Review and Regional Strategy Development
III. Public Outreach – Jan Erkert
IV. Next Steps
V. Wrap Up & Future Meetings
Project Websites
SharePoint Site: http://projects.dewberry.com/GWRC2010/default.aspx
Email [email protected] if you need your password reset or other technical support
D R A
F T

D R A
F T

Hazard Mitigation Plan George Washington Regional Commission March 2012
APPENDIX D – 2006 MITIGATION STRATEGIES UPDATE
D R A
F T

Hazard Mitigation Plan George Washington Regional Commission March 2012
This page intentionally left blank.
D R A
F T

Mitigation Strategies
Strategy ID
# (when
provided)
Priority
H = High
M=Medium
L = Low
Project Status
(Not Started, Cancelled,
Modified, In Progress,
Completed)
If Delayed / Canceled Why? (Lack of
$, support, manpower, etc)
It is recommended to investigate the feasibility of updating
the Flood Insurance Studies and Flood Insurance Rate Maps
for Caroline County, the Town of Bowling Green, and the
Town of Port Royal. CC- 1 H Completed
Flood Insurance Rate Maps
competed 03/09
It is recommended to ensure proper elevation through retrofit
and anchoring of mobile homes and other attendant
appurtenances located in the floodplain to reduce the risk of
future flood damage. CC- 2 H Ongoing
Retrofits occur during
reconstruction.It is recommended to investigate safeguards against severe
weather including hurricane clips, safe rooms, community
shelters, and/or model shelters. CC- 3 L Not Started Subject to VAUSBC regulation
It is recommended to develop a Regional Public Awareness
Program. CC- 4 H In-Progress Caroline Alert System createdIt is recommended to initiate a GIS needs assessment and
program. CC- 5 H Completed Needs Assessment Done
It is recommended to establish a minimum standard for GIS
capabilities and data throughout the RADCO region as
jurisdictions begin to add GIS to their current hazard
mitigation capabilities. CC- 6 L Not Started Awaiting Regional Coordination
It is recommended to establish a clearinghouse of GIS data
for all RADCO jurisdictions. This will allow all jurisdictions to
have access to compatible data in order to better assess the
region and each community’s
vulnerability to the natural hazards iden CC- 7 L Not Started
Caroline GIS data available for
GWRC use. Awaiting Regional
Coordination
It is recommended to establish an early warning system for
jurisdictions in the RADCO region that can provide event-
distinct information to citizens and businesses. CC- 8 H In-Progress
Caroline Alert establised. Alert
systems need coordination.
It is recommended to improve the flexibility of the
transportation network through coordination with the Virginia
Department of Transportation (VDOT) and neighboring
regions. CC- 9 L Not Started Awaiting Regional Coordination
It is recommended to investigate the feasibility of establishing
a common means of communication, such as one radio
frequency or equipment to connect existing radio
frequencies, for use by all emergency services departments
in the RADCO region. CC- 10 H In-Progress
RFP for radio system upgrade
received and under review.
System upgade will ensure
interoperability with other
jurisdictions
Caroline County Mitigation Strategies
*Note* 2006 Mitigation Strategies for Towns of Bowling Green and Port Royal were
previously incorporated into Caroline County's.
D R A
F T

Mitigation Strategies
Strategy ID
# (when
provided)
Project Status
(Not Started, Cancelled, Modified,
In Progress, Completed)
If Delayed / Canceled Why?
(Lack of $, support, manpower,
etc)
It is recommended to investigate the feasibility of mitigating the City’s
repetitive loss structures from future flooding events. F- 1 Canceled Lack of funding
It is recommended to investigate the potential to include a provision
in the floodplain management ordinance that any project that
requires placement of fill in the floodplain will be required to provide
110 percent compensatory floodplain storage. F- 2 Completed
It is recommended to assist the Study Contractor in preparing
revised Digital Flood Insurance Rate Maps (FIRMs) by identifying
areas within the community, which flood frequently and are not
reflected appropriately on existing FIRMs. Additionally, provide F- 3 Completed
It is recommended to investigate participation in the Community
Rating System. F- 4 Cancelled
Lack of Staffing due to
budget cuts
It is recommended to develop and adopt development design
standards based upon FIREWISE principles into the City’s
subdivision ordinance. The design standards should include
standard setbacks from trees and above-ground propane tanks, and
minimum distance F- 5 Cancelled
Lack of Staffing due to
budget cuts
It is recommended to investigate safeguards against severe weather
including hurricane clips, safe rooms, community shelters, and/or
model shelters. F- 6 In Progress
Process is continuing &
involves several City
deparmtments.It is recommended to investigate warning systems for severe
weather. F- 7 Completed
It is recommended to identify all critical facilities using GIS. F- 8 In Progress
Process is continuing -
GIS installation is nearing
completion
It is recommended to identify priorities for protection among critical
facilities identified in the plan as well as methods for protection
against natural hazards, including the retrofitting of structures for
quick external power generator hook up. F- 9 In Progress
Process is continuing -
personnel & budget
reductions have slowed
the process.
It is recommended to develop a Regional Public Awareness
Program. F- 10 Cancelled
Lack of staffing due to
budget cuts
It is recommended to investigate the development of a community
based emergency contact network. F- 11 Cancelled
Lack of staffing due to
budget cutsIt is recommended to establish a minimum level of GIS data for the
City. F- 12 Completed
It is recommended to establish a clearinghouse of GIS data for all
RADCO jurisdictions. This will allow all jurisdictions to have access
to compatible data in order to better assess the region and each
community’s
vulnerability to the natural hazards iden F- 13 Cancelled
Lack of staffing due to
budget cutsIt is recommended to establish an early warning system for
jurisdictions in the RADCO region that can provide event-distinct
information to citizens and businesses. F- 14 Completed
It is recommended to improve the flexibility of the transportation
network through coordination with the Virginia Department of
Transportation (VDOT) and neighboring regions. F- 15 Cancelled
Lack of staffing due to
budget cuts
It is recommended to investigate the feasibility of establishing a
common means of communication, such as one radio frequency or
equipment to connect existing radio frequencies, for use by all
emergency services departments in the RADCO region. F- 16 In Progress
On-going process in
cooperation with other
agencies and City
departments
City of Fredericksburg Mitigation Strategies
D R A
F T

Mitigation Strategies
Strategy ID
# (when
provided)
Project Status
(Not Started, Cancelled, Modified,
In Progress, Completed)
If Delayed / Canceled Why?
(Lack of $, support, manpower,
etc)
City of Fredericksburg Mitigation Strategies
It is recommended to investigate and potentially purchase the
equipment required to eliminate radio communication gaps in
valleys. F- 17 CompletedIt is recommended to investigate and potentially purchase the
equipment required to eliminate radio communication gaps in
valleys. F- 18 Completed
D R A
F T

Action # Action
Project Status
(Not Started,
Cancelled, Modified,
In Progress,
Completed)
If Delayed / Canceled Why?
(Lack of $, support, manpower,
etc)
GWRC - 1It is recommended for all jurisdictions currently participating in the
National Flood Insurance Program (NFIP) remain compliant.Completed
GWRC -2
It is recommended to develop and conduct a multi-hazard, seasonal
Public Awareness Program that provides citizens and businesses
with accurate information describing the risk and vulnerability to
natural hazards, and is implemented on an annual basis.
Not Started or
Unknown, Will
Confirm with
Committee
Members
GWRC -3
It is recommended to establish a clearinghouse of GIS data for all
GWRC jurisdictions. This will allow all jurisdictions to have access to
compatible data in order to better assess the region and each
community’s vulnerability to the natural hazards identified in this
plan.
In Progress
GWRC -4
It is recommended to establish a minimum standard for GIS
capabilities and data throughout the GWRC region as jurisdictions
begin to add GIS to their current hazard mitigation capabilities.
In Progress
GWRC -5
It is recommended to establish an early warning system, such as
river gauging and flood warning systems, for jurisdictions in the
GWRC region that can provide event-distinct information to citizens
and businesses.
Flood gauge
installed on
Rappahannock
River by the City
GWRC - 6
It is recommended to improve the flexibility of the transportation
network through coordination with the Virginia Department of
Transportation (VDOT) and neighboring regions. The following
actions were suggested by the HMPC:
GWRC - 6.1
Improve signage along major interstates and thoroughfares with
interactive signs, operated by VDOT, to provide hazard warnings,
including weather reports during tornado and hurricane events, road
closings and blockages. The signs can also alert motorists to call
511 for road conditions, or to tune their radios to the emergency
radio station for up-to-date conditions. Suggested locations include I-
95 and Routes 1, 3, 17, 301, and 610.
GWRC - 6.2Investigate emergency lane/shoulder improvements for Emergency
Services access on all primary roads.
GWRC - 6.3 Identify and publicize local evacuation routes throughout the region.
GWRC - 6.4Identify traffic plan/alternate routes due to closures on primary routes
such as 1, 3, 17, 301, and 610.
GWRC - 6.5Coordinate locally with VDOT on updates to VDOT’s Regional
Transportation Plans.
GWRC - 6.6
Purchase and place into operation AM radio stations along routes to
relay emergency information to motorists during a disaster or
emergency.
GWRC - 6.7Facilitate discussions with neighboring regions on traffic flow for
emergency service vehicles.
GWRC -7
It is recommended to investigate the feasibility of establishing a
common means of communication, such as one radio frequency or
equipment to connect existing radio frequencies, for use by all
emergency services departments in the GWRC region.
GWRC -8
It is recommended to investigate and potentially purchase the
equipment required to eliminate radio communication gaps in
valleys.
GWRC Mitigation Strategies
In Progress
through Regional
Inter-Operability
Communications
Group monthly
meetings
In progress,
presentation
planned to
FAMPO Technical
Advisory
Committee in
Spetember to add
emergency
signage and
regional disaster
traffic mitigation
plan to Unified
Plannig Work
Program.D R A
F T

Mitigation Strategies
Strategy ID
# (when
provided)
Priority
H = High
M=Medium L
= Low
Project Status
(Not Started, Cancelled,
Modified, In Progress,
Completed)
If Delayed / Canceled Why?
(Lack of $, support,
manpower, etc)
Revise and create Digital Flood Insurance Rate Maps
(FIRMs) by identifying areas within the community, that flood
frequently, and are not reflected appropriately on the existing FIRMs.
Additionally, providing GIS capabilities and upcoming aerial
photograph KG- 1 H Completed
Update the County Ordinance and Zoning to prohibit construction of
large occupancy structures within identified hazard areas, such as
floodplains or areas adjacent to hazardous materials facilities. KG- 2 H Cancelled Applying alternativeUpdate the existing floodplain ordinance to require first floor
elevations in the floodplain to be constructed at the base flood
elevation plus 2 feet. KG- 3 M Cancelled Exceeds requirements
Develop and adopt development design standards based upon
FIREWISE principles into a subdivision ordinance. The design
standards should include standard setbacks from trees and above-
ground propane tanks, and minimum distances from fire hydrants. KG- 4 L Cancelled Not feasible
Ensure all new construction of critical facilities includes hurricane
shutters and straps, safe rooms, fire walls, and sprinkler systems. KG- 5 H Completed
Identify priorities for protection among critical facilities identified in
the plan as well as methods for protection against natural hazards,
including the retrofitting of structures for quick external power
generator hook up and purchasing required generators. KG- 6 H CompletedEstablish a County ordinance that requires future development of
mobile home parks to include a community shelter for citizen
protection in the event of a disaster or emergency. KG- 7 M Cancelled
Not economically
feasible
Develop a Regional Public Awareness Program. KG- 8 H Not Started Regional activityContinue the use of KGALERT to distribute preparedness
information to citizens. KG- 9 M CompletedDevelop a “hotline” for citizens to call for non-emergency information
during a disaster. KG- 10 M Completed
Encourage and provide incentives for citizens to purchase a home
generator and for local contractors and builders to include home
generators in all homes built in King George County. A county
ordinance would be the preferred method. KG- 11 M Cancelled
Not economically
feasible
Implement citizen notification System for potential dam failures. KG- 12 M CompletedEstablish a minimum standard for GIS capabilities and data
throughout the RADCO region as jurisdictions begin to add GIS to
their current hazard mitigation capabilities. KG- 13 n/a Not Started Regional activity
Establish a clearinghouse of GIS data for all RADCO jurisdictions.
This will allow all jurisdictions to have access to compatible data in
order to better assess the region and each community’s vulnerability
to the natural hazards identified in this plan. KG- 14 M Not Started Regional activityProvide additional money to Community Development for the aerial
photography to be created from the County flyover in Spring 2006, to
improve disaster preparedness capability. KG- 15 M CompletedEstablish an early warning system for jurisdictions in the RADCO
region that can provide event-distinct information to citizens and
businesses. KG- 16 H
Completed at KG
levelImprove the flexibility of the transportation network through
coordination with the Virginia Department of Transportation (VDOT)
and neighboring regions. KG- 17 M In Progress
Investigate the feasibility of establishing one radio frequency for use
by all emergency services departments in the RADCO Region. KG- 18 M In Progress Regional activity
King George County Mitigation Strategies
D R A
F T

Mitigation Strategies
Strategy ID
# (when
provided)
Priority
H = High
M=Medium L
= Low
Project Status
(Not Started, Cancelled,
Modified, In Progress,
Completed)
If Delayed / Canceled Why?
(Lack of $, support,
manpower, etc)
King George County Mitigation Strategies
Investigate and potentially purchase the equipment required to
eliminate radio communication gaps in valleys. KG- 19 H Completed
D R A
F T

Mitigation Strategies
Strategy ID # (when
provided)
Project Status
(Not Started, Cancelled,
Modified, In Progress,
Completed)
If Delayed / Canceled Why? (Lack
of $, support, manpower, etc)
It is recommended to investigate the need to include a
provision in the floodplain management ordinance that
any project that requires the placement of fill in the
floodplain will be required to provide 110 percent
compensatory floodplain storage. SP- 1 Complete
It is recommended to develop a comprehensive local
stormwater management ordinance that provides
water quality protection that could compensate for
loopholes in related state erosion and sediment control
laws, such as the 1 percent loophole noted in Minim SP- 2 Complete
It is recommended to develop and adopt development
design standards based upon FIREWISE principles
and defensible space into the County’s subdivision
ordinance. The design standards should include
standard setbacks from trees and above-ground
propane tank SP- 3 in progress
It is recommended to create a multi-season power line
right-of-way maintenance plan in conjunction with
Virginia Dominion Power and Rappahannock Electric
Cooperative SP- 4 Not Started
Not appropriate to Subd. Ord,
setbacks in zoning
It is recommended to identify priorities for protection
among critical facilities identified in this plan as well as
methods for protection against natural hazards,
including the retrofitting of structures for quick external
power generator hook up. SP- 5 In Progress
It is recommended to develop a Regional Public
Awareness Program. SP- 6 in progress
It is recommended to develop a Weather Spotter
program within the County. SP- 7 In progress
It is recommended to establish a minimum standard for
GIS capabilities and data throughout the RADCO
region as jurisdictions begin to add GIS to their current
hazard mitigation capabilities. SP- 8 In progress
It is recommended to establish a clearinghouse of GIS
data for all RADCO jurisdictions. This will allow all
jurisdictions to have access to compatible data in order
to better assess the region and each community’s
vulnerability to the natural hazards iden SP- 9 in progress
It is recommended to establish an early warning
system for jurisdictions in the RADCO region that can
provide event-distinct information to citizens and
businesses. SP- 10 Complete
It is recommended to improve the flexibility of the
transportation network through coordination with the
Virginia Department of Transportation (VDOT) and
neighboring regions. SP- 11 In Progress
Spotsylvania County Mitigation Strategies
D R A
F T

Mitigation Strategies
Strategy ID # (when
provided)
Project Status
(Not Started, Cancelled,
Modified, In Progress,
Completed)
If Delayed / Canceled Why? (Lack
of $, support, manpower, etc)
Spotsylvania County Mitigation Strategies
It is recommended to investigate the feasibility of
establishing a common means of communication, such
as one radio frequency or equipment to connect
existing radio frequencies, for use by all emergency
services departments in the RADCO region. SP- 12 In progress
It is recommended to investigate and potentially
purchase the equipment required to eliminate radio
communication gaps in valleys SP- 13 In progress
D R A
F T

Mitigation Strategies
Strategy ID
# (when
provided)
Project Status
(Not Started, Cancelled, Modified, In Progress,
Completed)
If Delayed / Canceled Why?
(Lack of $, support,
manpower, etc)
It is recommended to investigate the feasibility of
mitigating the County’s repetitive loss structures and
historic homes from future flooding events
ST- 1
In progress - Letters were sent to all repetitive loss
area homeowners notifying of the danger and
recommended course of action to protect their home
and property from flooding (as part of Community
Rating System Program). No physical mitigation was
done.
It is recommended to ensure proper elevation through
retrofit and anchoring of mobile homes and other
attendant appurtenances located in the floodplain to
reduce the risk of future flood damage.
ST- 2 Not StartedStaffing, funding and resources
available
It is recommended to increase the inspection cycle for
public and private storm water detention/retention
facilities.
ST- 3
The Public Works Department now requires formal
maintenance inspections of stormwater management
facilities at least once every two years by County staff
or the owner. Additionally, the standard Maintenance
Agreement for Stormwater Facilities requires more
frequent inspections by the owner than our formal
inspection program requires.
It is recommended to develop and adopt development
design standards based upon FIREWISE principles and
defensible space into the County’s subdivision
ordinance. The design standards should include
standard setbacks from trees and above-ground
propane tank
ST- 4 Not Started Staffing and resources available
It is recommended to investigate safeguards against
severe weather including hurricane clips, safe rooms,
community shelters, and/or model shelters.
ST- 5
Completed - implemented public warning system,
attached that to social media, identified shelters and
created CERT program.
It is recommended to investigate the development of a
tree-trimming program, which includes training for local
contractors.
ST- 6 Not Started Staffing and resources available
It is recommended to identify all critical facilities using
GIS.ST- 7 Completed
It is recommended to identify priorities for protection
among critical facilities identified in this plan as well as
methods for protection against natural hazards,
including the retrofitting of structures for quick external
power generator hook up.
ST- 8Completed - Generators installed at all critical public
facilities.
It is recommended to develop a Regional Public
Awareness Program.ST- 9
In progress - Stafford has utilized the national model
to reach out to communities on National
Preparedness Month as well as woking with the NOVA
region to develop a Regional preparedness web site
ReadyNova.org.
It is recommended to establish a minimum standard for
GIS capabilities and data throughout the RADCO region
as jurisdictions begin to add GIS to their current hazard
mitigation capabilities.
ST- 10 Not Started Staffing and resources available
It is recommended to establish a clearinghouse of GIS
data for all RADCO jurisdictions. This will allow all
jurisdictions to have access to compatible data in order
to better assess the region and each community’s
vulnerability to the natural hazards
ST- 11 Not Started Staffing and resources available
Stafford County Mitigation Strategies
D R A
F T

Mitigation Strategies
Strategy ID
# (when
provided)
Project Status
(Not Started, Cancelled, Modified, In Progress,
Completed)
If Delayed / Canceled Why?
(Lack of $, support,
manpower, etc)
Stafford County Mitigation Strategies
It is recommended to establish an early warning system
for jurisdictions in the RADCO region that can provide
event-distinct information to citizens and businesses.
ST- 12 Completed
It is recommended to investigate the feasibility of
establishing a common means of communication, such
as one radio frequency or equipment to connect existing
radio frequencies, for use by all emergency services
departments in the RADCO region.
ST- 13
Completed - Stafford has the ability to communicate
with VHF and 700/800MHz digital voice radio with all
surrounding jurisdictions. We also have the ability to
link our system to other radio systems and hospitals
N/A
D R A
F T

Hazard Mitigation Plan
George Washington Regional Commission
March 2012
APPENDIX E – PUBLIC OUTREACH
D R A
F T

Hazard Mitigation Plan
George Washington Regional Commission
March 2012
This page intentionally left blank.
D R A
F T

Hazard Mitigation Plan
George Washington Regional Commission
March 2012
E-1
The following are screenshots of where this mitigation plan was posted to each of the participating jurisdictions’ websites. These constitute the first public outreach effort to incorporate public input into the planning process. The plan was posted to these websites for a minimum of two weeks between the middle of December, 2011 to early January, 2012. All of the jurisdictions, as well as the region, posted the plan to their website, with the exception of the Town of Port Royal, which doesn’t have a website.
George Washington Regional Commission Draft Plan Notice
12-13-11
http://www.gwregion.org/regional-planning/reports-and-studies/ D R A
F T

Hazard Mitigation Plan
George Washington Regional Commission
March 2012
E-2
Town of Bowling Green Draft Plan Notice
12-19-11
http://www.townofbowlinggreen.com/?q=node/182 D R
A F
T
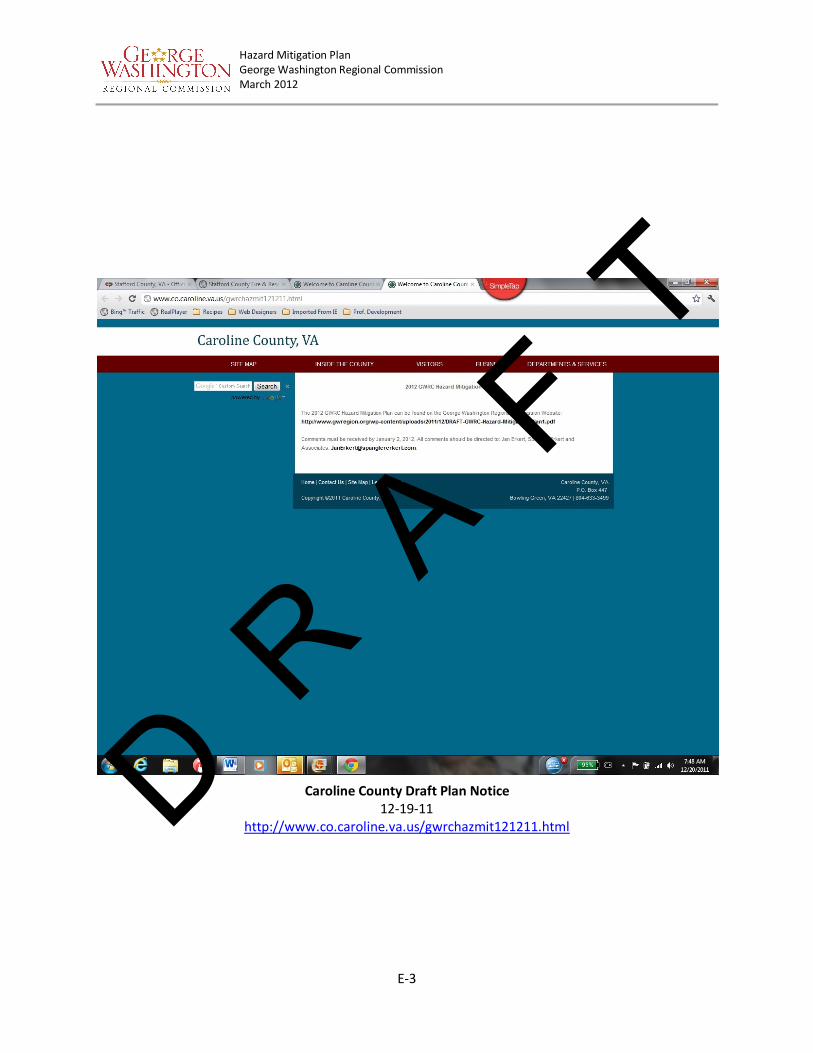
Hazard Mitigation Plan
George Washington Regional Commission
March 2012
E-3
Caroline County Draft Plan Notice
12-19-11
http://www.co.caroline.va.us/gwrchazmit121211.html D R A
F T

Hazard Mitigation Plan
George Washington Regional Commission
March 2012
E-4
City of Fredericksburg Draft Plan Notice
12-19-11
http://www.fredericksburgva.gov D R
A F
T

Hazard Mitigation Plan
George Washington Regional Commission
March 2012
E-5
King George County Draft Plan Notice
12-19-11
http://www.king-george.va.us/ D R A
F T

Hazard Mitigation Plan
George Washington Regional Commission
March 2012
E-6
Spotsylvania County Draft Plan Notice
12-19-11
http://spotsylvania.va.us/content/2614/147/2740/169/205/default.aspx D R
A F
T
Hazard Mitigation Plan
George Washington Regional Commission
March 2012
E-7
Stafford County Draft Plan Notice
12-19-11
http://www.staffordfirerescue.com/content/tech/ D R A
F T

Hazard Mitigation Plan
George Washington Regional Commission
March 2012
E-8
This page intentionally left blank.
D R A
F T