LOCAL LEVEL HAZARD MAPS - ReliefWeb
34
POLICY BRIEF LOCAL LEVEL HAZARD MAPS Comprehensive Disaster Management Programme (CDMPII) Ministry of Disaster Management and Relief
-
Upload
khangminh22 -
Category
Documents
-
view
0 -
download
0
Transcript of LOCAL LEVEL HAZARD MAPS - ReliefWeb
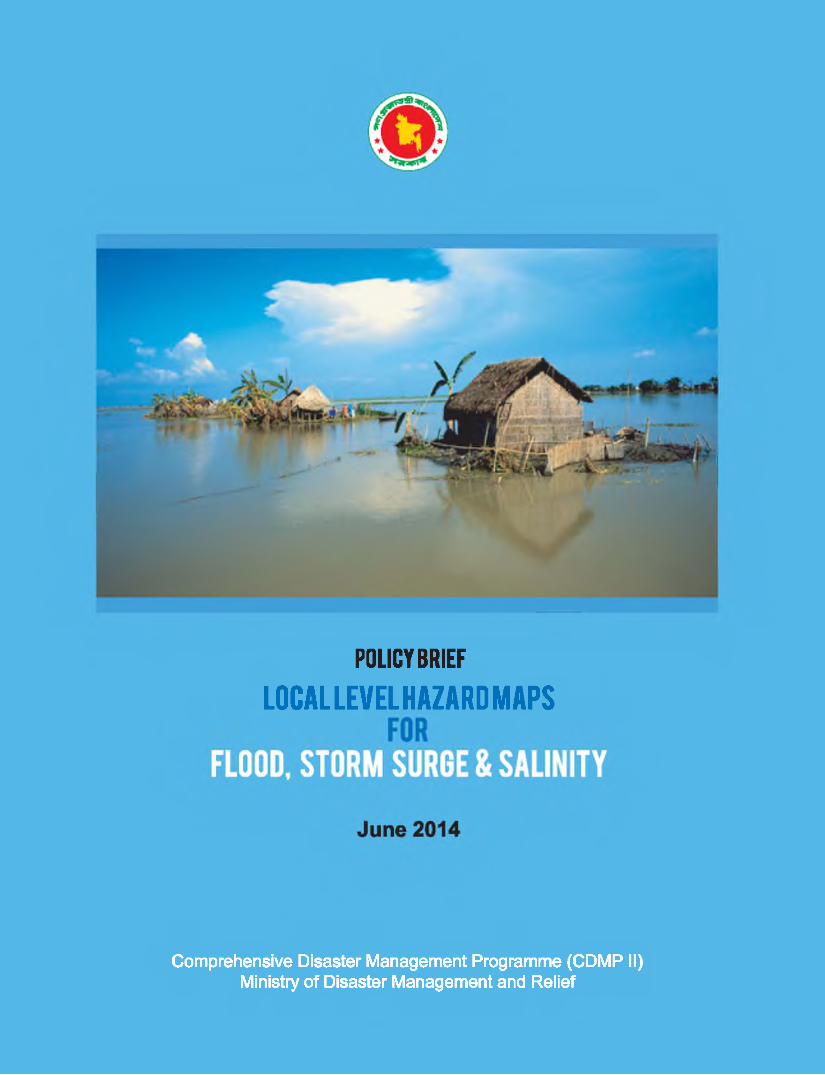
POLICY BRIEFLOCAL LEVEL HAZARD MAPS
Comprehensive Disaster Management Programme (CDMPII)Ministry of Disaster Management and Relief
POLICY BRIEF
LOCALLEVELHAZARDMAPS FOR
FLOOD, STORM SURGE & SALINITY
June 2014
Study Conducted by
Institute of Water Modeling
Supported byComprehensive Disaster Management Programme (CDMP II)
Ministry of Disaster Management and Relief
POLICY BRIEFLOCAL LEVEL HAZARD MAPS FORFLOOD, STORM SURGE & SALINITY
First Published in June 2014Comprehensive Disaster Management Programme (CDMPII) Department of Disaster Management Building (6th Floor) 92-93 Mohakhali C/A, Dhaka-1212, Bangladesh e-mail: [email protected] website: www.cxJmp.org.bd
Copyright@CDMP II2014All rights reserved. Reproduction, copy, transmission or translation of any part of the publication may be made with the prior written permission of the publisher.
Compiled from the main report byMirza Shawkat Ali, CDMP II Sanjib Kumar Saha, CDMP II G6ran Jonsson, UNDP
Design & PrintingReal Printing & AdvertisingKR Plaza, 31 Purana Paltan, 5th Floor, Dhaka-1000
This Policy Brief should be cited asComprehensive Disaster Management programme (CDMP II), 2014. "Policy Brief: Local Level Hazard Maps for Flood, Storm Surge & Salinity" Ministry of Disaster Management and Relief, Dhaka.
A. Storm Surge InundationB. Flood Inundation Maps
Flood Map for Base ConditionFlood Map for Climate Change Condition
C. SalinitySalinity/Salinity Intrusion Maps of the Coastal Area Salinity Distribution Map
- . kRecommendations
fmSr
17
212121
25


SecretaryMinistry of Disaster Management and Relief
MessageBangladesh is a disaster prone country and suffers from innumerable natural calamities. It is predicted, in the changing climate, the country will be even more vulnerable and all the development gains may suffer due to climate change impacts. As a developing country, our response towards climate change impact is to improve the resilience of the local communities through Climate Change Adaptation and Disaster Risk Reduction.
I am delighted to know that Comprehensive Disaster Management Programme (CDMP II) has completed several studies on climate change adaptation to improve the existing knowledge base of the country. The study, "Local Level Hazard Maps for Flood, Storm Surge and Salinity" has generated Flood, Storm Surge and Salinity Maps for Base and Future Climate Change Condition.
I appreciate CDMP II for further taking the initiative to develop a Policy Brief, taking excerpts from the main study, which can be used as a handy tool for decision making and in the planning purposes.
It is my expectation that this Policy Brief will be of great help to the Policy Makers, planners and relevant officials, while taking various decisions at National and Local level as well as during preparation of plans for local level adaptation.
Mesbah ul Alam
1

National Project Director Comprehensive Disaster Management Programme (CDMP II)
/
ForewordBangladesh is recognized globally as one of the most vulnerable countries to climate change impacts. Due to its geographical location, the country is prone to natural disasters. Climate change impact is predicted to further aggravate the existing vulnerability of the country and affect the much needed development gains that Bangladesh has attained over the years.
Though Bangladesh is highly vulnerable to Natural Disaster and Climate Change impacts, our technical/scientificknowledge base on climate induced vulnerability is quite low; most of the vulnerability information is based on few national and international studies. It is worthwhile to mention, as climate change is a slowonset event, collecting climate change related information requires longer time frame; often years, even decades. Taking the urgency into consideration,Comprehensive Disaster Management Programme (CDMP II) commissioneda series of research studies on climate change adaptation and disaster risk reduction. Recently four studies have been completed.The Study,"Local Level Hazard Maps for Flood, Storm Surge and Salinity" was conducted by Institute of Water Modeling, Bangladesh. The study has generated Union Level Flood, Storm Surge and Salinity maps for both base and climate change scenario, which is expected to support Climate Change Adaptation and Disaster Management Activities.
Drawing on the above mentioned study,a 'Policy Brief' hasbeen prepared, with the intention of assisting the policy makers, government officials, planners at various Ministries and Departments to understand the vulnerabilities of the respective sectors and areas of the country, enabling them to take informed decision for design/implementation of development initiatives.
I believe, thisstudy will contribute to the existing national knowledge pool on climate change and related vulnerabilities. I also believe,thisPolicy Brief will be a handy tool for Policy makers, planners and government officials in guiding their decision making and planning process.
Mohammad Abdul Qayyum
3

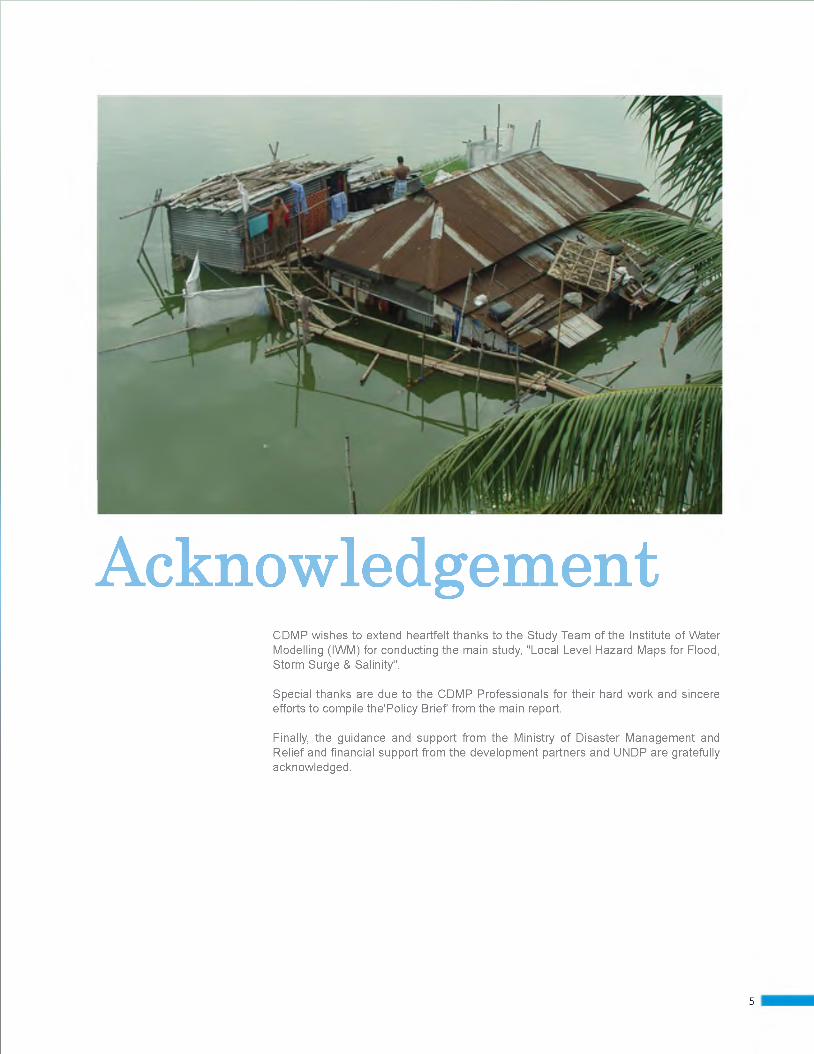
AcknowledgementCDMP wishes to extend heartfelt thanks to the Study Team of the Institute of Water Modelling (IWM) for conducting the main study, "Local Level Hazard Maps for Flood, Storm Surge & Salinity".
Special thanks are due to the CDMP Professionals for their hard work and sincere efforts to compile the'Policy Brief' from the main report.
Finally, the guidance and support from the Ministry of Disaster Management and Relief and financial support from the development partners and UNDP are gratefully acknowledged.
5 I

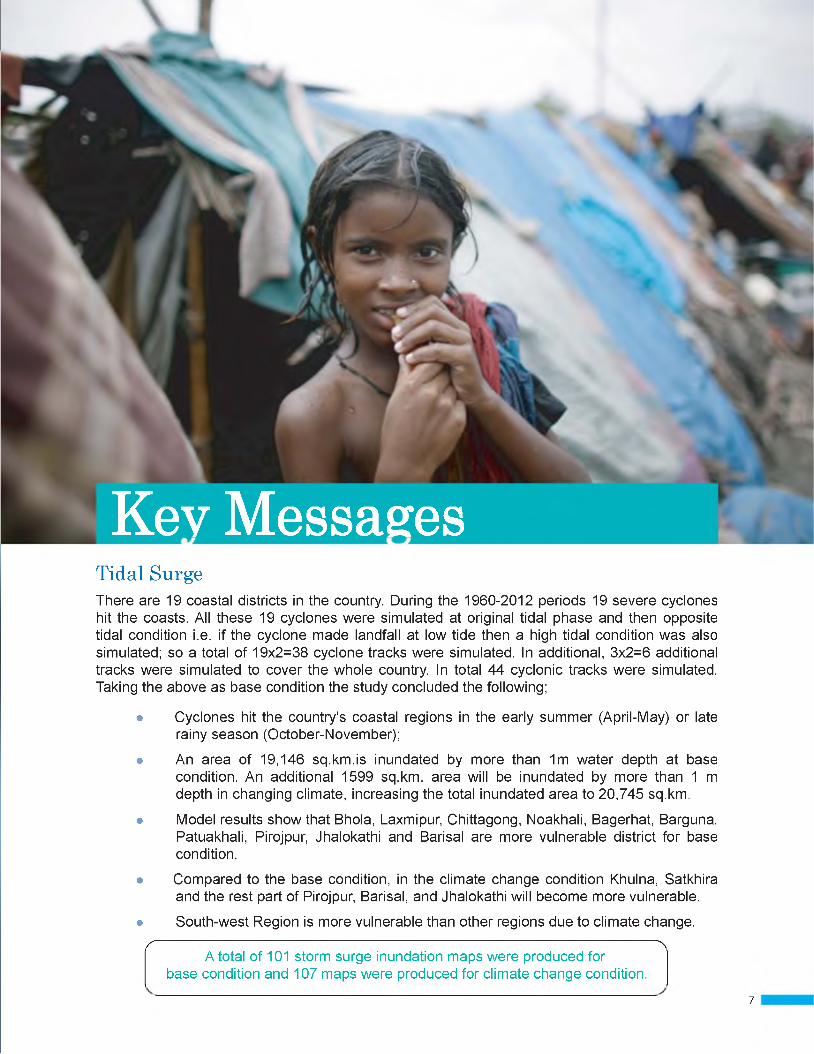
Key MessagesTidal SurgeThere are 19 coastal districts in the country. During the 1960-2012 periods 19 severe cyclones hit the coasts. All these 19 cyclones were simulated at original tidal phase and then opposite tidal condition i.e. if the cyclone made landfall at low tide then a high tidal condition was also simulated; so a total of 19x2=38 cyclone tracks were simulated. In additional, 3x2=6 additional tracks were simulated to cover the whole country. In total 44 cyclonic tracks were simulated. Taking the above as base condition the study concluded the following;
• Cyclones hit the country's coastal regions in the early summer (April-May) or late rainy season (October-November);
• An area of 19,146 sq.km.is inundated by more than 1m water depth at base condition. An additional 1599 sq.km. area will be inundated by more than 1 m depth in changing climate, increasing the total inundated area to 20,745 sq.km.
• Model results show that Bhola, Laxmipur, Chittagong, Noakhali, Bagerhat, Barguna, Patuakhali, Pirojpur, Jhalokathi and Barisal are more vulnerable district for base condition.
• Compared to the base condition, in the climate change condition Khulna, Satkhira and the rest part of Pirojpur, Barisal, and Jhalokathi will become more vulnerable.
• South-west Region is more vulnerable than other regions due to climate change.s x
A total of 101 storm surge inundation maps were produced for base condition and 107 maps were produced for climate change condition.
7
Local Vel HazardajMs forFlod , SOrm Sigte & S a ly n it
Flood Inundation
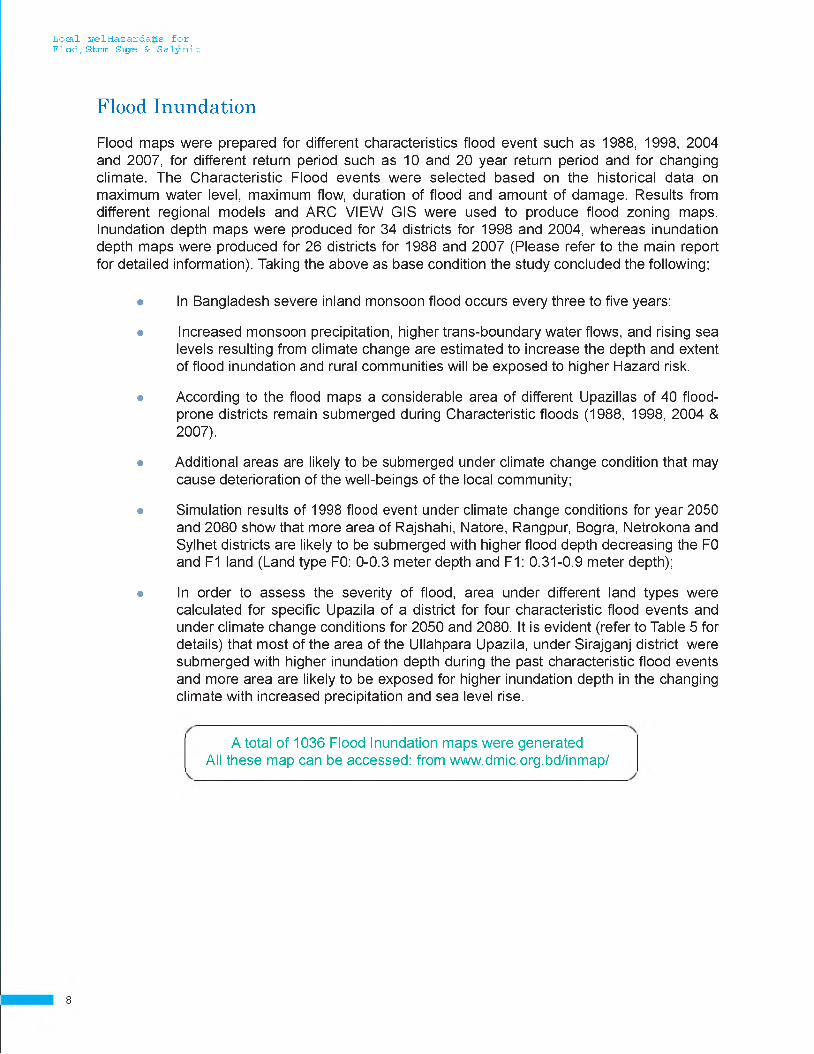
Flood maps were prepared for different characteristics flood event such as 1988, 1998, 2004 and 2007, for different return period such as 10 and 20 year return period and for changing climate. The Characteristic Flood events were selected based on the historical data on maximum water level, maximum flow, duration of flood and amount of damage. Results from different regional models and ARC VIEW GIS were used to produce flood zoning maps. Inundation depth maps were produced for 34 districts for 1998 and 2004, whereas inundation depth maps were produced for 26 districts for 1988 and 2007 (Please refer to the main report for detailed information). Taking the above as base condition the study concluded the following;
• In Bangladesh severe inland monsoon flood occurs every three to five years;
• Increased monsoon precipitation, higher trans-boundary water flows, and rising sea levels resulting from climate change are estimated to increase the depth and extent of flood inundation and rural communities will be exposed to higher Hazard risk.
• According to the flood maps a considerable area of different Upazillas of 40 flood- prone districts remain submerged during Characteristic floods (1988, 1998, 2004 & 2007).
• Additional areas are likely to be submerged under climate change condition that may cause deterioration of the well-beings of the local community;
• Simulation results of 1998 flood event under climate change conditions for year 2050 and 2080 show that more area of Rajshahi, Natore, Rangpur, Bogra, Netrokona and Sylhet districts are likely to be submerged with higher flood depth decreasing the F0 and F1 land (Land type F0: 0-0.3 meter depth and F1: 0.31-0.9 meter depth);
• In order to assess the severity of flood, area under different land types were calculated for specific Upazila of a district for four characteristic flood events and under climate change conditions for 2050 and 2080. It is evident (refer to Table 5 for details) that most of the area of the Ullahpara Upazila, under Sirajganj district were submerged with higher inundation depth during the past characteristic flood events and more area are likely to be exposed for higher inundation depth in the changing climate with increased precipitation and sea level rise.
A total of 1036 Flood Inundation maps were generated All these map can be accessed: from www.dmic.org.bd/inmap/
8
Salinity
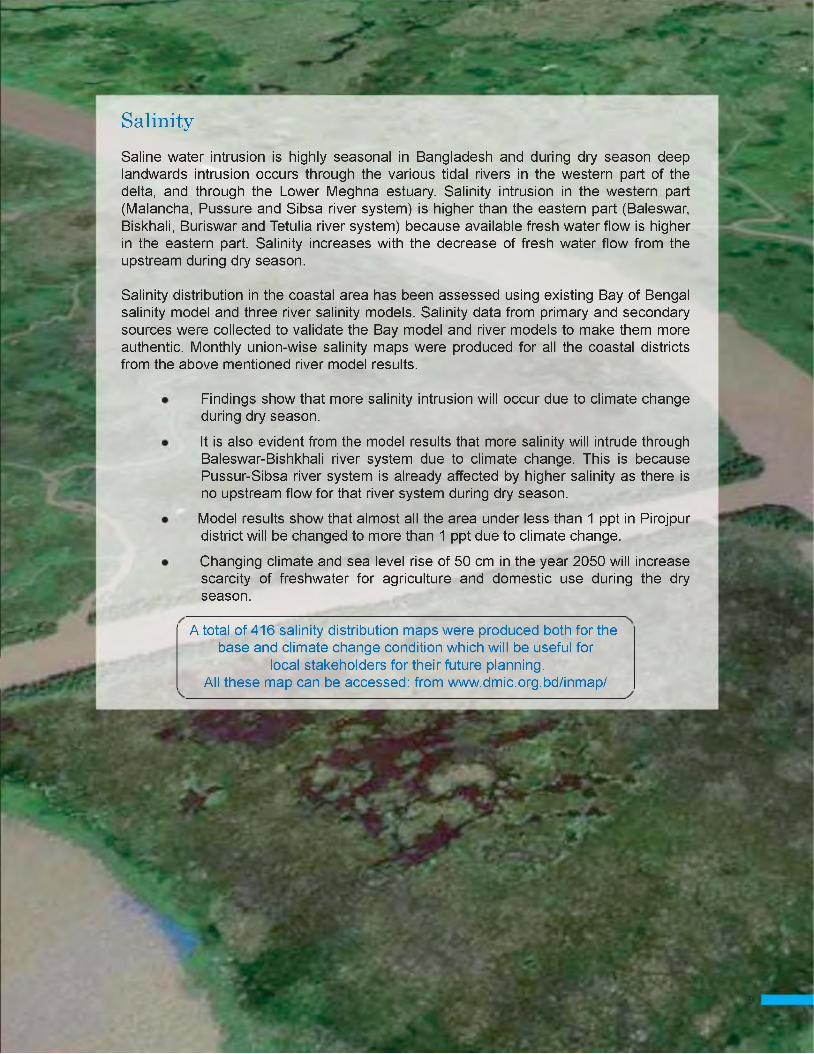
Saline water intrusion is highly seasonal in Bangladesh and during dry season deep landwards intrusion occurs through the various tidal rivers in the western part of the delta, and through the Lower Meghna estuary. Salinity intrusion in the western part (Malancha, Pussure and Sibsa river system) is higher than the eastern part (Baleswar, Biskhali, Buriswar and Tetulia river system) because available fresh water flow is higher in the eastern part. Salinity increases with the decrease of fresh water flow from the upstream during dry season.
Salinity distribution in the coastal area has been assessed using existing Bay of Bengal salinity model and three river salinity models. Salinity data from primary and secondary sources were collected to validate the Bay model and river models to make them more authentic. Monthly union-wise salinity maps were produced for all the coastal districts from the above mentioned river model results.
Findings show that more salinity intrusion will occur due to climate change during dry season.
It is also evident from the model results that more salinity will intrude through Baleswar-Bishkhali river system due to climate change. This is because Pussur-Sibsa river system is already affected by higher salinity as there is no upstream flow for that river system during dry season.
Model results show that almost all the area under less than 1 ppt in Pirojpur district will be changed to more than 1 ppt due to climate change.
Changing climate and sea level rise of 50 cm in the year 2050 will increase scarcity of freshwater for agriculture and domestic use during the dry season.
A total of 416 salinity distribution maps were produced both for the base and climate change condition which will be useful for
local stakeholders for their future planning.All these map can be accessed: from www.dmic.org.bd/inmap/

Local Level Hazard Maps for Flood, Storm Surge & Salinity
Bangladesh is a disaster prone country, which comprises unique geographical, geological and climatic settings with dynamic ecological characteristics governed by three large river systems - the Ganges, the Brahmaputra and the Meghna. Due to its location in the low-lying deltaic floodplains at the convergence of those three Rivers, heavy monsoon rainfall associated with poor drainage often results in annual flooding. About 21 percent of the country is subject to annual flooding and an additional 42 percent is atrisk of floods with varied intensity.
The coastal zone of Bangladesh is vulnerable to cyclonic storm surges and salinity intrusion, with the propensity to damage infrastructures, agriculture and aquaculture. The frequency and intensity of cyclone induced storm surges are likely to increase in the changing climate; exacerbated by a rising mean sea level; consequently the risk of associated Hazards are quite high. In this scenario the local communitiesin the coastal districts always bear the brunt of disasters and the changing climate.
Hazard MapsTo assess the vulnerability context of local communities, Comprehensive Disaster Management Programme (CDMP II) of the Ministry of Disaster Management and Relief has developed and introduced a simple and uniform Community Risk Assessment (CRA) methodology; as the basic building block of CDMP where the communities assess their own risk or hazard at present and in the changing climate. In order to assess community hazard, preparation of Hazard map of flood, storm surge and salinity maps are of immense importance. This union level maps may support and sustain disaster management activities at the Community level. The study prepared local level hazard maps on the following;
A. Storm Surge InundationB. Flood Inundation andC. Salinity of Coastal Area
10
Local Ve 1 HazardajMs forFlod , SOrm Sige & S a ly n it
The following sections provide illustrations on these.
A. Storm Surge InundationCyclones hit the country's coastal regions in the early summer (April-May) or late rainy season (October-November)
Cyclonic storms affect the coastal region of Bangladesh on a regular basis and cause heavy loss of life and property. The exposed coastal region on the Bay of Bengal suffers the worst because most of the tropical cyclones have their genesis over the Bay of Bengal and strike the coast of Bangladesh. The vulnerability of coastal areas to storm surge flooding is considerably high, since it is predominantly low-lying and characterized by numerous tidal rivers and polders. Usually cyclones hit the country's coastal regions in the early summer (April-May) or late rainy season (October-November).
During the last 52 years (1960-2012) about 19 severe cyclones hit the coast of Bangladesh
During the last 52 years (1960-2012) about 19 severe cyclones hit the coast of Bangladesh. All these 19 cyclones were simulated at original tidal phase and then opposite tidal condition i.e. if the cyclone made landfall at low tide then a high tidal condition was also simulated; so a total of 19x2=38 cyclone tracks were simulated. In additional, 3x2=6 additional synthetic tracks were simulated to cover the whole country. In total 44 cyclonic tracks were simulated in the country.
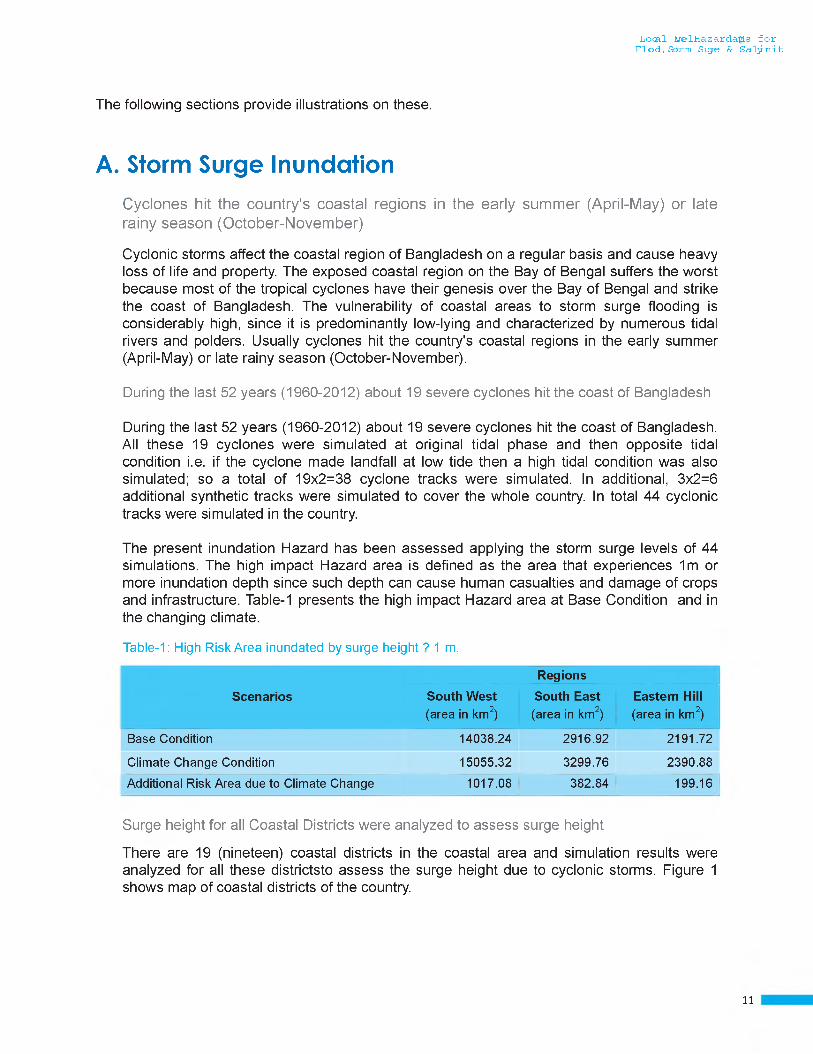
The present inundation Hazard has been assessed applying the storm surge levels of 44 simulations. The high impact Hazard area is defined as the area that experiences 1m or more inundation depth since such depth can cause human casualties and damage of crops and infrastructure. Table-1 presents the high impact Hazard area at Base Condition and in the changing climate.
Table-1: High Risk Area inundated by surge height ? 1 m.
ScenariosRegions
South West(area in km2)
South East(area in km2)
Eastern Hill(area in km2)
Base Condition 14038.24 2916.92 2191.72
Climate Change Condition 15055.32 3299.76 2390.88
Additional Risk Area due to Climate Change 1017.08 382.84 199.16
Surge height for all Coastal Districts were analyzed to assess surge height
There are 19 (nineteen) coastal districts in the coastal area and simulation results were analyzed for all these districtsto assess the surge height due to cyclonic storms. Figure 1 shows map of coastal districts of the country.
11
Local Vel HazardajMs forFlod , SOrm Sigte & S a ly n it
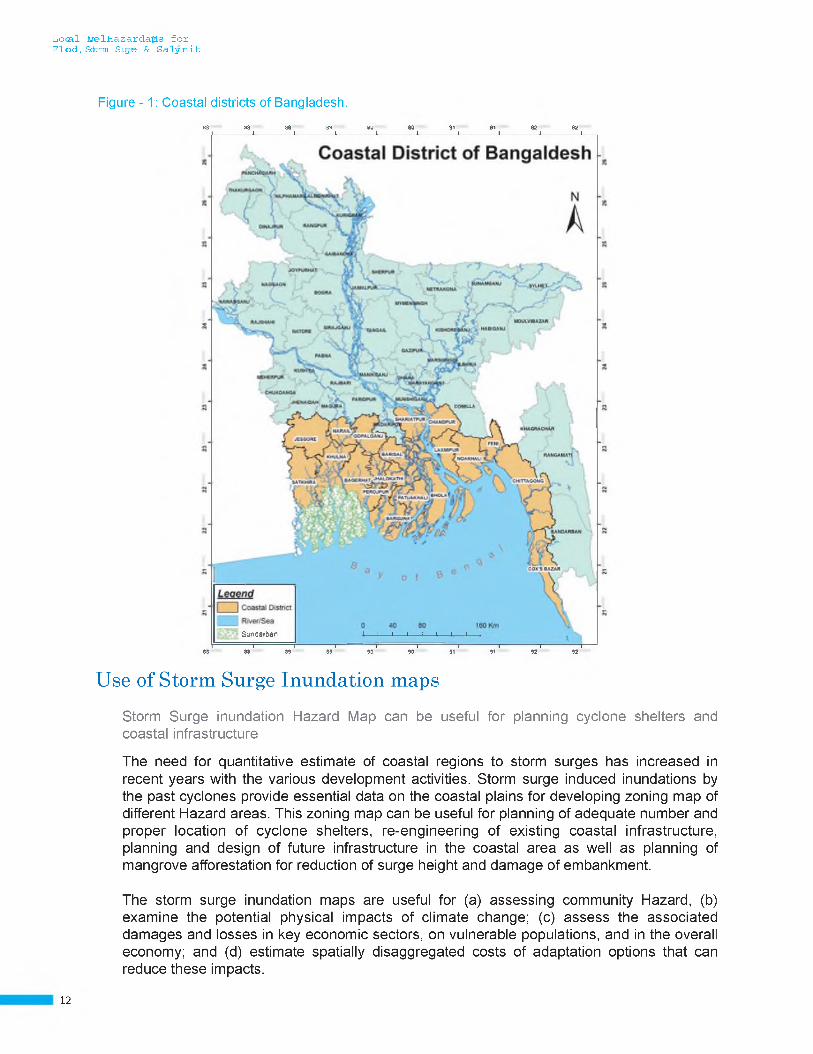
Figure - 1: Coastal districts of Bangladesh.
88 88 89 89 90 90 91 91 92 92__________________I__________________I_________________ I__________________I_________________ I__________________I_________________ I__________________I__________________L
Sundarban I---- 1---- 1---- 1---- 1---- 1---- 1---- 1---- 1-----------1----------------------1-----------1-----------1-----------1-----------1-----------1-----------1----
88 88 89 89 90 90 91 91 92 92
Use of Storm Surge Inundation maps
Storm Surge inundation Hazard Map can be useful for planning cyclone shelters and coastal infrastructure
The need for quantitative estimate of coastal regions to storm surges has increased in recent years with the various development activities. Storm surge induced inundations by the past cyclones provide essential data on the coastal plains for developing zoning map of different Hazard areas. This zoning map can be useful for planning of adequate number and proper location of cyclone shelters, re-engineering of existing coastal infrastructure, planning and design of future infrastructure in the coastal area as well as planning of mangrove afforestation for reduction of surge height and damage of embankment.
The storm surge inundation maps are useful for (a) assessing community Hazard, (b) examine the potential physical impacts of climate change; (c) assess the associated damages and losses in key economic sectors, on vulnerable populations, and in the overall economy; and (d) estimate spatially disaggregated costs of adaptation options that can reduce these impacts.
12
Local Ve 1 HazardajMs forFlod , SOrm Sige & S a lin it
Coastal Inundation Hazard Maps for Base & Climate Change Condition
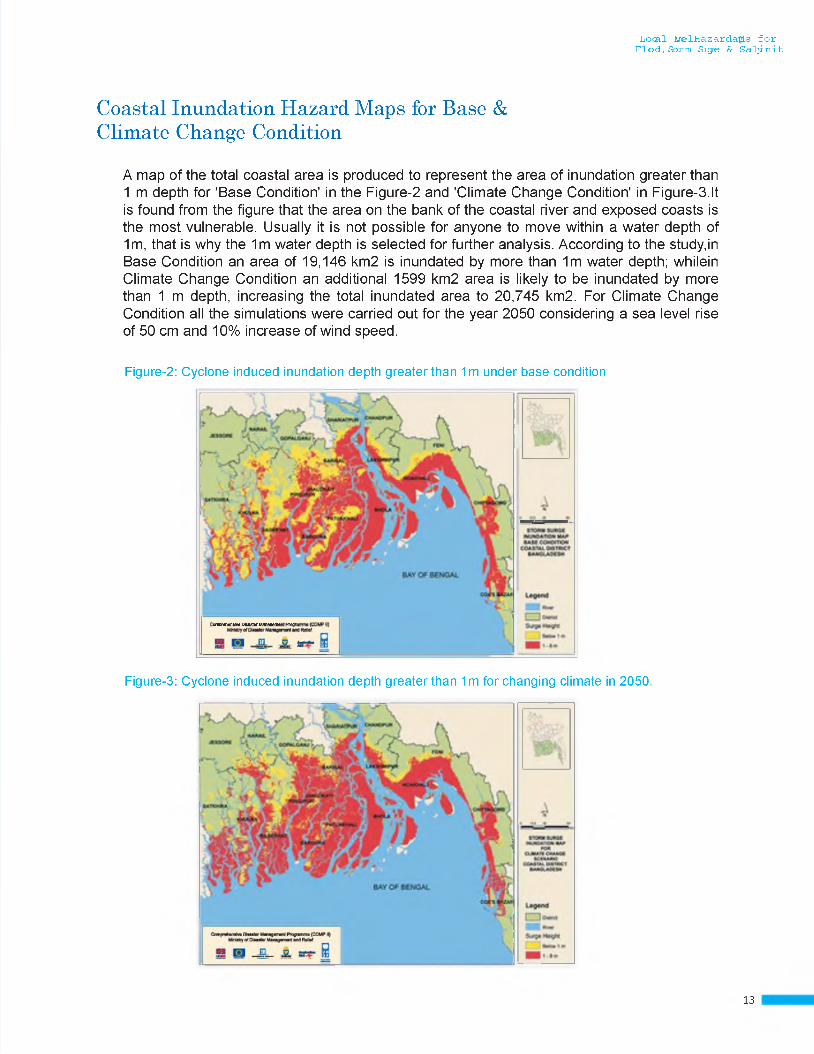
A map of the total coastal area is produced to represent the area of inundation greater than 1 m depth for 'Base Condition' in the Figure-2 and 'Climate Change Condition' in Figure-3.It is found from the figure that the area on the bank of the coastal river and exposed coasts is the most vulnerable. Usually it is not possible for anyone to move within a water depth of 1m, that is why the 1m water depth is selected for further analysis. According to the study,in Base Condition an area of 19,146 km2 is inundated by more than 1m water depth; whilein Climate Change Condition an additional 1599 km2 area is likely to be inundated by more than 1 m depth, increasing the total inundated area to 20,745 km2. For Climate Change Condition all the simulations were carried out for the year 2050 considering a sea level rise of 50 cm and 10% increase of wind speed.
Figure-2: Cyclone induced inundation depth greater than 1m under base condition
Figure-3: Cyclone induced inundation depth greater than 1m for changing climate in 2050.
13

Local L el HazardajMs forFlod , SOrm Sige & S a lin it
Union-wise Inundation Hazard Maps for Base & Climate Change Condition
A sample 'Union wise' inundation depth maps for the whole coastal area are prepared based on Digital Elevation Model
As mentioned earlier a total of 44 simulations have been carried out to produce maximum storm surge levels in the whole coastal area especially for the cyclone affected zone. Union- wise inundation depth maps for the whole coastal area are prepared based on Digital Elevation Model (gridded land level) and storm surge level using GIS technique. In this Policy Brief only one sample plot of Charfassion Upazilla under Bhola district is shown in figure 4 under the base condition (A) and Climate Change Condition (B).
Figure-4: Inundation depth map for Charfassion Upazilla, Bhola district in Base (A) & Climate Change Condition (B).
(A) (B)
Vulnerable Regions in Base and Climate Change Condition Most Vulnerable Districts under Base Condition
It is evident from the model results that Bhola, Laxmipur, Chittagong, Noakhali, Bagerhat, Barguna, Patuakhali, Pirojpur, Jhalokathi and Barisal are more vulnerable district for greater than 1 m inundation depth for base condition.
14
Local L el HazardajMs forFlod , Sdirm Suge & S a ly n it
Most Vulnerable Districts in Climate Change Condition
Compared to the base (present) condition, in the climate change condition Khulna, Satkhira and the rest part of Pirojpur, Barisal, and Jhalokathi will become more vulnerable for greater than 1 m inundation depth.
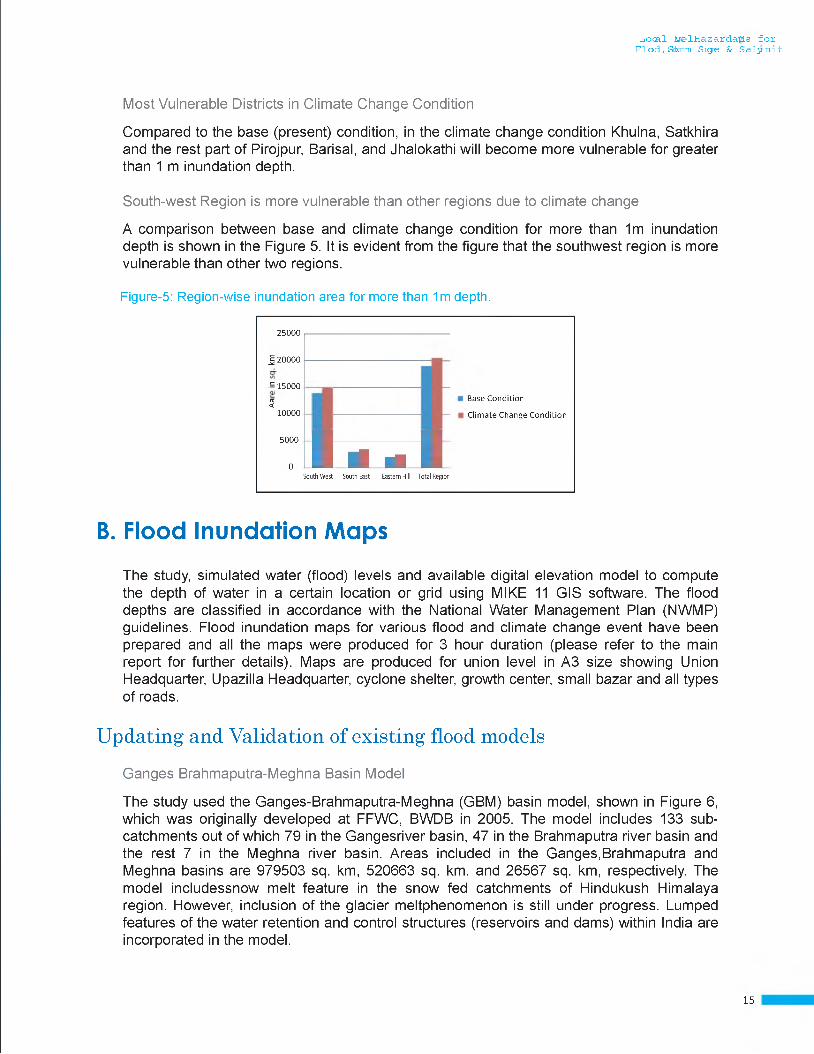
South-west Region is more vulnerable than other regions due to climate change
A comparison between base and climate change condition for more than 1m inundation depth is shown in the Figure 5. It is evident from the figure that the southwest region is more vulnerable than other two regions.
Figure-5: Region-wise inundation area for more than 1m depth.
25000
J 20000
• £ 15000
ra <10000
5000
0South West South East Eastern Hill Total Region
B. Flood Inundation Maps
The study, simulated water (flood) levels and available digital elevation model to compute the depth of water in a certain location or grid using MIKE 11 GIS software. The flood depths are classified in accordance with the National Water Management Plan (NWMP) guidelines. Flood inundation maps for various flood and climate change event have been prepared and all the maps were produced for 3 hour duration (please refer to the main report for further details). Maps are produced for union level in A3 size showing Union Headquarter, Upazilla Headquarter, cyclone shelter, growth center, small bazar and all types of roads.
Updating and Validation of existing flood models
Ganges Brahmaputra-Meghna Basin Model
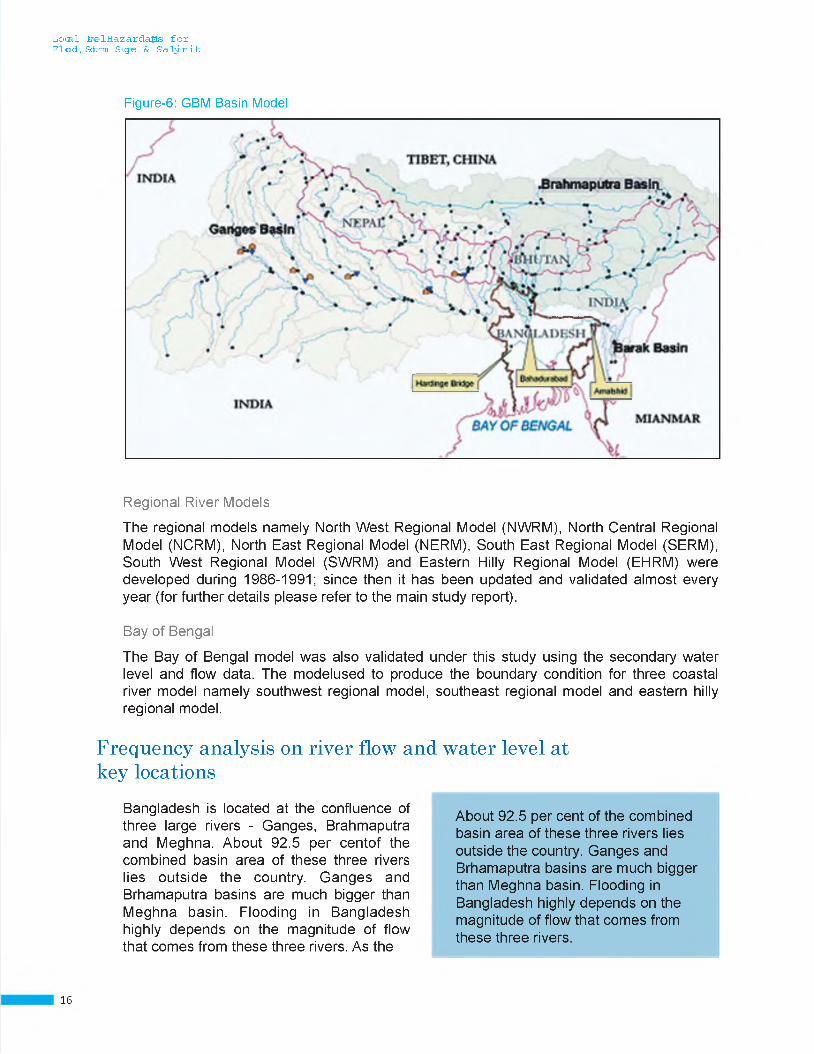
The study used the Ganges-Brahmaputra-Meghna (GBM) basin model, shown in Figure 6, which was originally developed at FFWC, BWDB in 2005. The model includes 133 subcatchments out of which 79 in the Gangesriver basin, 47 in the Brahmaputra river basin and the rest 7 in the Meghna river basin. Areas included in the Ganges,Brahmaputra and Meghna basins are 979503 sq. km, 520663 sq. km. and 26567 sq. km, respectively. The model includessnow melt feature in the snow fed catchments of Hindukush Himalaya region. However, inclusion of the glacier meltphenomenon is still under progress. Lumped features of the water retention and control structures (reservoirs and dams) within India are incorporated in the model.
Base Condition
Clim ate Change Condition
I ■ - I
15
Local Ve 1 HazardajMs fo rFlod , SOrm Suge & S a lin it
Figure-6: GBM Basin Model
Regional River Models
The regional models namely North West Regional Model (NWRM), North Central Regional Model (NCRM), North East Regional Model (NERM), South East Regional Model (SERM), South West Regional Model (SWRM) and Eastern Hilly Regional Model (EHRM) were developed during 1986-1991; since then it has been updated and validated almost every year (for further details please refer to the main study report).
Bay of Bengal
The Bay of Bengal model was also validated under this study using the secondary water level and flow data. The modelused to produce the boundary condition for three coastal river model namely southwest regional model, southeast regional model and eastern hilly regional model.
Frequency analysis on river flow and water level at key locations
Bangladesh is located at the confluence of three large rivers - Ganges, Brahmaputra and Meghna. About 92.5 per centof the combined basin area of these three rivers lies outside the country. Ganges and Brhamaputra basins are much bigger than Meghna basin. Flooding in Bangladesh highly depends on the magnitude of flow that comes from these three rivers. As the
About 92.5 per cent of the combined basin area of these three rivers lies outside the country. Ganges and Brhamaputra basins are much bigger than Meghna basin. Flooding in Bangladesh highly depends on the magnitude of flow that comes from these three rivers.
16

Local Level Hazard Maps forFlood, Storm Surge & Salinity
Figure-6: GBM Basin Model
.Brahmaputra Baslrv
1A N <JLAI)E5H
BAY OF BENGAL
TIBET, CHINA
. / *
- * v V , ^ V__ ; J ( nrV * •* ’ JiftlUTAN
.V- 1 * > ‘ •» •-<*
IN D IA
I Barak Basin
H s d iw t D 't tX1 I / a im w m, .V .U u • r r MIANMAK
IN D IA
Regional River Models
The regional models namely North West Regional Model (NWRM), North Central Regional Model (NCRM), North East Regional Model (NERM), South East Regional Model (SERM), South West Regional Model (SWRM) and Eastern Hilly Regional Model (EHRM) were developed during 1986-1991; since then it has been updated and validated almost every year (for further details please refer to the main study report).
Bay of Bengal
The Bay of Bengal model was also validated under this study using the secondary water level and flow data. The modelused to produce the boundary condition for three coastal river model namely southwest regional model, southeast regional model and eastern hilly regional model.
Frequency analysis on river flow and water level at key locations
Bangladesh is located at the confluence of three large rivers - Ganges, Brahmaputra and Meghna. About 92.5 per centof the combined basin area of these three rivers lies outside the country. Ganges and Brhamaputra basins are much bigger than Meghna basin. Flooding in Bangladesh highly depends on the magnitude of flow that comes from these three rivers. As the
About 92.5 per cent of the combined basin area of these three rivers lies outside the country. Ganges and Brhamaputra basins are much bigger than Meghna basin. Flooding in Bangladesh highly depends on the magnitude of flow that comes from these three rivers.
16
Local Level Hazard Maps forFlood, Storm Surge & Salinity
characteristics of these three basins are different, flooding pattern is also different in each basin and peak flood does not match with each other except the year 1998 and 2004. In the year 1998 and 2004 both the peak flow from Ganges and Brahmaputra coincided with each other and created huge flood all over the country.
Flood Map for Base Condition
In Bangladesh severe inland monsoon flood
Bangladesh has been incurring significant damages in terms of crop losses, destruction of roads and other infrastructure, disruption to industry and commerce, and injuries and losses in human lives from severe inland monsoon floods onceevery three to five years.
Increased monsoon precipitation, higher trans-boundary water flows, and rising sea levels resulting from climate change are estimated to increase the depth and extent of flood inundationand rural communities will be exposed to higher Hazard risks.
Flood Maps for 10 and 20 years return period
Flood maps for 10 and 20 years return period were produced based on the results of frequency analysis of historical maximum water level. Three different water level stations were selected from three basins to carry out the frequencyanalysis. The list of representative year for 10 and 20 years return period flood for three basins is shown in the Table 3.
Table-2: Representative year for 10 and 20 years return period
River Basin Representative year for 10 years return period flood
Representative year for 20 years return period
Brahmaputra 1995 2007
Ganges 1987 1998
Meghna 1998 1988
Regional river models were simulated according to three basins such as for the districts of Brahmaputra basin Northwestand North central regional model were simulated, for the districts of Ganges basin Northwest and Southwest regional models were simulated and for the districts of Meghna basin Northeast and Southeast regional models were simulated. A number of severely flood affected districts are also selected for return period analysis and the selected districts are furnished in the Table 4.
occurs every three to five years
The 1998 flood inundated over two- thirds of Bangladesh resulted in damages and losses of over $2 billion or 4.8 percent of GDP (WB, 2010).
17
Local Level Hazard Maps forFlood, Storm Surge & Salinity
Table-3: List of Districts for the 10 and 20 years return period flood
SI. Districts SI. Districts SI. Districts
1 Dhaka 7 Tangail 13 Sirajganj
2 Gopalganj 8 Jamalpur 14 Rangpur
3 Shariatpur g Manikganj 15 Nilphamari
4 Madaripur 10 Rajbari 16 Lalmonirhat
5 Faridpur 11 Gaibandha 17 Chandpur
6 Munshi ganj 12 Kurigram
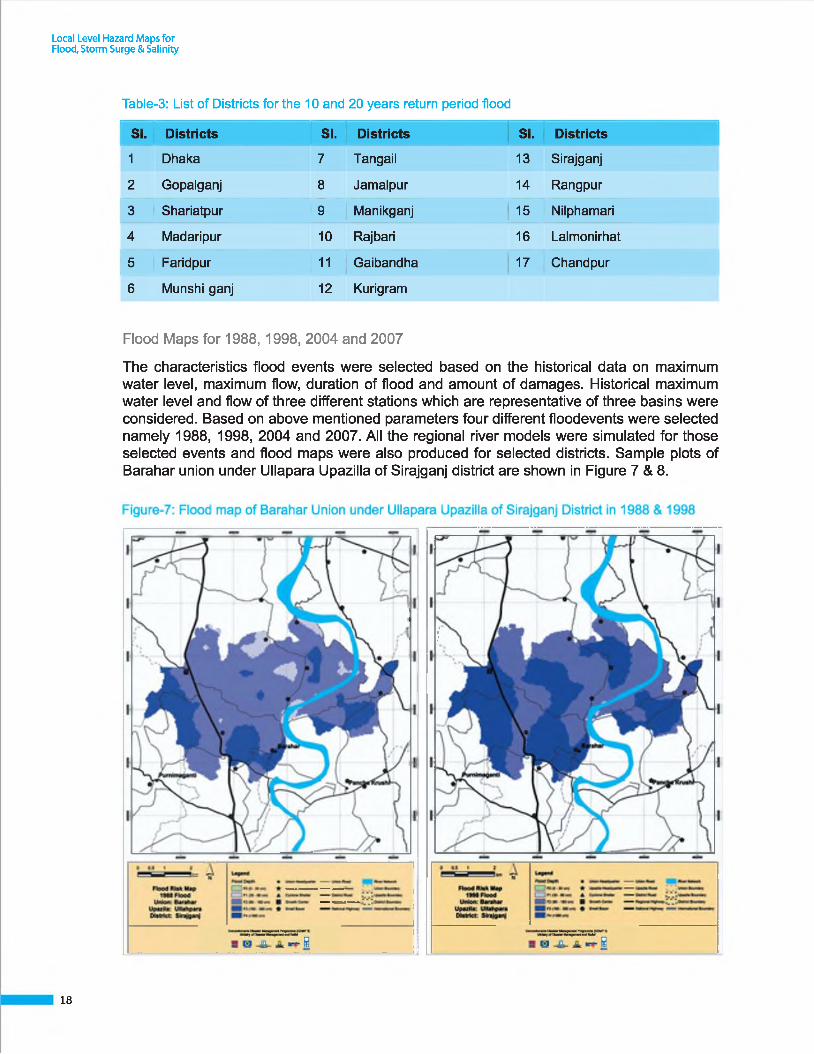
Flood Maps for 1988, 1998, 2004 and 2007
The characteristics flood events were selected based on the historical data on maximum water level, maximum flow, duration of flood and amount of damages. Historical maximum water level and flow of three different stations which are representative of three basins were considered. Based on above mentioned parameters four different floodevents were selected namely 1988, 1998, 2004 and 2007. All the regional river models were simulated for those selected events and flood maps were also produced for selected districts. Sample plots of Barahar union under Ullapara Upazilla of Sirajganj district are shown in Figure 7 & 8.
18

Local Ve 1 HazardajMs forFlod , SOrm Sige & S a lin it
Figure-8: Flood map of Barahar Union under Ullapara Upazilla of Sirajganj District in 2007.
Flood Map for Climate Change Condition
Additional area likely to be submerged under Climate Change Condition
The flood maps show a considerable area of different Upazillas of 40 flood-prone districts remain submerged during characteristic floods and additional area likely to be submerged under climate change condition that may cause deterioration of the well-beings of the local community.In order to assess the severity of flood, area under different land types were calculated for specific Upazilla of a district for four characteristic flood events and under climate change conditions for 2050 and 2080. It is evident from the Table 5th at most of the area of the Ullahpara Upazilla was submerged with higher inundation depth during the past characteristic flood events and more area are likely to beexposed to higher inundation depth in the changing climate with increased precipitation and sea level rise.
19
Local L el HazardajMs forFlod , SOrm Sige & S a lin it
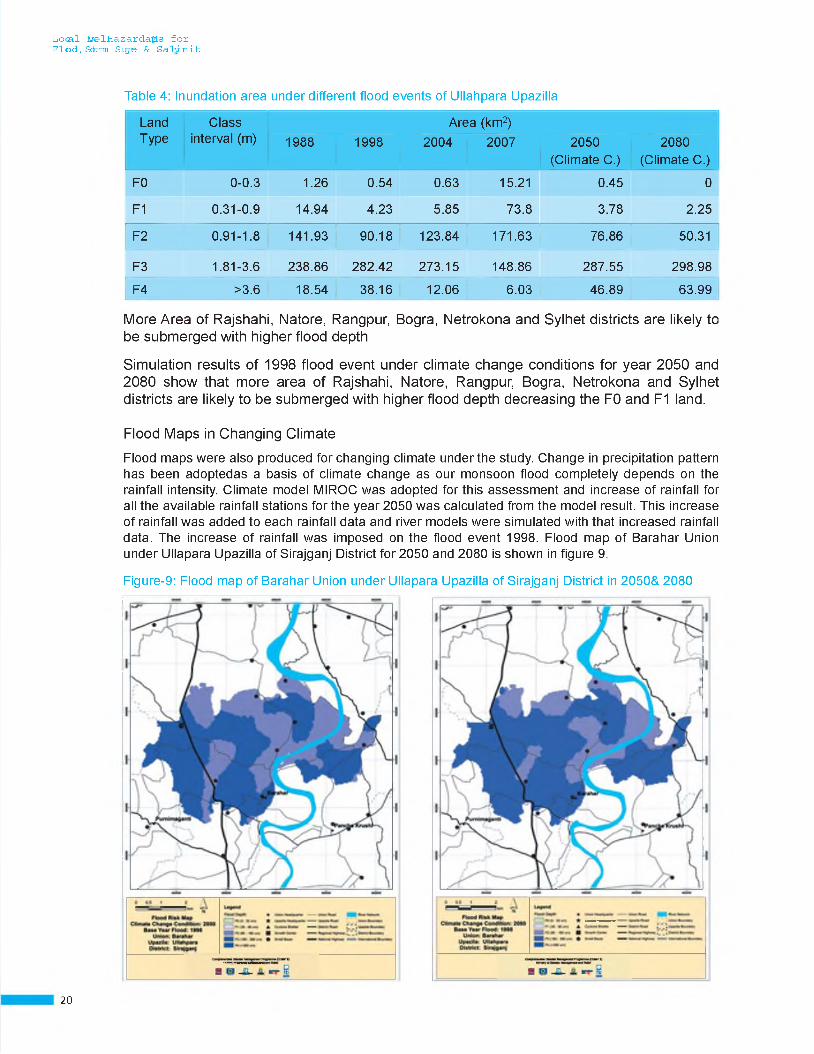
Table 4: Inundation area under different flood events of Ullahpara Upazilla
LandType
Class interval (m)
Area (km2)1988 1998 2004 2007 2050
(Climate C.)2080
(Climate C.)
F0 0-0.3 1.26 0.54 0.63 15.21 0.45 0
F1 0.31-0.9 14.94 4.23 5.85 73.8 3.78 2.25
F2 0.91-1.8 141.93 90.18 123.84 171.63 76.86 50.31
F3 1.81-3.6 238.86 282.42 273.15 148.86 287.55 298.98
F4 >3.6 18.54 38.16 12.06 6.03 46.89 63.99
More Area of Rajshahi, Natore, Rangpur, Bogra, Netrokona and Sylhet districts are likely to be submerged with higher flood depth
Simulation results of 1998 flood event under climate change conditions for year 2050 and 2080 show that more area of Rajshahi, Natore, Rangpur, Bogra, Netrokona and Sylhet districts are likely to be submerged with higher flood depth decreasing the F0 and F1 land.
Flood Maps in Changing Climate
Flood maps were also produced for changing climate under the study. Change in precipitation pattern has been adoptedas a basis of climate change as our monsoon flood completely depends on the rainfall intensity. Climate model MIROC was adopted for this assessment and increase of rainfall for all the available rainfall stations for the year 2050 was calculated from the model result. This increase of rainfall was added to each rainfall data and river models were simulated with that increased rainfall data. The increase of rainfall was imposed on the flood event 1998. Flood map of Barahar Union under Ullapara Upazilla of Sirajganj District for 2050 and 2080 is shown in figure 9.
Figure-9: Flood map of Barahar Union under Ullapara Upazilla of Sirajganj District in 2050& 2080
20
Local L el HazardajMs forFlod , Sdirm Suge & S a ly n it
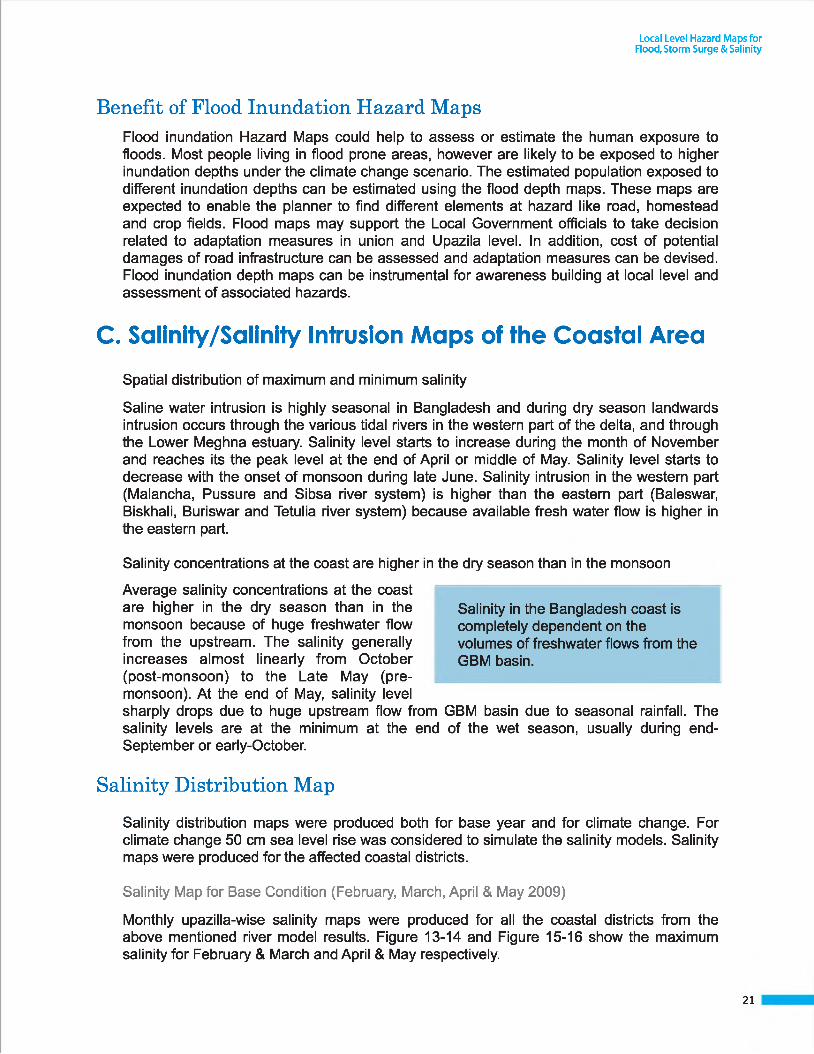
Benefit of Flood Inundation Hazard MapsFlood inundation Hazard Maps could help to assess or estimate the human exposure to floods. Most people living in flood prone areas, however are likely to be exposed to higher inundation depths under the climate change scenario. The estimated population exposed to different inundation depths can be estimated using the flood depth maps. These maps are expected to enable the planner to find different elements at hazard like road, homestead and crop fields. Flood maps may support the Local Government officials to take decision related to adaptation measures in union and Upazila level. In addition, cost of potential damages of road infrastructure can be assessed and adaptation measures can be devised. Flood inundation depth maps can be instrumental for awareness building at local level and assessment of associated hazards.
C. Salinity/Salinity Intrusion Maps of the Coastal Area
Spatial distribution of maximum and minimum salinity
Saline water intrusion is highly seasonal in Bangladesh and during dry season landwards intrusion occurs through the various tidal rivers in the western part of the delta, and through the Lower Meghna estuary. Salinity level starts to increase during the month of November and reaches its the peak level at the end of April or middle of May. Salinity level starts to decrease with the onset of monsoon during late June. Salinity intrusion in the western part (Malancha, Pussure and Sibsa river system) is higher than the eastern part (Baleswar, Biskhali, Buriswar and Tetulia river system) because available fresh water flow is higher in the eastern part.
Salinity concentrations at the coast are higher in
Average salinity concentrations at the coast are higher in the dry season than in the monsoon because of huge freshwater flow from the upstream. The salinity generally increases almost linearly from October (post-monsoon) to the Late May (premonsoon). At the end of May, salinity level sharply drops due to huge upstream flow from GBM basin due to seasonal rainfall. The salinity levels are at the minimum at the end of the wet season, usually during end- September or early-October.
Salinity Distribution Map
Salinity distribution maps were produced both for base year and for climate change. For climate change 50 cm sea level rise was considered to simulate the salinity models. Salinity maps were produced for the affected coastal districts.
Salinity Map for Base Condition (February, March, April & May 2009)
Monthly upazilla-wise salinity maps were produced for all the coastal districts from the above mentioned river model results. Figure 13-14 and Figure 15-16 show the maximum salinity for February & March and April & May respectively.
the dry season than in the monsoon
Salinity in the Bangladesh coast is completely dependent on the volumes of freshwater flows from the GBM basin.
21
Local Level Hazard Maps forFlood, Storm Surge & Salinity
Benefit of Flood Inundation Hazard MapsFlood inundation Hazard Maps could help to assess or estimate the human exposure to floods. Most people living in flood prone areas, however are likely to be exposed to higher inundation depths under the climate change scenario. The estimated population exposed to different inundation depths can be estimated using the flood depth maps. These maps are expected to enable the planner to find different elements at hazard like road, homestead and crop fields. Flood maps may support the Local Government officials to take decision related to adaptation measures in union and Upazila level. In addition, cost of potential damages of road infrastructure can be assessed and adaptation measures can be devised. Flood inundation depth maps can be instrumental for awareness building at local level and assessment of associated hazards.
C. Salinity/Salinity Intrusion Maps of the Coastal Area
Spatial distribution of maximum and minimum salinity
Saline water intrusion is highly seasonal in Bangladesh and during dry season landwards intrusion occurs through the various tidal rivers in the western part of the delta, and through the Lower Meghna estuary. Salinity level starts to increase during the month of November and reaches its the peak level at the end of April or middle of May. Salinity level starts to decrease with the onset of monsoon during late June. Salinity intrusion in the western part (Malancha, Pussure and Sibsa river system) is higher than the eastern part (Baleswar, Biskhali, Buriswar and Tetulia river system) because available fresh water flow is higher in the eastern part.
Salinity concentrations at the coast are higher in
Average salinity concentrations at the coast are higher in the dry season than in the monsoon because of huge freshwater flow from the upstream. The salinity generally increases almost linearly from October (post-monsoon) to the Late May (premonsoon). At the end of May, salinity level sharply drops due to huge upstream flow from GBM basin due to seasonal rainfall. The salinity levels are at the minimum at the end of the wet season, usually during end- September or early-October.
Salinity Distribution Map
Salinity distribution maps were produced both for base year and for climate change. For climate change 50 cm sea level rise was considered to simulate the salinity models. Salinity maps were produced for the affected coastal districts.
Salinity Map for Base Condition (February, March, April & May 2009)
Monthly upazilla-wise salinity maps were produced for all the coastal districts from the above mentioned river model results. Figure 13-14 and Figure 15-16 show the maximum salinity for February & March and April & May respectively.
the dry season than in the monsoon
Salinity in the Bangladesh coast is completely dependent on the volumes of freshwater flows from the GBM basin.
21
Local Ve 1 HazardajMs fo rFlod , SOrm Suge & S a ly n it
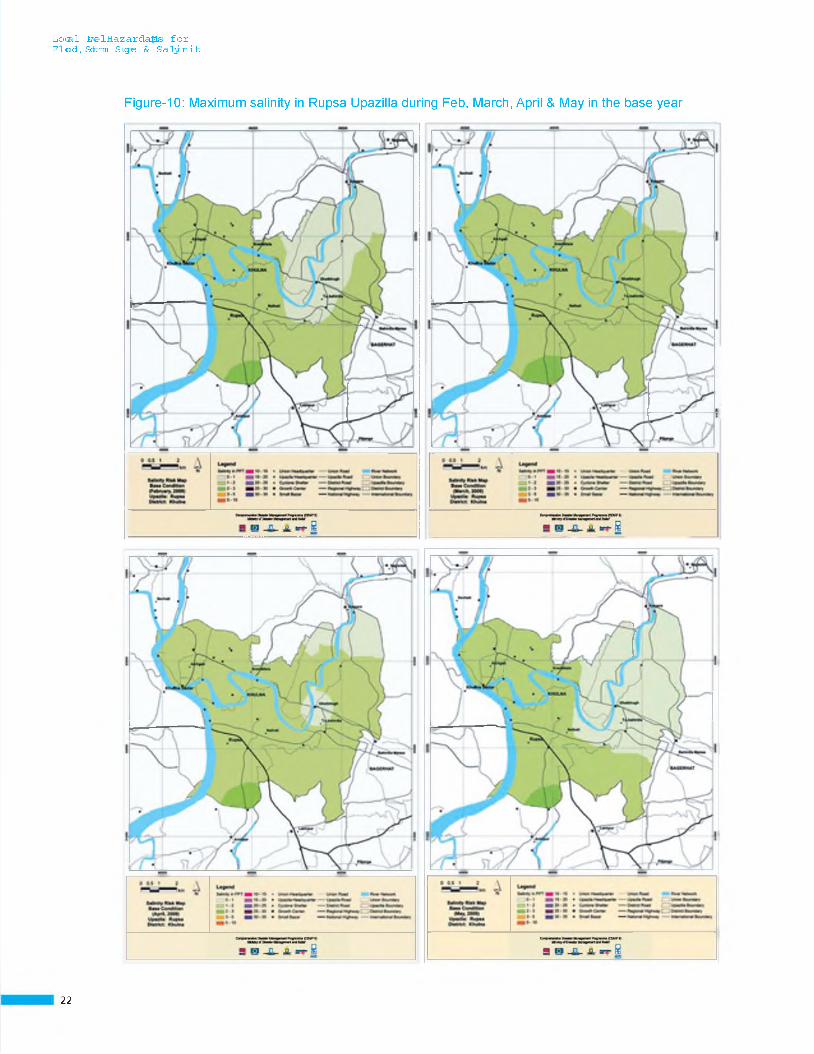
Figure-10: Maximum salinity in Rupsa Upazilla during Feb, March, April & May in the base year
22
Local Ve 1 HazardajMs forFlod , SOrm Sige & S a lin it
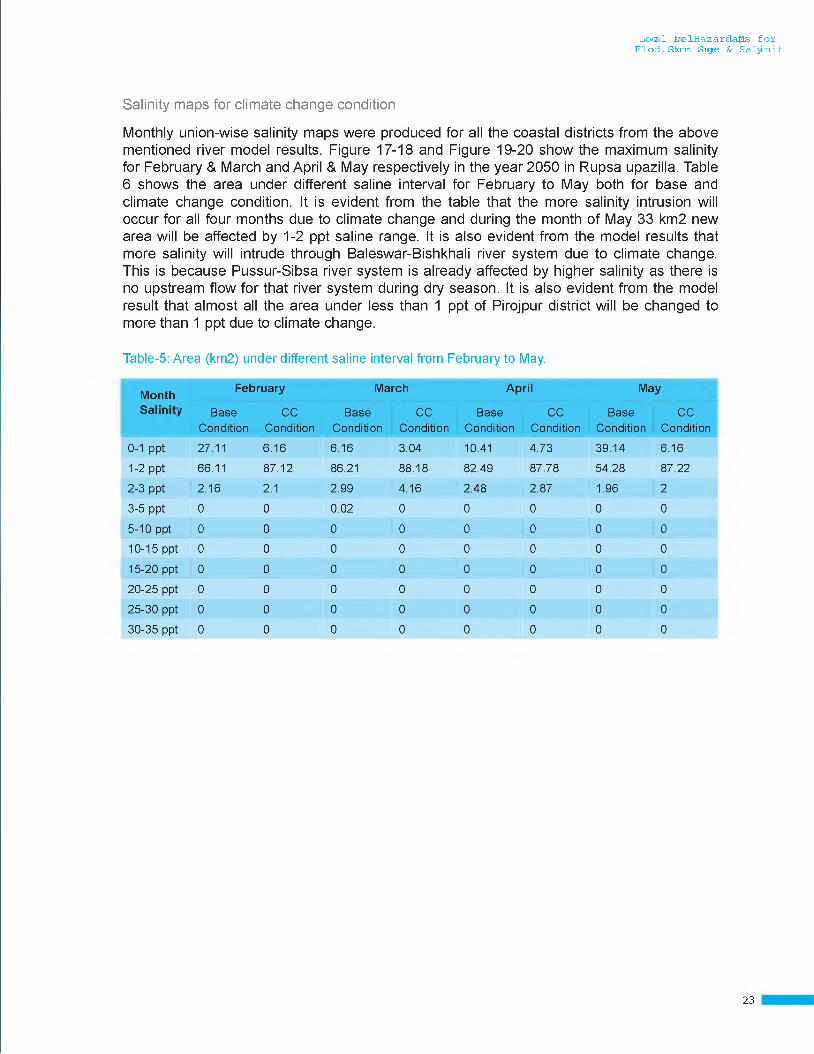
Salinity maps for climate change condition
Monthly union-wise salinity maps were produced for all the coastal districts from the above mentioned river model results. Figure 17-18 and Figure 19-20 show the maximum salinity for February & March and April & May respectively in the year 2050 in Rupsa upazilla. Table 6 shows the area under different saline interval for February to May both for base and climate change condition. It is evident from the table that the more salinity intrusion will occur for all four months due to climate change and during the month of May 33 km2 new area will be affected by 1-2 ppt saline range. It is also evident from the model results that more salinity will intrude through Baleswar-Bishkhali river system due to climate change. This is because Pussur-Sibsa river system is already affected by higher salinity as there is no upstream flow for that river system during dry season. It is also evident from the model result that almost all the area under less than 1 ppt of Pirojpur district will be changed to more than 1 ppt due to climate change.
Table-5: Area (km2) under different saline interval from February to May.
Month February March April May
Salini / BaseCondition
CCCondition
BaseCondition
CCCondition
BaseCondition
CCCondition
BaseCondition
CCCondition
0-1 ppt 27.11 6.16 6.16 3.04 10.41 4.73 39.14 6.16
1-2 ppt 66.11 87.12 86.21 88.18 82.49 87.78 54.28 87.22
2-3 ppt 2.16 2.1 2.99 4.16 2.48 2.87 1.96 2
3-5 ppt 0 0 0.02 0 0 0 0 0
5-10 ppt 0 0 0 0 0 0 0 0
10-15 ppt 0 0 0 0 0 0 0 0
15-20 ppt 0 0 0 0 0 0 0 0
20-25 ppt 0 0 0 0 0 0 0 0
25-30 ppt 0 0 0 0 0 0 0 0
30-35 ppt 0 0 0 0 0 0 0 0
23
Local L el HazardajMs forFlod , SOrm Sige & S a lin it
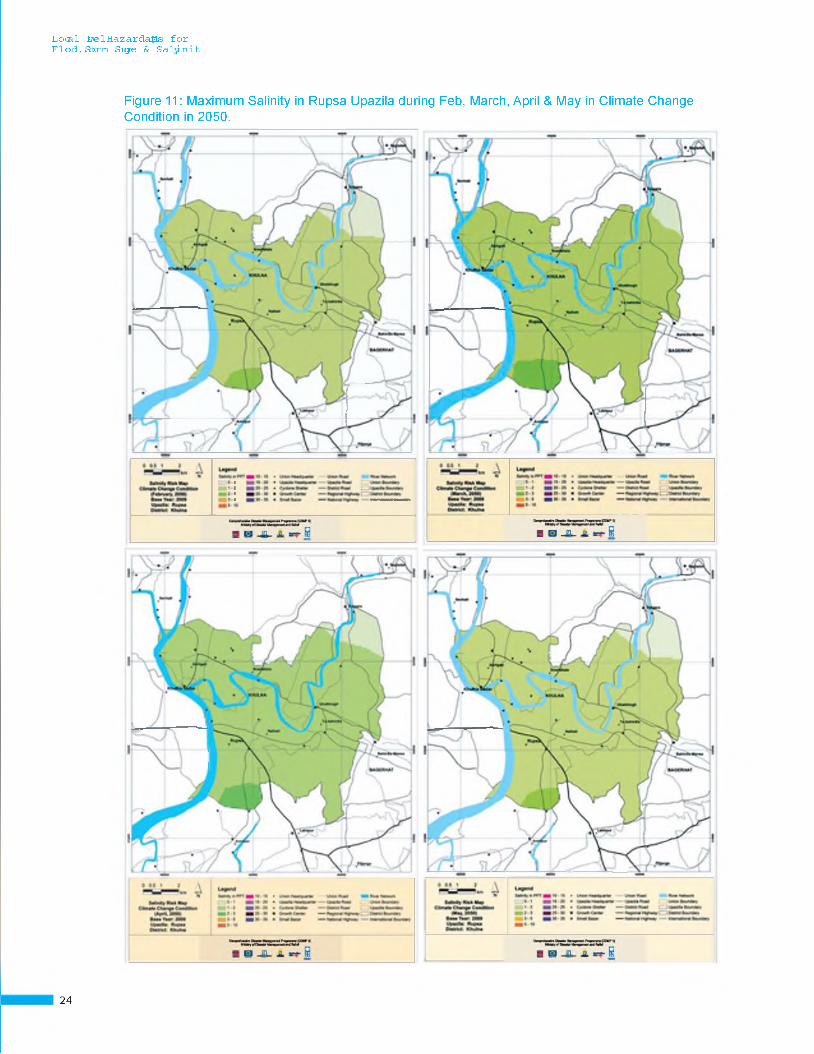
Figure 11: Maximum Salinity in Rupsa Upazila during Feb, March, April & May in Climate Change Condition in 2050.
24
Local Ve 1 HazardajMs forFlod , SOrm Sige & S a lin it
The study shows that more saline water intrusion is likely to occur during dry season with the increased sea level rise of 50cm in the year 2050
According to the study new areas are likely to be affected by higher salinity. It is also evident from the model results that more saline water intrusion will occur through Baleswar- Bishkhali river system under climate change and eventually freshwater zone becomes saline. Changing climate and sea level rise of 50 cm in the year 2050 will increase scarcity of freshwater for agriculture and domestic use during the dry season.
Benefits of Salinity Intrusion Hazard Maps
Salinity maps are useful to find the water availability in different months for agriculture, drinking, industrial and other household requirements. Adaptation in fisheries sector and crop planning can also be benefitted from salinity zoning maps. Salinity is an important parameter for characterizing the eco-systems and its sustainability in the changing climate. Salinity zoning maps can be used to find the effect of climate change on the coastal ecosystem as well as on biodiversity.
RecommendationsIn this study flood inundation Hazard maps for entire country and storm surge Hazard map and salinity distributionmap for entire coastal area were prepared at union level. Six regional river models, GBM basin model and Bay of Bengal model were used to produce flood inundation map; Bay of Bengal Storm Surge model was used to produce storm surge inundation map. Three regional salinity models and Bay of Bengal salinity model were used to produce salinity distribution maps.
Flood Inundation Map
• Flood inundation maps were prepared for four characteristic flood events such as 1988, 1998, 2004 and 2007, for two different return periods - 10 years and 20 years and for climate change.
• Climate change will decrease the F0 & F1 land type drastically in the year 2050 and 2080 which issuitable for T-Aman for all over the country.
• On the other hand, F3 and F4 land will increase due to climate change compared to the flood event 1998 in near future.
• Most people living in flood vulnerable areas, however, are likely to be exposed to higher inundation depths under the climate change scenario.
• The estimated population exposed to different inundation depths can be estimated using the flood depth maps. These maps will enable to planner to find different elements at Hazard like road, homestead and crop fields. Rural communities can also find adaptation measures for their homesteads based on these flood maps.Cost of potential damages of road infrastructure can be assessed and adaptation measures can be devised.
• Flood inundation depth maps can be instrumental for awareness building of local communities and assessment of associated Hazards.
25
Local L el HazardajMs forFlod , SOrm Sige & S a lin it
Strom Surge Inundation Map
• In the base condition Bhola, Laxmipur, Chittagong, Noakhali, Bagerhat, Barguna, Patuakhali, Pirojpur, Jhalokathi and Barisal is more vulnerable district; whereas in the climate change condition Khulna, Sathkhira and the rest part of Pirojpur, Barisal, and Jhalokathi will become vulnerable.
• Compared to Base Condition, in climate change condition an additional 1599 sq. km. area will be inundated by more than 1 m depth, increasing the total inundated area to 20,745 sq. km. from 19,146 sq. km.
• The generated maps will be helpful for decision makers and planners to go for proper adaptive measures especially the number and design of cyclone shelters and redesign of existing coastal embankment/infrastructures as well as future infrastructures and planning of mangrove afforestation for reduction of surge height and damage to embankments.
• The storm surge inundation maps are useful for (a) assessing community Hazard, (b) examine the potential physical impacts of climate change; (c) assess the associated damages and losses in key economic sectors, on vulnerable populations, and in the overall economy; and (d) estimate spatially disaggregated costs of adaptation options that can reduce these impacts;
Salinity Distribution Map
Model results show that more salinity will intrude through Baleswar-Bishkhali river system due to climate change. This is because Pussur-Sibsa river system is already affected by higher salinity as there is no upstream flow for that river system duringdry season.
• It is also evident that almost all the area under less than 1 ppt of Pirojpur district willbe changed to more than 1 ppt level due to climate change.
• Salinity maps are useful to find the water availability in different months for agriculture, drinking, industrial and other household requirement. Adaptation in fisheries sector and crop planning can also be benefitted from salinity zoningmaps.
• Salinity is an important parameter for characterizing the ecosystems and its sustainability in the changing climate. Salinity zoning maps can be used to find the effect of climate change on the coastal ecosystem as well as on bio-diversity.
26

Comprehensive Disaster Management Programme (CDMP II) Ministry of Disaster Management and Relief
MN O R W E G IA N E M B A S S Y
Iron the British |SWEDEN
AustralianA i d v - ^
urnS B
Empowered lives. Resilient nations.