Rapid Evidence Assessment: What can be learnt from other ...
Upload
khangminh22Category
view
2download
0
RAPID ASSESSMENT Possible Impact of COVID-19 on Livelihoods, Food
Security, Nutrition and Agricultural Supply Chain in
Pakistan
April 2020

1
Rapid Assessment – Possible Impact of the Novel Coronavirus Pandemic (COVID-
19) on Livelihoods, Food Security, Nutrition and Agricultural Supply Chain in
Pakistan1
Highlights
The COVID-19 pandemic is spreading fast in Pakistan like many other countries across the globe,
with over 7,000 confirmed cases and 134 deaths reported as of April 16. It came at a time when
the country is already going through high inflation and slow economic growth.
A quarter of the population (around 53 million people) lives below the national poverty line
and around two-fifth (around 84 million people) are multi-dimensionally poor
Similarly, food insecurity is also very high and between 20-30% population (40 to 62 million
people) is in some form of food insecurity in Pakistan. Given the scale of this emergency, while
the situation is still evolving, there is strong likelihood that number of food insecure people will
rise especially in areas already affected by high recurrence of food insecurity and hit hard by the
COVID.
The prevalence of acute malnutrition among children under five in all provinces/regions
excluding ICT and GB exceeds the emergency threshold (15%). The reduced immunity of
malnourished children will make them vulnerable to dying from COVID.
The most vulnerable are the poorest already facing acute hunger and malnutrition - the daily
wage class in both agriculture and non-agriculture sectors, low income urban households, small
scale farmers, market dependent rural households, internally displaced persons and refugees,
elderly people, those already suffering from medical conditions, women and child headed poor
households.
Though in general, the market mechanisms in Pakistan are strong enough and well-integrated to
a greater extent, but market prices of food items have risen overall and in regional markets
during March, due to supply disruptions and local unavailability in some areas, and likely to affect
vulnerable population in both urban and rural areas. Majority (79%) of households are
dependent on the markets for food procurement. These households are likely the worst
sufferers due to the prevailing lock-down situation in the country which would lead to severe
food access issues.
The COVID-19 and lock down would also affect the population in already vulnerable areas such
as drought affected areas of Sindh and Balochistan, locust affected areas of four provinces,
Newly Merged Areas of Khyber Pakhtunkhwa, and AJK and GB who have suffered natural
disasters and conflict in recent time and mostly dependent on unsustainable livelihood sources.
With few exceptions, as of now disruptions in supply chain are minimal as food supply has been
adequate and markets have been stable so far.
It is necessary to safeguard agriculture production, with focus on small holder farmers, and
ensure that food value chains are not disrupted, and continue to function so as to promote the
availability, access, utilization and stability of diversified, safe and nutritious food for all, while
safeguarding vulnerable people in rural and urban areas.

2
Introduction
The COVID-19 pandemic has turned into a global crisis which is already affecting the livelihoods and
food security of millions of people in Pakistan. If measures to keep the food chain alive and protect
the food consumption are not taken urgently, the pandemic will have a considerable impact on
everybody, especially on the poor and the most vulnerable.
The restrictions on movement of goods and people and lockdown are likely to cause adverse impacts
on livelihood and food and nutrition security of people if not accompanied by well thought policy
measures.
The restrictions and lock down, though necessary to control the spread of the coronavirus, may lead
to the disruption of market chains and trade of agricultural goods and services (labour flows), with
significant potential impacts on the populations that depend on them for their livelihoods and food
and nutrition needs.
The spread of the virus is relatively moderate in Pakistan so far, but potential massive spread is likely
to have profound and devastating effect, as the country is not well prepared to cope with this
pandemic due to poor public health infrastructure.
Border closures, quarantines, and market, supply chain and trade disruptions could restrict people’s
access to sufficient/diverse and nutritious sources of food, especially in areas hit hard by the virus or
already affected by high recurrences of food insecurity.
The current lock-down of cities and markets across the country is heavily impacting the livelihoods of
poor people who are becoming increasingly vulnerable with every passing day. The daily wagers and
workers associated with the informal sector are finding it hard to earn daily living due to the prevailing
situation which might lead to negative irreversible coping strategies on their part such as selling of
productive assets, less diverse diets etc.
It is necessary to ensure that food value chains are not disrupted and continue to function well and
promote the availability, access, stability and utilization of diversified, safe and nutritious food for all,
while safeguarding small holder farmers and vulnerable people in rural and urban areas.
Therefore, it is important to timely look into the main aspects of the food value chain to identify
vulnerabilities and based on other countries’ experiences of COVID19 and other previous crises to
anticipate and avoid any possible disruption with serious implications on food security and nutrition
of all the sections of society, particularly livelihoods of small holder farmers and other vulnerable
population.
1 Draft joint assessment report of FAO and WFP

3
The food value chain is a complex web of
interactions and actors such as producers,
transportation, inputs, processing plants,
shipping, etc.
As the COVID-19 spreads and infected cases mount and lockdowns increase there are seemingly countless ways the food system will be tested and strained in the coming weeks and months. The precautionary measures by the federal and provincial governments in order to prevent the spread of COVID-19 are also affecting the food value chain in Pakistan, starting from the supply chain. As of today, there is no major supply shock in terms of availability but there is starting to be a supply shock in terms of logistics of movement of food and of people associated with the production of food. Short, medium and long-term negative impacts are expected in the absence of specific measures on food supply, livelihoods and food security and nutrition. Lockdowns and restrictions on movement could disrupt food production, processing, distribution and sales, both at national level, within provinces and globally, with the potential to have an "immediate and severe" impact on those restricted by mobility, and the risk that the poor and the vulnerable would be the hardest hit. Food supply chains can be disrupted, or start being under stress after 3 weeks of lockdown.
Global food markets are well supplied but there is growing concern and that measures should be taken to ensure that both national food markets and the world market continue to be a transparent, stable and reliable source of food supply.
Referring to the 2007-08 global food price crisis, FAO noted that the uncertainty at that time triggered a wave of export restrictions by some countries, while others started importing food aggressively. These national-oriented short term actions contributed to excessive price volatility, which was damaging for low-income food-deficit countries.
As economic activities slow down due to the COVID-19 pandemic, access to food will be negatively affected by income reductions and loss of employment. There is need to ensure that agricultural trade continues to play its important role in contributing to global food security and better nutrition. So, it will be important now, more than ever before, to reduce uncertainty and strengthen market transparency through timely and reliable information, to ensure trade movements, from farmers to markets and consumers. In order to avoid food shortages, it is imperative that countries keep the food supply chains going.
Livelihoods of Rural and Urban Population The Coronavirus, lockdown and closure of a wide range of businesses in both urban and rural areas
are adversely affecting the hundreds of thousands of workers and daily wagers and their families,
particularly those without any financial resources to arrange even for essential daily food/non-food
items required for their survival. The rising prices of basic food items is further adding to their stress
and vulnerability. In the current context the groups engaged in the following livelihood activities are
particularly vulnerable:

4
1. Around half (51%) of the households in Pakistan are agricultural households, of which 68% are
engaged in farming and 32% are livestock holders2. The recent outbreak of COVID-19, resulting
restricted movements and lock down would affect the livelihoods of smallholder farmers3 who
are around 90% of the total farmers in Pakistan, in particular those who complement farming (in
these cases done by women) with off farm or on-farm employment based on daily wages. The
pandemic is restricting the farmers’ access to paid work (albeit in majority ‘informal’), and with
the reduced opportunities from the off-farm employment such as food supply/ business,
transportation, services, buildings. Small-scale farmers’ income generating opportunities have
suffered due to less sale of their produce, high transportation cost, loss of income from other
sources.
2. In Pakistan, out of a total 61.71 million employed population4, 23.8 million (38.5%) is engaged in
the agriculture sector, 14.6 million (23.7%) in industry (manufacturing and construction) and 23.3
million (37.8%) in the services sector. The agriculture and services sectors have the largest shares
of women in employment (67%) and men in employment (44%) respectively. According to PBS,
about 55.6% of total employment (around 34.7 million) in Pakistan is vulnerable5 and the
agriculture sector has the largest proportion (87.8%; 20.3 million) of vulnerable employment (12.4
million men and 7.9 million women). Among the other sectors, wholesale and retail trade has
69.6%; 6.49 million in vulnerable employment, real estate and business activities (63%; 0.20
million), transport and communication (49.4%; 1.95 million), hotels and restaurants (48.6%; 0.60
million), manufacturing (32.9%; 3.3 million) and other social, community and personal service
(53.2%; 0.43 million).
3. Across the provinces, Punjab has the highest proportion of vulnerable employment (58%; 21.84
million) followed by Balochistan (57.7%; 1.44 million), KP (54%; 3.89 million) and Sindh (49.5%;
7.15 million). Majority of the employment in agriculture sector is informal. In addition, of total
non-agriculture employment, 72% are working in the informal sector and 28% in formal sector.
The vulnerable employees and those working in informal sectors will suffer the most due to
movement restrictions and lock down in the country.
4. According to the Comprehensive Food Security and Livelihood Assessment (CFSLA) Report 2019,
the majority (65%) of the households of NMDs are dependent on unsustainable livelihood
strategies (daily wagers), while the remaining (35%) depend on somewhat sustainable sources.
The longer lockdown situation will also adversely affect smallholder farmers in terms of reduced
purchasing power for daily food items, inputs for kharif plantation and feed for livestock. Most of the
farmers store wheat for the household consumptions for the rest of the year. However, due to losses
of income from reduced sale of livestock and livestock products and vegetables/fruits produce and
other non-farm work, they may sell their wheat stocks.
As a coping strategy in these times of despair, the farmers would soon be turning to liquidate their
assets; mainly poultry, livestock and other valuable assets, to meet the food supplies and other
essentiality of life. The non-functionality of markets and slower economic activity have directly
affected the income of the farmers and hence has disrupted the supply chain of food commodities.
2 Agriculture Census, 2010, Pakistan Bureau of Statistics 3 Farmers who cultivate less than 12.5 acres of land. The proportion of small farmers is 95% in KP, 90% in Punjab, 83% in Sindh and 68% in Balochistan. 4 Age 15 and above; Pakistan Bureau of Statistics, 2017-18 5 Vulnerable employment is measured as the proportion of own-account workers and contributing family workers in total employment (PBS).

5
Similarly, small entrepreneurs, shopkeepers and small factories owners and laborers who are directly
dependent on income sources from daily trade and economic activities in rural and urban areas will
also experience a sharp decrease in their earnings. The population with unsustainable sources of
livelihood, are potentially more vulnerable to food insecurity.
Food Security and Nutrition
COVID-19 is likely to have serious implications on availability and household access to food thereby
reducing food intake and compromise on quality. Several factors determine access to food of an
individual or a household. Poverty is the most important limiting factor of a household’s access to food
in Pakistan. If the pandemic spreads widely and prolongs, it will have devastating effect in the country
affecting everybody, however, will have serious implications on those who are already below the
poverty line.
In Pakistan, a quarter of the population (around 53 million people) lives below the national poverty
line6. Additionally, 39% of the population (around 84.03 million people) is multi-dimensionally poor7.
Districts with extreme poverty are mostly found in Balochistan, Sindh, Khyber Pakhtunkhwa (KP) and
Southern Punjab.
Food insecurity is also quite high and ranges between 20-30%, depending upon the indicator used to
measure food insecurity and data source. The Prevalence of Undernourishment (PoU) and the
Prevalence of Moderate or Severe Food Insecurity based on Food Insecurity Experience Scale (FIES)
are two core indicators of SDG2-Zero Hunger for monitoring of food insecurity. According to Pakistan
Overview of Food Security and Nutrition (POFI) Report8, between 20-30% of population (between 40-
62 million people) in Pakistan is estimated to be undernourished9.
Around one-quarter of the households (around 49 million people) in Pakistan are estimated to be
moderately or severely food insecure based on FIES, whereas 10.1% of the households (around 21
million people) are severely food insecure10.
There also exists regional disparity in prevalence of undernourishment as around 36.4 million people
are estimated to be undernourished in rural areas compared to 26.0 million in urban areas. In case of
prevalence of moderate or severe food insecurity based on FIES indicator, 26.3% and 18.9%
households (34.8 and 14.3 million people) are estimated to be moderate or severe food insecure in
rural and urban areas respectively, whereas 11.6% and 7.7% households (15.3 million and 5.8 million
people) are severely food insecure in rural and urban areas respectively.
Table: Prevalence of Undernourishment in Pakistan
Pakistan, Province/Regions
Prevalence of Undernourishment (PoU)
(%)
Estimated Number of Undernourished People
(Million)
Estimated Number of Households with
Undernourished People (Million)
Pakistan 29.9 62.12 9.63
Rural 27.5 36.35 5.50
6 Poverty in Pakistan: raising the bar, Ministry of Planning, Development and Reforms and Ministry of Finance, April 2016. 7 Multidimensional poverty in Pakistan, Government of Pakistan, UNDP Pakistan and OPHI, 2016. 8 POFI report is a joint report of UN organizations (FAO, WFP, UNICEF and WHO) 9 Pakistan Overview of Food Security and Nutrition Report 2019; using data of Household Integrated Economic Survey (HIES 2015-16). 10 Pakistan Overview of Food Security and Nutrition Report 2019 using data of National Nutrition Survey 2018

6
Urban 34.4 26.00 4.19
Balochistan 48.4 5.97 0.86
Rural 49.6 4.44 0.65
Urban 45.0 1.53 0.21
Khyber Pakhtunkhwa
11.9 3.63 0.46
Rural 11.6 2.88 0.36
Urban 13.0 0.74 0.10
Punjab 30.8 33.88 5.27
Rural 26.9 18.73 2.88
Urban 38.9 15.71 2.49
Sindh 34.1 16.33 2.93
Rural 37.0 8.50 1.55
Urban 30.9 7.70 1.36
Prevalence of Undernourishment and number of households and household size of 2017 Population Census has been used to get estimates of estimated number of households with undernourished people and estimated number of undernourished people.
Figure: Prevalence of Undernourishment in Pakistan
Source: Pakistan Overview of Food Security and Nutrition (POFI) Report, 2019

7
Table: Prevalence of Moderate and Severe Food Insecurity based on Food Insecurity Experience
Scale (FIES) in Pakistan and Provinces/Regions
Pakistan, Province/Regions
Percentage of
Households Moderately or Severely
Food Insecure
Percentage of
Households Severely
Food Insecure
Estimated Number of Households
Moderately or Severely Food
Insecure (Million)
Estimated Number of Households
Severely Food Insecure (Million)
Estimated Number of
People Moderately or Severely
Food Insecure (Million)
Estimated Number of
People Severely
Food Insecure (Million)
Pakistan 23.5 10.1 7.56 3.25 48.81 20.96
Rural 26.3 11.6 5.27 2.31 34.82 15.28
Urban 18.9 7.7 2.30 0.94 14.26 5.82
Punjab 19.0 7.6 3.26 1.30 20.95 8.35
Rural 20.5 8.0 2.19 0.86 14.24 5.60
Urban 16.7 6.9 1.07 0.44 6.74 2.77
Sindh 33.3 14.7 2.86 1.26 15.93 7.04
Rural 46.3 21.6 1.94 0.91 10.63 4.97
Urban 21.5 8.4 0.95 0.37 5.35 2.10
KP 15.5 5.8 0.59 0.22 4.72 1.78
Rural 15.2 5.8 0.47 0.18 3.77 1.44
Urban 16.6 5.9 0.12 0.04 0.95 0.34
Balochistan 38.4 21.4 0.68 0.38 4.74 2.64
Rural 42.1 23.7 0.55 0.31 3.76 2.12
Urban 29.1 15.5 0.14 0.07 0.99 0.53
ICT 19.7 7.5 0.07 0.03 0.40 0.15
Rural 20.1 6.8 0.03 0.01 0.20 0.07
Urban 19.3 8.1 0.03 0.01 0.20 0.08
AKJ 22.3 11.8 0.14 0.08 0.90 0.48
Rural 24.1 13.0 0.13 0.07 0.81 0.43
Urban 10.7 4.4 0.01 0.00 0.08 0.03
GB 10.6 2.1 0.02 0.00 0.15 0.03
Rural 11.3 2.1 0.02 0.00 0.14 0.03
Urban 7.9 1.9 0.002 0.00 0.02 0.00
KP-NMD 27.1 12.1 0.15 0.07 1.36 0.60
Source: FAO Estimates using the Data of National Nutrition Survey 2018.

8
Prevalence of food insecurity based on FIES, and number of households and household size of 2017 Population Census has been used to get estimated number of food insecure households and food insecure people.
Figure: Prevalence of Moderate and Severe Food Insecurity based on Food Insecurity Experience
Scale (FIES) in Pakistan and Provinces/Regions
According to the findings from Integrated Context Analysis (ICA) Report 201711, which uses Multi-
Dimensional Poverty Index (MPI) as a relevant proxy for vulnerability to food insecurity, the persistent
and chronically vulnerable population is highly exposed to natural hazards and shocks which is also
true for the ongoing COIVD-19 pandemic. Map shows High to Low recurrences of vulnerability to food
insecurity by districts.
Total
Population
2017
(in Million)
Estimated Population Vulnerable to Food Insecurity
(in Millions)
Long-term
vulnerable
Chronically
vulnerable
Highest
vulnerable
Additional
vulnerable
(in case of a shock)
Pakistan 207.7 39.29 36.43 41.74 2.45
Balochistan 12.3 3.71 3.53 3.86 0.15
KP 30.5 7.25 6.69 7.74 0.49
Punjab 110.0 18.29 15.58 20.90 2.60
Sindh 47.8 9.77 9.13 10.40 0.62
11 http://www.ndma.gov.pk/publications/Integrated_Context_Analysis_Pakistan_2017.pdf

9
Food Security in the Vulnerable Districts
The emergence of Coronavirus is also putting additional pressure on an already fragile socio-economic
situation following various shocks resulting from consecutive climate related hazards (droughts and
floods) in some parts of the country and from conflict and displacement in others.
In 2018, 8 districts in Sindh and 18 in Balochistan experienced moderate to severe drought which
adversely affected the livelihoods and food security situation in these districts. Some of these districts
are also experiencing locust infestation, and the impact of heavy snowfalls in early 2020. In addition,
Newly Merged Areas of Khyber Pakhtunkhwa, have been facing terrorism and conflict which adversely
affected the livelihood and food security situation in these areas. These shocks had already negatively
impacted affected the agriculture and livestock production, and lives, livelihoods and food and
nutrition security of affected population.
FAO and WFP in partnership with the government and non-government partners conducted IPC12
acute food insecurity analyses for drought affected districts of Sindh and Balochistan and Newly
Merged Areas of KP. The findings of the analyses show that nearly 1.20 million people in drought
affected areas of 8 districts of Sindh, 1.79 million people in 14 drought affected districts of Balochistan
12 Integrated Food Security Phase Classification (IPC) is a set of tools and procedures to classify the severity and
characteristics of acute food insecurity and acute malnutrition crises as well as chronic food insecurity based on
international standards.

10
and 1.20 million people in newly merged areas of KP were/are food insecure (IPC Phase 3 Crisis and 4
Emergency) and urgent actions were required to save and protect their lives and livelihoods.
Furthermore, the intimidating burden of malnutrition in the country revealed in NNS 2018 reflects a
worrying situation of wasting i.e. 18% in children under 5, which exceeds the WHO critical threshold
for emergency (15%). Similarly, chronic malnutrition is also alarmingly high and according to the
survey, 40% of under 5 children are stunted, which means every 3rd to 4th child in the country is
stunted.
In addition, micronutrient deficiencies are also widespread among children under five children, adolescent and women of reproductive age. More than 50% of under 5 children and adolescents are suffering from Iron deficiency anemia. Similarly, Women of Reproductive Aged (WRA) 15–49 years bear a double burden of malnutrition i.e. one in seven, almost 14% are undernourished. About 42% of WRA are anemic while majority i.e. almost 80% are affected by vitamin D deficiency. Adequate and appropriate nutrition is known to boost immune system and in return helps to fight the
infections. Wasted children and individuals have reduced immunity making them more susceptible to
ongoing COVID-19 infection spread and will affect their health status resulting increase morbidities
and mortalities. It is therefore critical to ensure uninterrupted delivery of promotional, preventative
and life-saving nutrition services to the vulnerable children and PLW.
The food insecurity, malnutrition and poverty situation is further challenged by low resilience to
shocks such as climate induced disasters, increase in prices, slowdown in economic growth. The
situation of food insecurity and children malnutrition is more alarming in Sindh, Balochistan and Newly
Merged Districts (NMDs) of KP. The COVID-19 pandemic would further aggravate the food insecurity,
malnutrition and poverty situation in the vulnerable districts.
Poor diet diversity is also an important factor of the poor food security and nutrition situation in Pakistan. The average per capita energy intake in Pakistan is around 2,000 kcal/capita/day. Cereals consumption has the largest share (37%) in food consumption followed by consumption of milk and milk products (28%), vegetables (14%), fruits (6%), oil (4%) and meat (3%), pulses (1%) and others (7%). The food consumption expenditure by consumption groups (quintiles) and the expenditure share on major food items is reported in below table. Overall, major share of food expenditure is spent on milk and milk products, followed by cereals, vegetables, meat, ready-made food, edible oil fruits and others. The lowest consumption group spends largest share of food expenditure on cereals.
9
12
15
15
16
18
19
23
23
GB
Islamabad
KP
Punjab
AJK
Pakistan
Balochistan
NMD
Sindh
Prevalence of wasting among young children

11
Source: Household Integrated Economic Survey (HIES), 2015-16, Pakistan Bureau of Statistics (PBS).
A study conducted by WFP titled ‘Minimum Cost of the Diet, Pakistan 201613’ revealed that 68% of the
households in Pakistan (excluding GB, NMD, and AJK) are not able to afford staple adjusted nutritious
food considering a per capita requirement of 2,350 Kcal per person per day. Among the provinces,
Balochistan has the highest prevalence with 83%. Sindh, KP and Punjab has 71%, 67% and 66%,
respectively, while it was 32% for Islamabad.
The current lockdown situation may contribute to further deterioration in food patterns,
diversification and nutrition levels needed for a healthy life in the most vulnerable segments of
population. The small-scale food producers and daily wagers (agriculture and non-agriculture) and
other groups in the informal sector generally have low food stocks at hand and are likely to consume
less diversified and poorly nutrient food. The continued lockdown would also limit the economic and
physical access of people to diversified, safe and nutritious food, which is vital for helping immunity
against the spread of COVID-19.
The current situation of lockdown due to spread of COVID-19 cases and the disruption of the whole
economic system if not countered by policy and public spending in the form of social protection and
other required interventions will lead to rise in food insecurity and malnutrition.
Food Availability In general, Pakistan is net-surplus in producing wheat, rice and other cereals, fruits and vegetables,
milk and meat and net-deficient in production of oil seeds and pulses.
However, with different agro ecological zones and long distance from producing regions and imports from ports, a smooth uninterrupted supply chain is necessary for ensuring food availability in different markets, particularly in the backdrop of impact of COVID-19.
At present, Pakistan has adequate stocks of major food items and there is no major supply shock in sense of availability of food items in most parts of the country. According to the information from the Ministry of National Food Security and Research (MNFS&R), about 0.954 million tonnes of wheat is available with the public sector as of 14th April, which is sufficient for 13 days of consumption.
13 https://pndajk.gov.pk/uploadfiles/downloads/mcod%20pakistan%20july%202016.pdf

12
According to Pakistan Food Forecast, wheat production is forecasted to be 26.47 million tonnes in Pakistan and provincial break down is given in below table. However, recent rains in March/April are likely to impact on wheat production adversely. Table: Wheat Production Forecast
Pakistan/Provinces Wheat Production Forecast (million tonnes)
Pakistan 26.47
Punjab 20.09
Sindh 3.82
Khyber Pakhtunkhwa 1.34
Balochistan 0.94
Source: Pakistan Food Forecast Report
Pakistan is net surplus in rice production and is a major exporter of rice; hence, sufficient stocks of rice will be available in the country. Pakistan mostly relies on imported pulses. As of 11th April, stocks of mash are 7,000 tonnes, which are available for 40 days and 8,000 tonnes are in import process. The moong stocks are currently 11,000 tonnes, which are sufficient for 35 days, whereas 3,000 tonnes are in the trade process. Masoor stocks are 22,000 tonnes, adequate for 3 months, and further 4,000 tonnes are in process. Gram is the largest pulse produced and consumed in Pakistan. In 2020, 188,069 tonnes of Gram has been imported and harvesting of local production will start in mid of April, which is forecasted at around 385,000 tonnes according to Pakistan Food Forecast for Rabi 2019-20. The stock in hand as on 13th April is 72,000 tonnes and in pipeline is 60,000 tonnes, which will be sufficient for more than 2 months. Potato harvesting has completed in Punjab with the forecasted production of 4.62 million tonnes,
hence, sufficient stocks are available. Pakistan also exported 125,000 tonnes of potatoes in 2020.
The crushing season of sugarcane was completed in January, 2020 and sufficient stocks of sugar may
be available in Pakistan.
Similarly, Pakistan has adequate availability of beef (2,303,000 tonnes), mutton (748,000 tonnes) and chicken meat (1,657,000 tonnes). Current stocks of palm oil are 0.448 million tones with additional import of 0.557 million tonnes expected to arrive before 31st May. The country already has sufficient stocks of vegetable ghee/oil with 0.375 million tonnes available stocks and 0.75 million tonnes in processing. The cumulative stock is sufficient for 7 months. Temporary supply shocks are expected due to disruption in logistics and movement restrictions. Disruptions are expected in supply of perishable items (vegetables, fruits etc), imported food items and processed food such as Ghee/Oil is expected due to closure of businesses, labor shortage and logistics issues. The shortages of labor could disrupt production and processing of food, notably for labor-intensive crops. Restriction on transport movements, particularly obstructions for fresh food supply chains may also result in increased levels of food loss and waste. Transportation cost of food commodities is also likely to increase due to carriage prices. If the outbreak of COVID-19 around the provinces becomes severe and continues over long periods of
time and lock down across the country also continues, there are likely to be serious disruptions that

13
may reduce food availability in the markets over the medium and longer terms, particularly in the food
deficit provinces of Khyber Pakhtunkhwa, Gilgit Baltistan and Balochistan.
Food Access, Consumption and Demand
The continued lock down will affect the demand for food (negatively) not only due to limited physical access but also due to declining financial resources and incomes, especially those of daily wagers, contract workers and small-scale farmers. Further, the closure of hotels and restaurants throughout the country and a ban on social gatherings like wedding ceremonies, funerals, religious meetings etc have also played their part in reducing the demand for certain food items and affected consumption patterns of different food items.
COVID-19 can likely have serious implications on the food markets as households in Pakistan are highly dependent on markets for purchasing food and non-food items, agricultural inputs, labour and sale of farm outputs. Many rural markets are likely to be closed, thus drying up income from sale of agricultural produce and livestock for the rural households. Following the border closures, in-country and cross-border livestock movement will be affected.
Overall, Pakistani households are market dependent for 79% of their cereals, 92% of vegetables, 50% of milk and 70% of meat intake. Market dependency for cereals rises to almost 96% in AJK and 89% in NMDs. Consequently, households in these regions are most likely vulnerable to price shocks.
Evolution of Prices of Major Food Items since COVID-19 Outbreak
Pakistan is already facing a challenge of very high inflation (both general and food), which is likely to have adverse effects on purchasing power of the people, particularly the poor and middle income groups of the population, and subsequently their access to food.
The Consumer Price Index (CPI) inflation data released by Pakistan Bureau of Statistics (PBS), shows that overall CPI inflation (general) increased by 10.2% on year-on-year basis in March 2020. CPI inflation for urban consumers increased by 9.3%, whereas for rural consumers it increased by 11.7% on year-on-year basis in March 2020. On the other hand, inflation based on Sensitive Price Index (SPI) and Wholesale Price Index (WPI) increased by 11.8% and 9.2% respectively on year-on-year basis in March 2020. Food inflation rose by 13.0% and 15.5% for urban and rural consumers respectively over the same reference period.
The COVID-19 and restrictions in movements and lock down are also likely to have an impact on prices
of major food items. The analysis based on the weekly retail prices data of 17 cities and 50 markets
across Pakistan since the COVID-19 outbreak14 reveals that although the Government is trying to
monitor and control unreasonable price increase by retailers, there has been short-term fluctuations
in prices of major food items in different parts of the country. Overall, the prices of pulses increased
by 10-20%, prices of most of other food items increased up to 10%, whereas prices of vegetables
(onions and tomatoes) and chicken meat have reduced since outbreak of COVID-19. These are initial
signals and more changes in prices may be experienced in the coming weeks due to prolonged
extension of the lockdown, logistic issues and the possible increase in transportation cost due to
limited availability of goods transport.
14 The analysis is on average prices prevailing during week of February 28-March 5 and week of April-3 to April 9, published by the Pakistan Bureau of Statistics (PBS). The first case of COVID-19 was reported on 26 February and the intensity of the COVID-19 has increased during this period. Price trends are for each market for the analysis period and covers overall (Pakistan) and17 cities (50 markets) across Pakistan.

14
A detailed analysis on prices of different food groups is presented below:
Price Trend Analysis of Wheat, Wheat Flour and Rice Since the outbreak of COVID-19 in Pakistan, the prices of wheat and wheat flour have increased by 4%
and 1.9% respectively (during the week of April 3-9 as compared to week of February 28- 5 March).
Across the markets, the largest increase in wheat prices occurred in Gujranwala (33%) followed by
Faisalabad (27%), Sialkot (18%), Islamabad, Rawalpindi, Lahore, Bannu and Khuzdar (10% each),
Bahawalpur (9%), and Karachi (3%). Whereas, the price of wheat decreased by 15% in Hyderabad,
followed by Sukkur (12%), Larkana (11%) (might be due to start of harvesting season in Sindh),
Sargodha (6%), and around 4% each in Multan, Peshawar, and Quetta.
The largest increase in prices of wheat flour was observed in Bannu (14%) followed by Peshawar (9%),
Khuzdar (8%), Karachi
(6%) and Quetta (4%),
whereas, the
decrease in wheat
flour prices has been
reported in Sukkur
(7%) and Hyderabad
(2%).
The prices of IRRI rice showed a slight increase of 2.2%, whereas prices of basmati rice have reduced
by 0.5% since the outbreak of COVID-19. The prices of IRRI rice remained the same in all markets
except in Sargodha, Peshawar, Hyderabad, and Larkana where prices increased by 16%, 11%, 6.0%,
and 4% respectively, whereas, prices of basmati rice decreased by 7.6% in Faisalabad.
Pulses Since the outbreak of COVID-19, overall, the prices of pulses have increased sharply; masoor
(18.2%), moong (19.7%), mash (7.6%) and gram (10.2%).
At the local level, the highest increase in prices of masoor was observed in Gujranwala (41%)
followed by 36% in Larkana, 33% in Sialkot, 31% in Hyderabad, 29% in Lahore, 22% in Multan, 20% in
Karachi, 17% each in Bahawalpur and Rawalpindi and 16% in Sukkur.
The prices of moong
increased by 36% in
Multan, 33% in Lahore,
27% in Bahawalpur,
26% in Gujranwala,
25% in Hyderabad and
23% each in Islamabad
and Faisalabad, 22% in
Sialkot and 21% in
Sukkur. The prices of
mash increased by 17% in Faisalabad, 16% in Lahore, 13% each in Islamabad, Rawalpindi and
Peshawar, 10% in Gujranwala and Multan and 9% in Karachi and a slight increase in other markets.
The gram prices increased by 33% in Larkana, 23% in Sialkot, 19% in Multan, 17% in Lahore, and 15%
in Gujranwala.

15
The rise in prices of pulses in all the major markets may be due to consumer hoarding and increase in
demand.
Vegetables and Fruits Since outbreak of COVID-19, the prices of onions have decreased in Pakistan by 24% and tomatoes
by 13%, wheras, potato prices increased by 3%.
The potato prices
increased in some
markets of Pakistan and
largest increase was
observed in Sukkur
(21%) followed by 16% in
Khuzdar, 10% in Karachi,
9% in Rawalpindi and 8%
in Lahore, whereas
prices decreased by 17%
in Faisalabad, 7% in Sialkot and 5% in Islamabad.
Onion prices decreased in almost all markets and the highest decrease was in Faisalabad (45%), Bannu
and Sialkot (38% each), Sargodha (33%), Hyderabad (31%), Multan (29%), 27% in Lahore and 25% in
Islamabad and Gujranwala, 21% in Rawalpindi and 19% in Karachi and Sukkur, while prices of onions
increased in Khuzdar only by 14%.
Tomato prices decreased on average by 13% in Pakistan with the highest decrease in Larkana (33%),
Quetta and Bannu (29% each), Sukkur (24%), Faisalabad (20%), and Islamabad and Rawalpindi (16%
each), 14% in Peshawar and 12% each in Lahore and Karachi. However, tomato prices increased by
21% in Bahawalpur and 8% in Gujranwala.
Overall, banana prices increased by 2% in Pakistan. The largest increase in prices was in Quetta (29%)
followed by 23% in Khuzdar, 18% in Bahawalpur, 9% in Sukkur and 8% in Gujranwala, whereas prices
decreased by 14% in Rawalpindi, 11% in Islamabad, 9% in Larkana and 6% in Hyderabad. Prices of
other fruits, though not reported by PBS, are reportedly increasing and likely to continue increasing
till Ramazan.
Livestock Products Since the COVID-19 outbreak, there is an overall slight increase in the prices of beef (2.5%) and
mutton (2.4%), and a substantial increase in the prices of eggs (27.3%). However, the prices of fresh
milk decreased slightly (3%), whereas chicken meat prices increased by 13.8%.
Across the markets, the beef prices increased in Sukkur by 13%, Peshawar and Rawalpindi (6%),
Multan (5%) and Islamabad and Gujranwala (4% each). Mutton prices increased by 12% in Quetta, 7%
in Rawalpindi, 6% in Islamabad and Khuzdar and 4% in Gujranwala and Multan each. The chicken meat
prices decreased in all markets; most notable by 24% in Bahawalpur, 21% in Lahore, 20% in Faisalabad
and Multan, 18% in Sialkot, 17% in Islamabad and 16% each in Rawalpindi and Quetta.

16
The prices of fresh milk
decreased on average and the
highest decrease was in
Gujranwala (22%) followed by
Hyderabad (17%), Karachi (16%)
and Quetta (9%), while prices of
fresh milk increased by 7% each
in Bannu and Bahawalpur and
4% in Lahore.
The eggs prices have increased substantially, possibly due to limited supply after COVID-19 outbreak.
Except in Khuzdar, the eggs prices increased in all markets, by 52% in Hyderabad, 50% in Larkana, 33%
in Karachi, Sukkur and Sialkot, 29% in Rawalpindi and Peshawar, and 28% in Multan and Lahore, 22%
in Faisalabad, 20% in Bannu and 9% in Quetta.
Cooking Oil/Ghee, Sugar and Tea Since outbreak of COVID-19, the prices of cooking oil and vegetable ghee slightly decreased by 1.2%
and 1.3% each in Pakistan. In the regional markets across Pakistan, prices of cooking oil and vegetable
ghee decreased in Islamabad (5% each), Rawalpindi (5% and 4%, respectively), Sargodha (5% and 6%,
respectively) and Khuzdar (6% each).
The prices of sugar and gur increased by 2.1 and 2.2% respectively in Pakistan. The highest rise in sugar
prices was recorded in Karachi
(5%) followed by 4% in
Rawalpindi, Lahore, Faisalabad
and Peshawar, 3% in Islamabad
and Bannu, and 2% in Larkana,
Hyderabad and Quetta. The
highest rise in prices of gur was
recorded in Larkana (10%)
followed by 9% in Sukkur and
Sialkot and 8% in Quetta, whereas it reduced by 9% in Sargodha and 5% in Karachi.
Fuel and LPG In March, the government reduced the price of petrol and diesel by 13.3% and 12.1%, respectively
due to reduction in
international oil prices and to
provide relief to the public. The
prices of LPG, mostly used as a
fuel for cooking, decreased by
18.5% in Pakistan, possibly due
to decrease in demand due to
closure of restaurants and
teashops. Across the markets, prices of LPG decreased by 36% in Bannu, 33% in Bahawalpur and
Lahore, 30% each in Larkana and Multan, 29% in Sargodha, 21% in Islamabad and Rawalpindi, 19% in
Peshawar and 14% in Khuzdar.

17
Fertilizers The prices of two major fertilizers, Urea and Diammonium Phosphate (DAP) remained unchanged
during the week of April 3-9 as compared to the previous week (March 27-April 2). However, since the
outbreak of COVID-19, the overall prices of Urea fertilizer reduced by 1%, whereas the price of DAP
merely reduced by 0.1%.
Across the markets, the
prices of Urea reduced
by 6% in Sukkur, 5% in
Lahore, 3% in Rawalpindi
and 2% in Sargodha. The
price of DAP declined by
3% in Rawalpindi and
Peshawar and 1% in
Sukkur while increased by 5% in Hyderabad. The prices of fertilizer may change in the coming weeks
due to an expected increase in its demand during the sowing period of Kharif crops.
Agriculture Production and Supply Chain
Wheat Stocks The Government of Pakistan had wheat stocks of 2.387 million tonnes on March 2, 2020; however, in
the current situation, government may face challenges in ensuring the availability of wheat in different
parts of the country due to hoarding and delay in wheat harvesting. According to the information from
the Ministry of National Food Security and Research (MNFS&R), about 0.954 million tonnes of wheat
is available with the public sector as of 14th April, which is sufficient for only 13 days. Khyber
Pakhtunkhwa (KP) and Balochistan provinces already have limited stocks of wheat. A delay in wheat
harvest in Punjab, the possible lower than forecast wheat production due to recent rains in
March/April may lead to more limited supply for KP and Balochistan and Pak Administered Kashmir
(PAK) and Gilgit-Baltistan (GB).
In addition, the consumer hoarding for fast approaching Ramadan in the coming weeks may
exacerbate a situation of low stocks and therefore perceived shortage due to supply chain in the
Punjab and other provinces.
Table: Current Wheat Stocks
Province/Agency Stocks (Million tonnes) on 14-04-2020
Punjab 0.445
Sindh 0.225
Khyber Pakhtunkhwa 0.103
Balochistan 0.0061
PASSCO 0.175
Total 0.954 Source: Provincial Food Departments and PASSCO; Ministry of National Food Security & Research
Wheat Harvesting
Wheat harvesting has already started in Balochistan, Sindh, and in some parts of southern Punjab,
however, in most of the Punjab and KP it will start by 20th of April. The limited mobility due to lock
down, but most importantly the fear of getting infected among the farmers and migrant farm laborers
from the adjoining areas may impact the wheat harvesting, particularly in Punjab and KP provinces,
whereas cases of coronavirus are emerging rapidly. In Sindh and Balochistan, wheat harvesting has

18
started but there are reports of shortage of labour, storage bags and marketing of the produce. The
limited wheat stocks in the country would lead to total dependence of wheat procurement from the
Sindh province. Difficulties in the supply chain due to lockdown in Sindh province and a delay in wheat
harvest in Punjab and KP may lead to a potential wheat crisis in Pakistan.
Wheat Procurement, Storage and Supply Chain There is a significant delay in procurement campaign in Sindh and Punjab. As of 14th April, Sindh has
procured only 63,600 tonnes of wheat against the target of 1.4 million tonnes, whereas, Punjab has
only procured 1,500 tonnes and PASSCO 26,000 tonnes. Khyber Pakhtunkhwa and Balochistan
provinces have limited stocks of wheat, hence, prices of wheat flour are expected to increase in these
provinces.
The uncontrollable spread of COVID-19 may hamper the government efforts to achieve its wheat
procurement target of 8.25 million tons. This may be due to lower availability than forecast of wheat,
to limited mobility of human and financial resources as well as confusion in how to safely conduct the
procurement operations and fear may adversely affect the availability of labor and machinery required
for procurement and storage activities.
Another important hurdle that the government will have to face during its procurement drive is
anticipated competition from traders/hoarders in open market, which may lead to higher
procurement price in near future. Higher prices of wheat would also translate to higher wheat flour
prices. The international price of wheat has also risen by 3.1% from $215.32 per ton in February 2020
to $221.93 per ton in March 2020.
Plantation of Kharif (Summer) Crops and Fruits and Vegetable Production and Supply
Chain
Kharif crops plantation is expected to start in April/May in Sindh and Balochistan province and in
May/June in Punjab and KP province. The factors that may most impact the production will be the
possible shortage of availability of labour and access to agricultural inputs. The possible impact on
plantation of Kharif crops will be analyzed in next few weeks, as part of the work to develop the
Pakistan Food Forecast (Kharif).

19
The current availability of fruits and vegetables in the market comes from a majority of vegetables and
fruits produced in Sind province. In the next 3 to 4 weeks the situation may evolve. On one hand the
lockdown and related possible difficulties in transportation/movement of goods, on the other the
possible unfavorable weather conditions forecasted in Punjab especially in a time when vegetables
season is at its peak in the province, may create a shortage of vegetables in several markets of other
provinces, in the first two weeks of Ramazan.
The unavailability of sufficient inputs may also affect the timely cultivation and yield of certain fruits
and vegetables. The agriculture inputs (seeds and fertilizers etc) are necessary for cultivation and
limited availability would risk the cultivation of vegetables. The shortage of farm laborers for fruit and
vegetables may cause a decline in area under cultivation of labor intensive fruit and vegetable crops,
and can result in high post-harvest losses due to lack of timely labour and transportation availability,
as these commodities are highly perishable.
Livestock The continued lock down and restrictions are adversely affecting the livestock sector, particularly the
poultry industry. Demand for milk, dairy products, and meat has reduced, and the price of chicken
meat has shown a considerable decrease. In most of the areas, livestock inputs stores are closed and
the price of feed and straw/fodder has increased. Animal Mundi (livestock selling and purchasing
markets) are totally closed. Farmers are getting low prices of milk due to the closure of the hotels and
ice cream factories (disequilibrium/supply increased and demand decreased). There are reports of
purchasing livestock inputs at high prices, unavailability of veterinary/livestock treatment services at
local level.
Trade The COVID-19 crisis has caused demand and supply shocks in the world economies and these shocks
are inevitably causing major disruptions to trade. Pakistan is a exporter of rice, potato, fruits,
vegetables and meat products etc, worth of around USD 6.7 billion, and an importer of pulses, milk
products and cooking oil etc, worth of USD 5.7 billion.
The lock down situation and disruption in domestic and international supply chain and any
unprecedented situation in the international market is likely to disrupt the trade of essential food
items such as export of potatoes, rice and import of wheat, pulses, soybean and other commodities
listed in below tables. Pakistan would import 0.5 million tons of wheat for 2020-21 and international
prices of wheat have risen recently.
Table: Export of Food Commodities
Commodities
Total (Fiscal Year 2018-19) Total (Jan-Dec-2019) Total (Jan-Feb-2020)
Quantity ('000' MT)
Value Dollars (Million)
Quantity ('000' MT)
Value Dollars
(Million)
Quantity ('000' MT)
Value Dollars
(Million)
Rice 4187.9 2079.6 4502.6 2283.6 725.1 364.4
Basmati 696.2 612.0 847.4 762.5 138.1 120.2
Rice Others 3491.8 1467.6 3655.2 1521.2 587.0 244.2
Fish & Fish Preparations 200.6 438.6 214.4 480.1 25.2 53.6
Fruits 693.0 417.0 726.1 412.1 334.0 127.3
Vegetables 950.3 237.9 949.8 273.6 280.4 110.7

20
Tobacco 7.4 24.2 7.4 22.1 4.5 11.8
Wheat 683.9 152.6 273.9 66.9 0.0 0.0
Spices 25.7 86.2 24.0 85.2 4.4 17.1
Oil Seeds, Nuts and Kernals 54.1 74.4 31.9 42.4 1.7 2.4
Sugar 692.3 222.9 621.0 218.6 0.0 0.0
Meat and Meat Preparations 75.0 243.8 85.9 297.1 15.4 55.1
All Other Food Items 631.2 626.8 91.3
Food Group (Total) 6688.0 7092.4 1198.2
* Provisional, PBS
Table: Import of Food Commodities
Commodities
Fiscal Year 2018-19 Total (Jan-Dec-2019) Total (Jan-Feb-2020)
Quantity ('000' MT)
Value Dollars
(Million)
Quantity ('000' MT)
Value Dollars
(Million)
Quantity ('000' MT)
Value Dollars
(Million)
Milk, Cream & Milk Food 79.8 230.2 68.7 202.3 14.3 38.8
Dry Fruits & Nuts 31.0 43.0 26.8 40.9 1.9 3.5
Tea 229.2 571.7 209.0 498.9 38.0 95.4
Spices 145.5 162.5 155.0 166.6 24.5 26.3
Soyabean Oil 151.0 107.4 144.3 99.4 6.3 4.1
Palm Oil 3177.9 1844.6 3179.8 1755.4 496.0 340.5
Sugar 7.1 3.9 6.7 3.8 1.0 0.6
Pulses (Leguminous Veget 754.0 506.0 925.2 463.8 251.4 129.2
All Others Food Items 2195.9 2036.9 351.3
Food Group (Total) 5665.2 5268.0 989.9
*Provisional PBS
Food Utilization
A significant proportion of the population in the country lives in dense informal rural settlements with
poor living conditions, lack of basic services including water and sanitation and are vulnerable due to
unstable unemployment as they depend on casual labour or informal jobs. Under COVID situation with
limited livelihood opportunities, and existing poor access to water, sanitation and other related

21
ssential item in virus hard hit areas, the food utilization of the poor families and vulnerable groups is
at greater risk.
Summary of Recommendations
The following points are options for actions that FAO and WFP believe will support the Government
in its efforts to sustain the food system in Pakistan and lead to greater food and nutrition security:
Urgent Policy Measures and Information:
1. Strongly advocate to balance resource allocations (public money) between the public health emergency, and the food security and livelihood concerns of COVID-19. After public health, food security and livelihoods are the area next most strongly affected by both the lockdowns and the pandemic itself.
2. Regularly monitor food and nutrition security in highly food insecure and vulnerable populations including poor female headed, child headed households, households with pregnant and lactating women and those with children under two years. Where required, publicly fund emergency food and food system support to address the drivers of food and nutrition insecurity in these highly vulnerable populations.
3. Adjust the design of the National Agriculture Emergency Program (NAEP) and Ehsaas1 so that those vulnerable to an impact from COVID-19 (socio-economic or health) are reached faster. Being an agricultural country, Pakistan’s food and agriculture system requires immediate support to maintain the food supply, jobs and incomes.
4. Redesign current projects funded by international financing institutions and development partners to ensure quick delivery of emergency agriculture and food system support, where relevant.
5. Make information regarding agriculture production, food supply and market sales easily available during the COVID-19 response period via suitable government portals and at the level
Things to Monitor The Covid-19 pandemic has shown widespread, unprecedented impact globally, however being a new
phenomenon; it is not precisely clear how things will evolve in the country in the weeks and months or
year ahead. Therefore, it is important to monitor the situation closely. Following are the key issues that
need close monitoring:
1. Geographic Spread of the pandemic number of people affected. 2. Domestic trade and supplies 3. Markets and prices of food and other essential commodities 4. Impact on livelihoods: any loss of employment or income opportunities, particularly for the urban
poor. 5. Agriculture and livestock: impact on the yield of wheat production as the harvest is about to start
in many parts of the country. Also, the next cropping season is approaching, it is important to monitor how the agriculture sector performs, and the livestock in terms of livestock health and trade
6. Performance of the season for the approaching agricultural season 7. Any further spread or containment of the Desert Locust 8. National government and local government policies for trade and movement, economic and
financial measures and policies in supporting the affected population

22
of farm services centres in districts. Transparent dissemination of information will strengthen government management over the food market and supply chains and provide farmers with a sound environment in which to make rational production decisions.
6. Strengthen the National Food and Nutrition Security Information System and continue to publish flagship knowledge products such as the Pakistan Overview of Food Security and Nutrition, Pakistan Food Forecast, and other ad hoc reports as needed under the current situation. Enhance/develop a price monitor. Report regularly, including to the public.
7. Centralise and strengthen the data and analytical capacity of MNFSR for informed decision making in the national decision-making processes regarding food and nutrition security, in close coordination with existing provincial monitoring capacities.
8. Maintain and increase monitoring of regulatory measures to help discourage and control hoarding, price gouging and speculation during COVID-19 response in relation to the food, livestock and agriculture inputs and machinery, as part of continuation of normal price surveillance of food markets in Pakistan.
9. Maintain open international food trade with other countries, and request in bilateral and multilateral fora that other trading partner countries do not introduce trade protectionist policies under COVID-19 conditions, because they may increase food prices and may take considerable time to unwind. Accelerate customs clearance for food items.
10. Leverage additional public funding that may be required to address the COVID19 socio-economic response, including for the agriculture sector to ensure food security and nutrition, by levying a one-off additional tax, based on property or wealth, to fund interventions and re-ignite the national economy, and not by cancelling or redirecting PSDP funding.
Immediate Actions:
1. Provide unconditional cash assistance to vulnerable people in urban and rural areas to avoid hunger and poverty, and to sustain consumption and markets, including to those who suddenly became unemployed, those who have returned back to home provinces and villages and are without employment, those running their own farms in absence of labor and women-headed households in rural areas. Ensure payments are gender inclusive, as women’s burden under lockdown increases, including unpaid work in fields or as livestock caretakers. Carefully monitor social protection system to ensure the identification of possible blind spots.
2. Provide unconditional food assistance to the most vulnerable households impacted by the lockdown, affecting their access to food; Support in the form of in-kind transfers should be accompanied by nutrition and COVID-19 communication information.
3. Prioritize nutrition-specific assistance, such as community-based management of acute malnutrition (CMAM) in the districts with high GAM rates and other associated vulnerabilities. This will be scaled up to 40-50% coverage of the targeted areas and can be expanded and diverted to other areas according to need. The intervention will also upscale health facilities for the provision of nutrition services in order to increase access and integration with other health services.
4. Given schools are closed, replace school feeding programs with alternative means of ensuring school-age children (including those who were out- of-school before COVID-19) can access nutritionally balanced meals. For example, replace any onsite school meals with vouchers or cash transfers, consider removing the conditionality, and channel assistance through parents, with physical distancing measures in place.
5. Ensure the macro-nutrient composition of ration packs and other forms of food assistance are aligned with the Pakistan Dietary Guidelines for Better Nutrition (PDGN). Rations should include high-nutrient food items such vegetables, dried fruits and powdered milk; a
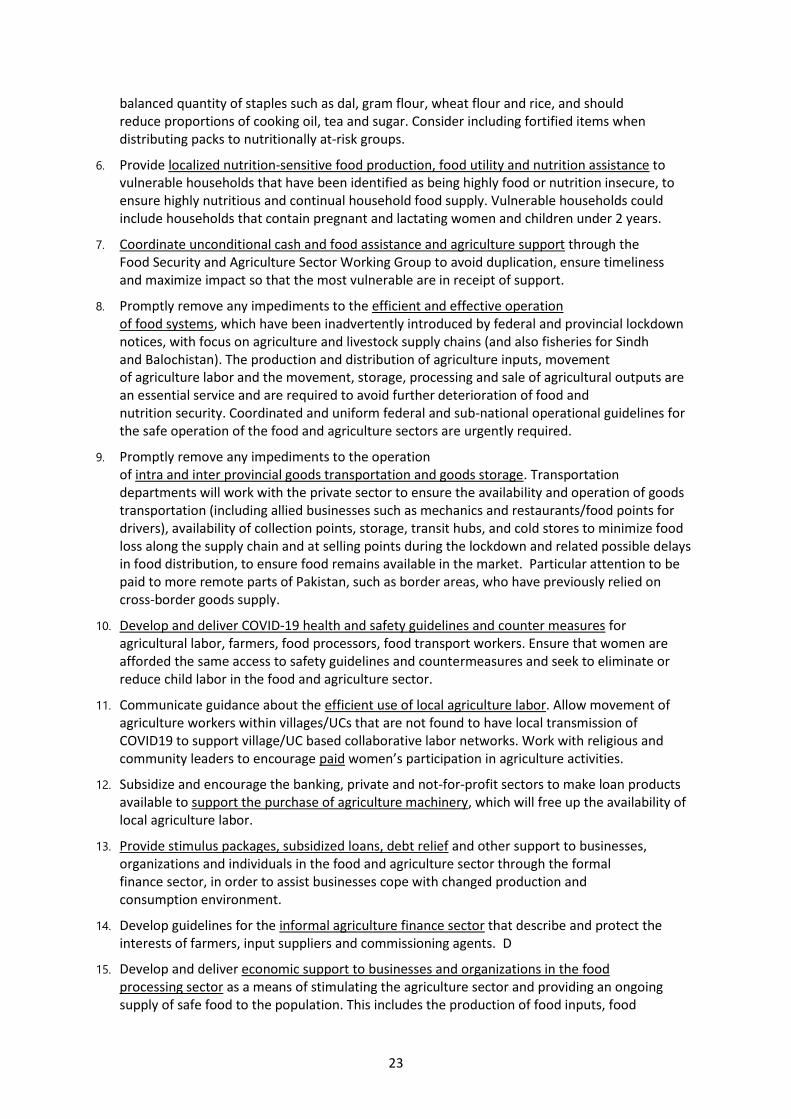
23
balanced quantity of staples such as dal, gram flour, wheat flour and rice, and should reduce proportions of cooking oil, tea and sugar. Consider including fortified items when distributing packs to nutritionally at-risk groups.
6. Provide localized nutrition-sensitive food production, food utility and nutrition assistance to vulnerable households that have been identified as being highly food or nutrition insecure, to ensure highly nutritious and continual household food supply. Vulnerable households could include households that contain pregnant and lactating women and children under 2 years.
7. Coordinate unconditional cash and food assistance and agriculture support through the Food Security and Agriculture Sector Working Group to avoid duplication, ensure timeliness and maximize impact so that the most vulnerable are in receipt of support.
8. Promptly remove any impediments to the efficient and effective operation of food systems, which have been inadvertently introduced by federal and provincial lockdown notices, with focus on agriculture and livestock supply chains (and also fisheries for Sindh and Balochistan). The production and distribution of agriculture inputs, movement of agriculture labor and the movement, storage, processing and sale of agricultural outputs are an essential service and are required to avoid further deterioration of food and nutrition security. Coordinated and uniform federal and sub-national operational guidelines for the safe operation of the food and agriculture sectors are urgently required.
9. Promptly remove any impediments to the operation of intra and inter provincial goods transportation and goods storage. Transportation departments will work with the private sector to ensure the availability and operation of goods transportation (including allied businesses such as mechanics and restaurants/food points for drivers), availability of collection points, storage, transit hubs, and cold stores to minimize food loss along the supply chain and at selling points during the lockdown and related possible delays in food distribution, to ensure food remains available in the market. Particular attention to be paid to more remote parts of Pakistan, such as border areas, who have previously relied on cross-border goods supply.
10. Develop and deliver COVID-19 health and safety guidelines and counter measures for agricultural labor, farmers, food processors, food transport workers. Ensure that women are afforded the same access to safety guidelines and countermeasures and seek to eliminate or reduce child labor in the food and agriculture sector.
11. Communicate guidance about the efficient use of local agriculture labor. Allow movement of agriculture workers within villages/UCs that are not found to have local transmission of COVID19 to support village/UC based collaborative labor networks. Work with religious and community leaders to encourage paid women’s participation in agriculture activities.
12. Subsidize and encourage the banking, private and not-for-profit sectors to make loan products available to support the purchase of agriculture machinery, which will free up the availability of local agriculture labor.
13. Provide stimulus packages, subsidized loans, debt relief and other support to businesses, organizations and individuals in the food and agriculture sector through the formal finance sector, in order to assist businesses cope with changed production and consumption environment.
14. Develop guidelines for the informal agriculture finance sector that describe and protect the interests of farmers, input suppliers and commissioning agents. D
15. Develop and deliver economic support to businesses and organizations in the food processing sector as a means of stimulating the agriculture sector and providing an ongoing supply of safe food to the population. This includes the production of food inputs, food

24
packaging and the provision of food safe technical services, including food safety protocol enforcement.
Medium Term Actions:
1. Continue to modernize and upgrade the social protection system using electronic technology to make it easier to expand horizontal and vertically, to verify eligibility and identify wrong exclusions, and distribute regular cash payments with speed during extended lockdown arrangements.
2. Upscale CMAM activities to provide prevention and treatment to malnourished children under five years and pregnant and lactating women through existing Public Health Clinics. During delivery of the CMAM program, introduction of distancing and hygiene measures are highly recommended. CMAM activities shall remain intact through the emergency in order to prevent and reduce mortalities and morbidities.
3. Introduce an incentive-based (food, cash or vouchers) education support programme for children of grades KG to 10, in food insecure and COVID-19 hard-hit areas, to ensure student retention once schools are re-opened.
4. Modernize and upgrade the supply chain through distribution, marketing and purchasing arrangements for food wherever possible, such as to introduce electronic transactions, online or tele-sales points, vertically-integrated ordering and delivery systems. This will require mobile data connectivity and e-banking services penetration, including in remote areas.
5. Ensure that marine and freshwater fish supply chains are functional and that the daily catch can be transported safely to markets and processors. Fishery value chains are cold value chains that require reliable cold transportation, processing and marketing opportunities for the catch to reach consumers safely.
6. Ensure vulnerable mountain communities that rely on forests products are included in the cash/food assistance. It will protect forest environments from fuel gathering and illegal activities such as logging and hunting and support people dependent on forestry livelihoods to maintain the integrity of forest ecosystems. Forests are very vulnerable in times of crisis. Households without cash could resort to wood collection from forests as a means to replace other fuel sources and/or could participate in illegal logging and hunting to earn cash. The provision of LPG and supporting forestry-based livelihoods would protect vulnerable forest ecosystems.
7. Design and implement programs that will support people who participate in agriculture, livestock, forestry and fishery livelihoods respond to the changed economic, social and business systems conditions related to COVID-19. Programs need to be inclusive and climate smart and innovatively assist different livelihood groups cope with changed conditions.
8. Undertake a comprehensive study on the impact of the short-term measures (particularly the impact of NAEP and Ehsaas) on Pakistan’s food system, and on food security and nutritional outcomes, should be commenced based on primary data while employing latest analytical tools and statistical techniques in the mid-term scenario.

25
Annex: Prevalence of Moderate and Severe Food Insecurity based on Food Insecurity Experience Scale (FIES)
in Pakistan by Districts
Districts
Percentage of
Households Moderately or Severely
Food Insecure
Percentage of Households
Severely Food Insecure
Estimated Number of Households Moderately or Severely
Food Insecure
Estimated Number of Households
Severely Food
Insecure
Estimated Number of
People Moderately or Severely
Food Insecure
Estimated Number of
People Severely Food
Insecure
Khyber Pakhtunkhwa
Bannu 3.8 1.9 4,548 2,280 44,263 22,190
Batagram 24.9 13.8 17,284 9,574 118,486 65,629
Buner 7.4 2.4 6,991 2,211 66,671 21,087
Charsadda 19.1 8.6 42,112 18,923 307,886 138,347
Chitral 15.6 4.5 9,588 2,754 69,610 19,997
Dera Ismail Khan 5.4 2.7 10,830 5,435 87,540 43,933
Hangu 11.9 3.8 5,763 1,820 61,944 19,559
Karak 20.5 10.0 14,987 7,285 144,721 70,347
Kohat 16.1 6.3 19,500 7,645 159,716 62,614
Kohistan 1.8 0.1 1,865 132 14,360 1,020
Lakki Marwat 2.5 0.7 2,461 647 21,992 5,783
Lower Dir 7.4 3.1 11,511 4,753 106,401 43,939
Malakand Protected Area
1.6 0.9 1,417 814 11,165 6,411
Mardan 7.6 4.7 23,671 14,595 180,115 111,059
Nowshera 1.8 0.3 3,598 676 27,486 5,163
Peshawar 36.7 10.6 179,968 51,825 1,568,460 451,669
Shangla 24.2 8.7 21,697 7,821 183,314 66,081
Swabi 18.1 7.6 38,686 16,366 293,406 124,121
Swat 3.9 0.9 10,710 2,554 90,073 21,479
Tank 5.8 0.7 2,507 280 22,808 2,547
Torghar 26.8 11.2 7,082 2,956 45,865 19,145
Upper Dir 52.8 23.2 63,516 27,857 499,994 219,286
Balochistan - - - -
Awaran 95.3 54.3 17,249 9,823 115,998 66,060
Barkhan 56.1 31.3 14,599 8,151 96,174 53,697
Chagai 80.6 49.1 25,039 15,264 182,072 110,993
Dera Bugti 79.8 50.2 37,170 23,400 249,426 157,020
Gwadar 67.4 46.5 26,911 18,572 177,635 122,587
Harnai 34.4 17.3 5,962 3,009 33,335 16,823
Jaffarabad 46.6 17.1 36,933 13,564 239,385 87,913
Jhal Magsi 92.1 60.4 23,073 15,121 137,466 90,087
Kachhi 40.6 8.5 12,222 2,556 96,116 20,100
Kalat 85.6 55.4 47,500 30,729 352,829 228,253
Kech 30.0 18.3 41,562 25,383 273,008 166,732
Kharan 51.3 16.3 12,330 3,915 80,106 25,437
Khuzdar 30.9 19.4 37,145 23,310 247,481 155,307
Killa Abdullah 60.8 38.3 59,133 37,202 460,835 289,925
Killa Saifullah 4.0 2.3 2,118 1,219 13,575 7,816
Kohlu 11.5 6.3 3,085 1,695 24,650 13,547
Lasbela 59.3 35.3 55,238 32,878 340,498 202,668
Lehri 46.6 20.5 8,699 3,820 55,057 24,176
Loralai 68.6 47.6 38,348 26,591 272,736 189,123

26
Mastung 13.6 6.2 5,269 2,421 36,185 16,627
Musakhel 60.8 36.5 15,089 9,066 101,513 60,995
Nasirabad 69.8 31.9 46,543 21,291 342,396 156,629
Nushki 42.5 21.0 9,627 4,766 75,953 37,601
Panjgur 27.2 13.5 11,599 5,733 86,088 42,554
Pishin 35.5 18.3 45,430 23,490 261,230 135,071
Quetta 13.2 5.2 36,637 14,417 301,303 118,564
Sherani 5.5 3.2 1,173 681 8,467 4,915
Sibi 17.7 8.3 3,574 1,677 23,956 11,239
Sohbatpur 25.1 9.6 7,670 2,930 50,395 19,252
Washuk 66.0 41.6 20,823 13,105 116,331 73,214
Zhob 1.0 0.5 460 207 3,105 1,397
Ziarat 9.8 3.8 2,836 1,093 15,689 6,048
Sindh
Badin 56.0 34.6 201,071 124,452 1,009,627 624,904
Dadu 26.9 4.0 77,008 11,386 416,246 61,546
Ghotki 24.4 13.1 72,269 38,775 401,043 215,174
Hyderabad 40.6 16.8 176,339 72,928 891,882 368,850
Jacobabad 31.0 13.6 55,157 24,101 312,053 136,353
Jamshoro 31.1 9.7 56,176 17,495 308,371 96,037
Kambar Shahdad Kot 49.0 28.6 109,279 63,822 656,708 383,538
Karachi Central 13.3 3.7 71,469 20,050 394,038 110,544
Karachi East 14.8 5.3 75,571 27,092 431,468 154,677
Karachi South 13.3 4.7 43,527 15,393 238,124 84,212
Karachi West 22.1 6.7 139,898 42,382 863,204 261,506
Kashmor 31.3 19.3 57,987 35,659 341,128 209,774
Khairpur 36.1 14.6 149,124 60,318 868,445 351,273
Korangi 16.8 5.4 70,663 22,683 411,796 132,188
Larkana 34.4 21.4 89,819 55,951 523,933 326,372
Malir 32.7 13.5 110,576 45,496 656,710 270,197
Matiari 39.5 16.3 56,423 23,241 303,508 125,019
Mirpur Khas 32.3 19.6 92,440 56,135 485,796 295,001
Naushahro Feroze 35.7 10.9 98,505 30,023 576,101 175,587
Sanghar 25.8 9.4 96,724 35,026 531,132 192,335
Shaheed Benazirabad 38.0 11.3 112,911 33,517 612,882 181,929
Shikarpur 36.9 20.4 76,609 42,403 454,540 251,592
Sujawal 69.6 36.5 106,455 55,821 544,014 285,262
Sukkur 20.8 6.8 54,608 17,755 308,889 100,433
Tando Allahyar 60.2 29.4 99,550 48,674 503,388 246,128
Tando Muhammad Khan 70.3 40.6 92,477 53,350 476,024 274,616
Tharparkar 64.0 27.0 193,040 81,469 1,055,783 445,573
Thatta 67.4 32.9 124,620 60,877 660,495 322,654
Umer Kot 58.2 26.2 123,549 55,616 624,356 281,057
Punjab
Attock 8.2 3.4 25,207 10,426 154,828 64,041
Bahawalnagar 15.1 4.9 72,432 23,775 448,779 147,307
Bahawalpur 39.5 21.9 231,021 127,793 1,448,902 801,481
Bhakkar 9.3 2.3 24,947 6,062 153,498 37,302
Chakwal 13.3 4.2 35,419 11,097 199,115 62,382
Chiniot 11.5 3.8 25,031 8,373 156,835 52,461
Dera Ghazi Khan 19.3 9.4 66,097 32,207 552,899 269,412
Faisalabad 17.0 5.2 208,418 63,469 1,339,352 407,869
Gujranwala 23.5 6.8 175,521 50,811 1,177,835 340,965
Gujrat 10.2 6.0 45,125 26,500 281,123 165,091

27
Hafizabad 18.3 8.7 32,110 15,258 212,070 100,771
Jhang 10.8 3.7 46,244 15,771 296,838 101,232
Jhelum 6.9 2.9 14,192 6,021 84,730 35,946
Kasur 28.3 12.2 148,958 64,034 978,109 420,473
Khanewal 24.9 7.8 116,038 36,425 726,990 228,207
Khushab 26.8 9.9 56,732 20,936 343,388 126,720
Lahore 20.0 9.9 352,066 173,308 2,228,595 1,097,052
Layyah 30.4 12.2 85,678 34,480 554,383 223,103
Lodhran 31.3 13.3 82,183 34,985 532,124 226,523
Mandi Bahauddin 12.9 4.0 32,473 10,060 205,216 63,572
Mianwali 4.4 1.3 10,353 2,975 67,255 19,326
Multan 15.1 6.3 114,737 48,010 715,562 299,416
Muzaffargarh 34.2 14.4 228,357 95,989 1,478,559 621,505
Nankana Sahib 13.1 5.8 28,331 12,438 177,956 78,127
Narowal 11.9 7.0 28,478 16,794 202,948 119,683
Okara 13.5 6.6 66,678 32,402 410,892 199,671
Pakpattan 22.9 9.3 69,770 28,371 417,989 169,968
Rahim Yar Khan 25.8 4.9 180,852 34,585 1,241,051 237,330
Rajanpur 22.5 10.2 59,060 26,669 449,091 202,789
Rawalpindi 19.1 5.4 169,843 47,727 1,033,016 290,282
Sahiwal 7.5 1.4 29,477 5,652 189,069 36,253
Sargodha 6.2 1.7 36,974 10,144 228,141 62,591
Sheikhupura 20.6 10.6 106,470 54,685 711,464 365,421
Sialkot 12.8 5.3 73,261 30,143 496,833 204,418
Toba Tek Singh 9.8 3.2 33,305 10,966 215,497 70,956
Vehari 29.0 13.7 132,840 62,710 840,259 396,660
KP-NMD
Bajaur 3.1 0.2 3,674 217 33,357 1,969
D.I.Khan Tribal Sub-Division
45.1 10.8 3,120 748 30,891 7,411
Kohat Tribal Sub-Division
14.5 3.9 2,082 564 17,218 4,660
Peshawar Tribal Sub-Division
24.3 9.3 1,715 658 15,701 6,023
Tank Tribal Sub-Division 17.5 3.0 728 124 6,364 1,084
Khyber 42.5 23.6 47,457 26,283 419,858 232,531
Kurram 26.2 14.2 17,625 9,555 162,385 88,038
Mohmand 56.4 16.9 27,119 8,151 263,192 79,107
Orakzai 37.4 16.1 11,689 5,022 95,129 40,875
AJK - - - -
Muzaffarabad 27.01 16.31 29,212 17,640 175,565 106,015
Neelum 20.75 8.43 5,638 2,290 39,633 16,101
Jhelum Valley 16.34 8.69 6,088 3,238 37,745 20,074
Bagh 11.17 2.64 6,995 1,653 41,552 9,821
Haveli 50.82 33.67 10,988 7,280 77,246 51,178
Poonch 17.55 8.08 14,974 6,894 87,750 40,400
Sudhnoti 32.67 20.81 15,236 9,705 97,357 62,014
Kotli 17.01 8.3 19,739 9,631 131,657 64,242
Mirpur 10.57 4.65 7,626 3,355 48,199 21,204
Bhimber 40.1 20.12 25,425 12,757 168,821 84,705
Gilgit Baltistan - - - -
Skardu 13.31 0.34 4,278 109 34,717 887
Ghanche 9.55 1.54 2,005 323 14,965 2,413
Kharmang 12.71 1.39 990 108 6,941 759
Shigar 32.54 3.95 3,165 384 24,255 2,944
28
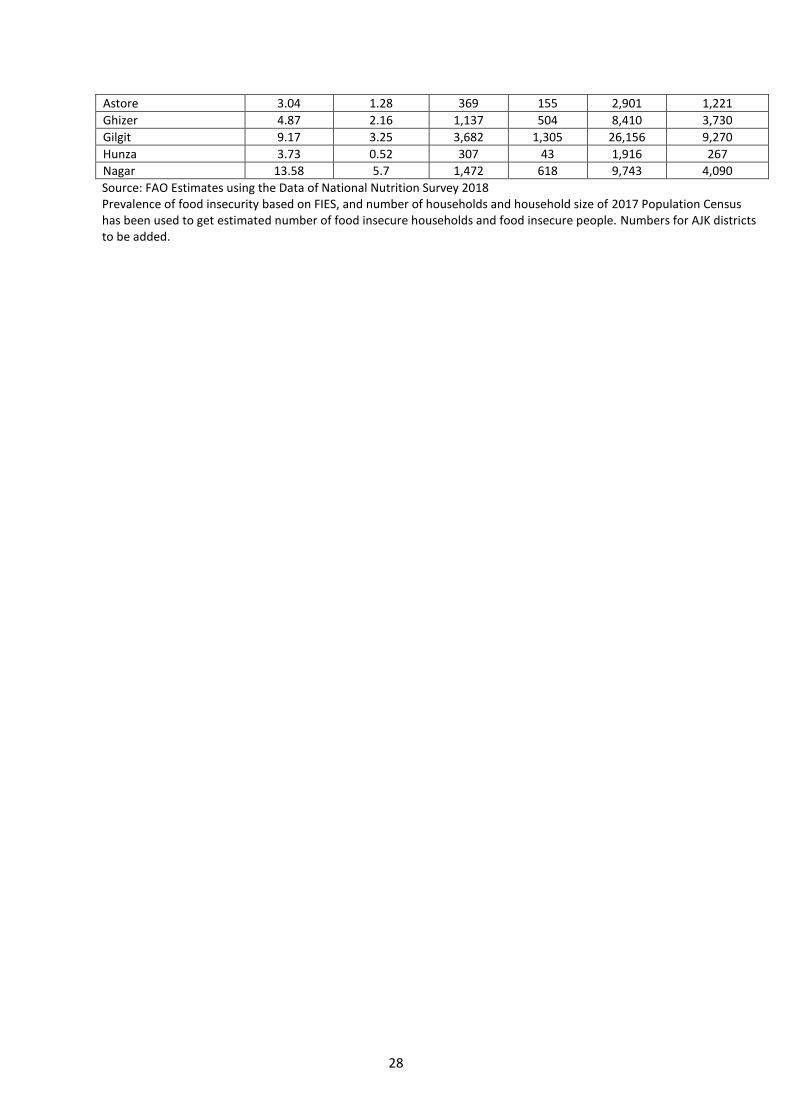
Astore 3.04 1.28 369 155 2,901 1,221
Ghizer 4.87 2.16 1,137 504 8,410 3,730
Gilgit 9.17 3.25 3,682 1,305 26,156 9,270
Hunza 3.73 0.52 307 43 1,916 267
Nagar 13.58 5.7 1,472 618 9,743 4,090
Source: FAO Estimates using the Data of National Nutrition Survey 2018 Prevalence of food insecurity based on FIES, and number of households and household size of 2017 Population Census has been used to get estimated number of food insecure households and food insecure people. Numbers for AJK districts to be added.

29
Annex: Map of Moderately or Severe Food Insecure Households in Pakistan
Annex: Map of Severe Food Insecure Households in Pakistan

30
Annex: IPC Acute Food Insecurity Analysis for Newly Merged Districts/Areas of Khyber
Pakhtunkhwa
The IPC analysis was also conducted for 13 newly merged areas namely Bajaur, Khyber, Kurram, Mohmand,
North Waziristan, Orakzai and South Waziristan districts (formerly known as Federally Administered Tribal
Agencies, FATA) and tribal sub-divisions of Bannu, Dera Ismail Khan, Kohat, Lakki Marwat, Peshawar and
Tank) (formerly known as Frontier Regions) in Januray 2020. The analysis was conducted using assessment
data of Comprehensive Food Security & Livelihood Assessment (CFSLA)15 and other secondary information.
Phase Classification of Rural Population based on IPC Acute Food Insecurity Analysis for the Current Period
(January – May 2020)
15 The CFSLA assessment was conducted by WFP in collaboration with FAO and other partners under the leadership of Planning & Development Department of KP.
CURRENT PERIOD (JANUARY – MAY 2020) PROJECTED PERIOD (JUNE – AUGUST 2020)
1.20 Million
(24% of the rural
population in 13 newly
merged districts/tribal sub-
divisions)
People facing severe acute
food insecurity
(IPC Phase 3+)
IN NEED OF URGENT
ACTION
Phase
5 0
People in Catastrophe 1.27 Million
(25% of the rural population
in 13 newly merged
districts/tribal sub-
divisions)
People facing severe acute
food insecurity
(IPC Phase 3+)
IN NEED OF URGENT
ACTION
Phase
5 0
People in Catastrophe
Phase
4 394,900
People in Emergency
Phase
4 394,900
People in Emergency
Phase
3 802,100
People in Crisis
Phase
3 870,000
People in Crisis
Phase
2 1,323,000
People in Stress
Phase
2 1,490,900
People in Stress
Phase
1
2,583,700
People minimally
food insecure
Phase 1 2,347,800
People minimally
food insecure
# pp % # pp % # pp % # pp % # pp %
1 BAJAUR 1,165,929 582,965 50.0 291,482 25.0 174,889 15.0 116,593 10.0 291,482 25.0 3
2 KHYBER 946,350 567,810 60.0 189,270 20.0 141,953 15.0 47,318 5.0 189,270 20.0 3
3 KURRAM 599,075 239,630 40.0 209,676 35.0 89,861 15.0 59,908 10.0 149,769 25.0 3
4 MOHMAND 483,662 217,648 45.0 169,282 35.0 72,549 15.0 24,183 5.0 96,732 20.0 3
5 NORTH WAZIRISTAN 562,975 281,488 50.0 168,893 30.0 84,446 15.0 28,149 5.0 112,595 20.0 3
6 ORAKZAI 257,622 115,930 45.0 51,524 20.0 64,406 25.0 25,762 10.0 90,168 35.0 3
7 SOUTH WAZIRISTAN 712,594 391,927 55.0 142,519 20.0 106,889 15.0 71,259 10.0 178,149 25.0 3
8 BANNU TRIBAL SUB-DIVISION 46,839 21,078 45.0 16,394 35.0 7,026 15.0 2,342 5.0 9,368 20.0 3
9 DERA ISMAIL KHAN TRIBAL SUB-DIVISION 72,745 29,098 40.0 21,824 30.0 18,186 25.0 3,637 5.0 21,824 30.0 3
10 KOHAT TRIBAL SUB-DIVISION 122,282 73,369 60.0 30,571 25.0 12,228 10.0 6,114 5.0 18,342 15.0 2
11 LAKKI MARWAT TRIBAL SUB-DIVISION 30,303 10,606 35.0 7,576 25.0 7,576 25.0 4,545 15.0 12,121 40.0 3
12 PESHAWAR TRIBAL SUB-DIVISION 65,952 29,678 45.0 16,488 25.0 16,488 25.0 3,298 5.0 19,786 30.0 3
13 TANK TRIBAL SUB-DIVISION 37,518 22,511 60.0 7,504 20.0 5,628 15.0 1,876 5.0 7,504 20.0 3
TOTAL 5,103,846 2,583,737 50 1,323,001 26 802,125 16 394,984 8 1,197,109 24
* Estimated population living in rural areas of these districts/tribal sub-divisions.
S.NArea
PhaseDistrict/Tribal Sub-Division
Total
Population*
Phase 1 Phase 2 Phase 3 Phase 4 Phase 3 or higher

31
Phase Classification of Rural Population based on IPC Acute Food Insecurity Analysis for the Projected
Period (June – August 2020)
Annex: IPC Acute Food Insecurity and Acute Malnutrition Analyses
Several districts in Sindh and Balochistan experienced drought during 2018. In this context, the Natural
Disasters Consortium (NDC)16 conducted Sindh Drought Needs Assessment (SDNA) in 8 drought affected
districts of Sindh in October 2018 and Balochistan Drought Needs Assessment (BDNA) in 14 drought affected
districts of Balochistan in January 2019. Using the NDC assessment data and other secondary information,
the Integrated Phase Classification (IPC) Acute Food Insecurity Analysis for drought affected areas of 7
districts in Sindh (Tharparkar, Umerkot, Sanghar, Jamshoro, Badin, Dadu and Qambar Shahdadkot) and 14
districts in Balochistan (Awaran, Chagai, Dera Bugti, Gwadar, Jhal Magsi, Kacchi, Kech, Kharan, Killa Abdullah,
Loralai, Nushki, Panjgur, Pishin and Washuk) in April 201917.
IPC Acute Food Insecurity Analysis for Drought Affected Areas of Sindh and Balochistan
16 NDC comprised of IOM, FAO, UNICEF, HANDS and ACTED. WFP, OCHA and WHO also provided technical support to complete the assessments. 17 Detailed reports on IPC acute analysis for drought affected districts of Sindh and Balochistan are available on IPC website http://www.ipcinfo.org/ipc-country-analysis/ and Food Security Cluster’s website https://fscluster.org/pakistan.
SINDH-CURRENT PERIOD (OCTOBER 2018 – July 2019) SINDH-PROJECTED PERIOD (JULY – OCTOBER 2019)
1.28 Million
(57% of the rural population
in drought-affected areas in
7 districts)
People facing severe acute
food insecurity
(IPC Phase 3+)
IN NEED OF URGENT
ACTION
Phase
5
0
People in
Catastrophe
1.25 Million
(56% of the rural population
in drought-affected areas in
7 districts)
People facing severe acute
food insecurity
(IPC Phase 3+)
IN NEED OF URGENT
ACTION
Phase
5
0
People in
Catastrophe
Phase
4
593,240
People in
Emergency
Phase
4
527,660
People in
Emergency
Phase
3 686,298
People in Crisis
Phase
3
726,691
People in Crisis
Phase
2 491,545
People in Stress
Phase
2
564,775
People in Stress
Phase
1
458,341
People minimally
food insecure
Phase
1
410, 298
People minimally
food insecure
# pp % # pp % # pp % # pp % # pp %
1 BAJAUR 1,165,929 524,668 45.0 349,779 30.0 174,889 15.0 116,593 10.0 291,482 25.0 3
2 KHYBER 946,350 567,810 60.0 189,270 20.0 141,953 15.0 47,318 5.0 189,270 20.0 3
3 KURRAM 599,075 209,676 35.0 209,676 35.0 119,815 20.0 59,908 10.0 179,723 30.0 3
4 MOHMAND 483,662 193,465 40.0 193,465 40.0 72,549 15.0 24,183 5.0 96,732 20.0 3
5 NORTH WAZIRISTAN 562,975 253,339 45.0 197,041 35.0 84,446 15.0 28,149 5.0 112,595 20.0 3
6 ORAKZAI 257,622 115,930 45.0 51,524 20.0 64,406 25.0 25,762 10.0 90,168 35.0 3
7 SOUTH WAZIRISTAN 712,594 320,667 45.0 178,149 25.0 142,519 20.0 71,259 10.0 213,778 30.0 3
8 BANNU TRIBAL SUB-DIVISION 46,839 18,736 40.0 16,394 35.0 9,368 20.0 2,342 5.0 11,710 25.0 3
9 DERA ISMAIL KHAN TRIBAL SUB-DIVISION 72,745 29,098 40.0 21,824 30.0 18,186 25.0 3,637 5.0 21,824 30.0 3
10 KOHAT TRIBAL SUB-DIVISION 122,282 55,027 45.0 48,913 40.0 12,228 10.0 6,114 5.0 18,342 15.0 2
11 LAKKI MARWAT TRIBAL SUB-DIVISION 30,303 9,091 30.0 9,091 30.0 7,576 25.0 4,545 15.0 12,121 40.0 3
12 PESHAWAR TRIBAL SUB-DIVISION 65,952 29,678 45.0 16,488 25.0 16,488 25.0 3,298 5.0 19,786 30.0 3
13 TANK TRIBAL SUB-DIVISION 37,518 20,635 55.0 9,380 25.0 5,628 15.0 1,876 5.0 7,504 20.0 3
TOTAL 5,103,846 2,347,820 46 1,490,992 29 870,050 17 394,984 8 1,265,034 25
Area
Phase
* Estimated population living in rural areas of these districts/tribal sub-divisions.
S.N District/Tribal Sub-Division (TSD)Total
Population*
Phase 1 Phase 2 Phase 3 Phase 4 Phase 3 or higher

32
Phase Classification of Rural Population based on IPC Acute Food Insecurity Analysis for the Current Period
(October 2018 – July 2019)
Phase Classification of Rural Population based on IPC Acute Food Insecurity Analysis for the Projected Period
(July – October 2019)
# % # % # % # % # %
Badin 163,955 32,791 20 49,187 30 57,384 35 24,593 15 81,978 50 3
Dadu 124,562 37,369 30 43,597 35 31,141 25 12,456 10 43,597 35 3
Jamshoro 163,559 32,712 20 40,890 25 57,246 35 32,712 20 89,957 55 4
Qambar Shahdadkot 48,048 9,610 20 12,012 25 19,219 40 7,207 15 26,426 55 3
Sanghar 50,375 10,075 20 10,075 20 17,631 35 12,594 25 30,225 60 4
Tharparkar 1,518,836 303,767 20 303,767 20 455,651 30 455,651 30 911,302 60 4
Umerkot 160,089 32,018 20 32,018 20 48,027 30 48,027 30 96,054 60 4
Grand Total 2,229,424 458,341 20 491,546 22 686,299 31 593,240 27 1,279,539 58
Phase 4 Level 3 or higher
Area PhaseDistrict Total # (pp)
Phase 1 Phase 2 Phase 3
IPC Acute Food Insecurity Analysis for Drought Affected Areas of Balochistan
BALOCHISTAN
CURRENT PERIOD (JANUARY – JULY 2019)
BALOCHISTAN
PROJECTED PERIOD (JULY – NOVEMBER 2019)
1.79 Million
(48% of the rural
population in 14 drought-
affected districts)
People facing severe acute
food insecurity
(IPC Phase 3+)
IN NEED OF URGENT
ACTION
Phase
5
0
People in
Catastrophe
1.78 Million
(48% of the rural
population in 14 drought-
affected districts)
People facing severe acute
food insecurity
(IPC Phase 3+)
IN NEED OF URGENT
ACTION
Phase
5 0
People in Catastrophe
Phase
4
418,674
People in
Emergency
Phase
4 490,288
People in Emergency
Phase
3 1,369,493
People in Crisis
Phase
3 1,294,235
People in Crisis
Phase
2 904,155
People in Stress
Phase
2 861,509
People in Stress
Phase 1 1,039,337
People minimally
food insecure
Phase
1
1,085,627
People minimally
food insecure
# % # % # % # % # %
Badin 163,955 24,593 15 40,989 25 73,780 45 24593 15 98,373 60 3
Dadu 124,562 18,684 15 43,597 35 43,597 35 18,684 15 62,281 50 3
Jamshoro 163,559 16,356 10 40,890 25 65,424 40 40,890 25 106,314 65 4
Qambar Shahdadkot 48,048 4,805 10 12,012 25 22,583 47 8,649 18 31,231 65 3
Sanghar 50,375 10,075 20 7,556 15 17,631 35 15,113 30 32,744 65 4
Tharparkar 1,518,836 303,767 20 379,709 25 455,651 30 379,709 25 835,360 55 4
Umerkot 160,089 32,018 20 40,022 25 48,027 30 40022 25 88,049 55 4
Total 2,229,424 410,298 18 564,775 25 726,691 33 527660 24 1,254,351 57
Area PhaseDistrict Total # (pp)
Level 3 or higherPhase 4Phase 3Phase 2Phase 1

33
Phase Classification of Rural Population based on IPC Acute Food Insecurity Analysis for the Current Period
(January – July 2019)
Phase Classification of Rural Population based on IPC Acute Food Insecurity Analysis for the Projected Period (July
– November 2019)

34
Annex: IPC Acute Malnutrition Analysis for Drought Affected Areas of Sindh
Annex: IPC Acute Malnutrition Analysis for Drought Affected Areas of Sindh
(Area) Total
population
Population
of children 6-
59 months of
age
GAM
(%)
Estimated
no. of GAM
cases
Estimated
no. of
MAM
cases
Estimated
no. of SAM
cases
Badin 1,804,516 241,805 28.0 169,550 114,253 55,011
Dadu 1,550,266 207,736 19.2 99,644 58,166 41,547
Jamshoro 993,142 133,081 23.7 78,714 39,259 39,592
Kambar Shahdadkot 1,341,042 179,700 27.5 123,636 65,590 57,953
Sanghar 2,057,057 275,646 21.7 149,782 93,030 56,507
Tharparakar 1,649,661 221,055 33.3 183,817 133,185 50,843
Thatta 979,817 131,295 24.3 79,880 50,877 28,885
Umerkot 1,073,146 143,802 32.2 115,815 80,888 34,872
Total 11,448,647 1,534,119 N/A 1,000,458 635,249 365,209
District Total
population
Population of
children 6-59
months of age
GAM
(%)
Estimated no.
of GAM cases
Estimated
no. of MAM
cases
Estimated no.
of SAM cases
Awaran 121,680 18,252 11.6 5,293 3,696 1,597
Chagai 209,689 31,453 16.5 12,975 5,583 7,392
Dera Bugti 312,603 46,890 26.5 31,065 16,294 14,770
Gwadar 263,514 39,527 12.6 12,451 6,917 5,534
Jhal Magsi 149,225 22,384 28.2 15,781 7,778 8,002
Kachhi 237,030 35,555 29.6 26,310 12,533 13,777
Kech 909,116 136,367 19.1 65,115 32,728 32,387
Kharan 156,152 23,423 20.6 12,063 4,567 7,495
Killa Abdullah 757,578 113,637 15.5 44,034 20,455 23,580
Loralai 397,400 59,610 17.8 26,526 11,028 15,499
Nushki 178,796 26,819 23.1 15,488 6,236 9,253
Panjgur 316,385 47,458 31.6 37,492 19,339 18,153
Pishin 736,481 110,472 29.0 80,092 42,808 37,284
Washuk 176,206 26,431 16.6 10,969 5,881 5,088
Total 4,921,855 738,278 N/A 395,654 195,843 199,811

35
Annex: COVID-19 - Economic and Food Security Implications for
Newly Merged Areas of Khyber Pakhtunkhwa
The Newly Merged Areas of Khyber Pakhtunkhwa were semi-autonomous tribal agencies until merger into Khyber Pakhtunkhwa province in May 2018. The Newly Merged Districts consists of seven Districts18 and six tribal subdivisions- previously known as the Frontier Regions19. The total estimated area of the newly merged district is about 27,220 square kilometers while the total population is 5,001,67620. The Newly Merged Areas are considered one of the under developed areas of Pakistan. The MPI (Multi-dimensional Poverty Index) of the newly merged areas is among the lowest in the country, as many as 73% of the population is in multidimensional poverty. Generally, socio-economic indicators are the poorest and the food security situation is not at par with rest of Pakistan. The food security and nutrition situation challenges are compounded by low production, limited livelihood opportunities, poor education, as well as the continuing law and order situation for more than a decade. The state of affairs was further aggravated by the prolonged crisis in the area. Potential Impact on the Livelihood of the People The economy of Merged Areas is the most underdeveloped in Pakistan, where most people have no permanent source of income, the situation has further been aggravated with the deterioration in the law and order situation for more than a decade. COVID-19 can have very serious implications on the livelihood of the households. The livelihood opportunities in ex-FATA are already very limited. Though so far Households are practicing subsistence agriculture and livestock raising, people seek employment in local law enforcement forces, while majority rely on unskilled daily labor (agriculture and non-agriculture. Around 26.8 percent of households in the merged areas rely on ‘Day Labor Farming Activities ‘and 25.9 percent on non-agricultural labor, an additional 14 percent rely on regular job (private or government) while11.6 percent are skilled workers or own their own business (12 percent). Even though the areas are moderately affected by COVID-19, however, are the area is expected to be heavily affected in view of the current lockdown situation. The people of ex-FATA frequently access settled districts to meet all their health and food related needs while the markets in the settled districts are already under severe shocks. Potential Impact on the Food security situation of the Newly Merged Areas COVID-19 can have very serious repercussions on the food security situation of the households in the
18 Khyber, Mohmand, Bajaur, Kurram, Orakzai, North Waziristan and South Waziristan 19 Bannu, Dera Ismail Khan, Kohat, Lakki , Peshawar and Tank 20 Provisional Summary Results of 6th Population and Housing Census 2017
Overall Foodin security
Food Secure
Marginally Food Secure
Moderately Food Insecure
Severely Food Insecure

36
newly merged areas. According to the recently conducted comprehensive food security and livelihood assessment (CFSLA)21 the food security situation is already very fragile where overall 35% households (1.75 million population, are either severely or moderately food insecure. Whereas about 60 percent of the households (around 3 million population) are moderately food secure, however, they are unable to afford some essential non-food expenditures, and if not considered for assistance, they might become food insecure with a minor shock.
Rank22 Total Population
Food Secure
Marginally Food Secure
Moderately Food Insecure
Severely Food Insecure
Moderate + Severe
Overall 5,001,676 245,082 2,996,004 1,550,520 210,070 1,750,587
Mer
ged
Dis
tric
ts 1 Orakzai 254,356 10,429 85,972 147,526 10,429 157,701
2 Mohmand 466,984 10,741 303,540 141,029 11,675 154,105
3 Bajaur 1,093,684 127,961 626,681 317,168 20,780 339,042
4 Kurram 619,553 43,369 394,036 146,215 35,934 179,670
5 SW 679,185 46,185 435,358 186,097 10,867 196,964
6 Khyber 986,973 115,476 601,067 243,782 27,635 266,483
7 NW 543,254 15,754 388,427 121,689 17,384 141,246
Trib
al S
ub
-Div
isio
n
1 DIK 68,556 960 22,075 36,883 8,570 45,247
2 Lakki 26,359 2,662 7,881 12,151 3,664 15,815
3 Peshawar 64,691 4,076 32,281 24,194 4,140 28,464
4 Kohat 118,578 13,518 64,625 38,775 1,660 40,317
5 Tank 36,389 218 25,727 10,444 - 10,553
6 Bannu 43,114 5,389 26,386 9,873 1,423 11,210
Food production in the newly merged Areas The local food production in the merged areas is already far below from adequate to meet the needs
of the population. The total area of merged areas is 2.72 million hectares, out which only 14 percent
is arable land and 37 percent cultivable waste23. The total area under major crops and their production
have reduced significantly with the onset of complex emergency starting in 2008. Overall, the
agriculture sector performance in the merged areas has been poor due to number of challenges and
constraints. These include farmers’ limited access to quality inputs at the local level, coupled with poor
purchasing power; limited water availability, limited technical skills and knowledge related to the
improved agriculture practices, and limited storage capacities and marketing skills.
The COVID-19 might impact the current wheat harvest (2020).
Impact on the Market Mechanisms in the Newly Merged Areas
The COVID-19 is likely to have very serious implications on the market demand and supply situation
especially in areas like ex-FATA where the Market mechanisms are historically weaker compared to
the other parts of the Khyber Pakhtunkhwa. COVID-19 has halted all the economic activities in
transportation, retail trade, daily wage etc. Since the food production in the newly merged districts is
far below its requirements, thus for food supply the markets to a greater extent are dependent on the
bigger markets of the settled districts and on markets of the Punjab Province. Due to the ongoing
lockdown, food supply in markets in the settled areas is even jeopardized. This can further deteriorate
the food security situation of the people living in the merged areas.
21 By Bureau of Statistics Merged Areas Khyber Pakhtunkhwa with the technical and financial support of the world food programme Pakistan and Pakistan Bureau of Statistics (2020) 22 Ranking is based on the prevalence of Moderate + severe food insecurity. 23 Development Statistics of FATA, 2015, Bureau of Statistics, Planning and Development Department, FATA

37
Annexure: Estimated Vulnerable Population to Food Insecurity24
24 Refernce Integrated Context Analysis Report, 2017
District Estimated vulnerable population to food insecurity
Vulnerability
to Food
Insecurity
Long-term average
vulnerable
Chronically
vulnerable
Highest
vulnerable
Additional
vulnerable (in
case of a shock)
Barkhan High 82,344 71,794 97,385 15,041
Chagai High 141,399 77,918 246,789 105,390
Dera Bugti High 160,808 150,072 170,670 9,862
Harnai High 67,913 57,249 73,596 5,683
Jaffarabad High 263,911 238,295 282,567 18,657
Jhal Magsi High 80,160 68,706 89,741 9,581
Kachhi High 164,408 142,839 183,242 18,834
Kalat High 106,733 81,376 141,840 35,106
Kech High 201,590 175,056 221,060 19,470
Kharan High 95,195 78,025 123,717 28,521
Killa Abdullah High 336,503 261,673 429,407 92,904
Lasbela High 164,454 145,427 185,281 20,827
Lehri High Insufficient Data Insufficient
Data
Insufficient
Data Insufficient Data
Nasirabad High 191,892 168,726 212,690 20,798
Panjgur High 153,925 139,299 168,551 14,626
Pishin High 226,057 196,064 262,504 36,447
Sohbatpur High Insufficient Data Insufficient
Data
Insufficient
Data Insufficient Data
Washuk High 62,548 55,987 69,109 6,561
Ziarat High 15,405 12,283 19,297 3,891
Gwadar Medium 84,340 72,445 95,285 10,945
Mastung Medium 66,019 47,054 92,717 26,698
Nushki Medium 57,085 50,097 64,072 6,988
Sibi Medium 60,387 31,794 93,504 33,117
Awaran High 58,154 42,937 69,150 10,996
Khuzdar High 224,313 184,104 264,829 40,516
Killa Saifullah High 121,821 105,853 135,598 13,777
Kohlu High 76,596 71,639 81,897 5,300
Loralai High 167,427 139,331 189,888 22,461
Musakhel High 93,380 74,567 106,393 13,014
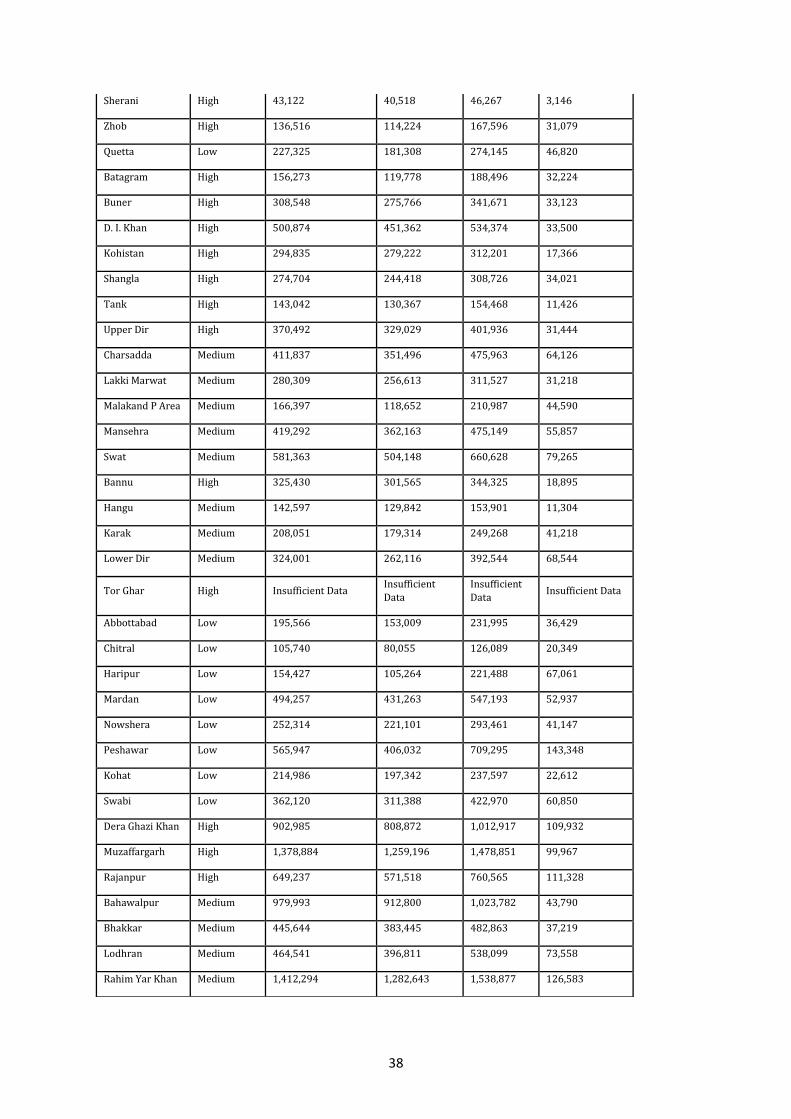
38
Sherani High 43,122 40,518 46,267 3,146
Zhob High 136,516 114,224 167,596 31,079
Quetta Low 227,325 181,308 274,145 46,820
Batagram High 156,273 119,778 188,496 32,224
Buner High 308,548 275,766 341,671 33,123
D. I. Khan High 500,874 451,362 534,374 33,500
Kohistan High 294,835 279,222 312,201 17,366
Shangla High 274,704 244,418 308,726 34,021
Tank High 143,042 130,367 154,468 11,426
Upper Dir High 370,492 329,029 401,936 31,444
Charsadda Medium 411,837 351,496 475,963 64,126
Lakki Marwat Medium 280,309 256,613 311,527 31,218
Malakand P Area Medium 166,397 118,652 210,987 44,590
Mansehra Medium 419,292 362,163 475,149 55,857
Swat Medium 581,363 504,148 660,628 79,265
Bannu High 325,430 301,565 344,325 18,895
Hangu Medium 142,597 129,842 153,901 11,304
Karak Medium 208,051 179,314 249,268 41,218
Lower Dir Medium 324,001 262,116 392,544 68,544
Tor Ghar High Insufficient Data Insufficient
Data
Insufficient
Data Insufficient Data
Abbottabad Low 195,566 153,009 231,995 36,429
Chitral Low 105,740 80,055 126,089 20,349
Haripur Low 154,427 105,264 221,488 67,061
Mardan Low 494,257 431,263 547,193 52,937
Nowshera Low 252,314 221,101 293,461 41,147
Peshawar Low 565,947 406,032 709,295 143,348
Kohat Low 214,986 197,342 237,597 22,612
Swabi Low 362,120 311,388 422,970 60,850
Dera Ghazi Khan High 902,985 808,872 1,012,917 109,932
Muzaffargarh High 1,378,884 1,259,196 1,478,851 99,967
Rajanpur High 649,237 571,518 760,565 111,328
Bahawalpur Medium 979,993 912,800 1,023,782 43,790
Bhakkar Medium 445,644 383,445 482,863 37,219
Lodhran Medium 464,541 396,811 538,099 73,558
Rahim Yar Khan Medium 1,412,294 1,282,643 1,538,877 126,583

39
Bahawalnagar Low 684,930 623,334 744,970 60,039
Chiniot Low 245,177 224,604 264,516 19,338
Jhang Low 678,138 478,752 941,822 263,684
Khanewal Low 681,056 580,380 762,006 80,949
Khushab Low 248,512 214,766 293,204 44,692
Leiah Low 398,473 338,569 469,534 71,061
Mianwali Low 348,177 306,586 383,934 35,757
Multan Low 925,423 811,768 1,021,958 96,535
Pakpattan Low 451,949 369,156 516,066 64,117
Sheikhupura Low 425,289 294,729 621,659 196,370
Toba Tek Singh Low 342,155 218,490 468,258 126,103
Vehari Low 635,881 557,896 729,139 93,258
Attock Low 176,085 88,184 247,739 71,654
Chakwal Low 106,204 69,581 144,533 38,329
Faisalabad Low 786,024 597,998 995,295 209,271
Gujranwala Low 400,012 310,149 542,846 142,834
Gujrat Low 230,720 200,173 267,523 36,804
Hafizabad Low 187,427 153,110 239,585 52,158
Jhelum Low 76,752 38,910 135,784 59,032
Kasur Low 537,946 402,304 662,011 124,065
Lahore Low 369,221 213,730 496,661 127,440
Mandi
Bahauddin Low 236,226 189,717 281,325 45,098
Nankana Sahib Low 203,116 155,309 250,923 47,807
Narowal Low 311,226 214,486 398,871 87,645
Okara Low 706,774 576,225 848,657 141,883
Rawalpindi Low 238,370 141,303 367,293 128,922
Sahiwal Low 481,157 371,543 575,476 94,319
Sargodha Low 687,444 545,891 790,408 102,964
Sialkot Low 406,800 277,916 539,468 132,668
Islamabad Low 41,212 24,723 55,763 14,551
Badin High 667,436 589,348 738,298 70,862
Ghotki High 548,912 499,179 603,557 54,645
Jacobabad High 389,964 343,164 440,245 50,281
Jamshoro High 307,019 288,934 325,105 18,086
Kashmore High 350,870 312,473 389,268 38,397

40
Mirpur Khas High 512,873 429,159 581,389 68,516
Shaheed Benazir
Abad High 481,834 446,113 524,058 42,224
Sujawal High 335,553 Insufficient
Data
Insufficient
Data Insufficient Data
Tando Allahyar High 224,497 214,810 234,184 9,687
Tando
Muhammad
Khan
High 233,007 216,785 249,228 16,221
Tharparkar High 703,359 650,091 745,386 42,026
Thatta High 355,594 338,583 377,483 21,889
Umer Kot High 495,740 454,269 538,837 43,097
Dadu Medium 512,430 433,106 621,543 109,113
Kambar Shahdad
Kot Medium 526,686 437,733 615,639 88,953
Khairpur Medium 672,712 579,619 779,061 106,350
Larkana Medium 441,295 316,189 578,490 137,195
Naushahro
Feroze Medium 394,569 333,285 453,711 59,142
Sanghar Medium 737,810 638,227 843,191 105,381
Shikarpur Medium 402,118 342,773 468,589 66,471
Karachi Low 759,291 407,562 1,112,116 352,825
Hyderabad Low 318,577 211,147 475,044 156,467
Matiari Low 221,560 209,648 233,471 11,911
Sukkur Low 332,439 299,545 383,426 50,988
Khyber Agency Medium 433,278 313,401 636,571 203,294
Kurram Agency Medium 279,408 224,519 366,485 87,076
Total 41,305,417 34,213,194 48,172,595 7,202,731

41
Annex: Prevalence of Malnutrition among 6-59 months Children
Weight for age Height for age Weight for height
Underweight Stunted Wasted Overweight
Percent below Percent below Percent below Percent
above
- 2 SD - 3 SD - 2 SD - 3 SD - 2 SD - 3 SD + 2 SD
Pakistan 28.9 12.1 40.2 19.6 17.7 8.0 9.5
Punjab Total 23.5 9.1 36.4 17.2 15.3 7.0 9.9
Attock 15.2 8.6 39.3 19.7 16.1 9.3 27.3
Rawalpindi 13.1 3.4 30.5 13.9 6.0 2.6 10.0
Jhelum 19.1 7.5 34.8 17.7 13.5 7.5 22.8
Chakwal 17.8 7.1 32.8 14.9 12.1 6.4 14.8
Sargodha 22.0 7.3 33.7 14.0 14.1 7.7 9.4
Bhakkar 30.3 15.3 38.2 18.6 19.3 11.7 18.6
Khushab 21.1 8.4 36.8 17.3 18.7 10.2 12.1
Mianwali 24.8 10.2 37.4 16.8 19.0 9.8 25.1
Faisalabad 25.5 9.2 33.4 14.1 17.5 7.5 5.4
Chiniot 22.1 9.0 34.6 15.4 16.2 7.5 8.8
Jhang 33.2 15.0 39.9 20.5 21.7 11.3 10.0
Toba Tek Singh 20.0 8.9 36.2 15.6 18.1 8.6 15.2
Gujranwala 19.5 5.0 33.9 14.4 10.3 4.5 4.4
Hafizabad 23.2 6.4 29.1 14.9 19.6 9.0 12.9
Gujrat 18.1 6.1 28.3 10.3 13.6 6.0 9.0
Mandi Bahauddin 22.3 8.1 34.8 15.5 10.6 5.5 6.9
Sialkot 16.9 6.5 28.3 10.6 12.5 5.7 8.5
Narowal 22.5 10.0 35.8 14.6 12.9 5.9 7.4
Lahore 18.1 7.4 32.6 15.8 13.0 5.1 9.6
Kasur 17.4 6.2 36.0 16.1 6.8 2.9 8.1
Sheikhupura 15.7 5.4 33.3 15.0 11.9 5.9 12.3
Nankana Sahib 21.5 7.2 36.5 17.5 15.2 9.4 9.8
Okara 22.7 11.0 36.2 22.0 14.8 7.0 16.5

42
Sahiwal 20.0 6.2 34.2 13.9 19.5 6.6 9.3
Pakpattan 34.1 16.0 38.0 22.1 28.1 16.4 18.0
Vehari 28.5 9.4 37.3 18.7 15.2 7.2 6.7
Multan 23.8 7.7 37.7 16.9 14.6 5.7 8.8
Lodhran 33.1 12.8 39.2 19.1 22.2 12.7 5.9
Khanewal 26.4 8.7 38.1 18.2 17.5 7.5 7.4
Dera Ghazi Khan 17.2 5.7 41.4 18.5 14.8 7.8 23.5
Rajanpur 32.5 17.6 48.4 26.9 21.1 12.7 15.2
Layyah 21.8 8.2 39.2 19.4 17.8 7.3 16.2
Muzaffargarh 32.7 16.0 45.3 24.8 24.1 14.7 17.5
Bahawalpur 26.7 10.2 42.5 21.1 14.0 5.2 6.1
Bahawalnagar 26.6 9.1 43.8 21.9 13.1 4.8 7.1
Rahim Yar Khan 42.6 18.5 45.3 21.5 22.2 7.8 2.3
Sindh Total 41.3 18.5 45.5 23.3 23.3 9.2 5.2
Jacobabad 42.4 22.0 45.8 24.7 30.5 18.4 8.3
Kashmor 29.8 15.5 38.3 17.5 21.6 12.3 12.1
Shikarpur 45.6 21.7 49.5 29.6 28.4 11.9 4.7
Larkana 43.3 18.1 49.3 26.0 22.9 9.5 5.8
Kambar Shahdad Kot 48.3 21.4 49.3 26.4 27.5 12.9 4.2
Sukkur 42.6 21.5 47.5 28.5 19.5 7.2 4.9
Ghotki 51.2 24.9 54.5 32.3 23.5 12.4 4.9
Khairpur 47.3 21.7 53.8 29.6 22.4 6.9 2.8
Naushahro Feroze 48.8 20.2 54.8 26.0 19.4 7.5 1.1
Shaheed Benazirabad 49.2 22.3 54.8 25.7 19.9 7.2 1.7
Dadu 35.3 18.8 49.2 29.8 19.2 8.0 10.3
Jamshoro 43.4 21.0 45.5 25.1 23.7 11.9 5.8
Hyderabad 40.1 13.0 44.1 19.9 16.6 3.9 0.7
Tando Allahyar 51.5 24.9 51.6 27.2 28.6 12.0 2.5
Tando Muhammad
Khan 45.0 24.4 46.0 26.9 25.6 11.2 5.9
Matiari 47.9 17.6 47.5 26.1 23.9 9.3 2.9

43
Badin 54.4 26.6 54.4 26.7 28.0 9.1 0.3
Thatta 47.5 21.7 51.4 26.7 24.3 8.8 1.4
Sujawal 52.6 23.6 53.6 27.1 26.6 8.8 1.2
Sanghar 46.5 22.5 50.7 27.7 21.7 8.2 2.9
Mirpur Khas 54.7 29.7 51.7 27.3 28.6 11.9 3.7
Umer Kot 56.2 28.4 51.3 28.2 32.2 9.7 2.4
Tharparkar 60.8 30.7 60.0 32.0 33.3 9.2 0.2
Karachi West 26.0 8.1 33.8 15.4 18.5 7.1 9.1
Malir 29.6 13.6 34.8 17.3 24.2 9.1 7.6
Karachi South 20.0 6.9 32.0 14.8 18.4 6.6 10.7
Karachi East 21.5 7.7 29.0 13.1 18.9 9.0 11.4
Karachi Central 24.0 7.4 28.9 11.6 22.5 10.8 11.2
Korangi 29.5 9.3 32.5 11.2 23.0 9.8 5.2
KP Total 23.1 9.1 40.0 19.6 15.0 8.0 12.9
Chitral 19.0 6.9 37.6 17.2 10.8 5.4 8.4
Upper Dir 30.7 12.4 46.3 25.8 14.8 8.5 9.0
Lower Dir 26.8 7.6 41.3 20.7 16.4 7.5 11.1
Swat 11.7 4.2 38.8 19.8 4.5 3.0 8.0
Shangla 43.1 19.5 46.4 25.0 27.4 15.9 5.1
Buner 17.9 9.3 48.7 26.5 12.5 7.2 29.8
Malakand Protected
Area 30.5 15.2 33.1 16.0 28.1 13.2 13.2
Kohistan 14.1 4.3 43.0 17.6 10.1 5.5 20.4
Batagram 39.1 16.3 40.5 20.7 26.0 14.0 10.3
Torghar 43.1 17.9 58.9 31.6 21.2 12.2 16.2
Mardan 11.5 6.8 39.2 12.4 17.4 13.3 20.1
Swabi 20.7 10.6 35.9 15.4 20.1 10.6 11.1
Charsadda 25.8 8.8 36.8 18.8 19.3 11.2 22.3
Peshawar 21.9 6.4 33.8 15.6 13.6 5.3 8.0
Nowshera 16.8 6.5 35.3 15.7 15.8 9.9 27.2
Kohat 26.7 13.5 40.6 20.8 17.6 11.2 12.7

44
Hangu 20.9 8.4 45.2 23.4 12.7 5.6 13.7
Karak 19.1 6.0 43.6 23.1 14.2 6.3 17.8
Bannu 28.7 13.8 45.9 26.0 18.1 11.1 12.3
Lakki Marwat 21.9 9.4 39.8 19.8 11.1 5.1 7.7
Dera Ismail Khan 32.7 12.3 49.2 24.3 13.4 7.4 8.4
Tank 23.3 11.0 50.7 28.2 8.5 3.9 24.5
Balochistan Total 31.0 14.2 46.6 23.7 18.9 10.0 16.7
Quetta 27.1 12.0 35.0 15.9 19.7 9.8 17.9
Pishin 24.2 8.4 39.8 18.9 29.0 13.5 23.8
Killa Abdullah 33.0 13.8 49.4 27.5 15.5 8.3 14.8
Chagai 24.6 9.8 47.1 28.3 16.5 9.4 20.8
Nushki 41.2 26.3 53.7 29.8 23.1 13.8 23.5
Loralai 43.9 23.1 56.4 28.1 17.8 10.4 5.7
Barkhan 34.4 17.6 54.1 27.5 24.4 14.9 16.2
Musakhel 20.5 7.8 36.9 22.3 18.1 10.4 28.2
Killa Saifullah 16.7 8.3 37.8 18.2 16.8 10.0 28.5
Zhob 25.9 8.9 56.0 33.7 9.5 5.6 13.2
Sherani 24.6 5.6 53.4 26.8 6.6 3.1 3.7
Sibi 39.9 18.8 45.2 20.2 28.0 18.2 12.0
Harnai 31.4 14.4 49.4 25.8 15.8 9.9 12.9
Ziarat 24.0 10.5 47.6 21.6 21.3 18.0 31.8
Kohlu 19.7 8.3 44.2 21.4 12.4 7.6 35.1
Dera Bugti 36.8 18.1 54.9 29.0 26.5 12.6 13.3
Lehri 40.6 19.0 44.7 23.4 25.3 14.0 18.6
Kachhi 59.0 27.5 61.6 32.4 29.6 15.5 5.7
Jaffarabad 51.6 32.1 52.7 24.4 33.9 20.4 10.5
Nasirabad 25.7 10.1 45.0 23.5 18.6 9.2 26.2
Jhal Magsi 48.9 24.3 52.7 31.3 28.2 14.3 5.9
Sohbatpur 44.0 26.6 50.1 29.6 25.2 13.3 16.2
Kalat 49.3 26.2 62.9 33.4 23.8 12.7 10.8
Mastung 14.6 2.8 46.3 25.9 9.7 4.8 31.5

45
Khuzdar 20.8 7.5 49.3 22.9 8.2 4.4 12.1
Awaran 22.4 5.3 51.0 23.0 11.6 3.5 42.1
Kharan 36.5 18.6 55.7 31.1 20.6 12.8 17.5
Washuk 28.6 11.5 48.8 28.2 16.6 7.7 28.4
Lasbela 38.2 20.2 42.7 23.4 26.3 13.0 14.9
Kech 31.2 11.9 46.0 23.2 19.1 9.5 17.2
Gwadar 27.3 9.9 55.6 30.9 12.6 5.6 23.6
Panjgur 60.2 34.1 54.0 29.3 31.6 15.3 11.7
ICT Total 19.2 7.4 32.6 14.6 12.2 5.0 5.8
Islamabad 19.2 7.4 32.6 14.6 12.2 5.0 5.8
KP-NMD Total 33.7 18.3 48.3 24.7 23.2 13.8 18.6
Bajaur 26.9 12.8 48.6 23.7 13.1 6.7 24.8
Mohmand 33.3 15.5 49.6 24.5 28.6 20.1 11.4
Khyber 52.5 37.0 48.6 28.1 42.6 26.6 10.1
Kurram 35.9 20.1 51.3 29.5 23.4 10.3 23.1
Orakzai 19.7 8.4 43.6 20.4 14.1 9.5 34.1
Bannu Tribal Sub-
Division 19.8 7.9 26.2 16.8 8.4 0.0 9.7
D.I.Khan Tribal Sub-
Division 3.8 1.2 43.8 11.4 1.2 0.0 46.8
Fr Kohat Tribal Sub-
Division 19.6 8.5 44.8 22.0 16.0 5.5 20.2
Lakki Marwat Tribal
Sub-Division 8.9 4.5 48.6 31.5 9.1 9.1 15.2
Peshawar Tribal Sub-
Division 14.7 3.6 37.1 16.2 10.0 3.1 21.4
Tank Tribal Sub-
Division 47.6 4.2 61.0 4.5 15.5 4.4 0.0
AJK Total 21.9 9.0 39.3 18.7 16.0 8.5 13.4
Muzaffarabad 22.6 9.0 40.4 16.3 15.6 10.0 10.8
Neelum 28.1 9.0 40.4 19.9 17.6 7.3 9.3
Hattian Bala 30.0 11.9 45.7 23.7 17.4 9.9 16.6
Bagh 21.9 11.9 46.5 21.0 13.2 8.7 13.3

46
Sudhnoti 25.8 12.9 42.0 20.1 22.1 12.0 13.1
Poonch 21.0 8.2 37.2 20.3 17.9 7.7 15.1
Haveli 34.7 19.8 34.6 15.1 30.6 19.5 14.7
Bhimber 18.8 8.3 34.2 16.7 16.8 7.9 13.8
Mirpur 14.4 5.6 31.5 13.9 18.6 12.0 23.2
Kotli 18.5 5.7 39.2 20.3 9.7 2.8 10.4
GB Total 21.3 8.2 46.6 22.6 9.4 5.0 12.2
Gilgit 17.5 7.8 44.3 21.7 5.9 3.2 9.5
Ghizer 17.0 6.5 44.8 22.9 11.4 5.4 11.5
Hunza 10.5 1.2 18.1 5.4 6.8 2.6 4.1
Nagar 19.9 8.2 40.5 16.0 11.8 5.2 8.4
Shigar 30.5 12.7 55.6 31.5 12.8 7.1 14.7
Ghanche 25.8 8.6 45.4 18.5 17.3 9.9 20.2
Baltistan 24.3 8.6 53.9 26.1 8.2 4.7 15.5
Kharmang 26.5 10.8 57.6 32.3 8.4 4.9 9.0
Astore 22.6 8.8 47.5 24.1 6.8 4.0 9.7
Source: National Nutrition Survey 2018

47
Annex: Percentage of Small Farmers in Pakistan
Copyright © 2022 FDOKUMEN