FSAU - ReliefWeb
90
FSAU Technical Series Report No IV.8 i Issued February 22, 2006 Technical Series Report No IV. 8 22 February, 2006 2005/06 Post DeyrAnalysis Food Security Analysis Unit - Somalia Kalson Towers, Parklands Box 1230 Village Market Nairobi, Kenya Ph: 254-20-3745734 Fax: 254-20-3745098 Web site: www.fsausomali.org Email: [email protected] FSAU USAID European Commission Funding Agencies Technical and Managerial Support Technical Partners
-
Upload
khangminh22 -
Category
Documents
-
view
1 -
download
0
Transcript of FSAU - ReliefWeb

FSAU Technical Series Report No IV.8 i Issued February 22, 2006
Technical SeriesReport No IV. 8
22 February, 2006
2005/06 Post DeyrAnalysis
Food Security Analysis Unit - SomaliaKalson Towers, Parklands
Box 1230 Village Market
Nairobi, Kenya
Ph: 254-20-3745734
Fax: 254-20-3745098
Web site: www.fsausomali.org
Email: [email protected]
FSAU
USAIDEuropean
Commission
Funding AgenciesTechnical and
Managerial Support
Technical Partners

FSAU Technical Series Report No IV.8 ii Issued February 22, 2006

FSAU Technical Series Report No IV.8 iii Issued February 22, 2006
Acknowledgment
FSAU would like to thank all our partner agencies for their participation and cooperation in this
assessment and analysis. This crucial assessment would not have been possible without the
effi cient and timely logistical and research assistance provided by the fi eld staff of all our partners.
This assessment and analysis would not have been possible without the dedication and expertise
of FSAU’s thirty four fi eld based analysts who continue to work under very diffi cult conditions.

FSAU Technical Series Report No IV.8 iv Issued February 22, 2006
TABLE OF CONTENTS
1 Executive Summary
11.1 Introduction and Key Findings
1.2 Regional Highlights
1.3 Sector Highlights
2 Analytical Processes and Methods
8
3 Sector Reports 103.1 Climate and Rainfall Outcome 10
3.2 Deyr Production and National Cereal Balance 13
3.3 Implications on Food Security following Ethiopia’s Suspension of Cross Border
Cereal Flow/Trade 18
3.4 Livestock Production and Export 19
3.5 Rangeland condition and Trends 22
3.6 Market Analysis and Trends 23
3.7 Nutrition Overview 24
3.8 Civil Insecurity 25
3.9 Charcoal Production 27
4 Regional Analysis 284.1 Southern Somalia 28
4.1.1 Gedo Region 28
4.1.2 Lower and Middle Juba 33
4.1.3 Sorghum Belt - Bay, Bakool and Hiran 38
4.1.4 Lower and Middle Shabelle 44
4.1.5 Displacement and IDPs 48
4.2 Central Somalia 49
4.3 Northeast and Northwest Somalia 52
5 Appendix 565.1 Components of the Food Security and Humanitarian Phase Classifi cation 56
5.1.1 Explanation of the Food Security and Humanitarian Phase Classifi cation 56
5.1.2 Integrated Food Security and Humanitarian Phase Classifi cation 57
5.1.3 Comparison of FSAU Integrated Food Security and Humanitarian Phase
Classifi cation for Gu ‘04, Deyr ‘04/’05 and Gu ‘05 59
5.1.4 Progression of Early Warning 60
5.2 Estimated Population Figures 61
5.2.1 Estimated Population by Region in Humanitarian Emergency (HE) and
Acute Food and Livelihood Crisis (AFLC), inclusive of the High Risk Groups 61
5.2.2 Estimated Population by District in Humanitarian Emergency (HE) and
Acute Food and Livelihood Crisis (AFLC), inclusive of the High Risk Groups 62
5.2.3 Estimated Population by Livelihood Zone in Humanitarian Emergency (HE) &
Acute Food and Livelihood Crisis (AFLC), inclusive of the High Risk Groups 64
5.3 List of Partner Agencies 66
5.4 Assessment Process, Analytical Tools and Timeline 67
5.4.1 Assessment Timeline 67
5.4.2 Assessment Instruments and Tools 67
5.4.2.1 Food Security Livelihoods and Nutrition Assessment Pastoral 68
5.4.2.2 Southern Somalia 2005/06 Deyr Seasons District Crop Establishment Survey 72
5.4.2.3 Southern Somalia 2005/06 Deyr Seasons Farmer Crop Establishment Survey 74
5.4.2.4 Food Security Livelihood and Nutrition Assessment, Market Questions 76
5.4.2.5 Key Parameter Form for Milk Production by District - Shebelle valley 77
5.4.2.6 Key Parameter Form for Livestock Production by District - Shebelle valley 78
5.4.2.7 Key Parameter Form for Other Food and Income Sources - Shebelle valley 79
5.4.2.8 Food Security Phase Classifi cation Evidence Based Analysis Template:
Post Deyr ’05/06 Assesment 80
6 Livelihood Zones of Somalia Map 81

FSAU Technical Series Report No IV.8 v Issued February 22, 2006
LIST OF ACRONYMS
ARI Acute Respiratory Infection
CCPP Caprine Pleura Pneumonia
CMR Crude Mortality Rate
FAO Food and Agriculture Organization
FEWS/NET Famine Early Warning Systems Network
FSAU Food Security Analysis Unit
GAM Global Acute Malnutrition
HA Hectare
HRG Humanitarian Response Group
IDP Internally Displaced Persons
IDS Institute for Development Studies
Lt Litre
LZ Livelihood Zone
MCH Maternal and Child Health Center
Mt Metric Tonne
MUAC Mid Upper Arm Circumference
NDVI Normalized Difference Vegetation Index
PWA Post War Average
SAM Severe Acute Malnutrition
SlSh Somaliland Shilling
SoSh Somali Shilling
TFC Thearupetic Feeding Center
U5 Under Five
WFH Weight for Height
HE Humanitarian Emergency
AFLC Acute Food and Livelihood Crisis

FSAU Technical Series Report No IV.8 vi Issued February 22, 2006
Map 1. Post Deyr 2005/6 Somalia Cross Border Food Security Situation Analysis 3
Map 2: Post Deyr January ’06 Integrated Food Security Phase Classifi cation 5
Map 3: Cumulative Rainfall Amounts (mm): October - December ’05 10
Map 4: Percent of Normal Rainfall October – December ’05 10
Map 5: NDVI Anomaly January ’06 10
Map 6: Livelihood Zones used in Time Series Analysis 12
Map 7: Deyr 2005/06 xxx Production as compared to Post War Average 14
Map 8: Post Deyr 2005/06 Livestock Migration Trends 19
Map 9: SomaliaMalnutrition Long Term Levels (1999-2005) 24
Map 10: Current Ranges Estimaites of Malnutrition January ’06 24
Map 11: Insecurity Hotspots for July ’05 25
Map 12: Somalia - Sea Piracy and Armed Robbery January - December ’05 26
Map 13: Gedo Livelihood Systems 28
Map 14: Food Security Phase Classifi cation - Gedo 28
Map 15: Juba Valley Livelihood Systems 33
Map 16: Food Security Phase Classifi cation - Juba 33
Table 1: Estimated Population by Region in Humanitarian Emergency (HE) and Acute Food
and Livelihood Crisis (AFLC), inclusive of the High Risk Groups 2
Table 2: Integrated Food Security and Humanitarian Phase Classifi cation Reference Table
(FAO/FSAU Feb 12, 2006) 4
Table 3: Overview of 2005/06 Post Deyr Assessment Analytical Process and Timeline 8
Table 4: Deyr Cereal Production Estimates in Southern Somalia 13
Table 5: Gu-Karan Cereal Production Estimates in Northwest Somalia 14
Table 6: Total Annual Cereal Production Estimates for Somalia 15
Table 7: Ceral balance Sheet 17
Table 8: Post Deyr 2005/06 Water and Pasture, Livestock Body Condition and
Migration Summary 19
Table 9: Livestock Exports from Bossaso January to December 2005 21
Table 10: Livestock Exports from Berbera January to December 2005 19
Table 11A: Estimated Population by District in Humanitarian Emergency (HE) and
Acute Food and Livelihood Crisis (AFLC), inclusive of the High Risk Groups in Gedo 28
Table 11B: Estimated Population by Livelihood Zone in Humanitarian Emergency (HE) and
Acute Food and Livelihood Crisis (AFLC), inclusive of the High Risk Groups in Gedo 29
Table 12A: Estimated Population by District in Humanitarian Emergency (HE) and Acute Food
and Livelihood Crisis (AFLC), inclusive of the High Risk Groups in Juba Valley 33
Table 12B: Estimated Population by Livelihood Zone in Humanitarian Emergency (HE) and
Acute Food and Livelihood Crisis (AFLC), inclusive of the High Risk Groups
in Juba Valley 34
Table 13A: Estimated Population by District in Humanitarian Emergency (HE)
and Acute Food and Livelihood Crisis (AFLC), inclusive of the
High Risk Groups in Bay Bakol 38
Table 13B: Estimated Population by Livelihood Zone in Humanitarian Emergency (HE)
and Acute Food and Livelihood Crisis (AFLC), inclusive of the High Risk
Groups in Bay Bakol 39
Table 14A: Estimated Population by District in Humanitarian Emergency (HE) and Acute Food
and Livelihood Crisis (AFLC), inclusive of the High Risk Groups in Hiran 39
Table 14B: Estimated Population by Livelihood Zone in Humanitarian Emergency (HE) and
Acute Food and Livelihood Crisis (AFLC), inclusive of the High Risk Groups in Hiran 39
Table 15: Estimated Population by District in Humanitarian Emergency (HE) and Acute Food
and Livelihood Crisis (AFLC), inclusive of the High Risk Groups in Central Region 49
Table 16: Estimated Population by District in Humanitarian Emergency (HE) and Acute Food
and Livelihood Crisis (AFLC), inclusive of the High Risk Groups in Central Region 53
LIST OF TABLES
LIST OF MAPS

FSAU Technical Series Report No IV.8 vii Issued February 22, 2006
Figure 1: Rainfall Performance and NDVI for Awdal Galbed, Togder, Nugal, Sanag, Bakol,
Galgadud, Juba, Bay, Lower Shabelle and Middle Shabelle 11
Figure 2: Historic NDVI Per cent Deviation from Long Term Average 12
Figure 3: Annual Cereal Production by Agricultural Season (1995-2005) 13
Figure 4: Regional Contributiion of Cereal Production Deyr PWA (1995 - 2005) 13
Figure 5: Regional Contribution of Cereal Production Deyr 2005/06 15
Figure 6: Regional Contribution of Deyr 2005/06 Maize Prodution 15
Figure 7: Regional Contribution of Deyr 2005/06 Sorghum Production 15
Figure 8: Annual Cereal Production (1995-2006) 15
Figure 9: Regional Average Monthly Cereal Prices (US$) 16
Figure 10: Commercial Cereal Import Trends (2002 - 2005) 16
Figure 11: Average Monthly Prices Local Quality Cattle (US$) 20
Figure 12: Goats Exports from berbera and Bossaso Ports, 1994-2005 21
Figure 13: Terms of Trade Imported Rice to Export Quality Goat (2002 -2006) 21
Figure 14 Juba Valley: Trend in Imported Commodity Prices compared to Exchange Rate 23
Figure 15: Sorghum Belt: Trend in Imported Commodity Prices compared to Exchange Rate 23
Figure 15: Monthly Exchange Rates - SOSH and SLSH to USD 23
Fugure 17: Shabelle Valley: Trend in Imported Commodity Prices compared to Exchange Rate 23
Figure 18: Deyr Maize and Sorghum Production in Gedo (1995/06 - 2005/06) 30
Figure 19: Annual Cereal Production in Gedo (1995-2005/06) 30
Figure 20: Sorghum Prices (US$) in Bay, Bakol, Hiran and Gedo Regions 31
Figure 21: Belet Hawa TFC Monthly Admissions 32
Figure 22: Deyr Cereal Production in Middle and Lower Juba (1995 - 2005/06) 36
Figure 23: Annual Cereal Production in Middle and Lower Juba (1995 - 2005/06) 36
Figure 24: Terms of Trade in Juba Valley - Sorghum to Local Goat and Labour (1995-2006) 37
Figure 25: Proportion of malnourished children in Juba Valley sentinel sites 37
Figure 26: Deyr Cereal Production in Bay & Bakol (1995 - 2005/06) 41
Figure 27: Terms of Trade in Bay, Bakol, Gedo and Hiran Region - Sorghum to Local Goat and
Labour (1995-2006) 41
Figure 28: Proportion of households by dietary diversity in Bay Region sentinel sites 42
Figure 29: Proportion of malnourished children in Bakool sites, Nov ‘05 42
Figure 30: Proportion of children with acute malnutrition in the sentinel sites
in Hiran Region in Dec ‘05 43
Figure 31: Terms of Trade in Shabelle Valley - Maize to Local Goat and Labour (1995-2006) 46
Figure 32: Distribution of childrens nuitritional status in the sentinel sites in Lower Shabelle Region 46
Figure 33: Various Commodity (Rice & Sorghum) Prices in Galkayo 50
Figure 34: Various Commodity (Export & Local Quality Goat and Camel Milk) Prices in Galkayo 51
Figure 35: Proportion of children with acute malnutrition in the sentinel sites in Galgadud Region 51
Figure 36: Terms of Trade in Northeast - Rice to Local or Export Goat & Labour (1998-2006) 54
Figure 37: Malnutrition (WFH z scores) among screened Children (N>900)
in Bosaso IDPs camps in ‘05 55
Map 17 Strategic Boreholes, Wells & Watering Points in Juba Valley 35
Map 18: Sorghum Belt Livelihood Systems 38
Map 19: Food Security Phase Classifi cation Bay, Bakol and Hiran 38
Map 20: Shabelle and Cowpea Belt Livelihood Systems 44
Map 21: Food Security Phase Classifi cation - Shabelle 44
Map 22: North and Central Regions: Livelihood Systems 49
Map 23: Food Security Phase Classifi cation - Central Region 49
Map 24: North and Central Regions: Livelihood Systems 52
Map 25: Food Security Phase Classifi cation - North 52
Map 26: Somalia Livelihood Zones 81
LIST OF FIGURES

FSAU Technical Series Report No IV.8 viii Issued February 22, 2006
FSAU Technical Series Report No IV.8 1 Issued February 22, 2006
Following early indications of a seriously deteriorating food security situation in Southern Somalia, FSAU and FEWSNET began to issue early warnings in November ‘05, advanced the timeline of its Deyr assessment fi eld-work, and expanded both the duration and coverage of fi eldwork in the South in order to generate a more in-depth understanding of the rapidly evolving crisis. Fieldwork by FSAU with FEWSNET Somalia and another forty two different partners was undertaken throughout December ’05. Fieldwork was followed by a series of regional analysis workshops and an overall consolidation analysis workshop held the fi rst week of January ‘06. Results were presented to TFG, UN, INGO/NGO agencies, donor agencies and other partners at the SACB/FSRD meeting on January 18, 2006. Key fi ndings of this assessment and analysis were published in the FSAU January 2006 Food Security and Nutrition Monthly Brief (January 26, 2006). To inform programming and facilitate a timely response FSAU released (through FSAU website and by E-mail) fi nalised estimated population numbers in Humanitarian Emergency (HE)
and Acute Food and Livelihood Crisis (AFLC), inclusive of High Risk groups disaggregated by region, district and livelihood zone (February 1, 2006). This FSAU Technical Series Report presents a comprehensive analysis and results of the Post Deyr ’05/06 Analysis.
1.1 KEY FINDINGS
An estimated 1.7 million people in the North, Central and Southern Regions of Somalia are facing conditions of Acute Food and Livelihood Crisis or Humanitarian Emergency at least until June ’06 (Table 1 and Map 1). If IDPs (Internally Displaced Populations) are included, estimated at 400,000, the total number of people in need of assistance throughout the country is 2.1 million people. The crisis is especially severe in the Southern regions of Somalia, where an estimated 1.4 million people are in urgent need of humanitarian assistance. Results confi rm previous early warnings of crop failure, considerable livestock deaths, rapidly increasing cereal prices, falling live-stock prices, abnormal population movements, and extreme shortages of, and limited access to, water and food (see FSAU Monthly Briefs for November and December ’05).
Depending on humanitarian access and response, the potential risks for outbreaks of resource based confl ict, and food and water supply shortages; FSAU further warns that there is a Moderate Risk of Famine in the coming months for Gedo and surrounding areas (Map 1). Threats against the humanitarian community in January led to the suspension of fl ights, and therefore access to, Garbaharey and Luq districts in Gedo. This incident underscores the potential for confl ict, the complexity of the situation, and implications for humanitarian response.
Further stressing the plight of the people in the South is that the drought is regional in nature, extending into Ethiopia and Kenya and covering large areas of the greater Somali livelihood system. The regional scope of this drought translates directly into fewer coping options within the greater Somali livelihood system (e.g. reduced migration and stretched social support) and greater stress on already limited resources. FSAU initiated a series of cross bor-der meetings with technical food security partners in Kenya and Ethiopia to develop an analytical and consistent understanding of the food security crisis in the bordering regions. This initial cross-border technical collaboration between regional partners (FEWSNET, WFP, SC [UK], CARE, UNDP, USAID, OXFAM, ALRMP, OCHA, Ministry of Agriculture, Kenya) and the application of the Integrated Food Security and Humanitarian Phase Classifi cation to the regional drought clearly delineates the extent and severity of the humanitarian crisis (Map 2).
The Southern region is faced with a crisis that will continue to deepen over the coming months. The effects of the drought will only be compounded and worsen over the long Jilaal dry season (Jan-April) and depending on the extent of the loss of livelihoods and lives during this period, the region will require continued humanitarian and development support for several months to come. If the Gu ’06 rains (April-June) fail or are again below normal in the southern region, the entire region will likely face a humanitarian catastrophe on a scale that could be compa-rable to the 1993 famine in Southern Somalia.
It must be emphasized that the humanitarian response needed for the current crisis is a multi-sector, ‘twin-track’ approach - addressing both the immediate life saving needs (food, water, health, nutrition), but also simultaneously addressing the medium-term livelihood needs in terms of the protection and rehabilitation of productive assets (livestock, seeds and tools, boreholes, water catchments, irrigation canals, rangelands). If the focus is only on ad-dressing immediate needs – whole livelihood systems could degenerate into relief-reliant communities, deepening poverty and prolonging the humanitarian crisis.
IMPLICATIONS FOR RESPONSE
• Response: A full range of response options is necessary, including: food aid, cash assistance, water relief and rehabilitation, livestock herd survival programmes (including destocking, breeding stock protection, provision of fodder), health and nutrition assistance, and protection of vulnerable groups.
• Timeframe of Response: Jan. - May: Humanitarian response focused on immediate needs and medium-term
1. EXECUTIVE SUMMARY
execu
tive su
mm
ary

FSAU Technical Series Report No IV.8 2 Issued February 22, 2006
exec
uti
ve
sum
ma
ry
protection and rehabilitation of assets. June – December: If Gu ’06 rains are good, continuation of immediate needs assistance for most vulnerable populations and full continuation of activities focused on protection and rehabilitation of assets. If Gu ’06 rains fail, increased and continued immediate needs response with expanded coverage and intensity.
• Implementation of Response: Somali authorities, civil society, and humanitarian actors urgently need to step up interventions to prevent a large scale disaster. Somali leaders will be critical in ensuring security and access to affected areas.
• Financial Response: Donors must urgently ensure implementing agencies and organisations have the full fi nan-cial backing to implement the necessary responses. As demonstrated in previous crises, the Somali Diaspora can play a key role through remittances to help mitigate the crisis.
• Consistent Regional Response: A balanced, needs-based humanitarian response for the entire drought affected region (Somalia, Ethiopia & Kenya) is necessary in order to prevent a further escalation of the crisis through cross border population movements and outbreaks of confl ict over resources.
• Crisis as Opportunity: The severity of the crisis will provoke critical awareness of Somalia’s situation from both the international community and Somali people’s perspective. Harnessed constructively, this energy can be used to address key underlying issues that will continue to undermine Somali livelihoods indefi nitely if left unchecked. Key opportunities include, demonstrating the benefi ts of a functioning civil society through Tran-sitional Federal Government leadership, and reversing the trend of massive and nearly irreversible degradation of rangelands through deforestation for charcoal production.
• Contingency Planning: Early climate forecasts indicate the possibility of below normal Gu ’06 rains. Thus, all humanitarian actors should prepare for what will be a further deterioration in the situation, which could include widespread famine.
Table 1B: SUMMARY TABLE 2
1Source: WHO 2004. Note this only includes population fi gures in affected regions. UNDP recently released region level population fi gures for 2005. However,
these estimates have not been fi nalised and therefore are not used in this analysis. 2Estimated numbers are rounded to the nearest fi ve thousand, based on resident population not considering current or ancipated migration, and are inclusive of
population in High Risk of AFLC or HE (estimated at 210,000) for purposes of planning. 3Roughly estimated as 30% and 20% of urban population in HE and AFLC areas respectively.4Actual number is 1,660,000, however, this is rounded to 1,700,000 for purposes of rough planning and ease of communication. 5Source: UN-OCHA updated April 2004 (376,630) and UNHCR IDP map Dec.2005 (407,000), rounded to 400,000 as an estimate. 6Percent of total population of Somalia estimated at 7,309,266 (WHO 2004).
Table 1A: Estimated Population by Region in Humanitarian Emergency (HE) and Acute Food and Liveli-
hood Crisis (AFLC), inclusive of the High Risk Groups.
Acute Food and
Livelihood Crisis
(AFLC)2
Humanitarian
Emergency
(HE)2
Total in AFLC or HE
as % of Region
Population
NorthBari 235,975 45,000 0 19
Nugal 99,635 20,000 0 20
Sanag 190,455 55,000 0 29
Sool 194,660 50,000 0 26
Togdheer 302,155 40,000 0 13
Coastal (fishing) 20,000
SUB-TOTAL 1,022,880 230,000 0 22
CentralGalgadud 319,735 40,000 0 13
Mudug 199,895 20,000 0 10
SUB-TOTAL 519,630 60,000 0 12
SouthBakol 225,450 45,000 105,000 67
Bay 655,686 135,000 395,000 81
Gedo 375,280 80,000 180,000 69
Hiran 280,880 55,000 0 20
Lower Juba 329,240 60,000 115,000 53
Middle Juba 244,275 50,000 120,000 70
SUB-TOTAL 2,110,811 425,000 915,000 63
TOTAL 3,653,321 715,000 915,000 45
Assessed and Contingency Population in AFLC and HEEstimated Population of
Affected Regions 1
Affected Regions
226
16
236
66
296
Estimated Total Population in Crisis 2,100,000
Assessed and Contigency Population Numbers in AFLC or
HE 1,630,000
30,000
Estimated Number of IDPs5
400,000
Urban Populations in Crisis Areas in the South 3
1,700,0004
Combined Assessed, Urban & Contingency Populations in
AFLC and HE

FSAU Technical Series Report No IV.8 3 Issued February 22, 2006
Map 1: Post Deyr (Jan 2006) Integrated Food Security Phase Classifi cation
execu
tive su
mm
ary

FSAU Technical Series Report No IV.8 4 Issued February 22, 2006
Table 2: Integrated Food Security and Humanitarian Phase Classifi cation Reference Table (FAO/FSAU Feb 12, 2006)
Key Reference Characteristics Strategic Response Framework PhaseClassification (current or imminent outcomes on lives and livelihoods;
based on convergence of evidence) (address immediate outcomes, support livelihoods,
and address underlying/structural causes)Crude Mortality Rate < 0.5 / 10,000 / day
Wasting <3 % (w/h <-2 z-score)
Disease acceptable and containable prevalence Investment in food and economic production systems
Food Access/ Availability usually adequate (> 2,100 kcal ppp day), stable Enable development of livelihood systems based on principles
Dietary Diversity consistent quality and quantity of diversity of sustainability, justice, and equity
Water Access/Avail. usually adequate (> 15 litres ppp day), stable Prevent emergence of structural hindrances to food security
Hazards moderate to low probability and vulnerability Advocacy
Civil Security prevailing and structural peace
5Generally
Food Secure
Livelihood Assets generally sustainable utilization (of 5 capitals)
Crude Mortality Rate 0.5-1/10,000/day; U5MR<= 2/10,000/day
Wasting <10 % (w/h <-2 z-score), usual range, stable Design & implement strategies to increase stability, resistance
Disease Sustained moderate to low prevalence and resilience of livelihood systems, thus reducing risk
Food Access/ Availability borderline adequate (2,100 kcal ppp day); unstable Provision of ‘safety nets’ to high risk groups
Dietary Diversity chronic dietary diversity deficit Interventions for optimal and sustainable use of livelihood assets
Water Access/Avail. borderline adequate (15 litres ppp day); unstable Create contingency plan
Hazards recurrent, with high livelihood vulnerability Redress structural hindrances to food security
Civil Security unstable, disruptive tension Close monitoring of relevant outcome and process indicators
Coping ‘insurance strategies’ Advocacy
Livelihood Assets stressed and unsustainable utilization (of 5 capitals)
4Chronically
Food Insecure
Structural Pronounced underlying hindrances to food security
Crude Mortality Rate 1-2 /10,000/day, >2x reference rate; U5MR 2-4/10,000/dy Support livelihoods and protect vulnerable groups
Wasting 10-15 % (w/h <-2 z-score), > than usual, increasing Strategic and complementary interventions to immediately food
Disease outbreak; increasing access/availability AND support livelihoods
Food Access/ Availability lack of entitlement; 2,100 kcal ppp day via asset stripping Selected provision of complementary sectoral support (e.g.,
Dietary Diversity acute dietary diversity deficit water, shelter, sanitation, health, etc.)
Water Access/Avail. 15 litres ppp day accessed via asset stripping, Strategic interventions at community to national levels to create,
Destitution/Displacement emerging; diffuse stabilise, rehabilitate, or protect priority livelihood assets
Civil Security limited spread, low intensity conflict Create or implement contingency plan
Coping ‘crisis strategies’; CSI > than reference; increasing Close monitoring of relevant outcome and process indicators
Livelihood Assets accelerated and critical depletion or loss of access Use ‘crisis as opportunity’ to redress underlying structural causes
3Acute Food and
LivelihoodCrisis
Advocacy
Crude Mortality Rate 2-4 / 10,000 / day, increasing; U5MR > 4/10,000/day
Wasting >15 % (w/h <-2 z-score), > than usual, increasing Urgent protection of vulnerable groups
Disease epidemic outbreak Urgently food access through complementary interventions
Food Access/ Availability severe entitlement gap; unable to meet 2,100 kcal ppp day Selected provision of complementary sectoral support (e.g.,
Dietary Diversity Regularly 2 or fewer food groups consumed water, shelter, sanitation, health, etc.)
Water Access/Avail. < 7.5 litres ppp day (human usage only) Protection against complete livelihood asset loss and/or
Destitution/Displacement concentrated; increasing advocacy for access
Civil Security widespread, high intensity conflict Close monitoring of relevant outcome and process indicators
Coping ‘distress strategies’; CSI significantly > than reference Use ‘crisis as opportunity’ to redress underlying structural causes
2Humanitarian Emergency
Livelihood Assets near complete & irreversible depletion or loss of access Advocacy
Excess Mortality > 5,000 deaths
Crude Mortality Rate > 4 / 10,000 / day Critically urgent protection of human lives and vulnerable groups
Wasting > 30 % (w/h <-2 z-score) Comprehensive assistance with basic needs (e.g. food, water,
Disease epidemic outbreak shelter, sanitation, health, etc.)
Food Access/ Availability extreme entitlement gap; much below 2,100 kcal ppp day Immediate policy/legal revisions where necessary
Water Access/Avail. < 4 litres ppp day (human usage only) Negotiations with varied political-economic interests
Destitution/Displacement large scale, concentrated Use ‘crisis as opportunity’ to redress underlying structural causes
Civil Security widespread, high intensity conflict Advocacy
1Famine /
Humanitarian Catastrophe
Livelihood Assets effectively complete loss; collapse
exec
uti
ve
sum
ma
ry
Early Warning Levels
Probability / Likelihood of
Worsening Phase Severity Key Reference Characteristics Implications for Action
Hazard: occurrence of, or predicted event stressing livelihoods; with low vulnerability Close monitoring and analysis Alert As yet unclear Not applicable
Process Indicators: small negative change from normal
Hazard: occurrence of, or predicted event stressing livelihoods; Close monitoring and analysis
with moderate vulnerability Contingency planning Moderate Risk
Elevated probability / likelihood
Process Indicators: large negative change from normal Step-up current Phase interventions
Hazard: occurrence of, or strongly predicted major event stressing livelihoods; with high vulnerability
Preventative interventions--with increased urgency for High Risk populations High Risk
High probability; ‘more likely than not’
Color of diagonal lines on map
match predicted Phase Class
Process Indicators: large and compounding negative changes Advocacy
Alert

FSAU Technical Series Report No IV.8 5 Issued February 22, 2006
1.2 REGIONAL HIGHLIGHTS
Southern Region
Southern Somalia is currently facing a dire Hu-manitarian Emergency with a severity that rivals other current humanitarian crises in the world. An estimated 1.4 million people in Gedo, Juba, Bay, Bakol and Hiran regions are facing conditions of either Acute Food and Livelihood Crisis or Hu-
manitarian Emergency and are in urgent need of humanitarian assistance (Map 1 and Table 1). Of this 1.4 million people, 915,000 people in Gedo, Juba and parts of Bay and Bakol are currently identifi ed in state of Humanitarian Emergency. Gedo, the most severely drought affected area within the region, is also identifi ed at a Moderate Risk to Famine in the coming months. It should be highlighted that there are two areas within this Humanitarian Emergency area, which were already in a sustained phase (longer than 3 years) of Humanitarian Emergency, that of Northern Gedo (Belet Hawa, Dolo and part of Luq) and Juba Riverine (Sakow, Buale Jilib and Jamame) (Map 1). Another 425,000 people in parts of Bakol, Bay, and Juba are estimated to be in a state of Acute
Food and Livelihood Crisis and are at a High Risk
of falling into a state of Humanitarian Emergency
before June ’06. Also included in the estimated 1.4 million people in HE or AFLC, is a rough estimate of 30,000 people from small rural urban centers in crisis areas of Gedo, Juba, Bay, and Bakool.
The current crisis is primarily due to the impact of two consecutive very poor rainy seasons (below normal Gu
’05 rains, followed by completely failed Deyr ’05 rains), compounded by ongoing civil insecurity. All livelihood systems (agro-pastoralists, pastoralists and riverine agriculturalists), are affected by this drought. Access to food and income is severely stressed due to a combination of poor crop and livestock production, limited income options (wage labour and sale of production), asset losses (cereal and livestock), and deteriorating terms of trade (increasing cereal prices and falling livestock prices). Even before this crisis, acute malnutrition rates in many of the affected areas were already among the worst in the region reaching over 20% W/H <-2 Z scores or oedema in parts of Gedo. Early indications of deteriorating nutrition status trends are already observed in many of the worst affected areas (parts of Belet Hawa, Luq, Dinsor, Qansah Dere, Baidoa, Rab Dhure, El Barde and Afmadow). Cereal production for the year in Gedo, Juba, Bay and Bakol is considered an almost complete crop failure, ranging between 7-23% of annual Post War Average. Cereal prices in Gedo, Juba and Bay and Bakol are increasing rapidly, roughly 50% between November - December alone and are expected to continue to increase sharply in the coming months. Sor-ghum prices, generally a cheaper cereal, are now higher than the maize prices in Shabelle and are at their highest levels in the last fi ve years. In Gedo, sorghum prices have more than doubled since September ’05.
Pasture and water is severely depleted, with the worst affected regions being Gedo, followed by Juba, Bay and Bakol. Already an estimated 20-30% of the cattle in Gedo have died due to lack of pasture, water and drought related disease, and preliminary estimates are that up to 80% of the cattle will die by April. Due to poor body condition, cattle prices have plummeted by over 40-50% in the past few months. Pastoralists are engaging in a range of distress coping strategies including abnormal migration, inducing still births to save breeding stock, skinning animals for their hide, sale of breeding animals, exposing animals to tsetse fl y infested areas, and conducting ‘compassion slaughtering’ of weak animals as they move from place to place in search of water. The regional nature of this drought (Map 1), further worsens the plight of pastoralists as it means that there are limited options for migration, as well as increased pressure on water and pasture due to in-migrating livestock from Kenya and Ethiopia.
Central Region
Central Region, although recovering from a previous phase of Humanitarian Emergency, continues to remain in a state of Acute Food and Livelihood Crisis (Map 1). There is a trend of improvement in most of Galgadud, but within northern Galgadud and south Mudug (between Adado/Gelinsor, Hobyo and Harar Dere) the situation is deteriorating due to the uncertainty surrounding the ongoing confl ict. A total of 60,000 people are estimated to be in a continu-
execu
tive su
mm
ary
Map 2. Somalia Cross Border Food Security Situation
Analysis: Post Deyr 2005/6 Projection, January 2006
Through June 20061
Alert
Moderate Risk
High Risk
Sustained Phase 2 or 3 for > 3 yrs
Areas with IDP Concentrations
Phase Classifi cation
Early Warning Levels for worsening Phase
5 Generally Food Secure
4 Chronically Food Insecure
3 Acute Food and Livelihood Crisis
2 Humanitarian Emergency
1 Famine/Humanitarian Catastrophe
1This Map is based on preliminary results and will be updated once the forthcom-
ing Kenya and Ethiopia seasonal analysis reports are published

FSAU Technical Series Report No IV.8 6 Issued February 22, 2006
exec
uti
ve
sum
ma
ry
ing state of Acute Food and Livelihood Crisis, of which 40,000 are in Galgadud and 20,000 in south Mudug (Table 1). Deyr ‘05/’06 rainfall in most inland pastoral areas was below normal (between 20% and 80%), with some areas up to 150% above normal. This is further supporting recovery in the area, especially as it follows above normal Gu ’05 rains, as well as good Deyr ’04/05 rains. While much of Galgadud benefi ted from improvements in security, unresolved confl ict in south Mudug and northern Galgadud continues to hinder livelihood recovery. Clan confl ict boundaries are disrupting the migrations of people and livestock, and have affected access to markets and hindered commercial trade. Concentrations of IDPs from the current insecurity are present in Dusa Mareb, Adado, Bandiradley and Harar Dere. Although there are pockets of water shortages in some areas, pasture conditions are considered normal and recovery signs include improved livestock conditions, and continuing recovery in livestock productivity and reproduction.
Northern Region
In the Northern Region the area recovering from a three year drought and humanitarian emergency continues to re-main in a state of Acute Food and Livelihood Crisis due to the lag time in livelihood recovery given the cumulative livestock deaths, reduced herd sizes and continuing indebtedness (Map 1). An estimated 230,000 people are in state of Acute Food and Livelihood Crisis and require immediate livelihood support. This includes the worst affected households who lost most of their assets (an estimated 30,000 people) who are now concentrated in pockets of urban areas and small towns throughout the region and an estimated 20,000 people from the coastal fi shing zone affected by the tsunami (Table 1A and 1B).
Pastoral livelihood recovery continues in most areas, following generally above normal Deyr ’05 rains, which follows the exceptionally good Gu ’05 rains and the above normal Deyr ‘04 rains. In the pockets that received poor Deyr ‘05 rains (within the Hawd of Togder, eastern Sanag and districts of Taleh, Hudun, Bandabeyla, Gardo, Badan and Dahar) livelihood recovery is threatened as the loss of pack animals limits pastoral mobility and access to available water sources. Water trucking has commenced unseasonably early and expenditure on water and animal transport, as well as competition for existing pasture resources is increasing in these areas. Northeast Bari (within Qandala, Alula and Iskushuban districts), the Hawd of Hargeisa, the southeast of the Hawd of Togder, and the Awdal and Marodi Jeh coastal zone are all identifi ed in Early Warning Levels of Alert (Map 1). In all these areas Deyr ’05 rains were below normal, leading to limited and deteriorating water and/or pasture availability, increasing distances between water and pasture resources, and abnormal migration patterns. The situation in northeast Bari is considered more severe and is identi-fi ed at a Moderate Risk of deteriorating to Acute Food and Livelihood Crisis. All of these areas in Early Warning
Levels of Alert require close monitoring over the coming long Jilaal dry season (January -April).
1.3 SECTOR HIGHLIGHTS
Climate
Deyr ’05/06 season rains (October-December) generally started late in the south and parts of central regions and were poorly distributed in terms of time and spatial coverage. Deyr rains in many parts of southern Somalia are 0-10% of the long term mean for the season, which is considered a complete rainfall failure (Map 3). Seasonal rains, similarly, failed in the neighboring border regions of Kenya and Ethiopia. This poor Deyr rainfall performance is further com-pounded by the fact that the previous main seasonal rains, Gu ’05 rains (April-June), were also largely below normal in much of the south, ranging between 20-50% of long term mean in parts of Bay, Shabele and Hiran, and between 50-80% of long term mean in Gedo, Juba and Bakol. Satellite images of vegetation coverage (Normalized Difference Vegetation Index, NDVI) clearly indicate a severe lack of vegetative cover in most of the agro-pastoral and pastoral areas in the southern region (Map 4). In the north, rains were largely above normal, with the exception of pockets in eastern Sanag, northeast Bari and parts of Hawd and Awdal region bordering Djibouti.
Agriculture
Deyr ‘05/06 cereal production in the southern Somalia, estimated at 42,400 MT, is the lowest Deyr production in a decade (39% of Deyr Post War Average or PWA, 34% of last Deyr). Two regions, Middle Juba and Lower Juba, experienced almost complete crop failure with estimated production levels less than 7% Deyr PWA (Lower Juba 1% and Middle Juba 7% of Deyr PWA). Cereal production estimates in another four regions (the Sorghum Belt) were also extremely poor, less than 20% Deyr PWA (Bakol 13%, Gedo 14%, Hiran 16% and Bay 23%). In addition, maize production estimates in Middle and Lower Shabelle was also signifi cantly below normal, 50% and 64% of Deyr PWA respectively. This combined with the very poor cereal production estimate of the preceding Gu ’05 season, which was also the lowest cereal production in a decade, translates into an overall annual cereal production (Gu ’05 plus Deyr
’05/06) which is 50% of PWA and the lowest annual cereal production in a decade.
The Annual Cereal Balance Sheet (June ’05-May ’06) was updated with Deyr production estimates and actual food aid distributions to December ’05. The results indicate that there will potentially be an overall shortfall in cereal sup-ply of approximately 55,000 MT. Two consecutive seasons of below normal sorghum and maize production is already

FSAU Technical Series Report No IV.8 7 Issued February 22, 2006
execu
tive su
mm
ary
resulting in increased cereal prices. On average, sorghum prices throughout the Sorghum-belt (Gedo, Bay, Bakol and Hiran) have reached their highest levels in the last fi ve years and are now even higher than maize prices in Shabelle. In the Sorghum-belt, on average sorghum prices have increased by more than 50% since October ’05. Maize prices in Juba have also increased sharply by almost 50% since September ’05. In contrast, Karan cereal production (har-vested in November ’05) in the northwest agro-pastoral areas (Awdal, Galbed and Togder) is estimated at 160% above normal Karan cereal production. Although, this above normal production will benefi t the northwestern regions, it only contributes roughly 26,000 MT to the total domestic cereal production.
Livestock
Livestock body conditions, production and reproduction throughout most of the South is extremely poor and severely stressed due to limited water and pasture as a result of the compounding effects of a poor Gu ’05 (April – June) and failed Deyr ‘05/’06 (October-December) rains. Cattle, the main livestock species in Gedo, Juba Valley and parts of Bay and Bakool regions, are the hardest hit by the drought and their survival over the coming long Jilaal dry season (January-April) is precarious at best. It is estimated that 20-30% of the cattle have already died in Gedo and parts of Juba Valley due to the lack of water, pasture and drought-related diseases. Preliminary estimates are that upwards to 80% of the cattle in Gedo could perish by April, before the next rains are expected. Abnormal livestock migration to Juba riverine areas has occurred since August ‘05, but is now increased and intensifi ed. Abnormal migration of pastoralists from northeast Kenya to the Juba riverine area in search of water and pasture is worsening the situation by further depleting limited resources. Competition over rangeland resources and market opportunities is increasing resource based confl icts between farmers and herders. The market value of livestock, especially cattle, has plummeted and will continue to fall. Cattle prices have declined signifi cantly, between 40-60% as compared to earlier this year (February ‘05), in Bar Dere (Gedo), Salagle, Sakow, Buale (Middle Juba) and, Afmadow (Lower Juba)). Body condi-tions of camels and shoats in the South are fairly normal due to their natural resilience to dry seasons. In Northern and Central Regions, livestock conditions are largely normal. In many parts of Sol Plateau and Nugal Valley camel calving is ongoing and camel milk is available. However, due to the severity of the livelihood impact of the three years of drought, many pastoralists in pocket areas where the Deyr rains failed to materialise are struggling to meet their water needs due to the lack of pack camels and their high continuing levels of indebtedness.
Markets
Both the Somali and Somaliland Shilling continue to remain stable at approximately the same level over the last one year (since January ’05). The Somali Shilling is stable at around 15,000-15,600 SoSh/US$ and the Somaliland Shilling at 6,000-6,400 SoSh/US$. Both currencies gained strength against the dollar after January ’04, but are still signifi -cantly lower in value than their pre-livestock ban levels, 131% and 55% depreciation against the US$ since January 2000 for SoSh and SlSh respectively.
Nutrition
A signifi cant proportion of the populations in areas currently experiencing a humanitarian emergency and livelihood crisis already show malnutrition levels that are among the highest in Somalia and in the region. As shown on the map (Map 10), global acute malnutrition levels of over 15% (W/H <-2 Z scores or oedema) are common with some areas indicating much higher levels. January’s FSAU Nutrition Monthly Update provides some of the background information leading to this analysis. Early indications of the further deterioration of the situation are noted in the increased levels ofmalnutrition in clinics and therapeutic feeding programme admissions. Decreasing access to adequate food and water of acceptable quality and adequate quantity are the main factors contributing to the current deterioration. These are accompanied by an increase in incidence of communicable diseases, including measles, decreased access to health care and the devastating impact on care at household level as a result of widespread population movement.
Civil Insecurity
Concurrent with the ongoing risk of widespread political confl ict due to, as yet, unresolved tensions within the TFG, competition over natural resources remains a key driver of confl ict. Unresolved confl icts in several locations (in Qansah Dere, Dinsor, Tieglow and Bulo-burti districts, continuing tension over water and grazing resources south of Brava, and renewed clan confl ict between north Galgadud and south Mudug) have disrupted trade and market access, led to population displacement and the destruction of assets. It is expected that as the impacts of the drought intensify the risk of resource-based confl ict in the Gedo and Juba riverine areas will increase, as pastoralists clash with riverine agriculturalists over access to grazing resources. Increased resource based confl ict will only further undermine the already rapidly deteriorating food and livelihood security situation. Furthermore, any security incidents (either con-tinuing marine piracy, localised confl ict or an increase in roadblocks on key strategic roads) that restrict the fl ow of commercial goods, including staple cereals and humanitarian assistance, risk further infl ating cereal prices and the overall availability of and access to food for populations in areas of Humanitarian Emergency or Acute Food and
Livelihood Crisis.

FSAU Technical Series Report No IV.8 8 Issued February 22, 2006
2. ANALYTICAL PROCESSES AND METHODS
an
aly
tica
l p
roce
ss a
nd
met
ho
ds
This Technical Series Report provides the full technical fi ndings of the Post Deyr ’05/06 Analysis. The analysis
focuses on the outcome of Deyr seasonal rains (mid October – mid December ’05) and provides food security pro-
jections to June 2006. The analysis updates the 2005 Post Gu Assessment Analysis (FSAU Technical Series, Report
No IV. 7, 2005 Post Gu Analysis September 13, 2005) and revises the annual food and livelihood security projec-
tions to June ’06. FSAU collaborated with over 42 partners in the fi eld and in Nairobi at all stages of the assessment
including planning, fi eldwork, and analysis. Table 3 provides an overview of the analytical process and timeline.
For a complete listing of partners and full timeline see Appendix 5.3 and 5.4.1
Analytical Process and Timeline
In November ’05, FSAU began to issue early warnings of the rapidly deteriorating food security situation in South-
ern Somalia (FSAU November’05 Food Security and Nutrition Monthly Brief, November 14, 2005). In order to
generate a more timely and in-depth understanding of the rapidly evolving crisis, FSAU advanced the timeline of
the post Deyr assessment fi eldwork to begin the fi rst week of December and expanded the fi eldwork, both in the
duration and coverage in the South.
Two technical partner planning meetings were held in Nairobi on November 30, 2005 one with an agricultural sector
focus and the other with pastoral and livestock sector focus. The purpose of these initial partner planning meetings
was to fi nalise survey instruments, plan partner collaboration and coordinate and plan fi eldwork logistics and sup-
port. Prior to fi eldwork, Regional Partner Planning Workshops designed to train participants on fi eld instruments
and plan fi eld logistics were held in Hargesia, Garowe, Belet Weyne, Marka, Wajid and Buale, from December 11
– 12. The team then conducted fi eldwork in their respective regions between December 12 and 29. Fieldwork was
followed by regional analysis meetings (December 31 – January 3, 2006) and then an FSAU All Team Analysis
Workshop was held with FEWSNET and partners in Hargeisa, Somaliland, from January 4 to January 10 2006 to
further consolidate fi ndings and analysis and develop the overall Phase Classifi cation Analysis for the country.
Given the projected severity of the crisis and the need to give early warning for a timely response, FSAU issued
a Press Release during the ongoing Post Deyr fi eldwork, as incoming information clearly indicated a serious and
deteriorating situation (FSAU Press Release, Deteriorating Food Security Situation Rapidly Leading to Widespread
Humanitarian Emergency in Southern Somalia, December 20, 2005). The post Deyr Assessment and Analysis was
then completed the second week of January ’06. Initial key analysis was then shared with partners from the Food
Security and Rural Development Committee of the Somalia Aid Coordination Body (FSRD/SACB), including
Activity Date Description/Location
FSAU Planning & Preparation Nov. 15 - 18 NBI
FSAU Issues Early Warning Nov. 14 FSAU Monthly Brief
Northwest Post Harvest Crop Assessment
Nov. 20 – Dec. 5 Somaliland with partners in Awdal, W. Galbeed, Togdheer
Partner Planning Meeting November 30 NBI with partners
Regional Fieldwork Planning Workshops
Dec. 11 - 12 Regional Workshops with partners in Belet Weyne, Wajid, Buale, Merka, Garowe, Hargeisa
Fieldwork Dec. 12 -29 Throughout region with partners
FSAU Issues Press Release of Deteriorating Situation
Dec. 20 FSAU Press Release
Regional Analysis Workshop Dec. 31 – Jan. 3 Regional Workshops with partners in Belet Weyne, Wajid, Buale, Jowhar, Garowe, Hargeisa
All Team Analysis Workshop Jan. 4 - 8 All FSAU team (NBI and field) in Hargeisa, SL
Analysis Consolidation with Partners
Jan. 16 FSAU with Primary Technical Partners in NBI
Cross Border Partner Analysis Workshop
Jan. 16 FSAU with Technical Lead Agencies and Institutions in Kenya and Ethiopia held in NBI
Release of Preliminary Results Jan. 18 Jan. 19 Jan. 26
SACB/FSRD FSAU Press Release FSAU Monthly Brief- Key Findings
Release of Technical Series Report Feb. 15 FSAU Website, Email distribution, Hardcopy Mailing
Table 3: Overview of 2005/06 Post Deyr Assessment Analytical Process and Timeline

FSAU Technical Series Report No IV.8 9 Issued February 22, 2006
FSAU All Team Post Deyr Analysis held in Hargeisa, January 2006
members of the TFG, UN, INGO/NGO agencies, donor agencies and other partners, in Nairobi on January 18, 2006.
The same presentation was made throughout Somalia and in Somaliland by FSAU Field Analysts to participating
agencies and local stakeholders in regional meetings in Belet Weyne, Mogadishu, Hargeisa, Garowe, and Wajid
(January 19-24, 2006).
Immediately following the release of these fi ndings, FSAU issued another Press Release on January 19, 2006,
which was subsequently picked up by several news agencies around the world (FSAU Press Release, Early Warn-
ing Confi rmed – Somalia Faces Dire Humanitarian Emergency, January 19, 2006). FSAU released highlights of
the preliminary results in a Monthly Food Security and Nutrition January Brief (January 26, 2006). To review the
news articles written based on the FSAU press release and January Monthly Brief, see FSAU website (http://www.
fsausomali.org)
Due to the regional scope of this drought, covering large areas of the greater Somali livelihood system, for the fi rst
time, FSAU initiated a series of cross border meetings in January 16, 2006 with technical food security partners
in Kenya and Ethiopia (FEWSNET, WFP, SC [UK], CARE, UNDP, USAID, OXFAM, ALRMP, OCHA, Kenya
Ministry of Agriculture) to develop an analytical and consistent understanding of the food security crisis (and live-
stock and human migration patterns) in the bordering regions. Technical partners in Kenya and Ethiopia applied
the FSAU Phase Classifi cation and worked with FSAU to apply the same reference characteristics and convergence
of evidence methods to arrive at a Cross Border Regional Food Security Phase Classifi cation Map of the greater
Somali Livelihood System (Map 2).
Assessment Methods and Instruments
Primary data collection methodologies included focus group discussions, key informant interviews, market price
surveys, crop production surveys, livestock surveys, and food and livelihood security questionnaires (Appendix
5.4.2). During this exercise the FSAU strengthened further its evidence based analysis by introducing new livelihood
key parameter forms, revised pastoral questionnaire for the data collection (Appendix 5.4.2.1), and improved ground
‘truthing’ of rainfall satellite imagery. In total, 269 crop production surveys, 227 pastoral questionnaires, 78 market
price surveys, and 36 Key Livelihood Parameter surveys were completed. These were supported and triangulated
by secondary data (including livelihood profi les, regional and district administrative maps, USG/NVDI satellite
imagery, nutrition and market data, and FSAU and partner situation reports). Areas not assessed due to security
constraints include parts of Sol, the area between south Galkayo, Hobyo, Abudwaq, and east and south of El Bur,
and the districts of Bur Hakaba, El Barde and Badade, and Kismayo town.
Nutritional data utilised during the analysis stage included recent district nutrition surveys, rapid assessments,
trends in health facility data, and sentinel site data (68 sites, covering Gedo, Lower and Middle Juba, Bay and
Bakol, Hiran, Lower Shabelle, south Mudug, and Galgadud). Weight for height (WFH) indicators were used in the
nutrition surveys and health facility monitoring. Measurement of the Mid-upper Arm Circumstance (MUAC) and
WFH indicators were utilized in rapid assessments. Nutritional data interpretation was based on the relationship to
typical or expected trends in the district.
FSAU utilises a livelihoods approach to analyse the situation to clearly highlight the causes and outcomes of food
and livelihood insecurity and to facilitate multi-sector response planning and monitoring. Evidence based templates
(Appendix 5.4.2.8) are used to consolidate all analytical fi eld and secondary data and analysis to arrive at an evidence
based identifi cation of area specifi c Food Security Phase Classifi cations (Appendix 5.1).
an
aly
tical p
rocess a
nd
meth
od
s

FSAU Technical Series Report No IV.8 10 Issued February 22, 2006
Deyr ’05 season rains (October-December) in southern and parts of central regions started late, were poorly dis-
tributed in terms of time and spatial coverage, and were signifi cantly below normal or failed completely. Satellite
imagery shows and fi eld reports confi rm that most of these areas received less than 50mm of rainfall between October
to December (Map 3). Compared to a long-term mean, these Deyr rains are less than 10% of the normal, which is
considered an almost complete rain failure (Map 4). An exception is Lower Juba Valley, where a few days of heavy
but localized rains fell in the hinterland during the fi rst dekad of November, which helped to replenish water catch-
ments, although they had little impact on pasture regeneration due to their short duration.
Further compounding this poor Deyr rainfall performance is that
this is the second consecutive season of below normal rainfall in
southern Somalia. The previous main 2005 rainy season or Gu rains
(April-June), were also largely below normal in much of the south,
ranging between 20-50% of normal in parts of Bay, Shabelle and
Hiran, and between 50-80% in Gedo, Juba Valley and Bakool (FSAU
Technical Series Report No IV.7). The current situation is only
worsened by the regional nature of the rain failure, as this seasons
rains were also poorly distributed and signifi cantly below normal
in the surrounding border areas of Kenya and Ethiopia.
Vegetation conditions in all the regions in southern Somalia and
the neighbouring border areas in Kenya and Ethiopia are currently
extremely poor, as clearly indicated by normalized difference veg-
etation index (NDVI) satellite imagery data (Map 5). NDVI values
for Juba, Gedo, Bay and Bakool, show a steadily declining trend
since early November and are signifi cantly below values for the
same period last year, as well as the average values for this period
between 1999-2004 (Figure 1). Field reports and recent fi eld assess-
ments confi rm the severity of pasture shortages in these areas. This
downward trend will only continue to decline and worsen in severity
over the next three months of long dry Jilaal season, at least until late
April or early May when the next Gu rains are expected. A review
of historic NDVI trend data analysis clearly depicts the severity of the current situation in a historical context and
indicates that NDVI vegetation conditions are poorer now than they have been in the last decade in agro-pastoral
areas in the south and the worst in over twenty-fi ve years in pastoral areas of Juba (Map 6 and Figure 2).
3. SECTOR REPORTS
3.1 CLIMATE AND RAINFALL OUTCOME
Source: FEWS NET /USGS
Map 5: NDVI anomaly December ’05
Source: NOAA /FEWSNET
Map 3: Cumulative rainfall amounts
(mm): October - December ’05
Map 4: Percent of Normal rainfall
October - December ’05
Source: FEWS NET / NOAA
clim
ate
an
d r
ain
fall
ou
tco
me

FSAU Technical Series Report No IV.8 11 Issued February 22, 2006
clima
te an
d ra
infa
llo
utco
me
Figure 1: Rainfall Performance and NDVI for Awdal Galbeed, Togdheer, Nugal, Sanaag, Bakol,
Galgadud, Juba, Bay, Lower Shabelle and Middle Shabelle

FSAU Technical Series Report No IV.8 12 Issued February 22, 2006
In the northwest and northeast, Deyr rains were largely normal,
with the exception of pockets in eastern Sanag, northeast Bari and
parts of Hawd and Awdal region bordering Djibouti. Cumulative
Deyr rainfall (October-December) in much of the area was between
60-75mm, which is well above average (up to 300% above long term
mean) in parts of Togder, Sol, Sanag, northeast Awdal and northwest
Galbed.
Field reports confi rm, however, that in several localised areas, rains
were below normal, including pockets in west Togder, east Galbed,
northwest Awdal, and parts of Sol and eastern Sanag regions. From
November ‘05 to January ‘06 Hays rains were received in parts of
Awadal and Bari regions regions. Although the rains were poor
with some areas receiving less than 10% of normal rainfall (Map 4)
they have improved rangeland condition and eased the problem of
water shortage. Similarly light showers were received in parts of the
South especially coastal areas of Juba Valley. However, it had little
impact on rangeland conditions in the South due to the severity of
the prevailing Jilaal season.
clim
ate
an
d r
ain
fall
ou
tco
me
Map 6: Livelihood Zones used in Time
Series Analysis
-35
-25
-15
-5
5
15
25
35
45
Jan
-90
Ju
l-90
Jan
-91
Ju
l-91
Jan
-92
Ju
l-92
Jan
-93
Ju
l-93
Jan
-94
Ju
l-94
Jan
-95
Ju
l-95
Jan
-96
Ju
l-96
Jan
-97
Ju
l-97
Jan
-98
Ju
l-98
Jan
-99
Ju
l-99
Jan
-00
Ju
l-00
Jan
-01
Ju
l-01
Jan
-02
Ju
l-02
Jan
-03
Ju
l-03
Jan
-04
Ju
l-04
Jan
-05
Ju
l-05
Jan
-06
Aver
age
% D
evia
tion
Addun Pastoral
Hawd Pastoral
Juba: South-East Pastoral
Southern Agro-Pastoral
Sool Plateau
Figure 2: Historic NDVI Per cent Deviation from Long Term Average

FSAU Technical Series Report No IV.8 13 Issued February 22, 2006
dey
r pro
du
ction
an
d n
atio
na
l cereal b
ala
nce
3.2. DEYR 2005/06 CEREAL CROP PRODUCTION
Deyr ’05/06 cereal crop production in Southern Somalia
is the lowest in a decade. In many areas, both sorghum
and maize crops failed primarily due to below normal and
delayed rains. Low cereal production of the Deyr ’05/06
season is mainly attributed to poor performance of the
rain-dependent cereal crops throughout the southern
regions. Deyr ’05/06 cereal production is estimated at
42,400 MT, (34% is sorghum and 66% is maize), which
is only 39% of Deyr Post War Average (PWA) and 34%
of Deyr 2004 production (Figure 1 and Table 1). Two
regions, Middle Juba and Lower Juba, experienced
almost complete cereal crop failure with estimated pro-
duction levels less than 70% Deyr PWA (Lower Juba 1%
and Middle Juba 7% of Deyr PWA). Cereal production
throughout the Sorghum-belt region was also extremely
poor at less than 25% of Deyr PWA (Bakool 13%, Gedo 14%, Hiran 16% and Bay 23%). Cereal production esti-
mates in Shabelle Valley regions are also signifi cantly below normal at 50% in Middle Shabelle and 64% in Lower
Shabelle of Deyr PWA respectively (Table 4).
Cereal production from three regions, Bay, Lower
Shabelle and Middle Shabelle, generally contribute the
bulk of Deyr cereal production of southern Somalia in
a normal year - 80% of total cereal production (Figure
2). This season, due to signifi cant crop failures in Juba,
Gedo and Hiran, these three regions make up more than
90% of the Deyr ’05/06 production (Figure 3). Although
cereal production in Lower Shabelle is lower than PWA,
its contribution to current Deyr ‘05/06 is 60% (up from
an average of 36% of PWA contribution). Most of the
production coming from Shabelle Valley this season is
maize produced along the riverine strip areas of Kurtun
Warey, Qoryoley and Jowhar districts near the source of
irrigation infrastructure. The expected contribution of
rain-dependent crops (sorghum, maize) from this region
is almost negligible.
In the northwest, unlike the southern bimodal cropping pattern, there is only one main cropping season (referred to
as Gu/Karancrop season), which runs from May to October, with harvest occurring in November. The 2005 Karan
cereal harvest in the agro-pastoral areas of Awdal, Galbed and Togder regions was exceptionally good. Karan 2005
cereal production is estimated at 25,700 MT, which is 151% of last season’s production (Karan ’04) and 159% above
PWA (Table 5). These are the fi nal production fi gures and replace the preliminary fi gures presented FSAU Monthly
Brief (December 14, 2005).
0
20,000
40,000
60,000
80,000
100,000
120,000
140,000
160,000
180,000
200,000
1995
/96
1996
/97
1997
/98
1998
/99
1999
/00
2000
/01
2001
/02
2002
/03
2003
/04
2004
/05
2005
/06
Year
maize
sorghum
PWA (1995-2005)
Figure 3: Annual Cereal Production by Agricultural
Season (1995-2006)
Bakol
2%Bay
29%
Lower
Shabelle
36%
Middle Juba
4%
Middle
Shabelle
14%
Lower Juba
2%
Hiran
7%
Gedo
6%
Figure 4: Regional Contributiion of Cereal
Production Deyr PWA (1995 - 2005)
Table 4: Deyr Cereal Production Estimates in southrn Somalia
Sorghum Maize Total Cereal
Bakool 250 0 250 9% 13%
Bay 6,650 430 7,080 16% 23%
Gedo 210 645 855 6% 14%
Hiran 750 470 1,220 11% 16%
L/Juba 0 25 25 3% 1%
L/Shabelle 3,580 21,750 25,330 70% 64%
M/Juba 100 200 300 6% 7%
M/Shabelle 2,820 4,500 7,320 87% 50%
Deyr 2005/06 Total 14,360 28,020 42,380 34% 39%
Regions
Deyr 2005/06 Production in MT Deyr 2005/06 as
% of Deyr
2004/05
Deyr 2005/06 as
% of Deyr PWA

FSAU Technical Series Report No IV.8 14 Issued February 22, 2006
Sorghum is the main cereal crop grown, representing 82% of this seasons crop production, followed by maize at 18%.
The three districts that produce most of the cereals, Gebiley, Borama and Hargeisa, all had above normal (PWA)
production this season. Cereal production from Gebiley district alone produced most of this cereal production, roughly
66% of total Karan production, of which 59% of this is rainfed sorghum production. Borama and Hargeisa districts
were the other two largest cereal productions in the region with 20% and 11% of the total Karan cereal production
respectively. Although Karan cereal production benefi ts the northwestern region, it contributes only a small propor-
tion to the overall total domestic cereal production, (5-10% of total annual cereal in a normal year).
Maize Production
Deyr ’05/06 maize production in southern Somalia is
extremely low compared to the long term average – ap-
proximately 40% lower than normal. Estimated at 28,000
MT, Deyr ’05/06 maize production is only 59% of the Post
War Average maize production (Table 4). Roughly 75%,
of Deyr maize production comes from Shabelle Valley.
However, due to the severity of maize crop failures in
Hiran, Gedo and Bay regions, most of this season’s maize
production solely comes from Shabelle Valley (93%),
i.e. 77% from Lower Shabelle and 16% from Middle
Shabelle (Figure 4).
Generally, all rain-dependent maize crops failed this
Deyr season throughout the southern region. Rainfed
maize entered the development stage without enough
assimilates for grain fi lling due to continued moisture
stress throughout the season which further inhibited
maize crop development and yield. Only localised pro-
duction of maize crop in irrigated areas of Shabelle Valley
was productive. Furthermore, reports from fi eld have
confi rmed that long dry spells also negatively affected
irrigated maize crops in Shabelle Valley.
In many areas, farmers have opted to sell their maize
crops as fodder for livestock instead of grain. Poor and
ineffective irrigation infrastructure or inaccessibility
to irrigation facilities, especially in Lower Shabelle,
contributed further to low production. In addition, fuel
prices were also high and thus limited the use of pump
irrigation for many farmers. The signifi cant loss of maize
crops this season will negatively impact on the avail-
ability of and access to (through increase price) maize
over the coming year.
Sorghum Production
Sorghum is the second most important staple food in Somalia, yet this season’s sorghum production, estimated at
14,360 MT, is only 24% of PWA and 59% of Deyr ’04/05 production. Sorghum production is rain dependent, and
although more drought resistant than maize crop, was negatively affected by the delayed onset and extremely poor
performance of the Deyr ’05/06 rains. The area planted, estimated at 85,870 Ha, is 47% of the area planted during
Deyr ’04/05 and 38% 0f PWA.
dey
r p
rod
uct
ion
an
d n
ati
on
al
cere
al
ba
lan
ce
Map 7: Deyr 2005/06 production as compared to post war
average
Table 5: Gu-Karan Cereal Production Estimates in Northwest Somalia
Sorghum Maize Total Cereal
Awdal 3,451 1,553 5,004 109% 176%
Galbeed 16,797 2,970 19,767 181% 158%
Togdheer 864 80 944 60% 119%
Gu-Karan 2005 21,112 4,603 25,715 151% 159%
Regions
Gu-Karan 2005 Production in MT
Deyr 2005/06 as %
of Deyr 2004/05
Deyr 2005/06 as %
of Deyr PWA

FSAU Technical Series Report No IV.8 15 Issued February 22, 2006
Delayed rains led to poor germination in the fi rst planting, while short and erratic rains discouraged further planting
and reduced overall production. In addition, in some areas, including parts of Gedo, Bay and Bakol, civil insecurity
and tension further discouraged and/or prevented sorghum planting and production. The major contribution of this
season’s sorghum production came from Bay (46%), followed by Lower Shabelle (25%) and Middle Shabelle (20%)
region (Figure 5).
Annual Cereal Production (Gu ’05, plus
Deyr ’05/06)
Total annual cereal production for ’05/06, estimated at
roughly 144,000 MT, is only 50% of the PWA annual
cereal production and is the lowest annual cereal produc-
tion in more than ten years (Figure 6 and Table 4). Both
the Gu ’05 and the Deyr ’05/06 season cereal production
were extremely poor, with crop losses of more than half
the expected cereal production and the lowest produc-
tion in over a decade showing 44% and 39% of PWA
respectively (FSAU Technical Series Report No. IV. 7
2005 Post Gu Analysis). Annual domestic cereal produc-
tion, both maize and sorghum, is extremely low (Figure
7) and thus will negatively impact on the availability and pricing of cereals in the lead up to the next Gu ’06 season
harvest (August ‘06). Annual domestic sorghum production is the most severely affected, however, both sorghum
and maize are less than 40% of their PWA annual cereal production levels. Annual domestic sorghum production
is only 39% of its PWA levels (53,915 MT 2005/06 annual domestic sorghum production), while annual domestic
maize production is 59% of its PWA levels (90,115 MT 2005/06 annual domestic maize production) (Table 6).
Cereal Prices
Two consecutive seasons of below normal cereal pro-
duction is already resulting in increased cereal prices.
All cereal prices in southern Somalia have signifi cantly
increased since September and are expected to continue
to increase over the next four to fi ve months in the lead
up to the next Gu cereal harvest in July ’06 (Figure 8).
On average, sorghum prices throughout the Sorghum Belt
(Gedo, Bay, Bakol and Hiran) have reached their highest
levels in the last fi ve years and are now even higher than
maize prices in Shabelle (Figure 9). In the Sorghum
Belt, on average sorghum prices increased 54% since
gu
pro
du
ction
an
d n
atio
na
l cereal b
ala
nce
Bakol
2%
Bay
46%
Gedo
1%
Hiran
5%
Lower Juba
0%
Lower Shabelle
25%
Middle Juba
1%
Middle Shabelle
20%
Figure 8: Regional Contribution of Deyr 2005/06 Sor-
ghum Production
0
50,000
100,000
150,000
200,000
250,000
300,000
350,000
400,000
450,000
1995
/96
1996
/97
1997
/98
1998
/99
1999
/00
2000
/01
2001
/02
2002
/03
2003
/04
2004
/05
2005
/06
Deyr
Gu
Avg (1995-2005)
Figure 7: Annual Cereal Production (1995-2006)
Table 6: Total Annual Cereal Production Estimates for Somalia
Sorghum Maize Total Cereal % of 2004/05 % of PWA
Gu 2005 Total 18,445 54,410 72,855 58% 44%
Off-season production 0 3,080 3,080
Gu Karan - Northwest 21,110 4,605 25,715 151% 159%
Deyr 2005/06 14,360 28,020 42,380 34% 39%
Annual Prod (Deyr+Gu) 05/06 53,915 90,115 144,030 54% 50%
Lower Shabelle
77%
Middle Juba
1%
Middle Shabelle
16%
Bay
2%Gedo
2%Hiran
2%Lower Juba
0%
Bakol
0%
Figure 6: Regional Contribution of Deyr 2005/06 Maize
Prodution
Bakol
1%Bay
17%
Lower
Shabelle
59%
Middle
Shabelle
17%Middle Juba
1%
Gedo
2%
Lower Juba
0%
Hiran
3%
Figure 5: Regional Contribution of Cereal
Production Deyr 2005/06

FSAU Technical Series Report No IV.8 16 Issued February 22, 2006
dey
r p
rod
uct
ion
an
d n
ati
on
al
cere
al
ba
lan
ce
October. ’05 and although generally is a cheaper cereal
than maize, prices are now higher than maize prices in
Shabelle. Maize prices in Juba have also increased sharply
by 47% between Sept.‘05 and Jan.’05, and are now signifi -
cantly higher than maize prices in Shabelle – 56% higher.
Maize prices in Shabelle are also increasing, although
not as sharply as in other regions, prices increased 23%
since September.
Locally produced cereal prices are closely linked with
local cereal production and stock levels. In general, two
consecutive seasons of poor production has depleted
stocks and created shortages in market supply, which is
clearly refl ected in signifi cantly increased cereal prices,
especially sorghum prices. The bulk of the inadequate
Deyr ’05/’06 cereal production from southern Somalia is
expected to enter into the markets by the end of January
2006, however, due to signifi cantly limited production
cereal prices are not expected to decline. Prices are ex-
pected to continue to increase over the next four to fi ve
months until the next Gu cereal harvest in July. If Gu
‘06 rains are normal, then a short period of cereal price
decline is expected following this harvest. Otherwise, if
the Gu ‘06 production is poor, cereal prices will continue
to increase and will likely to be unaffordable even in the
major producing areas of southern Somalia.
Cereal Balance Sheet
Following the Gu ’05 agricultural season, FSAU estimated an annual cereal balance sheet for the 2005/06 market-
ing year (June ’05-May 2006). Domestic cereal supply within this initial projected cereal balance sheet was based
on actual post Gu ’05 crop production estimates and assumed a ‘normal’ or average Deyr ’05/06 crop production.
Cereal imports consisted of two components, commercial imports, estimated as a three year average of actual cereal
imports (2002-04), and food aid distributed, stocks, transit or pipeline, as per actual donor fi gures at that time. In
the initial projections, even with the very poor Gu cereal production outcome, the overall cereal balance sheet did
not indicate an overall shortfall.
In November 2005, in response to growing concern over the poor performance of the Deyr ’05 rains in southern
Somalia, FSAU updated the cereal balance sheet with a forecast modeling scenario. This cereal balance sheet, pub-
lished in FSAU Food Security and Nutrition Monthly Brief (November 2005), was revised to account for the high
likelihood of a poor Deyr ‘05’06 seasonal crop outcome. This forecast modeled two scenarios 1.) a below normal
Deyr ‘05/06 cereal production, estimated as 50% of the PWA and 2.) a very poor Deyr ‘05/’06 cereal production,
estimated at 30% of PWA.
In addition to the scenarios of Deyr ‘05/’06 seasonal
outcome, a scenario of a revised commercial cereal
imports estimate was added, considering that roughly
25% of commercial imports fl ow across the borders
into Ethiopia and Northern Kenya (Figure 10). It must
be noted, that informal cross border cereal fl ows, in both
directions, between Ethiopia and Kenya, do occur, but
are not recorded.
The best estimate of the balancing of the cross-border ce-
real fl ows, from key informants and local understanding,
is one calculated assuming roughly 90% of imports from
the southern ports of El Maan and Jazira ports, and 70%
of the imports from Berbera and Bossaso Ports remain
within Somalia. This calculation results in an overall
reduction in actual cereal imports of what is collected - equivalent to 75% cereal imports. These are only estimates,
but given the complete absence of actual monitoring data and records, are the best estimates.
Crop failure due to below normal Deyr rains in the South
0
10000
20000
30000
40000
50000
60000
Jun Jul Aug Sep Oct Nov Dec Jan Feb Mar Apr May
Cer
eal
Imp
ort
s (C
erea
l E
qu
iva
len
ts)
Average (2002 - 2004)
2005
Figure 10: Commercial Cereal Import Trends (2002 - 2005)
Figure 9: Regional Average Monthly Cereal Prices (US$)
0.00
0.10
0.20
0.30
0.40
0.50
0.60
Jan-
03
Jul-03
Jan-
04
Jul-04
Jan-
05
Jul-05
Jan-
06
Month
Pric
e p
er K
g (
US
$)
Juba Valley (Maize White) Shabelle Valley (Maize White)
NorthWest (Imported Rice) NorthEast (Imported Rice)
Sorghum Belt (Sorghum Red) Central (Imported Rice)

FSAU Technical Series Report No IV.8 17 Issued February 22, 2006
This Cereal Balance Sheet is now updated in Table 3 below, with actual Deyr ’05/06 crop production estimates, Gu/
Karan post harvest fi gures for the northwest, off season production in Juba, as well as more current information on
food aid imports. Given the importance of cereal imports, actual cereal imports to date were analysed in relation to
the three year average estimated fi gure used (2002-2004) in the cereal balance sheet. The analysis of current actual
cereal imports indicates that current trend and levels in cereal imports are similar to the estimated three year aver-
age (Figure 7). Actual current year cereal imports are roughly 19,000 MT lower than the three year average for the
current time period (June – December), a difference of less than 6% of total cereal imports (303,000 MT). Monthly
cereal imports do vary slightly from month to month between the three year average and current year, however, the
total amount imported in the fi rst six months (June-Dec) is comparable, i.e. the three year average shows 253,000
MT (Figure 10) and the current actual is 234,000MT. The three year average is, therefore, retained in the cereal
balance sheet as an estimated projection, but FSAU will closely monitor cereal imports for signifi cant changes in
the remaining six months of the marketing year.
Calculations and underlining assumptions of the Cereal Balance Sheet are fully referenced in the notes below table
7. In summary, the updated estimated annual Cereal Balance Sheet for 2005/06 indicates that in the most likely
scenario (assuming 75% Commercial Imports)
• there is an overall projected cereal supply shortfall of roughly 55,000 MT
• this assumes that food aid stocks, transit and pipeline, foodaid of only 71,000 MT, which is the actual level as
of end of December ‘05.
• estimates only refl ect overall market supply conditions – they do not take into account the severe food access
problems faced by people identifi ed in state of Humanitarian Emergency or Acute Food and Livelihood
Crisis – people who can not access cereal due to their lack of purchasing power, even if cereals are available
in the market.
The Cereal Balance Sheet only provides an overall indication and estimation at the macro-level cereal supply and
demand situation for the entire country, i.e. overall cereal availability in relation to overall per capita needs. It does
not account for regional differences or blockages in cereal supply and fl ows, nor does it address issues of food ac-
cess, nor vulnerability levels related to access problems.
CURRENT ESTIMATED
Updated with Actual Deyr & Gu-Karan Crop
Estimates
Annual Cereal Balance Sheet for Somalia
(June 2005 to May 2006)
100%
Commercial Imports
(‘000MT)
75% Commercial
Imports1
(‘000 MT)
DOMESTIC AVAILABILITY 168 168
Opening Stocks2 24 24
Domestic Cereal Supply 2004/05 Gu 20053
Gu-Karan 2005 Northwest4
Off-season Gu 20055
Deyr 20056
14473263
42
14473263
42
DOMESTIC UTILIZATION
Cereal Utilization Requirements7633 633
IMPORT REQUIREMENTS
Anticipated Commercial Imports8395 303
Food Aid Distributed936 36
ESTIMATED SURPLUS/DEFICIT –
CEREAL
-34 -126
Stocks, Transit or Pipeline1071 71
ESTIMATED SURPLUS/DEFICIT –
CEREAL
37 -55
Table 7: Ceral balance Sheet
1Anticipated commercial imports estimated as 70 percent of imports from Berbera and Bossaso ports, and 90 percent of imports from El Maan and Jazira ports. This caters
for imports assumed to be going into Ethiopia.2Estimated opening stock consists of food aid and commercial import stocks at ports to markets. As of May 29, 2005 WFP stock are 6,075MT, CARE 1,540MT and com-
mercial stocks are estimated at 16,000MT based on FAO/WFP Crop and Food Supply Assessment, Sept 9, 1999.32005 Gu Crop production estimates in Southern Somalia is 72,857MT (rounded to 73,000MT).4Gu-Karan 2005 crop production estimates for Northwest Somalia is 25,715MT (rounded to 26,000MT).5Off-season crop production estimates are 3,081MT (rounded to 3,000MT).62005 Deyr Crop production estimates in Southern Somalia is 42,379 MT (rounded to 42,000MT).7Total cereal utilization requirement composed of 585,000 MT food use, 3000MT feed use, seed losses which are 10 percent of the crop production and 24,000MT closing
stocks this is similar to opening stock. ‘Food use’ calculated based on assumption of total population of 7,309,266 (WHO 2004) and per capita cereal consumption of
80kg/year (1999 FAO/WFP Crop and Food Supply Assessment, September 9, 1999). Per capita cereal consumption in Somalia is lower than would be dictated by the
standard 2,100 kilocalorie per capita per day. The percentage of kilocalories from cereals needs further research. Feed use and seed losses based on estimates derived for
Cereal Supply/Demand Balance, 1999/2000, FAO/WFP Crop and Food Supply Assessment, September 9, 1999.8Anticipated commercial imports estimated as actual three year average cereal imports for 2002 to 2004, for Berbera, Bossaso, El-Ma’an and Jazira Ports. The three year
average is 394,877MT (rounded to 395,000), with 361,187MT in 2002, 482,912MT in 2003, and 340,533MT in 2004. Data are from Berbera and Bossaso Offi cial Port
Import Statistics and El-Ma’an and Jazira Port Figures collected by WFP. Estimated commercial imports consist of rice, wheat grain, wheat fl our, pasta and small amounts
of maize and sorghum. These are expressed in cereal equivalents with conversion factors of wheat fl our = 1.33, pasta=2.00 and rice= 1. 9From June 2005 to January 2006, WFP distributed 19,738MT of food in Somalia and CARE distributed 16,230MT of food in Somalia.10 As of 2nd February 2006, WFP reports 4,755MT in stock and 56,199MT in the pipeline. As of 31st January 2006, CARE had 8,237MT in stocks and 1,830MT in transit.
List of assumptions and calculations:
dey
r p
rod
uct
ion
an
d n
ati
on
al
cere
al
ba
lan
ce

FSAU Technical Series Report No IV.8 18 Issued February 22, 2006
3.3 IMPLICATIONS ON FOOD SECURITY FOLLOWING ETHIOPIA’S
SUSPENSION OF CROSS BORDER CEREAL FLOW/TRADE
Normally, a substantial proportion of local produced cereals (maize and sorghum) and
food aid consumed in Somaliland originates in Ethiopia, especially from Jijiga, Korre-
hey and Godey Zones. Due to the close proximity to Somaliland and short transporta-
tion distance, Ethiopia cereals are much cheaper than cereals from southern Somalia.
The majority of poor households in rural and urban areas of Somaliland who cannot
easily afford to purchase expensive imported cereal commodities (rice and wheat fl our),
therefore, consume the cheaper cereals that fl ow in from across the border.
The Ministry of Trade and Industry in Ethiopia recently suspended exports of grain
products (teff, maize, sorghum, and wheat) indefi nitely to neighboring countries (OCHA
Humanitarian Bulletin, February 6, 2006). The suspension is intended to stabilize
prices of local staple food in response to recent price increases in Ethiopia and fears
of undue pressure on consumers. However, although the suspension is mainly in-
tended for ‘formal’ grain exports, it will likely affect the informal cross border trade
between Somalia and Ethiopia hence staple food availability and prices in Somaliland
markets.
The biggest impact will fall on refugees who engage in trading and selling the wheat
grain, sorghum and maize to Hargeisa markets as a means to generate income. Conse-
quently, the overall volume of cereals imported into Somaliland will be reduced, thus
affecting income opportunities for refugees. If the suspension of cereal trade continues,
then, it is possible that consumers in Somaliland will face higher wheat grain, sorghum
and maize prices in the coming months. However, buffering this reduction in cross-
border cereal fl ow, at least in the short term, is the recent Karan sorghum and maize
bumper harvest in Somaliland (November 2005), which was 159% of PWA.

FSAU Technical Series Report No IV.8 19 Issued February 22, 2006
livesto
ck p
rod
uctio
n a
nd
exp
ort
3.4 LIVESTOCK PRODUCTION AND EXPORT
Livestock Production and Migration
The livestock sector is the mainstay of Somalia’s econo-
my. With the exception of camel, which are considered
drought tolerant, the livestock body condition, produc-
tion and reproduction throughout most of the South is
extremely poor (Table 8) and severely stressed due to
limited water and pasture. This is due to the compound-
ing effects of a poor Gu ’05 (April – June) and failed
Deyr ‘05/’06 (October-December) rains.
Cattle, the main livestock species in Gedo, Juba Valley
and parts of Bay and Bakool regions, are the hardest hit by
the prevailing drought and their survival over the coming
long dry season or Jilaal (January-April) is precarious at
best. Already there is widespread cattle death in Gedo -
the epicentre of the drought - and parts of Juba Valley due
to the lack of water, pasture and drought related diseases.
Recent fi eld assessment by different agencies confi rms
that 20-30% of the cattle have died in Gedo and parts of
Juba Valley due to lack of water, pasture and diseases. A
signifi cant number of shoats have also died in Gedo and
parts of Juba Valley and Bakool where drought conditions
are most severe. Preliminary projections are that upwards
to 80% of the cattle in Gedo could perish by April, before
the next rains are expected if conditions persist.
Throughout southern Somalia, there are no signifi cant livestock remaining in the traditional grazing areas as most
cattle and shoats (sheep and goats) are clustering around the rivers and desheks. Scarcity of water is the one most
critical problem affecting livestock in the hinterland. Livestock body conditions have weakened considerably and
many are unable to trek long distances. Most will likely remain in the riverine areas over the coming 2-3 months
despite the obvious risks of tse tse fl y related diseases such as trypanosomiasis. Concentration of livestock around
water points will likely increase the incidence/spread of the endemic diseases. It is, however, clear that due to
the prevailing economic hardships, it is unlikely that the majority of the households will not be able to treat their
animals. This suggests that cattle deaths may reach alarming levels in the coming months.
Table 8: Post Deyr 2005/06 water and pasture, livestock body condition and migration summary
Map 8: Livestock migration Post Deyr-2005/06
Region Water
availability
Pasture
condition
Body condition Migration pattern Trends in LS
holdings
Calving/kid
ding trends
Milk production and
trends
Gedo and Serious water shortage in the hinterland
Generally very poor
Cattle and shoats very poor; Camel below normal
Abnormal in- migration from Kenya; out migration to Juba Valley
Cattle and shoats decreasing; camel is normal.
Camel calving normal except in Gedo; cattle and shoats decrease
Camel milk below normal; cattle and shoats milk insignificant
Juba Valley Serious water shortage in the hinterland
Generally very poor
Cattle very poor; Camel and shoats normal
Abnormal in- migration from Kenya
Cattle decreasing; camel and shoats normal.
Camel and shoats calving normal; cattle decrease
Camel milk normal; cattle and shoats milk insignificant
Bay/Bakool Below normal Very poor Cattle and sheep below normal; goats and camel normal
Abnormal migration from Gedo and Ethiopia
Cattle and shoats are decreasing; camel calving increasing
Camel is normal; cattle and shoats decreasing
Camel milk normal; Cattle and goats scarce
Shabele
Valley
Shortage in the rainfed area
Poor in the hinterland
Camel and shoats normal; cattle very poor
In migration from Bay; high internal migration
Cattle decreasing; camel and shoats normal
Cattle below normal; camel and shoats normal
Cattle below normal; camel normal
Central Normal except pockets in Galgadud
Generally normal except Hiran
Normal Internal migration due to pockets of water shortages
Increasing for all species
Normal for all species
Camel milk normal; cattle and shoats below normal
Northeast Normal except in eastern Sanaag, Bari and, part of Nugaal region
Generally normal
Normal for all species; Shoats in Qandala and Alula are under stress
Limited in-migration from Eastern Sanaag to Nugal Valley
Increase for all species. Problem of pack animals still remains;
High kidding and calving rates for all species
Milk availability is normal except in Qandala and Alula
Northwest Normal but pockets of below normal
Good in most places
Largely normal Normal with but limited out migration to Nugal Valley
Increase for shoats
High for shoats and cattle
Below normal
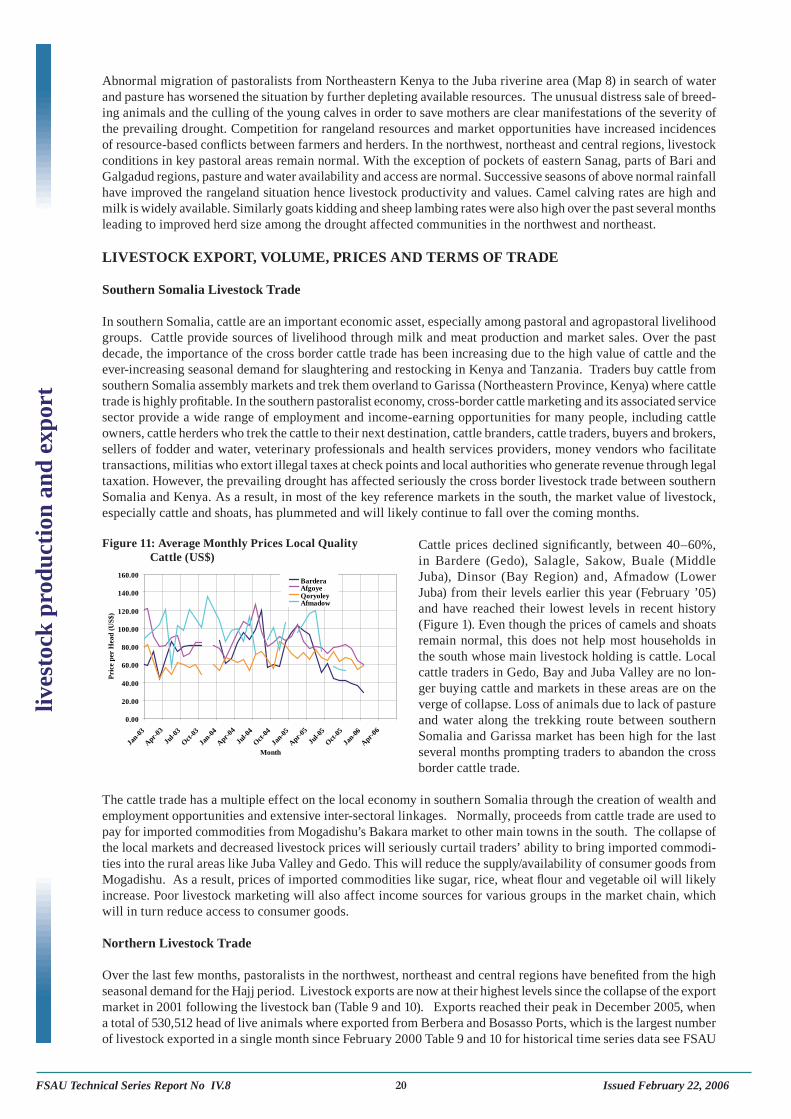
FSAU Technical Series Report No IV.8 20 Issued February 22, 2006
Abnormal migration of pastoralists from Northeastern Kenya to the Juba riverine area (Map 8) in search of water
and pasture has worsened the situation by further depleting available resources. The unusual distress sale of breed-
ing animals and the culling of the young calves in order to save mothers are clear manifestations of the severity of
the prevailing drought. Competition for rangeland resources and market opportunities have increased incidences
of resource-based confl icts between farmers and herders. In the northwest, northeast and central regions, livestock
conditions in key pastoral areas remain normal. With the exception of pockets of eastern Sanag, parts of Bari and
Galgadud regions, pasture and water availability and access are normal. Successive seasons of above normal rainfall
have improved the rangeland situation hence livestock productivity and values. Camel calving rates are high and
milk is widely available. Similarly goats kidding and sheep lambing rates were also high over the past several months
leading to improved herd size among the drought affected communities in the northwest and northeast.
LIVESTOCK EXPORT, VOLUME, PRICES AND TERMS OF TRADE
Southern Somalia Livestock Trade
In southern Somalia, cattle are an important economic asset, especially among pastoral and agropastoral livelihood
groups. Cattle provide sources of livelihood through milk and meat production and market sales. Over the past
decade, the importance of the cross border cattle trade has been increasing due to the high value of cattle and the
ever-increasing seasonal demand for slaughtering and restocking in Kenya and Tanzania. Traders buy cattle from
southern Somalia assembly markets and trek them overland to Garissa (Northeastern Province, Kenya) where cattle
trade is highly profi table. In the southern pastoralist economy, cross-border cattle marketing and its associated service
sector provide a wide range of employment and income-earning opportunities for many people, including cattle
owners, cattle herders who trek the cattle to their next destination, cattle branders, cattle traders, buyers and brokers,
sellers of fodder and water, veterinary professionals and health services providers, money vendors who facilitate
transactions, militias who extort illegal taxes at check points and local authorities who generate revenue through legal
taxation. However, the prevailing drought has affected seriously the cross border livestock trade between southern
Somalia and Kenya. As a result, in most of the key reference markets in the south, the market value of livestock,
especially cattle and shoats, has plummeted and will likely continue to fall over the coming months.
Cattle prices declined signifi cantly, between 40–60%,
in Bardere (Gedo), Salagle, Sakow, Buale (Middle
Juba), Dinsor (Bay Region) and, Afmadow (Lower
Juba) from their levels earlier this year (February ’05)
and have reached their lowest levels in recent history
(Figure 1). Even though the prices of camels and shoats
remain normal, this does not help most households in
the south whose main livestock holding is cattle. Local
cattle traders in Gedo, Bay and Juba Valley are no lon-
ger buying cattle and markets in these areas are on the
verge of collapse. Loss of animals due to lack of pasture
and water along the trekking route between southern
Somalia and Garissa market has been high for the last
several months prompting traders to abandon the cross
border cattle trade.
The cattle trade has a multiple effect on the local economy in southern Somalia through the creation of wealth and
employment opportunities and extensive inter-sectoral linkages. Normally, proceeds from cattle trade are used to
pay for imported commodities from Mogadishu’s Bakara market to other main towns in the south. The collapse of
the local markets and decreased livestock prices will seriously curtail traders’ ability to bring imported commodi-
ties into the rural areas like Juba Valley and Gedo. This will reduce the supply/availability of consumer goods from
Mogadishu. As a result, prices of imported commodities like sugar, rice, wheat fl our and vegetable oil will likely
increase. Poor livestock marketing will also affect income sources for various groups in the market chain, which
will in turn reduce access to consumer goods.
Northern Livestock Trade
Over the last few months, pastoralists in the northwest, northeast and central regions have benefi ted from the high
seasonal demand for the Hajj period. Livestock exports are now at their highest levels since the collapse of the export
market in 2001 following the livestock ban (Table 9 and 10). Exports reached their peak in December 2005, when
a total of 530,512 head of live animals where exported from Berbera and Bosasso Ports, which is the largest number
of livestock exported in a single month since February 2000 Table 9 and 10 for historical time series data see FSAU
Figure 11: Average Monthly Prices Local Quality
Cattle (US$)
0.00
20.00
40.00
60.00
80.00
100.00
120.00
140.00
160.00
Jan-0
3
Apr
-03
Jul-0
3
Oct
-03
Jan-0
4
Apr
-04
Jul-0
4
Oct
-04
Jan-0
5
Apr
-05
Jul-0
5
Oct
-05
Jan-0
6
Apr
-06
Month
Pri
ce p
er H
ead
(U
S$
)
BarderaAfgoyeQoryoleyAfmadow
liv
esto
ck p
rod
uct
ion
an
d e
xp
ort

FSAU Technical Series Report No IV.8 21 Issued February 22, 2006
livesto
ck p
rod
uctio
n a
nd
exp
ort
Market Update January 2006). Sheep and goat (shoats) exports continue to be the dominant species exported in the
north, constituting 91% of the livestock exports in December, followed by cattle at 6% and camels at 3%. Berbera
Port has begun to regain its share of exports in the north, exporting 45% of the total livestock exports in December.
The total number of livestock exported through Berbera and Bosasso Ports this year (January – December ’05) reached
1,023,795 heads, which is the largest annual export in the recent past (Figure 12). Although over 50% of the exported
animals through Berbera and Bossaso Ports are believed to have originated from Zone Five region of Ethiopia. The
supply of livestock to the market supply has improved
over the last year, due to improved rangeland situation
in the north and central regions and improved livestock
conditions. This was coupled with the increased demand
from export markets in the Gulf.
Export shoat prices increased sharply from September
in all markets in the north (Bosaso, Galkayo, Burao,
and Hargeisa), in the lead-up to the peak export period
in December (Figure 12). Export quality shoat prices in
Bossaso market increased the most, 30% from September
to December, reaching a level comparable to last year’s
peak export period. With the end of the 2005 Hajj period,
the seasonal export demand for livestock, especially
sheep and goats, will decrease and livestock prices are
expected to follow a normal downward trend.
In some areas, prices of local quality shoats have already
started to decline gradually by early January 2006.
Export of chilled meat is also fl ourishing. Informa-
tion from the fi eld confi rms that 6,000 heads of young
male-goat carcass meat was processed in Burao abat-
toir and exported to Arabian countries during January
’06. However, this is 25% less than last month’s fi gure.
This shows that with the conclusion of the Eidul Ad-ha
and Hajj festivals, demand from Gulf States started to
decrease substantially.
Prices of imported cereals (rice) in the northwest and
northeast, on the other hand, remained fairly stable for
the last few months – at around US$ 40/kg (Figure 9).
Terms of trade (livestock to cereal) in most markets,
therefore, improved during the lead-up to the peak export
period in direct response to improved livestock prices
(Figure 13).
0
500
1,000
1,500
2,000
2,500
3,000
3,500
4,000
1994 1995 1996 1997 1998 1999 2000 2001 2002 2003 2004 2005
Year
Vo
lum
e i
n T
ho
usa
nd
s.
Berbera
Bosasso
Average
Figure 12: Goats Exports from berbera and Bossaso Ports,
1994-2005
Table 9: Livestock Exports from Bossaso
January to December ’05
Month Shoats Cattle Camels
January 153,320 5,218 19
February 70,834 8,658 128
March 98,207 8,740 1,087
April 97,120 6,429 600
May 85,550 6,868 50
June 112,606 9,069 1,853
July 118,613 5,232 1,581
August 98,140 7,340 3,898
September 156,730 11,974 3,875
October 193,442 6,544 1,221
November 140,318 5,472 2,633
December 269,979 10,366 9,164
Total 1,594,859 91,910 26,109
Livestock Exports from Bossaso Jan -
Table 10: Livestock Exports from Berbera
January to December ’05
Month Shoats Cattle Camels
January 130,231 14,695 0
February 60,556 11,303 0
March 19,749 12,934 0
April 45,458 8,650 1,068
May 54,799 8,174 0
June 36,335 7,437 477
July 67,537 8,693 1,131
August 75,918 10,698 328
September 54,266 8,643 446
October 142,554 17,547 335
November 119,982 15,760 308
December 216,410 23,617 976
Total 1,023,795 148,151 5,069
Livestock Exports from Berbera
Improved body condition of shoats following good Deyr rains in the Northwest
Figure 13: Terms of Trade Imported Rice to Export
Quality Goat (2002 -2006)
0.00
20.00
40.00
60.00
80.00
100.00
120.00
140.00
Jan-0
2
Jul-0
2
Jan-0
3
Jul-0
3
Jan-0
4
Jul-0
4
Jan-0
5
Jul-0
5
Jan-0
6
Month
Kgs
of
Ric
e p
er 1
Hea
d E
xp
ort
Goat
Hargesia
Galkayo
Burao
Bossaso

FSAU Technical Series Report No IV.8 22 Issued February 22, 2006
In Burao, Hargeisa and Galkayo in September-October, one head of export quality goat was worth 50-60 kgs of
rice, but this has increased to around 70kgs of rice by December due to increased livestock prices. The largest im-
provement in terms of trade occurred in Bosasso, where one head of export quality goat had reached an exchange
of 100kg of rice by December 2005. Livestock export prices are beginning to decline as expected following the
end of the peak export season. Any decrease in prices of export quality animals without proportional decrease in
imported price will have an effect on purchasing power of the pastorals since terms of trade between livestock and
imported cereals will deteriorate.
3.5 RANGELAND CONDITION AND TRENDS
In Somalia, the pastoral tradition land ownership is based on clan settlement of grazing lands and owner-
ship of water rights (deegaan). Under the deegaan system, land is considered to belong to clans and their
subdivisions who usually confi ne their use of rangeland to their particular area.
In the past government policies on land tenure regarded rangelands as communal and open to all pastorals.
From 1978-1990 many projects engaged in rangeland management were implemented throughout the
country. These projects applied a rotational grazing system on rangelands. In order to reduce overgraz-
ing, parts of the pastoral lands were fenced and utilized only certain times of the year. These measures
enabled increased availability of grazing lands at different times of the year, contributed to the general
recovery of rangelands, and reduced the impact of droughts.
Since the collapse of the central government, however, there have been minimal range management projects.
This, combined with a dramatic increase in environmental degradation due to overgrazing, proliferation
of water points, increased human settlements and more importantly charcoal burning, have drastically
undermined rangeland recovery and accelerated deforestation (see article on charcoal in page xx).
The absence of government policies implemented by a central government has also reversed the situa-
tion to the traditional clan ownership and exclusiveness to rangelands. Similarly, the number of private
enclosures has increased thereby affecting the communal land use system and access. Hawd of Togder
and Hargeisa are some of the areas were the issue of private enclosures are a major problem. As a result,
incidences of resource based clan confl icts over rangelands and water has been increasing and reached
a climax during this drought. Some of the most recent confl icts include those in Haraale and, Gelin soor,
(Galgadud region), Hobyo(Mudug Region), Elwaq (Gedo Region) and many other places.
Impact of the current situation on rangland condition
Generally, grass species are the most affected as compared to browsing species due to low recession
capability, recurrent drought, poor rainfall, and disruption of traditional wet and dry season grazing pat-
terns. Seasonal and annual grasses are tending to be exhausted as a result of the recurrent and prolonged
droughts, which led to loss of seeds capacity to regenerate. North Gedo and, Sool Plateau are classical
examples where increasing trend of loss of grass species is evident to the detriment of livestock produc-
tion. Currently perennial grass, perennial forbs and acacia species are available for livestock feeding.
The most threatened grass species with high nutrient value include; sporobolus variegates, cenchcrus
ciliarus, chrysopogon aucheri, cynodon dactylon . These species are preferred by camel, sheep and cattle.
The main forbs that are declining into a lower trend include indigofera ruspolli, indigofera spinosa that
preferred by camel and shoats. Among the acacia species for browsing include: acacia millifera, acacia
bussei, acacia tortilis, acacia seyel, acacia misera, acacia Senegal,acacia socotrana. The acacia species
found in the rangeland had been in increasing trend with the exception of Acacia Bussei and acacia Et-
baica which are being depleted due to charcoal production. Sool Plateau, parts of Shabeele valley, Bay,
Bakool, Gedo and Juba valley experience serious depletion of acacia species due to rampant charcoal
production over the past several years.
Acacia species play an important role for livestock feeding as camels and goats rely a lot on browsing the
shoots and leaves. In the course of the dry seasons, the acacia species shed the leaves and pods which is
preferred by all species with exception of cattle.
Other saline plant species that are in depletion include; zygophyllum album, and salvadora persica. These
species, which are found near watershed zones and in the coastal belt, are very crucial for livestock feed-
ing since they maintain the metabolism of the herds.

FSAU Technical Series Report No IV.8 23 Issued February 22, 2006
3.6 MARKET ANALYSIS AND TRENDS
Somalia and Somaliland Exchange Rates
The exchange rate for both Somali and Somaliland
Shillings against the US Dollar remained fairly stable
throughout the year 2005 (Figure 14). The Somali
Shilling exchange rate was between 15,000-15,600
per US dollar in most of the major markets, while the
Somaliland Shilling rate ranged between 6,020-6,350
per US dollar.
Despite the stable exchange rate, both currencies are
still signifi cantly lower in value as compared to the
pre-livestock ban levels (in the year 2000). One of the
main factors which is contributing to the stability in
the exchange rates is the improvement of the livestock
export market in the Gulf States. Another factor is that
there was limited printing of money over the previous
several months.
Imported Commodity Prices and Trends
Major imported commodity prices like sugar, rice and
vegetable oil, remained fairly stable in most of the main
regional markets for the last eight months, with the ex-
ception of Juba Valley, the Sorghum Belt and Shabelle
Valley. However, the imported commodity prices are
generally 10-55% higher in inland markets of Juba Valley
(Gedo and Juba Region) and the Sorghum Belt (Gedo,
Bay, Bakool Region) which are away from the seaport.
0
5,000
10,000
15,000
20,000
25,000
Jan-9
8
Jul-9
8
Jan-9
9
Jul-9
9
Jan-0
0
Jul-0
0
Jan-0
1
Jul-0
1
Jan-0
2
Jul-0
2
Jan-0
3
Jul-0
3
Jan-0
4
Jul-0
4
Jan-0
5
Jul-0
5
Jan-0
6
Month
Pri
ce p
er U
nit
(S
OS
H)
PETROL 1 Liter
SUGAR 1 Kg
VEGETABLE OIL 1 Litre
RED RICE 1 Kg
SOMALI SHILLINGS PER DOLLAR
Figure 17: Sorghum Belt: Trend in Imported
Commodity Prices compared to Exchange Rate
0
5,000
10,000
15,000
20,000
25,000
Jan-9
8
Jul-9
8
Jan-9
9
Jul-9
9
Jan-0
0
Jul-0
0
Jan-0
1
Jul-0
1
Jan-0
2
Jul-0
2
Jan-0
3
Jul-0
3
Jan-0
4
Jul-0
4
Jan-0
5
Jul-0
5
Jan-0
6
Month
SO
SH
per
US
Doll
ar
0
1,000
2,000
3,000
4,000
5,000
6,000
7,000
8,000
9,000
SL
SH
per
US
Doll
ar
Baidoa - SOSH
Bossaso - SOSH
Galkayo - SOSH
Mogadishu - SOSH
Hargesia - SLSH
Figure 14: Monthly Exchange Rates - SOSH and
SLSH to USD
0
5,000
10,000
15,000
20,000
25,000
Jan-9
8
Jul-9
8
Jan-9
9
Jul-9
9
Jan-0
0
Jul-0
0
Jan-0
1
Jul-0
1
Jan-0
2
Jul-0
2
Jan-0
3
Jul-0
3
Jan-0
4
Jul-0
4
Jan-0
5
Jul-0
5
Jan-0
6
Month
Pri
ce p
er U
nit
(S
OS
H)
PETROL 1 LITER
SUGAR 1 Kg
VEGETABLE OIL 1 Litre
RED RICE 1 Kg
SOMALI SHILLINGS PER DOLLAR
Fugure 16: Shabelle Valley: Trend in Imported
Commodity Prices compared to Exchange Rate
0
5,000
10,000
15,000
20,000
25,000
Jan-9
8
Jul-9
8
Jan-9
9
Jul-9
9
Jan-0
0
Jul-0
0
Jan-0
1
Jul-0
1
Jan-0
2
Jul-0
2
Jan-0
3
Jul-0
3
Jan-0
4
Jul-0
4
Jan-0
5
Jul-0
5
Jan-0
6
Month
Pri
ce p
er U
nit
(S
OS
H)
PETROL 1 Litre
SUGAR 1 Kg
VEGETABLE OIL 1 Litre
RED RICE 1 Kg
SOMALI SHILLINGS PER DOLLAR
Figure 15: Juba Valley: Trend in Imported Commodity
Prices compared to Exchange Rate
For example, Juba Valley import commodity prices for
vegetable oil, sugar, rice and petrol in December 2005,
were between 20-55% higher than they are in Shabelle
Valley (Figure 15 and 16). The price of vegetable oil in
Juba Valley in December was around SoSh 17,600/litre,
but in Shabelle Valley it was only SoSh 11,300/litre or
55% higher. Import commodity prices in the Sorghum
Belt are also higher than Shabelle, but in December only
between 15-25% higher (Figure 17).
These higher price levels in the hinterland are due to a
combination of supply shortages, poor road infrastruc-
ture and high transportation costs associated with check
points and distortions. Although changes in the price of
imported commodities (rice, wheat fl our and sugar) usu-
ally refl ect changes in the exchange rate, it is striking that
the depreciation of the shilling exceeds price increases
(if any) of imported food items (Figure 15-17).
Demand for imported cereals (rice, wheat fl our and pasta)
will be high due to the very low domestic cereal produc-
tion for two consecutive seasons. However, it is not clear
whether traders will be able to respond and supply more
imported food items in the coming months ahead due to
off shore marine piracy off the coast of Somalia (Map
12). Accordingly, it is expected that import commodity
prices will likely increase over the coming months.
ma
rket a
na
lysis a
nd
trend
s

FSAU Technical Series Report No IV.8 24 Issued February 22, 2006
The following maps illustrate estimated levels of malnutrition in Somalia. Map 9 presents long term levels of global
acute malnutrition presented as weight for height <-2 Z score or oedema and shows consistent tendencies over the
past fi ve years. These past estimates indicate clear tendencies with some areas showing relatively low levels i.e.
< 10% W/H <-2 Z score or oedema and others consistently extremely high. In general, the lower rates are found
in areas with greater political stability, civil security and food and livelihood security whereas the higher rates are
typically seen in areas that have experienced civil unrest and/or food and livelihood insecurity. The high levels of
over 15% W/H <-2 Z score or oedema and even over 20% W/H <-2 Z score or oedema in Gedo represent levels that
are among the highest in the region.
Map 10 presents the current range estimates of malnutrition which indicate early signs of deterioration in Gedo,
Middle and Lower Juba and parts of Bay and Bakol. In many areas the numbers seeking treatment and care at
health facilities and therapeutic feeding centres are already increasing. The information that has allowed the de-
velopment of these maps and the estimation of ranges is derived from nutrition surveys, sentinel sites surveillance,
health facility data, rapid assessments and seasonal trends in dietary data. No single data set is used in isolation but
rather, triangulation is undertaken for an overall understanding of the nutrition situation in each area. The maps
are updated as new information becomes available.
In response to the continuing deterioration in food security and livelihoods, FSAU’s Nutrition Project has increased
the coverage with new surveillance sites throughout Southern Somalia. While a fi rst round of data collection has
already been completed in most sites, more useful trends data will become available in February and March 2006 as
second and third rounds of surveillance data are processed. Interagency nutrition surveys are currently in progress
in Rabdure and Wajid Districts and preliminary results of both will be available in early February.
3.7 NUTRITION OVERVIEW
nu
trit
ion
ov
erv
iew
Map 9: Somalia Malnutrition Long Term Levels
(1999-2005)
Map 10: Current Range Estimates of Malnutrition
January ‘06

FSAU Technical Series Report No IV.8 25 Issued February 22, 2006
3.8 CIVIL INSECURITY
There is a direct link between confl ict and food and livelihood security and this link is especially strong in the
context of a collapsed state which is characterised by chronic and widespread civil insecurity and political uncer-
tainity. FSAU began explicitly monitoring civil insecurity and its impact on food and livelihood security since
earlier this year both within seasonal analysis and monthly monitoring (FSAU Technical Series Report No. IV 7,
September 13, 2005 and FSAU Monthly Food Security and Nutrition Briefs).
The possibility of widespread reconciliation in southern and central Somalia cannot be ruled out, due to on-going
negotiations and reconciliations within the Transitional Federal Government (TFG). However, the recent agree-
ment over the location of the proposed parliamentary session resolves major divisions within the TFG. While
there have been improvements in some areas in the past few months’ tension and unresolved, often sporadic and
unrelated localised resource-based confl ict have intensifi ed in southern and central Somalia. Map 1 shows the
primary insecurity epicentres of concern as of January 2006. Of the fourteen insecurity epicentres identifi ed, 10
are located in southern Somalia and 6 are within the areas identifi ed in Humanitarian Emergency and Acute Food
and Livelihood Crisis. Civil insecurity will only further compound the problems of poor agricultural and livestock
production, as well as threaten or impede humanitarian access.
Areas in which the security situation has improved in the past few months include parts of Gedo region (although
the confl ict in El Wak, which straddles the Kenya Somalia border, has yet to reach a fi nal resolution), in El Berde
district in Bakol region, and in Habibayale and Rahole villages in Dinsor district of Bay region. Unfortunately,
in other areas, the security situation has deteriorated as new resource-based confl icts have erupted or intensifi ed
in the past few months. Tensions have continued in the villages of Idale in Qansah Dere district and in Tuger-
Hosle village in Dinsor district, both in Bay region. In Tieglow district (centred on the village of Sigle) fi ghting
subsided from December, but tensions remain as elders continue try to resolve disputes over control of charcoal
production resources.
Confl ict over rangeland resources in Bulo-burti district, and continuing tension over water and grazing resources in
the south of Brava district (Lower Shabelle region), also continue to cause concern. Renewed clan confl ict in south
Mudug, centred between Hobyo, Harar Dere and south Galkayo, is limiting access to the market in Galkayo for the
affected populations in Hobyo and is leading to displacement of people to Harar Dere. However, recent attempts by
TFG members to resolve the confl ict between the two clans fi ghting in this area are positive and encouraging.
Competition over natural resources is a key driver of
confl ict in Somalia, and given the current severity of the
Humanitarian Emergency in most of southern Somalia,
there is an increased risk for localised resource-based
confl ict in the lead up to the next Gu rains (April-June
’06). Limited pasture and water resources, combined
with poor agricultural production and rising cereal
prices, all contribute to heightened tension over the
control of limited resources. Clans and sub-clans from
within and between livelihood groups will increasingly
compete for access to and control of natural resources
out of sheer economic and survival necessity. As some
of the examples above illustrate, some of which have
been reported on over a period of several months, there
are serious and recurring clashes among and between
pastoral, agro-pastoral, and agricultural clan groups for
access to and control of land for animal grazing, charcoal
production, and of water points or sources.
In the worst affected Humanitarian Emergency areas of
Gedo and Juba Valley, limited water and poor rangeland
conditions have resulted in an increase in clashes between
cattle pastoralists and riverine agricultural communities
along the Juba river belt over access to grazing resources.
Weakened cattle, already at risk of tsetse fl y infection
(carrying trypanosomiasis), are reported to be grazing
in unfenced deshek (fl ood recession) and farm areas at
night, as the risk of infection is greatest during daylight.
civ
il i
nse
curi
ty
Map 11: Insecurity Hotspots for January 2006

FSAU Technical Series Report No IV.8 26 Issued February 22, 2006
In turn, fi eld reports indicate that riverine communities
are already adopting extreme counter measures, such as
burning available grazing (in one example, an estimated
500 hectares of grassland) in an effort to deter further
in-migration of cattle (See Photo). Large concentrations
of cattle are rapidly depleting available resources and
leading to further competition within pastoral groups
for ever decreasing resources. It is expected that as the
impacts of the droughts intensify, the risk of resource-
based confl ict of this nature will increase. The scenario
of pastoralists crossing the Juba River into grazing areas
south of Brava is a real possibility.
In resource poor environments, humanitarian assistance also is a potential source of increased tension and confl ict,
especially if it is insuffi cient to meet all the needs of the population or if it is perceived to be benefi ting some groups
while excluding others. In January 2006 the written security threat against the humanitarian community over allega-
tions of the unbalanced allocation of resources led to the immediate suspension of fl ights and access to Garbaharey
and Luuq districts of Gedo. This incident highlights not only the implications for humanitarian response but also
the fragility of humanitarian access to areas that require sustained humanitarian presence.
Marine piracy, 35 reported incidents during 2005 alone, continues to affect the importation of commercial goods,
including food, and the shipment of humanitarian relief supplies (Map 2). Humanitarian agencies are now forced to
make alternative arrangements requiring shipment overland and through Kenya. Incidents that restrict access for
the humanitarian community can only compound existing humanitarian problems as logistical constraints further
hinder the delivery of much needed resources into areas classifi ed as Humanitarian Emergency or Acute Food and
Livelihood Crisis.
While it can be expected that the impacts of the drought will deepen over the coming few months of the Jilaal
season, the timing, location and multiple impacts of confl ict are far less predictable. However, given the context
of already strained cereal supply and access within Southern Somalia and in the cross border areas of Ethiopia and
Kenya, any localised confl ict or increase in roadblock activity that restricts the transportation of cereals on strategi-
cally important roads (for example, from Mogadishu to Bur Hakaba/Baidoa or through Dinsor, through El Wak, or
through Garissa to Lower Juba) will have serious implications for cereal availability, price and access in the worst
affected areas of southern Somalia. Security on the roads in Lower and Middle Juba and from Sablale to Dinsor
is already problematic, with high numbers of roadblocks and banditry reported. Efforts at confl ict prevention and
reconciliation to improve humanitarian access should, therefore, be a priority.
civil in
security
Rangelands on fi re in Buale
Map 12: Somalia - Sea Piracy and Armed Robbery
January-Decemeber ’05
Source: ICC International Maritime Bureau (2006)
Piracy and Armed Robbery Against Ships Annual
Report, January - 31 December 2005. London

FSAU Technical Series Report No IV.8 27 Issued February 22, 2006
3.9 CHARCOAL PRODUCTION—UNDERMINING SOMALI LIVELIHOODS FOR
YEARS TO COME
Cargo ships fi lled with charcoal routinely depart Somalia’s main ports headed for the Arab Peninsula,
South Asia, and other destinations. While meeting the insatiable demand for fuel wood and incense burn-
ing in foreign states, this illicit trade has direct negative effects on the very basis of the Somali economy
and cultural identity.
By denuding the long-growing hard wood species of Somalia’s rangelands (in particular the Acacia busia),
the massive charcoal trade leads to a number of severe environmental consequences including: loss of
forage for livestock, loss of water retention in soils, unfavorable changes in micro-climates, increased
sheet and gulley erosion, and loss of woodlands for a number of important forest products. Given that
Somalia’s domestic economic activity is dominated by livestock production, and the Somali cultural core
is oriented around the pastoral way of life, this unabated destruction is tantamount to a direct and long
term assault on the Somali people, and must be stopped.
But who’s doing it? Who benefi ts? Who loses? Because this is an illicit trade, it is diffi cult to record
the volume and details of the chain of production. A number of studies, supported by direct observation,
confi rm the massive scale of charcoal production and the widespread impacts on rangelands throughout
Northern, Central, and Southern regions. The business is so lucrative that cartels have formed to ensure
the production, transport, and marketing to foreign states, in addition to domestic consumption. Further,
the charcoal trade can be directly linked to several on-going confl icts causing loss of life and property
to ordinary Somalis. Owing to the collapse of the Somali State over 15 years ago, there is a vacuum of
formal and informal resource management institutions that in the past had aggressively banned large scale
charcoal production. Last year a Somaliland Ministry of Pastoralism study detailed how the big winners
are the traders, not local people themselves. Further, the minimal money earned from charcoal produc-
tion locally is mostly not spent on investment or social needs of households—rather, it is perceived as
consumable income and mostly spent on khat and other unnecessary items.
So, while charcoal cartels profi t handsomely, and foreigners eat nice tasting food cooked with Somalia’s
trees and enjoy exotic aromas, the Somali people are left with a desertifi ed landscape—one with minimal
economic potential and a tragic contrast to the proud pastoral cultural identity of Somali people.
With every crisis there is an opportunity. Declining resistance to drought is directly linked to rangeland
degradation. The drought in Northern Regions a couple years ago was successfully used by NGOs like
PENHA, Horn Relief, Candlelight, and others, along with authorities in Somaliland (e.g., NERAD) and
Puntland (e.g., HADMA) to bring attention to the charcoal tragedy in the North and to initiate a number
of mitigating programmes. The current Humanitarian Emergency in the Southern Regions is also an op-
portunity to highlight the charcoal tragedy there.
What can be done? First and foremost, the charcoal tragedy must be stopped by Somali people them-
selves—members of civil society, community leaders, religious leaders and the like must join hands to
resist the trade locally. As well, the Transitional Federal Government and authorities in Somaliland regions
should assert leadership in this Somali-wide crisis, make clear policy statements, and take action against
the cartels. The international community and local development actors should make this a central theme
to all assistance programmes—through direct programming such as reforestation, alternative livelihoods,
alternative/improved energy sources, soil erosion and other projects; but also indirectly by using every
opportunity to link other assistance programmes to heightening community awareness and empowering
local actors to resist the trade. In the international arena, the importation of illicit charcoal by foreign states
should cease through international treatises endorsed by the United Nations Security Council.
The Somali charcoal tragedy is not a peripheral environmental issue, but is undermining the foundation
of Somali economic development and, sadly, over time it promises to undermine the very core of Somali
cultural identity.

FSAU Technical Series Report No IV.8 28 Issued February 22, 2006
4.1 SOUTHERN SOMALIA
4.1.1 Gedo Region
Overview
Gedo region is the epicenter of the ongoing Humanitarian Emergency which
affects the wider Somali livelihood system including the cross border areas in
northeastern Kenya and Ethiopia (Figure 2). Within Somalia, Gedo is the region
affected the most by the current ongoing drought and is identifi ed in a phase of
Humanitarian Emergency with a moderate risk of turning into a Famine or
Humanitarian Catastrophe before the next Gu rains (mid-April) (Map 14). An
estimated 260,000 people or roughly 70% of the entire Gedo region population
are either in a state of Humanitarian Emergency or Acute Food and Livelihood
Crisis (180,000 and 80,000 people respectively) (Table 11A). Roughly 60% of this
population is only recently affected by this current crisis, while 40% of the popu-
lation (from Belet Hawa, Dolow and western part of Luq) is suffering worsening
conditions from a previous sustained phase (more than 3 years) of Humanitarian
Emergency and Acute Food and Livelihood Crisis (FSAU Technical Series No.
IV 7 and IV 3, Feb. 28, 2004 and Sept 13, 2005 respectively). An estimated 92% of
all agro-pastoralists or 63,300 people are either in a state of either Humanitarian
Emergency or Acute Food and Livelihood Crisis. The largest livelihood popula-
tion affected are pastoralists, estimated at 172,000 people (72% of pastoralists) are
either in a Humanitarian Emergency or Acute Food and Livelihood Crisis (Table
11B). An estimated 26,000 riverine agriculturalists are
also affected (78% of the riverine agriculturalists).
The immediate key cause of the current crisis is the
year long drought, however, it is important to note that
the severity of its impact is due to compounding effect
of multiple shocks over a number of years, including in-
creased and recurrent confl ict, population displacement
and migration fl uxes, successive years of below normal
rainfall and drought conditions, and restricted movement
and market options, which has undermined the overall
resilience and livelihoods of the population and led to a
state of chronic ‘structural vulnerability’ (FSAU, Focus:
Gedo A Complex Emergency, February 2002). The
region suffered three successive years of below normal
rains (1999 -2002) that negatively affected the ability
of both pastoralists and agro-pastoralists to maintain
their livelihood asset bases. Although in the following
two years (2003 and 2004), the region received good
rains, clan-based confl ict restricted seasonal grazing patterns limiting the overall recovery process. This confl ict
negatively affected cross border trade and livestock and population movements which further increased the vulner-
ability of the Gedo pastoralists. The consistent infl ux of people and livestock over the last few years has lead to an
4. REGIONAL ANALYSIS
Map 14: Food Security Phase Classifi cation - Gedo
FSAU
NOTES:
1. Estimated populations do not include IDP or Urban
estimates, and are
rounded to the nearest 10,000
2. For category explanations see http://www.fsausomali.org
Phase Classifi cation
Alert
Moderate Risk
High Risk
Sustained Phase 2 or 3 for > 3 yrs
Areas with IDP Concentrations
Phase Classifi cation
Early Warning Levels for worsening Phase
5 Generally Food Secure
4 Chronically Food Insecure
3 Acute Food and Livelihood Crisis
2 Humanitarian Emergency
1 Famine/Humanitarian Catastrophe
Table 11A: Estimated Population by District in Humanitarian Emergency (HE) and Acute Food and
Livelihood Crisis (AFLC), inclusive of the High Risk Groups in Gedo
See Appendix 5.2.2 for Footnotes
Acute Food and
Livelihood Crisis
(AFLC)2
Humanitarian
Emergency
(HE)2
Total in AFLC or HE
as % of Region
Population
Gedo
Bardera 76,850 18,000 32,000 65
Belet Xaawo 58,035 11,000 32,000 74
Ceel Waaq 52,150 15,000 11,000 50
Dolow 39,050 7,000 25,000 82
Garbahaarey 76,075 15,000 48,000 83
Luuq 73,120 15,000 32,000 64
SUB-TOTAL 375,280 81,000 180,000 70
Affected Regions and
Districts
Estimated
Population of
Affected Districts 1
Assessed and Contingency Population in AFLC and HE
Map 13: Gedo Valley
Livelihood Systems
LIVELIHOOD SYSTEMSPASTORALISTSAGRO-PASTORALISTSRIVERINE
sou
ther
n s
om
ali
a

FSAU Technical Series Report No IV.8 29 Issued February 22, 2006
sou
ther
n s
om
ali
a
overcrowded, politically divided territory, fragmentation of administration and widespread insecurity. These events, in
turn have led to increased pressure on already degraded rangelands, undermining coping mechanisms, and an overall
crisis in production and trade. The impact of this year’s drought and its regional cross-border nature has pushed a large
proportion of the population beyond their limits of coping - with devastating effects in terms of collapsed livelihoods,
loss of livelihood assets, excessively high and increasing malnutrition rates and crude mortality rates.
Effects on livelihood Assets
Natural capital: Deyr ’05 rains started late, were erratic, poorly distributed and signifi cantly below normal. South
Gedo received 0-10% of normal rainfall for the season. The impact of this rain failure is compounded by preceding
Gu ’05 rains which were also signifi cantly below normal, leading community elders to conclude that the region is
facing the worst drought in living memory. Almost all water catchments are dry and the river water levels are below
normal. The water quality of most shallow wells is extremely poor and unfi t for both human and livestock consump-
tion. There are unconfi rmed cases of children who have died after consuming contaminated water from wells, as well
as many reports of livestock deaths caused by diarrhea after the consumption of contaminated water. Large popula-
tions are concentrating around the few remaining water points that still have water, while many people have already
migrated out of the area. There has been an unusual and large human migration to riverine areas within Gedo, as well
as to parts of Juba, and Bay/Bakool. Many rural villages in Bardera, Burdubo, Garba Harey and El Wak districts, are
currently completely abandoned, as whole households have left their homes in search of water and pasture.
Pasture, both grazing and browse, in the rangelands is completely depleted, due primarily to two consecutive seasons
of below normal rains and increased infl ux of livestock. A few areas in Bardera received patchy and light rains, but
pasture was overgrazed due to huge in-migration from all directions including from northeastern Kenya. Due to the
drought, whole plants, branches, leaves and pods from trees, like acacia, were cut and collected to feed livestock.
Extensive and increased exploitation of rangelands, particularly fi re-wood collection and charcoal production as a
distress coping strategy is leading to an increased rate of deforestation and land degradation (see articles on range-
land condition and charcoal production pages 22 and 27 respectively. Increased supply of fi rewood and charcoal is
leading to large market price declines in these commodities, i.e. the price of charcoal decreased by almost 40% this
year, from SoSh 40,000/50 kg in February ’05 to SoSh 25,000/50kg .
Physical Capital: Many villages in the region are currently faced with acute scarcity of water as several boreholes are
broken and nonfunctional, while operational boreholes are overworked due to the very high and heavy concentration
of livestock around them. River banks along the Juba River are eroded and destroyed due to the huge livestock and
human in-migration to riverine areas. Gedo’s transport and communication infrastructure are among the poorest in
the country as they have never been consistently developed and lack routine maintenances. Climatic extremes, both
drought and fl ooding, have contributed to the deteriorating road network. Poor transport infrastructure, road networks,
and civil insecurity have negatively affected staple food supply and market prices.
Social Capital: Due to the prolonged drought conditions social support systems, such as gifts, remittance, and other
systems of support (i.e. irmansi, xologoyo, shaxad), are over-stretched. Local kinship support is generally in the form
of in-kind transfers of gifts, such as livestock and milk. However, given the widespread nature of the drought, (in
terms of geographic spread, as well as also populations affected) and the resulting overall poor livestock conditions,
high livestock mortality rates and limited availability of livestock products, there is very little means for providing
social kinship support from within the community.
Human Capital: Current malnutrition levels in Gedo region are the highest malnutrition rates observed throughout the
country - levels which by international standards are exceedingly high and unacceptable. Current malnutrition levels
Table 11B: Estimated Population by Livelihood Zone in Humanitarian Emergency (HE) and Acute
Food and Livelihood Crisis (AFLC), inclusive of the High Risk Groups in Gedo
Acute Food and
Livelihood Crisis
(AFLC)2
Humanitarian
Emergency
(HE)2
Total in AFLC or HE
as % of Region
Population
Gedo
Southern Agro-Pastoral 45,343 2,000 41,000 95
Bay-Bakool Agro-Pastoral 23,055 4,000 16,000 87
Southern Inland Pastoral 111,441 38,000 28,000 59
Dawa Pastoral 125,016 31,000 75,000 85
Juba Pump Irrigated River 33,145 6,000 20,000 78
SUB-TOTAL 81,000 180,000
Affected Regions and
Livelihood Zones
Estimated Population
of Affected Livelihood
Zones 1
Assessed and Contingency Population in AFLC and HE
See Appendix 5.2.3 for Footnotes

FSAU Technical Series Report No IV.8 30 Issued February 22, 2006
sou
ther
n s
om
ali
a
in Belet Hawa and Luq district are > 25% and are the highest rates in the entire country (Map 10). In Dolo, El Wak
and Garba Harey districts, malnutrition rates are at 20-24.9% (weight-for-height <-2 SD). This region is chronically
faced with very high malnutrition rates generally, but there is very clear evidence that the situation is deteriorating
even further. Admission rates to therapeutic feeding centers in Belet Hawa, have steadily and continuously increased
since June ’05 and took a dramatic jump in November ’05 (Figure 20). Similarly, school attendance remains low due
mainly to the inability to pay the fees and that children are required to support household activities.
Financial Capital: The purchasing power of the majority of population remains low and is compounded by the ef-
fects of increased civil insecurity, failed Gu ’05 and Deyr ’05/06 crop productions, very low livestock selling prices,
and increased commodity and cereal prices. Access to loans and credit is limited, diffi cult to obtain or unavailable
due mainly to insecurity and non-repayment of debt by the poor and middle wealth groups. The northern districts of
the region are known for their high unemployment and dependence on humanitarian assistance.
Effect on Livelihood Strategies
Pastoralists in this region, both Dawa Pastoralists and Southern Inland Pastoralists, normally rely on purchases as
their main source of food (40-60%), supplemented with own production of milk and meat and dairy productions from
their livestock. Most of the income of pastoralists, if not all for the middle and better-off households, comes from
milk and dairy sales, followed by livestock sales. Poor pastoralists, supplement this income with small amounts of
employment in herding or sales of bush products, such as resins.
Agro-pastoralists, however, rely primarily on own production of cereal to cover the bulk of their food needs (50-
65%), supplemented by food purchases (35-45%), and milk and livestock products (5-10%). Most agro-pastoralists,
under normal conditions, rely primarily on livestock and livestock sales as the main source of income (55-75%), but
supplement this income with crop sales (10-20%) and remittances (15-25%). The poor agro-pastoralists have smaller
livestock holdings, therefore have a much smaller share of income (10-20%) derived from livestock and livestock
product sales. They supplement their income with self-employment (collection and sale of bush products such as
honey and dik-dik sales) and employment (agricultural labor, portaging, herding) (see FSAU Baseline Profi les).
Food Sources: Agro-pastoralists in the region face acute food access problems, attributed mainly to two consecu-
tive seasons of cereal crop failure. Deyr ’05/06 sorghum production failed completely and is the lowest production
in more than a decade (Figure 18). This season Deyr cereal production was only 6% compared to Deyr ’04 and 14%
compared to PWA Deyr (Table 4). The last seasonal production, Gu ’05, was also a complete crop failure and the
lowest Gu production in more than a decade. The combination of a failed Gu ’05, followed by a failed Deyr ‘05/’06
translates into an overall 2005/06 annual cereal production for Gedo which is less than 2,000 MT - the lowest cereal
production outcome since the collapse of the state (Figure 19). Although, two successive seasons of rain failure is
the primary reason for this, irrigated farms, which are not as adversely affected by poor rainfall, also had limited
production due to Juba River fl ooding during the Gu ’05. The fl ooding not only destroyed crops during the Gu ’05,
it also destroyed productive assets, such as irritation pumps and canals, which have not since been replaced, which
in turn negatively impacted Deyr ‘05/06 production potential.
In terms of cereal purchases, buyers are facing signifi cantly increased market prices. Sorghum prices in Bardere town
increased 142% in the last year between February ’05 and January ’05 (Figure 20). The sharpest and most dramatic
increase in cereal prices occurred when it became clear that the Deyr ‘05/’06 rains would again fail, sorghum prices
increased 54% in only 3 months (November ’05 to January ’06). Food access for pastoralists is also severely con-
strained, as their primary source of food, milk, meat and dairy, is extremely limited and below normal because of
the overall poor body conditions of all species. Cattle are the hardest hit by the drought, with an estimated 20-30%
Figure 18: Deyr Maize and Sorghum Production in Gedo
(1995/06 - 2005/06)
0
2,000
4,000
6,000
8,000
10,000
12,000
14,000
16,000
1995
/96
1996
/97
1997
/98
1998
/99
1999
/00
2000
/01
2001
/02
2002
/03
2003
/04
2004
/05
2005
/06
MT
Maize
Sorghum
Average Deyr
Figure 19: Annual Cereal Production in Gedo
(1995-2005/06)
0
5,000
10,000
15,000
20,000
25,000
30,000
1995
/96
1996
/97
1997
/98
1998
/99
1999
/00
2000
/01
2001
/02
2002
/03
2003
/04
2004
/05
2005
/06
Year
MT
Gu
Deyr
Avg (1995 - 2004)

FSAU Technical Series Report No IV.8 31 Issued February 22, 2006
of cattle that have already died. It is estimated that cattle
mortality could reach up to 80% before the next Gu rains
(mid-April - June ‘06). There are also reports of very
high abortion rates in cattle, as pastoralists abort new
born calves in a desperate effort to save breeding cows.
Strategic ‘culling’ of cattle, as well as mercy killing of
weakened animals has also been reported. Camels, the
more drought resistant livestock, are also negatively af-
fected. It is roughly estimated that around 60-70% of
the camels have out-migrated to Lower and Middle Juba
regions, while the camels that are still within the region,
notably pack camels and females, are weak. Culling rates
of camels is also reported to be high. Sheep and goats are
also in a weakened state and reproduction is below normal
as they did not conceive during the last Gu season.
Income sources: All primary sources of income, i.e. crop
sales and livestock sales and livestock product sales, for
agro-pastoralists, pastoralists and riverine are severely
constrained and reduced. The failure of both the Gu ’05
and Deyr ‘05/’06 crops, translates directly into an almost
complete loss of income from crop sales for riverine and
agro-pastoralists. For pastoralists and agro-pastoralists,
income from livestock production is also severely reduced
due to weak livestock body conditions and the absence of
livestock products. Milk and livestock products are lim-
ited or are simply not available for sale. Livestock body
conditions are very poor and livestock prices have plum-
meted over the past year. The price of local quality cattle
in Bardhere, for example, fell from SoSh 1,500,000/head
in February ’05 to a low price of only SoSh 400,000/head
by January ’06, a price fall of more than 73%.
Terms of trade of livestock (local goat and cattle) to cereal (sorghum) declined signifi cantly from earlier this year
(2005) due to the compounding effect of both falling livestock prices and increasing cereal prices. Terms of trade has
declined so dramatically that now one head of cattle can be traded for an amount of cereal that is even less than could
be traded for a shoat at the start of 2005. For example, in February ’05 in Bardere, one local goat could be traded for
around 222kg of sorghum, but by January ‘06 it only traded for 51kgs – a decline of more than 75%. Terms of trade
for cattle is even worse, in February one local cattle could be traded for 1,500kg of sorghum, but by January ’06 it
only be traded for 171kgs – an amount less than for a local quality goat in Feb. ’05 (a decline of more than 88%).
Employment opportunities are equally stressed due to the cumulative affects of the drought, with limited opportuni-
ties available and lower wage rates. The unskilled labour rate has fallen from SoSh 31,400 per day to as low as SoSh
12,000 per day, a more than three-fold drop. In Bardere in Feb. ’05, one could secure 25kgs of sorghum from one
day of wages, but by January ’06 one day’s wages, if one could fi nd employment, would earn 5 kgs of sorghum – a
decline in terms of trade of more than 80%.
Expenditure: Households in all livelihood groups are faced with rising household expenditures as they are forced
to cover more of their food needs through purchases, at the same time that market prices, for both local and imported
commodities, are increasing. In addition to cereal price increases, import commodity prices of petrol, vegetable oil,
sugar and rice have also increased in Gedo and throughout the Sorghum Belt as a whole.
Coping Strategies
Distress coping strategies are being adopted throughout the region by agro-pastoralists, pastoralists and agriculturalists
alike, as people try to survive the hardships arising from the drought. Households are fi lling the shortfall in their food
access by adopting rationing strategies namely, reduction of number of meals and quantity per day, and switching to
low quality food items. There is also a large out-migration to main towns and riverine areas seeking kinship support
from relatives and labour opportunities. Whole families are migrating out of the region and entire villages are being
abandoned. Families are splitting, as stronger family members are out migrating long distances with livestock in
search of pasture and water to save their herds. The collection of bush products and exploitation of natural resources
is intensifying, including fi rewood collection, charcoal and construction materials.
Figure 20: Sorghum Prices (US$) in Bay, Bakol, Hiran
and Gedo Regions
0.00
0.10
0.20
0.30
0.40
Jan-9
8
Jul-9
8
Jan-9
9
Jul-9
9
Jan-0
0
Jul-0
0
Jan-0
1
Jul-0
1
Jan-0
2
Jul-0
2
Jan-0
3
Jul-0
3
Jan-0
4
Jul-0
4
Jan-0
5
Jul-0
5
Jan-0
6
Month/Year
Pri
ce p
er K
g (
US
$)
Belet WeyneBarderaLuuqXudurBaidoa
sou
thern
som
alia
Cattle body condition deteriorating in Gedo

FSAU Technical Series Report No IV.8 32 Issued February 22, 2006
sou
ther
n s
om
ali
a
Nutrition Situation
Over the past fi ve years of monitoring, malnutrition
levels in Northern Gedo have consistently remained
among the worst in Somalia. The nutrition situation has
deteriorated further with the worsening food insecurity
in the past months. For example, between October ’05
and November’05, there was signifi cant increase in ad-
missions of Somali children recorded in the Belet Hawa
and Mandera (Kenya) Therapeutic Feeding Centres
(Figure 21). Severe water shortage is experienced by the
communities, with exception of the riverine population
and an increase in related disease has been noted in the
clinics. High malnutrition levels of children and women
are also reported in sentinel sites and clinics. Dietary
diversity is limited to two or three food groups and there
is severe milk scarcity following the high livestock mor-
tality, weakened body conditions and migration of livestock towards the Juba valley, in search of pastures and water.
Insecurity in Northern Gedo has infl uenced humanitarian operations and the prices of imported food commodities
have been high and unaffordable to many, due to levies of militia along the main trade links between Mogadishu and
Northern Gedo.
Figure 21: Belet Hawa TFC Monthly Admissions
0
10
20
30
40
50
60
70
80
90
100
Dec
04
Jan0
5
Feb
05
Mar
ch05
Apri
l05
May
05
June
05
July
05
Aug0
5
Sept
05
Oct
05
Nov
05
No
. o
f ca
ses

FSAU Technical Series Report No IV.8 33 Issued February 22, 2006
4.1.2 Lower and Middle Juba
Overview
Middle and Lower Juba regions are two of the most affected regions in the current
humanitarian crisis facing southern Somalia. An estimated 345,000 people or 60%
of the entire population in Middle and Lower Juba are identifi ed in a state of either
Humanitarian Emergency or Acute Food and Livelihood Crisis and are in need
of immediate humanitarian assistance (Table 12A and Map 16). Of this number of
people in need of assistance, it is estimated that 235,000 people (68%) are facing
conditions of Humanitarian Emergency, while another 110,000 people are in a
state of Acute Food and Livelihood Crisis. This current crisis is not confi ned to one
specifi c population. All livelihood systems are facing crisis, including riverine com-
munities, agro-pastoralists and pastoralists (Table 12B). In Lower Juba an estimated
47,000 agro-pastoralists, 32,000 pastoralists, and 37,000 riverine agriculturalists are
either facing conditions of Acute Food and Livelihood Crisis or Humanitarian
Emergency. In Middle Juba an estimated 45,000 agro-pastoralists, 8,000 pastoral-
ists, and 66,000 riverine agriculturalists are either facing conditions of Acute Food
and Livelihood Crisis or Humanitarian Emergency.
The food security situation of the riverine communities in Juba Valley is especially
precarious, as this population was already classifi ed in a state of Sustained Phase
of (more than 3 years) Humanitarian Emergency – a
sustained phase classifi cation for more than 3 years. In
addition, following the Gu ’05 there was a marked dete-
rioration in the severity of the situation and most of the
population was classifi ed as in a state of Humanitarian
Emergency (85% of total riverine population), while the
remaining population was identifi ed in state of Acute
Food and Livelihood Crisis (FSAU Technical Series
Report No IV. 7, 13 September, 2005).
It must be emphasised that both Middle and Lower Region
are also hosting a large number of people from northeast-
ern Kenya and Gedo, who have migrated into the area and
have settled around strategic boreholes and water points
along the Juba River. Table 12A only indicates resident
populations, not the increase in population due to recent
migrations.
The ongoing drought - both the failure of the Gu ’05 and
Deyr ’05/06 rains - remains the principal immediate cause
of the current crises. Access to food and income is signifi cantly and severely stressed, as all the primary sources of
food and income - crop production, livestock production, and market employment and purchases - are signifi cantly
Map 16: Food Security Phase Classifi cation - Juba
FSAU
NOTES:
1. Estimated populations do not include IDP or Urban
estimates, and are
rounded to the nearest 10,000
2. For category explanations see http://www.fsausomali.org
Phase Classifi cation
Alert
Moderate Risk
High Risk
Sustained Phase 2 or 3 for > 3 yrs
Areas with IDP Concentrations
Phase Classifi cation
Early Warning Levels for worsening Phase
5 Generally Food Secure
4 Chronically Food Insecure
3 Acute Food and Livelihood Crisis
2 Humanitarian Emergency
1 Famine/Humanitarian Catastrophe
Map 15: Juba Valley Livelihood
Systems
JUBA VALLEY
LIVELIHOOD SYSTEMSPASTORALISTSAGRO-PASTORALISTSRIVERINE
Table 12A: Estimated Population by District in Humanitarian Emergency (HE) and Acute Food and
Livelihood Crisis (AFLC), inclusive of the High Risk Groups in Juba Valley
Acute Food and
Livelihood Crisis
(AFLC)2
Humanitarian
Emergency
(HE)2
Total in AFLC or HE
as % of Region
Population
Lower Juba
Afmadow 100,075 23,000 46,000 69
Badhadhe 41,695 16,000 16,000 77
Jamame 100,625 9,000 42,000 51
Kismayo 86,845 13,000 12,000 29
SUB-TOTAL 329,240 61,000 116,000 54
Middle Juba
Buale 46,520 10,000 28,000 82
Jilib 109,820 19,000 53,000 66
Sakow 87,935 20,000 38,000 66
SUB-TOTAL 244,275 49,000 119,000 69
Affected Regions and
Districts
Estimated
Population of
Affected Districts 1
Assessed and Contingency Population in AFLC and HE
See Appendix 5.2.2 for Footnotes
sou
thern
som
alia

FSAU Technical Series Report No IV.8 34 Issued February 22, 2006
stressed and reduced. Annual cereal production for the region was a complete failure (the worst since the collapse of
the state) and follows the lowest two years of annual production in the last decade. Cereal supplies are limited and
cereal prices are high and continually increasing (47% in last four months). Livestock body conditions are very poor
and livestock products are not available or very limited. Livestock prices have plummeted 40-60% since earlier this
year. Livestock mortality is high and increasing (currently estimated at 20-30%). Purchasing power as measured by
terms of trade is dramatically reduced (60-75% decline since September ’05). Competition for rangeland resources
and market opportunities have increased incidences of resource based confl icts. Malnutrition rates and crude mortality
are extremely high, above internationally acceptable levels and are still increasing. This deepening crisis is alarming
and necessitates immediate humanitarian assistance.
Effect on Livelihood Assets
Natural Capital: The pastoral hinterland areas in Lower and Middle Juba are faced with extreme water pasture
shortages. Most rainfall water catchments are completely dry for the fi rst time in many years due to the compounding
impact of poor Gu ’05 rains, followed by poor Deyr’05/06 rains. Rains that did fall during the Deyr 2005/06 rains
were very localised and fell within a 2-5 day period, thus ineffective for pasture regeneration and replenishment of
water catchments. Field ground ‘truthing’ confi rms that satellite imagery overstates (refl ecting primarily cloud cover)
the overall Deyr rainfall outcome in the region.
Most range areas are completely bare due to the compounding impact of several seasons of erratic and below nor-
mal rainfall, rampant deforestation for charcoal production and export, and overgrazing due to high concentration
of livestock (See Rangeland condition, page xx). Throughout the Juba region charcoal production and export trade
to Gulf countries is booming and is leading to large scale deforestation and environmental degradation. Increased
production of charcoal and resulting high supply is already leading to signifi cant charcoal price declines. The price
of a 50kg bag of charcoal declined from SoSh 45,000 in December ’05 to only SoSh 25,000 in January ’06, a drop
of more than 44%. The consequence of environmental degradation will impact negatively and severely on the
long-term food and livelihood security of the entire population of the Juba region (See Charcoal Production, page
27).
Physical Capital: Boreholes are critical for watering livestock, especially given that most rainfed water catchments are
dry. Currently, over half (52%) of these strategic boreholes are not functioning at all, while those that are functioning
are working overcapacity, 24 hours a day, serving large concentrations of livestock that have come from as far away
as Gedo and northeastern Kenya (Map 17). Boreholes which are currently functioning are also concentrated within
a single ‘strip’ area and are close in proximity, which is leading to a large concentration of animals within a confi ned
area and overgrazing of pasture. Functioning boreholes will soon breakdown, given the high use, if not serviced.
Most of the region is diffi cult to access as infrastructure and road networks, especially west of the Juba River, are
extremely poor. Road networks are limited or nonexistent, thus the area is increasingly isolated and faced with high
Table 12B: Estimated Population by Livelihood Zone in Humanitarian Emergency (HE) and Acute
Food and Livelihood Crisis (AFLC), inclusive of the High Risk Groups in Juba Valley
Acute Food and
Livelihood Crisis
(AFLC)2
Humanitarian
Emergency
(HE)2
Total in AFLC or HE
as % of Region
Population
Lower Juba
Southern Agro-Pastoral 25,019 8,000 16,000 96
Lower Juba Agro-Pastoral 70,434 26,000 31,000 81
Southern Inland Pastoral 60,496 7,000 12,000 31
South-East Pastoral 46,968 17,000 20,000 79
Southern Juba Riverine 43,903 3,000 37,000 91
Southern Coastal Pastoral 25,156 0 0 0
SUB-TOTAL 61,000 116,000
Middle Juba
Southern Agro-Pastoral 62,183 19,000 39,000 93
Lower Juba AgroPastoral 10,982 3,000 6,000 82
Southern Inland Pastoral 30,895 3,000 8,000 36
South-East Pastoral 20,706 12,000 0 58
Southern Juba Riverine 67,188 5,000 57,000 92
Juba Pump Irrigated River 26,381 7,000 9,000 61
Southern Coastal Pastoral 13,728 0 0 0
SUB-TOTAL 49,000 119,000
Affected Regions and
Livelihood Zones
Estimated Population
of Affected Livelihood
Zones 1
Assessed and Contingency Population in AFLC and HE
See Appendix 5.2.3 for Footnotes
sou
ther
n s
om
ali
a

FSAU Technical Series Report No IV.8 35 Issued February 22, 2006
sou
thern
som
alia
transportation costs within the region and between other
regions. Further compounding this situation is that the
damage infl icted to feeder roads and other infrastructure
by fl oods in May and June ’05 have not been repaired,
thus infrastructure conditions are worsened and rapidly
deteriorating. Increased inaccessibility to the region, is
leading to higher transportation costs, unreliable market
supplies, and higher cereal and imported commodity
prices (Figure 13). Equally as important is that inac-
cessibility results in the inadequate access to essential
public services, such as veterinary care, health clinics
and schools.
Social Capital: Agro-pastoralists and pastoralists in Hu-
manitarian Emergency have limited access to support
in terms of remittances and traditional social networks.
Urban dwellers and the better off households, generally,
are the people who have access to remittances, while it
is the poorer and middle agro-pastoralist and pastoralist
households from the hinterland which are most severely
affected by the current crisis.
Traditional mechanisms of social support and sharing,
such as zakat (religious obligation paid annually) and
irmaansi (borrowing of milking cows), are also over-
stretched and reduced due to the cumulative affects of
drought, crop failure, increased costs for livestock (water-
ing, fodder, and veterinary drugs) and livestock losses.
Riverine communities have even less access to social support. These communities of Bantu ethnicity normally have
weak social links outside their community and in general are socially marginalised, with no clan affi liation of their own
for support during periods of hardship. The Sustained Phase (more than three years) of Humanitarian Emergency
for this population, combined now with another crop failure, further limits access to social support or sharing. Even
worse, the additional infl ux of people and livestock into the riverine area due to the drought is increasing tensions
and creating confl icts over already overstretched resources. Farmers are even resorting to extreme measures, such
as burning their fi elds in order to prevent in-migrating livestock from settling and grazing on their land.
Human Capital: Global acute malnutrition rates among
riverine communities remain high (GAM 20 -24.9%) and
are signifi cantly above long term trends of (Map 9 and
10). The nutrition situation beyond the riverine area is
also deteriorating, with global acute malnutrition rates
in agro-pastoral areas of Afmadow between 20-24.9%
(January ’06). The number of severely malnourished
children is also increasing.
Mareeray TFC, one of the few TFC clinics in the region,
is recording increased admissions of severely malnour-
ished children coming from riverine communities, as well
as from pastoral and agro-pastoral communities from
Afmadow and Hagar. The rapidly deteriorating nutrition
situation is attributed to inadequate dietary intake and
diversity (a maize based diet is mainly consumed) and high incidence of disease (measles and respiratory infections).
Food consumption problems are attributed to household food insecurity, to the high incidence of disease (such as
measles and acute respiratory illnesses), and to poor access to curative and preventive (e.g. vaccination) health services
facilities (see Nutrition Section below).
Financial Capital: Demand for credit and loans have increased due to crop failure, lack of labour opportunities, and
increasing market prices. Access to credit and loans, however, is severely strained and limited. In Juba Valley, the
cumulative impact of consecutive seasons of poor crop production (Gu ’05 and Deyr’05/06) have increased levels of
indebtedness and limited access to further credit.
Map 17 Strategic boreholes, wells & watering points in
Juba Valley
Source: FEWSNET
High rates of malnutrition in children in Hager

FSAU Technical Series Report No IV.8 36 Issued February 22, 2006
sou
ther
n s
om
ali
a
Effects on Livelihood Strategies
There are three main livelihood systems in Lower and Middle Juba region, riverine (pure agriculturalists-maize and
sorghum), agro-pastoralists (cattle and rainfed or recessional sorghum) and pastoral (either cattle with sheep/goats or
camels with sheep/goats) – all of which are affected by the current drought and Humanitarian Emergency. In a normal
situation, the main source of food for the riverine and agro-pastoralist is own crop production (50-60 %), which is
supplemented with market purchase, i.e. cereal, sugar, oil, milk (35-45%). Pastoralists, however, are primarily depen-
dent on market purchases as their main source of food (60-75%), followed by own livestock products (25-35%).
The two main sources of cash income for the resource-poor riverine community is fi rst employment/self-employment
(60%), followed by crop sales (35%). For middle riverine wealth groups, however, crop sales account for the largest
share of cash income (80%), followed by employment/self-employment. Poor agro-pastoralists, given their low crop
production and livestock holdings, obtain cash income from a number of sources, with employment/self-employment
the largest source (35-55%), followed by livestock and livestock product sales (20-30%), and crop sales (5-15%).
Middle wealth group agro-pastoralists, on the other hand rely primarily on livestock and livestock product sales (55-
75%), followed by cereal sales (10-20%) and remittances (15-25%). Pastoralists, irrespective of whether they are
poor or middle wealth groups, rely primarily on livestock and livestock product sales (65-85%), supplemented by
either petty trade or employment (FSAU Baseline Profi les).
Food Source: Agro-pastoralists, pastoralists and riverine communities access to food is signifi cantly and severely
stressed, as all primary food sources – cereal crops, market purchases, and livestock products - are signifi cantly reduced
and negatively affected. Deyr 2005/06 crop production in both Lower and Middle Juba was a complete failure, at
1% and 7% of Deyr PWA respectively (Table 4 and Figure 22).
Not only is this season’s crop production a complete failure, the previous Gu ’05 crop production also failed, result-
ing in the worst annual crop production the region has had since the collapse of the state (Figure 23). The high off
season fl ood recessional crop production (October ’05), though an important short-term outcome and boost to the
region, did not compensate for the huge crop losses of the main 2005/06 Gu and Deyr seasons. Worse yet, this year’s
failed crop production directly follows two years of the lowest annual cereal production in the last decade, thus the
compounding effect on overall food stocks and food access (Figure 23).
There is very little livestock production (meat, milk and
ghee) available for consumption, due to extremely poor
livestock body conditions. The Deyr season is generally
the calving production period for cattle, however, due
to the severity of the drought pastoralists are inducing
still births and slaughtering newborns to save breeding
animals, thus further reducing the availability of milk and
ghee production. Cereal market prices are high and have
dramatically increased since earlier this year. Maize prices
have increased sharply by 47% between September ’05
and January ’06, and are now signifi cantly higher than
maize prices in Shabelle - 56% higher (Figure 9).
Income Sources: Access to income is also severely and
signifi cantly reduced for agro-pastoralists, pastoralists and
riverine communities, as the primary means of livelihoods
Figure 22: Deyr Cereal Production in Middle and Lower
Juba (1995 - 2005/06)
0
2000
4000
6000
8000
10000
12000
1995/
96
1996/
97
1997/
98
1998/
99
1999/
00
2000/
01
2001/
02
2002/
03
2003/
04
2004/
05
2005/
06
MT
maize
sorghum
Average Deyr
Figure 23: Annual Cereal Production in Middle and
Lower Juba (1995 - 2005/06)
0
5000
10000
15000
20000
25000
30000
35000
40000
45000
1995
/96
1996
/97
1997
/98
1998
/99
1999
/00
2000
/01
2001
/02
2002
/03
2003
/04
2004
/05
2005
/06
Year
MT
Deyr
Gu
Avg (1995 - 2004)
Carcasses of animals dying because of the drought in Juba Valley

FSAU Technical Series Report No IV.8 37 Issued February 22, 2006
and earning income – crop sales, livestock and livestock product sales, and employment are all negatively impacted by the
ongoing drought. The Deyr ‘05/’06 crop failure, combined with the Gu ’05 crop failure translates directly into lost income
from crop sales for riverine agriculturalists and agro-pastoralists.
Income from livestock sales is also severely reduced and compromised. Livestock body conditions are extremely poor and
livestock are dying due to extremely poor pasture and water conditions. It is already estimated that 20-30% the cattle in
region have died and projections are that up to 80% could die before the end of the long dry Jilaal (mid-April). Although
cattle are the most susceptible to drought and are the fi rst to die, other livestock species have also started dying, i.e. donkey
and sheep. In response to poor livestock body conditions and reduced demand, cattle prices have plummeted throughout the
region – by more than 50% in the past few months (Figure 11). Local goat prices are also signifi cantly reduced and falling.
For example, in Afmadow goat prices have fallen from SoSh 219,200/head in May ’05 to SoSh 102,000/head in January
’06 - a drop of more than 53%, while in Doblei the price fell from SoSh 250,000/head to 110,000/head, a drop of more than
52%. Income from employment and self-employment is also reduced. During the Deyr ‘05/’06 season there were few farm
labour opportunities, such as weeding and harvesting, due to very poor rainfall and crop failure. Self-employment, such as
charcoal production and bush product sales, is also limited or unprofi table due either to increased transportation costs and/or
low market prices caused by low demand and high market supply as many people are engaged in these activities.
Purchasing power, as measured by the amount of cereals one can
buy by selling a local quality goat or by earning a day’s wage
(terms of trade), is severely and signifi cantly reduced. Rising
cereal prices combined with falling livestock prices and daily
wage rates has led to the lowest terms of trade in more than a
decade (Figure 24). In January ’06, selling one local quality
goat can buy only one quarter of the amount of cereals of what
it could only fi ve months ago, a 73% decline in terms of trade
since September ’05. The money earned from selling one goat
can only buy 27kg of maize now as opposed to roughly 100kgs
in September ‘05. Terms of trade between cereals and daily
wage labour is also signifi cantly reduced by almost 60% since
September ’05.
Expenditures: The complete failure of cereal crops, combined
with the limited availability of livestock products means that most people are now reliant on market purchases for food.
However, cereal prices are high and increasing, while income is falling. Import commodity prices (rice, sugar, vegetable
oil) are also increasing – between 15-42% in the last year (Figure 15). Staple food prices are expected to continue to increase
through the Jilaal season. The overall effect is that people must spend more money, thus expenditures are increasing. For
many of the poor, options for spending more are limited; therefore distress coping strategies are adopted.
Coping Strategies
Field assessments confi rm that for most people in this region, normal coping mechanisms are now exhausted, and people
are engaging in a number of distress coping strategies. Distress consumption coping strategies include increased wild food
consumption, reducing non-staple food purchases, reducing number of meals per day, reducing the quantity of food intake
and skipping whole days without food. There is also abnormal migration and population movements taking place, such as
whole families migrating from their villages and a general rural exodus to urban centres, riverine areas and water points.
Pastoralists and agro-pastoralists are engaging in a number of distressed coping strategies including, inducing still births in
livestock to save breeding animals, exposing animals to tsetse fl y infested areas and conducting ‘compassion slaughtering’
of weak animals.
Nutrition Situation
High levels of malnutrition have been recorded in many sites
in the fi rst round of data collection at surveillance sites in both
Middle and Lower Juba (Figure 25). The Marere supplementary
and therapeutic feeding programmes run by MSF Holland report
increasing number of admissions. About 60% of the admissions
manifest bilateral oedema, which indicates a worrying and seri-
ous nutritional problem. For the fi rst time, some of the TFC
benefi ciaries come from the pastoral community of Afmadow
and Hagar districts – a clear indication that the nutrition situation
is serious and deteriorating among pastoralist communities. Sig-
nifi cant increasing trends of malnutrition have been recorded in
Jamame, Bualle and Jilb MCH centres. Increased incidences of
communicable disease, such as measles and respiratory infection
have been reported.
Figure 25: Proportion of malnourished children in Juba
Valley sentinel sites
05
101520253035404550
Nyir
ey12/0
5
Bu
lom
am
o12/0
5
Ban
derja
did
12/0
5
Male
nd
e12/0
5
Hargeis
ayare12/0
5
Bil
isa12/0
5
Bu
lota
ag12/0
5
Mu
barak
12/0
5
Bard
ereyare12/0
5
Keyto
y12/0
5
Hil
osh
id12/0
5
Dan
wad
aag12/0
5
Qala
wil
e12/0
5
Hagar12/0
5
Jamame Jilib Afmadow Hagar
% m
aln
ou
ris
hed
Figure 24: Terms of Trade in Juba Valley - Sorghum to
Local Goat and Labour (1995-2006)
0.00
50.00
100.00
150.00
200.00
250.00
300.00
350.00
Jan-9
8
Jul-9
8
Jan-9
9
Jul-9
9
Jan-0
0
Jul-0
0
Jan-0
1
Jul-0
1
Jan-0
2
Jul-0
2
Jan-0
3
Jul-0
3
Jan-0
4
Jul-0
4
Jan-0
5
Jul-0
5
Jan-0
6
Month/Year
Kgs
of
Maiz
e p
er 1
Hea
d L
oca
l G
oat
0.00
5.00
10.00
15.00
20.00
25.00
30.00
35.00
Kgs
of
Maiz
e p
er D
ail
y L
ab
ou
r W
age
Maize (kg) per Local Goat (head)
Maize (kg) per Labour Wage (daily)
sou
thern
som
alia

FSAU Technical Series Report No IV.8 38 Issued February 22, 2006
sou
ther
n s
om
ali
a
4.1.3 Sorghum Belt – Bay, Bakol and Hiran
Overview
The food security situation in Bay and Bakol regions was reported in December ’05
to be deteriorating. Pastoralists and agro-pastoralists in the two regions were reported
to be facing a critical food security situation and remained at high risk of Acute
Food and Livelihood Crisis (FSAU January 2006 Monthly Brief). The predictions
proved accurate, and an estimated 105,000 people in Bakol and another 396,000 in
Bay region are identifi ed to be in a state of Humanitarian Emergency.
In addition, 47,000 people in Bakol and 133,000 people in Bay region are facing an
Acute Food and Livelihood Crisis. The Bay-Bakol Agro-Pastoral livelihood zone
is hardest hit with 240,000 people in Humanitarian Emergency and further 60,000
in Acute Food and Livelihood Crisis, followed by the Southern Agro-Pastorals with
130,000 people in HE and 60,000 in AFLC. In the Southern Agro-Pastoral liveli-
hood zone of Bakol region, 86,000 people are considered to be in Humanitarian
Emergency and a further 41,000 people in Acute Food and Livelihood Crisis (see
Map 19 and Table 13A and 13B).
Very poor Gu 2005 production and below normal rainfall
(between 0% and 10% in most areas) leading to Deyr
’05/06 crop production failure, compounded by continu-
ing and increased civil insecurity, has resulted in deterio-
rating livestock conditions, an increase in cereal prices
and reduced and declining purchasing power (labour to
sorghum) and terms of trade.
Consequently, pastoralists and agro-pastoralists are en-
gaging in a variety of extreme coping strategies including
abnormal out-migration in search of water and pasture,
killing of calves to save breeding stock, skinning weak
animals for their skins, sale of breeding females, and risk-
ing their livestock in tsetse fl y infested grazing areas.
In addition, migration to Lower and Middle Shabelle and
large urban centres in the northeast (including Galkayo,
Burtinle, Goldogob and Bosasso) in search of social sup-
port and employment is increasing and putting additional strain on urban infrastructure and support mechanisms in
these areas. Malnutrition rates in these areas are high and above the usual range observed (usual range is 15% -19.9%
GAM) (See Map 9 and 10).
Map 19: Food Security Phase Classifi cation Bay,
Bakol and Hiran
FSAU
NOTES:
1. Estimated populations do not include IDP or Urban estimates, and are
rounded to the nearest 10,000
2. For category explanations see http://www.fsausomali.org
Phase Classifi cation
Alert
Moderate Risk
High Risk
Sustained Phase 2 or 3 for > 3 yrs
Areas with IDP Concentrations
Phase Classifi cation
Early Warning Levels for worsening Phase
5 Generally Food Secure
4 Chronically Food Insecure
3 Acute Food and Livelihood Crisis
2 Humanitarian Emergency
1 Famine/Humanitarian Catastrophe
SORGHUM BELT
LIVELIHOOD SYSTEMSPASTORALISTSAGRO-PASTORALISTSRIVERINE
Map 18: Sorghum Belt
Livelihood Systems
Table 13A: Estimated Population by District in Humanitarian Emergency (HE) and Acute Food and
Livelihood Crisis (AFLC), inclusive of the High Risk Groups in Bay Bakol
See Appendix 5.2.2 for Footnotes
Acute Food and
Livelihood Crisis
(AFLC) 2
Humanitarian
Emergency
(HE) 2
Total in AFLC or HE
as % of Region
Population
Bakol
El Barde 42,350 4,000 9,000 31
Hudur 55,000 13,000 26,000 71
Rabdure 33,580 8,000 19,000 80
Tieglo 57,525 12,000 30,000 73
Wajid 36,995 10,000 21,000 84
SUB-TOTAL 225,450 47,000 105,000 67
Bay
Baidoa 303,104 58,000 182,000 79
Burhakaba 135,330 26,000 79,000 78
Dinsor 106,802 24,000 64,000 82
Q/dheere 110,450 25,000 71,000 87
SUB-TOTAL 655,686 133,000 396,000 81
Affected Regions and
Districts
Estimated
Population of
Affected Districts 1
Assessed and Contingency Population in AFLC and HE

FSAU Technical Series Report No IV.8 39 Issued February 22, 2006
An estimated 54,000 Riverine and agropastoral livelihood zones in Hiran region are in an Early Warning Level of
Alert, with High Risk of deteriorating to Acute Food and Livelihood Crisis of which 48,000 are Southern Agro-
pastoral and 6,000 Hiran Riverine (See Table 14A and 14B). Pastoral areas are in a state of Early Warning Level
of Alert (see Figure 25). Gu’ 05 and Deyr’05/06 season cereal production in Hiran was only 3% and 16% of PWA
respectively and is attributed to inadequate rainfall (40% of normal) in rain-fed production areas as well as high in-
festations of crop pests (such as stem borers and aphids). Livestock body condition is poor and anticipated to worsen
as the Jilaal progresses. Currently, there is no problem of water availability for agropastoral and reverine zones due
to the presence of permanent water sources (river and shallow wells).
The riverine community will remain susceptible to cyclical fl oods due to the continuing deterioration of river and
irrigation infrastructure (further damaged during the Gu ’05 fl ood). However, income from fodder sales and employ-
ment in urban centres partially offsets the loss of income from crop sales. The regional civil security situation is
generally calm, with the exception of localized clan clashes and tensions related to the TFG divisions in the region.
Malnutrition rates in Hiran are still within the usual range (15-19.9% in Beletweine district and 10-14.9% in Jalalaqsi
and Bulo-burti districts).
Acute Food and
Livelihood Crisis
(AFLC) 2
Humanitarian
Emergency
(HE) 2
Total in AFLC or HE
as % of Region
Population
Bakol
Southern Agro-Pastoral 137,679 41,000 86,000 92
Bay-Bakool Agro-Pastoral 14,863 2,000 10,000 81
Southern Inland Pastoral 72,909 4,000 9,000 18
SUB-TOTAL 47,000 105,000
Bay
Southern Agro-Past 207,190 60,000 130,000 92
Bay-Bakool Agro-Pastoral 343,560 60,000 240,000 87
Southern Inland Pastoral 46,429 3,000 5,000 17
South-East Pastoral 36,586 10,000 21,000 85
SUB-TOTAL 133,000 396,000
Affected Regions and
Livelihood Zones
Estimated Population
of Affected Livelihood
Zones 1
Assessed and Contingency Population in AFLC and HE
Table 13B: Estimated Population by Livelihood Zone in Humanitarian Emergency (HE) and Acute
Food and Livelihood Crisis (AFLC), inclusive of the High Risk Groups in Bay Bakol
See Appendix 5.2.3 for Footnotes
sou
thern
som
alia
Acute Food and
Livelihood Crisis
(AFLC)2
Humanitarian
Emergency
(HE)2
Total in AFLC or HE
as % of Region
Population
Hiran
Southern Agro-Pastoral 136,760 48,000 0 35
Hiran Riverine 32,441 6,000 0 18
Southern Inland Pastoral 57,768 0 0 0
Ciid Pastoral 32,630 0 0 0
SUB-TOTAL 54,000 0
Affected Regions and
Livelihood Zones
Estimated Population
of Affected Livelihood
Zones 1
Assessed and Contingency Population in AFLC and HE
Table 14A: Estimated Population by District in Humanitarian Emergency (HE) and Acute Food and
Livelihood Crisis (AFLC), inclusive of the High Risk Groups in Hiran
See Appendix 5.2.2 for Footnotes
Acute Food and
Livelihood Crisis
(AFLC)2
Humanitarian
Emergency
(HE)2
Total in AFLC or HE
as % of Region
Population
Hiran
Belet Weyne 163,150 31,000 0 19
Bulo Burti 87,060 18,000 0 21
Jalalaqsi 30,670 5,000 0 16
SUB-TOTAL 280,880 54,000 0 19
Affected Regions and
Districts
Estimated
Population of
Affected Districts 1
Assessed and Contingency Population in AFLC and HE
Table 14b: Estimated Population by Livelihood Zone in Humanitarian Emergency (HE) and Acute
Food and Livelihood Crisis (AFLC), inclusive of the High Risk Groups in Hiran
See Appendix 5.2.3 for Footnotes

FSAU Technical Series Report No IV.8 40 Issued February 22, 2006
sou
ther
n s
om
ali
a
Effects on Livelihood Assets - Bay and Bakol
Natural Capital: In Bay and Bakol regions, Deyr rains were erratic and inadequate to replenish water catchments
and regenerate pasture. Poor rains also affected crop development and yield. Some areas, including southern parts
of Hudur and Rabdure in Bakol, Ufurow in Qansah Dere, Tugar Hosle in Dinsor and southwest of Bur-Hakaba, are
already facing water shortages. Wildlife is also affected by acute water shortages. Reports on the competition for
water between humans/livestock and monkeys and pigs leading to damage to houses and loss of small ruminants
are widespread in Bakool. Water prices in El-barde have increased from SoSh 6,000/200 litre barrel in January ’05
to SoSh 16,000/barrel in December ’05, a 167% increase. Collection and sale of wild foods, fi rewood, charcoal and
lime production by poor households are increasing, especially in areas south of Huddur. These unsustainable distress
coping strategies further enhance environmental degradation (See Charcoal Production, page 27).
The distance between pasture and water sources continues to increase with most livestock trekking distances of 15 to
20 kilometres while return time for households has increased from 6 to 9 hours. Cattle from Qansah Dere district are
in Bur-Hakaba, and livestock from Bardere, Luq and Bur-Dubo are reportedly grazing in Doy (western Dinsor).
Physical Capital: Road networks are in poor condition
and deteriorating. The recently increased civil insecurity,
tensions and large number of roadblocks is further hin-
dering the fl ow of food commodities and accessibility to
major markets leading to increased market prices. Bay
and Bakol are currently facing acute water scarcity and
the pressure on the operational boreholes remains high
due to concentrations of livestock around them.
Human Capital: Malnutrition rates in Bay and Bakol in
general and Rabdure, El-barde and Wajid (Bakol), Qa-
nsah Dere, Dinsor (Bay) in particular, indicated a serious
nutrition situation long before the current drought. Cur-
rent rates of over 15% are greater than long-term trends.
Amongst IDP populations, prevalence of diseases (ARI,
malaria, intestinal parasites, diarrhea and measles) remains high. There are a limited number of health posts and
facilities and pastoralists in the hinterlands have very little access even to these limited facilities. School attendance
is low and unpredictable and school closures have increased due to prevailing civil unrest and the inability to pay
school fees.
Financial Capital: Crop production failure, the lack of labor opportunities and employment, and recurrent civil inse-
curity has led to a high demand and low access to and supply of credit. Escalating commodity prices and increasing
expenditures on basic household goods have led to an increase in the average level of household debt. Livestock prices
are declining in line with deteriorating body condition. In one example, a truckload of shoats from Hudur destined for
sale in the market of Belet Weyne returned with its unsold cargo after failing to reach a desirable price.
Social Capital: Payment of gifts and zakat, which play an important role in supporting poor wealth groups, are de-
creasing due to the increasing and widespread stress on the overall livelihood system. Local social support networks
are also interrupted due to widespread displacement. IDP camps are reported in Wajid and neighboring Burduhunle
village (an estimated 250 households in Burduhunle and 200 in Wajid) and are the result of out-migration from Rab-
dure due to on-going clan confl icts in the district.
Livelihood Strategies
The main elements of food access in the two regions are
cereal and livestock production, followed by employment
and self-employment. Poor agro-pastoralists rely on own
crop production (50-75% of annual food requirements),
followed by food purchases (30-45%). Poor agro-pas-
toralists earn 40-50% of their annual cash income from
employment (agricultural labour, portering, herding and
building construction) and self-employment (sale of
bush products). An additional 10-20% of cash income
comes from the sale of livestock and livestock products.
Pastoralists rely on food purchases to meet most of their A child carrying a weak cattle calf
Cattle carcass north of Dinsor

FSAU Technical Series Report No IV.8 41 Issued February 22, 2006
food needs (50-50%), supplemented with own livestock products. Pastoralists derive most of their cash income from
livestock and livestock product sales (70-80%).
Food Sources: Cereal production in Bay and Bakol was
23% and 13% of PWA respectively. Total cereal produc-
tion for the two regions is estimated at 7,330MT (250MT
of sorghum in Bakool and 6,650MT of sorghum and
430MT of maize in Bay) (See Figure 26). No sorghum
production was recorded in El-barde and Rabdhure of
Bakool region. Therefore locally produced staple food
is available although in short supply in most markets.
Purchasing power and access to food, especially for poor
households, is affected by increasing food prices.
Average sorghum prices are currently increasing through-
out the sorghum belt and at key locations within Bay
and Bakol (See Figure 20). The price in Hudur (Bakol
region) was SoSh 2,219/kg in January ’06, compared to
SoSh 2,000/kg in January 2005 (and a low of SoSh 1,250/kg in between March and May ’05). Prices in Baidoa have
increased dramatically – SoSh 800/kg in February ’05 compared to SoSh 1,575/kg, although the dynamics of confl ict
in the area have also played a role in distribution channels and market prices. This trend will continue through the
Jilaal season and until the benefi ts of 2006 Gu rains are felt. Poor households will increase their dependence on market
purchase as household stocks are depleted, while the better-off households have limited food reserves.
Income sources: Livestock body conditions are poor
and are attributed to the prolonged drought in the region.
This is further supported by the sharp decline in prices
of local quality cattle in Baidoa from SoSh 1,075,000 in
February ’05 (a high of SoSh 2,000,000 in April ’05) to
SoSh 450,000 in January ’06, a fall of over 50%.
In general, there has been a decline in terms of trade in
the sorghum belt (See Figure 27). Terms of trade for poor
households (labour to cereals) in Huddur have declined
from 6.88kg in January ’05 to 4.39kg in January ’06 (a
decline of 36%), and from a high of 12.40kg in March
’05. TOT in Baidoa (currently 12.70kg) are also lower
(by 50%) than for the same period in 2005. Charcoal
production, as an income source, has intensifi ed. Major charcoal producing areas include Werdile and Molimad vil-
lages of Baidoa district, Durey and Bakaro of Wajid district, Waney and Luway weyne of Huddur district, and, most
importantly, Sigle and Dalandole areas which remain the centre of confl ict in Tieglow district.
Expenditure: As prices of cereals continue to rise an increasing proportion of income will be used for staple food
purchase. Sale of water was for the fi rst time observed in the villages of Rahole and Habibayal of Dinsor district,
Esow, Mayaw and Hassan Mumin of Qansah Dere district where water is fetching between SoSh 10,000 and SoSh
20,000/200 litre drum.
Coping Strategies
Some Agro-pastoralists in Bay and Bakol regions have started exercising distress coping strategies, namely: killing
newly born animals to save their weak mothers; reducing the number of meals which will have negative implications
for nutrition at a time when energy demand on the body is high; and increasing practice of theft and begging in the
streets of main towns.
Figure 27: Terms of Trade in Bay, Bakol, Gedo and Hiran
Region - Sorghum to Local Goat and Labour (1995-2006)
0.00
50.00
100.00
150.00
200.00
250.00
300.00
350.00
Jan-9
8
Jul-98
Jan-9
9
Jul-99
Jan-0
0
Jul-00
Jan-0
1
Jul-01
Jan-0
2
Jul-02
Jan-0
3
Jul-03
Jan-0
4
Jul-04
Jan-0
5
Jul-05
Jan-0
6
Month/Year
Kgs
of
Sorg
hu
m p
er 1
Hea
d L
oca
l G
oat
0.00
5.00
10.00
15.00
20.00
25.00
30.00
35.00
Kgs
of
Sorg
hu
m p
er D
ail
y L
ab
ou
r W
ageSorghum (kg) per Local Goat (head)
Sorghum (kg) per Labour Wage (daily)
Figure 26: Deyr Cereal Production in Bay & Bakol
(1995 - 2005/06)
0
5,000
10,000
15,000
20,000
25,000
30,000
35,000
40,000
45,000
50,000
1995
/96
1996
/97
1997
/98
1998
/99
1999
/00
2000
/01
2001
/02
2002
/03
2003
/04
2004
/05
2005
/06
MT
maize
sorghum
Average - Deyr
sou
thern
som
alia

FSAU Technical Series Report No IV.8 42 Issued February 22, 2006
sou
ther
n s
om
ali
a
Nutrition
The malnutrition rate estimates for the Bay Region are
over 15% in all the districts with the exception of Bur
Hakaba District1 and the lower part of Dinsor District
where information indicates lower levels of malnutrition.
Early manifestations of the current crisis are seen noted
in the recent increase in malnutrition levels and commu-
nicable diseases at the MCH centres of Baidoa, Berdale
and Qansah Dere, increased admissions in supplementary
feeding programme and the high levels of malnutrition
recorded in the sentinel sites surveillance. In December
’05, there was an outbreak of measles in Bay Region.
Dietary diversity is generally decreasing with exception
of Bur Hakaba and Baidoa town where milk is available.
Insecurity hinders humanitarian interventions.
Malnutrition levels of over 15% in El Berde, Rabdure and
part of Wajiid signify a serious nutrition situation even
before the impact of the current food insecurity. Popula-
tion movement and household splitting indicate the impact
of the deteriorating situation. Insecurity in most parts of
Bakol Region (mainly El Berde, Rabdure and recently
Tayeglow) continues to disrupt both livelihood and hu-
manitarian activities. Increasing trends of malnutrition are
recorded in Tayeglow, Rabdure and Wajiid MCH while
the sentinel sites data show high levels of malnutrition,
especially in Rabdure and Hudur. High numbers of admis-
sions continue in the supplementary feeding programmes
in Bakol. Use of poor quality water, due to scarcity, is
on the increase with a resultant increase in water borne
diseases. Incidences of acute respiratory infections and
measles have also increased between September ’05 and December ’05. Population infl ux from Gedo puts further
pressure on resources available in Bakol. The population is relying on cereal based diets with severe scarcity of milk
and other animal products experienced in the Northern of Bakol region.
Livelihood Strategies – Hiran
Poor riverine households in Hiran primarily rely on own crop production (55-75%) and purchases (30- 40%) for their
food needs, while those who are better-off supplement this with own milk consumption. For the poor households
sources of income are diversifi ed between sales of own crops, including cereals, pulses, fruits and vegetables (25-
40%), self employment (25-35%), and employment (5-15%). Better off-households also supplement income through
milk and livestock sales.
Food Sources: Due to poor cereal crop production (and low household stocks) and increasing reliance on market
purchase access to staple cereals is declining as prices rise, especially for the poor households within the riverine
zone. The price of white maize in Belet Weyne was SoSh 2,800 in January ’06 compared to SoSh 2,225/kg in January
’05. Sorghum prices in Belet Weyne have risen from a low of SoSh 1,560/kg in May 2005 to a high of SoSh 2,900/kg
(compared to SoSh 2,400 in December ’04). High cereal demand from markets in Mogadishu markets, the largest
market concentration in southern Somalia, is further reducing cereal supply and availability in the region. Cereal
prices are expected to continue to rise over the coming months due to a shortfall in supply from local production and
from the high potential sorghum producing regions of Bay and Bakol. Furthermore, the recent announcement from
the Minister of Trade and Industry in Ethiopia to suspend all cereal exports until further notice may affect, negatively,
cereal supply.
Figure 29: Proportion of malnourished children in
Bakool sites, Nov ‘05
05
101520253035404550
Isk
iiri
Wa
rdu
jire
y
Go
ba
to
Gel
iye
Gu
do
Dh
an
aw
e
Bu
sley
Do
nd
ard
ir
Rabdure Wajiid Tayeglow Huddur
Sentinel sites
Figure 28: Proportion of households by dietary diversity
in Bay Region sentinel sites
0%10%20%30%40%50%60%70%80%90%
100%
J.S
hei
kh
To
swey
ne
Dh
arq
o
Aw
din
ley
Ko
ba
n
Du
rey
emed
Ma
do
y
Ufu
row
Mis
ra
Berdaale Baidoa Qansaxdheere Dinsor
<=3 Fd group >3 Fd group
1 Burhakaba District is well served by the World Vision sponsored primary health care programme and it is hosting camels which are still providing some milk to
most of the households.
Footnote

FSAU Technical Series Report No IV.8 43 Issued February 22, 2006
In Belet Weyne, terms of trade for the poor (labour to cereal) has decreased from a high of 20.78kg in June ‘05 to
11.64kg in January ’06 – in February ’05 the amount of cereal was 13.11. Terms of trade for the middle wealth group
(goat to cereal) follow a similar pattern – 175.00kg in June ’05, 91.38kg in January ’06 and 124.32kg in February ’05.
This is due mainly to increasing cereal prices and follows the trend throughout the sorghum belt (see Figure 3).
Income Sources: Agricultural labour, crop and fodder sales, employment and self-employment activities are the
most important income earning opportunities for the majority of the population in Hiran and the availability of
these income sources defi nes people’s purchasing power at any point in time. In the riverine zone, increasing sales
of fodder are partially offsetting the loss of income from crop sales. For riverine and agropastoral groups income
from employment in urban centres is increasing in importance. However, as the situation deteriorates in neighboring
regions and migration to urban centres throughout southern Somalia intensifi es it is expected that competition for
these opportunities will increase.
Expenditure: Prices of both local and imported commodities such as sorghum, maize, wheat grain have increased
further putting pressure on the purchasing power of poor households. Importantly for riverine households, the price
of diesel, used for pump irrigation, has risen from SoSh 8,000/litre in February ’05 to SoSh 10,000/litre in January
’06 (with a high in October 2005 of SoSh 10,625/litre).
Coping Strategies
In Hiran, agro-pastoralists and pastoralists are expanding their coping strategies in response to the deteriorating food
security situation. These strategies include migration to large urban centres for employment, the production and sale
of lime, and the reduction of the number of meals per day (from 3 to 2). To cope with the livelihood stress, communi-
ties are also resorting to the exploitation of natural resources through the collection and sale of construction materials
(sticks, thatch and poles), charcoal production, and hunting for wild animals.
Nutrition
Malnutrition levels in the region are still within the
long term levels for the area (see Map 9). Sentinel sites
surveillance data,2 a recent survey,3 and health facility in-
formation indicate that the situation remains stable. High
morbidity especially reports of diarrhoea, poor sanitation,
poor quality of drinking water and inadequate child care
practices are among the causes of malnutrition in the
region. Findings of the recent sentinel sites data indicate
that some areas are already experiencing stress in food
access for example Biyonef and Showli sites. Only 44%
households consumed a diversifi ed diet. Milk consump-
tion was particularly good in most areas though this could
decline as there is inadequate pasture and livestock are
moving towards Middle Shabelle and riverine areas of
Zone V in Ethiopia. Morbidity levels are high, in particular diarrhea and ARI. Under the prevailing conditions the
nutrition situation could deteriorate in the coming months and so close monitoring will continue.
Figure 30: Proportion of children with acute malnutrition
in the sentinel sites in Hiran Region in Dec ‘05
0%
5%
10%
15%
20%
25%
Hel
ob
an
aa
n
(0%
ma
ln)
Ha
lga
n
Biy
on
eef
Sh
ow
li (
0%
Ma
ln)
Ja
ma
ay
e
Sh
iin
Ra
ho
le (
0%
ma
ln)
(0%
Ma
ln)
Sib
ay
Dir
go
ys
Bu
lo A
li
Bulo Burti Jalalaqsi
2 In December 2005, FSAU commenced sentinel sites surveillance in Hiran region. Nine sites (Helobanaan, Halgan, Biyonef, Showli, Jamaye Shin, Rahole, Sibay,
Dirgoys and Bulo Ali) were selected from which both quantitative and qualitative data were collected. Except for Jamaye Shiin, all other sites indicated malnutri-
tion levels within or below the long term levels.3 Survey undertaken by SC-UK in selected villages of Belet Weyn District in October 2005 indicated a global acute malnutrition (weight for height <-2 Z score or
oedema) of 13.3%.
Footnotes
sou
thern
som
alia

FSAU Technical Series Report No IV.8 44 Issued February 22, 2006
4.1.4 Lower and Middle Shabelle
Overview
The Shabelle Valley, both riverine and agro-postural areas, is identifi ed as being in
Early Warning Level of Alert due to three consecutive seasons of below normal
rainfall, poor Deyr ’05/06 crop production, poor pasture conditions and unusual
livestock in-migration from neighbouring livelihood zones in search of pasture (see
Map 8).
Generally, the main livelihood of the Shabelle valley is crop production (Lower and
Middle) which are classifi ed as Riverine and Agro-pastoral. Both livelihoods rely
on rainfall for crop and livestock production. Deyr season rainfall was erratic in it’s
timing and distributed unevenly. Evidence from satellite imagery indicates that the
cumulative rainfall estimate from mid October to end December was less than 40%
of normal (see Map 3).
The Deyr season contributes normally 30-35% of annual
regional cereal production. However, due to insuffi cient
rainfall, crops in the Shabelle valley experienced severe
moisture stress, leading to poor crop production in both
livelihood zones. Most of the production coming from
Shabelle valley this season is maize produced along the
riverine strip areas of KurtunWarey, Qoryoley and Jowhar
districts near the source of irrigation infrastructure. The
expected contribution of rain-dependent crops (sorghum,
maize) from this region is almost negligible. Total cereal
production for this Deyr ’05/06 is estimated to be 25,330
MT in Lower Shabelle (70% of Deyr ’04 production) and
64% of the PWA. Cereal production in Middle Shabelle
is estimated to be 7,320 MT (87% of Deyr ’04/05 and
50% of PWA). However, sesame production, an impor-
tant crop that is expected to be harvested in February ’05
onwards, will increase income opportunities and help to
offset losses from cereal production.
Deyr rainfall was insuffi cient also for widespread pasture regeneration. In areas that received rains, in-migration of
livestock from other regions (Bay and Bakol) and from within the Shabelle valley, has led to competition for and
rapid depletion of pasture resources. This infl ux of livestock and herders is compounding existing problems in the
Shabelle valley. Disputes between host-farmers and in-migrants over access to grazing and water are frequent and
competition for employment opportunities in urban centres is increasing.
Effects on Livelihood Assets
Natural Capital: Water shortages for human and livestock are widespread throughout agro-pastoral zones of
Shabelle valley and water prices are rising in these areas (see the section on expenditure) and are expected to continue
to rise through the Jilaal season and to the next Gu rains. In riverine areas, the River Shabelle is the main water source
of water but access is restricted for livestock due to the presence of standing crops. Furthermore, farmers limit access
to livestock as they damage canal infrastructure. Widespread growth of an exotic invasive plant is overwhelming the
natural fl ora. The noxious exotic plant is invading agricultural and urban areas of the Shabelle valley.
Physical Capital: The road infrastructure is deteriorating season after season due to the lack of maintenance and the
impacts of river fl ooding and canal seepages. The irrigation infrastructure (river embankments, primary canals, cul-
verts and sluice gates) of the Shabelle valley is generally poor, contributing to lower production than pre-war levels.
Canal rehabilitation, such as the initiative in Marka district to rehabilitate one of the main canals, a length of 32km
starting at Jenale Bridge and ending in the coastal area of Bulo Marer, will play a signifi cant role in improving the
livelihoods of households in the riverine zone.
Financial Capital: Trust based credit systems from the better off, and cereal traders and other retailers, are available
for households with standing crops or other assets. In areas of poor rainfall, this form of credit has declined. However,
charcoal exporters are offering similar credit as cash or in-kind and this has attracted many people to opt for charcoal
Map 21: Food Security Phase Classifi cation - Shabelle
FSAU
NOTES:
1. Estimated populations do not include IDP or Urban estimates, and are
rounded to the nearest 10,000
2. For category explanations see http://www.fsausomali.org
Phase Classifi cation
Alert
Moderate Risk
High Risk
Sustained Phase 2 or 3 for > 3 yrs
Areas with IDP Concentrations
Phase Classifi cation
Early Warning Levels for worsening Phase
5 Generally Food Secure
4 Chronically Food Insecure
3 Acute Food and Livelihood Crisis
2 Humanitarian Emergency
1 Famine/Humanitarian Catastrophe
SHABELLE & COWPEA BELT
LIVELIHOOD SYSTEMSPASTORALISTSAGRO-PASTORALISTSRIVERINEURBAN
Map 20: Shabelle and Cowpea
Belt Livelihood Systems
sou
ther
n s
om
ali
a

FSAU Technical Series Report No IV.8 45 Issued February 22, 2006
sou
thern
som
alia
processing as an income option. No livestock disease outbreaks have been reported during this Deyr, though tsetse
(trypanosomiasis) infection is a concern for cattle pastoralists forced to seek pasture in unfavourable high-risk areas.
The knock-on effect of this will be deteriorating body condition and reduced milk production.
Human Capital: Ongoing nutritional surveillance information indicates that malnutrition levels are within the
usual range of <10%. Recent sentinel sites surveillance data indicated good dietary diversity in most sites. In order
of importance cereals, milk, fruits, sugar, pulses and oil were the commonly consumed food groups. Notably, there
was a signifi cant proportion of households consuming micronutrient rich foods namely milk, fruits, pulses and veg-
etables. However, dietary diversity could decrease as most households are gradually depleting previous food stocks
and as food prices increase. Safe drinking water is scarce in most parts of the region such that people are consuming
contaminated water from catchments and/or canals.
Social Capital: Poor crop production from this Deyr season will lead to a reduction of zakaat contributions. Other
mutual support (goob) and informal loans have also declined due to the increasing strain on the livelihood system.
Local money transfers from Mogadishu and Puntland, for example, contribute to riverine household’s income. Ab-
normal patterns of livestock migration due to poor pasture conditions are leading to increased tensions and disputes
over grazing between immigrants and herders from the host areas.
Livelihood strategies: There are two primary livelihood zones in the Shabelle valley: Agro-Pastoral (rainfed,
fl ood irrigated, maize and cattle) and Shabelle Riverine (irrigated maize). Both the poor agro-pastoralists and the
riverine communities rely primarily on own-crop production for their food needs (65-80%), supplementing this with
purchases (10-20%) and animal products (0-15%). Poor agro-pastoralists earn 45-65% of cash income through employ-
ment and self-employment, i.e. agricultural labour, collection and sale of bush products, which is supplemented with
the sale of livestock and livestock products (0-20%). Poor riverine households earn more than half of their income
from crop sales (both cereals and non-cereals) followed by seasonal casual labour.
Food sources: Due to successive seasons of poor cereal production households in riverine and agro-pastoral liveli-
hood zones (with the exception of those in Qoryoley, Marka and Kurtin-Warey districts who have access to stocks and
some Deyr season production), are relying increasingly on market purchase as previous cereal stocks have become
depleted and the consumption and sale of livestock products.
In January ’06, the average white maize price was SoSh 2,421/kg, an increase of 5% compared to the January ’05
price of SoSh 2,288/kg, though prices are currently lower than the high of SoSh 3,610/kg in June ’05 but have been
increasing steadily since October ’05. However, the bulk of the Deyr season production has not entered the market
yet. When it does the price is expected to fall, at least in the short term. The January ’06 price of maize in Sablaale
was SoSh 3,000/kg. This is thought to be due to high market demand arising from the concentration of in-migrants
from Bay and Bakol and from neighbouring districts.
Cattle milk availability is considered below normal. This situation is refl ected in market prices (January ’06) in
Brava and Jenale of SoSh 4,000/litre that are almost double what would be considered normal for this time of year.
Although there are high and increasing concentrations of cattle in the Shabelle valley area, available grazing resources
are depleting rapidly and cattle body condition is deteriorating, affecting the supply of milk. This is compounded by
high demand.
Crop Failutre in Lower ShabelleFire wood headed for markets in Middle Shabelle
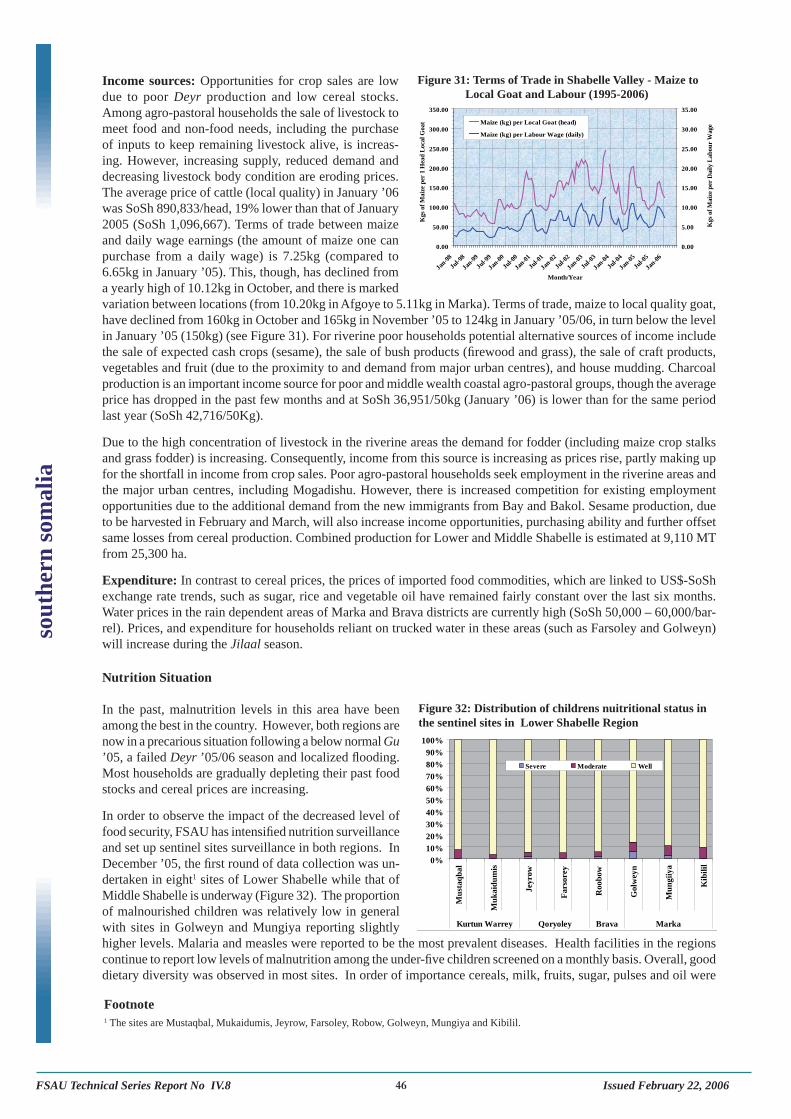
FSAU Technical Series Report No IV.8 46 Issued February 22, 2006
sou
ther
n s
om
ali
a
Income sources: Opportunities for crop sales are low
due to poor Deyr production and low cereal stocks.
Among agro-pastoral households the sale of livestock to
meet food and non-food needs, including the purchase
of inputs to keep remaining livestock alive, is increas-
ing. However, increasing supply, reduced demand and
decreasing livestock body condition are eroding prices.
The average price of cattle (local quality) in January ’06
was SoSh 890,833/head, 19% lower than that of January
2005 (SoSh 1,096,667). Terms of trade between maize
and daily wage earnings (the amount of maize one can
purchase from a daily wage) is 7.25kg (compared to
6.65kg in January ’05). This, though, has declined from
a yearly high of 10.12kg in October, and there is marked
variation between locations (from 10.20kg in Afgoye to 5.11kg in Marka). Terms of trade, maize to local quality goat,
have declined from 160kg in October and 165kg in November ’05 to 124kg in January ’05/06, in turn below the level
in January ’05 (150kg) (see Figure 31). For riverine poor households potential alternative sources of income include
the sale of expected cash crops (sesame), the sale of bush products (fi rewood and grass), the sale of craft products,
vegetables and fruit (due to the proximity to and demand from major urban centres), and house mudding. Charcoal
production is an important income source for poor and middle wealth coastal agro-pastoral groups, though the average
price has dropped in the past few months and at SoSh 36,951/50kg (January ’06) is lower than for the same period
last year (SoSh 42,716/50Kg).
Due to the high concentration of livestock in the riverine areas the demand for fodder (including maize crop stalks
and grass fodder) is increasing. Consequently, income from this source is increasing as prices rise, partly making up
for the shortfall in income from crop sales. Poor agro-pastoral households seek employment in the riverine areas and
the major urban centres, including Mogadishu. However, there is increased competition for existing employment
opportunities due to the additional demand from the new immigrants from Bay and Bakol. Sesame production, due
to be harvested in February and March, will also increase income opportunities, purchasing ability and further offset
same losses from cereal production. Combined production for Lower and Middle Shabelle is estimated at 9,110 MT
from 25,300 ha.
Expenditure: In contrast to cereal prices, the prices of imported food commodities, which are linked to US$-SoSh
exchange rate trends, such as sugar, rice and vegetable oil have remained fairly constant over the last six months.
Water prices in the rain dependent areas of Marka and Brava districts are currently high (SoSh 50,000 – 60,000/bar-
rel). Prices, and expenditure for households reliant on trucked water in these areas (such as Farsoley and Golweyn)
will increase during the Jilaal season.
Nutrition Situation
In the past, malnutrition levels in this area have been
among the best in the country. However, both regions are
now in a precarious situation following a below normal Gu
’05, a failed Deyr ’05/06 season and localized fl ooding.
Most households are gradually depleting their past food
stocks and cereal prices are increasing.
In order to observe the impact of the decreased level of
food security, FSAU has intensifi ed nutrition surveillance
and set up sentinel sites surveillance in both regions. In
December ’05, the fi rst round of data collection was un-
dertaken in eight1 sites of Lower Shabelle while that of
Middle Shabelle is underway (Figure 32). The proportion
of malnourished children was relatively low in general
with sites in Golweyn and Mungiya reporting slightly
higher levels. Malaria and measles were reported to be the most prevalent diseases. Health facilities in the regions
continue to report low levels of malnutrition among the under-fi ve children screened on a monthly basis. Overall, good
dietary diversity was observed in most sites. In order of importance cereals, milk, fruits, sugar, pulses and oil were
1 The sites are Mustaqbal, Mukaidumis, Jeyrow, Farsoley, Robow, Golweyn, Mungiya and Kibilil.
Footnote
0.00
50.00
100.00
150.00
200.00
250.00
300.00
350.00
Jan-9
8
Jul-98
Jan-9
9
Jul-99
Jan-0
0
Jul-00
Jan-0
1
Jul-01
Jan-0
2
Jul-02
Jan-0
3
Jul-03
Jan-0
4
Jul-04
Jan-0
5
Jul-05
Jan-0
6
Month/Year
Kg
s o
f M
aiz
e p
er 1
Hea
d L
oca
l G
oa
t
0.00
5.00
10.00
15.00
20.00
25.00
30.00
35.00
Kg
s o
f M
aiz
e p
er D
ail
y L
ab
ou
r W
ag
eMaize (kg) per Local Goat (head)
Maize (kg) per Labour Wage (daily)
Figure 31: Terms of Trade in Shabelle Valley - Maize to
Local Goat and Labour (1995-2006)
0%
10%
20%
30%
40%
50%
60%
70%
80%
90%
100%
Mu
sta
qb
al
Mu
ka
idu
mis
Jey
row
Fa
rso
rey
Ro
ob
ow
Go
lwey
n
Mu
ng
iiy
a
Kib
ilil
Kurtun Warrey Qoryoley Brava Marka
Severe Moderate Well
Figure 32: Distribution of childrens nuitritional status in
the sentinel sites in Lower Shabelle Region

FSAU Technical Series Report No IV.8 47 Issued February 22, 2006
the commonly consumed food groups. Notably, there is signifi cant proportion of households consuming micronutri-
ent rich foods namely milk, fruits, pulses and vegetables. Malnutrition rates are estimated to lie within the long term
estimated range shown on Map 9. Close monitoring will continue. Civil insecurity continues to dominate Benadir
region greatly hampering humanitarian access. The nutrition situation among the IDPs in Mogadishu remains poor2.
The two ACF managed TFC’s have noted a sharp increase in admissions of severely malnourished children since
October ’05. Some of these benefi ciaries are coming from other regions in South Central zone. With the prevailing
drought conditions in Southern Somalia, the admissions are likely to increase as additional households move into
Mogadishu in search of a means of livelihood. (See Displacement and IDPs on page 48).
Future outlook
Through the remainder of the Jilaal and up to the point that the benefi ts of Gu rains are felt, it is clear that the food
security and livelihood situation in areas identifi ed as Humanitarian Emergency and Acute Food and Livelihood
Crisis in southern Somalia will continue to deteriorate. Local cereal prices (maize and sorghum) are expected to
increase up to the next harvest (the Gu) in July/August ’06. Concurrently, livestock prices are expected to decrease
during the Jilaal. In areas with no permanent sources of water, household expenditure will increase as water is pur-
chased for both human and livestock consumption, if it is available. The combined impact of these factors will be a
decline in purchasing power, access to purchased food commodities, and terms of trade for all livelihood groups. The
limited availability of local cereals places increasing importance on imported food commodities (wheat, wheat fl our,
pasta, rice, and sugar). In turn, the prices of imported goods depend on SoSh/US$ exchange rate stability, marine
piracy, and in-country transportation costs. Over the previous three months insecurity has led to local and regional
price fl uctuation and variation and cannot be discounted also.
In areas where livestock have concentrated, including the Juba riverine areas or in areas receiving Deyr or Hays
rains, increasing competition for available pasture and water is leading to rapid depletion of resources. Households
are already pursuing opportunistic migration strategies in search of pasture, water, employment and social support.
Further deterioration in livelihood resources will lead, inevitably, to further migration (including household splitting)
and increasing strain on these resources. The risk of increasing tension and resource based confl ict over access and
control of water and grazing resources cannot be ruled out and this risk will increase further as the Jilaal progresses.
Alarmingly, an early forecast suggests below normal rainfall for the Gu ’06 season. However, this will be confi rmed
during the Climate Outlook Forum (March 3, 2006).
The Shabelle valley (Chronically Food Insecure, and Early Warning Levels of Alert risk of deteriorating) is a
focus for the coming months as a host for pastoral in-migrants from other regions of southern Somalia (including
Bay and Bakol). While this phase classifi cation indicates the relatively positive food and livelihood security status
of the region this in-migration has and will put additional strain on and competition for existing water and grazing
resources, in addition to employment opportunities in the major urban centres. Labour migration from Bay and Bakool
is a normal seasonal pattern, though this has intensifi ed due to the crop failure and poor rangeland conditions in those
areas. Labour opportunities have declined with the collapse of commercial farming (such as bananas and grapes) and
the demand for employment is high. It is expected that as employment requirements are unmet there will be a general
drift towards Mogadishu with a concomitant increase in ‘IDPs ( (See Displacement and IDPs on page 48).
2 A nutrition survey undertaken by UNICEF and partners in September 2005 indicated GAM levels of 16%, similar to a past survey done in
2004; health facility data and sentinel sites surveillance data trend analysis
Footnote
sou
thern
som
alia

FSAU Technical Series Report No IV.8 48 Issued February 22, 2006
4.1.5 Displacement and IDPs
Multiple displacements due to confl ict and naturally triggered disasters, such as drought and fl oods, or more simply because
the minimal requirements for life are unmet, have resulted in an estimated 370,000 to 400,000 people currently considered
internally displaced. However, this number refl ects what are considered the most vulnerable of the displaced. The major-
ity of these are women and children. Much of this displacement has been to urban areas in search of improved livelihood
opportunities, including employment, and access to basic social services. The largest concentrations are to be found in the
centre and south of the country with the majority displaced in Mogadishu and Kismayo, where an estimated 250,000 and
15,000 reside respectively (see Map 2).
However, in a livelihood system where mobility is the norm, distinguishing IDP migration from other forms of popula-
tion movement is diffi cult. Several Somali words hint at this and subtlety of population movement, even in the absence
of confl ict: the term kiinaan describes the voluntary seasonal movement of people in search of resources, for example
from Bakool to relatives living in Bay region, or in search of employment in Lower Shabelle; hayaan describes a long
journey; and qaxooti describes someone who has travelled a great distance and is destitute (this is often used as a synonym
of ‘refugee’). Perhaps barakac comes closest to the internationally accepted defi nition of IDP – it describes situations of
confl ict-induced displacement. Within the pastoral and agro-pastoral economy population displacements are by no means
random or limitless. In its grazing, permanent cultivating, and trading centres, and above all in its wells and water points,
every clan and group possesses a series of nodes between which movement rotates. Migration and household splitting
does not necessarily refl ect an exception to the normal patterns of society. In agricultural and agro-pastoral populations
household members do not even necessarily live together continuously year round: the numbers present at any given time
depend largely upon seasonality, the nature of the productive assets available to the household, economic and employment
opportunities elsewhere (more likely than not to be found in urban centres), kinship ties and the strength of social networks,
and the nature of the shock or stress experienced.
While vulnerable communities face similar challenges across the country, the displaced are particularly vulnerable in terms
of their food and livelihood security. The displaced are often disadvantaged in terms of their access to food, income, access
to basic services, and protection compared to a host or indigenous community, even during ‘non-crisis periods’. Levels of
acute malnutrition are generally above those of resident communities. In addition, their location may infl uence their access
to humanitarian assistance, their degree of social network support, and their ability to survive and regain their economic
security. The degree of vulnerability, and resilience to further shocks or stresses, is a function of their level of integration
into the host community. This varies between those who seek support directly from family (and this may be in its widest
sense of clan) and are relatively well integrated (and less ‘visible’), to those who have little or no clan affi liation within
the host community, and usually ‘reside’ in visible ‘camp like situations’ occupying private or ‘public’ land such as former
government buildings. Living conditions in camps are far from the humanitarian norms established by the international
community. Rents are paid in often exploitative arrangements with landlords where tenure of shelter is far from secure.
The degree of economic viability of the displaced is dictated by a number of factors: fi rstly, and most importantly, by
socio-ethnic status, that, in turn, affects the degree of access (or reinforces the lack of access) to education and health facili-
ties; the portfolio of marketable skills; access to social network support (including internal and external remittances and
direct or indirect access to productive assets in their areas of origin); and, fourthly, the supply of available opportunities
(for example, market portering, construction work, and housework). In turn, the degree of social network support and the
supply of available employment opportunities are largely reliant upon the strength of the local economy. In other words,
the displaced are not insulated from the world outside the camp or host environment.
It is expected that as the humanitarian situation continues and its impacts intensify there will be increased opportunistic
migration to urban areas in search of water, social support and employment (and even humanitarian assistance) in an ef-
fort to diversify the resource portfolio. Entire households may migrate (especially for those with no access to water), or
households may split, such as those with skills seeking employment. This infl ux will put further strain on existing urban
infrastructure. Perhaps more worryingly, as the economy weakens there will be less social support and fewer employ-
ment opportunities available. Inevitably for those already economically marginalised and stressed any increase in cereal
or water prices, or decline in income opportunities, or increase in rents as demand for shelter outstrips supply will lead to
deterioration in their food and livelihood status. Already, there are reports of increasing numbers of people from Bay and
Bakool present in Goldogob, Burtinle and Galkaacyo, and also in the Lower Shabelle. A further indication of an increase
in the severity of the humanitarian situation in southern Somalia will be an increase in registration applications in the
refugee camps in Kenya.
While the magnitude of the current humanitarian crisis is the largest in ten years, the IDP caseload will inevitably increase.
The food security, livelihood and protection needs of these marginalised groups should continue to be addressed but the
label IDP should not mask the problems faced by other vulnerable groups, including the urban poor. The situation will
need close monitoring.

FSAU Technical Series Report No IV.8 49 Issued February 22, 2006
centra
l som
alia
4.2. CENTRAL SOMALIA
Overview
In central Somalia, rainfall in most inland pastoral areas was below normal, between
20% and 80%, with pockets of up to 150% above normal. This follows above normal
Gu ’05 rains (up to 160% above normal), as well as following the good Deyr ’04/05
rains. Although satellite imagery suggests rainfall in the coastal cowpea belt at 0-
10% of normal, the fi eld assessment indicates ‘normal’ rains for the season.
While much of Galgadud has benefi ted from improvements in security, unresolved
confl ict in south Mudug and northern Galgadud continues to hinder livelihood
recovery and limit the presence of humanitarian actors. Clan confl ict boundaries
are disrupting the migrations of people and livestock, and have affected access to
markets and hindered commercial trade. Concentrations of IDPs from the current
insecurity are present in Dhusa Mareb, Adado, Bandiradley and Harar Dere. Al-
though there are pockets of water shortages in some areas, pasture conditions are
considered normal and recovery signs include improved livestock conditions, and
continuing recovery in livestock productivity and reproduction.
While the area remains in Acute Food and Liveli-
hood Crisis, there is a trend of improvement in most of
Galgadud. However, for the area of northern Galgadud
and south Mudug (between Adado/Gelinsor, Hobyo and
Harar Dere) there has been a deterioration in the situ-
ation due to the uncertainty surrounding the ongoing
confl ict. It is estimated that a total of 57,000 people are
in a state of Acute Food and Livelihood Crisis, 38,000
in Galgadud and 19,000 in south Mudug (See Map 23
and Table 15).
Effects on Livelihood Assets
Natural Capital: For households relying on rainwater
catchments (berkads) in Galgadud, water availability is
currently considered poor. Water trucking has started
earlier than normal for the season in Adado and Dhusa
Mareb (particularly in the Guri’el area) districts. While pastoral conditions throughout the two regions are generally
normal, an infl ux of livestock from Hobyo district, due to ongoing insecurity in this area, and from Hiran region and
the Somali Region of Ethiopia is increasing grazing pressure on available rangeland resources. The encroachment
of sand dunes to grazing lands and fertile areas remains a concern.
Map 23: Food Security Phase Classifi cation
Central Region
FSAU
NOTES:
1. Estimated populations do not include IDP or Urban estimates, and are
rounded to the nearest 10,000
2. For category explanations see http://www.fsausomali.org
Phase Classifi cation
Alert
Moderate Risk
High Risk
Sustained Phase 2 or 3 for > 3 yrs
Areas with IDP Concentrations
Phase Classifi cation
Early Warning Levels for worsening Phase
5 Generally Food Secure
4 Chronically Food Insecure
3 Acute Food and Livelihood Crisis
2 Humanitarian Emergency
1 Famine/Humanitarian Catastrophe
Map 22: North and Central
Regions: Livelihood Systems
Acute Food and
Livelihood Crisis
(AFLC)2
Humanitarian
Emergency
(HE)2
Total in AFLC or HE
as % of Region
Population
Galgadud
Abudwaq 62,500 3,000 0 5
Adado 48,740 7,000 0 14
Dusa Mareb 88,425 15,000 0 17
El Bur 56,155 13,000 0 23
El Der 63,915 0 0 0
SUB-TOTAL 319,735 38,000 0 12
Mudug
Galkayo 74,750 0 0 0
Goldogob 20,300 0 0 0
Haradhere 43,705 6,000 0 14
Hobyo 42,895 13,000 0 30
Jariban 18,245 0 0 0
SUB-TOTAL 199,895 19,000 0 10
TOTAL 519,630 57,000 0 11
Affected Regions and
Districts
Assessed and Contingency Population in AFLC and HEEstimated
Population of
Affected Districts 1
Table 15: Estimated Population by District in Humanitarian Emergency (HE) and Acute Food and
Livelihood Crisis (AFLC), inclusive of the High Risk Groups in Central Region
See Appendix 5.2.2 for Footnotes

FSAU Technical Series Report No IV.8 50 Issued February 22, 2006
cen
tra
l so
ma
lia
Physical Capital: In the coastal districts of El Der and Harar
Dere, the encroachment of sand dunes on roads restricts the
movement of commercial goods resulting in higher transporta-
tion costs. Roads and basic transport infrastructure are poor and
deteriorating making the central region one of the most isolated
and inaccessible parts of Somalia. Diffi culties of access due to
civil insecurity continue to limit the presence of international
actors in some areas and consequently the provision of humani-
tarian resources.
Social Capital: General improvements in livelihood condi-
tions have reduced the importance of previously strained social
support networks, from internal sources and from the diaspora.
Levels of traditional support for poor households (for example,
kaalmo, zakat, irmaansi, and amah) are continuous but normal for the current season. However, for those in the confl ict
areas, including out migrating IDPs, social support in host communities still remains important.
Human Capital: Access to health care services and education is extremely poor in rural areas and remains a concern.
Levels of malnutrition remain within the long term (past fi ve year) range estimates in both regions except among the Addun
pastoralists in Dhusa Mareb and El Bur districts which appear worse than long term levels (Map 9 and Figure 35).
Financial Capital: After two successive seasons of declining debt levels, this trend continues from an average of US$323
in the previous season to the current level of US$209. However, debt levels may increase once again for those households
having to pay for water. In Galgadud, livestock holdings have increased from previous Deyr ’04 levels: sheep and goats,
30-40%, camels 15-20%, and cattle 5-10%. Calving and kidding trends are normal for the season for all species with camels
expected to calve in January 2006. Cowpea and sorghum production in Harar Dere within the cowpea belt is estimated to
be 125-135% and 110-125% respectively of Deyr ’04 levels.
Effects on Livelihood Strategies
Knowledge of the primary sources of food and income is important in understanding the overall impact of different shocks
or seasonal changes on food and livelihood security. Under normal conditions, all pastoralists in this region, irrespective of
their wealth group, rely on livestock and livestock product sales for income generations (65-75%) with the exception of the
poor wealth groups whose livestock income (35-45%) is supplemented by self-employment and employment (40-50%). All
pastoralists purchase most of their food needs that consist mostly of sorghum or rice, sugar and oil. The consumption of own
livestock products of meat and milk make up the balance of their food needs (15-35%).
Food sources: Average sorghum prices in the Sorghum-belt (Bay,
Bakol, Hiran, and Gedo) have increased dramatically in recent
months as cereal availability and stocks have declined, from ap-
proximately SoSh 1,780/kg in October ’05 to SoSh 2,500/kg in
December ’05, a 40% increase. However, this is still considerably
lower than that reported in the markets of Galkayo (SoSh 5,000/kg)
and Abudwaq (SoSh 4,000/kg). Prices in these markets are generally
higher than those in southern Somalia due to the increased distance
and therefore transportation costs from production areas. However,
sorghum prices in Galkayo market have actually decreased over the
last two months (from SoSh 6,000/kg (US$ 0.40) in December ’05
to SoSh 5,000/kg (US$ 0.33) in January ’06), the opposite of the
trend noted above (Figure 32).
This may be attributed to the distribution of food aid in neighbour-
ing regions of Ethiopia in January ’06 that has had a defl ationary impact on cereal prices in the Central Regions. Imported
rice prices in Galkayo have remained relatively stable throughout 2005 (Figure 33). The inaccessibility and disruption of
markets in the Central Region (notably in Hobyo) due to ongoing confl ict often de-links the markets in the region (and from
Galkayo) and leads to localised supply shortages and spikes in prices, further compounded by increased transportation
costs due to the presence of shifting sand dunes on the coastal road. Cereal prices are reported to be higher than normal in
Hobyo, although no fi gures are available, due mainly to the increased transportation costs associated with confl ict in the
area. Camel milk availability is considered normal and is plentiful at this time due to ongoing calving. Camel milk prices
in Galkayo have fallen signifi cantly in the last two months, due to the increased supply following the high peak of camel
calving in November-December ’05.
Income Sources: Pastoral incomes continue to improve generally as a result of good to normal livestock body condition
and productivity, although there is increased expenditure on water in some areas. Goat prices (both local and export)
0.00
0.10
0.20
0.30
0.40
0.50
0.60
0.70
Jan-9
8
Jul-9
8
Jan-9
9
Jul-9
9
Jan-0
0
Jul-0
0
Jan-0
1
Jul-0
1
Jan-0
2
Jul-0
2
Jan-0
3
Jul-0
3
Jan-0
4
Jul-0
4
Jan-0
5
Jul-0
5
Month/Year
Pri
ce p
er 1
Kg
Im
po
rted
Ric
e o
r S
org
hu
m (
US
D)
0
5,000
10,000
15,000
20,000
25,000
30,000Imported Red Rice
Sorghum Red
SOMALI SHILLINGS PER DOLLAR
Figure 33: Various Commodity (Rice & Sorghum)
Prices in Galkayo
Improved sheep body condition in Central Regions

FSAU Technical Series Report No IV.8 51 Issued February 22, 2006
closely follow a seasonal pattern directly linked to the swing
in demand associated with peak livestock export season. In
Galkayo, the average price of export quality goats in December
’05 was SoSh 420,000/head (US$ 27.91) compared to SoSh
440,000/head (US$ 30.03) in December ’04 (see Figure 34).
While prices increased in response to the start of Ramadan
(October) and the peak livestock demand period of the Hajj
(January/February ’06) they are expected to decrease over
the following few months as demand declines. If imported or
local cereal prices remain stable, decreased livestock prices
immediately translate into decreased terms of trade (imported
rice to goat). Income for pastoralists remains balanced between
the need to increase livestock holdings through stock retention
for breeding purposes (as a consequence of the large mortality
during the prolonged drought) and the need for livestock sales to purchase food commodities.
Expenditures: In areas that have received below normal rainfall, water prices are increasing. Water prices in Gidhays
(Adado district) have risen to SoSh 20,000 per drum in December ’05, up to 30% higher than prices in December ’04.
In general, terms of trade have deteriorated. In December ’04 the sale of one export quality goat purchased 73kg of rice
compared to the December ’05 terms of 54kg of rice. Average sugar prices have declined from a peak in July ’05 of
SoSh 9,250/kg to SoSh 9,000/kg but are still higher than during the same period last year (SoSh 6,750/kg). In December
2005, vegetable oil prices were between SoSh 20,000/litre (in Dhusa Mareb and El Bur) and a low of SoSh 10,000/litre
(Harar Dere), with an average of SoSh 16,000/litre. There has also been an increase in prices compared to December
’04 (SoSh 13,750/litre).
Coping Strategies
The main current coping strategies include the confl ict induced migration of pastoral households affected by the unre-
solved confl ict in north Galgadud and south Mudug seeking protection and support in their home clan areas. This places
further strain on livelihood recovery for those affected and for the host households and communities. Migration of pas-
toralists in search of water and pasture is also ongoing. In-migration of livestock into Dhusa Mareb district is reported
from neighbouring Hiran.
Nutrition situation
The levels of malnutrition remain within the long term (past
fi ve year) range estimates in both regions except among the
Addun pastoralists in Dhusa Mareb and El Bur districts which
appear worse than long term levels. These areas host a high
proportion of non-residents whose means of livelihood have
been disrupted. These populations also report increased cases
of ARI and measles. Parts of Abud Wak district (Herale area)
show decreasing levels of malnutrition that are associated with
lower morbidity levels and good dietary diversity (Map 9 and
10). The situation in this area has deteriorated from that during
the Gu ’05 season. Milk availability has generally improved
for most households and is expected to further improve with
the increasing livestock holdings and calving of camels in
January ’06.
Future Outlook
While rangeland conditions and water availability for the entire region are generally similar, southern areas of Galgadud
will continue to see improvements in food and livelihood security due to the absence of civil insecurity. In areas of poor
rainfall, increasing expenditure on water and competition for available pasture resources will slow livelihood recovery.
However, predictions for the northern areas of Galgadud and south Mudug are uncertain due to the unresolved confl ict,
continuing tensions and the consequent disruption to livelihood activities and markets that threaten food and livelihood
security. The declining availability of sorghum and continuing insecurity are likely to further increase prices during the
Jilaal season, and before the benefi ts are felt from Gu rains, impacting, negatively, upon terms of trade and food access
for pastoralists.
Figure 35: Proportion of children with acute malnutrition
in the sentinel sites in Galgadud Region
0%
5%
10%
15%
20%
25%
30%
35%
Wa
ber
i
Ga
do
n
Her
aa
le
Ca
bu
dw
aa
q
El
Hel
e
Ga
l H
are
ri
(0%
ma
ln.
in O
ct0
5)
Ba
hd
ho
Dhusamareb Abudwaq El Bur Adado
Oct-05 Dec-05
Figure 34: Various Commodity (Export & Local Quality
Goat and Camel Milk) Prices in Galkayo
0.00
5.00
10.00
15.00
20.00
25.00
30.00
35.00
40.00
Jan-9
8
Jul-9
8
Jan-9
9
Jul-9
9
Jan-0
0
Jul-0
0
Jan-0
1
Jul-0
1
Jan-0
2
Jul-0
2
Jan-0
3
Jul-0
3
Jan-0
4
Jul-0
4
Jan-0
5
Jul-0
5
Month/Year
Pri
ce p
er 1
Hea
d E
xp
ort
or
Lo
cal
Qu
ali
ty
Go
at
(U
SD
)
0.00
0.20
0.40
0.60
0.80
1.00
1.20
1.40
1.60
1.80
Pri
ce p
er 1
Lit
re C
am
el M
ilk
(U
SD
)
Goat Export Quality (Head)
Goat Local Quality (Head)
Milk Camel Fresh 1 Litre
centra
l som
alia

FSAU Technical Series Report No IV.8 52 Issued February 22, 2006
cen
tra
l /
no
rth
east
an
d n
ort
hw
est
som
ali
a
4.3 NORTHEAST AND NORTHWEST SOMALIA
Overview
Cumulative Deyr rainfall (October - December) was well above average in some
areas of the northwest and northeast, up to 300% above normal in parts of Togder,
Sol, Sanag, northeast Awdal and northwest Galbed. However, west Togder, east
Galbeed, northwest Awdal, parts of Sol and most of eastern Sanag regions (including
Gardo, Dangorayo, Dahar, Bandabeyla and east Erigavo, Taleh and Hudun) received
below normal rainfall (0-20%). Satellite imagery does not necessarily refl ect be-
low normal rainfall in all these areas, therefore, this is primarily based on ground
‘truthing’ and fi eld reports. Many of the areas which received below normal Deyr
rains, however, benefi ted from late Hays rains (January ’06) received in Bossaso
and Iskushuban districts of the Northeast and the coastal and sub-coastal zones of
Awdal, the west of Odweyne district, north of Burao and parts of the Sarar plains of
the Hawd. In areas where the late Hays rains fell, water availability and rangeland
conditions have improved as a result. Deyr rains in Aaluula and Kandala districts
of Bari and Zeyla district of Awdal were 0-20% of normal and these areas did not
benefi t from Hays rains.
For those areas receiving above average Deyr ’05/06 rains
there have been positive effects on pastoral livelihoods
in terms of range resources, water availability, kidding
and milk production. Pasture conditions are generally
normal to good in most places, with livestock body condi-
tions largely normal for all species. Livelihood recovery
continues in those areas that received good rains, build-
ing upon the gains made during the previous Deyr and
Gu seasons (see FSAU Technical Series Reports No.
IV, 3 and 7). Recovery is threatened, however, in the
areas noted above which failed to receive good rains.
Localised rain failures normally would not create such
large problems for pastoralists, as migration is a normal
coping strategy. However, with the loss of pack camels
(up to 80% died during the three year drought ’02/04),
migration and trekking long distances to bring water
becomes problematic. For these pastoralists, faced with
increased water prices and limitations in migration,
conditions are deteriorating.
Due to the cumulative impacts of the prolonged drought and the lag time in overall recovery, the areas previously
considered in a state of Acute Food and Livelihood Crisis but receiving good rains remain in Acute Food and
Livelihood Crisis, with a positive trend of recovery. Areas that received poor rains also remain in Acute Food
and Livelihood Crisis, but with a downward trend of recovery. It is estimated that a total of 227,000 people are
in a state of Acute Food and Livelihood Crisis in these areas (including 20,000 in the coastal fi shing area) (Map
25 and Table 16). Diffi culties in access to the contested areas of Sool and Sanaag continue to limit the presence
of humanitarian actors, areas that require assistance support to livelihoods recovery. The situation in Northeast
Bari requires close monitoring as it is identifi ed in Early Warning Levels of Alert with moderate risk of being
downgraded to Acute Food and Livelihood Crisis. In the Northwest, the Awdal and Maroodi-jeeh coastal zone
are identifi ed to be in Early Warning Levels of Alert.
Effects on Livelihood Assets
Natural Capital: Pasture is generally available in the northeast and northwest due to above normal rainfall received
this season, as well as in two previous Gu and Deyr seasons. There are, however, areas where either pasture or water
is limited or strained. In west Sanag region, water is generally available, but there is no pasture, whereas in east
Sanag water is not available, but there is adequate pasture. Water shortages are also reported in Alula and Kandala
districts. In areas of poor rainfall, water trucking has commenced unseasonably early and distances to water and/or
pasture have increased. In other areas, such as in the central Hawd area of Bali Weyn, there is an increased pressure
on pasture resources due to high livestock concentrations. Late Hays rains received in January have decreased graz-
ing pressure in parts of the northeast, as livestock migrated from the Gebi Valley and Sol Plateau to the foothills of
Map 25: Food Security Phase Classifi cation- North
FSAU
NOTES:
1. Estimated populations do not include IDP or Urban estimates, and are
rounded to the nearest 10,000
2. For category explanations see http://www.fsausomali.org
Phase Classifi cation
Alert
Moderate Risk
High Risk
Sustained Phase 2 or 3 for > 3 yrs
Areas with IDP Concentrations
Phase Classifi cation
Early Warning Levels for worsening Phase
5 Generally Food Secure
4 Chronically Food Insecure
3 Acute Food and Livelihood Crisis
2 Humanitarian Emergency
1 Famine/Humanitarian Catastrophe
LIVELIHOOD SYSTEMS
Pastoral
Agro-Pastoral
Fishing
Map 24: North and Central
Regions: Livelihood Systems
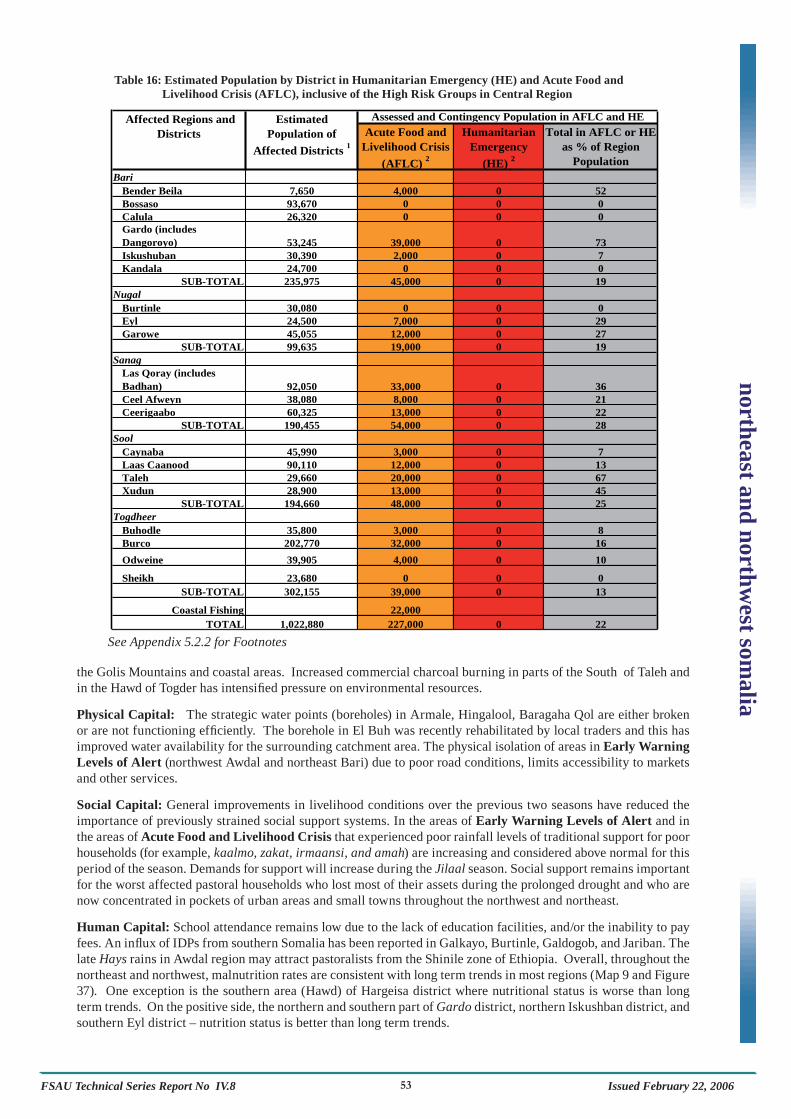
FSAU Technical Series Report No IV.8 53 Issued February 22, 2006
the Golis Mountains and coastal areas. Increased commercial charcoal burning in parts of the South of Taleh and
in the Hawd of Togder has intensifi ed pressure on environmental resources.
Physical Capital: The strategic water points (boreholes) in Armale, Hingalool, Baragaha Qol are either broken
or are not functioning effi ciently. The borehole in El Buh was recently rehabilitated by local traders and this has
improved water availability for the surrounding catchment area. The physical isolation of areas in Early Warning
Levels of Alert (northwest Awdal and northeast Bari) due to poor road conditions, limits accessibility to markets
and other services.
Social Capital: General improvements in livelihood conditions over the previous two seasons have reduced the
importance of previously strained social support systems. In the areas of Early Warning Levels of Alert and in
the areas of Acute Food and Livelihood Crisis that experienced poor rainfall levels of traditional support for poor
households (for example, kaalmo, zakat, irmaansi, and amah) are increasing and considered above normal for this
period of the season. Demands for support will increase during the Jilaal season. Social support remains important
for the worst affected pastoral households who lost most of their assets during the prolonged drought and who are
now concentrated in pockets of urban areas and small towns throughout the northwest and northeast.
Human Capital: School attendance remains low due to the lack of education facilities, and/or the inability to pay
fees. An infl ux of IDPs from southern Somalia has been reported in Galkayo, Burtinle, Galdogob, and Jariban. The
late Hays rains in Awdal region may attract pastoralists from the Shinile zone of Ethiopia. Overall, throughout the
northeast and northwest, malnutrition rates are consistent with long term trends in most regions (Map 9 and Figure
37). One exception is the southern area (Hawd) of Hargeisa district where nutritional status is worse than long
term trends. On the positive side, the northern and southern part of Gardo district, northern Iskushban district, and
southern Eyl district – nutrition status is better than long term trends.
Photo
no
rthea
st an
d n
orth
west so
ma
lia
Acute Food and
Livelihood Crisis
(AFLC)2
Humanitarian
Emergency
(HE)2
Total in AFLC or HE
as % of Region
Population
Bari
Bender Beila 7,650 4,000 0 52
Bossaso 93,670 0 0 0
Calula 26,320 0 0 0
Gardo (includes
Dangoroyo) 53,245 39,000 0 73
Iskushuban 30,390 2,000 0 7
Kandala 24,700 0 0 0
SUB-TOTAL 235,975 45,000 0 19
Nugal
Burtinle 30,080 0 0 0
Eyl 24,500 7,000 0 29
Garowe 45,055 12,000 0 27
SUB-TOTAL 99,635 19,000 0 19
Sanag
Las Qoray (includes
Badhan) 92,050 33,000 0 36
Ceel Afweyn 38,080 8,000 0 21
Ceerigaabo 60,325 13,000 0 22
SUB-TOTAL 190,455 54,000 0 28
Sool
Caynaba 45,990 3,000 0 7
Laas Caanood 90,110 12,000 0 13
Taleh 29,660 20,000 0 67
Xudun 28,900 13,000 0 45
SUB-TOTAL 194,660 48,000 0 25
Togdheer
Buhodle 35,800 3,000 0 8
Burco 202,770 32,000 0 16
Odweine 39,905 4,000 0 10
Sheikh 23,680 0 0 0
SUB-TOTAL 302,155 39,000 0 13
Coastal Fishing 22,000
TOTAL 1,022,880 227,000 0 22
Affected Regions and
Districts
Estimated
Population of
Affected Districts 1
Assessed and Contingency Population in AFLC and HE
Table 16: Estimated Population by District in Humanitarian Emergency (HE) and Acute Food and
Livelihood Crisis (AFLC), inclusive of the High Risk Groups in Central Region
See Appendix 5.2.2 for Footnotes
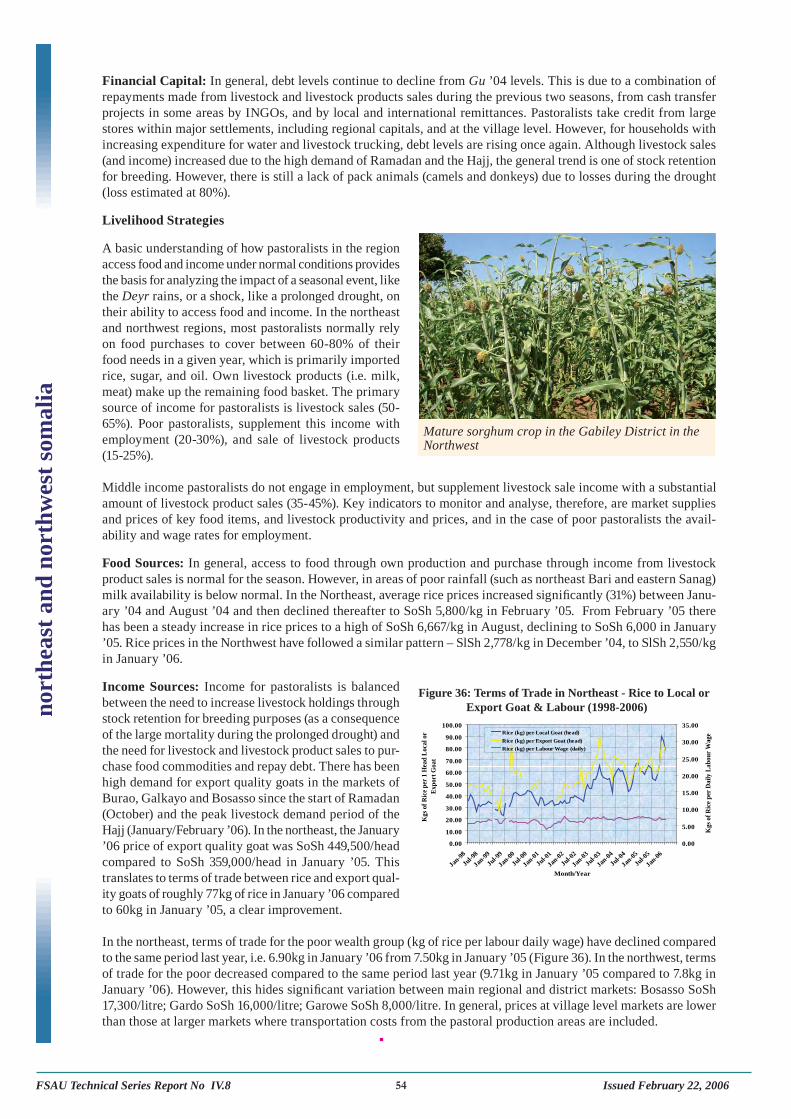
FSAU Technical Series Report No IV.8 54 Issued February 22, 2006
no
rth
east
an
d n
ort
hw
est
som
ali
a
Financial Capital: In general, debt levels continue to decline from Gu ’04 levels. This is due to a combination of
repayments made from livestock and livestock products sales during the previous two seasons, from cash transfer
projects in some areas by INGOs, and by local and international remittances. Pastoralists take credit from large
stores within major settlements, including regional capitals, and at the village level. However, for households with
increasing expenditure for water and livestock trucking, debt levels are rising once again. Although livestock sales
(and income) increased due to the high demand of Ramadan and the Hajj, the general trend is one of stock retention
for breeding. However, there is still a lack of pack animals (camels and donkeys) due to losses during the drought
(loss estimated at 80%).
Livelihood Strategies
A basic understanding of how pastoralists in the region
access food and income under normal conditions provides
the basis for analyzing the impact of a seasonal event, like
the Deyr rains, or a shock, like a prolonged drought, on
their ability to access food and income. In the northeast
and northwest regions, most pastoralists normally rely
on food purchases to cover between 60-80% of their
food needs in a given year, which is primarily imported
rice, sugar, and oil. Own livestock products (i.e. milk,
meat) make up the remaining food basket. The primary
source of income for pastoralists is livestock sales (50-
65%). Poor pastoralists, supplement this income with
employment (20-30%), and sale of livestock products
(15-25%).
Middle income pastoralists do not engage in employment, but supplement livestock sale income with a substantial
amount of livestock product sales (35-45%). Key indicators to monitor and analyse, therefore, are market supplies
and prices of key food items, and livestock productivity and prices, and in the case of poor pastoralists the avail-
ability and wage rates for employment.
Food Sources: In general, access to food through own production and purchase through income from livestock
product sales is normal for the season. However, in areas of poor rainfall (such as northeast Bari and eastern Sanag)
milk availability is below normal. In the Northeast, average rice prices increased signifi cantly (31%) between Janu-
ary ’04 and August ’04 and then declined thereafter to SoSh 5,800/kg in February ’05. From February ’05 there
has been a steady increase in rice prices to a high of SoSh 6,667/kg in August, declining to SoSh 6,000 in January
’05. Rice prices in the Northwest have followed a similar pattern – SlSh 2,778/kg in December ’04, to SlSh 2,550/kg
in January ’06.
Income Sources: Income for pastoralists is balanced
between the need to increase livestock holdings through
stock retention for breeding purposes (as a consequence
of the large mortality during the prolonged drought) and
the need for livestock and livestock product sales to pur-
chase food commodities and repay debt. There has been
high demand for export quality goats in the markets of
Burao, Galkayo and Bosasso since the start of Ramadan
(October) and the peak livestock demand period of the
Hajj (January/February ’06). In the northeast, the January
’06 price of export quality goat was SoSh 449,500/head
compared to SoSh 359,000/head in January ’05. This
translates to terms of trade between rice and export qual-
ity goats of roughly 77kg of rice in January ’06 compared
to 60kg in January ’05, a clear improvement.
In the northeast, terms of trade for the poor wealth group (kg of rice per labour daily wage) have declined compared
to the same period last year, i.e. 6.90kg in January ’06 from 7.50kg in January ’05 (Figure 36). In the northwest, terms
of trade for the poor decreased compared to the same period last year (9.71kg in January ’05 compared to 7.8kg in
January ’06). However, this hides signifi cant variation between main regional and district markets: Bosasso SoSh
17,300/litre; Gardo SoSh 16,000/litre; Garowe SoSh 8,000/litre. In general, prices at village level markets are lower
than those at larger markets where transportation costs from the pastoral production areas are included.
Mature sorghum crop in the Gabiley District in the Northwest
0.00
10.00
20.00
30.00
40.00
50.00
60.00
70.00
80.00
90.00
100.00
Jan-9
8
Jul-98
Jan-9
9
Jul-99
Jan-0
0
Jul-00
Jan-0
1
Jul-01
Jan-0
2
Jul-02
Jan-0
3
Jul-03
Jan-0
4
Jul-04
Jan-0
5
Jul-05
Jan-0
6
Month/Year
Kg
s o
f R
ice
per
1 H
ead
Lo
cal
or
Ex
po
rt G
oa
t
0.00
5.00
10.00
15.00
20.00
25.00
30.00
35.00
Kg
s o
f R
ice
per
Da
ily
La
bo
ur
Wa
geRice (kg) per Local Goat (head)
Rice (kg) per Export Goat (head)
Rice (kg) per Labour Wage (daily)
Figure 36: Terms of Trade in Northeast - Rice to Local or
Export Goat & Labour (1998-2006)

FSAU Technical Series Report No IV.8 55 Issued February 22, 2006
Expenditure: In areas of poor rainfall, expenditure on water and animal trucking has increased, although debt levels
were reduced over the previous two seasons. Water prices in northeast Bari are up to SoSh 60,000-80,000/200 litre
drum, in the Gebi Valley and Sool Plateau prices vary between SoSh 30,000 to SoSh 70,000/drum – the normal seasonal
price is SoSh 5,000-10,000/drum. This expenditure is expected to continue and increase during the Jilaal period.
Coping Strategies
The extreme coping strategies that pastoralists used during the prolonged drought, such as long distance migration to
urban centers, reducing the frequency of meals, feeding on wild fruits, and living with relatives, have declined due to
the continued general improvements in livelihood conditions. However, abnormal migration patterns are observed in
northeast Bari as the coastal Hays rains failed leaving many pastoralists trapped in the cold mountain areas of Kandala
and the Alula golis. In the Northwest, pastoralists from Oogo, Hawd and even from the Somali Region of Ethiopia nor-
mally migrate to the coastal Guban areas to benefi t from the Hays rains, avoiding the cold weather in the upland areas.
The pattern of this season is abnormal as pastoralists have remained in the highlands (the area between the Damal and
Salay grazing areas) for pasture and water. Opportunistic livestock migrations in eastern Sanag have been restricted
by the limited number of pack animals.
Nutrition Situation
The current nutritional situation analysis indicates acute
malnutrition rates to be within the typical ranges for the
area in most parts of Bari and Nugal. Analysis of data from
nutritional surveillance1 indicates acute malnutrition levels
of about 10 – 14.9% (WFH < -2z scores) except the coastal
Deh. Within the coastal Deh, the situation also remains
consistent with the longer term tendency i.e. 5-9.9% WFH
< -2z scores. This better situation is attributed to access
to fi sh and income from fi sh sales. The pastoral livelihood
groups of Kakar-daror (in Ishkushban and Qardho) and the
southern Sol plateau region of Qardho and Benderbeyla are
experiencing a decreased level of malnutrition attributed to
dietary diversity and improving health situation.
This is linked to humanitarian support and improving household food security. Bossasso IDPs face above typical levels
of acute malnutrition (Figure 37) attributed to limited access to food and non-food items. Sool plateau and Nugal region
of Eyl districts show better than typical rates (i.e. estimated at 5-9.9%). This is mainly due to access to fi sh, milk and
to on-going humanitarian assistance. However, sentinel sites surveillance data from Budunburto village indicates a
declining trend of malnutrition. The current situation in north Mudug is within typical levels in all the pastoral groups,
apart from Goldogob district where it is better than usual (i.e. 5-9.9%)2. This is attributed to access to meat, milk
and milk products by all wealth groups, and access to water. Mergaga IDPs are faced with above typical rates of acute
malnutrition, attributed to limited access to food and income. Admissions of severely malnourished children from the
Hawd to Galkaacyo TFC are mainly IDPs.
In Awdal, Galbed, Togder, Sol and Sanag regions levels of acute malnutrition are within the long term levels, except
for the Hawd of Hargeisa where there are some indications that levels are slightly higher than long term levels, and
within IDP and urban poor populations3. Within the Hawd, morbidity rates are also high with reports of an increased
incidence of measles, ARI and diarrhoea. Measles immunization and vitamin A supplementation were low during six
months prior to the assessment at 31% and 17% respectively.
Future Outlook
Areas benefi ting from normal to above normal Deyr rains will continue to see an improvement in food security and
livelihood conditions. However, full recovery is still limited mainly by the lack of pack animals. The problems experi-
enced in areas of poor rainfall threaten to slow down the recovery process as the burden is spread throughout the pastoral
system. The situation for pastoralists with limited mobility will deteriorate, and debt levels continue to increase, during
the Jilaal months. Although the security situation in the contested areas of Sool and Sanaag remains uncertain, there
has been a general reduction in the tension over the last few months. However, access to these areas for humanitarian
actors remains problematic. The situation in the Early Warning Levels of Alert areas requires close monitoring.
0
5
10
15
20
25
30
35
40
Jan-Feb Feb-Mar Mar-apr October
Pro
port
ion
Figure 37: Malnutrition (WFH z scores) among screened
Children (N>900) in Bosaso IDPs camps in ‘05
1Nutrition surveys in Allula/Qandala/Bargal/Ishkushban districts: Aug 2002 & Sept. 2004; Qardho district: Sept. 2004; Sool Plateau: July 2004; June 2003; Sanaag
region: May 2002; health facility and sentinel sites surveillance data trend analysis
2Goldogob nutrition survey Aug 05: GAM of 8.8% (WFH < -2z scores), health facility and sentinel sites surveillance data trend analysis3Nutrition assessment conducted in nine villages of Salahley and Balaygubadle Districts in December 2005 by FSAU/Ministry of Health and Labour indicated
malnutrition levels (weight for height Z score <-2 or oedema) of 11.4% among underfi ve children.
Footnotes
no
rthea
st an
d n
orth
west so
ma
lia

FSAU Technical Series Report No IV.8 56 Issued February 22, 2006
5. APPENDIX
5.1. COMPONENTS OF THE FOOD SECURITY AND HUMANITARIAN PHASE
CLASSIFICATION
5.1.1. Explanation of the Integrated Food Security and Humanitarian Phase Classifi cation
The Integrated Food Security and Humanitarian Phase Classifi cation (IPC) is a tool developed at FSAU over the
past two years to improve linkages between complex information on food, nutrition, and livelihood security; and
response. The classifi cation of ‘Generally Food Secure’, ‘Chronically Food Insecure’, ‘Acute Food and Livelihood
Crisis’, ‘Humanitarian Emergency’, and ‘Famine/Humanitarian Catastrophe’ is based on consistent and internation-
ally accepted criteria, and is mapped in a clear and informative manner (see forthcoming FSAU Technical Series for
more details). Evidence supporting a particular categorization is provided in the analytical text, guided by the FSAU’s
“Evidence-based Templates”. Because the classifi cation is based on consistent reference characteristics, it allows for
comparison of food security situations over space (see Map 1) and over time (see Appendix 5.1.3)
Over the past several months, FSAU has had the opportunity to present fi ndings utilizing the IPC as well as the IPC
itself to dozens of fora around the world, including not only meetings within East Africa, but also in Rome, Washing-
ton, Johannesburg, and Bangkok. Numerous professionals, government offi cials, donors, and media people within
the broad food security and humanitarian community have provided invaluable feedback towards improving the IPC.
While there is scope for further improvement, the resounding feedback has been positive, which is a strong indication
that the IPC is likely to have relevance beyond usage at the FSAU. As an example, the Food Security and Nutrition
Working Group of the Greater Horn of Africa is strongly considering adopting the IPC as a means to enhance the
comparability and rigour of analysis with the GHA.
As part of the 2006 Post Deyr analysis, FSAU has made a few improvements to various parts of the IPC (see FSAU
Technical Series IV.2 and IV.3, and IV.7 for explanations of previous developments), which should further enhance
its usefulness for interpretation and decision making. These include:
Further Refi ning the Phase Classifi cation Categories
• The worse possible category is now called
‘Famine/Humanitarian Catastrophe’, as
opposed to ‘Humanitarian Emergency
Level 1’
• ‘Intermittent Food Insecurity with High
Risk’ is now called ‘Chronically Food
Insecure’
• ‘Food Security with Moderate to Low Risk’
is now called ‘Generally Food Secure’
• The category of ‘Alert’ has been deleted
as a Phase Classifi cation, and shifted to an
‘Early Warning Level’ (see below).
• The order of the phase classes has been
reversed (with Generally Food Security
now on top) in order to highlight that as the
goal, and to be consistent with the notion
of ‘moving downwards’ on the reference
table means ‘getting worse’.
Inclusion of additional reference charac-
teristics
• A few reference characteristics have been
added including: ‘water availability/access’, ‘disease’, and ‘dietary diversity’. Each of these is
important and provide further objective and measurable triangulation to make the analysis more
comprehensive and rigorous.
ap
pen
dix
NOTES:
1. Estimated populations do not include IDP or Urban estimates,
and are rounded to the nearest 10,000
2. For category explanations see http://www.fsausomali.org
Phase Classifi cation
Alert
Moderate Risk
Phase Classifi cation
Early Warning Levels for worsening Phase
5 Generally Food Secure
4 Chronically Food Insecure
3 Acute Food and Livelihood Crisis
2 Humanitarian Emergency
1 Famine/Humanitarian Catastrophe
High Risk
Sustained Phase 2 or 3 for > 3 yrs
Areas with IDP Concentrations

FSAU Technical Series Report No IV.8 57 Issued February 22, 2006
ap
pen
dix
5.1.2. Integrated Food Security and Humanitarian Phase Classifi cation Reference Table
(FAO/FSAU Feb 12, 2006)
Key Reference Characteristics Strategic Response Framework PhaseClassification (current or imminent outcomes on lives and livelihoods;
based on convergence of evidence) (address immediate outcomes, support livelihoods,
and address underlying/structural causes)Crude Mortality Rate < 0.5 / 10,000 / day
Wasting <3 % (w/h <-2 z-score)
Disease acceptable and containable prevalence Investment in food and economic production systems
Food Access/ Availability usually adequate (> 2,100 kcal ppp day), stable Enable development of livelihood systems based on principles
Dietary Diversity consistent quality and quantity of diversity of sustainability, justice, and equity
Water Access/Avail. usually adequate (> 15 litres ppp day), stable Prevent emergence of structural hindrances to food security
Hazards moderate to low probability and vulnerability Advocacy
Civil Security prevailing and structural peace
5Generally
Food Secure
Livelihood Assets generally sustainable utilization (of 5 capitals)
Crude Mortality Rate 0.5-1/10,000/day; U5MR<= 2/10,000/day
Wasting <10 % (w/h <-2 z-score), usual range, stable Design & implement strategies to increase stability, resistance
Disease Sustained moderate to low prevalence and resilience of livelihood systems, thus reducing risk
Food Access/ Availability borderline adequate (2,100 kcal ppp day); unstable Provision of ‘safety nets’ to high risk groups
Dietary Diversity chronic dietary diversity deficit Interventions for optimal and sustainable use of livelihood assets
Water Access/Avail. borderline adequate (15 litres ppp day); unstable Create contingency plan
Hazards recurrent, with high livelihood vulnerability Redress structural hindrances to food security
Civil Security unstable, disruptive tension Close monitoring of relevant outcome and process indicators
Coping ‘insurance strategies’ Advocacy
Livelihood Assets stressed and unsustainable utilization (of 5 capitals)
4Chronically
Food Insecure
Structural Pronounced underlying hindrances to food security
Crude Mortality Rate 1-2 /10,000/day, >2x reference rate; U5MR 2-4/10,000/dy Support livelihoods and protect vulnerable groups
Wasting 10-15 % (w/h <-2 z-score), > than usual, increasing Strategic and complementary interventions to immediately food
Disease outbreak; increasing access/availability AND support livelihoods
Food Access/ Availability lack of entitlement; 2,100 kcal ppp day via asset stripping Selected provision of complementary sectoral support (e.g.,
Dietary Diversity acute dietary diversity deficit water, shelter, sanitation, health, etc.)
Water Access/Avail. 15 litres ppp day accessed via asset stripping, Strategic interventions at community to national levels to create,
Destitution/Displacement emerging; diffuse stabilise, rehabilitate, or protect priority livelihood assets
Civil Security limited spread, low intensity conflict Create or implement contingency plan
Coping ‘crisis strategies’; CSI > than reference; increasing Close monitoring of relevant outcome and process indicators
Livelihood Assets accelerated and critical depletion or loss of access Use ‘crisis as opportunity’ to redress underlying structural causes
3Acute Food and
LivelihoodCrisis
Advocacy
Crude Mortality Rate 2-4 / 10,000 / day, increasing; U5MR > 4/10,000/day
Wasting >15 % (w/h <-2 z-score), > than usual, increasing Urgent protection of vulnerable groups
Disease epidemic outbreak Urgently food access through complementary interventions
Food Access/ Availability severe entitlement gap; unable to meet 2,100 kcal ppp day Selected provision of complementary sectoral support (e.g.,
Dietary Diversity Regularly 2 or fewer food groups consumed water, shelter, sanitation, health, etc.)
Water Access/Avail. < 7.5 litres ppp day (human usage only) Protection against complete livelihood asset loss and/or
Destitution/Displacement concentrated; increasing advocacy for access
Civil Security widespread, high intensity conflict Close monitoring of relevant outcome and process indicators
Coping ‘distress strategies’; CSI significantly > than reference Use ‘crisis as opportunity’ to redress underlying structural causes
2Humanitarian Emergency
Livelihood Assets near complete & irreversible depletion or loss of access Advocacy
Excess Mortality > 5,000 deaths
Crude Mortality Rate > 4 / 10,000 / day Critically urgent protection of human lives and vulnerable groups
Wasting > 30 % (w/h <-2 z-score) Comprehensive assistance with basic needs (e.g. food, water,
Disease epidemic outbreak shelter, sanitation, health, etc.)
Food Access/ Availability extreme entitlement gap; much below 2,100 kcal ppp day Immediate policy/legal revisions where necessary
Water Access/Avail. < 4 litres ppp day (human usage only) Negotiations with varied political-economic interests
Destitution/Displacement large scale, concentrated Use ‘crisis as opportunity’ to redress underlying structural causes
Civil Security widespread, high intensity conflict Advocacy
1Famine /
Humanitarian Catastrophe
Livelihood Assets effectively complete loss; collapse
Early Warning Levels
Probability / Likelihood of
Worsening Phase Severity Key Reference Characteristics Implications for Action
Hazard: occurrence of, or predicted event stressing livelihoods; with low vulnerability Close monitoring and analysis Alert As yet unclear Not applicable
Process Indicators: small negative change from normal
Hazard: occurrence of, or predicted event stressing livelihoods; Close monitoring and analysis
with moderate vulnerability Contingency planning Moderate Risk
Elevated probability / likelihood
Process Indicators: large negative change from normal Step-up current Phase interventions
Hazard: occurrence of, or strongly predicted major event stressing livelihoods; with high vulnerability
Preventative interventions--with increased urgency for High Risk populations High Risk
High probability; ‘more likely than not’
Color of diagonal lines on map
match predicted Phase Class
Process Indicators: large and compounding negative changes Advocacy
Alert

FSAU Technical Series Report No IV.8 58 Issued February 22, 2006
ap
pen
dix
Inclusion of explicit ‘Early Warning Levels’
• On both the IPC reference table and the map, the reader will now see ‘Early Warning Levels’ of
three types: ‘Alert’, ‘Moderate Risk’, and ‘High Risk’. Each of these levels also have associated
probabilities/likelihoods, severity, reference characteristics, and implications for action.
Expansion of the ‘Defi ning Attributes of Areas in Phase 1,2, or 3 on the map
• In addition to the previously identifi ed defi ning attributes of ‘Key Immediate Causes’, ‘Key
Underlying Causes’, ‘Estimated Population’, ‘Criteria for Social Targeting’ (note, this name has
changed), and ‘Confi dence Level of Analysis’, the current IPC version includes ‘Usual Phase Prior
to Current’. This last attribute identifi es whether an area currently classifi ed as Phase 1, 2, or 3 was,
under previous ‘normal’ circumstances, ‘Generally Food Secure’ or ‘Chronically Food Insecure’.
This information enables the user to better distinguish transitory versus chronic food insecurity.
The colour scheme of the Phase Classifi cation on the map has changed to incorporate the deletion of ‘Alert’
as a category and to better distinguish the phases visually.
FSAU will release a Technical Series by April 2006 that comprehensively describes the concepts, technical
details, and practice of using the IPC. We welcome feedback on this and other tools.

FSAU Technical Series Report No IV.8 59 Issued February 22, 2006
ap
pen
dix
The
FS
AU
Food S
ecuri
ty P
has
e C
lass
ifca
tion h
as b
een u
sed s
ince
Feb
ruar
y 2
004.
Pre
sente
d h
ere
are
the
food s
ecuri
ty p
has
e cl
assi
fi ca
tions
for
Gu 2
004,
Dey
r 2004/2
005 a
nd t
he
Gu 2
005 f
or
tren
d a
nal
ysi
s. S
ee
pag
e xx f
or
the
expla
nat
ion a
nd e
volu
tion o
f th
e phas
e cl
assi
fi ca
tion.
The
tool
impro
ves
and i
llust
rate
s th
e co
mple
x l
inkag
es b
etw
en f
ood ,
nutr
itio
n a
nd l
ivel
ihood i
nfo
rmat
ion a
nd r
esponse
. A
tec
hnic
al r
eport
expla
inin
g t
his
phas
e cl
assi
fi ca
tion w
ill
be
rele
ased
in e
arly
Sep
tem
ber
.
5.1
.3.
Co
mp
ari
son
of
FS
AU
In
teg
rate
d F
oo
d S
ecu
rity
Ph
ase
Cla
ssifi
ca
tio
n f
or
Gu
20
04
, D
eyr
20
04
/05
an
d G
u 2
00
5
PO
ST
GU
AU
GU
ST
2005
PO
ST
GU
AU
GU
ST
2004
PO
ST
DE
YR
2004/0
5 (
JA
NU
AR
Y ’
05)
FSA
U

FSAU Technical Series Report No IV.8 60 Issued February 22, 2006
ap
pen
dix
5.1
.4.
Pro
gre
ssio
n o
f E
arl
y W
arn
ing
DE
CE
MB
ER
2005:
EA
RL
Y W
AR
NIN
GN
OV
EM
BE
R 2005:
EA
RL
Y W
AR
NIN
GP
OS
T D
EY
R 2
005/0
6 (
JA
NU
AR
Y ’
06)
FSA
U
Pre
sente
d h
ere
are
the
food s
ecuri
ty p
has
e cl
assi
fi ca
tions
for
Novem
ber
2005, P
ost
Dey
r 2005/2
006 a
nd t
he
Som
ali
Cro
ss B
ord
er F
ood S
ecuri
ty s
ituat
ion (
Januar
y 2
006).

FSAU Technical Series Report No IV.8 61 Issued February 22, 2006
5.2 ESTIMATED POPULATION FUGURES
5.2.1 Table 1A: Estimated Population by Region in Humanitarian Emergency (HE) and Acute Food and
Livelihood Crisis (AFLC), inclusive of the High Risk Groups.
Table 1B: SUMMARY TABLE 2
1Source: WHO 2004. Note this only includes population fi gures in affected regions. UNDP recently released region level population fi gures for 2005. However,
these estimates have not been fi nalised and therefore are not used in this analysis. 2Estimated numbers are rounded to the nearest fi ve thousand, based on resident population not considering current or ancipated migration, and are inclusive of
population in High Risk of AFLC or HE (estimated at 210,000) for purposes of planning. 3Roughly estimated as 30% and 20% of urban population in HE and AFLC areas respectively.4Actual number is 1,660,000, however, this is rounded to 1,700,000 for purposes of rough planning and ease of communication. 5Source: UN-OCHA updated April 2004 (376,630) and UNHCR IDP map Dec.2005 (407,000), rounded to 400,000 as an estimate. 6Percent of total population of Somalia estimated at 7,309,266 (WHO 2004).
Acute Food and
Livelihood Crisis
(AFLC)2
Humanitarian
Emergency
(HE)2
Total in AFLC or HE
as % of Region
Population
NorthBari 235,975 45,000 0 19
Nugal 99,635 20,000 0 20
Sanag 190,455 55,000 0 29
Sool 194,660 50,000 0 26
Togdheer 302,155 40,000 0 13
Coastal (fishing) 20,000
SUB-TOTAL 1,022,880 230,000 0 22
CentralGalgadud 319,735 40,000 0 13
Mudug 199,895 20,000 0 10
SUB-TOTAL 519,630 60,000 0 12
SouthBakol 225,450 45,000 105,000 67
Bay 655,686 135,000 395,000 81
Gedo 375,280 80,000 180,000 69
Hiran 280,880 55,000 0 20
Lower Juba 329,240 60,000 115,000 53
Middle Juba 244,275 50,000 120,000 70
SUB-TOTAL 2,110,811 425,000 915,000 63
TOTAL 3,653,321 715,000 915,000 45
Assessed and Contingency Population in AFLC and HEEstimated Population of
Affected Regions 1
Affected Regions
226
16
236
66
296
Estimated Total Population in Crisis 2,100,000
Assessed and Contigency Population Numbers in AFLC or
HE 1,630,000
30,000
Estimated Number of IDPs5
400,000
Urban Populations in Crisis Areas in the South 3
1,700,0004
Combined Assessed, Urban & Contingency Populations in
AFLC and HE
ap
pen
dix

FSAU Technical Series Report No IV.8 62 Issued February 22, 2006
ap
pen
dix
SOUTH
Acute Food and
Livelihood Crisis
(AFLC) 2
Humanitarian
Emergency
(HE) 2
Total in AFLC or HE
as % of Region
Population
Bakol
El Barde 42,350 4,000 9,000 31
Hudur 55,000 13,000 26,000 71
Rabdure 33,580 8,000 19,000 80
Tieglo 57,525 12,000 30,000 73
Wajid 36,995 10,000 21,000 84
SUB-TOTAL 225,450 47,000 105,000 67
Bay
Baidoa 303,104 58,000 182,000 79
Burhakaba 135,330 26,000 79,000 78
Dinsor 106,802 24,000 64,000 82
Q/dheere 110,450 25,000 71,000 87
SUB-TOTAL 655,686 133,000 396,000 81
Acute Food and
Livelihood Crisis
(AFLC)2
Humanitarian
Emergency
(HE)2
Total in AFLC or HE
as % of Region
Population
Gedo
Bardera 76,850 18,000 32,000 65
Belet Xaawo 58,035 11,000 32,000 74
Ceel Waaq 52,150 15,000 11,000 50
Dolow 39,050 7,000 25,000 82
Garbahaarey 76,075 15,000 48,000 83
Luuq 73,120 15,000 32,000 64
SUB-TOTAL 375,280 81,000 180,000 70
Acute Food and
Livelihood Crisis
(AFLC)2
Humanitarian
Emergency
(HE)2
Total in AFLC or HE
as % of Region
Population
Hiran
Belet Weyne 163,150 31,000 0 19
Bulo Burti 87,060 18,000 0 21
Jalalaqsi 30,670 5,000 0 16
SUB-TOTAL 280,880 54,000 0 19
Acute Food and
Livelihood Crisis
(AFLC)2
Humanitarian
Emergency
(HE)2
Total in AFLC or HE
as % of Region
Population
Lower Juba
Afmadow 100,075 23,000 46,000 69
Badhadhe 41,695 16,000 16,000 77
Jamame 100,625 9,000 42,000 51
Kismayo 86,845 13,000 12,000 29
SUB-TOTAL 329,240 61,000 116,000 54
Middle Juba
Buale 46,520 10,000 28,000 82
Jilib 109,820 19,000 53,000 66
Sakow 87,935 20,000 38,000 66
SUB-TOTAL 244,275 49,000 119,000 69
Affected Regions and
Districts
Estimated
Population of
Affected Districts 1
Assessed and Contingency Population in AFLC and HE
Affected Regions and
Districts
Estimated
Population of
Affected Districts 1
Assessed and Contingency Population in AFLC and HE
Table 2A: Estimated Population by District in Humanitarian Emergency (HE) and Acute Food
and Livelihood Crisis (AFLC), inclusive of the High Risk Groups.
Affected Regions and
Districts
Estimated
Population of
Affected Districts 1
Assessed and Contingency Population in AFLC and HE
Affected Regions and
Districts
Estimated
Population of
Affected Districts 1
Assessed and Contingency Population in AFLC and HE
5.2.2

FSAU Technical Series Report No IV.8 63 Issued February 22, 2006
CENTRAL
Acute Food and
Livelihood Crisis
(AFLC)2
Humanitarian
Emergency
(HE)2
Total in AFLC or HE
as % of Region
Population
Galgadud
Abudwaq 62,500 3,000 0 5
Adado 48,740 7,000 0 14
Dusa Mareb 88,425 15,000 0 17
El Bur 56,155 13,000 0 23
El Der 63,915 0 0 0
SUB-TOTAL 319,735 38,000 0 12
Mudug
Galkayo 74,750 0 0 0
Goldogob 20,300 0 0 0
Haradhere 43,705 6,000 0 14
Hobyo 42,895 13,000 0 30
Jariban 18,245 0 0 0
SUB-TOTAL 199,895 19,000 0 10
TOTAL 519,630 57,000 0 11
Affected Regions and
Districts
Assessed and Contingency Population in AFLC and HEEstimated
Population of
Affected Districts 1
Acute Food and
Livelihood Crisis
(AFLC)2
Humanitarian
Emergency
(HE)2
Total in AFLC or HE
as % of Region
Population
Bari
Bender Beila 7,650 4,000 0 52
Bossaso 93,670 0 0 0
Calula 26,320 0 0 0
Gardo (includes
Dangoroyo) 53,245 39,000 0 73
Iskushuban 30,390 2,000 0 7
Kandala 24,700 0 0 0
SUB-TOTAL 235,975 45,000 0 19
Nugal
Burtinle 30,080 0 0 0
Eyl 24,500 7,000 0 29
Garowe 45,055 12,000 0 27
SUB-TOTAL 99,635 19,000 0 19
Sanag
Las Qoray (includes
Badhan) 92,050 33,000 0 36
Ceel Afweyn 38,080 8,000 0 21
Ceerigaabo 60,325 13,000 0 22
SUB-TOTAL 190,455 54,000 0 28
Sool
Caynaba 45,990 3,000 0 7
Laas Caanood 90,110 12,000 0 13
Taleh 29,660 20,000 0 67
Xudun 28,900 13,000 0 45
SUB-TOTAL 194,660 48,000 0 25
Togdheer
Buhodle 35,800 3,000 0 8
Burco 202,770 32,000 0 16
Odweine 39,905 4,000 0 10
Sheikh 23,680 0 0 0
SUB-TOTAL 302,155 39,000 0 13
Coastal Fishing 22,000
TOTAL 1,022,880 227,000 0 22
Affected Regions and
Districts
Estimated
Population of
Affected Districts 1
Assessed and Contingency Population in AFLC and HE
NORTH
ap
pen
dix

FSAU Technical Series Report No IV.8 64 Issued February 22, 2006
ap
pen
dix
1Source: WHO 2004. Note this only includes population fi gures in affected regions. UNDP recently released region level population fi gures for
2005. However, these estimates have not been fi nalised and therefore are not used in this analysis. 2Estimated numbers are rounded to the nearest one thousand, based on resident population not considering current or ancipated migration, and are
inclusive of population in High Risk of AFLC or HE (estimated at 210,000) for purposes of planning. 3Estimated numbers are rounded to the nearest fi ve thousand.4Roughly estimated as 30% and 20% of urban population in HE and AFLC areas respectively.5Actual number is 1,660,000, however, this is rounded to 1,700,000 for purposes of rough planning and ease of communication. 6Source: UN-OCHA April 2004 (376,630) and UNHCR IDP map Dec.2005 (407,000), rounded to 400,000 as an estimate. 7Percent of total population of Somalia estimated at 7,309,266 (WHO 2004).
Acute Food and
Livelihood Crisis
Humanitarian
Emergency
Total in AFLC or HE
as % of Region
SOUTH 2,110,811 425,000 915,000 63
CENTRAL 519,630 60,000 0 12
NORTH 1,022,880 230,000 0 22
TOTAL 3,653,321 715,000 915,000
227
1 7
237
67
297
Combined Assessed, Urban & Contingency
Populations in AFLC and HE
Table 2B: Population Estimates for the North, Central and South.
Estimated Total Population in Crisis 2,100,000
Table 2C: SUMMARY TABLE 3
Estimated
Population Affected
in North, Central 1
Assessed and Contingency Population in AFLC and HE
Estimated Number of IDPs6
400,000
Assessed and Contigency Population Numbers in
AFLC or HE 1,630,000
Urban Populations in Crisis Areas in the South 4
30,000
1,700,0005
Appendix 4d
Acute Food and
Livelihood Crisis
(AFLC) 2
Humanitarian
Emergency
(HE) 2
Total in AFLC or HE
as % of Region
Population
Bakol
Southern Agro-Pastoral 137,679 41,000 86,000 92
Bay-Bakool Agro-Pastoral 14,863 2,000 10,000 81
Southern Inland Pastoral 72,909 4,000 9,000 18
SUB-TOTAL 47,000 105,000
Bay
Southern Agro-Past 207,190 60,000 130,000 92
Bay-Bakool Agro-Pastoral 343,560 60,000 240,000 87
Southern Inland Pastoral 46,429 3,000 5,000 17
South-East Pastoral 36,586 10,000 21,000 85
SUB-TOTAL 133,000 396,000
Acute Food and
Livelihood Crisis
(AFLC)2
Humanitarian
Emergency
(HE)2
Total in AFLC or HE
as % of Region
Population
Gedo
Southern Agro-Pastoral 45,343 2,000 41,000 95
Bay-Bakool Agro-Pastoral 23,055 4,000 16,000 87
Southern Inland Pastoral 111,441 38,000 28,000 59
Dawa Pastoral 125,016 31,000 75,000 85
Juba Pump Irrigated River 33,145 6,000 20,000 78
SUB-TOTAL 81,000 180,000
Table 3A: Estimated Population by Livelihood Zone in Humanitarian Emergency (HE) and Acute
Food and Livelihood Crisis (AFLC), inclusive of the High Risk Groups.
Affected Regions and
Livelihood Zones
Estimated Population
of Affected Livelihood
Zones 1
Assessed and Contingency Population in AFLC and HE
Affected Regions and
Livelihood Zones
Estimated Population
of Affected Livelihood
Zones 1
Assessed and Contingency Population in AFLC and HE
5.2.3

FSAU Technical Series Report No IV.8 65 Issued February 22, 2006
1Source: WHO 2004. Note this only includes population fi gures in affected regions. UNDP recently released region level population fi gures
for 2005. However, these estimates have not been fi nalised and therefore are not used in this analysis. 2Estimated numbers are rounded to the nearest one thousand, based on resident population not considering current or ancipated migration, and
are inclusive of population in High Risk of AFLC or HE (estimated at 210,000) for purposes of planning. 3Estimated numbers are rounded to the nearest fi ve thousand.4Roughly estimated as 30% and 20% of urban population in HE and AFLC areas respectively.5Actual number is 1,660,000, however, this is rounded to 1,700,000 for purposes of rough planning and ease of communication. 6Source: UN-OCHA April 2004 (376,630) and UNHCR IDP map Dec.2005 (407,000), rounded to 400,000 as an estimate. 7Percent of total population of Somalia estimated at 7,309,266 (WHO 2004).
Acute Food and
Livelihood Crisis
(AFLC)2
Humanitarian
Emergency
(HE)2
Total in AFLC or HE
as % of Region
Population
Hiran
Southern Agro-Pastoral 136,760 48,000 0 35
Hiran Riverine 32,441 6,000 0 18
Southern Inland Pastoral 57,768 0 0 0
Ciid Pastoral 32,630 0 0 0
SUB-TOTAL 54,000 0
Acute Food and
Livelihood Crisis
(AFLC)2
Humanitarian
Emergency
(HE)2
Total in AFLC or HE
as % of Region
Population
Lower Juba
Southern Agro-Pastoral 25,019 8,000 16,000 96
Lower Juba Agro-Pastoral 70,434 26,000 31,000 81
Southern Inland Pastoral 60,496 7,000 12,000 31
South-East Pastoral 46,968 17,000 20,000 79
Southern Juba Riverine 43,903 3,000 37,000 91
Southern Coastal Pastoral 25,156 0 0 0
SUB-TOTAL 61,000 116,000
Middle Juba
Southern Agro-Pastoral 62,183 19,000 39,000 93
Lower Juba AgroPastoral 10,982 3,000 6,000 82
Southern Inland Pastoral 30,895 3,000 8,000 36
South-East Pastoral 20,706 12,000 0 58
Southern Juba Riverine 67,188 5,000 57,000 92
Juba Pump Irrigated River 26,381 7,000 9,000 61
Southern Coastal Pastoral 13,728 0 0 0
SUB-TOTAL 49,000 119,000
Acute Food and
Livelihood Crisis
(AFLC)3
Humanitarian
Emergency
(HE)3
Total in AFLC or HE
as % of Region
Population
Agropastoral1,077,066 275,000 615,000
83
Pastoral680,726 125,000 180,000
45
Riverine 203,058 25,000 120,000 71
TOTAL 425,000 915,000
187
47
17
237
67
297
Table 3C: SUMMARY TABLE 3
Table 3B: South Region Livelihood System Population Estimate.
Affected Livelihood
Systems
Estimated Population
of Affected Livelihood
Systems 1
Estimated Total Population in Crisis 2,100,000
Urban Populations in Crisis Areas in the South 4
30,000Combined Assessed, Urban & Contingency
Populations in AFLC and HE 1,700,000 5
Estimated Number of IDPs 6
400,000
Assessed and Contigency Population Numbers in
AFLC or HE in the South 1,340,000Assessed Number in AFLC or HE in the North and
Central 290,000
Assessed and Contingency Population in AFLC and HE
Affected Regions and
Livelihood Zones
Estimated Population
of Affected Livelihood
Zones 1
Assessed and Contingency Population in AFLC and HE
Affected Regions and
Livelihood Zones
Estimated Population
of Affected Livelihood
Zones 1
Assessed and Contingency Population in AFLC and HE
ap
pen
dix

FSAU Technical Series Report No IV.8 66 Issued February 22, 2006
ap
pen
dix
5.3 LIST OF PARTNER AGENCIES
1. World Food Programme (WFP)
2. International Committee of The Red Cross (ICRC)
3. Candlelight
4. Horn of Africa Volunteer Youth Organization (HAVAYOCO)
5. Somali Red Crescent Society (SRCS)
6. Ministry of Health and Labour (Somaliland)
7. Ministry of Livestock (Somaliland)
8. Ministry of Agriculture (Somaliland) ,
9. National Environmental Research and Disaster Preparedness (NERAD)
10. United Livestock Professional Association (ULPA)
11. CARE
12. SACID
13. United Nations Children’s Fund (UNICEF)
14. Agrosphere
15. Somalia Euroean Committee for Agricultural Training (CEFA)
16. Africa Rescue Committee (AFREC)
17. Action Internationale Centre la Faim (ACF)
18. World Vision International (WVI)
19. Save The Children Fund
20. UN Offi ce for Coordination of Humanitarian Affairs (OCHA)
21. Danish Refugee Council (DRC)
22. Pastoral and Environmental Network for the Horn of Africa (PENHA),
23. Food and Agricultural Organisation (FAO),
24. Oxfam GB
25. Vetaid
26. Horn Relief
27. Ministry of Fisheries Puntland
28. Ministry of Agriculture and Livestock and Environment (Puntland) ,
29. Humanitarian Affairs and Disaster Management Agency (HADMA) Puntland,
30. Concern
31. Ministry of Planning and Rural Development (MPRD)
32. Ministry of Water & Mineral Resources Somaliland (MWMR)
33. Committee for Development and Initiatives (CDI)
34. Jubbaland Charity Center (JCC)
35. SDIO
36. Somali Aid Foundations (SAF)
37. MERCY
38. Sanaag Agricultral Development Organization (SADO)
39. ACA
40. BARDA
41. Transitional Federal Government of Samalia (TFG)
42. FEWSNET
FSAU would like to thank all the agencies that participated and made this assessment possible. Our regional
partners assisted with data collection and logistical support.

FSAU Technical Series Report No IV.8 67 Issued February 22, 2006
5.4 ASSESSMENT PROCESS, ANALYTICAL TOOLS AND TIMELINE
5.4.1 POST DEYR ASSESSMENT TIMELINE
Activity Date Description/Location
FSAU Planning & Preparation Nov. 15 - 18 NBI
FSAU Issues Early Warning Nov. 14 FSAU Monthly Brief
Northwest Post Harvest Crop Assessment
Nov. 20 – Dec. 5 Somaliland with partners in Awdal, W. Galbeed, Togdheer
Partner Planning Meeting November 30 NBI with partners
Regional Fieldwork Planning Workshops
Dec. 11 - 12 Regional Workshops with partners in Belet Weyne, Wajid, Buale, Merka, Garowe, Hargeisa
Fieldwork Dec. 12 -29 Throughout region with partners
FSAU Issues Press Release of Deteriorating Situation
Dec. 20 FSAU Press Release
Regional Analysis Workshop Dec. 31 – Jan. 3 Regional Workshops with partners in Belet Weyne, Wajid, Buale, Jowhar, Garowe, Hargeisa
All Team Analysis Workshop Jan. 4 - 8 All FSAU team (NBI and field) in Hargeisa, SL
Analysis Consolidation with Partners
Jan. 16 FSAU with Primary Technical Partners in NBI
Cross Border Partner Analysis Workshop
Jan. 16 FSAU with Technical Lead Agencies and Institutions in Kenya and Ethiopia held in NBI
Release of Preliminary Results Jan. 18 Jan. 19 Jan. 26
SACB/FSRD FSAU Press Release FSAU Monthly Brief- Key Findings
Release of Technical Series Report Feb. 15 FSAU Website, Email distribution, Hardcopy Mailing
The tools used during the Post Deyr Assessment and Analysis process are listed below.
5.4.2 Assessment Instruments and Tools
5.4.2.1 Food Security Livelihoods and Nutrition Assessment Pastoral
5.4.2.2 Southern Somalia 2005/6 Deyr Seasons District Crop Establishment Survey
5.4.2.3 Southern Somalia 2005/6 Deyr Seasons Farmer Crop Establishment Survey
5.4.2.4 Food Security Livelihood and Nutrition Assessment, Market Questions
5.4.2.5 Key Parameter Form for Milk Production by District - Shebelle valley
5.4.2.6 Key Parameter Form for Livestock Production by District - Shebelle valley
5.4.2.7 Key Parameter Form for Other Food and Income Sources - Shebelle valley
5.4.2.8 Food Security Phase Classifi cation Evidence Based Analysis Template:
Post Deyr ’05/06 Assessment
ap
pen
dix

FSAU Technical Series Report No IV.8 68 Issued February 22, 2006
ap
pen
dix
5.4.2.1 Food Security Livelihoods and Nutrition Assesment Pastoral
FOOD SECURITY ANALYSIS UNIT (FSAU)/FEWSNET
FOOD SECURITY, LIVELIHOODS AND NUTRITION ASSESSMENT
PASTORAL
Date: _____________________ Interviewer’s name: _______________________ Region: ____________________________
District: ___________________ Village/Settlement_________________________ Livelihood zone: _____________________
GPS Coordinates North: __________________________________ East: ______________________________
Key informant/focus group/household interview: (circle one) Data entry Number _________________
C. EFFECTS ON LIVELIHOOD ASSETS - NATURAL CAPITAL
WATER
13. Currently, what is the main source of water? (select only one) River Catchments Shallow well Borehole Water tanker Other (specify)
[ ] [ ] [ ] [ ] [ ] [ ]
14. Currently, where is the location of this main source of water? (give the location where)
[ ]
15. Currently, what is the distance (one way) to this main source of water? a. kilometres [ ] b. minutes [ ]
16. Is this main water source ‘normal’ for the season? Yes [ ] OR No [ ]
17. If NO, explain why?
18. How long will this main source of water last (select only one)? 0-2 months [ ] 2-4 months [ ]
4-6 months [ ] 6+ months [ ]
19. What is the current price of water for human consumption (currency/barrel)?
a. currency (specify) b. unit (litres)
[ ] [ ]
RANGELAND
20. What is the condition/quality of the main grazing areas? (select only one) Very good [ ] Good [ ] Average [ ]
Poor [ ] Very poor [ ]
21. What is the distance (one way) to the current grazing areas (by species)? Camel Goat . Sheep CattleOther (specify)
a. km [ ] c. km [ ] e. km [ ] g. km [ ] i. km [ ]
b. min [ ] d. min [ ] f. min [ ] h. min [ ] j. min [ ]
22. For those places that had good rains, will it be enough for rangeland
recovery? Yes [ ] OR No [ ]
23. Will it be enough to support the livestock from the area until the next rain
season? Yes [ ] OR No [ ]
24. If NO, for how many months will forage last? [ ] months
25. Has there been any in-migration of livestock from neighbouring districts, regions, or even countries (for example, Kenya or Ethiopia)?
Yes [ ] OR No [ ]
26. If YES, note the up to four main locations where the livestock originated
from. Rank these by importance (with ‘a’ being the most important). a. [ ] b. [ ] c. [ ] d. [ ]
CHARCOAL PRODUCTION
27. Currently, does charcoal production take place in this area? Yes [ ] OR No [ ]
28. Has the production of charcoal increased compared to this time last year? Yes [ ] OR No [ ]
A. EVENT/HAZARD/SHOCK/RISK
RAINS
1. Current season: when did the rains start? [ ] enter date
2. Current season: what is the total number of days that rain fell this season? [ ] days
3. Current season: for the days that rain fell, what was the intensity of heavy and light days?
a. Heavy [ ] days b. Light [ ] days
4. Current season: what was the distribution of rainfall? (select only one) Widespread [ ] OR Localised [ ]
5. How do this seasons rains compare with this season last year? (select only
one)
Better [ ] Same [ ] Worse [ ]
Map
AUsing a map of the district/region, identify the areas that have had poor rains and identify the areas that have had good
rains.
6. How do field reports of the rains compare with the satellite imagery? Are they:
Very Similar Somewhat Similar Different
[ ] [ ] [ ]
CIVIL INSECURITY
7. Currently, is civil insecurity disrupting food security and livelihoods in the area?
Yes [ ] OR No [ ]
8. If YES, explain why?
Map
BUsing a map identify where there are areas of civil insecurity
9. Is the risk of insecurity in the coming 6 months likely to increase? Yes [ ] OR No [ ]
10. If YES, explain why?
Map
CUsing a map identify where there are areas of civil insecurity by circling the areas.
B. OVERALL SEASONAL PERFORMANCE - CURRENT
11. Note the key events for the current season. Key events may include, for example, reference to floods, drought, freezing rains, conflict, and extreme currency fluctuation.
12. What is the overall seasonal (current and previous) performance
Rank 1-5 ? * Note that seasonal performance is a multi-factor indicator that includes
rainfall (duration, intensity, distribution), rangeland conditions (the availability of grazing and browsing), livestock health, and crop
performance
a. Current Season [ ]
b. Previous Season [ ]
Key: 1 very poor, 2 poor, 3 average, 4 good, 5 very good
5.4.2 ASSESSMENT INSTRUMENTS AND TOOLS

FSAU Technical Series Report No IV.8 69 Issued February 22, 2006
Map
EUsing a map identify the areas where the enclosures are located
29. If YES or NO, explain why
30. Is charcoal production leading to rangeland degradation in this area? Map
DUsing a map identify the areas where there are the most severe pockets of charcoal production
31. Is this trend expected to continue? Yes [ ] OR No [ ]
ENCLOSURES
32. Are there private land enclosures in your area? Yes [ ] OR No [ ]
33. If YES, what is the impact of private enclosures on pastoral livelihoods?
D. EFFECTS ON LIVELIHOOD ASSETS – PHYSICAL CAPITAL
MARKETS
34. What is the main market that serves this community? [ ]
35. Are there any factors that are limiting access to markets? Yes [ ] OR No [ ]
36. If YES, what is the two main factors limiting access to markets? a. main factor [ ] b. secondary factor [ ]
1. Poor roads 2. Insecurity 3. Communication 4. Other (specify)
37. If YES, describe in detail how access to named markets has been affected
INFRASTRUCTURE
38. Has there been any deterioration in the physical condition of ‘public’
infrastructure this season compared to the previous season? Yes [ ] OR No [ ]
39. If YES, indicate which infrastructure has been affected (YES or NO) a. Roads b. Bridges c. Riverbanks d. Other (specify)
Yes [ ] No [ ] Yes [ ] No [ ] Yes [ ] No [ ] Yes [ ] No [ ]
40. If YES, explain how?
Map
FUsing a map identify the areas affected
E. EFFECTS ON LIVELIHOOD ASSETS – FINANCIAL CAPITAL
LIVESTOCK HOLDINGS
41. What is the total estimated average % change of herd size by species
(due to death, distress sales, or births) since this season last year? a. Camel (general) b. Camel (pack) c. Goat d. Sheep e. Cattle f. Other (specify
[ %] [ %] [ %] [ %] [ %] [ %]
42. Is this trend normal? Yes [ ] OR No [ ]
43. If YES or NO, explain why
44. What is the average current body condition of livestock by species? Key: good = g, normal = n, poor = p
a. Camel (general) [ ]
b. Camel (pack) [ ]
c. Goat [ ]
d. Sheep [ ]
e. Cattle [ ]
f. Other (specify) [ ]
45. What is the current trend in average livestock holdings by species? Key: increasing = I, same = s, decreasing = d
a. Camel (general) [ ]
b. Camel (pack) [ ]
c. Goat [ ]
d. Sheep [ ]
e. Cattle [ ]
f. Other (specify) [ ]
DEBT
46. What is the average level of total accumulated household debt for poor
households?[ ] US$
47. What was the average level of total accumulated household debt for poor households in the previous season?
[ ] US$
48. If these are different explain the difference
49. What are the two most important sources of household debt for poor
households this season?
1. Food (staple food purchase), 2. Food (non-staple food purchase), 3. Transport, 4. Human health services, 5. Livestock health services, 6. Water (human), 7. Water (livestock), 8. Other (specify)___________
a. Main Source b. Secondary Source
[ ] [ ]
F. EFFECTS ON LIVELIHOOD ASSETS - SOCIAL CAPITAL
50. Are pastoralists receiving livelihood support from relatives and friends? Yes [ ] OR No [ ]
51. If YES, which wealth group in the community is benefiting most? [ ]
52. If YES, currently, what are the main types of livelihood support that are being received? Rank 1-9 or 10 (with 1 being the most important and 9 or 10 being the least important)
a. Xool goin [ ]
b. Irmaansi [ ]
c. Amah [ ]
d. Remittances [ ]
e. Shaxaad [ ]
f. Kaalmo [ ]
g. Zakat [ ]
h. Sadaqa [ ]
i. Other (specify) [ ]
53. If YES, how long can this support continue? [ ] months
54. If YES, is this support normal? Yes [ ] OR No [ ]
55. If NO, explain why it is not normal
56. According to the Imam of the nearest mosque has there has been an increase in the number of people seeking assistance?
Yes [ ] OR No [ ]
G. EFFECTS ON LIVELIHOOD ASSETS – HUMAN CAPITAL
EDUCATION
57. Is there a primary school in this community or nearby that this community use?
Yes [ ] OR No [ ]
58. If YES, has access (positively or negatively) to education changed compared to this time last year?
Yes [ ] OR b. Positive [ ] OR
No [ ] Negative [ ]
ap
pen
dix
FSAU Technical Series Report No IV.8 70 Issued February 22, 2006
ap
pen
dix
71. Currently, are income-earning labour opportunities available in the area? Yes [ ] OR No [ ]
72. If YES, where is the main location for these opportunities? [ ]
73. If YES, what are the four main opportunities? Rank these by importance (with ‘a’ being the most important).
a. [ ] b. [ ] c. [ ] d. [ ]
74. Are these opportunities normal for the season? Yes [ ] OR No [ ]
75. If NO, what has changed?
H. LIVELIHOOD STRATEGIES
FOOD SOURCES
76. Currently, is household access to food less than normal for this season? Yes [ ] OR No [ ]
77. If YES, what sources of food are constrained? (tick all that apply) a. own production (milk/meat) b. staple purchase c. non-staple purchase d. other (specify)
[ ] [ ] [ ] [ ]
78. If YES, explain why and how access to food is constrained?
79. If YES, identify which households are affected. This may be by wealth group or by other defining characteristics (such as by
location, or those displaced)
80. If the household has normal access to food, does the household anticipate a problem of food access in the next 6 months?
Yes [ ] OR No [ ]
81. If YES, explain why
INCOME SOURCES
82. Currently, is household access to income less than normal for this season? Yes [ ] OR No [ ]
83. If YES, what sources of income are constrained? a. Livestock sales b. Milk sales c. Labour d. Other (specify)
[ ] [ ] [ ] [ ]
84. If YES, explain why and how access to income is constrained?
85. If YES, identify which households are affected. This may be by wealth group or by other defining characteristics (such as by
location, or those displaced)
86. If the household has normal access to income, does the household anticipate a problem of food access in the next 6 months?
Yes [ ] OR No [ ]
87. If YES, explain why
EXPENDITURES
88. Currently, is household expenditure more than normal for this season? Yes [ ] OR No [ ]
89. If YES, explain how expenditure has changed?
90. If YES, explain why
91. If YES, identify which households are affected. This may be by wealth group or by other defining characteristics (such as by
location, or those displaced)
92. If YES, what strategies are households adopting to meet this change?
93. If the household has normal expenditure, does the household anticipate a problem of expenditure in the next 6 months?
Yes [ ] OR No [ ]
94. If YES, explain why
59. If YES, give the main reason why access has changed (select only one) Financial [ ]
Insecurity [ ]
HH labour [ ]
Other (specify) [ ]___________
60. If YES, explain any differences in access by households or for men and women, girls and boys
HUMAN HEALTH
61. Is there a health service in this community or nearby that this community use?
Yes [ ] OR No [ ]
62. If YES, has access (positively or negatively) to health services changed compared to this time last year?
Yes [ ] OR b. Positive [ ] OR
No [ ] Negative [ ]
63. If YES, give the main reason why access has changed Financial [ ]
Insecurity [ ]
HH labour [ ]
Other (specify) [ ]___________
64. If YES, explain any differences in access by households or for men and women, girls and boys
VETERINARY SERVICES
65. Is there a veterinary service in this community or nearby that this community use?
Yes [ ] OR No [ ]
66. If YES, has access (positively or negatively) to veterinary services changed compared to this time last year?
Positive [ ] OR Negative [ ]
67. If YES, give the main reason why access has changed. Rank 1-3 (where 1 is most important and 3 is least important
Financial [ ]
Insecurity [ ]
Other (specify) [ ]___________
68. Where is the nearest location where animal drugs can be purchased? [ ]
LABOUR
69. This season has the availability of labour (from family or other labour sources) been adequate for the management of household livestock?
Yes [ ] OR No [ ]
70. If NO, why is this and what are and will be the consequences?
I. COPING STRATEGIES
GENERAL
95. What are the main coping strategies currently used by pastoralists from various wealth groups? Rank these by importance (with ‘a’ being the most important).
a. [ ] b. [ ] c. [ ] d. [ ] e. [ ] f. [ ]
FSAU Technical Series Report No IV.8 71 Issued February 22, 2006
[ ]
LIVESTOCK MIGRATION MAP Map G Using a map, what is the current migration pattern of livestock (and note by species) in the area (including from Kenya
and/or Zone V of Ethiopia)? What parts of that migration are considered normal and what parts are not? Indicate with
arrows on the map the points of origin and destination for the migrations.
OUT-MIGRATION (OUTWARD)
96. Are out-migration patterns normal or abnormal for this season? Normal [ ] OR Abnormal [ ]
97. If out-migration is taking place are households splitting? Yes [ ] OR No [ ]
98. If YES, explain why they are splitting?
99. When did the main out-migration take place? (select only one) This month [ ]
1-2 month ago [ ]
3-4 months ago [ ]
5-6 months ago [ ]
6+ months ago [ ]
Other (specify) [ ]
100 If YES, what is the estimated total number of households (or partial households) that out-migrated?
[ ] Number of HH
101. If YES, identify and rank which wealth groups out-migrated (with ‘a’ being the most important).
a. [ ] b. [ ] c. [ ] d. [ ]
102. What were the reasons for the out-migration? Rank them 1 - 6 (1 being the most important)
a. Income [ ]
b. Water [ ]
c. Pasture [ ]
d. Insecurity [ ]
e. Pest & disease [ ]
f. Other (specify) [ ]
103. What are the factors, if any, that have limited migration mobility and rank them 1-8 (with 1 being the most important)?
a. Income [ ]
b. Water [ ]
c. Pasture [ ]
d. Insecurity [ ]
e. Pest & disease [ ]
f. Road conditions [ ]
g. Pack animals [ ]
f. Other (specify) [ ]
104. If any factors have been highlighted explain why?
IN-MIGRATION (INWARD)
105. Are in-migration patterns normal or abnormal for this season? Normal [ ] OR Abnormal [ ]
106. If in-migration is taking place are households splitting? Yes [ ] OR No [ ]
107. If YES, explain why they are splitting?
108. When did the main in-migration take place? (select only one) This month [ ]
1-2 month ago [ ]
3-4 months ago [ ]
5-6 months ago [ ]
6+ months ago [ ]
Other (specify) [ ]
109. If yes, what is the estimated total number of households (or partial households) that in-migrated?
[ ] Number of HH
110. If yes, identify and rank which wealth groups in-migrated (with ‘a’being the most important).
a. [ ] b. [ ] c. [ ] d. [ ]
111. What were the reasons for the in-migration and rank in importance 1 - 6 (with 1 being the most important)?
a. Income [ ]
b. Water [ ]
c. Pasture [ ]
d. Insecurity [ ]
e. Pest & disease [ ]
f. Other (specify) [ ]
112. What are the factors, if any, that have limited migration mobility and the choice of end destinations and rank in importance 1-8 (with 1 being the most important)?
a. Income [ ]
b. Water [ ]
c. Pasture [ ]
d. Insecurity [ ]
e. Pest & disease [ ]
f. Road conditions [ ]
g. Pack animals [ ]
f. Other (specify) [ ]
113. If any factors have been highlighted explain why?
CONSUMPTION STRATEGIES
114. In the past 30 days, if households have not had enough food or enough money to buy food, what are the most common consumption strategies
employed in this community?
a. [ ] b. [ ] c. [ ] d. [ ] e. [ ]
115. Are current household food consumption patterns different from this season last year?
Yes [ ] OR No [ ]
116. If YES, explain how
J. SCENARIO DEVELOPMENT
117. Develop the most likely scenario for the next 6 months, or until the next rain season whichever is sooner. This should include
information on the capital assets, potential coping strategies and food security outcomes
K. INDICATORS
118. What are the key 4 indicators to be monitored in order of importance (with ‘a’ being the most important) over the next 6 months?
a.b.c.e.
L. ISSUES OF CONCERN
119.
M. ADDITIONAL COMMENTS
120. Note the question(s) the additional comment(s) refers to.
ap
pen
dix

FSAU Technical Series Report No IV.8 72 Issued February 22, 2006
ap
pen
dix
5.4.2.2 Southern Somalia 2005/6 Deyr Season District Crop Establishment Survey
FOOD SECURITY ANALYSIS UNIT (FSAU)/FEWSNET
FOOD SECURITY, LIVELIHOODS AND NUTRITION ASSESSMENT
PASTORAL
Date: _____________________ Interviewer’s name: _______________________ Region: ____________________________
District: ___________________ Village/Settlement_________________________ Livelihood zone: _____________________
GPS Coordinates North: __________________________________ East: ______________________________
Key informant/focus group/household interview: (circle one) Data entry Number _________________
2: RAINFALL
2.1 When did this Deyr rainy season begin?
Date: ….. / ….. / 2005 If you are not sure about the date, please precise: Before After the 15th of the month of …..
2.2 How do you assess rainfall situation at this stage of the Deyr season? Very bad Bad Normal Good Very good
2.3 Are the rains at this time of the year better than the same time in a normal year? Worse Same Better
3: PLANTING
3.1 Compared to the normal situation, when did most of the households plant the main crop?
Early On time late Never 3.2 Date of first planting: ….. / ….. / 2005
If you are not sure about the date, specify: Before After the 15th of the month of …..
3.3 Date of last planting: ….. / ….. / 2005
If you are not sure about the date, please precise: Before After the 15th of the month of …..
3.4 Did a significant number of households have to replant? Yes No
If yes, specified the proportion: ___________________
3.5 Did all the villages within the FEG plant? Yes No
If no, what is the proportion of villages that did not plant? _________ Why? _____________________________________________________
4: SEEDS
4.1 Did most of the households have enough seeds at the beginning of this Deyr Season? Yes No
4.2 How was the situation of seeds this Deyr season compared with a normal Deyr?Worse Same Better Do not know
4.3 How was the germination of seeds? Bad Normal Good
5: PLANTED AREA
5.1 Compared to a normal year, the estimated planted area is: lower Why? _________
similar
higher Why? __________
CROP Poor Middle Better off
Maize
Sorghum
Cowpeas
Sesame
Other
5.2 Average planted area per household, by wealth group (range of ha):
AGRO-PASTORAL & AGRICULTURAL

FSAU Technical Series Report No IV.8 73 Issued February 22, 2006
Crop Failure Poor Normal Good crop Very good
Maize
Sorghum
Cowpeas
Sesame
Other (………..)
Crop Poor Middle Better off
Maize
Sorghum
Cowpeas
Sesame
Other crops
Crop Production compared to same season last year
Below Same Above Don’t Know
Maize
Sorghum
Other
<10% 10-25% 25-50% 50-75% >75%
Contribution (%)
Poor Middle Better off
Poor Middle Better off
6: CROP CONDITION
What is the crop condition at this time of the Deyr season?
7: EXPECTED PRODUTION
7.1 Indicate how much is expected to be the Deyr harvest, for each wealth group and type of crop grown (range of bags).
7.2 How does this season’s expected cereal production compare with same season last year?
7.3. Forecasted contribution of the FEG to the total cereal production of the district?
8: STOCKS
8.1 Estimation of average cereal stocks at household level (range of bags), by wealth group
8.2 How long do you expect these cereal stocks to last (number of months)?
9: ACCESS TO STAPLE FOOD
At this time of the year, how do the poor households access their staple food? Classify in decreasing order the origin of the
cereal consumed (only the 3 main ones, indicate the corresponding number: 1, 2, 3):
COMMENTS/OBSERVATIONS: ……………………………………….
ap
pen
dix

FSAU Technical Series Report No IV.8 74 Issued February 22, 2006
ap
pen
dix
5.4.2.3 Southern Somalia ’05/06 Deyr Season Farmer Crop Establishment Survey
3.3 When did you plant the main crop this season?
Before rains on time late
3.4 How is the germination of seeds?
Bad Normal Good
3.5 Did you have to replant?
Yes No
4: CROP CONDITION
What is the crop condition at this time of the Deyr season?
Crop Crop failure Poor crop Normal
crop
Good crop Other
Maize
Sorghum
Cowpeas
Sesame
Other
(Specify)
2: RAINFALL
2.1 When did this Deyr season rains begin?
Early On time late Never
2.2 How do you assess rainfall situation at this stage of the Deyr season?
Bad Normal Good
2.3 Are the rains at this time of the year better than the same time last year?
Worse Same Better
3: AGRICULTURAL INPUTS AND PLANTING
3.1 Did you have enough seeds at the beginning of this Deyr Season?
Yes No
3.2 How is the situation of seeds this Deyr season compared with last year’s Deyr?
Worse same better do not know
FOOD SECURITY ANALYSIS UNIT (FSAU)/FEWSNET
FOOD SECURITY, LIVELIHOODS AND NUTRITION ASSESSMENT
PASTORAL
Date: _____________________ Interviewer’s name: _______________________ Region: ____________________________
District: ___________________ Village/Settlement_________________________ Livelihood zone: _____________________
GPS Coordinates North: __________________________________ East: ______________________________
Key informant/focus group/household interview: (circle one) Data entry Number _________________
AGRICULTURAL

FSAU Technical Series Report No IV.8 75 Issued February 22, 2006
5: PLANTED AREA AND EXPECTED PRODUTION
5.1 How many fields do you have under each of the following crops and how big are they?
CROP FIELD 1 FIELD 2 FIELD 3 OTHER
FIELDS
TOTAL
AREA
Maize
Sorghum
Cowpeas
Sesame
Other
5.2 For each crop grown, indicate how much you expect to harvest this Deyr season.
CROP EXPECTED HARVEST
Units of Measurement Amount
Maize
Sorghum
Cowpeas
Sesame
Other crops
5.3 How does this season’s expected production compare with same season last year?
Crop Production compared to same season last year
% Below Same % Above Don’t Know
Maize
Sorghum
Cowpeas
Sesame
Other
6: LIVES TOCK CONDITION 6.1 How is the water availability for livestock situation this Deyr season?
Bad Normal Good
6.2 How are pasture conditions this Deyr season?
Bad Normal Good
6.3 Have there been any out break of livestock diseases in the last one month?
Yes No (skip Q5.4)
6.4 Were there any livestock deaths?
Yes No (skip Q5.5)
6.5 How many livestock died (numbers)?
6.6 Are livestock drugs available at the local markets?
Yes No
7: COPING MECHANIS M
7.1 How much food do you have in stock (food type and units)
7.2 How long do you expect this food stock to last? (Months/weeks/days)
7.3 If the food stocks do not last until the next harvest, how will you cope with the shortfall?
1. Purchase food
2. Stop non-food uses
3. Sell livestock
4. Non-food activities (Employment, petty trade)
5. Other (S pecify)
Thank the respondent for his/her co-operation
COMMENTS/OBS ERVATIONS
ap
pen
dix

FSAU Technical Series Report No IV.8 76 Issued February 22, 2006
ap
pen
dix
Unit Current prices (note
currency)
Expected change in
6 months
Reason
1. Price of major staples
and non-staples
Imported rice 1 kg
Sorghum 1 kg
Maize 1 kg
Wheat flour 1 kg
Vegetable oil 1 lt
Sugar 1 kg
2. Employment (non-
skilled) wage rates
Herding Per day
Agricultural labouring Per day
Construction Per day
Other (specify): Per day
Other (specify) Per day
3. Sale price of bush
products (self-
employment)
Firewood/logs Bundle
Charcoal Bag
Incense/gum 1 kg
Other (specify):
Other (specify):
4. Sale price of livestock
products
Camel milk 1 lt Cow milk 1 lt
Other (specify):
Other (specify):
5. Sale price of livestock
Export shoats Per head
Local shoats Per head
Local cattle Per head
Export cattle Per head
Local camel Per head
Other (specify): Per head
Other (specify): Per head
6. Price of water
Water (human) 1 drum
Local exchange rate US$1 =
FOOD SECURITY ANALYSIS UNIT (FSAU)/FEWSNET
FOOD SECURITY, LIVELIHOODS AND NUTRITION ASSESSMENT
MARKET QUESTIONS
Date & season: ___________________________________ Interviewer’s name: ______________________________________
Market location (region): __________________________ Market location (district): _________________________________
Market location (settlement): ______________________ Livelihood zone: _________________________________________
GPS Coordinates: North: _________________________ East: ___________________________________________________
5.4.2.4 Food Security, Livelihood and Nutrition Aassesment Market Questions

FSAU Technical Series Report No IV.8 77 Issued February 22, 2006
5.4.2.5 Key Parameter Form for Milk Production by District - Shabelle Valley
FOOD SECURITY ANALYSIS UNIT (FSAU)/FEWSNET
FOOD SECURITY, LIVELIHOODS AND NUTRITION ASSESSMENT
PASTORAL/AGROPASTORAL
Date & season: ___________________________________Interviewer’s name: ______________________________________
Village/settlement_________________________________Livelihood zone: _________________________________________
GPS Coordinates: North: _________________________East: ___________________________________________________
Key informant/focus group/household interview: ________________________________________________________________
MILK PRODUCTION BY DISTRICT - SHABELLE VALLEY
CURRENT YEAR MONITORING DATA
YEAR 2005-06
(A) Typical number of milking animals per 100 mature females in the season
(B) Actual number of milking animals per 100 mature females this season
(C) Typical milk yield in the season (liters per day)
(D) Actual milk yield this season
Camels
Region District 1st season 2nd season
Gu Deyr
(A) (B) (C) (D) (A) (B) (C) (D) Explantion Notes
L. Shabelle Afgooye/Awdheegle 45 3.5 45 3
L. Shabelle Brava
L. Shabelle Kurtunwarey 45 3.5 45 3
L. Shabelle Merka 45 3.5 45 3
L. Shabelle Qoryoley 45 3.5 45 3
L. Shabelle Sablaale 45 3.5 45 3
L. Shabelle Wanle Weyne 45 3.5 45 3
M. Shabelle Aden Yabaal/runnirgod
M. Shabelle Balcad/Warsheikh
M. Shabelle Cadale
M. Shabelle Jowhar 45 3.5 45 3
- -
Cattle
Region District 1st season 2nd season
Gu Deyr
(A) (B) (C) (D) (A) (B) (C) (D) Explantion Notes
L. Shabelle Afgooye/Awdheegle 50 2.75 50 2.25
L. Shabelle Brava
L. Shabelle Kurtunwarey 50 2.75 50 2.25
L. Shabelle Merka 50 2.75 50 2.25
L. Shabelle Qoryoley 50 2.75 50 2.25
L. Shabelle Sablaale 50 2.75 50 2.25
L. Shabelle Wanle Weyne 50 2.75 50 2.25
M. Shabelle Aden Yabaal/runnirgod
M. Shabelle Balcad/Warsheikh
M. Shabelle Cadale
M. Shabelle Jowhar 50 2.75 50 2.25
- -
Shoats
Region District 1st season 2nd season
Gu Deyr
(A) (B) (C) (D) (A) (B) (C) (D) Explantion Notes
L. Shabelle Afgooye/Awdheegle 60 0.4 60 0.4
L. Shabelle Brava
L. Shabelle Kurtunwarey 60 0.4 60 0.4
L. Shabelle Merka 60 0.4 60 0.4
L. Shabelle Qoryoley 60 0.4 60 0.4
L. Shabelle Sablaale 60 0.4 60 0.4
L. Shabelle Wanle Weyne 60 0.4 60 0.4
M. Shabelle Aden Yabaal/runnirgod
M. Shabelle Balcad/Warsheikh
M. Shabelle Cadale
M. Shabelle Jowhar 60 0.4 60 0.4
Data entry no:
ap
pen
dix

FSAU Technical Series Report No IV.8 78 Issued February 22, 2006
ap
pen
dix
FOOD SECURITY ANALYSIS UNIT (FSAU)/FEWSNET
FOOD SECURITY, LIVELIHOODS AND NUTRITION ASSESSMENT
PASTORAL/AGROPASTORAL
Date & season: ___________________________________Interviewer’s name: _____________________________________
Village/settlement_________________________________Livelihood zone: _______________________________________
GPS Coordinates: North: _________________________East: __________________________________________________
Key informant/focus group/household interview: _____________________________________________________________
LIVESTOCK PRODUCTION - SHABELLE VALLEYCURRENT YEAR MONITORING DATA
YEAR 2005-06
HERD SIZE BY DISTRICT AND LIVELIHOOD ZONE
1. The table gives reference year herd sizes by district and livelihood zone
2. Enter rev ised herd size in the yellow cells, or leave blank to retain existing herd sizes.
3. Changes in herd size are used to calculate changes in the number of livestock sold and in the number of mature females
4. Data for poor will be applied to very poor and for middle will be applied to b/off.
Camels
Region District Livelihood Zone
SIP - Southern Inland Pastoral
P M Explanation Notes
L. Shabelle Afgooye/Awdheegle 25 50
L. Shabelle Brava
L. Shabelle Kurtunwarey 25 50
L. Shabelle Merka 25 50
L. Shabelle Qoryoley 25 50
L. Shabelle Sablaale 25 50
L. Shabelle Wanle Weyne 25 50
M. Shabelle Aden Yabaal/runnirgod
M. Shabelle Balcad/Warsheikh
M. Shabelle Cadale
M. Shabelle Jowhar 25 50
- -
Cattle
Region District Livelihood Zone
SIP - Southern Inland Pastoral
P M Explanation Notes
L. Shabelle Afgooye/Awdheegle 7.5 20
L. Shabelle Brava
L. Shabelle Kurtunwarey 7.5 20
L. Shabelle Merka 7.5 20
L. Shabelle Qoryoley 7.5 20
L. Shabelle Sablaale 7.5 20
L. Shabelle Wanle Weyne 7.5 20
M. Shabelle Aden Yabaal/runnirgod
M. Shabelle Balcad/Warsheikh
M. Shabelle Cadale
M. Shabelle Jowhar 7.5 20
- -
Shoats
Region District Livelihood Zone
SIP - Southern Inland Pastoral
P M Explanation Notes
L. Shabelle Afgooye/Awdheegle 40 75
L. Shabelle Brava
L. Shabelle Kurtunwarey 40 75
L. Shabelle Merka 40 75
L. Shabelle Qoryoley 40 75
L. Shabelle Sablaale 40 75
L. Shabelle Wanle Weyne 40 75
M. Shabelle Aden Yabaal/runnirgod
M. Shabelle Balcad/Warsheikh
M. Shabelle Cadale
M. Shabelle Jowhar 40 75
- -
Data entry no:
5.4.2.6 Key Parameter Form for Livestock Production - Shabelle Valley

FSAU Technical Series Report No IV.8 79 Issued February 22, 2006
FOOD SECURITY ANALYSIS UNIT (FSAU)/FEWSNET
FOOD SECURITY, LIVELIHOODS AND NUTRITION ASSESSMENT
PASTORAL/AGROPASTORAL
Date & season: Interviewer’s name:
Village/settlement_________________________________Livelihood zone: _________________________________________
GPS Coordinates: North: _________________________East: ___________________________________________________
Key informant/focus group/household interview: ________________________________________________________________
OTHER FOOD AND INCOME SOURCES - SHABELLE VALLEY
CURRENT YEAR MONITORING DATA 2005-06
1. The table gives reference year herd sizes by district and livelihood zone
2. Enter estimated access (i.e. quantity) for year if it was greater or less than baseline year
e.g 100% = baseline access - same as baseline
e.g 50% = 50% of baseline access
3. Note - This is rough estimate for annual access: Year June 2005 to May 2006.
Region District
L. Shabelle Afgooye/Awdheegle
L. Shabelle Brava
L. Shabelle Kurtunwarey
L. Shabelle Merka
L. Shabelle Qoryoley
L. Shabelle Sablaale
L. Shabelle Wanle Weyne
M. Shabelle Aden Yabaal/runnirgod
M. Shabelle Balcad/Warsheikh
M. Shabelle Cadale
M. Shabelle Jowhar
- -
lab
ou
r m
igra
tio
n
rem
itta
nces
wo
od
/ch
arco
al
Ex
pla
na
tio
n n
ote
s
gu
ms/
resi
ns
oth
er l
ab
ou
r
loa
ns
gif
ts
foo
d s
tock
s
ag
.la
bo
ur -
gu
ag
.la
bo
ur -
dey
r
Data entry no:
5.4.2.7 Key Parameter Form for Other Food and Income Sources - Shabelle Valley
ap
pen
dix

FSAU Technical Series Report No IV.8 80 Issued February 22, 2006
5.4.2.8 Food Security Phase Classifi cation - Evidence Based Analysis Template: Post Deyr 05/06 Assessment
HE=Humanitarian Emergency, LC=Livelihood Crisis, A=Alert
Estimating Affected Population Numbers
1. Defi ne geographic area that spatially delineates the affected population (in a State Humanitarian Emergency, Livelihood Crisis, or Alert).
2. Identify the most current population estimates for this geographic area (i.e. WHO 2003 population estimates by district).
3. Adjust total population estimates to account for any known recent migration in or out of the affected area.
4. Estimate the percent of the population affected (by both Humanitarian Emergency and Livelihood Crisis) within the affected geographic area. The most appropriate method
could be by wealth group, but in come instances may be more accurate to estimate by clan, gender, etc.
Part 2
Part 3
Part 1
Part 2: Immediate Cause, Effects on Livelihoods, Risks to Monitor and Opportunities for Response
ACTION
Affected Area
(by Region/Area)
Phase
Classification
(HE, LC)
Immediate
Causes
(Driving
Forces)
Effect on Livelihood
Strategies
Summary Statements
Identification,
Characteristic
s & % of
Population
Affected
Projected Trend
(up until Nov 05) Improving situation
No change or
Uncertain
Worsening Situation
Risk Factors
to Monitor
Opportunities for
Response
(Immediate Response to
Improve Access to Food
and Assist with Other
Immediate Needs, i.e.
Health, Shelter, etc.)
PART 3: Underlying Causes, Effects on Capitals and Mitigation in the Medium and Long Term
ACTIONS
Affected Area
(by Region/Area)
Phase
Classification
(HE, LC or A)
Underlying Causes Effect on Specific Capitals
(Most Affected Capitals)
Projected Trend for
Specific Capitals
Opportunities for Mitigation by Specific
Capital
(Policy, Programmes, Advocacy, etc)
Part 1: Area Affected, Phase Classification, Characteristics and Evidence
Affected Area
by Region (Area)
Phase Classification
(HE or LC)
General Characteristics
International Standards
Key Evidence Indicator
Source; Evidence
Reliability Score (1=very
reliable, 2=somewhat
reliable 3=unconfirmed);
Relevant Phase
Classification HE or LC;
Supporting Evidence
Triangulation of Supporting Evidence; Source; Evidence Reliability
Score (1=very reliable, 2=somewhat reliable 3=unconfirmed);
Relevant Phase Classification HE or LC;
By Livelihood Assets and Livelihood Strategies (Strategies also done
by LZ)
ap
pen
dix

FSAU Technical Series Report No IV.8 81 Issued February 22, 2006
livelih
oo
d zo
nes m
ap
APPENDIX 6
Map 18: Livelihood Zones of Somalia

FSAU Technical Series Report No IV.8 82 Issued February 22, 2006